UNITED STATES
SECURITIES AND EXCHANGE COMMISSION
Washington, D.C. 20549
FORM N-CSR
CERTIFIED SHAREHOLDER REPORT OF REGISTERED
MANAGEMENT INVESTMENT COMPANIES
Investment Company Act file number 811-21780
MFS SERIES TRUST XII
(Exact name of registrant as specified in charter)
111 Huntington Avenue, Boston, Massachusetts 02199 (Address of principal executive offices) (Zip code)
Christopher R. Bohane
Massachusetts Financial Services Company
111 Huntington Avenue
Boston, Massachusetts 02199
(Name and address of agents for service)
Registrant's telephone number, including area code: (617) 954-5000
Date of fiscal year end: April 30*
Date of reporting period: October 31, 2022
*Effective as of the close of business on August 5, 2022, MFS Lifetime 2020 Fund was reorganized into MFS Lifetime Income Fund. MFS Core Bond Fund commenced investment operations on June 22, 2022.
ITEM 1. REPORTS TO STOCKHOLDERS.
Item 1(a):
Semiannual Report
October 31, 2022
MFS® Lifetime® Income Fund
MFS® Lifetime® 2025 Fund
MFS® Lifetime® 2030 Fund
MFS® Lifetime® 2035 Fund
MFS® Lifetime® 2040 Fund
MFS® Lifetime® 2045 Fund
MFS® Lifetime® 2050 Fund
MFS® Lifetime® 2055 Fund
MFS® Lifetime® 2060 Fund
MFS® Lifetime® 2065 Fund
| 1 |
| 2 |
| 12 |
| 23 |
| 34 |
| 43 |
| 45 |
| 47 |
| 106 |
| 144 |
| 148 |
| 148 |
| 148 |
| 148 |
| 148 |
The report is prepared for the general information of shareholders. It is authorized for distribution to prospective investors only when preceded or accompanied by a current prospectus.
NOT FDIC INSURED • MAY LOSE VALUE • NO BANK GUARANTEE
LETTER FROM THE CHAIR AND CEO
Dear Shareholders:
Global markets have recently been buffeted by a series of crosscurrents, including rising inflation, tighter financial conditions, and evolving geopolitical tensions. Consequently, at a time when global growth faces multiple headwinds, central banks have been presented with the challenge of reining in rising prices without tipping economies into recession. The U.S. Federal Reserve has made it clear that rates must move higher and tighter policy must be sustained to restore price stability and that this will likely bring some pain to households and businesses. Against that backdrop, richly valued, interest rate–sensitive growth equities have been hit particularly hard by rising interest rates. Volatility in fixed income and currency markets has picked up, with fiscal policy missteps in the United Kingdom leading to a crisis of market confidence that ultimately resulted in the ouster of Prime Minister Liz Truss. That episode could forewarn other governments to avoid policy overreach.
There are, however, encouraging signs for the markets. China has modestly relaxed its zero-COVID policy, and cases globally, while numerous, appear to be causing fewer serious illnesses. Meanwhile, unemployment is low and global supply chain bottlenecks are easing, though lingering coronavirus restrictions in China and disruptions stemming from Russia’s invasion of Ukraine could hamper these advances. Additionally, easier Chinese monetary and regulatory policies and the record pace of corporate stock buybacks are supportive elements, albeit in an otherwise turbulent investment environment.
It is important to have a deep understanding of company fundamentals during times of market transition, and we have built our unique global research platform to do just that.
At MFS®, we put our clients’ assets to work responsibly by carefully navigating increasingly complex global capital markets. Our investment team is guided by a commitment to long-term fundamental investing. Our global investment platform — combining collective expertise, long-term discipline, and thoughtful risk management — seeks to uncover what we believe are the best, most durable investment ideas in markets around the world, enabling us to potentially create value for investors.
Respectfully,
Michael W. Roberge
Chair and Chief Executive Officer
MFS Investment Management
December 15, 2022
The opinions expressed in this letter are subject to change and may not be relied upon for investment advice. No forecasts can be guaranteed.
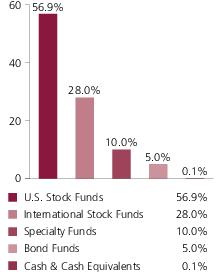
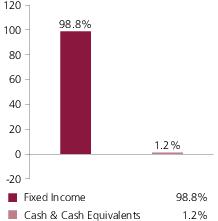
Portfolio Composition
MFS Lifetime Income Fund
Portfolio target allocation
Portfolio actual allocation
Portfolio holdings
| MFS Limited Maturity Fund | 19.9% |
| MFS Total Return Bond Fund | 19.9% |
| MFS Inflation-Adjusted Bond Fund | 10.0% |
| MFS Government Securities Fund | 10.0% |
| MFS Global Opportunistic Bond Fund | 7.0% |
| MFS Blended Research Mid Cap Equity Fund | 3.1% |
| MFS Blended Research International Equity Fund | 2.5% |
| MFS Blended Research Value Equity Fund | 2.0% |
| MFS Value Fund | 2.0% |
| MFS Blended Research Core Equity Fund | 2.0% |
| MFS Research Fund | 2.0% |
| MFS High Income Fund | 2.0% |
| MFS Blended Research Growth Equity Fund | 2.0% |
| MFS Growth Fund | 2.0% |
| MFS Global Real Estate Fund | 2.0% |
| MFS Commodity Strategy Fund | 2.0% |
| MFS Mid Cap Value Fund | 1.5% |
| MFS Mid Cap Growth Fund | 1.5% |
| MFS Research International Fund | 1.5% |
| MFS Blended Research Small Cap Equity Fund | 1.0% |
| MFS Emerging Markets Debt Local Currency Fund | 1.0% |
| MFS Emerging Markets Debt Fund | 1.0% |
| MFS New Discovery Value Fund | 0.5% |
| MFS New Discovery Fund | 0.5% |
| MFS International Growth Fund | 0.5% |
| MFS International Intrinsic Value Fund | 0.5% |
| Cash & Cash Equivalents | 0.1% |
Cash & Cash Equivalents includes any cash, investments in money market funds, short-term securities, and other assets less liabilities. MFS endeavors to fully invest all MFS funds-of-funds in underlying funds on a daily basis. Any divergence from 0.0% in Cash & Cash Equivalents is typically due to the timing of fund subscriptions/redemptions and the settlement of subsequent investment in/divestment from the underlying funds. While the MFS funds-of-funds' subscriptions/redemptions are processed at the same day NAV of the underlying funds, a positive/negative cash balance will be reflected on the MFS funds-of-funds' Statements of Assets and Liabilities until the trades with the underlying funds settle, which is typically two business days. Please see the Statements of Assets and Liabilities for additional information related to the fund’s cash position and other assets and liabilities.
Percentages are based on net assets as of October 31, 2022.
The portfolio is actively managed and current holdings may be different.
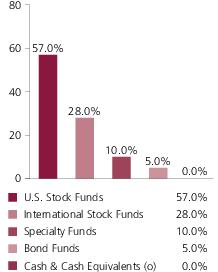
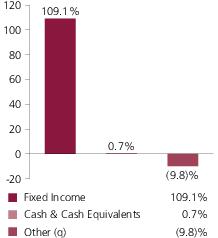
Portfolio Composition - continued
Portfolio target allocation
Portfolio actual allocation
Portfolio holdings
| MFS Total Return Bond Fund | 17.0% |
| MFS Limited Maturity Fund | 14.1% |
| MFS Inflation-Adjusted Bond Fund | 10.0% |
| MFS Government Securities Fund | 10.0% |
| MFS Global Opportunistic Bond Fund | 7.0% |
| MFS Blended Research Mid Cap Equity Fund | 3.5% |
| MFS Blended Research International Equity Fund | 3.3% |
| MFS High Income Fund | 3.2% |
| MFS Growth Fund | 2.6% |
| MFS Research Fund | 2.6% |
| MFS Value Fund | 2.6% |
| MFS Blended Research Growth Equity Fund | 2.6% |
| MFS Blended Research Value Equity Fund | 2.6% |
| MFS Blended Research Core Equity Fund | 2.5% |
| MFS Global Real Estate Fund | 2.0% |
| MFS Commodity Strategy Fund | 2.0% |
| MFS Mid Cap Value Fund | 1.8% |
| MFS Mid Cap Growth Fund | 1.8% |
| MFS Research International Fund | 1.8% |
| MFS Emerging Markets Debt Fund | 1.6% |
| MFS Emerging Markets Debt Local Currency Fund | 1.6% |
| MFS Blended Research Small Cap Equity Fund | 1.0% |
| MFS International Growth Fund | 0.8% |
| MFS International Intrinsic Value Fund | 0.8% |
| MFS New Discovery Fund | 0.5% |
| MFS New Discovery Value Fund | 0.5% |
| Cash & Cash Equivalents | 0.2% |
Cash & Cash Equivalents includes any cash, investments in money market funds, short-term securities, and other assets less liabilities. MFS endeavors to fully invest all MFS funds-of-funds in underlying funds on a daily basis. Any divergence from 0.0% in Cash & Cash Equivalents is typically due to the timing of fund subscriptions/redemptions and the settlement of subsequent investment in/divestment from the underlying funds. While the MFS funds-of-funds' subscriptions/redemptions are processed at the same day NAV of the underlying funds, a positive/negative cash balance will be reflected on the MFS funds-of-funds' Statements of Assets and Liabilities until the trades with the underlying funds settle, which is typically two business days. Please see the Statements of Assets and Liabilities for additional information related to the fund’s cash position and other assets and liabilities.
Percentages are based on net assets as of October 31, 2022.
The portfolio is actively managed and current holdings may be different.
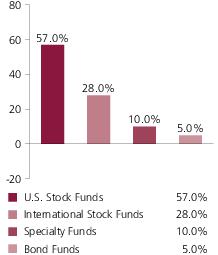
Portfolio Composition - continued
Portfolio target allocation
Portfolio actual allocation
Portfolio holdings
| MFS Total Return Bond Fund | 11.4% |
| MFS Government Securities Fund | 10.0% |
| MFS Inflation-Adjusted Bond Fund | 8.2% |
| MFS Blended Research Mid Cap Equity Fund | 5.8% |
| MFS Global Opportunistic Bond Fund | 5.8% |
| MFS Blended Research International Equity Fund | 5.1% |
| MFS Limited Maturity Fund | 4.1% |
| MFS High Income Fund | 4.0% |
| MFS Blended Research Value Equity Fund | 3.6% |
| MFS Value Fund | 3.6% |
| MFS Blended Research Core Equity Fund | 3.6% |
| MFS Research Fund | 3.6% |
| MFS Blended Research Growth Equity Fund | 3.6% |
| MFS Growth Fund | 3.6% |
| MFS Mid Cap Value Fund | 2.9% |
| MFS Mid Cap Growth Fund | 2.9% |
| MFS Global Real Estate Fund | 2.6% |
| MFS Research International Fund | 2.6% |
| MFS Emerging Markets Debt Fund | 2.6% |
| MFS Commodity Strategy Fund | 2.6% |
| MFS Emerging Markets Debt Local Currency Fund | 2.0% |
| MFS Blended Research Small Cap Equity Fund | 1.3% |
| MFS International Growth Fund | 1.3% |
| MFS International Intrinsic Value Fund | 1.3% |
| MFS New Discovery Value Fund | 0.6% |
| MFS New Discovery Fund | 0.6% |
| MFS International New Discovery Fund | 0.6% |
| Cash & Cash Equivalents | 0.1% |
Cash & Cash Equivalents includes any cash, investments in money market funds, short-term securities, and other assets less liabilities. MFS endeavors to fully invest all MFS funds-of-funds in underlying funds on a daily basis. Any divergence from 0.0% in Cash & Cash Equivalents is typically due to the timing of fund subscriptions/redemptions and the settlement of subsequent investment in/divestment from the underlying funds. While the MFS funds-of-funds' subscriptions/redemptions are processed at the same day NAV of the underlying funds, a positive/negative cash balance will be reflected on the MFS funds-of-funds' Statements of Assets and Liabilities until the trades with the underlying funds settle, which is typically two business days. Please see the Statements of Assets and Liabilities for additional information related to the fund’s cash position and other assets and liabilities.
Percentages are based on net assets as of October 31, 2022.
The portfolio is actively managed and current holdings may be different.
Portfolio Composition - continued
Portfolio target allocation
Portfolio actual allocation
Portfolio holdings
| MFS Blended Research Mid Cap Equity Fund | 8.1% |
| MFS Blended Research International Equity Fund | 7.4% |
| MFS Inflation-Adjusted Bond Fund | 5.8% |
| MFS Total Return Bond Fund | 5.5% |
| MFS Value Fund | 4.6% |
| MFS Blended Research Core Equity Fund | 4.6% |
| MFS Blended Research Growth Equity Fund | 4.6% |
| MFS Blended Research Value Equity Fund | 4.6% |
| MFS Research Fund | 4.6% |
| MFS Growth Fund | 4.5% |
| MFS Government Securities Fund | 4.2% |
| MFS Mid Cap Value Fund | 4.1% |
| MFS Mid Cap Growth Fund | 4.1% |
| MFS High Income Fund | 4.0% |
| MFS Global Opportunistic Bond Fund | 3.8% |
| MFS Global Real Estate Fund | 3.6% |
| MFS Commodity Strategy Fund | 3.5% |
| MFS Research International Fund | 3.3% |
| MFS Emerging Markets Debt Fund | 3.0% |
| MFS International Intrinsic Value Fund | 2.1% |
| MFS International Growth Fund | 2.1% |
| MFS Emerging Markets Debt Local Currency Fund | 2.0% |
| MFS Blended Research Small Cap Equity Fund | 1.8% |
| MFS International New Discovery Fund | 1.6% |
| MFS New Discovery Value Fund | 0.9% |
| MFS New Discovery Fund | 0.9% |
| MFS Emerging Markets Equity Fund | 0.3% |
| MFS Blended Research Emerging Markets Equity Fund | 0.3% |
| Cash & Cash Equivalents | 0.1% |
Cash & Cash Equivalents includes any cash, investments in money market funds, short-term securities, and other assets less liabilities. MFS endeavors to fully invest all MFS funds-of-funds in underlying funds on a daily basis. Any divergence from 0.0% in Cash & Cash Equivalents is typically due to the timing of fund subscriptions/redemptions and the settlement of subsequent investment in/divestment from the underlying funds. While the MFS funds-of-funds' subscriptions/redemptions are processed at the same day NAV of the underlying funds, a positive/negative cash balance will be reflected on the MFS funds-of-funds' Statements of Assets and Liabilities until the trades with the underlying funds settle, which is typically two business days. Please see the Statements of Assets and Liabilities for additional information related to the fund’s cash position and other assets and liabilities.
Percentages are based on net assets as of October 31, 2022.
The portfolio is actively managed and current holdings may be different.
Portfolio Composition - continued
Portfolio target allocation
Portfolio actual allocation
Portfolio holdings
| MFS Blended Research Mid Cap Equity Fund | 9.3% |
| MFS Blended Research International Equity Fund | 9.2% |
| MFS Growth Fund | 5.2% |
| MFS Blended Research Growth Equity Fund | 5.1% |
| MFS Blended Research Value Equity Fund | 5.1% |
| MFS Value Fund | 5.1% |
| MFS Blended Research Core Equity Fund | 5.0% |
| MFS Research Fund | 5.0% |
| MFS Mid Cap Growth Fund | 4.6% |
| MFS Mid Cap Value Fund | 4.6% |
| MFS Commodity Strategy Fund | 4.3% |
| MFS Global Real Estate Fund | 4.3% |
| MFS Inflation-Adjusted Bond Fund | 4.3% |
| MFS Research International Fund | 3.6% |
| MFS Total Return Bond Fund | 2.9% |
| MFS High Income Fund | 2.8% |
| MFS International Intrinsic Value Fund | 2.8% |
| MFS International Growth Fund | 2.8% |
| MFS International New Discovery Fund | 2.6% |
| MFS Blended Research Small Cap Equity Fund | 2.2% |
| MFS Emerging Markets Debt Fund | 2.1% |
| MFS Global Opportunistic Bond Fund | 2.1% |
| MFS Emerging Markets Debt Local Currency Fund | 1.4% |
| MFS New Discovery Value Fund | 1.1% |
| MFS New Discovery Fund | 1.1% |
| MFS Emerging Markets Equity Fund | 0.7% |
| MFS Blended Research Emerging Markets Equity Fund | 0.6% |
| Cash & Cash Equivalents | 0.1% |
Cash & Cash Equivalents includes any cash, investments in money market funds, short-term securities, and other assets less liabilities. MFS endeavors to fully invest all MFS funds-of-funds in underlying funds on a daily basis. Any divergence from 0.0% in Cash & Cash Equivalents is typically due to the timing of fund subscriptions/redemptions and the settlement of subsequent investment in/divestment from the underlying funds. While the MFS funds-of-funds' subscriptions/redemptions are processed at the same day NAV of the underlying funds, a positive/negative cash balance will be reflected on the MFS funds-of-funds' Statements of Assets and Liabilities until the trades with the underlying funds settle, which is typically two business days. Please see the Statements of Assets and Liabilities for additional information related to the fund’s cash position and other assets and liabilities.
Percentages are based on net assets as of October 31, 2022.
The portfolio is actively managed and current holdings may be different.
Portfolio Composition - continued
Portfolio target allocation
Portfolio actual allocation
Portfolio holdings
| MFS Blended Research International Equity Fund | 10.5% |
| MFS Blended Research Mid Cap Equity Fund | 9.8% |
| MFS Value Fund | 5.4% |
| MFS Growth Fund | 5.4% |
| MFS Blended Research Growth Equity Fund | 5.4% |
| MFS Blended Research Value Equity Fund | 5.4% |
| MFS Research Fund | 5.0% |
| MFS Blended Research Core Equity Fund | 5.0% |
| MFS Mid Cap Value Fund | 4.9% |
| MFS Mid Cap Growth Fund | 4.9% |
| MFS Global Real Estate Fund | 4.8% |
| MFS Commodity Strategy Fund | 4.8% |
| MFS Research International Fund | 3.9% |
| MFS International New Discovery Fund | 3.6% |
| MFS International Growth Fund | 3.3% |
| MFS International Intrinsic Value Fund | 3.3% |
| MFS Inflation-Adjusted Bond Fund | 3.0% |
| MFS Total Return Bond Fund | 2.5% |
| MFS Blended Research Small Cap Equity Fund | 2.4% |
| MFS New Discovery Value Fund | 1.2% |
| MFS New Discovery Fund | 1.2% |
| MFS Emerging Markets Equity Fund | 0.9% |
| MFS Blended Research Emerging Markets Equity Fund | 0.9% |
| MFS High Income Fund | 0.8% |
| MFS Global Opportunistic Bond Fund | 0.6% |
| MFS Emerging Markets Debt Fund | 0.6% |
| MFS Emerging Markets Debt Local Currency Fund | 0.4% |
| Cash & Cash Equivalents | 0.1% |
Cash & Cash Equivalents includes any cash, investments in money market funds, short-term securities, and other assets less liabilities. MFS endeavors to fully invest all MFS funds-of-funds in underlying funds on a daily basis. Any divergence from 0.0% in Cash & Cash Equivalents is typically due to the timing of fund subscriptions/redemptions and the settlement of subsequent investment in/divestment from the underlying funds. While the MFS funds-of-funds' subscriptions/redemptions are processed at the same day NAV of the underlying funds, a positive/negative cash balance will be reflected on the MFS funds-of-funds' Statements of Assets and Liabilities until the trades with the underlying funds settle, which is typically two business days. Please see the Statements of Assets and Liabilities for additional information related to the fund’s cash position and other assets and liabilities.
Percentages are based on net assets as of October 31, 2022.
The portfolio is actively managed and current holdings may be different.
Portfolio Composition - continued
Portfolio target allocation
Portfolio actual allocation
Portfolio holdings
| MFS Blended Research International Equity Fund | 11.0% |
| MFS Blended Research Mid Cap Equity Fund | 10.0% |
| MFS Value Fund | 5.5% |
| MFS Growth Fund | 5.5% |
| MFS Blended Research Value Equity Fund | 5.5% |
| MFS Blended Research Growth Equity Fund | 5.5% |
| MFS Research Fund | 5.0% |
| MFS Global Real Estate Fund | 5.0% |
| MFS Mid Cap Value Fund | 5.0% |
| MFS Commodity Strategy Fund | 5.0% |
| MFS Mid Cap Growth Fund | 5.0% |
| MFS Blended Research Core Equity Fund | 5.0% |
| MFS Research International Fund | 4.0% |
| MFS International New Discovery Fund | 4.0% |
| MFS International Intrinsic Value Fund | 3.5% |
| MFS International Growth Fund | 3.5% |
| MFS Inflation-Adjusted Bond Fund | 2.5% |
| MFS Total Return Bond Fund | 2.5% |
| MFS Blended Research Small Cap Equity Fund | 2.5% |
| MFS New Discovery Value Fund | 1.2% |
| MFS New Discovery Fund | 1.2% |
| MFS Emerging Markets Equity Fund | 1.0% |
| MFS Blended Research Emerging Markets Equity Fund | 1.0% |
| Cash & Cash Equivalents | 0.1% |
Cash & Cash Equivalents includes any cash, investments in money market funds, short-term securities, and other assets less liabilities. MFS endeavors to fully invest all MFS funds-of-funds in underlying funds on a daily basis. Any divergence from 0.0% in Cash & Cash Equivalents is typically due to the timing of fund subscriptions/redemptions and the settlement of subsequent investment in/divestment from the underlying funds. While the MFS funds-of-funds' subscriptions/redemptions are processed at the same day NAV of the underlying funds, a positive/negative cash balance will be reflected on the MFS funds-of-funds' Statements of Assets and Liabilities until the trades with the underlying funds settle, which is typically two business days. Please see the Statements of Assets and Liabilities for additional information related to the fund’s cash position and other assets and liabilities.
Percentages are based on net assets as of October 31, 2022.
The portfolio is actively managed and current holdings may be different.
Portfolio Composition - continued
Portfolio target allocation
Portfolio actual allocation
Portfolio holdings
| MFS Blended Research International Equity Fund | 11.0% |
| MFS Blended Research Mid Cap Equity Fund | 10.0% |
| MFS Value Fund | 5.5% |
| MFS Blended Research Growth Equity Fund | 5.5% |
| MFS Blended Research Value Equity Fund | 5.5% |
| MFS Growth Fund | 5.5% |
| MFS Research Fund | 5.0% |
| MFS Global Real Estate Fund | 5.0% |
| MFS Mid Cap Value Fund | 5.0% |
| MFS Commodity Strategy Fund | 5.0% |
| MFS Mid Cap Growth Fund | 5.0% |
| MFS Blended Research Core Equity Fund | 5.0% |
| MFS International New Discovery Fund | 4.0% |
| MFS Research International Fund | 4.0% |
| MFS International Intrinsic Value Fund | 3.5% |
| MFS International Growth Fund | 3.5% |
| MFS Inflation-Adjusted Bond Fund | 2.5% |
| MFS Total Return Bond Fund | 2.5% |
| MFS Blended Research Small Cap Equity Fund | 2.5% |
| MFS New Discovery Value Fund | 1.2% |
| MFS New Discovery Fund | 1.2% |
| MFS Emerging Markets Equity Fund | 1.0% |
| MFS Blended Research Emerging Markets Equity Fund | 1.0% |
| Cash & Cash Equivalents | 0.1% |
Cash & Cash Equivalents includes any cash, investments in money market funds, short-term securities, and other assets less liabilities. MFS endeavors to fully invest all MFS funds-of-funds in underlying funds on a daily basis. Any divergence from 0.0% in Cash & Cash Equivalents is typically due to the timing of fund subscriptions/redemptions and the settlement of subsequent investment in/divestment from the underlying funds. While the MFS funds-of-funds' subscriptions/redemptions are processed at the same day NAV of the underlying funds, a positive/negative cash balance will be reflected on the MFS funds-of-funds' Statements of Assets and Liabilities until the trades with the underlying funds settle, which is typically two business days. Please see the Statements of Assets and Liabilities for additional information related to the fund’s cash position and other assets and liabilities.
Percentages are based on net assets as of October 31, 2022.
The portfolio is actively managed and current holdings may be different.
Portfolio Composition - continued
Portfolio target allocation
Portfolio actual allocation
Portfolio holdings
| MFS Blended Research International Equity Fund | 11.0% |
| MFS Blended Research Mid Cap Equity Fund | 10.0% |
| MFS Growth Fund | 5.5% |
| MFS Blended Research Growth Equity Fund | 5.5% |
| MFS Blended Research Value Equity Fund | 5.5% |
| MFS Value Fund | 5.5% |
| MFS Research Fund | 5.0% |
| MFS Blended Research Core Equity Fund | 5.0% |
| MFS Mid Cap Growth Fund | 5.0% |
| MFS Global Real Estate Fund | 5.0% |
| MFS Commodity Strategy Fund | 5.0% |
| MFS Mid Cap Value Fund | 5.0% |
| MFS International New Discovery Fund | 4.0% |
| MFS Research International Fund | 4.0% |
| MFS International Intrinsic Value Fund | 3.5% |
| MFS International Growth Fund | 3.5% |
| MFS Blended Research Small Cap Equity Fund | 2.5% |
| MFS Total Return Bond Fund | 2.5% |
| MFS Inflation-Adjusted Bond Fund | 2.5% |
| MFS New Discovery Value Fund | 1.3% |
| MFS New Discovery Fund | 1.2% |
| MFS Blended Research Emerging Markets Equity Fund | 1.0% |
| MFS Emerging Markets Equity Fund | 1.0% |
| Cash & Cash Equivalents (o) | 0.0% |
Cash & Cash Equivalents includes any cash, investments in money market funds, short-term securities, and other assets less liabilities. MFS endeavors to fully invest all MFS funds-of-funds in underlying funds on a daily basis. Any divergence from 0.0% in Cash & Cash Equivalents is typically due to the timing of fund subscriptions/redemptions and the settlement of subsequent investment in/divestment from the underlying funds. While the MFS funds-of-funds' subscriptions/redemptions are processed at the same day NAV of the underlying funds, a positive/negative cash balance will be reflected on the MFS funds-of-funds' Statements of Assets and Liabilities until the trades with the underlying funds settle, which is typically two business days. Please see the Statements of Assets and Liabilities for additional information related to the fund’s cash position and other assets and liabilities.
Percentages are based on net assets as of October 31, 2022.
The portfolio is actively managed and current holdings may be different.
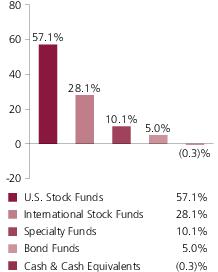
Portfolio Composition - continued
Portfolio target allocation
Portfolio actual allocation
Portfolio holdings
| MFS Blended Research International Equity Fund | 11.1% |
| MFS Blended Research Mid Cap Equity Fund | 10.0% |
| MFS Blended Research Value Equity Fund | 5.5% |
| MFS Value Fund | 5.5% |
| MFS Growth Fund | 5.5% |
| MFS Blended Research Growth Equity Fund | 5.5% |
| MFS Commodity Strategy Fund | 5.1% |
| MFS Mid Cap Growth Fund | 5.0% |
| MFS Global Real Estate Fund | 5.0% |
| MFS Mid Cap Value Fund | 5.0% |
| MFS Blended Research Core Equity Fund | 5.0% |
| MFS Research Fund | 5.0% |
| MFS International New Discovery Fund | 4.0% |
| MFS Research International Fund | 4.0% |
| MFS International Growth Fund | 3.5% |
| MFS International Intrinsic Value Fund | 3.5% |
| MFS Total Return Bond Fund | 2.5% |
| MFS Inflation-Adjusted Bond Fund | 2.5% |
| MFS Blended Research Small Cap Equity Fund | 2.5% |
| MFS New Discovery Fund | 1.3% |
| MFS New Discovery Value Fund | 1.3% |
| MFS Emerging Markets Equity Fund | 1.0% |
| MFS Blended Research Emerging Markets Equity Fund | 1.0% |
| Cash & Cash Equivalents | (0.3)% |
Cash & Cash Equivalents includes any cash, investments in money market funds, short-term securities, and other assets less liabilities. MFS endeavors to fully invest all MFS funds-of-funds in underlying funds on a daily basis. Any divergence from 0.0% in Cash & Cash Equivalents is typically due to the timing of fund subscriptions/redemptions and the settlement of subsequent investment in/divestment from the underlying funds. While the MFS funds-of-funds' subscriptions/redemptions are processed at the same day NAV of the underlying funds, a positive/negative cash balance will be reflected on the MFS funds-of-funds' Statements of Assets and Liabilities until the trades with the underlying funds settle, which is typically two business days. Please see the Statements of Assets and Liabilities for additional information related to the fund’s cash position and other assets and liabilities.
Percentages are based on net assets as of October 31, 2022.
The portfolio is actively managed and current holdings may be different.
Expense Tables
Fund expenses borne by the shareholders during the period,
May 1, 2022 through October 31, 2022
As a shareholder of the funds, you incur two types of costs: (1) transaction costs, including sales charges (loads) on certain purchase or redemption payments, and (2) ongoing costs, including distribution and service (12b-1) fees; and other fund expenses. These examples are intended to help you understand your ongoing costs (in dollars) of investing in the funds and to compare these costs with the ongoing costs of investing in other mutual funds.
In addition to the fees and expenses which each fund bears directly, each fund indirectly bears a pro rata share of the fees and expenses of the underlying funds in which each fund invests. Because the underlying funds have varied expenses and fee levels and each fund may own different proportions of the underlying funds at different times, the amount of fees and expenses incurred indirectly by each fund will vary. If these transactional and indirect costs were included, your costs would have been higher.
These examples are based on an investment of $1,000 invested at the beginning of the period and held for the entire period May 1, 2022 through October 31, 2022.
Actual Expenses
The first line for each share class in the following tables provides information about actual account values and actual expenses. You may use the information in this line, together with the amount you invested, to estimate the expenses that you paid over the period. Simply divide your account value by $1,000 (for example, an $8,600 account value divided by $1,000 = 8.6), then multiply the result by the number in the first line under the heading entitled “Expenses Paid During Period” to estimate the expenses you paid on your account during this period.
Hypothetical Example for Comparison Purposes
The second line for each share class in the following tables provides information about hypothetical account values and hypothetical expenses based on each fund’s actual expense ratio and an assumed rate of return of 5% per year before expenses, which is not each fund’s actual return. The hypothetical account values and expenses may not be used to estimate the actual ending account balance or expenses you paid for the period. You may use this information to compare the ongoing costs of investing in each fund and other funds. To do so, compare this 5% hypothetical example with the 5% hypothetical examples that appear in the shareholder reports of the other funds.
Please note that the expenses shown in the tables are meant to highlight your ongoing costs only and do not reflect any transactional costs, such as sales charges (loads). Therefore, the second line for each share class in the tables is useful in comparing ongoing costs only, and will not help you determine the relative total costs of owning different funds. In addition, if these transactional costs were included, your costs would have been higher.
Expense Tables - continued
MFS LIFETIME INCOME FUND
Share
Class | | Annualized
Expense
Ratio | Beginning
Account Value
5/01/22 | Ending
Account Value
10/31/22 | Expenses
Paid During
Period (p)
5/01/22-10/31/22 |
| A | Actual | 0.25% | $1,000.00 | $938.70 | $1.22 |
| Hypothetical (h) | 0.25% | $1,000.00 | $1,023.95 | $1.28 |
| B | Actual | 1.00% | $1,000.00 | $935.13 | $4.88 |
| Hypothetical (h) | 1.00% | $1,000.00 | $1,020.16 | $5.09 |
| C | Actual | 1.00% | $1,000.00 | $935.08 | $4.88 |
| Hypothetical (h) | 1.00% | $1,000.00 | $1,020.16 | $5.09 |
| I | Actual | 0.00% | $1,000.00 | $939.89 | $0.00 |
| Hypothetical (h) | 0.00% | $1,000.00 | $1,025.21 | $0.00 |
| R1 | Actual | 1.00% | $1,000.00 | $935.19 | $4.88 |
| Hypothetical (h) | 1.00% | $1,000.00 | $1,020.16 | $5.09 |
| R2 | Actual | 0.50% | $1,000.00 | $937.51 | $2.44 |
| Hypothetical (h) | 0.50% | $1,000.00 | $1,022.68 | $2.55 |
| R3 | Actual | 0.25% | $1,000.00 | $938.70 | $1.22 |
| Hypothetical (h) | 0.25% | $1,000.00 | $1,023.95 | $1.28 |
| R4 | Actual | 0.00% | $1,000.00 | $939.89 | $0.00 |
| Hypothetical (h) | 0.00% | $1,000.00 | $1,025.21 | $0.00 |
| R6 | Actual | 0.00% | $1,000.00 | $939.82 | $0.00 |
| Hypothetical (h) | 0.00% | $1,000.00 | $1,025.21 | $0.00 |
| (h) | 5% class return per year before expenses. |
| (p) | “Expenses Paid During Period” are equal to each class’s annualized expense ratio, as shown above, multiplied by the average account value over the period, multiplied by 184/365 (to reflect the one-half year period). Expenses paid do not include any applicable sales charges (loads). If these transaction costs had been included, your costs would have been higher. In addition to the fees and expenses which the fund bears directly, the fund indirectly bears a pro rata share of the fees and expenses of the underlying funds in which the fund invests. If these indirect costs were included, your costs would have been higher. |
Expense Tables - continued
MFS LIFETIME 2025 FUND
Share
Class | | Annualized
Expense
Ratio | Beginning
Account Value
5/01/22 | Ending
Account Value
10/31/22 | Expenses
Paid During
Period (p)
5/01/22-10/31/22 |
| A | Actual | 0.25% | $1,000.00 | $935.73 | $1.22 |
| Hypothetical (h) | 0.25% | $1,000.00 | $1,023.95 | $1.28 |
| B | Actual | 1.00% | $1,000.00 | $932.28 | $4.87 |
| Hypothetical (h) | 1.00% | $1,000.00 | $1,020.16 | $5.09 |
| C | Actual | 1.00% | $1,000.00 | $932.58 | $4.87 |
| Hypothetical (h) | 1.00% | $1,000.00 | $1,020.16 | $5.09 |
| I | Actual | 0.00% | $1,000.00 | $937.45 | $0.00 |
| Hypothetical (h) | 0.00% | $1,000.00 | $1,025.21 | $0.00 |
| R1 | Actual | 1.00% | $1,000.00 | $932.29 | $4.87 |
| Hypothetical (h) | 1.00% | $1,000.00 | $1,020.16 | $5.09 |
| R2 | Actual | 0.50% | $1,000.00 | $934.83 | $2.44 |
| Hypothetical (h) | 0.50% | $1,000.00 | $1,022.68 | $2.55 |
| R3 | Actual | 0.25% | $1,000.00 | $935.68 | $1.22 |
| Hypothetical (h) | 0.25% | $1,000.00 | $1,023.95 | $1.28 |
| R4 | Actual | 0.00% | $1,000.00 | $937.64 | $0.00 |
| Hypothetical (h) | 0.00% | $1,000.00 | $1,025.21 | $0.00 |
| R6 | Actual | 0.00% | $1,000.00 | $937.64 | $0.00 |
| Hypothetical (h) | 0.00% | $1,000.00 | $1,025.21 | $0.00 |
| (h) | 5% class return per year before expenses. |
| (p) | “Expenses Paid During Period” are equal to each class’s annualized expense ratio, as shown above, multiplied by the average account value over the period, multiplied by 184/365 (to reflect the one-half year period). Expenses paid do not include any applicable sales charges (loads). If these transaction costs had been included, your costs would have been higher. In addition to the fees and expenses which the fund bears directly, the fund indirectly bears a pro rata share of the fees and expenses of the underlying funds in which the fund invests. If these indirect costs were included, your costs would have been higher. |
Expense Tables - continued
MFS LIFETIME 2030 FUND
Share
Class | | Annualized
Expense
Ratio | Beginning
Account Value
5/01/22 | Ending
Account Value
10/31/22 | Expenses
Paid During
Period (p)
5/01/22-10/31/22 |
| A | Actual | 0.25% | $1,000.00 | $931.38 | $1.22 |
| Hypothetical (h) | 0.25% | $1,000.00 | $1,023.95 | $1.28 |
| B | Actual | 1.00% | $1,000.00 | $927.94 | $4.86 |
| Hypothetical (h) | 1.00% | $1,000.00 | $1,020.16 | $5.09 |
| C | Actual | 1.00% | $1,000.00 | $927.98 | $4.86 |
| Hypothetical (h) | 1.00% | $1,000.00 | $1,020.16 | $5.09 |
| I | Actual | 0.00% | $1,000.00 | $932.38 | $0.00 |
| Hypothetical (h) | 0.00% | $1,000.00 | $1,025.21 | $0.00 |
| R1 | Actual | 1.00% | $1,000.00 | $928.26 | $4.86 |
| Hypothetical (h) | 1.00% | $1,000.00 | $1,020.16 | $5.09 |
| R2 | Actual | 0.50% | $1,000.00 | $930.10 | $2.43 |
| Hypothetical (h) | 0.50% | $1,000.00 | $1,022.68 | $2.55 |
| R3 | Actual | 0.25% | $1,000.00 | $931.16 | $1.22 |
| Hypothetical (h) | 0.25% | $1,000.00 | $1,023.95 | $1.28 |
| R4 | Actual | 0.00% | $1,000.00 | $932.59 | $0.00 |
| Hypothetical (h) | 0.00% | $1,000.00 | $1,025.21 | $0.00 |
| R6 | Actual | 0.00% | $1,000.00 | $933.75 | $0.00 |
| Hypothetical (h) | 0.00% | $1,000.00 | $1,025.21 | $0.00 |
| (h) | 5% class return per year before expenses. |
| (p) | “Expenses Paid During Period” are equal to each class’s annualized expense ratio, as shown above, multiplied by the average account value over the period, multiplied by 184/365 (to reflect the one-half year period). Expenses paid do not include any applicable sales charges (loads). If these transaction costs had been included, your costs would have been higher. In addition to the fees and expenses which the fund bears directly, the fund indirectly bears a pro rata share of the fees and expenses of the underlying funds in which the fund invests. If these indirect costs were included, your costs would have been higher. |
Expense Tables - continued
MFS LIFETIME 2035 FUND
Share
Class | | Annualized
Expense
Ratio | Beginning
Account Value
5/01/22 | Ending
Account Value
10/31/22 | Expenses
Paid During
Period (p)
5/01/22-10/31/22 |
| A | Actual | 0.25% | $1,000.00 | $927.84 | $1.21 |
| Hypothetical (h) | 0.25% | $1,000.00 | $1,023.95 | $1.28 |
| B | Actual | 1.00% | $1,000.00 | $924.33 | $4.85 |
| Hypothetical (h) | 1.00% | $1,000.00 | $1,020.16 | $5.09 |
| C | Actual | 1.00% | $1,000.00 | $923.78 | $4.85 |
| Hypothetical (h) | 1.00% | $1,000.00 | $1,020.16 | $5.09 |
| I | Actual | 0.00% | $1,000.00 | $929.30 | $0.00 |
| Hypothetical (h) | 0.00% | $1,000.00 | $1,025.21 | $0.00 |
| R1 | Actual | 1.00% | $1,000.00 | $924.65 | $4.85 |
| Hypothetical (h) | 1.00% | $1,000.00 | $1,020.16 | $5.09 |
| R2 | Actual | 0.50% | $1,000.00 | $926.68 | $2.43 |
| Hypothetical (h) | 0.50% | $1,000.00 | $1,022.68 | $2.55 |
| R3 | Actual | 0.25% | $1,000.00 | $927.93 | $1.21 |
| Hypothetical (h) | 0.25% | $1,000.00 | $1,023.95 | $1.28 |
| R4 | Actual | 0.00% | $1,000.00 | $929.08 | $0.00 |
| Hypothetical (h) | 0.00% | $1,000.00 | $1,025.21 | $0.00 |
| R6 | Actual | 0.00% | $1,000.00 | $929.64 | $0.00 |
| Hypothetical (h) | 0.00% | $1,000.00 | $1,025.21 | $0.00 |
| (h) | 5% class return per year before expenses. |
| (p) | “Expenses Paid During Period” are equal to each class’s annualized expense ratio, as shown above, multiplied by the average account value over the period, multiplied by 184/365 (to reflect the one-half year period). Expenses paid do not include any applicable sales charges (loads). If these transaction costs had been included, your costs would have been higher. In addition to the fees and expenses which the fund bears directly, the fund indirectly bears a pro rata share of the fees and expenses of the underlying funds in which the fund invests. If these indirect costs were included, your costs would have been higher. |
Expense Tables - continued
MFS LIFETIME 2040 FUND
Share
Class | | Annualized
Expense
Ratio | Beginning
Account Value
5/01/22 | Ending
Account Value
10/31/22 | Expenses
Paid During
Period (p)
5/01/22-10/31/22 |
| A | Actual | 0.25% | $1,000.00 | $925.13 | $1.21 |
| Hypothetical (h) | 0.25% | $1,000.00 | $1,023.95 | $1.28 |
| B | Actual | 1.00% | $1,000.00 | $921.88 | $4.84 |
| Hypothetical (h) | 1.00% | $1,000.00 | $1,020.16 | $5.09 |
| C | Actual | 1.00% | $1,000.00 | $921.77 | $4.84 |
| Hypothetical (h) | 1.00% | $1,000.00 | $1,020.16 | $5.09 |
| I | Actual | 0.00% | $1,000.00 | $926.80 | $0.00 |
| Hypothetical (h) | 0.00% | $1,000.00 | $1,025.21 | $0.00 |
| R1 | Actual | 1.00% | $1,000.00 | $922.00 | $4.84 |
| Hypothetical (h) | 1.00% | $1,000.00 | $1,020.16 | $5.09 |
| R2 | Actual | 0.50% | $1,000.00 | $924.07 | $2.42 |
| Hypothetical (h) | 0.50% | $1,000.00 | $1,022.68 | $2.55 |
| R3 | Actual | 0.25% | $1,000.00 | $925.08 | $1.21 |
| Hypothetical (h) | 0.25% | $1,000.00 | $1,023.95 | $1.28 |
| R4 | Actual | 0.00% | $1,000.00 | $926.07 | $0.00 |
| Hypothetical (h) | 0.00% | $1,000.00 | $1,025.21 | $0.00 |
| R6 | Actual | 0.00% | $1,000.00 | $927.08 | $0.00 |
| Hypothetical (h) | 0.00% | $1,000.00 | $1,025.21 | $0.00 |
| (h) | 5% class return per year before expenses. |
| (p) | “Expenses Paid During Period” are equal to each class’s annualized expense ratio, as shown above, multiplied by the average account value over the period, multiplied by 184/365 (to reflect the one-half year period). Expenses paid do not include any applicable sales charges (loads). If these transaction costs had been included, your costs would have been higher. In addition to the fees and expenses which the fund bears directly, the fund indirectly bears a pro rata share of the fees and expenses of the underlying funds in which the fund invests. If these indirect costs were included, your costs would have been higher. |
Expense Tables - continued
MFS LIFETIME 2045 FUND
Share
Class | | Annualized
Expense
Ratio | Beginning
Account Value
5/01/22 | Ending
Account Value
10/31/22 | Expenses
Paid During
Period (p)
5/01/22-10/31/22 |
| A | Actual | 0.25% | $1,000.00 | $922.69 | $1.21 |
| Hypothetical (h) | 0.25% | $1,000.00 | $1,023.95 | $1.28 |
| B | Actual | 1.00% | $1,000.00 | $919.89 | $4.84 |
| Hypothetical (h) | 1.00% | $1,000.00 | $1,020.16 | $5.09 |
| C | Actual | 1.00% | $1,000.00 | $919.43 | $4.84 |
| Hypothetical (h) | 1.00% | $1,000.00 | $1,020.16 | $5.09 |
| I | Actual | 0.00% | $1,000.00 | $924.24 | $0.00 |
| Hypothetical (h) | 0.00% | $1,000.00 | $1,025.21 | $0.00 |
| R1 | Actual | 1.00% | $1,000.00 | $919.07 | $4.84 |
| Hypothetical (h) | 1.00% | $1,000.00 | $1,020.16 | $5.09 |
| R2 | Actual | 0.50% | $1,000.00 | $921.86 | $2.42 |
| Hypothetical (h) | 0.50% | $1,000.00 | $1,022.68 | $2.55 |
| R3 | Actual | 0.25% | $1,000.00 | $923.16 | $1.21 |
| Hypothetical (h) | 0.25% | $1,000.00 | $1,023.95 | $1.28 |
| R4 | Actual | 0.00% | $1,000.00 | $924.33 | $0.00 |
| Hypothetical (h) | 0.00% | $1,000.00 | $1,025.21 | $0.00 |
| R6 | Actual | 0.00% | $1,000.00 | $924.80 | $0.00 |
| Hypothetical (h) | 0.00% | $1,000.00 | $1,025.21 | $0.00 |
| (h) | 5% class return per year before expenses. |
| (p) | “Expenses Paid During Period” are equal to each class’s annualized expense ratio, as shown above, multiplied by the average account value over the period, multiplied by 184/365 (to reflect the one-half year period). Expenses paid do not include any applicable sales charges (loads). If these transaction costs had been included, your costs would have been higher. In addition to the fees and expenses which the fund bears directly, the fund indirectly bears a pro rata share of the fees and expenses of the underlying funds in which the fund invests. If these indirect costs were included, your costs would have been higher. |
Expense Tables - continued
MFS LIFETIME 2050 FUND
Share
Class | | Annualized
Expense
Ratio | Beginning
Account Value
5/01/22 | Ending
Account Value
10/31/22 | Expenses
Paid During
Period (p)
5/01/22-10/31/22 |
| A | Actual | 0.25% | $1,000.00 | $921.60 | $1.21 |
| Hypothetical (h) | 0.25% | $1,000.00 | $1,023.95 | $1.28 |
| B | Actual | 1.00% | $1,000.00 | $918.42 | $4.84 |
| Hypothetical (h) | 1.00% | $1,000.00 | $1,020.16 | $5.09 |
| C | Actual | 1.00% | $1,000.00 | $918.39 | $4.84 |
| Hypothetical (h) | 1.00% | $1,000.00 | $1,020.16 | $5.09 |
| I | Actual | 0.00% | $1,000.00 | $923.37 | $0.00 |
| Hypothetical (h) | 0.00% | $1,000.00 | $1,025.21 | $0.00 |
| R1 | Actual | 1.00% | $1,000.00 | $918.70 | $4.84 |
| Hypothetical (h) | 1.00% | $1,000.00 | $1,020.16 | $5.09 |
| R2 | Actual | 0.50% | $1,000.00 | $920.70 | $2.42 |
| Hypothetical (h) | 0.50% | $1,000.00 | $1,022.68 | $2.55 |
| R3 | Actual | 0.25% | $1,000.00 | $922.31 | $1.21 |
| Hypothetical (h) | 0.25% | $1,000.00 | $1,023.95 | $1.28 |
| R4 | Actual | 0.00% | $1,000.00 | $923.04 | $0.00 |
| Hypothetical (h) | 0.00% | $1,000.00 | $1,025.21 | $0.00 |
| R6 | Actual | 0.00% | $1,000.00 | $923.44 | $0.00 |
| Hypothetical (h) | 0.00% | $1,000.00 | $1,025.21 | $0.00 |
| (h) | 5% class return per year before expenses. |
| (p) | “Expenses Paid During Period” are equal to each class’s annualized expense ratio, as shown above, multiplied by the average account value over the period, multiplied by 184/365 (to reflect the one-half year period). Expenses paid do not include any applicable sales charges (loads). If these transaction costs had been included, your costs would have been higher. In addition to the fees and expenses which the fund bears directly, the fund indirectly bears a pro rata share of the fees and expenses of the underlying funds in which the fund invests. If these indirect costs were included, your costs would have been higher. |
Expense Tables - continued
MFS LIFETIME 2055 FUND
Share
Class | | Annualized
Expense
Ratio | Beginning
Account Value
5/01/22 | Ending
Account Value
10/31/22 | Expenses
Paid During
Period (p)
5/01/22-10/31/22 |
| A | Actual | 0.25% | $1,000.00 | $921.86 | $1.21 |
| Hypothetical (h) | 0.25% | $1,000.00 | $1,023.95 | $1.28 |
| B | Actual | 1.00% | $1,000.00 | $918.22 | $4.83 |
| Hypothetical (h) | 1.00% | $1,000.00 | $1,020.16 | $5.09 |
| C | Actual | 1.00% | $1,000.00 | $918.05 | $4.83 |
| Hypothetical (h) | 1.00% | $1,000.00 | $1,020.16 | $5.09 |
| I | Actual | 0.00% | $1,000.00 | $923.08 | $0.00 |
| Hypothetical (h) | 0.00% | $1,000.00 | $1,025.21 | $0.00 |
| R1 | Actual | 1.00% | $1,000.00 | $917.86 | $4.83 |
| Hypothetical (h) | 1.00% | $1,000.00 | $1,020.16 | $5.09 |
| R2 | Actual | 0.50% | $1,000.00 | $920.72 | $2.42 |
| Hypothetical (h) | 0.50% | $1,000.00 | $1,022.68 | $2.55 |
| R3 | Actual | 0.25% | $1,000.00 | $921.35 | $1.21 |
| Hypothetical (h) | 0.25% | $1,000.00 | $1,023.95 | $1.28 |
| R4 | Actual | 0.00% | $1,000.00 | $922.58 | $0.00 |
| Hypothetical (h) | 0.00% | $1,000.00 | $1,025.21 | $0.00 |
| R6 | Actual | 0.00% | $1,000.00 | $923.62 | $0.00 |
| Hypothetical (h) | 0.00% | $1,000.00 | $1,025.21 | $0.00 |
| (h) | 5% class return per year before expenses. |
| (p) | “Expenses Paid During Period” are equal to each class’s annualized expense ratio, as shown above, multiplied by the average account value over the period, multiplied by 184/365 (to reflect the one-half year period). Expenses paid do not include any applicable sales charges (loads). If these transaction costs had been included, your costs would have been higher. In addition to the fees and expenses which the fund bears directly, the fund indirectly bears a pro rata share of the fees and expenses of the underlying funds in which the fund invests. If these indirect costs were included, your costs would have been higher. |
Expense Tables - continued
MFS LIFETIME 2060 FUND
Share
Class | | Annualized
Expense
Ratio | Beginning
Account Value
5/01/22 | Ending
Account Value
10/31/22 | Expenses
Paid During
Period (p)
5/01/22-10/31/22 |
| A | Actual | 0.24% | $1,000.00 | $921.60 | $1.16 |
| Hypothetical (h) | 0.24% | $1,000.00 | $1,024.00 | $1.22 |
| B | Actual | 0.99% | $1,000.00 | $918.04 | $4.79 |
| Hypothetical (h) | 0.99% | $1,000.00 | $1,020.21 | $5.04 |
| C | Actual | 0.99% | $1,000.00 | $918.11 | $4.79 |
| Hypothetical (h) | 0.99% | $1,000.00 | $1,020.21 | $5.04 |
| I | Actual | 0.00% | $1,000.00 | $922.87 | $0.00 |
| Hypothetical (h) | 0.00% | $1,000.00 | $1,025.21 | $0.00 |
| R1 | Actual | 0.75% | $1,000.00 | $919.01 | $3.63 |
| Hypothetical (h) | 0.75% | $1,000.00 | $1,021.42 | $3.82 |
| R2 | Actual | 0.49% | $1,000.00 | $920.11 | $2.37 |
| Hypothetical (h) | 0.49% | $1,000.00 | $1,022.74 | $2.50 |
| R3 | Actual | 0.24% | $1,000.00 | $921.70 | $1.16 |
| Hypothetical (h) | 0.24% | $1,000.00 | $1,024.00 | $1.22 |
| R4 | Actual | 0.00% | $1,000.00 | $922.81 | $0.00 |
| Hypothetical (h) | 0.00% | $1,000.00 | $1,025.21 | $0.00 |
| R6 | Actual | 0.00% | $1,000.00 | $923.65 | $0.00 |
| Hypothetical (h) | 0.00% | $1,000.00 | $1,025.21 | $0.00 |
| (h) | 5% class return per year before expenses. |
| (p) | “Expenses Paid During Period” are equal to each class’s annualized expense ratio, as shown above, multiplied by the average account value over the period, multiplied by 184/365 (to reflect the one-half year period). Expenses paid do not include any applicable sales charges (loads). If these transaction costs had been included, your costs would have been higher. In addition to the fees and expenses which the fund bears directly, the fund indirectly bears a pro rata share of the fees and expenses of the underlying funds in which the fund invests. If these indirect costs were included, your costs would have been higher. |
Notes to Expense Table
For the MFS Lifetime 2060 Fund, for the period from September 1, 2022 through October 31, 2022, the distribution fee for Class R1 was not imposed. Had the distribution fee been imposed throughout the entire six month period, the annualized expense ratio, the actual expenses paid during the period, and the hypothetical expenses paid during the period would have been approximately 0.99%, $4.79, and $5.04 for Class R1. See Note 3 in the Notes to Financial Statements for additional information.
Expense Tables - continued
MFS LIFETIME 2065 FUND
Share
Class | | Annualized
Expense
Ratio | Beginning
Account Value
5/01/22 | Ending
Account Value
10/31/22 | Expenses
Paid During
Period (p)
5/01/22-10/31/22 |
| A | Actual | 0.12% | $1,000.00 | $921.66 | $0.58 |
| Hypothetical (h) | 0.12% | $1,000.00 | $1,024.60 | $0.61 |
| C | Actual | 0.87% | $1,000.00 | $918.11 | $4.21 |
| Hypothetical (h) | 0.87% | $1,000.00 | $1,020.82 | $4.43 |
| I | Actual | 0.00% | $1,000.00 | $921.84 | $0.00 |
| Hypothetical (h) | 0.00% | $1,000.00 | $1,025.21 | $0.00 |
| R1 | Actual | 0.87% | $1,000.00 | $918.11 | $4.21 |
| Hypothetical (h) | 0.87% | $1,000.00 | $1,020.82 | $4.43 |
| R2 | Actual | 0.37% | $1,000.00 | $920.51 | $1.79 |
| Hypothetical (h) | 0.37% | $1,000.00 | $1,023.34 | $1.89 |
| R3 | Actual | 0.12% | $1,000.00 | $921.75 | $0.58 |
| Hypothetical (h) | 0.12% | $1,000.00 | $1,024.60 | $0.61 |
| R4 | Actual | 0.00% | $1,000.00 | $921.84 | $0.00 |
| Hypothetical (h) | 0.00% | $1,000.00 | $1,025.21 | $0.00 |
| R6 | Actual | 0.00% | $1,000.00 | $922.90 | $0.00 |
| Hypothetical (h) | 0.00% | $1,000.00 | $1,025.21 | $0.00 |
| (h) | 5% class return per year before expenses. |
| (p) | “Expenses Paid During Period” are equal to each class’s annualized expense ratio, as shown above, multiplied by the average account value over the period, multiplied by 184/365 (to reflect the one-half year period). Expenses paid do not include any applicable sales charges (loads). If these transaction costs had been included, your costs would have been higher. In addition to the fees and expenses which the fund bears directly, the fund indirectly bears a pro rata share of the fees and expenses of the underlying funds in which the fund invests. If these indirect costs were included, your costs would have been higher. |
Portfolio of Investments
10/31/22 (unaudited)
The Portfolio of Investments is a complete list of all securities owned by your fund. It is categorized by broad-based asset classes.
MFS Lifetime Income Fund
| Issuer | | | Shares/Par | Value ($) |
| Investment Companies (h) – 100.0% |
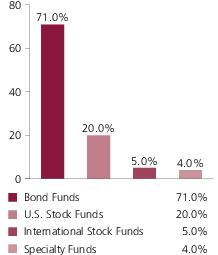
| Bond Funds – 70.8% |
| MFS Emerging Markets Debt Fund - Class R6 | | | 606,887 | $6,560,447 |
| MFS Emerging Markets Debt Local Currency Fund - Class R6 | | | 1,336,301 | 6,561,240 |
| MFS Global Opportunistic Bond Fund - Class R6 | | | 6,004,098 | 45,931,352 |
| MFS Government Securities Fund - Class R6 | | | 7,717,130 | 65,595,601 |
| MFS High Income Fund - Class R6 | | | 4,558,913 | 13,129,670 |
| MFS Inflation-Adjusted Bond Fund - Class R6 | | | 6,980,319 | 65,614,994 |
| MFS Limited Maturity Fund - Class R6 | | | 23,474,362 | 131,221,682 |
| MFS Total Return Bond Fund - Class R6 | | | 14,433,134 | 131,197,191 |
| | | | | $465,812,177 |
| International Stock Funds – 5.0% |
| MFS Blended Research International Equity Fund - Class R6 | | | 1,619,891 | $16,409,492 |
| MFS International Growth Fund - Class R6 | | | 96,875 | 3,282,128 |
| MFS International Intrinsic Value Fund - Class R6 | | | 87,414 | 3,281,511 |
| MFS Research International Fund - Class R6 | | | 543,943 | 9,845,377 |
| | | | | $32,818,508 |
| Specialty Funds – 4.0% |
| MFS Commodity Strategy Fund - Class R6 | | | 2,715,521 | $13,115,965 |
| MFS Global Real Estate Fund - Class R6 | | | 831,078 | 13,122,723 |
| | | | | $26,238,688 |
| U.S. Stock Funds – 20.1% |
| MFS Blended Research Core Equity Fund - Class R6 | | | 457,323 | $13,138,902 |
| MFS Blended Research Growth Equity Fund - Class R6 | | | 877,627 | 13,129,296 |
| MFS Blended Research Mid Cap Equity Fund - Class R6 | | | 1,662,683 | 20,035,326 |
| MFS Blended Research Small Cap Equity Fund - Class R6 | | | 475,058 | 6,617,560 |
| MFS Blended Research Value Equity Fund - Class R6 | | | 909,727 | 13,345,701 |
| MFS Growth Fund - Class R6 | | | 96,497 | 13,126,530 |
| MFS Mid Cap Growth Fund - Class R6 | | | 415,724 | 9,852,663 |
| MFS Mid Cap Value Fund - Class R6 | | | 339,700 | 9,871,677 |
| MFS New Discovery Fund - Class R6 | | | 126,918 | 3,288,451 |
| MFS New Discovery Value Fund - Class R6 | | | 188,923 | 3,309,931 |
| MFS Research Fund - Class R6 | | | 263,130 | 13,135,450 |
| MFS Value Fund - Class R6 | | | 271,627 | 13,244,517 |
| | | | | $132,096,004 |
| Money Market Funds – 0.1% | |
| MFS Institutional Money Market Portfolio, 3.02% (v) | | | 1,069,435 | $1,069,435 |
| Total Investment Companies (Identified Cost, $629,722,047) | $658,034,812 |
| Other Assets, Less Liabilities – (0.0)% | | (1,496) |
| Net Assets – 100.0% | $658,033,316 |
See Portfolio Footnotes and Notes to Financial Statements
Portfolio of Investments (unaudited) – continued
MFS Lifetime 2025 Fund
| Issuer | | | Shares/Par | Value ($) |
| Investment Companies (h) – 100.0% |
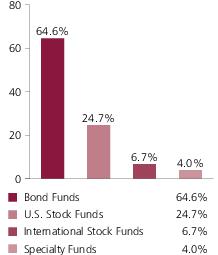
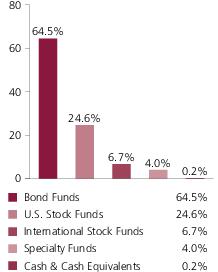
| Bond Funds – 64.5% |
| MFS Emerging Markets Debt Fund - Class R6 | | | 571,696 | $6,180,036 |
| MFS Emerging Markets Debt Local Currency Fund - Class R6 | | | 1,258,661 | 6,180,028 |
| MFS Global Opportunistic Bond Fund - Class R6 | | | 3,571,740 | 27,323,811 |
| MFS Government Securities Fund - Class R6 | | | 4,592,236 | 39,034,005 |
| MFS High Income Fund - Class R6 | | | 4,291,686 | 12,360,056 |
| MFS Inflation-Adjusted Bond Fund - Class R6 | | | 4,152,554 | 39,034,006 |
| MFS Limited Maturity Fund - Class R6 | | | 9,892,976 | 55,301,737 |
| MFS Total Return Bond Fund - Class R6 | | | 7,336,070 | 66,684,874 |
| | | | | $252,098,553 |
| International Stock Funds – 6.7% |
| MFS Blended Research International Equity Fund - Class R6 | | | 1,300,438 | $13,173,442 |
| MFS International Growth Fund - Class R6 | | | 91,205 | 3,090,016 |
| MFS International Intrinsic Value Fund - Class R6 | | | 82,313 | 3,090,015 |
| MFS Research International Fund - Class R6 | | | 386,376 | 6,993,414 |
| | | | | $26,346,887 |
| Specialty Funds – 4.0% |
| MFS Commodity Strategy Fund - Class R6 | | | 1,616,315 | $7,806,801 |
| MFS Global Real Estate Fund - Class R6 | | | 494,415 | 7,806,813 |
| | | | | $15,613,614 |
| U.S. Stock Funds – 24.6% |
| MFS Blended Research Core Equity Fund - Class R6 | | | 350,972 | $10,083,428 |
| MFS Blended Research Growth Equity Fund - Class R6 | | | 674,026 | 10,083,428 |
| MFS Blended Research Mid Cap Equity Fund - Class R6 | | | 1,160,733 | 13,986,829 |
| MFS Blended Research Small Cap Equity Fund - Class R6 | | | 280,215 | 3,903,401 |
| MFS Blended Research Value Equity Fund - Class R6 | | | 687,350 | 10,083,428 |
| MFS Growth Fund - Class R6 | | | 74,127 | 10,083,478 |
| MFS Mid Cap Growth Fund - Class R6 | | | 295,081 | 6,993,415 |
| MFS Mid Cap Value Fund - Class R6 | | | 240,654 | 6,993,415 |
| MFS New Discovery Fund - Class R6 | | | 75,326 | 1,951,700 |
| MFS New Discovery Value Fund - Class R6 | | | 111,399 | 1,951,700 |
| MFS Research Fund - Class R6 | | | 201,992 | 10,083,460 |
| MFS Value Fund - Class R6 | | | 206,798 | 10,083,451 |
| | | | | $96,281,133 |
| Money Market Funds – 0.2% | |
| MFS Institutional Money Market Portfolio, 3.02% (v) | | | 681,273 | $681,273 |
| Total Investment Companies (Identified Cost, $389,343,802) | $391,021,460 |
| Other Assets, Less Liabilities – 0.0% | | 109,193 |
| Net Assets – 100.0% | $391,130,653 |
See Portfolio Footnotes and Notes to Financial Statements
Portfolio of Investments (unaudited) – continued
MFS Lifetime 2030 Fund
| Issuer | | | Shares/Par | Value ($) |
| Investment Companies (h) – 100.0% |
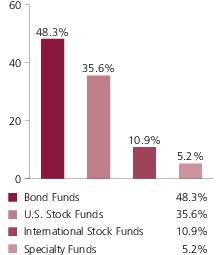
| Bond Funds – 48.1% |
| MFS Emerging Markets Debt Fund - Class R6 | | | 1,659,142 | $17,935,326 |
| MFS Emerging Markets Debt Local Currency Fund - Class R6 | | | 2,827,508 | 13,883,065 |
| MFS Global Opportunistic Bond Fund - Class R6 | | | 5,292,385 | 40,486,743 |
| MFS Government Securities Fund - Class R6 | | | 8,163,152 | 69,386,789 |
| MFS High Income Fund - Class R6 | | | 9,649,628 | 27,790,928 |
| MFS Inflation-Adjusted Bond Fund - Class R6 | | | 6,090,509 | 57,250,787 |
| MFS Limited Maturity Fund - Class R6 | | | 5,167,546 | 28,886,582 |
| MFS Total Return Bond Fund - Class R6 | | | 8,776,348 | 79,777,007 |
| | | | | $335,397,227 |
| International Stock Funds – 10.9% |
| MFS Blended Research International Equity Fund - Class R6 | | | 3,542,830 | $35,888,864 |
| MFS International Growth Fund - Class R6 | | | 264,850 | 8,973,130 |
| MFS International Intrinsic Value Fund - Class R6 | | | 238,982 | 8,971,391 |
| MFS International New Discovery Fund - Class R6 | | | 145,496 | 4,054,968 |
| MFS Research International Fund - Class R6 | | | 991,457 | 17,945,365 |
| | | | | $75,833,718 |
| Specialty Funds – 5.2% |
| MFS Commodity Strategy Fund - Class R6 | | | 3,712,574 | $17,931,735 |
| MFS Global Real Estate Fund - Class R6 | | | 1,136,961 | 17,952,608 |
| | | | | $35,884,343 |
| U.S. Stock Funds – 35.7% |
| MFS Blended Research Core Equity Fund - Class R6 | | | 867,900 | $24,934,770 |
| MFS Blended Research Growth Equity Fund - Class R6 | | | 1,664,768 | 24,904,932 |
| MFS Blended Research Mid Cap Equity Fund - Class R6 | | | 3,386,841 | 40,811,437 |
| MFS Blended Research Small Cap Equity Fund - Class R6 | | | 650,840 | 9,066,195 |
| MFS Blended Research Value Equity Fund - Class R6 | | | 1,730,699 | 25,389,354 |
| MFS Growth Fund - Class R6 | | | 183,015 | 24,895,531 |
| MFS Mid Cap Growth Fund - Class R6 | | | 844,044 | 20,003,852 |
| MFS Mid Cap Value Fund - Class R6 | | | 688,941 | 20,020,637 |
| MFS New Discovery Fund - Class R6 | | | 173,491 | 4,495,137 |
| MFS New Discovery Value Fund - Class R6 | | | 258,895 | 4,535,844 |
| MFS Research Fund - Class R6 | | | 499,246 | 24,922,352 |
| MFS Value Fund - Class R6 | | | 513,501 | 25,038,315 |
| | | | | $249,018,356 |
| Money Market Funds – 0.1% | |
| MFS Institutional Money Market Portfolio, 3.02% (v) | | | 848,776 | $848,776 |
| Total Investment Companies (Identified Cost, $634,501,144) | $696,982,420 |
| Other Assets, Less Liabilities – (0.0)% | | (49,100) |
| Net Assets – 100.0% | $696,933,320 |
See Portfolio Footnotes and Notes to Financial Statements
Portfolio of Investments (unaudited) – continued
MFS Lifetime 2035 Fund
| Issuer | | | Shares/Par | Value ($) |
| Investment Companies (h) – 100.0% |
| Bond Funds – 28.3% |
| MFS Emerging Markets Debt Fund - Class R6 | | | 1,334,078 | $14,421,387 |
| MFS Emerging Markets Debt Local Currency Fund - Class R6 | | | 1,958,097 | 9,614,255 |
| MFS Global Opportunistic Bond Fund - Class R6 | | | 2,408,916 | 18,428,206 |
| MFS Government Securities Fund - Class R6 | | | 2,356,952 | 20,034,090 |
| MFS High Income Fund - Class R6 | | | 6,676,567 | 19,228,514 |
| MFS Inflation-Adjusted Bond Fund - Class R6 | | | 2,983,241 | 28,042,467 |
| MFS Total Return Bond Fund - Class R6 | | | 2,908,894 | 26,441,841 |
| | | | | $136,210,760 |
| International Stock Funds – 17.1% |
| MFS Blended Research Emerging Markets Equity Fund - Class R6 | | | 133,383 | $1,401,860 |
| MFS Blended Research International Equity Fund - Class R6 | | | 3,539,197 | 35,852,070 |
| MFS Emerging Markets Equity Fund - Class R6 | | | 54,654 | 1,401,862 |
| MFS International Growth Fund - Class R6 | | | 295,585 | 10,014,411 |
| MFS International Intrinsic Value Fund - Class R6 | | | 266,766 | 10,014,411 |
| MFS International New Discovery Fund - Class R6 | | | 273,083 | 7,610,825 |
| MFS Research International Fund - Class R6 | | | 874,213 | 15,823,245 |
| | | | | $82,118,684 |
| Specialty Funds – 7.1% |
| MFS Commodity Strategy Fund - Class R6 | | | 3,566,274 | $17,225,103 |
| MFS Global Real Estate Fund - Class R6 | | | 1,090,887 | 17,225,106 |
| | | | | $34,450,209 |
| U.S. Stock Funds – 47.4% |
| MFS Blended Research Core Equity Fund - Class R6 | | | 766,872 | $22,032,234 |
| MFS Blended Research Growth Equity Fund - Class R6 | | | 1,472,743 | 22,032,234 |
| MFS Blended Research Mid Cap Equity Fund - Class R6 | | | 3,257,870 | 39,257,339 |
| MFS Blended Research Small Cap Equity Fund - Class R6 | | | 618,274 | 8,612,553 |
| MFS Blended Research Value Equity Fund - Class R6 | | | 1,501,856 | 22,032,234 |
| MFS Growth Fund - Class R6 | | | 161,966 | 22,032,194 |
| MFS Mid Cap Growth Fund - Class R6 | | | 828,214 | 19,628,669 |
| MFS Mid Cap Value Fund - Class R6 | | | 675,453 | 19,628,669 |
| MFS New Discovery Fund - Class R6 | | | 166,201 | 4,306,276 |
| MFS New Discovery Value Fund - Class R6 | | | 245,793 | 4,306,288 |
| MFS Research Fund - Class R6 | | | 441,351 | 22,032,233 |
| MFS Value Fund - Class R6 | | | 451,851 | 22,032,276 |
| | | | | $227,933,199 |
| Money Market Funds – 0.1% | |
| MFS Institutional Money Market Portfolio, 3.02% (v) | | | 401,391 | $401,391 |
| Total Investment Companies (Identified Cost, $447,312,389) | $481,114,243 |
| Other Assets, Less Liabilities – (0.0)% | | (10,486) |
| Net Assets – 100.0% | $481,103,757 |
See Portfolio Footnotes and Notes to Financial Statements
Portfolio of Investments (unaudited) – continued
MFS Lifetime 2040 Fund
| Issuer | | | Shares/Par | Value ($) |
| Investment Companies (h) – 100.0% |
| Bond Funds – 15.6% |
| MFS Emerging Markets Debt Fund - Class R6 | | | 1,140,444 | $12,328,204 |
| MFS Emerging Markets Debt Local Currency Fund - Class R6 | | | 1,673,889 | 8,218,795 |
| MFS Global Opportunistic Bond Fund - Class R6 | | | 1,611,529 | 12,328,194 |
| MFS High Income Fund - Class R6 | | | 5,707,497 | 16,437,591 |
| MFS Inflation-Adjusted Bond Fund - Class R6 | | | 2,635,778 | 24,776,316 |
| MFS Total Return Bond Fund - Class R6 | | | 1,821,510 | 16,557,526 |
| | | | | $90,646,626 |
| International Stock Funds – 22.3% |
| MFS Blended Research Emerging Markets Equity Fund - Class R6 | | | 356,463 | $3,746,430 |
| MFS Blended Research International Equity Fund - Class R6 | | | 5,285,185 | 53,538,925 |
| MFS Emerging Markets Equity Fund - Class R6 | | | 146,060 | 3,746,433 |
| MFS International Growth Fund - Class R6 | | | 477,998 | 16,194,558 |
| MFS International Intrinsic Value Fund - Class R6 | | | 431,395 | 16,194,558 |
| MFS International New Discovery Fund - Class R6 | | | 537,701 | 14,985,720 |
| MFS Research International Fund - Class R6 | | | 1,168,498 | 21,149,820 |
| | | | | $129,556,444 |
| Specialty Funds – 8.6% |
| MFS Commodity Strategy Fund - Class R6 | | | 5,154,502 | $24,896,247 |
| MFS Global Real Estate Fund - Class R6 | | | 1,576,710 | 24,896,245 |
| | | | | $49,792,492 |
| U.S. Stock Funds – 53.4% |
| MFS Blended Research Core Equity Fund - Class R6 | | | 1,009,594 | $29,005,645 |
| MFS Blended Research Growth Equity Fund - Class R6 | | | 1,995,422 | 29,851,511 |
| MFS Blended Research Mid Cap Equity Fund - Class R6 | | | 4,473,186 | 53,901,893 |
| MFS Blended Research Small Cap Equity Fund - Class R6 | | | 893,620 | 12,448,124 |
| MFS Blended Research Value Equity Fund - Class R6 | | | 2,034,868 | 29,851,511 |
| MFS Growth Fund - Class R6 | | | 219,449 | 29,851,639 |
| MFS Mid Cap Growth Fund - Class R6 | | | 1,137,171 | 26,950,946 |
| MFS Mid Cap Value Fund - Class R6 | | | 927,424 | 26,950,947 |
| MFS New Discovery Fund - Class R6 | | | 240,218 | 6,224,062 |
| MFS New Discovery Value Fund - Class R6 | | | 355,255 | 6,224,062 |
| MFS Research Fund - Class R6 | | | 581,043 | 29,005,645 |
| MFS Value Fund - Class R6 | | | 612,214 | 29,851,551 |
| | | | | $310,117,536 |
| Money Market Funds – 0.1% | |
| MFS Institutional Money Market Portfolio, 3.02% (v) | | | 355,659 | $355,659 |
| Total Investment Companies (Identified Cost, $482,796,797) | $580,468,757 |
| Other Assets, Less Liabilities – (0.0)% | | (33,523) |
| Net Assets – 100.0% | $580,435,234 |
See Portfolio Footnotes and Notes to Financial Statements
Portfolio of Investments (unaudited) – continued
MFS Lifetime 2045 Fund
| Issuer | | | Shares/Par | Value ($) |
| Investment Companies (h) – 100.0% |
| Bond Funds – 8.1% |
| MFS Emerging Markets Debt Fund - Class R6 | | | 217,783 | $2,354,231 |
| MFS Emerging Markets Debt Local Currency Fund - Class R6 | | | 319,651 | 1,569,487 |
| MFS Global Opportunistic Bond Fund - Class R6 | | | 307,742 | 2,354,231 |
| MFS High Income Fund - Class R6 | | | 1,089,922 | 3,138,975 |
| MFS Inflation-Adjusted Bond Fund - Class R6 | | | 1,210,290 | 11,376,724 |
| MFS Total Return Bond Fund - Class R6 | | | 1,078,904 | 9,807,236 |
| | | | | $30,600,884 |
| International Stock Funds – 26.3% |
| MFS Blended Research Emerging Markets Equity Fund - Class R6 | | | 320,987 | $3,373,573 |
| MFS Blended Research International Equity Fund - Class R6 | | | 3,895,709 | 39,463,534 |
| MFS Emerging Markets Equity Fund - Class R6 | | | 131,523 | 3,373,573 |
| MFS International Growth Fund - Class R6 | | | 365,882 | 12,396,063 |
| MFS International Intrinsic Value Fund - Class R6 | | | 330,209 | 12,396,062 |
| MFS International New Discovery Fund - Class R6 | | | 484,187 | 13,494,295 |
| MFS Research International Fund - Class R6 | | | 810,575 | 14,671,408 |
| | | | | $99,168,508 |
| Specialty Funds – 9.6% |
| MFS Commodity Strategy Fund - Class R6 | | | 3,736,021 | $18,044,980 |
| MFS Global Real Estate Fund - Class R6 | | | 1,142,811 | 18,044,981 |
| | | | | $36,089,961 |
| U.S. Stock Funds – 55.9% |
| MFS Blended Research Core Equity Fund - Class R6 | | | 655,403 | $18,829,724 |
| MFS Blended Research Growth Equity Fund - Class R6 | | | 1,358,311 | 20,320,325 |
| MFS Blended Research Mid Cap Equity Fund - Class R6 | | | 3,060,142 | 36,874,705 |
| MFS Blended Research Small Cap Equity Fund - Class R6 | | | 647,702 | 9,022,490 |
| MFS Blended Research Value Equity Fund - Class R6 | | | 1,385,162 | 20,320,325 |
| MFS Growth Fund - Class R6 | | | 149,381 | 20,320,354 |
| MFS Mid Cap Growth Fund - Class R6 | | | 777,947 | 18,437,353 |
| MFS Mid Cap Value Fund - Class R6 | | | 634,458 | 18,437,353 |
| MFS New Discovery Fund - Class R6 | | | 174,112 | 4,511,245 |
| MFS New Discovery Value Fund - Class R6 | | | 257,491 | 4,511,250 |
| MFS Research Fund - Class R6 | | | 377,198 | 18,829,724 |
| MFS Value Fund - Class R6 | | | 416,743 | 20,320,367 |
| | | | | $210,735,215 |
| Money Market Funds – 0.1% | |
| MFS Institutional Money Market Portfolio, 3.02% (v) | | | 374,344 | $374,344 |
| Total Investment Companies (Identified Cost, $345,336,154) | $376,968,912 |
| Other Assets, Less Liabilities – (0.0)% | | (11,389) |
| Net Assets – 100.0% | $376,957,523 |
See Portfolio Footnotes and Notes to Financial Statements
Portfolio of Investments (unaudited) – continued
MFS Lifetime 2050 Fund
| Issuer | | | Shares/Par | Value ($) |
| Investment Companies (h) – 100.0% |
| Bond Funds – 5.0% |
| MFS Inflation-Adjusted Bond Fund - Class R6 | | | 1,001,089 | $9,410,238 |
| MFS Total Return Bond Fund - Class R6 | | | 1,035,230 | 9,410,236 |
| | | | | $18,820,474 |
| International Stock Funds – 28.0% |
| MFS Blended Research Emerging Markets Equity Fund - Class R6 | | | 358,144 | $3,764,094 |
| MFS Blended Research International Equity Fund - Class R6 | | | 4,087,367 | 41,405,033 |
| MFS Emerging Markets Equity Fund - Class R6 | | | 146,748 | 3,764,095 |
| MFS International Growth Fund - Class R6 | | | 388,853 | 13,174,329 |
| MFS International Intrinsic Value Fund - Class R6 | | | 350,941 | 13,174,338 |
| MFS International New Discovery Fund - Class R6 | | | 540,236 | 15,056,365 |
| MFS Research International Fund - Class R6 | | | 831,845 | 15,056,391 |
| | | | | $105,394,645 |
| Specialty Funds – 10.0% |
| MFS Commodity Strategy Fund - Class R6 | | | 3,896,578 | $18,820,470 |
| MFS Global Real Estate Fund - Class R6 | | | 1,191,924 | 18,820,483 |
| | | | | $37,640,953 |
| U.S. Stock Funds – 56.9% |
| MFS Blended Research Core Equity Fund - Class R6 | | | 655,081 | $18,820,470 |
| MFS Blended Research Growth Equity Fund - Class R6 | | | 1,383,858 | 20,702,516 |
| MFS Blended Research Mid Cap Equity Fund - Class R6 | | | 3,123,729 | 37,640,939 |
| MFS Blended Research Small Cap Equity Fund - Class R6 | | | 675,537 | 9,410,235 |
| MFS Blended Research Value Equity Fund - Class R6 | | | 1,411,214 | 20,702,517 |
| MFS Growth Fund - Class R6 | | | 152,191 | 20,702,521 |
| MFS Mid Cap Growth Fund - Class R6 | | | 794,113 | 18,820,470 |
| MFS Mid Cap Value Fund - Class R6 | | | 647,642 | 18,820,470 |
| MFS New Discovery Fund - Class R6 | | | 181,595 | 4,705,117 |
| MFS New Discovery Value Fund - Class R6 | | | 268,557 | 4,705,119 |
| MFS Research Fund - Class R6 | | | 377,013 | 18,820,486 |
| MFS Value Fund - Class R6 | | | 424,581 | 20,702,550 |
| | | | | $214,553,410 |
| Money Market Funds – 0.1% | |
| MFS Institutional Money Market Portfolio, 3.02% (v) | | | 346,231 | $346,231 |
| Total Investment Companies (Identified Cost, $335,539,935) | $376,755,713 |
| Other Assets, Less Liabilities – (0.0)% | | (10,984) |
| Net Assets – 100.0% | $376,744,729 |
See Portfolio Footnotes and Notes to Financial Statements
Portfolio of Investments (unaudited) – continued
MFS Lifetime 2055 Fund
| Issuer | | | Shares/Par | Value ($) |
| Investment Companies (h) – 100.0% |
| Bond Funds – 5.0% |
| MFS Inflation-Adjusted Bond Fund - Class R6 | | | 592,161 | $5,566,307 |
| MFS Total Return Bond Fund - Class R6 | | | 612,354 | 5,566,300 |
| | | | | $11,132,607 |
| International Stock Funds – 28.0% |
| MFS Blended Research Emerging Markets Equity Fund - Class R6 | | | 211,848 | $2,226,519 |
| MFS Blended Research International Equity Fund - Class R6 | | | 2,417,741 | 24,491,712 |
| MFS Emerging Markets Equity Fund - Class R6 | | | 86,804 | 2,226,528 |
| MFS International Growth Fund - Class R6 | | | 230,012 | 7,792,819 |
| MFS International Intrinsic Value Fund - Class R6 | | | 207,588 | 7,792,849 |
| MFS International New Discovery Fund - Class R6 | | | 319,558 | 8,906,088 |
| MFS Research International Fund - Class R6 | | | 492,048 | 8,906,077 |
| | | | | $62,342,592 |
| Specialty Funds – 10.0% |
| MFS Commodity Strategy Fund - Class R6 | | | 2,304,885 | $11,132,596 |
| MFS Global Real Estate Fund - Class R6 | | | 705,041 | 11,132,598 |
| | | | | $22,265,194 |
| U.S. Stock Funds – 56.9% |
| MFS Blended Research Core Equity Fund - Class R6 | | | 387,490 | $11,132,596 |
| MFS Blended Research Growth Equity Fund - Class R6 | | | 818,573 | 12,245,856 |
| MFS Blended Research Mid Cap Equity Fund - Class R6 | | | 1,847,734 | 22,265,192 |
| MFS Blended Research Small Cap Equity Fund - Class R6 | | | 399,591 | 5,566,298 |
| MFS Blended Research Value Equity Fund - Class R6 | | | 834,755 | 12,245,856 |
| MFS Growth Fund - Class R6 | | | 90,023 | 12,245,850 |
| MFS Mid Cap Growth Fund - Class R6 | | | 469,730 | 11,132,596 |
| MFS Mid Cap Value Fund - Class R6 | | | 383,090 | 11,132,596 |
| MFS New Discovery Fund - Class R6 | | | 107,416 | 2,783,149 |
| MFS New Discovery Value Fund - Class R6 | | | 158,856 | 2,783,161 |
| MFS Research Fund - Class R6 | | | 223,009 | 11,132,617 |
| MFS Value Fund - Class R6 | | | 251,146 | 12,245,869 |
| | | | | $126,911,636 |
| Money Market Funds – 0.1% | |
| MFS Institutional Money Market Portfolio, 3.02% (v) | | | 234,443 | $234,443 |
| Total Investment Companies (Identified Cost, $211,114,480) | $222,886,472 |
| Other Assets, Less Liabilities – 0.0% | | 4,908 |
| Net Assets – 100.0% | $222,891,380 |
See Portfolio Footnotes and Notes to Financial Statements
Portfolio of Investments (unaudited) – continued
MFS Lifetime 2060 Fund
| Issuer | | | Shares/Par | Value ($) |
| Investment Companies (h) – 100.0% |
| Bond Funds – 5.0% |
| MFS Inflation-Adjusted Bond Fund - Class R6 | | | 256,212 | $2,408,396 |
| MFS Total Return Bond Fund - Class R6 | | | 264,950 | 2,408,396 |
| | | | | $4,816,792 |
| International Stock Funds – 28.0% |
| MFS Blended Research Emerging Markets Equity Fund - Class R6 | | | 91,661 | $963,358 |
| MFS Blended Research International Equity Fund - Class R6 | | | 1,046,095 | 10,596,942 |
| MFS Emerging Markets Equity Fund - Class R6 | | | 37,558 | 963,358 |
| MFS International Growth Fund - Class R6 | | | 99,520 | 3,371,754 |
| MFS International Intrinsic Value Fund - Class R6 | | | 89,818 | 3,371,754 |
| MFS International New Discovery Fund - Class R6 | | | 138,265 | 3,853,434 |
| MFS Research International Fund - Class R6 | | | 212,897 | 3,853,434 |
| | | | | $26,974,034 |
| Specialty Funds – 10.0% |
| MFS Commodity Strategy Fund - Class R6 | | | 997,266 | $4,816,791 |
| MFS Global Real Estate Fund - Class R6 | | | 305,053 | 4,816,792 |
| | | | | $9,633,583 |
| U.S. Stock Funds – 57.0% |
| MFS Blended Research Core Equity Fund - Class R6 | | | 167,657 | $4,816,792 |
| MFS Blended Research Growth Equity Fund - Class R6 | | | 354,176 | 5,298,471 |
| MFS Blended Research Mid Cap Equity Fund - Class R6 | | | 799,468 | 9,633,583 |
| MFS Blended Research Small Cap Equity Fund - Class R6 | | | 172,893 | 2,408,396 |
| MFS Blended Research Value Equity Fund - Class R6 | | | 361,177 | 5,298,471 |
| MFS Growth Fund - Class R6 | | | 38,951 | 5,298,471 |
| MFS Mid Cap Growth Fund - Class R6 | | | 203,240 | 4,816,792 |
| MFS Mid Cap Value Fund - Class R6 | | | 165,753 | 4,816,791 |
| MFS New Discovery Fund - Class R6 | | | 46,476 | 1,204,198 |
| MFS New Discovery Value Fund - Class R6 | | | 68,733 | 1,204,198 |
| MFS Research Fund - Class R6 | | | 96,490 | 4,816,792 |
| MFS Value Fund - Class R6 | | | 108,664 | 5,298,471 |
| | | | | $54,911,426 |
| Money Market Funds – 0.0% | |
| MFS Institutional Money Market Portfolio, 3.02% (v) | | | 35,761 | $35,761 |
| Total Investment Companies (Identified Cost, $99,965,609) | $96,371,596 |
| Other Assets, Less Liabilities – 0.0% | | 15,274 |
| Net Assets – 100.0% | $96,386,870 |
See Portfolio Footnotes and Notes to Financial Statements
Portfolio of Investments (unaudited) – continued
MFS Lifetime 2065 Fund
| Issuer | | | Shares/Par | Value ($) |
| Investment Companies (h) – 101.2% |
| Bond Funds – 5.0% |
| MFS Inflation-Adjusted Bond Fund - Class R6 | | | 5,220 | $49,068 |
| MFS Total Return Bond Fund - Class R6 | | | 5,399 | 49,077 |
| | | | | $98,145 |
| International Stock Funds – 28.1% |
| MFS Blended Research Emerging Markets Equity Fund - Class R6 | | | 1,863 | $19,584 |
| MFS Blended Research International Equity Fund - Class R6 | | | 21,264 | 215,406 |
| MFS Emerging Markets Equity Fund - Class R6 | | | 764 | 19,593 |
| MFS International Growth Fund - Class R6 | | | 2,022 | 68,506 |
| MFS International Intrinsic Value Fund - Class R6 | | | 1,823 | 68,428 |
| MFS International New Discovery Fund - Class R6 | | | 2,807 | 78,216 |
| MFS Research International Fund - Class R6 | | | 4,321 | 78,214 |
| | | | | $547,947 |
| Specialty Funds – 10.1% |
| MFS Commodity Strategy Fund - Class R6 | | | 20,617 | $99,582 |
| MFS Global Real Estate Fund - Class R6 | | | 6,203 | 97,939 |
| | | | | $197,521 |
| U.S. Stock Funds – 57.1% |
| MFS Blended Research Core Equity Fund - Class R6 | | | 3,408 | $97,901 |
| MFS Blended Research Growth Equity Fund - Class R6 | | | 7,191 | 107,584 |
| MFS Blended Research Mid Cap Equity Fund - Class R6 | | | 16,282 | 196,201 |
| MFS Blended Research Small Cap Equity Fund - Class R6 | | | 3,518 | 48,999 |
| MFS Blended Research Value Equity Fund - Class R6 | | | 7,346 | 107,767 |
| MFS Growth Fund - Class R6 | | | 791 | 107,615 |
| MFS Mid Cap Growth Fund - Class R6 | | | 4,132 | 97,939 |
| MFS Mid Cap Value Fund - Class R6 | | | 3,369 | 97,914 |
| MFS New Discovery Fund - Class R6 | | | 948 | 24,558 |
| MFS New Discovery Value Fund - Class R6 | | | 1,401 | 24,544 |
| MFS Research Fund - Class R6 | | | 1,960 | 97,833 |
| MFS Value Fund - Class R6 | | | 2,209 | 107,709 |
| | | | | $1,116,564 |
| Money Market Funds – 0.9% | |
| MFS Institutional Money Market Portfolio, 3.02% (v) | | | 16,920 | $16,920 |
| Total Investment Companies (Identified Cost, $2,210,171) | $1,977,097 |
| Other Assets, Less Liabilities – (1.2)% | | (22,613) |
| Net Assets – 100.0% | $1,954,484 |
Portfolio Footnotes:
| (h) | An affiliated issuer, which may be considered one in which the fund owns 5% or more of the outstanding voting securities, or a company which is under common control. At period end, the aggregate values of each fund’s investments in affiliated issuers were as follows: |
| | Affiliated Issuers |
| MFS Lifetime Income Fund | $658,034,812 |
| MFS Lifetime 2025 Fund | 391,021,460 |
| MFS Lifetime 2030 Fund | 696,982,420 |
| MFS Lifetime 2035 Fund | 481,114,243 |
| MFS Lifetime 2040 Fund | 580,468,757 |
| MFS Lifetime 2045 Fund | 376,968,912 |
| MFS Lifetime 2050 Fund | 376,755,713 |
| MFS Lifetime 2055 Fund | 222,886,472 |
| MFS Lifetime 2060 Fund | 96,371,596 |
| MFS Lifetime 2065 Fund | 1,977,097 |
Portfolio of Investments (unaudited) – continued
| (v) | Affiliated issuer that is available only to investment companies managed by MFS. The rate quoted for the MFS Institutional Money Market Portfolio is the annualized seven-day yield of the fund at period end. |
See Notes to Financial Statements
Financial Statements
Statements of Assets and Liabilities
At 10/31/22 (unaudited)
These statements represent each fund's balance sheet, which details the assets and liabilities comprising the total value of each fund.
| | MFS Lifetime
Income Fund | MFS Lifetime
2025 Fund | MFS Lifetime
2030 Fund |
| Assets | | | |
| Investments in affiliated issuers, at value (identified cost, $629,722,047, $389,343,802, and $634,501,144, respectively) | $658,034,812 | $391,021,460 | $696,982,420 |
| Receivables for | | | |
| Investments sold | 447,275 | 99,399 | 65,579 |
| Fund shares sold | 19,346,142 | 21,233,215 | 27,134,330 |
| Receivable from investment adviser | 113,324 | 76,020 | 125,055 |
| Other assets | 48,167 | 46,882 | 51,353 |
| Total assets | $677,989,720 | $412,476,976 | $724,358,737 |
| Liabilities | | | |
| Payable to custodian | $8 | $4 | $4 |
| Payables for | | | |
| Distributions | 44,533 | — | — |
| Investments purchased | 18,918,748 | 20,876,577 | 26,999,611 |
| Fund shares reacquired | 692,891 | 351,490 | 207,945 |
| Payable to affiliates | | | |
| Administrative services fee | 192 | 192 | 192 |
| Shareholder servicing costs | 199,162 | 74,632 | 161,488 |
| Distribution and service fees | 15,056 | 4,612 | 11,149 |
| Accrued expenses and other liabilities | 85,814 | 38,816 | 45,028 |
| Total liabilities | $19,956,404 | $21,346,323 | $27,425,417 |
| Net assets | $658,033,316 | $391,130,653 | $696,933,320 |
| Net assets consist of | | | |
| Paid-in capital | $637,945,373 | $380,319,621 | $619,208,777 |
| Total distributable earnings (loss) | 20,087,943 | 10,811,032 | 77,724,543 |
| Net assets | $658,033,316 | $391,130,653 | $696,933,320 |
Statements of Assets and Liabilities (unaudited) – continued
| | MFS Lifetime
Income Fund | MFS Lifetime
2025 Fund | MFS Lifetime
2030 Fund |
| Net assets | | | |
| Class A | $186,749,307 | $23,526,988 | $73,885,145 |
| Class B | 2,372,477 | 929,966 | 3,582,945 |
| Class C | 46,081,867 | 3,509,031 | 7,683,421 |
| Class I | 44,931,206 | 2,980,700 | 6,660,890 |
| Class R1 | 2,712,378 | 308,081 | 3,617,755 |
| Class R2 | 26,749,966 | 15,117,226 | 45,408,635 |
| Class R3 | 113,041,317 | 96,444,491 | 183,498,932 |
| Class R4 | 33,881,144 | 32,173,142 | 53,801,386 |
| Class R6 | 201,513,654 | 216,141,028 | 318,794,211 |
| Total net assets | $658,033,316 | $391,130,653 | $696,933,320 |
| Shares of beneficial interest outstanding | | | |
| Class A | 16,089,700 | 1,878,453 | 4,948,397 |
| Class B | 204,385 | 75,070 | 244,122 |
| Class C | 3,972,118 | 285,067 | 527,836 |
| Class I | 3,870,079 | 236,796 | 443,044 |
| Class R1 | 233,357 | 24,586 | 245,315 |
| Class R2 | 2,304,378 | 1,211,733 | 3,073,355 |
| Class R3 | 9,739,270 | 7,710,376 | 12,329,622 |
| Class R4 | 2,919,392 | 2,548,278 | 3,568,040 |
| Class R6 | 17,308,573 | 17,114,383 | 21,144,455 |
| Total shares of beneficial interest outstanding | 56,641,252 | 31,084,742 | 46,524,186 |
| Class A shares | | | |
Net asset value per share
(net assets / shares of beneficial interest outstanding) | $11.61 | $12.52 | $14.93 |
| Offering price per share (100 / 95.75 x net asset value per share) | $12.13 | $— | $— |
| Offering price per share (100 / 94.25 x net asset value per share) | $— | $13.28 | $15.84 |
| Class B shares | | | |
Net asset value and offering price per share
(net assets / shares of beneficial interest outstanding) | $11.61 | $12.39 | $14.68 |
| Class C shares | | | |
Net asset value and offering price per share
(net assets / shares of beneficial interest outstanding) | $11.60 | $12.31 | $14.56 |
| Class I shares | | | |
Net asset value, offering price, and redemption price per share
(net assets / shares of beneficial interest outstanding) | $11.61 | $12.59 | $15.03 |
| Class R1 shares | | | |
Net asset value, offering price, and redemption price per share
(net assets / shares of beneficial interest outstanding) | $11.62 | $12.53 | $14.75 |
| Class R2 shares | | | |
Net asset value, offering price, and redemption price per share
(net assets / shares of beneficial interest outstanding) | $11.61 | $12.48 | $14.77 |
| Class R3 shares | | | |
Net asset value, offering price, and redemption price per share
(net assets / shares of beneficial interest outstanding) | $11.61 | $12.51 | $14.88 |
| Class R4 shares | | | |
Net asset value, offering price, and redemption price per share
(net assets / shares of beneficial interest outstanding) | $11.61 | $12.63 | $15.08 |
Statements of Assets and Liabilities (unaudited) – continued
| | MFS Lifetime
Income Fund | MFS Lifetime
2025 Fund | MFS Lifetime
2030 Fund |
| Class R6 shares | | | |
Net asset value, offering price, and redemption price per share
(net assets / shares of beneficial interest outstanding) | $11.64 | $12.63 | $15.08 |
| On sales of $100,000 or more, the maximum offering price of Class A shares is reduced for the MFS Lifetime Income Fund. On sales of $50,000 or more, the maximum offering price of Class A shares is reduced for all other funds. A contingent deferred sales charge may be imposed on redemptions of Class A, Class B, and Class C shares. |
See Notes to Financial Statements
Statements of Assets and Liabilities (unaudited) – continued
| At 10/31/22 | MFS Lifetime
2035 Fund | MFS Lifetime
2040 Fund | MFS Lifetime
2045 Fund | MFS Lifetime
2050 Fund |
| Assets | | | | |
| Investments in affiliated issuers, at value (identified cost, $447,312,389, $482,796,797, $345,336,154, and $335,539,935, respectively) | $481,114,243 | $580,468,757 | $376,968,912 | $376,755,713 |
| Receivables for | | | | |
| Investments sold | 183,195 | — | — | — |
| Fund shares sold | 33,702,208 | 41,260,727 | 45,567,153 | 33,708,685 |
| Receivable from investment adviser | 88,776 | 101,449 | 74,071 | 78,361 |
| Other assets | 49,278 | 48,092 | 44,979 | 47,089 |
| Total assets | $515,137,700 | $621,879,025 | $422,655,115 | $410,589,848 |
| Liabilities | | | | |
| Payable to custodian | $4 | $3 | $4 | $4 |
| Payables for | | | | |
| Investments purchased | 33,440,072 | 41,136,810 | 45,393,159 | 33,606,172 |
| Fund shares reacquired | 454,286 | 131,294 | 184,405 | 106,182 |
| Payable to affiliates | | | | |
| Administrative services fee | 192 | 192 | 192 | 192 |
| Shareholder servicing costs | 94,694 | 123,770 | 77,691 | 87,767 |
| Distribution and service fees | 5,792 | 9,090 | 4,603 | 5,053 |
| Accrued expenses and other liabilities | 38,903 | 42,632 | 37,538 | 39,749 |
| Total liabilities | $34,033,943 | $41,443,791 | $45,697,592 | $33,845,119 |
| Net assets | $481,103,757 | $580,435,234 | $376,957,523 | $376,744,729 |
| Net assets consist of | | | | |
| Paid-in capital | $435,818,600 | $471,831,605 | $338,404,349 | $328,206,991 |
| Total distributable earnings (loss) | 45,285,157 | 108,603,629 | 38,553,174 | 48,537,738 |
| Net assets | $481,103,757 | $580,435,234 | $376,957,523 | $376,744,729 |
Statements of Assets and Liabilities (unaudited) – continued
| | MFS Lifetime
2035 Fund | MFS Lifetime
2040 Fund | MFS Lifetime
2045 Fund | MFS Lifetime
2050 Fund |
| Net assets | | | | |
| Class A | $29,300,949 | $46,588,178 | $19,774,704 | $22,814,939 |
| Class B | 1,166,681 | 2,213,388 | 665,411 | 1,048,562 |
| Class C | 3,456,071 | 7,176,175 | 2,381,623 | 3,134,064 |
| Class I | 1,793,012 | 7,204,085 | 2,480,579 | 21,580,346 |
| Class R1 | 940,917 | 3,518,470 | 400,175 | 690,301 |
| Class R2 | 15,281,689 | 38,142,265 | 9,620,036 | 16,704,940 |
| Class R3 | 129,818,214 | 159,217,597 | 117,577,910 | 109,858,466 |
| Class R4 | 38,579,266 | 39,474,952 | 19,835,129 | 23,046,760 |
| Class R6 | 260,766,958 | 276,900,124 | 204,221,956 | 177,866,351 |
| Total net assets | $481,103,757 | $580,435,234 | $376,957,523 | $376,744,729 |
| Shares of beneficial interest outstanding | | | | |
| Class A | 1,898,734 | 2,793,071 | 1,209,111 | 1,162,017 |
| Class B | 76,402 | 134,018 | 41,112 | 54,469 |
| Class C | 228,073 | 441,233 | 148,017 | 163,793 |
| Class I | 115,639 | 427,871 | 150,623 | 1,098,987 |
| Class R1 | 61,357 | 214,155 | 24,635 | 35,944 |
| Class R2 | 991,186 | 2,304,038 | 591,036 | 861,653 |
| Class R3 | 8,400,999 | 9,548,773 | 7,196,702 | 5,643,529 |
| Class R4 | 2,475,342 | 2,333,791 | 1,203,074 | 1,171,659 |
| Class R6 | 16,727,091 | 16,375,080 | 12,392,867 | 9,045,969 |
| Total shares of beneficial interest outstanding | 30,974,823 | 34,572,030 | 22,957,177 | 19,238,020 |
| Class A shares | | | | |
Net asset value per share
(net assets / shares of beneficial interest outstanding) | $15.43 | $16.68 | $16.35 | $19.63 |
| Offering price per share (100 / 94.25 x net asset value per share) | $16.37 | $17.70 | $17.35 | $20.83 |
| Class B shares | | | | |
Net asset value and offering price per share
(net assets / shares of beneficial interest outstanding) | $15.27 | $16.52 | $16.19 | $19.25 |
| Class C shares | | | | |
Net asset value and offering price per share
(net assets / shares of beneficial interest outstanding) | $15.15 | $16.26 | $16.09 | $19.13 |
| Class I shares | | | | |
Net asset value, offering price, and redemption price per share
(net assets / shares of beneficial interest outstanding) | $15.51 | $16.84 | $16.47 | $19.64 |
| Class R1 shares | | | | |
Net asset value, offering price, and redemption price per share
(net assets / shares of beneficial interest outstanding) | $15.34 | $16.43 | $16.24 | $19.21 |
| Class R2 shares | | | | |
Net asset value, offering price, and redemption price per share
(net assets / shares of beneficial interest outstanding) | $15.42 | $16.55 | $16.28 | $19.39 |
| Class R3 shares | | | | |
Net asset value, offering price, and redemption price per share
(net assets / shares of beneficial interest outstanding) | $15.45 | $16.67 | $16.34 | $19.47 |
| Class R4 shares | | | | |
Net asset value, offering price, and redemption price per share
(net assets / shares of beneficial interest outstanding) | $15.59 | $16.91 | $16.49 | $19.67 |
Statements of Assets and Liabilities (unaudited) – continued
| | MFS Lifetime
2035 Fund | MFS Lifetime
2040 Fund | MFS Lifetime
2045 Fund | MFS Lifetime
2050 Fund |
| Class R6 shares | | | | |
Net asset value, offering price, and redemption price per share
(net assets / shares of beneficial interest outstanding) | $15.59 | $16.91 | $16.48 | $19.66 |
| On sales of $50,000 or more, the maximum offering price of Class A shares is reduced. A contingent deferred sales charge may be imposed on redemptions of Class A, Class B, and Class C shares. |
See Notes to Financial Statements
Statements of Assets and Liabilities (unaudited) – continued
| At 10/31/22 | MFS Lifetime
2055 Fund | MFS Lifetime
2060 Fund | MFS Lifetime
2065 Fund |
| Assets | | | |
| Investments in affiliated issuers, at value (identified cost, $211,114,480, $99,965,609, and $2,210,171, respectively) | $222,886,472 | $96,371,596 | $1,977,097 |
| Receivables for | | | |
| Fund shares sold | 21,378,531 | 7,431,021 | 193,965 |
| Receivable from investment adviser | 56,963 | 37,245 | 9,836 |
| Other assets | 44,488 | 41,375 | 486 |
| Total assets | $244,366,454 | $103,881,237 | $2,181,384 |
| Liabilities | | | |
| Payable to custodian | $4 | $4 | $4 |
| Payables for | | | |
| Investments purchased | 21,362,065 | 7,361,592 | 195,666 |
| Fund shares reacquired | 15,783 | 74,859 | 11 |
| Payable to affiliates | | | |
| Administrative services fee | 192 | 192 | 192 |
| Shareholder servicing costs | 56,643 | 22,947 | 449 |
| Distribution and service fees | 3,180 | 1,298 | 31 |
| Accrued expenses and other liabilities | 37,207 | 33,475 | 30,547 |
| Total liabilities | $21,475,074 | $7,494,367 | $226,900 |
| Net assets | $222,891,380 | $96,386,870 | $1,954,484 |
| Net assets consist of | | | |
| Paid-in capital | $207,166,695 | $98,545,941 | $2,211,573 |
| Total distributable earnings (loss) | 15,724,685 | (2,159,071) | (257,089) |
| Net assets | $222,891,380 | $96,386,870 | $1,954,484 |
Statements of Assets and Liabilities (unaudited) – continued
| | MFS Lifetime
2055 Fund | MFS Lifetime
2060 Fund | MFS Lifetime
2065 Fund |
| Net assets | | | |
| Class A | $15,932,656 | $8,906,840 | $311,002 |
| Class B | 525,108 | 159,673 | — |
| Class C | 2,288,163 | 867,963 | 58,231 |
| Class I | 532,709 | 301,729 | 50,863 |
| Class R1 | 760,907 | 75,730 | 48,785 |
| Class R2 | 8,171,455 | 1,628,999 | 70,500 |
| Class R3 | 70,273,480 | 31,312,360 | 284,296 |
| Class R4 | 14,634,886 | 3,562,804 | 49,351 |
| Class R6 | 109,772,016 | 49,570,772 | 1,081,456 |
| Total net assets | $222,891,380 | $96,386,870 | $1,954,484 |
| Shares of beneficial interest outstanding | | | |
| Class A | 944,470 | 664,646 | 38,889 |
| Class B | 31,388 | 11,980 | — |
| Class C | 138,027 | 65,593 | 7,319 |
| Class I | 31,488 | 22,314 | 6,339 |
| Class R1 | 45,696 | 5,654 | 6,131 |
| Class R2 | 485,376 | 121,903 | 8,824 |
| Class R3 | 4,164,689 | 2,333,380 | 35,510 |
| Class R4 | 858,898 | 263,724 | 6,152 |
| Class R6 | 6,438,459 | 3,657,993 | 134,803 |
| Total shares of beneficial interest outstanding | 13,138,491 | 7,147,187 | 243,967 |
| Class A shares | | | |
Net asset value per share
(net assets / shares of beneficial interest outstanding) | $16.87 | $13.40 | $8.00 |
| Offering price per share (100 / 94.25 x net asset value per share) | $17.90 | $14.22 | $8.49 |
| Class B shares | | | |
Net asset value and offering price per share
(net assets / shares of beneficial interest outstanding) | $16.73 | $13.33 | $— |
| Class C shares | | | |
Net asset value and offering price per share
(net assets / shares of beneficial interest outstanding) | $16.58 | $13.23 | $7.96 |
| Class I shares | | | |
Net asset value, offering price, and redemption price per share
(net assets / shares of beneficial interest outstanding) | $16.92 | $13.52 | $8.02 |
| Class R1 shares | | | |
Net asset value, offering price, and redemption price per share
(net assets / shares of beneficial interest outstanding) | $16.65 | $13.39 | $7.96 |
| Class R2 shares | | | |
Net asset value, offering price, and redemption price per share
(net assets / shares of beneficial interest outstanding) | $16.84 | $13.36 | $7.99 |
| Class R3 shares | | | |
Net asset value, offering price, and redemption price per share
(net assets / shares of beneficial interest outstanding) | $16.87 | $13.42 | $8.01 |
| Class R4 shares | | | |
Net asset value, offering price, and redemption price per share
(net assets / shares of beneficial interest outstanding) | $17.04 | $13.51 | $8.02 |
Statements of Assets and Liabilities (unaudited) – continued
| | MFS Lifetime
2055 Fund | MFS Lifetime
2060 Fund | MFS Lifetime
2065 Fund |
| Class R6 shares | | | |
Net asset value, offering price, and redemption price per share
(net assets / shares of beneficial interest outstanding) | $17.05 | $13.55 | $8.02 |
| On sales of $50,000 or more, the maximum offering price of Class A shares is reduced. A contingent deferred sales charge may be imposed on redemptions of Class A, Class B, and Class C shares. |
See Notes to Financial Statements
Financial Statements
Statements of Operations
Six months ended 10/31/22 (unaudited)
These statements describe how much each fund earned in investment income and accrued in expenses. They also describe any gains or losses generated by each fund’s operations.
| | MFS Lifetime
Income Fund | MFS Lifetime
2025 Fund | MFS Lifetime
2030 Fund | MFS Lifetime
2035 Fund | MFS Lifetime
2040 Fund |
| Net investment income (loss) | | | | | |
| Dividends from affiliated issuers | $6,869,865 | $4,542,518 | $6,641,234 | $3,086,791 | $2,529,968 |
| Other | 78 | 56 | 90 | 60 | 73 |
| Excess expense reimbursement from investment adviser | 77,747 | 144,447 | 214,053 | 170,457 | 166,378 |
| Total investment income | $6,947,690 | $4,687,021 | $6,855,377 | $3,257,308 | $2,696,419 |
| Expenses | | | | | |
| Distribution and service fees | $680,431 | $227,471 | $543,706 | $278,869 | $440,484 |
| Shareholder servicing costs | 349,351 | 164,242 | 339,487 | 204,725 | 276,700 |
| Program manager fees | 5,181 | — | — | — | — |
| Administrative services fee | 8,823 | 8,823 | 8,823 | 8,823 | 8,823 |
| Independent Trustees' compensation | 5,091 | 4,168 | 6,466 | 4,608 | 5,344 |
| Custodian fee | 13,460 | 5,713 | 8,326 | 5,897 | 6,830 |
| Shareholder communications | 12,280 | 5,031 | 7,303 | 5,550 | 7,129 |
| Audit and tax fees | 22,518 | 20,685 | 21,068 | 20,685 | 21,065 |
| Legal fees | 9,531 | 983 | 1,719 | 1,092 | 1,339 |
| Registration fees | 69,987 | 64,445 | 70,382 | 66,011 | 68,626 |
| NASDAQ fee | 3,630 | 3,630 | 3,630 | 3,630 | 3,630 |
| N-CEN/N-PORT preparation fees | 5,545 | 5,545 | 5,545 | 5,545 | 5,545 |
| Miscellaneous | 9,429 | 8,370 | 9,999 | 8,669 | 9,288 |
| Total expenses | $1,195,257 | $519,106 | $1,026,454 | $614,104 | $854,803 |
| Reduction of expenses by investment adviser and distributor | (515,392) | (290,650) | (481,513) | (334,093) | (413,448) |
| Net expenses | $679,865 | $228,456 | $544,941 | $280,011 | $441,355 |
| Net investment income (loss) | $6,267,825 | $4,458,565 | $6,310,436 | $2,977,297 | $2,255,064 |
| Realized and unrealized gain (loss) | | | | | |
| Realized gain (loss) (identified cost basis) | | | | | |
| Investments in affiliated issuers | $(3,864,801) | $(2,566,805) | $(2,883,024) | $(2,066,868) | $(2,307,824) |
| Capital gain distributions from affiliated issuers | 47,773 | 43,986 | 105,299 | 95,650 | 135,301 |
| Net realized gain (loss) | $(3,817,028) | $(2,522,819) | $(2,777,725) | $(1,971,218) | $(2,172,523) |
| Change in unrealized appreciation or depreciation | | | | | |
| Affiliated issuers | $(46,436,944) | $(27,482,945) | $(52,675,546) | $(35,063,519) | $(42,779,518) |
| Net realized and unrealized gain (loss) | $(50,253,972) | $(30,005,764) | $(55,453,271) | $(37,034,737) | $(44,952,041) |
| Change in net assets from operations | $(43,986,147) | $(25,547,199) | $(49,142,835) | $(34,057,440) | $(42,696,977) |
See Notes to Financial Statements
Statements of Operations (unaudited) – continued
| Six months ended 10/31/22 | MFS Lifetime
2045 Fund | MFS Lifetime
2050 Fund | MFS Lifetime
2055 Fund | MFS Lifetime
2060 Fund | MFS Lifetime
2065 Fund |
| Net investment income (loss) | | | | | |
| Dividends from affiliated issuers | $944,343 | $747,727 | $435,495 | $182,319 | $3,517 |
| Other | 48 | 48 | 32 | 16 | 2 |
| Excess expense reimbursement from investment adviser | 122,030 | 105,994 | 66,512 | 26,951 | 612 |
| Total investment income | $1,066,421 | $853,769 | $502,039 | $209,286 | $4,131 |
| Expenses | | | | | |
| Distribution and service fees | $220,022 | $241,463 | $150,909 | $59,132 | $1,256 |
| Shareholder servicing costs | 171,036 | 191,558 | 128,685 | 58,080 | 2,093 |
| Administrative services fee | 8,823 | 8,823 | 8,823 | 8,823 | 8,823 |
| Independent Trustees' compensation | 3,723 | 3,626 | 2,638 | 1,722 | 1,513 |
| Custodian fee | 4,777 | 4,771 | 3,606 | 2,535 | 3,638 |
| Shareholder communications | 5,720 | 7,396 | 7,326 | 5,989 | 2,352 |
| Audit and tax fees | 20,683 | 20,747 | 20,680 | 20,323 | 15,445 |
| Legal fees | 798 | 791 | 457 | 161 | 17 |
| Registration fees | 66,638 | 66,786 | 62,414 | 61,446 | 95,684 |
| NASDAQ fee | 3,630 | 3,630 | 3,630 | 3,630 | 3,226 |
| N-CEN/N-PORT preparation fees | 5,545 | 5,545 | 5,545 | 5,545 | 5,545 |
| Miscellaneous | 8,110 | 8,009 | 7,396 | 6,805 | 5,145 |
| Total expenses | $519,505 | $563,145 | $402,109 | $234,191 | $144,737 |
| Reduction of expenses by investment adviser and distributor | (298,614) | (321,561) | (250,757) | (176,544) | (143,890) |
| Net expenses | $220,891 | $241,584 | $151,352 | $57,647 | $847 |
| Net investment income (loss) | $845,530 | $612,185 | $350,687 | $151,639 | $3,284 |
| Realized and unrealized gain (loss) | | | | | |
| Realized gain (loss) (identified cost basis) | | | | | |
| Investments in affiliated issuers | $(1,989,622) | $(1,932,856) | $(1,236,004) | $(584,507) | $(63,259) |
| Capital gain distributions from affiliated issuers | 92,558 | 98,923 | 57,156 | 23,761 | 400 |
| Net realized gain (loss) | $(1,897,064) | $(1,833,933) | $(1,178,848) | $(560,746) | $(62,859) |
| Change in unrealized appreciation or depreciation | | | | | |
| Affiliated issuers | $(26,065,760) | $(26,552,098) | $(15,400,130) | $(6,152,364) | $(48,149) |
| Net realized and unrealized gain (loss) | $(27,962,824) | $(28,386,031) | $(16,578,978) | $(6,713,110) | $(111,008) |
| Change in net assets from operations | $(27,117,294) | $(27,773,846) | $(16,228,291) | $(6,561,471) | $(107,724) |
See Notes to Financial Statements
Financial Statements
Statements of Changes in Net Assets
These statements describe the increases and/or decreases in net assets resulting from operations, any distributions, and any shareholder transactions.
| Six months ended 10/31/22 (unaudited) | MFS Lifetime
Income Fund | MFS Lifetime
2025 Fund | MFS Lifetime
2030 Fund | MFS Lifetime
2035 Fund | MFS Lifetime
2040 Fund |
| Change in net assets | | | | | |
| From operations | | | | | |
| Net investment income (loss) | $6,267,825 | $4,458,565 | $6,310,436 | $2,977,297 | $2,255,064 |
| Net realized gain (loss) | (3,817,028) | (2,522,819) | (2,777,725) | (1,971,218) | (2,172,523) |
| Net unrealized gain (loss) | (46,436,944) | (27,482,945) | (52,675,546) | (35,063,519) | (42,779,518) |
| Change in net assets from operations | $(43,986,147) | $(25,547,199) | $(49,142,835) | $(34,057,440) | $(42,696,977) |
| Total distributions to shareholders | $(5,115,861) | $— | $— | $— | $— |
| Change in net assets from fund share transactions | $100,716,520 | $3,293,401 | $19,505,498 | $41,457,221 | $52,391,998 |
| Total change in net assets | $51,614,512 | $(22,253,798) | $(29,637,337) | $7,399,781 | $9,695,021 |
| Net assets | | | | | |
| At beginning of period | 606,418,804 | 413,384,451 | 726,570,657 | 473,703,976 | 570,740,213 |
| At end of period | $658,033,316 | $391,130,653 | $696,933,320 | $481,103,757 | $580,435,234 |
| Six months ended 10/31/22 (unaudited) | MFS Lifetime
2045 Fund | MFS Lifetime
2050 Fund | MFS Lifetime
2055 Fund | MFS Lifetime
2060 Fund | MFS Lifetime
2065 Fund |
| Change in net assets | | | | | |
| From operations | | | | | |
| Net investment income (loss) | $845,530 | $612,185 | $350,687 | $151,639 | $3,284 |
| Net realized gain (loss) | (1,897,064) | (1,833,933) | (1,178,848) | (560,746) | (62,859) |
| Net unrealized gain (loss) | (26,065,760) | (26,552,098) | (15,400,130) | (6,152,364) | (48,149) |
| Change in net assets from operations | $(27,117,294) | $(27,773,846) | $(16,228,291) | $(6,561,471) | $(107,724) |
| Change in net assets from fund share transactions | $52,614,782 | $66,004,693 | $34,954,158 | $23,741,955 | $864,289 |
| Total change in net assets | $25,497,488 | $38,230,847 | $18,725,867 | $17,180,484 | $756,565 |
| Net assets | | | | | |
| At beginning of period | 351,460,035 | 338,513,882 | 204,165,513 | 79,206,386 | 1,197,919 |
| At end of period | $376,957,523 | $376,744,729 | $222,891,380 | $96,386,870 | $1,954,484 |
See Notes to Financial Statements
Statements of Changes in Net Assets – continued
| Year ended 4/30/22 | MFS Lifetime
Income Fund | MFS Lifetime
2025 Fund | MFS Lifetime
2030 Fund | MFS Lifetime
2035 Fund | MFS Lifetime
2040 Fund |
| Change in net assets | | | | | |
| From operations | | | | | |
| Net investment income (loss) | $21,615,542 | $16,761,168 | $31,615,206 | $23,018,018 | $29,003,785 |
| Net realized gain (loss) | 23,761,719 | 22,019,488 | 47,377,296 | 28,995,513 | 40,211,853 |
| Net unrealized gain (loss) | (73,559,442) | (55,472,776) | (108,414,506) | (68,863,615) | (88,442,373) |
| Change in net assets from operations | $(28,182,181) | $(16,692,120) | $(29,422,004) | $(16,850,084) | $(19,226,735) |
| Total distributions to shareholders | $(39,012,229) | $(31,208,353) | $(64,361,664) | $(37,038,214) | $(50,946,535) |
| Change in net assets from fund share transactions | $(21,995,852) | $(23,248,616) | $27,408,064 | $35,091,421 | $27,265,836 |
| Total change in net assets | $(89,190,262) | $(71,149,089) | $(66,375,604) | $(18,796,877) | $(42,907,434) |
| Net assets | | | | | |
| At beginning of period | 695,609,066 | 484,533,540 | 792,946,261 | 492,500,853 | 613,647,647 |
| At end of period | $606,418,804 | $413,384,451 | $726,570,657 | $473,703,976 | $570,740,213 |
| Year ended 4/30/22 | MFS Lifetime
2045 Fund | MFS Lifetime
2050 Fund | MFS Lifetime
2055 Fund | MFS Lifetime
2060 Fund | MFS Lifetime
2065 Fund (c) |
| Change in net assets | | | | | |
| From operations | | | | | |
| Net investment income (loss) | $17,513,448 | $16,945,910 | $9,898,339 | $3,479,950 | $41,545 |
| Net realized gain (loss) | 22,209,834 | 24,551,475 | 12,057,674 | 3,191,124 | 34,864 |
| Net unrealized gain (loss) | (50,689,207) | (51,421,231) | (28,453,984) | (10,062,604) | (184,925) |
| Change in net assets from operations | $(10,965,925) | $(9,923,846) | $(6,497,971) | $(3,391,530) | $(108,516) |
| Total distributions to shareholders | $(28,358,269) | $(29,748,163) | $(15,367,066) | $(4,367,018) | $(41,175) |
| Change in net assets from fund share transactions | $32,558,781 | $13,133,764 | $25,039,958 | $27,035,263 | $1,347,610 |
| Total change in net assets | $(6,765,413) | $(26,538,245) | $3,174,921 | $19,276,715 | $1,197,919 |
| Net assets | | | | | |
| At beginning of period | 358,225,448 | 365,052,127 | 200,990,592 | 59,929,671 | — |
| At end of period | $351,460,035 | $338,513,882 | $204,165,513 | $79,206,386 | $1,197,919 |
| (c) | For the period from the commencement of the fund’s investment operations, September 1, 2021, through the stated period end. |
See Notes to Financial Statements
Financial Statements
Financial Highlights
MFS LIFETIME INCOME FUND
The financial highlights table is intended to help you understand the fund's financial performance for the semiannual period and the past 5 fiscal years. Certain information reflects financial results for a single fund share. The total returns in the table represent the rate that an investor would have earned (or lost) on an investment in the fund share class (assuming reinvestment of all distributions) held for the entire period.
| | Six months
ended | Year ended |
| Class A | 10/31/22
(unaudited) | 4/30/22 | 4/30/21 | 4/30/20 | 4/30/19
| 4/30/18 |
| Net asset value, beginning of period | $12.48 | $13.84 | $12.29 | $12.39 | $12.25 | $12.20 |
| Income (loss) from investment operations | | | | | | |
| Net investment income (loss) (d)(l) | $0.13 | $0.45 | $0.23 | $0.30 | $0.31 | $0.27 |
| Net realized and unrealized gain (loss) | (0.89) | (1.01) | 1.72 | 0.05 | 0.30 | 0.20 |
| Total from investment operations | $(0.76) | $(0.56) | $1.95 | $0.35 | $0.61 | $0.47 |
| Less distributions declared to shareholders | | | | | | |
| From net investment income | $(0.11) | $(0.45) | $(0.27) | $(0.31) | $(0.32) | $(0.27) |
| From net realized gain | — | (0.35) | (0.13) | (0.14) | (0.15) | (0.15) |
| Total distributions declared to shareholders | $(0.11) | $(0.80) | $(0.40) | $(0.45) | $(0.47) | $(0.42) |
| Net asset value, end of period (x) | $11.61 | $12.48 | $13.84 | $12.29 | $12.39 | $12.25 |
| Total return (%) (r)(s)(t)(x) | (6.13)(n) | (4.52) | 16.01 | 2.78 | 5.18 | 3.84 |
| Ratios (%) (to average net assets) and Supplemental data: | | | | | | |
| Expenses before expense reductions (h) | 0.46(a) | 0.43 | 0.43 | 0.45 | 0.45 | 0.45 |
| Expenses after expense reductions (h) | 0.25(a) | 0.23 | 0.23 | 0.23 | 0.23 | 0.24 |
| Net investment income (loss) (l) | 2.19(a) | 3.28 | 1.77 | 2.37 | 2.57 | 2.19 |
| Portfolio turnover | 13(n) | 7 | 12 | 15 | 10 | 11 |
| Net assets at end of period (000 omitted) | $186,749 | $166,307 | $164,096 | $124,123 | $111,591 | $108,482 |
See Notes to Financial Statements
Financial Highlights − continued
MFS LIFETIME INCOME FUND − continued
| | Six months
ended | Year ended |
| Class B | 10/31/22
(unaudited) | 4/30/22 | 4/30/21 | 4/30/20 | 4/30/19
| 4/30/18 |
| Net asset value, beginning of period | $12.48 | $13.84 | $12.29 | $12.40 | $12.25 | $12.20 |
| Income (loss) from investment operations | | | | | | |
| Net investment income (loss) (d)(l) | $0.09 | $0.33 | $0.15 | $0.20 | $0.22 | $0.17 |
| Net realized and unrealized gain (loss) | (0.90) | (1.00) | 1.70 | 0.04 | 0.31 | 0.21 |
| Total from investment operations | $(0.81) | $(0.67) | $1.85 | $0.24 | $0.53 | $0.38 |
| Less distributions declared to shareholders | | | | | | |
| From net investment income | $(0.06) | $(0.34) | $(0.17) | $(0.21) | $(0.23) | $(0.18) |
| From net realized gain | — | (0.35) | (0.13) | (0.14) | (0.15) | (0.15) |
| Total distributions declared to shareholders | $(0.06) | $(0.69) | $(0.30) | $(0.35) | $(0.38) | $(0.33) |
| Net asset value, end of period (x) | $11.61 | $12.48 | $13.84 | $12.29 | $12.40 | $12.25 |
| Total return (%) (r)(s)(t)(x) | (6.49)(n) | (5.24) | 15.16 | 1.93 | 4.48 | 3.07 |
| Ratios (%) (to average net assets) and Supplemental data: | | | | | | |
| Expenses before expense reductions (h) | 1.21(a) | 1.18 | 1.19 | 1.20 | 1.20 | 1.20 |
| Expenses after expense reductions (h) | 1.00(a) | 0.98 | 0.98 | 0.98 | 0.99 | 0.99 |
| Net investment income (loss) (l) | 1.47(a) | 2.39 | 1.15 | 1.61 | 1.81 | 1.40 |
| Portfolio turnover | 13(n) | 7 | 12 | 15 | 10 | 11 |
| Net assets at end of period (000 omitted) | $2,372 | $1,914 | $3,347 | $5,774 | $9,111 | $11,818 |
| | Six months
ended | Year ended |
| Class C | 10/31/22
(unaudited) | 4/30/22 | 4/30/21 | 4/30/20 | 4/30/19
| 4/30/18 |
| Net asset value, beginning of period | $12.47 | $13.83 | $12.28 | $12.39 | $12.25 | $12.19 |
| Income (loss) from investment operations | | | | | | |
| Net investment income (loss) (d)(l) | $0.08 | $0.34 | $0.15 | $0.20 | $0.22 | $0.18 |
| Net realized and unrealized gain (loss) | (0.89) | (1.01) | 1.70 | 0.04 | 0.30 | 0.21 |
| Total from investment operations | $(0.81) | $(0.67) | $1.85 | $0.24 | $0.52 | $0.39 |
| Less distributions declared to shareholders | | | | | | |
| From net investment income | $(0.06) | $(0.34) | $(0.17) | $(0.21) | $(0.23) | $(0.18) |
| From net realized gain | — | (0.35) | (0.13) | (0.14) | (0.15) | (0.15) |
| Total distributions declared to shareholders | $(0.06) | $(0.69) | $(0.30) | $(0.35) | $(0.38) | $(0.33) |
| Net asset value, end of period (x) | $11.60 | $12.47 | $13.83 | $12.28 | $12.39 | $12.25 |
| Total return (%) (r)(s)(t)(x) | (6.49)(n) | (5.24) | 15.17 | 1.93 | 4.40 | 3.15 |
| Ratios (%) (to average net assets) and Supplemental data: | | | | | | |
| Expenses before expense reductions (h) | 1.21(a) | 1.18 | 1.19 | 1.20 | 1.20 | 1.20 |
| Expenses after expense reductions (h) | 1.00(a) | 0.98 | 0.98 | 0.98 | 0.99 | 0.99 |
| Net investment income (loss) (l) | 1.39(a) | 2.47 | 1.16 | 1.60 | 1.80 | 1.43 |
| Portfolio turnover | 13(n) | 7 | 12 | 15 | 10 | 11 |
| Net assets at end of period (000 omitted) | $46,082 | $55,415 | $81,542 | $98,286 | $112,773 | $128,791 |
See Notes to Financial Statements
Financial Highlights − continued
MFS LIFETIME INCOME FUND − continued
| | Six months
ended | Year ended |
| Class I | 10/31/22
(unaudited) | 4/30/22 | 4/30/21 | 4/30/20 | 4/30/19
| 4/30/18 |
| Net asset value, beginning of period | $12.48 | $13.84 | $12.29 | $12.40 | $12.25 | $12.20 |
| Income (loss) from investment operations | | | | | | |
| Net investment income (loss) (d)(l) | $0.15 | $0.49 | $0.28 | $0.33 | $0.34 | $0.31 |
| Net realized and unrealized gain (loss) | (0.90) | (1.02) | 1.70 | 0.04 | 0.31 | 0.19 |
| Total from investment operations | $(0.75) | $(0.53) | $1.98 | $0.37 | $0.65 | $0.50 |
| Less distributions declared to shareholders | | | | | | |
| From net investment income | $(0.12) | $(0.48) | $(0.30) | $(0.34) | $(0.35) | $(0.30) |
| From net realized gain | — | (0.35) | (0.13) | (0.14) | (0.15) | (0.15) |
| Total distributions declared to shareholders | $(0.12) | $(0.83) | $(0.43) | $(0.48) | $(0.50) | $(0.45) |
| Net asset value, end of period (x) | $11.61 | $12.48 | $13.84 | $12.29 | $12.40 | $12.25 |
| Total return (%) (r)(s)(t)(x) | (6.01)(n) | (4.28) | 16.30 | 2.96 | 5.53 | 4.10 |
| Ratios (%) (to average net assets) and Supplemental data: | | | | | | |
| Expenses before expense reductions (h) | 0.21(a) | 0.18 | 0.18 | 0.20 | 0.20 | 0.20 |
| Expenses after expense reductions (h) | 0.00(a) | 0.00 | 0.00 | 0.00 | 0.00 | 0.00 |
| Net investment income (loss) (l) | 2.42(a) | 3.58 | 2.14 | 2.61 | 2.82 | 2.46 |
| Portfolio turnover | 13(n) | 7 | 12 | 15 | 10 | 11 |
| Net assets at end of period (000 omitted) | $44,931 | $45,108 | $46,956 | $34,513 | $34,654 | $32,496 |
| | Six months
ended | Year ended |
| Class R1 | 10/31/22
(unaudited) | 4/30/22 | 4/30/21 | 4/30/20 | 4/30/19
| 4/30/18 |
| Net asset value, beginning of period | $12.49 | $13.85 | $12.30 | $12.41 | $12.26 | $12.21 |
| Income (loss) from investment operations | | | | | | |
| Net investment income (loss) (d)(l) | $0.09 | $0.36 | $0.14 | $0.20 | $0.21 | $0.18 |
| Net realized and unrealized gain (loss) | (0.90) | (1.03) | 1.71 | 0.04 | 0.32 | 0.20 |
| Total from investment operations | $(0.81) | $(0.67) | $1.85 | $0.24 | $0.53 | $0.38 |
| Less distributions declared to shareholders | | | | | | |
| From net investment income | $(0.06) | $(0.34) | $(0.17) | $(0.21) | $(0.23) | $(0.18) |
| From net realized gain | — | (0.35) | (0.13) | (0.14) | (0.15) | (0.15) |
| Total distributions declared to shareholders | $(0.06) | $(0.69) | $(0.30) | $(0.35) | $(0.38) | $(0.33) |
| Net asset value, end of period (x) | $11.62 | $12.49 | $13.85 | $12.30 | $12.41 | $12.26 |
| Total return (%) (r)(s)(t)(x) | (6.48)(n) | (5.23) | 15.15 | 1.93 | 4.48 | 3.06 |
| Ratios (%) (to average net assets) and Supplemental data: | | | | | | |
| Expenses before expense reductions (h) | 1.21(a) | 1.18 | 1.19 | 1.20 | 1.20 | 1.20 |
| Expenses after expense reductions (h) | 1.00(a) | 0.98 | 0.98 | 0.98 | 0.98 | 0.99 |
| Net investment income (loss) (l) | 1.49(a) | 2.61 | 1.08 | 1.58 | 1.72 | 1.42 |
| Portfolio turnover | 13(n) | 7 | 12 | 15 | 10 | 11 |
| Net assets at end of period (000 omitted) | $2,712 | $1,779 | $1,932 | $2,493 | $3,977 | $4,344 |
See Notes to Financial Statements
Financial Highlights − continued
MFS LIFETIME INCOME FUND − continued
| | Six months
ended | Year ended |
| Class R2 | 10/31/22
(unaudited) | 4/30/22 | 4/30/21 | 4/30/20 | 4/30/19
| 4/30/18 |
| Net asset value, beginning of period | $12.48 | $13.84 | $12.29 | $12.40 | $12.26 | $12.20 |
| Income (loss) from investment operations | | | | | | |
| Net investment income (loss) (d)(l) | $0.13 | $0.40 | $0.21 | $0.26 | $0.28 | $0.24 |
| Net realized and unrealized gain (loss) | (0.91) | (1.00) | 1.71 | 0.05 | 0.30 | 0.21 |
| Total from investment operations | $(0.78) | $(0.60) | $1.92 | $0.31 | $0.58 | $0.45 |
| Less distributions declared to shareholders | | | | | | |
| From net investment income | $(0.09) | $(0.41) | $(0.24) | $(0.28) | $(0.29) | $(0.24) |
| From net realized gain | — | (0.35) | (0.13) | (0.14) | (0.15) | (0.15) |
| Total distributions declared to shareholders | $(0.09) | $(0.76) | $(0.37) | $(0.42) | $(0.44) | $(0.39) |
| Net asset value, end of period (x) | $11.61 | $12.48 | $13.84 | $12.29 | $12.40 | $12.26 |
| Total return (%) (r)(s)(t)(x) | (6.25)(n) | (4.76) | 15.73 | 2.44 | 4.92 | 3.67 |
| Ratios (%) (to average net assets) and Supplemental data: | | | | | | |
| Expenses before expense reductions (h) | 0.70(a) | 0.68 | 0.69 | 0.70 | 0.70 | 0.70 |
| Expenses after expense reductions (h) | 0.50(a) | 0.48 | 0.48 | 0.48 | 0.49 | 0.49 |
| Net investment income (loss) (l) | 2.10(a) | 2.92 | 1.60 | 2.07 | 2.30 | 1.91 |
| Portfolio turnover | 13(n) | 7 | 12 | 15 | 10 | 11 |
| Net assets at end of period (000 omitted) | $26,750 | $7,981 | $10,823 | $14,259 | $19,458 | $27,110 |
| | Six months
ended | Year ended |
| Class R3 | 10/31/22
(unaudited) | 4/30/22 | 4/30/21 | 4/30/20 | 4/30/19
| 4/30/18 |
| Net asset value, beginning of period | $12.48 | $13.84 | $12.29 | $12.40 | $12.25 | $12.20 |
| Income (loss) from investment operations | | | | | | |
| Net investment income (loss) (d)(l) | $0.14 | $0.43 | $0.25 | $0.30 | $0.31 | $0.27 |
| Net realized and unrealized gain (loss) | (0.90) | (0.99) | 1.70 | 0.04 | 0.31 | 0.20 |
| Total from investment operations | $(0.76) | $(0.56) | $1.95 | $0.34 | $0.62 | $0.47 |
| Less distributions declared to shareholders | | | | | | |
| From net investment income | $(0.11) | $(0.45) | $(0.27) | $(0.31) | $(0.32) | $(0.27) |
| From net realized gain | — | (0.35) | (0.13) | (0.14) | (0.15) | (0.15) |
| Total distributions declared to shareholders | $(0.11) | $(0.80) | $(0.40) | $(0.45) | $(0.47) | $(0.42) |
| Net asset value, end of period (x) | $11.61 | $12.48 | $13.84 | $12.29 | $12.40 | $12.25 |
| Total return (%) (r)(s)(t)(x) | (6.13)(n) | (4.52) | 16.01 | 2.70 | 5.26 | 3.84 |
| Ratios (%) (to average net assets) and Supplemental data: | | | | | | |
| Expenses before expense reductions (h) | 0.46(a) | 0.43 | 0.43 | 0.45 | 0.45 | 0.45 |
| Expenses after expense reductions (h) | 0.25(a) | 0.23 | 0.23 | 0.23 | 0.24 | 0.24 |
| Net investment income (loss) (l) | 2.26(a) | 3.13 | 1.90 | 2.39 | 2.57 | 2.21 |
| Portfolio turnover | 13(n) | 7 | 12 | 15 | 10 | 11 |
| Net assets at end of period (000 omitted) | $113,041 | $61,647 | $75,909 | $67,237 | $54,540 | $54,156 |
See Notes to Financial Statements
Financial Highlights − continued
MFS LIFETIME INCOME FUND − continued
| | Six months
ended | Year ended |
| Class R4 | 10/31/22
(unaudited) | 4/30/22 | 4/30/21 | 4/30/20 | 4/30/19
| 4/30/18 |
| Net asset value, beginning of period | $12.48 | $13.84 | $12.29 | $12.39 | $12.25 | $12.20 |
| Income (loss) from investment operations | | | | | | |
| Net investment income (loss) (d)(l) | $0.16 | $0.45 | $0.28 | $0.33 | $0.34 | $0.31 |
| Net realized and unrealized gain (loss) | (0.91) | (0.98) | 1.70 | 0.05 | 0.30 | 0.19 |
| Total from investment operations | $(0.75) | $(0.53) | $1.98 | $0.38 | $0.64 | $0.50 |
| Less distributions declared to shareholders | | | | | | |
| From net investment income | $(0.12) | $(0.48) | $(0.30) | $(0.34) | $(0.35) | $(0.30) |
| From net realized gain | — | (0.35) | (0.13) | (0.14) | (0.15) | (0.15) |
| Total distributions declared to shareholders | $(0.12) | $(0.83) | $(0.43) | $(0.48) | $(0.50) | $(0.45) |
| Net asset value, end of period (x) | $11.61 | $12.48 | $13.84 | $12.29 | $12.39 | $12.25 |
| Total return (%) (r)(s)(t)(x) | (6.01)(n) | (4.28) | 16.30 | 3.04 | 5.44 | 4.10 |
| Ratios (%) (to average net assets) and Supplemental data: | | | | | | |
| Expenses before expense reductions (h) | 0.20(a) | 0.18 | 0.19 | 0.20 | 0.20 | 0.21 |
| Expenses after expense reductions (h) | 0.00(a) | 0.00 | 0.00 | 0.00 | 0.00 | 0.00 |
| Net investment income (loss) (l) | 2.58(a) | 3.28 | 2.14 | 2.61 | 2.82 | 2.51 |
| Portfolio turnover | 13(n) | 7 | 12 | 15 | 10 | 11 |
| Net assets at end of period (000 omitted) | $33,881 | $11,700 | $31,138 | $41,807 | $47,906 | $52,790 |
| | Six months
ended | Year ended |
| Class R6 | 10/31/22
(unaudited) | 4/30/22 | 4/30/21 | 4/30/20 | 4/30/19
| 4/30/18 |
| Net asset value, beginning of period | $12.52 | $13.88 | $12.32 | $12.43 | $12.29 | $12.23 |
| Income (loss) from investment operations | | | | | | |
| Net investment income (loss) (d)(l) | $0.16 | $0.50 | $0.30 | $0.34 | $0.35 | $0.35 |
| Net realized and unrealized gain (loss) | (0.91) | (1.02) | 1.71 | 0.04 | 0.30 | 0.17 |
| Total from investment operations | $(0.75) | $(0.52) | $2.01 | $0.38 | $0.65 | $0.52 |
| Less distributions declared to shareholders | | | | | | |
| From net investment income | $(0.13) | $(0.49) | $(0.32) | $(0.35) | $(0.36) | $(0.31) |
| From net realized gain | — | (0.35) | (0.13) | (0.14) | (0.15) | (0.15) |
| Total distributions declared to shareholders | $(0.13) | $(0.84) | $(0.45) | $(0.49) | $(0.51) | $(0.46) |
| Net asset value, end of period (x) | $11.64 | $12.52 | $13.88 | $12.32 | $12.43 | $12.29 |
| Total return (%) (r)(s)(t)(x) | (6.02)(n) | (4.18) | 16.44 | 3.04 | 5.52 | 4.28 |
| Ratios (%) (to average net assets) and Supplemental data: | | | | | | |
| Expenses before expense reductions (h) | 0.09(a) | 0.09 | 0.10 | 0.12 | 0.12 | 0.10 |
| Expenses after expense reductions (h) | 0.00(a) | 0.00 | 0.00 | 0.00 | 0.00 | 0.00 |
| Net investment income (loss) (l) | 2.64(a) | 3.61 | 2.24 | 2.69 | 2.84 | 2.83 |
| Portfolio turnover | 13(n) | 7 | 12 | 15 | 10 | 11 |
| Net assets at end of period (000 omitted) | $201,514 | $81,457 | $87,750 | $42,065 | $33,595 | $26,728 |
See Notes to Financial Statements
Financial Highlights − continued
MFS LIFETIME INCOME FUND − continued
| (a) | Annualized. |
| (d) | Per share data is based on average shares outstanding. |
| (h) | In addition to the fees and expenses which the fund bears directly, the fund indirectly bears a pro rata share of the fees and expenses of the underlying affiliated funds in which the fund invests. Accordingly, the expense ratio for the fund reflects only those fees and expenses borne directly by the fund. Because the underlying affiliated funds have varied expense and fee levels and the fund may own different proportions of the underlying affiliated funds at different times, the amount of fees and expenses incurred indirectly by the fund will vary. |
| (l) | Recognition of net investment income by the fund may be affected by the timing of the declaration of dividends by the underlying affiliated funds in which the fund invests and for interim net investment income ratios, the actual annual net investment income ratio may differ. The ratios and per share amounts do not include net investment income of the underlying affiliated funds in which the fund invests. |
| (n) | Not annualized. |
| (r) | Certain expenses have been reduced without which performance would have been lower. |
| (s) | From time to time the fund may receive proceeds from litigation settlements, without which performance would be lower. |
| (t) | Total returns do not include any applicable sales charges. |
| (x) | The net asset values and total returns have been calculated on net assets which include adjustments made in accordance with U.S. generally accepted accounting principles required at period end for financial reporting purposes. |
See Notes to Financial Statements
Financial Highlights − continued
MFS LIFETIME 2025 FUND
The financial highlights table is intended to help you understand the fund's financial performance for the semiannual period and the past 5 fiscal years. Certain information reflects financial results for a single fund share. The total returns in the table represent the rate that an investor would have earned (or lost) on an investment in the fund share class (assuming reinvestment of all distributions) held for the entire period.
| | Six months
ended | Year ended |
| Class A | 10/31/22
(unaudited) | 4/30/22 | 4/30/21 | 4/30/20 | 4/30/19
| 4/30/18 |
| Net asset value, beginning of period | $13.38 | $15.00 | $12.75 | $13.03 | $12.83 | $12.35 |
| Income (loss) from investment operations | | | | | | |
| Net investment income (loss) (d)(l) | $0.14 | $0.51 | $0.25 | $0.30 | $0.33 | $0.29 |
| Net realized and unrealized gain (loss) | (1.00) | (1.09) | 2.38 | (0.11) | 0.35 | 0.62 |
| Total from investment operations | $(0.86) | $(0.58) | $2.63 | $0.19 | $0.68 | $0.91 |
| Less distributions declared to shareholders | | | | | | |
| From net investment income | $— | $(0.53) | $(0.26) | $(0.28) | $(0.31) | $(0.35) |
| From net realized gain | — | (0.51) | (0.12) | (0.19) | (0.17) | (0.08) |
| Total distributions declared to shareholders | $— | $(1.04) | $(0.38) | $(0.47) | $(0.48) | $(0.43) |
| Net asset value, end of period (x) | $12.52 | $13.38 | $15.00 | $12.75 | $13.03 | $12.83 |
| Total return (%) (r)(s)(t)(x) | (6.43)(n) | (4.47) | 20.70 | 1.25 | 5.70 | 7.34 |
| Ratios (%) (to average net assets) and Supplemental data: | | | | | | |
| Expenses before expense reductions (h) | 0.47(a) | 0.46 | 0.47 | 0.51 | 0.52 | 0.54 |
| Expenses after expense reductions (h) | 0.25(a) | 0.25 | 0.25 | 0.23 | 0.22 | 0.23 |
| Net investment income (loss) (l) | 2.07(a) | 3.41 | 1.77 | 2.25 | 2.62 | 2.28 |
| Portfolio turnover | 9(n) | 14 | 24 | 18 | 14 | 37 |
| Net assets at end of period (000 omitted) | $23,527 | $26,794 | $29,637 | $26,335 | $19,689 | $16,710 |
See Notes to Financial Statements
Financial Highlights − continued
MFS LIFETIME 2025 FUND − continued
| | Six months
ended | Year ended |
| Class B | 10/31/22
(unaudited) | 4/30/22 | 4/30/21 | 4/30/20 | 4/30/19
| 4/30/18 |
| Net asset value, beginning of period | $13.29 | $14.89 | $12.64 | $12.93 | $12.72 | $12.26 |
| Income (loss) from investment operations | | | | | | |
| Net investment income (loss) (d)(l) | $0.08 | $0.40 | $0.14 | $0.20 | $0.23 | $0.19 |
| Net realized and unrealized gain (loss) | (0.98) | (1.09) | 2.36 | (0.12) | 0.36 | 0.60 |
| Total from investment operations | $(0.90) | $(0.69) | $2.50 | $0.08 | $0.59 | $0.79 |
| Less distributions declared to shareholders | | | | | | |
| From net investment income | $— | $(0.40) | $(0.13) | $(0.18) | $(0.21) | $(0.25) |
| From net realized gain | — | (0.51) | (0.12) | (0.19) | (0.17) | (0.08) |
| Total distributions declared to shareholders | $— | $(0.91) | $(0.25) | $(0.37) | $(0.38) | $(0.33) |
| Net asset value, end of period (x) | $12.39 | $13.29 | $14.89 | $12.64 | $12.93 | $12.72 |
| Total return (%) (r)(s)(t)(x) | (6.77)(n) | (5.15) | 19.83 | 0.48 | 4.96 | 6.40 |
| Ratios (%) (to average net assets) and Supplemental data: | | | | | | |
| Expenses before expense reductions (h) | 1.22(a) | 1.21 | 1.22 | 1.26 | 1.27 | 1.29 |
| Expenses after expense reductions (h) | 1.00(a) | 1.00 | 1.00 | 0.99 | 0.97 | 1.00 |
| Net investment income (loss) (l) | 1.30(a) | 2.71 | 1.00 | 1.49 | 1.82 | 1.47 |
| Portfolio turnover | 9(n) | 14 | 24 | 18 | 14 | 37 |
| Net assets at end of period (000 omitted) | $930 | $1,156 | $1,447 | $1,632 | $1,501 | $1,472 |
| | Six months
ended | Year ended |
| Class C | 10/31/22
(unaudited) | 4/30/22 | 4/30/21 | 4/30/20 | 4/30/19 | 4/30/18 |
| Net asset value, beginning of period | $13.20 | $14.80 | $12.58 | $12.86 | $12.66 | $12.21 |
| Income (loss) from investment operations | | | | | | |
| Net investment income (loss) (d)(l) | $0.08 | $0.40 | $0.14 | $0.19 | $0.22 | $0.19 |
| Net realized and unrealized gain (loss) | (0.97) | (1.09) | 2.35 | (0.11) | 0.37 | 0.60 |
| Total from investment operations | $(0.89) | $(0.69) | $2.49 | $0.08 | $0.59 | $0.79 |
| Less distributions declared to shareholders | | | | | | |
| From net investment income | $— | $(0.40) | $(0.15) | $(0.17) | $(0.22) | $(0.26) |
| From net realized gain | — | (0.51) | (0.12) | (0.19) | (0.17) | (0.08) |
| Total distributions declared to shareholders | $— | $(0.91) | $(0.27) | $(0.36) | $(0.39) | $(0.34) |
| Net asset value, end of period (x) | $12.31 | $13.20 | $14.80 | $12.58 | $12.86 | $12.66 |
| Total return (%) (r)(s)(t)(x) | (6.74)(n) | (5.19) | 19.86 | 0.45 | 4.94 | 6.42 |
| Ratios (%) (to average net assets) and Supplemental data: | | | | | | |
| Expenses before expense reductions (h) | 1.22(a) | 1.21 | 1.22 | 1.26 | 1.27 | 1.29 |
| Expenses after expense reductions (h) | 1.00(a) | 1.00 | 1.00 | 1.00 | 0.99 | 1.00 |
| Net investment income (loss) (l) | 1.31(a) | 2.74 | 1.03 | 1.46 | 1.78 | 1.50 |
| Portfolio turnover | 9(n) | 14 | 24 | 18 | 14 | 37 |
| Net assets at end of period (000 omitted) | $3,509 | $3,571 | $4,618 | $3,852 | $4,186 | $3,571 |
See Notes to Financial Statements
Financial Highlights − continued
MFS LIFETIME 2025 FUND − continued
| | Six months
ended | Year ended |
| Class I | 10/31/22
(unaudited) | 4/30/22 | 4/30/21 | 4/30/20 | 4/30/19
| 4/30/18 |
| Net asset value, beginning of period | $13.43 | $15.06 | $12.79 | $13.08 | $12.87 | $12.40 |
| Income (loss) from investment operations | | | | | | |
| Net investment income (loss) (d)(l) | $0.15 | $0.55 | $0.30 | $0.33 | $0.41 | $0.25 |
| Net realized and unrealized gain (loss) | (0.99) | (1.10) | 2.38 | (0.12) | 0.32 | 0.68 |
| Total from investment operations | $(0.84) | $(0.55) | $2.68 | $0.21 | $0.73 | $0.93 |
| Less distributions declared to shareholders | | | | | | |
| From net investment income | $— | $(0.57) | $(0.29) | $(0.31) | $(0.35) | $(0.38) |
| From net realized gain | — | (0.51) | (0.12) | (0.19) | (0.17) | (0.08) |
| Total distributions declared to shareholders | $— | $(1.08) | $(0.41) | $(0.50) | $(0.52) | $(0.46) |
| Net asset value, end of period (x) | $12.59 | $13.43 | $15.06 | $12.79 | $13.08 | $12.87 |
| Total return (%) (r)(s)(t)(x) | (6.25)(n) | (4.26) | 21.10 | 1.38 | 6.05 | 7.44 |
| Ratios (%) (to average net assets) and Supplemental data: | | | | | | |
| Expenses before expense reductions (h) | 0.22(a) | 0.21 | 0.22 | 0.26 | 0.27 | 0.32 |
| Expenses after expense reductions (h) | 0.00(a) | 0.00 | 0.00 | 0.00 | 0.00 | 0.00 |
| Net investment income (loss) (l) | 2.27(a) | 3.68 | 2.08 | 2.49 | 3.23 | 1.96 |
| Portfolio turnover | 9(n) | 14 | 24 | 18 | 14 | 37 |
| Net assets at end of period (000 omitted) | $2,981 | $4,104 | $3,131 | $1,445 | $1,228 | $538 |
| | Six months
ended | Year ended |
| Class R1 | 10/31/22
(unaudited) | 4/30/22 | 4/30/21 | 4/30/20 | 4/30/19 | 4/30/18 |
| Net asset value, beginning of period | $13.44 | $15.04 | $12.65 | $12.95 | $12.76 | $12.33 |
| Income (loss) from investment operations | | | | | | |
| Net investment income (loss) (d)(l) | $0.09 | $0.39 | $0.09 | $0.19 | $0.22 | $0.20 |
| Net realized and unrealized gain (loss) | (1.00) | (1.09) | 2.42 | (0.12) | 0.37 | 0.60 |
| Total from investment operations | $(0.91) | $(0.70) | $2.51 | $0.07 | $0.59 | $0.80 |
| Less distributions declared to shareholders | | | | | | |
| From net investment income | $— | $(0.39) | $— | $(0.18) | $(0.23) | $(0.29) |
| From net realized gain | — | (0.51) | (0.12) | (0.19) | (0.17) | (0.08) |
| Total distributions declared to shareholders | $— | $(0.90) | $(0.12) | $(0.37) | $(0.40) | $(0.37) |
| Net asset value, end of period (x) | $12.53 | $13.44 | $15.04 | $12.65 | $12.95 | $12.76 |
| Total return (%) (r)(s)(t)(x) | (6.77)(n) | (5.19) | 19.86 | 0.37 | 4.97 | 6.46 |
| Ratios (%) (to average net assets) and Supplemental data: | | | | | | |
| Expenses before expense reductions (h) | 1.22(a) | 1.21 | 1.23 | 1.26 | 1.27 | 1.30 |
| Expenses after expense reductions (h) | 1.00(a) | 1.00 | 1.00 | 1.00 | 0.99 | 1.00 |
| Net investment income (loss) (l) | 1.33(a) | 2.61 | 0.67 | 1.46 | 1.76 | 1.58 |
| Portfolio turnover | 9(n) | 14 | 24 | 18 | 14 | 37 |
| Net assets at end of period (000 omitted) | $308 | $310 | $374 | $1,902 | $1,578 | $1,234 |
See Notes to Financial Statements
Financial Highlights − continued
MFS LIFETIME 2025 FUND − continued
| | Six months
ended | Year ended |
| Class R2 | 10/31/22
(unaudited) | 4/30/22 | 4/30/21 | 4/30/20 | 4/30/19
| 4/30/18 |
| Net asset value, beginning of period | $13.35 | $14.95 | $12.69 | $12.96 | $12.74 | $12.29 |
| Income (loss) from investment operations | | | | | | |
| Net investment income (loss) (d)(l) | $0.12 | $0.47 | $0.21 | $0.25 | $0.28 | $0.26 |
| Net realized and unrealized gain (loss) | (0.99) | (1.08) | 2.37 | (0.11) | 0.37 | 0.60 |
| Total from investment operations | $(0.87) | $(0.61) | $2.58 | $0.14 | $0.65 | $0.86 |
| Less distributions declared to shareholders | | | | | | |
| From net investment income | $— | $(0.48) | $(0.20) | $(0.22) | $(0.26) | $(0.33) |
| From net realized gain | — | (0.51) | (0.12) | (0.19) | (0.17) | (0.08) |
| Total distributions declared to shareholders | $— | $(0.99) | $(0.32) | $(0.41) | $(0.43) | $(0.41) |
| Net asset value, end of period (x) | $12.48 | $13.35 | $14.95 | $12.69 | $12.96 | $12.74 |
| Total return (%) (r)(s)(t)(x) | (6.52)(n) | (4.64) | 20.43 | 0.93 | 5.48 | 6.95 |
| Ratios (%) (to average net assets) and Supplemental data: | | | | | | |
| Expenses before expense reductions (h) | 0.72(a) | 0.71 | 0.73 | 0.76 | 0.77 | 0.79 |
| Expenses after expense reductions (h) | 0.50(a) | 0.50 | 0.50 | 0.50 | 0.49 | 0.50 |
| Net investment income (loss) (l) | 1.84(a) | 3.15 | 1.49 | 1.89 | 2.21 | 2.06 |
| Portfolio turnover | 9(n) | 14 | 24 | 18 | 14 | 37 |
| Net assets at end of period (000 omitted) | $15,117 | $16,771 | $21,994 | $26,607 | $36,121 | $35,799 |
| | Six months
ended | Year ended |
| Class R3 | 10/31/22
(unaudited) | 4/30/22 | 4/30/21 | 4/30/20 | 4/30/19 | 4/30/18 |
| Net asset value, beginning of period | $13.37 | $14.98 | $12.73 | $13.02 | $12.81 | $12.35 |
| Income (loss) from investment operations | | | | | | |
| Net investment income (loss) (d)(l) | $0.13 | $0.51 | $0.25 | $0.30 | $0.33 | $0.29 |
| Net realized and unrealized gain (loss) | (0.99) | (1.08) | 2.38 | (0.12) | 0.36 | 0.60 |
| Total from investment operations | $(0.86) | $(0.57) | $2.63 | $0.18 | $0.69 | $0.89 |
| Less distributions declared to shareholders | | | | | | |
| From net investment income | $— | $(0.53) | $(0.26) | $(0.28) | $(0.31) | $(0.35) |
| From net realized gain | — | (0.51) | (0.12) | (0.19) | (0.17) | (0.08) |
| Total distributions declared to shareholders | $— | $(1.04) | $(0.38) | $(0.47) | $(0.48) | $(0.43) |
| Net asset value, end of period (x) | $12.51 | $13.37 | $14.98 | $12.73 | $13.02 | $12.81 |
| Total return (%) (r)(s)(t)(x) | (6.43)(n) | (4.41) | 20.74 | 1.17 | 5.75 | 7.19 |
| Ratios (%) (to average net assets) and Supplemental data: | | | | | | |
| Expenses before expense reductions (h) | 0.47(a) | 0.46 | 0.47 | 0.51 | 0.52 | 0.54 |
| Expenses after expense reductions (h) | 0.25(a) | 0.25 | 0.25 | 0.25 | 0.24 | 0.25 |
| Net investment income (loss) (l) | 2.06(a) | 3.43 | 1.80 | 2.25 | 2.56 | 2.24 |
| Portfolio turnover | 9(n) | 14 | 24 | 18 | 14 | 37 |
| Net assets at end of period (000 omitted) | $96,444 | $109,420 | $112,826 | $95,013 | $76,112 | $63,426 |
See Notes to Financial Statements
Financial Highlights − continued
MFS LIFETIME 2025 FUND − continued
| | Six months
ended | Year ended |
| Class R4 | 10/31/22
(unaudited) | 4/30/22 | 4/30/21 | 4/30/20 | 4/30/19
| 4/30/18 |
| Net asset value, beginning of period | $13.47 | $15.09 | $12.81 | $13.10 | $12.88 | $12.40 |
| Income (loss) from investment operations | | | | | | |
| Net investment income (loss) (d)(l) | $0.15 | $0.52 | $0.28 | $0.33 | $0.36 | $0.35 |
| Net realized and unrealized gain (loss) | (0.99) | (1.08) | 2.40 | (0.12) | 0.37 | 0.58 |
| Total from investment operations | $(0.84) | $(0.56) | $2.68 | $0.21 | $0.73 | $0.93 |
| Less distributions declared to shareholders | | | | | | |
| From net investment income | $— | $(0.55) | $(0.28) | $(0.31) | $(0.34) | $(0.37) |
| From net realized gain | — | (0.51) | (0.12) | (0.19) | (0.17) | (0.08) |
| Total distributions declared to shareholders | $— | $(1.06) | $(0.40) | $(0.50) | $(0.51) | $(0.45) |
| Net asset value, end of period (x) | $12.63 | $13.47 | $15.09 | $12.81 | $13.10 | $12.88 |
| Total return (%) (r)(s)(t)(x) | (6.24)(n) | (4.26) | 21.06 | 1.37 | 6.06 | 7.43 |
| Ratios (%) (to average net assets) and Supplemental data: | | | | | | |
| Expenses before expense reductions (h) | 0.22(a) | 0.21 | 0.23 | 0.26 | 0.27 | 0.28 |
| Expenses after expense reductions (h) | 0.00(a) | 0.00 | 0.00 | 0.00 | 0.00 | 0.00 |
| Net investment income (loss) (l) | 2.32(a) | 3.43 | 2.00 | 2.49 | 2.82 | 2.68 |
| Portfolio turnover | 9(n) | 14 | 24 | 18 | 14 | 37 |
| Net assets at end of period (000 omitted) | $32,173 | $34,089 | $82,037 | $105,160 | $105,032 | $81,894 |
| | Six months
ended | Year ended |
| Class R6 | 10/31/22
(unaudited) | 4/30/22 | 4/30/21 | 4/30/20 | 4/30/19
| 4/30/18 |
| Net asset value, beginning of period | $13.47 | $15.09 | $12.82 | $13.10 | $12.88 | $12.41 |
| Income (loss) from investment operations | | | | | | |
| Net investment income (loss) (d)(l) | $0.16 | $0.58 | $0.32 | $0.35 | $0.38 | $0.40 |
| Net realized and unrealized gain (loss) | (1.00) | (1.10) | 2.38 | (0.12) | 0.37 | 0.55 |
| Total from investment operations | $(0.84) | $(0.52) | $2.70 | $0.23 | $0.75 | $0.95 |
| Less distributions declared to shareholders | | | | | | |
| From net investment income | $— | $(0.59) | $(0.31) | $(0.32) | $(0.36) | $(0.40) |
| From net realized gain | — | (0.51) | (0.12) | (0.19) | (0.17) | (0.08) |
| Total distributions declared to shareholders | $— | $(1.10) | $(0.43) | $(0.51) | $(0.53) | $(0.48) |
| Net asset value, end of period (x) | $12.63 | $13.47 | $15.09 | $12.82 | $13.10 | $12.88 |
| Total return (%) (r)(s)(t)(x) | (6.24)(n) | (4.06) | 21.17 | 1.57 | 6.21 | 7.57 |
| Ratios (%) (to average net assets) and Supplemental data: | | | | | | |
| Expenses before expense reductions (h) | 0.08(a) | 0.07 | 0.08 | 0.12 | 0.14 | 0.15 |
| Expenses after expense reductions (h) | 0.00(a) | 0.00 | 0.00 | 0.00 | 0.00 | 0.00 |
| Net investment income (loss) (l) | 2.45(a) | 3.88 | 2.22 | 2.63 | 2.93 | 3.08 |
| Portfolio turnover | 9(n) | 14 | 24 | 18 | 14 | 37 |
| Net assets at end of period (000 omitted) | $216,141 | $217,171 | $228,469 | $65,523 | $47,026 | $32,384 |
See Notes to Financial Statements
Financial Highlights − continued
MFS LIFETIME 2025 FUND − continued
| (a) | Annualized. |
| (d) | Per share data is based on average shares outstanding. |
| (h) | In addition to the fees and expenses which the fund bears directly, the fund indirectly bears a pro rata share of the fees and expenses of the underlying affiliated funds in which the fund invests. Accordingly, the expense ratio for the fund reflects only those fees and expenses borne directly by the fund. Because the underlying affiliated funds have varied expense and fee levels and the fund may own different proportions of the underlying affiliated funds at different times, the amount of fees and expenses incurred indirectly by the fund will vary. |
| (l) | Recognition of net investment income by the fund may be affected by the timing of the declaration of dividends by the underlying affiliated funds in which the fund invests and for interim net investment income ratios, the actual annual net investment income ratio may differ. The ratios and per share amounts do not include net investment income of the underlying affiliated funds in which the fund invests. |
| (n) | Not annualized. |
| (r) | Certain expenses have been reduced without which performance would have been lower. |
| (s) | From time to time the fund may receive proceeds from litigation settlements, without which performance would be lower. |
| (t) | Total returns do not include any applicable sales charges. |
| (x) | The net asset values and total returns have been calculated on net assets which include adjustments made in accordance with U.S. generally accepted accounting principles required at period end for financial reporting purposes. |
See Notes to Financial Statements
Financial Highlights − continued
MFS LIFETIME 2030 FUND
The financial highlights table is intended to help you understand the fund's financial performance for the semiannual period and the past 5 fiscal years. Certain information reflects financial results for a single fund share. The total returns in the table represent the rate that an investor would have earned (or lost) on an investment in the fund share class (assuming reinvestment of all distributions) held for the entire period.
| | Six months
ended | Year ended |
| Class A | 10/31/22
(unaudited) | 4/30/22 | 4/30/21 | 4/30/20 | 4/30/19
| 4/30/18 |
| Net asset value, beginning of period | $16.03 | $18.20 | $14.61 | $15.59 | $15.48 | $14.57 |
| Income (loss) from investment operations | | | | | | |
| Net investment income (loss) (d)(l) | $0.13 | $0.72 | $0.26 | $0.32 | $0.37 | $0.34 |
| Net realized and unrealized gain (loss) | (1.23) | (1.34) | 3.96 | (0.46) | 0.49 | 1.13 |
| Total from investment operations | $(1.10) | $(0.62) | $4.22 | $(0.14) | $0.86 | $1.47 |
| Less distributions declared to shareholders | | | | | | |
| From net investment income | $— | $(0.73) | $(0.27) | $(0.32) | $(0.36) | $(0.36) |
| From net realized gain | — | (0.82) | (0.36) | (0.52) | (0.39) | (0.20) |
| Total distributions declared to shareholders | $— | $(1.55) | $(0.63) | $(0.84) | $(0.75) | $(0.56) |
| Net asset value, end of period (x) | $14.93 | $16.03 | $18.20 | $14.61 | $15.59 | $15.48 |
| Total return (%) (r)(s)(t)(x) | (6.86)(n) | (4.25) | 29.17 | (1.36) | 6.24 | 10.09 |
| Ratios (%) (to average net assets) and Supplemental data: | | | | | | |
| Expenses before expense reductions (h) | 0.45(a) | 0.44 | 0.44 | 0.46 | 0.46 | 0.46 |
| Expenses after expense reductions (h) | 0.25(a) | 0.25 | 0.24 | 0.24 | 0.23 | 0.23 |
| Net investment income (loss) (l) | 1.65(a) | 3.95 | 1.56 | 2.07 | 2.40 | 2.18 |
| Portfolio turnover | 5(n) | 15 | 27 | 18 | 18 | 19 |
| Net assets at end of period (000 omitted) | $73,885 | $78,464 | $81,398 | $66,732 | $63,579 | $61,458 |
See Notes to Financial Statements
Financial Highlights − continued
MFS LIFETIME 2030 FUND − continued
| | Six months
ended | Year ended |
| Class B | 10/31/22
(unaudited) | 4/30/22 | 4/30/21 | 4/30/20 | 4/30/19
| 4/30/18 |
| Net asset value, beginning of period | $15.82 | $17.96 | $14.41 | $15.37 | $15.26 | $14.37 |
| Income (loss) from investment operations | | | | | | |
| Net investment income (loss) (d)(l) | $0.07 | $0.55 | $0.13 | $0.20 | $0.25 | $0.21 |
| Net realized and unrealized gain (loss) | (1.21) | (1.30) | 3.91 | (0.46) | 0.50 | 1.13 |
| Total from investment operations | $(1.14) | $(0.75) | $4.04 | $(0.26) | $0.75 | $1.34 |
| Less distributions declared to shareholders | | | | | | |
| From net investment income | $— | $(0.57) | $(0.13) | $(0.18) | $(0.25) | $(0.25) |
| From net realized gain | — | (0.82) | (0.36) | (0.52) | (0.39) | (0.20) |
| Total distributions declared to shareholders | $— | $(1.39) | $(0.49) | $(0.70) | $(0.64) | $(0.45) |
| Net asset value, end of period (x) | $14.68 | $15.82 | $17.96 | $14.41 | $15.37 | $15.26 |
| Total return (%) (r)(s)(t)(x) | (7.21)(n) | (4.98) | 28.24 | (2.07) | 5.44 | 9.28 |
| Ratios (%) (to average net assets) and Supplemental data: | | | | | | |
| Expenses before expense reductions (h) | 1.20(a) | 1.19 | 1.19 | 1.21 | 1.21 | 1.21 |
| Expenses after expense reductions (h) | 1.00(a) | 1.00 | 0.99 | 0.99 | 0.99 | 0.99 |
| Net investment income (loss) (l) | 0.88(a) | 3.09 | 0.82 | 1.29 | 1.67 | 1.42 |
| Portfolio turnover | 5(n) | 15 | 27 | 18 | 18 | 19 |
| Net assets at end of period (000 omitted) | $3,583 | $4,398 | $6,394 | $6,495 | $8,727 | $8,834 |
| | Six months
ended | Year ended |
| Class C | 10/31/22
(unaudited) | 4/30/22 | 4/30/21 | 4/30/20 | 4/30/19 | 4/30/18 |
| Net asset value, beginning of period | $15.69 | $17.84 | $14.31 | $15.27 | $15.16 | $14.29 |
| Income (loss) from investment operations | | | | | | |
| Net investment income (loss) (d)(l) | $0.07 | $0.56 | $0.14 | $0.19 | $0.25 | $0.21 |
| Net realized and unrealized gain (loss) | (1.20) | (1.30) | 3.87 | (0.44) | 0.49 | 1.11 |
| Total from investment operations | $(1.13) | $(0.74) | $4.01 | $(0.25) | $0.74 | $1.32 |
| Less distributions declared to shareholders | | | | | | |
| From net investment income | $— | $(0.59) | $(0.12) | $(0.19) | $(0.24) | $(0.25) |
| From net realized gain | — | (0.82) | (0.36) | (0.52) | (0.39) | (0.20) |
| Total distributions declared to shareholders | $— | $(1.41) | $(0.48) | $(0.71) | $(0.63) | $(0.45) |
| Net asset value, end of period (x) | $14.56 | $15.69 | $17.84 | $14.31 | $15.27 | $15.16 |
| Total return (%) (r)(s)(t)(x) | (7.20)(n) | (4.97) | 28.24 | (2.05) | 5.46 | 9.21 |
| Ratios (%) (to average net assets) and Supplemental data: | | | | | | |
| Expenses before expense reductions (h) | 1.20(a) | 1.19 | 1.19 | 1.21 | 1.21 | 1.21 |
| Expenses after expense reductions (h) | 1.00(a) | 1.00 | 0.99 | 0.99 | 0.99 | 0.99 |
| Net investment income (loss) (l) | 0.87(a) | 3.15 | 0.85 | 1.26 | 1.63 | 1.42 |
| Portfolio turnover | 5(n) | 15 | 27 | 18 | 18 | 19 |
| Net assets at end of period (000 omitted) | $7,683 | $10,573 | $12,826 | $13,474 | $15,790 | $15,885 |
See Notes to Financial Statements
Financial Highlights − continued
MFS LIFETIME 2030 FUND − continued
| | Six months
ended | Year ended |
| Class I | 10/31/22
(unaudited) | 4/30/22 | 4/30/21 | 4/30/20 | 4/30/19
| 4/30/18 |
| Net asset value, beginning of period | $16.12 | $18.30 | $14.69 | $15.66 | $15.55 | $14.63 |
| Income (loss) from investment operations | | | | | | |
| Net investment income (loss) (d)(l) | $0.15 | $0.85 | $0.31 | $0.36 | $0.42 | $0.38 |
| Net realized and unrealized gain (loss) | (1.24) | (1.43) | 3.98 | (0.46) | 0.48 | 1.14 |
| Total from investment operations | $(1.09) | $(0.58) | $4.29 | $(0.10) | $0.90 | $1.52 |
| Less distributions declared to shareholders | | | | | | |
| From net investment income | $— | $(0.78) | $(0.32) | $(0.35) | $(0.40) | $(0.40) |
| From net realized gain | — | (0.82) | (0.36) | (0.52) | (0.39) | (0.20) |
| Total distributions declared to shareholders | $— | $(1.60) | $(0.68) | $(0.87) | $(0.79) | $(0.60) |
| Net asset value, end of period (x) | $15.03 | $16.12 | $18.30 | $14.69 | $15.66 | $15.55 |
| Total return (%) (r)(s)(t)(x) | (6.76)(n) | (4.02) | 29.48 | (1.07) | 6.50 | 10.38 |
| Ratios (%) (to average net assets) and Supplemental data: | | | | | | |
| Expenses before expense reductions (h) | 0.20(a) | 0.19 | 0.19 | 0.21 | 0.21 | 0.21 |
| Expenses after expense reductions (h) | 0.00(a) | 0.00 | 0.00 | 0.00 | 0.00 | 0.00 |
| Net investment income (loss) (l) | 1.93(a) | 4.65 | 1.86 | 2.29 | 2.70 | 2.48 |
| Portfolio turnover | 5(n) | 15 | 27 | 18 | 18 | 19 |
| Net assets at end of period (000 omitted) | $6,661 | $6,552 | $6,274 | $2,395 | $2,282 | $2,171 |
| | Six months
ended | Year ended |
| Class R1 | 10/31/22
(unaudited) | 4/30/22 | 4/30/21 | 4/30/20 | 4/30/19 | 4/30/18 |
| Net asset value, beginning of period | $15.89 | $18.05 | $14.43 | $15.42 | $15.32 | $14.44 |
| Income (loss) from investment operations | | | | | | |
| Net investment income (loss) (d)(l) | $0.07 | $0.58 | $0.11 | $0.21 | $0.26 | $0.21 |
| Net realized and unrealized gain (loss) | (1.21) | (1.34) | 3.94 | (0.46) | 0.48 | 1.13 |
| Total from investment operations | $(1.14) | $(0.76) | $4.05 | $(0.25) | $0.74 | $1.34 |
| Less distributions declared to shareholders | | | | | | |
| From net investment income | $— | $(0.58) | $(0.07) | $(0.22) | $(0.25) | $(0.26) |
| From net realized gain | — | (0.82) | (0.36) | (0.52) | (0.39) | (0.20) |
| Total distributions declared to shareholders | $— | $(1.40) | $(0.43) | $(0.74) | $(0.64) | $(0.46) |
| Net asset value, end of period (x) | $14.75 | $15.89 | $18.05 | $14.43 | $15.42 | $15.32 |
| Total return (%) (r)(s)(t)(x) | (7.17)(n) | (5.00) | 28.21 | (2.06) | 5.42 | 9.26 |
| Ratios (%) (to average net assets) and Supplemental data: | | | | | | |
| Expenses before expense reductions (h) | 1.20(a) | 1.19 | 1.20 | 1.21 | 1.21 | 1.21 |
| Expenses after expense reductions (h) | 1.00(a) | 1.00 | 0.99 | 1.00 | 0.99 | 0.99 |
| Net investment income (loss) (l) | 0.88(a) | 3.21 | 0.66 | 1.38 | 1.69 | 1.38 |
| Portfolio turnover | 5(n) | 15 | 27 | 18 | 18 | 19 |
| Net assets at end of period (000 omitted) | $3,618 | $4,148 | $5,636 | $7,150 | $7,423 | $6,825 |
See Notes to Financial Statements
Financial Highlights − continued
MFS LIFETIME 2030 FUND − continued
| | Six months
ended | Year ended |
| Class R2 | 10/31/22
(unaudited) | 4/30/22 | 4/30/21 | 4/30/20 | 4/30/19
| 4/30/18 |
| Net asset value, beginning of period | $15.88 | $18.04 | $14.47 | $15.43 | $15.32 | $14.43 |
| Income (loss) from investment operations | | | | | | |
| Net investment income (loss) (d)(l) | $0.11 | $0.65 | $0.20 | $0.28 | $0.33 | $0.30 |
| Net realized and unrealized gain (loss) | (1.22) | (1.31) | 3.94 | (0.46) | 0.49 | 1.12 |
| Total from investment operations | $(1.11) | $(0.66) | $4.14 | $(0.18) | $0.82 | $1.42 |
| Less distributions declared to shareholders | | | | | | |
| From net investment income | $— | $(0.68) | $(0.21) | $(0.26) | $(0.32) | $(0.33) |
| From net realized gain | — | (0.82) | (0.36) | (0.52) | (0.39) | (0.20) |
| Total distributions declared to shareholders | $— | $(1.50) | $(0.57) | $(0.78) | $(0.71) | $(0.53) |
| Net asset value, end of period (x) | $14.77 | $15.88 | $18.04 | $14.47 | $15.43 | $15.32 |
| Total return (%) (r)(s)(t)(x) | (6.99)(n) | (4.50) | 28.84 | (1.60) | 6.00 | 9.80 |
| Ratios (%) (to average net assets) and Supplemental data: | | | | | | |
| Expenses before expense reductions (h) | 0.70(a) | 0.69 | 0.70 | 0.71 | 0.71 | 0.71 |
| Expenses after expense reductions (h) | 0.50(a) | 0.50 | 0.49 | 0.49 | 0.49 | 0.49 |
| Net investment income (loss) (l) | 1.40(a) | 3.64 | 1.24 | 1.78 | 2.17 | 1.95 |
| Portfolio turnover | 5(n) | 15 | 27 | 18 | 18 | 19 |
| Net assets at end of period (000 omitted) | $45,409 | $51,968 | $60,402 | $66,342 | $78,171 | $112,223 |
| | Six months
ended | Year ended |
| Class R3 | 10/31/22
(unaudited) | 4/30/22 | 4/30/21 | 4/30/20 | 4/30/19 | 4/30/18 |
| Net asset value, beginning of period | $15.98 | $18.15 | $14.57 | $15.54 | $15.44 | $14.54 |
| Income (loss) from investment operations | | | | | | |
| Net investment income (loss) (d)(l) | $0.13 | $0.69 | $0.26 | $0.32 | $0.37 | $0.34 |
| Net realized and unrealized gain (loss) | (1.23) | (1.31) | 3.95 | (0.45) | 0.49 | 1.12 |
| Total from investment operations | $(1.10) | $(0.62) | $4.21 | $(0.13) | $0.86 | $1.46 |
| Less distributions declared to shareholders | | | | | | |
| From net investment income | $— | $(0.73) | $(0.27) | $(0.32) | $(0.37) | $(0.36) |
| From net realized gain | — | (0.82) | (0.36) | (0.52) | (0.39) | (0.20) |
| Total distributions declared to shareholders | $— | $(1.55) | $(0.63) | $(0.84) | $(0.76) | $(0.56) |
| Net asset value, end of period (x) | $14.88 | $15.98 | $18.15 | $14.57 | $15.54 | $15.44 |
| Total return (%) (r)(s)(t)(x) | (6.88)(n) | (4.27) | 29.18 | (1.31) | 6.21 | 10.07 |
| Ratios (%) (to average net assets) and Supplemental data: | | | | | | |
| Expenses before expense reductions (h) | 0.45(a) | 0.44 | 0.44 | 0.46 | 0.46 | 0.46 |
| Expenses after expense reductions (h) | 0.25(a) | 0.25 | 0.25 | 0.25 | 0.24 | 0.24 |
| Net investment income (loss) (l) | 1.64(a) | 3.84 | 1.58 | 2.06 | 2.44 | 2.20 |
| Portfolio turnover | 5(n) | 15 | 27 | 18 | 18 | 19 |
| Net assets at end of period (000 omitted) | $183,499 | $196,297 | $196,178 | $158,189 | $146,737 | $136,815 |
See Notes to Financial Statements
Financial Highlights − continued
MFS LIFETIME 2030 FUND − continued
| | Six months
ended | Year ended |
| Class R4 | 10/31/22
(unaudited) | 4/30/22 | 4/30/21 | 4/30/20 | 4/30/19
| 4/30/18 |
| Net asset value, beginning of period | $16.17 | $18.34 | $14.70 | $15.68 | $15.56 | $14.64 |
| Income (loss) from investment operations | | | | | | |
| Net investment income (loss) (d)(l) | $0.15 | $0.71 | $0.30 | $0.37 | $0.40 | $0.40 |
| Net realized and unrealized gain (loss) | (1.24) | (1.29) | 4.01 | (0.48) | 0.51 | 1.11 |
| Total from investment operations | $(1.09) | $(0.58) | $4.31 | $(0.11) | $0.91 | $1.51 |
| Less distributions declared to shareholders | | | | | | |
| From net investment income | $— | $(0.77) | $(0.31) | $(0.35) | $(0.40) | $(0.39) |
| From net realized gain | — | (0.82) | (0.36) | (0.52) | (0.39) | (0.20) |
| Total distributions declared to shareholders | $— | $(1.59) | $(0.67) | $(0.87) | $(0.79) | $(0.59) |
| Net asset value, end of period (x) | $15.08 | $16.17 | $18.34 | $14.70 | $15.68 | $15.56 |
| Total return (%) (r)(s)(t)(x) | (6.74)(n) | (4.03) | 29.58 | (1.14) | 6.56 | 10.30 |
| Ratios (%) (to average net assets) and Supplemental data: | | | | | | |
| Expenses before expense reductions (h) | 0.20(a) | 0.19 | 0.20 | 0.21 | 0.21 | 0.21 |
| Expenses after expense reductions (h) | 0.00(a) | 0.00 | 0.00 | 0.00 | 0.00 | 0.00 |
| Net investment income (loss) (l) | 1.90(a) | 3.87 | 1.80 | 2.32 | 2.61 | 2.57 |
| Portfolio turnover | 5(n) | 15 | 27 | 18 | 18 | 19 |
| Net assets at end of period (000 omitted) | $53,801 | $58,095 | $123,740 | $162,913 | $158,288 | $148,064 |
| | Six months
ended | Year ended |
| Class R6 | 10/31/22
(unaudited) | 4/30/22 | 4/30/21 | 4/30/20 | 4/30/19
| 4/30/18 |
| Net asset value, beginning of period | $16.15 | $18.33 | $14.70 | $15.68 | $15.56 | $14.65 |
| Income (loss) from investment operations | | | | | | |
| Net investment income (loss) (d)(l) | $0.16 | $0.79 | $0.34 | $0.38 | $0.44 | $0.45 |
| Net realized and unrealized gain (loss) | (1.23) | (1.35) | 3.98 | (0.47) | 0.49 | 1.08 |
| Total from investment operations | $(1.07) | $(0.56) | $4.32 | $(0.09) | $0.93 | $1.53 |
| Less distributions declared to shareholders | | | | | | |
| From net investment income | $— | $(0.80) | $(0.33) | $(0.37) | $(0.42) | $(0.42) |
| From net realized gain | — | (0.82) | (0.36) | (0.52) | (0.39) | (0.20) |
| Total distributions declared to shareholders | $— | $(1.62) | $(0.69) | $(0.89) | $(0.81) | $(0.62) |
| Net asset value, end of period (x) | $15.08 | $16.15 | $18.33 | $14.70 | $15.68 | $15.56 |
| Total return (%) (r)(s)(t)(x) | (6.63)(n) | (3.92) | 29.71 | (1.02) | 6.71 | 10.43 |
| Ratios (%) (to average net assets) and Supplemental data: | | | | | | |
| Expenses before expense reductions (h) | 0.06(a) | 0.05 | 0.06 | 0.08 | 0.08 | 0.08 |
| Expenses after expense reductions (h) | 0.00(a) | 0.00 | 0.00 | 0.00 | 0.00 | 0.00 |
| Net investment income (loss) (l) | 2.03(a) | 4.34 | 2.01 | 2.44 | 2.86 | 2.91 |
| Portfolio turnover | 5(n) | 15 | 27 | 18 | 18 | 19 |
| Net assets at end of period (000 omitted) | $318,794 | $316,077 | $300,098 | $116,212 | $108,358 | $73,753 |
See Notes to Financial Statements
Financial Highlights − continued
MFS LIFETIME 2030 FUND − continued
| (a) | Annualized. |
| (d) | Per share data is based on average shares outstanding. |
| (h) | In addition to the fees and expenses which the fund bears directly, the fund indirectly bears a pro rata share of the fees and expenses of the underlying affiliated funds in which the fund invests. Accordingly, the expense ratio for the fund reflects only those fees and expenses borne directly by the fund. Because the underlying affiliated funds have varied expense and fee levels and the fund may own different proportions of the underlying affiliated funds at different times, the amount of fees and expenses incurred indirectly by the fund will vary. |
| (l) | Recognition of net investment income by the fund may be affected by the timing of the declaration of dividends by the underlying affiliated funds in which the fund invests and for interim net investment income ratios, the actual annual net investment income ratio may differ. The ratios and per share amounts do not include net investment income of the underlying affiliated funds in which the fund invests. |
| (n) | Not annualized. |
| (r) | Certain expenses have been reduced without which performance would have been lower. |
| (s) | From time to time the fund may receive proceeds from litigation settlements, without which performance would be lower. |
| (t) | Total returns do not include any applicable sales charges. |
| (x) | The net asset values and total returns have been calculated on net assets which include adjustments made in accordance with U.S. generally accepted accounting principles required at period end for financial reporting purposes. |
See Notes to Financial Statements
Financial Highlights − continued
MFS LIFETIME 2035 FUND
The financial highlights table is intended to help you understand the fund's financial performance for the semiannual period and the past 5 fiscal years. Certain information reflects financial results for a single fund share. The total returns in the table represent the rate that an investor would have earned (or lost) on an investment in the fund share class (assuming reinvestment of all distributions) held for the entire period.
| | Six months
ended | Year ended |
| Class A | 10/31/22
(unaudited) | 4/30/22 | 4/30/21 | 4/30/20 | 4/30/19
| 4/30/18 |
| Net asset value, beginning of period | $16.63 | $18.63 | $13.79 | $14.94 | $14.61 | $13.49 |
| Income (loss) from investment operations | | | | | | |
| Net investment income (loss) (d)(l) | $0.09 | $0.88 | $0.23 | $0.29 | $0.34 | $0.31 |
| Net realized and unrealized gain (loss) | (1.29) | (1.44) | 5.04 | (0.85) | 0.52 | 1.28 |
| Total from investment operations | $(1.20) | $(0.56) | $5.27 | $(0.56) | $0.86 | $1.59 |
| Less distributions declared to shareholders | | | | | | |
| From net investment income | $— | $(0.86) | $(0.23) | $(0.29) | $(0.32) | $(0.37) |
| From net realized gain | — | (0.58) | (0.20) | (0.30) | (0.21) | (0.10) |
| Total distributions declared to shareholders | $— | $(1.44) | $(0.43) | $(0.59) | $(0.53) | $(0.47) |
| Net asset value, end of period (x) | $15.43 | $16.63 | $18.63 | $13.79 | $14.94 | $14.61 |
| Total return (%) (r)(s)(t)(x) | (7.22)(n) | (3.84) | 38.48 | (4.23) | 6.50 | 11.78 |
| Ratios (%) (to average net assets) and Supplemental data: | | | | | | |
| Expenses before expense reductions (h) | 0.47(a) | 0.47 | 0.48 | 0.52 | 0.54 | 0.56 |
| Expenses after expense reductions (h) | 0.25(a) | 0.25 | 0.25 | 0.25 | 0.24 | 0.25 |
| Net investment income (loss) (l) | 1.09(a) | 4.67 | 1.41 | 1.96 | 2.36 | 2.13 |
| Portfolio turnover | 4(n) | 18 | 28 | 13 | 12 | 33 |
| Net assets at end of period (000 omitted) | $29,301 | $29,272 | $27,770 | $20,382 | $16,563 | $15,369 |
See Notes to Financial Statements
Financial Highlights − continued
MFS LIFETIME 2035 FUND − continued
| | Six months
ended | Year ended |
| Class B | 10/31/22
(unaudited) | 4/30/22 | 4/30/21 | 4/30/20 | 4/30/19
| 4/30/18 |
| Net asset value, beginning of period | $16.52 | $18.50 | $13.70 | $14.84 | $14.49 | $13.39 |
| Income (loss) from investment operations | | | | | | |
| Net investment income (loss) (d)(l) | $0.03 | $0.69 | $0.11 | $0.17 | $0.22 | $0.19 |
| Net realized and unrealized gain (loss) | (1.28) | (1.39) | 4.99 | (0.85) | 0.54 | 1.28 |
| Total from investment operations | $(1.25) | $(0.70) | $5.10 | $(0.68) | $0.76 | $1.47 |
| Less distributions declared to shareholders | | | | | | |
| From net investment income | $— | $(0.70) | $(0.10) | $(0.16) | $(0.20) | $(0.27) |
| From net realized gain | — | (0.58) | (0.20) | (0.30) | (0.21) | (0.10) |
| Total distributions declared to shareholders | $— | $(1.28) | $(0.30) | $(0.46) | $(0.41) | $(0.37) |
| Net asset value, end of period (x) | $15.27 | $16.52 | $18.50 | $13.70 | $14.84 | $14.49 |
| Total return (%) (r)(s)(t)(x) | (7.57)(n) | (4.53) | 37.44 | (4.98) | 5.71 | 10.96 |
| Ratios (%) (to average net assets) and Supplemental data: | | | | | | |
| Expenses before expense reductions (h) | 1.22(a) | 1.22 | 1.23 | 1.27 | 1.29 | 1.31 |
| Expenses after expense reductions (h) | 1.00(a) | 1.00 | 1.00 | 1.00 | 1.00 | 1.00 |
| Net investment income (loss) (l) | 0.33(a) | 3.72 | 0.65 | 1.12 | 1.55 | 1.31 |
| Portfolio turnover | 4(n) | 18 | 28 | 13 | 12 | 33 |
| Net assets at end of period (000 omitted) | $1,167 | $1,370 | $1,597 | $1,387 | $1,650 | $1,730 |
| | Six months
ended | Year ended |
| Class C | 10/31/22
(unaudited) | 4/30/22 | 4/30/21 | 4/30/20 | 4/30/19 | 4/30/18 |
| Net asset value, beginning of period | $16.40 | $18.38 | $13.62 | $14.78 | $14.45 | $13.35 |
| Income (loss) from investment operations | | | | | | |
| Net investment income (loss) (d)(l) | $0.03 | $0.69 | $0.10 | $0.19 | $0.22 | $0.19 |
| Net realized and unrealized gain (loss) | (1.28) | (1.37) | 4.97 | (0.87) | 0.53 | 1.28 |
| Total from investment operations | $(1.25) | $(0.68) | $5.07 | $(0.68) | $0.75 | $1.47 |
| Less distributions declared to shareholders | | | | | | |
| From net investment income | $— | $(0.72) | $(0.11) | $(0.18) | $(0.21) | $(0.27) |
| From net realized gain | — | (0.58) | (0.20) | (0.30) | (0.21) | (0.10) |
| Total distributions declared to shareholders | $— | $(1.30) | $(0.31) | $(0.48) | $(0.42) | $(0.37) |
| Net asset value, end of period (x) | $15.15 | $16.40 | $18.38 | $13.62 | $14.78 | $14.45 |
| Total return (%) (r)(s)(t)(x) | (7.62)(n) | (4.50) | 37.40 | (4.97) | 5.69 | 11.00 |
| Ratios (%) (to average net assets) and Supplemental data: | | | | | | |
| Expenses before expense reductions (h) | 1.22(a) | 1.22 | 1.23 | 1.27 | 1.29 | 1.31 |
| Expenses after expense reductions (h) | 1.00(a) | 1.00 | 1.00 | 0.99 | 0.99 | 1.00 |
| Net investment income (loss) (l) | 0.35(a) | 3.72 | 0.63 | 1.26 | 1.54 | 1.35 |
| Portfolio turnover | 4(n) | 18 | 28 | 13 | 12 | 33 |
| Net assets at end of period (000 omitted) | $3,456 | $3,413 | $3,514 | $2,632 | $2,730 | $2,510 |
See Notes to Financial Statements
Financial Highlights − continued
MFS LIFETIME 2035 FUND − continued
| | Six months
ended | Year ended |
| Class I | 10/31/22
(unaudited) | 4/30/22 | 4/30/21 | 4/30/20 | 4/30/19
| 4/30/18 |
| Net asset value, beginning of period | $16.69 | $18.68 | $13.82 | $14.97 | $14.64 | $13.51 |
| Income (loss) from investment operations | | | | | | |
| Net investment income (loss) (d)(l) | $0.11 | $0.88 | $0.27 | $0.32 | $0.37 | $0.38 |
| Net realized and unrealized gain (loss) | (1.29) | (1.38) | 5.05 | (0.85) | 0.53 | 1.25 |
| Total from investment operations | $(1.18) | $(0.50) | $5.32 | $(0.53) | $0.90 | $1.63 |
| Less distributions declared to shareholders | | | | | | |
| From net investment income | $— | $(0.91) | $(0.26) | $(0.32) | $(0.36) | $(0.40) |
| From net realized gain | — | (0.58) | (0.20) | (0.30) | (0.21) | (0.10) |
| Total distributions declared to shareholders | $— | $(1.49) | $(0.46) | $(0.62) | $(0.57) | $(0.50) |
| Net asset value, end of period (x) | $15.51 | $16.69 | $18.68 | $13.82 | $14.97 | $14.64 |
| Total return (%) (r)(s)(t)(x) | (7.07)(n) | (3.55) | 38.83 | (4.03) | 6.76 | 12.10 |
| Ratios (%) (to average net assets) and Supplemental data: | | | | | | |
| Expenses before expense reductions (h) | 0.22(a) | 0.22 | 0.23 | 0.27 | 0.29 | 0.32 |
| Expenses after expense reductions (h) | 0.00(a) | 0.00 | 0.00 | 0.00 | 0.00 | 0.00 |
| Net investment income (loss) (l) | 1.34(a) | 4.69 | 1.66 | 2.17 | 2.55 | 2.59 |
| Portfolio turnover | 4(n) | 18 | 28 | 13 | 12 | 33 |
| Net assets at end of period (000 omitted) | $1,793 | $1,365 | $1,267 | $714 | $843 | $636 |
| | Six months
ended | Year ended |
| Class R1 | 10/31/22
(unaudited) | 4/30/22 | 4/30/21 | 4/30/20 | 4/30/19 | 4/30/18 |
| Net asset value, beginning of period | $16.59 | $18.59 | $13.70 | $14.83 | $14.50 | $13.44 |
| Income (loss) from investment operations | | | | | | |
| Net investment income (loss) (d)(l) | $0.03 | $0.72 | $(0.01) | $0.15 | $0.22 | $0.23 |
| Net realized and unrealized gain (loss) | (1.28) | (1.42) | 5.10 | (0.84) | 0.54 | 1.25 |
| Total from investment operations | $(1.25) | $(0.70) | $5.09 | $(0.69) | $0.76 | $1.48 |
| Less distributions declared to shareholders | | | | | | |
| From net investment income | $— | $(0.72) | $— | $(0.14) | $(0.22) | $(0.32) |
| From net realized gain | — | (0.58) | (0.20) | (0.30) | (0.21) | (0.10) |
| Total distributions declared to shareholders | $— | $(1.30) | $(0.20) | $(0.44) | $(0.43) | $(0.42) |
| Net asset value, end of period (x) | $15.34 | $16.59 | $18.59 | $13.70 | $14.83 | $14.50 |
| Total return (%) (r)(s)(t)(x) | (7.53)(n) | (4.52) | 37.27 | (5.01) | 5.72 | 11.00 |
| Ratios (%) (to average net assets) and Supplemental data: | | | | | | |
| Expenses before expense reductions (h) | 1.22(a) | 1.22 | 1.24 | 1.27 | 1.29 | 1.31 |
| Expenses after expense reductions (h) | 1.00(a) | 1.00 | 1.00 | 1.00 | 1.00 | 1.00 |
| Net investment income (loss) (l) | 0.33(a) | 3.84 | (0.05) | 1.00 | 1.55 | 1.61 |
| Portfolio turnover | 4(n) | 18 | 28 | 13 | 12 | 33 |
| Net assets at end of period (000 omitted) | $941 | $932 | $470 | $1,835 | $2,535 | $1,974 |
See Notes to Financial Statements
Financial Highlights − continued
MFS LIFETIME 2035 FUND − continued
| | Six months
ended | Year ended |
| Class R2 | 10/31/22
(unaudited) | 4/30/22 | 4/30/21 | 4/30/20 | 4/30/19
| 4/30/18 |
| Net asset value, beginning of period | $16.64 | $18.61 | $13.75 | $14.89 | $14.54 | $13.43 |
| Income (loss) from investment operations | | | | | | |
| Net investment income (loss) (d)(l) | $0.07 | $0.75 | $0.16 | $0.23 | $0.27 | $0.27 |
| Net realized and unrealized gain (loss) | (1.29) | (1.35) | 5.04 | (0.84) | 0.56 | 1.28 |
| Total from investment operations | $(1.22) | $(0.60) | $5.20 | $(0.61) | $0.83 | $1.55 |
| Less distributions declared to shareholders | | | | | | |
| From net investment income | $— | $(0.79) | $(0.14) | $(0.23) | $(0.27) | $(0.34) |
| From net realized gain | — | (0.58) | (0.20) | (0.30) | (0.21) | (0.10) |
| Total distributions declared to shareholders | $— | $(1.37) | $(0.34) | $(0.53) | $(0.48) | $(0.44) |
| Net asset value, end of period (x) | $15.42 | $16.64 | $18.61 | $13.75 | $14.89 | $14.54 |
| Total return (%) (r)(s)(t)(x) | (7.33)(n) | (4.01) | 38.06 | (4.50) | 6.23 | 11.57 |
| Ratios (%) (to average net assets) and Supplemental data: | | | | | | |
| Expenses before expense reductions (h) | 0.72(a) | 0.72 | 0.74 | 0.77 | 0.79 | 0.81 |
| Expenses after expense reductions (h) | 0.50(a) | 0.50 | 0.50 | 0.50 | 0.50 | 0.50 |
| Net investment income (loss) (l) | 0.85(a) | 4.01 | 0.97 | 1.58 | 1.84 | 1.86 |
| Portfolio turnover | 4(n) | 18 | 28 | 13 | 12 | 33 |
| Net assets at end of period (000 omitted) | $15,282 | $17,075 | $20,783 | $26,572 | $32,592 | $32,185 |
| | Six months
ended | Year ended |
| Class R3 | 10/31/22
(unaudited) | 4/30/22 | 4/30/21 | 4/30/20 | 4/30/19 | 4/30/18 |
| Net asset value, beginning of period | $16.65 | $18.64 | $13.80 | $14.96 | $14.63 | $13.50 |
| Income (loss) from investment operations | | | | | | |
| Net investment income (loss) (d)(l) | $0.09 | $0.83 | $0.23 | $0.30 | $0.34 | $0.30 |
| Net realized and unrealized gain (loss) | (1.29) | (1.38) | 5.04 | (0.87) | 0.52 | 1.30 |
| Total from investment operations | $(1.20) | $(0.55) | $5.27 | $(0.57) | $0.86 | $1.60 |
| Less distributions declared to shareholders | | | | | | |
| From net investment income | $— | $(0.86) | $(0.23) | $(0.29) | $(0.32) | $(0.37) |
| From net realized gain | — | (0.58) | (0.20) | (0.30) | (0.21) | (0.10) |
| Total distributions declared to shareholders | $— | $(1.44) | $(0.43) | $(0.59) | $(0.53) | $(0.47) |
| Net asset value, end of period (x) | $15.45 | $16.65 | $18.64 | $13.80 | $14.96 | $14.63 |
| Total return (%) (r)(s)(t)(x) | (7.21)(n) | (3.81) | 38.44 | (4.27) | 6.46 | 11.85 |
| Ratios (%) (to average net assets) and Supplemental data: | | | | | | |
| Expenses before expense reductions (h) | 0.47(a) | 0.47 | 0.48 | 0.52 | 0.54 | 0.56 |
| Expenses after expense reductions (h) | 0.25(a) | 0.25 | 0.25 | 0.25 | 0.25 | 0.25 |
| Net investment income (loss) (l) | 1.08(a) | 4.41 | 1.40 | 2.00 | 2.31 | 2.10 |
| Portfolio turnover | 4(n) | 18 | 28 | 13 | 12 | 33 |
| Net assets at end of period (000 omitted) | $129,818 | $142,758 | $141,555 | $96,287 | $71,027 | $58,283 |
See Notes to Financial Statements
Financial Highlights − continued
MFS LIFETIME 2035 FUND − continued
| | Six months
ended | Year ended |
| Class R4 | 10/31/22
(unaudited) | 4/30/22 | 4/30/21 | 4/30/20 | 4/30/19
| 4/30/18 |
| Net asset value, beginning of period | $16.78 | $18.76 | $13.87 | $15.02 | $14.69 | $13.54 |
| Income (loss) from investment operations | | | | | | |
| Net investment income (loss) (d)(l) | $0.11 | $0.78 | $0.25 | $0.33 | $0.38 | $0.38 |
| Net realized and unrealized gain (loss) | (1.30) | (1.29) | 5.09 | (0.86) | 0.52 | 1.26 |
| Total from investment operations | $(1.19) | $(0.51) | $5.34 | $(0.53) | $0.90 | $1.64 |
| Less distributions declared to shareholders | | | | | | |
| From net investment income | $— | $(0.89) | $(0.25) | $(0.32) | $(0.36) | $(0.39) |
| From net realized gain | — | (0.58) | (0.20) | (0.30) | (0.21) | (0.10) |
| Total distributions declared to shareholders | $— | $(1.47) | $(0.45) | $(0.62) | $(0.57) | $(0.49) |
| Net asset value, end of period (x) | $15.59 | $16.78 | $18.76 | $13.87 | $15.02 | $14.69 |
| Total return (%) (r)(s)(t)(x) | (7.09)(n) | (3.56) | 38.82 | (4.01) | 6.73 | 12.11 |
| Ratios (%) (to average net assets) and Supplemental data: | | | | | | |
| Expenses before expense reductions (h) | 0.22(a) | 0.22 | 0.23 | 0.27 | 0.29 | 0.30 |
| Expenses after expense reductions (h) | 0.00(a) | 0.00 | 0.00 | 0.00 | 0.00 | 0.00 |
| Net investment income (loss) (l) | 1.34(a) | 4.12 | 1.56 | 2.22 | 2.58 | 2.61 |
| Portfolio turnover | 4(n) | 18 | 28 | 13 | 12 | 33 |
| Net assets at end of period (000 omitted) | $38,579 | $39,766 | $89,097 | $120,415 | $115,939 | $87,528 |
| | Six months
ended | Year ended |
| Class R6 | 10/31/22
(unaudited) | 4/30/22 | 4/30/21 | 4/30/20 | 4/30/19
| 4/30/18 |
| Net asset value, beginning of period | $16.77 | $18.76 | $13.87 | $15.02 | $14.69 | $13.55 |
| Income (loss) from investment operations | | | | | | |
| Net investment income (loss) (d)(l) | $0.12 | $0.94 | $0.31 | $0.35 | $0.39 | $0.44 |
| Net realized and unrealized gain (loss) | (1.30) | (1.42) | 5.07 | (0.86) | 0.53 | 1.22 |
| Total from investment operations | $(1.18) | $(0.48) | $5.38 | $(0.51) | $0.92 | $1.66 |
| Less distributions declared to shareholders | | | | | | |
| From net investment income | $— | $(0.93) | $(0.29) | $(0.34) | $(0.38) | $(0.42) |
| From net realized gain | — | (0.58) | (0.20) | (0.30) | (0.21) | (0.10) |
| Total distributions declared to shareholders | $— | $(1.51) | $(0.49) | $(0.64) | $(0.59) | $(0.52) |
| Net asset value, end of period (x) | $15.59 | $16.77 | $18.76 | $13.87 | $15.02 | $14.69 |
| Total return (%) (r)(s)(t)(x) | (7.04)(n) | (3.42) | 39.08 | (3.90) | 6.90 | 12.23 |
| Ratios (%) (to average net assets) and Supplemental data: | | | | | | |
| Expenses before expense reductions (h) | 0.07(a) | 0.07 | 0.09 | 0.12 | 0.15 | 0.16 |
| Expenses after expense reductions (h) | 0.00(a) | 0.00 | 0.00 | 0.00 | 0.00 | 0.00 |
| Net investment income (loss) (l) | 1.48(a) | 4.97 | 1.86 | 2.35 | 2.67 | 3.03 |
| Portfolio turnover | 4(n) | 18 | 28 | 13 | 12 | 33 |
| Net assets at end of period (000 omitted) | $260,767 | $237,753 | $206,449 | $62,093 | $44,655 | $26,567 |
See Notes to Financial Statements
Financial Highlights − continued
MFS LIFETIME 2035 FUND − continued
| (a) | Annualized. |
| (d) | Per share data is based on average shares outstanding. |
| (h) | In addition to the fees and expenses which the fund bears directly, the fund indirectly bears a pro rata share of the fees and expenses of the underlying affiliated funds in which the fund invests. Accordingly, the expense ratio for the fund reflects only those fees and expenses borne directly by the fund. Because the underlying affiliated funds have varied expense and fee levels and the fund may own different proportions of the underlying affiliated funds at different times, the amount of fees and expenses incurred indirectly by the fund will vary. |
| (l) | Recognition of net investment income by the fund may be affected by the timing of the declaration of dividends by the underlying affiliated funds in which the fund invests and for interim net investment income ratios, the actual annual net investment income ratio may differ. The ratios and per share amounts do not include net investment income of the underlying affiliated funds in which the fund invests. |
| (n) | Not annualized. |
| (r) | Certain expenses have been reduced without which performance would have been lower. |
| (s) | From time to time the fund may receive proceeds from litigation settlements, without which performance would be lower. |
| (t) | Total returns do not include any applicable sales charges. |
| (x) | The net asset values and total returns have been calculated on net assets which include adjustments made in accordance with U.S. generally accepted accounting principles required at period end for financial reporting purposes. |
See Notes to Financial Statements
Financial Highlights − continued
MFS LIFETIME 2040 FUND
The financial highlights table is intended to help you understand the fund's financial performance for the semiannual period and the past 5 fiscal years. Certain information reflects financial results for a single fund share. The total returns in the table represent the rate that an investor would have earned (or lost) on an investment in the fund share class (assuming reinvestment of all distributions) held for the entire period.
| | Six months
ended | Year ended |
| Class A | 10/31/22
(unaudited) | 4/30/22 | 4/30/21 | 4/30/20 | 4/30/19
| 4/30/18 |
| Net asset value, beginning of period | $18.03 | $20.33 | $14.79 | $16.46 | $16.38 | $15.00 |
| Income (loss) from investment operations | | | | | | |
| Net investment income (loss) (d)(l) | $0.06 | $0.94 | $0.21 | $0.30 | $0.35 | $0.31 |
| Net realized and unrealized gain (loss) | (1.41) | (1.48) | 5.86 | (1.02) | 0.57 | 1.61 |
| Total from investment operations | $(1.35) | $(0.54) | $6.07 | $(0.72) | $0.92 | $1.92 |
| Less distributions declared to shareholders | | | | | | |
| From net investment income | $— | $(0.97) | $(0.22) | $(0.30) | $(0.36) | $(0.36) |
| From net realized gain | — | (0.79) | (0.31) | (0.65) | (0.48) | (0.18) |
| Total distributions declared to shareholders | $— | $(1.76) | $(0.53) | $(0.95) | $(0.84) | $(0.54) |
| Net asset value, end of period (x) | $16.68 | $18.03 | $20.33 | $14.79 | $16.46 | $16.38 |
| Total return (%) (r)(s)(t)(x) | (7.49)(n) | (3.60) | 41.38 | (5.08) | 6.45 | 12.86 |
| Ratios (%) (to average net assets) and Supplemental data: | | | | | | |
| Expenses before expense reductions (h) | 0.46(a) | 0.45 | 0.46 | 0.49 | 0.48 | 0.48 |
| Expenses after expense reductions (h) | 0.25(a) | 0.25 | 0.24 | 0.24 | 0.24 | 0.24 |
| Net investment income (loss) (l) | 0.67(a) | 4.60 | 1.21 | 1.86 | 2.15 | 1.90 |
| Portfolio turnover | 4(n) | 14 | 27 | 13 | 17 | 18 |
| Net assets at end of period (000 omitted) | $46,588 | $50,245 | $56,524 | $41,909 | $36,747 | $36,354 |
See Notes to Financial Statements
Financial Highlights − continued
MFS LIFETIME 2040 FUND − continued
| | Six months
ended | Year ended |
| Class B | 10/31/22
(unaudited) | 4/30/22 | 4/30/21 | 4/30/20 | 4/30/19
| 4/30/18 |
| Net asset value, beginning of period | $17.92 | $20.20 | $14.68 | $16.34 | $16.23 | $14.87 |
| Income (loss) from investment operations | | | | | | |
| Net investment income (loss) (d)(l) | $(0.01) | $0.78 | $0.08 | $0.17 | $0.22 | $0.19 |
| Net realized and unrealized gain (loss) | (1.39) | (1.48) | 5.81 | (1.01) | 0.59 | 1.59 |
| Total from investment operations | $(1.40) | $(0.70) | $5.89 | $(0.84) | $0.81 | $1.78 |
| Less distributions declared to shareholders | | | | | | |
| From net investment income | $— | $(0.79) | $(0.06) | $(0.17) | $(0.22) | $(0.24) |
| From net realized gain | — | (0.79) | (0.31) | (0.65) | (0.48) | (0.18) |
| Total distributions declared to shareholders | $— | $(1.58) | $(0.37) | $(0.82) | $(0.70) | $(0.42) |
| Net asset value, end of period (x) | $16.52 | $17.92 | $20.20 | $14.68 | $16.34 | $16.23 |
| Total return (%) (r)(s)(t)(x) | (7.81)(n) | (4.34) | 40.36 | (5.80) | 5.66 | 12.00 |
| Ratios (%) (to average net assets) and Supplemental data: | | | | | | |
| Expenses before expense reductions (h) | 1.21(a) | 1.20 | 1.21 | 1.24 | 1.23 | 1.23 |
| Expenses after expense reductions (h) | 1.00(a) | 1.00 | 0.99 | 0.99 | 0.99 | 0.99 |
| Net investment income (loss) (l) | (0.09)(a) | 3.85 | 0.44 | 1.05 | 1.39 | 1.20 |
| Portfolio turnover | 4(n) | 14 | 27 | 13 | 17 | 18 |
| Net assets at end of period (000 omitted) | $2,213 | $2,641 | $3,527 | $3,577 | $4,588 | $4,965 |
| | Six months
ended | Year ended |
| Class C | 10/31/22
(unaudited) | 4/30/22 | 4/30/21 | 4/30/20 | 4/30/19 | 4/30/18 |
| Net asset value, beginning of period | $17.64 | $19.94 | $14.48 | $16.13 | $16.03 | $14.70 |
| Income (loss) from investment operations | | | | | | |
| Net investment income (loss) (d)(l) | $(0.01) | $0.77 | $0.08 | $0.16 | $0.21 | $0.19 |
| Net realized and unrealized gain (loss) | (1.37) | (1.46) | 5.73 | (0.99) | 0.58 | 1.57 |
| Total from investment operations | $(1.38) | $(0.69) | $5.81 | $(0.83) | $0.79 | $1.76 |
| Less distributions declared to shareholders | | | | | | |
| From net investment income | $— | $(0.82) | $(0.04) | $(0.17) | $(0.21) | $(0.25) |
| From net realized gain | — | (0.79) | (0.31) | (0.65) | (0.48) | (0.18) |
| Total distributions declared to shareholders | $— | $(1.61) | $(0.35) | $(0.82) | $(0.69) | $(0.43) |
| Net asset value, end of period (x) | $16.26 | $17.64 | $19.94 | $14.48 | $16.13 | $16.03 |
| Total return (%) (r)(s)(t)(x) | (7.82)(n) | (4.40) | 40.39 | (5.79) | 5.65 | 11.99 |
| Ratios (%) (to average net assets) and Supplemental data: | | | | | | |
| Expenses before expense reductions (h) | 1.21(a) | 1.20 | 1.22 | 1.24 | 1.23 | 1.23 |
| Expenses after expense reductions (h) | 1.00(a) | 1.00 | 1.00 | 1.00 | 0.99 | 1.00 |
| Net investment income (loss) (l) | (0.09)(a) | 3.84 | 0.48 | 1.03 | 1.35 | 1.19 |
| Portfolio turnover | 4(n) | 14 | 27 | 13 | 17 | 18 |
| Net assets at end of period (000 omitted) | $7,176 | $7,809 | $8,727 | $9,202 | $10,994 | $11,735 |
See Notes to Financial Statements
Financial Highlights − continued
MFS LIFETIME 2040 FUND − continued
| | Six months
ended | Year ended |
| Class I | 10/31/22
(unaudited) | 4/30/22 | 4/30/21 | 4/30/20 | 4/30/19
| 4/30/18 |
| Net asset value, beginning of period | $18.17 | $20.49 | $14.91 | $16.57 | $16.47 | $15.08 |
| Income (loss) from investment operations | | | | | | |
| Net investment income (loss) (d)(l) | $0.08 | $1.04 | $0.28 | $0.32 | $0.42 | $0.37 |
| Net realized and unrealized gain (loss) | (1.41) | (1.54) | 5.88 | (1.00) | 0.55 | 1.60 |
| Total from investment operations | $(1.33) | $(0.50) | $6.16 | $(0.68) | $0.97 | $1.97 |
| Less distributions declared to shareholders | | | | | | |
| From net investment income | $— | $(1.03) | $(0.27) | $(0.33) | $(0.39) | $(0.40) |
| From net realized gain | — | (0.79) | (0.31) | (0.65) | (0.48) | (0.18) |
| Total distributions declared to shareholders | $— | $(1.82) | $(0.58) | $(0.98) | $(0.87) | $(0.58) |
| Net asset value, end of period (x) | $16.84 | $18.17 | $20.49 | $14.91 | $16.57 | $16.47 |
| Total return (%) (r)(s)(t)(x) | (7.32)(n) | (3.41) | 41.67 | (4.81) | 6.75 | 13.11 |
| Ratios (%) (to average net assets) and Supplemental data: | | | | | | |
| Expenses before expense reductions (h) | 0.21(a) | 0.20 | 0.21 | 0.24 | 0.23 | 0.23 |
| Expenses after expense reductions (h) | 0.00(a) | 0.00 | 0.00 | 0.00 | 0.00 | 0.00 |
| Net investment income (loss) (l) | 0.92(a) | 5.06 | 1.57 | 1.92 | 2.55 | 2.30 |
| Portfolio turnover | 4(n) | 14 | 27 | 13 | 17 | 18 |
| Net assets at end of period (000 omitted) | $7,204 | $5,129 | $3,870 | $1,201 | $1,432 | $1,622 |
| | Six months
ended | Year ended |
| Class R1 | 10/31/22
(unaudited) | 4/30/22 | 4/30/21 | 4/30/20 | 4/30/19 | 4/30/18 |
| Net asset value, beginning of period | $17.82 | $20.13 | $14.61 | $16.27 | $16.16 | $14.82 |
| Income (loss) from investment operations | | | | | | |
| Net investment income (loss) (d)(l) | $(0.01) | $0.79 | $0.05 | $0.16 | $0.21 | $0.18 |
| Net realized and unrealized gain (loss) | (1.38) | (1.48) | 5.81 | (1.00) | 0.60 | 1.58 |
| Total from investment operations | $(1.39) | $(0.69) | $5.86 | $(0.84) | $0.81 | $1.76 |
| Less distributions declared to shareholders | | | | | | |
| From net investment income | $— | $(0.83) | $(0.03) | $(0.17) | $(0.22) | $(0.24) |
| From net realized gain | — | (0.79) | (0.31) | (0.65) | (0.48) | (0.18) |
| Total distributions declared to shareholders | $— | $(1.62) | $(0.34) | $(0.82) | $(0.70) | $(0.42) |
| Net asset value, end of period (x) | $16.43 | $17.82 | $20.13 | $14.61 | $16.27 | $16.16 |
| Total return (%) (r)(s)(t)(x) | (7.80)(n) | (4.36) | 40.32 | (5.80) | 5.71 | 11.91 |
| Ratios (%) (to average net assets) and Supplemental data: | | | | | | |
| Expenses before expense reductions (h) | 1.21(a) | 1.20 | 1.22 | 1.24 | 1.23 | 1.23 |
| Expenses after expense reductions (h) | 1.00(a) | 1.00 | 1.00 | 1.00 | 0.99 | 1.00 |
| Net investment income (loss) (l) | (0.09)(a) | 3.90 | 0.29 | 1.01 | 1.32 | 1.16 |
| Portfolio turnover | 4(n) | 14 | 27 | 13 | 17 | 18 |
| Net assets at end of period (000 omitted) | $3,518 | $4,001 | $3,965 | $4,153 | $4,958 | $4,606 |
See Notes to Financial Statements
Financial Highlights − continued
MFS LIFETIME 2040 FUND − continued
| | Six months
ended | Year ended |
| Class R2 | 10/31/22
(unaudited) | 4/30/22 | 4/30/21 | 4/30/20 | 4/30/19
| 4/30/18 |
| Net asset value, beginning of period | $17.91 | $20.21 | $14.70 | $16.34 | $16.24 | $14.88 |
| Income (loss) from investment operations | | | | | | |
| Net investment income (loss) (d)(l) | $0.04 | $0.87 | $0.16 | $0.24 | $0.31 | $0.27 |
| Net realized and unrealized gain (loss) | (1.40) | (1.46) | 5.82 | (0.99) | 0.57 | 1.59 |
| Total from investment operations | $(1.36) | $(0.59) | $5.98 | $(0.75) | $0.88 | $1.86 |
| Less distributions declared to shareholders | | | | | | |
| From net investment income | $— | $(0.92) | $(0.16) | $(0.24) | $(0.30) | $(0.32) |
| From net realized gain | — | (0.79) | (0.31) | (0.65) | (0.48) | (0.18) |
| Total distributions declared to shareholders | $— | $(1.71) | $(0.47) | $(0.89) | $(0.78) | $(0.50) |
| Net asset value, end of period (x) | $16.55 | $17.91 | $20.21 | $14.70 | $16.34 | $16.24 |
| Total return (%) (r)(s)(t)(x) | (7.59)(n) | (3.89) | 40.98 | (5.30) | 6.23 | 12.55 |
| Ratios (%) (to average net assets) and Supplemental data: | | | | | | |
| Expenses before expense reductions (h) | 0.71(a) | 0.70 | 0.72 | 0.74 | 0.73 | 0.73 |
| Expenses after expense reductions (h) | 0.50(a) | 0.50 | 0.50 | 0.50 | 0.49 | 0.50 |
| Net investment income (loss) (l) | 0.41(a) | 4.26 | 0.90 | 1.49 | 1.92 | 1.69 |
| Portfolio turnover | 4(n) | 14 | 27 | 13 | 17 | 18 |
| Net assets at end of period (000 omitted) | $38,142 | $44,155 | $53,097 | $48,086 | $59,429 | $86,042 |
| | Six months
ended | Year ended |
| Class R3 | 10/31/22
(unaudited) | 4/30/22 | 4/30/21 | 4/30/20 | 4/30/19 | 4/30/18 |
| Net asset value, beginning of period | $18.02 | $20.33 | $14.80 | $16.46 | $16.37 | $15.00 |
| Income (loss) from investment operations | | | | | | |
| Net investment income (loss) (d)(l) | $0.06 | $0.94 | $0.22 | $0.30 | $0.36 | $0.31 |
| Net realized and unrealized gain (loss) | (1.41) | (1.48) | 5.84 | (1.01) | 0.56 | 1.61 |
| Total from investment operations | $(1.35) | $(0.54) | $6.06 | $(0.71) | $0.92 | $1.92 |
| Less distributions declared to shareholders | | | | | | |
| From net investment income | $— | $(0.98) | $(0.22) | $(0.30) | $(0.35) | $(0.37) |
| From net realized gain | — | (0.79) | (0.31) | (0.65) | (0.48) | (0.18) |
| Total distributions declared to shareholders | $— | $(1.77) | $(0.53) | $(0.95) | $(0.83) | $(0.55) |
| Net asset value, end of period (x) | $16.67 | $18.02 | $20.33 | $14.80 | $16.46 | $16.37 |
| Total return (%) (r)(s)(t)(x) | (7.49)(n) | (3.63) | 41.32 | (5.02) | 6.45 | 12.81 |
| Ratios (%) (to average net assets) and Supplemental data: | | | | | | |
| Expenses before expense reductions (h) | 0.46(a) | 0.45 | 0.46 | 0.49 | 0.48 | 0.48 |
| Expenses after expense reductions (h) | 0.25(a) | 0.25 | 0.25 | 0.25 | 0.24 | 0.25 |
| Net investment income (loss) (l) | 0.66(a) | 4.60 | 1.26 | 1.82 | 2.20 | 1.94 |
| Portfolio turnover | 4(n) | 14 | 27 | 13 | 17 | 18 |
| Net assets at end of period (000 omitted) | $159,218 | $171,589 | $156,544 | $104,521 | $89,830 | $88,577 |
See Notes to Financial Statements
Financial Highlights − continued
MFS LIFETIME 2040 FUND − continued
| | Six months
ended | Year ended |
| Class R4 | 10/31/22
(unaudited) | 4/30/22 | 4/30/21 | 4/30/20 | 4/30/19
| 4/30/18 |
| Net asset value, beginning of period | $18.26 | $20.56 | $14.94 | $16.61 | $16.51 | $15.11 |
| Income (loss) from investment operations | | | | | | |
| Net investment income (loss) (d)(l) | $0.08 | $0.91 | $0.25 | $0.34 | $0.39 | $0.39 |
| Net realized and unrealized gain (loss) | (1.43) | (1.40) | 5.93 | (1.02) | 0.58 | 1.58 |
| Total from investment operations | $(1.35) | $(0.49) | $6.18 | $(0.68) | $0.97 | $1.97 |
| Less distributions declared to shareholders | | | | | | |
| From net investment income | $— | $(1.02) | $(0.25) | $(0.34) | $(0.39) | $(0.39) |
| From net realized gain | — | (0.79) | (0.31) | (0.65) | (0.48) | (0.18) |
| Total distributions declared to shareholders | $— | $(1.81) | $(0.56) | $(0.99) | $(0.87) | $(0.57) |
| Net asset value, end of period (x) | $16.91 | $18.26 | $20.56 | $14.94 | $16.61 | $16.51 |
| Total return (%) (r)(s)(t)(x) | (7.39)(n) | (3.38) | 41.74 | (4.84) | 6.73 | 13.09 |
| Ratios (%) (to average net assets) and Supplemental data: | | | | | | |
| Expenses before expense reductions (h) | 0.21(a) | 0.20 | 0.22 | 0.24 | 0.23 | 0.23 |
| Expenses after expense reductions (h) | 0.00(a) | 0.00 | 0.00 | 0.00 | 0.00 | 0.00 |
| Net investment income (loss) (l) | 0.92(a) | 4.36 | 1.40 | 2.07 | 2.36 | 2.44 |
| Portfolio turnover | 4(n) | 14 | 27 | 13 | 17 | 18 |
| Net assets at end of period (000 omitted) | $39,475 | $41,621 | $105,822 | $144,006 | $143,534 | $145,328 |
| | Six months
ended | Year ended |
| Class R6 | 10/31/22
(unaudited) | 4/30/22 | 4/30/21 | 4/30/20 | 4/30/19
| 4/30/18 |
| Net asset value, beginning of period | $18.24 | $20.55 | $14.94 | $16.61 | $16.51 | $15.12 |
| Income (loss) from investment operations | | | | | | |
| Net investment income (loss) (d)(l) | $0.09 | $1.06 | $0.31 | $0.36 | $0.43 | $0.43 |
| Net realized and unrealized gain (loss) | (1.42) | (1.52) | 5.89 | (1.02) | 0.56 | 1.56 |
| Total from investment operations | $(1.33) | $(0.46) | $6.20 | $(0.66) | $0.99 | $1.99 |
| Less distributions declared to shareholders | | | | | | |
| From net investment income | $— | $(1.06) | $(0.28) | $(0.36) | $(0.41) | $(0.42) |
| From net realized gain | — | (0.79) | (0.31) | (0.65) | (0.48) | (0.18) |
| Total distributions declared to shareholders | $— | $(1.85) | $(0.59) | $(1.01) | $(0.89) | $(0.60) |
| Net asset value, end of period (x) | $16.91 | $18.24 | $20.55 | $14.94 | $16.61 | $16.51 |
| Total return (%) (r)(s)(t)(x) | (7.29)(n) | (3.24) | 41.92 | (4.72) | 6.89 | 13.21 |
| Ratios (%) (to average net assets) and Supplemental data: | | | | | | |
| Expenses before expense reductions (h) | 0.07(a) | 0.06 | 0.08 | 0.10 | 0.10 | 0.10 |
| Expenses after expense reductions (h) | 0.00(a) | 0.00 | 0.00 | 0.00 | 0.00 | 0.00 |
| Net investment income (loss) (l) | 1.05(a) | 5.12 | 1.69 | 2.20 | 2.62 | 2.63 |
| Portfolio turnover | 4(n) | 14 | 27 | 13 | 17 | 18 |
| Net assets at end of period (000 omitted) | $276,900 | $243,550 | $221,571 | $77,824 | $75,378 | $49,071 |
See Notes to Financial Statements
Financial Highlights − continued
MFS LIFETIME 2040 FUND − continued
| (a) | Annualized. |
| (d) | Per share data is based on average shares outstanding. |
| (h) | In addition to the fees and expenses which the fund bears directly, the fund indirectly bears a pro rata share of the fees and expenses of the underlying affiliated funds in which the fund invests. Accordingly, the expense ratio for the fund reflects only those fees and expenses borne directly by the fund. Because the underlying affiliated funds have varied expense and fee levels and the fund may own different proportions of the underlying affiliated funds at different times, the amount of fees and expenses incurred indirectly by the fund will vary. |
| (l) | Recognition of net investment income by the fund may be affected by the timing of the declaration of dividends by the underlying affiliated funds in which the fund invests and for interim net investment income ratios, the actual annual net investment income ratio may differ. The ratios and per share amounts do not include net investment income of the underlying affiliated funds in which the fund invests. |
| (n) | Not annualized. |
| (r) | Certain expenses have been reduced without which performance would have been lower. |
| (s) | From time to time the fund may receive proceeds from litigation settlements, without which performance would be lower. |
| (t) | Total returns do not include any applicable sales charges. |
| (x) | The net asset values and total returns have been calculated on net assets which include adjustments made in accordance with U.S. generally accepted accounting principles required at period end for financial reporting purposes. |
See Notes to Financial Statements
Financial Highlights − continued
MFS LIFETIME 2045 FUND
The financial highlights table is intended to help you understand the fund's financial performance for the semiannual period and the past 5 fiscal years. Certain information reflects financial results for a single fund share. The total returns in the table represent the rate that an investor would have earned (or lost) on an investment in the fund share class (assuming reinvestment of all distributions) held for the entire period.
| | Six months
ended | Year ended |
| Class A | 10/31/22
(unaudited) | 4/30/22 | 4/30/21 | 4/30/20 | 4/30/19
| 4/30/18 |
| Net asset value, beginning of period | $17.72 | $19.84 | $14.08 | $15.53 | $15.15 | $13.79 |
| Income (loss) from investment operations | | | | | | |
| Net investment income (loss) (d)(l) | $0.03 | $0.97 | $0.19 | $0.28 | $0.32 | $0.30 |
| Net realized and unrealized gain (loss) | (1.40) | (1.46) | 5.97 | (1.12) | 0.57 | 1.52 |
| Total from investment operations | $(1.37) | $(0.49) | $6.16 | $(0.84) | $0.89 | $1.82 |
| Less distributions declared to shareholders | | | | | | |
| From net investment income | $— | $(0.98) | $(0.19) | $(0.27) | $(0.31) | $(0.35) |
| From net realized gain | — | (0.65) | (0.21) | (0.34) | (0.20) | (0.11) |
| Total distributions declared to shareholders | $— | $(1.63) | $(0.40) | $(0.61) | $(0.51) | $(0.46) |
| Net asset value, end of period (x) | $16.35 | $17.72 | $19.84 | $14.08 | $15.53 | $15.15 |
| Total return (%) (r)(s)(t)(x) | (7.73)(n) | (3.41) | 44.10 | (5.93) | 6.45 | 13.18 |
| Ratios (%) (to average net assets) and Supplemental data: | | | | | | |
| Expenses before expense reductions (h) | 0.50(a) | 0.49 | 0.51 | 0.57 | 0.60 | 0.62 |
| Expenses after expense reductions (h) | 0.25(a) | 0.25 | 0.25 | 0.25 | 0.25 | 0.25 |
| Net investment income (loss) (l) | 0.31(a) | 4.83 | 1.09 | 1.78 | 2.13 | 1.99 |
| Portfolio turnover | 5(n) | 18 | 30 | 8 | 12 | 30 |
| Net assets at end of period (000 omitted) | $19,775 | $19,763 | $18,980 | $11,409 | $8,749 | $7,789 |
See Notes to Financial Statements
Financial Highlights − continued
MFS LIFETIME 2045 FUND − continued
| | Six months
ended | Year ended |
| Class B | 10/31/22
(unaudited) | 4/30/22 | 4/30/21 | 4/30/20 | 4/30/19
| 4/30/18 |
| Net asset value, beginning of period | $17.60 | $19.71 | $14.00 | $15.43 | $15.03 | $13.70 |
| Income (loss) from investment operations | | | | | | |
| Net investment income (loss) (d)(l) | $(0.04) | $0.79 | $0.05 | $0.14 | $0.20 | $0.17 |
| Net realized and unrealized gain (loss) | (1.37) | (1.44) | 5.93 | (1.10) | 0.59 | 1.51 |
| Total from investment operations | $(1.41) | $(0.65) | $5.98 | $(0.96) | $0.79 | $1.68 |
| Less distributions declared to shareholders | | | | | | |
| From net investment income | $— | $(0.81) | $(0.06) | $(0.13) | $(0.19) | $(0.24) |
| From net realized gain | — | (0.65) | (0.21) | (0.34) | (0.20) | (0.11) |
| Total distributions declared to shareholders | $— | $(1.46) | $(0.27) | $(0.47) | $(0.39) | $(0.35) |
| Net asset value, end of period (x) | $16.19 | $17.60 | $19.71 | $14.00 | $15.43 | $15.03 |
| Total return (%) (r)(s)(t)(x) | (8.01)(n) | (4.13) | 42.95 | (6.62) | 5.71 | 12.28 |
| Ratios (%) (to average net assets) and Supplemental data: | | | | | | |
| Expenses before expense reductions (h) | 1.25(a) | 1.24 | 1.26 | 1.32 | 1.35 | 1.37 |
| Expenses after expense reductions (h) | 1.00(a) | 1.00 | 1.00 | 1.00 | 1.00 | 1.00 |
| Net investment income (loss) (l) | (0.45)(a) | 3.98 | 0.30 | 0.89 | 1.31 | 1.15 |
| Portfolio turnover | 5(n) | 18 | 30 | 8 | 12 | 30 |
| Net assets at end of period (000 omitted) | $665 | $736 | $930 | $724 | $919 | $948 |
| | Six months
ended | Year ended |
| Class C | 10/31/22
(unaudited) | 4/30/22 | 4/30/21 | 4/30/20 | 4/30/19 | 4/30/18 |
| Net asset value, beginning of period | $17.50 | $19.62 | $13.91 | $15.35 | $14.97 | $13.66 |
| Income (loss) from investment operations | | | | | | |
| Net investment income (loss) (d)(l) | $(0.04) | $0.78 | $0.05 | $0.16 | $0.20 | $0.19 |
| Net realized and unrealized gain (loss) | (1.37) | (1.42) | 5.90 | (1.11) | 0.58 | 1.48 |
| Total from investment operations | $(1.41) | $(0.64) | $5.95 | $(0.95) | $0.78 | $1.67 |
| Less distributions declared to shareholders | | | | | | |
| From net investment income | $— | $(0.83) | $(0.03) | $(0.15) | $(0.20) | $(0.25) |
| From net realized gain | — | (0.65) | (0.21) | (0.34) | (0.20) | (0.11) |
| Total distributions declared to shareholders | $— | $(1.48) | $(0.24) | $(0.49) | $(0.40) | $(0.36) |
| Net asset value, end of period (x) | $16.09 | $17.50 | $19.62 | $13.91 | $15.35 | $14.97 |
| Total return (%) (r)(s)(t)(x) | (8.06)(n) | (4.13) | 43.01 | (6.60) | 5.70 | 12.24 |
| Ratios (%) (to average net assets) and Supplemental data: | | | | | | |
| Expenses before expense reductions (h) | 1.25(a) | 1.24 | 1.27 | 1.32 | 1.35 | 1.37 |
| Expenses after expense reductions (h) | 1.00(a) | 1.00 | 0.99 | 0.97 | 0.99 | 1.00 |
| Net investment income (loss) (l) | (0.44)(a) | 3.93 | 0.30 | 1.02 | 1.37 | 1.28 |
| Portfolio turnover | 5(n) | 18 | 30 | 8 | 12 | 30 |
| Net assets at end of period (000 omitted) | $2,382 | $2,027 | $1,943 | $1,960 | $2,301 | $1,966 |
See Notes to Financial Statements
Financial Highlights − continued
MFS LIFETIME 2045 FUND − continued
| | Six months
ended | Year ended |
| Class I | 10/31/22
(unaudited) | 4/30/22 | 4/30/21 | 4/30/20 | 4/30/19
| 4/30/18 |
| Net asset value, beginning of period | $17.82 | $19.94 | $14.15 | $15.60 | $15.22 | $13.85 |
| Income (loss) from investment operations | | | | | | |
| Net investment income (loss) (d)(l) | $0.05 | $1.01 | $0.24 | $0.31 | $0.36 | $0.33 |
| Net realized and unrealized gain (loss) | (1.40) | (1.45) | 6.00 | (1.12) | 0.57 | 1.53 |
| Total from investment operations | $(1.35) | $(0.44) | $6.24 | $(0.81) | $0.93 | $1.86 |
| Less distributions declared to shareholders | | | | | | |
| From net investment income | $— | $(1.03) | $(0.24) | $(0.30) | $(0.35) | $(0.38) |
| From net realized gain | — | (0.65) | (0.21) | (0.34) | (0.20) | (0.11) |
| Total distributions declared to shareholders | $— | $(1.68) | $(0.45) | $(0.64) | $(0.55) | $(0.49) |
| Net asset value, end of period (x) | $16.47 | $17.82 | $19.94 | $14.15 | $15.60 | $15.22 |
| Total return (%) (r)(s)(t)(x) | (7.58)(n) | (3.17) | 44.43 | (5.72) | 6.75 | 13.42 |
| Ratios (%) (to average net assets) and Supplemental data: | | | | | | |
| Expenses before expense reductions (h) | 0.25(a) | 0.24 | 0.25 | 0.32 | 0.35 | 0.37 |
| Expenses after expense reductions (h) | 0.00(a) | 0.00 | 0.00 | 0.00 | 0.00 | 0.00 |
| Net investment income (loss) (l) | 0.56(a) | 5.03 | 1.37 | 2.01 | 2.40 | 2.24 |
| Portfolio turnover | 5(n) | 18 | 30 | 8 | 12 | 30 |
| Net assets at end of period (000 omitted) | $2,481 | $2,458 | $2,145 | $395 | $296 | $161 |
| | Six months
ended | Year ended |
| Class R1 | 10/31/22
(unaudited) | 4/30/22 | 4/30/21 | 4/30/20 | 4/30/19 | 4/30/18 |
| Net asset value, beginning of period | $17.67 | $19.74 | $13.97 | $15.41 | $15.06 | $13.75 |
| Income (loss) from investment operations | | | | | | |
| Net investment income (loss) (d)(l) | $(0.04) | $0.69 | $(0.04) | $0.15 | $0.23 | $0.17 |
| Net realized and unrealized gain (loss) | (1.39) | (1.34) | 6.02 | (1.11) | 0.55 | 1.52 |
| Total from investment operations | $(1.43) | $(0.65) | $5.98 | $(0.96) | $0.78 | $1.69 |
| Less distributions declared to shareholders | | | | | | |
| From net investment income | $— | $(0.77) | $— | $(0.14) | $(0.23) | $(0.27) |
| From net realized gain | — | (0.65) | (0.21) | (0.34) | (0.20) | (0.11) |
| Total distributions declared to shareholders | $— | $(1.42) | $(0.21) | $(0.48) | $(0.43) | $(0.38) |
| Net asset value, end of period (x) | $16.24 | $17.67 | $19.74 | $13.97 | $15.41 | $15.06 |
| Total return (%) (r)(s)(t)(x) | (8.09)(n) | (4.13) | 42.98 | (6.67) | 5.70 | 12.27 |
| Ratios (%) (to average net assets) and Supplemental data: | | | | | | |
| Expenses before expense reductions (h) | 1.25(a) | 1.24 | 1.28 | 1.32 | 1.35 | 1.37 |
| Expenses after expense reductions (h) | 1.00(a) | 1.00 | 1.00 | 1.00 | 1.00 | 1.00 |
| Net investment income (loss) (l) | (0.45)(a) | 3.47 | (0.25) | 0.98 | 1.54 | 1.14 |
| Portfolio turnover | 5(n) | 18 | 30 | 8 | 12 | 30 |
| Net assets at end of period (000 omitted) | $400 | $398 | $552 | $995 | $1,093 | $872 |
See Notes to Financial Statements
Financial Highlights − continued
MFS LIFETIME 2045 FUND − continued
| | Six months
ended | Year ended |
| Class R2 | 10/31/22
(unaudited) | 4/30/22 | 4/30/21 | 4/30/20 | 4/30/19
| 4/30/18 |
| Net asset value, beginning of period | $17.66 | $19.75 | $14.00 | $15.42 | $15.04 | $13.71 |
| Income (loss) from investment operations | | | | | | |
| Net investment income (loss) (d)(l) | $0.01 | $0.84 | $0.11 | $0.20 | $0.25 | $0.25 |
| Net realized and unrealized gain (loss) | (1.39) | (1.38) | 5.96 | (1.07) | 0.59 | 1.51 |
| Total from investment operations | $(1.38) | $(0.54) | $6.07 | $(0.87) | $0.84 | $1.76 |
| Less distributions declared to shareholders | | | | | | |
| From net investment income | $— | $(0.90) | $(0.11) | $(0.21) | $(0.26) | $(0.32) |
| From net realized gain | — | (0.65) | (0.21) | (0.34) | (0.20) | (0.11) |
| Total distributions declared to shareholders | $— | $(1.55) | $(0.32) | $(0.55) | $(0.46) | $(0.43) |
| Net asset value, end of period (x) | $16.28 | $17.66 | $19.75 | $14.00 | $15.42 | $15.04 |
| Total return (%) (r)(s)(t)(x) | (7.81)(n) | (3.62) | 43.65 | (6.12) | 6.15 | 12.87 |
| Ratios (%) (to average net assets) and Supplemental data: | | | | | | |
| Expenses before expense reductions (h) | 0.75(a) | 0.74 | 0.77 | 0.82 | 0.85 | 0.87 |
| Expenses after expense reductions (h) | 0.50(a) | 0.50 | 0.50 | 0.50 | 0.50 | 0.50 |
| Net investment income (loss) (l) | 0.06(a) | 4.21 | 0.67 | 1.31 | 1.65 | 1.70 |
| Portfolio turnover | 5(n) | 18 | 30 | 8 | 12 | 30 |
| Net assets at end of period (000 omitted) | $9,620 | $11,276 | $15,161 | $17,299 | $21,895 | $20,428 |
| | Six months
ended | Year ended |
| Class R3 | 10/31/22
(unaudited) | 4/30/22 | 4/30/21 | 4/30/20 | 4/30/19 | 4/30/18 |
| Net asset value, beginning of period | $17.70 | $19.82 | $14.07 | $15.52 | $15.14 | $13.78 |
| Income (loss) from investment operations | | | | | | |
| Net investment income (loss) (d)(l) | $0.03 | $0.92 | $0.18 | $0.27 | $0.32 | $0.28 |
| Net realized and unrealized gain (loss) | (1.39) | (1.41) | 5.97 | (1.11) | 0.57 | 1.54 |
| Total from investment operations | $(1.36) | $(0.49) | $6.15 | $(0.84) | $0.89 | $1.82 |
| Less distributions declared to shareholders | | | | | | |
| From net investment income | $— | $(0.98) | $(0.19) | $(0.27) | $(0.31) | $(0.35) |
| From net realized gain | — | (0.65) | (0.21) | (0.34) | (0.20) | (0.11) |
| Total distributions declared to shareholders | $— | $(1.63) | $(0.40) | $(0.61) | $(0.51) | $(0.46) |
| Net asset value, end of period (x) | $16.34 | $17.70 | $19.82 | $14.07 | $15.52 | $15.14 |
| Total return (%) (r)(s)(t)(x) | (7.68)(n) | (3.42) | 44.05 | (5.93) | 6.49 | 13.20 |
| Ratios (%) (to average net assets) and Supplemental data: | | | | | | |
| Expenses before expense reductions (h) | 0.50(a) | 0.49 | 0.51 | 0.57 | 0.60 | 0.62 |
| Expenses after expense reductions (h) | 0.25(a) | 0.25 | 0.25 | 0.25 | 0.25 | 0.25 |
| Net investment income (loss) (l) | 0.31(a) | 4.61 | 1.08 | 1.77 | 2.10 | 1.87 |
| Portfolio turnover | 5(n) | 18 | 30 | 8 | 12 | 30 |
| Net assets at end of period (000 omitted) | $117,578 | $127,223 | $109,034 | $69,136 | $53,767 | $42,729 |
See Notes to Financial Statements
Financial Highlights − continued
MFS LIFETIME 2045 FUND − continued
| | Six months
ended | Year ended |
| Class R4 | 10/31/22
(unaudited) | 4/30/22 | 4/30/21 | 4/30/20 | 4/30/19
| 4/30/18 |
| Net asset value, beginning of period | $17.84 | $19.94 | $14.14 | $15.58 | $15.20 | $13.82 |
| Income (loss) from investment operations | | | | | | |
| Net investment income (loss) (d)(l) | $0.05 | $0.85 | $0.21 | $0.32 | $0.35 | $0.36 |
| Net realized and unrealized gain (loss) | (1.40) | (1.30) | 6.02 | (1.12) | 0.57 | 1.50 |
| Total from investment operations | $(1.35) | $(0.45) | $6.23 | $(0.80) | $0.92 | $1.86 |
| Less distributions declared to shareholders | | | | | | |
| From net investment income | $— | $(1.00) | $(0.22) | $(0.30) | $(0.34) | $(0.37) |
| From net realized gain | — | (0.65) | (0.21) | (0.34) | (0.20) | (0.11) |
| Total distributions declared to shareholders | $— | $(1.65) | $(0.43) | $(0.64) | $(0.54) | $(0.48) |
| Net asset value, end of period (x) | $16.49 | $17.84 | $19.94 | $14.14 | $15.58 | $15.20 |
| Total return (%) (r)(s)(t)(x) | (7.57)(n) | (3.17) | 44.39 | (5.67) | 6.73 | 13.47 |
| Ratios (%) (to average net assets) and Supplemental data: | | | | | | |
| Expenses before expense reductions (h) | 0.25(a) | 0.24 | 0.27 | 0.32 | 0.35 | 0.36 |
| Expenses after expense reductions (h) | 0.00(a) | 0.00 | 0.00 | 0.00 | 0.00 | 0.00 |
| Net investment income (loss) (l) | 0.56(a) | 4.18 | 1.23 | 2.04 | 2.33 | 2.43 |
| Portfolio turnover | 5(n) | 18 | 30 | 8 | 12 | 30 |
| Net assets at end of period (000 omitted) | $19,835 | $20,668 | $68,489 | $90,453 | $83,824 | $70,628 |
| | Six months
ended | Year ended |
| Class R6 | 10/31/22
(unaudited) | 4/30/22 | 4/30/21 | 4/30/20 | 4/30/19 | 4/30/18 |
| Net asset value, beginning of period | $17.82 | $19.93 | $14.14 | $15.58 | $15.20 | $13.83 |
| Income (loss) from investment operations | | | | | | |
| Net investment income (loss) (d)(l) | $0.06 | $1.05 | $0.27 | $0.33 | $0.36 | $0.47 |
| Net realized and unrealized gain (loss) | (1.40) | (1.46) | 5.98 | (1.11) | 0.59 | 1.41 |
| Total from investment operations | $(1.34) | $(0.41) | $6.25 | $(0.78) | $0.95 | $1.88 |
| Less distributions declared to shareholders | | | | | | |
| From net investment income | $— | $(1.05) | $(0.25) | $(0.32) | $(0.37) | $(0.40) |
| From net realized gain | — | (0.65) | (0.21) | (0.34) | (0.20) | (0.11) |
| Total distributions declared to shareholders | $— | $(1.70) | $(0.46) | $(0.66) | $(0.57) | $(0.51) |
| Net asset value, end of period (x) | $16.48 | $17.82 | $19.93 | $14.14 | $15.58 | $15.20 |
| Total return (%) (r)(s)(t)(x) | (7.52)(n) | (2.99) | 44.58 | (5.55) | 6.91 | 13.57 |
| Ratios (%) (to average net assets) and Supplemental data: | | | | | | |
| Expenses before expense reductions (h) | 0.10(a) | 0.09 | 0.11 | 0.17 | 0.21 | 0.23 |
| Expenses after expense reductions (h) | 0.00(a) | 0.00 | 0.00 | 0.00 | 0.00 | 0.00 |
| Net investment income (loss) (l) | 0.71(a) | 5.23 | 1.56 | 2.14 | 2.42 | 3.11 |
| Portfolio turnover | 5(n) | 18 | 30 | 8 | 12 | 30 |
| Net assets at end of period (000 omitted) | $204,222 | $166,911 | $140,992 | $37,856 | $26,219 | $15,910 |
See Notes to Financial Statements
Financial Highlights − continued
MFS LIFETIME 2045 FUND − continued
| (a) | Annualized. |
| (d) | Per share data is based on average shares outstanding. |
| (h) | In addition to the fees and expenses which the fund bears directly, the fund indirectly bears a pro rata share of the fees and expenses of the underlying affiliated funds in which the fund invests. Accordingly, the expense ratio for the fund reflects only those fees and expenses borne directly by the fund. Because the underlying affiliated funds have varied expense and fee levels and the fund may own different proportions of the underlying affiliated funds at different times, the amount of fees and expenses incurred indirectly by the fund will vary. |
| (l) | Recognition of net investment income by the fund may be affected by the timing of the declaration of dividends by the underlying affiliated funds in which the fund invests and for interim net investment income ratios, the actual annual net investment income ratio may differ. The ratios and per share amounts do not include net investment income of the underlying affiliated funds in which the fund invests. |
| (n) | Not annualized. |
| (r) | Certain expenses have been reduced without which performance would have been lower. |
| (s) | From time to time the fund may receive proceeds from litigation settlements, without which performance would be lower. |
| (t) | Total returns do not include any applicable sales charges. |
| (x) | The net asset values and total returns have been calculated on net assets which include adjustments made in accordance with U.S. generally accepted accounting principles required at period end for financial reporting purposes. |
See Notes to Financial Statements
Financial Highlights − continued
MFS LIFETIME 2050 FUND
The financial highlights table is intended to help you understand the fund's financial performance for the semiannual period and the past 5 fiscal years. Certain information reflects financial results for a single fund share. The total returns in the table represent the rate that an investor would have earned (or lost) on an investment in the fund share class (assuming reinvestment of all distributions) held for the entire period.
| | Six months
ended | Year ended |
| Class A | 10/31/22
(unaudited) | 4/30/22 | 4/30/21 | 4/30/20 | 4/30/19
| 4/30/18 |
| Net asset value, beginning of period | $21.30 | $23.98 | $16.99 | $18.80 | $18.30 | $16.63 |
| Income (loss) from investment operations | | | | | | |
| Net investment income (loss) (d)(l) | $0.02 | $1.17 | $0.22 | $0.32 | $0.38 | $0.33 |
| Net realized and unrealized gain (loss) | (1.69) | (1.73) | 7.23 | (1.33) | 0.71 | 1.86 |
| Total from investment operations | $(1.67) | $(0.56) | $7.45 | $(1.01) | $1.09 | $2.19 |
| Less distributions declared to shareholders | | | | | | |
| From net investment income | $— | $(1.18) | $(0.23) | $(0.32) | $(0.37) | $(0.37) |
| From net realized gain | — | (0.94) | (0.23) | (0.48) | (0.22) | (0.15) |
| Total distributions declared to shareholders | $— | $(2.12) | $(0.46) | $(0.80) | $(0.59) | $(0.52) |
| Net asset value, end of period (x) | $19.63 | $21.30 | $23.98 | $16.99 | $18.80 | $18.30 |
| Total return (%) (r)(s)(t)(x) | (7.84)(n) | (3.36) | 44.17 | (5.93) | 6.47 | 13.16 |
| Ratios (%) (to average net assets) and Supplemental data: | | | | | | |
| Expenses before expense reductions (h) | 0.50(a) | 0.50 | 0.51 | 0.57 | 0.57 | 0.58 |
| Expenses after expense reductions (h) | 0.25(a) | 0.25 | 0.25 | 0.25 | 0.25 | 0.25 |
| Net investment income (loss) (l) | 0.18(a) | 4.85 | 1.08 | 1.74 | 2.11 | 1.83 |
| Portfolio turnover | 4(n) | 17 | 24 | 8 | 24 | 20 |
| Net assets at end of period (000 omitted) | $22,815 | $22,761 | $22,708 | $14,315 | $12,791 | $12,353 |
See Notes to Financial Statements
Financial Highlights − continued
MFS LIFETIME 2050 FUND − continued
| | Six months
ended | Year ended |
| Class B | 10/31/22
(unaudited) | 4/30/22 | 4/30/21 | 4/30/20 | 4/30/19
| 4/30/18 |
| Net asset value, beginning of period | $20.96 | $23.62 | $16.75 | $18.55 | $18.07 | $16.44 |
| Income (loss) from investment operations | | | | | | |
| Net investment income (loss) (d)(l) | $(0.06) | $0.95 | $0.06 | $0.18 | $0.25 | $0.20 |
| Net realized and unrealized gain (loss) | (1.65) | (1.70) | 7.11 | (1.32) | 0.70 | 1.83 |
| Total from investment operations | $(1.71) | $(0.75) | $7.17 | $(1.14) | $0.95 | $2.03 |
| Less distributions declared to shareholders | | | | | | |
| From net investment income | $— | $(0.97) | $(0.07) | $(0.18) | $(0.25) | $(0.25) |
| From net realized gain | — | (0.94) | (0.23) | (0.48) | (0.22) | (0.15) |
| Total distributions declared to shareholders | $— | $(1.91) | $(0.30) | $(0.66) | $(0.47) | $(0.40) |
| Net asset value, end of period (x) | $19.25 | $20.96 | $23.62 | $16.75 | $18.55 | $18.07 |
| Total return (%) (r)(s)(t)(x) | (8.16)(n) | (4.11) | 43.04 | (6.61) | 5.67 | 12.36 |
| Ratios (%) (to average net assets) and Supplemental data: | | | | | | |
| Expenses before expense reductions (h) | 1.25(a) | 1.25 | 1.26 | 1.32 | 1.32 | 1.33 |
| Expenses after expense reductions (h) | 1.00(a) | 1.00 | 1.00 | 1.00 | 1.00 | 1.00 |
| Net investment income (loss) (l) | (0.57)(a) | 3.98 | 0.32 | 0.97 | 1.39 | 1.15 |
| Portfolio turnover | 4(n) | 17 | 24 | 8 | 24 | 20 |
| Net assets at end of period (000 omitted) | $1,049 | $1,265 | $1,727 | $1,359 | $1,630 | $1,270 |
| | Six months
ended | Year ended |
| Class C | 10/31/22
(unaudited) | 4/30/22 | 4/30/21 | 4/30/20 | 4/30/19 | 4/30/18 |
| Net asset value, beginning of period | $20.83 | $23.49 | $16.65 | $18.45 | $17.96 | $16.35 |
| Income (loss) from investment operations | | | | | | |
| Net investment income (loss) (d)(l) | $(0.06) | $0.91 | $0.06 | $0.17 | $0.23 | $0.20 |
| Net realized and unrealized gain (loss) | (1.64) | (1.65) | 7.08 | (1.31) | 0.72 | 1.81 |
| Total from investment operations | $(1.70) | $(0.74) | $7.14 | $(1.14) | $0.95 | $2.01 |
| Less distributions declared to shareholders | | | | | | |
| From net investment income | $— | $(0.98) | $(0.07) | $(0.18) | $(0.24) | $(0.25) |
| From net realized gain | — | (0.94) | (0.23) | (0.48) | (0.22) | (0.15) |
| Total distributions declared to shareholders | $— | $(1.92) | $(0.30) | $(0.66) | $(0.46) | $(0.40) |
| Net asset value, end of period (x) | $19.13 | $20.83 | $23.49 | $16.65 | $18.45 | $17.96 |
| Total return (%) (r)(s)(t)(x) | (8.16)(n) | (4.11) | 43.12 | (6.66) | 5.67 | 12.30 |
| Ratios (%) (to average net assets) and Supplemental data: | | | | | | |
| Expenses before expense reductions (h) | 1.25(a) | 1.25 | 1.26 | 1.32 | 1.32 | 1.33 |
| Expenses after expense reductions (h) | 1.00(a) | 1.00 | 1.00 | 1.00 | 1.00 | 1.00 |
| Net investment income (loss) (l) | (0.58)(a) | 3.85 | 0.31 | 0.94 | 1.31 | 1.16 |
| Portfolio turnover | 4(n) | 17 | 24 | 8 | 24 | 20 |
| Net assets at end of period (000 omitted) | $3,134 | $3,223 | $3,898 | $3,029 | $3,344 | $2,775 |
See Notes to Financial Statements
Financial Highlights − continued
MFS LIFETIME 2050 FUND − continued
| | Six months
ended | Year ended |
| Class I | 10/31/22
(unaudited) | 4/30/22 | 4/30/21 | 4/30/20 | 4/30/19
| 4/30/18 |
| Net asset value, beginning of period | $21.27 | $23.95 | $16.97 | $18.78 | $18.29 | $16.62 |
| Income (loss) from investment operations | | | | | | |
| Net investment income (loss) (d)(l) | $0.05 | $1.18 | $0.28 | $0.41 | $0.50 | $0.41 |
| Net realized and unrealized gain (loss) | (1.68) | (1.68) | 7.21 | (1.37) | 0.62 | 1.83 |
| Total from investment operations | $(1.63) | $(0.50) | $7.49 | $(0.96) | $1.12 | $2.24 |
| Less distributions declared to shareholders | | | | | | |
| From net investment income | $— | $(1.24) | $(0.28) | $(0.37) | $(0.41) | $(0.42) |
| From net realized gain | — | (0.94) | (0.23) | (0.48) | (0.22) | (0.15) |
| Total distributions declared to shareholders | $— | $(2.18) | $(0.51) | $(0.85) | $(0.63) | $(0.57) |
| Net asset value, end of period (x) | $19.64 | $21.27 | $23.95 | $16.97 | $18.78 | $18.29 |
| Total return (%) (r)(s)(t)(x) | (7.66)(n) | (3.14) | 44.49 | (5.71) | 6.70 | 13.47 |
| Ratios (%) (to average net assets) and Supplemental data: | | | | | | |
| Expenses before expense reductions (h) | 0.25(a) | 0.25 | 0.26 | 0.32 | 0.32 | 0.33 |
| Expenses after expense reductions (h) | 0.00(a) | 0.00 | 0.00 | 0.00 | 0.00 | 0.00 |
| Net investment income (loss) (l) | 0.49(a) | 4.92 | 1.36 | 2.23 | 2.73 | 2.26 |
| Portfolio turnover | 4(n) | 17 | 24 | 8 | 24 | 20 |
| Net assets at end of period (000 omitted) | $21,580 | $1,445 | $1,033 | $354 | $213 | $566 |
| | Six months
ended | Year ended |
| Class R1 | 10/31/22
(unaudited) | 4/30/22 | 4/30/21 | 4/30/20 | 4/30/19 | 4/30/18 |
| Net asset value, beginning of period | $20.91 | $23.59 | $16.67 | $18.46 | $17.97 | $16.38 |
| Income (loss) from investment operations | | | | | | |
| Net investment income (loss) (d)(l) | $(0.06) | $0.95 | $(0.04) | $0.16 | $0.25 | $0.21 |
| Net realized and unrealized gain (loss) | (1.64) | (1.69) | 7.20 | (1.30) | 0.69 | 1.82 |
| Total from investment operations | $(1.70) | $(0.74) | $7.16 | $(1.14) | $0.94 | $2.03 |
| Less distributions declared to shareholders | | | | | | |
| From net investment income | $— | $(1.00) | $— | $(0.17) | $(0.23) | $(0.29) |
| From net realized gain | — | (0.94) | (0.24) | (0.48) | (0.22) | (0.15) |
| Total distributions declared to shareholders | $— | $(1.94) | $(0.24) | $(0.65) | $(0.45) | $(0.44) |
| Net asset value, end of period (x) | $19.21 | $20.91 | $23.59 | $16.67 | $18.46 | $17.97 |
| Total return (%) (r)(s)(t)(x) | (8.13)(n) | (4.08) | 43.08 | (6.64) | 5.65 | 12.35 |
| Ratios (%) (to average net assets) and Supplemental data: | | | | | | |
| Expenses before expense reductions (h) | 1.25(a) | 1.25 | 1.28 | 1.32 | 1.32 | 1.33 |
| Expenses after expense reductions (h) | 1.00(a) | 1.00 | 1.00 | 1.00 | 1.00 | 1.00 |
| Net investment income (loss) (l) | (0.57)(a) | 4.02 | (0.21) | 0.90 | 1.42 | 1.18 |
| Portfolio turnover | 4(n) | 17 | 24 | 8 | 24 | 20 |
| Net assets at end of period (000 omitted) | $690 | $731 | $695 | $1,184 | $1,322 | $1,052 |
See Notes to Financial Statements
Financial Highlights − continued
MFS LIFETIME 2050 FUND − continued
| | Six months
ended | Year ended |
| Class R2 | 10/31/22
(unaudited) | 4/30/22 | 4/30/21 | 4/30/20 | 4/30/19
| 4/30/18 |
| Net asset value, beginning of period | $21.06 | $23.70 | $16.79 | $18.55 | $18.07 | $16.44 |
| Income (loss) from investment operations | | | | | | |
| Net investment income (loss) (d)(l) | $(0.01) | $1.00 | $0.15 | $0.26 | $0.34 | $0.30 |
| Net realized and unrealized gain (loss) | (1.66) | (1.62) | 7.15 | (1.30) | 0.69 | 1.82 |
| Total from investment operations | $(1.67) | $(0.62) | $7.30 | $(1.04) | $1.03 | $2.12 |
| Less distributions declared to shareholders | | | | | | |
| From net investment income | $— | $(1.08) | $(0.15) | $(0.24) | $(0.33) | $(0.34) |
| From net realized gain | — | (0.94) | (0.24) | (0.48) | (0.22) | (0.15) |
| Total distributions declared to shareholders | $— | $(2.02) | $(0.39) | $(0.72) | $(0.55) | $(0.49) |
| Net asset value, end of period (x) | $19.39 | $21.06 | $23.70 | $16.79 | $18.55 | $18.07 |
| Total return (%) (r)(s)(t)(x) | (7.93)(n) | (3.59) | 43.72 | (6.12) | 6.18 | 12.89 |
| Ratios (%) (to average net assets) and Supplemental data: | | | | | | |
| Expenses before expense reductions (h) | 0.75(a) | 0.75 | 0.77 | 0.82 | 0.82 | 0.83 |
| Expenses after expense reductions (h) | 0.50(a) | 0.50 | 0.50 | 0.50 | 0.50 | 0.50 |
| Net investment income (loss) (l) | (0.07)(a) | 4.18 | 0.72 | 1.41 | 1.92 | 1.67 |
| Portfolio turnover | 4(n) | 17 | 24 | 8 | 24 | 20 |
| Net assets at end of period (000 omitted) | $16,705 | $19,078 | $28,781 | $26,545 | $28,575 | $46,468 |
| | Six months
ended | Year ended |
| Class R3 | 10/31/22
(unaudited) | 4/30/22 | 4/30/21 | 4/30/20 | 4/30/19 | 4/30/18 |
| Net asset value, beginning of period | $21.11 | $23.79 | $16.86 | $18.67 | $18.18 | $16.53 |
| Income (loss) from investment operations | | | | | | |
| Net investment income (loss) (d)(l) | $0.02 | $1.10 | $0.22 | $0.33 | $0.38 | $0.34 |
| Net realized and unrealized gain (loss) | (1.66) | (1.67) | 7.17 | (1.33) | 0.70 | 1.84 |
| Total from investment operations | $(1.64) | $(0.57) | $7.39 | $(1.00) | $1.08 | $2.18 |
| Less distributions declared to shareholders | | | | | | |
| From net investment income | $— | $(1.17) | $(0.23) | $(0.33) | $(0.37) | $(0.38) |
| From net realized gain | — | (0.94) | (0.23) | (0.48) | (0.22) | (0.15) |
| Total distributions declared to shareholders | $— | $(2.11) | $(0.46) | $(0.81) | $(0.59) | $(0.53) |
| Net asset value, end of period (x) | $19.47 | $21.11 | $23.79 | $16.86 | $18.67 | $18.18 |
| Total return (%) (r)(s)(t)(x) | (7.77)(n) | (3.41) | 44.16 | (5.96) | 6.48 | 13.19 |
| Ratios (%) (to average net assets) and Supplemental data: | | | | | | |
| Expenses before expense reductions (h) | 0.50(a) | 0.50 | 0.51 | 0.57 | 0.57 | 0.58 |
| Expenses after expense reductions (h) | 0.25(a) | 0.25 | 0.25 | 0.25 | 0.25 | 0.25 |
| Net investment income (loss) (l) | 0.18(a) | 4.60 | 1.08 | 1.77 | 2.10 | 1.90 |
| Portfolio turnover | 4(n) | 17 | 24 | 8 | 24 | 20 |
| Net assets at end of period (000 omitted) | $109,858 | $118,076 | $113,346 | $70,610 | $54,561 | $48,180 |
See Notes to Financial Statements
Financial Highlights − continued
MFS LIFETIME 2050 FUND − continued
| | Six months
ended | Year ended |
| Class R4 | 10/31/22
(unaudited) | 4/30/22 | 4/30/21 | 4/30/20 | 4/30/19
| 4/30/18 |
| Net asset value, beginning of period | $21.31 | $23.97 | $16.97 | $18.77 | $18.28 | $16.60 |
| Income (loss) from investment operations | | | | | | |
| Net investment income (loss) (d)(l) | $0.04 | $0.94 | $0.26 | $0.37 | $0.42 | $0.42 |
| Net realized and unrealized gain (loss) | (1.68) | (1.46) | 7.24 | (1.33) | 0.70 | 1.82 |
| Total from investment operations | $(1.64) | $(0.52) | $7.50 | $(0.96) | $1.12 | $2.24 |
| Less distributions declared to shareholders | | | | | | |
| From net investment income | $— | $(1.20) | $(0.26) | $(0.36) | $(0.41) | $(0.41) |
| From net realized gain | — | (0.94) | (0.24) | (0.48) | (0.22) | (0.15) |
| Total distributions declared to shareholders | $— | $(2.14) | $(0.50) | $(0.84) | $(0.63) | $(0.56) |
| Net asset value, end of period (x) | $19.67 | $21.31 | $23.97 | $16.97 | $18.77 | $18.28 |
| Total return (%) (r)(s)(t)(x) | (7.70)(n) | (3.16) | 44.52 | (5.69) | 6.71 | 13.49 |
| Ratios (%) (to average net assets) and Supplemental data: | | | | | | |
| Expenses before expense reductions (h) | 0.25(a) | 0.25 | 0.27 | 0.32 | 0.32 | 0.33 |
| Expenses after expense reductions (h) | 0.00(a) | 0.00 | 0.00 | 0.00 | 0.00 | 0.00 |
| Net investment income (loss) (l) | 0.43(a) | 3.88 | 1.28 | 2.01 | 2.30 | 2.35 |
| Portfolio turnover | 4(n) | 17 | 24 | 8 | 24 | 20 |
| Net assets at end of period (000 omitted) | $23,047 | $24,207 | $71,368 | $76,018 | $69,834 | $70,936 |
| | Six months
ended | Year ended |
| Class R6 | 10/31/22
(unaudited) | 4/30/22 | 4/30/21 | 4/30/20 | 4/30/19 | 4/30/18 |
| Net asset value, beginning of period | $21.29 | $23.96 | $16.97 | $18.76 | $18.27 | $16.60 |
| Income (loss) from investment operations | | | | | | |
| Net investment income (loss) (d)(l) | $0.06 | $1.26 | $0.32 | $0.39 | $0.44 | $0.51 |
| Net realized and unrealized gain (loss) | (1.69) | (1.72) | 7.20 | (1.31) | 0.71 | 1.75 |
| Total from investment operations | $(1.63) | $(0.46) | $7.52 | $(0.92) | $1.15 | $2.26 |
| Less distributions declared to shareholders | | | | �� | | |
| From net investment income | $— | $(1.27) | $(0.30) | $(0.39) | $(0.44) | $(0.44) |
| From net realized gain | — | (0.94) | (0.23) | (0.48) | (0.22) | (0.15) |
| Total distributions declared to shareholders | $— | $(2.21) | $(0.53) | $(0.87) | $(0.66) | $(0.59) |
| Net asset value, end of period (x) | $19.66 | $21.29 | $23.96 | $16.97 | $18.76 | $18.27 |
| Total return (%) (r)(s)(t)(x) | (7.66)(n) | (2.97) | 44.70 | (5.52) | 6.89 | 13.60 |
| Ratios (%) (to average net assets) and Supplemental data: | | | | | | |
| Expenses before expense reductions (h) | 0.10(a) | 0.09 | 0.12 | 0.17 | 0.18 | 0.19 |
| Expenses after expense reductions (h) | 0.00(a) | 0.00 | 0.00 | 0.00 | 0.00 | 0.00 |
| Net investment income (loss) (l) | 0.57(a) | 5.23 | 1.54 | 2.11 | 2.44 | 2.82 |
| Portfolio turnover | 4(n) | 17 | 24 | 8 | 24 | 20 |
| Net assets at end of period (000 omitted) | $177,866 | $147,729 | $121,495 | $44,463 | $39,175 | $23,365 |
See Notes to Financial Statements
Financial Highlights − continued
MFS LIFETIME 2050 FUND − continued
| (a) | Annualized. |
| (d) | Per share data is based on average shares outstanding. |
| (h) | In addition to the fees and expenses which the fund bears directly, the fund indirectly bears a pro rata share of the fees and expenses of the underlying affiliated funds in which the fund invests. Accordingly, the expense ratio for the fund reflects only those fees and expenses borne directly by the fund. Because the underlying affiliated funds have varied expense and fee levels and the fund may own different proportions of the underlying affiliated funds at different times, the amount of fees and expenses incurred indirectly by the fund will vary. |
| (l) | Recognition of net investment income by the fund may be affected by the timing of the declaration of dividends by the underlying affiliated funds in which the fund invests and for interim net investment income ratios, the actual annual net investment income ratio may differ. The ratios and per share amounts do not include net investment income of the underlying affiliated funds in which the fund invests. |
| (n) | Not annualized. |
| (r) | Certain expenses have been reduced without which performance would have been lower. |
| (s) | From time to time the fund may receive proceeds from litigation settlements, without which performance would be lower. |
| (t) | Total returns do not include any applicable sales charges. |
| (x) | The net asset values and total returns have been calculated on net assets which include adjustments made in accordance with U.S. generally accepted accounting principles required at period end for financial reporting purposes. |
See Notes to Financial Statements
Financial Highlights − continued
MFS LIFETIME 2055 FUND
The financial highlights table is intended to help you understand the fund's financial performance for the semiannual period and the past 5 fiscal years. Certain information reflects financial results for a single fund share. The total returns in the table represent the rate that an investor would have earned (or lost) on an investment in the fund share class (assuming reinvestment of all distributions) held for the entire period.
| | Six months
ended | Year ended |
| Class A | 10/31/22
(unaudited) | 4/30/22 | 4/30/21 | 4/30/20 | 4/30/19
| 4/30/18 |
| Net asset value, beginning of period | $18.30 | $20.42 | $14.47 | $15.93 | $15.45 | $14.00 |
| Income (loss) from investment operations | | | | | | |
| Net investment income (loss) (d)(l) | $0.02 | $1.02 | $0.19 | $0.28 | $0.32 | $0.29 |
| Net realized and unrealized gain (loss) | (1.45) | (1.52) | 6.15 | (1.14) | 0.60 | 1.55 |
| Total from investment operations | $(1.43) | $(0.50) | $6.34 | $(0.86) | $0.92 | $1.84 |
| Less distributions declared to shareholders | | | | | | |
| From net investment income | $— | $(1.02) | $(0.20) | $(0.27) | $(0.31) | $(0.31) |
| From net realized gain | — | (0.60) | (0.19) | (0.33) | (0.13) | (0.08) |
| Total distributions declared to shareholders | $— | $(1.62) | $(0.39) | $(0.60) | $(0.44) | $(0.39) |
| Net asset value, end of period (x) | $16.87 | $18.30 | $20.42 | $14.47 | $15.93 | $15.45 |
| Total return (%) (r)(s)(t)(x) | (7.81)(n) | (3.35) | 44.11 | (5.87) | 6.46 | 13.10 |
| Ratios (%) (to average net assets) and Supplemental data: | | | | | | |
| Expenses before expense reductions (h) | 0.56(a) | 0.56 | 0.61 | 0.72 | 0.81 | 0.92 |
| Expenses after expense reductions (h) | 0.25(a) | 0.25 | 0.25 | 0.25 | 0.25 | 0.25 |
| Net investment income (loss) (l) | 0.18(a) | 4.94 | 1.09 | 1.78 | 2.08 | 1.91 |
| Portfolio turnover | 4(n) | 19 | 24 | 11 | 20 | 18 |
| Net assets at end of period (000 omitted) | $15,933 | $15,144 | $14,314 | $7,729 | $5,866 | $4,833 |
See Notes to Financial Statements
Financial Highlights − continued
MFS LIFETIME 2055 FUND − continued
| | Six months
ended | Year ended |
| Class B | 10/31/22
(unaudited) | 4/30/22 | 4/30/21 | 4/30/20 | 4/30/19
| 4/30/18 |
| Net asset value, beginning of period | $18.22 | $20.33 | $14.41 | $15.87 | $15.39 | $13.95 |
| Income (loss) from investment operations | | | | | | |
| Net investment income (loss) (d)(l) | $(0.05) | $0.82 | $0.05 | $0.15 | $0.21 | $0.18 |
| Net realized and unrealized gain (loss) | (1.44) | (1.48) | 6.13 | (1.14) | 0.60 | 1.55 |
| Total from investment operations | $(1.49) | $(0.66) | $6.18 | $(0.99) | $0.81 | $1.73 |
| Less distributions declared to shareholders | | | | | | |
| From net investment income | $— | $(0.85) | $(0.07) | $(0.14) | $(0.20) | $(0.21) |
| From net realized gain | — | (0.60) | (0.19) | (0.33) | (0.13) | (0.08) |
| Total distributions declared to shareholders | $— | $(1.45) | $(0.26) | $(0.47) | $(0.33) | $(0.29) |
| Net asset value, end of period (x) | $16.73 | $18.22 | $20.33 | $14.41 | $15.87 | $15.39 |
| Total return (%) (r)(s)(t)(x) | (8.18)(n) | (4.09) | 43.06 | (6.61) | 5.65 | 12.36 |
| Ratios (%) (to average net assets) and Supplemental data: | | | | | | |
| Expenses before expense reductions (h) | 1.32(a) | 1.31 | 1.36 | 1.48 | 1.56 | 1.67 |
| Expenses after expense reductions (h) | 1.00(a) | 1.00 | 1.00 | 1.00 | 1.00 | 1.00 |
| Net investment income (loss) (l) | (0.57)(a) | 3.96 | 0.31 | 0.93 | 1.34 | 1.22 |
| Portfolio turnover | 4(n) | 19 | 24 | 11 | 20 | 18 |
| Net assets at end of period (000 omitted) | $525 | $590 | $713 | $517 | $605 | $470 |
| | Six months
ended | Year ended |
| Class C | 10/31/22
(unaudited) | 4/30/22 | 4/30/21 | 4/30/20 | 4/30/19 | 4/30/18 |
| Net asset value, beginning of period | $18.06 | $20.17 | $14.29 | $15.75 | $15.28 | $13.86 |
| Income (loss) from investment operations | | | | | | |
| Net investment income (loss) (d)(l) | $(0.05) | $0.82 | $0.05 | $0.14 | $0.20 | $0.18 |
| Net realized and unrealized gain (loss) | (1.43) | (1.47) | 6.08 | (1.11) | 0.60 | 1.53 |
| Total from investment operations | $(1.48) | $(0.65) | $6.13 | $(0.97) | $0.80 | $1.71 |
| Less distributions declared to shareholders | | | | | | |
| From net investment income | $— | $(0.86) | $(0.06) | $(0.16) | $(0.20) | $(0.21) |
| From net realized gain | — | (0.60) | (0.19) | (0.33) | (0.13) | (0.08) |
| Total distributions declared to shareholders | $— | $(1.46) | $(0.25) | $(0.49) | $(0.33) | $(0.29) |
| Net asset value, end of period (x) | $16.58 | $18.06 | $20.17 | $14.29 | $15.75 | $15.28 |
| Total return (%) (r)(s)(t)(x) | (8.19)(n) | (4.06) | 43.08 | (6.59) | 5.63 | 12.29 |
| Ratios (%) (to average net assets) and Supplemental data: | | | | | | |
| Expenses before expense reductions (h) | 1.31(a) | 1.31 | 1.36 | 1.48 | 1.56 | 1.67 |
| Expenses after expense reductions (h) | 1.00(a) | 1.00 | 1.00 | 0.99 | 1.00 | 1.00 |
| Net investment income (loss) (l) | (0.57)(a) | 4.03 | 0.29 | 0.92 | 1.32 | 1.19 |
| Portfolio turnover | 4(n) | 19 | 24 | 11 | 20 | 18 |
| Net assets at end of period (000 omitted) | $2,288 | $2,426 | $2,585 | $2,126 | $2,179 | $1,789 |
See Notes to Financial Statements
Financial Highlights − continued
MFS LIFETIME 2055 FUND − continued
| | Six months
ended | Year ended |
| Class I | 10/31/22
(unaudited) | 4/30/22 | 4/30/21 | 4/30/20 | 4/30/19
| 4/30/18 |
| Net asset value, beginning of period | $18.33 | $20.45 | $14.49 | $15.94 | $15.46 | $14.00 |
| Income (loss) from investment operations | | | | | | |
| Net investment income (loss) (d)(l) | $0.04 | $1.00 | $0.25 | $0.32 | $0.35 | $0.30 |
| Net realized and unrealized gain (loss) | (1.45) | (1.45) | 6.14 | (1.14) | 0.61 | 1.58 |
| Total from investment operations | $(1.41) | $(0.45) | $6.39 | $(0.82) | $0.96 | $1.88 |
| Less distributions declared to shareholders | | | | | | |
| From net investment income | $— | $(1.07) | $(0.24) | $(0.30) | $(0.35) | $(0.34) |
| From net realized gain | — | (0.60) | (0.19) | (0.33) | (0.13) | (0.08) |
| Total distributions declared to shareholders | $— | $(1.67) | $(0.43) | $(0.63) | $(0.48) | $(0.42) |
| Net asset value, end of period (x) | $16.92 | $18.33 | $20.45 | $14.49 | $15.94 | $15.46 |
| Total return (%) (r)(s)(t)(x) | (7.69)(n) | (3.13) | 44.42 | (5.65) | 6.74 | 13.40 |
| Ratios (%) (to average net assets) and Supplemental data: | | | | | | |
| Expenses before expense reductions (h) | 0.31(a) | 0.31 | 0.35 | 0.48 | 0.56 | 0.67 |
| Expenses after expense reductions (h) | 0.00(a) | 0.00 | 0.00 | 0.00 | 0.00 | 0.00 |
| Net investment income (loss) (l) | 0.43(a) | 4.85 | 1.39 | 1.99 | 2.29 | 1.98 |
| Portfolio turnover | 4(n) | 19 | 24 | 11 | 20 | 18 |
| Net assets at end of period (000 omitted) | $533 | $512 | $434 | $98 | $156 | $114 |
| | Six months
ended | Year ended |
| Class R1 | 10/31/22
(unaudited) | 4/30/22 | 4/30/21 | 4/30/20 | 4/30/19 | 4/30/18 |
| Net asset value, beginning of period | $18.14 | $20.26 | $14.30 | $15.76 | $15.32 | $13.92 |
| Income (loss) from investment operations | | | | | | |
| Net investment income (loss) (d)(l) | $(0.05) | $0.81 | $(0.06) | $0.14 | $0.20 | $0.17 |
| Net realized and unrealized gain (loss) | (1.44) | (1.46) | 6.21 | (1.12) | 0.60 | 1.55 |
| Total from investment operations | $(1.49) | $(0.65) | $6.15 | $(0.98) | $0.80 | $1.72 |
| Less distributions declared to shareholders | | | | | | |
| From net investment income | $— | $(0.87) | $— | $(0.15) | $(0.23) | $(0.24) |
| From net realized gain | — | (0.60) | (0.19) | (0.33) | (0.13) | (0.08) |
| Total distributions declared to shareholders | $— | $(1.47) | $(0.19) | $(0.48) | $(0.36) | $(0.32) |
| Net asset value, end of period (x) | $16.65 | $18.14 | $20.26 | $14.30 | $15.76 | $15.32 |
| Total return (%) (r)(s)(t)(x) | (8.21)(n) | (4.07) | 43.16 | (6.60) | 5.65 | 12.31 |
| Ratios (%) (to average net assets) and Supplemental data: | | | | | | |
| Expenses before expense reductions (h) | 1.32(a) | 1.31 | 1.39 | 1.48 | 1.56 | 1.66 |
| Expenses after expense reductions (h) | 1.00(a) | 1.00 | 1.00 | 1.00 | 1.00 | 1.00 |
| Net investment income (loss) (l) | (0.57)(a) | 3.95 | (0.34) | 0.93 | 1.32 | 1.13 |
| Portfolio turnover | 4(n) | 19 | 24 | 11 | 20 | 18 |
| Net assets at end of period (000 omitted) | $761 | $701 | $663 | $1,597 | $1,523 | $854 |
See Notes to Financial Statements
Financial Highlights − continued
MFS LIFETIME 2055 FUND − continued
| | Six months
ended | Year ended |
| Class R2 | 10/31/22
(unaudited) | 4/30/22 | 4/30/21 | 4/30/20 | 4/30/19
| 4/30/18 |
| Net asset value, beginning of period | $18.29 | $20.35 | $14.39 | $15.84 | $15.36 | $13.94 |
| Income (loss) from investment operations | | | | | | |
| Net investment income (loss) (d)(l) | $(0.01) | $0.83 | $0.11 | $0.22 | $0.26 | $0.26 |
| Net realized and unrealized gain (loss) | (1.44) | (1.38) | 6.16 | (1.12) | 0.62 | 1.53 |
| Total from investment operations | $(1.45) | $(0.55) | $6.27 | $(0.90) | $0.88 | $1.79 |
| Less distributions declared to shareholders | | | | | | |
| From net investment income | $— | $(0.91) | $(0.12) | $(0.22) | $(0.27) | $(0.29) |
| From net realized gain | — | (0.60) | (0.19) | (0.33) | (0.13) | (0.08) |
| Total distributions declared to shareholders | $— | $(1.51) | $(0.31) | $(0.55) | $(0.40) | $(0.37) |
| Net asset value, end of period (x) | $16.84 | $18.29 | $20.35 | $14.39 | $15.84 | $15.36 |
| Total return (%) (r)(s)(t)(x) | (7.93)(n) | (3.56) | 43.78 | (6.12) | 6.19 | 12.82 |
| Ratios (%) (to average net assets) and Supplemental data: | | | | | | |
| Expenses before expense reductions (h) | 0.81(a) | 0.81 | 0.87 | 0.98 | 1.06 | 1.16 |
| Expenses after expense reductions (h) | 0.50(a) | 0.50 | 0.50 | 0.50 | 0.50 | 0.50 |
| Net investment income (loss) (l) | (0.06)(a) | 4.02 | 0.64 | 1.39 | 1.73 | 1.73 |
| Portfolio turnover | 4(n) | 19 | 24 | 11 | 20 | 18 |
| Net assets at end of period (000 omitted) | $8,171 | $8,981 | $17,589 | $17,485 | $18,695 | $15,534 |
| | Six months
ended | Year ended |
| Class R3 | 10/31/22
(unaudited) | 4/30/22 | 4/30/21 | 4/30/20 | 4/30/19 | 4/30/18 |
| Net asset value, beginning of period | $18.31 | $20.42 | $14.47 | $15.93 | $15.45 | $14.00 |
| Income (loss) from investment operations | | | | | | |
| Net investment income (loss) (d)(l) | $0.02 | $0.97 | $0.19 | $0.27 | $0.32 | $0.29 |
| Net realized and unrealized gain (loss) | (1.46) | (1.46) | 6.15 | (1.13) | 0.60 | 1.55 |
| Total from investment operations | $(1.44) | $(0.49) | $6.34 | $(0.86) | $0.92 | $1.84 |
| Less distributions declared to shareholders | | | | | | |
| From net investment income | $— | $(1.02) | $(0.20) | $(0.27) | $(0.31) | $(0.31) |
| From net realized gain | — | (0.60) | (0.19) | (0.33) | (0.13) | (0.08) |
| Total distributions declared to shareholders | $— | $(1.62) | $(0.39) | $(0.60) | $(0.44) | $(0.39) |
| Net asset value, end of period (x) | $16.87 | $18.31 | $20.42 | $14.47 | $15.93 | $15.45 |
| Total return (%) (r)(s)(t)(x) | (7.86)(n) | (3.33) | 44.10 | (5.88) | 6.46 | 13.14 |
| Ratios (%) (to average net assets) and Supplemental data: | | | | | | |
| Expenses before expense reductions (h) | 0.56(a) | 0.56 | 0.61 | 0.73 | 0.81 | 0.92 |
| Expenses after expense reductions (h) | 0.25(a) | 0.25 | 0.25 | 0.25 | 0.25 | 0.25 |
| Net investment income (loss) (l) | 0.18(a) | 4.69 | 1.09 | 1.73 | 2.07 | 1.89 |
| Portfolio turnover | 4(n) | 19 | 24 | 11 | 20 | 18 |
| Net assets at end of period (000 omitted) | $70,273 | $73,743 | $65,613 | $36,674 | $27,658 | $21,438 |
See Notes to Financial Statements
Financial Highlights − continued
MFS LIFETIME 2055 FUND − continued
| | Six months
ended | Year ended |
| Class R4 | 10/31/22
(unaudited) | 4/30/22 | 4/30/21 | 4/30/20 | 4/30/19
| 4/30/18 |
| Net asset value, beginning of period | $18.47 | $20.56 | $14.55 | $16.01 | $15.53 | $14.06 |
| Income (loss) from investment operations | | | | | | |
| Net investment income (loss) (d)(l) | $0.04 | $0.80 | $0.22 | $0.32 | $0.36 | $0.37 |
| Net realized and unrealized gain (loss) | (1.47) | (1.25) | 6.21 | (1.14) | 0.60 | 1.52 |
| Total from investment operations | $(1.43) | $(0.45) | $6.43 | $(0.82) | $0.96 | $1.89 |
| Less distributions declared to shareholders | | | | | | |
| From net investment income | $— | $(1.04) | $(0.23) | $(0.31) | $(0.35) | $(0.34) |
| From net realized gain | — | (0.60) | (0.19) | (0.33) | (0.13) | (0.08) |
| Total distributions declared to shareholders | $— | $(1.64) | $(0.42) | $(0.64) | $(0.48) | $(0.42) |
| Net asset value, end of period (x) | $17.04 | $18.47 | $20.56 | $14.55 | $16.01 | $15.53 |
| Total return (%) (r)(s)(t)(x) | (7.74)(n) | (3.09) | 44.49 | (5.67) | 6.71 | 13.42 |
| Ratios (%) (to average net assets) and Supplemental data: | | | | | | |
| Expenses before expense reductions (h) | 0.31(a) | 0.31 | 0.36 | 0.47 | 0.56 | 0.67 |
| Expenses after expense reductions (h) | 0.00(a) | 0.00 | 0.00 | 0.00 | 0.00 | 0.00 |
| Net investment income (loss) (l) | 0.43(a) | 3.86 | 1.27 | 2.04 | 2.31 | 2.43 |
| Portfolio turnover | 4(n) | 19 | 24 | 11 | 20 | 18 |
| Net assets at end of period (000 omitted) | $14,635 | $14,606 | $38,374 | $37,665 | $30,137 | $26,747 |
| | Six months
ended | Year ended |
| Class R6 | 10/31/22
(unaudited) | 4/30/22 | 4/30/21 | 4/30/20 | 4/30/19 | 4/30/18 |
| Net asset value, beginning of period | $18.46 | $20.58 | $14.56 | $16.01 | $15.53 | $14.06 |
| Income (loss) from investment operations | | | | | | |
| Net investment income (loss) (d)(l) | $0.05 | $1.11 | $0.28 | $0.34 | $0.37 | $0.49 |
| Net realized and unrealized gain (loss) | (1.46) | (1.53) | 6.18 | (1.13) | 0.61 | 1.42 |
| Total from investment operations | $(1.41) | $(0.42) | $6.46 | $(0.79) | $0.98 | $1.91 |
| Less distributions declared to shareholders | | | | | | |
| From net investment income | $— | $(1.10) | $(0.25) | $(0.33) | $(0.37) | $(0.36) |
| From net realized gain | — | (0.60) | (0.19) | (0.33) | (0.13) | (0.08) |
| Total distributions declared to shareholders | $— | $(1.70) | $(0.44) | $(0.66) | $(0.50) | $(0.44) |
| Net asset value, end of period (x) | $17.05 | $18.46 | $20.58 | $14.56 | $16.01 | $15.53 |
| Total return (%) (r)(s)(t)(x) | (7.64)(n) | (2.99) | 44.75 | (5.50) | 6.88 | 13.56 |
| Ratios (%) (to average net assets) and Supplemental data: | | | | | | |
| Expenses before expense reductions (h) | 0.16(a) | 0.15 | 0.21 | 0.33 | 0.42 | 0.52 |
| Expenses after expense reductions (h) | 0.00(a) | 0.00 | 0.00 | 0.00 | 0.00 | 0.00 |
| Net investment income (loss) (l) | 0.58(a) | 5.32 | 1.54 | 2.16 | 2.40 | 3.15 |
| Portfolio turnover | 4(n) | 19 | 24 | 11 | 20 | 18 |
| Net assets at end of period (000 omitted) | $109,772 | $87,462 | $60,705 | $21,065 | $16,579 | $7,695 |
See Notes to Financial Statements
Financial Highlights − continued
MFS LIFETIME 2055 FUND − continued
| (a) | Annualized. |
| (d) | Per share data is based on average shares outstanding. |
| (h) | In addition to the fees and expenses which the fund bears directly, the fund indirectly bears a pro rata share of the fees and expenses of the underlying affiliated funds in which the fund invests. Accordingly, the expense ratio for the fund reflects only those fees and expenses borne directly by the fund. Because the underlying affiliated funds have varied expense and fee levels and the fund may own different proportions of the underlying affiliated funds at different times, the amount of fees and expenses incurred indirectly by the fund will vary. |
| (l) | Recognition of net investment income by the fund may be affected by the timing of the declaration of dividends by the underlying affiliated funds in which the fund invests and for interim net investment income ratios, the actual annual net investment income ratio may differ. The ratios and per share amounts do not include net investment income of the underlying affiliated funds in which the fund invests. |
| (n) | Not annualized. |
| (r) | Certain expenses have been reduced without which performance would have been lower. |
| (s) | From time to time the fund may receive proceeds from litigation settlements, without which performance would be lower. |
| (t) | Total returns do not include any applicable sales charges. |
| (x) | The net asset values and total returns have been calculated on net assets which include adjustments made in accordance with U.S. generally accepted accounting principles required at period end for financial reporting purposes. |
See Notes to Financial Statements
Financial Highlights − continued
MFS LIFETIME 2060 FUND
The financial highlights table is intended to help you understand the fund's financial performance for the semiannual period and the past 5 fiscal years. Certain information reflects financial results for a single fund share. The total returns in the table represent the rate that an investor would have earned (or lost) on an investment in the fund share class (assuming reinvestment of all distributions) held for the entire period.
| | Six months
ended | Year ended |
| Class A | 10/31/22
(unaudited) | 4/30/22 | 4/30/21 | 4/30/20 | 4/30/19
| 4/30/18 |
| Net asset value, beginning of period | $14.54 | $15.99 | $11.25 | $12.26 | $11.85 | $10.73 |
| Income (loss) from investment operations | | | | | | |
| Net investment income (loss) (d)(l) | $0.01 | $0.78 | $0.15 | $0.22 | $0.41 | $0.25 |
| Net realized and unrealized gain (loss) | (1.15) | (1.22) | 4.82 | (0.89) | 0.30 | 1.16 |
| Total from investment operations | $(1.14) | $(0.44) | $4.97 | $(0.67) | $0.71 | $1.41 |
| Less distributions declared to shareholders | | | | | | |
| From net investment income | $— | $(0.79) | $(0.14) | $(0.21) | $(0.25) | $(0.23) |
| From net realized gain | — | (0.22) | (0.09) | (0.13) | (0.05) | (0.06) |
| Total distributions declared to shareholders | $— | $(1.01) | $(0.23) | $(0.34) | $(0.30) | $(0.29) |
| Net asset value, end of period (x) | $13.40 | $14.54 | $15.99 | $11.25 | $12.26 | $11.85 |
| Total return (%) (r)(s)(t)(x) | (7.84)(n) | (3.51) | 44.39 | (5.83) | 6.47 | 13.19 |
| Ratios (%) (to average net assets) and Supplemental data: | | | | | | |
| Expenses before expense reductions (h) | 0.73(a) | 0.79 | 1.08 | 1.84 | 4.01 | 9.75 |
| Expenses after expense reductions (h) | 0.24(a) | 0.25 | 0.24 | 0.22 | 0.20 | 0.16 |
| Net investment income (loss) (l) | 0.19(a) | 4.80 | 1.06 | 1.81 | 3.49 | 2.17 |
| Portfolio turnover | 3(n) | 18 | 21 | 9 | 34 | 37 |
| Net assets at end of period (000 omitted) | $8,907 | $8,023 | $5,584 | $2,879 | $1,362 | $306 |
See Notes to Financial Statements
Financial Highlights − continued
MFS LIFETIME 2060 FUND − continued
| | Six months
ended | Year ended |
| Class B | 10/31/22
(unaudited) | 4/30/22 | 4/30/21 | 4/30/20 | 4/30/19
| 4/30/18 |
| Net asset value, beginning of period | $14.52 | $15.95 | $11.24 | $12.25 | $11.82 | $10.70 |
| Income (loss) from investment operations | | | | | | |
| Net investment income (loss) (d)(l) | $(0.04) | $0.65 | $0.04 | $0.12 | $0.17 | $0.14 |
| Net realized and unrealized gain (loss) | (1.15) | (1.21) | 4.80 | (0.89) | 0.48 | 1.19 |
| Total from investment operations | $(1.19) | $(0.56) | $4.84 | $(0.77) | $0.65 | $1.33 |
| Less distributions declared to shareholders | | | | | | |
| From net investment income | $— | $(0.65) | $(0.04) | $(0.11) | $(0.17) | $(0.15) |
| From net realized gain | — | (0.22) | (0.09) | (0.13) | (0.05) | (0.06) |
| Total distributions declared to shareholders | $— | $(0.87) | $(0.13) | $(0.24) | $(0.22) | $(0.21) |
| Net asset value, end of period (x) | $13.33 | $14.52 | $15.95 | $11.24 | $12.25 | $11.82 |
| Total return (%) (r)(s)(t)(x) | (8.20)(n) | (4.15) | 43.16 | (6.53) | 5.78 | 12.39 |
| Ratios (%) (to average net assets) and Supplemental data: | | | | | | |
| Expenses before expense reductions (h) | 1.48(a) | 1.54 | 1.83 | 2.65 | 4.98 | 11.79 |
| Expenses after expense reductions (h) | 0.99(a) | 1.00 | 0.99 | 0.97 | 0.95 | 0.90 |
| Net investment income (loss) (l) | (0.57)(a) | 4.02 | 0.33 | 0.99 | 1.44 | 1.26 |
| Portfolio turnover | 3(n) | 18 | 21 | 9 | 34 | 37 |
| Net assets at end of period (000 omitted) | $160 | $179 | $191 | $137 | $149 | $73 |
| | Six months
ended | Year ended |
| Class C | 10/31/22
(unaudited) | 4/30/22 | 4/30/21 | 4/30/20 | 4/30/19 | 4/30/18 |
| Net asset value, beginning of period | $14.41 | $15.86 | $11.18 | $12.21 | $11.81 | $10.70 |
| Income (loss) from investment operations | | | | | | |
| Net investment income (loss) (d)(l) | $(0.04) | $0.67 | $0.05 | $0.13 | $0.20 | $0.14 |
| Net realized and unrealized gain (loss) | (1.14) | (1.23) | 4.78 | (0.89) | 0.44 | 1.19 |
| Total from investment operations | $(1.18) | $(0.56) | $4.83 | $(0.76) | $0.64 | $1.33 |
| Less distributions declared to shareholders | | | | | | |
| From net investment income | $— | $(0.67) | $(0.06) | $(0.14) | $(0.19) | $(0.16) |
| From net realized gain | — | (0.22) | (0.09) | (0.13) | (0.05) | (0.06) |
| Total distributions declared to shareholders | $— | $(0.89) | $(0.15) | $(0.27) | $(0.24) | $(0.22) |
| Net asset value, end of period (x) | $13.23 | $14.41 | $15.86 | $11.18 | $12.21 | $11.81 |
| Total return (%) (r)(s)(t)(x) | (8.19)(n) | (4.20) | 43.28 | (6.53) | 5.75 | 12.38 |
| Ratios (%) (to average net assets) and Supplemental data: | | | | | | |
| Expenses before expense reductions (h) | 1.48(a) | 1.54 | 1.83 | 2.61 | 4.88 | 11.46 |
| Expenses after expense reductions (h) | 0.99(a) | 1.00 | 0.99 | 0.96 | 0.95 | 0.90 |
| Net investment income (loss) (l) | (0.56)(a) | 4.14 | 0.34 | 1.11 | 1.68 | 1.24 |
| Portfolio turnover | 3(n) | 18 | 21 | 9 | 34 | 37 |
| Net assets at end of period (000 omitted) | $868 | $891 | $761 | $432 | $283 | $107 |
See Notes to Financial Statements
Financial Highlights − continued
MFS LIFETIME 2060 FUND − continued
| | Six months
ended | Year ended |
| Class I | 10/31/22
(unaudited) | 4/30/22 | 4/30/21 | 4/30/20 | 4/30/19
| 4/30/18 |
| Net asset value, beginning of period | $14.65 | $16.09 | $11.32 | $12.32 | $11.88 | $10.74 |
| Income (loss) from investment operations | | | | | | |
| Net investment income (loss) (d)(l) | $0.03 | $0.85 | $0.19 | $0.23 | $0.28 | $0.26 |
| Net realized and unrealized gain (loss) | (1.16) | (1.25) | 4.84 | (0.87) | 0.47 | 1.19 |
| Total from investment operations | $(1.13) | $(0.40) | $5.03 | $(0.64) | $0.75 | $1.45 |
| Less distributions declared to shareholders | | | | | | |
| From net investment income | $— | $(0.82) | $(0.17) | $(0.23) | $(0.26) | $(0.25) |
| From net realized gain | — | (0.22) | (0.09) | (0.13) | (0.05) | (0.06) |
| Total distributions declared to shareholders | $— | $(1.04) | $(0.26) | $(0.36) | $(0.31) | $(0.31) |
| Net asset value, end of period (x) | $13.52 | $14.65 | $16.09 | $11.32 | $12.32 | $11.88 |
| Total return (%) (r)(s)(t)(x) | (7.71)(n) | (3.25) | 44.66 | (5.58) | 6.76 | 13.50 |
| Ratios (%) (to average net assets) and Supplemental data: | | | | | | |
| Expenses before expense reductions (h) | 0.48(a) | 0.54 | 0.82 | 1.60 | 4.04 | 11.01 |
| Expenses after expense reductions (h) | 0.00(a) | 0.00 | 0.00 | 0.00 | 0.00 | 0.00 |
| Net investment income (loss) (l) | 0.44(a) | 5.20 | 1.33 | 1.86 | 2.37 | 2.23 |
| Portfolio turnover | 3(n) | 18 | 21 | 9 | 34 | 37 |
| Net assets at end of period (000 omitted) | $302 | $295 | $232 | $103 | $66 | $62 |
| | Six months
ended | Year ended |
| Class R1 | 10/31/22
(unaudited) | 4/30/22 | 4/30/21 | 4/30/20 | 4/30/19 | 4/30/18 |
| Net asset value, beginning of period | $14.57 | $16.01 | $11.28 | $12.28 | $11.83 | $10.70 |
| Income (loss) from investment operations | | | | | | |
| Net investment income (loss) (d)(l) | $(0.02) | $0.65 | $0.04 | $0.12 | $0.16 | $0.14 |
| Net realized and unrealized gain (loss) | (1.16) | (1.22) | 4.82 | (0.88) | 0.48 | 1.19 |
| Total from investment operations | $(1.18) | $(0.57) | $4.86 | $(0.76) | $0.64 | $1.33 |
| Less distributions declared to shareholders | | | | | | |
| From net investment income | $— | $(0.65) | $(0.04) | $(0.11) | $(0.14) | $(0.14) |
| From net realized gain | — | (0.22) | (0.09) | (0.13) | (0.05) | (0.06) |
| Total distributions declared to shareholders | $— | $(0.87) | $(0.13) | $(0.24) | $(0.19) | $(0.20) |
| Net asset value, end of period (x) | $13.39 | $14.57 | $16.01 | $11.28 | $12.28 | $11.83 |
| Total return (%) (r)(s)(t)(x) | (8.10)(n) | (4.20) | 43.20 | (6.46) | 5.69 | 12.41 |
| Ratios (%) (to average net assets) and Supplemental data: | | | | | | |
| Expenses before expense reductions (h) | 1.24(a) | 1.54 | 1.83 | 2.65 | 5.04 | 12.02 |
| Expenses after expense reductions (h) | 0.75(a) | 1.00 | 0.99 | 0.97 | 0.95 | 0.90 |
| Net investment income (loss) (l) | (0.32)(a) | 3.99 | 0.32 | 0.99 | 1.36 | 1.23 |
| Portfolio turnover | 3(n) | 18 | 21 | 9 | 34 | 37 |
| Net assets at end of period (000 omitted) | $76 | $82 | $86 | $60 | $64 | $61 |
See Notes to Financial Statements
Financial Highlights − continued
MFS LIFETIME 2060 FUND − continued
| | Six months
ended | Year ended |
| Class R2 | 10/31/22
(unaudited) | 4/30/22 | 4/30/21 | 4/30/20 | 4/30/19
| 4/30/18 |
| Net asset value, beginning of period | $14.52 | $15.97 | $11.25 | $12.25 | $11.84 | $10.72 |
| Income (loss) from investment operations | | | | | | |
| Net investment income (loss) (d)(l) | $(0.00)(w) | $0.75 | $0.13 | $0.17 | $0.27 | $0.18 |
| Net realized and unrealized gain (loss) | (1.16) | (1.23) | 4.80 | (0.87) | 0.42 | 1.21 |
| Total from investment operations | $(1.16) | $(0.48) | $4.93 | $(0.70) | $0.69 | $1.39 |
| Less distributions declared to shareholders | | | | | | |
| From net investment income | $— | $(0.75) | $(0.12) | $(0.17) | $(0.23) | $(0.21) |
| From net realized gain | — | (0.22) | (0.09) | (0.13) | (0.05) | (0.06) |
| Total distributions declared to shareholders | $— | $(0.97) | $(0.21) | $(0.30) | $(0.28) | $(0.27) |
| Net asset value, end of period (x) | $13.36 | $14.52 | $15.97 | $11.25 | $12.25 | $11.84 |
| Total return (%) (r)(s)(t)(x) | (7.99)(n) | (3.73) | 43.97 | (6.03) | 6.29 | 12.92 |
| Ratios (%) (to average net assets) and Supplemental data: | | | | | | |
| Expenses before expense reductions (h) | 0.98(a) | 1.04 | 1.33 | 2.13 | 4.31 | 10.36 |
| Expenses after expense reductions (h) | 0.49(a) | 0.50 | 0.49 | 0.47 | 0.45 | 0.41 |
| Net investment income (loss) (l) | (0.04)(a) | 4.62 | 0.99 | 1.39 | 2.34 | 1.56 |
| Portfolio turnover | 3(n) | 18 | 21 | 9 | 34 | 37 |
| Net assets at end of period (000 omitted) | $1,629 | $2,107 | $1,580 | $980 | $797 | $151 |
| | Six months
ended | Year ended |
| Class R3 | 10/31/22
(unaudited) | 4/30/22 | 4/30/21 | 4/30/20 | 4/30/19 | 4/30/18 |
| Net asset value, beginning of period | $14.56 | $16.00 | $11.27 | $12.28 | $11.85 | $10.73 |
| Income (loss) from investment operations | | | | | | |
| Net investment income (loss) (d)(l) | $0.01 | $0.77 | $0.16 | $0.24 | $0.24 | $0.25 |
| Net realized and unrealized gain (loss) | (1.15) | (1.21) | 4.81 | (0.90) | 0.48 | 1.17 |
| Total from investment operations | $(1.14) | $(0.44) | $4.97 | $(0.66) | $0.72 | $1.42 |
| Less distributions declared to shareholders | | | | | | |
| From net investment income | $— | $(0.78) | $(0.15) | $(0.22) | $(0.24) | $(0.24) |
| From net realized gain | — | (0.22) | (0.09) | (0.13) | (0.05) | (0.06) |
| Total distributions declared to shareholders | $— | $(1.00) | $(0.24) | $(0.35) | $(0.29) | $(0.30) |
| Net asset value, end of period (x) | $13.42 | $14.56 | $16.00 | $11.27 | $12.28 | $11.85 |
| Total return (%) (r)(s)(t)(x) | (7.83)(n) | (3.46) | 44.28 | (5.78) | 6.48 | 13.21 |
| Ratios (%) (to average net assets) and Supplemental data: | | | | | | |
| Expenses before expense reductions (h) | 0.73(a) | 0.79 | 1.07 | 1.80 | 4.15 | 9.15 |
| Expenses after expense reductions (h) | 0.24(a) | 0.25 | 0.24 | 0.22 | 0.20 | 0.16 |
| Net investment income (loss) (l) | 0.20(a) | 4.74 | 1.12 | 1.99 | 2.04 | 2.11 |
| Portfolio turnover | 3(n) | 18 | 21 | 9 | 34 | 37 |
| Net assets at end of period (000 omitted) | $31,312 | $28,505 | $17,477 | $7,252 | $2,505 | $1,203 |
See Notes to Financial Statements
Financial Highlights − continued
MFS LIFETIME 2060 FUND − continued
| | Six months
ended | Year ended |
| Class R4 | 10/31/22
(unaudited) | 4/30/22 | 4/30/21 | 4/30/20 | 4/30/19
| 4/30/18 |
| Net asset value, beginning of period | $14.64 | $16.07 | $11.31 | $12.31 | $11.88 | $10.74 |
| Income (loss) from investment operations | | | | | | |
| Net investment income (loss) (d)(l) | $0.03 | $0.57 | $0.18 | $0.28 | $0.31 | $0.30 |
| Net realized and unrealized gain (loss) | (1.16) | (0.98) | 4.84 | (0.92) | 0.43 | 1.15 |
| Total from investment operations | $(1.13) | $(0.41) | $5.02 | $(0.64) | $0.74 | $1.45 |
| Less distributions declared to shareholders | | | | | | |
| From net investment income | $— | $(0.80) | $(0.17) | $(0.23) | $(0.26) | $(0.25) |
| From net realized gain | — | (0.22) | (0.09) | (0.13) | (0.05) | (0.06) |
| Total distributions declared to shareholders | $— | $(1.02) | $(0.26) | $(0.36) | $(0.31) | $(0.31) |
| Net asset value, end of period (x) | $13.51 | $14.64 | $16.07 | $11.31 | $12.31 | $11.88 |
| Total return (%) (r)(s)(t)(x) | (7.72)(n) | (3.31) | 44.61 | (5.55) | 6.72 | 13.51 |
| Ratios (%) (to average net assets) and Supplemental data: | | | | | | |
| Expenses before expense reductions (h) | 0.48(a) | 0.55 | 0.83 | 1.55 | 3.79 | 8.82 |
| Expenses after expense reductions (h) | 0.00(a) | 0.00 | 0.00 | 0.00 | 0.00 | 0.00 |
| Net investment income (loss) (l) | 0.44(a) | 3.51 | 1.33 | 2.29 | 2.63 | 2.54 |
| Portfolio turnover | 3(n) | 18 | 21 | 9 | 34 | 37 |
| Net assets at end of period (000 omitted) | $3,563 | $3,227 | $8,871 | $4,568 | $1,524 | $356 |
| | Six months
ended | Year ended |
| Class R6 | 10/31/22
(unaudited) | 4/30/22 | 4/30/21 | 4/30/20 | 4/30/19 | 4/30/18 |
| Net asset value, beginning of period | $14.67 | $16.11 | $11.33 | $12.33 | $11.88 | $10.74 |
| Income (loss) from investment operations | | | | | | |
| Net investment income (loss) (d)(l) | $0.04 | $0.88 | $0.21 | $0.27 | $0.29 | $0.25 |
| Net realized and unrealized gain (loss) | (1.16) | (1.26) | 4.85 | (0.90) | 0.48 | 1.20 |
| Total from investment operations | $(1.12) | $(0.38) | $5.06 | $(0.63) | $0.77 | $1.45 |
| Less distributions declared to shareholders | | | | | | |
| From net investment income | $— | $(0.84) | $(0.19) | $(0.24) | $(0.27) | $(0.25) |
| From net realized gain | — | (0.22) | (0.09) | (0.13) | (0.05) | (0.06) |
| Total distributions declared to shareholders | $— | $(1.06) | $(0.28) | $(0.37) | $(0.32) | $(0.31) |
| Net asset value, end of period (x) | $13.55 | $14.67 | $16.11 | $11.33 | $12.33 | $11.88 |
| Total return (%) (r)(s)(t)(x) | (7.63)(n) | (3.15) | 44.87 | (5.50) | 6.95 | 13.51 |
| Ratios (%) (to average net assets) and Supplemental data: | | | | | | |
| Expenses before expense reductions (h) | 0.35(a) | 0.40 | 0.69 | 1.48 | 3.80 | 10.10 |
| Expenses after expense reductions (h) | 0.00(a) | 0.00 | 0.00 | 0.00 | 0.00 | 0.00 |
| Net investment income (loss) (l) | 0.57(a) | 5.38 | 1.49 | 2.21 | 2.43 | 2.18 |
| Portfolio turnover | 3(n) | 18 | 21 | 9 | 34 | 37 |
| Net assets at end of period (000 omitted) | $49,571 | $35,897 | $25,148 | $7,641 | $3,309 | $1,268 |
See Notes to Financial Statements
Financial Highlights − continued
MFS LIFETIME 2060 FUND − continued
| (a) | Annualized. |
| (d) | Per share data is based on average shares outstanding. |
| (h) | In addition to the fees and expenses which the fund bears directly, the fund indirectly bears a pro rata share of the fees and expenses of the underlying affiliated funds in which the fund invests. Accordingly, the expense ratio for the fund reflects only those fees and expenses borne directly by the fund. Because the underlying affiliated funds have varied expense and fee levels and the fund may own different proportions of the underlying affiliated funds at different times, the amount of fees and expenses incurred indirectly by the fund will vary. |
| (l) | Recognition of net investment income by the fund may be affected by the timing of the declaration of dividends by the underlying affiliated funds in which the fund invests and for interim net investment income ratios, the actual annual net investment income ratio may differ. The ratios and per share amounts do not include net investment income of the underlying affiliated funds in which the fund invests. |
| (n) | Not annualized. |
| (r) | Certain expenses have been reduced without which performance would have been lower. |
| (s) | From time to time the fund may receive proceeds from litigation settlements, without which performance would be lower. |
| (t) | Total returns do not include any applicable sales charges. |
| (w) | Per share amount was less than $0.01. |
| (x) | The net asset values and total returns have been calculated on net assets which include adjustments made in accordance with U.S. generally accepted accounting principles required at period end for financial reporting purposes. |
See Notes to Financial Statements
Financial Highlights − continued
MFS LIFETIME 2065 FUND
The financial highlights table is intended to help you understand the fund's financial performance for the semiannual period and the past 5 fiscal years (or life of a particular share class, if shorter). Certain information reflects financial results for a single fund share. The total returns in the table represent the rate that an investor would have earned (or lost) on an investment in the fund share class (assuming reinvestment of all distributions) held for the entire period.
| | Six months
ended | Year ended |
| Class A | 10/31/22
(unaudited) | 4/30/22(c) |
| Net asset value, beginning of period | $8.68 | $10.00 |
| Income (loss) from investment operations | | |
| Net investment income (loss) (d)(l) | $0.01 | $0.21 |
| Net realized and unrealized gain (loss) | (0.69) | (1.12) |
| Total from investment operations | $(0.68) | $(0.91) |
| Less distributions declared to shareholders | | |
| From net investment income | $— | $(0.41) |
| Net asset value, end of period (x) | $8.00 | $8.68 |
| Total return (%) (r)(s)(t)(x) | (7.83)(n) | (9.56)(n) |
| Ratios (%) (to average net assets) and Supplemental data: | | |
| Expenses before expense reductions (h) | 19.19(a) | 11.82(a) |
| Expenses after expense reductions (h) | 0.12(a) | 0.12(a) |
| Net investment income (loss) (l) | 0.34(a) | 3.44(a) |
| Portfolio turnover | 15(n) | 4(n) |
| Net assets at end of period (000 omitted) | $311 | $240 |
| | Six months
ended | Year ended |
| Class C | 10/31/22
(unaudited) | 4/30/22(c) |
| Net asset value, beginning of period | $8.67 | $10.00 |
| Income (loss) from investment operations | | |
| Net investment income (loss) (d)(l) | $(0.02) | $0.40 |
| Net realized and unrealized gain (loss) | (0.69) | (1.35) |
| Total from investment operations | $(0.71) | $(0.95) |
| Less distributions declared to shareholders | | |
| From net investment income | $— | $(0.38) |
| Net asset value, end of period (x) | $7.96 | $8.67 |
| Total return (%) (r)(s)(t)(x) | (8.19)(n) | (9.93)(n) |
| Ratios (%) (to average net assets) and Supplemental data: | | |
| Expenses before expense reductions (h) | 20.23(a) | 13.66(a) |
| Expenses after expense reductions (h) | 0.87(a) | 0.87(a) |
| Net investment income (loss) (l) | (0.43)(a) | 6.35(a) |
| Portfolio turnover | 15(n) | 4(n) |
| Net assets at end of period (000 omitted) | $58 | $52 |
See Notes to Financial Statements
Financial Highlights − continued
MFS LIFETIME 2065 FUND − continued
| | Six months
ended | Year ended |
| Class I | 10/31/22
(unaudited) | 4/30/22(c) |
| Net asset value, beginning of period | $8.70 | $10.00 |
| Income (loss) from investment operations | | |
| Net investment income (loss) (d)(l) | $0.02 | $0.48 |
| Net realized and unrealized gain (loss) | (0.70) | (1.37) |
| Total from investment operations | $(0.68) | $(0.89) |
| Less distributions declared to shareholders | | |
| From net investment income | $— | $(0.41) |
| Net asset value, end of period (x) | $8.02 | $8.70 |
| Total return (%) (r)(s)(t)(x) | (7.82)(n) | (9.32)(n) |
| Ratios (%) (to average net assets) and Supplemental data: | | |
| Expenses before expense reductions (h) | 19.20(a) | 12.75(a) |
| Expenses after expense reductions (h) | 0.00(a) | 0.00(a) |
| Net investment income (loss) (l) | 0.58(a) | 7.56(a) |
| Portfolio turnover | 15(n) | 4(n) |
| Net assets at end of period (000 omitted) | $51 | $46 |
| | Six months
ended | Year ended |
| Class R1 | 10/31/22
(unaudited) | 4/30/22(c) |
| Net asset value, beginning of period | $8.67 | $10.00 |
| Income (loss) from investment operations | | |
| Net investment income (loss) (d)(l) | $(0.02) | $0.42 |
| Net realized and unrealized gain (loss) | (0.69) | (1.37) |
| Total from investment operations | $(0.71) | $(0.95) |
| Less distributions declared to shareholders | | |
| From net investment income | $— | $(0.38) |
| Net asset value, end of period (x) | $7.96 | $8.67 |
| Total return (%) (r)(s)(t)(x) | (8.19)(n) | (9.93)(n) |
| Ratios (%) (to average net assets) and Supplemental data: | | |
| Expenses before expense reductions (h) | 20.34(a) | 13.76(a) |
| Expenses after expense reductions (h) | 0.87(a) | 0.87(a) |
| Net investment income (loss) (l) | (0.40)(a) | 6.58(a) |
| Portfolio turnover | 15(n) | 4(n) |
| Net assets at end of period (000 omitted) | $49 | $45 |
See Notes to Financial Statements
Financial Highlights − continued
MFS LIFETIME 2065 FUND − continued
| | Six months
ended | Year ended |
| Class R2 | 10/31/22
(unaudited) | 4/30/22(c) |
| Net asset value, beginning of period | $8.68 | $10.00 |
| Income (loss) from investment operations | | |
| Net investment income (loss) (d)(l) | $0.00(w) | $0.44 |
| Net realized and unrealized gain (loss) | (0.69) | (1.36) |
| Total from investment operations | $(0.69) | $(0.92) |
| Less distributions declared to shareholders | | |
| From net investment income | $— | $(0.40) |
| Net asset value, end of period (x) | $7.99 | $8.68 |
| Total return (%) (r)(s)(t)(x) | (7.95)(n) | (9.67)(n) |
| Ratios (%) (to average net assets) and Supplemental data: | | |
| Expenses before expense reductions (h) | 19.47(a) | 13.14(a) |
| Expenses after expense reductions (h) | 0.37(a) | 0.37(a) |
| Net investment income (loss) (l) | 0.08(a) | 7.00(a) |
| Portfolio turnover | 15(n) | 4(n) |
| Net assets at end of period (000 omitted) | $71 | $60 |
| | Six months
ended | Year ended |
| Class R3 | 10/31/22
(unaudited) | 4/30/22(c) |
| Net asset value, beginning of period | $8.69 | $10.00 |
| Income (loss) from investment operations | | |
| Net investment income (loss) (d)(l) | $0.02 | $0.47 |
| Net realized and unrealized gain (loss) | (0.70) | (1.37) |
| Total from investment operations | $(0.68) | $(0.90) |
| Less distributions declared to shareholders | | |
| From net investment income | $— | $(0.41) |
| Net asset value, end of period (x) | $8.01 | $8.69 |
| Total return (%) (r)(s)(t)(x) | (7.83)(n) | (9.50)(n) |
| Ratios (%) (to average net assets) and Supplemental data: | | |
| Expenses before expense reductions (h) | 19.51(a) | 13.01(a) |
| Expenses after expense reductions (h) | 0.12(a) | 0.12(a) |
| Net investment income (loss) (l) | 0.43(a) | 7.33(a) |
| Portfolio turnover | 15(n) | 4(n) |
| Net assets at end of period (000 omitted) | $284 | $45 |
See Notes to Financial Statements
Financial Highlights − continued
MFS LIFETIME 2065 FUND − continued
| | Six months
ended | Year ended |
| Class R4 | 10/31/22
(unaudited) | 4/30/22(c) |
| Net asset value, beginning of period | $8.70 | $10.00 |
| Income (loss) from investment operations | | |
| Net investment income (loss) (d)(l) | $0.02 | $0.48 |
| Net realized and unrealized gain (loss) | (0.70) | (1.37) |
| Total from investment operations | $(0.68) | $(0.89) |
| Less distributions declared to shareholders | | |
| From net investment income | $— | $(0.41) |
| Net asset value, end of period (x) | $8.02 | $8.70 |
| Total return (%) (r)(s)(t)(x) | (7.82)(n) | (9.32)(n) |
| Ratios (%) (to average net assets) and Supplemental data: | | |
| Expenses before expense reductions (h) | 19.26(a) | 12.76(a) |
| Expenses after expense reductions (h) | 0.00(a) | 0.00(a) |
| Net investment income (loss) (l) | 0.58(a) | 7.58(a) |
| Portfolio turnover | 15(n) | 4(n) |
| Net assets at end of period (000 omitted) | $49 | $45 |
| | Six months
ended | Year ended |
| Class R6 | 10/31/22
(unaudited) | 4/30/22(c) |
| Net asset value, beginning of period | $8.69 | $10.00 |
| Income (loss) from investment operations | | |
| Net investment income (loss) (d)(l) | $0.02 | $0.43 |
| Net realized and unrealized gain (loss) | (0.69) | (1.32) |
| Total from investment operations | $(0.67) | $(0.89) |
| Less distributions declared to shareholders | | |
| From net investment income | $— | $(0.42) |
| Net asset value, end of period (x) | $8.02 | $8.69 |
| Total return (%) (r)(s)(t)(x) | (7.71)(n) | (9.42)(n) |
| Ratios (%) (to average net assets) and Supplemental data: | | |
| Expenses before expense reductions (h) | 18.85(a) | 12.42(a) |
| Expenses after expense reductions (h) | 0.00(a) | 0.00(a) |
| Net investment income (loss) (l) | 0.59(a) | 6.79(a) |
| Portfolio turnover | 15(n) | 4(n) |
| Net assets at end of period (000 omitted) | $1,081 | $664 |
See Notes to Financial Statements
Financial Highlights − continued
MFS LIFETIME 2065 FUND − continued
| (a) | Annualized. |
| (c) | For the period from the commencement of the fund’s investment operations, September 1, 2021, through the stated period end. |
| (d) | Per share data is based on average shares outstanding. |
| (h) | In addition to the fees and expenses which the fund bears directly, the fund indirectly bears a pro rata share of the fees and expenses of the underlying affiliated funds in which the fund invests. Accordingly, the expense ratio for the fund reflects only those fees and expenses borne directly by the fund. Because the underlying affiliated funds have varied expense and fee levels and the fund may own different proportions of the underlying affiliated funds at different times, the amount of fees and expenses incurred indirectly by the fund will vary. |
| (l) | Recognition of net investment income by the fund may be affected by the timing of the declaration of dividends by the underlying affiliated funds in which the fund invests and for interim net investment income ratios, the actual annual net investment income ratio may differ. The ratios and per share amounts do not include net investment income of the underlying affiliated funds in which the fund invests. |
| (n) | Not annualized. |
| (r) | Certain expenses have been reduced without which performance would have been lower. |
| (s) | From time to time the fund may receive proceeds from litigation settlements, without which performance would be lower. |
| (t) | Total returns do not include any applicable sales charges. |
| (w) | Per share amount was less than $0.01. |
| (x) | The net asset values and total returns have been calculated on net assets which include adjustments made in accordance with U.S. generally accepted accounting principles required at period end for financial reporting purposes. |
See Notes to Financial Statements
Notes to Financial Statements
(unaudited)
(1) Business and Organization
MFS Lifetime Income Fund, MFS Lifetime 2025 Fund, MFS Lifetime 2030 Fund, MFS Lifetime 2035 Fund, MFS Lifetime 2040 Fund, MFS Lifetime 2045 Fund, MFS Lifetime 2050 Fund, MFS Lifetime 2055 Fund, MFS Lifetime 2060 Fund, and MFS Lifetime 2065 Fund (the funds) are each a diversified series of MFS Series Trust XII (the trust). The trust is organized as a Massachusetts business trust and is registered under the Investment Company Act of 1940, as amended, as an open-end management investment company.
Each fund is an investment company and accordingly follows the investment company accounting and reporting guidance of the Financial Accounting Standards Board (FASB) Accounting Standards Codification Topic 946 Financial Services - Investment Companies.
(2) Significant Accounting Policies
General — The preparation of financial statements in conformity with U.S. generally accepted accounting principles requires management to make estimates and assumptions that affect the reported amounts of assets and liabilities, and disclosure of contingent assets and liabilities at the date of the financial statements and the reported amounts of increases and decreases in net assets from operations during the reporting period. Actual results could differ from those estimates. In the preparation of these financial statements, management has evaluated subsequent events occurring after the date of each fund’s Statement of Assets and Liabilities through the date that the financial statements were issued.
Each fund is a “fund of funds”, which invests the majority of its assets in other MFS mutual funds (hereafter referred to as “underlying affiliated funds” or “underlying funds”), which may have different fiscal year ends than the funds. The underlying funds, in turn, may engage in a number of investment techniques and practices, which involve certain risks. Certain underlying funds invest their portfolio in high-yield securities rated below investment grade. Investments in below investment grade quality securities can involve a substantially greater risk of default or can already be in default, and their values can decline significantly. Below investment grade quality securities tend to be more sensitive to adverse news about the issuer, or the market or economy in general, than higher quality debt instruments. Certain underlying funds invest a significant portion of their assets in asset-backed and/or mortgage-backed securities. For these securities, the value of the debt instrument also depends on the credit quality and adequacy of the underlying assets or collateral as well as whether there is a security interest in the underlying assets or collateral. Enforcing rights, if any, against the underlying assets or collateral may be difficult. U.S. Government securities not supported as to the payment of principal or interest by the U.S. Treasury, such as those issued by Fannie Mae, Freddie Mac, and the Federal Home Loan Banks, are subject to greater credit risk than are U.S. Government securities supported by the U.S. Treasury, such as those issued by Ginnie Mae. Certain underlying funds invest in foreign securities, including securities of emerging market issuers. Investments in foreign securities are vulnerable to the effects of changes in the relative values of the local currency and the U.S. dollar and to the effects of changes in each country’s market, economic, industrial, political, regulatory, geopolitical, environmental, public health, and other conditions. Investments in emerging markets can involve additional and greater risks than the risks associated with investments in developed foreign markets. Emerging markets can have less developed markets, greater custody and operational risk, less developed legal, regulatory, accounting, and auditing systems, greater government involvement in the economy, greater risk of new or inconsistent government treatment of or restrictions on issuers and instruments, and greater political, social, and economic instability than developed markets.
The accounting policies of the underlying funds in which each fund invests are outlined in the underlying funds’ shareholder reports, which are available without charge by calling 1-800-225-2606, at mfs.com and on the Securities and Exchange Commission (SEC) web site at http://www.sec.gov. The underlying funds' shareholder reports are not covered by this report.
Investment Valuations — Open-end investment companies (underlying funds) are generally valued at their net asset value per share. The investments of underlying funds managed by the adviser are valued as described below. For purposes of this policy disclosure, “fund” also refers to the underlying funds in which the fund-of-funds invests.
Subject to its oversight, the funds' Board of Trustees has delegated primary responsibility for determining or causing to be determined the value of each fund’s investments to MFS as the funds' adviser, pursuant to each fund’s valuation policy and procedures which have been adopted by the adviser and approved by the Board. Effective September 8, 2022, and in accordance with Rule 2a-5 under the Investment Company Act of 1940, the Board of Trustees designated the adviser as the “valuation designee” of each fund. If the adviser, as valuation designee, determines that reliable market quotations are not readily available for an investment, the investment is valued at fair value as determined in good faith by the adviser in accordance with the adviser’s fair valuation policy and procedures.
Under each fund's valuation policy and procedures, equity securities, including restricted equity securities and equity securities sold short, are generally valued at the last sale or official closing price on their primary market or exchange as provided by a third-party pricing service. Equity securities, for which there were no sales reported that day, are generally valued at the last quoted daily bid quotation on their primary market or exchange as provided by a third-party pricing service. Equity securities sold short, for which there were no sales reported that day, are generally valued at the last quoted daily ask quotation on their primary market or exchange as provided by a third-party pricing service. Debt instruments and floating rate loans, including restricted debt instruments, are generally valued at an evaluated or composite bid as provided by a third-party pricing service. Debt instruments sold short are
Notes to Financial Statements (unaudited) - continued
generally valued at an evaluated or composite mean as provided by a third-party pricing service. Short-term instruments with a maturity at issuance of 60 days or less may be valued at amortized cost, which approximates market value. Exchange-traded options are generally valued at the last sale or official closing price on their primary exchange as provided by a third-party pricing service. Exchange-traded options for which there were no sales reported that day are generally valued at the last daily bid quotation on their primary exchange as provided by a third-party pricing service. For put options, the position may be valued at the last daily ask quotation if there are no trades reported during the day. Options not traded on an exchange are generally valued at a broker/dealer bid quotation. Foreign currency options are generally valued at valuations provided by a third-party pricing service. Futures contracts are generally valued at last posted settlement price on their primary exchange as provided by a third-party pricing service. Futures contracts for which there were no trades that day for a particular position are generally valued at the closing bid quotation on their primary exchange as provided by a third-party pricing service. Forward foreign currency exchange contracts are generally valued at the mean of bid and asked prices for the time period interpolated from rates provided by a third-party pricing service for proximate time periods. Swap agreements are generally valued using valuations provided by a third-party pricing service, which for cleared swaps includes an evaluation of any trading activity at the clearinghouses. Open-end investment companies are generally valued at net asset value per share. The values of foreign securities and other assets and liabilities expressed in foreign currencies are converted to U.S. dollars using the mean of bid and asked prices for rates provided by a third-party pricing service.
Under each fund’s valuation policy and procedures, market quotations are not considered to be readily available for debt instruments, floating rate loans, and many types of derivatives. These investments are generally valued at fair value based on information from third-party pricing services or otherwise determined by the adviser in accordance with the adviser’s fair valuation policy and procedures. Securities and other assets, including commodity-linked structured notes, generally valued on the basis of information from a third-party pricing service may also be valued at a broker/dealer bid quotation. In determining values, third-party pricing services can utilize both transaction data and market information such as yield, quality, coupon rate, maturity, type of issue, trading characteristics, spreads and other market data. An investment may also be valued at fair value if the adviser determines that the investment’s value has been materially affected by events occurring after the close of the exchange or market on which the investment is principally traded (such as foreign exchange or market) and prior to the determination of each fund’s net asset value, or after the halt of trading of a specific security where trading does not resume prior to the close of the exchange or market on which the security is principally traded. Events that occur after foreign markets close (such as developments in foreign markets and significant movements in the U.S. markets) and prior to the determination of the fund’s net asset value may be deemed to have a material effect on the value of securities traded in foreign markets. Accordingly, the fund’s foreign equity securities may often be valued at fair value. The adviser generally relies on third-party pricing services or other information (such as the correlation with price movements of similar securities in the same or other markets; the type, cost and investment characteristics of the security; the business and financial condition of the issuer; and trading and other market data) to assist in determining whether to fair value and at what value to fair value an investment. The value of an investment for purposes of calculating each fund’s net asset value can differ depending on the source and method used to determine value. When fair valuation is used, the value of an investment used to determine each fund’s net asset value may differ from quoted or published prices for the same investment. There can be no assurance that each fund could obtain the fair value assigned to an investment if it were to sell the investment at the same time at which each fund determines its net asset value per share.
Various inputs are used in determining the value of each fund's assets or liabilities. These inputs are categorized into three broad levels. In certain cases, the inputs used to measure fair value may fall into different levels of the fair value hierarchy. In such cases, an investment's level within the fair value hierarchy is based on the lowest level of input that is significant to the fair value measurement. Each fund's assessment of the significance of a particular input to the fair value measurement in its entirety requires judgment, and considers factors specific to the investment. Level 1 includes unadjusted quoted prices in active markets for identical assets or liabilities. Level 2 includes other significant observable market-based inputs (including quoted prices for similar securities, interest rates, prepayment speed, and credit risk). Level 3 includes significant unobservable inputs, which may include the adviser's own assumptions in determining the fair value of investments. The following is a summary of the levels used as of October 31, 2022 in valuing each fund's assets and liabilities:
| | Level 1 | Level 2 | Level 3 | Total |
| MFS Lifetime Income Fund | | | | |
| Financial Instruments | | | | |
| Mutual Funds | $658,034,812 | $— | $— | $658,034,812 |
| MFS Lifetime 2025 Fund | | | | |
| Financial Instruments | | | | |
| Mutual Funds | $391,021,460 | $— | $— | $391,021,460 |
| MFS Lifetime 2030 Fund | | | | |
| Financial Instruments | | | | |
| Mutual Funds | $696,982,420 | $— | $— | $696,982,420 |
Notes to Financial Statements (unaudited) - continued
| | Level 1 | Level 2 | Level 3 | Total |
| MFS Lifetime 2035 Fund | | | | |
| Financial Instruments | | | | |
| Mutual Funds | $481,114,243 | $— | $— | $481,114,243 |
| MFS Lifetime 2040 Fund | | | | |
| Financial Instruments | | | | |
| Mutual Funds | $580,468,757 | $— | $— | $580,468,757 |
| MFS Lifetime 2045 Fund | | | | |
| Financial Instruments | | | | |
| Mutual Funds | $376,968,912 | $— | $— | $376,968,912 |
| MFS Lifetime 2050 Fund | | | | |
| Financial Instruments | | | | |
| Mutual Funds | $376,755,713 | $— | $— | $376,755,713 |
| MFS Lifetime 2055 Fund | | | | |
| Financial Instruments | | | | |
| Mutual Funds | $222,886,472 | $— | $— | $222,886,472 |
| MFS Lifetime 2060 Fund | | | | |
| Financial Instruments | | | | |
| Mutual Funds | $96,371,596 | $— | $— | $96,371,596 |
| MFS Lifetime 2065 Fund | | | | |
| Financial Instruments | | | | |
| Mutual Funds | $1,977,097 | $— | $— | $1,977,097 |
For further information regarding security characteristics, see the Portfolio of Investments. Please refer to the underlying funds’ shareholder reports for further information regarding the levels used in valuing the underlying funds’ assets and liabilities.
Derivatives — Each fund does not invest in derivatives directly. Each fund does invest in underlying funds that may use derivatives primarily to increase or decrease exposure to a particular market or segment of the market, or security, to increase or decrease interest rate or currency exposure, or as alternatives to direct investments. Derivatives are used for hedging or non-hedging purposes. While hedging can reduce or eliminate losses, it can also reduce or eliminate gains. When the underlying funds use derivatives as an investment to increase market exposure, or for hedging purposes, gains and losses from derivative instruments may be substantially greater than the derivative’s original cost.
Indemnifications — Under each fund's organizational documents, its officers and Trustees may be indemnified against certain liabilities and expenses arising out of the performance of their duties to each fund. Additionally, in the normal course of business, each fund enters into agreements with service providers that may contain indemnification clauses. Each fund's maximum exposure under these agreements is unknown as this would involve future claims that may be made against each fund that have not yet occurred.
Investment Transactions and Income — Investment transactions are recorded on the trade date. Interest income is recorded on the accrual basis. All premium and discount is amortized or accreted for financial statement purposes in accordance with U.S. generally accepted accounting principles. Distributions of income and capital gains from the underlying funds are recorded on the ex-dividend date. Recognition of net investment income by each fund is affected by the timing of the declaration of distributions by the underlying funds in which each fund invests. In determining the net gain or loss on securities sold, the cost of securities is determined on the identified cost basis.
Each fund and/or the underlying funds may receive proceeds from litigation settlements. Any proceeds received from litigation involving portfolio holdings are reflected in the Statements of Operations in realized gain/loss if the security has been disposed of by the fund or in unrealized gain/loss if the security is still held by the fund. Any other proceeds from litigation not related to portfolio holdings are reflected as other income in the Statements of Operations.
Notes to Financial Statements (unaudited) - continued
Tax Matters and Distributions — Each fund intends to qualify as a regulated investment company, as defined under Subchapter M of the Internal Revenue Code, and to distribute all of its taxable income, including realized capital gains. As a result, no provision for federal income tax is required. Each fund’s federal tax returns, when filed, will remain subject to examination by the Internal Revenue Service for a three year period. Management has analyzed each fund’s tax positions taken on federal and state tax returns for all open tax years and does not believe that there are any uncertain tax positions that require recognition of a tax liability.
Distributions to shareholders are recorded on the ex-dividend date. Income and capital gain distributions are determined in accordance with income tax regulations, which may differ from U.S. generally accepted accounting principles. Certain capital accounts in the financial statements are periodically adjusted for permanent differences in order to reflect their tax character. These adjustments have no impact on net assets or net asset value per share. Temporary differences which arise from recognizing certain items of income, expense, gain or loss in different periods for financial statement and tax purposes will reverse at some time in the future.
Book/tax differences primarily relate to wash sale loss deferrals and treating a portion of the proceeds from redemptions as a distribution for tax purposes.
The tax character of distributions made during the current period will be determined at fiscal year end. The tax character of distributions declared to shareholders for the last fiscal year is as follows:
| Year ended 4/30/22 | MFS Lifetime
Income Fund | MFS Lifetime
2025 Fund | MFS Lifetime
2030 Fund | MFS Lifetime
2035 Fund | MFS Lifetime
2040 Fund |
| Ordinary income (including any short-term capital gains) | $22,090,828 | $18,622,133 | $33,162,261 | $25,561,088 | $31,745,852 |
| Long-term capital gains | 16,921,401 | 12,586,220 | 31,199,403 | 11,477,126 | 19,200,683 |
| Total distributions | $39,012,229 | $31,208,353 | $64,361,664 | $37,038,214 | $50,946,535 |
| Year ended 4/30/22 | MFS Lifetime
2045 Fund | MFS Lifetime
2050 Fund | MFS Lifetime
2055 Fund | MFS Lifetime
2060 Fund | MFS Lifetime
2065 Fund (c) |
| Ordinary income (including any short-term capital gains) | $21,180,190 | $21,192,108 | $11,791,033 | $3,768,650 | $41,175 |
| Long-term capital gains | 7,178,079 | 8,556,055 | 3,576,033 | 598,368 | — |
| Total distributions | $28,358,269 | $29,748,163 | $15,367,066 | $4,367,018 | $41,175 |
| (c) | For the period from the commencement of the fund’s investment operations, September 1, 2021, through the stated period end. |
The federal tax cost and the tax basis components of distributable earnings were as follows:
| As of 10/31/22 | MFS Lifetime
Income Fund | MFS Lifetime
2025 Fund | MFS Lifetime
2030 Fund | MFS Lifetime
2035 Fund | MFS Lifetime
2040 Fund |
| Cost of investments | $646,009,651 | $395,562,753 | $650,971,924 | $456,145,443 | $495,181,024 |
| Gross appreciation | 55,121,804 | 27,680,430 | 94,748,467 | 47,389,268 | 99,647,440 |
| Gross depreciation | (43,096,643) | (32,221,723) | (48,737,971) | (22,420,468) | (14,359,707) |
| Net unrealized appreciation (depreciation) | $12,025,161 | $(4,541,293) | $46,010,496 | $24,968,800 | $85,287,733 |
| As of 4/30/22 | | | | | |
| Undistributed ordinary income | 313,739 | 2,404,560 | 2,932,313 | 1,718,344 | 1,253,544 |
| Undistributed long-term capital gain | 10,968,412 | 10,806,145 | 24,738,295 | 17,591,934 | 21,814,898 |
| Other temporary differences | (850,561) | — | — | — | — |
| Net unrealized appreciation (depreciation) | 33,838,767 | 23,147,526 | 99,196,770 | 60,032,319 | 128,232,164 |
| As of 10/31/22 | MFS Lifetime
2045 Fund | MFS Lifetime
2050 Fund | MFS Lifetime
2055 Fund | MFS Lifetime
2060 Fund | MFS Lifetime
2065 Fund |
| Cost of investments | $345,336,154 | $341,384,067 | $211,114,480 | $101,031,750 | $2,213,413 |
| Gross appreciation | 39,600,629 | 40,960,656 | 17,531,882 | 1,191,585 | — |
| Gross depreciation | (7,967,871) | (5,589,010) | (5,759,890) | (5,851,739) | (236,316) |
| Net unrealized appreciation (depreciation) | $31,632,758 | $35,371,646 | $11,771,992 | $(4,660,154) | $(236,316) |
| As of 4/30/22 | | | | | |
| Undistributed ordinary income | 575,142 | 329,420 | 333,843 | — | 967 |
| Undistributed long-term capital gain | 14,502,706 | 14,058,420 | 8,268,871 | 2,910,190 | 39,328 |
| Post-October capital loss deferral | — | — | — | — | (1,493) |
| Net unrealized appreciation (depreciation) | 50,592,620 | 61,923,744 | 23,350,262 | 1,492,210 | (188,167) |
The aggregate cost above includes prior fiscal year end tax adjustments, if applicable.
Notes to Financial Statements (unaudited) - continued
Multiple Classes of Shares of Beneficial Interest — Each fund offers multiple classes of shares, which differ in their respective distribution, service, and program manager fees. For the MFS Lifetime Income Fund, income and common expenses are allocated to shareholders based on the value of settled shares outstanding of each class. For the MFS Lifetime Income Fund, realized and unrealized gain (loss) are allocated to shareholders based on the daily net assets of each class. For all other funds, income, realized and unrealized gain (loss), and common expenses are allocated to shareholders based on the daily net assets of each class. Dividends are declared separately for each class. Differences in per share dividend rates are generally due to differences in separate class expenses. Class B and Class C shares will convert to Class A shares approximately eight years after purchase. Effective March 21, 2022, all Class 529B and Class 529C shares were converted into Class 529A shares. Effective May 20, 2022, all Class 529A shares were redeemed. Each fund’s distributions declared to shareholders as reported in the Statements of Changes in Net Assets are presented by class as follows:
| | MFS Lifetime
Income Fund | | MFS Lifetime
2025 Fund | | MFS Lifetime
2030 Fund |
| | Six Months Ended
10/31/22 | | Year Ended
4/30/22 | | Six Months Ended
10/31/22 | | Year Ended
4/30/22 | | Six Months Ended
10/31/22 | | Year Ended
4/30/22 |
| Class A | $1,579,147 | | $9,807,685 | | $— | | $1,985,756 | | $— | | $7,032,486 |
| Class B | 11,262 | | 118,063 | | — | | 80,251 | | — | | 419,626 |
| Class C | 262,835 | | 3,422,376 | | — | | 247,400 | | — | | 940,949 |
| Class I | 466,561 | | 2,936,897 | | — | | 243,332 | | — | | 676,119 |
| Class R1 | 11,422 | | 102,365 | | — | | 20,049 | | — | | 392,788 |
| Class R2 | 135,972 | | 483,548 | | — | | 1,206,479 | | — | | 4,512,901 |
| Class R3 | 784,170 | | 3,817,424 | | — | | 7,706,830 | | — | | 16,429,472 |
| Class R4 | 233,376 | | 1,034,446 | | — | | 3,010,853 | | — | | 6,112,707 |
| Class R6 | 1,456,580 | | 5,476,938 | | — | | 16,707,403 | | — | | 27,844,616 |
| Class 529A | 174,536 | | 10,204,625 | | — | | — | | — | | — |
| Class 529B | — | | 189,988 | | — | | — | | — | | — |
| Class 529C | — | | 1,417,874 | | — | | — | | — | | — |
| Total | $5,115,861 | | $39,012,229 | | $— | | $31,208,353 | | $— | | $64,361,664 |
| | MFS Lifetime
2035 Fund | | MFS Lifetime
2040 Fund | | MFS Lifetime
2045 Fund |
| | Six Months Ended
10/31/22 | | Year Ended
4/30/22 | | Six Months Ended
10/31/22 | | Year Ended
4/30/22 | | Six Months Ended
10/31/22 | | Year Ended
4/30/22 |
| Class A | $— | | $2,320,230 | | $— | | $4,665,291 | | $— | | $1,610,443 |
| Class B | — | | 103,003 | | — | | 239,217 | | — | | 65,242 |
| Class C | — | | 246,316 | | — | | 662,292 | | — | | 154,889 |
| Class I | — | | 108,427 | | — | | 443,211 | | — | | 205,037 |
| Class R1 | — | | 34,032 | | — | | 327,198 | | — | | 26,093 |
| Class R2 | — | | 1,258,518 | | — | | 3,858,573 | | — | | 852,143 |
| Class R3 | — | | 10,933,795 | | — | | 14,205,982 | | — | | 9,293,873 |
| Class R4 | — | | 3,492,794 | | — | | 4,836,677 | | — | | 2,461,266 |
| Class R6 | — | | 18,541,099 | | — | | 21,708,094 | | — | | 13,689,283 |
| Total | $— | | $37,038,214 | | $— | | $50,946,535 | | $— | | $28,358,269 |
Notes to Financial Statements (unaudited) - continued
| | MFS Lifetime
2050 Fund | | MFS Lifetime
2055 Fund | | MFS Lifetime
2060 Fund |
| | Six Months Ended
10/31/22 | | Year Ended
4/30/22 | | Six Months Ended
10/31/22 | | Year Ended
4/30/22 | | Six Months Ended
10/31/22 | | Year Ended
4/30/22 |
| Class A | $— | | $2,107,096 | | $— | | $1,258,975 | | $— | | $455,356 |
| Class B | — | | 124,989 | | — | | 47,582 | | — | | 10,248 |
| Class C | — | | 292,874 | | — | | 180,306 | | — | | 47,868 |
| Class I | — | | 103,644 | | — | | 41,450 | | — | | 18,437 |
| Class R1 | — | | 60,077 | | — | | 49,193 | | — | | 4,654 |
| Class R2 | — | | 1,642,015 | | — | | 650,149 | | — | | 111,001 |
| Class R3 | — | | 10,063,249 | | — | | 5,387,396 | | — | | 1,429,297 |
| Class R4 | — | | 2,509,146 | | — | | 1,232,418 | | — | | 184,859 |
| Class R6 | — | | 12,845,073 | | — | | 6,519,597 | | — | | 2,105,298 |
| Total | $— | | $29,748,163 | | $— | | $15,367,066 | | $— | | $4,367,018 |
| | MFS Lifetime
2065 Fund |
| | Six Months Ended
10/31/22 | | Year Ended
4/30/22 (c) |
| Class A | $— | | $5,464 |
| Class C | — | | 1,913 |
| Class I | — | | 2,074 |
| Class R1 | — | | 1,908 |
| Class R2 | — | | 2,355 |
| Class R3 | — | | 2,033 |
| Class R4 | — | | 2,075 |
| Class R6 | — | | 23,353 |
| Total | $— | | $41,175 |
| (c) | For the period from the commencement of the fund’s investment operations, September 1, 2021, through the stated period end. |
(3) Transactions with Affiliates
Note regarding references to Class 529A shares in this “Note (3) Transactions with Affiliates”: Effective May 20, 2022, all Class 529A shares were redeemed. Accordingly, information with respect to Class 529A shares is for the period ending May 20, 2022.
Investment Adviser — Each fund has an investment advisory agreement with MFS to provide overall investment management and related administrative services and facilities to the funds. MFS receives no compensation under this agreement; however MFS receives management fees from the underlying MFS funds.
For classes other than Class R6 shares, the investment adviser has agreed in writing to pay all of each fund’s operating expenses, excluding distribution and service fees, program manager fees, interest, taxes, extraordinary expenses, brokerage and transaction costs and investment-related expenses including fees and expenses associated with investments in investment companies and other similar investment vehicles (“Other Expenses”). For the six months ended October 31, 2022, this reduction amounted to the following for each fund and is included in the reduction of total expenses in the Statements of Operations:
MFS Lifetime
Income Fund | MFS Lifetime
2025 Fund | MFS Lifetime
2030 Fund | MFS Lifetime
2035 Fund | MFS Lifetime
2040 Fund |
| $513,180 | $290,648 | $481,240 | $334,037 | $413,105 |
MFS Lifetime
2045 Fund | MFS Lifetime
2050 Fund | MFS Lifetime
2055 Fund | MFS Lifetime
2060 Fund | MFS Lifetime
2065 Fund |
| $298,611 | $321,518 | $250,727 | $176,541 | $143,889 |
For Class R6 shares, the investment adviser has agreed to bear each fund's expenses, or make payment to such fund, such that the “Other Expenses” of the class do not exceed (0.14)% annually of average daily net assets for all funds except for the MFS Lifetime Income Fund. For the period from May 1, 2022 through August 5, 2022, for Class R6 shares of the MFS Lifetime Income Fund, the investment adviser had agreed to bear the fund's expenses, or make payment to such fund, such that the “Other Expenses” of the class did not exceed (0.10%) annually of average daily net assets of the MFS Lifetime Income Fund. Effective August 6, 2022, for Class R6 shares of the MFS Lifetime Income Fund, the investment adviser has agreed to bear the fund's expenses, or make payment
Notes to Financial Statements (unaudited) - continued
to such fund, such that the “Other Expenses” of the class do not exceed (0.12%) annually of average daily net assets of the MFS Lifetime Income Fund. These written agreements will continue until modified by the funds’ Board of Trustees, but such agreements will continue at least until August 31, 2023. Payments made to certain classes of the funds to further reduce “Other Expenses” below 0.00% annually of average daily net assets are included in “Excess expense reimbursement from investment adviser” in the Statements of Operations.
In addition to the fees and expenses which each fund bears directly, each fund indirectly bears a pro rata share of the fees and expenses of the underlying funds in which each fund invests. Accordingly, the expense ratio for each fund reflects only those fees and expenses borne directly by each fund.
Distributor — MFS Fund Distributors, Inc. (MFD), a wholly-owned subsidiary of MFS, as distributor, received the following amounts for the six months ended October 31, 2022, as its portion of the initial sales charge on sales of Class A and Class 529A shares of each fund:
| | Class A | Class 529A |
| MFS Lifetime Income Fund | $1,625 | $504 |
| MFS Lifetime 2025 Fund | 2,619 | — |
| MFS Lifetime 2030 Fund | 9,510 | — |
| MFS Lifetime 2035 Fund | 4,748 | — |
| MFS Lifetime 2040 Fund | 9,916 | — |
| MFS Lifetime 2045 Fund | 6,953 | — |
| MFS Lifetime 2050 Fund | 7,766 | — |
| MFS Lifetime 2055 Fund | 5,780 | — |
| MFS Lifetime 2060 Fund | 7,059 | — |
| MFS Lifetime 2065 Fund | 416 | — |
The Board of Trustees has adopted a distribution plan for certain share classes pursuant to Rule 12b-1 of the Investment Company Act of 1940.
Each fund's distribution plan provides that each fund will pay MFD for services provided by MFD and financial intermediaries in connection with the distribution and servicing of certain share classes. One component of the plan is a distribution fee paid to MFD and another component of the plan is a service fee paid to MFD. MFD may subsequently pay all, or a portion, of the distribution and/or service fees to financial intermediaries.
Distribution Plan Fee Table:
| | Class A |
| | Distribution
Fee Rate (d) | Service
Fee Rate (d) | Total
Distribution
Plan (d) | Annual
Effective
Rate (e) | Distribution
and Service
Fee |
| MFS Lifetime Income Fund | — | 0.25% | 0.25% | 0.25% | $221,876 |
| MFS Lifetime 2025 Fund | — | 0.25% | 0.25% | 0.25% | 32,009 |
| MFS Lifetime 2030 Fund | — | 0.25% | 0.25% | 0.25% | 95,469 |
| MFS Lifetime 2035 Fund | — | 0.25% | 0.25% | 0.25% | 36,655 |
| MFS Lifetime 2040 Fund | — | 0.25% | 0.25% | 0.25% | 60,732 |
| MFS Lifetime 2045 Fund | — | 0.25% | 0.25% | 0.25% | 24,622 |
| MFS Lifetime 2050 Fund | — | 0.25% | 0.25% | 0.25% | 28,303 |
| MFS Lifetime 2055 Fund | — | 0.25% | 0.25% | 0.25% | 19,357 |
| MFS Lifetime 2060 Fund | — | 0.25% | 0.25% | 0.25% | 10,640 |
| MFS Lifetime 2065 Fund | — | 0.25% | 0.25% | 0.25% | 346 |
Notes to Financial Statements (unaudited) - continued
| | Class B |
| | Distribution
Fee Rate (d) | Service
Fee Rate (d) | Total
Distribution
Plan (d) | Annual
Effective
Rate (e) | Distribution
and Service
Fee |
| MFS Lifetime Income Fund | 0.75% | 0.25% | 1.00% | 1.00% | $10,948 |
| MFS Lifetime 2025 Fund | 0.75% | 0.25% | 1.00% | 1.00% | 5,399 |
| MFS Lifetime 2030 Fund | 0.75% | 0.25% | 1.00% | 1.00% | 19,887 |
| MFS Lifetime 2035 Fund | 0.75% | 0.25% | 1.00% | 1.00% | 6,276 |
| MFS Lifetime 2040 Fund | 0.75% | 0.25% | 1.00% | 1.00% | 12,053 |
| MFS Lifetime 2045 Fund | 0.75% | 0.25% | 1.00% | 1.00% | 3,499 |
| MFS Lifetime 2050 Fund | 0.75% | 0.25% | 1.00% | 1.00% | 5,832 |
| MFS Lifetime 2055 Fund | 0.75% | 0.25% | 1.00% | 1.00% | 2,791 |
| MFS Lifetime 2060 Fund | 0.75% | 0.25% | 1.00% | 1.00% | 846 |
| | Class C |
| | Distribution
Fee Rate (d) | Service
Fee Rate (d) | Total
Distribution
Plan (d) | Annual
Effective
Rate (e) | Distribution
and Service
Fee |
| MFS Lifetime Income Fund | 0.75% | 0.25% | 1.00% | 1.00% | $256,667 |
| MFS Lifetime 2025 Fund | 0.75% | 0.25% | 1.00% | 1.00% | 17,281 |
| MFS Lifetime 2030 Fund | 0.75% | 0.25% | 1.00% | 1.00% | 45,093 |
| MFS Lifetime 2035 Fund | 0.75% | 0.25% | 1.00% | 1.00% | 17,692 |
| MFS Lifetime 2040 Fund | 0.75% | 0.25% | 1.00% | 1.00% | 37,229 |
| MFS Lifetime 2045 Fund | 0.75% | 0.25% | 1.00% | 1.00% | 10,131 |
| MFS Lifetime 2050 Fund | 0.75% | 0.25% | 1.00% | 1.00% | 15,528 |
| MFS Lifetime 2055 Fund | 0.75% | 0.25% | 1.00% | 1.00% | 11,773 |
| MFS Lifetime 2060 Fund | 0.75% | 0.25% | 1.00% | 1.00% | 4,397 |
| MFS Lifetime 2065 Fund | 0.75% | 0.25% | 1.00% | 1.00% | 280 |
| | Class R1 |
| | Distribution
Fee Rate (d) | Service
Fee Rate (d) | Total
Distribution
Plan (d) | Annual
Effective
Rate (e) | Distribution
and Service
Fee |
| MFS Lifetime Income Fund | 0.75% | 0.25% | 1.00% | 1.00% | $11,090 |
| MFS Lifetime 2025 Fund | 0.75% | 0.25% | 1.00% | 1.00% | 1,569 |
| MFS Lifetime 2030 Fund | 0.75% | 0.25% | 1.00% | 1.00% | 19,419 |
| MFS Lifetime 2035 Fund | 0.75% | 0.25% | 1.00% | 1.00% | 4,542 |
| MFS Lifetime 2040 Fund | 0.75% | 0.25% | 1.00% | 1.00% | 18,836 |
| MFS Lifetime 2045 Fund | 0.75% | 0.25% | 1.00% | 1.00% | 2,045 |
| MFS Lifetime 2050 Fund | 0.75% | 0.25% | 1.00% | 1.00% | 3,472 |
| MFS Lifetime 2055 Fund | 0.75% | 0.25% | 1.00% | 1.00% | 3,675 |
| MFS Lifetime 2060 Fund | 0.75% | 0.25% | 1.00% | 0.76% | 299 |
| MFS Lifetime 2065 Fund | 0.75% | 0.25% | 1.00% | 1.00% | 233 |
| | Class R2 |
| | Distribution
Fee Rate (d) | Service
Fee Rate (d) | Total
Distribution
Plan (d) | Annual
Effective
Rate (e) | Distribution
and Service
Fee |
| MFS Lifetime Income Fund | 0.25% | 0.25% | 0.50% | 0.50% | $44,143 |
| MFS Lifetime 2025 Fund | 0.25% | 0.25% | 0.50% | 0.50% | 41,710 |
| MFS Lifetime 2030 Fund | 0.25% | 0.25% | 0.50% | 0.50% | 123,509 |
| MFS Lifetime 2035 Fund | 0.25% | 0.25% | 0.50% | 0.50% | 42,128 |
| MFS Lifetime 2040 Fund | 0.25% | 0.25% | 0.50% | 0.50% | 103,003 |
| MFS Lifetime 2045 Fund | 0.25% | 0.25% | 0.50% | 0.50% | 26,756 |
| MFS Lifetime 2050 Fund | 0.25% | 0.25% | 0.50% | 0.50% | 44,972 |
| MFS Lifetime 2055 Fund | 0.25% | 0.25% | 0.50% | 0.50% | 22,588 |
| MFS Lifetime 2060 Fund | 0.25% | 0.25% | 0.50% | 0.50% | 5,078 |
| MFS Lifetime 2065 Fund | 0.25% | 0.25% | 0.50% | 0.50% | 160 |
Notes to Financial Statements (unaudited) - continued
| | Class R3 |
| | Distribution
Fee Rate (d) | Service
Fee Rate (d) | Total
Distribution
Plan (d) | Annual
Effective
Rate (e) | Distribution
and Service
Fee |
| MFS Lifetime Income Fund | — | 0.25% | 0.25% | 0.25% | $109,800 |
| MFS Lifetime 2025 Fund | — | 0.25% | 0.25% | 0.25% | 129,503 |
| MFS Lifetime 2030 Fund | — | 0.25% | 0.25% | 0.25% | 240,329 |
| MFS Lifetime 2035 Fund | — | 0.25% | 0.25% | 0.25% | 171,576 |
| MFS Lifetime 2040 Fund | — | 0.25% | 0.25% | 0.25% | 208,631 |
| MFS Lifetime 2045 Fund | — | 0.25% | 0.25% | 0.25% | 152,969 |
| MFS Lifetime 2050 Fund | — | 0.25% | 0.25% | 0.25% | 143,356 |
| MFS Lifetime 2055 Fund | — | 0.25% | 0.25% | 0.25% | 90,725 |
| MFS Lifetime 2060 Fund | — | 0.25% | 0.25% | 0.25% | 37,872 |
| MFS Lifetime 2065 Fund | — | 0.25% | 0.25% | 0.25% | 237 |
| | Class 529A |
| | Distribution
Fee Rate (d) | Service
Fee Rate (d) | Total
Distribution
Plan (d) | Annual
Effective
Rate (e) | Distribution
and Service
Fee |
| MFS Lifetime Income Fund | — | 0.25% | 0.25% | 0.23% | $25,907 |
| | MFS Lifetime
Income Fund | MFS Lifetime
2025 Fund | MFS Lifetime
2030 Fund | MFS Lifetime
2035 Fund | MFS Lifetime
2040 Fund |
| Total Distribution and Service Fees | $680,431 | $227,471 | $543,706 | $278,869 | $440,484 |
| | MFS Lifetime
2045 Fund | MFS Lifetime
2050 Fund | MFS Lifetime
2055 Fund | MFS Lifetime
2060 Fund | MFS Lifetime
2065 Fund |
| Total Distribution and Service Fees | $220,022 | $241,463 | $150,909 | $59,132 | $1,256 |
| (d) | In accordance with the distribution plan for certain classes, each fund pays distribution and/or service fees equal to these annual percentage rates of each class’s average daily net assets. The distribution and service fee rates disclosed by class represent the current rates in effect at the end of the reporting period. Any rate changes, if applicable, are detailed below. |
| (e) | The annual effective rates represent actual fees incurred under the distribution plan for the six months ended October 31, 2022 based on each class's average daily net assets. MFD has voluntarily agreed to rebate a portion of each class’s 0.25% service fee attributable to accounts for which there is no financial intermediary specified on the account except for accounts attributable to MFS or its affiliates’ seed money. For the six months ended October 31, 2022, these rebates amounted to the following and are included in the reduction of total expenses in the Statements of Operations: |
| | MFS Lifetime
Income Fund | MFS Lifetime
2025 Fund | MFS Lifetime
2030 Fund | MFS Lifetime
2035 Fund | MFS Lifetime
2040 Fund |
| Class A | $7 | $1 | $— | $— | $— |
| Class B | 1 | — | — | — | — |
| Class C | 4 | — | — | — | 1 |
| Class R2 | 101 | — | 253 | — | 56 |
| Class R3 | 6 | 1 | 20 | 56 | 286 |
| Class 529A | 2,093 | N/A | N/A | N/A | N/A |
| | MFS Lifetime
2045 Fund | MFS Lifetime
2050 Fund | MFS Lifetime
2055 Fund | MFS Lifetime
2060 Fund | MFS Lifetime
2065 Fund |
| Class A | $1 | $— | $1 | $2 | $1 |
| Class C | — | 1 | — | 1 | — |
| Class R3 | 2 | 42 | 29 | — | — |
For the MFS Lifetime 2060 Fund, for the period from September 1, 2022 through October 31, 2022, the 0.75% distribution fee was not imposed for Class R1 shares due to the sales charge limitations contained in Financial Industry Regulatory Authority (“FINRA”) Rule 2341.
Notes to Financial Statements (unaudited) - continued
Certain Class A shares are subject to a contingent deferred sales charge (CDSC) in the event of a shareholder redemption within 18 months of purchase. Class B shares are subject to a CDSC in the event of a shareholder redemption within six years of purchase. Class C shares are subject to a CDSC in the event of a shareholder redemption within 12 months of purchase. All contingent deferred sales charges are paid to MFD and during the six months ended October 31, 2022, were as follows:
| CDSC Imposed | MFS Lifetime
Income Fund | MFS Lifetime
2025 Fund | MFS Lifetime
2030 Fund | MFS Lifetime
2035 Fund | MFS Lifetime
2040 Fund |
| Class A | $474 | $355 | $691 | $99 | $345 |
| Class B | 264 | 186 | 295 | 113 | 14 |
| Class C | 1,991 | 178 | 316 | 211 | 308 |
| CDSC Imposed | MFS Lifetime
2045 Fund | MFS Lifetime
2050 Fund | MFS Lifetime
2055 Fund | MFS Lifetime
2060 Fund | MFS Lifetime
2065 Fund |
| Class A | $309 | $137 | $53 | $96 | $5 |
| Class B | — | 111 | 10 | — | N/A |
| Class C | 41 | 47 | 186 | 224 | 15 |
The MFS Lifetime Income Fund has entered into and may from time to time enter into contracts with program managers and other parties which administer the tuition programs through which an investment in the fund’s 529 share classes is made. The MFS Lifetime Income Fund has entered into an agreement with MFD pursuant to which MFD receives an annual fee of up to 0.05% of the average daily net assets attributable to each 529 share class. As described above, all Class 529A shares were redeemed on or before May 20, 2022. Accordingly, the foregoing agreement between the fund and MFD was terminated effective May 20, 2022. The services provided by MFD, or a third party with which MFD contracts, include recordkeeping and tax reporting and account services, as well as services designed to maintain the program’s compliance with the Internal Revenue Code and other regulatory requirements. Program manager fees for the MFS Lifetime Income Fund for the six months ended October 31, 2022, were as follows:
Shareholder Servicing Agent — MFS Service Center, Inc. (MFSC), a wholly-owned subsidiary of MFS, receives a fee from each fund for its services as shareholder servicing agent calculated as a percentage of the average daily net assets of each fund as determined periodically under the supervision of the funds’ Board of Trustees. For the six months ended October 31, 2022, each fund paid the following fee, which equated to the following annual percentage of each fund’s average daily net assets:
| | MFS Lifetime
Income Fund | MFS Lifetime
2025 Fund | MFS Lifetime
2030 Fund | MFS Lifetime
2035 Fund | MFS Lifetime
2040 Fund |
| Expenses paid | $62,026 | $12,029 | $28,239 | $15,205 | $25,759 |
| Annual percentage of average daily net assets | 0.0220% | 0.0061% | 0.0081% | 0.0066% | 0.0093% |
| | MFS Lifetime
2045 Fund | MFS Lifetime
2050 Fund | MFS Lifetime
2055 Fund | MFS Lifetime
2060 Fund | MFS Lifetime
2065 Fund |
| Expenses paid | $15,339 | $19,925 | $17,488 | $11,871 | $777 |
| Annual percentage of average daily net assets | 0.0090% | 0.0115% | 0.0173% | 0.0283% | 0.1027% |
MFSC also receives reimbursement from each fund for out-of-pocket expenses, sub-accounting and other shareholder servicing costs which may be paid to affiliated and unaffiliated service providers. Class R6 shares do not incur sub-accounting fees. For the six months ended October 31, 2022, these out-of-pocket expenses, sub-accounting and other shareholder servicing costs amounted to the following:
MFS Lifetime
Income Fund | MFS Lifetime
2025 Fund | MFS Lifetime
2030 Fund | MFS Lifetime
2035 Fund | MFS Lifetime
2040 Fund |
| $287,325 | $152,213 | $311,248 | $189,520 | $250,941 |
MFS Lifetime
2045 Fund | MFS Lifetime
2050 Fund | MFS Lifetime
2055 Fund | MFS Lifetime
2060 Fund | MFS Lifetime
2065 Fund |
| $155,697 | $171,633 | $111,197 | $46,209 | $1,316 |
Notes to Financial Statements (unaudited) - continued
Administrator – MFS provides certain financial, legal, shareholder communications, compliance, and other administrative services to each fund. Under an administrative services agreement, each fund reimburses MFS the costs incurred to provide these services. Each fund pays an annual fixed amount of $17,500. The administrative services fee incurred for the six months ended October 31, 2022 was equivalent to the following annual effective rates of each fund's average daily net assets:
| | MFS Lifetime
Income Fund | MFS Lifetime
2025 Fund | MFS Lifetime
2030 Fund | MFS Lifetime
2035 Fund | MFS Lifetime
2040 Fund |
| Percentage of average daily net assets | 0.0031% | 0.0045% | 0.0025% | 0.0038% | 0.0032% |
| | MFS Lifetime
2045 Fund | MFS Lifetime
2050 Fund | MFS Lifetime
2055 Fund | MFS Lifetime
2060 Fund | MFS Lifetime
2065 Fund |
| Percentage of average daily net assets | 0.0052% | 0.0051% | 0.0087% | 0.0210% | 1.1669% |
Trustees’ and Officers’ Compensation — Each fund pays compensation to independent Trustees in the form of a retainer, attendance fees, and additional compensation to Board and Committee chairpersons. The funds do not pay compensation directly to Trustees or officers of each fund who are also officers of the investment adviser, all of whom receive remuneration from MFS for their services to each fund. Certain officers and Trustees of each fund are officers or directors of MFS, MFD, and MFSC.
Other — Each fund invests in the MFS Institutional Money Market Portfolio which is managed by MFS and seeks current income consistent with preservation of capital and liquidity. This money market fund does not pay a management fee to MFS but does incur investment and operating costs.
On June 18, 2021, MFS redeemed the following fund shares:
| Fund | Class | Shares | Amount |
| MFS Lifetime 2060 Fund | Class A | 5,555 | $89,153 |
| MFS Lifetime 2060 Fund | Class R2 | 5,505 | 88,187 |
| MFS Lifetime 2060 Fund | Class R4 | 5,587 | 90,174 |
On August 31, 2021, MFS purchased the following fund shares as an initial investment in the fund:
| Fund | Class | Shares | Amount |
| MFS Lifetime 2065 Fund | Class A | 5,000 | $50,000 |
| MFS Lifetime 2065 Fund | Class C | 5,000 | 50,000 |
| MFS Lifetime 2065 Fund | Class I | 5,000 | 50,000 |
| MFS Lifetime 2065 Fund | Class R1 | 5,000 | 50,000 |
| MFS Lifetime 2065 Fund | Class R2 | 5,000 | 50,000 |
| MFS Lifetime 2065 Fund | Class R3 | 5,000 | 50,000 |
| MFS Lifetime 2065 Fund | Class R4 | 5,000 | 50,000 |
| MFS Lifetime 2065 Fund | Class R6 | 50,000 | 500,000 |
On August 3, 2022, MFS purchased the following fund shares:
| Fund | Class | Shares | Amount |
| MFS Lifetime 2065 Fund | Class I | 699 | $6,000 |
| MFS Lifetime 2065 Fund | Class R1 | 937 | 8,000 |
| MFS Lifetime 2065 Fund | Class R4 | 815 | 7,000 |
At October 31, 2022, MFS held 100% of the outstanding shares of Class R1 of the MFS Lifetime 2060 Fund. Also, MFS held approximately 71%, 93%, 59%, and 98% of the outstanding shares of Class C, Class I, Class R2, and Class R4, respectively, and 100% of the outstanding shares of Class R1 of the MFS Lifetime 2065 Fund.
(4) Portfolio Securities
For the six months ended October 31, 2022, purchases and sales of shares of underlying funds, excluding the MFS Institutional Money Market Portfolio, aggregated to the following:
| | MFS Lifetime
Income Fund | MFS Lifetime
2025 Fund | MFS Lifetime
2030 Fund | MFS Lifetime
2035 Fund | MFS Lifetime
2040 Fund |
| Purchases | $69,515,171 | $38,263,563 | $56,998,080 | $59,779,955 | $74,008,652 |
| Sales | $205,323,652 | $35,102,084 | $37,884,312 | $18,474,512 | $21,944,355 |
Notes to Financial Statements (unaudited) - continued
| | MFS Lifetime
2045 Fund | MFS Lifetime
2050 Fund | MFS Lifetime
2055 Fund | MFS Lifetime
2060 Fund | MFS Lifetime
2065 Fund |
| Purchases | $68,271,159 | $80,235,091 | $42,886,272 | $26,040,115 | $1,065,806 |
| Sales | $15,796,387 | $14,408,123 | $8,064,329 | $2,382,050 | $223,004 |
(5) Shares of Beneficial Interest
Each fund's Declaration of Trust permits the Trustees to issue an unlimited number of full and fractional shares of beneficial interest. Transactions in fund shares were as follows:
| | MFS Lifetime Income Fund | | MFS Lifetime 2025 Fund |
| | Six Months Ended
10/31/22 | | Year ended
4/30/22 | | Six Months Ended
10/31/22 | | Year ended
4/30/22 |
| | Shares | Amount | | Shares | Amount | | Shares | Amount | | Shares | Amount |
| Shares sold | | | | | | | | | | | |
| Class A | 890,170 | $ 10,681,198 | | 2,936,702 | $ 40,058,978 | | 214,615 | $ 2,772,278 | | 430,550 | $ 6,355,462 |
| Class B | 2,858 | 34,655 | | 1,642 | 21,697 | | — | — | | 2,519 | 34,202 |
| Class C | 152,297 | 1,836,354 | | 297,217 | 4,097,934 | | 43,095 | 540,749 | | 35,343 | 519,570 |
| Class I | 386,327 | 4,702,316 | | 764,329 | 10,436,927 | | 2,177 | 28,783 | | 92,075 | 1,322,459 |
| Class R1 | 29,316 | 352,120 | | 73,584 | 985,960 | | 2,854 | 37,225 | | 3,924 | 58,622 |
| Class R2 | 115,916 | 1,393,925 | | 128,678 | 1,763,836 | | 129,819 | 1,678,261 | | 208,574 | 3,047,245 |
| Class R3 | 942,072 | 11,288,980 | | 1,826,018 | 24,825,448 | | 815,658 | 10,449,403 | | 2,638,787 | 38,972,441 |
| Class R4 | 949,987 | 11,744,738 | | 187,548 | 2,578,863 | | 275,909 | 3,643,619 | | 664,421 | 10,072,796 |
| Class R6 | 5,363,005 | 64,986,633 | | 1,170,180 | 16,004,181 | | 3,013,744 | 38,647,338 | | 3,924,237 | 58,102,536 |
| Class 529A | 248,093 | 2,495,454 | | 10,660,485 | 116,626,233 | | — | — | | — | — |
| Class 529B | — | — | | 103,719 | 1,177,862 | | — | — | | — | — |
| Class 529C | — | — | | 994,778 | 11,228,950 | | — | — | | — | — |
| | 9,080,041 | $109,516,373 | | 19,144,880 | $229,806,869 | | 4,497,871 | $57,797,656 | | 8,000,430 | $118,485,333 |
Shares issued in connection with
acquisition of MFS Lifetime 2020 Fund | | | | | | | | | | | |
| Class A | 3,049,968 | $ 37,667,110 | | | | | | | | | |
| Class B | 95,301 | 1,176,967 | | | | | | | | | |
| Class C | 312,197 | 3,852,508 | | | | | | | | | |
| Class I | 265,139 | 3,274,471 | | | | | | | | | |
| Class R1 | 84,922 | 1,050,490 | | | | | | | | | |
| Class R2 | 1,809,715 | 22,349,976 | | | | | | | | | |
| Class R3 | 4,949,814 | 61,130,203 | | | | | | | | | |
| Class R4 | 1,478,497 | 18,259,440 | | | | | | | | | |
| Class R6 | 6,629,463 | 82,139,036 | | | | | | | | | |
| | 18,675,016 | $230,900,201 | | | | | | | | | |
Shares issued to shareholders in
reinvestment of distributions | | | | | | | | | | | |
| Class A | 127,125 | $ 1,520,344 | | 689,857 | $ 9,419,979 | | — | $ — | | 132,057 | $ 1,933,315 |
| Class B | 918 | 10,949 | | 8,328 | 113,846 | | — | — | | 5,508 | 80,251 |
| Class C | 21,744 | 260,636 | | 248,765 | 3,397,857 | | — | — | | 17,086 | 247,400 |
| Class I | 33,440 | 400,708 | | 186,728 | 2,550,053 | | — | — | | 16,570 | 243,250 |
| Class R1 | 956 | 11,411 | | 7,486 | 102,357 | | — | — | | 1,360 | 20,049 |
| Class R2 | 11,097 | 131,023 | | 32,909 | 449,634 | | — | — | | 82,392 | 1,203,748 |
| Class R3 | 65,712 | 781,462 | | 277,602 | 3,793,525 | | — | — | | 527,143 | 7,706,830 |
| Class R4 | 19,577 | 231,599 | | 74,556 | 1,020,508 | | — | — | | 202,854 | 2,988,038 |
| Class R6 | 114,143 | 1,358,915 | | 370,055 | 5,069,546 | | — | — | | 1,057,427 | 15,554,744 |
| Class 529A | — | — | | 886,980 | 9,822,798 | | — | — | | — | — |
| Class 529B | — | — | | 16,690 | 185,729 | | — | — | | — | — |
| Class 529C | — | — | | 123,651 | 1,372,374 | | — | — | | — | — |
| | 394,712 | $4,707,047 | | 2,923,607 | $37,298,206 | | — | $— | | 2,042,397 | $29,977,625 |
Notes to Financial Statements (unaudited) - continued
| | MFS Lifetime Income Fund − continued | | MFS Lifetime 2025 Fund − continued |
| | Six Months Ended
10/31/22 | | Year ended
4/30/22 | | Six Months Ended
10/31/22 | | Year ended
4/30/22 |
| | Shares | Amount | | Shares | Amount | | Shares | Amount | | Shares | Amount |
| Shares reacquired | | | | | | | | | | | |
| Class A | (1,304,894) | $ (15,711,438) | | (2,157,843) | $ (29,606,727) | | (338,285) | $ (4,401,989) | | (536,436) | $ (7,945,279) |
| Class B | (48,056) | (571,957) | | (98,490) | (1,355,317) | | (11,930) | (150,258) | | (18,211) | (264,868) |
| Class C | (956,847) | (11,481,793) | | (1,998,702) | (27,273,041) | | (28,527) | (364,007) | | (94,069) | (1,384,791) |
| Class I | (428,563) | (5,135,649) | | (729,666) | (9,874,183) | | (70,856) | (950,359) | | (11,130) | (158,823) |
| Class R1 | (24,195) | (292,458) | | (78,201) | (1,040,745) | | (1,315) | (17,169) | | (7,134) | (107,589) |
| Class R2 | (271,682) | (3,219,005) | | (304,094) | (4,198,716) | | (174,649) | (2,182,577) | | (505,389) | (7,496,808) |
| Class R3 | (1,158,528) | (13,807,135) | | (2,649,414) | (36,350,168) | | (1,292,276) | (16,580,914) | | (2,510,547) | (37,409,023) |
| Class R4 | (466,517) | (5,660,537) | | (1,574,635) | (21,845,808) | | (257,697) | (3,381,518) | | (3,774,324) | (57,600,980) |
| Class R6 | (1,306,481) | (15,717,138) | | (1,354,687) | (18,330,604) | | (2,024,615) | (26,475,464) | | (3,999,012) | (59,343,413) |
| Class 529A | (17,366,010) | (172,809,991) | | (8,564,743) | (94,605,539) | | — | — | | — | — |
| Class 529B | — | — | | (459,429) | (4,980,248) | | — | — | | — | — |
| Class 529C | — | — | | (3,678,567) | (39,639,831) | | — | — | | — | — |
| | (23,331,773) | $(244,407,101) | | (23,648,471) | $(289,100,927) | | (4,200,150) | $(54,504,255) | | (11,456,252) | $(171,711,574) |
| Net change | | | | | | | | | | | |
| Class A | 2,762,369 | $ 34,157,214 | | 1,468,716 | $ 19,872,230 | | (123,670) | $ (1,629,711) | | 26,171 | $ 343,498 |
| Class B | 51,021 | 650,614 | | (88,520) | (1,219,774) | | (11,930) | (150,258) | | (10,184) | (150,415) |
| Class C | (470,609) | (5,532,295) | | (1,452,720) | (19,777,250) | | 14,568 | 176,742 | | (41,640) | (617,821) |
| Class I | 256,343 | 3,241,846 | | 221,391 | 3,112,797 | | (68,679) | (921,576) | | 97,515 | 1,406,886 |
| Class R1 | 90,999 | 1,121,563 | | 2,869 | 47,572 | | 1,539 | 20,056 | | (1,850) | (28,918) |
| Class R2 | 1,665,046 | 20,655,919 | | (142,507) | (1,985,246) | | (44,830) | (504,316) | | (214,423) | (3,245,815) |
| Class R3 | 4,799,070 | 59,393,510 | | (545,794) | (7,731,195) | | (476,618) | (6,131,511) | | 655,383 | 9,270,248 |
| Class R4 | 1,981,544 | 24,575,240 | | (1,312,531) | (18,246,437) | | 18,212 | 262,101 | | (2,907,049) | (44,540,146) |
| Class R6 | 10,800,130 | 132,767,446 | | 185,548 | 2,743,123 | | 989,129 | 12,171,874 | | 982,652 | 14,313,867 |
| Class 529A | (17,117,917) | (170,314,537) | | 2,982,722 | 31,843,492 | | — | — | | — | — |
| Class 529B | — | — | | (339,020) | (3,616,657) | | — | — | | — | — |
| Class 529C | — | — | | (2,560,138) | (27,038,507) | | — | — | | — | — |
| | 4,817,996 | $100,716,520 | | (1,579,984) | $(21,995,852) | | 297,721 | $3,293,401 | | (1,413,425) | $(23,248,616) |
| | MFS Lifetime 2030 Fund | | MFS Lifetime 2035 Fund |
| | Six Months Ended
10/31/22 | | Year ended
4/30/22 | | Six Months Ended
10/31/22 | | Year ended
4/30/22 |
| | Shares | Amount | | Shares | Amount | | Shares | Amount | | Shares | Amount |
| Shares sold | | | | | | | | | | | |
| Class A | 325,492 | $ 5,003,409 | | 826,763 | $ 14,694,261 | | 186,492 | $ 2,969,118 | | 476,912 | $ 8,872,004 |
| Class B | — | — | | 2,065 | 35,716 | | 8 | 132 | | 1,731 | 31,681 |
| Class C | 36,371 | 545,686 | | 105,073 | 1,863,284 | | 35,445 | 557,382 | | 33,896 | 621,545 |
| Class I | 227,774 | 3,627,383 | | 205,174 | 3,755,925 | | 35,004 | 557,960 | | 28,791 | 543,880 |
| Class R1 | 16,334 | 249,650 | | 69,206 | 1,197,444 | | 9,286 | 141,766 | | 35,265 | 596,340 |
| Class R2 | 210,999 | 3,230,347 | | 660,459 | 11,565,292 | | 145,138 | 2,326,334 | | 274,581 | 5,031,795 |
| Class R3 | 1,543,589 | 23,533,743 | | 4,067,997 | 72,621,265 | | 1,027,268 | 16,231,443 | | 2,763,648 | 51,327,402 |
| Class R4 | 922,974 | 14,850,525 | | 719,442 | 13,299,398 | | 213,310 | 3,510,883 | | 550,838 | 10,453,575 |
| Class R6 | 3,463,462 | 53,078,086 | | 4,580,292 | 82,014,152 | | 3,515,158 | 55,420,768 | | 3,809,173 | 70,909,801 |
| | 6,746,995 | $104,118,829 | | 11,236,471 | $201,046,737 | | 5,167,109 | $81,715,786 | | 7,974,835 | $148,388,023 |
Notes to Financial Statements (unaudited) - continued
| | MFS Lifetime 2030 Fund − continued | | MFS Lifetime 2035 Fund − continued |
| | Six Months Ended
10/31/22 | | Year ended
4/30/22 | | Six Months Ended
10/31/22 | | Year ended
4/30/22 |
| | Shares | Amount | | Shares | Amount | | Shares | Amount | | Shares | Amount |
Shares issued to shareholders in
reinvestment of distributions | | | | | | | | | | | |
| Class A | — | $ — | | 382,031 | $ 6,788,684 | | — | $ — | | 112,150 | $ 2,088,232 |
| Class B | — | — | | 23,777 | 418,000 | | — | — | | 5,556 | 103,003 |
| Class C | — | — | | 52,579 | 916,459 | | — | — | | 13,264 | 244,060 |
| Class I | — | — | | 35,638 | 636,136 | | — | — | | 5,478 | 102,283 |
| Class R1 | — | — | | 22,242 | 392,788 | | — | — | | 1,829 | 34,032 |
| Class R2 | — | — | | 254,531 | 4,484,827 | | — | — | | 67,516 | 1,258,495 |
| Class R3 | — | — | | 927,695 | 16,429,472 | | — | — | | 586,577 | 10,933,795 |
| Class R4 | — | — | | 337,284 | 6,040,757 | | — | — | | 186,183 | 3,492,794 |
| Class R6 | — | — | | 1,373,585 | 24,559,697 | | — | — | | 847,437 | 15,880,967 |
| | — | $— | | 3,409,362 | $60,666,820 | | — | $— | | 1,825,990 | $34,137,661 |
| Shares reacquired | | | | | | | | | | | |
| Class A | (272,237) | $ (4,216,352) | | (785,435) | $ (13,841,138) | | (47,864) | $ (750,907) | | (319,863) | $ (5,934,680) |
| Class B | (33,937) | (514,918) | | (103,891) | (1,831,513) | | (6,566) | (105,679) | | (10,676) | (196,141) |
| Class C | (182,601) | (2,761,491) | | (202,667) | (3,545,624) | | (15,527) | (242,407) | | (30,159) | (559,164) |
| Class I | (191,170) | (2,949,972) | | (177,252) | (3,124,276) | | (1,142) | (18,170) | | (20,277) | (374,225) |
| Class R1 | (32,035) | (493,209) | | (142,680) | (2,459,583) | | (4,088) | (65,902) | | (6,212) | (114,759) |
| Class R2 | (409,911) | (6,187,742) | | (990,552) | (17,692,675) | | (180,323) | (2,766,103) | | (432,190) | (8,148,030) |
| Class R3 | (1,500,120) | (22,932,900) | | (3,520,953) | (63,715,683) | | (1,198,661) | (18,976,211) | | (2,370,103) | (44,408,051) |
| Class R4 | (948,395) | (15,203,482) | | (4,210,706) | (78,281,457) | | (108,533) | (1,775,143) | | (3,116,882) | (60,059,835) |
| Class R6 | (1,886,407) | (29,353,265) | | (2,758,911) | (49,813,544) | | (967,969) | (15,558,043) | | (1,481,695) | (27,639,378) |
| | (5,456,813) | $(84,613,331) | | (12,893,047) | $(234,305,493) | | (2,530,673) | $(40,258,565) | | (7,788,057) | $(147,434,263) |
| Net change | | | | | | | | | | | |
| Class A | 53,255 | $ 787,057 | | 423,359 | $ 7,641,807 | | 138,628 | $ 2,218,211 | | 269,199 | $ 5,025,556 |
| Class B | (33,937) | (514,918) | | (78,049) | (1,377,797) | | (6,558) | (105,547) | | (3,389) | (61,457) |
| Class C | (146,230) | (2,215,805) | | (45,015) | (765,881) | | 19,918 | 314,975 | | 17,001 | 306,441 |
| Class I | 36,604 | 677,411 | | 63,560 | 1,267,785 | | 33,862 | 539,790 | | 13,992 | 271,938 |
| Class R1 | (15,701) | (243,559) | | (51,232) | (869,351) | | 5,198 | 75,864 | | 30,882 | 515,613 |
| Class R2 | (198,912) | (2,957,395) | | (75,562) | (1,642,556) | | (35,185) | (439,769) | | (90,093) | (1,857,740) |
| Class R3 | 43,469 | 600,843 | | 1,474,739 | 25,335,054 | | (171,393) | (2,744,768) | | 980,122 | 17,853,146 |
| Class R4 | (25,421) | (352,957) | | (3,153,980) | (58,941,302) | | 104,777 | 1,735,740 | | (2,379,861) | (46,113,466) |
| Class R6 | 1,577,055 | 23,724,821 | | 3,194,966 | 56,760,305 | | 2,547,189 | 39,862,725 | | 3,174,915 | 59,151,390 |
| | 1,290,182 | $19,505,498 | | 1,752,786 | $27,408,064 | | 2,636,436 | $41,457,221 | | 2,012,768 | $35,091,421 |
| | MFS Lifetime 2040 Fund | | MFS Lifetime 2045 Fund |
| | Six Months Ended
10/31/22 | | Year ended
4/30/22 | | Six Months Ended
10/31/22 | | Year ended
4/30/22 |
| | Shares | Amount | | Shares | Amount | | Shares | Amount | | Shares | Amount |
| Shares sold | | | | | | | | | | | |
| Class A | 208,558 | $ 3,599,327 | | 425,267 | $ 8,531,346 | | 147,317 | $ 2,518,590 | | 329,248 | $ 6,388,573 |
| Class B | — | — | | 1,125 | 22,234 | | — | — | | 1,088 | 22,886 |
| Class C | 35,516 | 593,743 | | 63,872 | 1,263,480 | | 39,636 | 644,749 | | 26,229 | 516,992 |
| Class I | 196,584 | 3,380,479 | | 100,043 | 2,073,275 | | 14,398 | 248,948 | | 32,031 | 637,136 |
| Class R1 | 16,220 | 274,735 | | 50,673 | 992,387 | | 4,111 | 69,300 | | 8,590 | 163,825 |
| Class R2 | 245,261 | 4,192,355 | | 494,238 | 9,886,682 | | 72,209 | 1,211,937 | | 181,664 | 3,559,399 |
| Class R3 | 1,243,636 | 21,162,192 | | 3,248,381 | 65,135,731 | | 993,506 | 16,518,950 | | 2,577,120 | 50,476,937 |
| Class R4 | 546,968 | 9,967,136 | | 504,057 | 10,531,298 | | 181,124 | 3,155,820 | | 373,295 | 7,583,357 |
| Class R6 | 3,967,228 | 67,755,639 | | 3,284,786 | 66,975,268 | | 3,763,994 | 62,460,121 | | 2,748,174 | 54,592,402 |
| | 6,459,971 | $110,925,606 | | 8,172,442 | $165,411,701 | | 5,216,295 | $86,828,415 | | 6,277,439 | $123,941,507 |
Notes to Financial Statements (unaudited) - continued
| | MFS Lifetime 2040 Fund − continued | | MFS Lifetime 2045 Fund − continued |
| | Six Months Ended
10/31/22 | | Year ended
4/30/22 | | Six Months Ended
10/31/22 | | Year ended
4/30/22 |
| | Shares | Amount | | Shares | Amount | | Shares | Amount | | Shares | Amount |
Shares issued to shareholders in
reinvestment of distributions | | | | | | | | | | | |
| Class A | — | $ — | | 205,626 | $ 4,165,987 | | — | $ — | | 66,848 | $ 1,332,945 |
| Class B | — | — | | 11,659 | 235,401 | | — | — | | 3,285 | 65,242 |
| Class C | — | — | | 33,117 | 658,368 | | — | — | | 7,846 | 154,889 |
| Class I | — | — | | 20,701 | 422,501 | | — | — | | 10,231 | 205,037 |
| Class R1 | — | — | | 16,295 | 327,198 | | — | — | | 1,309 | 26,093 |
| Class R2 | — | — | | 188,169 | 3,791,607 | | — | — | | 42,840 | 852,096 |
| Class R3 | — | — | | 701,530 | 14,205,982 | | — | — | | 466,560 | 9,293,873 |
| Class R4 | — | — | | 235,870 | 4,835,335 | | — | — | | 122,644 | 2,460,233 |
| Class R6 | — | — | | 903,861 | 18,502,034 | | — | — | | 601,572 | 12,043,466 |
| | — | $— | | 2,316,828 | $47,144,413 | | — | $— | | 1,323,135 | $26,433,874 |
| Shares reacquired | | | | | | | | | | | |
| Class A | (202,774) | $ (3,445,532) | | (623,289) | $ (12,624,513) | | (53,402) | $ (901,460) | | (237,630) | $ (4,730,304) |
| Class B | (13,413) | (227,551) | | (39,948) | (805,661) | | (720) | (12,078) | | (9,732) | (189,192) |
| Class C | (36,908) | (618,919) | | (92,124) | (1,832,800) | | (7,456) | (119,305) | | (17,250) | (340,339) |
| Class I | (50,923) | (881,438) | | (27,399) | (556,413) | | (1,691) | (27,925) | | (11,941) | (225,417) |
| Class R1 | (26,567) | (450,688) | | (39,436) | (771,691) | | (2,014) | (33,686) | | (15,303) | (308,639) |
| Class R2 | (406,125) | (6,886,320) | | (844,519) | (17,188,282) | | (119,695) | (1,923,860) | | (353,461) | (7,099,753) |
| Class R3 | (1,216,784) | (20,618,409) | | (2,127,556) | (42,990,532) | | (983,107) | (16,331,966) | | (1,359,158) | (27,204,271) |
| Class R4 | (492,878) | (9,023,077) | | (3,608,044) | (75,675,554) | | (136,383) | (2,399,535) | | (2,772,888) | (56,611,260) |
| Class R6 | (945,422) | (16,381,674) | | (1,616,528) | (32,844,832) | | (737,548) | (12,463,818) | | (1,056,516) | (21,107,425) |
| | (3,391,794) | $(58,533,608) | | (9,018,843) | $(185,290,278) | | (2,042,016) | $(34,213,633) | | (5,833,879) | $(117,816,600) |
| Net change | | | | | | | | | | | |
| Class A | 5,784 | $ 153,795 | | 7,604 | $ 72,820 | | 93,915 | $ 1,617,130 | | 158,466 | $ 2,991,214 |
| Class B | (13,413) | (227,551) | | (27,164) | (548,026) | | (720) | (12,078) | | (5,359) | (101,064) |
| Class C | (1,392) | (25,176) | | 4,865 | 89,048 | | 32,180 | 525,444 | | 16,825 | 331,542 |
| Class I | 145,661 | 2,499,041 | | 93,345 | 1,939,363 | | 12,707 | 221,023 | | 30,321 | 616,756 |
| Class R1 | (10,347) | (175,953) | | 27,532 | 547,894 | | 2,097 | 35,614 | | (5,404) | (118,721) |
| Class R2 | (160,864) | (2,693,965) | | (162,112) | (3,509,993) | | (47,486) | (711,923) | | (128,957) | (2,688,258) |
| Class R3 | 26,852 | 543,783 | | 1,822,355 | 36,351,181 | | 10,399 | 186,984 | | 1,684,522 | 32,566,539 |
| Class R4 | 54,090 | 944,059 | | (2,868,117) | (60,308,921) | | 44,741 | 756,285 | | (2,276,949) | (46,567,670) |
| Class R6 | 3,021,806 | 51,373,965 | | 2,572,119 | 52,632,470 | | 3,026,446 | 49,996,303 | | 2,293,230 | 45,528,443 |
| | 3,068,177 | $52,391,998 | | 1,470,427 | $27,265,836 | | 3,174,279 | $52,614,782 | | 1,766,695 | $32,558,781 |
| | MFS Lifetime 2050 Fund | | MFS Lifetime 2055 Fund |
| | Six Months Ended
10/31/22 | | Year ended
4/30/22 | | Six Months Ended
10/31/22 | | Year ended
4/30/22 |
| | Shares | Amount | | Shares | Amount | | Shares | Amount | | Shares | Amount |
| Shares sold | | | | | | | | | | | |
| Class A | 154,916 | $ 3,128,113 | | 252,045 | $ 6,019,630 | | 161,803 | $ 2,801,544 | | 267,258 | $ 5,465,294 |
| Class B | 371 | 6,840 | | — | — | | — | — | | — | — |
| Class C | 27,066 | 525,337 | | 23,288 | 545,886 | | 16,300 | 277,396 | | 22,614 | 460,659 |
| Class I | 1,055,848 | 22,054,395 | | 36,143 | 835,341 | | 5,273 | 92,432 | | 22,339 | 470,696 |
| Class R1 | 4,455 | 88,607 | | 16,104 | 366,729 | | 9,995 | 172,114 | | 12,186 | 244,259 |
| Class R2 | 129,893 | 2,601,392 | | 235,308 | 5,569,204 | | 110,832 | 1,940,690 | | 165,525 | 3,365,611 |
| Class R3 | 896,456 | 17,750,830 | | 1,887,642 | 44,538,296 | | 802,782 | 13,839,610 | | 1,442,570 | 29,397,607 |
| Class R4 | 244,453 | 5,143,168 | | 300,510 | 7,295,992 | | 212,845 | 3,837,077 | | 292,896 | 6,109,365 |
| Class R6 | 2,688,872 | 53,362,158 | | 2,223,596 | 52,785,092 | | 2,151,240 | 37,013,103 | | 2,119,489 | 43,471,257 |
| | 5,202,330 | $104,660,840 | | 4,974,636 | $117,956,170 | | 3,471,070 | $59,973,966 | | 4,344,877 | $88,984,748 |
Notes to Financial Statements (unaudited) - continued
| | MFS Lifetime 2050 Fund − continued | | MFS Lifetime 2055 Fund − continued |
| | Six Months Ended
10/31/22 | | Year ended
4/30/22 | | Six Months Ended
10/31/22 | | Year ended
4/30/22 |
| | Shares | Amount | | Shares | Amount | | Shares | Amount | | Shares | Amount |
Shares issued to shareholders in
reinvestment of distributions | | | | | | | | | | | |
| Class A | — | $ — | | 79,973 | $ 1,917,746 | | — | $ — | | 48,841 | $ 1,006,129 |
| Class B | — | — | | 5,284 | 124,989 | | — | — | | 2,314 | 47,582 |
| Class C | — | — | | 12,452 | 292,874 | | — | — | | 8,776 | 178,864 |
| Class I | — | — | | 4,329 | 103,644 | | — | — | | 2,010 | 41,450 |
| Class R1 | — | — | | 2,545 | 60,077 | | — | — | | 2,403 | 49,193 |
| Class R2 | — | — | | 69,177 | 1,641,562 | | — | — | | 31,118 | 641,026 |
| Class R3 | — | — | | 423,181 | 10,063,249 | | — | — | | 261,397 | 5,387,396 |
| Class R4 | — | — | | 104,635 | 2,509,146 | | — | — | | 59,336 | 1,232,418 |
| Class R6 | — | — | | 487,643 | 11,674,167 | | — | — | | 281,838 | 5,848,135 |
| | — | $— | | 1,189,219 | $28,387,454 | | — | $— | | 698,033 | $14,432,193 |
| Shares reacquired | | | | | | | | | | | |
| Class A | (61,673) | $ (1,264,305) | | (210,167) | $ (4,983,056) | | (44,665) | $ (776,439) | | (189,613) | $ (3,838,565) |
| Class B | (6,276) | (120,699) | | (18,044) | (418,212) | | (986) | (16,894) | | (5,030) | (103,673) |
| Class C | (17,980) | (363,463) | | (47,005) | (1,103,526) | | (12,639) | (214,410) | | (25,177) | (512,363) |
| Class I | (24,772) | (502,652) | | (15,694) | (365,356) | | (1,690) | (29,037) | | (17,663) | (378,837) |
| Class R1 | (3,461) | (69,556) | | (13,151) | (302,751) | | (2,962) | (51,332) | | (8,673) | (178,727) |
| Class R2 | (174,320) | (3,449,742) | | (612,710) | (14,769,906) | | (116,498) | (1,938,921) | | (569,713) | (11,814,420) |
| Class R3 | (845,075) | (16,716,653) | | (1,483,387) | (35,605,071) | | (665,666) | (11,444,317) | | (888,868) | (18,521,840) |
| Class R4 | (208,811) | (4,402,264) | | (2,246,946) | (55,508,210) | | (144,925) | (2,649,100) | | (1,427,936) | (30,312,705) |
| Class R6 | (583,269) | (11,766,813) | | (841,717) | (20,153,772) | | (450,031) | (7,899,358) | | (614,339) | (12,715,853) |
| | (1,925,637) | $(38,656,147) | | (5,488,821) | $(133,209,860) | | (1,440,062) | $(25,019,808) | | (3,747,012) | $(78,376,983) |
| Net change | | | | | | | | | | | |
| Class A | 93,243 | $ 1,863,808 | | 121,851 | $ 2,954,320 | | 117,138 | $ 2,025,105 | | 126,486 | $ 2,632,858 |
| Class B | (5,905) | (113,859) | | (12,760) | (293,223) | | (986) | (16,894) | | (2,716) | (56,091) |
| Class C | 9,086 | 161,874 | | (11,265) | (264,766) | | 3,661 | 62,986 | | 6,213 | 127,160 |
| Class I | 1,031,076 | 21,551,743 | | 24,778 | 573,629 | | 3,583 | 63,395 | | 6,686 | 133,309 |
| Class R1 | 994 | 19,051 | | 5,498 | 124,055 | | 7,033 | 120,782 | | 5,916 | 114,725 |
| Class R2 | (44,427) | (848,350) | | (308,225) | (7,559,140) | | (5,666) | 1,769 | | (373,070) | (7,807,783) |
| Class R3 | 51,381 | 1,034,177 | | 827,436 | 18,996,474 | | 137,116 | 2,395,293 | | 815,099 | 16,263,163 |
| Class R4 | 35,642 | 740,904 | | (1,841,801) | (45,703,072) | | 67,920 | 1,187,977 | | (1,075,704) | (22,970,922) |
| Class R6 | 2,105,603 | 41,595,345 | | 1,869,522 | 44,305,487 | | 1,701,209 | 29,113,745 | | 1,786,988 | 36,603,539 |
| | 3,276,693 | $66,004,693 | | 675,034 | $13,133,764 | | 2,031,008 | $34,954,158 | | 1,295,898 | $25,039,958 |
| | MFS Lifetime 2060 Fund | | MFS Lifetime 2065 Fund |
| | Six Months Ended
10/31/22 | | Year ended
4/30/22 | | Six Months Ended
10/31/22 | | Year ended
4/30/22 (c) |
| | Shares | Amount | | Shares | Amount | | Shares | Amount | | Shares | Amount |
| Shares sold | | | | | | | | | | | |
| Class A | 132,075 | $ 1,818,331 | | 241,447 | $ 3,962,591 | | 11,680 | $ 96,230 | | 27,184 | $ 256,895 |
| Class C | 10,065 | 138,055 | | 17,566 | 282,211 | | 1,981 | 16,202 | | 5,793 | 57,270 |
| Class I | 2,690 | 37,086 | | 6,289 | 103,954 | | 1,021 | 8,516 | | 5,110 | 51,001 |
| Class R1 | — | — | | 250 | 4,095 | | 936 | 8,000 | | 5,001 | 50,000 |
| Class R2 | 53,983 | 742,617 | | 79,064 | 1,283,102 | | 1,890 | 15,391 | | 6,711 | 66,322 |
| Class R3 | 699,207 | 9,621,408 | | 1,157,847 | 18,542,592 | | 30,304 | 244,971 | | 5,000 | 50,000 |
| Class R4 | 60,627 | 841,443 | | 162,924 | 2,654,422 | | 1,001 | 8,519 | | 5,000 | 50,000 |
| Class R6 | 1,489,067 | 20,431,968 | | 1,265,249 | 20,560,682 | | 61,165 | 498,628 | | 74,096 | 727,018 |
| | 2,447,714 | $33,630,908 | | 2,930,636 | $47,393,649 | | 109,978 | $896,457 | | 133,895 | $1,308,506 |
Notes to Financial Statements (unaudited) - continued
| | MFS Lifetime 2060 Fund − continued | | MFS Lifetime 2065 Fund − continued |
| | Six Months Ended
10/31/22 | | Year ended
4/30/22 | | Six Months Ended
10/31/22 | | Year ended
4/30/22 (c) |
| | Shares | Amount | | Shares | Amount | | Shares | Amount | | Shares | Amount |
Shares issued to shareholders in
reinvestment of distributions | | | | | | | | | | | |
| Class A | — | $ — | | 27,762 | $ 455,025 | | — | $ — | | 558 | $ 5,464 |
| Class B | — | — | | 625 | 10,248 | | — | — | | — | — |
| Class C | — | — | | 2,940 | 47,868 | | — | — | | 195 | 1,913 |
| Class I | — | — | | 1,117 | 18,437 | | — | — | | 211 | 2,074 |
| Class R1 | — | — | | 283 | 4,654 | | — | — | | 194 | 1,908 |
| Class R2 | — | — | | 6,781 | 111,001 | | — | — | | 240 | 2,355 |
| Class R3 | — | — | | 87,099 | 1,429,297 | | — | — | | 207 | 2,033 |
| Class R4 | — | — | | 11,210 | 184,859 | | — | — | | 211 | 2,075 |
| Class R6 | — | — | | 107,040 | 1,768,301 | | — | — | | 2,381 | 23,353 |
| | — | $— | | 244,857 | $4,029,690 | | — | $— | | 4,197 | $41,175 |
| Shares reacquired | | | | | | | | | | | |
| Class A | (19,278) | $ (269,798) | | (66,640) | $ (1,105,947) | | (440) | $ (3,478) | | (93) | $ (869) |
| Class B | (360) | (4,923) | | (268) | (4,289) | | — | — | | — | — |
| Class C | (6,280) | (87,553) | | (6,669) | (107,515) | | (626) | (5,165) | | (24) | (222) |
| Class I | (498) | (6,730) | | (1,676) | (27,029) | | — | — | | (3) | (25) |
| Class R1 | — | — | | (251) | (4,211) | | — | — | | — | — |
| Class R2 | (77,226) | (1,021,858) | | (39,650) | (646,274) | | (10) | (87) | | (7) | (66) |
| Class R3 | (323,751) | (4,401,009) | | (379,140) | (6,129,529) | | (1) | (9) | | — | — |
| Class R4 | (17,360) | (243,498) | | (505,627) | (8,417,983) | | (60) | (481) | | — | — |
| Class R6 | (277,390) | (3,853,584) | | (487,073) | (7,945,299) | | (2,743) | (22,948) | | (96) | (889) |
| | (722,143) | $(9,888,953) | | (1,486,994) | $(24,388,076) | | (3,880) | $(32,168) | | (223) | $(2,071) |
| Net change | | | | | | | | | | | |
| Class A | 112,797 | $ 1,548,533 | | 202,569 | $ 3,311,669 | | 11,240 | $ 92,752 | | 27,649 | $ 261,490 |
| Class B | (360) | (4,923) | | 357 | 5,959 | | — | — | | — | — |
| Class C | 3,785 | 50,502 | | 13,837 | 222,564 | | 1,355 | 11,037 | | 5,964 | 58,961 |
| Class I | 2,192 | 30,356 | | 5,730 | 95,362 | | 1,021 | 8,516 | | 5,318 | 53,050 |
| Class R1 | — | — | | 282 | 4,538 | | 936 | 8,000 | | 5,195 | 51,908 |
| Class R2 | (23,243) | (279,241) | | 46,195 | 747,829 | | 1,880 | 15,304 | | 6,944 | 68,611 |
| Class R3 | 375,456 | 5,220,399 | | 865,806 | 13,842,360 | | 30,303 | 244,962 | | 5,207 | 52,033 |
| Class R4 | 43,267 | 597,945 | | (331,493) | (5,578,702) | | 941 | 8,038 | | 5,211 | 52,075 |
| Class R6 | 1,211,677 | 16,578,384 | | 885,216 | 14,383,684 | | 58,422 | 475,680 | | 76,381 | 749,482 |
| | 1,725,571 | $23,741,955 | | 1,688,499 | $27,035,263 | | 106,098 | $864,289 | | 137,869 | $1,347,610 |
| (c) | For the period from the commencement of the fund’s investment operations, September 1, 2021, through the stated period end. |
Effective June 1, 2019, purchases of each fund's Class B and Class 529B (if applicable) shares were closed to new and existing investors subject to certain exceptions. For the MFS Lifetime Income Fund, effective after the close of business on March 18, 2022, all sales of Class 529B and Class 529C shares were suspended, and Class 529B and Class 529C shares were converted into Class 529A shares of the fund effective March 21, 2022. Effective after the close of business on May 13, 2022, all sales and redemptions of Class 529A shares were suspended, and all Class 529A shares were redeemed on May 20, 2022.
(6) Line of Credit
Each fund and certain other funds managed by MFS participate in a $1.45 billion unsecured committed line of credit of which $1.2 billion is reserved for use by each fund and certain other MFS U.S. funds. The line of credit is provided by a syndicate of banks under a credit agreement. Borrowings may be made for temporary financing needs. Interest is charged to each fund, based on its borrowings, generally at a rate equal to the highest of 1) Daily Simple SOFR (Secured Overnight Financing Rate) plus 0.10%, 2) the Federal Funds Effective Rate, or 3) the Overnight Bank Funding Rate, each plus an agreed upon spread. A commitment fee, based on the average daily unused portion of the committed line of credit, is allocated among the participating funds. The line of credit expires on March 16, 2023 unless extended or renewed. In addition, each fund and other funds managed by MFS have established unsecured uncommitted borrowing arrangements with certain banks for temporary financing needs. Interest is charged to each fund,
Notes to Financial Statements (unaudited) - continued
based on its borrowings, at rates equal to customary reference rates plus an agreed upon spread. For the six months ended October 31, 2022, each fund’s commitment fee and interest expense were as follows and are included in “Miscellaneous” expense in the Statements of Operations:
| | MFS Lifetime
Income Fund | MFS Lifetime
2025 Fund | MFS Lifetime
2030 Fund | MFS Lifetime
2035 Fund | MFS Lifetime
2040 Fund |
| Commitment Fee | $1,240 | $939 | $1,583 | $1,060 | $1,266 |
| Interest Expense | — | — | — | — | — |
| | MFS Lifetime
2045 Fund | MFS Lifetime
2050 Fund | MFS Lifetime
2055 Fund | MFS Lifetime
2060 Fund | MFS Lifetime
2065 Fund |
| Commitment Fee | $798 | $758 | $453 | $180 | $3 |
| Interest Expense | — | — | — | — | — |
(7) Investments in Affiliated Issuers
An affiliated issuer may be considered one in which the fund owns 5% or more of the outstanding voting securities, or a company which is under common control. For the purposes of this report, the following were affiliated issuers:
| | MFS Lifetime Income Fund |
| Affiliated Issuers | Beginning
Value | Purchases | Sales
Proceeds | Realized
Gain
(Loss) | Change in
Unrealized
Appreciation or
Depreciation | Ending
Value |
| MFS Blended Research Core Equity Fund | $11,705,628 | $5,685,328 | $3,685,120 | $157,743 | $(724,677) | $13,138,902 |
| MFS Blended Research Growth Equity Fund | 11,477,935 | 6,146,478 | 3,171,038 | (237,460) | (1,086,619) | 13,129,296 |
| MFS Blended Research International Equity Fund | 14,893,022 | 7,840,992 | 4,324,956 | 392,253 | (2,391,819) | 16,409,492 |
| MFS Blended Research Mid Cap Equity Fund | 17,517,440 | 8,746,648 | 5,932,138 | 30,290 | (326,914) | 20,035,326 |
| MFS Blended Research Small Cap Equity Fund | 5,749,446 | 2,948,003 | 1,798,667 | 82,788 | (364,010) | 6,617,560 |
| MFS Blended Research Value Equity Fund | 11,811,522 | 5,651,120 | 4,234,850 | 715,820 | (597,911) | 13,345,701 |
| MFS Commodity Strategy Fund | 12,356,039 | 7,266,699 | 5,109,239 | 603,539 | (2,001,073) | 13,115,965 |
| MFS Emerging Markets Debt Fund | 6,060,907 | 3,187,724 | 1,837,694 | (362,432) | (488,058) | 6,560,447 |
| MFS Emerging Markets Debt Local Currency Fund (a) | 5,994,229 | 3,179,223 | 1,988,845 | (530,237) | (93,130) | 6,561,240 |
| MFS Global Opportunistic Bond Fund | 42,810,062 | 20,751,547 | 14,356,180 | (2,316,702) | (957,375) | 45,931,352 |
| MFS Global Real Estate Fund | 11,830,220 | 7,012,026 | 2,764,116 | 447,796 | (3,403,203) | 13,122,723 |
| MFS Government Securities Fund | 61,201,977 | 30,838,086 | 21,072,347 | (2,237,946) | (3,134,169) | 65,595,601 |
| MFS Growth Fund | 11,446,018 | 6,429,146 | 3,095,791 | 863,530 | (2,516,373) | 13,126,530 |
| MFS High Income Fund | 12,202,992 | 5,819,059 | 3,892,989 | (472,904) | (526,488) | 13,129,670 |
| MFS Inflation-Adjusted Bond Fund | 61,414,378 | 31,463,385 | 19,662,568 | (256,884) | (7,343,317) | 65,614,994 |
| MFS Institutional Money Market Portfolio | 1,061,965 | 15,743,607 | 15,735,798 | (339) | — | 1,069,435 |
| MFS International Growth Fund | 2,987,425 | 1,519,506 | 873,256 | 197,128 | (548,675) | 3,282,128 |
| MFS International Intrinsic Value Fund | 2,978,250 | 1,598,407 | 827,302 | 97,156 | (565,000) | 3,281,511 |
| MFS Limited Maturity Fund | 123,552,457 | 61,456,092 | 49,450,644 | (2,426,447) | (1,909,776) | 131,221,682 |
| MFS Mid Cap Growth Fund | 8,604,487 | 4,615,814 | 2,495,346 | 513,350 | (1,385,642) | 9,852,663 |
| MFS Mid Cap Value Fund | 8,808,563 | 4,390,618 | 3,044,951 | 1,420,488 | (1,703,041) | 9,871,677 |
| MFS New Discovery Fund | 2,880,117 | 1,500,055 | 856,534 | (239,236) | 4,049 | 3,288,451 |
| MFS New Discovery Value Fund | 2,921,131 | 1,554,130 | 971,000 | 312,196 | (506,526) | 3,309,931 |
| MFS Research Fund | 11,667,473 | 5,803,427 | 3,608,958 | 1,465,139 | (2,191,631) | 13,135,450 |
| MFS Research International Fund | 8,918,970 | 4,756,359 | 2,605,408 | 626,460 | (1,851,004) | 9,845,377 |
| MFS Total Return Bond Fund | 121,888,157 | 61,231,827 | 39,622,768 | (4,343,399) | (7,956,626) | 131,197,191 |
| MFS Value Fund | 11,791,665 | 5,728,227 | 4,040,948 | 1,633,509 | (1,867,936) | 13,244,517 |
| | $606,532,475 | $322,863,533 | $221,059,451 | $(3,864,801) | $(46,436,944) | $658,034,812 |
Notes to Financial Statements (unaudited) - continued
| | MFS Lifetime Income Fund - continued |
| Affiliated Issuers | Dividend
Income | Capital Gain
Distributions |
| MFS Blended Research Core Equity Fund | $— | $— |
| MFS Blended Research Growth Equity Fund | — | — |
| MFS Blended Research International Equity Fund | — | — |
| MFS Blended Research Mid Cap Equity Fund | — | — |
| MFS Blended Research Small Cap Equity Fund | — | — |
| MFS Blended Research Value Equity Fund | — | — |
| MFS Commodity Strategy Fund | — | — |
| MFS Emerging Markets Debt Fund | 151,689 | — |
| MFS Emerging Markets Debt Local Currency Fund (a) | 134,586 | — |
| MFS Global Opportunistic Bond Fund | 343,497 | — |
| MFS Global Real Estate Fund | — | — |
| MFS Government Securities Fund | 572,359 | — |
| MFS Growth Fund | — | — |
| MFS High Income Fund | 295,551 | — |
| MFS Inflation-Adjusted Bond Fund | 2,286,270 | — |
| MFS Institutional Money Market Portfolio | 9,355 | — |
| MFS International Growth Fund | — | — |
| MFS International Intrinsic Value Fund | — | — |
| MFS Limited Maturity Fund | 1,234,253 | — |
| MFS Mid Cap Growth Fund | — | — |
| MFS Mid Cap Value Fund | — | — |
| MFS New Discovery Fund | — | — |
| MFS New Discovery Value Fund | 31,016 | 47,773 |
| MFS Research Fund | — | — |
| MFS Research International Fund | — | — |
| MFS Total Return Bond Fund | 1,697,830 | — |
| MFS Value Fund | 113,459 | — |
| | $6,869,865 | $47,773 |
Notes to Financial Statements (unaudited) - continued
| | MFS Lifetime 2025 Fund |
| Affiliated Issuers | Beginning
Value | Purchases | Sales
Proceeds | Realized
Gain
(Loss) | Change in
Unrealized
Appreciation or
Depreciation | Ending
Value |
| MFS Blended Research Core Equity Fund | $10,782,613 | $593,267 | $1,008,998 | $(54,228) | $(229,226) | $10,083,428 |
| MFS Blended Research Growth Equity Fund | 10,499,972 | 1,278,207 | 952,798 | (121,326) | (620,627) | 10,083,428 |
| MFS Blended Research International Equity Fund | 14,395,742 | 1,195,404 | 643,724 | (6,316) | (1,767,664) | 13,173,442 |
| MFS Blended Research Mid Cap Equity Fund | 14,777,601 | 686,165 | 1,381,240 | (109,985) | 14,288 | 13,986,829 |
| MFS Blended Research Small Cap Equity Fund | 3,951,872 | 326,664 | 270,246 | (23,646) | (81,243) | 3,903,401 |
| MFS Blended Research Value Equity Fund | 10,883,003 | 252,399 | 1,179,119 | 221,368 | (94,223) | 10,083,428 |
| MFS Commodity Strategy Fund | 8,416,875 | 1,811,041 | 1,350,465 | 169,504 | (1,240,154) | 7,806,801 |
| MFS Emerging Markets Debt Fund | 7,005,802 | 734,956 | 683,093 | (152,041) | (725,588) | 6,180,036 |
| MFS Emerging Markets Debt Local Currency Fund (a) | 6,924,168 | 685,206 | 764,774 | (195,687) | (468,885) | 6,180,028 |
| MFS Global Opportunistic Bond Fund | 29,272,064 | 2,420,548 | 2,423,537 | (452,133) | (1,493,131) | 27,323,811 |
| MFS Global Real Estate Fund | 8,084,897 | 1,749,271 | 245,842 | (9,727) | (1,771,786) | 7,806,813 |
| MFS Government Securities Fund | 41,981,960 | 3,898,780 | 3,661,498 | (560,726) | (2,624,511) | 39,034,005 |
| MFS Growth Fund | 10,447,231 | 1,470,088 | 838,641 | (34,971) | (960,229) | 10,083,478 |
| MFS High Income Fund | 14,118,503 | 913,294 | 1,746,173 | (246,084) | (679,484) | 12,360,056 |
| MFS Inflation-Adjusted Bond Fund | 42,079,286 | 5,327,757 | 3,669,043 | (304,541) | (4,399,453) | 39,034,006 |
| MFS Institutional Money Market Portfolio | 786,735 | 5,136,868 | 5,242,318 | (54) | 42 | 681,273 |
| MFS International Growth Fund | 3,443,816 | 215,427 | 231,158 | 5,507 | (343,576) | 3,090,016 |
| MFS International Intrinsic Value Fund | 3,446,023 | 320,150 | 234,205 | (36,065) | (405,888) | 3,090,015 |
| MFS Limited Maturity Fund | 55,283,420 | 7,542,357 | 5,637,195 | (373,086) | (1,513,759) | 55,301,737 |
| MFS Mid Cap Growth Fund | 7,250,048 | 796,732 | 607,772 | (31,152) | (414,441) | 6,993,415 |
| MFS Mid Cap Value Fund | 7,433,952 | 460,728 | 725,232 | 170,107 | (346,140) | 6,993,415 |
| MFS New Discovery Fund | 1,957,953 | 225,046 | 140,541 | (49,998) | (40,760) | 1,951,700 |
| MFS New Discovery Value Fund | 2,007,626 | 217,766 | 147,178 | (2,333) | (124,181) | 1,951,700 |
| MFS Research Fund | 10,754,605 | 693,373 | 1,001,618 | 145,182 | (508,082) | 10,083,460 |
| MFS Research International Fund | 7,493,796 | 688,445 | 295,773 | (10,222) | (882,832) | 6,993,414 |
| MFS Total Return Bond Fund | 69,081,249 | 7,898,681 | 4,132,400 | (746,771) | (5,415,885) | 66,684,874 |
| MFS Value Fund | 10,874,564 | 441,614 | 1,129,819 | 242,619 | (345,527) | 10,083,451 |
| | $413,435,376 | $47,980,234 | $40,344,400 | $(2,566,805) | $(27,482,945) | $391,021,460 |
Notes to Financial Statements (unaudited) - continued
| | MFS Lifetime 2025 Fund - continued |
| Affiliated Issuers | Dividend
Income | Capital Gain
Distributions |
| MFS Blended Research Core Equity Fund | $— | $— |
| MFS Blended Research Growth Equity Fund | — | — |
| MFS Blended Research International Equity Fund | — | — |
| MFS Blended Research Mid Cap Equity Fund | — | — |
| MFS Blended Research Small Cap Equity Fund | — | — |
| MFS Blended Research Value Equity Fund | — | — |
| MFS Commodity Strategy Fund | — | — |
| MFS Emerging Markets Debt Fund | 170,675 | — |
| MFS Emerging Markets Debt Local Currency Fund (a) | 157,966 | — |
| MFS Global Opportunistic Bond Fund | 241,562 | — |
| MFS Global Real Estate Fund | — | — |
| MFS Government Securities Fund | 384,506 | — |
| MFS Growth Fund | — | — |
| MFS High Income Fund | 332,231 | — |
| MFS Inflation-Adjusted Bond Fund | 1,581,517 | — |
| MFS Institutional Money Market Portfolio | 6,698 | — |
| MFS International Growth Fund | — | — |
| MFS International Intrinsic Value Fund | — | — |
| MFS Limited Maturity Fund | 562,564 | — |
| MFS Mid Cap Growth Fund | — | — |
| MFS Mid Cap Value Fund | — | — |
| MFS New Discovery Fund | — | — |
| MFS New Discovery Value Fund | 28,557 | 43,986 |
| MFS Research Fund | — | — |
| MFS Research International Fund | — | — |
| MFS Total Return Bond Fund | 969,896 | — |
| MFS Value Fund | 106,346 | — |
| | $4,542,518 | $43,986 |
Notes to Financial Statements (unaudited) - continued
| | MFS Lifetime 2030 Fund |
| Affiliated Issuers | Beginning
Value | Purchases | Sales
Proceeds | Realized
Gain
(Loss) | Change in
Unrealized
Appreciation or
Depreciation | Ending
Value |
| MFS Blended Research Core Equity Fund | $26,155,986 | $1,080,322 | $1,584,762 | $(182,273) | $(534,503) | $24,934,770 |
| MFS Blended Research Growth Equity Fund | 25,428,615 | 3,101,828 | 1,759,959 | (375,556) | (1,489,996) | 24,904,932 |
| MFS Blended Research International Equity Fund | 38,779,672 | 2,435,736 | 452,333 | (39,639) | (4,834,572) | 35,888,864 |
| MFS Blended Research Mid Cap Equity Fund | 43,282,606 | 961,102 | 3,066,789 | (296,541) | (68,941) | 40,811,437 |
| MFS Blended Research Small Cap Equity Fund | 9,436,167 | 400,547 | 502,223 | (57,899) | (210,397) | 9,066,195 |
| MFS Blended Research Value Equity Fund | 26,499,506 | 328,293 | 1,753,598 | 103,319 | 211,834 | 25,389,354 |
| MFS Commodity Strategy Fund | 20,637,693 | 2,453,590 | 2,527,410 | 203,894 | (2,836,032) | 17,931,735 |
| MFS Emerging Markets Debt Fund | 19,688,678 | 1,821,152 | 1,027,203 | (277,212) | (2,270,089) | 17,935,326 |
| MFS Emerging Markets Debt Local Currency Fund (a) | 14,473,431 | 1,560,453 | 687,497 | (213,704) | (1,249,618) | 13,883,065 |
| MFS Global Opportunistic Bond Fund | 41,584,240 | 3,698,710 | 1,950,149 | (399,878) | (2,446,180) | 40,486,743 |
| MFS Global Real Estate Fund | 19,338,072 | 3,148,597 | 334,325 | (21,168) | (4,178,568) | 17,952,608 |
| MFS Government Securities Fund | 74,471,760 | 6,161,555 | 5,542,987 | (886,392) | (4,817,147) | 69,386,789 |
| MFS Growth Fund | 25,325,250 | 3,504,141 | 1,437,130 | (151,005) | (2,345,725) | 24,895,531 |
| MFS High Income Fund | 29,635,816 | 1,744,067 | 1,575,823 | (265,351) | (1,747,781) | 27,790,928 |
| MFS Inflation-Adjusted Bond Fund | 59,401,973 | 7,242,666 | 2,573,659 | (273,561) | (6,546,632) | 57,250,787 |
| MFS Institutional Money Market Portfolio | 841,299 | 7,639,155 | 7,631,520 | (154) | (4) | 848,776 |
| MFS International Growth Fund | 9,683,106 | 445,599 | 172,988 | (24,887) | (957,700) | 8,973,130 |
| MFS International Intrinsic Value Fund | 9,687,739 | 815,772 | 247,071 | (74,082) | (1,210,967) | 8,971,391 |
| MFS International New Discovery Fund | 5,011,385 | 81,482 | 428,860 | 53,508 | (662,547) | 4,054,968 |
| MFS Limited Maturity Fund | 23,037,233 | 7,007,560 | 263,449 | (19,624) | (875,138) | 28,886,582 |
| MFS Mid Cap Growth Fund | 21,094,491 | 1,766,464 | 1,515,451 | (186,027) | (1,155,625) | 20,003,852 |
| MFS Mid Cap Value Fund | 21,799,501 | 407,446 | 1,625,961 | 674,367 | (1,234,716) | 20,020,637 |
| MFS New Discovery Fund | 4,655,782 | 376,761 | 313,409 | (118,692) | (105,305) | 4,495,137 |
| MFS New Discovery Value Fund | 4,816,515 | 273,436 | 242,661 | (10,136) | (301,310) | 4,535,844 |
| MFS Research Fund | 26,070,056 | 1,319,852 | 1,541,029 | (50,551) | (875,976) | 24,922,352 |
| MFS Research International Fund | 19,305,075 | 1,228,646 | 253,706 | (18,432) | (2,316,218) | 17,945,365 |
| MFS Total Return Bond Fund | 80,130,856 | 9,710,034 | 2,746,620 | (549,234) | (6,768,029) | 79,777,007 |
| MFS Value Fund | 26,407,386 | 661,967 | 1,757,260 | 573,886 | (847,664) | 25,038,315 |
| | $726,679,889 | $71,376,933 | $45,515,832 | $(2,883,024) | $(52,675,546) | $696,982,420 |
Notes to Financial Statements (unaudited) - continued
| | MFS Lifetime 2030 Fund - continued |
| Affiliated Issuers | Dividend
Income | Capital Gain
Distributions |
| MFS Blended Research Core Equity Fund | $— | $— |
| MFS Blended Research Growth Equity Fund | — | — |
| MFS Blended Research International Equity Fund | — | — |
| MFS Blended Research Mid Cap Equity Fund | — | — |
| MFS Blended Research Small Cap Equity Fund | — | — |
| MFS Blended Research Value Equity Fund | — | — |
| MFS Commodity Strategy Fund | — | — |
| MFS Emerging Markets Debt Fund | 490,143 | — |
| MFS Emerging Markets Debt Local Currency Fund (a) | 340,859 | — |
| MFS Global Opportunistic Bond Fund | 352,000 | — |
| MFS Global Real Estate Fund | — | — |
| MFS Government Securities Fund | 688,362 | — |
| MFS Growth Fund | — | — |
| MFS High Income Fund | 726,449 | — |
| MFS Inflation-Adjusted Bond Fund | 2,292,721 | — |
| MFS Institutional Money Market Portfolio | 6,836 | — |
| MFS International Growth Fund | — | — |
| MFS International Intrinsic Value Fund | — | — |
| MFS International New Discovery Fund | — | — |
| MFS Limited Maturity Fund | 263,242 | — |
| MFS Mid Cap Growth Fund | — | — |
| MFS Mid Cap Value Fund | — | — |
| MFS New Discovery Fund | — | — |
| MFS New Discovery Value Fund | 68,364 | 105,299 |
| MFS Research Fund | — | — |
| MFS Research International Fund | — | — |
| MFS Total Return Bond Fund | 1,148,235 | — |
| MFS Value Fund | 264,023 | — |
| | $6,641,234 | $105,299 |
Notes to Financial Statements (unaudited) - continued
| | MFS Lifetime 2035 Fund |
| Affiliated Issuers | Beginning
Value | Purchases | Sales
Proceeds | Realized
Gain
(Loss) | Change in
Unrealized
Appreciation or
Depreciation | Ending
Value |
| MFS Blended Research Core Equity Fund | $21,867,447 | $1,622,673 | $847,358 | $(153,619) | $(456,909) | $22,032,234 |
| MFS Blended Research Emerging Markets Equity Fund | 1,653,042 | 216,670 | 169,904 | (3,876) | (294,072) | 1,401,860 |
| MFS Blended Research Growth Equity Fund | 21,578,585 | 3,091,927 | 1,040,582 | (216,536) | (1,381,160) | 22,032,234 |
| MFS Blended Research International Equity Fund | 36,469,319 | 4,427,101 | 399,735 | (69,517) | (4,575,098) | 35,852,070 |
| MFS Blended Research Mid Cap Equity Fund | 39,286,395 | 1,783,683 | 1,497,871 | (140,491) | (174,377) | 39,257,339 |
| MFS Blended Research Small Cap Equity Fund | 8,508,325 | 582,619 | 235,993 | (25,368) | (217,030) | 8,612,553 |
| MFS Blended Research Value Equity Fund | 22,140,738 | 664,621 | 1,035,683 | (40,898) | 303,456 | 22,032,234 |
| MFS Commodity Strategy Fund | 19,519,425 | 3,275,099 | 3,132,148 | 240,483 | (2,677,756) | 17,225,103 |
| MFS Emerging Markets Debt Fund | 14,340,782 | 2,680,953 | 703,552 | (206,109) | (1,690,687) | 14,421,387 |
| MFS Emerging Markets Debt Local Currency Fund (a) | 9,467,167 | 1,680,214 | 570,037 | (176,877) | (786,212) | 9,614,255 |
| MFS Emerging Markets Equity Fund | 1,651,576 | 224,272 | 182,550 | (14,273) | (277,163) | 1,401,862 |
| MFS Global Opportunistic Bond Fund | 17,436,968 | 3,004,403 | 787,155 | (176,544) | (1,049,466) | 18,428,206 |
| MFS Global Real Estate Fund | 17,605,232 | 3,543,542 | 59,842 | (7,797) | (3,856,029) | 17,225,106 |
| MFS Government Securities Fund | 14,791,461 | 6,675,093 | 21,970 | (4,225) | (1,406,269) | 20,034,090 |
| MFS Growth Fund | 21,536,165 | 3,467,026 | 838,522 | (192,021) | (1,940,454) | 22,032,194 |
| MFS High Income Fund | 19,291,780 | 2,196,295 | 935,153 | (159,039) | (1,165,369) | 19,228,514 |
| MFS Inflation-Adjusted Bond Fund | 27,296,432 | 5,260,729 | 1,318,642 | (167,670) | (3,028,382) | 28,042,467 |
| MFS Institutional Money Market Portfolio | 300,295 | 3,790,994 | 3,689,926 | 14 | 14 | 401,391 |
| MFS International Growth Fund | 10,356,498 | 878,979 | 162,541 | (38,533) | (1,019,992) | 10,014,411 |
| MFS International Intrinsic Value Fund | 10,316,796 | 1,220,800 | 140,680 | (41,844) | (1,340,661) | 10,014,411 |
| MFS International New Discovery Fund | 7,996,231 | 721,774 | 88,500 | (29,218) | (989,462) | 7,610,825 |
| MFS Mid Cap Growth Fund | 19,233,587 | 2,510,032 | 866,693 | (206,747) | (1,041,510) | 19,628,669 |
| MFS Mid Cap Value Fund | 19,730,215 | 1,242,526 | 826,391 | 23,126 | (540,807) | 19,628,669 |
| MFS New Discovery Fund | 4,242,088 | 458,667 | 188,672 | (107,339) | (98,468) | 4,306,276 |
| MFS New Discovery Value Fund | 4,312,581 | 380,329 | 103,597 | (12,696) | (270,329) | 4,306,288 |
| MFS Research Fund | 21,785,630 | 1,889,305 | 853,020 | (119,360) | (670,322) | 22,032,233 |
| MFS Research International Fund | 15,728,873 | 2,086,347 | 48,327 | (11,462) | (1,932,186) | 15,823,245 |
| MFS Total Return Bond Fund | 23,195,151 | 5,939,365 | 431,709 | (90,568) | (2,170,398) | 26,441,841 |
| MFS Value Fund | 22,020,168 | 1,234,078 | 987,685 | 82,136 | (316,421) | 22,032,276 |
| | $473,658,952 | $66,750,116 | $22,164,438 | $(2,066,868) | $(35,063,519) | $481,114,243 |
Notes to Financial Statements (unaudited) - continued
| | MFS Lifetime 2035 Fund - continued |
| Affiliated Issuers | Dividend
Income | Capital Gain
Distributions |
| MFS Blended Research Core Equity Fund | $— | $— |
| MFS Blended Research Emerging Markets Equity Fund | — | — |
| MFS Blended Research Growth Equity Fund | — | — |
| MFS Blended Research International Equity Fund | — | — |
| MFS Blended Research Mid Cap Equity Fund | — | — |
| MFS Blended Research Small Cap Equity Fund | — | — |
| MFS Blended Research Value Equity Fund | — | — |
| MFS Commodity Strategy Fund | — | — |
| MFS Emerging Markets Debt Fund | 366,579 | — |
| MFS Emerging Markets Debt Local Currency Fund (a) | 224,778 | — |
| MFS Emerging Markets Equity Fund | — | — |
| MFS Global Opportunistic Bond Fund | 150,309 | — |
| MFS Global Real Estate Fund | — | — |
| MFS Government Securities Fund | 162,020 | — |
| MFS Growth Fund | — | — |
| MFS High Income Fund | 477,987 | — |
| MFS Inflation-Adjusted Bond Fund | 1,069,868 | — |
| MFS Institutional Money Market Portfolio | 3,274 | — |
| MFS International Growth Fund | — | — |
| MFS International Intrinsic Value Fund | — | — |
| MFS International New Discovery Fund | — | — |
| MFS Mid Cap Growth Fund | — | — |
| MFS Mid Cap Value Fund | — | — |
| MFS New Discovery Fund | — | — |
| MFS New Discovery Value Fund | 62,099 | 95,650 |
| MFS Research Fund | — | — |
| MFS Research International Fund | — | — |
| MFS Total Return Bond Fund | 348,861 | — |
| MFS Value Fund | 221,016 | — |
| | $3,086,791 | $95,650 |
Notes to Financial Statements (unaudited) - continued
| | MFS Lifetime 2040 Fund |
| Affiliated Issuers | Beginning
Value | Purchases | Sales
Proceeds | Realized
Gain
(Loss) | Change in
Unrealized
Appreciation or
Depreciation | Ending
Value |
| MFS Blended Research Core Equity Fund | $28,312,455 | $2,468,661 | $957,607 | $(209,196) | $(608,668) | $29,005,645 |
| MFS Blended Research Emerging Markets Equity Fund | 3,859,421 | 878,812 | 247,145 | (44,903) | (699,755) | 3,746,430 |
| MFS Blended Research Growth Equity Fund | 28,769,174 | 4,411,490 | 1,159,519 | (277,677) | (1,891,957) | 29,851,511 |
| MFS Blended Research International Equity Fund | 53,611,685 | 7,438,675 | 672,313 | (108,512) | (6,730,610) | 53,538,925 |
| MFS Blended Research Mid Cap Equity Fund | 53,159,033 | 2,927,976 | 1,724,970 | (203,197) | (256,949) | 53,901,893 |
| MFS Blended Research Small Cap Equity Fund | 12,141,806 | 985,111 | 322,460 | (46,253) | (310,080) | 12,448,124 |
| MFS Blended Research Value Equity Fund | 29,630,663 | 1,650,426 | 1,756,862 | (88,280) | 415,564 | 29,851,511 |
| MFS Commodity Strategy Fund | 27,273,956 | 5,306,961 | 4,238,080 | 267,449 | (3,714,039) | 24,896,247 |
| MFS Emerging Markets Debt Fund | 11,197,569 | 3,057,962 | 389,507 | (123,407) | (1,414,413) | 12,328,204 |
| MFS Emerging Markets Debt Local Currency Fund (a) | 7,391,878 | 1,936,334 | 327,296 | (106,048) | (676,073) | 8,218,795 |
| MFS Emerging Markets Equity Fund | 3,841,219 | 910,847 | 273,637 | (79,261) | (652,735) | 3,746,433 |
| MFS Global Opportunistic Bond Fund | 11,301,874 | 2,358,843 | 525,447 | (121,687) | (685,389) | 12,328,194 |
| MFS Global Real Estate Fund | 24,945,572 | 5,567,366 | 103,196 | (13,509) | (5,499,988) | 24,896,245 |
| MFS Growth Fund | 28,641,829 | 4,949,738 | 851,519 | (213,719) | (2,674,690) | 29,851,639 |
| MFS High Income Fund | 15,047,206 | 2,875,662 | 414,157 | (78,284) | (992,836) | 16,437,591 |
| MFS Inflation-Adjusted Bond Fund | 24,100,473 | 4,984,357 | 1,482,769 | (187,342) | (2,638,403) | 24,776,316 |
| MFS Institutional Money Market Portfolio | 352,442 | 6,276,094 | 6,273,032 | 156 | (1) | 355,659 |
| MFS International Growth Fund | 16,285,597 | 1,809,713 | 220,330 | (56,537) | (1,623,885) | 16,194,558 |
| MFS International Intrinsic Value Fund | 16,120,441 | 2,419,162 | 155,538 | (51,320) | (2,138,187) | 16,194,558 |
| MFS International New Discovery Fund | 15,346,929 | 1,751,688 | 139,565 | (50,930) | (1,922,402) | 14,985,720 |
| MFS Mid Cap Growth Fund | 25,968,686 | 3,586,334 | 894,994 | (268,877) | (1,440,203) | 26,950,946 |
| MFS Mid Cap Value Fund | 26,597,356 | 2,182,137 | 1,122,753 | 54,152 | (759,945) | 26,950,947 |
| MFS New Discovery Fund | 6,025,744 | 717,608 | 218,912 | (135,418) | (164,960) | 6,224,062 |
| MFS New Discovery Value Fund | 6,135,094 | 661,433 | 167,935 | (25,371) | (379,159) | 6,224,062 |
| MFS Research Fund | 28,209,288 | 2,720,274 | 875,926 | (151,209) | (896,782) | 29,005,645 |
| MFS Research International Fund | 20,830,358 | 2,986,464 | 78,676 | (17,523) | (2,570,803) | 21,149,820 |
| MFS Total Return Bond Fund | 16,243,273 | 2,930,240 | 1,128,811 | (221,955) | (1,265,221) | 16,557,526 |
| MFS Value Fund | 29,484,992 | 2,197,107 | 1,494,433 | 250,834 | (586,949) | 29,851,551 |
| | $570,826,013 | $82,947,475 | $28,217,389 | $(2,307,824) | $(42,779,518) | $580,468,757 |
Notes to Financial Statements (unaudited) - continued
| | MFS Lifetime 2040 Fund - continued |
| Affiliated Issuers | Dividend
Income | Capital Gain
Distributions |
| MFS Blended Research Core Equity Fund | $— | $— |
| MFS Blended Research Emerging Markets Equity Fund | — | — |
| MFS Blended Research Growth Equity Fund | — | — |
| MFS Blended Research International Equity Fund | — | — |
| MFS Blended Research Mid Cap Equity Fund | — | — |
| MFS Blended Research Small Cap Equity Fund | — | — |
| MFS Blended Research Value Equity Fund | — | — |
| MFS Commodity Strategy Fund | — | — |
| MFS Emerging Markets Debt Fund | 298,492 | — |
| MFS Emerging Markets Debt Local Currency Fund (a) | 182,125 | — |
| MFS Emerging Markets Equity Fund | — | — |
| MFS Global Opportunistic Bond Fund | 98,687 | — |
| MFS Global Real Estate Fund | — | — |
| MFS Growth Fund | — | — |
| MFS High Income Fund | 387,836 | — |
| MFS Inflation-Adjusted Bond Fund | 945,706 | — |
| MFS Institutional Money Market Portfolio | 2,541 | — |
| MFS International Growth Fund | — | — |
| MFS International Intrinsic Value Fund | — | — |
| MFS International New Discovery Fund | — | — |
| MFS Mid Cap Growth Fund | — | — |
| MFS Mid Cap Value Fund | — | — |
| MFS New Discovery Fund | — | — |
| MFS New Discovery Value Fund | 87,843 | 135,301 |
| MFS Research Fund | — | — |
| MFS Research International Fund | — | — |
| MFS Total Return Bond Fund | 231,669 | — |
| MFS Value Fund | 295,069 | — |
| | $2,529,968 | $135,301 |
Notes to Financial Statements (unaudited) - continued
| | MFS Lifetime 2045 Fund |
| Affiliated Issuers | Beginning
Value | Purchases | Sales
Proceeds | Realized
Gain
(Loss) | Change in
Unrealized
Appreciation or
Depreciation | Ending
Value |
| MFS Blended Research Core Equity Fund | $17,343,389 | $2,601,706 | $614,586 | $(131,144) | $(369,641) | $18,829,724 |
| MFS Blended Research Emerging Markets Equity Fund | 3,265,023 | 995,260 | 255,208 | (65,930) | (565,572) | 3,373,573 |
| MFS Blended Research Growth Equity Fund | 18,469,926 | 4,015,119 | 770,674 | (191,405) | (1,202,641) | 20,320,325 |
| MFS Blended Research International Equity Fund | 37,255,821 | 7,802,264 | 809,986 | (202,486) | (4,582,079) | 39,463,534 |
| MFS Blended Research Mid Cap Equity Fund | 34,351,259 | 4,040,165 | 1,218,762 | (141,705) | (156,252) | 36,874,705 |
| MFS Blended Research Small Cap Equity Fund | 8,290,707 | 1,208,103 | 233,407 | (34,221) | (208,692) | 9,022,490 |
| MFS Blended Research Value Equity Fund | 19,070,087 | 2,175,593 | 1,136,732 | (59,031) | 270,408 | 20,320,325 |
| MFS Commodity Strategy Fund | 19,633,090 | 4,740,299 | 3,987,457 | 276,281 | (2,617,233) | 18,044,980 |
| MFS Emerging Markets Debt Fund | 1,618,580 | 1,003,596 | 21,819 | (7,725) | (238,401) | 2,354,231 |
| MFS Emerging Markets Debt Local Currency Fund (a) | 1,071,127 | 644,911 | 20,053 | (7,191) | (119,307) | 1,569,487 |
| MFS Emerging Markets Equity Fund | 3,259,767 | 1,013,024 | 278,315 | (99,645) | (521,258) | 3,373,573 |
| MFS Global Opportunistic Bond Fund | 1,630,698 | 893,530 | 39,672 | (9,992) | (120,333) | 2,354,231 |
| MFS Global Real Estate Fund | 17,179,117 | 4,721,242 | 80,199 | (15,910) | (3,759,269) | 18,044,981 |
| MFS Growth Fund | 18,428,930 | 4,337,159 | 592,437 | (182,204) | (1,671,094) | 20,320,354 |
| MFS High Income Fund | 2,171,688 | 1,155,613 | 19,517 | (4,391) | (164,418) | 3,138,975 |
| MFS Inflation-Adjusted Bond Fund | 10,354,733 | 3,132,061 | 887,765 | (123,667) | (1,098,638) | 11,376,724 |
| MFS Institutional Money Market Portfolio | 370,745 | 2,923,481 | 2,919,836 | (46) | — | 374,344 |
| MFS International Growth Fund | 11,752,791 | 2,111,195 | 247,068 | (77,609) | (1,143,246) | 12,396,063 |
| MFS International Intrinsic Value Fund | 11,682,049 | 2,470,481 | 167,747 | (61,986) | (1,526,735) | 12,396,062 |
| MFS International New Discovery Fund | 12,949,456 | 2,370,402 | 146,979 | (55,595) | (1,622,989) | 13,494,295 |
| MFS Mid Cap Growth Fund | 16,760,372 | 3,388,003 | 611,901 | (198,043) | (901,078) | 18,437,353 |
| MFS Mid Cap Value Fund | 17,208,543 | 2,467,534 | 782,201 | (67,987) | (388,536) | 18,437,353 |
| MFS New Discovery Fund | 4,131,238 | 747,672 | 162,323 | (114,295) | (91,047) | 4,511,245 |
| MFS New Discovery Value Fund | 4,202,065 | 707,065 | 120,952 | (18,073) | (258,855) | 4,511,250 |
| MFS Research Fund | 17,268,649 | 2,810,534 | 606,902 | (107,234) | (535,323) | 18,829,724 |
| MFS Research International Fund | 13,688,692 | 2,804,898 | 114,466 | (30,705) | (1,677,011) | 14,671,408 |
| MFS Total Return Bond Fund | 9,155,665 | 2,397,305 | 908,377 | (176,117) | (661,240) | 9,807,236 |
| MFS Value Fund | 18,947,922 | 2,550,173 | 960,882 | (81,566) | (135,280) | 20,320,367 |
| | $351,512,129 | $72,228,388 | $18,716,223 | $(1,989,622) | $(26,065,760) | $376,968,912 |
Notes to Financial Statements (unaudited) - continued
| | MFS Lifetime 2045 Fund - continued |
| Affiliated Issuers | Dividend
Income | Capital Gain
Distributions |
| MFS Blended Research Core Equity Fund | $— | $— |
| MFS Blended Research Emerging Markets Equity Fund | — | — |
| MFS Blended Research Growth Equity Fund | — | — |
| MFS Blended Research International Equity Fund | — | — |
| MFS Blended Research Mid Cap Equity Fund | — | — |
| MFS Blended Research Small Cap Equity Fund | — | — |
| MFS Blended Research Value Equity Fund | — | — |
| MFS Commodity Strategy Fund | — | — |
| MFS Emerging Markets Debt Fund | 48,245 | — |
| MFS Emerging Markets Debt Local Currency Fund (a) | 29,019 | — |
| MFS Emerging Markets Equity Fund | — | — |
| MFS Global Opportunistic Bond Fund | 15,713 | — |
| MFS Global Real Estate Fund | — | — |
| MFS Growth Fund | — | — |
| MFS High Income Fund | 62,510 | — |
| MFS Inflation-Adjusted Bond Fund | 406,733 | — |
| MFS Institutional Money Market Portfolio | 3,152 | — |
| MFS International Growth Fund | — | — |
| MFS International Intrinsic Value Fund | — | — |
| MFS International New Discovery Fund | — | — |
| MFS Mid Cap Growth Fund | — | — |
| MFS Mid Cap Value Fund | — | — |
| MFS New Discovery Fund | — | — |
| MFS New Discovery Value Fund | 60,093 | 92,558 |
| MFS Research Fund | — | — |
| MFS Research International Fund | — | — |
| MFS Total Return Bond Fund | 129,655 | — |
| MFS Value Fund | 189,223 | — |
| | $944,343 | $92,558 |
Notes to Financial Statements (unaudited) - continued
| | MFS Lifetime 2050 Fund |
| Affiliated Issuers | Beginning
Value | Purchases | Sales
Proceeds | Realized
Gain
(Loss) | Change in
Unrealized
Appreciation or
Depreciation | Ending
Value |
| MFS Blended Research Core Equity Fund | $16,671,828 | $3,295,125 | $651,173 | $(138,375) | $(356,935) | $18,820,470 |
| MFS Blended Research Emerging Markets Equity Fund | 3,411,427 | 1,288,295 | 223,218 | (53,199) | (659,211) | 3,764,094 |
| MFS Blended Research Growth Equity Fund | 18,072,086 | 4,884,131 | 862,463 | (222,057) | (1,169,181) | 20,702,516 |
| MFS Blended Research International Equity Fund | 37,240,734 | 9,838,370 | 580,650 | (115,974) | (4,977,447) | 41,405,033 |
| MFS Blended Research Mid Cap Equity Fund | 33,516,363 | 5,561,795 | 1,187,169 | (140,611) | (109,439) | 37,640,939 |
| MFS Blended Research Small Cap Equity Fund | 8,253,490 | 1,619,333 | 221,346 | (32,392) | (208,850) | 9,410,235 |
| MFS Blended Research Value Equity Fund | 18,567,362 | 2,797,777 | 895,226 | (45,110) | 277,714 | 20,702,517 |
| MFS Commodity Strategy Fund | 19,384,284 | 5,184,374 | 3,285,706 | 163,911 | (2,626,393) | 18,820,470 |
| MFS Emerging Markets Equity Fund | 3,412,530 | 1,303,206 | 250,524 | (83,543) | (617,574) | 3,764,095 |
| MFS Global Real Estate Fund | 17,041,408 | 5,882,655 | 106,016 | (17,955) | (3,979,609) | 18,820,483 |
| MFS Growth Fund | 18,058,648 | 5,278,121 | 758,604 | (218,450) | (1,657,194) | 20,702,521 |
| MFS Inflation-Adjusted Bond Fund | 8,676,178 | 2,614,508 | 820,331 | (93,225) | (966,892) | 9,410,238 |
| MFS Institutional Money Market Portfolio | 342,745 | 22,235,354 | 22,231,945 | 73 | 4 | 346,231 |
| MFS International Growth Fund | 11,867,190 | 2,820,196 | 208,341 | (62,886) | (1,241,830) | 13,174,329 |
| MFS International Intrinsic Value Fund | 11,807,261 | 3,299,140 | 225,956 | (84,339) | (1,621,768) | 13,174,338 |
| MFS International New Discovery Fund | 13,545,971 | 3,479,327 | 81,366 | (33,902) | (1,853,665) | 15,056,365 |
| MFS Mid Cap Growth Fund | 16,459,315 | 4,174,049 | 717,462 | (218,970) | (876,462) | 18,820,470 |
| MFS Mid Cap Value Fund | 16,786,442 | 3,226,188 | 734,872 | (60,584) | (396,704) | 18,820,470 |
| MFS New Discovery Fund | 4,118,791 | 969,814 | 180,114 | (117,959) | (85,415) | 4,705,117 |
| MFS New Discovery Value Fund | 4,174,567 | 907,316 | 86,445 | (14,755) | (275,564) | 4,705,119 |
| MFS Research Fund | 16,621,965 | 3,482,737 | 644,314 | (114,542) | (525,360) | 18,820,486 |
| MFS Research International Fund | 13,492,158 | 3,435,529 | 76,037 | (22,953) | (1,772,306) | 15,056,391 |
| MFS Total Return Bond Fund | 8,580,801 | 2,478,107 | 815,806 | (152,708) | (680,158) | 9,410,236 |
| MFS Value Fund | 18,463,133 | 3,258,611 | 794,984 | (52,351) | (171,859) | 20,702,550 |
| | $338,566,677 | $103,314,058 | $36,640,068 | $(1,932,856) | $(26,552,098) | $376,755,713 |
Notes to Financial Statements (unaudited) - continued
| | MFS Lifetime 2050 Fund - continued |
| Affiliated Issuers | Dividend
Income | Capital Gain
Distributions |
| MFS Blended Research Core Equity Fund | $— | $— |
| MFS Blended Research Emerging Markets Equity Fund | — | — |
| MFS Blended Research Growth Equity Fund | — | — |
| MFS Blended Research International Equity Fund | — | — |
| MFS Blended Research Mid Cap Equity Fund | — | — |
| MFS Blended Research Small Cap Equity Fund | — | — |
| MFS Blended Research Value Equity Fund | — | — |
| MFS Commodity Strategy Fund | — | — |
| MFS Emerging Markets Equity Fund | — | — |
| MFS Global Real Estate Fund | — | — |
| MFS Growth Fund | — | — |
| MFS Inflation-Adjusted Bond Fund | 353,973 | — |
| MFS Institutional Money Market Portfolio | 3,037 | — |
| MFS International Growth Fund | — | — |
| MFS International Intrinsic Value Fund | — | — |
| MFS International New Discovery Fund | — | — |
| MFS Mid Cap Growth Fund | — | — |
| MFS Mid Cap Value Fund | — | — |
| MFS New Discovery Fund | — | — |
| MFS New Discovery Value Fund | 64,224 | 98,923 |
| MFS Research Fund | — | — |
| MFS Research International Fund | — | — |
| MFS Total Return Bond Fund | 127,997 | — |
| MFS Value Fund | 198,496 | — |
| | $747,727 | $98,923 |
Notes to Financial Statements (unaudited) - continued
| | MFS Lifetime 2055 Fund |
| Affiliated Issuers | Beginning
Value | Purchases | Sales
Proceeds | Realized
Gain
(Loss) | Change in
Unrealized
Appreciation or
Depreciation | Ending
Value |
| MFS Blended Research Core Equity Fund | $10,068,073 | $1,681,098 | $327,283 | $(69,509) | $(219,783) | $11,132,596 |
| MFS Blended Research Emerging Markets Equity Fund | 2,051,008 | 722,157 | 130,790 | (37,470) | (378,386) | 2,226,519 |
| MFS Blended Research Growth Equity Fund | 10,936,760 | 2,577,186 | 429,800 | (110,051) | (728,239) | 12,245,856 |
| MFS Blended Research International Equity Fund | 22,391,014 | 5,568,799 | 523,549 | (154,681) | (2,789,871) | 24,491,712 |
| MFS Blended Research Mid Cap Equity Fund | 20,180,051 | 2,897,297 | 684,740 | (82,954) | (44,462) | 22,265,192 |
| MFS Blended Research Small Cap Equity Fund | 4,985,091 | 844,872 | 121,137 | (19,228) | (123,300) | 5,566,298 |
| MFS Blended Research Value Equity Fund | 11,162,121 | 1,364,455 | 431,753 | (26,446) | 177,479 | 12,245,856 |
| MFS Commodity Strategy Fund | 11,824,961 | 2,713,284 | 1,929,598 | 99,924 | (1,575,975) | 11,132,596 |
| MFS Emerging Markets Equity Fund | 2,050,488 | 728,857 | 142,652 | (56,363) | (353,802) | 2,226,528 |
| MFS Global Real Estate Fund | 10,206,748 | 3,369,377 | 109,736 | (23,934) | (2,309,857) | 11,132,598 |
| MFS Growth Fund | 10,931,160 | 2,838,164 | 400,864 | (130,171) | (992,439) | 12,245,850 |
| MFS Inflation-Adjusted Bond Fund | 5,240,023 | 1,305,849 | 361,749 | (46,375) | (571,441) | 5,566,307 |
| MFS Institutional Money Market Portfolio | 234,418 | 1,476,237 | 1,476,186 | (26) | — | 234,443 |
| MFS International Growth Fund | 7,133,979 | 1,549,608 | 129,674 | (43,636) | (717,458) | 7,792,819 |
| MFS International Intrinsic Value Fund | 7,119,649 | 1,787,826 | 114,300 | (47,474) | (952,852) | 7,792,849 |
| MFS International New Discovery Fund | 8,162,609 | 1,939,805 | 96,023 | (37,775) | (1,062,528) | 8,906,088 |
| MFS Mid Cap Growth Fund | 9,935,823 | 2,234,659 | 381,234 | (126,030) | (530,622) | 11,132,596 |
| MFS Mid Cap Value Fund | 10,116,935 | 1,676,314 | 407,598 | (38,696) | (214,359) | 11,132,596 |
| MFS New Discovery Fund | 2,488,472 | 516,625 | 101,320 | (76,644) | (43,984) | 2,783,149 |
| MFS New Discovery Value Fund | 2,519,938 | 484,250 | 54,791 | (10,014) | (156,222) | 2,783,161 |
| MFS Research Fund | 10,046,739 | 1,795,172 | 334,477 | (59,939) | (314,878) | 11,132,617 |
| MFS Research International Fund | 8,120,509 | 1,934,406 | 109,266 | (33,411) | (1,006,161) | 8,906,077 |
| MFS Total Return Bond Fund | 5,176,549 | 1,235,369 | 362,871 | (69,292) | (413,455) | 5,566,300 |
| MFS Value Fund | 11,126,903 | 1,611,434 | 379,124 | (35,809) | (77,535) | 12,245,869 |
| | $204,210,021 | $44,853,100 | $9,540,515 | $(1,236,004) | $(15,400,130) | $222,886,472 |
Notes to Financial Statements (unaudited) - continued
| | MFS Lifetime 2055 Fund - continued |
| Affiliated Issuers | Dividend
Income | Capital Gain
Distributions |
| MFS Blended Research Core Equity Fund | $— | $— |
| MFS Blended Research Emerging Markets Equity Fund | — | — |
| MFS Blended Research Growth Equity Fund | — | — |
| MFS Blended Research International Equity Fund | — | — |
| MFS Blended Research Mid Cap Equity Fund | — | — |
| MFS Blended Research Small Cap Equity Fund | — | — |
| MFS Blended Research Value Equity Fund | — | — |
| MFS Commodity Strategy Fund | — | — |
| MFS Emerging Markets Equity Fund | — | — |
| MFS Global Real Estate Fund | — | — |
| MFS Growth Fund | — | — |
| MFS Inflation-Adjusted Bond Fund | 206,850 | — |
| MFS Institutional Money Market Portfolio | 2,061 | — |
| MFS International Growth Fund | — | — |
| MFS International Intrinsic Value Fund | — | — |
| MFS International New Discovery Fund | — | — |
| MFS Mid Cap Growth Fund | — | — |
| MFS Mid Cap Value Fund | — | — |
| MFS New Discovery Fund | — | — |
| MFS New Discovery Value Fund | 37,108 | 57,156 |
| MFS Research Fund | — | — |
| MFS Research International Fund | — | — |
| MFS Total Return Bond Fund | 75,034 | — |
| MFS Value Fund | 114,442 | — |
| | $435,495 | $57,156 |
Notes to Financial Statements (unaudited) - continued
| | MFS Lifetime 2060 Fund |
| Affiliated Issuers | Beginning
Value | Purchases | Sales
Proceeds | Realized
Gain
(Loss) | Change in
Unrealized
Appreciation or
Depreciation | Ending
Value |
| MFS Blended Research Core Equity Fund | $3,924,341 | $1,083,006 | $83,593 | $(26,082) | $(80,880) | $4,816,792 |
| MFS Blended Research Emerging Markets Equity Fund | 805,259 | 371,021 | 36,376 | (11,756) | (164,790) | 963,358 |
| MFS Blended Research Growth Equity Fund | 4,301,765 | 1,478,457 | 143,500 | (61,555) | (276,696) | 5,298,471 |
| MFS Blended Research International Equity Fund | 8,744,055 | 3,227,039 | 160,220 | (52,706) | (1,161,226) | 10,596,942 |
| MFS Blended Research Mid Cap Equity Fund | 7,840,106 | 2,007,434 | 210,198 | (84,654) | 80,895 | 9,633,583 |
| MFS Blended Research Small Cap Equity Fund | 1,956,988 | 564,108 | 63,356 | (19,718) | (29,626) | 2,408,396 |
| MFS Blended Research Value Equity Fund | 4,323,930 | 983,938 | 91,248 | (18,874) | 100,725 | 5,298,471 |
| MFS Commodity Strategy Fund | 4,239,956 | 1,612,866 | 452,917 | 23,488 | (606,602) | 4,816,791 |
| MFS Emerging Markets Equity Fund | 808,192 | 371,243 | 40,886 | (17,691) | (157,500) | 963,358 |
| MFS Global Real Estate Fund | 3,929,413 | 1,877,146 | 21,288 | (4,977) | (963,502) | 4,816,792 |
| MFS Growth Fund | 4,310,622 | 1,598,426 | 146,159 | (52,593) | (411,825) | 5,298,471 |
| MFS Inflation-Adjusted Bond Fund | 2,036,881 | 768,751 | 135,889 | (20,132) | (241,215) | 2,408,396 |
| MFS Institutional Money Market Portfolio | 43,353 | 1,166,981 | 1,174,589 | 16 | — | 35,761 |
| MFS International Growth Fund | 2,791,325 | 938,889 | 44,250 | (15,478) | (298,732) | 3,371,754 |
| MFS International Intrinsic Value Fund | 2,780,109 | 1,058,455 | 49,994 | (22,161) | (394,655) | 3,371,754 |
| MFS International New Discovery Fund | 3,181,249 | 1,173,173 | 41,377 | (17,247) | (442,364) | 3,853,434 |
| MFS Mid Cap Growth Fund | 3,910,612 | 1,321,532 | 148,692 | (56,332) | (210,328) | 4,816,792 |
| MFS Mid Cap Value Fund | 3,928,243 | 1,078,159 | 102,099 | (12,400) | (75,112) | 4,816,791 |
| MFS New Discovery Fund | 981,012 | 314,857 | 46,608 | (35,953) | (9,110) | 1,204,198 |
| MFS New Discovery Value Fund | 983,319 | 310,828 | 25,480 | (5,417) | (59,052) | 1,204,198 |
| MFS Research Fund | 3,923,159 | 1,124,397 | 83,373 | (20,209) | (127,182) | 4,816,792 |
| MFS Research International Fund | 3,174,421 | 1,159,073 | 46,189 | (15,489) | (418,382) | 3,853,434 |
| MFS Total Return Bond Fund | 2,015,561 | 727,754 | 128,341 | (25,892) | (180,686) | 2,408,396 |
| MFS Value Fund | 4,318,370 | 1,095,332 | 80,017 | (10,695) | (24,519) | 5,298,471 |
| | $79,252,241 | $27,412,865 | $3,556,639 | $(584,507) | $(6,152,364) | $96,371,596 |
Notes to Financial Statements (unaudited) - continued
| | MFS Lifetime 2060 Fund - continued |
| Affiliated Issuers | Dividend
Income | Capital Gain
Distributions |
| MFS Blended Research Core Equity Fund | $— | $— |
| MFS Blended Research Emerging Markets Equity Fund | — | — |
| MFS Blended Research Growth Equity Fund | — | — |
| MFS Blended Research International Equity Fund | — | — |
| MFS Blended Research Mid Cap Equity Fund | — | — |
| MFS Blended Research Small Cap Equity Fund | — | — |
| MFS Blended Research Value Equity Fund | — | — |
| MFS Commodity Strategy Fund | — | — |
| MFS Emerging Markets Equity Fund | — | — |
| MFS Global Real Estate Fund | — | — |
| MFS Growth Fund | — | — |
| MFS Inflation-Adjusted Bond Fund | 87,433 | — |
| MFS Institutional Money Market Portfolio | 313 | — |
| MFS International Growth Fund | — | — |
| MFS International Intrinsic Value Fund | — | — |
| MFS International New Discovery Fund | — | — |
| MFS Mid Cap Growth Fund | — | — |
| MFS Mid Cap Value Fund | — | — |
| MFS New Discovery Fund | — | — |
| MFS New Discovery Value Fund | 15,427 | 23,761 |
| MFS Research Fund | — | — |
| MFS Research International Fund | — | — |
| MFS Total Return Bond Fund | 31,323 | — |
| MFS Value Fund | 47,823 | — |
| | $182,319 | $23,761 |
Notes to Financial Statements (unaudited) - continued
| | MFS Lifetime 2065 Fund |
| Affiliated Issuers | Beginning
Value | Purchases | Sales
Proceeds | Realized
Gain
(Loss) | Change in
Unrealized
Appreciation or
Depreciation | Ending
Value |
| MFS Blended Research Core Equity Fund | $61,203 | $47,252 | $9,113 | $(2,736) | $1,295 | $97,901 |
| MFS Blended Research Emerging Markets Equity Fund | 12,246 | 12,774 | 2,176 | (689) | (2,571) | 19,584 |
| MFS Blended Research Growth Equity Fund | 67,315 | 57,154 | 11,183 | (5,330) | (372) | 107,584 |
| MFS Blended Research International Equity Fund | 134,683 | 123,722 | 22,058 | (5,648) | (15,293) | 215,406 |
| MFS Blended Research Mid Cap Equity Fund | 122,400 | 96,831 | 24,900 | (9,533) | 11,403 | 196,201 |
| MFS Blended Research Small Cap Equity Fund | 30,597 | 24,838 | 6,073 | (1,913) | 1,550 | 48,999 |
| MFS Blended Research Value Equity Fund | 67,326 | 49,390 | 11,123 | (2,024) | 4,198 | 107,767 |
| MFS Commodity Strategy Fund | 62,117 | 63,812 | 15,670 | (3,462) | (7,215) | 99,582 |
| MFS Emerging Markets Equity Fund | 12,247 | 12,879 | 2,268 | (815) | (2,450) | 19,593 |
| MFS Global Real Estate Fund | 61,204 | 64,182 | 10,773 | (2,260) | (14,414) | 97,939 |
| MFS Growth Fund | 67,319 | 59,968 | 11,668 | (4,247) | (3,757) | 107,615 |
| MFS Inflation-Adjusted Bond Fund | 30,618 | 30,003 | 6,893 | (938) | (3,722) | 49,068 |
| MFS Institutional Money Market Portfolio | 285 | 282,013 | 265,385 | 6 | 1 | 16,920 |
| MFS International Growth Fund | 42,855 | 37,507 | 6,505 | (1,907) | (3,444) | 68,506 |
| MFS International Intrinsic Value Fund | 42,853 | 39,414 | 6,820 | (2,632) | (4,387) | 68,428 |
| MFS International New Discovery Fund | 48,977 | 45,163 | 8,037 | (2,890) | (4,997) | 78,216 |
| MFS Mid Cap Growth Fund | 61,193 | 53,414 | 12,479 | (5,040) | 851 | 97,939 |
| MFS Mid Cap Value Fund | 61,203 | 49,637 | 12,026 | (1,228) | 328 | 97,914 |
| MFS New Discovery Fund | 15,298 | 13,347 | 3,498 | (2,927) | 2,338 | 24,558 |
| MFS New Discovery Value Fund | 15,301 | 13,229 | 3,066 | (494) | (426) | 24,544 |
| MFS Research Fund | 61,202 | 48,504 | 9,568 | (2,129) | (176) | 97,833 |
| MFS Research International Fund | 48,974 | 44,849 | 8,070 | (1,977) | (5,562) | 78,214 |
| MFS Total Return Bond Fund | 30,614 | 29,209 | 7,053 | (1,182) | (2,511) | 49,077 |
| MFS Value Fund | 67,323 | 52,451 | 11,985 | (1,264) | 1,184 | 107,709 |
| | $1,225,353 | $1,351,542 | $488,390 | $(63,259) | $(48,149) | $1,977,097 |
Notes to Financial Statements (unaudited) - continued
| | MFS Lifetime 2065 Fund - continued |
| Affiliated Issuers | Dividend
Income | Capital Gain
Distributions |
| MFS Blended Research Core Equity Fund | $— | $— |
| MFS Blended Research Emerging Markets Equity Fund | — | — |
| MFS Blended Research Growth Equity Fund | — | — |
| MFS Blended Research International Equity Fund | — | — |
| MFS Blended Research Mid Cap Equity Fund | — | — |
| MFS Blended Research Small Cap Equity Fund | — | — |
| MFS Blended Research Value Equity Fund | — | — |
| MFS Commodity Strategy Fund | — | — |
| MFS Emerging Markets Equity Fund | — | — |
| MFS Global Real Estate Fund | — | — |
| MFS Growth Fund | — | — |
| MFS Inflation-Adjusted Bond Fund | 1,618 | — |
| MFS Institutional Money Market Portfolio | 193 | — |
| MFS International Growth Fund | — | — |
| MFS International Intrinsic Value Fund | — | — |
| MFS International New Discovery Fund | — | — |
| MFS Mid Cap Growth Fund | — | — |
| MFS Mid Cap Value Fund | — | — |
| MFS New Discovery Fund | — | — |
| MFS New Discovery Value Fund | 260 | 400 |
| MFS Research Fund | — | — |
| MFS Research International Fund | — | — |
| MFS Total Return Bond Fund | 556 | — |
| MFS Value Fund | 890 | — |
| | $3,517 | $400 |
| (a) | Amounts reflect the impact of a return of capital distribution adjustment which has the effect of reducing dividend income and increasing realized gain (loss) and/or change in unrealized appreciation (depreciation). |
(8) Acquisitions
At close of business on August 5, 2022, the MFS Lifetime Income Fund with net assets of approximately $466,542,514, acquired all of the assets and liabilities of MFS Lifetime 2020 Fund, a series of MFS Series Trust XII. The purpose of the transaction was to provide shareholders of MFS Lifetime 2020 Fund the opportunity to participate in a larger combined portfolio with a similar investment objective and similar investment policies and strategies. The acquisition was accomplished by a tax-free exchange of approximately 18,675,016 shares of the MFS Lifetime Income Fund (valued at approximately $230,900,201) for all of the assets and liabilities of MFS Lifetime 2020 Fund. MFS Lifetime 2020 Fund then distributed the shares of the MFS Lifetime Income Fund that MFS Lifetime 2020 Fund received from the MFS Lifetime Income Fund to its shareholders. MFS Lifetime 2020 Fund’s investments on that date were valued at approximately $230,624,564 with a cost basis of approximately $205,704,676. For financial reporting purposes, assets received and shares issued by the MFS Lifetime Income Fund were recorded at fair value; however, the cost basis of the investments received from MFS Lifetime 2020 Fund were carried forward to align ongoing reporting of the MFS Lifetime Income Fund's realized and unrealized gains and losses with amounts distributable to shareholders for tax purposes.
Assuming the acquisition had been completed on May 1, 2022, the fund's pro forma results of operations for the six months ended October 31, 2022 are as follows:
| Net investment income | $6,456,218 |
| Net realized and unrealized gain (loss) on investments and foreign currency | (53,548,262) |
| Change in net assets from operations | $(47,092,044) |
(9) LIBOR Transition
Certain of each fund's investments, including investments in certain debt instruments and derivatives (if any), as well as borrowings by each fund and certain other contractual arrangements of each fund, may be based on the London Interbank Offered Rate (“LIBOR”). In 2017, the regulatory authority that oversees financial services firms in the United Kingdom announced plans to transition away from LIBOR by the end of 2021. In March 2021, the administrator of LIBOR announced the extension of the
Notes to Financial Statements (unaudited) - continued
publication of the more commonly used U.S. dollar LIBOR settings to the end of June 2023. Although the full impacts of the transition away from LIBOR are not fully known, the transition may result in, among other things, an increase in volatility or illiquidity of the markets for instruments that currently rely on LIBOR to determine interest rates and this could have an adverse impact on each fund's performance. With respect to each fund's accounting for investments, including investments in certain debt instruments and derivatives, as well as borrowings by each fund and any other contractual arrangements of each fund that undergo reference rate-related modifications as a result of the transition, management will rely upon the relief provided by FASB Codification Topic 848 – Reference Rate Reform (Topic 848). The guidance in Topic 848 permits the funds to account for those modified contracts as a continuation of the existing contracts. Management is still evaluating the impact to the funds of the June 30, 2023 planned discontinuation of the more commonly used U.S. dollar LIBOR settings.
(10) Russia and Ukraine Conflict
The market disruptions, which began in late February 2022, associated with geopolitical events related to the conflict between Russia and Ukraine may adversely affect the value of each fund’s assets and thus each fund’s performance. Management continues to monitor these events and to evaluate the related impacts, if any, to the funds.
Board Review of Investment Advisory Agreement
The Investment Company Act of 1940 requires that both the full Board of Trustees and a majority of the non-interested (“independent”) Trustees, voting separately, annually approve the continuation of the Funds’ investment advisory agreements with MFS. The Trustees consider matters bearing on the Funds and their advisory arrangements at their meetings throughout the year, including a review of performance data at each regular meeting. In addition, the independent Trustees met several times over the course of three months beginning in May and ending in July, 2022 (“contract review meetings”) for the specific purpose of considering whether to approve the continuation of the investment advisory agreements for the Funds and the other investment companies that the Board oversees (the “MFS Funds”). The independent Trustees were assisted in their evaluation of the Funds’ investment advisory agreements by independent legal counsel, from whom they received separate legal advice and with whom they met separately from MFS during various contract review meetings. The independent Trustees were also assisted in this process by an independent consultant who was retained by and reported to the independent Trustees.
In connection with their deliberations regarding the continuation of the investment advisory agreements, the Trustees, including the independent Trustees, considered such information and factors as they believed, in light of the legal advice furnished to them and their own business judgment, to be relevant. The investment advisory agreements for the Funds were considered separately, although the Trustees also took into account the common interests of all MFS Funds in their review. As described below, the Trustees considered the nature, quality, and extent of the various investment advisory, administrative, and shareholder services performed by MFS under the existing investment advisory agreements and other arrangements with the Funds.
In connection with their contract review meetings, the Trustees received and relied upon materials that included, among other items: (i) information provided by Broadridge Financial Solutions, Inc. (“Broadridge”), an independent third party, on the investment performance of the Funds for various time periods ended December 31, 2021 and the investment performance of a group of funds with substantially similar investment classifications/objectives (the “Broadridge performance universe”), (ii) information provided by Broadridge on the Funds’ fees and expenses and the fees and expenses of comparable funds identified by Broadridge as well as all other funds in the same investment classification/category (the “Broadridge expense group and universe”), (iii) information as to whether and to what extent applicable expense waivers and reimbursements are observed for the Funds, (iv) information regarding MFS’ financial results and financial condition, including MFS’ and certain of its affiliates’ estimated profitability from services performed for the Funds and the MFS Funds as a whole, and compared to MFS’ institutional business, (v) MFS’ views regarding the outlook for the mutual fund industry and the strategic business plans of MFS, (vi) descriptions of various functions performed by MFS for the Funds, such as compliance monitoring and portfolio trading practices, and (vii) information regarding the overall organization of MFS, including information about MFS’ senior management and other personnel providing investment advisory, administrative and other services to the Funds and the other MFS Funds. The comparative performance, fee and expense information prepared and provided by Broadridge was not independently verified and the independent Trustees did not independently verify any information provided to them by MFS.
The Trustees’ conclusion as to the continuation of the investment advisory agreements was based on a comprehensive consideration of all information provided to the Trustees and not the result of any single factor. Some of the factors that figured particularly in the Trustees’ deliberations are described below, although individual Trustees may have evaluated the information presented differently from one another, giving different weights to various factors. It is also important to recognize that the fee arrangements for the Funds and other MFS Funds are the result of years of review and discussion between the independent Trustees and MFS, that certain aspects of such arrangements may receive greater scrutiny in some years than in others, and that the Trustees’ conclusions may be based, in part, on their consideration of these same arrangements during the course of the year and in prior years.
MFS Lifetime Income Fund
Based on information provided by Broadridge and MFS, the Trustees reviewed the Fund’s total return investment performance as well as the Broadridge performance universe over various time periods. The Trustees placed particular emphasis on the total return performance of the Fund’s Class I shares in comparison to the performance of funds in its Broadridge performance universe over the five-year period ended December 31, 2021, which the Trustees believed was a long enough period to reflect differing market conditions. The total return performance of the Fund’s Class I shares was in the 2nd quintile relative to the other funds in the universe for this five-year period (the 1st quintile being the best performers and the 5th quintile being the worst performers). The total return performance of the Fund’s Class I shares was in the 2nd quintile for each of the one- and three-year periods ended December 31, 2021 relative to the Broadridge performance universe.
Board Review of Investment Advisory Agreement - continued
MFS Lifetime 2025 Fund
Based on information provided by Broadridge and MFS, the Trustees reviewed the Fund’s total return investment performance as well as the Broadridge performance universe over various time periods. The Trustees placed particular emphasis on the total return performance of the Fund’s Class I shares in comparison to the performance of funds in its Broadridge performance universe over the five-year period ended December 31, 2021, which the Trustees believed was a long enough period to reflect differing market conditions. The total return performance of the Fund’s Class I shares was in the 4th quintile relative to the other funds in the universe for this five-year period (the 1st quintile being the best performers and the 5th quintile being the worst performers). The total return performance of the Fund’s Class I shares was in the 4th quintile for each of the one- and three-year periods ended December 31, 2021 relative to the Broadridge performance universe.
MFS Lifetime 2030 Fund
Based on information provided by Broadridge and MFS, the Trustees reviewed the Fund’s total return investment performance as well as the Broadridge performance universe over various time periods. The Trustees placed particular emphasis on the total return performance of the Fund’s Class I shares in comparison to the performance of funds in its Broadridge performance universe over the five-year period ended December 31, 2021, which the Trustees believed was a long enough period to reflect differing market conditions. The total return performance of the Fund’s Class I shares was in the 2nd quintile relative to the other funds in the universe for this five-year period (the 1st quintile being the best performers and the 5th quintile being the worst performers). The total return performance of the Fund’s Class I shares was in the 2nd quintile for the one-year period and the 3rd quintile for the three-year period ended December 31, 2021 relative to the Broadridge performance universe.
MFS Lifetime 2035 Fund
Based on information provided by Broadridge and MFS, the Trustees reviewed the Fund’s total return investment performance as well as the Broadridge performance universe over various time periods. The Trustees placed particular emphasis on the total return performance of the Fund’s Class I shares in comparison to the performance of funds in its Broadridge performance universe over the five-year period ended December 31, 2021, which the Trustees believed was a long enough period to reflect differing market conditions. The total return performance of the Fund’s Class I shares was in the 1st quintile relative to the other funds in the universe for this five-year period (the 1st quintile being the best performers and the 5th quintile being the worst performers). The total return performance of the Fund’s Class I shares was in the 1st quintile for each of the one- and three-year periods ended December 31, 2021 relative to the Broadridge performance universe.
MFS Lifetime 2040 Fund
Based on information provided by Broadridge and MFS, the Trustees reviewed the Fund’s total return investment performance as well as the Broadridge performance universe over various time periods. The Trustees placed particular emphasis on the total return performance of the Fund’s Class I shares in comparison to the performance of funds in its Broadridge performance universe over the five-year period ended December 31, 2021, which the Trustees believed was a long enough period to reflect differing market conditions. The total return performance of the Fund’s Class I shares was in the 1st quintile relative to the other funds in the universe for this five-year period (the 1st quintile being the best performers and the 5th quintile being the worst performers). The total return performance of the Fund’s Class I shares was in the 1st quintile for the one-year period and the 2nd quintile for the three-year period ended December 31, 2021 relative to the Broadridge performance universe.
MFS Lifetime 2045 Fund
Based on information provided by Broadridge and MFS, the Trustees reviewed the Fund’s total return investment performance as well as the Broadridge performance universe over various time periods. The Trustees placed particular emphasis on the total return performance of the Fund’s Class I shares in comparison to the performance of funds in its Broadridge performance universe over the five-year period ended December 31, 2021, which the Trustees believed was a long enough period to reflect differing market conditions. The total return performance of the Fund’s Class I shares was in the 1st quintile relative to the other funds in the universe for this five-year period (the 1st quintile being the best performers and the 5th quintile being the worst performers). The total return performance of the Fund’s Class I shares was in the 1st quintile for each of the one- and three-year periods ended December 31, 2021 relative to the Broadridge performance universe.
MFS Lifetime 2050 Fund
Based on information provided by Broadridge and MFS, the Trustees reviewed the Fund’s total return investment performance as well as the Broadridge performance universe over various time periods. The Trustees placed particular emphasis on the total return performance of the Fund’s Class I shares in comparison to the performance of funds in its Broadridge performance universe over the five-year period ended December 31, 2021, which the Trustees believed was a long enough period to reflect differing market conditions. The total return performance of the Fund’s Class I shares was in the 1st quintile relative to the other funds in the universe for this five-year period (the 1st quintile being the best performers and the 5th quintile being the worst performers). The total return performance of the Fund’s Class I shares was in the 1st quintile for the one-year period and the 2nd quintile for the three-year period ended December 31, 2021 relative to the Broadridge performance universe.
Board Review of Investment Advisory Agreement - continued
MFS Lifetime 2055 Fund
Based on information provided by Broadridge and MFS, the Trustees reviewed the Fund’s total return investment performance as well as the Broadridge performance universe over various time periods. The Trustees placed particular emphasis on the total return performance of the Fund’s Class I shares in comparison to the performance of funds in its Broadridge performance universe over the five-year period ended December 31, 2021, which the Trustees believed was a long enough period to reflect differing market conditions. The total return performance of the Fund’s Class I shares was in the 1st quintile relative to the other funds in the universe for this five-year period (the 1st quintile being the best performers and the 5th quintile being the worst performers). The total return performance of the Fund’s Class I shares was in the 1st quintile for the one-year period and the 2nd quintile for the three-year period ended December 31, 2021 relative to the Broadridge performance universe.
MFS Lifetime 2060 Fund
Based on information provided by Broadridge and MFS, the Trustees reviewed the Fund’s total return investment performance as well as the Broadridge performance universe over various time periods. The Trustees placed particular emphasis on the total return performance of the Fund’s Class I shares in comparison to the performance of funds in its Broadridge performance universe over the five-year period ended December 31, 2021, which the Trustees believed was a long enough period to reflect differing market conditions. The total return performance of the Fund’s Class I shares was in the 1st quintile relative to the other funds in the universe for this five-year period (the 1st quintile being the best performers and the 5th quintile being the worst performers). The total return performance of the Fund’s Class I shares was in the 1st quintile for the one-year period and the 2nd quintile for the three-year period ended December 31, 2021 relative to the Broadridge performance universe.
General
Because of the passage of time, the performance results stated above may differ from the performance results for more recent periods, including those shown elsewhere in this report.
In the course of their deliberations, the Trustees took into account information provided by MFS in connection with the contract review meetings, as well as during investment review meetings conducted with portfolio management personnel during the course of the year regarding the Funds’ performance. After reviewing these and related factors, the Trustees concluded, within the context of their overall conclusions regarding the investment advisory agreements, that they were satisfied with MFS’ responses and efforts relating to investment performance.
The Trustees considered that MFS does not charge any advisory fees for providing investment advisory services to the Funds, but that the Funds pay their pro rata share of the advisory fees paid by the underlying funds in which they invest (the “Underlying Funds”).
In assessing the reasonableness of the Funds’ expenses, the Trustees considered, among other information, the total expense ratios of the Funds’ Class I shares as a percentage of average daily net assets and the total expense ratios of the Broadridge expense groups based on information provided by Broadridge. The Trustees considered that MFS currently observes an expense limitation for each Fund, which may not be changed without the Trustees’ approval. The Trustees also considered that, according to the data provided by Broadridge (which takes into account any expense limitations that were in effect during the Funds’ last fiscal year), the total expense ratio for each of MFS Lifetime Income Fund, MFS Lifetime 2030 Fund and MFS Lifetime 2060 was lower than the Broadridge expense group median and the total expense ratio for each of MFS Lifetime 2025 Fund, MFS Lifetime 2035 Fund, MFS Lifetime 2040 Fund, MFS Lifetime 2045 Fund, MFS Lifetime 2050 Fund and MFS Lifetime 2055 Fund was approximately at the Broadridge expense group median. Because the Funds do not pay advisory fees, the Trustees did not consider the extent to which economies of scale would be realized due to the Funds’ growth of assets, whether fee levels reflect economies of scale for the Funds’ shareholders, or the fees paid by similar funds to other investment advisers or by similar clients of MFS.
The Trustees also considered information prepared by MFS relating to MFS’ costs and profits with respect to the Funds, the MFS Funds considered as a group, and other investment companies and accounts advised by MFS, as well as MFS’ methodologies used to determine and allocate its costs to the MFS Funds, the Funds and other accounts and products for purposes of estimating profitability.
In addition, the Trustees considered MFS’ resources and related efforts to continue to retain, attract and motivate capable personnel to serve the Funds. The Trustees also considered current and developing conditions in the financial services industry, including the presence of large and well-capitalized companies which are spending, and appear to be prepared to continue to spend, substantial sums to engage personnel and to provide services to competing investment companies. In this regard, the Trustees also considered the financial resources of MFS and its ultimate parent, Sun Life Financial Inc. The Trustees also considered the advantages and possible disadvantages to the Funds of having an adviser that also serves other investment companies as well as other accounts.
The Trustees also considered the nature, quality, cost, and extent of administrative, transfer agency, and distribution services provided to the Funds by MFS and its affiliates under agreements and plans other than the investment advisory agreements, including any 12b-1 fees the Funds pay to MFS Fund Distributors, Inc., an affiliate of MFS. The Trustees also considered the nature, extent and quality of certain other services MFS performs or arranges for on the Funds’ or the Underlying Funds’ behalf, which may include securities lending programs, directed expense payment programs, class action recovery programs, and MFS’ interaction with third-party service providers, principally custodians and sub-custodians. The Trustees concluded that the various non-advisory services provided by MFS and its affiliates on behalf of the Funds were satisfactory.
Board Review of Investment Advisory Agreement - continued
The Trustees considered so-called “fall-out benefits” to MFS such as reputational value derived from serving as investment manager to the MFS Funds. The Trustees also considered that MFS discontinued its historic practice of obtaining investment research from portfolio brokerage commissions paid by certain MFS Funds effective January 2018, and directly pays or voluntarily reimburses a Fund, if applicable, for the costs of external research acquired through the use of the Fund’s portfolio brokerage commissions.
Based on their evaluation of factors that they deemed to be material, including those factors described above, the Board of Trustees, including the independent Trustees, concluded that the Funds’ investment advisory agreements with MFS should be continued for an additional one-year period, commencing August 1, 2022.
Proxy Voting Policies and Information
MFS votes proxies on behalf of the funds pursuant to proxy voting policies and procedures that are available without charge, upon request, by calling 1-800-225-2606, by visiting mfs.com/proxyvoting, or by visiting the SEC’s Web site at http://www.sec.gov.
Information regarding how each fund voted proxies relating to portfolio securities during the most recent twelve-month period ended June 30 is available by August 31 of each year without charge by visiting mfs.com/proxyvoting, or by visiting the SEC’s Web site at http://www.sec.gov.
Quarterly Portfolio Disclosure
Each fund files a complete schedule of portfolio holdings with the SEC for the first and third quarters of each fiscal year as an exhibit to its reports on Form N-PORT. Each fund's Form N-PORT reports are available on the SEC's Web site at http://www.sec.gov. A shareholder can obtain the portfolio holdings report for the first and third quarters of each fund's fiscal year at mfs.com/openendfunds by choosing the fund's name and then scrolling to the “Resources” section and clicking on the “Prospectus and Reports” tab.
Further Information
From time to time, MFS may post important information about each fund or the MFS Funds on the MFS Web site (mfs.com). This information is available at https://www.mfs.com/announcements or at mfs.com/openendfunds by choosing each fund’s name and then scrolling to the “Resources” section and clicking on the “Announcements” tab, if any.
Information About Fund Contracts and Legal Claims
Each fund has entered into contractual arrangements with an investment adviser, administrator, distributor, shareholder servicing agent, and custodian who each provide services to the fund. Unless expressly stated otherwise, shareholders are not parties to, or intended beneficiaries of these contractual arrangements, and these contractual arrangements are not intended to create any shareholder right to enforce them against the service providers or to seek any remedy under them against the service providers, either directly or on behalf of the fund.
Under the Trust’s By-Laws and Declaration of Trust, any claims asserted against or on behalf of the MFS Funds, including claims against Trustees and Officers, must be brought in state and federal courts located within the Commonwealth of Massachusetts.
Provision of Financial Reports and Summary Prospectuses
Each fund produces financial reports every six months and updates its summary prospectus and prospectus annually. To avoid sending duplicate copies of materials to households, only one copy of each fund’s annual and semiannual report and summary prospectus may be mailed to shareholders having the same last name and residential address on the fund’s records. However, any shareholder may contact MFSC (please see back cover for address and telephone number) to request that copies of these reports and summary prospectuses be sent personally to that shareholder.
Save paper with eDelivery.
MFS® will send you prospectuses, reports, and proxies directly via e-mail so you will get information faster with less mailbox clutter.
To sign up:
1. Go to mfs.com.
2. Log in via MFS® Access.
3. Select eDelivery.
If you own your MFS fund shares through a financial institution or a retirement plan, MFS® TALK, MFS® Access, or eDelivery may not be available to you.
CONTACT
WEB SITE
mfs.com
MFS TALK
1-800-637-8255
24 hours a day
ACCOUNT SERVICE AND LITERATURE
Shareholders
1-800-225-2606
Financial advisors
1-800-343-2829
Retirement plan services
1-800-637-1255
MAILING ADDRESS
MFS Service Center, Inc.
P.O. Box 219341
Kansas City, MO 64121-9341
OVERNIGHT MAIL
MFS Service Center, Inc.
Suite 219341
430 W 7th Street
Kansas City, MO 64105-1407
Semiannual Report
October 31, 2022
| 1 |
| 2 |
| 4 |
| 6 |
| 14 |
| 16 |
| 17 |
| 18 |
| 23 |
| 35 |
| 38 |
| 38 |
| 38 |
| 38 |
| 38 |
The report is prepared for the general information of shareholders. It is authorized for distribution to prospective investors only when preceded or accompanied by a current prospectus.
NOT FDIC INSURED • MAY LOSE VALUE • NO BANK GUARANTEE
LETTER FROM THE CHAIR AND CEO
Dear Shareholders:
Global markets have recently been buffeted by a series of crosscurrents, including rising inflation, tighter financial conditions, and evolving geopolitical tensions. Consequently, at a time when global growth faces multiple headwinds, central banks have been presented with the challenge of reining in rising prices without tipping economies into recession. The U.S. Federal Reserve has made it clear that rates must move higher and tighter policy must be sustained to restore price stability and that this will likely bring some pain to households and businesses. Against that backdrop, richly valued, interest rate–sensitive growth equities have been hit particularly hard by rising interest rates. Volatility in fixed income and currency markets has picked up, with fiscal policy missteps in the United Kingdom leading to a crisis of market confidence that ultimately resulted in the ouster of Prime Minister Liz Truss. That episode could forewarn other governments to avoid policy overreach.
There are, however, encouraging signs for the markets. China has modestly relaxed its zero-COVID policy, and cases globally, while numerous, appear to be causing fewer serious illnesses. Meanwhile, unemployment is low and global supply chain bottlenecks are easing, though lingering coronavirus restrictions in China and disruptions stemming from Russia’s invasion of Ukraine could hamper these advances. Additionally, easier Chinese monetary and regulatory policies and the record pace of corporate stock buybacks are supportive elements, albeit in an otherwise turbulent investment environment.
It is important to have a deep understanding of company fundamentals during times of market transition, and we have built our unique global research platform to do just that.
At MFS®, we put our clients’ assets to work responsibly by carefully navigating increasingly complex global capital markets. Our investment team is guided by a commitment to long-term fundamental investing. Our global investment platform — combining collective expertise, long-term discipline, and thoughtful risk management — seeks to uncover what we believe are the best, most durable investment ideas in markets around the world, enabling us to potentially create value for investors.
Respectfully,
Michael W. Roberge
Chair and Chief Executive Officer
MFS Investment Management
December 15, 2022
The opinions expressed in this letter are subject to change and may not be relied upon for investment advice. No forecasts can be guaranteed.
Portfolio structure at value (v)
Portfolio structure reflecting equivalent exposure of derivative positions (i)
Fixed income sectors (i)
| U.S. Treasury Securities | 38.4% |
| Investment Grade Corporates | 29.7% |
| Mortgage-Backed Securities | 26.0% |
| Collateralized Debt Obligations | 9.2% |
| Commercial Mortgage-Backed Securities | 5.3% |
| Asset-Backed Securities | 0.3% |
| High Yield Corporates | 0.2% |
Composition including fixed income credit quality (a)(i)
| AAA | 10.2% |
| AA | 4.0% |
| A | 9.1% |
| BBB | 21.2% |
| BB | 0.2% |
| U.S. Government | 28.6% |
| Federal Agencies | 26.0% |
| Not Rated | 9.8% |
| Cash & Cash Equivalents | 0.7% |
| Other (q) | (9.8)% |
Portfolio facts
| Average Duration (d) | 5.9 |
| Average Effective Maturity (m) | 8.3 yrs. |
Portfolio Composition - continued
| (a) | For all securities other than those specifically described below, ratings are assigned to underlying securities utilizing ratings from Moody’s, Fitch, and Standard & Poor’s rating agencies and applying the following hierarchy: If all three agencies provide a rating, the middle rating (after dropping the highest and lowest ratings) is assigned; if two of the three agencies rate a security, the lower of the two is assigned. If none of the 3 rating agencies above assign a rating, but the security is rated by DBRS Morningstar, then the DBRS Morningstar rating is assigned. If none of the 4 rating agencies listed above rate the security, but the security is rated by the Kroll Bond Rating Agency (KBRA), then the KBRA rating is assigned. Ratings are shown in the S&P and Fitch scale (e.g., AAA). Securities rated BBB or higher are considered investment grade. All ratings are subject to change. U.S. Government includes securities issued by the U.S. Department of the Treasury. Not Rated includes fixed income securities and fixed income derivatives that have not been rated by any rating agency. |
The fund may or may not have held all of these instruments on this date. The fund is not rated by these agencies.
| (d) | Duration is a measure of how much a bond’s price is likely to fluctuate with general changes in interest rates, e.g., if rates rise 1.00%, a bond with a 5-year duration is likely to lose about 5.00% of its value due to the interest rate move. The Average Duration calculation reflects the impact of the equivalent exposure of derivative positions, if any. |
| (i) | For purposes of this presentation, the components include the value of securities, and reflect the impact of the equivalent exposure of derivative positions, if any. These amounts may be negative from time to time. Equivalent exposure is a calculated amount that translates the derivative position into a reasonable approximation of the amount of the underlying asset that the portfolio would have to hold at a given point in time to have the same price sensitivity that results from the portfolio’s ownership of the derivative contract. When dealing with derivatives, equivalent exposure is a more representative measure of the potential impact of a position on portfolio performance than value. The bond component will include any accrued interest amounts. |
| (m) | In determining each instrument’s effective maturity for purposes of calculating the fund’s dollar-weighted average effective maturity, MFS uses the instrument’s stated maturity or, if applicable, an earlier date on which MFS believes it is probable that a maturity-shortening device (such as a put, pre-refunding or prepayment) will cause the instrument to be repaid. Such an earlier date can be substantially shorter than the instrument’s stated maturity. |
| (q) | For purposes of this presentation, Other includes equivalent exposure from currency derivatives and/or any offsets to derivative positions and may be negative. |
| (v) | For purposes of this presentation, market value of fixed income and/or equity derivatives, if any, is included in Cash & Cash Equivalents. |
Where the fund holds convertible bonds, they are treated as part of the equity portion of the portfolio.
Cash & Cash Equivalents includes any cash, investments in money market funds, short-term securities, and other assets less liabilities. Please see the Statement of Assets and Liabilities for additional information related to the fund’s cash position and other assets and liabilities.
Percentages are based on net assets as of October 31, 2022.
The portfolio is actively managed and current holdings may be different.
Expense Table
Fund expenses borne by the shareholders during the period,
June 22, 2022 through October 31, 2022
As a shareholder of the fund, you incur two types of costs: (1) transaction costs, including sales charges (loads) on certain purchase or redemption payments, and (2) ongoing costs, including management fees; distribution and service (12b-1) fees; and other fund expenses. This example is intended to help you understand your ongoing costs (in dollars) of investing in the fund and to compare these costs with the ongoing costs of investing in other mutual funds.
The example is based on an investment of $1,000 invested at the beginning of the period and held for the entire period June 22, 2022 through October 31, 2022.
Actual Expenses
The first line for each share class in the following table provides information about actual account values and actual expenses. You may use the information in this line, together with the amount you invested, to estimate the expenses that you paid over the period. Simply divide your account value by $1,000 (for example, an $8,600 account value divided by $1,000 = 8.6), then multiply the result by the number in the first line under the heading entitled “Expenses Paid During Period” to estimate the expenses you paid on your account during this period.
Hypothetical Example for Comparison Purposes
The second line for each share class in the following table provides information about hypothetical account values and hypothetical expenses based on the fund’s actual expense ratio and an assumed rate of return of 5% per year before expenses, which is not the fund’s actual return. The hypothetical account values and expenses may not be used to estimate the actual ending account balance or expenses you paid for the period. You may use this information to compare the ongoing costs of investing in the fund and other funds. To do so, compare this 5% hypothetical example with the 5% hypothetical examples that appear in the shareholder reports of the other funds.
Please note that the expenses shown in the table are meant to highlight your ongoing costs only and do not reflect any transactional costs, such as sales charges (loads). Therefore, the second line for each share class in the table is useful in comparing ongoing costs only, and will not help you determine the relative total costs of owning different funds. In addition, if these transactional costs were included, your costs would have been higher.
Expense Table - continued
Share
Class | | Annualized
Expense
Ratio | Beginning
Account Value
6/22/22 | Ending
Account Value
10/31/22 | Expenses
Paid During
Period (p)
6/22/22-10/31/22 |
| A | Actual | 0.59% | $1,000.00 | $950.48 | $2.08 |
| Hypothetical (h) | 0.59% | $1,000.00 | $1,022.23 | $3.01 |
| C | Actual | 1.34% | $1,000.00 | $947.85 | $4.72 |
| Hypothetical (h) | 1.34% | $1,000.00 | $1,018.45 | $6.82 |
| I | Actual | 0.34% | $1,000.00 | $951.27 | $1.20 |
| Hypothetical (h) | 0.34% | $1,000.00 | $1,023.49 | $1.73 |
| R1 | Actual | 1.34% | $1,000.00 | $947.85 | $4.72 |
| Hypothetical (h) | 1.34% | $1,000.00 | $1,018.45 | $6.82 |
| R2 | Actual | 0.84% | $1,000.00 | $949.56 | $2.96 |
| Hypothetical (h) | 0.84% | $1,000.00 | $1,020.97 | $4.28 |
| R3 | Actual | 0.59% | $1,000.00 | $950.42 | $2.08 |
| Hypothetical (h) | 0.59% | $1,000.00 | $1,022.23 | $3.01 |
| R4 | Actual | 0.34% | $1,000.00 | $951.28 | $1.20 |
| Hypothetical (h) | 0.34% | $1,000.00 | $1,023.49 | $1.73 |
| R6 | Actual | 0.33% | $1,000.00 | $951.30 | $1.16 |
| Hypothetical (h) | 0.33% | $1,000.00 | $1,023.54 | $1.68 |
| (h) | 5% class return per year before expenses. |
(p) “Expenses Paid During Period” are equal to each class’s annualized expense ratio, as shown above, multiplied by the average account value over the period, multiplied by 132/365 for Actual Expenses (for Hypothetical Expenses, multiplied by 184/365 to reflect the one-half year period). Expenses paid do not include any applicable sales charges (loads). If these transaction costs had been included, your costs would have been higher. For actual expenses paid, the calculation is based on the period from the commencement of the fund's investment operations, June 22, 2022, through October 31, 2022. For hypothetical expenses paid, it is assumed that the fund was in existence for the entire six month period ended October 31, 2022.
Portfolio of Investments
10/31/22 (unaudited)
The Portfolio of Investments is a complete list of all securities owned by your fund. It is categorized by broad-based asset classes.
| Issuer | | | Shares/Par | Value ($) |
| Bonds – 98.8% |
| Asset-Backed & Securitized – 14.8% |
| ACRES 2021-FL2 Issuer Ltd., “C”, FLR, 6.062% (LIBOR - 1mo. + 2.65%), 1/15/2037 (n) | | $ | 200,000 | $187,824 |
| Allegro CLO V Ltd., 2017-1A, “BR”, FLR, 5.529% (LIBOR - 3mo. + 1.45%), 10/16/2030 (n) | | | 250,000 | 237,196 |
| Arbor Realty Trust, Inc., CLO, 2021-FL3, “B”, FLR, 5.012% (LIBOR - 1mo. + 1.6%), 8/15/2034 (n) | | | 200,000 | 182,795 |
| BDS 2021-FL10 Ltd., 2021-FL7, “A”, FLR, 4.513% (LIBOR - 1mo. + 1.07%), 6/16/2036 (n) | | | 200,000 | 192,230 |
| BSPRT 2021-FL6 Issuer Ltd., “C”, FLR, 5.462% (LIBOR - 1mo. + 2.05%), 3/15/2036 (n) | | | 100,000 | 92,134 |
| Commercial Mortgage Trust, 2015-PC1, “A5”, 3.902%, 7/10/2050 | | | 250,000 | 238,165 |
| Dryden 68 CLO, Ltd., 2019-68A, “BR”, FLR, 5.779% (LIBOR - 3mo. + 1.7%), 7/15/2035 (n) | | | 250,000 | 234,022 |
| JPMBB Commercial Mortgage Securities Trust, 2014-C26, “A4”, 3.494%, 1/15/2048 | | | 75,000 | 71,247 |
| KREF 2018-FT1 Ltd., “A”, FLR, 4.482% (LIBOR - 1mo. + 1.1%), 2/15/2039 (n) | | | 200,000 | 193,260 |
| LoanCore 2021-CRE5 Ltd., “B”, FLR, 5.412% (LIBOR - 1mo. + 2%), 7/15/2036 (n) | | | 100,000 | 92,273 |
| MF1 2021-FL7 Ltd., “AS”, FLR, 4.893% (LIBOR - 1mo. + 1.45%), 10/16/2036 (n) | | | 250,000 | 235,231 |
| MF1 2022-FL10 Ltd., “AS”, FLR, 6.654% (SOFR - 1mo. + 3.187%), 9/17/2037 (n) | | | 250,000 | 246,075 |
| MF1 2022-FL8 Ltd., “B”, FLR, 4.844% (SOFR - 30 day + 1.95%), 2/19/2037 (n) | | | 100,000 | 94,786 |
| Palmer Square Loan Funding 2020-2A Ltd., “A1”, FLR, 3.784% (LIBOR - 3mo. + 0.8%), 5/20/2029 (n) | | | 107,614 | 105,722 |
| Palmer Square Loan Funding 2022-5A Ltd., “A1”, FLR, 4.084% (SOFR - 3mo. + 1.56%), 1/15/2031 (n) | | | 250,000 | 245,549 |
| Ready Capital Mortgage Financing LLC, 2022-FL9, FLR, 6.709% (SOFR - 1mo. + 3.111%), 6/25/2037 (z) | | | 250,000 | 248,341 |
| Santander Drive Auto Receivables Trust, 2022-6, “A2”, 4.37%, 5/15/2025 | | | 22,000 | 21,862 |
| Wells Fargo Commercial Mortgage Trust, 2015-C28, “A4”, 3.54%, 5/15/2048 | | | 250,000 | 236,736 |
| Wells Fargo Commercial Mortgage Trust, 2015-NXS1, “A5”, 3.148%, 5/15/2048 | | | 250,000 | 234,388 |
| Wells Fargo Commercial Mortgage Trust, 2017-RB1, “A5”, 3.635%, 3/15/2050 | | | 175,000 | 160,600 |
Portfolio of Investments (unaudited) – continued
| Issuer | | | Shares/Par | Value ($) |
| Bonds – continued |
| Asset-Backed & Securitized – continued |
| Westlake Automobile Receivables Trust, 2022-3A, “A2”, 5.24%, 7/15/2025 (n) | | $ | 61,000 | $60,771 |
| | | | | $3,611,207 |
| Automotive – 2.1% |
| Hyundai Capital America, 2.65%, 2/10/2025 (n) | | $ | 65,000 | $60,113 |
| Lear Corp., 3.8%, 9/15/2027 | | | 68,000 | 61,473 |
| Magna International, Inc., 2.45%, 6/15/2030 | | | 68,000 | 54,526 |
| Stellantis N.V., 2.691%, 9/15/2031 (n) | | | 200,000 | 142,462 |
| Volkswagen Group of America Finance LLC, 3.35%, 5/13/2025 (n) | | | 200,000 | 188,297 |
| | | | | $506,871 |
| Broadcasting – 0.8% |
| Magallanes, Inc., 5.141%, 3/15/2052 (n) | | $ | 161,000 | $112,413 |
| Walt Disney Co., 3.5%, 5/13/2040 | | | 94,000 | 71,786 |
| | | | | $184,199 |
| Brokerage & Asset Managers – 0.6% |
| Intercontinental Exchange, Inc., 2.1%, 6/15/2030 | | $ | 103,000 | $82,466 |
| Raymond James Financial, Inc., 4.95%, 7/15/2046 | | | 73,000 | 61,806 |
| | | | | $144,272 |
| Building – 0.3% |
| Masco Corp., 2%, 2/15/2031 | | $ | 117,000 | $86,415 |
| Business Services – 1.1% |
| Equinix, Inc., 1.8%, 7/15/2027 | | $ | 83,000 | $69,067 |
| Fiserv, Inc., 2.65%, 6/01/2030 | | | 88,000 | 71,219 |
| Global Payments, Inc., 1.2%, 3/01/2026 | | | 87,000 | 74,226 |
| Global Payments, Inc., 2.9%, 11/15/2031 | | | 77,000 | 58,763 |
| | | | | $273,275 |
| Cable TV – 1.1% |
| Charter Communications Operating LLC/Charter Communications Operating Capital Corp., 6.384%, 10/23/2035 | | $ | 69,000 | $63,022 |
| Charter Communications Operating LLC/Charter Communications Operating Capital Corp., 5.375%, 5/01/2047 | | | 98,000 | 75,384 |
| Cox Communications, Inc., 1.8%, 10/01/2030 (n) | | | 88,000 | 64,423 |
| Time Warner Entertainment Co. LP, 8.375%, 7/15/2033 | | | 58,000 | 61,314 |
| | | | | $264,143 |
| Chemicals – 0.3% |
| Sherwin-Williams Co., 2.3%, 5/15/2030 | | $ | 89,000 | $70,570 |
Portfolio of Investments (unaudited) – continued
| Issuer | | | Shares/Par | Value ($) |
| Bonds – continued |
| Computer Software – 0.3% |
| Dell International LLC/EMC Corp., 4.9%, 10/01/2026 | | $ | 74,000 | $71,027 |
| Conglomerates – 1.2% |
| Carrier Global Corp., 3.377%, 4/05/2040 | | $ | 159,000 | $113,503 |
| Roper Technologies, Inc., 2%, 6/30/2030 | | | 89,000 | 67,508 |
| Westinghouse Air Brake Technologies Corp., 3.2%, 6/15/2025 | | | 129,000 | 119,735 |
| | | | | $300,746 |
| Consumer Services – 0.2% |
| Booking Holdings, Inc., 4.625%, 4/13/2030 | | $ | 60,000 | $56,458 |
| Electrical Equipment – 0.3% |
| Arrow Electronics, Inc., 2.95%, 2/15/2032 | | $ | 90,000 | $68,404 |
| Electronics – 0.9% |
| Broadcom, Inc., 4.15%, 11/15/2030 | | $ | 78,000 | $67,086 |
| Broadcom, Inc., 4.3%, 11/15/2032 | | | 63,000 | 52,977 |
| Broadcom, Inc., 4.926%, 5/15/2037 (n) | | | 108,000 | 89,047 |
| | | | | $209,110 |
| Energy - Independent – 0.5% |
| EQT Corp., 7%, 2/01/2030 | | $ | 113,000 | $115,831 |
| Financial Institutions – 1.3% |
| AerCap Ireland Capital DAC/AerCap Global Aviation Trust, 2.45%, 10/29/2026 | | $ | 150,000 | $126,667 |
| Air Lease Corp., 2.875%, 1/15/2032 | | | 93,000 | 69,463 |
| Avolon Holdings Funding Ltd., 4.375%, 5/01/2026 (n) | | | 79,000 | 69,448 |
| Avolon Holdings Funding Ltd., 3.25%, 2/15/2027 (n) | | | 78,000 | 63,724 |
| | | | | $329,302 |
| Food & Beverages – 0.6% |
| Anheuser-Busch InBev Worldwide, Inc., 4.375%, 4/15/2038 | | $ | 163,000 | $139,186 |
| Gaming & Lodging – 0.4% |
| GLP Capital LP/GLP Financing II, Inc., 5.3%, 1/15/2029 | | $ | 64,000 | $57,641 |
| Las Vegas Sands Corp., 3.9%, 8/08/2029 | | | 65,000 | 52,539 |
| | | | | $110,180 |
| Insurance – 0.8% |
| Corebridge Financial, Inc., 3.9%, 4/05/2032 (n) | | $ | 82,000 | $68,536 |
| Metropolitan Life Global Funding I, 3.3%, 3/21/2029 (n) | | | 150,000 | 130,618 |
| | | | | $199,154 |
| Insurance - Health – 0.3% |
| Humana, Inc., 3.7%, 3/23/2029 | | $ | 79,000 | $70,388 |
Portfolio of Investments (unaudited) – continued
| Issuer | | | Shares/Par | Value ($) |
| Bonds – continued |
| Insurance - Property & Casualty – 0.6% |
| Brown & Brown, Inc., 4.2%, 3/17/2032 | | $ | 84,000 | $70,483 |
| Fairfax Financial Holdings Ltd., 5.625%, 8/16/2032 (n) | | | 85,000 | 76,970 |
| | | | | $147,453 |
| Machinery & Tools – 0.3% |
| CNH Industrial Capital LLC, 1.875%, 1/15/2026 | | $ | 79,000 | $69,551 |
| Major Banks – 5.9% |
| Bank of America Corp., 2.572% to 10/20/2031, FLR (SOFR + 1.21%) to 10/20/2032 | | $ | 302,000 | $227,841 |
| Capital One Financial Corp., 3.273% to 3/01/2029, FLR (SOFR - 1 day + 1.79%) to 3/01/2030 | | | 87,000 | 71,400 |
| Deutsche Bank AG, 2.311% to 11/16/2026, FLR (SOFR - 1 day + 1.219%) to 11/16/2027 | | | 150,000 | 119,730 |
| Goldman Sachs Group, Inc., 2.6%, 2/07/2030 | | | 172,000 | 136,787 |
| Goldman Sachs Group, Inc., 2.383% to 7/21/2031, FLR (SOFR - 1 day + 1.248%) to 7/21/2032 | | | 98,000 | 72,927 |
| JPMorgan Chase & Co., 4.323% to 4/26/2027, FLR (SOFR - 1 day + 1.56%) to 4/26/2028 | | | 74,000 | 68,834 |
| JPMorgan Chase & Co., 2.956% to 5/13/2030, FLR (SOFR - 1 day + 2.515%) to 5/13/2031 | | | 72,000 | 56,645 |
| JPMorgan Chase & Co., 2.963% to 1/25/2032, FLR (SOFR - 1 day + 1.26%) to 1/25/2033 | | | 69,000 | 53,905 |
| JPMorgan Chase & Co., 3.109% to 4/22/2040, FLR (SOFR - 1 day + 2.46%) to 4/22/2041 | | | 102,000 | 69,810 |
| JPMorgan Chase & Co., 3.157% to 4/22/2041, FLR (SOFR - 1 day + 1.46%) to 4/22/2042 | | | 152,000 | 103,871 |
| Morgan Stanley, 2.699% to 1/22/2030, FLR (SOFR - 1 day + 1.143%) to 1/22/2031 | | | 97,000 | 77,673 |
| Morgan Stanley, 2.943% to 1/21/2032, FLR (SOFR - 1 day + 1.29%) to 1/21/2033 | | | 127,000 | 98,920 |
| UBS Group AG, 2.095% to 2/11/2031, FLR (CMT - 1yr. + 1.0%) to 2/11/2032 (n) | | | 200,000 | 140,553 |
| Wells Fargo & Co., 3.35% to 3/02/2032, FLR (SOFR - 1 day + 1.5%) to 3/02/2033 | | | 162,000 | 130,596 |
| | | | | $1,429,492 |
| Medical & Health Technology & Services – 1.3% |
| Alcon, Inc., 2.6%, 5/27/2030 (n) | | $ | 200,000 | $160,852 |
| Becton, Dickinson and Co., 4.669%, 6/06/2047 | | | 78,000 | 65,271 |
| HCA Healthcare, Inc., 4.375%, 3/15/2042 (n) | | | 34,000 | 25,546 |
| HCA, Inc., 4.125%, 6/15/2029 | | | 79,000 | 69,710 |
| | | | | $321,379 |
Portfolio of Investments (unaudited) – continued
| Issuer | | | Shares/Par | Value ($) |
| Bonds – continued |
| Metals & Mining – 1.0% |
| Anglo American Capital PLC, 5.625%, 4/01/2030 (n) | | $ | 200,000 | $188,748 |
| Glencore Funding LLC, 2.5%, 9/01/2030 (n) | | | 87,000 | 66,934 |
| | | | | $255,682 |
| Midstream – 1.0% |
| Cheniere Corpus Christi Holdings LLC, 3.7%, 11/15/2029 | | $ | 84,000 | $73,159 |
| Plains All American Pipeline LP, 3.8%, 9/15/2030 | | | 113,000 | 94,211 |
| Sabine Pass Liquefaction LLC, 4.5%, 5/15/2030 | | | 75,000 | 68,407 |
| | | | | $235,777 |
| Mortgage-Backed – 25.9% | |
| Fannie Mae, 3%, 8/01/2046 | | $ | 34,567 | $30,063 |
| Fannie Mae, UMBS, 2.5%, 5/01/2037 - 9/01/2052 | | | 1,357,776 | 1,122,661 |
| Fannie Mae, UMBS, 2%, 6/01/2037 - 7/01/2052 | | | 1,526,998 | 1,219,607 |
| Fannie Mae, UMBS, 3%, 5/01/2043 - 8/01/2052 | | | 118,050 | 101,177 |
| Fannie Mae, UMBS, 3.5%, 7/01/2043 | | | 49,242 | 44,658 |
| Fannie Mae, UMBS, 4%, 9/01/2046 | | | 49,516 | 46,302 |
| Fannie Mae, UMBS, 4.5%, 6/01/2052 - 10/01/2052 | | | 223,908 | 210,241 |
| Freddie Mac, UMBS, 2%, 7/01/2037 - 4/01/2052 | | | 319,678 | 278,766 |
| Freddie Mac, UMBS, 3.5%, 1/01/2041 - 10/01/2052 | | | 363,861 | 323,657 |
| Freddie Mac, UMBS, 2.5%, 2/01/2051 - 10/01/2052 | | | 247,255 | 202,820 |
| Freddie Mac, UMBS, 3%, 3/01/2052 - 6/01/2052 | | | 446,286 | 380,220 |
| Freddie Mac, UMBS, 5%, 9/01/2052 | | | 173,009 | 166,979 |
| Ginnie Mae, 2.5%, 5/20/2052 - 7/20/2052 | | | 320,389 | 271,894 |
| Ginnie Mae, 3%, 5/20/2052 - 6/20/2052 | | | 174,056 | 151,690 |
| Ginnie Mae, 2%, 7/20/2052 | | | 73,457 | 60,479 |
| Ginnie Mae, 4%, 9/20/2052 - 10/20/2052 | | | 149,882 | 138,274 |
| Ginnie Mae, 4.5%, 9/20/2052 | | | 174,646 | 165,708 |
| Ginnie Mae, 5%, 9/20/2052 | | | 49,890 | 48,634 |
| Ginnie Mae, 3.5%, 10/20/2052 | | | 124,988 | 111,987 |
| Ginnie Mae, TBA, 3%, 11/15/2052 | | | 175,000 | 152,318 |
| Ginnie Mae, TBA, 3.5%, 11/15/2052 | | | 150,000 | 134,237 |
| Ginnie Mae, TBA, 5%, 11/15/2052 | | | 200,000 | 194,539 |
| UMBS, TBA, 3%, 11/25/2037 - 11/25/2052 | | | 150,000 | 134,442 |
| UMBS, TBA, 2%, 11/25/2052 | | | 50,000 | 39,391 |
| UMBS, TBA, 4%, 11/25/2052 | | | 200,000 | 181,778 |
| UMBS, TBA, 5.5%, 11/25/2052 - 12/25/2052 | | | 275,000 | 270,975 |
| UMBS, TBA, 6%, 11/25/2052 - 12/25/2052 | | | 150,000 | 150,427 |
| | | | | $6,333,924 |
| Natural Gas - Distribution – 0.3% |
| NiSource, Inc., 5.65%, 2/01/2045 | | $ | 73,000 | $66,109 |
Portfolio of Investments (unaudited) – continued
| Issuer | | | Shares/Par | Value ($) |
| Bonds – continued |
| Network & Telecom – 0.5% |
| Verizon Communications, Inc., 2.55%, 3/21/2031 | | $ | 84,000 | $66,379 |
| Verizon Communications, Inc., 4.272%, 1/15/2036 | | | 78,000 | 65,560 |
| | | | | $131,939 |
| Oils – 0.3% |
| Marathon Petroleum Corp., 4.75%, 9/15/2044 | | $ | 83,000 | $65,423 |
| Other Banks & Diversified Financials – 0.5% |
| Macquarie Group Ltd., 4.442% to 6/21/2032, FLR (SOFR - 1 day + 2.405%) to 6/21/2033 (n) | | $ | 148,000 | $122,995 |
| Retailers – 0.6% |
| Alimentation Couche-Tard, Inc., 3.439%, 5/13/2041 (n) | | $ | 117,000 | $78,038 |
| Best Buy Co., Inc., 4.45%, 10/01/2028 | | | 63,000 | 58,422 |
| | | | | $136,460 |
| Specialty Stores – 0.2% |
| Genuine Parts Co., 2.75%, 2/01/2032 | | $ | 63,000 | $48,833 |
| Telecommunications - Wireless – 1.3% |
| Crown Castle, Inc., REIT, 3.65%, 9/01/2027 | | $ | 79,000 | $71,440 |
| Rogers Communications, Inc., 3.8%, 3/15/2032 (n) | | | 146,000 | 124,303 |
| T-Mobile USA, Inc., 2.05%, 2/15/2028 | | | 69,000 | 57,267 |
| T-Mobile USA, Inc., 4.5%, 4/15/2050 | | | 83,000 | 65,760 |
| | | | | $318,770 |
| Tobacco – 0.6% |
| B.A.T. International Finance PLC, 4.448%, 3/16/2028 | | $ | 158,000 | $139,939 |
| Transportation - Services – 0.4% |
| ERAC USA Finance LLC, 7%, 10/15/2037 (n) | | $ | 107,000 | $109,286 |
| U.S. Treasury Obligations – 28.5% |
| U.S. Treasury Bonds, 2.375%, 2/15/2042 | | $ | 1,500,000 | $1,095,235 |
| U.S. Treasury Bonds, 2.25%, 2/15/2052 | | | 1,600,000 | 1,073,000 |
| U.S. Treasury Notes, 2.25%, 3/31/2024 (f) | | | 2,250,000 | 2,176,084 |
| U.S. Treasury Notes, 4.25%, 9/30/2024 | | | 2,250,000 | 2,238,574 |
| U.S. Treasury Notes, 2.5%, 3/31/2027 | | | 400,000 | 371,125 |
| | | | | $6,954,018 |
| Utilities - Electric Power – 1.2% |
| American Electric Power Co., Inc., 5.95%, 11/01/2032 (w) | | $ | 43,000 | $42,706 |
| Duke Energy Progress LLC, 3.45%, 3/15/2029 | | | 118,000 | 105,834 |
| Pacific Gas & Electric Co., 2.1%, 8/01/2027 | | | 82,000 | 67,425 |
| Pacific Gas & Electric Co., 3%, 6/15/2028 | | | 108,000 | 88,864 |
| | | | | $304,829 |
Portfolio of Investments (unaudited) – continued
| Issuer | | | Shares/Par | Value ($) |
| Bonds – continued |
| Utilities - Gas – 0.5% |
| East Ohio Gas Co., 2%, 6/15/2030 (n) | | $ | 176,000 | $134,477 |
| Total Bonds (Identified Cost, $25,595,462) | | $24,137,074 |
| Investment Companies (h) – 6.5% |
| Money Market Funds – 6.5% | |
| MFS Institutional Money Market Portfolio, 3.02% (v) (Identified Cost, $1,577,486) | | | 1,577,623 | $1,577,623 |
|
|
| Other Assets, Less Liabilities – (5.3)% | | (1,295,752) |
| Net Assets – 100.0% | $24,418,945 |
| (f) | All or a portion of the security has been segregated as collateral for open futures contracts. |
| (h) | An affiliated issuer, which may be considered one in which the fund owns 5% or more of the outstanding voting securities, or a company which is under common control. At period end, the aggregate values of the fund's investments in affiliated issuers and in unaffiliated issuers were $1,577,623 and $24,137,074, respectively. |
| (n) | Securities exempt from registration under Rule 144A of the Securities Act of 1933. These securities may be sold in the ordinary course of business in transactions exempt from registration, normally to qualified institutional buyers. At period end, the aggregate value of these securities was $4,617,651, representing 18.9% of net assets. |
| (v) | Affiliated issuer that is available only to investment companies managed by MFS. The rate quoted for the MFS Institutional Money Market Portfolio is the annualized seven-day yield of the fund at period end. |
| (w) | When-issued security. |
| (z) | Restricted securities are not registered under the Securities Act of 1933 and are subject to legal restrictions on resale. These securities generally may be resold in transactions exempt from registration or to the public if the securities are subsequently registered. Disposal of these securities may involve time-consuming negotiations and prompt sale at an acceptable price may be difficult. The fund holds the following restricted securities: |
| Restricted Securities | Acquisition
Date | Cost | Value |
| Ready Capital Mortgage Financing LLC, 2022-FL9, FLR, 6.709% (SOFR - 1mo. + 3.111%), 6/25/2037 | 6/23/2022 | $248,032 | $248,341 |
| % of Net assets | | | 1.0% |
Portfolio of Investments (unaudited) – continued
| The following abbreviations are used in this report and are defined: |
| CLO | Collateralized Loan Obligation |
| CMT | Constant Maturity Treasury |
| FLR | Floating Rate. Interest rate resets periodically based on the parenthetically disclosed reference rate plus a spread (if any). The period-end rate reported may not be the current rate. All reference rates are USD unless otherwise noted. |
| LIBOR | London Interbank Offered Rate |
| REIT | Real Estate Investment Trust |
| SOFR | Secured Overnight Financing Rate |
| TBA | To Be Announced |
| UMBS | Uniform Mortgage-Backed Security |
Derivative Contracts at 10/31/22
| Futures Contracts |
| Description | Long/
Short | Currency | Contracts | Notional
Amount | Expiration
Date | Value/Unrealized
Appreciation
(Depreciation) |
| Asset Derivatives |
| Interest Rate Futures | | |
| U.S. Treasury Ultra Note 10 yr | Short | USD | 7 | $811,891 | December – 2022 | $31,007 |
| Liability Derivatives |
| Interest Rate Futures | | |
| U.S. Treasury Note 5 yr | Long | USD | 30 | $3,197,813 | December – 2022 | $(139,563) |
At October 31, 2022, the fund had liquid securities with an aggregate value of $33,850 to cover any collateral or margin obligations for certain derivative contracts.
See Notes to Financial Statements
Financial Statements
Statement of Assets and Liabilities
At 10/31/22 (unaudited)
This statement represents your fund’s balance sheet, which details the assets and liabilities comprising the total value of the fund.
| Assets | |
| Investments in unaffiliated issuers, at value (identified cost, 25,595,462) | $24,137,074 |
| Investments in affiliated issuers, at value (identified cost, 1,577,486) | 1,577,623 |
| Receivables for | |
| Investments sold | 357,975 |
| Interest and dividends | 126,658 |
| Receivable from investment adviser | 12,764 |
| Other assets | 159 |
| Total assets | $26,212,253 |
| Liabilities | |
| Payable to custodian | $9,250 |
| Payables for | |
| Net daily variation margin on open futures contracts | 3,953 |
| Investments purchased | 1,696,995 |
| Fund shares reacquired | 327 |
| When-issued investments purchased | 42,706 |
| Payable to affiliates | |
| Administrative services fee | 192 |
| Shareholder servicing costs | 125 |
| Distribution and service fees | 29 |
| Accrued expenses and other liabilities | 39,731 |
| Total liabilities | $1,793,308 |
| Net assets | $24,418,945 |
| Net assets consist of | |
| Paid-in capital | $26,000,112 |
| Total distributable earnings (loss) | (1,581,167) |
| Net assets | $24,418,945 |
| Shares of beneficial interest outstanding | 2,601,478 |
Statement of Assets and Liabilities (unaudited) – continued
| | Net assets | Shares
outstanding | Net asset value
per share (a) |
| Class A | $522,047 | 55,615 | $9.39 |
| Class C | 47,375 | 5,047 | 9.39 |
| Class I | 361,173 | 38,484 | 9.39 |
| Class R1 | 47,375 | 5,047 | 9.39 |
| Class R2 | 47,461 | 5,056 | 9.39 |
| Class R3 | 47,503 | 5,061 | 9.39 |
| Class R4 | 47,547 | 5,065 | 9.39 |
| Class R6 | 23,298,464 | 2,482,103 | 9.39 |
| (a) | Maximum offering price per share was equal to the net asset value per share for all share classes, except for Class A, for which the maximum offering price per share was $9.81 [100 / 95.75 x $9.39]. On sales of $100,000 or more, the maximum offering price of Class A shares is reduced. A contingent deferred sales charge may be imposed on redemptions of Class A and Class C shares. Redemption price per share was equal to the net asset value per share for Classes I, R1, R2, R3, R4, and R6. |
See Notes to Financial Statements
Financial Statements
Statement of Operations
Six months ended 10/31/22 (c) (unaudited)
This statement describes how much your fund earned in investment income and accrued in expenses. It also describes any gains and/or losses generated by fund operations.
| Net investment income (loss) | |
| Income | |
| Interest | 321,199 |
| Dividends from affiliated issuers | 27,084 |
| Other | 5,841 |
| Total investment income | $354,124 |
| Expenses | |
| Management fee | 29,642 |
| Distribution and service fees | 878 |
| Shareholder servicing costs | 1,235 |
| Administrative services fee | 6,329 |
| Independent Trustees' compensation | 843 |
| Custodian fee | 4,718 |
| Shareholder communications | 2,656 |
| Audit and tax fees | 19,579 |
| Legal fees | 62 |
| Registration fees | 6,767 |
| Miscellaneous | 13,599 |
| Total expenses | $86,308 |
| Fees paid indirectly | (12) |
| Reduction of expenses by investment adviser | (55,318) |
| Net expenses | $30,978 |
| Net investment income (loss) | $323,146 |
| Realized and unrealized gain (loss) |
| Realized gain (loss) (identified cost basis) | |
| Unaffiliated issuers | 19,417 |
| Affiliated issuers | 394 |
| Futures contracts | (33,865) |
| Net realized gain (loss) | $(14,054) |
| Change in unrealized appreciation or depreciation | |
| Unaffiliated issuers | (1,458,388) |
| Affiliated issuers | 137 |
| Futures contracts | (108,556) |
| Net unrealized gain (loss) | $(1,566,807) |
| Net realized and unrealized gain (loss) | $(1,580,861) |
| Change in net assets from operations | $(1,257,715) |
| (c) For the period from the commencement of the fund’s investment operations, June 22, 2022, through the stated period end. | |
See Notes to Financial Statements
Financial Statements
Statement of Changes in Net Assets
These statements describe the increases and/or decreases in net assets resulting from operations, any distributions, and any shareholder transactions.
| | Year ended |
| | 10/31/22(c)
(unaudited) |
| Change in net assets | |
| From operations | |
| Net investment income (loss) | 323,146 |
| Net realized gain (loss) | (14,054) |
| Net unrealized gain (loss) | (1,566,807) |
| Change in net assets from operations | $(1,257,715) |
| Total distributions to shareholders | $(323,452) |
| Change in net assets from fund share transactions | $26,000,112 |
| Total change in net assets | $24,418,945 |
| Net assets | |
| At beginning of period | — |
| At end of period | $24,418,945 |
| (c) | For the period from the commencement of the fund’s investment operations, June 22, 2022, through the stated period end. |
See Notes to Financial Statements
Financial Statements
Financial Highlights
The financial highlights table is intended to help you understand the fund's financial performance for the semiannual period and the past 5 fiscal years (or life of a particular share class, if shorter). Certain information reflects financial results for a single fund share. The total returns in the table represent the rate that an investor would have earned (or lost) on an investment in the fund share class (assuming reinvestment of all distributions) held for the entire period.
| Class A | Six months
ended |
| | 10/31/22(c)
(unaudited) |
| Net asset value, beginning of period | 10.00 |
| Income (loss) from investment operations |
| Net investment income (loss) (d) | 0.12 |
| Net realized and unrealized gain (loss) | (0.61) |
| Total from investment operations | (0.49) |
| Less distributions declared to shareholders |
| From net investment income | (0.12) |
| Net asset value, end of period (x) | 9.39 |
| Total return (%) (r)(s)(t)(x) | (4.95)(n) |
Ratios (%) (to average net assets)
and Supplemental data: |
| Expenses before expense reductions (f) | 1.19(a) |
| Expenses after expense reductions (f) | 0.59(a) |
| Net investment income (loss) | 3.41(a) |
| Portfolio turnover | 82(n) |
| Net assets at end of period (000 omitted) | 522 |
See Notes to Financial Statements
Financial Highlights – continued
| Class C | Six months
ended |
| | 10/31/22(c)
(unaudited) |
| Net asset value, beginning of period | 10.00 |
| Income (loss) from investment operations |
| Net investment income (loss) (d) | 0.09 |
| Net realized and unrealized gain (loss) | (0.61) |
| Total from investment operations | (0.52) |
| Less distributions declared to shareholders |
| From net investment income | (0.09) |
| Net asset value, end of period (x) | 9.39 |
| Total return (%) (r)(s)(t)(x) | (5.22)(n) |
Ratios (%) (to average net assets)
and Supplemental data: |
| Expenses before expense reductions (f) | 1.95(a) |
| Expenses after expense reductions (f) | 1.34(a) |
| Net investment income (loss) | 2.52(a) |
| Portfolio turnover | 82(n) |
| Net assets at end of period (000 omitted) | 47 |
| Class I | Six months
ended |
| | 10/31/22(c)
(unaudited) |
| Net asset value, beginning of period | 10.00 |
| Income (loss) from investment operations |
| Net investment income (loss) (d) | 0.13 |
| Net realized and unrealized gain (loss) | (0.61) |
| Total from investment operations | (0.48) |
| Less distributions declared to shareholders |
| From net investment income | (0.13) |
| Net asset value, end of period (x) | 9.39 |
| Total return (%) (r)(s)(t)(x) | (4.87)(n) |
Ratios (%) (to average net assets)
and Supplemental data: |
| Expenses before expense reductions (f) | 0.96(a) |
| Expenses after expense reductions (f) | 0.34(a) |
| Net investment income (loss) | 3.80(a) |
| Portfolio turnover | 82(n) |
| Net assets at end of period (000 omitted) | 361 |
See Notes to Financial Statements
Financial Highlights – continued
| Class R1 | Six months
ended |
| | 10/31/22(c)
(unaudited) |
| Net asset value, beginning of period | 10.00 |
| Income (loss) from investment operations |
| Net investment income (loss) (d) | 0.09 |
| Net realized and unrealized gain (loss) | (0.61) |
| Total from investment operations | (0.52) |
| Less distributions declared to shareholders |
| From net investment income | (0.09) |
| Net asset value, end of period (x) | 9.39 |
| Total return (%) (r)(s)(t)(x) | (5.22)(n) |
Ratios (%) (to average net assets)
and Supplemental data: |
| Expenses before expense reductions (f) | 1.95(a) |
| Expenses after expense reductions (f) | 1.34(a) |
| Net investment income (loss) | 2.54(a) |
| Portfolio turnover | 82(n) |
| Net assets at end of period (000 omitted) | 47 |
| Class R2 | Six months
ended |
| | 10/31/22(c)
(unaudited) |
| Net asset value, beginning of period | 10.00 |
| Income (loss) from investment operations |
| Net investment income (loss) (d) | 0.11 |
| Net realized and unrealized gain (loss) | (0.61) |
| Total from investment operations | (0.50) |
| Less distributions declared to shareholders |
| From net investment income | (0.11) |
| Net asset value, end of period (x) | 9.39 |
| Total return (%) (r)(s)(t)(x) | (5.04)(n) |
Ratios (%) (to average net assets)
and Supplemental data: |
| Expenses before expense reductions (f) | 1.45(a) |
| Expenses after expense reductions (f) | 0.84(a) |
| Net investment income (loss) | 3.05(a) |
| Portfolio turnover | 82(n) |
| Net assets at end of period (000 omitted) | 47 |
See Notes to Financial Statements
Financial Highlights – continued
| Class R3 | Six months
ended |
| | 10/31/22(c)
(unaudited) |
| Net asset value, beginning of period | 10.00 |
| Income (loss) from investment operations |
| Net investment income (loss) (d) | 0.12 |
| Net realized and unrealized gain (loss) | (0.61) |
| Total from investment operations | (0.49) |
| Less distributions declared to shareholders |
| From net investment income | (0.12) |
| Net asset value, end of period (x) | 9.39 |
| Total return (%) (r)(s)(t)(x) | (4.96)(n) |
Ratios (%) (to average net assets)
and Supplemental data: |
| Expenses before expense reductions (f) | 1.20(a) |
| Expenses after expense reductions (f) | 0.59(a) |
| Net investment income (loss) | 3.30(a) |
| Portfolio turnover | 82(n) |
| Net assets at end of period (000 omitted) | 48 |
| Class R4 | Six months
ended |
| | 10/31/22(c)
(unaudited) |
| Net asset value, beginning of period | 10.00 |
| Income (loss) from investment operations |
| Net investment income (loss) (d) | 0.13 |
| Net realized and unrealized gain (loss) | (0.61) |
| Total from investment operations | (0.48) |
| Less distributions declared to shareholders |
| From net investment income | (0.13) |
| Net asset value, end of period (x) | 9.39 |
| Total return (%) (r)(s)(t)(x) | (4.87)(n) |
Ratios (%) (to average net assets)
and Supplemental data: |
| Expenses before expense reductions (f) | 0.95(a) |
| Expenses after expense reductions (f) | 0.34(a) |
| Net investment income (loss) | 3.55(a) |
| Portfolio turnover | 82(n) |
| Net assets at end of period (000 omitted) | 48 |
See Notes to Financial Statements
Financial Highlights – continued
| Class R6 | Six months
ended |
| | 10/31/22(c)
(unaudited) |
| Net asset value, beginning of period | 10.00 |
| Income (loss) from investment operations |
| Net investment income (loss) (d) | 0.13 |
| Net realized and unrealized gain (loss) | (0.61) |
| Total from investment operations | (0.48) |
| Less distributions declared to shareholders |
| From net investment income | (0.13) |
| Net asset value, end of period (x) | 9.39 |
| Total return (%) (r)(s)(t)(x) | (4.87)(n) |
Ratios (%) (to average net assets)
and Supplemental data: |
| Expenses before expense reductions (f) | 0.94(a) |
| Expenses after expense reductions (f) | 0.33(a) |
| Net investment income (loss) | 3.55(a) |
| Portfolio turnover | 82(n) |
| Net assets at end of period (000 omitted) | 23,298 |
| (a) | Annualized. |
| (c) | For the period from the commencement of the fund’s investment operations, June 22, 2022, through the stated period end. |
| (d) | Per share data is based on average shares outstanding. |
| (f) | Ratios do not reflect reductions from fees paid indirectly, if applicable. See Note 2 in the Notes to Financial Statements for additional information. |
| (n) | Not annualized. |
| (r) | Certain expenses have been reduced without which performance would have been lower. |
| (s) | From time to time the fund may receive proceeds from litigation settlements, without which performance would be lower. |
| (t) | Total returns do not include any applicable sales charges. |
| (x) | The net asset values and total returns have been calculated on net assets which include adjustments made in accordance with U.S. generally accepted accounting principles required at period end for financial reporting purposes. |
See Notes to Financial Statements
Notes to Financial Statements
(unaudited)
(1) Business and Organization
MFS Core Bond Fund (the fund) is a diversified series of MFS Series Trust XII (the trust). The trust is organized as a Massachusetts business trust and is registered under the Investment Company Act of 1940, as amended, as an open-end management investment company.
The fund is an investment company and accordingly follows the investment company accounting and reporting guidance of the Financial Accounting Standards Board (FASB) Accounting Standards Codification Topic 946 Financial Services - Investment Companies.
(2) Significant Accounting Policies
General — The preparation of financial statements in conformity with U.S. generally accepted accounting principles requires management to make estimates and assumptions that affect the reported amounts of assets and liabilities, and disclosure of contingent assets and liabilities at the date of the financial statements and the reported amounts of increases and decreases in net assets from operations during the reporting period. Actual results could differ from those estimates. In the preparation of these financial statements, management has evaluated subsequent events occurring after the date of the fund’s Statement of Assets and Liabilities through the date that the financial statements were issued.
Balance Sheet Offsetting — The fund's accounting policy with respect to balance sheet offsetting is that, absent an event of default by the counterparty or a termination of the agreement, the International Swaps and Derivatives Association (ISDA) Master Agreement, or similar agreement, does not result in an offset of reported amounts of financial assets and financial liabilities in the Statement of Assets and Liabilities across transactions between the fund and the applicable counterparty. The fund's right to setoff may be restricted or prohibited by the bankruptcy or insolvency laws of the particular jurisdiction to which a specific master netting agreement counterparty is subject. Balance sheet offsetting disclosures, to the extent applicable to the fund, have been included in the fund’s Significant Accounting Policies note under the captions for each of the fund’s in-scope financial instruments and transactions.
Investment Valuations — Subject to its oversight, the fund's Board of Trustees has delegated primary responsibility for determining or causing to be determined the value of the fund’s investments to MFS as the fund's adviser, pursuant to the fund’s valuation policy and procedures which have been adopted by the adviser and approved by the Board. Effective September 8, 2022, and in accordance with Rule 2a-5 under the Investment Company Act of 1940, the Board of Trustees designated the adviser as the “valuation designee” of the fund. If the adviser, as valuation designee, determines that reliable market quotations are not readily available for an investment, the investment is valued at fair value as determined in good faith by the adviser in accordance with the adviser’s fair valuation policy and procedures.
Under the fund's valuation policy and procedures, debt instruments and floating rate loans, including restricted debt instruments, are generally valued at an evaluated or composite bid as provided by a third-party pricing service. Short-term instruments with a maturity at issuance of 60 days or less may be valued at amortized cost, which approximates market value. Futures contracts are generally valued at last posted
Notes to Financial Statements (unaudited) - continued
settlement price on their primary exchange as provided by a third-party pricing service. Futures contracts for which there were no trades that day for a particular position are generally valued at the closing bid quotation on their primary exchange as provided by a third-party pricing service. Open-end investment companies are generally valued at net asset value per share. The values of foreign securities and other assets and liabilities expressed in foreign currencies are converted to U.S. dollars using the mean of bid and asked prices for rates provided by a third-party pricing service.
Under the fund’s valuation policy and procedures, market quotations are not considered to be readily available for debt instruments, floating rate loans, and many types of derivatives. These investments are generally valued at fair value based on information from third-party pricing services or otherwise determined by the adviser in accordance with the adviser’s fair valuation policy and procedures. Securities and other assets generally valued on the basis of information from a third-party pricing service may also be valued at a broker/dealer bid quotation. In determining values, third-party pricing services can utilize both transaction data and market information such as yield, quality, coupon rate, maturity, type of issue, trading characteristics, spreads and other market data. An investment may also be valued at fair value if the adviser determines that the investment’s value has been materially affected by events occurring after the close of the exchange or market on which the investment is principally traded (such as foreign exchange or market) and prior to the determination of the fund’s net asset value, or after the halt of trading of a specific security where trading does not resume prior to the close of the exchange or market on which the security is principally traded. The adviser generally relies on third-party pricing services or other information (such as the correlation with price movements of similar securities in the same or other markets; the type, cost and investment characteristics of the security; the business and financial condition of the issuer; and trading and other market data) to assist in determining whether to fair value and at what value to fair value an investment. The value of an investment for purposes of calculating the fund’s net asset value can differ depending on the source and method used to determine value. When fair valuation is used, the value of an investment used to determine the fund’s net asset value may differ from quoted or published prices for the same investment. There can be no assurance that the fund could obtain the fair value assigned to an investment if it were to sell the investment at the same time at which the fund determines its net asset value per share.
Various inputs are used in determining the value of the fund's assets or liabilities. These inputs are categorized into three broad levels. In certain cases, the inputs used to measure fair value may fall into different levels of the fair value hierarchy. In such cases, an investment's level within the fair value hierarchy is based on the lowest level of input that is significant to the fair value measurement. The fund's assessment of the significance of a particular input to the fair value measurement in its entirety requires judgment, and considers factors specific to the investment. Level 1 includes unadjusted quoted prices in active markets for identical assets or liabilities. Level 2 includes other significant observable market-based inputs (including quoted prices for similar securities, interest rates, prepayment speed, and credit risk). Level 3 includes significant unobservable inputs, which may include the adviser's own assumptions in determining the fair value of investments. Other financial instruments are derivative instruments, such as futures contracts. The following is a summary of the levels used as of October 31, 2022 in valuing the fund's assets and liabilities:
Notes to Financial Statements (unaudited) - continued
| Financial Instruments | Level 1 | Level 2 | Level 3 | Total |
| U.S. Treasury Bonds & U.S. Government Agencies & Equivalents | $— | $6,954,018 | $— | $6,954,018 |
| U.S. Corporate Bonds | — | 5,377,015 | — | 5,377,015 |
| Residential Mortgage-Backed Securities | — | 6,333,924 | — | 6,333,924 |
| Commercial Mortgage-Backed Securities | — | 1,281,750 | — | 1,281,750 |
| Asset-Backed Securities (including CDOs) | — | 2,329,457 | — | 2,329,457 |
| Foreign Bonds | — | 1,860,910 | — | 1,860,910 |
| Mutual Funds | 1,577,623 | — | — | 1,577,623 |
| Total | $1,577,623 | $24,137,074 | $— | $25,714,697 |
| Other Financial Instruments | | | | |
| Futures Contracts – Assets | $31,007 | $— | $— | $31,007 |
| Futures Contracts – Liabilities | (139,563) | — | — | (139,563) |
For further information regarding security characteristics, see the Portfolio of Investments.
Derivatives — The fund uses derivatives primarily to increase or decrease exposure to a particular market or segment of the market, or security, to increase or decrease interest rate or currency exposure, or as alternatives to direct investments. Derivatives are used for hedging or non-hedging purposes. While hedging can reduce or eliminate losses, it can also reduce or eliminate gains. When the fund uses derivatives as an investment to increase market exposure, or for hedging purposes, gains and losses from derivative instruments may be substantially greater than the derivative’s original cost.
The derivative instruments used by the fund during the period were futures contracts. Depending on the type of derivative, a fund may exit a derivative position by entering into an offsetting transaction with a counterparty or exchange, negotiating an agreement with the derivative counterparty, or novating the position to a third party. The fund may be unable to promptly close out a futures position in instances where the daily fluctuation in the price for that type of future exceeds the daily limit set by the exchange. The fund's period end derivatives, as presented in the Portfolio of Investments and the associated Derivative Contract tables, generally are indicative of the volume of its derivative activity during the period.
The following table presents, by major type of derivative contract, the fair value, on a gross basis, of the asset and liability components of derivatives held by the fund at October 31, 2022 as reported in the Statement of Assets and Liabilities:
| | | Fair Value (a) |
| Risk | Derivative Contracts | Asset Derivatives | Liability Derivatives |
| Interest Rate | Futures Contracts | $31,007 | $(139,563) |
| (a) | Values presented in this table for futures contracts correspond to the values reported in the Portfolio of Investments. Only the current day net variation margin for futures contracts is reported separately within the Statement of Assets and Liabilities. |
Notes to Financial Statements (unaudited) - continued
The following table presents, by major type of derivative contract, the realized gain (loss) on derivatives held by the fund for the period ended October 31, 2022 as reported in the Statement of Operations:
| Risk | Futures
Contracts |
| Interest Rate | $(33,865) |
The following table presents, by major type of derivative contract, the change in unrealized appreciation or depreciation on derivatives held by the fund for the period ended October 31, 2022 as reported in the Statement of Operations:
| Risk | Futures
Contracts |
| Interest Rate | $(108,556) |
Derivative counterparty credit risk is managed through formal evaluation of the creditworthiness of all potential counterparties. On certain, but not all, uncleared derivatives, the fund attempts to reduce its exposure to counterparty credit risk whenever possible by entering into an ISDA Master Agreement on a bilateral basis. The ISDA Master Agreement gives each party to the agreement the right to terminate all transactions traded under such agreement if there is a specified deterioration in the credit quality of the other party. Upon an event of default or a termination of the ISDA Master Agreement, the non-defaulting party has the right to close out all transactions traded under such agreement and to net amounts owed under each agreement to one net amount payable by one party to the other. This right to close out and net payments across all transactions traded under the ISDA Master Agreement could result in a reduction of the fund's credit risk to such counterparty equal to any amounts payable by the fund under the applicable transactions, if any.
Collateral and margin requirements differ by type of derivative. For cleared derivatives (e.g., futures contracts, cleared swaps, and exchange-traded options), margin requirements are set by the clearing broker and the clearing house and collateral, in the form of cash or securities, is posted by the fund directly with the clearing broker. Collateral terms are counterparty agreement specific for uncleared derivatives (e.g., forward foreign currency exchange contracts, uncleared swap agreements, and uncleared options) and collateral, in the form of cash and securities, is held in segregated accounts with the fund's custodian in connection with these agreements. For derivatives traded under an ISDA Master Agreement, which contains a credit support annex, the collateral requirements are netted across all transactions traded under such counterparty-specific agreement and an amount is posted from one party to the other to collateralize such obligations. Cash that has been segregated or delivered to cover the fund's collateral or margin obligations under derivative contracts, if any, will be reported separately in the Statement of Assets and Liabilities as restricted cash for uncleared derivatives and/or deposits with brokers for cleared derivatives. Securities pledged as collateral or margin for the same purpose, if any, are noted in the Portfolio of Investments. The fund may be required to make payments of interest on uncovered collateral or margin obligations with the broker. Any such payments are included in “Miscellaneous” expense in the Statement of Operations.
Notes to Financial Statements (unaudited) - continued
Futures Contracts — The fund entered into futures contracts which may be used to hedge against or obtain broad market exposure, interest rate exposure, currency exposure, or to manage duration. A futures contract represents a commitment for the future purchase or sale of an asset at a specified price on a specified date.
Upon entering into a futures contract, the fund is required to deposit with the broker, either in cash or securities, an initial margin in an amount equal to a specified percentage of the notional amount of the contract. Subsequent payments (variation margin) are made or received by the fund each day, depending on the daily fluctuations in the value of the contract, and are recorded for financial statement purposes as unrealized gain or loss by the fund until the contract is closed or expires at which point the gain or loss on futures contracts is realized.
The fund bears the risk of interest rates, exchange rates or securities prices moving unexpectedly, in which case, the fund may not achieve the anticipated benefits of the futures contracts and may realize a loss. While futures contracts may present less counterparty risk to the fund since the contracts are exchange traded and the exchange’s clearinghouse guarantees payments to the broker, there is still counterparty credit risk due to the insolvency of the broker. The fund’s maximum risk of loss due to counterparty credit risk is equal to the margin posted by the fund to the broker plus any gains or minus any losses on the outstanding futures contracts.
Indemnifications — Under the fund's organizational documents, its officers and Trustees may be indemnified against certain liabilities and expenses arising out of the performance of their duties to the fund. Additionally, in the normal course of business, the fund enters into agreements with service providers that may contain indemnification clauses. The fund's maximum exposure under these agreements is unknown as this would involve future claims that may be made against the fund that have not yet occurred.
Investment Transactions and Income — Investment transactions are recorded on the trade date. Interest income is recorded on the accrual basis. All premium and discount is amortized or accreted for financial statement purposes in accordance with U.S. generally accepted accounting principles. Interest payments received in additional securities are recorded on the ex-interest date in an amount equal to the value of the security on such date. In determining the net gain or loss on securities sold, the cost of securities is determined on the identified cost basis.
The fund may receive proceeds from litigation settlements. Any proceeds received from litigation involving portfolio holdings are reflected in the Statement of Operations in realized gain/loss if the security has been disposed of by the fund or in unrealized gain/loss if the security is still held by the fund. Any other proceeds from litigation not related to portfolio holdings are reflected as other income in the Statement of Operations.
The fund invests a significant portion of its assets in asset-backed and/or mortgage-backed securities. For these securities, the value of the debt instrument also depends on the credit quality and adequacy of the underlying assets or collateral as well as whether there is a security interest in the underlying assets or collateral. Enforcing rights, if any, against the underlying assets or collateral may be difficult. U.S. Government securities not supported as to the payment of principal or interest by
Notes to Financial Statements (unaudited) - continued
the U.S. Treasury, such as those issued by Fannie Mae, Freddie Mac, and the Federal Home Loan Banks, are subject to greater credit risk than are U.S. Government securities supported by the U.S. Treasury, such as those issued by Ginnie Mae.
To mitigate the counterparty credit risk on TBA transactions, mortgage dollar rolls, and other types of forward settling mortgage-backed and asset-backed security transactions, the fund whenever possible enters into a Master Securities Forward Transaction Agreement (“MSFTA”) on a bilateral basis with each of the counterparties with whom it undertakes a significant volume of transactions. The MSFTA gives each party to the agreement the right to terminate all transactions traded under such agreement if there is a specified deterioration in the credit quality of the other party. Upon an event of default or a termination of the MSFTA, the non-defaulting party has the right to close out all transactions traded under such agreement and to net amounts owed under each transaction to one net amount payable by one party to the other. This right to close out and net payments across all transactions traded under the MSFTA could result in a reduction of the fund's credit risk to such counterparty equal to any amounts payable by the fund under the applicable transactions, if any.
For mortgage-backed and asset-backed securities traded under a MSFTA, the collateral and margining requirements are contract specific. Collateral amounts across all transactions traded under such agreement are netted and an amount is posted from one party to the other to collateralize such obligations. Cash that has been pledged to cover the fund's collateral or margin obligations under a MSFTA, if any, will be reported separately on the Statement of Assets and Liabilities as restricted cash. Securities pledged as collateral or margin for the same purpose, if any, are noted in the Portfolio of Investments.
Fees Paid Indirectly — The fund's custody fee may be reduced by a credit earned under an arrangement that measures the value of U.S. dollars deposited with the custodian by the fund. The amount of the credit, for the period ended October 31, 2022, is shown as a reduction of total expenses in the Statement of Operations.
Tax Matters and Distributions — The fund intends to qualify as a regulated investment company, as defined under Subchapter M of the Internal Revenue Code, and to distribute all of its taxable income, including realized capital gains. As a result, no provision for federal income tax is required. The fund’s federal tax returns, when filed, will remain subject to examination by the Internal Revenue Service for a three year period. Management has analyzed the fund’s tax positions taken on federal and state tax returns for all open tax years and does not believe that there are any uncertain tax positions that require recognition of a tax liability. Foreign taxes, if any, have been accrued by the fund in the accompanying financial statements in accordance with the applicable foreign tax law. Foreign income taxes may be withheld by certain countries in which the fund invests. Additionally, capital gains realized by the fund on securities issued in or by certain foreign countries may be subject to capital gains tax imposed by those countries.
Distributions to shareholders are recorded on the ex-dividend date. Income and capital gain distributions are determined in accordance with income tax regulations, which may differ from U.S. generally accepted accounting principles. Certain capital accounts in the financial statements are periodically adjusted for permanent differences in order to reflect their tax character. These adjustments have no impact on net assets or net
Notes to Financial Statements (unaudited) - continued
asset value per share. Temporary differences which arise from recognizing certain items of income, expense, gain or loss in different periods for financial statement and tax purposes will reverse at some time in the future.
The tax character of distributions made during the current period will be determined at fiscal year end. The federal tax cost and the tax basis components of distributable earnings were as follows:
| As of 10/31/22 | |
| Cost of investments | 27,171,525 |
| Gross appreciation | 2,626 |
| Gross depreciation | (1,459,454) |
| Net unrealized appreciation (depreciation) | $(1,456,828) |
Multiple Classes of Shares of Beneficial Interest — The fund offers multiple classes of shares, which differ in their respective distribution and service fees. The fund's income and common expenses are allocated to shareholders based on the value of settled shares outstanding of each class. The fund's realized and unrealized gain (loss) are allocated to shareholders based on the daily net assets of each class. Dividends are declared separately for each class. Differences in per share dividend rates are generally due to differences in separate class expenses. Class C shares will convert to Class A shares approximately eight years after purchase. The fund’s distributions declared to shareholders as reported in the Statement of Changes in Net Assets are presented by class as follows:
| | Six months ended
10/31/22(c) |
| Class A | $5,602 |
| Class C | 459 |
| Class I | 1,828 |
| Class R1 | 459 |
| Class R2 | 548 |
| Class R3 | 593 |
| Class R4 | 638 |
| Class R6 | 313,325 |
| Total | $323,452 |
| (c) | For the period from the commencement of the fund’s investment operations, June 22, 2022, through the stated period end. |
(3) Transactions with Affiliates
Investment Adviser — The fund has an investment advisory agreement with MFS to provide overall investment management and related administrative services and facilities to the fund. The management fee is computed daily and paid monthly at the following annual rates based on the fund's average daily net assets:
| Up to $1 billion | 0.325% |
| In excess of $1 billion and up to $2.5 billion | 0.31% |
| In excess of $2.5 billion | 0.30% |
Notes to Financial Statements (unaudited) - continued
MFS has agreed in writing to reduce its management fee by a specified amount if certain MFS mutual fund assets exceed thresholds agreed to by MFS and the fund's Board of Trustees. MFS has also agreed in writing to waive at least 0.01% of its management fee as part of this agreement. The agreement to waive at least 0.01% of the management fee will continue until modified by the fund's Board of Trustees, but such agreement will continue at least until August 31, 2023. For the period ended October 31, 2022, this management fee reduction amounted to $1,276, which is included in the reduction of total expenses in the Statement of Operations. The management fee incurred for the period ended October 31, 2022 was equivalent to an annual effective rate of 0.31% of the fund's average daily net assets.
The investment adviser has agreed in writing to pay a portion of the fund’s total annual operating expenses, excluding interest, taxes, extraordinary expenses, brokerage and transaction costs, certain tax reclaim recovery expenses (including contingency fees and closing agreement expenses), and investment-related expenses, such that total fund operating expenses do not exceed the following rates annually of each class’s average daily net assets:
| | | | Classes | | | | |
| A | C | I | R1 | R2 | R3 | R4 | R6 |
| 0.64% | 1.39% | 0.39% | 1.39% | 0.89% | 0.64% | 0.39% | 0.33% |
This written agreement will continue until modified by the fund’s Board of Trustees, but such agreement will continue at least until August 31, 2023. For the period ended October 31, 2022, this reduction amounted to $54,042, which is included in the reduction of total expenses in the Statement of Operations.
Distributor — MFS Fund Distributors, Inc. (MFD), a wholly-owned subsidiary of MFS, as distributor, received $24 for the period ended October 31, 2022, as its portion of the initial sales charge on sales of Class A shares of the fund.
The Board of Trustees has adopted a distribution plan for certain share classes pursuant to Rule 12b-1 of the Investment Company Act of 1940.
The fund's distribution plan provides that the fund will pay MFD for services provided by MFD and financial intermediaries in connection with the distribution and servicing of certain share classes. One component of the plan is a distribution fee paid to MFD and another component of the plan is a service fee paid to MFD. MFD may subsequently pay all, or a portion, of the distribution and/or service fees to financial intermediaries.
Notes to Financial Statements (unaudited) - continued
Distribution Plan Fee Table:
| | Distribution
Fee Rate (d) | Service
Fee Rate (d) | Total
Distribution
Plan (d) | Annual
Effective
Rate (e) | Distribution
and Service
Fee |
| Class A | — | 0.25% | 0.25% | 0.25% | $ 383 |
| Class C | 0.75% | 0.25% | 1.00% | 1.00% | 180 |
| Class R1 | 0.75% | 0.25% | 1.00% | 1.00% | 180 |
| Class R2 | 0.25% | 0.25% | 0.50% | 0.50% | 90 |
| Class R3 | — | 0.25% | 0.25% | 0.25% | 45 |
| Total Distribution and Service Fees | | | | | $878 |
| (d) | In accordance with the distribution plan for certain classes, the fund pays distribution and/or service fees equal to these annual percentage rates of each class’s average daily net assets. The distribution and service fee rates disclosed by class represent the current rates in effect at the end of the reporting period. Any rate changes, if applicable, are detailed below. |
| (e) | The annual effective rates represent actual fees incurred under the distribution plan for the period ended October 31, 2022 based on each class's average daily net assets. MFD has voluntarily agreed to rebate a portion of each class's 0.25% service fee attributable to accounts for which there is no financial intermediary specified on the account except for accounts attributable to MFS or its affiliates' seed money. There were no service fee rebates for the period ended October 31, 2022. |
Certain Class A shares are subject to a contingent deferred sales charge (CDSC) in the event of a shareholder redemption within 18 months of purchase. Class C shares are subject to a CDSC in the event of a shareholder redemption within 12 months of purchase. There were no contingent deferred sales charges imposed during the period ended October 31, 2022.
Shareholder Servicing Agent — MFS Service Center, Inc. (MFSC), a wholly-owned subsidiary of MFS, receives a fee from the fund for its services as shareholder servicing agent calculated as a percentage of the average daily net assets of the fund as determined periodically under the supervision of the fund's Board of Trustees. For the period ended October 31, 2022, the fee was $1,099, which equated to 0.0121% annually of the fund's average daily net assets. MFSC also receives reimbursement from the fund for out-of-pocket expenses, sub-accounting and other shareholder servicing costs which may be paid to affiliated and unaffiliated service providers. Class R6 shares do not incur sub-accounting fees. For the period ended October 31, 2022, these out-of-pocket expenses, sub-accounting and other shareholder servicing costs amounted to $136.
Administrator — MFS provides certain financial, legal, shareholder communications, compliance, and other administrative services to the fund. Under an administrative services agreement, the fund reimburses MFS the costs incurred to provide these services. The fund is charged an annual fixed amount of $17,500 plus a fee based on average daily net assets. The administrative services fee incurred for the period ended October 31, 2022 was equivalent to an annual effective rate of 0.0694% of the fund's average daily net assets.
Trustees’ and Officers’ Compensation —The fund pays compensation to independent Trustees in the form of a retainer, attendance fees, and additional compensation to Board and Committee chairpersons. The fund does not pay
Notes to Financial Statements (unaudited) - continued
compensation directly to Trustees or officers of the fund who are also officers of the investment adviser, all of whom receive remuneration from MFS for their services to the fund. Certain officers and Trustees of the fund are officers or directors of MFS, MFD, and MFSC.
Other — The fund invests in the MFS Institutional Money Market Portfolio which is managed by MFS and seeks current income consistent with preservation of capital and liquidity. This money market fund does not pay a management fee to MFS but does incur investment and operating costs.
On June 21, 2022, MFS purchased 20,000 shares of Class A, 5,000 shares each of Class C, Class I, Class R1, Class R2, Class R3, and Class R4, and 2,450,000 shares of Class R6, for an aggregate amount of $25,000,000 as an initial investment in the fund.
At October 31, 2022, MFS held 100% of the outstanding shares each of Class C, Class R1, Class R2, Class R3, Class R4, and Class R6.
(4) Portfolio Securities
| | Purchases | Sales |
| U.S. Government securities | $34,379,789 | $20,304,940 |
| Non-U.S. Government securities | 11,512,979 | 73,366 |
(5) Shares of Beneficial Interest
The fund's Declaration of Trust permits the Trustees to issue an unlimited number of full and fractional shares of beneficial interest. Transactions in fund shares were as follows:
| | Six months ended
10/31/22 (c) |
| | Shares | Amount |
| Shares sold | | |
| Class A | 55,110 | $556,828 |
| Class C | 5,000 | 50,000 |
| Class I | 38,680 | 374,219 |
| Class R1 | 5,000 | 50,000 |
| Class R2 | 5,000 | 50,000 |
| Class R3 | 5,000 | 50,000 |
| Class R4 | 5,000 | 50,000 |
| Class R6 | 2,450,000 | 24,500,000 |
| | 2,568,790 | $25,681,047 |
Notes to Financial Statements (unaudited) - continued
| | Six months ended
10/31/22 (c) |
| | Shares | Amount |
Shares issued to shareholders
in reinvestment of distributions | | |
| Class A | 578 | $5,602 |
| Class C | 47 | 459 |
| Class I | 192 | 1,828 |
| Class R1 | 47 | 459 |
| Class R2 | 56 | 548 |
| Class R3 | 61 | 593 |
| Class R4 | 65 | 638 |
| Class R6 | 32,103 | 313,325 |
| | 33,149 | $323,452 |
| Shares reacquired | | |
| Class A | (73) | $(712) |
| Class I | (388) | (3,675) |
| | (461) | $(4,387) |
| Net change | | |
| Class A | 55,615 | $561,718 |
| Class C | 5,047 | 50,459 |
| Class I | 38,484 | 372,372 |
| Class R1 | 5,047 | 50,459 |
| Class R2 | 5,056 | 50,548 |
| Class R3 | 5,061 | 50,593 |
| Class R4 | 5,065 | 50,638 |
| Class R6 | 2,482,103 | 24,813,325 |
| | 2,601,478 | $26,000,112 |
| (c) | For the period from the commencement of the fund’s investment operations, June 22, 2022, through the stated period end. |
(6) Investments in Affiliated Issuers
An affiliated issuer may be considered one in which the fund owns 5% or more of the outstanding voting securities, or a company which is under common control. For the purposes of this report, the following were affiliated issuers:
| Affiliated Issuers | Beginning
Value | Purchases | Sales
Proceeds | Realized
Gain
(Loss) | Change in
Unrealized
Appreciation or
Depreciation | Ending
Value |
| MFS Institutional Money Market Portfolio | $— | $21,749,840 | $20,172,748 | $394 | $137 | $1,577,623 |
Notes to Financial Statements (unaudited) - continued
| Affiliated Issuers | Dividend
Income | Capital Gain
Distributions |
| MFS Institutional Money Market Portfolio | $27,084 | $— |
(7) LIBOR Transition
Certain of the fund's investments, including investments in certain debt instruments and derivatives (if any), as well as borrowings by the fund and certain other contractual arrangements of the fund, may be based on the London Interbank Offered Rate (“LIBOR”). In 2017, the regulatory authority that oversees financial services firms in the United Kingdom announced plans to transition away from LIBOR by the end of 2021. In March 2021, the administrator of LIBOR announced the extension of the publication of the more commonly used U.S. dollar LIBOR settings to the end of June 2023. Although the full impacts of the transition away from LIBOR are not fully known, the transition may result in, among other things, an increase in volatility or illiquidity of the markets for instruments that currently rely on LIBOR to determine interest rates and this could have an adverse impact on the fund's performance. With respect to the fund's accounting for investments, including investments in certain debt instruments and derivatives, as well as borrowings by the fund and any other contractual arrangements of the fund that undergo reference rate-related modifications as a result of the transition, management will rely upon the relief provided by FASB Codification Topic 848 – Reference Rate Reform (Topic 848). The guidance in Topic 848 permits the fund to account for those modified contracts as a continuation of the existing contracts. Management is still evaluating the impact to the fund of the June 30, 2023 planned discontinuation of the more commonly used U.S. dollar LIBOR settings.
(8) Russia and Ukraine Conflict
The market disruptions, which began in late February 2022, associated with geopolitical events related to the conflict between Russia and Ukraine may adversely affect the value of the fund’s assets and thus the fund’s performance. Management continues to monitor these events and to evaluate the related impacts, if any, to the fund.
Board Approval of Investment Advisory Agreement
MFS Core Bond Fund
The Investment Company Act of 1940 requires that both the full Board of Trustees and a majority of the non-interested (“independent”) Trustees, voting separately, initially approve the Fund’s investment advisory agreement with MFS (the “Agreement”) and, beginning on the second anniversary of the initial effective date of the Agreement, annually approve the continuation of the Agreement. In March and May 2022, the Board met to consider the initial approval of the Agreement (“the initial review meetings”). The independent Trustees were assisted in their evaluation of the Agreement by independent legal counsel, from whom they received separate legal advice and with whom they met separately from MFS.
In connection with their deliberations regarding the initial approval of the Agreement, the Trustees, including the independent Trustees, considered such information and factors as they believed, in light of the legal advice furnished to them and their own business judgment, to be relevant. As described below, the Trustees considered the nature, quality, and extent of the various investment advisory, administrative, and shareholder services to be performed by MFS under the Agreement and other arrangements with the Fund.
In connection with their initial review meetings, the Trustees received and relied upon materials that included, among other items: (i) information provided by Broadridge Financial Solutions Inc. (“Broadridge”), an independent third party, on the Fund’s proposed advisory fees and other expenses and the advisory fees and other expenses of comparable funds identified by Broadridge, as well as all other funds in the same investment classification/category (the “Broadridge expense group and universe”), (ii) information provided by MFS on the advisory fees it charges to other registered funds managed in a similar style to the Fund, and (iii) information as to whether and to what extent applicable expense waivers, reimbursements or fee “breakpoints” would be observed for the Fund. In addition, in connection with the independent Trustees’ May 2022 meeting for the purpose of considering whether to approve the continuation of the investment advisory agreements for the other investment companies that the Board oversees (the “MFS Funds”), the independent Trustees received: (i) information provided by MFS on the advisory fees of portfolios of other clients of MFS, including institutional separate accounts and other clients, (ii) information regarding MFS’ financial results and financial condition, including MFS’ and certain of its affiliates’ estimated profitability from services performed for the MFS Funds as a whole, and compared to MFS’ institutional business, (iii) MFS’ views regarding the outlook for the mutual fund industry and the strategic business plans of MFS, (iv) descriptions of various functions performed by MFS for the Funds, such as compliance monitoring and portfolio trading practices, and (v) information regarding the overall organization of MFS, including information about MFS’ senior management and other personnel that would provide investment advisory, administrative and other services to the Fund and the other MFS Funds. The comparative fee and expense information prepared and provided by Broadridge was not independently verified and the independent Trustees did not independently verify any information provided to them by MFS.
Board Approval of Investment Advisory Agreement - continued
The Trustees’ conclusion as to the initial approval of the Agreement was based on a comprehensive consideration of all information provided to the Trustees and not the result of any single factor. Some of the factors that figured particularly in the Trustees’ deliberations are described below, although individual Trustees may have evaluated the information presented differently from one another, giving different weights to various factors. Because the Fund is newly organized and had not yet commenced investment operations at the time of the initial review meetings, the Fund had no investment performance for the Trustees to review.
In assessing the reasonableness of the Fund’s advisory fee, the Trustees considered, among other information, the Fund’s proposed advisory fee and the estimated total expense ratio of the Fund’s Class I shares as a percentage of average daily net assets and the advisory fee and total expense ratios of peer groups of funds based on information provided by Broadridge. The Trustees also considered that MFS will observe an expense limitation for the Fund, which may not be changed without the Trustees’ approval. The Trustees considered that, according to the data provided by Broadridge (which takes into account any proposed fee reductions or expense limitations for the Fund), the Fund’s effective advisory fee rate and total expense ratio would each be lower than the Broadridge expense group median.
The Trustees also considered whether the Fund may benefit from any economies of scale in the management of the Fund in the event of growth in assets of the Fund and/or growth in assets of the MFS Funds as a whole. They noted that the Fund’s proposed advisory fee rate schedule is subject to contractual breakpoints that reduce the Fund’s advisory fee rate on average daily net assets over $1 billion and $2.5 billion. The Trustees also noted that MFS has agreed in writing to waive a portion of the management fees of certain MFS Funds, including the Fund, if the total combined assets of certain funds within the MFS Funds’ complex increase above agreed upon thresholds (the “group fee waiver”), enabling the Fund’s shareholders to share in the benefits from any economies of scale at the complex level. The group fee waiver is reviewed and renewed annually between the Board and MFS. The Trustees concluded that the proposed contractual breakpoints and the group fee waiver were sufficient to allow the Fund to benefit from economies of scale as its assets and overall complex assets grow.
The Trustees did not consider MFS’ costs and profits with respect to the Fund because the Fund had not yet commenced operations. The Trustees considered information prepared by MFS relating to MFS’ costs and profits with respect to the MFS Funds considered as a group, and other investment companies and institutional accounts advised by MFS, as well as MFS’ methodologies used to determine and allocate its costs to the MFS Funds and other accounts and products for purposes of estimating profitability.
After reviewing these and other factors described herein, the Trustees concluded, within the context of their overall conclusions regarding the Agreement, that the advisory fee to be charged to the Fund represents reasonable compensation in light of the services to be provided by MFS to the Fund.
In addition, the Trustees considered MFS’ resources and related efforts to continue to retain, attract and motivate capable personnel to serve the Fund. The Trustees also considered current and developing conditions in the financial services industry, including the presence of large and well-capitalized companies which are spending,
Board Approval of Investment Advisory Agreement - continued
and appear to be prepared to continue to spend, substantial sums to engage personnel and to provide services to competing investment companies. In this regard, the Trustees also considered the financial resources of MFS and its ultimate parent, Sun Life Financial Inc. The Trustees also considered the advantages and possible disadvantages to the Fund of having an adviser that also serves other investment companies as well as other accounts.
The Trustees also considered the nature, quality, cost, and extent of administrative, transfer agency, and distribution services to be provided to the Fund by MFS and its affiliates under agreements and plans other than the Agreement, including any 12b-1 fees the Fund will pay to MFS Fund Distributors, Inc., an affiliate of MFS. The Trustees also considered the nature, extent and quality of certain other services MFS may perform or arrange for on the Fund’s behalf, which may include securities lending programs, directed expense payment programs, class action recovery programs, and MFS’ interaction with third-party service providers, principally custodians and sub-custodians. The Trustees concluded that the various non-advisory services to be provided by MFS and its affiliates on behalf of the Fund were satisfactory.
The Trustees considered so-called “fall-out benefits” to MFS such as reputational value derived from serving as investment manager to the MFS Funds. The Trustees also considered that MFS discontinued its historic practice of obtaining investment research from portfolio brokerage commissions paid by certain MFS Funds effective January 2018, and directly pays or voluntarily reimburses a Fund, if applicable, for the costs of external research acquired through the use of the Fund’s portfolio brokerage commissions.
Based on their evaluation of factors that they deemed to be material, including those factors described above, the Board of Trustees, including the independent Trustees, concluded that the Fund’s Agreement with MFS should be approved for an initial two-year period, commencing upon its effective date, as set forth in the Agreement.
Proxy Voting Policies and Information
MFS votes proxies on behalf of the fund pursuant to proxy voting policies and procedures that are available without charge, upon request, by calling 1-800-225-2606, by visiting mfs.com/proxyvoting, or by visiting the SEC’s Web site at http://www.sec.gov.
Information regarding how the fund voted proxies relating to portfolio securities during the most recent twelve-month period ended June 30 is available by August 31 of each year without charge by visiting mfs.com/proxyvoting, or by visiting the SEC’s Web site at http://www.sec.gov.
Quarterly Portfolio Disclosure
The fund files a complete schedule of portfolio holdings with the SEC for the first and third quarters of each fiscal year as an exhibit to its reports on Form N-PORT. The fund's Form N-PORT reports are available on the SEC's Web site at http://www.sec.gov. A shareholder can obtain the portfolio holdings report for the first and third quarters of the fund's fiscal year at mfs.com/openendfunds by choosing the fund's name and then scrolling to the “Resources” section and clicking on the “Prospectus and Reports” tab.
Further Information
From time to time, MFS may post important information about the fund or the MFS Funds on the MFS Web site (mfs.com). This information is available at https://www.mfs.com/announcements or at mfs.com/openendfunds by choosing the fund’s name and then scrolling to the “Resources” section and clicking on the “Announcements” tab, if any.
Information About Fund Contracts and Legal Claims
The fund has entered into contractual arrangements with an investment adviser, administrator, distributor, shareholder servicing agent, and custodian who each provide services to the fund. Unless expressly stated otherwise, shareholders are not parties to, or intended beneficiaries of these contractual arrangements, and these contractual arrangements are not intended to create any shareholder right to enforce them against the service providers or to seek any remedy under them against the service providers, either directly or on behalf of the fund.
Under the Trust’s By-Laws and Declaration of Trust, any claims asserted against or on behalf of the MFS Funds, including claims against Trustees and Officers, must be brought in state and federal courts located within the Commonwealth of Massachusetts.
Provision of Financial Reports and Summary Prospectuses
The fund produces financial reports every six months and updates its summary prospectus and prospectus annually. To avoid sending duplicate copies of materials to households, only one copy of the fund’s annual and semiannual report and summary prospectus may be mailed to shareholders having the same last name and residential address on the fund’s records. However, any shareholder may contact MFSC (please see back cover for address and telephone number) to request that copies of these reports and summary prospectuses be sent personally to that shareholder.
Save paper with eDelivery.
MFS® will send you prospectuses, reports, and proxies directly via e-mail so you will get information faster with less mailbox clutter.
To sign up:
1. Go to mfs.com.
2. Log in via MFS® Access.
3. Select eDelivery.
If you own your MFS fund shares through a financial institution or a retirement plan, MFS® TALK, MFS® Access, or eDelivery may not be available to you.
CONTACT
WEB SITE
mfs.com
MFS TALK
1-800-637-8255
24 hours a day
ACCOUNT SERVICE AND LITERATURE
Shareholders
1-800-225-2606
Financial advisors
1-800-343-2829
Retirement plan services
1-800-637-1255
MAILING ADDRESS
MFS Service Center, Inc.
P.O. Box 219341
Kansas City, MO 64121-9341
OVERNIGHT MAIL
MFS Service Center, Inc.
Suite 219341
430 W 7th Street
Kansas City, MO 64105-1407
Item 1(b):
Not applicable
ITEM 2. CODE OF ETHICS.
During the period covered by this report, the Registrant has not amended any provision in its Code of Ethics (the "Code") that relates to an element of the Code's definition enumerated in paragraph (b) of Item 2 of this Form N-CSR. During the period covered by this report, the Registrant did not grant a waiver, including an implicit waiver, from any provision of the Code.
ITEM 3. AUDIT COMMITTEE FINANCIAL EXPERT.
Not applicable for semi-annual reports.
ITEM 4. PRINCIPAL ACCOUNTANT FEES AND SERVICES.
Not applicable for semi-annual reports.
ITEM 5. AUDIT COMMITTEE OF LISTED REGISTRANTS.
Not applicable to the Registrant.
ITEM 6. INVESTMENTS
A schedule of investments for each series covered by this Form N-CSR is included as part of the report to shareholders of such series under Item 1(a) of this Form N-CSR.
ITEM 7. DISCLOSURE OF PROXY VOTING POLICIES AND PROCEDURES FOR CLOSED-END MANAGEMENT INVESTMENT COMPANIES.
Not applicable to the Registrant.
ITEM 8. PORTFOLIO MANAGERS OF CLOSED-END MANAGEMENT INVESTMENT COMPANIES.
Not applicable to the Registrant.
ITEM 9. PURCHASES OF EQUITY SECURITIES BY CLOSED-END MANAGEMENT INVESTMENT COMPANY AND AFFILIATED PURCHASERS.
Not applicable to the Registrant.
ITEM 10. SUBMISSION OF MATTERS TO A VOTE OF SECURITY HOLDERS.
There were no material changes to the procedures by which shareholders may send recommendations to the Board for nominees to the Registrant's Board since the Registrant last provided disclosure as to such procedures in response to the requirements of Item 407 (c)(2)(iv) of Regulation S-K or this Item.
ITEM 11. CONTROLS AND PROCEDURES.
(a)Based upon their evaluation of the effectiveness of the registrant's disclosure controls and procedures (as defined in Rule 30a-3(c) under the Investment Company Act of 1940 (the "Act")) as conducted within 90 days of the filing date of this report on Form N-CSR, the registrant's principal financial officer and principal executive officer have concluded that those disclosure controls and procedures provide reasonable assurance that the material information required to be disclosed by the registrant on this report is recorded, processed, summarized and reported within the time periods specified in the Securities and Exchange Commission's rules and forms.
(b)There were no changes in the registrant's internal controls over financial reporting (as defined in Rule 30a-3(d) under the Act) that occurred during the period covered by the report that have materially affected, or are reasonably likely to materially affect, the registrant's internal control over financial reporting.
ITEM 12. DISCLOSURE OF SECURITIES LENDING ACTIVITIES FOR CLOSED-END MANAGEMENT INVESTMENT COMPANIES.
Not applicable to the Registrant.
ITEM 13. EXHIBITS.
(a)(1) Any code of ethics, or amendment thereto, that is the subject of the disclosure required by Item 2, to the extent that the registrant intends to satisfy the Item 2 requirements through filing of an exhibit: Not applicable.
(2)A separate certification for each principal executive officer and principal financial officer of the registrant as required by Rule 30a-2(a) under the Act (17 CFR 270.30a-2): Attached hereto as EX-99.302CERT.
(3)Any written solicitation to purchase securities under Rule 23c-1 under the Act (17 CFR 270.23c-1) sent or given during the period covered by the report by or on behalf of the registrant to 10 or more persons. Not applicable.
(4)Change in the registrant's independent public accountant. Not applicable.
(b)If the report is filed under Section 13(a) or 15(d) of the Exchange Act, provide the certifications required by Rule 30a-2(b) under the Act (17 CFR 270.30a-2(b)), Rule 13a-14(b) or Rule 15d-14(b) under the Exchange Act (17 CFR 240.13a-14(b) or
240.15d-14(b)) and Section 1350 of Chapter 63 of Title 18 of the United States Code (18 U.S.C. 1350) as an exhibit. A certification furnished pursuant to this paragraph will not be deemed "filed" for the purposes of Section 18 of the Exchange Act (15 U.S.C. 78r), or otherwise subject to the liability of that section. Such certification will not be deemed to be incorporated by reference into any filing under the Securities Act of 1933 or the Exchange Act, except to the extent that the registrant specifically incorporates it by reference. Attached hereto as EX-99.906CERT.
Notice
A copy of the Declaration of Trust, as amended, of the Registrant is on file with the Secretary of State of The Commonwealth of Massachusetts and notice is hereby given that this instrument is executed on behalf of the Registrant by an officer of the Registrant as an officer and not individually and the obligations of or arising out of this instrument are not binding upon any of the Trustees or shareholders individually, but are binding only upon the assets and property of the respective constituent series of the Registrant.
SIGNATURES
Pursuant to the requirements of the Securities Exchange Act of 1934 and the Investment Company Act of 1940, the registrant has duly caused this report to be signed on its behalf by the undersigned, thereunto duly authorized.
(Registrant) MFS SERIES TRUST XII
By (Signature and Title)*
/S/ DAVID L. DILORENZO
David L. DiLorenzo, President
Date: December 15, 2022
Pursuant to the requirements of the Securities Exchange Act of 1934 and the Investment Company Act of 1940, this report has been signed below by the following persons on behalf of the registrant and in the capacities and on the dates indicated.
By (Signature and Title)*
/S/ DAVID L. DILORENZO
David L. DiLorenzo, President (Principal Executive Officer)
Date: December 15, 2022
By (Signature and Title)*
/S/ JAMES O. YOST
James O. Yost, Treasurer (Principal Financial Officer and Accounting Officer)
Date: December 15, 2022
* Print name and title of each signing officer under his or her signature.