Table of Contents
UNITED STATES
SECURITIES AND EXCHANGE COMMISSION
Washington, D. C. 20549
AMENDMENT NO. 1 TO FORM 10
GENERAL FORM FOR REGISTRATION OF SECURITIES
PURSUANT TO SECTION 12(b) OR (g) OF
THE SECURITIES EXCHANGE ACT OF 1934
FEDERAL HOME LOAN BANK OF CHICAGO
(Exact name of registrant as specified in its charter)
Commission File No. 000-51401
| Federally chartered corporation | 36-6001019 | |
(State or other jurisdiction of incorporation or organization) | (I.R.S. Employer Identification No.) | |
111 East Wacker Drive Chicago, IL | 60601 | |
| (Address of principal executive offices) | (Zip Code) | |
Registrant’s telephone number, including area code: (312) 565-5700
Securities to be registered pursuant to Section 12(b) of the Act: None
Securities to be registered pursuant to Section 12(g) of the Act: Capital stock, $100 per share par value
1
Table of Contents
FEDERAL HOME LOAN BANK OF CHICAGO
TABLE OF CONTENTS
Item 1. | Business | 3 | ||
Item 1A. | Risk Factors | 53 | ||
Item 2. | Financial Information | 60 | ||
Item 3. | Properties | 116 | ||
Item 4. | Security Ownership of Certain Beneficial Owners and Management | 117 | ||
Item 5. | Directors and Executive Officers | 119 | ||
Item 6. | Executive Compensation | 123 | ||
Item 7. | Certain Relationships and Related Transactions | 129 | ||
Item 8. | Legal Proceedings | 132 | ||
Item 9. | Market Price of and Dividends on the Registrant’s Common Equity and Related Stockholder Matters | 133 | ||
Item 10. | Recent Sales of Unregistered Securities | 135 | ||
Item 11. | Description of Registrant’s Securities to be Registered | 136 | ||
Item 12. | Indemnification of Directors and Officers | 138 | ||
Item 13. | Financial Statements and Supplementary Data | 139 | ||
Item 14. | Changes in and Disagreements with Accountants on Accounting and Financial Disclosure | 140 | ||
Item 15. | Financial Statements and Exhibits | 141 |
2
Table of Contents
| I tem 1. | Business. |
1.1 | Overview | 4 | ||
1.2 | Business Segments | 7 | ||
1.3 | Funding Services | 40 | ||
1.4 | Use of Interest Rate Derivatives | 44 | ||
1.5 | Regulations | 45 | ||
1.6 | Taxation | 48 | ||
1.7 | REFCORP and AHP Assessments | 49 | ||
1.8 | Competition | 50 | ||
1.9 | Employees | 52 |
3
Table of Contents
Introduction
The Federal Home Loan Bank of Chicago (the “Bank”), a federally chartered corporation and a member–owned cooperative, is one of twelve Federal Home Loan Banks (the “FHLBs”) which, with the Federal Housing Finance Board (the “Finance Board”) and the Office of Finance, comprise the Federal Home Loan Bank System (the “System”). The twelve FHLBs are government-sponsored enterprises (“GSE”) of the United States of America and were organized under the Federal Home Loan Bank Act of 1932, as amended (“FHLB Act”). Each FHLB has members in a specifically defined geographic district. The Bank’s defined geographic membership territory consists of the states of Illinois and Wisconsin.
The mission of the Bank is to promote and support the growth and success of our members’ housing, community investment, and other financing activities by:
| • | Serving as a reliable source of liquidity. |
| • | Providing secured financing and asset liability management capabilities, which create value and are designed to meet our members’ specific needs. |
| • | Contributing direct support to affordable housing and community investment programs delivered through our members. |
The principal sources of credit provided by the Bank are in the form of secured loans, called advances, to members and through the Mortgage Partnership Finance® (MPF®) Program1 under which the Bank, in partnership with its members, provides funding for home mortgage loans. The Bank initiated the MPF Program in 1997. In 2003, the Bank initiated the MPF Shared Funding® program, pursuant to which a member of the Bank forms a trust that issues privately-placed mortgage-backed securities (“MBS”) which are sold to the FHLBs and their members, thereby providing competition in the MBS market.
These programs help the Bank accomplish its mission of supporting housing finance throughout America. All federally-insured depository institutions, insurance companies engaged in residential housing finance, credit unions and community financial institutions (“CFIs”) located in Illinois and Wisconsin are eligible to apply for membership in the Bank. All members are required to purchase capital stock in the Bank as a condition of membership, and all capital stock is owned by the Bank’s members. The capital stock is not publicly-traded.
The Bank combines private capital and public sponsorship to provide its member financial institutions with a reliable flow of credit and other services for housing and community development. The Bank serves the public through member financial institutions by providing members with liquidity and capital markets based financing, thereby enhancing the availability of residential mortgage and community investment credit. The Bank also provides members with funding for home mortgage loans through the MPF Program.
The Bank is supervised and regulated by the Finance Board, which is an independent federal agency in the executive branch of the United States Government. See “Item 1.5—Regulations—Regulatory Oversight.”
A primary source of funds for the Bank is the proceeds from the sale to the public of FHLB debt instruments (“consolidated obligations”) which are, by Finance Board regulation, the joint and several obligations of all the FHLBs. Consolidated obligations are not obligations of the United States Government and the United States Government does not guarantee them. The Office of Finance is a joint office of the FHLBs established by the Finance Board to facilitate issuing and servicing of the consolidated obligations. Additional funds are provided by deposits, other borrowings and the issuance of capital stock. Deposits are received from both member and non-member financial institutions and federal instrumentalities. The Bank also provides members and non-members with correspondent services such as safekeeping, wire transfers, and cash management.
The Bank maintains a web site located at www.fhlbc.com through which it makes available its financial statements and other information regarding the Bank. Following the Bank’s registration under the Securities Exchange Act of 1934, the Bank will be required to file with the Securities and Exchange Commission an annual report on Form 10-K, quarterly reports on Form
| 1 | “Mortgage Partnership Finance,” “MPF,” “ MPF Shared Funding” and “eMPF” are registered trademarks of the Federal Home Loan Bank of Chicago. |
4
Table of Contents
10-Q, and current reports on Form 8-K. The Securities and Exchange Commission maintains a website that contains these reports and other information regarding the Bank’s electronic filings located at www.sec.gov. These reports may also be read and copied at the Securities and Exchange Commission’s Public Reference Room at 100 F Street, NE, Washington, DC 20549. Further information about the operation of the Public Reference Room may be obtained by calling 1-800-SEC-0330. Information on those websites, or that can be accessed through those websites, does not constitute a part of this registration statement.
Membership Trends
At September 30, 2005, membership in the Bank was 885 members, down eight from December 31, 2004. Although the Bank added 17 new members, 3 members voluntarily withdrew from membership and 22 members were acquired by other institutions (15 within the Bank’s district and 7 outside of the district.) Capital stock decreased $399 million or 9.3% from December 31, 2004 because of voluntary redemptions and members being acquired by out of district financial institutions. On October 18, 2005, the Bank’s Board of Directors discontinued redemptions of voluntary stock for a period of time in order to ensure an adequate capital base for the Bank. Subsequent to the Bank announcing its discontinuation of voluntary capital stock redemptions on October 18, 2005, the Bank received membership withdrawal notices and related redemption requests from five members totaling $235 million through February 6, 2006. These requests were reclassified from equity to a liability upon notice. Redemption is pending the six month notice period and approval from the Finance Board. See “Item 2.2—Management’s Discussion and Analysis of Financial Condition and Results of Operations—Overview—Regulatory Agreement and Related Actions.”
Total membership in the Bank reached an all-time high of 893 members at December 31, 2004, up from 884 at December 31, 2003. Of those members, 79% were commercial banks, 16% thrift institutions, 4% credit unions, and 1% insurance companies. At the end of 2004, 42% of all members had less than $100 million in assets, 53% had assets between $100 million and $1 billion, and 5% had assets in excess of $1 billion.
Credit customers, defined as the number of members which have used advances, the MPF Program or other credit products at any point during the period, were 718 in 2004 compared to 681 during 2003. As a percentage of total membership, credit customer utilization was 80% in 2004 versus 77% in 2003. For the nine months ended September 30, 2005, the number of credit customers was 737, with a credit customer utilization ratio of 83% compared to 705 credit customers with a credit customer utilization ratio of 79% for the nine months ended September 30, 2004.
5
Table of Contents
The table below shows the outstanding advances, capital stock holdings and the geographic locations of the Bank’s members by type:
(Dollars in thousands) | September 30, 2005 | |||||||||||||||||||
Type of Institutions | Advances at Par | Percent of Total | Par Value of Capital Stock Held | Number of Institutions | Percent of Total | |||||||||||||||
| Illinois | Wisconsin | Total | ||||||||||||||||||
Commercial Banks | $ | 14,842,853 | 61.3 | % | $ | 2,300,003 | 474 | 227 | 701 | 79.2 | % | |||||||||
Thrifts | 7,484,295 | 30.9 | % | 996,418 | 100 | 36 | 136 | 15.4 | % | |||||||||||
Credit Unions | 178,685 | 0.7 | % | 294,405 | 16 | 21 | 37 | 4.2 | % | |||||||||||
Insurance Companies | 1,713,000 | 7.1 | % | 313,573 | 9 | 2 | 11 | 1.2 | % | |||||||||||
Total | $ | 24,218,833 | 100.0 | % | $ | 3,904,399 | 599 | 286 | 885 | 100.0 | % | |||||||||
Adjustments | 14,182 | 1 | (13,734 | ) 2 | ||||||||||||||||
Per Financial Statements | $ | 24,233,015 | $ | 3,890,665 | ||||||||||||||||
(Dollars in thousands) | December 31, 2004 | |||||||||||||||||||
Type of Institutions | Advances at Par | Percent of | Par Value of | Number of Institutions | Percent of | |||||||||||||||
| Illinois | Wisconsin | Total | ||||||||||||||||||
Commercial Banks | $ | 14,121,622 | 58.9 | % | $ | 2,312,005 | 478 | 229 | 707 | 79.2 | % | |||||||||
Thrifts | 7,954,899 | 33.2 | % | 1,253,481 | 104 | 37 | 141 | 15.8 | % | |||||||||||
Credit Unions | 174,083 | 0.7 | % | 303,138 | 16 | 19 | 35 | 3.9 | % | |||||||||||
Insurance Companies | 1,718,000 | 7.2 | % | 434,801 | 8 | 2 | 10 | 1.1 | % | |||||||||||
Total | $ | 23,968,604 | 100.0 | % | $ | 4,303,425 | 606 | 287 | 893 | 100.0 | % | |||||||||
Adjustments | 222,954 | 1 | (11,259 | ) 2 | ||||||||||||||||
Per Financial Statements | $ | 24,191,558 | $ | 4,292,166 | ||||||||||||||||
| 1 | Adjustment includes SFAS 133 basis adjustment for advances at par. |
| 2 | Adjustments include SFAS 150 adjustment of mandatorily redeemable capital stock for the par value of capital stock held. |
6
Table of Contents
The Bank manages its operations by grouping its products and services within two operating segments. The measure of profit or loss and total assets for each segment is contained in Note 10—Segment Information to the September 30, 2005 Financial Statements and Notes and in Note 17—Segment Information to the 2004 Annual Financial Statements and Notes. Management’s Discussion and Analysis on the operating results of the segments is contained in “Item 2.2—Management’s Discussion and Analysis of Financial Condition and Results of Operations—Operating Segment Results.” These operating segments are:
| • | Traditional Member Finance: This segment includes traditional funding, liquidity and deposit products consisting of loans to members called advances, standby letters of credit, investments and deposit products; and |
| • | the MPF Program. |
The segments reflect the manner in which financial information is evaluated by management including the chief operating decision makers.
Traditional Member Finance
Advances
The Bank extends advances (fixed or floating rate loans) to its members and eligible housing associates based on the security of mortgages and other collateral that the members and eligible housing associates pledge. Eligible housing associates are non-members that are approved mortgagees under Title II of the National Housing Act for which the Bank is permitted under the FHLB Act to make advances. These eligible housing associates must be chartered under law, be subject to inspection and supervision by some governmental agency, and lend their own funds as their principal activity in the mortgage field. Eligible housing associates are not subject to certain provisions of the FHLB Act that are applicable to members, such as the capital stock purchase requirements, but the same regulatory lending requirements that apply to members apply to them.
Advances generally support residential mortgages held in member portfolios, and may also be used for any valid business purpose in which a member is authorized to invest, including providing funds to any member CFI for secured loans to small businesses, small farms, and small agri-businesses. CFIs are defined as FDIC-insured depository institutions with total average year-end assets at or below a level prescribed by the Finance Board each year for the prior three years. This level was set at $567 million or less as of January 1, 2005 and $548 million or less as of January 1, 2004. Advances can serve as a funding source for a variety of conforming mortgage loans and nonconforming mortgages, including loans that members may be unable or unwilling to sell in the secondary mortgage market. Conforming mortgage loans are mortgage loans which meet Fannie Mae’s or Freddie Mac’s original loan amount limits and underwriting guides. Nonconforming mortgage loans are mortgage loans that do not meet these requirements. Thus, advances support important housing markets, including those focused on low- and moderate-income households. For those members that choose to sell or securitize their mortgages, advances can provide interim funding.
The Bank offers a variety of advances, including the following:
| • | Fixed-Rate Advances. Fixed-rate advances have maturities from two days to ten years. The Bank also offers putable fixed-rate advances in which the Bank has the right to put the advance after a specified lockout period, in whole or in part, at the par value with five business days notice. If the Bank has the right to put the advance, the member must extinguish the advance by using its existing liquidity or by obtaining funds under another advance product offered by the Bank at existing market prices for that member on the date the advance was put back to the member. |
| • | Variable-Rate Advances. Variable-rate advances include advances with maturities from six months to seven years with the interest rates reset periodically at a fixed spread to LIBOR or some other index. Depending upon the variable-rate advance selected, the member can have an interest-rate cap on the advance which limits the amount of interest the member would have to pay, or the member can prepay the advance with or without a prepayment fee. |
7
Table of Contents
| • | Open-Line Advances. Open-line advances are designed to provide flexible funding to meet borrowers’ daily liquidity needs and can be drawn for one day. These advances are automatically payable on demand by the member. Rates are set daily at the end of business. |
| • | Fixed Amortizing Advances. Fixed amortizing advances have maturities that range from one year to 15 years, with the principal repaid over the term of the advances monthly, quarterly or semi-annually. |
| • | Floating to Fixed Convertible Advances. Floating to fixed convertible advances have maturities that range from two years to ten years, with a defined lockout period where the interest rates adjust based on a spread to LIBOR. At the end of the lockout period, these advances convert to fixed-rate advances. The interest rates on the converted advances are set at origination. |
The tables below set forth the outstanding amount of advances by type:
(Dollars in thousands) | September 30, 2005 | |||||||||||||
Advance Type | Carrying Value | Percent of Total | Income for the | Percent of Advance Income | ||||||||||
Fixed-Rate | $ | 19,459,375 | 80.34 | % | $ | 516,191 | 81.53 | % | ||||||
Variable-Rate | 3,627,600 | 14.98 | % | 82,435 | 13.02 | % | ||||||||
Open-Line | 899,803 | 3.72 | % | 25,392 | 4.01 | % | ||||||||
Fixed Amortizing | 177,055 | 0.73 | % | 6,891 | 1.09 | % | ||||||||
Floating to Fixed Convertible | 55,000 | 0.23 | % | 2,219 | 0.35 | % | ||||||||
Total par value of advances | 24,218,833 | 100.00 | % | 633,128 | 100.00 | % | ||||||||
Other | (85 | ) | 561 | |||||||||||
SFAS 133 hedging adjustments | 14,267 | (68,394 | ) | |||||||||||
Total Advances | $ | 24,233,015 | $ | 565,295 | ||||||||||
(Dollars in thousands) | September 30, 2004 | |||||||||||||
Advance Type | Carrying Value | Percent of Total | Income for the | Percent of Advance Income | ||||||||||
Fixed-Rate | $ | 19,995,527 | 80.70 | % | $ | 556,936 | 88.03 | % | ||||||
Variable-Rate | 3,165,200 | 12.78 | % | 52,173 | 8.25 | % | ||||||||
Open-Line | 1,329,381 | 5.37 | % | 11,106 | 1.76 | % | ||||||||
Fixed Amortizing | 230,801 | 0.93 | % | 8,406 | 1.33 | % | ||||||||
Floating to Fixed Convertible | 55,000 | 0.22 | % | 4,004 | 0.63 | % | ||||||||
Total par value of advances | 24,775,909 | 100.00 | % | 632,625 | 100.00 | % | ||||||||
Other | (100 | ) | 3,210 | |||||||||||
SFAS 133 hedging adjustments | 349,091 | (223,884 | ) | |||||||||||
Total Advances | $ | 25,124,900 | $ | 411,951 | ||||||||||
8
Table of Contents
(Dollars in thousands) | December 31, 2004 | |||||||||||||
Advance Type | Carrying Value | Percent of Total | Income for the | Percent of Advance Income | ||||||||||
Fixed-Rate | $ | 19,398,370 | 80.93 | % | $ | 730,263 | 87.83 | % | ||||||
Variable-Rate | 3,207,400 | 13.38 | % | 68,423 | 8.23 | % | ||||||||
Open-Line | 1,085,281 | 4.53 | % | 16,953 | 2.04 | % | ||||||||
Fixed Amortizing | 222,553 | 0.93 | % | 11,049 | 1.33 | % | ||||||||
Floating to Fixed Convertible | 55,000 | 0.23 | % | 4,751 | 0.57 | % | ||||||||
Total par value of advances | 23,968,604 | 100.00 | % | 831,439 | 100.00 | % | ||||||||
Other | (97 | ) | 5,091 | |||||||||||
SFAS 133 hedging adjustments | 223,051 | (282,426 | ) | |||||||||||
Total Advances | $ | 24,191,558 | $ | 554,104 | ||||||||||
(Dollars in thousands) | December 31, 2003 | |||||||||||||
Advance Type | Carrying Value | Percent of Total | Income for the Year Ended | Percent of Advance Income | ||||||||||
Fixed-Rate | $ | 19,377,117 | 74.91 | % | $ | 800,274 | 89.71 | % | ||||||
Variable-Rate | 5,139,199 | 19.87 | % | 63,846 | 7.16 | % | ||||||||
Open-Line | 997,951 | 3.86 | % | 10,299 | 1.15 | % | ||||||||
Fixed Amortizing | 248,876 | 0.96 | % | 11,959 | 1.34 | % | ||||||||
Floating to Fixed Convertible | 105,000 | 0.40 | % | 5,733 | 0.64 | % | ||||||||
Total par value of advances | 25,868,143 | 100.00 | % | 892,111 | 100.00 | % | ||||||||
Other | (144 | ) | 4,042 | |||||||||||
SFAS 133 hedging adjustments | 575,064 | (340,958 | ) | |||||||||||
Total Advances | $ | 26,443,063 | $ | 555,195 | ||||||||||
(Dollars in thousands) | December 31, 2002 | |||||||||||||
Advance Type | Carrying Value | Percent of Total | Income for the Year Ended | Percent of Advance Income | ||||||||||
Fixed-Rate | $ | 18,805,122 | 78.27 | % | $ | 888,744 | 88.40 | % | ||||||
Variable-Rate | 4,529,598 | 18.85 | % | 88,144 | 8.77 | % | ||||||||
Open-Line | 412,022 | 1.71 | % | 11,087 | 1.10 | % | ||||||||
Fixed Amortizing | 279,130 | 1.16 | % | 11,617 | 1.16 | % | ||||||||
Floating to Fixed Convertible | 1,184 | 0.01 | % | 5,793 | 0.57 | % | ||||||||
Total par value of advances | 24,027,056 | 100.00 | % | 1,005,385 | 100.00 | % | ||||||||
Other | (233 | ) | 748 | |||||||||||
SFAS 133 hedging adjustments | 918,289 | (415,870 | ) | |||||||||||
Total Advances | $ | 24,945,112 | $ | 590,263 | ||||||||||
9
Table of Contents
The Bank’s credit products provide members with asset-liability management capabilities. The Bank offers advances that can be adjusted to help manage the maturity and prepayment characteristics of mortgage loans. These advances can reduce a member’s interest rate risk associated with holding long-term fixed-rate mortgages. Alternatively, members can enter into interest rate derivatives directly with the Bank to reduce their exposure to interest rate risk. In such cases, the Bank acts as an intermediary between the members and other non-member counterparties by entering into offsetting interest rate derivatives. This intermediation allows smaller members indirect access to the derivatives market. The derivatives used in intermediary activities do not qualify for SFAS 133 hedge accounting treatment and are separately recorded at fair value through earnings. At September 30, 2005 and December 31, 2004 and 2003, the Bank had $87.7 million, $127.4 million and $142.6 million in outstanding notional amounts of interest rate exchange agreements, respectively, between the Bank and its members. The fair value of these interest rate derivatives was ($5.0) million, $6.1 million and ($3.6) million at September 30, 2005 and December 31, 2004 and 2003, respectively.
To determine the maximum amount and term of the advances the Bank will lend to a member, the Bank assesses the member’s creditworthiness and financial condition. The Bank also values the collateral pledged to the Bank and conducts periodic collateral reviews to establish the amount it will lend against each collateral type. The Bank requires delivery of all securities collateral and may also require delivery of loan collateral under certain conditions (for example, when a member’s creditworthiness deteriorates).
The Bank is required to obtain and maintain a security interest in eligible collateral at the time it originates or renews an advance. Eligible collateral includes whole first mortgages on improved residential property, or securities representing a whole interest in such mortgages; securities issued, insured, or guaranteed by the U.S. Government or any of its agencies; without limitation mortgage-backed securities issued or guaranteed by the Federal National Mortgage Association (“Fannie Mae”), Federal Home Loan Mortgage Corporation (“Freddie Mac”), or the Government National Mortgage Association (“Ginnie Mae”); FHLB consolidated obligations; cash or deposits in the Bank; and other real estate-related collateral acceptable to the Bank provided that the collateral has a readily ascertainable value and the Bank can perfect a security interest in the related property.
CFIs are subject to expanded statutory collateral provisions which allow them to pledge secured small business, small farm, or small agri-business loans. We refer to this type of collateral as “community financial institution collateral”. As additional security for a member’s indebtedness, the Bank has a statutory lien on a member’s capital stock in the Bank.
The FHLB Act affords any security interest granted to the Bank by any member of the Bank, or any affiliate of any such member, priority over the claims and rights of any party, including any receiver, conservator, trustee, or similar party having rights of a lien creditor. The only two exceptions are claims and rights that would be entitled to priority under otherwise applicable law or are held by actual bona fide purchasers for value or by parties that are secured by actual perfected security interests. The Bank perfects the security interests granted to it by members by taking possession of securities collateral and filing UCC-1 forms on all other collateral.
Collateral arrangements will vary with member credit quality, borrowing capacity, collateral availability, and overall member credit exposure. The Bank manages collateral requirements and increases its monitoring of members when borrowings from all sources exceed 20% of their assets. At September 30, 2005, 14 of the Bank’s members had borrowings from the Bank that exceeded 20% of their assets, totaling $5.4 billion of advances at par value, which represented 22.5% of the Bank’s total advances outstanding at par.
10
Table of Contents
At December 31, 2004, 12 of the Bank’s members had borrowings from the Bank that exceeded 20% of their assets, totaling $2.9 billion of advances at par value, which represented 12% of the Bank’s total advances outstanding at par. At December 31, 2003, the comparable amounts were 11 of the Bank’s members had borrowings from the Bank that exceeded 20% of their assets, totaling $2.6 billion of advances at par, which represented 10% of the Bank’s total advances outstanding at par. In particular, one member accounted for over $2 billion of the outstanding advances at par, which represented 24% of that member’s September 30, 2005 assets and 23% of that member’s 2004 and 2003 assets. The Bank may require the delivery of collateral from any member at any time. The following table illustrates member borrowing capacity based on underlying collateral type:
Types of Collateral | Borrowing Capacity | |
U.S. Treasury and other government agency securities1 | 95 - 97% | |
Non-agency, rated mortgage-backed securities | 85 - 90% | |
Eligible first-lien single or multi-family mortgage loans | 60 - 85% | |
Community financial institution and other eligible collateral | 50% |
| 1 | Includes GSEs such as Fannie Mae, Freddie Mac, and FHLBs, as well as Governmental agencies such as Ginnie Mae, the Farm Services Agency, Small Business Administration, Bureau of Indian Affairs, and the United States Department of Agriculture. |
During the third quarter of 2005, changes were made to the Bank’s Credit Policy. The collateral loan value available to members for 1-4 family first liens pledged under a blanket lien arrangement was increased to 75%, while the collateral loan value available to members for 1-4 family first liens pledged under a comprehensive listing arrangement was increased to 85%.
At September 30, 2005, CFIs had pledged $467.2 million of CFI collateral to the Bank, securing $48.5 million of advances. The CFI collateral amounts pledged in excess of the amounts required to cover existing advances is available (after application of the borrowing capacity percentage) for potential future advances. At December 31, 2004, CFIs had pledged $339.6 million of CFI collateral to the Bank, which secured $52.1 million of advances at December 31, 2004. At December 31, 2003, CFIs had pledged $244 million of CFI collateral to the Bank, securing $45 million of advances at December 31, 2003.
The Bank requires that members annually deliver copies of their audited financial statements or 10-K report filed with the Securities and Exchange Commission. Members that are not otherwise required to produce audited financial statements, are required to submit their year-end call report or thrift report. The Bank also accesses all member quarterly reports filed with their applicable regulators. The Bank regularly reviews this financial information and will make adjustments to a member’s borrowing capacity and collateral requirements as needed.
Members with outstanding advances are required to deliver to the Bank a third party collateral verification report based upon agreed upon procedures attesting to the eligibility and sufficiency of the member’s mortgage collateral. Members are normally required to deliver these reports every two years provided they meet satisfactory credit and collateral conditions. Members that average more than $100 million in outstanding advances each year secured by single family or multiple family mortgage loans are required to deliver a collateral verification report annually. Credit worthy members with average outstanding advances less than $5 million secured by single family or multiple family mortgage loans with an outstanding book value at least 3 times greater than the amount of average outstanding advances are only required to deliver a collateral verification report every three years. Members pledging small business, small farm or small agri-business loans are required to provide the Bank with quarterly collateral listings and the Bank conducts collateral field reviews annually. The Bank conducts field reviews in other circumstances as well in order to determine collateral eligibility and whether any adjustment to a member’s borrowing capacity is necessary.
11
Table of Contents
At September 30, 2005 and December 31, 2004 and 2003, the Bank had 611, 586 and 563 advance borrowers, respectively. The table below sets forth the outstanding par amount of advances by the largest advance borrowers:
| Top Ten Largest Advance Borrowers | ||||||||||||||||||
| September 30, 2005 | December 31, 2004 | December 31, 2003 | ||||||||||||||||
(Dollars in thousands) | Advances at Par | % of Total | Advances at Par | % of Total | Advances at Par | % of Total | ||||||||||||
LaSalle Bank, N.A. | $ | 3,151,428 | 13.0 | % | $ | 3,151,471 | 13.2 | % | $ | 3,801,525 | 14.7 | % | ||||||
Mid America Bank, FSB | 2,358,000 | 9.7 | % | 2,188,125 | 9.1 | % | 2,104,375 | 8.1 | % | |||||||||
One Mortgage Partners Corp.1 | 1,615,000 | 6.7 | % | 1,615,000 | 6.7 | % | 4,865,000 | 18.8 | % | |||||||||
M & I Marshall & Ilsley Bank | 1,453,714 | 6.0 | % | 1,654,091 | 6.9 | % | 1,094,114 | 4.2 | % | |||||||||
The Northern Trust Company | 1,270,974 | 5.2 | % | 945,974 | 3.9 | % | 810,974 | 3.1 | % | |||||||||
Associated Bank, N.A. | 1,208,403 | 5.0 | % | 814,040 | 3.4 | % | 754,138 | 2.9 | % | |||||||||
State Farm Bank, FSB | 1,080,000 | 4.5 | % | 1,211,190 | 5.1 | % | 872,791 | 3.4 | % | |||||||||
Bank Mutual | 865,306 | 3.6 | % | 761,525 | 3.2 | % | n/a | n/a | ||||||||||
Anchor Bank, FSB | 710,928 | 2.9 | % | 761,328 | 3.2 | % | 684,618 | 2.6 | % | |||||||||
First Midwest Bank, FSB | 522,900 | 2.2 | % | 512,900 | 2.1 | % | 452,000 | 1.7 | % | |||||||||
Charter One Bank 2 | n/a | n/a | n/a | n/a | 662,154 | 2.6 | % | |||||||||||
All Other Members | 9,982,180 | 41.2 | % | 10,352,960 | 43.2 | % | 9,766,454 | 37.8 | % | |||||||||
Total | $ | 24,218,833 | 100.0 | % | $ | 23,968,604 | 100.0 | % | $ | 25,868,143 | 99.9 | % | ||||||
n/a = Not applicable as advance borrower was not a top 10 largest borrower.
| 1 | Bank One, N.A. was acquired by J.P. Morgan Chase, an out-of-district acquisition. The advance balances of Bank One, N.A. were transferred to its subsidiary, One Mortgage Partners Corp., an in-district member. |
| 2 | Charter One was acquired by an out-of-district institution during 2004, at which time all Charter One’s advances were extinguished. |
Standby Letters of Credit
The Bank also provides members with standby letters of credit to support certain obligations of the members to third parties. Members may use standby letters of credit to facilitate residential housing finance and community lending or for liquidity and asset-liability management purposes. The Bank’s underwriting and collateral requirements for standby letters of credit are the same as the underwriting and collateral requirements for advances. At September 30, 2005 and December 31, 2004 and 2003, the Bank had $554.4 million, $345.7 million and $395.8 million, respectively, in standby letters of credit outstanding.
Other Mission-Related Community Investment Cash Advance Programs
Direct and indirect support for housing and community economic development lending programs are designed to ensure that communities throughout the Bank’s district are safe and desirable places to work and live. Members are assisted in meeting their Community Reinvestment Act responsibilities through a variety of specialized programs. Through the Affordable Housing Program (AHP), Community Investment Program (CIP), and Community Economic Development Advance Program members have access to grants and below-market interest rate advances to help them provide funds for affordable rental housing and home-ownership, small business, and other commercial and economic development opportunities that benefit low- and moderate-income individuals, households, and neighborhoods. In addition, the Bank purchases mortgages that are guaranteed by the U.S. Department of Housing and Urban Development (HUD) under the HUD Section 184 Native American Program. The Bank administers and funds the programs described below:
| • | Affordable Housing Program - AHP subsidies in the form of direct grants and below-market interest rate advances are offered to member financial institutions in partnership with community sponsors to stimulate affordable rental and homeownership opportunities for households with incomes at or below 80% of the area’s median income adjusted for family size. AHP subsidies can be used to fund housing acquisition, rehabilitation, new construction, or to cover down payment and closing costs. This program is funded with approximately 10% of the Bank’s pre-assessment net earnings each year. Since its inception in 1990, the Bank has awarded $203.1 million in AHP subsidies to facilitate the development of projects that provided affordable housing to 49,061 households. |
12
Table of Contents
The Bank awarded AHP competitive subsidies totaling $14.5 million and $16.5 million during the nine months ended September 30, 2005 and 2004, respectively, for projects designed to provide housing to 2,859 and 2,917 households, respectively. The Bank awarded AHP competitive subsidies totaling $32.1 million and $22.2 million for the years ended December 31, 2004 and 2003, respectively, for projects designed to provide housing to 5,680 and 4,469 households, respectively. These subsidies are awarded semi-annually in the second and fourth quarters. Amounts accrued but not awarded are recorded as a liability on the Bank’s Statements of Condition. As a part of its annual affordable housing grant making process, the Bank announced that it anticipates approximately $30 million will be available to members and sponsors during 2006 to support the Bank’s Affordable Housing Program activities.
DownPayment Plus® is a sub-program of the AHP that, in partnership with the Bank’s members, assists primarily first-time home buyers with down payment and closing cost requirements. During the nine months ended September 30, 2005 and 2004, $4.8 million and $7.3 million, respectively, of the AHP was funded through DownPayment Plus® to assist 995 and 1,613 low-and-moderate income homebuyers. During the years ended December 31, 2004 and 2003, $10.4 million and $6.0 million, respectively, of the AHP was allocated to DownPayment Plus® for assistance to 2,278 and 1,648 low- and moderate-income homebuyers.
| • | Community Investment Program/Community Economic Development Advance Program - In addition to the AHP, the Bank offers two programs through which members may apply for advances to support affordable housing development or community economic development lending. These programs provide advance funding that has interest rates below regular advance rates, for terms typically up to 10 years. The Bank’s CIP and Community Economic Development Advance products have been used to finance affordable home ownership housing, multi-family rental projects, new roads and bridges, agriculture and farm activities, public facilities and infrastructure, and small businesses. As of September 30, 2005 and December 31, 2004 and 2003, the Bank had approximately $1.9 billion, $1.5 billion and $1.1 billion, respectively, in advances outstanding under the CIP and Community Economic Development Advance programs. |
| • | Native American Mortgage Purchase Program - Since December 2003, the Bank has purchased mortgages provided by its Wisconsin members on Indian land. These mortgages are fully guaranteed by the U.S. Department of Housing and Urban Development (“HUD”), in the event of default by the homeowner. Since the inception of the program through September 30, 2005, the Bank had purchased 65 mortgages totaling approximately $5.2 million with no default occurrences. |
Investments
The Bank maintains a portfolio of investments for liquidity purposes and to provide additional earnings. To ensure the availability of funds to meet member credit needs, the Bank maintains a portfolio of short-term investments made to highly rated institutions, principally overnight Federal funds. The longer-term investment portfolio includes securities issued by the U.S. Government, U.S. Government agencies, MPF Shared Funding®, and MBS that are issued by government sponsored enterprises or that carry the highest ratings from Moody’s Investors Service (“Moody’s”), Standard and Poor’s Rating Service (“S&P”), or Fitch Ratings, Inc. (“Fitch”). The long-term investment portfolio provides the Bank with higher returns than those available in the short-term money markets. It is not our practice to purchase investment securities issued directly by our members or their affiliates. Investment securities issued by affiliates of our members may be purchased in the secondary market through a third party at arm’s length. See Note 20, “Transactions with Related Parties and Other FHLBs” in the Bank’s 2004 Annual Financial Statements and Notes for further details.
Under Finance Board regulations, the Bank is prohibited from trading securities for speculative purposes or market-making activities. Additionally, the Bank is prohibited from investing in certain types of securities or loans, including:
| • | Instruments, such as common stock, that represent an ownership in an entity, other than common stock in small business investment companies, or certain investments targeted to low-income persons or communities; |
13
Table of Contents
| • | Instruments issued by non-U.S. entities, other than those issued by U.S. branches and agency offices of foreign commercial banks; |
| • | Non-investment grade debt instruments, other than certain investments targeted to low-income persons or communities, or instruments that were downgraded after purchase by the Bank; |
| • | Whole mortgages or other whole loans, other than, (1) those acquired under the Bank’s MPF Program, (2) certain investments targeted to low-income persons or communities, (3) certain marketable direct obligations of State, local, or tribal government units or agencies, having at least the second highest credit rating from a Nationally-Recognized Statistical Rating Organization (“NRSRO”), (4) MBS or asset-backed securities backed by manufactured housing loans or home equity loans; and, (5) certain foreign housing loans authorized under section 12(b) of the FHLB Act; and |
| • | Non-U.S. dollar denominated securities. |
The Finance Board regulations further limit the Bank’s investment in MBS and asset-backed securities. This regulation requires that the total carrying value of MBS owned by the Bank not exceed 300% of the Bank’s previous month-end capital on the day it purchases the securities. At September 30, 2005 and December 31, 2004 and 2003, the Bank’s MBS securities to total capital ratio was 105%, 119% and 87%, respectively. In addition, the Bank is prohibited from purchasing:
| • | Interest-only or principal-only stripped MBS; |
| • | Residual-interest or interest-accrual classes of collateralized mortgage obligations (“CMO”) and Real Estate Mortgage Investment Conduit (“REMIC”); and |
| • | Fixed rate MBS or floating rate MBS that on the trade date are at rates equal to their contractual cap and that have average lives that vary by more than 6 years under an assumed instantaneous interest rate change of 300 basis points. |
At September 30, 2005, the Bank held $34.1 million of consolidated obligations at fair market value ($33.0 million at par value) of other FHLBs that were purchased from 1995 to 1997. Of these consolidated obligations, $8.2 million (at par value) are scheduled to mature in the fourth quarter of 2005 with the remaining $24.8 million (at par value) scheduled to mature in 2008. These investments are classified as Trading on the statements of condition. The Bank was authorized to purchase these consolidated obligations in the secondary markets after their initial offering period because they qualified as authorized investments under the Finance Board’s Financial Management Policy. The Bank is the secondary obligor for consolidated obligations that it acquires and holds for investment purposes. Acquiring consolidated obligations of other FHLBs is not part of the Bank’s existing investment strategy. As a result, the Bank does not intend to purchase any additional consolidated obligations of other FHLBs.
14
Table of Contents
The Bank’s investment portfolio at fair value by type of investment and credit rating is shown in the following tables:
Investment Securities
September 30, 2005
(Dollars in thousands) | Long Term Rating | Short Term Rating | |||||||||||||
Total Portfolio | U.S. Government Agency and Government Sponsored Enterprises | AAA | AA | A-1 or Higher | Total | ||||||||||
Commercial paper | $ | — | $ | — | $ | — | $ | 449,405 | $ | 449,405 | |||||
Government-sponsored enterprises1 | 2,311,629 | — | — | — | 2,311,629 | ||||||||||
Other FHLB1 | 34,090 | — | — | — | 34,090 | ||||||||||
State or local housing agency obligations | — | 21,445 | 60,872 | — | 82,317 | ||||||||||
SBA/SBIC | 319,665 | — | — | — | 319,665 | ||||||||||
Mortgage-backed securities (MBS) | 2,864,961 | 1,589,132 | 11,530 | — | 4,465,623 | ||||||||||
Total investment securities | $ | 5,530,345 | $ | 1,610,577 | $ | 72,402 | $ | 449,405 | $ | 7,662,729 | |||||
Further Detail of MBS issued, Guaranteed or Fully insured By: | |||||||||||||||
Pools of Mortgages | |||||||||||||||
Government-sponsored enterprises1 | $ | 1,577,165 | $ | — | $ | — | $ | — | $ | 1,577,165 | |||||
Government-guaranteed | 57,002 | — | — | — | 57,002 | ||||||||||
CMOs/REMICS | |||||||||||||||
Government-sponsored enterprises1 | 1,216,626 | — | — | — | 1,216,626 | ||||||||||
Government-guaranteed | 14,168 | — | — | — | 14,168 | ||||||||||
MPF Shared Funding | — | 425,454 | 11,146 | — | 436,600 | ||||||||||
Privately issued MBS | |||||||||||||||
Non-conforming MBS | — | 62,567 | — | — | 62,567 | ||||||||||
CMOs/REMICS | — | 40,486 | 384 | — | 40,870 | ||||||||||
Asset Backed Securities | — | 312,725 | — | — | 312,725 | ||||||||||
Home Equity Loans | — | 747,900 | — | — | 747,900 | ||||||||||
Total Mortgage Backed Securities | $ | 2,864,961 | $ | 1,589,132 | $ | 11,530 | $ | — | $ | 4,465,623 | |||||
| 1 | Securities issued by government sponsored enterprises are not guaranteed by the U.S. federal government. |
15
Table of Contents
Investment Securities
December 31, 2004
(Dollars in thousands) | Long Term Rating | Short Term Rating | |||||||||||||
Total Portfolio | U.S. Government Agency and Government Sponsored Enterprises | AAA | AA | A-1 or Higher | Total | ||||||||||
Commercial paper | $ | — | $ | — | $ | — | $ | 699,722 | $ | 699,722 | |||||
Government-sponsored enterprises1 | 1,731,387 | — | — | — | 1,731,387 | ||||||||||
Other FHLB1 | 71,731 | — | — | — | 71,731 | ||||||||||
State or local housing agency obligations | — | 32,080 | 68,610 | — | 100,690 | ||||||||||
SBA/SBIC | 743,193 | — | — | — | 743,193 | ||||||||||
Mortgage-backed securities (MBS) | 3,198,200 | 2,294,138 | 11,845 | — | 5,504,183 | ||||||||||
Total investment securities | $ | 5,744,511 | $ | 2,326,218 | $ | 80,455 | $ | 699,722 | $ | 8,850,906 | |||||
Further Detail of MBS issued, Guaranteed or Fully insured By: | |||||||||||||||
Pools of Mortgages | |||||||||||||||
Government-sponsored enterprises1 | $ | 1,786,593 | $ | — | $ | — | $ | — | $ | 1,786,593 | |||||
Government-guaranteed | 74,984 | — | — | — | 74,984 | ||||||||||
CMOs/REMICS | |||||||||||||||
Government-sponsored enterprises1 | 1,316,163 | — | — | — | 1,316,163 | ||||||||||
Government-guaranteed | 20,460 | — | — | — | 20,460 | ||||||||||
MPF Shared Funding | — | 501,697 | 11,285 | — | 512,982 | ||||||||||
Non-Federal Agency MBS | |||||||||||||||
Non-conforming MBS | — | 85,177 | — | — | 85,177 | ||||||||||
CMOs/REMICS | — | 50,741 | 560 | — | 51,301 | ||||||||||
Asset Backed Securities | — | 366,797 | — | — | 366,797 | ||||||||||
Home Equity Loans | — | 1,289,726 | — | — | 1,289,726 | ||||||||||
Total Mortgage Backed Securities | $ | 3,198,200 | $ | 2,294,138 | $ | 11,845 | $ | — | $ | 5,504,183 | |||||
| 1 | Securities issued by government sponsored enterprises are not guaranteed by the U.S. federal government. |
16
Table of Contents
Investment Securities
December 31, 2003
(Dollars in thousands) | Long Term Rating | Short Term Rating | |||||||||||||
Total Portfolio | U.S. Government Agency and Government Sponsored Enterprises | AAA | AA | A-1 or Higher | Total | ||||||||||
U.S. Treasury obligations | $ | 50,246 | $ | — | $ | — | $ | — | $ | 50,246 | |||||
Commercial paper | — | — | — | 99,991 | 99,991 | ||||||||||
Government-sponsored enterprises1 | 1,608,285 | — | — | — | 1,608,285 | ||||||||||
Other FHLB1 | 75,700 | — | — | — | 75,700 | ||||||||||
State or local housing agency obligations | — | 43,795 | 88,593 | — | 132,388 | ||||||||||
SBA/SBIC | 598,981 | — | — | — | 598,981 | ||||||||||
Mortgage-backed securities (MBS) | 1,321,842 | 2,638,647 | 12,648 | — | 3,973,137 | ||||||||||
Total investment securities | $ | 3,655,054 | $ | 2,682,442 | $ | 101,241 | $ | 99,991 | $ | 6,538,728 | |||||
Further Detail of MBS issued, Guaranteed or Fully insured By: | |||||||||||||||
Pools of Mortgages | |||||||||||||||
Government-sponsored enterprises1 | $ | 1,001,887 | $ | — | $ | — | $ | — | $ | 1,001,887 | |||||
Government-guaranteed | 112,775 | — | — | — | 112,775 | ||||||||||
CMOs/REMICS | |||||||||||||||
Government-sponsored enterprises1 | 183,947 | — | — | — | 183,947 | ||||||||||
Government-guaranteed | 23,233 | — | — | — | 23,233 | ||||||||||
MPF Shared Funding | — | 610,004 | 11,455 | — | 621,459 | ||||||||||
Non-Federal Agency MBS | |||||||||||||||
Non-conforming MBS | — | 165,941 | — | — | 165,941 | ||||||||||
CMOs/REMICS | — | 134,252 | 1,193 | — | 135,445 | ||||||||||
Asset Backed Securities | — | 397,514 | — | — | 397,514 | ||||||||||
Home Equity Loans | — | 1,330,936 | — | — | 1,330,936 | ||||||||||
Total Mortgage Backed Securities | $ | 1,321,842 | $ | 2,638,647 | $ | 12,648 | $ | — | $ | 3,973,137 | |||||
| 1 | Securities issued by government sponsored enterprises are not guaranteed by the U.S. federal government. |
Deposits
Deposit programs provide a portion of the Banks’ funding resources. The Bank accepts deposits from its members, institutions eligible to become members, any institution for which it is providing correspondent services, other FHLBs, or other government instrumentalities. The Bank offers several types of deposit programs to its deposit customers including demand, overnight, and term deposits.
For a description of the Bank’s liquidity requirements with respect to deposits see “Item 2.2—Management’s Discussion and Analysis of Financial Conditions and Results of Operations—Liquidity and Capital Resources—Liquidity.”
17
Table of Contents
The tables below present the maturities for term deposits in denominations of $100 thousand or more:
(Dollars in thousands) | |||||||||
By remaining maturity | September 30, 2005 | December 31, 2004 | December 31, 2003 | ||||||
3 months or less | $ | 39,000 | $ | 28,000 | $ | 472,250 | |||
Over 3 months but within 6 months | 1,000 | 59,000 | 51,000 | ||||||
Over 6 months but within 12 months | 1,000 | 2,000 | 15,150 | ||||||
Total | $ | 41,000 | $ | 89,000 | $ | 538,400 | |||
Mortgage Partnership Finance® Program
Introduction
The MPF® Program is a unique secondary mortgage market structure under which participating FHLBs (“MPF Banks”) serve as a source of liquidity to their participating financial institution members (“PFIs”) who originate mortgage loans. The MPF Banks do this by either purchasing mortgage loans after they have been originated by the PFIs or, alternatively, by funding the mortgage loans themselves. In this regard, the mortgage loans purchased or funded are held on the MPF Bank’s balance sheet.
Under the MPF 100 product, the MPF Bank table funds MPF Loans, which means that the MPF Bank provides the funds, through the PFI as its agent, to make the MPF Loan to the borrower. The PFI performs all the traditional retail loan origination functions under this and all MPF products. The MPF Bank is considered the originator of the MPF Loan for accounting purposes since the PFI is acting as its agent when originating the MPF Loan. This differs from other MPF products in which the MPF Bank purchases loans that have already been closed by the PFI with its own funds. See “– MPF Products” for a description of products offered under the MPF Program.
The current MPF Banks are the Federal Home Loan Banks of: Atlanta, Boston, Chicago, Dallas, Des Moines, New York, Pittsburgh, San Francisco and Topeka. The Federal Home Loan Bank of Chicago acts as “MPF Provider” and provides programmatic and operational support to the MPF Banks and their PFIs.
MPF Program assets are qualifying conventional conforming and Government (i.e., FHA insured and VA guaranteed) fixed-rate mortgage loans and participations in pools of such mortgage loans, secured by one-to-four family residential properties, with maturities ranging from 5 to 30 years (“MPF Loans”). The Finance Board’s Acquired Member Asset regulation (12 C.F.R. § 955) (“AMA Regulation”) requires MPF Loans to be funded or purchased by the MPF Banks through or from PFIs and to be credit enhanced in part by the PFIs. MPF Banks generally acquire whole loans from their respective PFIs but may also acquire them from a member of another MPF Bank with permission of the PFI’s respective MPF Bank or may acquire participations from another MPF Bank. The AMA Regulation authorizes MPF Banks to fund loans, which the Bank does through funding arrangements with PFIs. The acquisition of eligible Bank funded loans and closed loans is consistent with and authorized as a core mission activity under the Finance Board regulations.
The Bank, in its role as MPF Provider, establishes the eligibility standards under which an MPF Bank member may become a PFI, establishes the structure of MPF products and the eligibility rules for MPF Loans, manages the pricing and delivery mechanism for MPF Loans, and manages the back-office processing of MPF Loans in its role as master servicer. The Bank publishes and maintains the MPF Origination Guide and MPF Servicing Guide (together “MPF Guides”), which detail the rules PFIs must follow in originating or selling and servicing MPF Loans. When a PFI fails to comply with the requirements of the PFI Agreement, MPF Guides, applicable law or terms of mortgage documents, the PFI may be required to repurchase the MPF Loans which are impacted by such failure. Reasons for which a PFI could be required to repurchase an MPF Loan may include but are not limited to MPF Loan ineligibility, failure to perfect collateral with an approved custodian, a servicing breach, fraud, or other misrepresentation.
For the nine months ended September 30, 2005 and 2004, respectively, the Bank’s PFIs were required to repurchase 0.03% and 0.02% of the average daily balance of conventional outstanding MPF Loans, respectively, for a total of $11.5 million
18
Table of Contents
and $9.4 million, respectively. Annually, in each of the three years ended December 31, 2004, 2003 and 2002, the Banks’ PFIs were required to repurchase less than 0.03% of the average daily balance of conventional MPF Loans outstanding for a total of $13.1 million, $9.8 million and $2.0 million, respectively. The Bank has not experienced any losses related to these conventional MPF Loan repurchases.
Without limiting or waiving the PFIs obligation as servicer to advance principal and interest under the scheduled/scheduled servicing option, the PFI may, under the terms of the MPF Servicing Guide, elect to repurchase any Government MPF Loan for an amount equal to 100 percent of the Government MPF Loan’s then current scheduled principal balance and accrued interest thereon provided there has been no payment made by the borrower for three consecutive months. This policy allows PFIs to comply with loss mitigation requirements of FHA, VA and HUD in order to preserve the insurance or guaranty coverage. In addition, just as for conventional MPF Loans, if a PFI fails to comply with the requirements of the PFI Agreement, MPF Guides, applicable law or terms of mortgage documents, the PFI may be required to repurchase the Government MPF Loans which are impacted by such failure. In the nine months ended September 30, 2005 and 2004, the Bank’s PFIs repurchased Government MPF Loans totaling $74.7 million and $8.7 million, respectively, which represents 1.13% and 0.13% of the average daily balance of Government MPF Loans outstanding during these respective periods. For the years ended December 31, 2004, 2003 and 2002, the Bank’s PFIs repurchased Government MPF Loans totaling $14.8 million, $75.8 million and $131.5 million, respectively, which represents 0.23%, 0.94% and 1.93% of the average daily balance of Government MPF Loans outstanding during these respective periods. The increase in Government MPF Loan repurchases during the nine months ended September 30, 2005 was the result of a change in repurchase policy by one of the Bank’s PFIs. In April 2005, one of the Bank’s PFIs changed its repurchase policy to seek approval to repurchase its Government MPF Loans immediately upon their becoming greater than ninety days past due, which is permitted within the Bank’s MPF Servicing Guide. Prior to the PFI’s internal change in policy, a majority of its repurchases occurred over a greater period of time after the MPF Loans became ninety days past due. The Bank has not experienced any losses related to the repurchase of Government MPF Loans.
PFIs are paid a credit enhancement fee as an incentive to minimize credit losses and share in the risk of loss on MPF Loans and to pay for Supplemental Mortgage Insurance (“SMI”), rather than paying a guaranty fee to other secondary market purchasers. These fees are paid monthly and are determined based on the remaining unpaid principal balance of the MPF Loans. The required credit enhancement obligation amount may vary depending on the MPF product alternatives selected. Credit enhancement fees, payable to a member as compensation for assuming credit risk, are recorded as an offset to mortgage loan interest income when paid by the Bank. The Bank also pays performance credit enhancement fees which are based on actual performance of the mortgage loans. In general, performance based fees are net of cumulative unrecovered losses paid by the Bank. To the extent that losses in the current month exceed performance credit enhancement fees accrued, the remaining losses are recovered from future performance credit enhancement fees payable to the member. The Bank recorded total credit enhancement fees of $35.4 million and $38.4 million for the nine months ended September 30, 2005 and 2004, respectively. The Bank recorded total credit enhancement fees of $51.0 million, $39.4 million and $18.1 million for the years ended December 31, 2004, 2003 and 2002, respectively.
The MPF Program has grown to $82.0 billion (at par) in outstanding assets for all MPF Banks at September 30, 2005, of which $43.4 billion (par value) were owned or participated in by the Bank and the remaining $38.6 billion (par value) were owned or participated in by the other MPF Banks. More than 930 commercial banks, thrifts, credit unions and insurance companies are approved PFIs that deliver MPF Loans into the MPF Program secured by homes in all 50 states, the District of Columbia and Puerto Rico.
At September 30, 2005 and December 31, 2004 and 2003, the Bank had $43.2 billion, $46.9 billion and $47.6 billion of MPF Loans outstanding, respectively. As of September 30, 2005, the Bank had 304 members that were approved as PFIs; 230 of those PFIs actively participated in the MPF Program during the nine months ended September 30, 2005. The Bank acquired $1.5 billion and $3.5 billion in MPF Loans from or through the Bank’s PFIs in the nine months ended September 30, 2005 and 2004, respectively; and acquired $4.1 billion, $15.9 billion and $5.8 billion in the three years ended December 31, 2004, 2003 and 2002, respectively, from or through the Bank’s PFIs. Of these purchases, the Bank participated out $878.9 million in participation interests to the FHLB of Topeka during the year ended December 31, 2004 under the MPF Program. The Bank did not transfer any participation interests to other FHLBs in the nine months ended September 30, 2005 and during the years ended December 31, 2003 and 2002. The Bank purchased participation interests from other FHLBs totaling $1.6 billion and $4.5 billion in the nine months ended September 30, 2005 and 2004, respectively. The Bank purchased participation interests from other FHLBs totaling $4.9 billion, $20.9 billion and $10.7 billion in the years ended December 31, 2004, 2003 and 2002, respectively.
19
Table of Contents
The Bank has been acquiring fewer participation interests in the MPF Loans of other MPF Banks. Instead the Bank has been charging a fee for acting as MPF Provider. In December 2003, the Bank began purchasing MPF Loans directly from PFIs of the FHLB of Dallas. The FHLB of Dallas acts as marketing agent for the Bank and receives a fee for its services rather than purchasing MPF Loans from its PFIs. Direct acquisitions from another FHLB’s members are permitted under the AMA Regulation with the consent of that FHLB. The Bank elected to purchase whole MPF Loans instead of participations in this instance because whole loans are more liquid assets than participation interests. The Bank purchased MPF Loans from the FHLB of Dallas’ PFIs totaling $162.9 million and $336.0 million during the nine months ending September 30, 2005 and 2004, respectively. The Bank purchased MPF Loans from the FHLB of Dallas’ PFIs totaling $568.9 million and $1.2 billion for the periods ending December 31, 2004 and 2003, respectively.
The MPF Program is designed to allocate the risks of MPF Loans among the MPF Banks and PFIs and to take advantage of their respective strengths. PFIs have direct knowledge of their mortgage markets and have developed expertise in underwriting and servicing residential mortgage loans. By allowing PFIs to originate MPF Loans, whether through retail or wholesale operations, and to retain or acquire servicing of MPF Loans, the MPF Program gives control of those functions that most impact credit quality to PFIs. The credit enhancement structure motivates PFIs to minimize MPF Loan losses. The MPF Banks are responsible for managing the interest rate risk, prepayment risk and liquidity risk associated with owning MPF Loans.
The MPF Program was established to help fulfill the FHLBs’ housing finance mission. The Finance Board’s regulations define the acquisition of AMA or “acquired member assets” as a core mission activity of the FHLBs. The MPF Program offers a structure in which the risk of loss associated with MPF Loans is shared with the PFIs while allowing the Bank to diversify its assets beyond its Traditional Member Finance.
Mortgage Standards
The MPF Guides set forth the eligibility standards for MPF Loans. PFIs are free to use an approved automated underwriting system or to underwrite MPF Loans manually when originating or acquiring loans though the loans must meet MPF Program underwriting and eligibility guidelines outlined in the MPF Origination Guide. In some circumstances, a PFI may be granted a waiver exempting it from complying with specified provisions of the MPF Guides.
The current underwriting and eligibility guidelines with respect to MPF Loans are broadly summarized as follows:
| • | Conforming loan size, which is established annually as required by the AMA Regulation and may not exceed the loan limits permitted to be set by the Office of Federal Housing Enterprise Oversight (“OFHEO”) each year; |
| • | Fixed-rate, fully-amortizing loans with terms from 5 to 30 years; |
| • | Secured by first liens on residential owner occupied primary residences and second homes; primary residences may be up to four units; |
| • | Condominium, planned unit development and manufactured homes are acceptable property types as are mortgages on leasehold estates (though manufactured homes must be on land owned in fee simple by the borrower); |
| • | 95% maximum loan-to-value ratio (“LTV”); except for FHLB AHP mortgage loans which may have LTVs up to 100% (but may not exceed 105% total LTV, which compares the property value to the total amount of all mortgages outstanding against a property) and Government MPF Loans which may not exceed the LTV limits set by FHA and VA; |
| • | MPF Loans with LTVs greater than 80% require certain amounts of mortgage guaranty insurance (“MI”), called primary MI, from an MI company rated at least “AA” or “Aa” and acceptable to S&P; |
| • | Unseasoned or current production with up to five payments made by the borrowers; |
| • | Credit reports and credit scores for each borrower; for borrowers with no credit score, alternative verification of credit is permitted; |
| • | Analysis of debt ratios; |
| • | Verification of income and sources of funds, if applicable; |
| • | Property appraisal; |
| • | Customary property or hazard insurance, and flood insurance, if applicable, from insurers acceptably rated as detailed in the MPF Guides; |
| • | Title insurance or, in those areas where title insurance is not customary, an attorney’s opinion of title; |
| • | The mortgage documents, mortgage transaction and mortgaged property must comply with all applicable laws and loans must be documented using standard Fannie Mae/Freddie Mac Uniform Instruments; |
20
Table of Contents
| • | Loans that are not ratable by a rating agency are not eligible for delivery under the MPF Program; and |
| • | Loans that are classified as high cost, high rate, high risk, Home Ownership and Equity Protection Act (HOEPA) loans or loans in similar categories defined under predatory lending or abusive lending laws are not eligible for delivery under the MPF Program. |
In addition to the underwriting guidelines, the MPF Guides contain MPF Program policies which include anti-predatory lending policies, eligibility requirements for PFIs such as insurance requirements and annual certification requirements, loan documentation and custodian requirements, as well as detailing the PFI’s servicing duties and responsibilities for reporting, remittances, default management and disposition of properties acquired by foreclosure or deed in lieu of foreclosure.
Upon any MPF Loan becoming 90 days or more delinquent, the master servicer monitors and reviews the PFI’s default management activities for that MPF Loan, including timeliness of notices to the mortgagor, forbearance proposals, property protection activities, and foreclosure referrals, all in accordance with the MPF Guides. Upon liquidation of any MPF Loan and submission of each realized loss calculation from the PFI, the master servicer reviews the realized loss calculation for conformity with the primary mortgage insurance requirements, if applicable, and conformity to the cost and timeliness standards of the MPF Guides, and disallows the reimbursement to the PFI of any servicing advances related to the PFI’s failure to perform in accordance with the MPF Guides standards.
During the third quarter of 2005, the Bank announced a special disaster relief initiative to lessen the hardship for victims of Hurricane Katrina. See “Item 1.2 – Business Segments – Mortgage Partnership Finance® – MPF® Servicing” for additional information.
Services Agreement
MPF Loans are delivered to each MPF Bank through the infrastructure maintained by the Bank, which includes both a telephonic delivery system and a web based delivery system accessed through the eMPF® website. The Bank has entered into an agreement (“Services Agreement”) with each of the other MPF Banks to make the MPF Program available to their respective PFIs. The Services Agreement sets forth the terms and conditions of the MPF Bank’s participation in the MPF Program. The Services Agreement outlines the Bank’s agreement to provide transaction processing services to the MPF Banks, including acting as master servicer and master custodian for the MPF Banks with respect to the MPF Loans. The Bank has engaged Wells Fargo Bank N.A. as its vendor for master servicing and as the primary custodian for the MPF Program, and has also contracted with other custodians meeting MPF Program eligibility standards at the request of certain PFIs. Such other custodians are typically affiliates of PFIs and in some cases a PFI acts as self-custodian.
Historically, in order to compensate the Bank, as MPF Provider, for its transaction processing services, the Bank has required that each of the MPF Banks sell to it not less than a twenty-five percent (25%) participation interest in MPF Loans acquired by that MPF Bank. Currently, all but one of the MPF Banks compensate the MPF Provider for its transaction processing services by paying a transactions services fee instead of granting the MPF Provider the right to purchase a participation interest with respect to MPF Loans acquired after 2003. One MPF Bank continues to compensate the MPF Provider for its transaction processing services by selling to the Bank not less than twenty-five percent (25%) participation interests in its MPF Loans. The Bank recorded $2.2 million and $812.1 thousand as transaction services fees in the nine months ended September 30, 2005 and 2004, respectively. The Bank recorded $1.2 million in transaction service fees for the year ended December 31, 2004, which was the first year in which the Bank recorded such fees.
In addition to buying participation interests as compensation for providing transaction processing services, the Bank may purchase participation interests in MPF Loans through an agreement with the relevant MPF Bank, and may also sell participation interests to other MPF Banks at the time MPF Loans are acquired, although it is the Bank’s intent to hold all MPF Loans for investment. As such, the participation percentages in MPF Loans may vary by each pool of MPF Loans funded or purchased by the MPF Bank (“Master Commitment”), by agreement of the MPF Bank selling the participation interests (the “Owner Bank”), and the MPF Provider and other MPF Banks purchasing a participation interest. In order to detail the responsibilities and obligations for all participation interests sold by an Owner Bank to the MPF Provider or to other participating MPF Banks, each Owner Bank has entered into a participation agreement with the MPF Provider and, as applicable, any other participant MPF Banks. For an explanation of participation arrangements, see “Item 1.2—Business Segments—Mortgage Partnership Finance Program—MPF Bank Participations.”
MPF Loans are funded through or purchased directly from PFIs by MPF Banks through the transactional services provided by the Bank. Under the Services Agreement between the MPF Bank and the Bank, the Bank provides the necessary systems for PFIs to deliver MPF Loans to the MPF Bank, establishes daily pricing for MPF Loans, prepares reports for both the PFI and the MPF Bank, and provides quality control services on purchased MPF Loans.
21
Table of Contents
The Bank calculates and publishes on its eMPF website pricing grids with the prices expiring at midnight the following day. The prices, rates and fees associated with the various MPF products are set by the Bank, in its role of MPF Provider, using observable third party pricing sources as inputs to its proprietary pricing model. If market prices move beyond preset ranges, the Bank will reset all or some of the prices at any time during a given business day. In limited circumstances, an MPF Bank may elect to apply alternative pricing to a specific pool of MPF Loans delivered by one of its PFIs.
Participating Financial Institution Agreement
A member (or eligible housing associate) of an MPF Bank must specifically apply to become a PFI. The MPF Bank reviews the general eligibility of the member while the Bank, as MPF Provider, reviews the member’s servicing qualifications and ability to supply documents, data and reports required to be delivered by PFIs under the MPF Program. The member and its MPF Bank sign an MPF Program Participating Financial Institution Agreement (“PFI Agreement”) that creates a relationship framework for the PFI to do business with its MPF Bank. The PFI Agreement provides the terms and conditions for the origination of the MPF Loans to be funded or purchased by the MPF Bank and establishes the terms and conditions for servicing MPF Loans for the MPF Bank. If a member is an affiliate of a holding company which has another affiliate that is an active PFI, the member is only eligible to become a PFI if it is a member of the same MPF Bank as the existing PFI. The eligibility requirements for holding company affiliates do not apply to the Mortgage Purchase Program but pertain solely to participation in the MPF Program. The Bank does not participate in the Mortgage Purchase Program, a competing program offered by other FHLBs, which may include member participants that are affiliates of PFIs participating in the MPF Program.
The PFI’s credit enhancement obligation (“CE Amount”) arises under its PFI Agreement while the amount and nature of the obligation are determined with respect to each Master Commitment. Under the AMA Regulation the PFI must “bear the economic consequences” of certain losses with respect to a Master Commitment based upon the MPF product and other criteria.
The PFI’s CE Amount for a Master Commitment covers the loan losses for that Master Commitment in excess of the first loss account (“FLA”), if any, up to an agreed upon amount. The final CE Amount is determined once the Master Commitment is closed (i.e., when the maximum amount of MPF Loans are delivered or the expiration date has occurred).
The table below summarizes the average CE Amount as a percentage of MPF Program Master Commitments participated in or held by the Bank:
MPF Program PFI CE Amount as % of
Master Commitments Participated in or Held by the Bank
| As of September 30, | As of December 31, | |||||||||||
| 2005 | 2004 | 2003 | 2002 | |||||||||
Original MPF | 1.73 | % | 1.64 | % | 1.53 | % | 1.97 | % | ||||
MPF 100 | 0.49 | % | 0.44 | % | 0.39 | % | 0.46 | % | ||||
MPF 125 | 0.82 | % | 0.71 | % | 0.59 | % | 0.76 | % | ||||
MPF Plus * | 1.34 | % | 1.35 | % | 1.37 | % | 1.77 | % | ||||
Original MPF for FHA/VA | N/A | N/A | N/A | N/A | ||||||||
| * | CE Amount includes SMI policy coverage |
The risk characteristics of each MPF Loan (as provided by the PFI) are analyzed by the MPF Provider using S&P’s LEVELS® model in order to determine the required CE Amount for a loan or group of loans to be funded or acquired by an MPF Bank (“MPF Program Methodology”) but which leaves the decision whether or not to deliver the loan or group of loans into the MPF Program with the PFI.
22
Table of Contents
The AMA Regulation provides the authority for the Bank’s investment in residential mortgage loans. As required by the AMA Regulation, the MPF Program credit enhancement methodology has been confirmed by S&P, a NRSRO, as providing an analysis of each Master Commitment that is “comparable to a methodology that the NRSRO would use in determining credit enhancement levels when conducting a rating review of the asset or pool of assets in a securitization transaction.” The AMA Regulation requires that MPF Loans be credit enhanced sufficient so that the risk of loss is limited to the losses of an investor in an “AA” rated mortgage backed security, unless additional retained earnings plus a general allowance for losses are maintained. The Bank is required to recalculate the estimated credit rating of a Master Commitment if there is evidence of a decline in credit quality of the related MPF Loans. The required amount of additional retained earnings is an amount equal to the outstanding balance of the MPF Loans under the related Master Commitment multiplied by the applicable factor listed below that is associated with the putative credit rating of the Master Commitment.
Putative rating of single-family mortgage assets | Percentage applicable to on-balance sheet equivalent value of AMA | ||
Third highest investment grade | 0.90 | % | |
Fourth highest investment grade | 1.50 | % | |
If downgraded to below investment grade after acquisition by Bank: | |||
Highest below investment grade | 2.25 | % | |
Second highest below investment grade | 2.60 | % | |
All other below investment grade | 100.00 | % |
For purposes of determining the appropriate amount of additional retained earnings as described in the preceding paragraph, the Bank must determine the estimated rating of the pool of MPF Loans for each Master Commitment. This determination is made based upon the MPF Program Methodology under S&P’s LEVELS program and the product type of the related MPF Loans. For a description of the different MPF product types and the calculation of the PFI’s CE Amount by product type see “Item 1.2—Business Segments—Mortgage Partnership Finance Program—MPF Products.”
The estimated rating for each Master Commitment is based upon the size of the PFI’s CE Amount and the Bank’s effective FLA exposure (after consideration of the Bank’s ability to reduce a PFI’s performance based credit enhancement fees) so that the Bank is in a position equivalent to that of an investor in a “AA” mortgage backed security. However, in June of 2002, the Bank agreed with the Finance Board that in determining the estimated rating for Master Commitments with an FLA equal to 100 basis points (all MPF 100, MPF 125 and some MPF Plus Master Commitments), the Bank will only partially rely on its ability to reduce performance based credit enhancement fees when measuring the Bank’s effective FLA exposure. As a result, the Bank either holds additional retained earnings against the related Master Commitments in accordance with the AMA regulations or purchases SMI to upgrade the estimated rating of the Master Commitment to the equivalent of a “AA” rated mortgage backed security. As of September 30, 2005, the outstanding balance of MPF Loans for which the Bank has purchased SMI in order to increase the estimated credit rating of a Master Commitment is $4.1 billion.
Under the MPF Program, the PFI’s credit enhancement may take the form of a direct liability to pay losses incurred with respect to that Master Commitment, or may require the PFI to obtain and pay for an SMI policy insuring the MPF Bank for a portion of the losses arising from the Master Commitment, or the PFI may contract for a contingent performance based credit enhancement fee whereby such fees are reduced by losses up to a certain amount arising under the Master Commitment. Under the AMA Regulation, any portion of the CE Amount that is a PFI’s direct liability must be collateralized by the PFI in the same way that advances from the MPF Bank are collateralized. The PFI Agreement provides that the PFI’s obligations under the PFI Agreement are secured along with other obligations of the PFI under its regular advances agreement with the MPF Bank and further, that the MPF Bank may request additional collateral to secure the PFI’s obligations.
Typically, a PFI will sign one Master Commitment to cover all the conventional MPF Loans it intends to deliver to the MPF Bank in a year. However, a PFI may also sign a Master Commitment for Government MPF Loans, it may choose to deliver MPF Loans under more than one conventional product, or it may choose to use different servicing remittance options and thus have several Master Commitments opened at any one time. Master Commitments may be for shorter periods than one year and may be extended or increased by agreement of the MPF Bank and the PFI. The Master Commitment defines the pool of MPF Loans for which the CE Amount is set so that the risk associated with investing in such pool of MPF Loans is equivalent to investing in a “AA” rated asset without giving effect to the MPF Bank’s obligation to incur losses up to the amount of the initial FLA.
23
Table of Contents
PFIs request funding or purchase commitments (“Delivery Commitments”) from their respective MPF Bank based on the Bank’s published daily pricing schedules. The PFI enters into a Delivery Commitment, which is a mandatory commitment of the PFI to sell or originate eligible mortgage loans.
PFIs deliver MPF Loans to the MPF Bank by complying with the Delivery Commitment. Each MPF Loan delivered must conform to specified ranges of interest rates and maturity terms detailed in the Delivery Commitment or it will be rejected by the MPF Provider. The MPF Loan under a Delivery Commitment is linked to a Master Commitment so that the cumulative credit enhancement level can be determined. Loans that exceed the maximum amount of a Master Commitment; exceed the PFI’s maximum CE Amount; or would be funded after the expiration of the Master Commitment, are rejected. The Delivery Commitment also specifies the number of business days the PFI has to deliver the MPF Loans, not to exceed 45 business days (unless extended for a fee).
The sum of MPF Loans delivered by the PFI under a specific Delivery Commitment cannot exceed the amount specified in the Delivery Commitment without the assessment of a price adjustment fee. Delivery Commitments that are not fully funded by their expiration dates are subject to pair-off fees (fees charged to a PFI for failing to deliver the amount of loans specified in a Delivery Commitment) or extension fees (fees charged to a PFI for extending the time deadline to deliver loans on a Delivery Commitment), which protect the MPF Bank against changes in market prices.
In connection with each sale to or funding by an MPF Bank, the PFI makes certain representations and warranties to the MPF Bank which are contained in the PFI Agreement and in the MPF Guides. The representations and warranties are similar to those required by Fannie Mae, Freddie Mac and for mortgage-backed securities and specifically include compliance with predatory lending laws and the integrity of the data transmitted to the MPF Program system.
Once an MPF Loan is funded or purchased, the PFI must deliver the promissory note and certain other relevant documents (“Collateral Package”) to the designated custodian. In some cases, a PFI or one of its affiliates may act as custodian. The custodian reports to the MPF Provider whether the Collateral Package matches the funding information in the MPF Program system and otherwise meets MPF Program requirements. If the PFI does not deliver a conforming Collateral Package within the time frames required under the MPF Guides it will be assessed a late fee and can be required to purchase or repurchase the MPF Loan.
Credit Risk Exposure Assumed by the Bank on MPF® Loans
The credit risk of loss on MPF Loans is the potential for financial loss due to borrower default or depreciation in the value of the real estate collateral securing the MPF Loan, offset by the PFI’s CE Amount required under the AMA Regulation. The Bank also faces credit risk of loss on MPF Loans to the extent such losses are not recoverable from the PFI or an SMI Provider, as applicable, as a credit enhancement provider.
The outstanding balance of the Bank’s MPF Loan portfolio exposed to credit losses not recoverable from the FHA and VA (including servicer paid losses not covered by the FHA or VA), PFI CE Amount, PMI, FLA account or SMI coverage was $35.2 billion, $38.2 billion, $38.9 billion and $17.9 billion at September 30, 2005 and December 31, 2004, 2003 and 2002, respectively.
Hurricane Katrina struck Louisiana, Mississippi, Alabama and surrounding areas on August 29, 2005. As of September 30, 2005, the Bank held approximately $500 million of conventional MPF Loans with properties located in the Individual Assistance and Public Assistance categories as designated by FEMA. The Bank assessed its potential loss exposure related to Hurricane Katrina and does not believe that there will be a material loss exposure due to the credit enhancement structures built into the MPF Program. The Bank recorded a provision for credit losses of $0.3 million in its fourth quarter financial statements of 2005. See “Participating Financial Institution Agreement” immediately above and “Allocation of Losses” following this section for a description of these credit enhancement structures.
24
Table of Contents
The risk-sharing of credit losses between MPF Banks for participations is based on each MPF Banks’ percentage interest in the Master Commitment. Accordingly, the credit risk assumed by the Bank is driven by its percentage interest in each Master Commitment.
MPF® Bank Participations
For a Master Commitment to be set up on the Bank’s MPF system, the MPF Bank that entered into the Master Commitment must specify the participation arrangement that will be applied to the MPF Loans to be acquired under that Master Commitment and in the related Delivery Commitments. That participation arrangement may range from 100% to be retained by the Owner Bank to 100% participated to another MPF Bank. Generally, the participation arrangement percentages will not change during the period that a Master Commitment is open. However, the participation arrangement could change as a result of an MPF Bank opting out of its share in the participation arrangement on a given day, or if the MPF Banks decide on a going forward basis to change their respective shares. If no changes are made, the risk-sharing of losses between MPF Banks is predetermined at the time the Master Commitment is signed. If the specified participation percentages in a Master Commitment never changes, then that percentage would automatically be applied to every Delivery Commitment that is issued under the Master Commitment.
For a Master Commitment with the same participation arrangement throughout the open period, the risk sharing and rights of the Owner Bank and participating MPF Bank(s) are as follows:
| • | each pays its respective pro rata shares of each MPF Loan acquired under the Master Commitment; |
| • | each receives its respective pro rata share of principal and interest payments; |
| • | each is responsible for its respective pro rata share of credit enhancement fees, FLA exposure and losses incurred with respect the Master Commitment; and |
| • | each may hedge its share of the Delivery Commitments as they are issued during the open period. |
The participation arrangement for a Master Commitment may be changed so that either specified future Delivery Commitments or all future Delivery Commitments after a specified date will be funded pro rata by the affected MPF Banks under a revised participation arrangement. An MPF Bank’s pro rata interest in each MPF Loan, if any, is based on the portion it funded or purchased of that MPF Loan whereas the MPF Bank’s pro rata interest in a Master Commitment is based on participant interest in the entire Master Commitment as compared to all the MPF Loans delivered by the PFI under the Master Commitment. The MPF Bank receives principal and interest payments based on its pro rata interest in individual MPF Loans. However, because the FLA and credit enhancement apply to all the MPF Loans in a Master Commitment regardless of participation arrangements, the MPF Bank’s share of losses is based on its respective participation interest in the entire Master Commitment. For example, assume a MPF Bank’s specified participation percentage was 25% under a $100 million Master Commitment and that no changes were made to the Master Commitment. The MPF Bank risk sharing percentage of losses would be 25%. In the case where an MPF Bank changes its initial percentage in the Master Commitment, the risk sharing percentage will also change. For example, if an MPF Bank were to acquire 25% of the first $50 million and 50% of the second $50 million of MPF Loans delivered under a Master Commitment, the MPF Bank would share in 37.5% of the losses in that $100 million Master Commitment, while it would receive principal and interest payments on the individual MPF Loans that remain outstanding in a given month, some in which it may own a 25% interest and the others in which it may own a 50% interest.
The Owner Bank is responsible for evaluating, monitoring, and certifying to any participant MPF Bank the creditworthiness of each relevant PFI initially, and at least annually thereafter. The Owner Bank is responsible for ensuring that adequate collateral is available from each of its PFIs to secure the credit enhancement obligations arising from the origination or sale of MPF Loans. The Owner Bank is also responsible for enforcing the PFI’s obligations under the PFI Agreement between the PFI and the Owner Bank (See “Item 1.2—Business Segments—Mortgage Partnership Finance Program—Participating Financial Institution Agreement”).
MPF® Servicing
The PFI or its servicing affiliate generally retains the right and responsibility for servicing MPF Loans it delivers. However, certain PFIs may desire to sell the servicing rights under the MPF Program’s concurrent sale of servicing option. To date, the MPF Program has designated one servicing PFI which is eligible to acquire servicing rights under this option. An originating PFI may also negotiate with other PFIs to purchase servicing rights, however this type of arrangement would not include direct support from the MPF Program. The current limited options for selling MPF Loans to the MPF Bank on a servicing-released basis may reduce the attractiveness of the MPF Program to potential PFIs that do not want to retain servicing.
25
Table of Contents
The PFI is responsible for collecting the borrower’s monthly payments and otherwise dealing with the borrower with respect to the MPF Loan and the mortgaged property. Monthly principal and interest payments are withdrawn from the PFI’s deposit account with the MPF Bank on the 18th day of each month (or prior business day if the 18th is not a business day) based on reports the PFI is required to provide to the master servicer. Based on these monthly reports, the MPF Program system makes the appropriate withdrawals from the PFI’s deposit account. Under the scheduled/scheduled remittance option, the PFI is required to make principal and interest payments to the MPF Bank on the due date whether or not the borrower has remitted any payments to the PFI provided that the collateral securing the MPF Loan is sufficient to reimburse the PFI for advanced amounts. The PFI recovers the scheduled payments made to the Bank either from future collections or upon the liquidation of the collateral securing the MPF Loan.
If an MPF Loan becomes delinquent, the PFI is required to contact the borrower to determine the cause of the delinquency and whether the borrower will be able to cure the default. The MPF Guides permit certain types of forbearance plans. If the PFI determines that an MPF Loan, which has become ninety (90) days delinquent, is not likely to be brought current, then the PFI is required to commence foreclosure activities or pursue an alternative to foreclosure in accordance with the servicing standards specified in the MPF Guides. The foreclosure process includes determining the current condition and a foreclosure sale bid value of the mortgaged property and the likelihood of loss upon disposition of the property after foreclosure or other approved alternatives to foreclosure such as a deed in lieu of foreclosure. The PFI is required to secure and insure the property after it acquires title through the date of disposition. After submitting its property disposition plan to the master servicer, the PFI provides monthly status reports regarding the progress of the disposition activities. Upon disposition a final report must be submitted to the master servicer detailing the outstanding loan balance, accrued and unpaid interest, the net proceeds of the disposition and the amounts advanced by the PFI, including any principal and interest advanced during the disposition period. If there is a loss on the conventional MPF Loan, the loss is allocated to the Master Commitment and shared in accordance with the risk sharing structure for that particular Master Commitment. Gains are the property of the MPF Bank but are available to a PFI as a credit against future economic losses related to future payouts of performance based credit enhancement fees under the Master Commitment.
Throughout the servicing process the MPF Provider’s vendor for master servicing monitors the PFI’s compliance with MPF Program requirements and makes periodic reports to the MPF Provider. The MPF Provider will bring any material concerns to the attention of the MPF Bank. Minor lapses in servicing are simply charged to the PFI rather than being included in determining a loss on an MPF Loan. Major lapses in servicing could result in a PFI’s servicing rights being terminated for cause and the servicing of the particular MPF Loans being transferred to a new, qualified servicing PFI. No PFI’s servicing rights have been terminated for cause in the history of the MPF Program. In addition, the MPF Guides require each PFI to maintain errors and omissions insurance and a fidelity bond and to provide an annual certification with respect to its insurance and its compliance with the MPF Program requirements.
During the third quarter of 2005, the Bank, as the MPF Provider of the MPF Program, authorized PFIs to provide special relief to borrowers of conventional MPF Loans affected by Hurricane Katrina. As part of this special relief, a payment suspension process was authorized for qualifying MPF Loans in the major disaster areas as designated by FEMA. These relief provisions authorized PFIs to suspend mortgage payments for the months of September, October and November, 2005 on those MPF Bank-owned loans whose borrowers qualified for public and individual assistance from FEMA. During this three month period, PFIs were expected to complete an assessment of each delinquent mortgage loan in the affected areas to determine the appropriate action that best fits the borrower’s circumstances (borrowers whose loans were delinquent prior to Katrina are not eligible for a loan modification workout unless they qualified for public and individual assistance from FEMA). The standard loan forbearance actions currently authorized in the MPF Servicing Guide requires the PFI and borrower to mutually agree upon a forbearance program to get the loan current within 18 months. In addition, the Bank granted the following loan modification approval authority to nine PFIs of the Dallas Federal Home Loan Bank located in the qualified areas: (i) loan modification to capitalize delinquent interest over the remaining term of the loan, or (ii) loan modification to capitalize delinquent interest and extend the term of the loan. All other loan forbearance requests will be handled by the PFI on a case by case basis with approval required by the MPF Program Master Servicer, the MPF Provider and the MPF Bank.
26
Table of Contents
Quality Assurance
The MPF Provider conducts an initial quality assurance review of a selected sample of MPF Loans from the PFI’s initial MPF Loan delivery. Thereafter periodic reviews of a sample of MPF Loans are performed to determine whether the reviewed MPF Loans complied with the MPF Program requirements at the time of acquisition. A quality assurance letter is sent to the PFI noting any critical or general compliance exception matters. The PFI is required to purchase or repurchase any MPF Loan or provide an indemnification covering related losses on any MPF Loan that is determined to be ineligible and for which the ineligibility cannot be cured. Any exception that indicates a negative trend is discussed with the PFI and can result in the suspension or termination of a PFI’s ability to deliver new MPF Loans if the concern is not adequately addressed. The Bank does not currently conduct any quality assurance reviews of Government MPF Loans.
A majority of the states, and some municipalities, have enacted laws against mortgage loans considered predatory or abusive. Some of these laws impose liability for violations not only on the originator, but also upon purchasers and assignees of mortgage loans. The Bank takes measures that it considers reasonable and appropriate to reduce its exposure to potential liability under these laws and is not aware of any claim, action or proceeding asserting that the Bank is liable under these laws. However, there can be no assurance that the Bank will never have any liability under predatory or abusive lending laws.
27
Table of Contents
Allocation of Losses
The MPF Bank and PFI share the risk of losses on MPF Loans by structuring potential losses on conventional MPF Loans into layers with respect to each Master Commitment. The general allocation of losses is described in the following table:
Allocation of Losses
| The first layer of protection against loss is the borrower’s equity in the real property securing the MPF Loan.
Second, as is customary for conventional mortgage loans with LTV’s greater than 80%, the next layer of protection comes from primary MI issued by qualified MI companies.
• Such coverage is required for MPF Loans with LTVs greater than 80%.
• Covered losses (all types of losses except those generally classified as special hazard losses) are reimbursed by the primary MI provider.
Third, losses for each Master Commitment that are not paid by primary MI are incurred by the MPF Bank, up to an agreed upon amount, called a “First Loss Account” or “FLA.”
• The FLA is structured by the MPF Banks as a memo account to track losses not covered by the CE Amount provided by the PFI (or not yet recovered by the withholding of performance based fees). The FLA is not a cash collateral account, and does not give MPF Banks any right/obligation to receive/pay cash or any other collateral, but rather, it functions as a tracking mechanism for determining the point after which the PFI, in its role as credit enhancer, would be required to reimburse MPF Banks under the CE Amount for losses incurred.
Fourth, losses for each Master Commitment in excess of the FLA, if any, up to an agreed upon amount (the “CE Amount”) are covered by the PFI’s credit enhancement.
• The PFI’s CE Amount is sized using the MPF Program Methodology to equal the amount of losses in excess of, or including, the FLA (depending on the MPF product) that would need to be paid so that any losses in excess of the CE Amount and initial FLA would be equivalent to losses experienced by an investor in an “AA” rated mortgage backed security. The PFI may procure SMI to cover losses equal to all or a portion of the CE Amount (except that losses generally classified as special hazard losses are covered by the MPF Bank, not by SMI).
• The PFI is paid a monthly credit enhancement fee for managing credit risk on the MPF Loans. In most cases, the credit enhancement fees are performance based which further motivates the PFI to minimize loan losses on MPF Loans.
Fifth, any remaining unallocated losses are absorbed by the MPF Bank. |
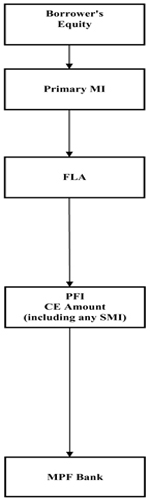
28
Table of Contents
With respect to participation interests, MPF Loan losses not covered by borrower’s equity or primary MI will be applied to the FLA and allocated amongst the participants pro ratably based upon their respective participation interests in the related Master Commitment. Next, losses will be applied to the PFI’s CE Amount which may include SMI, as indicated by the particular MPF product, and finally, further losses will be shared based on the participation interests of the Owner Bank and MPF Bank(s) in each Master Commitment. Under the Services Agreement, other than the obligation, (where applicable), to sell the MPF Provider a participation interest in MPF Loans funded by the Owner Bank, there are no minimum sales levels.
MPF® Products
The “Allocation of Losses” chart describes the general mechanics for the allocation of losses under the MPF Program. The charts below describe how the FLA and the PFI CE Amounts are determined for each MPF product type. Each of the MPF products is described in the MPF Guides and in marketing materials. The PFI selects the MPF product that best suits its business requirements.
Original MPF®
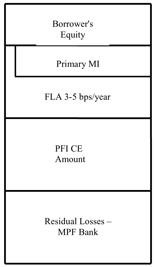 | FLA
• The FLA starts out at zero on the day the first MPF Loan under a Master Commitment is purchased but increases monthly over the life of the Master Commitment at a rate that ranges from 0.03% to 0.05% (3 to 5 basis points) per annum based on the month end outstanding aggregate principal balance of the Master Commitment.
• Over time the FLA is expected to cover expected losses on a Master Commitment, though losses early in the life of the Master Commitment could exceed the FLA and be charged in part to the PFI’s CE Amount.
PFI CE Amount
• The PFI’s CE Amount is sized using the MPF Program Methodology to equal the amount needed for the Master Commitment to have a rating equivalent to a “AA” rated mortgage backed security, as if there was not an FLA prior to the PFI’s obligation to cover losses equal to the CE Amount.
• The PFI is paid a monthly credit enhancement fee, typically 0.10% (10 basis points) per annum, based on the aggregate outstanding principal balance of the MPF Loans in the Master Commitment. |
29
Table of Contents
MPF® 100
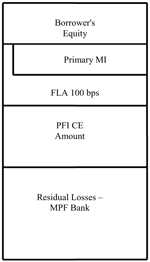 | FLA
• The FLA is equal to 1.00% (100 basis points) of the aggregate principal balance of the MPF Loans funded under the Master Commitment.
• Once the Master Commitment is fully funded, the FLA is expected to cover expected losses on that Master Commitment. The MPF Bank may economically recover a portion of losses incurred under the FLA by withholding performance based credit enhancement fees payable to the PFI.
PFI CE Amount
• The PFI’s CE Amount is calculated using the MPF Program Methodology to equal the difference between the amount needed for the Master Commitment to have a rating equivalent to a “AA” rated mortgage backed security and the amount of the FLA.
• The credit enhancement fee is between 0.07% and 0.10% (7 and 10 basis points) per annum of the aggregate outstanding principal balance of the MPF Loans in the Master Commitment.
• In addition, the PFI’s monthly credit enhancement fee after the first two or three years becomes performance based in that it is reduced by losses charged to the FLA.
Under the MPF 100 product, the MPF Bank table funds MPF Loans, which means that the MPF Bank provides the funds, through the PFI as its agent, to make the MPF Loan to the borrower. This differs from other MPF products in which the MPF Bank purchases loans that have already been closed by the PFI with its own funds. |
30
Table of Contents
MPF® 125
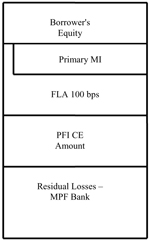 | FLA
• The FLA is equal to 1.00% (100 basis points) of the aggregate principal balance of the MPF Loans funded under the Master Commitment.
• Once the Master Commitment is fully funded, the FLA is expected to cover expected losses on that Master Commitment. The MPF Bank may economically recover a portion of losses incurred under the FLA by withholding performance based credit enhancement fees payable to the PFI.
PFI CE Amount
• The PFI’s CE Amount is calculated using the MPF Program Methodology to equal the difference between the amount needed for the Master Commitment to have a rating equivalent to a “AA” rated mortgage backed security and the amount of the FLA.
• The credit enhancement fee is between 0.07% and 0.10% (7 and 10 basis points) per annum of the aggregate outstanding principal balance of the MPF Loans in the Master Commitment and is performance based in that it is reduced by losses charged to the FLA. |
31
Table of Contents
MPF® Plus
| FLA
• The FLA is equal to an agreed upon number of basis points of the aggregate principal balance of the MPF Loans funded under the Master Commitment that is not less than the amount of expected losses on the Master Commitment.
• Once the Master Commitment is fully funded, the FLA is expected to cover expected losses on that Master Commitment. The MPF Bank may economically recover a portion of losses incurred under the FLA by withholding performance based credit enhancement fees payable to the PFI.
PFI CE Amount
• The PFI is required to provide an SMI policy covering the MPF Loans in the Master Commitment and having a deductible initially equal to the FLA.
• Depending upon the amount of the SMI policy, the PFI may or may not have a separate CE Amount obligation.
• The total amount of the PFI’s CE Amount (including the SMI policy) is calculated using the MPF Program Methodology to equal the difference between the amount needed for the Master Commitment to have a rating equivalent to a “AA” rated mortgage backed security and the amount of the FLA.
• The performance based portion of the credit enhancement fee is typically between 0.06% and 0.07% (6 and 7 basis points) per annum of the aggregate outstanding balance of the MPF Loans in the Master Commitment. The performance based fee is reduced by losses charged to the FLA and is delayed for one year from the date MPF Loans are sold to the MPF Bank. The fixed portion of the credit enhancement fee is typically 0.07% (7 basis points) per annum of the aggregate outstanding principal balance of the MPF Loans in the Master Commitment. The lower performance based credit enhancement fee is for Master Commitments without a direct PFI CE Amount obligation. |
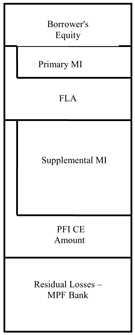
32
Table of Contents
Original MPF® for FHA/VA
| • | Only Government MPF Loans are eligible for sale under this product. |
| • | The PFI provides and maintains FHA insurance or a VA guaranty for the Government MPF Loans and the PFI is responsible for compliance with all FHA or VA requirements and for obtaining the benefit of the FHA insurance or the VA guaranty with respect to defaulted Government MPF Loans. |
| • | The PFI’s servicing obligations are essentially identical to those undertaken for servicing loans in a Ginnie Mae security. Because the PFI servicing these MPF Loans assumes the risk with respect to amounts not reimbursed by either the FHA or VA, the structure results in the MPF Banks having assets that are expected to perform the same as Ginnie Mae securities. |
| • | The PFI is paid a monthly government loan fee equal to 0.02% (2 basis points) per annum based on the month end outstanding aggregate principal balance of the Master Commitment in addition to the customary 0.44% (44 basis points) per annum servicing fee that is retained by the PFI on a monthly basis based on the outstanding aggregate principal balance of the MPF Loans. |
| • | Only PFIs that are licensed or qualified to originate and service FHA and VA loans and that maintain a mortgage loan delinquency ratio that is acceptable to the MPF Provider and that is comparable to the national average and/or regional delinquency rates as published by the Mortgage Bankers Association are eligible to sell and service Government MPF Loans under the MPF Program. |
33
Table of Contents
The following table provides a comparison of the MPF products:
Product Name | MPF Bank FLA 1 | PFI Credit Description | Average PFI CE Amount As % | Credit | Credit Enhancement Fee Offset 2 | Servicing Fee to PFI | ||||||
| Original MPF | 3 to 5 basis points/added each year based on the unpaid balance | Equivalent to “AA” | 1.73% | 9 to 11 basis points/year – paid monthly | No | 25 basis points/year | ||||||
| MPF 100 | 100 basis points fixed based on the size of the loan pool at closing | After FLA to “AA” | 0.49% | 7 to 10 basis points/year – paid monthly; performance based after 2 or 3 years | Yes –After first 2 to 3 years | 25 basis points/year | ||||||
| MPF 125 | 100 basis points fixed based on the size of the loan pool at closing | After FLA to “AA” | 0.82% | 7 to 10 basis points/year – paid monthly; performance based | Yes | 25 basis points/year | ||||||
| MPF Plus 4 | Sized to equal expected losses | 0-20 bps after FLA and SMI to “AA” | 1.34% | 7 basis points/year fixed plus 6 to 7 basis points/year performance based (delayed for 1 year); all fees paid monthly | Yes | 25 basis points/year | ||||||
| Original MPF for FHA/VA | N/A | N/A (Unreimbursed Servicing Expenses) | N/A | N/A | N/A | 44 basis points/year plus 2 basis points/year - - paid monthly 3 | ||||||
| 1 | MPF Program Master Commitments participated in or held by the Bank as of September 30, 2005. |
| 2 | Future payouts of performance based credit enhancement fees are reduced when losses are allocated to the FLA. |
| 3 | Government loan fee. |
| 4 | PFI CE Amount includes SMI policy coverage. |
As of September 30, 2005, the net exposure of the Bank’s obligation to incur losses up to the amount of the FLA was $305.9 million, compared to $296.0 million and $258.5 million at December 31, 2004 and 2003, respectively. Except with respect to Original MPF, losses incurred by the Bank under the FLA can be recovered by the Bank by withholding future performance based credit enhancement fees otherwise paid to the Bank’s PFIs.
For the nine months ended September 30, 2005 and 2004, the Bank accrued $18.9 million and $20.2 million, respectively, in performance based credit enhancement fees as a reduction to interest income, from which the Bank withheld $422.8 thousand and $165.9 thousand, respectively, to cover losses against the FLA. Total losses against the FLA were $514.5 thousand and $280.5 thousand for the nine months ended September 30, 2005 and 2004, respectively. In the years ended December 31, 2004 and 2003 the Bank incurred $26.9 million and $19.6 million in performance based credit enhancement fees as a reduction to interest income, respectively, from which the Bank withheld approximately $304.7 thousand and $65.7 thousand, respectively, to cover losses against the FLA. Actual reductions against the FLA were $435.0 thousand, $143.0 thousand, and $99.0 thousand for the years ended December 31, 2004, 2003 and 2002, respectively.
34
Table of Contents
The table below represents the total volume of MPF Loans purchased or funded by the Bank for each MPF product by period:
| For the Nine Months Ended September 30, | For the Years Ended December 31, | ||||||||||||||
(Dollars in thousands) | 2005 | 2004 | 2004 | 2003 | 2002 | ||||||||||
Original MPF | $ | 860,731 | $ | 1,000,987 | $ | 1,277,703 | $ | 3,384,939 | $ | 1,537,941 | |||||
MPF 100 | 448,872 | 1,048,771 | 1,337,703 | 4,320,637 | 3,586,030 | ||||||||||
MPF 125 | 220,471 | 281,410 | 340,441 | 358,244 | 175,134 | ||||||||||
MPF Plus | 715,113 | 4,073,889 | 4,277,045 | 26,558,020 | 7,363,647 | ||||||||||
Original MPF for FHA/VA | 1,060,915 | 1,941,936 | 2,373,550 | 3,330,186 | 3,836,384 | ||||||||||
Total Purchases and Fundings | $ | 3,306,102 | $ | 8,346,993 | $ | 9,606,442 | $ | 37,952,026 | $ | 16,499,136 | |||||
The MPF Plus program utilizes MI companies to provide SMI. Although the SMI policy in the MPF Plus Product is procured by the PFI, the MPF Bank(s) are named insureds and beneficiaries under the policy. In addition, the Bank has from time to time directly acquired SMI policies as described in “Item 1.2—Business Segment—Mortgage Partnership Finance Program— Participating Financial Institution Agreement.” The following table summarizes outstanding amounts of SMI for which the Bank is named insured and beneficiary:
| September 30, | December 31, | |||||||||||||||||
| 2005 | 2004 | 2003 | ||||||||||||||||
(Dollars in thousands) | Amounts Outstanding | Percent of Total | Amounts Outstanding | Percent of Total | Amounts Outstanding | Percent of Total | ||||||||||||
Mortgage Guaranty Insurance Company | $ | 427,298 | 68.4 | % | $ | 425,506 | 68.8 | % | $ | 413,939 | 72.8 | % | ||||||
GE Mortgage Insurance Corp. | 77,392 | 12.4 | % | 73,676 | 11.9 | % | 60,435 | 10.7 | % | |||||||||
PMI Mortgage Insurance Co. | 42,409 | 6.8 | % | 42,409 | 6.9 | % | 42,296 | 7.4 | % | |||||||||
United Guaranty Residential Insurance Co. | 53,033 | 8.5 | % | 53,201 | 8.6 | % | 35,319 | 6.2 | % | |||||||||
Republic Mortgage Insurance Co. | 17,930 | 2.9 | % | 17,037 | 2.8 | % | 16,619 | 2.9 | % | |||||||||
Radian Guaranty, Inc. | 6,071 | 1.0 | % | 6,071 | 1.0 | % | — | — | ||||||||||
Total SMI | $ | 624,133 | 100.0 | % | $ | 617,900 | 100.0 | % | $ | 568,608 | 100.0 | % | ||||||
35
Table of Contents
MPF Loans that the Bank has acquired or funded are secured by real estate across all fifty states, the District of Columbia and Puerto Rico. No single zip code represents more than 1% of MPF Loans on the Bank’s statements of condition. The following table summarizes the outstanding balances of the Bank’s MPF Loans by state:
| Largest Ten MPF States | |||||||||||||||||||
| As of September 30, 2005 | As of December 31, 2004 | As of December 31, 2003 | |||||||||||||||||
(Dollars in thousands) | Outstanding Value | Percent of Total | Outstanding Value | Percent of Total | Outstanding Value | Percent of Total | |||||||||||||
Wisconsin | $ | 7,194,885 | 16.7 | % | $ | 7,154,642 | 15.4 | % | $ | 6,710,433 | 14.3 | % | |||||||
California | 4,461,111 | 10.4 | % | 5,302,892 | 11.4 | % | 5,909,138 | 12.5 | % | ||||||||||
Illinois | 4,090,264 | 9.5 | % | 4,095,064 | 8.8 | % | 3,894,264 | 8.3 | % | ||||||||||
Texas | 2,887,009 | 6.7 | % | 2,988,555 | 6.4 | % | 2,824,223 | 6.0 | % | ||||||||||
Florida | 1,688,299 | 3.9 | % | 1,929,208 | 4.1 | % | 1,963,765 | 4.2 | % | ||||||||||
Ohio | 1,443,728 | 3.4 | % | 1,601,990 | 3.4 | % | 1,760,546 | 3.7 | % | ||||||||||
Pennsylvania | 1,436,446 | 3.3 | % | 1,575,275 | 3.4 | % | 1,664,862 | 3.5 | % | ||||||||||
Virginia | 1,321,650 | 3.1 | % | 1,525,845 | 3.3 | % | 1,610,143 | 3.4 | % | ||||||||||
Minnesota | 1,223,193 | 2.8 | % | 1,375,141 | 3.0 | % | 1,466,824 | 3.1 | % | ||||||||||
New York | 1,180,803 | 2.7 | % | n/a | n/a | n/a | n/a | ||||||||||||
Maryland | n/a | n/a | 1,336,696 | 2.9 | % | 1,462,218 | 3.1 | % | |||||||||||
All other states | 16,050,241 | 37.5 | % | 17,690,044 | 37.9 | % | 17,873,998 | 37.9 | % | ||||||||||
Total MPF mortgages - par | $ | 42,977,629 | 100.0 | % | $ | 46,575,352 | 100.0 | % | $ | 47,140,414 | 100.0 | % | |||||||
Non MPF mortgages 1 | 5,129 | 2,433 | 156 | ||||||||||||||||
Loan commitment basis adj. | 286,445 | 343,962 | 416,455 | ||||||||||||||||
SFAS 133 hedging adj. | (33,104 | ) | 3,683 | 48,165 | |||||||||||||||
Total mortgage loans held in portfolio | $ | 43,236,099 | $ | 46,925,430 | $ | 47,605,190 | |||||||||||||
n/a = not applicable as amount does not fall within the 10 largest states.
| 1 | Non-MPF mortgage loans include the Native American Mortgage Purchase Program HUD Section 184 loans. These loans are fully guaranteed by the U.S. Department of Housing and Urban Development, in the event of default by the homeowner. |
As of September 30, 2005, the top five PFIs represent in total 67.6% of the Bank’s outstanding MPF Loans (at par). If one or more of these PFIs were unable or failed to meet their contractual obligations to cover losses under the CE Amount, the Bank may incur increased losses depending upon the performance of the related MPF Loans.
36
Table of Contents
The following tables present MPF Loan concentrations by PFI for loan purchases and fundings by the Bank that exceed ten percent (10%):
MPF Loan Purchases and Funding Concentrations by PFI
| For the Nine Months Ended September 30, | ||||||||||||
(Dollars in thousands) | 2005 | 2004 | ||||||||||
PFI | Amounts | % of Total | Amounts | % of Total | ||||||||
Balboa Reinsurance Company 1 | $ | 1,265,380 | 38.3 | % | $ | 3,189,539 | 38.2 | % | ||||
LaSalle Bank, N.A. | n/a | n/a | 1,417,766 | 17.0 | % | |||||||
All Other Institutions | 2,040,722 | 61.7 | % | 3,739,688 | 44.8 | % | ||||||
Total | $ | 3,306,102 | 100.0 | % | $ | 8,346,993 | 100.0 | % | ||||
n/a = not applicable as amount is less than 10%.
| 1 | Balboa Reinsurance Company (a subsidiary of Countrywide Financial Corporation) is an out-of-district PFI. |
MPF Loan Purchases and Funding Concentrations by PFI
| For the Years Ended December 31, | ||||||||||||||||||
(Dollars in thousands) | 2004 | 2003 | 2002 | |||||||||||||||
PFI | Amounts | % of Total | Amounts | % of Total | Amounts | % of Total | ||||||||||||
Balboa Reinsurance Company 1 | $ | 3,603,059 | 37.5 | % | $ | 6,424,429 | 16.9 | % | n/a | n/a | ||||||||
LaSalle Bank, N. A. | 1,446,722 | 15.1 | % | 8,863,627 | 23.4 | % | n/a | n/a | ||||||||||
National City Bank Pennsylvania 2 | n/a | n/a | 7,229,115 | 19.0 | % | 6,041,392 | 36.6 | % | ||||||||||
All Other Institutions | 4,556,661 | 47.4 | % | 15,434,855 | 40.7 | % | 10,457,744 | 63.4 | % | |||||||||
Total | $ | 9,606,442 | 100.0 | % | $ | 37,952,026 | 100.0 | % | $ | 16,499,136 | 100.0 | % | ||||||
n/a = not applicable as amount is less than 10%.
| 1 | Balboa Reinsurance Company (a subsidiary of Countrywide Financial Corporation) is an out-of-district PFI. |
| 2 | National City Bank Pennsylvania is an out-of-district PFI. |
37
Table of Contents
The following table summarizes the outstanding balances of MPF Loans by geographic area:
Geographic Concentration of MPF Loans1,2
| September 30, | December 31, | ||||||||
| 2005 | 2004 | 2003 | |||||||
Midwest | 39 | % | 36 | % | 36 | % | |||
Northeast | 12 | % | 13 | % | 13 | % | |||
Southeast | 18 | % | 19 | % | 19 | % | |||
Southwest | 16 | % | 16 | % | 15 | % | |||
West | 15 | % | 16 | % | 17 | % | |||
Total | 100 | % | 100 | % | 100 | % | |||
| 1 | Percentages calculated based on the unpaid principal balance at the end of each period. |
| 2 | Midwest includes IA, IL, IN, MI, MN, ND, NE, OH, SD, and WI. |
Northeast includes CT, DE, MA, ME, NH, NJ, NY, PA, PR, RI, VI, and VT.
Southeast includes AL, DC, FL, GA, KY, MD, MS, NC, SC, TN, VA, and WV.
Southwest includes AR, AZ, CO, KS, LA, MO, NM, OK, TX, and UT.
West includes AK, CA, GU, HI, ID, MT, NV, OR, WA, and WY.
MPF Shared Funding® Program
The MPF Shared Funding program permits a PFI (“MPF Shared Funding PFI”) to deliver MPF Loans (“MPF Shared Funding Loans”) in the form of a security through the use of a third party trust. Under this option, the MPF Shared Funding PFI sponsors a trust and transfers MPF Shared Funding Loans it originates or acquires to the trust. Upon transfer of the assets into the trust, the trust issues securities with tranches having credit risk characteristics consistent with the MPF Program policy and in compliance with the AMA Regulation. The tranches are backed by the MPF Shared Funding Loans and all or almost all of the tranches receive public credit ratings determined by an NRSRO. The senior tranches, collectively referred to as the “A Certificates” have a credit rating of “AA” or “AAA” and may have different interest rate risk profiles and durations. The A Certificates, which may be structured to provide various risk and investment characteristics, are sold to the Bank, either directly by the trust or by the MPF Shared Funding PFI. The lower-rated tranches, collectively referred to as the “B Certificates,” provide the credit enhancement for the A Certificates. The A Certificates are sold to the Bank, either directly by the trust or by the MPF Shared Funding PFI, and the B Certificates are sold to the MPF Shared Funding PFI. The Bank may subsequently sell some or all of its A Certificates to Bank members and to other FHLBs and their members. No residual interest is created or retained on the Bank’s balance sheet.
The Bank completed two MPF Shared Funding transactions in March 2003 and June 2003. The outstanding principal balance of the A Certificates held by the Bank in connection with these transactions was $436.6 million as of September 30, 2005; these A Certificates are included in “Investment Securities—Held to Maturity.” In these two transactions, One Mortgage Partners Corp., a subsidiary of JPMorgan Chase & Co., (the “Shared Funding PFI”), acquired MPF Shared Funding Loans from National City Bank of Pennsylvania and Superior Guaranty Insurance Company, a subsidiary of Wells Fargo & Company, (the “Selling PFIs”), which are members of other MPF Banks. The Selling PFIs provided standard MPF Program representations and warranties to the Shared Funding PFI which were in turn passed through to the trust for the benefit of the holders of the A Certificates and the B Certificates (“Certificateholders”). The Bank agreed to act as the agent for the Shared Funding PFI so that the Selling PFIs could deliver their loans in much the same manner as they would if they were selling the loans to their respective MPF Banks under the MPF Program products. Aside from potential liquidity benefits on future transactions, there is not a material difference in the Bank’s risk profile or earnings between holding A Certificates and holding the MPF Loans backing the securities.
The Selling PFIs retained the servicing rights and obligations with respect to the MPF Shared Funding Loans which servicing obligations are performed through the MPF Program systems and processes supported by the Bank. The Bank is the master servicer for the trust for the benefit of the Certificateholders and Wells Fargo Bank N.A. is the Bank’s vendor for performing these master servicing functions.
38
Table of Contents
In the two MPF Shared Funding transactions that have been completed to date, the Bank assumes the interest rate risk related to the A Certificates that it acquires as the certificates are structured to pass-through the weighted average of the net mortgage rate of the related MPF Shared Funding Loans (the interest rate on the MPF Shared Funding Loans less servicing, master servicing and trustee fees). The majority of the credit risk in the transaction is borne by the B Certificates. A Certificates will only experience credit losses to the extent that losses exceed the principal amount of B Certificates outstanding at the time that the loss is incurred. Losses above a certain threshold related to fraud, mortgagor bankruptcy and special hazard losses are allocated pro rata among all outstanding A certificates and B certificates. Prepayment risk in the transaction is borne by both the Class A and Class B certificates as the yield for both classes of certificates is equal to the weighted average of the net mortgage rate of the related MPF Shared Funding Loans.
39
Table of Contents
The primary source of funds for the Bank is the sale of debt securities, known as consolidated obligations, in the capital markets. Consolidated obligations, which consist of bonds and discount notes, are by regulation the joint and several obligations of the FHLBs, although the primary obligation is with an individual FHLB. Consolidated obligations are sold to the public through the Office of Finance using authorized securities dealers. Consolidated obligations are backed only by the financial resources of the 12 FHLBs and are not guaranteed by the U.S. government. As of September 30, 2005, Moody’s has rated the consolidated obligations “Aaa/P-1”, and Standard Poor’s has rated them “AAA/A-1+”. These ratings measure the likelihood of timely payment of principal and interest on consolidated obligations.
The Bank is primarily liable for its portion of consolidated obligations, which are issued on its behalf and for which it receives proceeds. The Bank is also jointly and severally liable with the other 11 FHLBs for the payment of principal and interest on consolidated obligations of all the FHLBs. Under Finance Board regulation, each FHLB, individually and collectively, is required to ensure the timely payment of principal and interest on all consolidated obligations. At the same time, the regulation makes it clear that in the ordinary course of events, each FHLB is expected to be responsible for making the payments with respect to all consolidated obligations for which it has received the proceeds, which are referred to in the regulation as its “direct obligations.” If the principal or interest on any consolidated obligation issued on behalf of the Bank is not paid in full when due, the Bank may not pay dividends to, or redeem or repurchase shares of capital stock from any of its members. The Finance Board, in its discretion, may require the Bank to make principal or interest payments due on any FHLBs’ consolidated obligations. To the extent that the Bank makes a payment on a consolidated obligation on behalf of another FHLB, the Bank would be entitled to reimbursement from the non–complying FHLB. However, if the Finance Board determines that the non–complying FHLB is unable to satisfy its direct obligations (as primary obligor), then the Finance Board may allocate the outstanding liability among the remaining FHLBs on a pro rata basis in proportion to each FHLBs’ participation in all consolidated obligations outstanding, or on any other basis the Finance Board may determine, even in the absence of a default event by the primary obligor.
Finance Board regulations govern the issuance of debt on behalf of the Bank and related activities, and authorize the Bank to issue consolidated obligations, through the Office of Finance, under the authority of section 11(a) of the FHLB Act. By regulation, all of the FHLBs are jointly and severally liable for the consolidated obligations issued under section 11(a). No FHLB is permitted to issue individual debt under section 11(a) without the approval of the Finance Board.
Finance Board regulations also state that the Bank must maintain the following types of assets free from any lien or pledge in an amount at least equal to the amount of its consolidated obligations outstanding:
| • | Cash; |
| • | Obligations of, or fully guaranteed by, the United States; |
| • | Secured advances; |
| • | Mortgages, which have any guaranty, insurance, or commitment from the United States or any agency of the United States; |
| • | Investments described in Section 16(a) of the FHLB Act, which, among other items, includes securities that a fiduciary or trust fund may purchase under the laws of the state in which the FHLB is located; and |
| • | Other securities that are rated “Aaa” by Moody’s or “AAA” by S&P. |
The Office of Finance has responsibility for the issuance of consolidated obligations. It also services all outstanding debt, provides information to the Bank on capital market developments, manages the Bank’s relationship with ratings agencies with respect to consolidated obligations and prepares the FHLBs’ combined quarterly and annual financial statements. In addition, it administers payments to the Resolution Funding Corporation (“REFCORP”) and the Financing Corporation, two Corporations established by Congress in the 1980’s to provide funding for the resolution and disposition of insolvent savings institutions.
40
Table of Contents
In connection with managing its debt, the Bank is permitted to transfer consolidated obligations to other FHLBs at fair value. The transfer is accounted for as an extinguishment of debt since the Bank is released from being the primary obligor under the consolidated obligation. The FHLB assuming the consolidated obligation becomes the primary obligor. An extinguishment gain or loss is recorded for the difference between the carrying values of the consolidated obligations transferred, including fair value hedge related gains or losses and related deferred concession fees, and the amount of cash paid to the FHLB to assume the Bank’s consolidated obligation.
Consolidated Obligation Bonds
Consolidated obligation bonds (“bonds”) satisfy term funding requirements and are issued under various programs. Typically, the maturities of these securities range from 1 to 30 years, but the maturities are not subject to any statutory or regulatory limit. The bonds can be fixed or adjustable rate and callable or non-callable. The Bank also offers fixed-rate, non-callable (bullet) bonds via the FHLBs’ Tap issue program. This program uses specific maturities that may be reopened daily during a three-month period through competitive auctions. The goal of the Tap program is to aggregate frequent smaller issues into a larger bond issue that may have greater market liquidity.
The Tap issue program aggregates the most common maturities issued (1-, 2-, 3-, 4-, 5-, 7-, 10-, 15-, 20-, and 30-year) over a three-month period rather than frequently bringing numerous small bond issues of similar maturities to market. Tap issues generally remain open for three months, after which they are closed and a new series of Tap Issuances is opened to replace them. The Tap has reduced the number of separate bullet bonds issued.
Although the Bank predominantly issues fixed-rate bullet and callable bonds, the Bank may issue floaters, step-ups/downs, zero-coupons and other types of bonds. Bonds are issued and distributed daily through negotiated or competitively bid transactions with approved underwriters or selling group members.
The Bank receives 100 percent of the proceeds of a bond issued via direct negotiation with underwriters of FHLB debt when it is the only FHLB involved in the negotiation; the Bank is the sole FHLB that is primary obligor on the bond in those cases. When the Bank and one or more other FHLBs jointly negotiate the issuance of a bond directly with underwriters, the Bank receives the portion of the proceeds of the bond agreed upon with the other FHLBs; in those cases, the Bank is primary obligor for the pro-rata portion of the bond based on proceeds received. The majority of the Bank’s bond issuance is conducted via direct negotiation with underwriters of the FHLB bonds, some with and some without participation by other FHLBs.
The Bank may also request specific bonds to be offered by the Office of Finance for sale via competitive auction conducted with underwriters in a bond selling group. One or more other FHLBs may request amounts of the same bonds to be offered for sale for their benefit via the same auction. The Bank may receive from zero percent to 100 percent of the proceeds of the bonds issued via competitive auction depending on: the amount and cost for the bonds bid by underwriters; the maximum cost the Bank or other FHLBs participating in the same issue, if any, are willing to pay for the bonds; and guidelines for allocation of the bond proceeds among multiple participating FHLBs administered by the Office of Finance.
The Bank also participates in the Global Issuances Program. The 5-year and 10-year Global Issuances Program commenced in 2002 through the Office of Finance with the objective of providing funding to FHLBs at lower interest costs than consolidated bonds issued through the Tap program or Medium Term Note program. Debt issued under the Global Issuances Program has resulted in lower interest costs than the Tap program or Medium Term Note program because issuances occur less frequently, are larger in size and are placed by dealers to investors via a syndication process.
The Bank has principally utilized the Global Issuances Program as a source of 5-year and 10-year funding for the MPF Program. The Bank also has obtained funding in excess of its MPF Program requirements to facilitate the program’s objective of obtaining lower interest costs. In particular, the Bank historically has been the primary obligor on any debt issued under this program for which another FHLB has not requested funding in order to facilitate larger sized offerings at lower interest rates. The Bank was able to obtain excess funding due to its level of capital during 2005, 2004, 2003 and 2002, while remaining within its leverage limit requirements. Excess funding at the time of issuance was used to purchase government agency investment securities classified as either available-for-sale when used to mitigate the risk of participating in the program by economically hedging the interest rate risk associated with the debt issued or trading when used for liquidity purposes to facilitate future funding of MPF Loans, advances or other investment securities. For the reporting period beginning 2001 through the current reporting period, all 12 of the FHLBs have participated in the Global Issuance Program.
41
Table of Contents
In 2005, 2004 and 2003 the Bank recognized gains on the extinguishment of consolidated obligations along with losses on the sale of available for sale securities. In effect, the Bank bought non-FHLB government agency securities to economically hedge consolidated obligations. The Bank sold such securities to fund the transfer of consolidated obligations. As a result, the Bank recognized losses that economically limited any gain on extinguishment. The majority of the gains were a result of extinguishments related to consolidated obligations issued under the Global Issuances Program that were transferred to other FHLBs. While debt transfers are done primarily with respect to global notes, any consolidated obligation on the balance sheet is a potential candidate for debt transfer and the Bank does transfer non-global issues. The Bank considers such transfers at the request of another FHLB and accommodates such requests on a case-by-case basis. The Bank also occasionally proposes debt transfers to other FHLBs as an alternative to Medium Term Note or Tap issuances. The Bank is not obligated to provide funding to other FHLBs. The transfer of the Bank’s consolidated obligations to other FHLBs is predicated on whether such transfers make economic sense to the Bank. All debt transfers, global or otherwise, must fit within the overall asset-liability management, income, and risk-management objectives of the Bank. As a result, any gains or losses related to debt transfer activity are not driven by the funding needs of other FHLBs. For the reporting period beginning 2001 through the current reporting period, 11 of the 12 FHLBs have assumed consolidated obligation liabilities from the Bank via debt transfers.
The Bank records a transfer of its consolidated obligations to another FHLB as an extinguishment of debt since the Bank has been released from being the primary obligor. Specifically, the release is affected by the Office of Finance’s recordation of the transfer in its records. The Office of Finance is providing a release by acting within the confines of the banking regulations that governs the determination of which FHLB is the primary obligor. The FHLB assuming the consolidated obligation becomes the primary obligor since it now is directly responsible for repaying the debt. The Bank continues to disclose the transferred debt as a contingent liability since it still has a joint and several liability with respect to repaying the transferred consolidated obligation. The Bank does not record a financial guarantee at fair value with respect to the transferred consolidated obligation since FIN 45 does not require such accounting for a related party.
The gains from extinguishment resulted from increases in interest rates between the time the consolidated obligations were issued and the time they were subsequently extinguished. The losses from sales of available-for-sale securities resulted from increases in interest rates between the time the non-FHLB government agency securities were purchased and the time the securities were sold. Historically, approximately 30% of the debt issued under the Global Issuances Program was hedged economically with non-FHLB government agency securities, and approximately 45% of the debt was hedged with interest rate swaps that were accounted for under SFAS 133. This portion of debt was hedged at the same time the debt was issued. The hedge was terminated at the time of extinguishment and limited the amount of any gain recognized upon extinguishment.
Despite the fact that the Bank may recognize gains on the extinguishment of debt, assuming consolidated obligations from the Bank through the debt transfer process may be more economical and/or more flexible to other FHLBs than issuing bonds directly in the market. The Bank prices its consolidated obligations transferred to other FHLBs at rates that are competitive with, or lower in cost than the Tap program, or Medium Term Note program and may transfer consolidated obligations at fair value throughout the day and at smaller increments, unlike the Tap program. The Tap auction is only available once a day and at minimum funding increments of $5 million.
Consolidated Obligation Discount Notes
The FHLBs also sell consolidated obligation discount notes (“discount notes”) to provide short–term funds for advances to members for seasonal and cyclical fluctuations in savings flows and mortgage financing, short-term investments, and variable-rate and putable or convertible advance programs. These securities have maturities up to 360 days and are sold through a consolidated obligation discount-note selling group and through other authorized securities dealers. Discount notes are sold at a discount and mature at par.
42
Table of Contents
On a daily basis, the Bank may request specific amounts of discount notes with specific maturity dates to be offered by the Office of Finance at a specific cost for sale to underwriters in the discount note selling group. One or more other FHLBs may also request amounts of discount notes with the same maturities to be offered for sale for their benefit the same day. The Office of Finance commits to issue discount notes on behalf of the participating FHLBs when underwriters in the selling group submit orders for the specific discount notes offered for sale. The Bank may receive from zero to 100% of the proceeds of the discount notes issued via this sale process depending on: the maximum costs the Bank or other FHLBs participating in the same discount notes, if any, are willing to pay for the discount notes; the amount of orders for the discount notes submitted by Underwriters; and guidelines for allocation of discount note proceeds among multiple participating FHLBs administered by the Office of Finance.
Twice weekly, the Bank may also request specific amounts of discount notes with fixed maturity dates ranging from four weeks to 26 weeks to be offered by the Office of Finance for sale via competitive auction conducted with underwriters in the discount note selling group. One or more FHLBs may also request amounts of those same discount notes to be offered for sale for their benefit via the same auction. The Bank may receive from zero to 100% of the proceeds of the discount notes issued via competitive auction depending on the amounts and costs for the discount notes bid by the underwriters and guidelines for allocation of discount note proceeds among multiple participating FHLBs administered by the Office of Finance. The majority of the Bank’s issuance of discount notes is conducted via the twice weekly auctions.
43
Table of Contents
1.4 Use of Interest Rate Derivatives
The Bank uses interest rate derivatives, as part of its interest rate risk management and funding strategies to reduce identified risks inherent in the normal course of business. Interest rate derivatives (herein “derivatives”) include interest rate swaps (including callable swaps and putable swaps), swaptions, interest rate cap and floor agreements, and futures and forward contracts.
The Finance Board’s regulations, its Financial Management Policy, and the Bank’s Asset/Liability Management Policy all establish guidelines for the Bank’s use of derivatives. These regulations and policies prohibit trading in derivatives for profit and any other speculative use of these instruments. They also limit the amount of credit risk allowable from derivatives.
The Bank primarily uses derivatives to manage its exposure to changes in interest rates. The goal of the Bank’s interest rate risk management strategy is not to eliminate interest rate risk, but to manage it within appropriate limits. One key way the Bank manages interest rate risk is to acquire and maintain a portfolio of assets and liabilities, which, together with their associated derivatives, are reasonably matched with respect to the expected maturities or repricings of the assets and liabilities.
The Bank may also use derivatives to adjust the effective maturity, repricing frequency, or option characteristics of financial instruments (like advances and outstanding bonds) to achieve risk management objectives. From time to time, the Bank may also use derivatives to act as an intermediary between member institutions and a third-party counterparty for the members own risk management activities. At September 30, 2005 and December 31, 2004 and 2003, the total notional amount of the Bank’s outstanding derivatives was $47.2 billion, $46.2 billion and $53.7 billion, respectively. The contractual or notional amount of a derivative is not a measure of the amount of credit risk from that transaction. The notional amount serves as a basis for calculating periodic interest payments or cash flows.
The Bank is subject to credit risk in all derivatives transactions because of the potential nonperformance by the derivative counterparty. The Bank reduces this credit risk by executing derivatives transactions only with highly rated financial institutions. In addition, the legal agreements governing its derivatives transactions require the credit exposure of all derivative transactions with each counterparty to be netted and generally require each counterparty to deliver high quality collateral to the Bank once a specified unsecured net exposure is reached. At September 30, 2005 and December 31, 2004 and 2003, the maximum credit exposure of the Bank was approximately $192.3 million, $153.5 million and $454.3 million, respectively; after delivery of required collateral the unsecured net credit exposure was approximately $3.6 million, $2.9 million and $17.4 million, respectively.
The market risk of derivatives is measured on a portfolio basis, taking into account the entire balance sheet and all derivatives transactions. The market risk of the derivatives and the hedged items is included in the measurement of the Bank’s duration gap. The Bank’s duration gap was 1.28 months, 0.23 months and 1.49 months at September 30, 2005 and December 31, 2004 and 2003, respectively. See “Item 2.3—Risk Management—Quantitative and Qualitative Disclosures about Market Risk” for further discussion.
44
Table of Contents
Capital, Capital Rules and Dividends
Current Capital Rules
The Gramm-Leach-Bliley Act of 1999 (“GLB Act”) requires the Bank to create a new capital structure. Until such time as the Bank fully implements a new capital plan, the pre-GLB Act capital rules remain in effect. In particular, the FHLB Act requires members to purchase capital stock equal to the greater of one percent of their mortgage-related assets at the most recent calendar year-end, or five percent of outstanding advances from the Bank. Members may hold capital stock in excess of the foregoing statutory requirement (“voluntary capital stock”). Although Finance Board regulations give the Bank discretion to redeem at par value any voluntary capital stock, on October 18, 2005, the Bank’s Board of Directors discontinued redemptions of voluntary stock for a period of time in order to ensure an adequate capital base for the Bank. See “Item 2.2—Management’s Discussion and Analysis of Financial Condition and Results of Operations—Overview—Regulatory Agreement and Related Actions.” Members are permitted to sell capital stock to other members at par value with the Bank’s approval. Capital stock outstanding under the pre-GLB Act capital rules is redeemable at the option of a member on six months written notice of withdrawal from membership, provided that the Bank is in compliance with its regulatory capital requirements. For a further discussion of the Bank’s regulatory capital requirements and the Bank’s obligations under its Written Agreement, as amended, with the Finance Board see, “Item 2.2—Management’s Discussion and Analysis of Financial Condition and Results of Operations—Overview—Regulatory Agreement and Related Actions.”
GLB Act New Capital Structure
The GLB Act authorizes the Bank to have two classes of capital stock and each class may have sub-classes. Class A capital stock is conditionally redeemable on six months’ written notice from the member and Class B capital stock is conditionally redeemable on five years’ written notice from the member. The GLB Act made membership voluntary for all members. Members that withdraw from membership may not reapply for membership for five years.
The GLB Act and implementing Finance Board final rule define total capital for regulatory capital adequacy purposes for the Bank as the sum of the Bank’s permanent capital, plus the amounts paid-in by its members for Class A capital stock; any general loss allowance, if consistent with generally accepted accounting principles in the United States of America (“GAAP”) and not established for specific assets; and other amounts from sources determined by the Finance Board as available to absorb losses. The GLB Act defines permanent capital for the Bank as the amount paid-in for Class B capital stock, plus the amount of the Bank’s retained earnings, as determined in accordance with GAAP.
Under the GLB Act and the implementing final rule, the Bank is subject to risk-based capital rules under its capital plan when it is fully implemented. Only permanent capital, as previously defined, can satisfy the risk-based capital requirement. In addition, the GLB Act specifies a 5% minimum leverage ratio based on total capital, which includes a 1.5 weighting factor applicable to permanent capital, and a 4% minimum capital ratio that does not include the 1.5 weighting factor applicable to the permanent capital. Moreover, the members’ right to redeem is conditional on the member maintaining its minimum capital requirement and the Bank maintaining its leverage requirement. The Bank may not redeem or repurchase any of its capital stock without Finance Board approval if the Finance Board or the Bank’s Board of Directors determines that the Bank has incurred or is likely to incur losses that result in or are likely to result in charges against the capital of the Bank, even if the Bank is in compliance with its minimum capital requirements.
The Finance Board’s final rule implementing a new capital structure for the Bank includes risk-based and leverage capital requirements, different classes of capital stock that the Bank may issue and the rights and preferences that may be associated with each class of capital stock. The Finance Board originally approved the capital plan of the Bank on June 12, 2002. However, the Bank is re-assessing its capital plan and is likely to submit certain amendments to the capital plan to the Finance Board. Until such time as the Bank fully implements the new capital regulations, the current capital rules remain in effect.
45
Table of Contents
Dividends
Under Finance Board regulations, the Bank may pay dividends from current income or retained earnings. The Bank’s Board of Directors may declare and pay dividends in either cash or capital stock. The Bank may not pay dividends if it fails to satisfy certain liquidity requirements under applicable Finance Board regulations. The Finance Board’s regulations require that the Bank maintain eligible high quality assets in an amount equal to or greater than the deposits received from members. See “Item 1.2—Business Segments—Deposits” for a description of these assets. In addition, the Bank must hold contingency liquidity in an amount sufficient to meet its liquidity needs for at least five business days without access to the consolidated obligation debt markets.
As described in Note 14 of the December 31, 2004 Financial Statements and Notes, the Bank adopted a Business and Capital Management Plan for 2005-2007 as required under the terms of the Bank’s Written Agreement with the Finance Board. In accordance with the plan, on March 15, 2005, the Bank’s Board of Directors adopted a new dividend policy requiring the dividend payout ratio in a given quarter to not exceed 90% of adjusted core net income for that quarter. For these purposes, adjusted core net income is defined as the Bank’s GAAP net income, less
| (i) | fees for prepayment of advances and gains or losses on termination of associated derivative contracts and other hedge instruments; and |
| (ii) | gains or losses on debt transfer transactions including gains or losses on termination of associated derivative contracts and other hedge instruments; and |
| (iii) | significant non-recurring gains or losses related to restructuring of the Bank’s business |
plus an amount equal to the sum of
| (i) | for each prepayment of advances after October 1, 2004, the net amount of prepayment fee and gain or loss on termination of associated derivative contracts and other hedge instruments divided by the number of quarters of remaining maturity of the prepaid advance if it had not been prepaid; and |
| (ii) | for each debt transfer transaction after October 1, 2004, the net gain or loss on the transfer transaction including termination of associated derivative contracts and other hedge instruments divided by the number of quarters of remaining maturity of the transferred debt instrument if it had not been transferred. |
The Bank entered into an amendment to its Written Agreement on October 18, 2005. In accordance with the amendment, on December 14, 2005, the Bank submitted a revised retained earnings and dividend policy and updated business plan strategies to the Finance Board for approval and the Finance Board is reviewing the Bank’s submission. Until the Bank’s registration of its equity securities under the Securities and Exchange Act of 1934 becomes effective and a revised retained earnings and dividend policy and updated business plan strategies have been approved by the Finance Board, the Bank’s Board of Directors may declare a dividend only following consultation with, and approval by, the Finance Board. See “Item 2.2—Management’s Discussion and Analysis of Financial Condition and Results of Operations—Overview—Regulatory Agreement and Related Actions.”
Regulatory Oversight
The Bank is supervised and regulated by the Finance Board, which is an independent agency in the executive branch of the U.S. Government. Under the FHLB Act, the Finance Board is to ensure that the Bank carries out its housing finance mission, remains adequately capitalized and able to raise funds in the capital markets, and operates in a safe and sound manner. The Finance Board establishes regulations governing the operations of the Bank. The Finance Board is governed by a five-member board; four board members are appointed by the President of the United States, with the advice and consent of the Senate, to serve seven-year terms. The fifth member of the board is the Secretary of HUD or the Secretary’s designee. The Finance Board’s operating expenses are funded by assessments on the FHLBs; no tax dollars or other appropriations support the operations of the Finance Board or the Bank. To assess the safety and soundness of the Bank, the Finance Board conducts at least annual, on-site examinations of the Bank, as well as periodic on-site reviews. Additionally, the Bank is required to submit monthly financial information on the condition and results of operations of the Bank to the Finance Board.
46
Table of Contents
The Government Corporations Control Act, to which the Bank is subject, provides that before a government corporation issues and offers obligations to the public, the Secretary of the Treasury shall prescribe the form, denomination, maturity, interest rate, and conditions of the obligations; the way and time issued; and the selling price. The FHLB Act also authorizes the Secretary of the Treasury, at his or her discretion, to purchase consolidated obligations up to an aggregate principal amount of $4 billion. No borrowings under this authority have been outstanding since 1977. The U.S. Department of the Treasury receives a copy of the Finance Board’s annual report to the Congress, monthly reports reflecting securities transactions of the Bank, and other reports reflecting the operations of the Bank.
On June 23, 2004, the Finance Board unanimously adopted a rule requiring each of the FHLBs to voluntarily register a class of securities with the Securities and Exchange Commission (“SEC”) under section 12(g) of the Securities and Exchange Act of 1934. The Finance Board decision required an initial filing by each FHLB of a registration statement by June 30, 2005, and for each FHLB to ensure that the SEC declared the registration statement effective by August 29, 2005. The Finance Board issued an Advisory Bulletin requiring FHLBs that were unable to meet the August 29, 2005 deadline to make weekly progress reports to their Finance Board examiner. Once registered, the Bank will be required to file quarterly, annual and other periodic reports with the SEC as well as comply with the provisions of the Sarbanes-Oxley Act.
On June 30, 2004, the Bank entered into a Written Agreement with the Finance Board and subsequently amended the Written Agreement on October 18, 2005. For a description of the Written Agreement, see “Item 2.2—Management’s Discussion and Analysis of Financial Condition and Results of Operation—Overview—Regulatory Agreement and Related Actions.”
Regulatory Audits
The Bank has an internal audit department and the Bank’s Board of Directors has an audit committee. In addition, an independent public accounting firm audits the annual financial statements of the Bank. The independent public accounting firm conducts these audits following Generally Accepted Auditing Standards of the United States of America, Government Auditing Standards issued by the U.S. Comptroller General, and Auditing Standards No. 1 of the Public Company Accounting Oversight Board. The FHLBs, the Finance Board and the Congress all receive the audit reports. The Bank must submit annual management reports to the Congress, the President of the United States, the Office of Management and Budget, and the Comptroller General. These reports include a statement of financial condition, statement of operations, statement of cash flows, a statement of internal accounting and administrative control systems, and the report of the independent public auditors on the financial statements.
The Comptroller General has authority under the FHLB Act to audit or examine the Finance Board and the Bank and to decide the extent to which it fairly and effectively fulfills the purposes of the FHLB Act. Furthermore, the Government Corporations Control Act provides that the Comptroller General may review any audit of the financial statements conducted by an independent public accounting firm. If the Comptroller General conducts such a review, then the results and any recommendations must be reported to the Congress, the Office of Management and Budget, and the FHLBs in question. The Comptroller General may also conduct a separate audit of any financial statements of the Bank.
47
Table of Contents
The Bank is exempt from all federal, state and local taxation except for real estate property taxes, which are a component of the Bank’s lease payments for space or on real estate owned by the Bank as a result of foreclosure on MPF Loans.
48
Table of Contents
1.7 REFCORP and AHP Assessments
The Bank is obligated to make payments to REFCORP and set aside funds for AHP as described in “Item 2.2— Management’s Discussion and Analysis of Financial Condition and Results of Operation—Expenses.” Combined assessments for REFCORP and AHP are the equivalent of approximately a 26.5% effective rate on Income before Assessments for the nine months ended September 30, 2005 and 2004 and for the years ended December 31, 2004, 2003 and 2002. The combined REFCORP and AHP assessments were $68.3 million and $108.3 million for the nine months ended September 30, 2005 and 2004 and $132.1 million, $157.7 million, and $73.9 million for the years ended December 31, 2004, 2003 and 2002, respectively.
The table below sets forth the Bank’s AHP and REFCORP assessments, cash disbursements and account balances for the specified periods:
| For the Nine Months Ended September 30, | For the Years Ended December 31, | |||||||||||||||||||
(Dollars in thousands) | 2005 (restated) | 2004 | 2004 | 2003 | 2002 | |||||||||||||||
AFFORDABLE HOUSING PROGRAM | ||||||||||||||||||||
Beginning balance | $ | 82,456 | $ | 72,062 | $ | 72,062 | $ | 45,195 | $ | 37,084 | ||||||||||
Period assessments | 21,042 | 33,417 | 40,744 | 48,523 | 22,743 | |||||||||||||||
Cash disbursements | (20,441 | ) | (22,440 | ) | (30,350 | ) | (21,656 | ) | (14,632 | ) | ||||||||||
Ending balance | $ | 83,057 | $ | 83,039 | $ | 82,456 | $ | 72,062 | $ | 45,195 | ||||||||||
REFCORP: | ||||||||||||||||||||
Beginning balance | $ | 42,487 | $ | 33,218 | $ | 33,218 | $ | 11,674 | $ | 18,655 | ||||||||||
Period assessments | 47,210 | 74,910 | 91,395 | 109,164 | 51,175 | |||||||||||||||
Cash disbursements | (78,347 | ) | (60,065 | ) | (82,126 | ) | (87,620 | ) | (58,156 | ) | ||||||||||
Ending balance | $ | 11,350 | $ | 48,063 | $ | 42,487 | $ | 33,218 | $ | 11,674 | ||||||||||
49
Table of Contents
Traditional Member Finance
The Bank competes with other suppliers of wholesale funding, both secured and unsecured. Demand for the Bank’s advances is primarily affected by the cost of other available sources of liquidity for its members, including customer deposits held by its members. Other suppliers of wholesale funding may include investment banks, commercial banks, and other FHLBs when our members’ affiliated institutions are members of other FHLBs. (Under the FHLB Act and Finance Board regulations, affiliated institutions may be members of different FHLBs.) Smaller members may have limited access to alternative funding sources, such as repurchase agreements, while larger members may have access to a wider range of funding sources such as repurchase agreements, brokered deposits, commercial paper and other funding sources. Larger members also may have independent access to the national and global financial markets. The availability of alternative funding sources to members can significantly influence the demand for the Bank’s advances and can vary as a result of a number of factors, including, among others, market conditions, members’ creditworthiness, and availability of collateral. The Bank competes for advances on the basis of the total cost of its products to its members, which includes the rates the Bank charges as well as the dividends it pays.
Mortgage Partnership Finance® Program
The Bank competes for the purchase of mortgage loans with other secondary market participants, such as Fannie Mae and Freddie Mac. In addition, the Bank competes with other FHLBs that offer the Mortgage Purchase Program, a competing AMA program, to the extent that the Bank’s members have affiliates that are members of these other FHLBs. The Bank primarily competes on the basis of transaction structure, price, products, and services offered. The participation of FHLBs in the Mortgage Purchase Program may have implications on the MPF Program. Specifically, the competition for mortgage loans between the two programs may impact the amount of mortgage loans acquired and the purchase price for such loans. In this regard, the Bank faces pipeline and profit margin risk as a result of its competition with the Mortgage Purchase Program as well as other Acquired Member Asset programs. Because of the somewhat extensive infrastructure and processes required by the Bank’s members to participate in its MPF Program, the application approval process for this type of program can be relatively long. For example, the Bank requires an applicant to demonstrate ability and staff to originate and service industry accepted investment standards for mortgage loans. These infrastructure and process requirements can be disincentives to prospective participating members, as many of the Bank’s smaller members lack the resources to participate in more than one program.
Multi-district memberships are not currently permitted in the System so the Bank generally does not compete for MPF Loans from members of other MPF Banks. However, the Bank acquires participation interests in MPF Loans from non-district PFIs through other MPF Banks. Affiliated entities under a parent holding company are only permitted to access the MPF Program through one MPF Bank. However, it is possible that a PFI with an affiliate in another MPF Bank district could choose to terminate its participation in the MPF Program and then access the MPF Program through its affiliate. Other than to determine PFI eligibility, the Bank does not require members to report information concerning affiliates that may be members of other FHLBs. The eligibility requirements for holding company affiliates do not apply to the Mortgage Purchase Program but pertain solely to participation in the MPF Program. The Bank does not participate in the Mortgage Purchase Program, which may include member participants that are affiliates of PFIs participating in the MPF Program.
Debt Issuance
The Bank competes with Fannie Mae, Freddie Mac, and other GSEs, including other FHLBs, as well as corporate, sovereign and supranational entities, including the World Bank, for funds raised through the issuance of unsecured debt in the national and global debt markets. Increases in the supply of competing debt products may, in the absence of increases in demand, result in higher debt costs or lower amounts of debt issued at the same cost than otherwise would be the case. In addition, the availability and cost of funds raised through issuance of certain types of unsecured debt may be adversely affected by regulatory initiatives. Although the available supply of funds from the FHLBs’ debt issuances has kept pace with the funding requirements of the Bank’s members, there can be no assurance that this will continue to be the case. The sale of callable debt and the simultaneous execution of callable interest-rate swaps that mirror the debt has been an important source of competitive funding for the Bank. The Bank also relies heavily on the callable debt markets to reduce the interest rate exposure inherent in its mortgage-based assets. Consequently, the availability of markets for callable debt and interest-rate derivatives may be an important determinant of the Bank’s relative cost of funds and ability to manage interest rate risk. Due to the higher relative risk of this type of financial instrument, there is a more limited investor market relative to the supply generated from the FHLBs and other GSEs, including Fannie Mae or Freddie Mac. There is no assurance that the current breadth and depth of these markets will be sustained.
50
Table of Contents
General Considerations
On June 30, 2004 the Bank entered into a Written Agreement with the Finance Board. In accordance with the agreement, the Bank has submitted to and received approval from the Finance Board of its Business and Capital Management Plan for 2005 - 2007. Under the Business and Capital Management Plan, the Bank plans to implement actions that are likely to result in changes from its historic growth pattern. There is no assurance as to what impacts the Bank’s Business and Capital Management Plan will have on the Bank’s products, debt issuance or its competitive position.
On October 18, 2005, the Bank’s Board of Directors discontinued the redemption of the Bank’s voluntary stock for a period of time in accordance with Finance Board regulations. Under an amendment to the Written Agreement also entered into on October 18, 2005, the Bank’s minimum regulatory capital ratio is reduced from 5.1% to 4.5%. The amendment also requires the Bank to maintain minimum total regulatory capital stock of $3.978 billion defined as the total amount of capital stock outstanding on October 18, 2005, including stock classified as mandatorily redeemable under SFAS 150, plus the amount of the stock dividend approved based on the results of the third quarter of 2005. In order to address the capital concerns that led to the discontinuance of voluntary stock redemptions, on December 14, 2005, the Bank submitted a revised retained earnings and dividend policy and updated business plan strategies to the Finance Board for approval and the Finance Board is reviewing the Bank’s submission.
For a further discussion see “Item 2.2—Management’s Discussion and Analysis of Financial Condition and Results of Operation—Overview—Regulatory Agreement and Related Actions.”
51
Table of Contents
As of December 31, 2005, the Bank had 443 full-time equivalent employees.
52
Table of Contents
Recent Bank and Finance Board actions have negatively impacted a member’s ability to redeem capital stock.
On October 18, 2005, the Bank’s Board of Directors discontinued redemptions of voluntary capital stock for a period of time and the Bank amended its Written Agreement with the Finance Board. See “–Regulatory Agreement and Related Actions.” As a result, members are currently unable to redeem voluntary capital stock, including capital stock which becomes voluntary capital stock in connection with the pay off or pay down of an advance. Also, capital stock redemption in connection with a membership withdrawal is subject to the Bank meeting its regulatory capital requirements at the time of withdrawal which ordinarily occurs after expiration of a six month waiting period. The Bank is required to maintain a regulatory capital ratio of 4.5% and minimum total regulatory capital stock of $3.978 billion. Given the current level of regulatory capital stock of $3.979 billion as of October 31, 2005, the Bank’s present ability to honor capital stock redemptions in connection with a membership withdrawal is limited.
The Bank is subject to regulation by the Finance Board, and it is likely to incur significant costs related to governmental regulation.
The Bank is closely supervised and regulated by the Finance Board. Under the FHLB Act, the Finance Board is responsible for overseeing FHLBs with regard to their housing finance mission, adequate capitalization and ability to raise funds in the capital markets, and operation in a safe and sound manner. In this regard, the Finance Board promulgates rules covering the operations of the FHLBs.
On June 30, 2004, the Bank entered into a Written Agreement with the Finance Board, which requires the Bank to maintain a regulatory capital level of no less than 5.1%, restricts the annual on-balance sheet growth of acquired member assets under the MPF Program to 10% and required a review of the Bank’s management and board oversight, risk management policies and practices, internal audit functions and accounting, recordkeeping and reporting practices and controls. On October 18, 2005, the Finance Board amended the Written Agreement with the Bank reducing the Bank’s required regulatory capital ratio to 4.5% from 5.1% and requiring the Bank to maintain a separate measure of minimum total regulatory capital stock of $3.978 billion. In accordance with the amendment, on December 14, 2005, the Bank submitted a revised retained earnings and dividend policy and updated business plan strategies to the Finance Board for approval and the Finance Board is reviewing the Bank’s submission. In addition, Bank dividends are subject to approval by the Finance Board’s Office of Supervision until the Bank completes the process of registering its capital stock under the Securities Exchange Act of 1934, and until a revised retained earnings and dividend policy has been approved by the Finance Board. The Bank will comply with the terms of the Written Agreement, as amended, until it is terminated. See “Item 2.2—Management’s Discussion and Analysis of Financial Condition and Results of Operations—Overview—Regulatory Agreement.”
In accordance with the Written Agreement, the Bank adopted a Business and Capital Management Plan for 2005 – 2007, whereby it committed to, among other things, reducing the amount of the Bank’s voluntary stock and exploring alternative ways to liquefy MPF assets. In accordance with the amendment to the Written Agreement, the Bank submitted updated business strategies to the Finance Board for its approval on December 14, 2005.
Complying with the requirements of the Written Agreement, as amended, may adversely affect the Bank’s ability to operate its business. Also, there is no assurance as to the effect any new business strategies may have on the Bank’s business and operations. As a consequence of the Written Agreement and in connection with the Bank’s reduction of its voluntary capital stock ratio, the Bank may be required to maintain MPF volume in portfolio at current levels or to slightly reduce those levels in order to maintain its required capital-to-assets ratios. Should other FHLBs limit or discontinue their participation in the MPF Program, the Bank could also see reduced volumes related to participations in MPF Loans and could receive lower revenues in connection with fees the Bank assesses for providing MPF transaction processing services.
In addition, as a result of the Bank’s Written Agreement, as amended, to maintain a regulatory capital level of 4.5% instead of the statutorily required 4.0% and enhancements to the Bank’s market risk profiles relating to duration of equity, the Bank’s ability to generate higher earnings and a higher return on equity has been reduced. The Bank expects to incur increased operating expenses resulting from improvements to internal controls and the Bank’s infrastructure resulting from the implementation of the Bank’s Written Agreement. Also, the Bank’s liquidity position has been increased, which may have a negative impact on future earnings.
53
Table of Contents
The loss of significant members of the Bank may have a negative impact on its capital stock outstanding and result in lower demand for its products and services.
As of September 30, 2005, the Bank had 22.7% of its advances outstanding to two members, LaSalle Bank N.A. and Mid America Bank, FSB, and 15.7% of its capital stock was owned by two members, One Mortgage Partners Corp (a subsidiary of JP Morgan Chase & Co.) and LaSalle Bank N.A. If either LaSalle Bank or Mid America paid off their outstanding advances or if LaSalle Bank, Mid America Bank or One Mortgage Partners withdrew from membership with the Bank, the Bank may experience a material adverse effect on its outstanding capital stock and lower demand for its products and services. It is not possible for the Bank to predict whether or not the Bank’s actions with respect to the discontinuance of voluntary stock redemptions will increase the number of membership withdrawals and related stock redemption requests. Subsequent to the Bank announcing its discontinuation of redeeming voluntary capital stock on October 18, 2005, the Bank received membership withdrawal notices and related redemption requests from five members totaling $235 million through February 6, 2006. These requests were reclassified from equity to a liability upon notice. Redemption is pending the six month notice period and approval from the Finance Board. Also, larger banks that are not domiciled in the Bank’s district and who acquire or merge with the Bank’s members may choose not to maintain membership with the Bank, resulting in lower demand for the Bank’s products and services and redemption of capital stock.
Fluctuating interest rates or changing interest rate levels may adversely affect the amount of net interest income the Bank receives.
The Bank’s financial performance is affected by fiscal and monetary policies of the federal government and its agencies and in particular by the policies of the Federal Reserve Board. The Federal Reserve Board’s policies, which are difficult to predict, directly and indirectly influence the yield on the Bank’s interest-earning assets and the cost of the Bank’s interest-bearing liabilities.
Fluctuations in interest rates affect the Bank’s profitability in several ways, including but not limited to the following:
| • | decreases in interest rates typically cause mortgage prepayments to increase and may result in substandard performance in the Bank’s mortgage portfolio as the Bank experiences a return of principal that it must re-invest in a lower rate environment, adversely affecting the Bank’s net interest income over time; and |
| • | increases in interest rates may reduce overall demand for mortgage loans and advances, thereby reducing the origination of new mortgage loans or advances and volume of MPF Loans acquired by the Bank, which could have a material adverse effect on the Bank’s business, financial condition and results of operations, and which may increase the cost of funds. |
The MPF Program has different risks than those related to the Bank’s traditional advances business, which could adversely impact the Bank’s results of operations.
The residential mortgage origination business historically has been a cyclical industry, enjoying periods of strong growth and profitability followed by periods of shrinking volumes and industry-wide losses. The Mortgage Bankers Association of America has predicted that residential mortgage originations will drop 10% in 2006. During periods of rising interest rates, rate and term refinancing originations decrease, as higher interest rates provide reduced economic incentives for borrowers to refinance their existing mortgages. Because the Bank has not experienced a downturn in the real estate market since the MPF Program’s inception, the MPF Program’s historical performance may not be indicative of results in a rising interest rate environment, and the Bank’s results of operations may be materially adversely affected if interest rates rise.
In addition, the MPF Program as compared to the Bank’s traditional advance business is more susceptible to credit losses, and also carries more interest rate risk and operational complexity. For a description of the MPF Program, the obligations of the Bank with respect to credit losses and the PFI’s obligation to provide credit enhancement, see “Item 1—Business—Business Segments—Mortgage Partnership Finance Program.”
54
Table of Contents
The Bank hedges its interest rate risk associated with its consolidated obligations, advances and MPF Loans and any hedging strategy the Bank uses may not fully offset the related economic risk.
The Bank uses various cash and derivative financial instruments to provide a level of protection against interest rate risks, but no hedging strategy can protect the Bank completely. When interest rates change, the Bank expects the gain or loss on derivatives to be substantially offset by a related but inverse change in the value of the hedged item in hedging relationships where the Bank applies hedge accounting under the requirements of SFAS 133. Certain hedging strategies are designed to hedge the economic risks of the Bank, and may result in earnings volatility. Although the Finance Board’s regulations, its Financial Management Policy and the Bank’s Asset/Liability Management Policy establish guidelines with respect to the use of derivative financial instruments, there is no assurance that the Bank’s use of derivatives will fully offset the economic risks related to changes in interest rates. In addition, hedging strategies involve transaction and other costs. Any hedging strategy or derivatives the Bank uses may not adequately offset the risk of interest rate volatility and the Bank’s hedging transactions themselves may result in earnings volatility and losses.
If the prepayment rates for MPF Loans are higher or lower than expected, the Bank’s results of operations may be significantly impacted.
The rate and timing of unscheduled payments and collections of principal on MPF Loans are difficult to predict accurately and will be affected by a variety of factors, including, without limitation, the level of prevailing interest rates, restrictions on voluntary prepayments contained in the MPF Loans, the availability of lender credit and other economic, demographic, geographic, tax and legal factors. The Bank manages prepayment risk through a combination of debt issuance and derivatives. If the level of actual prepayments is higher or lower than expected, the Bank may be required to make a payment under a related derivative agreement or may experience a mismatch with a related debt issuance resulting in a loss or gain to the Bank. Also, increased prepayment levels will cause the amortization of deferred costs to increase, reducing net interest income.
If one or more of the PFIs that provide a substantial amount of the MPF Loan volume for the Bank were to discontinue or reduce their participation in the MPF Program, the Bank’s business, financial condition and results of operations may be adversely affected.
During 2004, Balboa Reinsurance Company (a subsidiary of Countrywide Financial Corporation) and LaSalle Bank, National Association, accounted for 37.5% and 15.1%, respectively, of MPF Loan volume for the Bank. For the nine months ended September 30, 2005, Balboa Reinsurance Company accounted for 38.3% of MPF Loan volume for the Bank. If one or more of these PFIs end or substantially reduce their participation in the MPF Program, the Bank’s business, financial condition and results of operations may be adversely affected by the reduced volume of loans available for the MPF Program.
The concentration of CE Amount coverage with a small number of PFIs increases the Bank’s risk exposure for losses.
At September 30, 2005, the top five PFIs represented in total 67.6% of the Bank’s outstanding MPF Loans (at par). If one or more of these PFIs were unable or failed to meet their contractual obligation to cover losses under the CE Amount, the Bank may incur increased losses depending upon the performance of the related MPF Loans.
The performance of the Bank’s MPF Loan portfolio depends in part upon the Bank’s vendors.
The Bank acts as master servicer for the MPF Program. In this regard, the Bank has engaged a vendor for master servicing, Wells Fargo Bank N.A., which monitors the PFIs’ compliance with the MPF Program requirements and issues periodic reports to the Bank. While the Bank manages MPF Program cash flows itself, if the vendor should refuse or be unable to provide the necessary service, the Bank may be required to engage another vendor which could result in delays in reconciling MPF Loan payments to be made to the Bank or increased expenses to retain a new master servicing vendor.
The Bank has contracted with S&P for the use of its modeling software, LEVELS, which calculates the PFI’s required CE Amount for MPF Loans. If S&P were to discontinue LEVELS or fail to honor the terms of its contract for the Bank’s use of LEVELS, the Bank would be required to engage another NRSRO or develop its own methodology (confirmed in writing by an NRSRO) to calculate the required level of credit enhancement for each MPF Loan Master Commitment as required under the AMA Regulation. Should either of these events occur, the Bank may experience a disruption in its ability to fund or purchase MPF Loans and may have a negative impact on the Bank’s business, results of operations and financial condition.
55
Table of Contents
The concentration of the SMI providers providing SMI coverage for MPF Loans increases the Bank’s exposure to potential losses in the event of an SMI provider default.
As of September 30, 2005, Mortgage Guaranty Insurance Company and GE Mortgage Insurance Corp. provided 68.4% and 12.4%, respectively, of SMI coverage for MPF Loans. Although historically the Bank has not claimed any losses against an SMI insurer, if one or both of these SMI insurers were to default on their insurance obligations and loan level losses for MPF Loans were to increase, the Bank may experience increased losses.
The Bank faces significant competition.
In connection with the MPF Program, the Bank is subject to significant competition regarding the purchase of conventional, conforming fixed-rate mortgage loans. In this regard, the Bank faces competition in the areas of customer service, purchase prices for the MPF Loans and ancillary services such as automated underwriting. The Bank’s strongest competitors are large mortgage aggregators, other GSEs, such as Fannie Mae and Freddie Mac, other FHLBs participating in the Mortgage Purchase Program, and private investors. Some of these competitors have greater resources, larger volumes of business and longer operating histories. In addition, because the volume of conventional, conforming fixed-rate mortgages has been reduced due to the rise in interest rates, as well as increased popularity of competitive financing products, such as hybrid adjustable-rate mortgages (which the Bank does not purchase), the demand for MPF Program products could diminish. These competitive factors may result in a material adverse effect on the Bank’s business, results of operations and financial condition.
With regard to Traditional Member Finance, the Bank competes with other sources of wholesale financing, such as investment and commercial banks, and sometimes other FHLBs, on a secured and unsecured basis. Some members may also choose to access the capital markets directly rather than through the Bank. Significant competition with regard to these wholesale financing activities may adversely affect the Bank’s business, results of operations and financial condition.
Concentration of the Bank’s MPF Loans in certain geographic areas, such as Wisconsin and California, increases the Bank’s exposure to the economic and natural hazard risks associated with those areas and could have a material adverse effect on its business, results of operations and financial condition.
Although the Bank has MPF Loans in all 50 states, Washington, D.C. and Puerto Rico, as of September 30, 2005, approximately 16.7% and 10.4% of the principal amount of MPF Loans held by the Bank were MPF Loans secured by properties located in Wisconsin and California, respectively. An overall decline in the economy or the residential real estate market of, or the occurrence of a natural disaster in, Wisconsin or California, could adversely affect the value of the mortgaged properties in those states and increase the risk of delinquency, foreclosure, bankruptcy or loss on MPF Loans in the Bank’s investment portfolio, which could negatively affect the Bank’s business, results of operations and financial condition.
The Bank’s business is dependent upon its computer operating systems and an inability to implement technological changes or an interruption in the Bank’s information systems may result in lost business.
The Bank’s business is dependent upon its ability to interface effectively with other FHLBs, PFIs, members and other third parties, and its products and services require a complex and sophisticated operating environment supported by operating systems, both purchased and custom-developed. Maintaining the effectiveness and efficiency of the technology used in the Bank’s operations is dependent on the continued timely implementation of technology solutions and systems necessary to effectively manage the Bank and mitigate risk, and may require significant capital expenditures. If the Bank was unable to maintain these technological capabilities, it may not be able to remain competitive and its business, financial condition and results of operations may be significantly compromised.
The Bank relies heavily on communications and information systems furnished by third party service providers to conduct its business. Any failure, interruption or breach in security of these systems, or any disruption of service could result in failures or interruptions in the Bank’s ability to conduct business. There is no assurance that such failures or interruptions will not occur or, if they do occur, that they will be adequately addressed by the Bank or the third parties on which the Bank relies. The occurrence of any failures or interruptions could have a material adverse effect on the Bank’s financial condition, results of operations and cash flows.
56
Table of Contents
The Bank is jointly and severally liable for the consolidated obligations of other FHLBs.
Under Finance Board rules, the Bank is jointly and severally liable with other FHLBs for consolidated obligations issued through the Office of Finance. If another FHLB defaults on its obligation to pay principal or interest on any consolidated obligation, the Finance Board has the ability to allocate the outstanding liability among one or more of the remaining FHLBs on a pro rata basis or on any other basis that the Finance Board may determine. Moreover, the Bank may not pay dividends to, or redeem or repurchase capital stock from any of its members until payment is made.
The Bank records a liability for consolidated obligations on its statements of condition in proportion to the proceeds it receives from the issuance of those consolidated obligations. No liability has been recorded for the joint and several obligations related to the other FHLBs’ share of the consolidated obligations due to the high credit quality of every other FHLB. The FHLBs are rated by Standard & Poor’s and Moody’s as shown in the following table.
Federal Home Loan Banks
Long Term Credit Ratings
As of January 31, 2006
| Standard & Poor’s | Moody’s | |||||||
| Rating | Outlook | Rating | Outlook | |||||
Atlanta | AAA | Stable | Aaa | Stable | ||||
Boston | AAA | Stable | Aaa | Stable | ||||
Chicago 1 | AA+ | Negative | Aaa | Stable | ||||
Cincinnati | AAA | Stable | Aaa | Stable | ||||
Dallas | AAA | Negative | Aaa | Stable | ||||
Des Moines | AAA | Negative | Aaa | Stable | ||||
Indianapolis | AAA | Negative | Aaa | Stable | ||||
New York 1 | AA+ | Stable | Aaa | Stable | ||||
Pittsburgh | AAA | Negative | Aaa | Stable | ||||
San Francisco | AAA | Stable | Aaa | Stable | ||||
Seattle 1 | AA+ | Negative | Aaa | Stable | ||||
Topeka | AAA | Stable | Aaa | Stable | ||||
FHLB Consolidated Obligation Bonds | AAA | Stable | Aaa | Stable | ||||
| 1 | S&P downgraded Chicago on July 1, 2004, New York on September 26, 2003 and Seattle on December 13, 2004. |
In addition, Chicago and Seattle are operating under written agreements in which they were required to submit to the Finance Board a three-year business and capital management plan. For details on the Chicago agreement, see “Item 2.2—Management’s Discussion and Analysis of Financial Condition and Results of Operations—Overview—Regulatory Agreement.”
Due to the high credit quality of each FHLB, management has concluded that the probability that a FHLB would be unable to repay its consolidated obligations is remote. Furthermore, Finance Board regulation requires all FHLBs to maintain not less than an AA rating.
The Federal Home Loan Bank Act or Federal Housing Finance Board rules may be amended in a manner that changes the Bank’s statutory and regulatory requirements and affects its business, operations and/or financial condition.
Since enactment in 1932, the FHLB Act has been amended many times in ways that have significantly affected the rights and obligations of FHLBs and the manner in which they fulfill their housing finance mission. Future legislative changes to the FHLB Act and new or amended regulations or policies adopted by the Finance Board, such as the AMA Regulation, may significantly affect the Bank’s business, results of operations and financial condition.
57
Table of Contents
Legislation is currently being considered in Congress to reform the regulatory structure of the three U.S. housing government sponsored enterprises: the FHLBs, the Federal National Mortgage Association (Fannie Mae) and the Federal Home Loan Mortgage Corporation (Freddie Mac). Similar legislation has been introduced and considered in each of the past several Congresses, though no legislation affecting the FHLBs has been enacted since the Gramm-Leach-Bliley Act of 1999. Earlier this year, a number of hearings were held in both the Senate and House committees of jurisdiction regarding legislation to create a new independent agency to oversee the safety and soundness and mission compliance of the housing GSEs. In May, the House Financial Services Committee approved H.R. 1461 on a 65-5 vote, and in October, the legislation was approved in amended form by the full House of Representatives by a margin of 331-90. In the Senate, S.190 was approved by the Senate Banking Committee in July on a vote of 11-9. The full Senate has yet to consider the bill.
In their current versions, the bills differ in several important respects, primarily in their treatment of the mortgage portfolios of Fannie Mae and Freddie Mac. However, the provisions affecting the FHLBs in both versions are very similar: both bills would abolish the FHLBs’ regulator, the Federal Housing Finance Board, replacing it with a new independent Federal agency with similar authority over the FHLBs. Also, director terms would be lengthened to 4 years from 3 years and the statutory caps on director compensation would be eliminated. Both bills would also allow voluntary mergers among the FHLBs, with the approval of the new regulator.
One difference between the House and Senate versions is the treatment of boards of directors at the individual FHLBs. The House version provides that at least two-fifths of the FHLB directors be independent (non-member) directors appointed by the new regulatory agency. By contrast, the Senate version requires at least one-third of the directors to be independent and allows a process for those directors to be elected by the financial institution members of the FHLB at large.
During legislative consideration, other provisions affecting the business of the FHLBs have been proposed, but have yet to be included in either of the committee-approved bills. Given the nature of the legislative process, it is impossible to predict with certainty the provisions of any final bill, whether such bill will ultimately be signed by the President and enacted into law, or if enacted, what effect such changes would have on the Bank’s business, results of operations or financial condition.
Increased attention on risk management and internal controls has resulted in the need to enhance the control environment at the Bank.
In accordance with the Written Agreement the Bank has made a considerable investment in resources dedicated to risk oversight and internal control activities at the Bank during the year ended December 31, 2005. Experienced senior managers were recruited to lead the Risk Management Group, Market Risk Analysis Department and Internal Audit Department. In addition, the Bank adopted a new enterprise risk management framework, which has helped managers elevate existing risk and internal control matters for remediation. As a result, during the course of 2005, deficiencies in internal controls have been identified in the credit, market, technology, operating and financial reporting areas. The Bank is in the process of developing formal remediation plans for each one.
The Federal Reserve Bank Policy Statement on Payments System Risk may impact the Bank’s operations.
The Federal Reserve Board in September 2004 announced that it had revised its Policy Statement on Payment System Risk relating to interest and principal payments on securities issued by GSEs and certain international organizations. Reserve Banks are currently processing and posting these payments to depository institutions’ Federal Reserve accounts by 9:15am Eastern Time, which is the same posting time for U.S. Treasury securities’ interest and redemption payments, even if the issuer has not fully funded these payments. The revised Federal Reserve policy requires that, beginning July 20, 2006, Federal Reserve Banks release these interest and principal payments as directed by the issuer only if the issuer’s Federal Reserve account contains sufficient funds to cover the payments. While the issuer will determine the timing of these payments during the day, each issuer will be required to fund its interest and principal payments by 4pm Eastern Time in order for the payments to be processed that day. In addition, beginning July 20, 2006, the revised Federal Reserve policy will align the treatment of the general corporate account activity of GSEs and certain international organizations with the treatment of activity of other account holders that do not have regular access to the discount window and thus are not eligible for intraday credit. Such treatment will include applying a penalty fee to daylight overdrafts resulting from these entities’ general corporate payment activity.
The Bank is evaluating the impact of this proposed change on its operations, including the Bank’s cash management and related business practices. However, it is not possible to predict what, if any, changes will be made and what effect these changes will have on the Bank’s business and operations.
58
Table of Contents
The Bank is subject to credit risk due to default.
The Bank faces credit risk on advances, investments, mortgage loans, derivative financial instruments and other financial instruments. The Bank protects against credit risk on advances through credit underwriting and collateralization of all advances. In addition, the Bank can call for additional or substitute collateral during the life of an advance to protect its security interest. The FHLB Act defines eligible collateral as certain investment securities, residential mortgage loans, deposits with the Bank, and other real estate related assets. All capital stock of the Bank owned by the borrower is also available as supplemental collateral. In addition, members that qualify as Community Financial Institutions – defined in the FHLB Act as FDIC-insured depository institutions with total average year-end assets for the prior three years of $587 million or less as of January 1, 2006 – may pledge secured small-business, small-farm, and small-agribusiness loans as collateral for advances. The Bank is also allowed to make advances to nonmember Housing Associates.
While the Bank faces minimal credit risk on advances, it is subject to credit risk on some investments and on derivative financial instruments. The Bank follows conservative guidelines established by its Board of Directors and the Finance Board on unsecured extensions of credit, whether on- or off-balance sheet, which limit the amounts and terms of unsecured credit exposure to highly rated counterparties, the U.S. Government and other FHLBs. Unsecured credit exposure to any counterparty is limited by the credit quality and capital level of the counterparty and by the capital level of the Bank.
The Bank may experience losses and increased delinquencies related to Hurricane Katrina.
Hurricane Katrina struck Louisiana, Mississippi, Alabama, Texas and surrounding areas during the third quarter of 2005. As of September 30, 2005, the Bank held approximately $500 million of conventional MPF Loans secured by properties located in the Individual Assistance and Public Assistance areas as designated by FEMA.
In connection with the sale or funding of MPF Loans and the PFI’s servicing responsibilities, the PFI makes representations to the Bank that hazard insurance and flood insurance (for those mortgaged properties located in a FEMA designated Special Flood Hazard Area) are in place. In the event that required insurance is not in place, the PFI is required to repurchase the related MPF Loan. If the required insurance does not fully cover the damage from the hurricane, including related flood damage, losses may be allocated to the Bank through the FLA and after the PFI’s CE Amount. The Bank may also experience losses if the PFI fails to fulfill its repurchase obligation or pay the required CE Amount.
In addition, even if the mortgaged property is in good repair, property values in these states may be adversely affected by the hurricane. Mortgaged properties may have experienced environmental hazards related to mold and to gas and oil leaks. Mortgagors in areas affected by the hurricane may also be affected by any decline in the economic environment.
During the third quarter of 2005, the Bank announced a special disaster relief initiative to lessen the hardship for victims of Hurricane Katrina. See “Item 1.2—Business Segments—Mortgage Partnership Finance Program—Mortgage Standards.” The relief provisions may increase the Bank’s overall mortgage delinquency rates and losses.
Although the Bank has assessed its potential loss exposure related to the hurricane and does not believe that there will be a material loss exposure, the Bank has never in the past evaluated losses related to a hurricane of such magnitude and its potential loss exposure may change once the Bank obtains additional information from the PFIs.
59
Table of Contents
| I tem 2. | Financial Information. |
60
Table of Contents
For the Nine Months Ended September 30, | For the Years Ended December 31, | |||||||||||||||||||||||||
(Dollars in thousands) | 2005 (restated)4 | 2004 | 2004 | 2003 | 2002 | 2001 | 2000 | |||||||||||||||||||
Statements of Income | ||||||||||||||||||||||||||
Net interest income before provision for credit losses on mortgage loans | $ | 386,809 | $ | 548,265 | $ | 704,343 | $ | 793,826 | $ | 522,893 | $ | 223,664 | $ | 212,243 | ||||||||||||
Provision for credit losses on mortgage loans | — | — | — | — | 2,217 | 1,810 | 906 | |||||||||||||||||||
Net interest income after provision for credit losses on mortgage loans | 386,809 | 548,265 | 704,343 | 793,826 | 520,676 | 221,854 | 211,337 | |||||||||||||||||||
Total other income (loss) | (40,662 | ) | (98,792 | ) | (127,131 | ) | (113,179 | ) | (184,378 | ) | 45,207 | 523 | ||||||||||||||
Total other expense | 89,113 | 82,955 | 121,056 | 86,430 | 57,681 | 43,931 | 36,052 | |||||||||||||||||||
Income before assessments | 257,034 | 366,518 | 456,156 | 594,217 | 278,617 | 223,130 | 175,808 | |||||||||||||||||||
AHP assessment | 21,042 | 33,417 | 40,744 | 48,523 | 22,743 | 18,264 | 14,355 | |||||||||||||||||||
REFCORP assessment | 47,210 | 74,910 | 91,395 | 109,164 | 51,175 | 41,080 | 32,299 | |||||||||||||||||||
Income before cumulative effect of change in accounting principle | 188,782 | 258,191 | 324,017 | 436,530 | 204,699 | 163,786 | 129,154 | |||||||||||||||||||
Cumulative effect of change in accounting principle 1 | — | 41,441 | 41,441 | — | — | 573 | — | |||||||||||||||||||
Net income | $ | 188,782 | $ | 299,632 | $ | 365,458 | $ | 436,530 | $ | 204,699 | $ | 164,359 | $ | 129,154 | ||||||||||||
Statements of Condition | ||||||||||||||||||||||||||
Liquid assets 2 | $ | 7,315,303 | $ | 7,719,591 | $ | 5,148,370 | $ | 5,445,229 | $ | 3,828,737 | $ | 3,216,994 | $ | 2,446,879 | ||||||||||||
Investments | 7,662,729 | 7,968,919 | 8,850,906 | 6,538,728 | 9,339,756 | 7,108,249 | 5,779,596 | |||||||||||||||||||
Advances | 24,233,015 | 25,124,900 | 24,191,558 | 26,443,063 | 24,945,112 | 21,901,609 | 18,462,288 | |||||||||||||||||||
Mortgage loans held in portfolio, net of allowance for loan losses on mortgage loans | 43,231,999 | 47,942,757 | 46,920,551 | 47,599,731 | 26,185,618 | 16,570,308 | 8,102,680 | |||||||||||||||||||
Total assets | 83,054,343 | 89,478,326 | 85,708,637 | 86,941,987 | 65,045,907 | 49,194,194 | 35,394,574 | |||||||||||||||||||
Total deposits | 1,307,516 | 1,638,147 | 1,223,752 | 2,348,071 | 3,047,540 | 1,760,216 | 2,010,132 | |||||||||||||||||||
Securities sold under agreements to repurchase | 1,200,000 | 1,200,000 | 1,200,000 | 1,200,000 | 1,399,000 | 800,000 | — | |||||||||||||||||||
Total consolidated obligations, net 3 | 75,358,293 | 80,227,103 | 77,747,276 | 77,927,450 | 55,770,001 | 43,276,955 | 30,907,644 | |||||||||||||||||||
Accrued interest payable | 630,120 | 615,323 | 513,993 | 502,327 | 400,931 | 446,532 | 664,059 | |||||||||||||||||||
AHP payable | 83,057 | 83,039 | 82,456 | 72,062 | 45,195 | 37,084 | 31,979 | |||||||||||||||||||
REFCORP payable | 11,350 | 48,063 | 42,487 | 33,218 | 11,674 | 18,655 | 8,696 | |||||||||||||||||||
Total liabilities | 78,809,874 | 84,786,206 | 81,082,778 | 82,368,547 | 61,679,760 | 46,692,280 | 33,693,305 | |||||||||||||||||||
Total Capital | 4,244,469 | 4,692,120 | 4,625,859 | 4,573,440 | 3,366,147 | 2,501,914 | 1,701,269 | |||||||||||||||||||
| 1 | Effective January 1, 2004, the Bank changed its method of accounting for premiums and discounts and other deferred loan origination fees under SFAS 91, “Accounting for Nonrefundable Fees and Costs Associated with Originating or Acquiring Loans and Initial Direct Costs of Leases.” As a result of implementing the change in accounting for amortization and accretion from the retrospective method to the contractual maturity method, the Bank recorded a cumulative effect of a change in accounting principle effective to January 1, 2004 which resulted in an increase to earnings excluding assessments of $41.4 million. The Bank adopted SFAS 133 as of January 2001 and recorded a net loss of $4.9 million on securities held at fair value and a $63 million net realized and unrealized gain on derivatives and hedging activities, including the transition adjustment of $573 thousand. |
| 2 | Liquid assets include cash and due from banks, securities purchased under agreements to resell and federal funds sold. |
| 3 | The Bank is jointly and severally liable for the consolidated obligations of all the FHLBs. The total consolidated obligations for all FHLBs (in billions) were $920.4, $869.2, $759.5, $680.7, $637.3, and $614.1 as of September 30, 2005 and December 31, 2004, 2003, 2002, 2001, and 2000 respectively. See “Note 13—Consolidated Obligations” to the Bank’s 2004 Annual Financial Statements and Notes for further discussion on the joint and several liability. |
| 4 | The Bank restated $11.9 million from Other Comprehensive Income to expense in September, 2005, which resulted in $8.7 million less net income (net of assessments). |
61
Table of Contents
Computation of Ratio of Earnings to Fixed Charges
| For the Nine Months Ended September 30, | For the Years Ended December 31, | ||||||||||||||||||||
(Dollars in thousands) | 2005 (restated) | 2004 | 2004 | 2003 | 2002 | 2001 | 2000 | ||||||||||||||
Income before cumulative effect of change in accounting principle | $ | 188,782 | $ | 258,191 | $ | 324,017 | $ | 436,530 | $ | 204,699 | $ | 163,786 | $ | 129,154 | |||||||
Cumulative effect of change in accounting principle | — | 41,441 | 41,441 | — | — | 573 | — | ||||||||||||||
Net Income | $ | 188,782 | $ | 299,632 | $ | 365,458 | $ | 436,530 | $ | 204,699 | $ | 164,359 | $ | 129,154 | |||||||
Total Assessments | 68,252 | 108,327 | 132,139 | 157,687 | 73,918 | 59,344 | 46,654 | ||||||||||||||
Interest portion of rental expense 1 | 473 | 434 | 707 | 598 | 496 | 418 | 443 | ||||||||||||||
Interest expense on all indebtedness | 2,228,805 | 1,823,133 | 2,506,181 | 1,939,283 | 1,757,406 | 1,823,143 | 1,902,783 | ||||||||||||||
Earnings, as adjusted | $ | 2,486,312 | $ | 2,231,526 | $ | 3,004,485 | $ | 2,534,098 | $ | 2,036,519 | $ | 2,047,264 | $ | 2,079,034 | |||||||
Fixed Charges: | |||||||||||||||||||||
Interest portion of rental expense 1 | $ | 473 | $ | 434 | $ | 707 | $ | 598 | $ | 496 | $ | 418 | $ | 443 | |||||||
Interest expense on all indebtedness | 2,228,805 | 1,823,133 | 2,506,181 | 1,939,283 | 1,757,406 | 1,823,143 | 1,902,783 | ||||||||||||||
Total Fixed Charges | $ | 2,229,278 | $ | 1,823,567 | $ | 2,506,888 | $ | 1,939,881 | $ | 1,757,902 | $ | 1,823,561 | $ | 1,903,226 | |||||||
Ratio of Earnings to Fixed Charges | 1.12 : 1 | 1.22 : 1 | 1.20 : 1 | 1.31 : 1 | 1.16 : 1 | 1.12 : 1 | 1.09 : 1 | ||||||||||||||
| 1 | Interest component of rental expense is 20%, which approximates the imputed interest factor of the operating lease. |
Key Ratios
| For the Nine Months Ended September 30, | For the Years Ended December 31, | ||||||||||||||||||||
2005 (restated) | 2004 1 | 2004 1 | 2003 | 2002 | 2001 1 | 2000 | |||||||||||||||
Net income to average assets (annualized) | 0.30 | % | 0.44 | % | 0.41 | % | 0.57 | % | 0.36 | % | 0.42 | % | 0.40 | % | |||||||
Return on equity (annualized) | 5.62 | % | 8.41 | % | 7.70 | % | 10.65 | % | 6.92 | % | 8.13 | % | 8.52 | % | |||||||
Total average equity to average assets | 5.27 | % | 5.24 | % | 5.26 | % | 5.33 | % | 5.24 | % | 5.15 | % | 4.72 | % | |||||||
| 1 | Net income for years 2004 and 2001 includes the cumulative effect of change in accounting principle, for SFAS 91 and SFAS 133, respectively. |
Forward-Looking Information
Statements contained in this report, including statements describing the objectives, projections, estimates, or future predictions of the Bank may be “forward-looking statements.” These statements may use forward-looking terminology, such as “anticipates”, “believes”, “expects”, “could”, “estimates”, “may”, “should”, “will”, or their negatives or other variations of these terms. The Bank cautions that, by their nature, forward-looking statements involve risk or uncertainty and that actual results could differ materially from those expressed or implied in these forward-looking statements or could affect the extent to which a particular objective, projection, estimate, or prediction is realized.
These forward-looking statements involve risks and uncertainties including, but not limited to, the following:
| • | changes in the level of interest rates, housing prices, employment rates and the general economy; |
| • | the size and volatility of the residential mortgage market; |
| • | demand for advances resulting from changes in members’ deposit flows and credit demands; |
| • | volatility of market prices, rates, and indices that could affect the value of collateral held by the Bank as security for the obligations of the Bank’s members and counterparties to derivative financial instruments and similar agreements which could result from the effects of, and changes in, various monetary or fiscal policies and regulations including those determined by the Federal Reserve Board and the Federal Deposit Insurance Corporation; |
62
Table of Contents
| • | the effect the Bank’s Written Agreement, as amended, with the Federal Housing Finance Board and the discontinuance of voluntary stock redemptions for a period of time, may have on its operations as more fully described in “Item 2—Financial Information—Management’s Discussion and Analysis of Financial Condition and Results of Operation—Overview—Regulatory Agreement and Related Actions”; |
| • | political events, including legislative, regulatory, judicial, or other developments that affect the FHLBs, their members, counterparties, and/or investors in the consolidated obligations of the FHLBs such as changes in the Federal Home Loan Bank Act of 1932, as amended or Finance Board regulations that affect the Bank’s operations and regulatory oversight; |
| • | competitive forces, including without limitation, other sources of capital available to Bank members, other entities borrowing funds in the capital markets, and the ability to attract and retain skilled individuals; |
| • | the pace of technological changes and the ability of the Bank to develop and support technology and information systems, including the Internet, sufficient to manage the risks of the Bank’s business effectively; |
| • | loss of large members including through mergers and similar activities; |
| • | changes in investor demand for consolidated obligations and/or the terms of derivative financial instruments and similar agreements, including without limitation, changes in the relative attractiveness of consolidated obligations as compared to other investment opportunities; |
| • | the availability, from acceptable counterparties, of derivative financial instruments of the types and in the quantities needed for risk management purposes; |
| • | volatility of reported results due to changes in fair value of certain instruments/assets; |
| • | our ability to introduce new Bank products and services, and successfully manage the risks associated with those products and services, including new types of collateral securing advances; |
| • | the Bank’s ability to identify, manage, mitigate and/or remedy internal control weaknesses and other operational risks; |
| • | the Bank’s ability to implement business process improvements; |
| • | risk of loss arising from litigation filed against one or more of the FHLBs; |
| • | significant business disruptions resulting from natural or other disaster, acts of war or terrorism; |
| • | the impact of new accounting standards, including the timely development of supporting systems; and |
| • | inflation/deflation. |
The Bank does not undertake to update any forward-looking statement in this document, whether as a result of new information, future events or changed circumstances.
63
Table of Contents
2.2 Management’s Discussion and Analysis of Financial Condition and Results of Operations
Restatement of Financial Statements
The Bank restated its financial statements at September 30, 2005 and for the nine month year-to-date period then ended.
The Bank determined through a review of its hedging activities, that for certain hedging transactions of mortgage loan delivery commitments, it applied a method of hedge accounting deemed to be inconsistent with the application of SFAS 133. As part of this restatement, management discontinued hedge accounting treatment of delivery commitments to conform to SFAS 133. The restatement consisted of recording in earnings losses on derivatives incorrectly deferred in Other Comprehensive Income (“OCI”) for the Bank’s hedges on delivery commitments and revising the timing of recognition in earnings of losses on these hedges.
The restatement resulted because the Bank did not sufficiently specify the forecasted transaction it intended to hedge with the delivery commitment to purchase mortgage loans. Specifically, the Bank identified the forecasted transaction as an amount within the range to be delivered under the delivery commitment that is within good delivery requirements. The Bank should have specifically identified a single amount rather than a range to comply with SFAS 133, paragraph 29.a.
The Bank assessed the impact of this error and determined it was immaterial for all prior periods. Accordingly, the Bank has recorded the cumulative impact in the accompanying financial statements. The effect of the restatement through September 30, 2005 was a decrease to the Bank’s cumulatively reported net income after assessments of $8.7 million. The negative balance at September 30, 2005 of OCI was $11.9 million less than previously reported.
The effect of the restatement on the Statement of Income for the nine months ended September 30, 2005 is set forth below:
For the nine months ended September 30, 2005 | Restated | Previously Reported | Impact on Income | |||||||||
| (in thousands) | ||||||||||||
Other Income (Loss): | ||||||||||||
Net realized and unrealized gain (loss) on derivatives and hedging activities | $ | (28,985 | ) | $ | (17,127 | ) | $ | (11,858 | ) | |||
Income before Assessments | 257,034 | 268,892 | (11,858 | ) | ||||||||
Affordable Housing Program | 21,042 | 22,010 | 968 | |||||||||
REFCORP | 47,210 | 49,388 | 2,178 | |||||||||
Net Income | $ | 188,782 | $ | 197,494 | $ | (8,712 | ) | |||||
64
Table of Contents
The effect of the restatement on the Statement of Condition as of September 30, 2005 is set forth below:
As of September 30, 2005 | Restated | Previously Reported | Impact on Capital | |||||||||
| (in thousands) | ||||||||||||
Liabilities: | ||||||||||||
Payable to Affordable Housing Program | $ | 83,057 | $ | 84,025 | $ | 968 | ||||||
Payable to REFCORP | 11,350 | 13,528 | 2,178 | |||||||||
Total Liabilities | 78,809,874 | 78,813,020 | 3,146 | |||||||||
Capital: | ||||||||||||
Retained Earnings | 508,456 | 517,168 | (8,712 | ) | ||||||||
OCI - Net unrealized loss relating to hedging activities | (147,960 | ) | (159,818 | ) | 11,858 | |||||||
Total Capital | $ | 4,244,469 | $ | 4,241,323 | $ | 3,146 | ||||||
Overview
Factors that impact the Bank’s business
Many factors impact the Bank’s business which includes the mortgage spreads in the marketplace. As mortgage spreads widen, new assets can be added to the balance sheet at higher spreads. The Bank’s debt spreads also drive performance. As the Bank’s debt issuance costs compared to the LIBOR curve decline, the Bank is able to create higher spreads for the balance sheet.
The general level of interest rates also impacts net income. When yield curves steepen, the Bank’s net income tends to rise. The Bank’s business runs on lower spreads than other financial institutions so that a significant portion of the Bank’s net income comes from the investment of its capital stock and retained earnings. As the capital investment rate rises, net income rises.
Growth in the economy and the Bank’s members’ need for funding drives member demand for advances from the Bank. When the economy is growing, members tend to utilize Bank advances as a funding source. In general, a flattening U.S. Treasury yield curve and a tightening asset spread trend may place pressure on the Bank’s financial performance. This pressure may be mitigated somewhat through improved debt issuance levels on a spread basis and reduced hedge costs as a result of generally lower levels of interest rate volatility.
The Bank’s restrictions on growing the balance sheet, which are part of the Written Agreement with the Finance Board, may impact performance. If rates decline and the mortgage market expands, the Bank may be limited by the 10% annual growth limit on AMA assets on the Bank’s balance sheet. The reduction in the voluntary capital stock ratio may limit the amount of asset growth.
Regulatory Agreement and Related Actions
On June 30, 2004, the Bank entered into a Written Agreement with the Finance Board in order to address issues identified in the Finance Board’s 2004 examination of the Bank. Under the Written Agreement the Bank agreed to implement changes to enhance the Bank’s risk management, capital management, governance and internal control practices. On October 18, 2005, the Bank amended its Written Agreement.
65
Table of Contents
Pursuant to the Written Agreement, as amended, the Bank is required to maintain a regulatory capital ratio of 4.5%. In addition, until amended or terminated, the amendment also requires the Bank to maintain minimum total regulatory capital stock of $3.978 billion, defined as the total amount of capital stock outstanding on October 18, 2005, including stock classified as mandatorily redeemable under SFAS 150, plus the amount of the stock dividend approved based on the results of the third quarter of 2005. Mandatorily redeemable capital stock under SFAS 150 and related dividends are considered capital stock for regulatory purposes. The Bank’s regulatory capital ratio on October 17, 2005, September 30, 2005 and December 31, 2004 was 5.1%, 5.3% and 5.6%, respectively, and the total regulatory capital stock outstanding as of October 31, 2005 was $3.979 billion. The Written Agreement also prohibits the Bank from increasing the aggregate net book value of its acquired member assets program (Mortgage Partnership Finance Program) greater than 10% per annum and the Bank remains in compliance with this restriction.
Under the Written Agreement, the Bank also was required to engage independent outside consultants to report on the Bank’s (i) management and board oversight, (ii) risk management policies and practices, (iii) internal audit functions, and (iv) accounting, recordkeeping and reporting practices and controls. The initiatives resulting from the Written Agreement and consulting reviews are focused on (i) enhanced governance, including improved Board reporting, increased frequency and documentation of Board and Board-level committee meetings, and a restructuring of Board committees including the establishment of a Risk Management Committee; (ii) a substantial increase in risk management staff and enhanced infrastructure, the adoption of an enterprise risk management framework, improved market risk modeling, research and oversight capabilities and a materially enhanced risk assessment process; (iii) the recruitment of an experienced senior Internal Audit manager, the dedication of increased audit resources, and changes to audit methodology and practices; and (iv) adjustments to accounting policy, improvements in hedge accounting documentation and reporting, increased accounting staff and support and substantial enhancement of policies and procedures associated with the transfer of debt between the Bank and other FHLBs.
In accordance with the Written Agreement, the Bank adopted a Business and Capital Management Plan for 2005 – 2007 acceptable to the Finance Board. The plan sets forth commitments made by the Bank for the management of its operations, including the following:
| • | The Bank will continue complying with the terms of the Written Agreement until it is terminated. |
| • | The Bank will manage a reduction of its voluntary capital stock ratio measured as a percent of regulatory capital (total capital stock plus retained earnings) to the following minimum targets: |
December 31, 2005 | 53 | % | |
December 31, 2006 | 48 | % | |
December 31, 2007 | 43 | % |
| • | The Bank will delay implementation of a new capital structure until December 31, 2006, or until a time mutually agreed upon with the Finance Board. Also, the Bank will reevaluate the structure of its capital plan, originally approved by the Finance Board on June 12, 2002, and may propose amendments for approval by the Finance Board based on the review. |
| • | As part of the continued development and evolution of the Mortgage Partnership Finance Program, the Bank will explore alternative methods of capitalizing and funding MPF assets including techniques to liquefy MPF assets, creating additional capacity for the Bank and other FHLBs. |
| • | The Bank agreed to and adopted a new dividend policy effective March 15, 2005 requiring its dividend payout ratio in a given quarter not to exceed 90% of adjusted core net income for that quarter. See “Item 1.5—Regulations—Dividends.” Additional restrictions on dividends imposed under the amendment to the Written Agreement are described below. |
On October 18, 2005, the Bank’s Board of Directors discontinued redemptions of voluntary stock for a period of time as permitted by the FHLB Act and Finance Board regulations. Although the Bank committed to a reduction of voluntary stock under its Business and Capital Management Plan for 2005—2007, year to date net redemptions through October 17, 2005 resulted in the Bank’s voluntary capital stock to regulatory capital ratio being reduced to 51%, which was 2% less than the amount called for by the end of 2005 under the plan. For the nine months ended September 30, 2005, voluntary capital stock decreased by $404.7 million and from October 1, 2005 through October 17, 2005 decreased by another $44.3 million. With the reduction in the dividend rate from an average of 6.125% paid in 2004 to 3.75% (annualized rate) to be paid in the fourth quarter 2005 (based upon third quarter 2005 results), the Bank expected the redemption rate to accelerate even more in the remaining months of 2005.
66
Table of Contents
The discontinuance of voluntary stock redemptions may affect the Bank’s ongoing advance volumes as members will be unable to redeem capital stock in connection with the payoff of advances. When an institution pays off or pays down its outstanding advances, the capital stock in excess of the member’s required stock amount will be considered voluntary stock and will not be subject to redemption while the restriction on redemptions remains in place. Also, a stock redemption request in connection with a membership withdrawal is subject to the Bank’s regulatory capital requirements.
The Bank’s dividends to members are subject to the Bank’s financial policies and the amendment to the Written Agreement requiring approval by the Finance Board’s Office of Supervision until the Bank completes the process of registering its capital stock under the Securities Exchange Act of 1934, and until a revised retained earnings and dividend policy has been approved by the Finance Board. Dividends paid in stock are voluntary stock and are not subject to redemption while the restriction on redemptions remains in place. In accordance with the amendment, on December 14, 2005, the Bank submitted a revised retained earnings and dividend policy and updated business plan strategies to the Finance Board for approval and the Finance Board is reviewing the Bank’s submission.
The Bank is undertaking various actions to address the capital concerns that led to the discontinuance of voluntary capital stock redemptions and the amendment to the Written Agreement. In addition to the revised retained earnings and dividend policy and updated business plan strategies required by the amendment to the Written Agreement, the Bank is modifying its previously approved capital plan and will submit the revised plan to the Finance Board for approval.
The Bank’s Written Agreement, as amended, has, and may continue to have, negative impacts on the Bank’s capital resources and results of operations, although the amendment of October 18, 2005 lowering the regulatory capital ratio from 5.1% to 4.5% may allow the Bank to reverse some but not all of the impact by allowing the Bank to make additional investments. Requirements to maintain higher ratios than the statutorily required 4.0% restricts the Bank’s ability to grow which may reduce the Bank’s earnings and returns on equity compared to what it would otherwise be able to earn in the absence of its Written Agreement. However, a lower regulatory capital ratio provides the Bank flexibility to grow its mortgage related assets and investment portfolios and fulfill funding and liquidity needs of members through offering advances. The Bank continues to experience increased operating expenses due to the increase in personnel as a result of infrastructure internal controls and process improvement initiatives resulting from the implementation of the Bank’s Written Agreement.
In accordance with the Bank’s Capital and Management Plan for 2005 – 2007, Bank management had preliminary discussions with the Finance Board, other FHLBs, external counsel and other third parties in order to explore risk transfer alternatives related to MPF Loans, including securitization. However, prior to entering into any new business activity, the Bank is required to file a notice with the Finance Board and receive the Finance Board’s approval to conduct that activity. The Bank has not submitted a new business activity notice to the Finance Board related to this issue.
The ability to securitize or sell MPF Loans would improve the Bank’s liquidity, while enhancing the Bank’s ability to assist PFIs in transferring mortgage loans. The Bank’s Written Agreement with the Finance Board restricts annual balance sheet growth of the Bank’s acquired member assets under the MPF Program to 10%, which could potentially restrict the Bank’s ability to meet PFI demand for the MPF Program. Accordingly, the ability to securitize or sell MPF Loans would provide the Bank with alternatives in meeting PFI demands.
The Bank has reviewed with the Finance Board staff the items under the Written Agreement completed by the Bank through June 1, 2005, which is the latest date of the Finance Board review. The Bank and the Finance Board staff have agreed upon the items remaining to be completed in order for the Bank to have completed the requirements of the Written Agreement. Although the Bank believes it is meeting its obligations under the terms of the Written Agreement, and the amendment thereto, the Bank expects the Finance Board to continue to monitor the Bank’s progress on completing open items and its ongoing execution of the Written Agreement, as amended.
67
Table of Contents
Nine months Ended September 30, 2005 Highlights
Net income for the nine months ended September 30, 2005 decreased $110.9 million or 37.0% to $188.8 million from $299.6 million for the nine months ended September 30, 2004. The decline in net income was principally due to a decline in net interest income of $161.5 million as a result of a flattening yield curve and reduction in average interest earning assets. The nine months ended September 30, 2004 included $41.4 million of a cumulative effect of a change in accounting principle related to SFAS 91 when the Bank changed its method of accounting for the deferred agent fees and premiums and discounts on mortgage loans to amortize such amounts on a constant effective yield over their contractual life.
Net interest income decreased $161.5 million or 29.4%, to $386.8 million from $548.3 million for the comparable period of 2004. The decrease in net interest income was primarily a result of two factors: a flattening yield curve and a reduction in interest earning assets. For the nine months ended September 30, 2005 flattening yield curve reduced net interest income by $86.2 million compared to the nine months ended September 30, 2004. During the nine months ended September 30, 2005, short-term interest rates increased more significantly than longer term interest rates. This decreased the net interest spread the Bank earned on its interest earning assets, particularly advances and mortgage loans, and the interest the Bank paid on its debt.
In addition, to a flattening yield curve, the Bank’s average balances of interest earning assets, including advances, mortgage loans and long-term investments decreased by $5.1 or 5.7% billion during the nine months ended September 30, 2005 compared to September 30, 2004. The decrease in average balances reduced net interest income by $75.3 million for the nine months ended September 30, 2005 compared to the nine months ended September 30, 2004.
Average advances decreased $2.7 billion as compared to September 30, 2004 primarily because one member paid off more than $3 billion of its advances after it had merged with an out-of-district institution in 2004. The decrease in average advances volume was more than offset by an increase in yield and interest rates so that interest income from advances increased by $153.3 million for the nine months ended September 30, 2005 compared to the same period in 2004. Average mortgage loans held in portfolio decreased $2.9 billion, or 6.0%, compared to September 30, 2004, primarily due to a decline in fixed-rate mortgage loan activity as demand for adjustable rate mortgages increased. In addition, as the mortgage loan portfolio has paid down, the Bank used excess funds to increase its liquidity position to meet voluntary capital stock redemption requests and pay down consolidated obligations to maintain its regulatory capital ratio above the required minimum level. The decrease in average mortgage loans reduced mortgage interest income by $56.3 million, or 3.3%, for the nine months ended September 30, 2005 compared to the same period in 2004. Consequently, the Bank’s annualized return on capital was 5.88% for the nine months ended September 30, 2005, compared to 8.41% for the same period in 2004.
The Bank assesses impairment of the capitalized amount of internal-use computer software at least annually and sooner if a triggering event occurs. On October 18, 2005 the Bank amended its Written Agreement. As a result of this change in the regulatory environment, the Bank re-evaluated its business opportunities and strategies as it related to the MPF Program. The Bank determined that certain internal-use computer software had become impaired due to management’s decision to abandon software being developed to support a new line of business related to servicing. An impairment write-down of $10.4 million was identified and will be recognized in the fourth quarter of 2005.
As described in Item 2.2 “Management’s Discussion and Analysis of Financial Condition and Results of Operations – Restatement of Financial Statements”, the Bank restated $11.9 million from OCI to expense which resulted in an $8.7 million reduction in net income.
Fiscal Year 2004 Highlights
Net income for the year ended December 31, 2004 (after a cumulative effect of change in accounting principle—see Note 2 in the December 31, 2004 Annual Financial Statements and Notes) decreased $71 million, or 16.3%, to $365.5 million from $436.5 million for the same period ended December 31, 2003. The decrease in net income was primarily attributable to:
| • | a $89.5 million decrease in net interest income to $704.3 million for the year ended December 31, 2004 from $793.8 million for the same period ended December 31, 2003, primarily due to a flattening of the yield curve between the fiscal years 2003 and 2004, reducing the Bank’s margins; |
68
Table of Contents
| • | a decrease of $60.4 million in net gain from early extinguishment of debt transferred to other FHLBs to $45.8 million for the year ended December 31, 2004 (offset by a loss of $25.2 million on associated sales of available-for-sale securities that hedged the transferred debt) from $106.3 million for the year ended December 31, 2003 (offset by a loss of $45.6 million on associated sales of available for sale securities that hedged the transferred debt, see “Liquidity and Capital Resources – Funding – Debt Transfer Activity” below); |
| • | a $34.6 million increase in other expenses to $121.1 million for the year ended December 31, 2004 from $86.4 million for the same period ended December 31, 2003, primarily due to increased personnel (both employees and consultants) and systems (hardware and software) to support increased regulatory requirements for risk management, Sarbanes-Oxley compliance, and preparation for SEC registration by August 29, 2005. |
These trends were partially offset by a decrease of $28.7 million in loss on trading securities to a loss of $27.9 million for the year ended December 31, 2004 from a loss of $56.6 million for the same year ended December 31, 2003. In addition, there was a cumulative effect of change in accounting principle of $41.4 million due to the change to a more preferable method of amortizing mortgage loan acquisition costs pursuant to SFAS 91.
Total assets were $85.7 billion at December 31, 2004, a decrease of $1.2 billion or 1.4%, from total assets of $86.9 billion at December 31, 2003. The decrease in total assets was primarily due to the Bank entering into a Written Agreement with the Finance Board, which restricted the annual on-balance sheet growth of its acquired member assets program (MPF Program) to 10%. However, in connection with the Bank’s commitment to reduce the voluntary capital stock ratio under its Business and Capital Management Plan for 2005 – 2007, current market conditions and customer demand, the Bank expects total assets to remain flat or slightly decrease. Advances to members decreased by $2.3 billion or 8.5% to $24.2 billion at December 31, 2004 from $26.4 billion at December 31, 2003. A majority of the decline resulted from a $1.6 billion prepayable advance paydown by a member of the Bank in 2004. Mortgage loans held in portfolio, net of allowance for loan losses, decreased $0.7 billion or 1.4% to $46.9 billion at December 31, 2004 from $47.6 billion at December 31, 2003. These decreases were partially offset by an increase in investments of $2.3 billion or 35.4% to $8.9 billion at December 31, 2004 from $6.5 billion at December 31, 2003, primarily due to an increase in the purchases of available-for-sale and held-to-maturity securities, acquired in lieu of MPF Loans.
Liabilities totaled $81.1 billion at December 31, 2004, a decrease of $1.3 billion compared to total liabilities of $82.4 billion at December 31, 2003. The decrease was primarily due to reduced deposits from the FDIC, a result of its decreased need for more liquid assets and a switch to higher yielding securities.
On July 1, 2004, S&P lowered its long-term counterparty credit rating on the Bank to AA+ from AAA and kept its outlook at negative in response to the announced Written Agreement with the Finance Board. At the same time, S&P affirmed the Bank’s A-1+ short-term counterparty credit rating. For most of the Bank’s derivatives counterparties, the collateralization threshold of the Bank changed to $5 million. As a result, the Bank was required to deliver $18.8 million and $25 million in additional collateral as of September 30, 2005 and December 31, 2004, respectively. This did not have any impact on earnings. The S&P rating for the consolidated obligations of the FHLBs is not affected by ratings actions pertaining to individual FHLBs and remains at AAA/A-1+ as of January 31, 2006.
On November 18, 2004, Moody’s Investor Service affirmed its “Aaa” long-term deposit rating and “Prime-1” short-term deposit rating on the Bank and is maintaining a stable outlook. The consolidated obligations credit ratings are unaffected by this action, and remain at “Aaa/Prime-1.”
Total Other Income (Loss)
Total other income (loss) was a net loss of $127.1 million in 2004, an increase of $13.9 million compared to a net loss of $113.2 million in 2003. The net loss in 2004 was primarily a result of fair value adjustments associated with derivatives and hedging activities under SFAS 133, where the Bank is required to record all of its derivatives on the balance sheet at fair value. If derivatives meet the hedging criteria specified in SFAS 133, the underlying hedged instruments may also be carried at fair value so that some or all of the unrealized gain or loss recognized on the derivative is offset by a corresponding unrealized loss or gain on the underlying hedged instrument.
69
Table of Contents
The unrealized gain or loss on the ineffective portion of all hedges, which represents the amount by which the change in the fair value of the derivative differs from the change in fair value of the hedged item or the variability in the cash flows of floating rate assets, liabilities or forecasted transactions, is recognized in current period earnings. In addition, certain derivatives are associated with assets or liabilities or are economic hedges of interest rate risk that do not qualify as fair value or cash flow hedges under SFAS 133. Economic hedges are recorded on the balance sheet at fair value with the unrealized gain or loss recorded in earnings without any offsetting unrealized gain or loss from the associated asset or liability.
The table below shows the types of hedges and the categories of hedged items that contributed to the gains and losses on derivatives and hedging activities that were recorded in earnings in 2004 and 2003.
Sources of Gains / (Losses) on Derivatives and Hedging Activities Recorded in Earnings
2004 Compared to 2003
(Dollars in thousands) | 2004 | 2003 | ||||||||||||||||||||||||||||||
Hedged Item | Fair Value Hedges | Cash Flow Hedges | Economic Hedges | Total | Fair Value Hedges | Cash Flow Hedges | Economic Hedges | Total | ||||||||||||||||||||||||
Advances | $ | (731 | ) | $ | 44,661 | $ | — | $ | 43,930 | $ | 436 | $ | 38,251 | $ | — | $ | 38,687 | |||||||||||||||
Consolidated Obligations | 2,638 | (1,835 | ) | — | 803 | (16,382 | ) | (3,457 | ) | — | (19,839 | ) | ||||||||||||||||||||
Investments | — | — | (1,473 | ) | (1,473 | ) | — | 857 | 1,879 | 2,736 | ||||||||||||||||||||||
MPF Program | (87,574 | ) | — | (88,191 | ) | (175,765 | ) | (111,417 | ) | — | (40 | ) | (111,457 | ) | ||||||||||||||||||
Stand-alone derivatives | — | — | 6,080 | 6,080 | — | — | (49,293 | ) | (49,293 | ) | ||||||||||||||||||||||
Total | $ | (85,667 | ) | $ | 42,826 | $ | (83,584 | ) | $ | (126,425 | ) | $ | (127,363 | ) | $ | 35,651 | $ | (47,454 | ) | $ | (139,166 | ) | ||||||||||
For the year ended December 31, 2004, the net loss on derivatives and hedging activities recorded in earnings was $126.4 million, a decrease of $12.7 million compared to a net loss of $139.2 million during 2003. The net loss in 2004 and 2003 was due principally to the Bank using stand-alone derivatives (i.e. interest rate swaps, swaptions, caps, floors and futures contracts) to manage its interest rate and prepayment risks associated with MPF Loans and duration of equity limits established by the Finance Board. For the years ended December 31, 2004 and 2003, the net loss associated with stand-alone derivatives was $93.1 million and $49.3 million, respectively. Ineffectiveness directly related to a specified portfolio of MPF Loans designated as fair value hedges under SFAS 133 was ($76.7) million and ($111.4) million for the years ended December 31, 2004 and 2003, respectively. In 2004, the MPF Loan portfolio being hedged decreased by $1.96 billion, as existing loans paid down. Further, the Bank hedged this portfolio to be neutral to changes in interest rate duration and volatility, and attempted to minimize the impact that significant interest rate movements had on the this portfolio. As interest rates increased during the year, the Bank incurred $76.7 million in losses due to derivatives and hedging activities related to this strategy.
The Bank hedged a specified portfolio of MPF Loans in 2003 to be neutral to both interest rate duration and interest rate volatility. As market rates decreased in 2003, the Bank recognized $111.4 million in losses due to derivatives and hedging activities associated with this strategy.
The Bank recognized $50.0 million and $38.3 million in earnings from cash flow hedges of floating rate advances for the year ended December 31, 2004. The gains were a result of floating rate advances being prepaid in both years by a member. As a result, gains previously deferred in Other Comprehensive Income (“OCI”) were recognized in earnings.
The Bank recognized $2.6 million and ($1.8) million in net gains/(losses) from fair value and cash flow hedges of consolidated obligations, respectively, in 2004. The Bank recognized ($16.4) million in losses on fair value hedges and ($3.5) million in losses from cash flow hedges of consolidated obligations in 2003.
Fiscal Year 2003 Highlights
Net income for the year ended December 31, 2003 increased $231.8 million, or 113.3%, to $436.5 million from $204.7 million for the year ended December 31, 2002. The increase in net income was primarily attributable to (i) a $452.8 million increase in interest income to $2.73 billion for the year ended December 31, 2003 from $2.28 billion for the same period ended December 31, 2002, primary due to the growth in the MPF Loan portfolio; and, (ii) an increase of $108.5 million in the gain from
70
Table of Contents
early extinguishment of debt to $106.3 million for the year ended December 31, 2003 from a loss of $2.3 million for the year ended December 31, 2002, due to the transfer of long-term consolidated obligations to other FHLBs and the extinguishment of the Bank’s consolidated obligations in the marketplace. These trends were partially offset by (i) a loss of $56.6 million in trading securities for the year ended December 31, 2003, compared to a $295.6 million gain for the year ended December 31, 2002; and (ii) a $28.7 million increase in other expenses to $86.4 million for the year ended December 31, 2003 from $57.7 million for the year ended December 31, 2002, primarily due to increased personnel (both employees and consultants) and systems (hardware and software) to support increased regulatory requirements for risk assessment and management.
The Bank’s MPF Loan portfolio continued to increase during 2003. The Bank had $47.6 billion in MPF Loans at the end of the year, compared to $26.2 billion at the end of 2002.
Advances to members increased to $26.4 billion, 6% above the prior year-end. The Bank continued to attract new member financial institutions. Total membership stood at 884 members on December 31, 2003, surpassing the prior year-end level of 874 members.
The Bank purchased its first MPF Shared Funding securities during 2003. The MPF Shared Funding program permits the transfer of MPF Program eligible loans by a member to the Bank in the form of a security through the use of a third-party sponsored trust. At December 31, 2003 the Bank had $621.5 million in held-to-maturity MPF Shared Funding securities.
In 2003, SFAS 133 resulted in net realized and unrealized losses in derivatives and hedging activities of $139.2 million. Beginning in 2003, the Bank recorded realized and unrealized gains and losses on stand alone derivatives used in economic hedges in “net realized and unrealized gain (loss) on derivatives and hedging activities” within “other income.” Previously, realized gains and losses on stand alone derivatives used in economic hedges were classified within “net interest income after mortgage loan loss provision” while unrealized gains (losses) on these derivatives were recorded in “net realized and unrealized gain (loss) on derivatives and hedging activities” within “other income.” The amount of unrealized gains and losses on stand alone derivatives for 2003 was $55.4 million.
The Bank adopted SFAS No. 149 on July 1, 2003. The application of SFAS 149 resulted in the Bank recording as derivatives its commitments to purchase mortgage loans. At December 31, 2003, the Bank had recorded $863,000 in loan commitment derivatives. The Bank accounted for the commitments as cash flow hedges and recorded the offset to OCI.
The Bank opened new markets for its members by launching a program to buy mortgages made on Indian reservations. In December 2003, the Bank purchased two mortgages totaling $156,000 that were guaranteed by HUD under its Section 184 program, which provides a 100% guarantee on loans made for buying, building, or rehabilitating homes on reservations. This HUD program is designed to give Native American families the opportunity to own their own homes. The involvement of the Bank extends the initiative to FHLB member financial institutions in Illinois and Wisconsin.
71
Table of Contents
Liquidity and Capital Resources
Liquidity
The Bank is required to maintain liquidity in accordance with certain Finance Board regulations and with policies established by its Board of Directors. The Bank needs liquidity to satisfy member demand for short- and long-term funds, repay maturing consolidated obligations, and meet other obligations. The Bank seeks to be in a position to meet its customers’ credit and liquidity needs without maintaining excessive holdings of low-yielding liquid investments or being forced to incur unnecessarily high borrowing costs. The Bank’s primary sources of liquidity are short-term investments, primarily overnight Fed funds and resale agreements, maturing advances and the issuance of new consolidated obligation bonds and discount notes. Other borrowings, such as securities sold under agreements to repurchase, also provide liquidity.
To support its member deposits, Finance Board regulations require the Bank to have an amount equal to the current deposits invested in obligations of the U.S. Government, deposits in eligible banks or trust companies, or advances with a maturity not exceeding five years. As of December 31, 2005, the Bank had excess liquidity of $27.8 billion to support member deposits.
In accordance with Finance Board regulations, the Bank is also required to maintain enough contingency liquidity to meet its liquidity needs for five business days without access to the debt market. Contingent liquidity is defined as (1) marketable assets with a maturity of one year or less; (2) self-liquidating assets with a maturity of seven days or less; (3) assets that are generally accepted as collateral in the repurchase agreement market; and (4) irrevocable lines of credit from financial institutions rated not lower than the second highest credit rating category by a nationally recognized statistical rating organization. The Bank’s Asset/Liability Management Policy defines the Bank’s liquidity needs for five business days as an amount equal to the total of all principal and interest payments on non-deposit liabilities coming due in the next five business days plus a reserve consisting of one-fourth of customer deposits and $1.0 billion.
Below is a tabular presentation that displays the Bank’s liquidity needs over a five business day period, the sources of liquidity that the Bank holds to cover the requirements, and the holdings in excess of the requirements as of December 31, 2005. Excess liquidity assumes a “scenario event”, that is, a localized credit crisis for all FHLBs where the FHLBs do not have the ability to issue any new consolidated obligations or borrow unsecured funds from other sources (e.g. Fed Funds purchased or member deposits).
Cumulative Five Business Days Liquidity Measurement
as of December 31, 2005
(Dollars in millions) | Cumulative Five Business Days | ||
Liquidity Sources | |||
Consolidated Obligations Traded but Not Settled | $ | 630 | |
Contractual Maturities Cash, Fed Funds, Resales | 6,978 | ||
Maturing Advances | 1,742 | ||
Securities Eligible for Sale/Resale | 6,643 | ||
Total Sources | $ | 15,993 | |
Liquidity Uses and Reserves | |||
Contractual Principal and Interest Payments | $ | 3,406 | |
Reserves1 | 1,135 | ||
Total Uses and Reserves | $ | 4,541 | |
Excess Liquidity | $ | 11,452 | |
| 1 | Reserves are equal to $1 billion plus 25% of member deposits. |
72
Table of Contents
In addition, under the Bank’s Asset/Liability Management Policy, the Bank is required to maintain for each day, overnight liquidity assets at least equal to five percent of total assets, or a level approved by the Bank’s Market Risk Committee and reported to the Bank’s Asset Liability Committee. For this purpose, overnight liquidity includes: (1) money market assets, including federal funds, with one day to maturity and (2) inter-FHLB loans with one day maturity. As of December 31, 2005, the Bank had excess overnight liquidity of $2.7 billion.
In light of available liquidity described above, the Bank expects to be able to remain in compliance with its liquidity requirements.
Statements of Condition Overview
The major components of the Bank’s Statements of Condition are as follows:
(Dollars in thousands) | September 30, 2005 (restated) | December 31, 2004 | Increase / (Decrease) | December 31, 2004 | December 31, 2003 | Increase / (Decrease) | ||||||||||||||||||||
| Amount | Percent | Amount | Percent | |||||||||||||||||||||||
Assets | ||||||||||||||||||||||||||
Fed funds sold and securities purchased under agreement to resell | $ | 7,295,200 | $ | 5,127,840 | $ | 2,167,360 | 42.3 | % | $ | 5,127,840 | $ | 5,441,600 | (313,760 | ) | -5.8 | % | ||||||||||
Investment securities | 7,662,729 | 8,850,906 | (1,188,177 | ) | -13.4 | % | 8,850,906 | 6,538,728 | 2,312,178 | 35.4 | % | |||||||||||||||
Advances | 24,233,015 | 24,191,558 | 41,457 | 0.2 | % | 24,191,558 | 26,443,063 | (2,251,505 | ) | -8.5 | % | |||||||||||||||
Mortgage loans held in portfolio, net of allowance | 43,231,999 | 46,920,551 | (3,688,552 | ) | -7.9 | % | 46,920,551 | 47,599,731 | (679,180 | ) | -1.4 | % | ||||||||||||||
Other assets | 631,400 | 617,782 | 13,618 | 2.2 | % | 617,782 | 918,865 | (301,083 | ) | -32.8 | % | |||||||||||||||
Total Assets | $ | 83,054,343 | $ | 85,708,637 | $ | (2,654,294 | ) | -3.1 | % | $ | 85,708,637 | $ | 86,941,987 | $ | (1,233,350 | ) | -1.4 | % | ||||||||
Liabilities and Capital | ||||||||||||||||||||||||||
Deposits | $ | 1,307,516 | $ | 1,223,752 | $ | 83,764 | 6.8 | % | $ | 1,223,752 | $ | 2,348,071 | $ | (1,124,319 | ) | -47.9 | % | |||||||||
Discount notes | 15,180,067 | 16,871,736 | (1,691,669 | ) | -10.0 | % | 16,871,736 | 20,456,395 | (3,584,659 | ) | -17.5 | % | ||||||||||||||
Bonds | 60,178,226 | 60,875,540 | (697,314 | ) | -1.1 | % | 60,875,540 | 57,471,055 | 3,404,485 | 5.9 | % | |||||||||||||||
Other liabilities | 2,144,065 | 2,111,750 | 32,315 | 1.5 | % | 2,111,750 | 2,093,026 | 18,724 | 0.9 | % | ||||||||||||||||
Total Liabilities | 78,809,874 | 81,082,778 | (2,272,904 | ) | -2.8 | % | 81,082,778 | 82,368,547 | (1,285,769 | ) | -1.6 | % | ||||||||||||||
Capital | 4,244,469 | 4,625,859 | (381,390 | ) | -8.2 | % | 4,625,859 | 4,573,440 | 52,419 | 1.1 | % | |||||||||||||||
Total Liabilities and Capital | $ | 83,054,343 | $ | 85,708,637 | $ | (2,654,294 | ) | -3.1 | % | $ | 85,708,637 | $ | 86,941,987 | $ | (1,233,350 | ) | -1.4 | % | ||||||||
Total assets declined $2.7 billion to $83.1 billion at September 30, 2005 compared to $85.7 billion at December 31, 2004. Mortgage loans held in portfolio at September 30, 2005 decreased $3.7 billion from $46.9 billion at December 31, 2004 because of a decrease in fixed-rate mortgage demand. In addition, as the mortgage loan portfolio has paid down, the Bank used excess funds to increase its liquidity position to meet voluntary capital stock redemption requests and pay down consolidated obligations to maintain its regulatory capital ratio above the required minimum level.
The Bank’s investment portfolio decreased $1.2 billion to $7.7 billion at September 30, 2005 from $8.9 billion at December 31, 2004 due to maturities and pay-downs of held-to-maturity investments. The Bank’s mortgage-backed securities portfolio decreased by $1.0 billion, or 18.9%, to $4.5 billion at September 30, 2005 from $5.5 billion at December 31, 2004. The proceeds were reinvested in shorter term investments such as Fed funds sold and securities purchased for liquidity purposes.
Total liabilities were $78.8 billion at September 30, 2005, a decrease of $2.3 billion or 2.8% compared to December 31, 2004. Consolidated obligation bonds decreased $697.3 million or 1.1% to $60.2 billion at September 30, 2005 from $60.9 billion at December 31, 2004. Discount notes decreased $1.7 billion or 10.0% to $15.2 billion at September 30, 2005.
Total assets decreased 1.4% to $85.7 billion at December 31, 2004 as compared to $86.9 billion at December 31, 2003. Advances declined by $2.3 billion dollars primarily due to the acquisition of one of the Bank’s members by an out-of-district member. The member paid down outstanding advances and transferred remaining advances to an affiliate that is an in-district member. The proceeds from the advance paydown were reinvested in held-to-maturity and available-for-sale securities, which increased investment securities in total by $2.3 billion from December 31, 2003 to December 31, 2004.
73
Table of Contents
The Bank experienced a decline in the balance of its Mortgage Loans Held in Portfolio, which declined $0.7 billion from December 31, 2003 to December 31, 2004. The decrease in total Mortgage Loans Held in Portfolio was primarily due to market conditions. In particular, customer demand for fixed rate mortgages (versus adjustable or interest rate only mortgages, which the Bank does not acquire) have declined since 2003. In addition, as interest rates have increased, fewer home owners are refinancing their mortgages, reducing new business for the Bank while existing loans are paid down.
Average assets increased to $90.2 billion for the year ended December 31, 2004, up from $76.9 billion from the year ended December 31, 2003, a growth rate of 17.3%. This growth in average assets occurred prior to the Written Agreement, primarily in housing finance-related assets including MPF Loans, advances to members, investments secured by mortgages and mortgage-backed instruments, and other mission-related investments. Total housing finance-related assets at year end decreased $1.9 billion, or 2.4% to $77.4 billion at December 31, 2004 from the year earlier. Total housing finance-related assets accounted for 89.8% of assets at December 31, 2004. In order to insure a mission-consistent balance sheet, the Bank maintains a ratio of housing finance-related assets to consolidated obligations of at least 85%. Housing finance-related assets were 126.4% of consolidated obligations at December 31, 2004.
The following table is a summary of the Bank’s assets:
| As of September 30, | As of December 31, | |||||||||||
(In percentages) | 2005 | 2004 | 2003 | 2002 | ||||||||
Investments | 9.2 | % | 10.3 | % | 7.5 | % | 14.4 | % | ||||
Advances | 29.2 | % | 28.2 | % | 30.4 | % | 38.4 | % | ||||
Mortgage loans held in portfolio, net | 52.1 | % | 54.7 | % | 54.8 | % | 40.2 | % | ||||
All other assets | 9.5 | % | 6.8 | % | 7.3 | % | 7.0 | % | ||||
Total | 100.0 | % | 100.0 | % | 100.0 | % | 100.0 | % | ||||
Mortgage loans, net of premiums, discounts and fair value SFAS 133 basis adjustments declined $0.7 billion to $46.9 billion or 54% of total Bank assets due to the higher interest rate environment in 2004 compared to 2003. Mortgage loans are secured by real estate in all 50 states, the District of Columbia and Puerto Rico.
Advances to members, including SFAS 133 basis adjustments, were $24.2 billion at December 31, 2004, down 8.5% from December 31, 2003. Advances at par reached $24.0 billion at December 31, 2004, down 7.3% from December 31, 2003.
The MBS portfolio averaged $4.8 billion through December 31, 2004, 2.49% higher than the average portfolio through December 31, 2003. The average MBS-to-equity ratio was 101% at December 31, 2004 compared to 103% at December 31, 2003. MBS holdings equal to 300% of capital is the maximum allowed by Finance Board regulation.
Investments
The Bank maintains investments of varying maturities in instruments that are liquid and have an open market for their trading. The Bank’s primary objective is to have sufficient funds available in low risk instruments to meet potential member funding requirements, while earning a return commensurate with the risks taken in the portfolio as a whole.
Investments in available-for-sale (“AFS”) securities more than doubled in 2004 as the Bank maintained liquidity in light of lower growth in its mortgage portfolio. AFS investments were made in instruments of varying maturities and included mortgage-backed securities for the first time.
74
Table of Contents
The Bank’s investment portfolio by category of securities is shown in the following tables:
Trading Securities
Trading securities had the following yield characteristics:
| As of September 30, | As of December 31, | |||||||||||||||||||||||
| 2005 | 2004 | 2003 | 2002 | |||||||||||||||||||||
(Dollars in thousands) | Carrying Value | Yield | Carrying Value | Yield | Carrying Value | Yield | Carrying Value | Yield | ||||||||||||||||
Government-sponsored enterprises 1 | $ | 1,127,044 | 4.73 | % | $ | 585,579 | 5.01 | % | $ | 593,574 | 4.54 | % | $ | 1,945,091 | 5.54 | % | ||||||||
Consolidated obligations of other FHLBs | 34,090 | 6.15 | % | 71,731 | 8.78 | % | 75,700 | 7.44 | % | 188,469 | 7.95 | % | ||||||||||||
Mortgage-backed securities: | ||||||||||||||||||||||||
Government-sponsored enterprises 1 | 43,031 | 4.77 | % | 52,711 | 4.77 | % | 68,654 | 4.79 | % | 125,693 | 5.20 | % | ||||||||||||
Government-guaranteed | 8,854 | 4.33 | % | 11,367 | 4.50 | % | 16,468 | 5.52 | % | 27,422 | 6.55 | % | ||||||||||||
Privately issued MBS | 31,871 | 6.42 | % | 38,669 | 6.42 | % | 39,901 | 6.39 | % | 41,147 | 6.39 | % | ||||||||||||
Total Trading Securities | $ | 1,244,890 | 4.81 | % | $ | 760,057 | 5.39 | % | $ | 794,297 | 4.90 | % | $ | 2,327,822 | 5.73 | % | ||||||||
| 1 | Securities issued by government sponsored enterprises are not guaranteed by the U.S. federal government. |
Available-for-Sale Securities
Available-for-sale securities had the following yield characteristics:
| As of September 30, | As of December 31, | |||||||||||||||||||||||
| 2005 | 2004 | 2003 | 2002 | |||||||||||||||||||||
(Dollars in thousands) | Carrying Value | Yield | Carrying Value | Yield | Carrying Value | Yield | Carrying Value | Yield | ||||||||||||||||
U.S. Treasury | $ | — | — | $ | — | — | $ | 50,246 | 4.27 | % | $ | — | — | |||||||||||
Government-sponsored enterprises 1 | 1,034,799 | 3.19 | % | 896,238 | 2.58 | % | 555,118 | 2.61 | % | 1,383,242 | 3.80 | % | ||||||||||||
Mortgage-backed securities: | ||||||||||||||||||||||||
Government-sponsored enterprises 1 | 80,989 | 4.67 | % | 91,372 | 4.67 | % | — | — | — | — | ||||||||||||||
Privately issued MBS | 364,740 | 2.60 | % | 542,078 | 2.36 | % | — | — | — | — | ||||||||||||||
Total Available-for-Sale Securities | $ | 1,480,528 | 3.13 | % | $ | 1,529,688 | 2.63 | % | $ | 605,364 | 2.74 | % | $ | 1,383,242 | 3.80 | % | ||||||||
| 1 | Securities issued by government sponsored enterprises are not guaranteed by the U.S. federal government. |
Held-to-Maturity Securities
Held-to-maturity securities had the following yield characteristics:
| As of September 30, | As of December 31, | |||||||||||||||||||||||
| 2005 | 2004 | 2003 | 2002 | |||||||||||||||||||||
(Dollars in thousands) | Carrying Value | Yield | Carrying Value | Yield | Carrying Value | Yield | Carrying Value | Yield | ||||||||||||||||
Commercial Paper | $ | 449,405 | 3.67 | % | $ | 699,722 | 2.26 | % | $ | 99,991 | 1.07 | % | $ | — | — | |||||||||
Government-sponsored enterprises 1 | 149,786 | 3.05 | % | 249,570 | 2.09 | % | 459,593 | 1.55 | % | 152,070 | 1.91 | % | ||||||||||||
State or local housing agency obligations | 82,317 | 4.50 | % | 100,690 | 3.90 | % | 132,388 | 3.61 | % | 222,841 | 4.76 | % | ||||||||||||
Other 2 | 319,665 | 4.18 | % | 743,193 | 2.76 | % | 598,981 | 2.00 | % | 612,230 | 2.59 | % | ||||||||||||
Mortgage-backed securities: | ||||||||||||||||||||||||
Government-sponsored enterprises 1 | 2,669,771 | 4.85 | % | 2,958,672 | 4.84 | % | 1,089,597 | 5.22 | % | 1,316,210 | 3.32 | % | ||||||||||||
Government-guaranteed | 62,316 | 4.44 | % | 84,077 | 4.11 | % | 119,539 | 4.70 | % | 194,797 | 5.45 | % | ||||||||||||
MPF Shared Funding® | 436,600 | 4.74 | % | 512,983 | 4.81 | % | 621,459 | 4.94 | % | — | — | |||||||||||||
Privately issued MBS | 767,451 | 4.73 | % | 1,212,254 | 3.75 | % | 2,017,519 | 2.67 | % | 3,130,544 | 3.85 | % | ||||||||||||
Total Held-to-Maturity Securities | $ | 4,937,311 | 4.60 | % | $ | 6,561,161 | 4.00 | % | $ | 5,139,067 | 3.35 | % | $ | 5,628,692 | 3.81 | % | ||||||||
| 1 | Securities issued by government sponsored enterprises are not guaranteed by the U.S. federal government. |
| 2 | “Other” includes investment securities guaranteed and/or issued by the Small Business Administration, Small Business Investment Corporation and Low- and Moderate-Income Investment created by the Community Reinvestment Act of 1979. |
75
Table of Contents
Funding
The Bank funds its assets principally through the issuance of consolidated obligations as well as through capital stock and deposits. Under the FHLB Act and Finance Board regulations, the Bank is jointly and severally liable with other FHLBs for consolidated obligations issued through the Office of Finance. The Bank records a liability for consolidated obligations on its statements of condition in proportion to the proceeds it receives from the issuance of those consolidated obligations. No liability has been recorded for the joint and several obligations related to the other FHLBs’ share of the consolidated obligations due to the high credit quality of every other FHLB. Refer to “Item 1A—Risk Factors” for further details.
The Bank issues consolidated obligations through the Office of Finance as its agent. Consolidated obligations constitute the largest portion of the Bank’s funding. As of January 31, 2006, the FHLB consolidated obligations are AAA/Aaa rated, and the Bank has access to short-term and long-term debt markets. Consolidated obligations decreased $2.4 billion to $75.4 billion at September 30, 2005 as compared with $77.7 billion at December 31, 2004. At September 30, 2005, consolidated obligation bonds represented 79.9% of the outstanding balance. At December 31, 2004, consolidated obligation bonds comprised 78.3% of the debt mix.
Proceeds from the issuance of discount notes and bonds decreased $98.2 billion and $6.3 billion, respectively, for the nine months ended September 30, 2005 compared to the nine months ended September 30, 2004. The total reduction in proceeds was a result of lower MPF Loan purchases by the Bank during the nine months ended September 30, 2005. In addition, the Bank’s demand for additional funding has declined in the current period in light of the Bank’s Written Agreement with the Finance Board to reduce voluntary capital stock while maintaining required regulatory capital. Fulfilling member redemption requests has required the Bank to reduce its level of consolidated obligations outstanding. Member deposits increased $83.8 million in the first nine months of 2005, compared to the 2004 year end balance of $1.2 billion.
The Bank utilizes diverse funding sources and channels its need for funding from the capital markets changes. The Bank participated in $3.0 billion of the $90.7 billion, or 3.3%, of the long term global FHLB bond issuances during the nine months ended September 30, 2005. During the nine months ended September 30, 2004, the Bank participated in $6.3 billion of the $72.0 billion, or 8.8%, of the long term global FHLB bond issuances.
The Bank’s balance in shorter term discount notes decreased $1.7 billion as of September 30, 2005 compared to year end 2004. Discount notes are a significant funding source for the Bank. The Bank uses discount notes to fund short-term advances, longer-term advances with short repricing intervals, and money market investments. Discount notes comprised 21.7% of outstanding consolidated obligations at December 31, 2004, but accounted for 94.9% of the issuances of consolidated obligations during 2004.
In recent years, the FHLBs and other housing GSEs have faced a significant amount of negative publicity, which occasionally has adversely affected the Bank’s cost of funds temporarily, but the Bank believes that other factors, such as supply and demand of GSE debt obligations and other market conditions have had a much greater impact on the cost of funds. The Bank believes that investors have recognized the inherent strength of the FHLBs’ joint and several obligation to pay the principal of and interest on the consolidated obligations, and that the combined strength of the FHLBs has lessened investor reaction to the recent adverse publicity surrounding certain individual FHLBs. The Bank does not believe that the FHLBs have suffered a material adverse effect on their ability to issue consolidated obligations to the public as a result of the Bank’s restatement of its December 31, 2003 financial statements.
The Office of Finance has not yet published the FHLBs’ 2004 third quarter combined Financial Report, 2004 full year combined Financial Report, or any 2005 combined Financial Report. In addition, the Office of Finance has announced that its board of directors decided to restate the FHLBs’ combined financial statements for the years ended December 31, 2001, 2002 and 2003, and subsequent interim periods. The Office of Finance has stated that the delays in publication and intended restatements were the result of certain regulatory and accounting matters at some of the FHLBs, and that the Office of Finance board of directors may elect to delay publication of the FHLBs’ combined Financial Reports until all or substantially all of the FHLBs have completed their registration with the SEC. The Bank and a majority of the other FHLBs were unable to comply with the Finance Board’s August 29, 2005 deadline for registration of a class of their equity securities with the SEC. Some of the FHLBs have announced that they will restate prior period financial statements. It is uncertain at this time what effect, if any, the delays in publication, the delays in registration, or the intended restatements will have on the cost of FHLB debt, the timing of the issuance of new FHLB debt, or the demand for FHLB debt.
76
Table of Contents
The Bank has emphasized diversification of funding sources and channels as the need for funding from the capital markets has grown. The Bank led an effort to issue the first FHLB syndicated global 10-year bond to help fund and economically hedge the growing mortgage loan asset base. The Bank led long-term global issues of $12 billion and $22 billion through December 31, 2004 and 2003 respectively. This initiative has established an important new funding option for the FHLBs. The Bank anticipates decreased demand for similar offerings. Future growth may be limited by the Bank’s Written Agreement with the Finance Board, which restricts the annual on-balance sheet growth of the MPF Program to 10%. The amendment to the Written Agreement reduces the Bank’s required minimum capital ratio from 5.1% to 4.5% effective October 18, 2005. As a result, the Bank has more flexibility to invest in mortgage related assets and investment portfolios, and fulfill funding and liquidity needs of members through offering advances. The Bank expects that MPF volume will remain flat or increase slightly during the fourth quarter of 2005. The Bank will also look to other investment strategies to reduce excess liquidity. As such, the Bank’s long term funding needs may increase slightly.
In the normal course of managing its balance sheet, the Bank may extinguish consolidated obligations through repurchases of the debt or the transfer of debt to other FHLBs for which it is the primary obligor. These extinguishments occur in the normal course of the Bank’s business. The Bank also uses a limited amount of repurchase agreements as a source of funding and identifies these transactions as long-term borrowings. The Bank is required to deliver additional collateral should the market value of the underlying securities decrease below the market value required as collateral.
Debt Transfer Activity
The Bank may use excess funding to fulfill funding requests from other FHLBs by transferring consolidated obligations, primarily those issued under the Global Issuances Program. See “Item 1.3—Funding Services—Consolidated Obligation Bonds” for a description of the Global Issuances Program. The timing of such transfers to other FHLBs typically occur from one day to six months after the issuance of debt. The Bank prices such consolidated obligations at rates that are competitive or lower in cost than the Tap program or Medium Term Note Program, and may transfer consolidated obligations at fair value throughout the day and at smaller increments than the Tap program. The Tap auction is only available once a day and at minimum funding increments of $5 million. FHLBs request funding through debt transfers in situations where it is more economical than the Tap program or Medium Term Note Program or in situations where debt transfers provide more flexibility than the Tap program.
Growth in other FHLBs’ mortgage loan programs and credit products resulted in an increase in the funding needs of other FHLBs during 2004 and 2003, and as a result, the Bank transferred $4.3 billion and $6.3 billion of consolidated obligations, respectively. For the nine months ended September 30, 2005, the Bank has transferred $975.2 million of consolidated obligations to other FHLBs. The Bank anticipates reduced debt transfer activity relative to prior years for several reasons. First, as the Global Issuances Program matured, more FHLBs have participated in issuances reducing the Bank’s need to facilitate larger sized offerings. Second, the Bank’s Written Agreement with the Finance Board contains annual limitations on the growth of MPF assets on the Bank’s balance sheet which might reduce the Bank’s funding needs. Third, current market conditions have slowed the growth of MPF purchases and fundings as well as other FHLBs’ mortgage programs, which thereby reduce the funding needs of other FHLBs.
77
Table of Contents
The table below summarizes the consolidated obligations of the FHLBs and the Bank when it is the primary obligor:
| As of September 30, | As of December 31, | |||||||||||||||
(Dollars in thousands) | 2005 | 2004 | 2003 | 2002 | ||||||||||||
Total par value of FHLB consolidated obligation bonds | $ | 735,340,777 | $ | 700,964,721 | $ | 595,608,350 | $ | 533,213,633 | ||||||||
Consolidated obligation bonds for which the Bank is the primary obligor, at par | 62,002,275 | 62,868,515 | 60,328,125 | 42,874,655 | ||||||||||||
Percent of consolidated obligation bonds for which the Bank is the primary obligor | 8.4 | % | 9.0 | % | 10.1 | % | 8.0 | % | ||||||||
Total par value of FHLB consolidated obligation discount notes | $ | 185,028,425 | $ | 168,276,869 | $ | 163,920,498 | $ | 147,481,425 | ||||||||
Consolidated obligation discount notes for which the Bank is the primary obligor, at par | 15,243,731 | 16,942,524 | 20,500,073 | 14,563,201 | ||||||||||||
Percent of consolidated obligation discount notes for which the Bank is the primary obligor | 8.2 | % | 10.1 | % | 12.5 | % | 9.9 | % | ||||||||
Total par value of FHLB obligations | $ | 920,369,202 | $ | 869,241,590 | $ | 759,528,848 | $ | 680,695,058 | ||||||||
Consolidated obligations for which the Bank is the primary obligor, at par | 77,246,006 | 79,811,039 | 80,828,198 | 57,437,856 | ||||||||||||
Percent of consolidated obligations for which the Bank is the primary obligor | 8.4 | % | 9.2 | % | 10.6 | % | 8.4 | % | ||||||||
Borrowings
Borrowings with original maturities of one year or less are classified as short-term. The following is a summary of short-term borrowings:
| As of September 30, | As of December 31, | |||||||||||||||
(Dollars in thousands) | 2005 | 2004 | 2003 | 2002 | ||||||||||||
Discount notes | ||||||||||||||||
Outstanding at period-end | $ | 15,180,067 | $ | 16,871,736 | $ | 20,456,395 | $ | 14,526,323 | ||||||||
Weighted average rate at period-end | 3.47 | % | 2.08 | % | 1.05 | % | 1.42 | % | ||||||||
Daily average outstanding for the period | $ | 17,071,617 | $ | 20,550,414 | $ | 17,423,431 | $ | 11,331,137 | ||||||||
Weighted average annualized rate for the period | 2.99 | % | 1.39 | % | 2.17 | % | 2.01 | % | ||||||||
Highest outstanding at any month-end | $ | 18,085,991 | $ | 23,049,674 | $ | 20,456,395 | $ | 14,526,323 | ||||||||
Federal funds purchased | ||||||||||||||||
Outstanding at period-end | $ | — | $ | — | $ | — | $ | — | ||||||||
Weighted average rate at period-end | — | — | — | — | ||||||||||||
Daily average outstanding for the period | $ | 341 | $ | 1,123 | $ | — | $ | 1,233 | ||||||||
Weighted average annualized rate for the period | 3.54 | % | 1.32 | % | — | 1.11 | % | |||||||||
Highest outstanding at any month-end | $ | — | $ | — | $ | — | $ | — | ||||||||
Total short-term borrowings | ||||||||||||||||
Outstanding at period-end | $ | 15,180,067 | $ | 16,871,736 | $ | 20,456,395 | $ | 14,526,323 | ||||||||
Weighted average annualized rate at period-end | 3.47 | % | 2.08 | % | 1.05 | % | 1.42 | % | ||||||||
Daily average outstanding for the period | $ | 17,071,958 | $ | 20,550,414 | $ | 17,423,431 | $ | 11,331,137 | ||||||||
Weighted average annualized rate for the period | 2.99 | % | 1.39 | % | 2.17 | % | 2.01 | % | ||||||||
78
Table of Contents
In general, changes in the total consolidated obligations are consistent with the changes in total Bank assets. The Bank maintains discount notes within a broad range that permits it to take advantage of interest rate spread across maturities. Daily average discount note balances increased until the fourth quarter of 2004 and have declined since as the Bank’s short-term funding needs have declined and short-term interest rates have risen. Funding through discount note and other short term instruments is not expected to increase in the near term as the yield curve has flattened. This pattern applies to the aggregate short term borrowings, as well.
Off-Balance-Sheet Arrangements
Standby letters of credit are executed with members for a fee. If the Bank is required to make a payment for a beneficiary’s draw, these amounts are converted into a collateralized advance to the member. Notional amounts of outstanding standby letters of credit were $554.4 million, $345.7 million, and $395.8 million at September 30, 2005, December 31, 2004, and December 31, 2003, respectively.
The Bank has entered into standby bond-purchase agreements with state-housing authorities, whereby the Bank, for a fee, agrees to purchase and hold the authority’s bonds until the designated marketing agent can find a suitable investor or the housing authority repurchases the bonds according to a schedule established by the standby agreement. Each standby agreement dictates the specific terms that would require the Bank to purchase the bonds. The bond purchase commitments entered into by the Bank expire after ten years, no later than 2015, though some are renewable at the option of the Bank. Total commitments for bond purchases were $272.8 million, $280.2 million, and $248.7 million at September 30, 2005, December 31, 2004, and December 31, 2003, respectively. The Bank was not required to purchase any bonds under these agreements through September 30, 2005.
The Bank only records a liability for consolidated obligations on its statements of condition for the proceeds it receives from the issuance of those consolidated obligations. However, each FHLB is jointly and severally obligated for the payment of all consolidated obligations of all of the FHLBs. This guarantee is not reflected on the Bank’s balance sheet. The par value of outstanding consolidated obligations for the FHLBs was $920.4 billion at September 30, 2005 and $869.2 billion at December 31, 2004. Accordingly, should one or more of the FHLBs be unable to repay their participation in the consolidated obligations, each of the other FHLBs could be called upon to repay all or part of such obligations, as determined or approved by the Finance Board. For additional information regarding the consolidated obligations, refer to Note 13 to the Bank’s 2004 Annual Financial Statements and Notes.
The Bank is required to pay 20 percent of its net earnings (after reduction of its AHP obligation) to REFCORP to support payment of part of the interest on bonds issued by REFCORP. The Bank must make these payments to REFCORP until the total amount of payments made by all FHLBs is equivalent to a $300 million annual annuity whose final maturity date is April 15, 2030. Additionally, the FHLBs must set aside annually for AHP the greater of $100 million or ten percent of the current year’s income before charges for AHP (but after expenses for REFCORP). See “Item 2.2—Management’s Discussion and Analysis of Financial Condition and Results of Operations—Results of Operations—Expenses.”
79
Table of Contents
Contractual Obligations and Commitments
The tables below present the Bank’s long term contractual obligations:
| As of September 30, 2005 | |||||||||||||||
(Dollars in thousands) | Contractual Payments Due By Period | ||||||||||||||
Contractual Obligations | Less than 1 year | 1-3 years | 3-5 years | After 5 years | Total | ||||||||||
Long-term debt (Bonds at par) | $ | 10,910,200 | $ | 20,196,805 | $ | 12,961,650 | $ | 17,933,620 | $ | 62,002,275 | |||||
Operating leases | 4,003 | 8,879 | 9,951 | 4,587 | 27,420 | ||||||||||
Other long-term obligations | — | — | — | 1,200,000 | 1,200,000 | ||||||||||
Letters of credit | — | 36,144 | 11,143 | 3,450 | 50,737 | ||||||||||
Mortgage loan commitments: | |||||||||||||||
MPF 100 | 22,424 | — | — | — | 22,424 | ||||||||||
Other MPF | 118,603 | — | — | — | 118,603 | ||||||||||
Total Contractual Cash Obligations | $ | 11,055,230 | $ | 20,241,828 | $ | 12,982,744 | $ | 19,141,657 | $ | 63,421,459 | |||||
Capital Resources
Members are required to purchase capital stock in amounts based on the greater of 1% of the balance of mortgage assets held by the member institution, or 5% of their level of advances outstanding, with a minimum purchase of $500. Effective March 15, 2005, the Bank no longer accepts new voluntary investments in its capital stock, and effective October 18, 2005, the Bank discontinued redemptions of voluntary capital stock for a period of time and amended its Written Agreement with the Finance Board to, among other things, revise the Bank’s minimum regulatory capital requirements. See “Item 2.2—Management’s Discussion and Analysis of Financial Condition and Results of Operations—Overview—Regulatory Agreement and Related Actions.”
Capital stock accounted for 91.7% of total equity as of September 30, 2005. Total capital (including retained earnings and OCI) includes an unrealized loss relating to hedging activities of $148.0 million and a $6.7 million net unrealized loss on available for sale securities (totaling $154.7 million) in OCI as of September 30, 2005. Retained earnings were $508.5 million, up from $489.4 million at December 31, 2004, primarily as a result of the Bank’s Written Agreement which restricts dividends to 90% of core earnings, as described in “Item 1.5—Regulations—Capital, Capital Rules, and Dividends—Dividends.” The value of capital stock decreased to $3.9 billion at the end of September 30, 2005 from $4.3 billion at the end of 2004 primarily due to the redemptions of voluntary capital stock and member withdrawals due to the acquisition of members by out-of-district institutions.
As of September 30, 2005 and December 31, 2004, voluntary capital stock was 53% and 57%, respectively, of the Bank’s regulatory capital. Regulatory capital consists of the Bank’s total capital stock (including the mandatorily redeemable capital stock) plus its retained earnings. At September 30, 2005, members held $2.3 billion of voluntary capital stock in the Bank. This is down $403.6 million from December 31, 2004 due to redemptions of voluntary capital stock by members and redemptions for member institutions that were acquired by out of district financial institutions.
Capital stock accounted for 92.8% of total equity as of December 31, 2004. Total capital included an unrealized loss relating to hedging activities of $148.5 million and a $7.2 million net unrealized loss on available for sale securities (totaling $155.7 million) in OCI as of December 31, 2004. Retained earnings were $489.4 million, up from $386.9 million at December 31, 2003. As a result of the growth in total membership, advance levels, capital stock dividends, and capital stock purchases by members for investment purposes, capital stock increased to $4.3 billion at the end of 2004 from $4.2 billion at the end of 2003.
80
Table of Contents
The following table shows the largest ten members by capital stock holdings:
Top Ten Capital Stock Outstanding by Member
| As of September 30, 2005 | As of December 31, 2004 | As of December 31, 2003 | ||||||||||||||||||
(Dollars in thousands) | Capital Stock | % of Total | Capital Stock | % of Total | Capital Stock | % of Total | ||||||||||||||
LaSalle Bank N.A. | $ | 307,681 | 7.9 | % | $ | 295,817 | 6.9 | % | $ | 278,482 | 6.7 | % | ||||||||
One Mortgage Partners Corp.1 | 303,273 | 7.8 | % | 422,474 | 9.8 | % | 378,216 | 9.1 | % | |||||||||||
Associated Bank Green Bay | 179,857 | 4.6 | % | 102,172 | 2.4 | % | n/a | n/a | ||||||||||||
State Farm Financial | 169,272 | 4.3 | % | 169,272 | 3.9 | % | n/a | n/a | ||||||||||||
Mid America Bank, FSB | 163,916 | 4.2 | % | 278,916 | 6.5 | % | 384,643 | 9.3 | % | |||||||||||
The PrivateBank & Trust Co. 2 | 147,000 | 3.7 | % | 207,000 | 4.8 | % | 208,536 | 5.0 | % | |||||||||||
M & I Marshall and Ilsley Bank | 119,717 | 3.1 | % | 107,153 | 2.5 | % | 85,843 | 2.1 | % | |||||||||||
Citizens Equity Federal C U | 70,257 | 1.8 | % | 67,548 | 1.6 | % | n/a | n/a | ||||||||||||
The Northern Trust Company | 64,778 | 1.7 | % | 72,011 | 1.7 | % | 115,000 | 2.8 | % | |||||||||||
Self-Reliance Ukrainian - FCU 2 | 64,568 | 1.6 | % | n/a | n/a | n/a | n/a | |||||||||||||
First Federal Capital Bank 3 | n/a | n/a | 62,843 | 1.5 | % | 59,160 | 1.4 | % | ||||||||||||
Associated Bank, N.A. | n/a | n/a | n/a | n/a | 96,185 | 2.3 | % | |||||||||||||
Anchor Bank, F.S.B. | n/a | n/a | n/a | n/a | 85,924 | 2.1 | % | |||||||||||||
Standard Bank & Trust | n/a | n/a | n/a | n/a | 64,253 | 1.5 | % | |||||||||||||
All Other Banks | 2,314,080 | 59.3 | % | 2,518,219 | 58.4 | % | 2,398,976 | 57.7 | % | |||||||||||
Total 4 | $ | 3,904,399 | 100 | % | $ | 4,303,425 | 100 | % | $ | 4,155,218 | 100 | % | ||||||||
Less mandatorily redeemable stock | (13,734 | ) | (11,259 | ) | — | |||||||||||||||
Total Capital Stock | $ | 3,890,665 | $ | 4,292,166 | $ | 4,155,218 | ||||||||||||||
n/a = Not applicable as amount does not fall within the 10 largest capital stockholders.
| 1 | Bank One, NA was acquired by JP Morgan Chase, an out-of-district financial institution, in 2004. The capital stock of Bank One, NA was transferred to its affiliate, One Mortgage Partners Corp., which remains an in-district member. |
| 2 | Subsequent to October 18, 2005, the PrivateBank & Trust Co. and Self-Reliance Ukrainian - FCU have submitted requests to redeem all of their capital stock and withdraw from membership in the Bank. Their capital stock amounts have been subsequently reclassified as a liability (mandatorily redeemable capital stock) in accordance with SFAS 150. These redemption requests are subject to the Bank’s ability to meet its regulatory capital requirements at the expiration of the six month withdrawal notice period. |
| 3 | First Federal Capital Bank was acquired by the Associated Bank of Green Bay in February 2005. |
| 4 | Includes mandatorily redeemable capital stock of $13.7 million at September 30, 2005 and $11.3 million at December 31, 2004 which is recorded as a liability per SFAS 150 in the accompanying financial statements and is included in the calculation of the regulatory capital to asset ratio. |
The Bank’s regulatory capital-to-assets ratios of 5.3%, 5.6% and 5.2% at September 30, 2005 and December 31, 2004 and 2003, respectively, were greater than the regulatory required level of 4.0% and greater than the current 4.5% capital level required by the Bank’s Written Agreement with the Finance Board, as amended on October 18, 2005. See “Item 9—Market Price and Dividends on the Registrant’s Common Equity Security and Related Stockholder Matters,” for a description of the Bank’s dividend policy. In accordance with the amendment, on December 14, 2005, the Bank submitted a revised retained earnings and dividend policy to the Finance Board for approval and the Finance Board is reviewing the Bank’s submission.
Under the GLB Act, the Bank is required to implement a new capital plan. The Finance Board published a final rule implementing a new capital structure for the Bank, which includes risk-based and leverage capital requirements, different classes of stock that the Bank may issue and the rights and preferences that may be associated with each class of stock. The Finance Board originally approved the Bank’s capital plan on June 12, 2002. However, the Bank is re-assessing its capital plan and is likely to propose amendments to its capital plan to the Finance Board. Until such time as the Bank fully implements its new capital plan, the current capital rules remain in effect.
81
Table of Contents
The current capital rules require members to purchase capital stock equal to the greater of 1% of their mortgage-related assets at the most recent calendar year end or 5% of outstanding member advances with the Bank. At September 30, 2005 and December 31, 2004, Bank members held 23,381,000 and 27,428,000 shares of voluntary capital stock, respectively. These holdings represented 53% and 57% of the Bank’s regulatory capital, respectively, which is equal to the Bank’s total capital stock plus its retained earnings and mandatorily redeemable capital stock. Voluntary capital stock at December 31, 2003 was 24,201,000 shares above membership collateral requirements, or 53% of the Bank’s regulatory capital.
When the new capital plan has been implemented, the Bank will be subject to risk-based capital rules. Each FHLB may offer two classes of stock. Provided the FHLB is adequately capitalized, members can redeem Class A stock by giving six months notice, and members can redeem Class B stock by giving five years notice. Only “permanent” capital, defined as retained earnings and Class B stock, satisfies the risk-based capital requirement. In addition, the 1999 Act specifies a 5% minimum leverage ratio based on total capital including a 1.5 weighting factor applicable to Class B stock. It also specifies a 4% minimum capital ratio that does not include the 1.5 weighting factor applicable to Class B stock used in determining compliance with the 5% minimum leverage ratio.
The following table summarizes the Bank’s total capital and leverage requirements under both the current regulatory requirements and the proposed regulatory requirements.
(Dollars in thousands) | Regulatory Capital In Effect (1) | Regulatory Capital In Effect | Actual (restated) | Standard & Proposed Regulatory Capital Requirement (2) | |||||
Total Capital (1) | |||||||||
October 18, 2005 | 4.5 | % | 3,728,483 | 4,455,976 | 3,314,207 | ||||
September 30, 2005 | 5.1 | % | 4,235,771 | 4,412,855 | 3,322,174 | ||||
December 31, 2004 | 5.1 | % | 4,371,140 | 4,792,793 | 3,428,345 | ||||
December 31, 2003 | 4.0 | % | 3,477,679 | 4,542,092 | 3,477,679 | ||||
December 31, 2002 | 4.0 | % | 2,601,836 | 3,296,041 | 2,601,836 | ||||
Leverage Capital (3) | |||||||||
October 18, 2005 | n/a | n/a | 6,683,964 | 4,142,759 | |||||
September 30, 2005 | n/a | n/a | 6,619,283 | 4,152,718 | |||||
December 31, 2004 | n/a | n/a | 7,189,190 | 4,285,432 | |||||
December 31, 2003 | n/a | n/a | 6,813,138 | 4,347,099 | |||||
December 31, 2002 | n/a | n/a | 4,944,062 | 3,252,295 |
| 1 | The regulatory capital ratio required by Finance Board regulations for all FHLBs is 4.0% for all periods presented. However, effective June 30, 2004, the Bank had been operating under a Written Agreement that required a 5.1% regulatory capital ratio. On October 18, 2005, the Written Agreement was amended to reduce the regulatory capital ratio to 4.5%. In addition, until amended or terminated, the amendment also requires the Bank to maintain another separate measure of minimum total regulatory capital stock of $3.978 billion. The minimum dollar requirement is currently more restrictive than the requirement in the table above and takes precedence until such time as the Bank’s assets increase to a point where the regulatory capital ratio would become more restrictive. |
| 2 | The standard and proposed regulatory capital requirement was calculated assuming the regulatory capital ratio was 4.0%. |
| 3 | Actual leverage capital was calculated assuming all current capital stock will be converted into Class B capital stock. |
n/a = not applicable
82
Table of Contents
The Bank maintains a diversified membership base within the Bank’s geographical territory of Illinois and Wisconsin. Bank membership is reflective of all of the diverse areas and economies within the region. The Bank endeavors to serve all of its membership while not becoming dependent on any member or segment of members. The Bank had 885 members as of September 30, 2005, down 8 from 893 members as of December 31, 2004, but a net increase of 1 from the December 31, 2003 member count of 884. Mandatorily redeemable capital stock held by former members is redeemed as their advances mature provided that the Bank is able to meet its minimum regulatory capital requirements. There are no requirements for members who have sold MPF Loans to the Bank to maintain additional capital stock in the Bank. The largest ten stockholders control 40.7% of the Bank’s total capital stock as of September 30, 2005.
As of September 30, 2005, six members had outstanding requests notifying the Bank to redeem their capital stock, five due to mergers and one due to withdrawal from membership. The Bank reclassified $13.7 million of capital stock to mandatorily redeemable capital stock on the statements of condition with payment subject to a six month waiting period and the Bank meeting its minimum regulatory capital requirements. The Bank anticipates these redemptions will occur beyond 2005 due to collateral borrowing requirements. As of December 31, 2004, two members had outstanding requests that the Bank redeem their capital stock and withdraw them from membership. The Bank reclassified $4.6 million of capital stock to mandatorily redeemable capital stock on the statements of condition with payment subject to a six month waiting period. During the nine months ended September 30, 2005, the Bank has completed the redemptions of both members.
In accordance with SFAS 150, the Bank reclassifies capital stock subject to redemption from equity to a liability once a member gives notice of intent to withdraw from membership or attains non-member status by merger or acquisition, charter termination, or involuntary termination from membership. In each case such shares of capital stock meet the definition of a mandatorily redeemable financial instrument. The restriction on paying out voluntary capital stock or other provisions that may delay or accelerate the timing of a mandatory redemption (related to a withdrawal of membership) does not affect the classification of mandatorily redeemable capital stock as a liability. Capital stock is reclassified to a liability (mandatorily redeemable capital stock) at fair value. Dividends related to capital stock classified as a liability are accrued at the expected dividend rate and reported as interest expense in the statements of income.
83
Table of Contents
The following table is a summary of mandatorily redeemable capital stock:
| For the Nine Months Ended September 30, 2005 | For the Year Ended December 31, 2004 | |||||||||||||
(Dollars in thousands) | Amount | Number of Members | Amount | Number of Members | ||||||||||
Mandatorily redeemable capital stock | ||||||||||||||
- beginning balance | $ | 11,259 | 5 | $ | 33,588 | 6 | ||||||||
Redemption requests: | ||||||||||||||
Acquisition related | 145,873 | 7 | 55 | — | ||||||||||
Withdrawals | 121 | 1 | 4,558 | 2 | ||||||||||
Redemption distributions: | ||||||||||||||
Acquisition related | (138,082 | ) | (3 | ) | (26,942 | ) | (3 | ) | ||||||
Withdrawals | (5,437 | ) | (4 | ) | — | — | ||||||||
Mandatorily redeemable capital stock | ||||||||||||||
-ending balance | $ | 13,734 | 6 | $ | 11,259 | 5 | ||||||||
Earnings impact from reclassification of dividends to interest expense | $ | 733 | $ | 1,516 | ||||||||||
Subsequent to the Bank announcing its discontinuation of redeeming voluntary capital stock on October 18, 2005, the Bank received membership withdrawal notices and related redemption requests from five members totaling $235 million through February 6, 2006. These requests were reclassified from equity to a liability upon receipt of the members’ notice. Redemption occurs after the six month notice period subject to the Bank meeting its capital requirements.
In addition, the amount of redemption requests for voluntary capital stock that have been denied (since the decision by the Bank’s Board of Directors to discontinue voluntary stock redemptions) is $240 million as of February 6, 2006. This amount may not be indicative of future redemption requests and also may not be indicative of the potential impact on the Bank’s future capital position once the restriction on voluntary stock redemptions is lifted. It should be noted that once a redemption request for voluntary capital stock is not approved, the redemption request does not remain outstanding. Instead, the member would need to submit a new redemption request after the restriction on voluntary stock redemptions is lifted. The Bank’s accounting policy is to not reclassify voluntary capital stock redemption requests from capital stock to a liability unless the Bank, at its discretion, determines that it will honor such requests. As long as the Bank decides not to approve such redemption requests, no reclassification from equity to liability is recorded, because members do not have the ability to redeem their voluntary capital stock.
During the period from October 1, 2005 through December 31, 2005, no payments were made to redemption requests previously classified in mandatorily redeemable capital stock. Redemption requests are honored subject to the Bank maintaining its minimum regulatory capital requirements. The Bank also considers its liquidity requirements in conjunction with redemptions.
The following events involving members holding substantial amounts of the Bank’s capital stock would reduce the Bank’s capital-to-assets ratio provided the Bank would remain in compliance with its regulatory capital requirements.
| • | A mandatory redemption of capital stock in connection with a consolidation by a member with a financial institution outside of the Bank’s geographic district; or |
| • | A mandatory redemption of capital stock in connection with a voluntary withdrawal from membership. |
The Bank does not currently have a risk-based capital requirement. However, the Bank uses the Office of Thrift Supervision defined regulatory requirement based on Title 12 Part 567 of the Code of Federal Regulations in order to compare to
84
Table of Contents
industry standards. Using this standard, the September 30, 2005 total risk-based capital was 22.1% of regulatory capital, compared to 22.8% at December 31, 2004, and 23.4% at December 31, 2003. The Bank’s debt-to-capital ratio was 17 times at September 30, 2005 and December 31, 2004 and 2003.
The Bank has paid dividends in the form of additional shares of capital stock since 2000 except for fractional amounts of less than one share which have been paid in cash until the fourth quarter of 2005 when fractional shares have begun to be paid in fractional shares of stock. The dividends based on fourth quarter 2005 results and paid in the first quarter of 2006 were paid all in cash and the Bank anticipates that it will continue to pay cash dividends in the near future.
While payment of a capital stock dividend has not affected total capital, it has affected the composition of capital as the dividend reduces retained earnings and increases capital stock. Redemption requests associated with capital stock dividend payments are considered to be voluntary stock redemptions. In connection with the redemptions of capital stock in cash due to regularly recurring redemption requests after capital stock dividends, the Bank is subject to liquidity requirements as described in “Item 1.5—Regulations—Capital, Capital Rules, and Dividends—Dividends.” As of September 30, 2005, all such redemption requests had been honored. However, beginning October 18, 2005, the Bank discontinued redemptions of voluntary stock, including redemptions of stock dividends and effective with the dividend on fourth quarter 2005 results to be paid in the first quarter of 2006, dividends will be paid all in cash and are expected to continue to be paid in cash in the near future.
An increasing minority of active members have established a pattern of requesting redemption of voluntary capital stock which corresponds to the amount of the stock dividend shortly after that dividend has been paid (“Dividend Redemptions”). The Bank does not give priority to Dividend Redemption requests and does not differentiate Dividend Redemptions from other voluntary redemptions. However, on October 18, 2005, the Bank’s Board of Director’s discontinued voluntary capital stock redemptions and therefore the Bank will be unable to honor Dividend Redemption requests while the discontinuance of voluntary stock redemptions remains in effect.
85
Table of Contents
| For the Nine Months Ended September 30, | For the Years Ended December 31, | |||||||||||||||||||||||||||||||||||
(Dollars in thousands) | 2005 (restated) | 2004 | Inc/(Decr) 2005/2004 | 2004 | 2003 | Incr/(Decr) 2004/2003 | 2003 | 2002 | Incr/(Decr) 2003/2002 | |||||||||||||||||||||||||||
Net interest income after provision for credit losses on mortgage loans | $ | 386,809 | $ | 548,265 | $ | (161,456 | ) | $ | 704,343 | $ | 793,826 | $ | (89,483 | ) | $ | 793,826 | $ | 520,676 | $ | 273,150 | ||||||||||||||||
Other income (loss) | (40,662 | ) | (98,792 | ) | 58,130 | (127,131 | ) | (113,179 | ) | (13,952 | ) | (113,179 | ) | (184,378 | ) | 71,199 | ||||||||||||||||||||
Other expense | 89,113 | 82,955 | 6,158 | 121,056 | 86,430 | 34,626 | 86,430 | 57,681 | 28,749 | |||||||||||||||||||||||||||
Income before assessments | 257,034 | 366,518 | (109,484 | ) | 456,156 | 594,217 | (138,061 | ) | 594,217 | 278,617 | 315,600 | |||||||||||||||||||||||||
Assessments | 68,252 | 108,327 | (40,075 | ) | 132,139 | 157,687 | (25,548 | ) | 157,687 | 73,918 | 83,769 | |||||||||||||||||||||||||
Cumulative effect of change in accounting principle | — | 41,441 | (41,441 | ) | 41,441 | — | 41,441 | — | — | — | ||||||||||||||||||||||||||
Net income | $ | 188,782 | $ | 299,632 | $ | (110,850 | ) | $ | 365,458 | $ | 436,530 | $ | (71,072 | ) | $ | 436,530 | $ | 204,699 | $ | 231,831 | ||||||||||||||||
Other operating expense to average assets (annualized)* | 0.14 | % | 0.12 | % | 0.02 | % | 0.12 | % | 0.10 | % | 0.02 | % | 0.10 | % | 0.09 | % | 0.01 | % | ||||||||||||||||||
Interest spread between yields on interest earning assets and interest-bearing liabilities | 0.43 | % | 0.68 | % | -0.25 | % | 0.65 | % | 0.96 | % | -0.31 | % | 0.96 | % | 0.79 | % | 0.17 | % | ||||||||||||||||||
Yield on average assets | 4.13 | % | 3.53 | % | 0.60 | % | 3.61 | % | 3.64 | % | -0.03 | % | 3.64 | % | 4.12 | % | -0.48 | % | ||||||||||||||||||
Return on equity (annualized) | 5.62 | % | 8.41 | % | -2.79 | % | 7.70 | % | 10.65 | % | -2.95 | % | 10.65 | % | 6.92 | % | 3.73 | % | ||||||||||||||||||
| * | Other operating expense includes salary and benefits, professional service fees, depreciation of premises and equipment, and other operating expenses. |
Nine months ended September 30, 2005 compared to nine months ended September 30, 2004
Net income decreased $110.9 million, or 37.0%, to $188.8 million for the nine months ended September 30, 2005 from $299.6 million for the comparable period in 2004. The decline in net income was principally due to a decline in net interest income of $161.5 million as a result of a flattening yield curve and reduction in average interest earning assets. The nine months ended September 30, 2004 included $41.4 million of a cumulative effect of a change in accounting principle related to SFAS 91 when the Bank changed its method of accounting for the deferred agent fees and premiums and discounts on mortgage loans to amortize such amounts on a constant effective yield over their contractual life.
Net interest income decreased $161.5 million or 29.4%, to $386.8 million from $548.3 million for the comparable period of 2004. The decrease in net interest income was primarily a result of two factors: a flattening yield curve and a reduction in interest earning assets. For the nine months ended September 30, 2005 flattening yield curve reduced net interest income by $86.2 million compared to the nine months ended September 30, 2004. During the nine months ended September 30, 2005, short-term interest rates increased more significantly than longer term interest rates. This decreased the net interest spread the Bank earned on its interest earning assets, particularly advances and mortgage loans, and the interest the Bank paid on its debt
In addition, to a flattening yield curve, the Bank’s average balances of interest earning assets, including advances, mortgage loans and long-term investments decreased by $5.1 or 5.7% billion during the nine months ended September 30, 2005 compared to September 30, 2004. The decrease in average balances reduced net interest income by $75.3 million for the nine months ended September 30, 2005 compared to the nine months ended September 30, 2004.
Average advances for the nine months ended September 30, 2005 decreased $2.7 billion, or 10.0%, from 2004 primarily because one member paid off more than $3 billion of its advances after it merged with an out-of-district institution. The decrease in average advances volume was more than offset by an increase in yield and interest rates so that interest income from advances increased by $153.3 million, or 37.2%, for the nine months ended September 30, 2005 compared to the same period in 2004. Average mortgage loans held in portfolio for the nine months ended September 30, 2005 decreased $2.9 billion, or 6.0%,
86
Table of Contents
compared to September 30, 2004 primarily due to paydowns of existing mortgages and a decline in fixed-rate mortgage loan activity as demand for adjustable rate mortgages increased. In addition, as the mortgage loan portfolio has paid down, the Bank used excess funds to increase its liquidity position to meet voluntary capital stock redemption requests and pay down consolidated obligations to maintain its regulatory capital ratio above the required minimum level. The decrease in average mortgage loans reduced interest income by $56.3 million, or 3.3%, for the nine months ended September 30, 2005 compared to the same period in 2004.
Other income (loss) declined $58.1 million, or 58.8%, to a loss of $40.7 million from a loss of $98.8 million primarily due to the following reasons:
| • | Net realized gain (loss) from sale of available-for-sale securities declined $19.2 million, or 91.3%, to a loss of $1.8 million for the nine months ended September 30, 2005 from a loss of $21.1 million for the comparable period in 2004. The Bank had minimal sales of available for sale securities in the nine months ended September 30, 2005. In 2004, the Bank sold available for sale securities for a loss due to a rise in short term interest rates. These sales were primarily the result of a hedge against consolidated obligations transferred to other FHLBs. |
| • | Net realized and unrealized gain (loss) on derivatives and hedging activities declined $76.4 million, or 72.5%, to a loss of $29.0 million for the nine months ended September 30, 2005 from a loss of $105.4 million for the comparable period in 2004, primarily a result of fair value adjustments associated with derivatives and hedging activities. Some or all of the unrealized gain or loss recognized on the derivative is offset by a corresponding unrealized loss or gain on the underlying hedged instrument. As described in Item 2.2 “Management’s Discussion and Analysis of Financial Condition and Results of Operations – Restatement of Financial Statements”, the Bank restated $11.9 million from OCI to expense (net realized and unrealized gain (loss) on derivatives and hedging activities). Below is a chart summarizing the sources of gains/(losses) on derivatives and hedging activities recorded in earnings, including the effect of the restatement as stand-alone derivatives. |
Sources of Gains / (Losses) on Derivatives and Hedging Activities Recorded in Earnings
(Dollars in thousands) | For the Nine Months Ended September 30, 2005 | For the Nine Months Ended September 30, 2004 | ||||||||||||||||||||||||||||||
Hedged Item | Fair Value Hedges | Cash Flow Hedges | Economic (restated) | Total (restated) | Fair Value Hedges | Cash Flow Hedges | Economic Hedges | Total | ||||||||||||||||||||||||
Advances | $ | 1,080 | $ | (3,281 | ) | $ | 1 | $ | (2,200 | ) | $ | (1,018 | ) | $ | 44,532 | $ | — | $ | 43,514 | |||||||||||||
Consolidated Obligations | 1,802 | 3,286 | (83 | ) | 5,005 | 3,226 | (3,427 | ) | — | (201 | ) | |||||||||||||||||||||
Investments | — | — | 10,476 | 10,476 | — | — | (4,487 | ) | (4,487 | ) | ||||||||||||||||||||||
MPF Program | (18,967 | ) | 4 | (11,831 | ) | (30,794 | ) | (73,400 | ) | — | (71,166 | ) | (144,566 | ) | ||||||||||||||||||
Stand-alone derivatives | — | — | (11,472 | ) | (11,472 | ) | — | — | 363 | 363 | ||||||||||||||||||||||
Total | $ | (16,085 | ) | $ | 9 | $ | (12,909 | ) | $ | (28,985 | ) | $ | (71,192 | ) | $ | 41,105 | $ | (75,290 | ) | $ | (105,377 | ) | ||||||||||
The above increases in other income (loss) were partially offset by the following decrease:
| • | Net realized gain from early extinguishment of debt transferred to other FHLBs decreased $41.9 million, or 90.1%, to $4.6 million for the nine months ended September 30, 2005 from $46.5 million for the comparable period in 2004 due to the minimal amount of consolidated obligations that were transferred to other FHLBs in 2005. The amount of transfers in 2004 were higher due to the Bank’s reduced need for funding pending the Written Agreement with the Finance Board and the rising interest rate environment, resulting in a gain when the debt was transferred to the other FHLBs at market rates. The gain on the consolidated obligations sold was offset by a loss of $2.4 million on associated sales of available-for-sale securities that hedged the transferred debt. The loss was recorded in the net realized gain (loss) from sale of available-for-sale securities line in the Statements of Income. |
87
Table of Contents
Other expenses increased $6.2 million, or 7.4%, to $89.1 million for the nine months ended September 30, 2005 from $82.9 million for the comparable period in 2004 primarily due to the following reason:
| • | Salary and benefits increased $8.5 million, or 25.7%, to $41.3 million for the nine months ended September 30, 2005 from $32.8 million for the comparable period in 2004. The number of employees at September 30, 2005 was 427 full-time equivalents, compared to 358 a year ago. The Bank has added employees to support the build out of new computer hardware and software in Information Systems and in control functions in Finance, Legal and Risk Management in response to requirements under Sarbanes-Oxley, including Section 404 compliance, SEC Registration and Written Agreement requirements. |
The Bank is obligated to set aside funds for the Affordable Housing Program (AHP) and to make payments to Resolution Funding Corporation (REFCORP). Currently, combined assessments for AHP and REFCORP are the equivalent of an approximately 26.5% effective tax rate for the Bank, and accordingly the amount of such payments declined as the Bank’s income decreased. AHP and REFCORP accruals for the nine months ended September 30, 2005 were $21.0 million and $47.2 million compared to $33.4 million and $74.9 million, respectively, for the same period in 2004. Assessment amounts on the statements of income for the nine month period ended September 30, 2004 include the amounts for the cumulative effect of change in accounting principle in the amounts of $7.6 million and $3.4 million for REFCORP and AHP, respectively. The Bank is exempt from all federal, state, and local taxation except for real estate property taxes, which are a component of the Bank’s lease payments for space or on real estate owned by the Bank as a result of foreclosure on MPF Loans.
Year ended December 31, 2004 compared to year ended December 31, 2003
Net income for the year ended December 31, 2004 decreased $71.0 million, or 16.3%, to $365.5 million from $436.5 million for the same period ended December 31, 2003. The Bank’s return on equity (“ROE”) was 7.70% for the year ended December 31, 2004, compared to 10.65% for the same period in 2003.
The Bank’s decline in net income was primarily due to the higher interest expense on consolidated obligations. For the year ended December 31, 2004, consolidated obligations interest expense increased $576.5 million or 30.8% compared with the same period in 2003. The higher interest expense reflects the growth in the Bank’s assets and an increase in weighted average interest rates on long-term consolidated obligation bonds from 3.59% to 3.68% and on short-term consolidated discount notes from 1.05% to 2.08%.
Net interest income after mortgage loan loss decreased $89.5 million or 11.3% for the year ended December 31, 2004 compared to the year ended December 31, 2003. The net interest spread between the yield on earning assets and the cost of interest-bearing liabilities for the year ended December 31, 2004 was 65 basis points compared with a net interest spread of 96 basis points during the same period in 2003. The yield on average assets was 3.61% for the year ended December 31, 2004, 3 basis points lower than the same period in 2003. The yield on average interest bearing liabilities was 2.96% for the year ended December 31, 2004, 28 basis points higher than the same period in 2003. This compression in spread and higher cost of funding is attributable to the flattening of the yield curve related to the Federal Reserve’s short term rate increases throughout the second half of 2004.
Although the Bank’s interest-rate spread declined for the year ended December 31, 2004, average balances in both MPF Loan products and advances increased from 2003 to partially offset the decline in net interest rates. For the year ended December 31, 2004 average daily advances outstanding increased 5.6% to $26.2 billion, while average daily MPF Loans outstanding increased 25.2% to $47.5 billion. Interest income on MPF Loans was $420.2 million or 22.7% higher than the year ended December 31, 2003 as a result of the Bank’s increased average daily mortgage loans balance.
In the other income (loss) section, net gains on derivatives of $89.3 million represented a $414.7 million decline from 2003 and were primarily related to economic hedges of mortgage loans. The decrease was offset by a corresponding $400.5 million increase in the SFAS 133 adjustments recognized primarily on consolidated obligation hedging instruments. The interest impact of non-effective hedges was lower in 2004 and comprised the $12.7 million residual difference in net realized and unrealized gain (loss) on derivatives and hedging activities. Reduced levels of debt extinguishment from the transfer of instruments to other FHLBs contributed to the lower net loss of ($127.1) million in other income (loss).
88
Table of Contents
Other expenses increased $34.6 million or 40.0% to $121.1 million for the year ended December 31, 2004. Salaries and benefits increased $10.0 million or 28.1% for the year ended December 31, 2004 compared to the year ended December 31, 2003 primarily due to an increase in the number of employees to support increased regulatory requirements for risk management, compliance with the Sarbanes-Oxley Act of 2002, and preparation for SEC registration. Other operating expenses increased $8.9 million or 51.1% and were related to the MPF Program, due to the continued national development of the program. The percentage of operating expenses (salary and benefits, professional service fees, depreciation of premises and equipment, and other operating expenses) to average assets for the year ended December 31, 2004 was 0.118%, compared with 0.096% for the year ended December 31, 2003.
In 2004, the Bank recorded a $41.4 million cumulative effect adjustment (pre-assessment) as a result of a change in accounting principle for the amortization of mortgage loan premiums and discounts. The Bank changed its method of accounting for deferred agent fees and premiums and discounts on mortgage loans to amortize such amounts on a constant effective yield over their contractual life. For further details on this change in accounting principle, refer to Note 2 – Change in Accounting Principle and Recently Issued Accounting Standards and Interpretations to the Bank’s 2004 Annual Financial Statements and Notes.
Year ended December 31, 2003 compared to year ended December 31, 2002
Net Income for the Bank increased to $436.5 million in 2003 from $204.7 million in 2002, an increase of $231.8 million or 113.3% over the previous year. The Bank’s return on equity (“ROE”) was 10.65% in 2003, compared to 6.92% in 2002. Net Interest Income (after provision for credit losses on mortgage loans) increased $273.1 million or 52.5% for the year. The spread between the yield on earning assets and the cost of interest-bearing liabilities in 2003 was 96 basis points, 17 basis points higher than in 2002. The yield on average assets was 3.64% in 2003, 48 basis points lower than in 2002. The yield on average liabilities was 2.68% for 2003, 65 basis points lower than 2002. This expansion in spread income and lower cost of funding as attributable to the benefits of sustained low short term interest rates in 2003 compared to the Federal Reserve’s short term rate decreases throughout 2002.
The Bank’s interest-rate spread increased for 2003, as volumes in both the advance and MPF Loan products increased from 2002. Average MPF Loans outstanding increased 86.0% to $38.0 billion for 2003. Average advances increased 4.7% to $24.8 billion. Interest income on MPF Loans was $609.7 million higher than 2002 as a result of the Bank’s increased mortgage loans balance.
Another contributor to the Bank’s $273.1 million or 52.5% increase in net interest income (after provision for credit losses on mortgage loans) for the year ended December 31, 2003 was the Bank’s ability to manage its market risk profile with a combination of cash and derivative transactions. Interest rates in May 2003 were the lowest in over 40 years, causing unprecedented activity in mortgage refinancing. The continued steep slope of the yield curve allowed the Bank to replace its higher-cost long-term debt with shorter-term lower-cost debt in anticipation of the higher refinancing activity. The asset mix of the Bank’s balance sheet continued to be shifted toward higher-yielding MPF assets. At year-end, MPF Loans represented 54.7% of the Bank’s assets compared to 40.3% at the end of 2002.
The Bank lowered the cost of its long-term borrowings through the continued development of syndicated global bond offerings, a program begun at the Bank in May 2002. Although the Bank lowered its yield on long-term borrowings from 3.97% in 2002 to 3.33% in 2003, the increased volume needed to fund the growing mortgage portfolio increased the 2003 total consolidated obligation interest expense $200.4 million over 2002.
Total premium/discount amortization related to the Bank’s mortgage loans for the year was $193.7 million. This was substantially higher than in 2002 due to the high level of mortgage refinance activity experienced during the year as well as higher average mortgage balances.
The yield on long-term investments also declined by 141 basis points for the year ended December 31, 2003 compared to December 31, 2002, as interest rates declined and prepayments from MBS were invested in lower yielding securities.
89
Table of Contents
Total other income went from a loss of $184.4 million in 2002 to a loss of $113.2 million in 2003. The Bank transferred long-term bonds to other FHLBs, increasing the gain on extinguishment of debt by $108.5 million over 2002. This activity allowed participating FHLBs to generate funding at levels better than comparable FHLB Tap issues (a program for issuing bullet bonds with specified maturities that is reopened at competitive auction over a three-month period), thereby providing direct, tangible benefits to both the Bank and the FHLBs. All eleven other FHLBs participated in 2003.
Net gains on derivatives of $504.0 million were $689.8 million above the 2002 net loss of ($185.8) million, but this was partially offset by a net reduction of ($435.8) million in SFAS 133 adjustments in 2003, particularly in advance instruments. Reductions in the losses on futures contracts and on the interest impact of non-effective hedges also contributed to lower other income (loss) in 2003.
The Bank sold available-for-sale securities during 2003 at a loss of $35.8 million as a result of declining interest rates on adjustable rate securities. The Bank also reported a $56.6 million loss on trading securities in 2003, compared with a $295.6 million gain in 2002 that was primarily due to a $1.5 billion decrease in balance sheet position to realize the gains in market value.
Other expense increased $28.7 million, to $86.4 million in 2003. Salaries and benefits increased $9.8 million primarily due to an increase in the number of employees, a direct result of the growth of the MPF Program and the MPF Shared Funding initiative. Increases in other operating expenses were related to the MPF Program, due to the continued national development of the program and the increase in MPF volume. The percentage of operating expenses to average assets for 2003 was 0.096%, compared with 0.088% for 2002.
90
Table of Contents
Average Balances/Net Interest Margin/Rates
| For the Nine Months Ended September 30, | ||||||||||||||||||||
| 2005 | 2004 | |||||||||||||||||||
(Dollars in thousands) | Average Balance (restated) | Interest | Yield/ Rate | Average Balance | Interest | Yield/ Rate | ||||||||||||||
Assets | ||||||||||||||||||||
Federal funds sold and securities purchased under agreements to resell | $ | 6,922,730 | $ | 155,061 | 2.95 | % | $ | 6,300,706 | $ | 52,866 | 1.10 | % | ||||||||
Other short-term investments | 952,183 | 23,108 | 3.20 | % | 1,071,148 | 10,275 | 1.26 | % | ||||||||||||
Long-term investments 1 | 7,213,345 | 232,235 | 4.29 | % | 7,261,799 | 200,121 | 3.67 | % | ||||||||||||
Advances 1 | 24,269,713 | 565,295 | 3.07 | % | 26,993,753 | 411,951 | 2.01 | % | ||||||||||||
Mortgage loans held in portfolio 1,2,3 | 44,798,135 | 1,639,915 | 4.88 | % | 47,659,308 | 1,696,185 | 4.75 | % | ||||||||||||
Total earning assets | 84,156,106 | $ | 2,615,614 | 4.13 | % | 89,286,714 | $ | 2,371,398 | 3.53 | % | ||||||||||
Allowance for loan losses on mortgage loans | (4,596 | ) | (5,199 | ) | ||||||||||||||||
Other assets | 759,125 | 1,286,625 | ||||||||||||||||||
Total assets | $ | 84,910,635 | $ | 90,568,140 | ||||||||||||||||
Liabilities and Capital | ||||||||||||||||||||
Time Deposits | $ | 111,135 | $ | 2,292 | 2.72 | % | $ | 315,810 | $ | 2,849 | 1.19 | % | ||||||||
Other interest-bearing deposits | 1,074,965 | 22,993 | 2.82 | % | 1,662,457 | 12,705 | 1.00 | % | ||||||||||||
Short term borrowings | 17,071,617 | 382,196 | 2.95 | % | 20,727,314 | 185,066 | 1.17 | % | ||||||||||||
Long-term debt 1 | 60,658,562 | 1,781,577 | 3.92 | % | 61,181,322 | 1,599,377 | 3.49 | % | ||||||||||||
Other borrowings | 1,216,706 | 39,747 | 4.31 | % | 1,229,912 | 23,136 | 2.47 | % | ||||||||||||
Total interest-bearing liabilities | 80,132,985 | $ | 2,228,805 | 3.70 | % | 85,116,815 | $ | 1,823,133 | 2.85 | % | ||||||||||
Non-interest-bearing deposits | 69,915 | 58,139 | ||||||||||||||||||
Other liabilities 4 | 229,893 | 642,906 | ||||||||||||||||||
Total Capital 4 | 4,477,842 | 4,750,280 | ||||||||||||||||||
Total Liabilities and Capital | $ | 84,910,635 | $ | 90,568,140 | ||||||||||||||||
Net interest income and net yield on interest-earning assets | $ | 386,809 | 0.61 | % | $ | 548,265 | 0.82 | % | ||||||||||||
Interest rate spread | 0.43 | % | 0.68 | % | ||||||||||||||||
Average interest earning assets to interest bearing liabilities | 105.02 | % | 104.90 | % | ||||||||||||||||
| Notes: |
| 1 | Yields/Rates are based on average amortized cost balances. |
| 2 | Nonperforming loans, which include non-accrual and renegotiated loans, are included in average balances used to determine the yield. |
| 3 | Interest income includes amortization of net premiums of approximately $75.3 million and $105.7 million during the nine months ended September 30, 2005 and 2004, respectively. |
| 4 | Restated amounts include other liabilities and total capital. |
91
Table of Contents
Average Balances/Net Interest Margin/Rates (cont’d)
| For the Years Ended December 31, | ||||||||||||||||||||||||||||||
| 2004 | 2003 | 2002 | ||||||||||||||||||||||||||||
(Dollars in thousands) | Average Balance | Interest | Yield /Rate | Average Balance | Interest | Yield /Rate | Average Balance | Interest | Yield /Rate | |||||||||||||||||||||
Assets | ||||||||||||||||||||||||||||||
Federal funds sold and securities purchased under agreements to resell | $ | 6,708,407 | $ | 91,532 | 1.36 | % | $ | 4,244,571 | $ | 48,219 | 1.14 | % | $ | 3,185,038 | $ | 63,362 | 1.99 | % | ||||||||||||
Other short-term investments | 1,157,827 | 17,933 | 1.55 | % | 365,594 | 5,948 | 1.63 | % | 408,984 | 8,953 | 2.19 | % | ||||||||||||||||||
Long-term investments (1) | 7,275,987 | 276,888 | 3.81 | % | 7,677,708 | 273,840 | 3.57 | % | 7,578,628 | 377,541 | 4.98 | % | ||||||||||||||||||
Advances (1) | 26,229,269 | 554,103 | 2.11 | % | 24,837,901 | 555,196 | 2.24 | % | 23,733,666 | 590,264 | 2.49 | % | ||||||||||||||||||
Mortgage loans held in portfolio (1) (2) (3) | 47,505,233 | 2,270,068 | 4.78 | % | 37,951,971 | 1,849,906 | 4.87 | % | 20,400,463 | 1,240,179 | 6.08 | % | ||||||||||||||||||
Total earning assets | 88,876,723 | $ | 3,210,524 | 3.61 | % | 75,077,745 | $ | 2,733,109 | 3.64 | % | 55,306,779 | $ | 2,280,299 | 4.12 | % | |||||||||||||||
Allowance for loan losses on mortgage loans | (5,080 | ) | (5,521 | ) | (4,621 | ) | ||||||||||||||||||||||||
Other assets | 1,292,948 | 1,810,298 | 1,128,446 | |||||||||||||||||||||||||||
Total assets | $ | 90,164,591 | $ | 76,882,522 | $ | 56,430,604 | ||||||||||||||||||||||||
Liabilities and Capital | ||||||||||||||||||||||||||||||
Time Deposits | $ | 267,121 | 3,420 | 1.28 | % | $ | 406,277 | 5,265 | 1.30 | % | $ | 196,679 | 4,980 | 2.53 | % | |||||||||||||||
Other interest-bearing deposits | 1,585,472 | 18,959 | 1.20 | % | 3,012,403 | 30,851 | 1.02 | % | 2,764,618 | 42,611 | 1.54 | % | ||||||||||||||||||
Short term borrowings | 20,550,414 | 286,291 | 1.39 | % | 17,423,431 | 204,750 | 1.18 | % | 11,331,137 | 193,891 | 1.71 | % | ||||||||||||||||||
Long-term debt (1) | 61,114,753 | 2,164,771 | 3.54 | % | 50,189,364 | 1,669,792 | 3.33 | % | 37,328,355 | 1,480,237 | 3.97 | % | ||||||||||||||||||
Other borrowings | 1,231,120 | 32,740 | 2.66 | % | 1,242,383 | 28,625 | 2.30 | % | 1,196,923 | 35,687 | 2.98 | % | ||||||||||||||||||
Total interest-bearing liabilities | 84,748,880 | $ | 2,506,181 | 2.96 | % | 72,273,858 | $ | 1,939,283 | 2.68 | % | 52,817,712 | $ | 1,757,406 | 3.33 | % | |||||||||||||||
Non-interest-bearing deposits | 60,714 | 53,060 | 3,794 | |||||||||||||||||||||||||||
Other liabilities | 608,439 | 455,852 | 652,896 | |||||||||||||||||||||||||||
Total Capital | 4,746,558 | 4,099,752 | 2,956,202 | |||||||||||||||||||||||||||
Total Liabilities and Capital | $ | 90,164,591 | $ | 76,882,522 | $ | 56,430,604 | ||||||||||||||||||||||||
Net interest income and net yield on interest-earning assets | $ | 704,343 | 0.79 | % | $ | 793,826 | 1.06 | % | $ | 522,893 | 0.95 | % | ||||||||||||||||||
Interest rate spread | 0.65 | % | 0.96 | % | 0.79 | % | ||||||||||||||||||||||||
Average interest earning assets to interest bearing liabilities | 104.87 | % | 103.88 | % | 104.71 | % | ||||||||||||||||||||||||
| Notes: |
| (1) | Yields/Rates are based on average amortized cost balances. |
| (2) | Nonperforming loans, which include non-accrual and renegotiated loans, are included in average balances used to determine the yield. |
| (3) | Interest income includes amortization of net premiums of approximately $133 million, $194 million and $58 million in 2004, 2003 and 2002, respectively. |
92
Table of Contents
The table below shows the approximate effect on net interest income of volume and rate changes. For purposes of this table, changes that are not due solely to volume or rate changes are allocated to volume.
| For the Nine Months Ended September 30, | For the Years Ended December 31, | |||||||||||||||||||||||||||||||||||
| 2005 over 2004 | 2004 over 2003 | 2003 over 2002 | ||||||||||||||||||||||||||||||||||
(Dollars in thousands) | Volume | Rate | Increase/ (Decrease) | Volume | Rate | Increase/ (Decrease) | Volume | Rate | Increase/ (Decrease) | |||||||||||||||||||||||||||
Increase (decrease) in interest income: | ||||||||||||||||||||||||||||||||||||
Federal funds sold and securities purchased under agreements to resell | $ | 5,200 | $ | 96,995 | $ | 102,195 | $ | 28,555 | $ | 14,758 | $ | 43,313 | $ | 20,936 | $ | (36,079 | ) | $ | (15,143 | ) | ||||||||||||||||
Other short-term investments | (810 | ) | 13,643 | 12,833 | 12,911 | (926 | ) | 11,985 | (958 | ) | (2,047 | ) | (3,005 | ) | ||||||||||||||||||||||
Long-term investments | (14,183 | ) | 46,297 | 32,114 | (14,414 | ) | 17,462 | 3,048 | 4,555 | (108,256 | ) | (103,701 | ) | |||||||||||||||||||||||
Advances | (47,534 | ) | 200,878 | 153,344 | 33,005 | (34,098 | ) | (1,093 | ) | 27,027 | (62,095 | ) | (35,068 | ) | ||||||||||||||||||||||
Mortgage loans held in portfolio | (70,468 | ) | 14,198 | (56,270 | ) | 462,917 | (42,755 | ) | 420,162 | 1,068,946 | (459,219 | ) | 609,727 | |||||||||||||||||||||||
Total | $ | (127,795 | ) | $ | 372,011 | $ | 244,216 | $ | 522,974 | $ | (45,559 | ) | $ | 477,415 | $ | 1,120,506 | $ | (667,696 | ) | $ | 452,810 | |||||||||||||||
Increase (decrease) in interest expense: | ||||||||||||||||||||||||||||||||||||
Time deposits | $ | (1,872 | ) | $ | 1,315 | $ | (557 | ) | $ | (1,792 | ) | $ | (53 | ) | $ | (1,845 | ) | $ | 5,282 | $ | (4,997 | ) | $ | 285 | ||||||||||||
Other interest-bearing deposits | (4,584 | ) | 14,872 | 10,288 | (14,746 | ) | 2,854 | (11,892 | ) | 3,904 | (15,664 | ) | (11,760 | ) | ||||||||||||||||||||||
Short-term borrowings | (33,060 | ) | 230,190 | 197,130 | 38,385 | 43,156 | 81,541 | 103,203 | (92,344 | ) | 10,859 | |||||||||||||||||||||||||
Long-term debt | (12,350 | ) | 194,550 | 182,200 | 366,638 | 128,341 | 494,979 | 510,767 | (321,212 | ) | 189,555 | |||||||||||||||||||||||||
Other borrowings | (588 | ) | 17,199 | 16,611 | (317 | ) | 4,432 | 4,115 | 1,386 | (8,448 | ) | (7,062 | ) | |||||||||||||||||||||||
Total | $ | (52,454 | ) | $ | 458,126 | $ | 405,672 | $ | 388,168 | $ | 178,730 | $ | 566,898 | $ | 624,542 | $ | (442,665 | ) | $ | 181,877 | ||||||||||||||||
Increase (decrease) in net interest income | $ | (75,341 | ) | $ | (86,115 | ) | $ | (161,456 | ) | $ | 134,806 | $ | (224,289 | ) | $ | (89,483 | ) | $ | 495,964 | $ | (225,031 | ) | $ | 270,933 | ||||||||||||
Expenses
Affordable Housing Program (“AHP”)
The Bank’s AHP expense was $21.0 million and $33.4 million for the nine months ended September 30, 2005 and 2004, respectively; and $40.7 million, $48.5 million, and $22.7 million for the years ended December 31, 2004, 2003, and 2002, respectively. The Financial Institutions Reform, Recovery and Enforcement Act of 1989 (FIRREA) contains provisions for the establishment of an Affordable Housing Program (AHP) by each FHLB. Each FHLB provides subsidies in the form of direct grants or below-market interest-rate advances for members which use the funds for qualifying affordable housing projects. Annually, the FHLBs individually and collectively must set aside for the AHP the greater of: (1) that FHLB’s pro-rata share of $100 million to be contributed in total by the FHLBs on the basis of net earnings (defined as net earnings before charges for AHP and interest expense on mandatorily redeemable capital stock but after the charge to REFCORP or “pre-assessment net earnings”); or (2) 10% of that Bank’s current year’s pre-assessment net earnings for the AHP Program, which is then charged to income and recognized as a liability of the Bank. As subsidies are provided, the AHP liability is relieved.
Other than where the FHLBs’ net income is insufficient to meet the annual $100 million AHP obligation, the AHP assessment is equal to regulatory net income times 10%. Regulatory net income for AHP assessment purposes is equal to net income reported in accordance with U.S. GAAP before mandatorily redeemable capital stock related interest expense, AHP assessment and REFCORP assessment. The exclusion of mandatorily redeemable capital stock related interest expense is a regulatory calculation determined by the Finance Board.
If the results of the aggregate 10% calculation described above is less than $100 million for all twelve FHLBs, the Finance Board, the Bank’s regulator, will allocate the shortfall among the FHLBs based on the ratio of each FHLB’s pre-assessment net earnings to the sum of the pre-assessment net earnings of the twelve FHLBs. There was no shortfall in either 2004 or 2003. If the Bank has a loss, a credit is recorded. This credit can be used to apply for a refund for previous amounts paid, reimbursed from other FHLBs that had income, or carried forward against future income. The Bank had outstanding AHP-related advances of $796.5 thousand, $1.2 million, and $2.1 million at September 30, 2005, December 31, 2004 and 2003, respectively. For the nine months ended September 30, 2005, and for the years ended December 31, 2004, 2003, and 2002, the Bank has not issued any new AHP advances, with all AHP subsidies having been provided in the form of outright grants.
93
Table of Contents
REFCORP Payment
The REFCORP assessment of the Bank was $47.2 million and $74.9 million for the nine months ended September 30, 2005 and 2004, and $91.4 million, $109.2 million and $51.2 million for the years ended December 31, 2004, 2003, and 2002, respectively. Although the Bank is exempt from ordinary federal, state and local taxation except for local real estate tax, it is required to make payments to REFCORP. Each FHLB is required to pay 20% of net earnings after AHP assessment to REFCORP. The REFCORP assessment amounts to U.S. GAAP net income before the AHP and REFCORP assessments minus the AHP assessment. The result is multiplied by 20%. The Resolution Funding Corporation has been designated as the calculation agent for AHP and REFCORP assessments. Each FHLB provides its net income before AHP and REFCORP to the Resolution Funding Corporation, which then performs the calculations for each quarter end.
The FHLBs will continue to expense these amounts until the aggregate amounts actually paid by all twelve FHLBs are equivalent to a $300 million annual annuity (or a scheduled payment of $75 million per quarter) whose final maturity date is April 15, 2030, at which point the required payment of each FHLB to REFCORP will be fully satisfied. The Finance Board in consultation with the Secretary of the Treasury will select the appropriate discounting factors to be used in this annuity calculation. The FHLBs use the actual payments made to determine the amount of the future obligation that has been defeased. The cumulative amount to be paid to REFCORP by the FHLBs is not determinable at this time due to the interrelationships of all future FHLBs’ earnings and interest rates. If the Bank experienced a net loss during a quarter, but still had net income for the year, the Bank’s obligation to the REFCORP would be calculated based on the Bank’s year-to-date net income. The Bank would be entitled to a refund of amounts paid for the full year that were in excess of its calculated annual obligation. If the Bank had net income in subsequent quarters, it would be required to contribute additional amounts to meet its calculated annual obligation. If the Bank experienced a net loss for a full year, the Bank would have no obligation to the REFCORP for the year.
The Finance Board is required to extend the term of the Bank’s obligation to the REFCORP for each calendar quarter in which there is a deficit quarterly payment. A deficit quarterly payment is the amount by which the actual quarterly payment falls short of $75 million.
As a result of the REFCORP payments of $396.4 million made by the FHLBs in the first, second and third quarters of 2005, the overall period during which the FHLBs must continue to make quarterly payments was shortened to April 15, 2018.
Office of Finance Expenses
The Office of Finance assessment for the nine months ended September 30, 2005 was $1.3 million compared to $1.4 million for the same period in 2004. The FHLBs fund the costs of the Office of Finance as a joint office that facilitates issuing and servicing the consolidated obligations of the FHLBs, preparation of the FHLBs combined quarterly and annual financial reports, and certain other functions. For the years ended December 31, 2004, 2003 and 2002, the Office of Finance assessments were $1.9 million, $1.7 million and $1.3 million, respectively.
Finance Board Expenses
The FHLBs are assessed the costs of operating the Finance Board and have no control over these costs. The Finance Board assessed the Bank $2.4 million and $2.1 million for the nine months ended September 30, 2005 and 2004, respectively. The Bank was assessed $2.9 million during the year ended December 31, 2004, compared to $2.1 million and $1.6 million in 2003 and 2002, respectively. The Finance Board regulates the FHLBs, who are required to fund the cost of the regulation. These expenses have increased due to Finance Board concerns related to interest rate risk management within the FHLBs and congressional concerns over accounting irregularities at Freddie Mac and Fannie Mae. As a result, the Board increased their regulatory scrutiny over the FHLBs.
94
Table of Contents
Principal Accounting Fees and Services
The following table sets forth the aggregate fees billed to the Bank by its external accounting firm:
| As of December 31, | |||||||||
(Dollars in thousands) | 2004 | 2003 | 2002 | ||||||
Audit fees | $ | 762 | $ | 246 | $ | 188 | |||
Audit related fees | 191 | 132 | 32 | ||||||
All other fees | 90 | 281 | 589 | ||||||
Total fees | $ | 1,043 | $ | 659 | $ | 809 | |||
Audit fees during the three years ended December 31, 2004 were for professional services rendered for the audits of the financial statements of the Bank. Audit related fees for the three years ended December 31, 2004 were for assurance and related services primarily related to accounting consultations and the Bank’s capital plan conversion.
The Bank is exempt from all federal, state, and local income taxation. Therefore, no tax related fees were paid during the three years ended December 31, 2004.
All other fees paid during the three years ended December 31, 2004 were for services rendered for information system related consulting on the Bank’s Hedge Accounting User System. No fees were paid to the external accounting firm for financial information system design and implementation.
95
Table of Contents
The Bank manages its operations by grouping its products and services within two operating segments. The measure of profit or loss and total assets for each segment is contained in Note 17 to the December 31, 2004 Annual Financial Statements and Notes. These operating segments are:
| • | Traditional funding, liquidity and deposit products consisting of loans to members called advances, standby letters of credit, investments and deposit products; and |
| • | The MPF Program. |
The internal organization that is used by management for making operating decisions and assessing performance is the source of the Bank’s reportable segments.
The tables below summarize operating segment results:
| For the Nine Months Ended September 30, | |||||||||||||||||||||||
| 2005 (restated) | 2004 | ||||||||||||||||||||||
(Dollars in thousands) | Traditional Member Finance | Mortgage Partnership Finance | Total Bank | Traditional Member Finance | Mortgage Partnership Finance | Total Bank | |||||||||||||||||
Interest income | $ | 955,161 | $ | 1,660,453 | $ | 2,615,614 | $ | 597,841 | $ | 1,773,557 | $ | 2,371,398 | |||||||||||
Interest expense | 868,276 | 1,360,529 | 2,228,805 | 498,132 | 1,325,001 | 1,823,133 | |||||||||||||||||
Net interest income | 86,885 | 299,924 | 386,809 | 99,709 | 448,556 | 548,265 | |||||||||||||||||
Provision for loan losses | — | — | — | — | — | — | |||||||||||||||||
Other income (loss) | (12,116 | ) | (28,546 | ) | (40,662 | ) | 15,904 | (114,696 | ) | (98,792 | ) | ||||||||||||
Other expense | 37,648 | 51,465 | 89,113 | 31,162 | 51,793 | 82,955 | |||||||||||||||||
Income before assessments | 37,121 | 231,771 | 268,892 | 84,451 | 282,067 | 366,518 | |||||||||||||||||
Assessments | 9,856 | 58,396 | 68,252 | 22,393 | 85,934 | 108,327 | |||||||||||||||||
Cumulative effect of change in accounting principle | — | — | — | — | 41,441 | 41,441 | |||||||||||||||||
Net income | $ | 27,265 | $ | 161,517 | $ | 188,782 | $ | 62,058 | $ | 237,574 | $ | 299,632 | |||||||||||
| For the Years Ended December 31, | ||||||||||||||||||||||||||||||||||
| 2004 | 2003 | 2002 | ||||||||||||||||||||||||||||||||
(Dollars in | Traditional Member Finance | Mortgage Partnership Finance | Total Bank | Traditional Member Finance | Mortgage Partnership Finance | Total Bank | Traditional Member Finance | Mortgage Partnership Finance | Total Bank | |||||||||||||||||||||||||
Interest income | $ | 851,607 | $ | 2,358,917 | $ | 3,210,524 | $ | 761,796 | $ | 1,971,313 | $ | 2,733,109 | $ | 1,030,745 | $ | 1,249,554 | $ | 2,280,299 | ||||||||||||||||
Interest expense | 721,771 | 1,784,410 | 2,506,181 | 609,988 | 1,329,295 | 1,939,283 | 697,175 | 1,060,231 | 1,757,406 | |||||||||||||||||||||||||
Net interest income | 129,836 | 574,507 | 704,343 | 151,808 | 642,018 | 793,826 | 333,570 | 189,323 | 522,893 | |||||||||||||||||||||||||
Provision for loan losses | — | — | — | — | — | — | — | 2,217 | 2,217 | |||||||||||||||||||||||||
Other income (loss) | 10,858 | (137,989 | ) | (127,131 | ) | 7,590 | (120,769 | ) | (113,179 | ) | (146,034 | ) | (38,344 | ) | (184,378 | ) | ||||||||||||||||||
Other expense | 48,571 | 72,485 | 121,056 | 35,327 | 51,103 | 86,430 | 28,918 | 28,763 | 57,681 | |||||||||||||||||||||||||
Income before assessments | 92,123 | 364,033 | 456,156 | 124,071 | 470,146 | 594,217 | 158,618 | 119,999 | 278,617 | |||||||||||||||||||||||||
Assessments | 24,441 | 107,698 | 132,139 | 32,917 | 124,770 | 157,687 | 42,082 | 31,836 | 73,918 | |||||||||||||||||||||||||
Cumulative effect of change in accounting principle | — | 41,441 | 41,441 | — | — | — | — | — | — | |||||||||||||||||||||||||
Net income | $ | 67,682 | $ | 297,776 | $ | 365,458 | $ | 91,154 | $ | 345,376 | $ | 436,530 | $ | 116,536 | $ | 88,163 | $ | 204,699 | ||||||||||||||||
96
Table of Contents
Traditional Member Finance
The table below compares the results for Traditional Member Finance by period:
| For the Nine Months Ended September 30, | For the Years Ended December 31, | For the Years Ended December 31, | |||||||||||||||||||||||||||||||||||||||
(Dollars in | 2005 | 2004 | Incr. / (Decr.) | % Change | 2004 | 2003 | Incr. / (Decr.) | % Change | 2003 | 2002 | Incr. / (Decr.) | % Change | |||||||||||||||||||||||||||||
Condensed Income Statement | |||||||||||||||||||||||||||||||||||||||||
Interest Income | $ | 955,161 | $ | 597,841 | $ | 357,320 | 59.8 | % | $ | 851,607 | $ | 761,796 | $ | 89,811 | 11.8 | % | $ | 761,796 | $ | 1,030,745 | $ | (268,949 | ) | -26.1 | % | ||||||||||||||||
Interest Expense | 868,276 | 498,132 | 370,144 | 74.3 | % | 721,771 | 609,988 | 111,783 | 18.3 | % | 609,988 | 697,175 | (87,187 | ) | -12.5 | % | |||||||||||||||||||||||||
Net interest income | 86,885 | 99,709 | (12,824 | ) | -12.9 | % | 129,836 | 151,808 | (21,972 | ) | -14.5 | % | 151,808 | 333,570 | (181,762 | ) | -54.5 | % | |||||||||||||||||||||||
Provision for loan losses | — | — | — | — | — | — | — | — | — | ||||||||||||||||||||||||||||||||
Other income (loss) | (12,116 | ) | 15,904 | (28,020 | ) | -176.2 | % | 10,858 | 7,590 | 3,268 | 43.1 | % | 7,590 | (146,034 | ) | 153,624 | 105.2 | % | |||||||||||||||||||||||
Other expense | 37,648 | 31,162 | 6,486 | 20.8 | % | 48,571 | 35,327 | 13,244 | 37.5 | % | 35,327 | 28,918 | 6,409 | 22.2 | % | ||||||||||||||||||||||||||
Income before assessments | 37,121 | 84,451 | (47,330 | ) | -56.0 | % | 92,123 | 124,071 | (31,948 | ) | -25.7 | % | 124,071 | 158,618 | (34,547 | ) | -21.8 | % | |||||||||||||||||||||||
Assessments | 9,856 | 22,393 | (12,537 | ) | -56.0 | % | 24,441 | 32,917 | (8,476 | ) | -25.7 | % | 32,917 | 42,082 | (9,165 | ) | -21.8 | % | |||||||||||||||||||||||
Net Income | $ | 27,265 | $ | 62,058 | $ | (34,793 | ) | -56.1 | % | $ | 67,682 | $ | 91,154 | $ | (23,472 | ) | -25.7 | % | $ | 91,154 | $ | 116,536 | $ | (25,382 | ) | -21.8 | % | ||||||||||||||
Net income in the Traditional Member Finance operating segment declined over the past three years. The decrease in net income was primarily due to lower rates on advances to members and higher rates on the Bank’s sources of funding. In particular, the net balance sheet spread on interest earning assets and interest earning liabilities declined to 0.65% in 2004 from 0.79% in 2002 due in large part to the lowest short-term interest rates in 40 years and the resultant impact on the available yields on the balance sheet. Other operating expenses also increased over the period as noted in the following paragraphs.
Nine months ended September 30, 2005 compared to nine months ended September 30, 2004
For the nine months ended September 30, 2005, Traditional Member Finance net income decreased $34.8 million to $27.3 million from $62.1 million for the same period ended September 30, 2004. Total assets of this segment as of September 30, 2005 decreased $1.2 billion over the same period in 2004 because of advance repayments.
Net interest income decreased $12.8 million in the segment for the nine months ended September 30, 2005 as compared to the nine months ended September 30, 2004. Interest income increased $357.3 million, primarily on advances despite a $2.7 billion decrease in average advances outstanding. The average rate on advances (the largest component of interest income for this segment) increased 106 basis points over the prior year period. This was offset by a $370.1 million increase in interest expense, primarily on discount notes. The average rate on discount notes that primarily support this segment increased by 178 basis points.
Other income (loss) for the nine months ended September 30, 2005 decreased $28.0 million, to a loss of $12.1 million from a gain of $15.9 million, due to the following reasons:
| • | Gain (loss) on early extinguishment of debt decreased $40.5 million, or 97.4%, to a gain of $1.1 million from a gain of $41.6 million due to consolidated obligations that were transferred to other FHLBs. The transfers in 2004 were higher due to the Bank’s reduced need for funding pending the Written Agreement with the Finance Board and the rising interest rate environment. Net realized and unrealized gain (loss) on investments and derivatives decreased $9.7 million, or 63.8%, to a gain of $5.5 million from a gain of $15.2 million. |
The above decreases were offset by the following increases:
| • | The gain on the consolidated obligations sold in 2004 was offset by a gain of $19.2 million on associated sales of available-for-sale securities that hedged the transferred debt. The 2004 loss was recorded in the net realized gain (loss) from sale of available-for-sale securities line in the Statements of Income. |
| • | In addition to selling securities in 2004, the Bank also recorded unrealized gains on trading securities in 2005 versus losses in 2004 due to declining long-term rates. |
Other operating expense increased $6.5 million for the nine months ended September 30, 2005 over September 30, 2004 due in large part to the increase in Bank staffing requirements. Bank-wide staffing at September 30, 2005 was 427 full-time equivalent employees compared to 358 a year ago. The Bank has added employees to support the build out of new computer hardware and software in Information Systems and in control functions in Finance, Legal and Risk Management.
97
Table of Contents
Year ended December 31, 2004 compared to year ended December 31, 2003
For the year ended December 31, 2004, the Traditional Member Finance operating segment’s net income decreased to $67.7 million from $91.2 million for the same period ended December 31, 2003, a decrease of 25.7%. The decrease in net income was primarily due to an increase in interest expense and other operating expenses, and partially offset by an increase in interest income.
For the year ended December 31, 2004, interest expense increased $111.8 million, or 18.3% compared to the same period ended December 31, 2003. A 21 basis points increase in yield on the Bank’s average long term and short term debt, in addition to a $14.1 billion increase in the average balance of consolidated obligations was the primary cause of this increase.
For the year ended December 31, 2004, other operating expenses increased to $48.6 million, or 37.5% compared to $35.3 million for the same period ended December 31, 2003. Salaries and benefit expense increased $3.1 million, or 17.2% as the Bank continued to expand its growth of full time employees in 2004.
For the year ended December 31, 2004, interest income increased $89.8 million, or 11.8% compared to the same period ended December 31, 2003. A 13 basis point decrease in yield on advances coupled with an increase of $1.0 billion in the average balance increased interest income by $36.4 million for the year ended December 31, 2004 as compared to the same period ended December 31, 2003. Increases in average balances of Federal Funds Sold of $2.4 billion, partially offset by a 13 basis point decline in yield, increased interest income by $43.9 million for the year ended December 31, 2004 as compared to the same period ending December 31, 2003.
Year ended December 31, 2003 compared to year ended December 31, 2002
Net interest income was $152 million for the year ended December 31, 2003, down $182 million or 54% from the year ended December 31, 2002. The decrease in net interest income was due to the lower level of interest rates on the types of assets over the course of the year.
Non-interest income was $8 million in 2003, a 105.2% increase from the negative $146 million for 2002, which had consisted primarily of losses on hedging activities. Non-interest expense was $35 million for the year ended December 31, 2003, up $6 million or 22% from the previous year end. The increase in non-interest expense was predominantly due to depreciation of the Bank’s increased investment in back office technology and infrastructure.
98
Table of Contents
Mortgage Partnership Finance® Program
The table below compares the results for the MPF Program by period:
| For the Nine Months Ended September 30, | For the Years Ended December 31, | For the Years Ended December 31, | |||||||||||||||||||||||||||||||||||||||||||
(Dollars in | 2005 (restated) | 2004 | Incr. / (Decr.) | % Change | 2004 | 2003 | Incr. / (Decr.) | % Change | 2003 | 2002 | Incr. / (Decr.) | % Change | |||||||||||||||||||||||||||||||||
Condensed income statement: | |||||||||||||||||||||||||||||||||||||||||||||
Interest income | $ | 1,660,453 | $ | 1,773,557 | $ | (113,104 | ) | -6.4 | % | $ | 2,358,917 | $ | 1,971,313 | $ | 387,604 | 19.7 | % | $ | 1,971,313 | $ | 1,249,554 | $ | 721,759 | 57.8 | % | ||||||||||||||||||||
Interest expense | 1,360,529 | 1,325,001 | 35,528 | 2.7 | % | 1,784,410 | 1,329,295 | 455,115 | 34.2 | % | 1,329,295 | 1,060,231 | 269,064 | 25.4 | % | ||||||||||||||||||||||||||||||
Net interest income | 299,924 | 448,556 | (148,632 | ) | -33.1 | % | 574,507 | 642,018 | (67,511 | ) | -10.5 | % | 642,018 | 189,323 | $ | 452,695 | 239.1 | % | |||||||||||||||||||||||||||
Provision for loan losses | — | — | — | 0.0 | % | — | — | — | 0.0 | % | — | 2,217 | (2,217 | ) | -100.0 | % | |||||||||||||||||||||||||||||
Other income (loss) | (28,546 | ) | (114,696 | ) | 86,150 | -75.1 | % | (137,989 | ) | (120,769 | ) | (17,220 | ) | 14.3 | % | (120,769 | ) | (38,344 | ) | (82,425 | ) | 215.0 | % | ||||||||||||||||||||||
Other expense | 51,465 | 51,793 | (328 | ) | -0.6 | % | 72,485 | 51,103 | 21,382 | 41.8 | % | 51,103 | 28,763 | 22,340 | 77.7 | % | |||||||||||||||||||||||||||||
Income before assessments | 219,913 | 282,067 | (62,154 | ) | -22.0 | % | 364,033 | 470,146 | (106,113 | ) | -22.6 | % | 470,146 | 119,999 | 350,147 | 291.8 | % | ||||||||||||||||||||||||||||
Assessments | 58,396 | 85,934 | (27,538 | ) | -32.0 | % | 107,698 | 124,770 | (17,072 | ) | -13.7 | % | 124,770 | 31,836 | 92,934 | 291.9 | % | ||||||||||||||||||||||||||||
Cumulative effect of change in accounting principle | — | 41,441 | (41,441 | ) | 0.0 | % | 41,441 | — | 41,441 | 0.0 | % | — | — | — | 0.0 | % | |||||||||||||||||||||||||||||
Net Income | $ | 161,517 | $ | 237,574 | $ | (76,057 | ) | -32.0 | % | $ | 297,776 | $ | 345,376 | (47,600 | ) | -13.8 | % | $ | 345,376 | $ | 88,163 | 257,213 | 291.7 | % | |||||||||||||||||||||
Nine months ended September 30, 2005 compared to nine months ended September 30, 2004
For the nine months ended September 30, 2005, the Mortgage Partnership Finance operating segment’s net income decreased $76.1 million, or 32.0%, to $161.5 million from $237.6 million for the same period ended September 30, 2004. Total assets attributable to this segment, primarily mortgages, decreased $5.2 billion over the year ago period due to paydowns of existing mortgages and a decline in fixed-rate mortgage loans purchased or funded by the Bank from or through its PFIs, a result of an increase in borrower demand for adjustable rate and interest only mortgages that the Bank does not purchase or fund.
Net interest income for the nine months ended September 30, 2005 decreased $148.6 million, or 33.1%, from September 30, 2004. Interest income on MPF products declined $113.1 million or 6.4% for the nine months ended September 30, 2005 as compared to the same period in 2004, primarily due to the decrease of $2.9 billion or 6.0%, in the average daily balance in mortgages held for portfolio. The decrease was partially offset by an increase in average yields on mortgage loans of 13 basis points, but this was insufficient to offset the decline in mortgage loans outstanding. Interest expense increased $35.5 million, or 2.7%, primarily due to the average rate on consolidated obligation bonds that primarily support this segment increasing 43 basis points over the year ago period. Average consolidated obligation bonds outstanding declined over the year ago period, but this was insufficient to offset the increase in rates.
Other income (loss) declined $86.2 million for the nine months ended September 30, 2005, to a loss of $28.5 million from a loss of $114.7 million, primarily due to a net realized and unrealized gain (loss) on derivatives improving $86.1 million to a loss of $34.4 million for the nine months ended September 30, 2005 from a loss of $120.6 million for the nine months ended September 30, 2004. As described in Item 2.2 “Management’s Discussion and Analysis of Financial Condition and Results of Operations – Restatement of Financial Statements”, the Bank restated $11.9 million from OCI to an expense (net realized and unrealized gain (loss) on derivatives and hedging activities).
In 2004, the Mortgage Partnership Finance segment recorded a $41.4 million cumulative effect adjustment (pre- AHP and REFCORP assessments) as a result of a change in accounting principle for the amortization of mortgage loan premiums and discounts. The Bank changed its method of accounting for deferred agent fees and premiums and discounts on mortgage loans to amortize such amounts on a constant effective yield over their contractual life. For further details on this change in accounting principle see Note 2 – Change in Accounting Principle and Recently Issued Accounting Standards and Interpretations to the Bank’s 2004 Annual Financial Statements and Notes.
99
Table of Contents
Year ended December 31, 2004 compared to year ended December 31, 2003.
For the year ended December 31, 2004, the Mortgage Partnership Finance operating segment’s net income decreased to $297.8 million from $345.4 million for the same period ended December 31, 2003, a decrease of 13.8%. The decrease in net income was primarily due to an increase in interest expense and other operating expenses, and a decline in other income, partially offset by an increase in interest income.
For the year ended December 31, 2004, interest expense increased $455.1 million or 34.2% compared to the same period ended December 31, 2003. A 21 basis points increase in yield on the Bank’s average long term and short term debt, in addition to a $14.1 billion increase in the average balance of consolidated obligation bonds was the primary cause of this increase.
For the year ended December 31, 2004, other operating expenses increased to $72.5 million, or 41.8%, compared to $51.1 million for the same period ended December 31, 2003. Salaries and benefit expense increased $6.8 million, or 39.8% as the Bank continued to expand its growth in full time employees in 2004, as compared to the same period ended December 31, 2003. Finance Board and Office of Finance expenses increased to $3.3 million, or 84.7% for the period ended December 31, 2004, as compared to the same period ended December 31, 2003.
For the year ended December 31, 2004, other income declined $17.2 million, or 14.3% as compared to the same period ended December 31, 2003. The primary cause of this decline was a $43.1 million, or 90.1% decline in income generated from the early extinguishment of debt for the period ended December 31, 2004, as compared to the same period ended December 31, 2003. This was partially offset by a $27.1 million, or 15.7% decline in the net realized and unrealized loss on derivatives and hedging activities for the period ended December 31, 2004, as compared to the same period ended December 31, 2003.
For the year ended December 31, 2004, interest income increased $387.6 million, or 19.7% compared to the same period ended December 31, 2003. The increase in interest income from 2003 to 2004 was the result of a 25.0% increase in the average balance of MPF Loans held in portfolio, which was partially offset by a nine basis points decline in yield earned on those assets.
Year ended December 31, 2003 compared to year ended December 31, 2002.
Net interest income for the MPF segment was $642 million at December 31, 2003, up $453 million or 239% from 2002 despite a period of record mortgage refinance activity and historical low interest rates. The increase in net interest income was due to the Bank’s growth in mortgage volume and the spread for mortgage assets held on the Balance Sheet. Total mortgage loans for the segment increased by 82% in 2003 to reach $47.6 billion at December 31, 2003. The Bank purchased or funded $38.3 billion in MPF Loans and collected $16.7 billion of principal payments in 2003 to reach $47.6 billion at December 31, 2003.
The increase in the Bank’s non interest expense was due to depreciation for our increased investments in back office technology and infrastructure. Capital expenditures for the MPF Program were $29 million in 2003, up from $8 million in 2002.
100
Table of Contents
Critical Accounting Policies and Estimates
The accounting principles generally accepted in the United States of America, or “GAAP,” require the Bank’s management to make a number of judgments, estimates and assumptions that affect the reported amount of assets, liabilities, income and expense in the Bank’s financial statements and accompanying notes. The Bank’s management believes that the judgments, estimates and assumptions used in the preparation of the Bank’s financial statements are appropriate given the factual circumstances as of September 30, 2005 and December 31, 2004. However, these critical accounting policies and the use of other judgments, estimates and assumptions might materially impact amounts reported in the financial statements.
Certain accounting policies, by their nature, are inherently subject to estimation techniques, valuation assumptions and other subjective assessments. In addition, certain accounting principles require significant judgment in applying the complex accounting principles to individual transactions to determine the most appropriate treatment. The Bank identified policies that, due to the judgments, estimates and assumptions inherent in those policies, are critical to an understanding of the Bank’s financial statements. The following is a brief discussion of these critical accounting policies.
Accounting for Derivatives
SFAS 133 requires that all derivative financial instruments be recorded on the statements of condition at their fair value. Changes in fair value of derivatives are recorded each period in current earnings or OCI, depending on whether a derivative is designated as part of a hedge transaction and, if it is, the type of hedge transaction.
By regulation, derivative financial instruments are only permitted to be used by the Bank in order to mitigate identifiable risks. All of the Bank’s derivatives are positioned to offset some or all of the risk exposure inherent in its member lending, mortgage finance investment, and funding activities. The Bank utilizes the most cost-efficient hedging techniques available while, at the same time, reviewing the resulting accounting consequences as an important consideration.
The Bank formally documents all relationships between derivative hedging instruments and hedged items, as well as its risk management objectives and strategies for undertaking various hedge transactions and its method of assessing hedge effectiveness. This process includes linking all derivatives that are designated as fair value or cash flow hedges to (1) assets and liabilities on the balance sheet, (2) firm commitments, or (3) forecasted transactions.
For a derivative qualifying as a cash flow hedge, the Bank reports changes in the fair value of the derivatives in a separate component of accumulated OCI to the extent the hedge is effective. The remaining ineffective portion is reported as net gain (loss) on derivative and hedging activities in the period of ineffectiveness.
The Bank recognizes the effective portion of the cumulative changes in fair value as income (expense) related to derivatives during the period(s) in which the hedged item affects earnings, unless (a) occurrence of the forecasted transaction is not probable, in which case the amount in accumulated OCI is reclassified to earnings immediately, (b) the Bank expects at any time that continued reporting of a net loss in accumulated OCI would lead to recognizing a net loss on the combination of a hedging instrument and hedged transaction (and related asset acquired or liability incurred) in one or more future periods, in which case a loss shall be reclassified immediately into earnings for the amount that is not expected to be recovered, or (c) the occurrence of the forecasted transaction was the issuance of long-term debt; in which case, the Bank recognizes the effective portion of the cumulative changes in fair value as long-term debt expense.
If a derivative no longer qualifies as a cash flow hedge, the Bank discontinues hedge accounting prospectively. The Bank continues to carry the derivative on the balance sheet at fair value and records further fair value gains (losses) in the statements of income as net gain (loss) on derivative and hedging activities until the derivative is terminated or re-designated. The Bank monitors its sensitivity to changes in interest rates and uses derivative financial instruments to reduce exposure to adverse changes in interest rates. Accordingly, all derivatives are recorded in the financial statements at their respective fair value. Certain derivative financial instruments’ changes in fair value are reflected in current period earnings.
Fair Values
Certain of the Bank’s assets and liabilities including investments classified as available-for-sale and trading securities, and all derivatives are presented in the statements of condition at fair value. Under GAAP, the fair value of an asset or liability is
101
Table of Contents
the amount at which that asset could be bought or sold, or that liability could be incurred or settled in a current transaction between willing parties, other than in liquidation. Fair values are based on market prices when they are available. If market quotes are not available, fair values are based on discounted cash flows using market estimates of interest rates and volatility or on dealer prices and prices of similar instruments. Pricing models and their underlying assumptions are based on Bank management’s best estimates for discount rates, prepayments, market volatility and other factors. These assumptions may have a significant effect on the reported fair values of assets and liabilities, including derivatives, and the related income and expense. The use of different assumptions as well as changes in market conditions could result in materially different net income and retained earnings.
Fair value amounts have been determined by the Bank: first, by using available market information and, second, if market values were not available, using the Bank’s best judgment of appropriate valuation methods. These estimates are based on pertinent information available to the Bank. Although the Bank uses its best judgment in estimating the fair value of these financial instruments, there are inherent limitations in any estimation technique or valuation methodology. For example, because an active secondary market does not exist for a portion of the Bank’s financial instruments, in certain cases, fair values are not subject to precise quantification or verification and their values may change as economic and market factors, and the evaluation of those factors, change. Therefore, estimated fair values may not be necessarily indicative of the amounts that would be realized in current market transactions. The fair value tables do not represent an estimate of overall market value of the Bank as a going concern, which would take into account future business opportunities.
Consolidated Obligations
The Bank records a liability for consolidated obligations on its statements of condition in proportion to the proceeds it receives from the issuance of those consolidated obligations. Consolidated obligations are the joint and several obligations of the FHLBs and consist of consolidated obligation bonds and discount notes. Accordingly, should one or more of the FHLBs be unable to repay their consolidated obligations, the Bank could be called upon to repay all or part of such obligations, as determined or approved by the Finance Board. No liability has been recorded for the joint and several obligations related to the other FHLBs’ share of the consolidated obligations. Due to the high credit quality of each FHLB, management has concluded that the probability that a FHLB would be unable to repay its consolidated obligations is remote. Refer to “Item 1A—Risk Factors” for further details.
The Bank records a transfer of its consolidated obligations to another FHLB as an extinguishment of debt since the Bank has been released from being the primary obligor. Specifically, the release is affected by the Office of Finance’s recordation of the transfer in its records. The Office of Finance is providing a release by acting within the confines of the banking regulations that governs the determination of which FHLB is the primary obligor. The FHLB assuming the consolidated obligation becomes the primary obligor since it now is directly responsible for repaying the debt. The Bank continues to disclose the transferred debt as a contingent liability since it still has a joint and several liability with respect to repaying the transferred consolidated obligation. The Bank does not record a financial guarantee at fair value with respect to the transferred consolidated obligation since FIN 45 does not require such accounting for a related party.
Premiums, Discounts, Nonrefundable Fees, and Costs
When the Bank buys MBS, mortgage loans, or mortgage-related securities, the Bank may not pay the seller the exact amount of the unpaid principal balance (“UPB”). If the Bank pays more that the UPB and purchases the mortgage assets at a premium, the premium reduces the yield the Bank recognizes on the assets below the coupon amount. If the Bank pays less than the UPB and purchases the mortgage assets at a discount, the discount increases the yield above the coupon amount.
In addition to premiums and discounts on mortgage assets, the Bank may pay/receive loan origination fees (“agent fee”) to/from PFIs for the origination of MPF Loans as agent for the Bank, and the Bank may pay concession fees to dealers in connection with the sale of consolidated obligation bonds (herein collectively referred to as “nonrefundable fees”).
Effective January 1, 2004, the Bank changed its methods of accounting for the amortization of mortgage loan premiums and discounts (agent fees) under SFAS 91, “Accounting for Nonrefundable Fees and Costs Associated with Originating or Acquiring Loans and Initial Direct Costs of Leases”. In accordance with SFAS 91, the Bank defers and amortizes agent fees as interest income over the contractual life of the loan. The contractual method recognizes the income effects of premiums and
102
Table of Contents
discounts in a manner that is proportionate to the actual behavior of the underlying assets and reflects the contractual terms of the assets without regard to changes in estimates based on assumptions about future borrower behavior. The Bank believes that the use of the contractual method is preferable under GAAP due to a decreased reliance on the use of estimates inherent in calculating the weighted average lives that were used to determine the loan pool amortization periods.
Historically, the Bank deferred and amortized agent fees and premiums and discounts paid to and received by its members as interest income over the estimated lives of the related mortgage loans. Actual prepayment experience and estimates of future principal repayments were used in calculating the estimated lives of the mortgage loans.
As a result of implementing the change in accounting for amortization and accretion from the estimated life method to the contractual maturity method, the Bank recorded a cumulative change in accounting principle retroactively to January 1, 2004 resulting in an increase to retained earnings of $41.4 million. As a result of implementing the change, the Bank reduced agent fee amortization expense by $16.8 million during 2004.
| Allowance | for Loan Losses |
The allowance for loan losses represents management’s estimate of probable losses inherent in the Bank’s advances and MPF Loan portfolios. Loan losses deemed to be uncollectible are charged against the allowance for loan losses. Cash recovered on previously charged off amounts is credited to the allowance for loan losses.
The Bank performs periodic and systematic detailed reviews of its advances and MPF Loan portfolios to identify credit risks and to assess the overall collectibility of these loans. Since MPF Loans are homogeneous in nature, the allowance for loan losses related to these loans is based on the aggregated portfolio with the exception of MPF Loans that are viewed as collateral dependent loans under SFAS 114, “Accounting by Creditors for Impairment of a Loan.” The allowance for loan losses for MPF Loans that are deemed to be collateral dependent are assessed on an individual loan basis. A loss forecast model is utilized for the aggregate MPF Loan portfolio which considers a variety of factors including, but not limited to, historical loss experience, estimated defaults or foreclosures based on portfolio trends, delinquencies, and economic conditions. This MPF Loan loss forecast model is updated on a quarterly basis in order to incorporate information reflective of the current economic environment. The Bank also factors in the PFI’s CE Amount when determining the amount of the allowance for loans.
In addition, since the PMI and SMI as well as FHA/VA insurance/guarantees are not severable from the loans to which they relate, the cash flows associated with these components are inextricably tied to the loans’ cash flows. As such, the MPF Banks also consider these credit protections when determining the adequacy of the allowance for loan losses. Advances are reviewed on an individual basis to determine the creditworthiness of the member and to ensure that sufficient eligible collateral is available. On a quarterly basis (or more frequently as deemed necessary) the continued creditworthiness of the member as well as the level of eligible collateral is monitored in accordance with the Bank’s underwriting procedures.
The Bank has experienced no credit losses on advances since 1932 when the FHLBs were created, nor does the Bank’s management anticipate any credit losses on advances. The Bank has recorded no allowance for losses on its advances. The Bank is required by the FHLB Act to obtain sufficient collateral on advances to protect against losses, and to accept as collateral for advances only certain United States Government or government-agency securities, residential mortgage loans, deposits in the Bank, and other real estate-related and Community Financial Institutions’ assets. At September 30, 2005, December 31, 2004 and 2003, the Bank had a security interest in collateral, either loans or securities, on a member-by-member basis, with an estimated fair value in excess of outstanding advances.
103
Table of Contents
General
Lending, acquiring MPF Loans, investing funds, and engaging in derivative financial instruments have the potential to expose the Bank to a number of risks including, interest rate, credit and operational risk. To control and manage these risks the Bank has established policies and practices to evaluate and actively manage these risk positions. The Finance Board has established regulations governing the Bank’s risk management practices. The Bank must file periodic compliance reports with the Finance Board. The Finance Board also conducts an annual on-site examination of the Bank, quarterly on-site examination updates and off-site analysis.
The Bank is required to maintain liquidity in accordance with certain Finance Board regulations, with the Finance Board’s Financial Management Policy (“FMP”), and with policies established by the Bank’s Board of Directors. The Bank requires liquidity to satisfy member demand for short- and long-term funds, repay maturing consolidated obligations, and meet other obligations. Members may look to the Bank to provide standby liquidity in their asset/liability management planning. The Bank seeks to be in a position to meet its members’ credit and liquidity needs without being forced to incur unnecessarily high borrowing costs. The Bank’s primary sources of liquidity are high quality short-term investments and the issuance of new consolidated obligation bonds and discount notes. The Bank maintains liquidity to enable the Bank to meet its obligations and the needs of its members in the event of operational disruptions at the Bank, the Office of Finance, or the short-term capital markets.
With respect to interest rate risk, the Bank measures its exposure to changing interest rates in several ways. The one-year repricing gap at September 30, 2005, defined as the cumulative difference between assets and liabilities scheduled to reprice within one year, stood at -3.3% of assets. The Bank’s duration gap, which is calculated by aggregating the dollar duration of all assets, liabilities and derivatives, and dividing that amount by the total market value of assets, was 1.28 months at September 30, 2005. The Bank also simulates the sensitivity of the market value of its equity to changes in interest rates.
The Bank regularly uses interest rate derivatives in order to reduce exposure to changing interest rates. As of September 30, 2005, the Bank had interest rate derivatives totaling $47.2 billion in outstanding notional principal, which includes notional principal of interest rate swaps of $33.6 billion, $2.7 billion in outstanding interest rate caps, $0.6 billion in interest rate floors, $2.2 billion in futures and $8.1 billion in swaptions. These instruments are used to control and manage interest rate risk and minimize variations in income and the market value of financial instruments.
The Bank charges a prepayment fee on advances that allows the Bank to be economically indifferent as to whether the advance prepays or remains in place prior to its maturity. The Bank recorded $0.6 million in prepayment fees for the nine months ended September 30, 2005 and $5.1 million for the year ended December 31, 2004.
The Bank uses callable debt to mitigate interest rate risk. Excluding discount notes, 38.8% of the Bank’s debt at September 30, 2005 was callable by the Bank. Further, the Bank issues debt with complex coupon payment terms (structured debt). At September 30, 2005, 0.15% of the Bank’s issued debt was in the form of structured debt. In the case of certain issues of such debt, the Bank simultaneously enters into interest rate derivatives with cash flow features that offset the structured features of the bond, effectively converting the instrument into a conventional fixed rate or adjustable rate instrument with a coupon tied to a common index, such as LIBOR.
For financial instruments that have an active, liquid market with available market prices, the Bank determines fair value based on price quotations supplied from third party pricing services and broker-dealers or transaction data, if available. For financial instruments where such price information is not available, the Bank uses various industry standard analytical tools to estimate fair values. These tools estimate the present value of expected future cash flows using valuation models that incorporate observable market data obtained from third-party pricing services and broker-dealers. When requisite data is not obtainable from such sources, the Bank uses its best judgment about the appropriate valuation methods.
104
Table of Contents
The Bank has never experienced a credit loss on advances. Credit risk on advances is minimized by active monitoring of member credit quality and by requiring members to pledge sufficient collateral against the outstanding advance balance. Advances are collateralized primarily by single-family residential mortgages, securities and other high quality collateral. Based on the collateral pledged and the repayment history of advances, the Bank has no loan loss reserves for advances and believes no loan loss reserve is necessary. The Bank limits its investments and investment counterparties to those with the highest credit grades. The credit quality of borrowing members and the Bank’s unsecured credit exposures are regularly monitored by Bank management.
Currently, the Bank calculates its loan loss allowance based on the Bank’s loan portfolio performance history, adjusted for an analysis of current trends and conditions including the credit enhancement provided by members on MPF Loans. The allowance for loan losses on mortgage loans totaled $4.1 million at September 30, 2005. All MPF Master Commitments have credit enhancement coverage provided by one or more parties including the PFI, mortgage insurance companies or the federal government through the FHA and VA loan programs.
Loan Portfolio Analysis
The Bank’s nonperforming MPF Loans increased to 0.17% of the total MPF Loan portfolio at September 30, 2005, compared to 0.15% and 0.12% at December 31, 2004 and 2003. The increase resulted primarily from the ongoing aging of the Bank’s MPF Loan portfolio. The weighted average age of loans in the Bank’s MPF Loan portfolio was 2.18 years, 1.59 years and 0.88 years at September 30, 2005 and December 31, 2004 and 2003, respectively. As the Bank’s MPF Loan portfolio continues to age, the expectation is that non-performing loans will also continue to gradually increase and then stabilize.
The Bank’s outstanding MPF Loans, nonperforming loans and loans 90 days or more past due and accruing interest are as follows:
(Dollars in thousands) | September 30, 2005 | December 31, | ||||||||||||||||||||||
| 2004 | 2003 | 2002 | 2001 | 2000 | ||||||||||||||||||||
Mortgage loans | $ | 43,236,099 | $ | 46,925,430 | $ | 47,605,190 | $ | 26,191,082 | $ | 16,573,648 | $ | 8,104,183 | ||||||||||||
Nonperforming mortgage loans 1 | $ | 75,061 | $ | 71,159 | $ | 57,347 | $ | 25,295 | $ | 4,734 | $ | 1,304 | ||||||||||||
Interest contractually due during the period | $ | 3,342 | $ | 4,297 | $ | 3,663 | $ | 1,688 | $ | 323 | $ | 85 | ||||||||||||
Interest actually received during the period | (3,251 | ) | (4,257 | ) | (3,636 | ) | (858 | ) | (165 | ) | (41 | ) | ||||||||||||
Difference 2 | $ | 91 | $ | 40 | $ | 27 | $ | 830 | $ | 158 | $ | 44 | ||||||||||||
Mortgage loans past due 90 days or more and still accruing interest 3 | $ | 72,255 | $ | 100,134 | $ | 123,544 | $ | 118,906 | $ | 99,899 | $ | — | ||||||||||||
| 1 | Nonperforming loans include non-accrual and renegotiated conventional MPF Loans. |
| 2 | Represents interest contractually due less interest actually received on nonperforming conventional mortgage loans. |
| 3 | Contains government loans only (e.g., FHA, VA), which continue to accrue interest after 90 days or more delinquent. |
The allowance for loan losses on mortgage loans is as follows:
| For the Nine Months Ended September 30, | For the Years Ended December 31, | |||||||||||||||||||||||||||
(Dollars in thousands) | 2005 | 2004 | 2004 | 2003 | 2002 | 2001 | 2000 | |||||||||||||||||||||
Balance at beginning of period | $ | 4,879 | $ | 5,459 | $ | 5,459 | $ | 5,464 | $ | 3,340 | $ | 1,503 | $ | 687 | ||||||||||||||
Charge-offs | (1,074 | ) | (747 | ) | (1,094 | ) | (176 | ) | (138 | ) | (13 | ) | (90 | ) | ||||||||||||||
Recoveries | 295 | 215 | 514 | 171 | 45 | 40 | — | |||||||||||||||||||||
Net (charge-offs) recoveries | (779 | ) | (532 | ) | (580 | ) | (5 | ) | (93 | ) | 27 | (90 | ) | |||||||||||||||
Provision for credit losses | — | — | — | — | 2,217 | 1,810 | 906 | |||||||||||||||||||||
Balance at end of period | $ | 4,100 | $ | 4,927 | $ | 4,879 | $ | 5,459 | $ | 5,464 | $ | 3,340 | $ | 1,503 | ||||||||||||||
Average loan portfolio balance | $ | 44,798,135 | $ | 47,659,308 | $ | 47,505,233 | $ | 37,951,971 | $ | 20,400,463 | $ | 10,454,673 | $ | 4,864,189 | ||||||||||||||
Net (charge-off)/recovery percentage | -0.00174 | % | -0.00112 | % | -0.00122 | % | -0.00001 | % | -0.00046 | % | 0.00026 | % | -0.00185 | % | ||||||||||||||
105
Table of Contents
Conventional Mortgage Loan Delinquencies
Bank PFI’s MPF Delinquency Summary
September 30, 2005
| Percent of Total Amount Outstanding | MBA Average2 | |||||
30 Days | 0.63 | % | 1.31 | % | ||
60 Days | 0.11 | % | 0.27 | % | ||
90+ Days1 | 0.16 | % | 0.62 | % | ||
In Foreclosure | 0.04 | % | 0.41 | % |
| 1 | Percentage 90 days or more includes loans in foreclosure. |
| 2 | Data on 1-4 unit prime fixed-rate mortgages (not seasonally adjusted) from the Mortgage Bankers Association National Delinquency Survey as of June 30, 2005 (latest date available). |
Quantitative and Qualitative Disclosures about Market Risk
| Market | Risk Management |
Market risk is the potential for loss due to a change in the value of a financial instrument held by the Bank as a result of fluctuations in interest rates. The Bank is exposed to interest rate risk primarily from changes in the interest rates on its interest-earning assets and its funding sources which finance these assets. To mitigate the risk of loss, the Bank has established policies and procedures which include setting guidelines on the amount of balance sheet exposure to interest rate changes, and by monitoring the risk to the Bank’s revenue, net interest margin and average maturity of its interest-earning assets and funding sources.
Management controls interest rate exposure through the use of funding instruments and by employing cash and derivative hedging strategies. Hedge positions may be executed to reduce balance sheet exposure or the risk associated with a single transaction or group of transactions. The Bank’s hedge positions are evaluated daily and adjusted as deemed necessary by management.
Asset/Liability Management
Management oversight of market risk resides in the Bank’s Asset/Liability Management Committee through meetings and reports and through regular reports to the Board of Directors. Reports on compliance with interest rate risk limits are presented at every meeting of the Board of Directors. Market risk management policies and controls are incorporated in the Bank’s Asset/Liability Management Policy.
Impact of Changes in Interest Rates on the Net Value of the Bank’s Interest Rate-Sensitive Financial Instruments
The Bank performs various sensitivity analyses that quantify the net financial impact of changes in interest rates on interest rate-sensitive assets, liabilities and commitments. These analyses incorporate assumed changes in the interest rate environment, including selected hypothetical, instantaneous parallel shifts in the yield curve.
The Bank employs various commonly used modeling techniques to value its financial instruments in connection with these sensitivity analyses. For mortgage loans, mortgage-backed-securities, and collateralized mortgage obligations, option-adjusted spread (“OAS”) models are used. The primary assumptions used in these models for purpose of these sensitivity analyses are the implied market volatility of interest rates and prepayment speeds. An option-pricing model is used for options. The primary assumption used in this model is implied market volatility of interest rates. Other key assumptions used in these models are prepayment rates and discount rates. All relevant cash flows associated with the financial instruments are incorporated in the various models.
106
Table of Contents
Based upon this modeling, the following table summarizes the estimated change in fair value of the Bank’s equity including derivatives and commitments, given several hypothetical, instantaneous, parallel shifts in the yield curve.
September 30, 2005 | December 31, 2004 | December 31, 2003 | December 31, 2002 | |||||
Interest Rate Change | Fair Value Change | Fair Value Change | Fair Value Change | Fair Value Change | ||||
+1.00% | -4.7% | -3.6% | -3.4% | -5.9% | ||||
+.50% | -2.1% | -1.3% | -1.5% | -2.5% | ||||
Base | 0.0% | 0.0% | 0.0% | 0.0% | ||||
-.50% | 0.1% | -1.1% | 1.0% | 0.7% | ||||
-1.00% | -1.9% | -4.4% | 0.8% | -0.6% |
These sensitivity analyses are limited in that they (i) were performed at a particular point in time; (ii) only contemplate certain movements in interest rates; (iii) do not incorporate changes in interest rate volatility or changes in the relationship of one interest rate index to another; (iv) are subject to the accuracy of various assumptions used, including prepayment forecasts and discount rates; and (v) do not incorporate other factors that would impact the Bank’s overall financial performance in such scenarios. In addition, not all of the changes in fair value would impact current period earnings. Significant portions of the assets and liabilities on the statements of condition are not held at fair value.
| Duration | Gap |
The duration gap is calculated by aggregating the dollar duration of all assets, liabilities and derivatives, and dividing that amount by the total market value of assets. Dollar duration is the result of multiplying the fair market value of an instrument by its duration. Duration gap is expressed in months and determines the sensitivity of the balance sheet to interest rate changes. A positive duration gap indicates that the portfolio has exposure to rising interest rates, whereas a negative duration gap indicates the portfolio has exposure to falling interest rates.
Presented below is the Bank’s estimated Portfolio Duration Gap:
Portfolio Duration Gap (in months)
12-Month Rolling Average
12 months ended September 30, | 12 months ended December 31, | |||||
2005 | 2004 | 2003 | 2002 | |||
| -0.11 | 1.02 | 0.69 | 1.70 | |||
The 12-month rolling average duration gap is calculated using twelve consecutive month-end observations of this measure. The lower average reported for September 30, 2005 was mainly the result of pay-downs of mortgage related assets. Funds were used to purchase more liquid and shorter-duration investments to allow for members’ voluntary stock redemptions. Voluntary capital stock decreased by $404.7 million during the first nine months of 2005.
Duration of Equity
The duration of equity measures the impact of interest rate changes on the value of the Bank’s equity. It is calculated using the net interest rate sensitivity of the portfolio to a +/- 25 basis point parallel shock across the yield curve (change in market value of equity) and dividing that amount by the total fair market value of equity. Duration of equity is reported in years.
Finance Board policy requires that the Bank’s duration of equity (at current interest rate levels using the consolidated obligation cost curve or an appropriate discounting methodology) be maintained within a range of +/-5 years. The Bank must maintain its duration of equity, under an assumed instantaneous +/-200 basis points parallel shift in interest rates, within a range of +/-7 years.
107
Table of Contents
The table below reflects the results of the Bank’s measurement of its exposure to interest rate risk in accordance with the Finance Board policy. The table summarizes the interest rate risk associated with all instruments entered into by the Bank.
Duration of Equity (In Years)
As of September 30, | As of December 31, | |||||||||||||||||||||
2005 | 2004 | 2003 | 2002 | |||||||||||||||||||
Up 200 | Base | Down 200 | Up 200 | Base | Down 200 | Up 200 | Base | Down 200 | Up 200 | Base | Down 200 | |||||||||||
5.1 | 2.6 | -1.8 | 4.1 | 0.4 | 2.0 | 4.6 | 2.6 | 0.3 | 5.4 | 3.3 | -3.0 | |||||||||||
Relationship between Duration of Equity and Duration Gap
The duration gap is the duration of equity times the leverage ratio of the Bank. The leverage ratio, applied here, is market value of assets divided by the market value of equity.
Derivatives
The Bank enters into derivative financial instruments to manage its exposure to changes in interest rates. Derivatives are an integral part of the Bank’s risk management activities, and provide a means to adjust the Bank’s risk profile in response to changing market conditions. The Bank uses interest rate derivatives as part of its interest rate risk management and funding strategies to reduce identified risks inherent in the normal course of business. Interest rate derivatives include interest rate swaps (including callable swaps and putable swaps), swaptions, interest rate cap and floor agreements, and futures and forward contracts. At September 30, 2005 and December 31, 2004, the total notional amount of the Bank’s outstanding interest rate derivatives was $47.2 billion and $46.2 billion, respectively. Refer to Note 9 – Derivative Financial Instruments to the Bank’s September 30, 2005 Financial Statements and Notes (Unaudited) for further detail.
The Finance Board’s regulations, its Financial Management Policy, and the Bank’s Asset/Liability Management Policy all establish guidelines for the Bank’s use of interest rate derivatives. These regulations and policies prohibit trading in interest rate derivatives for profit and any other speculative use of these instruments. They also limit the amount of counterparty credit risk allowable.
The goal of the Bank’s interest rate risk management strategy is not to eliminate interest rate risk, but to manage it within appropriate limits. One way the Bank manages interest rate risk is to acquire and maintain a portfolio of assets and liabilities, which, together with their associated interest rate derivatives, are reasonably matched with respect to the expected maturities or repricings of the assets and liabilities.
The Bank may also use interest rate derivatives to adjust the effective maturity, repricing frequency, or option characteristics of financial instruments (such as advances, mortgages and bonds) to achieve risk management objectives. The Bank may also use interest rate derivatives when acting as an intermediary for member institutions in their own risk management activities. Members can enter into interest rate derivatives directly with the Bank to reduce their exposure to interest rate risk. In such cases, the Bank acts as an intermediary between the members and other non-member counterparties by entering into offsetting interest rate derivatives. This intermediation allows smaller members indirect access to the derivatives market. The derivatives used in intermediary activities do not qualify for SFAS 133 hedge accounting treatment and are separately recorded at fair value through earnings.
Interest rate swaps are contractual agreements that set out the periodic exchange of cash flows between two parties. For example, on the asset side, the Bank can reduce a positive duration exposure and maintain a positive spread income by swapping out coupon cash flows from long-term advances in return for receiving a spread relative to a floating rate index, LIBOR. On the liability side, the Bank can reduce a negative duration exposure by entering into an interest rate swap through which the Bank receives a fixed rate that matches its consolidated debt obligation interest expense, and pays a floating rate index (LIBOR).
108
Table of Contents
The purchase of interest rate options can protect net interest income in volatile interest rate environments. By purchasing interest rate floors, the Bank will receive interest rate payments if the reference rate falls below a pre-determined level. This protects the Bank when floating rate assets reprice in a lower prevailing interest rate environment. By purchasing interest rate caps, the Bank will receive interest payments if the reference rate exceeds a pre-determined level. This protects the Bank when floating rate liabilities reprice in a higher prevailing interest rate environment.
Swaptions are contractual agreements that grant the owner the right but not the obligation to enter into an interest rate swap. Where the underlying swap is the right to pay a fixed rate and to receive a floating rate, the swaption is known as a payer swaption. Where the underlying swap is the right to receive a fixed rate and pay a floating rate, the swaption is known as a receiver swaption. By purchasing a payer swaption, the Bank is protected against the risk of a rate increase by having the option to receive a higher prevailing floating rate cash flow stream while paying a lower fixed rate cash flow stream. By purchasing a receiver swaption, the Bank is protected against a rate decrease by having the option to receive a higher fixed rate cash flow stream while paying a lower prevailing floating rate cash flow stream.
The use of interest rate options allows the Bank to manage its net interest income and manage its duration and convexity profile within limits established by the Finance Board and Bank policy. Bank policy and Finance Board regulations prohibits the speculative use of derivative financial instruments. The Bank uses derivatives solely for risk mitigation purposes.
The Bank enters into interest rate swaps, swaptions, interest rate cap and floor agreements, calls, puts and futures to manage its exposure to changes in interest rates. These derivatives are used by the Bank to adjust the effective maturity, repricing frequency, or option characteristics of financial instruments to achieve risk management objectives. Derivative financial instruments are used in two ways:
| • | By designating them as a fair-value or cash-flow hedge in accordance with SFAS 133; or |
| • | By acting as an intermediary or for asset-liability management purposes (economic hedge). |
For example, the Bank uses derivative financial instruments in its overall interest rate risk management to adjust the interest rate sensitivity of consolidated obligations to approximate more closely the interest rate sensitivity of assets (advances, investments and mortgage loans), and/or to adjust the interest rate sensitivity of advances, investments or mortgage loans to approximate more closely the interest rate sensitivity of liabilities. In addition to using derivative financial instruments to manage mismatches of interest rates between assets and liabilities, the Bank also uses derivative financial instruments to manage embedded options in assets and liabilities and to hedge the change in fair value of fixed funding costs.
Types of Derivatives
The Bank, consistent with Finance Board regulations, enters into derivative financial instruments to reduce the market risk exposure inherent in otherwise unhedged assets and funding positions. Bank management may utilize interest rate derivatives that do not necessarily qualify for hedge accounting under SFAS 133 accounting rules. As a result, the Bank recognizes only the change in fair value of these interest rate derivatives in other income as “net realized and unrealized gain (loss) on derivatives and hedging activities” with no offsetting fair value adjustments to the hedged item.
Swaps
A swap is an agreement between two entities to exchange cash flows in the future. The agreement defines the dates when the cash flows are to be paid and the way in which they will be calculated. A “plain vanilla” interest rate swap is when an entity agrees to pay cash flows equal to interest at a predetermined fixed rate on a notional principal for a number of years. In return, it receives interest at a floating rate on the same notional principal for the same period of time. The floating rate in most interest rate swap agreements used by the Bank is LIBOR.
Options
Premiums paid to acquire options are included in the initial basis of the instrument and reported in derivative assets on the statements of condition. With respect to interest rate caps and floors designated in a cash flow hedging relationship, the initial basis of the instrument at the inception of the hedge is allocated to the respective caplets or floorlets comprising the cap or floor. All subsequent changes in fair value of the cap or floor, to the extent deemed effective, are recognized in OCI. The change in the allocated fair value of each respective caplet or floorlet is reclassified out of OCI when each of the corresponding hedged forecasted transactions impacts earnings.
109
Table of Contents
A swaption is an option on a swap that gives the buyer the right to enter into a specified interest rate swap at a certain time in the future. When used as a hedge, a receiver swaption provides protection against interest rate decreases and a payer swaption provides protection against interest rate increases. The Bank purchases both payer swaptions (the option to pay fixed at a later date) and receiver swaptions (the option to receive fixed at a later date).
A cap is a contract or financial instrument that generates a cash flow if the price or rate of an underlying variable rises above some threshold “cap” price. A floor is a contract or financial instrument that generates a cash flow if the price or rate of an underlying variable falls below some threshold “floor” price. Caps are used in conjunction with interest bearing liabilities and floors with interest earning assets. Caps and floors are designed to provide insurance against the rate of interest on a floating rate asset or liability rising or falling above or below a certain level.
| Futures |
The Bank uses futures contracts in order to hedge interest rate risk. SFAS 133 states that the benchmark interest rate is the designated risk in a hedge of interest rate risk. The benchmark interest rate is derived from both U.S. Treasury rates and LIBOR. In order to hedge the benchmark interest rate risk the Bank enters into both Eurodollar futures contracts, which are based upon 3-month LIBOR, and Treasury futures contracts.
All futures contracts are standardized with specific value dates and fixed contract sizes and are traded through an exchange. Eurodollar futures contracts are traded through the Chicago Mercantile Exchange and include daily cash settlements to insure against the risk of counter-party defaults. Treasury futures contracts are traded through the Chicago Board of Trade and include daily cash settlements to insure against the risk of counterparty defaults.
Types of Assets and Liabilities Hedged
The Bank enters into the derivative financial instruments discussed above to manage its exposure to changes in interest rates for the following asset and liability accounts.
Consolidated Obligations
The Bank manages the risk arising from changing market prices and volatility of a consolidated obligation by matching the cash inflow on the derivative financial instruments with the cash outflow on the consolidated obligation. For instance, when fixed-rate consolidated obligations are issued for the Bank, the Bank may simultaneously enter into a matching derivative financial instrument in which the Bank receives fixed cash flows from a counterparty designed to offset in timing and amount the cash outflows the Bank pays on the consolidated obligations. Such transactions are treated as fair value hedges. Hedge effectiveness is assessed under the short-cut method provided all the conditions in SFAS 133, paragraph 68 are met. In cases where the conditions are not met, which occurs when terms of the derivative do not perfectly match the underlying terms of the consolidated obligations, the long-haul approach to assessing hedge effectiveness is applied. This intermediation between the capital and swap markets permits the Bank to raise funds at lower costs than would otherwise be available through the issuance of floating-rate consolidated obligations in the capital markets.
Advances
With issuances of putable advances, the Bank may purchase from the member an embedded option that enables the Bank to put an advance back to the member to extinguish the advance. Depending on the liquidity needs of the member, the member may extinguish the existing advance by using another advance product offered by the Bank at existing market prices on the date that the advance was put back. The Bank may hedge a putable advance by entering into a cancelable interest rate swap where the Bank pays fixed interest payments and receives variable interest payments. This type of hedge is accounted for as a fair value hedge. Hedge effectiveness is assessed under the short-cut method provided all the conditions in SFAS 133, paragraph 68 are met. In cases where the conditions are not met, which occurs when terms of the derivative do not perfectly match the underlying terms of the consolidated obligations, the long-haul approach to assessing hedge effectiveness is applied. The swap counterparty can cancel the derivative financial instrument on the same put date that the Bank can put the advance back to the member.
110
Table of Contents
The optionality embedded in certain financial instruments held by the Bank can create interest rate risk. When a member prepays an advance, the Bank could suffer lower future income if the principal portion of the prepaid advance were invested in lower-yielding assets that continue to be funded by higher-cost debt. To protect against this risk, the Bank generally charges a prepayment fee that makes it financially indifferent to a borrower’s decision to prepay an advance. When the Bank offers advances (other than short-term advances) that a member may prepay without a prepayment fee, it usually finances such advances with callable debt or otherwise hedges this option.
Mortgage Assets
The Bank invests in mortgage assets including mortgage-backed securities and mortgage loans. The prepayment options embedded in mortgage assets can result in extensions or contractions in the expected maturities of these investments, primarily depending on changes in interest rates. The Finance Board’s regulation limits this source of interest rate risk by restricting the types of mortgage securities the Bank may own to those with limited average life changes under certain interest rate shock scenarios and establishing limitations on duration of equity and change in market value of equity. The Bank may manage against prepayment and duration risk by funding some mortgage assets with consolidated obligations that have call features. In addition, the Bank may use derivative financial instruments to manage the prepayment and duration variability of mortgage assets. Net income could be reduced if the Bank replaces the mortgages with lower-yielding assets and if the Bank’s higher funding costs are not reduced concomitantly.
The Bank manages the interest rate and prepayment risk associated with mortgage assets through a combination of debt issuance and derivatives. The Bank issues both callable and non-callable debt to achieve cash flow patterns and liability durations similar to those expected on mortgage assets. The Bank may also use derivatives to match the expected prepayment characteristics of the mortgage assets
Mortgage Loans
A combination of swaps and options, including futures, is used as a portfolio of derivatives linked to a portfolio of mortgage loans. The portfolio of mortgage loans consists of one or more pools of similar assets, as designated by factors such as product type and coupon. As the portfolio of loans changes due to new loans, liquidations and paydowns, the derivatives portfolio is modified accordingly to hedge the interest rate and prepayment risks effectively. A new daily hedge relationship is created between a portfolio of derivatives linked to a portfolio of mortgage loans. The relationship is accounted for as a fair value hedge. The long-haul method is used to assess hedge ineffectiveness for this hedging relationship.
Options may also be used to hedge prepayment risk on the mortgages, many of which are not identified to specific mortgages and, therefore, do not receive fair value or cash flow hedge accounting treatment. The options are marked-to-market through current earnings. These options include interest rate caps, floors, calls, puts and swaptions. The Bank may also purchase callable swaps to minimize the prepayment risk embedded in the mortgage loans. Although these derivatives are economic hedges against the prepayment risk of the loans, they are not specifically identified to individual loans and, therefore, do not receive either fair value or cash flow hedge accounting. The derivatives are marked-to-market through earnings.
The Bank analyzes the risk of the mortgage portfolio on a regular basis and considers the interest rate environment under various rate scenarios and also performs analysis of the duration and convexity of the portfolio.
Anticipated Streams of Future Cash Flows
The Bank may enter into an option to hedge a specified future variable cash stream as a result of rolling over short term, fixed-rate financial instruments such as LIBOR advances and discount notes. The option will effectively cap or floor the variable cash stream at a predetermined target rate. Such hedge transactions are accounted for as a cash flow hedge. Hedge effectiveness is assessed using the hypothetical derivative method as described under DIG Issue G7 – “Measuring the ineffectiveness of a Cash Flow Hedge under Paragraph 30(b) When the Shortcut Method is Not Applied.” Such relationships are accounted for under the guidance in DIG Issue G20 – “Assessing and Measuring the Effectiveness of a Purchased Option Used in a Cash Flow Hedge.” Under such guidance, the Bank measures hedge effectiveness monthly. For effective hedges, the option premium is reclassified out of OCI using the caplet/floorlet method.
111
Table of Contents
Firm Commitment Strategies
The Bank may hedge a firm commitment for a forward starting advance through the use of an interest rate swap. In this case, the swap will function as the hedging instrument for both the firm commitment and the subsequent advance. The basis movement associated with the firm commitment will be rolled into the basis of the advance at the time the commitment is terminated and the advance is issued. The basis adjustment will then be amortized into interest income over the life of the advance.
Investments
The Bank invests in Government-Sponsored Enterprise (GSE) obligations, mortgage-backed securities and the taxable portion of state or local housing finance agency securities. The interest rate and prepayment risk associated with these investment securities is managed through a combination of debt issuance and derivatives. The Bank may manage against prepayment and duration risk by funding investment securities with consolidated obligations that have call features, by hedging the prepayment risk with caps or floors or by adjusting the duration of the securities by using derivative financial instruments to modify the cash flows of the securities. These securities may be classified as available-for-sale or trading securities on the statements of condition.
For available-for-sale securities that have been hedged and qualify as a fair value hedge, the Bank records the portion of the change in value related to the risk being hedged in other income as “net realized and unrealized gain (loss) on derivatives and hedging activities” together with the related change in the fair value of the derivative financial instruments, and the remainder of the change in other comprehensive income as “net unrealized gain or (loss) on available-for-sale securities.” The long-haul method is used to assess hedge ineffectiveness for this hedging relationship.
The Bank may also manage the risk arising from changing market prices and volatility of investment securities classified as “trading securities” by entering into derivative financial instruments (economic hedges) that offset the changes in fair value of the securities. The market value changes of both the trading securities and the associated derivative financial instruments are included in other income in the statements of income.
Anticipated Debt Issuance
The Bank may enter into interest rate swap agreements as hedges of anticipated issuance of debt to effectively lock in a spread between the earning asset and the cost of funding. All amounts deemed effective, as defined in SFAS 133, are recorded in OCI while amounts deemed ineffective are recorded in current earnings. The swap is terminated upon issuance of the debt instrument, and amounts reported in accumulated OCI are reclassified into earnings over the periods in which earnings are affected by the variability of the cash flows of the debt that was issued. Hedge effectiveness is assessed using the hypothetical derivative methods as defined in DIG Issue G7.
112
Table of Contents
| Managing | Credit Risk |
Credit risk is the risk of loss due to default. The Bank faces credit risk on advances, investments, mortgage loans, derivative financial instruments and other financial instruments. The Bank protects against credit risk on advances through credit underwriting and collateralization of all advances. In addition, the Bank can call for additional or substitute collateral during the life of an advance to protect its security interest. The FHLB Act defines eligible collateral as certain investment securities, residential mortgage loans, deposits with the Bank, and other real estate related assets. All capital stock of the Bank owned by the borrower is also available as supplemental collateral. In addition, members that qualify as Community Financial Institutions – defined in the FHLB Act as FDIC-insured depository institutions with total average year-end assets for the prior three years of $567 million or less as of January 1, 2005 – may pledge secured small-business, small-farm, and small-agribusiness loans as collateral for advances. The Bank is also allowed to make advances to nonmember Housing Associates.
While the Bank faces minimal credit risk on advances, it is subject to credit risk on some investments and on derivative financial instruments. The Bank follows conservative guidelines established by its Board of Directors and the Finance Board on unsecured extensions of credit, whether on- or off-balance sheet, which limit the amounts and terms of unsecured credit exposure to highly rated counterparties, the U.S. Government and other FHLBs. Unsecured credit exposure to any counterparty is limited by the credit quality and capital level of the counterparty and by the capital level of the Bank.
Mortgage Loans Held in Portfolio
The MPF Program involves the acquisition of MPF Loans (PFI originated conforming residential mortgage loans and participations in such mortgage loans acquired by other FHLBs). Under the MPF Program, the PFI originating or selling MPF Loans assumes or retains a defined portion of the credit risk. Though these assets have credit risk, the PFI provides a credit enhancement (which is collateralized to the extent of the PFI’s obligation to pay losses) in a sufficient amount so that the risk associated with investing in MPF Loans is equivalent to investing in a “AA” rated assets, excluding the Bank’s first loss account (FLA) exposure. At September 30, 2005 and December 31, 2004, the Bank had outstanding balances of $43.2 billion and $46.9 billion, respectively, in MPF Loans classified as mortgage loans held in portfolio, net of allowance for credit losses. The Bank has established an appropriate loan loss allowance, and Management of the Bank believes that it has the policies and procedures in place to manage appropriately this credit risk.
Derivative Credit Risk
The contractual or notional amount of an interest rate derivative is not a measure of the amount of credit risk from that transaction. The notional amount serves as a basis for calculating periodic interest payments or cash flows.
The Bank is subject to credit risk in all derivatives transactions because of the potential nonperformance by the derivative counterparty. The Bank manages counterparty credit risk through credit analysis and collateral requirements and by following the requirements set forth in Finance Board regulations. In addition, the Bank reduces this credit risk by executing derivatives transactions only with highly rated financial institutions. In addition, the legal agreements governing its derivatives transactions require the credit exposure of all derivative transactions with each counterparty to be netted and generally require each counterparty to deliver high quality collateral to the Bank once a specified unsecured net exposure is reached. At September 30, 2005 and December 31, 2004, the credit exposure at fair value of the Bank was approximately $192.3 million and $153.5 million, respectively, which after the delivery of required collateral left an unsecured net credit exposure of $3.6 million and $2.9 million, respectively. The Bank values its net credit exposure with all counterparties each business day, exchanging collateral as required. Based on management’s credit analysis, collateral requirements and master netting arrangements, the Bank does not anticipate any losses on these agreements.
113
Table of Contents
The following charts detail the Bank’s derivative counterparty credit exposure:
Derivative Counterparty Credit Exposure
As of September 30, 2005
Net Exposure | ||||||||||||
(Dollars in thousands) | ||||||||||||
Credit Rating | Notional Amount | Exposure at Fair Value | Collateral Held | After Collateral2 | ||||||||
AAA | $ | 262,550 | $ | — | $ | — | $ | — | ||||
AA | 24,047,557 | 109,365 | 107,693 | 1,911 | ||||||||
A | 15,893,809 | 52,279 | 54,109 | 1,540 | ||||||||
BBB | 11,100 | — | — | — | ||||||||
Member Institutions (1)(3) | 6,949,322 | 30,609 | 30,461 | 152 | ||||||||
Total Derivatives | $ | 47,164,338 | $ | 192,253 | $ | 192,263 | $ | 3,603 | ||||
| As of December 31, 2004 | ||||||||||||
Net Exposure | ||||||||||||
(Dollars in thousands) | ||||||||||||
Credit Rating | Notional Amount | Exposure at Fair Value | Collateral Held | After Collateral2 | ||||||||
AAA | $ | 280,550 | $ | — | $ | — | $ | — | ||||
AA | 19,209,671 | 81,872 | 87,681 | 2,914 | ||||||||
A | 19,075,646 | 47,365 | 49,099 | — | ||||||||
BBB | 17,100 | — | — | — | ||||||||
Member Institutions (1)(3) | 7,660,585 | 24,259 | 24,259 | — | ||||||||
Total Derivatives | $ | 46,243,552 | $ | 153,496 | $ | 161,039 | $ | 2,914 | ||||
| As of December 31, 2003 | ||||||||||||
Net Exposure | ||||||||||||
(Dollars in thousands) | ||||||||||||
Credit Rating | Notional Amount | Exposure at Fair Value | Collateral Held | After Collateral2 | ||||||||
AAA | $ | 456,450 | $ | — | $ | — | $ | — | ||||
AA | 28,286,336 | 289,068 | 277,330 | 13,714 | ||||||||
A | 18,274,036 | 163,149 | 167,217 | 3,728 | ||||||||
BBB | 6,140,200 | — | — | — | ||||||||
Member Institutions (1) (3) | 509,956 | 2,110 | 2,110 | — | ||||||||
Total Derivatives | $ | 53,666,978 | $ | 454,327 | $ | 446,657 | $ | 17,442 | ||||
| As of December 31, 2002 | ||||||||||||
Net Exposure | ||||||||||||
(Dollars in thousands) | ||||||||||||
Credit Rating | Notional Amount | Exposure at Fair Value | Collateral Held | After Collateral2 | ||||||||
AAA | $ | 504,400 | $ | 6,570 | $ | — | $ | 6,570 | ||||
AA | 32,517,518 | 201,460 | 183,995 | 17,465 | ||||||||
A | 18,850,331 | 176,045 | 176,045 | — | ||||||||
BBB | 1,760,855 | — | — | — | ||||||||
Member Institutions (1) (3) | 268,832 | — | — | — | ||||||||
Total Derivatives | $ | 53,901,936 | $ | 384,075 | $ | 360,040 | $ | 24,035 | ||||
| (1) | Collateral held with respect to derivative financial instruments with member institutions represents either collateral physically held by or on behalf of the Bank or collateral assigned to the Bank, as evidenced by a written security agreement, and held by the member institution for the benefit of the Bank. |
| (2) | Net exposure after collateral is monitored and reported on an individual counterparty basis. Therefore, because some counterparties are over- collateralized, net exposure after collateral will generally not equal the difference between Exposure at Fair value and Collateral Held. |
| (3) | Member Institutions include derivative counterparties who are affiliated with members of the Bank. |
114
Table of Contents
Operational and Business Risk
Operational risk is the risk of potential loss due to human error, systems malfunctions, man-made or natural disasters, fraud, or circumvention or failure of internal controls. The Bank has established comprehensive systems of risk assessment along with financial and operating polices and procedures and appropriate insurance coverage to mitigate the likelihood of, and potential losses from, such occurrences. The Bank’s policies and procedures include controls to ensure that system-generated data are reconciled to source documentation on a regular basis. In addition, the Bank has a disaster recovery plan that is designed to restore critical business processes and systems in the event of disasters.
In accordance with the Written Agreement the Bank has made a considerable investment in resources dedicated to risk oversight and internal control activities at the Bank during the year ended December 31, 2005. See “Item 1A – Risk Factors”.
Business risk is the risk of an adverse impact on the Bank’s profitability resulting from external factors that may occur in both the short and long term. Business risk includes political, strategic, reputation and/or regulatory events that are beyond the Bank’s control. The Bank mitigates these risks through long-term strategic planning and through continually monitoring economic indicators and the external environment.
115
Table of Contents
| Item 3. | Properties. |
The Bank occupies approximately 135,500 square feet of leased office space on five floors of a thirty story building at 111 East Wacker Drive, Chicago, Illinois 60601. The Bank also maintains a leased off-site back-up facility approximately 15 miles northwest of the main facility which is on a separate electrical distribution grid.
116
Table of Contents
| Item 4. | Security Ownership of Certain Beneficial Owners and Management. |
The Bank is cooperatively owned. Its members own all of the outstanding capital stock of the Bank, and a majority of the directors of the Bank are elected by and from the membership. The exclusive voting rights of members are for the election of ten of the Bank’s directors who represent the members. Each member is eligible to vote for the number of open director seats in the state in which its principal place of business is located. The number of votes that any member may cast for any one directorship is based on the level of Bank capital stock held, but shall not exceed the average number of shares of Bank capital stock that were required to be held by all the members in that state as of December 31 of the preceding calendar year. Membership is voluntary, and members must give notice of their intent to withdraw from membership. Members that withdraw from membership may not be readmitted to membership for five years.
The Bank does not offer any compensation plan under which capital stock of the Bank is authorized for issuance. Ownership of the Bank’s capital stock is concentrated entirely within the financial services industry, and is stratified across various institution types. No Bank officer, manager or employee is eligible to own capital stock in the Bank.
The majority of the Bank’s Board of Directors is elected from the membership of the Bank and these elected directors are officers of member institutions that own the Bank’s capital stock. These institutions are listed in the following table. The Bank’s directors do not own capital stock.
117
Table of Contents
Capital Stock outstanding as of January 31, 2006 for Member Institutions whose
Officers served as a Director of the Bank as of January 31, 2006.
(Dollars in thousands)
Institution Name and Address | Director Name | Capital Stock Par Value $100 | Percent of Total Capital Stock | |||
LaSalle Bank, N.A. 135 South LaSalle Street Ste 260 Chicago, IL 60603 | Thomas M. Goldstein | 310,572 | 7.8% | |||
Guaranty Bank 400 West Brown Deer Rd Brown Deer, WI 53209 | Gerald J. Levy | 46,980 | 1.2 | |||
North Shore Bank, FSB 15700 West Bluemound Road Brookfield, WI 53005 | James F. McKenna | 13,177 | n/a | |||
Busey Bank 201 West Main Street Urbana, IL 61801 | P. David Kuhl | 8,881 | n/a | |||
Baylake Bank 217 N. 4th Avenue Sturgeon Bay, WI 54235 | Thomas L. Herlache | 8,081 | n/a | |||
First Citizens State Bank 207 West Main Street Whitewater, WI 53190 | James K. Caldwell | 5,068 | n/a | |||
McHenry Savings Bank 353 Bank Drive McHenry, IL 60050 | Kathleen E. Marinangel | 4,905 | n/a | |||
The Harvard State Bank 35 North Ayer Street Harvard, IL 60033 | Roger L. Lehmann | 698 | n/a | |||
Illinois National Bank 322 East Capitol Ave Springfield, IL 62701 | Richard K. McCord | 445 | n/a |
n/a = not meaningful as amount is less than 1%
118
Table of Contents
| Item 5. | Directors and Executive Officers. |
Directors
The following table sets forth information regarding each of the Bank’s directors as of January 31, 2006.
Name | Age | Company Director Since | Expiration of Term as Director | |||
James K. Caldwell | 62 | 1998 | 12-31-2006 | |||
Thomas M. Goldstein | 46 | 2005 | 12-31-2008 | |||
Terry W. Grosenheider | 49 | 2002 | 12-31-2006 | |||
Thomas L. Herlache | 63 | 2005 | 12-31-2008 | |||
P. David Kuhl | 56 | 2000 | 12-31-2007 | |||
Alex J. LaBelle | 67 | 2004 | 12-31-2006 | |||
Roger L. Lehmann | 64 | 2004 | 12-31-2006 | |||
Gerald J. Levy | 73 | 2005 | 12-31-2007 | |||
Kathleen E. Marinangel | 59 | 2002 | 12-31-2007 | |||
Richard K. McCord | 61 | 2003 | 12-31-2008 | |||
James F. McKenna | 61 | 2004 | 12-31-2006 |
Mr. Caldwell has been President and Chief Executive Officer of the First Citizens State Bank of Whitewater, in Whitewater, Wisconsin, since 1979. Mr. Caldwell is the president of Whitewater Bancorp, Vice President of Palmyra State Bank, and a director of Weiler & Company. Mr. Caldwell served as the President of the Wisconsin Bankers Association from 1993 to 1994. Mr. Caldwell is past chairman of the University of Wisconsin, Whitewater Foundation and continues to serve as board member. Mr. Caldwell also chaired the Whitewater Community Development Authority and serves on the board and executive committee of the Fairhaven Corporation, a Senior Citizens Home, where he is currently Chairman of the Board of Directors.
Mr. Goldstein has been Senior Executive Vice President of the LaSalle Bank Corporation since 2003. Mr. Goldstein is also the Chairman, President and Chief Executive Officer of ABN AMRO Mortgage Group, Inc. Prior to joining LaSalle Bank Corporation in 1998, Mr. Goldstein worked for Morgan Stanley Dean Witter, Manufacturers Hanover, and Pfizer, Inc.
Mr. Grosenheider has been a private banking relationship manager with U.S. Bank, N.A. since 2002. Previously, he served as the Deputy Secretary of the Wisconsin Department of Financial Institutions from 2000 to 2002. Mr. Grosenheider serves on the Advisory Board for Saint Vincent DePaul which provides transitional housing and housing support for low and moderate income families and is an advisor to the Madison Community Reinvestment Associates. Mr. Grosenheider also held several positions within the Wisconsin Department of Commerce, including Administrator of the Division of Community Development, Administrator of the Division of Economic Development and the Administrator of Marketing, Advocacy and Technology Development, from 1992 until his 2000 appointment as Deputy Secretary.
Mr. Herlache has been President, CEO and Chairman of the Board for Baylake Bank and Baylake Corp., a one bank holding company, in Sturgeon Bay Wisconsin since 1996. Mr. Herlache has previously served on the Door County Board of Supervisors, Door County Chamber of Commerce Board, as well as served on the Sturgeon Bay Utility Commission from 1981-1986 and as its President for a part of that time.
Mr. Kuhl has served as Chairman of the Board and CEO of Busey Bank in Urbana, Illinois since 2003. Mr. Kuhl has been with the Busey Bank since 1979, serving previously as President and CEO. Mr. Kuhl also serves as a director of Busey Bank, First Busey Securities Inc. and First Busey Trust and Investment Company and First Busey Resources. Mr. Kuhl previously served as a director for First Busey Corporation and Busey Insurance Services. First Busey Corporation is the holding company for Busey Bank, First Busey Securities and First Busey Trust and Investment Company.
119
Table of Contents
Mr. LaBelle has been a Broker-Associate with Smothers Realty Group in LaGrange, Illinois, since 1998, and a partner of Kensington Partners, a construction and rehab company since 2002. Mr. LaBelle is also the Secretary and Vice President of LaBelle Gourmet Ltd. During his career as a broker, he has been active in Realtor® associations at the local, state and national levels, and was named Illinois Realtor of the Year for 2003. Mr. LaBelle has also served as a member of the Illinois Office of Banks and Real Estate Board and is a member and past president of the Illinois Real Estate Administration & Disciplinary Board. Mr. LaBelle also served as an Assistant Vice President of the Bank during the late 1960’s and early 1970’s.
Mr. Lehmann joined The Harvard State Bank in 1978 and currently serves as President, CEO and Chairman of the Board of The Harvard State Bank and its holding company Harvard Bancorp, Inc., in Harvard, Illinois. Mr. Lehmann is a past Chairman, and currently serves on the board, of the Community Bankers Association of Illinois. Mr. Lehmann has also served on the boards of several economic and community development organizations in Harvard and in McHenry County.
Mr. Levy joined Guaranty Bank in 1959 and has held a series of officer positions, including President and CEO since 1973 and Chairman of the Board and CEO since 1984 and Executive Chairman since 2003. He is a director of Fiserv, Republic Mortgage Insurance Company and Asset Management Fund. Mr. Levy is a member of the State Bar of Wisconsin. Mr. Levy previously served as Chairman of the Savings & Loan Review Board of Wisconsin from 1972-1980. He is a past president of the Wisconsin League of Financial Institutions and Past Chairman of the United States League of Savings Institutions. He served as a Director and Vice Chairman of the Federal Home Loan Bank of Chicago. Mr. Levy served as a member of the Advisory Committee of the Federal Home Loan Mortgage Corporation and Federal National Mortgage Corporation. He was a Director of the Federal Asset Disposition Association from its inception in 1986 until it was phased out in 1989. He was the Past Chairman of the Wisconsin Partnership for Housing Development and in 1990 chaired the Fair Lending Action Committee which was formed by the Mayor of Milwaukee and Governor of the State of Wisconsin. He is Past Chairman of the Real Estate Services Providers Council.
Ms. Marinangel has worked at McHenry Savings Bank since 1973 and has served as President of McHenry Bank since 1991, CEO of McHenry Savings Bank since 1990, and Chairman of the Board of the McHenry Savings bank since 1989. Ms. Marinangel has also been the Chairman of the Board, CEO and President of McHenry Bancorp, Inc. (MBI) since its inception in January of 2003. MBI is a holding company and the major stockholder of McHenry Savings Bank. Locally she serves on the McHenry County Public Building Commission, the City of McHenry’s Economic Development Commission and serves on the Board of Governors of Centegra Hospital. On a statewide basis she serves as a director of the Illinois League of Financial Institutions and was Past Chairman from 1996-1997. She currently is Chairman of the League’s Banking ERISA Medical Insurance Trust. She is Chairman of the Illinois Board of Savings Institutions. Nationally, she serves as a director of the banking trade group, America’s Community Bankers. She also served a two year term on the Federal Reserve Board’s Thrift Institutions Advisory Council.
Mr. McCord has served as the President and Chief Executive Officer and a director of Illinois National Bank in Springfield and of Illinois National Bancorp, Inc. since 1999. Prior to re-establishing Illinois National Bank in 1999, Mr. McCord was named in 1995 as President and Chief Operating Officer and a director for First of America Bank-Illinois, N.A. Mr. McCord retired from National City Bank, the successor to First of America Bank in 1998, and launched the second generation of Illinois National Bank in 1999. Mr. McCord served as a director of the Community Bank Council of the Federal Reserve Bank of Chicago.
Mr. McKenna has served as President and Chief Executive Officer of North Shore Bank, Brookfield, Wisconsin, since 1970. Mr. McKenna serves on the Board of Directors for ACB Partners, a subsidiary of America’s Community Bankers. He is a member of the Greater Milwaukee Committee.
There is no family relationship among the above directors.
120
Table of Contents
Executive Officers
The following table sets forth certain information regarding the executive officers of the Bank as of January 31, 2006.
Executive Officer | Age | Capacity in which Served | Employee of the Bank Since | |||
| J. Mikesell Thomas | 55 | President and Chief Executive Officer | 2004 | |||
| Kenneth L. Gould | 61 | Executive Vice President, Operations | 1992 | |||
| Charles A. Huston | 58 | Executive Vice President, Membership Relationship Management; Acting President June 30, 2004 through August 30, 2004 | 1991 | |||
| Peter E. Gutzmer | 52 | Executive Vice President, General Counsel and Corporate Secretary | 1985 | |||
| Roger D. Lundstrom | 45 | Executive Vice President, Financial Information | 1984 | |||
| Gnanesh Coomaraswamy | 45 | Senior Vice President, Co-Head, Financial Markets | 1993 | |||
| Eldridge Edgecombe | 57 | Senior Vice President, Community Investment | 2001 | |||
| Matthew R. Feldman | 52 | Senior Vice President, Risk Management | 2003 | |||
| Michael E. McFerrin | 47 | Senior Vice President, Co-Head, Financial Markets | 1992 | |||
| Thomas D. Sheehan | 60 | Senior Vice President, Corporate Services | 1997 |
J. Mikesell Thomas became President and Chief Executive Officer of the Bank in August 2004. Prior to his employment with the Bank, Mr. Thomas served as an independent financial advisor to companies on a range of financial and strategic issues from April 2001 to August 2004. Mr. Thomas was a Managing Director of Lazard Freres & Company, where he was responsible for advising management and boards of client companies on strategic transactions from January 1995 to March 2001. He held positions of increasing responsibility at First Chicago Corporation, including Chief Financial Officer and later, Executive Vice President and Co-Head of Corporate and Institutional Banking, from 1973 to 1995. Mr. Thomas is trustee and chair of the Audit Committee for the following trusts: The UBS Funds, UBS Relationship Funds and SMA Relationship Trust. He is a trustee and a member of the Audit Committee of UBS Private Portfolios Trust and director and chair of the Audit Committee of Fort Dearborn Income Securities, Inc.
Kenneth L. Gould has been Executive Vice President-Operations of the Bank since 2003. Mr. Gould was Executive Vice President- Mortgage Partnership Finance from 1997 to 2003 and Executive Vice President- Operations from 1992 to 1997. Prior to his employment with the Bank, Mr. Gould was Vice President-Operations of M&I Data Services from 1991 to 1992, Executive Vice President-Operations & Retail Banking of Community Federal Savings and Loan from 1989 to 1990, Executive Vice President-Operations & Retail Banking of Altus Bank from 1985 to 1989, and held various positions of increasing responsibility at Continental Bank from 1967 to 1985.
Charles A. Huston has been Executive Vice President-Member Relationship Management of the Bank since 2003. Mr. Huston was Executive Vice President-Banking from 1991 to 2003. Mr. Huston served as Acting President and Chairman of the Management Committee during the interim period from June 30, 2004 through August 30, 2004. Prior to his employment with the Bank, Mr. Huston was Vice President-Corporate Lending of Daiwa Bank Ltd. from 1989 to 1991, and Vice President-Corporate Finance of Continental Bank from 1988 to 1989. From 1971 to 1988 Mr. Huston held various positions of increasing responsibility at Continental Bank.
Peter E. Gutzmer was promoted to Executive Vice President-General Counsel and Corporate Secretary of the Bank in 2003. Mr. Gutzmer was Senior Vice President-General Counsel and Corporate Secretary of the Bank from 1992 to 2003, and General Counsel of the Bank from 1985 to 1991. Prior to his employment with the Bank, Mr. Gutzmer was Assistant Secretary and Attorney of LaSalle Bank, NA from 1980 to 1985.
Roger D. Lundstrom was promoted to Executive Vice President-Financial Information of the Bank in 2003. Mr. Lundstrom was Senior Vice President-Financial Information of the Bank from 1997 to 2003, and Senior Vice President-Financial Reporting and Analysis of the Bank from 1992 to 1997. Mr. Lundstrom held various positions with the Bank in analysis and reporting functions with increasing levels of responsibility from 1984 to 1992.
121
Table of Contents
Gnanesh Coomaraswamy became Senior Vice President, Co-Head-Financial Markets of the Bank in November 2005. Mr. Coomaraswamy was Senior Vice President-Balance Sheet Management from 2002 to 2005 and held various positions with the Bank in financial market functions with increasing levels of responsibility from 1993 through 2002. Prior to his employment with the Bank, Mr. Coomaraswamy was a Teaching and Research Associate of Northwestern University from 1986 to 1992, Consultant of International Telecommunication Satellite during 1989, Consultant of Plantronics Futurecomms Inc. during 1988 and Chief Engineer of Department of Telecom of Colombo, Sri Lanka from 1983 to 1986.
Eldridge Edgecombe has been Senior Vice President for the Bank’s Community Investment Group since 2001. Prior to his employment with the Bank, Mr. Edgecombe was Vice President and Chief Operating Officer, Housing and Community Investment, for the Federal Home Loan Bank of Cincinnati from 1999 to 2001. Previously, Mr. Edgecombe was Executive Director and Chief Executive Officer of the Columbus Housing Partnership from 1996 to 1999, Director of the Community Development Division/Deputy Director Ohio Department of Development from 1992 to 1996, Manager of the Office of Local Government Services for the Ohio Department of Development from 1991 to 1992, and Commissioner-Controller of the Department of Neighborhoods for the City of Toledo from 1983 to 1991.
Matthew R. Feldman has been Senior Vice President-Risk Management of the Bank since 2004. Mr. Feldman was Senior Vice President-Manager of Operations Analysis of the Bank from 2003 to 2004. Prior to his employment with the Bank, Mr. Feldman was founder and Chief Executive Officer of Learning Insights, Inc. from 1995 to 2003. Mr. Feldman conceived, established, financed and directed the operations of this privately held e-learning company of which he is still Non-Executive Chairman. Mr. Feldman was President of Continental Trust Company, a wholly-owned subsidiary of Continental Bank from 1992 to 1995 and Managing Director-Global Trading and Distribution of Continental Bank from 1988 to 1992.
Michael E. McFerrin became Senior Vice President, Co-Head-Financial Markets of the Bank in November 2005. Mr. McFerrin was Senior Vice President-Mortgage Finance from 2001 to 2005 and Vice President-Financial Markets from 1992 to 1994. Mr. McFerrin was also President/Principal of Benjamin Investments LLC from 1999 to 2001, Vice President of Nomura Securities International from 1994 to 1999, Vice President, Senior Investment Analyst and Portfolio Manager of Farm and Home Savings Association from 1991 to 1992 and held positions of increasing responsibility at First Federal Savings and Loan Association of Pittsburg from 1986 to 1991.
Thomas D. Sheehan has been Senior Vice President-Corporate Services of the Bank since 2003. Mr. Sheehan was Senior Vice President-Corporate Operations from 1997 to 2003. Prior to his employment with the Bank, Mr. Sheehan was Deputy Director-Office of Policy of the Federal Housing Finance Board from 1989 to 1997, Director-Policy Division of the Federal Home Loan Bank Board from 1985 to 1989 and Operations Officer of the American National Bank of Chicago from 1984 to 1985, and Operations Officer of Continental Bank of Chicago from 1978 to 1984.
There is no family relationship among the above officers.
The Bank has adopted a code of ethics for all of its employees and directors, including its President and CEO, principal financial officer, and those individuals who perform similar functions. A copy of the code of ethics will be provided without charge upon request to: Vice President of Human Resources, Federal Home Loan Bank of Chicago, 111 East Wacker Drive, Chicago, Illinois 60601.
122
Table of Contents
| Item 6. | Executive Compensation. |
The following table sets forth all compensation received from the Bank for the year ended December 31, 2005, by the Bank’s President and Chief Executive Officer and the four most highly paid executive officers (other than the Chief Executive Officer) who were serving as executive officers at the end of 2005 (collectively, the “Named Executive Officers”). Annual compensation includes amounts deferred.
Summary Compensation Table
| Annual Compensation | ||||||||||||||||
Name | Principal Position | Year | Salary ($) | Bonus ($) | Other Annual Comp ($) | LTIP2 Payout ($) | ||||||||||
Thomas, J. Mikesell | President and | |||||||||||||||
| Executive Officer | 2005 | $ | 650,000 | $ | 650,000 | $ | 29,008 | $ | — | |||||||
Moore, Michael W. 1 | Executive Vice President - | |||||||||||||||
| Financial Markets | 2005 | 416,000 | 104,000 | 182,945 | 146,850 | |||||||||||
Michael E. McFerrin | Senior Vice President - | |||||||||||||||
| Co-Head-Financial Markets | 2005 | 415,000 | 80,904 | 87,737 | 104,263 | |||||||||||
Gnanesh Coomaraswamy | Senior Vice President - | |||||||||||||||
| Co-Head-Financial Markets | 2005 | 372,000 | 72,521 | 97,057 | 96,186 | |||||||||||
Gould, Kenneth L. | Executive Vice President - | |||||||||||||||
| Operations | 2005 | 327,500 | 83,217 | 109,603 | 165,940 | |||||||||||
Gutzmer, Peter E. | Executive Vice President - | |||||||||||||||
| General Counsel and | ||||||||||||||||
| Corporate Secretary | 2005 | 250,500 | 63,652 | 78,900 | 129,228 | |||||||||||
Lundstrom, Roger D. | Executive Vice President - | |||||||||||||||
| Financial Information | 2005 | 250,500 | 63,652 | 93,961 | 129,228 | |||||||||||
| 1 | Mr. Moore resigned effective December 31, 2005. |
| 2 | Long Term Incentive Plan (LTIP) amount represents payout net of the cost of performance units purchased in 2003. Amount was awarded for the three year performance period ending December 31, 2005 and paid out in the first quarter of 2006. |
Personnel and Compensation Committee
The Bank’s Board of Directors has established a Personnel and Compensation Committee to assist the Board of Directors in matters pertaining to the employment and compensation of the President and CEO and executive officers and Bank employment and benefits programs in general. The Personnel and Compensation Committee consists of not less than five directors.
123
Table of Contents
The Personnel and Compensation Committee is responsible for making recommendations to the Board regarding the compensation of the President and CEO and approving compensation of the executive officers, including base salary, merit increases, incentive compensation and other compensation and benefits. Its responsibilities include seeing that the Bank’s compensation is reasonable and comparable with the compensation of executives at the other FHLBs and other similar financial institutions that involve similar duties and responsibilities. All major components of the Bank’s executive compensation program, other than base salary are linked to annual and long term performance measures.
The Bank’s executive compensation program has three components: base salary, an annual incentive award, and long term incentive award. The two incentive award programs tie executive officer total compensation to different time periods.
Summary of Compensation Plans
Employment Agreement
In connection with Mr. Thomas joining the Bank on August 30, 2004, the Bank entered into an Employment Agreement with Mr. Thomas. The material terms of the agreement are as follows. Mr. Thomas’ period of employment is scheduled to end on December 31, 2007, subject to automatic one year extensions until such date as the Bank or Mr. Thomas gives notice of non-extension. Mr. Thomas is to receive an annual salary of not less than $625,000 (prorated) for 2004, $650,000 for 2005, $676,000 for 2006 and $703,040 for 2007. The Board of Directors may, in its discretion, increase the base salary from the minimum amount described above. Mr. Thomas is entitled to participate in the President’s Incentive Compensation Plan and Long Term Incentive Compensation Plan, with a minimum total incentive compensation during the period ending not later than December 31, 2007 equal to 100% of base salary for the calendar year (pro rated for any partial calendar years). The maximum total incentive compensation amount is 125% of base salary for the calendar year (pro rated for any partial calendar years). Beginning January 1, 2008, the total incentive compensation target for each calendar year will not be less than 74% of base salary.
Mr. Thomas is also entitled to reimbursement for all expenses and disbursements reasonably incurred in the performance of his employment. In addition, the Bank agreed to reimburse Mr. Thomas up to $10,000 for legal fees incurred in connection with the negotiation of his Employment Agreement. Mr. Thomas and his eligible family members are entitled to participate in any group and/or executive life, hospitalization or disability insurance plan, health program, vacation policy, pension, profit sharing, 401(k) and similar benefit plans or other fringe benefits of the Bank on terms generally applicable to the Bank’s senior executives. If Mr. Thomas chooses not to participate in the Bank’s health program, the Bank is required to pay Mr. Thomas an amount in cash equal to the premiums for the forgone health insurance coverage.
In the event the Employment Agreement is terminated by the Bank without cause or by Mr. Thomas with good reason, in lieu of any of any other severance benefits, Mr. Thomas is entitled to receive an amount equal to two (2) times his base salary as of the date of termination plus his minimum total incentive compensation as of such date. The base salary amounts are payable within ten (10) days of the date a release is executed. Fifty percent of the total incentive compensation amount is payable on each of the first two anniversaries of the termination date. No severance is payable in connection with a non-renewal of the Employment Agreement. The Employment Agreement also provides for certain obligations to which Mr. Thomas has agreed with regard to maintaining confidential information and nonsolicitation of protected employees.
Executive Base Salary
Each year, the base salary for the President and CEO, is determined by the Board of Directors following a recommendation from the Personnel & Compensation Committee and is based on the Committee’s review of the President and CEO’s performance, Bank performance and market data obtained from the other FHLBs and other similar financial institutions.
The Personnel and Compensation Committee also reviews the President and CEO’s recommendations of the base salaries for members of the Bank’s Management Committee. These recommendations are based on the individual performance of each Management Committee member and market data obtained from the other FHLBs and other similar financial institutions.
124
Table of Contents
Annual Incentive Award
The President’s annual incentive compensation is based on the establishment of performance criteria and targets that are consistent with the Bank’s Business Plan as approved by the Board of Directors. Each year, in January, plan criteria, performance targets, and definitions of Plan Criteria are established by the Personnel and Compensation Committee and approved by the Board of Directors. Performance Criteria may include such factors as profitability, innovation and leadership, market share, and control. Following the Plan Year, the President’s performance is reviewed by the Personnel and Compensation Committee and measured against the Performance Targets. Following this review and approval by the Board of Directors, any award made to the President is paid in cash.
The Management Incentive Compensation Plan, which covers the Bank’s Management Committee, is based on a series of performance criteria that are consistent with the Bank’s Business Plan for the year. Each year, in January, plan criteria, performance targets, and definitions of Plan Criteria are established and approved by the Personnel and Compensation Committee. Performance criteria may include such factors as: profitability, market share, control and System leadership. In addition, one or more key personal goals are established for each participant.
Following the Plan Year, both attainment of performance targets and the completion of individual performance goals are reviewed by the President and CEO and reported to the Personnel and Compensation Committee. The cash portion of any award is payable after the year-end results are reported to the Personnel and Compensation Committee and approved. Awards are paid as follows: 60% in cash and 40% is deferred and held in a Bank-maintained account.
Long Term Incentive Award
The Long Term Incentive Compensation Plan covers a three year performance period. A new Performance Period is established each year. As of the beginning of each performance period, the Personnel and Compensation Committee, with the approval of the Board of Directors, establishes one or more performance goals. The Personnel and Compensation Committee designates those officers who are eligible to participate in the Plan for the Performance Period.
A Participant may elect to purchase from twenty percent (20%) to one hundred percent (100%) of the allocated Performance Units awarded in the plan. The purchase price for a Performance Unit is determined by the Personnel and Compensation Committee. A Participant receives three additional Performance Units for each Performance Unit purchased and is not required to pay for these additional Performance Units. A Participant must be actively employed by the Bank at the end of the Performance Period to be vested in these three additional Performance Units.
At the end of the Performance Period, the Personnel and Compensation Committee determines the extent to which the Performance Goals were achieved and the value of the Performance Unit. Final awards are approved by the Board of Directors. Under this plan, if the Bank fails to meet a minimum threshold established by the Committee, the amount paid out will be less than the amount paid in by the officer, resulting in a negative net return. Payments due for the vested Performance Units generally are made within ninety (90) days of the end of the Performance Period. If a Participant owns at least three hundred (300) Performance Units at the end of the Performance Period, the Participant may elect to defer distribution of the Performance Units. A deferral is for a period of not less than two (2) years from the applicable time of payment. Interest accrues on deferred payments from the end of the applicable Performance Period to the date of payment at a rate equal to the 90 day FHLB note.
125
Table of Contents
Below is a table summarizing awards under the Plan for the Bank’s President and Chief Executive Officer and the four most highly paid executive officers:
| Long-Term Incentive Plan Award | |||||||||||||||||||
| Estimated Future Payouts under Non-Stock Price-Based Plans | |||||||||||||||||||
Name | Number of Units Purchased (#) | Total Units (#) | Performance Period Until Maturation | Amount Purchased ($) | Threshold ($) | Target ($) | Maximum ($) | ||||||||||||
Thomas, J. Mikesell 1 | — | — | - | $ | — | $ | — | $ | — | $ | — | ||||||||
Moore, Michael W. 2 | Refunded | — | January 1, 2005 - December 31, 2007 | (22,355 | ) | — | — | — | |||||||||||
Michael E. McFerrin | 307 | 921 | January 1, 2005 - December 31, 2007 | 20,185 | 16,885 | 92,100 | 184,200 | ||||||||||||
Gnanesh Coomaraswamy | 226 | 678 | January 1, 2005 - December 31, 2007 | 14,860 | 12,430 | 67,800 | 135,600 | ||||||||||||
Gould, Kenneth L. | 272 | 816 | January 1, 2005 - December 31, 2007 | 17,884 | 14,960 | 81,600 | 163,200 | ||||||||||||
Gutzmer, Peter E. | 233 | 699 | January 1, 2005 - December 31, 2007 | 15,320 | 12,815 | 69,900 | 139,800 | ||||||||||||
Lundstrom, Roger D. | 233 | 699 | January 1, 2005 - December 31, 2007 | 15,320 | 12,815 | 69,900 | 139,800 | ||||||||||||
| 1 | Mr. Thomas elected not to participate in the 2005-2007 period plan. |
| 2 | Mr. Moore resigned effective December 31, 2005. |
The table reflects the total number of performance units purchased in 2005 and estimated payouts to be made in the first quarter of 2008 for the three year performance period ending December 31, 2007, based on the attainment of Bank goals at the end of the performance period. The dollar amount purchased represents the number of purchased performance units multiplied by $65.75 per unit. The total number of units represents both the number of units purchased and additional performance units to be granted at the end of the performance period.
At the end of the performance period the Personnel and Compensation Committee determines the extent to which performance goals were achieved and the value of each purchased performance unit and each granted performance unit. Purchased performance units can have a maximum value of $200, a target value of $100 and a minimum threshold value of $55. Granted performance units have a maximum value of $200, a target value of $100 and a minimum threshold value of $0.
The estimated future payout columns reflect the value for both the purchased and granted performance units at the end of the performance period at threshold, target and maximum performance.
Retention and Severance Agreements
The Bank’s executive officers and certain other key employees were participants in the Bank’s Employee Severance and Retention Plan which covers the period from June 30, 2004 to June 30, 2005. Under the plan, if any of Mr. Gutzmer, Mr. Lundstrom, Mr. Moore, Mr. Gould, or Mr. Huston were to be terminated for other than cause, including a constructive discharge, that officer would be entitled to receive the greater of: (1) four weeks’ base salary for each full year of calendar service, or (2) one year’s base salary. In addition, the Bank will make COBRA payments required to continue health insurance benefits for a time period equal to the number of weeks of pay such named executive officer is entitled to receive. Effective July 1, 2005, the Bank has adopted an Employee Severance Plan, covering all Bank employees, which also continues the previously described severance benefits for these named executive officers.
126
Table of Contents
Under the Bank’s Employee Severance and Retention Plan for the period from June 30, 2004 to June 30, 2005, Mr. Gutzmer, Mr. Lundstrom, Mr. Moore, Mr. Gould, and Mr. Huston were also entitled to receive a retention payment. In order to receive a retention payment, the named executive officer must have been employed continuously with the Bank during the plan period from June 30, 2004 to June 30, 2005 or the named executive officer must have been terminated other than for cause during the plan period. The retention payment was an amount equal to the named executive officer’s target award percentage payable under the Bank’s Management Incentive Compensation Plan. The retention payment was accrued on a pro-rata basis over the 12 month period and was paid out on June 30, 2005.
Retirement Plans
For a description of the Bank’s retirement plans, see Note 15 to the 2004 Annual Financial Statements.
The following table show estimated annual benefits payable from Financial Institutions Retirement Plan and Benefit Equalization Plan combined upon retirement at age 65 and calculated in accordance with the formula currently in effect for specified years-of-service and remuneration classes for the executive officers participating in both plans.
Pension Plan Table
Years of Service | ||||||||||
Remuneration | 15 | 20 | 25 | 30 | 35 | |||||
300,000 | 101,250 | 135,000 | 168,750 | 202,500 | 236,250 | |||||
400,000 | 135,000 | 180,000 | 225,000 | 270,000 | 315,000 | |||||
500,000 | 168,750 | 225,000 | 281,250 | 337,500 | 393,750 | |||||
600,000 | 202,500 | 270,000 | 337,500 | 405,000 | 472,500 | |||||
700,000 | 236,250 | 315,000 | 393,750 | 472,500 | 551,250 | |||||
800,000 | 270,000 | 360,000 | 450,000 | 540,000 | 630,000 | |||||
900,000 | 303,750 | 405,000 | 506,250 | 607,500 | 708,750 | |||||
Compensation is the average annual salary (base and bonus) for the five consecutive years of highest salary during benefit service. The formula for determining normal retirement allowance is 2.25% times years and months of benefit service times high five-year average salary.
The covered executive officers have approximately the following years of credit service as of December 31, 2005:
| Years of Credit Service | ||
Mr. Thomas | 0.8 | |
Mr. Moore | 13.4 | |
Mr. McFerrin | 11.0 | |
Mr. Coomaraswamy | 11.8 | |
Mr. Gould | 13.4 | |
Mr. Gutzmer | 20.2 | |
Mr. Lundstrom | 21.3 |
The regular form of retirement benefits is a straight-line annuity including a lump-sum retirement death benefit. Retirement benefits are not subject to any deductions for Social Security benefits or other offset amounts.
127
Table of Contents
Compensation Committee Interlocks and Insider Participation
None of the members of the Bank’s Personnel and Compensation Committee has at any time been an officer or employee of the Bank. None of the Bank’s Executive Officers serves as a member of the Board of Directors or the Personnel and Compensation Committee of the Bank.
Compensation of Directors
The Bank has established a policy governing the compensation and travel reimbursement provided to its Board of Directors. The goal of the policy is to compensate members of the Board of Directors for work performed on behalf of the Bank. Under this policy, compensation is comprised of per-meeting fees which are subject to an annual cap established by the GLB Act. The fees compensate Directors for time spent reviewing materials sent to them on a periodic basis by the Bank, for preparing for meetings, for participating in any other activities for the Bank and for actual time spent attending the meetings of the Board or its committees. Directors are also reimbursed for reasonable Bank-related travel expenses. Total Directors’ fees paid by the Bank during 2004, 2003 and 2002 were $289,580, $274,586 and $250,901, respectively. Total Directors’ travel expenses paid by the Bank were $73,341, $46,441 and $47,940, respectively.
The following table sets forth the per-meeting fees and the annual caps established for 2006:
| Per Meeting Fee | Annual Cap | |||||
Chair | $ | 4,300 | $ | 29,357 | ||
Vice-chair | 3,500 | 23,486 | ||||
Other members 1 | 2,700 | 17,614 | ||||
| 1 | This fee is $2,900 for a member that is chairing one or more committee meetings. |
The following table sets forth the per-meeting fees and the annual caps established for 2005:
| Per Meeting Fee | Annual Cap | |||||
Chair | $ | 4,200 | $ | 28,364 | ||
Vice-chair | 3,400 | 22,692 | ||||
Other members 1 | 2,600 | 17,019 | ||||
| 1 | This fee is $2,800 for a member that is chairing one or more committee meetings. |
The following table sets forth the per-meeting fees and the annual caps established for 2004:
| Per Meeting Fee | Annual Cap | |||||
Chair | $ | 4,100 | $ | 27,405 | ||
Vice-chair | 3,300 | 21,924 | ||||
Other members 1 | 2,500 | 16,443 | ||||
| 1 | This fee is $2,700 for a member that is chairing one or more committee meetings. |
128
Table of Contents
| Item 7. | Certain Relationships and Related Transactions. |
Transactions with Related Parties and other FHLBs
The Bank does not participate in activities with related parties which are not a part of the Bank’s ordinary course of business. All transactions with related parties are recorded within the Bank’s two operating segments; MPF Program and Traditional Member Finance. The following summarizes the Bank’s transactions with related parties and other FHLBs.
Related Parties: The Bank is a cooperative whose member institutions own the capital stock of the Bank and may receive dividends on their investments. In addition, certain former members that still have outstanding transactions are also required to maintain their investment in Bank capital stock until the transactions mature or are paid off. All transactions with members are entered into in the normal course of business. In instances where the member also has an officer who is a director of the Bank, those transactions are subject to the same eligibility and credit criteria, as well as the same terms and conditions, as all other transactions. The Bank defines related parties as those members with capital stock outstanding in excess of 10% of total capital stock outstanding. At September 30, 2005 and December 31, 2004 and 2003 the Bank had no member with capital stock outstanding in excess of 10% of the Bank’s total capital stock. Investment securities issued by affiliates of our members may be purchased in the secondary market through a third party at arm’s length.
Outlined below is the level of activity the Bank has with its members and their affiliates as reported in the statements of condition.
| • | Federal funds sold related to members and their affiliates reported in the Bank’s statements of condition at September 30, 2005 and December 31, 2004 and 2003 was $0 million, $0 and $350.0 million, respectively. |
| • | The Bank acquired $1.5 billion and $3.5 billion in MPF Loans from or through member PFIs in the nine months ended September 30, 2005 and 2004, respectively. The Bank acquired $4.1 billion, $15.9 billion and $5.8 billion in MPF Loans from or through member PFIs during the three years ended December 31, 2004, 2003 and 2002, respectively. |
| • | Held-to-maturity securities of members’ affiliates at September 30, 2005 and December 31, 2004 and 2003 were $12.8 million, $30.4 million and $45.0 million, respectively. |
| • | Derivative assets of members and their affiliates at September 30, 2005 and December 31, 2004 and 2003 were $30.6 million, $24.3 million and $28.7 million, respectively. Derivative liabilities of members and their affiliates at September 30, 2005 and December 31, 2004 and 2003 were $72.6 million, $91.7 million and $4.7 million, respectively. |
| • | Interest and non-interest bearing deposits from members of $838.8 million, $885.2 million and $1.3 billion at September 30, 2005 and December 31, 2004 and 2003 are maintained by the Bank for its members primarily to facilitate settlement activities that are directly related to advances and mortgage loan purchases. |
Other FHLBs: The Office of Finance may issue consolidated obligations through the Global Issuances Program. Historically, the Bank has been the primary obligor on any consolidated obligation debt issued under this program that is not taken by another FHLB. If another FHLB needs liquidity or additional funding, then the FHLB could obtain funding by issuing new consolidated obligations through the Office of Finance, or the Bank could transfer its consolidated obligations at fair value to the other FHLB. Due to the fact that the Bank is no longer considered the primary obligor of the transferred consolidated obligations by the Office of Finance, the Bank considers itself released from its obligation and records the transfer as an extinguishment of debt with a corresponding gain or loss recorded in the statements of income. The Bank transferred $975.2 million and $3.8 billion of consolidated obligations to other FHLBs for the nine months ended September 30, 2005 and 2004, respectively. In addition, the Bank recognized a net realized gain from early extinguishment of debt transferred to other FHLBs of $4.6 million and $46.5 million for the nine months ended September 30, 2005 and 2004, respectively. The Bank transferred $4.3 billion, $6.3 billion and $729.3 million of consolidated obligations to other FHLBs for the years ended December 31, 2004, 2003 and 2002, respectively. In addition, the Bank recognized a net realized gain (loss) from early extinguishment of debt transferred to other FHLBs of $45.8 million, $106.3 million and ($2.3 million) for the years ended December 31, 2004, 2003 and 2002, respectively. There were no such sales of available-for-sale securities being used to hedge the transferred debt for the year ended December 31, 2002.
129
Table of Contents
The Bank records a transfer of its consolidated obligations to another FHLB as an extinguishment of debt since the Bank has been released from being the primary obligor. Specifically, the release is affected by the Office of Finance’s recordation of the transfer in its records. The Office of Finance is providing a release by acting within the confines of the banking regulations that governs the determination of which FHLB is the primary obligor. The FHLB assuming the consolidated obligation becomes the primary obligor since it now is directly responsible for repaying the debt. The Bank continues to disclose the transferred debt as a contingent liability since it still has a joint and several liability with respect to repaying the transferred consolidated obligation. The Bank does not record a financial guarantee at fair value with respect to the transferred consolidated obligation since FIN 45 does not require such accounting for a related party.
As the MPF Provider, the Bank recorded $2.2 million and $812.1 thousand as transaction services fees in the nine months ended September 30, 2005 and 2004, respectively. The Bank recorded $1.2 million in transaction service fees for the year ended December 31, 2004, which was the first year in which the Bank recorded such fees. Prior to 2004 the Bank incurred these costs to promote the MPF Program. Transaction service fees are recorded in “Other, net” on the Bank’s statements of income.
In December 2002, the Bank agreed to begin purchasing MPF Loans directly from members of the FHLB of Dallas and pay the FHLB of Dallas as the Bank’s marketing agent. The FHLB of Dallas acts as marketing agent for the Bank and receives a marketing fee for its services rather than purchasing MPF Loans from its members. Direct acquisitions from another FHLB’s members are permitted under the AMA Regulation with the consent of that FHLB. The Bank incurred $305.5 thousand and $629.3 thousand in marketing fees paid to the FHLB of Dallas during the nine months ended September 30, 2005 and 2004, respectively. The Bank incurred $731.8 thousand and $1.7 million in marketing fees paid to the FHLB of Dallas during the years ended December 31, 2004 and 2003, respectively. The Bank did not incur any such fees in 2002. Marketing fees paid to Dallas are recorded in “Mortgage Loan Expense “ on the Bank’s statements of income.
The Bank purchased $1.6 billion and $4.5 billion in participation interests from other FHLBs during the nine months ended September 30, 2005 and 2004, respectively. The Bank purchased $4.9 billion, $20.9 billion and $10.7 billion in participation interests from other FHLBs during the years ended December 31, 2004, 2003 and 2002, respectively. Participation interests purchased are recorded as a component of “Loans held in portfolio purchased from other FHLBs” on the statements of cash flows.
The Bank sold $878.9 million in participation interests to the FHLB of Topeka in 2004, and did not sell any participation interests to other FHLBs in 2003. The purchase and immediate sale to the FHLB of Topeka was recorded net in Operating Activities, and accordingly, there was no impact to the Bank’s statements of cash flows related to this transaction.
The Bank completed two MPF Shared Funding transactions in March 2003 and June 2003. The outstanding principal balance of the A Certificates held by the Bank in connection with these transactions was $436.6 million and $513.0 million as of September 30, 2005 and December 31, 2004, respectively.
The Bank paid participation fees of $225.0 thousand to the FHLB of Des Moines for the nine month periods ended September 30, 2005 and 2004. The Bank paid participation fees of $300.0 thousand to the FHLB of Des Moines during each of the three years ended December 31, 2004, 2003 and 2002. Participation fees paid to the FHLB of Des Moines are recorded in “Mortgage Loan Expense” on the Bank’s statements of income.
As of September 30, 2005 and December 31, 2004 and 2003, the Bank held investment securities classified as trading in the Bank’s statements of condition of $34.1 million, $71.7 million and $75.7 million of consolidated obligations of other FHLBs which were purchased from 1995 to 1997. The FHLB of Dallas was the primary obligor of $28.0 million of consolidated obligations at September 30, 2005 and $41.7 million and $43.6 million at December 31, 2004 and 2003, respectively. The FHLB
130
Table of Contents
of San Francisco was the primary obligor for $6.1 million of consolidated obligations held at September 30, 2005 and $30.0 million and $32.1 million held at December 31, 2004 and 2003, respectively. The respective changes in fair value are recorded within net (loss) gain on trading securities on the statements of income and within Operating Activities as a net (increase) decrease on trading securities in the Bank’s statement of cash flows.
The Bank has receivables with other FHLBs, which were $1.1 million, $1.0 million and $1.8 million at September 30, 2005 and December 31, 2004 and 2003, respectively. Receivables are classified in other assets on the Bank’s statements of condition. Other FHLBs have deposits with the Bank that are separately reported on the Bank’s statements of condition.
131
Table of Contents
| Item 8. | Legal Proceedings. |
The Bank is not currently aware of any pending or threatened legal proceedings against it that could have a material adverse effect on the Bank’s financial condition or results of operations.
132
Table of Contents
| Item 9. | Market Price of and Dividends on the Registrant’s Common Equity and Related Stockholder Matters. |
Members own all the capital stock of the Bank and elect the majority of the directors of the Bank. The Bank conducts its business in mortgages and advances almost exclusively with its members. There is no established marketplace for the Bank’s capital stock and the capital stock is not publicly traded. By regulation, the Bank has the discretion to repurchase capital stock held by members in excess of their required capital stock holdings (“voluntary capital stock”) at any time. However, on October 18, 2005, the Bank discontinued voluntary stock redemptions and amended its Written Agreement with the Finance Board. Under the amendment, the Bank agreed to maintain new minimum capital requirements. See “Item 2.2—Management’s Discussion and Analysis of Financial Condition and Results of Operations—Overview—Regulatory Agreement and Related Actions.” Par value of all capital stock is $100 per share. As of September 30, 2005, the Bank had approximately 38.9 million shares of capital stock outstanding and there were 885 stockholders of record. As of December 31, 2004, the Bank had approximately 43 million shares of capital stock outstanding and there were 893 stockholders of record.
The Bank’s dividend payments to members have been principally in the form of capital stock rather than cash which has been acceptable to the Bank’s membership. Fractional shares of stock dividends were paid in cash until the fourth quarter of 2005 when fractional shares have begun to be paid in fractional shares of capital stock. The dividends based on fourth quarter 2005 results and paid in the first quarter of 2006 were paid all in cash and the Bank anticipates that it will continue to pay cash dividends in the near future. Beginning in 2004, the Bank added 100 basis points above the quarterly 52 week average of the one-year LIBOR rate as its minimum dividend rate goal. With regard to dividends, in 2003, the Bank used a one-year LIBOR plus 75 basis points as its minimum dividend rate goal. Because LIBOR represents the rate at which banks can borrow and lend US dollars globally, it is widely used as a borrowing index on U.S. commercial and corporate loans.
The Bank uses one-year LIBOR in calculating its minimum dividend rate goal because management believes its average duration gap is close to zero and equity would be invested in shorter term assets with rates that approximate LIBOR. The dividend rate is dependent on the Bank’s return on equity, which is dependent on LIBOR. Further, the dividend rate is dependent on the interest spread between yields on interest earning assets and interest-bearing liabilities. As the Bank’s asset mix has shifted toward MPF Loans, the Bank’s net interest rate spread and return on equity has been higher than forecasted, resulting in higher dividends from the minimum dividend goal.
On December 20, 2004 the Bank’s Board of Directors announced that in an effort to achieve full implementation of its Written Agreement with the Finance Board, that the fourth quarter 2004 dividend would be limited to the lesser of 5.5% annualized or 100% of core earnings, as defined as net income less any material, non recurring items. In accordance with the Bank’s Business and Capital & Management Plan for 2005 – 2007, the Bank’s Board of Directors adopted a new dividend policy requiring its dividend payout ratio in a given quarter not to exceed 90% of adjusted core net income for that quarter. See “Item—1.5—Regulations—Capital, Capital Rules and Dividends—Dividends.” Also, the amendment to the Written Agreement requires that dividends receive approval by the Finance Board’s Office of Supervision until such time that the Bank completes the process of registering its capital stock under the Securities Exchange Act of 1934 and it submits and the Finance Board approves a revised retained earnings and dividend policy.
In the first quarter of 2005, the Bank’s dividend rate paid was 5.50%, totaling $60.3 million in dividends to stockholders after reclassifying $241 thousand to interest expense for the adoption of FAS 150. In the second quarter of 2005, the Bank’s dividend rate paid was 5.50% totaling $57.7 million in dividends to stockholders. In the third quarter of 2005, the Bank’s dividend rate paid was 5.0% totaling $51.7 million in dividends to stockholders. On October 18, 2005, the Board of Directors declared and approved a 3.75% (annualized rate) stock dividend based on third quarter 2005 results to be paid to members in the fourth quarter on November 15, 2005. This dividend was below the Bank’s minimum dividend rate goal of 4.33%, consisting of the actual one-year moving average LIBOR rate of 3.33% for the quarter plus 100 basis points. On January 18, 2006, the Board of Directors declared and approved a 3.00% (annualized rate) cash dividend based on fourth quarter 2005 results to be paid to members on February 15, 2006. The Bank’s recent dividends were below the Bank’s minimum dividend rate goal of 4.33% because of the constraints imposed by the Finance Board’s Written Agreement, as amended.
133
Table of Contents
Given the Finance Board’s current dividend approval requirements and the Written Agreement, as amended, requirement for Finance Board approval of a new retained earnings and dividend policy, it is unlikely that the Bank will meet its dividend rate goal in the near term and there is no assurance as to what the dividend rate goal will be under the new retained earnings and dividend policy.
In 2004, the Bank’s average annualized dividend rate was 6.125%, approximately 400 basis points over the minimum dividend goal of 2.12% (1-year LIBOR plus 100 basis points). The Bank declared and paid $147.6 million in dividends to stockholders during 2002, declared and paid $219.6 million in 2003 and declared and paid $263.0 million in 2004 after reclassifying $1.5 million to interest expense for the adoption of SFAS 150.
The Bank paid quarterly dividends as outlined in the table below.
| For the Years Ended December 31, | ||||||||||||||||||||||||
(Dollars in thousands) | 2005 | 2004 | 2003 | 2002 | ||||||||||||||||||||
Quarter in which Paid 1 | Amount | Annualized Percent | Amount | Annualized Percent | Amount | Annualized Percent | Amount | Annualized Percent | ||||||||||||||||
First | $ | 60,299 | 5.50 | % | $ | 67,279 | 6.50 | % | $ | 39,136 | 5.00 | % | $ | 30,693 | 5.00 | % | ||||||||
Second | 57,676 | 5.50 | % | 63,564 | 6.00 | % | 52,951 | 6.50 | % | 33,540 | 5.00 | % | ||||||||||||
Third | 51,719 | 5.00 | % | 66,790 | 6.00 | % | 58,413 | 6.50 | % | 36,410 | 5.00 | % | ||||||||||||
Fourth | 38,164 | 3.75 | % | 65,332 | 6.00 | % | 69,089 | 7.00 | % | 46,963 | 6.00 | % | ||||||||||||
Total | $ | 207,858 | $ | 262,9652 | $ | 219,589 | $ | 147,606 | ||||||||||||||||
| 1 | Prior to and during the fourth quarter 2002, dividends were declared and paid in the current quarter. After the fourth quarter 2002, dividends were declared and paid in the subsequent quarter. A special dividend was declared in the first quarter of 2003. |
| 2 | 2004 excludes $1,598,000 related to the application of SFAS 150. |
For the Nine Months Ended September 30, | For the Years Ended December 31, | |||||||||||||||
| 2005 | 2004 | 2003 | 2002 | |||||||||||||
Dividends 1 | ||||||||||||||||
Dividends paid in capital stock (in thousands) | $ | 169,561 | $ | 262,782 | $ | 219,411 | $ | 147,429 | ||||||||
Dividends paid in cash (in thousands) | 133 | 181 | 178 | 177 | ||||||||||||
Average Annualized Dividend Rate | 5.33 | % | 6.125 | % | 6.25 | % | 5.25 | % | ||||||||
| 1 | Prior to and during the fourth quarter 2002, dividends were declared and paid in the current quarter. After the fourth quarter 2002, dividends are declared and paid in the subsequent quarter. A special dividend was declared in the first quarter of 2003. |
134
Table of Contents
| Item 10. | Recent Sales of Unregistered Securities. |
Consolidated obligations issued by the Bank are exempt under Section 3(a)(2) of the Securities Act of 1933. The following table provides information regarding consolidated obligations sold by the Bank through the Office of Finance as agent for the Bank and equity securities sold directly to the Bank’s members. All securities were sold for cash and the Bank used the net cash proceeds from these sales for general corporate purposes.
(Dollars in thousands) Title of Securities | For the Nine Months Ended September 30, | For the Years Ended December 31, | ||||||||||
| 2005 | 2004 | 2003 | 2002 | |||||||||
Consolidated Obligations: | ||||||||||||
Discount Notes | $ | 273,842,229 | $ | 461,220,783 | $ | 357,816,650 | $ | 328,044,532 | ||||
Bonds | 13,565,477 | 24,766,023 | 46,345,417 | 23,672,974 | ||||||||
Capital Stock | 402,211 | 1,089,857 | 1,365,706 | 1,089,076 | ||||||||
The Bank issues letters of credit in its ordinary course of business. From time-to-time the Bank provides standby letters of credit to support a member’s letter of credit issued to support unaffiliated, third-party offerings of notes, bonds or other securities to finance housing-related or economic development projects. The Bank provided $14.9 million, $3.4 million, $20.3 million and $18.7 million of such standby letters of credit during the first nine months of 2005 and during 2004, 2003 and 2002, respectively. To the extent that these standby letters of credit are securities for purposes of the Securities Act of 1933, the issuance of these standby letters of credit by the Bank is exempt from registration pursuant to section 3(a)(2) of the Securities Act of 1933.
135
Table of Contents
| Item 11. | Description of Registrant’s Securities to be Registered. |
The Bank currently issues a single class of capital stock to its members in accordance with a formula set forth in the FHLB Act and regulations of the Finance Board. In accordance with that formula, each member must purchase capital stock in the Bank in an amount equal to the greater of (i) $500, (ii) one percent of the member’s aggregate unpaid loan principal on certain residential mortgage loans and mortgage-backed securities, or (iii) five percent of the advances outstanding to the member. The Finance Board may, from time to time, increase or decrease the amount of Bank capital stock that members are required to hold. Each member’s required minimum investment in the capital stock of the Bank is adjusted annually based on calendar year-end financial data provided by the member.
The rights associated with the capital stock of the Bank are prescribed by the FHLB Act and Finance Board regulations. These rights include the following:
| • | Par Value. The par value of the capital stock is $100. The capital stock is issued at par, unless the Finance Board has fixed a different price. |
| • | Dividends. Holders of capital stock are entitled to non-cumulative dividends if, as and when declared by the Board of Directors of the Bank. Under Finance Board regulations, dividends may be paid out of current net earnings and retained earnings of the Bank. Dividends may not be paid if such payment would result in a projected impairment of the par value of the capital stock of the Bank. Dividends also may not be paid if any principal or interest due on consolidated obligations issued through the Office of Finance has not been paid in full or, under certain circumstances, if the Bank becomes a non-complying FHLB under Finance Board regulations as a result of its inability to comply with regulatory liquidity requirements or to satisfy its current obligations or to provide certain required certifications to the Finance Board. For a description of the Bank’s dividend policy and the current restrictions on the payment of dividends, see “Item 9—Market Price and Dividends on the Registrant’s Common Equity Security and Related Stockholder Matters.” |
| • | Redemption. Members of the Bank are entitled to redemption of their capital stock after a six-month notice period in the case of a member that is voluntarily withdrawing from membership in the Bank. Members are also entitled to redemption of their capital stock following other events that terminate their membership in the Bank, such as a merger of a member into a non-member institution. However, if a member has indebtedness outstanding at the time of its termination from membership, the Bank may determine not to redeem the member’s capital stock until such indebtedness is liquidated. All stock redemptions are subject to the Bank meeting its minimum regulatory capital requirements. Members may not currently redeem voluntary stock due to the Bank’s discontinuance of voluntary stock redemptions. See “Item 2.2—Management’s Discussion and Analysis of Financial Condition and Results of Operations—Overview—Regulatory Agreement and Related Actions”. |
| • | Voting Rights. Holders of capital stock of the Bank have the right to vote only with respect to the election of directors. These rights are set forth in the FHLB Act and regulations of the Finance Board. |
In order to be eligible to vote, holders of capital stock must be members of the Bank as of December 31 of the year immediately preceding an election (the “record date”). For each directorship in a member’s state that is to be filled in an election, the member will be entitled to cast one vote for each share of capital stock that the member was required to hold as of the record date; except that, the number of votes that each member may cast for each directorship will not exceed the average number of shares of capital stock that were required to be held by all members located in that state on the record date. This voting “cap” limits the ability of large stockholders of the Bank to control the outcome of any election.
There are no voting preferences for any share of capital stock and members are not entitled to vote any shares of voluntary capital stock in the election of directors.
136
Table of Contents
| • | Liquidation Rights. The FHLB Act provides that, in accordance with rules, regulations and orders that may be prescribed by the Finance Board, the Bank may be liquidated and its capital stock paid off and retired, in whole or in part, after paying or making provision for the payment of its liabilities. The FHLB Act also provides that, following implementation by the Bank of the new capital structure mandated by the GLB Act, the holders of Class B capital stock would have an ownership interest in the retained earnings of the Bank. It has not been determined whether, prior to implementation of the Bank’s new capital structure, the holders of capital stock, upon a liquidation of the Bank, would be entitled to share in any residual assets following the payment of the Bank’s creditors and the redemption of the Bank’s capital stock. |
| • | Ownership Limitations and Transferability. Only members of the Bank, or former members that have voluntarily withdrawn from membership or whose membership has otherwise been terminated, may own capital stock of the Bank. Subject to approval of the Bank and the Finance Board, a member may transfer its capital stock only to another member or to enable an institution to become a member. |
| • | Modification of Rights. The Bank is subject to the FHLB Act and regulations adopted thereunder by the Finance Board. From time to time, Congress has amended the FHLB Act, and the Finance Board has amended its regulations, in ways that have significantly affected the rights and obligations of the Bank and its members. For example, the GLB Act mandated that the Bank implement a new capital structure which, among other things, significantly affects the ownership interests of the holders of the Bank’s capital stock. It is possible that legislative or regulatory changes in the future could further modify the rights of holders of Bank capital stock. |
The GLB Act requires the Bank to create a new capital structure. Until the Bank implements its new capital plan, the pre-GLB Act capital rules remain in effect. The Finance Board’s final rule implementing a new capital structure for the Bank includes risk-based and leverage capital requirements, different classes of capital stock that the Bank may issue and the rights and preferences that may be associated with each class of capital stock. Under the Bank’s Business and Capital Management Plan for 2005—2007, the Bank will delay implementation of a new capital structure until December 31, 2006, or until a time mutually agreed upon with the Finance Board. Also, the Bank is reviewing the structure of its capital plan, originally approved by the Finance Board on June 12, 2002 and is likely to propose amendments for approval by the Finance Board based on such review.
137
Table of Contents
| Item 12. | Indemnification of Directors and Officers. |
Section 10 of the Bank’s bylaws requires the Bank, subject to the limitations described below, to indemnify any person against whom an action is brought or threatened because that person is or was a director, officer or employee of the Bank for (i) any amount for which that person becomes liable under a judgment or settlement in such action and (ii) reasonable costs and expenses, including reasonable attorney’s fees, actually paid or incurred by that person in defending or settling such action, or in enforcing his rights under the bylaws if he attains a favorable judgment in such enforcement action. Each director, officer or employee of the Bank is also entitled to such indemnification rights in connection with any action brought or threatened against a director, officer, or employee of the Bank because of that person’s service to or on behalf of a Bank-related office, a System office or a System committee.
A Bank director, officer or employee will be entitled to indemnification only if: (i) such person has received a final judgment on the merits in his favor or (ii) in the case of settlement, judgment against such person or final judgment in his favor other than on the merits, a majority of a quorum of disinterested directors of the Bank duly adopts a resolution determining that such person was acting in good faith within the scope of his employment or authority as he could reasonably have perceived it under the circumstances and for a purpose he could reasonably have believed under the circumstances was in the best interest of the Bank or its members. In the event that the necessary resolution cannot be duly adopted by a majority of a quorum of the Bank’s disinterested directors, then the indemnification determination will be made by independent legal counsel pursuant to the standards set forth in the Bank’s bylaws.
A director, officer or employee of the Bank will have no liability for monetary damages directly or indirectly to any person other than the Bank or the Finance Board (including without limitation, any member, non-member borrower, stockholder, director, officer or agent of a member or a non-member borrower, director, officer, employee, or agent of the Bank or contractor with or supplier to the Bank) in respect of his acts or omissions in his capacity as a director, officer or employee of the Bank or otherwise because of his position as a director, officer or employee of the Bank except for liability which may exist (i) for acts or omissions which involve intentional misconduct or a knowing and culpable violation of criminal law, (ii) for acts or omissions which a director, officer or employee believes to be contrary to the best interests of the Bank, or which otherwise involve bad faith on the part of the director, officer or employee, or (iii) for any transaction from which a director, officer or employee derived an improper personal economic benefit, directors, officers and employees of the Bank will be entitled to receive advance payments of their expenses related to their indemnification amounts upon satisfaction of the conditions specified in the bylaws. The Bank also maintains insurance to protect it and its directors, officers, and employees from potential losses arising from claims against any of them for alleged wrongful acts committed in their capacity as directors, officers or employees.
138
Table of Contents
| Item 13. | Financial Statements and Supplementary Data. |
Financial Statements
The December 31, 2004 Annual Financial Statements and Notes, including the Report of Independent Auditors and the unaudited September 30, 2005 Financial Statements and Notes, are set forth starting on page F-1 of this Form 10.
Supplementary Data
Supplemental financial data for the nine months ended September 30, 2005 and each full quarter within the two years ended December 31, 2004 are included in the table below.
(Dollars in thousands except per share) | 3rd Qtr 2005 | 2nd Qtr 2005 | 1st Qtr 2005 | 4th Qtr 2004 | 3rd Qtr 2004 | 2nd Qtr 2004 | 1st Qtr 2004 | 4th Qtr 2003 | 3rdQtr 2003 | 2nd Qtr 2003 | 1st Qtr 2003 | |||||||||||||||||||||||||||||||||
Interest income | $ | 895,648 | $ | 876,519 | $ | 843,447 | $ | 839,126 | $ | 817,721 | $ | 775,388 | $ | 778,288 | $ | 755,528 | $ | 719,299 | $ | 623,616 | $ | 634,666 | ||||||||||||||||||||||
Interest expense | 778,083 | 750,148 | 700,574 | 683,048 | 663,119 | 616,343 | 543,670 | 549,160 | 512,158 | 455,953 | 422,012 | |||||||||||||||||||||||||||||||||
Provision for credit losses on mortgage loans | — | — | — | — | — | — | — | — | — | — | — | |||||||||||||||||||||||||||||||||
Net interest income after provision for credit losses on mortgage loans | 117,565 | 126,371 | 142,873 | 156,078 | 154,602 | 159,045 | 234,618 | 206,368 | 207,141 | 167,663 | 212,654 | |||||||||||||||||||||||||||||||||
Other income (loss) | (27,444 | ) | (2,615 | ) | (10,603 | ) | (28,338 | ) | (7,283 | ) | 26,417 | (117,926 | ) | (54,445 | ) | 15,266 | (10,440 | ) | (63,560 | ) | ||||||||||||||||||||||||
Other expense | 28,538 | 29,259 | 31,316 | 38,101 | 30,682 | 29,791 | 22,482 | 29,957 | 21,083 | 18,648 | 16,742 | |||||||||||||||||||||||||||||||||
Total assessments | 16,358 | 25,096 | 26,798 | 23,813 | 30,974 | 41,341 | 36,011 | 32,358 | 52,746 | 37,444 | 35,139 | |||||||||||||||||||||||||||||||||
Income before cumulative effect of change in accounting principle | 45,225 | 69,401 | 74,156 | 65,826 | 85,663 | 114,330 | 58,199 | 89,608 | 148,578 | 101,131 | 97,213 | |||||||||||||||||||||||||||||||||
Cumulative effect of change in accounting principle | — | — | — | — | — | — | 41,441 | — | — | — | — | |||||||||||||||||||||||||||||||||
Net income | $ | 45,225 | $ | 69,401 | $ | 74,156 | $ | 65,826 | $ | 85,663 | $ | 114,330 | $ | 99,640 | $ | 89,608 | $ | 148,578 | $ | 101,131 | $ | 97,213 | ||||||||||||||||||||||
Annualized dividend rate paid | 5.00 | % | 5.50 | % | 5.50 | % | 6.00 | % | 6.00 | % | 6.00 | % | 6.50 | % | 7.00 | % | 6.50 | % | 6.50 | % | 5.00 | % | ||||||||||||||||||||||
139
Table of Contents
| Item 14. | Changes in and Disagreements with Accountants on Accounting and Financial Disclosure. |
None.
140
Table of Contents
| Item 15. | Financial Statements. |
(a) The Bank’s financial statements included as part of this Form 10 are identified in the Table of Contents to the 2004 Annual Financial Statements and Notes and in the September 30, 2005 Financial Statements and Notes, as set forth starting on page F-1 of this Form 10, and are incorporated in this Item 15 by reference.
(b) Exhibits – previously filed
| Exhibit No. | Description | |
| 3.1 | Federal Home Loan Bank of Chicago Charter | |
| 3.2 | Federal Home Loan Bank of Chicago Bylaws | |
| 10.1 | Lease for Lincoln-Carlyle Illinois Center & FHLBC dated 12/30/97-7/31/11 | |
| 10.1.1 | First Amendment to Lease (12/15/2000) | |
| 10.1.2 | Second Amendment to Lease (10/29/2003) | |
| 10.2 | Advances, Collateral Pledge and Security Agreement | |
| 10.3 | Written Agreement between the Federal Home Loan Bank of Chicago and the Federal Housing Finance Board dated June 30, 2004 | |
| 10.3.1 | Amendment No. 1 to Written Agreement between the Federal Home Loan Bank of Chicago and the Federal Housing Finance Board dated October 18, 2005. | |
| 10.4 | Mortgage Partnership Finance Program Participating Financial Institution Agreement [Origination or Purchase] | |
| 10.4.1 | Mortgage Partnership Finance Program Participating Financial Institution Agreement [Purchase Only] | |
| 10.5 | MPF Services Agreement between FHLB Pittsburgh and FHLBC dated 4/30/99 | |
| 10.5.1 | First Amendment to Mortgage Partnership Finance Services Agreement | |
| 10.5.2 | Second Amendment to Mortgage Partnership Finance Services Agreement | |
| 10.5.3 | Third Amendment to Mortgage Partnership Finance Services Agreement | |
| 10.5.4 | Fourth Amendment to Mortgage Partnership Finance Services Agreement | |
| 10.5.5 | Fifth Amendment to Mortgage Partnership Finance Services Agreement | |
| 10.5.6 | Sixth Amendment to Mortgage Partnership Finance Services Agreement | |
| 10.5.7 | Seventh Amendment to Mortgage Partnership Finance Services Agreement | |
| 10.5.8 | Pro Rata MPF Participation Agreement | |
| 10.6 | MPF Investment & Services Agreement between FHLB Boston and FHLBC dated 4/20/00 | |
| 10.6.1 | First Amendment to Mortgage Partnership Finance Investment & Services Agreement | |
| 10.6.2 | Second Amendment to Mortgage Partnership Finance Investment & Services Agreement | |
| 10.6.3 | Third Amendment to Mortgage Partnership Finance Investment & Services Agreement | |
| 10.6.4 | Fourth Amendment to Mortgage Partnership Finance Investment & Services Agreement | |
| 10.7 | Mortgage Partnership Finance Program Liquidity Option and Master Participation Agreement | |
| 10.7.1 | First Amendment to Liquidity Option and Master Participation Agreement | |
| 10.7.2 | Second Amendment to Liquidity Option and Master Participation Agreement | |
| 10.8 | Employment Agreement between the Chicago Federal Home Loan Bank and J. Mikesell Thomas dated August 30, 2004 | |
| 10.8.1 | Federal Home Loan Bank of Chicago President’s Incentive Compensation Plan | |
| 10.8.2 | Federal Home Loan Bank of Chicago Management Incentive Compensation Plan | |
| 10.8.3 | Federal Home Loan Bank of Chicago Long Term Incentive Compensation Plan | |
141
Table of Contents
| 10.8.4 | Federal Home Loan Bank of Chicago Benefit Equalization Plan | |
| 10.8.5 | Federal Home Loan Bank of Chicago Employee Severance and Retention Plan | |
| 10.8.6 | Federal Home Loan Bank of Chicago Employee Severance Plan | |
| 10.8.7 | Federal Home Loan Bank of Chicago board of Directors 2004 Compensation Policy | |
| 10.8.8 | Federal Home Loan Bank of Chicago Board of Directors 2005 Compensation Policy | |
142
Table of Contents
Federal Home Loan Bank of Chicago
2004 Annual Financial Statements and Notes
Table of Contents
| Page | ||
Financial Statements and Notes | ||
| F-2 | ||
| F-3 | ||
| F-4 | ||
| F-5 | ||
| F-6 | ||
| F-8 | ||
F-1
Table of Contents
Report of Independent Registered Public Accounting Firm
To the Board of Directors and Shareholders of
the Federal Home Loan Bank of Chicago
In our opinion, the accompanying statements of condition and the related statements of income, capital and of cash flows present fairly, in all material respects, the financial position of the Federal Home Loan Bank of Chicago (the “Bank”) at December 31, 2004 and 2003 and the results of its operations and its cash flows for each of the three years in the period ended December 31, 2004, in conformity with accounting principles generally accepted in the United States of America. These financial statements are the responsibility of the Bank’s management. Our responsibility is to express an opinion on these financial statements based on our audits. We conducted our audits of these statements in accordance with the standards of the Public Company Accounting Oversight Board (United States). Those standards require that we plan and perform the audit to obtain reasonable assurance about whether the financial statements are free of material misstatement. An audit includes examining, on a test basis, evidence supporting the amounts and disclosures in the financial statements, assessing the accounting principles used and significant estimates made by management, and evaluating the overall financial statement presentation. We believe that our audits provide a reasonable basis for our opinion.
As discussed in Note 2, the Bank changed its method of accounting for amortization of deferred loan origination fees and premiums and discounts paid to and received on mortgage loans under SFAS No. 91, Accounting for Nonrefundable Fees and Costs Associated with Originating or Acquiring Loans and Initial Direct Costs of Leases, on January 1, 2004. The Bank also adopted Statement of Financial Accounting Standards No. 150, Accounting for Certain Financial Instruments with Characteristics of both Liabilities and Equity, on January 1, 2004.

March 15, 2005, except for Notes 10, 14 and 20, as to which the date is June 27, 2005
Chicago, Illinois
F-2
Table of Contents
(In thousands, except par value)
| December 31, | |||||||
| 2004 | 2003 | ||||||
| Assets | |||||||
Cash and due from banks | $ | 20,530 | $ | 3,629 | |||
Securities purchased under agreements to resell | 389,840 | 418,600 | |||||
Federal funds sold | 4,738,000 | 5,023,000 | |||||
Investment securities: | |||||||
Trading includes $477,416 and $505,510 pledged in 2004 and 2003 | 760,057 | 794,297 | |||||
Available-for-sale includes $705,628 and $400,784 pledged in 2004 and 2003 | 1,529,688 | 605,364 | |||||
Held-to-maturity includes $226,607 and $539,451 pledged in 2004 and 2003 | 6,561,161 | 5,139,067 | |||||
Advances | 24,191,558 | 26,443,063 | |||||
Mortgage loans held in portfolio, net of allowance for loan losses on mortgage loans of $4,879 and $5,459 in 2004 and 2003 | 46,920,551 | 47,599,731 | |||||
Accrued interest receivable | 317,837 | 336,655 | |||||
Derivative assets | 153,496 | 454,327 | |||||
Premises and equipment, net | 62,664 | 61,283 | |||||
Other assets | 63,255 | 62,971 | |||||
Total Assets | $ | 85,708,637 | $ | 86,941,987 | |||
Liabilities and Capital | |||||||
Liabilities | |||||||
Deposits: | |||||||
Interest-bearing | |||||||
Demand and overnight | $ | 920,360 | $ | 1,319,093 | |||
Term | 89,000 | 538,400 | |||||
Deposits from other FHLBanks for mortgage loan program | 13,395 | 27,646 | |||||
Other | 146,031 | 428,928 | |||||
Other non-interest bearing | 54,966 | 34,004 | |||||
Total deposits | 1,223,752 | 2,348,071 | |||||
Borrowings: | |||||||
Securities sold under agreements to repurchase | 1,200,000 | 1,200,000 | |||||
Consolidated obligations, net: | |||||||
Discount notes | 16,871,736 | 20,456,395 | |||||
Bonds | 60,875,540 | 57,471,055 | |||||
Total consolidated obligations, net | 77,747,276 | 77,927,450 | |||||
Mandatorily redeemable capital stock | 11,259 | — | |||||
Accrued interest payable | 513,993 | 502,327 | |||||
Derivative liabilities | 199,250 | 223,540 | |||||
Affordable Housing Program | 82,456 | 72,062 | |||||
Payable to Resolution Funding Corporation (REFCORP) | 42,487 | 33,218 | |||||
Other liabilities | 62,305 | 61,879 | |||||
Total Liabilities | 81,082,778 | 82,368,547 | |||||
Commitments and contingencies (Note 19) | |||||||
Capital | |||||||
Capital stock - Putable ($100 par value) issued and outstanding shares: 42,922 and 41,552 shares in 2004 and 2003 | 4,292,166 | 4,155,218 | |||||
Retained earnings | 489,368 | 386,874 | |||||
Accumulated other comprehensive (loss) income: | |||||||
Net unrealized (loss) gain on available-for-sale securities | (7,224 | ) | 1,500 | ||||
Net unrealized (loss) gain relating to hedging activities | (148,451 | ) | 29,848 | ||||
Total Capital | 4,625,859 | 4,573,440 | |||||
Total Liabilities and Capital | $ | 85,708,637 | $ | 86,941,987 | |||
The accompanying notes are an integral part of these financial statements.
F-3
Table of Contents
(In thousands)
| For the Years Ended December 31, | ||||||||||||
| 2004 | 2003 | 2002 | ||||||||||
| Interest Income: | ||||||||||||
Mortgage loans held in portfolio | $ | 2,270,138 | $ | 1,849,907 | $ | 1,240,179 | ||||||
Advances | 554,104 | 555,195 | 590,263 | |||||||||
Securities purchased under agreements to resell | 6,532 | 5,044 | 3,877 | |||||||||
Federal funds sold | 84,999 | 43,176 | 59,485 | |||||||||
Investment securities: | ||||||||||||
Trading | 54,492 | 69,230 | 154,423 | |||||||||
Available-for-sale | 33,389 | 31,765 | 5,535 | |||||||||
Held-to-maturity | 206,799 | 178,643 | 226,069 | |||||||||
Loans to other FHLBanks | 71 | 149 | 468 | |||||||||
Total interest income | 3,210,524 | 2,733,109 | 2,280,299 | |||||||||
Interest Expense: | ||||||||||||
Consolidated obligations | 2,451,062 | 1,874,542 | 1,674,128 | |||||||||
Deposits | 22,019 | 35,203 | 46,489 | |||||||||
Deposits from other FHLBanks for mortgage loan program | 360 | 913 | 1,102 | |||||||||
Securities sold under agreements to repurchase | 31,209 | 28,620 | 35,545 | |||||||||
Mandatorily redeemable capital stock | 1,516 | — | — | |||||||||
Other | 15 | 5 | 142 | |||||||||
Total interest expense | 2,506,181 | 1,939,283 | 1,757,406 | |||||||||
Net Interest Income before provision for credit losses on mortgage loans | 704,343 | 793,826 | 522,893 | |||||||||
Provision for credit losses on mortgage loans | — | — | 2,217 | |||||||||
Net Interest Income after provision for credit losses on mortgage loans | 704,343 | 793,826 | 520,676 | |||||||||
Other Income (Loss): | ||||||||||||
Service fees | 1,028 | 1,097 | 1,053 | |||||||||
Net (loss) gain on trading securities | (27,914 | ) | (56,642 | ) | 295,582 | |||||||
Net realized loss from sale of available-for-sale securities | (22,366 | ) | (35,796 | ) | — | |||||||
Net realized gain from sale of held-to-maturity securities | — | 399 | — | |||||||||
Net realized and unrealized (loss) on derivatives and hedging activities | (126,425 | ) | (139,166 | ) | (489,670 | ) | ||||||
Net realized gain (loss) from early extinguishment of debt transferred to other FHLBs | 45,849 | 106,276 | (2,252 | ) | ||||||||
Other, net | 2,697 | 10,653 | 10,909 | |||||||||
Total other income (loss) | (127,131 | ) | (113,179 | ) | (184,378 | ) | ||||||
Other Expense: | ||||||||||||
Salary and benefits | 45,473 | 35,497 | 25,727 | |||||||||
Professional service fees | 21,918 | 10,457 | 3,185 | |||||||||
Depreciation of premises and equipment | 13,025 | 10,455 | 7,190 | |||||||||
Mortgage loan expense | 9,625 | 8,860 | 4,930 | |||||||||
Finance Board | 2,852 | 2,113 | 1,600 | |||||||||
Office of Finance | 1,897 | 1,668 | 1,270 | |||||||||
Other operating | 26,266 | 17,380 | 13,779 | |||||||||
Total other expense | 121,056 | 86,430 | 57,681 | |||||||||
Income before Assessments | 456,156 | 594,217 | 278,617 | |||||||||
Affordable Housing Program | 40,744 | 48,523 | 22,743 | |||||||||
Resolution Funding Corporation | 91,395 | 109,164 | 51,175 | |||||||||
Total assessments | 132,139 | 157,687 | 73,918 | |||||||||
Income before cumulative effect of change in accounting principle | 324,017 | 436,530 | 204,699 | |||||||||
Cumulative effect of change in accounting principle | 41,441 | — | — | |||||||||
Net Income | $ | 365,458 | $ | 436,530 | $ | 204,699 | ||||||
The accompanying notes are an integral part of these financial statements.
F-4
Table of Contents
For the Years Ended December 31,
(In thousands)
| Capital Stock - Putable | Retained Earnings | Accumulated Comprehensive (Loss) Income | Total Capital | ||||||||||||||||
| Shares | Par Value | ||||||||||||||||||
2002 | |||||||||||||||||||
Balance, December 31, 2001 | 23,943 | $ | 2,394,334 | $ | 112,839 | $ | (5,259 | ) | $ | 2,501,914 | |||||||||
Proceeds from issuance of capital stock | 10,891 | 1,089,076 | 1,089,076 | ||||||||||||||||
Redemption of capital stock | (5,047 | ) | (504,730 | ) | (504,730 | ) | |||||||||||||
Comprehensive income: | |||||||||||||||||||
Net Income | 204,699 | 204,699 | |||||||||||||||||
Other comprehensive income: | |||||||||||||||||||
Net unrealized gain on available-for-sale securities | 8,174 | 8,174 | |||||||||||||||||
Net unrealized gain on hedging activities | 164,409 | 164,409 | |||||||||||||||||
Reclassification adjustment for gain on hedging activities included in net income | (97,218 | ) | (97,218 | ) | |||||||||||||||
Total other comprehensive income | 75,365 | 75,365 | |||||||||||||||||
Total comprehensive income | 280,064 | ||||||||||||||||||
Dividends on capital stock: | |||||||||||||||||||
Cash | (177 | ) | (177 | ) | |||||||||||||||
Stock | 1,474 | 147,429 | (147,429 | ) | — | ||||||||||||||
2003 | |||||||||||||||||||
Balance, December 31, 2002 | 31,261 | $ | 3,126,109 | $ | 169,932 | $ | 70,106 | $ | 3,366,147 | ||||||||||
Proceeds from issuance of capital stock | 13,657 | 1,365,706 | 1,365,706 | ||||||||||||||||
Redemption of capital stock | (5,560 | ) | (556,007 | ) | (556,007 | ) | |||||||||||||
Comprehensive income: | |||||||||||||||||||
Net Income | 436,530 | 436,530 | |||||||||||||||||
Other comprehensive income: | |||||||||||||||||||
Net unrealized loss on available-for-sale securities | (49,665 | ) | (49,665 | ) | |||||||||||||||
Net unrealized loss on hedging activities | (99,020 | ) | (99,020 | ) | |||||||||||||||
Reclassification adjustment for loss on available-for-sale securities included in net income | 42,991 | 42,991 | |||||||||||||||||
Reclassification adjustment for loss on hedging activities included in net income | 66,936 | 66,936 | |||||||||||||||||
Total other comprehensive income | (38,758 | ) | (38,758 | ) | |||||||||||||||
Total comprehensive income | 397,772 | ||||||||||||||||||
Dividends on capital stock: | |||||||||||||||||||
Cash | (178 | ) | (178 | ) | |||||||||||||||
Stock | 2,194 | 219,410 | (219,410 | ) | — | ||||||||||||||
2004 | |||||||||||||||||||
Balance, December 31, 2003 | 41,552 | $ | 4,155,218 | $ | 386,874 | $ | 31,348 | $ | 4,573,440 | ||||||||||
Proceeds from issuance of capital stock | 10,899 | 1,089,857 | 1,089,857 | ||||||||||||||||
Redemption of capital stock | (11,775 | ) | (1,177,491 | ) | (1,177,491 | ) | |||||||||||||
Reclassification of mandatorily redeemable capital stock | (382 | ) | (38,201 | ) | (38,201 | ) | |||||||||||||
Comprehensive income: | |||||||||||||||||||
Earnings before cumulative effect of change in accounting principle | 324,017 | 324,017 | |||||||||||||||||
Other comprehensive income: | |||||||||||||||||||
Net unrealized loss on available-for-sale securities | (31,090 | ) | (31,090 | ) | |||||||||||||||
Net unrealized loss on hedging activities | (217,665 | ) | (217,665 | ) | |||||||||||||||
Reclassification adjustment for loss on available-for-sale securities included in net income | 22,367 | 22,367 | |||||||||||||||||
Reclassification adjustment for loss on hedging activities included in net income | 39,365 | 39,365 | |||||||||||||||||
Total other comprehensive income | (187,023 | ) | (187,023 | ) | |||||||||||||||
Total comprehensive income | 136,994 | ||||||||||||||||||
Cumulative effect of change in accounting principle | 41,441 | 41,441 | |||||||||||||||||
Dividends on capital stock: | |||||||||||||||||||
Cash | (181 | ) | (181 | ) | |||||||||||||||
Stock | 2,628 | 262,783 | (262,783 | ) | — | ||||||||||||||
Balance, December 31, 2004 | 42,922 | $ | 4,292,166 | $ | 489,368 | $ | (155,675 | ) | $ | 4,625,859 | |||||||||
The accompanying notes are an integral part of these financial statements.
F-5
Table of Contents
(In thousands)
| For the Years Ended December 31, | ||||||||||||
| 2004 | 2003 | 2002 | ||||||||||
Operating Activities: | ||||||||||||
Net Income | $ | 365,458 | $ | 436,530 | $ | 204,699 | ||||||
Cumulative effect of change in accounting principle | (41,441 | ) | — | — | ||||||||
Income before cumulative effect of change in accounting principle | 324,017 | 436,530 | 204,699 | |||||||||
Adjustments to reconcile income before cumulative effect of change in accounting principle to net cash provided by operating activities: | ||||||||||||
Depreciation and amortization: | ||||||||||||
Net premiums and discounts on consolidated obligations, investments, and deferred costs and fees received on interest-rate exchange agreements | (205,631 | ) | (132,719 | ) | 18,697 | |||||||
Net premiums and discounts on mortgage loans | 132,813 | 193,665 | 57,848 | |||||||||
Concessions on consolidated obligation bonds | 19,675 | 19,870 | 11,421 | |||||||||
Net deferred losses on hedges | 893 | 1,465 | 2,029 | |||||||||
Premises and equipment | 13,025 | 10,455 | 7,190 | |||||||||
Provision for credit losses on mortgage loans held in portfolio | — | — | 2,217 | |||||||||
Non-cash interest on mandatorily redeemable capital stock | 114 | — | — | |||||||||
Net (increase) decrease on trading securities | (292 | ) | 1,302,700 | (215,241 | ) | |||||||
Net realized losses on sale of available-for-sale securities | 22,366 | 35,796 | — | |||||||||
Net realized gains on sale of held-to-maturity securities | — | (399 | ) | — | ||||||||
Loss (gain) due to change in net fair value adjustment on derivatives and hedging activities | 217,050 | (234,927 | ) | (274,469 | ) | |||||||
Net realized loss (gain) on early extinguishment of debt | 1,317 | (5,392 | ) | (416 | ) | |||||||
Net realized (gain) loss on early extinguishment of debt transferred to other FHLBs | (45,849 | ) | (106,276 | ) | 2,252 | |||||||
Net realized loss on disposal of premises and equipment | 20 | — | 1,093 | |||||||||
Decrease (increase) in accrued interest receivable | 15,000 | (40,572 | ) | (68,135 | ) | |||||||
Decrease in derivative assets-net accrued interest | 12,492 | 22,355 | 8,943 | |||||||||
(Decrease) increase in derivative liabilities-net accrued interest | (2,356 | ) | (6,361 | ) | 6,350 | |||||||
Increase in other assets | (93,478 | ) | (65,719 | ) | (35,958 | ) | ||||||
Net increase in Affordable Housing Program (AHP) liability and discount on AHP advances | 10,347 | 26,778 | 8,034 | |||||||||
Increase (decrease) in accrued interest payable | 11,551 | 101,396 | (45,601 | ) | ||||||||
(Decrease) increase in payable to Resolution Funding Corporation | 9,270 | 21,544 | (6,981 | ) | ||||||||
Increase (decrease) in other liabilities | 426 | (506,475 | ) | 546,022 | ||||||||
Total adjustments | 118,753 | 637,184 | 25,295 | |||||||||
Net cash provided by operating activities | 442,770 | 1,073,714 | 229,994 | |||||||||
Investing activities: | ||||||||||||
Net decrease (increase) in securities purchased under agreements to resell | 28,760 | (14,640 | ) | (354,065 | ) | |||||||
Net decrease (increase) in Federal funds sold | 285,000 | (1,602,000 | ) | (256,000 | ) | |||||||
Net (increase) decrease in short-term held-to-maturity securities | (750,561 | ) | (94,553 | ) | 273,657 | |||||||
Proceeds from sale of long-term held-to-maturity securities | — | 97,441 | — | |||||||||
Purchase of mortgage-backed securities | (2,950,814 | ) | (2,358,782 | ) | (3,502,119 | ) | ||||||
Proceeds from maturities and sale of mortgage-backed securities | 1,308,564 | 3,018,989 | 2,905,919 | |||||||||
Purchases of long-term held-to-maturity securities | (258,460 | ) | (143,357 | ) | (239,763 | ) | ||||||
Proceeds from maturities of long-term held-to-maturity securities | 600,963 | 17,205 | 105,271 | |||||||||
Purchase of available-for-sale securities | (2,648,995 | ) | (2,543,986 | ) | (1,344,687 | ) | ||||||
Proceeds from sale of available-for-sale securities | 2,342,734 | 2,956,642 | — | |||||||||
Proceeds from sale of available-for-sale securities to other FHLBs | — | 322,876 | — | |||||||||
Principal collected on advances | 25,813,692 | 24,399,215 | 18,059,815 | |||||||||
Advances made | (23,914,154 | ) | (26,240,300 | ) | (20,668,510 | ) | ||||||
Principal collected on mortgage loans held in portfolio | 10,164,954 | 16,696,022 | 7,077,226 | |||||||||
Mortgage loans held in portfolio originated or purchased | (4,698,072 | ) | (17,476,169 | ) | (6,005,574 | ) | ||||||
Mortgage loans held in portfolio purchased from other FHLBs | (4,924,069 | ) | (20,850,023 | ) | (10,675,169 | ) | ||||||
Recoveries on mortgage loans held in portfolio | 514 | 171 | 45 | |||||||||
Proceeds from sale of foreclosed assets | 73,518 | 16,216 | 4,787 | |||||||||
Purchase of premises and equipment | (14,425 | ) | (39,709 | ) | (20,856 | ) | ||||||
Net cash provided by (used in) investing activities | 459,149 | (23,838,742 | ) | (14,640,023 | ) | |||||||
(Continued on following page)
F-6
Table of Contents
Statements of Cash Flows
(In thousands)
(Continued from previous page)
| For the Years Ended December 31, | ||||||||||||
| 2004 | 2003 | 2002 | ||||||||||
Financing Activities: | ||||||||||||
Net (decrease) increase in deposits | $ | (1,110,068 | ) | $ | (657,469 | ) | $ | 1,238,488 | ||||
Net (decrease) increase in deposits from other FHLBs for mortgage loan program | (14,252 | ) | (42,000 | ) | 48,837 | |||||||
Net (decrease) increase in securities sold under agreement to repurchase | — | (199,000 | ) | 599,000 | ||||||||
Net proceeds from issuance of consolidated obligations: | ||||||||||||
Discount notes | 461,220,783 | 357,816,650 | 328,044,532 | |||||||||
Bonds | 24,766,023 | 46,345,417 | 23,672,974 | |||||||||
Payments for maturing and retiring consolidated obligations: | ||||||||||||
Discount notes | (464,528,907 | ) | (351,678,933 | ) | (322,519,155 | ) | ||||||
Bonds | (16,787,861 | ) | (23,335,937 | ) | (16,527,865 | ) | ||||||
Transfer of bonds to other FHLBs | (4,315,979 | ) | (6,293,369 | ) | (729,273 | ) | ||||||
Proceeds from issuance of capital stock | 1,089,857 | 1,365,706 | 1,089,076 | |||||||||
Payments for redemption of capital stock | (1,177,491 | ) | (556,007 | ) | (504,730 | ) | ||||||
Mandatorily redeemable shares | (26,942 | ) | — | — | ||||||||
Cash dividends paid | (181 | ) | (178 | ) | (177 | ) | ||||||
Net cash (used in) provided by financing activities | (885,018 | ) | 22,764,880 | 14,411,707 | ||||||||
Net increase (decrease) in cash and due from banks | 16,901 | (148 | ) | 1,678 | ||||||||
Cash and due from banks at beginning of year | 3,629 | 3,777 | 2,099 | |||||||||
Cash and due from banks at end of year | $ | 20,530 | $ | 3,629 | $ | 3,777 | ||||||
Supplemental Disclosures: | ||||||||||||
Interest paid | $ | 2,493,113 | $ | 2,010,054 | $ | 1,637,068 | ||||||
REFCORP paid | 82,126 | 87,620 | 58,156 | |||||||||
AHP paid | 30,350 | 21,656 | 14,632 | |||||||||
The accompanying notes are an integral part of these financial statements.
F-7
Table of Contents
Background Information
The Federal Home Loan Bank of Chicago (the Bank), a federally chartered corporation, is one of twelve Federal Home Loan Banks (the FHLBs) which, with the Federal Housing Finance Board (the Finance Board), and the Office of Finance, comprise the Federal Home Loan Bank System (the System). The mission of the FHLBs and the System is to safely and soundly support residential mortgage finance through a variety of programs and services, primarily credit programs for their financial institution membership, so that their members can provide economical residential mortgage financing, in all phases of widely varying financial and economic cycles. The Bank provides credit to its members principally in the form of advances and through the Mortgage Partnership Finance® (MPF®)1 Program, under which the Bank, in partnership with its members, provides funding for home mortgage loans. In addition, the Bank also invests in other Acquired Member Assets (AMA) such as MPF Shared Funding® securities. AMA are assets acquired from or through System members or housing associates by means of either a purchase or a funding transaction, subject to Finance Board regulations. These instruments help the Bank accomplish its mission of supporting housing finance throughout the United States.
All regulated depository institutions and insurance companies engaged in residential housing finance are eligible to apply for membership in the FHLBs. Each FHLB has members in a specifically defined geographic district. The Bank’s defined geographic membership territory is the states of Illinois and Wisconsin. The Bank is a cooperative which means that current members own nearly all of the outstanding capital stock of the Bank and may receive dividends on their investment. Former members own the remaining capital stock to support business transactions still carried on the Bank’s statements of condition. All members must purchase stock in the Bank. Members must own capital stock in the Bank based on the amount of their total assets. As a result of these requirements, the Bank conducts business with related parties in the normal course of business. See Note 20 for more information.
The FHLBs and the Office of Finance are supervised and regulated by the Finance Board which is an independent federal agency in the executive branch of the United States Government. The Finance Board ensures that the FHLBs carry out their housing finance mission, remain adequately capitalized and are able to raise funds in the capital markets and operate in a safe and sound manner. Also, the Finance Board establishes policies and regulations covering certain operations of the FHLBs. Each FHLB operates as a separate entity with its own management, employees, and board of directors.
A primary source of funds for the Bank is the proceeds from the sale to the public of the System’s debt instruments (consolidated obligations) which are the joint and several obligations of all the FHLBs. Additional funds are provided by deposits, other borrowings and capital stock purchased by members. The Bank primarily uses these funds to provide advances to members and to fund or purchase loans from members through the MPF Program. Deposits are received from both member and non-member financial institutions and federal instrumentalities. The Bank also provides members and non-members with operating services such as safekeeping, collection, and settlement.
| 1 | “Mortgage Partnership Finance,” “MPF” and “MPF Shared Funding” are registered trademarks of the Federal Home Loan Bank of Chicago. |
F-8
Table of Contents
Note 1 - Summary of Significant Accounting Policies
Use of Estimates - The preparation of financial statements in conformity with generally accepted accounting principles requires management to make estimates and assumptions that affect the reported amounts of assets and liabilities, as well as the disclosure of contingent assets and liabilities at the date of the financial statements and the reported amounts of income and expenses. Actual results could differ from those estimates.
Federal Funds Sold – The Bank utilizes federal funds sold as a means of investing excess funds on a short-term basis. Federal funds sold are reflected on the statements of condition at cost.
Investment Securities – The Bank carries investments at cost for which it has both the ability and the intent to hold to maturity. The carrying value is adjusted for the amortization of premiums and accretion of discounts.
Under Statement of Financial Accounting Standards (SFAS) No. 115, “Accounting for Certain Investments in Debt and Equity Securities” (SFAS 115), certain circumstances may cause the Bank to change its intent to hold a certain security to maturity in the future. Thus, the sale or transfer of a held-to-maturity security due to certain changes in circumstances such as evidence of significant deterioration in the issuer’s creditworthiness or change in regulatory requirements modifying what constitutes permissible investments or the maximum level of investments, is not considered to be inconsistent with its original classification. Other events that are isolated, nonrecurring and unusual that could not have been reasonably anticipated may cause the Bank to sell or transfer a held-to-maturity security without necessarily calling into question its intent to hold other debt securities to maturity. In addition, sales of debt securities that meet either of the following two conditions may be considered as maturities for purposes of the classification of held-to-maturity:
1) The sale occurs near enough to the maturity date (or call date if exercise of the call is probable) that interest rate risk is substantially eliminated as a pricing factor and the changes in market interest rates would not have a significant effect on the security’s fair value, or
2) The sale of a security occurs after the Bank has already collected a substantial portion (at least 85 percent) of the principal outstanding at acquisition due either to prepayments on the debt security or to scheduled payments on a debt security paid in equal installments (both principal and interest) over its term.
The Bank classifies certain investments that it may sell before maturity as available-for-sale and carries them at fair value. The change in fair value of available-for-sale securities is recorded in other comprehensive income as a net unrealized gain or loss on available-for-sale securities. The Bank classifies certain investments as trading securities and carries them at fair value. The Bank records changes in the fair value of these investments in other income. Securities classified as trading are held for asset-liability management and liquidity purposes.
The Bank computes the amortization and accretion of premiums and discounts on mortgage-backed securities using the level-yield method over the estimated lives of the securities. This method requires a retrospective adjustment of the effective yield each time the Bank changes the estimated life as if the new estimate had been known since the original acquisition date of the securities. The Bank computes the amortization and accretion of premiums and discounts on other investments using the level-yield method to the contractual maturity of the securities.
Gains and losses on sales of investment securities are computed using the specific identification method and are included in other income. The Bank treats securities purchased under agreements to resell as collateralized financings.
The Bank regularly evaluates outstanding investments for impairment. Impairment is evaluated considering numerous factors and their relative significance will vary from case to case. Factors that are considered in this analysis include: the credit-worthiness of the issuer and underlying collateral; the length of time and extent to which market value has been less than cost; and the intent and ability to retain the security in order to allow for an anticipated recovery in market value. If, based on this analysis, it is determined that there is an other-than-temporary impairment in the value of a security, the security is written down and a loss is recognized in the statements of income as other expense.
Advances - Advances to members are presented net of discounts on advances for the Affordable Housing Program. The Bank amortizes premiums and accretes discounts on advances as a component of interest income using the level-yield method. Interest on advances is credited to income as earned. Following the requirements of the Federal Home Loan Bank Act of 1932 (the FHLB Act), as amended, the Bank obtains collateral on advances to protect it from losses. As Note 8 more fully describes, the FHLB Act limits eligible collateral to certain investment securities, residential mortgage loans, cash or deposits with the Bank, and other eligible real estate-related assets. However, “community financial institutions,” (FDIC-insured institutions with average assets of $548 million or less at the last three year ends (2003, 2002, and 2001)) are eligible to utilize expanded statutory
F-9
Table of Contents
collateral rules that include small business and agricultural loans. The Bank also factors in the Participating Financial Institutions’ Credit Enhancement amount when determining the amount of the allowance for loan losses. The Bank has not incurred any credit losses on advances since its inception. Based upon the collateral held as security on the advances and prior repayment history, no allowance for credit losses on advances is deemed necessary by management.
Mortgage Loans Held in Portfolio – The Bank invests in Government loans (e.g. residential mortgage loans guaranteed by the Department of Veteran’s Affairs and insured by the Federal Housing Administration) and conventional residential mortgage loans which are either funded by the Bank through or purchased from its members or members of another FHLB or purchased as participations from other FHLB’s (“MPF® Loans”). The Bank manages the liquidity, interest rate and prepayment risk of the MPF Loans, while the members manage the credit risk and retain the marketing and servicing activities. In the normal course of business, the Bank will participate with other FHLBs in the funding of MPF Loans under the MPF Program. Each participant will fund their agreed upon percentage of the total loan proceeds and the Bank’s share of the total funding is reflected on the statement of cash flows as “Mortgage loans held in portfolio originated or purchased.”
The Bank classifies MPF Loans as held for investment and reports them at their principal amount outstanding net of deferred loan fees and premiums and discounts in accordance with SFAS No. 65, “Accounting for Certain Mortgage Banking Activities”. MPF Loans that qualify for fair value hedge accounting under SFAS 133, “Accounting for Derivative Instruments and Hedging Activities”, are recorded at their carrying amount, adjusted for changes in fair value due to the hedged risk.
As described in Note 2, effective January 1, 2004, the Bank changed its method of accounting for amortization of deferred loan origination fees and premiums and discounts paid to and received by the Bank’s members. The Bank defers and amortizes mortgage loan origination fees and premium and discounts paid to and received by the Bank members as interest income over the contractual life of the related mortgage loans based on a constant effective yield. Principal prepayments are not anticipated to shorten the term of the MPF Loans. In prior periods the Bank deferred and amortized such amounts to interest income on an effective yield basis, over the estimated life of the related mortgage loans. Actual prepayment experience and estimates of future principal prepayments were used in calculating the estimated lives of the MPF Loans. The Bank aggregated the MPF Loans by similar characteristics (type, maturity, note rate and acquisition date) in determining prepayment estimates.
The Bank records non-origination fees, such as delivery commitment extension fees and pair-off fees, in other income as they are received. Extension fees are received when a member requests to extend the period of the delivery commitment beyond the original stated maturity. Pair-off fees are received when the amount funded is less than or greater than a specified percentage of the delivery commitment amount.
The Bank and members share in the credit risk of the MPF Loans with the Bank assuming the first loss obligation not to exceed the amount of the First Loss Account (FLA), and the members assuming credit losses in excess of the FLA, “Second Loss Credit Enhancement,” up to the amount of the member’s credit enhancement obligation as specified in the master commitment. Under the MPF Plus product, members obtain supplemental mortgage insurance (SMI) and assume credit losses in excess of the FLA and SMI up to the amount of the required credit enhancement. The amount of the credit enhancement is determined such that any losses in excess of the enhancement (either excluding the FLA for Original MPF or including the FLA for other MPF products) are limited to those required for an equivalent instrument (e.g. mortgage-backed security) with a long term credit rating of “AA” by a nationally recognized statistical rating organization. Losses in excess of the FLA and the member’s credit enhancement, if any, are absorbed by the Bank.
The Bank pays the member a credit enhancement fee for assuming its portion of the credit risk in the MPF Loans. These fees are paid monthly and are determined based on the remaining unpaid principal balance of the MPF Loans. The required credit enhancement obligation amount may vary depending on the MPF product alternatives selected. Credit enhancement fees, payable to a member as compensation for assuming credit risk, are recorded as an offset to mortgage loan interest income when paid by the Bank. The Bank also pays performance credit enhancement fees which are based on actual performance of the mortgage loans. In general, performance based fees are net of cumulative unrecovered losses paid by the Bank. To the extent that losses in the current month exceed performance credit enhancement fees accrued, the remaining losses are recovered from future performance credit enhancement fees payable to the member. The Bank recorded total credit enhancement fees of $50,955,000, $39,419,000 and $18,075,000 for the years ended December 31, 2004, 2003 and 2002, respectively.
MPF Loans are placed on non-accrual status when it is determined that the payment of interest or principal is doubtful of collection or when interest or principal is past due for 90 days or more, except when the loan is well secured and in the process of collection. When an MPF Loan is placed on non-accrual status, accrued but uncollected interest and the amortization of agent fees or premiums and discounts are reversed against interest income. The Bank records cash payments received on non-accrual MPF Loans as a reduction of principal with any remainder reported in interest income.
F-10
Table of Contents
The Bank bases its allowance for loan losses on management’s estimate of loan losses inherent in the Bank’s MPF Loan portfolio as of the balance sheet date. The Bank performs periodic reviews of its portfolio to identify losses inherent within the portfolio and to determine the likelihood of collection of the portfolio. The analysis includes consideration of various data observations such as past performance, current performance, loan portfolio characteristics, collateral valuations, industry data and prevailing economic conditions. The Bank also factors in the Participating Financial Institutions’ credit enhancement amount when determining the amount of the allowance for loan losses.
The Bank evaluates whether to record a charge-off on an MPF Loan upon the occurrence of a confirming event. The occurrence of a confirming event results in an MPF Loan being considered a collateral dependent loan. Confirming events include, but are not limited to, a debtor that has filed for bankruptcy, the occurrence of an in-substance foreclosure, the initiation of foreclosure proceedings, or the servicer discontinues advancing scheduled payments on behalf of the borrower because it has determined that the servicer’s advances would not be recoverable out of insurance proceeds, liquidation proceeds or otherwise based on the collateral value of the underlying property. A charge off is recorded if the fair value of the underlying collateral, less disposal costs, is less than the carrying value of the MPF Loan.
MPF Shared Funding® Program – The Bank participates in the MPF Shared Funding program. Under this MPF product, mortgage loans otherwise eligible for the MPF Program are sold by a member to a third party sponsored trust and “pooled” into securities. The Bank purchases the Acquired Member Asset eligible securities, which are rated at least AA, and are either retained or pursuant to subscription agreements, partially sold to other FHLBs. The retained investment securities are classified as held-to-maturity and are not publicly traded or guaranteed by any of the FHLBs.
Affordable Housing Program – As more fully discussed in Note 9, the FHLB Act requires the Bank to establish and fund an Affordable Housing Program (AHP). The Bank provides AHP subsidies to members in the form of direct grants. The required AHP funding of direct subsidies is charged to earnings and an offsetting liability is established. Alternatively, the Bank may provide subsidies in the form of advances. Advances that qualify under the Bank’s AHP are made at interest rates below the customary interest rate for non-subsidized advances or contain other forms of subsidies to promote the use of AHP advances. When an AHP advance is made, the subsidy is determined to be the present value of the difference in the interest rates between the AHP advance rate and the System’s related cost of funds rate for a funding liability with a comparable maturity.
Prepayment Fees – The Bank charges its members a prepayment fee when they prepay certain advances before the original maturity. The Bank records prepayment fees net of SFAS 133 basis adjustments included in the book basis of the advance as a component of advance interest income on the statements of income. The Bank nets gains and losses on derivatives associated with prepaid advances with prepayment fees in net interest income. In cases where a new advance is issued concurrent with an advance terminating, the Bank evaluates whether the new advance meets the criteria to qualify as a modification of an existing advance. If the new advance qualifies as a modification, the net prepayment fee on the prepaid advance is deferred, recorded in the basis of the modified advance, and amortized over the life of the modified advance to advance interest income. If the modified advance is hedged under SFAS 133, it is recorded at fair value after the amortization of the basis adjustment. If the Bank determines that the advance should be treated as a new advance, it records the net fees as a component of advance interest income on the statements of income. Mortgage loans with prepayment fees are ineligible for delivery under the MPF Program, and the Bank does not receive any prepayment fees with respect to MPF Loans.
Derivatives and Hedging Activities – The Bank accounts for derivatives in accordance with SFAS No. 133, “Accounting for Derivative Instruments and Hedging Activities”, as amended by SFAS No. 137, “Accounting for Derivative Instruments and Hedging Activities-Deferral of Effective Date of FASB Statement No. 133”, SFAS No. 138, “Accounting for Certain Derivative Instruments and Certain Hedging Activities”, and SFAS No. 149, “Amendment of Statement 133 on Derivative Instruments and Hedging Activities” (SFAS 133). Accordingly, all derivatives are recognized on the balance sheet at their fair value and are designated as (1) a hedge of the fair value of (a) a recognized asset or liability or (b) an unrecognized firm commitment (a “fair value” hedge); (2) a hedge of (a) a forecasted transaction or (b) the variability of cash flows that are to be received or paid in connection with either a recognized asset or liability or stream of variable cash flows (a “cash flow” hedge); (3) a hedge of the foreign currency component of a hedged item in a fair value or cash flow hedge; or (4) a non-SFAS 133 hedge of an asset, liability or derivative (i.e. where the Bank acts as an intermediary) for asset-liability and risk management purposes (“economic hedge”).
Changes in the fair value of a derivative that is designated and qualifies as a fair value hedge, along with changes in the fair value of the hedged asset or liability that are attributable to the hedged risk (including changes that reflect losses or gains on firm commitments), are recorded in other income as “net realized and unrealized gain (loss) on derivatives and hedging activities”. Changes in the fair value of a derivative that is designated and qualifies as a cash flow hedge, to the extent that the hedge is effective, are recorded in other comprehensive income, until earnings are affected by the variability of cash flows of the hedged transaction (i.e., until the periodic recognition of interest on a variable-rate asset or liability is recorded in interest income or expense). Amounts recorded in other comprehensive income are reclassified to interest income or expense during the period in which the hedged transaction impacts earnings. Changes in the fair value of a derivative that is designated and qualifies as a foreign-currency hedge is recorded in either current-period earnings or other comprehensive income, depending on whether the hedging relationship satisfies the criteria for a fair value or cash flow hedge. Changes in the fair value and periodic settlements of a derivative designated as an economic hedge are recorded in current-period earnings in other income as “net realized and unrealized gain (loss) on derivative and hedging activities” with no fair value adjustment to an asset, liability or firm commitment.
F-11
Table of Contents
The Bank formally documents all relationships between derivative hedging instruments and hedged items, its risk management objectives and strategies for undertaking various hedge transactions and its method of assessing effectiveness and measuring ineffectiveness. This process includes linking all derivatives that are designated as fair value, cash flow, or foreign-currency hedges to (1) assets and liabilities on the balance sheet, (2) firm commitments, or (3) forecasted transactions. Also, the Bank formally assesses (both at the hedge’s inception and at least quarterly) whether the derivatives that are used in hedging transactions have been effective in offsetting changes in the fair value or cash flows of hedged items and whether those derivatives may be expected to remain effective in future periods. The Bank uses dollar value offset and regression analyses to assess the effectiveness of its hedges.
For both fair value and cash flow hedges, any hedge ineffectiveness (which represents the amount by which the change in the fair value of the derivative differs from the change in the fair value of the hedged item or the variability in the cash flows of the forecasted transaction) is recorded in other income as “net realized and unrealized gain (loss) on derivatives and hedging activities”.
The Bank discontinues hedge accounting prospectively when: (1) it determines that the derivative is no longer effective in offsetting changes in the fair value or cash flows of a hedged item; (2) the derivative and/or the hedged item expires or is sold, terminated, or exercised; (3) it is no longer probable that the forecasted transaction will occur; (4) a hedged firm commitment no longer meets the definition of a firm commitment; or (5) management determines that designating the derivative as a hedging instrument is no longer appropriate.
When hedge accounting is discontinued due to the Bank’s determination that the derivative no longer qualifies as an effective fair value hedge, the Bank will continue carrying the derivative on the balance sheet at its fair value, cease adjusting the hedged asset or liability for changes in fair value attributable to the hedged risk, and begin amortizing the cumulative basis adjustment on the hedged item into earnings over the remaining life of the hedged item using the level-yield method. When hedge accounting is discontinued because the hedged item no longer meets the definition of a firm commitment, the Bank will continue carrying the derivative on the balance sheet at its fair value, removing from the balance sheet any asset or liability that was recorded to recognize the firm commitment and recording it as a gain or loss in current period earnings.
The Bank discontinues hedge accounting when it is no longer probable that the forecasted transaction will occur in the originally expected period or within an additional two month period of time thereafter. The gain or loss that was accumulated in other comprehensive income will be recognized immediately in earnings. When hedge accounting is discontinued due to the Bank’s determination that the derivative no longer qualifies as an effective cash flow hedge of an existing hedged item, the Bank will continue carrying the derivative on the balance sheet at its fair value and begin amortizing the accumulated other comprehensive income adjustment to earnings when earnings are affected by the original forecasted transaction. In all situations in which hedge accounting is discontinued and the derivative remains outstanding, the Bank will carry the derivative at its fair value on the balance sheet, recognizing changes in the fair value of the derivative in current period earnings.
Embedded Derivatives – The Bank may purchase financial instruments in which a derivative instrument is “embedded” in the financial instrument. Upon executing these transactions, the Bank assesses whether the economic characteristics of the embedded derivative are clearly and closely related to the economic characteristics of the remaining component of the financial instrument (i.e., the host contract) and whether a separate, non-embedded instrument with the same terms as the embedded instrument meets the definition of a derivative instrument. When it is determined that (1) the embedded derivative possesses economic characteristics that are not clearly and closely related to the economic characteristics of the host contract and (2) a separate, stand-alone instrument with the same terms qualifies as a derivative instrument, the embedded derivative is separated from the host contract, carried at fair value, and designated as either (1) a hedging instrument in a fair value, cash flow, or foreign-currency hedge or (2) a derivative instrument pursuant to an economic hedge. However, if the entire contract (the host contract and the embedded derivative) were to be measured at fair value, with changes in fair value reported in current earnings (e.g., an investment security classified as “trading” under SFAS 115), or if the Bank could not reliably identify and measure the embedded derivative for purposes of separating that derivative from its host contract, the entire contract would be recorded at fair value.
Purchased Options – Premiums paid to acquire options are included in the initial basis of the instrument and reported in derivative assets on the statements of condition. With respect to interest rate caps and floors designated in a cash flow hedging relationship, the initial basis of the instrument at the inception of the hedge is allocated to the respective caplets or floorlets comprising the cap or floor. All subsequent changes in fair value of the cap or floor, to the extent deemed effective, are recognized in other comprehensive income. The change in the allocated fair value of each respective caplet or floorlet is reclassified out of other comprehensive income when each of the corresponding hedged forecasted transactions impacts earnings.
F-12
Table of Contents
Premises and Equipment – The Bank records premises and equipment at cost, net of accumulated depreciation and amortization of $38,072,000 and $24,933,000 at December 31, 2004 and 2003, respectively. The Bank computes depreciation and amortization on the straight-line method over the estimated useful lives of the assets ranging from 3-10 years. Computer hardware and software are depreciated over 3 years and equipment over 5 years. Leasehold improvements are amortized on a straight-line basis over 10 years or the remaining term of the lease, whichever is shorter. Improvements and major renewals are capitalized; ordinary maintenance and repairs are expensed as incurred. The Bank includes gains and losses on disposal of premises and equipment in other income.
Cost of computer software developed or obtained for internal use is accounted for in accordance with Statement of Position No. 98-1, “Accounting for the Costs of Computer Software Developed or Obtained for Internal Use” (SOP 98-1). SOP 98-1 requires the cost of purchased software and certain costs incurred in developing computer software for internal use to be capitalized and amortized over future periods. As of December 31, 2004 and 2003, the Bank had $56,999,000 and $55,278,000, respectively, in unamortized computer software costs included in premises and equipment. Amortization of computer software costs charged to expense was $11,662,000, $9,401,000, and $6,056,000 for the years ended December 31, 2004, 2003, and 2002, respectively.
Real Estate Owned – Real estate owned includes assets that have been received in satisfaction of debt. Real estate owned is initially recorded and subsequently carried at the lower of cost or fair value less estimated selling costs as an other asset in the statements of financial condition. Fair value is defined as the amount that a willing seller could expect from a willing buyer in an arm’s-length transaction. Any valuation adjustments required at the date of transfer are charged to the allowance for loan losses. Realized gains and losses on sale are included in other expense. Operating results from real estate owned are recorded in other expense.
Concessions on Consolidated Obligations – The amounts paid to dealers in connection with the sale of consolidated obligation bonds are deferred and amortized using the level-yield method over the estimated life of the bond. The amount of the concession is allocated to the Bank from the Office of Finance based upon the percentage of the debt issued that is assumed by the Bank. Unamortized concessions were $31,742,000 and $32,137,000 at December 31, 2004 and 2003, respectively, and are included in other assets. Amortization of such concessions are included in consolidated obligation interest expense.
Discounts and Premiums on Consolidated Obligations – Discounts and premiums on consolidated obligation bonds are amortized to expense using the level-yield method over the estimated life of the bond. The discounts on consolidated obligation discount notes are amortized to expense using the straight-line method throughout the term of the related notes due to their short-term nature.
Assessments – Although the Bank is exempt from ordinary federal, state and local taxation except for local real estate tax, it is required to make payments to REFCORP. Each FHLB is required to pay 20 percent of net earnings after AHP assessments to REFCORP. The REFCORP assessment amounts are equal to U.S. GAAP income before assessments minus the AHP assessment. The result is multiplied by 20 percent. The Resolution Funding Corporation has been designated as the calculation agent for AHP and REFCORP assessments. Each FHLB provides its net income before AHP and REFCORP to the Resolution Funding Corporation, who then performs the calculations for each quarter end.
Other than in the situation where the combined FHLBs’ net income is not sufficient enough to meet the annual $100 million AHP obligation, the AHP assessment is equal to regulatory net income times 10 percent. Regulatory net income for AHP assessment purposes is equal to net income reported in accordance with U.S. GAAP before mandatorily redeemable capital stock related interest expense, AHP assessment and REFCORP assessment. The exclusion of mandatorily redeemable capital stock related interest expense is a regulatory calculation determined by the Finance Board.
The FHLBs will continue to expense these amounts until the aggregate amounts actually paid by all twelve FHLBs are equivalent to a $300 million annual annuity (or a scheduled payment of $75 million per quarter) whose final maturity date is April 15, 2030, at which point the required payment of each FHLB to REFCORP will be fully satisfied. The Finance Board in consultation with the Secretary of the Treasury will select the appropriate discounting factors to be used in this annuity calculation. The FHLBs use the actual payments made to determine the amount of the future obligation that has been defeased. The cumulative amount to be paid to REFCORP by the FHLBs is not determinable at this time due to the interrelationships of all future FHLBs’ earnings and interest rates. If the Bank experienced a net loss during a quarter, but still had net income for the year, the Bank’s obligation to the REFCORP would be calculated based on the Bank’s year to date net income. The Bank would be entitled to a refund of amounts paid for the full year that were in excess of its calculated annual obligation. If the Bank had net income in subsequent quarters, it would be required to contribute additional amounts to meet its calculated annual obligation. If the Bank experienced a net loss for a full year, the Bank would have no obligation to the REFCORP for the year.
F-13
Table of Contents
The Finance Board is required to extend the term of the Banks’ obligation to the REFCORP for each calendar quarter in which there is a deficit quarterly payment. A deficit quarterly payment is the amount by which the actual quarterly payment falls short of $75 million.
The FHLBs’ aggregate payments through 2004 defease all future benchmark payments after the 3rd quarter of 2019 and $45 million of the $75 million benchmark payment for the 1st quarter of 2019. This date assumes that all $300 million annual payments required after December 31, 2004 will be made. The benchmark payments or portions of them could be reinstated if the actual REFCORP payments of the FHLBs fall short of $75 million in a quarter. The maturity date of the REFCORP obligation may be extended beyond April 15, 2030 if such extension is necessary to ensure that the value of the aggregate amounts paid by the FHLBs exactly equals a $300 million annual annuity. Any payment beyond April 15, 2030 will be paid to the Department of Treasury.
Professional Service Fees – Professional service fees include fees paid to consultants for contractual services and fees for audit and legal services.
Mortgage Loan Expense – Mortgage loan expense includes master service fees paid to the Bank’s vendor for master servicing, MPF custody fees and losses/(gains) on loans repurchased by PFIs due to failure to meet MPF eligibility requirements.
Finance Board and Office of Finance Expenses – The Bank is assessed for its proportionate share of the costs of operating the Finance Board, the Bank’s primary regulator, and the Office of Finance, which manages the issuance, sale and servicing of consolidated obligations. The Finance Board allocates its operating and capital expenditures to the FHLBs based on each FHLB’s percentage of total capital. The Office of Finance allocates its operating and capital expenditures based on each FHLB’s percentage of capital stock, percentage of consolidated obligations issued and the percentage of consolidated obligations outstanding. Such assessments are expensed when incurred and charged to the Bank.
Estimated Fair Values – The fair value of publicly traded securities is based on independent market quotations. Some of the Bank’s financial instruments lack an available trading market characterized by transactions between a willing buyer and a willing seller engaging in an exchange transaction. Therefore, the Bank uses internal models employing significant estimates and present-value calculations when determining and disclosing estimated fair values.
Mandatorily Redeemable Capital Stock – In accordance with SFAS 150, the Bank reclassifies capital stock subject to redemption from equity to a liability once a member gives notice of intent to withdraw from membership or attains non-member status by merger or acquisition, charter termination, or involuntary termination from membership. In each case such shares of capital stock meet the definition of a mandatorily redeemable financial instrument. The restriction on paying out voluntary capital stock or other provisions that may delay or accelerate the timing of a mandatory redemption (related to a withdrawal of membership) does not affect the classification of mandatorily redeemable capital stock as a liability. Capital stock is reclassified to a liability (mandatorily redeemable capital stock) at fair value. Dividends related to capital stock classified as a liability are accrued at the expected dividend rate and reported as interest expense in the statements of income.
If a member were to cancel its written notice of redemption or notice of withdrawal, the Bank would reclassify the mandatorily redeemable capital stock from a liability back to equity. After the reclassification, dividends on the capital stock would no longer be classified as interest expense. Although mandatorily redeemable capital stock is not included in capital for financial reporting purposes, such outstanding stock is considered capital for regulatory purposes. See Note 14 for more information, including significant restrictions on stock redemption.
Cash Flows – For purposes of the statements of cash flows, the Bank considers cash and due from banks as cash and cash equivalents.
Reclassifications – Certain amounts in the 2003 and 2002 financial statements have been reclassified to conform to the 2004 presentation.
F-14
Table of Contents
Note 2 - Change in Accounting Principle and Recently Issued Accounting Standards & Interpretations
Change in Accounting Principle for Amortization of Mortgage Loan Premiums and Discounts – Effective January 1, 2004, the Bank changed its method of accounting for premiums and discounts and other deferred loan origination fees under SFAS 91, “Accounting for Nonrefundable Fees and Costs Associated with Originating or Acquiring Loans and Initial Direct Costs of Leases” (SFAS 91). In accordance with SFAS 91, the Bank defers and amortizes agent fees and premiums and discounts paid to and received by the Bank’s members as a component of interest income over the contractual life of the MPF Loan. Historically, the Bank deferred and amortized agent fees and premiums and discounts paid to and received by its members as a component of interest income over the estimated lives of the related mortgage loans. Actual prepayment experience and estimates of future principal repayments were used in calculating such estimated lives.
The Bank changed to the contractual method, which recognizes the income effects of premiums and discounts in a manner that is consistent with the actual behavior of the underlying MPF Loans and reflects the contractual terms of the assets without regard to changes in estimates based on assumptions about future borrower behavior. The Bank believes this method is preferable because it relies less than the previous method on the use of estimates inherent in calculating the weighted average lives that are used to determine the loan pool amortization periods. As a result the contractual method does not create income volatility related to estimate changes but instead reflects volatility related to actual loan behavior.
As a result of implementing the change in accounting for amortization and accretion from the retrospective method to the contractual maturity method, the Bank recorded a cumulative effect of a change in accounting principle effective to January 1, 2004 which resulted in an increase to earnings excluding REFCORP and AHP assessments of $41,441,000.
Adoption of SFAS 150 – The FASB issued Statement of Financial Accounting Standards No. 150, “Accounting for Certain Financial Instruments with Characteristics of both Liabilities and Equity” (SFAS 150) in May 2003. This statement establishes a standard for how certain financial instruments with characteristics of both liabilities and equity are classified in the financial statements and provides accounting guidance for, among other things, mandatorily redeemable financial instruments. The Bank adopted SFAS 150 effective January 1, 2004. The Bank adopted SFAS 150 as of this date because the Bank met the definition of “nonpublic SEC registrant” as defined in SFAS 150. Specifically, the Bank meets the SFAS 150 definition because (a) the Bank’s equity does not trade in a public market; (b) the Bank is not registering its equity securities in preparation for the sale of any class of equity securities; and (c) the Bank is not controlled by an entity covered by (a) or (b).
Upon adoption of SFAS 150 on January 1, 2004, the Bank reclassified $33.6 million in capital stock subject to mandatory redemption from 6 members and former members as a liability (“mandatorily redeemable capital stock”) in the statements of condition. The earnings impact for the mandatorily redeemable dividend reclassification from retained earnings to interest expense resulted in an additional expense of $1.5 million through December 31, 2004. The Finance Board has confirmed that the SFAS 150 accounting treatment for certain shares of the Bank’s capital stock will not affect the definition of total capital for purposes of determining the Bank’s compliance with its regulatory capital requirements, calculating its mortgage securities investment authority (300% of total capital), calculating its unsecured credit exposure to other Government-sponsored enterprises (100% of total capital), or calculating its unsecured credit limits to other counterparties (various percentages of total capital depending on the rating of the counterparty).
EITF Issue No. 03-1 – “The Meaning of Other-Than-Temporary Impairment and Its Application to Certain Investments” (EITF 03-1). In March 2004, the Financial Accounting Standards Board (FASB) reached a consensus on EITF 03-1, which clarifies the application of an impairment model to determine whether investments are other-than-temporarily impaired. Provisions of EITF 03-1 must be applied prospectively to all current and future investments accounted for in accordance with SFAS 115 “Accounting for Certain Investments in Debt and Equity”. On September 15, September 30 and November 15, 2004, the FASB issued proposed staff positions to provide guidance on the application and scope of certain paragraphs and to defer the effective date of the impairment and recognition provisions contained in specific paragraphs of EITF 03-1. This deferral will be superseded in FASB’s final issuance of the staff position. The Bank is not able to determine the impact EITF 03-1 will have on its results of operations or financial condition until the final guidance has been issued.
Adoption of SOP 03-3 – The American Institute of Certified Public Accountants issued Statement of Position 03-3 (SOP 03-3), Accounting for Certain Loans or Debt Securities Acquired in a Transfer in December 2003. SOP 03-3 provides guidance on the accounting for differences between contractual and expected cash flows from the purchaser’s initial investment in loans or debt securities acquired in a transfer, if those differences are attributable, at least in part, to credit quality. Among other things, SOP 03-3: (1) prohibits the recognition of the excess of contractual cash flows over expected cash flows as an adjustment of yield, loss accrual or valuation allowance at the time of purchase; (2) requires that subsequent increases in expected cash flows be recognized prospectively through an adjustment of yield; and (3) requires that subsequent decreases in expected cash flows be recognized as an impairment. In addition, SOP 03-3 prohibits the creation or carryover of a valuation allowance in the initial
F-15
Table of Contents
accounting of all loans within its scope that are acquired in a transfer. The Bank will adopt SOP 03-3 as of January 1, 2005. The Bank does not expect the new rules to have a material impact on its results of operations or financial condition at the time of adoption.
Adoption of SFAS 149 – On April 30, 2003 FASB issued Statement 149, “Amendment of Statement 133 on Derivative Instruments and Hedging Activities” (SFAS 149), which amends and clarifies financial accounting and reporting for derivative instruments and for hedging activities under FASB Statement No. 133, “Accounting for Derivative Instruments and Hedging Activities”. SFAS 149 applies to mortgage loan commitments entered into or modified after June 30, 2003. Certain of these commitments are designated as cash flow hedges of forecasted purchases with resulting changes in their fair value recorded in accumulated other comprehensive income. When the loan commitment is settled, the Bank amortizes the amount recorded in accumulated other comprehensive income into earnings with an equal and offsetting amount from the amortization of the matching basis adjustment recorded to the loan balance over its life. Consequently, this amortization has no ongoing effect on earnings. Commitments that are not designated as cash flow hedges are hedged economically by selling “to be announced” mortgage-backed securities or other derivatives for forward settlement. Accordingly, the Bank marks these derivatives to market through earnings. The Bank adopted SFAS 149 as of the effective date and the adoption did not have a material impact on the Bank’s financial statements.
Adoption of FIN 46-R – In January 2003, the Financial Accounting Standards Board (FASB) issued FASB Interpretation No. 46, “Consolidation of Variable Interest Entities” (FIN 46), a new interpretation on consolidation accounting. In December 2003, the FASB issued a revision to FIN 46 (entitled FIN 46-R) to address various technical corrections and implementation issues that had arisen since the issuance of FIN 46. Application of FIN 46-R to the Bank is limited to the MPF Shared Funding® securities and certain investments in Mortgage Backed Securities (MBSs). In regards to the Shared Funding Program, the Bank currently holds two MPF Shared Funding MBS issued by qualifying special purpose entities (QSPE) that are sponsored by One Mortgage Partners Corp., a subsidiary of JPMorgan Chase. A QSPE generally can be described as an entity whose permitted activities are limited to passively holding financial assets and distributing cash flows to investors based on pre-set terms. Further, a QSPE must meet certain criteria in SFAS 140 to be considered a QSPE. FIN 46-R does not require an investor to consolidate a QSPE, as long as the investor does not have the unilateral ability to liquidate the QSPE or cause it to no longer meet the QSPE criteria. The Bank meets this scope exception for QSPEs under FIN 46-R, and accordingly, does not consolidate its investments in the MPF Shared Funding securities.
Adoption of FIN 45 – FASB issued Interpretation No. 45 “Guarantor’s Accounting and Disclosure Requirements for Guarantees, Including Indirect Guarantees of Indebtedness of Others, an interpretation of FASB Statements No. 5, 57 and 107 and Rescission of FASB Interpretation No. 34” (FIN 45) on November 25, 2002. FIN 45 expands existing disclosure requirements at December 31, 2002 for guarantees and provides initial recognition and measurement provisions to be applied on a prospective basis for guarantees issued or modified after December 31, 2002. The initial recognition and measurement provisions apply to the Bank’s letters of credit. The resulting amounts recognized in “other liabilities” in 2003 were not material.
Note 3 - Cash and Due from Banks
Compensating Balances – The Bank maintains compensating balances based upon average daily collected cash balances with various commercial banks in consideration for certain services. There are no legal restrictions under these agreements as to the withdrawal of funds. The average compensating balances maintained for the years ended December 31, 2004 and 2003 were $828,000 and $584,000, respectively.
In addition, the Bank maintained average collected balances with various Federal Reserve Banks and branches of $22,838,000 and $15,319,000 for the years ended December 31, 2004 and 2003, respectively. The Bank was required to maintain minimum average daily clearing balances of $2,000,000 for the years ended December 31, 2004 and 2003. These are required clearing balances and may not be withdrawn; however, the Bank may use earnings credits on these balances to pay for services received from the Federal Reserve.
Pass-through Deposit Reserves –The Bank acts as a pass-through correspondent for some of its member institutions that are required to deposit reserves with the Federal Reserve Banks. The amount shown as cash and due from banks includes pass-through deposit reserves with Federal Reserve Banks of $20,130,000 and $18,491,000 at December 31, 2004 and 2003, respectively. Member reserve balances are included in deposits in the statements of condition.
Note 4 - Securities Purchased Under Agreements to Resell
The Bank has purchased securities under agreements to resell those securities. The amounts advanced under these agreements represent short term loans and are reflected as assets in the statements of condition. Securities purchased under
F-16
Table of Contents
agreements to resell are held in safekeeping in the name of the Bank. Should the market value of the underlying securities decrease below the market value required as collateral, the counterparty is required to place an equivalent amount of additional securities in safekeeping in the name of the Bank or the dollar value of the resale agreement will be decreased accordingly. At December 31, 2004 and 2003, the fair value of collateral accepted by the Bank in connection with these activities was $389,840,000 and $418,596,000, respectively. Of the total collateral pledged at December 31, 2004 and 2003, $389,840,000 and $418,596,000 of collateral, respectively, was permitted to be sold or repledged by the Bank.
Note 5 - Trading Securities
Major Security Types – Trading securities as of December 31, 2004 and 2003 were as follows:
(Dollars in thousands) | 2004 | 2003 | ||||
Government-sponsored enterprises | $ | 585,579 | $ | 593,574 | ||
Other FHLB | 71,731 | 75,700 | ||||
| 657,310 | 669,274 | |||||
Mortgage-backed securities: | ||||||
Government-sponsored enterprises | 52,711 | 68,654 | ||||
Ginnie Mae | 11,367 | 16,468 | ||||
Other | 38,669 | 39,901 | ||||
Total trading securities | $ | 760,057 | $ | 794,297 | ||
The net (loss) gain on trading securities for the years ended December 31, 2004, 2003, and 2002 were as follows:
(Dollars in thousands) | 2004 | 2003 | 2002 | ||||||||
Net realized gain | $ | 14,796 | $ | 13,448 | $ | 2,289 | |||||
Net unrealized (loss) gain | (42,710 | ) | (70,090 | ) | 293,293 | ||||||
Net (loss) gain on trading securities | $ | (27,914 | ) | $ | (56,642 | ) | $ | 295,582 | |||
F-17
Table of Contents
Note 6 - Available-for-Sale Securities
Major Security Types – The amortized cost and estimated fair value of available-for-sale securities as of December 31, 2004 and 2003 were as follows:
| December 31, 2004 | |||||||||||||
(Dollars in thousands) | Amortized Cost | Gross Unrealized Gains | Gross Unrealized Losses | Estimated Fair Value | |||||||||
Government-sponsored enterprises | $ | 901,046 | $ | 524 | $ | (5,332 | ) | $ | 896,238 | ||||
Mortgage-backed securities: | |||||||||||||
Government-sponsored enterprises | 93,560 | 551 | (2,739 | ) | 91,372 | ||||||||
Other | 541,783 | 339 | (44 | ) | 542,078 | ||||||||
Total available-for-sale securities | $ | 1,536,389 | $ | 1,414 | $ | (8,115 | ) | $ | 1,529,688 | ||||
| December 31, 2003 | |||||||||||||
(Dollars in thousands) | Amortized Cost | Gross Unrealized Gains | Gross Unrealized Losses | Estimated Fair Value | |||||||||
U.S. Treasury | $ | 50,207 | $ | 39 | $ | — | $ | 50,246 | |||||
Government-sponsored enterprises | 553,132 | 2,820 | (834 | ) | 555,118 | ||||||||
Total available-for-sale securities | $ | 603,339 | $ | 2,859 | $ | (834 | ) | $ | 605,364 | ||||
Maturity Terms - - The amortized cost and estimated fair value of available-for-sale securities, by contractual maturity at December 31, 2004 and 2003 are shown below. Expected maturities of some securities and mortgaged-backed securities may differ from contractual maturities because borrowers may have the right to call or prepay obligations with or without call or prepayment fees.
| 2004 | 2003 | |||||||||||
(Dollars in thousands) | Amortized Cost | Estimated Fair Value | Amortized Cost | Estimated Fair Value | ||||||||
| Year of Maturity | ||||||||||||
Due in one year or less | $ | 335,738 | $ | 334,374 | $ | — | $ | — | ||||
Due after one year through five years | 513,325 | 510,395 | 451,827 | 454,647 | ||||||||
Due after five years through ten years | 51,983 | 51,469 | 151,512 | 150,717 | ||||||||
| 901,046 | 896,238 | 603,339 | 605,364 | |||||||||
Mortgage-backed securities: | ||||||||||||
Government-sponsored enterprises | 93,560 | 91,372 | — | — | ||||||||
Other | 541,783 | 542,078 | — | — | ||||||||
Total available-for-sale securities | $ | 1,536,389 | $ | 1,529,688 | $ | 603,339 | $ | 605,364 | ||||
The amortized cost of the Bank’s mortgage-backed securities classified as available-for-sale includes net discounts of $695,000 at December 31, 2004.
F-18
Table of Contents
Interest Rate Payment Terms - The following amortized cost table details interest rate payment terms for investment securities classified as available-for-sale at December 31, 2004 and 2003.
(Dollars in thousands) | 2004 | 2003 | ||||
Amortized cost of available-for-sale securities other than mortgage-backed securities: | ||||||
Fixed-rate | $ | 901,046 | $ | 603,339 | ||
| 901,046 | 603,339 | |||||
Amortized cost of available-for-sale mortgage-backed securities: | ||||||
Pass-through securities: | ||||||
Fixed-rate | 93,560 | — | ||||
Collateralized mortgage obligations: | ||||||
Variable-rate | 541,783 | — | ||||
| 635,343 | — | |||||
Total available-for-sale securities | $ | 1,536,389 | $ | 603,339 | ||
The following tables summarize the available-for-sale securities with unrealized losses as of December 31, 2004 and 2003. The unrealized losses are aggregated by major security type and length of time that individual securities have been in a continuous loss position. Securities with unrealized losses are rated “AA” or better. The overall depreciation in fair value is attributable to changes in market interest rates. The overall depreciation is considered temporary as the Bank has the intent and ability to hold these investments to maturity with the expectation that the unrealized market value loss will be recovered.
| December 31, 2004 | ||||||||||||||||||||
| Less than 12 Months | 12 Months or More | Total | ||||||||||||||||||
(Dollars in thousands) | Fair Value | Unrealized Losses | Fair Value | Unrealized Losses | Fair Value | Unrealized Losses | ||||||||||||||
Government-sponsored enterprises | $ | 896,238 | $ | (5,332 | ) | $ | — | $ | — | $ | 896,238 | $ | (5,332 | ) | ||||||
Mortgage-backed securities: | ||||||||||||||||||||
Other | 19,963 | (2,783 | ) | — | — | 19,963 | $ | (2,783 | ) | |||||||||||
Total temporarily impaired | $ | 916,201 | $ | (8,115 | ) | $ | — | $ | — | $ | 916,201 | $ | (8,115 | ) | ||||||
| December 31, 2003 | ||||||||||||||||||||
| Less than 12 Months | 12 Months or More | Total | ||||||||||||||||||
(Dollars in thousands) | Fair Value | Unrealized Losses | Fair Value | Unrealized Losses | Fair Value | Unrealized Losses | ||||||||||||||
Government-sponsored enterprises | $ | 100,470 | $ | (834 | ) | $ | — | $ | — | $ | 100,470 | $ | (834 | ) | ||||||
Total temporarily impaired | $ | 100,470 | $ | (834 | ) | $ | — | $ | — | $ | 100,470 | $ | (834 | ) | ||||||
Gains and Losses – The following table presents realized gains and losses from available-for-sale securities for the years ended December 31, 2004, 2003, and 2002:
(Dollars in thousands) | 2004 | 2003 | 2002 | ||||||||
Realized gain | $ | 16,639 | $ | 25,031 | $ | — | |||||
Realized loss | (39,005 | ) | (60,827 | ) | — | ||||||
Net realized loss from sale of available-for-sale securities | $ | (22,366 | ) | $ | (35,796 | ) | $ | — | |||
F-19
Table of Contents
The following table summarizes available-for-sale MPF Shared Funding activity for the year ended December 31, 2003. There was no available-for-sale activity in 2004:
For the Year Ended December 31, 2003
(Dollars in thousands) | ||||
MPF Shared Funding: | ||||
January 1, 2003 Opening Balance | $ | — | ||
Purchases | 322,876 | |||
Sales to other FHLB | (322,876 | ) | ||
December 31, 2003 Ending Balance | $ | — | ||
Note 7 - Held-To-Maturity Securities
Major Security Types - Held-to-maturity securities as of December 31, 2004 and 2003 were as follows:
| December 31, 2004 | |||||||||||||
(Dollars in thousands) | Amortized Cost | Gross Unrealized Gains | Gross Unrealized Losses | Estimated Fair Value | |||||||||
Commercial paper | $ | 699,722 | $ | — | $ | (62 | ) | $ | 699,660 | ||||
Government-sponsored enterprises | 249,570 | — | (1,553 | ) | 248,017 | ||||||||
State or local housing agency obligations | 100,690 | 902 | (137 | ) | 101,455 | ||||||||
Other(1) | 743,193 | 1,668 | (318 | ) | 744,543 | ||||||||
| 1,793,175 | 2,570 | (2,070 | ) | 1,793,675 | |||||||||
Mortgage-backed securities: | |||||||||||||
Government-sponsored enterprises | 2,958,672 | 21,056 | (33,095 | ) | 2,946,633 | ||||||||
Ginnie Mae | 84,077 | 1,418 | — | 85,495 | |||||||||
MPF Shared Funding® | 512,983 | — | (16,164 | ) | 496,819 | ||||||||
Other | 1,212,254 | 23,364 | (160 | ) | 1,235,458 | ||||||||
Total held-to-maturity securities | $ | 6,561,161 | $ | 48,408 | $ | (51,489 | ) | $ | 6,558,080 | ||||
| December 31, 2003 | |||||||||||||
(Dollars in thousands) | Amortized Cost | Gross Unrealized Gains | Gross Unrealized Losses | Estimated Fair Value | |||||||||
Commercial paper | $ | 99,991 | $ | — | $ | (3 | ) | $ | 99,988 | ||||
Government-sponsored enterprises | 459,593 | 271 | — | 459,864 | |||||||||
State or local housing agency obligations | 132,388 | 1,439 | (1,479 | ) | 132,348 | ||||||||
Other(1) | 598,981 | 2,962 | — | 601,943 | |||||||||
| 1,290,953 | 4,672 | (1,482 | ) | 1,294,143 | |||||||||
Mortgage-backed securities: | |||||||||||||
Government-sponsored enterprises | 1,089,597 | 28,576 | (25 | ) | 1,118,148 | ||||||||
Ginnie Mae | 119,539 | 2,877 | — | 122,416 | |||||||||
MPF Shared Funding® | 621,459 | 695 | (6,794 | ) | 615,360 | ||||||||
Other | 2,017,519 | 34,976 | (1,179 | ) | 2,051,316 | ||||||||
Total held-to-maturity securities | $ | 5,139,067 | $ | 71,796 | $ | (9,480 | ) | $ | 5,201,383 | ||||
| (1) | Other includes investment securities issued by the Small Business Administration, Small Business Investment Corporation and Low-and Moderate-Income Investments created by the Community Reinvestment Act of 1979. |
F-20
Table of Contents
Maturity Terms –The amortized cost and estimated fair value of held-to-maturity securities by contractual maturity at December 31, 2004 and 2003 are shown below. Expected maturities may differ from contractual maturities because borrowers may have the right to call or prepay obligations with or without call or prepayment fees:
| 2004 | 2003 | |||||||||||
(Dollars in thousands) | Amortized Cost | Estimated Fair Value | Amortized Cost | Estimated Fair Value | ||||||||
Due in one year or less | $ | 1,603,627 | $ | 1,601,810 | $ | 1,071,079 | $ | 1,071,614 | ||||
Due after one year through five years | 57,250 | 58,919 | 16,658 | 17,035 | ||||||||
Due after five years through ten years | 25,509 | 25,744 | 71,717 | 74,792 | ||||||||
Due after ten years | 106,789 | 107,202 | 131,499 | 130,702 | ||||||||
| 1,793,175 | 1,793,675 | 1,290,953 | 1,294,143 | |||||||||
Mortgage-backed securities: | ||||||||||||
Government-sponsored enterprises | 2,958,672 | 2,946,633 | 1,089,597 | 1,118,148 | ||||||||
Ginnie Mae | 84,077 | 85,495 | 119,539 | 122,416 | ||||||||
MPF Shared Funding® | 512,983 | 496,819 | 621,459 | 615,360 | ||||||||
Other | 1,212,254 | 1,235,458 | 2,017,519 | 2,051,316 | ||||||||
Total held-to-maturity securities | $ | 6,561,161 | $ | 6,558,080 | $ | 5,139,067 | $ | 5,201,383 | ||||
The amortized cost of the Bank’s mortgage-backed securities classified as held-to-maturity includes net premiums of $15,234,000 and $13,288,000 at December 31, 2004 and 2003, respectively.
Interest Rate Payment Terms – The following amortized cost table details interest rate payment terms for investment securities classified as held-to-maturity at December 31, 2004 and 2003:
(Dollars in thousands) | 2004 | 2003 | ||||
Amortized cost of held-to-maturity securities other than mortgage-backed securities: | ||||||
Fixed-rate | $ | 1,732,680 | $ | 1,219,988 | ||
Variable-rate | 60,495 | 70,965 | ||||
| 1,793,175 | 1,290,953 | |||||
Amortized cost of held-to-maturity mortgage-backed securities: | ||||||
Pass-through securities: | ||||||
Fixed-rate | 1,630,733 | 923,401 | ||||
Variable-rate | 72,654 | 106,139 | ||||
Collateralized mortgage obligations: | ||||||
Fixed-rate | 2,217,657 | 1,323,803 | ||||
Variable-rate | 846,942 | 1,494,771 | ||||
| 4,767,986 | 3,848,114 | |||||
Total held-to-maturity securities | $ | 6,561,161 | $ | 5,139,067 | ||
F-21
Table of Contents
The following table summarizes the held-to-maturity securities with unrealized losses as of December 31, 2004. The unrealized losses are aggregated by major security type and length of time that individual securities have been in a continuous unrealized loss position.
| Less than 12 Months | 12 Months or More | Total | |||||||||||||||||||
(Dollars in thousands) | Fair Value | Unrealized Losses | Fair Value | Unrealized Losses | Fair Value | Unrealized Losses | |||||||||||||||
Commercial paper | $ | 699,660 | $ | (62 | ) | $ | — | $ | — | $ | 699,660 | $ | (62 | ) | |||||||
Government-sponsored enterprises | 248,017 | (1,553 | ) | — | — | 248,017 | (1,553 | ) | |||||||||||||
State or local housing agency obligations | 1,705 | (5 | ) | 4,068 | (132 | ) | 5,773 | (137 | ) | ||||||||||||
Other | 508,403 | (318 | ) | — | — | 508,403 | (318 | ) | |||||||||||||
Mortgage-backed securities: | |||||||||||||||||||||
Government-sponsored enterprises | 1,589,954 | (33,091 | ) | 1,354 | (4 | ) | 1,591,308 | (33,095 | ) | ||||||||||||
Ginnie Mae | — | — | — | — | — | — | |||||||||||||||
MPF Shared Funding® | 488,772 | (15,529 | ) | 8,046 | (635 | ) | 496,818 | (16,164 | ) | ||||||||||||
Other | 179,655 | (151 | ) | 5,693 | (9 | ) | 185,348 | (160 | ) | ||||||||||||
Total temporarily impaired | $ | 3,716,166 | $ | (50,709 | ) | $ | 19,161 | $ | (780 | ) | $ | 3,735,327 | $ | (51,489 | ) | ||||||
Securities with unrealized losses predominantly relate to mortgage-backed-securities that are rated AA or better. The overall depreciation in fair value is attributable to no established secondary market for the Bank’s MPF Shared Funding® investments and changes in market interest rates. The overall depreciation is considered temporary as the Bank has the intent and ability to hold these investments to maturity with the expectation that the unrealized market value loss will be recovered.
The following table summarizes the held-to-maturity securities with unrealized losses as of December 31, 2003.
| Less than 12 Months | 12 Months or More | Total | |||||||||||||||||||
(Dollars in thousands) | Fair Value | Unrealized Losses | Fair Value | Unrealized Losses | Fair Value | Unrealized Losses | |||||||||||||||
Commercial paper | $ | 99,988 | $ | (3 | ) | $ | — | $ | — | $ | 99,988 | $ | (3 | ) | |||||||
State or local housing agency obligations | 2,635 | (110 | ) | 17,016 | (1,369 | ) | 19,651 | (1,479 | ) | ||||||||||||
Mortgage-backed securities: | |||||||||||||||||||||
Government-sponsored enterprises | 8,006 | (25 | ) | 259 | — | 8,265 | (25 | ) | |||||||||||||
Ginnie Mae | — | — | — | — | — | — | |||||||||||||||
MPF Shared Funding® | 497,013 | (6,794 | ) | — | — | 497,013 | (6,794 | ) | |||||||||||||
Other | 553,545 | (887 | ) | 269,714 | (292 | ) | 823,259 | (1,179 | ) | ||||||||||||
Total temporarily impaired | $ | 1,161,187 | $ | (7,819 | ) | $ | 286,989 | $ | (1,661 | ) | $ | 1,448,176 | $ | (9,480 | ) | ||||||
The following table summarizes held-to-maturity MPF Shared Funding activity since inception:
MPF Shared Funding:
(Dollars in thousands) | ||||
January 1, 2003 Opening Balance | $ | — | ||
Purchases | 695,193 | |||
Paydowns | (70,214 | ) | ||
Amortization | (3,520 | ) | ||
December 31, 2003 Ending Balance | 621,459 | |||
Purchases | — | |||
Paydowns | (102,103 | ) | ||
Amortization | (6,373 | ) | ||
December 31, 2004 Ending Balance | $ | 512,983 | ||
The Bank had two occurrences during 2003 in which securities classified as held-to-maturity were sold. In the first occurrence, Standard and Poor’s stated they would no longer rate future issuances of this specific security. The second occurrence was precipitated due to a downgrade by Moody’s from “Aaa” to “Baa1”. The Bank’s policy outlines that securities held must be rated “Aa” or above by Moody’s or “AA” or above by Standard and Poor’s. Both of these events provided evidence of a significant deterioration in the issuers’ creditworthiness. As a result of these downgrades, the Bank liquidated these securities.
F-22
Table of Contents
Note 8 - Advances
Redemption Terms – At December 31, 2004 and 2003, the Bank had advances outstanding to members, including AHP advances, at interest rates ranging from 1.20% to 8.47% and 0.89% to 8.47%, respectively, as summarized below. AHP subsidized advances have an average interest rate of 6.07% and 5.66% as of December 31, 2004 and 2003, respectively.
(Dollars in thousands) | 2004 | 2003 | ||||||||||||
Year of Maturity | Amount | Weighted Average Interest Rate | Amount | Weighted Average Interest Rate | ||||||||||
2004 | $ | — | — | $ | 7,548,016 | 2.92 | % | |||||||
2005 | 6,943,773 | 2.95 | % | 5,338,526 | 3.77 | % | ||||||||
2006 | 5,732,457 | 2.88 | % | 2,733,695 | 2.76 | % | ||||||||
2007 | 3,427,577 | 3.21 | % | 3,404,312 | 1.96 | % | ||||||||
2008 | 2,589,505 | 3.92 | % | 2,756,531 | 3.83 | % | ||||||||
2009 | 1,479,162 | 3.74 | % | 406,850 | 5.54 | % | ||||||||
2010 | 2,048,603 | 3.18 | % | 2,038,818 | 2.85 | % | ||||||||
Thereafter | 1,747,527 | 4.72 | % | 1,641,395 | 4.75 | % | ||||||||
Total par value | 23,968,604 | 3.27 | % | 25,868,143 | 3.20 | % | ||||||||
Discount on AHP Advances | (97 | ) | (144 | ) | ||||||||||
SFAS 133 hedging adjustments | 223,051 | 575,064 | ||||||||||||
Total Advances | $ | 24,191,558 | $ | 26,443,063 | ||||||||||
Some of the Bank’s advances to members are callable at the member’s option (callable advances) such that a member may repay the advance on pertinent call dates without incurring prepayment fees. Other advances may only be prepaid by paying a fee to the Bank (prepayment fee) that makes the Bank financially indifferent to the prepayment of the advance. At December 31, 2004 and 2003, the Bank had callable advances outstanding totaling $132,600,000 and $2,348,600,000, respectively.
The following table summarizes advances at December 31, 2004 and 2003 by year of maturity or next call date for callable advances:
(Dollars in thousands) | ||||||
Year of Maturity or Next Call Date | 2004 | 2003 | ||||
2004 | $ | — | $ | 9,881,116 | ||
2005 | 7,061,273 | 5,333,526 | ||||
2006 | 5,698,457 | 1,981,095 | ||||
2007 | 3,419,577 | 1,903,812 | ||||
2008 | 2,514,505 | 2,681,531 | ||||
2009 | 1,478,662 | 406,850 | ||||
2010 | 2,048,603 | 2,038,818 | ||||
Thereafter | 1,747,527 | 1,641,395 | ||||
Total par value | $ | 23,968,604 | $ | 25,868,143 | ||
The Bank also issues advances to members in which the Bank has the right to put the advance after a specified lockout period, in whole or in part, at the par value with five business days notice. If the Bank exercises the right to put the advance, the member may pay off the advance with its existing liquidity or by obtaining funds under another advance product offered by the Bank at existing market prices for that member on the date that the advance was put back to the member. At December 31, 2004 and 2003, the Bank had putable advances outstanding totaling $4,588,863,000 and $5,150,586,000, respectively.
F-23
Table of Contents
The following table summarizes advances at December 31, 2004 and 2003 by year of maturity or next put date for putable advances:
(Dollars in thousands) | ||||||
Year of Maturity or Next Put Date | 2004 | 2003 | ||||
2004 | $ | — | $ | 11,332,398 | ||
2005 | 9,632,981 | 4,552,526 | ||||
2006 | 5,836,324 | 2,620,287 | ||||
2007 | 3,552,577 | 3,429,312 | ||||
2008 | 1,815,510 | 1,581,036 | ||||
2009 | 706,162 | 204,850 | ||||
2010 | 1,655,603 | 1,645,818 | ||||
Thereafter | 769,447 | 501,916 | ||||
Total par value | $ | 23,968,604 | $ | 25,868,143 | ||
Security Terms – The Bank lends to financial institutions in Illinois and Wisconsin involved in housing finance, in accordance with federal statutes, including the FHLB Act. The Bank is required by statute to obtain sufficient collateral on advances to protect against losses and to accept certain investment securities, residential mortgage loans, deposits in the Bank, and other real estate related assets as collateral on such advances. However, “Community Financial Institutions” (CFIs) are eligible to utilize expanded statutory collateral provisions for small business and agriculture loans under the provisions of the Gramm-Leach-Bliley Act of 1999 (1999 Act). The capital stock of the Bank owned by borrowing members is also pledged as additional collateral on advances. The FHLB Act requires that the aggregate advances from the Bank to any single member not exceed 20 times the amount paid by that member for capital stock of the Bank. At December 31, 2004 and 2003, the Bank had rights to collateral with an estimated value in excess of outstanding advances. Based upon the financial condition of the member, the Bank:
| 1. | Allows a member to physically retain possession of the collateral assigned to the Bank, provided that the member executes a written security agreement and agrees to hold the collateral for the benefit of and subject to the direction and control of the Bank; and perfects the security interest in such collateral; or |
| 2. | Requires the member to specifically assign or place physical possession of the collateral with the Bank or its safekeeping agent. |
Beyond these provisions, Section 10(e) of the FHLB Act affords any security interest granted by a member to the Bank priority over the claims or rights of any other party. The two exceptions are claims for which the third party has a perfected security interest and those that would be entitled to priority under otherwise applicable law.
Credit Risk – While the Bank has never experienced a credit loss on an advance to a member, the expanded eligible collateral for CFIs provides additional credit risk to the Bank. The management of the Bank has policies and procedures in place to appropriately manage this credit risk. Accordingly, the Bank has not provided any allowances for losses on advances.
The Bank’s potential credit risk from advances is concentrated in commercial banks and savings institutions. As of December 31, 2004, the Bank had advances of $3,151,471,000 outstanding to one member institution, and this represented 13% of total advances outstanding. The interest income from advances to this member institution amounted to $90,004,000 and $106,055,000 during 2004 and 2003, respectively. The Bank held sufficient collateral to cover the advances to this institution, and the Bank does not expect to incur any credit losses on these advances.
F-24
Table of Contents
Interest Rate Payment Terms – Additional interest rate payment terms for advances at December 31, 2004 and 2003 are detailed in the following table:
(Dollars in thousands) | 2004 | 2003 | ||||
Par Amount of advances: | ||||||
Fixed-rate | $ | 19,675,923 | $ | 19,730,994 | ||
Variable-rate | 4,292,681 | 6,137,149 | ||||
Total par value | $ | 23,968,604 | $ | 25,868,143 | ||
Note 9 - Affordable Housing Program
The Financial Institutions Reform, Recovery and Enforcement Act of 1989 (FIRREA) contains provisions for the establishment of an Affordable Housing Program (AHP) by each FHLB. Each FHLB provides subsidies in the form of direct grants or below-market interest rate advances for members who use the funds for qualifying affordable housing projects. Annually, the FHLBs individually and as a System must set aside for the AHP the greater of: (1) that FHLB’s pro-rata share of $100 million to be contributed in total by the FHLBs on the basis of net earnings (defined as net earnings before charges for AHP and interest expense on mandatorily redeemable capital stock but after the charge to REFCORP or “pre-assessment net earnings”); or (2) ten percent of that Bank’s current year’s pre-assessment net earnings. Each month, the Bank calculates ten percent of period pre-assessment net earnings for the AHP program, which is then charged to income and recognized as a liability of the Bank. As subsidies are provided, the AHP liability is relieved.
If the results of the aggregate ten percent calculation described above is less than $100 million for all twelve FHLBs, the Finance Board will allocate the shortfall among the FHLBs based on the ratio of each FHLB’s pre-assessment net earnings to the sum of the pre-assessment net earnings of the twelve FHLBs. There was no shortfall in either 2004, 2003 or 2002. If the Bank has a loss, a credit is recorded. This credit can be used to apply for a refund for previous amounts paid, reimbursed from other FHLBs that had income, or carried forward against future income. The Bank had outstanding principal in AHP-related advances of $1,199,000 and $2,090,000 at December 31, 2004 and 2003, respectively. For the three years ended December 31, 2004, the Bank has not issued any new AHP advances.
Note 10 - Mortgage Loans Held in Portfolio
The Mortgage Partnership Finance Program involves investment by the Bank in MPF Loans which are either funded by the Bank through or purchased from its members or members of another FHLB or purchased as participations from other FHLB’s. The MPF Loans are held-for-investment under the MPF Program whereby the PFIs create, service and credit enhance MPF Loans which are owned by the Bank. The following table presents information as of December 31, 2004 and 2003 on MPF Loans:
(Dollars in thousands) | 2004 | 2003 | ||||||
Mortgages: | ||||||||
Fixed medium-term(1) single-family mortgages | $ | 17,129,505 | $ | 17,365,079 | ||||
Fixed long-term(2) single-family mortgages | 29,448,280 | 29,775,492 | ||||||
Unamortized premiums, net | 282,427 | 353,247 | ||||||
Plus: deferred loan cost, net | 61,535 | 63,207 | ||||||
Total mortgage loans | 46,921,747 | 47,557,025 | ||||||
Loan commitment basis adjustment | (15,072 | ) | (11,123 | ) | ||||
SFAS 133 hedging adjustments | 18,755 | 59,288 | ||||||
Total mortgage loans held in portfolio | $ | 46,925,430 | $ | 47,605,190 | ||||
| (1) | Medium-term is defined as a term of 15 years or less. |
| (2) | Long-term is defined as a term of greater than 15 years. |
F-25
Table of Contents
The par value of MPF Loans outstanding at December 31, 2004 and 2003, was comprised of Government loans (See Note 1) totaling $6,797,115,000 and $6,607,715,000 and conventional loans totaling $39,780,670,000 and $40,532,856,000, respectively.
The allowance for loan losses on MPF Loans was as follows:
(Dollars in thousands) | 2004 | 2003 | 2002 | |||||||||
Allowance for credit losses: | ||||||||||||
Balance, beginning of year | $ | 5,459 | $ | 5,464 | $ | 3,340 | ||||||
Chargeoffs | (1,094 | ) | (176 | ) | (138 | ) | ||||||
Recoveries | 514 | 171 | 45 | |||||||||
Net (chargeoffs) | (580 | ) | (5 | ) | (93 | ) | ||||||
Provisions for credit losses | — | — | 2,217 | |||||||||
Balance, end of year | $ | 4,879 | $ | 5,459 | $ | 5,464 | ||||||
MPF Loans are placed on non-accrual status when it is determined that the payment of interest or principal is doubtful of collection or when interest or principal is past due for 90 days or more, except when the MPF Loan is well secured and in the process of collection. When an MPF Loan is placed on non-accrual status, accrued but uncollected interest and the amortization of agent fees, premiums and discounts are reversed against interest income. The Bank records cash payments received on non-accrual MPF Loans as a reduction of principal with any remainder reported in interest income. At December 31, 2004 and 2003, the Bank had $71.2 million and $57.3 million of MPF Loans on non-accrual. At December 31, 2004 and 2003, the Bank had $18.3 million and $12.6 million from MPF Loans that have been foreclosed but not yet liquidated. Renegotiated MPF Loans are those for which concessions, such as the deferral of interest or principal payments, have been granted as a result of deterioration in the borrowers’ financial condition. MPF Loans may be renegotiated by the PFI acting in its role of servicer in accordance with the servicing agreement. The PFI servicer also may take physical possession of the property upon foreclosure or receipt of a deed in lieu of foreclosure.
MPF Loans that are on non-accrual and that are viewed as collateral dependent loans are considered impaired. Impaired MPF Loans are viewed as collateral-dependent loans when repayment is expected to be provided solely by the sale of the underlying property and there are no other available and reliable sources of repayment. An MPF Loan is considered collateral dependent when the debtor has filed for bankruptcy, an in-substance foreclosure has occurred or foreclosure proceedings have been initiated. Impaired MPF Loans are written down to the lower of cost or collateral value, less disposal costs. In the case where an in-substance foreclosure has occurred, MPF Loans are reclassified to other assets.
| As of December 31, | ||||||
(Dollars in thousands) | 2004 | 2003 | ||||
Impaired MPF Loans with an allowance | $ | — | $ | — | ||
Impaired MPF Loans without an allowance(a) | 40,964 | 34,543 | ||||
Total Impaired Loans | 40,964 | 34,543 | ||||
Allowance for Impaired Loans under SFAS 114 | $ | — | $ | — | ||
| (a) | When the collateral value less estimated selling costs exceeds the recorded investment in the MPF Loan, then the MPF Loan does not require an allowance under SFAS 114 (e.g., if the MPF Loan has been charged down to the recorded investment in the MPF Loan). |
| For the years ended December 31, | ||||||
(Dollars in thousands) | 2004 | 2003 | 2002 | |||
Average balance of impaired loans during the year | 37,753 | 23,375 | 7,086 | |||
Interest income recognized on impaired loans during the year | 2,525 | 2,216 | 839 | |||
F-26
Table of Contents
Note 11 - Deposits
The Bank offers demand, overnight and short term interest bearing deposit programs for members and qualifying non-members. The weighted average interest rates paid on the average interest-bearing deposits were 2.02%, 0.81%, and 1.05% during 2004, 2003, and 2002, respectively. In addition, PFIs that service MPF Loans (See Note 10) must deposit in the Bank funds collected in connection with certain MPF Loans pending disbursement of such funds to the owners of the MPF Loans; these items are classified as other non-interest bearing deposits on the statements of condition. If the PFI is a member of another FHLB, then the PFI’s respective FHLB must maintain these deposits on its behalf in the Bank.
Note 12 - Borrowings
Securities Sold Under Agreements to Repurchase – The Bank has sold securities under repurchase agreements. The amounts received under these agreements represent borrowings on the statements of condition. The Bank has delivered securities sold under agreements to repurchase to the primary dealer. Should the market value of the underlying securities fall below the market value required as collateral, the Bank must deliver additional securities to the dealer. Assets having a book value of $1,240,205,000 and $1,239,388,000 as of December 31, 2004 and 2003, respectively, were pledged as collateral for repurchase agreements. The assets pledged were comprised of investment securities. Of the total collateral pledged as of December 31, 2004 and 2003, $1,014,000,000 and $810,482,000 of collateral was permitted to be sold or repledged by the secured party.
Note 13 - Consolidated Obligations
Consolidated obligations are the joint and several obligations of the FHLBs and consist of consolidated bonds and discount notes. The FHLBs issue consolidated obligations through the Office of Finance as their agent. Consolidated bonds are issued primarily to raise intermediate and long-term funds for the FHLBs. Usually, the maturity of consolidated bonds range from one year to fifteen years, but they are not subject to any statutory or regulatory limits on maturity. Consolidated discount notes are issued primarily to raise short-term funds. Discount notes are issued at less than their face amount and redeemed at par value when they mature.
The Finance Board, at its discretion, may require a FHLB to make principal or interest payments due on any consolidated obligation. Although it has never occurred, to the extent that a FHLB makes a payment on a consolidated obligation on behalf of another FHLB, the paying FHLB would be entitled to a reimbursement from the non-complying FHLB. If the Finance Board determines that the non-complying FHLB is unable to satisfy its direct obligations (as primary obligor), then the Finance Board may allocate the outstanding liability among the remaining FHLBs on a pro rata basis in proportion to each FHLB’s participation in all consolidated obligations outstanding, or on any other basis the Finance Board may prescribe, even in the absence of a default event by the primary obligor.
The par value of outstanding consolidated obligation bonds and discount notes for the System was $869.2 billion and $759.5 billion at December 31, 2004 and 2003, respectively. Regulations require the FHLBs to maintain, in the aggregate, unpledged qualifying assets in an amount equal to the consolidated obligations outstanding. Qualifying assets are defined as: cash, secured advances, assets with an assessment or rating at least equivalent to the current assessment or rating of the FHLB consolidated obligations, obligations, participations, mortgages, or other securities of or issued by the United States government or an agency of the United States government; and such securities as fiduciary and trust funds may invest in under the laws of the state in which each FHLB is located.
On June 2, 2000, the Finance Board adopted a final rule amending the FHLBs’ leverage limit requirements. Effective July 1, 2000, each FHLB’s leverage limit is based on a ratio of assets to capital, rather than a ratio of liabilities to capital. The Finance Board’s former regulations prohibited the issuance of consolidated obligations if such issuance would bring the FHLBs’ outstanding consolidated obligations and other unsecured senior liabilities above 20 times the FHLB’s total capital. The Finance Board’s Financial Management Policy also applied this limit on a FHLB-by-FHLB basis. The final rule deletes the FHLBs’ overall leverage limit from the regulations, but limits each FHLB’s assets generally to no more than 21 times its capital. Nevertheless, any FHLB whose non-mortgage assets, after deducting deposits and capital, do not exceed 11% of its assets may have total assets in an amount not greater than 25 times its capital.
In order to provide the holders of consolidated obligations issued prior to January 29, 1993 (prior bondholders) protection equivalent to that provided under the FHLBs’ previous leverage limit of twelve times FHLBs’ capital stock, prior bondholders have a singular claim on a certain amount of the qualifying assets (Special Asset Account (SAA)) if capital stock is less than 8.33% of consolidated obligations. At December 31, 2004 and 2003, the FHLBs’ capital stock was 4.7% and 5.0% of the par value of consolidated obligations outstanding, and the SAA balance was approximately $219,000 and $24.0 million,
F-27
Table of Contents
respectively. Each FHLB is required to transfer qualifying assets in the amount of its allocated share of the FHLBs’ SAA balance to a trust for the benefit of the prior bondholders if its capital-to-assets ratio falls below 2%. The FHLBs’ capital-to-assets ratios were greater than 2% at December 31, 2004, and 2003.
General Terms – Consolidated obligations are generally issued with either fixed or floating-rate payment terms that use a variety of indices for interest rate resets including the London Interbank Offered Rate (LIBOR), Constant Maturity Treasury (CMT), 11th District Cost of Funds Index (COFI), and others. In addition, to meet the specific needs of certain investors in consolidated obligations, both fixed-rate bonds and variable-rate bonds may also contain certain embedded features, which may result in complex coupon payment terms and call features. When such consolidated obligations are issued, the Bank concurrently enters into interest rate exchange agreements containing offsetting features, that effectively converts the terms of the bond to a straightforward variable-rate bond tied to an index or a fixed-rate bond.
These consolidated obligation bonds, beyond having fixed-rate or simple variable-rate coupon payment terms, may also have the following broad terms regarding either principal repayment or coupon payment terms:
Optional Redemption Bonds (callable bonds) - May be redeemed in whole or in part at the discretion of the Bank on predetermined call dates in accordance with terms of bond offerings.
Step-Up Bonds – Pays interest at increasing fixed rates for specified intervals over the life of the bond. These bonds generally contain provisions enabling the bonds to be called at the Bank’s option on the step-up dates.
Inverse Floating Bonds – Coupon rates increase as an index declines and decrease as an index rises.
Comparative-Index Bonds – Coupon rates are determined by the difference between two or more market indices, typically CMT and LIBOR.
Zero-Coupon Bonds – Long-term discounted instruments that earn a fixed yield to maturity or to the optional principal redemption date. All principal and interest are paid at maturity or on the optional principal redemption date, if exercised prior to maturity.
Interest Rate Payment Terms – Interest rate payment terms for consolidated bonds at December 31, 2004 and 2003 are detailed in the following table. Range bonds are classified as comparative-index bonds.
(Dollars in thousands) | 2004 | 2003 | ||||
Par amount of consolidated bonds: | ||||||
Fixed rate | $ | 59,501,465 | $ | 53,396,075 | ||
Variable rate | 625,500 | 2,625,500 | ||||
Inverse floating rate | 50,000 | 50,000 | ||||
Comparative-index | 41,550 | 41,550 | ||||
Step-up | 220,000 | 385,000 | ||||
Zero coupon | 2,430,000 | 3,830,000 | ||||
Total par value | $ | 62,868,515 | $ | 60,328,125 | ||
F-28
Table of Contents
Redemption Terms – The following is a summary of the Bank’s participation in consolidated obligation bonds at December 31, 2004 and 2003 by year of maturity.
(Dollars in thousands) | 2004 | 2003 | ||||||||||||
Year of Maturity | Amount | Weighted Average Interest Rate | Amount | Weighted Average Interest Rate | ||||||||||
2004 | $ | — | — | $ | 7,664,585 | 2.65 | % | |||||||
2005 | 11,446,710 | 2.96 | % | 8,508,210 | 3.34 | % | ||||||||
2006 | 11,059,200 | 2.73 | % | 9,484,200 | 2.79 | % | ||||||||
2007 | 7,568,915 | 3.49 | % | 6,222,915 | 3.74 | % | ||||||||
2008 | 6,512,000 | 3.50 | % | 6,200,500 | 3.70 | % | ||||||||
2009 | 4,071,470 | 4.11 | % | 1,480,500 | 4.99 | % | ||||||||
2010 | 4,235,000 | 4.92 | % | 3,516,000 | 5.33 | % | ||||||||
Thereafter | 17,975,220 | 4.48 | % | 17,251,215 | 4.00 | % | ||||||||
Total par value | 62,868,515 | 3.68 | % | 60,328,125 | 3.59 | % | ||||||||
Bond premiums | 68,848 | 81,225 | ||||||||||||
Bond discounts | (1,860,386 | ) | (2,993,465 | ) | ||||||||||
SFAS 133 hedging adjustments | (200,987 | ) | 56,512 | |||||||||||
Deferred net loss on terminated interest rate exchange agreements | (450 | ) | (1,342 | ) | ||||||||||
Total consolidated obligation bonds | $ | 60,875,540 | $ | 57,471,055 | ||||||||||
The Bank makes significant use of fixed-rate callable debt to finance MPF Loans, callable advances and mortgage-backed securities. Contemporaneous with such a debt issue, the Bank may also enter into a swap (in which the Bank pays variable interest payments and receives fixed interest payments) with a call feature that mirrors the option embedded in the debt (a sold callable swap). The combined sold callable swap and callable debt allows the Bank to provide its members with lower priced variable-rate advances.
The Bank’s consolidated bonds outstanding at December 31, 2004 and 2003 include:
| 2004 | 2003 | |||||||||||
(Dollars in thousands) | Amount | Percentage of Callable/ Non- Callable Bonds to Total | Amount | Percentage of Callable/ Non- Callable Bonds to Total | ||||||||
Par amount of consolidated bonds: | ||||||||||||
Non-callable or non-putable | $ | 39,421,085 | 62.70 | % | $ | 36,229,225 | 60.05 | % | ||||
Callable | 23,447,430 | 37.30 | % | 24,098,900 | 39.95 | % | ||||||
Total par value | $ | 62,868,515 | 100.00 | % | $ | 60,328,125 | 100.00 | % | ||||
F-29
Table of Contents
The following table summarizes the Bank’s participation in consolidated bonds outstanding at December 31, 2004 and 2003, by year of maturity or next call date:
(Dollars in thousands) | ||||||
Year of Maturity or Next Call Date | 2004 | 2003 | ||||
2004 | $ | — | $ | 20,742,485 | ||
2005 | 21,725,740 | 11,315,710 | ||||
2006 | 11,342,200 | 6,974,200 | ||||
2007 | 5,968,915 | 4,732,915 | ||||
2008 | 4,118,000 | 2,522,500 | ||||
2009 | 2,511,250 | 975,500 | ||||
2010 | 2,809,000 | 1,525,000 | ||||
Thereafter | 14,393,410 | 11,539,815 | ||||
Total par value | $ | 62,868,515 | $ | 60,328,125 | ||
Discount Notes – The Bank’s participation in consolidated discount notes, all of which are due within one year, is as follows:
(Dollars in thousands) | Book Value | Par Value | Weighted Average Interest Rate | ||||||
December 31, 2004 | $ | 16,871,736 | $ | 16,942,524 | 2.08 | % | |||
December 31, 2003 | $ | 20,456,395 | $ | 20,500,073 | 1.05 | % | |||
The FHLB Act authorizes the Secretary of the Treasury, at his or her discretion, to purchase consolidated obligations of the FHLBs aggregating not more than $4 billion. The terms, conditions, and interest rates are determined by the Secretary of the Treasury. There were no such purchases by the U.S. Treasury during the three years ended December 31, 2004.
Note 14 - Capital
The Finance Board published a final rule implementing a new capital structure for the Bank, which includes risk-based and leverage capital requirements, different classes of stock that the Bank may issue and the rights and preferences that may be associated with each class of stock. The Finance Board originally approved the Bank’s capital plan on June 12, 2002. However, the Bank is in the process of re-assessing its capital plan and may propose amendments to its capital plan to the Finance Board. Until such time as the Bank fully implements its new capital plan, the current capital rules remain in effect.
The current capital rules require members to purchase capital stock equal to the greater of 1 percent of their mortgage-related assets at the most recent calendar year end or 5 percent of outstanding member advances with the Bank. Members may, at the Bank’s discretion, redeem at par value any capital stock greater than their statutory requirement or, with the Bank’s approval, sell it to other Bank members at par value. Members may purchase through the Bank or from other members, with the Bank’s permission, Bank capital stock in excess of membership or collateral requirements. Member excess capital is referred to as voluntary capital stock. At December 31, 2004, Bank members held 27,428,000 shares of voluntary capital stock. These holdings represented 57% of the Bank’s regulatory capital which is equal to the Bank’s total capital stock plus its retained earnings and mandatorily redeemable capital stock. Voluntary capital stock at December 31, 2003 was 24,201,000 shares above membership collateral requirements, or 53% of the Bank’s regulatory capital.
When the new capital plan has been implemented, the Bank will be subject to risk-based capital rules. Each FHLB may offer two classes of stock. Provided the FHLB is adequately capitalized, members can redeem Class A stock by giving six months notice, and members can redeem Class B stock by giving five years notice. Only “permanent” capital, defined as retained earnings and Class B stock, satisfies the risk-based capital requirement. In addition, the 1999 Act specifies a 5 percent minimum leverage ratio based on total capital including a 1.5 weighting factor applicable to Class B stock and retained earnings. It also specifies a 4 percent minimum capital ratio that does not include the 1.5 weighting factor applicable to Class B stock used in determining compliance with the 5 percent minimum leverage ratio.
F-30
Table of Contents
The following table summarizes the Bank’s total regulatory capital requirements.
| (Dollars in thousands) | Current Regulatory Requirement | Actual | |||
December 31, 2004 | 3,428,345 | (1) | 4,792,793 | ||
December 31, 2003 | 3,477,679 | (2) | 4,542,092 | ||
December 31, 2002 | 2,601,836 | (2) | 3,296,041 |
| (1) | The total regulatory capital requirement is 4%, as shown in the table. Total regulatory capital required by the Finance Board under the Written Agreement calculated at 5.1% was $4,371,140. |
| (2) | The total regulatory capital required by Finance Board regulations was calculated at 4%. |
On June 30, 2004, the Bank entered into a Written Agreement with the Finance Board. Pursuant to the Written Agreement, the Bank will maintain a regulatory capital level of no less than of 5.1%. As of December 31, 2004, the Bank’s regulatory capital level was 5.6%. In accordance with the Written Agreement, the Bank has adopted a Business and Capital Management Plan for 2005-2007 which was accepted by the Finance Board on February 10, 2005. The plan sets forth commitments made by the Bank for the management of its operations, including the following:
| • | The Bank will continue complying with the terms of the Written Agreement until it is terminated. |
| • | The Bank will manage a reduction of its voluntary capital stock ratio measured as a percent of regulatory capital (total capital stock plus retained earnings) to the following minimum targets: |
December 31, 2005 53%
December 31, 2006 48%
December 31, 2007 43%
| • | The Bank will delay implementation of a new capital structure until December 31, 2006, or until a time mutually agreed upon with the Finance Board. Also, the Bank will reevaluate the structure of the Bank’s capital plan, originally approved by the Finance Board on June 12, 2002, and may propose amendments for approval by the Finance Board based on the review. |
| • | As part of the continued development and evolution of the Mortgage Partnership Finance Program, the Bank will explore alternative methods of capitalizing and funding MPF assets including techniques to liquefy MPF assets, creating additional capacity for the Bank and other FHLBs. |
| • | The Bank agreed to adopt a new dividend policy requiring its dividend payout ratio in a given quarter not to exceed 90% of adjusted core net income for that quarter. For these purposes, adjusted core net income means the Bank’s GAAP net income, excluding gains or losses arising from significant non-recurring events, such as advance prepayment fees and gains or losses on debt transfer transactions and associated derivative contracts and other hedge instruments. The Bank’s Board of Directors adopted the new dividend policy on March 15, 2005. While the Written Agreement remains in effect, quarterly dividends of greater than 5.5%, on an annualized basis, will require regulatory approval. Dividends may be in the form of cash or capital stock. Historically, the Bank’s Board of Directors could declare and pay dividends out of previous retained earnings and current net earnings in either cash or capital stock. |
Mandatorily Redeemable Capital Stock
The 1999 Act established voluntary membership for all members. All members may withdraw from membership and redeem their capital after giving notice to do so within the required timeframe. Members that withdraw from membership must wait 5 years before being readmitted to membership in the Bank. Members may redeem capital stock through the Bank. The Bank’s customary practice is to honor member redemption requests promptly. However, all stock redemption requests remain subject to bank regulatory requirements and require Bank approval.
The Bank’s policy regarding capital stock redemption is governed by both the FHLB Act and Finance Board regulations. Under the FHLB Act and the regulations, the Bank in its discretion and upon application of a member may retire the stock of that member in excess of that member’s required capital stock amount. It is currently the Bank’s practice to redeem voluntary capital stock on the same day a member request is received, taking into account the Bank’s liquidity and capital needs at the time.
F-31
Table of Contents
Also, in accordance with Finance Board regulations, a member may withdraw from membership. In the case of a withdrawal, there is a six month notice period before redemption of all capital stock subject to the member satisfying all outstanding obligations to the Bank. The member has the option to rescind its withdrawal request without penalty during that six month period. The Bank considers all withdrawal requests to be substantive in nature. Redemption is made after the expiration of the six month period if the terminating member does not have outstanding obligations with the Bank and provided that the Written Agreement with the Finance Board allows the Bank to make the redemption. Although the Bank allows a member to rescind their redemption request without penalty, the Bank none the less reclassifies the member’s equity to a liability because it views the redemption request on membership withdrawals as substantive when made. In effect, the Bank believes that once a member has decided to withdraw, the potential of the member rescinding its withdrawal request is remote.
The following table is a summary of mandatorily redeemable capital stock since adoption of SFAS 150 on January 1, 2004:
| For the year ended December 31, 2004 | |||||||
(Dollars in thousands) | Amount | Number of Members | |||||
Mandatorily Redeemable Capital Stock | |||||||
- Beginning Balance | $ | 33,588 | 6 | ||||
Redemption Requests: | |||||||
Out-of-District Acquisitions | 1,450 | * | — | ||||
Withdrawals | 4,558 | 2 | |||||
Redemption Distributions: | |||||||
Out-of-District Acquisitions | (28,337 | ) | (3 | ) | |||
Withdrawals | — | — | |||||
Mandatorily Redeemable Capital Stock | |||||||
- Ending Balance | $ | 11,259 | 5 | ||||
Earnings impact from reclassification of dividends to interest expense | $ | 1,516 | |||||
| * | Includes partial paydowns or redemption requests |
At December 31, 2004 the Bank had $11,259,000 in capital stock subject to mandatory redemption from five members and former members. This amount has been classified as a liability (“mandatorily redeemable capital stock”) in the statements of condition. The Finance Board has confirmed that the SFAS 150 accounting treatment for certain shares of the Bank’s capital stock will not affect the definition of total capital for purposes of determining the Bank’s compliance with its regulatory capital requirements, calculating its mortgage securities investment authority (300% of total capital), calculating its unsecured credit exposure to other Government-sponsored enterprises (100% of total capital), or calculating its unsecured credit limits to other counterparties (various percentages of total capital depending on the rating of the counterparty).
Note 15 - Employee Retirement Plans
The Bank participates in the Financial Institutions Retirement Fund (FIRF), a defined benefit plan. Substantially all officers and employees of the Bank are covered by the plan. The Bank’s contributions to FIRF through June 30, 1987, represented the normal cost of the plan. The plan reached the full-funding limitation, as defined by the Employee Retirement Income Security Act, for the plan year beginning July 1, 1987 because of favorable investment and other actuarial experience during previous years. As a result, FIRF suspended employer contributions for all plan years ending after June 30, 1987 through June 30, 2002. Contributions to the Plan resumed on July 1, 2002. Funding and administrative costs of FIRF charged to other operating expenses were $3,138,000, $2,690,000 and $465,000 in 2004, 2003 and 2002, respectively. The plan is fully funded through June 30, 2005. The FIRF is a multiemployer plan and does not segregate its assets, liabilities or costs by participating employer. As a result, disclosure of the accumulated benefit obligations, plan assets and the components of annual pension expense attributable to the Bank cannot be made.
F-32
Table of Contents
The Bank also participates in the Financial Institutions Thrift Plan (FITP), a defined contribution plan. The Bank’s contribution is equal to a percentage of participants’ compensation and a matching contribution equal to a percentage of voluntary employee contributions, subject to certain limitations. The Bank contributed approximately $670,000, $581,000 and $523,000 for the years ended December 31, 2004, 2003, and 2002, respectively.
The Bank offers a supplemental retirement plan which is an unfunded non-qualified deferred compensation plan providing benefits limited in the other retirement plans by laws governing such plans. In addition, the Bank provides health care and life insurance benefits for active and retired employees. Substantially all of the Bank’s employees with at least five years of full-time employment service become eligible for postretirement benefits at age 60 or older at retirement date. Under the Bank’s current plan, eligible retirees are entitled to full medical coverage provided under Medicare. The Bank also provides term life insurance premium payments for eligible employees retiring after age 45.
On December 8, 2003, the Medicare Prescription Drug, Improvement and Modernization Act of 2003 (the “Medicare Act”) was signed into law. The Medicare Act introduced a prescription drug benefit program under Medicare as well as a federal subsidy to sponsors of retiree health care benefit plans. Eligibility for the federal subsidy is dependent upon whether the prescription dug benefit under the employer plan is at least actuarially equivalent to the Medicare Part D benefit. The Bank’s actuarial consultant has not yet determined if the Bank’s program is actuarially equivalent to Medicare Part D. Therefore, the Bank has not anticipated any reduction resulting from this legislation or the subsidy effects upon the projected benefit obligation. Medicare prescription drug subsidy payments are expected to be released beginning in 2006. As a result, any measures of the postretirement benefit costs in the financial statements do not reflect any subsidy effects of the Medicare Act.
F-33
Table of Contents
The following table shows the activity as of December 31, 2004 and 2003.
Supplemental Plan | Postretirement Plan | |||||||||||||||
(Dollars in thousands) | 2004 | 2003 | 2004 | 2003 | ||||||||||||
Change in benefit obligation | ||||||||||||||||
Benefit obligation at beginning of year | $ | 4,267 | $ | 3,526 | $ | 3,869 | $ | 3,388 | ||||||||
Service cost | 383 | 344 | 504 | 352 | ||||||||||||
Interest cost | 320 | 257 | 283 | 218 | ||||||||||||
Actuarial gain | 1,744 | 140 | 911 | — | ||||||||||||
Benefits paid | — | — | (103 | ) | (89 | ) | ||||||||||
Settlements | (2,187 | ) | — | — | — | |||||||||||
Benefit obligation at end of year | $ | 4,527 | $ | 4,267 | $ | 5,464 | $ | 3,869 | ||||||||
Change in plan assets | ||||||||||||||||
Fair value of plan assets at beginning of year | $ | — | $ | — | $ | — | $ | — | ||||||||
Employer contribution | 2,187 | — | — | — | ||||||||||||
Plan participants’ contributions | — | — | 103 | 89 | ||||||||||||
Benefits paid | — | — | (103 | ) | (89 | ) | ||||||||||
Settlements | (2,187 | ) | ||||||||||||||
Fair value of plan assets at end of year | $ | — | $ | — | $ | — | $ | — | ||||||||
Funded status | $ | (4,527 | ) | $ | (4,267 | ) | $ | (5,464 | ) | $ | (3,869 | ) | ||||
Unrecognized net actuarial loss | 2,724 | 2,071 | 1,594 | 763 | ||||||||||||
Unrecognized prior service cost (benefit) | (270 | ) | (295 | ) | 124 | 138 | ||||||||||
Net amount recognized | $ | (2,073 | ) | $ | (2,491 | ) | $ | (3,746 | ) | $ | (2,968 | ) | ||||
Components of the net periodic pension cost for the Bank’s supplemental retirement and postretirement health benefit plan for the years ended December 31, 2004, 2003 and 2002 were:
Retirement Plan | Health Benefit Plan | ||||||||||||||||||||
(Dollars in thousands) | 2004 | 2003 | 2002 | 2004 | 2003 | 2002 | |||||||||||||||
Service Cost | $ | 383 | $ | 344 | $ | 299 | $ | 504 | $ | 352 | $ | 301 | |||||||||
Interest Cost | 320 | 257 | 203 | 283 | 218 | 170 | |||||||||||||||
Amortization of unrecognized prior service cost | (25 | ) | (18 | ) | 2 | 14 | 14 | 14 | |||||||||||||
Amortization of unrecognized net loss | 206 | 195 | 165 | 80 | 19 | (79 | ) | ||||||||||||||
Settlement loss | 885 | — | — | — | — | — | |||||||||||||||
Net periodic benefit cost | $ | 1,769 | $ | 778 | $ | 669 | $ | 881 | $ | 603 | $ | 406 | |||||||||
The measurement date used to determine the current year’s benefit obligation was December 31, 2004.
Key assumptions and other information for the actuarial calculations for the Bank’s supplemental retirement plan for the years ended December 31, 2004 and 2003 were:
| 2004 | 2003 | |||||||
Discount Rate | 5.75 | % | 7.50 | % | ||||
Salary Increases | 5.50 | % | 5.50 | % | ||||
Amortization period | 8 years | 8 years | ||||||
Settlement paid during the year (in thousands) | $ | 2,187 | $ | — | ||||
F-34
Table of Contents
Key assumptions and other information for the Bank’s postretirement health benefit plan for the years ended December 31, 2004 and 2003 were:
| 2004 | 2003 | |||||
Discount Rate | 6.0 | % | 6.0 | % | ||
Weighted average discount rate at the end of the year | 6.0 | % | 6.0 | % | ||
Health care cost trend rates: | ||||||
Assumed for next year | 5.0 | % | 7.5 | % | ||
Ultimate rate | 5.0 | % | 5.0 | % | ||
Year that ultimate rate is reached | — | 1 year | ||||
Alternative amortization methods used to amortize | �� | |||||
Prior service cost Straight-line | None | None | ||||
Unrecognized net (gain) or loss | Minimum method | | Minimum method | |
The effect of a percentage point increase or decrease in the assumed healthcare trend rates:
(Dollars in thousands) | +1% | -1% | |||||
Effect on service and interest cost components | $ | 197 | $ | (181 | ) | ||
Effect on postretirement benefit obligation | 929 | (874 | ) | ||||
Estimated future benefits payments through 2014 reflecting expected benefit services for the periods ended December 31 are:
(Dollars in thousands) | |||
Years | Payments | ||
2005 | $ | 145 | |
2006 | 176 | ||
2007 | 196 | ||
2008 | 220 | ||
2009 | 289 | ||
2010-2014 | 2,176 | ||
Note 16 - Derivative Financial Instruments
In connection with its interest rate risk management program, the Bank uses various derivative financial instruments. Interest rate swap transactions involve the contractual exchange of a floating rate for a fixed or another floating rate interest payment obligation based on a notional principal amount as defined in the agreement. Forward contracts are commitments to buy or sell at a future date a financial instrument or currency at a contracted price and may be settled in cash or through delivery. Interest rate cap and floor agreements, for which a premium is paid, allow the Bank to manage its exposure to unfavorable interest fluctuations over or under a specified rate. Interest rate caps and floors obligate one of the parties to the contract to make payments to the other if an interest rate index exceeds a specified upper “capped” level or if the index falls below a specified “floor” level.
The Bank enters into derivative financial instruments to hedge interest rate and embedded option risk on selected advances to members, structured Agency bonds held as investments, mortgage loans, and structured debt. These agreements effectively convert long term financial instruments from a fixed or an indexed rate with embedded options to a variable rate. The Bank also enters into derivative financial instruments to hedge groups of assets and liabilities. These agreements reduce market risk associated with the change in interest rates in conjunction with the Bank’s asset and liability management. The following section summarizes the Bank’s hedging activities.
F-35
Table of Contents
Hedging Activities
General – The Bank may enter into interest rate swaps, swaptions, interest rate cap and floor agreements, calls, puts, futures and forward contracts (collectively, derivative financial instruments) to manage its exposure to changes in interest rates or to adjust the effective maturity, repricing frequency, or option characteristics of financial instruments to achieve risk management objectives. The Bank uses derivative financial instruments as part of its hedging activities in one of two ways: (1) by designating them as either a fair value or cash flow hedge or (2) by designating them as a non-SFAS 133 economic hedge as part of its asset-liability management activities.
Economic Hedges – A non-SFAS 133 economic hedge is defined as a derivative financial instrument hedging specific or non-specific underlying assets, liabilities, forecasted transactions or firm commitments that does not qualify for hedge accounting under SFAS 133, but is an acceptable hedging strategy under the Bank’s risk management program, and complies with the Finance Board’s regulatory requirements. For example, the Bank may use derivative financial instruments in its overall interest rate risk management to adjust the interest rate sensitivity of consolidated obligations to approximate more closely the interest rate sensitivity of assets (advances, investments and mortgage loans). In addition to using derivative financial instruments to manage mismatches of interest rates between assets and liabilities, the Bank may also use derivative financial instruments to manage embedded options in assets and liabilities, to hedge the market value of existing assets and liabilities, to hedge the duration risk of prepayable instruments and to fix funding costs. A non-SFAS 133 economic hedge by definition introduces the potential for earnings variability due to the change in fair value recorded on the derivative financial instrument(s) that is not offset by corresponding changes in the value of the economically hedged assets, liabilities, forecasted transactions or firm commitments.
Economic hedges also include derivative financial instruments in which the Bank is an intermediary. This may arise when the Bank: (1) enters into interest rate exchange agreements with members and offsetting interest rate exchange agreements with other counterparties to allow smaller members indirect access to the swap market, or (2) enters into interest rate exchange agreements to offset the economic effect of other derivative financial instruments that are no longer designated to either advances, investments, or consolidated obligations. The notional principal of derivative financial instruments in which the Bank was an intermediary is $341,734,000 and $552,241,000 at December 31, 2004 and 2003, respectively. The net result of this activity does not significantly affect the operating results of the Bank.
Consolidated Obligations – The Bank manages the risk arising from changing market prices and volatility of a consolidated obligation by matching the cash inflow on the derivative financial instruments with the cash outflow on the consolidated obligation. For instance, when fixed-rate consolidated obligations are issued for the Bank, the Bank may simultaneously enter into a matching derivative financial instrument in which the Bank receives fixed cash flows from a counterparty designed to offset in timing and amount the cash outflows the Bank pays on the consolidated obligations. Such transactions are treated as fair value hedges. This intermediation between the capital and swap markets permits the Bank to raise funds at lower costs than would otherwise be available through the issuance of floating-rate consolidated obligations in the capital markets.
Advances – With issuances of putable advances, the Bank may purchase from the member an embedded option that enables the Bank to put the advance and extend additional credit on new terms. The Bank may hedge a putable advance by entering into a cancelable interest rate swap where the Bank pays fixed interest payments and receives variable interest payments. This type of hedge is accounted for as a fair value hedge. The swap counterparty can cancel the derivative financial instrument on the same date the Bank can put the advance to the member.
The optionality embedded in certain financial instruments held by the Bank can create interest rate risk. When a member prepays an advance prior to the call date, the Bank could suffer lower future income if the principal portion of the prepaid advance were invested in lower-yielding assets that continue to be funded by higher-cost debt. To protect against this risk, the Bank generally charges a prepayment fee that makes it financially indifferent to a borrower’s decision to prepay an advance. When the Bank offers advances (other than short-term advances) that a member may prepay without a prepayment fee, they usually finance such advances with callable debt or otherwise hedge this option.
Mortgage Loans – The Bank invests in mortgage loans. The prepayment options embedded in mortgage loans can result in extensions or contractions in the expected maturities of these investments, primarily depending on changes in interest rates. Finance Board regulations limit this source of interest rate risk by restricting the types of mortgage loans the Bank may own and establishing limitations on duration of equity and change in market value of equity.
The Bank manages the interest rate and prepayment risk associated with mortgage loans through a combination of debt issuance and derivatives. The Bank issues both callable and non-callable debt to achieve cash flow patterns and liability durations similar to those expected on the mortgage loans.
F-36
Table of Contents
A combination of swaps and options, including futures, may be used as a portfolio of derivative financial instruments linked to a portfolio of mortgage loans. The portfolio of mortgage loans consists of one or more pools of similar assets, as designated by factors such as product type and coupon. As the portfolio of mortgage loans changes due to new mortgage loans, liquidations and payments, the derivatives portfolio is modified accordingly to hedge the interest rate and prepayment risks effectively. A new hedging relationship is created with each change to the mortgage loan portfolio. Such relationships are accounted for as fair value hedges.
In addition, the Bank may use interest rate caps and floors, swaptions, callable swaps, calls, and puts as non-SFAS 133 economic hedges to minimize the prepayment risk embedded in the mortgage loans. Although these derivatives are valid economic hedges against the prepayment risk of the mortgage loans, they are not specifically identified to individual mortgage loans and, therefore, do not receive either fair value or cash flow hedge accounting.
Anticipated Streams of Future Cash Flows – The Bank may enter into an option to hedge a specified future variable cash stream as a result of rolling over short term, fixed-rate financial instruments such as LIBOR advances and discount notes. The option will effectively cap or floor the variable cash stream at a predetermined target rate. Such hedge transactions are accounted for as a cash flow hedge.
Firm Commitment Strategies – The Bank may enter into mortgage purchase commitments as a cash flow hedge of the anticipated purchase of mortgage loans made in the normal course of business. The change in value of the delivery commitment is recorded as a basis adjustment on the resulting mortgage loans with offsetting changes in accumulated other comprehensive income. Upon settlement of the mortgage purchase commitment, the basis adjustments on the resulting performing mortgage loans and the balance in accumulated other comprehensive income are then amortized into net interest income in offsetting amounts over the life of these mortgage loans, resulting in no impact on earnings.
The Bank may also hedge a firm commitment for a forward starting advance through the use of an interest rate swap. In this case, the swap will function as the hedging instrument for both the firm commitment and the subsequent advance. The basis movement associated with the firm commitment will be rolled into the basis of the advance at the time the commitment is terminated and the advance is issued. The basis adjustment will then be amortized into interest income over the life of the advance.
Investments – The Bank invests in Government-Sponsored Enterprise (GSE) obligations, mortgage-backed securities and the taxable portion of state or local housing finance agency securities. The interest rate and prepayment risks associated with these investment securities are managed through a combination of debt issuance and derivatives. The Bank may manage against prepayment and duration risk by funding investment securities with consolidated obligations that have call features, by hedging the prepayment risk with caps or floors or by adjusting the duration of the securities by using derivative financial instruments to modify the cash flows of the securities. These securities may be classified as available-for-sale or trading securities on the statements of condition.
For available-for-sale securities that have been hedged and qualify as a fair value hedge, the Bank records the portion of the change in value related to the risk being hedged in other income as “net realized and unrealized gain (loss) on derivatives and hedging activities” together with the related change in the fair value of the derivative financial instruments, and the remainder of the change in other comprehensive income as “net unrealized gain or (loss) on available-for-sale securities”.
The Bank may also manage the risk arising from changing market prices and volatility of investment securities classified as trading by entering into derivative financial instruments (economic hedges) that offset the changes in fair value of the securities. The market value changes of both the securities classified as trading and the associated derivative financial instruments are included in other income in the statements of income.
Anticipated Debt Issuance – The Bank may enter into interest rate swap agreements as hedges of anticipated issuance of debt to effectively lock in a spread between the earning asset and the cost of funding. All amounts deemed effective, as defined in SFAS 133, are recorded in other comprehensive income while amounts deemed ineffective are recorded in current earnings. The swap is terminated upon issuance of the debt instrument, and amounts reported in accumulated other comprehensive income are reclassified into earnings over the periods in which earnings are affected by the variability of the cash flows of the debt that was issued.
Foreign Currencies – The Bank has issued some consolidated obligations denominated in currencies other than U.S. dollars, and the Bank uses forward exchange contracts to hedge the related foreign currency risk. These contracts are agreements to exchange different currencies at specified future dates and at specified rates. The use of these contracts effectively simulates the conversion of these consolidated obligations denominated in foreign currencies to ones denominated in U.S. dollars. Such transactions are treated as foreign currency fair value hedges under SFAS 133, whereby the fair value changes of the foreign-currency-denominated obligation and the forward contract are recorded in current period earnings.
F-37
Table of Contents
There was no amount for the years ended December 31, 2004, 2003, and 2002 that was reclassified into earnings as a result of the discontinuance of cash flow hedges because it became probable that the original forecasted transaction would not occur by the end of the originally specified time period or within a two month period thereafter. Further, there was no amount reclassified into earnings as a result of firm commitments no longer qualifying as fair value hedges for years ended December 31, 2004, 2003, and 2002. Over the next twelve months, it is expected that $12,995,000 recorded in other comprehensive income at December 31, 2004 will be recognized in earnings. The maximum length of time over which forecasted transactions are hedged is nine years relating to traditional member finance activities.
Debt Extinguishments – The accounting treatment of the Bank’s derivative hedges resulting from the extinguishment of the Bank’s debt is to include the cumulative basis adjustment from previous and current fair value hedge relationships accounted for under SFAS 133 in the extinguishment gain or loss determination. Additionally, amounts deferred in Other Comprehensive Income from previously-anticipated debt issuance hedges under SFAS 133 would also be immediately recognized into earnings and included in net realized and unrealized (loss) on derivatives.
The following table summarizes the results of the Bank’s hedging activities for the years ended December 31, 2004, 2003, and 2002, respectively.
(Dollars in thousands) | 2004 | 2003 | 2002 | |||||||||
Loss related to fair value hedge ineffectiveness | $ | (85,667 | ) | $ | (127,363 | ) | $ | (34,063 | ) | |||
Loss on economic hedges | (83,584 | ) | (47,454 | ) | (455,607 | ) | ||||||
Gain related to cash flow hedge ineffectiveness | 42,826 | 35,651 | — | |||||||||
Net loss on derivative and hedging activities | $ | (126,425 | ) | $ | (139,166 | ) | $ | (489,670 | ) | |||
F-38
Table of Contents
The following table represents outstanding notional balances and estimated fair value of derivatives outstanding, at December 31, 2004 and 2003:
| 2004 | 2003 | |||||||||||||||
(Dollars in thousands) | Notional | Estimated Fair Value | Notional | Estimated Fair Value | ||||||||||||
Interest rate Swaps: | ||||||||||||||||
Fair Value | $ | 23,444,454 | $ | (237,183 | ) | $ | 26,855,857 | $ | (499,342 | ) | ||||||
Cash Flow | — | — | 600,000 | 9,239 | ||||||||||||
Economic | 2,015,117 | (37,105 | ) | 955,285 | (55,336 | ) | ||||||||||
Total | 25,459,571 | (274,288 | ) | 28,411,142 | (545,439 | ) | ||||||||||
Interest rate Swaptions: | ||||||||||||||||
Fair Value | 4,000,000 | 30,604 | 7,482,000 | 121,977 | ||||||||||||
Economic | 7,249,000 | 37,524 | 5,079,000 | 182,048 | ||||||||||||
Total | 11,249,000 | 68,128 | 12,561,000 | 304,025 | ||||||||||||
Interest rate Caps/Floors: | ||||||||||||||||
Fair Value | — | — | 600,000 | 9,239 | ||||||||||||
Cash Flow | 3,400,500 | 153,204 | 4,090,000 | 307,296 | ||||||||||||
Economic | 8,000 | 8 | 1,698,000 | 133,058 | ||||||||||||
Total | 3,408,500 | 153,212 | 6,388,000 | 449,593 | ||||||||||||
Interest rate Futures/Forwards: | ||||||||||||||||
Fair Value | 5,578,000 | (3,240 | ) | 6,073,000 | (2,169 | ) | ||||||||||
Economic | 150,000 | (26 | ) | — | — | |||||||||||
Total | 5,728,000 | (3,266 | ) | 6,073,000 | (2,169 | ) | ||||||||||
Interest rate Forward Settlement Agreements: | ||||||||||||||||
Cash Flow | 300,000 | (4,068 | ) | — | — | |||||||||||
Mortgage Delivery Commitments: | ||||||||||||||||
Cash Flow | 98,481 | 751 | 233,836 | 863 | ||||||||||||
Other: | — | — | — | — | ||||||||||||
Total | $ | 46,243,552 | $ | (59,531 | ) | $ | 53,666,978 | $ | 206,873 | |||||||
Total Derivatives Excluding Accrued Interest | (59,531 | ) | 206,873 | |||||||||||||
Accrued Interest at year end | 13,777 | 23,914 | ||||||||||||||
Net Derivative Balance at year end | (45,754 | ) | 230,787 | |||||||||||||
Net Derivative Asset Balance at year end | 153,496 | 454,327 | ||||||||||||||
Net Derivative Liability Balance at year end | (199,250 | ) | (223,540 | ) | ||||||||||||
Net Derivative Balance at year end | $ | (45,754 | ) | $ | 230,787 | |||||||||||
Derivative financial instruments involve, to varying degrees, elements of credit and interest rate risk in excess of the amount recognized in the statements of condition. The contract or notional amounts of these instruments reflect the extent of involvement the Bank has in particular classes of financial instruments; the notional amount does not represent exposure to credit loss. The amounts potentially subject to loss due to credit risks are the book value amounts of the derivatives, and not the notional amounts. Maximum credit risk is defined as the estimated cost of replacement for favorable interest rate swaps, forward agreements, mandatory delivery contracts for mortgage loans executed after June 30, 2003, and purchased caps and floors in the event of counterparty default and the related collateral, if any, proved to be of no value to the Bank. This collateral has not been sold or repledged. The Bank is subject to credit risk only due to the nonperformance by counterparties to the derivative agreements. The Bank manages counterparty credit risk through credit analysis and collateral requirements and by following the requirements set forth in the Finance Board’s regulations. Based on management’s credit analysis, collateral requirements and master netting arrangements, the Bank does not anticipate any losses on these agreements.
F-39
Table of Contents
At December 31, 2004 and 2003, the Bank’s maximum credit risk, as defined above, was approximately $153,496,000 and $454,327,000 respectively, including $13,778,000 and $23,914,000 of net accrued interest receivable, respectively. Accrued interest receivables and payables and legal right to offset assets and liabilities by a counterparty, in which amounts recognized for individual contracts may be offset against amounts recognized for other contracts, are considered in determining the maximum credit risk. The Bank held cash and securities with a market value of approximately $154,830,000 and $446,115,000 as collateral for interest rate exchange agreements as of December 31, 2004 and 2003, respectively. Additionally, collateral with respect to interest rate exchange agreements with member institutions includes collateral assigned to the Bank, as evidenced by a written security agreement.
A significant portion of the Bank’s derivative financial instruments are transacted with financial institutions such as major banks and broker-dealers, with no single institution dominating the business. Assets pledged as collateral by the Bank to these counterparties are discussed more fully in Note 19.
Note 17- Segment Information
The Bank has two business segments (MPF Program and traditional member finance) as defined in SFAS No. 131, “Disclosures about Segments of an Enterprise and Related Information”. The products and services provided reflect the manner in which financial information is evaluated by management including the chief operating decision makers. The Bank’s reporting process measures the performance of the operating segments based on the structure of the Bank and is not necessarily comparable with similar information for any other financial institution. The Bank’s operating segments are defined by the products it provides. The MPF Program income is derived primarily from the difference, or spread, between the yield on MPF Loans and the borrowing cost related to those loans. The traditional member finance segment includes products such as advances, investments and deposits.
F-40
Table of Contents
The following table sets forth the Bank’s financial performance by operating segment for the years ended December 31, 2004, 2003 and 2002.
(Dollars in thousands) | MPF | Traditional Member Finance | Total | |||||||||
2004 | ||||||||||||
Net interest income | $ | 574,507 | $ | 129,836 | $ | 704,343 | ||||||
Provision for credit losses on mortgage loans | — | — | — | |||||||||
Other income | (137,989 | ) | 10,858 | (127,131 | ) | |||||||
Other expenses | 72,485 | 48,571 | 121,056 | |||||||||
Income before assessments | 364,033 | 92,123 | 456,156 | |||||||||
Affordable Housing Program | 33,222 | 7,522 | 40,744 | |||||||||
REFCORP | 74,476 | 16,919 | 91,395 | |||||||||
Total assessments | 107,698 | 24,441 | 132,139 | |||||||||
Income before cumulative effect of change in accounting principle | $ | 256,335 | $ | 67,682 | $ | 324,017 | ||||||
Cumulative effect of change in accounting principle | $ | 41,441 | $ | — | $ | 41,441 | ||||||
Net income | $ | 297,776 | $ | 67,682 | $ | 365,458 | ||||||
2004 | ||||||||||||
Total mortgage loans, net | $ | 46,918,118 | $ | 2,433 | $ | 46,920,551 | ||||||
Average mortgage loans, net | 47,512,138 | 1,375 | 47,513,512 | |||||||||
Total assets | 48,047,208 | 37,661,429 | 85,708,637 | |||||||||
2003 | ||||||||||||
Net interest income | $ | 642,018 | $ | 151,808 | $ | 793,826 | ||||||
Provision for credit losses on mortgage loans | — | — | — | |||||||||
Other income | (120,769 | ) | 7,590 | (113,179 | ) | |||||||
Other expenses | 51,103 | 35,327 | 86,430 | |||||||||
Income before assessments | 470,146 | 124,071 | 594,217 | |||||||||
Affordable Housing Program | 38,395 | 10,128 | 48,523 | |||||||||
REFCORP | 86,375 | 22,789 | 109,164 | |||||||||
Total assessments | 124,770 | 32,917 | 157,687 | |||||||||
Net income | $ | 345,376 | $ | 91,154 | $ | 436,530 | ||||||
2003 | ||||||||||||
Total mortgage loans, net | $ | 47,599,575 | $ | 156 | $ | 47,599,731 | ||||||
Average mortgage loans, net | 38,004,705 | 10 | 38,004,715 | |||||||||
Total assets | 49,392,492 | 37,549,495 | 86,941,987 | |||||||||
2002 | ||||||||||||
Net interest income | $ | 189,323 | $ | 333,570 | $ | 522,893 | ||||||
Provision for credit losses on mortgage loans | 2,217 | — | 2,217 | |||||||||
Other income | (38,344 | ) | (146,034 | ) | (184,378 | ) | ||||||
Other expenses | 28,763 | 28,918 | 57,681 | |||||||||
Income before assessments | 119,999 | 158,618 | 278,617 | |||||||||
Affordable Housing Program | 9,795 | 12,948 | 22,743 | |||||||||
REFCORP | 22,041 | 29,134 | 51,175 | |||||||||
Total assessments | 31,836 | 42,082 | 73,918 | |||||||||
Net income | $ | 88,163 | $ | 116,536 | $ | 204,699 | ||||||
2002 | ||||||||||||
Total mortgage loans, net | $ | 26,185,618 | $ | — | $ | 26,185,618 | ||||||
Average mortgage loans, net | 20,430,459 | — | 20,430,459 | |||||||||
Total assets | 27,080,375 | 37,965,532 | 65,045,907 | |||||||||
F-41
Table of Contents
Note 18 - Estimated Fair Values
The following estimated fair value amounts have been determined by the Bank: first, by using available market information and, second, if market values were not available, using the Bank’s best judgment of appropriate valuation methods. These estimates are based on pertinent information available to the Bank as of December 31, 2004 and 2003. Although the Bank uses its best judgment in estimating the fair value of these financial instruments, there are inherent limitations in any estimation technique or valuation methodology. For example, because an active secondary market does not exist for a portion of the Bank’s financial instruments, in certain cases, fair values are not subject to precise quantification or verification and their values may change as economic and market factors, and the evaluation of those factors, change. Therefore, estimated fair values may not be necessarily indicative of the amounts that would be realized in current market transactions. The fair value summary tables do not represent an estimate of overall market value of the Bank as a going concern, which would take into account future business opportunities.
Cash and Due From Banks – The estimated fair value approximates the carrying value.
Securities Purchased Under Agreements to Resell - The estimated fair value is determined by calculating the present value of expected future cash flows. The discount rates used in these calculations are the rates for securities with similar terms.
Federal Funds Sold – The estimated fair value has been determined by calculating the present value of the expected future cash flows. The discount rates used in these calculations are the rates for Federal funds with similar terms.
Held-To-Maturity Securities – The estimated fair values of held-to-maturity securities have been determined based on quoted market prices as of the last business day of the year when those prices are available. However, active markets do not exist for many types of financial instruments. Consequently, fair values for these instruments were estimated using techniques such as discounted cash flow analysis and comparison to similar instruments. Estimates developed using these methods require judgments regarding significant matters such as the amount and timing of future cash flows and the selection of discount rates that appropriately reflect market and credit risks. Changes in these judgments often have a material effect on the fair value estimates.
Advances - The estimated fair values have been determined by calculating the present value of expected future cash flows from the advances and excluding the amount for accrued interest receivable. The discount rates used in these calculations are the replacement advance rates for advances with similar terms. Per the Finance Board regulations, advances with a maturity or repricing period greater than six months generally require a fee sufficient to make the Bank financially indifferent to the borrower’s decision to prepay the advances. Therefore the estimated fair value of advances does not assume prepayment risk. For advances with floating rates and three months or less to repricing, the estimated fair value approximates the carrying value.
Mortgage Loans Held in Portfolio – The estimated fair values for MPF Loans are based on modeled prices. The modeled prices start with prices for new mortgage-backed securities issued by U.S. government agencies. Prices are then adjusted for differences in coupon, average loan rate, seasoning and cash flow remittance between the Bank’s MPF Loans and the mortgage-backed securities. The referenced mortgage-backed securities are highly dependent upon the underlying prepayment assumptions priced in the market. Changes in the prepayment rates often have a material effect on the fair value estimates. Since these underlying prepayment assumptions are made as of a specific point in time, they are susceptible to material changes in the near term.
Accrued Interest Receivable and Payable – The estimated fair value approximates the carrying value.
Derivative Assets and Liabilities – The Bank bases the estimated fair values of derivative financial instruments with similar terms on available market prices including accrued interest receivable and payable. Fair values of derivatives that do not have markets are estimated using techniques such as discounted cash flow analysis and comparisons to similar instruments. Estimates developed using these methods are highly subjective and require judgments regarding significant matters such as the amount and timing of future cash flows and the selection of discount rates that appropriately reflect market and credit risks. Changes in these judgments often have a material effect on the fair value estimates. Since these estimates are made as of a specific point in time, they are susceptible to material near term changes. The fair values are netted by counterparty where such legal right exists. If these netted amounts are positive, they are classified as an asset and if negative, a liability.
Deposits – The estimated fair value of deposits with fixed rates has been determined by calculating the present value of expected future cash flows from the deposits and reducing this amount for accrued interest payable. The discount rates used in these calculations are the cost of deposits with similar terms. The estimated fair value approximates the carrying value for deposits with floating rates with three months or less to repricing.
F-42
Table of Contents
Consolidated Obligations – Estimated fair values have been determined by calculating the present value of expected cash flows from the consolidated obligations. The discount rates used in these calculations are the replacement funding rates for liabilities with similar terms.
Securities Sold Under Agreements to Repurchase – The estimated fair values have been determined by calculating the present value of expected future cash flows from the borrowings and reducing this amount for accrued interest payable. The discount rates used in these calculations are the cost of borrowings with similar terms.
Mandatorily Redeemable Capital Stock – The fair value of capital subject to mandatory redemption is generally at par value. Fair value also includes estimated dividends earned at the time of reclassification from equity to liabilities, until such amount is paid, and any subsequently declared stock dividend. Stocks can only be acquired by members at par value and redeemed at par value. Stock is not traded and no market mechanism exits for the exchange of stock outside the cooperative structure.
Commitments – The estimated fair values of the Bank’s commitments to extend credit are estimated using the fees currently charged to enter into similar agreements, taking into account the remaining terms of the agreements and the present creditworthiness of the counterparties. For fixed rate loan commitments, fair value also considers the difference between current levels of interest rates and the committed rates. The estimated fair values of standby letters of credit are based on the present value of fees currently charged for similar agreements or on the estimated cost to terminate them or otherwise settle the obligations with the counterparties.
The carrying values and estimated fair values of the Bank’s financial instruments at December 31, 2004 were as follows:
(Dollars in thousands) | ||||||||||||
Financial Instrument | Carrying Value | Net Unrecognized Gain or (Loss) | Estimated Fair Value | |||||||||
Financial Assets | ||||||||||||
Cash and due from banks | $ | 20,530 | $ | — | $ | 20,530 | ||||||
Securities purchased under agreements to resell | 389,840 | (8 | ) | 389,832 | ||||||||
Federal funds sold | 4,738,000 | (84 | ) | 4,737,916 | ||||||||
Trading securities | 760,057 | — | 760,057 | |||||||||
Available-for-sale securities | 1,529,688 | — | 1,529,688 | |||||||||
Held-to-maturity securities | 6,561,161 | (3,081 | ) | 6,558,080 | ||||||||
Advances | 24,191,558 | (164,239 | ) | 24,027,319 | ||||||||
Mortgage loans held in portfolio, net | 46,920,551 | 79,539 | 47,000,090 | |||||||||
Accrued interest receivable | 317,837 | — | 317,837 | |||||||||
Derivative assets | 153,496 | — | 153,496 | |||||||||
Total Financial Assets | $ | 85,582,718 | $ | (87,873 | ) | $ | 85,494,845 | |||||
Financial Liabilities | ||||||||||||
Deposits | $ | (1,223,752 | ) | $ | 181 | $ | (1,223,571 | ) | ||||
Securities sold under agreements to repurchase | (1,200,000 | ) | (96,311 | ) | (1,296,311 | ) | ||||||
Consolidated obligations: | ||||||||||||
Discount notes | (16,871,736 | ) | 7,962 | (16,863,774 | ) | |||||||
Bonds | (60,875,540 | ) | (514,258 | ) | (61,389,798 | ) | ||||||
Mandatorily redeemable capital stock | (11,259 | ) | — | (11,259 | ) | |||||||
Accrued interest payable | (513,993 | ) | — | (513,993 | ) | |||||||
Derivative liabilities | (199,250 | ) | — | (199,250 | ) | |||||||
Total Financial Liabilities | $ | (80,895,530 | ) | $ | (602,426 | ) | $ | (81,497,956 | ) | |||
Commitments: | ||||||||||||
Loan commitments | $ | — | $ | 339 | $ | 339 | ||||||
F-43
Table of Contents
The carrying values and estimated fair values of the Bank’s financial instruments at December 31, 2003 were as follows:
(Dollars in thousands) | ||||||||||||
Financial Instrument | Carrying Value | Net Unrecognized Gain or (Loss) | Estimated Fair Value | |||||||||
Financial Assets | ||||||||||||
Cash and due from banks | $ | 3,629 | $ | — | $ | 3,629 | ||||||
Securities purchased under agreements to resell | 418,600 | (4 | ) | 418,596 | ||||||||
Federal funds sold | 5,023,000 | (43 | ) | 5,022,957 | ||||||||
Trading securities | 794,297 | — | 794,297 | |||||||||
Available-for-sale securities | 605,364 | — | 605,364 | |||||||||
Held-to-maturity securities | 5,139,067 | 62,316 | 5,201,383 | |||||||||
Advances | 26,443,063 | (26,259 | ) | 26,416,804 | ||||||||
Mortgage loans held in portfolio, net | 47,599,731 | 304,929 | 47,904,660 | |||||||||
Accrued interest receivable | 336,655 | — | 336,655 | |||||||||
Derivative assets | 454,327 | — | 454,327 | |||||||||
Total Financial Assets | $ | 86,817,733 | $ | 340,939 | $ | 87,158,672 | ||||||
Financial Liabilities | ||||||||||||
Deposits | (2,348,071 | ) | 2 | (2,348,069 | ) | |||||||
Securities sold under agreements to repurchase | (1,200,000 | ) | (41,920 | ) | (1,241,920 | ) | ||||||
Consolidated obligations: | ||||||||||||
Discount notes | (20,456,395 | ) | (5,621 | ) | (20,462,016 | ) | ||||||
Bonds | (57,471,055 | ) | (674,006 | ) | (58,145,061 | ) | ||||||
Accrued interest payable | (502,327 | ) | — | (502,327 | ) | |||||||
Derivative liabilities | (223,540 | ) | — | (223,540 | ) | |||||||
Total Financial Liabilities | $ | (82,201,388 | ) | $ | (721,545 | ) | $ | (82,922,933 | ) | |||
Commitments: | ||||||||||||
Loan commitments | $ | — | $ | 727 | $ | 727 | ||||||
Note 19 - Commitments and Contingencies
As described in Note 13, the FHLBs have joint and several liability for all the consolidated obligations issued on their behalf. Accordingly, should one or more of the FHLBs be unable to repay its participation in the consolidated obligations, each of the other FHLBs could be called upon to repay all or part of such obligations, as determined or approved by the Finance Board. For the years ended December 31, 2004, 2003 and 2002, no FHLB has had to assume or pay the consolidated obligation of another FHLB. Neither the Bank nor any other FHLB has had to assume or pay the consolidated obligation of another FHLB. However, the Bank considers the joint and several liability as a related party guarantee meeting the scope exceptions as noted in FIN 45, “Guarantor’s Accounting and Disclosure Requirements for Guarantees, Including Indirect Guarantees of Indebtedness of Others”. Accordingly, the Bank has not recognized a liability for its joint and several obligations related to other FHLBs’ consolidated obligations at December 31, 2004 and 2003.
Commitments that legally bind and unconditionally obligate the Bank for additional advances totaled approximately $1,150,000 and $105,000 at December 31, 2004 and 2003, respectively. Commitments typically are for periods up to 12 months. Standby letters of credit are executed for members for a fee and are fully collateralized at the time of issuance. Based on management’s credit analysis, collateral requirements and master netting arrangements, the Bank does not deem it necessary to have any additional liability on these commitments and letters of credit.
The Bank has entered into standby bond purchase agreements with state housing authorities within its two state district whereby the Bank, for a fee, agrees to purchase and hold the authorities’ bonds until the designated marketing agent can find a suitable investor or the housing authority repurchases the bond according to a schedule established by the standby agreement. Each standby agreement dictates the specific terms that would require the Bank to purchase the bond. The bond purchase commitments entered into by the Bank expire after 10 years, no later than 2014 though some are renewable at the option of the
F-44
Table of Contents
Bank. Total commitments for bond purchases with the Wisconsin Housing Economic Development Authority (WHEDA) were $242,651,000 and $248,656,000 and for the Illinois Housing Development Authority (IHDA) were $38,441,000 and $0 at December 31, 2004 and 2003, respectively. Both WHEDA and IHDA are state housing authorities. During 2004 and 2003, the Bank was not required to purchase any bonds under these agreements.
Commitments which unconditionally obligate the Bank to fund or purchase mortgage loans totaled $147,135,000 and $288,942,000 at December 31, 2004 and 2003, respectively. Commitments are generally for periods not to exceed 45 business days. Such commitments were recorded as derivatives at their fair value.
The Bank enters into bilateral collateral agreements and executes derivatives with major banks and broker-dealers. As of December 31, 2004, the Bank had pledged, as collateral, securities with a carrying value of $209,652,000, which cannot be sold or repledged, to counterparties who have market risk exposure from the Bank related to derivatives.
Lease agreements for Bank premises generally provide for increases in the basic rentals resulting from increases in property taxes and maintenance expenses. Such increases are not expected to have a material effect on the Bank. Lease agreements for services and equipment are not material to the Bank.
The Bank charged to operating expenses net rental costs of approximately $3,537,000, $2,992,000, and $2,482,000, for the years ending December 31, 2004, 2003, and 2002. Future minimum rentals at December 31, 2004, were as follows:
(Dollars in thousands) | |||
Year | Premises | ||
2005 | $ | 3,712 | |
2006 | 4,024 | ||
2007 | 4,387 | ||
2008 | 4,603 | ||
2009 | 4,873 | ||
Thereafter | 8,515 | ||
Total | $ | 30,114 | |
The Bank is subject to legal proceedings arising in the normal course of business. After consultation with legal counsel, management does not anticipate that the ultimate liability, if any, arising out of these matters will have a material effect on the Bank’s financial condition or results of operations.
Note 20 - Transactions with Related Parties and Other FHLBs
Related Parties: The Bank is a cooperative whose member institutions own the capital stock of the Bank and may receive dividends on their investments. In addition, certain former members that still have outstanding transactions are also required to maintain their investment in Bank capital stock until the transactions mature or are paid off. All transactions with members are entered into in the normal course of business. In instances where the member also has an officer who is a director of the Bank, those transactions are subject to the same eligibility and credit criteria, as well as the same terms and conditions, as all other transactions. The Bank defines related parties as those members with capital stock outstanding in excess of 10% of total capital stock outstanding. Investment securities issued by affiliates of our members may be purchased in the secondary market through a third party at arm’s length.
Outlined below is the level of activity the Bank has with its members as reported in the statements of condition.
| • | Federal funds sold related to members reported in the Bank’s statements of condition at December 31, 2004 and 2003 were $0 and $350.0 million, respectively. |
| • | Held-to-maturity securities relating to affiliates of members reported in the Bank’s statements of condition at December 31, 2004 and 2003 were $30.4 million and $45.0 million, respectively. |
| • | All advances reported in the Bank’s statement of condition at December 31, 2004 and 2003 were issued to its members. |
| • | Derivative assets relating to members and their affiliates reported in the Bank’s statements of condition at December 31, 2004 and 2003 were $24.3 million and $28.7 million, respectively. Derivative liabilities relating to members and their affiliates reported in the Bank’s statements of condition at December 31, 2004 and 2003 were $91.7 million and $4.7 million, respectively. |
F-45
Table of Contents
| • | Interest and non-interest bearing deposits from members of $885.2 million and $1.3 billion respectively at December 31, 2004 and 2003 are maintained by the Bank for its members primarily to facilitate settlement activities that are directly related to advances and mortgage loan purchases. |
| • | Mandatorily redeemable capital stock reported in the Bank’s statements of condition at December 31, 2004 and 2003 relates to members. |
The following table summarizes interest-rate exchange agreement activity in which the Bank was an intermediary with its members and third party counterparties.
| Years Ended December 31, | |||||||||
(Notional dollars in thousands) | 2004 | 2003 | 2002 | ||||||
Beginning Notional | $ | 285,240 | $ | 228,543 | $ | 55,911 | |||
New Contracts | 19,493 | 56,697 | 172,632 | ||||||
Maturities | 50,000 | — | — | ||||||
Ending Notional | $ | 254,733 | $ | 285,240 | $ | 228,543 | |||
The following table summarizes the change in fair value related to interest-rate exchange agreement activity in which the Bank was an intermediary with its members and third party counterparties.
| Years Ended December 31, | ||||||||||
(Dollars in thousands) | 2004 | 2003 | 2002 | |||||||
Beginning Fair Value, net | $ | 441 | $ | 204 | $ | 86 | ||||
Change in Derivative Asset | (42,612 | ) | 59,404 | 186,130 | ||||||
Change in Derivative Liability | (42,456 | ) | 59,167 | 186,012 | ||||||
Ending Fair Value, net | $ | 285 | $ | 441 | $ | 204 | ||||
Other FHLBs: The Office of Finance may issue consolidated obligations through the Global Issuances Program. Historically, the Bank has been the primary obligor on any debt issued that is not taken by another FHLB. If another FHLB needs liquidity or additional funding, then the FHLB could obtain funding by issuing new consolidated obligations through the Office of Finance or the Bank could transfer its consolidated obligations at fair value to the other FHLB. Due to the fact that the Bank is no longer considered the primary obligor of the transferred consolidated obligations by the Office of Finance, the Bank considers itself released from its obligation and records the transfer as an extinguishment of debt with a corresponding gain or loss recorded in the statements of income. The Bank transferred $4.3 billion, $6.3 billion and $729.3 million of consolidated obligations to other FHLBs for the years ended December 31, 2004, 2003, and 2002. In addition, the Bank recognized a net realized gain (loss) from early extinguishment of debt transferred to other FHLBs of $45.8 million, $106.3 million and ($2.3 million) for the years ended December 31, 2004, 2003 and 2002, respectively.
The Bank records a transfer of its consolidated obligations to another FHLB as an extinguishment of debt since the Bank has been released from being the primary obligor. Specifically, the release is affected by the Office of Finance’s recordation of the transfer in its records. The Office of Finance is providing a release by acting within the confines of the banking regulations that governs the determination of which FHLB is the primary obligor. The FHLB assuming the consolidated obligation becomes the primary obligor since it now is directly responsible for repaying the debt. The Bank continues to disclose the transferred debt as a contingent liability since it still has a joint and several liability with respect to repaying the transferred consolidated obligation. The Bank does not record a financial guarantee at fair value with respect to the transferred consolidated obligation since FIN 45 does not require such accounting for a related party.
F-46
Table of Contents
As the MPF Provider, the Bank recorded $1.2 million as transaction service fees for the year ended December 31, 2004, which was the first year in which the Bank recorded such fees. Prior to 2004 the Bank incurred these costs to promote the MPF Program.
In December 2002, the Bank agreed to begin purchasing MPF Loans directly from members of the FHLB of Dallas and to pay the FHLB of Dallas a fee as the Bank’s marketing agent. The FHLB of Dallas acts as marketing agent for the Bank and receives a marketing fee for its services rather than purchasing MPF Loans from its members. The Bank incurred $731.8 thousand and $1.7 million in marketing fees paid to the FHLB of Dallas during the years ended December 31, 2004 and 2003, respectively. The Bank did not incur any such fees in 2002.
Upon joining the MPF Program in November 1999, the FHLB of Des Moines paid the Bank an MPF Program contribution of $1.5 million in installments that were due no later than the third anniversary after joining the MPF Program. In return, the Bank agreed to pay the FHLB of Des Moines a participation fee based on the outstanding balance of MPF Loans. These payments will terminate when there are less than $2 billion of MPF Loans in the MPF Program, but otherwise will continue in perpetuity. The Bank paid participation fees of $300,000 to the FHLB of Des Moines during each of the three years ended December 31, 2004, 2003 and 2002.
As of December 31, 2004 and 2003, the Bank held investment securities classified as trading in the Bank’s statements of condition of $71.7 million and $75.7 million of consolidated obligations in other FHLBs which were purchased from 1995 to 1997. The FHLB of Dallas was the primary obligor of $41.7 million of consolidated obligations at December 31, 2004 and $43.6 million at December 31, 2003. The FHLB of San Francisco was the primary obligor of $30.0 million of consolidated obligations held by the Bank at December 31, 2004 and $32.1 million held at December 31, 2003. The respective changes in fair value are recorded within net (loss) gain on trading securities on the statements of income and within operating activities as a net (increase) decrease on trading securities in the Bank’s statements of cash flows.
The Bank has accounts receivable with other FHLBs, which was $1.0 million and $1.8 million at December 31, 2004 and 2003, respectively. Accounts receivable is classified in other assets in the Bank’s statements of condition, with the respective changes being recorded as Operating Activities in the Bank’s statements of cash flows. Other FHLBs have deposits with the Bank that are separately reported in the Bank’s statements of condition within interest-bearing deposits, with the respective changes being recorded as Financing Activities within the Bank’s statements of cash flows.
The Bank sold $878.9 million in participation interests to the FHLB of Topeka in 2004, and did not sell any participation interests to other FHLBs in 2003. The purchase and immediate sale to the FHLB of Topeka was recorded net in Operating Activities, and accordingly, there was no impact to the Bank’s statements of cash flows related to this transaction.
The Bank purchased $4.9 billion, $20.9 billion and $10.7 billion in participation interests from other FHLBs during the years ended December 31, 2004, 2003 and 2002, respectively. Participation interests purchased are recorded as Investing Activities in the Bank’s statements of cash flows in “Mortgage loans held in portfolio purchased from other FHLBs.”
The Bank completed two MPF Shared Funding transactions in March 2003 and June 2003. The outstanding principal balance of the A Certificates held by the Bank in connection with these transactions was $513.0 million at December 31, 2004. The Bank sold $322.9 million of MPF Shared Funding Certificates, classified as available-for-sale, to the FHLB of Des Moines and the FHLB of Pittsburgh in March 2003. The Bank recognized no gain or loss on the sales, and there have been no subsequent sales. In these two transactions, One Mortgage Partners Corp., a subsidiary of JPMorgan Chase & Co., (the “ Shared Funding PFI”) acquired Shared Funding MPF Loans from National City Bank of Pennsylvania, a member of the FHLB of Pittsburgh, and Superior Guaranty Insurance Company, a subsidiary of Wells Fargo & Company and a member of the FHLB of Des Moines (the “Selling PFIs”). The Selling PFIs provided standard MPF Program representations and warranties to the Shared Funding PFI which was in turn passed through to the trust for the benefit of the holders of the A Certificates and the B Certificates. The Bank agreed to act as the agent for the Shared Funding PFI so that the Selling PFIs could deliver their loans in much the same manner as they would if they were selling the loans to their respective MPF Banks under the MPF Program products.
F-47
Table of Contents
Federal Home Loan Bank of Chicago
September 30, 2005
Restated Financial Statements and Notes (Unaudited)
F-48
Table of Contents
FEDERAL HOME LOAN BANK OF CHICAGO
TABLE OF CONTENTS
F-49
Table of Contents
Statements of Condition (unaudited)
(In thousands, except par value)
| September 30, 2005 (restated) | December 31, 2004 | |||||||
Assets | ||||||||
Cash and due from banks | $ | 20,103 | $ | 20,530 | ||||
Securities purchased under agreements to resell | 388,200 | 389,840 | ||||||
Federal funds sold | 6,907,000 | 4,738,000 | ||||||
Investment securities: | ||||||||
Trading ($451,389 and $477,416 pledged in 2005 and 2004) | 1,244,890 | 760,057 | ||||||
Available-for-sale ($773,515 and $705,628 pledged in 2005 and 2004) | 1,480,528 | 1,529,688 | ||||||
Held-to-maturity ($149,786 and $226,607 pledged in 2005 and 2004) | 4,937,311 | 6,561,161 | ||||||
Advances | 24,233,015 | 24,191,558 | ||||||
Mortgage loans held in portfolio, net of allowance for loan losses of $4,100 and $4,879 in 2005 and 2004 | 43,231,999 | 46,920,551 | ||||||
Accrued interest receivable | 310,147 | 317,837 | ||||||
Derivative assets | 192,253 | 153,496 | ||||||
Premises and equipment, net | 61,257 | 62,664 | ||||||
Other assets | 47,640 | 63,255 | ||||||
Total Assets | $ | 83,054,343 | $ | 85,708,637 | ||||
Liabilities and Capital | ||||||||
Liabilities | ||||||||
Deposits: | ||||||||
Interest-bearing | ||||||||
Demand and overnight | $ | 1,013,831 | $ | 920,360 | ||||
Term | 41,000 | 89,000 | ||||||
Deposits from other FHLBs for MPF Program | 10,334 | 13,395 | ||||||
Other | 180,100 | 146,031 | ||||||
Other non-interest bearing | 62,251 | 54,966 | ||||||
Total deposits | 1,307,516 | 1,223,752 | ||||||
Securities sold under agreements to repurchase | 1,200,000 | 1,200,000 | ||||||
Consolidated obligations, net: | ||||||||
Discount notes | 15,180,067 | 16,871,736 | ||||||
Bonds | 60,178,226 | 60,875,540 | ||||||
Total consolidated obligations, net | 75,358,293 | 77,747,276 | ||||||
Accrued interest payable | 630,120 | 513,993 | ||||||
Derivative liabilities | 142,673 | 199,250 | ||||||
Affordable Housing Program | 83,057 | 82,456 | ||||||
Payable to Resolution Funding Corporation (REFCORP) | 11,350 | 42,487 | ||||||
Mandatorily redeemable capital stock | 13,734 | 11,259 | ||||||
Other liabilities | 63,131 | 62,305 | ||||||
Total Liabilities | 78,809,874 | 81,082,778 | ||||||
Commitments and contingencies (Note 12) | ||||||||
Capital | ||||||||
Capital stock - Putable ($100 par value) issued and outstanding shares: | ||||||||
38,907 and 42,922 shares in 2005 and 2004 | 3,890,665 | 4,292,166 | ||||||
Retained earnings | 508,456 | 489,368 | ||||||
Accumulated other comprehensive income (loss): | ||||||||
Net unrealized loss on available-for-sale securities | (6,692 | ) | (7,224 | ) | ||||
Net unrealized loss relating to hedging activities | (147,960 | ) | (148,451 | ) | ||||
Total Capital | 4,244,469 | 4,625,859 | ||||||
Total Liabilities and Capital | $ | 83,054,343 | $ | 85,708,637 | ||||
The accompanying notes are an integral part of these financial statements (unaudited).
F-50
Table of Contents
Statements of Income (unaudited)
(In thousands)
| For the nine months ended September 30, | ||||||||
| 2005 (restated) | 2004 | |||||||
Interest Income: | ||||||||
Mortgage loans held in portfolio | $ | 1,640,060 | $ | 1,696,229 | ||||
Advances | 565,295 | 411,951 | ||||||
Securities purchased under agreements to resell | 8,575 | 4,192 | ||||||
Federal funds sold | 146,486 | 48,674 | ||||||
Investment securities: | ||||||||
Trading | 38,587 | 41,479 | ||||||
Available-for-sale | 31,872 | 25,413 | ||||||
Held-to-maturity | 184,704 | 143,403 | ||||||
Other | 35 | 57 | ||||||
Total interest income | 2,615,614 | 2,371,398 | ||||||
Interest Expense: | ||||||||
Consolidated obligations | 2,163,773 | 1,784,443 | ||||||
Deposits | 24,926 | 15,287 | ||||||
Deposits from other FHLBs for MPF Program | 359 | 267 | ||||||
Securities sold under agreements to repurchase | 39,005 | 21,720 | ||||||
Mandatorily redeemable stock | 733 | 1,403 | ||||||
Other | 9 | 13 | ||||||
Total interest expense | 2,228,805 | 1,823,133 | ||||||
Net interest income before provision for credit losses on mortgage loans | 386,809 | 548,265 | ||||||
Provision for credit losses on mortgage loans | — | — | ||||||
Net interest income after provision for credit losses on mortgage loans | 386,809 | 548,265 | ||||||
Other Income (Loss): | ||||||||
Service fees | 685 | 755 | ||||||
Net gain (loss) on trading securities | (20,863 | ) | (21,388 | ) | ||||
Net realized gain (loss) on sale of available-for-sale securities | (1,843 | ) | (21,080 | ) | ||||
Net realized and unrealized gain (loss) on derivatives and hedging activities | (28,985 | ) | (105,377 | ) | ||||
Net realized gain from early extinguishment of debt transferred to other FHLBs | 4,618 | 46,499 | ||||||
Other, net | 5,726 | 1,799 | ||||||
Total other income (loss) | (40,662 | ) | (98,792 | ) | ||||
Other Expense: | ||||||||
Salary and benefits | 41,279 | 32,825 | ||||||
Professional service fees | 9,554 | 12,540 | ||||||
Depreciation of premises and equipment | 13,505 | 9,646 | ||||||
Mortgage loan expense | 5,526 | 8,183 | ||||||
Finance Board | 2,375 | 2,061 | ||||||
Office of Finance | 1,308 | 1,433 | ||||||
Other operating | 15,566 | 16,267 | ||||||
Total other expense | 89,113 | 82,955 | ||||||
Income before Assessments | 257,034 | 366,518 | ||||||
Affordable Housing Program | 21,042 | 33,417 | ||||||
Resolution Funding Corporation | 47,210 | 74,910 | ||||||
Total assessments | 68,252 | 108,327 | ||||||
Income before cumulative effect of change in accounting principle | 188,782 | 258,191 | ||||||
Cumulative effect of change in accounting principle | — | 41,441 | ||||||
Net Income | $ | 188,782 | $ | 299,632 | ||||
The accompanying notes are an integral part of these financial statements (unaudited).
F-51
Table of Contents
Statements of Capital (unaudited)
For the nine months ended September 30,
(In thousands)
| Capital Stock - Putable | Retained Earnings | Accumulated Other Comprehensive (Loss) Income | Total Capital | ||||||||||||||||
| Shares | Par Value | ||||||||||||||||||
2004 | |||||||||||||||||||
Balance, December 31, 2003 | 41,552 | $ | 4,155,218 | $ | 386,874 | $ | 31,348 | 4,573,440 | |||||||||||
Proceeds from issuance of capital stock | 5,796 | 579,573 | 579,573 | ||||||||||||||||
Redemption of capital stock | (5,590 | ) | (558,925 | ) | (558,925 | ) | |||||||||||||
Reclassification of mandatorily redeemable capital stock | (343 | ) | (34,342 | ) | (34,342 | ) | |||||||||||||
Comprehensive income: | |||||||||||||||||||
Earnings before cumulative effect of change in accounting principle | 258,191 | 258,191 | |||||||||||||||||
Other comprehensive income: | |||||||||||||||||||
Net unrealized loss on available-for-sale securities | (7,485 | ) | (7,485 | ) | |||||||||||||||
Net unrealized loss on hedging activities | (159,638 | ) | (159,638 | ) | |||||||||||||||
Total other comprehensive income | (167,123 | ) | (167,123 | ) | |||||||||||||||
Total comprehensive income | 91,068 | ||||||||||||||||||
Cumulative effect of change in accounting principle | 41,441 | 41,441 | |||||||||||||||||
Dividends on capital stock: | |||||||||||||||||||
Cash | (135 | ) | (135 | ) | |||||||||||||||
Stock | 1,975 | 197,498 | (197,498 | ) | — | ||||||||||||||
Balance, September 30, 2004 | 43,390 | $ | 4,339,022 | $ | 488,873 | $ | (135,775 | ) | $ | 4,692,120 | |||||||||
2005 | |||||||||||||||||||
Balance, December 31, 2004 | 42,922 | $ | 4,292,166 | $ | 489,368 | $ | (155,675 | ) | 4,625,859 | ||||||||||
Proceeds from issuance of capital stock | 4,022 | 402,211 | 402,211 | ||||||||||||||||
Redemption of capital stock | (8,124 | ) | (827,279 | ) | (827,279 | ) | |||||||||||||
Reclassification of mandatorily redeemable capital stock | (1,609 | ) | (145,994 | ) | (145,994 | ) | |||||||||||||
Comprehensive income: | |||||||||||||||||||
Net Income (restated) | 188,782 | 188,782 | |||||||||||||||||
Other comprehensive income: | |||||||||||||||||||
Net unrealized loss on available-for-sale securities | (1,311 | ) | (1,311 | ) | |||||||||||||||
Net unrealized gain on hedging activities (restated) | 2,334 | 2,334 | |||||||||||||||||
Total other comprehensive income | 1,023 | 1,023 | |||||||||||||||||
Total comprehensive income | 189,805 | ||||||||||||||||||
Dividends on capital stock: | |||||||||||||||||||
Cash | (133 | ) | (133 | ) | |||||||||||||||
Stock | 1,696 | 169,561 | (169,561 | ) | — | ||||||||||||||
Balance, September 30, 2005 (restated) | 38,907 | $ | 3,890,665 | $ | 508,456 | $ | (154,652 | ) | $ | 4,244,469 | |||||||||
The accompanying notes are an integral part of these financial statements (unaudited).
F-52
Table of Contents
Statements of Cash Flows (unaudited)
(In thousands)
| For the nine months ended September 30, | ||||||||
| 2005 (restated) | 2004 | |||||||
Operating Activities: | ||||||||
Net Income | $ | 188,782 | $ | 299,632 | ||||
Cumulative effect of change in accounting principle | — | (41,441 | ) | |||||
Income before cumulative effect of change in accounting principle | 188,782 | 258,191 | ||||||
Adjustments to reconcile income before cumulative effect of change in accounting principle to net cash used in operating activities: | ||||||||
Depreciation and amortization: | ||||||||
Net premium (discount) on consolidated obligations, investments, and deferred costs and fees received on interest rate derivatives | 383,688 | (133,718 | ) | |||||
Net premium (discount) on mortgage loans | 75,254 | 105,679 | ||||||
Concessions on consolidated obligation bonds | 11,672 | 15,543 | ||||||
Premises and equipment | 13,505 | 9,646 | ||||||
Non-cash interest on mandatorily redeemable capital stock | 209 | 369 | ||||||
Net (increase) decrease on trading securities | (518,247 | ) | 99,847 | |||||
Net realized (gain) loss on sale of available-for-sale securities | 1,843 | 21,080 | ||||||
Net (gain) loss due to change in net fair value adjustment on derivatives and hedging activities | 5,408 | 75,984 | ||||||
Net realized (gain) loss on early extinguishment of debt | 83 | 1,318 | ||||||
Net realized (gain) on early extinguishment of debt transferred to other FHLBs | (4,618 | ) | (46,499 | ) | ||||
Net (increase) decrease in accrued interest receivable | 9,844 | 19,147 | ||||||
Decrease in derivative assets-net accrued interest | 6,077 | 19,782 | ||||||
Increase in derivative liabilities-net accrued interest | (11,952 | ) | 291 | |||||
Net (increase) decrease in other assets | (38,839 | ) | (77,908 | ) | ||||
Net increase (decrease) in Affordable Housing Program (AHP) liability and discount on AHP advances | 589 | 10,933 | ||||||
Net increase (decrease) in accrued interest payable | 115,918 | 112,995 | ||||||
Net increase (decrease) in payable to Resolution Funding Corporation | (31,137 | ) | 14,845 | |||||
Net increase (decrease) in other liabilities | 828 | (7,199 | ) | |||||
Total adjustments | 20,125 | 242,135 | ||||||
Net cash provided by (used in) operating activities | 208,907 | 500,326 | ||||||
Investing activities: | ||||||||
Net (increase) decrease in securities purchased under agreements to resell | 1,640 | (75,930 | ) | |||||
Net (increase) decrease in Federal funds sold | (2,169,000 | ) | (2,181,000 | ) | ||||
Net (increase) decrease in short-term held-to-maturity securities | 658,812 | (99,336 | ) | |||||
Purchase of mortgage-backed securities | — | (1,740,936 | ) | |||||
Proceeds from maturities and sale of mortgage-backed securities | 1,107,954 | 1,106,921 | ||||||
Purchase of long-term held-to-maturity securities | (57,147 | ) | (258,344 | ) | ||||
Proceeds from maturities of long-term held-to-maturity securities | 263,846 | 489,368 | ||||||
Purchase of available-for-sale securities | (619,979 | ) | (2,437,447 | ) | ||||
Proceeds from sale of available-for-sale securities | 321,187 | 2,035,375 | ||||||
Principal collected on advances | 15,833,139 | 19,091,671 | ||||||
Advances made | (16,083,369 | ) | (17,999,438 | ) | ||||
Principal collected on mortgage loans held in portfolio | 6,906,532 | 7,879,271 | ||||||
Mortgage loans held in portfolio originated or purchased | (1,692,862 | ) | (3,802,016 | ) | ||||
Mortgage loans held in portfolio purchased from other FHLBs | (1,637,443 | ) | (4,529,799 | ) | ||||
Recoveries on mortgage loans held in portfolio | 294 | 215 | ||||||
Proceeds from sale of foreclosed assets | 42,773 | 48,646 | ||||||
Purchase of premises and equipment | (12,099 | ) | (5,338 | ) | ||||
Net cash provided by (used in) investing activities | $ | 2,864,278 | $ | (2,478,117 | ) | |||
(Continued on following page)
F-53
Table of Contents
Statements of Cash Flows (unaudited)
(Continued from previous page)
(In thousands)
| For the nine months ended September 30, | ||||||||
| 2005 (restated) | 2004 | |||||||
Financing Activities: | ||||||||
Net increase (decrease) in demand, overnight, term, and other deposits | $ | 86,824 | $ | (699,270 | ) | |||
Net increase (decrease) in deposits from other FHLBs for MPF Program | (3,061 | ) | (10,656 | ) | ||||
Net proceeds from issuance of consolidated obligations: | ||||||||
Discount notes | 273,842,229 | 372,011,780 | ||||||
Bonds | 13,565,477 | 19,837,497 | ||||||
Payments for maturing and retiring consolidated obligations: | ||||||||
Discount notes | (275,894,398 | ) | (372,961,491 | ) | ||||
Bonds | (14,101,963 | ) | (16,201,754 | ) | ||||
Proceeds from issuance of capital stock | 402,211 | 579,573 | ||||||
Payments for redemption of capital stock | (827,279 | ) | (558,925 | ) | ||||
Payments for redemption of mandatorily redeemable capital stock | (143,519 | ) | (1,396 | ) | ||||
Cash dividends paid | (133 | ) | (135 | ) | ||||
Net cash provided by (used in) financing activities | (3,073,612 | ) | 1,995,223 | |||||
Net increase (decrease) in cash and due from banks | (427 | ) | 17,432 | |||||
Cash and due from banks at beginning of year | 20,530 | 3,629 | ||||||
Cash and due from banks at September 30, | $ | 20,103 | $ | 21,061 | ||||
Supplemental Disclosures: | ||||||||
Interest paid | $ | 2,112,678 | $ | 1,708,735 | ||||
REFCORP paid | 78,348 | 60,064 | ||||||
AHP paid | 20,442 | 22,440 | ||||||
The accompanying notes are an integral part of these financial statements (unaudited).
F-54
Table of Contents
Notes to Financial Statements (unaudited)
Note 1 - Restatement of Financial Statements
The Bank restated its financial statements at September 30, 2005 and for the nine month year-to-date period then ended.
The Bank determined through a review of its hedging activities, that for certain hedging transactions of mortgage loan delivery commitments, it applied a method of hedge accounting deemed to be inconsistent with the application of SFAS 133. As part of this restatement, management discontinued hedge accounting treatment of delivery commitments to conform to SFAS 133. The restatement consisted of recording in earnings losses on derivatives incorrectly deferred in Other Comprehensive Income (“OCI”) for the Bank’s hedges on delivery commitments and revising the timing of recognition in earnings of losses on these hedges.
The restatement resulted because the Bank did not sufficiently specify the forecasted transaction it intended to hedge with the delivery commitment to purchase mortgage loans. Specifically, the Bank identified the forecasted transaction as an amount within the range to be delivered under the delivery commitment that is within good delivery requirements. The Bank should have specifically identified a single amount rather than a range to comply with SFAS 133, paragraph 29.a.
The Bank assessed the impact of this error and determined it was immaterial for all prior periods. Accordingly, the Bank has recorded the cumulative impact in the accompanying financial statements. The effect of the restatement through September 30, 2005 was a decrease to the Bank’s cumulatively reported net income after assessments of $8.7 million. The negative balance at September 30, 2005 of OCI was $11.9 million less than previously reported.
The effect of the restatement on the Statement of Income for the nine months ended September 30, 2005 is set forth below:
For the nine months ended September 30, 2005 | Restated | Previously Reported | Impact on Income | |||||||||
| (in thousands) | ||||||||||||
Other Income (Loss): | ||||||||||||
Net realized and unrealized gain (loss) on derivatives and hedging activities | $ | (28,985 | ) | $ | (17,127 | ) | $ | (11,858 | ) | |||
Income before Assessments | 257,034 | 268,892 | (11,858 | ) | ||||||||
Affordable Housing Program | 21,042 | 22,010 | 968 | |||||||||
REFCORP | 47,210 | 49,388 | 2,178 | |||||||||
Net Income | $ | 188,782 | $ | 197,494 | $ | (8,712 | ) | |||||
F-55
Table of Contents
The effect of the restatement on the Statement of Condition as of September 30, 2005 is set forth below:
As of September 30, 2005 | Restated | Previously Reported | Impact on Capital | |||||||||
| (in thousands) | ||||||||||||
Liabilities: | ||||||||||||
Payable to Affordable Housing Program | $ | 83,057 | $ | 84,025 | $ | 968 | ||||||
Payable to REFCORP | 11,350 | 13,528 | 2,178 | |||||||||
Total Liabilities | 78,809,874 | 78,813,020 | 3,146 | |||||||||
Capital: | ||||||||||||
Retained Earnings | 508,456 | 517,168 | (8,712 | ) | ||||||||
OCI - Net unrealized loss relating to hedging activities | (147,960 | ) | (159,818 | ) | 11,858 | |||||||
Total Capital | $ | 4,244,469 | $ | 4,241,323 | $ | 3,146 | ||||||
Note 2 – Basis of Presentation
The Federal Home Loan Bank of Chicago (the “Bank”), a federally chartered corporation and a member-owned cooperative, is one of twelve Federal Home Loan Banks (the “FHLBs”) which, with the Federal Housing Finance Board (the “Finance Board”) and the Office of Finance, comprise the Federal Home Loan Bank System. The twelve FHLBs are government-sponsored enterprises (“GSE”) of the United States of America and were organized under the Federal Home Loan Bank Act of 1932, as amended (the “FHLB Act”). Each FHLB has members in a specifically defined geographic district. The Bank’s defined geographic membership territory consists of the states of Illinois and Wisconsin. The Bank provides credit to its members principally in the form of advances and through the Mortgage Partnership Finance® (“MPF”®) Program1, under which the Bank, in partnership with its members, provides funding for home mortgage loans. In addition, the Bank also invests in other Acquired Member Assets (“AMA”) such as MPF Shared Funding® securities. AMA are assets acquired from or through FHLB members or housing associates by means of either a purchase or a funding transaction, subject to Finance Board regulations.
The accounting and financial reporting policies of the Bank conform to accounting principles generally accepted in the United States of America (“GAAP”) and prevailing industry practices for interim reporting. The unaudited financial statements prepared in conformity with GAAP requires management to make estimates and assumptions that affect the reported amounts of assets and liabilities, as well as the disclosure of contingent assets and liabilities at the date of the financial statements and the reported amounts of income and expenses. Actual results could differ from those estimates. In addition, certain amounts in the prior period have been reclassified to conform to the current presentation. In the opinion of management, all normal recurring adjustments have been included for a fair statement of this interim financial information. These unaudited financial statements should be read in conjunction with the audited financial statements for the year ended December 31, 2004.
| 1 | “Mortgage Partnership Finance”, “MPF” and “MPF Shared Funding” are registered trademarks of the Federal Home Loan Bank of Chicago. |
F-56
Table of Contents
Note 3 - Business Developments
Capital Stock Actions, Dividends and Amendment to the Written Agreement - On October 18, 2005, the Bank’s Board of Directors discontinued redemptions of voluntary stock for a period of time as permitted by the FHLB Act and the Finance Board regulations. The Bank also entered into an amendment to its Written Agreement with the Finance Board, which reduced the Bank’s minimum regulatory capital ratio from 5.1% to 4.5%. The amendment also requires the Bank to maintain minimum total regulatory capital stock of $3.978 billion which is the total amount of capital stock outstanding on October 18, 2005, including stock classified as mandatorily redeemable under Statement of Financial Accounting Standards No. 150 “Accounting for Certain Financial Instruments with Characteristics of both Liabilities and Equity” (“SFAS 150”), plus the amount of the stock dividend approved based on the results of the third quarter, 2005. The minimum regulatory capital stock requirement was previously reported by the Bank to be $3.964 billion and was subsequently revised to $3.978 billion in order to include stock classified as mandatorily redeemable under SFAS 150. Under the terms of the amendment, the Bank submitted on December 14, 2005 a revised retained earnings and dividend policy and updated business plan strategies to the Finance Board for approval. See Note 8 – Capital for additional information on capital stock classified as mandatorily redeemable under SFAS 150.
The Board of Directors discontinued voluntary stock redemptions in part because net redemptions during the year had by October 17, 2005, reduced the Bank’s ratio of voluntary capital stock to regulatory capital ratio to 51%, which was 2% less than the amount expected by the end of the year under the Bank’s Business and Capital Management Plan for 2005-2007. For the nine months ended September 30, 2005, voluntary capital stock decreased by $404.7 million and from October 1 through October 17, 2005 decreased by another $44.3 million. With the reduction in the dividend rate from an average of 6.125% paid in 2004 to 3.75% to be paid in the fourth quarter of 2005 (see below), the Bank expected the redemption rate to accelerate even more in the remaining months of 2005.
Bank dividends are subject to the Bank’s financial policies and the Written Agreement, as amended requiring approval by the Finance Board’s Office of Supervision until the Bank completes the process of registering its capital stock under the Securities Exchange Act of 1934, and until a revised retained earnings and dividend policy has been approved by the Finance Board. On October 18, 2005, the Board of Directors declared, with the approval of the Finance Board, a dividend on third quarter results equal to an annualized rate of 3.75%, which was paid to members in stock on November 15, 2005. When paid, stock dividends are voluntary stock and are not subject to redemption while the restriction on redemptions remains in place.
On January 18, 2006, the Board of Directors declared and approved a 3.00% (annualized rate) cash dividend based on fourth quarter 2005 results to be paid to members on February 15, 2006.
The Bank is undertaking various actions in order to address the capital concerns that led to the discontinuation of voluntary stock redemptions. The Bank submitted a revised retained earnings and dividend policy and updated business plan strategies to the Finance Board for approval on December 14, 2005. The Bank is also in the process of modifying its previously approved capital plan and will submit the revised plan to the Finance Board for approval.
Computer Software - The Bank assesses impairment of the capitalized amount of internal-use computer software at least annually and sooner if a triggering event occurs. On October 18, 2005 the Bank amended its Written Agreement. As a result of this change in the regulatory environment, the Bank re-evaluated its business opportunities and strategies as it related to the MPF Program. The Bank determined that certain internal-use computer software had become impaired due to management’s decision to abandon software being developed to support a new line of business related to servicing. An impairment write-down of $10.4 million was identified and will be recognized in the fourth quarter of 2005.
Publication of Combined Financial Reports and SEC Registration Process - The Office of Finance has not yet published the 2004 third quarter combined Financial Report or 2004 full year combined Financial Report. In addition, the Office of Finance has announced that its board of directors decided to restate the FHLBs’ combined financial statements for the years ended December 31, 2001, 2002 and 2003, and subsequent interim periods. The Office of Finance has stated that the delays in publication and intended restatements were the result of regulatory and accounting matters at certain FHLBs, and that the Office of Finance board of directors may elect to delay publication of the FHLBs’ combined Financial Reports until all or substantially all of the FHLBs have completed their registration with the SEC.
Hurricane Katrina - Hurricane Katrina struck Louisiana, Mississippi, Alabama, Texas and surrounding areas during the third quarter, 2005. As of September 30, 2005, the Bank held approximately $500 million of conventional MPF Loans secured by properties located in the Individual Assistance and Public Assistance areas as designated by the Federal Emergency
F-57
Table of Contents
Management Agency (“FEMA”). “MPF Loans” are mortgage loans that are either funded by the Bank through, or purchased from, participating financial institutions (“PFIs”) or purchased as participations from other FHLBs. The Bank has assessed its potential loss exposure related to Hurricane Katrina and does not believe that there will be a material loss exposure due to the credit enhancement structures built into the MPF Program.
F-58
Table of Contents
Accounting and Reporting Developments
FSP FAS 115-1 – On November 3, 2005, The Financial Accounting Standards Board (“FASB”) published FASB Staff Position (“FSP”) FAS 115-1, “The Meaning of Other-Than-Temporary Impairment and Its Application to Certain Investments.” The FSP addresses the determination of when an investment is considered impaired, whether the impairment is other than temporary and the measurement of impairment loss. The FSP indicates that existing FASB and SEC guidance should be used to determine whether impairment is other-than-temporary. The FSP clarifies that an investor should recognize impairment when impairment is other than temporary even if a decision to sell a specific investment has not been made and provides impairment guidance on cost-method investments. The FSP also requires quantitative and qualitative disclosures related to unrealized losses that support why such unrealized losses are not other than temporary. The Bank does not anticipate the FSP will have a material effect on its financial statements.
DIG Issue B38 and DIG Issue B39 - On June 30, 2005, the FASB issued Derivatives Implementation Group (“DIG”) Issue B38, “Evaluation of Net Settlement with Respect to the Settlement of a Debt Instrument through Exercise of an Embedded Put Option or Call Option” and DIG Issue B39, “Application of Paragraph 13(b) to Call Options That Are Exercisable Only by the Debtor.” DIG Issue B38 addresses an application issue when applying SFAS 133, paragraph 12(c) to a put option or call option (including a prepayment option) embedded in a debt instrument. DIG Issue B39 addresses the conditions in SFAS 133, paragraph 13(b) as they relate to whether an embedded call option in a hybrid instrument containing a host contract is clearly and closely related to the host contract if the right to accelerate the settlement of debt is exercisable only by the debtor. DIG Issues B38 and B39 become effective for periods beginning after December 15, 2005. The Bank does not expect DIG Issues B38 and B39 to have a material impact on its results of operations or financial condition at the time of adoption.
SFAS 154 – On May 5, 2005 the FASB issued SFAS No. 154 “Accounting Changes and Error Corrections - a replacement of APB Opinion No. 20 and FASB Statement No. 3” (“SFAS 154”). SFAS 154 replaces APB Opinion No. 20, Accounting Changes, and SFAS No. 3, “Reporting Accounting Changes in Interim Financial Statements”, and changes the requirements for the accounting for and reporting of a change in accounting principle. SFAS 154 applies to all voluntary changes in accounting principle. APB Opinion No. 20 previously required that most voluntary changes in accounting principle be recognized by including in net income of the period of the change, the cumulative effect of changing to the new accounting principle. In general, SFAS 154 requires retrospective application to prior periods’ financial statements of changes in accounting principle.
Retrospective application is the application of a different accounting principle to prior accounting periods as if that principle had always been used or as the adjustment of previously issued financial statements to reflect a change in the reporting entity. SFAS 154 also redefines restatement as the revising of previously issued financial statements to reflect the correction of an error. The Bank does not expect this statement to have a material impact on its financial condition or results of operations.
FIN 47 – In March 2005, the FASB issued Interpretation No. 47, “Accounting for Conditional Asset Retirement Obligations – An Interpretation of FASB Statement No. 143”, (“FIN 47”) which clarifies the term “conditional asset retirement obligation” used in SFAS No. 143, “Accounting for Asset Retirement Obligations,” and specifically when an entity would have sufficient information to reasonably estimate the fair value of an asset retirement obligation. The Bank is required to adopt FIN 47 no later than December 31, 2005. The Bank does not expect the adoption of FIN 47 to have a material impact on its financial condition or results of operations.
F-59
Table of Contents
Note 4 – Investment Securities
For additional information concerning the Bank’s investment securities refer to Notes 5, 6 and 7 in the December 31, 2004 Financial Statements and Notes.
Trading Securities – Trading securities as of September 30, 2005 and December 31, 2004 were as follows:
(Dollars in thousands) | September 30, 2005 | December 31, 2004 | ||||
Government-sponsored enterprises 1 | $ | 1,127,044 | $ | 585,579 | ||
Consolidated obligations of other FHLBs | 34,090 | 71,731 | ||||
Mortgage-backed securities: | ||||||
Government-sponsored enterprises 1 | 43,031 | 52,711 | ||||
Government-guaranteed | 8,854 | 11,367 | ||||
Privately issued MBS | 31,871 | 38,669 | ||||
Total trading securities | $ | 1,244,890 | $ | 760,057 | ||
| 1 | Securities issued by government sponsored enterprises are not guaranteed by the U.S. federal government. |
The net (loss) gain on trading securities for the nine months ended September 30, 2005 and 2004 were as follows:
(Dollars in thousands) | For the nine months ended September 30, | |||||||
| 2005 | 2004 | |||||||
Net realized (loss) gain | $ | (563 | ) | $ | 12,550 | |||
Net unrealized gain (loss) | (20,300 | ) | (33,938 | ) | ||||
Net (loss) gain on trading securities | $ | (20,863 | ) | $ | (21,388 | ) | ||
Available-for-Sale Securities - The amortized cost and estimated fair value of available-for-sale securities as of September 30, 2005 and December 31, 2004 were as follows:
| September 30, 2005 | December 31, 2004 | |||||||||||||||||||||||||
(Dollars in thousands) | Amortized Cost | Gross Unrealized Gains | Gross Unrealized Losses | Estimated Fair Value | Amortized Cost | Gross Unrealized Gains | Gross Unrealized Losses | Estimated Fair Value | ||||||||||||||||||
Government-sponsored enterprises 1 | $ | 1,038,523 | $ | 1,099 | $ | (4,823 | ) | $ | 1,034,799 | $ | 901,046 | $ | 524 | $ | (5,332 | ) | $ | 896,238 | ||||||||
Mortgage-backed securities: | ||||||||||||||||||||||||||
Government-sponsored enterprises | 84,457 | — | (3,468 | ) | 80,989 | 93,560 | 551 | (2,739 | ) | 91,372 | ||||||||||||||||
Privately issued MBS | 364,240 | 500 | — | 364,740 | 541,783 | 339 | (44 | ) | 542,078 | |||||||||||||||||
Total available-for-sale securities | $ | 1,487,220 | $ | 1,599 | $ | (8,291 | ) | $ | 1,480,528 | $ | 1,536,389 | $ | 1,414 | $ | (8,115 | ) | $ | 1,529,688 | ||||||||
| 1 | Securities issued by government sponsored enterprises are not guaranteed by the U.S. federal government. |
F-60
Table of Contents
Gains and Losses – Realized gains and losses from available-for-sale securities for the nine months ended September 30, 2005 and 2004 were as follows:
| For the nine months ended September 30, | ||||||||
(Dollars in thousands) | 2005 | 2004 | ||||||
Realized gain | $ | 1,083 | $ | 16,115 | ||||
Realized loss | (2,926 | ) | (37,195 | ) | ||||
Net realized (loss) gain from sale of available-for-sale securities | $ | (1,843 | ) | $ | (21,080 | ) | ||
Held-to-Maturity Securities – Held-to-maturity securities as of September 30, 2005 and December 31, 2004 were as follows:
| September 30, 2005 | December 31, 2004 | |||||||||||||||||||||||||
(Dollars in thousands) | Amortized Cost | Gross Unrealized Gains | Gross Unrealized Losses | Estimated Fair Value | Amortized Cost | Gross Unrealized Gains | Gross Unrealized Losses | Estimated Fair Value | ||||||||||||||||||
Commercial paper | $ | 449,405 | $ | — | $ | (83 | ) | $ | 449,322 | $ | 699,722 | $ | — | $ | (62 | ) | $ | 699,660 | ||||||||
Government-sponsored enterprises 1 | 149,786 | — | (714 | ) | 149,072 | 249,570 | — | (1,553 | ) | 248,017 | ||||||||||||||||
State or local housing agency obligations | 82,317 | 672 | (21 | ) | 82,968 | 100,690 | 902 | (137 | ) | 101,455 | ||||||||||||||||
Other 2 | 319,665 | 339 | (197 | ) | 319,807 | 743,193 | 1,668 | (318 | ) | 744,543 | ||||||||||||||||
| 1,001,173 | 1,011 | (1,015 | ) | 1,001,169 | 1,793,175 | 2,570 | (2,070 | ) | 1,793,675 | |||||||||||||||||
Mortgage-backed securities: | ||||||||||||||||||||||||||
Government-sponsored enterprises 1 | 2,669,771 | 4,196 | (59,341 | ) | 2,614,626 | 2,958,672 | 21,056 | (33,095 | ) | 2,946,633 | ||||||||||||||||
Government-guaranteed | 62,316 | 496 | (51 | ) | 62,761 | 84,077 | 1,418 | — | 85,495 | |||||||||||||||||
MPF Shared Funding ® | 436,600 | — | (17,933 | ) | 418,667 | 512,983 | — | (16,164 | ) | 496,819 | ||||||||||||||||
Privately issued MBS | 767,451 | 12,351 | (493 | ) | 779,309 | 1,212,254 | 23,364 | (160 | ) | 1,235,458 | ||||||||||||||||
Total held-to-maturity securities | $ | 4,937,311 | $ | 18,054 | $ | (78,833 | ) | $ | 4,876,532 | $ | 6,561,161 | $ | 48,408 | $ | (51,489 | ) | $ | 6,558,080 | ||||||||
| 1 | Securities issued by government sponsored enterprises are not guaranteed by the U.S. federal government. |
| 2 | Other includes investment securities guaranteed by the Small Business Administration. |
F-61
Table of Contents
Note 5 – Advances
For additional information concerning advances refer to Note 8 – Advances in the December 31, 2004 Annual Financial Statements and Notes.
Redemption Terms – At September 30, 2005 and December 31, 2004, the Bank had advances outstanding to members, at interest rates ranging from 1.53% to 8.47% and 1.20% to 8.47%, respectively, as summarized below.
(Dollars in thousands) | September 30, 2005 | December 31, 2004 | ||||||||||
Contractual Maturity | Amount | Weighted Average Interest Rate | Amount | Weighted Average Interest Rate | ||||||||
2005 | $ | 3,175,192 | 3.67 | % | $ | 6,943,773 | 2.95 | % | ||||
2006 | 6,735,215 | 3.16 | % | 5,732,457 | 2.88 | % | ||||||
2007 | 4,668,491 | 3.74 | % | 3,427,577 | 3.21 | % | ||||||
2008 | 3,228,011 | 4.22 | % | 2,589,505 | 3.92 | % | ||||||
2009 | 1,439,716 | 3.98 | % | 1,479,162 | 3.74 | % | ||||||
2010 | 2,608,922 | 3.68 | % | 2,048,603 | 3.18 | % | ||||||
Thereafter | 2,363,286 | 4.42 | % | 1,747,527 | 4.72 | % | ||||||
Total par value | 24,218,833 | 3.71 | % | 23,968,604 | 3.27 | % | ||||||
SFAS 133 hedging adjustments and discount on AHP advances | 14,182 | 222,954 | ||||||||||
Total Advances | $ | 24,233,015 | $ | 24,191,558 | ||||||||
Credit Risk – The Bank’s advances are concentrated with commercial bank and thrift members. As of both September 30, 2005 and December 31, 2004, the Bank had outstanding advances at par of $3.2 billion to one member institution (LaSalle Bank N.A.). This represented 13.0% and 13.2% of total outstanding advances at September 30, 2005 and December 31, 2004, respectively. The interest income from advances to this member was $62.5 million and $70.5 million for the nine months ended September 30, 2005 and September 30, 2004, respectively. The Bank held sufficient collateral to cover the par value of these advances, and the Bank does not expect to incur any credit losses. No other member holds more than 10% of advances at September 30, 2005 or December 31, 2004.
Note 6 – Mortgage Loans Held in Portfolio
For additional information concerning mortgage loans held in portfolio refer to Note 10 – Mortgage Loans Held in Portfolio in the December 31, 2004 Annual Financial Statements and Notes.
The MPF Program involves investment by the Bank in MPF Loans which are either funded by the Bank through or purchased from its members or members of another FHLB or purchased as participations from other FHLBs. Under the MPF 100 product, the Bank table funds MPF Loans, which means that the Bank provides the funds, through the PFI as its agent, to make the loan to the borrower. The PFI performs all the traditional retail loan origination functions under this and all MPF products. For the MPF 100 product, the Bank is considered the originator of the loan for accounting purposes since the PFI is acting as its agent when originating the loan. This differs from the other MPF products in which the Bank purchases loans that have already been closed by the PFI with its own funds.
The MPF Loans are held-for-investment under the MPF Program whereby the PFIs create, service and credit enhance the residential mortgage loans owned by the Bank.
F-62
Table of Contents
The Bank pays the member a credit enhancement fee for assuming its portion of the credit risk in the MPF Loans. These fees are paid monthly and are determined based on the remaining unpaid principal balance of the MPF Loans. The required credit enhancement obligation amount may vary depending on the MPF product alternatives selected. Credit enhancement fees, payable to a member as compensation for assuming credit risk, are recorded as an offset to mortgage loan interest income when paid by the Bank. The Bank also pays performance credit enhancement fees which are based on actual performance of the mortgage loans. In general, performance based fees are net of cumulative unrecovered losses paid by the Bank. To the extent that losses in the current month exceed performance credit enhancement fees accrued, the remaining losses are recovered from future performance credit enhancement fees payable to the member. The Bank recorded total credit enhancement fees of $35,396,000 and $38,441,000 for the nine months ended September 30, 2005 and 2004, respectively.
The following table presents information as of September 30, 2005 and December 31, 2004 on MPF Loans:
(Dollars in thousands) | September 30, 2005 | December 31, 2004 | ||||||
Mortgages: | ||||||||
Fixed medium term1 single-family mortgages | $ | 15,416,879 | $ | 17,129,505 | ||||
Fixed long term2 single-family mortgages | 27,565,879 | 29,448,280 | ||||||
Unamortized premiums, net | 234,429 | 282,427 | ||||||
Plus: deferred loan cost, net | 52,016 | 61,535 | ||||||
Total mortgage loans | 43,269,203 | 46,921,747 | ||||||
Loan commitment basis adjustment | (12,519 | ) | (15,072 | ) | ||||
SFAS 133 hedging adjustments | (20,585 | ) | 18,755 | |||||
Total mortgage loans held in portfolio | $ | 43,236,099 | $ | 46,925,430 | ||||
| 1 | Medium term is defined as a term of 15 years or less. |
| 2 | Long term is defined as a term of greater than 15 years. |
The par value of outstanding MPF Loans at September 30, 2005 and December 31, 2004, was comprised of Federal Housing Administration insured and Veteran’s Administration guaranteed government loans totaling $6.4 billion and $6.8 billion and conventional loans totaling $36.6 billion and $39.8 billion, respectively.
The allowance for loan losses on mortgage loans was as follows:
(Dollars in thousands) | For the nine months ended September 30, | |||||||
| 2005 | 2004 | |||||||
Allowance for credit losses: | ||||||||
Balance, beginning of year | $ | 4,879 | $ | 5,459 | ||||
Chargeoffs | (1,074 | ) | (747 | ) | ||||
Recoveries | 295 | 215 | ||||||
Net (chargeoffs) | (779 | ) | (532 | ) | ||||
Balance at end of period | $ | 4,100 | $ | 4,927 | ||||
MPF Loans are placed on non-accrual status when it is determined that the payment of interest or principal is doubtful of collection or when interest or principal is past due for 90 days or more, except when the MPF Loan is well secured and in the process of collection. When an MPF Loan is placed on non-accrual status, accrued but uncollected interest and the amortization of agent fees, premiums and discounts are reversed against interest income. Subsequent accruals and amortization are discontinued. The Bank records cash payments received on non-accrual MPF Loans as a reduction of principal with any remainder reported in interest income. At September 30, 2005 and December 31, 2004, the Bank had $75.1 million and $71.2 million of MPF Loans on non-accrual. At September 30, 2005 and December 31, 2004, the Bank had $14.5 million and $18.3 million in MPF Loans that have been foreclosed but not yet liquidated. Renegotiated MPF Loans are those for which concessions, such as the deferral of interest or principal payments, have been granted as a result of deterioration in the borrowers’ financial condition. MPF Loans may be renegotiated by the PFI acting in its role of servicer in accordance with the servicing agreement. The PFI servicer also may take physical possession of the property upon foreclosure or receipt of a deed in lieu of foreclosure.
F-63
Table of Contents
MPF Loans that are on non-accrual status and that are viewed as collateral dependent loans are considered impaired. Impaired MPF Loans are viewed as collateral-dependent loans when repayment is expected to be provided solely by the sale of the underlying property and there are no other available and reliable sources of repayment. An MPF Loan is considered collateral dependent when the debtor has filed for bankruptcy, an in-substance foreclosure has occurred or foreclosure proceedings have been initiated. Impaired MPF Loans are written down to the lower of cost or collateral value, less disposal costs. In the case where an in-substance foreclosure has occurred, MPF Loans are reclassified to other assets.
(Dollars in thousands) | September 30, 2005 | December 31, 2004 | ||||
Impaired MPF Loans 1 | $ | 41,154 | $ | 40,964 | ||
Total Impaired Loans | $ | 41,154 | $ | 40,964 | ||
Allowance for Impaired Loans under SFAS 114 | $ | — | $ | — | ||
| 1 | When the collateral value less estimated selling costs exceeds the recorded investment in the MPF Loan, then the MPF Loan does not require an allowance under SFAS 114 (e.g., if the MPF Loan has been charged down to the recorded investment in the MPF Loan). |
| For the nine months ended September 30, | ||||||
(Dollars in thousands) | 2005 | 2004 | ||||
Average balance of impaired loans | $ | 41,059 | $ | 36,131 | ||
Interest income recognized on impaired loans | $ | 1,813 | $ | 1,774 | ||
Note 7 – Consolidated Obligations
For additional information concerning consolidated obligations refer to Note 13 – Consolidated Obligations in the December 31, 2004 Annual Financial Statements and Notes.
Consolidated obligations are the joint and several obligations of the FHLBs and consist of consolidated bonds and discount notes. The FHLBs issue consolidated obligations through the Office of Finance as their agent. Consolidated bonds are issued primarily to raise intermediate and long term funds for the FHLBs. Usually, the maturities of consolidated bonds range from one year to fifteen years, but they are not subject to any statutory or regulatory limits on maturity. Consolidated discount notes are issued primarily to raise short term funds. Discount notes are issued at less than their face amount and are redeemed at par value when they mature.
The Finance Board, at its discretion, may require a FHLB to make principal or interest payments due from another FHLB on any consolidated obligation. To the extent that a FHLB makes a payment on a consolidated obligation on behalf of another FHLB, the paying FHLB would be entitled to reimbursement from the non-complying FHLB. If the Finance Board determines that the non-complying FHLB is unable to satisfy its direct obligations (as primary obligor), then the Finance Board may allocate the outstanding liabilities among the remaining FHLBs on a pro rata basis in proportion to each FHLB’s participation in all consolidated obligations outstanding, or on any other basis the Finance Board may prescribe, even in the absence of a default event by the primary obligor. The par value of outstanding consolidated obligation bonds and discount notes for the FHLBs was $920.4 billion at September 30, 2005 and $869.2 billion at December 31, 2004.
F-64
Table of Contents
Interest Rate Payment Terms – Interest rate payment terms for consolidated bonds at September 30, 2005 and December 31, 2004 are detailed in the following table.
(Dollars in thousands) | September 30, 2005 | December 31, 2004 | ||||
Par amount of consolidated bonds: | ||||||
Fixed Rate1 | $ | 59,025,225 | $ | 59,501,465 | ||
Variable rate | 675,500 | 625,500 | ||||
Zero coupon | 2,050,000 | 2,430,000 | ||||
Step-up | 160,000 | 220,000 | ||||
Inverse floating rate | 50,000 | 50,000 | ||||
Comparative-index | 41,550 | 41,550 | ||||
Total par value | $ | 62,002,275 | $ | 62,868,515 | ||
| 1 | Fixed rate consolidated obligation bonds include non-callable bonds and bonds that are callable at the option of the Bank. At September 30, 2005 and December 31, 2004, the Bank had callable bonds, at par, of $22.7 billion and $23.4 billion, respectively. |
Redemption Terms – The following table is a summary of the Bank’s participation in consolidated obligation bonds at September 30, 2005 and December 31, 2004 by year of contractual maturity.
(Dollars in thousands) | September 30, 2005 | December 31, 2004 | ||||||||||||
Year of Maturity | Amount | Weighted Average Interest Rate | Amount | Weighted Average Interest Rate | ||||||||||
2005 | $ | 2,475,200 | 2.51 | % | $ | 11,446,710 | 2.96 | % | ||||||
2006 | 11,602,200 | 2.78 | % | 11,059,200 | 2.73 | % | ||||||||
2007 | 9,758,605 | 3.63 | % | 7,568,915 | 3.49 | % | ||||||||
2008 | 8,939,000 | 3.71 | % | 6,512,000 | 3.50 | % | ||||||||
2009 | 5,056,650 | 4.17 | % | 4,071,470 | 4.11 | % | ||||||||
2010 | 6,636,000 | 4.56 | % | 4,235,000 | 4.92 | % | ||||||||
Thereafter | 17,534,620 | 4.51 | % | 17,975,220 | 4.48 | % | ||||||||
Total par value | 62,002,275 | 3.83 | % | 62,868,515 | 3.68 | % | ||||||||
Bond premiums | 58,592 | 68,848 | ||||||||||||
Bond discounts | (1,511,583 | ) | (1,860,386 | ) | ||||||||||
SFAS 133 hedging adjustments | (371,058 | ) | (201,437 | ) | ||||||||||
Total consolidated obligation bonds | $ | 60,178,226 | $ | 60,875,540 | ||||||||||
The following table is a summary of the Bank’s participation in consolidated obligation discount notes at September 30, 2005 and December 31, 2004.
| September 30, 2005 | December 31, 2004 | |||||||||||||||||
(Dollars in thousands) | Carrying Value | Par Value | Weighted Average Interest Rate | Carrying Value | Par Value | Weighted Average Interest Rate | ||||||||||||
Discount notes | $ | 15,180,067 | $ | 15,243,731 | 3.47 | % | $ | 16,871,736 | $ | 16,942,524 | 2.08 | % | ||||||
F-65
Table of Contents
Note 8 – Capital
The following table summarizes the Bank’s regulatory capital requirements as a percentage of the Bank’s total assets. Regulatory capital is defined as capital stock (including capital stock classified as mandatorily redeemable under SFAS 150) and retained earnings.
(Dollars in thousands) | Regulatory Capital Ratio In Effect (1) | Regulatory Capital In Effect | Actual (restated) | Standard Regulatory Capital | ||||||||
Total Capital | ||||||||||||
October 18, 2005 | 4.5 | % | $ | 3,728,483 | $ | 4,455,976 | $ | 3,314,207 | ||||
September 30, 2005 | 5.1 | % | 4,235,771 | 4,412,855 | 3,322,174 | |||||||
December 31, 2004 | 5.1 | % | 4,371,140 | 4,792,793 | 3,428,345 | |||||||
December 31, 2003 | 4.0 | % | 3,477,679 | 4,542,092 | 3,477,679 | |||||||
| 1 | The regulatory capital ratio required by Finance Board regulations for all FHLBs is 4.0% for all periods presented. However, effective June 30, 2004, the Bank had been operating under a Written Agreement that required a 5.1% regulatory capital ratio. On October 18, 2005, the Written Agreement was amended to reduce the regulatory capital ratio to 4.5% and added a required minimum total regulatory capital stock amount of $3.978 billion as further described below. The minimum dollar amount requirement is currently more restrictive than the regulatory capital ratio requirement in the table above and takes precedence until such a time that the Bank’s assets were to increase to a point where the regulatory capital ratio would become more restrictive. |
| 2 | The standard regulatory capital requirement was calculated assuming the regulatory capital ratio was 4.0%. |
For additional information concerning capital reporting refer to Note 14 – Capital in the December 31, 2004 Annual Financial Statements and Notes.
On October 18, 2005 the Finance Board amended the Written Agreement with the Bank reducing the Bank’s required regulatory capital ratio to 4.5% from 5.1%. In addition, until amended or terminated, the amendment also requires the Bank to maintain another separate measure of minimum total regulatory capital stock of $3.978 billion defined as the total amount of capital stock outstanding on October 18, 2005, including stock classified as mandatorily redeemable under SFAS 150, plus the amount of the stock dividend approved based on the results of the third quarter, 2005. Additionally, Bank stock may not be redeemed, including in connection with a membership withdrawal, if redemptions would cause the Bank to fail to meet any of its minimum capital requirements. Also, on October 18, 2005, the Bank’s Board of Directors discontinued the redemption of voluntary capital stock for a period of time in accordance with the FHLB Act and Finance Board regulations.
At September 30, 2005 and December 31, 2004, Bank members held 23.4 million and 27.4 million shares, respectively, of voluntary capital stock. At September 30, 2005 and December 31, 2004, these holdings represented 53% and 57%, respectively, of the Bank’s regulatory capital.
Pursuant to the Written Agreement prior to the amendment, the Bank agreed to maintain a regulatory capital ratio of no less than 5.1% beginning June 30, 2004. The Bank’s regulatory capital ratio on September 30, 2005 and December 31, 2004 was 5.3% and 5.6%, respectively.
At September 30, 2005 and December 31, 2004, the Bank had $13.7 million and $11.3 million in capital stock subject to mandatory redemption from six current members and five former members. This amount has been classified as a liability (“mandatorily redeemable capital stock”) in the statements of condition.
In accordance with SFAS 150, the Bank reclassifies capital stock subject to redemption from equity to a liability once a member gives notice of intent to withdraw from membership or attains non-member status by merger or acquisition, charter termination, or involuntary termination from membership. In each case such shares of capital stock meet the definition of a mandatorily redeemable financial instrument. The restriction on paying out voluntary capital stock or other provisions that may delay or accelerate the timing of a mandatory redemption related to the withdrawal of membership does not affect the classification of mandatorily redeemable capital stock as a liability. Capital stock is reclassified to a liability (mandatorily redeemable capital stock) at fair value. Dividends related to capital stock classified as a liability are accrued at the expected dividend rate and reported as interest expense in the statements of income.
F-66
Table of Contents
The following table summarizes the effects of mandatorily redeemable capital stock:
| For the nine months ended September 30, 2005 | For the nine months ended September 30, 2004 | ||||||||||||
(Dollars in thousands) | Amount | Number of Members | Amount | Number of Members | |||||||||
Mandatorily redeemable capital stock - beginning balance | $ | 11,259 | 5 | $ | 33,588 | 6 | |||||||
Redemption requests: | |||||||||||||
Acquisition related | 145,873 | 7 | 1,408 | * | — | ||||||||
Withdrawals | 121 | 1 | 698 | 1 | |||||||||
Redemption distributions: | |||||||||||||
Acquisition related | (138,082 | ) | (3 | ) | (1,396 | )* | — | ||||||
Withdrawals | (5,437 | ) | (4 | ) | — | — | |||||||
Mandatorily redeemable capital stock - ending balance | $ | 13,734 | 6 | $ | 34,298 | 7 | |||||||
Earnings impact from reclassification of dividends to interest expense | $ | 733 | $ | 1,403 | |||||||||
| * | Includes partial paydowns or redemption requests |
Subsequent to the Bank announcing its discontinuation of redeeming voluntary capital stock on October 18, 2005, the Bank received membership withdrawal notices and related redemption requests from five members totaling $235 million through February 6, 2006. These requests were reclassified from equity to a liability upon receipt of the notice. Redemption occurs after the six month notice period subject to the Bank meeting its capital requirements.
During the period from October 1, 2005 through December 31, 2005, no payments were made based on redemption requests previously classified as mandatorily redeemable capital stock. Redemption requests are honored subject to the Bank maintaining its minimum regulatory capital requirements. The Bank also considers its liquidity requirements in conjunction with redemptions.
Note 9 - Derivative Financial Instruments
For additional information concerning derivative financial instruments refer to Note 16 – Derivative Financial Instruments in the December 31, 2004 Annual Financial Statements and Notes.
In connection with the Bank’s interest rate risk management program, the Bank uses various derivative financial instruments, including interest rate swaps, swaptions, interest rate cap and floor agreements, calls, puts, futures and forward contracts (collectively, derivative financial instruments) to manage its exposure to changes in interest rates or to adjust the effective maturity, repricing frequency, or option characteristics of financial instruments to achieve risk management objectives. The Bank uses derivative financial instruments as part of its hedging activities in one of two ways: (1) by designating them as either a fair value or cash flow hedge or (2) by designating them as a non-SFAS 133 economic hedge as part of its asset-liability management activities.
F-67
Table of Contents
For the nine month periods ended September 30, 2005 and September 30, 2004, no amount was reclassified into earnings as a result of the discontinuance of cash flow hedges because it became probable that a forecasted transaction would not occur by the end of the originally specified time period or within a two month period thereafter. Further, there was no amount reclassified into earnings as a result of firm commitments no longer qualifying as fair value hedges for the nine months ended September 30, 2005 or September 30, 2004. Over the next twelve months it is expected that $12.9 million recorded in other comprehensive income on September 30, 2005 will be recognized in earnings. The length of time over which the Bank is hedging its exposure to the variability in future cash flows is from overnight to eight years.
The following table summarizes derivative activity in which the Bank was an intermediary for its members.
| For the nine months ended September 30, | ||||||
Dollars in thousands | 2005 | 2004 | ||||
Beginning Notional | $ | 254,734 | $ | 285,241 | ||
Additions | 50,000 | 19,259 | ||||
Maturities/Terminations | 129,284 | 106 | ||||
Ending Notional | $ | 175,450 | $ | 304,394 | ||
The following table summarizes the change in fair value related to derivative activity in which the Bank was an intermediary for its members.
| For the nine months ended September 30, | ||||||||
Dollars in thousands | 2005 | 2004 | ||||||
Beginning Fair Value, net | $ | 285 | $ | 441 | ||||
Change in Derivative Asset | (81,827 | ) | 10,484 | |||||
Change in Derivative Liability | 81,748 | (10,594 | ) | |||||
Ending Fair Value, net | $ | 206 | $ | 331 | ||||
The following table summarizes the results of the Bank’s hedging activities.
| For the nine months ended September 30, | ||||||||
(Dollars in thousands) | 2005 (restated) | 2004 | ||||||
Gain (loss) related to fair value hedge ineffectiveness | $ | (16,085 | ) | $ | (71,192 | ) | ||
Gain (loss) on economic hedges | (12,909 | ) | (75,290 | ) | ||||
Gain (loss) related to cash flow hedge ineffectiveness | 9 | 41,105 | ||||||
Net gain (loss) on derivatives and hedging activities | $ | (28,985 | ) | $ | (105,377 | ) | ||
F-68
Table of Contents
The following table represents outstanding notional balances and estimated fair values of derivatives outstanding, at September 30, 2005 and December 31, 2004:
| September 30, 2005 | December 31, 2004 | |||||||||||||
(Dollars in thousands) | Notional | Estimated Fair Value | Notional | Estimated Fair Value | ||||||||||
Interest rate Swaps: | ||||||||||||||
Fair Value | $ | 26,310,580 | $ | (161,325 | ) | $ | 23,444,454 | $ | (237,183 | ) | ||||
Economic | 7,254,321 | (16,199 | ) | 2,015,117 | (37,105 | ) | ||||||||
Total | 33,564,901 | (177,524 | ) | 25,459,571 | (274,288 | ) | ||||||||
Interest rate Swaptions: | ||||||||||||||
Fair Value | 3,301,000 | 51,000 | 4,000,000 | 30,604 | ||||||||||
Economic | 4,765,000 | 19,915 | 7,249,000 | 37,524 | ||||||||||
Total | 8,066,000 | 70,915 | 11,249,000 | 68,128 | ||||||||||
Interest rate Caps/Floors: | ||||||||||||||
Cash Flow | 3,300,500 | 131,740 | 3,400,500 | 153,204 | ||||||||||
Economic | 8,000 | 7 | 8,000 | 8 | ||||||||||
Total | 3,308,500 | 131,747 | 3,408,500 | 153,212 | ||||||||||
Interest rate Futures/Forwards: | ||||||||||||||
Fair Value | 2,107,000 | 5,208 | 5,578,000 | (3,240 | ) | |||||||||
Economic | — | — | 150,000 | (26 | ) | |||||||||
Total | 2,107,000 | 5,208 | 5,728,000 | (3,266 | ) | |||||||||
Interest rate Forward Settlement Agreements: | ||||||||||||||
Cash Flow | — | — | 300,000 | (4,068 | ) | |||||||||
Mortgage Delivery Commitments: | ||||||||||||||
Cash Flow | 117,937 | 269 | 98,481 | 751 | ||||||||||
Other | ||||||||||||||
Deferred Fees | — | (689 | ) | — | — | |||||||||
Total | $ | 47,164,338 | $ | 29,926 | $ | 46,243,552 | $ | (59,531 | ) | |||||
Total derivatives excluding accrued interest | $ | 29,926 | $ | (59,531 | ) | |||||||||
Accrued interest (payable) receivable at end of period | 19,654 | 13,777 | ||||||||||||
Net derivative balance at end of period | 49,580 | (45,754 | ) | |||||||||||
Net derivative asset balance at end of period | 192,253 | 153,496 | ||||||||||||
Net derivative liability balance at end of period | (142,673 | ) | (199,250 | ) | ||||||||||
Net derivative balance at end of period | $ | 49,580 | $ | (45,754 | ) | |||||||||
The amounts potentially subject to loss due to credit risks are the fair value amounts of the derivatives, and not the notional amounts. Maximum credit risk is defined as the estimated cost of replacement for favorable interest rate swaps, forward agreements, mandatory delivery contracts for mortgage loans, and purchased caps and floors in the event of counterparty default and the related collateral, if any, proved to be of no value to the Bank. Using this definition the Bank’s maximum credit risk was approximately $192.3 million and $153.5 million at September 30, 2005 and December 31, 2004, respectively, including $19.7 million and $13.8 million of net accrued interest receivables, respectively. Accrued interest receivables and payables and legal
F-69
Table of Contents
rights to offset assets and liabilities by a counterparty, in which amounts recognized for individual contracts may be offset against amounts recognized for other contracts, are considered in determining the maximum credit risk. The Bank held cash and securities with a market value of approximately $192.3 million and $161.0 million as collateral for derivative financial instruments as of September 30, 2005 and December 31, 2004, respectively. Collateral with respect to derivative financial instruments with member institutions includes collateral assigned to the Bank, as evidenced by a written security agreement.
A significant portion of the Bank’s derivative financial instruments are transacted with major banks and broker-dealers, with no single institution dominating such transactions.
Note 10 – Segment Information
The Bank has two business segments (MPF Program and Traditional Member Finance). The products and services provided reflect the manner in which financial information is evaluated by management including the chief operating decision makers. The Bank’s reporting process measures the performance of the operating segments based on the structure of the Bank and is not necessarily comparable with similar information for any other financial institution. The Bank’s operating segments are defined by the products each provides. MPF Program income is derived primarily from the difference, or spread, between the yield on mortgage loans and the borrowing cost related to those mortgage loans. The Traditional Member Finance segment includes products such as advances, investments and deposits.
The following table sets forth the Bank’s financial performance by operating segment for the nine months ended September 30, 2005 and 2004.
| Nine months ended September 30, 2005 | Nine months ended September 30, 2004 | ||||||||||||||||||||||
| MPF (restated) | Traditional Member Finance | Total (restated) | MPF | Traditional Member Finance | Total | ||||||||||||||||||
Net interest income | $ | 299,924 | $ | 86,885 | $ | 386,809 | $ | 448,556 | $ | 99,709 | $ | 548,265 | |||||||||||
Other income (loss) | (28,546 | ) | (12,116 | ) | (40,662 | ) | (114,696 | ) | 15,904 | (98,792 | ) | ||||||||||||
Other expense | 51,465 | 37,648 | 89,113 | 51,793 | 31,162 | 82,955 | |||||||||||||||||
Income before assessments | 219,913 | 37,121 | 257,034 | 282,067 | 84,451 | 366,518 | |||||||||||||||||
Affordable Housing Program | 18,004 | 3,038 | 21,042 | 26,514 | 6,903 | 33,417 | |||||||||||||||||
REFCORP | 40,392 | 6,818 | 47,210 | 59,420 | 15,490 | 74,910 | |||||||||||||||||
Total assessments | 58,396 | 9,856 | 68,252 | 85,934 | 22,393 | 108,327 | |||||||||||||||||
Income before cumulative effect of change in accounting principle | $ | 161,517 | $ | 27,265 | $ | 188,782 | $ | 196,133 | $ | 62,058 | $ | 258,191 | |||||||||||
Cumulative effect of change in accounting principle | — | — | — | — | — | 41,441 | |||||||||||||||||
Net income | $ | 161,517 | $ | 27,265 | $ | 188,782 | $ | 196,133 | $ | 62,058 | $ | 299,632 | |||||||||||
As of September 30, | |||||||||||||||||||||||
Total mortgage loans, net1 | $ | 43,226,870 | $ | 5,129 | $ | 43,231,999 | $ | 47,940,752 | $ | 2,006 | $ | 47,942,758 | |||||||||||
Total assets | 44,116,983 | 38,937,360 | 83,054,343 | 49,312,025 | 40,166,301 | 89,478,326 | |||||||||||||||||
| 1 | Mortgage loans in the Traditional Member Finance segment include the Native American Mortgage Purchase Program HUD Section 184 loans. These loans are fully guaranteed by the U.S. Department of Housing and Urban Development, in the event of default by the homeowner. |
Note 11 – Estimated Fair Values
For additional information concerning the estimated fair values information refer to Note 18 – Estimated Fair Values in the December 31, 2004 Annual Financial Statements and Notes.
The following estimated fair value amounts have been determined by the Bank: first, by using available market information and, second, if market values were not available, using the Bank’s best judgment of appropriate valuation methods. These estimates are based on pertinent information available to the Bank as of September 30, 2005 and December 31, 2004. Although the Bank uses its best judgment in estimating the fair value of these financial instruments, there are inherent limitations in any estimation technique or valuation methodology. For example, because an active secondary market does not exist for a portion of the Bank’s financial instruments, in certain cases, fair values are not subject to precise quantification or verification and their values may change as economic and market factors, and the evaluation of those factors, change. Therefore, estimated fair values may not be necessarily indicative of the amounts that would be realized in current market transactions. The fair value tables do not represent an estimate of overall market value of the Bank as a going concern, which would take into account future business opportunities.
F-70
Table of Contents
The carrying values and estimated fair values of the Bank’s financial instruments at September 30, 2005 were as follows:
(Dollars in thousands) | Carrying Value | Net Unrecognized | Estimated Fair Value | |||||||||
Financial Instrument | ||||||||||||
Financial Assets | ||||||||||||
Cash and due from banks | $ | 20,103 | $ | — | $ | 20,103 | ||||||
Securities purchased under agreements to resell | 388,200 | (5 | ) | 388,195 | ||||||||
Federal funds sold | 6,907,000 | — | 6,907,000 | |||||||||
Trading securities | 1,244,890 | 1,244,890 | ||||||||||
Available-for-sale securities | 1,480,528 | — | 1,480,528 | |||||||||
Held-to-maturity securities | 4,937,311 | (60,779 | ) | 4,876,532 | ||||||||
Advances | 24,233,015 | (193,047 | ) | 24,039,968 | ||||||||
Mortgage loans held in portfolio, net | 43,231,999 | (471,974 | ) | 42,760,025 | ||||||||
Accrued interest receivable | 310,147 | — | 310,147 | |||||||||
Derivative assets | 192,253 | — | 192,253 | |||||||||
Total Financial Assets | $ | 82,945,446 | $ | (725,805 | ) | $ | 82,219,641 | |||||
Financial Liabilities | ||||||||||||
Deposits | $ | (1,307,516 | ) | $ | 14 | $ | (1,307,502 | ) | ||||
Securities sold under agreements to repurchase | (1,200,000 | ) | (105,330 | ) | (1,305,330 | ) | ||||||
Consolidated obligations: | ||||||||||||
Discount notes | (15,180,067 | ) | 5,394 | (15,174,673 | ) | |||||||
Bonds | (60,178,226 | ) | 6,479 | (60,171,747 | ) | |||||||
Accrued interest payable | (630,120 | ) | — | (630,120 | ) | |||||||
Derivative liabilities | (142,673 | ) | — | (142,673 | ) | |||||||
Mandatorily redeemable capital stock | (13,734 | ) | — | (13,734 | ) | |||||||
Total Financial Liabilities | $ | (78,652,336 | ) | $ | (93,443 | ) | $ | (78,745,779 | ) | |||
Commitments: | ||||||||||||
Loan commitments | $ | — | $ | 104 | $ | 104 | ||||||
F-71
Table of Contents
The carrying values and estimated fair values of the Bank’s financial instruments at December 31, 2004 were as follows:
(Dollars in thousands) | Carrying Value | Net Unrecognized | Estimated Fair Value | |||||||||
Financial Instrument | ||||||||||||
Financial Assets | ||||||||||||
Cash and due from banks | $ | 20,530 | $ | — | $ | 20,530 | ||||||
Securities purchased under agreements to resell | 389,840 | (8 | ) | 389,832 | ||||||||
Federal funds sold | 4,738,000 | (84 | ) | 4,737,916 | ||||||||
Trading securities | 760,057 | — | 760,057 | |||||||||
Available-for-sale securities | 1,529,688 | — | 1,529,688 | |||||||||
Held-to-maturity securities | 6,561,161 | (3,081 | ) | 6,558,080 | ||||||||
Advances | 24,191,558 | (164,239 | ) | 24,027,319 | ||||||||
Mortgage loans held in portfolio, net | 46,920,551 | 79,539 | 47,000,090 | |||||||||
Accrued interest receivable | 317,837 | — | 317,837 | |||||||||
Derivative assets | 153,496 | — | 153,496 | |||||||||
Total Financial Assets | $ | 85,582,718 | $ | (87,873 | ) | $ | 85,494,845 | |||||
Financial Liabilities | ||||||||||||
Deposits | $ | (1,223,752 | ) | $ | 181 | $ | (1,223,571 | ) | ||||
Securities sold under agreements to repurchase | (1,200,000 | ) | (96,311 | ) | (1,296,311 | ) | ||||||
Consolidated obligations: | ||||||||||||
Discount notes | (16,871,736 | ) | 7,962 | (16,863,774 | ) | |||||||
Bonds | (60,875,540 | ) | (514,258 | ) | (61,389,798 | ) | ||||||
Accrued interest payable | (513,993 | ) | — | (513,993 | ) | |||||||
Derivative liabilities | (199,250 | ) | — | (199,250 | ) | |||||||
Mandatorily redeemable capital stock | (11,259 | ) | — | (11,259 | ) | |||||||
Total Financial Liabilities | $ | (80,895,530 | ) | $ | (602,426 | ) | $ | (81,497,956 | ) | |||
Commitments: | ||||||||||||
Loan commitments | $ | — | $ | 339 | $ | 339 | ||||||
Note 12 – Commitments and Contingencies
The Bank is not currently aware of any pending or threatened legal proceedings against it that could have a material effect on the Bank’s financial condition or results of operations and there have been no significant changes in commitments and contingencies since December 31, 2004. Refer to Note 19 – Commitments and Contingencies in the December 31, 2004 Annual Financial Statements and Notes for further discussion.
Note 13 – Transactions with Related Parties and Other FHLBs
Related Parties: The Bank is a cooperative whose member institutions own the capital stock of the Bank and may receive dividends on their investments. In addition, certain former members that still have outstanding transactions are also required to maintain their investment in Bank capital stock until the transactions mature or are paid off. All transactions with members are entered into in the normal course of business. In instances where the member also has an officer who is a director of the Bank, those transactions are subject to the same eligibility and credit criteria, as well as the same terms and conditions, as all other transactions. The Bank defines related parties as those members with capital stock outstanding in excess of 10% of total capital stock outstanding. At September 30, 2005 and December 31, 2004 the Bank had no member with capital stock outstanding in excess of 10% of the Bank’s total capital stock.
F-72
Table of Contents
Outlined below is the level of activity the Bank has with its members and their affiliates as reported in the statements of condition.
| • | The Bank acquired $1.5 billion and $3.5 billion in MPF Loans from or through member PFIs during the nine months ended September 30, 2005 and 2004, respectively. |
| • | Investment securities issued by affiliates of our members may be purchased in the secondary market through a third party at arm’s length. Held-to-maturity securities issued by affiliates of our members at September 30, 2005 and December 31, 2004 were $12.8 million and $30.4 million, respectively. |
| • | Derivative assets of members and their affiliates at September 30, 2005 and December 31, 2004 were $30.6 million and $24.3 million, respectively. Derivative liabilities of members and their affiliates at September 30, 2005 and December 31, 2004 were $72.6 million and $91.7 million, respectively. |
| �� | • | Interest and non-interest bearing deposits from members of $838.8 million and $885.2 million at September 30, 2005 and December 31, 2004, respectively are maintained by the Bank for its members primarily to facilitate settlement activities that are directly related to advances and mortgage loan purchases. |
Other FHLBs: The Office of Finance may issue consolidated obligations through the Global Issuances Program. Historically, the Bank has been the primary obligor on any consolidated obligation debt issued under this program that is not taken by another FHLB. If another FHLB needs liquidity or additional funding, then the FHLB could obtain funding by issuing new consolidated obligations through the Office of Finance, or the Bank could transfer its consolidated obligations at fair value to the other FHLB. Due to the fact that the Bank is no longer designated the primary obligor of the transferred consolidated obligations by the Office of Finance, the Bank considers itself released from its obligation and records the transfer as an extinguishment of debt with a corresponding gain or loss recorded in the statements of income. The Bank transferred $975.2 million and $3.8 billion of consolidated obligations to other FHLBs for the nine months ended September 30, 2005 and 2004, respectively. In addition, the Bank recognized a net realized gain from early extinguishment of debt transferred to other FHLBs of $4.6 million and $46.5 million for the nine months ended September 30, 2005 and 2004, respectively.
The Bank records a transfer of its consolidated obligations to another FHLB as an extinguishment of debt since the Bank has been released from being the primary obligor. Specifically, the release is affected by the Office of Finance’s recordation of the transfer in its records. The Office of Finance is providing a release by acting within the confines of the banking regulations that governs the determination of which FHLB is the primary obligor. The FHLB assuming the consolidated obligation becomes the primary obligor since it now is directly responsible for repaying the debt. The Bank continues to disclose the transferred debt as a contingent liability since it still has a joint and several liability with respect to repaying the transferred consolidated obligation. The Bank does not record a financial guarantee at fair value with respect to the transferred consolidated obligation since FIN 45 does not require such accounting for a related party.
The Bank purchased $1.6 billion and $4.5 billion in participation interests from other FHLBs during the nine months ended September 30, 2005 and 2004, respectively. Participation interests purchased are recorded as a component of “Loans held in portfolio purchased from other FHLBs” on the statements of cash flows.
The Bank purchased A certificates from two MPF Shared Funding transactions in March 2003 and June 2003. The outstanding principal balance of the A Certificates held by the Bank in connection with these transactions is $436.6 million as of September 30, 2005.
F-73
Table of Contents
As the MPF Provider, the Bank recorded $2.2 million and $812.1 thousand in the nine months ended September 30, 2005 and 2004, respectively. Transaction service fees are recorded in other income on the Bank’s statements of income.
In December 2002, the Bank agreed to begin purchasing MPF Loans directly from members of the FHLB of Dallas and pay the FHLB of Dallas as the Bank’s marketing agent. The FHLB of Dallas acts as marketing agent for the Bank and receives a marketing fee for its services rather than purchasing MPF Loans from its members. Direct acquisitions from another FHLB’s members are permitted under the AMA Regulation with the consent of that FHLB. The Bank incurred $305.5 thousand and $629.3 thousand during the nine months ended September 30, 2005 and 2004, respectively. Marketing fees paid to Dallas are recorded in mortgage loan expense on the Bank’s statements of income.
The Bank paid participation fees of $225.0 thousand to the FHLB of Des Moines for both nine month periods ended September 30, 2005 and 2004. Participation fees paid to the FHLB of Des Moines are recorded in mortgage loan expense on the Bank’s statements of income.
As of September 30, 2005 and December 31, 2004, the Bank held investment securities classified as trading in the Bank’s statements of condition of $34.1 million and $71.7 million related to consolidated obligations of other FHLBs which were purchased from 1995 to 1997. The FHLB of Dallas was the primary obligor of $28.0 million of consolidated obligations at September 30, 2005 and $41.7 million at December 31, 2004. The FHLB of San Francisco was the primary obligor for $6.1 million of consolidated obligations held at September 30, 2005 and $30.0 million held at December 31, 2004. The respective changes in fair value are recorded within net (loss) gain on trading securities on the statements of income and within Operating Activities as a net (increase) decrease on trading securities in the Bank’s statement of cash flows.
The Bank has receivables with other FHLBs, which were $1.1 million and $1.0 million at September 30, 2005 and December 31, 2004, respectively. Receivables are classified in other assets on the Bank’s statements of condition. Other FHLBs have deposits with the Bank that are separately reported on the Bank’s statements of condition.
Note 14 – Employee Retirement Plans
For additional information concerning employee retirement benefit plans refer to the Note 15 – Employee Retirement Plans in the December 31, 2004 Annual Financial Statements and Notes.
The following table shows the components of the net periodic pension cost for the Bank’s supplemental retirement and post retirement health benefit plan for the nine months ended September 30, 2005 and 2004.
| Supplemental Retirement Plan | Post- retirement Health Benefit | |||||||||||||
(Dollars in thousands) | 2005 | 2004 | 2005 | 2004 | ||||||||||
Service Cost | $ | 312 | $ | 287 | $ | 561 | $ | 378 | ||||||
Interest Cost | 221 | 240 | 233 | 212 | ||||||||||
Amortization of unrecognized prior service cost | (19 | ) | (19 | ) | 11 | 11 | ||||||||
Amortization of unrecognized net loss | 233 | 155 | 52 | 60 | ||||||||||
Net periodic benefit cost | $ | 747 | $ | 663 | $ | 857 | $ | 661 | ||||||
In December 2003 the Medicare Prescription Drug, Improvement and Modernization Act of 2003 (the “Medicare Act”) was enacted. The Medicare Act introduces a prescription drug benefit for individuals under Medicare (Medicare Part D), as well as a federal subsidy equal to 28% of the prescription drug claims for sponsors of retiree health care plans with drug benefits that are at least actuarially equivalent to those to be offered under Medicare Part D. In January 2004, the FASB issued FASB Staff Position (“FSP”) FAS 106-1 “Accounting and Disclosure Requirements Related to the Medicare Prescription Drug, Improvement and Modernization Act of 2003,” which allowed for a one-time election to defer accounting for the Medicare Act until authoritative guidance on the federal subsidy is issued or sooner if a significant event occurs that calls for remeasurement of a plan’s assets and obligations. The Bank elected this one-time deferral. In May 2004, the FASB issued Staff Position (“FSP”) FAS 106-2 “Accounting and Disclosure Requirements Related to the Medicare Prescription Drug, Improvement and Modernization Act of 2003” (FSP FAS 106-2), which supersedes FSP FAS 106-1, in response to the December 2003 enactment of the Medicare Act. FSP FAS 106-2 provides authoritative guidance on the accounting for the federal subsidy. Specifically, if a plan is determined to be actuarially equivalent to Medicare Part D, FSP FAS 106-2 requires plan sponsors to recognize and disclose the effect of the subsidy on the net periodic postretirement expense and the accumulated postretirement benefit obligation in their interim and annual financial statements for periods beginning after June 15, 2004.
F-74
Table of Contents
Prior to the second quarter of 2005, the Bank’s actuarial consultant had not determined if the Bank’s program was actuarially equivalent to Medicare Part D and as such, the 2004 Bank’s net periodic postretirement obligation and expense did not include amounts for the subsidy. In May 2005, the Bank’s actuarial consultant reviewed the Bank’s program and concluded that the Bank’s post retirement program is actuarially equivalent to Medicare Part D. As a result of this determination, the Bank will apply for the subsidy under the Medicare Act and has included the subsidy in the accumulated postretirement benefit obligation and net post retirement benefit expense prospectively. The Bank expects the actual subsidy amounts to be immaterial.
The Bank participates in the Financial Institutions Thrift Plan (FITP), a defined contribution plan. The Bank’s contribution is equal to a percentage of participants’ compensation and a matching contribution equal to a percentage of voluntary employee contributions, subject to certain limitations. The Bank expects to contribute approximately $1.0 million for the year ended December 31, 2005 as compared to $0.7 million contributed for the year ended December 31, 2004.
F-75
Table of Contents
SIGNATURES
Pursuant to the requirements of Section 12 of the Securities Exchange Act of 1934, the registrant has duly caused this registration statement to be signed on its behalf by the undersigned, thereunto duly authorized.
| Federal Home Loan Bank of Chicago | ||
| /S/ J. MIKESELL THOMAS | ||
| By: | J. Mikesell Thomas | |
| Title: | President and Chief Executive Officer | |
Date: February 10, 2006
S-1