Exhibit 99.1
February 22, 2011
To Our Members:
The exclusive focus of the management and Board of Directors of the Federal Home Loan Bank of Chicago is on building the financial strength of this cooperative and the value of your membership in the Bank. This letter will update you on the progress we made in 2010 - and our focus in 2011 and beyond.
As we have indicated in previous letters, our goals are to:
| |
| • | Provide our members with short-term liquidity and long-term funding as integral components of their business strategies; |
| |
| • | Generate consistent , profitable results while extending the benefits of our funding advantage to our members; |
| |
| • | Resume an appropriate dividend; |
| |
| • | Grow retained earnings; |
| |
| • | Stabilize our capital base through a capital stock conversion; |
| |
| & bull; | Simplify the business model and operations of the Bank; and |
| |
| • | Restore full liquidity to our stock. |
We h ave made substantial progress in achieving many of these goals, including the restoration of a nominal dividend, and are fully focused on attaining the others. Each goal is an essential component tied directly to the future success of the Bank, based on our relationship with you, our members. We have been working for three years to remediate the issues of the past and now our efforts are gradually transitioning to building the Bank of the future. That Bank, focused on supporting you by providing liquidity and term financing, will be entirely defined by the degree to which you use our products and services.
The results discussed here are preliminary and unaudited. Please refer to the attached Condensed Statements of Income and Statements of Condition. Also, please review the discussion o f the market value of the Bank's equity, level of retained earnings, and the spread of return on average regulatory capital to three-month Libor that follows the Condensed Statement of Income. (See “Remediation Dashboard,” page 8.) We expect to file our 2010 Form 10-K Annual Report with the Securities and Exchange Commission next month. You will be able to access it through our website, www.fhlbc.com, or the SEC's reporting website, www.sec.gov/edgar.
2010 Financial Highlights
| |
| • | We recorded net income of $366 million for 2010, a material improvement over the loss of $65 million in 2009. Several major factors contributed significantly to our net income for the year, including strong net interest income resulting from our balance sheet restructuring and management; unexpectedly high levels of prepayment fees from resolved or merged members, as well as members restructuring their balance sheets; and gains on derivatives and hedging activities due to favorable market conditions. These positives were partially offset by credit- |
related other-than-temporary impairment charges (OTTI) of $163 million on our private-label mortgage-backed securities (MBS) portfolio.
| |
| • | Advances outstanding at year-end 2010 were $18.9 billion, 22% lower than the previous year-end level of $24.1 billion. As is the case for many of the Home Loan Banks across the system, our lower advance levels reflect reduced overall levels of lending and deposit-rich balance sheets across our membership. |
| |
| • | Mortgage Partnership Finance® (MPF®) loans held in portfolio declined $5.5 billion (23%) to $18.3 billion. These reductions are a direct result of our 2008 decision not to add MPF loans to our balance sheet. MPF Xtra® loan sales, however, were $3.4 billion for 2010. |
| |
| • | Total investment securities increased $4.9 billion (14%) to $39.0 billion as the Bank continued to acquire lower-risk investments to replace lower levels of advances and the run-off in the MPF portfolio. |
| |
| • | Total assets fell $4.0 billion (4%) to $84.1 billion. |
| |
| & bull; | Primarily as a result of our net income, our retained earnings grew $391 million to $1.1 billion. |
| |
| • | We awarded $4.6 million in grants through our competitive Affordable Housing Program (AHP) and $2.0 million in assistance through our Downpay ment Plus® Program. |
| |
| • | We remain in compliance with all of our regulatory capital requirements. |
Summary of 2010 Financial Results
Consistent Net Interest Income
Net interest income for the year was $756 million, a 33% increase over 2009 net interest income of $570 million. During 2010, we continued to invest in lower-credit-risk, simpler-to-hedge investment securities, primarily government agency MBS, to offset the reduced earnings from reduced Advances and the paydowns on our MPF portfolio. That investment program is now completed and the Bank will con tinue to benefit from the strong net interest income generated by those investments during our transition to focusing our balance sheet on member advances. In addition, over the past two years, we have replaced both maturing and callable higher-cost term debt with lower-cost debt. Generating and maintaining consistent net interest income is a key component to our successful transition to a business model focused on advances rather than the acquisition of MPF loans, which are subject to more income volatility from hedging activities.
Significant Prepayment Fees Positively Impact Net Income
Prepayment fees on advances had a net positi ve impact on net interest income of $169 million for the year. The fees resulted from member resolutions, as well as several members choosing to restructure their portfolios to take advantage of the low-rate environment. Gross prepayment fees of $213 million were reduced by $44 million in hedging adjustments. The Bank also incurred a loss of $30 million in non-interest gain (loss) related to extinguished and transferred debt that was funding a portion of the advances prepaid during 2010.
OTTI Charges on Private-Label MBS Portfolio Continue
OTTI charges on our investment in private-label MBS continued to have a significant negative impact on financial results in 2010, with net credit-related OTTI charges of $163 million in 2010 compared to $437 million in 2009. We may experience additional OTTI charges in the future. We intend to hold the private-label MBS portfolio to maturity and will continue to analyze these securities quarterly. Along with the other FHLBanks, we will assess the degree to which future OTTI charges should be recognized.
Hedging Costs Fluctua te Due to Market Volatility and Balance Sheet Composition
We recognized a gain of $52 million on derivative and hedging activities in 2010 compared to a loss of $83 million in 2009. Fluctuations over the last several years have reflected volatility in the markets and the interest rate risk exposure of a balance sheet with a falling, but still significant, portfolio of mortgage loans. As long as the MPF portfolio remains a relatively large component of the overall balance sheet, we anticipate fluctuations in gains or losses from derivative and hedging activities from quarter to quarter and year to year. As we have stated previously, we expect that the Bank's sensitivity to market rate movements will decline, and that the variability of income due to gains and losses on derivative and hedging activities, will moderate over time.
Non-Interest Expenses Reflect Streamlining Efforts and Market Influences
Non-interest expense for the year increased $3 million (2%) to $131 million in 2010, despite the beneficial impact of reductions in consultant fees and salaries following the implementation of our operating system. Our head count has fallen 10% since the end of 2009 to 300 employees, with commensurate reductions in salaries. Offsetting the reductions in salaries and consultant fees, however, were increased contributions to the pension plan and the increase in expenses associated with other real estate owned. Due primarily to the low-rate environment, the Bank was required to contribute $15 million to the pension plan c ompared to $8 million in 2009. The loss on real estate owned increased from $1 million in 2009 to $10 million in 2010.
Reduction in Size of Balance Sheet
Advances outstanding at the year-end were $18.9 billion, 22% lower than the previous year-end level of $24.1 billion. As is the case for many of the Home Loan Banks across the system, lower advance levels reflect lower overall levels of members' loan demand and deposit-rich balance sheets. Also, several members have been acquired by out-of-district financial institutions or have collapsed their chart ers in our district. As a result, their maturing advances will not be renewed. We also believe that some members view us exclusively as a lender of last resort, while others benefit daily from the flexible terms and competitive pricing of our advances. While we are pleased that all members recognize our importance as a back-up source of liquidity, the repositioning of the Bank requires that members also use the Bank as part of their core financing. We are taking steps to enhance our ease of use and to expand the collateral options available to our members so that they can borrow from the Bank without utilizing collateral that they may wish to use for back-up liquidity.
Total MPF loans held in portfolio were $18.3 billion at year-end 2010, a reduction of $5.5 billion
(23%) from $23.8 billion at the previous year-end. While we expected reductions in the level of MPF loans as a result of our 2008 decision not to acquire new MPF loans for the Bank's balance sheet, the pace of the portfolio reduction over the past two years reflects the low level of mortgage rates and accompanying prepayments/refinancings. We increased our allowance for loan loss from $14 million to $33 million consistent with the increase in our nonperforming and impaired MPF Loan amounts. It is important to note that MPF loans continue to have lower delinquency rates than the national average for conventional conforming mortgage loans.
The MPF Xtra product continues to grow in popularity among our members, as well as the members of the Federal Home Loan Banks of Boston, Des Moines, and Pittsburgh. Since the inception of the program in late 2008, 265 participating financial institutions system-wide have funded more than $6.8 billion in loans. In 2011, we anticipate offering a servicing-released option under the MPF Xtra product.
Total assets fell $4.0 billion (4%) to $84.1 billion at year-end, due primarily to the lower level of advances and the continuing run-off in the MPF portfolio. We anticipate that the overall size of the Bank will fall as MPF loans continue to pay down and we seek to operate at the scale dictated by the level of our members' borrowing levels.
As you can see on page 8 retained earnings have grown to $1.1 billion at year-end 2010. The level of retained earnings is an important indicator of the improving financial strength of the Bank.
Member Credit Concerns
During 2010, 16 of our member institutions were resolved by the FDIC or NCUA. At the time of their resolutions, we had nearly $900 million in advances outstanding to these members. We are pleased to report that the Federal Home Loan Bank model of securing advances with mortgage assets and securities has proven to be sound as we have not experienced any credit losses as a result of the resolutions. Our credit monitoring includes careful analysis of members' financial conditions in conjunction with enhanced collateral precautions. Of equal importance to our members, our practice of coordinating closely with membe rs in financial distress, has permitted us to maintain liquidity to depository institution members even as their condition deteriorates. We believe this continued access to liquidity represents an important component in the value proposition of membership in the Federal Home Loan Bank of Chicago.
Commitment to Community Investment and Affordable Housing
Since 1990, we have awarded more than $300 million in grants through several programs supporting affordable housing and down payment assistance initiatives, directly impacting 75,000 housing units. As I mentioned in our dividend announcement letter, one of the most exciting aspects of our significant, if extraordinary, income in 2010 is the opportunity to increase the funds committed to our Downpayment Plus and competitive Affordable Housing Programs. We anticipate having $12 million available for Downpayment Plus and approximately $23 million available in grants through AHP in 2011. We look forward to providing more information on these expanded programs soon.
Summary
Member owned. Member focused. Our new tagline, in conjunction with our revised mission statement, succinctly states our commitment to our members as a cooperative owned by you, our members.
The mission of the FHLB Chicago is to partner with our member shareholders in Illinois and Wisconsin to provide them competitively priced funding, a reasonable return on their investment in the Bank, and support for community investment activities.
We were very pleased to pay a nominal dividend last week based on our preliminary fourth quarter 2010 earnings. As you know, the restoration of a dividend payment was one of the essential steps in our progress in re storing the financial strength of the Federal Home Loan Bank of Chicago and supporting
you in the future. When evaluating the appropriate timing for restoration of a dividend, management and the Board took into consideration the importance to our members of maintaining a dividend once restored.
We are working with our regulator to gain approval for our submitted capital stock conversion plan. Even after we have successfully implemented our capital plan and, in time, have restored full liquidity to your stock, we will not have fully succeeded until all of our members incorporate the Bank into their core funding plans, not just as a reliable source of back-up liquidity.
Our January 31 announcement regarding expanded collateral capacity and simplified collateral reporting available through the updated Advances Agreement outlined some of our efforts to spur member utilization of the cooperative to ensure its viability for all members. The strength of the cooperative going forward will be, in large part, built on the foundation of usage by you, its members, balanced by our efforts to safeguard your investment in the Bank. We are member owned and member focused. Our success - your success - will be member driven.
As always, we welcome your comments and questions and look forward to working with you and to reporting on our progress during 2011.
|
| Best regards, |
|
| Matt Feldman |
| President and CEO |
This letter contains forward-looking statements which are based upon our current expectations and speak only as of the date hereof. These statements may use forwar d-looking terms, such as “anticipates,” “believes,” “expects,” “could,” “plans,” “estimates,” “may,” “should,” “will,” or their negatives or other variations on these terms. We caution that, by their nature, forward-looking statements involve risk or uncertainty, that actual results could differ materially from those expressed or implied in these forward-looking statements, and that actual events could affect the extent to which a particular objective, projection, estimate, or prediction is realized. These forward-looking statements involve risks and uncertainties including, but not limited to, instability in the credit and debt markets, economic conditions (including effects on, among other things, mortgage-backed securities), changes in mortgage interest rates and prepayment speeds on mortgage assets, our ability to successfully transition to a new business model and to pay future dividends and the r isk factors set forth in our periodic filings with the Securities and Exchange Commission, which are available on our website at www.fhlbc.com. We assume no obligation to update any forward-looking statements made in this letter. The financial results discussed in this letter are preliminary and unaudited. “Mortgage Partnership Finance,” “MPF,” “MPF Xtra,” and “Downpayment Plus” are registered trademarks of the Federal Home Loan Bank of Chicago.
Condensed Statements of Condition
(Dollars in millions)
(Preliminary and Unaudited)
| | | | | | | | | | | |
| | | December 31, 2010 | | December 31, 2009 | | Change |
| Cash and due from banks | | $ | 282 | | | $ | 2,823 | | | (90 | )% |
| Federal Funds sold and securities purchased under agreement to resell | | 7,243 | | | 2,715 | | | 167 | % |
| Investment securities | | 38,996 | | | 34,078 | | | 14 | % |
| Advances | | 18,901 | | | 24,148 | | | (22 | )% |
| MPF Loans held in portfolio, net | | 18,294 | | | 23,838 | | | (23 | )% |
| Other | | 400 | | | 472 | | | (15 | )% |
| Total assets | | $ | 84,116 | | | $ | 88,074 | | | (4 | )% |
| | | | | | | |
| Consolidated obligation discount notes | | $ | 18,421 | | | $ | 22,139 | | | (17 | )% |
| Consolidated obligation bonds | | 57,849 | | | 58,225 | | | (1 | )% |
| Subordinated notes | | 1,000 | | | 1,000 | | | — | % |
| Other | | 3,897 | | | 4,332 | | | (10 | )% |
| Total liabilities | | 81,167 | | | 85,696 | | | (5 | )% |
| | | | | | | |
| Capital stock | | 2,333 | | | 2,328 | | | 0 | % |
| Retained earnings | | 1,099 | | | 708 | | | 55 | % |
| Accumulated other comprehensive income (loss) | | (483 | ) | | (658 | ) | | 27 | % |
| Total capital | | 2,949 | | | 2,378 | | | 24 | % |
| Total liabilities and capital | | $ | 84,116 | | | $ | 88,074 | | | (4 | )% |
| | | | | | | |
| Regulatory capital stock plus Designated Amount of subordinated notes | | $ | 3,863 | | | $ | 3,794 | | | 2 | % |
Condensed Statements of Income
(Dollars in millions)
(Preliminary and Unaudited)
| | | | | | | | | | | | | | | | | |
| | For the Years ended December 31, |
| | 2010 | | 2009 | | 2010 / 2009 Change | | 2008 | | 2009 / 2008 Change |
| Interest income | $ | 2,774 | | | $ | 2,956 | | | (6 | )% | | $ | 3,772 | | | (2 2 | )% |
| Interest expense | 1,997 | | | 2,376 | | | (16 | )% | | 3,570 | | | (33 | )% |
| Provision for credit losses | 21 | | | 10 | | | 110 | % | | 3 | | | 233 | % |
| Net interest income | 756 | | | 570 | | | 33 | % | | 199 | | | 186 | % |
| Other-than-temporary impairment (credit loss) | (163 | ) | | (437 | ) | | 63 | % | | (292 | ) | | (50 | )% |
| Other non-interest gain (loss) | 36 | | | (70 | ) | | 151 | % | | 100 | | | (170 | )% |
| Non-interest expense | 131 | | | 128 | | | 2 | % | | 126 | &n bsp; | | 2 | % |
| Assessments | 132 | | | — | | | N/M | | | — | | | - | |
| Net income (loss) | $ | 366 | | | $ | (65 | ) | | 663 | % | | $ | (119 | ) | | 45 | % |
| | | | | | | | | | |
| Net yield on interest-earning assets | 0.89 | % | | 0.65 | % | | 0.24 | % | | 0.22 | % | | 0.43 | % |
| N/M= not meaningful | | | | | | | | | |
Remediation Dashboard
In order to provide our members with greater clarity as we work to transition the Bank, we regularly monitor our ratio of Market Value to Book Value, the level of our Retained Earnings, and our Spread on the Return of Average Regulatory Capital to Three-month Libor. Together, these metrics provide a view of our progress in restructuring our business model and our balance sheet to fortify the financial strength of the Bank.
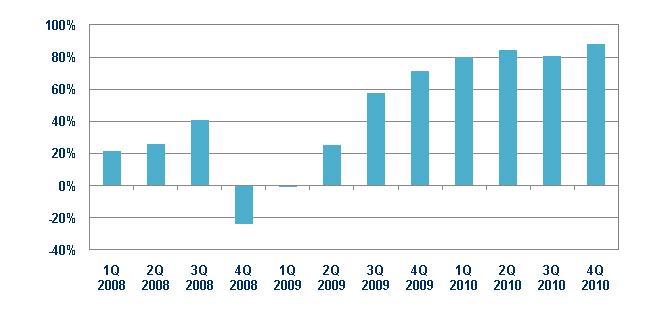
Ratio of Market Value to Book Value
During 2009 and 2010, the market value of the Bank has been positively impacted by the balance sheet restructuring and the increase in value of investment securities. The ratio of market value to book value improved from 71% at year-end 2009 to 88% at year-end 2010, reflecting our efforts to remediate the Bank which we believe will lead us to restore full liquidity to our stock in the future, subject to the approval of our regulator.
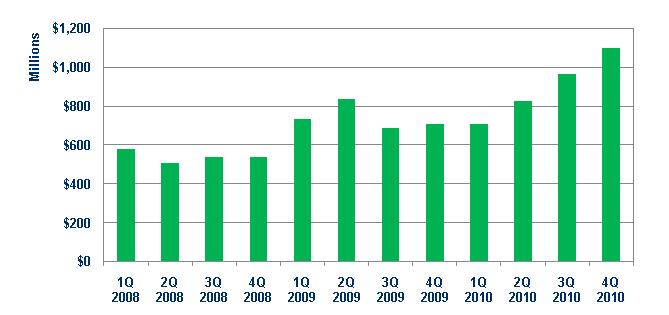
Retained Earnings
The growth of retained earnings is a key element in the Bank's plan to improve its financial strength and stability. Retained earnings at year-end 2010 were $1.1 billion compared to $708 million at the previous year-end.
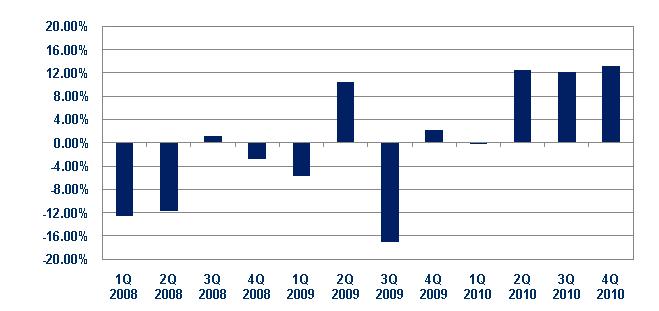
Spread on Return on Average Regulatory Capital to Three-Month Libor
We will regularly highlight changes in the spread of our return on average regulatory capital (which excludes subordinated notes) relative to three-month Libor. Over time, we have seen substantial variability in this measure, largely as a result of fluctuating gains and losses on derivative and hedging activities and continuing OTTI charges. Our goal is to reduce the variability in this measure over time.