Table of Contents
UNITED STATES
SECURITIES AND EXCHANGE COMMISSION
Washington, D.C. 20549
FORM 10-Q
x QUARTERLY REPORT PURSUANT TO SECTION 13 OR 15(d) OF THE SECURITIES EXCHANGE ACT OF 1934
For the quarterly period ended June 30, 2008
OR
o TRANSITION REPORT PURSUANT TO SECTION 13 OR 15(d) OF THE SECURITIES EXCHANGE ACT OF 1934
Commission File Number: 000-51402
FEDERAL HOME LOAN BANK OF BOSTON
(Exact name of registrant as specified in its charter)
Federally chartered corporation (State or other jurisdiction of incorporation or organization) | | 04-6002575 (I.R.S. employer identification number) |
| | |
111 Huntington Avenue Boston, MA (Address of principal executive offices) | | 02199 (Zip code) |
(617) 292-9600
(Registrant’s telephone number, including area code)
Indicate by check mark whether the registrant (1) has filed all reports required to be filed by Section 13 or 15(d) of the Securities Exchange Act of 1934 during the preceding 12 months (or for such shorter period that the registrant was required to file such reports), and (2) has been subject to such filing requirements for the past 90 days.
x Yes o No
Indicate by check mark whether the registrant is a large accelerated filer, an accelerated filer, or a non-accelerated filer. See definition of “accelerated filer and large accelerated filer” in Rule 12b-2 of the Exchange Act. (Check one):
Large accelerated filer o | | Accelerated filer o |
| | |
Non-accelerated filer x (Do not check if a smaller reporting company) | | Smaller reporting company o |
Indicate by check mark whether the registrant is a shell company (as defined in Rule 12b-2 of the Exchange Act).
o Yes x No
Indicate the number of shares outstanding of each of the issuer’s classes of common stock, as of the latest practicable date.
| | Shares outstanding
as of July 31, 2008 | |
Class B Stock, par value $100 | | 36,595,393 | |
Table of Contents
Part I. FINANCIAL INFORMATION
Item 1. Financial Statements
FEDERAL HOME LOAN BANK OF BOSTON
STATEMENTS OF CONDITION
(dollars and shares in thousands, except par value)
(unaudited)
| | June 30, | | December 31, | |
| | 2008 | | 2007 | |
ASSETS | | | | | |
Cash and due from banks | | $ | 6,645 | | $ | 6,823 | |
Interest-bearing deposits in banks | | 3,450,075 | | 5,330,050 | |
Securities purchased under agreements to resell | | — | | 500,000 | |
Federal funds sold | | 2,180,000 | | 2,908,000 | |
Investments: | | | | | |
Trading securities | | 86,953 | | 112,869 | |
Available-for-sale securities - includes $101,343 and $88,844 pledged as collateral at June 30, 2008, and December 31, 2007, respectively, that may be repledged | | 1,070,092 | | 1,063,759 | |
Held-to-maturity securities (a) | | 10,033,867 | | 7,947,881 | |
Advances | | 63,071,856 | | 55,679,740 | �� |
Mortgage loans held for portfolio, net of allowance for credit losses of $125 at June 30, 2008, and December 31, 2007 | | 4,049,996 | | 4,091,314 | |
Accrued interest receivable | | 305,343 | | 457,407 | |
Premises, software, and equipment, net | | 5,747 | | 6,349 | |
Derivative assets | | 11,906 | | 67,047 | |
Other assets | | 43,726 | | 29,099 | |
| | | | | |
Total Assets | | $ | 84,316,206 | | $ | 78,200,338 | |
| | | | | |
LIABILITIES | | | | | |
Deposits: | | | | | |
Interest-bearing | | $ | 910,010 | | $ | 707,056 | |
Non-interest-bearing | | 10,613 | | 6,070 | |
Total deposits | | 920,623 | | 713,126 | |
| | | | | |
Consolidated obligations, net: | | | | | |
Bonds | | 34,683,409 | | 30,421,987 | |
Discount notes | | 44,332,438 | | 42,988,169 | |
Total consolidated obligations, net | | 79,015,847 | | 73,410,156 | |
| | | | | |
Mandatorily redeemable capital stock | | 93,175 | | 31,808 | |
Accrued interest payable | | 283,174 | | 280,452 | |
Affordable Housing Program (AHP) | | 55,406 | | 48,451 | |
Payable to Resolution Funding Corporation (REFCorp) | | 13,118 | | 16,318 | |
Derivative liabilities | | 306,910 | | 286,789 | |
Other liabilities | | 23,115 | | 25,724 | |
| | | | | |
Total liabilities | | 80,711,368 | | 74,812,824 | |
Commitments and contingencies (Note 16) | | | | | |
| | | | | |
CAPITAL | | | | | |
Capital stock — Class B — putable ($100 par value), 33,804 shares and 31,638 shares issued and outstanding at June 30, 2008, and December 31, 2007, respectively | | 3,380,380 | | 3,163,793 | |
Retained earnings | | 252,464 | | 225,922 | |
Accumulated other comprehensive income: | | | | | |
Net unrealized loss on available-for-sale securities | | (24,964 | ) | (89 | ) |
Net unrealized gain relating to hedging activities | | 30 | | 558 | |
Pension and postretirement benefits | | (3,072 | ) | (2,670 | ) |
| | | | | |
Total capital | | 3,604,838 | | 3,387,514 | |
| | | | | |
Total Liabilities and Capital | | $ | 84,316,206 | | $ | 78,200,338 | |
(a) Fair values of held-to-maturity securities were $8,960,117 and $7,785,535 at June 30, 2008, and December 31, 2007, respectively.
The accompanying notes are an integral part of these financial statements.
1
Table of Contents
FEDERAL HOME LOAN BANK OF BOSTON
STATEMENTS OF INCOME
(dollars in thousands)
(unaudited)
| | For the Three Months Ended June 30, | | For the Six Months Ended June 30, | |
| | 2008 | | 2007 | | 2008 | | 2007 | |
INTEREST INCOME | | | | | | | | | |
Advances | | $ | 451,527 | | $ | 512,146 | | $ | 1,062,263 | | $ | 997,875 | |
Prepayment fees on advances, net | | 43 | | 1,815 | | 4,490 | | 2,485 | |
Interest-bearing deposits in banks | | 24,930 | | 18,453 | | 75,205 | | 36,976 | |
Securities purchased under agreements to resell | | 1,458 | | 17,105 | | 10,461 | | 44,842 | |
Federal funds sold | | 8,252 | | 65,971 | | 23,253 | | 105,222 | |
Investments: | | | | | | | | | |
Trading securities | | 1,319 | | 1,935 | | 2,873 | | 4,006 | |
Available-for-sale securities | | 6,876 | | 11,816 | | 16,848 | | 23,537 | |
Held-to-maturity securities | | 90,941 | | 97,607 | | 175,681 | | 195,885 | |
Prepayment fees on investments | | 1,364 | | 728 | | 2,081 | | 2,660 | |
Mortgage loans held for portfolio | | 51,622 | | 54,952 | | 103,882 | | 111,247 | |
Total interest income | | 638,332 | | 782,528 | | 1,477,037 | | 1,524,735 | |
| | | | | | | | | |
INTEREST EXPENSE | | | | | | | | | |
Consolidated obligations: | | | | | | | | | |
Bonds | | 288,026 | | 443,870 | | 607,532 | | 866,932 | |
Discount notes | | 260,419 | | 254,781 | | 675,618 | | 492,900 | |
Deposits | | 4,842 | | 11,331 | | 11,898 | | 22,135 | |
Mandatorily redeemable capital stock | | 323 | | 185 | | 635 | | 436 | |
Other borrowings | | 206 | | 45 | | 357 | | 49 | |
Total interest expense | | 553,816 | | 710,212 | | 1,296,040 | | 1,382,452 | |
| | | | | | | | | |
NET INTEREST INCOME | | 84,516 | | 72,316 | | 180,997 | | 142,283 | |
| | | | | | | | | |
(Reduction of) provision for credit losses | | — | | (9 | ) | — | | (9 | ) |
| | | | | | | | | |
NET INTEREST INCOME AFTER REDUCTION OF PROVISION FOR CREDIT LOSSES | | 84,516 | | 72,325 | | 180,997 | | 142,292 | |
| | | | | | | | | |
OTHER INCOME (LOSS) | | | | | | | | | |
Loss on early extinguishment of debt | | — | | (641 | ) | (2,699 | ) | (641 | ) |
Service fees | | 1,302 | | 937 | | 2,607 | | 2,003 | |
Net unrealized losses on trading securities | | (687 | ) | (785 | ) | (612 | ) | (859 | ) |
Net gains (losses) on derivatives and hedging activities | | 137 | | (3,979 | ) | (4,169 | ) | (2,983 | ) |
Other | | 47 | | 9 | | 63 | | 11 | |
Total other income (loss) | | 799 | | (4,459 | ) | (4,810 | ) | (2,469 | ) |
| | | | | | | | | |
OTHER EXPENSE | | | | | | | | | |
Operating | | 12,516 | | 12,055 | | 25,560 | | 23,614 | |
Finance Board and Office of Finance | | 1,066 | | 897 | | 2,165 | | 1,964 | |
Other | | 280 | | 264 | | 541 | | 537 | |
Total other expense | | 13,862 | | 13,216 | | 28,266 | | 26,115 | |
| | | | | | | | | |
INCOME BEFORE ASSESSMENTS | | 71,453 | | 54,650 | | 147,921 | | 113,708 | |
| | | | | | | | | |
AHP | | 5,866 | | 4,480 | | 12,140 | | 9,327 | |
REFCorp | | 13,117 | | 10,034 | | 27,156 | | 20,876 | |
Total assessments | | 18,983 | | 14,514 | | 39,296 | | 30,203 | |
| | | | | | | | | |
NET INCOME | | $ | 52,470 | | $ | 40,136 | | $ | 108,625 | | $ | 83,505 | |
The accompanying notes are an integral part of these financial statements.
2
Table of Contents
FEDERAL HOME LOAN BANK OF BOSTON
STATEMENTS OF CAPITAL
THREE MONTHS ENDED JUNE 30, 2008 AND 2007
(dollars and shares in thousands)
(unaudited)
| | Capital Stock
Class B - Putable | | Retained | | Accumulated
Other
Comprehensive | | Total | |
| | Shares | | Par Value | | Earnings | | Income | | Capital | |
| | | | | | | | | | | |
BALANCE, MARCH 31, 2007 | | 23,790 | | $ | 2,378,964 | | $ | 190,881 | | $ | 3,612 | | $ | 2,573,457 | |
| | | | | | | | | | | |
Proceeds from sale of capital stock | | 545 | | 54,468 | | | | | | 54,468 | |
Repurchase/redemption of capital stock | | (58 | ) | (5,776 | ) | | | | | (5,776 | ) |
Comprehensive income: | | | | | | | | | | | |
Net income | | | | | | 40,136 | | | | 40,136 | |
Other comprehensive income: | | | | | | | | | | | |
Net unrealized gains on available-for-sale securities | | | | | | | | 5,475 | | 5,475 | |
Reclassification adjustment for previously deferred hedging gains and losses included in income | | | | | | | | (318 | ) | (318 | ) |
Pension and postretirement benefits | | | | | | | | (498 | ) | (498 | ) |
Total comprehensive income | | | | | | | | | | 44,795 | |
Cash dividends on capital stock (6.75%) (1) | | | | | | (38,671 | ) | | | (38,671 | ) |
| | | | | | | | | | | |
BALANCE, JUNE 30, 2007 | | 24,277 | | $ | 2,427,656 | | $ | 192,346 | | $ | 8,271 | | $ | 2,628,273 | |
| | | | | | | | | | | |
BALANCE, MARCH 31, 2008 | | 33,062 | | $ | 3,306,246 | | $ | 232,450 | | $ | (39,330 | ) | $ | 3,499,366 | |
| | | | | | | | | | | |
Proceeds from sale of capital stock | | 1,632 | | 163,210 | | | | | | 163,210 | |
Repurchase/redemption of capital stock | | (27 | ) | (2,709 | ) | | | | | (2,709 | ) |
Reclassification of shares to mandatorily redeemable capital stock | | (863 | ) | (86,367 | ) | | | | | (86,367 | ) |
Comprehensive income: | | | | | | | | | | | |
Net income | | | | | | 52,470 | | | | 52,470 | |
Other comprehensive income: | | | | | | | | | | | |
Net unrealized gains on available-for-sale securities | | | | | | | | 12,032 | | 12,032 | |
Reclassification adjustment for previously deferred hedging gains and losses included in income | | | | | | | | (239 | ) | (239 | ) |
Pension and postretirement benefits | | | | | | | | (469 | ) | (469 | ) |
Total comprehensive income | | | | | | | | | | 63,794 | |
Cash dividends on capital stock (4.00%) (1) | | | | | | (32,456 | ) | | | (32,456 | ) |
| | | | | | | | | | | |
BALANCE, JUNE 30, 2008 | | 33,804 | | $ | 3,380,380 | | $ | 252,464 | | $ | (28,006 | ) | $ | 3,604,838 | |
(1) Dividend rate is annualized.
The accompanying notes are an integral part of these financial statements.
3
Table of Contents
FEDERAL HOME LOAN BANK OF BOSTON
STATEMENTS OF CAPITAL
SIX MONTHS ENDED JUNE 30, 2008 AND 2007
(dollars and shares in thousands)
(unaudited)
| | Capital Stock
Class B - Putable | | Retained | | Accumulated
Other
Comprehensive | | Total | |
| | Shares | | Par Value | | Earnings | | Income | | Capital | |
| | | | | | | | | | | |
BALANCE, DECEMBER 31, 2006 | | 23,425 | | $ | 2,342,517 | | $ | 187,304 | | $ | 2,693 | | $ | 2,532,514 | |
| | | | | | | | | | | |
Proceeds from sale of capital stock | | 1,885 | | 188,492 | | | | | | 188,492 | |
Repurchase/redemption of capital stock | | (948 | ) | (94,803 | ) | | | | | (94,803 | ) |
Reclassification of shares to mandatorily redeemable capital stock | | (85 | ) | (8,550 | ) | | | | | (8,550 | ) |
Comprehensive income: | | | | | | | | | | | |
Net income | | | | | | 83,505 | | | | 83,505 | |
Other comprehensive income: | | | | | | | | | | | |
Net unrealized gains on available-for-sale securities | | | | | | | | 6,698 | | 6,698 | |
Reclassification adjustment for previously deferred hedging gains and losses included in income | | | | | | | | (689 | ) | (689 | ) |
Pension and postretirement benefits | | | | | | | | (431 | ) | (431 | ) |
Total comprehensive income | | | | | | | | | | 89,083 | |
Cash dividends on capital stock (6.69%) (1) | | | | | | (78,463 | ) | | | (78,463 | ) |
| | | | | | | | | | | |
BALANCE, JUNE 30, 2007 | | 24,277 | | $ | 2,427,656 | | $ | 192,346 | | $ | 8,271 | | $ | 2,628,273 | |
| | | | | | | | | | | |
BALANCE, DECEMBER 31, 2007 | | 31,638 | | $ | 3,163,793 | | $ | 225,922 | | $ | (2,201 | ) | $ | 3,387,514 | |
| | | | | | | | | | | |
Proceeds from sale of capital stock | | 3,073 | | 307,324 | | | | | | 307,324 | |
Repurchase/redemption of capital stock | | (29 | ) | (2,949 | ) | | | | | (2,949 | ) |
Reclassification of shares to mandatorily redeemable capital stock | | (878 | ) | (87,788 | ) | | | | | (87,788 | ) |
Comprehensive income: | | | | | | | | | | | |
Net income | | | | | | 108,625 | | | | 108,625 | |
Other comprehensive income: | | | | | | | | | | | |
Net unrealized losses on available-for-sale securities | | | | | | | | (24,875 | ) | (24,875 | ) |
Reclassification adjustment for previously deferred hedging gains and losses included in income | | | | | | | | (528 | ) | (528 | ) |
Pension and postretirement benefits | | | | | | | | (402 | ) | (402 | ) |
Total comprehensive income | | | | | | | | | | 82,820 | |
Cash dividends on capital stock (5.00%) (1) | | | | | | (82,083 | ) | | | (82,083 | ) |
| | | | | | | | | | | |
BALANCE, JUNE 30, 2008 | | 33,804 | | $ | 3,380,380 | | $ | 252,464 | | $ | (28,006 | ) | $ | 3,604,838 | |
(1) Dividend rate is annualized.
The accompanying notes are an integral part of these financial statements.
4
Table of Contents
FEDERAL HOME LOAN BANK OF BOSTON
STATEMENTS OF CASH FLOWS
(dollars in thousands)
(unaudited)
| | For the Six Months Ended June 30, | |
| | 2008 | | 2007 | |
OPERATING ACTIVITIES | | | | | |
| | | | | |
Net income | | $ | 108,625 | | $ | 83,505 | |
| | | | | |
Adjustments to reconcile net income to net cash provided by operating activities: | | | | | |
Depreciation and amortization | | (117,880 | ) | 29,234 | |
Reduction of provision for credit losses on mortgage loans | | — | | (9 | ) |
Change in net fair-value adjustments on derivatives and hedging activities | | 18,422 | | (3,024 | ) |
Other adjustments | | 2,642 | | 615 | |
Net change in: | | | | | |
Market value of trading securities | | 612 | | 859 | |
Accrued interest receivable | | 152,064 | | (4,701 | ) |
Other assets | | (11,600 | ) | (971 | ) |
Net derivative accrued interest | | 6,666 | | (75,918 | ) |
Accrued interest payable | | 2,636 | | 55,264 | |
Other liabilities | | 611 | | 676 | |
| | | | | |
Total adjustments | | 54,173 | | 2,025 | |
Net cash provided by operating activities | | 162,798 | | 85,530 | |
| | | | | |
INVESTING ACTIVITIES | | | | | |
| | | | | |
Net change in: | | | | | |
Interest-bearing deposits in banks | | 1,879,975 | | (90,000 | ) |
Securities purchased under agreements to resell | | 500,000 | | 1,250,000 | |
Federal funds sold | | 728,000 | | (2,531,500 | ) |
Premises, software, and equipment | | (373 | ) | (584 | ) |
Trading securities: | | | | | |
Proceeds | | 25,304 | | 24,423 | |
Available-for-sale securities: | | | | | |
Proceeds | | — | | 9,175 | |
Purchases | | (30,551 | ) | — | |
Held-to-maturity securities: | | | | | |
Net increase in short-term | | — | | (44,993 | ) |
Proceeds | | 1,220,179 | | 1,272,844 | |
Purchases | | (3,306,832 | ) | (1,271,554 | ) |
Advances to members: | | | | | |
Proceeds | | 493,136,094 | | 212,340,434 | |
Disbursements | | (500,551,691 | ) | (213,893,087 | ) |
Mortgage loans held for portfolio: | | | | | |
Proceeds | | 313,236 | | 315,721 | |
Purchases | | (278,205 | ) | (81,206 | ) |
Proceeds from sale of foreclosed assets | | 2,264 | | 1,844 | |
| | | | | |
Net cash used in investing activities | | (6,362,600 | ) | (2,698,483 | ) |
| | | | | |
FINANCING ACTIVITIES | | | | | |
| | | | | |
Net change in deposits | | 242,615 | | (78,330 | ) |
Net proceeds on derivative contracts with financing elements | | 1,709 | | — | |
Net proceeds from issuance of consolidated obligations: | | | | | |
Discount notes | | 770,081,790 | | 399,044,917 | |
Bonds | | 18,365,853 | | 15,579,650 | |
Payments for maturing and retiring consolidated obligations: | | | | | |
Discount notes | | (768,603,762 | ) | (398,452,720 | ) |
Bonds | | (14,084,451 | ) | (13,481,102 | ) |
Proceeds from issuance of capital stock | | 307,324 | | 188,492 | |
Payments for redemption of mandatorily redeemable capital stock | | (26,421 | ) | (16,616 | ) |
Payments for repurchase/redemption of capital stock | | (2,949 | ) | (94,803 | ) |
Cash dividends paid | | (82,084 | ) | (78,684 | ) |
| | | | | |
Net cash provided by financing activities | | 6,199,624 | | 2,610,804 | |
| | | | | |
Net decrease in cash and cash equivalents | | (178 | ) | (2,149 | ) |
| | | | | |
Cash and cash equivalents at beginning of the year | | 6,823 | | 8,197 | |
| | | | | |
Cash and cash equivalents at period end | | $ | 6,645 | | $ | 6,048 | |
| | | | | |
Supplemental disclosures: | | | | | |
Interest paid | | $ | 1,462,218 | | $ | 1,384,213 | |
AHP payments | | $ | 4,514 | | $ | 5,155 | |
REFCorp assessments paid | | $ | 30,356 | | $ | 24,118 | |
Non-cash transfers of mortgage loans held for portfolio to real estate owned (REO) | | $ | 3,097 | | $ | 1,503 | |
The accompanying notes are an integral part of these financial statements.
5
Table of Contents
FEDERAL HOME LOAN BANK OF BOSTON
NOTES TO FINANCIAL STATEMENTS
(unaudited)
Note 1 — Basis of Presentation
The accompanying unaudited financial statements have been prepared in accordance with accounting principles generally accepted in the United States of America (GAAP) for interim financial information. Accordingly, they do not include all of the information and footnotes required by GAAP for complete annual financial statements. In the opinion of management, all adjustments (consisting only of normal recurring accruals), considered necessary for a fair statement have been included. The presentation of financial statements in conformity with GAAP requires management to make estimates and assumptions that affect the amounts reported in the financial statements and accompanying notes. Actual results could differ from those estimates. The results of operations for interim periods are not necessarily indicative of the results to be expected for the year ending December 31, 2008. The unaudited financial statements should be read in conjunction with the Federal Home Loan Bank of Boston (the Bank) audited financial statements and related notes filed in the Bank’s Annual Report on Form 10-K for the year ended December 31, 2007.
Certain amounts in the 2007 financial statements have been reclassified to conform to the 2008 presentation, as described in Note 2 below.
Note 2 — Recently Issued Accounting Standards and Interpretations
Effective January 1, 2008, the Bank adopted Statement of Financial Accounting Standards (SFAS) No. 157, Fair Value Measurements (SFAS 157), and SFAS No. 159, The Fair Value Option for Financial Assets and Financial Liabilities - Including an Amendment of FASB Statement No. 115 (SFAS 159). SFAS 157 defines fair value, establishes a framework for measuring fair value, establishes a fair-value hierarchy based on the inputs used to measure fair value and enhances disclosure requirements for fair-value measurements. SFAS 157 defines “fair value” as the price that would be received to sell an asset, or paid to transfer a liability, in an orderly transaction between market participants at the measurement date. SFAS 159 allows an entity to irrevocably elect fair value as the initial and subsequent measurement attribute for certain financial assets and financial liabilities, with changes in fair value recognized in earnings as they occur. The effect of adopting SFAS 157 was immaterial to the Bank’s financial condition at January 1, 2008. Upon the adoption of SFAS 159, the Bank did not elect to record any additional financial assets and liabilities at fair value at January 1, 2008. For additional information on the fair value of certain financial assets and financial liabilities, see Note 15 - Estimated Fair Values.
FASB Staff Position No. FIN 39-1, Amendment of FASB Interpretation No. 39 (FSP FIN 39-1). On April 30, 2007, the Financial Accounting Standards Board (FASB) issued FSP FIN 39-1, which permits an entity to offset fair-value amounts recognized for derivative instruments and fair-value amounts recognized for the right to reclaim cash collateral (a receivable) or the obligation to return cash collateral (a payable) arising from derivative instruments recognized at fair value executed with the same counterparty under a master-netting arrangement. Under FSP FIN 39-1, the receivable or payable related to cash collateral may not be offset if the amount recognized does not represent or approximate fair value or arises from instruments in a master-netting arrangement that are not eligible to be offset. The decision whether to offset such fair-value amounts represents an elective accounting policy decision that, once elected, must be applied consistently. FSP FIN 39-1 became effective on January 1, 2008. An entity should recognize the effects of applying FSP FIN 39-1 as a change in accounting principle through retrospective application for all financial statements presented unless it is impracticable to do so. Upon adoption of FSP FIN 39-1, an entity is permitted to change its accounting policy to offset or not offset fair-value amounts recognized for derivative instruments under master-netting arrangements. The previous and current accounting policy of the Bank is to offset derivative instruments of the same counterparty under a master-netting arrangement. At December 31, 2007, the Bank held cash collateral, including accrued interest from derivative counterparties totaling $61.2 million, classified as deposits and accrued interest payable in the statement of condition. Upon adoption of FSP FIN 39-1 on January 1, 2008, this amount was reclassified to derivative assets or derivative liabilities and the Bank does not consider this to have had a material impact on its financial condition. Because FSP FIN 39-1 is retroactive, we have revised the December 31, 2007, statement of condition as if FSP FIN 39-1 had been in effect on that date. As a result of this revision, we recorded the following changes to the statement of condition as of December 31, 2007 (dollars in thousands):
| | As Originally | | FSP FIN 39-1 | | | |
| | Presented | | Adjustments | | Revised | |
| | | | | | | |
Derivative assets | | $ | 117,823 | | $ | (50,776 | ) | $ | 67,047 | |
Total assets | | 78,251,114 | | (50,776 | ) | 78,200,338 | |
| | | | | | | |
Deposits | | 774,041 | | (60,915 | ) | 713,126 | |
Accrued interest payable | | 280,687 | | (235 | ) | 280,452 | |
Derivative liabilities | | 276,415 | | 10,374 | | 286,789 | |
Total liabilities | | 74,863,600 | | (50,776 | ) | 74,812,824 | |
| | | | | | | | | | |
6
Table of Contents
DIG Issue E23. On December 20, 2007, the FASB issued DIG Issue No. E23, Issues Involving the Application of the Shortcut Method Under Paragraph 68 (DIG Issue E23). DIG Issue E23 amends paragraph 68 of SFAS 133 with respect to the conditions that must be satisfied in order to apply the shortcut method for assessing hedge effectiveness. DIG Issue E23 is effective for hedging relationships designated on or after January 1, 2008. The Bank’s adoption of DIG Issue E23 at January 1, 2008, did not have a material effect on its financial condition, results of operations, or cash flows.
SFAS No. 161, Disclosures about Derivative Instruments and Hedging Activities — an Amendment of FASB Statement No. 133 (SFAS 161). On March 19, 2008, the FASB issued SFAS 161, which is intended to improve financial reporting about derivative instruments and hedging activities by requiring enhanced disclosures to enable investors to better understand their effects on the entities’ financial position, financial performance, and cash flows. SFAS 161 is effective for financial statements issued for fiscal years and interim periods beginning after November 15, 2008 (January 1, 2009, for the Bank), with early adoption allowed. The Bank has not yet determined the effect that the adoption of SFAS 161 will have on its financial statement disclosures.
Cash Flows from Trading Securities. SFAS 159 amends SFAS No. 95, Statement of Cash Flows (as amended) (SFAS 95), and SFAS No. 115, Accounting for Certain Investments in Debt and Equity Securities (SFAS 115), to specify that cash flows from trading securities (which include securities for which an entity has elected the fair-value option) should be classified in the statement of cash flows based on the nature of and purpose for which the securities were acquired. Prior to this statement, SFAS 95 and SFAS 115 specified that all cash flows from trading securities must be classified as cash flows from operating activities.
On a retroactive basis, beginning in the first quarter of 2008, the Bank classifies purchases, sales, and maturities of trading securities held for investment purposes as cash flows from investing activities. Cash flows related to trading securities held for trading purposes continue to be reported as cash flows from operating activities. Previously, all cash flows associated with trading securities were reflected in the statement of cash flows as operating activities. While the Bank classified certain investments acquired for purposes of liquidity and asset/liability management as trading and carried them at fair value, the Bank does not participate in speculative trading practices and may hold certain trading investments indefinitely as management periodically evaluates its liquidity needs.
Note 3 — Trading Securities
Major Security Types. Trading securities as of June 30, 2008, and December 31, 2007, were as follows (dollars in thousands):
| | June 30, 2008 | | December 31, 2007 | |
Mortgage-backed securities | | | | | |
U.S. government guaranteed | | $ | 29,152 | | $ | 32,827 | |
Government-sponsored enterprises | | 39,982 | | 47,754 | |
Other | | 17,819 | | 32,288 | |
| | | | | |
Total | | $ | 86,953 | | $ | 112,869 | |
Net losses on trading securities for the six months ended June 30, 2008 and 2007, consist of a change in net unrealized holding losses of $612,000 and $859,000 for securities held on June 30, 2008 and 2007, respectively.
The Bank does not participate in speculative trading practices and holds these investments over a longer time horizon as management periodically evaluates its liquidity needs.
Note 4 — Available-for-Sale Securities
Major Security Types. Available-for-sale securities as of June 30, 2008, were as follows (dollars in thousands):
| | | | | | Amounts Recorded in | | | |
| | | | | | Accumulated Other | | | |
| | | | SFAS 133 | | Comprehensive Income | | | |
| | | | Carrying | | | | | | | |
| | Amortized | | Value | | Unrealized | | Unrealized | | Estimated | |
| | Cost | | Adjustments | | Gains | | Losses | | Fair Value | |
| | | | | | | | | | | |
Supranational banks | | $ | 350,239 | | $ | 45,192 | | $ | — | | $ | (4,403 | ) | $ | 391,028 | |
U.S. government corporations | | 213,398 | | 22,978 | | — | | (12,216 | ) | 224,160 | |
Government-sponsored enterprises | | 143,559 | | 13,217 | | 72 | | (5,191 | ) | 151,657 | |
| | | | | | | | | | | |
| | 707,196 | | 81,387 | | 72 | | (21,810 | ) | 766,845 | |
Mortgage-backed securities | | | | | | | | | | | |
Government-sponsored enterprises | | 299,301 | | 7,172 | | — | | (3,226 | ) | 303,247 | |
| | | | | | | | | | | |
Total | | $ | 1,006,497 | | $ | 88,559 | | $ | 72 | | $ | (25,036 | ) | $ | 1,070,092 | |
7
Table of Contents
Available-for-sale securities as of December 31, 2007, were as follows (dollars in thousands):
| | | | | | Amounts Recorded in | | | |
| | | | | | Accumulated Other | | | |
| | | | SFAS 133 | | Comprehensive Income | | | |
| | | | Carrying | | | | | | | |
| | Amortized | | Value | | Unrealized | | Unrealized | | Estimated | |
| | Cost | | Adjustments | | Gains | | Losses | | Fair Value | |
| | | | | | | | | | | |
Supranational banks | | $ | 350,603 | | $ | 44,075 | | $ | 1,964 | | $ | (301 | ) | $ | 396,341 | |
U.S. government corporations | | 213,485 | | 21,715 | | 2,004 | | — | | 237,204 | |
Government-sponsored enterprises | | 143,586 | | 12,635 | | 424 | | (581 | ) | 156,064 | |
| | | | | | | | | | | |
| | 707,674 | | 78,425 | | 4,392 | | (882 | ) | 789,609 | |
Mortgage-backed securities | | | | | | | | | | | |
Government-sponsored enterprises | | 269,248 | | 8,501 | | — | | (3,599 | ) | 274,150 | |
| | | | | | | | | | | |
Total | | $ | 976,922 | | $ | 86,926 | | $ | 4,392 | | $ | (4,481 | ) | $ | 1,063,759 | |
Impairment Analysis on Available-for-Sale Securities. Management has evaluated the available-for-sale investment securities portfolio and has concluded that no securities were other-than-temporarily impaired as of June 30, 2008.
Non-Mortgage-Backed Securities. Management believes that the unrealized loss on non-mortgage-backed securities is the result of the current interest-rate environment and illiquidity in the credit markets. While investments in government-sponsored enterprise (GSE) securities, specifically debentures issued by the Federal National Mortgage Association (Fannie Mae) and the Federal Home Loan Mortgage Corporation (Freddie Mac), were additionally impacted by investor concerns regarding those entities’ capital levels needed to offset credit losses that may result from declining home prices, the Housing and Economic Recovery Act of 2008 contains provisions allowing the U.S. Treasury Department to provide support to Fannie Mae and Freddie Mac. Management has reviewed these available-for-sale securities and has determined that all unrealized losses reflected above are temporary given the creditworthiness of the issuers. Because the decline in market value is attributable to illiquidity in the credit markets and not to deterioration in the fundamental credit quality of these securities, and because the Bank has the ability and intent to hold these investments through to a recovery of fair value, which may be maturity, the Bank does not consider these investments to be other-than-temporarily impaired at June 30, 2008.
Mortgage-Backed Securities. Management believes that the unrealized losses on the Bank’s investment in mortgage-backed securities (MBS) are the result of the current interest-rate environment and illiquidity in the credit markets. All of these MBS are issued and guaranteed by a GSE. While investments in GSE-issued MBS, specifically Fannie Mae and Freddie Mac, have been impacted by investor concerns regarding capital levels in the face of expected credit losses, the Housing and Economic Recovery Act of 2008 contains provisions allowing the U.S. Treasury Department to provide support to Fannie Mae and Freddie Mac. This legislation has helped stem the concerns of GSE securities holders. Management has determined that all unrealized losses reflected above are temporary given the creditworthiness of the issuers and the underlying collateral. In addition, for GSE securities, the issuer guarantees the timely payment of principal and interest of these investments. Because the decline in market value is largely attributable to illiquidity in the credit markets and not solely to deterioration in the fundamental credit quality of these securities, and because the Bank has the ability and intent to hold these investments through to a recovery of fair value, which may be maturity, the Bank does not consider these investments to be other-than-temporarily impaired at June 30, 2008.
Redemption Terms. The amortized cost and estimated fair value of available-for-sale securities by contractual maturity at June 30, 2008, and December 31, 2007, are shown below (dollars in thousands). Expected maturities of some securities and MBS may differ from contractual maturities because borrowers may have the right to call or prepay obligations with or without call or prepayment fees.
8
Table of Contents
| | June 30, 2008 | | December 31, 2007 | |
| | | | Estimated | | | | Estimated | |
| | Amortized | | Fair | | Amortized | | Fair | |
Year of Maturity | | Cost | | Value | | Cost | | Value | |
| | | | | | | | | |
Due in one year or less | | $ | 54,893 | | $ | 55,484 | | $ | 29,913 | | $ | 30,315 | |
Due after one year through five years | | — | | — | | 24,984 | | 25,206 | |
Due after five years through 10 years | | — | | — | | — | | — | |
Due after 10 years | | 652,303 | | 711,361 | | 652,777 | | 734,088 | |
| | 707,196 | | 766,845 | | 707,674 | | 789,609 | |
| | | | | | | | | |
Mortgage-backed securities | | 299,301 | | 303,247 | | 269,248 | | 274,150 | |
| | | | | | | | | |
Total | | $ | 1,006,497 | | $ | 1,070,092 | | $ | 976,922 | | $ | 1,063,759 | |
As of June 30, 2008, the amortized cost of the Bank’s available-for-sale securities includes net premiums of $41.8 million. Of that amount, $40.4 million relate to non-MBS and $1.4 million relate to MBS. As of December 31, 2007, the amortized cost of the Bank’s available-for-sale securities includes net premiums of $40.9 million. Of that amount, $40.9 million relate to non-MBS and $32,000 relate to MBS.
Note 5 — Held-to-Maturity Securities
Major Security Types. Held-to-maturity securities as of June 30, 2008, were as follows (dollars in thousands):
| | Amortized
Cost | | Gross
Unrealized
Gains | | Gross
Unrealized
Losses | | Estimated
Fair
Value | |
| | | | | | | | | |
U.S. agency obligations | | $ | 46,345 | | $ | 1,059 | | $ | — | | $ | 47,404 | |
State or local housing-finance-agency obligations | | 284,563 | | 1,640 | | (18,017 | ) | 268,186 | |
| | 330,908 | | 2,699 | | (18,017 | ) | 315,590 | |
| | | | | | | | | |
Mortgage-backed securities | | | | | | | | | |
U.S. government guaranteed | | 12,720 | | 630 | | (13 | ) | 13,337 | |
Government-sponsored enterprises | | 4,698,217 | | 25,458 | | (27,632 | ) | 4,696,043 | |
Other | | 4,992,022 | | 661 | | (1,057,536 | ) | 3,935,147 | |
| | 9,702,959 | | 26,749 | | (1,085,181 | ) | 8,644,527 | |
| | | | | | | | | |
Total | | $ | 10,033,867 | | $ | 29,448 | | $ | (1,103,198 | ) | $ | 8,960,117 | |
Held-to-maturity securities as of December 31, 2007, were as follows (dollars in thousands):
| | Amortized
Cost | | Gross
Unrealized
Gains | | Gross
Unrealized
Losses | | Estimated
Fair
Value | |
| | | | | | | | | |
U.S. agency obligations | | $ | 51,634 | | $ | 1,831 | | $ | — | | $ | 53,465 | |
State or local housing-finance-agency obligations | | 299,653 | | 2,396 | | (14,821 | ) | 287,228 | |
| | 351,287 | | 4,227 | | (14,821 | ) | 340,693 | |
| | | | | | | | | |
Mortgage-backed securities | | | | | | | | | |
U.S. government guaranteed | | 13,661 | | 636 | | — | | 14,297 | |
Government-sponsored enterprises | | 1,658,407 | | 26,305 | | (2,342 | ) | 1,682,370 | |
Other | | 5,924,526 | | 2,789 | | (179,140 | ) | 5,748,175 | |
| | 7,596,594 | | 29,730 | | (181,482 | ) | 7,444,842 | |
| | | | | | | | | |
Total | | $ | 7,947,881 | | $ | 33,957 | | $ | (196,303 | ) | $ | 7,785,535 | |
Impairment Analysis on Held-to-Maturity Securities. The ongoing deterioration in U.S. housing markets, as reflected in declines in values of residential real estate and high levels of delinquencies on loans underlying MBS, poses risks to the Bank in respect to the ultimate collection of principal and interest due on its private label collateralized mortgage obligation holdings. While the resultant illiquidity in the capital markets due to the turmoil in housing credit has been the principal driver behind the decline in the fair value of the Bank’s private label collateralized mortgage obligation securities since December 31, 2007, the Bank closely monitors the performance of its securities to evaluate its exposure to the risk of loss on these investments to determine if a loss is other than temporary.
9
Table of Contents
State or Local Housing-Finance-Agency Obligations. Management has reviewed its investments in state or local housing-finance-agency obligations and has determined that the unrealized losses shown are the result of the current interest-rate environment and illiquidity in the credit markets. The Bank has determined that all unrealized losses reflected above are temporary given the creditworthiness of the issuers and the underlying collateral. Because the decline in market value is attributable to changes in interest rates and illiquidity in the credit markets and not to a deterioration in the fundamental credit quality of these obligations, and because the Bank has the ability and intent to hold these investments through to a recovery of fair value, which may be maturity, the Bank does not consider these investments to be other-than-temporarily impaired at June 30, 2008.
Mortgage-Backed Securities. The Bank invests in high-quality securities, which must be rated triple-A at the time of purchase. Each of the securities contains one or more of the following forms of credit protection:
· Guarantee of principal and interest — The issuer guarantees the timely payment of principal and interest.
· Excess spread — The average coupon rate of the underlying mortgage loans in the pool is higher than the coupon rate on the MBS note. The spread differential may be used to offset any losses that may be realized.
· Overcollateralization — The total outstanding balance on the underlying mortgage loans in the pool is greater than the outstanding MBS note balance. The excess collateral is available to offset any losses that may be realized.
· Subordination — The structure of classes of the security, where subordinated classes absorb any credit losses before the senior classes.
· Insurance wrap — A third-party bond insurance company guarantees timely payment of principal and interest to certain classes of the security.
Credit safeguards for the Bank’s MBS consist of either guarantee of principal and interest in the case of U.S. government-guaranteed MBS and GSE MBS, or credit enhancement for residential MBS issued by entities other than GSEs (private label MBS). Credit enhancements for private label MBS primarily consist of overcollateralization and senior-subordinated shifting interest features; the latter results in the prioritization of payments to senior classes over junior classes. The Bank solely invests in senior classes of GSE and private label MBS.
The Bank has higher exposure to the risk of loss on its investments in MBS when the loans backing the MBS exhibit high rates of delinquency and foreclosure and high losses on the sale of foreclosed properties. With respect to its GSE MBS holdings, the Bank has concluded that despite the ongoing deterioration in the nation’s housing markets, the guarantee of principal and interest on the Bank’s GSE MBS by Fannie Mae and Freddie Mac is still assured, and therefore the securities are not other-than-temporarily impaired. No U.S. government guaranteed or GSE MBS is considered by the Bank to be other-than-temporarily impaired at June 30, 2008.
Since the surety of the Bank’s private label MBS holdings relies on credit enhancements and the quality of the underlying loan collateral the Bank tests these MBS investments on an ongoing basis in an effort to determine whether the credit enhancement associated with each security is sufficient to protect against losses of principal and interest on the underlying mortgage loans. As part of its analysis of private label MBS, the Bank employs a third-party model to project expected loan collateral losses and the lifetime cash flows that would be passed through to its MBS investments. This third-party model evaluates individual loans within a security based on borrower credit qualities and sensitivity of these borrowers to changes in external market conditions, such as forward interest rates and housing price changes. These factors are used by the third-party model to derive resultant voluntary and involuntary prepayments and attendant loss severities as the basis of collateral loss projections.
After underlying loan collateral cash flows are modeled, the Bank determines whether each security’s credit support structure is sufficient to absorb projected principal losses and interest shortfall, if any. A second third-party model is used to monitor the sufficiency of each security’s credit support structure to fully return the Bank’s original investment plus accrued interest. Based on the loan collateral loss forecast, the Bank creates a default projection that is unique for each security that takes into account the vintage, collateral type, and historical default experience of the particular MBS. Loss severities, also known as losses given default (LGD), are modeled in order to project the actual loss to individual loans after defaults occur, based on projected realized value net of servicing costs. The Bank uses consensus economic forecasts to determine degree and timing of continuing housing-price depreciation, and constructs LGD projections that account for severities to date and projected ongoing housing-price deterioration. In addition, the LGD projections incorporate collateral type and vintage to refine loss assumptions further. The Bank uses consensus voluntary prepayment speeds to model the impact of prepayments to its MBS holdings’ senior class position within the respective deal structures. Generally, faster voluntary prepayments benefit the Bank as principal and interest are first applied towards the senior classes the Bank owns prior to application to subordinated classes, which the Bank does not own, allowing the Bank’s holdings to pay off before subordinated classes are eroded to a point wherein the subordinated classes cannot absorb collateral losses. These factors are modeled through the third-party model to determine the sufficiency of credit support to absorb the expected cash flows. The third-party model applies the
10
Table of Contents
collateral cash flows to the deal structure waterfalls, applying shifting interest triggers where applicable. For those securities whose performance is further enhanced by third-party financial guarantors, the third-party model incorporates that credit enhancement into its analysis.
Under the base case scenario described above, the Bank has projected no shortfalls of interest or principal on any of its investment securities as of June 30, 2008. Given the analysis indicates that the Bank will receive all amounts due on these securities, the Bank believes that the decline in MBS market values is a temporary impairment.
While the results of the Bank’s impairment analysis show no loss, if loan credit performance of the Bank’s private-label MBS portfolio deteriorates beyond the forecast assumptions concerning loan default rates, loss severities, and prepayment speeds, some of the Bank’s securities could become impaired, which, in the event that the severely depressed market values as of June 30, 2008, persist, could lead to a significant impairment charge. If it is determined that an impairment is other-than-temporary, then an impairment loss will be recognized in earnings equal to the entire difference between the investment’s then current carrying amount and its fair value. The fair value of the investment would then become the new cost basis of the investment. In periods subsequent to the recognition of an other-than-temporary impairment loss, the Bank would account for the other-than-temporarily impaired debt security as if the debt security had been purchased on the measurement date of the other-than-temporary impairment. The resulting discount or reduced premium recorded for the debt security, based on the new cost basis, would be amortized over the remaining life of the debt security in a prospective manner based on the amount and timing of future estimated cash flows.
Since the decline in market value is primarily attributable to illiquidity in the credit markets, as opposed to deterioration in the fundamental credit quality of these securities, and because the Bank has the ability and intent to hold these investments through to a recovery of fair value, which may be maturity, the Bank does not consider its investments in private label MBS to be other-than-temporarily impaired at June 30, 2008.
Redemption Terms. The amortized cost and estimated fair value of held-to-maturity securities by contractual maturity at June 30, 2008, and December 31, 2007, are shown below (dollars in thousands). Expected maturities of some securities and MBS may differ from contractual maturities because borrowers may have the right to call or prepay obligations with or without call or prepayment fees.
| | June 30, 2008 | | December 31, 2007 | |
| | | | Estimated | | | | Estimated | |
| | Amortized | | Fair | | Amortized | | Fair | |
Year of Maturity | | Cost | | Value | | Cost | | Value | |
| | | | | | | | | |
Due in one year or less | | $ | 1,020 | | $ | 1,028 | | $ | 1,020 | | $ | 1,039 | |
Due after one year through five years | | 7,198 | | 7,449 | | 7,793 | | 8,099 | |
Due after five years through 10 years | | 7,511 | | 7,819 | | 3,743 | | 3,927 | |
Due after 10 years | | 315,179 | | 299,294 | | 338,731 | | 327,628 | |
| | 330,908 | | 315,590 | | 351,287 | | 340,693 | |
| | | | | | | | | |
Mortgage-backed securities | | 9,702,959 | | 8,644,527 | | 7,596,594 | | 7,444,842 | |
| | | | | | | | | |
Total | | $ | 10,033,867 | | $ | 8,960,117 | | $ | 7,947,881 | | $ | 7,785,535 | |
As of June 30, 2008, the amortized cost of the Bank’s held-to-maturity securities includes net discounts of $20.1 million. Of that amount, $283,000 relate to non-MBS and $19.8 million relate to MBS. As of December 31, 2007, the amortized cost of the Bank’s held-to-maturity securities includes net discounts of $18.7 million. Of that amount, $420,000 relate to non-MBS and $18.3 million relate to MBS.
Note 6 — Advances
Redemption Terms. At June 30, 2008, and December 31, 2007, the Bank had advances outstanding, including AHP advances (see Note 11 — Affordable Housing Program), at interest rates ranging from zero percent to 8.44 percent, as summarized below (dollars in thousands). Advances with interest rates of zero percent are AHP-subsidized advances.
11
Table of Contents
| | June 30, 2008 | | December 31, 2007 | |
Year of Contractual Maturity | | Amount | | Weighted
Average
Rate | | Amount | | Weighted
Average
Rate | |
| | | | | | | | | |
Overdrawn demand-deposit accounts | | $ | 20,618 | | 2.41 | % | $ | 61,496 | | 4.64 | % |
Due in one year or less | | 39,162,329 | | 2.69 | | 35,745,494 | | 4.65 | |
Due after one year through two years | | 5,245,417 | | 4.40 | | 6,801,904 | | 4.59 | |
Due after two years through three years | | 5,562,315 | | 3.86 | | 3,883,697 | | 4.89 | |
Due after three years through four years | | 2,115,541 | | 4.53 | | 1,974,447 | | 4.88 | |
Due after four years through five years | | 4,887,910 | | 3.21 | | 1,966,414 | | 4.54 | |
Thereafter | | 5,806,346 | | 4.21 | | 4,951,427 | | 4.45 | |
| | | | | | | | | |
Total par value | | 62,800,476 | | 3.18 | % | 55,384,879 | | 4.65 | % |
| | | | | | | | | |
Premiums | | 3,497 | | | | 4,278 | | | |
Discounts | | (17,921 | ) | | | (17,861 | ) | | |
SFAS 133 hedging adjustments | | 285,804 | | | | 308,444 | | | |
| | | | | | | | | |
Total | | $ | 63,071,856 | | | | $ | 55,679,740 | | | |
The Bank offers advances to members that may be prepaid on pertinent dates (call dates) without incurring prepayment or termination fees (callable advances). Other advances may only be prepaid by paying a fee to the Bank (prepayment fee) that makes the Bank financially indifferent to the prepayment of the advance. At June 30, 2008, and December 31, 2007, the Bank had callable advances outstanding totaling $5.5 million and $30.0 million, respectively.
The following table summarizes advances at June 30, 2008, and December 31, 2007, by year of contractual maturity or next call date for callable advances (dollars in thousands):
Year of Contractual Maturity or Next Call Date | | June 30, 2008 | | December 31, 2007 | |
| | | | | |
Overdrawn demand-deposit accounts | | $ | 20,618 | | $ | 61,496 | |
Due in one year or less | | 39,167,829 | | 35,775,494 | |
Due after one year through two years | | 5,245,417 | | 6,801,904 | |
Due after two years through three years | | 5,556,815 | | 3,883,697 | |
Due after three years through four years | | 2,115,541 | | 1,944,447 | |
Due after four years through five years | | 4,887,910 | | 1,966,414 | |
Thereafter | | 5,806,346 | | 4,951,427 | |
| | | | | |
Total par value | | $ | 62,800,476 | | $ | 55,384,879 | |
The Bank also offers putable advances. With a putable advance, the Bank has the right to terminate the advance at predetermined exercise dates, which the Bank can exercise when interest rates increase above a certain interest rate specified in the related putable advance contract, and the borrower may then apply for a new advance at the prevailing market rate. At June 30, 2008, and December 31, 2007, the Bank had putable advances outstanding totaling $9.3 billion and $8.0 billion, respectively.
The following table summarizes advances outstanding at June 30, 2008, and December 31, 2007, by year of contractual maturity or next put date for putable advances (dollars in thousands):
Year of Contractual Maturity or Next Put Date | | June 30, 2008 | | December 31, 2007 | |
| | | | | |
Overdrawn demand-deposit accounts | | $ | 20,618 | | $ | 61,496 | |
Due in one year or less | | 45,711,304 | | 41,613,769 | |
Due after one year through two years | | 5,290,667 | | 7,260,154 | |
Due after two years through three years | | 4,638,715 | | 2,681,797 | |
Due after three years through four years | | 1,739,991 | | 1,336,647 | |
Due after four years through five years | | 3,770,960 | | 987,864 | |
Thereafter | | 1,628,221 | | 1,443,152 | |
| | | | | |
Total par value | | $ | 62,800,476 | | $ | 55,384,879 | |
Security Terms. The Bank lends to financial institutions involved in housing finance within the six New England states in accordance with federal statutes, including the Federal Home Loan Bank Act of 1932 (FHLBank Act). The FHLBank Act requires the Bank to obtain sufficient collateral on advances to protect against losses and permits the Bank to accept the following as eligible collateral on such advances: residential mortgage loans; certain U.S. government or government-agency securities; cash or deposits, and other eligible real-estate-related assets. The capital stock of the Bank owned by each borrowing member is pledged as additional collateral for the member’s indebtedness to the Bank. However, the capital stock investment in the Bank is not eligible as collateral to originate
12
Table of Contents
a new advance. Community Financial Institutions (CFIs) are eligible, under expanded statutory collateral rules, to pledge as collateral for advances small business, small farm, and small agriculture loans fully secured by collateral other than real estate, or securities representing a whole interest in such secured loans. At June 30, 2008, and December 31, 2007, the Bank had rights to collateral, on a member-by-member basis, with an estimated value greater than outstanding advances.
Credit Risk. While the Bank has never experienced a credit loss on an advance to a member or borrower, weakening economic and credit market conditions along with the expansion of collateral for CFIs and nonmember housing associates provide the potential for additional credit risk for the Bank. Management of the Bank has policies and procedures in place to manage this credit risk. Based on these policies and procedures, the Bank has not provided any allowances for losses on advances. The Bank’s potential credit risk from advances is concentrated in federally insured depository institutions, including commercial banks, savings institutions, and credit unions.
Related-Party Activities. The Bank defines related parties as those members whose ownership of the Bank’s capital stock is in excess of 10 percent of the Bank’s total capital stock outstanding. The following table presents outstanding advances and total accrued interest receivable from advances as of June 30, 2008, and December 31, 2007 (dollars in thousands):
| | Par
Value of
Advances | | Percent
of Total
Advances | | Total Accrued Interest
Receivable | | Percent of Total
Accrued Interest
Receivable on
Advances | |
| | | | | | | | | |
As of June 30, 2008 | | | | | | | | | |
Bank of America Rhode Island, N.A., Providence, RI | | $ | 23,749,313 | | 37.8 | % | $ | 131,617 | | 56.0 | % |
RBS Citizens N.A., Providence, RI | | 10,238,894 | | 16.3 | | 13,932 | | 5.9 | |
| | | | | | | | | |
As of December 31, 2007 | | | | | | | | | |
Bank of America Rhode Island, N.A., Providence, RI | | $ | 23,772,544 | | 42.9 | % | $ | 260,666 | | 70.1 | % |
RBS Citizens N.A., Providence, RI | | 6,241,960 | | 11.3 | | 22,661 | | 6.1 | |
The Bank held sufficient collateral to cover the advances to the above institutions such that the Bank does not expect to incur any credit losses on these advances.
The Bank recognized interest income on outstanding advances with the above members during the three and six months ended June 30, 2008 and 2007, as follows (dollars in thousands):
| | For the Three Months Ended June 30, | | For the Six Months Ended June 30, | |
Name | | 2008 | | 2007 | | 2008 | | 2007 | |
| | | | | | | | | |
Bank of America Rhode Island, N.A., Providence, RI | | $ | 165,443 | | $ | 136,067 | | $ | 410,895 | | $ | 243,168 | |
RBS Citizens N.A., Providence, RI (1) | | 55,025 | | — | | 134,478 | | — | |
Citizens Financial Group, Providence, RI (1) | | — | | 93,250 | | — | | 185,643 | |
| | | | | | | | | | | | | |
(1) During 2007, five of the Bank’s members: Citizens Bank of Connecticut, Citizens Bank of Massachusetts, Citizens Bank of New Hampshire, Citizens Bank of Rhode Island, and RBS National Bank, were merged into Citizens Bank, N.A. Following the consolidation, Citizens Bank, N.A. was renamed RBS Citizens, N.A. Prior to the merger, these five members were independent subsidiaries of Citizens Financial Group, Inc. Upon consolidation, all Bank advances outstanding and accrued interest receivable to these five member institutions were transferred to RBS Citizens, N.A.
The following table presents an analysis of advances activity with related parties for the six months ended June 30, 2008 (dollars in thousands):
| | | | For the Six Months Ended
June 30, 2008 | | | |
| | Balance at
December 31,
2007 | | Disbursements to
Members | | Payments from
Members | | Balance at
June 30, 2008 | |
| | | | | | | | | |
Bank of America Rhode Island, N.A., Providence, RI | | $ | 23,772,544 | | $ | 28,372,830 | | $ | (28,396,061 | ) | $ | 23,749,313 | |
RBS Citizens N.A., Providence, RI | | 6,241,960 | | 275,010,000 | | (271,013,066 | ) | 10,238,894 | |
| | | | | | | | | | | | | |
Interest-Rate-Payment Terms. The following table details additional interest-rate-payment terms for advances at June 30, 2008, and
13
Table of Contents
December 31, 2007 (dollars in thousands):
| | June 30, 2008 | | December 31, 2007 | |
Par amount of advances | | | | | |
Fixed-rate | | $ | 56,314,656 | | $ | 51,044,476 | |
Variable-rate | | 6,485,820 | | 4,340,403 | |
| | | | | |
Total | | $ | 62,800,476 | | $ | 55,384,879 | |
Variable-rate advances noted in the above table include advances outstanding at June 30, 2008, and December 31, 2007, totaling $91.5 million and $378.8 million, respectively, which contain embedded interest-rate caps or floors.
Note 7 — Mortgage Loans Held for Portfolio
Under the Bank’s Mortgage Partnership Finance® (MPF®) program the Bank invests in fixed-rate single-family mortgages that are purchased from participating members. All mortgages are held-for-portfolio. Under the MPF program, the Bank’s members originate, service, and credit-enhance residential real estate mortgages that are then sold to the Bank.
The following table presents mortgage loans held for portfolio as of June 30, 2008, and December 31, 2007 (dollars in thousands):
| | June 30, 2008 | | December 31, 2007 | |
Real estate | | | | | |
Fixed-rate 15-year single-family mortgages | | $ | 1,083,904 | | $ | 1,129,572 | |
Fixed-rate 20- and 30-year single-family mortgages | | 2,946,576 | | 2,938,886 | |
Premiums | | 32,853 | | 35,252 | |
Discounts | | (11,584 | ) | (11,270 | ) |
Deferred derivative gains and losses, net | | (1,628 | ) | (1,001 | ) |
| | | | | |
Total mortgage loans held for portfolio | | 4,050,121 | | 4,091,439 | |
| | | | | |
Less: allowance for credit losses | | (125 | ) | (125 | ) |
| | | | | |
Total mortgage loans, net of allowance for credit losses | | $ | 4,049,996 | | $ | 4,091,314 | |
The following table details the par value of mortgage loans held for portfolio at June 30, 2008, and December 31, 2007 (dollars in thousands):
| | June 30, 2008 | | December 31, 2007 | |
| | | | | |
Conventional loans | | $ | 3,631,490 | | $ | 3,637,590 | |
Government-insured or guaranteed loans | | 398,990 | | 430,868 | |
| | | | | |
Total par value | | $ | 4,030,480 | | $ | 4,068,458 | |
The allowance for credit losses on mortgage loans was $125,000 at both June 30, 2008, and December 31, 2007. The Bank did not have any allowance for credit-loss activity for the six months ended June 30, 2008. For the six months ended June 30, 2007 the Bank had recoveries amount to $9,000 and a reduction of provision for credit losses of $9,000.
Mortgage loans, other than those included in large groups of smaller-balance homogeneous loans, are considered impaired when, based on current information and events, it is probable that the Bank will be unable to collect all principal and interest amounts due according to the contractual terms of the mortgage-loan agreement. At June 30, 2008, and December 31, 2007, the Bank had no recorded investments in impaired mortgage loans. Mortgage loans on nonaccrual status at June 30, 2008, and December 31, 2007, totaled $12.8 million and $8.0 million, respectively. The Bank’s mortgage-loan portfolio is geographically diversified on a national basis. There is no material concentration of delinquent loans in any geographic region. REO at June 30, 2008, and December 31, 2007, totaled $2.7 million and $2.2 million, respectively. REO is recorded on the statement of condition in other assets.
® “Mortgage Partnership Finance,” “MPF,” and “eMPF” are registered trademarks of the Federal Home Loan Bank of Chicago.
14
Table of Contents
Sale of REO Assets. During the six months ended June 30, 2008 and 2007, the Bank sold REO assets with a recorded carrying value of $2.2 million and $1.8 million, respectively. Upon sale of these properties, and inclusive of any proceeds received from primary mortgage-insurance coverage, the Bank recognized net gains totaling $43,000 and $18,000 on the sale of REO assets during the six months ended June 30, 2008 and 2007, respectively. Gains and losses on the sale of REO assets are recorded in other income.
Note 8 — Derivatives and Hedging Activities
For the three months ended June 30, 2008 and 2007, the Bank recorded net gains (losses) on derivatives and hedging activities totaling $137,000 and ($4.0 million), respectively, in other income. For the six months ended June 30, 2008 and 2007, the Bank recorded net losses on derivatives and hedging activities totaling $4.2 million and $3.0 million, respectively. Net gains (losses) on derivatives and hedging activities for the three months and six months ended June 30, 2008 and 2007, were as follows (dollars in thousands):
| | For the Three Months Ended June 30, | |
| | 2008 | | 2007 | |
| | | | | |
Net losses related to fair-value hedge ineffectiveness | | $ | (1,240 | ) | $ | (4,645 | ) |
Net gains resulting from economic hedges not receiving hedge accounting | | 1,377 | | 666 | |
| | | | | |
Net gains (losses) on derivatives and hedging activities | | $ | 137 | | $ | (3,979 | ) |
| | For the Six Months Ended June 30, | |
| | 2008 | | 2007 | |
| | | | | |
Net gains (losses) related to fair-value hedge ineffectiveness | | $ | 458 | | $ | (3,522 | ) |
Net (losses) gains resulting from economic hedges not receiving hedge accounting | | (4,627 | ) | 539 | |
| | | | | |
Net losses on derivatives and hedging activities | | $ | (4,169 | ) | $ | (2,983 | ) |
The following table presents outstanding notional balances and estimated fair values of derivatives outstanding at June 30, 2008, and December 31, 2007 (dollars in thousands):
| | June 30, 2008 | | December 31, 2007 | |
| | Notional | | Estimated
Fair Value | | Notional | | Estimated
Fair Value | |
Interest-rate swaps: | | | | | | | | | |
Fair value | | $ | 32,380,551 | | $ | (409,528 | ) | $ | 28,508,718 | | $ | (375,455 | ) |
Economic | | 175,500 | | (1,998 | ) | 180,500 | | (2,319 | ) |
| | | | | | | | | |
Interest-rate caps/floors: | | | | | | | | | |
Economic | | 122,500 | | 391 | | 409,800 | | 586 | |
Member intermediated | | 20,000 | | — | | 20,000 | | — | |
| | | | | | | | | |
Forward contracts: | | | | | | | | | |
Economic | | 10,000 | | 102 | | — | | — | |
| | | | | | | | | |
Total | | 32,708,551 | | (411,033 | ) | 29,119,018 | | (377,188 | ) |
| | | | | | | | | |
Mortgage-delivery commitments (1) | | 11,142 | | 16 | | 9,600 | | (27 | ) |
| | | | | | | | | |
Total derivatives | | $ | 32,719,693 | | (411,017 | ) | $ | 29,128,618 | | (377,161 | ) |
| | | | | | | | | |
Accrued interest | | | | 211,903 | | | | 218,569 | |
Cash collateral | | | | (95,890 | ) | | | (61,150 | ) |
| | | | | | | | | |
Net derivatives fair value | | | | $ | (295,004 | ) | | | $ | (219,742 | ) |
| | | | | | | | | |
Derivative assets | | | | $ | 11,906 | | | | $ | 67,047 | |
Derivative liabilities | | | | (306,910 | ) | | | (286,789 | ) |
| | | | | | | | | |
Net derivatives fair value | | | | $ | (295,004 | ) | | | $ | (219,742 | ) |
(1) Mortgage-delivery commitments are classified as derivatives pursuant to SFAS 149 with changes in fair value recorded in other income.
15
Table of Contents
Credit Risk. At June 30, 2008, and December 31, 2007, the Bank’s credit risk on derivatives as measured by current replacement cost net of cash collateral and accrued interest was approximately $11.9 million and $67.0 million, respectively. These totals include $66.6 million and $92.6 million of net accrued interest receivable, respectively. In determining current replacement cost, the Bank considers accrued interest receivable and payable, and the legal right to offset derivative assets and liabilities by counterparty. The Bank held cash of $95.7 million as collateral as of June 30, 2008. The Bank held cash and securities, including accrued interest with a fair value of $127.0 million as collateral as of December 31, 2007. The securities collateral held on December 31, 2007, had not been sold or repledged.
The Bank executes derivatives with counterparties rated single-A or better by either Standard & Poor’s Ratings Services (S&P) or Moody’s Investors Service (Moody’s). Some of these counterparties or their affiliates buy, sell, and distribute COs. Note 10 discusses COs and Note 16 discusses assets pledged by the Bank to these counterparties. The Bank is not a derivatives dealer and does not trade derivatives for short-term profit.
Related-Party Activities. The following table presents an analysis of outstanding derivative contracts with related parties and affiliates of related parties at June 30, 2008, and December 31, 2007 (dollars in thousands):
| | | | | | June 30, 2008 | | December 31, 2007 | |
Derivatives Counterparty | | Affiliate Member | |
Primary Relationship
| |
Notional
Outstanding
| | Percent of Notional
Outstanding | | Notional
Outstanding | | Percent of Notional
Outstanding | |
| | | | | | | | | | | | | |
Bank of America, N.A. | | Bank of America Rhode Island, N.A. | | Dealer | | $ | 2,041,904 | | 6.24 | % | $ | 1,305,910 | | 4.48 | % |
Royal Bank of Scotland, PLC | | RBS Citizens, N.A. | | Dealer | | 1,436,760 | | 4.39 | | 896,500 | | 3.08 | |
| | | | | | | | | | | | | | | |
Note 9 — Deposits
The Bank offers demand and overnight deposits for members and qualifying nonmembers. In addition, the Bank offers short-term interest-bearing deposit programs to members. Members that service mortgage loans may deposit in the Bank funds collected in connection with mortgage loans pending disbursement of such funds to the owners of the mortgage loans; the Bank classifies these items as other in the following table.
The following table details interest-bearing and non-interest-bearing deposits at June 30, 2008, and December 31, 2007 (dollars in thousands):
| | June 30, 2008 | | December 31, 2007 | |
Interest bearing | | | | | |
Demand and overnight | | $ | 875,877 | | $ | 672,893 | |
Term | | 30,788 | | 30,770 | |
Other | | 3,345 | | 3,393 | |
Non-interest bearing | | | | | |
Other | | 10,613 | | 6,070 | |
| | | | | |
Total deposits | | $ | 920,623 | | $ | 713,126 | |
Note 10 — Consolidated Obligations
Consolidated obligations (COs) consist of consolidated bonds and discount notes and are backed only by the financial resources of the 12 district Federal Home Loan Banks (FHLBanks). The FHLBanks issue COs through the Office of Finance, which serves as their fiscal agent. In connection with each debt issuance, each FHLBank specifies the amount of debt it wants issued on its behalf. The Office of Finance tracks the amount of debt issued on behalf of each FHLBank. In addition, the Bank separately tracks and records as a liability its specific portion of COs for which it is the primary obligor. Prior to July 30, 2008, the Bank’s regulator was the Federal Housing Finance Board (Finance Board) and from July 30, 2008, the Bank’s regulator is the Federal Housing Finance Agency. All references herein to the Finance Board mean the Bank’s actual regulator at the referenced or related time. The Finance Board and the U.S. Secretary of the Treasury have oversight over the issuance of FHLBank debt through the Office of Finance. CO bonds are issued primarily to raise intermediate and long-term funds for the FHLBanks and are not subject to any statutory or regulatory limits on maturity. CO discount notes are issued to raise short-term funds. These notes sell at less than their par value and are redeemed at par value when they mature.
16
Table of Contents
Interest-Rate-Payment Terms. The following table details CO bonds by interest-rate-payment type at June 30, 2008, and December 31, 2007 (dollars in thousands):
| | June 30, 2008 | | December 31, 2007 | |
Par value of CO bonds | | | | | |
Fixed-rate bonds | | $ | 31,843,805 | | $ | 28,377,715 | |
Zero-coupon bonds | | 3,955,000 | | 4,209,700 | |
Simple variable-rate bonds | | 2,000,000 | | 1,000,000 | |
Step-up bonds | | — | | 65,000 | |
| | | | | |
Total par value | | $ | 37,798,805 | | $ | 33,652,415 | |
Redemption Terms. The following is a summary of the Bank’s participation in CO bonds outstanding at June 30, 2008, and December 31, 2007, by year of contractual maturity (dollars in thousands):
| | June 30, 2008 | | December 31, 2007 | |
| | | | Weighted | | | | Weighted | |
| | | | Average | | | | Average | |
Year of Contractual Maturity | | Amount | | Rate | | Amount | | Rate | |
| | | | | | | | | |
Due in one year or less | | $ | 13,796,840 | | 3.22 | % | $ | 11,247,010 | | 4.39 | % |
Due after one year through two years | | 7,749,085 | | 3.50 | | 6,335,475 | | 4.63 | |
Due after two years through three years | | 3,686,000 | | 4.05 | | 3,218,350 | | 4.57 | |
Due after three years through four years | | 1,380,200 | | 4.65 | | 1,705,500 | | 4.86 | |
Due after four years through five years | | 2,433,680 | | 4.39 | | 1,836,080 | | 5.03 | |
Thereafter | | 8,753,000 | | 5.74 | | 9,310,000 | | 5.74 | |
| | | | | | | | | |
Total par value | | 37,798,805 | | 4.07 | % | 33,652,415 | | 4.89 | % |
| | | | | | | | | |
Premiums | | 72,304 | | | | 29,577 | | | |
Discounts | | (3,201,646 | ) | | | (3,329,419 | ) | | |
SFAS 133 hedging adjustments | | 13,946 | | | | 69,414 | | | |
| | | | | | | | | |
Total | | $ | 34,683,409 | | | | $ | 30,421,987 | | | |
The Bank’s CO bonds outstanding at June 30, 2008, and December 31, 2007, included (dollars in thousands):
| | June 30, 2008 | | December 31, 2007 | |
Par value of CO bonds | | | | | |
Callable | | $ | 14,303,000 | | $ | 18,514,700 | |
Noncallable or non-putable | | 23,495,805 | | 15,137,715 | |
| | | | | |
Total par value | | $ | 37,798,805 | | $ | 33,652,415 | |
The following table summarizes CO bonds outstanding at June 30, 2008, and December 31, 2007, by year of contractual maturity or next call date (dollars in thousands):
Year of Contractual Maturity or Next Call Date | | June 30, 2008 | | December 31, 2007 | |
| | | | | |
Due in one year or less | | $ | 23,258,840 | | $ | 23,076,710 | |
Due after one year through two years | | 7,325,085 | | 4,140,475 | |
Due after two years through three years | | 2,674,000 | | 2,293,350 | |
Due after three years through four years | | 500,200 | | 671,800 | |
Due after four years through five years | | 1,652,680 | | 956,080 | |
Thereafter | | 2,388,000 | | 2,514,000 | |
| | | | | |
Total par value | | $ | 37,798,805 | | $ | 33,652,415 | |
Consolidated Obligation Discount Notes. CO discount notes are issued to raise short-term funds. Discount notes are COs with original
17
Table of Contents
maturities up to 365 days. These notes are issued at less than their par value and redeemed at par value when they mature.
The Bank’s participation in CO discount notes, all of which are due within one year, was as follows (dollars in thousands):
| | Book Value | | Par Value | | Weighted
Average
Rate (1) | |
| | | | | | | |
June 30, 2008 | | $ | 44,332,438 | | $ | 44,478,954 | | 2.31 | % |
| | | | | | | |
December 31, 2007 | | $ | 42,988,169 | | $ | 43,264,750 | | 4.33 | % |
(1) The CO discount notes weighted-average rate represents a yield to maturity.
Note 11 — Affordable Housing Program
The Bank charges the amount set aside for AHP to income and recognizes it as a liability. The Bank then reduces the AHP liability as members use subsidies. The Bank had outstanding principal in AHP-related advances of $81.6 million and $80.9 million at June 30, 2008, and December 31, 2007, respectively.
The following table is an analysis of the AHP liability for the six months ended June 30, 2008, and the year ended December 31, 2007 (dollars in thousands):
Roll-Forward of the AHP Liability | | June 30, 2008 | | December 31, 2007 | |
| | | | | |
Balance at beginning of period | | $ | 48,451 | | $ | 44,971 | |
AHP expense for the period | | 12,140 | | 22,182 | |
AHP direct grant disbursements | | (4,514 | ) | (13,410 | ) |
AHP subsidy for below-market-rate advance disbursements | | (895 | ) | (5,409 | ) |
Return of previously disbursed grants and subsidies | | 224 | | 117 | |
| | | | | |
Balance at end of period | | $ | 55,406 | | $ | 48,451 | |
Note 12 — Capital
The Bank is subject to three capital requirements under its capital structure plan and Finance Board rules and regulations. The Bank must maintain at all times:
1. Permanent capital in an amount at least equal to the sum of its credit-risk capital requirement, its market-risk capital requirement, and its operations-risk capital requirement, calculated in accordance with Bank policy and Finance Board rules and regulations. Only permanent capital, defined as Class B stock and retained earnings, satisfies this risk-based capital requirement. The Finance Board may require the Bank to maintain a greater amount of permanent capital than is required as defined by the risk-based capital requirements.
2. At least a four percent total capital-to-assets ratio. Total capital is the sum of permanent capital, any general loss allowance, if consistent with GAAP and not established for specific assets, and other amounts from sources determined by the Finance Board as available to absorb losses.
3. At least a five percent leverage capital-to-assets ratio. A leverage capital-to-assets ratio is defined as permanent capital weighted 1.5 times divided by total assets.
The following table demonstrates the Bank’s compliance with these capital requirements at June 30, 2008, and December 31, 2007 (dollars in thousands).
| | June 30, 2008 | | December 31, 2007 | |
Regulatory Capital Requirements | | Required | | Actual | | Required | | Actual | |
| | | | | | | | | |
Risk-based capital | | $ | 775,169 | | $ | 3,726,019 | | $ | 363,537 | | $ | 3,421,523 | |
| | | | | | | | | |
Total regulatory capital | | $ | 3,372,648 | | $ | 3,726,019 | | $ | 3,128,014 | | $ | 3,421,523 | |
Total capital-to-assets ratio | | 4.0 | % | 4.4 | % | 4.0 | % | 4.4 | % |
| | | | | | | | | |
Leverage capital | | $ | 4,215,810 | | $ | 5,589,027 | | $ | 3,910,017 | | $ | 5,132,284 | |
Leverage capital-to-assets ratio | | 5.0 | % | 6.6 | % | 5.0 | % | 6.6 | % |
18
Table of Contents
Mandatorily redeemable capital stock, which is classified as a liability under GAAP, is considered capital for determining the Bank’s compliance with these regulatory requirements.
Related-Party Activities. The Bank defines related parties as those members whose capital stock outstanding was in excess of 10 percent of the Bank’s total capital stock outstanding. The following table presents member holdings of 10 percent or more of the Bank’s total capital stock outstanding at June 30, 2008, and December 31, 2007 (dollars in thousands):
| | June 30, 2008 | | December 31, 2007 | |
Name | | Capital Stock
Outstanding | | Percent
of Total | | Capital Stock
Outstanding | | Percent
of Total | |
| | | | | | | | | |
Bank of America Rhode Island, N.A., Providence, RI | | $ | 1,077,504 | | 31.0 | % | $ | 1,057,094 | | 33.1 | % |
RBS Citizens N.A., Providence, RI | | 440,784 | | 12.7 | | 344,634 | | 10.8 | |
| | | | | | | | | | | |
Note 13 — Employee Retirement Plans
Employee Retirement Plans. The Bank participates in the Pentegra Defined Benefit Plan for Financial Institutions (Pentegra Defined Benefit Plan), a funded, tax-qualified, non-contributory defined-benefit pension plan. The plan covers substantially all officers and employees of the Bank. Funding and administrative costs of the Pentegra Defined Benefit Plan charged to operating expenses were $794,000 and $816,000 for the three months ended June 30, 2008 and 2007, respectively. Funding and administrative costs of the Pentegra Defined Benefit Plan charged to operating expenses were $1.7 million for the six months ended June 30, 2008 and 2007. The Pentegra Defined Benefit Plan is a multi-employer plan in which assets contributed by one participating employer may be used to provide benefits to employees of other participating employers since assets contributed by an employer are not segregated in a separate account or restricted to provide benefits only to employees of that employer. As a result, disclosure of the accumulated benefit obligations, plan assets, and the components of annual pension expense attributable to the Bank are not made.
Additionally, the Bank maintains a nonqualified, unfunded defined benefit plan covering certain senior officers, and the Bank sponsors a fully insured retirement benefit program that includes life insurance benefits for eligible retirees.
The following tables present the components of net periodic benefit cost and other amounts recognized in accumulated other comprehensive income for the Bank’s supplemental retirement and postretirement benefit plans for the three months and six months ended June 30, 2008 and 2007 (dollars in thousands):
| | Supplemental Retirement Plan for the Three Months Ended June 30, | | Postretirement Benefit Plan for the Three Months Ended June 30, | |
| | 2008 | | 2007 | | 2008 | | 2007 | |
Net Periodic Benefit Cost | | | | | | | | | |
Service cost | | $ | 127 | | $ | 122 | | $ | 4 | | $ | 8 | |
Interest cost | | 176 | | 158 | | 5 | | 5 | |
Amortization of prior service cost | | (5 | ) | 6 | | — | | — | |
Amortization of net actuarial loss | | 118 | | 140 | | — | | 1 | |
Amortization of transition obligation | | — | | 4 | | — | | — | |
Net periodic benefit cost | | $ | 416 | | $ | 430 | | $ | 9 | | $ | 14 | |
| | | | | | | | | |
| | Supplemental Retirement Plan for the Six Months Ended June 30, | | Postretirement Benefit Plan for the Six Months Ended June 30, | |
| | 2008 | | 2007 | | 2008 | | 2007 | |
Net Periodic Benefit Cost | | | | | | | | | |
Service cost | | $ | 255 | | $ | 216 | | $ | 10 | | $ | 13 | |
Interest cost | | 352 | | 277 | | 10 | | 10 | |
Amortization of prior service cost | | (9 | ) | 11 | | — | | — | |
Amortization of net actuarial loss | | 236 | | 196 | | — | | 1 | |
Amortization of transition obligation | | — | | 9 | | — | | — | |
Net periodic benefit cost | | $ | 834 | | $ | 709 | | $ | 20 | | $ | 24 | |
19
Table of Contents
Note 14 — Segment Information
As part of its method of internal reporting, the Bank analyzes its financial performance based on the net interest income of two operating segments: mortgage-loan finance and all other business activity. The products and services provided reflect the manner in which financial information is evaluated by management. The mortgage-loan-finance segment includes mortgage loans acquired through the MPF program and the related funding of those mortgage loans. Income from the mortgage-loan-finance segment is derived primarily from the difference, or spread, between the yield on mortgage loans and the borrowing and hedging costs related to those assets. The remaining business segment includes products such as advances and investments and their related funding and hedging costs. Income from this segment is derived primarily from the difference, or spread, between the yield on advances and investments and the borrowing and hedging costs related to those assets. Regulatory capital is allocated to the segments based upon asset size.
The following tables present net interest income after reduction of provision for credit losses on mortgage loans by business segment, other income/(loss), other expense, and income before assessments for the three months and six months ended June 30, 2008 and 2007 (dollars in thousands):
| | Net Interest Income after Reduction of Provision for Credit Losses on Mortgage Loans by Segment | | | | | | | |
For the Three Months Ended June 30, | | Mortgage
Loan
Finance | | Other
Business
Activities | | Total | | Other Income / (Loss) | | Other
Expense | | Income
Before
Assessments | |
| | | | | | | | | | | | | |
2008 | | $ | 7,552 | | $ | 76,964 | | $ | 84,516 | | $ | 799 | | $ | 13,862 | | $ | 71,453 | |
| | | | | | | | | | | | | |
2007 | | $ | 7,296 | | $ | 65,029 | | $ | 72,325 | | $ | (4,459 | ) | $ | 13,216 | | $ | 54,650 | |
| | | | | | | | | | | | | |
| | Net Interest Income after Reduction of Provision for Credit Losses on Mortgage Loans by Segment | | | | | | | |
For the Six Months Ended June 30, | | Mortgage Loan Finance | | Other Business Activities | | Total | | Other (Loss)/ Income | | Other Expense | | Income Before Assessments | |
| | | | | | | | | | | | | |
2008 | | $ | 14,556 | | $ | 166,441 | | $ | 180,997 | | $ | (4,810 | ) | $ | 28,266 | | $ | 147,921 | |
| | | | | | | | | | | | | |
2007 | | $ | 15,197 | | $ | 127,095 | | $ | 142,292 | | $ | (2,469 | ) | $ | 26,115 | | $ | 113,708 | |
The following table presents total assets by business segment at June 30, 2008, and December 31, 2007 (dollars in thousands):
| | Total Assets by Segment | |
| | Mortgage
Loan
Finance | | Other
Business
Activities | | Total | |
| | | | | | | |
June 30, 2008 | | $ | 4,071,856 | | $ | 80,244,350 | | $ | 84,316,206 | |
| | | | | | | |
December 31, 2007 | | $ | 4,112,988 | | $ | 74,087,350 | | $ | 78,200,338 | |
The following tables present average-earning assets by business for the three months and six months ended June 30, 2008 and 2007 (dollars in thousands):
| | Total Average-Earning Assets by Segment | |
For the Three Months Ended June 30, | | Mortgage
Loan
Finance | | Other
Business
Activities | | Total | |
| | | | | | | |
2008 | | $ | 4,056,869 | | $ | 76,757,587 | | $ | 80,814,456 | |
| | | | | | | |
2007 | | $ | 4,329,440 | | $ | 54,819,824 | | $ | 59,149,264 | |
| | | | | | | |
| | Total Average-Earning Assets by Segment | |
For the Six Months Ended June 30, | | Mortgage Loan Finance | | Other Business Activities | | Total | |
| | | | | | | |
2008 | | $ | 4,064,724 | | $ | 76,306,797 | | $ | 80,371,521 | |
| | | | | | | |
2007 | | $ | 4,385,971 | | $ | 53,584,525 | | $ | 57,970,496 | |
20
Table of Contents
Note 15 — Estimated Fair Values
As discussed in Note 2 above, the Bank adopted SFAS 157 and SFAS 159 on January 1, 2008. SFAS 157 defines fair value, establishes a framework for measuring fair value under GAAP, and expands disclosures about fair-value measurements. SFAS 157 applies whenever other accounting pronouncements require or permit assets or liabilities to be measured at fair value. Accordingly, SFAS 157 does not expand the use of fair value in any new circumstances.
SFAS 159 provides an option to elect fair value as an alternative measurement for selected financial assets, financial liabilities, unrecognized firm commitments, and written loan commitments not previously carried at fair value. It requires entities to record at fair value those assets and liabilities for which the company has chosen to use fair value on the face of the balance sheet. In addition, unrealized gains and losses on items for which the fair-value option has been elected are reported in earnings. Under SFAS 159, fair value is used for both the initial and subsequent measurement of the designated assets, liabilities, and commitments, with the changes in fair value recognized in net income. Upon adopting SFAS 159, the Bank did not elect to record any financial assets and liabilities at fair value and did not apply the fair-value option to any new assets or liabilities during the six months ended June 30, 2008.
Fair value is defined as the price that would be received to sell an asset, or paid to transfer a liability, in an orderly transaction between market participants at the measurement date. The transaction to sell the asset or transfer the liability is a hypothetical transaction at the measurement date, considered from the perspective of a market participant that holds the asset or owes the liability. In general, the transaction price will equal the exit price and, therefore, represents the fair value of the asset or liability at initial recognition. In determining whether a transaction price represents the fair value of the asset or liability at initial recognition, each reporting entity is required to consider factors specific to the asset or liability, the principal or most advantageous market for the assets or liability, and market participants with whom the entity would transact in that market.
Described below are the Bank’s fair-value-measurement methodologies for assets and liabilities measured or disclosed at fair value.
Cash and Due from Banks. The estimated fair value approximates the recorded book balance.
Interest-Bearing Deposits in Banks. The estimated fair value is determined by calculating the present value of expected future cash flows. The discount rates used in these calculations are the rates for interest-bearing deposits with similar terms.
Investment Securities. Fair values of investment securities that are actively traded by market participants in the secondary market are determined based on independent market-based prices received from a third-party pricing service. The Bank’s principal markets for securities portfolios are the secondary institutional markets, with an exit price that is predominantly reflective of bid-level pricing in that market. Dealer quotes are used to determine the fair value of investment securities when a market-based price is unavailable or the security is not actively traded. When quoted prices are not available, the estimated fair value is determined by calculating the present value of the expected future cash flows and reducing the amount for accrued interest receivable. In obtaining such valuation information from third parties, the Bank generally reviews the valuation methodologies used to develop the fair values in order to determine whether such valuations are representative of an exit price in the Bank’s principal markets. Further, the Bank performs an internal, independent price verification function that tests valuations received from third parties. Available-for-sale securities and trading securities are carried on the statement of condition at fair value.
Securities Purchased under Agreements to Resell. The estimated fair value is determined by calculating the present value of expected future cash flows. The discount rates used in these calculations are the rates for securities with similar terms.
Federal Funds Sold. The estimated fair value is determined by calculating the present value of the expected future cash flows. The discount rates used in these calculations are the rates for federal funds with similar terms.
Advances. The Bank determines the estimated fair value of advances by calculating the present value of expected future cash flows from the advances and excluding the amount of the accrued interest receivable. The discount rates used in these calculations are the current replacement rates for advances with similar terms. In accordance with the Finance Board’s advances regulations, except in cases where advances are funded by callable debt or otherwise hedged so as to be financially indifferent to prepayments, advances with a maturity or repricing period greater than six months require a prepayment fee sufficient to make the Bank financially indifferent to the borrower’s decision to prepay the advances. Therefore, the estimated fair value of advances does not assume prepayment risk. Credit risk related to advances does not have an impact on the estimated fair values of the Bank’s advances. Collateral requirements for advances provide a measure of additional credit enhancement to make credit losses remote. The Bank enjoys certain unique advantages as a creditor to its members. The Bank has the ability to establish a blanket lien on assets of members, and in the case of Federal Deposit Insurance Corporation (FDIC)-insured institutions, the ability to establish priority above all other creditors with respect to collateral that has not been perfected by other parties. All of these factors serve to mitigate credit risk on advances.
21
Table of Contents
Mortgage Loans. The estimated fair values for mortgage loans are determined based on quoted market prices of similar mortgage loans available in the market or modeled prices. The modeled prices start with prices for new MBS issued by GSEs. Prices are then adjusted for differences in coupon, average loan rate, seasoning, and cash-flow remittance between the Bank’s mortgage loans and the MBS. The prices of the referenced MBS and the mortgage loans are highly dependent upon the underlying prepayment assumptions priced in the secondary market. Changes in the prepayment rates could have a material effect on the estimated fair value. Since these underlying prepayment assumptions are made at a specific point in time, they are susceptible to material changes in the near term.
Accrued Interest Receivable and Payable. The estimated fair value is the recorded book value.
Derivative Assets/Liabilities — Interest-Rate Exchange Agreements. The Bank bases the estimated fair values of interest-rate-exchange agreements on available market prices of derivatives having similar terms, including accrued interest receivable and payable. The estimated fair value is based on the London Inter-Bank Offered Rate (LIBOR) swap curve and forward rates at period-end and, for agreements containing options, the market’s expectations of future interest-rate volatility implied from current market prices of similar options. The estimated fair value uses standard valuation techniques for derivatives such as discounted cash-flow analysis and comparisons with similar instruments. The fair values are netted by counterparty, including cash collateral received or delivered from/to the counterparty, where such legal right of offset exists. If these netted amounts are positive, they are classified as an asset, and if negative, they are classified as a liability. Credit risk does not impact the estimated fair values of derivatives. The Bank enters into master-netting agreements for interest-rate-exchange agreements with institutions that have long-term senior unsecured credit ratings that are at or above single-A by S&P and Moody’s, establishes master-netting agreements to reduce its exposure from counterparty defaults, and enters into bilateral-collateral-exchange agreements that require credit exposures beyond a defined amount to be secured by U.S. government or GSE-issued securities or cash. All of these factors serve to mitigate credit and nonperformance risk to the Bank.
Derivative Assets/Liabilities — Mortgage-Loan-Purchase Commitments. Mortgage-loan-purchase commitments are recorded as derivatives in the statement of condition. The estimated fair values of mortgage-loan-purchase commitments are based on the end-of-day delivery commitment prices provided by the FHLBank of Chicago, which are derived from MBS to be announced (TBA) delivery-commitment prices with adjustment for the contractual features of the MPF program, such as servicing and credit-enhancement features.
Deposits. The Bank determines fair values of deposits by calculating the present value of expected future cash flows from the deposits and reducing this amount by any accrued interest payable. The discount rates used in these calculations are the cost of deposits with similar terms.
Consolidated Obligations. The Bank estimates fair values based on the cost of issuing comparable term debt, excluding noninterest selling costs. Fair values of CO bonds and CO discount notes without embedded options are determined based on internal valuation models which use market-based yield curve (CO curve) inputs obtained from the Office of Finance. Fair values of COs with embedded options are determined based on internal valuation models with market-based inputs obtained from the Office of Finance and derivative dealers.
Mandatorily Redeemable Capital Stock. The fair value of capital stock subject to mandatory redemption is generally at par. Capital stock can only be acquired by the Bank’s members at par value and redeemed at par value. The Bank’s capital stock is not traded and no market mechanism exists for the exchange of capital stock outside the cooperative structure.
Commitments. The estimated fair value of the Bank’s standby bond-purchase agreements is based on the present value of the estimated fees the Bank is to receive for providing these agreements, taking into account the remaining terms of such agreements. For fixed-rate loan commitments, fair value also considers the difference between current levels of interest rates and the committed rates.
The following estimated fair-value amounts have been determined by the Bank using available market information and the Bank’s best judgment of appropriate valuation methods. These estimates are based on pertinent information available to the Bank as of June 30, 2008, and December 31, 2007. Although the Bank uses its best judgment in estimating the fair value of these financial instruments, there are inherent limitations in any estimation technique or valuation methodology. For example, because an active secondary market does not exist for a portion of the Bank’s financial instruments, in certain cases, fair values are not subject to precise quantification or verification and may change as economic and market factors and evaluation of those factors change. Therefore, these estimated fair values are not necessarily indicative of the amounts that would be realized in current market transactions. The fair-value summary tables do not represent an estimate of the overall market value of the Bank as a going concern, which would take into account future business opportunities and the net profitability of assets versus liabilities.
The carrying values and estimated fair values of the Bank’s financial instruments at June 30, 2008, were as follows (dollars in thousands):
22
Table of Contents
| | Carrying
Value | | Net
Unrealized
Gain (Loss) | | Estimated
Fair
Value | |
Financial instruments | | | | | | | |
Assets: | | | | | | | |
Cash and due from banks | | $ | 6,645 | | $ | — | | $ | 6,645 | |
Interest-bearing deposits in banks | | 3,450,075 | | 166 | | 3,450,241 | |
Federal funds sold | | 2,180,000 | | — | | 2,180,000 | |
Trading securities | | 86,953 | | — | | 86,953 | |
Available-for-sale securities | | 1,070,092 | | — | | 1,070,092 | |
Held-to-maturity securities | | 10,033,867 | | (1,073,750 | ) | 8,960,117 | |
Advances | | 63,071,856 | | 113,810 | | 63,185,666 | |
Mortgage loans, net | | 4,049,996 | | (73,512 | ) | 3,976,484 | |
Accrued interest receivable | | 305,343 | | — | | 305,343 | |
Derivative assets | | 11,906 | | — | | 11,906 | |
| | | | | | | |
Liabilities: | | | | | | | |
Deposits | | (920,623 | ) | 589 | | (920,034 | ) |
Consolidated obligations: | | | | | | | |
Bonds | | (34,683,409 | ) | 94,289 | | (34,589,120 | ) |
Discount notes | | (44,332,438 | ) | 10,921 | | (44,321,517 | ) |
Mandatorily redeemable capital stock | | (93,175 | ) | — | | 93,175 | |
Accrued interest payable | | (283,174 | ) | — | | 283,174 | |
Derivative liabilities | | (306,910 | ) | — | | 306,910 | |
| | | | | | | |
Other: | | | | | | | |
Commitments to extend credit for advances | | — | | (282 | ) | (282 | ) |
Standby bond-purchase agreements | | — | | 2,285 | | 2,285 | |
Standby letters of credit | | (678 | ) | — | | (678 | ) |
| | | | | | | | | | |
The carrying values and estimated fair values of the Bank’s financial instruments at December 31, 2007, were as follows (dollars in thousands):
| | Carrying
Value | | Net
Unrealized
Gain (Loss) | | Estimated
Fair
Value | |
Financial instruments | | | | | | | |
Assets: | | | | | | | |
Cash and due from banks | | $ | 6,823 | | $ | — | | $ | 6,823 | |
Interest-bearing deposits in banks | | 5,330,050 | | 2,096 | | 5,332,146 | |
Securities purchased under agreements to resell | | 500,000 | | (3 | ) | 499,997 | |
Federal funds sold | | 2,908,000 | | (184 | ) | 2,907,816 | |
Trading securities | | 112,869 | | — | | 112,869 | |
Available-for-sale securities | | 1,063,759 | | — | | 1,063,759 | |
Held-to-maturity securities | | 7,947,881 | | (162,346 | ) | 7,785,535 | |
Advances | | 55,679,740 | | 186,075 | | 55,865,815 | |
Mortgage loans, net | | 4,091,314 | | (30,553 | ) | 4,060,761 | |
Accrued interest receivable | | 457,407 | | — | | 457,407 | |
Derivative assets | | 67,047 | | — | | 67,047 | |
| | | | | | | |
Liabilities: | | | | | | | |
Deposits | | (713,126 | ) | 435 | | (712,691 | ) |
Consolidated obligations: | | | | | | | |
Bonds | | (30,421,987 | ) | (83,778 | ) | (30,505,765 | ) |
Discount notes | | (42,988,169 | ) | (10,236 | ) | (42,998,405 | ) |
Mandatorily redeemable capital stock | | (31,808 | ) | — | | (31,808 | ) |
Accrued interest payable | | (280,452 | ) | — | | (280,452 | ) |
Derivative liabilities | | (286,789 | ) | — | | (286,789 | ) |
| | | | | | | |
Other: | | | | | | | |
Commitments to extend credit for advances | | — | | (681 | ) | (681 | ) |
Standby bond-purchase agreements | | — | | 1,752 | | 1,752 | |
Standby letters of credit | | (773 | ) | — | | (773 | ) |
| | | | | | | | | | |
23
Table of Contents
SFAS 157 establishes a fair-value hierarchy to prioritize the inputs of valuation techniques used to measure fair value. The inputs are evaluated and an overall level for the measurement is determined. This overall level is an indication of how market observable the fair- value measurement is and defines the level of disclosure. SFAS 157 clarifies fair value in terms of the price in an orderly transaction between market participants to sell an asset or transfer a liability in the principal (or most advantageous) market for the asset or liability. The objective of a fair-value measurement is to determine the price that would be received to sell the asset or paid to transfer the liability at the measurement date (an exit price). In order to determine the fair value or the exit price, entities must determine the unit of account, highest and best use, principal market, and market participants. These determinations allow the reporting entity to define the inputs for fair value and level of hierarchy.
Outlined below is the application of the fair-value hierarchy established by SFAS 157 to the Bank’s financial assets and financial liabilities that are carried at fair value.
Level 1 Inputs to the valuation methodology are quoted prices (unadjusted) for identical assets or liabilities in active markets. An active market for the asset or liability is a market in which the transactions for the asset or liability occur with sufficient frequency and volume to provide pricing information on an ongoing basis. The types of assets and liabilities carried at Level 1 fair value generally include certain types of investments such as U.S. Treasury securities and other U.S. government and agency mortgage-backed debt securities that are highly liquid and are actively traded in over-the-counter markets.
Level 2 Inputs to the valuation methodology include quoted prices for similar assets and liabilities in active markets, and inputs that are observable for the asset or liability, either directly or indirectly, for substantially the full term of the financial instrument. The types of assets and liabilities carried at Level 2 fair value generally include certain investment securities, including agency and private-label mortgage-backed debt securities, and derivative contracts.
Level 3 Inputs to the valuation methodology are unobservable and significant to the fair-value measurement. Unobservable inputs are supported by little or no market activity or by the entity’s own assumptions.
The Bank utilizes valuation techniques that maximize the use of observable inputs and minimize the use of unobservable inputs.
The following table presents the Bank’s assets and liabilities that are measured at fair value on its statement of condition at June 30, 2008 (dollars in thousands), by SFAS 157 fair-value hierarchy level:
| | | | | | | | Netting | | | |
| | Level 1 | | Level 2 | | Level 3 | | Adjustment (1) | | Total | |
Assets: | | | | | | | | | | | |
Trading securities | | $ | — | | $ | 86,953 | | $ | — | | $ | — | | $ | 86,953 | |
Available-for-sale securities | | — | | 1,070,092 | | — | | — | | 1,070,092 | |
Derivative assets | | 102 | | 368,770 | | — | | (356,966 | ) | 11,906 | |
Total assets at fair value | | $ | 102 | | $ | 1,525,815 | | $ | — | | $ | (356,966 | ) | $ | 1,168,951 | |
| | | | | | | | | | | |
Liabilities: | | | | | | | | | | | |
Derivative liabilities | | $ | — | | $ | (567,986 | ) | $ | — | | $ | 261,076 | | $ | (306,910 | ) |
Total liabilities at fair value | | $ | — | | $ | (567,986 | ) | $ | — | | $ | 261,076 | | $ | (306,910 | ) |
(1) Amounts represent the effect of legally enforceable master-netting agreements that allow the Bank to settle positive and negative positions and also cash collateral held or placed with the same counterparties. Net cash collateral associated with derivative contracts, including accrued interest, as of June 30, 2008, totaled $95.9 million.
For instruments carried at fair-value, the Bank reviews the fair-value hierarchy classifications on a quarterly basis. Changes in the observability of the valuation attributes may result in a reclassification of certain financial assets or liabilities. If a change in classification results in an item moving into or out of the Level 3 fair-value hierarchy, such reclassification will be reported as a transfer in/out of Level 3 at fair value in the quarter in which the change occurs.
Note 16 — Commitments and Contingencies
As described in Note 10, as provided by both the FHLBank Act and Finance Board regulation, COs are backed by the financial resources of the FHLBanks. The joint and several liability regulation of the Finance Board authorizes the Finance Board to require any FHLBank to repay all or a portion of the principal and interest on COs for which another FHLBank is the primary obligor. No FHLBank has had to assume or pay the CO of another FHLBank.
24
Table of Contents
The Bank considered the guidance under FASB interpretation No. 45, Guarantor’s Accounting and Disclosure Requirements for Guarantees, Including Indirect Guarantees of Indebtedness of Others-an Interpretation of FASB Statements No. 5, 57, and 107 and Rescission of FASB Interpretation No. 34 (FIN 45), and determined it was not necessary to recognize a liability for the fair value of the Bank’s joint and several liability for all of the COs. The joint and several obligation is mandated by Finance Board regulation and is not the result of an arms-length transaction among the FHLBanks. The FHLBanks have no control over the amount of the guaranty or the determination of how each FHLBank would perform under the joint and several obligation. Because the FHLBanks are subject to the authority of the Finance Board as it relates to decisions involving the allocation of the joint and several liability for the FHLBanks’ COs, the FHLBanks’ joint and several obligation is excluded from the initial recognition and measurement provisions of FIN 45. Accordingly, the Bank has not recognized a liability for its joint and several obligation related to other FHLBanks’ COs at June 30, 2008, and December 31, 2007. The par amounts of other FHLBanks’ outstanding COs for which the Bank is jointly and severally liable aggregated to approximately $1.2 trillion and $1.1 trillion at June 30, 2008, and December 31, 2007, respectively.
Commitments to Extend Credit. Commitments that legally bind and unconditionally obligate the Bank for additional advances totaled approximately $84.2 million and $873.5 million at June 30, 2008, and December 31, 2007, respectively. Commitments generally are for periods up to 12 months. Standby letters of credit are executed with members for a fee. A standby letter of credit is a financing arrangement between the Bank and a member. If the Bank is required to make payment for a beneficiary’s draw, these amounts are converted into a collateralized advance to the member. Outstanding standby letters of credit as of June 30, 2008, and December 31, 2007, were as follows (dollars in thousands):
| | June 30, 2008 | | December 31, 2007 |
| | | | |
Outstanding notional | | $ | 2,015,160 | | $ | 2,578,743 |
Original terms | | Two months to 20 years | | Three months to 20 years |
Final expiration year | | 2024 | | 2024 |
| | | | | | |
Unearned fees for transactions prior to 2003 as well as the value of the guarantees related to standby letters of credit entered into after 2002 are recorded in other liabilities and totaled $678,000 and $773,000 at June 30, 2008, and December 31, 2007, respectively. Based on management’s credit analyses and collateral requirements, the Bank has not deemed it necessary to record any additional liability on these commitments. Commitments are fully collateralized at the time of issuance.
Commitments for unused line-of-credit advances totaled approximately $1.4 billion at both June 30, 2008, and December 31, 2007, respectively. Commitments are generally for periods of up to 12 months. Since many of these commitments are not expected to be drawn upon, the total commitment amount does not necessarily represent future cash requirements.
Mortgage Loans. Commitments that obligate the Bank to purchase mortgage loans totaled $11.1 million and $9.6 million at June 30, 2008, and December 31, 2007, respectively. Commitments are generally for periods not to exceed 45 business days. Such commitments are recorded as derivatives at their fair values on the statement of condition.
Standby Bond-Purchase Agreements. The Bank has entered into standby bond-purchase agreements with state-housing authorities whereby the Bank, for a fee, agrees to purchase and hold the authority’s bonds until the designated marketing agent can find a suitable investor or the housing authority repurchases the bond according to a schedule established by the standby agreement. Each standby agreement dictates the specific terms that would require the Bank to purchase the bond. The bond-purchase commitments entered into by the Bank expire within three years, currently no later than 2011. Total commitments for bond purchases were $498.7 million and $501.5 million, respectively, at June 30, 2008, and December 31, 2007, with two state-housing authorities. For the six months ended June 30, 2008, the Bank was not required to purchase any bonds under these agreements.
Counterparty Credit Exposure. The Bank executes derivatives with counterparties rated single-A or better by either S&P or Moody’s, and enters into bilateral-collateral agreements. As of June 30, 2008, and December 31, 2007, the Bank had pledged as collateral securities with a carrying value, including accrued interest, of $102.2 million and $90.0 million, respectively, to counterparties that have credit-risk exposure to the Bank related to derivatives. These amounts pledged as collateral were subject to contractual agreements whereby counterparties had the right to sell or repledge the collateral.
Unsettled Consolidated Obligations. The Bank had $88.0 million and $89.0 million par value of CO bonds that had traded but not settled as of June 30, 2008, and December 31, 2007, respectively. Additionally, there were no unsettled CO discount notes as of June 30, 2008. The Bank had $730.0 million par value of CO discount notes that had been traded but not settled as of December 31, 2007.
Legal Proceedings. The Bank is subject to various pending legal proceedings arising in the normal course of business. Management does not anticipate that the ultimate liability, if any, arising out of these matters will have a material effect on the Bank’s financial condition or results of operations.
25
Table of Contents
Note 17 — Transactions with Related Parties and Other FHLBanks
Transactions with Related Parties. The Bank defines related parties as 1) those members whose capital stock outstanding was in excess of 10 percent of the Bank’s total capital stock outstanding and 2) other FHLBanks. As discussed in Note 11, Bank of America Rhode Island, N.A. and RBS Citizens N.A. held more than 10 percent of the Bank’s total capital stock outstanding as of June 30, 2008. Advances, derivative contracts, and capital stock activity with Bank of America Rhode Island, N.A. and RBS Citizens N.A. are discussed in Notes 6, 8, and 12.
Transactions with Other FHLBanks. The Bank may occasionally enter into transactions with other FHLBanks. These transactions are summarized below.
Investments in Consolidated Obligations. As of June 30, 2008, and December 31, 2007, the Bank did not hold any investments in other FHLBank COs. For the six months ended June 30, 2008, the Bank did not record any interest income from investments in other FHLBank COs. For the three and six months ended June 30, 2007, the Bank recorded interest income of $203,000 and $405,000, respectively, from these investment securities. Purchases of COs issued for other FHLBanks occur at market prices through third-party securities dealers.
Overnight Funds. The Bank may borrow or lend unsecured overnight funds from or to other FHLBanks. All such transactions are at current market rates. Interest income and interest expense related to these transactions with other FHLBanks are included within other interest income and interest expense from other borrowings in the statements of income.
The Bank did not have any loans to other FHLBanks outstanding at June 30, 2008, and December 31, 2007. The Bank did not have any interest income from loans to other FHLBanks during the three months and six months ended June 30, 2008 and 2007.
The Bank did not have any borrowings from other FHLBanks outstanding at June 30, 2008, and December 31, 2007. Interest expense on borrowings from other FHLBanks for the three months and six months ended June 30, 2008 and 2007, is shown in the following table, by FHLBank (dollars in thousands):
| | For the Three Months Ended June 30, | | For the Six Months Ended June 30, | |
Interest Expense to Other FHLBanks | | 2008 | | 2007 | | 2008 | | 2007 | |
| | | | | | | | | |
FHLBank of Atlanta | | $ | 6 | | $ | — | | $ | 24 | | $ | — | |
FHLBank of Cincinnati | | 51 | | 35 | | 161 | | 35 | |
FHLBank of Dallas | | 36 | | — | | 36 | | — | |
FHLBank of Des Moines | | 8 | | — | | 8 | | — | |
FHLBank of Indianapolis | | 22 | | — | | 22 | | — | |
FHLBank of Pittsburgh | | 4 | | — | | 4 | | — | |
FHLBank of San Francisco | | 36 | | 3 | | 46 | | 3 | |
FHLBank of Seattle | | 1 | | — | | 4 | | — | |
FHLBank of Topeka | | 15 | | — | | 24 | | — | |
| | | | | | | | | |
Total | | $ | 179 | | $ | 38 | | $ | 329 | | $ | 38 | |
| | | | | | | | | | | | | | | |
MPF Mortgage Loans. The Bank pays a transaction-services fee to the FHLBank of Chicago for the Bank’s participation in the MPF program. This fee is assessed monthly, and is based upon the amount of MPF loans purchased after January 1, 2004, and which remain outstanding on the Bank’s statement of condition. The Bank recorded $262,000 and $260,000 in MPF transaction-services fee expense to the FHLBank of Chicago during the three months ended June 30, 2008 and 2007, respectively, which has been recorded in the statements of income as other expense. The Bank recorded $517,000 and $523,000 in MPF transaction-services fee expense to the FHLBank of Chicago during the six months ended June 30, 2008 and 2007, respectively.
Note 18 — Subsequent Events
On August 7, 2008, the board of directors approved payment of a cash dividend at an annualized rate of 3.05 percent based on average capital stock balances outstanding during the second quarter of 2008. The dividend amounted to $25.5 million and will be paid on September 3, 2008.
26
Table of Contents
Item 2. Management’s Discussion and Analysis of Financial Condition and Results of Operations
Statements contained in this quarterly report on Form 10-Q, including statements describing the objectives, projections, estimates, or predictions of the future of the Federal Home Loan Bank of Boston (the Bank), may be “forward-looking statements.” These statements may use forward-looking terms, such as “anticipates,” “believes,” “could,” “estimates,” “may,” “should,” “will,” or their negatives or other variations on these terms. The Bank cautions that by their nature, forward-looking statements involve risk or uncertainty and that actual results could differ materially from those expressed or implied in these forward-looking statements or could affect the extent to which a particular objective, projection, estimate, or prediction is realized. These forward-looking statements involve risks and uncertainties including, but not limited to, the following:
· economic and market conditions;
· volatility of market prices, rates, and indices;
· increase in borrower defaults on mortgage loans and fluctuations in the housing market;
· political, legislative, regulatory, or judicial events;
· changes in the Bank’s capital structure;
· membership changes;
· changes in the demand by Bank members for Bank advances;
· competitive forces, including the availability of other sources of funding for Bank members;
· changes in investor demand for COs and/or the terms of interest-rate-exchange agreements and similar agreements;
· the ability of the Bank to introduce new products and services to meet market demand and to manage successfully the risk associated with new products and services;
· the ability of each of the other FHLBanks to repay the principal and interest on COs for which it is the primary obligor and with respect to which the Bank has joint and several liability; and
· timing and volume of market activity.
This Management’s Discussion and Analysis of Financial Condition and Results of Operations should be read in conjunction with the Bank’s interim financial statements and notes, which begin on page 1, and the Bank’s Annual Report on Form 10-K for the year ended December 31, 2007.
PRIMARY BUSINESS RELATED DEVELOPMENTS
Investment securities. The broad-based deterioration of credit performance of residential mortgage loans and the accompanying decline in residential real estate values in many parts of the United States increase the level of credit risk to which the Bank is exposed in its investments in mortgage-related securities. The Bank’s investments in MBS and asset-backed securities (ABS) are directly or indirectly supported by underlying mortgage loans. The deterioration of mortgage loan credit performance and house prices, combined with the market effects of large-scale forced MBS liquidations by major holders of mortgages caused a sharp decrease in MBS prices and resulted in an increase in the Bank’s net unrealized loss attributable to MBS from $155.4 million as of December 31, 2007, to $1.1 billion as of June 30, 2008. Due to the decline in values of residential real estate, the Bank closely monitors the performance of its securities to evaluate its exposure to the risk of loss on these investments to determine if a loss is other than temporary. See Critical Accounting Estimates — Other-Than-Temporary Impairment Analysis within this item for additional information regarding the Bank’s investment analysis procedures. As of June 30, 2008, management has determined that none of its MBS is other-than-temporarily impaired.
Enactment of the Housing and Economic Recovery Act of 2008. On July 30, 2008, the President signed into law the Housing and Economic Recovery Act of 2008, which is designed to strengthen the regulation of Fannie Mae, Freddie Mac, and the FHLBanks and to address other GSE reform issues. The legislation eliminates the Finance Board and replaces it with a new regulator, the Federal Housing Finance Agency (FHFA), overseeing the FHLBanks, Fannie Mae, and Freddie Mac. All references herein to the Finance Board mean the Bank’s actual regulator at the referenced or related time. See Recent Legislative and Regulatory Developments within this item for additional information.
FINANCIAL HIGHLIGHTS
The following financial highlights for the year ended December 31, 2007, have been derived from the Bank’s audited financial statements. Financial highlights for the June 30, 2008 and 2007, interim periods have been derived from the Bank’s unaudited financial statements.
27
SELECTED FINANCIAL DATA
(dollars in thousands)
| | June 30, | | December 31, | |
| | 2008 | | 2007 | |
Statement of Condition | | | | | |
Total assets | | $ | 84,316,206 | | $ | 78,200,338 | |
Investments (1) | | 16,820,987 | | 17,362,559 | |
Securities purchased under agreements to resell | | — | | 500,000 | |
Advances | | 63,071,856 | | 55,679,740 | |
Mortgage loans held for portfolio, net | | 4,049,996 | | 4,091,314 | |
Deposits and other borrowings | | 920,623 | | 713,126 | |
Consolidated obligations, net | | 79,015,847 | | 73,410,156 | |
AHP liability | | 55,406 | | 48,451 | |
Payable to REFCorp | | 13,118 | | 16,318 | |
Mandatorily redeemable capital stock | | 93,175 | | 31,808 | |
Class B capital stock outstanding — putable (2) | | 3,380,380 | | 3,163,793 | |
Total capital | | 3,604,838 | | 3,387,514 | |
| | | | | |
Other Information | | | | | |
Total capital ratio (3) | | 4.4 | % | 4.4 | % |
| | | | | | | |
| | For the Three Months Ended
June 30, | | For the Six Months Ended
June 30, | |
| | 2008 | | 2007 | | 2008 | | 2007 | |
Results of Operations | | | | | | | | | |
Net interest income | | $ | 84,516 | | $ | 72,316 | | $ | 180,997 | | $ | 142,283 | |
Other income (loss) | | 799 | | (4,459 | ) | (4,810 | ) | (2,469 | ) |
Other expense | | 13,862 | | 13,216 | | 28,266 | | 26,115 | |
AHP and REFCorp assessments | | 18,983 | | 14,514 | | 39,296 | | 30,203 | |
Net income | | 52,470 | | 40,136 | | 108,625 | | 83,505 | |
| | | | | | | | | |
Other Information (4) | | | | | | | | | |
Dividends declared | | $ | 32,456 | | $ | 38,671 | | $ | 82,083 | | $ | 78,463 | |
Dividend payout ratio | | 61.86 | % | 96.35 | % | 75.57 | % | 93.96 | % |
Weighted-average dividend rate (5) | | 4.00 | | 6.75 | | 5.00 | | 6.69 | |
Return on average equity (6) | | 5.86 | | 6.20 | | 6.16 | | 6.59 | |
Return on average assets | | 0.26 | | 0.27 | | 0.27 | | 0.29 | |
Net interest margin (7) | | 0.42 | | 0.49 | | 0.45 | | 0.50 | |
(1) Investments include available-for-sale securities, held-to-maturity securities, trading securities, interest-bearing deposits in banks, and federal funds sold.
(2) Capital stock is putable at the option of a member.
(3) Total capital ratio is capital stock (including mandatorily redeemable capital stock) plus retained earnings as a percentage of total assets. See Item 2 — Management’s Discussion and Analysis of Financial Condition and Results of Operations-Financial Condition-Capital regarding the Bank’s regulatory capital ratios.
(4) Yields are annualized.
(5) Weighted-average dividend rate is dividend amount declared divided by the average daily balance of capital stock eligible to receive dividends.
(6) Return on average equity is net income divided by the total of the average daily balance of outstanding Class B capital stock and retained earnings. The average daily balance of accumulated other comprehensive income is not included in the calculation.
(7) Net interest margin is net interest income before mortgage-loan-loss provision as a percentage of average earning assets.
Quarterly Overview
Second Quarter of 2008 Compared with Second Quarter of 2007. Net income for the three months ended June 30, 2008, was $52.5 million, compared with $40.1 million for the same period in 2007. This $12.3 million increase was primarily due to an increase of $12.2 million in net interest income, a $4.1 million increase in net gains on derivatives and hedging activities, and a $641,000 decrease in loss on extinguishment of debt. These increases to net income were partially offset by a $4.5 million increase in assessments.
Net interest income for the three months ended June 30, 2008, was $84.5 million, compared with $72.3 million for the same period in 2007. This $12.2 million increase was primarily attributable to a significant increase in the average size of the balance sheet in the second quarter of 2008 as compared to the same period in 2007. Average total earning assets were $21.6 billion higher in the second quarter of 2008 than in the same period of 2007, that mainly resulted from increased advances activity due to the liquidity shortage
28
Table of Contents
impacting the U.S. banking system. Prepayment-fee income recognized during the three months ended June 30, 2008, compared with the same period in 2007, decreased by $1.1 million.
For the quarters ended June 30, 2008 and 2007, average total assets were $81.5 billion and $59.9 billion, respectively. Return on average assets and return on average equity were 0.26 percent and 5.86 percent, respectively, for the quarter ended June 30, 2008, compared with 0.27 percent and 6.20 percent, respectively, for the quarter ended June 30, 2007.
Net interest spread for the second quarter of 2008 was 0.28 percent, a two basis-point increase from the net interest spread for the second quarter of 2007. Net interest margin for the second quarter of 2008 was 0.42 percent, a seven basis-point decline from net interest margin for the second quarter of 2007. See Results of Operations — Net Interest Spread and Net Interest Margin in this item for additional discussion of these topics.
Six Months Ended June 30, 2008, Compared with Six Months Ended June 30, 2007. Net income for the six months ended June 30, 2008, was $108.6 million, compared with $83.5 million for the same period in 2007. This $25.1 million increase was primarily due to an increase of $38.7 million in net interest income which was partially offset by a $2.1 million increase in loss on extinguishment of debt, a $1.2 million increase in net losses on derivatives and hedging activities, a $1.9 million increase in operating expenses, and a $9.1 million increase in assessments.
Net interest income for the six months ended June 30, 2008, was $181.0 million, compared with $142.3 million for the same period in 2007. This $38.7 million increase was primarily attributable to a significant increase in the average size of the balance sheet in the first six months of 2008 as compared with the same period in 2007. Average total earning assets were $22.4 billion higher in the first six months of 2008 than in the same period of 2007, that mainly resulted from increased advances activity due to the liquidity shortage impacting the U.S. banking system. Prepayment-fee income recognized during the six months ended June 30, 2008, compared with the same period in 2007, increased by $1.4 million.
For the six months ended June 30, 2008 and 2007, average total assets were $81.2 billion and $58.7 billion, respectively. Return on average assets and return on average equity were 0.27 percent and 6.16 percent, respectively, for the six months ended June 30, 2008, compared with 0.29 percent and 6.59 percent, respectively, for the six months ended June 30, 2007.
Net interest spread for the six months ended June 30, 2008, was 0.30 percent, a four basis-point increase from the net interest spread for the same period in 2007. Net interest margin for the first six months of 2008 was 0.45 percent, a five basis-point decline from net interest margin for the same period of 2007. See Results of Operations — Net Interest Spread and Net Interest Margin in this item for additional discussion of these topics.
Financial Condition at June 30, 2008, versus December 31, 2007.
The composition of the Bank’s total assets changed during the six months ended June 30, 2008, as follows:
· Advances increased to 74.8 percent of total assets at June 30, 2008, up from 71.2 percent of total assets at December 31, 2007. This increase in advances reflects a continued increase in member demand caused by recent market conditions. As of June 30, 2008, advances balances increased by approximately $7.4 billion from December 31, 2007, ending the period at $63.1 billion.
· Short-term money-market investments decreased to 6.7 percent of total assets at June 30, 2008, down from 11.2 percent of total assets at December 31, 2007. As of June 30, 2008, federal funds sold, interest-bearing deposits in banks, and securities purchased under agreements to resell in total had decreased by $3.1 billion, ending the period at $5.6 billion.
· Investment securities increased to 13.3 percent of total assets at June 30, 2008, up from 11.7 percent of total assets at December 31, 2007. Investment securities in total increased by $2.1 billion from December 31, 2007, to June 30, 2008. The increase is the result of $3.3 billion of GSE MBS purchases. These purchases were made under the Bank’s pre-existing authority to purchase MBS up to 300 percent of capital and have not used the temporary increase in MBS investment authority granted to the FHLBanks by the Finance Board at its March 24, 2008, meeting. At June 30, 2008, the Bank’s MBS and Small Business Administration (SBA) holdings represented 278 percent of capital compared with 226 percent at December 31, 2007.
· Net mortgage loans decreased to 4.8 percent of total assets at June 30, 2008, down from 5.2 percent of total assets at December 31, 2007. The decrease primarily reflects the decline in mortgage-loan balances outstanding, as mortgage loan- principal repayments outpaced mortgage loan-purchase activity during the six months ended June 30, 2008.
29
Table of Contents
RESULTS OF OPERATIONS
Net Interest Spread and Net Interest Margin
Second Quarter of 2008 compared with Second Quarter of 2007. Net interest income for the three months ended June 30, 2008, was $84.5 million, compared with $72.3 million for the same period in 2007, increasing 16.9 percent from the previous year. However, net interest margin for the second quarter of 2007 in comparison with the second quarter of 2008 decreased from 49 basis points to 42 basis points, while net interest spread increased from 26 basis points to 28 basis points, respectively.
The increase in net interest income was largely attributable to a significant increase in the average size of the balance sheet in the second quarter of 2008 as compared with the same period in 2007, but also reflected an increase in the Bank’s net interest spread. Average total earning assets were $21.6 billion higher in the second quarter of 2008 than in the same period of 2007, which was largely attributable to the $21.8 billion increase in average advances balances.
Net interest spread for the second quarter of 2008 was 0.28 percent, a two basis-point increase from the net interest spread for the second quarter of 2007. Net interest spread is the difference between the yields on interest-earning assets and interest-bearing liabilities. Net interest margin for the second quarter of 2008 was 0.42 percent, a seven basis-point decline from net interest margin for the second quarter of 2007. Net interest margin is expressed as the percentage of net interest income to average earning assets. The increase in the Bank’s net interest spread was attributable to the sharp decline in the cost of CO discount note funding relative to the yield of assets with comparable terms, such as advances and money-market investments, the relatively elevated yields obtained on GSE MBS purchased during the first and second quarters of 2008, and an increase in prepayment fee income. The decrease in the Bank’s net interest margin reflected the offsetting impact of the investment of the Bank’s interest-free capital at lower average asset yields, reflecting the drop in short-term interest rates between the two periods.
For the three months ended June 30, 2008, the average yields on total interest-earning assets decreased 213 basis points and yields on total interest-bearing liabilities decreased 215 basis points, compared with the three months ended June 30, 2007.
Prepayment-fee income recognized on advances and investments decreased $1.1 million to $1.4 million for the three months ended June 30, 2008, from $2.5 million for the three months ended June 30, 2007.
Six Months Ended June 30, 2008, Compared with Six Months Ended June 30, 2007. Net interest income for the six months ended June 30, 2008, was $181.0 million, compared with $142.3 million for the same period in 2007, increasing 27.2 percent from the previous year. However, net interest margin for the first six months of 2007 in comparison with the same period in 2008 decreased from 50 basis points to 45 basis points, while net interest spread increased from 26 basis points to 30 basis points, respectively.
The increase in net interest income was largely attributable to a significant increase in the average size of the balance sheet in the first six months of 2008 as compared with the same period in 2007, but also reflected an increase in the Bank’s net interest spread. Average total earning assets were $22.4 billion higher in the first six months of 2008 than in the same period of 2007, which was largely attributable to the $21.6 billion increase in average advances balances.
Net interest spread for the first six months of 2008 was 0.30 percent, a four basis-point increase from the net interest spread for the same period in 2007. Net interest spread is the difference between the yields on interest-earning assets and interest-bearing liabilities. Net interest margin for the first six months of 2008 was 0.45 percent, a five basis-point decline from net interest margin for the same period in 2007. The increase in the Bank’s net interest spread was attributable to the sharp decline in the cost of CO discount note funding relative to the yield of assets with comparable terms, such as advances and money-market investments, as well as an increase in prepayment-fee income. The decrease in the Bank’s net interest margin reflected the offsetting impact of the investment of the Bank’s interest-free capital at lower average asset yields, reflecting the drop in short-term interest rates between the two periods.
For the six months ended June 30, 2008, the average yields on total interest-earning assets decreased 161 basis points and yields on total interest-bearing liabilities decreased 165 basis points, compared with the six months ended June 30, 2007.
Prepayment-fee income recognized on advances and investments increased $1.4 million to $6.6 million for the six months ended June 30, 2008, from $5.1 million for the six months ended June 30, 2007.
The following table presents major categories of average balances, related interest income/expense, and average yields for interest-earning assets and interest-bearing liabilities. The primary source of earnings for the Bank is net interest income, which is the interest earned on advances, mortgage loans, and investments less interest paid on COs, deposits, and other borrowings.
30
Table of Contents
Net Interest Spread and Margin
(dollars in thousands)
| | For the Three Months Ended June 30, | |
| | 2008 | | 2007 | |
| | Average
Balance | | Interest
Income /
Expense | | Average
Yield (1) | | Average
Balance | | Interest
Income /
Expense | | Average
Yield (1) | |
Assets | | | | | | | | | | | | | |
Advances | | $ | 60,801,092 | | $ | 451,570 | | 2.99 | % | $ | 38,971,297 | | $ | 513,961 | | 5.29 | % |
Interest-bearing deposits in banks (2) | | 3,478,528 | | 24,930 | | 2.88 | | 1,383,689 | | 18,453 | | 5.35 | |
Securities purchased under agreements to resell | | 270,879 | | 1,458 | | 2.16 | | 1,284,616 | | 17,105 | | 5.34 | |
Federal funds sold | | 1,500,418 | | 8,252 | | 2.21 | | 4,964,547 | | 65,971 | | 5.33 | |
Investment securities (3) | | 10,628,264 | | 100,500 | | 3.80 | | 8,174,575 | | 112,086 | | 5.50 | |
Mortgage loans | | 4,056,869 | | 51,622 | | 5.12 | | 4,329,440 | | 54,952 | | 5.09 | |
| | | | | | | | | | | | | |
Total interest-earning assets | | 80,736,050 | | 638,332 | | 3.18 | % | 59,108,164 | | 782,528 | | 5.31 | % |
| | | | | | | | | | | | | |
Other non-interest-earning assets | | 772,302 | | | | | | 813,203 | | | | | |
| | | | | | | | | | | | | |
Total assets | | $ | 81,508,352 | | $ | 638,332 | | 3.15 | % | $ | 59,921,367 | | $ | 782,528 | | 5.24 | % |
| | | | | | | | | | | | | |
Liabilities and capital | | | | | | | | | | | | | |
Consolidated obligations | | | | | | | | | | | | | |
Discount notes | | $ | 42,670,218 | | $ | 260,419 | | 2.45 | % | $ | 19,590,415 | | $ | 254,781 | | 5.22 | % |
Bonds | | 33,082,986 | | 288,026 | | 3.50 | | 35,873,773 | | 443,870 | | 4.96 | |
Deposits (4) | | 1,077,200 | | 4,842 | | 1.81 | | 924,035 | | 11,331 | | 4.92 | |
Mandatorily redeemable capital stock | | 41,072 | | 323 | | 3.16 | | 8,779 | | 185 | | 8.45 | |
Other borrowings | | 41,044 | | 206 | | 2.02 | | 4,265 | | 45 | | 4.23 | |
| | | | | | | | | | | | | |
Total interest-bearing liabilities | | 76,912,520 | | 553,816 | | 2.90 | % | 56,401,267 | | 710,212 | | 5.05 | % |
| | | | | | | | | | | | | |
Other non-interest-bearing liabilities | | 1,028,378 | | | | | | 917,045 | | | | | |
Total capital | | 3,567,454 | | | | | | 2,603,055 | | | | | |
| | | | | | | | | | | | | |
Total liabilities and capital | | $ | 81,508,352 | | $ | 553,816 | | 2.73 | % | $ | 59,921,367 | | $ | 710,212 | | 4.75 | % |
| | | | | | | | | | | | | |
Net interest income | | | | $ | 84,516 | | | | | | $ | 72,316 | | | |
Net interest spread | | | | | | 0.28 | % | | | | | 0.26 | % |
Net interest margin | | | | | | 0.42 | % | | | | | 0.49 | % |
| | For the Six Months Ended June 30, | |
| | 2008 | | 2007 | |
| | Average
Balance | | Interest
Income /
Expense | | Average
Yield (1) | | Average
Balance | | Interest
Income /
Expense | | Average
Yield (1) | |
Assets | | | | | | | | | | | | | |
Advances | | $ | 59,867,900 | | $ | 1,066,753 | | 3.58 | % | $ | 38,256,356 | | $ | 1,000,360 | | 5.27 | % |
Interest-bearing deposits in banks (2) | | 4,198,885 | | 75,205 | | 3.60 | | 1,393,951 | | 36,976 | | 5.35 | |
Securities purchased under agreements to resell | | 638,462 | | 10,461 | | 3.29 | | 1,693,370 | | 44,842 | | 5.34 | |
Federal funds sold | | 1,707,601 | | 23,253 | | 2.74 | | 3,981,556 | | 105,222 | | 5.33 | |
Investment securities (3) | | 9,809,703 | | 197,483 | | 4.05 | | 8,214,101 | | 226,088 | | 5.55 | |
Mortgage loans | | 4,064,724 | | 103,882 | | 5.14 | | 4,385,971 | | 111,247 | | 5.11 | |
| | | | | | | | | | | | | |
Total interest-earning assets | | 80,287,275 | | 1,477,037 | | 3.70 | % | 57,925,305 | | 1,524,735 | | 5.31 | % |
| | | | | | | | | | | | | |
Other non-interest-earning assets | | 909,886 | | | | | | 800,751 | | | | | |
| | | | | | | | | | | | | |
Total assets | | $ | 81,197,161 | | $ | 1,477,037 | | 3.66 | % | $ | 58,726,056 | | $ | 1,524,735 | | 5.24 | % |
| | | | | | | | | | | | | |
Liabilities and capital | | | | | | | | | | | | | |
Consolidated obligations | | | | | | | | | | | | | |
Discount notes | | $ | 43,769,307 | | $ | 675,618 | | 3.10 | % | $ | 19,033,135 | | $ | 492,900 | | 5.22 | % |
Bonds | | 31,683,227 | | 607,532 | | 3.86 | | 35,282,282 | | 866,932 | | 4.95 | |
Deposits (4) | | 1,046,845 | | 11,898 | | 2.29 | | 909,112 | | 22,135 | | 4.91 | |
Mandatorily redeemable capital stock | | 36,611 | | 635 | | 3.49 | | 12,091 | | 436 | | 7.27 | |
Other borrowings | | 29,283 | | 357 | | 2.45 | | 2,941 | | 49 | | 3.36 | |
| | | | | | | | | | | | | |
Total interest-bearing liabilities | | 76,565,273 | | 1,296,040 | | 3.40 | % | 55,239,561 | | 1,382,452 | | 5.05 | % |
| | | | | | | | | | | | | |
Other non-interest-bearing liabilities | | 1,112,313 | | | | | | 927,010 | | | | | |
Total capital | | 3,519,575 | | | | | | 2,559,485 | | | | | |
| | | | | | | | | | | | | |
Total liabilities and capital | | $ | 81,197,161 | | $ | 1,296,040 | | 3.21 | % | $ | 58,726,056 | | $ | 1,382,452 | | 4.75 | % |
| | | | | | | | | | | | | |
Net interest income | | | | $ | 180,997 | | | | | | $ | 142,283 | | | |
Net interest spread | | | | | | 0.30 | % | | | | | 0.26 | % |
Net interest margin | | | | | | 0.45 | % | | | | | 0.50 | % |
(1) Yields are annualized.
(2) The average balance of cash collateral delivered to derivative counterparties is reflected in interest-bearing deposits in banks to properly calculate the average yield and net interest spread and net interest margin, while the period-end balance of such cash collateral is reflected in either derivative assets or derivative liabilities on the statement of condition.
(3) The average balances of available-for-sale securities are reflected at amortized cost; therefore the resulting yields do not give effect to changes in fair value.
(4) The average balance of cash collateral received from derivative counterparties is reflected in deposits to properly calculate the average yield and net interest spread and net interest margin, while the period-end balance of such cash collateral is reflected in either derivative assets or derivative liabilities on the statement of condition.
31
Table of Contents
The average balance of total advances increased $21.6 billion, or 56.5 percent, for the six months ended June 30, 2008, compared with the same period in 2007. The increase in average advances was attributable to strong member demand for short-term advances, while long-term fixed-rate and putable fixed-rate advances showed only a moderate increase during the six months ended June 30, 2008, as compared with the same period in 2007. The following table summarizes average balances of advances outstanding during the six months ended June 30, 2008 and 2007, by product type.
Average Balances of Advances Outstanding
By Product Type
(dollars in thousands)
| | For the Six Months Ending June 30, | |
| | 2008 | | 2007 | |
| | | | | |
Overnight advances — par value | | $ | 3,164,706 | | $ | 1,106,777 | |
| | | | | |
Fixed-rate advances — par value | | | | | |
Short-term | | 29,254,853 | | 15,288,276 | |
Long-term | | 11,448,652 | | 8,527,242 | |
Amortizing | | 2,410,935 | | 2,443,119 | |
Putable | | 8,862,981 | | 5,857,780 | |
Callable | | 18,126 | | 30,000 | |
| | 51,995,547 | | 32,146,417 | |
| | | | | |
Variable-rate indexed advances — par value | | | | | |
Simple variable | | 4,221,381 | | 5,016,315 | |
Putable, convertible to fixed | | 12,000 | | 4,050 | |
| | 4,233,381 | | 5,020,365 | |
| | | | | |
Total average par value | | 59,393,634 | | 38,273,559 | |
| | | | | |
Premiums and discounts | | (14,216 | ) | (10,551 | ) |
SFAS 133 hedging adjustments | | 488,482 | | (6,652 | ) |
| | | | | |
Total average advances | | $ | 59,867,900 | | $ | 38,256,356 | |
As displayed in the above table, the total average advances increased by $21.6 billion from the six months ended June 30, 2007, to the same period in 2008. The increase was attributable to the following components:
· The average balance of short-term fixed-rate advances increased by approximately $14.0 billion during the six months ended June 30, 2008, as compared with the same period in 2007. All short-term fixed-rate advances have a maturity of one year or less, with interest rates that closely follow short-term market interest-rate trends. The yield spread to the Bank’s funding cost for these advances is generally narrower for short-term products than for other products with longer terms to maturity.
32
Table of Contents
· Average fixed-rate putable advances increased by $3.0 billion from the six months ended June 30, 2007, to the same period in 2008. Putable advances are intermediate and long-term advances for which the Bank holds the option to cancel the advance on certain specified dates after an initial lockout period.
· Average overnight advances increased by $2.1 billion from the six months ended June 30, 2007, as compared with the same period in 2008. The interest rate on overnight advances changes on a daily basis and is based on market indications each day.
· The above increases were offset by a decline in average variable-rate indexed advances of $787.0 million from the six months ended June 30, 2007, to the same period in 2008. These advances have coupon rates that reset on a predetermined basis based on changes in an index, typically one- or three-month LIBOR, or on the offered yield on three-month FHLBank CO discount notes, as determined by the Office of Finance.
Putable advances that are classified as fixed-rate advances in the table above are typically hedged with interest-rate-exchange agreements in which a short-term rate is received, typically three-month LIBOR. Therefore, a significant portion of the Bank’s advances, including overnight advances, short-term fixed-rate advances, fixed-rate putable advances, and variable-rate advances, either earn a short-term interest rate or are swapped to a short-term index, resulting in yields that closely follow short-term market interest-rate trends. The average balance of these advances totaled $45.5 billion for the six months ended June 30, 2008, representing 76.6 percent of the total average balance of advances outstanding during the six months ended June 30, 2008. For the six months ended June 30, 2007, the average balance of these advances totaled $27.3 billion, representing 71.3 percent of total average advances outstanding during the six months ended June 30, 2007.
In the past, the foregoing trend toward a higher proportion of short-term advances would generally lead to declining net interest spreads to funding costs for the overall advances portfolio. Additionally, due to reduced advance demand that the Bank had experienced in the first half of 2007, the Bank offered advances at net interest spreads that were lower than historical averages for longer-term products, further diminishing the favorable impact of long-term advances upon the Bank’s net interest spread. However, in the latter half of 2007, the Bank’s typical yield spread to funding cost on short-term advances increased as the Bank’s cost of borrowing CO discount notes decreased relative to interbank borrowing interest rates, such as overnight and term federal funds rates. This led to an overall increase in net interest income on advances for the year ended December 31, 2007. This trend has diminished through the six months ended June 30, 2008, as the yield spreads available from the issuance of CO discount notes compressed during the second quarter of 2008 toward long-term historical averages.
Second Quarter of 2008 Compared with Second Quarter of 2007. During the three months ended June 30, 2008, advances totaling $475.7 million were prepaid, resulting in gross prepayment-fee income of $43,000. For the three months ended June 30, 2007, advances totaling $290.2 million were prepaid, resulting in gross prepayment-fee income of $1.9 million, which was partially offset by a $50,000 loss related to fair-value hedging adjustments on those prepaid advances.
Prepayment-fee income is unpredictable and inconsistent from period to period, occurring only when advances and investments are prepaid prior to the scheduled maturity or repricing dates. Because prepayment-fee income recognized during these periods does not necessarily represent a trend that will continue in future periods, and due to the fact that prepayment-fee income represents a one-time fee recognized in the period in which the corresponding advance or investment security is prepaid, we believe it is important to review the results of net interest spread and net interest margin excluding the impact of prepayment-fee income. These results are presented in the following table.
Six Months Ended June 30, 2008, Compared with Six Months Ended June 30, 2007. During the six months ended June 30, 2008, advances totaling $812.7 million were prepaid, resulting in gross prepayment-fee income of $5.3 million, which was partially offset by a $799,000 loss related to fair-value hedging adjustments. For the six months ended June 30, 2007, advances totaling $550.2 million were prepaid, resulting in gross prepayment-fee income of $3.2 million, which was offset by a $683,000 loss related to fair-value hedging adjustments on those prepaid advances.
33
Table of Contents
Net Interest Spread and Margin without Prepayment-Fee Income
(dollars in thousands)
| | For the Three Months Ended June 30, | |
| | 2008 | | 2007 | |
| | Interest
Income | | Average
Yield (1) | | Interest
Income | | Average
Yield (1) | |
| | | | | | | | | |
Advances | | $ | 451,527 | | 2.99 | % | $ | 512,146 | | 5.27 | % |
Investment securities | | 99,136 | | 3.75 | | 111,358 | | 5.46 | |
Total interest-earning assets | | 636,925 | | 3.17 | | 779,985 | | 5.29 | |
| | | | | | | | | |
Net interest income | | 83,109 | | | | 69,773 | | | |
Net interest spread | | | | 0.27 | % | | | 0.24 | % |
Net interest margin | | | | 0.41 | % | | | 0.47 | % |
| | | | | | | | | | | |
| | For the Six Months Ended June 30, | |
| | 2008 | | 2007 | |
| | Interest
Income | | Average
Yield (1) | | Interest
Income | | Average
Yield (1) | |
| | | | | | | | | |
Advances | | $ | 1,062,263 | | 3.57 | % | $ | 997,875 | | 5.26 | % |
Investment securities | | 195,402 | | 4.01 | | 223,428 | | 5.49 | |
Total interest-earning assets | | 1,470,466 | | 3.68 | | 1,519,590 | | 5.29 | |
| | | | | | | | | |
Net interest income | | 174,426 | | | | 137,138 | | | |
Net interest spread | | | | 0.28 | % | | | 0.24 | % |
Net interest margin | | | | 0.44 | % | | | 0.48 | % |
| | | | | | | | | | | |
(1) Yields are annualized.
Average short-term money-market investments, consisting of interest-bearing deposits in banks, securities purchased under agreements to resell, and federal funds sold, decreased $523.9 million, or 7.4 percent, from the average balances for the six months ended June 30, 2007, to June 30, 2008. The lower average balances in the six months ended June 30, 2008, resulted from the decreased activity in federal funds sold and securities purchased under agreements to resell. The yield earned on short-term money-market investments is tied directly to short-term market-interest rates. These investments are used for liquidity management and to manage the Bank’s leverage ratio in response to fluctuations in other asset balances.
Average investment-securities balances increased $1.6 billion or 19.4 percent for the six months ended June 30, 2008, compared with the same period in 2007. The growth in average investments is due to the increase in average held-to-maturity securities of $1.6 billion. The increase was attributable to the Bank’s capacity to purchase MBS due to the increase in capital that occurred during 2007 and into 2008, and which were made under the Bank’s pre-existing authority to purchase MBS up to 300 percent of capital. Average total capital increased by $960.1 million during the six months ended June 30, 2008, compared with the same period in 2007. Furthermore, due to decreased global demand for MBS stemming from recent turmoil in the mortgage market, net interest spread opportunities with respect to all types of MBS improved over the course of 2008 and 2007, as compared with prior periods. Accordingly, the Bank has been able to purchase MBS at more favorable risk-adjusted net interest spreads than during prior periods.
Average mortgage-loan balances for the six months ended June 30, 2008 and 2007, amounted to $4.1 billion and $4.4 billion, respectively. The $321.2 million decrease in the average balance for the six months ended June 30, 2008, in comparison to the same period in 2007, represented a decline of 7.3 percent. This continuing decline in average mortgage-loan balances was attributable to mortgage-loan principal repayments that outpaced loan-purchase activity during the six months ended June 30, 2008.
Overall, the yield on the mortgage-loan portfolio has increased three basis points for the three months ended June 30, 2008, compared with the same period in 2007. This increase is attributable to the following factors:
· The average stated coupon rate of the mortgage-loan portfolio increased two basis points due to the acquisition of mortgage loans at higher interest rates in 2008 relative to the coupons on pre-existing loans.
· The premium/discount amortization expense has declined $100,000, or 6.4 percent, representing an increase in the average yield of one basis point.
Overall, the yield on the mortgage-loan portfolio has increased three basis points for the six months ended June 30, 2008, compared with the same period in 2007. This increase is attributable to the following factors:
· The premium/discount amortization expense has declined $644,000, or 19.5 percent, representing an increase in the average yield of two basis points.
· The average stated coupon rate of the mortgage-loan portfolio increased one basis point due to the acquisition of loans at higher interest rates in the latter half of 2007 and into 2008 relative to the coupons on pre-existing loans.
34
Table of Contents
Composition of the Yields of Mortgage Loans
(dollars in thousands)
| | For the Three Months Ended June 30, | |
| | 2008 | | 2007 | |
| | Interest
Income | | Average
Yield (1) | | Interest
Income | | Average
Yield (1) | |
| | | | | | | | | |
Coupon accrual | | $ | 54,163 | | 5.37 | % | $ | 57,705 | | 5.35 | % |
Premium/discount amortization | | (1,470 | ) | (0.14 | ) | (1,570 | ) | (0.15 | ) |
Credit-enhancement fees | | (1,071 | ) | (0.11 | ) | (1,183 | ) | (0.11 | ) |
| | | | | | | | | |
Total interest income | | $ | 51,622 | | 5.12 | % | $ | 54,952 | | 5.09 | % |
| | For the Six Months Ended June 30, | |
| | 2008 | | 2007 | |
| | Interest
Income | | Average
Yield (1) | | Interest
Income | | Average
Yield (1) | |
| | | | | | | | | |
Coupon accrual | | $ | 108,713 | | 5.38 | % | $ | 116,918 | | 5.37 | % |
Premium/discount amortization | | (2,657 | ) | (0.13 | ) | (3,301 | ) | (0.15 | ) |
Credit-enhancement fees | | (2,174 | ) | (0.11 | ) | (2,370 | ) | (0.11 | ) |
| | | | | | | | | |
Total interest income | | $ | 103,882 | | 5.14 | % | $ | 111,247 | | 5.11 | % |
(1) Yields are annualized.
Average CO balances increased $21.1 billion, or 38.9 percent, from the six months ended June 30, 2007, to the six months ended June 30, 2008. This increase was largely due to a $24.7 billion increase in CO discount notes that was partially offset by a decrease of $3.6 billion in CO bonds. The increase in COs funded the growth of the advances portfolio.
Net interest income includes interest paid and received on interest-rate-exchange agreements that are associated with advances, investments, deposits, and debt instruments that qualify for hedge accounting under SFAS 133. The Bank generally utilizes derivative instruments that qualify for hedge accounting as an interest-rate risk-management tool. These derivatives serve to stabilize net interest income and net interest margin when interest rates fluctuate. Accordingly, the impact of derivatives on net interest income and net interest margin should be viewed in the overall context of the Bank’s risk-management strategy. The following table provides a summary of the impact of derivative instruments on interest income and interest expense.
Impact of Derivatives on Gross Interest Income and Gross Interest Expense
(dollars in thousands)
| | For the Three Months Ended June 30, | | For the Six Months Ended June 30, | |
| | 2008 | | 2007 | | 2008 | | 2007 | |
| | | | | | | | | |
Gross interest income before effect of derivatives | | $ | 696,486 | | $ | 766,693 | | $ | 1,543,011 | | $ | 1,494,572 | |
Net interest adjustment for derivatives | | (58,154 | ) | 15,835 | | (65,974 | ) | 30,163 | |
| | | | | | | | | |
Total interest income reported | | $ | 638,332 | | $ | 782,528 | | $ | 1,477,037 | | $ | 1,524,735 | |
| | | | | | | | | |
Gross interest expense before effect of derivatives | | $ | 601,144 | | $ | 702,559 | | $ | 1,368,462 | | $ | 1,360,986 | |
Net interest adjustment for derivatives | | (47,328 | ) | 7,653 | | (72,422 | ) | 21,466 | |
| | | | | | | | | |
Total interest expense reported | | $ | 553,816 | | $ | 710,212 | | $ | 1,296,040 | | $ | 1,382,452 | |
Reported net interest margin for the three months ended June 30, 2008 and 2007, was 0.42 percent and 0.49 percent, respectively. If derivative instruments had not been used as hedges to mitigate the impact of interest-rate fluctuations, net interest margin would have been 0.47 percent and 0.44 percent, respectively.
Reported net interest margin for the six months ended June 30, 2008 and 2007, was 0.45 percent and 0.50 percent, respectively. If derivative instruments had not been used as hedges to mitigate the impact of interest-rate fluctuations, net interest margin would have been 0.44 percent and 0.47 percent, respectively.
Interest paid and received on interest-rate-exchange agreements that are used by the Bank in its asset and liability management, but which do not meet hedge-accounting requirements of SFAS 133 (economic hedges), are classified as net gain (loss) on derivatives and hedging activities in other income. As shown in the Other Income (Loss) and Operating Expenses section below, interest accruals on
35
Table of Contents
derivatives classified as economic hedges totaled a loss of $734,000 and a gain of $202,000 for the three months ended June 30, 2008 and 2007, respectively. For the six months ended June 30, 2008 and 2007, interest accruals on derivatives classified as economic hedges totaled a loss of $840,000 and a gain of $397,000, respectively.
Rate and Volume Analysis
Changes in both average balances (volume) and interest rates influence changes in net interest income and net interest margin. The increase in net interest income is due primarily to higher average capital levels that are invested in earning assets without corresponding interest cost and an increase in average advance balances. The following table summarizes changes in interest income and interest expense between the three months and six months ended June 30, 2008 and 2007. Changes in interest income and interest expense that are not identifiable as either volume-related or rate-related, but rather equally attributable to both volume and rate changes, have been allocated to the volume and rate categories based upon the proportion of the volume and rate changes.
Rate and Volume Analysis
(dollars in thousands)
| | For the Three Months Ended
June 30, 2008 vs. 2007 | | For the Six Months Ended
June 30, 2008 vs. 2007 | |
| | Increase (decrease) due to | | Increase (decrease) due to | |
| | Volume | | Rate | | Total | | Volume | | Rate | | Total | |
Interest income | | | | | | | | | | | | | |
Advances | | $ | 287,896 | | $ | (350,287 | ) | $ | (62,391 | ) | $ | 565,117 | | $ | (498,724 | ) | $ | 66,393 | |
Interest-bearing deposits in banks | | 27,937 | | (21,460 | ) | 6,477 | | 74,404 | | (36,175 | ) | 38,229 | |
Securities purchased under agreements to resell | | (13,498 | ) | (2,149 | ) | (15,647 | ) | (27,935 | ) | (6,446 | ) | (34,381 | ) |
Federal funds sold | | (46,033 | ) | (11,686 | ) | (57,719 | ) | (60,095 | ) | (21,874 | ) | (81,969 | ) |
Investment securities | | 33,644 | | (45,230 | ) | (11,586 | ) | 43,918 | | (72,523 | ) | (28,605 | ) |
Mortgage loans | | (3,460 | ) | 130 | | (3,330 | ) | (8,148 | ) | 783 | | (7,365 | ) |
| | | | | | | | | | | | | |
Total interest income | | 286,486 | | (430,682 | ) | (144,196 | ) | 587,261 | | (634,959 | ) | (47,698 | ) |
| | | | | | | | | | | | | |
Interest expense | | | | | | | | | | | | | |
Consolidated obligations | | | | | | | | | | | | | |
Discount notes | | 300,162 | | (294,524 | ) | 5,638 | | 640,591 | | (457,873 | ) | 182,718 | |
Bonds | | (34,531 | ) | (121,313 | ) | (155,844 | ) | (88,434 | ) | (170,966 | ) | (259,400 | ) |
Deposits | | 1,878 | | (8,367 | ) | (6,489 | ) | 3,354 | | (13,591 | ) | (10,237 | ) |
Mandatorily redeemable capital stock | | 681 | | (543 | ) | 138 | | 884 | | (685 | ) | 199 | |
Other borrowings | | 388 | | (227 | ) | 161 | | 439 | | (131 | ) | 308 | |
| | | | | | | | | | | | | |
Total interest expense | | 268,578 | | (424,974 | ) | (156,396 | ) | 556,834 | | (643,246 | ) | (86,412 | ) |
| | | | | | | | | | | | | |
Change in net interest income | | $ | 17,908 | | $ | (5,708 | ) | $ | 12,200 | | $ | 30,427 | | $ | 8,287 | | $ | 38,714 | |
Other Income (Loss) and Operating Expenses
The following table presents a summary of other income (loss) for the three months and six months ended June 30, 2008 and 2007. Additionally, detail on the components of net gain (loss) on derivatives and hedging activities is provided, indicating the source of these gains and losses by type of hedging relationship and hedge accounting treatment.
Other Income (Loss)
(dollars in thousands)
| | For the Three Months Ended
June 30, | | For the Six Months Ended
June 30, | |
| | 2008 | | 2007 | | 2008 | | 2007 | |
(Losses) gains on derivatives and hedging activities: | | | | | | | | | |
Net (losses) gains related to fair-value hedge ineffectiveness | | $ | (1,241 | ) | $ | (4,645 | ) | $ | 458 | | $ | (3,523 | ) |
Net unrealized (losses) gains related to derivatives not receiving hedge accounting under SFAS 133 associated with: | | | | | | | | | |
Advances | | 444 | | 200 | | (357 | ) | 176 | |
Trading securities | | 1,835 | | 398 | | 385 | | 93 | |
Mortgage loans | | — | | — | | (3,375 | ) | — | |
Mortgage delivery commitments | | (167 | ) | (134 | ) | (440 | ) | (126 | ) |
Net interest accruals related to derivatives not receiving hedge accounting under SFAS 133 | | (734 | ) | 202 | | (840 | ) | 397 | |
Net gains (losses) on derivatives and hedging activities | | 137 | | (3,979 | ) | (4,169 | ) | (2,983 | ) |
| | | | | | | | | |
Loss on early extinguishment of debt | | — | | (641 | ) | (2,699 | ) | (641 | ) |
Service-fee income | | 1,302 | | 937 | | 2,607 | | 2,003 | |
Net unrealized loss on trading securities | | (687 | ) | (785 | ) | (612 | ) | (859 | ) |
Other | | 47 | | 9 | | 63 | | 11 | |
| | | | | | | | | |
Total other income (loss) | | $ | 799 | | $ | (4,459 | ) | $ | (4,810 | ) | $ | (2,469 | ) |
36
Table of Contents
Second Quarter of 2008 Compared with Second Quarter of 2007. As noted in the Other Income (Loss) table above, SFAS 133 introduces the potential for considerable timing differences between income recognition from assets or liabilities and income effects of hedging instruments entered into to mitigate interest-rate risk and cash-flow activity.
There were no losses on early extinguishment of debt for the three months ended June 30, 2008. For the three months ending June 30, 2007, losses on early extinguishment of debt totaled $641,000 due to the extinguishment of debt with a book value of $22.3 million. Early extinguishment of debt is primarily driven by the prepayment of advances and investments, which generates fee income to the Bank in the form of make-whole prepayment penalties. The Bank may use a portion of the fees of prepaid advances and investments to retire higher-costing debt and to manage the relative interest-rate sensitivities of assets and liabilities. However, the Bank is constrained in its ability to employ this strategy due to the limited availability of specific bonds for purchase and retirement. In this manner, the Bank endeavors to preserve its asset-liability repricing balance and to stabilize the net interest margin.
Changes in the fair value of trading securities are recorded in other income (loss). For the three months ended June 30, 2008 and 2007, the Bank recorded net unrealized losses on trading securities of $687,000 and $785,000, respectively. These securities are economically hedged with interest-rate-exchange agreements that do not qualify for hedge accounting under SFAS 133, but are acceptable hedging strategies under the Bank’s risk-management program. Changes in the fair value of these economic hedges are recorded in current-period earnings and amounted to net gains of $1.8 million and $398,000 for the three months ended June 30, 2008 and 2007, respectively. Also included in other income (loss) are interest accruals on these economic hedges, which resulted in losses of $723,000 and gains of $202,000 for the three months ended June 30, 2008 and 2007, respectively.
Six Months Ended June 30, 2008, Compared with Six Months Ended June 30, 2007. Losses on early extinguishment of debt totaled $2.7 million for the six months ended June 30, 2008, due to the extinguishment of debt with a book value of $84.0 million. Losses on early extinguishment of debt totaled $641,000 for the six months ended June 30, 2007, due to the extinguishment of debt with a book value of $22.3 million.
Changes in the fair value of trading securities are recorded in other income (loss). For the six months ended June 30, 2008 and 2007, the Bank recorded net unrealized losses on trading securities of $612,000 and $859,000, respectively. These securities are economically hedged with interest-rate-exchange agreements that do not qualify for hedge accounting under SFAS 133, but are acceptable hedging strategies under the Bank’s risk-management program. Changes in the fair value of these economic hedges are recorded in current-period earnings and amounted to net gains of $385,000 and $93,000 for the six months ended June 30, 2008 and 2007, respectively. Also included in other income (loss) are interest accruals on these economic hedges, which resulted in losses of $1.0 million and gains of $397,000 for the six months ended June 30, 2008 and 2007, respectively.
The following table summarizes operating expenses for the three months and six months ended June 30, 2008 and 2007:
Operating Expenses
(dollars in thousands)
| | For the Three Months Ended
June 30, | | For the Six Months Ended
June 30, | |
| | 2008 | | 2007 | | 2008 | | 2007 | |
| | | | | | | | | |
Salaries, incentive compensation, and benefits | | $ | 7,989 | | $ | 7,475 | | $ | 16,471 | | $ | 15,161 | |
Occupancy costs | | 1,027 | | 964 | | 2,103 | | 2,014 | |
Other operating expenses | | 3,500 | | 3,616 | | 6,986 | | 6,439 | |
| | | | | | | | | |
Total operating expenses | | $ | 12,516 | | $ | 12,055 | | $ | 25,560 | | $ | 23,614 | |
| | | | | | | | | |
Annualized ratio of operating expenses to average assets | | 0.06 | % | 0.08 | % | 0.06 | % | 0.08 | % |
Second Quarter of 2008 Compared with Second Quarter of 2007. For the three months ended June 30, 2008, total operating expenses increased $461,000 from the same period in 2007. This increase was mainly due to a $514,000 increase in salaries and
37
Table of Contents
benefits consisting primarily of a $408,000 increase in salary expenses attributable to planned staffing increases and annual merit increases and an increase of $98,000 in employee benefits. The increase in employee benefits was primarily attributable to an increase in costs associated with the Bank’s pension plans.
The Bank, together with the other FHLBanks, is charged for the cost of operating the Finance Board and the Office of Finance. These expenses totaled $1.1 million and $897,000 for the three months ended June 30, 2008 and 2007, respectively, and are included in other expense.
Six Months Ended June 30, 2008, Compared with Six Months Ended June 30, 2007. For the six months ended June 30, 2008, total operating expenses increased $1.9 million from the same period in 2007. This increase was mainly due to a $1.3 million increase in salaries and benefits and a $547,000 increase in other operating expenses. The $1.3 million increase in salaries and benefits is due primarily to a $962,000 increase in salary expenses attributable to planned staffing increases and annual merit increases and an increase of $327,000 in employee benefits. The increase in employee benefits was primarily attributable to an increase in costs associated with the Bank’s pension plans.
The $547,000 increase in other operating expenses is largely attributable to a $120,000 increase in travel expenses for the Bank’s officers and directors, a $199,000 increase in contractual services, and a $281,000 increase in equipment expenses.
The Bank, together with the other FHLBanks, is charged for the cost of operating the Finance Board and the Office of Finance. These expenses totaled $2.2 million and $2.0 million for the six months ended June 30, 2008 and 2007, respectively, and are included in other expense.
FINANCIAL CONDITION
Advances
At June 30, 2008, the advances portfolio totaled $63.1 billion, an increase of $7.4 billion compared with a total of $55.7 billion at December 31, 2007. This increase was primarily the result of a $3.2 billion increase in fixed-rate advances, a $2.2 billion increase in variable rate advances and a $1.9 billion increase in overnight advances. The increase in fixed-rate advances was concentrated in long-term advances and putable advances, which increased $2.2 billion and $1.3 billion, respectively, as members increased their borrowings during 2008 in response to their own balance-sheet demands. In part, the growth was reflective of a nationwide trend of advance growth at the FHLBanks during the second half of 2007 and through the first half of 2008, as the U.S. banking industry faced significant liquidity tightening during this period. At June 30, 2008, 41.0 percent of total advances outstanding had original maturities of greater than one year, compared with 44.3 percent as of December 31, 2007.
The following table summarizes advances outstanding at June 30, 2008, and December 31, 2007, by year of contractual maturity.
Advances Outstanding by Year of Contractual Maturity
(dollars in thousands)
| | June 30, 2008 | | December 31, 2007 | |
Year of Contractual Maturity | | Amount | | Weighted
Average
Rate | | Amount | | Weighted
Average
Rate | |
| | | | | | | | | |
Overdrawn demand-deposit accounts | | $ | 20,618 | | 2.41 | % | $ | 61,496 | | 4.64 | % |
Due in one year or less | | 39,162,329 | | 2.69 | | 35,745,494 | | 4.65 | |
Due after one year through two years | | 5,245,417 | | 4.40 | | 6,801,904 | | 4.59 | |
Due after two years through three years | | 5,562,315 | | 3.86 | | 3,883,697 | | 4.89 | |
Due after three years through four years | | 2,115,541 | | 4.53 | | 1,974,447 | | 4.88 | |
Due after four years through five years | | 4,887,910 | | 3.21 | | 1,966,414 | | 4.54 | |
Thereafter | | 5,806,346 | | 4.21 | | 4,951,427 | | 4.45 | |
| | | | | | | | | |
Total par value | | 62,800,476 | | 3.18 | % | 55,384,879 | | 4.65 | % |
| | | | | | | | | |
Premiums | | 3,497 | | | | 4,278 | | | |
Discounts | | (17,921 | ) | | | (17,861 | ) | | |
SFAS 133 hedging adjustments | | 285,804 | | | | 308,444 | | | |
| | | | | | | | | |
Total | | $ | 63,071,856 | | | | $ | 55,679,740 | | | |
38
Table of Contents
As of June 30, 2008, SFAS 133 hedging adjustments decreased $22.6 million from December 31, 2007. Higher market-interest rates at the quarter ended June 30, 2008, as compared to the quarter ended June 30, 2007, have resulted in a lower estimated fair value of the hedged advances.
The Bank offers advances to members that may be prepaid on pertinent dates (call dates) without incurring prepayment or termination fees (callable advances). At June 30, 2008, and December 31, 2007, the Bank had outstanding callable advances of $5.5 million and $30.0 million, respectively.
The following table summarizes advances outstanding at June 30, 2008, and December 31, 2007, by year of contractual maturity or next call date for callable advances.
Advances Outstanding by Year of Contractual Maturity or Next Call Date
(dollars in thousands)
Year of Contractual Maturity or Next Call Date | | June 30, 2008 | | December 31, 2007 | |
| | | | | |
Overdrawn demand-deposit accounts | | $ | 20,618 | | $ | 61,496 | |
Due in one year or less | | 39,167,829 | | 35,775,494 | |
Due after one year through two years | | 5,245,417 | | 6,801,904 | |
Due after two years through three years | | 5,556,815 | | 3,883,697 | |
Due after three years through four years | | 2,115,541 | | 1,944,447 | |
Due after four years through five years | | 4,887,910 | | 1,966,414 | |
Thereafter | | 5,806,346 | | 4,951,427 | |
| | | | | |
Total par value | | $ | 62,800,476 | | $ | 55,384,879 | |
The Bank also offers putable advances, in which the Bank purchases a put option from the member that allows the Bank to terminate the related advance on specific dates through its term. At June 30, 2008, and December 31, 2007, the Bank had putable advances outstanding totaling $9.3 billion and $8.0 billion, respectively. The following table summarizes advances outstanding at June 30, 2008, and December 31, 2007, by year of contractual maturity or next put date for putable advances.
Advances Outstanding by Year of Contractual Maturity or Next Put Date
(dollars in thousands)
Year of Contractual Maturity or Next Put Date | | June 30, 2008 | | December 31, 2007 | |
| | | | | |
Overdrawn demand-deposit accounts | | $ | 20,618 | | $ | 61,496 | |
Due in one year or less | | 45,711,304 | | 41,613,769 | |
Due after one year through two years | | 5,290,667 | | 7,260,154 | |
Due after two years through three years | | 4,638,715 | | 2,681,797 | |
Due after three years through four years | | 1,739,991 | | 1,336,647 | |
Due after four years through five years | | 3,770,960 | | 987,864 | |
Thereafter | | 1,628,221 | | 1,443,152 | |
| | | | | |
Total par value | | $ | 62,800,476 | | $ | 55,384,879 | |
The following table summarizes advances outstanding by product type at June 30, 2008, and December 31, 2007.
Advances Outstanding by Product Type
(dollars in thousands)
| | June 30, 2008 | | December 31, 2007 | |
| | Balance | | Percent of
Total | | Balance | | Percent of
Total | |
| | | | | | | | | |
Overnight advances | | $ | 3,302,769 | | 5.2 | % | $ | 1,363,868 | | 2.5 | % |
| | | | | | | | | |
Fixed-rate advances | | | | | | | | | |
Short-term | | 28,936,027 | | 46.1 | | 29,377,410 | | 53.0 | |
Long-term | | 12,305,497 | | 19.6 | | 10,088,175 | | 18.2 | |
Amortizing | | 2,535,508 | | 4.0 | | 2,381,301 | | 4.3 | |
Putable | | 9,263,175 | | 14.8 | | 7,939,325 | | 14.3 | |
Callable | | 5,500 | | — | | 30,000 | | 0.1 | |
| | 53,045,707 | | 84.5 | | 49,816,211 | | 89.9 | |
| | | | | | | | | |
Variable-rate advances | | | | | | | | | |
Simple variable | | 6,440,000 | | 10.3 | | 4,158,800 | | 7.5 | |
Putable, convertible to fixed | | 12,000 | | — | | 46,000 | | 0.1 | |
| | 6,452,000 | | 10.3 | | 4,204,800 | | 7.6 | |
| | | | | | | | | |
Total par value | | $ | 62,800,476 | | 100.0 | % | $ | 55,384,879 | | 100.0 | % |
39
Table of Contents
The Bank lends to member financial institutions within the six New England states. Advances are diversified across the Bank’s member institutions. At June 30, 2008, the Bank had advances outstanding to 361, or 79.7 percent, of its 453 members.
At December 31, 2007, the Bank had advances outstanding to 353, or 77.2 percent, of its 457 members.
Top Five Advance-Holding Members
(dollars in millions)
| | | | | | As of June 30, 2008 | | Advances Interest Income for the | |
Name | | City | | State | | Par Value of Advances | | Percent of Total Advances | | Weighted- Average Rate (1) | | Three
Months Ended June 30, 2008 | | Six
Months Ended June 30, 2008 | |
| | | | | | | | | | | | | | | |
Bank of America Rhode Island, N.A | | Providence | | RI | | $ | 23,749.3 | | 37.8 | % | 2.55 | % | $ | 165.4 | | $ | 410.9 | |
RBS Citizens, N.A. | | Providence | | RI | | 10,238.9 | | 16.3 | | 2.40 | | 55.0 | | 134.5 | |
NewAlliance Bank | | New Haven | | CT | | 2,237.0 | | 3.6 | | 4.57 | | 25.9 | | 51.5 | |
Webster Bank | | Waterbury | | CT | | 1,413.1 | | 2.3 | | 3.29 | | 11.7 | | 22.7 | |
Washington Trust Company | | Westerly | | RI | | 845.3 | | 1.3 | | 3.99 | | 7.8 | | 15.1 | |
| | | | | | | | | | | | | | | | | | |
(1) Weighted-average rates are based on the contract rate of each advance without taking into consideration the effects of interest-rate-exchange agreements that may be used by the Bank as a hedging instrument.
Investments
At June 30, 2008, investment securities and short-term money-market instruments totaled $16.8 billion, compared with $17.9 billion at December 31, 2007. The decline in investments was due to a decrease of $3.1 billion in money-market instruments, offset by a $2.1 billion increase in held-to-maturity securities. Under the Bank’s pre-existing authority to purchase MBS, additional investments in MBS and certain securities issued by the SBA are prohibited if the Bank’s investments in such securities exceed 300 percent of capital as measured at the previous monthend. At June 30, 2008, and December 31, 2007, the Bank’s MBS and SBA holdings represented 278 percent and 226 percent of capital, respectively.
Additional financial data on the Bank’s investment securities as of June 30, 2008, and December 31, 2007, are included in the following tables.
Trading Securities
(dollars in thousands)
| | June 30, 2008 | | December 31, 2007 | |
Mortgage-backed securities | | | | | |
U.S. government guaranteed | | $ | 29,152 | | $ | 32,827 | |
Government-sponsored enterprises | | 39,982 | | 47,754 | |
Other | | 17,819 | | 32,288 | |
| | | | | |
Total | | $ | 86,953 | | $ | 112,869 | |
Available-for-Sale Securities
(dollars in thousands)
| | June 30, 2008 | | December 31, 2007 | |
| | Amortized | | Fair | | Amortized | | Fair | |
| | Cost | | Value | | Cost | | Value | |
| | | | | | | | | |
Supranational banks | | $ | 350,239 | | $ | 391,028 | | $ | 350,603 | | $ | 396,341 | |
U.S. government corporations | | 213,398 | | 224,160 | | 213,485 | | 237,204 | |
Government-sponsored enterprises | | 143,559 | | 151,657 | | 143,586 | | 156,064 | |
| | 707,196 | | 766,845 | | 707,674 | | 789,609 | |
| | | | | | | | | |
Mortgage-backed securities | | | | | | | | | |
Government-sponsored enterprises | | 299,301 | | 303,247 | | 269,248 | | 274,150 | |
| | | | | | | | | |
Total | | $ | 1,006,497 | | $ | 1,070,092 | | $ | 976,922 | | $ | 1,063,759 | |
40
Table of Contents
Held-to-Maturity Securities
(dollars in thousands)
| | June 30, 2008 | | December 31, 2007 | |
| | Amortized | | Fair | | Amortized | | Fair | |
| | Cost | | Value | | Cost | | Value | |
| | | | | | | | | |
U.S. agency obligations | | $ | 46,345 | | $ | 47,404 | | $ | 51,634 | | $ | 53,465 | |
State or local housing-finance-agency obligations | | 284,563 | | 268,186 | | 299,653 | | 287,228 | |
| | 330,908 | | 315,590 | | 351,287 | | 340,693 | |
| | | | | | | | | |
Mortgage-backed securities: | | | | | | | | | |
U.S. government guaranteed | | 12,720 | | 13,337 | | 13,661 | | 14,297 | |
Government-sponsored enterprises | | 4,698,217 | | 4,696,043 | | 1,658,407 | | 1,682,370 | |
Other | | 4,992,022 | | 3,935,147 | | 5,924,526 | | 5,748,175 | |
| | 9,702,959 | | 8,644,527 | | 7,596,594 | | 7,444,842 | |
| | | | | | | | | |
Total | | $ | 10,033,867 | | $ | 8,960,117 | | $ | 7,947,881 | | $ | 7,785,535 | |
The Bank’s MBS investment portfolio consists of the following categories of securities as of June 30, 2008, and December 31, 2007.
Mortgage-Backed Securities
| | June 30, 2008 | | December 31, 2007 | |
| | | | | |
Private-label residential mortgage-backed securities | | 47.1 | % | 68.6 | % |
U.S. government-guaranteed and GSE residential mortgage-backed securities | | 50.4 | | 25.4 | |
Private-label commercial mortgage-backed securities | | 2.1 | | 5.4 | |
Home-equity loans | | 0.4 | | 0.6 | |
| | | | | |
Total mortgage-backed securities | | 100.0 | % | 100.0 | % |
Mortgage Loans
Mortgage loans as of June 30, 2008, totaled $4.0 billion, a decrease of $41.3 million from the December 31, 2007, balance of $4.1 billion. The following table presents information relating to the Bank’s mortgage portfolio as of June 30, 2008, and December 31, 2007.
Mortgage Loans Held in Portfolio
(dollars in thousands)
| | June 30, 2008 | | December 31, 2007 | |
Real estate | | | | | |
Fixed-rate 15-year single-family mortgages | | $ | 1,083,904 | | $ | 1,129,572 | |
Fixed-rate 20- and 30-year single-family mortgages | | 2,946,576 | | 2,938,886 | |
Premiums | | 32,853 | | 35,252 | |
Discounts | | (11,584 | ) | (11,270 | ) |
Deferred derivative gains and losses, net | | (1,628 | ) | (1,001 | ) |
| | | | | |
Total mortgage loans held for portfolio | | 4,050,121 | | 4,091,439 | |
| | | | | |
Less: allowance for credit losses | | (125 | ) | (125 | ) |
| | | | | |
Total mortgage loans, net of allowance for credit losses | | $ | 4,049,996 | | $ | 4,091,314 | |
41
Table of Contents
The following table details the par value of mortgage loans held for portfolio at June 30, 2008, and December 31, 2007 (dollars in thousands):
| | June 30, 2008 | | December 31, 2007 | |
| | | | | |
Conventional loans | | $ | 3,631,490 | | $ | 3,637,590 | |
Government-insured or guaranteed loans | | 398,990 | | 430,868 | |
| | | | | |
Total par value | | $ | 4,030,480 | | $ | 4,068,458 | |
The FHLBank of Chicago, which acts as the MPF provider and provides operational support to the FHLBanks participating in the MPF program (MPF Banks) and their participating financial institution members (PFIs), calculates and publishes daily prices, rates, and fees associated with the various MPF products. See Item 7 — Management’s Discussion and Analysis of Financial Condition and Results of Operations — Financial Condition — Mortgage Loans of the Bank’s Annual Report on Form 10-K for additional information regarding the Bank’s relationship with the FHLBank of Chicago as MPF Provider.
The following table presents purchases of mortgage loans during the six months ended June 30, 2008 and 2007 (dollars in thousands):
| | For the Six Months Ended June 30, | |
| | 2008 | | 2007 | |
| | | | | |
Conventional loans | | | | | |
Original MPF | | $ | 190,584 | | $ | 59,202 | |
MPF 125 | | 42,966 | | 21,745 | |
MPF Plus | | 44,511 | | — | |
Total conventional loans | | 278,061 | | 80,947 | |
| | | | | |
Government-insured or guaranteed loans | | 122 | | — | |
| | | | | |
Total par value | | $ | 278,183 | | $ | 80,947 | |
Allowance for Credit Losses on Mortgage Loans. The allowance for credit losses on mortgage loans was $125,000 at both June 30, 2008, and December 31, 2007. See the Bank’s Annual Report on Form 10-K Item 7 — Management’s Discussion and Analysis of Financial Condition and Results of Operations — Critical Accounting Estimates — Allowance for Loan Losses for a description of the Bank’s methodology for estimating the allowance for loan losses. The Bank did not have any allowance for credit losses activity for the six months ended June 30, 2008. For the six months ended June 30, 2007, the Bank had recoveries amount to $9,000 and a reduction of provision for credit losses of $9,000.
The Bank places conventional mortgage loans on nonaccrual when the collection of the contractual principal or interest is 90 days or more past due. Accrued interest on nonaccrual loans is reversed against interest income. The Bank monitors the delinquency levels of the mortgage-loan portfolio on a monthly basis. A summary of mortgage-loan delinquencies at June 30, 2008, and December 31, 2007, are provided in the following tables.
Summary of Delinquent Mortgage Loans
As of June 30, 2008
(dollars in thousands)
Days Delinquent | | Conventional | | Government (1) | | Total | |
| | | | | | | |
30 days | | $ | 33,309 | | $ | 17,180 | | $ | 50,489 | |
60 days | | 7,886 | | 5,399 | | 13,285 | |
90 days or more and accruing | | — | | 10,060 | | 10,060 | |
90 days or more and nonaccruing | | 12,772 | | — | | 12,772 | |
| | | | | | | |
Total delinquencies | | $ | 53,967 | | $ | 32,639 | | $ | 86,606 | |
| | | | | | | |
Total par value of mortgage loans outstanding | | $ | 3,631,490 | | $ | 398,990 | | $ | 4,030,480 | |
| | | | | | | |
Total delinquencies as a percentage of total par value of mortgage loans outstanding | | 1.49 | % | 8.18 | % | 2.15 | % |
| | | | | | | |
Delinquencies 90 days or more as a percentage of total par value of mortgage loans outstanding | | 0.35 | % | 2.52 | % | 0.57 | % |
(1) Government loans continue to accrue interest after 90 or more days delinquent since the U.S. government insures or guarantees the repayment of principal and interest.
42
Table of Contents
Summary of Delinquent Mortgage Loans
As of December 31, 2007
(dollars in thousands)
Days Delinquent | | Conventional | | Government (1) | | Total | |
| | | | | | | |
30 days | | $ | 37,231 | | $ | 18,074 | | $ | 55,305 | |
60 days | | 6,333 | | 6,902 | | 13,235 | |
90 days or more and accruing | | — | | 10,723 | | 10,723 | |
90 days or more and nonaccruing | | 7,982 | | — | | 7,982 | |
| | | | | | | |
Total delinquencies | | $ | 51,546 | | $ | 35,699 | | $ | 87,245 | |
| | | | | | | |
Total par value of mortgage loans outstanding | | $ | 3,637,590 | | $ | 430,868 | | $ | 4,068,458 | |
| | | | | | | |
Total delinquencies as a percentage of total par value of mortgage loans outstanding | | 1.42 | % | 8.29 | % | 2.14 | % |
| | | | | | | |
Delinquencies 90 days or more as a percentage of total par value of mortgage loans outstanding | | 0.22 | % | 2.49 | % | 0.46 | % |
(1) Government loans continue to accrue interest after 90 or more days delinquent since the U.S. government insures or guarantees the repayment of principal and interest.
Sale of REO Assets. During the six months ended June 30, 2008 and 2007, the Bank sold REO assets with a recorded carrying value of $2.2 million and $1.8 million, respectively. Upon sale of these properties, and inclusive of any proceeds received from primary mortgage-insurance coverage, the Bank recognized net gains totaling $43,000 and $18,000 on the sale of REO assets during the six months ended June 30, 2008 and 2007, respectively. Gains and losses on the sale of REO assets are recorded in other income.
Debt Financing — Consolidated Obligations
At June 30, 2008, and December 31, 2007, outstanding COs, including both CO bonds and CO discount notes, totaled $79.0 billion and $73.4 billion, respectively. CO bonds have an initial maturity of greater than one year and are generally issued with either fixed-rate coupon-payment terms or variable-rate coupon-payment terms that use a variety of indices for interest-rate resets. In addition, to meet the needs of the Bank and of certain investors in COs, fixed-rate bonds and variable-rate bonds may also contain certain provisions that may result in complex coupon-payment terms and call or amortization features. When such COs (structured bonds) are issued, the Bank either enters into interest-rate-exchange agreements containing offsetting features, which effectively change the characteristics of the bond to those of a simple variable-rate bond, or use the bond to fund assets with characteristics similar to those of the bond.
The following is a summary of the Bank’s CO bonds outstanding at June 30, 2008, and December 31, 2007, by the year of contractual maturity, for which the Bank is primarily liable.
43
Table of Contents
Consolidated Obligation Bonds Outstanding
by Year of Contractual Maturity
(dollars in thousands)
| | June 30, 2008 | | December 31, 2007 | |
Year of Contractual Maturity | | Amount | | Weighted
Average
Rate | | Amount | | Weighted
Average
Rate | |
| | | | | | | | | |
Due in one year or less | | $ | 13,796,840 | | 3.22 | % | $ | 11,247,010 | | 4.39 | % |
Due after one year through two years | | 7,749,085 | | 3.50 | | 6,335,475 | | 4.63 | |
Due after two years through three years | | 3,686,000 | | 4.05 | | 3,218,350 | | 4.57 | |
Due after three years through four years | | 1,380,200 | | 4.65 | | 1,705,500 | | 4.86 | |
Due after four years through five years | | 2,433,680 | | 4.39 | | 1,836,080 | | 5.03 | |
Thereafter | | 8,753,000 | | 5.74 | | 9,310,000 | | 5.74 | |
| | | | | | | | | |
Total par value | | 37,798,805 | | 4.07 | % | 33,652,415 | | 4.89 | % |
| | | | | | | | | |
Premiums | | 72,304 | | | | 29,577 | | | |
Discounts | | (3,201,646 | ) | | | (3,329,419 | ) | | |
SFAS 133 hedging adjustments | | 13,946 | | | | 69,414 | | | |
| | | | | | | | | |
Total | | $ | 34,683,409 | | | | $ | 30,421,987 | | | |
CO bonds outstanding at June 30, 2008, and December 31, 2007, include issued callable bonds totaling $14.3 billion and $18.5 billion, respectively.
SFAS 133 hedging adjustments on CO bonds decreased by $55.5 million from December 31, 2007, to June 30, 2008. Higher market interest rates at June 30, 2008, as compared with December 31, 2007, resulted in a lower estimated fair value of the hedged CO bonds.
The following table summarizes CO bonds outstanding at June 30, 2008, and December 31, 2007, by the earlier of the year of contractual maturity or next call date.
Consolidated Obligation Bonds Outstanding
by Year of Contractual Maturity or Next Call Date
(dollars in thousands)
Year of Contractual Maturity or Next Call Date | | June 30, 2008 | | December 31, 2007 | |
| | | | | |
Due in one year or less | | $ | 23,258,840 | | $ | 23,076,710 | |
Due after one year through two years | | 7,325,085 | | 4,140,475 | |
Due after two years through three years | | 2,674,000 | | 2,293,350 | |
Due after three years through four years | | 500,200 | | 671,800 | |
Due after four years through five years | | 1,652,680 | | 956,080 | |
Thereafter | | 2,388,000 | | 2,514,000 | |
| | | | | |
Total par value | | $ | 37,798,805 | | $ | 33,652,415 | |
CO discount notes are also a significant funding source for the Bank. CO discount notes are short-term instruments with maturities ranging from overnight to one year. The Bank uses CO discount notes primarily to fund short-term advances and investments and longer-term advances and investments with short repricing intervals. CO discount notes comprised 56.1 percent and 58.6 percent of outstanding COs at June 30, 2008, and December 31, 2007, respectively, but accounted for 97.7 percent and 97.8 percent of the proceeds from the issuance of all COs during the six months ended June 30, 2008, and the year ended December 31, 2007, respectively, due, in particular, to the Bank’s frequent overnight CO discount note issuances.
The Bank’s outstanding CO discount notes, all of which are due within one year, were as follows:
CO Discount Notes Outstanding
(dollars in thousands)
| | Book Value | | Par Value | | Weighted
Average
Rate | |
June 30, 2008 | | $ | 44,332,438 | | $ | 44,478,954 | | 2.31 | % |
December 31, 2007 | | 42,988,169 | | 43,264,750 | | 4.33 | |
| | | | | | | | | |
44
Table of Contents
Average Consolidated Obligations Outstanding
(dollars in thousands)
| | For the Three Months Ended June 30, | |
| | 2008 | | 2007 | |
| | Average
Balance | | Yield (1) | | Average
Balance | | Yield (1) | |
| | | | | | | | | |
Overnight discount notes | | $ | 5,503,145 | | 1.98 | % | $ | 2,398,440 | | 5.17 | % |
Term discount notes | | 37,167,073 | | 2.53 | | 17,191,975 | | 5.22 | |
Total discount notes | | 42,670,218 | | 2.45 | | 19,590,415 | | 5.22 | |
| | | | | | | | | |
Bonds | | 33,082,986 | | 3.50 | | 35,873,773 | | 4.96 | |
| | | | | | | | | |
Total consolidated obligations | | $ | 75,753,204 | | 2.91 | % | $ | 55,464,188 | | 5.05 | % |
| | For the Six Months Ended June 30, | |
| | 2008 | | 2007 | |
| | Average
Balance | | Yield (1) | | Average
Balance | | Yield (1) | |
| | | | | | | | | |
Overnight discount notes | | $ | 5,407,367 | | 2.38 | % | $ | 2,722,753 | | 5.20 | % |
Term discount notes | | 38,361,940 | | 3.21 | | 16,310,382 | | 5.23 | |
Total discount notes | | 43,769,307 | | 3.10 | | 19,033,135 | | 5.22 | |
| | | | | | | | | |
Bonds | | 31,683,227 | | 3.86 | | 35,282,282 | | 4.95 | |
| | | | | | | | | |
Total consolidated obligations | | $ | 75,452,534 | | 3.42 | % | $ | 54,315,417 | | 5.05 | % |
(1) Yields are annualized.
The average balances of COs for the six months ended June 30, 2008, were higher than the average balances for the same period in 2007, which is consistent with the increase in total average assets, primarily short-term advances. The average balance of term CO discount notes and overnight CO discount notes increased $22.1 billion and $2.7 billion, respectively, from the prior period. Average balances of CO bonds decreased $3.6 billion from the prior period. The average balance of CO discount notes represented approximately 58.0 percent of total average COs during the six months ended June 30, 2008, as compared with 35.0 percent of total average COs during the six months ended June 30, 2007, and the average balance of bonds represented 42.0 percent and 65.0 percent of total average COs outstanding during the six months ended June 30, 2008 and 2007, respectively.
Deposits
As of June 30, 2008, deposits totaled $920.6 million compared with $713.1 million at December 31, 2007, an increase of $207.5 million. This increase was mainly the result of a higher level of member deposits in the Bank’s overnight and demand-deposit accounts, which provide members with a short-term liquid investment.
The following table presents term deposits issued in amounts of $100,000 or greater at June 30, 2008, and December 31, 2007.
Term Deposits Greater than $100,000
(dollars in thousands)
| | June 30, 2008 | | December 31, 2007 | |
| | | | Weighted | | | | Weighted | |
| | | | Average | | | | Average | |
Term Deposits by Maturity | | Amount | | Rate | | Amount | | Rate | |
| | | | | | | | | |
Three months or less | | $ | 4,000 | | 2.36 | % | $ | 3,950 | | 4.98 | % |
Over three months through six months | | — | | — | | — | | — | |
Over six months through 12 months | | — | | — | | — | | — | |
Greater than 12 months (1) | | 26,250 | | 4.19 | | 26,250 | | 4.19 | |
| | | | | | | | | |
Total par value | | $ | 30,250 | | 3.94 | % | $ | 30,200 | | 4.29 | % |
(1) Represents eight term deposit accounts totaling $6.3 million with maturity dates of August 31, 2011, and one term deposit totaling $20.0 million with a maturity date of September 22, 2014.
45
Table of Contents
Capital
The Bank is subject to risk-based capital rules established by the Finance Board. Only permanent capital, defined as retained earnings plus Class B stock, can satisfy the risk-based capital requirement. The Bank has remained in compliance with these requirements through June 30, 2008, as noted in the following table.
Risk-Based Capital Requirements
(dollars in thousands)
| | June 30, 2008 | | December 31, 2007 | |
Permanent capital | | | | | |
Class B capital stock | | $ | 3,380,380 | | $ | 3,163,793 | |
Mandatorily redeemable capital stock | | 93,175 | | 31,808 | |
Retained earnings | | 252,464 | | 225,922 | |
| | | | | |
Permanent capital | | $ | 3,726,019 | | $ | 3,421,523 | |
| | | | | |
Risk-based capital requirement | | | | | |
Credit-risk capital | | $ | 177,966 | | $ | 167,538 | |
Market-risk capital | | 418,318 | | 112,106 | |
Operations-risk capital | | 178,885 | | 83,893 | |
| | | | | |
Total risk-based capital requirement | | $ | 775,169 | | $ | 363,537 | |
The increase in the Bank’s market-risk capital requirement reflects the sharp decline in the ratio of the Bank’s market value of equity to its book value of equity from 95.9 percent at December 31, 2007 to 75.8 percent at June 30, 2008, which primarily resulted from the sharp decline in the market value of MBS during the first half of 2008. See Item 3 — Quantitative and Qualitative Disclosures about Market Risk — Measurement of Market and Interest Rate Risk for further discussion. Under Finance Board regulations, the dollar amount by which the Bank’s market value of equity is less than 85 percent of its book value of equity must be added to the market risk component of its risk-based capital requirement. As of June 30, 2008, this incremental risk-based capital total was $316.6 million, and was the principal driver behind the increase in the Bank’s market risk component from $112.1 million at December 31, 2007, to $418.3 million at June 30, 2008. Management believes that the decline in the ratio of the Bank’s market value of equity to its book value of equity is temporary and will recover as liquidity returns to the MBS market. However, management cannot predict how long MBS prices will remain depressed, and the current situation could persist for an indefinite period of time.
In addition to the risk-based capital requirements, the Gramm-Leach-Bliley Act of 1999 specifies a five percent minimum leverage ratio based on total capital using a 1.5 weighting factor applied to permanent capital, and a four percent minimum capital ratio that does not include a weighting factor applicable to permanent capital. The Bank was in compliance with these requirements through June 30, 2008.
The following table provides the Bank’s capital ratios as of June 30, 2008, and December 31, 2007.
Capital Ratio Requirements
(dollars in thousands)
| | June 30, 2008 | | December 31, 2007 | |
Capital ratio | | | | | |
Minimum capital (4% of total assets) | | $ | 3,372,648 | | $ | 3,128,014 | |
Actual capital (capital stock plus retained earnings) | | 3,726,019 | | 3,421,523 | |
Total assets | | 84,316,206 | | 78,200,338 | |
Capital ratio (permanent capital as a percentage of total assets) | | 4.4 | % | 4.4 | % |
| | | | | |
Leverage ratio | | | | | |
Minimum leverage capital (5% of total assets) | | $ | 4,215,810 | | $ | 3,910,017 | |
Leverage capital (permanent capital multiplied by a 1.5 weighting factor) | | 5,589,027 | | 5,132,284 | |
Leverage ratio (leverage capital as a percentage of total assets) | | 6.6 | % | 6.6 | % |
Derivative Instruments
SFAS 133 requires all derivative instruments be recorded on the statement of condition at fair value, while FASB Interpretation No. 39, Offsetting of Amounts Related to Certain Contracts, allows derivative instruments to be classified as assets or liabilities according to the net fair value of derivatives aggregated by counterparty. Derivative assets’ net fair value net of cash collateral and accrued interest totaled $11.9 million and $67.0 million as of June 30, 2008, and December 31, 2007, respectively. Derivative
46
Table of Contents
liabilities’ net fair value net of cash collateral and accrued interest totaled $306.9 million and $286.8 million as of June 30, 2008, and December 31, 2007, respectively.
Effective January 1, 2008, the Bank implemented FSP FIN 39-1, which permits the Bank to offset fair-value amounts recognized for derivative instruments and fair-value amounts recognized for the right to reclaim cash collateral (a receivable) or the obligation to return cash collateral (a payable) arising from derivative instruments recognized at fair value executed with the same counterparty under a master-netting arrangement. Upon the adoption of FSP FIN 39-1, the Bank recognized the effects of applying FSP FIN 39-1 as a change in accounting principle through retrospective application for all financial statements presented. At December 31, 2007, the Bank held cash collateral, including accrued interest from derivative counterparties, totaling $61.2 million classified as deposits and accrued interest payable in the statement of condition. Upon adoption of FSP FIN 39-1 on January 1, 2008, this amount was reclassified to derivative assets or derivative liabilities.
The Bank had commitments for which it was obligated to purchase mortgage loans with par values totaling $11.1 million and $9.6 million at June 30, 2008, and December 31, 2007, respectively. Under SFAS No. 149, Amendment of Statement 133 on Derivative Instruments and Hedging Activities (SFAS 149), all mortgage-loan-purchase commitments are recorded at fair value on the statement of condition as derivative instruments. Upon fulfillment of the commitment, the recorded fair value is then reclassified as a basis adjustment of the purchased mortgage assets.
The following table presents a summary of the notional amounts and estimated fair values of the Bank’s outstanding derivative financial instruments, excluding accrued interest, and related hedged item by product and type of accounting treatment as of June 30, 2008, and December 31, 2007. The hedge designation “fair value” represents the hedge classification for transactions that qualify for hedge-accounting treatment in accordance with SFAS 133 and are hedged with the benchmark interest rate. The hedge designation “economic” represents hedge strategies that do not qualify for hedge accounting under the guidelines of SFAS 133, but are acceptable hedging strategies under the Bank’s risk-management policy.
Hedged Item and Hedge-Accounting Treatment
(dollars in thousands)
| | | | SFAS 133 | | June 30, 2008 | | December 31, 2007 | |
| | Hedge | | Notional | | Estimated | | Notional | | Estimated | | | |
Hedged Item | | Derivative | | Designation | | Amount | | Fair Value | | Amount | | Fair Value | |
| | | | | | | | | | | | | |
Advances | | Swaps | | Fair value | | $ | 15,683,984 | | $ | (287,967 | ) | $ | 12,535,860 | | $ | (310,871 | ) |
| | Swaps | | Economic | | 29,000 | | (825 | ) | 29,000 | | (756 | ) |
| | Caps and floors | | Economic | | 122,500 | | 391 | | 409,800 | | 586 | |
| | | | | | | | | | | | | |
Total associated with advances | | | | | | 15,835,484 | | (288,401 | ) | 12,974,660 | | (311,041 | ) |
| | | | | | | | | | | | | |
Available-for-sale securities | | Swaps | | Fair value | | 964,686 | | (132,871 | ) | 936,031 | | (129,834 | ) |
| | | | | | | | | | | | | |
Trading securities | | Swaps | | Economic | | 146,500 | | (1,173 | ) | 126,500 | | (1,559 | ) |
| | | | | | | | | | | | | |
Consolidated obligations | | Swaps | | Fair value | | 15,711,881 | | 7,193 | | 15,016,827 | | 60,840 | |
| | Swaps | | Economic | | — | | — | | 25,000 | | (4 | ) |
| | | | | | | | | | | | | |
Total associated with consolidated obligations | | | | | | 15,711,881 | | 7,193 | | 15,041,827 | | 60,836 | |
| | | | | | | | | | | | | |
Deposits | | Swaps | | Fair value | | 20,000 | | 4,117 | | 20,000 | | 4,410 | |
| | | | | | | | | | | | | |
Member intermediated | | Caps and floors | | Not applicable | | 20,000 | | — | | 20,000 | | — | |
| | | | | | | | | | | | | |
Total | | | | | | 32,698,551 | | (411,135 | ) | 29,119,018 | | (377,188 | ) |
| | | | | | | | | | | | | |
Mortgage delivery commitments (1) | | | | | | 11,142 | | 16 | | 9,600 | | 27 | |
Forward contracts | | | | | | 10,000 | | 102 | | — | | — | |
| | | | | | | | | | | | | |
Total derivatives | | | | | | $ | 32,719,693 | | (411,017 | ) | $ | 29,128,618 | | (377,161 | ) |
| | | | | | | | | | | | | |
Accrued interest | | | | | | | | 211,903 | | | | 218,569 | |
Cash collateral | | | | | | | | (95,890 | ) | | | (61,150 | ) |
| | | | | | | | | | | | | |
Net derivatives | | | | | | | | $ | (295,004 | ) | | | $ | (219,742 | ) |
| | | | | | | | | | | | | |
Derivative asset | | | | | | | | $ | 11,906 | | | | $ | 67,047 | |
Derivative liability | | | | | | | | (306,910 | ) | | | (286,789 | ) |
| | | | | | | | | | | | | |
Net derivatives | | | | | | | | $ | (295,004 | ) | | | $ | (219,742 | ) |
(1) Mortgage delivery commitments are classified as derivatives pursuant to SFAS 149, with changes in their fair value recorded in other income.
47
Table of Contents
The Bank has entered into derivative contracts with its members in which the Bank acts as an intermediary between the member and a derivative counterparty. Effective March 2007, the Bank discontinued this program and no longer offers derivatives to its members on an intermediated basis, but will allow existing transactions to remain outstanding until expiration. The Bank also engages in derivatives directly with affiliates of certain of the Bank’s members, which act as derivatives dealers to the Bank. These derivative contracts are entered into for the Bank’s own risk-management purposes and are not related to requests from the Bank’s members to enter into such contracts.
Outstanding Derivative Contracts with Members and Affiliates of Members
(dollars in thousands)
| | | | | | June 30, 2008 | |
Derivatives Counterparty | | Affiliate Member | | Primary
Relationship | | Notional
Outstanding | | Percent of Total Derivatives
Outstanding (1) | |
| | | | | | | | | |
Bank of America, N.A. | | Bank of America Rhode Island, N.A. | | Dealer | | $ | 2,041,904 | | 6.24 | % |
Royal Bank of Scotland, PLC | | RBS Citizens, N.A. | | Dealer | | 1,436,760 | | 4.39 | |
Auburn Savings Bank | | Auburn Savings Bank | | Member | | 10,000 | | 0.03 | |
| | | | | | | | | | |
(1) The percent of total derivatives outstanding is based on the stated notional amount of all derivative contracts outstanding.
LIQUIDITY AND CAPITAL RESOURCES
The Bank’s financial strategies are designed to enable the Bank to expand and contract its assets, liabilities, and capital in response to changes in membership composition and member credit needs. The Bank’s liquidity and capital resources are designed to support these financial strategies. The Bank’s primary source of liquidity is its access to the capital markets through CO issuance, which is described in the Bank’s Annual Report on Form 10-K in Item 1 — Business — Consolidated Obligations. The Bank’s equity capital resources are governed by the capital plan, which is described in the Capital section in this item below.
Liquidity
The Bank strives to maintain the liquidity necessary to meet member credit demands, repay maturing COs, meet other obligations and commitments, and respond to changes in membership composition. The Bank monitors its financial position in an effort to ensure that it has ready access to sufficient liquid funds to meet normal transaction requirements, take advantage of investment opportunities, and cover unforeseen liquidity demands.
The Bank is not able to predict future trends in member credit needs since they are driven by complex interactions among a number of factors, including, but not limited to: mortgage originations, other loan-portfolio growth, deposit growth, and the attractiveness of the pricing and availability of advances versus other wholesale borrowing alternatives. However, the Bank regularly monitors current trends and anticipates future debt-issuance needs in an effort to be prepared to fund its members’ credit needs and its investment opportunities.
Short-term liquidity management practices are described in Part 1 Item 3 — Quantitative and Qualitative Disclosures About Market Risk — Liquidity Risk. The Bank manages its liquidity needs to ensure that it is able to meet all of its contractual obligations and operating expenditures as they come due and to support its members’ daily liquidity needs. Through the Bank’s contingency liquidity plans, the Bank attempts to ensure that it is able to meet its obligations and the liquidity needs of members in the event of operational disruptions at the Bank or the Office of Finance or short-term disruptions of the capital markets. For further information and discussion of the Bank’s guarantees and other commitments, see Management’s Discussion and Analysis of Financial Condition and Results of Operations — Liquidity and Capital Resources — Off-Balance Sheet Arrangements and Aggregate Contractual Obligations, and for further information and discussion of the Bank’s joint and several liability for FHLBank COs, see Management’s Discussion and Analysis of Financial Condition and Results of Operations — Financial Condition — Debt Financing-Consolidated Obligations.
Under the Federal Home Loan Banks P&I Funding Contingency Plan Agreement (the Agreement) which became effective in 2006, in the event the Bank does not fund its principal and interest payments under a CO by deadlines established in the Agreement, the 11 other FHLBanks will be obligated to fund any shortfall in funding to the extent that any of the 11 other FHLBanks have a net positive settlement balance (that is, the amount by which end-of-day proceeds received by such FHLBank from the sale of COs on one day
48
Table of Contents
exceeds payments by such FHLBank on COs on the same day) in its account with the Office of Finance on the day the shortfall occurs. The Bank would then be required to repay the funding FHLBanks.
In the latter half of July 2008, investor confidence in the capital adequacy of Fannie Mae and Freddie Mac adversely affected their access to the capital markets. This market unrest also impacted the FHLBanks’ issuance of COs, which generally are grouped into the same GSE asset class as Fannie Mae and Freddie Mac. As a result, the cost of the FHLBanks’ longer-term debt increased relative to LIBOR in the latter half of July 2008 as some investors were only willing to purchase debt with very short-term maturities.
The FHLBanks were able to continue issuing short-term CO discount notes in sufficient amounts and at funding costs comparable to historical norms during this particularly stressful period. Importantly, the FHLBanks continue to have access to all consolidated bond and discount note funding channels in auctioned, negotiated, and selling group formats.
Capital
Total capital as of June 30, 2008 was $3.6 billion, a 6.4 percent increase from $3.4 billion as of December 31, 2007.
The Bank’s ability to expand in response to member-credit needs is based primarily on the capital-stock requirements for advances. Members are required to increase their capital-stock investment in the Bank as their outstanding advances increase. The capital-stock requirement for advances is currently based on the original term to maturity of the advances, as follows:
· 3.0 percent for overnight advances;
· 4.0 percent for advances with an original maturity greater than overnight and up to three months; and
· 4.5 percent for all other advances.
On April 17, 2008, the board of directors of the Bank voted to adjust the activity-based stock-investment requirement for mortgage loans that members sell to the Bank under the MPF program to 4.50 percent. The adjustment to the activity-based stock-investment requirement will support any future growth in the Bank’s MPF portfolio. Effective June 1, 2008, the 4.50 percent activity-based stock-investment requirement affects outstanding balances for loans funded under MPF master commitments entered into, or amended, from April 18, 2008, forward. Loans funded pursuant to MPF master commitments prior to April 18, 2008, will continue to be subject to the activity-based stock-investment requirement that applied prior to April 18, 2008, if any.
The Bank’s minimum capital-to-assets leverage limit is currently 4.0 percent based on Finance Board requirements. The additional capital stock from higher balances of advances expands the Bank’s capacity to issue COs, which are used not only to support the increase in these balances but also to increase the Bank’s purchases of mortgage loans, MBS, and other investments.
The Bank can also contract its balance sheet and liquidity requirements in response to members’ reduced credit needs. Member-credit needs that result in reduced advance and mortgage-loan balances will result in capital stock in excess of the amount required by the Bank’s capital plan. The Bank’s capital-stock policies allow the Bank to repurchase excess capital stock if a member reduces its advance balances. The Bank’s Excess Stock Repurchase Program helps it manage its capital by reducing the amount of excess capital stock held by members. The Bank may also, at its sole discretion, repurchase shares of excess stock upon request by members. During the six months ended June 30, 2008, the Bank did not complete any repurchases of excess capital stock.
Members may submit a written request for redemption of excess capital stock. The shares of capital stock subject to the redemption request will be redeemed at par value by the Bank upon expiration of a five-year stock-redemption period, provided that the member continues to meet its total stock-investment requirement at that time and that the Bank would remain in compliance with its minimum capital requirements. While historically the Bank has repurchased excess capital stock at a member’s request prior to the expiration of the redemption period, the decision to repurchase remains at the Bank’s discretion. Also subject to a five-year stock-redemption period are shares of capital stock held by a member that either gives notice of intent to withdraw from membership, or becomes a nonmember due to merger or acquisition, charter termination, or involuntary termination of membership. Capital stock subject to the five-year stock-redemption period is reclassified to mandatorily redeemable capital stock in the liability section of the statement of condition. Mandatorily redeemable capital stock totaled $93.2 million and $31.8 million at June 30, 2008, and December 31, 2007, respectively. The following table summarizes the anticipated stock-redemption period for these shares of capital stock as of June 30, 2008, and December 31, 2007 (dollars in thousands):
49
Table of Contents
Anticipated Stock-Redemption Period | | June 30, 2008 | | December 31, 2007 | |
| | | | | |
Due in one year or less | | $ | — | | $ | — | |
Due after one year through two years | | 4,185 | | 4,185 | |
Due after two years through three years | | 103 | | 103 | |
Due after three years through four years | | — | | — | |
Due after four years through five years | | 88,887 | | 27,520 | |
| | | | | |
Total mandatorily redeemable capital stock | | $ | 93,175 | | $ | 31,808 | |
The Bank is not required to redeem or repurchase activity-based stock until the later of the expiration of the five-year notice of redemption or until the termination of the related activity. If activity-based stock becomes excess capital stock as a result of the termination of the related activity, the Bank may, in its sole discretion, repurchase the excess activity-based stock prior to the expiration of the five-year redemption notice period.
A member may cancel or revoke its written notice of redemption or its notice of withdrawal from membership prior to the end of the five-year stock-redemption period. The Bank’s capital plan provides that the Bank will charge the member a cancellation fee equal to two percent of the par amount of the shares of Class B stock that is the subject of the redemption notice. The Bank will assess a redemption-cancellation fee unless the board of directors decides that it has a bona fide business purpose for waiving the imposition of the fee, and the waiver is consistent with Section 7(j) of the FHLBank Act.
At June 30, 2008, and December 31, 2007, members and nonmembers with capital stock outstanding held $207.7 million and $233.8 million, respectively, in excess capital stock. The following table summarizes member capital-stock requirements as of June 30, 2008, and December 31, 2007 (dollars in thousands):
| | Membership Stock
Investment
Requirement | | Activity-Based
Stock
Requirement | | Total Stock
Investment
Requirement (1) | | Outstanding Class B
Capital Stock (2) | | Excess Class B
Capital Stock | |
| | | | | | | | | | | |
June 30, 2008 | | $ | 498,165 | | $ | 2,767,653 | | $ | 3,265,840 | | $ | 3,473,555 | | $ | 207,715 | |
| | | | | | | | | | | |
December 31, 2007 | | 489,501 | | 2,472,449 | | 2,961,830 | | 3,195,601 | | 233,771 | |
| | | | | | | | | | | | | | | | |
(1) Total stock-investment requirement is rounded up to the nearest hundredth on an individual member basis.
(2) Class B capital stock outstanding includes mandatorily redeemable capital stock.
Provisions of the Bank’s capital plan are more fully discussed in Note 15 to the Bank’s 2007 financial statements in the Bank’s Annual Report on Form 10-K.
Retained Earnings Target. In July 2008, the Bank’s board of directors adopted a revised targeted retained earnings range of $375.0 million to $400.0 million to address the challenges presented by the continuing downturn in the housing market and volatility in the credit and capital markets. While no specific date has been set for reaching this level of retained earnings, it is expected that the increase of retained earnings will occur over the next several years. The Bank expects the increased target will result in dividend yield spreads that will be somewhat narrower to short-term interest rates until the target range is achieved, though there can be no assurance of a specific dividend level. This new target is remeasured periodically based on projected changes to the Bank’s balance-sheet composition and on projected market conditions. To the extent that the periodically measured retained earnings requirement amount remains below $375.0 million, the targeted minimum retained earnings level is $375.0 million. If the periodically measured retained earnings requirement exceeds $375.0 million, the remeasured value becomes the new requirement until such time as a subsequent remeasurement falls below $375.0 million. As of June 30, 2008, the Bank had retained earnings of $252.5 million. The Bank’s second quarter dividend, totaling $25.5 million, will be paid in early September 2008.
The Bank’s retained earnings target could be superseded by Finance Board mandates, either in the form of an order specific to the Bank or by promulgation of new regulations requiring a level of retained earnings that is different from the Bank’s currently targeted level. Moreover, management and the board of directors of the Bank may, at any time, change the Bank’s methodology or assumptions for modeling the Bank’s retained earnings requirement. If either of these occur, the Bank would continue its initiative to increase retained earnings and may reduce its dividend payout, as necessary.
Capital Requirements
The FHLBank Act and Finance Board regulations specify that each FHLBank must meet certain minimum regulatory capital standards. The Bank must maintain (1) total capital in an amount equal to at least 4.0 percent of its total assets, (2) leverage capital in an amount equal to at least 5.0 percent of its total assets, and (3) permanent capital in an amount equal to at least its regulatory risk-based capital requirement. In addition, the Finance Board has indicated that mandatorily redeemable capital stock is considered capital
50
Table of Contents
for regulatory purposes. At June 30, 2008, the Bank had a total capital-to-assets ratio of 4.4 percent, a leverage capital to assets ratio of 6.6 percent, and a risk-based capital requirement of $775.2 million, which was satisfied by the Bank’s permanent capital of $3.7 billion. Permanent capital is defined as total capital stock outstanding, including mandatorily redeemable capital stock, plus retained earnings. At December 31, 2007, the Bank had a total capital to assets ratio of 4.4 percent, a leverage capital to assets ratio of 6.6 percent, and a risk-based capital requirement of $363.5 million, which was satisfied by the Bank’s permanent capital of $3.4 billion. See Financial Condition — Capital in this item for discussion concerning the increase in the Bank’s risk-based capital requirement.
The Bank’s capital requirements are more fully discussed in Note 15 to the Bank’s 2007 financial statements in the Bank’s Annual Report on Form 10-K.
Off-Balance-Sheet Arrangements and Aggregate Contractual Obligations
The Bank’s significant off-balance-sheet arrangements consist of the following:
· Commitments that legally bind and obligate the Bank for additional advances;
· Standby letters of credit;
· Commitments for unused lines-of-credit advances;
· Standby bond-purchase agreements with state housing authorities; and
· Unsettled COs.
Off-balance-sheet arrangements are more fully discussed in Note 19 to the Bank’s 2007 financial statements in the Bank’s Annual Report on Form 10-K.
The Bank is required to pay 20 percent of its net earnings (after its AHP obligation) to REFCorp to support payment of part of the interest on bonds issued by REFCorp. The Bank must make these payments to REFCorp until the total amount of payments made by all FHLBanks is equivalent to a $300 million annual annuity with a final maturity date of April 15, 2030. Additionally, the FHLBanks must annually set aside for the AHP the greater of an aggregate of $100 million or 10 percent of the current year’s income before charges for AHP (but after expenses for REFCorp). See the Bank’s Annual Report on Form 10-K - Item 1 - Business - Assessments for additional information regarding REFCorp and AHP assessments.
CRITICAL ACCOUNTING ESTIMATES
The Bank’s financial statements and reported results of operations are based on GAAP, which requires the Bank to use estimates and assumptions that may affect our reported results and disclosures. Management believes the application of the following accounting policies involve the most critical or complex estimates and assumptions used in preparing the Bank’s financial statements: accounting for derivatives, the use of fair-value estimates, amortization of deferred premium/discount associated with prepayable assets, the allowance for loan losses, and other-than-temporary impairment analysis. The assumptions involved in applying these policies are discussed in the Bank’s 2007 Annual Report on Form 10-K.
During the six months ended June 30, 2008, the Bank had not made any significant changes to the estimates and assumptions used in applying its critical accounting policies and estimates from those used to prepare its audited financial statements, except as described below.
Fair-Value Estimates
The Bank measures certain assets and liabilities, including investment securities classified as available-for-sale and trading, as well as all derivatives and mandatorily redeemable capital stock at fair value. Management also estimates the fair value of collateral that borrowers pledge against advance borrowings to confirm that collateral is sufficient to meet regulatory requirements and to protect against losses. Fair values play an important role in the valuation of certain Bank assets, liabilities, and derivative transactions. The Bank adopted SFAS 157, Fair Value Measurements, on January 1, 2008. SFAS 157 defines fair value, establishes a framework for measuring fair value, establishes fair-value hierarchy based on the inputs used to measure fair value and enhances disclosure requirements for fair-value measurements.
SFAS 157 defines “fair value” as the price that would be received to sell an asset, or paid to transfer a liability, in an orderly transaction between market participants at the measurement date, or an exit price. In general, the transaction price will equal the exit price and, therefore, represent the fair value of the asset or liability at initial recognition. In determining whether a transaction price represents the fair value of the asset or liability at initial recognition, each reporting entity is required to consider factors specific to the transaction and the asset or liability. In order to determine the fair value or the exit price, entities must determine the unit of account,
51
Table of Contents
highest and best use, principal market, and market participants. These determinations allow the reporting entity to define the inputs for fair value and level of hierarchy.
Fair values are based on quoted market prices or market-based prices, if such prices are available. If quoted market prices or market-based prices are not available, fair values are determined based on valuation models that use either:
· discounted cash flows, using market estimates of interest rates and volatility; or
· dealer prices and prices of similar instruments.
Pricing models and their underlying assumptions are based on management’s best estimate with respect to:
· discount rates;
· prepayments;
· market volatility; and
· other factors.
These assumptions may have a significant effect on the reported fair values of assets and liabilities, including derivatives, and the income and expense related thereto. The use of different assumptions, as well as changes in market conditions, could result in materially different net income and retained earnings.
The Bank categorizes its financial instruments measured at fair value into a three-level classification in accordance with SFAS 157. The valuation hierarchy is based upon the transparency (observable or unobservable) of inputs to the valuation of an asset or liability as of the measurement date. Observable inputs reflect market data obtained from independent sources, while unobservable inputs reflect the Bank’s market assumptions.
The degree of management judgment involved in determining the fair value of a financial instrument is dependent upon the availability of quoted market prices or observable market parameters. For financial instruments that are actively traded and have quoted market prices or parameters readily available, there is little to no subjectivity in determining fair value. If market quotes are not available, fair values are based on discounted cash flows using market estimates of interest rates and volatility or on dealer prices or prices of similar instruments. Pricing models and their underlying assumptions are based on management’s best estimates for discount rates, prepayments, market volatility, and other factors. These assumptions may have a significant effect on the reported fair values of assets and liabilities, including derivatives, and the related income and expense. The use of different models and assumptions as well as changes in market conditions could significantly affect the Bank’s financial position and results of operations.
For purposes of estimating the fair value of derivatives and items for which the Bank is hedging the changes in fair value attributable to changes in the designated benchmark interest rate, the Bank employs a valuation model that uses market data from the Eurodollar futures, cash LIBOR, U.S. Treasury obligations, and the U.S. dollar interest-rate-swap markets to construct discount and forward-yield curves using standard bootstrapping and smoothing techniques. “Bootstrapping” is the name given to the methodology of constructing a yield curve using shorter-dated instruments to obtain near-term discount factors progressing to longer-dated instruments to obtain the longer-dated discount factors. “Smoothing techniques” refer to the use of parametric equations to estimate a continuous series of discount factors by fitting an equation (representing a curve or line) to discount factors directly observed from market data. The model also calibrates an implied volatility surface from the at-the-money LIBOR cap/floor prices and the at-the-money swaptions prices. The application uses a modified Black-Karasinski process to model the term structure of interest rates.
The SFAS 133 valuation adjustments for the Bank’s hedged items in which the designated risk is the risk of changes in fair value attributable to changes in the benchmark LIBOR interest rate are calculated using the same model that is used to calculate the fair values of the associated hedging derivatives.
Fair values of investment securities classified as available-for-sale or trading for which quoted market prices are not readily available are determined on the basis of spreads listed in dealer publications or dealer quotations.
Other-Than-Temporary Impairment Analysis
The fair value of the Bank’s investment security portfolio has been declining as a result of recent turmoil in the credit markets. Due to these market conditions as well as the subjective and complex nature of management’s other-than-temporary impairment assessment, the Bank has determined that its quarterly evaluation of other-than-temporary impairment is a critical accounting policy. The evaluation of unrealized losses for other than temporary impairment contemplates numerous factors. The Bank performs the evaluation on a security-by-security basis considering all available information. Important factors include an analysis of cash flows based on default and prepayment assumptions, and our intent and ability to retain the security in order to allow for a recovery in fair value. Implicit in the cash-flow analysis is information relevant to expected cash flows (such as default and prepayment assumptions)
52
Table of Contents
that also underlies the other impairment factors mentioned above, and the Bank qualitatively considers all available information when assessing whether an impairment is other-than-temporary. The relative importance of this information varies based on the facts and circumstances surrounding each security, as well as the economic environment at the time of assessment. Based on the results of this evaluation, if it is determined that the impairment is other than temporary, the carrying value of the security is written down to fair value, and a loss is recognized through earnings.
In evaluating whether we could maintain our assertion that we have the ability and intent to hold our remaining securities in unrealized loss positions until the latest of maturity or recovery, we consider expectations about market conditions, projections of future results, and liquidity needs.
The Bank invests in high quality, senior class securities rated triple-A at the time of purchase that achieve their ratings through either guarantee of timely payment of principal and interest or credit enhancement, primarily over collateralization and senior-subordinated shifting interest features; the latter results in the prioritization of payments to senior classes over junior classes. The Bank tests its MBS investments on an ongoing basis to determine whether the credit enhancement associated with each security is sufficient to protect against losses of principal and interest on the underlying mortgage loans. As part of its analysis of other-than-temporary impairment of residential MBS issued by entities other than GSEs, the Bank employs third-party models to project expected losses associated with the underlying loan collateral and to model the resultant lifetime cash flows as to how they would pass through the deal structures underlying the Bank’s MBS investments. These models use expected borrower default rates, projected loss severities, and forecasted voluntary prepayment speeds, all tailored to individual security product type. The Bank performs analysis based on expected behavior of the loans, whereby these loan performance scenarios are applied against each security’s credit-support structure to monitor credit-enhancement sufficiency to protect the Bank’s investment. The model output includes projected cash flows, including any shortfalls in the capacity of the underlying collateral to fully return the Bank’s original investment, plus accrued interest.
See Item 1 — Notes to the Financial Statements — Note 5 — Held-to-Maturity Securities and Item 3 — Quantitative and Qualitative Disclosures About Market Risk — Credit Risk — Investments for additional information related to management’s other-than-temporary impairment analysis for the current period.
RECENT ACCOUNTING DEVELOPMENTS
SFAS No. 157, Fair Value Measurements (SFAS 157). On September 15, 2006, the FASB issued SFAS 157. In defining fair value, SFAS 157 retains the exchange price notion in earlier definitions of fair value. However, the definition of fair value under SFAS 157 focuses on the price that would be received to sell an asset or paid to transfer a liability (an exit price), not the price that would be paid to acquire the asset or received to assume the liability (an entry price). SFAS 157 applies whenever other accounting pronouncements require or permit assets or liabilities to be measured at fair value. Accordingly, SFAS 157 does not expand the use of fair value in any new circumstances. SFAS 157 also establishes a fair-value hierarchy that prioritizes the information used to develop assumptions used to determine the exit price. SFAS 157 establishes valuation techniques that are used to measure fair value. To increase consistency and comparability in fair-value measurements and related disclosures, the fair-value hierarchy prioritizes the inputs to valuation techniques used to measure fair value into three broad levels:
· Level 1 - quoted prices in active markets for identical assets or liabilities;
· Level 2 - directly or indirectly observable inputs other than quoted prices; and
· Level 3 - unobservable inputs.
SFAS 157 requires disclosures detailing (1) the extent to which companies measure assets and liabilities at fair value, (2) the methods and assumptions used to measure fair value, and (3) the effect of fair-value measurements on earnings, as applicable. SFAS 157 is effective for financial statements issued for fiscal years beginning after November 15, 2007 (January 1, 2008, for the Bank), and interim periods within those fiscal years, with early adoption permitted provided the entity has not yet issued financial statements for that fiscal year, including financial statements for an interim period within that fiscal year. The Bank’s adoption of SFAS 157 on January 1, 2008, did not have a material impact on the Bank’s earnings or statement of condition.
SFAS No. 159, The Fair Value Option for Financial Assets and Financial Liabilities, Including an Amendment of FASB Statement No. 115 (SFAS 159). On February 15, 2007, the FASB issued SFAS 159, which creates a fair-value option allowing, but not requiring, an entity to irrevocably elect fair value as the initial and subsequent measurement attribute for certain financial assets and financial liabilities, with changes in fair value recognized in earnings as they occur. SFAS 159 also requires an entity to report those financial assets and financial liabilities measured at fair value in a manner that separates those reported fair values from the carrying amounts of assets and liabilities measured using another measurement attribute on the face of the statement of condition. Lastly, SFAS 159 requires an entity to provide information that would allow users to understand the effect on earnings of changes in the fair value on those instruments selected for the fair-value election. SFAS 159 is effective for fiscal years beginning after November 15, 2007 (January 1, 2008, for the Bank). Upon adoption of SFAS 159 on January 1, 2008, the Bank did not elect the fair-value option for any existing assets or liabilities, and therefore, there was no impact to the Bank’s earnings or statement of condition.
53
Table of Contents
FASB Staff Position No. FIN 39-1, Amendment of FASB Interpretation No. 39 (FSP FIN 39-1). On April 30, 2007, the FASB issued FSP FIN 39-1, which permits an entity to offset fair-value amounts recognized for derivative instruments and fair-value amounts recognized for the right to reclaim cash collateral (a receivable) or the obligation to return cash collateral (a payable) arising from derivative instruments recognized at fair value executed with the same counterparty under a master-netting arrangement. Under FSP FIN 39-1, the receivable or payable related to cash collateral may not be offset if the amount recognized does not represent or approximate fair value or arises from instruments in a master-netting arrangement that are not eligible to be offset. The decision whether to offset such fair-value amounts represents an elective accounting policy decision that, once elected, must be applied consistently. FSP FIN 39-1 is effective for fiscal years beginning after November 15, 2007 (January 1, 2008, for the Bank), with earlier application permitted. An entity should recognize the effects of applying FSP FIN 39-1 as a change in accounting principle through retrospective application for all financial statements presented unless it is impracticable to do so. Upon adoption of FSP FIN 39-1, an entity is permitted to change its accounting policy to offset or not offset fair-value amounts recognized for derivative instruments under master-netting arrangements. The current accounting policy of the Bank is to offset derivative instruments of the same counterparty under a master-netting arrangement. This policy remained in effect following the adoption of FSP FIN 39-1. At December 31, 2007, the Bank held cash collateral, including accrued interest from derivative counterparties totaling $61.2 million classified as deposits and accrued interest payable in the statement of condition. Upon adoption of FSP FIN 39-1 on January 1, 2008, this amount was reclassified to derivative assets or derivative liabilities and did not have a material impact to our financial condition.
DIG Issue No. E23, Issues Involving the Application of the Shortcut Method Under Paragraph 68 (DIG E23). On December 20, 2007, the FASB issued DIG E23, which amends paragraph 68 of SFAS 133 with respect to the conditions that must be met in order to apply the shortcut method for assessing hedge effectiveness. DIG E23 is effective for hedging relationships designated on or after January 1, 2008. The Bank’s adoption of DIG E23 on January 1, 2008, did not have a material impact on the Bank’s financial condition or results of operations.
SFAS No. 161, Disclosures about Derivative Instruments and Hedging Activities — an Amendment of FASB Statement No. 133 (SFAS 161). On March 19, 2008, the FASB issued SFAS 161, which is intended to improve financial reporting about derivative instruments and hedging activities by requiring enhanced disclosures to enable investors to better understand their effects on the entity’s financial position, financial performance, and cash flows. SFAS 161 is effective for financial statements issued for fiscal years and interim periods beginning after November 15, 2008 (January 1, 2009, for the Bank), with early adoption allowed. The Bank has not yet determined the effect that the adoption of SFAS 61 will have on its financial statement disclosures.
RECENT LEGISLATIVE AND REGULATORY DEVELOPMENTS
Enactment of the Housing and Economic Recovery Act of 2008
On July 30, 2008, the President signed into law the Housing and Economic Recovery Act of 2008, which is designed to strengthen the regulation of Fannie Mae, Freddie Mac, and the FHLBanks and to address other GSE reform issues. The legislation will eliminate the Finance Board within one year of the date of enactment and immediately creates a new regulator, the Federal Housing Finance Agency (FHFA), which began overseeing the FHLBanks, Fannie Mae, and Freddie Mac upon enactment. The FHFA assumes the current regulatory authorities previously held by the Finance Board. The Bank will be responsible for its share of the operating expenses for both the FHFA and the Finance Board.
Key provisions of the new law:
· require the director of the FHFA (Director) to consider the differences between the FHLBanks and FannieMae/Freddie Mac before taking supervisory, regulatory, or enforcement action;
· allocate responsibility to the Director for setting risk-based capital standards for the FHLBanks and other capital standards and reserve requirements for FHLBank activities and products;
· require independent directors be nominated by the FHLBanks boards of directors and elected by an FHLBank’s members;
· repeal the statutory limits on the compensation of FHLBank directors;
· eliminate the prohibition on the FHLBanks establishing joint offices;
· require assessments collected from the FHLBanks by the FHFA not exceed the costs and expenses related to the FHLBanks;
· authorize voluntary mergers of FHLBanks, subject to regulatory and member approval;
· provide the Director broad conservatorship and receivership authority over the FHLBanks;
· allow the Director to liquidate an FHLBank upon notice and hearing;
· make community development banking institutions eligible for FHLBank membership;
· increase to $1 billion in assets institutions that may meet the definition of community financial institution;
· authorize the FHLBanks on behalf of members to issue letters of credit to support tax-exempt bond issuances; and
· temporarily authorize the Secretary of the Treasury to purchase the obligations of any FHLBank.
54
Table of Contents
The Bank is unable to predict what effect the new law will ultimately have on the FHLBanks.
RECENT REGULATORY ACTIONS AND CREDIT RATING AGENCY ACTIONS
All FHLBanks have joint and several liability for FHLBank COs. The joint and several liability regulation of the Finance Board authorizes the Finance Board to require any FHLBank to repay all or a portion of the principal or interest on COs for which another FHLBank is the primary obligor. The Bank has never been asked or required to repay the principal or interest on any CO on behalf of another FHLBank. The par amount of the outstanding COs of all 12 FHLBanks was $1.3 trillion and $1.2 trillion, respectively, at June 30, 2008, and December 31, 2007.
Some of the FHLBanks have recently been the subject of regulatory actions pursuant to which their boards of directors and/or management have agreed with the Office of Supervision of the Finance Board to, among other things, maintain higher levels of capital. While supervisory agreements generally are publicly announced by the Finance Board, the Bank cannot provide assurance that it has been informed or will be informed of regulatory actions taken at other FHLBanks. In addition, the Bank or any other FHLBank may be the subject of regulatory actions in the future.
On June 12, 2008, S&P lowered the counterparty credit rating of the FHLBank of Chicago to double-A, with a stable outlook. At the request of the FHLBank of Chicago, on July 24, 2008, the Finance Board amended the cease and desist order to allow the FHLBank of Chicago, under certain conditions, to repurchase or redeem any capital stock issued to support new advances after repayment of those new advances.
The Bank has evaluated the financial condition of the other FHLBanks based on known regulatory actions, publicly available financial information, and individual long-term credit-rating downgrades as of each period-end presented. Management believes that the probability that the Bank will be required by the Finance Board to repay any principal or interest associated with COs for which the Bank is not the primary obligor has not materially increased.
ITEM 3. QUANTITATIVE AND QUALITATIVE DISCLOSURES ABOUT MARKET RISK
The Bank has a comprehensive risk-governance structure. The Bank’s Risk-Management Policy identifies seven major risk categories relevant to business activities:
· Credit risk is the risk to earnings or capital of an obligor’s failure to meet the terms of any contract with the Bank or otherwise perform as agreed. The Credit Committee oversees credit risk primarily through ongoing oversight and limits on credit exposure.
· Market risk is the risk to earnings or market value of equity (MVE) due to adverse movements in interest rates, market prices, or interest-rate spreads. Market risk is primarily overseen by the Asset-Liability Committee through ongoing review of VaR and the economic value of capital. The Asset-Liability Committee also reviews income simulations to oversee potential exposure to future earnings volatility.
· Liquidity risk is the risk that the Bank may be unable to meet its funding requirements, or meet the credit needs of members, at a reasonable cost and in a timely manner. The Asset-Liability Committee, through its regular reviews of funding and liquidity, oversees liquidity risk.
· Leverage risk is the risk that the capital of the Bank is not sufficient to support the level of assets. The risk results from a deterioration of the Bank’s capital base, a deterioration of the assets, or from overbooking assets. The Bank’s treasurer, under the direction of the chief financial officer, provides primary oversight of leverage activity.
· Business risk is the risk to earnings or capital arising from adverse business decisions or improper implementation of those decisions, or from external factors as may occur in both the short- and long-run. Business risk is overseen by the Management Committee through the development of the strategic business plan.
· Operational risk is the risk of loss resulting from inadequate or failed internal processes and systems, human error, or from internal or external events, inclusive of exposure to potential litigation resulting from inappropriate conduct of Bank personnel. The Operational Risk Committee primarily oversees operational risk.
· Reputation risk is the risk to earnings or capital arising from negative public opinion, which can affect the Bank’s ability to establish new business relationships or to maintain existing business relationships. The Management Committee oversees reputation risk.
The board of directors defines the desired risk profile of the Bank and provides risk oversight through the review and approval of the Bank’s Risk-Management Policy. The Risk and Finance Committees of the board of directors provide additional oversight for market risk and credit risk. The board’s Audit Committee provides additional oversight for operational risk. The board of directors also
55
Table of Contents
reviews the result of an annual risk assessment conducted by management for its major business processes.
Management further delineates the Bank’s risk appetite for specific business activities and provides risk oversight through the following committees:
· Management Committee is the Bank’s overall risk-governance, strategic-planning, and policymaking group. The committee, which is comprised of the Bank’s senior officers, reviews and recommends to the board of directors for approval all revisions to major policies of the organization. All decisions by this committee are subject to final approval by the president of the Bank.
· Asset-Liability Committee is responsible for approving policies and risk limits for the management of market risk, including liquidity and options risks. The Asset-Liability Committee also conducts monitoring and oversight of these risks on an ongoing basis, and promulgates strategies to enhance the Bank’s financial performance within established risk limits consistent with the strategic business plan.
· Credit Committee oversees the Bank’s credit-underwriting functions and collateral eligibility standards. The committee also reviews the creditworthiness of the Bank’s investments, including purchased mortgage assets, and oversees the classification of the Bank’s assets and the adequacy of its loan-loss reserves.
· Operational Risk Committee reviews and assesses the Bank’s exposure to operational risks and determines tolerances for potential operational threats that may arise from new products and services. The committee may also discuss operational exceptions and assess appropriate control actions to mitigate reoccurrence and improve future detection.
· Information Technology and Security Oversight Committee provides senior management oversight and governance of the information technology, information security, and business-continuity functions of the Bank. The committee approves the major priorities and overall level of funding for these functions, within the context of the Bank’s strategic business priorities and established risk-management objectives.
This list of internal management committees or their respective missions may change from time to time based on new business or regulatory requirements.
Credit Risk
Credit Risk — Advances. The Bank endeavors to minimize credit risk on advances by monitoring the financial condition of its borrowing entities and by holding sufficient collateral to protect itself from losses. The Bank is prohibited by Section 10(a) of the FHLBank Act from making advances without sufficient collateral to secure the advance. The Bank has never experienced a credit loss on an advance.
The Bank closely monitors the financial condition of all members and nonmember borrowers by reviewing available financial data, such as regulatory call reports filed by depository institution members, regulatory financial statements filed with the appropriate state insurance department by insurance company members, audited financial statements of housing associates, Securities and Exchange Commission (SEC) filings, and rating-agency reports to ensure that potentially troubled members are identified as soon as possible. In addition, the Bank has access to most members’ regulatory examination reports. The Bank analyzes this information on a regular basis. Based upon the financial condition of the member, the Bank classifies each member into one of three collateral categories: blanket-lien status, listing-collateral status, or delivery-collateral status.
The Bank assigns members that it has determined are in good financial condition to blanket-lien status. Members that demonstrate characteristics that evidence potential weakness in their financial condition are assigned to listing-collateral status. The Bank may also assign members with a high level of borrowings as a percentage of their assets to listing-collateral status regardless of their financial condition. In addition, the Bank established an advances borrowing limit of 50 percent of the member’s assets. This limit may be waived by the president of the Bank after considering factors such as, the member’s credit rating, collateral quality, and earnings stability. Members whose total advances exceed 50 percent of assets are placed in listing-collateral status or, if necessary, delivery-collateral status with the Bank. As of June 30, 2008, only Bank of America Rhode Island, N.A. had advances outstanding that exceeded 50 percent of its assets and is in listing-collateral status. The Bank assigns members that it has determined are financially weak to delivery-collateral status as well as all insurance company members that have a nationally recognized statistical-rating organization (NRSRO) long-term debt rating lower than BBB-, insurance company members that do not have an NRSRO long-term debt rating, and all nonmember borrowers. Additionally, housing associates are placed in delivery-collateral status.
The assignment of a member to a collateral status category reflects the Bank’s increasing level of control over the collateral pledged by the member as a member’s financial condition deteriorates. When the Bank classifies a member as being in blanket-lien status, the member retains possession of eligible one- to four-family mortgage-loan collateral pledged to the Bank, provided the member executes a written security agreement and agrees to hold such collateral for the benefit of the Bank. Members in blanket-lien status must specifically list with the Bank all mortgage-loan collateral other than loans secured by first-mortgage loans on owner-occupied
56
Table of Contents
one- to four-family residential property. Under listing-collateral status, the member retains possession of eligible mortgage-loan collateral, however, the Bank requires the member to specifically list all mortgage-loan collateral with the Bank. Securities pledged to the Bank by members in either blanket-lien or listing-collateral status must be delivered to the Bank, the Bank’s approved safekeeping agent, or held by a member’s securities corporation. For members in delivery-collateral status, the Bank requires the member to place physical possession of all pledged eligible collateral with the Bank or the Bank’s approved safekeeping agent.
The Bank’s agreements with its borrowers require each borrowing entity to pledge sufficient eligible collateral to the Bank to fully secure all outstanding extensions of credit, including cash advances, accrued interest receivable, standby letters of credit, MPF credit- enhancement obligations, and lines of credit (collectively, extensions of credit) at all times. The assets that constitute eligible collateral to secure extensions of credit are set forth in Section 10(a) of the FHLBank Act. In accordance with the FHLBank Act, the Bank accepts the following assets as collateral:
· Fully disbursed, whole first mortgages on improved residential property (not more than 45 days delinquent), or securities representing a whole interest in such mortgages;
· Securities issued, insured, or guaranteed by the U.S. government or any agency thereof (including without limitation, MBS issued or guaranteed by the Federal Home Loan Mortgage Corporation, the Federal National Mortgage Association, and the Government National Mortgage Association);
· Cash or deposits of an FHLBank; and
· Other real-estate-related collateral acceptable to the Bank if such collateral has a readily ascertainable value and the Bank can perfect its interest in the collateral.
In addition, in the case of any Community Financial Institution, as defined in accordance with the FHLBank Act, the Bank may accept secured loans for small business and agriculture, or securities representing a whole interest in such secured loans.
In order to mitigate the credit risk, market risk, liquidity risk, and operational risk associated with collateral, the Bank applies a discount to the book value or market value of pledged collateral to establish the lending value of the collateral to the Bank. Collateral that the Bank has determined to contain a low level of risk, such as U.S. government obligations, is discounted at a lower rate than collateral that carries a higher level of risk, such as commercial real estate mortgage loans. The Bank has analyzed the discounts applied to all eligible collateral types and concluded that the current discounts are sufficient to fully secure the Bank against losses in the event of a borrower default.
The Bank generally requires all borrowing members to execute a security agreement that grants the Bank a blanket lien on substantially all assets of the member. The Bank protects its security interest in these assets by filing a Uniform Commercial Code (UCC) financing statement in the appropriate jurisdiction. The Bank also requires that borrowing members in blanket-lien and listing-collateral status must submit to the Bank, on at least an annual basis, an audit opinion that confirms that the member is maintaining sufficient amounts of qualified collateral in accordance with the Bank’s policies. However, blanket-lien and listing-collateral status members that have voluntarily delivered all of their collateral to the Bank may not be required, at the Bank’s discretion, to submit such an audit opinion. Bank employees conduct on-site reviews of collateral pledged by members to confirm the existence of the pledged collateral and to determine that the pledged collateral conforms to the Bank’s eligibility requirements. The Bank may conduct an on-site collateral review at any time.
The Bank’s agreements with borrowers allow the Bank, in its sole discretion, to refuse to make extensions of credit against any collateral, require substitution of collateral, or adjust the discounts applied to collateral at any time. The Bank also may require members to pledge additional collateral regardless of whether the collateral would be eligible to originate a new extension of credit. The Bank’s agreements with its borrowers also afford the Bank the right, in its sole discretion, to declare any borrower to be in default if the Bank deems itself to be insecure.
Beyond these provisions, Section 10(e) of the FHLBank Act affords any security interest granted by a federally insured depository institution member or such a member’s affiliate to the Bank priority over the claims or rights of any other party, including any receiver, conservator, trustee, or similar entity that has the rights of a lien creditor, unless these claims and rights would be entitled to priority under otherwise applicable law and are held by actual purchasers or by parties that are secured by actual perfected security interests. In this regard, the priority granted to the security interests of the Bank under Section 10(e) may not apply when lending to insurance company members. This is due to the anti-preemption provision contained in the McCarran-Ferguson Act in which Congress declared that federal law would not preempt state insurance law unless the federal law expressly regulates the business of insurance. Thus, if state law conflicts with Section 10(e) of the FHLBank Act, the protection afforded by this provision may not be available to the Bank. However, the Bank protects its security interests in the collateral pledged by its members, including insurance company members, by filing UCC-1 financing statements, or by taking possession or control of such collateral, or by taking other appropriate steps.
57
Table of Contents
Advances outstanding to members in blanket-lien status at June 30, 2008, totaled $38.5 billion. For these advances, the Bank had access to collateral through security agreements, where the member agrees to hold such collateral for the benefit of the Bank, totaling $68.4 billion as of June 30, 2008. Of this total, $5.3 billion of securities have been delivered to the Bank or to a third-party custodian, an additional $3.0 billion of securities are held by members’ securities corporations, and $32.8 billion of residential mortgage loans have been pledged by members’ real-estate-investment trusts.
The following table provides information regarding advances outstanding with members and nonmember borrowers in listing- and delivery-collateral status at June 30, 2008, along with their corresponding collateral balances.
Advances Outstanding by Borrower Collateral Status
As of June 30, 2008
(dollars in thousands)
| | Number of
Borrowers | | Advances
Outstanding | | Collateral (1) | | Ratio of Collateral to Advances | |
| | | | | | | | | |
Listing-collateral status | | 18 | | $ | 24,060,388 | | $ | 25,284,599 | | 105.1 | % |
Delivery-collateral status | | 16 | | 243,120 | | 3,227,867 | | 1,327.7 | |
| | | | | | | | | |
Total par value | | 34 | | $ | 24,303,508 | | $ | 28,512,466 | | 117.3 | % |
(1) In accordance with the Bank’s collateral policies, qualified collateral includes only collateral that has not been in default within the most recent 12-month period, except that whole first-mortgage collateral on one- to four-family residential property is acceptable provided no payment is overdue by more than 45 days, unless the collateral is insured or guaranteed by the U.S. or any agency thereof.
The Bank allows members in blanket-lien status to pledge owner-occupied one- to four-family mortgage loans to the Bank under a blanket pledge without specific loan-level information. The Bank requires members in blanket-lien status to provide a listing of all other loan collateral pledged to the Bank. Members in listing-collateral status must provide a listing of all loan collateral that they pledge to the Bank. All securities pledged as collateral by all members must be delivered to the Bank or to a Bank-approved third-party custodian. Members in delivery-collateral status must deliver all loan and securities collateral to the Bank or a Bank-approved third-party custodian.
The Bank assigns members to blanket-lien status, listing-collateral status, and delivery-collateral status based on the Bank’s assessment of the financial condition of the member. The method by which a member pledges collateral is dependent upon the collateral status to which it is assigned based on its financial condition and on the type of collateral that the member pledges. For example, securities collateral pledged by a member that is in blanket-lien status based on its financial condition appears in the table below as being in collateral delivered to the Bank, since all securities collateral must be delivered to the Bank or to a Bank-approved third-party custodian. Based upon the method by which members pledge collateral to the Bank, the following table shows the total potential lending value of the collateral that members have pledged to the Bank, net of the Bank’s collateral valuation discounts.
Collateral by Pledge Type
As of June 30, 2008
(dollars in thousands)
| | Amount of Collateral | |
| | | |
Collateral pledged under blanket lien | | $ | 60,489,858 | |
Collateral specifically listed and identified | | 5,712,577 | |
Collateral delivered to the Bank | | 36,707,057 | |
| | | | |
Based upon the collateral held as security on advances, the Bank’s prior repayment history, and the protections provided by Section 10(e) of the FHLBank Act, the Bank does not believe that an allowance for losses on advances is necessary at this time.
Credit Risk — Investments. The Bank is also subject to credit risk on unsecured investments consisting primarily of money-market instruments and bonds issued by U.S. agencies and instrumentalities. The Bank places funds with large, high-quality financial institutions with long-term credit ratings no lower than single-A on an unsecured basis for terms of up to 95 days; most such placements expire within 35 days. Management actively monitors the credit quality of these counterparties. At June 30, 2008, the
58
Table of Contents
Bank’s unsecured credit exposure, including accrued interest related to investment securities and money-market instruments, was $6.5 billion to 26 counterparties and issuers, of which $2.2 billion was for overnight federal funds sold, and $4.3 billion was for other unsecured investments. As of June 30, 2008, the Royal Bank of Scotland PLC represented 10.1 percent of the Bank’s total unsecured credit exposure.
The Bank also invests in and is subject to secured credit risk related to MBS, ABS, and state and local housing-finance-agency obligations (HFA) that are directly or indirectly supported by underlying mortgage loans. Investments in MBS and ABS may be purchased as long as the balance of outstanding MBS/ABS is equal to or less than 300 percent of the Bank’s total capital, and must be rated triple-A at the time of purchase. HFA bonds must carry a credit rating of double-A or higher as of the date of purchase.
Credit ratings on these investments as of June 30, 2008, are provided in the following table.
Credit Ratings of Investments at Book Value
As of June 30, 2008
(dollars in thousands)
| | Long-Term Credit Rating (1) |
Investment Category | | Triple-A | | Double-A | | Single-A | | Triple-B | | Unrated | |
| | | | | | | | | | | |
Money-market instruments (2): | | | | | | | | | | | |
Interest-bearing deposits | | $ | 75 | | $ | 1,390,000 | | $ | 2,060,000 | | $ | — | | $ | — | |
Federal funds sold | | — | | 1,155,000 | | 1,025,000 | | — | | — | |
| | | | | | | | | | | |
Investment securities: | | | | | | | | | | | |
U.S. agency obligations | | 46,345 | | — | | — | | — | | — | |
U.S. government corporations | | 224,160 | | — | | — | | — | | — | |
Government-sponsored enterprises | | 121,470 | | — | | — | | — | | 30,187 | |
Supranational banks | | 391,028 | | — | | — | | — | | — | |
State or local housing-finance-agency obligations (3) | | 161,046 | | 68,289 | | 55,228 | | — | | — | |
GSE MBS | | 5,083,318 | | — | | — | | — | | — | |
Private-label MBS (4) | | 4,825,368 | | 118,860 | | 23,716 | | — | | — | |
ABS backed by home-equity loans (5) | | 25,002 | | 8,587 | | 6,906 | | 1,402 | | — | |
| | | | | | | | | | | |
Total investments | | $ | 10,877,812 | | $ | 2,740,736 | | $ | 3,170,850 | | $ | 1,402 | | $ | 30,187 | |
(1) Ratings are obtained from Moody’s, Fitch, and S&P. If there is a split rating, the lowest rating is used.
(2) The issuer rating is used, and if a rating is on negative credit watch, the rating in the next lower rating category is used and then the lowest rating is determined.
(3) As of July 31, 2008, there were three double-A-rated state or local housing-finance-agency obligations with June 30, 2008, book values of $4.1 million on review for downgrade by at least one of the three major rating agencies. As of July 31, 2008, there were 12 triple-A-rated state or local housing-finance-agency obligations with June 30, 2008, book value of $127.6 million on review for downgrade by at least one of the three major rating agencies.
(4) On July 25, 2008, one MBS with a June 30, 2008, book value of $91.7 million was downgraded by Moody’s from Aaa to A3, one MBS with a book value of $53.2 million was downgraded by Moody’s from Aaa to Ba2, and one MBS with a book value of $102.1 million was downgraded by Moody’s from Aaa to B1. On July 31, 2008, one MBS with a June 30, 2008 book value of $15.0 million was downgraded by Moody’s from Aaa to Aa1, one MBS with a book value of $49.7 million was downgraded by Moody’s from Aaa to Aa2, one MBS with a book value of $29.9 million was downgraded from Aaa to Aa3, one MBS with a book value of $11.9 million was downgraded by Moody’s from Aaa to A1, and three MBS with a book value of $132.4 million was downgraded by Moody’s from Aaa to Baa1. Additionally, as of July 31, 2008, there were 34 triple-A-rated MBS with June 30, 2008, book values of $901.9 million on review for downgrade by at least one of the three major rating agencies.
(5) As of July 31, 2008, there were three double-A-rated ABS with a June 30, 2008, book value of $8.6 million on review for downgrade by at least one of the three major rating agencies. As of July 31, 2008, there were nine triple-A-rated ABS with a June 30, 2008, book value of $5.9 million on review for downgrade by at least one of the three major rating agencies.
Of the Bank’s $10.1 billion in par value of MBS and ABS investments at June 30, 2008, $4.8 billion in par value are private label securities backed by residential mortgage loans. Of this amount, $4.0 billion in par value are securities backed primarily by Alt-A loans, while $753.6 million in par value are backed primarily by prime loans. Only $36.8 million in par value of these investments are backed primarily by subprime mortgages. While there is no universally accepted definition for prime and Alt-A underwriting standards, in general, prime underwriting implies a borrower without a history of delinquent payments and documented income and a loan amount that is at or less than 80 percent of the market value of the house, while Alt-A underwriting implies a prime borrower with limited income documentation and/or a loan-to-value ratio of higher than 80 percent. The Bank does not hold any collateralized debt obligations.
59
Table of Contents
The following table provides additional information related to the Bank’s MBS issued by private trusts and ABS backed by home-equity loans, indicating whether the underlying mortgage collateral is considered to be prime, Alt-A, or subprime at the time of issuance. Additionally, the amounts outstanding as of June 30, 2008, are stratified by year of issuance of the security, including private label commercial mortgage-backed securities (CMBS).
Private-Label Mortgage- and Asset-Backed Securities
Par Values as of June 30, 2008
(dollars in thousands)
| | Private-Label MBS | | Home Equity ABS | | Private-Label |
Year of Issuance | | Prime | | Alt-A | | Subprime | | Prime | | Alt-A | | Subprime | | CMBS |
| | | | | | | | | | | | | | |
2007 | | $ | 169,061 | | $ | 1,104,750 | | $ | — | | $ | — | | $ | — | | $ | — | | $ | — |
2006 | | 122,450 | | 1,780,408 | | — | | — | | — | | — | | — |
2005 | | 103,308 | | 1,024,385 | | — | | — | | — | | — | | — |
2004 | | 116,232 | | 85,316 | | — | | — | | — | | 6,385 | | — |
2003 and Prior | | 237,428 | | 23,170 | | — | | 5,130 | | — | | 30,382 | | 208,621 |
| | | | | | | | | | | | | | |
Total | | $ | 748,479 | | $ | 4,018,029 | | $ | — | | $ | 5,130 | | $ | — | | $ | 36,767 | | $ | 208,621 |
The following table shows the summary credit enhancements associated with the Bank’s residential MBS issued by entities other than GSEs, with detail by collateral type and vintage. Average current credit enhancements as of June 30, 2008, reflect the percentage of subordinated class outstanding balance as of June 30, 2008, to the Bank’s senior class holding outstanding balances as of June 30, 2008, weighted by the par value of the Bank’s respective senior class securities, and shown by underlying loan collateral type and issuance vintage. Average current credit enhancements as of June 30, 2008, reflect the ability of subordinated classes to absorb loan collateral, lost principal, and interest shortfall before senior classes are impacted. The average current credit enhancements do not fully reflect the Bank’s credit protection in its private label MBS holdings as prioritization in the timing of receipt of cash flows and credit event triggers accelerate return of the Bank’s investment before losses can no longer be absorbed by subordinate classes.
Private-Label Mortgage- and Asset-Backed Securities
Summary Credit Enhancements
As of June 30, 2008
(dollars in thousands)
| | | | | | | | Credit Enhancement Statistics | |
| | Par Value | | Book Value | | Fair Value | | Average Current | | Monoline Financial Guaranteed Amount | |
Prime | | | | | | | | | | | |
2007 | | $ | 169,061 | | $ | 168,101 | | $ | 154,905 | | 11.21 | % | $ | — | |
2006 | | 122,450 | | 122,351 | | 119,331 | | 10.19 | | — | |
2005 | | 103,308 | | 102,654 | | 92,219 | | 23.88 | | — | |
2004 | | 116,232 | | 116,467 | | 106,141 | | 19.01 | | — | |
2003 and Prior | | 242,558 | | 242,757 | | 235,326 | | 9.15 | | 5,130 | |
Total prime | | 753,609 | | 752,330 | | 707,922 | | 13.32 | | 5,130 | |
| | | | | | | | | | | |
Alt-A | | | | | | | | | | | |
2007 | | 1,104,750 | | 1,101,892 | | 819,004 | | 25.47 | | 168,833 | |
2006 | | 1,780,408 | | 1,779,688 | | 1,266,539 | | 27.92 | | 21,778 | |
2005 | | 1,024,385 | | 1,022,069 | | 827,319 | | 32.42 | | 48,344 | |
2004 | | 85,316 | | 85,316 | | 74,570 | | 22.05 | | — | |
2003 and Prior | | 23,170 | | 23,170 | | 21,095 | | 18.43 | | 2,303 | |
Total Alt-A | | 4,018,029 | | 4,012,135 | | 3,008,527 | | 28.21 | | 241,258 | |
| | | | | | | | | | | |
Subprime | | | | | | | | | | | |
2007 | | — | | — | | — | | — | | — | |
2006 | | — | | — | | — | | — | | — | |
2005 | | — | | — | | — | | — | | — | |
2004 | | 6,385 | | 6,385 | | 5,010 | | 21.23 | | 6,385 | |
2003 and Prior | | 30,382 | | 30,382 | | 26,889 | | 45.61 | | 30,382 | |
Total subprime | | 36,767 | | 36,767 | | 31,899 | | 41.37 | | 36,767 | |
| | | | | | | | | | | |
Total investments | | $ | 4,808,405 | | $ | 4,801,232 | | $ | 3,748,348 | | 25.98 | % | $ | 283,155 | |
60
Table of Contents
In 2007 and 2008, delinquency and foreclosure rates for subprime and Alt-A mortgages increased significantly nationwide, a trend that has continued through the date of this report and may continue through 2008. Moreover, home prices have fallen in many areas, increasing the likelihood and magnitude of potential losses to lenders on foreclosed real estate. The widespread impact of these trends has led to the recognition of significant losses by financial institutions, including commercial banks, investment banks, and financial guaranty providers. Uncertainty as to the depth and duration of these trends has led to a significant reduction in the market values of securities backed by subprime and Alt-A mortgages, and has elevated the potential for other-than-temporary impairment of some of these securities.
Prices of many of the Bank’s private-label MBS dropped dramatically during the six months ended June 30, 2008, as delinquencies and foreclosures affecting the loans underlying these securities continued to worsen and as credit markets became highly illiquid in late February and March 2008. The following graph demonstrates how average prices declined with respect to various asset classes in the Bank’s MBS portfolio during the first half of 2008:
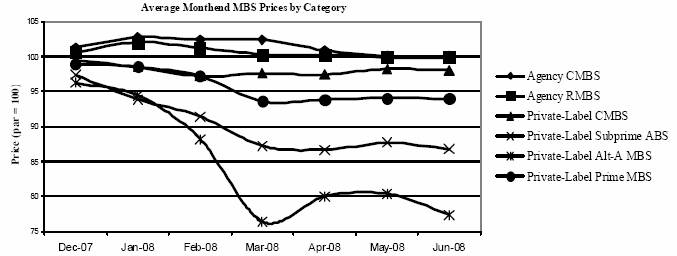
The following table provides further information regarding the Bank’s MBS issued by private trusts through disclosure of pro forma impacts associated with stress-test scenarios applied to the private label MBS holdings. In addition to the other-than-temporary —impairment (OTTI) testing, described in Note 5 of the Notes to the Financial Statements, the Bank also performs stress tests of key variable assumptions to assess potential exposure of the Bank’s private label MBS to changes in assumptions. The Bank assumes instantaneous adverse shifts to its conservative base case OTTI assumptions, and measures potential loss of principal and interest shortfall. Similar to the methodology described in Note 5 of the Notes to the Financial Statements, the Bank uses third-party models to project expected losses associated with the underlying loan collateral and to model the resultant lifetime cash flows as to how they would pass through the deal structures underlying the Bank’s MBS investments. For its key variable stress testing, the Bank assumes that the key variable is instantly shocked above the OTTI testing level while all other assumptions remain in line with their respective OTTI levels.
The table indicates potential lost principal and interest shortfall resultant from stress moves in securities’ default rates, loss severities, or voluntary prepayment rates.
· Base case OTTI loss severity assumptions, as described in Note 5 of the Notes to the Financial Statements, are shocked by an additive five percentage points through final maturity to determine the impact of increased collateral loan losses realized at final disposition of defaulted pool loans.
· The Bank’s base case OTTI assumption for each individual security in respect to default rates, as described in Note 5 of the Notes to the Financial Statements, is shocked by an additive 10 percentage points through final maturity to determine the impact of increased unpaid principal balance which is defaulted upon by borrowers.
· Voluntary prepayment rates were adjusted downward by a proportional 15 percent through final maturity to estimate the impact on the Bank’s holdings if cash flows slowed, potentially exposing the Bank to risk if the subordinate classes eroded prior to the Bank’s receipt of its principal and interest due.
All lost principal and interest shortfall are shown in non-discounted dollars. Similar to the table above, the table indicates whether the underlying mortgage collateral is considered to be prime, Alt-A, or subprime at the time of issuance. Additionally, the amounts outstanding as of June 30, 2008, are stratified by year of issuance of the security.
61
Table of Contents
Private-Label Mortgage Backed Securities
Stress-Test Scenarios
As of June 30, 2008
(dollars in thousands)
| | | | | | | | Stress Test Scenarios: Principal and Interest Shortfall | |
| | Par Value | | Book Value | | Fair Value | | 5 Percentage Point Increase in Loss Severities | | 10 Percentage Point Increase in Conditional Default Rates | | 15 Percent Proportional Decrease in Voluntary Prepayment Rates | |
Prime | | | | | | | | | | | | | |
2007 | | $ | 169,061 | | $ | 168,101 | | $ | 154,905 | | $ | — | | $ | — | | $ | — | |
2006 | | 122,450 | | 122,351 | | 119,331 | | — | | — | | — | |
2005 | | 103,308 | | 102,654 | | 92,219 | | — | | — | | — | |
2004 | | 116,232 | | 116,467 | | 106,141 | | — | | — | | — | |
2003 and Prior | | 242,558 | | 242,757 | | 235,326 | | — | | — | | — | |
Total prime | | 753,609 | | 752,330 | | 707,922 | | — | | — | | — | |
| | | | | | | | | | | | | |
Alt-A | | | | | | | | | | | | | |
2007 | | 1,104,750 | | 1,101,892 | | 819,004 | | 1,368 | | 29 | | 6 | |
2006 | | 1,780,408 | | 1,779,688 | | 1,266,539 | | 1,293 | | 386 | | 222 | |
2005 | | 1,024,385 | | 1,022,069 | | 827,319 | | 4 | | — | | — | |
2004 | | 85,316 | | 85,316 | | 74,570 | | — | | — | | — | |
2003 and Prior | | 23,170 | | 23,170 | | 21,095 | | — | | — | | — | |
Total Alt-A | | 4,018,029 | | 4,012,135 | | 3,008,527 | | 2,665 | | 415 | | 228 | |
| | | | | | | | | | | | | |
Subprime | | | | | | | | | | | | | |
2007 | | — | | — | | — | | — | | — | | — | |
2006 | | — | | — | | — | | — | | — | | — | |
2005 | | — | | — | | — | | — | | — | | — | |
2004 | | 6,385 | | 6,385 | | 5,010 | | — | | — | | — | |
2003 and Prior | | 30,382 | | 30,382 | | 26,889 | | — | | — | | — | |
Total subprime | | 36,767 | | 36,767 | | 31,899 | | — | | — | | — | |
| | | | | | | | | | | | | |
Total private label MBS | | $ | 4,808,405 | | $ | 4,801,232 | | $ | 3,748,348 | | $ | 2,665 | | $ | 415 | | $ | 228 | |
The scenarios and associated results presented in the table above do not represent the Bank’s current expectations for performance in its private label MBS portfolio, but rather an indicative measure if assumptions used in its OTTI assessment described in Note 5 of the Notes to the Financial Statements change under further deterioration within U.S. housing markets. The differential between potential losses under stress-test scenarios and unrealized fair-value losses as of June 30, 2008, are representative of the Bank’s assertion that the depressed market values associated with its private label MBS holdings are due to illiquidity currently experienced in MBS markets, and not reflective of other-than-temporary impairment due to credit.
In the scenario whereby loss severities are increased by five percentage points, potential lost principal and interest shortfall is $2.7 million, or 0.06 percent of par value as of June 30, 2008; the unrealized loss in fair value associated with the securities impacted in this scenario is $240.5 million as of June 30, 2008. Under the scenario wherein default rates are increased by 10 percentage points, projected lost principal and interest shortfall is $415,000, or 0.009 percent of par value as of June 30, 2008, while the unrealized loss in fair value is $157.1 million as of June 30, 2008. When voluntary prepayment rates are decreased by a proportional 15 percent, the resultant potential loss of principal and interest is $228,000, or 0.005 percent of par value as of June 30, 2008, while the unrealized loss in fair value for those securities affected is $104.5 million as of June 30, 2008. If it is determined that an impairment is other-than-temporary, then an impairment loss will be recognized in earnings equal to the entire difference between the investment’s then current carrying amount and its fair value. The fair value of the investment would then become the new cost basis of the investment. In periods subsequent to the recognition of an other-than-temporary impairment loss, the Bank would account for the other-than-temporarily impaired debt security as if the debt security had been purchased on the measurement date of the other-than-temporary impairment. The resulting discount or reduced premium recorded for the debt security, based on the new cost basis, would be amortized over the remaining life of the debt security in a prospective manner based on the amount and timing of future estimated cash flows.
Certain of the Bank’s investments in HFA bonds and MBS/ABS are insured by a third-party bond insurer. The bond insurance on these investments guarantees the timely payments of principal and interest if these payments cannot be satisfied from the cash flows of the underlying mortgage pool.
The following table provides the credit ratings of these third-party bond insurers, along with the amount of investment securities outstanding as of June 30, 2008.
62
Table of Contents
Investments Insured by Financial Guarantors
Book Values as of June 30, 2008
(dollars in thousands)
Financial Guarantors | | Insurer Financial Strength Ratings (Fitch/Moody’s/S&P) As of July 31, 2008 | | HFA Bonds | | MBS/ABS | | Total
Insured
Investments | |
| | | | | | | | | |
Ambac Assurance Corp (1) | | wd/Aa3/AA* | | $ | 30,583 | | $ | 197,577 | | $ | 228,160 | |
Financial Security Assurance, Inc. | | AAA/Aaa*/AAA | | 127,640 | | 59,464 | | 187,104 | |
MBIA Insurance Corp (1) | | wd/A2/AA* | | 53,785 | | 17,594 | | 71,379 | |
XL Capital Assurance, Inc. | | CCC/B2/BBB-* | | — | | 6,385 | | 6,385 | |
Financial Guaranty Insurance Company | | CCC/B1/BB* | | — | | 1,402 | | 1,402 | |
| | | | | | | | | |
Total | | | | $ | 212,008 | | $ | 282,422 | | $ | 494,430 | |
(1) On June 26, 2008, Fitch withdrew the ratings of Ambac Assurance Corp and MBIA Insurance Corp.
* Rating is on negative watch for possible downgrade
Credit Risk — Mortgage Loans. The Bank is subject to credit risk on purchased mortgage loans acquired through the MPF program. All mortgage loans acquired under the MPF program are fixed-rate, fully amortizing mortgage loans. While Bank management believes that credit risk on this portfolio is appropriately managed through underwriting standards and member credit enhancement obligations, the Bank also maintains an allowance for credit losses. The Bank’s allowance for credit losses pertaining to mortgage loans was $125,000 at both June 30, 2008, and December 31, 2007. As of June 30, 2008, nonaccrual loans amounted to $12.8 million and consisted of 139 loans out of a total of approximately 43,600 loans. The Bank places certain conventional mortgage loans on nonaccrual status when the collection of the contractual principal or interest is 90 days or more past due. The Bank had no charge-offs related to mortgage loans foreclosed upon during the six months ended June 30, 2008. The Bank had no recoveries during the six months ended June 30, 2008, from the resolution of loans previously charged off.
The Bank is exposed to credit risk from mortgage-insurance (MI) companies that provide credit enhancements in place of the PFI on MPF Plus-type master commitments, as well as primary MI coverage on individual loans in all types of conventional master commitments. As of June 30, 2008, the Bank was the beneficiary of primary MI coverage on $230.1 million of conventional mortgage loans, and the Bank was the beneficiary of supplemental mortgage guaranty insurance (SMI) coverage on mortgage pools with a total unpaid principal balance of $2.2 billion. Eight MI companies provide all of the coverage under these policies.
As of August 5, 2008, five of these MI companies have been downgraded to a rating lower than double-A minus by at least one NRSRO, citing poor results for the first quarter of 2008 and the continued deterioration in key variables that influence claims for mortgage insurance. The table below shows the ratings of these companies as of August 5, 2008.
The Bank has analyzed its potential loss exposure to all of the mortgage-insurance companies and does not expect incremental losses due to these rating actions. This expectation is based on the credit-enhancement features of the Bank’s master commitments (exclusive of mortgage insurance), the underwriting characteristics of the loans that back the Bank’s master commitments, the seasoning of the loans that back these master commitments, and the strong performance of the loans to date. The Bank closely monitors the financial conditions of these MI companies. The Bank has established limits on exposure to individual MI companies to ensure that the insurance coverage is sufficiently diversified. The following table shows MI companies as of June 30, 2008.
63
Mortgage-Insurance Companies That Provide MI Coverage
As of June 30, 2008
(dollars in thousands)
Mortgage Insurance
Company | | Mortgage-Insurance
Company Ratings
(Fitch/Moody’s/S&P)
As of August 5, 2008 | | Balance of
Loans with
Primary MI | | Primary MI | | SMI | | MI Coverage | | Percent of
Total MI
Coverage | |
| | | | | | | | | | | | | |
Mortgage Guaranty Insurance Corporation | | A+*/A1/A | | $ | 68,497 | | $ | 14,500 | | $ | 1,612 | | $ | 16,112 | | 27.1 | % |
| | | | | | | | | | | | | |
United Guaranty Residential Insurance Corporation | | AA+/Aa3/AA+* | | 21,340 | | 4,427 | | 9,348 | | 13,775 | | 23.2 | |
| | | | | | | | | | | | | |
Genworth Mortgage Insurance Corporation | | AA*/Aa3/AA | | 59,534 | | 13,258 | | — | | 13,258 | | 22.3 | |
| | | | | | | | | | | | | |
PMI Mortgage Insurance Company | | A+*/A3/A+ | | 24,956 | | 4,836 | | — | | 4,836 | | 8.1 | |
| | | | | | | | | | | | | |
Radian Guaranty Incorporated | | NR/A2/A* | | 21,941 | | 3,962 | | 399 | | 4,361 | | 7.4 | |
| | | | | | | | | | | | | |
Republic Mortgage Insurance Company | | AA-*/A1/AA- | | 18,554 | | 3,609 | | 405 | | 4,014 | | 6.8 | |
| | | | | | | | | | | | | |
CMG Mortgage Insurance Company | | AA/NR/AA- | | 7,900 | | 1,714 | | — | | 1,714 | | 2.9 | |
| | | | | | | | | | | | | |
Triad Guaranty Insurance Corporation | | BB*/B1/NR | | 7,388 | | 1,321 | | — | | 1,321 | | 2.2 | |
| | | | | | | | | | | | | |
| | | | $ | 230,110 | | $ | 47,627 | | $ | 11,764 | | $ | 59,391 | | 100.0 | % |
* Rating is on watch for possible downgrade.
Credit Risk — Derivative Instruments. The Bank is subject to credit risk on derivative instruments. Credit exposure from derivatives arises from the risk of counterparty default on the derivative contract. The amount of loss created by default is the replacement cost, or current positive fair value, of the defaulted contract, net of any collateral held by the Bank. The credit risk to the Bank arising from unsecured credit exposure on derivatives is mitigated by the credit quality of the counterparties. The Bank enters into derivatives only with nonmember institutions that have long-term senior unsecured credit ratings that are at or above single-A by S&P and Moody’s. Also, the Bank uses master-netting agreements to reduce its credit exposure from counterparty defaults. The nonmember master agreements contain bilateral-collateral-exchange provisions that require credit exposures beyond a defined amount be secured by U.S. government or GSE-issued securities or cash. Exposures are measured daily, and adjustments to collateral positions are made as necessary to minimize the Bank’s exposure to credit risk. The nonmember agreements generally provide for smaller amounts of unsecured exposure to lower-rated counterparties. As of June 30, 2008, the Bank had two derivative contracts outstanding with one member institution which involved no credit exposure since they were interest-rate options sold to the member. The Bank does not enter into interest-rate-exchange agreements with other FHLBanks, and had no such agreements as of June 30, 2008.
As illustrated in the following table, the Bank’s maximum credit exposure on interest-rate-exchange agreements is much less than the notional amount of the agreements. Additionally, mortgage-loan-purchase commitments are reflected in the following table as derivative instruments, in accordance with the provisions of SFAS 149. The Bank does not collateralize mortgage-loan-purchase commitments. However, should the PFI fail to deliver the mortgage loans as agreed, the member institution is charged a fee to compensate the Bank for nonperformance of the agreement.
Derivative Instruments
(dollars in thousands)
| | Notional
Amount | | Number of
Counterparties | | Total Net
Exposure at
Fair Value | | Net Exposure
after
Collateral | |
As of June 30, 2008 | | | | | | | | | |
Interest-rate-exchange agreements: (1) | | | | | | | | | |
Double-A | | $ | 26,483,016 | | 15 | | $ | 8,926 | | $ | 8,926 | |
Single-A | | 6,205,535 | | 3 | | 2,834 | | 2,834 | |
Unrated (2) | | 10,000 | | 1 | | — | | — | |
Total interest-rate-exchange agreements | | 32,698,551 | | 19 | | 11,760 | | 11,760 | |
Mortgage-loan-purchase commitments (3) | | 11,142 | | — | | 44 | | — | |
Forward contracts | | 10,000 | | 1 | | 102 | | — | |
| | | | | | | | | |
Total derivatives | | $ | 32,719,693 | | 20 | | $ | 11,906 | | $ | 11,760 | |
| | | | | | | | | |
As of December 31, 2007 | | | | | | | | | |
Interest-rate-exchange agreements: (1) | | | | | | | | | |
Double-A | | $ | 20,151,961 | | 13 | | $ | 65,016 | | $ | 8,661 | |
Single-A | | 8,957,057 | | 5 | | 2,002 | | 2,002 | |
Unrated (2) | | 10,000 | | 1 | | — | | — | |
Total interest-rate-exchange agreements | | 29,119,018 | | 19 | | 67,018 | | 10,663 | |
Mortgage-loan-purchase commitments (3) | | 9,600 | | — | | 29 | | — | |
| | | | | | | | | |
Total derivatives | | $ | 29,128,618 | | 19 | | $ | 67,047 | | $ | 10,663 | |
(1) Ratings are obtained from Moody’s, Fitch, and S&P. If there is a split rating, the lowest rating is used.
(2) This represents two contracts with a member institution.
(3) Total fair-value exposures related to mortgage-loan-purchase commitments are offset by pair-off fees from the Bank’s members.
64
Table of Contents
As of June 30, 2008, and December 31, 2007, the following counterparties accounted for more than 10 percent of the total notional amount of interest-rate-exchange agreements outstanding (dollars in thousands):
| | June 30, 2008 | |
Counterparty | | Notional Amount
Outstanding | | Percent of Total
Notional
Outstanding | |
| | | | | |
Deutsche Bank AG | | $ | 4,994,408 | | 15.3 | % |
Credit Suisse First Boston International | | 4,279,560 | | 13.1 | |
Barclays Bank PLC | | 3,649,950 | | 11.2 | |
| | | | | |
| | December 31, 2007 | |
Counterparty | | Notional Amount
Outstanding | | Percent of Total
Notional
Outstanding | |
| | | | | |
Deutsche Bank AG | | $ | 4,010,358 | | 13.8 | % |
JP Morgan Chase Bank | | 3,772,555 | | 13.0 | |
Goldman Sachs Capital Markets LP | | 3,364,616 | | 11.6 | |
Morgan Stanley Capital Services Inc | | 3,204,350 | | 11.0 | |
The Bank may deposit funds with these counterparties and their affiliates for short-term money-market investments, including overnight federal funds, term federal funds, and interest-bearing certificates of deposit. Terms for such investments are overnight to 270 days. The Bank also engages in short-term secured reverse-repurchase agreements with affiliates of these counterparties. All of these counterparties and/or their affiliates buy, sell, and distribute the Bank’s COs.
Contingent Credit Risk— Standby Bond-Purchase Agreements. The Bank has entered into standby bond-purchase agreements with two state-housing authorities whereby the Bank, for a fee, agrees to purchase and hold the authority’s bonds until the designated remarketing agent can find a suitable investor or the housing authority repurchases the bonds according to a schedule established by the agreement. Each commitment agreement contains termination provisions in the event of a rating downgrade of the subject bond. All of the subject bonds are triple-A-rated by at least two rating agencies. Total commitments for bond purchases were $498.7 million at June 30, 2008, of which $492.5 million were to one housing-finance agency. Of the total subject bonds, $456.0 million are guaranteed by a financial guarantor that is currently rated double-A, however, the standalone rating of all $456.0 million in subject bonds remains triple-A. An additional $6.2 million are guaranteed by another financial guarantor whose triple-A rating is on negative watch by one rating agency. These standby bond-purchase agreements have never been drawn upon. However, due to current market conditions, there may be an increased likelihood that they will be drawn upon in the future.
Market and Interest-Rate Risk
Sources of Market and Interest-Rate Risk
The Bank’s balance sheet is a collection of different portfolios that require different types of market and interest-rate-risk-management strategies. The majority of the Bank’s balance sheet is comprised of assets that can be funded individually or collectively without imposing significant residual interest-rate risk on the Bank.
However, the Bank’s mortgage-related assets, including the portfolio of whole loans acquired through the MPF program, its portfolio of MBS and ABS, and its portfolio of bonds issued by HFAs, represent more complex cash-flow structures and contain more risk of prepayment and/or call options. Because many of these assets are backed by residential mortgages that allow the borrower to prepay and refinance at any time, the behavior of these portfolios is asymmetric based on the movement of interest rates. If rates fall, borrowers have an incentive to refinance mortgages without penalty, which could leave the Bank with lower-yielding replacement
65
Table of Contents
assets against existing debt assigned to the portfolio. If rates rise, borrowers will tend to hold existing loans longer than they otherwise would, imposing on the Bank the risk of having to refinance maturing debt assigned to these portfolios at a higher rate, thereby narrowing the interest-rate spread generated by the assets.
These risks cannot be profitably managed with a strategy in which each asset is offset by a liability with a substantially identical cash-flow structure. Therefore, the Bank views each portfolio as a whole and allocates funding and hedging to these portfolios based on an evaluation of the collective market and interest-rate risks posed by these portfolios. The Bank measures the estimated impact to fair values of these portfolios as well as the potential for income to decline due to movements in interest rates, and makes adjustments to the funding and hedge instruments assigned as necessary to keep the portfolios within established risk limits.
Types of Market and Interest-Rate Risk
Interest-rate and market risk can be divided into several categories, including repricing risk, yield-curve risk, basis risk, and options risk. Repricing risk refers to differences in the average sensitivities of asset and liability yields attributable to differences in the average timing of maturities and/or coupon resets between assets and liabilities. In isolation, repricing risk assumes that all rates may change by the same magnitude. However, differences in the timing of repricing of assets and liabilities can cause spreads between assets and liabilities to decline.
Yield-curve risk reflects the sensitivity of net income to changes in the shape or slope of the yield curve that could impact the performance of assets and liabilities differently, even though average sensitivities are the same.
When assets and liabilities are affected by yield changes in different markets, basis risk can result. For example, if the Bank invests in LIBOR-based floating-rate assets and funds those assets with short-term discount notes, potential compression in the spread between LIBOR and discount note rates could adversely affect the Bank’s net income.
The Bank also faces options risk, particularly in its portfolios of advances, mortgage loans, MBS, and HFA bonds. When a member prepays an advance, the Bank could suffer lower future income if the principal portion of the prepaid advance is reinvested in lower-yielding assets that continue to be funded by higher-cost debt. In the mortgage loan, MBS, and HFA-bond portfolios, borrowers or issuers often have the right to redeem their obligations prior to maturity without penalty, potentially requiring the Bank to reinvest the returned principal at lower yields. If interest rates decline, borrowers may be able to refinance existing mortgage loans at lower interest rates, resulting in the prepayment of these existing mortgages and forcing the Bank to reinvest the proceeds in lower-yielding assets. If interest rates rise, borrowers may avoid refinancing mortgage loans for periods longer than the average term of liabilities funding the mortgage loans, causing the Bank to have to refinance the assets at higher cost. This right of redemption is effectively a call option that the Bank has written to the obligor. Another less prominent form of options risk includes coupon-cap risk, which may be embedded into certain MBS and limit the amount by which asset coupons may increase.
Strategies to Manage Market and Interest-Rate Risk
General
The Bank uses various strategies and techniques to manage its market and interest-rate risk. Principal among its tools for interest-rate-risk management is the issuance of debt that is used to match interest-rate-risk exposures of the Bank’s assets. The Bank can issue COs with maturities ranging from overnight to 20 years or more. The debt may be noncallable until maturity or callable on and/or after a certain date.
To reduce the earnings exposure to rising interest rates caused by long-term, fixed-rate assets, the Bank may issue long-term, fixed-rate bonds. These bonds may be issued to fund specific assets or to generally manage the overall exposure of a portfolio or the balance sheet. At June 30, 2008, fixed-rate noncallable debt not hedged by interest-rate-exchange agreements amounted to $12.8 billion, compared with $11.2 billion at December 31, 2007. Fixed-rate callable debt not hedged by interest-rate-exchange agreements amounted to $4.6 billion and $3.7 billion at June 30, 2008, and December 31, 2007, respectively.
To achieve certain risk-management objectives, the Bank also uses interest-rate derivatives that alter the effective maturities, repricing frequencies, or option-related characteristics of financial instruments. These may include swaps, swaptions, caps, collars, and floors; futures and forward contracts; and exchange-traded options. For example, as an alternative to issuing a fixed-rate bond to fund a fixed-rate advance, the Bank might enter into an interest-rate swap that receives a floating-rate coupon and pays a fixed-rate coupon, thereby effectively converting the fixed-rate advance to a floating-rate advance.
Advances
In addition to the general strategies described above, one tool that the Bank uses to reduce the interest-rate risk associated with advances is a contractual provision that requires members to pay prepayment fees for advances that, if prepaid prior to maturity, might
66
Table of Contents
expose the Bank to a loss of income under certain interest-rate environments. In accordance with applicable regulations, the Bank has an established policy to charge fees sufficient to make the Bank financially indifferent to a member’s decision to repay an advance prior to its maturity. Prepayment fees are recorded as income for the period in which they are received.
Prepayment-fee income can be used to offset the cost of purchasing and retiring high-cost debt in order to maintain the Bank’s asset-liability sensitivity profile. In cases where derivatives are used to hedge prepaid advances, prepayment-fee income can be used to offset the cost of terminating the associated hedge.
Investments
The Bank holds certain long-term bonds issued by U.S. agencies, U.S. government corporations and instrumentalities, and supranational banks as available-for-sale. To hedge the market and interest-rate risk associated with these assets, the Bank has entered into interest-rate swaps with matching terms to those of the bonds in order to create synthetic floating-rate assets. At June 30, 2008, and December 31, 2007, this portfolio had an amortized cost of $707.2 million and $707.7 million, respectively.
The Bank also manages the market and interest-rate risk in its MBS portfolio in several ways. For MBS classified as held-to-maturity, the Bank uses debt that matches the characteristics of the portfolio assets. For example, for floating-rate ABS, the Bank uses debt that reprices on a short-term basis, such as CO discount notes or CO bonds that are swapped to a LIBOR-based floating-rate. For commercial MBS that are nonprepayable or prepayable for a fee for an initial period, the Bank may use fixed-rate debt. For MBS that are classified as trading securities, the Bank uses interest-rate swaps to economically hedge the duration characteristics and interest-rate caps to economically hedge the option risk in these assets.
Mortgage Loans
The Bank manages the interest-rate and prepayment risk associated with mortgages through a combination of debt issuance and derivatives. The Bank issues both callable and noncallable debt to achieve cash-flow patterns and liability durations similar to those expected on the mortgage loans.
The Bank mitigates much of its exposure to changes in interest rates by funding a significant portion of its mortgage portfolio with callable debt. When interest rates change, the Bank’s option to redeem this debt offsets a large portion of the fair-value change driven by the mortgage-prepayment option. These bonds are effective in managing prepayment risk by allowing the Bank to respond in kind to prepayment activity. Conversely, if interest rates increase the debt may remain outstanding until maturity. The Bank uses various cash instruments including shorter-term debt, callable, and noncallable long-term debt in order to reprice debt when mortgages prepay faster or slower than expected. The Bank’s debt-repricing capacity depends on market demand for callable and noncallable debt, which fluctuates from time to time. Additionally, because the mortgage-prepayment option is not fully hedged by callable debt, the combined market value of our mortgage assets and debt will be affected by changes in interest rates. As such, the Bank has enacted a more comprehensive strategy incorporating the use of derivatives. Derivatives provide a flexible, liquid, efficient, and cost-effective method to hedge interest-rate and prepayment risks.
To hedge the interest-rate-sensitivity risk due to potentially high prepayment speeds in the event of a drop in interest rates, the Bank has periodically purchased options to receive fixed rates on interest-rate swaps exercisable on specific future dates (receiver swaptions). These derivatives are structured to increase in value as interest rates decline, and provide an offset to the loss of market value that might result from rapid prepayments in the event of a downturn in interest rates. With the addition of these option-based derivatives, the market value of the portfolio becomes more stable because a greater portion of prepayment risk is covered. At June 30, 2008, the Bank had no receiver swaptions.
Interest-rate-risk management activities can significantly affect the level and timing of net income due to a variety of factors. As receiver swaptions are accounted for on a standalone basis and not as part of a hedge relationship under SFAS 133, changes in their fair values are recorded through net income each month. This may increase net income volatility if the offsetting periodic change in the MPF prepayment activity is markedly different from the fair-value change in the receiver swaptions. Additionally, performance of the MPF portfolio is interest-rate-path dependent, while receiver swaptions values are solely based on forward-looking rate expectations.
When the Bank executes transactions to purchase mortgage loans, in some cases the Bank may be exposed to significant market risk until permanent hedging and funding can be obtained in the market. In these cases, the Bank may enter into a forward sale of MBS to be announced (TBA) or other derivatives for forward settlement. As of June 30, 2008, the Bank had $10.0 million of outstanding TBA hedges. The total fair value of these hedges as of June 30, 2008, was an unrealized gain of $102,000.
67
Table of Contents
Swapped Consolidated Obligation Debt
The Bank may also issue CO bonds in conjunction with interest-rate swaps that receive a coupon that offsets the bond coupon, and that offset any optionality embedded in the bond, thereby effectively creating a floating-rate liability. The Bank employs this strategy to achieve a lower cost of funds than may be available from the issuance of short-term consolidated discount notes. Total CO bond debt used in conjunction with interest-rate-exchange agreements was $18.4 billion, or 48.6 percent of the Bank’s total outstanding CO bonds at June 30, 2008, up from $17.8 billion, or 53.0 percent of total outstanding CO bonds, at December 31, 2007. Total CO discount note debt used in conjunction with interest-rate-exchange agreements was $700.0 million, or 1.6 percent of the Bank’s total outstanding CO discount notes, at June 30, 2008, which was largely unchanged from the Bank’s total outstanding CO discount notes at December 31, 2007. Because the interest-rate swaps and hedged CO bonds trade in different markets, they are subject to basis risk that is reflected in the Bank’s value at risk calculations, but that is not reflected in hedge ineffectiveness as measured in accordance with SFAS 133, because these interest-rate swaps are designed to hedge changes in fair values of the CO bonds that are attributable to changes in the benchmark LIBOR interest rate.
The Bank also uses interest-rate swaps, caps, and floors to manage the fair-value sensitivity of the portion of its MBS portfolio that is classified as trading securities. These interest-rate-exchange agreements provide an economic offset to the duration and convexity risks arising from these assets.
See Item 2 — Management’s Discussion and Analysis of Financial Condition and Results of Operations — Financial Condition — Derivative Instruments for a summary of the Bank’s hedged items.
Measurement of Market and Interest-Rate Risk
The Bank measures its exposure to market and interest-rate risk using several techniques applied to the balance sheet and to certain portfolios within the balance sheet. Principal among these measurements as applied to the balance sheet is the potential future change in MVE and interest income due to potential changes in interest rates, spreads, and market prices. For purposes of measuring interest-income sensitivity over time, the Bank measures the repricing gaps between its assets and liabilities. The Bank also measures the duration gap of its mortgage-loan portfolio, including all assigned funding and hedging transactions.
The Bank uses sophisticated information systems to evaluate its financial position. These systems are capable of employing various interest-rate term-structure models and valuation techniques to determine the values and sensitivities of complex or option-embedded instruments such as mortgage loans; MBS; callable bonds and swaps; and adjustable-rate instruments with embedded caps and floors, among others. These models require the following:
· Specification of the contractual and behavioral features of each instrument;
· Determination and specification of appropriate market data, such as yield curves and implied volatilities;
· Utilization of appropriate term-structure and prepayment models to reasonably describe the potential evolution of interest rates over time and the expected behavior of financial instruments in response;
· For option-free instruments, the expected cash flows are specified in accordance with the term structure of interest rates and discounted using spot rates derived from the same term structure;
· For option-embedded instruments that are path-independent, such as callable bonds and swaps, a backward-induction process is used to evaluate each node on a lattice that captures the variety of scenarios specified by the term-structure model; and
· For option-embedded instruments that are path-dependent, such as mortgage-related instruments, a Monte Carlo simulation process is used to specify a large number of potential interest-rate scenarios that are randomly generated in accordance with the term structure of interest rates.
Market Value of Equity Estimation and Risk Limit. MVE is the net economic value (or net present value) of total assets and liabilities, including any off-balance-sheet items. In contrast to the GAAP-based shareholders’ equity account, MVE represents the shareholder’s equity account in present-value terms. Specifically, MVE equals the difference between the theoretical market value of assets and the theoretical market value of liabilities. MVE, and in particular, the ratio of MVE to the book value of equity (BVE), can be an indicator of future net income to the extent that it demonstrates the impact of prior interest-rate movements on the capacity of the current balance sheet to generate net interest income. For example, a liability-sensitive bank that has a lower MVE following an increase in interest rates can be expected to earn less net interest income in the future, as the increase in interest rates would have reduced the market value of assets to a greater extent than the market value of liabilities. However, MVE does not always provide an accurate indication of future net income. Even a bank with perfectly matched asset and liability repricing characteristics might experience fluctuations in its MVE if the discount rates used to evaluate assets and liabilities change differentially due to basis risk. For example, if yields used to discount assets increase more rapidly than yields used to discount liabilities, MVE will decline, despite the fact that the change in interest rates does not affect yields on current balance-sheet items. As another example, an entity whose debt securities decline in value due to credit concerns about the entity will show an increase in MVE if asset values do not fall by as much. Therefore,
68
Table of Contents
care must be taken to properly interpret the results of the MVE analysis.
The ratio of the MVE to the BVE is one of the metrics used to track the Bank’s potential future exposure to losses or reduced net income. At December 31, 2007, the Bank’s MVE was $3.3 billion and its BVE was $3.4 billion. At June 30, 2008, the Bank’s MVE had declined to $2.7 billion while its BVE had increased to $3.6 billion. Therefore, the Bank’s ratio of MVE to BVE was 75.8 percent at June 30, 2008, down from 95.9 percent at December 31, 2007. The decline in this ratio is almost fully attributable to the decline in market values of the Bank’s MBS portfolio. In turn, the decline in the market values of the Bank’s MBS was attributable to investor concerns about credit risk associated primarily with private-label MBS that have experienced unprecedented high rates of loan delinquencies and foreclosures, which have been exacerbated by the illiquidity attending the ongoing credit crisis. As noted previously, management believes that this impairment is temporary at this time.
Interest-rate-risk analysis using MVE involves evaluating the potential changes in fair values of assets and liabilities and off-balance-sheet items under different potential future interest-rate scenarios and determining the potential impact on MVE according to each scenario and the scenario’s likelihood.
Value at risk (VaR) is defined to equal the ninety-ninth percentile potential reduction in MVE based on historical simulation of interest-rate scenarios. These scenarios correspond to interest-rate changes historically observed over 120-business-day periods starting at the most recent monthend and going back monthly to the beginning of 1978. This approach is useful in establishing risk-tolerance limits and is commonly used in asset/liability management; however, it does not imply a forecast of future interest-rate behavior. The Bank’s risk-management policy requires that VaR not exceed the latest quarterend dividend-adjusted level of retained earnings plus the Bank’s most recent quarterly estimate of net income over the next six months.
The table below presents the historical simulation VaR estimate as of June 30, 2008, and December 31, 2007, which represents the estimates of potential reduction to the Bank’s MVE from potential future changes in interest rates and other market factors. Estimated potential risk exposures are expressed as a percentage of then current MVE and are based on historical behavior of interest rates and other market factors over a 120-business-day time horizon.
| | Value-at-Risk | |
| | (Gain) Loss Exposure | |
| | June 30, 2008 | | December 31, 2007 | |
Confidence Level | | % of
MVE (1) | | $ (million) | | % of
MVE (1) | | $ (million) | |
| | | | | | | | | |
50% | | -0.01 | % | $ | (0.4 | ) | -0.15 | % | $ | (4.8 | ) |
75% | | 0.83 | | 23.5 | | 0.85 | | 28.0 | |
95% | | 2.42 | | 68.4 | | 2.10 | | 68.9 | |
99% | | 3.60 | | 101.7 | | 3.42 | | 112.1 | |
| | | | | | | | | | | |
(1) Loss exposure is expressed as a percentage of base MVE.
As measured by VaR, the Bank’s potential losses to MVE due to changes in interest rates and other market factors decreased by $10.4 million to $101.7 million as of June 30, 2008, from $112.1 million as of December 31, 2007. The primary driver behind the decrease in VaR from December 31, 2007, was a lower market-rate environment experienced at June 30, 2008, from the prior yearend. Commencing in September 2007, the Federal Reserve Board of Governors sought to address perceived liquidity and recessionary concerns by lowering the targeted Fed funds rate; the target was lowered 100 basis points between September and December 2007 and a further 225 basis points during the six months ended June 30, 2008. In turn, other market rates moved lower as well, as three-month LIBOR was 192 basis points lower, and the two-year swap rate had declined by 26 basis points at June 30, 2008 from its December 31, 2007 level. VaR incorporates the impact of changes in market rates and volatility on the value of the Bank’s assets, liabilities, and derivative positions, and does not include further potential price deterioration that is due to market illiquidity and is independent of rate changes.
Also contributing to the decrease in VaR was the Bank’s decision to terminate $1.2 billion of interest rate swaps in which the Bank receives a fixed rate associated with fixed rate term debt. This action was taken in order to minimize volatility in the Bank’s internal retained earnings model during this period of credit instability. As discussed in the Strategies to Manage Market and Interest-Rate Risk — Swapped Consolidated Obligation Debt section in this item, the decision to swap term CO issues in order to match advance and investment opportunities poses an adverse impact to the Bank’s VaR measurement in those historical scenarios wherein six month movements in swap rates have been greater than similar period shifts in debt yields. In these scenarios, the impact to the Bank’s receive fixed swap valuation outweighs the benefit to VaR from improved valuation of the Bank’s pay fixed term debt. On a pro forma basis, if the $1.2 billion in receive fixed swaps had not been unwound during the second quarter of 2008, the Bank’s VaR as of June 30, 2008 would have been $25.0 million higher than the $101.7 million reported.
While the Bank seeks to manage interest-rate risk through matching the tenor, interest-rate-reset characteristics, and optionality of its
69
Table of Contents
assets and liabilities, mismatches may occur, primarily between the Bank’s MPF mortgage-loan portfolio and associated liabilities. As a result, the Bank has a residual exposure to interest-rate movements, as illustrated by its duration of equity. Duration of equity, as measured by the Bank, represents the net percentage change in value between the Bank’s assets and liabilities for parallel +/- 50 basis point shifts in interest rates. A positive duration of equity indicates that the Bank’s MVE appreciates in declining rate scenarios, and the converse holds true for rising rate environments. As of June 30, 2008, the Bank’s duration of equity was 0.67 years, indicating that the Bank depreciates in value in those VaR scenarios that incorporate rising rate environments.
Income Simulation and Repricing Gaps. To provide an additional perspective on market and interest-rate risks, the Bank has an income-simulation model that projects net interest income over a range of potential interest-rate scenarios, including parallel interest-rate shocks, nonparallel interest-rate shocks, and nonlinear changes to the Bank’s funding curve and LIBOR. The Bank measures simulated 12-month net income and return on equity (with an assumption of no prepayment-fee income or related hedge or debt-retirement expense) under these scenarios. Management has put in place escalation-action triggers whereby senior management is explicitly informed of instances where the Bank’s projected return on equity would fall below three-month LIBOR in any of the assumed interest-rate scenarios. The results of this analysis for June 30, 2008, showed that in the worst-case scenario, the Bank’s return on equity would fall to 140 basis points above the average yield on three-month LIBOR under a steeper yield curve scenario wherein interest rates instantaneously rise by 300 basis points.
Liquidity Risk
The Bank maintains operational liquidity in order to ensure that it meets its day-to-day business needs as well as its contractual obligations with normal sources of funding. The Bank’s risk-management policy has established a metric and policy limit within which the Bank operates. The Bank defines structural liquidity as the difference between contractual sources and uses of funds adjusted to assume that all maturing advances are renewed; member overnight deposits are withdrawn at a rate of 50 percent per day; and commitments (MPF and other commitments) are taken down at a conservatively projected pace. The Bank defines available liquidity as the sources of funds available to the Bank through its access to the capital markets, subject to leverage, line, and collateral constraints. The risk-management policy requires the Bank to maintain structural liquidity each day so that any excess of uses over sources is covered by available liquidity for a four-week forecast period and 50 percent of the excess of uses over sources is covered by available liquidity over eight- and 12-week forecast periods. In addition to these minimum requirements, management measures structural liquidity over a three-month forecast period. If the Bank’s excess of uses over sources is not fully covered by available liquidity over a two-month or three-month forecast period, senior management will be immediately notified so that a decision can be made as to whether immediate remedial action is necessary. The following table shows the Bank’s structural liquidity as of June 30, 2008.
Structural Liquidity
(dollars in thousands)
| | Month 1 | | Month 2 | | Month 3 | |
| | | | | | | |
Contractual sources of funds | | $ | 4,733,546 | | $ | 3,206,563 | | $ | 916,216 | |
Less: Contractual uses of funds | | (7,847,766 | ) | (7,949,718 | ) | (9,113,688 | ) |
Equals: Net cash flow | | (3,114,220 | ) | (4,743,155 | ) | (8,197,472 | ) |
| | | | | | | |
Less: Cumulative contingent obligations | | (16,338,626 | ) | (22,118,922 | ) | (27,839,363 | ) |
Equals: Net structural liquidity | | (19,452,846 | ) | (26,862,077 | ) | (36,036,835 | ) |
| | | | | | | |
Available borrowing capacity | | $ | 29,236,383 | | $ | 36,418,375 | | $ | 44,644,090 | |
| | | | | | | |
Ratio of available borrowing capacity to net structural liquidity need | | 1.50 | | 1.36 | | 1.24 | |
Required ratio | | 1.00 | | 0.50 | | 0.50 | |
Management action trigger | | — | | 1.00 | | 1.00 | |
The Bank also maintains contingency-liquidity plans designed to enable it to meet its obligations in the event of operational disruption at the Bank, the Office of Finance, or the capital markets. The Bank is required to ensure that it can meet its liquidity needs for a minimum of five business days without access to proceeds of CO issuance. As of June 30, 2008, and December 31, 2007, the Bank held a surplus of $7.8 billion and $9.8 billion, respectively, of liquidity (exclusive of access to CO issuance) within the first five prospective business days. Management measures liquidity on a daily basis and maintains an adequate base of operating and contingency liquidity by investing in short-term, high-quality, money-market investments that can provide a ready source of liquidity during stressed market conditions. As of June 30, 2008, the Bank’s contingency liquidity, as measured in accordance with Finance Board regulations, was determined as follows:
70
Table of Contents
Contingency Liquidity
(dollars in thousands)
| | Cumulative Fifth
Business Day | |
| | | |
Contractual sources of funds | | $ | 5,932,741 | |
Less: contractual uses of funds | | (9,103,673 | ) |
Equals: net cash flow | | (3,170,932 | ) |
| | | |
Contingency borrowing capacity (exclusive of CO debt issuance) | | 10,990,010 | |
| | | |
Net contingency borrowing capacity | | $ | 7,819,078 | |
Additional information regarding liquidity is provided in Item 2 — Management’s Discussion and Analysis of Financial Condition and Results of Operations — Liquidity and Capital Resources.
Leverage Risk
The Bank has controls in place in an effort to ensure that capital is maintained within regulatory limitations. Accordingly, the Bank maintains at all times total capital in an amount equal to at least 4.0 percent of total assets and a leverage ratio in an amount equal to at least 5.0 percent of total assets. In order to balance the need to maintain compliance with these regulatory requirements against the need to adequately lever shareholder equity to provide an efficient return to shareholders, the Bank maintains its ratio of total capital to total assets between 4.0 percent and 5.5 percent measured at the end of each calendar month. Leverage limits are included in the Bank’s board-approved risk-management policy and ratios are reported to the board of directors monthly.
Business Risk
Management’s strategies for mitigating business risk include annual and long-term strategic planning exercises; continually monitoring key economic indicators, projections, and the Bank’s external environment; and developing contingency plans where appropriate. The Bank’s risk-assessment process also considers business risk, where appropriate, for each of the Bank’s major business activities.
Operational Risk
The Bank has instituted policies and procedures to mitigate operational risks. The Bank ensures that employees are properly trained for their roles and that written policies and procedures exist to support the key functions of the Bank. The Bank maintains a system of internal controls to ensure that responsibilities are adequately segregated and that the activities of the Bank are appropriately monitored and reported to management and the board of directors. Annual risk assessments review these risks and related controls for efficacy and potential opportunities for enhancement. Additionally, the Bank’s Operational Risk Committee oversees the Bank’s exposure to operational risk and reviews the following: new products, new processes, annual risk assessments, exceptions and related reports, new regulations affecting products and operations, and staff turnover. The Bank’s Internal Audit Department, which reports directly to the Audit Committee of the board of directors, regularly monitors the Bank’s adherence to established policies and procedures. However, some operational risks are beyond the Bank’s control, and the failure of other parties to adequately address their operational risks could adversely affect the Bank.
Disaster-Recovery/Business Continuity Provisions. The Bank maintains a disaster-recovery site in Westborough, Massachusetts to provide continuity of operations in the event that its Boston headquarters becomes unavailable. Data for critical computer systems is backed up regularly and stored offsite to avoid disruption in the event of a computer failure. The Bank also has a reciprocal back-up agreement in place with the FHLBank of Topeka to provide short-term liquidity advances in the event that both of the Massachusetts facilities are inoperable. In the event that the FHLBank of Topeka’s facilities are inoperable, the Bank will provide short-term liquidity advances to their members.
Insurance Coverage. The Bank has insurance coverage for employee fraud, forgery, alteration, and embezzlement, as well as director and officer liability protection for breach of duty, misappropriation of funds, negligence, and acts of omission. Additionally, comprehensive insurance coverage is currently in place for electronic data-processing equipment and software, personal property, leasehold improvements, fire/explosion/water damage, and personal injury including slander and libelous actions. The Bank maintains additional insurance protection as deemed appropriate, which covers automobiles, company credit cards, and business-travel accident and supplemental traveler’s coverage for both directors and staff. The Bank uses the services of an insurance consultant who periodically conducts a comprehensive review of insurance-coverage levels.
71
Table of Contents
Reputation Risk
The Bank has established a code of conduct and operational risk-management procedures to ensure ethical behavior among its staff and directors, and provides training to employees about its code of conduct. The Bank works to ensure that all communications are presented accurately, consistently, and in a timely way to multiple audiences and stakeholders. In particular, the Bank regularly conducts outreach efforts with its membership and with housing and economic-development advocacy organizations throughout New England. The Bank also cultivates relationships with government officials at the federal, state, and municipal levels; key media outlets; nonprofit housing and community-development organizations; and regional and national trade and business associations to foster awareness of the Bank’s mission, activities, and value to members. The Bank works closely with the Council of Federal Home Loan Banks and the Office of Finance to coordinate communications on a broader scale.
Item 4. Controls and Procedures
Disclosure Controls and Procedures
The Bank’s senior management is responsible for establishing and maintaining a system of disclosure controls and procedures designed to ensure that information required to be disclosed by the Bank in the reports filed or submitted under the Securities Exchange Act of 1934 is recorded, processed, summarized, and reported within the time periods specified in the rules and forms of the SEC. The Bank’s disclosure controls and procedures include, without limitation, controls and procedures designed to ensure that information required to be disclosed by the Bank in the reports that it files or submits under the Securities Exchange Act of 1934 is accumulated and communicated to the Bank’s management, including its principal executive officer and principal financial officer, as appropriate to allow timely decisions regarding required disclosure. In designing and evaluating the Bank’s disclosure controls and procedures, the Bank’s management recognizes that any controls and procedures, no matter how well designed and operated, can provide only reasonable assurance of achieving the desired control objectives, and the Bank’s management necessarily is required to apply its judgment in evaluating the cost-benefit relationship of controls and procedures.
Management of the Bank has evaluated the effectiveness of the design and operation of its disclosure controls and procedures with the participation of the president and chief executive officer and chief financial officer as of the end of the period covered by this report. Based on that evaluation, the Bank’s president and chief executive officer and chief financial officer have concluded that the Bank’s disclosure controls and procedures were effective at a reasonable assurance level as of the end of the fiscal quarter covered by this report.
Internal Control Over Financial Reporting
During the second quarter of 2008, there were no changes in the Bank’s internal control over financial reporting that have materially affected, or are reasonably likely to materially affect, the Bank’s internal control over financial reporting.
72
Table of Contents
Part II — OTHER INFORMATION
Item 1. Legal Proceedings
The Bank from time to time is subject to various pending legal proceedings arising in the normal course of business. After consultation with legal counsel, management does not anticipate that the ultimate liability, if any, arising out of these matters will have a material adverse effect on the Bank’s financial condition or results of operations.
Item 1A. Risk Factors
There are no material changes for the risk factors as previously disclosed in the Bank’s Form 10-K for the year ended December 31, 2007, as filed with the Securities Exchange Commission on March 20, 2008.
Item 2. Unregistered Sales of Equity Securities and Use of Proceeds
Not applicable.
Item 3. Defaults Upon Senior Securities
None.
Item 4. Submission of Matters to a Vote of Security Holders
None.
Item 5. Other Information
None.
Item 6. Exhibits
31.1 | | Certification of the president and chief executive officer pursuant to Section 302 of the Sarbanes-Oxley Act of 2002 |
| | |
31.2 | | Certification of the chief financial officer pursuant to Section 302 of the Sarbanes-Oxley Act of 2002 |
| | |
32.1 | | Certification of the president and chief executive officer pursuant to 18 U.S.C. Section 1350, as adopted pursuant to Section 906 of the Sarbanes-Oxley Act of 2002 |
| | |
32.2 | | Certification of the chief financial officer pursuant to 18 U.S.C. Section 1350, as adopted pursuant to Section 906 of the Sarbanes-Oxley Act of 2002 |
| | |
SIGNATURES
Pursuant to the requirements of Section 13 or 15(d) of the Securities Exchange Act of 1934, the registrant has duly caused this report to be signed on its behalf by the undersigned, thereunto duly authorized.
Date | | | FEDERAL HOME LOAN BANK OF BOSTON |
| | | (Registrant) |
| | | |
August 8, 2008 | By: | /s/ | Michael A. Jessee |
| | | Michael A. Jessee |
| | | President and Chief Executive Officer |
| | | (Principal Executive Officer) |
| | | |
August 8, 2008 | By: | /s/ | Frank Nitkiewicz |
| | | Frank Nitkiewicz |
| | | Executive Vice President and Chief Financial Officer |
| | | (Principal Financial Officer) |
73