Exhibit 99.2
| 78th Annual Shareholders Meeting April 21, 2011 |

| 2 Today’s Agenda State of the Bank: Ed Hjerpe Keynote Address: Gillian Tett Adjourn |

| 3 Cautionary Statements Regarding Forward-Looking Statements, Data, and Adjusted Information Forward-looking statements: This presentation, including the first quarter 2011 highlights herein, uses forward-looking statements within the meaning of the "safe harbor" provisions of the Private Securities Litigation Reform Act of 1995 and are based on the Bank’s expectations as of the date hereof. The words “will,” “expect,” “project,” and similar statements and their plural, negative, past, and progressive forms as well as statements about the Bank’s operating plan and future plans are used in this presentation to identify some, but not all, of such forward-looking statements. The Bank cautions that, by their nature, forward-looking statements involve risks and uncertainties, including, but not limited to, the application of accounting standards relating to, among other things, the amortization of discounts and premiums on financial assets, financial liabilities, and certain fair-value gains and losses; hedge accounting of derivatives and underlying financial instruments; the fair values of financial instruments, including investment securities and derivatives; and other-than-temporary impairment of investment securities, in addition to instability in the credit and debt markets, economic conditions (including effects on, among other things, mortgage-backed securities), changes in interest rates, and prepayment spreads on mortgage assets. The Bank does not undertake to update any forward-looking statement herein or that may be made from time to time on behalf of the Bank. Data: Data set forth herein is unaudited. Data identified herein with a third-party source is provided to you without any independent verification by the Federal Home Loan Bank of Boston, and the Federal Home Loan Bank of Boston expressly disclaims any responsibility for, its accuracy, completeness or whether any additional information is necessary to make such data not materially misleading. Accordingly, you are cautioned against placing any undue reliance on such data. Adjusted information: This presentation uses non-GAAP financial information. Specifically, the Bank adjusts GAAP net income for the impact of (i) Affordable Housing Program and Resolution Funding Corporation assessments and (ii) OTTI charges. Management believes this information may be informative to investors in gauging the Bank’s financial performance, identifying trends, and providing meaningful period-to-period comparisons. |
| 2010 Accomplishments and Solutions 4 |

| 2010 Accomplishments Entered 2010 with primary objective to restore consistent profitability and normal operations so that we can pay a dividend, repurchase excess stock, and more fully fund the Affordable Housing Program Earned $106.6 million in net income Grew retained earnings by 75 percent Resumed dividend payments Funded the AHP at more robust level Continued to provide reliable liquidity, develop new products and services, and enhance value of membership Five new members joined the Bank 5 5 |
| Solutions to Meet Evolving Member Needs 2010 Direct+ Advance restructurings Refundable municipal letters of credit Collar advance Corridor advance Classic Plus Cap advance 2011 Excess stock pool Redesigned Community Development advance program, with deeper discounted rates Three- and five-year advance specials to be offered on April 27 and 28 Member use of Bank products helps us return to consistent profitability 6 6 |
| 2010 Operational Performance Accomplishments Organizational realignment Key staff additions Carol Pratt, Senior Vice President, General Counsel Tim Barrett, Senior Vice President, Treasurer Tom Wolf, First Vice President, Chief Technology Officer Increased focus on credit risk and operational risk Streamlined internal committee structure Signed Prudential Tower lease 7 |
| Financial Results 8 |

| 9 Recent Financial Highlights Q4 2010 Q1 2011 Assets $58.6 billion $55.6 billion Advances $28.0 billion $25.9 billion Pre-Assessment Net Income Before OTTI, REFCorp and AHP $57.8 million $62.1 million Credit-Related OTTI Losses $(25.6 million) $(30.6 million) REFCorp $5.9 million $5.8 million AHP $2.6 million $2.6 million Net Income $23.6 million $23.1 million Dividend 0.30% 0.31% |
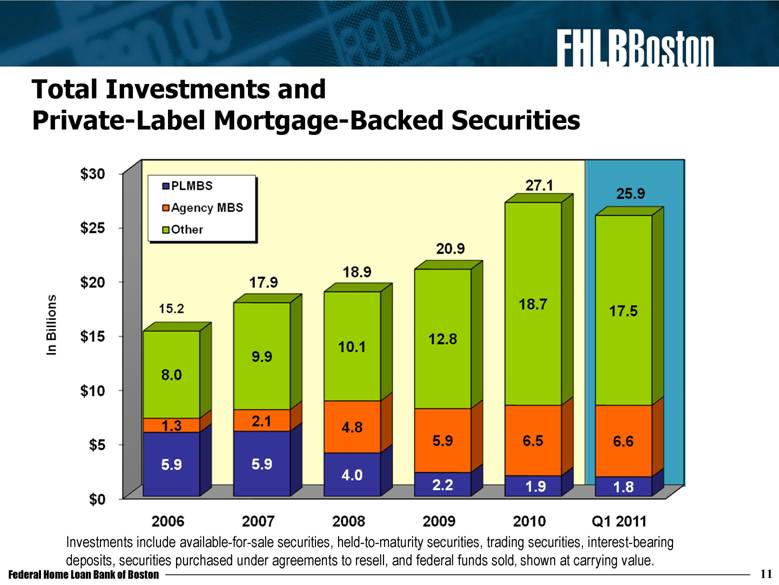
| 11 Total Investments and Private-Label Mortgage-Backed Securities Investments include available-for-sale securities, held-to-maturity securities, trading securities, interest-bearing deposits, securities purchased under agreements to resell, and federal funds sold, shown at carrying value. |
| 12 Net Income *Includes $349.1 million of noncredit losses on PLMBS, subsequently reclassified to accumulated OCI upon adoption of amended accounting guidance related to OTTI. |
| Pre-Assessment Net Income Before OTTI, REFCorp, and AHP In Millions 2006 2007 2008 2009 2010 Q1 2011 $300 $250 $200 $150 $100 $50 $0 Federal Home Loan Bank of Boston 13 |
| Return on Average Assets and Average Equity 8% 6% 4% 2% 0% -2% -4% -6% -8% Return on Average Assets Return on Average Equity 2006 2007 2008 2009 2010 Q1 2011 Federal Home Loan Bank 01 Boston 14 |
| 15 Total Capital In Millions $4,500 $4,000 $3,500 $3,000 $2,500 $2,000 $1,500 $1,000 $500 $0 ($500) ($1,000) ($1,500) 2006 2007 2008 2009 2010 Q1 2011 Federal Home Loan Bank of Boston |
| 16 Regulatory Capital Ratio Minimum Minimum 7.5% 7.0% 6.5% 6.0% 5.5% 5.0% 4.5% 4.0 3.5% 3.0% 2.5% 2.0% 1.5% 1.0% 2006 01 2011 2007 2008 2009 2010 |
| 17 Market Value of Equity/Par Stock 120% 96.1% 100% 80% 60% 40% 20% 0% 109.4% 93.6% 77.6% 2006 2007 2008 2009 2010 Q1 2011 Federal Home Loan Bank of Boston |
| Private-Label Mortgage-Backed Securities 18 Par Value Vintage 12/31/07 Avg. Price 12/31/07 Avg. Price 12/31/08 Avg. Price 12/31/09 Avg. Price 12/31/10 Par Value 3/31/11 prior $3.2 billion $97 $52 $53 $56 $1.5 billion 2004 to 2007 $1.4 billion $96 $45 $49 $60 $959 million and prior $900 million $99 $75 $82 $88 $349 million and prior $45 million $97 $72 $68 $73 $29 million and prior $431 million $100 $83 $97 $100 $35 million $6.0 billion $97 $55 $58 $62 $2.9 billion |
| MPF Portfolio Performance (as of 12/31/10) MPF portfolio comprised of member-generated, plain vanilla, 15- to 30-year fixed-rate instruments with conservative underwriting standards and members’ “skin in the game” 19 Delinquency Rates FHLB Boston MPF Portfolio Mortgage Bankers Association Data 30 days 1.79% 2.13% 60 days 0.70% 0.79% 90+ days 2.30% 4.13% |
| Current Business Issues 20 |
| Positioned for Stabilized Performance and a Strengthening Balance Sheet Six quarters of positive net income achieved along with two quarters of dividend payouts Economy, interest rates, and private-label MBS continue to play important factors Retained earnings growth continues to be priority Consideration of incremental excess stock repurchases on horizon Move to the Prudential Tower 21 |
| FHLBank System Capital Initiative REFCorp created by Congress in 1989 as part of FIRREA FHLBanks have been contributing 20 percent of net income Total payments through Q1 2011 FHLB Boston: $451.7 million FHLBank System: $8.7 billion REFCorp obligation expected to be satisfied in 2011 In February, the 12 FHLBanks entered into Joint Capital Enhancement Agreement Initiative will enhance System’s safety and soundness and benefit the Affordable Housing Program 22 |
| Collateral Study Comprehensive evaluation of collateral policies, processes, and practices Cross-functional team working with outside expertise We will engage membership in various ways Regulatory environment is an important consideration 23 |
| Other Initiatives Move to Prudential Tower will reduce lease cost by 30+ percent and increase operational efficiency Co-location of computer facility will result in stronger, more secure operating environment and enhance future capabilities Implementation of changes regarding derivative transactions as Dodd-Frank regulations go into effect Yesterday, Bank filed complaint against securities dealers related to certain investments in private-label residential MBS Seeking to rescind purchases of 115 securities, for which the Bank originally paid approximately $5.8 billion Member outreach meetings will begin again on August 1 24 |
| New Study Shows Affordable Housing Program’s Effect on Regional Economic Activity Examined impact of AHP financing on construction and rehabilitation of rental and ownership housing in New England Analyzed 173 completed AHP initiatives from 2005-2009 $53.7 million in AHP subsidy Construction or rehabilitation of 3,810 housing units across New England Leveraged $138.6 million in member financing, $761.6 million total development value Econometric model utilized detailed matrices Calculated ripple economic effect 25 |
| Result: The AHP Plays Important Catalytic Role Creating Affordable Housing and Boosting Economy For every $1 million of AHP funding, $14.2 million of housing is built or rehabilitated Each $1 million of AHP funding contributes to generating $27.6 million total output (including ripple effect of job creation and value-added spending) 26 $761.6 Million Housing Built or Rehabilitated Economic Activity $53.7 Million $1.48 Billion 2005 to 2009 AHP Completed Projects Source: New England Market Research, Inc. and I2 Community Development Consulting |
| FHLB Boston and Its Members Are Committed to Housing Finance and Economic Development 27 BankNewport Sandywoods Farm Tiverton, Rhode Island Fifty units of affordable housing created along with library, art gallery, community center, and recreational preserve Naugatuck Valley Savings & Loan 16 Bank St. Apts. Seymour, Connecticut Historic building restored to create senior housing and revitalize rundown downtown with restaurants and shops Hanover Insurance Group CitySquare Project Worcester, Massachusetts Construction of an office building that will reinvigorate the downtown area and several city neighborhoods |
| Redesigned Community Development Advance Program CDA Program offers readily available discounted funds for affordable housing and economic development CDA discounted advances finance wide range of community development and mixed-use initiatives CDA Extra provides deeply discounted advances for affordable housing for households at or below moderate income and economic development or mixed-use initiatives for low-income households Contact your relationship manager or community investment manager for eligibility requirements and more details 28 |
| Financial Reform Legislation Fannie Mae and Freddie Mac are primary focus, but FHLBanks included Administration report to Congress acknowledged important role of FHLBanks as liquidity supplier, but took position advocating: Single FHLBank membership Advance level cap Investment portfolio limit GSE reform hearings underway on proposals offered by Administration and others, but Republican majority in House and Democrat majority in Senate makes outcome uncertain Appreciate support of members and New England trade associations 29 |
| Industry and Economic Outlook 30 |

| MT WY ID WA OR NV UT CA AZ ND SD NE CO NM TX OK KS AR LA MO IA MN WI IL IN KY TN MS AL GA FL SC NC VA WV OH MI NY PA MD DE NJ CT RI MA ME VT NH AK HI PR VI 1 9 6 14 1 11 1 1 1 1 7 1 1 42 57 5 47 37 10 4 1 11 5 3 3 3 6 4 4 2 4 3 2 6 14 1 2 5 8 Source: FDIC April 15, 2011 1 346 Bank Failures Since IndyMac Failed in 2008 31 |
| FHLB Boston Members Aggregate financial condition of the Bank’s members is among strongest in FHLBank System 88 percent of depository institution members have nonperforming asset/total asset ratio of less than 3 percent Most depository institution members appear to have adequate capital cushion against adverse earnings and asset quality trends of past two years Just two members have failed since 1993 32 |
| New England Bank Performance 33 Source: FDIC Quarterly Banking Profile Fourth Quarter 2010 NE CT ME MA NH RI VT % of Unprofitable Banks 21.0 12.0 20.4 6.9 10.3 8.3 28.6 0 % of YoY Earnings Gains 67.5 78.0 70.4 89.7 77.0 87.5 78.6 78.6 Net Interest Margin 3.76 3.02 3.56 3.64 2.66 3.68 3.14 3.92 Return on Assets 0.66 0.67 0.46 0.44 0.99 0.21 0.27 0.83 Equity Capital to Total Assets 11.2 12.1 13.1 11.1 10.7 10.8 14.6 9.4 Net Charge-Offs to Total Loans 2.5 0.9 0.7 0.4 0.3 0.4 1.8 0.2 Non-Performing Assets to Total Assets 3.1 1.4 2.2 1.25 0.6 1.29 2.7 1.1 Loan-Loss Allowance to Non-Current Loans 64.2 60.9 50.1 62.2 76.7 85.2 58.9 93.5 |

| National Economic Outlook Economy in recovery, but we have a way to go Job creation offers biggest challenge Lost 7.9 million jobs from 2008 to 2009, then regained .9 million jobs in 2010 Projected gain of 1.2 million jobs in 2011 still leaves 7.6 million gap Foreclosures follow job losses Foreclosed 8 million homes from 2008 through 2010 2011 foreclosures projected to be higher than 2010 (2.9 million) then lower in 2012 Housing recession not over Gross domestic product growth 2007: 1.9%, 2008: 0%, 2009: -2.6%, 2010: 2.9% No change in GDP projected in 2011 34 |
| 35 Six consecutive quarters of profitability, reintroduction of dividends, and more fully funded AHP attest to sound approach Still chance of choppy water ahead, but Bank will continue to build retained earnings and, when possible, begin to repurchase excess stock We will provide the steady supply of liquidity and funding you need to lend to your communities in all business cycles commitment cooperative |

| Federal Home Loan Bank of Boston 78th Annual Shareholders Meeting April 21, 2011 |