 Investor Presentation Keefe, Bruyette & Woods 7 th Annual Community Bank Investor Conference August 2006 FCB Bancorp FCB Bancorp Exhibit 99.1 |
 2 Forward-Looking Statements This document contains forward-looking statements about the company for which the company claims the protection of the safe harbor provisions contained in the Private Securities Litigation Reform Act of 1995. Forward-looking statements are based on management’s knowledge and belief as of today and include information concerning the company’s possible or assumed future financial condition, and its results of operations, business and earnings outlook. These forward-looking statements are subject to risks and uncertainties. A number of factors, some of which are beyond the company’s ability to control or predict, could cause future results to differ materially from those contemplated by such forward-looking statements. These factors include (1) changes in interest rates, (2) significant changes in banking laws or regulations, (3) increased competition in the company’s market, (4) higher- than-expected credit losses, (5) earthquake or other natural disasters impacting the condition of real estate collateral, (6) the effect of acquisitions and integration of acquired businesses, (7) unanticipated changes in regulatory, judicial, or legislative tax treatment of business transactions, (8) unknown economic impacts caused by the State of California’s budget shortfall, and (9) economic uncertainty created by worldwide geopolitical unrest, hostilities, terrorist attacks and related events. Management cannot predict at this time the severity or duration of the effects of the recent business slowdown on our specific business activities and profitability. Weaker or a further decline in capital and consumer spending, and related recessionary trends could adversely affect our performance in a number of ways including decreased demand for our products and services and increased credit losses. Likewise, changes in deposit interest rates, among other things, could slow the rate of growth or put pressure on current deposit levels. Forward-looking statements speak only as of the date they are made, and the company does not undertake to update forward-looking statements to reflect circumstances or events that occur after the date the statements are made, or to update earnings guidance including the factors that influence earnings. For a more complete discussion of these risks and uncertainties, see the company’s Annual Report for the year-ended December 31, 2005. |
 3 The Management Team Name Position FCBA Service Banking Experience C. G. Kum President & CEO 7 Years Over 29 years Romolo Santarosa EVP & CFO 4 Years Over 15 years Thomas E. Anthony EVP & CCO 7 Years Over 36 years |
 4 Investment Highlights Attractive High Growth Markets Ventura, Orange and Los Angeles counties Experienced Management Team That Knows How to Manage Growth and Risk Since 1999, a 33% CAGR in Loans Since 1999, a 26% CAGR in Deposits Excellent credit quality; net charge-offs averaged $83,000 per year since 1999 Proven Track Record of Building a Strong Core Deposit Franchise Since 1999, 4 successful de novo branches A successful purchase and integration of a 3 office, $145 million bank in 2005 Strong core deposits; core deposits averaged 83% of total deposits since 1999 |
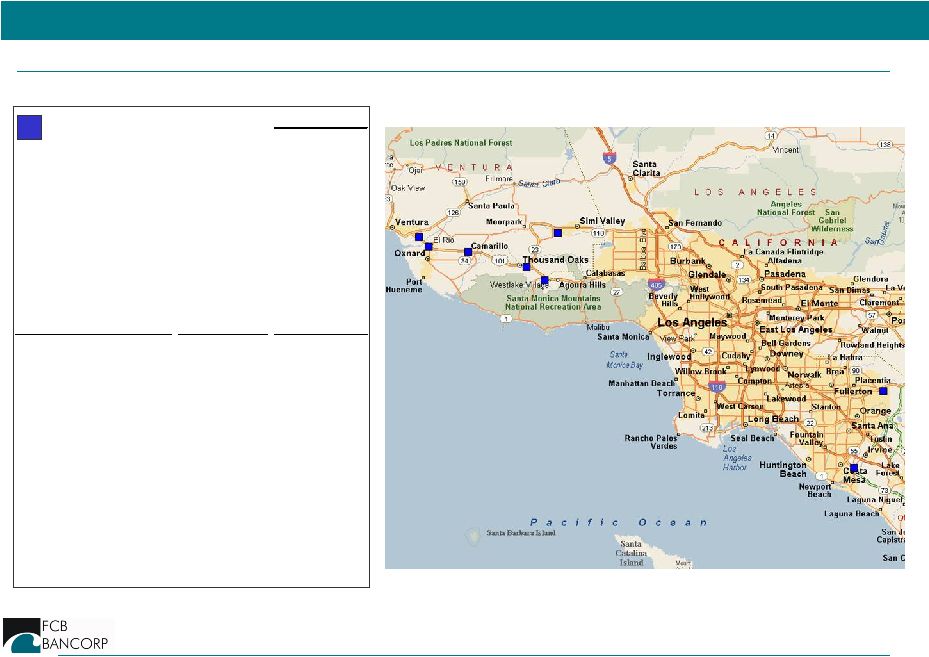 5 The Franchise FCB Bancorp Q1 2006 (in millions) Assets $481.1 Loans $353.6 ROTE 13.9% Net Interest Margin 5.1% Date Deposits City Opened 2006 (in millions) Camarillo 1979 $110.8 Westlake Village 1990 $38.7 Oxnard 2000 $32.6 Ventura 2002 $28.9 Thousand Oaks 2003 $36.9 Simi Valley 2005 $24.8 Irvine acquired 2005 $60.8 Anaheim Hills acquired 2005 $30.3 |
 6 Overview of the Company First California Bank (“FCBA”) is a state-chartered bank headquartered in Camarillo, California and founded in 1979. This Management Team joined First California Bank in 1999. Currently FCBA conducts its business from 8 full service offices in Anaheim Hills, Camarillo, Irvine, Oxnard, Simi Valley, Thousand Oaks, Ventura, and Westlake Village. As of June 30, 2006, FCBA had approximately $500 million in assets and 130 full-time equivalent employees. Current Ownership: Board & Senior Management owns approximately 27% Institutional investors own approximately 33% |
 7 The Business Strategy Focus on Small Business Banking Up to $65 million in annual sales $1 million to $3 million average credit facility Focus on Expansion Strategy De Novo Branching Acquisitions Increase Low Cost Core Deposits Business relationship banking – deposit opportunities with every loan Focus on Risk Management |
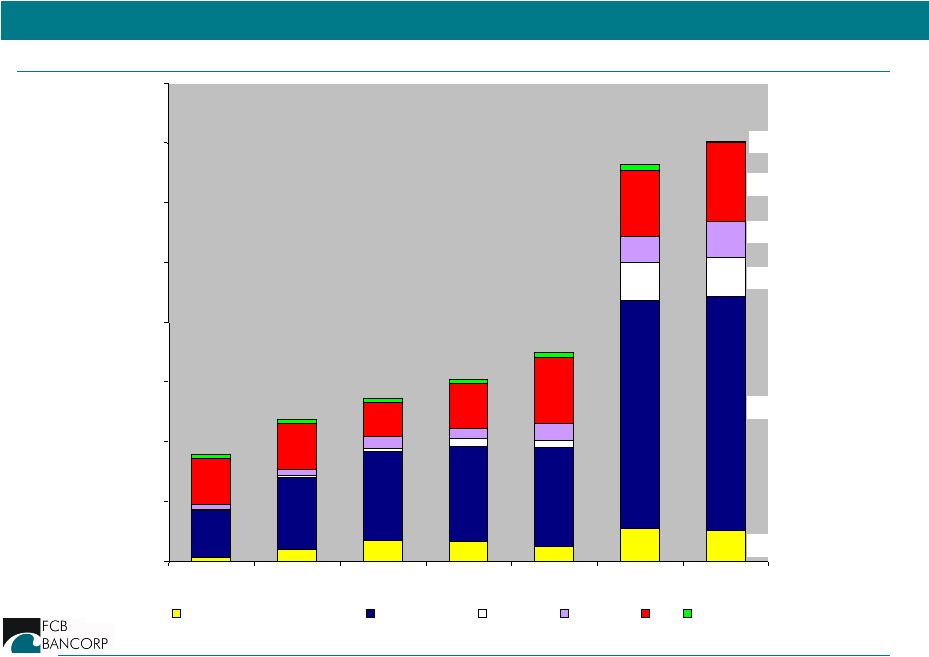 8 Well Diversified Loan Portfolio *Compound annual growth rate (CAGR) reflects 12/31/2000-3/31/2006 CAGR*: 30% $26,301 $195,864 $31,859 $29,860 $66,107 $1,347 $0 $50,000 $100,000 $150,000 $200,000 $250,000 $300,000 $350,000 $400,000 2000 2001 2002 2003 2004 2005 1Q 2006 Construction & Development Commercial RE Multifamily 1-4 Family C&I Consumer |
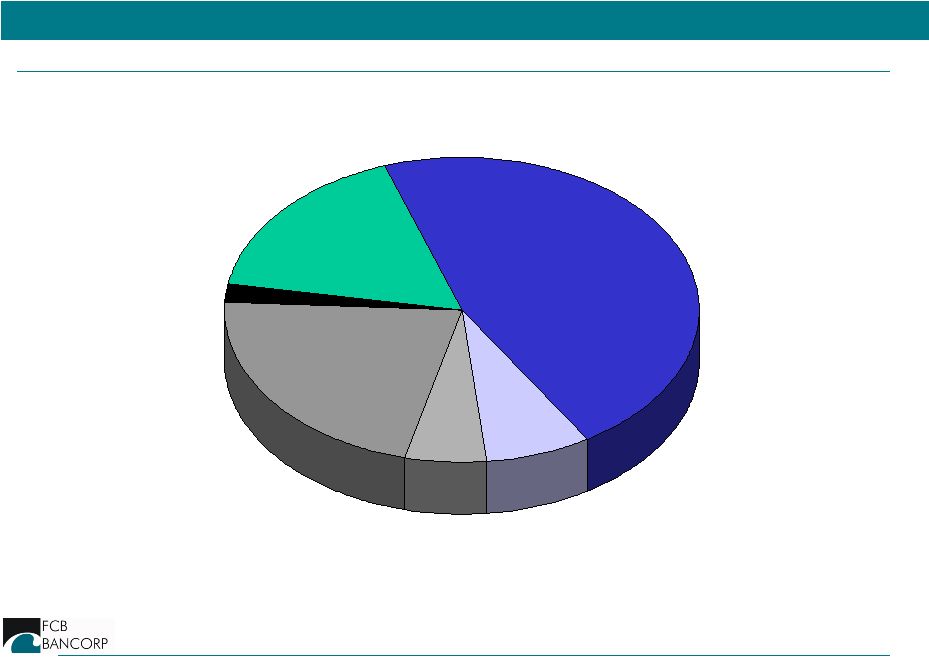
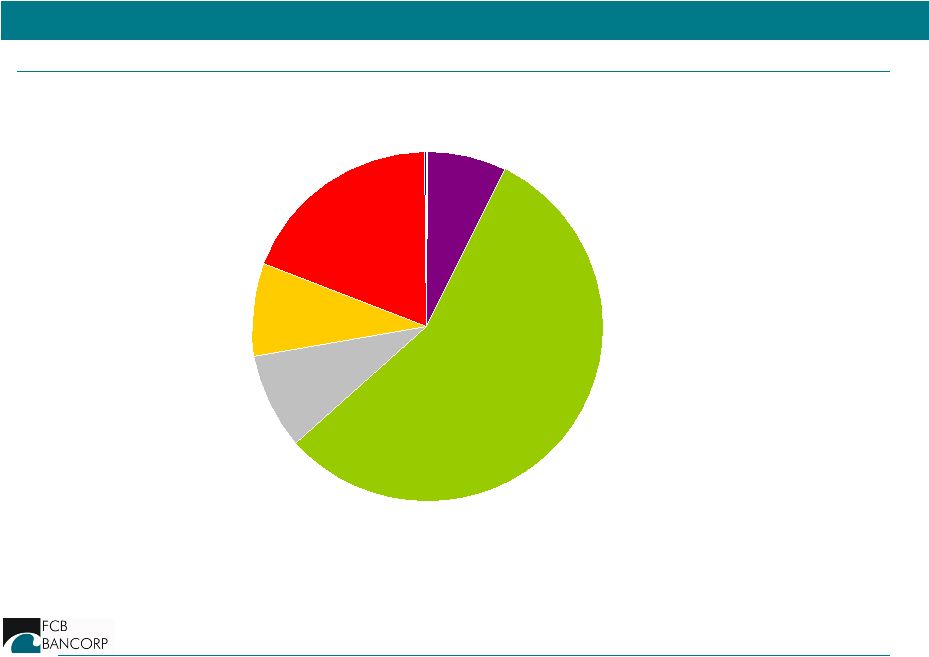 9 Loan Portfolio as of March 31, 2006 Multifamily RE 9.1% Commercial RE 55.7% Consumer 0.4% Construction 7.5% C&I 18.8% 1-4 Family RE 8.5% |
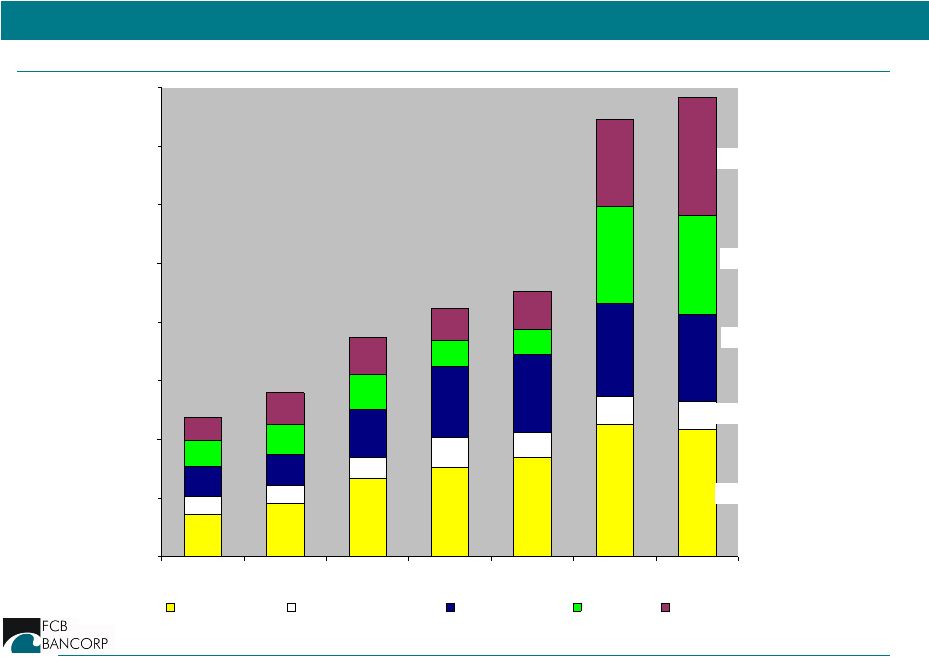 10 High Level of Core Deposits CAGR*: 26% *Compound annual growth rate (CAGR) reflects 12/31/2000-3/31/2006 $108,560 $24,280 $73,548 $84,869 $100,575 $0 $50,000 $100,000 $150,000 $200,000 $250,000 $300,000 $350,000 $400,000 2000 2001 2002 2003 2004 2005 1Q 2006 Demand Deposits Other Transaction Accts MMDAs & Savings CD < $100k CD > $100k |
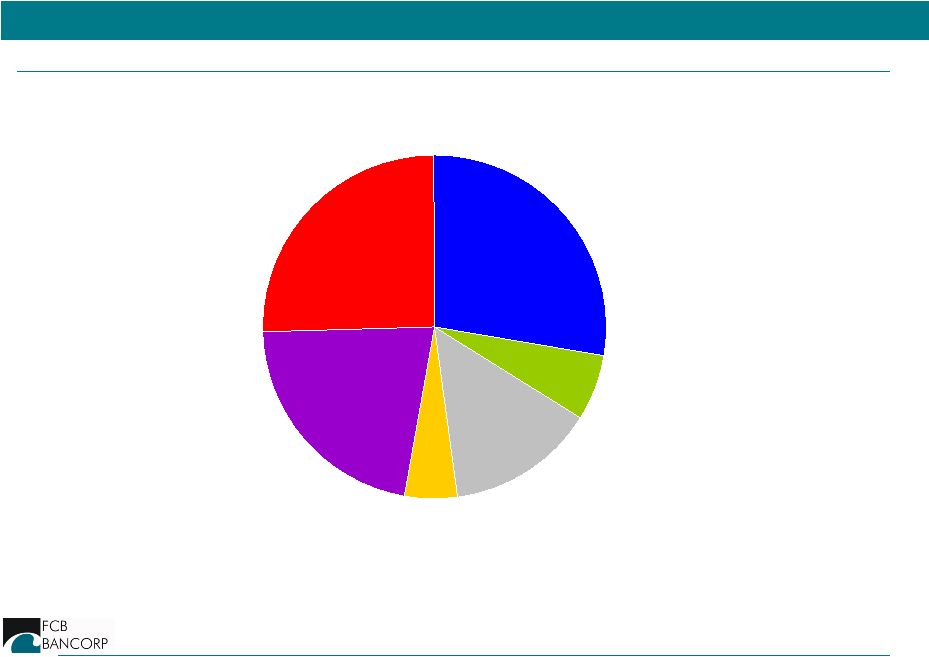 11 Deposits as of March 31, 2006 MMDA 13.8% Other savings 5.0% CD < $100k 21.7% CD > $100k 25.6% Transaction accounts 6.2% Demand deposits 27.7% |
 12 De Novo Branch Growth Strategy De Novo Branching Growth Strategy Target communities Recruit talent Build LPO / Branch around talent Target 12 month break-even Success Oxnard opened 2000 Ventura opened 2002 Thousand Oaks opened 2003 Simi Valley opened 2005 - Deposits today $25 million |
 13 Acquisition Growth Strategy South Coast Acquisition On February 2, 2005 FCBA announced the acquisition of South Coast Bancorp for $36 million in cash. Transaction multiples include: – Price/Book – Price/Tangible Book – Price/LTM earnings (1) Assumes 2004 earnings are adjusted to reflect full tax-effects and book value adjusted to reflect purchase accounting fair value adjustments (2) Source SNL; Reflects average of M&A bank transactions announced since January 1, 2004 < $150 M deal value Actual Adjusted (1) 2.1x 1.8x 2.6x 2.1x 1.8x 2.6x 12.0x 18.7x 23.8x Avg. Western M&A Multiples (2) |
 14 Acquisition Growth Strategy (cont’d) Execution & Integration On September 30, 2005, completed formation of new bank-holding company FCB Bancorp FCB Bancorp On September 30, 2005: – Completed successful Common Equity Offering of $22 million – Issued $10 million of Trust Preferred securities – Closed South Coast Acquisition On December 5, 2005: – Integrated South Coast Bank – Sold South Coast charter for $1 million On March 31, 2006: – Reported FD EPS of $0.31 15% increase over prior year (on a pro-forma basis) |
 FCB Bancorp & National Mercantile Bancorp FCB Bancorp & National Mercantile Bancorp Merger of Equals Merger of Equals Announced June 15, 2006 |
 16 Forward-Looking Statements This presentation contains forward-looking statements that are: subject to contingencies & uncertainties not a guarantee of future performance based on assumptions that may change not to be relied on unduly These include statements relating to EPS and other growth rates Accretion Costs savings Increased liquidity and visibility Many factors are beyond our ability to control or predict, including: Shareholder and regulatory approvals Interest rate volatility Impact of national/regional economy on small business loan demand Loan delinquency rates Ability of companies to retain employees and customers Acquisition synergies and cost saving Please see risk factors in MBLA’s and FCBA’s 10-K and other SEC filings. |
 17 Additional Information The proposed merger will be submitted to the shareholders of each of National Mercantile Bancorp and FCB Bancorp for their consideration. First California Financial Group, Inc. will file a registration statement, which will include a joint proxy statement/prospectus to be sent to the shareholders of each of National Mercantile Bancorp and FCB Bancorp, and each of First California Financial Group, National Mercantile Bancorp and FCB Bancorp may file other relevant documents concerning the proposed merger with the SEC. Shareholders are urged to read the registration statement and the joint proxy statement/prospectus regarding the proposed merger when they become available and any other relevant documents filed with the SEC, as well as any amendments or supplements to those documents, because they will contain important information. You will be able to obtain a free copy of the joint proxy statement/prospectus, as well as other filings containing information about First California Financial Group, National Mercantile Bancorp and FCB Bancorp, at the SEC’s website (http://www.sec.gov). You will also be able to obtain these documents, free of charge, by accessing National Mercantile Bancorp’s website (http://www.nmbla.com) under the tab “Investor Relations”, or by accessing FCB Bancorp’s website (http://www.fcbank.com) under the tab “About Us”. National Mercantile Bancorp and FCB Bancorp and their respective directors and executive officers may be deemed to be participants in the solicitation of proxies from the shareholders of National Mercantile Bancorp and FCB Bancorp in connection with the proposed merger. Information about the directors and executive officers of National Mercantile Bancorp is set forth in the proxy statement for its 2006 annual meeting of shareholders, as filed with the SEC on April 20, 2006. Information about the directors and executive officers of FCB Bancorp is set forth in its Annual Report on Form 10- K, as filed with the SEC on March 31, 2006. Additional information regarding the interests of those participants and other persons who may be deemed participants in the transaction may be obtained by reading the joint proxy statement/prospectus regarding the proposed merger when it becomes available. You may obtain free copies of these documents as described above. |
 18 Partnership of 2 Fast Growing Banks MBLA 11 quarters of EPS growth 1Q06 EPS increased 40% NIM 5.49% in 1Q06 NPA/Assets 0.06% Serving affluent communities LA and Orange Counties Expertise in business niche markets FCBA 25% + CAGR in loans and deposits since 2000 1Q06 EPS increased 75% NIM 5.05% in 1Q06 Total NCOs since 2000 <$500,000 Focus on small businesses LA, Ventura & Orange Counties As of March 31, 2006, compared to prior year |
 19 Expected Transaction Benefits Enhances both banking franchises Expanded reach in fast-growing markets $1 billion in assets Appealing demographics Complementary branch locations Enhanced lending capabilities Larger legal lending limit Accretive to GAAP EPS in 2007 Low risk transaction Modest cost savings Expanded platform for growth Strong management team Enhanced opportunities for staff Increase market cap Improve liquidity and visibility |
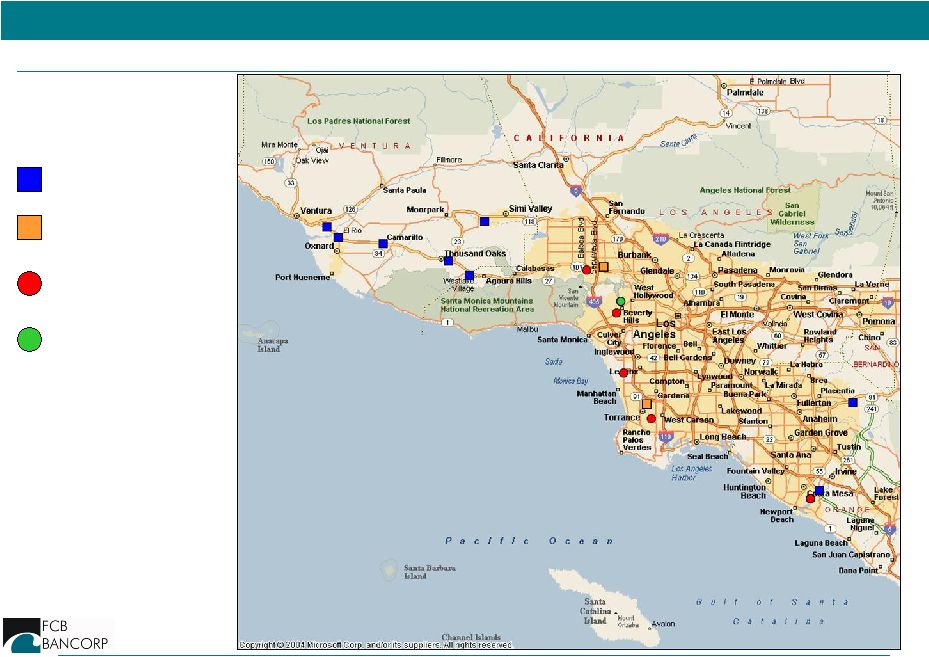 20 Southern California Branch Franchise FCBA (8) MBLA (5) MBLA LPO (1) FCBA LPO (2) |
 21 Summary of Transaction Terms Consideration: 100% FCFG Stock, Tax-free exchange Fixed FCBA Exchange Ratio: 1.7904 x FCFG shares /FCBA share (no collars/no walk-aways) Fixed MBLA Exchange Ratio: 1 x FCFG Shares/MBLA share Fully Diluted Ownership: MBLA 50.5% and FCBA 49.5% Treatment of Options: Options roll Expected Closing: Fourth Quarter of 2006 |
 22 Pro Forma Entity National Mercantile Bancorp + FCB Bancorp = First California Financial Group, Inc. Board of Directors: Initially 5 directors from MBLA and 5 directors from FCB Bancorp Chairman will be Robert E. Gipson, now Chairman of MBLA Vice Chairman will be John W. Birchfield, now Chairman of FCBA |
 23 Leadership Team • President and CEO C. G. Kum, FCBA’s CEO • Chief Financial Officer Romolo C. Santarosa, FCBA’s CFO • Chief Credit Officer Robert W. Bartlett, MBLA’s COO • Chief Strategy Officer David R. Brown, MBLA’s CFO • Head of Commercial Banking Thomas E. Anthony, FCBA’s CCO Scott Montgomery, MBLA’s President and CEO, after assisting in the transition, will retire. |
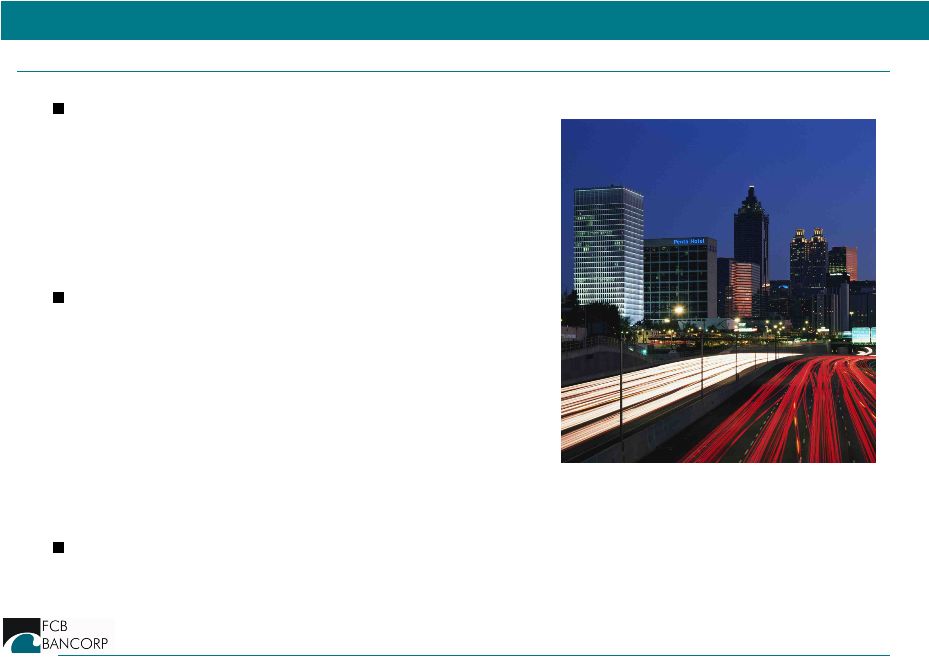 24 Large and Growing Markets Population Total 13.7 million • LA County = 9.9 million • Ventura County = 0.8 million • Orange County = 3.0 million Diverse Economy • Manufacturing • Trade • Tourism • Technology • Entertainment Rising employment and personal income |
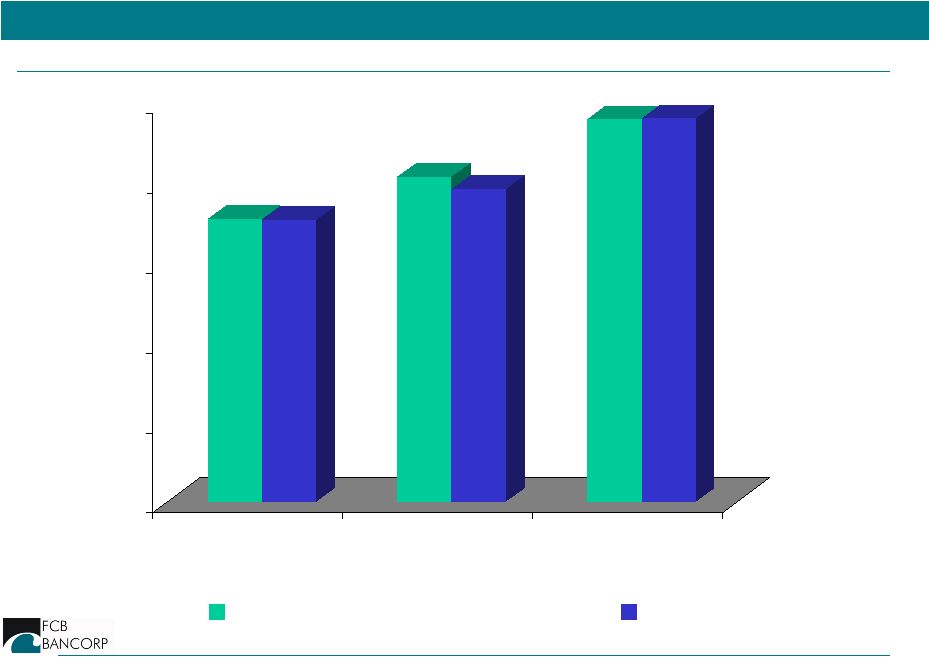 25 Balance Sheet $0 $100 $200 $300 $400 $500 Loans Deposits Assets MBLA FCBA $ in millions As of March 31, 2006 |
 26 Pro Forma Financial Impact $ 46.7 $ 39 1.8 $ 353.6 $ 481.0 FCBA $ 39.3 $ 405.4 $ 353.5 $ 479.9 MBLA $ 123.8 Equity $ 797.2 Deposits $ 707.1 Loans $ 998.7 Assets Pro Forma ($ in millions) As of March 31, 2006 |
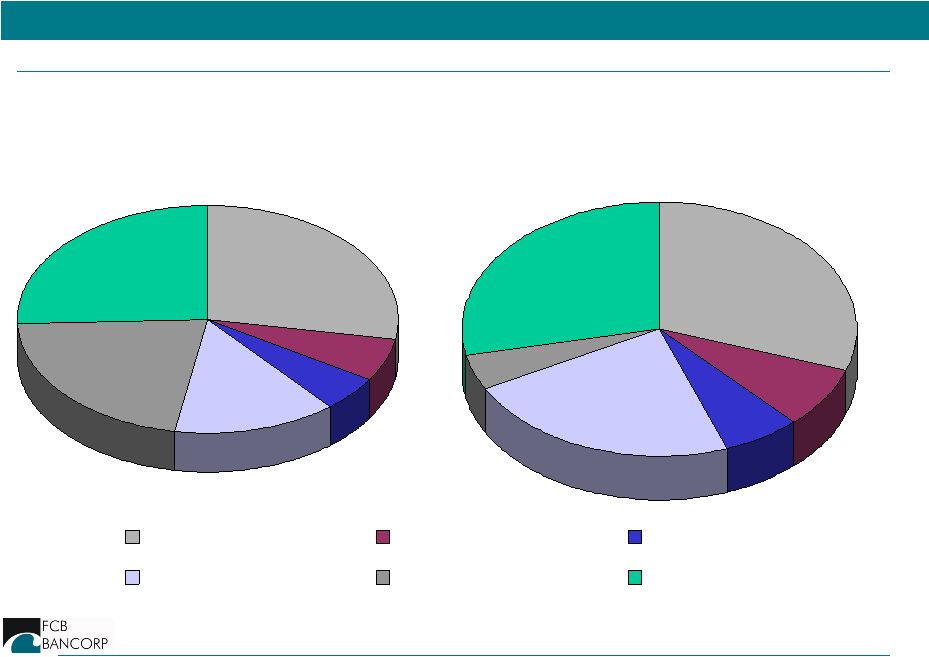
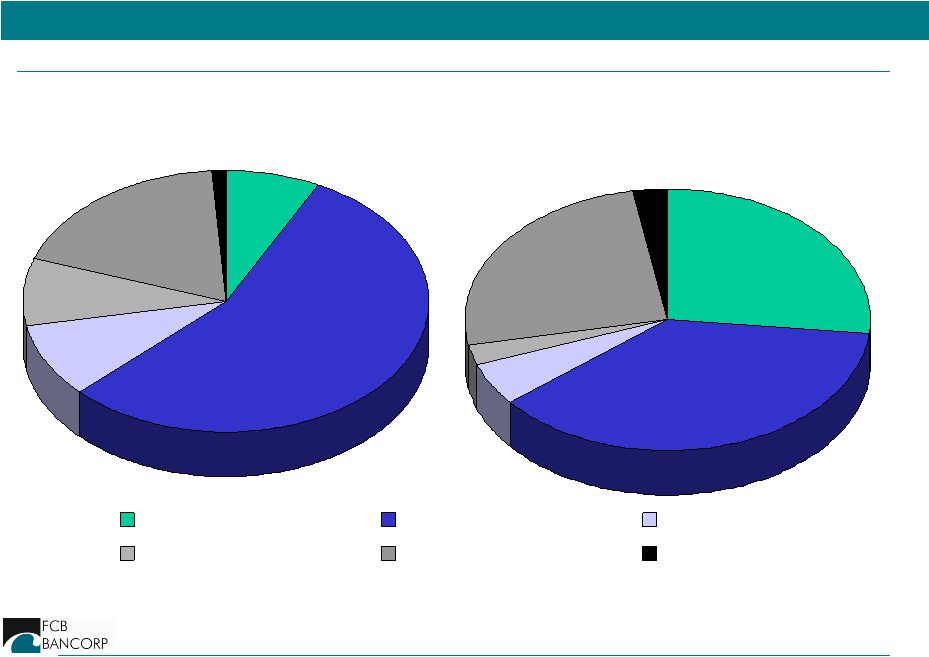 27 Loan Mix MBLA 3% 3% 25% 5% 27% 37% Construction Commercial RE Multifamily Residential C&I Consumer & Other FCBA 1% 19% 7% 56% 9% 8% As of March 31, 2006 |
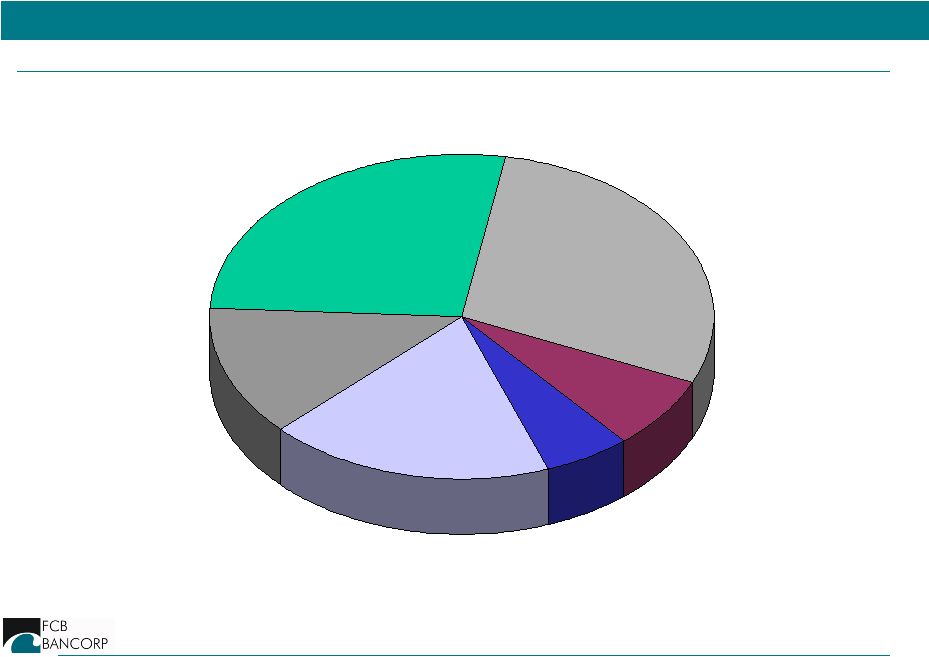
 28 Pro Forma Loan Mix Construction 17% Multifamily 7% Residential 6% Consumer & Other 2% Commercial RE 46% C&I 22% As of March 31, 2006 |
 29 MBLA 28% 5% 23% 8% 30% 6% Checking Interest Checking Savings Money Market CD<$100K CD>$100K Deposit Mix FCBA 26% 14% 22% 27% 6% 5% As of March 31, 2006 |
 30 Pro Forma Deposit Mix Checking 29% Savings 6% CD>$100K 27% Interest Checking 7% Money Market 18% CD<$100K 13% As of March 31, 2006 |
 31 Pro Forma Bank Deposit Market Share* * Banks headquartered in L.A., Orange and Ventura Counties Source: SNL Securities as of 6/30/2005 Rank Company Name Ticker 1 City National Corporation CYN 2 Fremont General Corporation FMT 3 East West Bancorp, Inc. EWBC 4 Cathay General Bancorp, Inc. CATY 5 Hanmi Financial Corporation HAFC 6 Farmers & Merchants Bank of Long Beach FMBL 7 Nara Bancorp, Inc. NARA 8 Center Financial Corporation CLFC 9 Wilshire Bancorp Inc. WIBC 10 First Regional Bancorp FRGB 11 Preferred Bank PFBC First California Financial Group, Inc. 12 Beverly Hills Bancorp Inc. BHBC 13 Pacific Mercantile Bancorp PMBC 14 Alliance Bancshares California ABNS 15 American Business Bank AMBZ 16 Saehan Bancorp SAEB 17 National Mercantile Bancorp MBLA 18 FCB Bancorp FCBA 19 Premier Commercial Bancorp PCBP 20 Sunwest Bancorp SWBC 21 Pacific City Bank PFCY Total Other (31) Total Deposits Market YTD Share ($000) (%) 11,908,529 22.24% 9,256,980 17.29% 7,023,676 13.12% 5,024,464 9.38% 2,818,866 5.26% 2,139,797 4.00% 1,650,623 3.08% 1,491,082 2.78% 1,481,237 2.77% 1,468,438 2.74% 995,310 1.86% 797,184 1.49% 684,032 1.28% 625,162 1.17% 574,645 1.07% 456,314 0.85% 434,665 0.81% 405,352 0.76% 391,832 0.73% 254,523 0.48% 247,320 0.46% 236,746 0.44% 3,173,197 5.93% 53,539,974 100.00% |
 32 • Enhances banking franchise • Low risk transaction • Expected to be accretive to EPS • Diversifies and expands lending capacity • Increases presence in fast-growing SoCal market Transaction Summary Transaction Summary |
 33 Q & A |