Pioneer Multi-Asset
Income Fund
Semiannual Report | January 31, 2021
| |
|
|
|
|
|
A: PMAIX
|
C: PMACX
|
K: PMFKX
|
R: PMFRX
|
Y: PMFYX
|
Paper copies of the Fund’s shareholder reports may no longer be sent by mail, unless you specifically request paper copies of the reports from the Fund or from your financial intermediary, such as a broker-dealer,
bank or insurance company. Instead, the reports will be made available on the Fund’s website, and you will be notified by mail each time a report is posted and provided with a website link to access the report.
You may elect to receive shareholder reports and other communications electronically by contacting your financial intermediary or, if you invest directly with the Fund, by calling 1-800-225-6292.
You may elect to receive all future reports in paper free of charge. If you invest directly with the Fund, you can inform the Fund that you wish to continue receiving paper copies of your shareholder reports by
calling 1-800-225-6292. If you invest through a financial intermediary, you can contact your financial intermediary to request that you continue to receive paper copies of your shareholder reports. Your election to receive reports in paper will
apply to all funds held in your account if you invest through your financial intermediary or all funds held within the Pioneer Fund complex if you invest directly.
visit us: www.amundi.com/us
Pioneer Multi-Asset Income Fund | Semiannual Report | 1/31/21 1
President’s Letter
Dear Shareholders,
The first several weeks of 2021 have brought some better news on the COVID-19 global pandemic front, as the deployment of the first approved COVID-19 vaccines is well underway, with expectations for widespread vaccine
distribution by the middle of the year. In general, COVID-19 cases and related hospitalizations have been on the decline in the US, and that has had a positive effect on overall market sentiment.
While there may finally be a light visible at the end of the pandemic tunnel, the long-term impact on the global economy from COVID-19, while currently unknown, is likely to be considerable. It is clear that several
industries have already felt greater effects than others, and the markets, which do not thrive on uncertainty, have been volatile. With that said, in these still-early days of 2021, equity markets and other so-called “riskier” assets, such as
high-yield bonds, have outperformed investments regarded as less risky, such as government debt. In addition, we’ve witnessed the long-awaited rebound in the performance of cyclical stocks, or stocks of companies with greater exposure to the ebbs
and flows of the economic cycle, as investors have appeared to embrace the potential for a more widespread reopening of the economy in the coming months. Additional fiscal stimulus from the US government has also helped provide some market
momentum.
However, despite the dramatic market rebound since its March 2020 low point, volatility has remained elevated, with momentum rising and falling on seemingly every bit of positive or negative news about the virus. In
addition, the recent US Presidential and Congressional elections have resulted in a power shift in Washington, DC, and that most likely portends some changes in fiscal policy above and beyond just additional pandemic-related stimulus. That, too,
could lead to increased market volatility as investors analyze the various tax and spending plans, and wait to see what proposed policy alterations actually become law.
With the advent of COVID-19 in early 2020, we implemented our business continuity plan according to the new COVID-19 guidelines, and most of our employees have been working remotely since March 2020. To date, our
operating environment has faced no interruption. I am proud of the careful planning that has taken place and confident we can maintain this environment for as long as is prudent. History in the making for a company that first opened its doors way
back in 1928.
2 Pioneer Multi-Asset Income Fund | Semiannual Report | 1/31/21
Since 1928, Amundi US’s investment process has been built on a foundation of fundamental research and active management, principles which have guided our investment decisions for more than 90 years. We believe active
management – that is, making active investment decisions – can help mitigate the risks during periods of market volatility. As 2020 has reminded us, investment risk can arise from a number of factors in today’s global economy, including slower or
stagnating growth, changing U.S. Federal Reserve policy, oil price shocks, political and geopolitical factors and, unfortunately, major public health concerns such as a viral pandemic.
At Amundi US, active management begins with our own fundamental, bottom-up research process. Our team of dedicated research analysts and portfolio managers analyzes each security under consideration, communicating
directly with the management teams of the companies issuing the securities and working together to identify those securities that best meet our investment criteria for our family of funds. Our risk management approach begins with each and every
security, as we strive to carefully understand the potential opportunity, while considering any and all risk factors.
Today, as investors, we have many options. It is our view that active management can serve shareholders well, not only when markets are thriving, but also during periods of market stress.
As you consider your long-term investment goals, we encourage you to work with your financial professional to develop an investment plan that paves the way for you to pursue both your short-term and long-term goals.
We remain confident that the current crisis, like others in human history, will pass, and we greatly appreciate the trust you have placed in us and look forward to continuing to serve you in the future.
Sincerely,
Lisa M. Jones
Head of the Americas, President and CEO of US.
Amundi Asset Management US, Inc.
March 2021
Any information in this shareowner report regarding market or economic trends or the factors influencing the Fund’s historical or future performance are statements of opinion as of the date of this report. Past
performance is no guarantee of future results.
Pioneer Multi-Asset Income Fund | Semiannual Report | 1/31/21 3
Portfolio Management Discussion |
1/31/21
In the following interview, portfolio manager Marco Pirondini discusses Pioneer Multi-Asset Income Fund’s performance and investment strategies during the six-month period ended January 31, 2021,
along with his outlook for the coming months. Mr. Pirondini, Senior Managing Director, Head of Equities, US, and a portfolio manager at Amundi Asset Management US, Inc. (Amundi US), co-manages the Fund along with Howard Weiss, a vice president and
a portfolio manager at Amundi US, and Michele Garau, a senior vice president and a portfolio manager at Amundi US.
Q How did the Fund perform during the six-month period ended January 31, 2021?
A The Fund’s Class A shares returned 10.84% at net asset value during the six-month period ended January 31, 2021, while the Fund’s
benchmarks, the Bloomberg Barclays US Aggregate Bond Index and the Morgan Stanley Capital International Index (MSCI) All Country World NR Index1 (the MSCI Index)
returned -0.91% and 17.24%, respectively. During the same period, the average return of the 474 mutual funds in Morningstar’s World Allocation Funds category was 10.78%.
Q How would you describe the global investment environment during the six-month period ended January 31, 2021?
A It was a rewarding time to be invested in riskier assets, despite bouts of market volatility. At the regional level, emerging markets
and Japanese stocks led the way, with each segment posting gains of more than 24% for the six-month period. European and US stocks also fared well, returning more than 14% apiece. Meanwhile, global fixed-income markets also rallied, but lagged the
performance of equities, as the Bloomberg Barclays Global Aggregate Bond Index returned 1.85% for the six-month
1 The MSCI information may only be used for your internal use, may not be reproduced or
redisseminated in any form and may not be used as a basis for or a component of any financial instruments or products or indices. None of the MSCI information is intended to constitute investment advice or a recommendation to make (or refrain from
making) any kind of investment decision and may not be relied on as such. Historical data and analysis should not be taken as an indication or guarantee of any future performance analysis, forecast or prediction. The MSCI information is provided on
an “as is” basis and the user of this information assumes the entire risk of any use made of this information. MSCI, each of its affiliates and each other person involved in or related to compiling, computing or creating any MSCI information
(collectively, the “MSCI Parties”) expressly disclaims all warranties (including, without limitation, any warranties of originality, accuracy, completeness, timeliness, non-infringement, merchantability and fitness for a particular purpose) with
respect to this information. Without limiting any of the foregoing, in no event shall any MSCI Party have any liability for any direct, indirect, special, incidental, punitive, consequential (including, without limitation, lost profits) or any
other damages.
4 Pioneer Multi-Asset Income Fund | Semiannual Report | 1/31/21
period. In the US, the Fund’s fixed-income benchmark, the Bloomberg Barclays US Aggregate Bond Index (the Bloomberg Barclays Index), turned in negative performance over the period (-0.91%).
When the six-month period began in August 2020, global equity and credit-sensitive fixed-income markets were on an upswing, with investors upbeat about the massive liquidity-boosting and other
stimulus measures enacted by monetary and fiscal authorities in several countries, in an attempt to stem the tide of economic distress caused by the initial fallout from the COVID-19 pandemic. Economic and business data had been improving as
pandemic-related lockdowns eased over the summer of 2020, thus lending further support to the capital markets. Improving prospects for a COVID-19 vaccine underpinned the rally as well. The larger-cap/larger-growth names, along with shares of
cyclical companies that had continued to rebound off their pandemic-induced lows of February and March, led the rally in the equity markets during that timeframe.
In September 2020, market sentiment reversed course due to uncertainty surrounding the timing of the development of successful COVID-19 vaccines, delays in the passage of additional fiscal stimulus
in the US, global trade tensions, and difficult Brexit negotiations in the United Kingdom. A subsequent sell-off in riskier assets gained momentum in October 2020, when rising COVID-19 infection rates in several areas increased fears of renewed
lockdowns that investors thought would jeopardize the global economic recovery. The market momentum behind growth stocks versus value stocks continued as investors perceived shares of stable growth companies as more defensive investments amid the
uncertain environment.
In early November 2020, Pfizer and Moderna announced high-efficacy rates for their COVID-19 vaccines during clinical trials and each applied for emergency-use authorization for the vaccines from the
US Food and Drug Administration (FDA). (The former is a Fund holding, the latter is not.) The vaccine news sparked strong rallies across global equity markets. Stocks then enjoyed an additional boost from the US election results given that
President-Elect Biden had made additional fiscal stimulus and infrastructure spending a key part of his platform during the campaign. At that time, stock market leadership began to shift away from large-cap technology growth companies and towards
the smaller-cap, cyclical, and value-oriented stocks that had underperformed for most of the 2020 calendar year, but that seemed poised to benefit from a broader reopening of the global economy once vaccine distributions had begun in earnest. The
US government’s announcement of another COVID-19 relief package just before the close of 2020 added more fuel to the market rally for the balance of the six-month period.
Pioneer Multi-Asset Income Fund | Semiannual Report | 1/31/21 5
Commodities also saw strong gains during the six-month period, as the rollout of COVID-19 vaccines increased optimism about a return of global travel. However, in the closing weeks of the period,
rising yields and the risk of higher inflation due to the unprecedented stimulus pumped into the economy by various central banks and governments generated valuation concerns for interest-rate-sensitive investments, particularly high-growth
technology stocks. The yield on the bellwether 10-year US Treasury, a key driver of global borrowing costs, rose from a low of 0.52% in August of 2020 to 1.07% by late January of 2021, more than doubling in a relatively short period of time.
Q What factors drove the Fund’s benchmark-relative performance during the six-month period ended January 31, 2021?
A As a diversified*, multi-asset portfolio, the Fund’s returns have generally fallen in between that of the Bloomberg Barclays Index, a
pure bond index, and the MSCI Index, a pure equity index, and that was the case during the most recent six-month reporting period.
The primary factor behind the Fund’s benchmark-relative performance for the six-month period was security selection within equities. On an individual security level, the equity positions that
contributed the most to the Fund’s positive relative returns over the period included KB Financial Group and Fiat Chrysler Automobiles (FCA). KB Financial is a large Korean-based bank. The stock performed well for most of the period as the company
completed a previous acquisition and released a solid earnings report in the fall of 2020. FCA finalized the terms of a merger during the period, with the agreement forming a new company, which management hopes may allow it to achieve the scale
needed to survive in an industry facing technology changes and pandemic-related challenges. The merger, which was approved by shareholders in January 2021, combines such popular auto brands as Jeep, Ram truck, Alfa Romeo, and Maserati under one
roof. Just before the deal closed, FCA made a one-time cash distribution to shareholders of common stock, which included the Pioneer Multi-Asset Income Fund. Finally, some energy-related positions, which rallied on vaccine news and optimism about
global economies reopening, aided the Fund’s relative performance. Notable positive contributors in the sector included the portfolio’s investment in Marathon Oil, as well as exposure to energy master limited partnerships (MLPs).
Also aiding the Fund’s relative returns over the six-month period were positions in equity-linked notes (ELNs), which benefited from the strong equity rally in the second half of the period. ELNs
are products that
* Diversification does not assure a profit nor protect against loss.
6 Pioneer Multi-Asset Income Fund | Semiannual Report | 1/31/21
combine a fixed-income investment with the potential for additional returns tied to the performance of underlying equities or equity-related securities. ELNs seek to produce yield by selling
volatility against a single equity, basket of equities, or equity index. They are, in effect, covered call strategies, in which a call option – or a contractual agreement to buy a security at a predetermined price and within a predetermined
timeframe –against the underlying investment is sold to produce income. (Selling volatility entails seeking relatively expensive options of highly-volatile investments, with the goal of selling the options at a higher-than-average price, in
anticipation that they will lose value at a faster rate than lower-cost, comparable options might decline in value.) While ELNs still bear the price risk of the referenced stock(s), periods of elevated volatility may result in ELNs offering richer
coupons, which in turn could help to mute volatility of net returns when compared to the actual owning of stock shares. ELNs are subject to additional risks and, of course, there is no assurance that investments in ELNs will be profitable.
Detractors from the Fund’s benchmark-relative performance during the six-month period included exposures to financials stocks in Europe and Asia. The Fund’s hedges (discussed on Page 9) and a small
cash position also detracted from relative returns during the fourth quarter of 2020 as riskier assets rallied. We would note, however, that the portfolio’s hedges are more structural in nature, used mainly to address the equity portion of the
Fund’s ELN positions. Individual equity positions that were a drag on the Fund’s relative performance for the period included China Mobile, Gilead Sciences, and Eisai.
With regard to China Mobile, last November, then-President Trump issued an executive order that barred American citizens from purchasing shares of US-listed Chinese companies with alleged ties to
the Chinese military after January 11, 2021. Selling existing positions in those securities would be permitted until November 11, 2020. China Mobile was among the Chinese telecom companies included on the list. On New Year’s Eve, the New York Stock
Exchange announced it would suspend trading in those telecom companies between January 7 and January 11, 2021, and start the delisting process. The announcement caused China Mobile’s stock price to tumble. The Fund had no exposure to China Mobile
as of period-end. Shares of Gilead Sciences underperformed during the period as the company announced an acquisition and also reduced earnings guidance. Shares of Eisai, a Japanese pharmaceutical firm, sold off during the fourth quarter of 2020
after its drug therapy for the treatment of Alzheimer’s disease, which is currently in co-development with another pharmaceutical company, failed to receive support from the US FDA’s Advisory Committee. The lack of initial support does not
necessarily mean that the Alzheimer’s drug will not receive FDA approval, but it certainly represented at least a short-term setback.
Pioneer Multi-Asset Income Fund | Semiannual Report | 1/31/21 7
On the fixed-income side, the Fund’s security selection results within high yield aided benchmark-relative returns. Investments in mortgage-backed securities (MBS) also augmented returns. Finally,
the Fund’s performance benefited from its underweight exposure to investment-grade bonds as well as to fixed income in general during the six-month period. With global bond yields ticking higher in the final weeks of the period due to concerns
about the effects of government stimulus on deficit spending and inflation, the reduced exposure to fixed-income was beneficial for performance. (As bond yields rise, bond prices fall.)
There were no significant detractors from benchmark-relative performance within the Fund’s fixed-income holdings.
Q What changes did you make to the Fund’s positioning during the six-month period ended January 31, 2021?
A With regard to specific management strategies, our outlook began to markedly improve in early November 2020 when the first COVID-19
vaccines received authorization from the US FDA for immediate US distribution. At that time, equities had been selling off sharply in response to various investor concerns, as previously discussed, thus creating attractive buying opportunities, in
our view. Accordingly, we realigned the portfolio with a focus on stocks of companies that could benefit from a broader reopening of the global economy. We believe the combination of positive vaccine developments, the unprecedented size of the
global monetary and fiscal policy responses from central banks and governments, and pent-up consumer demand, could provide plenty of “dry powder” to fuel a recovery in 2021. Those decisions proved rewarding during the final three months of the
semiannual reporting period, as global equity markets repeatedly set new highs.
Within fixed-income, we have adapted to changing market conditions by reducing the portfolio’s allocation to high-yield bonds, as spreads have compressed and valuations have become less compelling.
(Credit spreads are commonly defined as the difference in yield between Treasuries and other types of fixed-income securities with similar maturities.) While MBS have played a smaller role within the Fund’s fixed-income allocation, we slightly
increased exposure to that segment of the market, given the relatively more attractive yields available on a risk/return basis. ELNs have remained an important part of our investment strategy, due to what we view as compelling yield-generation
opportunities that have been helping to offset the yield compression experienced by other income-producing securities. Finally, we established Fund positions in insurance-linked securities (ILS) and emerging markets bonds in an attempt to maintain
portfolio diversification.
8 Pioneer Multi-Asset Income Fund | Semiannual Report | 1/31/21
Within equities, we have continued to diversify the Fund’s holdings on a global scale. We increased exposure to developed-market international stocks during the period, in sectors and countries that
we believe have offered quality earnings, compelling dividend** yields, and attractive valuations. As part of the strategy, we increased the Fund’s investments in cyclical stocks in Japan, Korea, and China, countries that seem to have weathered the
pandemic relatively well and have implemented longer-term structural improvements. The portfolio’s US and European equity exposures have been focused on dividend-paying companies that we believe to be attractively valued, in such sectors as
financials, industrials, and utilities.
Q Did the Fund have exposure to derivative investments during the six-month period ended January 31, 2021, and did the derivatives have an effect on the Fund’s
benchmark-performance?
A Yes. In addition to the ELN investments discussed earlier, the Fund had exposure to equity hedges during the period. However, as the
period progressed and the broader climate improved, the Fund’s ELN positions became less equity-like due to price action, and so we reduced the hedges accordingly. (Equity hedge investing consists of maintaining core portfolio holdings of equities,
or common stock positions, offset with investments in equity index futures, such as Standard & Poor’s 500 options.) As one might expect, the equity hedges detracted from the Fund’s relative returns in the fourth quarter of 2020, but had a
positive effect on performance for the full 2020 calendar year, given the significant market sell-off last March.
Q Yields hovered near historical lows during the six-month period ended January 31, 2021. In that environment, how did you maintain the Fund’s competitive
yield?
A During the six-month period, we utilized the Fund’s investment flexibility to adjust the portfolio’s asset allocation as market
conditions changed. As opportunities arose and valuations became compelling during the fall 2020 sell-off, we deployed cash into attractive areas of the fixed-income and equity markets. We believe that kind of flexibility underscores the Fund’s
value proposition, as we have the ability to adjust allocations in response to changes in valuations, and to seek out what we view as the most attractive income-generating opportunities across relevant asset classes.
** Dividends are not guaranteed.
Pioneer Multi-Asset Income Fund | Semiannual Report | 1/31/21 9
As part of our strategy, we seek to have the Fund pay a distribution*** that exceeds the income earned by the holdings in the portfolio, and is therefore paid from principal. In that vein, the
Fund’s positioning in ELNs was helpful, as those exposures derived a substantial income benefit from the equity market’s elevated volatility, which translated into higher coupons. In addition, several companies in the portfolio were at risk of
reducing or suspending their dividends due to regulatory pressure, but were never mandated to take those actions.
Q What is your outlook for the coming months?
A We believe the COVID-19 vaccines may present the global economy with the greatest form of stimulus in the months ahead. Increasing
employment combined with consumers unleashing a wave of pent-up demand for services such as travel, dining, and entertainment, could help kick-start economies around the globe in 2021. We believe those developments, along with stimulus measures,
may further propel a continued shift in market concentration away from a few large-cap growth, tech-oriented companies, and into the broader equity categories. In addition, we believe stocks of more cyclical companies may continue to recover as
economic growth stabilizes and corporate earnings potentially improve in the coming quarters.
Against this backdrop, we believe the Fund’s equity bias and our focus on quality value may be well served in the months ahead.
Please refer to the Schedule of Investments on pages 22–42 for a full listing of Fund securities.
All investments are subject to risk, including the possible loss of principal. In the past several years, financial markets have experienced increased volatility and heightened uncertainty. The
market prices of securities may go up or down, sometimes rapidly or unpredictably, due to general market conditions, such as real or perceived adverse economic, political, or regulatory conditions, recessions, inflation, changes in interest or
currency rates, lack of liquidity in the bond markets, the spread of infectious illness or other public health issues or adverse investor sentiment. These conditions may continue, recur, worsen or spread.
Equity-linked notes (ELNs) may not perform as expected and could cause the Fund to realize significant losses including its entire principal investment. Other risks include the risk of counterparty
default, liquidity risk and imperfect correlation between ELNs and the underlying securities.
*** Distributions are not guaranteed.
10 Pioneer Multi-Asset Income Fund | Semiannual Report | 1/31/21
High yield bonds possess greater price volatility, illiquidity, and possibility of default.
Investments in fixed-income securities involve interest rate, credit, inflation, and reinvestment risks. As interest rates rise, the value of fixed income securities falls.
Prepayment risk is the chance that an issuer may exercise the right to prepay its security, if falling interest rates prompt the issuer to do so. Forced to reinvest the unanticipated proceeds at
lower interest rates, the Fund would experience a decline in income and lose the opportunity for additional price appreciation.
The Fund may invest in mortgage-backed securities, which during times of fluctuating interest rates may increase or decrease more than other fixed-income securities. Mortgage-backed securities are
also subject to pre-payments.
The Fund may invest in subordinated securities which may be disproportionately adversely affected by a default or even a perceived decline in creditworthiness of the issuer.
International investments are subject to special risks including currency fluctuations, social, economic and political uncertainties, which could increase volatility. These risks are magnified in
emerging markets.
The Fund may invest in inflation-linked securities. As inflationary expectations increase, inflation-linked securities may become more attractive, because they protect future interest payments
against inflation. Conversely, as inflationary concerns decrease, inflation-linked securities will become less attractive and less valuable.
The Fund may invest in insurance-linked securities. The return of principal and the payment of interest and/or dividends on insurance-linked securities are contingent on the non-occurrence of a
pre-defined “trigger” event, such as a hurricane or an earthquake of a specific magnitude.
The Fund may invest in floating-rate loans. The value of collateral, if any, securing a floating rate loan can decline or may be insufficient to meet the issuer’s obligations or may be difficult to
liquidate.
The Fund may invest in underlying funds (including ETFs). In addition to the Fund’s operating expenses, you will indirectly bear the operating expenses of investments in any underlying funds.
Investments in equity securities are subject to price fluctuation.
Investments in small-and mid-cap stocks involve greater risks and volatility than investments in large-cap stocks.
The Fund may invest in master limited partnerships, which are subject to increased risks of liquidity, price valuation, control, voting rights and taxation. In addition, the structure affords fewer
protections to investors in the Partnership than direct investors in a corporation.
Pioneer Multi-Asset Income Fund | Semiannual Report | 1/31/21 11
The Fund may invest in zero-coupon bonds and payment-in-kind securities, which may be more speculative and fluctuate more in value than other fixed income securities. The accrual of income from
these securities is payable as taxable annual dividends to shareholders.
The Fund and some of the underlying funds in which the Fund invests may use derivatives, such as options and futures, which can be illiquid, may disproportionately increase losses, and have a
potentially large impact on Fund performance.
The Fund may invest in credit default swaps, which may in some cases be illiquid, and they increase credit risk since the Fund has exposure to both the issuer of the referenced obligation and the
counterparty to the credit default swap.
The Fund and some of the underlying funds employ leverage, which increases the volatility of investment returns and subjects the Fund to magnified losses if an underlying fund’s investments decline
in value.
These risks may increase share price volatility.
There is no assurance that these and other strategies used by the Fund or underlying funds will be successful.
Before investing, consider the product’s investment objectives, risks, charges and expenses. Contact your investment professional or Amundi Asset Management US, Inc., for a
prospectus or summary prospectus containing this information. Read it carefully.
Any information in this shareholder report regarding market or economic trends or the factors influencing the Fund’s historical or future performance are statements of opinion as of the date of this
report. Past performance is not a guarantee of future results.
12 Pioneer Multi-Asset Income Fund | Semiannual Report | 1/31/21
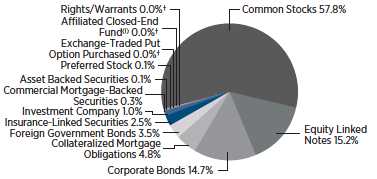
Portfolio Summary |
1/31/21
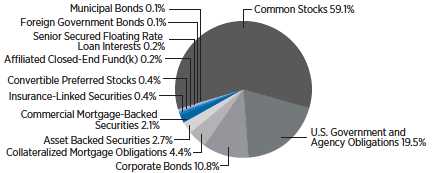
Portfolio Diversification
(As a percentage of total investments)*
† Amount rounds to less than 0.1%.
(i) Pioneer Floating Rate Trust is an affiliated fund managed by Amundi Asset Management US, Inc.
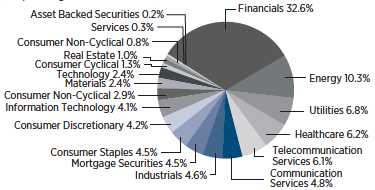
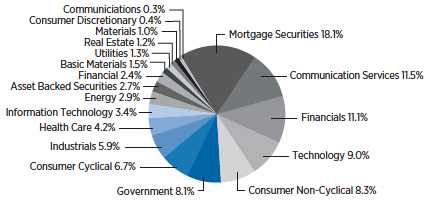
Sector Distribution
(As a percentage of total investments)*
10 Largest Holdings
(As a percentage of total investments)*
| |
|
|
|
1.
|
Lumen Technologies, Inc., 7.65%, 3/15/42
|
3.10%
|
|
2.
|
Lumen Technologies, Inc., 7.6%, 9/15/39
|
3.02
|
|
3.
|
Pfizer, Inc.
|
2.63
|
|
4.
|
KB Financial Group, Inc.
|
2.36
|
|
5.
|
Sumitomo Mitsui Financial Group, Inc.
|
2.28
|
|
6.
|
Mitsubishi UFJ Financial Group, Inc.
|
2.16
|
|
7.
|
CenterPoint Energy, Inc.
|
2.11
|
|
8.
|
PPL Corp.
|
2.02
|
|
9.
|
Royal Dutch Shell Plc, Class B (A.D.R.)
|
1.98
|
|
10.
|
AbbVie, Inc.
|
1.76
|
* Excludes temporary cash investments and all derivative contracts except for options purchased. The Fund is actively managed, and current holdings may be different. The
holdings listed should not be considered recommendations to buy or sell any securities.
Pioneer Multi-Asset Income Fund | Semiannual Report | 1/31/21 13
Prices and Distributions |
1/31/21
Net Asset Value per Share
| |
|
|
|
Class
|
1/31/21
|
7/31/20
|
|
A
|
$10.97
|
$10.17
|
|
C
|
$10.93
|
$10.13
|
|
K
|
$11.30
|
$10.47
|
|
R
|
$10.99
|
$10.19
|
|
Y
|
$10.93
|
$10.13
|
| |
|
|
|
|
Distributions per Share: 8/1/20–1/31/21
|
|
|
|
|
Net Investment
|
Short-Term
|
Long-Term
|
|
Class
|
Income
|
Capital Gains
|
Capital Gains
|
|
A
|
$0.2903
|
$ —
|
$ —
|
|
C
|
$0.2469
|
$ —
|
$ —
|
|
K
|
$0.3136
|
$ —
|
$ —
|
|
R
|
$0.2495
|
$ —
|
$ —
|
|
Y
|
$0.3000
|
$ —
|
$ —
|
Index Definitions
The Bloomberg Barclays US Aggregate Bond Index is an unmanaged measure of the U.S. bond market. The MSCI All Country World NR Index is
an unmanaged, free float-adjusted, market capitalization-weighted index that is designed to measure the equity market performance of developed and emerging markets. The Index consists of 45 country indices comprising 24 developed and 21 emerging
market country indices. Index returns are calculated monthly, assume reinvestment of dividends and, unlike Fund returns, do not reflect any fees, expenses or sales charges. It is not possible to invest directly in an index.
The indices defined here pertains to the “Value of $10,000 Investment” and “Value of $5 Million Investment” charts on pages 15–19.
14 Pioneer Multi-Asset Income Fund | Semiannual Report | 1/31/21
| |
|
Performance Update | 1/31/21
|
Class A Shares
|
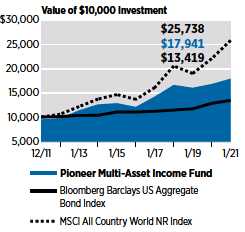
Investment Returns
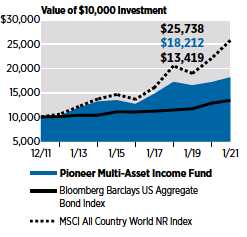
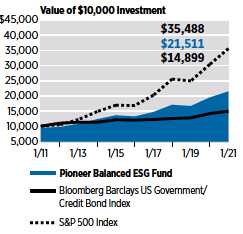
The mountain chart on the right shows the change in value of a $10,000 investment made in Class A shares of Pioneer Multi-Asset Income Fund at public offering price during the periods shown, compared to that of the
Bloomberg Barclays US Aggregate Bond Index and the MSCI All Country World NR Index.
| |
|
|
|
|
|
Average Annual Total Returns
|
|
|
(As of January 31, 2021)
|
|
|
|
|
|
|
Bloomberg
|
MSCI
|
|
|
|
|
Barclays
|
All
|
|
|
Net
|
Public
|
US
|
Country
|
|
|
Asset
|
Offering
|
Aggregate
|
World
|
|
|
Value
|
Price
|
Bond
|
NR
|
|
Period
|
(NAV)
|
(POP)
|
Index
|
Index
|
|
Since
|
|
|
|
|
|
inception
|
|
|
|
|
|
12/22/11
|
7.17%
|
6.63%
|
3.33%
|
11.01%
|
|
5 years
|
8.12
|
7.13
|
4.00
|
13.56
|
|
1 year
|
6.54
|
1.75
|
4.72
|
17.02
|
|
|
|
Expense Ratio
|
|
|
|
|
(Per prospectus dated December 1, 2020)
|
|
Gross
|
|
Net
|
|
|
|
0.95%
|
|
0.91%
|
|
|
Call 1-800-225-6292 or visit www.amundi.com/us for the most recent month-end performance results. Current performance may be lower or higher than the performance data quoted.
The performance data quoted represents past performance, which is no guarantee of future results. Investment return and principal value will fluctuate, and shares, when redeemed, may be worth more
or less than their original cost.
NAV results represent the percent change in net asset value per share. NAV returns would have been lower had sales charges been reflected. POP returns reflect deduction of maximum 4.50% sales charge. All results are
historical and assume the reinvestment of dividends and capital gains. Other share classes are available for which performance and expenses will differ.
Performance results reflect any applicable expense waivers in effect during the periods shown. Without such waivers Fund performance would be lower. Waivers may not be in effect for all funds. Certain fee waivers are
contractual through a specified period. Otherwise, fee waivers can be rescinded at any time. See the prospectus and financial statements for more information.
The net expense ratio reflects the contractual expense limitation currently in effect through December 1, 2021 for Class A shares. There can be no assurance that Amundi US will extend the expense limitation beyond
such time. Please see the prospectus for more information. Expense ratios in the financial highlights, unlike those shown in the prospectus, do not reflect acquired fund fees and expenses.
The performance table and graph do not reflect the deduction of fees and taxes that a shareowner would pay on Fund distributions or the redemption of Fund shares.
Please see the financial highlights for more current expense ratios.
Pioneer Multi-Asset Income Fund | Semiannual Report | 1/31/21 15
| |
|
|
Performance Update | 1/31/21
|
Class C Shares
|
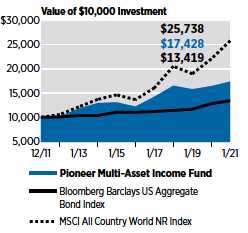
Investment Returns
The mountain chart on the right shows the change in value of a $10,000 investment made in Class C shares of Pioneer Multi-Asset Income Fund during the periods shown, compared to that of the Bloomberg Barclays US
Aggregate Bond Index and the MSCI All Country World NR Index.
| |
|
|
|
|
|
Average Annual Total Returns
|
|
|
(As of January 31, 2021)
|
|
|
|
|
|
|
Bloomberg
|
MSCI
|
|
|
|
|
Barclays
|
All
|
|
|
|
|
US
|
Country
|
|
|
|
|
Aggregate
|
World
|
|
|
If
|
If
|
Bond
|
NR
|
|
Period
|
Held
|
Redeemed
|
Index
|
Index
|
|
Since
|
|
|
|
|
|
inception
|
|
|
|
|
|
12/22/11
|
6.29%
|
6.29%
|
3.33%
|
11.01%
|
|
5 years
|
7.25
|
7.25
|
4.00
|
13.56
|
|
1 year
|
5.69
|
5.69
|
4.72
|
17.02
|
|
|
|
Expense Ratio
|
|
|
|
|
(Per prospectus dated December 1, 2020)
|
|
Gross
|
|
|
|
|
|
1.72%
|
|
|
|
|
Call 1-800-225-6292 or visit www.amundi.com/us for the most recent month-end performance results. Current performance may be lower or higher than the performance data quoted.
The performance data quoted represents past performance, which is no guarantee of future results. Investment return and principal value will fluctuate, and shares, when redeemed, may be worth more
or less than their original cost.
Class C shares held for less than one year are subject to a 1% contingent deferred sales charge (CDSC). “If Held” results represent the percent change in net asset value per share. NAV returns would have been lower
had sales charges been reflected. All results are historical and assume the reinvestment of dividends and capital gains. Other share classes are available for which performance and expenses will differ.
Performance results reflect any applicable expense waivers in effect during the periods shown. Without such waivers Fund performance would be lower. Waivers may not be in effect for all funds. Certain fee waivers are
contractual through a specified period. Otherwise, fee waivers can be rescinded at any time. See the prospectus and financial statements for more information.
Expense ratios in the financial highlights, unlike those shown in the prospectus, do not reflect acquired fund fees and expenses.
The performance table and graph do not reflect the deduction of fees and taxes that a shareowner would pay on Fund distributions or the redemption of Fund shares.
Please see the financial highlights for a more current expense ratio.
16 Pioneer Multi-Asset Income Fund | Semiannual Report | 1/31/21
| |
|
|
Performance Update | 1/31/21
|
Class K Shares
|
Investment Returns
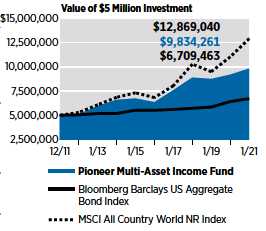
The mountain chart on the right shows the change in value of a $5 million investment made in Class K shares of Pioneer Multi-Asset Income Fund during the periods shown, compared to that of the Bloomberg Barclays US
Aggregate Bond Index and the MSCI All Country World NR Index.
| |
|
|
|
|
Average Annual Total Returns
|
|
|
(As of January 31, 2021)
|
|
|
|
|
Bloomberg
|
MSCI
|
|
|
|
Barclays
|
All
|
|
|
Net
|
US
|
Country
|
|
|
Asset
|
Aggregate
|
World
|
|
|
Value
|
Bond
|
NR
|
|
Period
|
(NAV)
|
Index
|
Index
|
|
Since
|
|
|
|
|
inception
|
|
|
|
|
12/22/11
|
7.71%
|
3.33%
|
11.01%
|
|
5 years
|
9.03
|
4.00
|
13.56
|
|
1 year
|
6.81
|
4.72
|
17.02
|
|
|
|
Expense Ratio
|
|
|
|
(Per prospectus dated December 1, 2020)
|
|
Gross
|
|
|
|
|
0.64%
|
|
|
|
Call 1-800-225-6292 or visit www.amundi.com/us for the most recent month-end performance results. Current performance may be lower or higher than the performance data quoted.
The performance data quoted represents past performance, which is no guarantee of future results. Investment return and principal value will fluctuate, and shares, when redeemed, may be worth more
or less than their original cost.
The performance shown for Class K shares for the period prior to the commencement of operations of Class K shares on December 1, 2014, is the net asset value performance of the Fund’s Class A shares, which has not
been restated to reflect any differences in expenses, including Rule 12b-1 fees applicable to Class A shares. Since fees for Class A shares generally are higher than those of Class K shares, the performance of Class K shares prior to their
inception would have been higher than the performance shown. For the period beginning December 1, 2014, the actual performance of Class K shares is reflected. Class K shares are not subject to sales charges and are available for limited groups of
eligible investors, including institutional investors. All results are historical and assume the reinvestment of dividends and capital gains. Other share classes are available for which performance and expenses will differ.
Performance results reflect any applicable expense waivers in effect during the periods shown. Without such waivers Fund performance would be lower. Waivers may not be in effect for all funds. Certain fee waivers are
contractual through a specified period. Otherwise, fee waivers can be rescinded at any time. See the prospectus and financial statements for more information.
Expense ratios in the financial highlights, unlike those shown in the prospectus, do not reflect acquired fund fees and expenses.
The performance table and graph do not reflect the deduction of fees and taxes that a shareowner would pay on Fund distributions or the redemption of Fund shares.
Please see the financial highlights for a more current expense ratio.
Pioneer Multi-Asset Income Fund | Semiannual Report | 1/31/21 17
| |
|
|
Performance Update | 1/31/21
|
Class R Shares
|
Investment Returns
The mountain chart on the right shows the change in value of a $10,000 investment made in Class R shares of Pioneer Multi-Asset Income Fund during the periods shown, compared to that of the Bloomberg Barclays US
Aggregate Bond Index and the MSCI All Country World NR Index.
| |
|
|
|
|
Average Annual Total Returns
|
|
|
(As of January 31, 2021)
|
|
|
|
|
Bloomberg
|
MSCI |
|
|
|
Barclays
|
All
|
|
|
Net
|
US
|
Country
|
|
|
Asset
|
Aggregate
|
World
|
|
|
Value
|
Bond
|
NR
|
|
Period
|
(NAV)
|
Index
|
Index
|
|
Since
|
|
|
|
|
inception
|
|
|
|
|
12/22/11
|
6.80%
|
3.33%
|
11.01%
|
|
5 years
|
7.43
|
4.00
|
13.56
|
|
1 year
|
5.76
|
4.72
|
17.02
|
|
|
|
Expense Ratio
|
|
|
|
(Per prospectus dated December 1, 2020)
|
|
Gross
|
|
|
|
|
1.69%
|
|
|
|
Call 1-800-225-6292 or visit www.amundi.com/us for the most recent month-end performance results. Current performance may be lower or higher than the performance data quoted.
The performance data quoted represents past performance, which is no guarantee of future results. Investment return and principal value will fluctuate, and shares, when redeemed, may be worth more
or less than their original cost.
The performance shown for Class R shares for the period prior to the commencement of operations of Class R shares on December 1, 2014, is based on the performance of Class A shares, reduced to reflect the higher
distribution and service fees of Class R shares. For the period beginning December 1, 2014, the actual performance of Class R shares is reflected. Class R shares are not subject to sales charges and are available for limited groups of eligible
investors, including institutional investors. All results are historical and assume the reinvestment of dividends and capital gains. Other share classes are available for which performance and expenses will differ.
Performance results reflect any applicable expense waivers in effect during the periods shown. Without such waivers Fund performance would be lower. Waivers may not be in effect for all funds. Certain fee waivers are
contractual through a specified period. Otherwise, fee waivers can be rescinded at any time. See the prospectus and financial statements for more information.
Expense ratios in the financial highlights, unlike those shown in the prospectus, do not reflect acquired fund fees and expenses.
The performance table and graph do not reflect the deduction of fees and taxes that a shareowner would pay on Fund distributions or the redemption of Fund shares.
Please see the financial highlights for a more current expense ratio.
18 Pioneer Multi-Asset Income Fund | Semiannual Report | 1/31/21
| |
|
|
Performance Update | 1/31/21
|
Class Y Shares
|
Investment Returns
The mountain chart on the right shows the change in value of a $5 million investment made in Class Y shares of Pioneer Multi-Asset Income Fund during the periods shown, compared to that of the Bloomberg Barclays US
Aggregate Bond Index and the MSCI All Country World NR Index.
| |
|
|
|
|
Average Annual Total Returns
|
|
|
(As of January 31, 2021)
|
|
|
|
|
Bloomberg
|
MSCI
|
|
|
|
Barclays
|
All
|
|
|
Net
|
US
|
Country
|
|
|
Asset
|
Aggregate
|
World
|
|
|
Value
|
Bond
|
NR
|
|
Period
|
(NAV)
|
Index
|
Index
|
|
Since
|
|
|
|
|
inception
|
|
|
|
|
12/22/11
|
7.34%
|
3.33%
|
11.01%
|
|
5 years
|
8.29
|
4.00
|
13.56
|
|
1 year
|
6.57
|
4.72
|
17.02
|
|
|
|
Expense Ratio
|
|
|
|
(Per prospectus dated December 1, 2020)
|
|
Gross
|
Net
|
|
|
|
0.74%
|
0.71%
|
|
|
Call 1-800-225-6292 or visit www.amundi.com/us for the most recent month-end performance results. Current performance may be lower or higher than the performance data quoted.
The performance data quoted represents past performance, which is no guarantee of future results. Investment return and principal value will fluctuate, and shares, when redeemed, may be worth more
or less than their original cost.
Class Y shares are not subject to sales charges and are available for limited groups of eligible investors, including institutional investors. All results are historical and assume the reinvestment of dividends and
capital gains. Other share classes are available for which performance and expenses will differ.
Performance results reflect any applicable expense waivers in effect during the periods shown. Without such waivers Fund performance would be lower. Waivers may not be in effect for all funds. Certain fee waivers are
contractual through a specified period. Otherwise, fee waivers can be rescinded at any time. See the prospectus and financial statements for more information.
The net expense ratio reflects the contractual expense limitation currently in effect through December 1, 2021 for Class Y shares. There can be no assurance that Amundi US will extend the expense limitation beyond
such time. Please see the prospectus for more information. Expense ratios in the financial highlights, unlike those shown in the prospectus, do not reflect acquired fund fees and expenses.
The performance table and graph do not reflect the deduction of fees and taxes that a shareowner would pay on Fund distributions or the redemption of Fund shares.
Please see the financial highlights for more current expense ratios.
Pioneer Multi-Asset Income Fund | Semiannual Report | 1/31/21 19
Comparing Ongoing Fund Expenses
As a shareowner in the Fund, you incur two types of costs:
|
(1)
|
ongoing costs, including management fees, distribution and/or service (12b-1) fees, and other Fund expenses; and
|
|
(2)
|
transaction costs, including sales charges (loads) on purchase payments.
|
This example is intended to help you understand your ongoing expenses (in dollars) of investing in the Fund and to compare these costs with the ongoing costs of investing in other mutual funds. The example is based on
an investment of $1,000 at the beginning of the Fund’s latest six-month period and held throughout the six months.
Using the Tables
Actual Expenses
The first table below provides information about actual account values and actual expenses. You may use the information in this table, together with the amount you invested, to estimate the expenses that you paid over
the period as follows:
|
(1)
|
Divide your account value by $1,000
|
|
|
Example: an $8,600 account value ÷ $1,000 = 8.6
|
|
(2)
|
Multiply the result in (1) above by the corresponding share class’s number in the third row under the heading entitled “Expenses Paid During Period” to estimate the expenses you paid on your account during this period.
|
Expenses Paid on a $1,000 Investment in Pioneer Multi-Asset Income Fund
Based on actual returns from August 1, 2020 through January 31, 2021.
| |
|
|
|
|
|
|
Share Class
|
A
|
C
|
K
|
R
|
Y
|
|
Beginning Account
|
$1,000.00
|
$1,000.00
|
$1,000.00
|
$1,000.00
|
$1,000.00
|
|
Value on 8/1/20
|
|
|
|
|
|
|
Ending Account Value
|
$1,108.40
|
$1,104.30
|
$1,110.50
|
$1,104.00
|
$1,109.80
|
|
(after expenses)
|
|
|
|
|
|
|
on 1/31/21
|
|
|
|
|
|
|
Expenses Paid
|
$4.52
|
$8.65
|
$2.98
|
$7.90
|
$3.46
|
|
During Period*
|
|
|
|
|
|
* Expenses are equal to the Fund’s annualized expense ratio of 0.85%, 1.63%, 0.56%, 1.49%, and 0.65% for class A, C, K, R, and Y respectively, multiplied by the average account
value over the period multiplied by 184/365 (to reflect the partial year period).
20 Pioneer Multi-Asset Income Fund | Semiannual Report | 1/31/21
Hypothetical Example for Comparison Purposes
The table below provides information about hypothetical account values and hypothetical expenses based on the Fund’s actual expense ratio and an assumed rate of return of 5% per year before expenses, which is not the
Fund’s actual return. The hypothetical account values and expenses may not be used to estimate the actual ending account balance or expenses you paid for the period.
You may use this information to compare the ongoing costs of investing in the Fund and other funds. To do so, compare this 5% hypothetical example with the 5% hypothetical examples that appear in the shareholder
reports of the other funds.
Please note that the expenses shown in the tables are meant to highlight your ongoing costs only and do not reflect any transaction costs, such as sales charges (loads) that are charged at the time of the transaction.
Therefore, the table below is useful in comparing ongoing costs only and will not help you determine the relative total costs of owning different funds. In addition, if these transaction costs were included, your costs would have been higher.
Expenses Paid on a $1,000 Investment in Pioneer Multi-Asset Income Fund
Based on a hypothetical 5% return per year before expenses, reflecting the period from August 1, 2020 through January 31, 2021.
| |
|
|
|
|
|
|
Share Class
|
A
|
C
|
K
|
R
|
Y
|
|
Beginning Account
|
$1,000.00
|
$1,000.00
|
$1,000.00
|
$1,000.00
|
$1,000.00
|
|
Value on 8/1/20
|
|
|
|
|
|
|
Ending Account Value
|
$1,020.92
|
$1,016.99
|
$1,022.38
|
$1,017.69
|
$1,021.93
|
|
(after expenses)
|
|
|
|
|
|
|
on 1/31/21
|
|
|
|
|
|
|
Expenses Paid
|
$4.33
|
$8.29
|
$2.85
|
$7.58
|
$3.31
|
|
During Period*
|
|
|
|
|
|
* Expenses are equal to the Fund’s annualized expense ratio of 0.85%, 1.63%, 0.56%, 1.49%, and 0.65% for class A, C, K, R, and Y respectively, multiplied by the average account
value over the period multiplied by 184/365 (to reflect the partial year period).
Pioneer Multi-Asset Income Fund | Semiannual Report | 1/31/21 21
Schedule of Investments |
1/31/21
(unaudited)
| |
|
|
|
|
Shares
|
|
|
Value
|
|
|
|
UNAFFILIATED ISSUERS — 92.9%
|
|
|
|
|
COMMON STOCKS — 53.7% of Net Assets
|
|
|
|
|
Aerospace & Defense — 0.4%
|
|
|
343,575(a)
|
|
Hensoldt AG
|
$ 5,944,172
|
|
|
|
Total Aerospace & Defense
|
$ 5,944,172
|
|
|
|
Air Freight & Logistics — 0.6%
|
|
|
378,667
|
|
Cia de Distribucion Integral Logista Holdings SA
|
$ 7,139,352
|
|
3,949
|
|
United Parcel Service, Inc., Class B
|
612,095
|
|
|
|
Total Air Freight & Logistics
|
$ 7,751,447
|
|
|
|
Automobiles — 0.3%
|
|
|
257,685
|
|
Stellantis NV
|
$ 3,917,333
|
|
|
|
Total Automobiles
|
$ 3,917,333
|
|
|
|
Banks — 7.4%
|
|
|
831,128(a)
|
|
ABN AMRO Bank NV (144A)
|
$ 8,682,032
|
|
365,900(a)
|
|
Grupo Financiero Banorte SAB de CV, Class O
|
1,819,666
|
|
826,129
|
|
KB Financial Group, Inc.
|
29,775,473
|
|
28,365
|
|
M&T Bank Corp.
|
3,757,512
|
|
6,082,600
|
|
Mitsubishi UFJ Financial Group, Inc.
|
27,255,112
|
|
926,900
|
|
Sumitomo Mitsui Financial Group, Inc.
|
28,718,103
|
|
|
|
Total Banks
|
$ 100,007,898
|
|
|
|
Beverages — 0.2%
|
|
|
62,100
|
|
Asahi Group Holdings, Ltd.
|
$ 2,497,400
|
|
|
|
Total Beverages
|
$ 2,497,400
|
|
|
|
Biotechnology — 1.6%
|
|
|
216,665
|
|
AbbVie, Inc.
|
$ 22,203,829
|
|
|
|
Total Biotechnology
|
$ 22,203,829
|
|
|
|
Capital Markets — 2.1%
|
|
|
395,576
|
|
AllianceBernstein Holding LP
|
$ 13,983,612
|
|
5,225
|
|
Artisan Partners Asset Management, Inc.
|
252,890
|
|
83,870
|
|
Lazard, Ltd.
|
3,455,444
|
|
170,526
|
|
Morgan Stanley
|
11,433,768
|
|
|
|
Total Capital Markets
|
$ 29,125,714
|
|
|
|
Chemicals — 0.1%
|
|
|
2,117,467
|
|
Chevron Lubricants Lanka Plc
|
$ 1,226,632
|
|
|
|
Total Chemicals
|
$ 1,226,632
|
|
|
|
Construction & Engineering — 0.6%
|
|
|
17,263,500
|
|
Sinopec Engineering Group Co., Ltd., Class H
|
$ 7,971,332
|
|
|
|
Total Construction & Engineering
|
$ 7,971,332
|
|
|
|
Consumer Discretionary — 0.4%
|
|
|
84,219
|
|
Omnicom Group, Inc.
|
$ 5,253,581
|
|
|
|
Total Consumer Discretionary
|
$ 5,253,581
|
The accompanying notes are an integral part of these financial statements.
22 Pioneer Multi-Asset Income Fund | Semiannual Report | 1/31/21
| |
|
|
|
|
Shares
|
|
|
Value
|
|
|
|
Diversified Telecommunication Services — 1.5%
|
|
|
180,060
|
|
AT&T, Inc.
|
$ 5,155,118
|
|
737,943
|
|
Deutsche Telekom AG
|
13,161,047
|
|
132,394
|
|
Lumen Technologies, Inc.
|
1,639,038
|
|
|
|
Total Diversified Telecommunication Services
|
$ 19,955,203
|
|
|
|
Electric Utilities — 3.4%
|
|
|
1,414,771
|
|
EDP - Energias de Portugal SA
|
$ 8,877,587
|
|
178,455
|
|
FirstEnergy Corp.
|
5,489,276
|
|
161,237
|
|
Portland General Electric Co.
|
6,818,713
|
|
920,101
|
|
PPL Corp.
|
25,459,195
|
|
|
|
Total Electric Utilities
|
$ 46,644,771
|
|
|
|
Electrical Equipment — 0.7%
|
|
|
612,800
|
|
Mitsubishi Electric Corp.
|
$ 9,329,351
|
|
|
|
Total Electrical Equipment
|
$ 9,329,351
|
|
|
|
Energy Equipment & Services — 0.1%
|
|
|
99,457(a)
|
|
FTS International, Inc.
|
$ 1,676,845
|
|
|
|
Total Energy Equipment & Services
|
$ 1,676,845
|
|
|
|
Equity Real Estate Investment Trusts (REITs) — 0.4%
|
|
|
19,447
|
|
Digital Realty Trust, Inc.
|
$ 2,799,395
|
|
1,544,500
|
|
Frasers Logistics & Commercial Trust
|
1,674,066
|
|
714,200
|
|
Mapletree Industrial Trust
|
1,542,851
|
|
166,530
|
|
Mapletree Logistics Trust
|
248,187
|
|
|
|
Total Equity Real Estate Investment Trusts (REITs)
|
$ 6,264,499
|
|
|
|
Financials — 0.9%
|
|
|
223,391
|
|
Citigroup, Inc.
|
$ 12,954,444
|
|
|
|
Total Financials
|
$ 12,954,444
|
|
|
|
Food & Staples Retailing — 1.9%
|
|
|
478,315
|
|
Magnit PJSC (G.D.R.)
|
$ 7,136,460
|
|
281,300
|
|
Seven & i Holdings Co., Ltd.
|
10,638,557
|
|
122,389
|
|
Walgreens Boots Alliance, Inc.
|
6,150,047
|
|
37,426
|
|
X5 Retail Group NV (G.D.R.)
|
1,324,132
|
|
|
|
Total Food & Staples Retailing
|
$ 25,249,196
|
|
|
|
Food Products — 0.7%
|
|
|
61,338
|
|
Danone SA
|
$ 4,090,032
|
|
159,271
|
|
Kraft Heinz Co.
|
5,337,171
|
|
|
|
Total Food Products
|
$ 9,427,203
|
|
|
|
Gas Utilities — 0.4%
|
|
|
248,351
|
|
Enagas SA
|
$ 5,476,343
|
|
|
|
Total Gas Utilities
|
$ 5,476,343
|
The accompanying notes are an integral part of these financial statements.
Pioneer Multi-Asset Income Fund | Semiannual Report | 1/31/21 23
Schedule of Investments | 1/31/21
(unaudited) (continued)
| |
|
|
|
|
Shares
|
|
|
Value
|
|
|
|
Health Care — 2.2%
|
|
|
229,200
|
|
Gilead Sciences, Inc.
|
$ 15,035,520
|
|
95,319
|
|
Johnson & Johnson
|
15,549,389
|
|
|
|
Total Health Care
|
$ 30,584,909
|
|
|
|
Household Durables — 0.4%
|
|
|
156,226
|
|
Persimmon Plc
|
$ 5,462,088
|
|
|
|
Total Household Durables
|
$ 5,462,088
|
|
|
|
Industrial Conglomerates — 0.6%
|
|
|
231,800
|
|
Toshiba Corp.
|
$ 7,558,094
|
|
|
|
Total Industrial Conglomerates
|
$ 7,558,094
|
|
|
|
Information Technology — 0.7%
|
|
|
206,738
|
|
Cisco Systems, Inc.
|
$ 9,216,380
|
|
|
|
Total Information Technology
|
$ 9,216,380
|
|
|
|
Insurance — 2.8%
|
|
|
12,938
|
|
Allianz SE
|
$ 2,927,810
|
|
62,916
|
|
AXA SA
|
1,396,891
|
|
353,611
|
|
Hartford Financial Services Group, Inc.
|
16,980,400
|
|
34,799
|
|
NN Group NV
|
1,448,142
|
|
583,181
|
|
Old Republic International Corp.
|
10,555,576
|
|
144,800
|
|
Power Corp. of Canada
|
3,367,863
|
|
12,043
|
|
Progressive Corp.
|
1,050,029
|
|
|
|
Total Insurance
|
$ 37,726,711
|
|
|
|
Internet & Direct Marketing Retail — 0.2%
|
|
|
52,445
|
|
eBay, Inc.
|
$ 2,963,667
|
|
|
|
Total Internet & Direct Marketing Retail
|
$ 2,963,667
|
|
|
|
IT Services — 0.6%
|
|
|
67,007
|
|
International Business Machines Corp.
|
$ 7,981,204
|
|
|
|
Total IT Services
|
$ 7,981,204
|
|
|
|
Leisure Products — 0.3%
|
|
|
5,479,000
|
|
Honma Golf, Ltd. (144A)
|
$ 3,801,917
|
|
|
|
Total Leisure Products
|
$ 3,801,917
|
|
|
|
Metals & Mining — 1.2%
|
|
|
216,244
|
|
Rio Tinto Plc
|
$ 16,564,299
|
|
|
|
Total Metals & Mining
|
$ 16,564,299
|
|
|
|
Mortgage Real Estate Investment Trusts (REITs) — 3.3%
|
|
|
435,753
|
|
AGNC Investment Corp.
|
$ 6,797,747
|
|
460,130
|
|
Annaly Capital Management, Inc.
|
3,736,255
|
|
725,494
|
|
New Residential Investment Corp.
|
6,812,388
|
|
397,275
|
|
PennyMac Mortgage Investment Trust
|
6,852,994
|
|
1,264,031
|
|
Redwood Trust, Inc.
|
10,845,386
|
The accompanying notes are an integral part of these financial statements.
24 Pioneer Multi-Asset Income Fund | Semiannual Report | 1/31/21
| |
|
|
|
|
Shares
|
|
|
Value
|
|
|
|
Mortgage Real Estate Investment Trusts
|
|
|
|
|
(REITs) — (continued)
|
|
|
184,668
|
|
Starwood Property Trust, Inc.
|
$ 3,464,372
|
|
1,026,070
|
|
Two Harbors Investment Corp.
|
6,228,245
|
|
|
|
Total Mortgage Real Estate Investment Trusts (REITs)
|
$ 44,737,387
|
|
|
|
Multi-Utilities — 2.5%
|
|
|
1,262,130
|
|
CenterPoint Energy, Inc.
|
$ 26,618,322
|
|
173,434
|
|
RWE AG
|
7,461,450
|
|
|
|
Total Multi-Utilities
|
$ 34,079,772
|
|
|
|
Oil, Gas & Consumable Fuels — 8.0%
|
|
|
1,101,659
|
|
Avance Gas Holding, Ltd. (144A)
|
$ 4,652,363
|
|
1,336,688
|
|
BW LPG, Ltd. (144a)
|
8,779,227
|
|
482,800
|
|
Enable Midstream Partners LP
|
2,568,496
|
|
1,183,658
|
|
Energy Transfer LP
|
7,421,536
|
|
221,362
|
|
Enterprise Products Partners LP
|
4,478,153
|
|
446,100
|
|
Inpex Corp.
|
2,576,889
|
|
58,036
|
|
LUKOIL PJSC (A.D.R.)
|
4,145,512
|
|
98,335
|
|
Magellan Midstream Partners LP
|
4,371,974
|
|
313,605
|
|
Marathon Petroleum Corp.
|
13,535,192
|
|
486,017
|
|
MPLX LP
|
11,231,853
|
|
324,063
|
|
PBF Logistics LP
|
3,237,389
|
|
11,947
|
|
Plains All American Pipeline LP
|
99,996
|
|
702,223
|
|
Rosneft Oil Co. PJSC (G.D.R.)
|
4,352,378
|
|
716,487
|
|
Royal Dutch Shell Plc, Class B (A.D.R.)
|
24,998,232
|
|
305,844
|
|
TOTAL SE
|
12,948,321
|
|
|
|
Total Oil, Gas & Consumable Fuels
|
$ 109,397,511
|
|
|
|
Personal Products — 0.8%
|
|
|
183,603
|
|
Unilever Plc
|
$ 10,670,029
|
|
|
|
Total Personal Products
|
$ 10,670,029
|
|
|
|
Pharmaceuticals — 3.4%
|
|
|
29,300
|
|
Eisai Co., Ltd.
|
$ 2,138,157
|
|
925,939
|
|
Pfizer, Inc.
|
33,241,210
|
|
26,824
|
|
Roche Holding AG
|
9,251,577
|
|
72,772(a)
|
|
Viatris, Inc.
|
1,236,396
|
|
|
|
Total Pharmaceuticals
|
$ 45,867,340
|
|
|
|
Real Estate Management & Development — 0.4%
|
|
|
118,870
|
|
Grand City Properties SA
|
$ 2,959,375
|
|
995
|
|
LEG Immobilien AG
|
142,930
|
|
67,319
|
|
TAG Immobilien AG
|
2,072,906
|
|
|
|
Total Real Estate Management & Development
|
$ 5,175,211
|
The accompanying notes are an integral part of these financial statements.
Pioneer Multi-Asset Income Fund | Semiannual Report | 1/31/21 25
Schedule of Investments | 1/31/21
(unaudited) (continued)
| |
|
|
|
|
Shares
|
|
|
Value
|
|
|
|
Semiconductors & Semiconductor Equipment — 0.0%†
|
|
|
4,792
|
|
Analog Devices, Inc.
|
$ 706,005
|
|
|
|
Total Semiconductors & Semiconductor Equipment
|
$ 706,005
|
|
|
|
Software — 1.2%
|
|
|
261,263
|
|
Oracle Corp.
|
$ 15,788,123
|
|
|
|
Total Software
|
$ 15,788,123
|
|
|
|
Technology Hardware, Storage & Peripherals — 0.8%
|
|
|
344,000
|
|
Asustek Computer, Inc.
|
$ 3,518,475
|
|
108,463
|
|
NetApp, Inc.
|
7,206,282
|
|
|
|
Total Technology Hardware, Storage & Peripherals
|
$ 10,724,757
|
|
|
|
Trading Companies & Distributors — 0.6%
|
|
|
35,000
|
|
Inaba Denki Sangyo Co., Ltd.
|
$ 817,062
|
|
198,200
|
|
Marubeni Corp.
|
1,313,890
|
|
112,900
|
|
Mitsubishi Corp.
|
2,853,895
|
|
159,400
|
|
Mitsui & Co., Ltd.
|
2,947,230
|
|
|
|
Total Trading Companies & Distributors
|
$ 7,932,077
|
|
|
|
TOTAL COMMON STOCKS
|
|
|
|
|
(Cost $696,194,836)
|
$ 729,814,674
|
|
|
|
PREFERRED STOCK — 0.1% of Net Assets
|
|
|
|
|
Retail — 0.1%
|
|
|
7,000
|
|
Qurate Retail, Inc., 8.0%
|
$ 700,420
|
|
|
|
Total Retail
|
$ 700,420
|
|
|
|
TOTAL PREFERRED STOCK
|
|
|
|
|
(Cost $698,221)
|
$ 700,420
|
|
|
|
Principal
|
|
|
|
|
Amount
|
|
|
|
|
USD ($)
|
|
|
|
|
|
|
ASSET BACKED SECURITIES — 0.2%
|
|
|
|
|
of Net Assets
|
|
|
575,000
|
|
AMSR Trust, Series 2020-SFR2, Class G, 4.0%,
|
|
|
|
|
7/17/37 (144A)
|
$ 575,618
|
|
852,000
|
|
Crossroads Asset Trust, Series 2021-A, Class E, 5.48%,
|
|
|
|
|
1/20/28 (144A)
|
849,482
|
|
500,000
|
|
Rosy, Series 2018-1, Class A1, 6.25%, 12/15/25 (144A)
|
475,000
|
|
|
|
TOTAL ASSET BACKED SECURITIES
|
|
|
|
|
(Cost $1,875,034)
|
$ 1,900,100
|
|
|
|
COLLATERALIZED MORTGAGE
|
|
|
|
|
OBLIGATIONS — 4.5% of Net Assets
|
|
|
290,000(b)
|
|
Bellemeade Re, Ltd., Series 2020-3A, Class B1, 6.48%
|
|
|
|
|
(1 Month USD LIBOR + 635 bps), 10/25/30 (144A)
|
$ 295,789
|
|
2,100,000(b)
|
|
Bellemeade Re, Ltd., Series 2020-3A, Class M2, 4.98%
|
|
|
|
|
(1 Month USD LIBOR + 485 bps), 10/25/30 (144A)
|
2,166,595
|
The accompanying notes are an integral part of these financial statements.
26 Pioneer Multi-Asset Income Fund | Semiannual Report | 1/31/21
| |
|
|
|
|
Principal
|
|
|
|
|
Amount
|
|
|
|
|
USD ($)
|
|
|
Value
|
|
|
|
COLLATERALIZED MORTGAGE
|
|
|
|
|
OBLIGATIONS — (continued)
|
|
|
470,000(b)
|
|
Bellemeade Re, Ltd., Series 2020-4A, Class B1, 5.15%
|
|
|
|
|
(1 Month USD LIBOR + 500 bps), 6/25/30 (144A)
|
$ 471,770
|
|
1,900,000(c)
|
|
CFMT LLC, Series 2020-HB4, Class M4, 4.948%,
|
|
|
|
|
12/26/30 (144A)
|
1,900,000
|
|
1,270,000(c)
|
|
CFMT LLC, Series 2020-HB4, Class M5, 6.0%,
|
|
|
|
|
12/26/30 (144A)
|
1,227,310
|
|
4,100,000(b)
|
|
Connecticut Avenue Securities Trust, Series 2019-HRP1,
|
|
|
|
|
Class B1, 9.38% (1 Month USD LIBOR +
|
|
|
|
|
925 bps), 11/25/39 (144A)
|
4,194,970
|
|
2,190,000(b)
|
|
Connecticut Avenue Securities Trust, Series 2019-R04,
|
|
|
|
|
Class 2B1, 5.38% (1 Month USD LIBOR +
|
|
|
|
|
525 bps), 6/25/39 (144A)
|
2,239,885
|
|
2,700,000(b)
|
|
Eagle Re, Ltd., Series 2019-1, Class B1, 4.63% (1 Month
|
|
|
|
|
USD LIBOR + 450 bps), 4/25/29 (144A)
|
2,686,758
|
|
4,430,000(b)
|
|
Eagle Re, Ltd., Series 2020-2, Class B1, 7.13% (1 Month
|
|
|
|
|
USD LIBOR + 700 bps), 10/25/30 (144A)
|
4,445,743
|
|
2,670,000(b)
|
|
Eagle Re, Ltd., Series 2020-2, Class M2, 5.73% (1 Month
|
|
|
|
|
USD LIBOR + 560 bps), 10/25/30 (144A)
|
2,780,979
|
|
3,155,000(b)
|
|
Freddie Mac Stacr Remic Trust, Series 2019-HQA4,
|
|
|
|
|
Class B1, 3.08% (1 Month USD LIBOR +
|
|
|
|
|
295 bps), 11/25/49 (144A)
|
3,156,972
|
|
1,460,000(b)
|
|
Freddie Mac Stacr Remic Trust, Series 2020-DNA3,
|
|
|
|
|
Class B1, 5.23% (1 Month USD LIBOR +
|
|
|
|
|
510 bps), 6/25/50 (144A)
|
1,528,432
|
|
1,100,000(b)
|
|
Freddie Mac Stacr Remic Trust, Series 2020-DNA3,
|
|
|
|
|
Class B2, 9.48% (1 Month USD LIBOR +
|
|
|
|
|
935 bps), 6/25/50 (144A)
|
1,292,188
|
|
1,340,000(b)
|
|
Freddie Mac Stacr Remic Trust, Series 2020-DNA5,
|
|
|
|
|
Class B1, 4.882% (SOFR30A +
|
|
|
|
|
480 bps), 10/25/50 (144A)
|
1,399,070
|
|
4,200,000(b)
|
|
Freddie Mac Stacr Remic Trust, Series 2020-DNA5,
|
|
|
|
|
Class B2, 11.582% (SOFR30A +
|
|
|
|
|
1,150 bps), 10/25/50 (144A)
|
5,176,962
|
|
850,000(b)
|
|
Freddie Mac Stacr Remic Trust, Series 2020-DNA6,
|
|
|
|
|
Class B1, 3.082% (SOFR30A +
|
|
|
|
|
300 bps), 12/25/50 (144A)
|
859,557
|
|
1,000,000(b)
|
|
Freddie Mac Stacr Remic Trust, Series 2020-DNA6,
|
|
|
|
|
Class B2, 5.732% (SOFR30A +
|
|
|
|
|
565 bps), 12/25/50 (144A)
|
1,040,029
|
|
2,500,000(b)
|
|
Freddie Mac Stacr Remic Trust, Series 2020-HQA4,
|
|
|
|
|
Class B1, 5.38% (1 Month USD LIBOR +
|
|
|
|
|
525 bps), 9/25/50 (144A)
|
2,625,119
|
|
2,710,000(b)
|
|
Freddie Mac Stacr Remic Trust, Series 2021-DNA1,
|
|
|
|
|
Class B2, 4.829% (SOFR30A +
|
|
|
|
|
475 bps), 1/25/51 (144A)
|
2,730,020
|
|
2,700,000(b)
|
|
Freddie Mac Stacr Trust, Series 2019-DNA1, Class B2,
|
|
|
|
|
10.88% (1 Month USD LIBOR +
|
|
|
|
|
1,075 bps), 1/25/49 (144A)
|
3,134,154
|
The accompanying notes are an integral part of these financial statements.
Pioneer Multi-Asset Income Fund | Semiannual Report | 1/31/21 27
Schedule of Investments | 1/31/21
(unaudited) (continued)
| |
|
|
|
|
Principal
|
|
|
|
|
Amount
|
|
|
|
|
USD ($)
|
|
|
Value
|
|
|
|
COLLATERALIZED MORTGAGE
|
|
|
|
|
OBLIGATIONS — (continued)
|
|
|
2,790,000(b)
|
|
Freddie Mac Stacr Trust, Series 2019-DNA2, Class B2,
|
|
|
|
|
10.63% (1 Month USD LIBOR +
|
|
|
|
|
1,050 bps), 3/25/49 (144A)
|
$ 3,111,271
|
|
1,000,000(b)
|
|
Freddie Mac Stacr Trust, Series 2019-HQA1, Class B2,
|
|
|
|
|
12.38% (1 Month USD LIBOR +
|
|
|
|
|
1,225 bps), 2/25/49 (144A)
|
1,164,847
|
|
1,000,000(b)
|
|
Freddie Mac Stacr Trust, Series 2019-HQA2, Class B2,
|
|
|
|
|
11.38% (1 Month USD LIBOR +
|
|
|
|
|
1,125 bps), 4/25/49 (144A)
|
1,124,767
|
|
1,905,841(b)
|
|
Freddie Mac Structured Agency Credit Risk Debt Notes,
|
|
|
|
|
Series 2015-HQ1, Class B, 10.88% (1 Month USD LIBOR
|
|
|
|
|
+ 1,075 bps), 3/25/25
|
2,049,233
|
|
1,900,000(b)
|
|
Freddie Mac Structured Agency Credit Risk Debt Notes,
|
|
|
|
|
Series 2020-HQA5, Class B2, 7.482% (SOFR30A +
|
|
|
|
|
740 bps), 11/25/50 (144A)
|
2,085,358
|
|
19,084
|
|
Global Mortgage Securitization, Ltd., Series 2004-A,
|
|
|
|
|
Class B1, 5.25%, 11/25/32 (144A)
|
11,866
|
|
176,418
|
|
Global Mortgage Securitization, Ltd., Series 2004-A,
|
|
|
|
|
Class B2, 5.25%, 11/25/32 (144A)
|
4,685
|
|
430,000(b)
|
|
Home Re, Ltd., Series 2020-1, Class B1, 7.13% (1 Month
|
|
|
|
|
USD LIBOR + 700 bps), 10/25/30 (144A)
|
443,413
|
|
1,690,000(b)
|
|
Home Re, Ltd., Series 2020-1, Class M2, 5.38% (1 Month
|
|
|
|
|
USD LIBOR + 525 bps), 10/25/30 (144A)
|
1,748,210
|
|
1,550,000(b)
|
|
Oaktown Re V, Ltd., Series 2020-2A, Class M2, 5.38% (1
|
|
|
|
|
Month USD LIBOR + 525 bps), 10/25/30 (144A)
|
1,574,632
|
|
400,000(b)
|
|
Traingle Re, Ltd., Series 2020-1, Class B1, 7.88% (1
|
|
|
|
|
Month USD LIBOR + 775 bps), 10/25/30 (144A)
|
413,146
|
|
1,360,000(b)
|
|
Traingle Re, Ltd., Series 2020-1, Class M2, 5.73% (1
|
|
|
|
|
Month USD LIBOR + 560 bps), 10/25/30 (144A)
|
1,404,777
|
|
310,000(c)
|
|
Verus Securitization Trust, Series 2020-INV1, Class B1,
|
|
|
|
|
5.75%, 3/25/60 (144A)
|
323,154
|
|
430,000(c)
|
|
Verus Securitization Trust, Series 2020-INV1, Class B2,
|
|
|
|
|
6.0%, 3/25/60 (144A)
|
437,634
|
|
|
|
TOTAL COLLATERALIZED MORTGAGE OBLIGATIONS
|
|
|
|
|
(Cost $57,985,761)
|
$ 61,249,295
|
|
|
|
COMMERCIAL MORTGAGE-BACKED SECURITIES —
|
|
|
|
|
0.3% of Net Assets
|
|
|
275,000(b)
|
|
Freddie Mac Multifamily Structured Credit Risk, Series
|
|
|
|
|
2021-MN1, Class B1, 7.836% (SOFR30A +
|
|
|
|
|
775 bps), 1/25/51 (144A)
|
$ 303,949
|
|
2,500,000(b)
|
|
Multifamily Connecticut Avenue Securities Trust, Series
|
|
|
|
|
2020-01, Class M10, 3.88% (1 Month USD LIBOR
|
|
|
|
|
+ 375 bps), 3/25/50 (144A)
|
2,608,590
|
|
417,825(c)
|
|
Sutherland Commercial Mortgage Loans, Series 2017-SBC6,
|
|
|
|
|
Class A, 3.192%, 5/25/37 (144A)
|
415,651
|
|
|
|
TOTAL COMMERCIAL MORTGAGE-BACKED SECURITIES
|
|
|
|
|
(Cost $2,722,411)
|
$ 3,328,190
|
The accompanying notes are an integral part of these financial statements.
28 Pioneer Multi-Asset Income Fund | Semiannual Report | 1/31/21
| |
|
|
|
|
Principal
|
|
|
|
|
Amount
|
|
|
|
|
USD ($)
|
|
|
Value
|
|
|
|
CORPORATE BONDS — 13.6% of Net Assets
|
|
|
|
|
Advertising — 0.3%
|
|
|
3,444,000(d)
|
|
MDC Partners, Inc., 7.5%, 5/1/24 (144A)
|
$ 3,512,880
|
|
|
|
Total Advertising
|
$ 3,512,880
|
|
|
|
Airlines — 0.2%
|
|
|
840,000
|
|
British Airways 2020-1 Class B Pass Through Trust,
|
|
|
|
|
8.375%, 11/15/28 (144A)
|
$ 959,505
|
|
1,720,000
|
|
Mileage Plus Holdings LLC/Mileage Plus Intellectual
|
|
|
|
|
Property Assets, Ltd., 6.5%, 6/20/27 (144A)
|
1,881,250
|
|
|
|
Total Airlines
|
$ 2,840,755
|
|
|
|
Auto Parts & Equipment — 0.3%
|
|
|
2,617,000
|
|
American Axle & Manufacturing, Inc., 6.25%, 3/15/26
|
$ 2,675,882
|
|
1,773,000
|
|
Dealer Tire LLC/DT Issuer LLC, 8.0%, 2/1/28 (144A)
|
1,883,813
|
|
|
|
Total Auto Parts & Equipment
|
$ 4,559,695
|
|
|
|
Banks — 2.3%
|
|
|
2,324,000
|
|
Freedom Mortgage Corp., 8.25%, 4/15/25 (144A)
|
$ 2,428,580
|
|
8,650,000(c)(e)
|
|
ING Groep NV, 6.5% (5 Year USD Swap Rate + 445 bps)
|
9,526,677
|
|
5,857,000(c)(e)
|
|
Lloyds Banking Group Plc, 7.5% (5 Year USD Swap
|
|
|
|
|
Rate + 450 bps)
|
6,679,616
|
|
8,125,000(c)(e)
|
|
Natwest Group Plc, 8.0% (5 Year USD Swap Rate + 572 bps)
|
9,538,750
|
|
2,920,000
|
|
Provident Funding Associates LP/PFG Finance Corp.,
|
|
|
|
|
6.375%, 6/15/25 (144A)
|
2,978,400
|
|
|
|
Total Banks
|
$ 31,152,023
|
|
|
|
Coal — 0.3%
|
|
|
4,190,000
|
|
SunCoke Energy Partners LP/SunCoke Energy
|
|
|
|
|
Partners Finance Corp., 7.5%, 6/15/25 (144A)
|
$ 4,284,275
|
|
|
|
Total Coal
|
$ 4,284,275
|
|
|
|
Commercial Services — 0.2%
|
|
|
2,255,000
|
|
Allied Universal Holdco LLC/Allied Universal Finance
|
|
|
|
|
Corp., 9.75%, 7/15/27 (144A)
|
$ 2,457,950
|
|
|
|
Total Commercial Services
|
$ 2,457,950
|
|
|
|
Diversified Financial Services — 0.2%
|
|
|
56,500
|
|
Citigroup Global Markets Holdings, Inc., 19.24%, 7/28/21
|
$ 3,335,195
|
|
|
|
Total Diversified Financial Services
|
$ 3,335,195
|
|
|
|
Engineering & Construction — 0.3%
|
|
|
3,155,000
|
|
PowerTeam Services LLC, 9.033%, 12/4/25 (144A)
|
$ 3,494,163
|
|
|
|
Total Engineering & Construction
|
$ 3,494,163
|
|
|
|
Entertainment — 0.5%
|
|
|
2,342,000
|
|
Enterprise Development Authority, 12.0%, 7/15/24 (144A)
|
$ 2,634,750
|
|
4,396,000
|
|
Scientific Games International, Inc., 8.25%, 3/15/26 (144A)
|
4,648,264
|
|
|
|
Total Entertainment
|
$ 7,283,014
|
The accompanying notes are an integral part of these financial statements.
Pioneer Multi-Asset Income Fund | Semiannual Report | 1/31/21 29
Schedule of Investments | 1/31/21
(unaudited) (continued)
| |
|
|
|
|
Principal
|
|
|
|
|
Amount
|
|
|
|
|
USD ($)
|
|
|
Value
|
|
|
|
Food — 0.3%
|
|
|
3,443,000
|
|
FAGE International SA/FAGE USA Dairy Industry, Inc.,
|
|
|
|
|
5.625%, 8/15/26 (144A)
|
$ 3,537,682
|
|
|
|
Total Food
|
$ 3,537,682
|
|
|
|
Forest Products & Paper — 0.3%
|
|
|
4,236,000
|
|
Schweitzer-Mauduit International, Inc., 6.875%,
|
|
|
|
|
10/1/26 (144A)
|
$ 4,491,770
|
|
|
|
Total Forest Products & Paper
|
$ 4,491,770
|
|
|
|
Healthcare-Services — 0.4%
|
|
|
4,350,000
|
|
Surgery Center Holdings, Inc., 10.0%, 4/15/27 (144A)
|
$ 4,806,750
|
|
|
|
Total Healthcare-Services
|
$ 4,806,750
|
|
|
|
Holding Companies-Diversified — 0.2%
|
|
|
2,710,000
|
|
VistaJet Malta Finance Plc/XO Management Holding, Inc.,
|
|
|
|
|
10.5%, 6/1/24 (144A)
|
$ 2,770,975
|
|
|
|
Total Holding Companies-Diversified
|
$ 2,770,975
|
|
|
|
Home Builders — 0.5%
|
|
|
3,921,000
|
|
Beazer Homes USA, Inc., 5.875%, 10/15/27
|
$ 4,141,556
|
|
245,000
|
|
Beazer Homes USA, Inc., 7.25%, 10/15/29
|
275,013
|
|
2,768,000
|
|
M/I Homes, Inc., 4.95%, 2/1/28
|
2,915,396
|
|
|
|
Total Home Builders
|
$ 7,331,965
|
|
|
|
Media — 0.3%
|
|
|
2,183,000
|
|
Clear Channel Worldwide Holdings, Inc., 9.25%, 2/15/24
|
$ 2,268,279
|
|
1,783,000
|
|
Diamond Sports Group LLC/Diamond Sports Finance Co.,
|
|
|
|
|
6.625%, 8/15/27 (144A)
|
1,132,205
|
|
|
|
Total Media
|
$ 3,400,484
|
|
|
|
Mining — 0.2%
|
|
|
1,908,000
|
|
First Quantum Minerals, Ltd., 6.875%, 3/1/26 (144A)
|
$ 1,986,705
|
|
1,315,000
|
|
First Quantum Minerals, Ltd., 7.5%, 4/1/25 (144A)
|
1,359,421
|
|
|
|
Total Mining
|
$ 3,346,126
|
|
|
|
Miscellaneous Manufacturer — 0.0%†
|
|
|
226,000
|
|
Koppers, Inc., 6.0%, 2/15/25 (144A)
|
$ 232,215
|
|
|
|
Total Miscellaneous Manufacturer
|
$ 232,215
|
|
|
|
Oil & Gas — 0.2%
|
|
|
3,932,000
|
|
PBF Holding Co. LLC/PBF Finance Corp., 6.0%, 2/15/28
|
$ 2,281,445
|
|
ARS22,000,000
|
|
YPF SA, 16.5%, 5/9/22 (144A)
|
176,383
|
|
|
|
Total Oil & Gas
|
$ 2,457,828
|
|
|
|
Pipelines — 0.7%
|
|
|
3,619,000
|
|
American Midstream Partners LP/American Midstream
|
|
|
|
|
Finance Corp., 9.5%, 12/15/21 (144A)
|
$ 3,604,524
|
|
2,200,000
|
|
Delek Logistics Partners LP/Delek Logistics Finance Corp.,
|
|
|
|
|
6.75%, 5/15/25
|
2,167,000
|
The accompanying notes are an integral part of these financial statements.
30 Pioneer Multi-Asset Income Fund | Semiannual Report | 1/31/21
| |
|
|
|
|
Principal
|
|
|
|
|
Amount
|
|
|
|
|
USD ($)
|
|
|
Value
|
|
|
|
Pipelines — (continued)
|
|
|
1,669,000(c)(e)
|
|
Energy Transfer Operating LP, 6.25% (3 Month USD
|
|
|
|
|
LIBOR + 403 bps)
|
$ 1,359,534
|
|
3,328,000
|
|
EnLink Midstream Partners LP, 5.6%, 4/1/44
|
2,670,720
|
|
|
|
Total Pipelines
|
$ 9,801,778
|
|
|
|
Retail — 0.2%
|
|
|
3,180,000
|
|
AAG FH LP/AAG FH Finco, Inc., 9.75%, 7/15/24 (144A)
|
$ 3,021,000
|
|
|
|
Total Retail
|
$ 3,021,000
|
|
|
|
Telecommunications — 5.7%
|
|
|
30,784,000
|
|
Lumen Technologies, Inc., 7.6%, 9/15/39
|
$ 38,052,102
|
|
31,613,000
|
|
Lumen Technologies, Inc., 7.65%, 3/15/42
|
39,143,217
|
|
|
|
Total Telecommunications
|
$ 77,195,319
|
|
|
|
TOTAL CORPORATE BONDS
|
|
|
|
|
(Cost $156,231,282)
|
$ 185,313,842
|
|
|
|
FOREIGN GOVERNMENT BONDS — 3.2%
|
|
|
|
|
of Net Assets
|
|
|
|
|
Indonesia — 3.2%
|
|
|
IDR188,453,000,000
|
|
Indonesia Treasury Bond, 8.375%, 3/15/24
|
$ 14,655,948
|
|
IDR176,212,000,000
|
|
Indonesia Treasury Bond, 8.75%, 5/15/31
|
14,594,322
|
|
IDR174,584,000,000
|
|
Indonesia Treasury Bond, 9.0%, 3/15/29
|
14,520,586
|
|
|
|
Total Indonesia
|
$ 43,770,856
|
|
|
|
TOTAL FOREIGN GOVERNMENT BONDS
|
|
|
|
|
(Cost $38,642,121)
|
$ 43,770,856
|
|
|
|
INSURANCE-LINKED SECURITIES — 2.3%
|
|
|
|
|
of Net Assets#
|
|
|
|
|
Event Linked Bonds — 0.8%
|
|
|
|
|
Earthquakes – U.S. — 0.0%†
|
|
|
400,000(b)
|
|
Acorn Re 2018-1, 2.773% (3 Month USD LIBOR +
|
|
|
|
|
275 bps), 11/10/21 (144A)
|
$ 401,760
|
|
|
|
Multiperil – U.S. — 0.4%
|
|
|
700,000(b)
|
|
Bonanza Re, 4.801% (3 Month U.S. Treasury Bill +
|
|
|
|
|
475 bps), 2/20/24 (144A)
|
$ 704,200
|
|
1,250,000(b)
|
|
Easton Re Pte, 4.0% (3 Month U.S. Treasury Bill +
|
|
|
|
|
400 bps), 1/8/24 (144A)
|
1,249,750
|
|
500,000(b)
|
|
Four Lakes Re, 7.051% (3 Month U.S. Treasury Bill +
|
|
|
|
|
700 bps), 1/5/24 (144A)
|
500,000
|
|
500,000(b)
|
|
Four Lakes Re, 9.551% (3 Month U.S. Treasury Bill +
|
|
|
|
|
950 bps), 1/5/24 (144A)
|
499,400
|
|
500,000(b)
|
|
Herbie Re, 9.0% (3 Month U.S. Treasury Bill +
|
|
|
|
|
900 bps), 1/8/25 (144A)
|
509,100
|
|
500,000(b)
|
|
Residential Reinsurance 2020, 6.298% (3 Month U.S.
|
|
|
|
|
Treasury Bill + 625 bps), 12/6/24 (144A)
|
504,500
|
The accompanying notes are an integral part of these financial statements.
Pioneer Multi-Asset Income Fund | Semiannual Report | 1/31/21 31
Schedule of Investments | 1/31/21
(unaudited) (continued)
| |
|
|
|
|
Principal
|
|
|
|
|
Amount
|
|
|
|
|
USD ($)
|
|
|
Value
|
|
|
|
Multiperil – U.S. — (continued)
|
|
|
1,250,000(b)
|
|
Sussex Re 2020-1, 7.798% (3 Month U.S. Treasury Bill +
|
|
|
|
|
775 bps), 1/8/25 (144A)
|
$ 1,250,000
|
|
|
|
|
$ 5,216,950
|
|
|
|
Multiperil – U.S. & Canada — 0.0%†
|
|
|
500,000(b)
|
|
Mystic Re IV, 0.5% (3 Month U.S. Treasury Bill +
|
|
|
|
|
900 bps), 1/8/24 (144A)
|
$ 500,400
|
|
|
|
Multiperil – U.S. Regional — 0.1%
|
|
|
750,000(b)
|
|
Long Point Re III 2018, 2.798% (3 Month U.S. Treasury Bill +
|
|
|
|
|
275 bps), 6/1/22 (144A)
|
$ 751,125
|
|
|
|
Multiperil – Worldwide — 0.1%
|
|
|
1,000,000(b)
|
|
Northshore Re II, 5.75% (3 Month U.S. Treasury Bill +
|
|
|
|
|
575 bps), 1/8/24 (144A)
|
$ 1,000,500
|
|
|
|
Pandemic – U.S. — 0.0%†
|
|
|
250,000(b)
|
|
Vitality Re XI, 1.848% (3 Month U.S. Treasury Bill +
|
|
|
|
|
180 bps), 1/9/24 (144A)
|
$ 238,000
|
|
|
|
Windstorm – U.S. — 0.0%†
|
|
|
500,000(b)
|
|
Bonanza Re, 4.801% (3 Month U.S. Treasury Bill +
|
|
|
|
|
475 bps), 12/23/24 (144A)
|
$ 500,300
|
|
|
|
Windstorm – U.S. Regional — 0.2%
|
|
|
500,000(b)
|
|
Matterhorn Re, 4.44% (3 Month USD LIBOR +
|
|
|
|
|
425 bps), 12/7/22 (144A)
|
$ 500,200
|
|
1,500,000(b)
|
|
Matterhorn Re, 5.69% (3 Month USD LIBOR +
|
|
|
|
|
550 bps), 12/7/22 (144A)
|
1,500,300
|
|
|
|
|
$ 2,000,500
|
|
|
|
Total Event Linked Bonds
|
$ 10,609,535
|
|
|
|
Face
|
|
|
|
|
Amount
|
|
|
|
|
USD ($)
|
|
|
|
|
|
|
Collateralized Reinsurance — 0.3%
|
|
|
|
|
Multiperil – U.S. — 0.3%
|
|
|
1,800,000+(a)(f)
|
|
Ballybunion Re, 2/28/22
|
$ 1,881,100
|
|
1,500,000+(f)
|
|
Ballybunion Re 2020-3, 7/31/24
|
1,500,000
|
|
300,000+(f)
|
|
Dingle Re 2019, 2/1/22
|
6,158
|
|
250,000+(a)(f)
|
|
Dingle Re 2020, 12/31/21
|
258,623
|
|
|
|
|
$ 3,645,881
|
|
|
|
Multiperil – Worldwide — 0.0%†
|
|
|
700,000+(a)(f)
|
|
Cypress Re 2017, 1/10/22
|
$ 70
|
|
500,000+(a)(f)
|
|
Limestone Re, 3/1/24 (144A)
|
207,350
|
|
12,000+(f)
|
|
Limestone Re 2016-1, 8/31/21
|
600
|
|
12,000+(f)
|
|
Limestone Re 2016-1, 8/31/21
|
600
|
|
250,000+(a)(f)
|
|
Merion Re 2021-1, 12/31/24
|
218,963
|
The accompanying notes are an integral part of these financial statements.
32 Pioneer Multi-Asset Income Fund | Semiannual Report | 1/31/21
| |
|
|
|
|
Face
|
|
|
|
|
Amount
|
|
|
|
|
USD ($)
|
|
|
Value
|
|
|
|
Multiperil – Worldwide — (continued)
|
|
|
250,000+(a)(f)
|
|
Old Head Re 2021, 12/31/24
|
$ 194,699
|
|
700,000+(a)(f)
|
|
Resilience Re, 5/1/21
|
70
|
|
300,000+(a)(f)
|
|
Walton Health Re 2019, 6/30/21
|
252,102
|
|
|
|
|
$ 874,454
|
|
|
|
Windstorm – U.S. Regional — 0.0%†
|
|
|
250,000+(a)(f)
|
|
Oakmont Re 2017, 4/30/21
|
$ 7,350
|
|
|
|
Total Collateralized Reinsurance
|
$ 4,527,685
|
|
|
|
Reinsurance Sidecars — 1.2%
|
|
|
|
|
Multiperil – U.S. — 0.1%
|
|
|
1,500,000+(a)(f)
|
|
Carnoustie Re 2017, 11/30/21
|
$ 197,700
|
|
500,000+(a)(f)
|
|
Carnoustie Re 2021, 12/31/24
|
503,748
|
|
1,500,000+(g)
|
|
Harambee Re 2019, 12/31/22
|
13,800
|
|
|
|
|
$ 715,248
|
|
|
|
Multiperil – Worldwide — 1.1%
|
|
|
2,400+(f)
|
|
Alturas Re 2019-1, 3/10/23 (144A)
|
$ 19,795
|
|
12,149+(g)
|
|
Alturas Re 2019-2, 3/10/22
|
56,415
|
|
500,000+(g)
|
|
Alturas Re 2020-2, 3/10/23
|
535,250
|
|
750,000+(f)
|
|
Bantry Re 2019, 12/31/22
|
25,473
|
|
750,000+(a)(f)
|
|
Bantry Re 2021, 12/31/24
|
756,375
|
|
900,000+(a)(f)
|
|
Berwick Re 2017-1, 2/1/22
|
29,790
|
|
46,259+(a)(f)
|
|
Berwick Re 2018-1, 12/31/21
|
5,630
|
|
1,391,977+(a)(f)
|
|
Berwick Re 2019-1, 12/31/22
|
166,341
|
|
1,500,000+(a)(f)
|
|
Berwick Re 2021-1, 12/31/24
|
1,506,750
|
|
15,000+(f)
|
|
Eden Re II, 3/22/23 (144A)
|
56,030
|
|
100,000+(a)(f)
|
|
Eden Re II 2020, 3/22/24 (144A)
|
226,800
|
|
600,000+(a)
|
|
Eden Re II, 3/21/25 (144A)
|
600,000
|
|
900,000+(a)
|
|
Eden Re II, Series B, 12/31/24
|
900,000
|
|
750,000+(f)
|
|
Gleneagles Re 2019, 12/31/22
|
16,760
|
|
500,000+(a)(f)
|
|
Gleneagles Re 2021, 12/31/24
|
501,250
|
|
638,678+(a)
|
|
Gullane Re 2021, 12/31/24
|
638,678
|
|
26,000+(f)
|
|
Limestone Re 2019-A, 9/9/22 (144A)
|
—
|
|
19,000+(f)
|
|
Limestone Re 2019-B, 9/9/22 (144A)
|
—
|
|
250,000+(a)(g)
|
|
Lion Rock Re 2021, 12/31/24
|
255,025
|
|
2,000,000+(a)(f)
|
|
Merion Re 2021-2, 12/31/24
|
2,019,569
|
|
1,250,000+(g)
|
|
NCM Re 2019, 12/31/22
|
147,125
|
|
1,250,000+(a)(f)
|
|
Pangaea Re 2019-1, 2/1/23
|
26,047
|
|
750,000+(f)
|
|
Pangaea Re 2020-1, 2/1/24
|
86,475
|
|
1,500,000+(a)(f)
|
|
Pangaea Re 2020-1, 12/31/24
|
1,503,750
|
|
300,000+(a)(f)
|
|
Sector Re V, 3/1/25 (144A)
|
363,362
|
|
500,000+(a)(f)
|
|
Sector Re V, 12/1/25 (144A)
|
509,275
|
|
900,000+(a)(f)
|
|
Sector Re V, 12/1/25 (144A)
|
916,696
|
The accompanying notes are an integral part of these financial statements.
Pioneer Multi-Asset Income Fund | Semiannual Report | 1/31/21 33
Schedule of Investments | 1/31/21
(unaudited) (continued)
| |
|
|
|
|
Face
|
|
|
|
|
Amount
|
|
|
|
|
USD ($)
|
|
|
Value
|
|
|
|
Multiperil – Worldwide — (continued)
|
|
|
200,000+(a)(f)
|
|
Sector Re V, Series 9, Class A, 3/1/24 (144A)
|
$ 85,861
|
|
100,000+(a)(f)
|
|
Sector Re V, Series 9, Class C, 12/1/24 (144A)
|
250,813
|
|
1,000,000+(a)(f)
|
|
St. Andrews Re 2017-1, 2/1/22
|
67,800
|
|
608,294+(a)(f)
|
|
St. Andrews Re 2017-4, 6/1/21
|
59,856
|
|
1,500,000+(a)(g)
|
|
Thopas Re 2019, 12/31/22
|
59,250
|
|
1,000,000+(g)
|
|
Thopas Re 2020, 12/31/23
|
7,300
|
|
1,500,000+(a)(g)
|
|
Thopas Re 2021, 12/31/24
|
1,508,700
|
|
1,500,000+(a)(f)
|
|
Versutus Re 2017, 11/30/21
|
20,850
|
|
1,600,000+(f)
|
|
Versutus Re 2019-B, 12/31/21
|
64,320
|
|
1,500,000+(g)
|
|
Viribus Re 2019, 12/31/22
|
61,500
|
|
1,000,000+(a)(g)
|
|
Viribus Re 2020, 12/31/23
|
910,600
|
|
600,000+(a)(f)
|
|
Woburn Re 2019, 12/31/22
|
202,025
|
|
|
|
|
$ 15,167,536
|
|
|
|
Total Reinsurance Sidecars
|
$ 15,882,784
|
|
|
|
TOTAL INSURANCE-LINKED SECURITIES
|
|
|
|
|
(Cost $29,408,799)
|
$ 31,020,004
|
|
|
|
Shares
|
|
|
|
|
|
|
EQUITY LINKED NOTES — 14.1% of Net Assets
|
|
|
|
|
Aerospace & Defense — 0.5%
|
|
|
189,500
|
|
Merrill Lynch International & Co. CV (Spirit AeroSystems
|
|
|
|
|
Holdings, Inc.), 20.36%, 12/27/21
|
$ 6,719,670
|
|
|
|
Total Aerospace & Defense
|
$ 6,719,670
|
|
|
|
Banks — 0.7%
|
|
|
118,700(a)
|
|
Credit Suisse AG (Citigroup, Inc.), 12/13/21
|
$ 6,812,015
|
|
417,400
|
|
Goldman Sachs International (New Residential Investment
|
|
|
|
|
Corp.), 27.54%, 5/24/21
|
2,665,516
|
|
|
|
Total Banks
|
$ 9,477,531
|
|
|
|
Biotechnology — 0.2%
|
|
|
4,400
|
|
Royal Bank of Canada (Regeneron Pharmaceuticals, Inc.),
|
|
|
|
|
12.47%, 5/25/21 (144A)
|
$ 2,293,830
|
|
|
|
Total Biotechnology
|
$ 2,293,830
|
|
|
|
Electric Utilities — 0.2%
|
|
|
113,000
|
|
Merrill Lynch International & Co. CV (First Energy Corp.),
|
|
|
|
|
11.67%, 12/21/21
|
$ 3,408,080
|
|
|
|
Total Electric Utilities
|
$ 3,408,080
|
|
|
|
Food — 0.1%
|
|
|
45,300
|
|
Goldman Sachs International (Sysco Corp.),
|
|
|
|
|
21.78%, 3/29/21
|
$ 1,497,074
|
|
|
|
Total Food
|
$ 1,497,074
|
The accompanying notes are an integral part of these financial statements.
34 Pioneer Multi-Asset Income Fund | Semiannual Report | 1/31/21
| |
|
|
|
|
Shares
|
|
|
Value
|
|
|
|
Food & Staples Retailing — 0.3%
|
|
|
85,350
|
|
Credit Suisse AG London (Walgreens Boots
|
|
|
|
|
Alliance, Inc.), 9.28%, 3/8/21
|
$ 4,155,606
|
|
|
|
Total Food & Staples Retailing
|
$ 4,155,606
|
|
|
|
Healthcare-Services — 0.3%
|
|
|
66,000
|
|
Toronto-Dominion Bank (Centene Corp.), 9.25%, 1/14/22
|
$ 3,975,873
|
|
|
|
Total Healthcare-Services
|
$ 3,975,873
|
|
|
|
Hotels, Restaurants & Leisure — 0.8%
|
|
|
86,400
|
|
Credit Suisse AG London (Darden Restaurants, Inc.),
|
|
|
|
|
34.0%, 3/26/21
|
$ 3,611,261
|
|
98,500
|
|
Morgan Stanley Finance LLC (Darden Restaurants, Inc.),
|
|
|
|
|
5/3/21 (144A)
|
7,296,560
|
|
|
|
Total Hotels, Restaurants & Leisure
|
$ 10,907,821
|
|
|
|
Insurance — 0.6%
|
|
|
146,000
|
|
BNP Paribas Issuance B.V. (Hartford Financial Services
|
|
|
|
|
Group), 11.59%, 11/23/21 (144A)
|
$ 6,945,950
|
|
18,500
|
|
Goldman Sachs International (The Progressive Corp.),
|
|
|
|
|
15.28%, 3/29/21
|
1,417,803
|
|
|
|
Total Insurance
|
$ 8,363,753
|
|
|
|
Interactive Media & Services — 1.5%
|
|
|
4,400
|
|
Merrill Lynch International & Co. CV (Alphabet, Inc.),
|
|
|
|
|
0.085%, 10/12/21
|
$ 7,027,768
|
|
39,000
|
|
Merrill Lynch International & Co. CV (Facebook, Inc.),
|
|
|
|
|
7.51%, 2/12/21
|
8,951,943
|
|
26,511
|
|
Royal Bank of Canada (Facebook, Inc.), 10.22%,
|
|
|
|
|
3/23/21 (144A)
|
4,999,550
|
|
|
|
Total Interactive Media & Services
|
$ 20,979,261
|
|
|
|
Internet & Direct Marketing Retail — 2.6%
|
|
|
720
|
|
Citigroup Global Markets Holdings, Inc. (Amazon.com,
|
|
|
|
|
Inc.), 12.35%, 3/29/21 (144A)
|
$ 1,405,198
|
|
94,800
|
|
Citigroup Global Markets Holdings, Inc. (eBay, Inc.),
|
|
|
|
|
10.62%, 10/28/21 (144A)
|
5,131,524
|
|
4,110
|
|
JP Morgan Structured Products (Amazon.com, Inc.),
|
|
|
|
|
7.97%, 3/16/21
|
8,766,219
|
|
2,436
|
|
Merrill Lynch International & Co. CV (Amazon.com, Inc.),
|
|
|
|
|
6.84%, 2/11/21 (144A)
|
5,440,647
|
|
139,400
|
|
Morgan Stanley Finance LLC (eBay, Inc.), 6/24/21
|
7,091,975
|
|
3,200
|
|
Wells Fargo Bank National Association (Amazon.com, Inc.),
|
|
|
|
|
6.71%, 2/23/21
|
7,378,246
|
|
|
|
Total Internet & Direct Marketing Retail
|
$ 35,213,809
|
|
|
|
IT Services — 1.5%
|
|
|
32,100
|
|
Royal Bank of Canada (Advanced Micro Devices, Inc.),
|
|
|
|
|
22.92%, 3/29/21 (144A)
|
$ 1,330,577
|
The accompanying notes are an integral part of these financial statements.
Pioneer Multi-Asset Income Fund | Semiannual Report | 1/31/21 35
Schedule of Investments | 1/31/21
(unaudited) (continued)
| |
|
|
|
|
Shares
|
|
|
Value
|
|
|
|
IT Services — (continued)
|
|
|
204,000
|
|
Wells Fargo Bank National Association (Cognizant
|
|
|
|
|
Technology Solutions Corp.), 9.7%, 3/19/21
|
$ 12,081,696
|
|
194,000
|
|
Wells Fargo Bank National Association (OneMain
|
|
|
|
|
Holdings, Inc.), 24.74%, 3/19/21
|
7,037,932
|
|
|
|
Total IT Services
|
$ 20,450,205
|
|
|
|
Mining — 0.7%
|
|
|
160,300
|
|
UBS AG (Newmont Corp.), 15.05%, 4/22/21 (144A)
|
$ 9,432,052
|
|
|
|
Total Mining
|
$ 9,432,052
|
|
|
|
Oil, Gas & Consumable Fuels — 0.8%
|
|
|
69,200
|
|
BNP Paribas Issuance (Marathon Petroleum Corp.),
|
|
|
|
|
18.85%, 8/12/21
|
$ 2,851,386
|
|
24,800
|
|
BNP Paribas Issuance BV (CW Corp. of Delaware), 8.92%,
|
|
|
|
|
11/30/21 (144A)
|
3,329,896
|
|
119,700
|
|
JP Morgan Structured Products BV (Marathon Petroleum
|
|
|
|
|
Corp.), 18.4%, 11/10/21
|
4,244,080
|
|
|
|
Total Oil, Gas & Consumable Fuels
|
$ 10,425,362
|
|
|
|
Semiconductors & Semiconductor Equipment — 2.5%
|
|
|
54,700
|
|
BNP Paribas Issuance BV (Micron Technology, Inc.),
|
|
|
|
|
12.58%, 11/23/21 (144A)
|
$ 3,632,080
|
|
222,900
|
|
Citigroup Global Market (Walgreens Boots Alliance, Inc.),
|
|
|
|
|
15.95%, 3/23/21 (144A)
|
10,224,423
|
|
80,300(a)
|
|
Goldman Sachs International (Micron Technology, Inc.),
|
|
|
|
|
13.35%, 10/19/21
|
4,422,763
|
|
47,400
|
|
JP Morgan Structured Products BV (QUALCOMM, Inc.),
|
|
|
|
|
11.5%, 11/17/21
|
6,862,487
|
|
75,500
|
|
Royal Bank of Canada (Micron Technology, Inc.), 13.37%,
|
|
|
|
|
10/22/21 (144A)
|
4,333,217
|
|
59,400
|
|
Royal Bank of Canada (Micron Technology, Inc.), 12.78%,
|
|
|
|
|
11/30/21 (144A)
|
3,936,735
|
|
|
|
Total Semiconductors & Semiconductor Equipment
|
$ 33,411,705
|
|
|
|
Software — 0.3%
|
|
|
76,100
|
|
Royal Bank of Canada (Oracle Corp.), 8.43%, 6/29/21
|
$ 4,335,798
|
|
|
|
Total Software
|
$ 4,335,798
|
|
|
|
Trading Companies & Distributors — 0.2%
|
|
|
20,000
|
|
Citigroup Global Markets Holdings, Inc. (United Rentals,
|
|
|
|
|
Inc.), 16.33%, 6/1/21 (144A)
|
$ 2,813,704
|
|
|
|
Total Trading Companies & Distributors
|
$ 2,813,704
|
|
|
|
Transportation — 0.3%
|
|
|
100,300
|
|
UBS AG (Knight-Swift Transportation), 9.85%, 11/23/21
|
$ 3,936,775
|
|
|
|
Total Transportation
|
$ 3,936,775
|
|
|
|
TOTAL EQUITY LINKED NOTES
|
|
|
|
|
(Cost $181,893,009)
|
$ 191,797,909
|
The accompanying notes are an integral part of these financial statements.
36 Pioneer Multi-Asset Income Fund | Semiannual Report | 1/31/21
| |
|
|
|
|
Shares
|
|
|
Value
|
|
|
|
INVESTMENT COMPANY — 0.9% of Net Assets
|
|
|
2,912,398
|
|
Invesco Senior Income Trust
|
$ 12,086,452
|
|
|
|
TOTAL INVESTMENT COMPANY
|
|
|
|
|
(Cost $12,579,011)
|
$ 12,086,452
|
|
|
|
RIGHT/WARRANT — 0.0%† of Net Assets
|
|
|
|
|
Health Care Providers & Services — 0.0%†
|
|
|
959,816(h)
|
|
ANR, Inc., 3/31/23
|
$ 4,511
|
|
|
|
Total Health Care Providers & Services
|
$ 4,511
|
|
|
|
TOTAL RIGHT/WARRANT
|
|
|
|
|
(Cost $—)
|
$ 4,511
|
|
|
|
Number of
|
|
|
Notional
|
Strike
|
Expiration
|
|
|
Contracts
|
Description
|
Counterparty
|
Amount
|
Price
|
Date
|
|
|
|
|
EXCHANGE-TRADED PUT OPTION
|
|
|
|
|
|
|
PURCHASED — 0.0%†
|
|
|
|
|
950
|
Put Option
|
Citigroup Global
|
|
|
|
|
|
on Euro
|
Markets, Ltd.
|
USD 1,026,912
|
USD 1.20
|
3/5/21 |
$ 415,625
|
|
|
|
TOTAL EXCHANGE-TRADED PUT OPTION PURCHASED
|
|
|
|
|
(Premiums paid $1,026,912)
|
|
|
$ 415,625
|
|
|
|
TOTAL OPTIONS PURCHASED
|
|
|
|
|
|
|
(Premiums paid $1,026,912)
|
|
|
$ 415,625
|
|
|
|
TOTAL INVESTMENTS IN UNAFFILIATED ISSUERS — 92.9%
|
|
|
|
|
(Cost $1,179,257,397)
|
|
|
$ 1,261,401,878
|
| |
|
|
|
|
|
|
|
|
|
|
|
Change
|
|
|
|
|
|
|
Net
|
|
|
|
|
|
|
|
Realized
|
Unrealized
|
|
|
|
|
|
Dividend
|
Gain
|
Appreciation
|
|
|
Shares
|
|
|
Income
|
(Loss)
|
(Depreciation)
|
|
|
|
|
AFFILIATED ISSUER — 0.0%†
|
|
|
|
|
CLOSED-END FUND — 0.0%† of Net Assets
|
|
|
|
23,901(i)
|
|
Pioneer Floating
|
|
|
|
|
|
|
Rate Trust
|
$191,027
|
$(52,131) |
$778,742 |
$ 253,829
|
|
|
|
TOTAL CLOSED-END FUND
|
|
|
|
|
|
|
(Cost $253,083)
|
|
|
$ 253,829
|
|
|
TOTAL INVESTMENTS IN AFFILIATED ISSUER — 0.0%†
|
|
|
|
|
(Cost $253,083)
|
|
|
$ 253,829
|
|
|
|
OTHER ASSETS AND LIABILITIES — 7.1%
|
|
$ 96,579,707
|
|
|
|
NET ASSETS — 100.0%
|
$ 1,358,235,414
|
| |
|
|
bps
|
Basis Points.
|
|
LIBOR
|
London Interbank Offered Rate.
|
|
REIT
|
Real Estate Investment Trust.
|
The accompanying notes are an integral part of these financial statements.
Pioneer Multi-Asset Income Fund | Semiannual Report | 1/31/21 37
Schedule of Investments | 1/31/21
(unaudited) (continued)
| |
|
|
(144A)
|
Security is exempt from registration under Rule 144A of the Securities Act of 1933. Such securities may be resold normally to qualified institutional buyers in a transaction exempt from registration. At January 31, 2021, the value of
these securities amounted to $235,018,811, or 17.3% of net assets.
|
|
(A.D.R.)
|
American Depositary Receipts.
|
|
(G.D.R.)
|
Global Depositary Receipts.
|
|
†
|
Amount rounds to less than 0.1%.
|
|
+
|
Security that used significant unobservable inputs to determine its value.
|
|
(a)
|
Non-income producing security.
|
|
(b)
|
Floating rate note. Coupon rate, reference index and spread shown at January 31, 2021.
|
|
(c)
|
The interest rate is subject to change periodically. The interest rate and/or reference index and spread shown at January 31, 2021.
|
|
(d)
|
Debt obligation initially issued at one coupon which converts to a higher coupon at a specific date. The rate shown is the rate at January 31, 2021.
|
|
(e)
|
Security is perpetual in nature and has no stated maturity date.
|
|
(f)
|
Issued as participation notes.
|
|
(g)
|
Issued as preference shares.
|
|
(h)
|
ANR, Inc. warrants are exercisable into 959,816 shares.
|
|
(i)
|
Pioneer Floating Rate Trust is an affiliated closed-end fund managed by Amundi Asset Management US, Inc., (the “Adviser”).
|
|
#
|
Securities are restricted as to resale.
|
| |
|
|
|
|
|
|
|
| |
Restricted Securities
|
Acquisition date
|
|
Cost
|
|
Value
|
|
| |
Acorn Re 2018-1
|
4/24/2019
|
|
$
|
398,790
|
|
$
|
401,760
|
|
| |
Alturas Re 2019-1
|
12/20/2018
|
|
|
2,400
|
|
|
19,795
|
|
| |
Alturas Re 2019-2
|
12/19/2018
|
|
|
12,149
|
|
|
56,415
|
|
| |
Alturas Re 2020-2
|
1/1/2020
|
|
|
500,000
|
|
|
535,250
|
|
| |
Ballybunion Re
|
12/31/2019
|
|
|
1,804,847
|
|
|
1,881,100
|
|
| |
Ballybunion Re 2020-3
|
1/21/2021
|
|
|
1,503,281
|
|
|
1,500,000
|
|
| |
Bantry Re 2019
|
2/1/2019
|
|
|
—
|
|
|
25,473
|
|
| |
Bantry Re 2021
|
1/11/2021
|
|
|
750,000
|
|
|
756,375
|
|
| |
Berwick Re 2017-1
|
1/5/2017
|
|
|
29,846
|
|
|
29,790
|
|
| |
Berwick Re 2018-1
|
1/29/2018
|
|
|
8,813
|
|
|
5,630
|
|
| |
Berwick Re 2019-1
|
2/27/2019
|
|
|
166,329
|
|
|
166,341
|
|
| |
Berwick Re 2021-1
|
12/28/2020
|
|
|
1,500,000
|
|
|
1,506,750
|
|
| |
Bonanza Re
|
2/13/2020
|
|
|
700,000
|
|
|
704,200
|
|
| |
Bonanza Re
|
12/15/2020
|
|
|
500,000
|
|
|
500,300
|
|
| |
Carnoustie Re 2017
|
1/3/2017
|
|
|
356,635
|
|
|
197,700
|
|
| |
Carnoustie Re 2021
|
1/11/2021
|
|
|
500,000
|
|
|
503,748
|
|
| |
Cypress Re 2017
|
1/24/2017
|
|
|
2,353
|
|
|
70
|
|
| |
Dingle Re 2019
|
3/4/2019
|
|
|
—
|
|
|
6,158
|
|
| |
Dingle Re 2020
|
2/13/2020
|
|
|
232,875
|
|
|
258,623
|
|
| |
Easton Re Pte
|
12/15/2020
|
|
|
1,250,000
|
|
|
1,249,750
|
|
| |
Eden Re II
|
12/14/2018
|
|
|
4,320
|
|
|
56,030
|
|
| |
Eden Re II 2020
|
12/23/2019
|
|
|
100,000
|
|
|
226,800
|
|
| |
Eden Re II Ltd.
|
12/14/2020
|
|
|
600,000
|
|
|
600,000
|
|
| |
Eden Re II, Series B
|
1/25/2021
|
|
|
900,000
|
|
|
900,000
|
|
The accompanying notes are an integral part of these financial statements.
38 Pioneer Multi-Asset Income Fund | Semiannual Report | 1/31/21
| |
|
|
|
|
|
|
|
| |
Restricted Securities
|
Acquisition date
|
|
Cost
|
|
Value
|
|
| |
Four Lakes Re
|
11/5/2020
|
|
$
|
500,000
|
|
$
|
500,000
|
|
| |
Four Lakes Re
|
11/5/2020
|
|
|
500,000
|
|
|
499,400
|
|
| |
Gleneagles Re 2019
|
1/24/2019
|
|
|
—
|
|
|
16,760
|
|
| |
Gleneagles Re 2021
|
1/13/2021
|
|
|
500,000
|
|
|
501,250
|
|
| |
Gullane Re 2021
|
1/13/2021
|
|
|
638,678
|
|
|
638,678
|
|
| |
Harambee Re 2019
|
12/20/2018
|
|
|
—
|
|
|
13,800
|
|
| |
Herbie Re
|
10/19/2020
|
|
|
500,000
|
|
|
509,100
|
|
| |
Limestone Re
|
1/3/2020
|
|
|
154,341
|
|
|
207,350
|
|
| |
Limestone Re 2016-1
|
12/15/2016
|
|
|
990
|
|
|
600
|
|
| |
Limestone Re 2016-1
|
12/15/2016
|
|
|
990
|
|
|
600
|
|
| |
Limestone Re 2019-A
|
12/27/2018
|
|
|
15,143
|
|
|
—
|
|
| |
Limestone Re 2019-B
|
12/15/2016
|
|
|
11,024
|
|
|
—
|
|
| |
Lion Rock Re 2021
|
12/30/2020
|
|
|
250,000
|
|
|
255,025
|
|
| |
Long Point Re III 2018
|
3/1/2019
|
|
|
750,252
|
|
|
751,125
|
|
| |
Matterhorn Re
|
11/24/2020
|
|
|
500,000
|
|
|
500,200
|
|
| |
Matterhorn Re
|
11/24/2020
|
|
|
1,500,000
|
|
|
1,500,300
|
|
| |
Merion Re 2021-1
|
1/8/2021
|
|
|
216,019
|
|
|
218,963
|
|
| |
Merion Re 2021-2
|
12/28/2020
|
|
|
2,000,000
|
|
|
2,019,569
|
|
| |
Mystic Re IV Ltd.
|
12/15/2020
|
|
|
500,000
|
|
|
500,400
|
|
| |
NCM Re 2019
|
12/27/2018
|
|
|
6,805
|
|
|
147,125
|
|
| |
Northshore Re II
|
12/2/2020
|
|
|
1,000,000
|
|
|
1,000,500
|
|
| |
Oakmont Re 2017
|
5/10/2017
|
|
|
—
|
|
|
7,350
|
|
| |
Old Head Re 2021
|
1/11/2021
|
|
|
189,818
|
|
|
194,699
|
|
| |
Pangaea Re 2019-1
|
1/9/2019
|
|
|
13,124
|
|
|
26,047
|
|
| |
Pangaea Re 2020-1
|
1/21/2020
|
|
|
(750,000
|
)
|
|
86,475
|
|
| |
Pangaea Re 2020-1
|
1/19/2021
|
|
|
1,500,000
|
|
|
1,503,750
|
|
| |
Residential Reinsurance 2020
|
10/30/2020
|
|
|
500,000
|
|
|
504,500
|
|
| |
Resilience Re
|
2/8/2017
|
|
|
339
|
|
|
70
|
|
| |
Sector Re V
|
12/21/2020
|
|
|
900,000
|
|
|
916,696
|
|
| |
Sector Re V
|
4/29/2020
|
|
|
300,000
|
|
|
363,362
|
|
| |
Sector Re V
|
12/4/2020
|
|
|
500,000
|
|
|
509,275
|
|
| |
Sector Re V, Series 9, Class A
|
4/23/2019
|
|
|
200,000
|
|
|
85,861
|
|
| |
Sector Re V, Series 9, Class C
|
12/4/2019
|
|
|
100,000
|
|
|
250,813
|
|
| |
St. Andrews Re 2017-1
|
1/3/2017
|
|
|
67,748
|
|
|
67,800
|
|
| |
St. Andrews Re 2017-4
|
3/31/2017
|
|
|
—
|
|
|
59,856
|
|
| |
Sussex Re 2020-1
|
12/7/2020
|
|
|
1,250,000
|
|
|
1,250,000
|
|
| |
Thopas Re 2019
|
12/21/2018
|
|
|
56,837
|
|
|
59,250
|
|
| |
Thopas Re 2020
|
2/5/2020
|
|
|
—
|
|
|
7,300
|
|
| |
Thopas Re 2021
|
12/30/2020
|
|
|
1,500,000
|
|
|
1,508,700
|
|
| |
Versutus Re 2017
|
12/28/2016
|
|
|
99,361
|
|
|
20,850
|
|
| |
Versutus Re 2019-B
|
12/24/2018
|
|
|
—
|
|
|
64,320
|
|
| |
Viribus Re 2019
|
12/27/2018
|
|
|
—
|
|
|
61,500
|
|
| |
Viribus Re 2020
|
3/12/2020
|
|
|
1,000,000
|
|
|
910,600
|
|
| |
Vitality Re XI
|
1/31/2020
|
|
|
248,388
|
|
|
238,000
|
|
| |
Walton Health Re 2019
|
7/18/2019
|
|
|
185,097
|
|
|
252,102
|
|
| |
Woburn Re 2019
|
1/30/2019
|
|
|
181,207
|
|
|
202,025
|
|
| |
Total Restricted Securities
|
|
|
|
|
$
|
31,020,004
|
|
| |
% of Net assets
|
|
|
|
|
|
|
2.3
|
%
|
The accompanying notes are an integral part of these financial statements.
Pioneer Multi-Asset Income Fund | Semiannual Report | 1/31/21 39
Schedule of Investments | 1/31/21
(unaudited) (continued)
FUTURES CONTRACT
INDEX FUTURES CONTRACT
| |
|
|
|
|
|
|
|
|
|
|
|
|
|
Number of
|
|
|
|
|
|
|
|
|
|
|
|
|
|
Contracts
|
|
|
Expiration
|
|
Notional
|
|
|
Market
|
|
|
Unrealized
|
|
|
Short
|
|
Description
|
Date
|
|
Amount
|
|
|
Value
|
|
|
(Depreciation)
|
|
| |
1,006
|
|
S&P 500 E-MINI
|
3/19/21
|
|
$
|
184,379,736
|
|
|
$
|
186,374,075
|
|
|
$
|
(1,994,339
|
)
|
|
TOTAL FUTURES CONTRACT
|
|
$
|
(184,379,736
|
)
|
|
$
|
(186,374,075
|
)
|
|
$
|
(1,994,339
|
)
|
Principal amounts are denominated in U.S. dollars (“USD”) unless otherwise noted.
| |
|
|
|
ARS
|
—
|
Argentine Peso
|
|
IDR
|
—
|
Indonesian Rupiah
|
Purchases and sales of securities (excluding temporary cash investments) for the six months ended January 31, 2021, aggregated $551,907,771 and $709,574,580, respectively.
The Fund is permitted to engage in purchase and sale transactions (“cross trades”) with certain funds and accounts for which the Adviser serves as the Fund’s investment adviser, as set forth in Rule 17a-7 under the
Investment Company Act of 1940, pursuant to procedures adopted by the Board of Trustees. Under these procedures, cross trades are effected at current market prices. During the six months ended January 31, 2021, the Fund did not engage in any cross
trade activity.
At January 31, 2021, the net unrealized appreciation on investments based on cost for federal tax purposes of $1,190,061,578 was as follows:
|
|
|
|
|
|
Aggregate gross unrealized appreciation for all investments in which
|
|
|
|
|
there is an excess of value over tax cost
|
|
$
|
115,658,622
|
|
|
Aggregate gross unrealized depreciation for all investments in which
|
|
|
|
|
|
there is an excess of tax cost over value
|
|
|
(46,058,832
|
)
|
|
Net unrealized appreciation
|
|
$
|
69,599,790
|
|
Various inputs are used in determining the value of the Fund’s investments. These inputs are summarized in the three broad levels below.
Level 1 – unadjusted quoted prices in active markets for identical securities.
Level 2 – other significant observable inputs (including quoted prices for similar securities, interest rates, prepayment speeds, credit risks, etc.). See Notes to Financial
Statements — Note 1A.
Level 3 – significant unobservable inputs (including the Fund’s own assumptions in determining fair value of investments). See Notes to Financial Statements — Note 1A.
The accompanying notes are an integral part of these financial statements.
40 Pioneer Multi-Asset Income Fund | Semiannual Report | 1/31/21
The following is a summary of the inputs used as of January 31, 2021, in valuing the Fund’s investments:
| |
|
|
|
|
|
|
|
|
|
|
|
|
|
|
|
Level 1
|
|
|
Level 2
|
|
|
Level 3
|
|
|
Total
|
|
|
Common Stocks
|
|
|
|
|
|
|
|
|
|
|
|
|
|
Food & Staples Retailing
|
|
$
|
16,788,604
|
|
|
$
|
8,460,592
|
|
|
$
|
—
|
|
|
$
|
25,249,196
|
|
|
All Other Common Stocks
|
|
|
704,565,478
|
|
|
|
—
|
|
|
|
—
|
|
|
|
704,565,478
|
|
|
Preferred Stock
|
|
|
700,420
|
|
|
|
—
|
|
|
|
—
|
|
|
|
700,420
|
|
|
Asset Backed Securities
|
|
|
—
|
|
|
|
1,900,100
|
|
|
|
—
|
|
|
|
1,900,100
|
|
|
Collateralized Mortgage
|
|
|
|
|
|
|
|
|
|
|
|
|
|
|
|
|
|
Obligations
|
|
|
—
|
|
|
|
61,249,295
|
|
|
|
—
|
|
|
|
61,249,295
|
|
|
Commercial Mortgage-Backed
|
|
|
|
|
|
|
|
|
|
|
|
|
|
|
|
|
|
Securities
|
|
|
—
|
|
|
|
3,328,190
|
|
|
|
—
|
|
|
|
3,328,190
|
|
|
Corporate Bonds
|
|
|
—
|
|
|
|
185,313,842
|
|
|
|
—
|
|
|
|
185,313,842
|
|
|
Foreign Government Bonds
|
|
|
—
|
|
|
|
43,770,856
|
|
|
|
—
|
|
|
|
43,770,856
|
|
|
Insurance-Linked Securities
|
|
|
|
|
|
|
|
|
|
|
|
|
|
|
|
|
|
Collateralized Reinsurance
|
|
|
|
|
|
|
|
|
|
|
|
|
|
|
|
|
|
Multiperil – U.S.
|
|
|
—
|
|
|
|
—
|
|
|
|
3,645,881
|
|
|
|
3,645,881
|
|
|
Multiperil – Worldwide
|
|
|
—
|
|
|
|
—
|
|
|
|
874,454
|
|
|
|
874,454
|
|
|
Windstorm – U.S. Regional
|
|
|
—
|
|
|
|
—
|
|
|
|
7,350
|
|
|
|
7,350
|
|
|
Reinsurance Sidecars
|
|
|
|
|
|
|
|
|
|
|
|
|
|
|
|
|
|
Multiperil – U.S.
|
|
|
—
|
|
|
|
—
|
|
|
|
715,248
|
|
|
|
715,248
|
|
|
Multiperil – Worldwide
|
|
|
—
|
|
|
|
—
|
|
|
|
15,167,536
|
|
|
|
15,167,536
|
|
|
All Other Insurance-Linked
|
|
|
|
|
|
|
|
|
|
|
|
|
|
|
|
|
|
Securities
|
|
|
—
|
|
|
|
10,609,535
|
|
|
|
—
|
|
|
|
10,609,535
|
|
|
Investment Company
|
|
|
12,086,452
|
|
|
|
—
|
|
|
|
—
|
|
|
|
12,086,452
|
|
|
Equity Linked Notes
|
|
|
—
|
|
|
|
191,797,909
|
|
|
|
—
|
|
|
|
191,797,909
|
|
|
Right/Warrant
|
|
|
—
|
|
|
|
4,511
|
|
|
|
—
|
|
|
|
4,511
|
|
|
Exchange-Traded Put
|
|
|
|
|
|
|
|
|
|
|
|
|
|
|
|
|
|
Option Purchased
|
|
|
415,625
|
|
|
|
—
|
|
|
|
—
|
|
|
|
415,625
|
|
|
Affiliated Closed-End Fund
|
|
|
253,829
|
|
|
|
—
|
|
|
|
—
|
|
|
|
253,829
|
|
|
Total Investments
|
|
|
|
|
|
|
|
|
|
|
|
|
|
|
|
|
|
in Securities
|
|
$
|
734,810,408
|
|
|
$
|
506,434,830
|
|
|
$
|
20,410,469
|
|
|
$
|
1,261,655,707
|
|
|
Other Financial Instruments
|
|
|
|
|
|
|
|
|
|
|
|
|
|
|
|
|
|
Net unrealized depreciation
|
|
|
|
|
|
|
|
|
|
|
|
|
|
|
|
|
|
on futures contracts
|
|
$
|
(1,994,339
|
)
|
|
$
|
—
|
|
|
$
|
—
|
|
|
$
|
(1,994,339
|
)
|
|
Total Other
|
|
|
|
|
|
|
|
|
|
|
|
|
|
|
|
|
|
Financial Instruments
|
|
$
|
(1,994,339
|
)
|
|
$
|
—
|
|
|
$
|
—
|
|
|
$
|
(1,994,339
|
)
|
The accompanying notes are an integral part of these financial statements.
Pioneer Multi-Asset Income Fund | Semiannual Report | 1/31/21 41
Schedule of Investments | 1/31/21
(unaudited) (continued)
The following is a reconciliation of assets valued using significant unobservable inputs (Level 3):
| |
|
|
|
|
|
|
Insurance-
|
|
|
|
|
Linked
|
|
|
|
|
Securities
|
|
|
Balance as of 7/31/20
|
|
$
|
15,006,494
|
|
|
Realized gain (loss)(1)
|
|
|
(263,460
|
)
|
|
Changed in unrealized appreciation (depreciation)(2)
|
|
|
596,994
|
|
|
Accrued discounts/premiums
|
|
|
(24
|
)
|
|
Purchases
|
|
|
13,947,821
|
|
|
Sales
|
|
|
(8,877,356
|
)
|
|
Transfers in to Level 3*
|
|
|
—
|
|
|
Transfers out of Level 3*
|
|
|
—
|
|
|
Balance as of 1/31/21
|
|
$
|
20,410,469
|
|
(1) Realized gain (loss) on these securities is included in the realized gain (loss) from
investments on the Statement of Operations.
(2) Unrealized appreciation (depreciation) on these securities is included in the change in
unrealized appreciation (depreciation) from investments on the Statement of Operations.
* Transfers are calculated on the beginning of period value. For the six months ended January 31, 2021, there were no transfers in or out of Level 3.
| |
|
|
|
|
Net change in unrealized appreciation (depreciation) of Level 3 investments still held
|
|
|
|
|
and considered Level 3 at January 31, 2021:
|
|
$
|
783,964
|
|
The accompanying notes are an integral part of these financial statements.
42 Pioneer Multi-Asset Income Fund | Semiannual Report | 1/31/21
Statement of Assets and Liabilities |
1/31/21
(unaudited)
| |
|
|
|
|
ASSETS:
|
|
|
|
|
Investments in unaffiliated issuers, at value (cost $1,179,257,397)
|
|
$
|
1,261,401,878
|
|
|
Investments in affiliated issuers, at value (cost $253,083)
|
|
|
253,829
|
|
|
Cash
|
|
|
59,562,964
|
|
|
Foreign currencies, at value (cost $5,793,284)
|
|
|
5,890,811
|
|
|
Futures collateral
|
|
|
861,001
|
|
|
Due from broker for futures
|
|
|
14,212,353
|
|
|
Variation margin for futures contracts
|
|
|
3,722,200
|
|
|
Receivables —
|
|
|
|
|
|
Investment securities sold
|
|
|
14,944,967
|
|
|
Fund shares sold
|
|
|
1,523,115
|
|
|
Dividends
|
|
|
4,908,518
|
|
|
Interest
|
|
|
5,935,727
|
|
|
Other assets
|
|
|
65,681
|
|
|
Total assets
|
|
$
|
1,373,283,044
|
|
|
LIABILITIES:
|
|
|
|
|
|
Payables —
|
|
|
|
|
|
Investment securities purchased
|
|
$
|
6,436,219
|
|
|
Fund shares repurchased
|
|
|
4,880,383
|
|
|
Distributions
|
|
|
411,686
|
|
|
Trustees’ fees
|
|
|
5,437
|
|
|
Net unrealized depreciation on futures contracts
|
|
|
1,994,339
|
|
|
Reserve for repatriation taxes
|
|
|
760,341
|
|
|
Due to affiliates
|
|
|
191,730
|
|
|
Accrued expenses
|
|
|
367,495
|
|
|
Total liabilities
|
|
$
|
15,047,630
|
|
|
NET ASSETS:
|
|
|
|
|
|
Paid-in capital
|
|
$
|
1,538,085,589
|
|
|
Distributable earnings (loss)
|
|
|
(179,850,175
|
)
|
|
Net assets
|
|
$
|
1,358,235,414
|
|
|
NET ASSET VALUE PER SHARE:
|
|
|
|
|
|
No par value (unlimited number of shares authorized)
|
|
|
|
|
|
Class A (based on $317,148,840/28,922,359 shares)
|
|
$
|
10.97
|
|
|
Class C (based on $296,467,693/27,132,144 shares)
|
|
$
|
10.93
|
|
|
Class K (based on $132,248,022/11,706,693 shares)
|
|
$
|
11.30
|
|
|
Class R (based on $1,600,221/145,569 shares)
|
|
$
|
10.99
|
|
|
Class Y (based on $610,770,638/55,897,265 shares)
|
|
$
|
10.93
|
|
|
MAXIMUM OFFERING PRICE PER SHARE:
|
|
|
|
|
|
Class A (based on $10.97 net asset value per share/100%-4.50%
|
|
|
|
|
|
maximum sales charge)
|
|
$
|
11.49
|
|
The accompanying notes are an integral part of these financial statements.
Pioneer Multi-Asset Income Fund | Semiannual Report | 1/31/21 43
Statement of Operations (unaudited)
FOR THE SIX MONTHS ENDED 1/31/21
| |
|
|
|
|
|
|
|
INVESTMENT INCOME:
|
|
|
|
|
|
|
|
Interest from unaffiliated issuers (net of foreign taxes
|
|
|
|
|
|
|
|
withheld $357,353)
|
|
$
|
27,788,685
|
|
|
|
|
|
Dividends from unaffiliated issuers (net of foreign taxes
|
|
|
|
|
|
|
|
|
withheld $677,638)
|
|
|
16,706,344
|
|
|
|
|
|
Dividends from affiliated issuers
|
|
|
191,027
|
|
|
|
|
|
Total investment income
|
|
|
|
|
|
$
|
44,686,056
|
|
|
EXPENSES:
|
|
|
|
|
|
|
|
|
|
Management fees
|
|
$
|
3,287,507
|
|
|
|
|
|
|
Administrative expense
|
|
|
192,681
|
|
|
|
|
|
|
Transfer agent fees
|
|
|
|
|
|
|
|
|
|
Class A
|
|
|
72,156
|
|
|
|
|
|
|
Class C
|
|
|
100,063
|
|
|
|
|
|
|
Class K
|
|
|
102
|
|
|
|
|
|
|
Class R
|
|
|
2,639
|
|
|
|
|
|
|
Class Y
|
|
|
298,926
|
|
|
|
|
|
|
Distribution fees
|
|
|
|
|
|
|
|
|
|
Class A
|
|
|
393,218
|
|
|
|
|
|
|
Class C
|
|
|
1,534,692
|
|
|
|
|
|
|
Class R
|
|
|
3,836
|
|
|
|
|
|
|
Shareowner communications expense
|
|
|
34,385
|
|
|
|
|
|
|
Custodian fees
|
|
|
88,873
|
|
|
|
|
|
|
Registration fees
|
|
|
54,067
|
|
|
|
|
|
|
Professional fees
|
|
|
56,703
|
|
|
|
|
|
|
Printing expense
|
|
|
49,818
|
|
|
|
|
|
|
Pricing fees
|
|
|
2,753
|
|
|
|
|
|
|
Trustees’ fees
|
|
|
28,642
|
|
|
|
|
|
|
Insurance expense
|
|
|
837
|
|
|
|
|
|
|
Miscellaneous
|
|
|
51,655
|
|
|
|
|
|
|
Total expenses
|
|
|
|
|
|
$
|
6,253,553
|
|
|
Less fees waived and expenses reimbursed by the Adviser
|
|
|
|
|
|
|
(93,956
|
)
|
|
Net expenses
|
|
|
|
|
|
$
|
6,159,597
|
|
|
Net investment income
|
|
|
|
|
|
$
|
38,526,459
|
|
|
REALIZED AND UNREALIZED GAIN (LOSS) ON INVESTMENTS:
|
|
|
|
|
|
|
|
|
|
Net realized gain (loss) on:
|
|
|
|
|
|
|
|
|
|
Investments in unaffiliated issuers
|
|
$
|
14,051,644
|
|
|
|
|
|
|
Investments in affiliated issuers
|
|
|
(52,131
|
)
|
|
|
|
|
|
Forward foreign currency exchange contracts
|
|
|
670,175
|
|
|
|
|
|
|
Futures contracts
|
|
|
(16,990,935
|
)
|
|
|
|
|
|
Other assets and liabilities denominated in
|
|
|
|
|
|
|
|
|
|
foreign currencies
|
|
|
1,110,715
|
|
|
$
|
(1,210,532
|
)
|
|
Change in net unrealized appreciation (depreciation) on:
|
|
|
|
|
|
|
|
|
|
Investments in unaffiliated issuers (net of foreign capital
|
|
|
|
|
|
|
|
|
|
gains tax of $167,606)
|
|
$
|
98,478,396
|
|
|
|
|
|
|
Investments in affiliated issuers
|
|
|
778,742
|
|
|
|
|
|
|
Forward foreign currency exchange contracts
|
|
|
(140,743
|
)
|
|
|
|
|
|
Futures contracts
|
|
|
1,322,811
|
|
|
|
|
|
|
Other assets and liabilities denominated in
|
|
|
|
|
|
|
|
|
|
foreign currencies
|
|
|
(786,353
|
)
|
|
$
|
99,652,853
|
|
|
Net realized and unrealized gain (loss) on investments
|
|
|
|
|
|
$
|
98,442,321
|
|
|
Net increase in net assets resulting from operations
|
|
|
|
|
|
$
|
136,968,780
|
|
The accompanying notes are an integral part of these financial statements.
44 Pioneer Multi-Asset Income Fund | Semiannual Report | 1/31/21
Statements of Changes in Net Assets
| |
|
|
|
|
|
|
|
|
|
Six Months
|
|
|
|
|
|
|
|
Ended
|
|
|
Year
|
|
|
|
|
1/31/21
|
|
|
Ended
|
|
|
|
|
(unaudited)
|
|
|
7/31/20
|
|
|
FROM OPERATIONS:
|
|
|
|
|
|
|
|
Net investment income (loss)
|
|
$
|
38,526,459
|
|
|
$
|
90,321,897
|
|
|
Net realized gain (loss) on investments
|
|
|
(1,210,532
|
)
|
|
|
(91,499,853
|
)
|
|
Change in net unrealized appreciation (depreciation)
|
|
|
|
|
|
|
|
|
|
on investments
|
|
|
99,652,853
|
|
|
|
(18,544,001
|
)
|
|
Net increase (decrease) in net assets resulting
|
|
|
|
|
|
|
|
|
|
from operations
|
|
$
|
136,968,780
|
|
|
$
|
(19,721,957
|
)
|
|
DISTRIBUTIONS TO SHAREOWNERS:
|
|
|
|
|
|
|
|
|
|
Class A ($0.29 and $0.64 per share, respectively)
|
|
$
|
(8,561,678
|
)
|
|
$
|
(21,061,508
|
)
|
|
Class C ($0.25 and $0.56 per share, respectively)
|
|
|
(7,124,598
|
)
|
|
|
(19,400,160
|
)
|
|
Class K ($0.31 and $0.69 per share, respectively)
|
|
|
(3,631,545
|
)
|
|
|
(7,887,973
|
)
|
|
Class R ($0.25 and $0.57 per share, respectively)
|
|
|
(35,839
|
)
|
|
|
(89,191
|
)
|
|
Class Y ($0.30 and $0.66 per share, respectively)
|
|
|
(16,894,598
|
)
|
|
|
(44,672,048
|
)
|
|
Total distributions to shareowners
|
|
$
|
(36,248,258
|
)
|
|
$
|
(93,110,880
|
)
|
|
FROM FUND SHARE TRANSACTIONS:
|
|
|
|
|
|
|
|
|
|
Net proceeds from sales of shares
|
|
$
|
109,777,097
|
|
|
$
|
314,652,956
|
|
|
Reinvestment of distributions
|
|
|
35,361,392
|
|
|
|
91,349,099
|
|
|
Cost of shares repurchased
|
|
|
(220,018,092
|
)
|
|
|
(728,876,580
|
)
|
|
Net decrease in net assets resulting
|
|
|
|
|
|
|
|
|
|
from Fund share transactions
|
|
$
|
(74,879,603
|
)
|
|
$
|
(322,874,525
|
)
|
|
Net increase (decrease) in net assets
|
|
$
|
25,840,919
|
|
|
$
|
(435,707,362
|
)
|
|
NET ASSETS:
|
|
|
|
|
|
|
|
|
|
Beginning of period
|
|
$
|
1,332,394,495
|
|
|
$
|
1,768,101,857
|
|
|
End of period
|
|
$
|
1,358,235,414
|
|
|
$
|
1,332,394,495
|
|
The accompanying notes are an integral part of these financial statements.
Pioneer Multi-Asset Income Fund | Semiannual Report | 1/31/21 45
Statements of Changes in Net Assets
(continued)
| |
|
|
|
|
|
|
|
|
|
|
|
|
|
|
|
Six Months
|
|
|
Six Months
|
|
|
|
|
|
|
|
|
|
|
Ended
|
|
|
Ended
|
|
|
Year
|
|
|
Year
|
|
|
|
|
1/31/21
|
|
|
1/31/21
|
|
|
Ended
|
|
|
Ended
|
|
|
|
|
Shares
|
|
|
Amounts
|
|
|
7/31/20
|
|
|
7/31/20
|
|
|
|
|
(unaudited)
|
|
|
(unaudited) |
|
|
Shares
|
|
|
Amount
|
|
|
Class A
|
|
|
|
|
|
|
|
|
|
|
|
|
|
Shares sold
|
|
|
2,412,815
|
|
|
$
|
25,728,379
|
|
|
|
7,668,449
|
|
|
$
|
79,765,265
|
|
|
Reinvestment of distributions
|
|
|
793,074
|
|
|
|
8,347,284
|
|
|
|
2,002,558
|
|
|
|
20,648,856
|
|
|
Less shares repurchased
|
|
|
(4,781,492
|
)
|
|
|
(50,311,882
|
)
|
|
|
(14,173,550
|
)
|
|
|
(145,263,617
|
)
|
|
Net decrease
|
|
|
(1,575,603
|
)
|
|
$
|
(16,236,219
|
)
|
|
|
(4,502,543
|
)
|
|
$
|
(44,849,496
|
)
|
|
Class C
|
|
|
|
|
|
|
|
|
|
|
|
|
|
|
|
|
|
Shares sold
|
|
|
789,055
|
|
|
$
|
8,427,392
|
|
|
|
3,328,768
|
|
|
$
|
35,335,764
|
|
|
Reinvestment of distributions
|
|
|
669,871
|
|
|
|
7,020,930
|
|
|
|
1,868,959
|
|
|
|
19,216,209
|
|
|
Less shares repurchased
|
|
|
(5,176,145
|
)
|
|
|
(54,599,285
|
)
|
|
|
(13,662,815
|
)
|
|
|
(140,288,919
|
)
|
|
Net decrease
|
|
|
(3,717,219
|
)
|
|
$
|
(39,150,963
|
)
|
|
|
(8,465,088
|
)
|
|
$
|
(85,736,946
|
)
|
|
Class K
|
|
|
|
|
|
|
|
|
|
|
|
|
|
|
|
|
|
Shares sold
|
|
|
153,700
|
|
|
$
|
1,766,250
|
|
|
|
154,206
|
|
|
$
|
1,538,830
|
|
|
Reinvestment of distributions
|
|
|
327,982
|
|
|
|
3,557,780
|
|
|
|
737,624
|
|
|
|
7,821,447
|
|
|
Less shares repurchased
|
|
|
(354,447
|
)
|
|
|
(3,849,429
|
)
|
|
|
(629,533
|
)
|
|
|
(6,360,070
|
)
|
|
Net increase
|
|
|
127,235
|
|
|
$
|
1,474,601
|
|
|
|
262,297
|
|
|
$
|
3,000,207
|
|
|
Class R
|
|
|
|
|
|
|
|
|
|
|
|
|
|
|
|
|
|
Shares sold
|
|
|
7,390
|
|
|
$
|
77,723
|
|
|
|
168,738
|
|
|
$
|
1,770,339
|
|
|
Reinvestment of distributions
|
|
|
3,354
|
|
|
|
35,397
|
|
|
|
8,324
|
|
|
|
86,230
|
|
|
Less shares repurchased
|
|
|
(9,497
|
)
|
|
|
(97,620
|
)
|
|
|
(109,829
|
)
|
|
|
(1,157,078
|
)
|
|
Net increase
|
|
|
1,247
|
|
|
$
|
15,500
|
|
|
|
67,233
|
|
|
$
|
699,491
|
|
|
Class Y
|
|
|
|
|
|
|
|
|
|
|
|
|
|
|
|
|
|
Shares sold
|
|
|
6,989,748
|
|
|
$
|
73,777,353
|
|
|
|
18,853,035
|
|
|
$
|
196,242,758
|
|
|
Reinvestment of distributions
|
|
|
1,563,059
|
|
|
|
16,400,001
|
|
|
|
4,228,360
|
|
|
|
43,576,357
|
|
|
Less shares repurchased
|
|
|
(10,575,642
|
)
|
|
|
(111,159,876
|
)
|
|
|
(43,225,023
|
)
|
|
|
(435,806,896
|
)
|
|
Net decrease
|
|
|
(2,022,835
|
)
|
|
$
|
(20,982,522
|
)
|
|
|
(20,143,628
|
)
|
|
$
|
(195,987,781
|
)
|
The accompanying notes are an integral part of these financial statements.
46 Pioneer Multi-Asset Income Fund | Semiannual Report | 1/31/21
Financial Highlights
| |
|
|
|
|
|
|
|
|
|
|
|
|
|
|
|
|
|
|
|
|
|
Six Months
|
|
|
|
|
|
|
|
|
|
|
|
|
|
|
|
|
|
|
|
Ended
|
|
|
Year
|
|
|
Year
|
|
|
Year
|
|
|
Year
|
|
|
Year
|
|
|
|
|
1/31/21
|
|
|
Ended
|
|
|
Ended
|
|
|
Ended
|
|
|
Ended
|
|
|
Ended
|
|
|
|
|
(unaudited)
|
|
|
7/31/20
|
|
|
7/31/19
|
|
|
7/31/18
|
|
|
7/31/17
|
|
|
7/31/16*
|
|
|
Class A
|
|
|
|
|
|
|
|
|
|
|
|
|
|
|
|
|
|
|
|
Net asset value, beginning of period
|
|
$
|
10.17
|
|
|
$
|
10.79
|
|
|
$
|
11.59
|
|
|
$
|
11.69
|
|
|
$
|
10.57
|
|
|
$
|
11.15
|
|
|
Increase (decrease) from investment operations:
|
|
|
|
|
|
|
|
|
|
|
|
|
|
|
|
|
|
|
|
|
|
|
|
|
|
Net investment income (loss) (a)
|
|
$
|
0.31
|
|
|
$
|
0.62
|
|
|
$
|
0.62
|
|
|
$
|
0.68
|
|
|
$
|
0.67
|
|
|
$
|
0.62
|
|
|
Net realized and unrealized gain (loss) on investments
|
|
|
0.78
|
|
|
|
(0.60
|
)
|
|
|
(0.80
|
)
|
|
|
(0.05
|
)
|
|
|
0.99
|
|
|
|
(0.57
|
)
|
|
Net increase (decrease) from investment operations
|
|
$
|
1.09
|
|
|
$
|
0.02
|
|
|
$
|
(0.18
|
)
|
|
$
|
0.63
|
|
|
$
|
1.66
|
|
|
$
|
0.05
|
|
|
Distributions to shareowners:
|
|
|
|
|
|
|
|
|
|
|
|
|
|
|
|
|
|
|
|
|
|
|
|
|
|
Net investment income
|
|
$
|
(0.29
|
)
|
|
$
|
(0.64
|
)
|
|
$
|
(0.62
|
)
|
|
$
|
(0.73
|
)
|
|
$
|
(0.54
|
)
|
|
$
|
(0.63
|
)
|
|
Total distributions
|
|
$
|
(0.29
|
)
|
|
$
|
(0.64
|
)
|
|
$
|
(0.62
|
)
|
|
$
|
(0.73
|
)
|
|
$
|
(0.54
|
)
|
|
$
|
(0.63
|
)
|
|
Net increase (decrease) in net asset value
|
|
$
|
0.80
|
|
|
$
|
(0.62
|
)
|
|
$
|
(0.80
|
)
|
|
$
|
(0.10
|
)
|
|
$
|
1.12
|
|
|
$
|
(0.58
|
)
|
|
Net asset value, end of period
|
|
$
|
10.97
|
|
|
$
|
10.17
|
|
|
$
|
10.79
|
|
|
$
|
11.59
|
|
|
$
|
11.69
|
|
|
$
|
10.57
|
|
|
Total return (b)
|
|
|
10.84
|
%(c)
|
|
|
0.28
|
%
|
|
|
(1.56
|
)%
|
|
|
5.41
|
%
|
|
|
16.13
|
%
|
|
|
0.81
|
%
|
|
Ratio of net expenses to average net assets
|
|
|
0.85
|
%(d)
|
|
|
0.85
|
%
|
|
|
0.85
|
%
|
|
|
0.85
|
%
|
|
|
0.85
|
%
|
|
|
0.85
|
%
|
|
Ratio of net investment income (loss) to average net assets
|
|
|
5.78
|
%(d)
|
|
|
6.01
|
%
|
|
|
5.58
|
%
|
|
|
5.77
|
%
|
|
|
6.07
|
%
|
|
|
5.99
|
%
|
|
Portfolio turnover rate
|
|
|
44
|
%(c)
|
|
|
126
|
%
|
|
|
108
|
%
|
|
|
126
|
%
|
|
|
131
|
%
|
|
|
109
|
%
|
|
Net assets, end of period (in thousands)
|
|
$
|
317,149
|
|
|
$
|
310,126
|
|
|
$
|
377,722
|
|
|
$
|
374,395
|
|
|
$
|
238,281
|
|
|
$
|
238,779
|
|
|
Ratios with no waiver of fees and assumption of expenses by
|
|
|
|
|
|
|
|
|
|
|
|
|
|
|
|
|
|
|
|
|
|
|
|
|
|
the Adviser and no reduction for fees paid indirectly:
|
|
|
|
|
|
|
|
|
|
|
|
|
|
|
|
|
|
|
|
|
|
|
|
|
|
Total expenses to average net assets
|
|
|
0.87
|
%(d)
|
|
|
0.89
|
%
|
|
|
0.89
|
%
|
|
|
0.87
|
%
|
|
|
0.92
|
%
|
|
|
0.94
|
%
|
|
Net investment income (loss) to average net assets
|
|
|
5.76
|
%(d)
|
|
|
5.97
|
%
|
|
|
5.54
|
%
|
|
|
5.75
|
%
|
|
|
6.00
|
%
|
|
|
5.90
|
%
|
| |
|
|
*
|
The Fund was audited by an independent registered public accounting firm other than Ernst & Young LLP.
|
|
(a)
|
The per-share data presented above is based on the average shares outstanding for the period presented.
|
|
(b)
|
Assumes initial investment at net asset value at the beginning of each period, reinvestment of all distributions, the complete redemption of the investment at net asset value at the end of each period and no sales charges. Total return
would be reduced if sales charges were taken into account.
|
|
(c)
|
Not annualized.
|
|
(d)
|
Annualized. |
The accompanying notes are an integral part of these financial statements.
Pioneer Multi-Asset Income Fund | Semiannual Report | 1/31/21 47
Financial Highlights (continued)
| |
|
|
|
|
|
|
|
|
|
|
|
|
|
|
|
|
|
|
|
|
|
Six Months
|
|
|
|
|
|
|
|
|
|
|
|
|
|
|
|
|
|
|
|
Ended
|
|
|
Year
|
|
|
Year
|
|
|
Year
|
|
|
Year
|
|
|
Year
|
|
|
|
|
1/31/21
|
|
|
Ended
|
|
|
Ended
|
|
|
Ended
|
|
|
Ended
|
|
|
Ended
|
|
|
|
|
(unaudited)
|
|
|
7/31/20
|
|
|
7/31/19
|
|
|
7/31/18
|
|
|
7/31/17
|
|
|
7/31/16*
|
|
|
Class C
|
|
|
|
|
|
|
|
|
|
|
|
|
|
|
|
|
|
|
|
Net asset value, beginning of period
|
|
$
|
10.13
|
|
|
$
|
10.76
|
|
|
$
|
11.56
|
|
|
$
|
11.66
|
|
|
$
|
10.55
|
|
|
$
|
11.12
|
|
|
Increase (decrease) from investment operations:
|
|
|
|
|
|
|
|
|
|
|
|
|
|
|
|
|
|
|
|
|
|
|
|
|
|
Net investment income (loss) (a)
|
|
$
|
0.26
|
|
|
$
|
0.54
|
|
|
$
|
0.53
|
|
|
$
|
0.58
|
|
|
$
|
0.57
|
|
|
$
|
0.53
|
|
|
Net realized and unrealized gain (loss) on investments
|
|
|
0.79
|
|
|
|
(0.61
|
)
|
|
|
(0.80
|
)
|
|
|
(0.05
|
)
|
|
|
0.99
|
|
|
|
(0.55
|
)
|
|
Net increase (decrease) from investment operations
|
|
$
|
1.05
|
|
|
$
|
(0.07
|
)
|
|
$
|
(0.27
|
)
|
|
$
|
0.53
|
|
|
$
|
1.56
|
|
|
$
|
(0.02
|
)
|
|
Distributions to shareowners:
|
|
|
|
|
|
|
|
|
|
|
|
|
|
|
|
|
|
|
|
|
|
|
|
|
|
Net investment income
|
|
$
|
(0.25
|
)
|
|
$
|
(0.56
|
)
|
|
$
|
(0.53
|
)
|
|
$
|
(0.63
|
)
|
|
$
|
(0.45
|
)
|
|
$
|
(0.55
|
)
|
|
Total distributions
|
|
$
|
(0.25
|
)
|
|
$
|
(0.56
|
)
|
|
$
|
(0.53
|
)
|
|
$
|
(0.63
|
)
|
|
$
|
(0.45
|
)
|
|
$
|
(0.55
|
)
|
|
Net increase (decrease) in net asset value
|
|
$
|
0.80
|
|
|
$
|
(0.63
|
)
|
|
$
|
(0.80
|
)
|
|
$
|
(0.10
|
)
|
|
$
|
1.11
|
|
|
$
|
(0.57
|
)
|
|
Net asset value, end of period
|
|
$
|
10.93
|
|
|
$
|
10.13
|
|
|
$
|
10.76
|
|
|
$
|
11.56
|
|
|
$
|
11.66
|
|
|
$
|
10.55
|
|
|
Total return (b)
|
|
|
10.43
|
%(c)
|
|
|
(0.62
|
)%
|
|
|
(2.33
|
)%
|
|
|
4.60
|
%
|
|
|
15.12
|
%
|
|
|
0.06
|
%
|
|
Ratio of net expenses to average net assets
|
|
|
1.63
|
%(d)
|
|
|
1.65
|
%
|
|
|
1.64
|
%
|
|
|
1.62
|
%
|
|
|
1.69
|
%
|
|
|
1.69
|
%
|
|
Ratio of net investment income (loss) to average net assets
|
|
|
4.99
|
%(d)
|
|
|
5.20
|
%
|
|
|
4.78
|
%
|
|
|
4.94
|
%
|
|
|
5.24
|
%
|
|
|
5.16
|
%
|
|
Portfolio turnover rate
|
|
|
44
|
%(c)
|
|
|
126
|
%
|
|
|
108
|
%
|
|
|
126
|
%
|
|
|
131
|
%
|
|
|
109
|
%
|
|
Net assets, end of period (in thousands)
|
|
$
|
296,468
|
|
|
$
|
312,559
|
|
|
$
|
422,863
|
|
|
$
|
439,179
|
|
|
$
|
310,023
|
|
|
$
|
304,609
|
|
|
Ratios with no waiver of fees and assumption of expenses by
|
|
|
|
|
|
|
|
|
|
|
|
|
|
|
|
|
|
|
|
|
|
|
|
|
|
the Adviser and no reduction for fees paid indirectly:
|
|
|
|
|
|
|
|
|
|
|
|
|
|
|
|
|
|
|
|
|
|
|
|
|
|
Total expenses to average net assets
|
|
|
1.64
|
%(d)
|
|
|
1.66
|
%
|
|
|
1.65
|
%
|
|
|
1.62
|
%
|
|
|
1.69
|
%
|
|
|
1.69
|
%
|
|
Net investment income (loss) to average net assets
|
|
|
4.98
|
%(d)
|
|
|
5.19
|
%
|
|
|
4.77
|
%
|
|
|
4.94
|
%
|
|
|
5.24
|
%
|
|
|
5.16
|
%
|
| |
|
|
*
|
The Fund was audited by an independent registered public accounting firm other than Ernst & Young LLP.
|
|
(a)
|
The per-share data presented above is based on the average shares outstanding for the period presented.
|
|
(b)
|
Assumes initial investment at net asset value at the beginning of each period, reinvestment of all distributions, the complete redemption of the investment at net asset value at the end of each period and no sales charges. Total return
would be reduced if sales charges were taken into account.
|
|
(c)
|
Not annualized.
|
|
(d)
|
Annualized.
|
The accompanying notes are an integral part of these financial statements.
48 Pioneer Multi-Asset Income Fund | Semiannual Report | 1/31/21
| |
|
|
|
|
|
|
|
|
|
|
|
|
|
|
|
|
|
|
|
|
|
Six Months
|
|
|
|
|
|
|
|
|
|
|
|
|
|
|
|
|
|
|
|
Ended
|
|
|
Year
|
|
|
Year
|
|
|
Year
|
|
|
Year
|
|
|
Year
|
|
|
|
|
1/31/21
|
|
|
Ended
|
|
|
Ended
|
|
|
Ended
|
|
|
Ended
|
|
|
Ended
|
|
|
|
|
(unaudited)
|
|
|
7/31/20
|
|
|
7/31/19
|
|
|
7/31/18
|
|
|
7/31/17
|
|
|
7/31/16*
|
|
|
Class K
|
|
|
|
|
|
|
|
|
|
|
|
|
|
|
|
|
|
|
|
Net asset value, beginning of period
|
|
$
|
10.47
|
|
|
$
|
11.12
|
|
|
$
|
11.95
|
|
|
$
|
11.85
|
|
|
$
|
10.69
|
|
|
$
|
11.15
|
|
|
Increase (decrease) from investment operations:
|
|
|
|
|
|
|
|
|
|
|
|
|
|
|
|
|
|
|
|
|
|
|
|
|
|
Net investment income (loss) (a)
|
|
$
|
0.33
|
|
|
$
|
0.67
|
|
|
$
|
0.67
|
|
|
$
|
0.90
|
|
|
$
|
0.72
|
|
|
$
|
0.57
|
|
|
Net realized and unrealized gain (loss) on investments
|
|
|
0.81
|
|
|
|
(0.63
|
)
|
|
|
(0.83
|
)
|
|
|
(0.03
|
)
|
|
|
1.01
|
|
|
|
(0.37
|
)
|
|
Net increase (decrease) from investment operations
|
|
$
|
1.14
|
|
|
$
|
0.04
|
|
|
$
|
(0.16
|
)
|
|
$
|
0.87
|
|
|
$
|
1.73
|
|
|
$
|
0.20
|
|
|
Distributions to shareowners:
|
|
|
|
|
|
|
|
|
|
|
|
|
|
|
|
|
|
|
|
|
|
|
|
|
|
Net investment income
|
|
$
|
(0.31
|
)
|
|
$
|
(0.69
|
)
|
|
$
|
(0.67
|
)
|
|
$
|
(0.77
|
)
|
|
$
|
(0.57
|
)
|
|
$
|
(0.66
|
)
|
|
Total distributions
|
|
$
|
(0.31
|
)
|
|
$
|
(0.69
|
)
|
|
$
|
(0.67
|
)
|
|
$
|
(0.77
|
)
|
|
$
|
(0.57
|
)
|
|
$
|
(0.66
|
)
|
|
Net increase (decrease) in net asset value
|
|
$
|
0.83
|
|
|
$
|
(0.65
|
)
|
|
$
|
(0.83
|
)
|
|
$
|
0.10
|
|
|
$
|
1.16
|
|
|
$
|
(0.46
|
)
|
|
Net asset value, end of period
|
|
$
|
11.30
|
|
|
$
|
10.47
|
|
|
$
|
11.12
|
|
|
$
|
11.95
|
|
|
$
|
11.85
|
|
|
$
|
10.69
|
|
|
Total return (b)
|
|
|
11.05
|
%(c)
|
|
|
0.44
|
%
|
|
|
(1.32
|
)%
|
|
|
7.51
|
%
|
|
|
16.65
|
%
|
|
|
2.20
|
%
|
|
Ratio of net expenses to average net assets
|
|
|
0.56
|
%(d)
|
|
|
0.58
|
%
|
|
|
0.56
|
%
|
|
|
0.56
|
%
|
|
|
0.63
|
%
|
|
|
0.60
|
%
|
|
Ratio of net investment income (loss) to average net assets
|
|
|
6.06
|
%(d)
|
|
|
6.30
|
%
|
|
|
5.87
|
%
|
|
|
7.47
|
%
|
|
|
6.46
|
%
|
|
|
5.51
|
%
|
|
Portfolio turnover rate
|
|
|
44
|
%(c)
|
|
|
126
|
%
|
|
|
108
|
%
|
|
|
126
|
%
|
|
|
131
|
%
|
|
|
109
|
%
|
|
Net assets, end of period (in thousands)
|
|
$
|
132,248
|
|
|
$
|
121,281
|
|
|
$
|
125,831
|
|
|
$
|
126,017
|
|
|
$
|
558
|
|
|
$
|
245
|
|
|
Ratios with no waiver of fees and assumption of expenses by
|
|
|
|
|
|
|
|
|
|
|
|
|
|
|
|
|
|
|
|
|
|
|
|
|
|
the Adviser and no reduction for fees paid indirectly:
|
|
|
|
|
|
|
|
|
|
|
|
|
|
|
|
|
|
|
|
|
|
|
|
|
|
Total expenses to average net assets
|
|
|
0.57
|
%(d)
|
|
|
0.58
|
%
|
|
|
0.57
|
%
|
|
|
0.56
|
%
|
|
|
0.63
|
%
|
|
|
0.60
|
%
|
|
Net investment income (loss) to average net assets
|
|
|
6.05
|
%(d)
|
|
|
6.30
|
%
|
|
|
5.86
|
%
|
|
|
7.47
|
%
|
|
|
6.46
|
%
|
|
|
5.51
|
%
|
| |
|
|
*
|
The Fund was audited by an independent registered public accounting firm other than Ernst & Young LLP.
|
|
(a)
|
The per-share data presented above is based on the average shares outstanding for the period presented.
|
|
(b)
|
Assumes initial investment at net asset value at the beginning of each period, reinvestment of all distributions and the complete redemption of the investment at net asset value at the end of each period.
|
|
(c)
|
Not annualized.
|
|
(d)
|
Annualized.
|
The accompanying notes are an integral part of these financial statements.
Pioneer Multi-Asset Income Fund | Semiannual Report | 1/31/21 49
Financial Highlights (continued)
| |
|
|
|
|
|
|
|
|
|
|
|
|
|
|
|
|
|
|
|
|
|
Six Months
|
|
|
|
|
|
|
|
|
|
|
|
|
|
|
|
|
|
|
|
Ended
|
|
|
Year
|
|
|
Year
|
|
|
Year
|
|
|
Year
|
|
|
Year
|
|
|
|
|
1/31/21
|
|
|
Ended
|
|
|
Ended
|
|
|
Ended
|
|
|
Ended
|
|
|
Ended
|
|
|
|
|
(unaudited)
|
|
|
7/31/20
|
|
|
7/31/19
|
|
|
7/31/18
|
|
|
7/31/17
|
|
|
7/31/16*
|
|
|
Class R
|
|
|
|
|
|
|
|
|
|
|
|
|
|
|
|
|
|
|
|
Net asset value, beginning of period
|
|
$
|
10.19
|
|
|
$
|
10.83
|
|
|
$
|
11.64
|
|
|
$
|
11.74
|
|
|
$
|
10.62
|
|
|
$
|
11.20
|
|
|
Increase (decrease) from investment operations:
|
|
|
|
|
|
|
|
|
|
|
|
|
|
|
|
|
|
|
|
|
|
|
|
|
|
Net investment income (loss) (a)
|
|
$
|
0.27
|
|
|
$
|
0.53
|
|
|
$
|
0.55
|
|
|
$
|
0.51
|
|
|
$
|
0.64
|
|
|
$
|
0.59
|
|
|
Net realized and unrealized gain (loss) on investments
|
|
|
0.78
|
|
|
|
(0.60
|
)
|
|
|
(0.81
|
)
|
|
|
0.06
|
|
|
|
0.97
|
|
|
|
(0.58
|
)
|
|
Net increase (decrease) from investment operations
|
|
$
|
1.05
|
|
|
$
|
(0.07
|
)
|
|
$
|
(0.26
|
)
|
|
$
|
0.57
|
|
|
$
|
1.61
|
|
|
$
|
0.01
|
|
|
Distributions to shareowners:
|
|
|
|
|
|
|
|
|
|
|
|
|
|
|
|
|
|
|
|
|
|
|
|
|
|
Net investment income
|
|
$
|
(0.25
|
)
|
|
$
|
(0.57
|
)
|
|
$
|
(0.55
|
)
|
|
$
|
(0.67
|
)
|
|
$
|
(0.49
|
)
|
|
$
|
(0.59
|
)
|
|
Total distributions
|
|
$
|
(0.25
|
)
|
|
$
|
(0.57
|
)
|
|
$
|
(0.55
|
)
|
|
$
|
(0.67
|
)
|
|
$
|
(0.49
|
)
|
|
$
|
(0.59
|
)
|
|
Net increase (decrease) in net asset value
|
|
$
|
0.80
|
|
|
$
|
(0.64
|
)
|
|
$
|
(0.81
|
)
|
|
$
|
(0.10
|
)
|
|
$
|
1.12
|
|
|
$
|
(0.58
|
)
|
|
Net asset value, end of period
|
|
$
|
10.99
|
|
|
$
|
10.19
|
|
|
$
|
10.83
|
|
|
$
|
11.64
|
|
|
$
|
11.74
|
|
|
$
|
10.62
|
|
|
Total return (b)
|
|
|
10.40
|
%(c)
|
|
|
(0.57
|
)%
|
|
|
(2.22
|
)%
|
|
|
4.89
|
%
|
|
|
15.53
|
%
|
|
|
0.41
|
%
|
|
Ratio of net expenses to average net assets
|
|
|
1.49
|
%(d)
|
|
|
1.63
|
%
|
|
|
1.57
|
%
|
|
|
1.37
|
%
|
|
|
1.37
|
%
|
|
|
1.37
|
%
|
|
Ratio of net investment income (loss) to average net assets
|
|
|
5.14
|
%(d)
|
|
|
5.13
|
%
|
|
|
4.92
|
%
|
|
|
4.33
|
%
|
|
|
5.74
|
%
|
|
|
5.68
|
%
|
|
Portfolio turnover rate
|
|
|
44
|
%(c)
|
|
|
126
|
%
|
|
|
108
|
%
|
|
|
126
|
%
|
|
|
131
|
%
|
|
|
109
|
%
|
|
Net assets, end of period (in thousands)
|
|
$
|
1,600
|
|
|
$
|
1,470
|
|
|
$
|
835
|
|
|
$
|
554
|
|
|
$
|
1,751
|
|
|
$
|
1,225
|
|
|
Ratios with no waiver of fees and assumption of expenses by
|
|
|
|
|
|
|
|
|
|
|
|
|
|
|
|
|
|
|
|
|
|
|
|
|
|
the Adviser and no reduction for fees paid indirectly:
|
|
|
|
|
|
|
|
|
|
|
|
|
|
|
|
|
|
|
|
|
|
|
|
|
|
Total expenses to average net assets
|
|
|
1.49
|
%(d)
|
|
|
1.63
|
%
|
|
|
1.59
|
%
|
|
|
1.37
|
%
|
|
|
1.37
|
%
|
|
|
1.37
|
%
|
|
Net investment income (loss) to average net assets
|
|
|
5.14
|
%(d)
|
|
|
5.13
|
%
|
|
|
4.90
|
%
|
|
|
4.33
|
%
|
|
|
5.74
|
%
|
|
|
5.68
|
%
|
| |
|
|
*
|
The Fund was audited by an independent registered public accounting firm other than Ernst & Young LLP.
|
|
(a)
|
The per-share data presented above is based on the average shares outstanding for the period presented.
|
|
(b)
|
Assumes initial investment at net asset value at the beginning of each period, reinvestment of all distributions and the complete redemption of the investment at net asset value at the end of each period.
|
|
(c)
|
Not annualized.
|
|
(d)
|
Annualized.
|
The accompanying notes are an integral part of these financial statements.
50 Pioneer Multi-Asset Income Fund | Semiannual Report | 1/31/21
| |
|
|
|
|
|
|
|
|
|
|
|
|
|
|
|
|
|
|
|
|
|
Six Months
|
|
|
|
|
|
|
|
|
|
|
|
|
|
|
|
|
|
|
|
Ended
|
|
|
Year
|
|
|
Year
|
|
|
Year
|
|
|
Year
|
|
|
Year
|
|
|
|
|
1/31/21
|
|
|
Ended
|
|
|
Ended
|
|
|
Ended
|
|
|
Ended
|
|
|
Ended
|
|
|
|
|
(unaudited)
|
|
|
7/31/20
|
|
|
7/31/19
|
|
|
7/31/18
|
|
|
7/31/17
|
|
|
7/31/16*
|
|
|
Class Y
|
|
|
|
|
|
|
|
|
|
|
|
|
|
|
|
|
|
|
|
Net asset value, beginning of period
|
|
$
|
10.13
|
|
|
$
|
10.77
|
|
|
$
|
11.57
|
|
|
$
|
11.67
|
|
|
$
|
10.56
|
|
|
$
|
11.14
|
|
|
Increase (decrease) from investment operations:
|
|
|
|
|
|
|
|
|
|
|
|
|
|
|
|
|
|
|
|
|
|
|
|
|
|
Net investment income (loss) (a)
|
|
$
|
0.32
|
|
|
$
|
0.64
|
|
|
$
|
0.64
|
|
|
$
|
0.71
|
|
|
$
|
0.70
|
|
|
$
|
0.63
|
|
|
Net realized and unrealized gain (loss) on investments
|
|
|
0.78
|
|
|
|
(0.62
|
)
|
|
|
(0.80
|
)
|
|
|
(0.06
|
)
|
|
|
0.97
|
|
|
|
(0.56
|
)
|
|
Net increase (decrease) from investment operations
|
|
$
|
1.10
|
|
|
$
|
0.02
|
|
|
$
|
(0.16
|
)
|
|
$
|
0.65
|
|
|
$
|
1.67
|
|
|
$
|
0.07
|
|
|
Distributions to shareowners:
|
|
|
|
|
|
|
|
|
|
|
|
|
|
|
|
|
|
|
|
|
|
|
|
|
|
Net investment income
|
|
$
|
(0.30
|
)
|
|
$
|
(0.66
|
)
|
|
$
|
(0.64
|
)
|
|
$
|
(0.75
|
)
|
|
$
|
(0.56
|
)
|
|
$
|
(0.65
|
)
|
|
Total distributions
|
|
$
|
(0.30
|
)
|
|
$
|
(0.66
|
)
|
|
$
|
(0.64
|
)
|
|
$
|
(0.75
|
)
|
|
$
|
(0.56
|
)
|
|
$
|
(0.65
|
)
|
|
Net increase (decrease) in net asset value
|
|
$
|
0.80
|
|
|
$
|
(0.64
|
)
|
|
$
|
(0.80
|
)
|
|
$
|
(0.10
|
)
|
|
$
|
1.11
|
|
|
$
|
(0.58
|
)
|
|
Net asset value, end of period
|
|
$
|
10.93
|
|
|
$
|
10.13
|
|
|
$
|
10.77
|
|
|
$
|
11.57
|
|
|
$
|
11.67
|
|
|
$
|
10.56
|
|
|
Total return (b)
|
|
|
10.98
|
%(c)
|
|
|
0.27
|
%
|
|
|
(1.36
|
)%
|
|
|
5.64
|
%
|
|
|
16.27
|
%
|
|
|
1.00
|
%
|
|
Ratio of net expenses to average net assets
|
|
|
0.65
|
%(d)
|
|
|
0.65
|
%
|
|
|
0.65
|
%
|
|
|
0.65
|
%
|
|
|
0.65
|
%
|
|
|
0.65
|
%
|
|
Ratio of net investment income (loss) to average net assets
|
|
|
5.97
|
%(d)
|
|
|
6.20
|
%
|
|
|
5.83
|
%
|
|
|
6.03
|
%
|
|
|
6.38
|
%
|
|
|
6.10
|
%
|
|
Portfolio turnover rate
|
|
|
44
|
%(c)
|
|
|
126
|
%
|
|
|
108
|
%
|
|
|
126
|
%
|
|
|
131
|
%
|
|
|
109
|
%
|
|
Net assets, end of period (in thousands)
|
|
$
|
610,771
|
|
|
$
|
586,958
|
|
|
$
|
840,851
|
|
|
$
|
637,945
|
|
|
$
|
319,117
|
|
|
$
|
202,134
|
|
|
Ratios with no waiver of fees and assumption of expenses by
|
|
|
|
|
|
|
|
|
|
|
|
|
|
|
|
|
|
|
|
|
|
|
|
|
|
the Adviser and no reduction for fees paid indirectly:
|
|
|
|
|
|
|
|
|
|
|
|
|
|
|
|
|
|
|
|
|
|
|
|
|
|
Total expenses to average net assets
|
|
|
0.67
|
%(d)
|
|
|
0.68
|
%
|
|
|
0.68
|
%
|
|
|
0.66
|
%
|
|
|
0.72
|
%
|
|
|
0.72
|
%
|
|
Net investment income (loss) to average net assets
|
|
|
5.95
|
%(d)
|
|
|
6.17
|
%
|
|
|
5.80
|
%
|
|
|
6.02
|
%
|
|
|
6.31
|
%
|
|
|
6.04
|
%
|
| |
|
|
*
|
The Fund was audited by an independent registered public accounting firm other than Ernst & Young LLP.
|
|
(a)
|
The per-share data presented above is based on the average shares outstanding for the period presented.
|
|
(b)
|
Assumes initial investment at net asset value at the beginning of each period, reinvestment of all distributions and the complete redemption of the investment at net asset value at the end of each
|
|
|
period.
|
|
(c)
|
Not annualized.
|
|
(d)
|
Annualized.
|
The accompanying notes are an integral part of these financial statements.
Pioneer Multi-Asset Income Fund | Semiannual Report | 1/31/21 51
Notes to Financial Statements |
1/31/21
(unaudited)
1. Organization and Significant Accounting Policies
Pioneer Multi-Asset Income Fund (the “Fund”) is one of two portfolios comprising Pioneer Series Trust IV (the “Trust”), a Delaware statutory trust. The Fund is registered under the Investment Company Act of 1940 as a
diversified, open-end management investment company. The investment objective of the Fund is to seek a high level of current income to the extent consistent with a relatively high level of stability of principal.
The Fund offers five classes of shares designated as Class A, Class C, Class K, Class R and Class Y shares. Each class of shares represents an interest in the same portfolio of investments of the Fund and has
identical rights (based on relative net asset values) to assets and liquidation proceeds. Share classes can bear different rates of class-specific fees and expenses, such as transfer agent and distribution fees. Differences in class-specific fees
and expenses will result in differences in net investment income and, therefore, the payment of different dividends from net investment income earned by each class. The Amended and Restated Declaration of Trust of the Fund gives the Board of
Trustees the flexibility to specify either per-share voting or dollar-weighted voting when submitting matters for shareowner approval. Under per-share voting, each share of a class of the Fund is entitled to one vote. Under dollar-weighted voting,
a shareowner’s voting power is determined not by the number of shares owned, but by the dollar value of the shares on the record date. Each share class has exclusive voting rights with respect to matters affecting only that class, including with
respect to the distribution plan for that class. There is no distribution plan for Class K and Class Y shares.
Amundi Asset Management US, Inc., an indirect, wholly owned subsidiary of Amundi and Amundi’s wholly owned subsidiary, Amundi USA, Inc., serves as the Fund’s investment adviser (the “Adviser”). Prior to January 1,
2021, the Adviser was named Amundi Pioneer Asset Management, Inc. Amundi Distributor US, Inc., an affiliate of Amundi Asset Management, Inc., serves as the Fund’s distributor (the “Distributor”).
In August 2018, the Financial Accounting Standards Board (FASB) issued Accounting Standards Update 2018-13 “Disclosure Framework - Changes to the Disclosure Requirements for Fair Value Measurement” (“ASU 2018-13”)
which modifies disclosure requirements for fair value measurements, principally for Level 3 securities and transfers between levels of the fair value hierarchy. ASU 2018-13 is effective for fiscal years beginning after December 15, 2019 and for
interim periods within those fiscal years. The
52 Pioneer Multi-Asset Income Fund | Semiannual Report | 1/31/21
Fund has adopted ASU 2018-13 for the six months ended January 31, 2021. The impact to the Fund’s adoption was limited to changes in the Fund’s disclosures regarding fair value, primarily those disclosures related to
transfers between levels of the fair value hierarchy and disclosure of the range and weighted average used to develop significant unobservable inputs for Level 3 fair value investments, when applicable.
In March 2020, FASB issued an Accounting Standard Update, ASU 2020-04, Reference Rate Reform (Topic 848) — Facilitation of the Effects of Reference Rate Reform on Financial Reporting (“ASU 2020-04”), which provides
optional, temporary relief with respect to the financial reporting of contracts subject to certain types of modifications due to the planned discontinuation of the London Interbank Offered Rate (“LIBOR”) and other LIBOR-based reference rates at the
end of 2021. The temporary relief provided by ASU 2020-04 is effective for certain reference rate-related contract modifications that occur during the period from March 12, 2020 through December 31, 2022. Management is evaluating the impact of ASU
2020-04 on the Fund’s investments, derivatives, debt and other contracts that will undergo reference rate-related modifications as a result of the reference rate reform.
The Fund is an investment company and follows investment company accounting and reporting guidance under U.S. Generally Accepted Accounting Principles (“U.S. GAAP”). U.S. GAAP requires the management of the Fund to
make estimates and assumptions that affect the reported amounts of assets and liabilities, the disclosure of contingent assets and liabilities at the date of the financial statements, and the reported amounts of income, expenses and gain or loss on
investments during the reporting period. Actual results could differ from those estimates.
The following is a summary of significant accounting policies followed by the Fund in the preparation of its financial statements:
A. Security Valuation
The net asset value of the Fund is computed once daily, on each day the New York Stock Exchange (“NYSE”) is open, as of the close of regular trading on the NYSE.
Equity securities that have traded on an exchange are valued by using the last sale price on the principal exchange where they are traded. Equity securities that have not traded on the date of
valuation, or securities for which sale prices are not available, generally are valued using the mean between the last bid and asked prices or, if both last bid and asked prices are not available, at the last quoted bid price. Last sale and bid and
asked prices are provided by independent third party pricing services. In the case
Pioneer Multi-Asset Income Fund | Semiannual Report | 1/31/21 53
of equity securities not traded on an exchange, prices are typically determined by independent third party pricing services using a variety of techniques and methods.
The value of foreign securities is translated into U.S. dollars based on foreign currency exchange rate quotations supplied by a third party pricing source. Trading in non-U.S. equity securities is
substantially completed each day at various times prior to the close of the NYSE. The values of such securities used in computing the net asset value of the Fund’s shares are determined as of such times. The Fund may use a fair value model
developed by an independent pricing service to value non-U.S. equity securities.
Loan interests are valued in accordance with guidelines established by the Board of Trustees at the mean between the last available bid and asked prices from one or more brokers or dealers as
obtained from Loan Pricing Corporation, an independent third party pricing service. If price information is not available from Loan Pricing Corporation, or if the price information is deemed to be unreliable, price information will be obtained from
an alternative loan interest pricing service. If no reliable price quotes are available from either the primary or alternative pricing service, broker quotes will be solicited.
Equity-linked notes and fixed-income securities are valued by using prices supplied by independent pricing services, which consider such factors as market prices, market events, quotations from one
or more brokers, Treasury spreads, yields, maturities and ratings, or may use a pricing matrix or other fair value methods or techniques to provide an estimated value of the security or instrument. A pricing matrix is a means of valuing a debt
security on the basis of current market prices for other debt securities, historical trading patterns in the market for fixed-income securities and/or other factors. Non-U.S. debt securities that are listed on an exchange will be valued at the bid
price obtained from an independent third party pricing service. When independent third party pricing services are unable to supply prices, or when prices or market quotations are considered to be unreliable, the value of that security may be
determined using quotations from one or more broker-dealers.
Event-linked bonds are valued at the bid price obtained from an independent third party pricing service. Other insurance-linked securities (including reinsurance sidecars, collateralized reinsurance
and industry loss warranties) may be valued at the bid price obtained from an independent pricing service, or through a third party using a pricing matrix, insurance industry valuation models, or other fair value methods or techniques to provide an
estimated value of the instrument.
54 Pioneer Multi-Asset Income Fund | Semiannual Report | 1/31/21
Options contracts are generally valued at the mean between the last bid and ask prices on the principal exchange where they are traded. Over-the-counter (“OTC”) options and options on swaps
(“swaptions”) are valued using prices supplied by independent pricing services, which consider such factors as market prices, market events, quotations from one or more brokers, Treasury spreads, yields, maturities and ratings, or may use a pricing
matrix or other fair value methods or techniques to provide an estimated value of the security or instrument.
Forward foreign currency exchange contracts are valued daily using the foreign exchange rate or, for longer term forward contract positions, the spot currency rate and the forward points on a daily
basis, in each case provided by a third party pricing service. Contracts whose forward settlement date falls between two quoted days are valued by interpolation.
Futures contracts are generally valued at the closing settlement price established by the exchange on which they are traded.
Swap contracts, including interest rate swaps, caps and floors (other than centrally cleared swap contracts), are valued at the dealer quotations obtained from reputable International Swap Dealers
Association members. Centrally cleared swaps are valued at the daily settlement price provided by the central clearing counterparty.
Shares of open-end registered investment companies (including money market mutual funds) are valued at such funds’ net asset value.
Shares of exchange-listed closed-end funds are valued by using the last sale price on the principal exchange where they are traded. Shares of closed-end interval funds that offer their shares at net
asset value are valued at such funds’ net asset value.
Repurchase agreements are valued at par. Cash may include overnight time deposits at approved financial institutions.
Securities or loan interests for which independent pricing services or broker-dealers are unable to supply prices or for which market prices and/or quotations are not readily available or are
considered to be unreliable are valued by a fair valuation team comprised of certain personnel of the Adviser pursuant to procedures adopted by the Fund’s Board of Trustees. The Adviser’s fair valuation team uses fair value methods approved by the
Valuation Committee of the Board of Trustees. The Adviser’s fair valuation team is responsible for monitoring developments that may impact fair valued securities and for discussing and assessing fair values on an ongoing basis, and at least
quarterly, with the Valuation Committee of the Board of Trustees.
Pioneer Multi-Asset Income Fund | Semiannual Report | 1/31/21 55
Inputs used when applying fair value methods to value a security may include credit ratings, the financial condition of the company, current market conditions and comparable securities. The Fund may
use fair value methods if it is determined that a significant event has occurred after the close of the exchange or market on which the security trades and prior to the determination of the Fund’s net asset value. Examples of a significant event
might include political or economic news, corporate restructurings, natural disasters, terrorist activity or trading halts. Thus, the valuation of the Fund’s securities may differ significantly from exchange prices, and such differences could be
material.
At January 31, 2021, no securities were valued using fair value methods (other than securities valued using prices supplied by independent pricing services, broker-dealers or using a third party
insurance industry pricing model).
B. Investment Income and Transactions
Dividend income is recorded on the ex-dividend date, except that certain dividends from foreign securities where the ex-dividend date may have passed are recorded as soon as the Fund becomes aware
of the ex-dividend data in the exercise of reasonable diligence.
Interest income, including interest on income-bearing cash accounts, is recorded on the accrual basis. Dividend and interest income are reported net of unrecoverable foreign taxes withheld at the
applicable country rates and net of income accrued on defaulted securities.
Interest and dividend income payable by delivery of additional shares is reclassified as PIK (payment-in-kind) income upon receipt and is included in interest and dividend income, respectively.
Principal amounts of mortgage-backed securities are adjusted for monthly paydowns. Premiums and discounts related to certain mortgage-backed securities are amortized or accreted in proportion to the
monthly paydowns. All discounts/premiums on purchase prices of debt securities are accreted/amortized for financial reporting purposes over the life of the respective securities, and such accretion/amortization is included in interest income.
Security transactions are recorded as of trade date. Gains and losses on sales of investments are calculated on the identified cost method for both financial reporting and federal income tax
purposes.
56 Pioneer Multi-Asset Income Fund | Semiannual Report | 1/31/21
C. Foreign Currency Translation
The books and records of the Fund are maintained in U.S. dollars. Amounts denominated in foreign currencies are translated into U.S. dollars using current exchange rates.
Net realized gains and losses on foreign currency transactions, if any, represent, among other things, the net realized gains and losses on foreign currency exchange contracts, disposition of
foreign currencies and the difference between the amount of income accrued and the U.S. dollars actually received. Further, the effects of changes in foreign currency exchange rates on investments are not segregated on the Statement of Operations
from the effects of changes in the market prices of those securities, but are included with the net realized and unrealized gain or loss on investments.
D. Federal Income Taxes
It is the Fund’s policy to comply with the requirements of the Internal Revenue Code applicable to regulated investment companies and to distribute all of its net taxable income and net realized
capital gains, if any, to its shareowners. Therefore, no provision for federal income taxes is required. As of July 31, 2020, the Fund did not accrue any interest or penalties with respect to uncertain tax positions, which, if applicable, would be
recorded as an income tax expense on the Statement of Operations. Tax returns filed within the prior three years remain subject to examination by federal and state tax authorities.
In determining the daily net asset value, the Fund estimates the reserve for the repatriation of taxes, if any, associated with its investments in certain countries. The estimated reserve for
capital gains is based on the net unrealized appreciation on certain portfolio securities, the holding period of such securities and the related tax rates, tax loss carryforwards (if applicable) and other such factors. As of July 31, 2020, the Fund
had accrued $592,736 in reserve for repatriation taxes related to capital gains.
A portion of the dividend income recorded by the Fund is from distributions by publicly traded Real Estate Investment Trusts (“REITs”), and such distributions for tax purposes may also consist of
capital gains and return of capital. The actual return of capital and capital gains portions of such distributions will be determined by formal notifications from the REITs subsequent to the calendar year-end. Distributions received from the REITs
that are determined to be a return of capital are recorded by the Fund as a reduction of the cost basis of the securities held and those determined to be capital gain are reflected as such on the Statement of Operations.
Pioneer Multi-Asset Income Fund | Semiannual Report | 1/31/21 57
The amount and character of income and capital gain distributions to shareowners are determined in accordance with federal income tax rules, which may differ from U.S. GAAP. Distributions in excess
of net investment income or net realized gains are temporary over distributions for financial statement purposes resulting from differences in the recognition or classification of income or distributions for financial statement and tax purposes.
Capital accounts within the financial statements are adjusted for permanent book/tax differences to reflect tax character, but are not adjusted for temporary differences.
The tax character of current year distributions payable will be determined at the end of the current taxable year. The tax character of distributions paid during the year ended July 31, 2020 was as
follows:
|
|
|
|
|
|
|
|
2020
|
|
|
Distributions paid from:
|
|
|
|
|
Ordinary income
|
|
$
|
92,499,267
|
|
|
Distribution in Excess
|
|
|
611,613
|
|
|
Total
|
|
$
|
93,110,880
|
|
The following shows the components of distributable earnings (losses) on a federal income tax basis at July 31, 2020:
|
|
|
|
|
|
|
|
2020
|
|
|
Distributable earnings/(loss):
|
|
|
|
|
Capital loss carryforward
|
|
$
|
(249,956,236
|
)
|
|
Current year dividend payable
|
|
|
(38,208
|
)
|
|
Net unrealized depreciation
|
|
|
(30,576,253
|
)
|
|
Total
|
|
$
|
(280,570,697
|
)
|
The difference between book-basis and tax-basis net unrealized appreciation is attributable to the tax deferral of losses on wash sales, adjustments relating to catastrophe bonds and PFIC’s, the
mark to market of forward foreign currency contracts and futures contracts, interest on defaulted bonds, tax basis adjustments on Real Estate Investment Trust (“REIT”), partnerships and other holdings.
E. Fund Shares
The Fund records sales and repurchases of its shares as of trade date. The Distributor earned $29,321 in underwriting commissions on the sale of Class A shares during the six months ended January
31, 2021.
F. Class Allocations
Income, common expenses and realized and unrealized gains and losses are calculated at the fund level and allocated daily to each class of shares based on its respective percentage of adjusted net
assets at the beginning of the day.
58 Pioneer Multi-Asset Income Fund | Semiannual Report | 1/31/21
Distribution fees are calculated based on the average daily net asset value attributable to Class A, Class C and Class R shares of the Fund, respectively (see Note 5). Class K and Class Y shares do
not pay distribution fees. All expenses and fees paid to the Fund’s transfer agent for its services are allocated among the classes of shares based on the number of accounts in each class and the ratable allocation of related out-of-pocket expenses
(see Note 4).
The Fund declares as daily dividends substantially all of its net investment income. All dividends are paid on a monthly basis. Short-term capital gain distributions, if any, may be declared with
the daily dividends. Distributions to shareowners are recorded as of the ex-dividend date. Distributions paid by the Fund with respect to each class of shares are calculated in the same manner and at the same time, except that net investment income
dividends to Class A, Class C, Class K, Class R and Class Y shares can reflect different transfer agent and distribution expense rates.
G. Risks
The value of securities held by the Fund may go up or down, sometimes rapidly or unpredictably, due to general market conditions, such as real or perceived adverse economic, political or regulatory
conditions, recessions, the spread of infectious illness or other public health issues, inflation, changes in interest rates, lack of liquidity in the bond markets or adverse investor sentiment. In the past several years, financial markets have
experienced increased volatility, depressed valuations, decreased liquidity and heightened uncertainty. These conditions may continue, recur, worsen or spread.
At times, the Fund’s investments may represent industries or industry sectors that are interrelated or have common risks, making the Fund more susceptible to any economic, political, or regulatory
developments or other risks affecting those industries and sectors. The Fund’s investments in foreign markets and countries with limited developing markets may subject the Fund to a greater degree of risk than investments in a developed market.
These risks include disruptive political or economic conditions and the imposition of adverse governmental laws or currency exchange restrictions.
The Fund invests in below-investment-grade (high-yield) debt securities and preferred stocks. Some of these high-yield securities may be convertible into equity securities of the issuer. Debt
securities rated below-investment-grade are commonly referred to as “junk bonds” and are considered speculative. These securities involve greater risk of loss, are subject to greater price volatility, and are less liquid, especially during periods
of economic uncertainty or change, than higher rated debt securities.
Pioneer Multi-Asset Income Fund | Semiannual Report | 1/31/21 59
The Fund’s investments, payment obligations and financing terms may be based on floating rates, such as LIBOR (London Interbank Offered Rate). Plans are underway to phase out the use of LIBOR by the
end of 2021. The administrator of LIBOR recently announced a possible delay in the phase out of a majority of the U.S. dollar LIBOR publications until mid-2023, with the remainder of the LIBOR publications to end at the end of 2021. There remains
uncertainty regarding the nature of any replacement rate and the impact of the transition from LIBOR on the fund, issuers of instruments in which the fund invests, and financial markets generally.
With the increased use of technologies such as the Internet to conduct business, the Fund is susceptible to operational, information security and related risks. While the Fund’s Adviser has
established business continuity plans in the event of, and risk management systems to prevent, limit or mitigate, such cyber-attacks, there are inherent limitations in such plans and systems, including the possibility that certain risks have not
been identified. Furthermore, the Fund cannot control the cybersecurity plans and systems put in place by service providers to the Fund such as Brown Brothers Harriman & Co., the Fund’s custodian and accounting agent, and DST Asset Manager
Solutions, Inc., the Fund’s transfer agent. In addition, many beneficial owners of Fund shares hold them through accounts at broker-dealers, retirement platforms and other financial market participants over which neither the Fund nor the Adviser
exercises control. Each of these may in turn rely on service providers to them, which are also subject to the risk of cyber-attacks. Cybersecurity failures or breaches at the Adviser or the Fund’s service providers or intermediaries have the
ability to cause disruptions and impact business operations, potentially resulting in financial losses, interference with the Fund’s ability to calculate its net asset value, impediments to trading, the inability of Fund shareowners to effect share
purchases, redemptions or exchanges or receive distributions, loss of or unauthorized access to private shareowner information and violations of applicable privacy and other laws, regulatory fines, penalties, reputational damage, or additional
compliance costs. Such costs and losses may not be covered under any insurance. In addition, maintaining vigilance against cyber-attacks may involve substantial costs over time, and system enhancements may themselves be subject to cyber-attacks.
COVID-19
The respiratory illness COVID-19 caused by a novel coronavirus has resulted in a global pandemic and major disruption to economies and markets around the world, including the United States. Global
financial markets have experienced extreme volatility and severe losses, and trading in many
60 Pioneer Multi-Asset Income Fund | Semiannual Report | 1/31/21
instruments has been disrupted. Liquidity for many instruments has been greatly reduced for periods of time. Some interest rates are very low and in some cases yields are negative. Some sectors of
the economy and individual issuers have experienced particularly large losses. These circumstances may continue for an extended period of time, and may continue to affect adversely the value and liquidity of the Fund’s investments. The ultimate
economic fallout from the pandemic, and the long-term impact on economies, markets, industries and individual issuers, are not known. Governments and central banks, including the Federal Reserve in the U.S., have taken extraordinary and
unprecedented actions to support local and global economies and the financial markets. These actions have resulted in significant expansion of public debt, including in the U.S. The impact of these measures, and whether they will be effective to
mitigate the economic and market disruption, will not be known for some time. The consequences of high public debt, including its future impact on the economy and securities markets, likewise may not be known for some time.
The Fund’s prospectus contains unaudited information regarding the Fund’s principal risks. Please refer to that document when considering the Fund’s principal risks.
H. Restricted Securities
Restricted Securities are subject to legal or contractual restrictions on resale. Restricted securities generally are resold in transactions exempt from registration under the Securities Act of
1933. Private placement securities are generally considered to be restricted except for those securities traded between qualified institutional investors under the provisions of Rule 144A of the Securities Act of 1933.
Disposal of restricted investments may involve negotiations and expenses, and prompt sale at an acceptable price may be difficult to achieve. Restricted investments held by the Fund at January 31,
2021 are listed in the Schedule of Investments.
I. Insurance-Linked Securities (“ILS”)
The Fund invests in ILS. The Fund could lose a portion or all of the principal it has invested in an ILS, and the right to additional interest or dividend payments with respect to the security, upon
the occurrence of one or more trigger events, as defined within the terms of an insurance-linked security. Trigger events, generally, are hurricanes, earthquakes, or other natural events of a specific size or magnitude that occur in a designated
geographic region during a specified time period, and/or that involve losses or other metrics that exceed a specific amount. There is no way to accurately predict
Pioneer Multi-Asset Income Fund | Semiannual Report | 1/31/21 61
whether a trigger event will occur, and accordingly, ILS carry significant risk. The Fund is entitled to receive principal, and interest and/or dividend payments so long as no trigger event occurs
of the description and magnitude specified by the instrument. In addition to the specified trigger events, ILS may expose the Fund to other risks, including but not limited to issuer (credit) default, adverse regulatory or jurisdictional
interpretations and adverse tax consequences.
The Fund’s investments in ILS may include event-linked bonds. ILS also may include special purpose vehicles (“SPVs”) or similar instruments structured to comprise a portion of a reinsurer’s
catastrophe-oriented business, known as quota share instruments (sometimes referred to as reinsurance sidecars), or to provide reinsurance relating to specific risks to insurance or reinsurance companies through a collateralized instrument, known
as collateralized reinsurance. Structured reinsurance investments also may include industry loss warranties (“ILWs”). A traditional ILW takes the form of a bilateral reinsurance contract, but there are also products that take the form of
derivatives, collateralized structures, or exchange-traded instruments.
Where the ILS are based on the performance of underlying reinsurance contracts, the Fund has limited transparency into the individual underlying contracts, and therefore must rely upon the risk
assessment and sound underwriting practices of the issuer. Accordingly, it may be more difficult for the Adviser to fully evaluate the underlying risk profile of the Fund’s structured reinsurance investments, and therefore the Fund’s assets are
placed at greater risk of loss than if the Adviser had more complete information. Structured reinsurance instruments generally will be considered illiquid securities by the Fund. These securities may be difficult to purchase, sell or unwind.
Illiquid securities also may be difficult to value. If the Fund is forced to sell an illiquid asset, the Fund may be forced to sell at a loss.
J. Repurchase Agreements
Repurchase agreements are arrangements under which the Fund purchases securities from a broker-dealer or a bank, called the counterparty, upon the agreement of the counterparty to repurchase the
securities from the Fund at a later date, and at a specific price, which is typically higher than the purchase price paid by the Fund. The securities purchased serve as the Fund’s collateral for the obligation of the counterparty to repurchase the
securities. The value of the collateral, including accrued interest, is required
62 Pioneer Multi-Asset Income Fund | Semiannual Report | 1/31/21
to be equal to or in excess of the repurchase price. The collateral for all repurchase agreements is held in safekeeping in the customer-only account of the Fund’s custodian or a sub-custodian of
the Fund. The Adviser is responsible for determining that the value of the collateral remains at least equal to the repurchase price. In the event of a default by the counterparty, the Fund is entitled to sell the securities, but the Fund may not
be able to sell them for the price at which they were purchased, thus causing a loss to the Fund. Additionally, if the counterparty becomes insolvent, there is some risk that the Fund will not have a right to the securities, or the immediate right
to sell the securities.
Open repurchase agreements at January 31, 2021, if any, are disclosed in the Schedule of Investments.
K. Purchased Options
The Fund may purchase put and call options to seek to increase total return. Purchased call and put options entitle the Fund to buy and sell a specified number of shares or units of a particular
security, currency or index at a specified price at a specific date or within a specific period of time. Upon the purchase of a call or put option, the premium paid by the Fund is included on the Statement of Assets and Liabilities as an
investment. All premiums are marked-to-market daily, and any unrealized appreciation or depreciation is recorded on the Fund’s Statement of Operations. As the purchaser of an index option, the Fund has the right to receive a cash payment equal to
any depreciation in the value of the index below the strike price of the option (in the case of a put) or equal to any appreciation in the value of the index over the strike price of the option (in the case of a call) as of the valuation date of
the option. Premiums paid for purchased call and put options which have expired are treated as realized losses on investments on the Statement of Operations. Upon the exercise or closing of a purchased put option, the premium is offset against the
proceeds on the sale of the underlying security or financial instrument in order to determine the realized gain or loss on investments. Upon the exercise or closing of a purchased call option, the premium is added to the cost of the security or
financial instrument. The risk associated with purchasing options is limited to the premium originally paid.
The average market value of purchased options contracts open during the six months ended January 31, 2021, was $807,325. Open purchased options at January 31, 2021, are listed in the Schedule of
Investments.
Pioneer Multi-Asset Income Fund | Semiannual Report | 1/31/21 63
L. Forward Foreign Currency Exchange Contracts
The Fund may enter into forward foreign currency exchange contracts (“contracts”) for the purchase or sale of a specific foreign currency at a fixed price on a future date. All contracts are
marked-to-market daily at the applicable exchange rates, and any resulting unrealized appreciation or depreciation is recorded in the Fund’s financial statements. The Fund records realized gains and losses at the time a contract is offset by entry
into a closing transaction or extinguished by delivery of the currency. Risks may arise upon entering into these contracts from the potential inability of counterparties to meet the terms of the contract and from unanticipated movements in the
value of foreign currencies relative to the U.S. dollar (see Note 8).
During the six months ended January 31, 2021, the Fund had entered into various forward foreign currency exchange contracts that obligated the Fund to deliver or take delivery of currencies at
specified future maturity dates. Alternatively, prior to the settlement date of a forward foreign currency exchange contract, the Fund may close out such contract by entering into an offsetting contract.
The average market value of forward foreign currency exchange contracts open during the six months ended January 31, 2021, was $2,659,966. There were no open forward foreign currency exchange
contracts at January 31, 2021.
M. Futures Contracts
The Fund may enter into futures transactions in order to attempt to hedge against changes in interest rates, securities prices and currency exchange rates or to seek to increase total return.
Futures contracts are types of derivatives. All futures contracts entered into by the Fund are traded on a futures exchange. Upon entering into a futures contract, the Fund is required to deposit with a broker an amount of cash or securities equal
to the minimum “initial margin” requirements of the associated futures exchange. The amount of cash deposited with the broker as collateral at January 31, 2021, is recorded as “Futures collateral” on the Statement of Assets and Liabilities.
Subsequent payments for futures contracts (“variation margin”) are paid or received by the Fund, depending on the daily fluctuation in the value of the contracts, and are recorded by the Fund as
unrealized appreciation or depreciation. Cash received from or paid to the broker related to previous margin movement is held in a segregated account at the broker and is recorded as either “Due from broker for futures” or “Due to broker for
futures” on the Statement of Assets and Liabilities. When the contract is
64 Pioneer Multi-Asset Income Fund | Semiannual Report | 1/31/21
closed, the Fund realizes a gain or loss equal to the difference between the opening and closing value of the contract as well as any fluctuation in foreign currency exchange rates where applicable.
Futures contracts are subject to market risk, interest rate risk and currency exchange rate risk. Changes in value of the contracts may not directly correlate to the changes in value of the underlying securities. With futures, there is reduced
counterparty credit risk to the Fund since futures are exchange-traded and the exchange’s clearinghouse, as counterparty to all exchange-traded futures, guarantees the futures against default.
The average market value of futures contracts open during the six months ended January 31, 2021, was $(100,102,850). Open futures contracts outstanding at January 31, 2021, are listed in the
Schedule of Investments.
K. Equity-Linked Notes
Equity-linked notes seek to generate income and provide exposure to the performance of an underlying security, group of securities or exchange-traded funds (the “underlying reference instrument”).
In an equity-linked note, the Fund purchases a note from a bank or broker-dealer and in return, the issuer provides for interest payments during the term of the note. At maturity or when the security is sold, the Fund will either settle by taking
physical delivery of the underlying reference instrument or by receipt of a cash settlement amount equal to the value of the note at termination or maturity. The use of equity-linked notes involves the risk that the value of the note changes
unfavorably due to movements in the value of the underlying reference instrument. Equity-linked notes are considered general unsecured contractual obligations of the bank or broker-dealer. The Fund must rely on the creditworthiness of the issuer
for its investment returns.
2. Management Agreement
The Adviser manages the Fund’s portfolio. Management fees are calculated daily and paid monthly at the annual rate of 0.50% of the Fund’s average daily net assets up to $1 billion, 0.45% of the next $4 billion of the
Fund’s average daily net assets, and 0.40% of the Fund’s average daily net assets over $5 billion. For the six months ended January 31, 2021, the effective management fee was equivalent to 0.49% (excluding waivers and/or assumption of expenses) of
the Fund’s average daily net assets.
The Adviser has agreed to waive its management fee with respect to any portion of the Fund’s assets invested in Pioneer Floating Rate Trust, an affiliated fund managed by the Adviser. For the six months ended
Pioneer Multi-Asset Income Fund | Semiannual Report | 1/31/21 65
January 31, 2021, the Adviser waived $17,125 in management fees with respect to the Fund, which is reflected on the Statement of Operations as an expense waiver.
The Adviser has contractually agreed to limit ordinary operating expenses (ordinary operating expenses means all fund expenses other than extraordinary expenses, such as litigation, taxes, brokerage commissions and
acquired fund fees and expenses) of the Fund to the extent required to reduce Fund expenses to 0.85% and 0.65% of the average daily net assets attributable to Class A and Class Y shares, respectively. These expense limitations are in effect through
December 1, 2021 for Class A shares and Class Y shares. There can be no assurance that the Adviser will extend the expense limitation agreement for a class of shares beyond the date referred to above.
In addition, under the management and administration agreements, certain other services and costs, including accounting, regulatory reporting and insurance premiums, are paid by the Fund as administrative
reimbursements. Included in “Due to affiliates” reflected on the Statement of Assets and Liabilities is $93,664 in management fees, administrative costs and certain other reimbursements payable to the Adviser at January 31, 2021.
3. Compensation of Trustees and Officers
The Fund pays an annual fee to its Trustees. The Adviser reimburses the Fund for fees paid to the Interested Trustees. The Fund does not pay any salary or other compensation to its officers. For the six months ended
January 31, 2021, the Fund paid $28,642 in Trustees’ compensation, which is reflected on the Statement of Operations as Trustees’ fees. At January 31, 2021, the Fund had a payable for Trustees’ fees on its Statement of Assets and Liabilities of
$5,437.
4. Transfer Agent
DST Asset Manager Solutions, Inc. serves as the transfer agent to the Fund at negotiated rates. Transfer agent fees and payables shown on the Statement of Operations and the Statement of Assets and Liabilities,
respectively, include sub-transfer agent expenses incurred through the Fund’s omnibus relationship contracts.
In addition, the Fund reimbursed the transfer agent for out-of-pocket expenses incurred by the transfer agent related to shareowner communications activities such as proxy and statement mailings, and outgoing phone
calls. For the six months ended January 31, 2021, such out-of-pocket expenses by class of shares were as follows:
66 Pioneer Multi-Asset Income Fund | Semiannual Report | 1/31/21
| |
|
|
|
|
Shareowner Communications:
|
|
|
|
|
Class A
|
|
$
|
13,661
|
|
|
Class C
|
|
|
8,083
|
|
|
Class R
|
|
|
671
|
|
|
Class Y
|
|
|
11,970
|
|
|
Total
|
|
$
|
34,385
|
|
5. Distribution and Service Plans
The Fund has adopted a distribution plan (the “Plan”) pursuant to Rule 12b-1 of the Investment Company Act of 1940 with respect to its Class A, Class C and Class R shares (the “Plan”). Pursuant to the Plan, the Fund
pays the Distributor 0.25% of the average daily net assets attributable to Class A shares as compensation for personal services and/or account maintenance services or distribution services with regard to Class A shares. Pursuant to the Plan, the
Fund also pays the Distributor 1.00% of the average daily net assets attributable to Class C shares. The fee for Class C shares consists of a 0.25% service fee and a 0.75% distribution fee paid as compensation for personal services and/or account
maintenance services or distribution services with regard to Class C shares. Pursuant to the Plan, the Fund further pays the Distributor 0.50% of the average daily net assets attributable to Class R shares for distribution services. Included in
“Due to affiliates” reflected on the Statement of Assets and Liabilities is $51,955 in distribution fees payable to the Distributor at January 31, 2021.
The Fund also has adopted a separate service plan for Class R shares (the “Service Plan”). The Service Plan authorizes the Fund to pay securities dealers, plan administrators or other service organizations that agree
to provide certain services to retirement plans or plan participants holding shares of the Fund a service fee of up to 0.25% of the Fund’s average daily net assets attributable to Class R shares held by such plans.
In addition, redemptions of Class A and Class C shares may be subject to a contingent deferred sales charge (“CDSC”). A CDSC of 1.00% may be imposed on redemptions of certain net asset value purchases of Class A
shares within 12 months of purchase. Redemptions of Class C shares within 12 months of purchase are subject to a CDSC of 1.00% based on the lower of cost or market value of shares being redeemed. Shares purchased as part of an exchange remain
subject to any CDSC that applied to the original purchase of those shares. There is no CDSC for Class K, Class R and Class Y shares. Proceeds from the CDSCs are paid to the Distributor. For the six months ended January 31, 2021, CDSCs in the amount
of $9,884 were paid to the Distributor.
Pioneer Multi-Asset Income Fund | Semiannual Report | 1/31/21 67
6. Line of Credit Facility
The Fund, along with certain other funds in the Pioneer Family of Funds (the “Funds”), participates in a committed, unsecured revolving line of credit (“credit facility”). Borrowings are used solely for temporary or
emergency purposes. The Fund may borrow up to the lesser of the amount available under the credit facility or the limits set for borrowing by the Fund’s prospectus and the 1940 Act. Effective March 11, 2020, the Fund participates in a facility in
the amount of $300 million. Prior to March 11, 2020, the Fund participated in a facility in the amount of $250 million. Under such facility, depending on the type of loan, interest on borrowings is payable at the London Interbank Offered Rate
(“LIBOR”) plus a credit spread. The Fund also pays an annual commitment fee to participate in the credit facility. The commitment fee in the amount of 0.30% of the daily unused portion of each lenders commitment is allocated among participating
Funds based on an allocation schedule set forth in the credit agreement. For the six months ended January 31, 2021, the Fund had no borrowings under the credit facility.
7. Transactions in Affiliated Issuers
An affiliated issuer is a company in which the Fund has a direct or indirect ownership of, control of, or voting power of 5 percent or more of the outstanding voting ,or a company which is under common control. At
January 31, 2021, the value of the Fund’s investment in affiliated issuers was $253,829, which represents less than one percent of the Fund’s net assets. Transactions in affiliated issuers by the Fund for the six month period ended January 31, 2021
were as follows:
| |
|
|
|
|
|
|
|
|
|
|
|
|
|
|
|
Change in net
|
|
|
|
|
|
|
|
Net
|
|
unrealized
|
|
|
|
|
|
|
|
Realized
|
|
appreciation/
|
|
|
|
|
|
|
|
gain/loss
|
Dividends
|
depreciation
|
Shares
|
|
|
Name
|
|
|
|
from
|
from
|
from
|
held
|
|
|
of the
|
Value at
|
|
|
Investments
|
Investments
|
Investments
|
at
|
Value at
|
|
Affiliated
|
July 31,
|
|
|
in Affiliated
|
in Affiliated
|
in Affiliated
|
January 31,
|
January 31,
|
|
Issuer
|
2020
|
Purchases
|
Sales
|
Issuer
|
Issuer
|
Issuer
|
2021
|
2021
|
|
Pioneer
|
|
|
|
|
|
|
|
|
|
Floating
|
|
|
|
|
|
|
|
|
|
Rate
|
|
|
|
|
|
|
|
|
|
Trust
|
$5,877,053
|
$ —
|
$(4,673,416)
|
$(52,131)
|
$191,027
|
$778,742
|
23,901
|
$253,829
|
|
Total
|
$5,877,053
|
$ —
|
$(4,673,416)
|
$(52,131)
|
$191,027
|
$778,742
|
23,901
|
$253,829
|
Annual and semi-annual reports for the underlying Pioneer funds are available on the funds’ web page(s) at www.amundi.com/us.
68 Pioneer Multi-Asset Income Fund | Semiannual Report | 1/31/21
8. Additional Disclosures about Derivative Instruments and Hedging Activities
The Fund’s use of derivatives may enhance or mitigate the Fund’s exposure to the following risks:
Interest rate risk relates to the fluctuations in the value of interest-bearing securities due to changes in the prevailing levels of market interest rates.
Credit risk relates to the ability of the issuer of a financial instrument to make further principal or interest payments on an obligation or commitment that it has to the Fund.
Foreign exchange rate risk relates to fluctuations in the value of an asset or liability due to changes in currency exchange rates.
Equity risk relates to the fluctuations in the value of financial instruments as a result of changes in market prices (other than those arising from interest rate risk or foreign exchange rate risk), whether caused by
factors specific to an individual investment, its issuer, or all factors affecting all instruments traded in a market or market segment.
Commodity risk relates to the risk that the value of a commodity or commodity index will fluctuate based on increases or decreases in the commodities market and factors specific to a particular industry or commodity.
The fair value of open derivative instruments (not considered to be hedging instruments for accounting disclosure purposes) by risk exposure at January 31, 2021, was as follows:
| |
|
|
|
|
|
|
|
|
|
|
|
|
|
|
|
|
|
|
|
|
|
|
|
|
Foreign
|
|
|
|
|
|
|
|
|
Statement of
|
|
Interest
|
|
|
Credit
|
|
|
Exchange
|
|
|
Equity
|
|
|
Commodity
|
|
|
Assets and Liabilities
|
|
Rate Risk
|
|
|
Risk
|
|
|
Rate Risk
|
|
|
Risk
|
|
|
Risk
|
|
|
Liabilities
|
|
|
|
|
|
|
|
|
|
|
|
|
|
|
|
|
|
|
|
|
|
|
|
|
|
|
|
|
|
|
|
|
|
depreciation on
|
|
|
|
|
|
|
|
|
|
|
|
|
|
|
|
|
futures contracts
|
|
$
|
—
|
|
|
$
|
—
|
|
|
$
|
—
|
|
|
$
|
1,994,339
|
|
|
$
|
—
|
|
|
Total Value
|
|
$
|
—
|
|
|
$
|
—
|
|
|
$
|
—
|
|
|
$
|
1,994,339
|
|
|
$
|
—
|
|
Pioneer Multi-Asset Income Fund | Semiannual Report | 1/31/21 69
The effect of derivative instruments (not considered to be hedging instruments for accounting disclosure purposes) on the Statement of Operations by risk exposure at January 31, 2021, was as follows:
| |
|
|
|
|
|
|
|
|
|
|
|
|
|
|
|
|
|
|
|
|
|
|
|
|
Foreign
|
|
|
|
|
|
|
|
|
Statement of
|
|
Interest
|
|
|
Credit
|
|
|
Exchange
|
|
|
Equity
|
|
|
Commodity
|
|
|
Operations
|
|
Rate Risk
|
|
|
Risk
|
|
|
Rate Risk
|
|
|
Risk
|
|
|
Risk
|
|
|
Net realized gain
|
|
|
|
|
|
|
|
|
|
|
|
|
|
|
|
|
(loss) on:
|
|
|
|
|
|
|
|
|
|
|
|
|
|
|
|
|
Options purchased*
|
|
$
|
—
|
|
|
$
|
—
|
|
|
$
|
—
|
|
|
$
|
(3,068,525
|
)
|
|
$
|
—
|
|
|
Forward foreign
|
|
|
|
|
|
|
|
|
|
|
|
|
|
|
|
|
|
|
|
|
|
currency exchange
|
|
|
|
|
|
|
|
|
|
|
|
|
|
|
|
|
|
|
|
|
|
contracts
|
|
|
—
|
|
|
|
—
|
|
|
|
670,175
|
|
|
|
—
|
|
|
|
—
|
|
|
Futures contracts
|
|
|
—
|
|
|
|
—
|
|
|
|
(4,599
|
)
|
|
|
(16,986,336
|
)
|
|
|
—
|
|
|
Total Value
|
|
$
|
—
|
|
|
$
|
—
|
|
|
$
|
665,576
|
|
|
$
|
(20,054,861
|
)
|
|
$
|
—
|
|
|
Change in net
|
|
|
|
|
|
|
|
|
|
|
|
|
|
|
|
|
|
|
|
|
|
unrealized
|
|
|
|
|
|
|
|
|
|
|
|
|
|
|
|
|
|
|
|
|
|
appreciation
|
|
|
|
|
|
|
|
|
|
|
|
|
|
|
|
|
|
|
|
|
|
(depreciation) on:
|
|
|
|
|
|
|
|
|
|
|
|
|
|
|
|
|
|
|
|
|
|
Options purchased**
|
|
$
|
—
|
|
|
$
|
—
|
|
|
$
|
(611,287
|
)
|
|
$
|
—
|
|
|
$
|
—
|
|
|
Forward foreign
|
|
|
|
|
|
|
|
|
|
|
|
|
|
|
|
|
|
|
|
|
|
currency exchange
|
|
|
|
|
|
|
|
|
|
|
|
|
|
|
|
|
|
|
|
|
|
contracts
|
|
|
—
|
|
|
|
—
|
|
|
|
(140,743
|
)
|
|
|
—
|
|
|
|
—
|
|
|
Futures contracts
|
|
|
—
|
|
|
|
—
|
|
|
|
—
|
|
|
|
1,322,811
|
|
|
|
—
|
|
|
Total Value
|
|
$
|
—
|
|
|
$
|
—
|
|
|
$
|
(752,030
|
)
|
|
$
|
1,322,811
|
|
|
$
|
—
|
|
|
*
|
Reflects the net realized gain (loss) on purchased option contracts (see Note 1.K). These amounts are included in net realized gain (loss) on investments in unaffiliated issuers, on the statements of operations.
|
|
**
|
Reflects the change in net unrealized appreciation (depreciation) on purchased option contracts (see Note 1.K). These amounts are included in change in net unrealized appreciation (deprecia- tion) on Investments in unaffiliated issuers,
on the statements of operations.
|
70 Pioneer Multi-Asset Income Fund | Semiannual Report | 1/31/21
Approval of Investment Management Agreement
Amundi Pioneer Asset Management, Inc.1 (“APAM”) serves as the investment adviser to Pioneer Multi-Asset Income Fund (the “Fund”)
pursuant to an investment management agreement between APAM and the Fund. In order for APAM to remain the investment adviser of the Fund, the Trustees of the Fund must determine annually whether to renew the investment management agreement for the
Fund.
The contract review process began in January 2020 as the Trustees of the Fund agreed on, among other things, an overall approach and timeline for the process. Contract review materials were provided to the Trustees in
March 2020, July 2020 and September 2020. In addition, the Trustees reviewed and discussed the Fund’s performance at regularly scheduled meetings throughout the year, and took into account other information related to the Fund provided to the
Trustees at regularly scheduled meetings, in connection with the review of the Fund’s investment management agreement.
In March 2020, the Trustees, among other things, discussed the memorandum provided by Fund counsel that summarized the legal standards and other considerations that are relevant to the Trustees in their deliberations
regarding the renewal of the investment management agreement, and reviewed and discussed the qualifications of the investment management teams for the Fund, as well as the level of investment by the Fund’s portfolio managers in the Fund. In July
2020, the Trustees, among other things, reviewed the Fund’s management fees and total expense ratios, the financial statements of APAM and its parent companies, profitability analyses provided by APAM, and analyses from APAM as to possible
economies of scale. The Trustees also reviewed the profitability of the institutional business of APAM and APAM’s affiliate, Amundi Pioneer Institutional Asset Management, Inc.2 (“APIAM” and, together with APAM, “Amundi Pioneer”), as compared to that of APAM’s fund management business, and considered the differences between the fees and expenses of the Fund and the fees and expenses of APAM’s and
APIAM’s institutional accounts, as well as the different services provided by APAM to the Fund
|
1
|
Effective January 1, 2021, Amundi Pioneer Asset Management, Inc. changed its name to Amundi Asset Management US, Inc. (“Amundi US”).
|
|
2
|
Effective January 1, 2021, Amundi Pioneer Institutional Asset Management, Inc. (“APIAM”) merged with and into Amundi US. After the Merger, the investment advisory services previously provided by APIAM are now provided through Amundi US.
|
Pioneer Multi-Asset Income Fund | Semiannual Report | 1/31/21 71
and by APAM and APIAM to the institutional accounts. The Trustees further considered contract review materials, including additional materials received in response to the Trustees’ request, in September 2020.
At a meeting held on September 15, 2020, based on their evaluation of the information provided by APAM and third parties, the Trustees of the Fund, including the Independent Trustees voting separately, unanimously
approved the renewal of the investment management agreement for another year. In approving the renewal of the investment management agreement, the Trustees considered various factors that they determined were relevant, including the factors
described below. The Trustees did not identify any single factor as the controlling factor in determining to approve the renewal of the agreement.
Nature, Extent and Quality of Services
The Trustees considered the nature, extent and quality of the services that had been provided by APAM to the Fund, taking into account the investment objective and strategy of the Fund. The Trustees also reviewed
APAM’s investment approach for the Fund and its research process. The Trustees considered the resources of APAM and the personnel of APAM who provide investment management services to the Fund. They also reviewed the amount of non-Fund assets
managed by the portfolio managers of the Fund. They considered the non-investment resources and personnel of APAM that are involved in APAM’s services to the Fund, including APAM’s compliance, risk management, and legal resources and personnel. The
Trustees noted the substantial attention and high priority given by APAM’s senior management to the Pioneer Fund complex. The Trustees considered the implementation and effectiveness of APAM’s business continuity plan in response to the COVID-19
pandemic.
The Trustees considered that APAM supervises and monitors the performance of the Fund’s service providers and provides the Fund with personnel (including Fund officers) and other resources that are necessary for the
Fund’s business management and operations. The Trustees also considered that, as administrator, APAM is responsible for the administration of the Fund’s business and other affairs. The Trustees considered the fees paid to APAM for the provision of
administration services.
72 Pioneer Multi-Asset Income Fund | Semiannual Report | 1/31/21
Based on these considerations, the Trustees concluded that the nature, extent and quality of services that had been provided by APAM to the Fund were satisfactory and consistent with the terms of the investment
management agreement.
Performance of the Fund
In considering the Fund’s performance, the Trustees regularly review and discuss throughout the year data prepared by APAM and information comparing the Fund’s performance with the performance of its peer group of
funds, as classified by Morningstar, Inc. (Morningstar), and with the performance of the Fund’s benchmark index. They also discuss the Fund’s performance with APAM on a regular basis.
The Trustees discussed the Fund’s performance with APAM on a more frequent basis in light of the Fund’s unfavorable performance compared to its benchmark index and peers over certain periods. The Trustees noted APAM’s
explanation for the Fund’s relative performance and the steps taken by APAM to address the Fund’s performance, including enhancing the investment process used for the Fund. The Trustees’ regular reviews and discussions were factored into the
Trustees’ deliberations concerning the renewal of the investment management agreement.
Management Fee and Expenses
The Trustees considered information showing the fees and expenses of the Fund in comparison to the management fees of its peer group of funds as classified by Morningstar and also to the expense ratios of a peer group
of funds selected on the basis of criteria determined by the Independent Trustees for this purpose using data provided by Strategic Insight Mutual Fund Research and Consulting, LLC (Strategic Insight), an independent third party. The peer group
comparisons referred to below are organized in quintiles. Each quintile represents one-fifth of the peer group. In all peer group comparisons referred to below, first quintile is most favorable to the Fund’s shareowners. The Trustees noted that
they separately review and consider the impact of the Fund’s transfer agency and Fund- and APAM-paid expenses for sub-transfer agency and intermediary arrangements, and that the results of the most recent such review were considered in the
consideration of the Fund’s expense ratio.
The Trustees considered that the Fund’s management fee for the most recent fiscal year was in the first quintile relative to the management fees paid by other funds in its Morningstar category for the comparable
period. The Trustees also considered the breakpoints in the management fee schedule and the reduced fee rates above certain asset levels. The Trustees
Pioneer Multi-Asset Income Fund | Semiannual Report | 1/31/21 73
considered that the expense ratio of the Fund’s Class A shares for the most recent fiscal year was in the first quintile relative to its Strategic Insight peer group for the comparable period. The Trustees considered
that the expense ratio of the Fund’s Class Y shares for the most recent fiscal year was in the second quintile relative to its Strategic Insight peer group for the comparable period. The Trustees noted that APAM had agreed to waive fees and/or
reimburse expenses in order to limit the ordinary operating expenses of the Fund.
The Trustees reviewed management fees charged by APAM and APIAM to institutional and other clients, including publicly offered European funds sponsored by APAM’s affiliates, unaffiliated U.S. registered investment
companies (in a sub-advisory capacity), and unaffiliated foreign and domestic separate accounts. The Trustees also considered APAM’s costs in providing services to the Fund and APAM’s and APIAM’s costs in providing services to the other clients and
considered the differences in management fees and profit margins for fund and non-fund services. In evaluating the fees associated with APAM’s and APIAM’s client accounts, the Trustees took into account the respective demands, resources and
complexity associated with the Fund and other client accounts. The Trustees noted that, in some instances, the fee rates for those clients were lower than the management fee for the Fund and considered that, under the investment management
agreement with the Fund, APAM performs additional services for the Fund that it does not provide to those other clients or services that are broader in scope, including oversight of the Fund’s other service providers and activities related to
compliance and the extensive regulatory and tax regimes to which the Fund is subject. The Trustees also considered the entrepreneurial risks associated with APAM’s management of the Fund.
The Trustees concluded that the management fee payable by the Fund to APAM was reasonable in relation to the nature and quality of the services provided by APAM.
Profitability
The Trustees considered information provided by APAM regarding the profitability of APAM with respect to the advisory services provided by APAM to the Fund, including the methodology used by APAM in allocating certain
of its costs to the management of the Fund. The Trustees also considered APAM’s profit margin in connection with the overall operation of the Fund. They further reviewed the financial results, including the profit margins, realized by APAM and
APIAM from non-fund businesses. The Trustees considered APAM’s profit margins in comparison to the limited industry data available and noted that the profitability of any adviser was
74 Pioneer Multi-Asset Income Fund | Semiannual Report | 1/31/21
affected by numerous factors, including its organizational structure and method for allocating expenses. The Trustees concluded that APAM’s profitability with respect to the management of the Fund was not
unreasonable.
Economies of Scale
The Trustees considered APAM’s views relating to economies of scale in connection with the Pioneer Funds as fund assets grow and the extent to which any such economies of scale are shared with the Fund and Fund
shareholders. The Trustees noted the breakpoints in the management fee schedule. The Trustees recognize that economies of scale are difficult to identify and quantify, and that, among other factors that may be relevant, are the following: fee
levels, expense subsidization, investment by APAM in research and analytical capabilities and APAM’s commitment and resource allocation to the Fund. The Trustees noted that profitability also may be an indicator of the availability of any economies
of scale, although profitability may vary for other reasons including due to reductions in expenses. The Trustees concluded that economies of scale, if any, were being appropriately shared with the Fund.
Other Benefits
The Trustees considered the other benefits that APAM enjoys from its relationship with the Fund. The Trustees considered the character and amount of fees paid or to be paid by the Fund, other than under the investment
management agreement, for services provided by APAM and its affiliates. The Trustees further considered the revenues and profitability of APAM’s businesses other than the Fund business. To the extent applicable, the Trustees also considered the
benefits to the Fund and to APAM and its affiliates from the use of “soft” commission dollars generated by the Fund to pay for research and brokerage services.
The Trustees considered that Amundi Pioneer is the principal U.S. asset management business of Amundi, which is one of the largest asset managers globally. Amundi’s worldwide asset management business manages over
$1.7 trillion in assets (including the Pioneer Funds). The Trustees considered that APAM’s relationship with Amundi creates potential opportunities for APAM, APIAM and Amundi that derive from APAM’s relationships with the Fund, including Amundi’s
ability to market the services of APAM globally. The Trustees noted that APAM has access to additional research and portfolio management capabilities as a result of its relationship with Amundi and Amundi’s enhanced global presence that may
contribute to an increase in the resources available to APAM. The Trustees
Pioneer Multi-Asset Income Fund | Semiannual Report | 1/31/21 75
considered that APAM and the Fund receive reciprocal intangible benefits from the relationship, including mutual brand recognition and, for the Fund, direct and indirect access to the resources of a large global asset
manager. The Trustees concluded that any such benefits received by APAM as a result of its relationship with the Fund were reasonable.
Conclusion
After consideration of the factors described above as well as other factors, the Trustees, including the Independent Trustees, concluded that the investment management agreement for the Fund, including the fees
payable thereunder, was fair and reasonable and voted to approve the proposed renewal of the investment management agreement.
76 Pioneer Multi-Asset Income Fund | Semiannual Report | 1/31/21
Trustees, Officers and Service Providers
| |
|
|
Trustees
|
Officers
|
|
Thomas J. Perna, Chairman
|
Lisa M. Jones, President and
|
|
John E. Baumgardner, Jr.
|
Chief Executive Officer
|
|
Diane Durnin
|
Mark E. Bradley, Treasurer and
|
|
Benjamin M. Friedman
|
Chief Financial and
|
|
Lisa M. Jones
|
Accounting Officer
|
|
Lorraine H. Monchak
|
Christopher J. Kelley, Secretary and
|
|
Marguerite A. Piret
|
Chief Legal Officer
|
|
Fred J. Ricciardi
|
|
|
Kenneth J. Taubes
|
|
Investment Adviser and Administrator
Amundi Asset Management US, Inc.
Custodian and Sub-Administrator
Brown Brothers Harriman & Co.
Principal Underwriter
Amundi Distributor US, Inc.
Legal Counsel
Morgan, Lewis & Bockius LLP
Transfer Agent
DST Asset Manager Solutions, Inc.
Proxy Voting Policies and Procedures of the Fund are available without charge, upon request, by calling our toll free number (1-800-225-6292). Information regarding how the
Fund voted proxies relating to portfolio securities during the most recent 12-month period ended June 30 is publicly available to shareowners at www.amundi.com/us. This information is also available on the Securities and Exchange Commission’s web
site at www.sec.gov.
Pioneer Multi-Asset Income Fund | Semiannual Report | 1/31/21 77
This page was intentionally left blank.
78 Pioneer Multi-Asset Income Fund | Semiannual Report | 1/31/21
This page was intentionally left blank.
Pioneer Multi-Asset Income Fund | Semiannual Report | 1/31/21 79
This page was intentionally left blank.
80 Pioneer Multi-Asset Income Fund | Semiannual Report | 1/31/21
This page was intentionally left blank.
Pioneer Multi-Asset Income Fund | Semiannual Report | 1/31/21 81
This page was intentionally left blank.
82 Pioneer Multi-Asset Income Fund | Semiannual Report | 1/31/21
This page was intentionally left blank.
Pioneer Multi-Asset Income Fund | Semiannual Report | 1/31/21 83
This page was intentionally left blank.
84 Pioneer Multi-Asset Income Fund | Semiannual Report | 1/31/21
How to Contact Amundi
We are pleased to offer a variety of convenient ways for you to contact us for assistance or information.
| |
|
|
Call us for:
|
|
|
Account Information, including existing accounts,
|
|
new accounts, prospectuses, applications
|
|
|
and service forms
|
1-800-225-6292
|
| |
|
|
FactFoneSM for automated fund yields, prices,
|
|
|
account information and transactions
|
1-800-225-4321
|
| |
|
|
Retirement plans information
|
1-800-622-0176
|
|
|
|
Write to us:
|
|
|
Amundi
|
|
|
P.O. Box 219427
|
|
|
Kansas City, MO 64121-9427
|
|
| |
|
|
Our toll-free fax
|
1-800-225-4240
|
| |
|
|
Our internet e-mail address
|
us.askamundi@amundi.com
|
|
(for general questions about Amundi only)
|
|
|
|
|
Visit our web site: www.amundi.com/us
|
|
This report must be preceded or accompanied by a prospectus.
The Fund files a complete schedule of portfolio holdings with the Securities and Exchange Commission for the first and third quarters of each fiscal year as an exhibit to its reports on Form N-PORT.
Shareholders may view the filed Form N-PORT by visiting the Commission’s web site at https://www.sec.gov.
Amundi Asset Management US, Inc.
60 State Street
Boston, MA 02109
www.amundi.com/us
Securities offered through Amundi Distributor US, Inc.,
60 State Street, Boston, MA 02109
Underwriter of Pioneer Mutual Funds, Member SIPC
© 2021 Amundi Asset Management US, Inc. 25512-09-0321
Pioneer Balanced ESG Fund
Semiannual Report | January 31, 2021
| |
|
|
|
|
|
A: AOBLX
|
C: PCBCX
|
K: PCBKX
|
R: CBPRX
|
Y: AYBLX
|
Paper copies of the Fund’s shareholder reports may no longer be sent by mail, unless you specifically request paper copies of the reports from the Fund or from your financial intermediary, such as a broker-dealer,
bank or insurance company. Instead, the reports will be made available on the Fund’s website, and you will be notified by mail each time a report is posted and provided with a website link to access the report.
You may elect to receive shareholder reports and other communications electronically by contacting your financial intermediary or, if you invest directly with the Fund, by calling 1-800-225-6292.
You may elect to receive all future reports in paper free of charge. If you invest directly with the Fund, you can inform the Fund that you wish to continue receiving paper copies of your shareholder reports by
calling 1-800-225-6292. If you invest through a financial intermediary, you can contact your financial intermediary to request that you continue to receive paper copies of your shareholder reports. Your election to receive reports in paper will
apply to all funds held in your account if you invest through your financial intermediary or all funds held within the Pioneer Fund complex if you invest directly.
visit us: www.amundi.com/us
| |
|
|
|
|
| |
|
|
|
2
|
| |
|
|
|
4
|
| |
|
|
|
13
|
| |
|
|
|
14
|
| |
|
|
|
15
|
| |
|
|
|
20
|
| |
|
|
|
22
|
| |
|
|
|
54
|
| |
|
|
|
63
|
| |
|
|
|
79
|
| |
|
|
|
84
|
Pioneer Balanced ESG Fund | Semiannual Report | 1/31/21 1
President’s Letter
Dear Shareholders,
The first several weeks of 2021 have brought some better news on the COVID-19 global pandemic front, as the deployment of the first approved COVID-19 vaccines is well underway, with expectations for widespread
vaccine distribution by the middle of the year. In general, COVID-19 cases and related hospitalizations have been on the decline in the US, and that has had a positive effect on overall market sentiment.
While there may finally be a light visible at the end of the pandemic tunnel, the long-term impact on the global economy from COVID-19, while currently unknown, is likely to be considerable. It is clear that
several industries have already felt greater effects than others, and the markets, which do not thrive on uncertainty, have been volatile. With that said, in these still-early days of 2021, equity markets and other so-called “riskier” assets,
such as high-yield bonds, have outperformed investments regarded as less risky, such as government debt. In addition, we’ve witnessed the long-awaited rebound in the performance of cyclical stocks, or stocks of companies with greater exposure
to the ebbs and flows of the economic cycle, as investors have appeared to embrace the potential for a more widespread reopening of the economy in the coming months. Additional fiscal stimulus from the US government has also helped provide some
market momentum.
However, despite the dramatic market rebound since its March 2020 low point, volatility has remained elevated, with momentum rising and falling on seemingly every bit of positive or negative news about the virus.
In addition, the recent US Presidential and Congressional elections have resulted in a power shift in Washington, DC, and that most likely portends some changes in fiscal policy above and beyond just additional pandemic-related stimulus. That,
too, could lead to increased market volatility as investors analyze the various tax and spending plans, and wait to see what proposed policy alterations actually become law.
With the advent of COVID-19 in early 2020, we implemented our business continuity plan according to the new COVID-19 guidelines, and most of our employees have been working remotely since March 2020. To date, our
operating environment has faced no interruption. I am proud of the careful planning that has taken place and confident we can maintain this environment for as long as is prudent. History in the making for a company that first opened its doors
way back in 1928.
2 Pioneer Balanced ESG Fund | Semiannual Report | 1/31/21
Since 1928, Amundi US’s investment process has been built on a foundation of fundamental research and active management, principles which have guided our investment decisions for more than 90 years. We believe
active management – that is, making active investment decisions – can help mitigate the risks during periods of market volatility. As 2020 has reminded us, investment risk can arise from a number of factors in today’s global economy, including
slower or stagnating growth, changing U.S. Federal Reserve policy, oil price shocks, political and geopolitical factors and, unfortunately, major public health concerns such as a viral pandemic.
At Amundi US, active management begins with our own fundamental, bottom-up research process. Our team of dedicated research analysts and portfolio managers analyzes each security under consideration, communicating
directly with the management teams of the companies issuing the securities and working together to identify those securities that best meet our investment criteria for our family of funds. Our risk management approach begins with each and every
security, as we strive to carefully understand the potential opportunity, while considering any and all risk factors.
Today, as investors, we have many options. It is our view that active management can serve shareholders well, not only when markets are thriving, but also during periods of market stress.
As you consider your long-term investment goals, we encourage you to work with your financial professional to develop an investment plan that paves the way for you to pursue both your short-term and long-term
goals.
We remain confident that the current crisis, like others in human history, will pass, and we greatly appreciate the trust you have placed in us and look forward to continuing to serve you in the future.
Sincerely,
Lisa M. Jones
Head of the Americas, President and CEO of US.
Amundi Asset Management US, Inc.
March 2021
Any information in this shareowner report regarding market or economic trends or the factors influencing the Fund’s historical or future performance are statements of opinion as of the date of this report. Past
performance is no guarantee of future results.
Pioneer Balanced ESG Fund | Semiannual Report | 1/31/21 3
Portfolio Management Discussion |
1/31/21
In the following interview, Walter Hunnewell, Jr., Bradley Komenda, and Lawrence Zeno discuss the factors that affected the performance of Pioneer Balanced ESG Fund during the six-month period
ended January 31, 2021. Mr. Hunnewell, a vice president and portfolio manager at Amundi Asset Management US, Inc. (Amundi US), Mr. Komenda, Deputy Director of Investment-Grade Corporates, a senior vice president, and a portfolio manager at
Amundi US, and Mr. Zeno, a vice president and portfolio manager at Amundi US, are responsible for the day-to-day management of the Fund.
Q How did the Fund perform during the six-month period ended January 31, 2021?
A Pioneer Balanced ESG Fund’s Class A shares returned 8.26% at net asset value during the six-month period ended January 31, 2021,
while the Fund’s benchmarks, the Standard & Poor’s 500 Index (the S&P 500) and the Bloomberg Barclays US Government/Credit Bond Index (the Bloomberg Barclays Index), returned 14.47% and -1.44%, respectively. During the same period, the
average return of the 678 mutual funds in Morningstar’s 50% to 70% Equity Allocation Funds category was 11.28%.
Q How would you describe the investment environment in the domestic markets during the six-month period ended January 31, 2021?
A After simmering throughout the summer of 2020, macroeconomic uncertainty bubbled over during September, weighing on investor
sentiment and the performance of so-called risky assets. The focus of the financial markets on heightened risks revolved around three key areas: the status of future fiscal stimulus legislation in the US, the lingering COVID-19 pandemic, and
the November US elections. A partisan dispute over when to appoint Supreme Court Justice Ginsburg’s replacement further hardened both major US political parties’ negotiating positions and lowered the odds of additional fiscal support for the
economy prior to the November election. At the same time, a notable uptick in European COVID-19 cases reignited fears that the US remained at risk for a “second wave” of cases and a new round of economic lockdowns by state and local
governments. Finally, concerns mounted over the potential for a protracted dispute over the presidential election results.
The US economic outlook then received two “shots in the arm” during December as a pair of COVID-19 vaccines were authorized for emergency use by the Food and Drug Administration (FDA), and
Congress finally
4 Pioneer Balanced ESG Fund | Semiannual Report | 1/31/21
agreed upon a $900 billion COVID-19 relief package. Distribution of the vaccines began shortly after their approval by the FDA. The vaccines could help alleviate the uncertainty related to
public health and bring forward the timing of a return to economic normalcy, while the additional fiscal measures may offer needed support for many individuals and businesses. As the end of the 2020 calendar year neared, investors elected to
focus their attention on those positive developments and looked beyond what turned out to be a second surge in COVID-19 cases in the US, as well as data that suggested a slowing in the rate of economic recovery from the robust third-quarter
gross domestic product (GDP) numbers. The generally positive market sentiment led to a rally in riskier assets and an increase in US Treasury yields into the end of the calendar year. In addition, in January 2021, the removal of political
uncertainty bolstered investors’ hopes for passage of a bigger, broader COVID-19 stimulus package by the spring, as a new administration and Congress – with full Democratic Party control – took office in Washington.
During the six-month period, the financials, industrials, materials, information technology, communication services, and consumer discretionary sectors, in that order, led performance within the
S&P 500, while real estate turned in the worst performance, followed by utilities, consumer staples, and energy. Within the Fund’s fixed-income benchmark, the Bloomberg Barclays Index, corporate bonds were the top performers, while
Treasuries lagged, given the rise in yields over the six-month period.
Q How did you position the Fund’s portfolio during the six-month period ended January 31, 2021?
A At the start of the period in August 2020, we had allocated approximately 61% of the Fund’s assets to common stocks and 39% to
fixed-income and other types of securities. As of January 31, 2021, the Fund’s allocation to common stocks stood at roughly 59%, with approximately 41% in fixed-income and other assets. The portfolio’s strategic target allocations typically
have been 62.5% equity/37.5% fixed income.
Q Could you review the Fund’s commitment to environmental, social, and governance (ESG) investing?
A ESG refers to the three primary factors in measuring the sustainability and ethical impact of an investment in a company or
business. With a focus on companies with sustainable business models, our management of the portfolio follows an ESG-friendly investment approach.
Pioneer Balanced ESG Fund | Semiannual Report | 1/31/21 5
Per the prospectus, the Fund generally will not invest in companies significantly involved in certain business activities, including but not limited to: the production of alcohol and tobacco
products; the production of certain controversial military weapons; and the operation of coal mines, gambling casinos, and other gaming businesses. In addition, the Fund’s management team uses an ESG screening process, which includes, for the
Social factor, evaluating a company’s deployment and treatment of human capital (for example, employee morale), product safety, and social opportunities. Environmental factors include, for example, dependence upon water resources in
water-stressed geographies.
Governance factor categories typically include corporate governance and business ethics (such as accounting principles), among other considerations. We view the governance aspect of ESG as
critically important, as we believe companies that take steps to better manage risk exposure than their competitors may help reduce volatility, which could lead to solid performance during more difficult periods for both the economy and the
markets.
Q What specific investments within the portfolio’s equity allocations had noteworthy effects on the Fund’s benchmark-relative performance during the
six-month period ended January 31, 2021?
A Among equities, stock selection (as distinguished from sector allocation) was the primary detractor from the Fund’s
benchmark-relative performance during the six-month period, with selection within information technology proving most challenging. Our investment strategy has emphasized diversification*, reasonable valuations, good ESG standings, and the
ability of companies to pay dividends**. Over much of the period, however, the S&P 500 experienced narrow leadership by a handful of “big tech” and technology-related stocks with high valuations and low/no dividend payouts, and that has
been a headwind to the Fund’s relative performance. Stock selection within consumer discretionary and financials also held back the Fund’s relative results during the period, as portfolio exposures to the automobile and banking & financial
services segments underperformed the rest of the market.
Positive stock selection results in the industrials sector and a portfolio underweight to the underperforming utilities sector partially offset the disappointing results for the Fund within
information technology, consumer discretionary, and financials, but not enough to overcome the negative effects on relative performance from those three sectors.
* Diversification does not assure a profit nor protect against loss.
** Dividends are not guaranteed.
6 Pioneer Balanced ESG Fund | Semiannual Report | 1/31/21
With regard to individual equity positions, the biggest detractors from the Fund’s relative performance during the six-month period included AstraZeneca, Cisco Systems, Verizon Communications,
Fidelity National Information Services, and an underweight to Apple.
AstraZeneca’s pharmaceutical business performed strongly for much of 2020, but the stock has given back some of its performance in recent months due to conflicting news reports regarding the
company’s COVID-19 vaccine effort. While we trimmed the Fund’s position, AstraZeneca remains part of the portfolio, as we like the company’s promising developmental pipeline in treatment areas such as oncology. Cisco’s shares underperformed
during the period after management indicated in the late summer of 2020 that some of its enterprise customers were delaying or canceling orders. We have retained the position, as Cisco’s management has recently stated that its business was
regaining strength. Verizon proved to be far too defensive a name in the prevailing “risk-on” market environment during the six-month period, and so we trimmed the Fund’s exposure to the stock, as we had observed an eroding competitive
environment as well as renewed capital commitments by the company. The Fund’s underweight to Apple has continued to be a drag on relative performance, as it has been one of the big-tech stocks driving market returns for the better part of a
year. However, by period-end we began to see evidence that investors might be growing fatigued by Apple’s size and extraordinary share-price performance. Lastly, shares of Fidelity National, which we have regarded as a fine, steadily growing
company, lagged the more rapidly growing companies within the information technology sector over the six-month period. We have increased the Fund’s position incrementally.
On the positive side, the Fund’s benchmark-relative performance during the period benefited from positions in Timken, Alphabet (parent of Google), Caterpillar, Qualcomm, and Lam Research.
Timken, a manufacturer of high-quality bearings, saw demand rise for its modestly valued stock as the transportation and general industrial markets began to recover. Alphabet’s share price rose at the end of the period on the market’s
anticipation of a strong earnings report as cyclical advertising markets also began to recover. Caterpillar’s stock also benefited from the improving conditions in the industrials sector, which was one of the better performers within the
S&P 500 over the six-month period. Qualcomm’s shares saw solid performance due to the market’s positive response to the company’s favorable chip-technology positioning as 5G networks have been rolled out. Finally, semiconductor firm Lam
Research
Pioneer Balanced ESG Fund | Semiannual Report | 1/31/21 7
has continued to perform well for the Fund. The company offers technology that is integral to the current trend in semiconductor manufacturing of vertical, rather than horizontal, expansion.
Overall, sector allocation within equities had an essentially neutral effect on the Fund’s benchmark-relative performance for the six-month period. The largest detractors from relative returns
from an allocation perspective were a Fund underweight to financials and an overweight to real estate. The most beneficial allocation decision for the Fund was an underweight to utilities.
Over the six-month period, the Fund’s largest overweights versus the S&P 500 were in communication services, industrials, and health care, while the largest underweights were to utilities,
information technology, and consumer discretionary. At approximately 25% of equity holdings, information technology was the Fund’s largest absolute weighting over the period, despite the underweight versus the S&P 500, as the sector’s
concentration within the index has grown substantially over the past year.
Q What investment strategies within the portfolio’s fixed-income allocations had noteworthy effects on the Fund’s benchmark-relative performance during the
six-month period ended January 31, 2021?
A Positive contributions to relative performance within fixed income were led by the Fund’s non-benchmark positioning in high-yield
corporate bonds. Entering the period, we had broadly viewed high-yield markets as having avoided the excesses that had characterized some past cycles. As investors’ sentiment towards riskier assets continued to mend with the help of strong
policy support from the Federal Reserve (Fed) and the US government, we took advantage of still-attractive relative valuations to meaningfully increase the Fund’s exposure to the high-yield asset class. The stance benefited the Fund’s relative
performance as returns for high-yield corporates notably outpaced those for their investment-grade counterparts over the six-month period.
The Fund’s positioning with respect to investment-grade corporate bonds also notably aided benchmark-relative returns, with an overweight to and security selection within industrials
contributing the most positive performance within investment grade. In the aftermath of the liquidity crisis in the first quarter of 2020, we took the opportunity to add portfolio exposure to high-quality industrial names at discounted prices.
8 Pioneer Balanced ESG Fund | Semiannual Report | 1/31/21
That stance benefited the Fund’s performance into the second half of 2020 as credit-market sentiment among investors remained firm. An overweight to and selection results within financials also
proved beneficial for the Fund’s relative returns in the investment-grade segment.
Elsewhere within fixed income, we have preferred to have portfolio exposure to securitized assets in lieu of Treasuries, given historically low interest rates. That positioning worked out well
for the Fund as Treasury yields drifted higher over the second half of the six-month period (bond/fixed-income yields typically move in the opposite direction of prices). Within securitized assets, the Fund’s allocations to commercial
mortgage-backed securities (CMBS) and asset-backed securities (ABS) aided relative results, as investors sought out sectors which had lagged the initial recovery in the riskier asset classes. Positioning with respect to residential
mortgage-backed securities (RMBS) also contributed positively to the Fund’s relative performance, as we were able to identify opportunities created by the Fed’s broad-based purchases within the asset class – initiated in response to the March
2020 market sell-off and liquidity stress – in its effort to drive down borrowing costs.
The Fund’s duration stance versus the Bloomberg Barclays Index also aided relative results in the rising interest-rate environment that prevailed over the six-month period, as we maintained an
overall portfolio duration in a range modestly below that of the benchmark. (Duration is a measure of the price sensitivity of a fixed-income investment to a change in interest rates, expressed as a number of years.)
There were no significant, material detractors from relative returns among the Fund’s fixed-income exposures.
Q Did the Fund have any exposure to derivative securities during the six-month period ended January 31, 2021?
A Yes, within the Fund’s fixed-income allocation, we invested in US Treasury futures as part of our duration-management strategy for
the portfolio. We believe the use of Treasury futures has allowed us to express our views on duration and yield-curve positioning in the most efficient manner. The use of futures had a modest positive impact on the Fund’s performance during the
six-month period as interest rates rose.
Pioneer Balanced ESG Fund | Semiannual Report | 1/31/21 9
Q Did the Fund’s yield, or distributions*** to shareholders, change during the six-month period ended January 31, 2020?
A The Fund’s distributions declined over the period as the yield on the fixed-income portion of the portfolio also declined,
primarily driven by the downward spiral of interest rates caused by the recessionary environment in the wake of COVID-19. Over the latter part of the period, we did see a steady increase in bond yields, with the 10-year Treasury yield rising
from 0.53% to 1.07% as interest rates began the process of normalizing in anticipation of a possible post-pandemic world getting closer to reality.
Q What is your investment outlook?
A We anticipate accelerating domestic economic growth in 2021 as the rollout of COVID-19 vaccines continues and increasingly
confident consumers open their pocketbooks and unleash a wave of pent-up demand for leisure services, such as travel and dining, during the second half of the calendar year. Despite this outlook, we do not expect the Fed to start removing
accommodation in 2021, as it has signaled an intense focus on getting the US economy back to full employment. In our view, the Fed has learned from its policy mistakes of 2018, and may likely be willing to maintain a highly supportive
environment for monetary policy even if inflation ticks up above the central bank’s target rate (2%).
With regard to the Fund’s positioning, we have significantly increased the portfolio’s exposure to cyclical stocks – that is, shares of companies with more exposure to the ebbs and flows of the
economic cycle – in anticipation of further stimulus measures from the US government, the reopening of previously closed sectors of the economy, and the drawdown of precautionary savings by consumers, which have increased since March 2020. In
addition, we believe there is still value to be found in the sectors that have been hit hardest by the spread of COVID-19.
Within equities, as of period-end, the Fund’s largest sector overweight versus the S&P 500 was to industrials, followed by communications services, while the largest underweight was to the
consumer discretionary sector, followed by utilities.
Within fixed income, the Fund’s positioning has continued to reflect our constructive view overall on credit-based exposure. However, we have trimmed the portfolio’s risk profile given that most
sectors have rallied in recent months. We have maintained a positive outlook for sectors where
*** Distributions are not guaranteed.
10 Pioneer Balanced ESG Fund | Semiannual Report | 1/31/21
valuations are still below pre-pandemic levels and have appeared disconnected from fundamentals. Corporate bonds have continued to be supported by a backdrop of strong economic growth,
accommodative Fed monetary policy, and persistent global demand for yield. However, spreads now broadly reflect those expectations, and that highlights the importance of security selection, in our opinion. (Credit spreads are commonly defined
as the differences in yield between Treasuries and other types of fixed-income securities with similar maturities.)
We have maintained our view that US housing-related securitized assets could be in a position to benefit from solid consumer balance sheets, historically low mortgage rates, tight inventories,
and strong demand, driven in part by a pandemic-driven shift in preference among homebuyers toward single-family homes.
While the Fed has remained accommodative, the market has begun to anticipate tighter future monetary policies, as evidenced by the move to higher yields during the period, particularly in the
10-year and 30-year parts of the yield curve. We have favored a short-duration position for the Fund versus the Bloomberg Barclays Index, which is reflected in an underweight to the long end of the curve, as we believe domestic GDP growth may
exceed the market consensus, and that could lead to higher-than-anticipated inflation and increased pressure on the Fed to respond.
Please refer to the Schedule of Investments on pages 22–53 for a full listing of Fund securities.
All investments are subject to risk, including the possible loss of principal. In the past several years, financial markets have experienced increased volatility and heightened uncertainty. The
market prices of securities may go up or down, sometimes rapidly or unpredictably, due to general market conditions, such as real or perceived adverse economic, political, or regulatory conditions, recessions, inflation, changes in interest or
currency rates, lack of liquidity in the bond markets, the spread of infectious illness or other public health issues or adverse investor sentiment. These conditions may continue, recur, worsen or spread.
When interest rates rise, the prices of fixed-income securities in the Fund will generally fall. Conversely, when interest rates fall, the prices of fixed-income securities in the Fund will
generally rise.
Investments in the Fund are subject to possible loss due to the financial failure of issuers of underlying securities and their inability to meet their debt obligations.
Pioneer Balanced ESG Fund | Semiannual Report | 1/31/21 11
Prepayment risk is the chance that an issuer may exercise its right to prepay its security, if falling interest rates prompt the issuer to do so. Forced to reinvest the unanticipated proceeds at
lower interest rates, the Fund would experience a decline in income and lose the opportunity for additional price appreciation.
The securities issued by U.S. government-sponsored entities (e.g., FNMA, Freddie Mac) are neither guaranteed nor issued by the U.S. government.
The Fund may invest in mortgage-backed securities, which during times of fluctuating interest rates may increase or decrease more than other fixed-income securities. Mortgage-backed securities
are also subject to prepayments.
Investments in high-yield or lower-rated securities are subject to greater-than-average price volatility, illiquidity and possibility of default.
Investing in foreign and/or emerging markets securities involves risks relating to interest rates, currency exchange rates, economic, and political conditions.
The Fund invests in REIT securities, the value of which can fall for a variety of reasons, such as declines in rental income, fluctuating interest rates, poor property management, environmental
liabilities, uninsured damage, increased competition, or changes in real estate tax laws.
The Fund generally excludes corporate issuers that are significantly involved in certain business activities (ESG criteria). Excluding specific issuers limits the universe of investments
available to the Fund, which may mean forgoing some investment opportunities available to funds without similar ESG criteria.
At times, the Fund’s investments may represent industries or sectors that are interrelated or have common risks, making the Fund more susceptible to any economic, political, or regulatory
developments or other risks affecting those industries and sectors.
These risks may increase share price volatility.
Before investing, consider the product’s investment objectives, risks, charges and expenses. Contact your investment professional or Amundi Asset Management US, Inc., for a
prospectus or summary prospectus containing this information. Read it carefully.
Any information in this shareholder report regarding market or economic trends or the factors influencing the Fund’s historical or future performance are statements of opinion as of the date of
this report. Past performance is no guarantee of future results.
12 Pioneer Balanced ESG Fund | Semiannual Report | 1/31/21
Portfolio Summary |
1/31/21
Portfolio Diversification
(As a percentage of total investments)*
Sector Distribution
(As a percentage of total investments)*
10 Largest Holdings
(As a percentage of total investments)*
| |
|
|
|
1.
|
Alphabet, Inc.
|
4.06%
|
|
2.
|
Microsoft Corp.
|
3.08
|
|
3.
|
U.S. Treasury Bills, 2/18/21
|
2.06
|
|
4.
|
Amazon.com, Inc.
|
2.00
|
|
5.
|
Bank of America Corp.
|
1.71
|
|
6.
|
PepsiCo., Inc.
|
1.61
|
|
7.
|
U.S. Treasury Bills, 3/11/21
|
1.54
|
|
8.
|
Visa, Inc.
|
1.47
|
|
9.
|
Comcast Corp.
|
1.45
|
|
10.
|
Apple, Inc.
|
1.41
|
|
*
|
Excludes temporary cash investments and all derivative contracts except for options purchased. The Fund is actively managed, and current holdings may be different. The holdings listed
should not be considered recommendations to buy or sell any securities.
|
|
(k)
|
Pioneer ILS Interval Fund is an affiliated closed-end fund managed by Amundi Asset Management US, Inc.
|
Pioneer Balanced ESG Fund | Semiannual Report | 1/31/21 13
Prices and Distributions |
1/31/21
Net Asset Value per Share
|
Class
|
1/31/21
|
7/31/20
|
|
A
|
$10.20
|
$9.72
|
|
C
|
$10.11
|
$9.65
|
|
K
|
$10.19
|
$9.71
|
|
R
|
$10.22
|
$9.75
|
|
Y
|
$10.28
|
$9.79
|
|
Distributions per Share: 8/1/20–1/31/21
|
|
|
|
|
|
Net Investment
|
Short-Term
|
Long-Term
|
|
Class
|
Income
|
Capital Gains
|
Capital Gains
|
|
A
|
$0.0583
|
$ —
|
$0.2617
|
|
C
|
$0.0282
|
$ —
|
$0.2617
|
|
K
|
$0.0768
|
$ —
|
$0.2617
|
|
R
|
$0.0503
|
$ —
|
$0.2617
|
|
Y
|
$0.0767
|
$ —
|
$0.2617
|
Index Definitions
The Standard & Poor’s 500 Index is an unmanaged, commonly used measure of the broad U.S. stock market. The Bloomberg Barclays US
Government/ Credit Bond Index is unmanaged and measures the performance of debt obligations of the US government agencies and investment-grade domestic corporate debt. Index returns are calculated monthly, assume reinvestment of
dividends and, unlike Fund returns, do not reflect any fees, expenses or sales charges. It is not possible to invest directly in an index.
The indices defined here pertain to the “Value of $10,000 Investment” and “Value of $5 Million Investment” charts on pages 15–19.
14 Pioneer Balanced ESG Fund | Semiannual Report | 1/31/21
| |
|
Performance Update | 1/31/21
|
Class A Shares
|
Investment Returns
The mountain chart on the right shows the change in value of a $10,000 investment made in Class A shares of Pioneer Balanced ESG Fund at public offering price during the periods shown, compared to that of the
Standard & Poor’s 500 Index and Bloomberg Barclays US Government/Credit Bond Index.
| |
|
|
|
|
|
Average Annual Total Returns
|
|
|
(As of January 31, 2021)
|
|
|
|
|
|
|
|
|
|
Bloomberg
|
|
|
|
|
|
Barclays
|
|
|
Net
|
Public
|
|
US Govern-
|
|
|
Asset
|
Offering
|
S&P
|
ment/
|
|
|
Value
|
Price
|
500
|
Credit Bond
|
|
Period
|
(NAV)
|
(POP)
|
Index
|
Index
|
|
10 years
|
8.46%
|
7.96%
|
13.50%
|
4.07%
|
|
5 years
|
10.13
|
9.12
|
16.16
|
4.47
|
|
1 year
|
10.30
|
5.34
|
17.25
|
5.28
|
|
|
|
|
|
Expense Ratio
|
|
|
|
|
(Per prospectus dated December 1, 2020)
|
|
Gross
|
|
Net
|
|
|
|
1.04%
|
|
1.00%
|
|
|
Call 1-800-225-6292 or visit www.amundi.com/us for the most recent month-end performance results. Current performance may be lower or higher than the performance data quoted.
The performance data quoted represents past performance, which is no guarantee of future results. Investment return and principal value will fluctuate, and shares, when redeemed, may be worth
more or less than their original cost.
NAV results represent the percent change in net asset value per share. NAV returns would have been lower had sales charges been reflected. POP returns reflect deduction of the maximum 4.50% sales charge. All
results are historical and assume the reinvestment of dividends and capital gains. Other share classes are available for which performance and expenses will differ.
Performance results reflect any applicable expense waivers in effect during the periods shown. Without such waivers Fund performance would be lower. Waivers may not be in effect for all funds. Certain fee waivers
are contractual through a specified period. Otherwise, fee waivers can be rescinded at any time. See the prospectus and financial statements for more information.
The net expense ratio reflects the contractual expense limitation currently in effect through December 1, 2021 for Class A shares. There can be no assurance that Amundi will extend the expense limitation beyond
such time. Please see the prospectus and financial statements for more information. Expense ratios in the financial highlights, unlike those shown in the prospectus, do not reflect acquired fund fees and expenses.
The performance table and graph do not reflect the deduction of fees and taxes that a shareowner would pay on Fund distributions or the redemption of Fund shares.
Please see the financial highlights for more current expense ratios.
Pioneer Balanced ESG Fund | Semiannual Report | 1/31/21 15
| |
|
|
Performance Update | 1/31/21
|
Class C Shares
|
Investment Returns
The mountain chart on the right shows the change in value of a $10,000 investment made in Class C shares of Pioneer Balanced ESG Fund during the periods shown, compared to that of the Standard & Poor’s 500
Index and Bloomberg Barclays US Government/Credit Bond Index.
| |
|
|
|
|
|
Average Annual Total Returns
|
|
|
(As of January 31, 2021)
|
|
|
|
|
|
|
|
|
|
Bloomberg
|
|
|
|
|
|
Barclays
|
|
|
|
|
|
US Govern-
|
|
|
|
|
S&P
|
ment/
|
|
|
If
|
If Re-
|
500
|
Credit Bond
|
|
Period
|
Held
|
deemed
|
Index
|
Index
|
|
10 years
|
7.63%
|
7.63%
|
13.50%
|
4.07%
|
|
5 years
|
9.32
|
9.32
|
16.16
|
4.47
|
|
1 year
|
9.55
|
9.55
|
17.25
|
5.28
|
|
|
|
|
|
Expense Ratio
|
|
|
|
|
(Per prospectus dated December 1, 2020)
|
|
Gross
|
|
|
|
|
|
1.76%
|
|
|
|
|
Call 1-800-225-6292 or visit www.amundi.com/us for the most recent month-end performance results. Current performance may be lower or higher than the performance data quoted.
The performance data quoted represents past performance, which is no guarantee of future results. Investment return and principal value will fluctuate, and shares, when redeemed, may be worth
more or less than their original cost.
Class C shares held for less than one year are also subject to a 1% contingent deferred sales charge (CDSC). “If Held” results represent the percent change in net asset value per share. NAV returns would have been
lower had sales charges been reflected. All results are historical and assume the reinvestment of dividends and capital gains. Other share classes are available for which performance and expenses will differ.
Performance results reflect any applicable expense waivers in effect during the periods shown. Without such waivers Fund performance would be lower. Waivers may not be in effect for all funds. Certain fee waivers
are contractual through a specified period. Otherwise, fee waivers can be rescinded at any time. See the prospectus and financial statements for more information.
Expense ratios in the financial highlights, unlike those shown in the prospectus, do not reflect acquired fund fees and expenses.
The performance table and graph do not reflect the deduction of fees and taxes that a shareowner would pay on Fund distributions or the redemption of Fund shares.
Please see the financial highlights for a more current expense ratio.
16 Pioneer Balanced ESG Fund | Semiannual Report | 1/31/21
| |
|
|
Performance Update | 1/31/21
|
Class K Shares
|
Investment Returns
The mountain chart on the right shows the change in value of a $5 million investment made in Class K shares of Pioneer Balanced ESG Fund during the periods shown, compared to that of the Standard & Poor’s 500
Index and Bloomberg Barclays US Government/Credit Bond Index.
| |
|
|
|
|
Average Annual Total Returns
|
|
|
(As of January 31, 2021)
|
|
|
|
|
|
|
|
|
Bloomberg
|
|
|
|
|
Barclays
|
|
|
Net
|
|
US Govern-
|
|
|
Asset
|
S&P
|
ment/
|
|
|
Value
|
500
|
Credit Bond
|
|
Period
|
(NAV)
|
Index
|
Index
|
|
10 years
|
8.61%
|
13.50%
|
4.07%
|
|
5 years
|
10.45
|
16.16
|
4.47
|
|
1 year
|
10.66
|
17.25
|
5.28
|
|
|
|
|
|
Expense Ratio
|
|
|
|
|
(Per prospectus dated December 1, 2020)
|
|
Gross
|
Net
|
|
|
|
0.71%
|
0.66%
|
|
|
Call 1-800-225-6292 or visit www.amundi.com/us for the most recent month-end performance results. Current performance may be lower or higher than the performance data quoted.
The performance data quoted represents past performance, which is no guarantee of future results. Investment return and principal value will fluctuate, and shares, when redeemed, may be worth
more or less than their original cost.
The performance shown for Class K shares for the period prior to the commencement of operations of Class K shares on December 1, 2015, is the net asset value performance of the Fund’s Class A shares, which has not
been restated to reflect any differences in expenses, including Rule 12b-1 fees applicable to Class A shares. Since fees for Class A shares generally are higher than those of Class K shares, the performance of Class K shares prior to their
inception on December 1, 2015, would have been higher than the performance shown. For the period beginning December 1, 2015, the actual performance of Class K shares is reflected. Class K shares are not subject to sales charges and are
available for limited groups of eligible investors, including institutional investors. All results are historical and assume the reinvestment of dividends and capital gains.
Performance results reflect any applicable expense waivers in effect during the periods shown. Without such waivers Fund performance would be lower. Waivers may not be in effect for all funds. Certain fee waivers
are contractual through a specified period. Otherwise, fee waivers can be rescinded at any time. See the prospectus and financial statements for more information.
The net expense ratio reflects the contractual expense limitation currently in effect through December 1, 2021 for Class K shares. There can be no assurance that Amundi will extend the expense limitation beyond
such time. Please see the prospectus and financial statements for more information. Expense ratios in the financial highlights, unlike those shown in the prospectus, do not reflect acquired fund fees and expenses.
The performance table and graph do not reflect the deduction of fees and taxes that a shareowner would pay on Fund distributions or the redemption of Fund shares.
Please see the financial highlights for more current expense ratios.
Pioneer Balanced ESG Fund | Semiannual Report | 1/31/21 17
| |
|
|
Performance Update | 1/31/21
|
Class R Shares
|
Investment Returns
The mountain chart on the right shows the change in value of a $10,000 investment made in Class R shares of Pioneer Balanced ESG Fund during the periods shown, compared to that of the Standard & Poor’s 500
Index and Bloomberg Barclays US Government/Credit Bond Index.
| |
|
|
|
|
Average Annual Total Returns
|
|
|
(As of January 31, 2021)
|
|
|
|
|
|
|
|
|
Bloomberg
|
|
|
|
|
Barclays
|
|
|
Net
|
|
US Govern-
|
|
|
Asset
|
S&P
|
ment/
|
|
|
Value
|
500
|
Credit Bond
|
|
Period
|
(NAV)
|
Index
|
Index
|
|
10 years
|
8.33%
|
13.50%
|
4.07%
|
|
5 years
|
9.90
|
16.16
|
4.47
|
|
1 year
|
10.05
|
17.25
|
5.28
|
|
|
|
|
|
Expense Ratio
|
|
|
|
|
(Per prospectus dated December 1, 2020)
|
|
Gross
|
Net
|
|
|
|
1.59%
|
1.31%
|
|
|
Call 1-800-225-6292 or visit www.amundi.com/us for the most recent month-end performance results. Current performance may be lower or higher than the performance data quoted.
The performance data quoted represents past performance, which is no guarantee of future results. Investment return and principal value will fluctuate, and shares, when redeemed, may be worth
more or less than their original cost.
The performance shown for Class R shares for the period prior to the commencement of operations of Class R shares on July 1, 2015, is the net asset value performance of the Fund’s Class A shares, which has not
been restated to reflect any differences in expenses, including Rule 12b-1 fees applicable to Class A shares. Since fees for Class A shares generally are higher than those of Class R shares, the performance of Class R shares prior to their
inception would have been higher than the performance shown. For the period beginning July 1, 2015, the actual performance of Class R shares is reflected.
Class R shares are not subject to sales charges and are available for limited groups of eligible investors, including institutional investors. All results are historical and assume the reinvestment of dividends
and capital gains. Other share classes are available for which performance and expenses will differ.
Performance results reflect any applicable expense waivers in effect during the periods shown. Without such waivers Fund performance would be lower. Waivers may not be in effect for all funds. Certain fee waivers
are contractual through a specified period. Otherwise, fee waivers can be rescinded at any time. See the prospectus and financial statements for more information.
The net expense ratio reflects the contractual expense limitation currently in effect through December 1, 2021 for Class R shares. There can be no assurance that Amundi will extend the expense limitation beyond
such time. Please see the prospectus and financial statements for more information. Expense ratios in the financial highlights, unlike those shown in the prospectus, do not reflect acquired fund fees and expenses.
The performance table and graph do not reflect the deduction of fees and taxes that a shareowner would pay on Fund distributions or the redemption of Fund shares.
Please see the financial highlights for more current expense ratios.
18 Pioneer Balanced ESG Fund | Semiannual Report | 1/31/21
| |
|
|
Performance Update | 1/31/21
|
Class Y Shares
|
Investment Returns
The mountain chart on the right shows the change in value of a $5 million investment made in Class Y shares of Pioneer Balanced ESG Fund during the periods shown, compared to that of the Standard & Poor’s 500
Index and Bloomberg Barclays US Government/Credit Bond Index.
| |
|
|
|
|
Average Annual Total Returns
|
|
|
(As of January 31, 2021)
|
|
|
|
|
|
|
|
|
Bloomberg
|
|
|
|
|
Barclays
|
|
|
Net
|
|
US Govern-
|
|
|
Asset
|
S&P
|
ment/
|
|
|
Value
|
500
|
Credit Bond
|
|
Period
|
(NAV)
|
Index
|
Index
|
|
10 years
|
8.77%
|
13.50%
|
4.07%
|
|
5 years
|
10.44
|
16.16
|
4.47
|
|
1 year
|
10.79
|
17.25
|
5.28
|
|
|
|
|
|
Expense Ratio
|
|
|
|
|
(Per prospectus dated December 1, 2019)
|
|
Gross
|
Net
|
|
|
|
0.82%
|
0.66%
|
|
|
Call 1-800-225-6292 or visit www.amundi.com/us for the most recent month-end performance results. Current performance may be lower or higher than the performance data quoted.
The performance data quoted represents past performance, which is no guarantee of future results. Investment return and principal value will fluctuate, and shares, when redeemed, may be worth
more or less than their original cost.
Class Y shares are not subject to sales charges and are available for limited groups of eligible investors, including institutional investors. All results are historical and assume the reinvestment of dividends
and capital gains. Other share classes are available for which performance and expenses will differ.
Performance results reflect any applicable expense waivers in effect during the periods shown. Without such waivers Fund performance would be lower. Waivers may not be in effect for all funds. Certain fee waivers
are contractual through a specified period. Otherwise, fee waivers can be rescinded at any time. See the prospectus and financial statements for more information.
The net expense ratio reflects the contractual expense limitation currently in effect through December 1, 2021 for Class Y shares. There can be no assurance that Amundi will extend the expense limitation beyond
such time. Please see the prospectus and financial statements for more information. Expense ratios in the financial highlights, unlike those shown in the prospectus, do not reflect acquired fund fees and expenses.
The performance table and graph do not reflect the deduction of fees and taxes that a shareowner would pay on Fund distributions or the redemption of Fund shares.
Please see the financial highlights for more current expense ratios.
Pioneer Balanced ESG Fund | Semiannual Report | 1/31/21 19
Comparing Ongoing Fund Expenses
As a shareowner in the Fund, you incur two types of costs:
|
(1)
|
ongoing costs, including management fees, distribution and/or service (12b-1) fees, and other Fund expenses; and
|
| |
|
|
(2)
|
transaction costs, including sales charges (loads) on purchase payments.
|
This example is intended to help you understand your ongoing expenses (in dollars) of investing in the Fund and to compare these costs with the ongoing costs of investing in other mutual funds. The example is
based on an investment of $1,000 at the beginning of the Fund’s latest six-month period and held throughout the six months.
Using the Tables
Actual Expenses
The first table below provides information about actual account values and actual expenses. You may use the information in this table, together with the amount you invested, to estimate the expenses that you paid
over the period as follows:
|
(1)
|
Divide your account value by $1,000
|
|
|
Example: an $8,600 account value ÷ $1,000 = 8.6
|
| |
|
|
(2)
|
Multiply the result in (1) above by the corresponding share class’s number in the third row under the heading entitled “Expenses Paid During Period” to estimate the expenses you paid on your account during this period.
|
Expenses Paid on a $1,000 Investment in Pioneer Balanced ESG Fund
Based on actual returns from August 1, 2020 through January 31, 2021.
|
Share Class
|
A
|
C
|
K
|
R
|
Y
|
|
Beginning Account
|
$1,000.00
|
$1,000.00
|
$1,000.00
|
$1,000.00
|
$1,000.00
|
|
Value on 8/1/20
|
|
|
|
|
|
|
Ending Account
|
$1,082.60
|
$1,077.90
|
$1,084.70
|
$1,080.50
|
$1,085.00
|
|
Value (after expenses)
|
|
|
|
|
|
|
on 1/31/21
|
|
|
|
|
|
|
Expenses Paid
|
$5.20
|
$9.01
|
$3.42
|
$6.82
|
$3.42
|
|
During Period*
|
|
|
|
|
|
* Expenses are equal to the Fund’s annualized expense ratio of 0.99%, 1.72%, 0.65%, 1.30%, and 0.65% for class A, C, K, R, and Y respectively, and multiplied by the average
account value over the period multiplied by 184/365 (to reflect the partial year period)
20 Pioneer Balanced ESG Fund | Semiannual Report | 1/31/21
Hypothetical Example for Comparison Purposes
The table below provides information about hypothetical account values and hypothetical expenses based on the Fund’s actual expense ratio and an assumed rate of return of 5% per year before expenses, which is not
the Fund’s actual return. The hypothetical account values and expenses may not be used to estimate the actual ending account balance or expenses you paid for the period.
You may use this information to compare the ongoing costs of investing in the Fund and other funds. To do so, compare this 5% hypothetical example with the 5% hypothetical examples that appear in the shareholder
reports of the other funds.
Please note that the expenses shown in the tables are meant to highlight your ongoing costs only and do not reflect any transaction costs, such as sales charges (loads) that are charged at the time of the
transaction. Therefore, the table below is useful in comparing ongoing costs only and will not help you determine the relative total costs of owning different funds. In addition, if these transaction costs were included, your costs would have
been higher.
Expenses Paid on a $1,000 Investment in Pioneer Balanced ESG Fund
Based on a hypothetical 5% return per year before expenses, reflecting the period from August 1, 2020 through January 31, 2021.
|
Share Class
|
A
|
C
|
K
|
R
|
Y
|
|
Beginning Account
|
$1,000.00
|
$1,000.00
|
$1,000.00
|
$1,000.00
|
$1,000.00
|
|
Value on 8/1/20
|
|
|
|
|
|
|
Ending Account
|
$1,020.21
|
$1,016.53
|
$1,021.93
|
$1,018.65
|
$1,021.93
|
|
Value (after expenses)
|
|
|
|
|
|
|
on 1/31/21
|
|
|
|
|
|
|
Expenses Paid
|
$5.04
|
$8.74
|
$3.31
|
$6.61
|
$3.31
|
|
During Period*
|
|
|
|
|
|
* Expenses are equal to the Fund’s annualized expense ratio of 0.99%, 1.72%, 0.65%, 1.30%, and 0.65% for class A, C, K, R, and Y respectively, and multiplied by the average
account value over the period multiplied by 184/365 (to reflect the partial year period)
Pioneer Balanced ESG Fund | Semiannual Report | 1/31/21 21
Schedule of Investments |
1/31/21
(unaudited)
|
|
|
|
UNAFFILIATED ISSUERS — 103.3%
|
|
| |
|
|
COMMON STOCKS — 61.3% of Net Assets
|
|
|
|
|
Banks — 1.8%
|
|
|
|
224,405
|
|
Bank of America Corp.
|
$ 6,653,608
|
|
|
|
|
Total Banks
|
$ 6,653,608
|
|
|
|
|
Beverages — 1.7%
|
|
|
|
45,699
|
|
PepsiCo., Inc.
|
$ 6,241,112
|
|
|
|
|
Total Beverages
|
$ 6,241,112
|
|
|
|
|
Biotechnology — 1.2%
|
|
|
|
43,396
|
|
AbbVie, Inc.
|
$ 4,447,222
|
|
|
|
|
Total Biotechnology
|
$ 4,447,222
|
|
|
|
|
Capital Markets — 1.3%
|
|
|
|
15,649
|
|
CME Group, Inc.
|
$ 2,844,049
|
|
|
13,995
|
|
T.Rowe Price Group, Inc.
|
2,189,938
|
|
|
|
|
Total Capital Markets
|
$ 5,033,987
|
|
|
|
|
Chemicals — 1.8%
|
|
|
|
33,776
|
|
Dow, Inc.
|
$ 1,752,974
|
|
|
9,727
|
|
Ecolab, Inc.
|
1,989,269
|
|
|
16,298
|
|
FMC Corp.
|
1,764,910
|
|
|
44,987
|
|
Huntsman Corp.
|
1,188,557
|
|
|
|
|
Total Chemicals
|
$ 6,695,710
|
|
|
|
|
Commercial Services & Supplies — 1.4%
|
|
|
|
68,873(a)
|
|
IAA, Inc.
|
$ 3,935,403
|
|
|
75,303
|
|
KAR Auction Services, Inc.
|
1,390,094
|
|
|
|
|
Total Commercial Services & Supplies
|
$ 5,325,497
|
|
|
|
|
Communications Equipment — 2.5%
|
|
|
|
98,570
|
|
Cisco Systems, Inc.
|
$ 4,394,250
|
|
|
29,274
|
|
Motorola Solutions, Inc.
|
4,904,859
|
|
|
|
|
Total Communications Equipment
|
$ 9,299,109
|
|
|
|
|
Diversified Telecommunication Services — 1.4%
|
|
|
|
147,663
|
|
Lumen Technologies, Inc.
|
$ 1,828,068
|
|
|
64,970
|
|
Verizon Communications, Inc.
|
3,557,107
|
|
|
|
|
Total Diversified Telecommunication Services
|
$ 5,385,175
|
|
|
|
|
Electric Utilities — 0.3%
|
|
|
|
44,413
|
|
PPL Corp.
|
$ 1,228,908
|
|
|
|
|
Total Electric Utilities
|
$ 1,228,908
|
|
|
|
|
Electrical Equipment — 0.6%
|
|
|
|
19,989
|
|
Eaton Corp. Plc
|
$ 2,352,705
|
|
|
|
|
Total Electrical Equipment
|
$ 2,352,705
|
The accompanying notes are an integral part of these financial statements.
22 Pioneer Balanced ESG Fund | Semiannual Report | 1/31/21
| |
|
|
|
|
|
Shares
|
|
|
Value
|
|
|
|
|
Electronic Equipment, Instruments &
|
|
|
|
|
|
Components — 1.0%
|
|
|
|
29,705
|
|
TE Connectivity, Ltd.
|
$ 3,576,482
|
| |
|
|
Total Electronic Equipment, Instruments &
|
|
|
|
|
|
Components
|
$ 3,576,482
|
|
|
|
|
Entertainment — 0.6%
|
|
|
|
13,289(a)
|
|
Walt Disney Co.
|
$ 2,234,811
|
|
|
|
|
Total Entertainment
|
$ 2,234,811
|
|
|
|
|
Equity Real Estate Investment Trusts (REITs) — 1.7%
|
|
|
|
11,171
|
|
Alexandria Real Estate Equities, Inc.
|
$ 1,866,786
|
|
|
18,307
|
|
Crown Castle International Corp.
|
2,915,573
|
|
|
2,059
|
|
Equinix, Inc.
|
1,523,577
|
|
|
|
|
Total Equity Real Estate Investment Trusts (REITs)
|
$ 6,305,936
|
|
|
|
|
Financials — 1.5%
|
|
|
|
38,078
|
|
PNC Financial Services Group, Inc.
|
$ 5,464,955
|
|
|
|
|
Total Financials
|
$ 5,464,955
|
|
|
|
|
Food Products — 0.6%
|
|
|
|
28,076
|
|
Lamb Weston Holdings, Inc.
|
$ 2,097,277
|
|
|
|
|
Total Food Products
|
$ 2,097,277
|
|
|
|
|
Health Care — 0.9%
|
|
|
|
31,673
|
|
Medtronic Plc
|
$ 3,526,155
|
|
|
|
|
Total Health Care
|
$ 3,526,155
|
| |
|
|
Health Care Equipment & Supplies — 0.7%
|
|
|
|
10,759
|
|
Becton Dickinson and Co.
|
$ 2,816,599
|
|
|
|
|
Total Health Care Equipment & Supplies
|
$ 2,816,599
|
|
|
|
|
Health Care Providers & Services — 2.2%
|
|
|
|
5,896
|
|
Anthem, Inc.
|
$ 1,750,994
|
|
|
41,203
|
|
CVS Health Corp.
|
2,952,195
|
|
|
28,138
|
|
Quest Diagnostics, Inc.
|
3,634,023
|
|
|
|
|
Total Health Care Providers & Services
|
$ 8,337,212
|
|
|
|
|
Hotels, Restaurants & Leisure — 1.1%
|
|
|
|
42,485
|
|
Cedar Fair LP
|
$ 1,703,649
|
|
|
11,087
|
|
McDonald’s Corp.
|
2,304,322
|
|
|
|
|
Total Hotels, Restaurants & Leisure
|
$ 4,007,971
|
|
|
|
|
Household Products — 1.1%
|
|
|
|
33,432
|
|
Procter & Gamble Co.
|
$ 4,286,317
|
|
|
|
|
Total Household Products
|
$ 4,286,317
|
|
|
|
|
Industrial Conglomerates — 1.5%
|
|
|
|
27,954
|
|
Honeywell International, Inc.
|
$ 5,461,373
|
|
|
|
|
Total Industrial Conglomerates
|
$ 5,461,373
|
The accompanying notes are an integral part of these financial statements.
Pioneer Balanced ESG Fund | Semiannual Report | 1/31/21 23
Schedule of Investments | 1/31/21
(unaudited) (continued)
| |
|
|
|
|
|
Shares
|
|
|
Value
|
|
|
|
|
Information Technology — 1.5%
|
|
|
|
29,456
|
|
Visa, Inc.
|
$ 5,692,372
|
|
|
|
|
Total Information Technology
|
$ 5,692,372
|
|
|
|
|
Insurance — 1.9%
|
|
|
|
30,740
|
|
Chubb, Ltd.
|
$ 4,477,896
|
|
|
59,575
|
|
Sun Life Financial, Inc.
|
2,755,939
|
|
|
|
|
Total Insurance
|
$ 7,233,835
|
|
|
|
|
Interactive Media & Services — 4.2%
|
|
|
|
8,619(a)
|
|
Alphabet, Inc.
|
$ 15,750,016
|
|
|
|
|
Total Interactive Media & Services
|
$ 15,750,016
|
| |
|
|
Internet & Direct Marketing Retail — 2.4%
|
|
|
|
4,360(a)
|
|
Alibaba Group Holding, Ltd. (A.D.R.)
|
$ 1,106,699
|
|
|
2,421(a)
|
|
Amazon.com, Inc.
|
7,762,210
|
|
|
|
|
Total Internet & Direct Marketing Retail
|
$ 8,868,909
|
|
|
|
|
IT Services — 2.2%
|
|
|
|
11,007
|
|
Accenture Plc
|
$ 2,662,813
|
|
|
18,291
|
|
Automatic Data Processing, Inc.
|
3,020,210
|
|
|
20,186
|
|
Fidelity National Information Services, Inc.
|
2,492,164
|
|
|
|
|
Total IT Services
|
$ 8,175,187
|
|
|
|
|
Machinery — 2.3%
|
|
|
|
18,595
|
|
Caterpillar, Inc.
|
$ 3,399,910
|
|
|
67,304
|
|
Timken Co.
|
5,092,220
|
|
|
|
|
Total Machinery
|
$ 8,492,130
|
|
|
|
|
Media — 1.5%
|
|
|
|
113,350
|
|
Comcast Corp.
|
$ 5,618,760
|
|
|
|
|
Total Media
|
$ 5,618,760
|
|
|
|
|
Metals & Mining — 0.5%
|
|
|
|
9,753
|
|
Reliance Steel & Aluminum Co.
|
$ 1,132,128
|
|
|
20,404
|
|
Steel Dynamics, Inc.
|
699,245
|
|
|
|
|
Total Metals & Mining
|
$ 1,831,373
|
|
|
|
|
Oil, Gas & Consumable Fuels — 1.7%
|
|
|
|
34,977
|
|
ConocoPhillips
|
$ 1,400,129
|
|
|
28,898
|
|
Phillips 66
|
1,959,285
|
|
|
62,456
|
|
Targa Resources Corp.
|
1,709,421
|
|
|
25,066
|
|
Valero Energy Corp.
|
1,414,474
|
|
|
|
|
Total Oil, Gas & Consumable Fuels
|
$ 6,483,309
|
|
|
|
|
Pharmaceuticals — 3.3%
|
|
|
|
61,860
|
|
AstraZeneca Plc (A.D.R.)
|
$ 3,130,116
|
|
|
21,555
|
|
Eli Lilly & Co.
|
4,482,793
|
The accompanying notes are an integral part of these financial statements.
24 Pioneer Balanced ESG Fund | Semiannual Report | 1/31/21
| |
|
|
|
|
|
Shares
|
|
|
Value
|
|
|
|
|
Pharmaceuticals — (continued)
|
|
|
|
32,901
|
|
Merck & Co., Inc.
|
$ 2,535,680
|
|
|
15,115
|
|
Zoetis, Inc.
|
2,331,489
|
|
|
|
|
Total Pharmaceuticals
|
$ 12,480,078
|
|
|
|
|
Professional Services — 0.3%
|
|
|
|
18,807
|
|
Robert Half International, Inc.
|
$ 1,269,473
|
|
|
|
|
Total Professional Services
|
$ 1,269,473
|
|
|
|
|
Semiconductors & Semiconductor Equipment — 2.9%
|
|
|
|
12,541
|
|
Analog Devices, Inc.
|
$ 1,847,665
|
|
|
10,367
|
|
Lam Research Corp.
|
5,017,110
|
|
|
25,478
|
|
QUALCOMM, Inc.
|
3,981,702
|
|
|
|
|
Total Semiconductors & Semiconductor Equipment
|
$ 10,846,477
|
|
|
|
|
Software — 4.7%
|
|
|
|
3,944(a)
|
|
ANSYS, Inc.
|
$ 1,397,635
|
|
|
51,636
|
|
Microsoft Corp.
|
11,977,486
|
|
|
18,419(a)
|
|
salesforce.com, Inc.
|
4,154,590
|
|
|
|
|
Total Software
|
$ 17,529,711
|
|
|
|
|
Specialty Retail — 1.9%
|
|
|
|
16,757
|
|
Home Depot, Inc.
|
$ 4,538,131
|
|
|
39,722
|
|
TJX Cos., Inc.
|
2,543,797
|
|
|
|
|
Total Specialty Retail
|
$ 7,081,928
|
|
|
|
|
Technology Hardware, Storage & Peripherals — 1.5%
|
|
|
|
41,577
|
|
Apple, Inc.
|
$ 5,486,501
|
|
|
|
|
Total Technology Hardware, Storage & Peripherals
|
$ 5,486,501
|
|
|
|
|
Textiles, Apparel & Luxury Goods — 0.7%
|
|
|
|
74,537
|
|
Levi Strauss & Co.
|
$ 1,469,124
|
|
|
17,481
|
|
VF Corp.
|
1,343,765
|
|
|
|
|
Total Textiles, Apparel & Luxury Goods
|
$ 2,812,889
|
| |
|
|
Trading Companies & Distributors — 0.9%
|
|
|
|
279,428
|
|
Ferguson Plc (A.D.R.)
|
$ 3,274,896
|
|
|
|
|
Total Trading Companies & Distributors
|
$ 3,274,896
|
|
|
|
|
TOTAL COMMON STOCKS
|
|
|
|
|
|
(Cost $169,691,539)
|
$229,705,965
|
|
|
|
|
CONVERTIBLE PREFERRED STOCK — 0.4% of
|
|
|
|
|
|
Net Assets
|
|
|
|
|
|
Financials — 0.4%
|
|
|
|
1,040(b)
|
|
Wells Fargo & Co., 7.5%
|
$ 1,501,760
|
|
|
|
|
Total Financials
|
$ 1,501,760
|
|
|
|
|
TOTAL CONVERTIBLE PREFERRED STOCK
|
|
|
|
|
|
(Cost $1,543,349)
|
$ 1,501,760
|
The accompanying notes are an integral part of these financial statements.
Pioneer Balanced ESG Fund | Semiannual Report | 1/31/21 25
Schedule of Investments | 1/31/21
(unaudited) (continued)
|
Principal
|
|
|
|
|
Amount
|
|
|
|
|
USD ($)
|
|
|
Value
|
| |
|
ASSET BACKED SECURITIES — 2.8% of
|
|
|
|
|
Net Assets
|
|
|
450,405(c)
|
|
Ajax Mortgage Loan Trust, Series 2020-B, Class A1,
|
|
|
|
|
1.698%, 5/25/59 (144A)
|
$ 454,649
|
|
100,000
|
|
Amur Equipment Finance Receivables VI LLC,
|
|
|
|
|
Series 2018-2A, Class C, 4.27%, 1/20/23 (144A)
|
102,629
|
|
300,000
|
|
Amur Equipment Finance Receivables VI LLC,
|
|
|
|
|
Series 2018-2A, Class D, 4.45%, 6/20/23 (144A)
|
305,552
|
|
196,386
|
|
BCC Funding XIV LLC, Series 2018-1A, Class B, 3.39%,
|
|
|
|
|
8/21/23 (144A)
|
197,748
|
|
250,000(d)
|
|
Benefit Street Partners CLO XIX, Ltd., Series 2019-19A,
|
|
|
|
|
Class D, 4.041% (3 Month USD LIBOR + 380 bps),
|
|
|
|
|
1/15/33 (144A)
|
251,297
|
|
250,000(d)
|
|
Benefit Street Partners CLO XIX, Ltd., Series 2019-19A,
|
|
|
|
|
Class E, 7.261% (3 Month USD LIBOR + 702 bps),
|
|
|
|
|
1/15/33 (144A)
|
251,004
|
|
300,098
|
|
BXG Receivables Note Trust, Series 2018-A, Class C,
|
|
|
|
|
4.44%, 2/2/34 (144A)
|
311,528
|
|
250,000(d)
|
|
Carlyle US CLO, Ltd., Series 2019-4A, Class C, 4.241%
|
|
|
|
|
(3 Month USD LIBOR + 400 bps), 1/15/33 (144A)
|
252,069
|
|
183,729(e)
|
|
Cascade MH Asset Trust, Series 2019-MH1, Class A,
|
|
|
|
|
4.0%, 11/25/44 (144A)
|
194,231
|
|
100,000
|
|
Conn’s Receivables Funding LLC, Series 2019-B,
|
|
|
|
|
Class B, 3.62%, 6/17/24 (144A)
|
100,335
|
|
249,026
|
|
CoreVest American Finance Trust, Series 2020-3,
|
|
|
|
|
Class A, 1.358%, 8/15/53 (144A)
|
250,239
|
|
500,000
|
|
Crossroads Asset Trust, Series 2021-A, Class D, 2.52%,
|
|
|
|
|
1/20/26 (144A)
|
499,738
|
|
198,000
|
|
Domino’s Pizza Master Issuer LLC, Series 2019-1A,
|
|
|
|
|
Class A2, 3.668%, 10/25/49 (144A)
|
211,092
|
|
50,000
|
|
Drive Auto Receivables Trust, Series 2020-2, Class C,
|
|
|
|
|
2.28%, 8/17/26
|
51,803
|
|
30,000
|
|
Drive Auto Receivables Trust, Series 2020-2, Class D,
|
|
|
|
|
3.05%, 5/15/28
|
31,683
|
|
250,000(d)
|
|
First Eagle BSL CLO, Ltd., Series 2019-1A, Class C,
|
|
|
|
|
4.574% (3 Month USD LIBOR + 435 bps), 1/20/33 (144A)
|
251,858
|
|
142,503
|
|
Home Partners of America Trust, Series 2019-1, Class D,
|
|
|
|
|
3.406%, 9/17/39 (144A)
|
149,716
|
|
175,866
|
|
Home Partners of America Trust, Series 2019-2, Class E,
|
|
|
|
|
3.32%, 10/19/39 (144A)
|
177,783
|
|
339,723(d)
|
|
Invitation Homes Trust, Series 2018-SFR3, Class E,
|
|
|
|
|
2.129% (1 Month USD LIBOR + 200 bps), 7/17/37 (144A)
|
340,604
|
|
200,000
|
|
LL ABS Trust, Series 2019-1A, Class B, 3.52%,
|
|
|
|
|
3/15/27 (144A)
|
201,065
|
|
250,000(d)
|
|
Madison Park Funding XXXVI, Ltd., Series 2019-36A,
|
|
|
|
|
Class E, 7.491% (3 Month USD LIBOR +
|
|
|
|
|
725 bps), 1/15/33 (144A)
|
250,365
|
|
59,643
|
|
Mosaic Solar Loan Trust, Series 2019-2A, Class A, 2.88%,
|
|
|
|
|
9/20/40 (144A)
|
63,367
|
The accompanying notes are an integral part of these financial statements.
26 Pioneer Balanced ESG Fund | Semiannual Report | 1/31/21
| |
|
|
|
|
Principal
|
|
|
|
|
Amount
|
|
|
|
|
USD ($)
|
|
|
Value
|
| |
|
ASSET BACKED SECURITIES — (continued)
|
|
|
174,570
|
|
Mosaic Solar Loan Trust, Series 2020-1A, Class A, 2.1%,
|
|
|
|
|
4/20/46 (144A)
|
$ 179,205
|
|
200,000
|
|
NMEF Funding LLC, Series 2019-A, Class B, 3.06%,
|
|
|
|
|
8/17/26 (144A)
|
203,436
|
|
250,000
|
|
NMEF Funding LLC, Series 2019-A, Class D, 4.39%,
|
|
|
|
|
8/17/26 (144A)
|
256,819
|
|
250,000(d)
|
|
Palmer Square Loan Funding, Ltd., Series 2020-1A,
|
|
|
|
|
Class B, 2.124% (3 Month USD LIBOR +
|
|
|
|
|
190 bps), 2/20/28 (144A)
|
250,025
|
|
300,000
|
|
Progress Residential Trust, Series 2018-SFR3, Class E,
|
|
|
|
|
4.873%, 10/17/35 (144A)
|
307,133
|
|
210,000
|
|
Progress Residential Trust, Series 2019-SFR2, Class E,
|
|
|
|
|
4.142%, 5/17/36 (144A)
|
217,222
|
|
200,000
|
|
Republic FInance Issuance Trust, Series 2019-A, Class A,
|
|
|
|
|
3.43%, 11/22/27 (144A)
|
203,799
|
|
144,000
|
|
SCF Equipment Leasing LLC, Series 2019-1A, Class C,
|
|
|
|
|
3.92%, 11/20/26 (144A)
|
145,005
|
|
250,000(d)
|
|
Sound Point CLO XXV, Ltd., Series 2019-4A, Class D,
|
|
|
|
|
4.351% (3 Month USD LIBOR + 411 bps), 1/15/33 (144A)
|
252,067
|
|
250,000(d)
|
|
Sound Point CLO XXV, Ltd., Series 2019-4A, Class E,
|
|
|
|
|
7.861% (3 Month USD LIBOR + 762 bps), 1/15/33 (144A)
|
252,419
|
|
178,985
|
|
SpringCastle America Funding LLC, Series 2020-AA,
|
|
|
|
|
Class A, 1.97%, 9/25/37 (144A)
|
180,304
|
|
250,000(d)
|
|
Symphony CLO XXII, Ltd., Series 2020-22A, Class C,
|
|
|
|
|
2.373% (3 Month USD LIBOR + 215 bps), 4/18/33 (144A)
|
251,032
|
|
400,000(e)
|
|
Towd Point Mortgage Trust, Series 2017-2, Class B3,
|
|
|
|
|
4.153%, 4/25/57 (144A)
|
418,572
|
|
200,000(e)
|
|
Towd Point Mortgage Trust, Series 2017-4, Class M2,
|
|
|
|
|
3.25%, 6/25/57 (144A)
|
211,842
|
|
150,000(e)
|
|
Towd Point Mortgage Trust, Series 2018-3, Class M1,
|
|
|
|
|
3.875%, 5/25/58 (144A)
|
161,645
|
|
200,000(e)
|
|
Towd Point Mortgage Trust, Series 2018-3, Class M2,
|
|
|
|
|
3.875%, 5/25/58 (144A)
|
207,409
|
|
49,289(e)
|
|
Towd Point Mortgage Trust, Series 2018-SJ1, Class A1,
|
|
|
|
|
4.0%, 10/25/58 (144A)
|
49,415
|
|
500,000(e)
|
|
Towd Point Mortgage Trust, Series 2020-2, Class M1B,
|
|
|
|
|
3.0%, 4/25/60 (144A)
|
514,131
|
|
170,000
|
|
Tricon American Homes Trust, Series 2019-SFR1,
|
|
|
|
|
Class A, 2.75%, 3/17/38 (144A)
|
178,960
|
|
120,000
|
|
Tricon American Homes Trust, Series 2020-SFR2,
|
|
|
|
|
Class E1, 2.73%, 11/17/39 (144A)
|
121,324
|
|
250,000
|
|
United Auto Credit Securitization Trust, Series 2020-1,
|
|
|
|
|
Class D, 2.88%, 2/10/25 (144A)
|
256,662
|
|
367,921
|
|
Welk Resorts LLC, Series 2019-AA, Class C, 3.34%,
|
|
|
|
|
6/15/38 (144A)
|
380,783
|
|
217,504
|
|
Westgate Resorts LLC, Series 2020-1A, Class C, 6.213%,
|
|
|
|
|
3/20/34 (144A)
|
230,213
|
The accompanying notes are an integral part of these financial statements.
Pioneer Balanced ESG Fund | Semiannual Report | 1/31/21 27
Schedule of Investments | 1/31/21
(unaudited) (continued)
| |
|
|
|
|
Principal
|
|
|
|
|
Amount
|
|
|
|
|
USD ($)
|
|
|
Value
|
| |
|
ASSET BACKED SECURITIES — (continued)
|
|
|
100,000
|
|
Westlake Automobile Receivables Trust, Series 2019-3A,
|
|
|
|
|
Class E, 3.59%, 3/17/25 (144A)
|
$ 104,136
|
|
|
|
TOTAL ASSET BACKED SECURITIES
|
|
|
|
|
(Cost $10,242,486)
|
$ 10,433,913
|
|
|
|
COLLATERALIZED MORTGAGE OBLIGATIONS —
|
|
|
|
|
4.5% of Net Assets
|
|
|
110,000(e)
|
|
Angel Oak Mortgage Trust I LLC, Series 2019-1, Class M1,
|
|
|
|
|
4.5%, 11/25/48 (144A)
|
$ 114,350
|
|
182,428(d)
|
|
Bear Stearns ALT-A Trust, Series 2005-7, Class 11A1,
|
|
|
|
|
0.67% (1 Month USD LIBOR + 54 bps), 8/25/35
|
184,255
|
|
115,743(d)
|
|
Bellemeade Re, Ltd., Series 2018-1A, Class M1B, 1.73%
|
|
|
|
|
(1 Month USD LIBOR + 160 bps), 4/25/28 (144A)
|
115,853
|
|
81,858(d)
|
|
Bellemeade Re, Ltd., Series 2018-3A, Class M1B, 1.98%
|
|
|
|
|
(1 Month USD LIBOR + 185 bps), 10/25/28 (144A)
|
82,235
|
|
150,000(d)
|
|
Bellemeade Re, Ltd., Series 2019-1A, Class M1B, 1.88%
|
|
|
|
|
(1 Month USD LIBOR + 175 bps), 3/25/29 (144A)
|
150,290
|
|
150,000(d)
|
|
Bellemeade Re, Ltd., Series 2020-3A, Class M1C, 3.83%
|
|
|
|
|
(1 Month USD LIBOR + 370 bps), 10/25/30 (144A)
|
152,116
|
|
150,000(d)
|
|
Bellemeade Re, Ltd., Series 2020-3A, Class M2, 4.98%
|
|
|
|
|
(1 Month USD LIBOR + 485 bps), 10/25/30 (144A)
|
154,757
|
|
160,000(d)
|
|
Bellemeade Re, Ltd., Series 2020-4A, Class M2B, 3.75%
|
|
|
|
|
(1 Month USD LIBOR + 360 bps), 6/25/30 (144A)
|
160,788
|
|
500,000(e)
|
|
BRAVO Residential Funding Trust, Series 2020-RPL2,
|
|
|
|
|
Class A2, 2.5%, 5/25/59 (144A)
|
515,579
|
|
100,000(e)
|
|
Bunker Hill Loan Depositary Trust, Series 2020-1,
|
|
|
|
|
Class A2, 2.6%, 2/25/55 (144A)
|
102,971
|
|
100,000(e)
|
|
Bunker Hill Loan Depositary Trust, Series 2020-1,
|
|
|
|
|
Class A3, 3.253%, 2/25/55 (144A)
|
103,924
|
|
267,603(e)
|
|
CIM Trust, Series 2019-J2, Class B4, 3.835%,
|
|
|
|
|
10/25/49 (144A)
|
253,282
|
|
569,345(e)
|
|
Citigroup Mortgage Loan Trust, Inc., Series 2018-RP2,
|
|
|
|
|
Class A1, 2.397%, 2/25/58 (144A)
|
600,719
|
|
442,550(d)
|
|
Connecticut Avenue Securities Trust, Series 2019-R02,
|
|
|
|
|
Class 1M2, 2.43% (1 Month USD LIBOR +
|
|
|
|
|
230 bps), 8/25/31 (144A)
|
443,603
|
|
134,834(d)
|
|
Connecticut Avenue Securities Trust, Series 2019-R06,
|
|
|
|
|
Class 2M2, 2.23% (1 Month USD LIBOR +
|
|
|
|
|
210 bps), 9/25/39 (144A)
|
135,143
|
|
175,186(d)
|
|
Connecticut Avenue Securities Trust, Series 2019-R07,
|
|
|
|
|
Class 1M2, 2.23% (1 Month USD LIBOR +
|
|
|
|
|
210 bps), 10/25/39 (144A)
|
175,296
|
|
60,000(d)
|
|
Connecticut Avenue Securities Trust, Series 2020-R01,
|
|
|
|
|
Class 1M2, 2.18% (1 Month USD LIBOR +
|
|
|
|
|
205 bps), 1/25/40 (144A)
|
60,019
|
|
150,000(d)
|
|
Connecticut Avenue Securities Trust, Series 2020-R02,
|
|
|
|
|
Class 2M2, 2.13% (1 Month USD LIBOR +
|
|
|
|
|
200 bps), 1/25/40 (144A)
|
149,953
|
The accompanying notes are an integral part of these financial statements.
28 Pioneer Balanced ESG Fund | Semiannual Report | 1/31/21
| |
|
|
|
|
Principal
|
|
|
|
|
Amount
|
|
|
|
|
USD ($)
|
|
|
Value
|
|
|
|
COLLATERALIZED MORTGAGE
|
|
|
|
|
OBLIGATIONS — (continued)
|
|
|
100,000(d)
|
|
Connecticut Avenue Securities Trust, Series 2020-SBT1,
|
|
|
|
|
Class 1M2, 3.78% (1 Month USD LIBOR + 365 bps),
|
|
|
|
|
2/25/40 (144A)
|
$ 102,253
|
|
120,000(d)
|
|
Connecticut Avenue Securities Trust, Series 2020-SBT1,
|
|
|
|
|
Class 2M2, 3.78% (1 Month USD LIBOR + 365 bps),
|
|
|
|
|
2/25/40 (144A)
|
123,826
|
|
364,442(e)
|
|
CSMC Trust, Series 2020-RPL4, Class A1, 2.0%,
|
|
|
|
|
1/25/60 (144A)
|
374,556
|
|
82,591(d)
|
|
Eagle Re, Ltd., Series 2018-1, Class M1, 1.83% (1 Month
|
|
|
|
|
USD LIBOR + 170 bps), 11/25/28 (144A)
|
82,759
|
|
210,548(d)
|
|
Eagle Re, Ltd., Series 2019-1, Class M1B, 1.93% (1 Month
|
|
|
|
|
USD LIBOR + 180 bps), 4/25/29 (144A)
|
210,828
|
|
160,000(d)
|
|
Eagle Re, Ltd., Series 2020-2, Class M2, 5.73% (1 Month
|
|
|
|
|
USD LIBOR + 560 bps), 10/25/30 (144A)
|
166,650
|
|
143,495(e)
|
|
EverBank Mortgage Loan Trust, Series 2013-2, Class A,
|
|
|
|
|
3.0%, 6/25/43 (144A)
|
147,549
|
|
175,461(d)
|
|
Fannie Mae Connecticut Avenue Securities,
|
|
|
|
|
Series 2018-C04, Class 2M2, 2.68% (1 Month USD
|
|
|
|
|
LIBOR + 255 bps), 12/25/30
|
176,777
|
|
70,783(d)
|
|
Federal Home Loan Mortgage Corp. REMICS,
|
|
| |
|
Series 1671, Class S, 0.777% (1 Month USD
|
|
|
|
|
LIBOR + 65 bps), 2/15/24
|
70,498
|
|
636,797
|
|
Federal Home Loan Mortgage Corp. REMICS, Series 3816,
|
|
|
|
|
Class HA, 3.5%, 11/15/25
|
673,811
|
|
23,876(d)
|
|
Federal Home Loan Mortgage Corp. REMICS, Series 3868,
|
|
|
|
|
Class FA, 0.527% (1 Month USD LIBOR +
|
|
|
|
|
40 bps), 5/15/41
|
24,038
|
|
183,770(d)(f)
|
|
Federal Home Loan Mortgage Corp. REMICS, Series 4091,
|
|
|
|
|
Class SH, 6.424% (1 Month USD LIBOR +
|
|
|
|
|
655 bps), 8/15/42
|
39,486
|
|
29,944(d)
|
|
Federal National Mortgage Association REMICS, Series
|
|
| |
|
2006-23, Class FP, 0.43% (1 Month USD LIBOR +
|
|
|
|
|
30 bps), 4/25/36
|
30,018
|
|
23,994(d)
|
|
Federal National Mortgage Association REMICS, Series
|
|
|
|
|
2006-104, Class GF, 0.45% (1 Month USD LIBOR +
|
|
|
|
|
32 bps), 11/25/36
|
24,085
|
|
13,379(d)
|
|
Federal National Mortgage Association REMICS, Series
|
|
|
|
|
2007-93, Class FD, 0.68% (1 Month USD LIBOR +
|
|
|
|
|
55 bps), 9/25/37
|
13,525
|
|
79,036(d)
|
|
Federal National Mortgage Association REMICS, Series
|
|
|
|
|
2011-63, Class FG, 0.58% (1 Month USD LIBOR +
|
|
|
|
|
45 bps), 7/25/41
|
80,023
|
|
170,000(d)
|
|
Freddie Mac Stacr Remic Trust, Series 2020-DNA2,
|
|
|
|
|
Class M2, 1.98% (1 Month USD LIBOR +
|
|
|
|
|
185 bps), 2/25/50 (144A)
|
169,574
|
|
190,000(d)
|
|
Freddie Mac Stacr Remic Trust, Series 2020-DNA3,
|
|
|
|
|
Class B1, 5.23% (1 Month USD LIBOR +
|
|
|
|
|
510 bps), 6/25/50 (144A)
|
198,906
|
The accompanying notes are an integral part of these financial statements.
Pioneer Balanced ESG Fund | Semiannual Report | 1/31/21 29
Schedule of Investments | 1/31/21
(unaudited) (continued)
| |
|
|
|
|
Principal
|
|
|
|
|
Amount
|
|
|
|
|
USD ($)
|
|
|
Value
|
|
|
|
COLLATERALIZED MORTGAGE
|
|
|
|
|
OBLIGATIONS — (continued)
|
|
|
190,000(d)
|
|
Freddie Mac Stacr Remic Trust, Series 2020-DNA4,
|
|
|
|
|
Class B1, 6.13% (1 Month USD LIBOR + 600 bps),
|
|
|
|
|
8/25/50 (144A)
|
$ 203,293
|
|
60,000(d)
|
|
Freddie Mac Stacr Remic Trust, Series 2020-DNA4,
|
|
|
|
|
Class M2, 3.88% (1 Month USD LIBOR + 375 bps),
|
|
|
|
|
8/25/50 (144A)
|
60,790
|
|
130,000(d)
|
|
Freddie Mac Stacr Remic Trust, Series 2020-DNA5,
|
|
|
|
|
Class B1, 4.882% (SOFR30A + 480 bps),
|
|
|
|
|
10/25/50 (144A)
|
135,731
|
|
160,000(d)
|
|
Freddie Mac Stacr Remic Trust, Series 2020-DNA5,
|
|
|
|
|
Class M2, 2.882% (SOFR30A + 280 bps),
|
|
|
|
|
10/25/50 (144A)
|
161,951
|
|
90,000(d)
|
|
Freddie Mac Stacr Remic Trust, Series 2020-DNA6,
|
|
|
|
|
Class B1, 3.082% (SOFR30A + 300 bps),
|
|
|
|
|
12/25/50 (144A)
|
91,012
|
|
80,000(d)
|
|
Freddie Mac Stacr Remic Trust, Series 2020-DNA6,
|
|
|
|
|
Class B2, 5.732% (SOFR30A + 565 bps),
|
|
|
|
|
12/25/50 (144A)
|
83,202
|
|
150,000(d)
|
|
Freddie Mac Stacr Remic Trust, Series 2020-HQA2,
|
|
|
|
|
Class M2, 3.23% (1 Month USD LIBOR + 310 bps),
|
|
|
|
|
3/25/50 (144A)
|
152,159
|
|
60,000(d)
|
|
Freddie Mac Stacr Remic Trust, Series 2020-HQA4,
|
|
|
|
|
Class B1, 5.38% (1 Month USD LIBOR + 525 bps),
|
|
|
|
|
9/25/50 (144A)
|
63,003
|
|
130,000(d)
|
|
Freddie Mac Stacr Remic Trust, Series 2021-DNA1,
|
|
|
|
|
Class B1, 2.729% (SOFR30A + 265 bps), 1/25/51 (144A)
|
130,205
|
|
200,000(d)
|
|
Freddie Mac Stacr Remic Trust, Series 2021-DNA1,
|
|
|
|
|
Class B2, 4.829% (SOFR30A + 475 bps), 1/25/51 (144A)
|
201,477
|
|
40,000(d)
|
|
Freddie Mac Stacr Trust, Series 2018-DNA2, Class M2,
|
|
|
|
|
2.28% (1 Month USD LIBOR + 215 bps), 12/25/30 (144A)
|
40,125
|
|
24,969(d)
|
|
Freddie Mac Stacr Trust, Series 2018-HQA2, Class M1,
|
|
|
|
|
0.88% (1 Month USD LIBOR + 75 bps), 10/25/48 (144A)
|
24,969
|
|
195,075(d)
|
|
Freddie Mac Stacr Trust, Series 2019-DNA2, Class M2,
|
|
|
|
|
2.58% (1 Month USD LIBOR + 245 bps), 3/25/49 (144A)
|
195,992
|
|
57,914(d)
|
|
Freddie Mac Stacr Trust, Series 2019-HQA1, Class M2,
|
|
|
|
|
2.48% (1 Month USD LIBOR + 235 bps), 2/25/49 (144A)
|
58,174
|
|
310,000(d)
|
|
Freddie Mac Structured Agency Credit Risk Debt Notes,
|
|
|
|
|
Series 2017-DNA3, Class M2, 2.63% (1 Month USD
|
|
|
|
|
LIBOR + 250 bps), 3/25/30
|
315,533
|
|
130,000(d)
|
|
Freddie Mac Structured Agency Credit Risk Debt Notes,
|
|
|
|
|
Series 2020-HQA5, Class B1, 4.082% (SOFR30A +
|
|
|
|
|
400 bps), 11/25/50 (144A)
|
134,993
|
|
110,000(d)
|
|
Freddie Mac Structured Agency Credit Risk Debt Notes,
|
|
|
|
|
Series 2020-HQA5, Class B2, 7.482% (SOFR30A +
|
|
|
|
|
740 bps), 11/25/50 (144A)
|
120,731
|
|
642,176(f)
|
|
Government National Mortgage Association,
|
|
|
|
|
Series 2019-159, Class CI, 3.5%, 12/20/49
|
73,844
|
The accompanying notes are an integral part of these financial statements.
30 Pioneer Balanced ESG Fund | Semiannual Report | 1/31/21
| |
|
|
|
|
Principal
|
|
|
|
|
Amount
|
|
|
|
|
USD ($)
|
|
|
Value
|
|
|
|
COLLATERALIZED MORTGAGE
|
|
|
|
|
OBLIGATIONS — (continued)
|
|
|
517,164(d)(f)
|
|
Government National Mortgage Association, Series
|
|
|
|
|
2020-9, Class SA, 3.219% (1 Month USD LIBOR +
|
|
|
|
|
335 bps), 1/20/50
|
$ 43,888
|
|
300,000(e)
|
|
GS Mortgage-Backed Securities Corp. Trust, Series
|
|
|
|
|
2021-PJ1, Class A4, 2.5%, 6/25/51 (144A)
|
310,078
|
|
205,845(e)
|
|
GS Mortgage-Backed Securities Trust, Series 2020-NQM1,
|
|
|
|
|
Class A3, 2.352%, 9/27/60 (144A)
|
209,776
|
|
44,390(d)
|
|
Home Re, Ltd., Series 2018-1, Class M1, 1.73% (1 Month
|
|
|
|
|
USD LIBOR + 160 bps), 10/25/28 (144A)
|
44,454
|
|
68,968(d)
|
|
Home Re, Ltd., Series 2019-1, Class M1, 1.78% (1 Month
|
|
|
|
|
USD LIBOR + 165 bps), 5/25/29 (144A)
|
69,013
|
|
150,000(d)
|
|
Home Re, Ltd., Series 2020-1, Class M1C, 4.28% (1 Month
|
|
|
|
|
USD LIBOR + 415 bps), 10/25/30 (144A)
|
154,589
|
|
150,000(d)
|
|
Home Re, Ltd., Series 2020-1, Class M2, 5.38% (1 Month
|
|
|
|
|
USD LIBOR + 525 bps), 10/25/30 (144A)
|
155,167
|
|
100,000(e)
|
|
Homeward Opportunities Fund I Trust, Series 2020-2,
|
|
|
|
|
Class A3, 3.196%, 5/25/65 (144A)
|
103,517
|
|
200,791(e)
|
|
JP Morgan Mortgage Trust, Series 2019-LTV1, Class A3,
|
|
|
|
|
4.0%, 6/25/49 (144A)
|
207,223
|
|
491,432(e)
|
|
JP Morgan Mortgage Trust, Series 2020-3, Class B1A,
|
|
|
|
|
3.043%, 8/25/50 (144A)
|
502,981
|
|
192,302(e)
|
|
MFA Trust, Series 2020-NQM1, Class A3, 2.3%,
|
|
|
|
|
8/25/49 (144A)
|
195,896
|
|
811,218(e)
|
|
Mill City Mortgage Loan Trust, Series 2018-4, Class A1B,
|
|
|
|
|
3.5%, 4/25/66 (144A)
|
860,486
|
|
300,000(e)
|
|
Mill City Mortgage Loan Trust, Series 2019-GS2,
|
|
|
|
|
Class M3, 3.25%, 8/25/59 (144A)
|
313,256
|
|
442,080(d)
|
|
New Residential Mortgage Loan Trust, Series 2018-4A,
|
|
|
|
|
Class B1, 1.18% (1 Month USD LIBOR +
|
|
|
|
|
105 bps), 1/25/48 (144A)
|
431,620
|
|
151,077(e)
|
|
New Residential Mortgage Loan Trust, Series 2019-NQM4,
|
|
|
|
|
Class A1, 2.492%, 9/25/59 (144A)
|
154,054
|
|
201,454(e)
|
|
New Residential Mortgage Loan Trust, Series 2019-RPL2,
|
|
|
|
|
Class A1, 3.25%, 2/25/59 (144A)
|
213,608
|
|
265,000(d)
|
|
NovaStar Mortgage Funding Trust, Series 2004-3,
|
|
|
|
|
Class M4, 1.705% (1 Month USD LIBOR +
|
|
|
|
|
158 bps), 12/25/34
|
264,119
|
|
150,000(d)
|
|
Oaktown Re V, Ltd., Series 2020-2A, Class M1B, 3.73%
|
|
|
|
|
(1 Month USD LIBOR + 360 bps), 10/25/30 (144A)
|
151,882
|
|
150,000(d)
|
|
Oaktown Re V, Ltd., Series 2020-2A, Class M2, 5.38%
|
|
|
|
|
(1 Month USD LIBOR + 525 bps), 10/25/30 (144A)
|
152,384
|
|
224,226(e)
|
|
PMT Loan Trust, Series 2013-J1, Class A11, 3.5%,
|
|
|
|
|
9/25/43 (144A)
|
228,829
|
|
5,888(d)
|
|
Radnor Re, Ltd., Series 2018-1, Class M1, 1.53% (1 Month
|
|
|
|
|
USD LIBOR + 140 bps), 3/25/28 (144A)
|
5,888
|
|
191,559(d)
|
|
Radnor Re, Ltd., Series 2019-1, Class M1B, 2.08%
|
|
|
|
|
(1 Month USD LIBOR + 195 bps), 2/25/29 (144A)
|
191,918
|
The accompanying notes are an integral part of these financial statements.
Pioneer Balanced ESG Fund | Semiannual Report | 1/31/21 31
Schedule of Investments | 1/31/21
(unaudited) (continued)
| |
|
|
|
|
Principal
|
|
|
|
|
Amount
|
|
|
|
|
USD ($)
|
|
|
Value
|
|
|
|
COLLATERALIZED MORTGAGE
|
|
|
|
|
OBLIGATIONS — (continued)
|
|
|
360,000(d)
|
|
Radnor Re, Ltd., Series 2020-1, Class M1C, 1.88%
|
|
|
|
|
(1 Month USD LIBOR + 175 bps), 2/25/30 (144A)
|
$ 360,220
|
|
250,000(e)
|
|
RMF Buyout Issuance Trust, Series 2020-1, Class M2,
|
|
|
|
|
2.623%, 2/25/30 (144A)
|
248,959
|
|
107,436(e)
|
|
RMF Proprietary Issuance Trust, Series 2019-1, Class A,
|
|
|
|
|
2.75%, 10/25/63 (144A)
|
108,268
|
|
330,000(d)
|
|
STACR Trust, Series 2018-HRP2, Class M3, 2.53%
|
|
|
|
|
(1 Month USD LIBOR + 240 bps), 2/25/47 (144A)
|
332,985
|
|
750,000(e)
|
|
Towd Point Mortgage Trust, Series 2015-5, Class M1,
|
|
|
|
|
3.5%, 5/25/55 (144A)
|
787,693
|
|
650,000(e)
|
|
Towd Point Mortgage Trust, Series 2017-6, Class A2,
|
|
|
|
|
3.0%, 10/25/57 (144A)
|
691,277
|
|
150,000(d)
|
|
Traingle Re, Ltd., Series 2020-1, Class M1C, 4.63%
|
|
|
|
|
(1 Month USD LIBOR + 450 bps), 10/25/30 (144A)
|
153,933
|
|
217,439(e)
|
|
Visio Trust, Series 2019-2, Class A1, 2.722%,
|
|
|
|
|
11/25/54 (144A)
|
225,863
|
|
430,000(e)
|
|
Vista Point Securitization Trust, Series 2020-1,
|
|
|
|
|
Class A3, 3.201%, 3/25/65 (144A)
|
445,720
|
|
|
|
TOTAL COLLATERALIZED MORTGAGE OBLIGATIONS
|
|
|
|
|
(Cost $16,581,778)
|
$ 16,931,023
|
| |
|
COMMERCIAL MORTGAGE-BACKED
|
|
|
|
|
SECURITIES — 2.2% of Net Assets
|
|
|
200,000(d)
|
|
Austin Fairmont Hotel Trust, Series 2019-FAIR,
|
|
|
|
|
Class A, 1.176% (1 Month USD LIBOR + 105 bps),
|
|
|
|
|
9/15/32 (144A)
|
$ 199,874
|
|
500,000
|
|
BANK, Series 2017-BNK7, Class AS, 3.748%, 9/15/60
|
563,489
|
|
200,000
|
|
Benchmark Mortgage Trust, Series 2018-B8, Class A4,
|
|
|
|
|
3.963%, 1/15/52
|
230,228
|
|
150,000
|
|
Benchmark Mortgage Trust, Series 2019-B14, Class AS,
|
|
|
|
|
3.352%, 12/15/62
|
167,565
|
|
150,000
|
|
Benchmark Mortgage Trust, Series 2020-B18, Class AM,
|
|
|
|
|
2.335%, 7/15/53
|
156,310
|
|
250,000
|
|
Benchmark Mortgage Trust, Series 2020-B21, Class AS,
|
|
|
|
|
2.254%, 12/17/53
|
257,265
|
|
399,634(d)
|
|
BX Commercial Mortgage Trust, Series 2020-BXLP,
|
|
|
|
|
Class D, 1.376% (1 Month USD LIBOR + 125 bps),
|
|
|
|
|
12/15/36 (144A)
|
399,884
|
|
100,000
|
|
CD Mortgage Trust, Series 2018-CD7, Class A3,
|
|
|
|
|
4.013%, 8/15/51
|
116,245
|
|
250,000
|
|
CFCRE Commercial Mortgage Trust, Series 2016-C3,
|
|
|
|
|
Class A2, 3.597%, 1/10/48
|
276,128
|
|
199,141(d)
|
|
CHC Commercial Mortgage Trust, Series 2019-CHC,
|
|
|
|
|
Class D, 2.176% (1 Month USD LIBOR + 205 bps),
|
|
|
|
|
6/15/34 (144A)
|
185,262
|
The accompanying notes are an integral part of these financial statements.
32 Pioneer Balanced ESG Fund | Semiannual Report | 1/31/21
| |
|
|
|
|
Principal
|
|
|
|
|
Amount
|
|
|
|
|
USD ($)
|
|
|
Value
|
|
|
|
COMMERCIAL MORTGAGE-BACKED
|
|
|
|
|
SECURITIES — (continued)
|
|
|
248,926(d)
|
|
CHC Commercial Mortgage Trust, Series 2019-CHC,
|
|
|
|
|
Class E, 2.476% (1 Month USD LIBOR + 235 bps),
|
|
|
|
|
6/15/34 (144A)
|
$ 218,838
|
|
500,000(e)
|
|
Citigroup Commercial Mortgage Trust, Series 2014-GC19,
|
|
|
|
|
Class B, 4.805%, 3/10/47
|
544,978
|
|
200,000(d)
|
|
Cold Storage Trust, Series 2020-ICE5, Class D, 2.227%
|
|
|
|
|
(1 Month USD LIBOR + 210 bps), 11/15/37 (144A)
|
200,375
|
|
334,196
|
|
COMM Mortgage Trust, Series 2014-UBS3, Class A3,
|
|
|
|
|
3.546%, 6/10/47
|
360,032
|
|
1,909
|
|
Credit Suisse First Boston Mortgage Securities Corp.,
|
|
|
|
|
Series 2005-C2, Class AMFX, 4.877%, 4/15/37
|
1,889
|
|
400,000(d)
|
|
Credit Suisse Mortgage Capital Certificates, Series
|
|
|
|
|
2019-ICE4, Class E, 2.276% (1 Month USD LIBOR +
|
|
|
|
|
215 bps), 5/15/36 (144A)
|
401,027
|
|
250,000(e)
|
|
CSAIL Commercial Mortgage Trust, Series 2015-C4,
|
|
|
|
|
Class AS, 4.174%, 11/15/48
|
281,031
|
|
30,000(d)
|
|
Freddie Mac Multifamily Structured Credit Risk, Series
|
|
|
|
|
2021-MN1, Class M1, 2.086% (SOFR30A + 200 bps),
|
|
|
|
|
1/25/51 (144A)
|
30,384
|
|
300,000
|
|
Freddie Mac Multifamily Structured Pass Through
|
|
|
|
|
Certificates, Series K729, Class A2, 3.136%, 10/25/24
|
326,637
|
|
100,000(e)
|
|
FREMF Mortgage Trust, Series 2017-KW03, Class B,
|
|
|
|
|
4.059%, 7/25/27 (144A)
|
102,759
|
|
125,223(d)
|
|
FREMF Mortgage Trust, Series 2019-KF64, Class B,
|
|
|
|
|
2.444% (1 Month USD LIBOR + 230 bps), 6/25/26 (144A)
|
125,223
|
|
250,000(e)
|
|
FREMF Trust, Series 2018-KW04, Class B, 4.044%,
|
|
|
|
|
9/25/28 (144A)
|
251,991
|
|
1,342,182(e)(f)
|
|
Government National Mortgage Association, Series
|
|
|
|
|
2017-21, Class IO, 0.686%, 10/16/58
|
69,821
|
|
290,000
|
|
GS Mortgage Securities Trust, Series 2015-GC28,
|
|
|
|
|
Class A5, 3.396%, 2/10/48
|
317,967
|
|
200,000
|
|
JP Morgan Chase Commercial Mortgage Securities
|
|
|
|
|
Trust, Series 2016-JP2, Class A4, 2.822%, 8/15/49
|
217,197
|
|
375,000
|
|
JP Morgan Chase Commercial Mortgage Securities
|
|
| |
|
Trust, Series 2018-WPT, Class AFX, 4.248%,
|
|
|
|
|
7/5/33 (144A)
|
400,159
|
|
250,000
|
|
JPMDB Commercial Mortgage Securities Trust, Series
|
|
|
|
|
2018-C8, Class A4, 4.211%, 6/15/51
|
294,920
|
|
2,450,000(e)(f)
|
|
JPMDB Commercial Mortgage Securities Trust, Series
|
|
|
|
|
2018-C8, Class XB, 0.112%, 6/15/51
|
23,451
|
|
250,000
|
|
Key Commercial Mortgage Securities Trust, Series
|
|
|
|
|
2019-S2, Class A3, 3.469%, 6/15/52 (144A)
|
269,595
|
|
300,000(e)
|
|
Morgan Stanley Capital I Trust, Series 2018-MP, Class A,
|
|
|
|
|
4.276%, 7/11/40 (144A)
|
329,326
|
|
85,000
|
|
Palisades Center Trust, Series 2016-PLSD, Class A,
|
|
|
|
|
2.713%, 4/13/33 (144A)
|
78,412
|
The accompanying notes are an integral part of these financial statements.
Pioneer Balanced ESG Fund | Semiannual Report | 1/31/21 33
Schedule of Investments | 1/31/21
(unaudited) (continued)
| |
|
|
|
|
Principal
|
|
|
|
|
Amount
|
|
|
|
|
USD ($)
|
|
|
Value
|
|
|
|
COMMERCIAL MORTGAGE-BACKED
|
|
|
|
|
SECURITIES — (continued)
|
|
|
400,000(e)
|
|
Wells Fargo Commercial Mortgage Trust, Series
|
|
|
|
|
2018-C43, Class A4, 4.012%, 3/15/51
|
$ 464,180
|
|
250,000(e)
|
|
WFRBS Commercial Mortgage Trust, Series 2014-C25,
|
|
|
|
|
Class D, 3.803%, 11/15/47 (144A)
|
226,527
|
|
|
|
TOTAL COMMERCIAL MORTGAGE-BACKED SECURITIES
|
|
|
|
|
(Cost $7,937,514)
|
$ 8,088,969
|
|
|
|
CORPORATE BONDS — 11.1% of Net Assets
|
|
|
|
|
Advertising — 0.1%
|
|
|
226,000
|
|
Interpublic Group of Cos., Inc., 4.75%, 3/30/30
|
$ 276,486
|
|
75,000
|
|
Outfront Media Capital LLC/Outfront Media Capital Corp.,
|
|
|
|
|
6.25%, 6/15/25 (144A)
|
79,406
|
|
|
|
Total Advertising
|
$ 355,892
|
|
|
|
Aerospace & Defense — 0.1%
|
|
|
355,000
|
|
Raytheon Technologies Corp., 3.2%, 3/15/24
|
$ 382,589
|
|
|
|
Total Aerospace & Defense
|
$ 382,589
|
|
|
|
Airlines — 0.3%
|
|
|
138,648
|
|
Air Canada 2017-1 Class AA Pass Through Trust, 3.3%,
|
|
|
|
|
1/15/30 (144A)
|
$ 137,548
|
|
301,000
|
|
Alaska Airlines 2020-1 Class A Pass Through Trust, 4.8%,
|
|
|
|
|
8/15/27 (144A)
|
336,172
|
|
47,581
|
|
British Airways 2019-1 Class A Pass Through Trust,
|
|
|
|
|
3.35%, 6/15/29 (144A)
|
45,987
|
|
113,549
|
|
British Airways 2019-1 Class AA Pass Through Trust,
|
|
|
|
|
3.3%, 12/15/32 (144A)
|
114,422
|
|
60,000
|
|
British Airways 2020-1 Class A Pass Through Trust,
|
|
|
|
|
4.25%, 11/15/32 (144A)
|
64,541
|
|
55,000
|
|
British Airways 2020-1 Class B Pass Through Trust,
|
|
|
|
|
8.375%, 11/15/28 (144A)
|
62,825
|
|
21,342
|
|
Delta Air Lines 2020-1 Class AA Pass Through Trust,
|
|
|
|
|
2.0%, 6/10/28
|
21,367
|
|
60,000
|
|
Delta Air Lines, Inc./SkyMiles IP, Ltd., 4.75%, 10/20/28
|
|
|
|
|
(144A)
|
66,381
|
|
108,867
|
|
JetBlue 2019-1 Class AA Pass Through Trust,
|
|
|
|
|
2.75%, 5/15/32
|
107,984
|
|
42,000
|
|
JetBlue 2020-1 Class A Pass Through Trust,
|
|
|
|
|
4.0%, 11/15/32
|
45,786
|
|
140,000
|
|
Southwest Airlines Co., 2.625%, 2/10/30
|
141,674
|
|
74,000
|
|
United Airlines 2020-1 Class B Pass Through Trust,
|
|
|
|
|
4.875%, 1/15/26
|
75,665
|
|
|
|
Total Airlines
|
$ 1,220,352
|
|
|
|
Auto Manufacturers — 0.1%
|
|
|
300,000
|
|
Ford Motor Credit Co. LLC, 5.584%, 3/18/24
|
$ 324,285
|
|
|
|
Total Auto Manufacturers
|
$ 324,285
|
The accompanying notes are an integral part of these financial statements.
34 Pioneer Balanced ESG Fund | Semiannual Report | 1/31/21
| |
|
|
|
|
Principal
|
|
|
|
|
Amount
|
|
|
|
|
USD ($)
|
|
|
Value
|
|
|
|
Banks — 1.9%
|
|
|
200,000
|
|
ABN AMRO Bank NV, 4.8%, 4/18/26 (144A)
|
$ 233,257
|
|
200,000(e)
|
|
AIB Group Plc, 4.263% (3 Month USD LIBOR +
|
|
|
|
|
187 bps), 4/10/25 (144A)
|
218,273
|
|
200,000
|
|
Banco Santander Chile, 2.7%, 1/10/25 (144A)
|
211,430
|
|
217,000(e)
|
|
Bank of America Corp., 4.083% (3 Month USD LIBOR +
|
|
|
|
|
315 bps), 3/20/51
|
262,683
|
|
475,000(b)(e)
|
|
BNP Paribas SA, 6.625% (5 Year USD Swap Rate +
|
|
|
|
|
415 bps) (144A)
|
514,330
|
|
305,000(e)
|
|
BPCE SA, 2.277% (SOFRRATE + 131 bps), 1/20/32 (144A)
|
306,083
|
|
200,000
|
|
BPCE SA, 4.875%, 4/1/26 (144A)
|
232,576
|
|
195,000(b)(e)
|
|
Citigroup, Inc., 4.7% (SOFRRATE + 323 bps)
|
199,387
|
|
391,000(b)(e)
|
|
Credit Suisse Group AG, 5.1% (5 Year CMT Index +
|
|
|
|
|
329 bps) (144A)
|
399,915
|
|
465,000(b)(e)
|
|
Credit Suisse Group AG, 7.125% (5 Year USD Swap
|
|
|
|
|
Rate + 511 bps)
|
492,319
|
|
195,000(e)
|
|
Goldman Sachs Group, Inc., 3.272% (3 Month USD
|
|
|
|
|
LIBOR + 120 bps), 9/29/25
|
212,216
|
|
140,000(e)
|
|
Goldman Sachs Group, Inc., 4.223% (3 Month USD
|
|
|
|
|
LIBOR + 130 bps), 5/1/29
|
164,129
|
|
413,000(b)(e)
|
|
JPMorgan Chase & Co., 4.6% (SOFRRATE + 313 bps)
|
424,977
|
|
951,000(b)(e)
|
|
JPMorgan Chase & Co., 5.0% (SOFRRATE + 338 bps)
|
1,003,122
|
|
200,000(b)(e)
|
|
Societe Generale SA, 5.375% (5 Year CMT Index +
|
|
|
|
|
451 bps) (144A)
|
207,960
|
|
650,000(b)(e)
|
|
Societe Generale SA, 7.375% (5 Year USD Swap Rate +
|
|
|
|
|
624 bps) (144A)
|
667,063
|
|
225,000
|
|
Sumitomo Mitsui Financial Group, Inc., 3.202%, 9/17/29
|
242,725
|
|
250,000
|
|
Truist Bank, 2.25%, 3/11/30
|
257,771
|
|
240,000(b)(e)
|
|
Truist Financial Corp., 5.1% (5 Year CMT Index + 435 bps)
|
270,672
|
|
240,000(b)(e)
|
|
UBS Group AG, 7.0% (5 Year USD Swap Rate +
|
|
|
|
|
434 bps) (144A)
|
263,400
|
|
65,000(b)(e)
|
|
UBS Group AG, 7.125% (5 Year USD Swap Rate + 588 bps)
|
66,579
|
|
350,000(e)
|
|
UniCredit S.p.A., 2.569% (1 Year CMT Index +
|
|
|
|
|
230 bps), 9/22/26 (144A)
|
354,628
|
|
|
|
Total Banks
|
$ 7,205,495
|
|
|
|
Building Materials — 0.1%
|
|
|
116,000
|
|
Carrier Global Corp., 2.7%, 2/15/31
|
$ 122,528
|
|
118,000
|
|
Carrier Global Corp., 2.722%, 2/15/30
|
124,704
|
|
85,000
|
|
Standard Industries, Inc., 4.375%, 7/15/30 (144A)
|
90,206
|
|
10,000
|
|
Summit Materials LLC/Summit Materials Finance
|
|
|
|
|
Corp., 5.25%,
|
|
|
|
|
1/15/29 (144A)
|
10,525
|
|
|
|
Total Building Materials
|
$ 347,963
|
The accompanying notes are an integral part of these financial statements.
Pioneer Balanced ESG Fund | Semiannual Report | 1/31/21 35
Schedule of Investments | 1/31/21
(unaudited) (continued)
| |
|
|
|
|
Principal
|
|
|
|
|
Amount
|
|
|
|
|
USD ($)
|
|
|
Value
|
|
|
|
Chemicals — 0.1%
|
|
|
220,000
|
|
Albemarle Wodgina Pty, Ltd., 3.45%, 11/15/29
|
$ 232,973
|
|
55,000
|
|
Ingevity Corp., 3.875%, 11/1/28 (144A)
|
55,144
|
|
71,000
|
|
NOVA Chemicals Corp., 5.25%, 6/1/27 (144A)
|
74,017
|
|
|
|
Total Chemicals
|
$ 362,134
|
|
|
|
Commercial Services — 0.1%
|
|
|
35,000
|
|
Allied Universal Holdco LLC/Allied Universal Finance
|
|
|
|
|
Corp., 6.625%, 7/15/26 (144A)
|
$ 37,492
|
|
115,000
|
|
Garda World Security Corp., 4.625%, 2/15/27 (144A)
|
116,725
|
|
115,000
|
|
Prime Security Services Borrower LLC/Prime
|
|
|
|
|
Finance, Inc., 6.25%, 1/15/28 (144A)
|
122,475
|
|
|
|
Total Commercial Services
|
$ 276,692
|
|
|
|
Cosmetics/Personal Care — 0.0%†
|
|
|
75,000
|
|
Edgewell Personal Care Co., 5.5%, 6/1/28 (144A)
|
$ 80,230
|
|
|
|
Total Cosmetics/Personal Care
|
$ 80,230
|
|
|
|
Diversified Financial Services — 0.5%
|
|
|
145,000
|
|
Air Lease Corp., 3.125%, 12/1/30
|
$ 148,391
|
|
225,000
|
|
Alliance Data Systems Corp., 7.0%, 1/15/26 (144A)
|
238,500
|
|
18,000
|
|
Avolon Holdings Funding, Ltd., 3.95%, 7/1/24 (144A)
|
18,899
|
|
300,000
|
|
Capital One Financial Corp., 3.75%, 4/24/24
|
328,291
|
|
110,000
|
|
Capital One Financial Corp., 4.25%, 4/30/25
|
124,694
|
|
300,000(b)(e)
|
|
Charles Schwab Corp., 4.0% (5 Year CMT Index + 308 bps)
|
309,000
|
|
84,000(b)(e)
|
|
Charles Schwab Corp., 5.375% (5 Year CMT Index +
|
|
|
|
|
497 bps)
|
93,102
|
|
275,000
|
|
GE Capital Funding LLC, 4.55%, 5/15/32 (144A)
|
323,407
|
|
45,000
|
|
Nationstar Mortgage Holdings, Inc., 5.125%,
|
|
|
|
|
12/15/30 (144A)
|
46,688
|
|
50,000
|
|
Nationstar Mortgage Holdings, Inc., 5.5%,
|
|
|
|
|
8/15/28 (144A)
|
51,625
|
|
15,000
|
|
Nationstar Mortgage Holdings, Inc., 6.0%,
|
|
|
|
|
1/15/27 (144A)
|
15,863
|
|
|
|
Total Diversified Financial Services
|
$ 1,698,460
|
|
|
|
Electric — 0.9%
|
|
|
190,000
|
|
AES Corp., 2.45%, 1/15/31 (144A)
|
$ 190,125
|
|
60,000
|
|
AES Corp., 3.95%, 7/15/30 (144A)
|
67,254
|
|
125,000
|
|
American Electric Power Co., Inc., 4.3%, 12/1/28
|
147,469
|
|
220,000
|
|
Consolidated Edison Co. of New York, Inc.,
|
|
|
|
|
4.625%, 12/1/54
|
286,472
|
|
76,000(c)
|
|
Dominion Energy, Inc., 3.071%, 8/15/24
|
82,534
|
|
250,000
|
|
Duke Energy Carolinas LLC, 3.95%, 3/15/48
|
301,439
|
|
230,000
|
|
Edison International, 2.95%, 3/15/23
|
239,248
|
|
200,000(e)
|
|
Enel S.p.A., 8.75% (5 Year USD Swap Rate +
|
|
|
|
|
588 bps), 9/24/73 (144A)
|
233,500
|
|
310,000
|
|
Iberdrola International BV, 6.75%, 7/15/36
|
473,355
|
The accompanying notes are an integral part of these financial statements.
36 Pioneer Balanced ESG Fund | Semiannual Report | 1/31/21
| |
|
|
|
|
Principal
|
|
|
|
|
Amount
|
|
|
|
|
USD ($)
|
|
|
Value
|
|
|
|
Electric — (continued)
|
|
|
121,000
|
|
New York State Electric & Gas Corp., 3.3%,
|
|
|
|
|
9/15/49 (144A)
|
$ 127,859
|
|
365,000
|
|
NextEra Energy Capital Holdings, Inc., 3.55%, 5/1/27
|
415,403
|
|
25,000
|
|
Pattern Energy Operations LP/Pattern Energy
|
|
|
|
|
Operations, Inc., 4.5%, 8/15/28 (144A)
|
26,440
|
|
145,000
|
|
Puget Energy, Inc., 4.1%, 6/15/30
|
164,061
|
|
215,000
|
|
Sempra Energy, 3.4%, 2/1/28
|
240,751
|
|
200,000
|
|
Virginia Electric & Power Co., 4.45%, 2/15/44
|
254,337
|
|
|
|
Total Electric
|
$ 3,250,247
|
|
|
|
Electronics — 0.1%
|
|
|
220,000
|
|
Amphenol Corp., 3.125%, 9/15/21
|
$ 223,208
|
|
30,000
|
|
Sensata Technologies, Inc., 3.75%, 2/15/31 (144A)
|
30,789
|
|
|
|
Total Electronics
|
$ 253,997
|
|
|
|
Energy-Alternate Sources — 0.0%†
|
|
|
46,807
|
|
Alta Wind Holdings LLC, 7.0%, 6/30/35 (144A)
|
$ 54,243
|
|
|
|
Total Energy-Alternate Sources
|
$ 54,243
|
|
|
|
Environmental Control — 0.0%†
|
|
|
115,000
|
|
Covanta Holding Corp., 5.0%, 9/1/30
|
$ 120,750
|
|
|
|
Total Environmental Control
|
$ 120,750
|
|
|
|
Food — 0.1%
|
|
|
40,000
|
|
Pilgrim’s Pride Corp., 5.875%, 9/30/27 (144A)
|
$ 42,568
|
|
350,000
|
|
Smithfield Foods, Inc., 2.65%, 10/3/21 (144A)
|
352,889
|
|
155,000
|
|
Smithfield Foods, Inc., 3.0%, 10/15/30 (144A)
|
161,158
|
|
4,000
|
|
Smithfield Foods, Inc., 5.2%, 4/1/29 (144A)
|
4,742
|
|
|
|
Total Food
|
$ 561,357
|
|
|
|
Forest Products & Paper — 0.0%†
|
|
|
55,000
|
|
Clearwater Paper Corp., 4.75%, 8/15/28 (144A)
|
$ 56,909
|
|
41,000
|
|
International Paper Co., 7.3%, 11/15/39
|
65,142
|
|
|
|
Total Forest Products & Paper
|
$ 122,051
|
|
|
|
Gas — 0.2%
|
|
|
325,000
|
|
Boston Gas Co., 3.15%, 8/1/27 (144A)
|
$ 361,757
|
|
250,000
|
|
Southern California Gas Co., 5.125%, 11/15/40
|
335,096
|
|
|
|
Total Gas
|
$ 696,853
|
|
|
|
Healthcare-Products — 0.1%
|
|
|
140,000
|
|
Edwards Lifesciences Corp., 4.3%, 6/15/28
|
$ 163,484
|
|
350,000
|
|
Smith & Nephew Plc, 2.032%, 10/14/30
|
351,222
|
|
|
|
Total Healthcare-Products
|
$ 514,706
|
The accompanying notes are an integral part of these financial statements.
Pioneer Balanced ESG Fund | Semiannual Report | 1/31/21 37
Schedule of Investments | 1/31/21
(unaudited) (continued)
| |
|
|
|
|
Principal
|
|
|
|
|
Amount
|
|
|
|
|
USD ($)
|
|
|
Value
|
|
|
|
Healthcare-Services — 0.2%
|
|
|
70,000
|
|
Centene Corp., 4.625%, 12/15/29
|
$ 77,609
|
|
400,000
|
|
Fresenius Medical Care US Finance III, Inc., 2.375%,
|
|
|
|
|
2/16/31 (144A)
|
402,900
|
|
108,000
|
|
Health Care Service Corp. A Mutual Legal Reserve
|
|
|
|
|
Co., 3.2%, 6/1/50 (144A)
|
112,146
|
|
40,000
|
|
Legacy LifePoint Health LLC, 6.75%, 4/15/25 (144A)
|
42,700
|
|
|
|
Total Healthcare-Services
|
$ 635,355
|
|
|
|
Home Builders — 0.0%†
|
|
|
83,000
|
|
Meritage Homes Corp., 6.0%, 6/1/25
|
$ 93,894
|
|
|
|
Total Home Builders
|
$ 93,894
|
|
|
|
Insurance — 1.2%
|
|
|
250,000
|
|
AXA SA, 8.6%, 12/15/30
|
$ 390,420
|
|
293,000
|
|
CNO Financial Group, Inc., 5.25%, 5/30/29
|
351,905
|
|
50,000(e)
|
|
Farmers Exchange Capital III, 5.454% (3 Month USD
|
|
|
|
|
LIBOR + 345 bps), 10/15/54 (144A)
|
63,824
|
|
225,000(e)
|
|
Farmers Insurance Exchange, 4.747% (3 Month USD
|
|
|
|
|
LIBOR + 323 bps), 11/1/57 (144A)
|
244,209
|
|
875,000
|
|
Liberty Mutual Insurance Co., 7.697%, 10/15/97 (144A)
|
1,349,066
|
|
115,000
|
|
Nationwide Financial Services, Inc., 3.9%,
|
|
|
|
|
11/30/49 (144A)
|
126,066
|
|
250,000
|
|
Nationwide Financial Services, Inc., 5.3%,
|
|
|
|
|
11/18/44 (144A)
|
296,534
|
|
270,000
|
|
Nationwide Mutual Insurance Co., 4.35%, 4/30/50 (144A)
|
305,393
|
|
80,000
|
|
New York Life Insurance Co., 3.75%, 5/15/50 (144A)
|
92,267
|
|
270,000(e)
|
|
Nippon Life Insurance Co., 2.75% (5 Year CMT Index +
|
|
|
|
|
265 bps), 1/21/51 (144A)
|
267,145
|
|
305,000
|
|
Prudential Financial, Inc., 3.0%, 3/10/40
|
323,166
|
|
250,000
|
|
Prudential Financial, Inc., 3.878%, 3/27/28
|
293,976
|
|
110,000
|
|
Teachers Insurance & Annuity Association of America,
|
|
|
|
|
4.27%, 5/15/47 (144A)
|
133,824
|
|
110,000
|
|
Teachers Insurance & Annuity Association of America,
|
|
|
|
|
4.9%, 9/15/44 (144A)
|
143,448
|
|
20,000
|
|
Teachers Insurance & Annuity Association of America,
|
|
|
|
|
6.85%, 12/16/39 (144A)
|
30,636
|
|
40,000
|
|
Willis North America, Inc., 2.95%, 9/15/29
|
43,111
|
|
|
|
Total Insurance
|
$ 4,454,990
|
|
|
|
Internet — 0.1%
|
|
|
50,000
|
|
ANGI Group LLC, 3.875%, 8/15/28 (144A)
|
$ 49,812
|
|
390,000
|
|
Expedia Group, Inc., 3.25%, 2/15/30
|
398,351
|
|
|
|
Total Internet
|
$ 448,163
|
The accompanying notes are an integral part of these financial statements.
38 Pioneer Balanced ESG Fund | Semiannual Report | 1/31/21
| |
|
|
|
|
Principal
|
|
|
|
|
Amount
|
|
|
|
|
USD ($)
|
|
|
Value
|
|
|
|
Lodging — 0.2%
|
|
|
110,000
|
|
Hilton Domestic Operating Co., Inc., 3.75%,
|
|
|
|
|
5/1/29 (144A)
|
$ 111,721
|
|
105,000
|
|
Hilton Domestic Operating Co., Inc., 4.0%, 5/1/31 (144A)
|
107,879
|
|
150,000
|
|
Marriott International, Inc., 3.5%, 10/15/32
|
158,965
|
|
290,000
|
|
Marriott International, Inc., 4.625%, 6/15/30
|
331,225
|
|
25,000
|
|
Marriott International, Inc., 5.75%, 5/1/25
|
28,996
|
|
|
|
Total Lodging
|
$ 738,786
|
|
|
|
Machinery-Diversified — 0.2%
|
|
|
500,000
|
|
CNH Industrial Capital LLC, 1.875%, 1/15/26
|
$ 519,477
|
|
180,000
|
|
CNH Industrial Capital LLC, 1.95%, 7/2/23
|
185,316
|
|
|
|
Total Machinery-Diversified
|
$ 704,793
|
|
|
|
Media — 0.2%
|
|
|
170,000
|
|
Comcast Corp., 4.15%, 10/15/28
|
$ 201,399
|
|
200,000
|
|
CSC Holdings LLC, 4.625%, 12/1/30 (144A)
|
204,000
|
|
86,000
|
|
Diamond Sports Group LLC/Diamond Sports Finance
|
|
|
|
|
Co., 6.625%, 8/15/27 (144A)
|
54,610
|
|
30,000
|
|
Sinclair Television Group, Inc., 4.125%, 12/1/30 (144A)
|
29,887
|
|
350,000
|
|
Walt Disney Co., 3.8%, 3/22/30
|
409,104
|
|
|
|
Total Media
|
$ 899,000
|
|
|
|
Mining — 0.1%
|
|
|
250,000
|
|
Corp Nacional del Cobre de Chile, 5.625%,
|
|
|
|
|
10/18/43 (144A)
|
$ 337,489
|
|
|
|
Total Mining
|
$ 337,489
|
|
|
|
Miscellaneous Manufacturers — 0.1%
|
|
|
95,000
|
|
General Electric Co., 4.25%, 5/1/40
|
$ 108,214
|
|
205,000
|
|
General Electric Co., 4.35%, 5/1/50
|
236,121
|
|
|
|
Total Miscellaneous Manufacturers
|
$ 344,335
|
|
|
|
Multi-National — 0.1%
|
|
|
370,000
|
|
Banque Ouest Africaine de Developpement, 4.7%,
|
|
|
|
|
10/22/31 (144A)
|
$ 404,084
|
|
|
|
Total Multi-National
|
$ 404,084
|
|
|
|
Oil & Gas — 0.3%
|
|
|
385,000
|
|
Cenovus Energy, Inc., 6.75%, 11/15/39
|
$ 498,723
|
|
45,000
|
|
Hilcorp Energy I LP/Hilcorp Finance Co., 6.0%,
|
|
|
|
|
2/1/31 (144A)
|
45,675
|
|
95,000
|
|
MEG Energy Corp., 7.125%, 2/1/27 (144A)
|
98,087
|
|
30,000
|
|
PBF Holding Co. LLC/PBF Finance Corp., 9.25%,
|
|
|
|
|
5/15/25 (144A)
|
28,939
|
|
70,000
|
|
Phillips 66, 2.15%, 12/15/30
|
68,989
|
|
250,000
|
|
Sinopec Group Overseas Development 2014, Ltd.,
|
|
|
|
|
4.375%, 4/10/24 (144A)
|
274,870
|
The accompanying notes are an integral part of these financial statements.
Pioneer Balanced ESG Fund | Semiannual Report | 1/31/21 39
Schedule of Investments | 1/31/21
(unaudited) (continued)
| |
|
|
|
|
Principal
|
|
|
|
|
Amount
|
|
|
|
|
USD ($)
|
|
|
Value
|
|
|
|
Oil & Gas — (continued)
|
|
|
80,000
|
|
Valero Energy Corp., 2.15%, 9/15/27
|
$ 80,859
|
|
162,000
|
|
Valero Energy Corp., 6.625%, 6/15/37
|
212,529
|
|
|
|
Total Oil & Gas
|
$ 1,308,671
|
|
|
|
Pharmaceuticals — 0.5%
|
|
|
618,000
|
|
AbbVie, Inc., 3.2%, 11/21/29
|
$ 683,439
|
|
117,000
|
|
AbbVie, Inc., 4.05%, 11/21/39
|
136,212
|
|
200,000
|
|
Bayer US Finance II LLC, 4.25%, 12/15/25 (144A)
|
228,264
|
|
250,000
|
|
Cardinal Health, Inc., 4.9%, 9/15/45
|
299,732
|
|
135,000
|
|
Cigna Corp., 4.375%, 10/15/28
|
160,423
|
|
94,051
|
|
CVS Pass-Through Trust, 5.298%, 1/11/27 (144A)
|
103,340
|
|
86,694
|
|
CVS Pass-Through Trust, 5.773%, 1/10/33 (144A)
|
103,181
|
|
68,536
|
|
CVS Pass-Through Trust, 8.353%, 7/10/31 (144A)
|
90,825
|
|
|
|
Total Pharmaceuticals
|
$ 1,805,416
|
|
|
|
Pipelines — 0.9%
|
|
|
40,000
|
|
Enable Midstream Partners LP, 4.15%, 9/15/29
|
$ 39,477
|
|
68,000
|
|
Enable Midstream Partners LP, 4.4%, 3/15/27
|
70,923
|
|
332,000
|
|
Enable Midstream Partners LP, 4.95%, 5/15/28
|
349,827
|
|
225,000
|
|
Enbridge, Inc., 3.7%, 7/15/27
|
256,142
|
|
210,000
|
|
EnLink Midstream Partners LP, 5.45%, 6/1/47
|
167,869
|
|
47,000
|
|
EnLink Midstream Partners LP, 5.6%, 4/1/44
|
37,717
|
|
85,000
|
|
Hess Midstream Operations LP, 5.125%, 6/15/28 (144A)
|
88,213
|
|
280,000
|
|
MPLX LP, 4.25%, 12/1/27
|
321,677
|
|
105,000
|
|
MPLX LP, 4.875%, 12/1/24
|
119,264
|
|
55,000
|
|
MPLX LP, 4.875%, 6/1/25
|
63,080
|
|
400,000
|
|
Phillips 66 Partners LP, 3.75%, 3/1/28
|
433,304
|
|
125,000(b)(e)
|
|
Plains All American Pipeline LP, 6.125% (3 Month
|
|
|
|
|
USD LIBOR + 411 bps)
|
103,725
|
|
125,000
|
|
Plains All American Pipeline LP/PAA Finance Corp.,
|
|
|
|
|
4.9%, 2/15/45
|
130,396
|
|
290,000
|
|
Sabine Pass Liquefaction LLC, 5.0%, 3/15/27
|
342,636
|
|
300,000
|
|
Texas Eastern Transmission LP, 3.5%, 1/15/28 (144A)
|
329,034
|
|
205,000
|
|
Williams Cos., Inc., 5.75%, 6/24/44
|
256,866
|
|
242,000
|
|
Williams Cos., Inc., 7.75%, 6/15/31
|
324,359
|
|
|
|
Total Pipelines
|
$ 3,434,509
|
|
|
|
Real Estate — 0.1%
|
|
|
250,000(b)(e)
|
|
AT Securities BV, 5.25% (5 Year USD Swap Rate + 355 bps)
|
$ 260,750
|
|
|
|
Total Real Estate
|
$ 260,750
|
|
|
|
REITs — 0.7%
|
|
|
125,000
|
|
Alexandria Real Estate Equities, Inc., 1.875%, 2/1/33
|
$ 121,802
|
|
50,000
|
|
Alexandria Real Estate Equities, Inc., 3.45%, 4/30/25
|
55,273
|
|
300,000
|
|
Duke Realty LP, 3.75%, 12/1/24
|
332,036
|
|
399,000
|
|
Healthcare Realty Trust, Inc., 2.05%, 3/15/31
|
395,005
|
The accompanying notes are an integral part of these financial statements.
40 Pioneer Balanced ESG Fund | Semiannual Report | 1/31/21
| |
|
|
|
|
Principal
|
|
|
|
|
Amount
|
|
|
|
|
USD ($)
|
|
|
Value
|
|
|
|
REITs — (continued)
|
|
|
265,000
|
|
Healthcare Trust of America Holdings LP, 3.1%, 2/15/30
|
$ 286,315
|
|
23,000
|
|
Highwoods Realty LP, 2.6%, 2/1/31
|
23,320
|
|
350,000
|
|
Highwoods Realty LP, 3.625%, 1/15/23
|
364,926
|
|
82,000
|
|
Iron Mountain, Inc., 4.5%, 2/15/31 (144A)
|
83,845
|
|
160,000
|
|
iStar, Inc., 4.25%, 8/1/25
|
157,200
|
|
65,000
|
|
iStar, Inc., 4.75%, 10/1/24
|
66,671
|
|
110,000
|
|
Lexington Realty Trust, 2.7%, 9/15/30
|
112,990
|
|
160,000
|
|
MPT Operating Partnership LP/MPT Finance Corp.,
|
|
|
|
|
3.5%, 3/15/31
|
162,177
|
|
205,000
|
|
UDR, Inc., 1.9%, 3/15/33
|
199,939
|
|
155,000
|
|
UDR, Inc., 4.0%, 10/1/25
|
174,794
|
|
140,000
|
|
UDR, Inc., 4.4%, 1/26/29
|
164,794
|
|
|
|
Total REITs
|
$ 2,701,087
|
|
|
|
Retail — 0.4%
|
|
|
240,000
|
|
7-Eleven, Inc., 1.8%, 2/10/31 (144A)
|
$ 237,645
|
|
240,000
|
|
7-Eleven, Inc., 2.8%, 2/10/51 (144A)
|
236,358
|
|
250,000
|
|
AutoNation, Inc., 4.75%, 6/1/30
|
300,537
|
|
565,000
|
|
Best Buy Co., Inc., 1.95%, 10/1/30
|
558,551
|
|
|
|
Total Retail
|
$ 1,333,091
|
|
|
|
Semiconductors — 0.1%
|
|
|
60,000
|
|
Broadcom, Inc., 4.3%, 11/15/32
|
$ 69,204
|
|
391,000
|
|
Broadcom, Inc., 5.0%, 4/15/30
|
465,592
|
|
|
|
Total Semiconductors
|
$ 534,796
|
|
|
|
Software — 0.2%
|
|
|
415,000
|
|
Citrix Systems, Inc., 3.3%, 3/1/30
|
$ 446,330
|
|
175,000
|
|
Infor, Inc., 1.75%, 7/15/25 (144A)
|
180,563
|
|
|
|
Total Software
|
$ 626,893
|
|
|
|
Telecommunications — 0.3%
|
|
|
130,000
|
|
Level 3 Financing, Inc., 4.625%, 9/15/27 (144A)
|
$ 135,362
|
|
35,000
|
|
LogMeIn, Inc., 5.5%, 9/1/27 (144A)
|
36,619
|
|
110,000
|
|
Lumen Technologies, Inc., 5.8%, 3/15/22
|
114,950
|
|
215,000
|
|
Motorola Solutions, Inc., 2.3%, 11/15/30
|
215,292
|
|
625,000
|
|
T-Mobile USA, Inc., 2.55%, 2/15/31 (144A)
|
640,175
|
|
|
|
Total Telecommunications
|
$ 1,142,398
|
|
|
|
Transportation — 0.4%
|
|
|
150,000
|
|
Burlington Northern Santa Fe LLC, 5.15%, 9/1/43
|
$ 208,266
|
|
250,000
|
|
FedEx Corp., 4.55%, 4/1/46
|
302,383
|
|
370,000
|
|
Union Pacific Corp., 3.375%, 2/1/35
|
419,545
|
|
350,000
|
|
United Parcel Service, Inc., 4.45%, 4/1/30
|
429,693
|
|
|
|
Total Transportation
|
$ 1,359,887
|
The accompanying notes are an integral part of these financial statements.
Pioneer Balanced ESG Fund | Semiannual Report | 1/31/21 41
Schedule of Investments | 1/31/21
(unaudited) (continued)
| |
|
|
|
|
Principal
|
|
|
|
|
Amount
|
|
|
|
|
USD ($)
|
|
|
Value
|
|
|
|
Trucking & Leasing — 0.1%
|
|
|
165,000
|
|
Penske Truck Leasing Co. LP/PTL Finance Corp.,
|
|
|
|
|
3.35%, 11/1/29 (144A)
|
$ 179,729
|
|
99,000
|
|
Penske Truck Leasing Co. LP/PTL Finance Corp.,
|
|
|
|
|
4.2%, 4/1/27 (144A)
|
115,078
|
|
|
|
Total Trucking & Leasing
|
$ 294,807
|
|
|
|
Water — 0.0%†
|
|
|
75,000
|
|
Essential Utilities, Inc., 3.566%, 5/1/29
|
$ 84,673
|
|
|
|
Total Water
|
$ 84,673
|
|
|
|
TOTAL CORPORATE BONDS
|
|
|
|
|
(Cost $38,634,944)
|
$ 41,776,163
|
|
|
|
FOREIGN GOVERNMENT BONDS — 0.2% of
|
|
|
|
|
Net Assets
|
|
|
|
|
Mexico — 0.1%
|
|
|
300,000
|
|
Mexico Government International Bond, 4.6%, 2/10/48
|
$ 330,378
|
|
|
|
Total Mexico
|
$ 330,378
|
|
|
|
Philippines — 0.1%
|
|
|
200,000
|
|
Philippine Government International Bond,
|
|
|
|
|
5.0%, 1/13/37
|
$ 262,547
|
|
|
|
Total Philippines
|
$ 262,547
|
|
|
|
TOTAL FOREIGN GOVERNMENT BONDS
|
|
|
|
|
(Cost $537,090)
|
$ 592,925
|
|
|
|
INSURANCE-LINKED SECURITIES — 0.4% of
|
|
|
|
|
Net Assets#
|
|
|
|
|
Event Linked Bonds — 0.4%
|
|
|
|
|
Health – U.S. — 0.0%†
|
|
|
250,000(d)
|
|
Vitality Re X, 1.798% (3 Month U.S. Treasury Bill +
|
|
|
|
|
175 bps), 1/10/23 (144A)
|
$ 243,750
|
|
|
|
Multiperil – U.S. — 0.2%
|
|
|
250,000(d)
|
|
Easton Re Pte, 4.0% (3 Month U.S. Treasury Bill +
|
|
|
|
|
400 bps), 1/8/24 (144A)
|
$ 249,950
|
|
250,000(d)
|
|
Residential Reinsurance 2017, 5.978% (3 Month
|
|
|
|
|
U.S. Treasury Bill + 593 bps), 12/6/21 (144A)
|
250,500
|
|
250,000(d)
|
|
Tailwind Re 2017-1, 7.698% (3 Month U.S. Treasury
|
|
|
|
|
Bill + 765 bps), 1/8/22 (144A)
|
254,050
|
|
|
|
|
$ 754,500
|
|
|
|
Multiperil – U.S. & Canada — 0.1%
|
|
|
250,000(d)
|
|
Mona Lisa Re, 8.048% (3 Month U.S. Treasury Bill +
|
|
|
|
|
800 bps), 1/9/23 (144A)
|
$ 253,750
|
|
|
|
Windstorm – U.S. — 0.1%
|
|
|
250,000(d)
|
|
Bonanza Re, 4.801% (3 Month U.S. Treasury Bill +
|
|
|
|
|
475 bps), 12/23/24 (144A)
|
$ 250,150
|
|
|
|
Total Event Linked Bonds
|
$ 1,502,150
|
The accompanying notes are an integral part of these financial statements.
42 Pioneer Balanced ESG Fund | Semiannual Report | 1/31/21
|
Face
|
|
|
|
|
Amount
|
|
|
|
|
USD ($)
|
|
|
Value
|
|
|
|
Collateralized Reinsurance — 0.0%†
|
|
|
|
|
Multiperil – Worldwide — 0.0%†
|
|
|
250,000+(a)(g)
|
|
Resilience Re, 4/6/21
|
$ 25
|
|
|
|
Total Collateralized Reinsurance
|
$ 25
|
|
|
|
Reinsurance Sidecars — 0.0%†
|
|
|
|
|
Multiperil – Worldwide — 0.0%†
|
|
|
250,000+(a)(g)
|
|
Bantry Re 2016, 3/31/21
|
$ 20,150
|
|
100,000+(a)(h)
|
|
Lorenz Re 2018, 7/1/21
|
1,190
|
|
100,000+(a)(g)
|
|
Sector Re V, Series 9, Class A, 3/1/24 (144A)
|
42,930
|
|
|
|
|
$ 64,270
|
|
|
|
Total Reinsurance Sidecars
|
$ 64,270
|
|
|
|
TOTAL INSURANCE-LINKED SECURITIES
|
|
|
|
|
(Cost $1,643,752)
|
$ 1,566,445
|
|
Principal
|
|
|
|
|
Amount
|
|
|
|
|
USD ($)
|
|
|
|
|
|
|
MUNICIPAL BONDS — 0.1% of Net Assets(i)
|
|
|
|
|
Municipal Education — 0.0%†
|
|
|
100,000
|
|
Massachusetts Development Finance Agency,
|
|
|
|
|
Series B, 4.844%, 9/1/43
|
$ 127,493
|
|
|
|
Total Municipal Education
|
$ 127,493
|
|
|
|
Municipal General — 0.0%†
|
|
|
100,000(j)
|
|
Central Texas Regional Mobility Authority, 1/1/25
|
$ 96,213
|
|
|
|
Total Municipal General
|
$ 96,213
|
|
|
|
Municipal Higher Education — 0.1%
|
|
|
200,000
|
|
University of California, Series AG, 4.062%, 5/15/33
|
$ 213,140
|
|
|
|
Total Municipal Higher Education
|
$ 213,140
|
|
|
|
Municipal Medical — 0.0%†
|
|
|
100,000
|
|
Health & Educational Facilities Authority of the State of
|
|
| |
|
Missouri, Washington University, Series A,
|
|
|
|
|
3.685%, 2/15/47
|
$ 120,282
|
|
|
|
Total Municipal Medical
|
$ 120,282
|
|
|
|
TOTAL MUNICIPAL BONDS
|
|
|
|
|
(Cost $481,042)
|
$ 557,128
|
|
|
|
SENIOR SECURED FLOATING RATE LOAN
|
|
| |
|
INTERESTS — 0.2% of Net Assets*(d)
|
|
|
|
|
Broadcasting & Entertainment — 0.0%†
|
|
|
166,733
|
|
Sinclair Television Group, Inc., Tranche B Term Loan,
|
|
|
|
|
2.38% (LIBOR + 225 bps), 1/3/24
|
$ 166,191
|
|
|
|
Total Broadcasting & Entertainment
|
$ 166,191
|
The accompanying notes are an integral part of these financial statements.
Pioneer Balanced ESG Fund | Semiannual Report | 1/31/21 43
Schedule of Investments | 1/31/21
(unaudited) (continued)
| |
|
|
|
|
Principal
|
|
|
|
|
Amount
|
|
|
|
|
USD ($)
|
|
|
Value
|
|
|
|
Computers & Electronics — 0.1%
|
|
|
170,188
|
|
Iron Mountain Information Management LLC,
|
|
| |
|
Incremental Term B Loan, 1.871% (LIBOR +
|
|
|
|
|
175 bps), 1/2/26
|
$ 169,549
|
|
|
|
Total Computers & Electronics
|
$ 169,549
|
|
|
|
Insurance — 0.0%†
|
|
|
97,236
|
|
USI, Inc. (fka Compass Investors, Inc.), 2017 New
|
|
|
|
|
Term Loan, 3.254% (LIBOR + 300 bps), 5/16/24
|
$ 96,689
|
|
|
|
Total Insurance
|
$ 96,689
|
|
|
|
Leasing — 0.1%
|
|
|
73,718
|
|
Avolon TLB Borrower 1 (US) LLC, Term B-4 Loan,
|
|
|
|
|
2.25% (LIBOR + 150 bps), 2/12/27
|
$ 73,465
|
|
131,288
|
|
IBC Capital I, Ltd. (aka Goodpack, Ltd.), First Lien
|
|
|
|
|
Tranche B-1 Term Loan, 3.986% (LIBOR +
|
|
|
|
|
375 bps), 9/11/23
|
131,397
|
|
|
|
Total Leasing
|
$ 204,862
|
| |
|
Professional & Business Services — 0.0%†
|
|
|
79,327
|
|
SIWF Holdings, Inc., (aka Spring Window Fashions),
|
|
| |
|
First Lien Initial Term Loan, 4.371% (LIBOR +
|
|
|
|
|
425 bps), 6/15/25
|
$ 79,005
|
|
|
|
Total Professional & Business Services
|
$ 79,005
|
|
|
|
TOTAL SENIOR SECURED FLOATING RATE LOAN INTERESTS
|
|
|
|
|
(Cost $717,826)
|
$ 716,296
|
|
|
|
U.S. GOVERNMENT AND AGENCY
|
|
| |
|
OBLIGATIONS — 20.1% of Net Assets
|
|
|
309,909
|
|
Fannie Mae, 1.5%, 12/1/35
|
$ 317,697
|
|
2,000,000
|
|
Fannie Mae, 1.5%, 2/1/36 (TBA)
|
2,049,609
|
|
150,000
|
|
Fannie Mae, 1.5%, 2/1/51 (TBA)
|
150,527
|
|
1,053,257
|
|
Fannie Mae, 2.0%, 12/1/35
|
1,100,684
|
|
4,508,194
|
|
Fannie Mae, 2.0%, 1/1/51
|
4,651,296
|
|
600,000
|
|
Fannie Mae, 2.0%, 2/1/51 (TBA)
|
618,984
|
|
30,537
|
|
Fannie Mae, 2.5%, 3/1/43
|
32,430
|
|
20,630
|
|
Fannie Mae, 2.5%, 4/1/43
|
21,895
|
|
9,752
|
|
Fannie Mae, 2.5%, 8/1/43
|
10,347
|
|
19,743
|
|
Fannie Mae, 2.5%, 4/1/45
|
21,111
|
|
27,831
|
|
Fannie Mae, 2.5%, 4/1/45
|
29,764
|
|
23,396
|
|
Fannie Mae, 2.5%, 8/1/45
|
24,922
|
|
210,000
|
|
Fannie Mae, 2.5%, 2/1/51 (TBA)
|
221,173
|
|
57,612
|
|
Fannie Mae, 3.0%, 10/1/30
|
62,109
|
|
200,000
|
|
Fannie Mae, 3.0%, 9/1/39
|
210,197
|
|
244,944
|
|
Fannie Mae, 3.0%, 11/1/39
|
257,646
|
|
15,304
|
|
Fannie Mae, 3.0%, 2/1/43
|
16,641
|
|
141,757
|
|
Fannie Mae, 3.0%, 6/1/45
|
154,804
|
The accompanying notes are an integral part of these financial statements.
44 Pioneer Balanced ESG Fund | Semiannual Report | 1/31/21
| |
|
|
|
|
Principal
|
|
|
|
|
Amount
|
|
|
|
|
USD ($)
|
|
|
Value
|
|
|
|
U.S. GOVERNMENT AND AGENCY
|
|
|
|
|
OBLIGATIONS — (continued)
|
|
|
999,901
|
|
Fannie Mae, 3.0%, 7/1/45
|
$ 1,065,052
|
|
6,177
|
|
Fannie Mae, 3.0%, 5/1/46
|
6,634
|
|
7,900
|
|
Fannie Mae, 3.0%, 10/1/46
|
8,598
|
|
4,670
|
|
Fannie Mae, 3.0%, 1/1/47
|
5,083
|
|
24,636
|
|
Fannie Mae, 3.0%, 7/1/49
|
26,827
|
|
2,761,649
|
|
Fannie Mae, 3.0%, 12/1/49
|
2,902,644
|
|
529,947
|
|
Fannie Mae, 3.0%, 3/1/50
|
557,310
|
|
1,168,900
|
|
Fannie Mae, 3.0%, 6/1/50
|
1,227,385
|
|
4,150,000
|
|
Fannie Mae, 3.0%, 2/1/51 (TBA)
|
4,363,903
|
|
643,291
|
|
Fannie Mae, 3.5%, 7/1/43
|
703,845
|
|
176,536
|
|
Fannie Mae, 3.5%, 1/1/47
|
192,082
|
|
30,800
|
|
Fannie Mae, 3.5%, 2/1/49
|
32,643
|
|
35,514
|
|
Fannie Mae, 3.5%, 4/1/49
|
37,473
|
|
242,209
|
|
Fannie Mae, 3.5%, 5/1/49
|
267,360
|
|
360,310
|
|
Fannie Mae, 3.5%, 5/1/49
|
402,159
|
|
352,587
|
|
Fannie Mae, 3.5%, 6/1/49
|
393,475
|
|
1,115,000
|
|
Fannie Mae, 3.5%, 2/1/51 (TBA)
|
1,185,384
|
|
114,853
|
|
Fannie Mae, 4.0%, 10/1/40
|
130,284
|
|
215,520
|
|
Fannie Mae, 4.0%, 3/1/41
|
237,993
|
|
47,139
|
|
Fannie Mae, 4.0%, 5/1/42
|
51,559
|
|
284,293
|
|
Fannie Mae, 4.0%, 6/1/42
|
314,581
|
|
101,708
|
|
Fannie Mae, 4.0%, 9/1/42
|
112,265
|
|
168,622
|
|
Fannie Mae, 4.0%, 7/1/43
|
180,787
|
|
70,051
|
|
Fannie Mae, 4.0%, 8/1/43
|
76,656
|
|
145,598
|
|
Fannie Mae, 4.0%, 8/1/43
|
159,347
|
|
48,448
|
|
Fannie Mae, 4.0%, 4/1/47
|
52,906
|
|
12,665
|
|
Fannie Mae, 4.0%, 6/1/47
|
13,750
|
|
21,262
|
|
Fannie Mae, 4.0%, 6/1/47
|
23,164
|
|
382,019
|
|
Fannie Mae, 4.0%, 3/1/48
|
409,819
|
|
2,190,000
|
|
Fannie Mae, 4.0%, 2/1/51 (TBA)
|
2,348,390
|
|
204,439
|
|
Fannie Mae, 4.5%, 6/1/40
|
227,483
|
|
145,913
|
|
Fannie Mae, 4.5%, 4/1/41
|
165,632
|
|
178,141
|
|
Fannie Mae, 4.5%, 12/1/43
|
197,013
|
|
530,397
|
|
Fannie Mae, 4.5%, 5/1/49
|
582,416
|
|
316,659
|
|
Fannie Mae, 4.5%, 4/1/50
|
348,528
|
|
4,679,000
|
|
Fannie Mae, 4.5%, 2/1/51 (TBA)
|
5,082,564
|
|
100,515
|
|
Fannie Mae, 5.0%, 5/1/31
|
113,899
|
|
33,004
|
|
Fannie Mae, 5.0%, 6/1/49
|
36,439
|
|
23,583
|
|
Fannie Mae, 5.0%, 10/1/49
|
26,070
|
|
6,108
|
|
Fannie Mae, 5.5%, 3/1/23
|
6,292
|
|
5,559
|
|
Fannie Mae, 5.5%, 3/1/34
|
6,217
|
|
6,699
|
|
Fannie Mae, 5.5%, 12/1/34
|
7,660
|
The accompanying notes are an integral part of these financial statements.
Pioneer Balanced ESG Fund | Semiannual Report | 1/31/21 45
Schedule of Investments | 1/31/21
(unaudited) (continued)
| |
|
|
|
|
Principal
|
|
|
|
|
Amount
|
|
|
|
|
USD ($)
|
|
|
Value
|
|
|
|
U.S. GOVERNMENT AND AGENCY
|
|
|
|
|
OBLIGATIONS — (continued)
|
|
|
41,871
|
|
Fannie Mae, 5.5%, 10/1/35
|
$ 48,696
|
|
15,834
|
|
Fannie Mae, 5.5%, 12/1/35
|
18,505
|
|
20,076
|
|
Fannie Mae, 5.5%, 12/1/35
|
23,466
|
|
12,134
|
|
Fannie Mae, 5.5%, 5/1/37
|
14,225
|
|
77,111
|
|
Fannie Mae, 5.5%, 5/1/38
|
90,375
|
|
462
|
|
Fannie Mae, 6.0%, 9/1/29
|
528
|
|
1,402
|
|
Fannie Mae, 6.0%, 8/1/32
|
1,680
|
|
10,368
|
|
Fannie Mae, 6.0%, 12/1/33
|
11,960
|
|
7,670
|
|
Fannie Mae, 6.0%, 10/1/37
|
9,206
|
|
4,995
|
|
Fannie Mae, 6.0%, 12/1/37
|
5,956
|
|
9,274
|
|
Fannie Mae, 6.5%, 4/1/29
|
10,307
|
|
3,347
|
|
Fannie Mae, 6.5%, 7/1/29
|
3,762
|
|
12,682
|
|
Fannie Mae, 6.5%, 5/1/32
|
14,547
|
|
11,628
|
|
Fannie Mae, 6.5%, 9/1/32
|
13,885
|
|
5,302
|
|
Fannie Mae, 6.5%, 10/1/32
|
6,113
|
|
9,567
|
|
Fannie Mae, 7.0%, 1/1/36
|
11,329
|
|
481,802
|
|
Federal Home Loan Mortgage Corp., 1.5%, 1/1/36
|
493,947
|
|
1,485,593
|
|
Federal Home Loan Mortgage Corp., 1.5%, 1/1/51
|
1,491,405
|
|
915,539
|
|
Federal Home Loan Mortgage Corp., 2.0%, 12/1/35
|
956,764
|
|
49,470
|
|
Federal Home Loan Mortgage Corp., 3.0%, 2/1/43
|
54,055
|
|
92,191
|
|
Federal Home Loan Mortgage Corp., 3.0%, 4/1/43
|
100,735
|
|
54,823
|
|
Federal Home Loan Mortgage Corp., 3.0%, 5/1/43
|
59,626
|
|
109,015
|
|
Federal Home Loan Mortgage Corp., 3.0%, 6/1/46
|
118,525
|
|
27,220
|
|
Federal Home Loan Mortgage Corp., 3.0%, 12/1/46
|
29,541
|
|
214,057
|
|
Federal Home Loan Mortgage Corp., 3.0%, 2/1/47
|
233,652
|
|
9,614
|
|
Federal Home Loan Mortgage Corp., 3.0%, 11/1/47
|
10,475
|
|
213,749
|
|
Federal Home Loan Mortgage Corp., 3.0%, 4/1/50
|
224,840
|
|
154,276
|
|
Federal Home Loan Mortgage Corp., 3.5%, 3/1/42
|
167,377
|
|
151,879
|
|
Federal Home Loan Mortgage Corp., 3.5%, 8/1/46
|
166,780
|
|
155,896
|
|
Federal Home Loan Mortgage Corp., 3.5%, 8/1/46
|
170,275
|
|
161,130
|
|
Federal Home Loan Mortgage Corp., 3.5%, 8/1/46
|
175,746
|
|
15,329
|
|
Federal Home Loan Mortgage Corp., 3.5%, 6/1/47
|
16,741
|
|
176,551
|
|
Federal Home Loan Mortgage Corp., 4.0%, 2/1/40
|
195,304
|
|
262,836
|
|
Federal Home Loan Mortgage Corp., 4.0%, 11/1/40
|
287,715
|
|
268,431
|
|
Federal Home Loan Mortgage Corp., 4.0%, 11/1/40
|
295,684
|
|
167,263
|
|
Federal Home Loan Mortgage Corp., 4.0%, 1/1/41
|
183,682
|
|
30,998
|
|
Federal Home Loan Mortgage Corp., 4.0%, 4/1/47
|
34,000
|
|
37,039
|
|
Federal Home Loan Mortgage Corp., 4.0%, 4/1/47
|
40,201
|
|
91,913
|
|
Federal Home Loan Mortgage Corp., 4.0%, 4/1/47
|
100,110
|
|
27,499
|
|
Federal Home Loan Mortgage Corp., 4.5%, 8/1/34
|
30,552
|
|
97,836
|
|
Federal Home Loan Mortgage Corp., 4.5%, 5/1/40
|
109,551
|
|
45,894
|
|
Federal Home Loan Mortgage Corp., 4.5%, 7/1/40
|
51,027
|
The accompanying notes are an integral part of these financial statements.
46 Pioneer Balanced ESG Fund | Semiannual Report | 1/31/21
| |
|
|
|
|
Principal
|
|
|
|
|
Amount
|
|
|
|
|
USD ($)
|
|
|
Value
|
|
|
|
U.S. GOVERNMENT AND AGENCY
|
|
|
|
|
OBLIGATIONS — (continued)
|
|
|
102,862
|
|
Federal Home Loan Mortgage Corp., 4.5%, 5/1/41
|
$ 114,347
|
|
22,034
|
|
Federal Home Loan Mortgage Corp., 5.0%, 11/1/34
|
25,611
|
|
18,595
|
|
Federal Home Loan Mortgage Corp., 5.0%, 8/1/37
|
21,579
|
|
4,114
|
|
Federal Home Loan Mortgage Corp., 5.0%, 5/1/39
|
4,784
|
|
11,492
|
|
Federal Home Loan Mortgage Corp., 5.0%, 12/1/39
|
13,365
|
|
38,646
|
|
Federal Home Loan Mortgage Corp., 5.0%, 10/1/49
|
42,693
|
|
654,908
|
|
Federal Home Loan Mortgage Corp., 5.0%, 12/1/49
|
723,195
|
|
12,173
|
|
Federal Home Loan Mortgage Corp., 5.5%, 11/1/34
|
14,227
|
|
7,857
|
|
Federal Home Loan Mortgage Corp., 6.0%, 1/1/38
|
9,334
|
|
13,693
|
|
Federal Home Loan Mortgage Corp., 6.0%, 10/1/38
|
16,165
|
|
5,345
|
|
Federal Home Loan Mortgage Corp., 6.5%, 10/1/33
|
6,366
|
|
70,905
|
|
Federal Home Loan Mortgage Corp., 7.0%, 10/1/46
|
74,271
|
|
530,000
|
|
Government National Mortgage Association,
|
|
|
|
|
2.0%, 2/1/51 (TBA)
|
549,916
|
|
1,420,000
|
|
Government National Mortgage Association,
|
|
|
|
|
2.5%, 2/1/51 (TBA)
|
1,493,330
|
|
920,000
|
|
Government National Mortgage Association,
|
|
|
|
|
3.0%, 2/1/51 (TBA)
|
964,329
|
|
760,000
|
|
Government National Mortgage Association,
|
|
|
|
|
3.5%, 2/1/51 (TBA)
|
805,125
|
|
165,000
|
|
Government National Mortgage Association,
|
|
|
|
|
4.0%, 2/1/51 (TBA)
|
176,418
|
|
149,000
|
|
Government National Mortgage Association,
|
|
|
|
|
4.5%, 2/1/51 (TBA)
|
160,501
|
|
115,275
|
|
Government National Mortgage Association I,
|
|
|
|
|
3.5%, 11/15/41
|
124,655
|
|
20,060
|
|
Government National Mortgage Association I,
|
|
|
|
|
3.5%, 10/15/42
|
21,560
|
|
200,309
|
|
Government National Mortgage Association I,
|
|
|
|
|
4.0%, 9/15/41
|
217,194
|
|
34,376
|
|
Government National Mortgage Association I,
|
|
|
|
|
4.0%, 4/15/45
|
37,340
|
|
66,987
|
|
Government National Mortgage Association I,
|
|
|
|
|
4.0%, 6/15/45
|
73,602
|
|
35,193
|
|
Government National Mortgage Association I,
|
|
|
|
|
4.5%, 5/15/39
|
39,930
|
|
7,399
|
|
Government National Mortgage Association I,
|
|
|
|
|
5.5%, 8/15/33
|
8,560
|
|
10,006
|
|
Government National Mortgage Association I,
|
|
|
|
|
5.5%, 9/15/33
|
11,122
|
|
10,764
|
|
Government National Mortgage Association I,
|
|
|
|
|
6.0%, 10/15/33
|
12,605
|
|
9,456
|
|
Government National Mortgage Association I,
|
|
|
|
|
6.0%, 9/15/34
|
10,641
|
|
41,986
|
|
Government National Mortgage Association I,
|
|
|
|
|
6.0%, 9/15/38
|
50,125
|
The accompanying notes are an integral part of these financial statements.
Pioneer Balanced ESG Fund | Semiannual Report | 1/31/21 47
Schedule of Investments | 1/31/21
(unaudited) (continued)
| |
|
|
|
|
Principal
|
|
|
|
|
Amount
|
|
|
|
|
USD ($)
|
|
|
Value
|
|
|
|
U.S. GOVERNMENT AND AGENCY
|
|
|
|
|
OBLIGATIONS — (continued)
|
|
|
5,686
|
|
Government National Mortgage Association I,
|
|
|
|
|
6.5%, 10/15/28
|
$ 6,338
|
|
16,455
|
|
Government National Mortgage Association I,
|
|
|
|
|
6.5%, 5/15/31
|
18,611
|
|
10,674
|
|
Government National Mortgage Association I,
|
|
|
|
|
6.5%, 6/15/32
|
12,735
|
|
13,741
|
|
Government National Mortgage Association I,
|
|
|
|
|
6.5%, 12/15/32
|
16,339
|
|
13,247
|
|
Government National Mortgage Association I,
|
|
|
|
|
6.5%, 5/15/33
|
14,767
|
|
207
|
|
Government National Mortgage Association I,
|
|
|
|
|
7.0%, 8/15/28
|
232
|
|
2,514
|
|
Government National Mortgage Association I,
|
|
|
|
|
8.0%, 2/15/30
|
2,525
|
|
48,608
|
|
Government National Mortgage Association II,
|
|
|
|
|
4.5%, 9/20/44
|
52,429
|
|
23,191
|
|
Government National Mortgage Association II,
|
|
|
|
|
4.5%, 10/20/44
|
25,980
|
|
48,939
|
|
Government National Mortgage Association II,
|
|
|
|
|
4.5%, 11/20/44
|
54,936
|
|
16,895
|
|
Government National Mortgage Association II,
|
|
|
|
|
5.5%, 2/20/34
|
19,717
|
|
26,544
|
|
Government National Mortgage Association II,
|
|
|
|
|
6.5%, 11/20/28
|
30,279
|
|
1,380
|
|
Government National Mortgage Association II,
|
|
|
|
|
7.5%, 9/20/29
|
1,612
|
|
4,000,000(j)
|
|
U.S. Treasury Bills, 2/4/21
|
3,999,985
|
|
8,000,000(j)
|
|
U.S. Treasury Bills, 2/18/21
|
7,999,839
|
|
6,000,000(j)
|
|
U.S. Treasury Bills, 3/11/21
|
5,999,699
|
|
4,000,000(j)
|
|
U.S. Treasury Bills, 3/16/21
|
3,999,713
|
|
422,488
|
|
U.S. Treasury Inflation Indexed Bonds, 0.25%, 2/15/50
|
490,345
|
|
1,073,220
|
|
U.S. Treasury Inflation Indexed Bonds, 1.0%, 2/15/48
|
1,468,578
|
|
982,443
|
|
U.S. Treasury Inflation Indexed Bonds, 1.0%, 2/15/49
|
1,353,673
|
|
1,250,000
|
|
U.S. Treasury Notes, 0.375%, 4/30/25
|
1,251,709
|
|
2,500,000
|
|
U.S. Treasury Notes, 1.5%, 2/15/30
|
2,604,980
|
|
|
|
TOTAL U.S. GOVERNMENT AND AGENCY OBLIGATIONS
|
|
|
|
|
(Cost $74,355,901)
|
$ 75,572,168
|
|
|
|
TOTAL INVESTMENTS IN UNAFFILIATED ISSUERS — 103.3%
|
|
|
|
|
(Cost $322,367,221)
|
$387,442,755
|
The accompanying notes are an integral part of these financial statements.
48 Pioneer Balanced ESG Fund | Semiannual Report | 1/31/21
|
|
|
|
|
|
|
|
|
|
|
|
|
|
|
|
|
|
|
|
|
|
|
Dividend
|
Gain
|
|
|
|
Shares
|
|
|
Income |
(Loss)
|
(Depreciation)
|
|
|
|
|
|
AFFILIATED ISSUER — 0.3%
|
|
|
|
|
| |
|
|
CLOSED-END FUND — 0.3% of Net Assets
|
|
|
|
|
|
|
110,371(k)
|
|
Pioneer ILS
|
|
|
|
|
|
|
|
|
Interval Fund
|
$48,740
|
$ — |
|
$ 939,257
|
|
|
|
|
TOTAL CLOSED-END FUND
|
|
|
|
|
|
|
|
|
(Cost $1,123,856)
|
|
|
|
$ 939,257
|
| |
|
|
TOTAL INVESTMENTS IN AFFILIATED ISSUER — 0.3%
|
|
|
|
|
|
|
(Cost $1,123,856)
|
|
|
|
$ 939,257
|
| |
|
|
OTHER ASSETS AND LIABILITIES — (3.6)%
|
|
|
$ (13,220,918)
|
|
|
|
|
NET ASSETS — 100.0%
|
|
|
$375,161,094
|
|
bps
|
Basis Points.
|
|
CMT
|
Constant Maturity Treasury Index.
|
|
FREMF
|
Freddie Mac Multifamily Fixed-Rate Mortgage Loans.
|
|
ICE
|
Intercontinental Exchange.
|
|
LIBOR
|
London Interbank Offered Rate.
|
|
REIT
|
Real Estate Investment Trust.
|
|
REMICS
|
Real Estate Mortgage Investment Conduits.
|
|
SOFRRATE
|
Secured Overnight Financing Rate.
|
|
(144A)
|
Security is exempt from registration under Rule 144A of the Securities Act of 1933. Such
|
|
|
securities may be resold normally to qualified institutional buyers in a transaction exempt
|
|
|
from registration. At January 31, 2021, the value of these securities amounted to
|
|
|
$45,885,934, or 12.2% of net assets.
|
|
(A.D.R.)
|
American Depositary Receipts.
|
|
(TBA)
|
“To Be Announced” Securities.
|
|
†
|
Amount rounds to less than 0.1%.
|
|
*
|
Senior secured floating rate loan interests in which the Fund invests generally pay
|
|
|
interest at rates that are periodically redetermined by reference to a base lending rate
|
|
|
plus a premium. These base lending rates are generally (i) the lending rate offered by one
|
|
|
or more major European banks, such as LIBOR, (ii) the prime rate offered by one or more
|
|
|
major United States banks, (iii) the rate of a certificate of deposit or (iv) other base
|
|
|
lending rates used by commercial lenders. The interest rate shown is the rate accruing at
|
|
|
January 31, 2021.
|
|
+
|
Security that used significant unobservable inputs to determine its value.
|
|
(a)
|
Non-income producing security.
|
|
(b)
|
Security is perpetual in nature and has no stated maturity date.
|
|
(c)
|
Debt obligation initially issued at one coupon which converts to a higher coupon at a
|
|
|
specific date. The rate shown is the rate at January 31, 2021.
|
|
(d)
|
Floating rate note. Coupon rate, reference index and spread shown at January 31, 2021.
|
|
(e)
|
The interest rate is subject to change periodically. The interest rate and/or reference
|
|
|
index and spread shown at January 31, 2021.
|
The accompanying notes are an integral part of these financial statements.
Pioneer Balanced ESG Fund | Semiannual Report | 1/31/21 49
Schedule of Investments | 1/31/21
(unaudited) (continued)
| |
|
|
(f)
|
Security represents the interest-only portion payments on a pool of underlying
|
|
|
mortgages or mortgage-backed securities.
|
|
(g)
|
Issued as participation notes.
|
|
(h)
|
Issued as preference shares.
|
|
(i)
|
Consists of Revenue Bonds unless otherwise indicated.
|
|
(j)
|
Security issued with a zero coupon. Income is recognized through accretion of discount.
|
|
(k)
|
Pioneer ILS Interval Fund is an affiliated closed-end fund managed by Amundi Asset
|
|
|
Management US, Inc. (the “Adviser”).
|
|
#
|
Securities are restricted as to resale.
|
| |
|
|
|
|
|
|
|
|
Restricted Securities
|
Acquisition date
|
|
Cost
|
|
|
Value
|
|
|
Bantry Re 2016
|
2/6/2019
|
|
$
|
20,150
|
|
|
$
|
20,150
|
|
|
Bonanza Re
|
12/15/2020
|
|
|
250,000
|
|
|
|
250,150
|
|
|
Easton Re Pte
|
12/15/2020
|
|
|
250,000
|
|
|
|
249,950
|
|
|
Lorenz Re 2018
|
6/26/2018
|
|
|
22,995
|
|
|
|
1,190
|
|
|
Mona Lisa Re
|
12/30/2019
|
|
|
250,000
|
|
|
|
253,750
|
|
|
Residential Reinsurance 2017
|
11/3/2017
|
|
|
250,000
|
|
|
|
250,500
|
|
|
Resilience Re
|
4/13/2017
|
|
|
817
|
|
|
|
25
|
|
|
Sector Re V, Series 9, Class A
|
4/23/2019
|
|
|
100,000
|
|
|
|
42,930
|
|
|
Tailwind Re 2017-1
|
12/20/2017
|
|
|
250,000
|
|
|
|
254,050
|
|
|
Vitality Re X
|
2/3/2020
|
|
|
249,790
|
|
|
|
243,750
|
|
|
Total Restricted Securities
|
|
|
|
|
|
|
$
|
1,566,445
|
|
|
% of Net assets
|
|
|
|
|
|
|
|
0.4
|
%
|
FUTURES CONTRACTS
FIXED INCOME INDEX FUTURES CONTRACTS
|
Number of
|
|
|
|
|
|
|
|
|
|
|
Unrealized
|
|
|
Contracts
|
|
|
Expiration
|
|
Notional
|
|
|
Market
|
|
|
Appreciation
|
|
|
Long
|
|
Description
|
Date
|
|
Amount
|
|
|
Value
|
|
|
(Depreciation)
|
|
| |
54
|
|
U.S. 2 Year
|
|
|
|
|
|
|
|
|
|
|
| |
|
|
Note (CBT)
|
3/31/21
|
|
$
|
11,921,312
|
|
|
$
|
11,932,734
|
|
|
$
|
11,422
|
|
| |
18
|
|
U.S. 5 Year
|
|
|
|
|
|
|
|
|
|
|
|
|
|
| |
|
|
Note (CBT)
|
3/31/21
|
|
|
2,266,031
|
|
|
|
2,265,750
|
|
|
|
(281
|
)
|
| |
28
|
|
U.S. Ultra
|
|
|
|
|
|
|
|
|
|
|
|
|
|
| |
|
|
Bond (CBT)
|
3/22/21
|
|
|
6,057,805
|
|
|
|
5,732,125
|
|
|
|
(325,680
|
)
|
| |
|
|
|
|
|
$
|
20,245,148
|
|
|
$
|
19,930,609
|
|
|
$
|
(314,539
|
)
|
|
Number of
|
|
|
|
|
|
|
|
|
|
|
|
|
|
|
|
|
Contracts
|
|
|
Expiration
|
|
Notional
|
|
|
Market
|
|
|
Unrealized
|
|
|
Short
|
|
Description
|
Date
|
|
Amount
|
|
|
Value
|
|
|
Appreciation
|
|
| |
30
|
|
U.S. 10 Year
|
|
|
|
|
|
|
|
|
|
|
|
|
|
| |
|
|
Note (CBT)
|
3/22/21
|
|
$
|
(4,137,828
|
)
|
|
$
|
(4,110,937
|
)
|
|
$
|
26,891
|
|
| |
29
|
|
U.S. 10 Year Ultra
|
3/22/21
|
|
|
(4,533,563
|
)
|
|
|
(4,461,016
|
)
|
|
|
72,547
|
|
| |
1
|
|
U.S. Long
|
|
|
|
|
|
|
|
|
|
|
|
|
|
| |
|
|
Bond (CBT)
|
3/22/21
|
|
|
(174,875
|
)
|
|
|
(168,719
|
)
|
|
|
6,156
|
|
| |
|
|
|
|
|
$
|
(8,846,266
|
)
|
|
$
|
(8,740,672
|
)
|
|
$
|
105,594
|
|
|
TOTAL FUTURES CONTRACTS
|
|
|
$
|
11,398,882
|
|
|
$
|
11,189,937
|
|
|
$
|
(208,945
|
)
|
The accompanying notes are an integral part of these financial statements.
50 Pioneer Balanced ESG Fund | Semiannual Report | 1/31/21
Principal amounts are denominated in U.S. dollars (“USD”) unless otherwise noted.
Purchases and sales of securities (excluding temporary cash investments) for the six months ended January 31, 2021 were as follows:
|
|
|
Purchases
|
|
|
Sales
|
|
|
Long-Term U.S. Government Securities
|
|
$
|
15,992,567
|
|
|
$
|
7,601,666
|
|
|
Other Long-Term Securities
|
|
$
|
75,950,781
|
|
|
$
|
89,943,370
|
|
The Fund is permitted to engage in purchase and sale transactions (“cross trades”) with certain funds and accounts for which the Adviser serves as the Fund’s investment adviser, as set forth in Rule 17a-7 under
the Investment Company Act of 1940, pursuant to procedures adopted by the Board of Trustees. Under these procedures, cross trades are effected at current market prices. During the six months ended January 31, 2021, the Fund did not engage in
any cross trade activity.
At January 31, 2021, the net unrealized appreciation on investments based on cost for federal tax purposes of $323,578,926 was as follows:
|
Aggregate gross unrealized appreciation for all investments in which
|
|
|
|
|
there is an excess of value over tax cost
|
|
$
|
69,307,112
|
|
|
Aggregate gross unrealized depreciation for all investments in which
|
|
|
|
|
|
there is an excess of tax cost over value
|
|
|
(4,712,971
|
)
|
|
Net unrealized appreciation
|
|
$
|
64,594,141
|
|
Various inputs are used in determining the value of the Fund’s investments. These inputs are summarized in the three broad levels below.
Level 1 – unadjusted quoted prices in active markets for identical securities.
Level 2 – other significant observable inputs (including quoted prices for similar securities, interest rates, prepayment speeds, credit risks, etc.). See Notes to Financial
Statements — Note 1A.
Level 3 – significant unobservable inputs (including the Fund’s own assumptions in determining fair value of investments). See Notes to Financial Statements — Note 1A.
The accompanying notes are an integral part of these financial statements.
Pioneer Balanced ESG Fund | Semiannual Report | 1/31/21 51
Schedule of Investments | 1/31/21
(unaudited) (continued)
The following is a summary of the inputs used as of January 31, 2021, in valuing the Fund’s investments:
|
|
|
Level 1
|
|
|
Level 2
|
|
|
Level 3
|
|
|
Total
|
|
|
Common Stocks
|
|
$
|
229,705,965
|
|
|
$
|
—
|
|
|
$
|
—
|
|
|
$
|
229,705,965
|
|
|
Convertible Preferred Stock
|
|
|
1,501,760
|
|
|
|
—
|
|
|
|
—
|
|
|
|
1,501,760
|
|
|
Asset Backed Securities
|
|
|
—
|
|
|
|
10,433,913
|
|
|
|
—
|
|
|
|
10,433,913
|
|
|
Collateralized Mortgage
|
|
|
|
|
|
|
|
|
|
|
|
|
|
|
|
|
|
Obligations
|
|
|
—
|
|
|
|
16,931,023
|
|
|
|
—
|
|
|
|
16,931,023
|
|
|
Commercial Mortgage-Backed
|
|
|
|
|
|
|
|
|
|
|
|
|
|
|
|
|
|
Securities
|
|
|
—
|
|
|
|
8,088,969
|
|
|
|
—
|
|
|
|
8,088,969
|
|
|
Corporate Bonds
|
|
|
—
|
|
|
|
41,776,163
|
|
|
|
—
|
|
|
|
41,776,163
|
|
|
Foreign Government Bonds
|
|
|
—
|
|
|
|
592,925
|
|
|
|
—
|
|
|
|
592,925
|
|
|
Insurance-Linked Securities
|
|
|
|
|
|
|
|
|
|
|
|
|
|
|
|
|
|
Collateralized Reinsurance
|
|
|
|
|
|
|
|
|
|
|
|
|
|
|
|
|
|
Multiperil - Worldwide
|
|
|
—
|
|
|
|
—
|
|
|
|
25
|
|
|
|
25
|
|
|
Reinsurance Sidecars
|
|
|
|
|
|
|
|
|
|
|
|
|
|
|
|
|
|
Multiperil - Worldwide
|
|
|
—
|
|
|
|
—
|
|
|
|
64,270
|
|
|
|
64,270
|
|
|
All Other Insurance-Linked
|
|
|
|
|
|
|
|
|
|
|
|
|
|
|
|
|
|
Securities
|
|
|
—
|
|
|
|
1,502,150
|
|
|
|
—
|
|
|
|
1,502,150
|
|
|
Municipal Bonds
|
|
|
—
|
|
|
|
557,128
|
|
|
|
—
|
|
|
|
557,128
|
|
|
Senior Secured Floating
|
|
|
|
|
|
|
|
|
|
|
|
|
|
|
|
|
|
Rate Loan Interests
|
|
|
—
|
|
|
|
716,296
|
|
|
|
—
|
|
|
|
716,296
|
|
|
U.S. Government and
|
|
|
|
|
|
|
|
|
|
|
|
|
|
|
|
|
|
Agency Obligations
|
|
|
—
|
|
|
|
75,572,168
|
|
|
|
—
|
|
|
|
75,572,168
|
|
|
Affiliated Closed-End Fund
|
|
|
—
|
|
|
|
939,257
|
|
|
|
—
|
|
|
|
939,257
|
|
|
Total Investments
|
|
|
|
|
|
|
|
|
|
|
|
|
|
|
|
|
|
in Securities
|
|
$
|
231,207,725
|
|
|
$
|
157,109,992
|
|
|
$
|
64,295
|
|
|
$
|
388,382,012
|
|
|
Other Financial Instruments
|
|
|
|
|
|
|
|
|
|
|
|
|
|
|
|
|
|
Net unrealized depreciation
|
|
|
|
|
|
|
|
|
|
|
|
|
|
|
|
|
|
on futures contracts
|
|
$
|
(208,945
|
)
|
|
$
|
—
|
|
|
$
|
—
|
|
|
$
|
(208,945
|
)
|
|
Total Other Financial
|
|
|
|
|
|
|
|
|
|
|
|
|
|
|
|
|
|
Instruments
|
|
$
|
(208,945
|
)
|
|
$
|
—
|
|
|
$
|
—
|
|
|
$
|
(208,945
|
)
|
The accompanying notes are an integral part of these financial statements.
52 Pioneer Balanced ESG Fund | Semiannual Report | 1/31/21
The following is a reconciliation of assets valued using significant unobservable inputs (Level 3):
| |
|
|
|
|
|
|
Insurance-
|
|
|
|
|
Linked
|
|
|
|
|
Securities
|
|
|
Balance as of 7/31/20
|
|
$
|
71,650
|
|
|
Realized gain (loss)(1)
|
|
|
—
|
|
|
Change in unrealized appreciation (depreciation)(2)
|
|
|
(3,013
|
)
|
|
Accrued discounts/premiums
|
|
|
—
|
|
|
Purchases
|
|
|
—
|
|
|
Sales
|
|
|
(4,342
|
)
|
|
Transfers in to Level 3*
|
|
|
—
|
|
|
Transfers out of Level 3*
|
|
|
—
|
|
|
Balance as of 1/31/21
|
|
$
|
64,295
|
|
|
(1)
|
Realized gain (loss) on these securities is included in the realized gain (loss) in investments in the Statement of Operations.
|
|
(2)
|
Unrealized appreciation (depreciation) on these securities is included in the change in unrealized appreciation (depreciation) from investments in the Statement of Operations.
|
|
*
|
Transfers are calculated on the beginning of period value. For the six months ended January 31, 2020, there were no transfers in or out of Level 3.
|
| |
|
|
|
Net change in unrealized appreciation (depreciation) of Level 3 investments
|
|
|
|
still held and considered Level 3 at January 31, 2021:
|
$(3,013)
|
The accompanying notes are an integral part of these financial statements.
Pioneer Balanced ESG Fund | Semiannual Report | 1/31/21 53
Statement of Assets and Liabilities |
1/31/21
(unaudited)
| |
|
|
|
|
ASSETS:
|
|
|
|
|
Investments in unaffiliated issuers, at value (cost $322,367,221)
|
|
$
|
387,442,755
|
|
|
Investments in affiliated issuers, at value (cost $1,123,856)
|
|
|
939,257
|
|
|
Cash
|
|
|
6,666,180
|
|
|
Foreign currencies, at value (cost $1,619)
|
|
|
1,712
|
|
|
Futures collateral
|
|
|
103,663
|
|
|
Due from broker for futures
|
|
|
480,873
|
|
|
Receivables —
|
|
|
|
|
|
Investment securities sold
|
|
|
211,776
|
|
|
Fund shares sold
|
|
|
574,294
|
|
|
Dividends
|
|
|
248,694
|
|
|
Interest
|
|
|
676,818
|
|
|
Due from the Adviser
|
|
|
66,076
|
|
|
Other assets
|
|
|
52,017
|
|
|
Total assets
|
|
$
|
397,464,115
|
|
|
LIABILITIES:
|
|
|
|
|
|
Payables —
|
|
|
|
|
|
Investment securities purchased
|
|
$
|
21,538,944
|
|
|
Fund shares repurchased
|
|
|
242,600
|
|
|
Distributions
|
|
|
4,560
|
|
|
Trustees’ fees
|
|
|
1,406
|
|
|
Variation margin for futures contracts
|
|
|
19,360
|
|
|
Net unrealized depreciation on futures contracts
|
|
|
208,945
|
|
|
Due to affiliates
|
|
|
72,379
|
|
|
Accrued expenses
|
|
|
214,827
|
|
|
Total liabilities
|
|
$
|
22,303,021
|
|
|
NET ASSETS:
|
|
|
|
|
|
Paid-in capital
|
|
$
|
303,329,319
|
|
|
Distributable earnings
|
|
|
71,831,775
|
|
|
Net assets
|
|
$
|
375,161,094
|
|
|
NET ASSET VALUE PER SHARE:
|
|
|
|
|
|
No par value (unlimited number of shares authorized)
|
|
|
|
|
|
Class A (based on $256,788,348/25,172,581 shares)
|
|
$
|
10.20
|
|
|
Class C (based on $53,108,535/5,254,306 shares)
|
|
$
|
10.11
|
|
|
Class K (based on $1,159,122/113,798 shares)
|
|
$
|
10.19
|
|
|
Class R (based on $2,003,344/196,005 shares)
|
|
$
|
10.22
|
|
|
Class Y (based on $62,101,745/6,043,489 shares)
|
|
$
|
10.28
|
|
|
MAXIMUM OFFERING PRICE PER SHARE:
|
|
|
|
|
|
Class A (based on $10.20 net asset value per share/100%-4.5%
|
|
|
|
|
|
maximum sales charge)
|
|
$
|
10.68
|
|
The accompanying notes are an integral part of these financial statements.
54 Pioneer Balanced ESG Fund | Semiannual Report | 1/31/21
Statement of Operations (unaudited)
FOR THE SIX MONTHS ENDED 1/31/21
| |
|
|
|
|
|
|
|
INVESTMENT INCOME:
|
|
|
|
|
|
|
|
Dividends from unaffiliated issuers (net of foreign taxes
|
|
|
|
|
|
|
|
withheld $7,684)
|
|
$
|
2,312,249
|
|
|
|
|
|
Dividends from affiliated issuers
|
|
|
48,740
|
|
|
|
|
|
Interest from unaffiliated issuers
|
|
|
1,749,209
|
|
|
|
|
|
Total investment income
|
|
|
|
|
|
$
|
4,110,198
|
|
|
EXPENSES:
|
|
|
|
|
|
|
|
|
|
Management fees
|
|
$
|
910,167
|
|
|
|
|
|
|
Administrative expense
|
|
|
86,741
|
|
|
|
|
|
|
Transfer agent fees
|
|
|
|
|
|
|
|
|
|
Class A
|
|
|
101,385
|
|
|
|
|
|
|
Class C
|
|
|
16,755
|
|
|
|
|
|
|
Class K
|
|
|
109
|
|
|
|
|
|
|
Class R
|
|
|
2,730
|
|
|
|
|
|
|
Class Y
|
|
|
33,471
|
|
|
|
|
|
|
Distribution fees
|
|
|
|
|
|
|
|
|
|
Class A
|
|
|
308,626
|
|
|
|
|
|
|
Class C
|
|
|
283,595
|
|
|
|
|
|
|
Class R
|
|
|
4,933
|
|
|
|
|
|
|
Shareowner communications expense
|
|
|
39,188
|
|
|
|
|
|
|
Custodian fees
|
|
|
27,313
|
|
|
|
|
|
|
Registration fees
|
|
|
58,886
|
|
|
|
|
|
|
Professional fees
|
|
|
49,468
|
|
|
|
|
|
|
Printing expense
|
|
|
32,734
|
|
|
|
|
|
|
Pricing fees
|
|
|
28,306
|
|
|
|
|
|
|
Trustees’ fees
|
|
|
6,256
|
|
|
|
|
|
|
Insurance expense
|
|
|
111
|
|
|
|
|
|
|
Miscellaneous
|
|
|
18,903
|
|
|
|
|
|
|
Total expenses
|
|
|
|
|
|
$
|
2,009,677
|
|
|
Less fees waived and expenses reimbursed by the Adviser
|
|
|
|
|
|
|
(96,555
|
)
|
|
Net expenses
|
|
|
|
|
|
$
|
1,913,122
|
|
|
Net investment income
|
|
|
|
|
|
$
|
2,197,076
|
|
|
REALIZED AND UNREALIZED GAIN (LOSS) ON INVESTMENTS:
|
|
|
|
|
|
|
Net realized gain (loss) on:
|
|
|
|
|
|
|
|
|
|
Investments in unaffiliated issuers
|
|
$
|
11,476,385
|
|
|
|
|
|
|
Short sales
|
|
|
610
|
|
|
|
|
|
|
Futures contracts
|
|
|
(97,283
|
)
|
|
$
|
11,379,712
|
|
|
Change in net unrealized appreciation (depreciation) on:
|
|
|
|
|
|
|
|
|
|
Investments in unaffiliated issuers
|
|
$
|
14,865,075
|
|
|
|
|
|
|
Investments in affiliated issuers
|
|
|
(9,933
|
)
|
|
|
|
|
|
Futures contracts
|
|
|
(439,750
|
)
|
|
|
|
|
|
Other assets and liabilities denominated in foreign currencies
|
|
|
75
|
|
|
$
|
14,415,467
|
|
|
Net realized and unrealized gain (loss) on investments
|
|
|
|
|
|
$
|
25,795,179
|
|
|
Net increase in net assets resulting from operations
|
|
|
|
|
|
$
|
27,992,255
|
|
The accompanying notes are an integral part of these financial statements.
Pioneer Balanced ESG Fund | Semiannual Report | 1/31/21 55
Statements of Changes in Net Assets
| |
|
|
|
|
|
|
|
|
|
Six Months
|
|
|
|
|
|
|
|
Ended
|
|
|
Year
|
|
|
|
|
1/31/21
|
|
|
Ended
|
|
|
|
|
(unaudited)
|
|
|
7/31/20
|
|
|
FROM OPERATIONS:
|
|
|
|
|
|
|
|
Net investment income (loss)
|
|
$
|
2,197,076
|
|
|
$
|
5,026,800
|
|
|
Net realized gain (loss) on investments
|
|
|
11,379,712
|
|
|
|
10,569,757
|
|
|
Change in net unrealized appreciation (depreciation)
|
|
|
|
|
|
|
|
|
|
on investments
|
|
|
14,415,467
|
|
|
|
5,678,780
|
|
|
Net increase in net assets resulting from operations
|
|
$
|
27,992,255
|
|
|
$
|
21,275,337
|
|
|
DISTRIBUTIONS TO SHAREOWNERS:
|
|
|
|
|
|
|
|
|
|
Class A ($0.32 and $0.54 per share, respectively)
|
|
$
|
(7,680,833
|
)
|
|
$
|
(12,618,119
|
)
|
|
Class C ($0.29 and $0.48 per share, respectively)
|
|
|
(1,628,619
|
)
|
|
|
(2,588,765
|
)
|
|
Class K ($0.34 and $0.57 per share, respectively)
|
|
|
(34,966
|
)
|
|
|
(18,030
|
)
|
|
Class R ($0.31 and $0.52 per share, respectively)
|
|
|
(57,139
|
)
|
|
|
(69,484
|
)
|
|
Class Y ($0.34 and $0.58 per share, respectively)
|
|
|
(1,858,394
|
)
|
|
|
(2,477,347
|
)
|
|
Total distributions to shareowners
|
|
$
|
(11,259,951
|
)
|
|
$
|
(17,771,745
|
)
|
|
FROM FUND SHARE TRANSACTIONS:
|
|
|
|
|
|
|
|
|
|
Net proceeds from sales of shares
|
|
$
|
44,512,363
|
|
|
$
|
93,829,023
|
|
|
Reinvestment of distributions
|
|
|
10,980,734
|
|
|
|
17,237,725
|
|
|
Cost of shares repurchased
|
|
|
(42,667,793
|
)
|
|
|
(71,077,737
|
)
|
|
Net increase in net assets resulting from Fund
|
|
|
|
|
|
|
|
|
|
share transactions
|
|
$
|
12,825,304
|
|
|
$
|
39,989,011
|
|
|
Net increase in net assets
|
|
$
|
29,557,608
|
|
|
$
|
43,492,603
|
|
|
NET ASSETS:
|
|
|
|
|
|
|
|
|
|
Beginning of period
|
|
$
|
345,603,486
|
|
|
$
|
302,110,883
|
|
|
End of period
|
|
$
|
375,161,094
|
|
|
$
|
345,603,486
|
|
The accompanying notes are an integral part of these financial statements.
56 Pioneer Balanced ESG Fund | Semiannual Report | 1/31/21
| |
|
|
|
|
|
|
|
|
|
|
|
|
|
|
|
Six Months
|
|
|
Six Months
|
|
|
|
|
|
|
|
|
|
|
Ended
|
|
|
Ended
|
|
|
|
|
|
|
|
|
|
|
1/31/21
|
|
|
1/31/21
|
|
|
Year Ended
|
|
|
Year Ended
|
|
|
|
|
Shares
|
|
|
Amount
|
|
|
7/31/20
|
|
|
7/31/20
|
|
|
|
|
(unaudited)
|
|
|
(unaudited)
|
|
|
Shares
|
|
|
Amount
|
|
|
Class A
|
|
|
|
|
|
|
|
|
|
|
|
|
|
Shares sold
|
|
|
2,374,168
|
|
|
$
|
24,056,447
|
|
|
|
3,938,064
|
|
|
$
|
36,741,499
|
|
|
Reinvestment of distributions
|
|
|
735,077
|
|
|
|
7,470,841
|
|
|
|
1,315,168
|
|
|
|
12,252,583
|
|
|
Less shares repurchased
|
|
|
(1,939,574
|
)
|
|
|
(19,443,225
|
)
|
|
|
(4,187,913
|
)
|
|
|
(38,380,514
|
)
|
|
Net increase
|
|
|
1,169,671
|
|
|
$
|
12,084,063
|
|
|
|
1,065,319
|
|
|
$
|
10,613,568
|
|
|
Class C
|
|
|
|
|
|
|
|
|
|
|
|
|
|
|
|
|
|
Shares sold
|
|
|
636,136
|
|
|
$
|
6,374,611
|
|
|
|
2,022,008
|
|
|
$
|
19,027,763
|
|
|
Reinvestment of distributions
|
|
|
161,072
|
|
|
|
1,621,605
|
|
|
|
268,175
|
|
|
|
2,491,026
|
|
|
Less shares repurchased
|
|
|
(1,388,482
|
)
|
|
|
(13,983,064
|
)
|
|
|
(1,392,998
|
)
|
|
|
(12,866,360
|
)
|
|
Net increase/
|
|
|
|
|
|
|
|
|
|
|
|
|
|
|
|
|
|
(decrease)
|
|
|
(591,274
|
)
|
|
$
|
(5,986,848
|
)
|
|
|
897,185
|
|
|
$
|
8,652,429
|
|
|
Class K
|
|
|
|
|
|
|
|
|
|
|
|
|
|
|
|
|
|
Shares sold
|
|
|
83,722
|
|
|
$
|
840,518
|
|
|
|
40,377
|
|
|
$
|
378,646
|
|
|
Reinvestment of distributions
|
|
|
2,954
|
|
|
|
30,019
|
|
|
|
1,124
|
|
|
|
10,284
|
|
|
Less shares repurchased
|
|
|
(35,247
|
)
|
|
|
(365,138
|
)
|
|
|
(8,505
|
)
|
|
|
(74,265
|
)
|
|
Net increase
|
|
|
51,429
|
|
|
$
|
505,399
|
|
|
|
32,996
|
|
|
$
|
314,665
|
|
|
Class R
|
|
|
|
|
|
|
|
|
|
|
|
|
|
|
|
|
|
Shares sold
|
|
|
31,449
|
|
|
$
|
320,282
|
|
|
|
110,296
|
|
|
$
|
1,024,517
|
|
|
Reinvestment of distributions
|
|
|
5,615
|
|
|
|
57,139
|
|
|
|
7,515
|
|
|
|
69,484
|
|
|
Less shares repurchased
|
|
|
(51,016
|
)
|
|
|
(509,442
|
)
|
|
|
(49,960
|
)
|
|
|
(459,130
|
)
|
|
Net increase/
|
|
|
|
|
|
|
|
|
|
|
|
|
|
|
|
|
|
(decrease)
|
|
|
(13,952
|
)
|
|
$
|
(132,021
|
)
|
|
|
67,851
|
|
|
$
|
634,871
|
|
|
Class Y
|
|
|
|
|
|
|
|
|
|
|
|
|
|
|
|
|
|
Shares sold
|
|
|
1,263,951
|
|
|
$
|
12,920,505
|
|
|
|
3,864,642
|
|
|
$
|
36,656,598
|
|
|
Reinvestment of distributions
|
|
|
175,990
|
|
|
|
1,801,130
|
|
|
|
259,202
|
|
|
|
2,414,348
|
|
|
Less shares repurchased
|
|
|
(822,181
|
)
|
|
|
(8,366,924
|
)
|
|
|
(2,216,840
|
)
|
|
|
(19,297,468
|
)
|
|
Net increase
|
|
|
617,760
|
|
|
$
|
6,354,711
|
|
|
|
1,907,004
|
|
|
$
|
19,773,478
|
|
The accompanying notes are an integral part of these financial statements.
Pioneer Balanced ESG Fund | Semiannual Report | 1/31/21 57
Financial Highlights
|
|
|
Six Months
|
|
|
|
|
|
|
|
|
|
|
|
|
|
|
|
|
|
|
|
Ended
|
|
|
Year
|
|
|
Year
|
|
|
Year
|
|
|
Year
|
|
|
Year
|
|
|
|
|
1/31/21
|
|
|
Ended
|
|
|
Ended
|
|
|
Ended
|
|
|
Ended
|
|
|
Ended
|
|
|
|
|
(unaudited)
|
|
|
7/31/20
|
|
|
7/31/19
|
|
|
7/31/18
|
|
|
7/31/17
|
|
|
7/31/16*
|
|
|
Class A
|
|
|
|
|
|
|
|
|
|
|
|
|
|
|
|
|
|
|
|
Net asset value, beginning of period
|
|
$
|
9.72
|
|
|
$
|
9.57
|
|
|
$
|
9.64
|
|
|
$
|
9.65
|
|
|
$
|
9.07
|
|
|
$
|
9.36
|
|
|
Increase (decrease) from investment operations:
|
|
|
|
|
|
|
|
|
|
|
|
|
|
|
|
|
|
|
|
|
|
|
|
|
|
Net investment income (loss) (a)
|
|
$
|
0.06
|
|
|
$
|
0.15
|
|
|
$
|
0.18
|
|
|
$
|
0.17
|
|
|
$
|
0.17
|
|
|
$
|
0.16
|
|
|
Net realized and unrealized gain (loss) on investments
|
|
|
0.74
|
|
|
|
0.54
|
|
|
|
0.56
|
|
|
|
0.70
|
|
|
|
0.62
|
|
|
|
(0.09
|
)
|
|
Net increase (decrease) from investment operations
|
|
$
|
0.80
|
|
|
$
|
0.69
|
|
|
$
|
0.74
|
|
|
$
|
0.87
|
|
|
$
|
0.79
|
|
|
$
|
0.07
|
|
|
Distributions to shareowners:
|
|
|
|
|
|
|
|
|
|
|
|
|
|
|
|
|
|
|
|
|
|
|
|
|
|
Net investment income
|
|
$
|
(0.06
|
)
|
|
$
|
(0.15
|
)
|
|
$
|
(0.18
|
)
|
|
$
|
(0.17
|
)
|
|
$
|
(0.17
|
)
|
|
$
|
(0.18
|
)
|
|
Net realized gain
|
|
|
(0.26
|
)
|
|
|
(0.39
|
)
|
|
|
(0.63
|
)
|
|
|
(0.71
|
)
|
|
|
(0.04
|
)
|
|
|
(0.18
|
)
|
|
Total distributions
|
|
$
|
(0.32
|
)
|
|
$
|
(0.54
|
)
|
|
$
|
(0.81
|
)
|
|
$
|
(0.88
|
)
|
|
$
|
(0.21
|
)
|
|
$
|
(0.36
|
)
|
|
Net increase (decrease) in net asset value
|
|
$
|
0.48
|
|
|
$
|
0.15
|
|
|
$
|
(0.07
|
)
|
|
$
|
(0.01
|
)
|
|
$
|
0.58
|
|
|
$
|
(0.29
|
)
|
|
Net asset value, end of period
|
|
$
|
10.20
|
|
|
$
|
9.72
|
|
|
$
|
9.57
|
|
|
$
|
9.64
|
|
|
$
|
9.65
|
|
|
$
|
9.07
|
|
|
Total return (b)
|
|
|
8.26
|
%(c)
|
|
|
7.55
|
%
|
|
|
8.51
|
%
|
|
|
9.33
|
%
|
|
|
8.94
|
%(d)
|
|
|
0.88
|
%
|
|
Ratio of net expenses to average net assets
|
|
|
0.99
|
%(e)
|
|
|
0.99
|
%
|
|
|
1.01
|
%
|
|
|
1.16
|
%
|
|
|
1.16
|
%
|
|
|
1.16
|
%
|
|
Ratio of net investment income (loss) to average net assets
|
|
|
1.27
|
%(e)
|
|
|
1.65
|
%
|
|
|
1.97
|
%
|
|
|
1.76
|
%
|
|
|
1.87
|
%
|
|
|
1.87
|
%
|
|
Portfolio turnover rate
|
|
|
28
|
%(c)
|
|
|
65
|
%
|
|
|
60
|
%
|
|
|
65
|
%
|
|
|
51
|
%
|
|
|
47
|
%
|
|
Net assets, end of period (in thousands)
|
|
$
|
256,788
|
|
|
$
|
233,421
|
|
|
$
|
219,544
|
|
|
$
|
185,382
|
|
|
$
|
179,867
|
|
|
$
|
178,013
|
|
|
Ratios with no waiver of fees and assumption of expenses by
|
|
|
|
|
|
|
|
|
|
|
|
|
|
|
|
|
|
|
|
|
|
|
|
|
|
the Adviser and no reduction for fees paid indirectly:
|
|
|
|
|
|
|
|
|
|
|
|
|
|
|
|
|
|
|
|
|
|
|
|
|
|
Total expenses to average net assets
|
|
|
1.03
|
%(e)
|
|
|
1.04
|
%
|
|
|
1.07
|
%
|
|
|
1.17
|
%
|
|
|
1.19
|
%
|
|
|
1.22
|
%
|
|
Net investment income (loss) to average net assets
|
|
|
1.23
|
%(e)
|
|
|
1.60
|
%
|
|
|
1.91
|
%
|
|
|
1.75
|
%
|
|
|
1.84
|
%
|
|
|
1.81
|
%
|
|
*
|
The Fund was audited by an independent registered public accounting firm other than Ernst & Young LLP.
|
|
(a)
|
The per-share data presented above is based on the average shares outstanding for the period presented.
|
|
(b)
|
Assumes initial investment at net asset value at the beginning of each period, reinvestment of all distributions, the complete redemption of the investment at net asset value at the end of each period and no sales charges. Total
return would be reduced if sales charges were taken into account.
|
|
(c)
|
Not annualized.
|
|
(d)
|
If the Fund had not recognized gains in settlement of class action lawsuits during the year ended July 31, 2017, the total return would have been 8.83%.
|
| (e) |
Annualized.
|
The accompanying notes are an integral part of these financial statements.
58 Pioneer Balanced ESG Fund | Semiannual Report | 1/31/21
| |
|
Six Months
|
|
|
|
|
|
|
|
|
|
|
|
|
|
|
|
|
|
|
|
Ended
|
|
|
Year
|
|
|
Year
|
|
|
Year
|
|
|
Year
|
|
|
Year
|
|
|
|
|
1/31/21
|
|
|
Ended
|
|
|
Ended
|
|
|
Ended
|
|
|
Ended
|
|
|
Ended
|
|
|
|
|
(unaudited)
|
|
|
7/31/20
|
|
|
7/31/19
|
|
|
7/31/18
|
|
|
7/31/17
|
|
|
7/31/16*
|
|
|
Class C
|
|
|
|
|
|
|
|
|
|
|
|
|
|
|
|
|
|
|
|
Net asset value, beginning of period
|
|
$
|
9.65
|
|
|
$
|
9.50
|
|
|
$
|
9.57
|
|
|
$
|
9.58
|
|
|
$
|
9.00
|
|
|
$
|
9.30
|
|
|
Increase (decrease) from investment operations:
|
|
|
|
|
|
|
|
|
|
|
|
|
|
|
|
|
|
|
|
|
|
|
|
|
|
Net investment income (loss) (a)
|
|
$
|
0.03
|
|
|
$
|
0.09
|
|
|
$
|
0.11
|
|
|
$
|
0.10
|
|
|
$
|
0.10
|
|
|
$
|
0.10
|
|
|
Net realized and unrealized gain (loss) on investments
|
|
|
0.72
|
|
|
|
0.54
|
|
|
|
0.55
|
|
|
|
0.70
|
|
|
|
0.62
|
|
|
|
(0.11
|
)
|
|
Net increase (decrease) from investment operations
|
|
$
|
0.75
|
|
|
$
|
0.63
|
|
|
$
|
0.66
|
|
|
$
|
0.80
|
|
|
$
|
0.72
|
|
|
$
|
(0.01
|
)
|
|
Distributions to shareowners:
|
|
|
|
|
|
|
|
|
|
|
|
|
|
|
|
|
|
|
|
|
|
|
|
|
|
Net investment income
|
|
$
|
(0.03
|
)
|
|
$
|
(0.09
|
)
|
|
$
|
(0.10
|
)
|
|
$
|
(0.10
|
)
|
|
$
|
(0.10
|
)
|
|
$
|
(0.11
|
)
|
|
Net realized gain
|
|
|
(0.26
|
)
|
|
|
(0.39
|
)
|
|
|
(0.63
|
)
|
|
|
(0.71
|
)
|
|
|
(0.04
|
)
|
|
|
(0.18
|
)
|
|
Total distributions
|
|
$
|
(0.29
|
)
|
|
$
|
(0.48
|
)
|
|
$
|
(0.73
|
)
|
|
$
|
(0.81
|
)
|
|
$
|
(0.14
|
)
|
|
$
|
(0.29
|
)
|
|
Net increase (decrease) in net asset value
|
|
$
|
0.46
|
|
|
$
|
0.15
|
|
|
$
|
(0.07
|
)
|
|
$
|
(0.01
|
)
|
|
$
|
0.58
|
|
|
$
|
(0.30
|
)
|
|
Net asset value, end of period
|
|
$
|
10.11
|
|
|
$
|
9.65
|
|
|
$
|
9.50
|
|
|
$
|
9.57
|
|
|
$
|
9.58
|
|
|
$
|
9.00
|
|
|
Total return (b)
|
|
|
7.79
|
%(c)
|
|
|
6.82
|
%
|
|
|
7.68
|
%
|
|
|
8.63
|
%
|
|
|
8.10
|
%
|
|
|
0.04
|
%
|
|
Ratio of net expenses to average net assets
|
|
|
1.72
|
%(d)
|
|
|
1.72
|
%
|
|
|
1.75
|
%
|
|
|
1.90
|
%
|
|
|
1.91
|
%
|
|
|
1.93
|
%
|
|
Ratio of net investment income (loss) to average net assets
|
|
|
0.54
|
%(d)
|
|
|
0.92
|
%
|
|
|
1.23
|
%
|
|
|
1.03
|
%
|
|
|
1.12
|
%
|
|
|
1.10
|
%
|
|
Portfolio turnover rate
|
|
|
28
|
%(c)
|
|
|
65
|
%
|
|
|
60
|
%
|
|
|
65
|
%
|
|
|
51
|
%
|
|
|
47
|
%
|
|
Net assets, end of period (in thousands)
|
|
$
|
53,109
|
|
|
$
|
56,387
|
|
|
$
|
46,993
|
|
|
$
|
49,205
|
|
|
$
|
46,520
|
|
|
$
|
48,385
|
|
|
Ratios with no waiver of fees and assumption of expenses by
|
|
|
|
|
|
|
|
|
|
|
|
|
|
|
|
|
|
|
|
|
|
|
|
|
|
the Adviser and no reduction for fees paid indirectly:
|
|
|
|
|
|
|
|
|
|
|
|
|
|
|
|
|
|
|
|
|
|
|
|
|
|
Total expenses to average net assets
|
|
|
1.74
|
%(d)
|
|
|
1.76
|
%
|
|
|
1.79
|
%
|
|
|
1.90
|
%
|
|
|
1.91
|
%
|
|
|
1.93
|
%
|
|
Net investment income (loss) to average net assets
|
|
|
0.52
|
%(d)
|
|
|
0.88
|
%
|
|
|
1.19
|
%
|
|
|
1.03
|
%
|
|
|
1.12
|
%
|
|
|
1.10
|
%
|
|
*
|
The Fund was audited by an independent registered public accounting firm other than Ernst & Young LLP.
|
|
(a)
|
The per-share data presented above is based on the average shares outstanding for the period presented.
|
|
(b)
|
Assumes initial investment at net asset value at the beginning of each period, reinvestment of all distributions, the complete redemption of the investment at net asset value at the end of each period and no sales charges. Total
return would be reduced if sales charges were taken into account.
|
|
(c)
|
Not annualized.
|
| (d) |
Annualized.
|
|
|
The accompanying notes are an integral part of these financial statements.
Pioneer Balanced ESG Fund | Semiannual Report | 1/31/21 59
Financial Highlights (continued)
|
|
|
Six Months
|
|
|
|
|
|
|
|
|
|
|
|
|
|
|
|
|
|
|
|
Ended
|
|
|
Year
|
|
|
Year
|
|
|
Year
|
|
|
Year
|
|
|
|
|
|
|
|
1/31/21
|
|
|
Ended
|
|
|
Ended
|
|
|
Ended
|
|
|
Ended
|
|
|
12/1/15 to
|
|
|
|
|
(unaudited)
|
|
|
7/31/20
|
|
|
7/31/19
|
|
|
7/31/18
|
|
|
7/31/17
|
|
|
7/31/16*
|
|
|
Class K
|
|
|
|
|
|
|
|
|
|
|
|
|
|
|
|
|
|
|
|
Net asset value, beginning of period
|
|
$
|
9.71
|
|
|
$
|
9.56
|
|
|
$
|
9.63
|
|
|
$
|
9.65
|
|
|
$
|
9.06
|
|
|
$
|
9.01
|
|
|
Increase (decrease) from investment operations:
|
|
|
|
|
|
|
|
|
|
|
|
|
|
|
|
|
|
|
|
|
|
|
|
|
|
Net investment income (loss) (a)
|
|
$
|
0.08
|
|
|
$
|
0.18
|
|
|
$
|
0.20
|
|
|
$
|
0.20
|
|
|
$
|
0.20
|
|
|
$
|
0.12
|
|
|
Net realized and unrealized gain (loss) on investments
|
|
|
0.74
|
|
|
|
0.54
|
|
|
|
0.55
|
|
|
|
0.70
|
|
|
|
0.63
|
|
|
|
0.08
|
|
|
Net increase (decrease) from investment operations
|
|
$
|
0.82
|
|
|
$
|
0.72
|
|
|
$
|
0.75
|
|
|
$
|
0.90
|
|
|
$
|
0.83
|
|
|
$
|
0.20
|
|
|
Distributions to shareowners:
|
|
|
|
|
|
|
|
|
|
|
|
|
|
|
|
|
|
|
|
|
|
|
|
|
|
Net investment income
|
|
$
|
(0.08
|
)
|
|
$
|
(0.18
|
)
|
|
$
|
(0.19
|
)
|
|
$
|
(0.21
|
)
|
|
$
|
(0.20
|
)
|
|
$
|
(0.14
|
)
|
|
Net realized gain
|
|
|
(0.26
|
)
|
|
|
(0.39
|
)
|
|
|
(0.63
|
)
|
|
|
(0.71
|
)
|
|
|
(0.04
|
)
|
|
|
(0.01
|
)
|
|
Total distributions
|
|
$
|
(0.34
|
)
|
|
$
|
(0.57
|
)
|
|
$
|
(0.82
|
)
|
|
$
|
(0.92
|
)
|
|
$
|
(0.24
|
)
|
|
$
|
(0.15
|
)
|
|
Net increase (decrease) in net asset value
|
|
$
|
0.48
|
|
|
$
|
0.15
|
|
|
$
|
(0.07
|
)
|
|
$
|
(0.02
|
)
|
|
$
|
0.59
|
|
|
$
|
0.05
|
|
|
Net asset value, end of period
|
|
$
|
10.19
|
|
|
$
|
9.71
|
|
|
$
|
9.56
|
|
|
$
|
9.63
|
|
|
$
|
9.65
|
|
|
$
|
9.06
|
|
|
Total return (b)
|
|
|
8.47
|
%(c)
|
|
|
7.93
|
%
|
|
|
8.72
|
%
|
|
|
9.66
|
%
|
|
|
9.36
|
%(d)
|
|
|
2.29
|
%(c)
|
|
Ratio of net expenses to average net assets
|
|
|
0.65
|
%(e)
|
|
|
0.65
|
%
|
|
|
0.76
|
%
|
|
|
0.85
|
%
|
|
|
0.85
|
%
|
|
|
0.98
|
%(e)
|
|
Ratio of net investment income (loss) to average net assets
|
|
|
1.65
|
%(e)
|
|
|
1.95
|
%
|
|
|
2.21
|
%
|
|
|
2.07
|
%
|
|
|
2.19
|
%
|
|
|
2.00
|
%(e)
|
|
Portfolio turnover rate
|
|
|
28
|
%(c)
|
|
|
65
|
%
|
|
|
60
|
%
|
|
|
65
|
%
|
|
|
51
|
%
|
|
|
47
|
%(c)
|
|
Net assets, end of period (in thousands)
|
|
$
|
1,159
|
|
|
$
|
606
|
|
|
$
|
281
|
|
|
$
|
108
|
|
|
$
|
108
|
|
|
$
|
10
|
|
|
Ratios with no waiver of fees and assumption of expenses by
|
|
|
|
|
|
|
|
|
|
|
|
|
|
|
|
|
|
|
|
|
|
|
|
|
|
the Adviser and no reduction for fees paid indirectly:
|
|
|
|
|
|
|
|
|
|
|
|
|
|
|
|
|
|
|
|
|
|
|
|
|
|
Total expenses to average net assets
|
|
|
0.71
|
%(e)
|
|
|
0.71
|
%
|
|
|
0.81
|
%
|
|
|
0.85
|
%
|
|
|
0.85
|
%
|
|
|
0.98
|
%(e)
|
|
Net investment income (loss) to average net assets
|
|
|
1.59
|
%(e)
|
|
|
1.89
|
%
|
|
|
2.16
|
%
|
|
|
2.07
|
%
|
|
|
2.19
|
%
|
|
|
2.00
|
%(e)
|
| |
|
|
*
|
The Fund was audited by an independent registered public accounting firm other than Ernst & Young LLP.
|
|
(a)
|
The per-share data presented above is based on the average shares outstanding for the period presented.
|
|
(b)
|
Assumes initial investment at net asset value at the beginning of each period, reinvestment of all distributions and the complete redemption of the investment at net asset value at the end of each period.
|
|
(c)
|
Not annualized.
|
|
(d)
|
If the Fund had not recognized gains in settlement of class action lawsuits during the year ended July 31, 2017, the total return would have been 9.25%.
|
(e)
|
Annualized. |
The accompanying notes are an integral part of these financial statements.
60 Pioneer Balanced ESG Fund | Semiannual Report | 1/31/21
| |
|
Six Months
|
|
|
|
|
|
|
|
|
|
|
|
|
|
|
|
|
|
|
|
Ended
|
|
|
Year
|
|
|
Year
|
|
|
Year
|
|
|
Year
|
|
|
Year
|
|
|
|
|
1/31/21
|
|
|
Ended
|
|
|
Ended
|
|
|
Ended
|
|
|
Ended
|
|
|
Ended
|
|
|
|
|
(unaudited)
|
|
|
7/31/20
|
|
|
7/31/19
|
|
|
7/31/18
|
|
|
7/31/17
|
|
|
7/31/16*
|
|
|
Class R
|
|
|
|
|
|
|
|
|
|
|
|
|
|
|
|
|
|
|
|
Net asset value, beginning of period
|
|
$
|
9.75
|
|
|
$
|
9.59
|
|
|
$
|
9.64
|
|
|
$
|
9.64
|
|
|
$
|
9.06
|
|
|
$
|
9.36
|
|
|
Increase (decrease) from investment operations:
|
|
|
|
|
|
|
|
|
|
|
|
|
|
|
|
|
|
|
|
|
|
|
|
|
|
Net investment income (loss) (a)
|
|
$
|
0.05
|
|
|
$
|
0.12
|
|
|
$
|
0.15
|
|
|
$
|
0.15
|
|
|
$
|
0.15
|
|
|
$
|
0.15
|
|
|
Net realized and unrealized gain (loss) on investments
|
|
|
0.73
|
|
|
|
0.56
|
|
|
|
0.56
|
|
|
|
0.71
|
|
|
|
0.63
|
|
|
|
(0.10
|
)
|
|
Net increase (decrease) from investment operations
|
|
$
|
0.78
|
|
|
$
|
0.68
|
|
|
$
|
0.71
|
|
|
$
|
0.86
|
|
|
$
|
0.78
|
|
|
$
|
0.05
|
|
|
Distributions to shareowners:
|
|
|
|
|
|
|
|
|
|
|
|
|
|
|
|
|
|
|
|
|
|
|
|
|
|
Net investment income
|
|
$
|
(0.05
|
)
|
|
$
|
(0.13
|
)
|
|
$
|
(0.13
|
)
|
|
$
|
(0.15
|
)
|
|
$
|
(0.16
|
)
|
|
$
|
(0.17
|
)
|
|
Net realized gain
|
|
|
(0.26
|
)
|
|
|
(0.39
|
)
|
|
|
(0.63
|
)
|
|
|
(0.71
|
)
|
|
|
(0.04
|
)
|
|
|
(0.18
|
)
|
|
Total distributions
|
|
$
|
(0.31
|
)
|
|
$
|
(0.52
|
)
|
|
$
|
(0.76
|
)
|
|
$
|
(0.86
|
)
|
|
$
|
(0.20
|
)
|
|
$
|
(0.35
|
)
|
|
Net increase (decrease) in net asset value
|
|
$
|
0.47
|
|
|
$
|
0.16
|
|
|
$
|
(0.05
|
)
|
|
$
|
—
|
|
|
$
|
0.58
|
|
|
$
|
(0.30
|
)
|
|
Net asset value, end of period
|
|
$
|
10.22
|
|
|
$
|
9.75
|
|
|
$
|
9.59
|
|
|
$
|
9.64
|
|
|
$
|
9.64
|
|
|
$
|
9.06
|
|
|
Total return (b)
|
|
|
8.05
|
%(c)
|
|
|
7.32
|
%
|
|
|
8.24
|
%
|
|
|
9.17
|
%
|
|
|
8.78
|
%
|
|
|
0.67
|
%
|
|
Ratio of net expenses to average net assets
|
|
|
1.30
|
%(d)
|
|
|
1.30
|
%
|
|
|
1.30
|
%
|
|
|
1.30
|
%
|
|
|
1.30
|
%
|
|
|
1.30
|
%
|
|
Ratio of net investment income (loss) to average net assets
|
|
|
0.95
|
%(d)
|
|
|
1.32
|
%
|
|
|
1.65
|
%
|
|
|
1.56
|
%
|
|
|
1.64
|
%
|
|
|
1.73
|
%
|
|
Portfolio turnover rate
|
|
|
28
|
%(c)
|
|
|
65
|
%
|
|
|
60
|
%
|
|
|
65
|
%
|
|
|
51
|
%
|
|
|
47
|
%
|
|
Net assets, end of period (in thousands)
|
|
$
|
2,003
|
|
|
$
|
2,047
|
|
|
$
|
1,363
|
|
|
$
|
5,941
|
|
|
$
|
27,533
|
|
|
$
|
3,277
|
|
|
Ratios with no waiver of fees and assumption of expenses by
|
|
|
|
|
|
|
|
|
|
|
|
|
|
|
|
|
|
|
|
|
|
|
|
|
|
the Adviser and no reduction for fees paid indirectly:
|
|
|
|
|
|
|
|
|
|
|
|
|
|
|
|
|
|
|
|
|
|
|
|
|
|
Total expenses to average net assets
|
|
|
1.53
|
%(d)
|
|
|
1.59
|
%
|
|
|
1.77
|
%
|
|
|
1.57
|
%
|
|
|
1.56
|
%
|
|
|
1.53
|
%
|
|
Net investment income (loss) to average net assets
|
|
|
0.72
|
%(d)
|
|
|
1.03
|
%
|
|
|
1.18
|
%
|
|
|
1.29
|
%
|
|
|
1.38
|
%
|
|
|
1.50
|
%
|
|
*
|
The Fund was audited by an independent registered public accounting firm other than Ernst & Young LLP.
|
|
(a)
|
The per-share data presented above is based on the average shares outstanding for the period presented.
|
|
(b)
|
Assumes initial investment at net asset value at the beginning of each period, reinvestment of all distributions and the complete redemption of the investment at net asset value at the end of each period.
|
|
(c)
|
Not annualized.
|
| (d) |
Annualized.
|
The accompanying notes are an integral part of these financial statements.
Pioneer Balanced ESG Fund | Semiannual Report | 1/31/21 61
Financial Highlights (continued)
| |
|
Six Months
|
|
|
|
|
|
|
|
|
|
|
|
|
|
|
|
|
|
|
|
Ended
|
|
|
Year
|
|
|
Year
|
|
|
Year
|
|
|
Year
|
|
|
Year
|
|
|
|
|
1/31/21
|
|
|
Ended
|
|
|
Ended
|
|
|
Ended
|
|
|
Ended
|
|
|
Ended
|
|
|
|
|
(unaudited)
|
|
|
7/31/20
|
|
|
7/31/19
|
|
|
7/31/18
|
|
|
7/31/17
|
|
|
7/31/16*
|
|
|
Class Y
|
|
|
|
|
|
|
|
|
|
|
|
|
|
|
|
|
|
|
|
Net asset value, beginning of period
|
|
$
|
9.79
|
|
|
$
|
9.64
|
|
|
$
|
9.71
|
|
|
$
|
9.71
|
|
|
$
|
9.11
|
|
|
$
|
9.41
|
|
|
Increase (decrease) from investment operations:
|
|
|
|
|
|
|
|
|
|
|
|
|
|
|
|
|
|
|
|
|
|
|
|
|
|
Net investment income (loss) (a)
|
|
$
|
0.08
|
|
|
$
|
0.19
|
|
|
$
|
0.21
|
|
|
$
|
0.19
|
|
|
$
|
0.20
|
|
|
$
|
0.18
|
|
|
Net realized and unrealized gain (loss) on investments
|
|
|
0.75
|
|
|
|
0.54
|
|
|
|
0.55
|
|
|
|
0.72
|
|
|
|
0.63
|
|
|
|
(0.11
|
)
|
|
Net increase (decrease) from investment operations
|
|
$
|
0.83
|
|
|
$
|
0.73
|
|
|
$
|
0.76
|
|
|
$
|
0.91
|
|
|
$
|
0.83
|
|
|
$
|
0.07
|
|
|
Distributions to shareowners:
|
|
|
|
|
|
|
|
|
|
|
|
|
|
|
|
|
|
|
|
|
|
|
|
|
|
Net investment income
|
|
$
|
(0.08
|
)
|
|
$
|
(0.19
|
)
|
|
$
|
(0.20
|
)
|
|
$
|
(0.20
|
)
|
|
$
|
(0.19
|
)
|
|
$
|
(0.19
|
)
|
|
Net realized gain
|
|
|
(0.26
|
)
|
|
|
(0.39
|
)
|
|
|
(0.63
|
)
|
|
|
(0.71
|
)
|
|
|
(0.04
|
)
|
|
|
(0.18
|
)
|
|
Total distributions
|
|
$
|
(0.34
|
)
|
|
$
|
(0.58
|
)
|
|
$
|
(0.83
|
)
|
|
$
|
(0.91
|
)
|
|
$
|
(0.23
|
)
|
|
$
|
(0.37
|
)
|
|
Net increase (decrease) in net asset value
|
|
$
|
0.49
|
|
|
$
|
0.15
|
|
|
$
|
(0.07
|
)
|
|
$
|
–
|
|
|
$
|
0.60
|
|
|
$
|
(0.30
|
)
|
|
Net asset value, end of period
|
|
$
|
10.28
|
|
|
$
|
9.79
|
|
|
$
|
9.64
|
|
|
$
|
9.71
|
|
|
$
|
9.71
|
|
|
$
|
9.11
|
|
|
Total return (b)
|
|
|
8.50
|
%(c)
|
|
|
7.95
|
%
|
|
|
8.77
|
%
|
|
|
9.67
|
%
|
|
|
9.26
|
%
|
|
|
0.95
|
%
|
|
Ratio of net expenses to average net assets
|
|
|
0.65
|
%(d)
|
|
|
0.65
|
%
|
|
|
0.69
|
%
|
|
|
0.93
|
%
|
|
|
0.95
|
%
|
|
|
0.95
|
%
|
|
Ratio of net investment income (loss) to average net assets
|
|
|
1.61
|
%(d)
|
|
|
1.99
|
%
|
|
|
2.29
|
%
|
|
|
1.99
|
%
|
|
|
2.13
|
%
|
|
|
2.08
|
%
|
|
Portfolio turnover rate
|
|
|
28
|
%(c)
|
|
|
65
|
%
|
|
|
60
|
%
|
|
|
65
|
%
|
|
|
51
|
%
|
|
|
47
|
%
|
|
Net assets, end of period (in thousands)
|
|
$
|
62,102
|
|
|
$
|
53,142
|
|
|
$
|
33,930
|
|
|
$
|
30,892
|
|
|
$
|
36,849
|
|
|
$
|
61,801
|
|
|
Ratios with no waiver of fees and assumption of expenses by
|
|
|
|
|
|
|
|
|
|
|
|
|
|
|
|
|
|
|
|
|
|
|
|
|
|
the Adviser and no reduction for fees paid indirectly:
|
|
|
|
|
|
|
|
|
|
|
|
|
|
|
|
|
|
|
|
|
|
|
|
|
|
Total expenses to average net assets
|
|
|
0.79
|
%(d)
|
|
|
0.82
|
%
|
|
|
0.84
|
%
|
|
|
0.93
|
%
|
|
|
0.95
|
%
|
|
|
0.95
|
%
|
|
Net investment income (loss) to average net assets
|
|
|
1.47
|
%(d)
|
|
|
1.82
|
%
|
|
|
2.14
|
%
|
|
|
1.99
|
%
|
|
|
2.13
|
%
|
|
|
2.08
|
%
|
|
*
|
The Fund was audited by an independent registered public accounting firm other than Ernst & Young LLP.
|
|
(a)
|
The per-share data presented above is based on the average shares outstanding for the period presented.
|
|
(b)
|
Assumes initial investment at net asset value at the beginning of each period, reinvestment of all distributions and the complete redemption of the investment at net asset value at the end of each period.
|
|
(c)
|
Not annualized.
|
(d)
|
Annualized. |
The accompanying notes are an integral part of these financial statements.
62 Pioneer Balanced ESG Fund | Semiannual Report | 1/31/21
Notes to Financial Statements | 1/31/21
(unaudited)
1. Organization and Significant Accounting Policies
Pioneer Balanced ESG Fund (the “Fund”) is one of two portfolios comprising Pioneer Series Trust IV (the “Trust”), a Delaware statutory trust. The Fund is registered under the Investment Company Act of 1940 as a
diversified, open-end management investment company. The Fund’s investment objective is to seek capital growth and current income through a diversified portfolio of equity securities and bonds.
The Fund offers five classes of shares designated as Class A, Class C, Class K, Class R and Class Y shares. Each class of shares represents an interest in the same portfolio of investments of the Fund and has
identical rights (based on relative net asset values) to assets and liquidation proceeds. Share classes can bear different rates of class-specific fees and expenses, such as transfer agent and distribution fees. Differences in class-specific
fees and expenses will result in differences in net investment income and, therefore, the payment of different dividends from net investment income earned by each class. The Amended and Restated Declaration of Trust of the Fund gives the Board
of Trustees the flexibility to specify either per-share voting or dollar-weighted voting when submitting matters for shareowner approval. Under per-share voting, each share of a class of the Fund is entitled to one vote. Under dollar-weighted
voting, a shareowner’s voting power is determined not by the number of shares owned, but by the dollar value of the shares on the record date. Each share class has exclusive voting rights with respect to matters affecting only that class,
including with respect to the distribution plan for that class. There is no distribution plan for Class K and Class Y shares.
Amundi Asset Management US, Inc., an indirect, wholly owned subsidiary of Amundi and Amundi’s wholly owned subsidiary, Amundi USA, Inc., serves as the Fund’s investment adviser (the “Adviser”). Prior to January 1,
2021, the Adviser was named Amundi Pioneer Asset Management, Inc. Amundi Distributor US, Inc., an affiliate of Amundi Asset Management US, Inc., serves as the Fund’s distributor (the “Distributor”).
In August 2018, the Financial Accounting Standards Board (FASB) issued Accounting Standards Update 2018-13 “Disclosure Framework - Changes to the Disclosure Requirements for Fair Value Measurement” (“ASU 2018-13”)
which modifies disclosure requirements for fair value measurements, principally for Level 3 securities and transfers between levels of the fair value hierarchy. ASU 2018-13 is effective for fiscal years beginning after December 15, 2019 and for
interim periods within those fiscal years. The Fund has adopted ASU 2018-13 for the six months ended January 31, 2021.
Pioneer Balanced ESG Fund | Semiannual Report | 1/31/21 63
The impact to the Fund’s adoption was limited to changes in the Fund’s disclosures regarding fair value, primarily those disclosures related to transfers between levels of the fair value hierarchy and disclosure
of the range and weighted average used to develop significant unobservable inputs for Level 3 fair value investments, when applicable.
In March 2020, FASB issued an Accounting Standard Update, ASU 2020-04, Reference Rate Reform (Topic 848) — Facilitation of the Effects of Reference Rate Reform on Financial Reporting (“ASU 2020-04”), which
provides optional, temporary relief with respect to the financial reporting of contracts subject to certain types of modifications due to the planned discontinuation of the London Interbank Offered Rate (“LIBOR”) and other LIBOR-based reference
rates at the end of 2021. The temporary relief provided by ASU 2020-04 is effective for certain reference rate-related contract modifications that occur during the period from March 12, 2020 through December 31, 2022. Management is evaluating
the impact of ASU 2020-04 on the Fund’s investments, derivatives, debt and other contracts, if applicable, that will undergo reference rate-related modifications as a result of the reference rate reform.
The Fund is an investment company and follows investment company accounting and reporting guidance under U.S. Generally Accepted Accounting Principles (“U.S. GAAP”). U.S. GAAP requires the management of the Fund
to make estimates and assumptions that affect the reported amounts of assets and liabilities, the disclosure of contingent assets and liabilities at the date of the financial statements, and the reported amounts of income, expenses and gain or
loss on investments during the reporting period. Actual results could differ from those estimates.
The following is a summary of significant accounting policies followed by the Fund in the preparation of its financial statements:
A. Security Valuation
The net asset value of the Fund is computed once daily, on each day the New York Stock Exchange (“NYSE”) is open, as of the close of regular trading on the NYSE.
Equity securities that have traded on an exchange are valued by using the last sale price on the principal exchange where they are traded. Equity securities that have not traded on the date of
valuation, or securities for which sale prices are not available, generally are valued using the mean between the last bid and asked prices or, if both last bid and asked prices are not available, at the last quoted bid price. Last sale and bid
and asked prices are provided by independent third party pricing services. In the case
64 Pioneer Balanced ESG Fund | Semiannual Report | 1/31/21
of equity securities not traded on an exchange, prices are typically determined by independent third party pricing services using a variety of techniques and methods.
The value of foreign securities is translated into U.S. dollars based on foreign currency exchange rate quotations supplied by a third party pricing source. Trading in non-U.S. equity securities
is substantially completed each day at various times prior to the close of the NYSE. The values of such securities used in computing the net asset value of the Fund’s shares are determined as of such times. The Fund may use a fair value model
developed by an independent pricing service to value non-U.S. equity securities.
Fixed-income securities are valued by using prices supplied by independent pricing services, which consider such factors as market prices, market events, quotations from one or more brokers,
Treasury spreads, yields, maturities and ratings, or may use a pricing matrix or other fair value methods or techniques to provide an estimated value of the security or instrument. A pricing matrix is a means of valuing a debt security on the
basis of current market prices for other debt securities, historical trading patterns in the market for fixed-income securities and/or other factors. Non-U.S. debt securities that are listed on an exchange will be valued at the bid price
obtained from an independent third party pricing service. When independent third party pricing services are unable to supply prices, or when prices or market
quotations are considered to be unreliable, the value of that security may be determined using quotations from one or more broker-dealers.
Loan interests are valued in accordance with guidelines established by the Board of Trustees at the mean between the last available bid and asked prices from one or more brokers or dealers as
obtained from Loan Pricing Corporation, an independent third party pricing service. If price information is not available from Loan Pricing Corporation, or if the price information is deemed to be unreliable, price information will be obtained
from an alternative loan interest pricing service. If no reliable price quotes are available from either the primary or alternative pricing service, broker quotes will be solicited.
Event-linked bonds are valued at the bid price obtained from an independent third party pricing service. Other insurance-linked securities (including reinsurance sidecars, collateralized
reinsurance and industry loss warranties) may be valued at the bid price obtained from an independent pricing service, or through a third party using a pricing matrix, insurance industry valuation models, or other fair value methods or
techniques to provide an estimated value of the instrument.
Pioneer Balanced ESG Fund | Semiannual Report | 1/31/21 65
Futures contracts are generally valued at the closing settlement price established by the exchange on which they are traded.
Shares of open-end registered investment companies (including money market mutual funds) are valued at such funds’ net asset value. Shares of exchange-listed closed-end funds are valued by using
the last sale price on the principal exchange where they are traded. Shares of closed-end interval funds that offer their shares at net asset value are valued such fund’s net asset value.
Securities or loan interests for which independent pricing services or broker-dealers are unable to supply prices or for which market prices and/or quotations are not readily available or are
considered to be unreliable are valued by a fair valuation team comprised of certain personnel of the Adviser pursuant to procedures adopted by the Fund’s Board of Trustees. The Adviser’s fair valuation team uses fair value methods approved by
the Valuation Committee of the Board of Trustees. The Adviser’s fair valuation team is responsible for monitoring developments that may impact fair valued securities and for discussing and assessing fair values on an ongoing basis, and at least
quarterly, with the Valuation Committee of the Board of Trustees.
Inputs used when applying fair value methods to value a security may include credit ratings, the financial condition of the company, current market conditions and comparable securities. The Fund
may use fair value methods if it is determined that a significant event has occurred after the close of the exchange or market on which the security trades and prior to the determination of the Fund’s net asset value. Examples of a significant
event might include political or economic news, corporate restructurings, natural disasters, terrorist activity or trading halts. Thus, the valuation of the Fund’s securities may differ significantly from exchange prices, and such differences
could be material.
At January 31, 2021, no securities were valued using fair value methods (other than securities valued using prices supplied by independent pricing services, broker-dealers or using a third party
insurance industry pricing model).
B. Investment Income and Transactions
Dividend income is recorded on the ex-dividend date, except that certain dividends from foreign securities where the ex-dividend date may have passed are recorded as soon as the Fund becomes
aware of the ex-dividend data in the exercise of reasonable diligence.
66 Pioneer Balanced ESG Fund | Semiannual Report | 1/31/21
Interest income, including interest on income-bearing cash accounts, is recorded on the accrual basis. Dividend and interest income are reported net of unrecoverable foreign taxes withheld at
the applicable country rates and net of income accrued on defaulted securities.
Interest and dividend income payable by delivery of additional shares is reclassified as PIK (payment-in-kind) income upon receipt and is included in interest and dividend income, respectively.
Principal amounts of mortgage-backed securities are adjusted for monthly paydowns. Premiums and discounts related to certain mortgage-backed securities are amortized or accreted in proportion to
the monthly paydowns. All discounts/premiums on purchase prices of debt securities are accreted/amortized for financial reporting purposes over the life of the respective securities, and such accretion/amortization is included in interest
income.
Security transactions are recorded as of trade date. Gains and losses on sales of investments are calculated on the identified cost method for both financial reporting and federal income tax
purposes.
C. Foreign Currency Translation
The books and records of the Fund are maintained in U.S. dollars. Amounts denominated in foreign currencies are translated into U.S. dollars using current exchange rates.
Net realized gains and losses on foreign currency transactions, if any, represent, among other things, the net realized gains and losses on foreign currency exchange contracts, disposition of
foreign currencies and the difference between the amount of income accrued and the U.S. dollars actually received. Further, the effects of changes in foreign currency exchange rates on investments are not segregated on the Statement of
Operations from the effects of changes in the market prices of those securities, but are included with the net realized and unrealized gain or loss on investments.
D. Federal Income Taxes
It is the Fund’s policy to comply with the requirements of the Internal Revenue Code applicable to regulated investment companies and to distribute all of its net taxable income and net realized
capital gains, if any, to its shareowners. Therefore, no provision for federal income taxes is required. As of July 31, 2020, the Fund did not accrue any interest or penalties with respect to uncertain tax positions, which, if applicable,
Pioneer Balanced ESG Fund | Semiannual Report | 1/31/21 67
would be recorded as an income tax expense on the Statement of Operations. Tax returns filed within the prior three years remain subject to examination by federal and state tax authorities.
A portion of the dividend income recorded by the Fund is from distributions by publicly traded Real Estate Investment Trusts (“REITs”), and such distributions for tax purposes may also consist
of capital gains and return of capital. The actual return of capital and capital gains portions of such distributions will be determined by formal notifications from the REITs subsequent to the calendar year-end. Distributions received from the
REITs that are determined to be a return of capital are recorded by the Fund as a reduction of the cost basis of the securities held and those determined to be capital gain are reflected as such on the Statement of Operations.
The amount and character of income and capital gain distributions to shareowners are determined in accordance with federal income tax rules, which may differ from U.S. GAAP. Distributions in
excess of net investment income or net realized gains are temporary over distributions for financial statement purposes resulting from differences in the recognition or classification of income or distributions for financial statement and tax
purposes. Capital accounts within the financial statements are adjusted for permanent book/tax differences to reflect tax character, but are not adjusted for temporary differences.
The tax character of current year distributions payable will be determined at the end of the current taxable year. The tax character of distributions paid during the year ended July 31, 2020 was
as follows:
|
|
|
2020
|
|
|
Distributions paid from:
|
|
|
|
|
Ordinary income
|
|
$
|
6,978,648
|
|
|
Long-term capital gain
|
|
|
10,793,097
|
|
|
Total
|
|
$
|
17,771,745
|
|
The following shows the components of distributable earnings on a federal income tax basis at July 31, 2020:
|
|
|
2020
|
|
|
Distributable earnings:
|
|
|
|
|
Undistributed ordinary income
|
|
$
|
539,368
|
|
|
Undistributed long-term capital gain
|
|
|
9,221,238
|
|
|
Current year late year loss
|
|
|
(4,839,902
|
)
|
|
Net unrealized appreciation
|
|
|
50,178,767
|
|
|
Total
|
|
$
|
55,099,471
|
|
68 Pioneer Balanced ESG Fund | Semiannual Report | 1/31/21
The difference between book-basis and tax-basis net unrealized appreciation is attributable to the tax deferral of losses on wash sales, adjustments relating to event-linked bonds, the tax
treatment of premium and amortization, the mark to market of futures contracts, tax basis adjustments on Real Estate Investment Trust (“REIT”) holdings and common stock.
E. Fund Shares
The Fund records sales and repurchases of its shares as of trade date. The Distributor earned $20,060 in underwriting commissions on the sale of Class A shares during the six months ended
January 31, 2021.
F. Class Allocations
Income, common expenses and realized and unrealized gains and losses are calculated at the fund level and allocated daily to each class of shares based on its respective percentage of adjusted
net assets at the beginning of the day.
Distribution fees are calculated based on the average daily net asset value attributable to Class A, Class C and Class R shares of the Fund, respectively (see Note 5). Class K and Class Y shares
do not pay distribution fees. All expenses and fees paid to the Fund’s transfer agent for its services are allocated among the classes of shares based on the number of accounts in each class and the ratable allocation of related out-of-pocket
expenses (see Note 4).
Distributions to shareowners are recorded as of the ex-dividend date. Distributions paid by the Fund with respect to each class of shares are calculated in the same manner and at the same time,
except that net investment income dividends to Class A, Class C, Class K, Class R and Class Y shares can reflect different transfer agent and distribution expense rates.
G. Risks
The value of securities held by the Fund may go up or down, sometimes rapidly or unpredictably, due to general market conditions, such as real or perceived adverse economic, political or
regulatory conditions, recessions, the spread of infectious illness or other public health issues, inflation, changes in interest rates, lack of liquidity in the bond markets or adverse investor sentiment. In the past several years, financial
markets have experienced increased volatility, depressed valuations, decreased liquidity and heightened uncertainty. These conditions may continue, recur, worsen
Pioneer Balanced ESG Fund | Semiannual Report | 1/31/21 69
or spread. A general rise in interest rates could adversely affect the price and liquidity of fixed-income securities and could also result in increased redemptions from the Fund.
At times, the Fund’s investments may represent industries or industry sectors that are interrelated or have common risks, making the Fund more susceptible to any economic, political, or
regulatory developments or other risks affecting those industries and sectors. The Fund’s investments in foreign markets and countries with limited developing markets may subject the Fund to a greater degree of risk than investments in a
developed market. These risks include disruptive political or economic conditions and the imposition of adverse governmental laws or currency exchange restrictions.
The Fund invests in below-investment-grade (high-yield) debt securities and preferred stocks. Some of these high-yield securities may be convertible into equity securities of the issuer. Debt
securities rated below-investment-grade are commonly referred to as “junk bonds” and are considered speculative. These securities involve greater risk of loss, are subject to greater price volatility, and are less liquid, especially during
periods of economic uncertainty or change, than higher rated debt securities.
The Fund’s investments, payment obligations and financing terms may be based on floating rates, such as LIBOR (London Interbank Offered Rate). Plans are underway to phase out the use of LIBOR by
the end of 2021. The administrator of LIBOR recently announced a possible delay in the phase out of a majority of the U.S. dollar LIBOR publications until mid-2023, with the remainder of the LIBOR publications to end at the end of 2021. There
remains uncertainty regarding the nature of any replacement rate and the impact of the transition from LIBOR on the fund, issuers of instruments in which the fund invests, and financial markets generally.
With the increased use of technologies such as the Internet to conduct business, the Fund is susceptible to operational, information security and related risks. While the Fund’s Adviser has
established business continuity plans in the event of, and risk management systems to prevent, limit or mitigate, such cyber-attacks, there are inherent limitations in such plans and systems, including the possibility that certain risks have
not been identified. Furthermore, the Fund cannot control the cybersecurity plans and systems put in place by service providers to the Fund such as Brown Brothers Harriman & Co., the Fund’s custodian and accounting agent, and DST Asset
Manager Solutions, Inc., the Fund’s transfer agent. In addition, many beneficial owners of Fund shares hold them through accounts at broker-dealers, retirement platforms and other financial market participants over which neither the Fund nor
the Adviser exercises control. Each of these may in turn rely on service providers to them, which are also subject to the
70 Pioneer Balanced ESG Fund | Semiannual Report | 1/31/21
risk of cyber-attacks. Cybersecurity failures or breaches at the Adviser or the Fund’s service providers or intermediaries have the ability to cause disruptions and impact business operations,
potentially resulting in financial losses, interference with the Fund’s ability to calculate its net asset value, impediments to trading, the inability of Fund shareowners to effect share purchases, redemptions or exchanges or receive
distributions, loss of or unauthorized access to private shareowner information and violations of applicable privacy and other laws, regulatory fines, penalties, reputational damage, or additional compliance costs. Such costs and losses may not
be covered under any insurance. In addition, maintaining vigilance against cyber-attacks may involve substantial costs over time, and system enhancements may themselves be subject to cyber-attacks.
COVID-19
The respiratory illness COVID-19 caused by a novel coronavirus has resulted in a global pandemic and major disruption to economies and markets around the world, including the United States.
Global financial markets have experienced extreme volatility and severe losses, and trading in many instruments has been disrupted. Liquidity for many instruments has been greatly reduced for periods of time. Some interest rates are very low
and in some cases yields are negative. Some sectors of the economy and individual issuers have experienced particularly large losses. These circumstances may continue for an extended period of time, and may continue to affect adversely the
value and liquidity of the Fund’s investments. The ultimate economic fallout from the pandemic, and the long-term impact on economies, markets, industries and individual issuers, are not known. Governments and central banks, including the
Federal Reserve in the U.S., have taken extraordinary and unprecedented actions to support local and global economies and the financial markets. These actions have resulted in significant expansion of public debt, including in the U.S. The
impact of these measures, and whether they will be effective to mitigate the economic and market disruption, will not be known for some time. The consequences of high public debt, including its future impact on the economy and securities
markets, likewise may not be known for some time.
The Fund’s prospectus contains unaudited information regarding the Fund’s principal risks. Please refer to that document when considering the Fund’s principal risks.
H. Restricted Securities
Restricted Securities are subject to legal or contractual restrictions on resale. Restricted securities generally are resold in transactions exempt from registration under the Securities Act of
1933. Private placement securities
Pioneer Balanced ESG Fund | Semiannual Report | 1/31/21 71
are generally considered to be restricted except for those securities traded between qualified institutional investors under the provisions of Rule 144A of the Securities Act of 1933.
Disposal of restricted investments may involve negotiations and expenses, and prompt sale at an acceptable price may be difficult to achieve. Restricted investments held by the Fund at January
31, 2021 are listed in the Schedule of Investments.
I. Insurance-Linked Securities (“ILS”)
The Fund invests in ILS. The Fund could lose a portion or all of the principal it has invested in an ILS, and the right to additional interest or dividend payments with respect to the security,
upon the occurrence of one or more trigger events, as defined within the terms of an insurance-linked security. Trigger events, generally, are hurricanes, earthquakes, or other natural events of a specific size or magnitude that occur in a
designated geographic region during a specified time period, and/or that involve losses or other metrics that exceed a specific amount. There is no way to accurately predict whether a trigger event will occur, and accordingly, ILS carry
significant risk. The Fund is entitled to receive principal, and interest and/or dividend payments so long as no trigger event occurs of the description and magnitude specified by the instrument. In addition to the specified trigger events, ILS
may expose the Fund to other risks, including but not limited to issuer (credit) default, adverse regulatory or jurisdictional interpretations and adverse tax consequences.
The Fund’s investments in ILS may include event-linked bonds. ILS also may include special purpose vehicles (“SPVs”) or similar instruments structured to comprise a portion of a reinsurer’s
catastrophe-oriented business, known as quota share instruments (sometimes referred to as reinsurance sidecars), or to provide reinsurance relating to specific risks to insurance or reinsurance companies through a collateralized instrument,
known as collateralized reinsurance. Structured reinsurance investments also may include industry loss warranties (“ILWs”). A traditional ILW takes the form of a bilateral reinsurance contract, but there are also products that take the form of
derivatives, collateralized structures, or exchange-traded instruments.
Where the ILS are based on the performance of underlying reinsurance contracts, the Fund has limited transparency into the individual underlying contracts, and therefore must rely upon the risk
assessment and sound underwriting practices of the issuer. Accordingly, it may be more difficult for the Adviser to fully evaluate the underlying risk profile of the Fund’s structured reinsurance investments, and therefore the Fund’s assets are
placed at greater risk of loss than if the Adviser had more complete information. Structured reinsurance instruments generally will be
72 Pioneer Balanced ESG Fund | Semiannual Report | 1/31/21
considered illiquid securities by the Fund. These securities may be difficult to purchase, sell or unwind. Illiquid securities also may be difficult to value. If the Fund is forced to sell an
illiquid asset, the Fund may be forced to sell at a loss.
Additionally, the Fund may gain exposure to ILS by investing in a closed-end interval fund, Pioneer ILS Interval Fund, an affiliate of the Adviser. The Fund’s investment in Pioneer ILS Interval
Fund at January 31, 2021, is listed in the Schedule of Investments.
J. Futures Contracts
The Fund may enter into futures transactions in order to attempt to hedge against changes in interest rates, securities prices and currency exchange rates or to seek to increase total return.
Futures contracts are types of derivatives. All futures contracts entered into by the Fund are traded on a futures exchange. Upon entering into a futures contract, the Fund is required to deposit with a broker an amount of cash or securities
equal to the minimum “initial margin” requirements of the associated futures exchange. The amount of cash deposited with the broker as collateral at January 31, 2021, is recorded as “Futures collateral” on the Statement of Assets and
Liabilities.
Subsequent payments for futures contracts (“variation margin”) are paid or received by the Fund, depending on the daily fluctuation in the value of the contracts, and are recorded by the Fund as
unrealized appreciation or depreciation. Cash received from or paid to the broker related to previous margin movement is held in a segregated account at the broker and is recorded as either “Due from broker for futures” or “Due to broker for
futures” on the Statement of Assets and Liabilities. When the contract is closed, the Fund realizes a gain or loss equal to the difference between the opening and closing value of the contract as well as any fluctuation in foreign currency
exchange rates where applicable. Futures contracts are subject to market risk, interest rate risk and currency exchange rate risk. Changes in value of the contracts may not directly correlate to the changes in value of the underlying
securities. With futures, there is reduced counterparty credit risk to the Fund since futures are exchange-traded and the exchange’s clearinghouse, as counterparty to all exchange-traded futures, guarantees the futures against default.
The average market value of futures contracts open during the six months ended January 31, 2021, was $12,823,385. Open futures contracts outstanding at January 31, 2021, are listed in the
Schedule of Investments.
Pioneer Balanced ESG Fund | Semiannual Report | 1/31/21 73
2. Management Agreement
The Adviser manages the Fund’s portfolio. Management fees are calculated daily and paid monthly at the annual rate of 0.50% of the Fund’s average daily net assets up to $1 billion and 0.45% of the Fund’s average
daily net assets over $1 billion. For the six months ended January 31, 2020, the effective management fee (excluding waivers and/or assumption of expenses) was equivalent to 0.50% (annualized) of the Fund’s average daily net assets.
The Adviser has agreed to waive its management fee with respect to any portion of the Fund’s assets invested in Pioneer ILS Interval Fund, an affiliated fund managed by the Adviser. For the six ended January 31,
2021, the Adviser waived $8,337 in management fees with respect to the Fund’s which is reflected on the Statement of Operations as an expense waiver.
The Adviser has contractually agreed to limit ordinary operating expenses (ordinary operating expenses means all fund expenses other than extraordinary expenses, such as litigation, taxes, brokerage commissions
and acquired fund fees and expenses) of the Fund to the extent required to reduce Fund expenses to 0.99%, 0.65%, 1.30% and 0.65% of the average daily net assets attributable to Class A, Class K, Class R and Class Y shares, respectively. These
expense limitations are in effect through December 1, 2021. There can be no assurance that the Adviser will extend the expense limitation agreement for a class of shares beyond the date referred to above. Fees waived and expenses reimbursed
during the six months ended January 31, 2021 are reflected on the Statement of Operations.
In addition, under the management and administration agreements, certain other services and costs, including accounting, regulatory reporting and insurance premiums, are paid by the Fund as administrative
reimbursements. Included in “Due to affiliates” reflected on the Statement of Assets and Liabilities is $56,023 in management fees, administrative costs and certain other reimbursements payable to the Adviser at January 31, 2021.
3. Compensation of Trustees and Officers
The Fund pays an annual fee to its Trustees. The Adviser reimburses the Fund for fees paid to the Interested Trustees. The Fund does not pay any salary or other compensation to its officers. For the six months
ended January 31, 2021, the Fund paid $6,256 in Trustees’ compensation, which is reflected on the Statement of Operations as Trustees’ fees. At January 31, 2021, the Fund had a payable for Trustees’ fees on its Statement of Assets and
Liabilities of $1,406.
74 Pioneer Balanced ESG Fund | Semiannual Report | 1/31/21
4. Transfer Agent
DST Asset Manager Solutions, Inc. serves as the transfer agent to the Fund at negotiated rates. Transfer agent fees and payables shown on the Statement of Operations and the Statement of Assets and Liabilities,
respectively, include sub-transfer agent expenses incurred through the Fund’s omnibus relationship contracts.
In addition, the Fund reimbursed the transfer agent for out-of-pocket expenses incurred by the transfer agent related to shareowner communications activities such as proxy and statement mailings, and outgoing
phone calls. For the six months ended January 31, 2021, such out-of-pocket expenses by class of shares were as follows:
|
Shareowner Communications:
|
|
|
|
|
Class A
|
|
$
|
31,979
|
|
|
Class C
|
|
|
4,747
|
|
|
Class K
|
|
|
54
|
|
|
Class R
|
|
|
810
|
|
|
Class Y
|
|
|
1,598
|
|
|
Total
|
|
$
|
39,188
|
|
5. Distribution and Service Plans
The Fund has adopted a distribution plan (the “Plan”) pursuant to Rule 12b-1 of the Investment Company Act of 1940 with respect to its Class A, Class C and Class R shares. Pursuant to the Plan, the Fund pays the
Distributor 0.25% of the average daily net assets attributable to Class A shares as compensation for personal services and/or account maintenance services or distribution services with regard to Class A shares. Pursuant to the Plan, the Fund
also pays the Distributor 1.00% of the average daily net assets attributable to Class C shares. The fee for Class C shares consists of a 0.25% service fee and a 0.75% distribution fee paid as compensation for personal services and/or account
maintenance services or distribution services with regard to Class C shares. Pursuant to the Plan, the Fund further pays the Distributor 0.50% of the average daily net assets attributable to Class R shares for distribution services. Included in
“Due to affiliates” reflected on the Statement of Assets and Liabilities is $16,356 in distribution fees payable to the Distributor at January 31, 2021.
The Fund also has adopted a separate service plan for Class R shares (“Service Plan”). The Service Plan authorizes the Fund to pay securities dealers, plan administrators or other service organizations that agree
to provide certain services to retirement plans or plan participants holding shares of the Fund a service fee of up to 0.25% of the Fund’s average daily net assets attributable to Class R shares held by such plans.
Pioneer Balanced ESG Fund | Semiannual Report | 1/31/21 75
In addition, redemptions of Class A and Class C shares may be subject to a contingent deferred sales charge (“CDSC”). A CDSC of 1.00% may be imposed on redemptions of certain net asset value purchases of Class A
shares within 12 months of purchase. Redemptions of Class C shares within 12 months of purchase are subject to a CDSC of 1.00% based on the lower of cost or market value of shares being redeemed. Shares purchased as part of an exchange remain
subject to any CDSC that applied to the original purchase of those shares. There is no CDSC for Class K, Class R or Class Y shares. Proceeds from the CDSC are paid to the Distributor. For the six months ended January 31, 2021, CDSC in the
amount of $5,818 were paid to the Distributor.
6. Line of Credit Facility
The Fund, along with certain other funds in the Pioneer Family of Funds (the “Funds”), participates in a committed, unsecured revolving line of credit (“credit facility”). Borrowings are used solely for temporary
or emergency purposes. The Fund may borrow up to the lesser of the amount available under the facility or the limits set for borrowing by the Fund’s prospectus and the 1940 Act. Effective March 11, 2020, the Fund participates in a facility in
the amount of $300 million. Prior to February 5, 2020, the Fund participated in a facility in the amount of $25 million. The Fund pays an annual commitment fee to participate in a credit facility. Under such facility, depending on the type of
loan, interest on borrowings is payable at the London Interbank Offered Rate (“LIBOR”) plus a credit spread. The commitment fee is allocated among participating Funds based on an allocation schedule set forth in the credit agreement. For the
six months ended January 31, 2021, the Fund had no borrowings under the credit facility.
7. Affiliated Issuers
An affiliated issuer is a company in which the Fund has a direct or indirect ownership of, control of, or voting power of 5 percent or more of the outstanding voting shares, or a company which is under common
control. At January 31, 2021, the value of the Fund’s investment in affiliated issuers was $939,257, which represents 0.3% of the Fund’s net assets.
76 Pioneer Balanced ESG Fund | Semiannual Report | 1/31/21
Transactions in affiliated issuers by the Fund for the six month period ended January 31, 2021 ended were as follows:
|
|
|
|
Change in
|
|
|
|
|
|
|
|
|
Net Unrealized
|
Net
|
|
|
|
|
|
|
|
Appreciation/
|
Realized
|
|
|
|
|
|
|
|
(Depreciation)
|
Gain/(Loss)
|
Dividends
|
|
|
|
|
|
|
from
|
From
|
from
|
Shares
|
|
|
Name of
|
Value at
|
|
Investments
|
Investments
|
Investments
|
held at
|
Value at
|
|
the Affiliated
|
July 31,
|
Purchase
|
in Affiliated
|
In Affiliated
|
In Affiliated
|
January 31,
|
January 31, |
|
Issuer
|
2020
|
Costs
|
Issuers
|
Issuer
|
Issuers
|
2021
|
2021
|
|
Pioneer ILS
|
|
|
|
|
|
|
|
|
Interval Fund
|
$949,190
|
$ —
|
$(9,933)
|
$ —
|
$48,740
|
110,371
|
$939,257
|
|
Total
|
$949,190
|
$ —
|
$(9,933)
|
$ —
|
$48,740
|
110,371
|
$939,257
|
Annual and semi-annual reports for the underlying Pioneer funds are available on the funds’ web page(s) at www.amundipioneer.com/us.
8. Additional Disclosures about Derivative Instruments and Hedging Activities
The Fund’s use of derivatives may enhance or mitigate the Fund’s exposure to the following risks:
Interest rate risk relates to the fluctuations in the value of interest-bearing securities due to changes in the prevailing levels of market interest rates.
Credit risk relates to the ability of the issuer of a financial instrument to make further principal or interest payments on an obligation or commitment that it has to the Fund.
Foreign exchange rate risk relates to fluctuations in the value of an asset or liability due to changes in currency exchange rates.
Equity risk relates to the fluctuations in the value of financial instruments as a result of changes in market prices (other than those arising from interest rate risk or foreign exchange rate risk), whether
caused by factors specific to an individual investment, its issuer, or all factors affecting all instruments traded in a market or market segment.
Commodity risk relates to the risk that the value of a commodity or commodity index will fluctuate based on increases or decreases in the commodities market and factors specific to a particular industry or
commodity.
Pioneer Balanced ESG Fund | Semiannual Report | 1/31/21 77
The fair value of open derivative instruments (not considered to be hedging instruments for accounting disclosure purposes) by risk exposure at January 31, 2021, was as follows:
|
|
Interest
|
|
Foreign
|
|
|
|
Statement of
|
Rate
|
Credit
|
Exchange
|
Equity
|
Commodity
|
|
Assets and Liabilities
|
Risk
|
Risk
|
Rate Risk
|
Risk
|
Risk
|
|
Liabilities
|
|
|
|
|
|
|
Net unrealized
|
|
|
|
|
|
|
depreciation on
|
|
|
|
|
|
|
futures contracts
|
$208,945
|
$ —
|
$ —
|
$ —
|
$ —
|
|
Total Value
|
$208,945
|
$ —
|
$ —
|
$ —
|
$ —
|
The effect of derivative instruments (not considered to be hedging instruments for accounting disclosure purposes) on the Statement of Operations by risk exposure at January 31, 2021, was as follows:
|
|
Interest
|
|
Foreign
|
|
|
|
|
Rate
|
Credit
|
Exchange
|
Equity
|
Commodity
|
|
Statement of Operations
|
Risk
|
Risk
|
Rate Risk
|
Risk
|
Risk
|
|
Net realized gain (loss) on:
|
|
|
|
|
|
|
Futures contracts
|
$ (97,283)
|
$ —
|
$ —
|
$ —
|
$ —
|
|
Total Value
|
$ (97,283)
|
$ —
|
$ —
|
$ —
|
$ —
|
|
Change in net unrealized
|
|
|
|
|
|
|
appreciation
|
|
|
|
|
|
|
(depreciation) on:
|
|
|
|
|
|
|
Futures contracts
|
$(439,750)
|
$ —
|
$ —
|
$ —
|
$ —
|
|
Total Value
|
$(439,750)
|
$ —
|
$ —
|
$ —
|
$ —
|
78 Pioneer Balanced ESG Fund | Semiannual Report | 1/31/21
Approval of Investment
Management Agreement
Amundi Pioneer Asset Management, Inc.1 (“APAM”) serves as the investment adviser to Pioneer Balanced ESG Fund (the “Fund”) pursuant
to an investment management agreement between APAM and the Fund. In order for APAM to remain the investment adviser of the Fund, the Trustees of the Fund must determine annually whether to renew the investment management agreement for the Fund.
The contract review process began in January 2020 as the Trustees of the Fund agreed on, among other things, an overall approach and timeline for the process. Contract review materials were provided to the
Trustees in March 2020, July 2020 and September 2020. In addition, the Trustees reviewed and discussed the Fund’s performance at regularly scheduled meetings throughout the year, and took into account other information related to the Fund
provided to the Trustees at regularly scheduled meetings, in connection with the review of the Fund’s investment management agreement.
In March 2020, the Trustees, among other things, discussed the memorandum provided by Fund counsel that summarized the legal standards and other considerations that are relevant to the Trustees in their
deliberations regarding the renewal of the investment management agreement, and reviewed and discussed the qualifications of the investment management teams for the Fund, as well as the level of investment by the Fund’s portfolio managers in
the Fund. In July 2020, the Trustees, among other things, reviewed the Fund’s management fees and total expense ratios, the financial statements of APAM and its parent companies, profitability analyses provided by APAM, and analyses from APAM
as to possible economies of scale. The Trustees also reviewed the profitability of the institutional business of APAM and APAM’s affiliate, Amundi Pioneer Institutional Asset Management, Inc.2 (“APIAM” and, together with APAM, “Amundi Pioneer”), as compared to that of APAM’s fund management business, and considered the differences between the fees and expenses of the Fund and the fees and expenses of
APAM’s and APIAM’s institutional accounts, as well as the different services provided by APAM to the Fund and by APAM and APIAM to the institutional accounts. The Trustees further considered contract review materials, including additional
materials received in response to the Trustees’ request, in September 2020.
|
1
|
Effective January 1, 2021, Amundi Pioneer Asset Management, Inc. changed its name to Amundi Asset Management US, Inc. (“Amundi US”).
|
| |
|
|
2
|
Effective January 1, 2021, Amundi Pioneer Institutional Asset Management, Inc. (“APIAM”) merged with and into Amundi US. After the Merger, the investment advisory services previously provided by APIAM are now provided through Amundi
US.
|
Pioneer Balanced ESG Fund | Semiannual Report | 1/31/21 79
At a meeting held on September 15, 2020, based on their evaluation of the information provided by APAM and third parties, the Trustees of the Fund, including the Independent Trustees voting separately, unanimously
approved the renewal of the investment management agreement for another year. In approving the renewal of the investment management agreement, the Trustees considered various factors that they determined were relevant, including the factors
described below. The Trustees did not identify any single factor as the controlling factor in determining to approve the renewal of the agreement.
Nature, Extent and Quality of Services
The Trustees considered the nature, extent and quality of the services that had been provided by APAM to the Fund, taking into account the investment objective and strategy of the Fund. The Trustees also reviewed
APAM’s investment approach for the Fund and its research process. The Trustees considered the resources of APAM and the personnel of APAM who provide investment management services to the Fund. They also reviewed the amount of non-Fund assets
managed by the portfolio managers of the Fund. They considered the non-investment resources and personnel of APAM that are involved in APAM’s services to the Fund, including APAM’s compliance, risk management, and legal resources and personnel.
The Trustees noted the substantial attention and high priority given by APAM’s senior management to the Pioneer Fund complex. The Trustees considered the implementation and effectiveness of APAM’s business continuity plan in response to the
COVID-19 pandemic.
The Trustees considered that APAM supervises and monitors the performance of the Fund’s service providers and provides the Fund with personnel (including Fund officers) and other resources that are necessary for
the Fund’s business management and operations. The Trustees also considered that, as administrator, APAM is responsible for the administration of the Fund’s business and other affairs. The Trustees considered the fees paid to APAM for the
provision of administration services.
Based on these considerations, the Trustees concluded that the nature, extent and quality of services that had been provided by APAM to the Fund were satisfactory and consistent with the terms of the investment
management agreement.
80 Pioneer Balanced ESG Fund | Semiannual Report | 1/31/21
Performance of the Fund
In considering the Fund’s performance, the Trustees regularly review and discuss throughout the year data prepared by APAM and information comparing the Fund’s performance with the performance of its peer group of
funds, as classified by Morningstar, Inc. (Morningstar), and with the performance of the Fund’s benchmark index. They also discuss the Fund’s performance with APAM on a regular basis. The Trustees’ regular reviews and discussions were factored
into the Trustees’ deliberations concerning the renewal of the investment management agreement.
Management Fee and Expenses
The Trustees considered information showing the fees and expenses of the Fund in comparison to the management fees of its peer group of funds as classified by Morningstar and also to the expense ratios of a peer
group of funds selected on the basis of criteria determined by the Independent Trustees for this purpose using data provided by Strategic Insight Mutual Fund Research and Consulting, LLC (Strategic Insight), an independent third party. The peer
group comparisons referred to below are organized in quintiles. Each quintile represents one-fifth of the peer group. In all peer group comparisons referred to below, first quintile is most favorable to the Fund’s shareowners. The Trustees
noted that they separately review and consider the impact of the Fund’s transfer agency and Fund- and APAM-paid expenses for sub-transfer agency and intermediary arrangements, and that the results of the most recent such review were considered
in the consideration of the Fund’s expense ratio.
The Trustees considered that the Fund’s management fee for the most recent fiscal year was in the second quintile relative to the management fees paid by other funds in its Morningstar category for the comparable
period. The Trustees considered that the expense ratio of the Fund’s Class A shares for the most recent fiscal year was in the first quintile relative to its Strategic Insight peer group for the comparable period. The Trustees noted that APAM
had agreed to waive fees and/or reimburse expenses in order to limit the ordinary operating expenses of the Fund.
The Trustees reviewed management fees charged by APAM and APIAM to institutional and other clients, including publicly offered European funds sponsored by APAM’s affiliates, unaffiliated U.S. registered investment
companies (in a sub-advisory capacity), and unaffiliated foreign and domestic separate accounts. The Trustees also considered APAM’s costs in providing services to the Fund and APAM’s and APIAM’s costs in providing services to the other clients
and considered the differences in management fees and profit margins for fund and non-fund services. In evaluating the
Pioneer Balanced ESG Fund | Semiannual Report | 1/31/21 81
fees associated with APAM’s and APIAM’s client accounts, the Trustees took into account the respective demands, resources and complexity associated with the Fund and other client accounts. The Trustees noted that,
in some instances, the fee rates for those clients were lower than the management fee for the Fund and considered that, under the investment management agreement with the Fund, APAM performs additional services for the Fund that it does not
provide to those other clients or services that are broader in scope, including oversight of the Fund’s other service providers and activities related to compliance and the extensive regulatory and tax regimes to which the Fund is subject. The
Trustees also considered the entrepreneurial risks associated with APAM’s management of the Fund.
The Trustees concluded that the management fee payable by the Fund to APAM was reasonable in relation to the nature and quality of the services provided by APAM.
Profitability
The Trustees considered information provided by APAM regarding the profitability of APAM with respect to the advisory services provided by APAM to the Fund, including the methodology used by APAM in allocating
certain of its costs to the management of the Fund. The Trustees also considered APAM’s profit margin in connection with the overall operation of the Fund. They further reviewed the financial results, including the profit margins, realized by
APAM and APIAM from non-fund businesses. The Trustees considered APAM’s profit margins in comparison to the limited industry data available and noted that the profitability of any adviser was affected by numerous factors, including its
organizational structure and method for allocating expenses. The Trustees concluded that APAM’s profitability with respect to the management of the Fund was not unreasonable.
Economies of Scale
The Trustees considered APAM’s views relating to economies of scale in connection with the Pioneer Funds as fund assets grow and the extent to which any such economies of scale are shared with the Fund and Fund
shareholders. The Trustees recognize that economies of scale are difficult to identify and quantify, and that, among other factors that may be relevant, are the following: fee levels, expense subsidization, investment by APAM in research and
analytical capabilities and APAM’s commitment and resource allocation to the Fund. The Trustees noted that profitability also may be an indicator of the availability of any economies of scale, although profitability
82 Pioneer Balanced ESG Fund | Semiannual Report | 1/31/21
may vary for other reasons including due to reductions in expenses. The Trustees concluded that economies of scale, if any, were being appropriately shared with the Fund.
Other Benefits
The Trustees considered the other benefits that APAM enjoys from its relationship with the Fund. The Trustees considered the character and amount of fees paid or to be paid by the Fund, other than under the
investment management agreement, for services provided by APAM and its affiliates. The Trustees further considered the revenues and profitability of APAM’s businesses other than the Fund business. To the extent applicable, the Trustees also
considered the benefits to the Fund and to APAM and its affiliates from the use of “soft” commission dollars generated by the Fund to pay for research and brokerage services.
The Trustees considered that Amundi Pioneer is the principal U.S. asset management business of Amundi, which is one of the largest asset managers globally. Amundi’s worldwide asset management business manages over
$1.7 trillion in assets (including the Pioneer Funds). The Trustees considered that APAM’s relationship with Amundi creates potential opportunities for APAM, APIAM and Amundi that derive from APAM’s relationships with the Fund, including
Amundi’s ability to market the services of APAM globally. The Trustees noted that APAM has access to additional research and portfolio management capabilities as a result of its relationship with Amundi and Amundi’s enhanced global presence
that may contribute to an increase in the resources available to APAM. The Trustees considered that APAM and the Fund receive reciprocal intangible benefits from the relationship, including mutual brand recognition and, for the Fund, direct and
indirect access to the resources of a large global asset manager. The Trustees concluded that any such benefits received by APAM as a result of its relationship with the Fund were reasonable.
Conclusion
After consideration of the factors described above as well as other factors, the Trustees, including the Independent Trustees, concluded that the investment management agreement for the Fund, including the fees
payable thereunder, was fair and reasonable and voted to approve the proposed renewal of the investment management agreement.
Pioneer Balanced ESG Fund | Semiannual Report | 1/31/21 83
Trustees, Officers
and Service Providers
| |
|
|
Trustees
|
Officers
|
|
Thomas J. Perna, Chairman
|
Lisa M. Jones, President and
|
|
John E. Baumgardner, Jr.
|
Chief Executive Officer
|
|
Diane Durnin
|
Mark E. Bradley, Treasurer and
|
|
Benjamin M. Friedman
|
Chief Financial and
|
|
Lisa M. Jones
|
Accounting Officer
|
|
Lorraine H. Monchak
|
Christopher J. Kelley, Secretary and
|
|
Marguerite A. Piret
|
Chief Legal Officer
|
|
Fred J. Ricciardi
|
|
|
Kenneth J. Taubes
|
|
|
|
|
Investment Adviser and Administrator
|
|
|
Amundi Asset Management US, Inc.
|
|
|
|
|
Custodian and Sub-Administrator
|
|
|
Brown Brothers Harriman & Co.
|
|
|
|
|
Principal Underwriter
|
|
|
Amundi Distributor US, Inc.
|
|
|
|
|
Legal Counsel
|
|
|
Morgan, Lewis & Bockius LLP
|
|
|
|
|
Transfer Agent
|
|
|
DST Asset Manager Solutions, Inc.
|
|
Proxy Voting Policies and Procedures of the Fund are available without charge, upon request, by calling our toll free number (1-800-225-6292). Information regarding how the
Fund voted proxies relating to portfolio securities during the most recent 12-month period ended June 30 is publicly available to shareowners at www.amundi.com/us. This information is also available on the Securities and Exchange Commission’s
web site at www.sec.gov.
84 Pioneer Balanced ESG Fund | Semiannual Report | 1/31/21
How to Contact Amundi
We are pleased to offer a variety of convenient ways for you to contact us for assistance or information.
|
Call us for:
|
|
|
Account Information, including existing accounts,
|
|
new accounts, prospectuses, applications
|
|
|
and service forms
|
1-800-225-6292
|
| |
|
|
FactFoneSM for automated fund yields, prices,
|
|
|
account information and transactions
|
1-800-225-4321
|
| |
|
|
Retirement plans information
|
1-800-622-0176
|
|
|
|
Write to us:
|
|
|
Amundi
|
|
|
P.O. Box 219427
|
|
|
Kansas City, MO 64121-9427
|
|
| |
|
|
Our toll-free fax
|
1-800-225-4240
|
| |
|
|
Our internet e-mail address
|
us.askamundi@amundi.com
|
|
(for general questions about Amundi only)
|
|
|
|
|
Visit our web site: www.amundi.com/us
|
|
This report must be preceded or accompanied by a prospectus.
The Fund files a complete schedule of portfolio holdings with the Securities and Exchange Commission for the first and third quarters of each fiscal year as an exhibit to its reports on Form
N-PORT. Shareholders may view the filed Form N-PORT by visiting the Commission’s web site at https://www.sec.gov.
Amundi Asset Management US, Inc.
60 State Street
Boston, MA 02109
www.amundi.com/us
Securities offered through Amundi Distributor US, Inc.,
60 State Street, Boston, MA 02109
Underwriter of Pioneer Mutual Funds, Member SIPC
© 2021 Amundi Asset Management US, Inc. 18831-15-0321
ITEM 2. CODE OF ETHICS.
(a) Disclose whether, as of the end of the period covered by the report, the registrant has adopted a code of ethics that applies to the registrant’s principal executive officer,
principal financial officer, principal accounting officer or controller, or persons performing similar functions, regardless of whether these individuals are employed by the registrant or a third party. If the registrant has not adopted such a
code of ethics, explain why it has not done so.
The registrant has adopted, as of the end of the period covered by this report, a code of ethics that applies to the registrant’s principal executive officer, principal financial
officer, principal accounting officer and controller.
(b) For purposes of this Item, the term “code of ethics” means written standards that are reasonably designed to deter wrongdoing and to promote:
(1) Honest and ethical conduct, including the ethical handling of actual or apparent conflicts of interest between personal and professional relationships;
(2) Full, fair, accurate, timely, and understandable disclosure in reports and documents that a registrant files with, or submits to, the Commission and in other
public communications made by the registrant;
(3) Compliance with applicable governmental laws, rules, and regulations;
(4) The prompt internal reporting of violations of the code to an appropriate person or persons identified in the code; and
(5) Accountability for adherence to the code.
(c) The registrant must briefly describe the nature of any amendment, during the period covered by the report, to a provision of its code of ethics that applies to the registrant’s
principal executive officer, principal financial officer, principal accounting officer or controller, or persons performing similar functions, regardless of whether these individuals are employed by the registrant or a third party, and that
relates to any element of the code of ethics definition enumerated in paragraph (b) of this Item. The registrant must file a copy of any such amendment as an exhibit pursuant to Item 10(a), unless the registrant has elected to satisfy paragraph
(f) of this Item by posting its code of ethics on its website pursuant to paragraph (f)(2) of this Item, or by undertaking to provide its code of ethics to any person without charge, upon request, pursuant to paragraph (f)(3) of this Item.
The registrant has made no amendments to the code of ethics during the period covered by this report.
(d) If the registrant has, during the period covered by the report, granted a waiver, including an implicit waiver, from a provision of the code of ethics to the registrant’s
principal executive officer, principal financial officer, principal accounting officer or controller, or persons performing similar functions, regardless of whether these individuals are employed by the registrant or a third party, that relates
to one or more of the items set forth in paragraph (b) of this Item, the registrant must briefly describe the nature of the waiver, the name of the person to whom the waiver was granted, and the date of the waiver.
Not applicable.
(e) If the registrant intends to satisfy the disclosure requirement under paragraph (c) or (d) of this Item regarding an amendment to, or a waiver from, a provision of its code of
ethics that applies to the registrant’s principal executive officer, principal financial officer, principal accounting officer or controller, or persons performing similar functions and that relates to any element of the code of ethics definition
enumerated in paragraph (b) of this Item by posting such information on its Internet website, disclose the registrant’s Internet address and such intention.
Not applicable.
(f) The registrant must:
(1) File with the Commission, pursuant to Item 12(a)(1), a copy of its code of ethics that applies to the registrant’s principal executive officer, principal
financial officer, principal accounting officer or controller, or persons performing similar functions, as an exhibit to its annual report on this Form N-CSR (see attachment);
(2) Post the text of such code of ethics on its Internet website and disclose, in its most recent report on this Form N-CSR, its Internet address and the fact
that it has posted such code of ethics on its Internet website; or
(3) Undertake in its most recent report on this Form N-CSR to provide to any person without charge, upon request, a copy of such code of ethics and explain the
manner in which such request may be made. See Item 10(2)
ITEM 3. AUDIT COMMITTEE FINANCIAL EXPERT.
(a) (1) Disclose that the registrant’s board of trustees has determined that the registrant either:
(i) Has at least one audit committee financial expert serving on its audit committee; or
(ii) Does not have an audit committee financial expert serving on its audit committee.
The registrant’s Board of Trustees has determined that the registrant has at least one audit committee financial expert.
(2) If the registrant provides the disclosure required by paragraph (a)(1)(i) of this Item, it must disclose the name of the audit committee financial expert and whether that
person is “independent.” In order to be considered “independent” for purposes of this Item, a member of an audit committee may not, other than in his or her capacity as a member of the audit committee, the board of trustees, or any other board
committee:
(i) Accept directly or indirectly any consulting, advisory, or other compensatory fee from the issuer; or
(ii) Be an “interested person” of the investment company as defined in Section 2(a)(19) of the Act (15 U.S.C. 80a-2(a)(19)).
Mr. Fred J. Ricciardi, an independent trustee, is such an audit committee financial expert.
(3) If the registrant provides the disclosure required by paragraph (a)(1) (ii) of this Item, it must explain why it does not have an audit committee financial
expert.
Not applicable.
ITEM 4. PRINCIPAL ACCOUNTANT FEES AND SERVICES.
(a) Disclose, under the caption AUDIT FEES, the aggregate fees billed for each of the last two fiscal years for professional services rendered by the principal accountant for the
audit of the registrant’s annual financial statements or services that are normally provided by the accountant in connection with statutory and regulatory filings or engagements for those fiscal years.
N/A
(b) Disclose, under the caption AUDIT-RELATED FEES, the aggregate fees billed in each of the last two fiscal years for assurance and related services by the principal accountant
that are reasonably related to the performance of the audit of the registrant’s financial statements and are not reported under paragraph (a) of this Item. Registrants shall describe the nature of the services comprising the fees disclosed under
this category.
N/A
(c) Disclose, under the caption TAX FEES, the aggregate fees billed in each of the last two fiscal years for professional services rendered by the principal accountant for tax
compliance, tax advice, and tax planning. Registrants shall describe the nature of the services comprising the fees disclosed under this category.
N/A
(d) Disclose, under the caption ALL OTHER FEES, the aggregate fees billed in each of the last two fiscal years for products and services provided by the principal accountant, other
than the services reported in paragraphs (a) through (c) of this Item. Registrants shall describe the nature of the services comprising the fees disclosed under this category.
N/A
(e) (1) Disclose the audit committee’s pre-approval policies and procedures described in paragraph (c)(7) of Rule 2-01 of Regulation S-X.
PIONEER FUNDS
APPROVAL OF AUDIT, AUDIT-RELATED, TAX AND OTHER SERVICES
PROVIDED BY THE INDEPENDENT AUDITOR
SECTION I - POLICY PURPOSE AND APPLICABILITY
The Pioneer Funds recognize the importance of maintaining the independence of their outside auditors. Maintaining independence is a shared responsibility involving Amundi Pioneer
Asset Management, Inc, the audit committee and the independent auditors.
The Funds recognize that a Fund’s independent auditors: 1) possess knowledge of the Funds, 2) are able to incorporate certain services into the scope of the audit, thereby avoiding
redundant work, cost and disruption of Fund personnel and processes, and 3) have expertise that has value to the Funds. As a result, there are situations where it is desirable to use the Fund’s independent auditors for services in addition to the
annual audit and where the potential for conflicts of interests are minimal. Consequently, this policy, which is intended to comply with Rule 210.2-01(C)(7), sets forth guidelines and procedures to be followed by the Funds when retaining the
independent audit firm to perform audit, audit-related tax and other services under those circumstances, while also maintaining independence.
Approval of a service in accordance with this policy for a Fund shall also constitute approval for any other Fund whose pre-approval is required pursuant to Rule
210.2-01(c)(7)(ii).
In addition to the procedures set forth in this policy, any non-audit services that may be provided consistently with Rule 210.2-01 may be approved by the Audit Committee itself
and any pre-approval that may be waived in accordance with Rule 210.2-01(c)(7)(i)(C) is hereby waived.
Selection of a Fund’s independent auditors and their compensation shall be determined by the Audit Committee and shall not be subject to this policy.
|
SECTION II - POLICY
|
| |
|
SERVICE CATEGORY
|
SERVICE CATEGORY DESCRIPTION
|
SPECIFIC PRE-APPROVED SERVICE SUBCATEGORIES
|
| |
|
|
|
I. AUDIT SERVICES
|
Services that are directly
|
o Accounting research assistance
|
| |
related to performing the
|
o SEC consultation, registration
|
| |
independent audit of the Funds
|
statements, and reporting
|
| |
|
o Tax accrual related matters
|
| |
|
o Implementation of new accounting standards
|
| |
|
o Compliance letters (e.g. rating agency letters)
|
| |
|
o Regulatory reviews and assistance
|
| |
|
regarding financial matters
|
| |
|
o Semi-annual reviews (if requested)
|
| |
|
o Comfort letters for closed end offerings
|
|
II. AUDIT-RELATED
|
Services which are not
|
o AICPA attest and agreed-upon procedures
|
|
SERVICES
|
prohibited under Rule
|
o Technology control assessments
|
| |
210.2-01(C)(4) (the “Rule”)
|
o Financial reporting control assessments
|
| |
and are related extensions of
|
o Enterprise security architecture
|
| |
the audit services support the
|
assessment
|
| |
audit, or use the knowledge/expertise
|
|
| |
gained from the audit procedures as a
|
|
| |
foundation to complete the project.
|
|
| |
In most cases, if the Audit-Related
|
|
| |
Services are not performed by the
|
|
| |
Audit firm, the scope of the Audit
|
|
| |
Services would likely increase.
|
|
| |
The Services are typically well-defined
|
|
| |
and governed by accounting
|
|
| |
professional standards (AICPA,
|
|
| |
SEC, etc.)
|
|
|
AUDIT COMMITTEE APPROVAL POLICY
|
AUDIT COMMITTEE REPORTING POLICY
|
|
o “One-time” pre-approval
|
o A summary of all such
|
|
for the audit period for all
|
services and related fees
|
|
pre-approved specific service
|
reported at each regularly
|
|
subcategories. Approval of the
|
scheduled Audit Committee
|
|
independent auditors as
|
meeting.
|
|
auditors for a Fund shall
|
|
|
constitute pre approval for
|
|
|
these services.
|
|
| |
|
o “One-time” pre-approval
|
o A summary of all such
|
|
for the fund fiscal year within
|
services and related fees
|
|
a specified dollar limit
|
(including comparison to
|
|
for all pre-approved
|
specified dollar limits)
|
|
specific service subcategories
|
reported quarterly.
|
|
o Specific approval is
|
|
|
needed to exceed the
|
|
|
pre-approved dollar limit for
|
|
|
these services (see general
|
|
|
Audit Committee approval policy
|
|
|
below for details on obtaining
|
|
|
specific approvals)
|
|
| |
|
o Specific approval is
|
|
|
needed to use the Fund’s
|
|
|
auditors for Audit-Related
|
|
|
Services not denoted as
|
|
|
“pre-approved”, or
|
|
|
to add a specific service
|
|
|
subcategory as “pre-approved”
|
|
SECTION III - POLICY DETAIL, CONTINUED
| |
|
|
SERVICE CATEGORY
|
SERVICE CATEGORY DESCRIPTION
|
SPECIFIC PRE-APPROVED SERVICE
|
| |
|
SUBCATEGORIES
|
|
III. TAX SERVICES
|
Services which are not
|
o Tax planning and support
|
| |
prohibited by the Rule,
|
o Tax controversy assistance
|
| |
if an officer of the Fund
|
o Tax compliance, tax returns, excise
|
| |
determines that using the
|
tax returns and support
|
| |
Fund’s auditor to provide
|
o Tax opinions
|
| |
these services creates
|
|
| |
significant synergy in
|
|
| |
the form of efficiency,
|
|
| |
minimized disruption, or
|
|
| |
the ability to maintain a
|
|
| |
desired level of
|
|
| |
confidentiality.
|
|
| |
|
|
AUDIT COMMITTEE APPROVAL POLICY
|
AUDIT COMMITTEE REPORTING POLICY
|
|
o “One-time” pre-approval
|
o A summary of
|
|
for the fund fiscal year
|
all such services and
|
|
within a specified dollar limit
|
related fees
|
| |
(including comparison
|
| |
to specified dollar
|
| |
limits) reported
|
| |
quarterly.
|
| |
|
o Specific approval is
|
|
|
needed to exceed the
|
|
|
pre-approved dollar limits for
|
|
|
these services (see general
|
|
|
Audit Committee approval policy
|
|
|
below for details on obtaining
|
|
|
specific approvals)
|
|
| |
|
o Specific approval is
|
|
|
needed to use the Fund’s
|
|
|
auditors for tax services not
|
|
|
denoted as pre-approved, or to
|
|
|
add a specific service subcategory as
|
|
|
“pre-approved”
|
|
SECTION III - POLICY DETAIL, CONTINUED
| |
|
SERVICE CATEGORY
|
SERVICE CATEGORY DESCRIPTION
|
SPECIFIC PRE-APPROVED SERVICE
|
| |
|
SUBCATEGORIES
|
|
IV. OTHER SERVICES
|
Services which are not
|
o Business Risk Management support
|
| |
prohibited by the Rule,
|
o Other control and regulatory
|
|
A. SYNERGISTIC,
|
if an officer of the Fund
|
compliance projects
|
|
UNIQUE QUALIFICATIONS
|
determines that using the
|
|
| |
Fund’s auditor to provide
|
|
| |
these services creates
|
|
| |
significant synergy in
|
|
| |
the form of efficiency,
|
|
| |
minimized disruption,
|
|
| |
the ability to maintain a
|
|
| |
desired level of
|
|
| |
confidentiality, or where
|
|
| |
the Fund’s auditors
|
|
| |
posses unique or superior
|
|
| |
qualifications to provide
|
|
| |
these services, resulting
|
|
| |
in superior value and
|
|
| |
results for the Fund.
|
|
| |
|
|
AUDIT COMMITTEE APPROVAL POLICY
|
AUDIT COMMITTEE REPORTING POLICY
|
|
o “One-time” pre-approval
|
o A summary of
|
|
for the fund fiscal year within
|
all such services and
|
|
a specified dollar limit
|
related fees
|
| |
(including comparison
|
| |
to specified dollar
|
| |
limits) reported
|
| |
quarterly.
|
|
o Specific approval is
|
|
|
needed to exceed the
|
|
|
pre-approved dollar limits for
|
|
|
these services (see general
|
|
|
Audit Committee approval policy
|
|
|
below for details on obtaining
|
|
|
specific approvals)
|
|
| |
|
o Specific approval is
|
|
|
needed to use the Fund’s
|
|
|
auditors for “Synergistic” or
|
|
|
“Unique Qualifications” Other
|
|
|
Services not denoted as
|
|
|
pre-approved to the left, or to
|
|
|
add a specific service
|
|
|
subcategory as “pre-approved”
|
|
SECTION III - POLICY DETAIL, CONTINUED
| |
|
SERVICE CATEGORY
|
SERVICE CATEGORY DESCRIPTION
|
SPECIFIC PROHIBITED SERVICE
|
| |
|
SUBCATEGORIES
|
|
PROHIBITED SERVICES
|
Services which result
|
1. Bookkeeping or other services
|
| |
in the auditors losing
|
related to the accounting records or
|
| |
independence status
|
financial statements of the audit
|
| |
under the Rule.
|
client*
|
| |
|
2. Financial information systems design
|
| |
|
and implementation*
|
| |
|
3. Appraisal or valuation services,
|
| |
|
fairness* opinions, or
|
| |
|
contribution-in-kind reports
|
| |
|
4. Actuarial services (i.e., setting
|
| |
|
actuarial reserves versus actuarial
|
| |
|
audit work)*
|
| |
|
5. Internal audit outsourcing services*
|
| |
|
6. Management functions or human
|
| |
|
resources
|
| |
|
7. Broker or dealer, investment
|
| |
|
advisor, or investment banking services
|
| |
|
8. Legal services and expert services
|
| |
|
unrelated to the audit
|
| |
|
9. Any other service that the Public
|
| |
|
Company Accounting Oversight Board
|
| |
|
determines, by regulation, is
|
| |
|
impermissible
|
| |
|
|
AUDIT COMMITTEE APPROVAL POLICY
|
AUDIT COMMITTEE REPORTING POLICY
|
|
o These services are not to be
|
o A summary of all
|
|
performed with the exception of the(*)
|
services and related
|
|
services that may be permitted
|
fees reported at each
|
|
if they would not be subject to audit
|
regularly scheduled
|
|
procedures at the audit client (as
|
Audit Committee meeting
|
|
defined in rule 2-01(f)(4)) level
|
will serve as continual
|
|
the firm providing the service.
|
confirmation that has
|
| |
not provided any
|
| |
restricted services.
|
GENERAL AUDIT COMMITTEE APPROVAL POLICY:
o For all projects, the officers of the Funds and the Fund’s auditors will each make an assessment to determine that any proposed projects will not impair independence.
o Potential services will be classified into the four non-restricted service categories and the “Approval of Audit, Audit-Related, Tax and Other Services” Policy above will be
applied. Any services outside the specific pre-approved service subcategories set forth above must be specifically approved by the Audit Committee.
o At least quarterly, the Audit Committee shall review a report summarizing the services by service category, including fees, provided by the Audit firm as set forth in the above
policy.
(2) Disclose the percentage of services described in each of paragraphs (b) through (d) of this Item that were approved by the audit committee pursuant to
paragraph (c)(7)(i)(C) of Rule 2-01 of Regulation S-X.
N/A
(f) If greater than 50 percent, disclose the percentage of hours expended on the principal accountants engagement to audit the registrant’s financial statements for the most recent
fiscal year that were attributed to work performed by persons other than the principal accountant’s full-time, permanent employees.
N/A
(g) Disclose the aggregate non-audit fees billed by the registrants accountant for services rendered to the registrant, and rendered to the registrants investment adviser (not
including any sub-adviser whose role is primarily portfolio management and is subcontracted with or overseen by another investment adviser), and any entity controlling, controlled by, or under common control with the adviser that provides ongoing
services to the registrant for each of the last two fiscal years of the registrant.
N/A
(h) Disclose whether the registrants audit committee of the board of trustees has considered whether the provision of non-audit services that were rendered to the registrants
investment adviser (not including any subadviser whose role is primarily portfolio management and is subcontracted with or overseen by another investment adviser), and any entity controlling, controlled by, or under common control with the
investment adviser that provides ongoing services to the registrant that were not pre-approved pursuant to paragraph (c)(7)(ii) of Rule 2-01 of Regulation S-X is compatible with maintaining the principal accountant’s independence.
The Fund’s audit committee of the Board of Trustees has considered whether the provision of non-audit services that were rendered to the Affiliates (as defined) that were not pre-
approved pursuant to paragraph (c)(7)(ii) of Rule 2-01 of Regulation S-X is compatible with maintaining the principal accountant’s independence.
ITEM 5. AUDIT COMMITTEE OF LISTED REGISTRANTS
(a) If the registrant is a listed issuer as defined in Rule 10A-3 under the Exchange Act (17 CFR 240.10A-3), state whether or not the registrant has a separately-designated
standing audit committee established in accordance with Section 3(a)(58)(A) of the Exchange Act (15 U.S.C. 78c(a)(58)(A)). If the registrant has such a committee, however designated, identify each committee member. If the entire board of
directors is acting as the registrant’s audit committee as specified in Section 3(a)(58)(B) of the Exchange Act (15 U.S.C. 78c(a)(58)(B)), so state.
N/A
(b) If applicable, provide the disclosure required by Rule 10A-3(d) under the Exchange Act (17 CFR 240.10A-3(d)) regarding an exemption from the listing standards for audit
committees.
N/A
ITEM 6. SCHEDULE OF INVESTMENTS.
File Schedule of Investments in securities of unaffiliated issuers as of the close of the reporting period as set forth in 210.1212 of Regulation S-X [17 CFR 210.12-12], unless the
schedule is included as part of the report to shareholders filed under Item 1 of this Form.
Included in Item 1
ITEM 7. DISCLOSURE OF PROXY VOTING POLICIES AND PROCEDURES FOR CLOSED-END MANAGEMENT INVESTMENT COMPANIES.
A closed-end management investment company that is filing an annual report on this Form N-CSR must, unless it invests exclusively in non-voting securities, describe the policies
and procedures that it uses to determine how to vote proxies relating to portfolio securities, including the procedures that the company uses when a vote presents a conflict between the interests of its shareholders, on the one hand, and those of
the company’s investment adviser; principal underwriter; or any affiliated person (as defined in Section 2(a)(3) of the Investment Company Act of 1940 (15 U.S.C. 80a-2(a)(3)) and the rules thereunder) of the company, its investment adviser, or
its principal underwriter, on the other. Include any policies and procedures of the company’s investment adviser, or any other third party, that the company uses, or that are used on the company’s behalf, to determine how to vote proxies relating
to portfolio securities.
Not applicable to open-end management investment companies.
ITEM 8. PORTFOLIO MANAGERS OF CLOSED-END MANAGEMENT INVESTMENT COMPANIES.
(a) If the registrant is a closed-end management investment company that is filing an annual report on this Form N-CSR, provide the following information:
(1) State the name, title, and length of service of the person or persons employed by or associated with the registrant or an investment adviser of the registrant who are primarily
responsible for the day-to-day management of the registrant’s portfolio (“Portfolio Manager”). Also state each Portfolio Manager’s business experience during the past 5 years.
Not applicable to open-end management investment companies.
ITEM 9. PURCHASES OF EQUITY SECURITIES BY CLOSED-END MANAGEMENT INVESTMENT COMPANY AND AFFILIATED PURCHASERS.
(a) If the registrant is a closed-end management investment company, in the following tabular format, provide the information specified in paragraph (b) of this Item with respect
to any purchase made by or on behalf of the registrant or any affiliated purchaser, as defined in Rule 10b-18(a)(3) under the Exchange Act (17 CFR 240.10b-18(a)(3)), of shares or other units of any class of the registrant’s equity securities that
is registered by the registrant pursuant to Section 12 of the Exchange Act (15 U.S.C. 781).
Not applicable to open-end management investment companies.
ITEM 10. SUBMISSION OF MATTERS TO A VOTE OF SECURITY HOLDERS.
Describe any material changes to the procedures by which shareholders may recommend nominees to the registrant’s board of directors, where those changes were implemented after the
registrant last provided disclosure in response to the requirements of Item 407(c)(2)(iv) of Regulation S-R(17 CFR 229.407)(as required by Item 22(b)(15)) of Schedule 14A (17 CFR 240.14a-101), or this Item.
There have been no material changes to the procedures by which the shareholders may recommend nominees to the registrant’s board of directors since the registrant last provided
disclosure in response to the requirements of Item 407(c)(2)(iv) of Regulation S-R of Schedule 14(A) in its definitive proxy statement, or this item.
ITEM 11. CONTROLS AND PROCEDURES.
(a) Disclose the conclusions of the registrant’s principal executive and principal financials officers, or persons performing similar functions, regarding the effectiveness of the
registrant’s disclosure controls and procedures (as defined in Rule 30a-3(c) under the Act (17 CFR 270.30a-3(c))) as of a date within 90 days of the filing date of the report that includes the disclosure required by this paragraph, based on the
evaluation of these controls and procedures required by Rule 30a-3(b) under the Act (17 CFR 270.30(a)-3(b) and Rules 13a-15(b) or 15d-15(b) under the Exchange Act (17 CFR 240.13a-15(b) or 240.15d-15(b)).
The registrant’s principal executive officer and principal financial officer have concluded that the registrant’s disclosure controls and procedures are effective based on the
evaluation of these controls and procedures as of a date within 90 days of the filing date of this report.
(b) Disclose any change in the registrant’s internal control over financial reporting (as defined in Rule 30a-3(d) under the Act (17CFR 270.30a-3(d)) that occured during the second
fiscal quarter of the period covered by this report that has materially affected, or is reasonably likely to materially affect, the registrant’s internal control over financial reporting.
There were no significant changes in the registrant’s internal control over financial reporting that occurred during the second fiscal quarter of the period covered by this report
that have materially affected, or are reasonably likely to materially affect, the registrant’s internal control over financial reporting.
Item 12. Disclosure of Securities Lending Activities for Closed-End Management Investment Companies.
(a) If the registrant is a closed-end management investment company, provide the following dollar amounts of income and compensation related to the securities lending activities of
the registrant during its most recent fiscal year:
N/A
(1) Gross income from securities lending activities;
N/A
(2) All fees and/or compensation for each of the following securities lending activities and related services: any share of revenue generated by the securities lending program paid
to the securities lending agent(s) (revenue split); fees paid for cash collateral management services (including fees deducted from a pooled cash collateral reinvestment vehicle) that are not included in the revenue split; administrative fees
that are not included in the revenue split; fees for indemnification that are not included in the revenue split; rebates paid to borrowers; and any other fees relating to the securities lending program that are not included in the revenue split,
including a description of those other fees;
N/A
(3) The aggregate fees/compensation disclosed pursuant to paragraph (2); and
N/A
(4) Net income from securities lending activities (i.e., the dollar amount in paragraph (1) minus the dollar amount in paragraph (3)).
If a fee for a service is included in the revenue split, state that the fee is included in the revenue split.
N/A
(b) If the registrant is a closed-end management investment company, describe the services provided to the registrant by the securities lending agent in the registrants most recent
fiscal year.
N/A
ITEM 13. EXHIBITS.
(a) File the exhibits listed below as part of this Form. Letter or number the exhibits in the sequence indicated.
SIGNATURES
[See General Instruction F]
Pursuant to the requirements of the Securities Exchange Act of 1934 and the Investment Company Act of 1940, the registrant has duly caused this report to be signed on its behalf by
the undersigned, thereunto duly authorized.
(Registrant) Pioneer Series Trust IV
By (Signature and Title)* /s/ Lisa M. Jones
Lisa M. Jones, President & Chief Executive Officer
Date April 6, 2021
Pursuant to the requirements of the Securities Exchange Act of 1934 and the Investment Company Act of 1940, this report has been signed below by the following persons on behalf of
the registrant and in the capacities and on the dates indicated.
By (Signature and Title)* /s/ Lisa M. Jones
Lisa M. Jones, President & Chief Executive Officer
Date April 6, 2021
By (Signature and Title)* /s/ Mark E. Bradley
Mark E. Bradley, Treasurer & Chief Accounting & Financial Officer
Date April 6, 2021
* Print the name and title of each signing officer under his or her signature.