Exhibit 99.1
Pet DRxCorporation
Investor Presentation
January 30, 2008
1
Safe Harbor
January 30, 2008
Certain matters discussed in this presentation, including statements as to the expected
benefits of the combination of the two companies, future productand service offerings
and expected synergies, are forward-looking statements. These forward-looking
statements are subject to risks and uncertainties that may causeactual results to differ
materially, including, but not limited to, the ability to successfully integrate the two
companies and achieve expected synergies following the merger, the ability of the
Company to successfully acquire, integrate and operate veterinary hospitals and clinics,
requirements or changes affecting the businesses in which the Company is engaged,
veterinary services trends, including factors affecting supply and demand, dependence on
acquisitions for growth, labor and personnel relations, changinginterpretations of
generally accepted accounting principles and other risks detailed from time to time in the
Company’s SEC reports, including its Form 10-K and 10-Q filings and Form S-4
Registration Statement. These forward-looking statements speak only as of the date
hereof. The Company disclaims any intention or obligation to update or revise any
forward-looking statements.
This presentation includes pro forma financial information reflecting the merger of XLNT
Veterinary Care Inc. into a wholly owned subsidiary of Pet DRxCorp. (formerly known as
Echo Healthcare Acquisition Corp.).See the Company's Form 8-K filed January 10, 2008
for additional pro forma information.
2
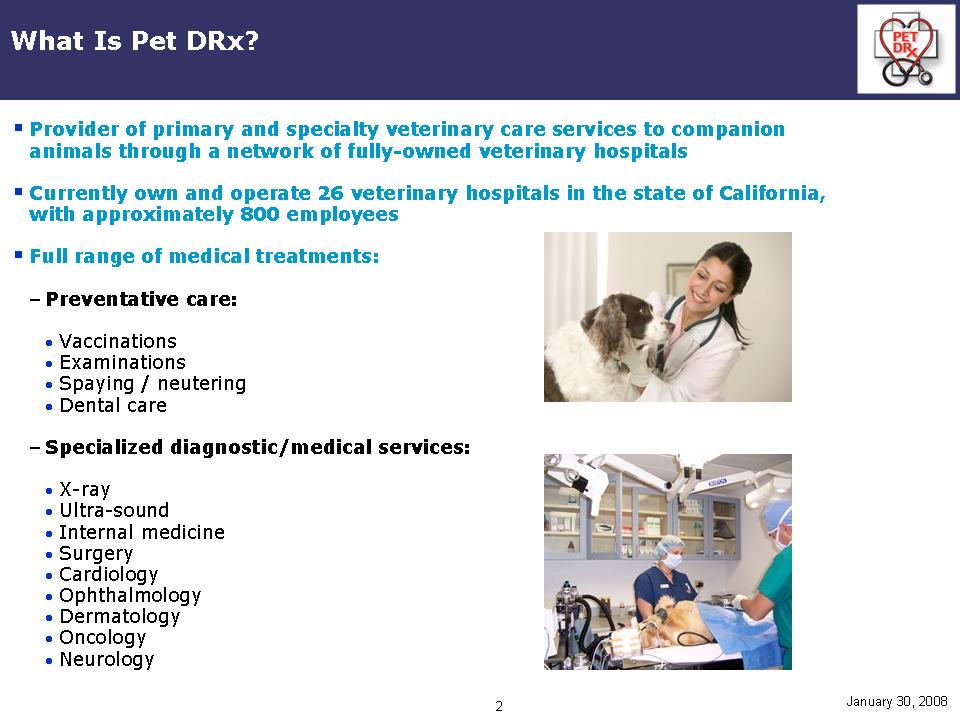
What Is Pet DRx?
..Provider of primary and specialty veterinary care services to companion
animals through a network of fully-owned veterinary hospitals
..Currently own and operate 26 veterinary hospitals in the state of California,
with approximately 800 employees
..Full range of medical treatments:
–Preventative care:
•Vaccinations
•Examinations
•Spaying / neutering
•Dental care
–Specialized diagnostic/medical services:
•X-ray
•Ultra-sound
•Internal medicine
•Surgery
•Cardiology
•Ophthalmology
•Dermatology
•Oncology
•Neurology
January 30, 2008
3
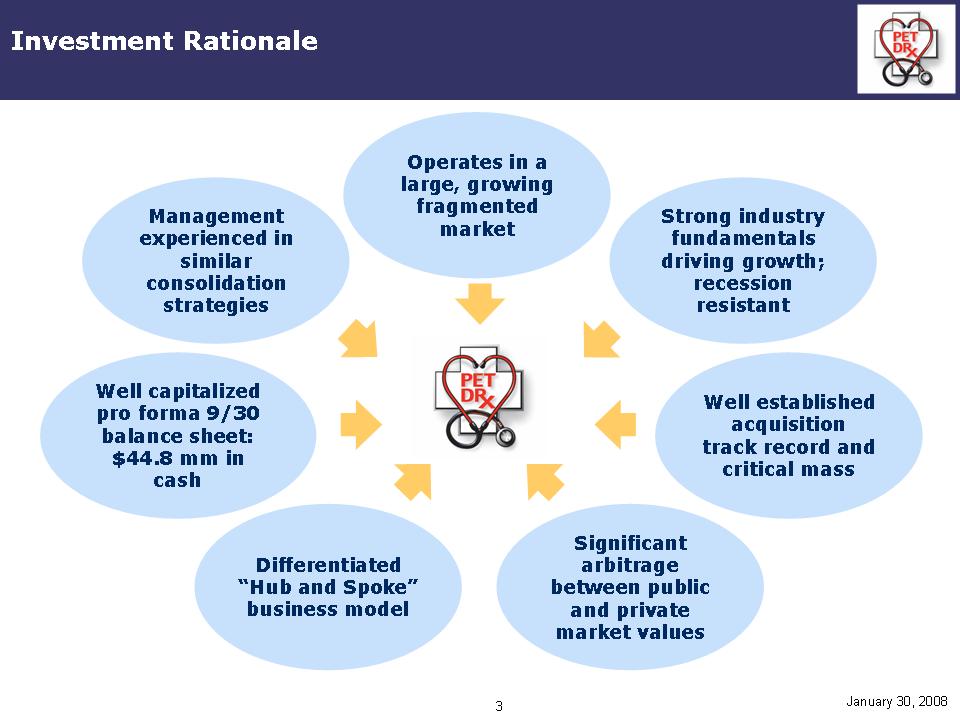
Investment Rationale
January 30, 2008
Management experienced in similar
consolidation strategies
Strong industry fundamentals
driving growth;
recession
resistant Well capitalized
pro forma 9/30
balance sheet:
$44.8 mm in
cash Well established
acquisition
track record and
critical mass Differentiated
“Hub and Spoke”
business model Significant
arbitrage
between public
and private
market values Operates in a
large, growing
fragmented
market
4
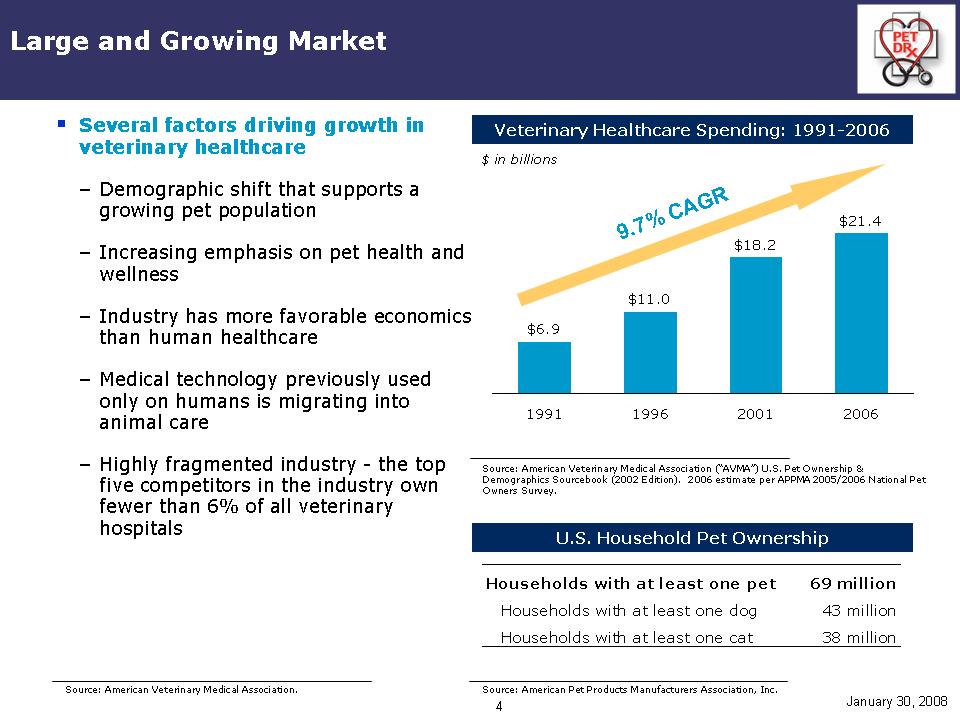
Large and Growing Market
Source: American Veterinary Medical Association (“AVMA”) U.S.Pet Ownership &
Demographics Sourcebook (2002 Edition). 2006 estimate per APMA 2005/2006 National Pet Owners Survey.
January 30, 2008
..Several factors driving growth in
veterinary healthcare –Demographic shift that supports a
growing pet population –Increasing emphasis on pet health and
wellness –Industry has more favorable economics
than human healthcare –Medical technology previously used
only on humans is migrating into
animal care –Highly fragmented industry - -the top
five competitors in the industry own
fewer than 6% of all veterinary hospitals
$6.9 $11.0 $18.2 $21.4 1991 1996 2001 2006 Veterinary Healthcare Spending: 1991-2006 9.7% CAGR $ in billions U.S. Household Pet Ownership
Source: American Pet Products Manufacturers Association, Inc.
Households with at least one pet 69 million Households with at least one dog 43 million Households with at least one cat 38 million
Source: American Veterinary Medical Association.
Source: American Veterinary Medical Association.
5
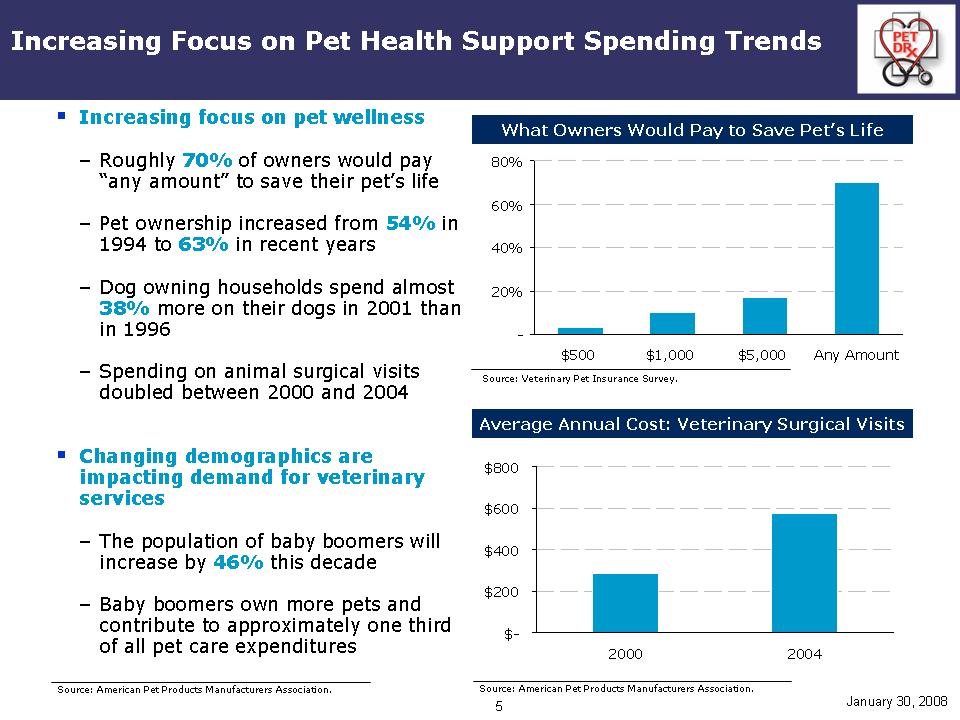
Increasing Focus on Pet Health Support Spending Trends
..Increasing focus on pet wellness–Roughly 70%of owners would pay
“any amount”to save their pet’s life –Pet ownership increased from 54% in
1994 to 63% in recent years –Dog owning households spend almost
38% more on their dogs in 2001 than
in 1996 –Spending on animal surgical visits
doubled between 2000 and 2004
..Changing demographics are
impacting demand for veterinary
services –The population of baby boomers will
increase by 46% this decade –Baby boomers own more pets and
contribute to approximately one third
of all pet care expenditures Average Annual Cost: Veterinary Surgical Visits Source: American Pet Products Manufacturers Association.
Source: Veterinary Pet Insurance Survey.
What Owners Would Pay to Save Pet’s Life
-
20%
40%
60%
80%
$500 $1,000 $5,000 Any Amount
$- $200 $400 $600 $800 2000 2004 Source: American Pet Products Manufacturers Association.
January 30, 2008
6
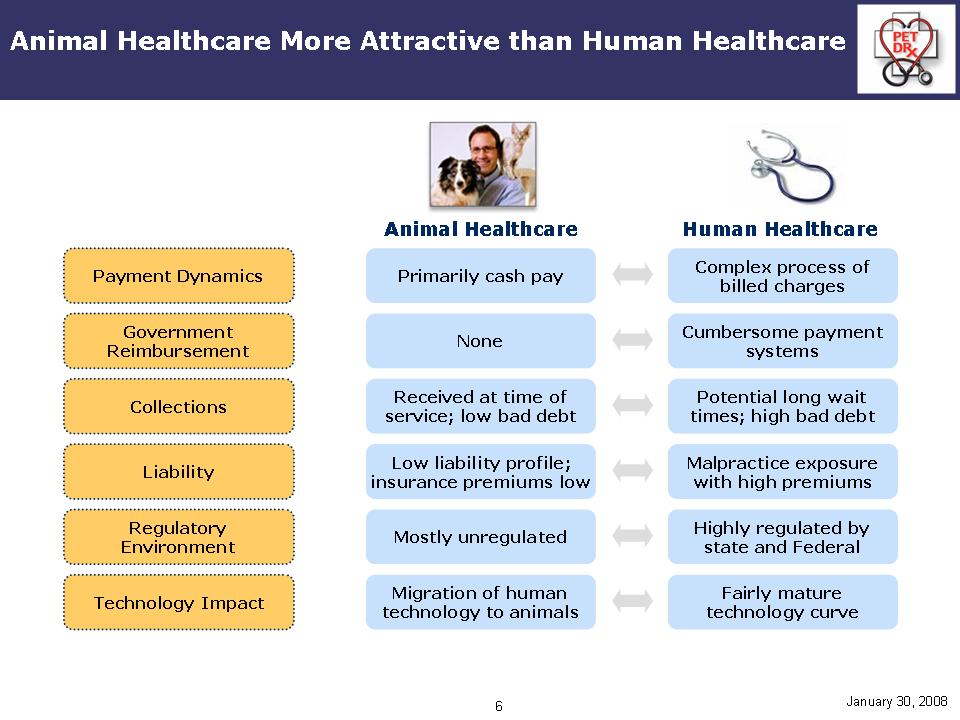
Animal Healthcare More Attractive than Human Healthcare
Animal Healthcare
Human Healthcare
January 30, 2008
Rounded Rectangle: Payment Dynamics
Rounded Rectangle: Government Reimbursement
Rounded Rectangle: Collections
Rounded Rectangle: Liability
Rounded Rectangle: Regulatory Environment
Rounded Rectangle: Technology Impact
Rounded Rectangle: Primarily cash pay
Rounded Rectangle: None
Rounded Rectangle: Received at time of service; low bad debt
Rounded Rectangle: Low liability profile; insurance premiums low
Rounded Rectangle: Mostly unregulated
Rounded Rectangle: Migration of human technology to animals
Rounded Rectangle: Complex process of billed charges
Rounded Rectangle: Cumbersome payment systems
Rounded Rectangle: Potential long wait times; high bad debt
Rounded Rectangle: Malpractice exposure with high premiums
Rounded Rectangle: Highly regulated by state and Federal
Rounded Rectangle: Fairly mature technology curve
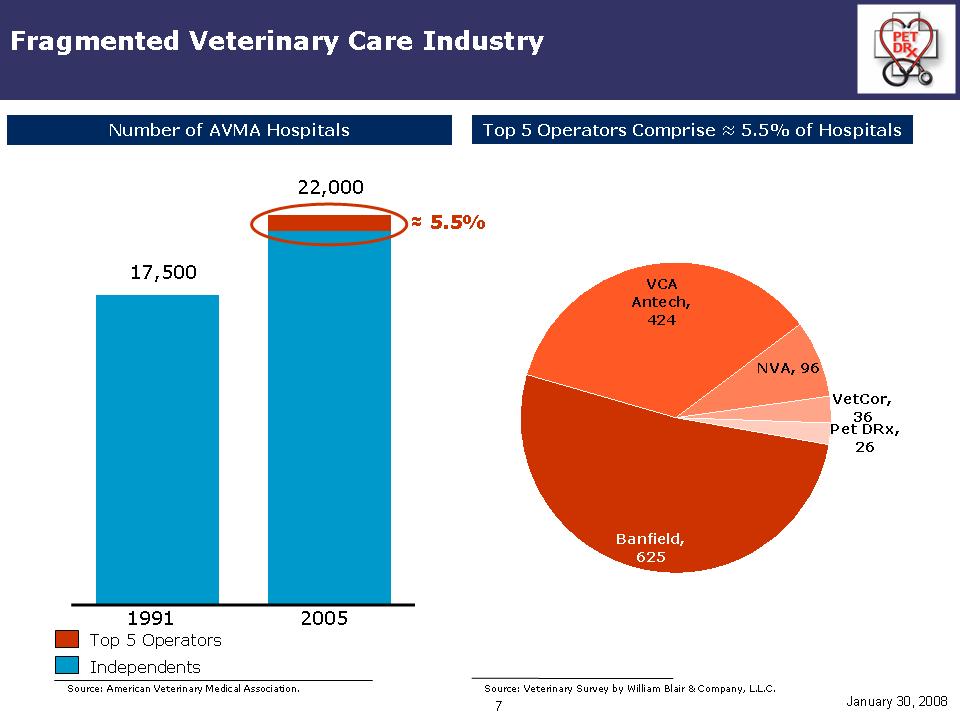
Fragmented Veterinary Care Industry
Source: Veterinary Survey by William Blair & Company, L.L.C.
January 30, 2008
1991 2005 Number of AVMA Hospitals 22,000 Top 5 Operators Top 5 Operators Comprise ≈ 5.5% of Hospitals 17,500 NVA, 96 VetCor, 36 Banfield, 625 VCA Antech,
424 Pet DRx, 26≈5.5%
Independents Source: American Veterinary Medical Association.
8
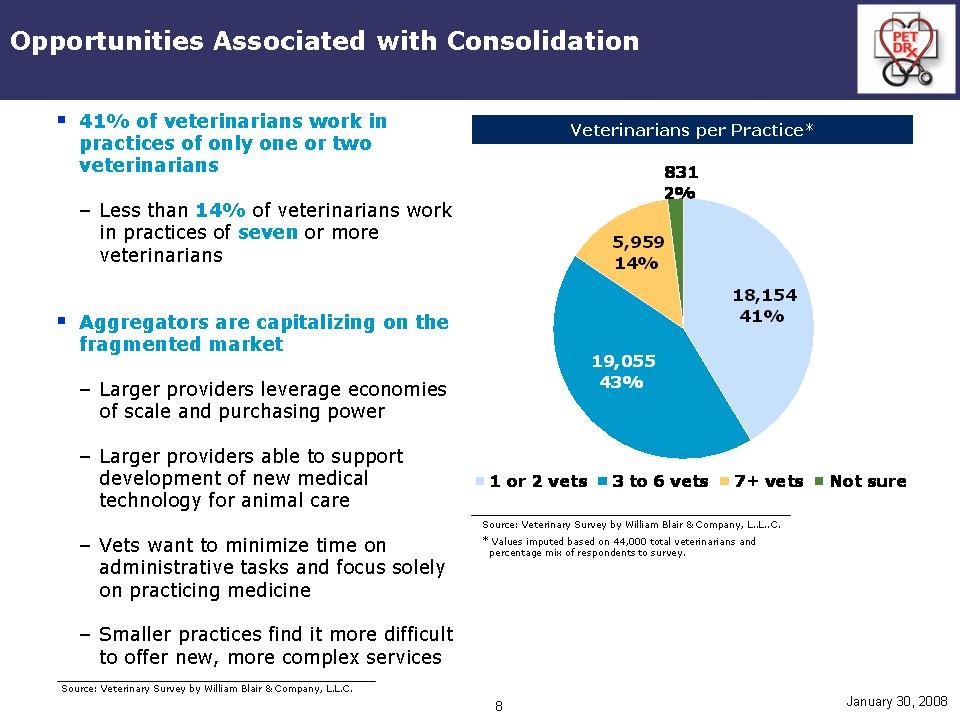
Opportunities Associated with Consolidation
January 30, 2008
Veterinarians per Practice*. ..41% of veterinarians work in practices of only one or two
Veterinarians –Less than 14%of veterinarians work
in practices of seven or more veterinarians
..Aggregators are capitalizing on the fragmented market –Larger providers leverage economies of scale and purchasing power –Larger providers able to support development of new medical technology for animal care –Vets want to minimize time on
administrative tasks and focus solely on practicing medicine –Smaller practices find it more difficult to offer new, more complex services Source: Veterinary Survey by William Blair & Company, L..L..C.
* Values imputed based on 44,000 total veterinarians and
percentage mix of respondents to survey.
831 2%
5,959 14%
18,154 41%
19,055 43%
1 or 2 vets 3 to 6 vets 7+ vets Not sure
Source: Veterinary Survey by William Blair & Company, L.L.C.
9
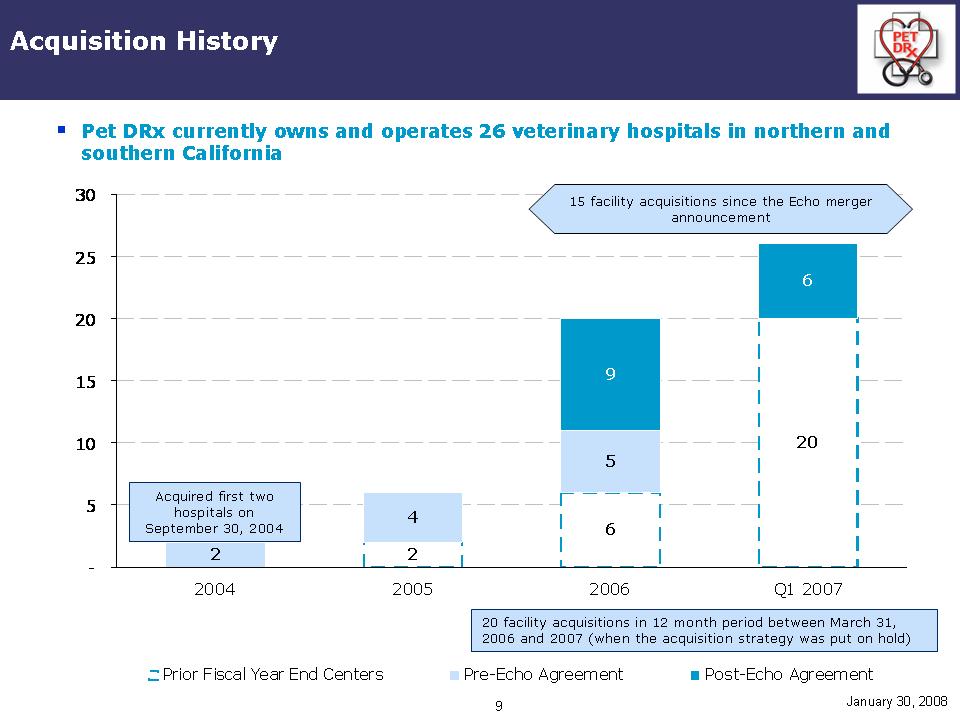
Acquisition History
..Pet DRx currently owns and operates 26 veterinary hospitals in northernand southern California
2 6 20 2 4 5 6 9
- 5 10 15 20 25 30 2004 2005 2006 Q1 2007 Prior Fiscal Year End Centers Pre-Echo Agreement Post-Echo Agreement Acquired first two hospitals on September 30, 2004 20 facility acquisitions in 12 month period between March 31, 2006 and 2007 (when the acquisition strategy was put on hold) 15 facility acquisitions since the Echo merger
Announcement January 30, 2008
10
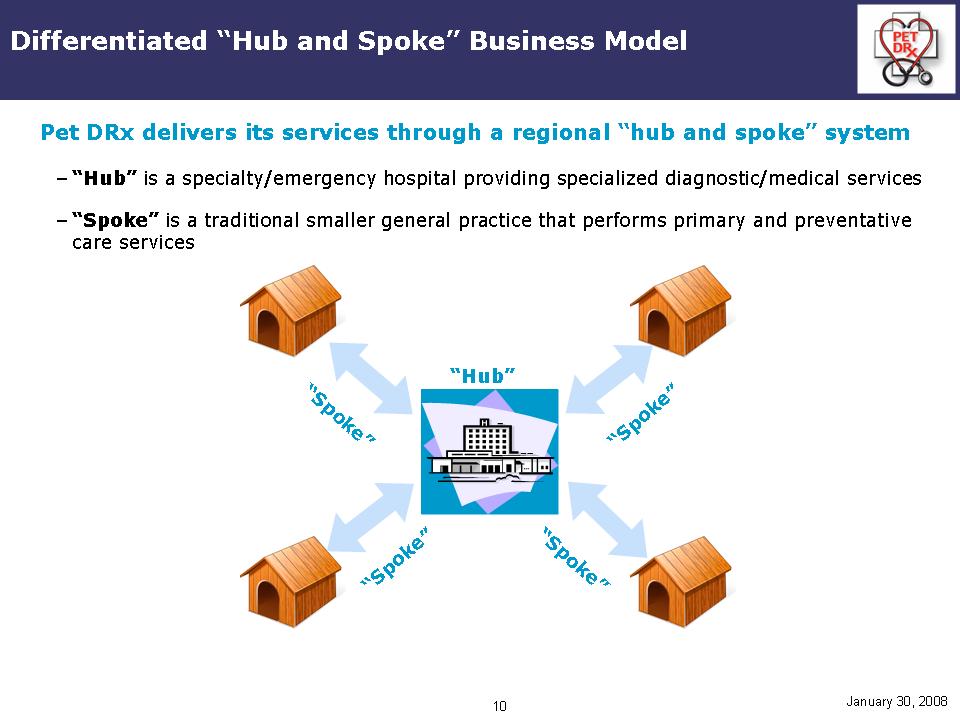
Differentiated “Hub and Spoke”Business Model
Pet DRxdelivers its services through a regional “hub and spoke”system
–“Hub”is a specialty/emergency hospital providing specialized diagnostic/medical services
–“Spoke”is a traditional smaller general practice that performs primaryand preventative
care services
January 30, 2008
“Hub”
“Spoke”
“Spoke”
“Spoke”
“Spoke”
11
January 30, 2008
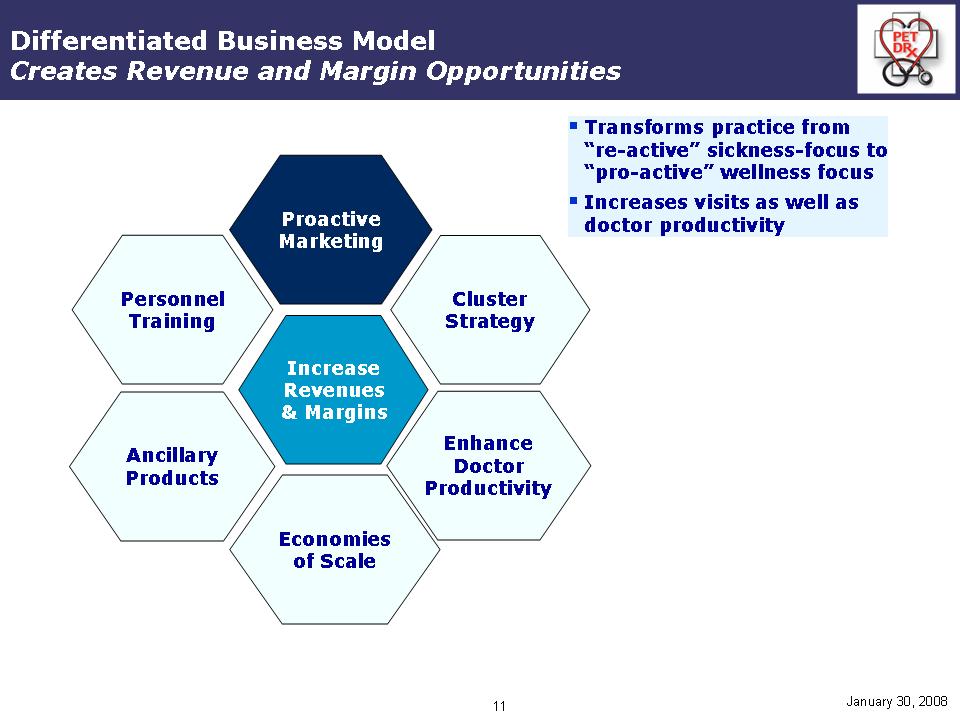
Differentiated Business Model
Creates Revenue and Margin Opportunities
Increase Revenues & Margins Proactive
Marketing Cluster Strategy Enhance Doctor Productivity Economies
of Scale Ancillary
Products Personnel Training
..Transforms practice from “re-active” sickness-focus to “pro-active”wellness focus
..Increases visits as well as doctor productivity
12
January 30, 2008
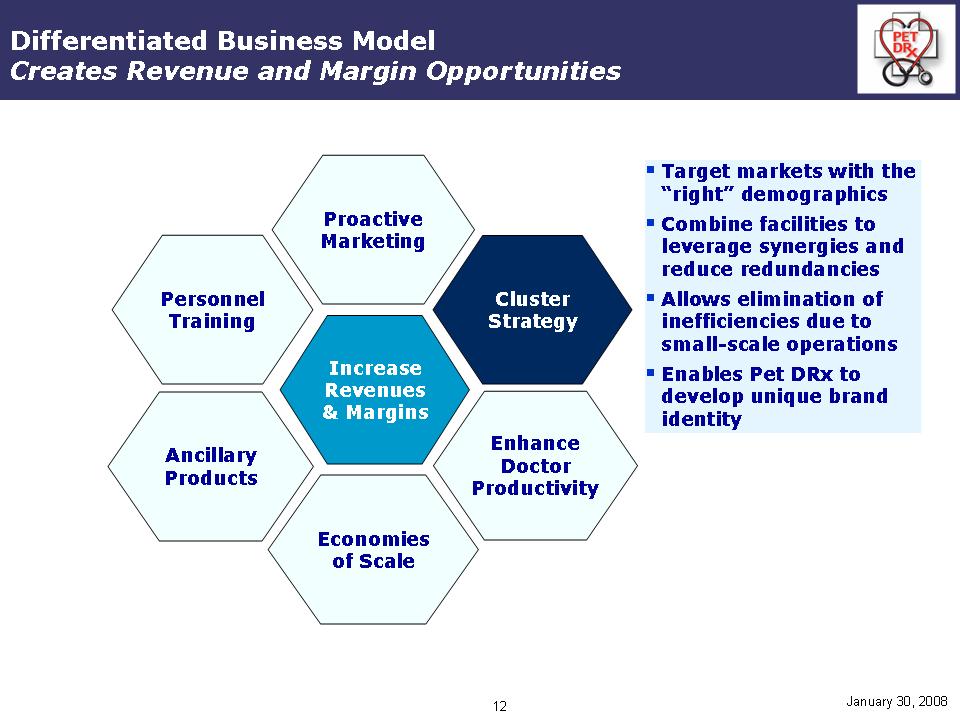
Differentiated Business Model Creates Revenue and Margin Opportunities
Increase Revenues& Margins Proactive
Marketing Cluster Strategy Enhance Doctor Productivity Economies of Scale Ancillary
Products Personnel Training
..Target markets with the “right” demographics
..Combine facilities to leverage synergies and reduce redundancies
..Allows elimination of inefficiencies due to small-scale operations
..Enables Pet DRx to develop unique brand identity
13
January 30, 2008
Differentiated Business Model Creates Revenue and Margin Opportunities
Increase Revenues& Margins Proactive Marketing Cluster Strategy Enhance Doctor Productivity Economies of Scale Ancillary Products Personnel Training
..Adoption of modern medical technology
..Centralization of administrative services and functions
14
January 30, 2008
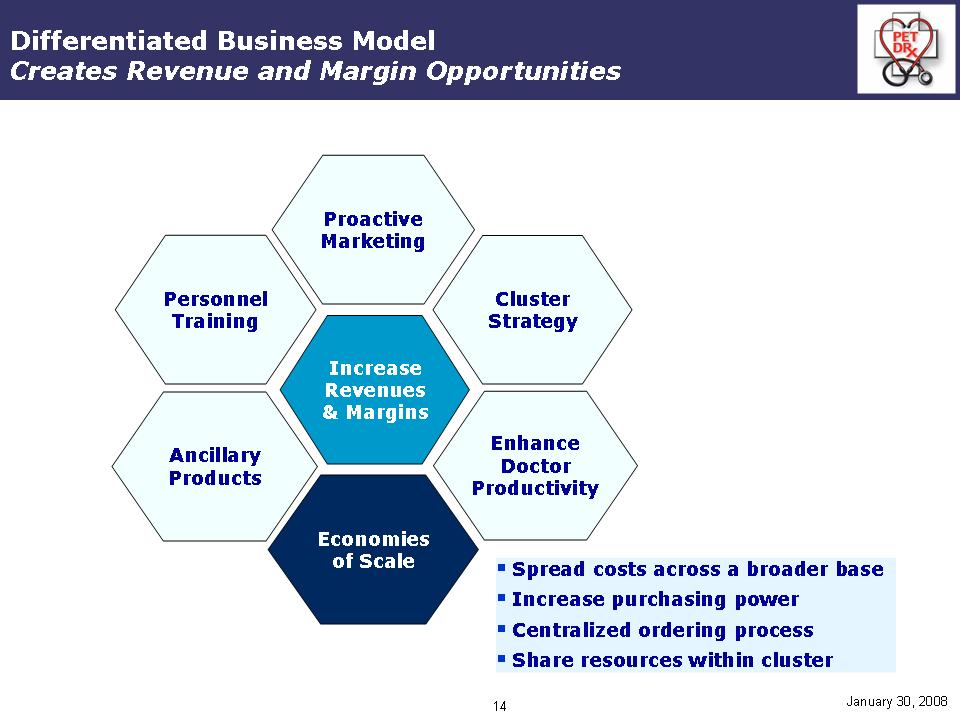
Differentiated Business Model Creates Revenue and Margin Opportunities Increase Revenues& Margins Proactive Marketing Cluster Strategy Enhance Doctor Productivity Econom ies of Scale Ancillary Products Personnel Training
..Spread costs across a broader base
..Increase purchasing power
..Centralized ordering process
..Share resources within cluster
15
January 30, 2008
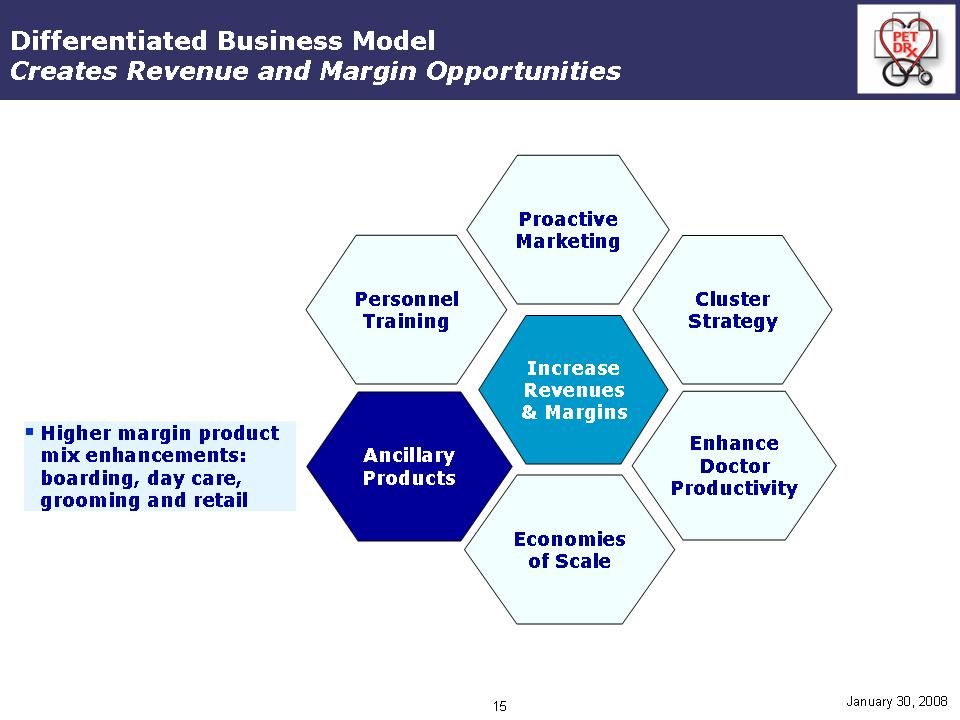
Differentiated Business Model Creates Revenue and Margin Opportunities Increase Revenues & Margins Proactive Marketing Cluster Strategy Enhance Doctor Productivity Economies of Scale Ancillary Products Personnel Training
..Higher margin product mix enhancements: boarding, day care, grooming and retail
16
January 30, 2008
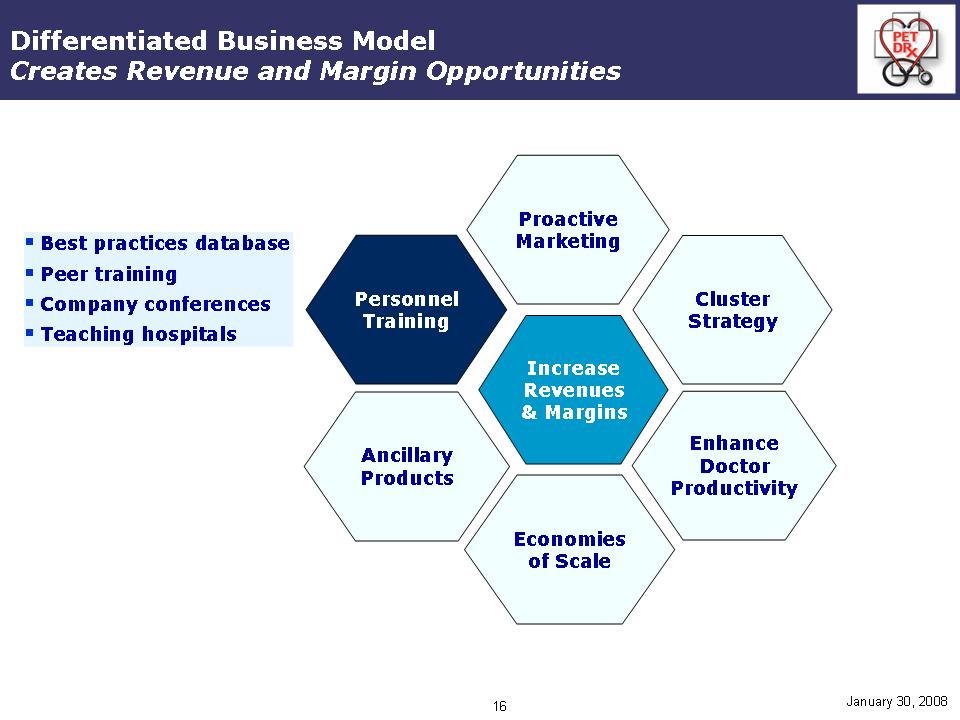
Differentiated Business Model
Creates Revenue and Margin Opportunities
Increase Revenues & Margins Proactive Marketing Cluster Strategy Enhance Doctor Productivity Economies of Scale Ancillary Products Personnel Training
..Best practices database
..Peer training
..Company conferences
..Teaching hospitals
17
$
January 30, 2008
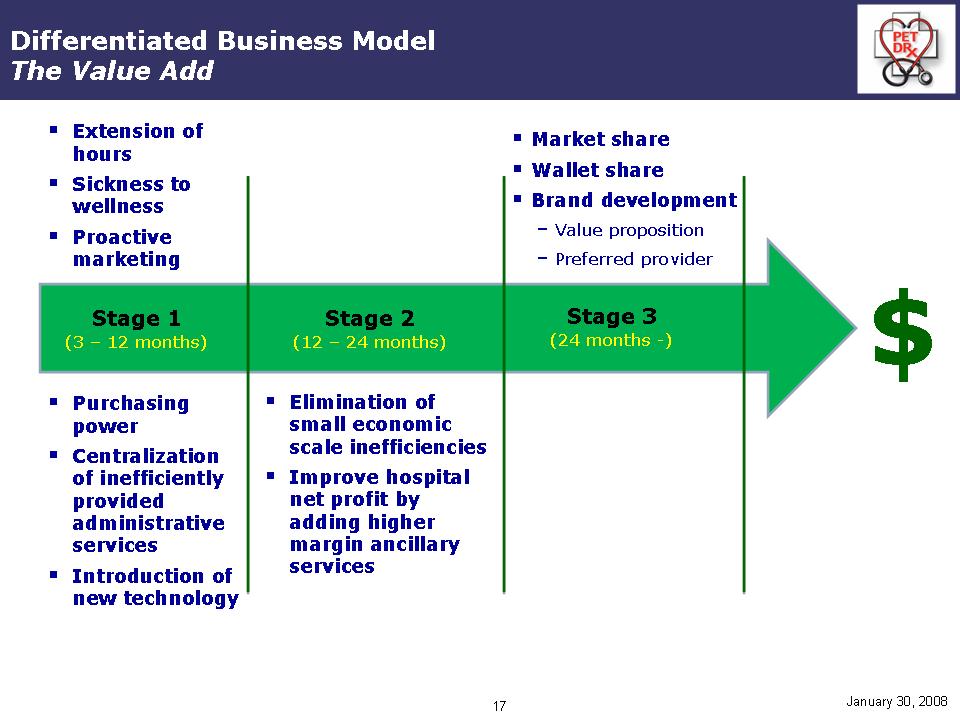
Stage 1(3 –12 months)
Stage 2(12 –24 months)
Stage 3(24 months -)
..Extension of hours
..Sickness to wellness
..Proactive marketing
..Elimination of small economic scale inefficiencies
..Improve hospital net profit by adding higher margin ancillary services
..Market share
..Wallet share
..Brand development–Value proposition–Preferred provider
..Purchasing power
..Centralization of inefficiently provided administrative services
..Introduction of new technology
Differentiated Business Model
The Value Add
18
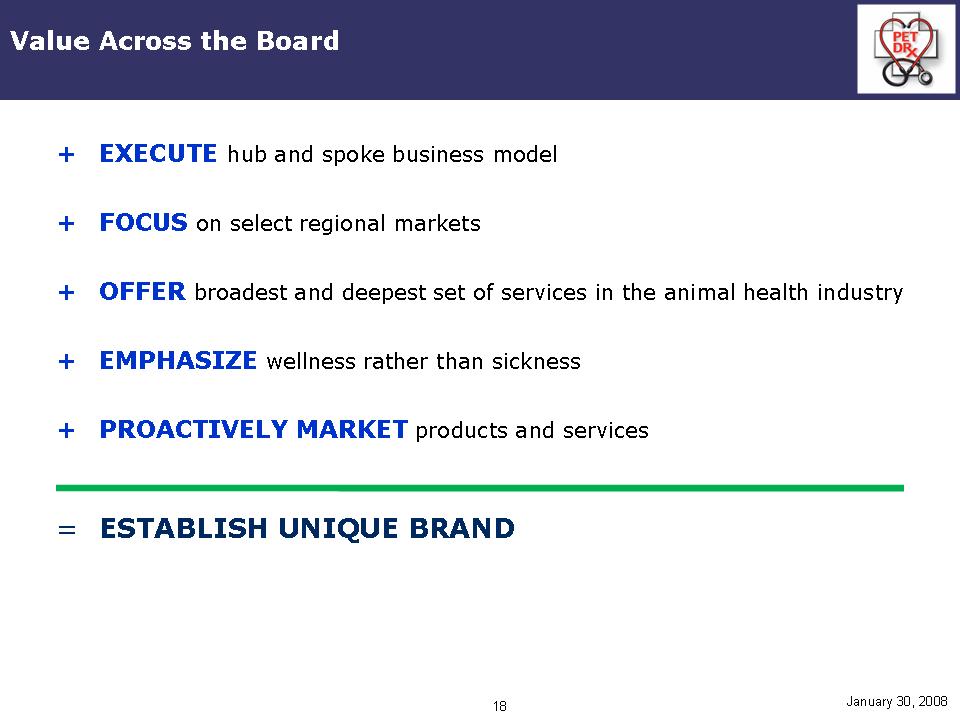
Value Across the Board
January 30, 2008
+EXECUTE hub and spoke business model
+ FOCUS on select regional markets
+ OFFER broadest and deepest set of services in the animal health industry
+ EMPHASIZE wellness rather than sickness
+ PROACTIVELY MARKET products and services
=ESTABLISH UNIQUE BRAND
19
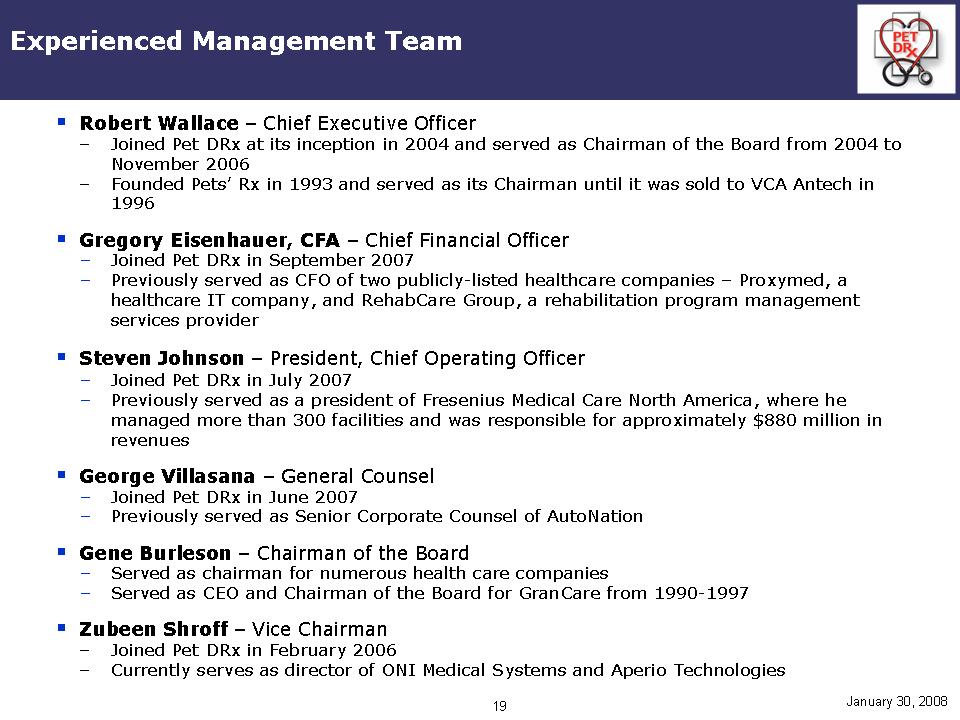
Experienced Management Team
January 30, 2008
..Robert Wallace –Chief Executive Officer
–Joined Pet DRx at its inception in 2004 and served as Chairman of the Board from 2004 to November 2006
–Founded Pets’ Rx in 1993 and served as its Chairman until it was sold to VCA Antechin 1996
..Gregory Eisenhauer, CFA–Chief Financial Officer
-Joined Pet DRx in September 2007
-Previously served as CFO of two publicly-listed healthcare companies – Proxymed, a healthcare IT company, and RehabCare Group, a rehabilitation program management services provider
..Steven Johnson – President, Chief Operating Officer
-Joined Pet DRx in July 2007
-Previously served as a president of Fresenius Medical Care North America, where he managed more than 300 facilities and was responsible for approximately $880 million in revenues
..George Villasana – General Counsel
-Joined Pet DRx in June 2007
-Previously served as Senior Corporate Counsel of AutoNation
..Gene Burleson – Chairman of the Board
-Served as chairman for numerous health care companies
-Served as CEO and Chairman of the Board for GranCare from 1990-1997
..ZubeenShroff – Vice Chairman
–Joined Pet DRx in February 2006
–Currently serves as director of ONI Medical Systems and Aperio Technologies
Financial Review
Echo Healthcare Acquisition Corp.
21
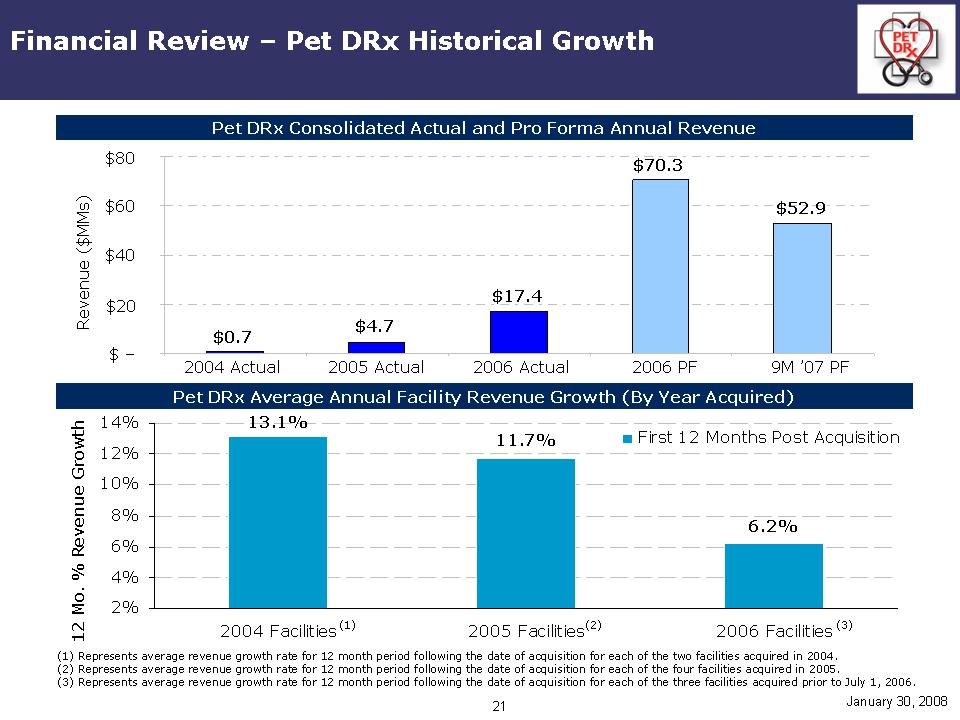
Financial Review –Pet DRx Historical Growth
13.1% 11.7% 6.2%
2% 4% 6% 8% 10% 12% 14%
2004 Facilities(1) 2005 Facilities(2) 2006 Facilities (3)
12 Mo. % Revenue Growth First 12 Months Post Acquisition
Pet DRx Consolidated Actual and Pro Forma Annual Revenue
Pet DRx Average Annual Facility Revenue Growth (By Year Acquired)
(1) Represents average revenue growth rate for 12 month period following the date of acquisition for each of the two facilities acquired in 2004.
(2) Represents average revenue growth rate for 12 month period following the date of acquisition for each of the four facilities acquired in 2005.
(3) Represents average revenue growth rate for 12 month period following the date of acquisition for each of the three facilities acquired prior to July 1, 2006.
January 30, 2008
$- $20 $40 $60 $80 2004 Actual 2005 Actual 2006 Actual 2006 PF 9M '07 PF Revenue ($MMs)
$0.7 $4.7 $17.4 $70.3 $52.9
22
Financial Review –Foundation for Growth
January 30, 2008
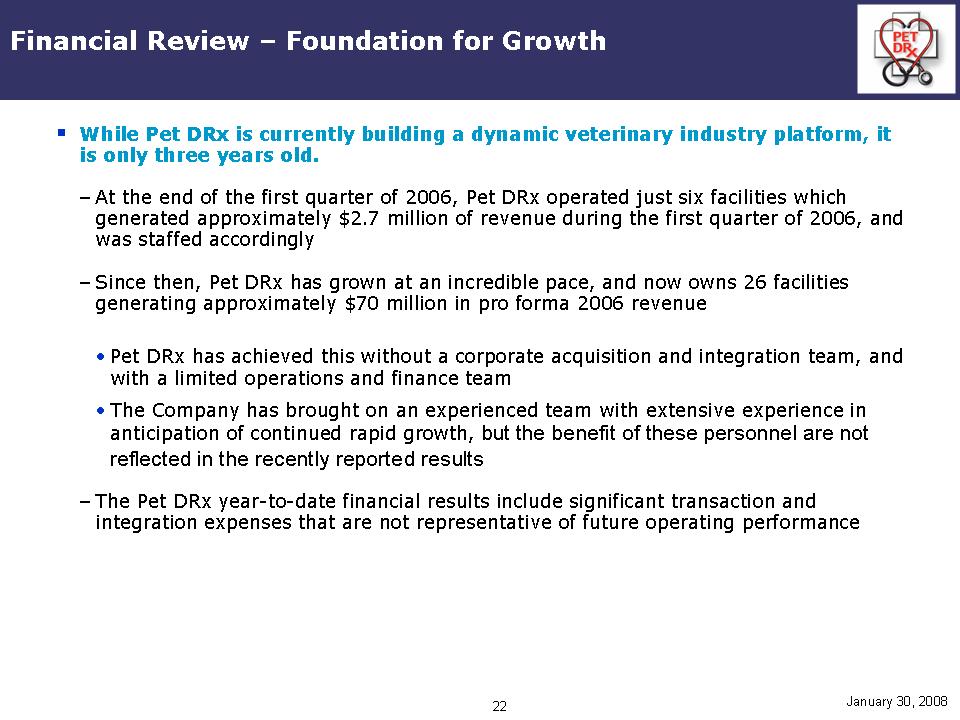
..While Pet DRx is currently building a dynamic veterinary industry platform, it is only three years old.
–At the end of the first quarter of 2006, Pet DRx operated just six facilities which generated approximately $2.7 million of revenue during the first quarter of 2006, and was staffed accordingly
–Since then, Pet DRx has grown at an incredible pace, and now owns 26 facilities generating approximately $70 million in pro forma 2006 revenue
•Pet DRx has achieved this without a corporate acquisition and integration team, and with a limited operations and finance team
•The Company has brought on an experienced team with extensive experience in anticipation of continued rapid growth, but the benefit of these personnel are not reflected in the recently reported results
–The Pet DRx year-to-date financial results include significant transaction and integration expenses that are not representative of future operating performance

23
Financial Review –Advantageous Business Structure
January 30, 2008
(1) Based on aggregate most recent twelve month revenue of VCA Antech's Animal Health Care division and CVS Group plc of $886.9 million and the total aggregate facilities for the same period of 562.
(2) Based on Pro Forma 2006 Revenue of $70.3 million and 26 centers owned as of March 31, 2007.
$1.6 $2.7 $- $1 $2 $3 $4 Market Comp(1) Pet DRx Pro Forma(2)
$ in millions Average Annual Revenue Per Facility
24
Financial Review –Business Improvement Opportunities
January 30, 2008
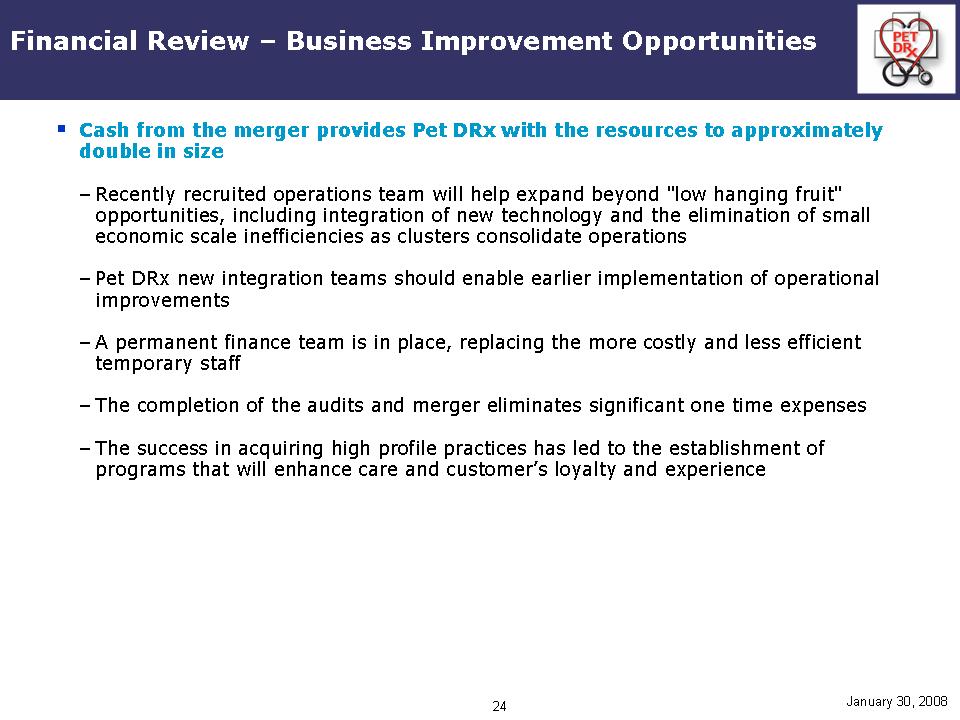
..Cash from the merger provides Pet DRx with the resources to approximately double in size
–Recently recruited operations team will help expand beyond "low hanging fruit" opportunities, including integration of new technology and the elimination of small economic scale inefficiencies as clusters consolidate operations
–Pet DRx new integration teams should enable earlier implementation of operational improvements
–A permanent finance team is in place, replacing the more costly and less efficient temporary staff
–The completion of the audits and merger eliminates significant one time expenses
–The success in acquiring high profile practices has led to the establishment of programs that will enhance care and customer’s loyalty and experience
25
Financial Review -Demonstrated Accelerated Growth
$67 million
$80 million
$69 million
$70 million
January 30, 2008
Pet DRx
VCA
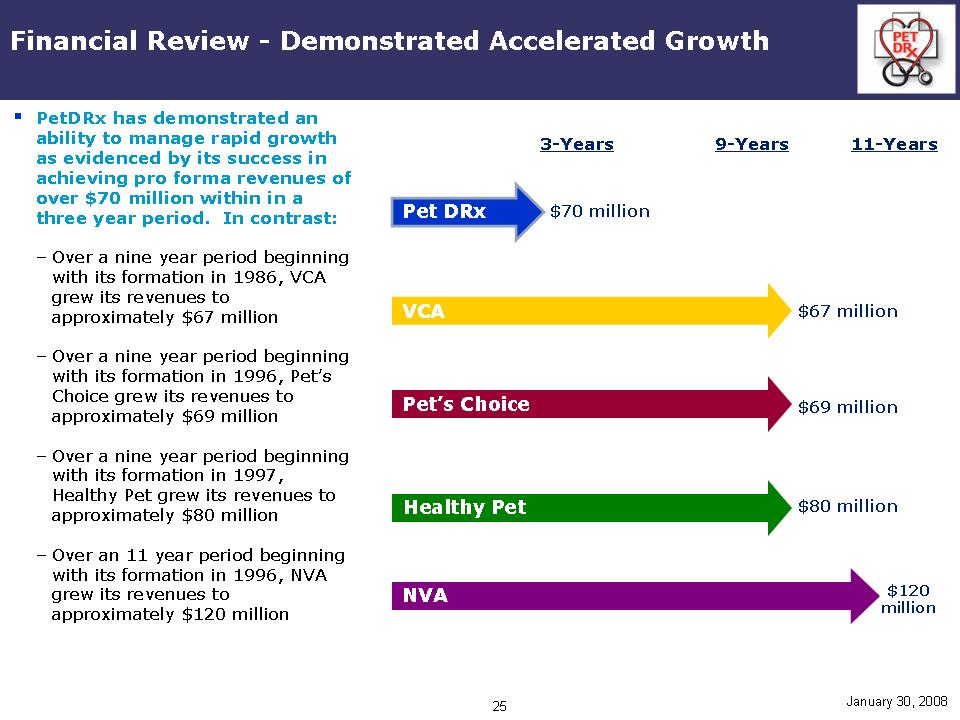
..PetDRx has demonstrated an ability to manage rapid growth as evidenced by its success in achieving pro forma revenues of over $70 million within in a three year period. In contrast:
–Over a nine year period beginning with its formation in 1986, VCA grew its revenues to approximately $67 million
–Over a nine year period beginning with its formation in 1996, Pet’s Choice grew its revenues to approximately $69 million
–Over a nine year period beginning with its formation in 1997, Healthy Pet grew its revenues to approximately $80 million
–Over an 11 year period beginning with its formation in 1996, NVA
grew its revenues to approximately $120 million
Pet’s Choice Healthy Pet $120 million NVA
26
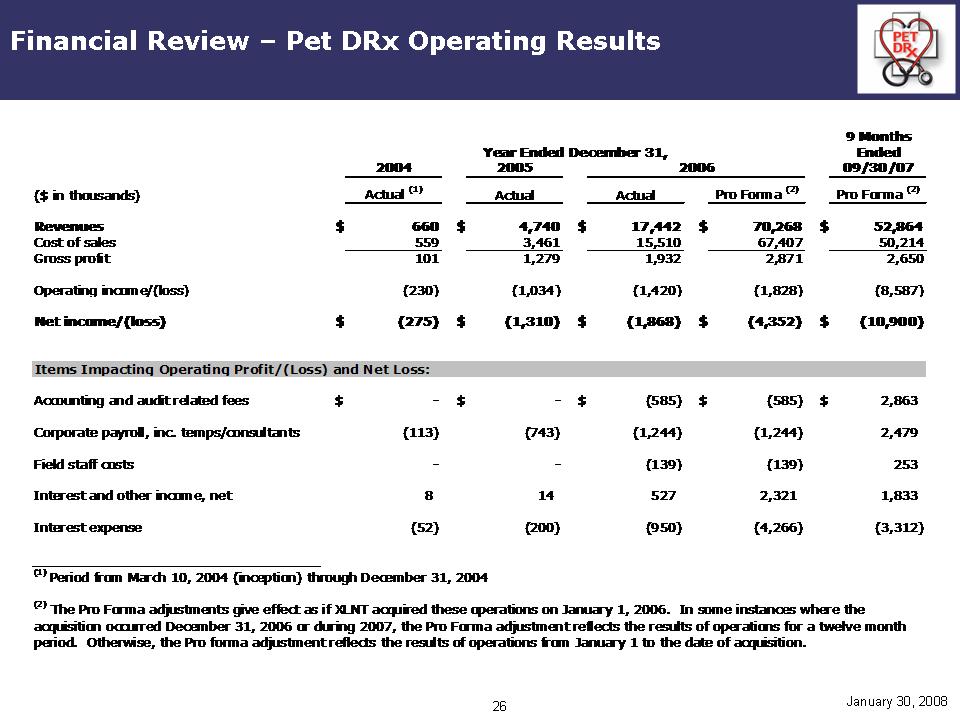
Financial Review –Pet DRx Operating Results
January 30, 2008
Year Ended December 31,
2004 2005 2006 9 Months Ended 09/30/07
($ in thousands) Actual (1) Actual Actual Pro Forma (2) Pro Forma (2)
Revenues $660 $4,740 $17,442 $70,268 $52,864
Cost of sales 559 3,461 15,510 67,407 50,214
Gross profit 101 1,279 1,932 2,871 2,650
Operating income/(loss) (230) (1,034) (1,420) (1,828) (8,587)
Net income/(loss) $(275) $(1,310) $(1,868) $(4,352) $(10,900)
Items Impacting Operating Profit/(Loss) and Net Loss:
Accounting and audit related fees $- $- $(585) $(585) $2,863
Corporate payroll, inc. temps/consultants (113) (743) (1,244) (1,244) 2,479
Field staff costs - - (139) (139) 253
Interest and other income, net 8 14 527 2,321 1,833
Interest expense (52) (200) (950) (4,266) (3,312)
(1) Period from March 10, 2004 (inception) through December 31, 2004
(2) The Pro Forma adjustments give effect as if XLNT acquired these operations on January 1, 2006. In some instances where the acquisition occurred December 31, 2006 or during 2007, the Pro Forma adjustment reflects the results of operations for a twelve month period. Otherwise, the Pro forma adjustment reflects the results of operations from January 1 to the date of acquisition.
27
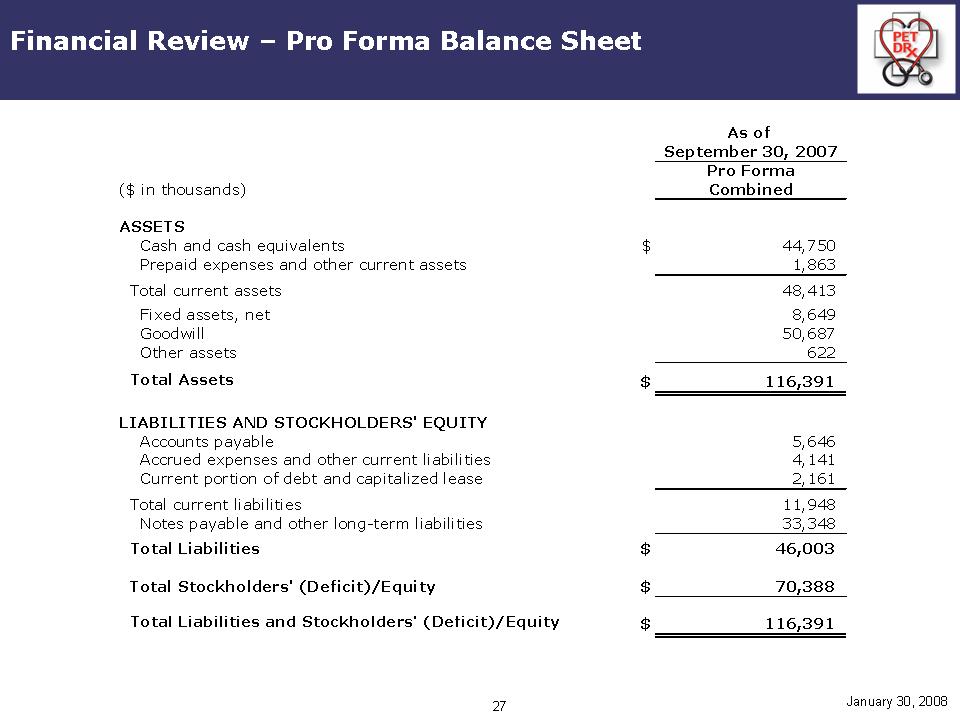
Financial Review –Pro Forma Balance Sheet
January 30, 2008
As of September 30, 2007 Pro Forma Combined ($ in thousands)
ASSETS
Cash and cash equivalents $44,750
Prepaid expenses and other current assets 1,863
Total current assets 48,413
Fixed assets, net 8,649
Goodwill 50,687
Other assets 622
Total Assets $116,391
LIABILITIES AND STOCKHOLDERS' EQUITY
Accounts payable 5,646
Accrued expenses and other current liabilities 4,141
Current portion of debt and capitalized lease 2,161
Total current liabilities 11,948
Notes payable and other long-term liabilities 33,348
Total Liabilities $46,003
Total Stockholders' (Deficit)/Equity $70,388
Total Liabilities and Stockholders' (Deficit)/Equity $116,391
29
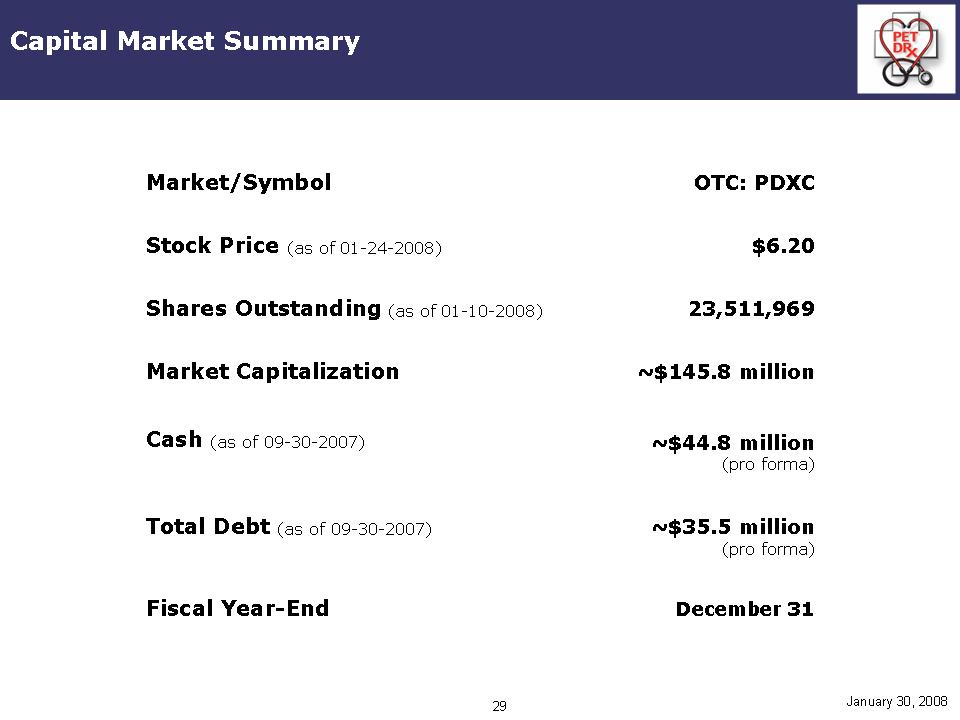
Capital Market Summary
January 30, 2008
Market/Symbol OTC: PDXC
Stock Price (as of 01-24-2008) $6.20
Shares Outstanding (as of 01-10-2008) 23,511,969
Market Capitalization ~$145.8 million
Cash (as of 09-30-2007) ~$44.8 million (pro forma)
Total Debt (as of 09-30-2007) ~$35.5 million (pro forma)
Fiscal Year-End December 31
30
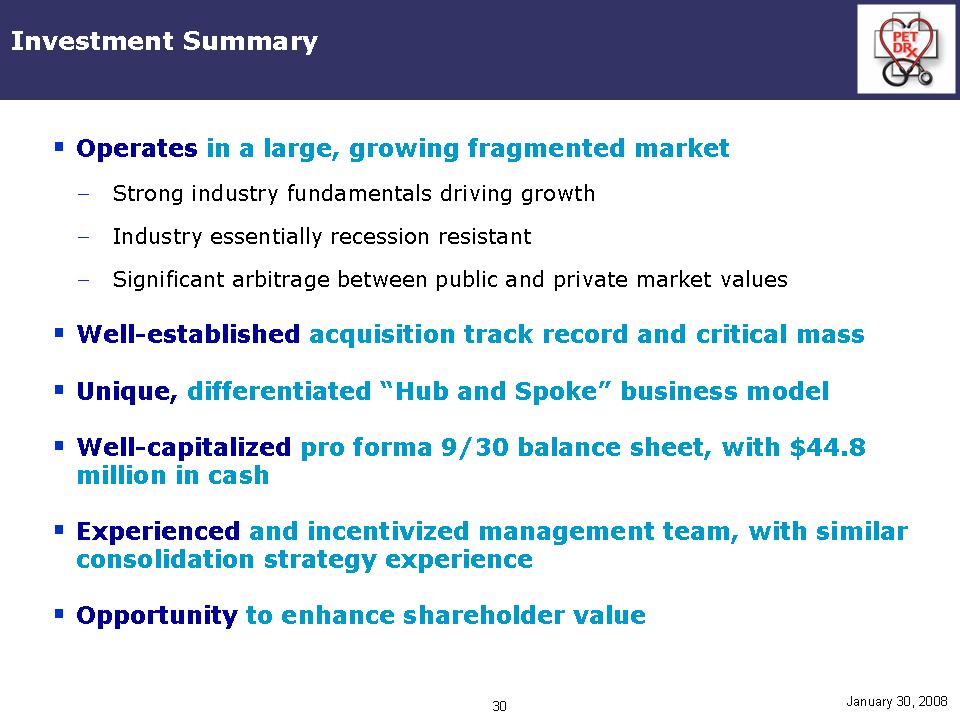
Investment Summary
January 30, 2008
..Operates in a large, growing fragmented market
-Strong industry fundamentals driving growth
-Industry essentially recession resistant
-Significant arbitrage between public and private market values
..Well-established acquisition track record and critical mass
..Unique, differentiated “Hub and Spoke” business model
..Well-capitalized pro forma 9/30 balance sheet, with $44.8 million in cash
..Experienced and incentivized management team, with similar consolidation strategy experience
..Opportunityto enhance shareholder value
Pet DRxCorporation
www.petdrx.com
January 2008