UNITED STATES
SECURITIES AND EXCHANGE COMMISSION
Washington, D.C. 20549
FORM N-CSR
CERTIFIED SHAREHOLDER REPORT OF REGISTERED MANAGEMENT INVESTMENT COMPANIES
Investment Company Act file number 811-21779
JOHN HANCOCK FUNDS II
---------------------------------------------------------
(Exact name of registrant as specified in charter)
601 CONGRESS STREET, BOSTON, MA 02210-2805
-------------------------------------------------------------
(Address of principal executive offices) (Zip code)
SALVATORE SCHIAVONE, 601 CONGRESS STREET, BOSTON, MA 02210-2805
------------------------------------------------------------------------------------------
(Name and address of agent for service)
Registrant's telephone number, including area code: (617) 663-4497
--------------
Date of fiscal year end: 12/31
Date of reporting period: 6/30/17
ITEM 1. REPORTS TO STOCKHOLDERS.
The Registrant prepared one semiannual report to shareholders for the period ended June 30, 2017. The report applies to the 5 Multimanager Lifestyle Portfolios.
Semiannual report 6/30/17


A message to shareholders
Dear shareholder,
Global financial markets extended their run of positive performance in recent months, with particular strength coming from outside the United States. Overseas markets generally have been attracting investors with their lower valuations and improving corporate fundamentals, while monetary policy remains extremely accommodative. U.S. stocks also generated positive returns so far this year and have benefited from stronger-than-expected corporate earnings. Fixed-income results were more muted, although standout returns came from convertible securities and emerging-market bonds. Interest-rate sensitive bonds in the United States remain most vulnerable, as the U.S. Federal Reserve withdraws economic stimulus and follows through with interest rate increases as is expected.
Advancing the interests of fund shareholders
One of our primary goals is to advance the interests of our fund shareholders wherever possible. To that end, we recently announced our third round of expense reductions this year, targeting six mutual funds and two closed-end funds that together represent more than $6.9 billion in assets under management. Details can be found at jhinvestments.com.
Recently, we learned that fund researcher Morningstar, Inc. formally recognized our shareholder friendly initiatives by upgrading our parent pillar rating—a key component of the Morningstar Analyst Rating system—to positive, the highest possible rating. The firm evaluates select funds and their parent firms based on intensive research, including on-site due diligence. They focused on such factors as whether our portfolio managers invest meaningfully in the funds they manage, the quality of our risk management, our corporate culture, and our commitment to recognizing shareholder interests—in other words, how good we are as stewards of investor capital. We're pleased to be recognized by Morningstar in this way and to continue our work of furthering the interests of our fund shareholders.
On behalf of everyone at John Hancock Investments, I'd like to take this opportunity to welcome new shareholders and to thank existing shareholders for the continued trust you've placed in us.
Sincerely,

Andrew G. Arnott
President and Chief Executive Officer
John Hancock Investments
This commentary reflects the CEO's views, which are subject to change at any time. Investing involves risks, including the potential loss of principal. Diversification does not guarantee a profit or eliminate the risk of a loss. For more up-to-date information, please visit our website at jhinvestments.com.
John Hancock
Multimanager Lifestyle Portfolios
Table of contents
| 2 | Multimanager Lifestyle Portfolios at a glance | |
| 5 | Discussion of portfolio performance | |
| 9 | Multimanager Lifestyle Aggressive Portfolio | |
| 10 | Multimanager Lifestyle Growth Portfolio | |
| 11 | Multimanager Lifestyle Balanced Portfolio | |
| 12 | Multimanager Lifestyle Moderate Portfolio | |
| 13 | Multimanager Lifestyle Conservative Portfolio | |
| 14 | Your expenses | |
| 18 | Portfolios' investments | |
| 23 | Financial statements | |
| 28 | Financial highlights | |
| 38 | Notes to financial statements | |
| 59 | Evaluation of advisory and subadvisory agreements | |
| 64 | More information |
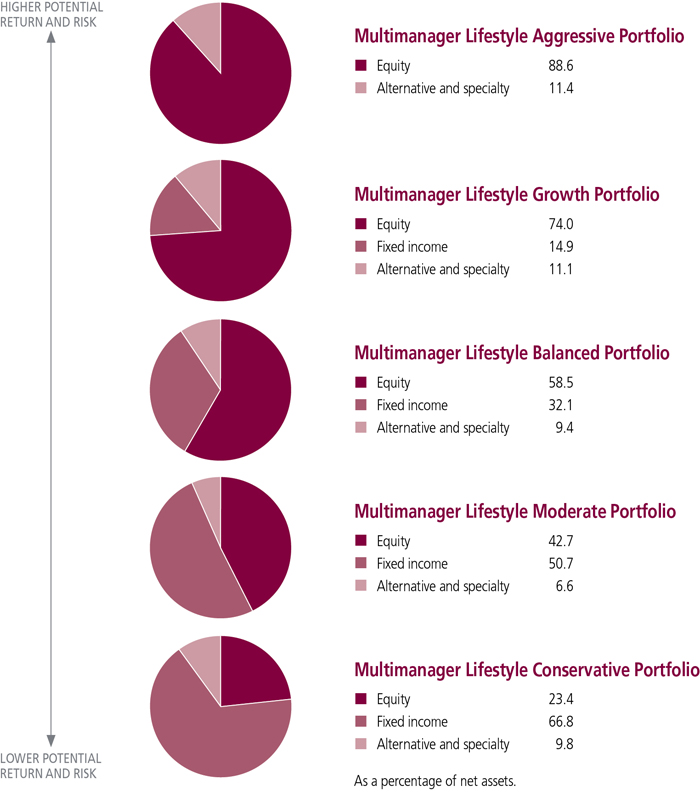
Multimanager Lifestyle Portfolios at a glance
PERFORMANCE HIGHLIGHTS OVER THE LAST SIX MONTHS
The portfolios posted positive absolute returns and good relative performance
With the exception of Multimanager Lifestyle Conservative Portfolio, the Multimanager Lifestyle Portfolios finished ahead of their benchmarks and Morningstar peer group averages in the six-month period.
Stocks rallied, led by international markets and the growth style
Signs of improving economic growth contributed to a broad-based advance in global equities.
Bonds also delivered gains
The backdrop of moderate growth, stable U.S. Federal Reserve policy, and healthy investor sentiment fueled strength in both rate- and credit-sensitive segments of the fixed-income market.
PORTFOLIO ALLOCATION AS OF 6/30/17 (%)
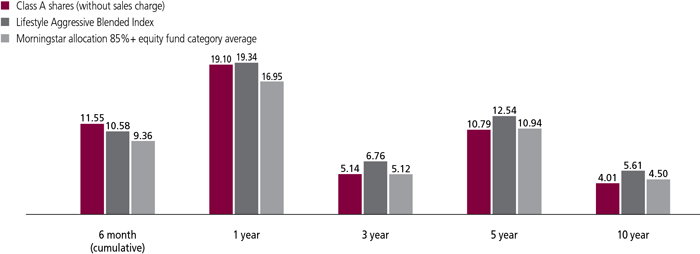
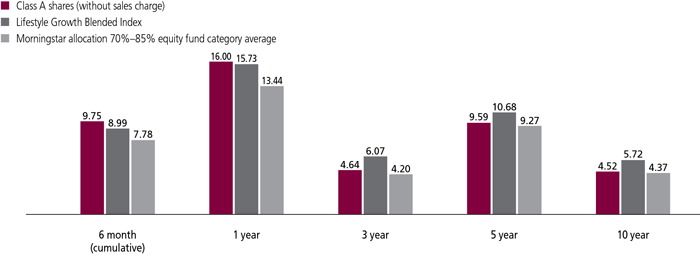
AVERAGE ANNUAL TOTAL RETURNS AS OF 6/30/17 (%)
Multimanager Lifestyle Aggressive Portfolio
Multimanager Lifestyle Growth Portfolio
Multimanager Lifestyle Balanced Portfolio
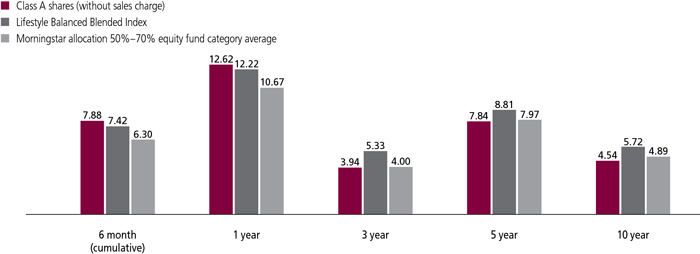
AVERAGE ANNUAL TOTAL RETURNS AS OF 6/30/17 (%)
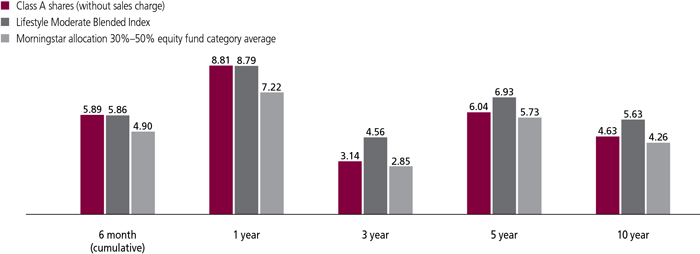
Multimanager Lifestyle Moderate Portfolio
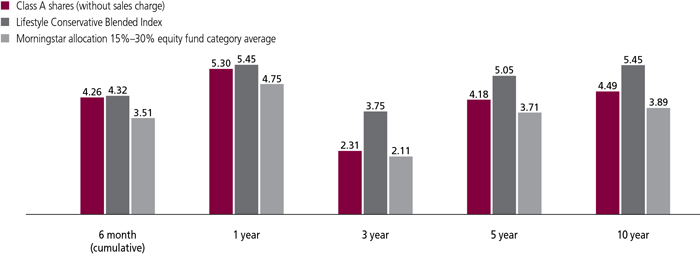
Multimanager Lifestyle Conservative Portfolio
Lifestyle Aggressive Blended Index is composed of 70% Russell 3000 Index and 30% MSCI All Country World ex-USA Index.
Lifestyle Growth Blended Index is composed of 56% Russell 3000 Index, 24% MSCI All Country World ex-USA Index, 16% Bloomberg Barclays U.S. Aggregate Bond Index, and 4% Bank of America Merrill Lynch U.S. High Yield Master II Index.
Lifestyle Balanced Blended Index is composed of 42% Russell 3000 Index, 18% MSCI All Country World ex-USA Index, 32% Bloomberg Barclays U.S. Aggregate Bond Index, and 8% Bank of America Merrill Lynch U.S. High Yield Master II Index.
Lifestyle Moderate Blended Index is composed of 28% Russell 3000 Index, 12% MSCI All Country World ex-USA Index, 48% Bloomberg Barclays U.S. Aggregate Bond Index, and 12% Bank of America Merrill Lynch U.S. High Yield Master II Index.
Lifestyle Conservative Blended Index is composed of 14% Russell 3000 Index, 6% MSCI All Country World ex-USA Index, 64% Bloomberg Barclays U.S. Aggregate Bond Index, and 16% Bank of America Merrill Lynch U.S. High Yield Master II Index.
It is not possible to invest directly in an index. Index figures do not reflect expenses or sales charges, which would result in lower returns.
Figures from Morningstar, Inc. include reinvested distributions and do not take into account sales charges. Actual load-adjusted performance is lower.
The past performance shown here reflects reinvested distributions and the beneficial effect of any expense reductions, and does not guarantee future results. Returns for periods shorter than one year are cumulative, and results for other share classes will vary. Shares will fluctuate in value and, when redeemed, may be worth more or less than their original cost. Current month-end performance may be lower or higher than the performance cited, and can be found at jhinvestments.com or by calling 800-225-5291. For further information on the portfolios' objectives, risks, and strategy, see the portfolios' prospectuses.
An interview with Portfolio Manager Robert M. Boyda, John Hancock Asset Management a division of Manulife Asset Management (US) LLC

Robert M. Boyda
Portfolio Manager
John Hancock Asset Management
The markets delivered strong gains across the major asset categories in the first half of the year, as signs of improving economic growth outside of the United States raised hopes for a broad-based recovery in the world economy. At the same time, it became clear that the expectations for rapidly accelerating domestic growth that followed the November 2016 elections had been far too optimistic. As a result, market participants grew increasingly confident that the U.S. Federal Reserve could maintain its gradual approach to raising interest rates rather than adopting a more aggressive posture.
These circumstances provided a boost to all segments of the global equity markets and led to three key departures from the trends that were in place in 2016.
First, the growth style outperformed value by a wide margin: the Russell 1000 Growth Index returned 13.99% in the first half of the year and finished well ahead of the 4.66% gain for the Russell 1000 Value Index (and the market as a whole, based on the 9.27% return of the Russell 1000 Index). The primary cause of this disparity was the substantial gains for a narrow group of fast-growing, mega-cap technology stocks, together with underperformance for value-oriented sectors such as energy, real estate, and telecommunication services. Second, the rally in tech giants contributed to sizable outperformance for the large-cap category relative to small caps, which rose 4.99% as measured by the Russell 2000 Index.
The third major change was the emergence of relative strength in non-U.S. equities. The developed-market MSCI EAFE Index and MSCI Emerging Markets Index returned 14.23% and 18.60%, respectively, outpacing the domestic indexes. Foreign stocks were boosted by the improvement in growth outside of the United States, as well as the increasing value of foreign currencies relative to the U.S. dollar.
The investment backdrop proved favorable for bonds, as well. The slow but steady expansion of the U.S. economy, together with mounting evidence that hoped-for fiscal stimulus will not be forthcoming in 2017, boosted U.S. Treasuries and other interest-rate sensitive market segments. Investment-grade corporate and high-yield bonds also performed very well thanks to the continued improvement in corporations' earnings and balance sheets, together with investors' robust demand for higher-risk, higher-yielding investments.
We believe the meaningful shift in performance trends in the first half of the year illustrates the benefit of holding diverse exposure across the full range of styles, capitalizations, and geographies rather than attempting to time the market.
How did the portfolios perform?
All five of the Multimanager Lifestyle Portfolios delivered positive absolute returns and outperformed their Morningstar peer group averages, while four of the five exceeded the return of their benchmarks. The portfolios' globally diversified approach to investing was a key reason for their robust showing in the first half of the year. We saw a potential opportunity overseas, given that the long period
of outperformance for U.S. equities had caused valuations to become more attractive outside of the United States. In addition, we have held the view that select non-U.S. markets, particularly in Europe, were several years behind the United States in terms of their growth recovery. We anticipated that non-U.S. assets would begin to play catch-up as the recovery gained momentum, a thesis we witnessed playing out in the first half of 2017. Whether this evolves into a sustained period of outperformance for non-U.S. stocks will only be known with the benefit of hindsight, but we believe a focus on valuation and fundamentals, combined with strategic allocations with a globally diversified portfolio, can provide better risk-adjusted returns over the long term.
How were the portfolios positioned as of the end of the period?
Within the context of our long-term strategy, we continue to favor stocks over bonds based on our belief that they offer a superior risk/return profile. Bond yields remain low both on an absolute basis and relative to their own history, yet the commentary from the major global central banks indicates that they are moving toward tighter monetary policies. We therefore have kept a below-average weighting in bonds, with a preference for credit-sensitive investments over those more dependent on the direction of interest rates.
With regard to equities, we see an increased likelihood of near-term volatility given the extent of the recent rally; however, we don't anticipate a more meaningful sell-off since bear markets rarely occur absent a recession. Seeing a low probability of growth turning negative, we think that equities remain a more compelling option than bonds. We continue to hold sizable allocations to U.S. assets, but with an increasing bias toward international stocks due to their improving fundamentals and attractive valuations. We maintained a steady overall approach within the equity allocation, although we did decide to reduce exposure to technology stocks in the dedicated sector portfolio. With the tech sector having performed so well in recent months, we believed it was prudent to take some profits.
Overall, we maintained an emphasis on value, fundamentals, and diversification as the cornerstones of our strategy.
Why did the name of the portfolios change?
Effective February 1, 2017, John Hancock Lifestyle Portfolios were renamed John Hancock Multimanager Lifestyle Portfolios. The move was made to better reflect the focus on our multimanager approach.
MULTIMANAGER LIFESTYLE AGGRESSIVE PORTFOLIO
The portfolio's Class A shares returned 11.55%, excluding sales charges, and its custom blended benchmark rose 10.58%. The funds in Morningstar's allocation 85%+ equity category averaged a gain of 9.36%. The bulk of the portfolio's outperformance stemmed from the strong showing of its underlying managers. Asset allocation was also a modest contributor during the period.
At the manager level, a number of our individual positions added value. Mid Cap Stock Fund (Wellington), Technical Opportunities Fund (Wellington), and Blue Chip Growth Fund (T. Rowe Price) were significant contributors in domestic equities. International Growth Fund (Wellington), International Small Cap Fund (Franklin Templeton) and International Growth Opportunities Fund (Baillie Gifford) helped performance in the international space. However, International Value Fund (Templeton) and Mid Value Fund (T. Rowe Price) were among a handful of detractors. International Growth Opportunities Fund was liquidated and no longer held as of the end of the period.
In terms of asset allocation, an overweight position in international small-cap stocks—which benefited from improving overseas growth and elevated investor risk appetites—was additive. An underweight in domestic mid caps was a further plus. Conversely, an allocation to natural resource stocks, which lagged the broader market due to the downturn in oil prices, detracted from performance within the dedicated sector portfolio. The portfolio's alternative allocation also detracted at a time of strong returns for equities, but we believe it remains an essential element of longer-term diversification.
MULTIMANAGER LIFESTYLE GROWTH PORTFOLIO
The portfolio's Class A shares returned 9.75%, excluding sales charges, and its custom blended benchmark rose 8.99%. The funds in Morningstar's allocation 70%-85% equity category averaged a gain of 7.78%. The bulk of the portfolio's outperformance stemmed from the strong showing of its underlying managers. Asset allocation was also a modest contributor in the period.
At the manager level, a number of our individual positions added value. Mid Cap Stock Fund (Wellington), Technical Opportunities Fund (Wellington), and Blue Chip Growth Fund (T. Rowe Price) were significant contributors in domestic equities. International Growth Fund (Wellington), International Small Cap Fund (Franklin Templeton) and International Growth Opportunities Fund (Baillie Gifford) helped performance in the international space; however, International Value Fund (Templeton) and Mid Value Fund (T. Rowe Price) were among a handful of detractors. International Growth Opportunities Fund was liquidated and no longer held as of the end of the period.
In terms of asset allocation, an overweight position in international small-cap stocks—which benefited from improving overseas growth and elevated investor risk appetites— was additive. An underweight in domestic mid caps was a further plus. Conversely, an allocation to natural resource stocks, which lagged the broader market due to the downturn in oil prices, detracted from performance within the dedicated sector portfolio. The portfolio's absolute return allocation also detracted at a time of strong returns for equities, but we believe it remains an essential element of longer-term diversification.
MULTIMANAGER LIFESTYLE BALANCED PORTFOLIO
The portfolio's Class A shares returned 7.88%, excluding sales charges, and its custom blended benchmark rose 7.42%. The funds in Morningstar's allocation 50%-70% equity category averaged a gain of 6.30%. The bulk of the portfolio's outperformance stemmed from the strong showing of its underlying managers. Asset allocation was a modest detractor.
At the manager level, a number of our individual positions added value. Mid Cap Stock Fund (Wellington), Technical Opportunities Fund (Wellington), and Blue Chip Growth Fund (T. Rowe Price) were contributors in domestic equities, while International Growth Fund (Wellington), International Small Cap Fund (Franklin Templeton) and International Growth Opportunities Fund (Baillie Gifford) helped performance in the international space; however, International Value Fund (Templeton) and Mid Value Fund (T. Rowe Price) were among a handful of detractors. International Growth Opportunities Fund was liquidated and no longer held as of the end of the period.
In terms of asset allocation, an overweight position in international small-cap stocks—which benefited from improving overseas growth and elevated investor risk appetites— was additive. An underweight in domestic mid caps was a further plus. Conversely, an allocation to natural resource stocks, which lagged the broader market due to the downturn in oil prices, detracted from performance within the dedicated sector portfolio. The portfolio's absolute return allocation also detracted somewhat at a time of strong returns for equities, but we believe it remains an essential element of longer-term diversification.
MULTIMANAGER LIFESTYLE MODERATE PORTFOLIO
The portfolio's Class A shares returned 5.89%, excluding sales charges, and its custom blended benchmark rose 5.86%. The funds in Morningstar's allocation 30%-50% equity category averaged a gain of 4.90%. The bulk of the portfolio's outperformance stemmed from the strong showing of its underlying managers. Asset allocation was a detractor.
At the manager level, a number of our individual positions added value. Mid Cap Stock Fund (Wellington), and Blue Chip Growth Fund (T. Rowe Price) were contributors in domestic equities. International Growth Fund (Wellington), International Small Cap Fund (Franklin Templeton) and International Growth Opportunities Fund (Baillie Gifford) helped performance in the international space. International Value Fund (Templeton) and Mid Value Fund (T. Rowe Price) were among the detractors. Active Bond Fund (JHAM) and Total Return Fund (PIMCO) contributed positively in the fixed-income portfolio, but Floating Rate Income Fund (WAMCO) and Short
Duration Credit Opportunities Fund (Stone Harbor) detracted. International Growth Opportunities Fund was liquidated and no longer held as of the end of the period.
In terms of asset allocation, an overweight position in international small-cap stocks—which benefited from improving overseas growth and elevated investor risk appetites— was additive. An underweight in domestic mid caps was a further plus. Conversely, an allocation to natural resource stocks, which lagged the broader market due to the downturn in oil prices, detracted from performance within the dedicated sector portfolio. On the fixed-income side, we benefited from having a tilt toward credit-oriented investments over those with more sensitivity to interest-rate movements. An allocation to emerging-market bonds, which outpaced the U.S. market, also contributed positively; however, we lost some relative performance by being overweight in loans and underweight in high yield, as well as having an allocation to Treasury Inflation-Protected Securities.
MULTIMANAGER LIFESTYLE CONSERVATIVE PORTFOLIO
The portfolio's Class A shares returned 4.26%, excluding sales charges, and its custom blended benchmark rose 4.32%. The funds in Morningstar's allocation 15%-30% equity category averaged a gain of 3.51%. The portfolio benefited from the strong relative performance of its underlying managers, while asset allocation detracted.
At the manager level, a significant number of our individual positions added value. Bond Fund (JHAM), Emerging Market Debt Fund (JHAM) and Total Return Fund (PIMCO) were key contributors in fixed income, though Floating Rate Income Fund (WAMCO) and Short Duration Credit Opportunities Fund (Stone Harbor) detracted. On the equity side, notable contributors included Enduring Assets Fund (Wellington), Mid Cap Stock Fund (Wellington), and Fundamental Global Franchise Fund (JHAM).
In terms of asset allocation, we benefited from having a tilt toward credit-oriented investments over those with more sensitivity to interest-rate movements. An allocation to emerging-market bonds, which outpaced the U.S. market, also contributed positively; however, we lost some relative performance by being overweight in loans and underweight in high yield, as well as having an allocation to Treasury Inflation-Protected Securities. In equities, a small allocation to natural resources stocks—which lagged the broader market due to the downturn in oil prices—detracted from performance within the dedicated sector portfolio.
The portfolios' performance depends on the subadvisors' ability to determine the strategic asset class allocations, the mix of underlying funds, and the performance of those underlying funds. The underlying funds' performance may be lower than the performance of the asset class that they were selected to represent. The portfolios are subject to the same risks as the underlying funds in which they invest, which include the following: Stocks, bonds, and derivatives can decline due to adverse issuer, market, regulatory, or economic developments; foreign investing, especially in emerging markets, has additional risks, such as currency and market volatility and political and social instability; the securities of small-capitalization companies are subject to higher volatility than larger, more established companies; and high-yield bonds are subject to additional risks, such as increased risk of default and interest-rate risk. Events in U.S. and global financial markets may at times result in unusually high market volatility. In addition, reduced liquidity in credit and fixed-income markets may adversely affect issuers worldwide. Liquidity—the extent to which a security may be sold or a derivative position closed without negatively affecting its market value—may be impaired by reduced trading volume, heightened volatility, rising interest rates, and other market conditions. Derivatives transactions, including hedging and other strategic transactions, may increase volatility and result in losses if not successful. For additional information on these and other risk considerations, please see the portfolios' prospectus.
The views expressed in this report are exclusively those of Robert M. Boyda, John Hancock Asset Management, and are subject to change. They are not meant as investment advice. Please note that the holdings discussed in this report may not have been held by the portfolio for the entire period. Portfolio composition is subject to review in accordance with the portfolio's investment strategy and may vary in the future. Current and future portfolio holdings are subject to risk.
MANAGED BY
| | Robert M. Boyda On the portfolio since 2010 Investing since 1979 |
 | Marcelle Daher, CFA On the portfolio since 2013 Investing since 1999 |
 | Nathan W. Thooft, CFA On the portfolio since 2013 Investing since 2000 |
![]()
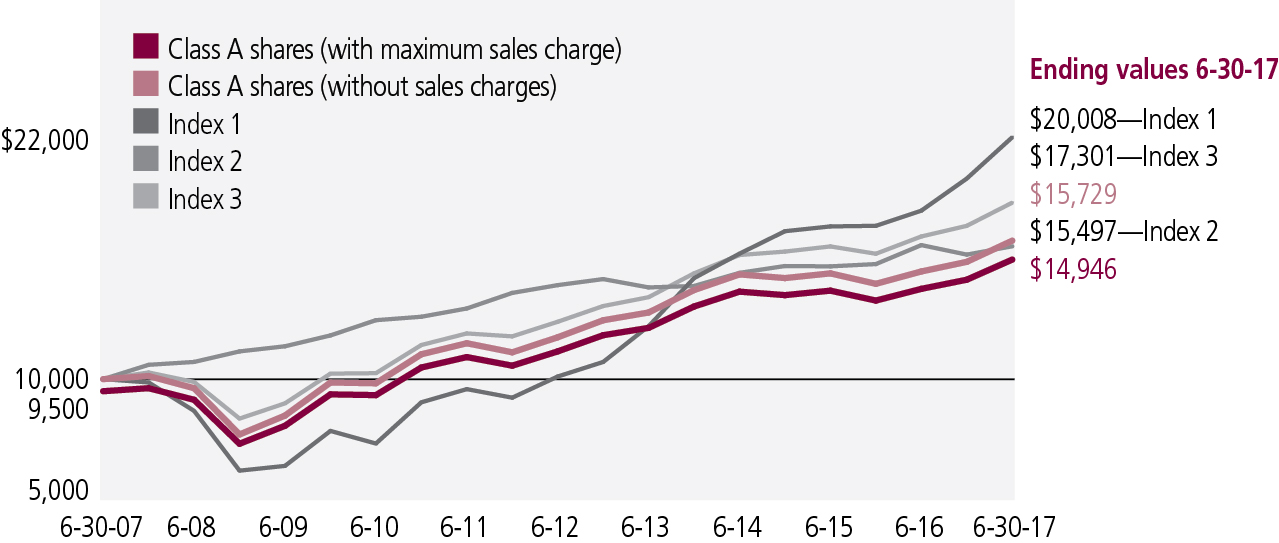
Multimanager Lifestyle Aggressive Portfolio
GROWTH OF $10,000
This chart shows what happened to a hypothetical $10,000 investment in John Hancock Multimanager Lifestyle Aggressive Portfolio for the share classes and periods indicated, assuming all distributions were reinvested. For comparison, we've shown the same investment in a blended index and two separate indexes.
Index 1 is the S&P 500, an unmanaged index that includes 500 widely traded common stocks.
Index 2 is the MSCI EAFE Index (Europe, Australasia, Far East) (gross of foreign withholding taxes on dividends), a free-float-adjusted market capitalization index that is designed to measure developed market equity performance.
Index 3 is 70% Russell 3000 Index and 30% MSCI All Country World ex-USA Index.
It is not possible to invest directly in an index. Index figures do not reflect expenses or sales charges, which would result in lower returns.
ASSET ALLOCATION (%)
| Equity | 88.6 | |
| U.S. Large Cap | 31.8 | |
| International Large Cap | 13.8 | |
| U.S. Mid Cap | 9.1 | |
| International Strategic Equity Allocation | 8.3 | |
| Emerging Markets | 7.7 | |
| U.S. Strategic Equity Allocation | 6.7 | |
| U.S. Small Cap | 4.7 | |
| International Small Cap | 4.0 | |
| Global Large Cap | 1.3 | |
| Large Blend | 1.2 | |
| Alternative and specialty | 11.4 | |
| Currency | 0.9 | |
| Technical Opportunities | 2.7 | |
| Financial Industries | 1.8 | |
| Science & Technology | 1.6 | |
| Natural Resources | 1.4 | |
| Global Focused Strategies | 1.1 | |
| Real Estate | 1.0 | |
| Health Sciences | 0.5 | |
| Seaport | 0.4 | |
As a percentage of net assets.
PERFORMANCE CHART
Total returns with maximum sales charge for the period ended 6-30-17 (%)
| Class A | Class B | Class C | Class I1,2 | Class R11 | Class R21,2 | Class R31 | Class R41 | Class R51 | Class R61,2 | Class 11 | Index 1 | Index 2 | Index 3 | |
| Average annual total returns | ||||||||||||||
| 1 year | 13.18 | 13.26 | 17.32 | 19.50 | 18.69 | 18.95 | 18.86 | 19.35 | 19.62 | 19.72 | 19.53 | 17.90 | 20.83 | 19.34 |
| 5 year | 9.66 | 9.68 | 10.01 | 10.53 | 10.32 | 10.68 | 10.44 | 10.86 | 11.12 | 11.28 | 11.21 | 14.63 | 9.18 | 12.54 |
| 10 year | 3.48 | 3.37 | 3.27 | 3.61 | 3.62 | 3.38 | 3.70 | 4.05 | 4.34 | 3.58 | 4.46 | 7.18 | 1.50 | 5.61 |
| Cumulative returns | ||||||||||||||
| 6 months | 6.00 | 6.19 | 10.25 | 11.72 | 11.40 | 11.48 | 11.51 | 11.66 | 11.78 | 11.79 | 11.74 | 9.34 | 14.23 | 10.58 |
| 5 year | 58.55 | 58.71 | 61.15 | 65.00 | 63.44 | 66.07 | 64.28 | 67.41 | 69.42 | 70.65 | 70.10 | 97.92 | 55.12 | 80.56 |
| 10 year | 40.74 | 39.28 | 37.90 | 42.58 | 42.70 | 39.47 | 43.82 | 48.72 | 52.94 | 42.17 | 54.72 | 100.08 | 16.09 | 72.64 |
Performance figures assume all distributions have been reinvested. Returns with maximum sales charge reflect a sales charge on Class A shares of 5%, and the applicable contingent deferred sales charge (CDSC) on Class B and Class C shares. The Class B shares' CDSC declines annually between years 1-6 according to the following schedule: 5%, 4%, 3%, 3%, 2%, 1%. No sales charges will be assessed after the sixth year. Class C shares held for less than one year are subject to a 1% CDSC. Sales charges are not applicable to Class I, Class R1, Class R2, Class R3, Class R4, Class R5, Class R6, and Class 1 shares.
Performance of the classes will vary based on the difference in sales charges paid by shareholders investing in the different classes and the fee structure of those classes.
The expense ratios of the portfolio, both net (including any fee waivers and/or expense limitations) and gross (excluding any fee waivers and/or expense limitations), are set forth according to the most recent publicly available prospectuses for the portfolio and may differ from those disclosed in the Financial highlights tables in this report. Had the contractual fee waivers and expense limitations not been in place, gross expenses would apply. The following expense ratios include expenses of the affiliated underlying funds in which the portfolio invests. The expense ratios are as follows:
| Class A | Class B | Class C | Class I | Class R1 | Class R2 | Class R3 | Class R4 | Class R5 | Class R6 | Class 1 | |
| Gross (%) | 1.43 | 2.13 | 2.13 | 1.12 | 1.77 | 1.52 | 1.67 | 1.37 | 1.07 | 1.02 | 1.06 |
| Net (%) | 1.41 | 2.13 | 2.13 | 1.12 | 1.77 | 1.52 | 1.67 | 1.27 | 1.07 | 1.02 | 1.06 |
Please refer to the most recent prospectus and annual or semiannual report for more information on expenses and any expense limitation arrangements for each class.
The returns reflect past results and should not be considered indicative of future performance. The return and principal value of an investment will fluctuate so that shares, when redeemed, may be worth more or less than their original cost. Due to market volatility, the portfolio's current performance may be higher or lower than the performance shown. For performance data current to the most recent month end, please call 800-225-5291 or visit the portfolio's website at jhinvestments.com.
This performance information does not reflect the deduction of taxes that a shareholder may pay on portfolio distributions or the redemption of portfolio shares. The portfolio's performance results reflect any applicable fee waivers or expense reductions, without which the expenses would increase and results would have been less favorable.
| 1 | For certain types of investors as described in the portfolio's prospectuses. |
| 2 | Class R2 shares were first offered on 3-1-12. The returns prior to this date are those of Class A shares that have been recalculated to apply the gross fees and expenses of Class R2 shares. Class R6 and Class I shares were first offered on 9-1-11 and 5-1-15, respectively. The returns prior to this date are those of Class 1 shares that have been recalculated to apply the gross fees and expenses of Class R6 and Class I shares, as applicable. |
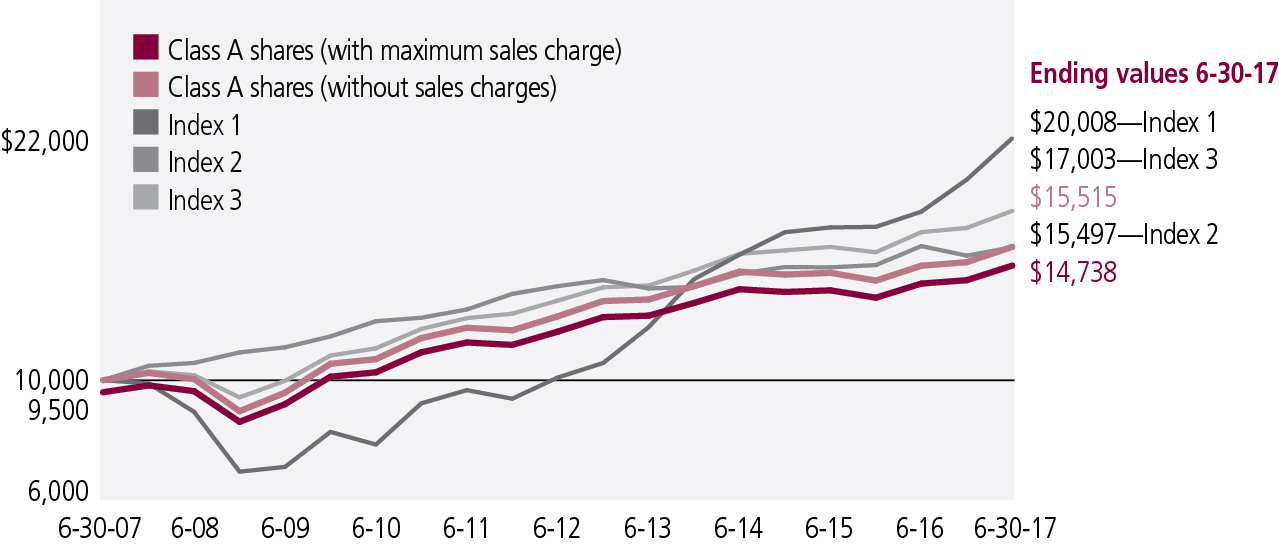
Multimanager Lifestyle Growth Portfolio
GROWTH OF $10,000
This chart shows what happened to a hypothetical $10,000 investment in John Hancock Multimanager Lifestyle Growth Portfolio for the share classes and periods indicated, assuming all distributions were reinvested. For comparison, we've shown the same investment in a blended index and two separate indexes.

Index 1 is the S&P 500, an unmanaged index that includes 500 widely traded common stocks.
Index 2 is the Bloomberg Barclays U.S. Aggregate Bond Index, an unmanaged index of dollar-denominated and non-convertible investment-grade debt issues.
Index 3 is 56% Russell 3000 Index, 24% MSCI All Country World ex-USA Index, 16% Bloomberg Barclays U.S. Aggregate Bond Index, and 4% Bank of America Merrill Lynch U.S. High Yield Master II Index.
It is not possible to invest directly in an index. Index figures do not reflect expenses or sales charges, which would result in lower returns.
ASSET ALLOCATION (%)
| Equity | 74.0 | |
| U.S. Large Cap | 26.3 | |
| International Large Cap | 11.7 | |
| International Strategic Equity Allocation | 7.1 | |
| U.S. Mid Cap | 7.1 | |
| U.S. Strategic Equity Allocation | 5.7 | |
| Emerging Markets | 5.0 | |
| International Small Cap | 3.1 | |
| U.S. Small Cap | 3.1 | |
| Multi-Sector Bond | 2.3 | |
| Global Large Cap | 1.3 | |
| Large Blend | 1.3 | |
| Fixed income | 14.9 | |
| Intermediate Bond | 4.5 | |
| Multi-Sector Bond | 3.2 | |
| Global Bond | 2.7 | |
| Bank Loan | 2.0 | |
| Treasury Inflation-Protected Securities | 1.5 | |
| High Yield Bond | 1.0 | |
| Alternative and specialty | 11.1 | |
| Technical Opportunities | 2.0 | |
| Global Absolute Return Strategies | 2.0 | |
| Currency | 1.6 | |
| Financial Industries | 1.5 | |
| Science & Technology | 1.4 | |
| Natural Resources | 1.1 | |
| Real Estate | 1.0 | |
| Seaport | 0.3 | |
| Health Sciences | 0.2 | |
As a percentage of net assets.
PERFORMANCE CHART
Total returns with maximum sales charge for the period ended 6-30-17 (%)
| Class A | Class B | Class C | Class I1,2 | Class R11 | Class R21,2 | Class R31 | Class R41 | Class R51 | Class R61,2 | Class 11 | Class 51 | Index 1 | Index 2 | Index 3 | |
| Average annual total returns | |||||||||||||||
| 1 year | 10.21 | 10.17 | 14.19 | 16.35 | 15.56 | 15.85 | 15.75 | 16.18 | 16.46 | 16.46 | 16.41 | 16.48 | 17.90 | -0.31 | 15.73 |
| 5 year | 8.48 | 8.51 | 8.80 | 9.38 | 9.20 | 9.47 | 9.30 | 9.73 | 9.96 | 10.05 | 10.00 | 10.07 | 14.63 | 2.21 | 10.68 |
| 10 year | 3.98 | 3.90 | 3.77 | 4.15 | 4.17 | 3.95 | 4.25 | 4.61 | 4.88 | 4.43 | 4.95 | 5.01 | 7.18 | 4.48 | 5.72 |
| Cumulative returns | |||||||||||||||
| 6 months | 4.24 | 4.31 | 8.32 | 9.94 | 9.58 | 9.67 | 9.63 | 9.83 | 9.95 | 9.93 | 9.93 | 10.01 | 9.34 | 2.27 | 8.99 |
| 5 year | 50.20 | 50.46 | 52.46 | 56.59 | 55.28 | 57.24 | 55.98 | 59.05 | 60.77 | 61.43 | 61.06 | 61.53 | 97.92 | 11.57 | 66.11 |
| 10 year | 47.76 | 46.59 | 44.77 | 50.16 | 50.40 | 47.29 | 51.58 | 56.98 | 60.99 | 54.26 | 62.17 | 63.08 | 100.08 | 54.97 | 74.35 |
Performance figures assume all distributions have been reinvested. Returns with maximum sales charge reflect a sales charge on Class A shares of 5%, and the applicable contingent deferred sales charge (CDSC) on Class B and Class C shares. The Class B shares' CDSC declines annually between years 1-6 according to the following schedule: 5%, 4%, 3%, 3%, 2%, 1%. No sales charges will be assessed after the sixth year. Class C shares held for less than one year are subject to a 1% CDSC. Sales charges are not applicable to Class I, Class R1, Class R2, Class R3, Class R4, Class R5, Class R6, Class 1, and Class 5 shares.
Performance of the classes will vary based on the difference in sales charges paid by shareholders investing in the different classes and the fee structure of those classes.
The expense ratios of the portfolio, both net (including any fee waivers and/or expense limitations) and gross (excluding any fee waivers and/or expense limitations), are set forth according to the most recent publicly available prospectuses for the portfolio and may differ from those disclosed in the Financial highlights tables in this report. Had the contractual fee waivers and expense limitations not been in place, gross expenses would apply. The following expense ratios include expenses of the affiliated underlying funds in which the portfolio invests. The expense ratios are as follows:
| Class A | Class B | Class C | Class I | Class R1 | Class R2 | Class R3 | Class R4 | Class R5 | Class R6 | Class 1 | Class 5 | |
| Gross (%) | 1.38 | 2.08 | 2.08 | 1.07 | 1.72 | 1.47 | 1.62 | 1.32 | 1.02 | 0.97 | 1.01 | 0.96 |
| Net (%) | 1.36 | 2.08 | 2.08 | 1.07 | 1.72 | 1.47 | 1.62 | 1.22 | 1.02 | 0.97 | 1.01 | 0.96 |
Please refer to the most recent prospectus and annual or semiannual report for more information on expenses and any expense limitation arrangements for each class.
The returns reflect past results and should not be considered indicative of future performance. The return and principal value of an investment will fluctuate so that shares, when redeemed, may be worth more or less than their original cost. Due to market volatility, the portfolio's current performance may be higher or lower than the performance shown. For performance data current to the most recent month end, please call 800-225-5291 or visit the portfolio's website at jhinvestments.com.
This performance information does not reflect the deduction of taxes that a shareholder may pay on portfolio distributions or the redemption of portfolio shares. The portfolio's performance results reflect any applicable fee waivers or expense reductions, without which the expenses would increase and results would have been less favorable.
| 1 | For certain types of investors as described in the portfolio's prospectuses. |
| 2 | Class R2 shares were first offered on 3-1-12. The returns prior to this date are those of Class A shares that have been recalculated to apply the gross fees and expenses of Class R2 shares. Class R6 and Class I shares were first offered on 9-1-11 and 5-1-15, respectively. The returns prior to this date are those of Class 1 shares that have been recalculated to apply the gross fees and expenses of Class R6 and Class I shares, as applicable. |
Multimanager Lifestyle Balanced Portfolio
GROWTH OF $10,000
This chart shows what happened to a hypothetical $10,000 investment in John Hancock Multimanager Lifestyle Balanced Portfolio for the share classes and periods indicated, assuming all distributions were reinvested. For comparison, we've shown the same investment in a blended index and two separate indexes.
Index 1 is the S&P 500, an unmanaged index that includes 500 widely traded common stocks.
Index 2 is the Bloomberg Barclays U.S. Aggregate Bond Index, an unmanaged index of dollar-denominated and non-convertible investment-grade debt issues.
Index 3 is 42% Russell 3000 Index, 18% MSCI All Country World ex-USA Index, 32% Bloomberg Barclays U.S. Aggregate Bond Index, and 8% Bank of America Merrill Lynch U.S. High Yield Master II Index.
It is not possible to invest directly in an index. Index figures do not reflect expenses or sales charges, which would result in lower returns.
ASSET ALLOCATION (%)
| Equity | 58.5 | |
| U.S. Large Cap | 20.5 | |
| International Large Cap | 8.5 | |
| Multi-Sector Bond | 5.1 | |
| U.S. Strategic Equity Allocation | 5.1 | |
| U.S. Mid Cap | 4.9 | |
| International Strategic Equity Allocation | 4.6 | |
| Emerging Markets | 3.1 | |
| U.S. Small Cap | 2.2 | |
| International Small Cap | 1.9 | |
| Global Large Cap | 1.3 | |
| Large Blend | 1.3 | |
| Fixed income | 32.1 | |
| Intermediate Bond | 11.3 | |
| Multi-Sector Bond | 7.0 | |
| Global Bond | 4.7 | |
| Bank Loan | 4.3 | |
| Treasury Inflation-Protected Securities | 2.7 | |
| High Yield Bond | 2.1 | |
| Alternative and specialty | 9.4 | |
| Global Absolute Return Strategies | 2.1 | |
| Currency | 1.8 | |
| Financial Industries | 1.2 | |
| Technical Opportunities | 1.2 | |
| Science & Technology | 1.1 | |
| Real Estate | 1.0 | |
| Natural Resources | 0.7 | |
| Seaport | 0.3 | |
As a percentage of net assets.
PERFORMANCE CHART
Total returns with maximum sales charge for the period ended 6-30-17 (%)
| Class A | Class B | Class C | Class I1,2 | Class R11 | Class R21,2 | Class R31 | Class R41 | Class R51 | Class R61,2 | Class 11 | Class 51 | Index 1 | Index 2 | Index 3 | |
| Average annual total returns | |||||||||||||||
| 1 year | 6.97 | 6.85 | 10.84 | 12.96 | 12.22 | 12.50 | 12.37 | 12.81 | 13.01 | 13.08 | 13.03 | 13.08 | 17.90 | -0.31 | 12.22 |
| 5 year | 6.74 | 6.74 | 7.06 | 7.63 | 7.43 | 7.72 | 7.56 | 8.00 | 8.20 | 8.28 | 8.23 | 8.30 | 14.63 | 2.21 | 8.81 |
| 10 year | 4.00 | 3.91 | 3.79 | 4.18 | 4.13 | 3.96 | 4.28 | 4.65 | 4.90 | 4.44 | 4.96 | 5.02 | 7.18 | 4.48 | 5.72 |
| Cumulative returns | |||||||||||||||
| 6 months | 2.51 | 2.45 | 6.44 | 8.01 | 7.66 | 7.79 | 7.69 | 7.97 | 8.06 | 8.07 | 7.97 | 8.07 | 9.34 | 2.27 | 7.42 |
| 5 year | 38.55 | 38.54 | 40.62 | 44.41 | 43.10 | 45.02 | 43.96 | 46.94 | 48.32 | 48.86 | 48.51 | 48.97 | 97.92 | 11.57 | 52.54 |
| 10 year | 48.02 | 46.72 | 45.09 | 50.59 | 49.91 | 47.47 | 52.00 | 57.50 | 61.41 | 54.42 | 62.27 | 63.17 | 100.08 | 54.97 | 74.47 |
Performance figures assume all distributions have been reinvested. Returns with maximum sales charge reflect a sales charge on Class A shares of 5%, and the applicable contingent deferred sales charge (CDSC) on Class B and Class C shares. The Class B shares' CDSC declines annually between years 1-6 according to the following schedule: 5%, 4%, 3%, 3%, 2%, 1%. No sales charges will be assessed after the sixth year. Class C shares held for less than one year are subject to a 1% CDSC. Sales charges are not applicable to Class I, Class R1, Class R2, Class R3, Class R4, Class R5, Class R6, Class 1, and Class 5 shares.
Performance of the classes will vary based on the difference in sales charges paid by shareholders investing in the different classes and the fee structure of those classes.
The expense ratios of the portfolio, both net (including any fee waivers and/or expense limitations) and gross (excluding any fee waivers and/or expense limitations), are set forth according to the most recent publicly available prospectuses for the portfolio and may differ from those disclosed in the Financial highlights tables in this report. Had the contractual fee waivers and expense limitations not been in place, gross expenses would apply. The following expense ratios include expenses of the affiliated underlying funds in which the portfolio invests. The expense ratios are as follows:
| Class A | Class B | Class C | Class I | Class R1 | Class R2 | Class R3 | Class R4 | Class R5 | Class R6 | Class 1 | Class 5 | |
| Gross (%) | 1.35 | 2.05 | 2.05 | 1.04 | 1.69 | 1.44 | 1.59 | 1.29 | 0.99 | 0.94 | 0.97 | 0.92 |
| Net (%) | 1.33 | 2.05 | 2.05 | 1.04 | 1.69 | 1.44 | 1.59 | 1.19 | 0.99 | 0.94 | 0.97 | 0.92 |
Please refer to the most recent prospectus and annual or semiannual report for more information on expenses and any expense limitation arrangements for each class.
The returns reflect past results and should not be considered indicative of future performance. The return and principal value of an investment will fluctuate so that shares, when redeemed, may be worth more or less than their original cost. Due to market volatility, the portfolio's current performance may be higher or lower than the performance shown. For performance data current to the most recent month end, please call 800-225-5291 or visit the portfolio's website at jhinvestments.com.
This performance information does not reflect the deduction of taxes that a shareholder may pay on portfolio distributions or the redemption of portfolio shares. The portfolio's performance results reflect any applicable fee waivers or expense reductions, without which the expenses would increase and results would have been less favorable.
| 1 | For certain types of investors as described in the portfolio's prospectuses. |
| 2 | Class R2 shares were first offered on 3-1-12. The returns prior to this date are those of Class A shares that have been recalculated to apply the gross fees and expenses of Class R2 shares. Class R6 and Class I shares were first offered on 9-1-11 and 5-1-15, respectively. The returns prior to this date are those of Class 1 shares that have been recalculated to apply the gross fees and expenses of Class R6 and Class I shares, as applicable. |
Multimanager Lifestyle Moderate Portfolio
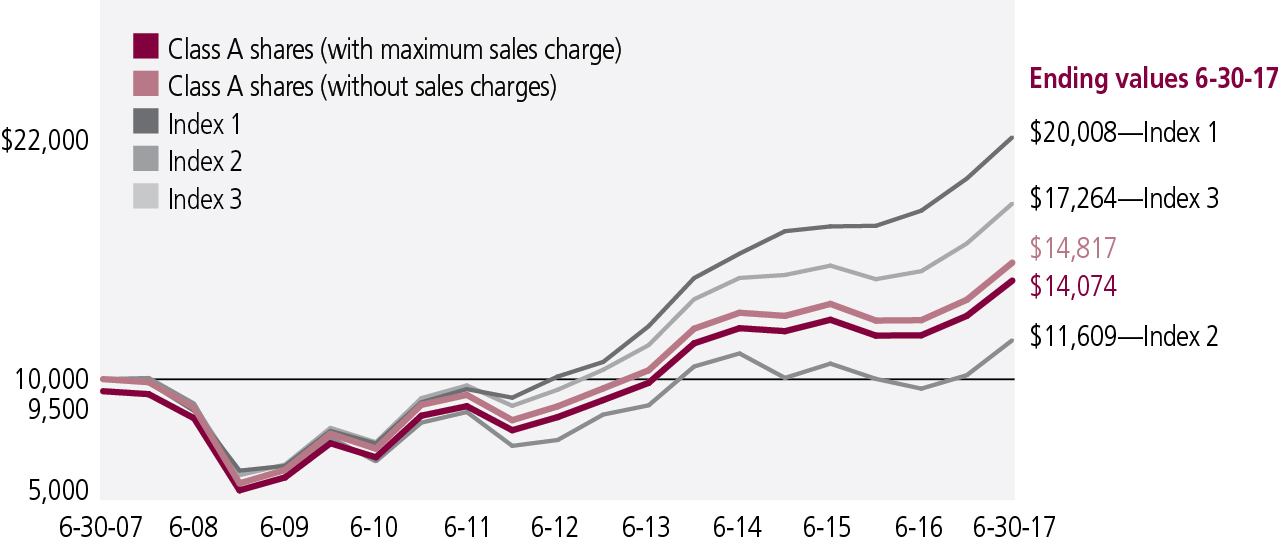
GROWTH OF $10,000
This chart shows what happened to a hypothetical $10,000 investment in John Hancock Multimanager Lifestyle Moderate Portfolio for the share classes and periods indicated, assuming all distributions were reinvested. For comparison, we've shown the same investment in a blended index and two separate indexes.
Index 1 is the S&P 500, an unmanaged index that includes 500 widely traded common stocks.
Index 2 is the Bloomberg Barclays U.S. Aggregate Bond Index, an unmanaged index of dollar-denominated and non-convertible investment-grade debt issues.
Index 3 is 28% Russell 3000 Index, 12% MSCI All Country World ex-USA Index, 48% Bloomberg Barclays U.S. Aggregate Bond Index, and 12% Bank of America Merrill Lynch U.S. High Yield Master II Index.
It is not possible to invest directly in an index. Index figures do not reflect expenses or sales charges, which would result in lower returns.
ASSET ALLOCATION (%)
| Equity | 42.7 | |
| U.S. Large Cap | 13.9 | |
| International Large Cap | 6.0 | |
| Multi-Sector Bond | 6.0 | |
| U.S. Strategic Equity Allocation | 3.6 | |
| International Strategic Equity Allocation | 3.6 | |
| U.S. Mid Cap | 3.0 | |
| Emerging Markets | 1.7 | |
| Large Blend | 1.3 | |
| Global Large Cap | 1.3 | |
| U.S. Small Cap | 1.2 | |
| International Small Cap | 1.1 | |
| Fixed income | 50.7 | |
| Intermediate Bond | 22.7 | |
| Multi-Sector Bond | 8.4 | |
| Global Bond | 7.4 | |
| Bank Loan | 5.6 | |
| Treasury Inflation-Protected Securities | 4.0 | |
| High Yield Bond | 2.6 | |
| Alternative and specialty | 6.6 | |
| Global Absolute Return Strategies | 2.3 | |
| Currency | 2.0 | |
| Real Estate | 1.0 | |
| Enduring Assets | 0.5 | |
| Natural Resources | 0.5 | |
| Seaport | 0.3 | |
As a percentage of net assets.
PERFORMANCE CHART
Total returns with maximum sales charge for the period ended 6-30-17 (%)
| Class A | Class B | Class C | Class I1,2 | Class R11 | Class R21,2 | Class R31 | Class R41 | Class R51 | Class R61,2 | Class 11 | Class 51 | Index 1 | Index 2 | Index 3 | |
| Average annual total returns | |||||||||||||||
| 1 year | 3.38 | 3.05 | 7.04 | 9.17 | 8.48 | 8.73 | 8.56 | 9.01 | 9.21 | 9.30 | 9.23 | 9.29 | 17.90 | -0.31 | 8.79 |
| 5 year | 4.95 | 4.94 | 5.28 | 5.88 | 5.61 | 5.92 | 5.71 | 6.14 | 6.34 | 6.48 | 6.45 | 6.49 | 14.63 | 2.21 | 6.93 |
| 10 year | 4.10 | 3.98 | 3.88 | 4.31 | 4.21 | 4.06 | 4.30 | 4.65 | 4.94 | 4.13 | 5.06 | 5.11 | 7.18 | 4.48 | 5.63 |
| Cumulative returns | |||||||||||||||
| 6 months | 0.60 | 0.61 | 4.52 | 6.07 | 5.81 | 5.86 | 5.78 | 6.07 | 6.09 | 6.13 | 6.10 | 6.13 | 9.34 | 2.27 | 5.86 |
| 5 year | 27.33 | 27.25 | 29.33 | 33.07 | 31.37 | 33.30 | 32.01 | 34.72 | 35.97 | 36.86 | 36.68 | 36.96 | 97.92 | 11.57 | 39.82 |
| 10 year | 49.46 | 47.77 | 46.32 | 52.50 | 51.10 | 48.84 | 52.28 | 57.58 | 61.94 | 49.89 | 63.79 | 64.59 | 100.08 | 54.97 | 73.01 |
Performance figures assume all distributions have been reinvested. Returns with maximum sales charge reflect a sales charge on Class A shares of 5%, and the applicable contingent deferred sales charge (CDSC) on Class B and Class C shares. The Class B shares' CDSC declines annually between years 1-6 according to the following schedule: 5%, 4%, 3%, 3%, 2%, 1%. No sales charges will be assessed after the sixth year. Class C shares held for less than one year are subject to a 1% CDSC. Sales charges are not applicable to Class I, Class R1, Class R2, Class R3, Class R4, Class R5, Class R6, Class 1, and Class 5 shares.
Performance of the classes will vary based on the difference in sales charges paid by shareholders investing in the different classes and the fee structure of those classes.
The expense ratios of the portfolio, both net (including any fee waivers and/or expense limitations) and gross (excluding any fee waivers and/or expense limitations), are set forth according to the most recent publicly available prospectuses for the portfolio and may differ from those disclosed in the Financial highlights tables in this report. Had the contractual fee waivers and expense limitations not been in place, gross expenses would apply. The following expense ratios include expenses of the affiliated underlying funds in which the portfolio invests. The expense ratios are as follows:
| Class A | Class B | Class C | Class I | Class R1 | Class R2 | Class R3 | Class R4 | Class R5 | Class R6 | Class 1 | Class 5 | |
| Gross (%) | 1.30 | 2.00 | 2.00 | 0.99 | 1.64 | 1.39 | 1.54 | 1.24 | 0.94 | 0.89 | 0.93 | 0.88 |
| Net (%) | 1.28 | 2.00 | 2.00 | 0.99 | 1.64 | 1.39 | 1.54 | 1.14 | 0.94 | 0.89 | 0.93 | 0.88 |
Please refer to the most recent prospectus and annual or semiannual report for more information on expenses and any expense limitation arrangements for each class.
The returns reflect past results and should not be considered indicative of future performance. The return and principal value of an investment will fluctuate so that shares, when redeemed, may be worth more or less than their original cost. Due to market volatility, the portfolio's current performance may be higher or lower than the performance shown. For performance data current to the most recent month end, please call 800-225-5291 or visit the portfolio's website at jhinvestments.com.
This performance information does not reflect the deduction of taxes that a shareholder may pay on portfolio distributions or the redemption of portfolio shares. The portfolio's performance results reflect any applicable fee waivers or expense reductions, without which the expenses would increase and results would have been less favorable.
| 1 | For certain types of investors as described in the portfolio's prospectuses. |
| 2 | Class R2 shares were first offered on 3-1-12. The returns prior to this date are those of Class A shares that have been recalculated to apply the gross fees and expenses of Class R2 shares. Class R6 and Class I shares were first offered on 9-1-11 and 5-1-15, respectively. The returns prior to this date are those of Class 1 shares that have been recalculated to apply the gross fees and expenses of Class R6 and Class I shares, as applicable. |
Multimanager Lifestyle Conservative Portfolio
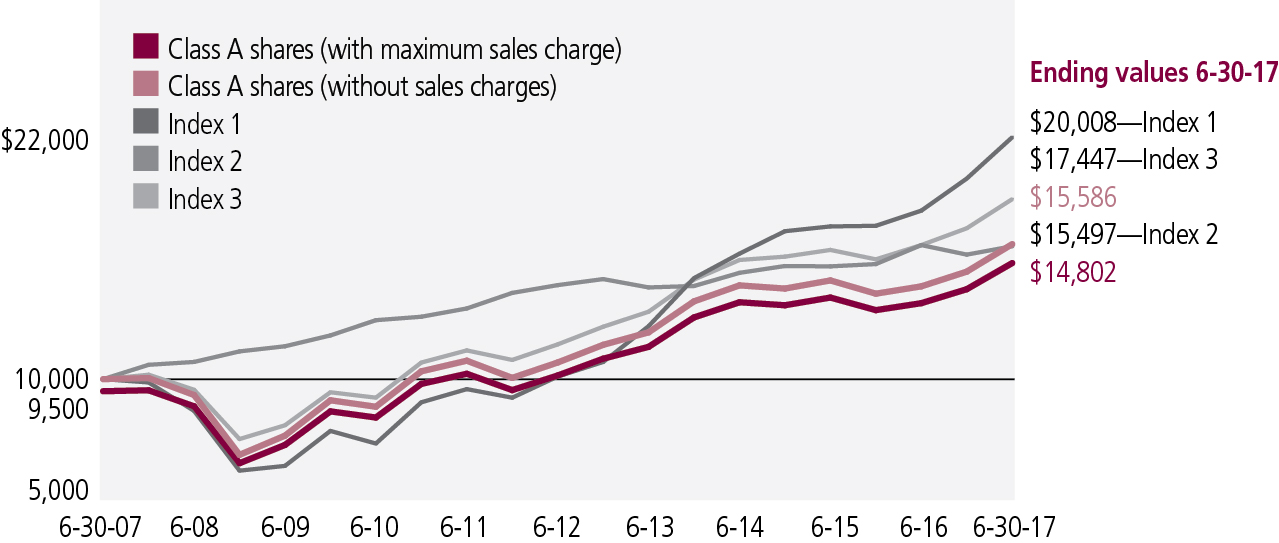
GROWTH OF $10,000
This chart shows what happened to a hypothetical $10,000 investment in John Hancock Multimanager Lifestyle Conservative Portfolio for the share classes and periods indicated, assuming all distributions were reinvested. For comparison, we've shown the same investment in a blended index and two separate indexes.
Index 1 is the S&P 500, an unmanaged index that includes 500 widely traded common stocks.
Index 2 is the Bloomberg Barclays U.S. Aggregate Bond Index, an unmanaged index of dollar-denominated and non-convertible investment-grade debt issues.
Index 3 is 14% Russell 3000 Index, 6% MSCI All Country World ex-USA Index, 64% Bloomberg Barclays U.S. Aggregate Bond Index, and 16% Bank of America Merrill Lynch U.S. High Yield Master II Index.
It is not possible to invest directly in an index. Index figures do not reflect expenses or sales charges, which would result in lower returns.
ASSET ALLOCATION (%)
| Equity | 23.4 | |
| Multi-Sector Bond | 6.8 | |
| U.S. Large Cap | 5.5 | |
| International Large Cap | 3.0 | |
| International Strategic Equity Allocation | 2.5 | |
| U.S. Strategic Equity Allocation | 1.5 | |
| U.S. Mid Cap | 1.2 | |
| Global Large Cap | 0.9 | |
| Emerging Markets | 0.8 | |
| Large Blend | 0.8 | |
| U.S. Small Cap | 0.4 | |
| Fixed income | 66.8 | |
| Intermediate Bond | 30.3 | |
| Multi-Sector Bond | 9.3 | |
| Global Bond | 9.0 | |
| Bank Loan | 6.0 | |
| Treasury Inflation-Protected Securities | 5.9 | |
| Short-Term Bond | 4.0 | |
| High Yield Bond | 2.3 | |
| Alternative and specialty | 9.8 | |
| Global Absolute Return Strategies | 3.4 | |
| Currency | 3.0 | |
| Enduring Assets | 1.7 | |
| Real Estate | 1.2 | |
| Natural Resources | 0.3 | |
| Seaport | 0.2 | |
As a percentage of net assets.
PERFORMANCE CHART
Total returns with maximum sales charge for the period ended 6-30-17 (%)
| Class A | Class B | Class C | Class I1,2 | Class R11 | Class R21,2 | Class R31 | Class R41 | Class R51 | Class R61,2 | Class 11 | Index 1 | Index 2 | Index 3 | |
| Average annual total returns | ||||||||||||||
| 1 year | 0.01 | -0.44 | 3.56 | 5.63 | 4.95 | 5.19 | 5.12 | 5.39 | 5.67 | 5.75 | 5.70 | 17.90 | -0.31 | 5.45 |
| 5 year | 3.12 | 3.08 | 3.45 | 4.05 | 3.75 | 4.08 | 3.89 | 4.26 | 4.51 | 4.63 | 4.58 | 14.63 | 2.21 | 5.05 |
| 10 year | 3.95 | 3.86 | 3.75 | 4.19 | 4.06 | 3.91 | 4.18 | 4.49 | 4.80 | 3.85 | 4.92 | 7.18 | 4.48 | 5.45 |
| Cumulative returns | ||||||||||||||
| 6 months | -0.93 | -1.11 | 2.82 | 4.42 | 4.08 | 4.12 | 4.17 | 4.26 | 4.45 | 4.48 | 4.38 | 9.34 | 2.27 | 4.32 |
| 5 year | 16.60 | 16.39 | 18.46 | 21.93 | 20.20 | 22.14 | 21.05 | 23.17 | 24.67 | 25.41 | 25.08 | 97.92 | 11.57 | 27.93 |
| 10 year | 47.38 | 46.03 | 44.50 | 50.81 | 48.93 | 46.80 | 50.65 | 55.17 | 59.83 | 45.89 | 61.62 | 100.08 | 54.97 | 70.03 |
Performance figures assume all distributions have been reinvested. Returns with maximum sales charge reflect a sales charge on Class A shares of 5%, and the applicable contingent deferred sales charge (CDSC) on Class B and Class C shares. The Class B shares' CDSC declines annually between years 1-6 according to the following schedule: 5%, 4%, 3%, 3%, 2%, 1%. No sales charges will be assessed after the sixth year. Class C shares held for less than one year are subject to a 1% CDSC. Sales charges are not applicable to Class I, Class R1, Class R2, Class R3, Class R4, Class R5, Class R6, Class 1, and Class 5 shares.
Performance of the classes will vary based on the difference in sales charges paid by shareholders investing in the different classes and the fee structure of those classes.
The expense ratios of the portfolio, both net (including any fee waivers and/or expense limitations) and gross (excluding any fee waivers and/or expense limitations), are set forth according to the most recent publicly available prospectuses for the portfolio and may differ from those disclosed in the Financial highlights tables in this report. Had the contractual fee waivers and expense limitations not been in place, gross expenses would apply. The following expense ratios include expenses of the affiliated underlying funds in which the portfolio invests. The expense ratios are as follows:
| Class A | Class B | Class C | Class I | Class R1 | Class R2 | Class R3 | Class R4 | Class R5 | Class R6 | Class 1 | |
| Gross (%) | 1.27 | 1.97 | 1.97 | 0.96 | 1.61 | 1.36 | 1.51 | 1.21 | 0.91 | 0.86 | 0.89 |
| Net (%) | 1.25 | 1.97 | 1.97 | 0.96 | 1.61 | 1.36 | 1.51 | 1.11 | 0.91 | 0.86 | 0.89 |
Please refer to the most recent prospectus and annual or semiannual report for more information on expenses and any expense limitation arrangements for each class.
The returns reflect past results and should not be considered indicative of future performance. The return and principal value of an investment will fluctuate so that shares, when redeemed, may be worth more or less than their original cost. Due to market volatility, the portfolio's current performance may be higher or lower than the performance shown. For performance data current to the most recent month end, please call 800-225-5291 or visit the portfolio's website at jhinvestments.com.
This performance information does not reflect the deduction of taxes that a shareholder may pay on portfolio distributions or the redemption of portfolio shares. The portfolio's performance results reflect any applicable fee waivers or expense reductions, without which the expenses would increase and results would have been less favorable.
| 1 | For certain types of investors as described in the portfolio's prospectuses. |
| 2 | Class R2 shares were first offered on 3-1-12. The returns prior to this date are those of Class A shares that have been recalculated to apply the gross fees and expenses of Class R2 shares. Class R6 and Class I shares were first offered on 9-1-11 and 5-1-15, respectively. The returns prior to this date are those of Class 1 shares that have been recalculated to apply the gross fees and expenses of Class R6 and Class I shares, as applicable. |
Your expenses
As a shareholder of a John Hancock Funds II Multimanager Lifestyle Portfolios, you incur two types of costs: (1) transaction costs, including sales charges (loads) on certain purchases or redemptions, and (2) ongoing costs, including management fees, distribution and service (Rule 12b-1) fees, and other portfolio expenses. In addition to the operating expenses which each portfolio bears directly, the portfolio indirectly bears a pro rata share of the operating expenses of the underlying funds in which each portfolio invests. Because underlying funds have varied operating expenses and transaction costs and the portfolio may own different proportions of the underlying funds at different times, the amount of expenses incurred indirectly by the portfolio will vary. Had these indirect expenses been reflected in the following analysis, total expenses would have been higher than the amounts shown.
These examples are intended to help you understand your ongoing costs (in dollars) of investing in a portfolio so you can compare these costs with the ongoing costs of investing in other mutual funds. The examples are based on an investment of $1,000 at the beginning of the period and held for the entire period (January 1, 2017 through June 30, 2017).
Actual expenses:
The first line of each share class in the tables below and on the following pages provides information about actual account values and actual expenses. You may use the information in this line, together with the amount you invested, to estimate the expenses that you paid over the period. Simply divide your account value by $1,000 (for example, an $8,600 account value divided by $1,000 = 8.6), then multiply the result by the number in the first line under the heading entitled "Expenses paid during period" to estimate the expenses you paid on your account during this period.
Hypothetical example for comparison purposes:
The second line of each share class in the tables on the following pages provides information about hypothetical account values and hypothetical expenses based on the actual expense ratio for the share class and an assumed annualized rate of return of 5% per year before expenses, which is not the actual return of the share class. The hypothetical account values and expenses may not be used to estimate the actual ending account balance or expenses you paid for the period. You may use this information to compare the ongoing costs of investing in a portfolio and other funds. To do so, compare this 5% hypothetical example with the 5% hypothetical examples that appear in the shareholder reports of the other funds.
Please note that the expenses shown in the tables are meant to highlight your ongoing costs only and do not reflect any transactional costs. Therefore, the second line of each share class in the table is useful in comparing ongoing costs only, and will not help you determine the relative total costs of owning different funds. In addition, if these transactional costs were included, your costs would have been higher. See the portfolios' prospectuses for details regarding transaction costs.
SHAREHOLDER EXPENSE EXAMPLE CHART
| Beginning account value 1-1-2017 | Ending account value 6-30-2017 | Expenses paid during period1 1-1-2017-6-30-2017 | Annualized expense ratio2 | ||
| Multimanager Lifestyle Aggressive Portfolio | |||||
| Class A | Actual | $1,000.00 | $1,115.50 | $2.52 | 0.48% |
| Hypothetical (5% annualized return before expenses) | 1,000.00 | 1,022.40 | 2.41 | 0.48% | |
| Class B | Actual | 1,000.00 | 1,111.90 | 6.23 | 1.19% |
| Hypothetical (5% annualized return before expenses) | 1,000.00 | 1,018.90 | 5.96 | 1.19% | |
| Class C | Actual | 1,000.00 | 1,112.50 | 6.23 | 1.19% |
| Hypothetical (5% annualized return before expenses) | 1,000.00 | 1,018.90 | 5.96 | 1.19% | |
| Class I | Actual | 1,000.00 | 1,117.20 | 0.89 | 0.17% |
| Hypothetical (5% annualized return before expenses) | 1,000.00 | 1,024.00 | 0.85 | 0.17% | |
| Class R1 | Actual | 1,000.00 | 1,114.00 | 4.30 | 0.82% |
| Hypothetical (5% annualized return before expenses) | 1,000.00 | 1,020.70 | 4.11 | 0.82% | |
| Class R2 | Actual | 1,000.00 | 1,114.80 | 3.04 | 0.58% |
| Hypothetical (5% annualized return before expenses) | 1,000.00 | 1,021.90 | 2.91 | 0.58% | |
| Class R3 | Actual | 1,000.00 | 1,115.10 | 3.78 | 0.72% |
| Hypothetical (5% annualized return before expenses) | 1,000.00 | 1,021.20 | 3.61 | 0.72% | |
| Class R4 | Actual | 1,000.00 | 1,116.60 | 1.68 | 0.32% |
| Hypothetical (5% annualized return before expenses) | 1,000.00 | 1,023.20 | 1.61 | 0.32% | |
| Class R5 | Actual | 1,000.00 | 1,117.80 | 0.68 | 0.13% |
| Hypothetical (5% annualized return before expenses) | 1,000.00 | 1,024.10 | 0.65 | 0.13% | |
| Class R6 | Actual | 1,000.00 | 1,117.90 | 0.37 | 0.07% |
| Hypothetical (5% annualized return before expenses) | 1,000.00 | 1,024.40 | 0.35 | 0.07% | |
| Class 1 | Actual | 1,000.00 | 1,117.40 | 0.63 | 0.12% |
| Hypothetical (5% annualized return before expenses) | 1,000.00 | 1,024.20 | 0.60 | 0.12% | |
| Multimanager Lifestyle Growth Portfolio | |||||
| Class A | Actual | $1,000.00 | $1,097.50 | $2.50 | 0.48% |
| Hypothetical (5% annualized return before expenses) | 1,000.00 | 1,022.40 | 2.41 | 0.48% | |
| Class B | Actual | 1,000.00 | 1,093.10 | 6.18 | 1.19% |
| Hypothetical (5% annualized return before expenses) | 1,000.00 | 1,018.90 | 5.96 | 1.19% | |
| Class C | Actual | 1,000.00 | 1,093.20 | 6.18 | 1.19% |
| Hypothetical (5% annualized return before expenses) | 1,000.00 | 1,018.90 | 5.96 | 1.19% | |
| Class I | Actual | 1,000.00 | 1,099.40 | 0.88 | 0.17% |
| Hypothetical (5% annualized return before expenses) | 1,000.00 | 1,024.00 | 0.85 | 0.17% | |
| Class R1 | Actual | 1,000.00 | 1,095.80 | 4.26 | 0.82% |
| Hypothetical (5% annualized return before expenses) | 1,000.00 | 1,020.70 | 4.11 | 0.82% | |
| Class R2 | Actual | 1,000.00 | 1,096.70 | 3.02 | 0.58% |
| Hypothetical (5% annualized return before expenses) | 1,000.00 | 1,021.90 | 2.91 | 0.58% | |
| Class R3 | Actual | 1,000.00 | 1,096.30 | 3.74 | 0.72% |
| Hypothetical (5% annualized return before expenses) | 1,000.00 | 1,021.20 | 3.61 | 0.72% | |
| Class R4 | Actual | 1,000.00 | 1,098.30 | 1.66 | 0.32% |
| Hypothetical (5% annualized return before expenses) | 1,000.00 | 1,023.20 | 1.61 | 0.32% | |
| Class R5 | Actual | 1,000.00 | 1,099.50 | 0.68 | 0.13% |
| Hypothetical (5% annualized return before expenses) | 1,000.00 | 1,024.10 | 0.65 | 0.13% | |
| Class R6 | Actual | 1,000.00 | 1,099.30 | 0.36 | 0.07% |
| Hypothetical (5% annualized return before expenses) | 1,000.00 | 1,024.40 | 0.35 | 0.07% | |
| Class 1 | Actual | 1,000.00 | 1,099.30 | 0.62 | 0.12% |
| Hypothetical (5% annualized return before expenses) | 1,000.00 | 1,024.20 | 0.60 | 0.12% | |
| Class 5 | Actual | 1,000.00 | 1,100.10 | 0.36 | 0.07% |
| Hypothetical (5% annualized return before expenses) | 1,000.00 | 1,024.40 | 0.35 | 0.07% | |
SHAREHOLDER EXPENSE EXAMPLE CHART (continued)
| Beginning account value 1-1-2017 | Ending account value 6-30-2017 | Expenses paid during period1 1-1-2017-6-30-2017 | Annualized expense ratio2 | ||
| Multimanager Lifestyle Balanced Portfolio | |||||
| Class A | Actual | $1,000.00 | $1,078.80 | $2.47 | 0.48% |
| Hypothetical (5% annualized return before expenses) | 1,000.00 | 1,022.40 | 2.41 | 0.48% | |
| Class B | Actual | 1,000.00 | 1,074.50 | 6.12 | 1.19% |
| Hypothetical (5% annualized return before expenses) | 1,000.00 | 1,018.90 | 5.96 | 1.19% | |
| Class C | Actual | 1,000.00 | 1,074.40 | 6.12 | 1.19% |
| Hypothetical (5% annualized return before expenses) | 1,000.00 | 1,018.90 | 5.96 | 1.19% | |
| Class I | Actual | 1,000.00 | 1,080.10 | 0.93 | 0.18% |
| Hypothetical (5% annualized return before expenses) | 1,000.00 | 1,023.90 | 0.90 | 0.18% | |
| Class R1 | Actual | 1,000.00 | 1,076.60 | 4.27 | 0.83% |
| Hypothetical (5% annualized return before expenses) | 1,000.00 | 1,020.70 | 4.16 | 0.83% | |
| Class R2 | Actual | 1,000.00 | 1,077.90 | 2.94 | 0.57% |
| Hypothetical (5% annualized return before expenses) | 1,000.00 | 1,022.00 | 2.86 | 0.57% | |
| Class R3 | Actual | 1,000.00 | 1,076.90 | 3.76 | 0.73% |
| Hypothetical (5% annualized return before expenses) | 1,000.00 | 1,021.20 | 3.66 | 0.73% | |
| Class R4 | Actual | 1,000.00 | 1,079.70 | 1.70 | 0.33% |
| Hypothetical (5% annualized return before expenses) | 1,000.00 | 1,023.20 | 1.66 | 0.33% | |
| Class R5 | Actual | 1,000.00 | 1,080.60 | 0.72 | 0.14% |
| Hypothetical (5% annualized return before expenses) | 1,000.00 | 1,024.10 | 0.70 | 0.14% | |
| Class R6 | Actual | 1,000.00 | 1,080.70 | 0.41 | 0.08% |
| Hypothetical (5% annualized return before expenses) | 1,000.00 | 1,024.40 | 0.40 | 0.08% | |
| Class 1 | Actual | 1,000.00 | 1,079.70 | 0.62 | 0.12% |
| Hypothetical (5% annualized return before expenses) | 1,000.00 | 1,024.20 | 0.60 | 0.12% | |
| Class 5 | Actual | 1,000.00 | 1,080.70 | 0.36 | 0.07% |
| Hypothetical (5% annualized return before expenses) | 1,000.00 | 1,024.40 | 0.35 | 0.07% | |
| Multimanager Lifestyle Moderate Portfolio | |||||
| Class A | Actual | $1,000.00 | $1,058.90 | $2.50 | 0.49% |
| Hypothetical (5% annualized return before expenses) | 1,000.00 | 1,022.40 | 2.46 | 0.49% | |
| Class B | Actual | 1,000.00 | 1,056.10 | 6.12 | 1.20% |
| Hypothetical (5% annualized return before expenses) | 1,000.00 | 1,018.80 | 6.01 | 1.20% | |
| Class C | Actual | 1,000.00 | 1,055.20 | 6.11 | 1.20% |
| Hypothetical (5% annualized return before expenses) | 1,000.00 | 1,018.80 | 6.01 | 1.20% | |
| Class I | Actual | 1,000.00 | 1,060.70 | 0.97 | 0.19% |
| Hypothetical (5% annualized return before expenses) | 1,000.00 | 1,023.90 | 0.95 | 0.19% | |
| Class R1 | Actual | 1,000.00 | 1,058.10 | 4.24 | 0.83% |
| Hypothetical (5% annualized return before expenses) | 1,000.00 | 1,020.70 | 4.16 | 0.83% | |
| Class R2 | Actual | 1,000.00 | 1,058.60 | 2.96 | 0.58% |
| Hypothetical (5% annualized return before expenses) | 1,000.00 | 1,021.90 | 2.91 | 0.58% | |
| Class R3 | Actual | 1,000.00 | 1,057.80 | 3.83 | 0.75% |
| Hypothetical (5% annualized return before expenses) | 1,000.00 | 1,021.10 | 3.76 | 0.75% | |
| Class R4 | Actual | 1,000.00 | 1,060.70 | 1.69 | 0.33% |
| Hypothetical (5% annualized return before expenses) | 1,000.00 | 1,023.20 | 1.66 | 0.33% | |
| Class R5 | Actual | 1,000.00 | 1,060.90 | 0.72 | 0.14% |
| Hypothetical (5% annualized return before expenses) | 1,000.00 | 1,024.10 | 0.70 | 0.14% | |
| Class R6 | Actual | 1,000.00 | 1,061.30 | 0.41 | 0.08% |
| Hypothetical (5% annualized return before expenses) | 1,000.00 | 1,024.40 | 0.40 | 0.08% | |
| Class 1 | Actual | 1,000.00 | 1,061.00 | 0.66 | 0.13% |
| Hypothetical (5% annualized return before expenses) | 1,000.00 | 1,024.10 | 0.65 | 0.13% | |
| Class 5 | Actual | 1,000.00 | 1,061.30 | 0.41 | 0.08% |
| Hypothetical (5% annualized return before expenses) | 1,000.00 | 1,024.40 | 0.40 | 0.08% | |
SHAREHOLDER EXPENSE EXAMPLE CHART (continued)
| Beginning account value 1-1-2017 | Ending account value 6-30-2017 | Expenses paid during period1 1-1-2017-6-30-2017 | Annualized expense ratio2 | ||
| Multimanager Lifestyle Conservative Portfolio | |||||
| Class A | Actual | $1,000.00 | $1,042.60 | $2.53 | 0.50% |
| Hypothetical (5% annualized return before expenses) | 1,000.00 | 1,022.30 | 2.51 | 0.50% | |
| Class B | Actual | 1,000.00 | 1,038.90 | 6.12 | 1.21% |
| Hypothetical (5% annualized return before expenses) | 1,000.00 | 1,018.80 | 6.06 | 1.21% | |
| Class C | Actual | 1,000.00 | 1,038.20 | 6.11 | 1.21% |
| Hypothetical (5% annualized return before expenses) | 1,000.00 | 1,018.80 | 6.06 | 1.21% | |
| Class I | Actual | 1,000.00 | 1,044.20 | 0.96 | 0.19% |
| Hypothetical (5% annualized return before expenses) | 1,000.00 | 1,023.90 | 0.95 | 0.19% | |
| Class R1 | Actual | 1,000.00 | 1,040.80 | 4.25 | 0.84% |
| Hypothetical (5% annualized return before expenses) | 1,000.00 | 1,020.60 | 4.21 | 0.84% | |
| Class R2 | Actual | 1,000.00 | 1,041.20 | 3.04 | 0.60% |
| Hypothetical (5% annualized return before expenses) | 1,000.00 | 1,021.80 | 3.01 | 0.60% | |
| Class R3 | Actual | 1,000.00 | 1,041.70 | 3.59 | 0.71% |
| Hypothetical (5% annualized return before expenses) | 1,000.00 | 1,021.30 | 3.56 | 0.71% | |
| Class R4 | Actual | 1,000.00 | 1,042.60 | 1.77 | 0.35% |
| Hypothetical (5% annualized return before expenses) | 1,000.00 | 1,023.10 | 1.76 | 0.35% | |
| Class R5 | Actual | 1,000.00 | 1,044.50 | 0.76 | 0.15% |
| Hypothetical (5% annualized return before expenses) | 1,000.00 | 1,024.10 | 0.75 | 0.15% | |
| Class R6 | Actual | 1,000.00 | 1,044.80 | 0.46 | 0.09% |
| Hypothetical (5% annualized return before expenses) | 1,000.00 | 1,024.30 | 0.45 | 0.09% | |
| Class 1 | Actual | 1,000.00 | 1,043.80 | 0.71 | 0.14% |
| Hypothetical (5% annualized return before expenses) | 1,000.00 | 1,024.10 | 0.70 | 0.14% | |
| 1 | Expenses are equal to the annualized expense ratio, multiplied by the average account value over the period, multiplied by the number of days in the period (181) and divided by 365 (to reflect the one-half year period). |
| 2 | The portfolios' expense ratios do not include fees and expenses indirectly incurred by the underlying funds and can vary based on the mix of underlying funds held by the portfolios. The range of expense ratios of the underlying funds held by the portfolios was as follows: |
| Period ended | Multimanager Lifestyle Aggressive Portfolio | Multimanager Lifestyle Growth Portfolio | Multimanager Lifestyle Balanced Portfolio | Multimanager Lifestyle Moderate Portfolio | Multimanager Lifestyle Conservative Portfolio |
| 6-30-17 | 0.54%-3.50% | 0.41%-3.50% | 0.41%-3.50% | 0.41%-3.50% | 0.41%-3.50% |
| Portfolios’ investments |
| INVESTMENT COMPANIES | |||
| Underlying Funds’ Investment Managers | |||
| Allianz Global Investors U.S. LLC | (Allianz) | ||
| Barrow, Hanley, Mewhinney & Strauss, LLC | (Barrow Hanley) | ||
| Boston Partners Global Investors, Inc. | (Boston Partners) | ||
| Brandywine Asset Management, Inc. | (Brandywine) | ||
| Deutsche Investment Management Americas, Inc. | (Deutsche) | ||
| Dimensional Fund Advisors LP | (DFA) | ||
| Epoch Investment Partners, Inc. | (Epoch) | ||
| First Quadrant, L.P. | (First Quadrant) | ||
| Franklin Templeton Investments Corp. | (Franklin Templeton) | ||
| Invesco Advisors, Inc. | (Invesco) | ||
| Jennison Associates LLC | (Jennison) | ||
| John Hancock Asset Management | (JHAM) | ||
| Pacific Investment Management Company LLC | (PIMCO) | ||
| Standard Life Investments (Corporate Funds) Limited | (Standard Life) | ||
| Stone Harbor Investment Partners LP | (Stone Harbor) | ||
| T. Rowe Price Associates, Inc. | (T. Rowe Price) | ||
| Templeton Investment Counsel, LLC | (Templeton) | ||
| Wellington Management Company, LLP | (Wellington) | ||
| Wells Capital Management, Incorporated | (Wells Capital) | ||
| Western Asset Management Company | (WAMCO) | ||
| MULTIMANAGER LIFESTYLE AGGRESSIVE PORTFOLIO | |||||
| As of 6-30-17 (unaudited) | |||||
| Shares | Value | ||||
| AFFILIATED INVESTMENT COMPANIES (A) - 100.0% | |||||
| Equity - 88.6% | |||||
| Blue Chip Growth, Class NAV (T. Rowe Price) | 4,453,191 | $163,832,891 | |||
| Capital Appreciation, Class NAV (Jennison) | 9,186,469 | 158,466,594 | |||
| Capital Appreciation Value, Class NAV (T. Rowe Price) | 14,819,777 | 178,726,505 | |||
| Disciplined Value, Class NAV (Boston Partners) | 8,224,186 | 169,911,684 | |||
| Emerging Markets, Class NAV (DFA) | 14,208,997 | 152,888,804 | |||
| Emerging Markets Equity, Class NAV (JHAM) (B)(C) | 14,569,365 | 153,561,107 | |||
| Equity Income, Class NAV (T. Rowe Price) | 10,860,863 | 217,977,522 | |||
| Fundamental Global Franchise, Class NAV (JHAM) (B)(C) | 3,938,075 | 53,360,910 | |||
| Fundamental Large Cap Core, Class NAV (JHAM) (B)(C) | 3,582,703 | 181,428,065 | |||
| Global Equity, Class NAV (JHAM) (B)(C) | 5,934,215 | 71,269,921 | |||
| Global Shareholder Yield, Class NAV (Epoch) | 4,004,439 | 44,689,540 | |||
| Greater China Opportunities, Class NAV (JHAM) (B)(C) | 652,277 | 14,089,191 | |||
| International Growth, Class NAV (Wellington) | 3,585,171 | 88,517,882 | |||
| International Growth Stock, Class NAV (Invesco) | 9,802,433 | 133,019,019 | |||
| International Small Cap, Class NAV (Franklin Templeton) | 4,098,092 | 83,846,966 | |||
| International Small Company, Class NAV (DFA) | 7,075,693 | 83,846,966 | |||
| International Strategic Equity Allocation, Class NAV (JHAM) (B)(C) | 30,526,808 | 345,868,733 | |||
| International Value, Class NAV (Templeton) | 12,050,553 | 200,641,702 | |||
| International Value Equity, Class NAV (JHAM) (B)(C) | 9,957,450 | 83,742,157 | |||
| Mid Cap Stock, Class NAV (Wellington) | 8,740,644 | 189,934,196 | |||
| Mid Value, Class NAV (T. Rowe Price) | 8,315,032 | 132,791,055 | |||
| New Opportunities, Class NAV (Brandywine/Invesco/DFA) | 1,051,213 | 29,265,779 | |||
| Small Cap Core, Class NAV (JHAM) (B)(C) | 2,229,972 | 29,346,438 | |||
| Small Cap Growth, Class NAV (Wellington) (D) | 3,758,484 | 34,465,295 | |||
| Small Cap Value, Class NAV (Wellington) | 1,974,065 | 41,277,699 | |||
| Small Company Growth, Class NAV (Invesco) | 1,731,055 | 34,465,295 | |||
| Small Company Value, Class NAV (T. Rowe Price) | 945,336 | 27,433,657 | |||
| Strategic Growth, Class NAV (JHAM) (B)(C) | 8,920,643 | 159,857,931 | |||
| U.S. Strategic Equity Allocation, Class NAV (JHAM) (B)(C) | 24,771,390 | 281,402,995 | |||
| Value, Class NAV (Invesco) | 4,965,448 | 57,003,341 | |||
| Value Equity, Class NAV (Barrow Hanley) | 8,087,986 | 97,136,710 | |||
| Alternative and specialty - 11.4% | |||||
| Absolute Return Currency, Class NAV (First Quadrant) (D) | 3,677,016 | 37,358,478 | |||
| Financial Industries, Class NAV (JHAM) (B)(C) | 3,681,189 | 73,366,095 | |||
| Global Focused Strategies, Class NAV (Standard Life) | 4,723,532 | 46,479,559 | |||
| Global Real Estate, Class NAV (Deutsche) | 2,189,047 | 20,795,946 | |||
| Health Sciences, Class NAV (T. Rowe Price) | 4,288,124 | 20,840,281 | |||
| Natural Resources, Class NAV (Jennison) | 5,410,145 | 58,429,566 | |||
| Real Estate Equity, Class NAV (T. Rowe Price) | 2,022,122 | 20,746,967 | |||
| 18 | JOHN HANCOCK MULTIMANAGER LIFESTYLE PORTFOLIOS | SEMIANNUAL REPORT | SEE NOTES TO FINANCIAL STATEMENTS |
| Shares | Value | ||||
| Alternative and specialty - (continued) | |||||
| Science & Technology, Class NAV (T. Rowe Price/Allianz) | 5,086,539 | $65,921,548 | |||
| Seaport, Class NAV (Wellington) | 1,787,020 | 20,961,741 | |||
| Technical Opportunities, Class NAV (Wellington) | 8,633,098 | 111,194,308 | |||
| TOTAL AFFILIATED INVESTMENT COMPANIES (Cost $3,175,564,601) | $4,170,161,039 | ||||
| SHORT-TERM INVESTMENTS - 0.0% | |||||
| Money market funds - 0.0% | |||||
| State Street Institutional U.S. Government Money Market Fund, Premier Class 0.8844% (E) | 1,003 | 1,003 | |||
| TOTAL SHORT-TERM INVESTMENTS (Cost $1,003) | $1,003 | ||||
| Total Investments (Multimanager Lifestyle Aggressive Portfolio) (Cost $3,175,565,604) - 100.0% | $4,170,162,042 | ||||
| Other assets and liabilities, net - 0.0% | (193,845 | ) | |||
| TOTAL NET ASSETS - 100.0% | $4,169,968,197 | ||||
| MULTIMANAGER LIFESTYLE GROWTH PORTFOLIO | |||||
| As of 6-30-17 (unaudited) | |||||
| Shares | Value | ||||
| AFFILIATED INVESTMENT COMPANIES (A) - 100.0% | |||||
| Equity - 74.0% | |||||
| Blue Chip Growth, Class NAV (T. Rowe Price) | 11,093,767 | $408,139,671 | |||
| Capital Appreciation, Class NAV (Jennison) | 22,843,551 | 394,051,250 | |||
| Capital Appreciation Value, Class NAV (T. Rowe Price) | 46,390,603 | 559,470,673 | |||
| Disciplined Value, Class NAV (Boston Partners) | 20,463,479 | 422,775,482 | |||
| Emerging Markets, Class NAV (DFA) | 29,858,224 | 321,274,489 | |||
| Emerging Markets Equity, Class NAV (JHAM) (B)(C) | 30,619,309 | 322,727,518 | |||
| Equity Income, Class NAV (T. Rowe Price) | 27,083,354 | 543,562,905 | |||
| Fundamental Global Franchise, Class NAV (JHAM) (B)(C) | 12,373,603 | 167,662,315 | |||
| Fundamental Large Cap Core, Class NAV (JHAM) (B)(C) | 8,224,393 | 416,483,252 | |||
| Global Equity, Class NAV (JHAM) (B)(C) | 18,676,191 | 224,301,049 | |||
| Global Shareholder Yield, Class NAV (Epoch) | 14,971,583 | 167,082,864 | |||
| International Growth, Class NAV (Wellington) | 9,603,967 | 237,121,950 | |||
| International Growth Stock, Class NAV (Invesco) | 26,371,710 | 357,864,105 | |||
| International Small Cap, Class NAV (Franklin Templeton) | 9,689,993 | 198,257,260 | |||
| International Small Company, Class NAV (DFA) | 16,730,570 | 198,257,260 | |||
| International Strategic Equity Allocation, Class NAV (JHAM) (B)(C) | 80,116,438 | 907,719,243 | |||
| International Value, Class NAV (Templeton) | 27,243,148 | 453,598,413 | |||
| International Value Equity, Class NAV (JHAM) (B)(C) | 26,920,724 | 226,403,291 | |||
| Mid Cap Stock, Class NAV (Wellington) | 21,030,718 | 456,997,512 | |||
| Mid Value, Class NAV (T. Rowe Price) | 19,740,231 | 315,251,485 | |||
| New Opportunities, Class NAV (Brandywine/Invesco/DFA) | 2,334,856 | 65,002,380 | |||
| Shares | Value | ||||
| Equity - (continued) | |||||
| Small Cap Core, Class NAV (JHAM) (B)(C) | 4,926,771 | $64,836,312 | |||
| Small Cap Growth, Class NAV (Wellington) (D) | 7,256,415 | 66,541,326 | |||
| Small Cap Value, Class NAV (Wellington) | 3,746,249 | 78,334,062 | |||
| Small Company Growth, Class NAV (Invesco) | 3,356,225 | 66,822,447 | |||
| Small Company Value, Class NAV (T. Rowe Price) | 1,822,058 | 52,876,110 | |||
| Strategic Growth, Class NAV (JHAM) (B)(C) | 22,241,768 | 398,572,483 | |||
| Strategic Income Opportunities, Class NAV (JHAM) (B)(C) | 27,525,384 | 298,099,909 | |||
| U.S. Strategic Equity Allocation, Class NAV (JHAM) (B)(C) | 66,034,974 | 750,157,306 | |||
| Value, Class NAV (Invesco) | 11,785,578 | 135,298,431 | |||
| Value Equity, Class NAV (Barrow Hanley) | 20,115,558 | 241,587,847 | |||
| Fixed income - 14.9% | |||||
| Asia Pacific Total Return Bond, Class NAV (JHAM) (B)(C) | 7,947,806 | 76,855,287 | |||
| Bond, Class NAV (JHAM) (B)(C) | 17,167,667 | 273,480,942 | |||
| Core Bond, Class NAV (Wells Capital) | 7,250,266 | 93,963,442 | |||
| Emerging Markets Debt, Class NAV (JHAM) (B)(C) | 16,593,319 | 159,627,730 | |||
| Floating Rate Income, Class NAV (WAMCO) | 29,970,619 | 254,450,559 | |||
| Global Bond, Class NAV (PIMCO) | 3,115,303 | 38,629,760 | |||
| Global Income, Class NAV (Stone Harbor) | 5,943,589 | 56,166,912 | |||
| Global Short Duration Credit, Class NAV (JHAM) (B)(C) | 7,366,136 | 67,400,144 | |||
| High Yield, Class NAV (JHAM) (B)(C)* | 17,001,031 | 59,843,628 | |||
| High Yield, Class NAV (WAMCO) | 3,718,864 | 30,308,739 | |||
| Real Return Bond, Class NAV (PIMCO) | 17,199,307 | 189,364,372 | |||
| Short Duration Credit Opportunities, Class NAV (Stone Harbor) | 20,278,450 | 196,700,970 | |||
| Spectrum Income, Class NAV (T. Rowe Price) | 15,277,914 | 164,390,357 | |||
| Total Return, Class NAV (PIMCO) | 15,388,534 | 208,668,519 | |||
| U.S. High Yield Bond, Class NAV (Wells Capital) | 3,887,739 | 43,853,692 | |||
| Alternative and specialty - 11.1% | |||||
| Absolute Return Currency, Class NAV (First Quadrant) (D) | 20,758,423 | 210,905,582 | |||
| Financial Industries, Class NAV (JHAM) (B)(C) | 9,784,603 | 195,007,141 | |||
| Global Absolute Return Strategies, Class NAV (Standard Life) (D) | 24,460,709 | 252,189,908 | |||
| Global Real Estate, Class NAV (Deutsche) | 6,715,082 | 63,793,284 | |||
| Health Sciences, Class NAV (T. Rowe Price) | 6,609,191 | 32,120,668 | |||
| Natural Resources, Class NAV (Jennison) | 13,145,059 | 141,966,640 | |||
| Real Estate Equity, Class NAV (T. Rowe Price) | 6,138,023 | 62,976,117 | |||
| Science & Technology, Class NAV (T. Rowe Price/Allianz) | 13,409,398 | 173,785,800 | |||
| Seaport, Class NAV (Wellington) | 3,324,930 | 39,001,428 | |||
| Technical Opportunities, Class NAV (Wellington) | 19,998,405 | 257,579,461 | |||
| TOTAL AFFILIATED INVESTMENT COMPANIES (Cost $10,322,888,088) | $12,860,161,682 | ||||
| SHORT-TERM INVESTMENTS - 0.0% | |||||
| Money market funds - 0.0% | |||||
| State Street Institutional U.S. Government Money Market Fund, Premier Class 0.8844% (E) | 1,003 | 1,003 | |||
| TOTAL SHORT-TERM INVESTMENTS (Cost $1,003) | $1,003 |
| SEE NOTES TO FINANCIAL STATEMENTS | SEMIANNUAL REPORT | JOHN HANCOCK MULTIMANAGER LIFESTYLE PORTFOLIOS | 19 |
| Total Investments (Multimanager Lifestyle Growth Portfolio) | |||||
| (Cost $10,322,889,091) - 100.0% | $12,860,162,685 | ||||
| Other assets and liabilities, net - 0.0% | (1,208,706 | ) | |||
| TOTAL NET ASSETS - 100.0% | $12,858,953,979 | ||||
| MULTIMANAGER LIFESTYLE BALANCED PORTFOLIO | |||||
| As of 6-30-17 (unaudited) | |||||
| Shares | Value | ||||
| AFFILIATED INVESTMENT COMPANIES (A) - 100.0% | |||||
| Equity - 58.5% | |||||
| Blue Chip Growth, Class NAV (T. Rowe Price) | 8,172,420 | $300,663,336 | |||
| Capital Appreciation, Class NAV (Jennison) | 16,821,962 | 290,178,846 | |||
| Capital Appreciation Value, Class NAV (T. Rowe Price) | 47,467,623 | 572,459,532 | |||
| Disciplined Value, Class NAV (Boston Partners) | 15,147,700 | 312,951,477 | |||
| Emerging Markets, Class NAV (DFA) | 18,359,458 | 197,547,764 | |||
| Emerging Markets Equity, Class NAV (JHAM) (B)(C) | 18,839,964 | 198,573,224 | |||
| Equity Income, Class NAV (T. Rowe Price) | 20,045,260 | 402,308,372 | |||
| Fundamental Global Franchise, Class NAV (JHAM) (B)(C) | 12,610,024 | 170,865,828 | |||
| Fundamental Large Cap Core, Class NAV (JHAM) (B)(C) | 6,025,254 | 305,118,878 | |||
| Global Equity, Class NAV (JHAM) (B)(C) | 18,032,585 | 216,571,351 | |||
| Global Shareholder Yield, Class NAV (Epoch) | 14,730,280 | 164,389,929 | |||
| International Growth, Class NAV (Wellington) | 6,320,162 | 156,044,789 | |||
| International Growth Stock, Class NAV (Invesco) | 17,316,950 | 234,991,012 | |||
| International Small Cap, Class NAV (Franklin Templeton) | 6,061,395 | 124,016,144 | |||
| International Small Company, Class NAV (DFA) | 10,465,497 | 124,016,144 | |||
| International Strategic Equity Allocation, Class NAV (JHAM) (B)(C) | 53,200,143 | 602,757,624 | |||
| International Value, Class NAV (Templeton) | 20,583,829 | 342,720,759 | |||
| International Value Equity, Class NAV (JHAM) (B)(C) | 17,942,332 | 150,895,012 | |||
| Mid Cap Stock, Class NAV (Wellington) | 14,641,981 | 318,170,252 | |||
| Mid Value, Class NAV (T. Rowe Price) | 13,893,780 | 221,883,670 | |||
| New Opportunities, Class NAV (Brandywine/Invesco/DFA) | 1,406,717 | 39,162,993 | |||
| Small Cap Core, Class NAV (JHAM) (B)(C) | 2,975,911 | 39,162,993 | |||
| Small Cap Growth, Class NAV (Wellington) (D) | 5,752,592 | 52,751,272 | |||
| Small Cap Value, Class NAV (Wellington) | 3,028,200 | 63,319,670 | |||
| Small Company Growth, Class NAV (Invesco) | 2,675,122 | 53,261,670 | |||
| Small Company Value, Class NAV | |||||
| (T. Rowe Price) | 1,456,201 | 42,258,959 | |||
| Strategic Growth, Class NAV (JHAM) (B)(C) | 16,376,593 | 293,468,546 | |||
| Strategic Income Opportunities, Class NAV (JHAM) (B)(C) | 60,703,252 | 657,416,223 | |||
| U.S. Strategic Equity Allocation, Class NAV (JHAM) (B)(C) | 58,245,759 | 661,671,820 | |||
| Value, Class NAV (Invesco) | 8,323,743 | 95,556,574 | |||
| Value Equity, Class NAV (Barrow Hanley) | 14,888,024 | 178,805,171 | |||
| Fixed income - 32.1% | |||||
| Asia Pacific Total Return Bond, Class NAV (JHAM) (B)(C) | 13,499,560 | 130,540,740 | |||
| Shares | Value | ||||
| Fixed income - (continued) | |||||
| Bond, Class NAV (JHAM) (B)(C) | 43,808,014 | $697,861,668 | |||
| Core Bond, Class NAV (Wells Capital) | 18,076,506 | 234,271,517 | |||
| Emerging Markets Debt, Class NAV (JHAM) (B)(C) | 23,156,140 | 222,762,071 | |||
| Floating Rate Income, Class NAV (WAMCO) | 65,339,752 | 554,734,492 | |||
| Global Bond, Class NAV (PIMCO) | 10,527,479 | 130,540,741 | |||
| Global Income, Class NAV (Stone Harbor) | 11,661,639 | 110,202,493 | |||
| Global Short Duration Credit, Class NAV (JHAM) (B)(C) | 14,322,388 | 131,049,849 | |||
| High Yield, Class NAV (JHAM) (B)(C)* | 33,176,633 | 116,781,746 | |||
| High Yield, Class NAV (WAMCO) | 7,263,831 | 59,200,226 | |||
| Real Return Bond, Class NAV (PIMCO) | 32,310,566 | 355,739,330 | |||
| Short Duration Credit Opportunities, Class NAV (Stone Harbor) | 45,183,246 | 438,277,482 | |||
| Spectrum Income, Class NAV (T. Rowe Price) | 33,943,019 | 365,226,884 | |||
| Total Return, Class NAV (PIMCO) | 39,018,647 | 529,092,850 | |||
| U.S. High Yield Bond, Class NAV (Wells Capital) | 7,567,428 | 85,360,590 | |||
| Alternative and specialty - 9.4% | |||||
| Absolute Return Currency, Class NAV (First Quadrant) (D) | 22,966,390 | 233,338,520 | |||
| Financial Industries, Class NAV (JHAM) (B)(C) | 8,097,880 | 161,390,698 | |||
| Global Absolute Return Strategies, Class NAV (Standard Life) (D) | 26,369,228 | 271,866,736 | |||
| Global Real Estate, Class NAV (Deutsche) | 6,805,878 | 64,655,840 | |||
| Natural Resources, Class NAV (Jennison) | 9,186,067 | 99,209,519 | |||
| Real Estate Equity, Class NAV (T. Rowe Price) | 6,246,530 | 64,089,402 | |||
| Science & Technology, Class NAV (T. Rowe Price/Allianz) | 11,164,042 | 144,685,979 | |||
| Seaport, Class NAV (Wellington) | 3,114,735 | 36,535,837 | |||
| Technical Opportunities, Class NAV (Wellington) | 11,786,819 | 151,814,231 | |||
| TOTAL AFFILIATED INVESTMENT COMPANIES (Cost $10,979,194,202) | $12,973,189,275 | ||||
| SHORT-TERM INVESTMENTS - 0.0% | |||||
| Money market funds - 0.0% | |||||
| State Street Institutional U.S. Government Money Market Fund, Premier Class 0.8844% (E) | 1,003 | 1,003 | |||
| TOTAL SHORT-TERM INVESTMENTS (Cost $1,003) | $1,003 | ||||
| Total Investments (Multimanager Lifestyle Balanced Portfolio) | |||||
| (Cost $10,979,195,205) - 100.0% | $12,973,190,278 | ||||
| Other assets and liabilities, net - 0.0% | (2,848,330 | ) | |||
| TOTAL NET ASSETS - 100.0% | $12,970,341,948 | ||||
| MULTIMANAGER LIFESTYLE MODERATE PORTFOLIO | |||||
| As of 6-30-17 (unaudited) | |||||
| Shares | Value | ||||
| AFFILIATED INVESTMENT COMPANIES (A) - 100.0% | |||||
| Equity - 42.7% | |||||
| Blue Chip Growth, Class NAV (T. Rowe Price) | 1,216,770 | $44,764,972 | |||
| Capital Appreciation, Class NAV (Jennison) | 2,511,465 | 43,322,776 | |||
| Capital Appreciation Value, Class NAV (T. Rowe Price) | 13,962,162 | 168,383,676 | |||
| 20 | JOHN HANCOCK MULTIMANAGER LIFESTYLE PORTFOLIOS | SEMIANNUAL REPORT | SEE NOTES TO FINANCIAL STATEMENTS |
| Shares | Value | ||||
| Equity - (continued) | |||||
| Disciplined Value, Class NAV (Boston Partners) | 2,245,875 | $46,399,778 | |||
| Emerging Markets, Class NAV (DFA) | 3,102,276 | 33,380,493 | |||
| Emerging Markets Equity, Class NAV (JHAM) (B)(C) | 3,186,481 | 33,585,507 | |||
| Equity Income, Class NAV (T. Rowe Price) | 2,972,524 | 59,658,554 | |||
| Fundamental Global Franchise, Class NAV (JHAM) (B)(C) | 3,823,421 | 51,807,361 | |||
| Fundamental Large Cap Core, Class NAV (JHAM) (B)(C) | 2,283,754 | 115,649,281 | |||
| Global Equity, Class NAV (JHAM) (B)(C) | 5,783,777 | 69,463,163 | |||
| Global Shareholder Yield, Class NAV (Epoch) | 4,649,033 | 51,883,213 | |||
| International Growth, Class NAV (Wellington) | 1,251,385 | 30,896,695 | |||
| International Growth Stock, Class NAV (Invesco) | 3,424,552 | 46,471,169 | |||
| International Small Cap, Class NAV (Franklin Templeton) | 1,063,619 | 21,761,642 | |||
| International Small Company, Class NAV (DFA) | 1,836,426 | 21,761,642 | |||
| International Strategic Equity Allocation, Class NAV (JHAM) (B)(C) | 12,548,035 | 142,169,237 | |||
| International Value, Class NAV (Templeton) | 3,698,175 | 61,574,606 | |||
| International Value Equity, Class NAV (JHAM) (B)(C) | 3,594,058 | 30,226,025 | |||
| Mid Cap Stock, Class NAV (Wellington) | 2,688,025 | 58,410,784 | |||
| Mid Value, Class NAV (T. Rowe Price) | 3,685,370 | 58,855,351 | |||
| Small Cap Growth, Class NAV (Wellington) (D) | 1,250,951 | 11,471,217 | |||
| Small Cap Value, Class NAV (Wellington) | 1,085,721 | 22,702,416 | |||
| Small Company Growth, Class NAV (Invesco) | 579,688 | 11,541,584 | |||
| Strategic Growth, Class NAV (JHAM) (B)(C) | 2,435,108 | 43,637,132 | |||
| Strategic Income Opportunities, Class NAV (JHAM) (B)(C) | 21,791,000 | 235,996,526 | |||
| U.S. Strategic Equity Allocation, Class NAV (JHAM) (B)(C) | 12,657,488 | 143,789,063 | |||
| Value Equity, Class NAV (Barrow Hanley) | 2,207,626 | 26,513,594 | |||
| Fixed income - 50.7% | |||||
| Asia Pacific Total Return Bond, Class NAV (JHAM) (B)(C) | 7,364,835 | 71,217,957 | |||
| Bond, Class NAV (JHAM) (B)(C) | 19,345,632 | 308,175,925 | |||
| Core Bond, Class NAV (Wells Capital) | 22,622,875 | 293,192,458 | |||
| Emerging Markets Debt, Class NAV (JHAM) (B)(C) | 9,532,043 | 91,698,254 | |||
| Floating Rate Income, Class NAV (WAMCO) | 26,097,406 | 221,566,977 | |||
| Global Bond, Class NAV (PIMCO) | 6,275,285 | 77,813,531 | |||
| Global Income, Class NAV (Stone Harbor) | 4,585,834 | 43,336,127 | |||
| Global Short Duration Credit, Class NAV (JHAM) (B)(C) | 5,653,331 | 51,727,976 | |||
| High Yield, Class NAV (JHAM) (B)(C)* | 13,045,385 | 45,919,756 | |||
| High Yield, Class NAV (WAMCO) | 2,856,486 | 23,280,359 | |||
| Real Return Bond, Class NAV (PIMCO) | 14,231,755 | 156,691,619 | |||
| Short Duration Credit Opportunities, Class NAV (Stone Harbor) | 16,219,828 | 157,332,336 | |||
| Spectrum Income, Class NAV (T. Rowe Price) | 12,185,154 | 131,112,258 | |||
| Total Return, Class NAV (PIMCO) | 21,536,789 | 292,038,859 | |||
| U.S. High Yield Bond, Class NAV (Wells Capital) | 2,975,833 | 33,567,397 | |||
| Alternative and specialty - 6.6% | |||||
| Absolute Return Currency, Class NAV (First Quadrant) (D) | 7,827,793 | 79,530,379 | |||
| Enduring Assets, Class NAV (Wellington) | 1,637,979 | 19,147,977 |
| Shares | Value | ||||
| Alternative and specialty - (continued) | |||||
| Global Absolute Return Strategies, Class NAV (Standard Life) (D) | 9,025,597 | $93,053,906 | |||
| Global Real Estate, Class NAV (Deutsche) | 2,063,775 | 19,605,867 | |||
| Natural Resources, Class NAV (Jennison) | 1,670,805 | 18,044,691 | |||
| Real Estate Equity, Class NAV (T. Rowe Price) | 1,913,376 | 19,631,243 | |||
| Seaport, Class NAV (Wellington) | 910,741 | 10,682,988 | |||
| TOTAL AFFILIATED INVESTMENT COMPANIES (Cost $3,567,299,239) | $3,944,446,297 | ||||
| SHORT-TERM INVESTMENTS - 0.0% | |||||
| Money market funds - 0.0% | |||||
| State Street Institutional U.S. Government Money Market Fund, Premier Class 0.8844% (E) | 1,003 | 1,003 | |||
| TOTAL SHORT-TERM INVESTMENTS (Cost $1,003) | $1,003 | ||||
| Total Investments (Multimanager Lifestyle Moderate Portfolio) | |||||
| (Cost $3,567,300,242) - 100.0% | $3,944,447,300 | ||||
| Other assets and liabilities, net - 0.0% | (417,697 | ) | |||
| TOTAL NET ASSETS - 100.0% | $3,944,029,603 | ||||
| MULTIMANAGER LIFESTYLE CONSERVATIVE PORTFOLIO | |||||
| As of 6-30-17 (unaudited) | |||||
| Shares | Value | ||||
| AFFILIATED INVESTMENT COMPANIES (A) - 100.0% | |||||
| Equity - 23.4% | |||||
| Blue Chip Growth, Class NAV (T. Rowe Price) | 229,499 | $8,443,274 | |||
| Capital Appreciation, Class NAV (Jennison) | 473,936 | 8,175,391 | |||
| Capital Appreciation Value, Class NAV (T. Rowe Price) | 7,139,119 | 86,097,776 | |||
| Disciplined Value, Class NAV (Boston Partners) | 424,714 | 8,774,586 | |||
| Emerging Markets, Class NAV (DFA) | 1,163,099 | 12,514,943 | |||
| Emerging Markets Equity, Class NAV (JHAM) (B)(C) | 1,196,893 | 12,615,257 | |||
| Equity Income, Class NAV (T. Rowe Price) | 562,718 | 11,293,751 | |||
| Fundamental Global Franchise, Class NAV (JHAM) (B)(C) | 1,944,892 | 26,353,286 | |||
| Fundamental Large Cap Core, Class NAV (JHAM) (B)(C) | 618,322 | 31,311,820 | |||
| Global Equity, Class NAV (JHAM) (B)(C) | 2,793,496 | 33,549,888 | |||
| Global Shareholder Yield, Class NAV (Epoch) | 2,137,214 | 23,851,306 | |||
| International Growth, Class NAV (Wellington) | 114,595 | 2,829,356 | |||
| International Growth Stock, Class NAV (Invesco) | 1,206,420 | 16,371,114 | |||
| International Strategic Equity Allocation, Class NAV (JHAM) (B)(C) | 6,386,703 | 72,361,338 | |||
| International Value, Class NAV (Templeton) | 1,941,702 | 32,329,334 | |||
| International Value Equity, Class NAV (JHAM) (B)(C) | 840,195 | 7,066,036 | |||
| Mid Cap Stock, Class NAV (Wellington) | 843,636 | 18,332,208 | |||
| Mid Value, Class NAV (T. Rowe Price) | 1,160,461 | 18,532,556 | |||
| Small Cap Growth, Class NAV (Wellington) (D) | 735,460 | 6,744,168 | |||
| Small Cap Value, Class NAV (Wellington) | 320,930 | 6,710,656 | |||
| Strategic Growth, Class NAV (JHAM) (B)(C) | 459,526 | 8,234,713 | |||
| SEE NOTES TO FINANCIAL STATEMENTS | SEMIANNUAL REPORT | JOHN HANCOCK MULTIMANAGER LIFESTYLE PORTFOLIOS | 21 |
| Shares | Value | ||||
| Equity - (continued) | |||||
| Strategic Income Opportunities, Class NAV (JHAM) (B)(C) | 19,023,092 | $206,020,090 | |||
| U.S. Strategic Equity Allocation, Class NAV (JHAM) (B)(C) | 3,860,873 | 43,859,517 | |||
| Value Equity, Class NAV (Barrow Hanley) | 417,995 | 5,020,119 | |||
| Fixed income - 66.8% | |||||
| Asia Pacific Total Return Bond, Class NAV (JHAM) (B)(C) | 5,963,237 | 57,664,502 | |||
| Bond, Class NAV (JHAM) (B)(C) | 20,083,311 | 319,927,151 | |||
| Core Bond, Class NAV (Wells Capital) | 22,931,274 | 297,189,310 | |||
| Emerging Markets Debt, Class NAV (JHAM) (B)(C) | 10,170,997 | 97,844,990 | |||
| Floating Rate Income, Class NAV (WAMCO) | 21,448,578 | 182,098,427 | |||
| Global Bond, Class NAV (PIMCO) | 6,894,041 | 85,486,107 | |||
| Global Income, Class NAV (Stone Harbor) | 3,058,160 | 28,899,610 | |||
| Global Short Duration Credit, Class NAV (JHAM) (B)(C) | 3,445,939 | 31,530,343 | |||
| High Yield, Class NAV (JHAM) (B)(C)* | 8,702,270 | 30,631,990 | |||
| High Yield, Class NAV (WAMCO) | 1,905,517 | 15,529,961 | |||
| Real Return Bond, Class NAV (PIMCO) | 16,191,706 | 178,270,688 | |||
| Short Duration Credit Opportunities, Class NAV (Stone Harbor) | 14,159,561 | 137,347,739 | |||
| Short Term Government Income, Class NAV (JHAM) (B)(C) | 12,811,307 | 121,323,077 | |||
| Spectrum Income, Class NAV (T. Rowe Price) | 10,637,075 | 114,454,931 | |||
| Total Return, Class NAV (PIMCO) | 21,989,931 | 298,183,461 | |||
| U.S. High Yield Bond, Class NAV (Wells Capital) | 1,984,841 | 22,389,002 | |||
| Alternative and specialty - 9.8% | |||||
| Absolute Return Currency, Class NAV (First Quadrant) (D) | 8,852,602 | 89,942,439 | |||
| Enduring Assets, Class NAV (Wellington) | 4,333,187 | 50,654,955 | |||
| Global Absolute Return Strategies, Class NAV (Standard Life) (D) | 10,190,295 | 105,061,937 | |||
| Global Real Estate, Class NAV (Deutsche) | 1,895,593 | 18,008,129 | |||
| Natural Resources, Class NAV (Jennison) | 904,372 | 9,767,221 | |||
| Real Estate Equity, Class NAV (T. Rowe Price) | 1,759,956 | 18,057,146 | |||
| Seaport, Class NAV (Wellington) | 413,032 | 4,844,863 | |||
| TOTAL AFFILIATED INVESTMENT COMPANIES (Cost $2,877,980,787) | $3,022,500,462 | ||||
| SHORT-TERM INVESTMENTS - 0.0% | |||||
| Money market funds - 0.0% | |||||
| State Street Institutional U.S. Government Money Market Fund, Premier Class 0.8844% (E) | 1,003 | 1,003 | |||
| TOTAL SHORT-TERM INVESTMENTS (Cost $1,003) | $1,003 | ||||
| Total Investments (Multimanager Lifestyle | |||||
| Conservative Portfolio) | |||||
| (Cost $2,877,981,790) - 100.0% | $3,022,501,465 | ||||
| Other assets and liabilities, net - 0.0% | (907,442 | ) | |||
| TOTAL NET ASSETS - 100.0% | $3,021,594,023 | ||||
| (A) | The underlying funds’ subadvisor is shown parenthetically. |
| (B) | The subadvisor is an affiliate of the advisor. |
| (C) | Manulife Asset Management (US) LLC is doing business as John Hancock Asset Management. |
| (D) | Non-income producing. |
| (E) | The rate shown is the annualized seven-day yield as of 6-30-17. |
| * | Formerly known as Focused High Yield Fund. |
| 22 | JOHN HANCOCK MULTIMANAGER LIFESTYLE PORTFOLIOS | SEMIANNUAL REPORT | SEE NOTES TO FINANCIAL STATEMENTS |
Financial statements
STATEMENTS OF ASSETS AND LIABILITIES 6-30-17 (unaudited)
| Multimanager Lifestyle Aggressive Portfolio | Multimanager Lifestyle Growth Portfolio | Multimanager Lifestyle Balanced Portfolio | Multimanager Lifestyle Moderate Portfolio | Multimanager Lifestyle Conservative Portfolio | ||||||||||||||||||||||||||||||||||||||||||||||||||||||||
| Assets | ||||||||||||||||||||||||||||||||||||||||||||||||||||||||||||
| Investments in unaffiliated funds, at value | $1,003 | $1,003 | $1,003 | $1,003 | $1,003 | |||||||||||||||||||||||||||||||||||||||||||||||||||||||
| Investments in affiliated funds, at value | 4,170,161,039 | 12,860,161,682 | 12,973,189,275 | 3,944,446,297 | 3,022,500,462 | |||||||||||||||||||||||||||||||||||||||||||||||||||||||
| Total investments, at value | 4,170,162,042 | 12,860,162,685 | 12,973,190,278 | 3,944,447,300 | 3,022,501,465 | |||||||||||||||||||||||||||||||||||||||||||||||||||||||
| Receivable for investments sold | 19,694,822 | 48,809,943 | 47,130,925 | 12,039,550 | 7,314,018 | |||||||||||||||||||||||||||||||||||||||||||||||||||||||
| Receivable for fund shares sold | 605,024 | 2,647,488 | 2,907,636 | 1,383,696 | 794,118 | |||||||||||||||||||||||||||||||||||||||||||||||||||||||
| Dividends and interest receivable | 105,556 | 4,950,021 | 10,193,810 | 3,994,832 | 3,492,867 | |||||||||||||||||||||||||||||||||||||||||||||||||||||||
| Receivable due from advisor | 23 | 81 | 89 | 34 | 30 | |||||||||||||||||||||||||||||||||||||||||||||||||||||||
| Other assets | 85,039 | 115,895 | 126,416 | 88,820 | 88,212 | |||||||||||||||||||||||||||||||||||||||||||||||||||||||
| Total assets | 4,190,652,506 | 12,916,686,113 | 13,033,549,154 | 3,961,954,232 | 3,034,190,710 | |||||||||||||||||||||||||||||||||||||||||||||||||||||||
| Liabilities | ||||||||||||||||||||||||||||||||||||||||||||||||||||||||||||
| Due to custodian | 21,268 | 94,728 | 109,796 | 43,758 | 40,390 | |||||||||||||||||||||||||||||||||||||||||||||||||||||||
| Payable for investments purchased | — | 4,892,437 | 10,374,833 | 4,093,743 | 3,609,503 | |||||||||||||||||||||||||||||||||||||||||||||||||||||||
| Payable for fund shares repurchased | 20,392,741 | 51,888,854 | 51,765,215 | 13,361,532 | 8,461,609 | |||||||||||||||||||||||||||||||||||||||||||||||||||||||
| Distributions payable | — | — | 75,696 | 117,200 | 239,075 | |||||||||||||||||||||||||||||||||||||||||||||||||||||||
| Payable to affiliates | ||||||||||||||||||||||||||||||||||||||||||||||||||||||||||||
| Accounting and legal services fees | 148,939 | 455,946 | 458,011 | 137,869 | 104,645 | |||||||||||||||||||||||||||||||||||||||||||||||||||||||
| Transfer agent fees | 61,708 | 233,110 | 258,686 | 102,633 | 91,123 | |||||||||||||||||||||||||||||||||||||||||||||||||||||||
| Trustees' fees | 1,618 | 5,856 | 6,338 | 1,743 | 527 | |||||||||||||||||||||||||||||||||||||||||||||||||||||||
| Distribution and service fees | 8,356 | 20,760 | 21,579 | 8,746 | 6,676 | |||||||||||||||||||||||||||||||||||||||||||||||||||||||
| Other liabilities and accrued expenses | 49,679 | 140,443 | 137,052 | 57,405 | 43,139 | |||||||||||||||||||||||||||||||||||||||||||||||||||||||
| Total liabilities | 20,684,309 | 57,732,134 | 63,207,206 | 17,924,629 | 12,596,687 | |||||||||||||||||||||||||||||||||||||||||||||||||||||||
| Net assets | $4,169,968,197 | $12,858,953,979 | $12,970,341,948 | $3,944,029,603 | $3,021,594,023 | |||||||||||||||||||||||||||||||||||||||||||||||||||||||
| Net assets consist of | ||||||||||||||||||||||||||||||||||||||||||||||||||||||||||||
| Paid-in capital | $3,041,828,908 | $10,016,640,261 | $10,825,491,681 | $3,500,036,512 | $2,903,312,117 | |||||||||||||||||||||||||||||||||||||||||||||||||||||||
| Undistributed net investment income (loss) | (1,367,634 | ) | 29,097,105 | 498,269 | 199,372 | 184,577 | ||||||||||||||||||||||||||||||||||||||||||||||||||||||
| Accumulated undistributed net realized gain (loss) on investments | 134,910,485 | 275,943,019 | 150,356,925 | 66,646,661 | (26,422,346 | ) | ||||||||||||||||||||||||||||||||||||||||||||||||||||||
| Net unrealized appreciation (depreciation) on investments | 994,596,438 | 2,537,273,594 | 1,993,995,073 | 377,147,058 | 144,519,675 | |||||||||||||||||||||||||||||||||||||||||||||||||||||||
| Net assets | $4,169,968,197 | $12,858,953,979 | $12,970,341,948 | $3,944,029,603 | $3,021,594,023 | |||||||||||||||||||||||||||||||||||||||||||||||||||||||
| Investments in unaffiliated funds, at cost | $1,003 | $1,003 | $1,003 | $1,003 | $1,003 | |||||||||||||||||||||||||||||||||||||||||||||||||||||||
| Investments in affiliated funds, at cost | $3,175,564,601 | $10,322,888,088 | $10,979,194,202 | $3,567,299,239 | $2,877,980,787 | |||||||||||||||||||||||||||||||||||||||||||||||||||||||
| Net asset value per share | ||||||||||||||||||||||||||||||||||||||||||||||||||||||||||||
| The portfolios have an unlimited number of shares authorized with par value of $0.01 per share. Net asset value is calculated by dividing the net assets of each class of shares by the number of outstanding shares in the class. | ||||||||||||||||||||||||||||||||||||||||||||||||||||||||||||
| Class A1 | ||||||||||||||||||||||||||||||||||||||||||||||||||||||||||||
| Net assets | $457,830,277 | $1,645,005,335 | $1,794,340,063 | $683,905,450 | $608,834,363 | |||||||||||||||||||||||||||||||||||||||||||||||||||||||
| Shares outstanding | 27,881,686 | 101,482,154 | 116,611,066 | 48,842,388 | 46,690,748 | |||||||||||||||||||||||||||||||||||||||||||||||||||||||
| Net asset value and redemption price per share | $16.42 | $16.21 | $15.39 | $14.00 | $13.04 | |||||||||||||||||||||||||||||||||||||||||||||||||||||||
| Class B1 | ||||||||||||||||||||||||||||||||||||||||||||||||||||||||||||
| Net assets | $10,964,496 | $51,073,487 | $52,741,890 | $22,530,347 | $19,902,488 | |||||||||||||||||||||||||||||||||||||||||||||||||||||||
| Shares outstanding | 668,478 | 3,152,072 | 3,429,661 | 1,610,430 | 1,525,526 | |||||||||||||||||||||||||||||||||||||||||||||||||||||||
| Net asset value, offering price and redemption price per share | $16.40 | $16.20 | $15.38 | $13.99 | $13.05 | |||||||||||||||||||||||||||||||||||||||||||||||||||||||
| Class C1 | ||||||||||||||||||||||||||||||||||||||||||||||||||||||||||||
| Net assets | $150,185,453 | $644,329,334 | $749,183,926 | $326,884,774 | $285,922,566 | |||||||||||||||||||||||||||||||||||||||||||||||||||||||
| Shares outstanding | 9,148,980 | 39,810,398 | 48,670,779 | 23,341,761 | 21,923,344 | |||||||||||||||||||||||||||||||||||||||||||||||||||||||
| Net asset value, offering price and redemption price per share | $16.42 | $16.18 | $15.39 | $14.00 | $13.04 | |||||||||||||||||||||||||||||||||||||||||||||||||||||||
| Class I | ||||||||||||||||||||||||||||||||||||||||||||||||||||||||||||
| Net assets | $7,494,070 | $30,286,012 | $33,332,712 | $9,762,362 | $12,798,420 | |||||||||||||||||||||||||||||||||||||||||||||||||||||||
| Shares outstanding | 457,103 | 1,875,416 | 2,178,320 | 699,852 | 983,149 | |||||||||||||||||||||||||||||||||||||||||||||||||||||||
| Net asset value, offering price and redemption price per share | $16.39 | $16.15 | $15.30 | $13.95 | $13.02 | |||||||||||||||||||||||||||||||||||||||||||||||||||||||
| Class R1 | ||||||||||||||||||||||||||||||||||||||||||||||||||||||||||||
| Net assets | $6,749,469 | $18,506,041 | $16,874,065 | $6,178,917 | $7,131,441 | |||||||||||||||||||||||||||||||||||||||||||||||||||||||
| Shares outstanding | 411,021 | 1,138,537 | 1,101,582 | 442,052 | 547,319 | |||||||||||||||||||||||||||||||||||||||||||||||||||||||
| Net asset value, offering price and redemption price per share | $16.42 | $16.25 | $15.32 | $13.98 | $13.03 | |||||||||||||||||||||||||||||||||||||||||||||||||||||||
STATEMENTS OF ASSETS AND LIABILITIES 6-30-17 (unaudited)
Continued
| Multimanager Lifestyle Aggressive Portfolio | Multimanager Lifestyle Growth Portfolio | Multimanager Lifestyle Balanced Portfolio | Multimanager Lifestyle Moderate Portfolio | Multimanager Lifestyle Conservative Portfolio | |||||||||||||||||||||||||||||||||||||||||||||
| Class R2 | |||||||||||||||||||||||||||||||||||||||||||||||||
| Net assets | $6,858,883 | $16,550,599 | $14,937,214 | $6,989,251 | $2,977,197 | ||||||||||||||||||||||||||||||||||||||||||||
| Shares outstanding | 420,147 | 1,027,731 | 975,839 | 500,865 | 228,596 | ||||||||||||||||||||||||||||||||||||||||||||
| Net asset value, offering price and redemption price per share | $16.32 | $16.10 | $15.31 | $13.95 | $13.02 | ||||||||||||||||||||||||||||||||||||||||||||
| Class R3 | |||||||||||||||||||||||||||||||||||||||||||||||||
| Net assets | $4,737,311 | $12,814,950 | $15,133,967 | $5,789,902 | $4,728,507 | ||||||||||||||||||||||||||||||||||||||||||||
| Shares outstanding | 289,472 | 792,641 | 985,963 | 414,383 | 363,571 | ||||||||||||||||||||||||||||||||||||||||||||
| Net asset value, offering price and redemption price per share | $16.37 | $16.17 | $15.35 | $13.97 | $13.01 | ||||||||||||||||||||||||||||||||||||||||||||
| Class R4 | |||||||||||||||||||||||||||||||||||||||||||||||||
| Net assets | $7,026,785 | $11,480,806 | $17,583,919 | $7,385,658 | $4,328,589 | ||||||||||||||||||||||||||||||||||||||||||||
| Shares outstanding | 429,321 | 708,648 | 1,145,017 | 529,531 | 332,638 | ||||||||||||||||||||||||||||||||||||||||||||
| Net asset value, offering price and redemption price per share | $16.37 | $16.20 | $15.36 | $13.95 | $13.01 | ||||||||||||||||||||||||||||||||||||||||||||
| Class R5 | |||||||||||||||||||||||||||||||||||||||||||||||||
| Net assets | $7,566,081 | $25,935,784 | $21,582,128 | $10,178,049 | $8,635,859 | ||||||||||||||||||||||||||||||||||||||||||||
| Shares outstanding | 461,184 | 1,597,265 | 1,403,515 | 729,025 | 663,259 | ||||||||||||||||||||||||||||||||||||||||||||
| Net asset value, offering price and redemption price per share | $16.41 | $16.24 | $15.38 | $13.96 | $13.02 | ||||||||||||||||||||||||||||||||||||||||||||
| Class R6 | |||||||||||||||||||||||||||||||||||||||||||||||||
| Net assets | $17,440,015 | $46,723,120 | $46,113,109 | $28,165,963 | $13,027,328 | ||||||||||||||||||||||||||||||||||||||||||||
| Shares outstanding | 1,063,454 | 2,890,731 | 3,014,272 | 2,020,366 | 1,001,381 | ||||||||||||||||||||||||||||||||||||||||||||
| Net asset value, offering price and redemption price per share | $16.40 | $16.16 | $15.30 | $13.94 | $13.01 | ||||||||||||||||||||||||||||||||||||||||||||
| Class 1 | |||||||||||||||||||||||||||||||||||||||||||||||||
| Net assets | $3,493,115,357 | $10,065,214,926 | $10,049,441,820 | $2,776,365,587 | $2,053,307,265 | ||||||||||||||||||||||||||||||||||||||||||||
| Shares outstanding | 213,323,570 | 622,688,993 | 657,085,765 | 198,877,103 | 157,792,923 | ||||||||||||||||||||||||||||||||||||||||||||
| Net asset value, offering price and redemption price per share | $16.37 | $16.16 | $15.29 | $13.96 | $13.01 | ||||||||||||||||||||||||||||||||||||||||||||
| Class 5 | |||||||||||||||||||||||||||||||||||||||||||||||||
| Net assets | — | $291,033,585 | $159,077,135 | $59,893,343 | — | ||||||||||||||||||||||||||||||||||||||||||||
| Shares outstanding | — | 18,025,192 | 10,396,754 | 4,295,111 | — | ||||||||||||||||||||||||||||||||||||||||||||
| Net asset value, offering price and redemption price per share | — | $16.15 | $15.30 | $13.94 | — | ||||||||||||||||||||||||||||||||||||||||||||
| Maximum Public Offering Price Per Share: | |||||||||||||||||||||||||||||||||||||||||||||||||
| Class A (net asset value per share ÷ 95%)2 | $17.28 | $17.06 | $16.20 | $14.74 | $13.73 | ||||||||||||||||||||||||||||||||||||||||||||
| 1 | Redemption price per share is equal to net asset value less any applicable contingent deferred sales charge. | |||||||||||||||||||||||||||||||||||||
| 2 | On single retail sales of less than $50,000. On sales of $50,000 or more and on group sales the offering price is reduced. | |||||||||||||||||||||||||||||||||||||
STATEMENTS OF OPERATIONS For the six months ended 6-30-17 (unaudited)
| Multimanager Lifestyle Aggressive Portfolio | Multimanager Lifestyle Growth Portfolio | Multimanager Lifestyle Balanced Portfolio | Multimanager Lifestyle Moderate Portfolio | Multimanager Lifestyle Conservative Portfolio | ||||||||||||||||||||||||||||||||||||||||||||||||||||||||||||||
| Investment income | ||||||||||||||||||||||||||||||||||||||||||||||||||||||||||||||||||
| Income distributions received from affiliated funds | $2,775,712 | $43,355,549 | $81,198,518 | $33,567,287 | $30,461,935 | |||||||||||||||||||||||||||||||||||||||||||||||||||||||||||||
| Interest | 88 | 12 | 13 | 7 | 7 | |||||||||||||||||||||||||||||||||||||||||||||||||||||||||||||
| Total investment income | 2,775,800 | 43,355,561 | 81,198,531 | 33,567,294 | 30,461,942 | |||||||||||||||||||||||||||||||||||||||||||||||||||||||||||||
| Expenses | ||||||||||||||||||||||||||||||||||||||||||||||||||||||||||||||||||
| Investment management fees | 2,172,264 | 5,887,409 | 5,791,987 | 1,753,475 | 1,277,188 | |||||||||||||||||||||||||||||||||||||||||||||||||||||||||||||
| Distribution and service fees | 2,421,710 | 8,682,476 | 9,529,859 | 3,614,050 | 3,084,491 | |||||||||||||||||||||||||||||||||||||||||||||||||||||||||||||
| Transfer agent fees | 365,680 | 1,402,500 | 1,571,901 | 626,192 | 557,278 | |||||||||||||||||||||||||||||||||||||||||||||||||||||||||||||
| Accounting and legal services fees | 341,326 | 1,055,757 | 1,072,390 | 326,796 | 252,253 | |||||||||||||||||||||||||||||||||||||||||||||||||||||||||||||
| State registration fees | 84,918 | 104,498 | 110,044 | 93,207 | 96,545 | |||||||||||||||||||||||||||||||||||||||||||||||||||||||||||||
| Professional fees | 50,771 | 107,013 | 110,481 | 51,739 | 45,479 | |||||||||||||||||||||||||||||||||||||||||||||||||||||||||||||
| Printing and postage | 34,610 | 106,302 | 98,308 | 39,841 | 33,483 | |||||||||||||||||||||||||||||||||||||||||||||||||||||||||||||
| Custodian fees | 13,964 | 13,122 | 13,987 | 14,506 | 14,527 | |||||||||||||||||||||||||||||||||||||||||||||||||||||||||||||
| Trustees' fees | 35,882 | 112,876 | 117,028 | 35,757 | 27,614 | |||||||||||||||||||||||||||||||||||||||||||||||||||||||||||||
| Other | 25,239 | 61,085 | 63,272 | 26,181 | 16,736 | |||||||||||||||||||||||||||||||||||||||||||||||||||||||||||||
| Total expenses before reductions | 5,546,364 | 17,533,038 | 18,479,257 | 6,581,744 | 5,405,594 | |||||||||||||||||||||||||||||||||||||||||||||||||||||||||||||
| Less expense reductions | (1,402,930 | ) | (3,274,582 | ) | (2,876,013 | ) | (791,400 | ) | (451,137 | ) | ||||||||||||||||||||||||||||||||||||||||||||||||||||||||
| Net expenses | 4,143,434 | 14,258,456 | 15,603,244 | 5,790,344 | 4,954,457 | |||||||||||||||||||||||||||||||||||||||||||||||||||||||||||||
| Net investment income (loss) | (1,367,634 | ) | 29,097,105 | 65,595,287 | 27,776,950 | 25,507,485 | ||||||||||||||||||||||||||||||||||||||||||||||||||||||||||||
| Realized and unrealized gain (loss) | ||||||||||||||||||||||||||||||||||||||||||||||||||||||||||||||||||
| Net realized gain (loss) on | ||||||||||||||||||||||||||||||||||||||||||||||||||||||||||||||||||
| Investments in affiliated funds | 59,050,226 | 159,268,162 | 166,647,631 | 41,832,615 | 17,802,324 | |||||||||||||||||||||||||||||||||||||||||||||||||||||||||||||
| 59,050,226 | 159,268,162 | 166,647,631 | 41,832,615 | 17,802,324 | ||||||||||||||||||||||||||||||||||||||||||||||||||||||||||||||
| Change in net unrealized appreciation (depreciation) of | ||||||||||||||||||||||||||||||||||||||||||||||||||||||||||||||||||
| Investments in affiliated funds | 399,668,497 | 1,019,773,320 | 769,230,839 | 165,657,717 | 88,027,963 | |||||||||||||||||||||||||||||||||||||||||||||||||||||||||||||
| 399,668,497 | 1,019,773,320 | 769,230,839 | 165,657,717 | 88,027,963 | ||||||||||||||||||||||||||||||||||||||||||||||||||||||||||||||
| Net realized and unrealized gain (loss) | 458,718,723 | 1,179,041,482 | 935,878,470 | 207,490,332 | 105,830,287 | |||||||||||||||||||||||||||||||||||||||||||||||||||||||||||||
| Increase (decrease) in net assets from operations | $457,351,089 | $1,208,138,587 | $1,001,473,757 | $235,267,282 | $131,337,772 | |||||||||||||||||||||||||||||||||||||||||||||||||||||||||||||
STATEMENTS OF CHANGES IN NET ASSETS
| Multimanager Lifestyle Aggressive Portfolio | Multimanager Lifestyle Growth Portfolio | Multimanager Lifestyle Balanced Portfolio | ||||||||||||||||||||||||||||||||||||||||||||||||||||||||||||
| Six months ended 6-30-17 | Year ended 12-31-16 | Six months ended 6-30-17 | Year ended 12-31-16 | Six months ended 6-30-17 | Year ended 12-31-16 | |||||||||||||||||||||||||||||||||||||||||||||||||||||||||
| (unaudited) | (unaudited) | (unaudited) | ||||||||||||||||||||||||||||||||||||||||||||||||||||||||||||
| Increase (decrease) in net assets | ||||||||||||||||||||||||||||||||||||||||||||||||||||||||||||||
| From operations | ||||||||||||||||||||||||||||||||||||||||||||||||||||||||||||||
| Net investment income (loss) | ($1,367,634 | ) | $41,416,511 | $29,097,105 | $184,254,167 | $65,595,287 | $250,400,744 | |||||||||||||||||||||||||||||||||||||||||||||||||||||||
| Net realized gain (loss) | 59,050,226 | 177,286,406 | 159,268,162 | 427,472,623 | 166,647,631 | 342,887,568 | ||||||||||||||||||||||||||||||||||||||||||||||||||||||||
| Change in net unrealized appreciation (depreciation) | 399,668,497 | 63,547,358 | 1,019,773,320 | 250,590,415 | 769,230,839 | 309,157,109 | ||||||||||||||||||||||||||||||||||||||||||||||||||||||||
| Increase (decrease) in net assets resulting from operations | 457,351,089 | 282,250,275 | 1,208,138,587 | 862,317,205 | 1,001,473,757 | 902,445,421 | ||||||||||||||||||||||||||||||||||||||||||||||||||||||||
| Distributions to shareholders | ||||||||||||||||||||||||||||||||||||||||||||||||||||||||||||||
| From net investment income | ||||||||||||||||||||||||||||||||||||||||||||||||||||||||||||||
| Class A | — | (3,218,990 | ) | — | (19,430,324 | ) | (6,783,306 | ) | (29,899,184 | ) | ||||||||||||||||||||||||||||||||||||||||||||||||||||
| Class B | — | (7,713 | ) | — | (299,188 | ) | (21,371 | ) | (575,848 | ) | ||||||||||||||||||||||||||||||||||||||||||||||||||||
| Class C | — | (98,633 | ) | — | (3,497,576 | ) | (303,974 | ) | (7,665,867 | ) | ||||||||||||||||||||||||||||||||||||||||||||||||||||
| Class I | — | (43,057 | ) | — | (251,322 | ) | (154,427 | ) | (287,174 | ) | ||||||||||||||||||||||||||||||||||||||||||||||||||||
| Class R1 | — | (28,448 | ) | — | (161,430 | ) | (34,820 | ) | (232,529 | ) | ||||||||||||||||||||||||||||||||||||||||||||||||||||
| Class R2 | — | (44,752 | ) | — | (206,131 | ) | (48,322 | ) | (216,407 | ) | ||||||||||||||||||||||||||||||||||||||||||||||||||||
| Class R3 | — | (26,671 | ) | — | (134,021 | ) | (44,530 | ) | (305,632 | ) | ||||||||||||||||||||||||||||||||||||||||||||||||||||
| Class R4 | — | (63,105 | ) | — | (206,152 | ) | (84,548 | ) | (405,540 | ) | ||||||||||||||||||||||||||||||||||||||||||||||||||||
| Class R5 | — | (73,148 | ) | — | (338,729 | ) | (106,637 | ) | (397,004 | ) | ||||||||||||||||||||||||||||||||||||||||||||||||||||
| Class R6 | — | (210,363 | ) | — | (744,875 | ) | (264,354 | ) | (997,200 | ) | ||||||||||||||||||||||||||||||||||||||||||||||||||||
| Class 1 | — | (38,066,059 | ) | — | (156,818,267 | ) | (56,335,050 | ) | (207,293,577 | ) | ||||||||||||||||||||||||||||||||||||||||||||||||||||
| Class 5 | — | — | — | (4,208,726 | ) | (915,679 | ) | (3,056,259 | ) | |||||||||||||||||||||||||||||||||||||||||||||||||||||
| From net realized gain | ||||||||||||||||||||||||||||||||||||||||||||||||||||||||||||||
| Class A | — | (27,909,709 | ) | — | (92,322,383 | ) | — | (82,642,493 | ) | |||||||||||||||||||||||||||||||||||||||||||||||||||||
| Class B | — | (817,462 | ) | — | (3,364,282 | ) | — | (2,751,637 | ) | |||||||||||||||||||||||||||||||||||||||||||||||||||||
| Class C | — | (10,432,315 | ) | — | (39,324,335 | ) | — | (36,972,468 | ) | |||||||||||||||||||||||||||||||||||||||||||||||||||||
| Class I | — | (269,732 | ) | — | (961,952 | ) | — | (815,958 | ) | |||||||||||||||||||||||||||||||||||||||||||||||||||||
| Class R1 | — | (433,014 | ) | — | (1,051,894 | ) | — | (817,266 | ) | |||||||||||||||||||||||||||||||||||||||||||||||||||||
| Class R2 | — | (444,458 | ) | — | (1,059,704 | ) | — | (653,258 | ) | |||||||||||||||||||||||||||||||||||||||||||||||||||||
| Class R3 | — | (344,861 | ) | — | (796,682 | ) | — | (999,944 | ) | |||||||||||||||||||||||||||||||||||||||||||||||||||||
| Class R4 | — | (461,662 | ) | — | (877,509 | ) | — | (955,852 | ) | |||||||||||||||||||||||||||||||||||||||||||||||||||||
| Class R5 | — | (440,781 | ) | — | (1,259,192 | ) | — | (869,530 | ) | |||||||||||||||||||||||||||||||||||||||||||||||||||||
| Class R6 | — | (1,195,997 | ) | — | (2,660,666 | ) | — | (2,043,345 | ) | |||||||||||||||||||||||||||||||||||||||||||||||||||||
| Class 1 | — | (225,914,064 | ) | — | (577,626,577 | ) | — | (471,372,267 | ) | |||||||||||||||||||||||||||||||||||||||||||||||||||||
| Class 5 | — | — | — | (15,033,566 | ) | — | (6,995,620 | ) | ||||||||||||||||||||||||||||||||||||||||||||||||||||||
| Total distributions | — | (310,544,994 | ) | — | (922,635,483 | ) | (65,097,018 | ) | (859,221,859 | ) | ||||||||||||||||||||||||||||||||||||||||||||||||||||
| From portfolio share transactions | ||||||||||||||||||||||||||||||||||||||||||||||||||||||||||||||
| Portfolio share transactions | (288,158,604 | ) | (181,326,869 | ) | (915,734,397 | ) | (605,837,535 | ) | (943,057,746 | ) | (862,309,450 | ) | ||||||||||||||||||||||||||||||||||||||||||||||||||
| Total increase (decrease) | 169,192,485 | (209,621,588 | ) | 292,404,190 | (666,155,813 | ) | (6,681,007 | ) | (819,085,888 | ) | ||||||||||||||||||||||||||||||||||||||||||||||||||||
| Net assets | ||||||||||||||||||||||||||||||||||||||||||||||||||||||||||||||
| Beginning of period | 4,000,775,712 | 4,210,397,300 | 12,566,549,789 | 13,232,705,602 | 12,977,022,955 | 13,796,108,843 | ||||||||||||||||||||||||||||||||||||||||||||||||||||||||
| End of period | $4,169,968,197 | $4,000,775,712 | $12,858,953,979 | $12,566,549,789 | $12,970,341,948 | $12,977,022,955 | ||||||||||||||||||||||||||||||||||||||||||||||||||||||||
| Undistributed net investment income (loss) | ($1,367,634 | ) | — | $29,097,105 | — | $498,269 | — | |||||||||||||||||||||||||||||||||||||||||||||||||||||||
STATEMENTS OF CHANGES IN NET ASSETS
Continued
| Multimanager Lifestyle Moderate Portfolio | Multimanager Lifestyle Conservative Portfolio | |||||||||||||||||||||||||||||||||||||||||||
| Six months ended 6-30-17 | Year ended 12-31-16 | Six months ended 6-30-17 | Year ended 12-31-16 | |||||||||||||||||||||||||||||||||||||||||
| (unaudited) | (unaudited) | |||||||||||||||||||||||||||||||||||||||||||
| Increase (decrease) in net assets | ||||||||||||||||||||||||||||||||||||||||||||
| From operations | ||||||||||||||||||||||||||||||||||||||||||||
| Net investment income (loss) | $27,776,950 | $92,976,398 | $25,507,485 | $77,982,770 | ||||||||||||||||||||||||||||||||||||||||
| Net realized gain (loss) | 41,832,615 | 85,126,799 | 17,802,324 | 6,822,892 | ||||||||||||||||||||||||||||||||||||||||
| Change in net unrealized appreciation (depreciation) | 165,657,717 | 90,259,011 | 88,027,963 | 92,092,035 | ||||||||||||||||||||||||||||||||||||||||
| Increase (decrease) in net assets resulting from operations | 235,267,282 | 268,362,208 | 131,337,772 | 176,897,697 | ||||||||||||||||||||||||||||||||||||||||
| Distributions to shareholders | ||||||||||||||||||||||||||||||||||||||||||||
| From net investment income | ||||||||||||||||||||||||||||||||||||||||||||
| Class A | (4,059,833 | ) | (14,223,227 | ) | (4,496,809 | ) | (13,615,988 | ) | ||||||||||||||||||||||||||||||||||||
| Class B | (56,943 | ) | (359,299 | ) | (79,783 | ) | (382,135 | ) | ||||||||||||||||||||||||||||||||||||
| Class C | (820,346 | ) | (5,010,793 | ) | (1,137,479 | ) | (4,993,427 | ) | ||||||||||||||||||||||||||||||||||||
| Class I | (67,087 | ) | (95,856 | ) | (117,796 | ) | (204,955 | ) | ||||||||||||||||||||||||||||||||||||
| Class R1 | (28,141 | ) | (128,543 | ) | (41,004 | ) | (169,299 | ) | ||||||||||||||||||||||||||||||||||||
| Class R2 | (35,935 | ) | (138,493 | ) | (19,989 | ) | (117,994 | ) | ||||||||||||||||||||||||||||||||||||
| Class R3 | (29,209 | ) | (140,273 | ) | (31,986 | ) | (128,849 | ) | ||||||||||||||||||||||||||||||||||||
| Class R4 | (51,795 | ) | (212,767 | ) | (40,489 | ) | (169,125 | ) | ||||||||||||||||||||||||||||||||||||
| Class R5 | (74,348 | ) | (237,455 | ) | (71,634 | ) | (193,836 | ) | ||||||||||||||||||||||||||||||||||||
| Class R6 | (231,307 | ) | (833,683 | ) | (122,259 | ) | (366,238 | ) | ||||||||||||||||||||||||||||||||||||
| Class 1 | (21,650,054 | ) | (70,876,986 | ) | (19,163,680 | ) | (57,750,868 | ) | ||||||||||||||||||||||||||||||||||||
| Class 5 | (472,580 | ) | (1,385,919 | ) | — | — | ||||||||||||||||||||||||||||||||||||||
| From net realized gain | ||||||||||||||||||||||||||||||||||||||||||||
| Class A | — | (19,576,124 | ) | — | (9,398,309 | ) | ||||||||||||||||||||||||||||||||||||||
| Class B | — | (724,740 | ) | — | (355,913 | ) | ||||||||||||||||||||||||||||||||||||||
| Class C | — | (10,252,293 | ) | — | (4,818,492 | ) | ||||||||||||||||||||||||||||||||||||||
| Class I | — | (140,248 | ) | — | (175,734 | ) | ||||||||||||||||||||||||||||||||||||||
| Class R1 | — | (210,258 | ) | — | (141,363 | ) | ||||||||||||||||||||||||||||||||||||||
| Class R2 | — | (204,548 | ) | — | (66,999 | ) | ||||||||||||||||||||||||||||||||||||||
| Class R3 | — | (219,917 | ) | — | (91,983 | ) | ||||||||||||||||||||||||||||||||||||||
| Class R4 | — | (236,417 | ) | — | (93,031 | ) | ||||||||||||||||||||||||||||||||||||||
| Class R5 | — | (260,995 | ) | — | (110,943 | ) | ||||||||||||||||||||||||||||||||||||||
| Class R6 | — | (898,735 | ) | — | (218,440 | ) | ||||||||||||||||||||||||||||||||||||||
| Class 1 | — | (82,079,684 | ) | — | (33,556,198 | ) | ||||||||||||||||||||||||||||||||||||||
| Class 5 | — | (1,624,346 | ) | — | — | |||||||||||||||||||||||||||||||||||||||
| Total distributions | (27,577,578 | ) | (210,071,599 | ) | (25,322,908 | ) | (127,120,119 | ) | ||||||||||||||||||||||||||||||||||||
| From portfolio share transactions | ||||||||||||||||||||||||||||||||||||||||||||
| Portfolio share transactions | (273,508,694 | ) | (283,720,406 | ) | (230,957,611 | ) | (150,616,571 | ) | ||||||||||||||||||||||||||||||||||||
| Total increase (decrease) | (65,818,990 | ) | (225,429,797 | ) | (124,942,747 | ) | (100,838,993 | ) | ||||||||||||||||||||||||||||||||||||
| Net assets | ||||||||||||||||||||||||||||||||||||||||||||
| Beginning of period | 4,009,848,593 | 4,235,278,390 | 3,146,536,770 | 3,247,375,763 | ||||||||||||||||||||||||||||||||||||||||
| End of period | $3,944,029,603 | $4,009,848,593 | $3,021,594,023 | $3,146,536,770 | ||||||||||||||||||||||||||||||||||||||||
| Undistributed net investment income (loss) | $199,372 | — | $184,577 | — | ||||||||||||||||||||||||||||||||||||||||
Financial highlights
| Multimanager Lifestyle Aggressive Portfolio | ||||||||||||||||||||||||||||||||||||||||||||||||||||||||||||||||||||||||||||||||||||||||||||||||||
| Per share operating performance for a share outstanding throughout each period | Ratios and supplemental data | |||||||||||||||||||||||||||||||||||||||||||||||||||||||||||||||||||||||||||||||||||||||||||||||||
| Income (loss) from investment operations | Less Distributions | Ratios to average net assets | ||||||||||||||||||||||||||||||||||||||||||||||||||||||||||||||||||||||||||||||||||||||||||||||||
| Period ended | Net asset value, beginning of period($) | Net invest- ment income (loss) ($)1,2 | Net realized and unrealized gain (loss) on invest- ments($) | Total from invest- ment operations($) | From net invest- ment income($) | From net realized gain ($)3 | From tax return of capital($) | Total distribu- tions($) | Net asset value, end of period($) | Total return (%)4,5 | Expenses before reductions (%)6 | Expenses including reductions (%)6 | Net investment income (loss) (%)1 | Net assets, end of period (in millions) | Portfolio turnover (%) | |||||||||||||||||||||||||||||||||||||||||||||||||||||||||||||||||||||||||||||||||||
| CLASS A | ||||||||||||||||||||||||||||||||||||||||||||||||||||||||||||||||||||||||||||||||||||||||||||||||||
| 06-30-20177 | 14.72 | (0.03 | ) | 1.73 | 1.70 | — | — | — | — | 16.42 | 11.55 | 8 | 0.55 | 9 | 0.48 | 9 | (0.34 | ) 9 | 458 | 9 | ||||||||||||||||||||||||||||||||||||||||||||||||||||||||||||||||||||||||||||||
| 12-31-2016 | 14.87 | 0.12 | 0.91 | 1.03 | (0.12 | ) | (1.06 | ) | — | (1.18 | ) | 14.72 | 6.92 | 0.53 | 0.47 | 0.78 | 419 | 31 | ||||||||||||||||||||||||||||||||||||||||||||||||||||||||||||||||||||||||||||||||
| 12-31-2015 | 16.29 | 0.11 | (0.34 | ) | (0.23 | ) | (0.10 | ) | (1.09 | ) | — | (1.19 | ) | 14.87 | (1.54 | ) | 0.52 | 0.47 | 0.64 | 411 | 15 | |||||||||||||||||||||||||||||||||||||||||||||||||||||||||||||||||||||||||||||
| 12-31-2014 | 15.94 | 0.10 | 0.60 | 0.70 | (0.09 | ) | (0.26 | ) | — | (0.35 | ) | 16.29 | 4.39 | 0.53 | 0.47 | 0.59 | 393 | 18 | ||||||||||||||||||||||||||||||||||||||||||||||||||||||||||||||||||||||||||||||||
| 12-31-2013 | 12.95 | 0.09 | 3.24 | 3.33 | (0.09 | ) | (0.25 | ) | — | (0.34 | ) | 15.94 | 25.70 | 0.54 | 0.52 | 0.58 | 337 | 21 | ||||||||||||||||||||||||||||||||||||||||||||||||||||||||||||||||||||||||||||||||
| 12-31-2012 | 11.30 | 0.08 | 1.71 | 1.79 | (0.08 | ) | (0.06 | ) | — | (0.14 | ) | 12.95 | 15.83 | 0.58 | 0.57 | 0.66 | 239 | 21 | ||||||||||||||||||||||||||||||||||||||||||||||||||||||||||||||||||||||||||||||||
| CLASS B | ||||||||||||||||||||||||||||||||||||||||||||||||||||||||||||||||||||||||||||||||||||||||||||||||||
| 06-30-20177 | 14.75 | (0.08 | ) | 1.73 | 1.65 | — | — | — | — | 16.40 | 11.19 | 8 | 1.25 | 9 | 1.19 | 9 | (1.06 | ) 9 | 11 | 9 | ||||||||||||||||||||||||||||||||||||||||||||||||||||||||||||||||||||||||||||||
| 12-31-2016 | 14.90 | (0.01 | ) | 0.93 | 0.92 | (0.01 | ) | (1.06 | ) | — | (1.07 | ) | 14.75 | 6.15 | 1.23 | 1.19 | (0.08 | ) | 12 | 31 | ||||||||||||||||||||||||||||||||||||||||||||||||||||||||||||||||||||||||||||||
| 12-31-2015 | 16.33 | (0.04 | ) | (0.32 | ) | (0.36 | ) | — | (1.07 | ) | — | (1.07 | ) | 14.90 | (2.31 | ) | 1.24 | 1.21 | (0.26 | ) | 16 | 15 | ||||||||||||||||||||||||||||||||||||||||||||||||||||||||||||||||||||||||||||
| 12-31-2014 | 15.98 | (0.06 | ) | 0.63 | 0.57 | — | (0.22 | ) | — | (0.22 | ) | 16.33 | 3.58 | 1.28 | 1.26 | (0.36 | ) | 22 | 18 | |||||||||||||||||||||||||||||||||||||||||||||||||||||||||||||||||||||||||||||||
| 12-31-2013 | 12.98 | (0.05 | ) | 3.26 | 3.21 | — | (0.21 | ) | — | (0.21 | ) | 15.98 | 24.73 | 1.32 | 10 | 1.32 | (0.33 | ) | 27 | 21 | ||||||||||||||||||||||||||||||||||||||||||||||||||||||||||||||||||||||||||||||
| 12-31-2012 | 11.33 | (0.02 | ) | 1.71 | 1.69 | — | (0.04 | ) | — | (0.04 | ) | 12.98 | 14.94 | 1.37 | 10 | 1.35 | (0.18 | ) | 24 | 21 | ||||||||||||||||||||||||||||||||||||||||||||||||||||||||||||||||||||||||||||||
| CLASS C | ||||||||||||||||||||||||||||||||||||||||||||||||||||||||||||||||||||||||||||||||||||||||||||||||||
| 06-30-20177 | 14.76 | (0.08 | ) | 1.74 | 1.66 | — | — | — | — | 16.42 | 11.25 | 8 | 1.25 | 9 | 1.19 | 9 | (1.05 | ) 9 | 150 | 9 | ||||||||||||||||||||||||||||||||||||||||||||||||||||||||||||||||||||||||||||||
| 12-31-2016 | 14.92 | — | 11 | 0.91 | 0.91 | (0.01 | ) | (1.06 | ) | — | (1.07 | ) | 14.76 | 6.07 | 1.23 | 1.19 | 0.01 | 155 | 31 | |||||||||||||||||||||||||||||||||||||||||||||||||||||||||||||||||||||||||||||||
| 12-31-2015 | 16.33 | (0.02 | ) | (0.32 | ) | (0.34 | ) | — | (1.07 | ) | — | (1.07 | ) | 14.92 | (2.19 | ) | 1.22 | 1.19 | (0.11 | ) | 167 | 15 | ||||||||||||||||||||||||||||||||||||||||||||||||||||||||||||||||||||||||||||
| 12-31-2014 | 15.99 | (0.03 | ) | 0.60 | 0.57 | — | (0.23 | ) | — | (0.23 | ) | 16.33 | 3.56 | 1.23 | 1.21 | (0.19 | ) | 169 | 18 | |||||||||||||||||||||||||||||||||||||||||||||||||||||||||||||||||||||||||||||||
| 12-31-2013 | 12.98 | (0.02 | ) | 3.25 | 3.23 | — | (0.22 | ) | — | (0.22 | ) | 15.99 | 24.90 | 1.24 | 1.23 | (0.17 | ) | 159 | 21 | |||||||||||||||||||||||||||||||||||||||||||||||||||||||||||||||||||||||||||||||
| 12-31-2012 | 11.33 | (0.01 | ) | 1.71 | 1.70 | — | (0.05 | ) | — | (0.05 | ) | 12.98 | 15.00 | 1.28 | 1.27 | (0.11 | ) | 121 | 21 | |||||||||||||||||||||||||||||||||||||||||||||||||||||||||||||||||||||||||||||||
| CLASS I | ||||||||||||||||||||||||||||||||||||||||||||||||||||||||||||||||||||||||||||||||||||||||||||||||||
| 06-30-20177 | 14.67 | — | 11 | 1.72 | 1.72 | — | — | — | — | 16.39 | 11.72 | 8 | 0.24 | 9 | 0.17 | 9 | (0.03 | ) 9 | 7 | 9 | ||||||||||||||||||||||||||||||||||||||||||||||||||||||||||||||||||||||||||||||
| 12-31-2016 | 14.83 | 0.19 | 0.87 | 1.06 | (0.16 | ) | (1.06 | ) | — | (1.22 | ) | 14.67 | 7.18 | 0.22 | 0.17 | 1.25 | 4 | 31 | ||||||||||||||||||||||||||||||||||||||||||||||||||||||||||||||||||||||||||||||||
| 12-31-201512 | 17.07 | 0.28 | (1.28 | ) | (1.00 | ) | (0.15 | ) | (1.09 | ) | — | (1.24 | ) | 14.83 | (5.98 | ) 8 | 0.20 | 9 | 0.17 | 9 | 2.56 | 9 | 3 | 15 | 13 | |||||||||||||||||||||||||||||||||||||||||||||||||||||||||||||||||||||||||
| CLASS R1 | ||||||||||||||||||||||||||||||||||||||||||||||||||||||||||||||||||||||||||||||||||||||||||||||||||
| 06-30-20177 | 14.74 | (0.05 | ) | 1.73 | 1.68 | — | — | — | — | 16.42 | 11.40 | 8 | 0.88 | 9 | 0.82 | 9 | (0.68 | ) 9 | 7 | 9 | ||||||||||||||||||||||||||||||||||||||||||||||||||||||||||||||||||||||||||||||
| 12-31-2016 | 14.90 | 0.05 | 0.91 | 0.96 | (0.06 | ) | (1.06 | ) | — | (1.12 | ) | 14.74 | 6.48 | 0.88 | 0.84 | 0.35 | 6 | 31 | ||||||||||||||||||||||||||||||||||||||||||||||||||||||||||||||||||||||||||||||||
| 12-31-2015 | 16.32 | 0.02 | (0.31 | ) | (0.29 | ) | (0.04 | ) | (1.09 | ) | — | (1.13 | ) | 14.90 | (1.89 | ) | 0.89 | 0.86 | 0.12 | 7 | 15 | |||||||||||||||||||||||||||||||||||||||||||||||||||||||||||||||||||||||||||||
| 12-31-2014 | 15.98 | (0.03 | ) | 0.64 | 0.61 | (0.01 | ) | (0.26 | ) | — | (0.27 | ) | 16.32 | 3.82 | 1.02 | 1.00 | (0.18 | ) | 8 | 18 | ||||||||||||||||||||||||||||||||||||||||||||||||||||||||||||||||||||||||||||||
| 12-31-2013 | 12.98 | 0.01 | 3.26 | 3.27 | (0.02 | ) | (0.25 | ) | — | (0.27 | ) | 15.98 | 25.18 | 0.95 | 0.94 | 0.10 | 10 | 21 | ||||||||||||||||||||||||||||||||||||||||||||||||||||||||||||||||||||||||||||||||
| 12-31-2012 | 11.33 | 0.02 | 1.73 | 1.75 | (0.04 | ) | (0.06 | ) | — | (0.10 | ) | 12.98 | 15.42 | 0.97 | 0.96 | 0.19 | 9 | 21 | ||||||||||||||||||||||||||||||||||||||||||||||||||||||||||||||||||||||||||||||||
| CLASS R2 | ||||||||||||||||||||||||||||||||||||||||||||||||||||||||||||||||||||||||||||||||||||||||||||||||||
| 06-30-20177 | 14.64 | (0.03 | ) | 1.71 | 1.68 | — | — | — | — | 16.32 | 11.48 | 8 | 0.64 | 9 | 0.58 | 9 | (0.44 | ) 9 | 7 | 9 | ||||||||||||||||||||||||||||||||||||||||||||||||||||||||||||||||||||||||||||||
| 12-31-2016 | 14.80 | 0.10 | 0.90 | 1.00 | (0.10 | ) | (1.06 | ) | — | (1.16 | ) | 14.64 | 6.78 | 0.62 | 0.58 | 0.67 | 7 | 31 | ||||||||||||||||||||||||||||||||||||||||||||||||||||||||||||||||||||||||||||||||
| 12-31-2015 | 16.22 | 0.07 | (0.32 | ) | (0.25 | ) | (0.08 | ) | (1.09 | ) | — | (1.17 | ) | 14.80 | (1.65 | ) | 0.65 | 0.60 | 0.44 | 5 | 15 | |||||||||||||||||||||||||||||||||||||||||||||||||||||||||||||||||||||||||||||
| 12-31-2014 | 15.88 | 0.14 | 0.53 | 0.67 | (0.07 | ) | (0.26 | ) | — | (0.33 | ) | 16.22 | 4.19 | 1.01 | 0.62 | 0.85 | 5 | 18 | ||||||||||||||||||||||||||||||||||||||||||||||||||||||||||||||||||||||||||||||||
| 12-31-2013 | 12.89 | 0.13 | 3.18 | 3.31 | (0.07 | ) | (0.25 | ) | — | (0.32 | ) | 15.88 | 25.66 | 1.59 | 0.62 | 0.89 | 2 | 21 | ||||||||||||||||||||||||||||||||||||||||||||||||||||||||||||||||||||||||||||||||
| 12-31-201214 | 12.49 | 0.09 | 0.44 | 0.53 | (0.07 | ) | (0.06 | ) | — | (0.13 | ) | 12.89 | 4.27 | 8 | 16.29 | 9 | 0.62 | 9 | 0.69 | 8 | — | 15 | 21 | 16 | ||||||||||||||||||||||||||||||||||||||||||||||||||||||||||||||||||||||||||
| CLASS R3 | ||||||||||||||||||||||||||||||||||||||||||||||||||||||||||||||||||||||||||||||||||||||||||||||||||
| 06-30-20177 | 14.68 | (0.05 | ) | 1.74 | 1.69 | — | — | — | — | 16.37 | 11.51 | 8 | 0.79 | 9 | 0.72 | 9 | (0.59 | ) 9 | 5 | 9 | ||||||||||||||||||||||||||||||||||||||||||||||||||||||||||||||||||||||||||||||
| 12-31-2016 | 14.84 | 0.07 | 0.91 | 0.98 | (0.08 | ) | (1.06 | ) | — | (1.14 | ) | 14.68 | 6.59 | 0.77 | 0.73 | 0.45 | 5 | 31 | ||||||||||||||||||||||||||||||||||||||||||||||||||||||||||||||||||||||||||||||||
| 12-31-2015 | 16.27 | 0.06 | (0.35 | ) | (0.29 | ) | (0.05 | ) | (1.09 | ) | — | (1.14 | ) | 14.84 | (1.86 | ) | 0.81 | 0.78 | 0.34 | 6 | 15 | |||||||||||||||||||||||||||||||||||||||||||||||||||||||||||||||||||||||||||||
| 12-31-2014 | 15.92 | (0.01 | ) | 0.64 | 0.63 | (0.02 | ) | (0.26 | ) | — | (0.28 | ) | 16.27 | 3.94 | 0.94 | 0.92 | (0.06 | ) | 7 | 18 | ||||||||||||||||||||||||||||||||||||||||||||||||||||||||||||||||||||||||||||||
| 12-31-2013 | 12.93 | — | 11 | 3.27 | 3.27 | (0.03 | ) | (0.25 | ) | — | (0.28 | ) | 15.92 | 25.29 | 0.85 | 0.85 | 0.02 | 9 | 21 | |||||||||||||||||||||||||||||||||||||||||||||||||||||||||||||||||||||||||||||||
| 12-31-2012 | 11.28 | 0.03 | 1.72 | 1.75 | (0.04 | ) | (0.06 | ) | — | (0.10 | ) | 12.93 | 15.53 | 0.88 | 0.88 | 0.27 | 10 | 21 | ||||||||||||||||||||||||||||||||||||||||||||||||||||||||||||||||||||||||||||||||
| CLASS R4 | ||||||||||||||||||||||||||||||||||||||||||||||||||||||||||||||||||||||||||||||||||||||||||||||||||
| 06-30-20177 | 14.66 | (0.01 | ) | 1.72 | 1.71 | — | — | — | — | 16.37 | 11.66 | 8 | 0.49 | 9 | 0.32 | 9 | (0.19 | ) 9 | 7 | 9 | ||||||||||||||||||||||||||||||||||||||||||||||||||||||||||||||||||||||||||||||
| 12-31-2016 | 14.81 | 0.11 | 0.94 | 1.05 | (0.14 | ) | (1.06 | ) | — | (1.20 | ) | 14.66 | 7.10 | 0.47 | 0.33 | 0.76 | 7 | 31 | ||||||||||||||||||||||||||||||||||||||||||||||||||||||||||||||||||||||||||||||||
| 12-31-2015 | 16.24 | 0.10 | (0.32 | ) | (0.22 | ) | (0.12 | ) | (1.09 | ) | — | (1.21 | ) | 14.81 | (1.46 | ) | 0.51 | 0.38 | 0.60 | 6 | 15 | |||||||||||||||||||||||||||||||||||||||||||||||||||||||||||||||||||||||||||||
| 12-31-2014 | 15.90 | 0.09 | 0.59 | 0.68 | (0.08 | ) | (0.26 | ) | — | (0.34 | ) | 16.24 | 4.25 | 0.68 | 0.56 | 0.53 | 7 | 18 | ||||||||||||||||||||||||||||||||||||||||||||||||||||||||||||||||||||||||||||||||
| 12-31-2013 | 12.91 | 0.07 | 3.25 | 3.32 | (0.08 | ) | (0.25 | ) | — | (0.33 | ) | 15.90 | 25.76 | 0.59 | 0.48 | 0.45 | 8 | 21 | ||||||||||||||||||||||||||||||||||||||||||||||||||||||||||||||||||||||||||||||||
| 12-31-2012 | 11.27 | 0.06 | 1.73 | 1.79 | (0.09 | ) | (0.06 | ) | — | (0.15 | ) | 12.91 | 15.86 | 0.59 | 0.53 | 0.52 | 8 | 21 | ||||||||||||||||||||||||||||||||||||||||||||||||||||||||||||||||||||||||||||||||
| Multimanager Lifestyle Aggressive Portfolio (continued) | |||||||||||||||||||||||||||||||||||||||||||||||||||||||||||||||||||||||||||||||||||||||||||||||||
| Per share operating performance for a share outstanding throughout each period | Ratios and supplemental data | ||||||||||||||||||||||||||||||||||||||||||||||||||||||||||||||||||||||||||||||||||||||||||||||||
| Income (loss) from investment operations | Less Distributions | Ratios to average net assets | |||||||||||||||||||||||||||||||||||||||||||||||||||||||||||||||||||||||||||||||||||||||||||||||
| Period ended | Net asset value, beginning of period($) | Net invest- ment income (loss) ($)1,2 | Net realized and unrealized gain (loss) on invest- ments($) | Total from invest- ment operations($) | From net invest- ment income($) | From net realized gain ($)3 | From tax return of capital($) | Total distribu- tions($) | Net asset value, end of period($) | Total return (%)4,5 | Expenses before reductions (%)6 | Expenses including reductions (%)6 | Net investment income (loss) (%)1 | Net assets, end of period (in millions) | Portfolio turnover (%) | ||||||||||||||||||||||||||||||||||||||||||||||||||||||||||||||||||||||||||||||||||
| CLASS R5 | |||||||||||||||||||||||||||||||||||||||||||||||||||||||||||||||||||||||||||||||||||||||||||||||||
| 06-30-20177 | 14.68 | — | 11 | 1.73 | 1.73 | — | — | — | — | 16.41 | 11.78 | 8 | 0.20 | 9 | 0.13 | 9 | 0.01 | 9 | 8 | 9 | |||||||||||||||||||||||||||||||||||||||||||||||||||||||||||||||||||||||||||||
| 12-31-2016 | 14.83 | 0.15 | 0.93 | 1.08 | (0.17 | ) | (1.06 | ) | — | (1.23 | ) | 14.68 | 7.30 | 0.17 | 0.13 | 1.01 | 7 | 31 | |||||||||||||||||||||||||||||||||||||||||||||||||||||||||||||||||||||||||||||||
| 12-31-2015 | 16.26 | 0.13 | (0.31 | ) | (0.18 | ) | (0.16 | ) | (1.09 | ) | — | (1.25 | ) | 14.83 | (1.25 | ) | 0.19 | 0.16 | 0.81 | 8 | 15 | ||||||||||||||||||||||||||||||||||||||||||||||||||||||||||||||||||||||||||||
| 12-31-2014 | 15.92 | 0.12 | 0.61 | 0.73 | (0.13 | ) | (0.26 | ) | — | (0.39 | ) | 16.26 | 4.56 | 0.28 | 0.26 | 0.75 | 12 | 18 | |||||||||||||||||||||||||||||||||||||||||||||||||||||||||||||||||||||||||||||||
| 12-31-2013 | 12.92 | 0.12 | 3.25 | 3.37 | (0.12 | ) | (0.25 | ) | — | (0.37 | ) | 15.92 | 26.08 | 0.25 | 0.25 | 0.81 | 11 | 21 | |||||||||||||||||||||||||||||||||||||||||||||||||||||||||||||||||||||||||||||||
| 12-31-2012 | 11.27 | 0.08 | 1.75 | 1.83 | (0.12 | ) | (0.06 | ) | — | (0.18 | ) | 12.92 | 16.22 | 0.27 | 0.26 | 0.62 | 9 | 21 | |||||||||||||||||||||||||||||||||||||||||||||||||||||||||||||||||||||||||||||||
| Class R6 | |||||||||||||||||||||||||||||||||||||||||||||||||||||||||||||||||||||||||||||||||||||||||||||||||
| 06-30-20177 | 14.67 | — | 11 | 1.73 | 1.73 | — | — | — | — | 16.40 | 11.79 | 8 | 0.15 | 9 | 0.07 | 9 | 0.06 | 9 | 17 | 9 | |||||||||||||||||||||||||||||||||||||||||||||||||||||||||||||||||||||||||||||
| 12-31-2016 | 14.82 | 0.16 | 0.93 | 1.09 | (0.18 | ) | (1.06 | ) | — | (1.24 | ) | 14.67 | 7.38 | 0.12 | 0.06 | 1.10 | 18 | 31 | |||||||||||||||||||||||||||||||||||||||||||||||||||||||||||||||||||||||||||||||
| 12-31-2015 | 16.23 | 0.18 | (0.33 | ) | (0.15 | ) | (0.17 | ) | (1.09 | ) | — | (1.26 | ) | 14.82 | (1.07 | ) | 0.13 | 0.06 | 1.12 | 21 | 15 | ||||||||||||||||||||||||||||||||||||||||||||||||||||||||||||||||||||||||||||
| 12-31-2014 | 15.89 | 0.20 | 0.56 | 0.76 | (0.16 | ) | (0.26 | ) | — | (0.42 | ) | 16.23 | 4.76 | 0.26 | 0.06 | 1.24 | 15 | 18 | |||||||||||||||||||||||||||||||||||||||||||||||||||||||||||||||||||||||||||||||
| 12-31-2013 | 12.89 | 0.18 | 3.21 | 3.39 | (0.14 | ) | (0.25 | ) | — | (0.39 | ) | 15.89 | 26.30 | 0.38 | 0.11 | 1.26 | 5 | 21 | |||||||||||||||||||||||||||||||||||||||||||||||||||||||||||||||||||||||||||||||
| 12-31-2012 | 11.24 | 0.36 | 1.49 | 1.85 | (0.14 | ) | (0.06 | ) | — | (0.20 | ) | 12.89 | 16.43 | 2.57 | 0.11 | 2.88 | 2 | 21 | |||||||||||||||||||||||||||||||||||||||||||||||||||||||||||||||||||||||||||||||
| CLASS 1 | |||||||||||||||||||||||||||||||||||||||||||||||||||||||||||||||||||||||||||||||||||||||||||||||||
| 06-30-20177 | 14.65 | — | 11 | 1.72 | 1.72 | — | — | — | — | 16.37 | 11.74 | 8 | 0.18 | 9 | 0.12 | 9 | 0.02 | 9 | 3,493 | 9 | |||||||||||||||||||||||||||||||||||||||||||||||||||||||||||||||||||||||||||||
| 12-31-2016 | 14.81 | 0.16 | 0.91 | 1.07 | (0.17 | ) | (1.06 | ) | — | (1.23 | ) | 14.65 | 7.26 | 0.16 | 0.11 | 1.10 | 3,360 | 31 | |||||||||||||||||||||||||||||||||||||||||||||||||||||||||||||||||||||||||||||||
| 12-31-2015 | 16.22 | 0.16 | (0.32 | ) | (0.16 | ) | (0.16 | ) | (1.09 | ) | — | (1.25 | ) | 14.81 | (1.12 | ) | 0.14 | 0.11 | 0.94 | 3,560 | 15 | ||||||||||||||||||||||||||||||||||||||||||||||||||||||||||||||||||||||||||||
| 12-31-2014 | 15.88 | 0.14 | 0.61 | 0.75 | (0.15 | ) | (0.26 | ) | — | (0.41 | ) | 16.22 | 4.71 | 0.13 | 0.11 | 0.88 | 3,937 | 18 | |||||||||||||||||||||||||||||||||||||||||||||||||||||||||||||||||||||||||||||||
| 12-31-2013 | 12.89 | 0.13 | 3.25 | 3.38 | (0.14 | ) | (0.25 | ) | — | (0.39 | ) | 15.88 | 26.23 | 0.11 | 0.11 | 0.91 | 4,048 | 21 | |||||||||||||||||||||||||||||||||||||||||||||||||||||||||||||||||||||||||||||||
| 12-31-2012 | 11.24 | 0.13 | 1.72 | 1.85 | (0.14 | ) | (0.06 | ) | — | (0.20 | ) | 12.89 | 16.43 | 0.12 | 0.11 | 1.05 | 3,375 | 21 | |||||||||||||||||||||||||||||||||||||||||||||||||||||||||||||||||||||||||||||||
| 1 | Recognition of net investment income by the portfolio is affected by the timing and frequency of the declaration of dividends by the underlying funds in which the portfolio invests. | |||||||||||||||||||||||||||||||||||||||||||||||||||||||||||||||||||||||||||||||||||||||||||||||||
| 2 | Based on average daily shares outstanding. | |||||||||||||||||||||||||||||||||||||||||||||||||||||||||||||||||||||||||||||||||||||||||||||||||
| 3 | Capital gain distributions may vary between classes due to expense differences applied to ordinary income distributions from underlying funds. | |||||||||||||||||||||||||||||||||||||||||||||||||||||||||||||||||||||||||||||||||||||||||||||||||
| 4 | Does not reflect the effect of sales charges, if any. | |||||||||||||||||||||||||||||||||||||||||||||||||||||||||||||||||||||||||||||||||||||||||||||||||
| 5 | Total returns would have been lower had certain expenses not been reduced during the applicable periods. | |||||||||||||||||||||||||||||||||||||||||||||||||||||||||||||||||||||||||||||||||||||||||||||||||
| 6 | Ratios do not include expenses indirectly incurred from underlying funds and can vary based on the mix of underlying funds held by the portfolio. The range of expense ratios of the underlying funds held by the portfolio was as follows: 0.54%-3.50%, 0.66%-3.77%, 0.66%-2.99%, 0.67%-2.85%, 0.69%-3.11% and 0.73%-1.48% for the periods ended 6-30-17, 12-31-16, 12-31-15, 12-31-14, 12-31-13 and 12-31-12, respectively. | |||||||||||||||||||||||||||||||||||||||||||||||||||||||||||||||||||||||||||||||||||||||||||||||||
| 7 | Six months ended 6-30-17. Unaudited. | |||||||||||||||||||||||||||||||||||||||||||||||||||||||||||||||||||||||||||||||||||||||||||||||||
| 8 | Not annualized. | |||||||||||||||||||||||||||||||||||||||||||||||||||||||||||||||||||||||||||||||||||||||||||||||||
| 9 | Annualized. | |||||||||||||||||||||||||||||||||||||||||||||||||||||||||||||||||||||||||||||||||||||||||||||||||
| 10 | Includes the impact of expense recapture for the following periods ended: 12-31-13: 0.04% of average net assets for Class B shares and 12-31-12: 0.04% of average net assets for Class B shares. | |||||||||||||||||||||||||||||||||||||||||||||||||||||||||||||||||||||||||||||||||||||||||||||||||
| 11 | Less than $0.005 per share. | |||||||||||||||||||||||||||||||||||||||||||||||||||||||||||||||||||||||||||||||||||||||||||||||||
| 12 | The inception date for Class I shares is 5-1-15. | |||||||||||||||||||||||||||||||||||||||||||||||||||||||||||||||||||||||||||||||||||||||||||||||||
| 13 | The portfolio turnover is shown for the period from 1-1-15 to 12-31-15. | |||||||||||||||||||||||||||||||||||||||||||||||||||||||||||||||||||||||||||||||||||||||||||||||||
| 14 | The inception date for Class R2 shares is 3-1-12. | |||||||||||||||||||||||||||||||||||||||||||||||||||||||||||||||||||||||||||||||||||||||||||||||||
| 15 | Less than $500,000. | |||||||||||||||||||||||||||||||||||||||||||||||||||||||||||||||||||||||||||||||||||||||||||||||||
| 16 | The portfolio turnover is shown for the period from 1-1-12 to 12-31-12. | |||||||||||||||||||||||||||||||||||||||||||||||||||||||||||||||||||||||||||||||||||||||||||||||||
Financial highlights continued
| Multimanager Lifestyle Growth Portfolio | ||||||||||||||||||||||||||||||||||||||||||||||||||||||||||||||||||||||||||||||||||||||||||||||||||
| Per share operating performance for a share outstanding throughout each period | Ratios and supplemental data | |||||||||||||||||||||||||||||||||||||||||||||||||||||||||||||||||||||||||||||||||||||||||||||||||
| Income (loss) from investment operations | Less Distributions | Ratios to average net assets | ||||||||||||||||||||||||||||||||||||||||||||||||||||||||||||||||||||||||||||||||||||||||||||||||
| Period ended | Net asset value, beginning of period($) | Net invest- ment income (loss) ($)1,2 | Net realized and unrealized gain (loss) on invest- ments($) | Total from invest- ment operations($) | From net invest- ment income($) | From net realized gain($) | From tax return of capital($) | Total distribu- tions($) | Net asset value, end of period($) | Total return (%)3,4 | Expenses before reductions (%)5 | Expenses including reductions (%)5 | Net investment income (loss) (%)1 | Net assets, end of period (in millions) | Portfolio turnover (%) | |||||||||||||||||||||||||||||||||||||||||||||||||||||||||||||||||||||||||||||||||||
| CLASS A | ||||||||||||||||||||||||||||||||||||||||||||||||||||||||||||||||||||||||||||||||||||||||||||||||||
| 06-30-20176 | 14.77 | 0.02 | 1.42 | 1.44 | — | — | — | — | 16.21 | 9.75 | 7 | 0.54 | 8 | 0.48 | 8 | 0.20 | 8 | 1,645 | 10 | |||||||||||||||||||||||||||||||||||||||||||||||||||||||||||||||||||||||||||||||
| 12-31-2016 | 14.89 | 0.18 | 0.82 | 1.00 | (0.20 | ) | (0.92 | ) | — | (1.12 | ) | 14.77 | 6.69 | 0.52 | 0.47 | 1.19 | 1,587 | 28 | ||||||||||||||||||||||||||||||||||||||||||||||||||||||||||||||||||||||||||||||||
| 12-31-2015 | 16.35 | 0.19 | (0.41 | ) | (0.22 | ) | (0.19 | ) | (1.05 | ) | — | (1.24 | ) | 14.89 | (1.45 | ) | 0.51 | 0.47 | 1.17 | 1,611 | 15 | |||||||||||||||||||||||||||||||||||||||||||||||||||||||||||||||||||||||||||||
| 12-31-2014 | 16.09 | 0.19 | 0.54 | 0.73 | (0.18 | ) | (0.29 | ) | — | (0.47 | ) | 16.35 | 4.48 | 0.52 | 0.47 | 1.14 | 1,535 | 16 | ||||||||||||||||||||||||||||||||||||||||||||||||||||||||||||||||||||||||||||||||
| 12-31-2013 | 13.53 | 0.17 | 2.78 | 2.95 | (0.17 | ) | (0.22 | ) | — | (0.39 | ) | 16.09 | 21.81 | 0.53 | 0.52 | 1.13 | 1,274 | 20 | ||||||||||||||||||||||||||||||||||||||||||||||||||||||||||||||||||||||||||||||||
| 12-31-2012 | 11.96 | 0.17 | 1.62 | 1.79 | (0.16 | ) | (0.06 | ) | — | (0.22 | ) | 13.53 | 15.01 | 0.57 | 0.56 | 1.28 | 890 | 23 | ||||||||||||||||||||||||||||||||||||||||||||||||||||||||||||||||||||||||||||||||
| CLASS B | ||||||||||||||||||||||||||||||||||||||||||||||||||||||||||||||||||||||||||||||||||||||||||||||||||
| 06-30-20176 | 14.82 | (0.04 | ) | 1.42 | 1.38 | — | — | — | — | 16.20 | 9.31 | 7 | 1.24 | 8 | 1.19 | 8 | (0.52 | ) 8 | 51 | 10 | ||||||||||||||||||||||||||||||||||||||||||||||||||||||||||||||||||||||||||||||
| 12-31-2016 | 14.94 | 0.06 | 0.82 | 0.88 | (0.08 | ) | (0.92 | ) | — | (1.00 | ) | 14.82 | 5.92 | 1.22 | 1.19 | 0.37 | 57 | 28 | ||||||||||||||||||||||||||||||||||||||||||||||||||||||||||||||||||||||||||||||||
| 12-31-2015 | 16.39 | 0.05 | (0.38 | ) | (0.33 | ) | (0.07 | ) | (1.05 | ) | — | (1.12 | ) | 14.94 | (2.09 | ) | 1.22 | 1.19 | 0.30 | 76 | 15 | |||||||||||||||||||||||||||||||||||||||||||||||||||||||||||||||||||||||||||||
| 12-31-2014 | 16.14 | 0.04 | 0.56 | 0.60 | (0.06 | ) | (0.29 | ) | — | (0.35 | ) | 16.39 | 3.65 | 1.23 | 1.21 | 0.23 | 100 | 16 | ||||||||||||||||||||||||||||||||||||||||||||||||||||||||||||||||||||||||||||||||
| 12-31-2013 | 13.57 | 0.04 | 2.80 | 2.84 | (0.05 | ) | (0.22 | ) | — | (0.27 | ) | 16.14 | 20.93 | 1.24 | 1.24 | 0.29 | 119 | 20 | ||||||||||||||||||||||||||||||||||||||||||||||||||||||||||||||||||||||||||||||||
| 12-31-2012 | 12.00 | 0.06 | 1.64 | 1.70 | (0.07 | ) | (0.06 | ) | — | (0.13 | ) | 13.57 | 14.18 | 1.28 | 1.28 | 0.50 | 108 | 23 | ||||||||||||||||||||||||||||||||||||||||||||||||||||||||||||||||||||||||||||||||
| CLASS C | ||||||||||||||||||||||||||||||||||||||||||||||||||||||||||||||||||||||||||||||||||||||||||||||||||
| 06-30-20176 | 14.80 | (0.04 | ) | 1.42 | 1.38 | — | — | — | — | 16.18 | 9.32 | 7 | 1.24 | 8 | 1.19 | 8 | (0.51 | ) 8 | 644 | 10 | ||||||||||||||||||||||||||||||||||||||||||||||||||||||||||||||||||||||||||||||
| 12-31-2016 | 14.92 | 0.07 | 0.81 | 0.88 | (0.08 | ) | (0.92 | ) | — | (1.00 | ) | 14.80 | 5.93 | 1.22 | 1.19 | 0.45 | 670 | 28 | ||||||||||||||||||||||||||||||||||||||||||||||||||||||||||||||||||||||||||||||||
| 12-31-2015 | 16.37 | 0.07 | (0.40 | ) | (0.33 | ) | (0.07 | ) | (1.05 | ) | — | (1.12 | ) | 14.92 | (2.09 | ) | 1.21 | 1.19 | 0.42 | 730 | 15 | |||||||||||||||||||||||||||||||||||||||||||||||||||||||||||||||||||||||||||||
| 12-31-2014 | 16.12 | 0.06 | 0.54 | 0.60 | (0.06 | ) | (0.29 | ) | — | (0.35 | ) | 16.37 | 3.66 | 1.22 | 1.20 | 0.38 | 739 | 16 | ||||||||||||||||||||||||||||||||||||||||||||||||||||||||||||||||||||||||||||||||
| 12-31-2013 | 13.56 | 0.06 | 2.77 | 2.83 | (0.05 | ) | (0.22 | ) | — | (0.27 | ) | 16.12 | 20.88 | 1.23 | 1.23 | 0.39 | 646 | 20 | ||||||||||||||||||||||||||||||||||||||||||||||||||||||||||||||||||||||||||||||||
| 12-31-2012 | 11.99 | 0.07 | 1.63 | 1.70 | (0.07 | ) | (0.06 | ) | — | (0.13 | ) | 13.56 | 14.21 | 1.27 | 1.26 | 0.52 | 485 | 23 | ||||||||||||||||||||||||||||||||||||||||||||||||||||||||||||||||||||||||||||||||
| CLASS I | ||||||||||||||||||||||||||||||||||||||||||||||||||||||||||||||||||||||||||||||||||||||||||||||||||
| 06-30-20176 | 14.69 | 0.04 | 1.42 | 1.46 | — | — | — | — | 16.15 | 9.94 | 7 | 0.22 | 8 | 0.17 | 8 | 0.56 | 8 | 30 | 10 | |||||||||||||||||||||||||||||||||||||||||||||||||||||||||||||||||||||||||||||||
| 12-31-2016 | 14.82 | 0.34 | 0.69 | 1.03 | (0.24 | ) | (0.92 | ) | — | (1.16 | ) | 14.69 | 6.97 | 0.21 | 0.17 | 2.27 | 16 | 28 | ||||||||||||||||||||||||||||||||||||||||||||||||||||||||||||||||||||||||||||||||
| 12-31-20159 | 16.97 | 0.23 | (1.09 | ) | (0.86 | ) | (0.24 | ) | (1.05 | ) | — | (1.29 | ) | 14.82 | (5.17 | ) 7 | 0.20 | 8 | 0.17 | 8 | 2.11 | 8 | 6 | 15 | 10 | |||||||||||||||||||||||||||||||||||||||||||||||||||||||||||||||||||||||||
| CLASS R1 | ||||||||||||||||||||||||||||||||||||||||||||||||||||||||||||||||||||||||||||||||||||||||||||||||||
| 06-30-20176 | 14.83 | (0.01 | ) | 1.43 | 1.42 | — | — | — | — | 16.25 | 9.58 | 7 | 0.87 | 8 | 0.82 | 8 | (0.14 | ) 8 | 19 | 10 | ||||||||||||||||||||||||||||||||||||||||||||||||||||||||||||||||||||||||||||||
| 12-31-2016 | 14.96 | 0.13 | 0.80 | 0.93 | (0.14 | ) | (0.92 | ) | — | (1.06 | ) | 14.83 | 6.24 | 0.85 | 0.81 | 0.83 | 18 | 28 | ||||||||||||||||||||||||||||||||||||||||||||||||||||||||||||||||||||||||||||||||
| 12-31-2015 | 16.41 | 0.13 | (0.40 | ) | (0.27 | ) | (0.13 | ) | (1.05 | ) | — | (1.18 | ) | 14.96 | (1.73 | ) | 0.86 | 0.83 | 0.76 | 20 | 15 | |||||||||||||||||||||||||||||||||||||||||||||||||||||||||||||||||||||||||||||
| 12-31-2014 | 16.15 | 0.10 | 0.56 | 0.66 | (0.11 | ) | (0.29 | ) | — | (0.40 | ) | 16.41 | 4.04 | 0.89 | 0.87 | 0.62 | 22 | 16 | ||||||||||||||||||||||||||||||||||||||||||||||||||||||||||||||||||||||||||||||||
| 12-31-2013 | 13.58 | 0.10 | 2.80 | 2.90 | (0.11 | ) | (0.22 | ) | — | (0.33 | ) | 16.15 | 21.36 | 0.88 | 0.88 | 0.69 | 23 | 20 | ||||||||||||||||||||||||||||||||||||||||||||||||||||||||||||||||||||||||||||||||
| 12-31-2012 | 12.01 | 0.13 | 1.63 | 1.76 | (0.13 | ) | (0.06 | ) | — | (0.19 | ) | 13.58 | 14.67 | 0.87 | 0.86 | 0.97 | 19 | 23 | ||||||||||||||||||||||||||||||||||||||||||||||||||||||||||||||||||||||||||||||||
| CLASS R2 | ||||||||||||||||||||||||||||||||||||||||||||||||||||||||||||||||||||||||||||||||||||||||||||||||||
| 06-30-20176 | 14.68 | 0.01 | 1.41 | 1.42 | — | — | — | — | 16.10 | 9.67 | 7 | 0.63 | 8 | 0.58 | 8 | 0.09 | 8 | 17 | 10 | |||||||||||||||||||||||||||||||||||||||||||||||||||||||||||||||||||||||||||||||
| 12-31-2016 | 14.81 | 0.17 | 0.80 | 0.97 | (0.18 | ) | (0.92 | ) | — | (1.10 | ) | 14.68 | 6.56 | 0.61 | 0.58 | 1.14 | 18 | 28 | ||||||||||||||||||||||||||||||||||||||||||||||||||||||||||||||||||||||||||||||||
| 12-31-2015 | 16.27 | 0.18 | (0.42 | ) | (0.24 | ) | (0.17 | ) | (1.05 | ) | — | (1.22 | ) | 14.81 | (1.55 | ) | 0.62 | 0.59 | 1.09 | 15 | 15 | |||||||||||||||||||||||||||||||||||||||||||||||||||||||||||||||||||||||||||||
| 12-31-2014 | 16.02 | 0.18 | 0.51 | 0.69 | (0.15 | ) | (0.29 | ) | — | (0.44 | ) | 16.27 | 4.29 | 0.73 | 0.62 | 1.07 | 12 | 16 | ||||||||||||||||||||||||||||||||||||||||||||||||||||||||||||||||||||||||||||||||
| 12-31-2013 | 13.47 | 0.26 | 2.66 | 2.92 | (0.15 | ) | (0.22 | ) | — | (0.37 | ) | 16.02 | 21.67 | 0.90 | 11 | 0.62 | 1.72 | 9 | 20 | |||||||||||||||||||||||||||||||||||||||||||||||||||||||||||||||||||||||||||||||
| 12-31-201212 | 13.05 | 0.16 | 0.48 | 0.64 | (0.16 | ) | (0.06 | ) | — | (0.22 | ) | 13.47 | 4.90 | 7 | 16.20 | 8 | 0.62 | 8 | 1.21 | 7 | — | 13 | 23 | 14 | ||||||||||||||||||||||||||||||||||||||||||||||||||||||||||||||||||||||||||
| CLASS R3 | ||||||||||||||||||||||||||||||||||||||||||||||||||||||||||||||||||||||||||||||||||||||||||||||||||
| 06-30-20176 | 14.75 | — | 15 | 1.42 | 1.42 | — | — | — | — | 16.17 | 9.63 | 7 | 0.77 | 8 | 0.72 | 8 | (0.05 | ) 8 | 13 | 10 | ||||||||||||||||||||||||||||||||||||||||||||||||||||||||||||||||||||||||||||||
| 12-31-2016 | 14.87 | 0.14 | 0.82 | 0.96 | (0.16 | ) | (0.92 | ) | — | (1.08 | ) | 14.75 | 6.44 | 0.74 | 0.71 | 0.91 | 14 | 28 | ||||||||||||||||||||||||||||||||||||||||||||||||||||||||||||||||||||||||||||||||
| 12-31-2015 | 16.33 | 0.12 | (0.38 | ) | (0.26 | ) | (0.15 | ) | (1.05 | ) | — | (1.20 | ) | 14.87 | (1.70 | ) | 0.77 | 0.74 | 0.71 | 18 | 15 | |||||||||||||||||||||||||||||||||||||||||||||||||||||||||||||||||||||||||||||
| 12-31-2014 | 16.08 | 0.11 | 0.55 | 0.66 | (0.12 | ) | (0.29 | ) | — | (0.41 | ) | 16.33 | 4.09 | 0.82 | 0.80 | 0.69 | 23 | 16 | ||||||||||||||||||||||||||||||||||||||||||||||||||||||||||||||||||||||||||||||||
| 12-31-2013 | 13.52 | 0.12 | 2.78 | 2.90 | (0.12 | ) | (0.22 | ) | — | (0.34 | ) | 16.08 | 21.45 | 0.79 | 0.79 | 0.79 | 24 | 20 | ||||||||||||||||||||||||||||||||||||||||||||||||||||||||||||||||||||||||||||||||
| 12-31-2012 | 11.95 | 0.11 | 1.65 | 1.76 | (0.13 | ) | (0.06 | ) | — | (0.19 | ) | 13.52 | 14.77 | 0.81 | 0.81 | 0.83 | 19 | 23 | ||||||||||||||||||||||||||||||||||||||||||||||||||||||||||||||||||||||||||||||||
| CLASS R4 | ||||||||||||||||||||||||||||||||||||||||||||||||||||||||||||||||||||||||||||||||||||||||||||||||||
| 06-30-20176 | 14.75 | 0.03 | 1.42 | 1.45 | — | — | — | — | 16.20 | 9.83 | 7 | 0.47 | 8 | 0.32 | 8 | 0.33 | 8 | 11 | 10 | |||||||||||||||||||||||||||||||||||||||||||||||||||||||||||||||||||||||||||||||
| 12-31-2016 | 14.87 | 0.18 | 0.84 | 1.02 | (0.22 | ) | (0.92 | ) | — | (1.14 | ) | 14.75 | 6.85 | 0.46 | 0.33 | 1.18 | 15 | 28 | ||||||||||||||||||||||||||||||||||||||||||||||||||||||||||||||||||||||||||||||||
| 12-31-2015 | 16.33 | 0.18 | (0.38 | ) | (0.20 | ) | (0.21 | ) | (1.05 | ) | — | (1.26 | ) | 14.87 | (1.30 | ) | 0.47 | 0.34 | 1.10 | 19 | 15 | |||||||||||||||||||||||||||||||||||||||||||||||||||||||||||||||||||||||||||||
| 12-31-2014 | 16.08 | 0.21 | 0.52 | 0.73 | (0.19 | ) | (0.29 | ) | — | (0.48 | ) | 16.33 | 4.49 | 0.51 | 0.39 | 1.26 | 29 | 16 | ||||||||||||||||||||||||||||||||||||||||||||||||||||||||||||||||||||||||||||||||
| 12-31-2013 | 13.51 | 0.18 | 2.79 | 2.97 | (0.18 | ) | (0.22 | ) | — | (0.40 | ) | 16.08 | 21.99 | 0.50 | 0.40 | 1.20 | 24 | 20 | ||||||||||||||||||||||||||||||||||||||||||||||||||||||||||||||||||||||||||||||||
| 12-31-2012 | 11.95 | 0.16 | 1.65 | 1.81 | (0.19 | ) | (0.06 | ) | — | (0.25 | ) | 13.51 | 15.11 | 0.50 | 0.44 | 1.21 | 19 | 23 | ||||||||||||||||||||||||||||||||||||||||||||||||||||||||||||||||||||||||||||||||
| Multimanager Lifestyle Growth Portfolio (continued) | |||||||||||||||||||||||||||||||||||||||||||||||||||||||||||||||||||||||||||||||||||||||||||||||||
| Per share operating performance for a share outstanding throughout each period | Ratios and supplemental data | ||||||||||||||||||||||||||||||||||||||||||||||||||||||||||||||||||||||||||||||||||||||||||||||||
| Income (loss) from investment operations | Less Distributions | Ratios to average net assets | |||||||||||||||||||||||||||||||||||||||||||||||||||||||||||||||||||||||||||||||||||||||||||||||
| Period ended | Net asset value, beginning of period($) | Net invest- ment income (loss) ($)1,2 | Net realized and unrealized gain (loss) on invest- ments($) | Total from invest- ment operations($) | From net invest- ment income($) | From net realized gain($) | From tax return of capital($) | Total distribu- tions($) | Net asset value, end of period($) | Total return (%)3,4 | Expenses before reductions (%)5 | Expenses including reductions (%)5 | Net investment income (loss) (%)1 | Net assets, end of period (in millions) | Portfolio turnover (%) | ||||||||||||||||||||||||||||||||||||||||||||||||||||||||||||||||||||||||||||||||||
| CLASS R5 | |||||||||||||||||||||||||||||||||||||||||||||||||||||||||||||||||||||||||||||||||||||||||||||||||
| 06-30-20176 | 14.77 | 0.04 | 1.43 | 1.47 | — | — | — | — | 16.24 | 9.95 | 7 | 0.18 | 8 | 0.13 | 8 | 0.57 | 8 | 26 | 10 | ||||||||||||||||||||||||||||||||||||||||||||||||||||||||||||||||||||||||||||||
| 12-31-2016 | 14.89 | 0.21 | 0.84 | 1.05 | (0.25 | ) | (0.92 | ) | — | (1.17 | ) | 14.77 | 7.05 | 0.16 | 0.13 | 1.40 | 21 | 28 | |||||||||||||||||||||||||||||||||||||||||||||||||||||||||||||||||||||||||||||||
| 12-31-2015 | 16.35 | 0.22 | (0.38 | ) | (0.16 | ) | (0.25 | ) | (1.05 | ) | — | (1.30 | ) | 14.89 | (1.10 | ) | 0.16 | 0.14 | 1.34 | 28 | 15 | ||||||||||||||||||||||||||||||||||||||||||||||||||||||||||||||||||||||||||||
| 12-31-2014 | 16.10 | 0.22 | 0.55 | 0.77 | (0.23 | ) | (0.29 | ) | — | (0.52 | ) | 16.35 | 4.71 | 0.19 | 0.17 | 1.34 | 38 | 16 | |||||||||||||||||||||||||||||||||||||||||||||||||||||||||||||||||||||||||||||||
| 12-31-2013 | 13.52 | 0.21 | 2.80 | 3.01 | (0.21 | ) | (0.22 | ) | — | (0.43 | ) | 16.10 | 22.29 | 0.18 | 0.18 | 1.40 | 37 | 20 | |||||||||||||||||||||||||||||||||||||||||||||||||||||||||||||||||||||||||||||||
| 12-31-2012 | 11.95 | 0.21 | 1.63 | 1.84 | (0.21 | ) | (0.06 | ) | — | (0.27 | ) | 13.52 | 15.43 | 0.18 | 0.18 | 1.58 | 32 | 23 | |||||||||||||||||||||||||||||||||||||||||||||||||||||||||||||||||||||||||||||||
| Class R6 | |||||||||||||||||||||||||||||||||||||||||||||||||||||||||||||||||||||||||||||||||||||||||||||||||
| 06-30-20176 | 14.70 | 0.05 | 1.41 | 1.46 | — | — | — | — | 16.16 | 9.93 | 7 | 0.13 | 8 | 0.07 | 8 | 0.62 | 8 | 47 | 10 | ||||||||||||||||||||||||||||||||||||||||||||||||||||||||||||||||||||||||||||||
| 12-31-2016 | 14.82 | 0.23 | 0.83 | 1.06 | (0.26 | ) | (0.92 | ) | — | (1.18 | ) | 14.70 | 7.16 | 0.11 | 0.06 | 1.56 | 41 | 28 | |||||||||||||||||||||||||||||||||||||||||||||||||||||||||||||||||||||||||||||||
| 12-31-2015 | 16.28 | 0.27 | (0.42 | ) | (0.15 | ) | (0.26 | ) | (1.05 | ) | — | (1.31 | ) | 14.82 | (1.04 | ) | 0.11 | 0.06 | 1.63 | 47 | 15 | ||||||||||||||||||||||||||||||||||||||||||||||||||||||||||||||||||||||||||||
| 12-31-2014 | 16.03 | 0.30 | 0.49 | 0.79 | (0.25 | ) | (0.29 | ) | — | (0.54 | ) | 16.28 | 4.86 | 0.17 | 0.06 | 1.81 | 37 | 16 | |||||||||||||||||||||||||||||||||||||||||||||||||||||||||||||||||||||||||||||||
| 12-31-2013 | 13.47 | 0.29 | 2.71 | 3.00 | (0.22 | ) | (0.22 | ) | — | (0.44 | ) | 16.03 | 22.31 | 0.19 | 0.11 | 1.95 | 19 | 20 | |||||||||||||||||||||||||||||||||||||||||||||||||||||||||||||||||||||||||||||||
| 12-31-2012 | 11.90 | 0.58 | 1.27 | 1.85 | (0.22 | ) | (0.06 | ) | — | (0.28 | ) | 13.47 | 15.60 | 2.23 | 0.11 | 4.39 | 3 | 23 | |||||||||||||||||||||||||||||||||||||||||||||||||||||||||||||||||||||||||||||||
| CLASS 1 | |||||||||||||||||||||||||||||||||||||||||||||||||||||||||||||||||||||||||||||||||||||||||||||||||
| 06-30-20176 | 14.70 | 0.04 | 1.42 | 1.46 | — | — | — | — | 16.16 | 9.93 | 7 | 0.17 | 8 | 0.12 | 8 | 0.56 | 8 | 10,065 | 10 | ||||||||||||||||||||||||||||||||||||||||||||||||||||||||||||||||||||||||||||||
| 12-31-2016 | 14.83 | 0.23 | 0.81 | 1.04 | (0.25 | ) | (0.92 | ) | — | (1.17 | ) | 14.70 | 7.03 | 0.15 | 0.11 | 1.55 | 9,850 | 28 | |||||||||||||||||||||||||||||||||||||||||||||||||||||||||||||||||||||||||||||||
| 12-31-2015 | 16.28 | 0.24 | (0.39 | ) | (0.15 | ) | (0.25 | ) | (1.05 | ) | — | (1.30 | ) | 14.83 | (1.02 | ) | 0.13 | 0.11 | 1.46 | 10,420 | 15 | ||||||||||||||||||||||||||||||||||||||||||||||||||||||||||||||||||||||||||||
| 12-31-2014 | 16.03 | 0.23 | 0.55 | 0.78 | (0.24 | ) | (0.29 | ) | — | (0.53 | ) | 16.28 | 4.80 | 0.13 | 0.11 | 1.41 | 11,576 | 16 | |||||||||||||||||||||||||||||||||||||||||||||||||||||||||||||||||||||||||||||||
| 12-31-2013 | 13.47 | 0.22 | 2.78 | 3.00 | (0.22 | ) | (0.22 | ) | — | (0.44 | ) | 16.03 | 22.31 | 0.11 | 0.11 | 1.45 | 11,766 | 20 | |||||||||||||||||||||||||||||||||||||||||||||||||||||||||||||||||||||||||||||||
| 12-31-2012 | 11.91 | 0.21 | 1.63 | 1.84 | (0.22 | ) | (0.06 | ) | — | (0.28 | ) | 13.47 | 15.50 | 0.11 | 0.11 | 1.64 | 10,106 | 23 | |||||||||||||||||||||||||||||||||||||||||||||||||||||||||||||||||||||||||||||||
| CLASS 5 | |||||||||||||||||||||||||||||||||||||||||||||||||||||||||||||||||||||||||||||||||||||||||||||||||
| 06-30-20176 | 14.68 | 0.05 | 1.42 | 1.47 | — | — | — | 16.15 | 10.01 | 7 | 0.12 | 8 | 0.07 | 8 | 0.62 | 8 | 291 | 10 | |||||||||||||||||||||||||||||||||||||||||||||||||||||||||||||||||||||||||||||||
| 12-31-2016 | 14.81 | 0.25 | 0.80 | 1.05 | (0.26 | ) | (0.92 | ) | — | (1.18 | ) | 14.68 | 7.09 | 0.10 | 0.06 | 1.65 | 259 | 28 | |||||||||||||||||||||||||||||||||||||||||||||||||||||||||||||||||||||||||||||||
| 12-31-2015 | 16.26 | 0.26 | (0.40 | ) | (0.14 | ) | (0.26 | ) | (1.05 | ) | — | (1.31 | ) | 14.81 | (0.98 | ) | 0.08 | 0.06 | 1.57 | 243 | 15 | ||||||||||||||||||||||||||||||||||||||||||||||||||||||||||||||||||||||||||||
| 12-31-2014 | 16.01 | 0.25 | 0.54 | 0.79 | (0.25 | ) | (0.29 | ) | — | (0.54 | ) | 16.26 | 4.86 | 0.08 | 0.06 | 1.53 | 233 | 16 | |||||||||||||||||||||||||||||||||||||||||||||||||||||||||||||||||||||||||||||||
| 12-31-2013 | 13.46 | 0.24 | 2.76 | 3.00 | (0.23 | ) | (0.22 | ) | — | (0.45 | ) | 16.01 | 22.31 | 0.06 | 0.06 | 1.60 | 201 | 20 | |||||||||||||||||||||||||||||||||||||||||||||||||||||||||||||||||||||||||||||||
| 12-31-2012 | 11.90 | 0.23 | 1.62 | 1.85 | (0.23 | ) | (0.06 | ) | — | (0.29 | ) | 13.46 | 15.57 | 0.06 | 0.06 | 1.78 | 142 | 23 | |||||||||||||||||||||||||||||||||||||||||||||||||||||||||||||||||||||||||||||||
| 1 | Recognition of net investment income by the portfolio is affected by the timing and frequency of the declaration of dividends by the underlying funds in which the portfolio invests. | |||||||||||||||||||||||||||||||||||||||||||||||||||||||||||||||||||||||||||||||||||||||||||||||||
| 2 | Based on average daily shares outstanding. | |||||||||||||||||||||||||||||||||||||||||||||||||||||||||||||||||||||||||||||||||||||||||||||||||
| 3 | Does not reflect the effect of sales charges, if any. | |||||||||||||||||||||||||||||||||||||||||||||||||||||||||||||||||||||||||||||||||||||||||||||||||
| 4 | Total returns would have been lower had certain expenses not been reduced during the applicable periods. | |||||||||||||||||||||||||||||||||||||||||||||||||||||||||||||||||||||||||||||||||||||||||||||||||
| 5 | Ratios do not include expenses indirectly incurred from underlying funds and can vary based on the mix of the underlying funds held by the portfolio. The range of expense ratio of the underlying funds held by the portfolio was as follows: 0.41%-3.50%, 0.60%-3.77%, 0.57%-2.99%, 0.55%-2.85%, 0.63%-3.11% and 0.63%-1.48% for the periods ended 6-30-17, 12-31-16, 12-31-15, 12-31-14, 12-31-13 and 12-31-12, respectively. | |||||||||||||||||||||||||||||||||||||||||||||||||||||||||||||||||||||||||||||||||||||||||||||||||
| 6 | Six months ended 6-30-17. Unaudited. | |||||||||||||||||||||||||||||||||||||||||||||||||||||||||||||||||||||||||||||||||||||||||||||||||
| 7 | Not annualized. | |||||||||||||||||||||||||||||||||||||||||||||||||||||||||||||||||||||||||||||||||||||||||||||||||
| 8 | Annualized. | |||||||||||||||||||||||||||||||||||||||||||||||||||||||||||||||||||||||||||||||||||||||||||||||||
| 9 | The inception date for Class I shares is 5-1-15. | |||||||||||||||||||||||||||||||||||||||||||||||||||||||||||||||||||||||||||||||||||||||||||||||||
| 10 | The portfolio turnover is shown for the period from 1-1-15 to 12-31-15. | |||||||||||||||||||||||||||||||||||||||||||||||||||||||||||||||||||||||||||||||||||||||||||||||||
| 11 | Includes the impact of expense recapture for the following periods ended: 12-31-13: 0.01% of average net assets for Class R2 shares. | |||||||||||||||||||||||||||||||||||||||||||||||||||||||||||||||||||||||||||||||||||||||||||||||||
| 12 | The inception date for Class R2 shares is 3-1-12. | |||||||||||||||||||||||||||||||||||||||||||||||||||||||||||||||||||||||||||||||||||||||||||||||||
| 13 | Less than $500,000. | |||||||||||||||||||||||||||||||||||||||||||||||||||||||||||||||||||||||||||||||||||||||||||||||||
| 14 | The portfolio turnover is shown for the period from 1-1-12 to 12-31-12. | |||||||||||||||||||||||||||||||||||||||||||||||||||||||||||||||||||||||||||||||||||||||||||||||||
| 15 | Less than $0.005 per share. | |||||||||||||||||||||||||||||||||||||||||||||||||||||||||||||||||||||||||||||||||||||||||||||||||
Financial highlights continued
| Multimanager Lifestyle Balanced Portfolio | ||||||||||||||||||||||||||||||||||||||||||||||||||||||||||||||||||||||||||||||||||||||||||||||||||
| Per share operating performance for a share outstanding throughout each period | Ratios and supplemental data | |||||||||||||||||||||||||||||||||||||||||||||||||||||||||||||||||||||||||||||||||||||||||||||||||
| Income (loss) from investment operations | Less Distributions | Ratios to average net assets | ||||||||||||||||||||||||||||||||||||||||||||||||||||||||||||||||||||||||||||||||||||||||||||||||
| Period ended | Net asset value, beginning of period($) | Net invest- ment income (loss) ($)1,2 | Net realized and unrealized gain (loss) on invest- ments($) | Total from invest- ment operations($) | From net invest- ment income($) | From net realized gain($) | From tax return of capital($) | Total distribu- tions($) | Net asset value, end of period($) | Total return (%)3,4 | Expenses before reductions (%)5 | Expenses including reductions (%)5 | Net investment income (loss) (%)1 | Net assets, end of period (in millions) | Portfolio turnover (%) | |||||||||||||||||||||||||||||||||||||||||||||||||||||||||||||||||||||||||||||||||||
| CLASS A | ||||||||||||||||||||||||||||||||||||||||||||||||||||||||||||||||||||||||||||||||||||||||||||||||||
| 06-30-20176 | 14.32 | 0.06 | 1.07 | 1.13 | (0.06 | ) | — | — | (0.06 | ) | 15.39 | 7.88 | 7 | 0.53 | 8 | 0.48 | 8 | 0.77 | 8 | 1,794 | 14 | |||||||||||||||||||||||||||||||||||||||||||||||||||||||||||||||||||||||||||||
| 12-31-2016 | 14.31 | 0.24 | 0.72 | 0.96 | (0.25 | ) | (0.70 | ) | — | (0.95 | ) | 14.32 | 6.73 | 0.52 | 0.47 | 1.64 | 1,782 | 23 | ||||||||||||||||||||||||||||||||||||||||||||||||||||||||||||||||||||||||||||||||
| 12-31-2015 | 15.55 | 0.27 | (0.50 | ) | (0.23 | ) | (0.26 | ) | (0.75 | ) | — | (1.01 | ) | 14.31 | (1.54 | ) | 0.51 | 0.47 | 1.69 | 1,843 | 13 | |||||||||||||||||||||||||||||||||||||||||||||||||||||||||||||||||||||||||||||
| 12-31-2014 | 15.36 | 0.28 | 0.34 | 0.62 | (0.27 | ) | (0.16 | ) | — | (0.43 | ) | 15.55 | 4.00 | 0.52 | 0.47 | 1.77 | 1,786 | 15 | ||||||||||||||||||||||||||||||||||||||||||||||||||||||||||||||||||||||||||||||||
| 12-31-2013 | 13.61 | 0.25 | 1.89 | 2.14 | (0.24 | ) | (0.15 | ) | — | (0.39 | ) | 15.36 | 15.76 | 0.53 | 0.51 | 1.69 | 1,461 | 19 | ||||||||||||||||||||||||||||||||||||||||||||||||||||||||||||||||||||||||||||||||
| 12-31-2012 | 12.26 | 0.26 | 1.40 | 1.66 | (0.24 | ) | (0.07 | ) | — | (0.31 | ) | 13.61 | 13.59 | 0.56 | 0.56 | 1.96 | 1,043 | 20 | ||||||||||||||||||||||||||||||||||||||||||||||||||||||||||||||||||||||||||||||||
| CLASS B | ||||||||||||||||||||||||||||||||||||||||||||||||||||||||||||||||||||||||||||||||||||||||||||||||||
| 06-30-20176 | 14.32 | — | 9 | 1.07 | 1.07 | (0.01 | ) | — | — | (0.01 | ) | 15.38 | 7.45 | 7 | 1.23 | 8 | 1.19 | 8 | 0.05 | 8 | 53 | 14 | ||||||||||||||||||||||||||||||||||||||||||||||||||||||||||||||||||||||||||||
| 12-31-2016 | 14.31 | 0.12 | 0.74 | 0.86 | (0.15 | ) | (0.70 | ) | — | (0.85 | ) | 14.32 | 5.99 | 1.22 | 1.19 | 0.83 | 59 | 23 | ||||||||||||||||||||||||||||||||||||||||||||||||||||||||||||||||||||||||||||||||
| 12-31-2015 | 15.54 | 0.13 | (0.46 | ) | (0.33 | ) | (0.15 | ) | (0.75 | ) | — | (0.90 | ) | 14.31 | (2.20 | ) | 1.22 | 1.19 | 0.85 | 78 | 13 | |||||||||||||||||||||||||||||||||||||||||||||||||||||||||||||||||||||||||||||
| 12-31-2014 | 15.35 | 0.13 | 0.37 | 0.50 | (0.15 | ) | (0.16 | ) | — | (0.31 | ) | 15.54 | 3.21 | 1.24 | 1.22 | 0.85 | 98 | 15 | ||||||||||||||||||||||||||||||||||||||||||||||||||||||||||||||||||||||||||||||||
| 12-31-2013 | 13.61 | 0.12 | 1.90 | 2.02 | (0.13 | ) | (0.15 | ) | — | (0.28 | ) | 15.35 | 14.84 | 1.28 | 1.28 | 0.81 | 116 | 19 | ||||||||||||||||||||||||||||||||||||||||||||||||||||||||||||||||||||||||||||||||
| 12-31-2012 | 12.26 | 0.16 | 1.41 | 1.57 | (0.15 | ) | (0.07 | ) | — | (0.22 | ) | 13.61 | 12.80 | 1.29 | 1.28 | 1.18 | 107 | 20 | ||||||||||||||||||||||||||||||||||||||||||||||||||||||||||||||||||||||||||||||||
| CLASS C | ||||||||||||||||||||||||||||||||||||||||||||||||||||||||||||||||||||||||||||||||||||||||||||||||||
| 06-30-20176 | 14.33 | — | 9 | 1.07 | 1.07 | (0.01 | ) | — | — | (0.01 | ) | 15.39 | 7.44 | 7 | 1.23 | 8 | 1.19 | 8 | 0.06 | 8 | 749 | 14 | ||||||||||||||||||||||||||||||||||||||||||||||||||||||||||||||||||||||||||||
| 12-31-2016 | 14.32 | 0.13 | 0.73 | 0.86 | (0.15 | ) | (0.70 | ) | — | (0.85 | ) | 14.33 | 5.99 | 1.22 | 1.19 | 0.90 | 792 | 23 | ||||||||||||||||||||||||||||||||||||||||||||||||||||||||||||||||||||||||||||||||
| 12-31-2015 | 15.55 | 0.15 | (0.48 | ) | (0.33 | ) | (0.15 | ) | (0.75 | ) | — | (0.90 | ) | 14.32 | (2.19 | ) | 1.21 | 1.19 | 0.95 | 876 | 13 | |||||||||||||||||||||||||||||||||||||||||||||||||||||||||||||||||||||||||||||
| 12-31-2014 | 15.37 | 0.16 | 0.33 | 0.49 | (0.15 | ) | (0.16 | ) | — | (0.31 | ) | 15.55 | 3.18 | 1.22 | 1.20 | 1.00 | 892 | 15 | ||||||||||||||||||||||||||||||||||||||||||||||||||||||||||||||||||||||||||||||||
| 12-31-2013 | 13.62 | 0.14 | 1.89 | 2.03 | (0.13 | ) | (0.15 | ) | — | (0.28 | ) | 15.37 | 14.93 | 1.23 | 1.23 | 0.96 | 767 | 19 | ||||||||||||||||||||||||||||||||||||||||||||||||||||||||||||||||||||||||||||||||
| 12-31-2012 | 12.27 | 0.16 | 1.41 | 1.57 | (0.15 | ) | (0.07 | ) | — | (0.22 | ) | 13.62 | 12.81 | 1.26 | 1.26 | 1.19 | 579 | 20 | ||||||||||||||||||||||||||||||||||||||||||||||||||||||||||||||||||||||||||||||||
| CLASS I | ||||||||||||||||||||||||||||||||||||||||||||||||||||||||||||||||||||||||||||||||||||||||||||||||||
| 06-30-20176 | 14.24 | 0.09 | 1.05 | 1.14 | (0.08 | ) | — | — | (0.08 | ) | 15.30 | 8.01 | 7 | 0.22 | 8 | 0.18 | 8 | 1.16 | 8 | 33 | 14 | |||||||||||||||||||||||||||||||||||||||||||||||||||||||||||||||||||||||||||||
| 12-31-2016 | 14.24 | 0.35 | 0.65 | 1.00 | (0.30 | ) | (0.70 | ) | — | (1.00 | ) | 14.24 | 7.01 | 0.21 | 0.17 | 2.42 | 17 | 23 | ||||||||||||||||||||||||||||||||||||||||||||||||||||||||||||||||||||||||||||||||
| 12-31-201510 | 16.00 | 0.34 | (1.08 | ) | (0.74 | ) | (0.27 | ) | (0.75 | ) | — | (1.02 | ) | 14.24 | (4.70 | ) 7 | 0.20 | 8 | 0.17 | 8 | 3.26 | 8 | 6 | 13 | 11 | |||||||||||||||||||||||||||||||||||||||||||||||||||||||||||||||||||||||||
| CLASS R1 | ||||||||||||||||||||||||||||||||||||||||||||||||||||||||||||||||||||||||||||||||||||||||||||||||||
| 06-30-20176 | 14.26 | 0.03 | 1.06 | 1.09 | (0.03 | ) | — | — | (0.03 | ) | 15.32 | 7.66 | 7 | 0.87 | 8 | 0.83 | 8 | 0.42 | 8 | 17 | 14 | |||||||||||||||||||||||||||||||||||||||||||||||||||||||||||||||||||||||||||||
| 12-31-2016 | 14.25 | 0.19 | 0.72 | 0.91 | (0.20 | ) | (0.70 | ) | — | (0.90 | ) | 14.26 | 6.39 | 0.86 | 0.83 | 1.28 | 16 | 23 | ||||||||||||||||||||||||||||||||||||||||||||||||||||||||||||||||||||||||||||||||
| 12-31-2015 | 15.48 | 0.20 | (0.48 | ) | (0.28 | ) | (0.20 | ) | (0.75 | ) | — | (0.95 | ) | 14.25 | (1.86 | ) | 0.86 | 0.84 | 1.27 | 17 | 13 | |||||||||||||||||||||||||||||||||||||||||||||||||||||||||||||||||||||||||||||
| 12-31-2014 | 15.30 | 0.19 | 0.35 | 0.54 | (0.20 | ) | (0.16 | ) | — | (0.36 | ) | 15.48 | 3.52 | 0.92 | 0.91 | 1.22 | 20 | 15 | ||||||||||||||||||||||||||||||||||||||||||||||||||||||||||||||||||||||||||||||||
| 12-31-2013 | 13.57 | 0.18 | 1.88 | 2.06 | (0.18 | ) | (0.15 | ) | — | (0.33 | ) | 15.30 | 15.23 | 0.90 | 0.90 | 1.21 | 19 | 19 | ||||||||||||||||||||||||||||||||||||||||||||||||||||||||||||||||||||||||||||||||
| 12-31-2012 | 12.22 | 0.20 | 1.42 | 1.62 | (0.20 | ) | (0.07 | ) | — | (0.27 | ) | 13.57 | 13.29 | 0.86 | 0.86 | 1.52 | 17 | 20 | ||||||||||||||||||||||||||||||||||||||||||||||||||||||||||||||||||||||||||||||||
| CLASS R2 | ||||||||||||||||||||||||||||||||||||||||||||||||||||||||||||||||||||||||||||||||||||||||||||||||||
| 06-30-20176 | 14.25 | 0.05 | 1.06 | 1.11 | (0.05 | ) | — | — | (0.05 | ) | 15.31 | 7.79 | 7 | 0.61 | 8 | 0.57 | 8 | 0.69 | 8 | 15 | 14 | |||||||||||||||||||||||||||||||||||||||||||||||||||||||||||||||||||||||||||||
| 12-31-2016 | 14.24 | 0.23 | 0.72 | 0.95 | (0.24 | ) | (0.70 | ) | — | (0.94 | ) | 14.25 | 6.66 | 0.61 | 0.58 | 1.57 | 16 | 23 | ||||||||||||||||||||||||||||||||||||||||||||||||||||||||||||||||||||||||||||||||
| 12-31-2015 | 15.48 | 0.25 | (0.50 | ) | (0.25 | ) | (0.24 | ) | (0.75 | ) | — | (0.99 | ) | 14.24 | (1.66 | ) | 0.63 | 0.59 | 1.58 | 14 | 13 | |||||||||||||||||||||||||||||||||||||||||||||||||||||||||||||||||||||||||||||
| 12-31-2014 | 15.29 | 0.29 | 0.30 | 0.59 | (0.24 | ) | (0.16 | ) | — | (0.40 | ) | 15.48 | 3.87 | 0.79 | 0.62 | 1.86 | 10 | 15 | ||||||||||||||||||||||||||||||||||||||||||||||||||||||||||||||||||||||||||||||||
| 12-31-2013 | 13.56 | 0.34 | 1.76 | 2.10 | (0.22 | ) | (0.15 | ) | — | (0.37 | ) | 15.29 | 15.59 | 1.09 | 12 | 0.62 | 2.30 | 5 | 19 | |||||||||||||||||||||||||||||||||||||||||||||||||||||||||||||||||||||||||||||||
| 12-31-201213 | 13.15 | 0.24 | 0.48 | 0.72 | (0.24 | ) | (0.07 | ) | — | (0.31 | ) | 13.56 | 5.48 | 7 | 16.33 | 8 | 0.61 | 8 | 1.78 | 7 | — | 14 | 20 | 15 | ||||||||||||||||||||||||||||||||||||||||||||||||||||||||||||||||||||||||||
| CLASS R3 | ||||||||||||||||||||||||||||||||||||||||||||||||||||||||||||||||||||||||||||||||||||||||||||||||||
| 06-30-20176 | 14.29 | 0.04 | 1.06 | 1.10 | (0.04 | ) | — | — | (0.04 | ) | 15.35 | 7.69 | 7 | 0.77 | 8 | 0.73 | 8 | 0.48 | 8 | 15 | 14 | |||||||||||||||||||||||||||||||||||||||||||||||||||||||||||||||||||||||||||||
| 12-31-2016 | 14.28 | 0.20 | 0.72 | 0.92 | (0.21 | ) | (0.70 | ) | — | (0.91 | ) | 14.29 | 6.48 | 0.75 | 0.72 | 1.38 | 22 | 23 | ||||||||||||||||||||||||||||||||||||||||||||||||||||||||||||||||||||||||||||||||
| 12-31-2015 | 15.51 | 0.20 | (0.46 | ) | (0.26 | ) | (0.22 | ) | (0.75 | ) | — | (0.97 | ) | 14.28 | (1.75 | ) | 0.76 | 0.74 | 1.30 | 24 | 13 | |||||||||||||||||||||||||||||||||||||||||||||||||||||||||||||||||||||||||||||
| 12-31-2014 | 15.33 | 0.20 | 0.36 | 0.56 | (0.22 | ) | (0.16 | ) | — | (0.38 | ) | 15.51 | 3.64 | 0.80 | 0.78 | 1.27 | 30 | 15 | ||||||||||||||||||||||||||||||||||||||||||||||||||||||||||||||||||||||||||||||||
| 12-31-2013 | 13.59 | 0.19 | 1.90 | 2.09 | (0.20 | ) | (0.15 | ) | — | (0.35 | ) | 15.33 | 15.43 | 0.77 | 0.77 | 1.31 | 35 | 19 | ||||||||||||||||||||||||||||||||||||||||||||||||||||||||||||||||||||||||||||||||
| 12-31-2012 | 12.24 | 0.21 | 1.42 | 1.63 | (0.21 | ) | (0.07 | ) | — | (0.28 | ) | 13.59 | 13.38 | 0.78 | 0.77 | 1.62 | 33 | 20 | ||||||||||||||||||||||||||||||||||||||||||||||||||||||||||||||||||||||||||||||||
| CLASS R4 | ||||||||||||||||||||||||||||||||||||||||||||||||||||||||||||||||||||||||||||||||||||||||||||||||||
| 06-30-20176 | 14.29 | 0.07 | 1.07 | 1.14 | (0.07 | ) | — | — | (0.07 | ) | 15.36 | 7.97 | 7 | 0.47 | 8 | 0.33 | 8 | 0.90 | 8 | 18 | 14 | |||||||||||||||||||||||||||||||||||||||||||||||||||||||||||||||||||||||||||||
| 12-31-2016 | 14.28 | 0.24 | 0.74 | 0.98 | (0.27 | ) | (0.70 | ) | — | (0.97 | ) | 14.29 | 6.90 | 0.46 | 0.33 | 1.68 | 21 | 23 | ||||||||||||||||||||||||||||||||||||||||||||||||||||||||||||||||||||||||||||||||
| 12-31-2015 | 15.52 | 0.25 | (0.46 | ) | (0.21 | ) | (0.28 | ) | (0.75 | ) | — | (1.03 | ) | 14.28 | (1.42 | ) | 0.47 | 0.34 | 1.57 | 24 | 13 | |||||||||||||||||||||||||||||||||||||||||||||||||||||||||||||||||||||||||||||
| 12-31-2014 | 15.33 | 0.28 | 0.35 | 0.63 | (0.28 | ) | (0.16 | ) | — | (0.44 | ) | 15.52 | 4.12 | 0.49 | 0.37 | 1.78 | 40 | 15 | ||||||||||||||||||||||||||||||||||||||||||||||||||||||||||||||||||||||||||||||||
| 12-31-2013 | 13.59 | 0.26 | 1.89 | 2.15 | (0.26 | ) | (0.15 | ) | — | (0.41 | ) | 15.33 | 15.90 | 0.46 | 0.35 | 1.76 | 77 | 19 | ||||||||||||||||||||||||||||||||||||||||||||||||||||||||||||||||||||||||||||||||
| 12-31-2012 | 12.24 | 0.28 | 1.40 | 1.68 | (0.26 | ) | (0.07 | ) | — | (0.33 | ) | 13.59 | 13.77 | 0.46 | 0.39 | 2.10 | 70 | 20 | ||||||||||||||||||||||||||||||||||||||||||||||||||||||||||||||||||||||||||||||||
| Multimanager Lifestyle Balanced Portfolio (continued) | |||||||||||||||||||||||||||||||||||||||||||||||||||||||||||||||||||||||||||||||||||||||||||||||||
| Per share operating performance for a share outstanding throughout each period | Ratios and supplemental data | ||||||||||||||||||||||||||||||||||||||||||||||||||||||||||||||||||||||||||||||||||||||||||||||||
| Income (loss) from investment operations | Less Distributions | Ratios to average net assets | |||||||||||||||||||||||||||||||||||||||||||||||||||||||||||||||||||||||||||||||||||||||||||||||
| Period ended | Net asset value, beginning of period($) | Net invest- ment income (loss) ($)1,2 | Net realized and unrealized gain (loss) on invest- ments($) | Total from invest- ment operations($) | From net invest- ment income($) | From net realized gain($) | From tax return of capital($) | Total distribu- tions($) | Net asset value, end of period($) | Total return (%)3,4 | Expenses before reductions (%)5 | Expenses including reductions (%)5 | Net investment income (loss) (%)1 | Net assets, end of period (in millions) | Portfolio turnover (%) | ||||||||||||||||||||||||||||||||||||||||||||||||||||||||||||||||||||||||||||||||||
| CLASS R5 | |||||||||||||||||||||||||||||||||||||||||||||||||||||||||||||||||||||||||||||||||||||||||||||||||
| 06-30-20176 | 14.31 | 0.09 | 1.06 | 1.15 | (0.08 | ) | — | — | (0.08 | ) | 15.38 | 8.06 | 7 | 0.18 | 8 | 0.14 | 8 | 1.15 | 8 | 22 | 14 | ||||||||||||||||||||||||||||||||||||||||||||||||||||||||||||||||||||||||||||
| 12-31-2016 | 14.30 | 0.27 | 0.74 | 1.01 | (0.30 | ) | (0.70 | ) | — | (1.00 | ) | 14.31 | 7.10 | 0.16 | 0.13 | 1.86 | 17 | 23 | |||||||||||||||||||||||||||||||||||||||||||||||||||||||||||||||||||||||||||||||
| 12-31-2015 | 15.53 | 0.30 | (0.47 | ) | (0.17 | ) | (0.31 | ) | (0.75 | ) | — | (1.06 | ) | 14.30 | (1.16 | ) | 0.16 | 0.14 | 1.88 | 29 | 13 | ||||||||||||||||||||||||||||||||||||||||||||||||||||||||||||||||||||||||||||
| 12-31-2014 | 15.35 | 0.31 | 0.34 | 0.65 | (0.31 | ) | (0.16 | ) | — | (0.47 | ) | 15.53 | 4.25 | 0.19 | 0.17 | 1.96 | 41 | 15 | |||||||||||||||||||||||||||||||||||||||||||||||||||||||||||||||||||||||||||||||
| 12-31-2013 | 13.60 | 0.28 | 1.91 | 2.19 | (0.29 | ) | (0.15 | ) | — | (0.44 | ) | 15.35 | 16.20 | 0.17 | 0.17 | 1.93 | 41 | 19 | |||||||||||||||||||||||||||||||||||||||||||||||||||||||||||||||||||||||||||||||
| 12-31-2012 | 12.26 | 0.28 | 1.42 | 1.70 | (0.29 | ) | (0.07 | ) | — | (0.36 | ) | 13.60 | 13.96 | 0.17 | 0.17 | 2.13 | 39 | 20 | |||||||||||||||||||||||||||||||||||||||||||||||||||||||||||||||||||||||||||||||
| Class R6 | |||||||||||||||||||||||||||||||||||||||||||||||||||||||||||||||||||||||||||||||||||||||||||||||||
| 06-30-20176 | 14.24 | 0.09 | 1.06 | 1.15 | (0.09 | ) | — | — | (0.09 | ) | 15.30 | 8.07 | 7 | 0.13 | 8 | 0.08 | 8 | 1.19 | 8 | 46 | 14 | ||||||||||||||||||||||||||||||||||||||||||||||||||||||||||||||||||||||||||||
| 12-31-2016 | 14.24 | 0.28 | 0.73 | 1.01 | (0.31 | ) | (0.70 | ) | — | (1.01 | ) | 14.24 | 7.13 | 0.11 | 0.06 | 1.92 | 44 | 23 | |||||||||||||||||||||||||||||||||||||||||||||||||||||||||||||||||||||||||||||||
| 12-31-2015 | 15.47 | 0.35 | (0.51 | ) | (0.16 | ) | (0.32 | ) | (0.75 | ) | — | (1.07 | ) | 14.24 | (1.08 | ) | 0.11 | 0.06 | 2.27 | 66 | 13 | ||||||||||||||||||||||||||||||||||||||||||||||||||||||||||||||||||||||||||||
| 12-31-2014 | 15.29 | 0.36 | 0.31 | 0.67 | (0.33 | ) | (0.16 | ) | — | (0.49 | ) | 15.47 | 4.38 | 0.16 | 0.06 | 2.29 | 39 | 15 | |||||||||||||||||||||||||||||||||||||||||||||||||||||||||||||||||||||||||||||||
| 12-31-2013 | 13.55 | 0.36 | 1.83 | 2.19 | (0.30 | ) | (0.15 | ) | — | (0.45 | ) | 15.29 | 16.26 | 0.17 | 0.11 | 2.49 | 21 | 19 | |||||||||||||||||||||||||||||||||||||||||||||||||||||||||||||||||||||||||||||||
| 12-31-2012 | 12.21 | 0.46 | 1.25 | 1.71 | (0.30 | ) | (0.07 | ) | — | (0.37 | ) | 13.55 | 14.09 | 1.15 | 0.11 | 3.50 | 5 | 20 | |||||||||||||||||||||||||||||||||||||||||||||||||||||||||||||||||||||||||||||||
| CLASS 1 | |||||||||||||||||||||||||||||||||||||||||||||||||||||||||||||||||||||||||||||||||||||||||||||||||
| 06-30-20176 | 14.24 | 0.08 | 1.05 | 1.13 | (0.08 | ) | — | — | (0.08 | ) | 15.29 | 7.97 | 7 | 0.16 | 8 | 0.12 | 8 | 1.13 | 8 | 10,049 | 14 | ||||||||||||||||||||||||||||||||||||||||||||||||||||||||||||||||||||||||||||
| 12-31-2016 | 14.23 | 0.29 | 0.72 | 1.01 | (0.30 | ) | (0.70 | ) | — | (1.00 | ) | 14.24 | 7.16 | 0.14 | 0.11 | 2.00 | 10,041 | 23 | |||||||||||||||||||||||||||||||||||||||||||||||||||||||||||||||||||||||||||||||
| 12-31-2015 | 15.46 | 0.31 | (0.47 | ) | (0.16 | ) | (0.32 | ) | (0.75 | ) | — | (1.07 | ) | 14.23 | (1.13 | ) | 0.13 | 0.11 | 1.99 | 10,678 | 13 | ||||||||||||||||||||||||||||||||||||||||||||||||||||||||||||||||||||||||||||
| 12-31-2014 | 15.28 | 0.32 | 0.34 | 0.66 | (0.32 | ) | (0.16 | ) | — | (0.48 | ) | 15.46 | 4.33 | 0.13 | 0.11 | 2.02 | 12,041 | 15 | |||||||||||||||||||||||||||||||||||||||||||||||||||||||||||||||||||||||||||||||
| 12-31-2013 | 13.55 | 0.29 | 1.89 | 2.18 | (0.30 | ) | (0.15 | ) | — | (0.45 | ) | 15.28 | 16.18 | 0.11 | 0.11 | 2.00 | 12,284 | 19 | |||||||||||||||||||||||||||||||||||||||||||||||||||||||||||||||||||||||||||||||
| 12-31-2012 | 12.21 | 0.30 | 1.41 | 1.71 | (0.30 | ) | (0.07 | ) | — | (0.37 | ) | 13.55 | 14.09 | 0.11 | 0.11 | 2.31 | 10,974 | 20 | |||||||||||||||||||||||||||||||||||||||||||||||||||||||||||||||||||||||||||||||
| CLASS 5 | |||||||||||||||||||||||||||||||||||||||||||||||||||||||||||||||||||||||||||||||||||||||||||||||||
| 06-30-20176 | 14.24 | 0.09 | 1.06 | 1.15 | (0.09 | ) | — | — | (0.09 | ) | 15.30 | 8.07 | 7 | 0.11 | 8 | 0.07 | 8 | 1.19 | 8 | 159 | 14 | ||||||||||||||||||||||||||||||||||||||||||||||||||||||||||||||||||||||||||||
| 12-31-2016 | 14.24 | 0.30 | 0.71 | 1.01 | (0.31 | ) | (0.70 | ) | — | (1.01 | ) | 14.24 | 7.13 | 0.09 | 0.06 | 2.10 | 150 | 23 | |||||||||||||||||||||||||||||||||||||||||||||||||||||||||||||||||||||||||||||||
| 12-31-2015 | 15.47 | 0.33 | (0.49 | ) | (0.16 | ) | (0.32 | ) | (0.75 | ) | — | (1.07 | ) | 14.24 | (1.07 | ) | 0.08 | 0.06 | 2.09 | 141 | 13 | ||||||||||||||||||||||||||||||||||||||||||||||||||||||||||||||||||||||||||||
| 12-31-2014 | 15.29 | 0.34 | 0.33 | 0.67 | (0.33 | ) | (0.16 | ) | — | (0.49 | ) | 15.47 | 4.38 | 0.08 | 0.06 | 2.14 | 139 | 15 | |||||||||||||||||||||||||||||||||||||||||||||||||||||||||||||||||||||||||||||||
| 12-31-2013 | 13.55 | 0.31 | 1.89 | 2.20 | (0.31 | ) | (0.15 | ) | — | (0.46 | ) | 15.29 | 16.31 | 0.06 | 0.06 | 2.15 | 118 | 19 | |||||||||||||||||||||||||||||||||||||||||||||||||||||||||||||||||||||||||||||||
| 12-31-2012 | 12.21 | 0.33 | 1.39 | 1.72 | (0.31 | ) | (0.07 | ) | — | (0.38 | ) | 13.55 | 14.14 | 0.06 | 0.06 | 2.49 | 85 | 20 | |||||||||||||||||||||||||||||||||||||||||||||||||||||||||||||||||||||||||||||||
| 1 | Recognition of net investment income by the portfolio is affected by the timing and frequency of the declaration of dividends by the underlying funds in which the portfolio invests. | |||||||||||||||||||||||||||||||||||||||||||||||||||||||||||||||||||||||||||||||||||||||||||||||||
| 2 | Based on average daily shares outstanding. | |||||||||||||||||||||||||||||||||||||||||||||||||||||||||||||||||||||||||||||||||||||||||||||||||
| 3 | Does not reflect the effect of sales charges, if any. | |||||||||||||||||||||||||||||||||||||||||||||||||||||||||||||||||||||||||||||||||||||||||||||||||
| 4 | Total returns would have been lower had certain expenses not been reduced during the applicable periods. | |||||||||||||||||||||||||||||||||||||||||||||||||||||||||||||||||||||||||||||||||||||||||||||||||
| 5 | Ratios do not include expenses indirectly incurred from underlying funds and can vary based on the mix of underlying funds held by the portfolio. The range of expense ratios of the underlying funds held by the portfolio was as follows: 0.41%-3.50%, 0.60%-3.77%, 0.57%-2.99%, 0.55%- 2.85%, 0.62%-3.11% and 0.63%-1.48%, for the periods ended 6-30-17, 12-31-16, 12-31-15, 12-31-14, 12-31-13 and 12-31-12, respectively. | |||||||||||||||||||||||||||||||||||||||||||||||||||||||||||||||||||||||||||||||||||||||||||||||||
| 6 | Six months ended 6-30-17. Unaudited. | |||||||||||||||||||||||||||||||||||||||||||||||||||||||||||||||||||||||||||||||||||||||||||||||||
| 7 | Not annualized. | |||||||||||||||||||||||||||||||||||||||||||||||||||||||||||||||||||||||||||||||||||||||||||||||||
| 8 | Annualized. | |||||||||||||||||||||||||||||||||||||||||||||||||||||||||||||||||||||||||||||||||||||||||||||||||
| 9 | Less than $0.005 per share. | |||||||||||||||||||||||||||||||||||||||||||||||||||||||||||||||||||||||||||||||||||||||||||||||||
| 10 | The inception date for Class I shares is 5-1-15. | |||||||||||||||||||||||||||||||||||||||||||||||||||||||||||||||||||||||||||||||||||||||||||||||||
| 11 | The portfolio turnover is shown for the period from 1-1-15 to 12-31-15. | |||||||||||||||||||||||||||||||||||||||||||||||||||||||||||||||||||||||||||||||||||||||||||||||||
| 12 | Includes the impact of expense recapture for the period ended: 12-31-13: 0.005% of average net assets for Class R2 shares. | |||||||||||||||||||||||||||||||||||||||||||||||||||||||||||||||||||||||||||||||||||||||||||||||||
| 13 | The inception date for Class R2 shares is 3-1-12. | |||||||||||||||||||||||||||||||||||||||||||||||||||||||||||||||||||||||||||||||||||||||||||||||||
| 14 | Less than $500,000. | |||||||||||||||||||||||||||||||||||||||||||||||||||||||||||||||||||||||||||||||||||||||||||||||||
| 15 | The portfolio turnover is shown for the period from 1-1-12 to 12-31-12. | |||||||||||||||||||||||||||||||||||||||||||||||||||||||||||||||||||||||||||||||||||||||||||||||||
Financial highlights continued
| Multimanager Lifestyle Moderate Portfolio | ||||||||||||||||||||||||||||||||||||||||||||||||||||||||||||||||||||||||||||||||||||||||||||||||||
| Per share operating performance for a share outstanding throughout each period | Ratios and supplemental data | |||||||||||||||||||||||||||||||||||||||||||||||||||||||||||||||||||||||||||||||||||||||||||||||||
| Income (loss) from investment operations | Less Distributions | Ratios to average net assets | ||||||||||||||||||||||||||||||||||||||||||||||||||||||||||||||||||||||||||||||||||||||||||||||||
| Period ended | Net asset value, beginning of period($) | Net invest- ment income (loss) ($)1,2 | Net realized and unrealized gain (loss) on invest- ments($) | Total from invest- ment operations($) | From net invest- ment income($) | From net realized gain($) | From tax return of capital($) | Total distribu- tions($) | Net asset value, end of period($) | Total return (%)3,4 | Expenses before reductions (%)5 | Expenses including reductions (%)5 | Net investment income (loss) (%)1 | Net assets, end of period (in millions) | Portfolio turnover (%) | |||||||||||||||||||||||||||||||||||||||||||||||||||||||||||||||||||||||||||||||||||
| CLASS A | ||||||||||||||||||||||||||||||||||||||||||||||||||||||||||||||||||||||||||||||||||||||||||||||||||
| 06-30-20176 | 13.30 | 0.08 | 0.70 | 0.78 | (0.08 | ) | — | — | (0.08 | ) | 14.00 | 5.89 | 7 | 0.54 | 8 | 0.49 | 8 | 1.21 | 8 | 684 | 19 | |||||||||||||||||||||||||||||||||||||||||||||||||||||||||||||||||||||||||||||
| 12-31-2016 | 13.13 | 0.28 | 0.57 | 0.85 | (0.29 | ) | (0.39 | ) | — | (0.68 | ) | 13.30 | 6.52 | 0.51 | 0.48 | 2.06 | 680 | 25 | ||||||||||||||||||||||||||||||||||||||||||||||||||||||||||||||||||||||||||||||||
| 12-31-2015 | 14.11 | 0.31 | (0.54 | ) | (0.23 | ) | (0.31 | ) | (0.44 | ) | — | (0.75 | ) | 13.13 | (1.67 | ) | 0.51 | 0.47 | 2.21 | 680 | 11 | |||||||||||||||||||||||||||||||||||||||||||||||||||||||||||||||||||||||||||||
| 12-31-2014 | 14.29 | 0.35 | 0.17 | 0.52 | (0.33 | ) | (0.37 | ) | — | (0.70 | ) | 14.11 | 3.63 | 0.52 | 0.47 | 2.36 | 662 | 14 | ||||||||||||||||||||||||||||||||||||||||||||||||||||||||||||||||||||||||||||||||
| 12-31-2013 | 13.35 | 0.31 | 1.02 | 1.33 | (0.30 | ) | (0.09 | ) | — | (0.39 | ) | 14.29 | 10.05 | 0.53 | 0.52 | 2.22 | 551 | 17 | ||||||||||||||||||||||||||||||||||||||||||||||||||||||||||||||||||||||||||||||||
| 12-31-2012 | 12.28 | 0.33 | 1.13 | 1.46 | (0.31 | ) | (0.08 | ) | — | (0.39 | ) | 13.35 | 11.94 | 0.57 | 0.57 | 2.50 | 399 | 18 | ||||||||||||||||||||||||||||||||||||||||||||||||||||||||||||||||||||||||||||||||
| CLASS B | ||||||||||||||||||||||||||||||||||||||||||||||||||||||||||||||||||||||||||||||||||||||||||||||||||
| 06-30-20176 | 13.28 | 0.03 | 0.71 | 0.74 | (0.03 | ) | — | — | (0.03 | ) | 13.99 | 5.61 | 7 | 1.24 | 8 | 1.20 | 8 | 0.48 | 8 | 23 | 19 | |||||||||||||||||||||||||||||||||||||||||||||||||||||||||||||||||||||||||||||
| 12-31-2016 | 13.13 | 0.17 | 0.56 | 0.73 | (0.19 | ) | (0.39 | ) | — | (0.58 | ) | 13.28 | 5.61 | 1.21 | 1.19 | 1.27 | 25 | 25 | ||||||||||||||||||||||||||||||||||||||||||||||||||||||||||||||||||||||||||||||||
| 12-31-2015 | 14.10 | 0.19 | (0.51 | ) | (0.32 | ) | (0.21 | ) | (0.44 | ) | — | (0.65 | ) | 13.13 | (2.33 | ) | 1.22 | 1.20 | 1.36 | 30 | 11 | |||||||||||||||||||||||||||||||||||||||||||||||||||||||||||||||||||||||||||||
| 12-31-2014 | 14.28 | 0.21 | 0.20 | 0.41 | (0.22 | ) | (0.37 | ) | — | (0.59 | ) | 14.10 | 2.84 | 1.25 | 1.24 | 1.43 | 39 | 14 | ||||||||||||||||||||||||||||||||||||||||||||||||||||||||||||||||||||||||||||||||
| 12-31-2013 | 13.34 | 0.19 | 1.04 | 1.23 | (0.20 | ) | (0.09 | ) | — | (0.29 | ) | 14.28 | 9.23 | 1.26 | 1.25 | 1.36 | 45 | 17 | ||||||||||||||||||||||||||||||||||||||||||||||||||||||||||||||||||||||||||||||||
| 12-31-2012 | 12.27 | 0.23 | 1.14 | 1.37 | (0.22 | ) | (0.08 | ) | — | (0.30 | ) | 13.34 | 11.14 | 1.30 | 1.30 | 1.74 | 45 | 18 | ||||||||||||||||||||||||||||||||||||||||||||||||||||||||||||||||||||||||||||||||
| CLASS C | ||||||||||||||||||||||||||||||||||||||||||||||||||||||||||||||||||||||||||||||||||||||||||||||||||
| 06-30-20176 | 13.30 | 0.03 | 0.70 | 0.73 | (0.03 | ) | — | — | (0.03 | ) | 14.00 | 5.52 | 7 | 1.24 | 8 | 1.20 | 8 | 0.48 | 8 | 327 | 19 | |||||||||||||||||||||||||||||||||||||||||||||||||||||||||||||||||||||||||||||
| 12-31-2016 | 13.14 | 0.17 | 0.57 | 0.74 | (0.19 | ) | (0.39 | ) | — | (0.58 | ) | 13.30 | 5.69 | 1.21 | 1.19 | 1.30 | 354 | 25 | ||||||||||||||||||||||||||||||||||||||||||||||||||||||||||||||||||||||||||||||||
| 12-31-2015 | 14.11 | 0.21 | (0.53 | ) | (0.32 | ) | (0.21 | ) | (0.44 | ) | — | (0.65 | ) | 13.14 | (2.32 | ) | 1.21 | 1.19 | 1.46 | 392 | 11 | |||||||||||||||||||||||||||||||||||||||||||||||||||||||||||||||||||||||||||||
| 12-31-2014 | 14.30 | 0.23 | 0.17 | 0.40 | (0.22 | ) | (0.37 | ) | — | (0.59 | ) | 14.11 | 2.79 | 1.22 | 1.21 | 1.59 | 411 | 14 | ||||||||||||||||||||||||||||||||||||||||||||||||||||||||||||||||||||||||||||||||
| 12-31-2013 | 13.35 | 0.20 | 1.04 | 1.24 | (0.20 | ) | (0.09 | ) | — | (0.29 | ) | 14.30 | 9.34 | 1.23 | 1.23 | 1.47 | 366 | 17 | ||||||||||||||||||||||||||||||||||||||||||||||||||||||||||||||||||||||||||||||||
| 12-31-2012 | 12.28 | 0.23 | 1.14 | 1.37 | (0.22 | ) | (0.08 | ) | — | (0.30 | ) | 13.35 | 11.17 | 1.27 | 1.27 | 1.77 | 288 | 18 | ||||||||||||||||||||||||||||||||||||||||||||||||||||||||||||||||||||||||||||||||
| CLASS I | ||||||||||||||||||||||||||||||||||||||||||||||||||||||||||||||||||||||||||||||||||||||||||||||||||
| 06-30-20176 | 13.25 | 0.11 | 0.69 | 0.80 | (0.10 | ) | — | — | (0.10 | ) | 13.95 | 6.07 | 7 | 0.23 | 8 | 0.19 | 8 | 1.61 | 8 | 10 | 19 | |||||||||||||||||||||||||||||||||||||||||||||||||||||||||||||||||||||||||||||
| 12-31-2016 | 13.09 | 0.37 | 0.51 | 0.88 | (0.33 | ) | (0.39 | ) | — | (0.72 | ) | 13.25 | 6.78 | 0.20 | 0.18 | 2.77 | 5 | 25 | ||||||||||||||||||||||||||||||||||||||||||||||||||||||||||||||||||||||||||||||||
| 12-31-20159 | 14.42 | 0.33 | (0.92 | ) | (0.59 | ) | (0.30 | ) | (0.44 | ) | — | (0.74 | ) | 13.09 | (4.13 | ) 7 | 0.19 | 8 | 0.17 | 8 | 3.55 | 8 | 2 | 11 | 10 | |||||||||||||||||||||||||||||||||||||||||||||||||||||||||||||||||||||||||
| CLASS R1 | ||||||||||||||||||||||||||||||||||||||||||||||||||||||||||||||||||||||||||||||||||||||||||||||||||
| 06-30-20176 | 13.27 | 0.06 | 0.71 | 0.77 | (0.06 | ) | — | — | (0.06 | ) | 13.98 | 5.81 | 7 | 0.87 | 8 | 0.83 | 8 | 0.85 | 8 | 6 | 19 | |||||||||||||||||||||||||||||||||||||||||||||||||||||||||||||||||||||||||||||
| 12-31-2016 | 13.12 | 0.22 | 0.57 | 0.79 | (0.25 | ) | (0.39 | ) | — | (0.64 | ) | 13.27 | 6.03 | 0.84 | 0.82 | 1.67 | 7 | 25 | ||||||||||||||||||||||||||||||||||||||||||||||||||||||||||||||||||||||||||||||||
| 12-31-2015 | 14.09 | 0.25 | (0.53 | ) | (0.28 | ) | (0.25 | ) | (0.44 | ) | — | (0.69 | ) | 13.12 | (1.99 | ) | 0.87 | 0.85 | 1.77 | 8 | 11 | |||||||||||||||||||||||||||||||||||||||||||||||||||||||||||||||||||||||||||||
| 12-31-2014 | 14.28 | 0.24 | 0.20 | 0.44 | (0.26 | ) | (0.37 | ) | — | (0.63 | ) | 14.09 | 3.07 | 1.01 | 1.00 | 1.65 | 8 | 14 | ||||||||||||||||||||||||||||||||||||||||||||||||||||||||||||||||||||||||||||||||
| 12-31-2013 | 13.35 | 0.23 | 1.04 | 1.27 | (0.25 | ) | (0.09 | ) | — | (0.34 | ) | 14.28 | 9.55 | 0.94 | 0.94 | 1.68 | 10 | 17 | ||||||||||||||||||||||||||||||||||||||||||||||||||||||||||||||||||||||||||||||||
| 12-31-2012 | 12.27 | 0.27 | 1.15 | 1.42 | (0.26 | ) | (0.08 | ) | — | (0.34 | ) | 13.35 | 11.58 | 0.96 | 0.96 | 2.10 | 10 | 18 | ||||||||||||||||||||||||||||||||||||||||||||||||||||||||||||||||||||||||||||||||
| CLASS R2 | ||||||||||||||||||||||||||||||||||||||||||||||||||||||||||||||||||||||||||||||||||||||||||||||||||
| 06-30-20176 | 13.25 | 0.08 | 0.70 | 0.78 | (0.08 | ) | — | — | (0.08 | ) | 13.95 | 5.86 | 7 | 0.62 | 8 | 0.58 | 8 | 1.11 | 8 | 7 | 19 | |||||||||||||||||||||||||||||||||||||||||||||||||||||||||||||||||||||||||||||
| 12-31-2016 | 13.09 | 0.26 | 0.57 | 0.83 | (0.28 | ) | (0.39 | ) | — | (0.67 | ) | 13.25 | 6.35 | 0.60 | 0.58 | 1.98 | 7 | 25 | ||||||||||||||||||||||||||||||||||||||||||||||||||||||||||||||||||||||||||||||||
| 12-31-2015 | 14.06 | 0.30 | (0.54 | ) | (0.24 | ) | (0.29 | ) | (0.44 | ) | — | (0.73 | ) | 13.09 | (1.72 | ) | 0.64 | 0.60 | 2.12 | 6 | 11 | |||||||||||||||||||||||||||||||||||||||||||||||||||||||||||||||||||||||||||||
| 12-31-2014 | 14.25 | 0.36 | 0.13 | 0.49 | (0.31 | ) | (0.37 | ) | — | (0.68 | ) | 14.06 | 3.41 | 1.02 | 0.62 | 2.50 | 4 | 14 | ||||||||||||||||||||||||||||||||||||||||||||||||||||||||||||||||||||||||||||||||
| 12-31-2013 | 13.32 | 0.39 | 0.92 | 1.31 | (0.29 | ) | (0.09 | ) | — | (0.38 | ) | 14.25 | 9.92 | 1.68 | 11 | 0.62 | 2.82 | 2 | 17 | |||||||||||||||||||||||||||||||||||||||||||||||||||||||||||||||||||||||||||||||
| 12-31-201212 | 12.96 | 0.30 | 0.45 | 0.75 | (0.31 | ) | (0.08 | ) | — | (0.39 | ) | 13.32 | 5.80 | 7 | 16.03 | 8 | 0.62 | 8 | 2.29 | 7 | — | 13 | 18 | 14 | ||||||||||||||||||||||||||||||||||||||||||||||||||||||||||||||||||||||||||
| CLASS R3 | ||||||||||||||||||||||||||||||||||||||||||||||||||||||||||||||||||||||||||||||||||||||||||||||||||
| 06-30-20176 | 13.27 | 0.06 | 0.71 | 0.77 | (0.07 | ) | — | — | (0.07 | ) | 13.97 | 5.78 | 7 | 0.78 | 8 | 0.75 | 8 | 0.91 | 8 | 6 | 19 | |||||||||||||||||||||||||||||||||||||||||||||||||||||||||||||||||||||||||||||
| 12-31-2016 | 13.11 | 0.24 | 0.57 | 0.81 | (0.26 | ) | (0.39 | ) | — | (0.65 | ) | 13.27 | 6.18 | 0.74 | 0.72 | 1.78 | 8 | 25 | ||||||||||||||||||||||||||||||||||||||||||||||||||||||||||||||||||||||||||||||||
| 12-31-2015 | 14.08 | 0.26 | (0.52 | ) | (0.26 | ) | (0.27 | ) | (0.44 | ) | — | (0.71 | ) | 13.11 | (1.89 | ) | 0.78 | 0.76 | 1.82 | 8 | 11 | |||||||||||||||||||||||||||||||||||||||||||||||||||||||||||||||||||||||||||||
| 12-31-2014 | 14.27 | 0.27 | 0.19 | 0.46 | (0.28 | ) | (0.37 | ) | — | (0.65 | ) | 14.08 | 3.16 | 0.89 | 0.87 | 1.82 | 10 | 14 | ||||||||||||||||||||||||||||||||||||||||||||||||||||||||||||||||||||||||||||||||
| 12-31-2013 | 13.33 | 0.25 | 1.04 | 1.29 | (0.26 | ) | (0.09 | ) | — | (0.35 | ) | 14.27 | 9.70 | 0.84 | 0.84 | 1.82 | 11 | 17 | ||||||||||||||||||||||||||||||||||||||||||||||||||||||||||||||||||||||||||||||||
| 12-31-2012 | 12.26 | 0.27 | 1.16 | 1.43 | (0.28 | ) | (0.08 | ) | — | (0.36 | ) | 13.33 | 11.64 | 0.88 | 0.88 | 2.08 | 10 | 18 | ||||||||||||||||||||||||||||||||||||||||||||||||||||||||||||||||||||||||||||||||
| CLASS R4 | ||||||||||||||||||||||||||||||||||||||||||||||||||||||||||||||||||||||||||||||||||||||||||||||||||
| 06-30-20176 | 13.24 | 0.09 | 0.71 | 0.80 | (0.09 | ) | — | — | (0.09 | ) | 13.95 | 6.07 | 7 | 0.47 | 8 | 0.33 | 8 | 1.33 | 8 | 7 | 19 | |||||||||||||||||||||||||||||||||||||||||||||||||||||||||||||||||||||||||||||
| 12-31-2016 | 13.09 | 0.28 | 0.57 | 0.85 | (0.31 | ) | (0.39 | ) | — | (0.70 | ) | 13.24 | 6.53 | 0.45 | 0.34 | 2.07 | 8 | 25 | ||||||||||||||||||||||||||||||||||||||||||||||||||||||||||||||||||||||||||||||||
| 12-31-2015 | 14.06 | 0.30 | (0.51 | ) | (0.21 | ) | (0.32 | ) | (0.44 | ) | — | (0.76 | ) | 13.09 | (1.50 | ) | 0.48 | 0.36 | 2.15 | 10 | 11 | |||||||||||||||||||||||||||||||||||||||||||||||||||||||||||||||||||||||||||||
| 12-31-2014 | 14.25 | 0.34 | 0.18 | 0.52 | (0.34 | ) | (0.37 | ) | — | (0.71 | ) | 14.06 | 3.60 | 0.57 | 0.45 | 2.36 | 14 | 14 | ||||||||||||||||||||||||||||||||||||||||||||||||||||||||||||||||||||||||||||||||
| 12-31-2013 | 13.31 | 0.31 | 1.03 | 1.34 | (0.31 | ) | (0.09 | ) | — | (0.40 | ) | 14.25 | 10.17 | 0.55 | 0.44 | 2.19 | 13 | 17 | ||||||||||||||||||||||||||||||||||||||||||||||||||||||||||||||||||||||||||||||||
| 12-31-2012 | 12.24 | 0.33 | 1.14 | 1.47 | (0.32 | ) | (0.08 | ) | — | (0.40 | ) | 13.31 | 12.02 | 0.57 | 0.51 | 2.51 | 11 | 18 | ||||||||||||||||||||||||||||||||||||||||||||||||||||||||||||||||||||||||||||||||
| Multimanager Lifestyle Moderate Portfolio (continued) | |||||||||||||||||||||||||||||||||||||||||||||||||||||||||||||||||||||||||||||||||||||||||||||||||
| Per share operating performance for a share outstanding throughout each period | Ratios and supplemental data | ||||||||||||||||||||||||||||||||||||||||||||||||||||||||||||||||||||||||||||||||||||||||||||||||
| Income (loss) from investment operations | Less Distributions | Ratios to average net assets | |||||||||||||||||||||||||||||||||||||||||||||||||||||||||||||||||||||||||||||||||||||||||||||||
| Period ended | Net asset value, beginning of period($) | Net invest- ment income (loss) ($)1,2 | Net realized and unrealized gain (loss) on invest- ments($) | Total from invest- ment operations($) | From net invest- ment income($) | From net realized gain($) | From tax return of capital($) | Total distribu- tions($) | Net asset value, end of period($) | Total return (%)3,4 | Expenses before reductions (%)5 | Expenses including reductions (%)5 | Net investment income (loss) (%)1 | Net assets, end of period (in millions) | Portfolio turnover (%) | ||||||||||||||||||||||||||||||||||||||||||||||||||||||||||||||||||||||||||||||||||
| CLASS R5 | |||||||||||||||||||||||||||||||||||||||||||||||||||||||||||||||||||||||||||||||||||||||||||||||||
| 06-30-20176 | 13.26 | 0.11 | 0.70 | 0.81 | (0.11 | ) | — | — | (0.11 | ) | 13.96 | 6.09 | 7 | 0.18 | 8 | 0.14 | 8 | 1.58 | 8 | 10 | 19 | ||||||||||||||||||||||||||||||||||||||||||||||||||||||||||||||||||||||||||||
| 12-31-2016 | 13.10 | 0.31 | 0.58 | 0.89 | (0.34 | ) | (0.39 | ) | — | (0.73 | ) | 13.26 | 6.82 | 0.15 | 0.13 | 2.31 | 9 | 25 | |||||||||||||||||||||||||||||||||||||||||||||||||||||||||||||||||||||||||||||||
| 12-31-2015 | 14.07 | 0.35 | (0.53 | ) | (0.18 | ) | (0.35 | ) | (0.44 | ) | — | (0.79 | ) | 13.10 | (1.29 | ) | 0.18 | 0.16 | 2.47 | 11 | 11 | ||||||||||||||||||||||||||||||||||||||||||||||||||||||||||||||||||||||||||||
| 12-31-2014 | 14.26 | 0.36 | 0.18 | 0.54 | (0.36 | ) | (0.37 | ) | — | (0.73 | ) | 14.07 | 3.78 | 0.27 | 0.26 | 2.45 | 12 | 14 | |||||||||||||||||||||||||||||||||||||||||||||||||||||||||||||||||||||||||||||||
| 12-31-2013 | 13.32 | 0.35 | 1.02 | 1.37 | (0.34 | ) | (0.09 | ) | — | (0.43 | ) | 14.26 | 10.39 | 0.25 | 0.25 | 2.53 | 13 | 17 | |||||||||||||||||||||||||||||||||||||||||||||||||||||||||||||||||||||||||||||||
| 12-31-2012 | 12.26 | 0.31 | 1.19 | 1.50 | (0.36 | ) | (0.08 | ) | — | (0.44 | ) | 13.32 | 12.26 | 0.27 | 0.27 | 2.41 | 9 | 18 | |||||||||||||||||||||||||||||||||||||||||||||||||||||||||||||||||||||||||||||||
| Class R6 | |||||||||||||||||||||||||||||||||||||||||||||||||||||||||||||||||||||||||||||||||||||||||||||||||
| 06-30-20176 | 13.24 | 0.11 | 0.70 | 0.81 | (0.11 | ) | — | — | (0.11 | ) | 13.94 | 6.13 | 7 | 0.13 | 8 | 0.08 | 8 | 1.59 | 8 | 28 | 19 | ||||||||||||||||||||||||||||||||||||||||||||||||||||||||||||||||||||||||||||
| 12-31-2016 | 13.08 | 0.32 | 0.57 | 0.89 | (0.34 | ) | (0.39 | ) | — | (0.73 | ) | 13.24 | 6.90 | 0.10 | 0.07 | 2.41 | 29 | 25 | |||||||||||||||||||||||||||||||||||||||||||||||||||||||||||||||||||||||||||||||
| 12-31-2015 | 14.05 | 0.38 | (0.54 | ) | (0.16 | ) | (0.37 | ) | (0.44 | ) | — | (0.81 | ) | 13.08 | (1.20 | ) | 0.11 | 0.06 | 2.74 | 30 | 11 | ||||||||||||||||||||||||||||||||||||||||||||||||||||||||||||||||||||||||||||
| 12-31-2014 | 14.24 | 0.42 | 0.15 | 0.57 | (0.39 | ) | (0.37 | ) | — | (0.76 | ) | 14.05 | 3.99 | 0.21 | 0.06 | 2.90 | 20 | 14 | |||||||||||||||||||||||||||||||||||||||||||||||||||||||||||||||||||||||||||||||
| 12-31-2013 | 13.31 | 0.45 | 0.93 | 1.38 | (0.36 | ) | (0.09 | ) | — | (0.45 | ) | 14.24 | 10.49 | 0.32 | 0.11 | 3.22 | 11 | 17 | |||||||||||||||||||||||||||||||||||||||||||||||||||||||||||||||||||||||||||||||
| 12-31-2012 | 12.24 | 0.62 | 0.90 | 1.52 | (0.37 | ) | (0.08 | ) | — | (0.45 | ) | 13.31 | 12.50 | 4.79 | 0.11 | 4.66 | 2 | 18 | |||||||||||||||||||||||||||||||||||||||||||||||||||||||||||||||||||||||||||||||
| CLASS 1 | |||||||||||||||||||||||||||||||||||||||||||||||||||||||||||||||||||||||||||||||||||||||||||||||||
| 06-30-20176 | 13.26 | 0.11 | 0.70 | 0.81 | (0.11 | ) | — | — | (0.11 | ) | 13.96 | 6.10 | 7 | 0.17 | 8 | 0.13 | 8 | 1.56 | 8 | 2,776 | 19 | ||||||||||||||||||||||||||||||||||||||||||||||||||||||||||||||||||||||||||||
| 12-31-2016 | 13.10 | 0.32 | 0.57 | 0.89 | (0.34 | ) | (0.39 | ) | — | (0.73 | ) | 13.26 | 6.84 | 0.14 | 0.12 | 2.40 | 2,821 | 25 | |||||||||||||||||||||||||||||||||||||||||||||||||||||||||||||||||||||||||||||||
| 12-31-2015 | 14.07 | 0.35 | (0.52 | ) | (0.17 | ) | (0.36 | ) | (0.44 | ) | — | (0.80 | ) | 13.10 | (1.25 | ) | 0.13 | 0.11 | 2.50 | 3,005 | 11 | ||||||||||||||||||||||||||||||||||||||||||||||||||||||||||||||||||||||||||||
| 12-31-2014 | 14.26 | 0.38 | 0.18 | 0.56 | (0.38 | ) | (0.37 | ) | — | (0.75 | ) | 14.07 | 3.93 | 0.12 | 0.11 | 2.62 | 3,455 | 14 | |||||||||||||||||||||||||||||||||||||||||||||||||||||||||||||||||||||||||||||||
| 12-31-2013 | 13.32 | 0.35 | 1.04 | 1.39 | (0.36 | ) | (0.09 | ) | — | (0.45 | ) | 14.26 | 10.55 | 0.11 | 0.11 | 2.51 | 3,562 | 17 | |||||||||||||||||||||||||||||||||||||||||||||||||||||||||||||||||||||||||||||||
| 12-31-2012 | 12.25 | 0.37 | 1.15 | 1.52 | (0.37 | ) | (0.08 | ) | — | (0.45 | ) | 13.32 | 12.49 | 0.11 | 0.11 | 2.87 | 3,414 | 18 | |||||||||||||||||||||||||||||||||||||||||||||||||||||||||||||||||||||||||||||||
| CLASS 5 | |||||||||||||||||||||||||||||||||||||||||||||||||||||||||||||||||||||||||||||||||||||||||||||||||
| 06-30-20176 | 13.24 | 0.11 | 0.70 | 0.81 | (0.11 | ) | — | — | (0.11 | ) | 13.94 | 6.13 | 7 | 0.12 | 8 | 0.08 | 8 | 1.62 | 8 | 60 | 19 | ||||||||||||||||||||||||||||||||||||||||||||||||||||||||||||||||||||||||||||
| 12-31-2016 | 13.08 | 0.34 | 0.55 | 0.89 | (0.34 | ) | (0.39 | ) | — | (0.73 | ) | 13.24 | 6.90 | 0.09 | 0.07 | 2.50 | 57 | 25 | |||||||||||||||||||||||||||||||||||||||||||||||||||||||||||||||||||||||||||||||
| 12-31-2015 | 14.06 | 0.37 | (0.54 | ) | (0.17 | ) | (0.37 | ) | (0.44 | ) | — | (0.81 | ) | 13.08 | (1.27 | ) | 0.08 | 0.06 | 2.61 | 52 | 11 | ||||||||||||||||||||||||||||||||||||||||||||||||||||||||||||||||||||||||||||
| 12-31-2014 | 14.24 | 0.40 | 0.18 | 0.58 | (0.39 | ) | (0.37 | ) | — | (0.76 | ) | 14.06 | 4.06 | 0.07 | 0.06 | 2.72 | 52 | 14 | |||||||||||||||||||||||||||||||||||||||||||||||||||||||||||||||||||||||||||||||
| 12-31-2013 | 13.31 | 0.36 | 1.03 | 1.39 | (0.37 | ) | (0.09 | ) | — | (0.46 | ) | 14.24 | 10.54 | 0.06 | 0.06 | 2.62 | 48 | 17 | |||||||||||||||||||||||||||||||||||||||||||||||||||||||||||||||||||||||||||||||
| 12-31-2012 | 12.24 | 0.39 | 1.14 | 1.53 | (0.38 | ) | (0.08 | ) | — | (0.46 | ) | 13.31 | 12.56 | 0.06 | 0.06 | 3.03 | 39 | 18 | |||||||||||||||||||||||||||||||||||||||||||||||||||||||||||||||||||||||||||||||
| 1 | Recognition of net investment income by the portfolio is affected by the timing and frequency of the declaration of dividends by the underlying funds in which the portfolio invests. | |||||||||||||||||||||||||||||||||||||||||||||||||||||||||||||||||||||||||||||||||||||||||||||||||
| 2 | Based on average daily shares outstanding. | |||||||||||||||||||||||||||||||||||||||||||||||||||||||||||||||||||||||||||||||||||||||||||||||||
| 3 | Does not reflect the effect of sales charges, if any. | |||||||||||||||||||||||||||||||||||||||||||||||||||||||||||||||||||||||||||||||||||||||||||||||||
| 4 | Total returns would have been lower had certain expenses not been reduced during the applicable periods. | |||||||||||||||||||||||||||||||||||||||||||||||||||||||||||||||||||||||||||||||||||||||||||||||||
| 5 | Ratios do not include expenses indirectly incurred from underlying funds and can vary based on the mix of the underlying funds held by the portfolio. The range of expense ratio of the underlying funds held by the portfolio was as follows: 0.41%-3.50%, 0.60%-3.77%, 0.57%-2.99%, 0.55%-2.85%, 0.62%-3.11% and 0.63%-1.48% for the periods ended 6-30-17, 12-31-16, 12-31-15, 12-31-14, 12-31-13 and 12-31-12, respectively. | |||||||||||||||||||||||||||||||||||||||||||||||||||||||||||||||||||||||||||||||||||||||||||||||||
| 6 | Six months ended 6-30-17. Unaudited. | |||||||||||||||||||||||||||||||||||||||||||||||||||||||||||||||||||||||||||||||||||||||||||||||||
| 7 | Not annualized. | |||||||||||||||||||||||||||||||||||||||||||||||||||||||||||||||||||||||||||||||||||||||||||||||||
| 8 | Annualized. | |||||||||||||||||||||||||||||||||||||||||||||||||||||||||||||||||||||||||||||||||||||||||||||||||
| 9 | The inception date for Class I shares is 5-1-15. | |||||||||||||||||||||||||||||||||||||||||||||||||||||||||||||||||||||||||||||||||||||||||||||||||
| 10 | The portfolio turnover is shown for the period from 1-1-15 to 12-31-15. | |||||||||||||||||||||||||||||||||||||||||||||||||||||||||||||||||||||||||||||||||||||||||||||||||
| 11 | Includes the impact of expense recapture for the following periods ended: 12-31-13: 0.01% of average net assets for Class R2 shares. | |||||||||||||||||||||||||||||||||||||||||||||||||||||||||||||||||||||||||||||||||||||||||||||||||
| 12 | The inception date for Class R2 shares is 3-1-12. | |||||||||||||||||||||||||||||||||||||||||||||||||||||||||||||||||||||||||||||||||||||||||||||||||
| 13 | Less than $500,000. | |||||||||||||||||||||||||||||||||||||||||||||||||||||||||||||||||||||||||||||||||||||||||||||||||
| 14 | The portfolio turnover is shown for the period from 1-1-12 to 12-31-12. | |||||||||||||||||||||||||||||||||||||||||||||||||||||||||||||||||||||||||||||||||||||||||||||||||
Financial highlights continued
| Multimanager Lifestyle Conservative Portfolio | ||||||||||||||||||||||||||||||||||||||||||||||||||||||||||||||||||||||||||||||||||||||||||||||||||
| Per share operating performance for a share outstanding throughout each period | Ratios and supplemental data | |||||||||||||||||||||||||||||||||||||||||||||||||||||||||||||||||||||||||||||||||||||||||||||||||
| Income (loss) from investment operations | Less Distributions | Ratios to average net assets | ||||||||||||||||||||||||||||||||||||||||||||||||||||||||||||||||||||||||||||||||||||||||||||||||
| Period ended | Net asset value, beginning of period($) | Net invest- ment income (loss) ($)1,2 | Net realized and unrealized gain (loss) on invest- ments($) | Total from invest- ment operations($) | From net invest- ment income($) | From net realized gain($) | From tax return of capital($) | Total distribu- tions($) | Net asset value, end of period($) | Total return (%)3,4 | Expenses before reductions (%)5 | Expenses including reductions (%)5 | Net investment income (loss) (%)1 | Net assets, end of period (in millions) | Portfolio turnover (%) | |||||||||||||||||||||||||||||||||||||||||||||||||||||||||||||||||||||||||||||||||||
| CLASS A | ||||||||||||||||||||||||||||||||||||||||||||||||||||||||||||||||||||||||||||||||||||||||||||||||||
| 06-30-20176 | 12.60 | 0.10 | 0.44 | 0.54 | (0.10 | ) | — | — | (0.10 | ) | 13.04 | 4.26 | 7 | 0.53 | 8 | 0.50 | 8 | 1.50 | 8 | 609 | 19 | |||||||||||||||||||||||||||||||||||||||||||||||||||||||||||||||||||||||||||||
| 12-31-2016 | 12.42 | 0.29 | 0.38 | 0.67 | (0.28 | ) | (0.21 | ) | — | (0.49 | ) | 12.60 | 5.40 | 0.51 | 0.48 | 2.26 | 607 | 23 | ||||||||||||||||||||||||||||||||||||||||||||||||||||||||||||||||||||||||||||||||
| 12-31-2015 | 13.30 | 0.33 | (0.56 | ) | (0.23 | ) | (0.33 | ) | (0.32 | ) | — | (0.65 | ) | 12.42 | (1.74 | ) | 0.51 | 0.47 | 2.47 | 576 | 10 | |||||||||||||||||||||||||||||||||||||||||||||||||||||||||||||||||||||||||||||
| 12-31-2014 | 13.68 | 0.37 | 0.10 | 0.47 | (0.37 | ) | (0.48 | ) | — | (0.85 | ) | 13.30 | 3.44 | 0.53 | 0.47 | 2.67 | 600 | 22 | ||||||||||||||||||||||||||||||||||||||||||||||||||||||||||||||||||||||||||||||||
| 12-31-2013 | 13.44 | 0.33 | 0.29 | 0.62 | (0.33 | ) | (0.05 | ) | — | (0.38 | ) | 13.68 | 4.66 | 0.54 | 0.52 | 2.44 | 530 | 17 | ||||||||||||||||||||||||||||||||||||||||||||||||||||||||||||||||||||||||||||||||
| 12-31-2012 | 12.63 | 0.38 | 0.88 | 1.26 | (0.37 | ) | (0.08 | ) | — | (0.45 | ) | 13.44 | 10.03 | 0.56 | 0.56 | 2.89 | 472 | 14 | ||||||||||||||||||||||||||||||||||||||||||||||||||||||||||||||||||||||||||||||||
| CLASS B | ||||||||||||||||||||||||||||||||||||||||||||||||||||||||||||||||||||||||||||||||||||||||||||||||||
| 06-30-20176 | 12.61 | 0.05 | 0.44 | 0.49 | (0.05 | ) | — | — | (0.05 | ) | 13.05 | 3.89 | 7 | 1.23 | 8 | 1.21 | 8 | 0.76 | 8 | 20 | 19 | |||||||||||||||||||||||||||||||||||||||||||||||||||||||||||||||||||||||||||||
| 12-31-2016 | 12.43 | 0.18 | 0.40 | 0.58 | (0.19 | ) | (0.21 | ) | — | (0.40 | ) | 12.61 | 4.66 | 1.21 | 1.19 | 1.42 | 23 | 23 | ||||||||||||||||||||||||||||||||||||||||||||||||||||||||||||||||||||||||||||||||
| 12-31-2015 | 13.30 | 0.22 | (0.54 | ) | (0.32 | ) | (0.23 | ) | (0.32 | ) | — | (0.55 | ) | 12.43 | (2.39 | ) | 1.22 | 1.20 | 1.64 | 30 | 10 | |||||||||||||||||||||||||||||||||||||||||||||||||||||||||||||||||||||||||||||
| 12-31-2014 | 13.68 | 0.24 | 0.12 | 0.36 | (0.26 | ) | (0.48 | ) | — | (0.74 | ) | 13.30 | 2.65 | 1.25 | 1.24 | 1.75 | 39 | 22 | ||||||||||||||||||||||||||||||||||||||||||||||||||||||||||||||||||||||||||||||||
| 12-31-2013 | 13.44 | 0.22 | 0.30 | 0.52 | (0.23 | ) | (0.05 | ) | — | (0.28 | ) | 13.68 | 3.87 | 1.26 | 1.26 | 1.65 | 47 | 17 | ||||||||||||||||||||||||||||||||||||||||||||||||||||||||||||||||||||||||||||||||
| 12-31-2012 | 12.63 | 0.28 | 0.88 | 1.16 | (0.27 | ) | (0.08 | ) | — | (0.35 | ) | 13.44 | 9.24 | 1.30 | 1.30 | 2.13 | 48 | 14 | ||||||||||||||||||||||||||||||||||||||||||||||||||||||||||||||||||||||||||||||||
| CLASS C | ||||||||||||||||||||||||||||||||||||||||||||||||||||||||||||||||||||||||||||||||||||||||||||||||||
| 06-30-20176 | 12.61 | 0.05 | 0.43 | 0.48 | (0.05 | ) | — | — | (0.05 | ) | 13.04 | 3.82 | 7 | 1.23 | 8 | 1.21 | 8 | 0.77 | 8 | 286 | 19 | |||||||||||||||||||||||||||||||||||||||||||||||||||||||||||||||||||||||||||||
| 12-31-2016 | 12.42 | 0.19 | 0.40 | 0.59 | (0.19 | ) | (0.21 | ) | — | (0.40 | ) | 12.61 | 4.74 | 1.21 | 1.19 | 1.48 | 310 | 23 | ||||||||||||||||||||||||||||||||||||||||||||||||||||||||||||||||||||||||||||||||
| 12-31-2015 | 13.30 | 0.23 | (0.56 | ) | (0.33 | ) | (0.23 | ) | (0.32 | ) | — | (0.55 | ) | 12.42 | (2.47 | ) | 1.21 | 1.19 | 1.73 | 349 | 10 | |||||||||||||||||||||||||||||||||||||||||||||||||||||||||||||||||||||||||||||
| 12-31-2014 | 13.68 | 0.27 | 0.09 | 0.36 | (0.26 | ) | (0.48 | ) | — | (0.74 | ) | 13.30 | 2.66 | 1.23 | 1.21 | 1.91 | 378 | 22 | ||||||||||||||||||||||||||||||||||||||||||||||||||||||||||||||||||||||||||||||||
| 12-31-2013 | 13.43 | 0.23 | 0.30 | 0.53 | (0.23 | ) | (0.05 | ) | — | (0.28 | ) | 13.68 | 3.98 | 1.24 | 1.24 | 1.71 | 355 | 17 | ||||||||||||||||||||||||||||||||||||||||||||||||||||||||||||||||||||||||||||||||
| 12-31-2012 | 12.62 | 0.29 | 0.88 | 1.17 | (0.28 | ) | (0.08 | ) | — | (0.36 | ) | 13.43 | 9.28 | 1.26 | 1.26 | 2.17 | 335 | 14 | ||||||||||||||||||||||||||||||||||||||||||||||||||||||||||||||||||||||||||||||||
| CLASS I | ||||||||||||||||||||||||||||||||||||||||||||||||||||||||||||||||||||||||||||||||||||||||||||||||||
| 06-30-20176 | 12.58 | 0.12 | 0.44 | 0.56 | (0.12 | ) | — | — | (0.12 | ) | 13.02 | 4.42 | 7 | 0.22 | 8 | 0.19 | 8 | 1.82 | 8 | 13 | 19 | |||||||||||||||||||||||||||||||||||||||||||||||||||||||||||||||||||||||||||||
| 12-31-2016 | 12.40 | 0.39 | 0.32 | 0.71 | (0.32 | ) | (0.21 | ) | — | (0.53 | ) | 12.58 | 5.73 | 0.20 | 0.18 | 3.04 | 11 | 23 | ||||||||||||||||||||||||||||||||||||||||||||||||||||||||||||||||||||||||||||||||
| 12-31-20159 | 13.49 | 0.34 | (0.80 | ) | (0.46 | ) | (0.31 | ) | (0.32 | ) | — | (0.63 | ) | 12.40 | (3.40 | ) 7 | 0.19 | 8 | 0.17 | 8 | 3.84 | 8 | 4 | 10 | 10 | |||||||||||||||||||||||||||||||||||||||||||||||||||||||||||||||||||||||||
| CLASS R1 | ||||||||||||||||||||||||||||||||||||||||||||||||||||||||||||||||||||||||||||||||||||||||||||||||||
| 06-30-20176 | 12.59 | 0.07 | 0.44 | 0.51 | (0.07 | ) | — | — | (0.07 | ) | 13.03 | 4.08 | 7 | 0.87 | 8 | 0.84 | 8 | 1.12 | 8 | 7 | 19 | |||||||||||||||||||||||||||||||||||||||||||||||||||||||||||||||||||||||||||||
| 12-31-2016 | 12.41 | 0.24 | 0.39 | 0.63 | (0.24 | ) | (0.21 | ) | — | (0.45 | ) | 12.59 | 5.04 | 0.86 | 0.84 | 1.90 | 9 | 23 | ||||||||||||||||||||||||||||||||||||||||||||||||||||||||||||||||||||||||||||||||
| 12-31-2015 | 13.29 | 0.26 | (0.54 | ) | (0.28 | ) | (0.28 | ) | (0.32 | ) | — | (0.60 | ) | 12.41 | (2.11 | ) | 0.87 | 0.86 | 1.95 | 8 | 10 | |||||||||||||||||||||||||||||||||||||||||||||||||||||||||||||||||||||||||||||
| 12-31-2014 | 13.68 | 0.30 | 0.09 | 0.39 | (0.30 | ) | (0.48 | ) | — | (0.78 | ) | 13.29 | 2.86 | 1.00 | 0.99 | 2.14 | 10 | 22 | ||||||||||||||||||||||||||||||||||||||||||||||||||||||||||||||||||||||||||||||||
| 12-31-2013 | 13.43 | 0.27 | 0.30 | 0.57 | (0.27 | ) | (0.05 | ) | — | (0.32 | ) | 13.68 | 4.31 | 0.91 | 0.91 | 1.97 | 9 | 17 | ||||||||||||||||||||||||||||||||||||||||||||||||||||||||||||||||||||||||||||||||
| 12-31-2012 | 12.62 | 0.31 | 0.88 | 1.19 | (0.30 | ) | (0.08 | ) | — | (0.38 | ) | 13.43 | 9.52 | 1.07 | 1.07 | 2.36 | 9 | 14 | ||||||||||||||||||||||||||||||||||||||||||||||||||||||||||||||||||||||||||||||||
| CLASS R2 | ||||||||||||||||||||||||||||||||||||||||||||||||||||||||||||||||||||||||||||||||||||||||||||||||||
| 06-30-20176 | 12.59 | 0.09 | 0.43 | 0.52 | (0.09 | ) | — | — | (0.09 | ) | 13.02 | 4.12 | 7 | 0.63 | 8 | 0.60 | 8 | 1.35 | 8 | 3 | 19 | |||||||||||||||||||||||||||||||||||||||||||||||||||||||||||||||||||||||||||||
| 12-31-2016 | 12.40 | 0.25 | 0.42 | 0.67 | (0.27 | ) | (0.21 | ) | — | (0.48 | ) | 12.59 | 5.39 | 0.60 | 0.58 | 1.95 | 4 | 23 | ||||||||||||||||||||||||||||||||||||||||||||||||||||||||||||||||||||||||||||||||
| 12-31-2015 | 13.28 | 0.31 | (0.55 | ) | (0.24 | ) | (0.32 | ) | (0.32 | ) | — | (0.64 | ) | 12.40 | (1.86 | ) | 0.65 | 0.61 | 2.31 | 5 | 10 | |||||||||||||||||||||||||||||||||||||||||||||||||||||||||||||||||||||||||||||
| 12-31-2014 | 13.67 | 0.46 | (0.02 | ) | 0.44 | (0.35 | ) | (0.48 | ) | — | (0.83 | ) | 13.28 | 3.21 | 1.13 | 0.62 | 3.30 | 5 | 22 | |||||||||||||||||||||||||||||||||||||||||||||||||||||||||||||||||||||||||||||||
| 12-31-2013 | 13.42 | 0.39 | 0.23 | 0.62 | (0.32 | ) | (0.05 | ) | — | (0.37 | ) | 13.67 | 4.67 | 2.55 | 0.62 | 2.86 | 2 | 17 | ||||||||||||||||||||||||||||||||||||||||||||||||||||||||||||||||||||||||||||||||
| 12-31-201211 | 13.12 | 0.35 | 0.39 | 0.74 | (0.36 | ) | (0.08 | ) | — | (0.44 | ) | 13.42 | 5.73 | 7 | 10.39 | 8 | 0.62 | 8 | 2.64 | 7 | — | 12 | 14 | 13 | ||||||||||||||||||||||||||||||||||||||||||||||||||||||||||||||||||||||||||
| CLASS R3 | ||||||||||||||||||||||||||||||||||||||||||||||||||||||||||||||||||||||||||||||||||||||||||||||||||
| 06-30-20176 | 12.57 | 0.08 | 0.44 | 0.52 | (0.08 | ) | — | — | (0.08 | ) | 13.01 | 4.17 | 7 | 0.74 | 8 | 0.71 | 8 | 1.25 | 8 | 5 | 19 | |||||||||||||||||||||||||||||||||||||||||||||||||||||||||||||||||||||||||||||
| 12-31-2016 | 12.39 | 0.25 | 0.40 | 0.65 | (0.26 | ) | (0.21 | ) | — | (0.47 | ) | 12.57 | 5.19 | 0.69 | 0.68 | 1.94 | 6 | 23 | ||||||||||||||||||||||||||||||||||||||||||||||||||||||||||||||||||||||||||||||||
| 12-31-2015 | 13.26 | 0.27 | (0.52 | ) | (0.25 | ) | (0.30 | ) | (0.32 | ) | — | (0.62 | ) | 12.39 | (1.94 | ) | 0.76 | 0.75 | 2.04 | 8 | 10 | |||||||||||||||||||||||||||||||||||||||||||||||||||||||||||||||||||||||||||||
| 12-31-2014 | 13.65 | 0.31 | 0.10 | 0.41 | (0.32 | ) | (0.48 | ) | — | (0.80 | ) | 13.26 | 3.01 | 0.88 | 0.86 | 2.21 | 11 | 22 | ||||||||||||||||||||||||||||||||||||||||||||||||||||||||||||||||||||||||||||||||
| 12-31-2013 | 13.41 | 0.30 | 0.28 | 0.58 | (0.29 | ) | (0.05 | ) | — | (0.34 | ) | 13.65 | 4.39 | 0.75 | 0.75 | 2.18 | 11 | 17 | ||||||||||||||||||||||||||||||||||||||||||||||||||||||||||||||||||||||||||||||||
| 12-31-2012 | 12.60 | 0.31 | 0.91 | 1.22 | (0.33 | ) | (0.08 | ) | — | (0.41 | ) | 13.41 | 9.71 | 0.97 | 0.97 | 2.38 | 11 | 14 | ||||||||||||||||||||||||||||||||||||||||||||||||||||||||||||||||||||||||||||||||
| CLASS R4 | ||||||||||||||||||||||||||||||||||||||||||||||||||||||||||||||||||||||||||||||||||||||||||||||||||
| 06-30-20176 | 12.58 | 0.10 | 0.44 | 0.54 | (0.11 | ) | — | — | (0.11 | ) | 13.01 | 4.26 | 7 | 0.47 | 8 | 0.35 | 8 | 1.55 | 8 | 4 | 19 | |||||||||||||||||||||||||||||||||||||||||||||||||||||||||||||||||||||||||||||
| 12-31-2016 | 12.40 | 0.30 | 0.39 | 0.69 | (0.30 | ) | (0.21 | ) | — | (0.51 | ) | 12.58 | 5.56 | 0.45 | 0.34 | 2.35 | 6 | 23 | ||||||||||||||||||||||||||||||||||||||||||||||||||||||||||||||||||||||||||||||||
| 12-31-2015 | 13.27 | 0.31 | (0.51 | ) | (0.20 | ) | (0.35 | ) | (0.32 | ) | — | (0.67 | ) | 12.40 | (1.56 | ) | 0.50 | 0.38 | 2.37 | 6 | 10 | |||||||||||||||||||||||||||||||||||||||||||||||||||||||||||||||||||||||||||||
| 12-31-2014 | 13.66 | 0.36 | 0.10 | 0.46 | (0.37 | ) | (0.48 | ) | — | (0.85 | ) | 13.27 | 3.36 | 0.63 | 0.51 | 2.62 | 9 | 22 | ||||||||||||||||||||||||||||||||||||||||||||||||||||||||||||||||||||||||||||||||
| 12-31-2013 | 13.42 | 0.34 | 0.29 | 0.63 | (0.34 | ) | (0.05 | ) | — | (0.39 | ) | 13.66 | 4.72 | 0.58 | 0.48 | 2.51 | 9 | 17 | ||||||||||||||||||||||||||||||||||||||||||||||||||||||||||||||||||||||||||||||||
| 12-31-2012 | 12.61 | 0.36 | 0.90 | 1.26 | (0.37 | ) | (0.08 | ) | — | (0.45 | ) | 13.42 | 10.06 | 0.60 | 0.54 | 2.72 | 8 | 14 | ||||||||||||||||||||||||||||||||||||||||||||||||||||||||||||||||||||||||||||||||
| Multimanager Lifestyle Conservative Portfolio (continued) | |||||||||||||||||||||||||||||||||||||||||||||||||||||||||||||||||||||||||||||||||||||||||||||||||
| Per share operating performance for a share outstanding throughout each period | Ratios and supplemental data | ||||||||||||||||||||||||||||||||||||||||||||||||||||||||||||||||||||||||||||||||||||||||||||||||
| Income (loss) from investment operations | Less Distributions | Ratios to average net assets | |||||||||||||||||||||||||||||||||||||||||||||||||||||||||||||||||||||||||||||||||||||||||||||||
| Period ended | Net asset value, beginning of period($) | Net invest- ment income (loss) ($)1,2 | Net realized and unrealized gain (loss) on invest- ments($) | Total from invest- ment operations($) | From net invest- ment income($) | From net realized gain($) | From tax return of capital($) | Total distribu- tions($) | Net asset value, end of period($) | Total return (%)3,4 | Expenses before reductions (%)5 | Expenses including reductions (%)5 | Net investment income (loss) (%)1 | Net assets, end of period (in millions) | Portfolio turnover (%) | ||||||||||||||||||||||||||||||||||||||||||||||||||||||||||||||||||||||||||||||||||
| CLASS R5 | |||||||||||||||||||||||||||||||||||||||||||||||||||||||||||||||||||||||||||||||||||||||||||||||||
| 06-30-20176 | 12.58 | 0.12 | 0.44 | 0.56 | (0.12 | ) | — | — | (0.12 | ) | 13.02 | 4.45 | 7 | 0.18 | 8 | 0.15 | 8 | 1.92 | 8 | 9 | 19 | ||||||||||||||||||||||||||||||||||||||||||||||||||||||||||||||||||||||||||||
| 12-31-2016 | 12.40 | 0.32 | 0.40 | 0.72 | (0.33 | ) | (0.21 | ) | — | (0.54 | ) | 12.58 | 5.77 | 0.15 | 0.13 | 2.53 | 7 | 23 | |||||||||||||||||||||||||||||||||||||||||||||||||||||||||||||||||||||||||||||||
| 12-31-2015 | 13.28 | 0.36 | (0.54 | ) | (0.18 | ) | (0.38 | ) | (0.32 | ) | — | (0.70 | ) | 12.40 | (1.41 | ) | 0.18 | 0.16 | 2.70 | 8 | 10 | ||||||||||||||||||||||||||||||||||||||||||||||||||||||||||||||||||||||||||||
| 12-31-2014 | 13.67 | 0.38 | 0.12 | 0.50 | (0.41 | ) | (0.48 | ) | — | (0.89 | ) | 13.28 | 3.64 | 0.26 | 0.24 | 2.75 | 13 | 22 | |||||||||||||||||||||||||||||||||||||||||||||||||||||||||||||||||||||||||||||||
| 12-31-2013 | 13.43 | 0.37 | 0.30 | 0.67 | (0.38 | ) | (0.05 | ) | — | (0.43 | ) | 13.67 | 5.03 | 0.17 | 0.17 | 2.70 | 15 | 17 | |||||||||||||||||||||||||||||||||||||||||||||||||||||||||||||||||||||||||||||||
| 12-31-2012 | 12.62 | 0.41 | 0.89 | 1.30 | (0.41 | ) | (0.08 | ) | — | (0.49 | ) | 13.43 | 10.37 | 0.31 | 0.31 | 3.11 | 15 | 14 | |||||||||||||||||||||||||||||||||||||||||||||||||||||||||||||||||||||||||||||||
| Class R6 | |||||||||||||||||||||||||||||||||||||||||||||||||||||||||||||||||||||||||||||||||||||||||||||||||
| 06-30-20176 | 12.57 | 0.12 | 0.44 | 0.56 | (0.12 | ) | — | — | (0.12 | ) | 13.01 | 4.48 | 7 | 0.13 | 8 | 0.09 | 8 | 1.91 | 8 | 13 | 19 | ||||||||||||||||||||||||||||||||||||||||||||||||||||||||||||||||||||||||||||
| 12-31-2016 | 12.39 | 0.34 | 0.39 | 0.73 | (0.34 | ) | (0.21 | ) | — | (0.55 | ) | 12.57 | 5.85 | 0.10 | 0.07 | 2.68 | 14 | 23 | |||||||||||||||||||||||||||||||||||||||||||||||||||||||||||||||||||||||||||||||
| 12-31-2015 | 13.27 | 0.39 | (0.56 | ) | (0.17 | ) | (0.39 | ) | (0.32 | ) | — | (0.71 | ) | 12.39 | (1.34 | ) | 0.13 | 0.06 | 2.95 | 13 | 10 | ||||||||||||||||||||||||||||||||||||||||||||||||||||||||||||||||||||||||||||
| 12-31-2014 | 13.65 | 0.47 | 0.06 | 0.53 | (0.43 | ) | (0.48 | ) | — | (0.91 | ) | 13.27 | 3.87 | 0.42 | 0.06 | 3.41 | 8 | 22 | |||||||||||||||||||||||||||||||||||||||||||||||||||||||||||||||||||||||||||||||
| 12-31-2013 | 13.42 | 0.43 | 0.24 | 0.67 | (0.39 | ) | (0.05 | ) | — | (0.44 | ) | 13.65 | 5.05 | 0.43 | 0.11 | 3.19 | 5 | 17 | |||||||||||||||||||||||||||||||||||||||||||||||||||||||||||||||||||||||||||||||
| 12-31-2012 | 12.61 | 0.51 | 0.81 | 1.32 | (0.43 | ) | (0.08 | ) | — | (0.51 | ) | 13.42 | 10.56 | 2.50 | 0.11 | 3.83 | 2 | 14 | |||||||||||||||||||||||||||||||||||||||||||||||||||||||||||||||||||||||||||||||
| CLASS 1 | |||||||||||||||||||||||||||||||||||||||||||||||||||||||||||||||||||||||||||||||||||||||||||||||||
| 06-30-20176 | 12.58 | 0.12 | 0.43 | 0.55 | (0.12 | ) | — | — | (0.12 | ) | 13.01 | 4.38 | 7 | 0.16 | 8 | 0.14 | 8 | 1.85 | 8 | 2,053 | 19 | ||||||||||||||||||||||||||||||||||||||||||||||||||||||||||||||||||||||||||||
| 12-31-2016 | 12.39 | 0.33 | 0.40 | 0.73 | (0.33 | ) | (0.21 | ) | — | (0.54 | ) | 12.58 | 5.88 | 0.13 | 0.12 | 2.59 | 2,149 | 23 | |||||||||||||||||||||||||||||||||||||||||||||||||||||||||||||||||||||||||||||||
| 12-31-2015 | 13.27 | 0.37 | (0.55 | ) | (0.18 | ) | (0.38 | ) | (0.32 | ) | — | (0.70 | ) | 12.39 | (1.39 | ) | 0.13 | 0.11 | 2.79 | 2,241 | 10 | ||||||||||||||||||||||||||||||||||||||||||||||||||||||||||||||||||||||||||||
| 12-31-2014 | 13.66 | 0.41 | 0.10 | 0.51 | (0.42 | ) | (0.48 | ) | — | (0.90 | ) | 13.27 | 3.74 | 0.13 | 0.11 | �� | 2.94 | 2,584 | 22 | ||||||||||||||||||||||||||||||||||||||||||||||||||||||||||||||||||||||||||||||
| 12-31-2013 | 13.42 | 0.38 | 0.30 | 0.68 | (0.39 | ) | (0.05 | ) | — | (0.44 | ) | 13.66 | 5.12 | 0.11 | 0.11 | 2.77 | 2,758 | 17 | |||||||||||||||||||||||||||||||||||||||||||||||||||||||||||||||||||||||||||||||
| 12-31-2012 | 12.61 | 0.43 | 0.89 | 1.32 | (0.43 | ) | (0.08 | ) | — | (0.51 | ) | 13.42 | 10.56 | 0.11 | 0.11 | 3.28 | 3,090 | 14 | |||||||||||||||||||||||||||||||||||||||||||||||||||||||||||||||||||||||||||||||
| 1 | Recognition of net investment income by the portfolio is affected by the timing and frequency of the declaration of dividends by the underlying funds in which the portfolio invests. | |||||||||||||||||||||||||||||||||||||||||||||||||||||||||||||||||||||||||||||||||||||||||||||||||
| 2 | Based on average daily shares outstanding. | |||||||||||||||||||||||||||||||||||||||||||||||||||||||||||||||||||||||||||||||||||||||||||||||||
| 3 | Does not reflect the effect of sales charges, if any. | |||||||||||||||||||||||||||||||||||||||||||||||||||||||||||||||||||||||||||||||||||||||||||||||||
| 4 | Total returns would have been lower had certain expenses not been reduced during the applicable periods. | |||||||||||||||||||||||||||||||||||||||||||||||||||||||||||||||||||||||||||||||||||||||||||||||||
| 5 | Ratios do not include expenses indirectly incurred from underlying funds and can vary based on the mix of the underlying funds held by the portfolio. The range of expense ratio of the underlying funds held by the portfolio was as follows: 0.41%-3.50%, 0.60%-3.77%, 0.62%-2.99%, 0.62%-2.85%, 0.62%-3.11% and 0.63%-1.48% for the periods ended 6-30-17, 12-31-16, 12-31-15, 12-31-14, 12-31-13 and 12-31-12, respectively. | |||||||||||||||||||||||||||||||||||||||||||||||||||||||||||||||||||||||||||||||||||||||||||||||||
| 6 | Six months ended 6-30-17. Unaudited. | |||||||||||||||||||||||||||||||||||||||||||||||||||||||||||||||||||||||||||||||||||||||||||||||||
| 7 | Not annualized. | |||||||||||||||||||||||||||||||||||||||||||||||||||||||||||||||||||||||||||||||||||||||||||||||||
| 8 | Annualized. | |||||||||||||||||||||||||||||||||||||||||||||||||||||||||||||||||||||||||||||||||||||||||||||||||
| 9 | The inception date for Class I shares is 5-1-15. | |||||||||||||||||||||||||||||||||||||||||||||||||||||||||||||||||||||||||||||||||||||||||||||||||
| 10 | The portfolio turnover is shown for the period from 1-1-15 to 12-31-15. | |||||||||||||||||||||||||||||||||||||||||||||||||||||||||||||||||||||||||||||||||||||||||||||||||
| 11 | The inception date for Class R2 shares is 3-1-12. | |||||||||||||||||||||||||||||||||||||||||||||||||||||||||||||||||||||||||||||||||||||||||||||||||
| 12 | Less than $500,000. | |||||||||||||||||||||||||||||||||||||||||||||||||||||||||||||||||||||||||||||||||||||||||||||||||
Note 1 — Organization
John Hancock Funds II (the Trust) is an open-end management investment company organized as a Massachusetts business trust and registered under the Investment Company Act of 1940, as amended (the 1940 Act). It is a series company with multiple investment series (the funds), five of which (collectively, Multimanager Lifestyle Portfolios, or the portfolios, and individually the portfolio) are presented in this report. The Multimanager Lifestyle Portfolios operate as "funds of funds" that invest in other series of the Trust and other John Hancock funds.
The portfolios may offer multiple classes of shares. The shares currently offered by the portfolios are detailed in the Statements of assets and liabilities. Class A and Class C are open to all investors. Class B shares are closed to new investors, subject to exceptions described in the portfolios' prospectus. Class I shares are offered to institutions and certain investors. Class R1, Class R2, Class R3, Class R4 and Class R5 shares are available only to certain retirement plans. Class R6 shares are only available to certain retirement plans, institutions and other investors. Class 1 shares are offered only to certain affiliates of Manulife Financial Corporation (MFC). Class 5 shares are available only to the John Hancock Freedom 529 plans. Class B shares convert to Class A shares eight years after purchase. Shareholders of each class have exclusive voting rights to matters that affect that class. The distribution and service fees, if any, and transfer agent fees for each class may differ.
The investment objectives of the portfolios are as follows:
Multimanager Lifestyle Aggressive Portfolio
To seek long-term growth of capital. Current income is not a consideration.
Multimanager Lifestyle Growth Portfolio
To seek long-term growth of capital. Current income is also a consideration.
Multimanager Lifestyle Balanced Portfolio
To seek a balance between a high level of current income and growth of capital, with a greater emphasis on growth of capital.
Multimanager Lifestyle Moderate Portfolio
To seek a balance between a high level of current income and growth of capital, with a greater emphasis on income.
Multimanager Lifestyle Conservative Portfolio
To seek a high level of current income with some consideration given to growth of capital.
Effective February 1, 2017, the portfolios changed their names as follows:
| Current Portfolio Name | Former Portfolio Name | |
| Multimanager Lifestyle Aggressive Portfolio | Lifestyle Aggressive Portfolio | |
| Multimanager Lifestyle Growth Portfolio | Lifestyle Growth Portfolio | |
| Multimanager Lifestyle Balanced Portfolio | Lifestyle Balanced Portfolio | |
| Multimanager Lifestyle Moderate Portfolio | Lifestyle Moderate Portfolio | |
| Multimanager Lifestyle Conservative Portfolio | Lifestyle Conservative Portfolio |
The accounting policies of the John Hancock underlying funds in which the portfolios invest are outlined in the underlying funds' shareholder reports, which include the underlying funds' financial statements, available without charge by calling 800-344-1029 or visiting jhinvestments.com, on the Securities and Exchange Commission (SEC) website at sec.gov or at the SEC's public reference room in Washington, D.C. The underlying funds are not covered by this report.
Note 2 — Significant accounting policies
The financial statements have been prepared in conformity with accounting principles generally accepted in the United States of America (US GAAP), which require management to make certain estimates and assumptions as of the date of the financial statements. Actual results could differ from those estimates and those differences could be significant. The portfolios qualify as investment companies under Topic 946 of Accounting Standards Codification of US GAAP.
Events or transactions occurring after the end of the fiscal period through the date that the financial statements were issued have been evaluated in the preparation of the financial statements. The following summarizes the significant accounting policies of the portfolios:
Security valuation. Investments are stated at value as of the scheduled close of regular trading on the New York Stock Exchange (NYSE), normally at 4:00 p.m., Eastern Time. In case of emergency or other disruption resulting in the NYSE not opening for trading or the NYSE closing at a time other than the regularly scheduled close, the net asset value (NAV) may be determined as of the regularly scheduled close of the NYSE pursuant to the portfolios' Valuation Policies and Procedures.
In order to value the securities, the portfolios use the following valuation techniques: Investments by the portfolios in underlying affiliated funds and/or other open-end management investment companies are valued at their respective NAVs each business day.
The portfolios use a three-tier hierarchy to prioritize the pricing assumptions, referred to as inputs, used in valuation techniques to measure fair value. Level 1 includes securities valued using quoted prices in active markets for identical securities, including registered investment companies. Level 2 includes securities valued using other significant observable inputs. Observable inputs may include quoted prices for similar securities, interest rates, prepayment speeds and credit risk. Prices for securities valued using these inputs are received from independent pricing vendors and brokers and are based on an evaluation of the inputs described. Level 3 includes securities valued using significant unobservable inputs when market prices are not readily available or reliable, including the portfolios' own assumptions in determining the fair value of investments. Factors used in determining value may include market or issuer specific events or trends, changes in interest rates and credit
quality. The inputs or methodology used for valuing securities are not necessarily an indication of the risks associated with investing in those securities. Changes in valuation techniques and related inputs may result in transfers into or out of an assigned level within the disclosure hierarchy.
As of June 30, 2017, all investments are categorized as Level 1 under the hierarchy described above.
Security transactions and related investment income. Investment security transactions are accounted for on a trade date plus one basis for daily NAV calculations. However, for financial reporting purposes, investment transactions are reported on trade date. Interest income is accrued as earned. Gains and losses on securities sold are determined on the basis of identified cost and may include proceeds from litigation. Income and capital gain distributions from underlying funds are recorded on ex-date.
Line of credit. The portfolios may have the ability to borrow from banks for temporary or emergency purposes, including meeting redemption requests that otherwise might require the untimely sale of securities. Pursuant to the portfolios' custodian agreement, the custodian may loan money to the portfolios to make properly authorized payments. The portfolios are obligated to repay the custodian for any overdraft, including any related costs or expenses. The custodian may have a lien, security interest or security entitlement in any portfolio property that is not otherwise segregated or pledged, to the extent of any overdraft, and to the maximum extent permitted by law.
Effective June 29, 2017, the portfolios and other affiliated funds have entered into a syndicated line of credit agreement with Citibank, N.A. as the administrative agent that enables them to participate in a $750 million unsecured committed line of credit. Excluding commitments designated for a certain fund and subject to the need of other affiliated funds, the portfolios can borrow up to an aggregate commitment amount of $500 million, subject to asset coverage and other limitations as specified in the agreement. A commitment fee payable at the end of each calendar quarter, based on the average daily unused portion of the line of credit, is charged to each participating portfolio based on a combination of fixed and asset based allocations and is reflected in Other expenses on the Statements of operations. Prior to June 29, 2017, the portfolios had a similar agreement that enabled it to participate in a $1 billion unsecured committed line of credit. For the six months ended June 30, 2017, the portfolios had no borrowings under either line of credit.
Commitment fees for the six months ended June 30, 2017 were as follows:
| Portfolio | Commitment fee |
| Multimanager Lifestyle Aggressive Portfolio | $5,768 |
| Multimanager Lifestyle Growth Portfolio | 15,196 |
| Multimanager Lifestyle Balanced Portfolio | 15,721 |
| Multimanager Lifestyle Moderate Portfolio | 5,849 |
| Multimanager Lifestyle Conservative Portfolio | 4,909 |
Expenses. Within the John Hancock group of funds complex, expenses that are directly attributable to an individual fund are allocated to such fund. Expenses that are not readily attributable to a specific fund are allocated among all funds in an equitable manner, taking into consideration, among other things, the nature and type of expense and the fund's relative net assets. Expense estimates are accrued in the period to which they relate and adjustments are made when actual amounts are known.
Class allocations. Income, common expenses and realized and unrealized gains (losses) are determined at the portfolio level and allocated daily to each class of shares based on the net assets of the class. Class-specific expenses, such as distribution and service fees, if any, and transfer agent fees, for all classes, are calculated daily at the class level based on the net assets of each class and the specific expense rates applicable to each class.
Federal income taxes. Each portfolio intends to continue to qualify as a regulated investment company by complying with the applicable provisions of the Internal Revenue Code and will not be subject to federal income tax on taxable income that is distributed to shareholders. Therefore, no federal income tax provision is required.
As of December 31, 2016, the portfolios have no uncertain tax positions that would require financial statement recognition, derecognition or disclosure. The portfolios' federal tax returns are subject to examination by the Internal Revenue Service for a period of three years.
The costs of investments owned on June 30, 2017, including short-term investments, for federal income tax purposes, were as follows:
| Portfolio | Aggregate cost | Unrealized appreciation | Unrealized (depreciation) | Net unrealized appreciation/ (depreciation) | ||||||||||
| Multimanager Lifestyle Aggressive Portfolio | $3,246,411,789 | $939,280,451 | ($15,530,198 | ) | $923,750,253 | |||||||||
| Multimanager Lifestyle Growth Portfolio | 10,592,665,250 | 2,325,410,622 | (57,913,187 | ) | 2,267,497,435 | |||||||||
| Multimanager Lifestyle Balanced Portfolio | 11,296,153,450 | 1,754,298,911 | (77,262,083 | ) | 1,677,036,828 | |||||||||
| Multimanager Lifestyle Moderate Portfolio | 3,618,441,349 | 357,552,185 | (31,546,234 | ) | 326,005,951 | |||||||||
| Multimanager Lifestyle Conservative Portfolio | 2,924,172,652 | 129,272,625 | (30,943,812 | ) | 98,328,813 |
Distribution of income and gains. Distributions to shareholders from net investment income and net realized gains, if any, are recorded on the ex-date. The Multimanager Lifestyle Aggressive and Multimanager Lifestyle Growth Portfolios generally declare and pay income dividends and capital gain distributions, if any, at least annually. The Multimanager Lifestyle Balanced, Multimanager Lifestyle Moderate and Multimanager Lifestyle Conservative Portfolios generally declare and pay income dividends quarterly and capital gain distributions, if any, at least annually.
Distributions paid by the portfolios with respect to each class of shares are calculated in the same manner, at the same time and in the same amount, except for the effect of class level expenses that may be applied differently to each class.
Such distributions, on a tax basis, are determined in conformity with income tax regulations, which may differ from US GAAP. Short-term gains from underlying funds are treated as ordinary income for tax purposes.
Capital accounts within the financial statements are adjusted for permanent book-tax differences. These adjustments have no impact on net assets or the results of operations. Temporary book-tax differences, if any, will reverse in a subsequent period. Book-tax differences are primarily attributable to wash sale loss deferrals.
Note 3 — Guarantees and indemnifications
Under the Trust's organizational documents, its Officers and Trustees are indemnified against certain liabilities arising out of the performance of their duties to the Trust, including the portfolios. Additionally, in the normal course of business, the Trust enters into contracts with service providers that contain general indemnification clauses. The Trust's maximum exposure under these arrangements is unknown, as this would involve future claims that may be made against the Trust that have not yet occurred. The risk of material loss from such claims is considered remote.
Note 4 — Fees and transactions with affiliates
John Hancock Advisers, LLC (the Advisor) serves as investment advisor for the portfolios. John Hancock Funds, LLC (the Distributor), an affiliate of the Advisor, serves as principal underwriter of the portfolios. The Advisor and the Distributor are indirect, wholly owned subsidiaries of Manulife Financial Corporation (MFC).
Management fee. The portfolios have an investment management agreement with the Advisor under which the portfolios pay a daily management fee to the Advisor, equivalent on an annual basis, as detailed below. Aggregate net assets include the net assets of the portfolios and the net assets of similar funds of John Hancock Variable Insurance Trust (JHVIT) and net assets of similar funds of the Trust. The Advisor has subadvisory agreements with John Hancock Asset Management a division of Manulife Asset management (North America) Limited and John Hancock Asset Management a division of Manulife Asset Management (US) LLC, which are indirect owned subsidiaries of MFC and affiliates of the Advisor. The portfolios are not responsible for payment of the subadvisory fees.
Under the advisory agreement, the portfolios pay a daily management fee to the Advisor as outlined below:
| First $7.5 billion of aggregate net assets | Excess over $7.5 billion of aggregate net assets | |
| Affiliated fund assets | 0.05% | 0.04% |
| Other assets | 0.50% | 0.49% |
The advisory fee has two components: (a) a fee on assets invested in affiliated funds (Affiliated fund assets) and (b) a fee on assets not invested in affiliated funds (Other assets). Affiliated funds are any funds of the Trust, JHVIT and John Hancock Funds III, excluding John Hancock 500 Index Trust B, John Hancock Total Bond Market Trust B and John Hancock International Equity Index Trust B.
The Advisor has contractually agreed to waive and/or reimburse all class-specific expenses for Class A and Class I shares of the portfolios to the extent they exceed 0.41% and 0.11%, respectively, of average net assets (on an annualized basis) attributable to the class (the class expense waiver). The class expense waiver expires on April 30, 2018, unless renewed by mutual agreement of the portfolios and the Advisor based upon a determination that this is appropriate under the circumstances at that time. Prior to May 1, 2017, the Advisor had contractually agreed to waive and/or reimburse all class-specific expenses to the extent they exceed 0.56% and 0.00% of average net assets for Class R2 and Class R6 shares, respectively.
The Advisor has contractually agreed to reduce its management fee and/ or make payment to each portfolio in an amount equal to the amount by which "Other expenses" of a portfolio exceed 0.05% of the average annual net assets (on an annualized basis) of the portfolio. "Other expenses" means all of the expenses of a portfolio, excluding certain expenses such as advisory fees, taxes, brokerage commissions, interest expense, litigation and indemnification expenses and other extraordinary expenses not incurred in the ordinary course of the portfolio's business, class-specific expenses, underlying fund expenses (acquired fund fees), and short dividend expense. The current expense limitation agreement expires on April 30, 2018, unless renewed by mutual agreement of a portfolio and the Advisor based upon a determination that this is appropriate under the circumstances at that time.
The Advisor has contractually agreed to waive its advisory fees and/or reduce expenses by 0.002% of each portfolio's average net assets. This expense limitation agreement expires on April 30, 2018, unless renewed by mutual agreement of the portfolios and the Advisor based upon a determination that this is appropriate under the circumstances at that time.
The Advisor voluntarily agreed to waive its advisory fee for each portfolio so that the aggregate advisory fee retained by the Advisor with respect to both the portfolio and its underlying investments (after payment of subadvisory fees) does not exceed 0.50% of the portfolio's first $7.5 billion of average net assets and 0.49% of the portfolio's average net assets in excess of $7.5 billion. This voluntary waiver may be terminated at any time by the Advisor upon notice to the Trust.
For the six months ended June 30, 2017, the expense reductions related to these agreements amounted to the following and are reflected as a reduction of the total expenses in the Statements of operations:
| Expense reimbursement by class | |||||||||||||||||||||||||||||||||||||||||
| Portfolio | Class A | Class B | Class C | Class I | Class R1 | Class R2 | Class R3 | Class R4 | Class R5 | Class R6 | Class 1 | Class 5 | Total | ||||||||||||||||||||||||||||
| Multimanager Lifestyle Aggressive Portfolio | $166,060 | $3,902 | $51,799 | $2,112 | $2,221 | $2,221 | $1,704 | $2,433 | $2,230 | $7,188 | $1,157,436 | — | $1,399,306 | ||||||||||||||||||||||||||||
| Expense reimbursement by class | |||||||||||||||||||||||||||||||||||||||||
| Portfolio | Class A | Class B | Class C | Class I | Class R1 | Class R2 | Class R3 | Class R4 | Class R5 | Class R6 | Class 1 | Class 5 | Total | ||||||||||||||||||||||||||||
| Multimanager Lifestyle Growth Portfolio | $473,168 | $13,643 | $165,827 | $5,799 | $4,621 | $4,144 | $3,335 | $3,566 | $5,597 | $12,755 | $2,505,979 | $68,993 | $3,267,427 | ||||||||||||||||||||||||||||
| Multimanager Lifestyle Balanced Portfolio | 459,814 | 11,935 | 165,459 | 5,277 | 3,562 | 3,081 | 4,261 | 4,419 | 3,763 | 11,932 | 2,158,846 | 33,353 | 2,865,702 | ||||||||||||||||||||||||||||
| Multimanager Lifestyle Moderate Portfolio | 157,886 | 4,526 | 64,746 | 1,581 | 1,247 | 1,250 | 1,238 | 1,533 | 1,775 | 7,269 | 533,137 | 11,171 | 787,359 | ||||||||||||||||||||||||||||
| Multimanager Lifestyle Conservative Portfolio | 109,370 | 2,886 | 40,675 | 1,758 | 1,032 | 538 | 711 | 769 | 986 | 2,477 | 287,101 | — | 448,303 | ||||||||||||||||||||||||||||
Expenses waived or reimbursed in the current fiscal period are not subject to recapture in future fiscal periods.
The investment management fees, including the impact of the waivers and reimbursements as described above, incurred for the six months ended June 30, 2017 were equivalent to a net annual effective rate of the portfolios' average daily net assets as follows:
| Portfolio | Annual effective rate |
| Multimanager Lifestyle Aggressive Portfolio | 0.04% |
| Multimanager Lifestyle Growth Portfolio | 0.04% |
| Multimanager Lifestyle Balanced Portfolio | 0.05% |
| Multimanager Lifestyle Moderate Portfolio | 0.05% |
| Multimanager Lifestyle Conservative Portfolio | 0.05% |
Accounting and legal services. Pursuant to a service agreement, the portfolios reimburse the Advisor for all expenses associated with providing the administrative, financial, legal, accounting and recordkeeping services to the portfolios, including the preparation of all tax returns, periodic reports to shareholders and regulatory reports, among other services. These expenses are allocated to each share class based on its relative net assets at the time the expense was incurred. These accounting and legal services fees incurred for the six months ended June 30, 2017 amounted to an annual rate of 0.02% of each portfolio's average daily net assets.
Distribution and service plans. The portfolios have a distribution agreement with the Distributor. The portfolios have adopted distribution and service plans with respect to Class A, Class B, Class C, Class R1, Class R2, Class R3, Class R4 and Class 1 shares pursuant to Rule 12b-1 under the 1940 Act, to pay the Distributor for services provided as the distributor of shares of the portfolios. In addition, under a service plan for Class R1, Class R2, Class R3, Class R4 and Class R5 shares, the portfolios pay for certain other services. The portfolios may pay up to the following contractual rates of distribution and service fees under these arrangements, expressed as an annual percentage of average daily net assets for each class of the portfolios' shares:
| Class | Rule 12b-1 fee | Service fee | Class | Rule 12b-1 fee | Service fee | |
| Class A | 0.30% | — | Class R3 | 0.50% | 0.15% | |
| Class B | 1.00% | — | Class R4 | 0.25% | 0.10% | |
| Class C | 1.00% | — | Class R5 | — | 0.05% | |
| Class R1 | 0.50% | 0.25% | Class 1 | 0.05% | — | |
| Class R2 | 0.25% | 0.25% |
The portfolios' Distributor has contractually agreed to waive 0.10% of Rule12b-1 fees for Class R4 shares. The current waiver agreement expires on April 30, 2018, unless renewed by mutual agreement of the portfolios and the Distributor based upon a determination that this is appropriate under the circumstances at the time. This contractual waiver amounted to the following for the six months ended June 30, 2017:
| Portfolio | Class R4 |
| Multimanager Lifestyle Aggressive Portfolio | $3,624 |
| Multimanager Lifestyle Growth Portfolio | 7,155 |
| Multimanager Lifestyle Balanced Portfolio | 10,311 |
| Multimanager Lifestyle Moderate Portfolio | 4,041 |
| Multimanager Lifestyle Conservative Portfolio | 2,834 |
Sales charges. Class A shares are assessed up-front sales charges of up to 5.00% of the net asset value of such shares. The following summarizes the net up-front sales charges received by the Distributor during the six months ended June 30, 2017:
| Multimanager Lifestyle Aggressive Portfolio | Multimanager Lifestyle Growth Portfolio | Multimanager Lifestyle Balanced Portfolio | Multimanager Lifestyle Moderate Portfolio | Multimanager Lifestyle Conservative Portfolio | |
| Net sales charges | $250,978 | $1,026,833 | $815,632 | $327,345 | $213,735 |
| Retained for printing prospectus, advertising and sales literature | 40,101 | 166,878 | 132,804 | 53,788 | 35,850 |
| Sales commission to unrelated broker-dealers | 198,314 | 835,855 | 659,060 | 268,617 | 171,995 |
| Sales commission to affiliated sales personnel | 12,563 | 24,100 | 23,768 | 4,940 | 5,890 |
Class A, Class B and Class C shares may be subject to contingent deferred sales charges (CDSCs). Certain Class A shares that are acquired through purchases of $1 million or more and are redeemed within one year of purchase are subject to a 1.00% sales charge. Class B shares that are redeemed within six years of purchase are subject to CDSCs, at declining rates, beginning at 5.00%. Class C shares that are redeemed within one year of purchase are subject to a 1.00% CDSC. CDSCs are applied to the lesser of the current market value at the time of redemption or the original purchase cost of the shares being redeemed. Proceeds from CDSCs are used to compensate the Distributor for providing distribution-related services in connection with the sale of these shares. During the six months ended June 30, 2017, CDSCs received by the Distributor were as follows:
| Portfolio | Class A | Class B | Class C |
| Multimanager Lifestyle Aggressive Portfolio | $404 | $3,846 | $13,008 |
| Multimanager Lifestyle Growth Portfolio | 2,637 | 31,980 | 43,079 |
| Multimanager Lifestyle Balanced Portfolio | 845 | 40,199 | 40,298 |
| Multimanager Lifestyle Moderate Portfolio | 10,189 | 14,782 | 16,847 |
| Multimanager Lifestyle Conservative Portfolio | 10,035 | 12,036 | 9,241 |
Transfer agent fees. The portfolios have a transfer agent agreement with John Hancock Signature Services, Inc. (Signature Services), an affiliate of the Advisor. The transfer agent fees paid to Signature Services are determined based on the cost to Signature Services (Signature Services Cost) of providing recordkeeping services. It also includes out-of-pocket expenses, including payments made to third-parties for recordkeeping services provided to their clients who invest in one or more John Hancock funds. In addition, Signature Services Cost may be reduced by certain fees that Signature Services receives in connection with retirement and small accounts. Signature Services Cost is calculated monthly and allocated, as applicable, to five categories of share classes: Retail Share and Institutional Share Classes of Non-Municipal Bond Funds, Class R6 Shares, Retirement Share Classes and Municipal Bond Share Classes. Within each of these categories, the applicable costs are allocated to the affected John Hancock affiliated funds and/or classes, based on the relative average daily net assets.
Class level expenses. Class level expenses for the six months ended June 30, 2017 were:
| Portfolio | Class | Distribution and service fees | Transfer agent fees | ||||||||
| Multimanager Lifestyle Aggressive Portfolio | Class A | $657,919 | $259,861 | ||||||||
| Class B | 58,327 | 6,923 | |||||||||
| Class C | 772,726 | 91,649 | |||||||||
| Class I | — | 3,300 | |||||||||
| Class R1 | 24,329 | 517 | |||||||||
| Class R2 | 16,359 | 516 | |||||||||
| Class R3 | 16,269 | 398 | |||||||||
| Class R4 | 12,320 | 565 | |||||||||
| Class R5 | 1,613 | 517 | |||||||||
| Class R6 | — | 1,434 | |||||||||
| Class 1 | 861,848 | — | |||||||||
| Total | $2,421,710 | $365,680 | |||||||||
| Multimanager Lifestyle Growth Portfolio | Class A | $2,417,543 | $955,284 | ||||||||
| Class B | 273,224 | 32,429 | |||||||||
| Class C | 3,312,535 | 392,885 | |||||||||
| Class I | — | 12,016 | |||||||||
| Class R1 | 67,684 | 1,439 | |||||||||
| Class R2 | 41,178 | 1,296 | |||||||||
| Class R3 | 42,686 | 1,041 | |||||||||
| Class R4 | 24,200 | 1,119 | |||||||||
| Class R5 | 5,023 | 1,732 | |||||||||
| Class R6 | — | 3,259 | |||||||||
| Class 1 | 2,498,403 | — | |||||||||
| Total | $8,682,476 | $1,402,500 | |||||||||
| Multimanager Lifestyle Balanced Portfolio | Class A | $2,675,891 | $1,057,589 |
| Portfolio | Class | Distribution and service fees | Transfer agent fees | ||||||||
| Class B | $279,341 | $33,157 | |||||||||
| Class C | 3,861,730 | 458,116 | |||||||||
| Class I | — | 12,649 | |||||||||
| Class R1 | 61,547 | 1,297 | |||||||||
| Class R2 | 34,533 | 1,109 | |||||||||
| Class R3 | 64,715 | 1,579 | |||||||||
| Class R4 | 35,286 | 1,609 | |||||||||
| Class R5 | 4,454 | 1,357 | |||||||||
| Class R6 | — | 3,439 | |||||||||
| Class 1 | 2,512,362 | — | |||||||||
| Total | $9,529,859 | $1,571,901 | |||||||||
| Multimanager Lifestyle Moderate Portfolio | Class A | $1,012,671 | $400,259 | ||||||||
| Class B | 119,383 | 14,168 | |||||||||
| Class C | 1,705,557 | 202,367 | |||||||||
| Class I | — | 4,192 | |||||||||
| Class R1 | 24,430 | 520 | |||||||||
| Class R2 | 15,821 | 506 | |||||||||
| Class R3 | 21,500 | 518 | |||||||||
| Class R4 | 13,534 | 632 | |||||||||
| Class R5 | 2,219 | 720 | |||||||||
| Class R6 | — | 2,310 | |||||||||
| Class 1 | 698,935 | — | |||||||||
| Total | $3,614,050 | $626,192 | |||||||||
| Multimanager Lifestyle Conservative Portfolio | Class A | $906,628 | $358,333 | ||||||||
| Class B | 106,103 | 12,597 | |||||||||
| Class C | 1,486,132 | 176,331 | |||||||||
| Class I | — | 6,779 | |||||||||
| Class R1 | 28,081 | 596 | |||||||||
| Class R2 | 7,743 | 243 | |||||||||
| Class R3 | 15,883 | 410 | |||||||||
| Class R4 | 9,742 | 443 | |||||||||
| Class R5 | 1,745 | 547 | |||||||||
| Class R6 | — | 999 | |||||||||
| Class 1 | 522,434 | — | |||||||||
| Total | $3,084,491 | $557,278 |
Trustee expenses. The Trust compensates each Trustee who is not an employee of the Advisor or its affiliates. The costs of paying Trustee compensation andexpenses are allocated to each portfolio based on its net assets relative to other funds within the John Hancock group of funds complex.
Note 5 — Portfolio share transactions
Transactions in portfolios shares for the six months ended June 30, 2017 and for the year ended December 31, 2016 were as follows:
Multimanager Lifestyle Aggressive Portfolio
| Six months ended 6-30-17 | Year ended 12-31-16 | |||||||||||||||||||||||||
| Shares | Amount | Shares | Amount | |||||||||||||||||||||||
| Class A shares | ||||||||||||||||||||||||||
| Sold | 3,201,729 | $50,409,738 | 5,662,486 | $84,401,989 | ||||||||||||||||||||||
| Distributions reinvested | 30 | 439 | 2,099,667 | 30,907,208 | ||||||||||||||||||||||
| Repurchased | (3,782,378 | ) | (59,472,511 | ) | (6,969,074 | ) | (104,543,452 | ) | ||||||||||||||||||
| Net increase (decrease) | (580,619 | ) | ($9,062,334 | ) | 793,079 | $10,765,745 | ||||||||||||||||||||
| Class B shares | ||||||||||||||||||||||||||
| Sold | 3,385 | $52,947 | 23,206 | $351,041 | ||||||||||||||||||||||
| Distributions reinvested | — | — | 55,295 | 816,164 | ||||||||||||||||||||||
| Repurchased | (162,510 | ) | (2,552,976 | ) | (328,675 | ) | (4,907,416 | ) | ||||||||||||||||||
| Net decrease | (159,125 | ) | ($2,500,029 | ) | (250,174 | ) | ($3,740,211 | ) | ||||||||||||||||||
| Six months ended 6-30-17 | Year ended 12-31-16 | |||||||||||||||||||||||||
| Shares | Amount | Shares | Amount | |||||||||||||||||||||||
| Class C shares | ||||||||||||||||||||||||||
| Sold | 436,596 | $6,846,027 | 1,136,537 | $16,665,444 | ||||||||||||||||||||||
| Distributions reinvested | 20 | 302 | 699,593 | 10,332,984 | ||||||||||||||||||||||
| Repurchased | (1,818,851 | ) | (28,715,218 | ) | (2,479,373 | ) | (37,306,586 | ) | ||||||||||||||||||
| Net decrease | (1,382,235 | ) | ($21,868,889 | ) | (643,243 | ) | ($10,308,158 | ) | ||||||||||||||||||
| Class I shares | ||||||||||||||||||||||||||
| Sold | 279,641 | $4,341,848 | 151,201 | $2,271,961 | ||||||||||||||||||||||
| Distributions reinvested | — | — | 21,307 | 312,789 | ||||||||||||||||||||||
| Repurchased | (97,879 | ) | (1,535,711 | ) | (88,138 | ) | (1,315,243 | ) | ||||||||||||||||||
| Net increase | 181,762 | $2,806,137 | 84,370 | $1,269,507 | ||||||||||||||||||||||
| Class R1 shares | ||||||||||||||||||||||||||
| Sold | 62,162 | $965,935 | 159,821 | $2,364,313 | ||||||||||||||||||||||
| Distributions reinvested | — | — | 26,298 | 387,896 | ||||||||||||||||||||||
| Repurchased | (83,520 | ) | (1,307,632 | ) | (198,431 | ) | (2,983,870 | ) | ||||||||||||||||||
| Net decrease | (21,358 | ) | ($341,697 | ) | (12,312 | ) | ($231,661 | ) | ||||||||||||||||||
| Class R2 shares | ||||||||||||||||||||||||||
| Sold | 57,811 | $896,719 | 264,321 | $3,920,042 | ||||||||||||||||||||||
| Distributions reinvested | — | — | 21,017 | 307,691 | ||||||||||||||||||||||
| Repurchased | (91,210 | ) | (1,398,509 | ) | (162,145 | ) | (2,438,206 | ) | ||||||||||||||||||
| Net increase (decrease) | (33,399 | ) | ($501,790 | ) | 123,193 | $1,789,527 | ||||||||||||||||||||
| Class R3 shares | ||||||||||||||||||||||||||
| Sold | 47,039 | $719,538 | 84,313 | $1,243,994 | ||||||||||||||||||||||
| Distributions reinvested | — | — | 25,292 | 371,532 | ||||||||||||||||||||||
| Repurchased | (109,978 | ) | (1,711,955 | ) | (191,875 | ) | (2,806,013 | ) | ||||||||||||||||||
| Net decrease | (62,939 | ) | ($992,417 | ) | (82,270 | ) | ($1,190,487 | ) | ||||||||||||||||||
| Class R4 shares | ||||||||||||||||||||||||||
| Sold | 25,320 | $397,995 | 434,736 | $6,281,793 | ||||||||||||||||||||||
| Distributions reinvested | — | — | 35,796 | 524,767 | ||||||||||||||||||||||
| Repurchased | (68,977 | ) | (1,102,888 | ) | (406,819 | ) | (6,196,872 | ) | ||||||||||||||||||
| Net increase (decrease) | (43,657 | ) | ($704,893 | ) | 63,713 | $609,688 | ||||||||||||||||||||
| Class R5 shares | ||||||||||||||||||||||||||
| Sold | 79,325 | $1,272,382 | 75,936 | $1,127,267 | ||||||||||||||||||||||
| Distributions reinvested | — | — | 35,009 | 513,929 | ||||||||||||||||||||||
| Repurchased | (64,987 | ) | (1,002,598 | ) | (221,825 | ) | (3,296,844 | ) | ||||||||||||||||||
| Net increase (decrease) | 14,338 | $269,784 | (110,880 | ) | ($1,655,648 | ) | ||||||||||||||||||||
| Class R6 shares | ||||||||||||||||||||||||||
| Sold | 215,873 | $3,391,644 | 469,407 | $7,014,690 | ||||||||||||||||||||||
| Distributions reinvested | — | — | 95,932 | 1,406,360 | ||||||||||||||||||||||
| Repurchased | (385,298 | ) | (6,078,659 | ) | (780,234 | ) | (11,582,699 | ) | ||||||||||||||||||
| Net decrease | (169,425 | ) | ($2,687,015 | ) | (214,895 | ) | ($3,161,649 | ) | ||||||||||||||||||
| Class 1 shares | ||||||||||||||||||||||||||
| Sold | 903,000 | $14,124,631 | 2,621,409 | $37,891,033 | ||||||||||||||||||||||
| Distributions reinvested | — | — | 18,019,121 | 263,980,123 | ||||||||||||||||||||||
| Repurchased | (16,988,201 | ) | (266,700,092 | ) | (31,640,557 | ) | (477,344,678 | ) | ||||||||||||||||||
| Net decrease | (16,085,201 | ) | ($252,575,461 | ) | (11,000,027 | ) | ($175,473,522 | ) | ||||||||||||||||||
| Total net decrease | (18,341,858 | ) | ($288,158,604 | ) | (11,249,446 | ) | ($181,326,869 | ) | ||||||||||||||||||
Multimanager Lifestyle Growth Portfolio
| Six months ended 6-30-17 | Year ended 12-31-16 | |||||||||||||||||||||||||
| Shares | Amount | Shares | Amount | |||||||||||||||||||||||
| Class A shares | ||||||||||||||||||||||||||
| Sold | 8,722,815 | $136,438,286 | 17,396,883 | $260,032,978 | ||||||||||||||||||||||
| Distributions reinvested | — | — | 7,459,406 | 110,175,462 | ||||||||||||||||||||||
| Repurchased | (14,674,877 | ) | (228,838,948 | ) | (25,604,077 | ) | (388,526,174 | ) | ||||||||||||||||||
| Net decrease | (5,952,062 | ) | ($92,400,662 | ) | (747,788 | ) | ($18,317,734 | ) | ||||||||||||||||||
| Class B shares | ||||||||||||||||||||||||||
| Sold | 13,464 | $207,871 | 30,840 | $465,132 | ||||||||||||||||||||||
| Distributions reinvested | — | — | 237,240 | 3,515,764 | ||||||||||||||||||||||
| Repurchased | (735,311 | ) | (11,510,999 | ) | (1,492,857 | ) | (22,420,633 | ) | ||||||||||||||||||
| Net decrease | (721,847 | ) | ($11,303,128 | ) | (1,224,777 | ) | ($18,439,737 | ) | ||||||||||||||||||
| Class C shares | ||||||||||||||||||||||||||
| Sold | 1,815,801 | $28,261,523 | 4,342,281 | $64,323,372 | ||||||||||||||||||||||
| Distributions reinvested | — | — | 2,825,421 | 41,816,295 | ||||||||||||||||||||||
| Repurchased | (7,312,113 | ) | (114,444,093 | ) | (10,800,739 | ) | (163,221,409 | ) | ||||||||||||||||||
| Net decrease | (5,496,312 | ) | ($86,182,570 | ) | (3,633,037 | ) | ($57,081,742 | ) | ||||||||||||||||||
| Class I shares | ||||||||||||||||||||||||||
| Sold | 1,126,668 | $17,583,963 | 998,582 | $15,257,590 | ||||||||||||||||||||||
| Distributions reinvested | — | — | 82,171 | 1,207,089 | ||||||||||||||||||||||
| Repurchased | (358,405 | ) | (5,588,437 | ) | (373,196 | ) | (5,629,316 | ) | ||||||||||||||||||
| Net increase | 768,263 | $11,995,526 | 707,557 | $10,835,363 | ||||||||||||||||||||||
| Class R1 shares | ||||||||||||||||||||||||||
| Sold | 131,354 | $2,043,171 | 244,488 | $3,672,546 | ||||||||||||||||||||||
| Distributions reinvested | — | — | 72,734 | 1,079,377 | ||||||||||||||||||||||
| Repurchased | (192,103 | ) | (3,017,960 | ) | (454,117 | ) | (6,806,332 | ) | ||||||||||||||||||
| Net decrease | (60,749 | ) | ($974,789 | ) | (136,895 | ) | ($2,054,409 | ) | ||||||||||||||||||
| Class R2 shares | ||||||||||||||||||||||||||
| Sold | 227,408 | $3,527,756 | 474,381 | $7,056,817 | ||||||||||||||||||||||
| Distributions reinvested | — | — | 70,057 | 1,028,442 | ||||||||||||||||||||||
| Repurchased | (452,711 | ) | (6,905,496 | ) | (306,593 | ) | (4,619,901 | ) | ||||||||||||||||||
| Net increase (decrease) | (225,303 | ) | ($3,377,740 | ) | 237,845 | $3,465,358 | ||||||||||||||||||||
| Class R3 shares | ||||||||||||||||||||||||||
| Sold | 83,579 | $1,300,617 | 209,483 | $3,113,122 | ||||||||||||||||||||||
| Distributions reinvested | — | — | 62,215 | 917,673 | ||||||||||||||||||||||
| Repurchased | (218,581 | ) | (3,410,543 | ) | (547,393 | ) | (8,068,432 | ) | ||||||||||||||||||
| Net decrease | (135,002 | ) | ($2,109,926 | ) | (275,695 | ) | ($4,037,637 | ) | ||||||||||||||||||
| Class R4 shares | ||||||||||||||||||||||||||
| Sold | 50,031 | $780,620 | 308,898 | $4,456,612 | ||||||||||||||||||||||
| Distributions reinvested | — | — | 73,469 | 1,083,661 | ||||||||||||||||||||||
| Repurchased | (370,343 | ) | (5,850,969 | ) | (601,852 | ) | (9,232,430 | ) | ||||||||||||||||||
| Net decrease | (320,312 | ) | ($5,070,349 | ) | (219,485 | ) | ($3,692,157 | ) | ||||||||||||||||||
| Class R5 shares | ||||||||||||||||||||||||||
| Sold | 268,067 | $4,300,018 | 199,083 | $2,967,358 | ||||||||||||||||||||||
| Distributions reinvested | — | — | 108,116 | 1,596,873 | ||||||||||||||||||||||
| Repurchased | (117,159 | ) | (1,820,573 | ) | (734,597 | ) | (11,282,366 | ) | ||||||||||||||||||
| Net increase (decrease) | 150,908 | $2,479,445 | (427,398 | ) | ($6,718,135 | ) | ||||||||||||||||||||
| Class R6 shares | ||||||||||||||||||||||||||
| Sold | 835,607 | $13,088,963 | 986,527 | $14,730,604 | ||||||||||||||||||||||
| Distributions reinvested | — | — | 231,669 | 3,405,541 | ||||||||||||||||||||||
| Repurchased | (714,130 | ) | (10,957,103 | ) | (1,597,792 | ) | (24,269,259 | ) | ||||||||||||||||||
| Net increase (decrease) | 121,477 | $2,131,860 | (379,596 | ) | ($6,133,114 | ) | ||||||||||||||||||||
| Six months ended 6-30-17 | Year ended 12-31-16 | |||||||||||||||||||||||||
| Shares | Amount | Shares | Amount | |||||||||||||||||||||||
| Class 1 shares | ||||||||||||||||||||||||||
| Sold | 1,135,467 | $17,836,507 | 3,746,536 | $54,360,119 | ||||||||||||||||||||||
| Distributions reinvested | — | — | 49,962,234 | 734,444,844 | ||||||||||||||||||||||
| Repurchased | (48,434,522 | ) | (755,018,670 | ) | (86,438,879 | ) | (1,310,087,831 | ) | ||||||||||||||||||
| Net decrease | (47,299,055 | ) | ($737,182,163 | ) | (32,730,109 | ) | ($521,282,868 | ) | ||||||||||||||||||
| Class 5 shares | ||||||||||||||||||||||||||
| Sold | 612,086 | $9,561,973 | 883,983 | $13,062,239 | ||||||||||||||||||||||
| Distributions reinvested | — | — | 1,310,783 | 19,242,292 | ||||||||||||||||||||||
| Repurchased | (213,498 | ) | (3,301,874 | ) | (964,305 | ) | (14,685,254 | ) | ||||||||||||||||||
| Net increase | 398,588 | $6,260,099 | 1,230,461 | $17,619,277 | ||||||||||||||||||||||
| Total net decrease | (58,771,406 | ) | ($915,734,397 | ) | (37,598,917 | ) | ($605,837,535 | ) | ||||||||||||||||||
Multimanager Lifestyle Balanced Portfolio
| Six months ended 6-30-17 | Year ended 12-31-16 | |||||||||||||||||||||||||
| Shares | Amount | Shares | Amount | |||||||||||||||||||||||
| Class A shares | ||||||||||||||||||||||||||
| Sold | 9,798,723 | $146,869,865 | 22,113,123 | $320,442,486 | ||||||||||||||||||||||
| Distributions reinvested | 440,842 | 6,701,015 | 7,751,881 | 111,330,445 | ||||||||||||||||||||||
| Repurchased | (18,021,811 | ) | (269,845,014 | ) | (34,258,173 | ) | (501,200,512 | ) | ||||||||||||||||||
| Net decrease | (7,782,246 | ) | ($116,274,134 | ) | (4,393,169 | ) | ($69,427,581 | ) | ||||||||||||||||||
| Class B shares | ||||||||||||||||||||||||||
| Sold | 6,647 | $98,508 | 74,741 | $1,095,731 | ||||||||||||||||||||||
| Distributions reinvested | 1,353 | 20,804 | 225,981 | 3,237,109 | ||||||||||||||||||||||
| Repurchased | (702,902 | ) | (10,504,381 | ) | (1,600,295 | ) | (23,292,977 | ) | ||||||||||||||||||
| Net decrease | (694,902 | ) | ($10,385,069 | ) | (1,299,573 | ) | ($18,960,137 | ) | ||||||||||||||||||
| Class C shares | ||||||||||||||||||||||||||
| Sold | 1,682,582 | $25,145,893 | 4,712,217 | $67,979,253 | ||||||||||||||||||||||
| Distributions reinvested | 19,544 | 300,781 | 3,054,592 | 43,785,415 | ||||||||||||||||||||||
| Repurchased | (8,325,652 | ) | (124,724,741 | ) | (13,662,609 | ) | (199,738,828 | ) | ||||||||||||||||||
| Net decrease | (6,623,526 | ) | ($99,278,067 | ) | (5,895,800 | ) | ($87,974,160 | ) | ||||||||||||||||||
| Class I shares | ||||||||||||||||||||||||||
| Sold | 1,441,976 | $21,585,777 | 1,100,754 | $16,043,006 | ||||||||||||||||||||||
| Distributions reinvested | 10,205 | 154,427 | 77,244 | 1,103,132 | ||||||||||||||||||||||
| Repurchased | (475,889 | ) | (7,106,061 | ) | (414,266 | ) | (6,030,228 | ) | ||||||||||||||||||
| Net increase | 976,292 | $14,634,143 | 763,732 | $11,115,910 | ||||||||||||||||||||||
| Class R1 shares | ||||||||||||||||||||||||||
| Sold | 199,318 | $2,945,704 | 370,538 | $5,291,898 | ||||||||||||||||||||||
| Distributions reinvested | 1,695 | 25,706 | 50,340 | 718,784 | ||||||||||||||||||||||
| Repurchased | (222,165 | ) | (3,302,619 | ) | (487,467 | ) | (7,093,786 | ) | ||||||||||||||||||
| Net decrease | (21,152 | ) | ($331,209 | ) | (66,589 | ) | ($1,083,104 | ) | ||||||||||||||||||
| Class R2 shares | ||||||||||||||||||||||||||
| Sold | 153,831 | $2,288,131 | 376,903 | $5,432,940 | ||||||||||||||||||||||
| Distributions reinvested | 1,631 | 24,674 | 38,904 | 555,426 | ||||||||||||||||||||||
| Repurchased | (295,446 | ) | (4,297,119 | ) | (262,571 | ) | (3,817,055 | ) | ||||||||||||||||||
| Net increase (decrease) | (139,984 | ) | ($1,984,314 | ) | 153,236 | $2,171,311 | ||||||||||||||||||||
| Class R3 shares | ||||||||||||||||||||||||||
| Sold | 140,579 | $2,087,131 | 355,851 | $5,116,896 | ||||||||||||||||||||||
| Distributions reinvested | 2,897 | 43,855 | 90,171 | 1,290,503 | ||||||||||||||||||||||
| Repurchased | (667,597 | ) | (10,069,713 | ) | (608,539 | ) | (8,737,558 | ) | ||||||||||||||||||
| Net decrease | (524,121 | ) | ($7,938,727 | ) | (162,517 | ) | ($2,330,159 | ) | ||||||||||||||||||
| Six months ended 6-30-17 | Year ended 12-31-16 | |||||||||||||||||||||||||
| Shares | Amount | Shares | Amount | |||||||||||||||||||||||
| Class R4 shares | ||||||||||||||||||||||||||
| Sold | 151,344 | $2,270,844 | 440,530 | $6,219,970 | ||||||||||||||||||||||
| Distributions reinvested | 5,581 | 84,548 | 94,910 | 1,361,167 | ||||||||||||||||||||||
| Repurchased | (457,902 | ) | (6,952,904 | ) | (747,578 | ) | (11,036,607 | ) | ||||||||||||||||||
| Net decrease | (300,977 | ) | ($4,597,512 | ) | (212,138 | ) | ($3,455,470 | ) | ||||||||||||||||||
| Class R5 shares | ||||||||||||||||||||||||||
| Sold | 349,563 | $5,348,913 | 329,707 | $4,723,107 | ||||||||||||||||||||||
| Distributions reinvested | 7,000 | 106,449 | 88,086 | 1,265,454 | ||||||||||||||||||||||
| Repurchased | (143,127 | ) | (2,131,857 | ) | (1,241,823 | ) | (17,665,520 | ) | ||||||||||||||||||
| Net increase (decrease) | 213,436 | $3,323,505 | (824,030 | ) | ($11,676,959 | ) | ||||||||||||||||||||
| Class R6 shares | ||||||||||||||||||||||||||
| Sold | 1,043,448 | $15,744,504 | 1,096,587 | $15,790,475 | ||||||||||||||||||||||
| Distributions reinvested | 17,466 | 263,888 | 212,796 | 3,040,545 | ||||||||||||||||||||||
| Repurchased | (1,139,687 | ) | (17,045,739 | ) | (2,841,335 | ) | (41,092,510 | ) | ||||||||||||||||||
| Net decrease | (78,773 | ) | ($1,037,347 | ) | (1,531,952 | ) | ($22,261,490 | ) | ||||||||||||||||||
| Class 1 shares | ||||||||||||||||||||||||||
| Sold | 1,742,427 | $26,087,134 | 3,411,339 | $48,456,584 | ||||||||||||||||||||||
| Distributions reinvested | 3,731,737 | 56,335,050 | 47,512,873 | 678,665,844 | ||||||||||||||||||||||
| Repurchased | (53,692,648 | ) | (799,350,231 | ) | (95,966,371 | ) | (1,394,627,178 | ) | ||||||||||||||||||
| Net decrease | (48,218,484 | ) | ($716,928,047 | ) | (45,042,159 | ) | ($667,504,750 | ) | ||||||||||||||||||
| Class 5 shares | ||||||||||||||||||||||||||
| Sold | 215,477 | $3,209,540 | 564,012 | $8,128,731 | ||||||||||||||||||||||
| Distributions reinvested | 60,608 | 915,679 | 703,275 | 10,051,879 | ||||||||||||||||||||||
| Repurchased | (426,734 | ) | (6,386,187 | ) | (629,360 | ) | (9,103,471 | ) | ||||||||||||||||||
| Net increase (decrease) | (150,649 | ) | ($2,260,968 | ) | 637,927 | $9,077,139 | ||||||||||||||||||||
| Total net decrease | (63,345,086 | ) | ($943,057,746 | ) | (57,873,032 | ) | ($862,309,450 | ) | ||||||||||||||||||
Multimanager Lifestyle Moderate Portfolio
| Six months ended 6-30-17 | Year ended 12-31-16 | |||||||||||||||||||||||||
| Shares | Amount | Shares | Amount | |||||||||||||||||||||||
| Class A shares | ||||||||||||||||||||||||||
| Sold | 4,805,931 | $66,190,991 | 10,505,121 | $141,098,845 | ||||||||||||||||||||||
| Distributions reinvested | 282,196 | 3,917,349 | 2,448,064 | 32,654,220 | ||||||||||||||||||||||
| Repurchased | (7,359,808 | ) | (100,992,364 | ) | (13,583,265 | ) | (183,053,388 | ) | ||||||||||||||||||
| Net decrease | (2,271,681 | ) | ($30,884,024 | ) | (630,080 | ) | ($9,300,323 | ) | ||||||||||||||||||
| Class B shares | ||||||||||||||||||||||||||
| Sold | 8,713 | $118,466 | 40,566 | $535,722 | ||||||||||||||||||||||
| Distributions reinvested | 3,732 | 51,829 | 74,617 | 992,924 | ||||||||||||||||||||||
| Repurchased | (287,673 | ) | (3,951,900 | ) | (535,863 | ) | (7,217,042 | ) | ||||||||||||||||||
| Net decrease | (275,228 | ) | ($3,781,605 | ) | (420,680 | ) | ($5,688,396 | ) | ||||||||||||||||||
| Class C shares | ||||||||||||||||||||||||||
| Sold | 770,975 | $10,583,770 | 2,892,969 | $38,619,042 | ||||||||||||||||||||||
| Distributions reinvested | 56,878 | 790,851 | 1,096,876 | 14,615,774 | ||||||||||||||||||||||
| Repurchased | (4,132,892 | ) | (56,817,762 | ) | (7,212,236 | ) | (97,319,754 | ) | ||||||||||||||||||
| Net decrease | (3,305,039 | ) | ($45,443,141 | ) | (3,222,391 | ) | ($44,084,938 | ) | ||||||||||||||||||
| Class I shares | ||||||||||||||||||||||||||
| Sold | 543,070 | $7,393,379 | 311,022 | $4,155,487 | ||||||||||||||||||||||
| Distributions reinvested | 4,829 | 66,822 | 17,672 | 234,724 | ||||||||||||||||||||||
| Repurchased | (215,739 | ) | (2,954,160 | ) | (115,432 | ) | (1,544,981 | ) | ||||||||||||||||||
| Net increase | 332,160 | $4,506,041 | 213,262 | $2,845,230 | ||||||||||||||||||||||
| Six months ended 6-30-17 | Year ended 12-31-16 | |||||||||||||||||||||||||
| Shares | Amount | Shares | Amount | |||||||||||||||||||||||
| Class R1 shares | ||||||||||||||||||||||||||
| Sold | 56,671 | $772,639 | 181,921 | $2,449,897 | ||||||||||||||||||||||
| Distributions reinvested | 1,666 | 23,077 | 20,174 | 268,405 | ||||||||||||||||||||||
| Repurchased | (154,475 | ) | (2,113,517 | ) | (261,574 | ) | (3,533,219 | ) | ||||||||||||||||||
| Net decrease | (96,138 | ) | ($1,317,801 | ) | (59,479 | ) | ($814,917 | ) | ||||||||||||||||||
| Class R2 shares | ||||||||||||||||||||||||||
| Sold | 138,374 | $1,896,025 | 157,917 | $2,096,988 | ||||||||||||||||||||||
| Distributions reinvested | 1,883 | 26,074 | 20,658 | 274,623 | ||||||||||||||||||||||
| Repurchased | (184,208 | ) | (2,486,265 | ) | (100,396 | ) | (1,355,350 | ) | ||||||||||||||||||
| Net increase (decrease) | (43,951 | ) | ($564,166 | ) | 78,179 | $1,016,261 | ||||||||||||||||||||
| Class R3 shares | ||||||||||||||||||||||||||
| Sold | 36,402 | $496,937 | 120,159 | $1,607,926 | ||||||||||||||||||||||
| Distributions reinvested | 2,109 | 29,208 | 27,065 | 360,190 | ||||||||||||||||||||||
| Repurchased | (200,631 | ) | (2,741,676 | ) | (214,418 | ) | (2,846,375 | ) | ||||||||||||||||||
| Net decrease | (162,120 | ) | ($2,215,531 | ) | (67,194 | ) | ($878,259 | ) | ||||||||||||||||||
| Class R4 shares | ||||||||||||||||||||||||||
| Sold | 69,958 | $957,177 | 230,583 | $3,049,018 | ||||||||||||||||||||||
| Distributions reinvested | 3,748 | 51,795 | 33,735 | 448,870 | ||||||||||||||||||||||
| Repurchased | (165,089 | ) | (2,276,711 | ) | (430,803 | ) | (5,849,049 | ) | ||||||||||||||||||
| Net decrease | (91,383 | ) | ($1,267,739 | ) | (166,485 | ) | ($2,351,161 | ) | ||||||||||||||||||
| Class R5 shares | ||||||||||||||||||||||||||
| Sold | 105,779 | $1,464,559 | 119,712 | $1,600,338 | ||||||||||||||||||||||
| Distributions reinvested | 5,370 | 74,348 | 37,438 | 498,449 | ||||||||||||||||||||||
| Repurchased | (66,650 | ) | (909,834 | ) | (289,125 | ) | (3,909,808 | ) | ||||||||||||||||||
| Net increase (decrease) | 44,499 | $629,073 | (131,975 | ) | ($1,811,021 | ) | ||||||||||||||||||||
| Class R6 shares | ||||||||||||||||||||||||||
| Sold | 321,797 | $4,405,948 | 1,156,892 | $15,291,215 | ||||||||||||||||||||||
| Distributions reinvested | 16,711 | 230,840 | 130,241 | 1,732,377 | ||||||||||||||||||||||
| Repurchased | (541,988 | ) | (7,464,773 | ) | (1,354,326 | ) | (18,186,868 | ) | ||||||||||||||||||
| Net decrease | (203,480 | ) | ($2,827,985 | ) | (67,193 | ) | ($1,163,276 | ) | ||||||||||||||||||
| Class 1 shares | ||||||||||||||||||||||||||
| Sold | 572,965 | $7,840,377 | 3,709,842 | $49,723,051 | ||||||||||||||||||||||
| Distributions reinvested | 1,565,124 | 21,650,054 | 11,492,433 | 152,956,670 | ||||||||||||||||||||||
| Repurchased | (16,058,393 | ) | (220,097,172 | ) | (31,868,341 | ) | (427,914,112 | ) | ||||||||||||||||||
| Net decrease | (13,920,304 | ) | ($190,606,741 | ) | (16,666,066 | ) | ($225,234,391 | ) | ||||||||||||||||||
| Class 5 shares | ||||||||||||||||||||||||||
| Sold | 181,459 | $2,471,212 | 469,793 | $6,232,805 | ||||||||||||||||||||||
| Distributions reinvested | 34,197 | 472,580 | 226,390 | 3,010,265 | ||||||||||||||||||||||
| Repurchased | (195,313 | ) | (2,678,867 | ) | (410,561 | ) | (5,498,285 | ) | ||||||||||||||||||
| Net increase | 20,343 | $264,925 | 285,622 | $3,744,785 | ||||||||||||||||||||||
| Total net decrease | (19,972,322 | ) | ($273,508,694 | ) | (20,854,480 | ) | ($283,720,406 | ) | ||||||||||||||||||
Multimanager Lifestyle Conservative Portfolio
| Six months ended 6-30-17 | Year ended 12-31-16 | |||||||||||||||||||||||||
| Shares | Amount | Shares | Amount | |||||||||||||||||||||||
| Class A shares | ||||||||||||||||||||||||||
| Sold | 5,400,338 | $69,572,809 | 14,176,545 | $180,940,396 | ||||||||||||||||||||||
| Distributions reinvested | 331,742 | 4,302,137 | 1,739,564 | 22,046,730 | ||||||||||||||||||||||
| Repurchased | (7,218,017 | ) | (92,987,223 | ) | (14,123,164 | ) | (180,168,889 | ) | ||||||||||||||||||
| Net increase (decrease) | (1,485,937 | ) | ($19,112,277 | ) | 1,792,945 | $22,818,237 | ||||||||||||||||||||
| Six months ended 6-30-17 | Year ended 12-31-16 | |||||||||||||||||||||||||
| Shares | Amount | Shares | Amount | |||||||||||||||||||||||
| Class B shares | ||||||||||||||||||||||||||
| Sold | 8,734 | $112,087 | 86,522 | $1,093,681 | ||||||||||||||||||||||
| Distributions reinvested | 5,358 | 69,592 | 50,215 | 636,002 | ||||||||||||||||||||||
| Repurchased | (299,734 | ) | (3,859,659 | ) | (716,296 | ) | (9,134,382 | ) | ||||||||||||||||||
| Net decrease | (285,642 | ) | ($3,677,980 | ) | (579,559 | ) | ($7,404,699 | ) | ||||||||||||||||||
| Class C shares | ||||||||||||||||||||||||||
| Sold | 802,097 | $10,324,216 | 3,298,644 | $41,857,180 | ||||||||||||||||||||||
| Distributions reinvested | 73,806 | 957,910 | 648,340 | 8,208,949 | ||||||||||||||||||||||
| Repurchased | (3,540,859 | ) | (45,631,528 | ) | (7,438,164 | ) | (94,841,371 | ) | ||||||||||||||||||
| Net decrease | �� | (2,664,956 | ) | ($34,349,402 | ) | (3,491,180 | ) | ($44,775,242 | ) | |||||||||||||||||
| Class I shares | ||||||||||||||||||||||||||
| Sold | 393,787 | $5,040,899 | 700,902 | $9,008,412 | ||||||||||||||||||||||
| Distributions reinvested | 9,101 | 117,796 | 30,153 | 380,689 | ||||||||||||||||||||||
| Repurchased | (318,452 | ) | (4,094,974 | ) | (160,676 | ) | (2,056,899 | ) | ||||||||||||||||||
| Net increase | 84,436 | $1,063,721 | 570,379 | $7,332,202 | ||||||||||||||||||||||
| Class R1 shares | ||||||||||||||||||||||||||
| Sold | 139,094 | $1,788,055 | 422,229 | $5,366,683 | ||||||||||||||||||||||
| Distributions reinvested | 2,502 | 32,445 | 18,129 | 229,306 | ||||||||||||||||||||||
| Repurchased | (316,433 | ) | (4,057,330 | ) | (334,387 | ) | (4,258,030 | ) | ||||||||||||||||||
| Net increase (decrease) | (174,837 | ) | ($2,236,830 | ) | 105,971 | $1,337,959 | ||||||||||||||||||||
| Class R2 shares | ||||||||||||||||||||||||||
| Sold | 21,503 | $276,593 | 192,763 | $2,430,962 | ||||||||||||||||||||||
| Distributions reinvested | 1,251 | 16,194 | 12,929 | 164,005 | ||||||||||||||||||||||
| Repurchased | (144,121 | ) | (1,830,014 | ) | (276,007 | ) | (3,523,169 | ) | ||||||||||||||||||
| Net decrease | (121,367 | ) | ($1,537,227 | ) | (70,315 | ) | ($928,202 | ) | ||||||||||||||||||
| Class R3 shares | ||||||||||||||||||||||||||
| Sold | 39,035 | $501,143 | 165,374 | $2,123,056 | ||||||||||||||||||||||
| Distributions reinvested | 2,471 | 31,967 | 17,466 | 220,832 | ||||||||||||||||||||||
| Repurchased | (150,795 | ) | (1,934,953 | ) | (357,112 | ) | (4,527,158 | ) | ||||||||||||||||||
| Net decrease | (109,289 | ) | ($1,401,843 | ) | (174,272 | ) | ($2,183,270 | ) | ||||||||||||||||||
| Class R4 shares | ||||||||||||||||||||||||||
| Sold | 42,466 | $546,182 | 282,338 | $3,527,294 | ||||||||||||||||||||||
| Distributions reinvested | 3,132 | 40,489 | 20,653 | 261,745 | ||||||||||||||||||||||
| Repurchased | (191,691 | ) | (2,487,707 | ) | (316,950 | ) | (4,074,003 | ) | ||||||||||||||||||
| Net decrease | (146,093 | ) | ($1,901,036 | ) | (13,959 | ) | ($284,964 | ) | ||||||||||||||||||
| Class R5 shares | ||||||||||||||||||||||||||
| Sold | 162,993 | $2,126,096 | 92,152 | $1,173,470 | ||||||||||||||||||||||
| Distributions reinvested | 5,529 | 71,634 | 24,031 | 304,346 | ||||||||||||||||||||||
| Repurchased | (74,931 | ) | (958,516 | ) | (216,737 | ) | (2,750,528 | ) | ||||||||||||||||||
| Net increase (decrease) | 93,591 | $1,239,214 | (100,554 | ) | ($1,272,712 | ) | ||||||||||||||||||||
| Class R6 shares | ||||||||||||||||||||||||||
| Sold | 145,469 | $1,876,434 | 398,653 | $5,070,203 | ||||||||||||||||||||||
| Distributions reinvested | 9,451 | 122,259 | 46,221 | 584,678 | ||||||||||||||||||||||
| Repurchased | (243,800 | ) | (3,119,540 | ) | (400,971 | ) | (5,113,423 | ) | ||||||||||||||||||
| Net increase (decrease) | (88,880 | ) | ($1,120,847 | ) | 43,903 | $541,458 | ||||||||||||||||||||
| Class 1 shares | ||||||||||||||||||||||||||
| Sold | 929,734 | $11,984,151 | 5,954,830 | $76,126,688 | ||||||||||||||||||||||
| Distributions reinvested | 1,481,097 | 19,163,680 | 7,211,377 | 91,307,065 | ||||||||||||||||||||||
| Repurchased | (15,475,897 | ) | (199,070,935 | ) | (23,082,056 | ) | (293,231,091 | ) | ||||||||||||||||||
| Net decrease | (13,065,066 | ) | ($167,923,104 | ) | (9,915,849 | ) | ($125,797,338 | ) | ||||||||||||||||||
| Total net decrease | (17,964,040 | ) | ($230,957,611 | ) | (11,832,490 | ) | ($150,616,571 | ) | ||||||||||||||||||
Affiliates of the portfolios owned 100% of Class 1 shares in each of the portfolios and 100% of Class 5 shares of Multimanager Lifestyle Growth Portfolio, Multimanager Lifestyle Balanced Portfolio and Multimanager Lifestyle Moderate Portfolio on June 30, 2017.
Note 6 — Purchase and sale of securities
The following summarizes the purchases and sales of the underlying portfolios for the six months ended June 30, 2017:
| Portfolio | Purchases | Sales |
| Multimanager Lifestyle Aggressive Portfolio | $375,908,296 | $665,593,260 |
| Multimanager Lifestyle Growth Portfolio | 1,343,895,669 | 2,231,642,264 |
| Multimanager Lifestyle Balanced Portfolio | 1,858,031,599 | 2,800,562,150 |
| Multimanager Lifestyle Moderate Portfolio | 761,303,817 | 1,034,927,062 |
| Multimanager Lifestyle Conservative Portfolio | 588,520,716 | 819,333,504 |
Note 7 — Investment in affiliated underlying funds
The portfolios invest primarily in affiliated underlying funds that are managed by the Advisor and its affiliates. The portfolios do not invest in the affiliated underlying funds for the purpose of exercising management or control; however, a portfolio's investment may represent a significant portion of each underlying fund's net assets. At June 30, 2017, the following portfolios held 5% or more of the net assets of the underlying funds shown below:
| Portfolio | Affiliated Class NAV | Percentage of underlying fund net assets | ||||||
| Multimanager Lifestyle Aggressive Portfolio | ||||||||
| JHF Global Focused Strategies Fund | 99.1% | |||||||
| JHF II Health Sciences Fund | 30.0% | |||||||
| JHF Greater China Opportunities Fund | 24.8% | |||||||
| JHF Small Cap Core Fund | 21.9% | |||||||
| JHF II Technical Opportunities | 18.7% | |||||||
| JHF II Small Company Growth Fund | 16.8% | |||||||
| JHF II International Strategic Equity Allocation Fund | 16.7% | |||||||
| JHF II Value Fund | 16.5% | |||||||
| JHF II Small Cap Growth Fund | 16.3% | |||||||
| JHF Value Equity Fund | 15.4% | |||||||
| JHF II Mid Value Fund | 15.0% | |||||||
| JHF II U.S. Strategic Equity Allocation Fund | 15.0% | |||||||
| JHF Emerging Markets Equity Fund | 14.7% | |||||||
| JHF II International Growth Stock Fund | 14.3% | |||||||
| JHF II Emerging Markets Fund | 14.2% | |||||||
| JHF II Science & Technology Fund | 13.9% | |||||||
| JHF II International Small Company Fund | 13.8% | |||||||
| JHF II International Small Cap Fund | 13.5% | |||||||
| JHF II International Value Fund | 13.3% | |||||||
| JHF II Equity-Income Fund | 12.8% | |||||||
| JHF III International Value Equity Fund | 12.5% | |||||||
| JHF II Mid Cap Stock Fund | 11.9% | |||||||
| JHF II Natural Resources Fund | 11.6% | |||||||
| JHF II Small Company Value Fund | 11.5% | |||||||
| JHF II Small Cap Value Fund | 9.4% | |||||||
| JHF II Capital Appreciation Value | 9.4% | |||||||
| JHF II Real Estate Equity Fund | 9.3% | |||||||
| JHF II Fundamental Global Franchise Fund | 9.3% | |||||||
| JHF II Capital Appreciation Fund | 8.8% | |||||||
| JHF II Global Real Estate Fund | 8.7% | |||||||
| JHF II Global Equity Fund | 8.4% | |||||||
| JHF III Strategic Growth Fund | 8.1% | |||||||
| JHF Financial Industries Fund | 7.7% | |||||||
| JHF II Blue Chip Growth Fund | 6.4% | |||||||
| JHF II New Opportunities Fund | 5.5% | |||||||
| Multimanager Lifestyle Growth Portfolio | ||||||||
| JHF Small Cap Core Fund | 48.4% | |||||||
| JHF II Health Sciences Fund | 46.3% | |||||||
| JHF II International Strategic Equity Allocation Fund | 43.9% | |||||||
| JHF II Technical Opportunities | 43.3% | |||||||
| JHF II U.S. Strategic Equity Allocation Fund | 39.9% | |||||||
| JHF II Value Fund | 39.1% | |||||||
| JHF II International Growth Stock Fund | 38.5% | |||||||
| JHF Value Equity Fund | 38.3% | |||||||
| JHF II Science & Technology Fund | 36.5% | |||||||
| JHF II Mid Value Fund | 35.7% | |||||||
| JHF III International Value Equity Fund | 33.9% | |||||||
| JHF II Small Company Growth Fund | 32.6% | |||||||
| JHF II International Small Company Fund | 32.6% | |||||||
| JHF II International Small Cap Fund | 32.0% | |||||||
| JHF II Equity-Income Fund | 31.9% | |||||||
| JHF II Small Cap Growth Fund | 31.4% | |||||||
| JHF Emerging Markets Equity Fund | 30.8% | |||||||
| JHF II International Value Fund | 30.1% | |||||||
| JHF II Emerging Markets Fund | 29.9% | |||||||
| JHF II Capital Appreciation Value | 29.4% | |||||||
| JHF II Fundamental Global Franchise Fund | 29.2% | |||||||
| JHF II Mid Cap Stock Fund | 28.6% | |||||||
| JHF II Real Estate Equity Fund | 28.4% | |||||||
| JHF II Natural Resources Fund | 28.3% | |||||||
| JHF II Global Real Estate Fund | 26.8% | |||||||
| JHF II Global Equity Fund | 26.4% | |||||||
| JHF II Emerging Markets Debt Fund | 23.7% | |||||||
| JHF II Small Company Value Fund | 22.2% | |||||||
| JHF II Capital Appreciation Fund | 21.8% | |||||||
| JHF Global Short Duration Credit Fund | 20.6% | |||||||
| JHF Financial Industries Fund | 20.6% | |||||||
| JHF III Strategic Growth Fund | 20.2% | |||||||
| JHF II Asia Pacific Total Return Bond Fund | 19.8% | |||||||
| JHF II Small Cap Value Fund | 17.9% | |||||||
| JHF II Global Income Fund | 17.8% | |||||||
| JHF II Spectrum Income Fund | 17.7% | |||||||
| JHF II Real Return Bond Fund | 17.1% | |||||||
| JHF II Short Duration Credit Opportunities Fund | 16.0% | |||||||
| JHF II Blue Chip Growth Fund | 15.8% | |||||||
| JHF II Absolute Return Currency Fund | 15.0% | |||||||
| JHF II U.S. High Yield Bond Fund | 14.4% | |||||||
| JHF II Floating Rate Income Fund | 13.5% | |||||||
| JHF II New Opportunities Fund | 12.1% | |||||||
| JHF II Total Return Fund | 9.5% | |||||||
| JHF II Global Bond Fund | 8.9% | |||||||
| JHF Fundamental Large Cap Core Fund | 8.7% | |||||||
| Portfolio | Affiliated Class NAV | Percentage of underlying fund net assets | ||||||
| Multimanager Lifestyle Growth Portfolio (continued) | ||||||||
| JHF III Global Shareholder Yield Fund | 7.0% | |||||||
| JHF Seaport Fund | 6.2% | |||||||
| JHF II High Yield Fund | 6.1% | |||||||
| JHF High Yield Fund | 6.0% | |||||||
| JHF II Core Bond Fund | 5.4% | |||||||
| Multimanager Lifestyle Balanced Portfolio | ||||||||
| JHF Global Short Duration Credit Fund | 40.1% | |||||||
| JHF II Spectrum Income Fund | 39.3% | |||||||
| JHF II Short Duration Credit Opportunities Fund | 35.6% | |||||||
| JHF II U.S. Strategic Equity Allocation Fund | 35.2% | |||||||
| JHF II Global Income Fund | 34.9% | |||||||
| JHF II Asia Pacific Total Return Bond Fund | 33.7% | |||||||
| JHF II Emerging Markets Debt Fund | 33.1% | |||||||
| JHF II Real Return Bond Fund | 32.1% | |||||||
| JHF II Science & Technology Fund | 30.4% | |||||||
| JHF II Global Bond Fund | 30.1% | |||||||
| JHF II Capital Appreciation Value | 30.0% | |||||||
| JHF II Fundamental Global Franchise Fund | 29.8% | |||||||
| JHF II Floating Rate Income Fund | 29.3% | |||||||
| JHF Small Cap Core Fund | 29.2% | |||||||
| JHF II International Strategic Equity Allocation Fund | 29.1% | |||||||
| JHF II Real Estate Equity Fund | 28.9% | |||||||
| JHF Value Equity Fund | 28.3% | |||||||
| JHF II U.S. High Yield Bond Fund | 28.0% | |||||||
| JHF II Value Fund | 27.6% | |||||||
| JHF II Global Real Estate Fund | 27.2% | |||||||
| JHF II Small Company Growth Fund | 26.0% | |||||||
| JHF II Technical Opportunities | 25.5% | |||||||
| JHF II Global Equity Fund | 25.5% | |||||||
| JHF II International Growth Stock Fund | 25.3% | |||||||
| JHF II Mid Value Fund | 25.1% | |||||||
| JHF II Small Cap Growth Fund | 24.9% | |||||||
| JHF II Total Return Fund | 24.0% | |||||||
| JHF II Equity-Income Fund | 23.6% | |||||||
| JHF II International Value Fund | 22.7% | |||||||
| JHF III International Value Equity Fund | 22.6% | |||||||
| JHF II International Small Company Fund | 20.4% | |||||||
| JHF II International Small Cap Fund | 20.0% | |||||||
| JHF II Mid Cap Stock Fund | 19.9% | |||||||
| JHF II Natural Resources Fund | 19.7% | |||||||
| JHF Emerging Markets Equity Fund | 18.9% | |||||||
| JHF II Emerging Markets Fund | 18.4% | |||||||
| JHF II Small Company Value Fund | 17.7% | |||||||
| JHF Financial Industries Fund | 17.0% | |||||||
| JHF II Absolute Return Currency Fund | 16.6% | |||||||
| JHF II Capital Appreciation Fund | 16.0% | |||||||
| JHF III Strategic Growth Fund | 14.8% | |||||||
| JHF II Small Cap Value Fund | 14.5% | |||||||
| JHF II Core Bond Fund | 13.5% | |||||||
| JHF II High Yield Fund | 12.0% | |||||||
| JHF II Blue Chip Growth Fund | 11.7% | |||||||
| JHF High Yield Fund | 11.6% | |||||||
| JHF II Strategic Income Opportunities Fund | 8.9% | |||||||
| JHF II New Opportunities Fund | 7.3% | |||||||
| JHF Bond Fund | 7.0% | |||||||
| JHF III Global Shareholder Yield Fund | 6.9% | |||||||
| JHF Fundamental Large Cap Core Fund | 6.4% | |||||||
| JHF Seaport Fund | 5.8% | |||||||
| Multimanager Lifestyle Moderate Portfolio | ||||||||
| JHF II Asia Pacific Total Return Bond Fund | 18.4% | |||||||
| JHF II Global Bond Fund | 17.9% | |||||||
| JHF Enduring Assets Fund | 17.8% | |||||||
| JHF II Core Bond Fund | 16.8% | |||||||
| JHF Global Short Duration Credit Fund | 15.8% | |||||||
| JHF II Spectrum Income Fund | 14.1% | |||||||
| JHF II Real Return Bond Fund | 14.1% | |||||||
| JHF II Global Income Fund | 13.7% | |||||||
| JHF II Emerging Markets Debt Fund | 13.6% | |||||||
| JHF II Total Return Fund | 13.2% | |||||||
| JHF II Short Duration Credit Opportunities Fund | 12.8% | |||||||
| JHF II Floating Rate Income Fund | 11.7% | |||||||
| JHF II U.S. High Yield Bond Fund | 11.0% | |||||||
| JHF II Fundamental Global Franchise Fund | 9.0% | |||||||
| JHF II Real Estate Equity Fund | 8.8% | |||||||
| JHF II Capital Appreciation Value | 8.8% | |||||||
| JHF II Global Real Estate Fund | 8.2% | |||||||
| JHF II Global Equity Fund | 8.2% | |||||||
| JHF II U.S. Strategic Equity Allocation Fund | 7.6% | |||||||
| JHF II International Strategic Equity Allocation Fund | 6.9% | |||||||
| JHF II Mid Value Fund | 6.7% | |||||||
| JHF II Absolute Return Currency Fund | 5.7% | |||||||
| JHF II Small Company Growth Fund | 5.6% | |||||||
| JHF II Small Cap Growth Fund | 5.4% | |||||||
| JHF II Small Cap Value Fund | 5.2% | |||||||
| JHF II International Growth Stock Fund | 5.0% | |||||||
| Multimanager Lifestyle Conservative Portfolio | ||||||||
| JHF Enduring Assets Fund | 47.1% | |||||||
| JHF II Short Term Government Income Fund | 43.7% | |||||||
| JHF II Global Bond Fund | 19.7% | |||||||
| JHF II Core Bond Fund | 17.1% | |||||||
| JHF II Real Return Bond Fund | 16.1% | |||||||
| JHF II Asia Pacific Total Return Bond Fund | 14.9% | |||||||
| JHF II Emerging Markets Debt Fund | 14.5% | |||||||
| JHF II Total Return Fund | 13.5% | |||||||
| JHF II Spectrum Income Fund | 12.3% | |||||||
| JHF II Short Duration Credit Opportunities Fund | 11.2% | |||||||
| JHF Global Short Duration Credit Fund | 9.6% | |||||||
| JHF II Floating Rate Income Fund | 9.6% | |||||||
| JHF II Global Income Fund | 9.2% | |||||||
| JHF II Real Estate Equity Fund | 8.1% | |||||||
| JHF II Global Real Estate Fund | 7.6% | |||||||
| JHF II U.S. High Yield Bond Fund | 7.4% | |||||||
| JHF II Absolute Return Currency Fund | 6.4% | |||||||
Information regarding the portfolios' fiscal year to date purchases and sales of the affiliated underlying funds as well as income and capital gains earned by the portfolios from their investments in affiliated underlying funds is as follows:
| Dividends and distributions | ||||||||||||||||||||||||||
| Portfolio | Beginning share amount | Shares purchased | Shares sold | Ending share amount | Income distributions received | Capital gain distributions received | Realized gain (loss) | Ending value | ||||||||||||||||||
| Multimanager Lifestyle Aggressive Portfolio | ||||||||||||||||||||||||||
| Absolute Return Currency | 3,177,427 | 499,589 | — | 3,677,016 | — | — | — | $37,358,478 | ||||||||||||||||||
| Alpha Opportunities | 3,643,070 | — | (3,643,070 | ) | — | — | — | $11,924,649 | — | |||||||||||||||||
| Blue Chip Growth | 5,143,532 | — | (690,341 | ) | 4,453,191 | — | — | 7,987,696 | 163,832,891 | |||||||||||||||||
| Capital Appreciation | 10,507,967 | — | (1,321,498 | ) | 9,186,469 | — | — | 2,585,811 | 158,466,594 | |||||||||||||||||
| Capital Appreciation Value | 15,818,261 | — | (998,484 | ) | 14,819,777 | — | — | (55,332 | ) | 178,726,505 | ||||||||||||||||
| Disciplined Value | 7,848,421 | 585,419 | (209,654 | ) | 8,224,186 | — | — | 145,491 | 169,911,684 | |||||||||||||||||
| Emerging Markets | 13,905,033 | 740,495 | (436,531 | ) | 14,208,997 | — | — | 354,257 | 152,888,804 | |||||||||||||||||
| Emerging Markets Equity | 14,446,576 | 291,357 | (168,568 | ) | 14,569,365 | — | — | (79,366 | ) | 153,561,107 | ||||||||||||||||
| Equity Income | 10,950,988 | 123,614 | (213,739 | ) | 10,860,863 | $1,935,116 | — | 69,369 | 217,977,522 | |||||||||||||||||
| Financial Industries | 3,700,657 | 69,321 | (88,789 | ) | 3,681,189 | — | — | 71,336 | 73,366,095 | |||||||||||||||||
| Fundamental Global Franchise | 4,332,397 | — | (394,322 | ) | 3,938,075 | — | — | (169,959 | ) | 53,360,910 | ||||||||||||||||
| Fundamental Large Cap Core, Class NAV | — | 3,747,601 | (164,898 | ) | 3,582,703 | — | — | 408,277 | 181,428,065 | |||||||||||||||||
| Fundamental Large Cap Core, Class R6 | 3,793,512 | — | (3,793,512 | ) | — | — | — | 7,422,713 | — | |||||||||||||||||
| Global Equity | 6,661,182 | — | (726,967 | ) | 5,934,215 | — | — | 413,868 | 71,269,921 | |||||||||||||||||
| Global Focused Strategies | 5,006,448 | 88,822 | (371,738 | ) | 4,723,532 | — | — | (84,707 | ) | 46,479,559 | ||||||||||||||||
| Global Real Estate | 2,234,359 | 111,096 | (156,408 | ) | 2,189,047 | — | — | 29,247 | 20,795,946 | |||||||||||||||||
| Global Shareholder Yield | 3,990,697 | 147,792 | (134,050 | ) | 4,004,439 | 840,596 | — | 46,285 | 44,689,540 | |||||||||||||||||
| Greater China Opportunities | 652,277 | — | — | 652,277 | — | — | — | 14,089,191 | ||||||||||||||||||
| Health Sciences | 6,556,617 | 56,277 | (2,324,770 | ) | 4,288,124 | — | — | (3,990,696 | ) | 20,840,281 | ||||||||||||||||
| International Growth | 1,072,656 | 2,947,274 | (434,759 | ) | 3,585,171 | — | — | 649,640 | 88,517,882 | |||||||||||||||||
| International Growth Opportunities | 6,162,387 | — | (6,162,387 | ) | — | — | — | 16,869,333 | — | |||||||||||||||||
| International Growth Stock | 10,411,130 | — | (608,697 | ) | 9,802,433 | — | — | (435,672 | ) | 133,019,019 | ||||||||||||||||
| International Small Cap | 4,756,178 | — | (658,086 | ) | 4,098,092 | — | — | 1,281,272 | 83,846,966 | |||||||||||||||||
| International Small Company | 7,925,816 | — | (850,123 | ) | 7,075,693 | — | — | 1,312,569 | 83,846,966 | |||||||||||||||||
| International Strategic Equity Allocation | 27,316,496 | 5,065,418 | (1,855,106 | ) | 30,526,808 | — | — | 512,135 | 345,868,733 | |||||||||||||||||
| International Value | 12,842,750 | — | (792,197 | ) | 12,050,553 | — | — | 1,066,262 | 200,641,702 | |||||||||||||||||
| International Value Equity | 10,608,469 | — | (651,019 | ) | 9,957,450 | — | — | (332,158 | ) | 83,742,157 | ||||||||||||||||
| Mid Cap Stock | 9,063,071 | 907,943 | (1,230,370 | ) | 8,740,644 | — | — | 242,937 | 189,934,196 | |||||||||||||||||
| Mid Value | 8,022,496 | 513,879 | (221,343 | ) | 8,315,032 | — | — | 40,187 | 132,791,055 | |||||||||||||||||
| Natural Resources | 5,664,905 | 89,482 | (344,242 | ) | 5,410,145 | — | — | (2,071,221 | ) | 58,429,566 | ||||||||||||||||
| New Opportunities | 1,050,865 | 14,287 | (13,939 | ) | 1,051,213 | — | — | 13,691 | 29,265,779 | |||||||||||||||||
| Real Estate Equity | 1,965,974 | 100,249 | (44,101 | ) | 2,022,122 | — | — | (33,936 | ) | 20,746,967 | ||||||||||||||||
| Redwood | 2,819,905 | — | (2,819,905 | ) | — | — | — | 942,799 | — | |||||||||||||||||
| Science & Technology | 8,663,771 | — | (3,577,232 | ) | 5,086,539 | — | — | 7,274,837 | 65,921,548 | |||||||||||||||||
| Seaport | 1,898,338 | — | (111,318 | ) | 1,787,020 | — | — | 120,831 | 20,961,741 | |||||||||||||||||
| Small Cap Core | 2,317,780 | — | (87,808 | ) | 2,229,972 | — | — | 255,501 | 29,346,438 | |||||||||||||||||
| Small Cap Growth | 4,082,536 | — | (324,052 | ) | 3,758,484 | — | — | (450,723 | ) | 34,465,295 | ||||||||||||||||
| Small Cap Value | 1,855,377 | 140,046 | (21,358 | ) | 1,974,065 | — | — | 3,932 | 41,277,699 | |||||||||||||||||
| Small Company Growth | 1,838,334 | — | (107,279 | ) | 1,731,055 | — | — | 40,302 | 34,465,295 | |||||||||||||||||
| Small Company Value | 926,559 | 22,471 | (3,694 | ) | 945,336 | — | — | 820 | 27,433,657 | |||||||||||||||||
| Strategic Growth | 9,874,794 | — | (954,151 | ) | 8,920,643 | — | — | 3,691,338 | 159,857,931 | |||||||||||||||||
| Technical Opportunities | 10,241,328 | 24,919 | (1,633,149 | ) | 8,633,098 | — | — | (224,927 | ) | 111,194,308 | ||||||||||||||||
| U.S. Strategic Equity Allocation | 25,327,927 | 1,072,431 | (1,628,968 | ) | 24,771,390 | — | — | 651,833 | 281,402,995 | |||||||||||||||||
| Value | 4,734,230 | 299,908 | (68,690 | ) | 4,965,448 | — | — | 10,933 | 57,003,341 | |||||||||||||||||
| Value Equity | 8,403,799 | — | (315,813 | ) | 8,087,986 | — | — | 242,335 | 97,136,710 | |||||||||||||||||
| $2,775,712 | — | $58,753,789 | $4,170,161,039 | |||||||||||||||||||||||
| Dividends and distributions | ||||||||||||||||||||||||||
| Portfolio | Beginning share amount | Shares purchased | Shares sold | Ending share amount | Income distributions received | Capital gain distributions received | Realized gain (loss) | Ending value | ||||||||||||||||||
| Multimanager Lifestyle Growth Portfolio | ||||||||||||||||||||||||||
| Absolute Return Currency | 19,101,835 | 1,656,588 | — | 20,758,423 | — | — | — | $210,905,582 | ||||||||||||||||||
| Active Bond | 26,224,547 | 751,925 | (26,976,472 | ) | — | $2,682,975 | — | $8,741,442 | — | |||||||||||||||||
| Alpha Opportunities | 8,333,714 | — | (8,333,714 | ) | — | — | — | 27,933,666 | — | |||||||||||||||||
| Asia Pacific Total Return Bond | 7,820,678 | 127,128 | — | 7,947,806 | — | — | — | 76,855,287 | ||||||||||||||||||
| Blue Chip Growth | 13,020,653 | — | (1,926,886 | ) | 11,093,767 | — | — | 24,324,298 | 408,139,671 | |||||||||||||||||
| Bond | — | 17,167,667 | — | 17,167,667 | 1,787,652 | — | — | 273,480,942 | ||||||||||||||||||
| Capital Appreciation | 26,602,036 | — | (3,758,485 | ) | 22,843,551 | — | — | 10,575,179 | 394,051,250 | |||||||||||||||||
| Capital Appreciation Value | 51,866,727 | — | (5,476,124 | ) | 46,390,603 | — | — | 4,377,647 | 559,470,673 | |||||||||||||||||
| Core Bond | 6,521,917 | 801,550 | (73,201 | ) | 7,250,266 | 739,754 | — | (35,916 | ) | 93,963,442 | ||||||||||||||||
| Disciplined Value | 18,036,181 | 3,232,182 | (804,884 | ) | 20,463,479 | — | — | 577,917 | 422,775,482 | |||||||||||||||||
| Emerging Markets | 29,787,610 | 2,037,942 | (1,967,328 | ) | 29,858,224 | — | — | 5,254,772 | 321,274,489 | |||||||||||||||||
| Emerging Markets Debt | 16,623,278 | 990,493 | (1,020,452 | ) | 16,593,319 | 4,264,816 | — | (701,309 | ) | 159,627,730 | ||||||||||||||||
| Emerging Markets Equity | 30,886,543 | 1,223,212 | (1,490,446 | ) | 30,619,309 | — | — | (1,039,876 | ) | 322,727,518 | ||||||||||||||||
| Equity Income | 27,712,352 | 244,370 | (873,368 | ) | 27,083,354 | 4,839,146 | — | 757,912 | 543,562,905 | |||||||||||||||||
| Financial Industries | 9,937,148 | 252,319 | (404,864 | ) | 9,784,603 | — | — | 363,268 | 195,007,141 | |||||||||||||||||
| Floating Rate Income | 29,314,446 | 756,638 | (100,465 | ) | 29,970,619 | 6,043,002 | — | (61,284 | ) | 254,450,559 | ||||||||||||||||
| Fundamental Global Franchise | 13,698,732 | — | (1,325,129 | ) | 12,373,603 | — | — | (109,375 | ) | 167,662,315 | ||||||||||||||||
| Fundamental Large Cap Core, Class NAV | — | 8,766,081 | (541,688 | ) | 8,224,393 | — | — | 1,251,282 | 416,483,252 | |||||||||||||||||
| Fundamental Large Cap Core, Class R6 | 8,863,786 | — | (8,863,786 | ) | — | — | — | 17,363,407 | — | |||||||||||||||||
| Global Absolute Return Strategies | 27,985,219 | — | (3,524,510 | ) | 24,460,709 | — | — | (3,536,322 | ) | 252,189,908 | ||||||||||||||||
| Global Bond | 3,061,213 | 54,090 | — | 3,115,303 | — | — | — | 38,629,760 | ||||||||||||||||||
| Global Equity | 20,726,572 | — | (2,050,381 | ) | 18,676,191 | — | — | 1,281,500 | 224,301,049 | |||||||||||||||||
| Global Income | 7,095,672 | 169,681 | (1,321,764 | ) | 5,943,589 | 1,616,292 | — | (750,561 | ) | 56,166,912 | ||||||||||||||||
| Global Real Estate | 6,999,752 | 253,432 | (538,102 | ) | 6,715,082 | — | — | 108,414 | 63,793,284 | |||||||||||||||||
| Global Shareholder Yield | 17,028,297 | 282,378 | (2,339,092 | ) | 14,971,583 | 3,155,409 | — | 2,934,024 | 167,082,864 | |||||||||||||||||
| Global Short Duration Credit | 7,329,214 | 185,805 | (148,883 | ) | 7,366,136 | 1,712,451 | — | (124,734 | ) | 67,400,144 | ||||||||||||||||
| Health Sciences | 19,342,221 | — | (12,733,030 | ) | 6,609,191 | — | — | (19,301,868 | ) | 32,120,668 | ||||||||||||||||
| High Yield | 4,360,509 | 103,030 | (744,675 | ) | 3,718,864 | 835,011 | — | 1,077,665 | 30,308,739 | |||||||||||||||||
| High Yield (FKA Focused High Yield) | 19,881,633 | 521,845 | (3,402,447 | ) | 17,001,031 | 1,849,450 | — | (1,183,079 | ) | 59,843,628 | ||||||||||||||||
| International Growth | 2,012,317 | 8,479,461 | (887,811 | ) | 9,603,967 | — | — | 1,276,500 | 237,121,950 | |||||||||||||||||
| International Growth Opportunities | 12,686,404 | — | (12,686,404 | ) | — | — | — | 37,808,694 | — | |||||||||||||||||
| International Growth Stock | 28,222,809 | 313,234 | (2,164,333 | ) | 26,371,710 | — | — | (1,998,530 | ) | 357,864,105 | ||||||||||||||||
| International Small Cap | 11,183,377 | — | (1,493,384 | ) | 9,689,993 | — | — | 2,396,670 | 198,257,260 | |||||||||||||||||
| International Small Company | 18,816,519 | — | (2,085,949 | ) | 16,730,570 | — | — | 3,838,327 | 198,257,260 | |||||||||||||||||
| International Strategic Equity Allocation | 71,533,964 | 14,356,666 | (5,774,192 | ) | 80,116,438 | — | — | 854,563 | 907,719,243 | |||||||||||||||||
| International Value | 30,225,280 | — | (2,982,132 | ) | 27,243,148 | — | — | 3,396,691 | 453,598,413 | |||||||||||||||||
| International Value Equity | 29,288,671 | — | (2,367,947 | ) | 26,920,724 | — | — | (1,592,117 | ) | 226,403,291 | ||||||||||||||||
| Mid Cap Stock | 22,754,594 | 1,555,048 | (3,278,924 | ) | 21,030,718 | — | — | 1,075,130 | 456,997,512 | |||||||||||||||||
| Mid Value | 19,690,978 | 498,729 | (449,476 | ) | 19,740,231 | — | — | 101,930 | 315,251,485 | |||||||||||||||||
| Natural Resources | 13,952,264 | — | (807,205 | ) | 13,145,059 | — | — | (4,776,927 | ) | 141,966,640 | ||||||||||||||||
| New Opportunities | 2,351,520 | 42,897 | (59,561 | ) | 2,334,856 | — | — | 57,793 | 65,002,380 | |||||||||||||||||
| Real Estate Equity | 6,123,240 | 173,018 | (158,235 | ) | 6,138,023 | — | — | (125,019 | ) | 62,976,117 | ||||||||||||||||
| Real Return Bond | 16,706,696 | 492,611 | — | 17,199,307 | 1,666,185 | — | — | 189,364,372 | ||||||||||||||||||
| Redwood | 9,737,215 | — | (9,737,215 | ) | — | — | — | 3,012,063 | — | |||||||||||||||||
| Science & Technology | 20,701,832 | — | (7,292,434 | ) | 13,409,398 | — | — | 14,232,321 | 173,785,800 | |||||||||||||||||
| Dividends and distributions | ||||||||||||||||||||||||||
| Portfolio | Beginning share amount | Shares purchased | Shares sold | Ending share amount | Income distributions received | Capital gain distributions received | Realized gain (loss) | Ending value | ||||||||||||||||||
| Seaport | 3,603,016 | — | (278,086 | ) | 3,324,930 | — | — | $319,941 | $39,001,428 | |||||||||||||||||
| Short Duration Credit Opportunities | 19,715,657 | 810,666 | (247,873 | ) | 20,278,450 | $3,374,045 | — | (118,990 | ) | 196,700,970 | ||||||||||||||||
| Small Cap Core | 5,186,494 | — | (259,723 | ) | 4,926,771 | — | — | 712,142 | 64,836,312 | |||||||||||||||||
| Small Cap Growth | 8,004,156 | — | (747,741 | ) | 7,256,415 | — | — | (1,033,540 | ) | 66,541,326 | ||||||||||||||||
| Small Cap Value | 3,633,835 | 170,090 | (57,676 | ) | 3,746,249 | — | — | (2,162 | ) | 78,334,062 | ||||||||||||||||
| Small Company Growth | 3,583,847 | — | (227,622 | ) | 3,356,225 | — | — | 134,730 | 66,822,447 | |||||||||||||||||
| Small Company Value | 1,814,798 | 33,189 | (25,929 | ) | 1,822,058 | — | — | 4,617 | 52,876,110 | |||||||||||||||||
| Spectrum Income | 14,704,020 | 755,706 | (181,812 | ) | 15,277,914 | 2,566,473 | — | 8,257 | 164,390,357 | |||||||||||||||||
| Strategic Growth | 24,999,093 | — | (2,757,325 | ) | 22,241,768 | — | — | 11,284,804 | 398,572,483 | |||||||||||||||||
| Strategic Income Opportunities | 26,631,078 | 1,083,064 | (188,758 | ) | 27,525,384 | 3,998,132 | — | (32,733 | ) | 298,099,909 | ||||||||||||||||
| Technical Opportunities | 24,306,643 | 7,904 | (4,316,142 | ) | 19,998,405 | — | — | (596,634 | ) | 257,579,461 | ||||||||||||||||
| Total Return | 14,546,138 | 939,895 | (97,499 | ) | 15,388,534 | 1,083,666 | — | 11,523 | 208,668,519 | |||||||||||||||||
| U.S. High Yield Bond | 4,507,957 | 101,977 | (722,195 | ) | 3,887,739 | 1,141,090 | — | 505,552 | 43,853,692 | |||||||||||||||||
| U.S. Strategic Equity Allocation | 72,502,178 | 4,290,843 | (10,758,047 | ) | 66,034,974 | — | — | 6,760,973 | 750,157,306 | |||||||||||||||||
| Value | 11,582,045 | 499,476 | (295,943 | ) | 11,785,578 | — | — | 93,747 | 135,298,431 | |||||||||||||||||
| Value Equity | 21,275,012 | — | (1,159,454 | ) | 20,115,558 | — | — | 922,501 | 241,587,847 | |||||||||||||||||
| $43,355,549 | — | $158,610,886 | $12,860,161,682 | |||||||||||||||||||||||
| Multimanager Lifestyle Balanced Portfolio | ||||||||||||||||||||||||||
| Absolute Return Currency | 21,125,812 | 2,046,989 | (206,411 | ) | 22,966,390 | — | — | $82,125 | $233,338,520 | |||||||||||||||||
| Active Bond | 58,038,398 | 11,412,895 | (69,451,293 | ) | — | $6,907,356 | — | 30,537,852 | — | |||||||||||||||||
| Alpha Opportunities | 6,056,117 | — | (6,056,117 | ) | — | — | — | 19,781,388 | — | |||||||||||||||||
| Asia Pacific Total Return Bond | 13,692,009 | — | (192,449 | ) | 13,499,560 | — | — | (73,412 | ) | 130,540,740 | ||||||||||||||||
| Blue Chip Growth | 9,860,364 | — | (1,687,944 | ) | 8,172,420 | — | — | 22,211,977 | 300,663,336 | |||||||||||||||||
| Bond | — | 44,197,637 | (389,623 | ) | 43,808,014 | 4,590,921 | — | 29,578 | 697,861,668 | |||||||||||||||||
| Capital Appreciation | 20,145,452 | — | (3,323,490 | ) | 16,821,962 | — | — | 12,873,399 | 290,178,846 | |||||||||||||||||
| Capital Appreciation Value | 55,049,119 | — | (7,581,496 | ) | 47,467,623 | — | — | 2,979,185 | 572,459,532 | |||||||||||||||||
| Core Bond | 18,343,892 | 962,126 | (1,229,512 | ) | 18,076,506 | 1,853,327 | — | (294,689 | ) | 234,271,517 | ||||||||||||||||
| Disciplined Value | 13,349,135 | 2,749,959 | (951,394 | ) | 15,147,700 | — | — | 617,056 | 312,951,477 | |||||||||||||||||
| Emerging Markets | 18,116,306 | 2,016,614 | (1,773,462 | ) | 18,359,458 | — | — | 6,129,435 | 197,547,764 | |||||||||||||||||
| Emerging Markets Debt | 23,169,713 | 1,521,037 | (1,534,610 | ) | 23,156,140 | 5,988,087 | — | (969,964 | ) | 222,762,071 | ||||||||||||||||
| Emerging Markets Equity | 18,804,061 | 1,571,418 | (1,535,515 | ) | 18,839,964 | — | — | 417,936 | 198,573,224 | |||||||||||||||||
| Equity Income | 20,986,483 | 181,993 | (1,123,216 | ) | 20,045,260 | 3,603,712 | — | 1,741,425 | 402,308,372 | |||||||||||||||||
| Financial Industries | 8,430,314 | 305,384 | (637,818 | ) | 8,097,880 | — | — | 558,508 | 161,390,698 | |||||||||||||||||
| Floating Rate Income | 65,024,867 | 1,541,549 | (1,226,664 | ) | 65,339,752 | 13,230,841 | — | (919,665 | ) | 554,734,492 | ||||||||||||||||
| Fundamental Global Franchise | 14,509,833 | — | (1,899,809 | ) | 12,610,024 | — | — | (371,505 | ) | 170,865,828 | ||||||||||||||||
| Fundamental Large Cap Core, Class NAV | — | 6,525,581 | (500,327 | ) | 6,025,254 | — | — | 1,180,657 | 305,118,878 | |||||||||||||||||
| Fundamental Large Cap Core, Class R6 | 6,644,471 | — | (6,644,471 | ) | — | — | — | 12,979,001 | — | |||||||||||||||||
| Global Absolute Return Strategies | 30,774,305 | — | (4,405,077 | ) | 26,369,228 | — | — | (4,322,108 | ) | 271,866,736 | ||||||||||||||||
| Global Bond | 13,256,947 | 84,256 | (2,813,724 | ) | 10,527,479 | — | — | 937,898 | 130,540,741 | |||||||||||||||||
| Global Equity | 19,797,226 | — | (1,764,641 | ) | 18,032,585 | — | — | 1,370,003 | 216,571,351 | |||||||||||||||||
| Global Income | 13,759,317 | 330,634 | (2,428,312 | ) | 11,661,639 | 3,148,695 | — | (1,404,120 | ) | 110,202,493 | ||||||||||||||||
| Global Real Estate | 10,231,090 | — | (3,425,212 | ) | 6,805,878 | — | — | 9,444,347 | 64,655,840 | |||||||||||||||||
| Global Shareholder Yield | 15,857,168 | 278,060 | (1,404,948 | ) | 14,730,280 | 3,107,125 | — | 2,405,553 | 164,389,929 | |||||||||||||||||
| Global Short Duration Credit | 14,369,298 | 361,486 | (408,396 | ) | 14,322,388 | 3,332,299 | — | (409,670 | ) | 131,049,849 | ||||||||||||||||
| Health Sciences | 15,426,195 | — | (15,426,195 | ) | — | — | — | (13,804,706 | ) | — | ||||||||||||||||
| High Yield | 8,544,212 | 201,557 | (1,481,938 | ) | 7,263,831 | 1,633,553 | — | 2,678,499 | 59,200,226 | |||||||||||||||||
| High Yield (FKA Focused High Yield) | 38,806,240 | 1,019,343 | (6,648,950 | ) | 33,176,633 | 3,612,392 | — | (2,320,537 | ) | 116,781,746 | ||||||||||||||||
| Dividends and distributions | ||||||||||||||||||||||||||
| Portfolio | Beginning share amount | Shares purchased | Shares sold | Ending share amount | Income distributions received | Capital gain distributions received | Realized gain (loss) | Ending value | ||||||||||||||||||
| International Growth | 1,487,433 | 5,737,286 | (904,557 | ) | 6,320,162 | — | — | $1,413,819 | $156,044,789 | |||||||||||||||||
| International Growth Opportunities | 9,748,227 | — | (9,748,227 | ) | — | — | — | 30,228,734 | — | |||||||||||||||||
| International Growth Stock | 19,309,032 | 78,308 | (2,070,390 | ) | 17,316,950 | — | — | (675,125 | ) | 234,991,012 | ||||||||||||||||
| International Small Cap | 7,228,102 | — | (1,166,707 | ) | 6,061,395 | — | — | 2,519,376 | 124,016,144 | |||||||||||||||||
| International Small Company | 12,139,946 | — | (1,674,449 | ) | 10,465,497 | — | — | 3,624,671 | 124,016,144 | |||||||||||||||||
| International Strategic Equity Allocation | 48,499,948 | 10,918,705 | (6,218,510 | ) | 53,200,143 | — | — | 1,581,040 | 602,757,624 | |||||||||||||||||
| International Value | 23,304,901 | — | (2,721,072 | ) | 20,583,829 | — | — | 3,276,394 | 342,720,759 | |||||||||||||||||
| International Value Equity | 19,992,632 | — | (2,050,300 | ) | 17,942,332 | — | — | (1,238,224 | ) | 150,895,012 | ||||||||||||||||
| Investment Quality Bond | 16,956,705 | — | (16,956,705 | ) | — | — | — | (4,526,619 | ) | — | ||||||||||||||||
| Mid Cap Stock | 16,530,590 | 900,052 | (2,788,661 | ) | 14,641,981 | — | — | 1,334,974 | 318,170,252 | |||||||||||||||||
| Mid Value | 14,046,312 | 175,042 | (327,574 | ) | 13,893,780 | — | — | 89,835 | 221,883,670 | |||||||||||||||||
| Natural Resources | 10,394,174 | 27,391 | (1,235,498 | ) | 9,186,067 | — | — | (5,331,616 | ) | 99,209,519 | ||||||||||||||||
| New Opportunities | 1,452,277 | 31,989 | (77,549 | ) | 1,406,717 | — | — | 249,516 | 39,162,993 | |||||||||||||||||
| Real Estate Equity | 6,339,528 | 138,027 | (231,025 | ) | 6,246,530 | — | — | (113,464 | ) | 64,089,402 | ||||||||||||||||
| Real Return Bond | 29,073,320 | 3,312,958 | (75,712 | ) | 32,310,566 | $2,855,939 | — | (34,511 | ) | 355,739,330 | ||||||||||||||||
| Redwood | 9,815,364 | — | (9,815,364 | ) | — | — | — | 3,265,575 | — | |||||||||||||||||
| Science & Technology | 18,269,171 | — | (7,105,129 | ) | 11,164,042 | — | — | 13,531,364 | 144,685,979 | |||||||||||||||||
| Seaport | 3,477,860 | — | (363,125 | ) | 3,114,735 | — | — | 421,732 | 36,535,837 | |||||||||||||||||
| Short Duration Credit Opportunities | 44,649,328 | 1,544,311 | (1,010,393 | ) | 45,183,246 | 7,570,880 | — | (615,771 | ) | 438,277,482 | ||||||||||||||||
| Small Cap Core | 3,203,130 | — | (227,219 | ) | 2,975,911 | — | — | 672,779 | 39,162,993 | |||||||||||||||||
| Small Cap Growth | 6,533,132 | — | (780,540 | ) | 5,752,592 | — | — | (985,849 | ) | 52,751,272 | ||||||||||||||||
| Small Cap Value | 2,969,010 | 143,466 | (84,276 | ) | 3,028,200 | — | — | (8,864 | ) | 63,319,670 | ||||||||||||||||
| Small Company Growth | 2,942,893 | — | (267,771 | ) | 2,675,122 | — | — | 98,972 | 53,261,670 | |||||||||||||||||
| Small Company Value | 1,483,228 | 30,848 | (57,875 | ) | 1,456,201 | — | — | 19,528 | 42,258,959 | |||||||||||||||||
| Spectrum Income | 33,971,593 | 1,014,751 | (1,043,325 | ) | 33,943,019 | 5,795,658 | — | 70,925 | 365,226,884 | |||||||||||||||||
| Strategic Growth | 18,931,559 | — | (2,554,966 | ) | 16,376,593 | — | — | 11,615,671 | 293,468,546 | |||||||||||||||||
| Strategic Income Opportunities | 60,770,405 | 1,820,837 | (1,887,990 | ) | 60,703,252 | 8,981,863 | — | (466,688 | ) | 657,416,223 | ||||||||||||||||
| Technical Opportunities | 14,726,752 | — | (2,939,933 | ) | 11,786,819 | — | — | (825,661 | ) | 151,814,231 | ||||||||||||||||
| Total Return | 30,489,477 | 8,702,532 | (173,362 | ) | 39,018,647 | 2,745,090 | — | (15,452 | ) | 529,092,850 | ||||||||||||||||
| U.S. High Yield Bond | 8,910,055 | 200,258 | (1,542,885 | ) | 7,567,428 | 2,240,780 | — | 627,634 | 85,360,590 | |||||||||||||||||
| U.S. Strategic Equity Allocation | 55,031,906 | 7,799,583 | (4,585,730 | ) | 58,245,759 | — | — | 1,260,769 | 661,671,820 | |||||||||||||||||
| Value | 8,289,726 | 351,056 | (317,039 | ) | 8,323,743 | — | — | 86,310 | 95,556,574 | |||||||||||||||||
| Value Equity | 16,110,576 | 36,118 | (1,258,670 | ) | 14,888,024 | — | — | 933,889 | 178,805,171 | |||||||||||||||||
| $81,198,518 | — | $166,151,109 | $12,973,189,275 | |||||||||||||||||||||||
| Multimanager Lifestyle Moderate Portfolio | ||||||||||||||||||||||||||
| Absolute Return Currency | 7,323,190 | 560,695 | (56,092 | ) | 7,827,793 | — | — | $21,825 | $79,530,379 | |||||||||||||||||
| Active Bond | 31,797,261 | 410,925 | (32,208,186 | ) | — | $3,118,397 | — | 10,964,444 | — | |||||||||||||||||
| Alpha Opportunities | 1,019,469 | — | (1,019,469 | ) | — | — | — | 2,157,555 | — | |||||||||||||||||
| Asia Pacific Total Return Bond | 7,779,304 | 24,195 | (438,664 | ) | 7,364,835 | — | — | (218,686 | ) | 71,217,957 | ||||||||||||||||
| Blue Chip Growth | 1,513,756 | — | (296,986 | ) | 1,216,770 | — | — | 4,998,056 | 44,764,972 | |||||||||||||||||
| Bond | — | 19,743,491 | (397,859 | ) | 19,345,632 | 2,038,490 | — | 21,115 | 308,175,925 | |||||||||||||||||
| Capital Appreciation | 3,092,877 | 5,729 | (587,141 | ) | 2,511,465 | — | — | 2,395,613 | 43,322,776 | |||||||||||||||||
| Capital Appreciation Value | 15,779,257 | — | (1,817,095 | ) | 13,962,162 | — | — | 998,077 | 168,383,676 | |||||||||||||||||
| Core Bond | 11,718,702 | 11,329,896 | (425,723 | ) | 22,622,875 | 2,314,979 | — | (46,142 | ) | 293,192,458 | ||||||||||||||||
| Disciplined Value | 2,483,262 | — | (237,387 | ) | 2,245,875 | — | — | 290,244 | 46,399,778 | |||||||||||||||||
| Emerging Markets | 2,767,540 | 574,590 | (239,854 | ) | 3,102,276 | — | — | 60,604 | 33,380,493 | |||||||||||||||||
| Emerging Markets Debt | 9,798,826 | 599,775 | (866,558 | ) | 9,532,043 | 2,488,764 | — | (550,308 | ) | 91,698,254 | ||||||||||||||||
| Emerging Markets Equity | 2,949,133 | 515,621 | (278,273 | ) | 3,186,481 | — | — | 91,526 | 33,585,507 | |||||||||||||||||
| Dividends and distributions | ||||||||||||||||||||||||||
| Portfolio | Beginning share amount | Shares purchased | Shares sold | Ending share amount | Income distributions received | Capital gain distributions received | Realized gain (loss) | Ending value | ||||||||||||||||||
| Enduring Assets | 1,910,111 | 22,837 | (294,969 | ) | 1,637,979 | $252,110 | — | $346,077 | $19,147,977 | |||||||||||||||||
| Equity Income | 3,233,495 | 27,666 | (288,637 | ) | 2,972,524 | 547,791 | — | 1,445,936 | 59,658,554 | |||||||||||||||||
| Floating Rate Income | 26,094,778 | 759,463 | (756,835 | ) | 26,097,406 | 5,319,833 | — | (606,172 | ) | 221,566,977 | ||||||||||||||||
| Fundamental Global Franchise | 4,475,851 | 1,319 | (653,749 | ) | 3,823,421 | — | — | (122,127 | ) | 51,807,361 | ||||||||||||||||
| Fundamental Large Cap Core, Class NAV | — | 2,546,879 | (263,125 | ) | 2,283,754 | — | — | 687,992 | 115,649,281 | |||||||||||||||||
| Fundamental Large Cap Core, Class R6 | 2,612,741 | — | (2,612,741 | ) | — | — | — | 5,080,202 | — | |||||||||||||||||
| Global Absolute Return Strategies | 10,673,246 | 24,448 | (1,672,097 | ) | 9,025,597 | — | — | (1,523,193 | ) | 93,053,906 | ||||||||||||||||
| Global Bond | 7,501,854 | 151,881 | (1,378,450 | ) | 6,275,285 | — | — | 529,100 | 77,813,531 | |||||||||||||||||
| Global Equity | 5,667,100 | 567,487 | (450,810 | ) | 5,783,777 | — | — | 275,954 | 69,463,163 | |||||||||||||||||
| Global Income | 5,539,173 | 131,482 | (1,084,821 | ) | 4,585,834 | 1,252,490 | — | (765,213 | ) | 43,336,127 | ||||||||||||||||
| Global Real Estate | 2,223,869 | 47,747 | (207,841 | ) | 2,063,775 | — | — | 63,825 | 19,605,867 | |||||||||||||||||
| Global Shareholder Yield | 4,428,191 | 721,901 | (501,059 | ) | 4,649,033 | 984,440 | — | 204,512 | 51,883,213 | |||||||||||||||||
| Global Short Duration Credit | 5,789,517 | 144,564 | (280,750 | ) | 5,653,331 | 1,332,777 | — | (275,835 | ) | 51,727,976 | ||||||||||||||||
| High Yield | 3,443,683 | 79,883 | (667,080 | ) | 2,856,486 | 647,401 | — | (41,847 | ) | 23,280,359 | ||||||||||||||||
| High Yield (FKA Focused High Yield) | 15,632,383 | 406,009 | (2,993,007 | ) | 13,045,385 | 1,439,036 | — | (1,039,421 | ) | 45,919,756 | ||||||||||||||||
| International Growth | 413,102 | 1,024,324 | (186,041 | ) | 1,251,385 | — | — | 300,569 | 30,896,695 | |||||||||||||||||
| International Growth Opportunities | 2,132,658 | — | (2,132,658 | ) | — | — | — | 6,610,617 | — | |||||||||||||||||
| International Growth Stock | 3,837,493 | 78,308 | (491,249 | ) | 3,424,552 | — | — | 188,536 | 46,471,169 | |||||||||||||||||
| International Small Cap | 1,304,960 | — | (241,341 | ) | 1,063,619 | — | — | 508,422 | 21,761,642 | |||||||||||||||||
| International Small Company | 2,169,367 | — | (332,941 | ) | 1,836,426 | — | — | 708,519 | 21,761,642 | |||||||||||||||||
| International Strategic Equity Allocation | 19,420,816 | 90 | (6,872,871 | ) | 12,548,035 | — | — | 2,580,036 | 142,169,237 | |||||||||||||||||
| International Value | 4,261,796 | — | (563,621 | ) | 3,698,175 | — | — | 1,969,785 | 61,574,606 | |||||||||||||||||
| International Value Equity | 3,973,216 | — | (379,158 | ) | 3,594,058 | — | — | (83,799 | ) | 30,226,025 | ||||||||||||||||
| Investment Quality Bond | 11,433,289 | 32,911 | (11,466,200 | ) | — | — | — | 1,452,208 | — | |||||||||||||||||
| Mid Cap Stock | 3,143,113 | 132,109 | (587,197 | ) | 2,688,025 | — | — | 853,114 | 58,410,784 | |||||||||||||||||
| Mid Value | 3,715,966 | 165,184 | (195,780 | ) | 3,685,370 | — | — | 46,887 | 58,855,351 | |||||||||||||||||
| Natural Resources | 1,905,086 | 36,234 | (270,515 | ) | 1,670,805 | — | — | (1,529,064 | ) | 18,044,691 | ||||||||||||||||
| Real Estate Equity | 1,956,744 | 25,835 | (69,203 | ) | 1,913,376 | — | — | (15,210 | ) | 19,631,243 | ||||||||||||||||
| Real Return Bond | 13,503,920 | 1,200,832 | (472,997 | ) | 14,231,755 | 1,294,905 | — | (235,933 | ) | 156,691,619 | ||||||||||||||||
| Redwood | 2,926,109 | — | (2,926,109 | ) | — | — | — | 1,024,801 | — | |||||||||||||||||
| Seaport | 1,009,472 | 140 | (98,871 | ) | 910,741 | — | — | 123,084 | 10,682,988 | |||||||||||||||||
| Short Duration Credit Opportunities | 16,244,824 | 561,620 | (586,616 | ) | 16,219,828 | 2,744,533 | — | (359,024 | ) | 157,332,336 | ||||||||||||||||
| Small Cap Growth | 1,435,658 | — | (184,707 | ) | 1,250,951 | — | — | (82,726 | ) | 11,471,217 | ||||||||||||||||
| Small Cap Value | 1,091,263 | 22,645 | (28,187 | ) | 1,085,721 | — | — | 2,419 | 22,702,416 | |||||||||||||||||
| Small Company Growth | 647,753 | — | (68,065 | ) | 579,688 | — | — | 71,647 | 11,541,584 | |||||||||||||||||
| Spectrum Income | 12,435,942 | 354,259 | (605,047 | ) | 12,185,154 | 2,104,349 | — | 196,468 | 131,112,258 | |||||||||||||||||
| Strategic Growth | 2,908,110 | — | (473,002 | ) | 2,435,108 | — | — | 2,243,735 | 43,637,132 | |||||||||||||||||
| Strategic Income Opportunities | 22,215,053 | 655,159 | (1,079,212 | ) | 21,791,000 | 3,264,948 | — | (216,721 | ) | 235,996,526 | ||||||||||||||||
| Total Return | 21,897,300 | 387,265 | (747,776 | ) | 21,536,789 | 1,535,871 | — | (154,161 | ) | 292,038,859 | ||||||||||||||||
| U.S. High Yield Bond | 3,573,005 | 79,199 | (676,371 | ) | 2,975,833 | 886,173 | — | (268,151 | ) | 33,567,397 | ||||||||||||||||
| U.S. Strategic Equity Allocation | 7,577,457 | 5,745,085 | (665,054 | ) | 12,657,488 | — | — | 157,449 | 143,789,063 | |||||||||||||||||
| Value Equity | 2,480,009 | — | (272,383 | ) | 2,207,626 | — | — | 212,528 | 26,513,594 | |||||||||||||||||
| $33,567,287 | — | $41,749,748 | $3,944,446,297 | |||||||||||||||||||||||
| Multimanager Lifestyle Conservative Portfolio | ||||||||||||||||||||||||||
| Absolute Return Currency | 8,447,981 | 561,244 | (156,623 | ) | 8,852,602 | — | — | $65,401 | $89,942,439 | |||||||||||||||||
| Dividends and distributions | ||||||||||||||||||||||||||
| Portfolio | Beginning share amount | Shares purchased | Shares sold | Ending share amount | Income distributions received | Capital gain distributions received | Realized gain (loss) | Ending value | ||||||||||||||||||
| Active Bond | 33,558,706 | 325,787 | (33,884,493 | ) | — | $3,258,136 | — | $10,165,914 | — | |||||||||||||||||
| Alpha Opportunities | 514,172 | — | (514,172 | ) | — | — | — | 569,279 | — | |||||||||||||||||
| Asia Pacific Total Return Bond | 6,502,483 | 3,870 | (543,116 | ) | 5,963,237 | — | — | (294,865 | ) | $57,664,502 | ||||||||||||||||
| Blue Chip Growth | 295,767 | — | (66,268 | ) | 229,499 | — | — | 1,152,146 | 8,443,274 | |||||||||||||||||
| Bond | — | 20,671,743 | (588,432 | ) | 20,083,311 | 2,120,474 | — | 17,762 | 319,927,151 | |||||||||||||||||
| Capital Appreciation | 603,747 | — | (129,811 | ) | 473,936 | — | — | (256,650 | ) | 8,175,391 | ||||||||||||||||
| Capital Appreciation Value | 7,260,209 | 1,038,246 | (1,159,336 | ) | 7,139,119 | — | — | 522,430 | 86,097,776 | |||||||||||||||||
| Core Bond | 12,679,496 | 11,313,762 | (1,061,984 | ) | 22,931,274 | 2,365,726 | — | (187,227 | ) | 297,189,310 | ||||||||||||||||
| Disciplined Value | 484,703 | 4,977 | (64,966 | ) | 424,714 | — | — | 75,972 | 8,774,586 | |||||||||||||||||
| Emerging Markets | 939,725 | 292,715 | (69,341 | ) | 1,163,099 | — | — | 48,302 | 12,514,943 | |||||||||||||||||
| Emerging Markets Debt | 11,050,984 | 369,727 | (1,249,714 | ) | 10,170,997 | 2,699,495 | — | (814,701 | ) | 97,844,990 | ||||||||||||||||
| Emerging Markets Equity | 926,533 | 277,208 | (6,848 | ) | 1,196,893 | — | — | 3,591 | 12,615,257 | |||||||||||||||||
| Enduring Assets | 5,264,747 | 57,376 | (988,936 | ) | 4,333,187 | 671,987 | — | 1,195,926 | 50,654,955 | |||||||||||||||||
| Equity Income | 631,114 | 5,629 | (74,025 | ) | 562,718 | 104,362 | — | 615,610 | 11,293,751 | |||||||||||||||||
| Floating Rate Income | 21,979,653 | 603,631 | (1,134,706 | ) | 21,448,578 | 4,413,792 | — | (863,705 | ) | 182,098,427 | ||||||||||||||||
| Fundamental Global Franchise | 2,340,894 | — | (396,002 | ) | 1,944,892 | — | — | (85,890 | ) | 26,353,286 | ||||||||||||||||
| Fundamental Large Cap Core, Class NAV | — | 706,754 | (88,432 | ) | 618,322 | — | — | 232,646 | 31,311,820 | |||||||||||||||||
| Fundamental Large Cap Core, Class R6 | 729,210 | — | (729,210 | ) | — | — | — | 1,419,674 | — | |||||||||||||||||
| Global Absolute Return Strategies | 12,311,131 | 2,457 | (2,123,293 | ) | 10,190,295 | — | — | (1,823,544 | ) | 105,061,937 | ||||||||||||||||
| Global Bond | 8,299,613 | 106 | (1,405,678 | ) | 6,894,041 | — | — | 381,598 | 85,486,107 | |||||||||||||||||
| Global Equity | 2,668,541 | 462,210 | (337,255 | ) | 2,793,496 | — | — | 130,789 | 33,549,888 | |||||||||||||||||
| Global Income | 3,464,460 | 86,429 | (492,729 | ) | 3,058,160 | 822,855 | — | (276,096 | ) | 28,899,610 | ||||||||||||||||
| Global Real Estate | 1,564,260 | 520,904 | (189,571 | ) | 1,895,593 | — | — | 22,350 | 18,008,129 | |||||||||||||||||
| Global Shareholder Yield | 2,130,495 | 277,808 | (271,089 | ) | 2,137,214 | 453,798 | — | 133,192 | 23,851,306 | |||||||||||||||||
| Global Short Duration Credit | 3,613,659 | 91,968 | (259,688 | ) | 3,445,939 | 818,646 | — | (241,193 | ) | 31,530,343 | ||||||||||||||||
| High Yield | 2,123,675 | 53,017 | (271,175 | ) | 1,905,517 | 429,677 | — | 77,822 | 15,529,961 | |||||||||||||||||
| High Yield (FKA Focused High Yield) | 9,810,350 | 267,162 | (1,375,242 | ) | 8,702,270 | 946,335 | — | 58,186 | 30,631,990 | |||||||||||||||||
| International Growth | 127,342 | 8,157 | (20,904 | ) | 114,595 | — | — | 49,102 | 2,829,356 | |||||||||||||||||
| International Growth Stock | 1,663,506 | — | (457,086 | ) | 1,206,420 | — | — | 1,118,493 | 16,371,114 | |||||||||||||||||
| International Strategic Equity Allocation | 7,616,284 | 90 | (1,229,671 | ) | 6,386,703 | — | — | 858,446 | 72,361,338 | |||||||||||||||||
| International Value | 2,556,840 | — | (615,138 | ) | 1,941,702 | — | — | 2,494,641 | 32,329,334 | |||||||||||||||||
| International Value Equity | 984,201 | 3,818 | (147,824 | ) | 840,195 | — | — | 76,830 | 7,066,036 | |||||||||||||||||
| Investment Quality Bond | 12,096,492 | — | (12,096,492 | ) | — | — | — | 2,257,693 | — | |||||||||||||||||
| Mid Cap Stock | 1,033,630 | 61,516 | (251,510 | ) | 843,636 | — | — | 425,474 | 18,332,208 | |||||||||||||||||
| Mid Value | 1,175,404 | 82,696 | (97,639 | ) | 1,160,461 | — | — | (17,945 | ) | 18,532,556 | ||||||||||||||||
| Natural Resources | 1,012,945 | 25,709 | (134,282 | ) | 904,372 | — | — | (749,285 | ) | 9,767,221 | ||||||||||||||||
| Real Estate Equity | 1,730,685 | 175,752 | (146,481 | ) | 1,759,956 | — | — | (154,105 | ) | 18,057,146 | ||||||||||||||||
| Real Return Bond | 16,089,530 | 962,156 | (859,980 | ) | 16,191,706 | 1,507,129 | — | (1,127,347 | ) | 178,270,688 | ||||||||||||||||
| Redwood | 1,608,441 | — | (1,608,441 | ) | — | — | — | 629,043 | — | |||||||||||||||||
| Seaport | 481,544 | — | (68,512 | ) | 413,032 | — | — | 80,276 | 4,844,863 | |||||||||||||||||
| Short Duration Credit Opportunities | 14,766,808 | 280,396 | (887,643 | ) | 14,159,561 | 2,426,413 | — | (376,398 | ) | 137,347,739 | ||||||||||||||||
| Short Term Government Income | 13,355,902 | 79,017 | (623,612 | ) | 12,811,307 | 514,533 | — | (361,852 | ) | 121,323,077 | ||||||||||||||||
| Small Cap Growth | 858,052 | — | (122,592 | ) | 735,460 | — | — | 83,226 | 6,744,168 | |||||||||||||||||
| Small Cap Value | 328,261 | 18,397 | (25,728 | ) | 320,930 | — | — | 4,482 | 6,710,656 | |||||||||||||||||
| Spectrum Income | 11,292,892 | 193,762 | (849,579 | ) | 10,637,075 | 1,859,588 | — | 297,301 | 114,454,931 | |||||||||||||||||
| Strategic Growth | 576,592 | — | (117,066 | ) | 459,526 | — | — | 138,470 | 8,234,713 | |||||||||||||||||
| Dividends and distributions | ||||||||||||||||||||||||||
| Portfolio | Beginning share amount | Shares purchased | Shares sold | Ending share amount | Income distributions received | Capital gain distributions received | Realized gain (loss) | Ending value | ||||||||||||||||||
| Strategic Income Opportunities | 20,159,969 | 303,077 | (1,439,954 | ) | 19,023,092 | $2,883,655 | — | ($46,469 | ) | $206,020,090 | ||||||||||||||||
| Total Return | 23,176,671 | 130,067 | (1,316,807 | ) | 21,989,931 | 1,573,427 | — | (313,102 | ) | 298,183,461 | ||||||||||||||||
| U.S. High Yield Bond | 2,233,160 | 52,901 | (301,220 | ) | 1,984,841 | 591,907 | — | 79,497 | 22,389,002 | �� | ||||||||||||||||
| U.S. Strategic Equity Allocation | 4,058,837 | 234,485 | (432,449 | ) | 3,860,873 | — | — | 258,938 | 43,859,517 | |||||||||||||||||
| Value Equity | 484,048 | 3,154 | (69,207 | ) | 417,995 | — | — | 52,196 | 5,020,119 | |||||||||||||||||
| $30,461,935 | — | $17,802,324 | $3,022,500,462 | |||||||||||||||||||||||
Note 8 — New rule issuance
In October 2016, the SEC issued Final Rule Release No.33-10231, Investment Company Reporting Modernization (the Release). The Release calls for the adoption of new rules and forms as well as amendments to its rules and forms to modernize the reporting and disclosure of information by registered investment companies. The SEC is adopting amendments to Regulation S-X, which will require standardized, enhanced disclosure about derivatives in investment company financial statements, as well as other amendments. The updates to Regulation S-X are effective August 1, 2017 and may result in additional disclosure relating to the presentation of derivatives and certain other financial instruments. These updates will have no impact on the fund's net assets or results of operations.
EVALUATION OF ADVISORY AND SUBADVISORY AGREEMENTS BY THE BOARD OF TRUSTEES
This section describes the evaluation by the Board of Trustees (the Board) of John Hancock Funds II (the Trust) of the Advisory Agreement (the Advisory Agreement) and each Subadvisory Agreement and Sub-Subadvisory Agreement (collectively, the Subadvisory Agreements) with respect to each of the portfolios of the Trust included in this report except those otherwise noted below (the Funds). The Advisory and Subadvisory Agreements are collectively referred to as the Agreements. Prior to the June 19-22, 2017 in-person meeting at which the Agreements were approved, the Board also discussed and considered information regarding the proposed continuation of the Agreements at an in-person meeting held on May 22-24, 2017.
Approval of Advisory and Subadvisory Agreements
At in-person meetings held on June 19-22, 2017, the Board, including the Trustees who are not parties to any Agreement or considered to be interested persons of the Trust under the Investment Company Act of 1940, as amended (the 1940 Act) (the Independent Trustees), reapproved for an annual period, the continuation of the Advisory Agreement between the Trust and the Advisor and the applicable Subadvisory Agreements between the Advisor and the sub-advisers (and sub-subadvisers) (each, a Subadvisor and collectively, the Subadvisors) with respect to each of the Funds in this report, except as noted above.
In considering the Advisory Agreement and the Subadvisory Agreements with respect to each Fund, the Board received in advance of the meetings a variety of materials relating to each Fund, the Advisor and each Subadvisor, including comparative performance, fee and expense information for peer groups of similar mutual funds prepared by an independent third-party provider of mutual fund data; performance information for the Funds' benchmark indices; and, with respect to each Subadvisor, comparative performance information for comparably managed accounts, as applicable; and other information provided by the Advisor and the Subadvisors regarding the nature, extent and quality of services provided by the Advisor and the Subadvisors under their respective Agreements, as well as information regarding the Advisor's revenues and costs of providing services to the Funds and any compensation paid to affiliates of the Advisor. At the meetings at which the renewal of the Advisory Agreement and Subadvisory Agreements are considered, particular focus is given to information concerning Fund performance, comparability of fees and total expenses, and profitability. However, the Board noted that the evaluation process with respect to the Advisor and the Subadvisors is an ongoing one. In this regard, the Board also took into account discussions with management and information provided to the Board (including its various committees) at prior meetings with respect to the services provided by the Advisor and the Subadvisors to the Funds, including quarterly performance reports prepared by management containing reviews of investment results, and periodic presentations from the Subadvisors with respect to the Funds they manage. The information received and considered by the Board both in conjunction with the May and June meetings and throughout the year was both written and oral. The Board noted the affiliation of certain of the Subadvisors with the Advisor, noting any potential conflicts of interest. The Board also considered the nature, quality, and extent of the non-advisory services, if any, to be provided to the Funds by the Advisor's affiliates, including distribution services. The Board considered the Advisory Agreement and the Subadvisory Agreements separately in the course of its review. In doing so, the Board noted the respective roles of the Advisor and the Subadvisors in providing services to the Funds. In addition, although the Board approved the renewal of the Agreements for all of the Funds at the June meeting, the Board considered each Fund separately.
Throughout the process, the Board asked questions of and requested additional information from management. The Board is assisted by counsel for the Trust and the Independent Trustees are also separately assisted by independent legal counsel throughout the process. The Independent Trustees also received a memorandum from their independent counsel discussing the legal standards for their consideration of the proposed continuation of the Agreements and discussed the proposed continuation of the Agreements in private sessions with their independent legal counsel at which no representatives of management were present.
Approval of Advisory Agreement
In approving the Advisory Agreement with respect to each Fund, the Board, including the Independent Trustees, considered a variety of factors, including those discussed below. The Board also considered other factors (including conditions and trends prevailing generally in the economy, the securities markets and the industry) and did not treat any single factor as determinative, and each Trustee may have attributed different weights to different factors. The Board's conclusions may be based in part on its consideration of the advisory and subadvisory arrangements in prior years and on the Board's ongoing regular review of Fund performance and operations throughout the year.
Nature, Extent and Quality of Services. Among the information received by the Board from the Advisor relating to the nature, extent and quality of services provided to the Funds, the Board reviewed information provided by the Advisor relating to its operations and personnel, descriptions of its organizational and management structure, and information regarding the Advisor's compliance and regulatory history, including its Form ADV. The Board also noted that on a regular basis it receives and reviews information from the Trust's Chief Compliance Officer (CCO) regarding the Funds' compliance policies and procedures established pursuant to Rule 38a-1 under the 1940 Act. The Board observed that the scope of services provided by the Advisor, and of the undertakings required of the Advisor in connection with those services, including maintaining and monitoring its own and the Fund's compliance programs, risk management programs, liquidity management programs and cybersecurity programs, had expanded over time as a result of regulatory, market and other developments. The Board considered that the Advisor is responsible for the management of the day-to-day operations of the Funds, including but not limited to, general supervision of and coordination of the services provided by the Subadvisors, and is also responsible for monitoring and reviewing the activities of the Subadvisors and other third-party service providers. The Board also considered the significant risks assumed by the Advisor in connection with the services provided to the Funds including entrepreneurial risk in sponsoring new Funds and ongoing risks including investment, operational, enterprise, litigation, regulatory and compliance risks with respect to all Funds.
In considering the nature, extent and quality of the services provided by the Advisor, the Trustees also took into account their knowledge of the Advisor's management and the quality of the performance of the Advisor's duties, through Board meetings, discussions and reports during the preceding year and through each Trustee's experience as a Trustee of the Trust and of the other trusts in the complex.
In the course of their deliberations regarding the Advisory Agreement, the Board considered, among other things:
| (a) | the skills and competency with which the Advisor has in the past managed the Trust's affairs and its subadvisory relationships, the Advisor's oversight and monitoring of the Subadvisors' investment performance and compliance programs, such as the Subadvisors' compliance with fund policies and objectives, review of brokerage matters including with respect to trade allocation and best execution, and the Advisor's timeliness in responding to performance issues; | |
| (b) | the background, qualifications and skills of the Advisor's personnel; | |
| (c) | the Advisor's compliance policies and procedures and its responsiveness to regulatory changes and mutual fund industry developments; | |
| (d) | the Advisor's administrative capabilities, including its ability to supervise the other service providers for the Funds; | |
| (e) | the financial condition of the Advisor and whether it has the financial wherewithal to provide a high level and quality of services to the Funds; | |
| (f) | the Advisor's initiatives intended to improve various aspects of the Trust's operations and investor experience with the Funds; and | |
| (g) | the Advisor's reputation and experience in serving as an investment adviser to the Trust and the benefit to shareholders of investing in funds that are part of a family of funds offering a variety of investments. |
The Board concluded that the Advisor may reasonably be expected to continue to provide a high quality of services under the Advisory Agreement with respect to the Funds.
Investment Performance. In considering each Fund's performance, the Board noted that it reviews at its regularly scheduled meetings information about the Funds' performance results. In connection with the consideration of the Advisory Agreement, the Board:
| (a) | reviewed information prepared by management regarding the Funds' performance; | |
| (b) | considered the comparative performance of each Fund's respective benchmark; | |
| (c) | considered the performance of comparable funds, if any, as included in the report prepared by an independent third-party provider of mutual fund data; and | |
| (d) | took into account the Advisor's analysis of each Fund's performance and its plans and recommendations regarding the Trust's subadvisory arrangements generally and with respect to particular Funds. |
The Board noted that while it found the data provided by the independent third-party generally useful it recognized its limitations, including in particular that the data may vary depending on the end date selected and that the results of the performance comparisons may vary depending on the selection of the peer group. The Board noted that each Fund had generally underperformed the historical performance of comparable funds and the Funds' benchmark. The Board concluded that each Fund's performance is being monitored and reasonably addressed.
Fees and Expenses. The Board reviewed comparative information prepared by an independent third-party provider of mutual fund data including, among other data, each Fund's contractual and net management fees (and subadvisory fees, to the extent available) and total expenses as compared to similarly situated investment companies deemed to be comparable to the Fund in light of the nature, extent and quality of the management and subadvisory services provided by the Advisor and the Subadvisors. The Board considered each Fund's ranking within a smaller group of peer funds chosen by the independent third-party provider, as well as the Fund's ranking within broader groups of funds. In comparing each Fund's contractual and net management fees to that of comparable funds, the Board noted that such fee includes both advisory and administrative costs.
The Board took into account management's discussion with respect to the overall management fee, the fees of each Subadvisor, including the amount of the advisory fee retained by the Advisor after payment of the subadvisory fees, in each case in light of the services rendered for those amounts and the risks undertaken by the Advisor. The Board also noted that, in addition, the Advisor is currently waiving fees and/or reimbursing expenses with respect to certain of the Funds. The Board also noted that the Advisor pays the subadvisory fees of the Funds. The Board also took into account that management had agreed to implement an overall fee waiver across the complex, which is discussed further below. The Board also noted management's discussion of the Funds' expenses, as well as certain actions taken over the past several years to reduce the Funds' operating expenses. The Board reviewed information provided by the Advisor concerning investment advisory fees charged to other clients (including other funds in the complex) having similar investment mandates, if any. The Board considered any differences between the Advisor's and Subadvisor's services to a Fund and the services they provide to other such comparable clients or funds. The Board concluded that the advisory fee paid with respect to each of the Funds is reasonable in light of the nature, extent and quality of the services provided to the Funds under the Advisory Agreement.
In addition, the Trustees reviewed the advisory fee to be paid to the Advisor for each Fund and concluded that the advisory fee to be paid to the Advisor with respect to each Fund is based on services provided that are in addition to, rather than duplicative of, the services provided pursuant to the advisory agreements for the underlying portfolios of the Fund and that the additional services are necessary because of the differences between the investment policies, strategies and techniques of a Fund and those of its underlying portfolios.
Profitability/Fall Out Benefits. In considering the costs of the services to be provided and the profits to be realized by the Advisor and its affiliates (including the Subadvisors that are affiliated with the Advisor) from the Advisor's relationship with the Trust, the Board:
| (a) | reviewed financial information of the Advisor; | |||||||
| (b) | reviewed and considered information presented by the Advisor regarding the net profitability to the Advisor and its affiliates, of each Fund; | |||||||
| (c) | received and reviewed profitability information with respect to the John Hancock fund complex as a whole and respect to each Fund; |
| (d) | received information with respect to the Advisor's allocation methodologies used in preparing the profitability data and considered that the Advisor hired an independent third-party consultant to provide an analysis of the Advisor's allocation methodologies; | |||||||
| (e) | considered that the John Hancock insurance companies that are affiliates of the Advisor, as shareholders of the Trust directly or through their separate accounts, receive certain tax credits or deductions relating to foreign taxes paid and dividends received by certain Funds of the Trust and noted that these tax benefits, which are not available to participants in qualified retirement plans under applicable income tax law, are reflected in the profitability analysis reviewed by the Board; | |||||||
| (f) | considered that the Advisor also provides administrative services to the Funds on a cost basis pursuant to an administrative services agreement; | |||||||
| (g) | noted that the Funds' Subadvisors are affiliates of the Advisor; | |||||||
| (h) | noted that affiliates of the Advisor provide transfer agency services and distribution services to the Funds, and that the Trust's distributor also receives Rule 12b-1 payments to support distribution of the products; | |||||||
| (i) | noted that the Advisor also derives reputational and other indirect benefits from providing advisory services to the Funds; | |||||||
| (j) | noted that the subadvisory fees for the Funds are paid by the Advisor; | |||||||
| (k) | with respect to each Fund, the Board noted that the advisory fee is in addition to the fees received by the Advisor and its affiliates with regard to the underlying portfolios in which the Funds may invest; | |||||||
| (l) | considered the Advisor's ongoing costs and expenditures necessary to improve services, meet new regulatory and compliance requirements, and adapt to other challenges impacting the mutual fund industry; and | |||||||
| (m) | considered that the Advisor should be entitled to earn a reasonable level of profits in exchange for the level of services it provides to each Fund and the risks that it assumes as Advisor, including entrepreneurial, operational, reputational, litigation and regulatory risk. |
Based upon its review, the Board concluded that the level of profitability, if any, of the Advisor and its affiliates (including the Subadvisors that are affiliated with the Advisor), from their relationship with each Fund was reasonable and not excessive.
Economies of Scale. In considering the extent to which economies of scale would be realized as a Fund grows and whether fee levels reflect these economies of scale for the benefit of Fund shareholders, the Board:
| (a) | considered that with respect to the John Hancock underlying portfolios in which the Funds invest, the Advisor has agreed to waive a portion of its management fee for such fund and for each of the other John Hancock funds in the complex (except as discussed below) (the Participating Portfolios) or otherwise reimburse the expenses of the Participating Portfolios (the Reimbursement). This waiver is based on the aggregate net assets of all the Participating Portfolios. The Board also noted that the Advisor had implemented additional breakpoints to the complex-wide fee waiver in recent years. | |
| (The Funds that are not Participating Portfolios as of the date of this annual report are each Fund and each other of the funds of funds of the Trust and John Hancock Variable Insurance Trust and John Hancock Collateral Trust. These funds of funds also benefit from such overall management fee waiver through their investment in underlying portfolios that include certain of the Participating Portfolios, which are subject to the Reimbursement. | ||
| (b) | the Board also considered the effect of the Funds' growth in size on their performance and fees. The Board also noted that if the Funds' assets increase over time, the Funds may realize other economies of scale. |
Approval of Subadvisory Agreements
In making its determination with respect to approval of the Subadvisory Agreements, the Board reviewed:
| (1) | information relating to each Subadvisor's business, including current subadvisory services to the Trust (and other funds in the John Hancock family of funds); | |
| (2) | the historical and current performance of each Fund and comparative performance information relating to the Fund's benchmark and comparable funds; and | |
| (3) | the subadvisory fee for each Fund and comparative fee information, where available, prepared by an independent third-party provider of mutual fund data. |
Nature, Extent and Quality of Services. With respect to the services provided by each of the Subadvisors with respect to each Fund, the Board received information provided to the Board by each Subadvisor, including each Subadvisor's Form ADV, as well as took into account information presented throughout the past year. The Board considered each Subadvisor's current level of staffing and its overall resources, as well as received information relating to a Subadvisor's compensation program. The Board reviewed each Subadvisor's history and investment experience, as well as information regarding the qualifications, background and responsibilities of the Subadvisor's investment and compliance personnel who provide services to the Funds. The Board also considered, among other things, the Subadvisor's compliance program and any disciplinary history. The Board also considered the Subadvisor's risk assessment and monitoring process. The Board reviewed each Subadvisor's regulatory history, including whether it was currently involved in any regulatory actions or investigations as well as material litigation, and any settlements and amelioratory actions undertaken, as appropriate. The Board noted that the Advisor conducts regular, periodic reviews of each Subadvisor and its operations, including regarding investment processes and organizational and staffing matters. The Board also noted that the CCO and his staff conduct regular, periodic compliance reviews with each of the Subadvisors and present reports to the Independent Trustees regarding the same, which includes evaluating the regulatory compliance systems of the
Subadvisors and procedures reasonably designed by them to assure compliance with the federal securities laws. The Board also took into account the financial condition of each Subadvisor.
The Board considered each Subadvisor's investment process and philosophy. The Board took into account that each Subadvisor's responsibilities include the development and maintenance of an investment program for the applicable Fund which is consistent with the Fund's investment objectives, the selection of investment securities and underlying funds and the placement of orders for the purchase and sale of such securities and underlying funds, as well as the implementation of compliance controls related to performance of these services. The Board also received information with respect to each Subadvisor's brokerage policies and practices, including with respect to best execution and soft dollars.
Subadvisor Compensation. In considering the cost of services to be provided by each Subadvisor and the profitability to that Subadvisor of its relationship with the Fund, the Board noted that the fees under the Subadvisory Agreements are paid by the Advisor and not the Funds. The Board also relied on the ability of the Advisor to negotiate each Subadvisory Agreement with Subadvisors that are not affiliated with the Advisor and the fees thereunder at arm's length. As a result, the costs of the services to be provided and the profits to be realized by unaffiliated Subadvisors from their relationship with the Trust were not a material factor in the Board's consideration of the Subadvisory Agreements.
The Board also received information regarding the nature and scope (including their significance to the Advisor and its affiliates and to unaffiliated Subadvisors) of any material relationships with respect to the unaffiliated Subadvisors, which include arrangements in which unaffiliated Subadvisors or their affiliates provide advisory, distribution or management services in connection with financial products sponsored by the Trust's Advisor or its affiliates, and may include shares of the Trust, other registered investment companies, a 529 education savings plan, managed separate accounts and exempt group annuity contracts sold to qualified plans. The Board also received information and took into account any other potential conflicts of interests the Advisor might have in connection with the Subadvisory Agreements.
In addition, the Board considered other potential indirect benefits that the Subadvisors and their affiliates may receive from the Subadvisor's relationship with the Fund, such as the opportunity to provide advisory services to additional portfolios of the Trusts and reputational benefits.
Subadvisory Fees. The Board considered that the Fund pays an advisory fee to the Advisor and that, in turn, the Advisor pays a subadvisory fee to each Subadvisor. As noted above, the Board also considered, if available, each Fund's sub-advisory fees as compared to similarly situated investment companies deemed to be comparable to the Fund as included in the report prepared by the independent third party provider of mutual fund data. The Board also took into account the sub-advisory fees paid by the Advisor to fees charged by each Fund's Subadvisor to manage other sub-advised portfolios and portfolios not subject to regulation under the 1940 Act, as applicable.
Subadvisor Performance. As noted above, the Board considered each Fund's performance as compared to the Fund's respective peer group and benchmark and noted that the Board reviews information about the Fund's performance results at its regularly scheduled meetings. The Board noted the Advisor's expertise and resources in monitoring the performance, investment style, and risk-adjusted performance of each Subadvisor. The Board was mindful of the Advisor's focus on each Subadvisor's performance. The Board also noted each Subadvisor's long-term performance record for similar accounts, as applicable.
The Board's decision to approve the Subadvisory Agreement with respect to each Fund was based on a number of determinations, including the following:
| (1) | Each Subadvisor has extensive experience and demonstrated skills as a manager; | |
| (2) | Although not without variation, the performance of each Fund managed by a Subadvisor generally has been in line with or outperformed the historical performance of comparable funds and the Fund's respective benchmarks, with the exceptions noted in Appendix A (with respect to such exceptions, the Board considered the steps the Subadvisor had taken to address performance and concluded that performance is being monitored and reasonably addressed); | |
| (3) | The subadvisory fees are reasonable in relation to the level and quality of services being provided under the Subadvisory Agreement; and | |
| (4) | Subadvisory fees are paid by the Adviser and not the Funds and the advisory fees for each Fund contains breakpoints that permit shareholders to benefit from economies of scale if those Funds grow. |
In addition, in the case of each Fund, the Trustees reviewed the subadvisory fee to be paid to the Subadvisor for the Fund and concluded that the subadvisory fee to be paid to the Subadvisor with respect to each Fund is based on services provided that are in addition to, rather than duplicative of, the services provided pursuant to the advisory agreements and subadvisory agreements for the underlying portfolios of the Fund and that the additional services are necessary because of the differences between the investment policies, strategies and techniques of a Fund and those of its underlying portfolios.
Additional information relating to each Fund's fees and expenses and performance that the Board considered in approving the Advisory Agreement and Subadvisory Agreement for a particular Fund is set forth in Appendix A.
* * *
Based on their evaluation of all factors that they deemed to be material, including those factors described above, the Board, including the Independent Trustees, concluded that renewal of the Advisory Agreement and each of the Subadvisory Agreements with respect to each Fund would be in the best interest of each of the respective Funds and its shareholders. Accordingly, the Board, and the Independent Trustees voting separately, approved the Advisory Agreement and Subadvisory Agreement with respect to each Fund for an additional one-year period.
APPENDIX A
| PORTFOLIO (SUBADVISER) | Performance as of 12.31.2016 | Fees and Expenses | Comments |
Multimanager Lifestyle Aggressive Portfolio (Manulife Asset Management (U.S.)) (Manulife Asset Management (North America)) | Benchmark Index - The Fund underperformed the benchmark index for the one, three- and five-year periods. Broadridge Category - The Fund was equal to the average for the one-year period, underperformed the average for the three-year period and outperformed the average for the five-year period. | Subadviser fee comparative data not provided due to limited size of Broadridge peer group for this purpose. Net management fees for this Fund are lower than the peer group median. Net total expenses for this Fund are lower than the peer group median. | The Board took into account management's discussion of the factors that contributed to the Fund's one-, three- and five-year performance relative to the benchmark index and to the peer group average for the three-year period. The Board noted the Fund's favorable performance relative to the peer group average for the one- and five-year periods. The Board noted the Fund's net management fees and net total expenses are lower than the peer group median. |
Multimanager Lifestyle Balanced Portfolio (Manulife Asset Management (U.S.)) (Manulife Asset Management (North America)) | Benchmark Index - The Fund underperformed the benchmark index for the one-, three- and five-year periods. Broadridge Category - The Fund outperformed the average for the one-, three- and five-year periods. | Subadviser fee comparative data not provided due to limited size of Broadridge peer group average for this purpose. Net management fees for this Fund are lower than the peer group median. Net total expenses for this Fund are lower than the peer group median. | The Board took into account management's discussion of the factors that contributed to the Fund's one-, three- and five-year performance relative to the benchmark index. The Board noted the Fund's favorable performance relative to the peer group average for the one-, three- and five-year periods. The Board noted the Fund's net management fees and net total expenses are lower than the peer group median. |
Multimanager Lifestyle Conservative Portfolio (Manulife Asset Management (U.S.)) (Manulife Asset Management (North America)) | Benchmark Index - The Fund underperformed the benchmark index for the one-, three- and five-year periods. Broadridge Category - The Fund underperformed the average for the one-, three- and five-year periods. | Subadviser fee comparative data not provided due to limited size of Broadridge peer group for this purpose. Net management fees for this Fund are equal to the peer group median. Net total expenses for this Fund are lower than the peer group median. | The Board took into account management's discussion of the factors that contributed to the Fund's one-, three- and five-year performance relative to the benchmark index and to the peer group average. The Board noted the Fund's net total expenses are lower than the peer group median. |
Multimanager Lifestyle Growth Portfolio (Manulife Asset Management (U.S.)) (Manulife Asset Management (North America)) | Benchmark Index - The Fund underperformed the benchmark index for the one-, three- and five-year periods. Broadridge Category - The Fund underperformed the average for the one- and three-year periods and outperformed the average for the five-year period. | Subadviser fee comparative data not provided due to limited size of Broadridge peer group for this purpose. Net management fees for this Fund are lower than the peer group median. Net total expenses for this Fund are lower than the peer group median. | The Board took into account management's discussion of the factors that contributed to the Fund's one-, three- and five-year performance relative to the benchmark index and to the peer group average for the one- and three-year periods. The Board noted the Fund's favorable performance relative to the peer group average for the five-year period. The Board noted the Fund's net management fees and net total expenses are lower than the peer group median. |
Multimanager Lifestyle Moderate Portfolio (Manulife Asset Management (U.S.)) (Manulife Asset Management (North America)) | Benchmark Index - The Fund underperformed the benchmark index for the one-, three- and five-year periods. Broadridge Category - The Fund underperformed the average for the one-, three- and five-year periods. | Subadviser fee comparative data not provided due to limited size of Broadridge peer group for this purpose. Net management fees for this Fund are lower than the peer group median. Net total expenses for this Fund are lower than the peer group median. | The Board took into account management's discussion of the factors that contributed to the Fund's one-, three- and five-year performance relative to the benchmark index and to the peer group average. The Board noted the Fund's net management fees and net total expenses are lower than the peer group median. |
Trustees Hassell H. McClellan, Chairperson Officers Andrew G. Arnott John J. Danello Francis V. Knox, Jr. Charles A. Rizzo Salvatore Schiavone | Investment advisor John Hancock Advisers, LLC Subadvisors John Hancock Asset Management a division of Manulife Asset Management (US) LLC Principal distributor John Hancock Funds, LLC Custodian State Street Bank and Trust Company Transfer agent John Hancock Signature Services, Inc. Legal counsel K&L Gates LLP |
*Member of the Audit Committee
†Non-Independent Trustee
#Effective 6-20-17
The fund's proxy voting policies and procedures, as well as the fund proxy voting record for the most recent twelve-month period ended June 30, are available free of charge on the Securities and Exchange Commission (SEC) website at sec.gov or on our website.
The fund's complete list of portfolio holdings, for the first and third fiscal quarters, is filed with the SEC on Form N-Q. The fund's Form N-Q is available on our website and the SEC's website, sec.gov, and can be reviewed and copied (for a fee) at the SEC's Public Reference Room in Washington, DC. Call 800-SEC-0330 to receive information on the operation of the SEC's Public Reference Room.
We make this information on your fund, as well as monthly portfolio holdings, and other fund details available on our website at jhinvestments.com or by calling 800-225-5291.
| You can also contact us: | |||
| 800-225-5291 jhinvestments.com | Regular mail: John Hancock Signature Services, Inc. | Express mail: John Hancock Signature Services, Inc. | |
John Hancock family of funds
DOMESTIC EQUITY FUNDS Balanced Blue Chip Growth Classic Value Disciplined Value Disciplined Value Mid Cap Equity Income Fundamental All Cap Core Fundamental Large Cap Core Fundamental Large Cap Value New Opportunities Small Cap Value Small Company Strategic Growth U.S. Global Leaders Growth U.S. Growth Value Equity GLOBAL AND INTERNATIONAL EQUITY FUNDS Disciplined Value International Emerging Markets Emerging Markets Equity Fundamental Global Franchise Global Equity Global Shareholder Yield Greater China Opportunities International Growth International Small Company International Value Equity | INCOME FUNDS Bond California Tax-Free Income Emerging Markets Debt Floating Rate Income Global Income Government Income High Yield High Yield Municipal Bond Income Investment Grade Bond Money Market Short Duration Credit Opportunities Spectrum Income Strategic Income Opportunities Tax-Free Bond ALTERNATIVE AND SPECIALTY FUNDS Absolute Return Currency Alternative Asset Allocation Enduring Assets Financial Industries Global Absolute Return Strategies Global Conservative Absolute Return Global Focused Strategies Natural Resources Redwood Regional Bank Seaport Technical Opportunities |
A fund's investment objectives, risks, charges, and expenses should be considered carefully before investing. The prospectus contains this and other important information about the fund. To obtain a prospectus, contact your financial professional, call John Hancock Investments at 800-225-5291, or visit our website at jhinvestments.com. Please read the prospectus carefully before investing or sending money.
ASSET ALLOCATION Income Allocation Fund Multi-Index Lifetime Portfolios Multi-Index Preservation Portfolios Multimanager Lifestyle Portfolios Multimanager Lifetime Portfolios EXCHANGE-TRADED FUNDS John Hancock Multifactor Consumer Discretionary ETF John Hancock Multifactor Consumer Staples ETF John Hancock Multifactor Developed International ETF John Hancock Multifactor Energy ETF John Hancock Multifactor Financials ETF John Hancock Multifactor Healthcare ETF John Hancock Multifactor Industrials ETF John Hancock Multifactor Large Cap ETF John Hancock Multifactor Materials ETF John Hancock Multifactor Mid Cap ETF John Hancock Multifactor Technology ETF John Hancock Multifactor Utilities ETF | ENVIRONMENTAL, SOCIAL, AND GOVERNANCE FUNDS ESG All Cap Core ESG Core Bond ESG International Equity ESG Large Cap Core CLOSED-END FUNDS Financial Opportunities Hedged Equity & Income Income Securities Trust Investors Trust Preferred Income Preferred Income II Preferred Income III Premium Dividend Tax-Advantaged Dividend Income Tax-Advantaged Global Shareholder Yield |
John Hancock Multifactor ETF shares are bought and sold at market price (not NAV), and are not individually redeemed
from the fund. Brokerage commissions will reduce returns.
John Hancock ETFs are distributed by Foreside Fund Services, LLC, and are subadvised by Dimensional Fund Advisors LP.
Foreside is not affiliated with John Hancock Funds, LLC or Dimensional Fund Advisors LP.
Dimensional Fund Advisors LP receives compensation from John Hancock in connection with licensing rights to the
John Hancock Dimensional indexes. Dimensional Fund Advisors LP does not sponsor, endorse, or sell, and makes no
representation as to the advisability of investing in, John Hancock Multifactor ETFs.
John Hancock Investments
A trusted brand
John Hancock Investments is a premier asset manager representing one of
America's most trusted brands, with a heritage of financial stewardship dating
back to 1862. Helping our shareholders pursue their financial goals is at the
core of everything we do. It's why we support the role of professional financial
advice and operate with the highest standards of conduct and integrity.
A better way to invest
We serve investors globally through a unique multimanager approach:
We search the world to find proven portfolio teams with specialized
expertise for every strategy we offer, then we apply robust investment
oversight to ensure they continue to meet our uncompromising standards
and serve the best interests of our shareholders.
Results for investors
Our unique approach to asset management enables us to provide a diverse set
of investments backed by some of the world's best managers, along with strong
risk-adjusted returns across asset classes.

 | John Hancock Funds, LLC n Member FINRA, SIPC This report is for the information of the shareholders of John Hancock Multimanager Lifestyle Portfolios. It is not authorized for distribution to prospective investors unless preceded or accompanied by a prospectus. | |
| MF384595 | LSSA 6/17 8/17 | |
ITEM 2. CODE OF ETHICS.
(a) Not Applicable
(b) Not Applicable
(c) Not Applicable
(d) Not Applicable
(e) Not Applicable
(f) Not Applicable
ITEM 3. AUDIT COMMITTEE FINANCIAL EXPERT.
Not Applicable
ITEM 4. PRINCIPAL ACCOUNTANT FEES AND SERVICES.
(a) Not Applicable
(b) Not Applicable
(c) Not Applicable
(d) Not Applicable
(e) Not Applicable
(f) Not Applicable
(g) Not Applicable
(h) Not Applicable
ITEM 5. AUDIT COMMITTEE OF LISTED REGISTRANTS
Not Applicable.
ITEM 6. SCHEDULE OF INVESTMENTS.
(a) Included with Item 1.
(b) Not Applicable
ITEM 7. DISCLOSURE OF PROXY VOTING POLICIES AND PROCEDURES FOR CLOSED-END MANAGEMENT INVESTMENT COMPANIES.
Not Applicable.
ITEM 8. PORTFOLIO MANAGERS OF CLOSED-END MANAGEMENT INVESTMENT COMPANIES.
Not Applicable.
ITEM 9. PURCHASE OF EQUITY SECURITIES BY CLOSED-END MANAGEMENT INVESTMENT COMPANIES AND AFFILIATED PURCHASERS.
Not Applicable.
ITEM 10. SUBMISSION OF MATTERS TO VOTE OF SECURITY HOLDERS.
Not Applicable.
ITEM 11. CONTROLS AND PROCEDURES.
| (a) | EVALUATION OF DISCLOSURE CONTROLS AND PROCEDURES. The Registrant maintains disclosure controls and procedures that are designed to ensure that information required to be disclosed in this Form N-CSR is recorded, processed, summarized and reported within the periods specified in the rules and forms of the Securities and Exchange Commission. Such disclosure controls and procedures include controls and procedures designed to ensure that such information is accumulated and communicated to the Registrant's management, including its principal executive officer and principal financial officer, as appropriate, to allow timely decisions regarding required disclosure. | |
| Within 90 days prior to the filing date of this Form N-CSR, the Registrant had carried out an evaluation, under the supervision and with the participation of the Registrant's management, including the Registrant's principal executive officer and the Registrant's principal financial officer, of the effectiveness of the design and operation of the Registrant's disclosure controls and procedures relating to information required to be disclosed on Form N-CSR. Based on such evaluation, the Registrant's principal executive officer and principal financial officer concluded that the Registrant's disclosure controls and procedures are operating effectively to ensure that: | ||
| (i) information required to be disclosed in this Form N-CSR is recorded, processed, summarized and reported within the periods specified in the rules and forms of the Securities and Exchange Commission, and (ii) information is accumulated and communicated to the Registrant’s management, including its principal executive officer and principal financial officer, as appropriate, to allow timely decisions regarding required disclosure. | ||
(b) CHANGE IN REGISTRANT’S INTERNAL CONTROL: Not Applicable.
ITEM 12. EXHIBITS.
(a)(1) Not applicable
(a)(2)(i) CERTIFICATION OF PRINCIPAL EXECUTIVE OFFICER.
(a)(2)(ii) CERTIFICATION OF PRINCIPAL FINANCIAL OFFICER.
(b) CERTIFICATION PURSUANT TO Rule 30a-2(b) OF THE INVESTMENT COMPANY ACT OF 1940
(c)(1) Submission of Matters to a Vote of Security Holders is attached. See attached “John Hancock Funds – Nominating and Governance Committee Charter”.
(c)(2) Contact person at the registrant.
SIGNATURES
Pursuant to the requirements of the Securities Exchange Act of 1934 and the Investment Company Act of 1940, the registrant has duly caused this report to be signed on its behalf by the undersigned, thereunto duly authorized.
| JOHN HANCOCK FUNDS II |
| /s/ Andrew Arnott |
| Andrew Arnott |
| President |
| Date: August 18, 2017 |
Pursuant to the requirements of the Securities Exchange Act of 1934 and the Investment Company Act of 1940, this report has been signed below by the following persons on behalf of the registrant and in the capacities and on the dates indicated.
| /s/ Andrew Arnott |
| Andrew Arnott |
| President |
| Date: August 18, 2017 |
| /s/ Charles A. Rizzo |
| Charles A. Rizzo |
| Chief Financial Officer |
| Date: August 18, 2017 |