UNITED STATES
SECURITIES AND EXCHANGE COMMISSION
Washington, D.C. 20549
FORM N-CSR
CERTIFIED SHAREHOLDER REPORT OF REGISTERED MANAGEMENT INVESTMENT COMPANIES
Investment Company Act file number 811-21779
JOHN HANCOCK FUNDS II
---------------------------------------------------------
(Exact name of registrant as specified in charter)
200 BERKELEY STREET, BOSTON, MA 02116
-------------------------------------------------------------
(Address of principal executive offices) (Zip code)
SALVATORE SCHIAVONE, 197 CLARENDON STREET, BOSTON, MA 02116
------------------------------------------------------------------------------------------
(Name and address of agent for service)
Registrant's telephone number, including area code: (617) 663-4497
--------------
| Date of fiscal year end: 7/31 |
| ------ |
| | |
| Date of reporting period: 7/31/19 |
| ------- |
ITEM 1. REPORTS TO STOCKHOLDERS.
The Registrant prepared five annual reports to shareholders for the year ended July 31, 2019 for series of John Hancock Funds II with July 31 fiscal year end. The first report applies to Short Duration Credit Opportunities Fund, the second report applies to Absolute Return Currency Fund, the third report applies to Fundamental All Cap Core Fund, the fourth report applies to Diversified Strategies Fund and the fifth report applies to Global Absolute Return Strategies Fund.
John Hancock
Short Duration Credit Opportunities Fund
Annual report 7/31/19
Beginning on January 1, 2021, as permitted by regulations adopted by the Securities and Exchange Commission, paper copies of the Fund's shareholder reports like this one will no longer be sent by mail, unless you specifically request paper copies of the reports from the Fund or from your financial intermediary. Instead, the reports will be made available on a website, and you will be notified by mail each time a report is posted and provided with a website link to access the report.
If you already elected to receive shareholder reports electronically, you will not be affected by this change, and you do not need to take any action. You may elect to receive shareholder reports and other communications electronically by calling John Hancock Investment Management at 800-225-5291 (Class A and Class C shares) or 888-972-8696 (Class I, Class R2, Class R4, Class R6, and Class NAV shares) or by contacting your financial intermediary.
You may elect to receive all reports in paper, free of charge, at any time. You can inform John Hancock Investment Management or your financial intermediary that you wish to continue receiving paper copies of your shareholder reports by following the instructions listed above. Your election to receive reports in paper will apply to all funds held with John Hancock Investment Management or your financial intermediary.

A message to shareholders
Dear shareholder,
It was a rather volatile time for bond markets in the United States during the 12 months ended July 31, 2019, with investor uncertainty surrounding trade with China and the broader health of the global economy leading to some dramatic swings in performance. The trend in longer-term yields was decidedly downward, with the 10-year U.S. Treasury finishing the period at just above 2%, triggering an inverted yield curve shortly after period end. In July, the U.S. Federal Reserve stepped in with a reduction in short-term interest rates in an attempt to offer a measure of stimulus to jittery markets, and investors greeted the news favorably.
While the economic fundamentals in the United States appear fairly solid, with a strong labor market and a confident consumer base, there are sure to be patches of market turbulence as the year goes on, particularly as the threat of a recession looms. As always, your best resource in unpredictable markets is your financial advisor, who can help position your portfolio so that it's sufficiently diversified to meet your long-term objectives and to withstand the inevitable bouts of market volatility along the way.
On behalf of everyone at John Hancock Investment Management, I'd like to take this opportunity to welcome new shareholders and thank existing shareholders for the continued trust you've placed in us.
Sincerely,
Andrew G. Arnott
President and CEO,
John Hancock Investment Management
Head of Wealth and Asset Management,
United States and Europe
This commentary reflects the CEO's views as of this report's period end and are subject to change at any time. Diversification does not guarantee investment returns and does not eliminate risk of loss. All investments entail risks, including the possible loss of principal. For more up-to-date information, you can visit our website at jhinvestments.com.
John Hancock
Short Duration Credit Opportunities Fund
Table of contents
| | | |
| 2 | | Your fund at a glance |
| 5 | | Discussion of fund performance |
| 7 | | A look at performance |
| 9 | | Your expenses |
| 11 | | Fund's investments |
| 48 | | Financial statements |
| 52 | | Financial highlights |
| 59 | | Notes to financial statements |
| 73 | | Report of independent registered public accounting firm |
| 74 | | Tax information |
| 75 | | Continuation of investment advisory and subadvisory agreements |
| 82 | | Trustees and Officers |
| 86 | | More information |
ANNUAL REPORT | JOHN HANCOCK SHORT DURATION CREDIT OPPORTUNITIES FUND 1
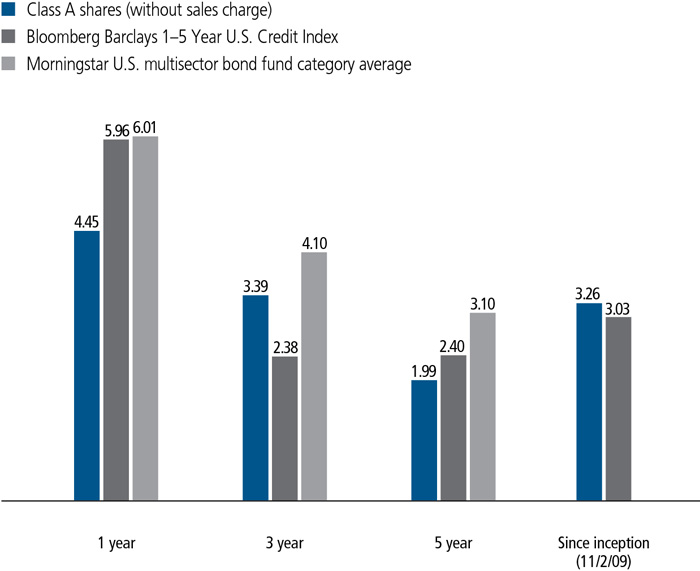
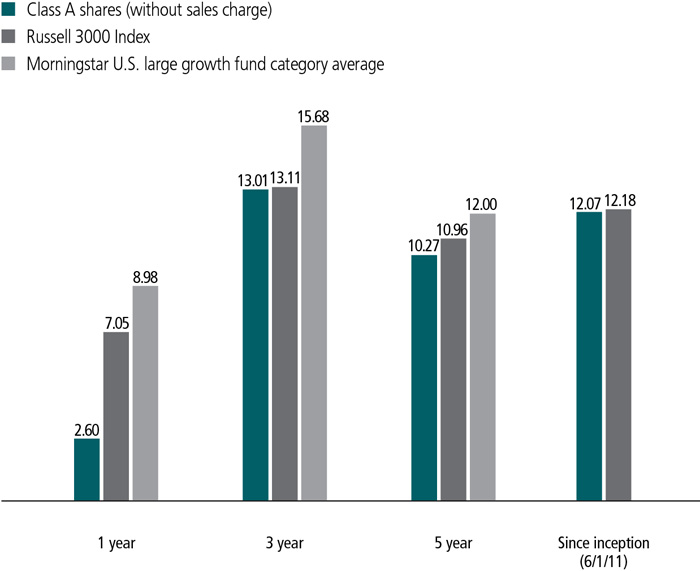
INVESTMENT OBJECTIVE
The fund seeks to maximize total return, which consists of income on its investments and capital appreciation.
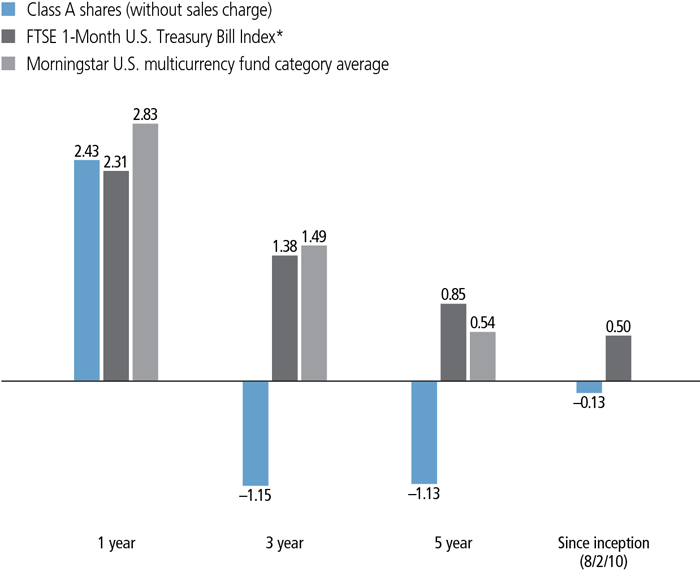
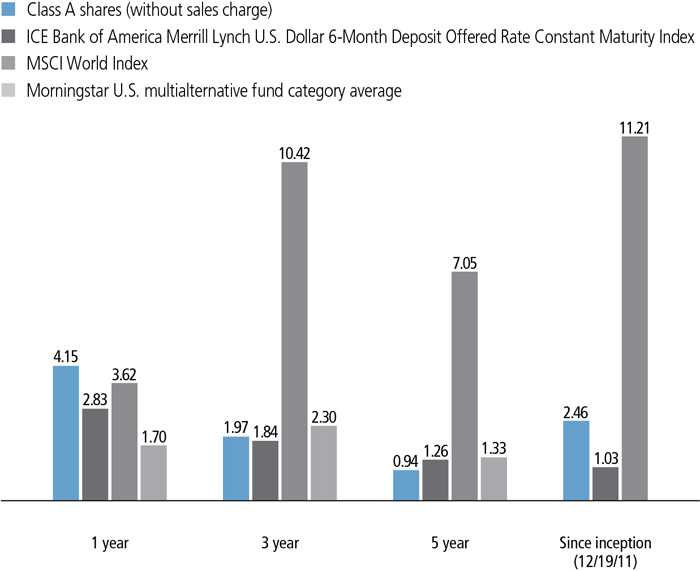
AVERAGE ANNUAL TOTAL RETURNS AS OF 7/31/19 (%)
The Bloomberg Barclays 1 - 5 Year U.S. Credit Index includes investment-grade corporate and international U.S. dollar-denominated bonds with maturities of 1 to 5 years.
It is not possible to invest directly in an index. Index figures do not reflect expenses or sales charges, which would result in lower returns.
Figures from Morningstar, Inc. include reinvested distributions and do not take into account sales charges. Actual load-adjusted performance is lower. Since-inception returns for the Morningstar fund category average are not available.
The past performance shown here reflects reinvested distributions and the beneficial effect of any expense reductions, and does not guarantee future results. Performance of the other share classes will vary based on the difference in the fees and expenses of those classes. Shares will fluctuate in value and, when redeemed, may be worth more or less than their original cost. Current month-end performance may be lower or higher than the performance cited, and can be found at jhinvestments.com or by calling 800-225-5291. For further information on the fund's objectives, risks, and strategy, see the fund's prospectus.
ANNUAL REPORT | JOHN HANCOCK SHORT DURATION CREDIT OPPORTUNITIES FUND 2
PERFORMANCE HIGHLIGHTS OVER THE LAST TWELVE MONTHS
Bonds produced broad-based gains in the 12-month period
The U.S. Federal Reserve's shift to a more accommodative monetary policy fueled healthy total returns for the world fixed-income markets.
The fund underperformed its benchmark
An effort to manage credit risk prevented the fund from fully participating in the rally.
Security selection added value
The fund's holdings in senior loans, securitized assets, and investment-grade corporates outpaced the respective categories.
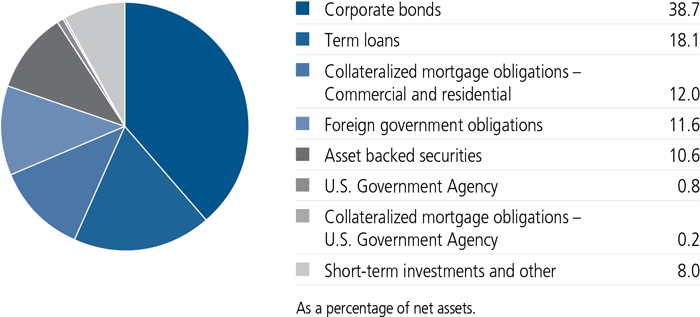
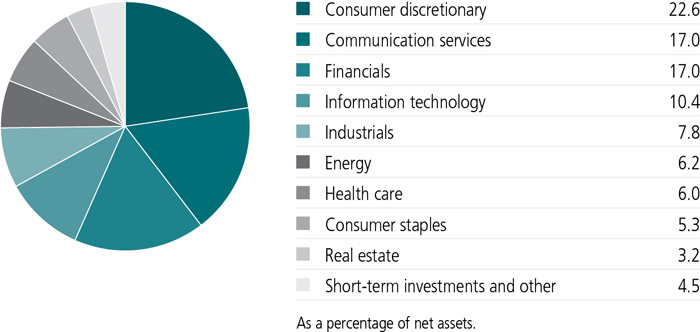
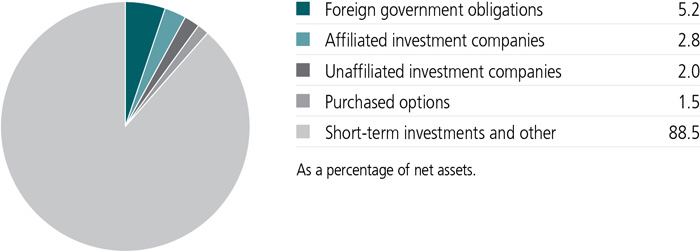
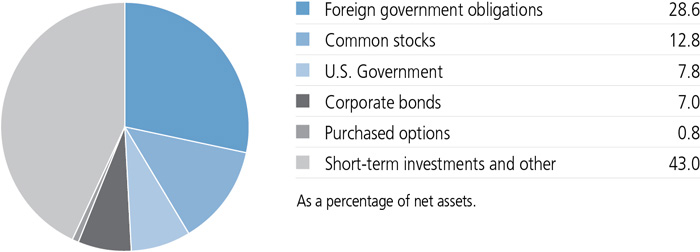
PORTFOLIO COMPOSITION AS OF 7/31/19 (%)
A note about risks
The fund is subject to various risks as described in the fund's prospectus. For more information, please refer to the "Principal risks" section of the prospectus.
ANNUAL REPORT | JOHN HANCOCK SHORT DURATION CREDIT OPPORTUNITIES FUND 3
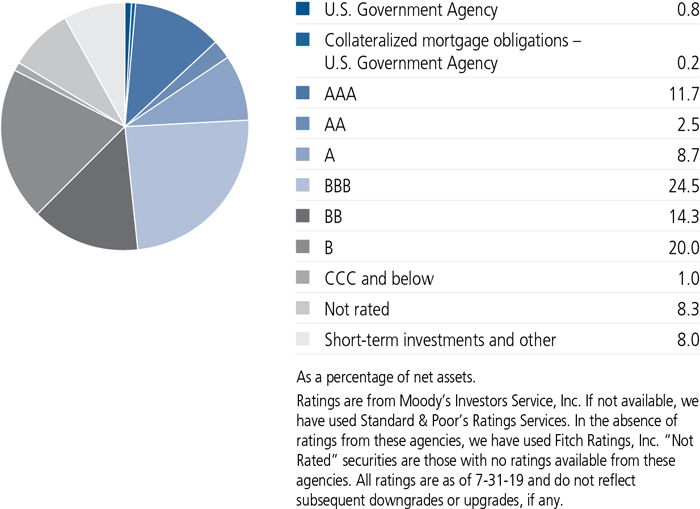
QUALITY COMPOSITION AS OF 7/31/19 (%)
ANNUAL REPORT | JOHN HANCOCK SHORT DURATION CREDIT OPPORTUNITIES FUND 4
Discussion of fund performance
Can you describe investment conditions during the 12 months ended July 31, 2019?
The world fixed-income markets delivered a gain, with both interest-rate- and credit-sensitive assets participating in the rally. A backdrop of low inflation and slow growth gave the U.S. Federal Reserve (Fed) and other major central banks the latitude to begin reducing interest rates, fueling strong returns for higher-quality issues such as government bonds and investment-grade corporates. High-yield corporate and emerging-market debt also gained ground thanks to investors' hearty appetite for risk from late December 2018 onward. Securitized assets and bank loans, while lagging somewhat, nonetheless posted solid absolute returns.
What elements of the fund's positioning helped and hurt results?
Although the fund produced a positive return, it finished behind its benchmark, the Bloomberg Barclays 1-5 Year U.S. Credit Index. A decision to hedge some of the portfolio's credit exposure by buying protection on high-yield, investment-grade, and emerging-market indexes at various points throughout the year was a key factor in the shortfall. While this strategy prevented the fund from fully capitalizing on the market's advance, we believed a defensive approach was warranted given the uncertainty surrounding trade policy and global growth. Derivatives were an additional detractor.
Security selection was a net positive for relative performance, with favorable results in senior loans, securitized assets, and investment-grade corporates offsetting a weaker showing in the emerging markets. Overweights in corporates and U.S. dollar-denominated emerging-market debt added value, but the benefit was counterbalanced by an overweight in the securitized space.
COUNTRY COMPOSITION AS OF 7/31/19 (%)
| | |
| United States | 74.8 |
| United Kingdom | 2.3 |
| Canada | 1.4 |
| Ireland | 1.4 |
| Netherlands | 1.2 |
| Indonesia | 1.0 |
| Other countries | 17.9 |
| TOTAL | 100.0 |
| As a percentage of net assets. | |
ANNUAL REPORT | JOHN HANCOCK SHORT DURATION CREDIT OPPORTUNITIES FUND 5
What were some of the key portfolio changes of the past 12 months?
We reduced the portfolio's weighting in local currency emerging-market issues to guard against the possibility of further strength in the U.S. dollar. We also lowered the fund's allocation to senior loans, since floating-rate assets may experience reduced demand now that the Fed is cutting rates. Separately, we sought to capitalize on the rally in rate-sensitive assets by increasing the portfolio's duration during the second calendar quarter.
How was the fund positioned at the end of the period?
Although global economic growth was in positive territory at the end of July, uncertainty regarding U.S. trade policy remained high. In addition, the likelihood of several additional Fed rate cuts appeared to be priced into the market already—indicating that any shift in the outlook could represent a meaningful headwind to performance.
Believing these factors argued for near-term caution, especially in light of the continued tightness in yield spreads across the credit sectors, we closed the period with a below-average risk profile and continued hedges on the fund's positions in investment-grade corporates, high yield, and the emerging markets.
Can you tell us about changes to the fund's portfolio management team?
Effective December 31, 2018, we added Kumaran Damodaran, Ph.D.; Matthew Kearns, CFA; David Oliver, CFA; William Perry; Hunter Schwartz; Stuart Sclater-Booth; and David Torchia to the team. Effective June 30, 2019, Marianne Rossi retired.
MANAGED BY
| |
| The Short Duration Credit Opportunities Fund is managed by a team that broadly manages across global fixed-income markets at Stone Harbor Investment Partners LP. |

The views expressed in this report are exclusively those of the portfolio management team at Stone Harbor Investment Partners LP, and are subject to change. They are not meant as investment advice. Please note that the holdings discussed in this report may not have been held by the fund for the entire period. Portfolio composition is subject to review in accordance with the fund's investment strategy and may vary in the future. Current and future portfolio holdings are subject to risk.
ANNUAL REPORT | JOHN HANCOCK SHORT DURATION CREDIT OPPORTUNITIES FUND 6
TOTAL RETURNS FOR THE PERIOD ENDED JULY 31, 2019
| | | | | | | | | | | | |
Average annual
total returns (%)
with maximum sales charge | | Cumulative total
returns (%)
with maximum sales charge | | SEC 30-day
yield (%)
subsidized | | SEC 30-day
yield (%)
unsubsidized1 |
| | 1-year | 5-year | Since
inception2 | | | 5-year | Since
inception2 | | as of
7-31-19 | | as of
7-31-19 |
| Class A | 1.88 | 1.48 | 2.99 | | | 7.64 | 33.20 | | 3.12 | | 3.12 |
| Class C3 | 2.74 | 1.28 | 2.88 | | | 6.54 | 31.85 | | 2.52 | | 2.51 |
| Class I4 | 4.87 | 2.32 | 3.57 | | | 12.15 | 40.69 | | 3.52 | | 3.51 |
| Class R23,4 | 4.74 | 2.15 | 3.34 | | | 11.21 | 37.72 | | 3.38 | | 3.37 |
| Class R43,4 | 4.84 | 2.24 | 3.38 | | | 11.70 | 38.32 | | 3.48 | | 3.37 |
| Class R63,4 | 4.99 | 2.38 | 3.46 | | | 12.47 | 39.28 | | 3.62 | | 3.62 |
| Class NAV4 | 5.00 | 2.47 | 3.74 | | | 12.96 | 42.98 | | 3.64 | | 3.63 |
| Index† | 5.96 | 2.40 | 3.03 | | | 12.58 | 33.73 | | — | | — |
Performance figures assume all distributions are reinvested. Figures reflect maximum sales charges on Class A shares of 2.5% and the applicable contingent deferred sales charge (CDSC) on Class C shares. The returns for Class A shares have been adjusted to reflect the reduction in the maximum sales charge from 4.5% to 2.5%, effective 2-3-14. Class C shares sold within one year of purchase are subject to a 1% CDSC. Sales charges are not applicable to Class I, Class R2, Class R4, Class R6, and Class NAV shares.
The expense ratios of the fund, both net (including any fee waivers and/or expense limitations) and gross (excluding any fee waivers and/or expense limitations), are set forth according to the most recent publicly available prospectuses for the fund and may differ from those disclosed in the Financial highlights tables in this report. Net expenses reflect contractual expense limitations in effect until November 30, 2019 and are subject to change. Had the contractual fee waivers and expense limitations not been in place, gross expenses would apply. The expense ratios are as follows:
| | | | | | | | |
| | Class A | Class C | Class I | Class R2 | Class R4 | Class R6 | Class NAV |
| Gross (%) | 1.19 | 1.89 | 0.89 | 1.29 | 1.14 | 0.79 | 0.78 |
| Net (%) | 1.18 | 1.88 | 0.88 | 1.28 | 1.03 | 0.78 | 0.77 |
Please refer to the most recent prospectus and annual or semiannual report for more information on expenses and any expense limitation arrangements for each class.
The returns reflect past results and should not be considered indicative of future performance. The return and principal value of an investment will fluctuate so that shares, when redeemed, may be worth more or less than their original cost. Due to market volatility and other factors, the fund's current performance may be higher or lower than the performance shown. For current to the most recent month-end performance data, please call 800-225-5291 or visit the fund's website at jhinvestments.com.
The performance table above and the chart on the next page do not reflect the deduction of taxes that a shareholder would pay on fund distributions or the redemption of fund shares. The fund's performance results reflect any applicable fee waivers or expense reductions, without which the expenses would increase and results would have been less favorable.
| † | Index is the Bloomberg Barclays 1-5 Year U.S. Credit Index. |
See the following page for footnotes.
ANNUAL REPORT | JOHN HANCOCK SHORT DURATION CREDIT OPPORTUNITIES FUND 7
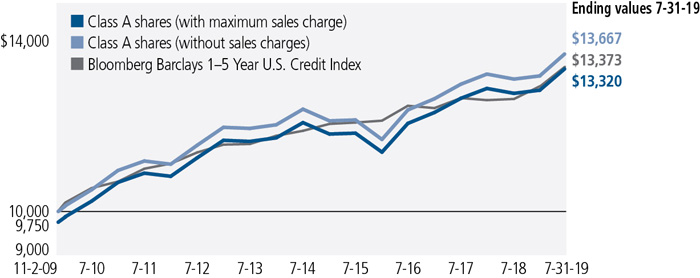
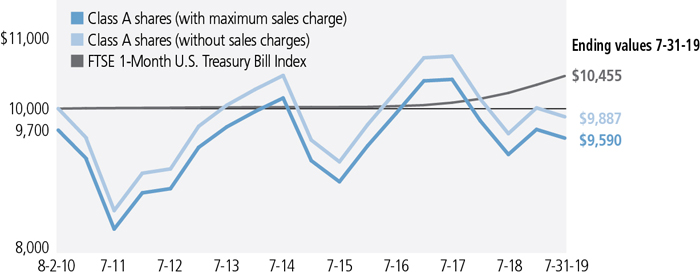
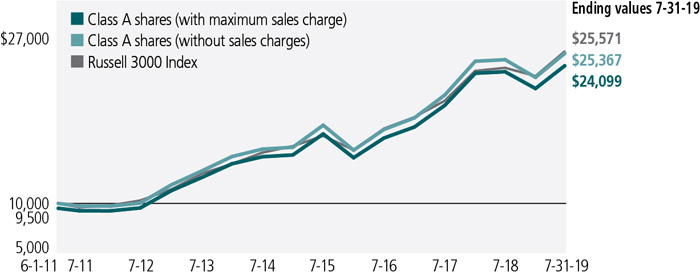
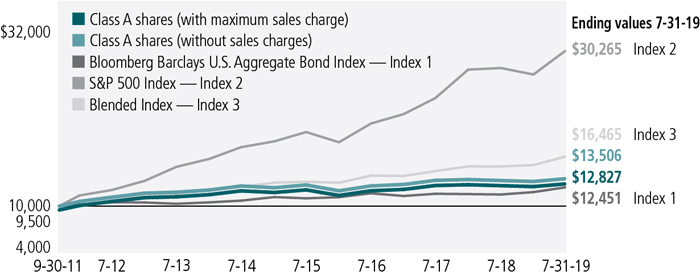
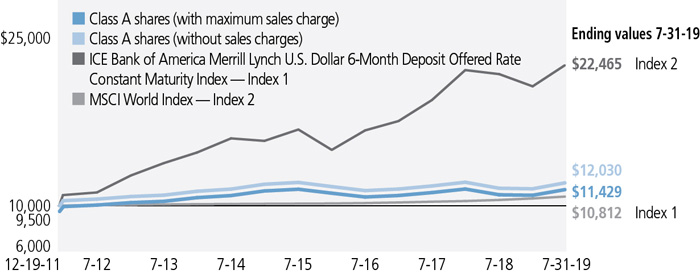
This chart and table show what happened to a hypothetical $10,000 investment in John Hancock Short Duration Credit Opportunities Fund for the share classes and periods indicated, assuming all distributions were reinvested. For comparison, we've shown the same investment in the Bloomberg Barclays 1-5 Year U.S. Credit Index.
| | | | | |
| | Start date | With maximum
sales charge ($) | Without
sales charge ($) | Index ($) |
| Class C3,5 | 11-2-09 | 13,185 | 13,185 | 13,373 |
| Class I4 | 11-2-09 | 14,069 | 14,069 | 13,373 |
| Class R23,4 | 11-2-09 | 13,772 | 13,772 | 13,373 |
| Class R43,4 | 11-2-09 | 13,832 | 13,832 | 13,373 |
| Class R63,4 | 11-2-09 | 13,928 | 13,928 | 13,373 |
| Class NAV4 | 11-2-09 | 14,298 | 14,298 | 13,373 |
The values shown in the chart for "Class A with maximum sales charge" have been adjusted to reflect the reduction in the Class A maximum sales charge from 4.5% to 2.5%, which became effective on 2-3-14.
The Bloomberg Barclays 1-5 Year U.S. Credit Index includes investment-grade corporate and international U.S. dollar-denominated bonds with maturities of 1 to 5 years.
It is not possible to invest directly in an index. Index figures do not reflect expenses or sales charges, which would result in lower returns.
Footnotes related to performance pages
| 1 | Unsubsidized yield reflects what the yield would have been without the effects of waivers and reimbursements. |
| 2 | From 11-2-09. |
| 3 | Class C shares were first offered on 6-27-14; Class R2, Class R4, and Class R6 shares were first offered on 3-27-15. Returns prior to these dates are those of Class A shares (first offered on 11-2-09) that have not been adjusted for class-specific expenses; otherwise, returns would vary. |
| 4 | For certain types of investors as described in the fund's prospectuses. |
| 5 | The contingent deferred sales charge is not applicable. |
ANNUAL REPORT | JOHN HANCOCK SHORT DURATION CREDIT OPPORTUNITIES FUND 8
These examples are intended to help you understand your ongoing operating expenses of investing in the fund so you can compare these costs with the ongoing costs of investing in other mutual funds.
Understanding fund expenses
As a shareholder of the fund, you incur two types of costs:
■Transaction costs,which include sales charges (loads) on purchases or redemptions (varies by share class), minimum account fee charge, etc.
■Ongoing operating expenses, including management fees, distribution and service fees (if applicable), and other fund expenses.
We are presenting only your ongoing operating expenses here.
Actual expenses/actual returns
The first line of each share class in the table on the following page is intended to provide information about the fund’s actual ongoing operating expenses, and is based on the fund’s actual return. It assumes an account value of $1,000.00 on February 1, 2019, with the same investment held until July 31, 2019.
Together with the value of your account, you may use this information to estimate the operating expenses that you paid over the period. Simply divide your account value at July 31, 2019, by $1,000.00, then multiply it by the “expenses paid” for your share class from the table. For example, for an account value of $8,600.00, the operating expenses should be calculated as follows:
Hypothetical example for comparison purposes
The second line of each share class in the table on the following page allows you to compare the fund’s ongoing operating expenses with those of any other fund. It provides an example of the fund’s hypothetical account values and hypothetical expenses based on each class’s actual expense ratio and an assumed 5% annualized return before expenses (which is not the class’s actual return). It assumes an account value of $1,000.00 on February 1, 2019, with the same investment held until July 31, 2019. Look in any other fund shareholder report to find its hypothetical example and you will be able to compare these expenses. Please remember that these hypothetical account values and expenses may not be used to estimate the actual ending account balance or expenses you paid for the period.
| | ANNUAL REPORT | JOHN HANCOCK SHORT DURATION CREDIT OPPORTUNITIES FUND | 9 |
Remember, these examples do not include any transaction costs, therefore, these examples will not help you to determine the relative total costs of owning different funds. If transaction costs were included, your expenses would have been higher. See the prospectuses for details regarding transaction costs.
SHAREHOLDER EXPENSE EXAMPLE CHART
| | | Account
value on
2-1-2019 | Ending
value on
7-31-2019 | Expenses
paid during
period ended
7-31-20191 | Annualized
expense
ratio |
| Class A | Actual expenses/actual returns | $1,000.00 | $1,038.60 | $5.96 | 1.18% |
| | Hypothetical example | 1,000.00 | 1,018.90 | 5.91 | 1.18% |
| Class C | Actual expenses/actual returns | 1,000.00 | 1,035.00 | 9.59 | 1.90% |
| | Hypothetical example | 1,000.00 | 1,015.40 | 9.49 | 1.90% |
| Class I | Actual expenses/actual returns | 1,000.00 | 1,040.10 | 4.55 | 0.90% |
| | Hypothetical example | 1,000.00 | 1,020.30 | 4.51 | 0.90% |
| Class R2 | Actual expenses/actual returns | 1,000.00 | 1,039.40 | 5.31 | 1.05% |
| | Hypothetical example | 1,000.00 | 1,019.60 | 5.26 | 1.05% |
| Class R4 | Actual expenses/actual returns | 1,000.00 | 1,039.90 | 4.80 | 0.95% |
| | Hypothetical example | 1,000.00 | 1,020.10 | 4.76 | 0.95% |
| Class R6 | Actual expenses/actual returns | 1,000.00 | 1,040.70 | 4.00 | 0.79% |
| | Hypothetical example | 1,000.00 | 1,020.90 | 3.96 | 0.79% |
| Class NAV | Actual expenses/actual returns | 1,000.00 | 1,040.70 | 3.95 | 0.78% |
| | Hypothetical example | 1,000.00 | 1,020.90 | 3.91 | 0.78% |
| 1 | Expenses are equal to the annualized expense ratio, multiplied by the average account value over the period, multiplied by 181/365 (to reflect the one-half year period). |
| 10 | JOHN HANCOCK SHORT DURATION CREDIT OPPORTUNITIES FUND | ANNUAL REPORT | |
AS OF 7-31-19
| | Rate (%) | Maturity date | | Par value^ | Value |
| U.S. Government and Agency obligations 0.8% | | | | $7,113,439 |
| (Cost $7,134,080) | | | | | |
| U.S. Government Agency 0.8% | | | 7,113,439 |
| Federal Home Loan Mortgage Corp. | | | |
| 30 Yr Pass Thru (12 month LIBOR + 1.650%) (A) | 2.211 | 12-01-42 | | 666,922 | 679,186 |
| 30 Yr Pass Thru (12 month LIBOR + 1.624%) (A) | 2.543 | 04-01-46 | | 1,285,812 | 1,301,384 |
| 30 Yr Pass Thru (12 month LIBOR + 1.616%) (A) | 4.617 | 05-01-43 | | 264,092 | 273,799 |
| 30 Yr Pass Thru (12 month LIBOR + 1.743%) (A) | 4.775 | 01-01-37 | | 48,951 | 51,457 |
| 30 Yr Pass Thru (12 month LIBOR + 1.864%) (A) | 4.902 | 03-01-42 | | 34,587 | 36,408 |
| Federal National Mortgage Association | | | |
| 30 Yr Pass Thru (12 month LIBOR + 1.600%) (A) | 2.306 | 08-01-45 | | 205,866 | 208,135 |
| 30 Yr Pass Thru (12 month LIBOR + 1.620%) (A) | 2.391 | 11-01-46 | | 1,260,686 | 1,264,408 |
| 30 Yr Pass Thru (12 month LIBOR + 1.582%) (A) | 2.844 | 12-01-44 | | 903,527 | 915,207 |
| 30 Yr Pass Thru (12 month LIBOR + 1.571%) (A) | 4.464 | 04-01-37 | | 564,651 | 591,061 |
| 30 Yr Pass Thru (12 month LIBOR + 1.657%) (A) | 4.563 | 08-01-35 | | 193,063 | 201,570 |
| 30 Yr Pass Thru (12 month LIBOR + 1.772%) (A) | 4.666 | 04-01-44 | | 420,453 | 442,597 |
| 30 Yr Pass Thru (1 Year CMT + 2.227%) (A) | 4.670 | 01-01-37 | | 244,095 | 257,493 |
| 30 Yr Pass Thru (12 month LIBOR + 1.764%) (A) | 4.706 | 10-01-38 | | 137,316 | 144,548 |
| Government National Mortgage Association | | | |
| 30 Yr Pass Thru (1 Year CMT + 1.500%) (A) | 4.000 | 01-20-41 | | 536,895 | 552,642 |
| 30 Yr Pass Thru | 4.500 | 01-15-40 | | 95,840 | 103,206 |
|
| 30 Yr Pass Thru | 6.000 | 08-15-35 | | 79,641 | 90,338 |
| Foreign government obligations 11.6% | | | $101,768,222 |
| (Cost $99,342,577) | | | | | |
| Angola 0.3% | | | 2,546,148 |
| Republic of Angola | | | | | |
| Bond (6 month LIBOR + 4.500%) (A) | 7.391 | 12-07-23 | | 189,000 | 179,550 |
| Bond | 8.250 | 05-09-28 | | 294,000 | 313,001 |
| Bond (B) | 9.375 | 05-08-48 | | 456,000 | 503,082 |
| Bond | 9.500 | 11-12-25 | | 285,000 | 329,976 |
| Bond (6 month LIBOR + 7.500%) (A) | 10.373 | 07-01-23 | | 1,115,385 | 1,220,539 |
| SEE NOTES TO FINANCIAL STATEMENTS | ANNUAL REPORT | JOHN HANCOCK SHORT DURATION CREDIT OPPORTUNITIES FUND | 11 |
| | Rate (%) | Maturity date | | Par value^ | Value |
| Argentina 0.6% | | | $5,460,226 |
| Republic of Argentina | | | | | |
| Bond | 4.500 | 02-13-20 | | 396,000 | 373,230 |
| Bond | 6.875 | 04-22-21 | | 1,889,000 | 1,695,378 |
| Bond | 7.820 | 12-31-33 | EUR | 3,629,150 | 3,391,618 |
| Bahrain 0.1% | | | 1,152,128 |
| Kingdom of Bahrain | | | | | |
| Bond (B) | 6.000 | 09-19-44 | | 140,000 | 137,928 |
| Bond | 6.125 | 08-01-23 | | 200,000 | 214,861 |
| Bond (B) | 6.750 | 09-20-29 | | 303,000 | 337,510 |
| Bond (B) | 7.000 | 10-12-28 | | 408,000 | 461,829 |
| Belarus 0.1% | | | 499,809 |
| Republic of Belarus | | | | | |
| Bond | 6.200 | 02-28-30 | | 200,000 | 211,799 |
| Bond | 7.625 | 06-29-27 | | 255,000 | 288,010 |
| Benin 0.1% | | | 725,574 |
| Republic of Benin | | | | | |
| Bond (B) | 5.750 | 03-26-26 | EUR | 637,000 | 725,574 |
| Bolivia 0.1% | | | 560,166 |
| Plurinational State of Bolivia | | | | | |
| Bond | 4.500 | 03-20-28 | | 576,000 | 560,166 |
| Brazil 0.8% | | | 6,697,927 |
| Brazil Minas SPE | | | | | |
| Bond | 5.333 | 02-15-28 | | 1,183,500 | 1,260,428 |
| Bond (B) | 5.333 | 02-15-28 | | 107,100 | 114,062 |
| Federative Republic of Brazil | | | | | |
| Bill (C) | 5.321 | 07-01-20 | BRL | 480,000 | 119,834 |
| Bond | 4.500 | 05-30-29 | | 552,000 | 575,460 |
| Bond | 4.625 | 01-13-28 | | 8,000 | 8,492 |
| Bond | 5.000 | 01-27-45 | | 1,126,000 | 1,161,480 |
| Bond | 5.625 | 01-07-41 | | 315,000 | 350,475 |
| Bond | 8.250 | 01-20-34 | | 152,000 | 209,762 |
| Note | 10.000 | 01-01-21 | BRL | 4,740,000 | 1,324,909 |
| Note | 10.000 | 01-01-23 | BRL | 2,080,000 | 608,840 |
| Note | 10.000 | 01-01-25 | BRL | 410,000 | 123,304 |
| Note | 10.000 | 01-01-27 | BRL | 2,740,000 | 840,881 |
| Cameroon 0.0% | | | 102,104 |
| Republic of Cameroon | | | | | |
| Bond (B) | 9.500 | 11-19-25 | | 94,000 | 102,104 |
| Chile 0.1% | | | 1,260,625 |
| Republic of Chile | | | | | |
| Bond | 4.500 | 03-01-21 | CLP | 130,000,000 | 194,830 |
| Bond | 4.500 | 03-01-26 | CLP | 250,000,000 | 399,920 |
| Bond (B) | 4.700 | 09-01-30 | CLP | 395,000,000 | 665,875 |
| 12 | JOHN HANCOCK SHORT DURATION CREDIT OPPORTUNITIES FUND | ANNUAL REPORT | SEE NOTES TO FINANCIAL STATEMENTS |
| | Rate (%) | Maturity date | | Par value^ | Value |
| Colombia 0.6% | | | $5,313,302 |
| Bogota Distrito Capital | | | | | |
| Bond | 9.750 | 07-26-28 | COP | 427,000,000 | 145,113 |
| Republic of Colombia | | | | | |
| Bond | 3.875 | 04-25-27 | | 144,000 | 150,265 |
| Bond | 4.375 | 03-21-23 | COP | 3,180,000,000 | 946,177 |
| Bond | 4.500 | 01-28-26 | | 325,000 | 349,863 |
| Bond | 4.500 | 03-15-29 | | 797,000 | 871,129 |
| Bond | 5.000 | 06-15-45 | | 143,000 | 159,016 |
| Bond | 5.200 | 05-15-49 | | 545,000 | 626,750 |
| Bond | 8.125 | 05-21-24 | | 312,000 | 383,916 |
| Bond | 9.850 | 06-28-27 | COP | 3,200,000,000 | 1,244,613 |
| Bond | 10.375 | 01-28-33 | | 278,000 | 436,460 |
| Czech Republic 0.1% | | | 612,720 |
| Czech Republic | | | | | |
| Bond | 0.250 | 02-10-27 | CZK | 10,110,000 | 402,824 |
| Bond | 0.950 | 05-15-30 | CZK | 1,300,000 | 53,596 |
| Bond | 1.000 | 06-26-26 | CZK | 2,620,000 | 110,662 |
| Bond | 2.750 | 07-23-29 | CZK | 930,000 | 45,638 |
| Dominican Republic 0.2% | | | 1,939,519 |
| Government of Dominican Republic | | | | | |
| Bond | 5.500 | 01-27-25 | | 202,000 | 214,880 |
| Bond (B) | 5.875 | 04-18-24 | | 93,000 | 99,631 |
| Bond | 5.950 | 01-25-27 | | 290,000 | 316,103 |
| Bond (B) | 6.000 | 07-19-28 | | 202,000 | 221,192 |
| Bond | 6.600 | 01-28-24 | | 347,000 | 385,607 |
| Bond (B) | 7.450 | 04-30-44 | | 595,000 | 702,106 |
| Ecuador 0.2% | | | 1,704,640 |
| Republic of Ecuador | | | | | |
| Bond | 7.875 | 01-23-28 | | 888,000 | 870,240 |
| Bond (B) | 10.750 | 01-31-29 | | 745,000 | 834,400 |
| Egypt 0.4% | | | 3,602,667 |
| Arab Republic of Egypt | | | | | |
| Bond (B) | 4.750 | 04-16-26 | EUR | 125,000 | 143,412 |
| Bond (B) | 5.577 | 02-21-23 | | 192,000 | 198,553 |
| Bond (B) | 5.625 | 04-16-30 | EUR | 979,000 | 1,103,986 |
| Bond (B) | 6.125 | 01-31-22 | | 609,000 | 635,536 |
| Bond (B) | 6.375 | 04-11-31 | EUR | 426,000 | 499,950 |
| Bond (B) | 8.500 | 01-31-47 | | 934,000 | 1,021,230 |
| El Salvador 0.2% | | | 1,539,838 |
| Republic of El Salvador | | | | | |
| Bond | 5.875 | 01-30-25 | | 214,000 | 219,620 |
| Bond (B) | 6.375 | 01-18-27 | | 345,000 | 355,785 |
| Bond (B) | 7.375 | 12-01-19 | | 180,000 | 181,802 |
| SEE NOTES TO FINANCIAL STATEMENTS | ANNUAL REPORT | JOHN HANCOCK SHORT DURATION CREDIT OPPORTUNITIES FUND | 13 |
| | Rate (%) | Maturity date | | Par value^ | Value |
| El Salvador (continued) | | | |
| Bond | 7.650 | 06-15-35 | | 523,000 | $568,114 |
| Bond | 8.250 | 04-10-32 | | 189,000 | 214,517 |
| Ghana 0.2% | | | 1,890,087 |
| Republic of Ghana | | | | | |
| Bond (B) | 8.125 | 03-26-32 | | 531,000 | 539,576 |
| Bond (B) | 8.950 | 03-26-51 | | 269,000 | 277,667 |
| Bond (B) | 10.750 | 10-14-30 | | 845,000 | 1,072,844 |
| Hungary 0.0% | | | 400,407 |
| Republic of Hungary | | | | | |
| Bond | 5.375 | 03-25-24 | | 147,000 | 164,401 |
| Bond | 7.625 | 03-29-41 | | 149,000 | 236,006 |
| Indonesia 0.7% | | | 6,628,208 |
| Republic of Indonesia | | | | | |
| Bond (B) | 3.850 | 07-18-27 | | 1,339,000 | 1,403,613 |
| Bond (B) | 4.350 | 01-08-27 | | 305,000 | 329,815 |
| Bond | 4.750 | 02-11-29 | | 404,000 | 455,553 |
| Bond | 5.250 | 01-17-42 | | 673,000 | 779,520 |
| Bond (B) | 5.250 | 01-08-47 | | 52,000 | 60,788 |
| Bond | 7.500 | 08-15-32 | IDR | 2,920,000,000 | 205,204 |
| Bond | 7.500 | 05-15-38 | IDR | 2,889,000,000 | 201,049 |
| Bond | 8.250 | 05-15-36 | IDR | 8,904,000,000 | 665,688 |
| Bond | 8.375 | 03-15-24 | IDR | 12,860,000,000 | 975,679 |
| Bond | 8.375 | 09-15-26 | IDR | 11,300,000,000 | 859,451 |
| Bond | 8.375 | 03-15-34 | IDR | 9,130,000,000 | 691,848 |
| Iraq 0.1% | | | 657,805 |
| Republic of Iraq | | | | | |
| Bond (B) | 6.752 | 03-09-23 | | 636,000 | 657,805 |
| Ivory Coast 0.1% | | | 856,455 |
| Republic of Ivory Coast | | | | | |
| Bond (B) | 6.125 | 06-15-33 | | 507,000 | 478,746 |
| Bond | 6.125 | 06-15-33 | | 400,000 | 377,709 |
| Jordan 0.1% | | | 543,643 |
| Kingdom of Jordan | | | | | |
| Bond (B) | 5.750 | 01-31-27 | | 531,000 | 543,643 |
| Kenya 0.1% | | | 1,029,034 |
| Republic of Kenya | | | | | |
| Bond | 6.875 | 06-24-24 | | 339,000 | 364,126 |
| Bond (B) | 7.000 | 05-22-27 | | 211,000 | 220,660 |
| Bond (B) | 8.000 | 05-22-32 | | 211,000 | 223,779 |
| Bond | 8.250 | 02-28-48 | | 211,000 | 220,469 |
| Lebanon 0.3% | | | 2,532,859 |
| Republic of Lebanon | | | | | |
| 14 | JOHN HANCOCK SHORT DURATION CREDIT OPPORTUNITIES FUND | ANNUAL REPORT | SEE NOTES TO FINANCIAL STATEMENTS |
| | Rate (%) | Maturity date | | Par value^ | Value |
| Lebanon (continued) | | | |
| Bond | 6.150 | 06-19-20 | | 151,000 | $144,043 |
| Bond | 6.250 | 11-04-24 | | 221,000 | 174,045 |
| Bond | 6.600 | 11-27-26 | | 24,000 | 18,580 |
| Bond | 6.650 | 04-22-24 | | 858,000 | 696,976 |
| Bond | 6.650 | 11-03-28 | | 82,000 | 62,772 |
| Bond | 6.650 | 02-26-30 | | 78,000 | 58,697 |
| Bond | 8.250 | 04-12-21 | | 1,477,000 | 1,377,746 |
| Malaysia 0.1% | | | 761,474 |
| Government of Malaysia | | | | | |
| Bond | 3.733 | 06-15-28 | MYR | 570,000 | 138,966 |
| Bond | 3.885 | 08-15-29 | MYR | 610,000 | 151,182 |
| Bond | 3.900 | 11-30-26 | MYR | 165,000 | 40,776 |
| Bond | 3.906 | 07-15-26 | MYR | 1,250,000 | 309,081 |
| Bond | 4.498 | 04-15-30 | MYR | 470,000 | 121,469 |
| Mexico 0.6% | | | 5,349,602 |
| Government of Mexico | | | | | |
| Bond | 3.750 | 01-11-28 | | 271,000 | 274,252 |
| Bond | 4.350 | 01-15-47 | | 203,000 | 198,181 |
| Bond | 4.500 | 04-22-29 | | 1,188,000 | 1,262,250 |
| Bond | 4.750 | 03-08-44 | | 128,000 | 132,160 |
| Bond | 5.750 | 03-05-26 | MXN | 12,910,000 | 616,527 |
| Bond | 7.500 | 06-03-27 | MXN | 15,710,000 | 821,080 |
| Bond | 7.750 | 11-13-42 | MXN | 8,680,000 | 445,411 |
| Bond | 10.000 | 12-05-24 | MXN | 27,412,500 | 1,599,741 |
| Nigeria 0.2% | | | 2,110,947 |
| Federal Republic of Nigeria | | | | | |
| Bond (B) | 6.500 | 11-28-27 | | 1,078,000 | 1,104,033 |
| Bond (B) | 7.143 | 02-23-30 | | 265,000 | 274,093 |
| Bond (B) | 7.625 | 11-28-47 | | 577,000 | 582,843 |
| Bond (B) | 7.875 | 02-16-32 | | 141,000 | 149,978 |
| Oman 0.3% | | | 2,447,826 |
| Sultanate of Oman | | | | | |
| Bond | 3.625 | 06-15-21 | | 521,000 | 517,947 |
| Bond (B) | 4.875 | 02-01-25 | | 499,000 | 498,002 |
| Bond (B) | 5.375 | 03-08-27 | | 1,016,000 | 993,974 |
| Bond (B) | 6.000 | 08-01-29 | | 439,000 | 437,903 |
| Pakistan 0.1% | | | 746,160 |
| Republic of Pakistan | | | | | |
| Bond | 6.875 | 12-05-27 | | 716,000 | 746,160 |
| Panama 0.2% | | | 1,596,137 |
| Republic of Panama | | | | | |
| Bond | 3.160 | 01-23-30 | | 1,062,000 | 1,071,558 |
| SEE NOTES TO FINANCIAL STATEMENTS | ANNUAL REPORT | JOHN HANCOCK SHORT DURATION CREDIT OPPORTUNITIES FUND | 15 |
| | Rate (%) | Maturity date | | Par value^ | Value |
| Panama (continued) | | | |
| Bond | 3.750 | 03-16-25 | | 499,000 | $524,579 |
| Papua New Guinea 0.1% | | | 711,720 |
| Independent State of Papua New Guinea | | | | | |
| Bond (B) | 8.375 | 10-04-28 | | 659,000 | 711,720 |
| Paraguay 0.1% | | | 827,062 |
| Republic of Paraguay | | | | | |
| Bond (B) | 5.400 | 03-30-50 | | 318,000 | 358,548 |
| Bond (B) | 6.100 | 08-11-44 | | 388,000 | 468,514 |
| Peru 0.2% | | | 1,798,433 |
| Republic of Peru | | | | | |
| Bond | 4.125 | 08-25-27 | | 233,000 | 258,865 |
| Bond | 5.625 | 11-18-50 | | 170,000 | 236,302 |
| Bond (B) | 5.940 | 02-12-29 | PEN | 350,000 | 118,281 |
| Bond (B) | 6.150 | 08-12-32 | PEN | 2,790,000 | 957,983 |
| Bond | 6.550 | 03-14-37 | | 160,000 | 227,002 |
| Poland 0.4% | | | 3,367,275 |
| Republic of Poland | | | | | |
| Bond | 2.000 | 04-25-21 | PLN | 290,000 | 75,483 |
| Bond | 2.500 | 01-25-23 | PLN | 1,910,000 | 505,162 |
| Bond | 2.500 | 04-25-24 | PLN | 1,290,000 | 342,876 |
| Bond | 2.750 | 04-25-28 | PLN | 1,918,000 | 519,671 |
| Bond | 2.750 | 10-25-29 | PLN | 2,770,000 | 754,445 |
| Bond | 4.000 | 10-25-23 | PLN | 4,165,000 | 1,169,638 |
| Qatar 0.3% | | | 2,670,920 |
| State of Qatar | | | | | |
| Bond (B) | 4.000 | 03-14-29 | | 728,000 | 793,041 |
| Bond (B) | 4.500 | 04-23-28 | | 199,000 | 224,747 |
| Bond | 4.817 | 03-14-49 | | 780,000 | 902,850 |
| Bond (B) | 5.103 | 04-23-48 | | 424,000 | 509,807 |
| Bond | 5.103 | 04-23-48 | | 200,000 | 240,475 |
| Romania 0.2% | | | 1,911,048 |
| Government of Romania | | | | | |
| Bond | 3.875 | 10-29-35 | EUR | 363,000 | 467,139 |
| Bond | 4.125 | 03-11-39 | EUR | 143,000 | 184,236 |
| Bond (B) | 4.625 | 04-03-49 | EUR | 136,000 | 187,135 |
| Bond | 5.000 | 02-12-29 | RON | 2,400,000 | 587,788 |
| Bond | 5.125 | 06-15-48 | | 434,000 | 484,750 |
| Russia 0.9% | | | 7,508,686 |
| Government of Russia | | | | | |
| Bond | 4.250 | 06-23-27 | | 600,000 | 626,767 |
| Bond | 4.750 | 05-27-26 | | 800,000 | 858,931 |
| Bond | 4.875 | 09-16-23 | | 200,000 | 215,268 |
| 16 | JOHN HANCOCK SHORT DURATION CREDIT OPPORTUNITIES FUND | ANNUAL REPORT | SEE NOTES TO FINANCIAL STATEMENTS |
| | Rate (%) | Maturity date | | Par value^ | Value |
| Russia (continued) | | | |
| Bond | 5.100 | 03-28-35 | | 800,000 | $872,266 |
| Bond | 5.250 | 06-23-47 | | 1,600,000 | 1,802,429 |
| Bond | 5.625 | 04-04-42 | | 200,000 | 236,250 |
| Bond | 7.050 | 01-19-28 | RUB | 51,960,000 | 814,771 |
| Bond | 7.400 | 12-07-22 | RUB | 40,340,000 | 643,691 |
| Bond | 7.700 | 03-23-33 | RUB | 11,427,000 | 184,796 |
| Bond | 7.750 | 09-16-26 | RUB | 31,960,000 | 520,273 |
| Bond | 7.950 | 10-07-26 | RUB | 21,710,000 | 357,306 |
| Bond | 8.150 | 02-03-27 | RUB | 22,520,000 | 375,938 |
| Saudi Arabia 0.2% | | | 1,673,865 |
| Kingdom of Saudi Arabia | | | | | |
| Bond (B) | 4.375 | 04-16-29 | | 115,000 | 126,835 |
| Bond (B) | 4.500 | 04-17-30 | | 106,000 | 118,228 |
| Bond | 4.500 | 10-26-46 | | 701,000 | 745,934 |
| Bond (B) | 5.000 | 04-17-49 | | 195,000 | 222,677 |
| Bond | 5.000 | 04-17-49 | | 403,000 | 460,191 |
| Senegal 0.1% | | | 555,754 |
| Republic of Senegal | | | | | |
| Bond (B) | 6.250 | 05-23-33 | | 560,000 | 555,754 |
| South Africa 0.5% | | | 4,478,091 |
| Republic of South Africa | | | | | |
| Bond | 4.665 | 01-17-24 | | 56,000 | 57,884 |
| Bond | 4.875 | 04-14-26 | | 591,000 | 605,286 |
| Bond | 5.000 | 10-12-46 | | 55,000 | 51,946 |
| Bond | 5.875 | 06-22-30 | | 164,000 | 174,887 |
| Bond | 6.250 | 03-31-36 | ZAR | 26,830,000 | 1,347,907 |
| Bond | 6.300 | 06-22-48 | | 351,000 | 376,356 |
| Bond | 7.000 | 02-28-31 | ZAR | 11,460,000 | 674,477 |
| Bond | 8.875 | 02-28-35 | ZAR | 700,000 | 45,714 |
| Bond | 10.500 | 12-21-26 | ZAR | 14,670,000 | 1,143,634 |
| Sri Lanka 0.3% | | | 2,456,209 |
| Republic of Sri Lanka | | | | | |
| Bond (B) | 5.750 | 04-18-23 | | 288,000 | 288,286 |
| Bond (B) | 6.125 | 06-03-25 | | 393,000 | 385,725 |
| Bond | 6.200 | 05-11-27 | | 504,000 | 486,709 |
| Bond | 6.250 | 07-27-21 | | 477,000 | 485,082 |
| Bond (B) | 6.750 | 04-18-28 | | 624,000 | 610,978 |
| Bond (B) | 7.850 | 03-14-29 | | 192,000 | 199,429 |
| Suriname 0.0% | | | 103,880 |
| Government of Suriname | | | | | |
| Bond | 9.250 | 10-26-26 | | 112,000 | 103,880 |
| SEE NOTES TO FINANCIAL STATEMENTS | ANNUAL REPORT | JOHN HANCOCK SHORT DURATION CREDIT OPPORTUNITIES FUND | 17 |
| | Rate (%) | Maturity date | | Par value^ | Value |
| Thailand 0.2% | | | $1,822,759 |
| Kingdom of Thailand | | | | | |
| Bond | 2.875 | 12-17-28 | THB | 26,210,000 | 924,678 |
| Bond | 3.775 | 06-25-32 | THB | 22,930,000 | 898,081 |
| Tunisia 0.0% | | | 322,240 |
| Banque Centrale de Tunisia | | | | | |
| Bond | 5.625 | 02-17-24 | EUR | 294,000 | 322,240 |
| Turkey 0.5% | | | 4,473,311 |
| Hazine Mustesarligi Varlik Kiralama AS | | | | | |
| Bond (B) | 5.800 | 02-21-22 | | 119,000 | 119,988 |
| Republic of Turkey | | | | | |
| Bond | 5.125 | 02-17-28 | | 75,000 | 68,545 |
| Bond | 5.750 | 03-22-24 | | 100,000 | 98,630 |
| Bond | 5.750 | 05-11-47 | | 754,000 | 639,338 |
| Bond | 6.000 | 03-25-27 | | 372,000 | 360,202 |
| Bond | 6.125 | 10-24-28 | | 389,000 | 376,033 |
| Bond | 6.250 | 09-26-22 | | 946,000 | 964,819 |
| Bond | 6.875 | 03-17-36 | | 177,000 | 173,782 |
| Bond | 7.375 | 02-05-25 | | 521,000 | 547,430 |
| Bond | 7.400 | 02-05-20 | TRY | 740,000 | 126,626 |
| Bond | 8.000 | 03-12-25 | TRY | 3,510,000 | 463,828 |
| Bond | 10.700 | 02-17-21 | TRY | 1,210,000 | 200,777 |
| Bond | 10.700 | 08-17-22 | TRY | 490,000 | 78,140 |
| Bond | 11.000 | 02-24-27 | TRY | 1,320,000 | 194,180 |
| Bond | 12.200 | 01-18-23 | TRY | 370,000 | 60,993 |
| Ukraine 0.3% | | | 2,518,393 |
| Republic of Ukraine | | | | | |
| Bond (B) | 6.750 | 06-20-26 | EUR | 705,000 | 848,517 |
| Bond (B) | 7.375 | 09-25-32 | | 431,000 | 437,896 |
| Bond | 7.750 | 09-01-23 | | 233,000 | 249,170 |
| Bond (B) | 7.750 | 09-01-26 | | 60,000 | 63,307 |
| Bond (B) | 7.750 | 09-01-27 | | 110,000 | 116,063 |
| Bond (B) | 8.994 | 02-01-24 | | 564,000 | 625,790 |
| GDP-Linked Bond (D) | 2.171* | 05-31-40 | | 209,000 | 177,650 |
| Uruguay 0.3% | | | 2,668,537 |
| Republic of Uruguay | | | | | |
| Bond | 4.125 | 11-20-45 | | 197,000 | 203,700 |
| Bond | 4.375 | 10-27-27 | | 723,000 | 787,173 |
| Bond | 5.100 | 06-18-50 | | 781,865 | 893,289 |
| Bond | 5.625 | 06-19-47 | | 628,000 | 714,350 |
| Bond (B) | 8.500 | 03-15-28 | UYU | 2,670,000 | 70,025 |
| Venezuela 0.0% | | | 209,535 |
| Republic of Venezuela | | | | | |
| Bond (E) | 7.750 | 10-13-19 | | 1,374,000 | 209,535 |
| 18 | JOHN HANCOCK SHORT DURATION CREDIT OPPORTUNITIES FUND | ANNUAL REPORT | SEE NOTES TO FINANCIAL STATEMENTS |
| | Rate (%) | Maturity date | | Par value^ | Value |
| Zambia 0.0% | | | $422,467 |
| Republic of Zambia | | | | | |
| Bond (B) | 5.375 | 09-20-22 | | 56,000 | 39,284 |
|
| Bond (B) | 8.500 | 04-14-24 | | 533,000 | 383,183 |
| Corporate bonds 38.7% | | | $339,457,988 |
| (Cost $328,772,202) | | | | | |
| Communication services 4.7% | | 41,670,411 |
| Diversified telecommunication services 1.0% | | |
| Altice France SA (B) | 7.375 | 05-01-26 | | 720,000 | 761,544 |
| AT&T, Inc. | 4.350 | 03-01-29 | | 2,225,000 | 2,403,599 |
| Axtel SAB de CV (B) | 6.375 | 11-14-24 | | 214,000 | 221,225 |
| Frontier Communications Corp. | 9.000 | 08-15-31 | | 704,000 | 381,920 |
| Frontier Communications Corp. | 10.500 | 09-15-22 | | 150,000 | 93,750 |
| Intelsat Jackson Holdings SA | 5.500 | 08-01-23 | | 525,000 | 483,656 |
| Midcontinent Communications (B) | 5.375 | 08-15-27 | | 230,000 | 235,750 |
| UPCB Finance IV, Ltd. (B) | 5.375 | 01-15-25 | | 485,000 | 497,125 |
| Verizon Communications, Inc. (B) | 4.016 | 12-03-29 | | 2,115,000 | 2,294,934 |
| Zayo Group LLC (B) | 5.750 | 01-15-27 | | 725,000 | 735,875 |
| Ziggo BV (B) | 5.500 | 01-15-27 | | 510,000 | 520,838 |
| Entertainment 0.1% | | |
| Lions Gate Capital Holdings LLC (B) | 6.375 | 02-01-24 | | 480,000 | 503,400 |
| Netflix, Inc. | 4.875 | 04-15-28 | | 645,000 | 666,366 |
| Interactive media and services 0.3% | | |
| Tencent Holdings, Ltd. (B) | 3.595 | 01-19-28 | | 2,300,000 | 2,370,391 |
| Media 2.6% | | |
| AMC Networks, Inc. | 4.750 | 08-01-25 | | 750,000 | 763,125 |
| Cablevision Systems Corp. | 5.875 | 09-15-22 | | 515,000 | 547,188 |
| CCO Holdings LLC (B) | 5.125 | 05-01-27 | | 520,000 | 536,250 |
| CCO Holdings LLC (B) | 5.375 | 06-01-29 | | 590,000 | 611,388 |
| CCO Holdings LLC (B) | 5.500 | 05-01-26 | | 410,000 | 427,938 |
| Charter Communications Operating LLC | 6.384 | 10-23-35 | | 1,600,000 | 1,888,923 |
| Charter Communications Operating LLC | 6.484 | 10-23-45 | | 1,375,000 | 1,617,050 |
| Comcast Corp. | 4.700 | 10-15-48 | | 2,100,000 | 2,463,750 |
| Cox Communications, Inc. (B) | 3.500 | 08-15-27 | | 2,275,000 | 2,328,064 |
| CSC Holdings LLC (B) | 7.500 | 04-01-28 | | 650,000 | 715,813 |
| Discovery Communications LLC | 3.950 | 03-20-28 | | 2,200,000 | 2,270,168 |
| DISH DBS Corp. | 7.750 | 07-01-26 | | 1,555,000 | 1,516,125 |
| Nexstar Broadcasting, Inc. (B) | 5.625 | 08-01-24 | | 515,000 | 534,956 |
| Omnicom Group, Inc. | 3.600 | 04-15-26 | | 2,100,000 | 2,169,990 |
| Sirius XM Radio, Inc. (B) | 4.625 | 07-15-24 | | 260,000 | 267,618 |
| Sirius XM Radio, Inc. (B) | 5.000 | 08-01-27 | | 785,000 | 809,531 |
| Telenet Finance Luxembourg Notes Sarl (B) | 5.500 | 03-01-28 | | 600,000 | 608,407 |
| SEE NOTES TO FINANCIAL STATEMENTS | ANNUAL REPORT | JOHN HANCOCK SHORT DURATION CREDIT OPPORTUNITIES FUND | 19 |
| | Rate (%) | Maturity date | | Par value^ | Value |
| Communication services (continued) | | |
| Media (continued) | | |
| The Interpublic Group of Companies, Inc. | 4.650 | 10-01-28 | | 2,150,000 | $2,377,902 |
| Unitymedia GmbH (B) | 6.125 | 01-15-25 | | 305,000 | 317,581 |
| Virgin Media Secured Finance PLC (B) | 5.500 | 05-15-29 | | 585,000 | 599,333 |
| Wireless telecommunication services 0.7% | | |
| Millicom International Cellular SA (B) | 6.250 | 03-25-29 | | 139,000 | 150,016 |
| Sprint Capital Corp. | 8.750 | 03-15-32 | | 1,100,000 | 1,368,125 |
| T-Mobile USA, Inc. | 5.375 | 04-15-27 | | 645,000 | 684,506 |
| T-Mobile USA, Inc. | 6.500 | 01-15-26 | | 325,000 | 346,028 |
| Vodafone Group PLC | 5.000 | 05-30-38 | | 3,250,000 | 3,580,263 |
| Consumer discretionary 3.8% | | 33,312,181 |
| Auto components 0.2% | | |
| Dana Financing Luxembourg Sarl (B) | 6.500 | 06-01-26 | | 385,000 | 400,400 |
| Lear Corp. | 5.250 | 05-15-49 | | 1,175,000 | 1,168,570 |
| Panther BF Aggregator 2 LP (B) | 6.250 | 05-15-26 | | 495,000 | 512,177 |
| Automobiles 1.2% | | |
| BMW US Capital LLC (B) | 3.625 | 04-18-29 | | 2,200,000 | 2,342,579 |
| Ford Motor Credit Company LLC | 4.389 | 01-08-26 | | 2,125,000 | 2,134,746 |
| General Motors Financial Company, Inc. | 4.300 | 07-13-25 | | 2,300,000 | 2,370,274 |
| Hyundai Capital America (B) | 3.000 | 10-30-20 | | 2,300,000 | 2,305,956 |
| Hyundai Capital America (B) | 3.250 | 09-20-22 | | 1,175,000 | 1,186,163 |
| Diversified consumer services 0.1% | | |
| Weight Watchers International, Inc. (B) | 8.625 | 12-01-25 | | 800,000 | 776,944 |
| Hotels, restaurants and leisure 0.9% | | |
| Boyd Gaming Corp. | 6.000 | 08-15-26 | | 220,000 | 229,900 |
| Boyd Gaming Corp. | 6.375 | 04-01-26 | | 325,000 | 342,875 |
| Churchill Downs, Inc. (B) | 5.500 | 04-01-27 | | 290,000 | 303,866 |
| Golden Nugget, Inc. (B) | 6.750 | 10-15-24 | | 365,000 | 375,724 |
| Hilton Domestic Operating Company, Inc. (B) | 4.875 | 01-15-30 | | 465,000 | 477,788 |
| International Game Technology PLC (B) | 6.250 | 01-15-27 | | 470,000 | 509,950 |
| Jacobs Entertainment, Inc. (B) | 7.875 | 02-01-24 | | 355,000 | 377,188 |
| Royal Caribbean Cruises, Ltd. | 2.650 | 11-28-20 | | 2,275,000 | 2,278,461 |
| Sands China, Ltd. | 4.600 | 08-08-23 | | 2,100,000 | 2,232,855 |
| Station Casinos LLC (B) | 5.000 | 10-01-25 | | 480,000 | 489,120 |
| Household durables 0.1% | | |
| TopBuild Corp. (B) | 5.625 | 05-01-26 | | 535,000 | 547,706 |
| Internet and direct marketing retail 0.5% | | |
| Alibaba Group Holding, Ltd. | 4.000 | 12-06-37 | | 2,100,000 | 2,207,098 |
| Amazon.com, Inc. | 3.875 | 08-22-37 | | 2,000,000 | 2,213,716 |
| 20 | JOHN HANCOCK SHORT DURATION CREDIT OPPORTUNITIES FUND | ANNUAL REPORT | SEE NOTES TO FINANCIAL STATEMENTS |
| | Rate (%) | Maturity date | | Par value^ | Value |
| Consumer discretionary (continued) | | |
| Leisure products 0.0% | | |
| Diamond Sports Group LLC (B) | 5.375 | 08-15-26 | | 310,000 | $315,038 |
| Multiline retail 0.3% | | |
| Dollar Tree, Inc. | 4.000 | 05-15-25 | | 2,175,000 | 2,267,102 |
| JC Penney Corp., Inc. | 7.400 | 04-01-37 | | 500,000 | 120,000 |
| JC Penney Corp., Inc. (B) | 8.625 | 03-15-25 | | 210,000 | 104,475 |
| Specialty retail 0.3% | | |
| AutoZone, Inc. | 3.750 | 04-18-29 | | 2,150,000 | 2,248,066 |
| Party City Holdings, Inc. (B)(F) | 6.625 | 08-01-26 | | 775,000 | 745,938 |
| Textiles, apparel and luxury goods 0.2% | | |
| Hanesbrands, Inc. (B) | 4.625 | 05-15-24 | | 650,000 | 674,512 |
| Levi Strauss & Company | 5.000 | 05-01-25 | | 555,000 | 575,813 |
| The William Carter Company (B) | 5.625 | 03-15-27 | | 455,000 | 477,181 |
| Consumer staples 2.2% | | 19,134,038 |
| Beverages 0.3% | | |
| Cott Holdings, Inc. (B) | 5.500 | 04-01-25 | | 505,000 | 517,625 |
| Keurig Dr. Pepper, Inc. | 3.430 | 06-15-27 | | 2,200,000 | 2,234,126 |
| Food and staples retailing 0.4% | | |
| Albertsons Companies LLC | 5.750 | 03-15-25 | | 215,000 | 219,300 |
| Albertsons Companies LLC | 6.625 | 06-15-24 | | 575,000 | 599,438 |
| Ingles Markets, Inc. | 5.750 | 06-15-23 | | 654,000 | 667,080 |
| The Kroger Company | 4.450 | 02-01-47 | | 1,075,000 | 1,057,793 |
| Walmart, Inc. | 3.050 | 07-08-26 | | 1,150,000 | 1,201,220 |
| Food products 1.0% | | |
| Adecoagro SA (B) | 6.000 | 09-21-27 | | 295,000 | 282,094 |
| B&G Foods, Inc. | 5.250 | 04-01-25 | | 825,000 | 820,875 |
| Chobani LLC (B) | 7.500 | 04-15-25 | | 775,000 | 720,750 |
| Dean Foods Company (B) | 6.500 | 03-15-23 | | 470,000 | 260,850 |
| JBS Investments GmbH (B) | 6.250 | 02-05-23 | | 82,000 | 83,436 |
| JBS Investments II GmbH (B) | 7.000 | 01-15-26 | | 290,000 | 310,445 |
| JBS USA LUX SA (B) | 6.500 | 04-15-29 | | 1,065,000 | 1,143,544 |
| Mars, Inc. (B) | 3.600 | 04-01-34 | | 2,300,000 | 2,475,179 |
| Minerva Luxembourg SA (B) | 6.500 | 09-20-26 | | 187,000 | 190,506 |
| NBM US Holdings, Inc. (B) | 7.000 | 05-14-26 | | 133,000 | 137,190 |
| Pilgrim's Pride Corp. (B) | 5.750 | 03-15-25 | | 375,000 | 387,188 |
| Pilgrim's Pride Corp. (B) | 5.875 | 09-30-27 | | 410,000 | 430,500 |
| Post Holdings, Inc. (B) | 5.500 | 03-01-25 | | 420,000 | 436,800 |
| Post Holdings, Inc. (B) | 5.500 | 12-15-29 | | 420,000 | 424,725 |
| Sigma Holdco BV (B) | 7.875 | 05-15-26 | | 355,000 | 329,263 |
| Food, beverage and tobacco 0.2% | | |
| Imperial Brands Finance PLC (B) | 3.500 | 07-26-26 | | 2,000,000 | 1,990,789 |
| SEE NOTES TO FINANCIAL STATEMENTS | ANNUAL REPORT | JOHN HANCOCK SHORT DURATION CREDIT OPPORTUNITIES FUND | 21 |
| | Rate (%) | Maturity date | | Par value^ | Value |
| Consumer staples (continued) | | |
| Household products 0.2% | | |
| Energizer Holdings, Inc. (B) | 5.500 | 06-15-25 | | 685,000 | $695,489 |
| Spectrum Brands, Inc. | 5.750 | 07-15-25 | | 450,000 | 466,178 |
| Personal products 0.1% | | |
| Prestige Brands, Inc. (B) | 6.375 | 03-01-24 | | 610,000 | 633,455 |
| Revlon Consumer Products Corp. | 6.250 | 08-01-24 | | 615,000 | 418,200 |
| Energy 5.7% | | 49,867,219 |
| Energy equipment and services 0.3% | | |
| Apergy Corp. | 6.375 | 05-01-26 | | 405,000 | 413,100 |
| Inkia Energy, Ltd. (B) | 5.875 | 11-09-27 | | 223,000 | 232,143 |
| Nabors Industries, Inc. | 5.500 | 01-15-23 | | 840,000 | 785,400 |
| Rowan Companies, Inc. | 7.375 | 06-15-25 | | 695,000 | 524,725 |
| SESI LLC | 7.125 | 12-15-21 | | 870,000 | 635,100 |
| SESI LLC | 7.750 | 09-15-24 | | 425,000 | 255,000 |
| Oil, gas and consumable fuels 5.4% | | |
| Abu Dhabi Crude Oil Pipeline LLC (B) | 3.650 | 11-02-29 | | 303,000 | 323,786 |
| Abu Dhabi Crude Oil Pipeline LLC (B) | 4.600 | 11-02-47 | | 1,163,000 | 1,312,736 |
| AI Candelaria Spain SLU (B) | 7.500 | 12-15-28 | | 326,000 | 364,957 |
| Alta Mesa Holdings LP | 7.875 | 12-15-24 | | 460,000 | 161,000 |
| Anadarko Petroleum Corp. | 6.450 | 09-15-36 | | 1,875,000 | 2,295,626 |
| Antero Midstream Partners LP (B) | 5.750 | 03-01-27 | | 1,120,000 | 1,050,022 |
| Antero Midstream Partners LP (B) | 5.750 | 01-15-28 | | 465,000 | 434,194 |
| Antero Resources Corp. (F) | 5.000 | 03-01-25 | | 600,000 | 536,892 |
| Apache Corp. | 5.100 | 09-01-40 | | 2,150,000 | 2,129,056 |
| Boardwalk Pipelines LP | 5.950 | 06-01-26 | | 2,125,000 | 2,357,081 |
| Concho Resources, Inc. | 3.750 | 10-01-27 | | 2,300,000 | 2,369,673 |
| DCP Midstream Operating LP | 5.125 | 05-15-29 | | 450,000 | 463,500 |
| Diamondback Energy, Inc. | 4.750 | 11-01-24 | | 445,000 | 457,104 |
| Empresa Nacional del Petroleo | 3.750 | 08-05-26 | | 210,000 | 215,838 |
| Enterprise Products Operating LLC (4.875% to 8-16-22, then 3 month LIBOR + 2.986%) | 4.875 | 08-16-77 | | 2,425,000 | 2,326,691 |
| Eterna Capital Pte, Ltd. (6.500% Cash or 1.000% PIK) | 6.500 | 12-11-22 | | 114,888 | 113,021 |
| Eterna Capital Pte, Ltd. (8.000% Cash or PIK) | 8.000 | 12-11-22 | | 31,414 | 25,019 |
| Geopark, Ltd. (B) | 6.500 | 09-21-24 | | 245,000 | 254,800 |
| Hilcorp Energy I LP (B) | 5.750 | 10-01-25 | | 830,000 | 807,175 |
| KazMunayGas National Company JSC (B) | 4.750 | 04-24-25 | | 407,000 | 440,586 |
| KazMunayGas National Company JSC (B) | 4.750 | 04-19-27 | | 517,000 | 558,805 |
| KazMunayGas National Company JSC | 5.375 | 04-24-30 | | 1,114,000 | 1,248,612 |
| 22 | JOHN HANCOCK SHORT DURATION CREDIT OPPORTUNITIES FUND | ANNUAL REPORT | SEE NOTES TO FINANCIAL STATEMENTS |
| | Rate (%) | Maturity date | | Par value^ | Value |
| Energy (continued) | | |
| Oil, gas and consumable fuels (continued) | | |
| KazMunayGas National Company JSC (B) | 5.750 | 04-19-47 | | 249,000 | $285,186 |
| KazMunayGas National Company JSC (B) | 6.375 | 10-24-48 | | 587,000 | 709,213 |
| KazTransGas JSC (B) | 4.375 | 09-26-27 | | 547,000 | 568,966 |
| Kinder Morgan Energy Partners LP | 5.500 | 03-01-44 | | 1,050,000 | 1,194,442 |
| Laredo Petroleum, Inc. | 5.625 | 01-15-22 | | 535,000 | 494,875 |
| Marathon Petroleum Corp. | 3.800 | 04-01-28 | | 1,025,000 | 1,047,226 |
| Marathon Petroleum Corp. | 5.125 | 12-15-26 | | 1,200,000 | 1,327,586 |
| Murphy Oil Corp. | 5.750 | 08-15-25 | | 475,000 | 486,875 |
| Nostrum Oil & Gas Finance BV (B) | 7.000 | 02-16-25 | | 160,000 | 96,077 |
| Oasis Petroleum, Inc. (B) | 6.250 | 05-01-26 | | 490,000 | 464,226 |
| Oasis Petroleum, Inc. | 6.875 | 03-15-22 | | 475,000 | 472,791 |
| Pertamina Persero PT (B) | 3.650 | 07-30-29 | | 320,000 | 321,884 |
| Pertamina Persero PT | 5.250 | 05-23-21 | | 242,000 | 252,835 |
| Pertamina Persero PT (B) | 5.625 | 05-20-43 | | 513,000 | 579,686 |
| Pertamina Persero PT | 6.450 | 05-30-44 | | 363,000 | 453,627 |
| Petroamazonas EP (B) | 4.625 | 02-16-20 | | 641,667 | 638,458 |
| Petroamazonas EP (B) | 4.625 | 11-06-20 | | 200,000 | 197,536 |
| Petrobras Global Finance BV | 5.750 | 02-01-29 | | 245,000 | 263,498 |
| Petrobras Global Finance BV | 6.900 | 03-19-49 | | 211,000 | 237,132 |
| Petroleos de Venezuela SA (E) | 5.375 | 04-12-27 | | 64,000 | 8,960 |
| Petroleos de Venezuela SA (E) | 6.000 | 05-16-24 | | 3,771,996 | 528,079 |
| Petroleos de Venezuela SA (E) | 6.000 | 11-15-26 | | 1,826,000 | 255,640 |
| Petroleos de Venezuela SA (E) | 9.750 | 05-17-35 | | 3,459,000 | 484,260 |
| Petroleos del Peru SA | 4.750 | 06-19-32 | | 403,000 | 434,841 |
| Petroleos Mexicanos | 4.250 | 01-15-25 | | 336,000 | 313,992 |
| Petroleos Mexicanos | 4.625 | 09-21-23 | | 89,000 | 87,710 |
| Petroleos Mexicanos | 4.875 | 01-24-22 | | 660,000 | 666,600 |
| Petroleos Mexicanos | 7.190 | 09-12-24 | MXN | 4,586,400 | 198,043 |
| Petroleos Mexicanos | 7.470 | 11-12-26 | MXN | 2,300,000 | 94,514 |
| Petroleos Mexicanos | 9.500 | 09-15-27 | | 97,000 | 109,368 |
| Petronas Capital, Ltd. (B) | 4.500 | 03-18-45 | | 452,000 | 528,510 |
| QEP Resources, Inc. | 5.250 | 05-01-23 | | 585,000 | 532,350 |
| Range Resources Corp. | 5.000 | 03-15-23 | | 460,000 | 402,357 |
| Sabine Pass Liquefaction LLC | 5.000 | 03-15-27 | | 2,175,000 | 2,371,365 |
| Saudi Arabian Oil Company (B) | 3.500 | 04-16-29 | | 538,000 | 550,569 |
| Saudi Arabian Oil Company (B) | 4.250 | 04-16-39 | | 540,000 | 561,729 |
| Sinopec Group Overseas Development 2016, Ltd. | 2.750 | 09-29-26 | | 223,000 | 219,484 |
| Sinopec Group Overseas Development 2017, Ltd. | 3.250 | 09-13-27 | | 223,000 | 226,126 |
| Sinopec Group Overseas Development 2017, Ltd. | 3.625 | 04-12-27 | | 753,000 | 783,004 |
| SEE NOTES TO FINANCIAL STATEMENTS | ANNUAL REPORT | JOHN HANCOCK SHORT DURATION CREDIT OPPORTUNITIES FUND | 23 |
| | Rate (%) | Maturity date | | Par value^ | Value |
| Energy (continued) | | |
| Oil, gas and consumable fuels (continued) | | |
| Sinopec Group Overseas Development 2018, Ltd. | 4.250 | 09-12-28 | | 735,000 | $805,276 |
| SM Energy Company | 5.625 | 06-01-25 | | 145,000 | 125,788 |
| SM Energy Company | 6.125 | 11-15-22 | | 275,000 | 268,813 |
| Southwestern Energy Company | 6.200 | 01-23-25 | | 775,000 | 668,438 |
| Targa Resources Partners LP (B) | 6.500 | 07-15-27 | | 1,235,000 | 1,344,631 |
| The Oil and Gas Holding Company BSCC (B) | 7.625 | 11-07-24 | | 671,000 | 750,429 |
| Unit Corp. | 6.625 | 05-15-21 | | 515,000 | 459,959 |
| Western Midstream Operating LP | 5.300 | 03-01-48 | | 975,000 | 863,500 |
| Western Midstream Operating LP | 5.450 | 04-01-44 | | 1,375,000 | 1,261,560 |
| Whiting Petroleum Corp. | 6.625 | 01-15-26 | | 825,000 | 777,563 |
| Financials 7.0% | | 61,950,896 |
| Banks 4.9% | | |
| Banco Mercantil del Norte SA (6.750% to 9-27-24, then 5 Year CMT + 4.967%) (B)(G) | 6.750 | 09-27-24 | | 187,000 | 186,533 |
| Banco Mercantil del Norte SA (7.500% to 6-27-29, then 10 Year CMT + 5.470%) (B)(G) | 7.500 | 06-27-29 | | 124,000 | 125,116 |
| Banco Nacional de Comercio Exterior SNC (3.800% to 8-11-21, then 5 Year CMT + 3.000%) (B) | 3.800 | 08-11-26 | | 443,000 | 446,881 |
| Banco Nacional de Comercio Exterior SNC (3.800% to 8-11-21, then 5 Year CMT + 3.000%) | 3.800 | 08-11-26 | | 115,000 | 116,007 |
| Bank of America Corp. | 3.950 | 04-21-25 | | 4,100,000 | 4,297,159 |
| Bank of America Corp. (4.078% to 4-23-39, then 3 month LIBOR + 1.320%) | 4.078 | 04-23-40 | | 2,400,000 | 2,580,799 |
| Bank of Montreal | 2.500 | 06-28-24 | | 1,425,000 | 1,422,369 |
| Barclays PLC | 4.836 | 05-09-28 | | 1,000,000 | 1,017,499 |
| Barclays PLC | 5.250 | 08-17-45 | | 1,100,000 | 1,173,009 |
| Brazil Loan Trust 1 (B) | 5.477 | 07-24-23 | | 157,212 | 163,894 |
| Citigroup, Inc. | 4.400 | 06-10-25 | | 4,025,000 | 4,288,354 |
| Citigroup, Inc. (2.876% to 7-24-22, then 3 month LIBOR + 0.950%) | 2.876 | 07-24-23 | | 375,000 | 377,892 |
| Deutsche Bank AG | 3.700 | 05-30-24 | | 2,325,000 | 2,293,219 |
| Fifth Third Bancorp | 3.650 | 01-25-24 | | 2,150,000 | 2,250,609 |
| HSBC Holdings PLC (3.950% to 5-18-23, then 3 month LIBOR + 0.987%) | 3.950 | 05-18-24 | | 2,225,000 | 2,317,398 |
| Intesa Sanpaolo SpA (B) | 3.875 | 07-14-27 | | 4,575,000 | 4,430,940 |
| JPMorgan Chase & Co. | 3.625 | 12-01-27 | | 2,100,000 | 2,177,356 |
| KeyBank NA | 3.900 | 04-13-29 | | 2,150,000 | 2,294,300 |
| Mizuho Financial Group, Inc. (B) | 2.632 | 04-12-21 | | 2,325,000 | 2,329,850 |
| 24 | JOHN HANCOCK SHORT DURATION CREDIT OPPORTUNITIES FUND | ANNUAL REPORT | SEE NOTES TO FINANCIAL STATEMENTS |
| | Rate (%) | Maturity date | | Par value^ | Value |
| Financials (continued) | | |
| Banks (continued) | | |
| Santander Holdings USA, Inc. | 3.700 | 03-28-22 | | 2,175,000 | $2,223,345 |
| Standard Chartered PLC (4.247% to 1-20-22, then 3 month LIBOR + 1.150%) (B) | 4.247 | 01-20-23 | | 2,225,000 | 2,291,850 |
| Synovus Financial Corp. | 3.125 | 11-01-22 | | 2,325,000 | 2,327,906 |
| The Royal Bank of Scotland Group PLC | 6.100 | 06-10-23 | | 1,975,000 | 2,125,530 |
| Ukreximbank Via Biz Finance PLC | 9.625 | 04-27-22 | | 181,500 | 190,461 |
| Capital markets 1.0% | | |
| 1MDB Global Investments, Ltd. | 4.400 | 03-09-23 | | 2,000,000 | 1,934,346 |
| Credit Suisse Group AG (4.207% to 6-12-23, then 3 month LIBOR + 1.240%) (B) | 4.207 | 06-12-24 | | 2,250,000 | 2,356,341 |
| The Goldman Sachs Group, Inc. (2.905% to 7-24-22, then 3 month LIBOR + 0.990%) | 2.905 | 07-24-23 | | 2,275,000 | 2,292,639 |
| UBS Group Funding Switzerland AG (B) | 2.650 | 02-01-22 | | 2,300,000 | 2,310,616 |
| Consumer finance 0.7% | | |
| Capital One Financial Corp. | 3.750 | 03-09-27 | | 3,275,000 | 3,403,281 |
| Synchrony Financial | 3.700 | 08-04-26 | | 2,400,000 | 2,421,904 |
| Diversified financial services 0.3% | | |
| GE Capital International Funding Company Unlimited Company | 3.373 | 11-15-25 | | 2,325,000 | 2,367,558 |
| MDC-GMTN BV (B) | 4.500 | 11-07-28 | | 234,000 | 262,997 |
| Insurance 0.1% | | |
| Nippon Life Insurance Company (5.100% to 10-16-24, then 5 Year U.S. ISDAFIX + 3.650%) (B) | 5.100 | 10-16-44 | | 1,075,000 | 1,152,938 |
| Health care 1.9% | | 16,941,685 |
| Health care equipment and supplies 0.0% | | |
| Hologic, Inc. (B) | 4.375 | 10-15-25 | | 370,000 | 371,569 |
| Health care providers and services 1.3% | | |
| CVS Health Corp. | 4.100 | 03-25-25 | | 2,125,000 | 2,236,765 |
| CVS Health Corp. | 4.780 | 03-25-38 | | 125,000 | 132,398 |
| DaVita, Inc. | 5.000 | 05-01-25 | | 580,000 | 568,412 |
| HCA, Inc. | 5.250 | 06-15-49 | | 2,750,000 | 2,894,018 |
| HCA, Inc. | 5.375 | 09-01-26 | | 595,000 | 644,088 |
| HCA, Inc. | 5.625 | 09-01-28 | | 790,000 | 871,133 |
| Tenet Healthcare Corp. | 4.625 | 07-15-24 | | 675,000 | 687,656 |
| Tenet Healthcare Corp. (B) | 6.250 | 02-01-27 | | 605,000 | 626,175 |
| UnitedHealth Group, Inc. | 3.875 | 08-15-59 | | 2,825,000 | 2,842,018 |
| Life sciences tools and services 0.1% | | |
| Charles River Laboratories International, Inc. (B) | 5.500 | 04-01-26 | | 720,000 | 761,400 |
| SEE NOTES TO FINANCIAL STATEMENTS | ANNUAL REPORT | JOHN HANCOCK SHORT DURATION CREDIT OPPORTUNITIES FUND | 25 |
| | Rate (%) | Maturity date | | Par value^ | Value |
| Health care (continued) | | |
| Pharmaceuticals 0.5% | | |
| Bausch Health Companies, Inc. (B) | 6.125 | 04-15-25 | | 815,000 | $834,112 |
| Bausch Health Companies, Inc. (B) | 7.000 | 01-15-28 | | 695,000 | 715,850 |
| Catalent Pharma Solutions, Inc. (B) | 5.000 | 07-15-27 | | 230,000 | 236,325 |
| Endo DAC (B) | 6.000 | 02-01-25 | | 630,000 | 378,000 |
| IQVIA, Inc. (B) | 5.000 | 05-15-27 | | 580,000 | 604,580 |
| Mallinckrodt International Finance SA (B) | 5.625 | 10-15-23 | | 490,000 | 309,778 |
| Par Pharmaceutical, Inc. (B) | 7.500 | 04-01-27 | | 215,000 | 195,113 |
| Teva Pharmaceutical Finance Netherlands III BV | 2.200 | 07-21-21 | | 1,100,000 | 1,032,295 |
| Industrials 2.9% | | 25,117,081 |
| Aerospace and defense 0.4% | | |
| The Boeing Company | 3.600 | 05-01-34 | | 2,325,000 | 2,433,235 |
| TransDigm, Inc. (B) | 6.250 | 03-15-26 | | 700,000 | 734,125 |
| Air freight and logistics 0.4% | | |
| FedEx Corp. | 4.400 | 01-15-47 | | 2,300,000 | 2,361,299 |
| Gol Finance, Inc. (B) | 7.000 | 01-31-25 | | 310,000 | 312,325 |
| Park-Ohio Industries, Inc. | 6.625 | 04-15-27 | | 535,000 | 533,663 |
| XPO Logistics, Inc. (B) | 6.125 | 09-01-23 | | 200,000 | 205,820 |
| XPO Logistics, Inc. (B) | 6.750 | 08-15-24 | | 225,000 | 239,839 |
| Building products 0.2% | | |
| American Woodmark Corp. (B) | 4.875 | 03-15-26 | | 670,000 | 664,138 |
| Griffon Corp. | 5.250 | 03-01-22 | | 870,000 | 866,738 |
| Commercial services and supplies 0.6% | | |
| ACCO Brands Corp. (B) | 5.250 | 12-15-24 | | 725,000 | 743,125 |
| Covanta Holding Corp. | 5.875 | 07-01-25 | | 655,000 | 679,563 |
| GFL Environmental, Inc. (B) | 8.500 | 05-01-27 | | 465,000 | 509,175 |
| Waste Management, Inc. | 4.150 | 07-15-49 | | 2,125,000 | 2,346,903 |
| Waste Pro USA, Inc. (B) | 5.500 | 02-15-26 | | 480,000 | 490,800 |
| West Corp. (B) | 8.500 | 10-15-25 | | 490,000 | 412,825 |
| Electrical equipment 0.1% | | |
| Resideo Funding, Inc. (B) | 6.125 | 11-01-26 | | 710,000 | 749,938 |
| Machinery 0.2% | | |
| Allison Transmission, Inc. (B) | 4.750 | 10-01-27 | | 400,000 | 400,000 |
| Mueller Water Products, Inc. (B) | 5.500 | 06-15-26 | | 475,000 | 495,188 |
| SPX FLOW, Inc. (B) | 5.625 | 08-15-24 | | 700,000 | 728,875 |
| Road and rail 0.2% | | |
| Ryder System, Inc. | 3.875 | 12-01-23 | | 2,000,000 | 2,101,971 |
| Trading companies and distributors 0.7% | | |
| Air Lease Corp. | 3.625 | 12-01-27 | | 3,550,000 | 3,592,684 |
| GATX Corp. | 4.550 | 11-07-28 | | 2,100,000 | 2,286,927 |
| 26 | JOHN HANCOCK SHORT DURATION CREDIT OPPORTUNITIES FUND | ANNUAL REPORT | SEE NOTES TO FINANCIAL STATEMENTS |
| | Rate (%) | Maturity date | | Par value^ | Value |
| Industrials (continued) | | |
| Trading companies and distributors (continued) | | |
| United Rentals North America, Inc. | 6.500 | 12-15-26 | | 625,000 | $676,375 |
| Transportation infrastructure 0.1% | | |
| Aeropuerto Internacional de Tocumen SA | 5.625 | 05-18-36 | | 243,000 | 275,805 |
| Aeropuerto Internacional de Tocumen SA (B) | 6.000 | 11-18-48 | | 184,000 | 223,790 |
| Rumo Luxembourg Sarl (B) | 7.375 | 02-09-24 | | 48,000 | 51,955 |
| Information technology 1.4% | | 12,119,292 |
| Communications equipment 0.2% | | |
| Hughes Satellite Systems Corp. | 6.625 | 08-01-26 | | 675,000 | 727,961 |
| ViaSat, Inc. (B) | 5.625 | 04-15-27 | | 475,000 | 496,366 |
| IT services 0.3% | | |
| Fiserv, Inc. | 3.200 | 07-01-26 | | 2,375,000 | 2,427,897 |
| Semiconductors and semiconductor equipment 0.7% | | |
| Broadcom, Inc. (B) | 4.250 | 04-15-26 | | 2,275,000 | 2,292,510 |
| Entegris, Inc. (B) | 4.625 | 02-10-26 | | 645,000 | 653,063 |
| Qorvo, Inc. | 5.500 | 07-15-26 | | 520,000 | 547,716 |
| Versum Materials, Inc. (B) | 5.500 | 09-30-24 | | 540,000 | 577,800 |
| Xilinx, Inc. | 2.950 | 06-01-24 | | 2,250,000 | 2,280,493 |
| Software 0.1% | | |
| Nuance Communications, Inc. | 5.625 | 12-15-26 | | 600,000 | 633,000 |
| SS&C Technologies, Inc. (B) | 5.500 | 09-30-27 | | 560,000 | 582,400 |
| Technology hardware, storage and peripherals 0.1% | | |
| Seagate HDD Cayman | 4.875 | 06-01-27 | | 896,000 | 900,086 |
| Materials 3.7% | | 32,274,111 |
| Chemicals 1.2% | | |
| Axalta Coating Systems LLC (B) | 4.875 | 08-15-24 | | 450,000 | 463,500 |
| CF Industries, Inc. | 5.150 | 03-15-34 | | 925,000 | 913,438 |
| CNAC HK Finbridge Company, Ltd. | 3.500 | 07-19-22 | | 328,000 | 329,536 |
| CNAC HK Finbridge Company, Ltd. | 5.125 | 03-14-28 | | 1,290,000 | 1,428,467 |
| Element Solutions, Inc. (B) | 5.875 | 12-01-25 | | 765,000 | 778,388 |
| GCP Applied Technologies, Inc. (B) | 5.500 | 04-15-26 | | 450,000 | 461,250 |
| Huntsman International LLC | 4.500 | 05-01-29 | | 2,250,000 | 2,315,458 |
| INEOS Group Holdings SA (B)(F) | 5.625 | 08-01-24 | | 255,000 | 254,363 |
| Nutrien, Ltd. | 5.000 | 04-01-49 | | 2,150,000 | 2,401,344 |
| OCI NV (B) | 6.625 | 04-15-23 | | 890,000 | 923,566 |
| OCP SA (B) | 6.875 | 04-25-44 | | 196,000 | 235,153 |
| Trinseo Materials Operating SCA (B) | 5.375 | 09-01-25 | | 235,000 | 222,369 |
| Construction materials 0.3% | | |
| U.S. Concrete, Inc. | 6.375 | 06-01-24 | | 515,000 | 535,600 |
| Vulcan Materials Company | 4.500 | 06-15-47 | | 2,300,000 | 2,274,346 |
| SEE NOTES TO FINANCIAL STATEMENTS | ANNUAL REPORT | JOHN HANCOCK SHORT DURATION CREDIT OPPORTUNITIES FUND | 27 |
| | Rate (%) | Maturity date | | Par value^ | Value |
| Materials (continued) | | |
| Containers and packaging 0.6% | | |
| Ardagh Packaging Finance PLC (B) | 4.125 | 08-15-26 | | 170,000 | $170,213 |
| Ardagh Packaging Finance PLC (B) | 6.000 | 02-15-25 | | 925,000 | 955,063 |
| Berry Global, Inc. (B) | 4.500 | 02-15-26 | | 540,000 | 539,179 |
| Berry Global, Inc. | 5.125 | 07-15-23 | | 245,000 | 250,206 |
| Cascades, Inc. (B) | 5.500 | 07-15-22 | | 685,000 | 691,850 |
| Crown Americas LLC | 4.750 | 02-01-26 | | 575,000 | 591,100 |
| Plastipak Holdings, Inc. (B)(F) | 6.250 | 10-15-25 | | 275,000 | 246,895 |
| WRKCo, Inc. | 3.900 | 06-01-28 | | 1,600,000 | 1,653,569 |
| Metals and mining 1.2% | | |
| Anglo American Capital PLC (B) | 4.000 | 09-11-27 | | 2,350,000 | 2,373,062 |
| ArcelorMittal | 4.550 | 03-11-26 | | 2,150,000 | 2,253,246 |
| Corp. Nacional del Cobre de Chile (B) | 3.625 | 08-01-27 | | 114,000 | 118,449 |
| Corp. Nacional del Cobre de Chile (B) | 4.375 | 02-05-49 | | 1,386,000 | 1,492,597 |
| Corp. Nacional del Cobre de Chile (B) | 4.500 | 09-16-25 | | 709,000 | 767,184 |
| Corp. Nacional del Cobre de Chile | 5.625 | 10-18-43 | | 136,000 | 171,150 |
| Freeport-McMoRan, Inc. | 4.550 | 11-14-24 | | 460,000 | 471,730 |
| Freeport-McMoRan, Inc. | 5.450 | 03-15-43 | | 425,000 | 393,482 |
| Indonesia Asahan Aluminium Persero PT (B) | 5.710 | 11-15-23 | | 195,000 | 214,695 |
| Kaiser Aluminum Corp. | 5.875 | 05-15-24 | | 510,000 | 530,400 |
| Newmont Goldcorp Corp. | 6.250 | 10-01-39 | | 975,000 | 1,264,963 |
| Paper and forest products 0.4% | | |
| Boise Cascade Company (B) | 5.625 | 09-01-24 | | 850,000 | 871,250 |
| Flex Acquisition Company, Inc. (B) | 6.875 | 01-15-25 | | 340,000 | 301,750 |
| Louisiana-Pacific Corp. | 4.875 | 09-15-24 | | 580,000 | 591,600 |
| Mercer International, Inc. | 5.500 | 01-15-26 | | 835,000 | 801,600 |
| Norbord, Inc. (B) | 5.750 | 07-15-27 | | 440,000 | 444,400 |
| Norbord, Inc. (B) | 6.250 | 04-15-23 | | 545,000 | 577,700 |
| Real estate 2.4% | | 20,972,243 |
| Equity real estate investment trusts 2.1% | | |
| American Homes 4 Rent LP | 4.250 | 02-15-28 | | 2,250,000 | 2,354,452 |
| Crown Castle International Corp. | 3.200 | 09-01-24 | | 2,250,000 | 2,295,351 |
| Digital Realty Trust LP | 2.750 | 02-01-23 | | 100,000 | 99,996 |
| Digital Realty Trust LP | 4.750 | 10-01-25 | | 1,975,000 | 2,155,276 |
| HCP, Inc. | 3.250 | 07-15-26 | | 1,700,000 | 1,719,473 |
| MGM Growth Properties Operating Partnership LP (B) | 5.750 | 02-01-27 | | 745,000 | 803,862 |
| Office Properties Income Trust | 4.250 | 05-15-24 | | 2,475,000 | 2,502,359 |
| Public Storage | 3.385 | 05-01-29 | | 2,275,000 | 2,388,095 |
| SITE Centers Corp. | 4.250 | 02-01-26 | | 2,125,000 | 2,232,389 |
| Welltower, Inc. | 3.950 | 09-01-23 | | 2,075,000 | 2,180,361 |
| 28 | JOHN HANCOCK SHORT DURATION CREDIT OPPORTUNITIES FUND | ANNUAL REPORT | SEE NOTES TO FINANCIAL STATEMENTS |
| | Rate (%) | Maturity date | | Par value^ | Value |
| Real estate (continued) | | |
| Real estate investment trusts 0.3% | | |
| WEA Finance LLC (B) | 3.500 | 06-15-29 | | 2,200,000 | $2,240,629 |
| Utilities 3.0% | | 26,098,831 |
| Electric utilities 1.6% | | |
| Electricite de France SA (B) | 4.500 | 09-21-28 | | 2,050,000 | 2,260,403 |
| Enel Finance International NV (B) | 4.625 | 09-14-25 | | 3,350,000 | 3,603,675 |
| Eskom Holdings SOC, Ltd. (B) | 5.750 | 01-26-21 | | 307,000 | 307,768 |
| Eskom Holdings SOC, Ltd. (B) | 7.125 | 02-11-25 | | 118,000 | 122,425 |
| Eskom Holdings SOC, Ltd. (B) | 8.450 | 08-10-28 | | 125,000 | 137,882 |
| FirstEnergy Corp. | 4.850 | 07-15-47 | | 2,075,000 | 2,385,317 |
| Georgia Power Company | 4.300 | 03-15-42 | | 1,100,000 | 1,177,557 |
| NextEra Energy Capital Holdings, Inc. | 3.342 | 09-01-20 | | 2,200,000 | 2,221,493 |
| NSTAR Electric Company | 3.200 | 05-15-27 | | 1,025,000 | 1,058,498 |
| Vistra Operations Company LLC (B) | 5.000 | 07-31-27 | | 220,000 | 225,225 |
| Vistra Operations Company LLC (B) | 5.625 | 02-15-27 | | 645,000 | 680,475 |
| Gas utilities 0.1% | | |
| Southern Gas Corridor CJSC | 6.875 | 03-24-26 | | 400,000 | 469,743 |
| Independent power and renewable electricity producers 0.6% | | |
| Calpine Corp. | 5.750 | 01-15-25 | | 716,000 | 716,000 |
| Exelon Generation Company LLC | 5.600 | 06-15-42 | | 2,050,000 | 2,343,187 |
| Minejesa Capital BV (B) | 4.625 | 08-10-30 | | 217,000 | 221,352 |
| Minejesa Capital BV (B) | 5.625 | 08-10-37 | | 33,000 | 35,441 |
| Mong Duong Finance Holdings BV (B) | 5.125 | 05-07-29 | | 214,000 | 216,067 |
| NRG Energy, Inc. | 5.750 | 01-15-28 | | 645,000 | 686,925 |
| Vistra Energy Corp. (B) | 8.000 | 01-15-25 | | 630,000 | 666,225 |
| Multi-utilities 0.7% | | |
| ACWA Power Management and Investments One, Ltd. (B) | 5.950 | 12-15-39 | | 637,000 | 683,466 |
| CenterPoint Energy, Inc. | 4.250 | 11-01-28 | | 2,100,000 | 2,285,715 |
| Cometa Energia SA de CV (B) | 6.375 | 04-24-35 | | 200,850 | 209,135 |
| Dominion Energy, Inc. | 2.579 | 07-01-20 | | 2,275,000 | 2,275,946 |
|
| Sempra Energy | 4.000 | 02-01-48 | | 1,100,000 | 1,108,911 |
| Term loans (H) 18.1% | | | $159,019,802 |
| (Cost $162,573,985) | | | | | |
| Communication services 3.4% | 29,675,375 |
| Diversified telecommunication services 1.0% | | |
| Altice France SA, USD Term Loan B11 (1 month LIBOR + 2.750%) | 4.984 | 07-31-25 | | 1,680,254 | 1,617,244 |
| Consolidated Communications, Inc., 2016 Term Loan B (1 month LIBOR + 3.000%) | 5.240 | 10-04-23 | | 1,619,319 | 1,508,866 |
| SEE NOTES TO FINANCIAL STATEMENTS | ANNUAL REPORT | JOHN HANCOCK SHORT DURATION CREDIT OPPORTUNITIES FUND | 29 |
| | Rate (%) | Maturity date | | Par value^ | Value |
| Communication services (continued) | |
| Diversified telecommunication services (continued) | | |
| Conterra Ultra Broadband Holdings, Inc., Term Loan (2 month LIBOR + 4.500%) | 6.840 | 04-24-26 | | 900,000 | $902,250 |
| Frontier Communications Corp., 2017 Term Loan B1 (1 month LIBOR + 3.750%) | 5.990 | 06-15-24 | | 1,588,023 | 1,568,173 |
| Intelsat Jackson Holdings SA, 2017 Term Loan B3 (1 month LIBOR + 3.750%) | 5.991 | 11-27-23 | | 835,000 | 836,787 |
| Level 3 Parent LLC, 2017 Term Loan B (1 month LIBOR + 2.250%) | 4.484 | 02-22-24 | | 964,000 | 964,405 |
| Telesat Canada, Term Loan B4 (3 month LIBOR + 2.500%) | 4.830 | 11-17-23 | | 1,684,249 | 1,684,249 |
| Entertainment 0.1% | | |
| UFC Holdings LLC, 2019 Term Loan (1 month LIBOR + 3.250%) | 5.490 | 04-29-26 | | 1,117,949 | 1,119,693 |
| Interactive media and services 0.3% | | |
| MH Sub I LLC, 2017 1st Lien Term Loan (1 month LIBOR + 3.750%) | 5.984 | 09-13-24 | | 1,344,281 | 1,335,879 |
| TierPoint LLC, 2017 1st Lien Term Loan (1 month LIBOR + 3.750%) | 5.984 | 05-06-24 | | 936,198 | 865,983 |
| Media 1.6% | | |
| Charter Communications Operating LLC, 2017 Term Loan B (3 month LIBOR + 2.000%) | 4.330 | 04-30-25 | | 1,112,503 | 1,114,149 |
| Cogeco Communications USA II LP, 2017 1st Lien Term Loan (1 month LIBOR + 2.250%) | 4.484 | 01-03-25 | | 1,029,800 | 1,026,968 |
| Creative Artists Agency LLC, 2018 Term Loan B (1 month LIBOR + 3.000%) | 5.234 | 02-15-24 | | 1,676,508 | 1,679,023 |
| CSC Holdings LLC, 2017 1st Lien Term Loan (1 month LIBOR + 2.250%) | 4.575 | 07-17-25 | | 1,705,378 | 1,698,983 |
| Cumulus Media New Holdings, Inc., Exit Term Loan (1 month LIBOR + 4.500%) | 6.740 | 05-15-22 | | 741,024 | 745,656 |
| Hubbard Radio LLC, 2015 Term Loan B (1 month LIBOR + 3.500%) | 5.740 | 03-28-25 | | 770,235 | 767,670 |
| Nascar Holdings, Inc., Term Loan B (I) | TBD | 07-26-26 | | 995,000 | 999,358 |
| Tribune Media Company, Term Loan (1 month LIBOR + 3.000%) | 5.234 | 12-27-20 | | 183,524 | 183,294 |
| Tribune Media Company, Term Loan C (1 month LIBOR + 3.000%) | 5.234 | 01-27-24 | | 2,287,387 | 2,283,110 |
| Unitymedia Finance LLC, Term Loan B (3 month LIBOR + 2.250%) | 4.604 | 09-30-25 | | 1,825,000 | 1,823,431 |
| Virgin Media Bristol LLC, USD Term Loan K (1 month LIBOR + 2.500%) | 4.825 | 01-15-26 | | 1,325,000 | 1,327,491 |
| 30 | JOHN HANCOCK SHORT DURATION CREDIT OPPORTUNITIES FUND | ANNUAL REPORT | SEE NOTES TO FINANCIAL STATEMENTS |
| | Rate (%) | Maturity date | | Par value^ | Value |
| Communication services (continued) | |
| Wireless telecommunication services 0.4% | | |
| SBA Senior Finance II LLC, 2018 Term Loan B (1 month LIBOR + 2.000%) | 4.240 | 04-11-25 | | 1,434,903 | $1,430,326 |
| Sprint Communications, Inc., 1st Lien Term Loan B (1 month LIBOR + 2.500%) | 4.750 | 02-02-24 | | 1,418,477 | 1,414,577 |
| Syniverse Holdings, Inc., 2018 1st Lien Term Loan (1 month LIBOR + 5.000%) | 7.325 | 03-09-23 | | 850,996 | 777,810 |
| Consumer discretionary 2.3% | 20,432,437 |
| Auto components 0.0% | | |
| Panther BF Aggregator 2 LP, USD Term Loan B (1 month LIBOR + 3.500%) | 5.734 | 04-30-26 | | 560,000 | 559,653 |
| Diversified consumer services 0.4% | | |
| PCI Gaming Authority, Term Loan (1 month LIBOR + 3.000%) | 5.234 | 05-29-26 | | 695,000 | 699,594 |
| Sunshine Luxembourg VII Sarl, Term Loan (I) | TBD | 07-16-26 | | 1,045,000 | 1,048,396 |
| Weight Watchers International, Inc., 2017 Term Loan B (1 and 3 month LIBOR + 4.750%) | 7.095 | 11-29-24 | | 1,564,830 | 1,550,167 |
| Whatabrands LLC, Term Loan B (I) | TBD | 07-23-26 | | 410,000 | 411,283 |
| Hotels, restaurants and leisure 0.9% | | |
| 1011778 BC ULC, Term Loan B3 (1 month LIBOR + 2.250%) | 4.484 | 02-16-24 | | 945,278 | 945,042 |
| Alterra Mountain Company, Term Loan B1 (1 month LIBOR + 3.000%) | 5.234 | 07-31-24 | | 1,756,076 | 1,755,339 |
| Boyd Gaming Corp., Term Loan B3 (1 week LIBOR + 2.250%) | 4.624 | 09-15-23 | | 1,319,738 | 1,318,748 |
| Caesars Resort Collection LLC, 2017 1st Lien Term Loan B (1 month LIBOR + 2.750%) | 4.984 | 12-22-24 | | 1,414,976 | 1,402,821 |
| CityCenter Holdings LLC, 2017 Term Loan B (1 month LIBOR + 2.250%) | 4.484 | 04-18-24 | | 791,728 | 792,717 |
| Golden Nugget LLC, 2017 Incremental Term Loan B (1 month LIBOR + 2.750%) | 5.020 | 10-04-23 | | 1,572,097 | 1,573,779 |
| Leisure products 0.3% | | |
| Diamond Sports Group LLC, Term Loan (I) | TBD | 07-17-26 | | 774,000 | 775,277 |
| Hayward Industries, Inc., 1st Lien Term Loan (1 month LIBOR + 3.500%) | 5.734 | 08-05-24 | | 1,615,559 | 1,597,384 |
| Multiline retail 0.2% | | |
| JC Penney Corp., Inc., 2016 Term Loan B (3 month LIBOR + 4.250%) | 6.771 | 06-23-23 | | 1,714,657 | 1,482,595 |
| Specialty retail 0.5% | | |
| Bass Pro Group LLC, Term Loan B (1 month LIBOR + 5.000%) | 7.234 | 09-25-24 | | 1,863,335 | 1,760,181 |
| SEE NOTES TO FINANCIAL STATEMENTS | ANNUAL REPORT | JOHN HANCOCK SHORT DURATION CREDIT OPPORTUNITIES FUND | 31 |
| | Rate (%) | Maturity date | | Par value^ | Value |
| Consumer discretionary (continued) | |
| Specialty retail (continued) | | |
| Party City Holdings, Inc., 2018 Term Loan B (1 and 3 month LIBOR + 2.500%) | 4.740 | 08-19-22 | | 692,549 | $690,569 |
| Petco Animal Supplies, Inc., 2017 Term Loan B (3 month LIBOR + 3.250%) | 5.506 | 01-26-23 | | 1,672,972 | 1,293,558 |
| PetSmart, Inc., Consenting Term Loan (1 month LIBOR + 4.000%) | 6.380 | 03-11-22 | | 790,238 | 775,334 |
| Consumer staples 2.1% | 18,094,591 |
| Beverages 0.2% | | |
| Refresco Holding BV, USD Term Loan B3 (3 month LIBOR + 3.250%) | 5.768 | 03-28-25 | | 1,390,950 | 1,390,088 |
| Food and staples retailing 0.2% | | |
| Albertson's LLC, Term Loan B7 (1 month LIBOR + 3.000%) | 5.234 | 11-17-25 | | 1,985,258 | 1,987,025 |
| Food products 1.1% | | |
| Chobani LLC, 2017 Term Loan B (1 month LIBOR + 3.500%) | 5.734 | 10-10-23 | | 1,097,008 | 1,085,006 |
| Dole Food Company, Inc., 2017 Term Loan B (1 month LIBOR + 2.750%) | 5.005 | 04-06-24 | | 1,418,055 | 1,403,874 |
| Hostess Brands LLC, 2017 Repriced Term Loan (1, 2 and 3 month LIBOR + 2.250%) | 4.508 | 08-03-22 | | 1,728,303 | 1,724,708 |
| JBS USA LUX SA, 2019 Term Loan B (1 month LIBOR + 2.500%) | 4.734 | 05-01-26 | | 862,838 | 864,399 |
| Nomad Foods Lux Sarl, 2017 USD Term Loan B4 (1 month LIBOR + 2.250%) | 4.575 | 05-15-24 | | 2,219,423 | 2,212,032 |
| Post Holdings, Inc., 2017 Series A Incremental Term Loan (3 month LIBOR + 2.000%) | 4.270 | 05-24-24 | | 1,654,133 | 1,653,670 |
| Upfield USA Corp., 2018 USD Term Loan B2 (3 month LIBOR + 3.000%) | 5.320 | 07-02-25 | | 654,390 | 652,139 |
| Household products 0.2% | | |
| Energizer Holdings, Inc., 2018 Term Loan B (1 month LIBOR + 2.250%) | 4.688 | 12-17-25 | | 1,473,750 | 1,470,994 |
| Personal products 0.4% | | |
| Prestige Brands, Inc., Term Loan B4 (1 month LIBOR + 2.000%) | 4.234 | 01-26-24 | | 1,096,154 | 1,094,784 |
| Revlon Consumer Products Corp., 2016 Term Loan B (3 month LIBOR + 3.500%) | 6.022 | 09-07-23 | | 3,148,905 | 2,555,872 |
| Energy 0.6% | 5,737,691 |
| Energy equipment and services 0.3% | | |
| Apergy Corp., 2018 1st Lien Term Loan (1 month LIBOR + 2.500%) | 4.750 | 05-09-25 | | 725,063 | 727,782 |
| Covia Holdings Corp., Term Loan (3 month LIBOR + 4.000%) | 6.313 | 06-01-25 | | 1,044,450 | 887,783 |
| 32 | JOHN HANCOCK SHORT DURATION CREDIT OPPORTUNITIES FUND | ANNUAL REPORT | SEE NOTES TO FINANCIAL STATEMENTS |
| | Rate (%) | Maturity date | | Par value^ | Value |
| Energy (continued) | |
| Energy equipment and services (continued) | | |
| HFOTCO LLC, 2018 Term Loan B (1 month LIBOR + 2.750%) | 4.990 | 06-26-25 | | 1,331,550 | $1,326,557 |
| Oil, gas and consumable fuels 0.3% | | |
| Granite Acquisition, Inc., Term Loan B (3 month LIBOR + 3.500%) | 5.819 | 12-19-21 | | 1,924,181 | 1,927,548 |
| Granite Acquisition, Inc., Term Loan C (3 month LIBOR + 3.500%) | 5.830 | 12-19-21 | | 88,066 | 88,220 |
| Prairie ECI Acquiror LP, Term Loan B (I) | TBD | 03-11-26 | | 778,050 | 779,801 |
| Financials 1.0% | 8,925,864 |
| Capital markets 0.2% | | |
| Blackstone CQP Holdco LP, Term Loan B (3 month LIBOR + 3.500%) | 5.887 | 09-30-24 | | 780,000 | 782,925 |
| Sequa Mezzanine Holdings LLC, 1st Lien Term Loan (3 month LIBOR + 5.000%) | 7.560 | 11-28-21 | | 816,218 | 805,248 |
| Diversified financial services 0.5% | | |
| AlixPartners LLP, 2017 Term Loan B (1 month LIBOR + 2.750%) | 4.984 | 04-04-24 | | 1,267,458 | 1,268,586 |
| Crown Finance US, Inc., 2018 USD Term Loan (1 month LIBOR + 2.250%) | 4.484 | 02-28-25 | | 959,913 | 955,882 |
| Deerfield Dakota Holding LLC, 2018 Term Loan B (1 month LIBOR + 3.250%) | 5.484 | 02-13-25 | | 948,186 | 921,077 |
| Refinitiv US Holdings, Inc., 2018 USD Term Loan (1 month LIBOR + 3.750%) | 5.984 | 10-01-25 | | 1,512,400 | 1,510,782 |
| Insurance 0.3% | | |
| Alliant Holdings Intermediate LLC, Term Loan B (1 month LIBOR + 3.250%) | 5.629 | 05-09-25 | | 660,000 | 654,773 |
| Asurion LLC, 2017 Term Loan B4 (1 month LIBOR + 3.000%) | 5.234 | 08-04-22 | | 1,013,262 | 1,014,894 |
| USI, Inc., 2017 Repriced Term Loan (3 month LIBOR + 3.000%) | 5.330 | 05-16-24 | | 1,026,885 | 1,011,697 |
| Health care 2.3% | 20,123,410 |
| Biotechnology 0.1% | | |
| Grifols Worldwide Operations USA, Inc., 2017 Acquisition Term Loan (1 week LIBOR + 2.250%) | 4.599 | 01-31-25 | | 957,551 | 959,591 |
| Health care equipment and supplies 0.3% | | |
| Air Medical Group Holdings, Inc., 2018 Term Loan B1 (1 month LIBOR + 3.250%) | 5.564 | 04-28-22 | | 1,110,641 | 1,074,546 |
| Kinetic Concepts, Inc., 2017 USD Term Loan B (3 month LIBOR + 3.250%) | 5.580 | 02-02-24 | | 1,656,055 | 1,660,709 |
| SEE NOTES TO FINANCIAL STATEMENTS | ANNUAL REPORT | JOHN HANCOCK SHORT DURATION CREDIT OPPORTUNITIES FUND | 33 |
| | Rate (%) | Maturity date | | Par value^ | Value |
| Health care (continued) | |
| Health care providers and services 1.0% | | |
| Air Methods Corp., 2017 Term Loan B (3 month LIBOR + 3.500%) | 5.830 | 04-21-24 | | 2,048,970 | $1,721,135 |
| Envision Healthcare Corp., 2018 1st Lien Term Loan (1 month LIBOR + 3.750%) | 5.984 | 10-10-25 | | 2,705,427 | 2,319,336 |
| RegionalCare Hospital Partners Holdings, Inc., 2018 Term loan B (3 month LIBOR + 4.500%) | 6.769 | 11-17-25 | | 2,015,449 | 2,026,534 |
| Surgery Center Holdings, Inc., 2017 Term Loan B (1 month LIBOR + 3.250%) | 5.490 | 09-02-24 | | 1,211,423 | 1,169,023 |
| Team Health Holdings, Inc., 1st Lien Term Loan (1 month LIBOR + 2.750%) | 4.984 | 02-06-24 | | 1,887,444 | 1,648,362 |
| Health care technology 0.1% | | |
| Change Healthcare Holdings LLC, 2017 Term Loan B (1 month LIBOR + 2.500%) | 4.734 | 03-01-24 | | 1,207,575 | 1,204,363 |
| Life sciences tools and services 0.2% | | |
| Jaguar Holding Company II, 2018 Term Loan (1 month LIBOR + 2.500%) | 4.734 | 08-18-22 | | 1,455,633 | 1,452,518 |
| Pharmaceuticals 0.6% | | |
| Bausch Health Americas, Inc., 2018 Term Loan B (1 month LIBOR + 3.000%) | 5.379 | 06-02-25 | | 1,448,268 | 1,452,975 |
| Catalent Pharma Solutions, Inc., Term Loan B2 (1 month LIBOR + 2.250%) | 4.484 | 05-18-26 | | 668,325 | 671,252 |
| Endo International PLC, 2017 Term Loan B (3 month LIBOR + 4.250%) | 6.500 | 04-29-24 | | 1,247,858 | 1,136,337 |
| IQVIA, Inc., 2017 USD Term Loan B2 (3 month LIBOR + 2.000%) | 4.330 | 01-17-25 | | 1,624,017 | 1,626,729 |
| Industrials 2.8% | 24,814,716 |
| Air freight and logistics 0.1% | | |
| XPO Logistics, Inc., 2018 Term Loan B (1 month LIBOR + 2.000%) | 4.234 | 02-24-25 | | 720,000 | 720,497 |
| Building products 0.1% | | |
| HNC Holdings, Inc., Term Loan B (1 month LIBOR + 4.000%) | 6.234 | 10-05-23 | | 840,725 | 841,078 |
| Commercial services and supplies 0.8% | | |
| Advanced Disposal Services, Inc., Term Loan B3 (1 week LIBOR + 2.250%) | 4.599 | 11-10-23 | | 1,748,697 | 1,751,547 |
| Clean Harbors, Inc., 2017 Term Loan B (1 month LIBOR + 1.750%) | 3.984 | 06-28-24 | | 1,196,075 | 1,198,467 |
| GFL Environmental, Inc., 2018 USD Term Loan B (1 month LIBOR + 3.000%) | 5.234 | 05-30-25 | | 1,287,356 | 1,276,324 |
| 34 | JOHN HANCOCK SHORT DURATION CREDIT OPPORTUNITIES FUND | ANNUAL REPORT | SEE NOTES TO FINANCIAL STATEMENTS |
| | Rate (%) | Maturity date | | Par value^ | Value |
| Industrials (continued) | |
| Commercial services and supplies (continued) | | |
| Prime Security Services Borrower LLC, 2016 1st Lien Term Loan (1 month LIBOR + 2.750%) | 4.984 | 05-02-22 | | 1,093,544 | $1,091,652 |
| TMS International Corp., 2018 Term Loan B2 (1 and 3 month LIBOR + 2.750%) | 4.997 | 08-14-24 | | 679,629 | 678,779 |
| West Corp., 2017 Term Loan (3 month LIBOR + 4.000%) | 6.522 | 10-10-24 | | 1,572,109 | 1,465,991 |
| Machinery 1.5% | | |
| Blount International, Inc., 2018 Term Loan B (1 month LIBOR + 3.750%) | 5.946 | 04-12-23 | | 1,992,369 | 1,989,878 |
| Douglas Dynamics LLC, 2017 Incremental Term Loan (1 month LIBOR + 3.000%) | 5.240 | 12-31-21 | | 1,183,886 | 1,183,152 |
| Filtration Group Corp., 2018 1st Lien Term Loan (1 month LIBOR + 3.000%) | 5.234 | 03-29-25 | | 2,286,583 | 2,288,618 |
| Gardner Denver, Inc., 2017 USD Term Loan B (1 month LIBOR + 2.750%) | 4.984 | 07-30-24 | | 810,178 | 811,685 |
| Gates Global LLC, 2017 USD Repriced Term Loan B (1 month LIBOR + 2.750%) | 4.984 | 04-01-24 | | 2,662,174 | 2,649,342 |
| Navistar, Inc., 2017 1st Lien Term Loan B (1 month LIBOR + 3.500%) | 5.830 | 11-06-24 | | 2,278,567 | 2,282,851 |
| Titan Acquisition, Ltd., 2018 Term Loan B (1 month LIBOR + 3.000%) | 5.234 | 03-28-25 | | 1,410,262 | 1,337,987 |
| Welbilt, Inc., 2018 Term Loan B (1 month LIBOR + 2.500%) | 4.734 | 10-23-25 | | 786,162 | 777,317 |
| Professional services 0.2% | | |
| Trans Union LLC, 2018 Term Loan B4 (1 month LIBOR + 2.000%) | 4.234 | 06-19-25 | | 1,410,000 | 1,411,763 |
| Trading companies and distributors 0.1% | | |
| Beacon Roofing Supply, Inc., 2017 Term Loan B (1 month LIBOR + 2.250%) | 4.619 | 01-02-25 | | 1,063,403 | 1,057,788 |
| Information technology 2.1% | 18,060,283 |
| Communications equipment 0.3% | | |
| Ciena Corp., 2018 Term Loan B (1 month LIBOR + 2.000%) | 4.277 | 09-26-25 | | 1,007,388 | 1,010,853 |
| Plantronics, Inc., 2018 Term Loan B (1 month LIBOR + 2.500%) | 4.734 | 07-02-25 | | 1,389,213 | 1,388,865 |
| Electronic equipment, instruments and components 0.6% | | |
| CPI International, Inc., 2017 1st Lien Term Loan (1 month LIBOR + 3.500%) | 5.734 | 07-26-24 | | 1,236,520 | 1,231,500 |
| Dell International LLC, 2017 Term Loan B | 4.240 | 09-07-23 | | 2,260,513 | 2,265,825 |
| SEE NOTES TO FINANCIAL STATEMENTS | ANNUAL REPORT | JOHN HANCOCK SHORT DURATION CREDIT OPPORTUNITIES FUND | 35 |
| | Rate (%) | Maturity date | | Par value^ | Value |
| Information technology (continued) | |
| Electronic equipment, instruments and components (continued) | | |
| Robertshaw US Holding Corp., 2018 1st Lien Term Loan (1 month LIBOR + 3.250%) | 5.500 | 02-28-25 | | 1,165,250 | $1,088,052 |
| Robertshaw US Holding Corp., 2018 2nd Lien Term Loan (1 month LIBOR + 8.000%) | 10.250 | 02-28-26 | | 700,000 | 600,250 |
| IT services 0.2% | | |
| Global Payments, Inc., 2018 Term Loan B4 (1 month LIBOR + 1.750%) | 3.984 | 10-17-25 | | 847,870 | 847,607 |
| Optiv Security, Inc., 1st Lien Term Loan (1 month LIBOR + 3.250%) | 5.484 | 02-01-24 | | 680,114 | 622,304 |
| Software 0.7% | | |
| Avaya, Inc., 2018 Term Loan B (1 month LIBOR + 4.250%) | 6.575 | 12-15-24 | | 2,465,675 | 2,369,365 |
| Infor US, Inc., Term Loan B6 (3 month LIBOR + 2.750%) | 5.080 | 02-01-22 | | 1,552,465 | 1,552,185 |
| Informatica LLC, 2018 USD Term Loan (1 month LIBOR + 3.250%) | 5.484 | 08-05-22 | | 638,375 | 640,929 |
| SS&C European Holdings Sarl, 2018 Term Loan B4 (1 month LIBOR + 2.250%) | 4.484 | 04-16-25 | | 594,558 | 594,190 |
| SS&C Technologies, Inc., 2018 Term Loan B3 (1 month LIBOR + 2.250%) | 4.484 | 04-16-25 | | 873,275 | 872,734 |
| The Ultimate Software Group, Inc., Term Loan B (3 month LIBOR + 3.750%) | 6.080 | 05-04-26 | | 655,000 | 659,808 |
| Technology hardware, storage and peripherals 0.3% | | |
| HCP Acquisition LLC, 2017 Term Loan B (1 month LIBOR + 2.750%) | 4.984 | 05-16-24 | | 925,796 | 923,148 |
| Western Digital Corp., 2018 Term Loan B4 (3 month LIBOR + 1.750%) | 4.012 | 04-29-23 | | 1,404,961 | 1,392,668 |
| Materials 0.9% | 8,360,129 |
| Chemicals 0.5% | | |
| Alpha 3 BV, 2017 Term Loan B1 (3 month LIBOR + 3.000%) | 5.330 | 01-31-24 | | 1,249,747 | 1,220,378 |
| Element Solutions, Inc., Term Loan (1 month LIBOR + 2.250%) | 4.484 | 01-30-26 | | 721,375 | 720,776 |
| Encapsys LLC, 1st Lien Term Loan (1 month LIBOR + 3.500%) | 5.734 | 11-07-24 | | 835,198 | 836,242 |
| Encapsys LLC, 2019 Term Loan (1 month LIBOR + 3.500%) | 5.734 | 11-07-24 | | 450,000 | 450,563 |
| Ferro Corp., 2018 USD Term Loan B1 (3 month LIBOR + 2.250%) | 4.580 | 02-14-24 | | 1,623,677 | 1,616,062 |
| Construction materials 0.1% | | |
| Summit Materials LLC, 2017 Term Loan B (1 month LIBOR + 2.000%) | 4.234 | 11-21-24 | | 699,786 | 696,868 |
| 36 | JOHN HANCOCK SHORT DURATION CREDIT OPPORTUNITIES FUND | ANNUAL REPORT | SEE NOTES TO FINANCIAL STATEMENTS |
| | Rate (%) | Maturity date | | Par value^ | Value |
| Materials (continued) | |
| Containers and packaging 0.1% | | |
| Berry Global, Inc., Term Loan Q (1 month LIBOR + 2.250%) | 4.629 | 10-01-22 | | 710,000 | $709,517 |
| Paper and forest products 0.2% | | |
| Flex Acquisition Company, Inc., 1st Lien Term Loan (3 month LIBOR + 3.000%) | 5.319 | 12-29-23 | | 2,209,504 | 2,109,723 |
| Real estate 0.2% | 1,471,077 |
| Equity real estate investment trusts 0.2% | | |
| VICI Properties 1 LLC, Replacement Term Loan B (1 month LIBOR + 2.000%) | 4.272 | 12-20-24 | | 1,475,000 | 1,471,077 |
| Utilities 0.4% | 3,324,229 |
| Electric utilities 0.2% | | |
| Vistra Operations Company LLC, 1st Lien Term Loan B3 (1 and 3 month LIBOR + 2.000%) | 4.270 | 12-31-25 | | 1,957,672 | 1,960,471 |
| Independent power and renewable electricity producers 0.2% | | |
|
| Calpine Corp., Term Loan B5 (3 month LIBOR + 2.500%) | 4.830 | 01-15-24 | | 1,363,567 | 1,363,758 |
| Collateralized mortgage obligations 12.2% | | | | $106,939,481 |
| (Cost $104,441,924) | | | | | |
| Commercial and residential 12.0% | | | | 105,461,334 |
280 Park Avenue Mortgage Trust
Series 2017-280P, Class A (1 month LIBOR + 0.880%) (A)(B) | 3.205 | 09-15-34 | | 2,500,000 | 2,500,786 |
Arroyo Mortgage Trust
Series 2018-1, Class A1 (B)(J) | 3.763 | 04-25-48 | | 1,943,587 | 1,985,222 |
| BBCMS Mortgage Trust | | | | |
| Series 2018-TALL, Class A (1 month LIBOR + 0.722%) (A)(B) | 3.047 | 03-15-37 | | 3,700,000 | 3,694,183 |
| Series 2018-TALL, Class B (1 month LIBOR + 0.971%) (A)(B) | 3.296 | 03-15-37 | | 2,225,000 | 2,224,290 |
| BBCMS Trust | | | | |
| Series 2018-BXH, Class A (1 month LIBOR + 1.000%) (A)(B) | 3.325 | 10-15-37 | | 2,003,002 | 2,001,101 |
| Series 2018-RRI, Class A (1 month LIBOR + 0.700%) (A)(B) | 3.025 | 02-15-33 | | 2,114,919 | 2,096,397 |
BX Commercial Mortgage Trust
Series 2019-IMC, Class B (1 month LIBOR + 1.300%) (A)(B) | 3.625 | 04-15-34 | | 3,000,000 | 3,007,514 |
BX Trust
Series 2017-SLCT, Class A (1 month LIBOR + 0.920%) (A)(B) | 3.245 | 07-15-34 | | 451,626 | 451,763 |
CG-CCRE Commercial Mortgage Trust
Series 2014-FL2, Class A (1 month LIBOR + 1.854%) (A)(B) | 4.179 | 11-15-31 | | 1,216,964 | 1,216,970 |
| SEE NOTES TO FINANCIAL STATEMENTS | ANNUAL REPORT | JOHN HANCOCK SHORT DURATION CREDIT OPPORTUNITIES FUND | 37 |
| | Rate (%) | Maturity date | | Par value^ | Value |
| Commercial and residential (continued) | | | | |
CGMS Commercial Mortgage Trust
Series 2017-MDRB, Class A (1 month LIBOR + 1.100%) (A)(B) | 3.425 | 07-15-30 | | 2,849,396 | $2,826,688 |
| CHL Mortgage Pass-Through Trust | | | | |
| Series 2004-25, Class 2A1 (1 month LIBOR + 0.680%) (A) | 2.946 | 02-25-35 | | 2,146,377 | 2,072,668 |
| Series 2006-3, Class 3A1 (1 month LIBOR + 0.250%) (A) | 2.516 | 02-25-36 | | 838,500 | 806,064 |
CHT Mortgage Trust
Series 2017-CSMO, Class A (1 month LIBOR + 0.930%) (A)(B) | 3.255 | 11-15-36 | | 4,900,000 | 4,901,501 |
| Citigroup Commercial Mortgage Trust (Citigroup/Drexel Hamilton) | | | | |
| Series 2018-TBR, Class A (1 month LIBOR + 0.830%) (A)(B) | 3.155 | 12-15-36 | | 3,575,000 | 3,572,723 |
| Series 2019-SST2, Class A (1 month LIBOR + 0.920%) (A)(B) | 3.245 | 12-15-36 | | 2,615,000 | 2,611,723 |
Citigroup Mortgage Loan Trust
Series 2013-2, Class 5A1 (1 month LIBOR + 0.140%) (A)(B) | 2.544 | 07-25-36 | | 1,130,910 | 1,118,137 |
COLT Mortgage Loan Trust
Series 2018-1, Class A1 (B)(J) | 2.930 | 02-25-48 | | 706,345 | 705,935 |
Credit Suisse Mortgage Capital Certificates
Series 2019-ICE4, Class A (1 month LIBOR + 0.980%) (A)(B) | 3.305 | 05-15-36 | | 3,000,000 | 3,009,522 |
DBGS Mortgage Trust
Series 2018-5BP, Class A (1 month LIBOR + 0.645%) (A)(B) | 2.970 | 06-15-33 | | 4,000,000 | 3,988,657 |
| Deephaven Residential Mortgage Trust | | | | |
| Series 2018-1A, Class A1 (B)(J) | 2.976 | 12-25-57 | | 1,512,087 | 1,511,734 |
| Series 2019-2A, Class A1 (B)(J) | 3.558 | 04-25-59 | | 2,984,088 | 3,007,952 |
Financial Asset Securities Corp. AAA Trust
Series 2005-2, Class A3 (1 month LIBOR + 0.300%) (A)(B) | 2.562 | 11-26-35 | | 2,005,256 | 1,941,837 |
GS Mortgage Securities Corp. Trust
Series 2018-FBLU, Class A (1 month LIBOR + 0.950%) (A)(B) | 3.275 | 11-15-35 | | 2,600,000 | 2,601,664 |
HarborView Mortgage Loan Trust
Series 2007-3, Class 2A1A (1 month LIBOR + 0.200%) (A) | 2.498 | 05-19-47 | | 1,979,957 | 1,937,331 |
Hilton Orlando Trust
Series 2018-ORL, Class A (1 month LIBOR + 0.770%) (A)(B) | 3.095 | 12-15-34 | | 2,675,000 | 2,674,107 |
Hudsons Bay Simon JV Trust
Series 2015-HBFL, Class AFL (1 month LIBOR + 1.830%) (A)(B) | 4.260 | 08-05-34 | | 6,250,000 | 6,256,190 |
IndyMac INDA Mortgage Loan Trust
Series 2005-AR2, Class 1A1 (J) | 3.269 | 01-25-36 | | 480,099 | 436,769 |
JPMBB Commercial Mortgage Securities Trust
Series 2015-C29, Class A2 | 2.921 | 05-15-48 | | 1,576,541 | 1,578,278 |
| 38 | JOHN HANCOCK SHORT DURATION CREDIT OPPORTUNITIES FUND | ANNUAL REPORT | SEE NOTES TO FINANCIAL STATEMENTS |
| | Rate (%) | Maturity date | | Par value^ | Value |
| Commercial and residential (continued) | | | | |
| JPMorgan Chase Commercial Mortgage Securities Trust | | | | |
| Series 2006-LDP9, Class AMS | 5.337 | 05-15-47 | | 4,446,252 | $4,093,355 |
| Series 2007-LDPX, Class AM (J) | 5.464 | 01-15-49 | | 389,214 | 387,883 |
Key Commercial Mortgage Securities Trust
Series 2019-S2, Class A1 (B) | 2.656 | 06-15-52 | | 3,075,000 | 3,069,791 |
LSTAR Securities Investment Trust
Series 2019-1, Class A1 (1 month LIBOR + 1.700%) (A)(B) | 3.930 | 03-01-24 | | 1,381,380 | 1,384,562 |
| LSTAR Securities Investment, Ltd. | | | | |
| Series 2019-3, Class A1 (1 month LIBOR + 1.500%) (A)(B) | 3.902 | 04-01-24 | | 3,276,041 | 3,276,649 |
| Series 2019-4, Class A1 (1 month LIBOR + 1.500%) (A)(B) | 3.902 | 05-01-24 | | 4,823,553 | 4,828,818 |
MSCG Trust
Series 2018-SELF, Class A (1 month LIBOR + 0.900%) (A)(B) | 3.225 | 10-15-37 | | 1,775,000 | 1,776,660 |
MTRO Commercial Mortgage Trust
Series 2019-TECH, Class A (1 month LIBOR + 0.900%) (A)(B) | 3.225 | 12-15-33 | | 2,100,000 | 2,103,293 |
RBS Commercial Funding, Inc. Trust
Series 2013-GSP, Class A (B)(J) | 3.834 | 01-15-32 | | 4,250,000 | 4,439,212 |
| RBSSP Resecuritization Trust | | | | |
| Series 2012-6, Class 10A1 (1 month LIBOR + 0.150%) (A)(B) | 2.554 | 08-26-36 | | 67,264 | 67,043 |
| Series 2012-6, Class 4A1 (1 month LIBOR + 0.330%) (A)(B) | 2.734 | 01-26-36 | | 945,504 | 940,831 |
| Series 2012-6, Class 6A1 (1 month LIBOR + 0.340%) (A)(B) | 3.084 | 11-26-35 | | 2,604,028 | 2,606,337 |
| Series 2012-6, Class 8A1 (1 month LIBOR + 0.500%) (A)(B) | 2.904 | 04-26-35 | | 530,943 | 528,905 |
Verus Securitization Trust
Series 2019-2, Class A1 (B)(J) | 3.211 | 04-25-59 | | 1,668,692 | 1,681,058 |
WaMu Mortgage Pass Through Certificates
Series 2005-AR6, Class 2A1A (1 month LIBOR + 0.460%) (A) | 2.726 | 04-25-45 | | 1,569,040 | 1,556,445 |
| WaMu Mortgage Pass-Through Certificates | | | | |
| Series 2005-AR1, Class A1A (1 month LIBOR + 0.640%) (A) | 2.906 | 01-25-45 | | 691,809 | 693,260 |
| Series 2005-AR11, Class A1A (1 month LIBOR + 0.320%) (A) | 2.586 | 08-25-45 | | 1,719,336 | 1,710,763 |
| Series 2005-AR19, Class A1A1 (1 month LIBOR + 0.270%) (A) | 2.536 | 12-25-45 | | 1,700,717 | 1,717,693 |
| Series 2005-AR8, Class 1A1A (1 month LIBOR + 0.540%) (A) | 2.806 | 07-25-45 | | 1,404,664 | 1,399,603 |
Wells Fargo Mortgage Backed Securities Trust
Series 2005-AR4, Class 2A2 (J) | 5.105 | 04-25-35 | | 454,085 | 461,467 |
| U.S. Government Agency 0.2% | | | | 1,478,147 |
| Federal Home Loan Mortgage Corp. | | | | |
| SEE NOTES TO FINANCIAL STATEMENTS | ANNUAL REPORT | JOHN HANCOCK SHORT DURATION CREDIT OPPORTUNITIES FUND | 39 |
| | Rate (%) | Maturity date | | Par value^ | Value |
| U.S. Government Agency (continued) | | | | |
| Series 2015-SC02, Class 1A | 3.000 | 09-25-45 | | 265,299 | $267,632 |
| Series 4013, Class DK | 3.000 | 02-15-31 | | 950,974 | 974,415 |
|
Government National Mortgage Association
Series 2014-80, Class XA | 3.000 | 06-20-40 | | 232,179 | 236,100 |
| Asset backed securities 10.6% | | | | $92,598,097 |
| (Cost $92,159,828) | | | | | |
| Asset backed securities 10.6% | | | | 92,598,097 |
AmeriCredit Automobile Receivables Trust
Series 2017-3, Class C | 2.690 | 06-19-23 | | 2,150,000 | 2,160,125 |
| Drive Auto Receivables Trust | | | | | |
| Series 2018-3, Class D | 4.300 | 09-16-24 | | 1,100,000 | 1,131,827 |
| Series 2019-1, Class C | 3.780 | 04-15-25 | | 2,415,000 | 2,462,419 |
Ford Credit Auto Owner Trust
Series 2018-1, Class A (B) | 3.190 | 07-15-31 | | 2,575,000 | 2,650,926 |
Hertz Fleet Lease Funding LP
Series 2017-1, Class A1 (1 month LIBOR + 0.650%) (A)(B) | 3.029 | 04-10-31 | | 1,223,360 | 1,225,336 |
Hyundai Auto Lease Securitization Trust
Series 2017-C, Class A3 (B) | 2.120 | 02-16-21 | | 2,497,068 | 2,495,838 |
| Invitation Homes Trust | | | | | |
| Series 2018-SFR1, Class A (1 month LIBOR + 0.700%) (A)(B) | 3.014 | 03-17-37 | | 2,870,788 | 2,834,493 |
| Series 2018-SFR2, Class A (1 month LIBOR + 0.900%) (A)(B) | 3.225 | 06-17-37 | | 2,665,519 | 2,664,372 |
| Series 2018-SFR3, Class A (1 month LIBOR + 1.000%) (A)(B) | 3.314 | 07-17-37 | | 3,159,336 | 3,162,835 |
Mill City Mortgage Loan Trust
Series 2016-1, Class A1 (B)(J) | 2.500 | 04-25-57 | | 1,091,662 | 1,086,904 |
New Residential Advance Receivables Trust
Series 2017-T1, Class AT1 (B) | 3.214 | 02-15-51 | | 4,625,000 | 4,663,819 |
Oak Hill Advisors Residential Loan Trust
Series 2017-NPL2, Class A1 (B) | 3.000 | 07-25-57 | | 989,585 | 983,924 |
Pretium Mortgage Credit Partners I LLC
Series 2019-NPL2, Class A1 (B) | 3.844 | 12-25-58 | | 2,252,007 | 2,257,706 |
PRPM LLC
Series 2019-3A, Class A1 (B) | 3.351 | 07-25-24 | | 1,550,000 | 1,548,022 |
RCO V Mortgage LLC
Series 2018-1, Class A1 (B) | 4.000 | 05-25-23 | | 1,720,531 | 1,719,998 |
Santander Drive Auto Receivables Trust
Series 2018-1, Class E (B) | 4.370 | 05-15-25 | | 1,775,000 | 1,789,213 |
SLC Student Loan Trust
Series 2004-1, Class A6 (3 month LIBOR + 0.160%) (A) | 2.678 | 05-15-23 | | 1,174,982 | 1,173,943 |
| SMB Private Education Loan Trust | | | | | |
| Series 2015-B, Class A3 (1 month LIBOR + 1.750%) (A)(B) | 4.075 | 05-17-32 | | 900,000 | 924,582 |
| 40 | JOHN HANCOCK SHORT DURATION CREDIT OPPORTUNITIES FUND | ANNUAL REPORT | SEE NOTES TO FINANCIAL STATEMENTS |
| | Rate (%) | Maturity date | | Par value^ | Value |
| Asset backed securities (continued) | | | | |
| Series 2017-B, Class A2B (1 month LIBOR + 0.750%) (A)(B) | 3.075 | 10-15-35 | | 2,760,000 | $2,759,134 |
| SoFi Professional Loan Program LLC | | | | | |
| Series 2015-C, Class A1 (1 month LIBOR + 1.050%) (A)(B) | 3.316 | 08-27-35 | | 641,468 | 646,342 |
| Series 2016-C, Class A1 (1 month LIBOR + 1.100%) (A)(B) | 3.366 | 10-27-36 | | 771,266 | 776,305 |
| Series 2016-D, Class A1 (1 month LIBOR + 0.950%) (A)(B) | 3.216 | 01-25-39 | | 461,132 | 463,690 |
Springleaf Funding Trust
Series 2016-AA, Class A (B) | 2.900 | 11-15-29 | | 1,830,190 | 1,831,285 |
TAL Advantage V LLC
Series 2013-2A, Class A (B) | 3.550 | 11-20-38 | | 1,625,000 | 1,635,567 |
| Towd Point Mortgage Trust | | | | | |
| Series 2016-2, Class A1A (B)(J) | 2.750 | 08-25-55 | | 1,116,681 | 1,119,765 |
| Series 2018-4, Class A1 (B)(J) | 3.000 | 06-25-58 | | 3,820,123 | 3,845,844 |
| Trafigura Securitisation Finance PLC | | | | | |
| Series 2017-1A, Class A1 (1 month LIBOR + 0.850%) (A)(B) | 3.175 | 12-15-20 | | 3,550,000 | 3,550,706 |
| Series 2018-1A, Class A1 (1 month LIBOR + 0.730%) (A)(B) | 3.055 | 03-15-22 | | 3,425,000 | 3,391,562 |
| Vericrest Opportunity Loan Trust | | | | | |
| Series 2019-NPL2, Class A1 (B) | 3.967 | 02-25-49 | | 1,956,770 | 1,964,428 |
| Series 2019-NPL3, Class A1 (B) | 3.967 | 03-25-49 | | 1,949,733 | 1,961,859 |
VOLT LXII LLC
Series 2017-NPL9, Class A1 (B) | 3.125 | 09-25-47 | | 1,134,473 | 1,133,572 |
VOLT LXIV LLC
Series 2017-NP11, Class A1 (B) | 3.375 | 10-25-47 | | 2,840,365 | 2,838,058 |
VOLT LXIX LLC
Series 2018-NPL5, Class A1A (B) | 4.213 | 08-25-48 | | 4,231,167 | 4,238,921 |
VOLT LXV LLC
Series 2018-NPL1, Class A1 (B) | 3.750 | 04-25-48 | | 3,507,918 | 3,507,100 |
VOLT LXX LLC
Series 2018-NPL6, Class A1A (B) | 4.115 | 09-25-48 | | 2,409,657 | 2,412,652 |
VOLT LXXII LLC
Series 2018-NPL8, Class A1A (B) | 4.213 | 10-26-48 | | 3,310,561 | 3,317,680 |
VOLT LXXIII LLC
Series 2018-NPL9, Class A1A (B) | 4.458 | 10-25-48 | | 969,000 | 972,570 |
VOLT LXXIV LLC
Series 2018-NP10, Class A1A (B) | 4.581 | 11-25-48 | | 3,036,321 | 3,046,187 |
VOLT LXXV LLC
Series 2019-NPL1, Class A1A (B) | 4.336 | 01-25-49 | | 2,489,906 | 2,499,293 |
Westlake Automobile Receivables Trust
Series 2018-1A, Class A2B (1 month LIBOR + 0.250%) (A)(B) | 2.575 | 12-15-20 | | 182,666 | 182,661 |
| World Financial Network Credit Card Master Trust | | | | | |
| Series 2017-C, Class M | 2.660 | 08-15-24 | | 3,375,000 | 3,371,277 |
| Series 2018-B, Class M | 3.810 | 07-15-25 | | 4,100,000 | 4,195,357 |
|
| SEE NOTES TO FINANCIAL STATEMENTS | ANNUAL REPORT | JOHN HANCOCK SHORT DURATION CREDIT OPPORTUNITIES FUND | 41 |
| | | | | Shares | Value |
| Common stocks 0.0% | | | $231,076 |
| (Cost $159,289) | | | | | |
| Communication services 0.0% | | | 64,595 |
| Media 0.0% | | | |
| Cumulus Media, Inc., Class A (D) | | | | 4,275 | 64,595 |
| Energy 0.0% | | | 166,481 |
| Energy equipment and services 0.0% | | | |
| Paragon Offshore PLC, Litigation Trust A (D) | | | | 2,695 | 539 |
| Paragon Offshore PLC, Litigation Trust B (D) | | | | 1,348 | 36,733 |
| Southcross Holdings Borrower LP | | | | 246 | 129,150 |
| Oil, gas and consumable fuels 0.0% | | | |
| Euronav NV | | | | 7 | 59 |
| | Rate (%) | Maturity date | | Par value^ | Value |
| Escrow certificates 0.0% | | | $16,813 |
| (Cost $4,430) | | | | | |
| Midstates Petroleum Company, Inc. (D)(K) | 10.750 | 10-01-20 | | 650,000 | 582 |
| Texas Competitive Electric Holdings Company LLC (D)(K) | 11.500 | 10-01-20 | | 10,820,544 | 16,231 |
| | | | | Shares | Value |
| Warrants 0.0% | | | | | $49 |
| (Cost $0) | | | | | |
| Halcon Resources Corp. (Expiration Date: 9-9-20; Strike Price: $14.04) (D) | | | | 4,896 | 49 |
| | | Yield (%) | | Shares | Value |
| Securities lending collateral 0.2% | | | | $1,851,041 |
| (Cost $1,850,374) | | | | | |
| John Hancock Collateral Trust (L) | | 2.4297(M) | | 184,980 | 1,851,041 |
|
| | Yield*(%) | Maturity date | | Par value^ | Value |
| Short-term investments 7.4% | | | $64,565,410 |
| (Cost $64,543,224) | | | | | |
| Foreign government 0.1% | | | | | 517,753 |
| Egypt Treasury Bills | 16.540 | 08-06-19 | EGP | 6,000,000 | 361,904 |
| Egypt Treasury Bills | 16.788 | 08-20-19 | EGP | 2,600,000 | 155,849 |
| | | Yield (%) | | Shares | Value |
| Money market funds 7.3% | | | | | 64,047,657 |
|
| State Street Institutional Treasury Plus Money Market Fund, Premier Class | | 2.2121(M) | | 64,047,657 | 64,047,657 |
| 42 | JOHN HANCOCK SHORT DURATION CREDIT OPPORTUNITIES FUND | ANNUAL REPORT | SEE NOTES TO FINANCIAL STATEMENTS |
|
| Total investments (Cost $860,981,913) 99.6% | | | $873,561,418 |
| Other assets and liabilities, net 0.4% | | | 3,797,777 |
| Total net assets 100.0% | | | $877,359,195 |
| The percentage shown for each investment category is the total value of the category as a percentage of the net assets of the fund. |
| ^All par values are denominated in U.S. dollars unless otherwise indicated. |
| Currency Abbreviations |
| BRL | Brazilian Real |
| CLP | Chilean Peso |
| COP | Colombian Peso |
| CZK | Czech Republic Koruna |
| EGP | Egyptian Pound |
| EUR | Euro |
| IDR | Indonesian Rupiah |
| MXN | Mexican Peso |
| MYR | Malaysian Ringgit |
| PEN | Peruvian Nuevo Sol |
| PLN | Polish Zloty |
| RON | Romanian New Leu |
| RUB | Russian Ruble |
| THB | Thai Bhat |
| TRY | Turkish Lira |
| UYU | Uruguayan Peso |
| ZAR | South African Rand |
| Security Abbreviations and Legend |
| CMT | Constant Maturity Treasury |
| ISDAFIX | International Swaps and Derivatives Association Fixed Interest Rate Swap Rate |
| LIBOR | London Interbank Offered Rate |
| PIK | Pay-in-Kind Security - Represents a payment-in-kind which may pay interest in additional par and/or cash. Rates shown are the current rate and most recent payment rate. |
| (A) | Variable rate obligation. The coupon rate shown represents the rate at period end. |
| (B) | These securities are exempt from registration under Rule 144A of the Securities Act of 1933. Such securities may be resold, normally to qualified institutional buyers, in transactions exempt from registration. Rule 144A securities amounted to $305,118,589 or 34.8% of the fund's net assets as of 7-31-19. |
| (C) | Zero coupon bonds are issued at a discount from their principal amount in lieu of paying interest periodically. Rate shown is the effective yield at period end. |
| (D) | Non-income producing security. |
| (E) | Non-income producing - Issuer is in default. |
| (F) | All or a portion of this security is on loan as of 7-31-19. |
| (G) | Perpetual bonds have no stated maturity date. Date shown as maturity date is next call date. |
| (H) | Term loans are variable rate obligations. The coupon rate shown represents the rate at period end. |
| (I) | This position represents an unsettled loan commitment at period end. Certain details associated with this purchase are not known prior to the settlement date, including coupon rate, which is disclosed as TBD (To Be Determined). |
| (J) | Variable or floating rate security, the interest rate of which adjusts periodically based on a weighted average of interest rates and prepayments on the underlying pool of assets. The interest rate shown is the current rate as of period end. |
| (K) | Security is valued using significant unobservable inputs and is classified as Level 3 in the fair value hierarchy. |
| SEE NOTES TO FINANCIAL STATEMENTS | ANNUAL REPORT | JOHN HANCOCK SHORT DURATION CREDIT OPPORTUNITIES FUND | 43 |
| (L) | Investment is an affiliate of the fund, the advisor and/or subadvisor. This security represents the investment of cash collateral received for securities lending. |
| (M) | The rate shown is the annualized seven-day yield as of 7-31-19. |
| * | Yield represents either the annualized yield at the date of purchase, the stated coupon rate or, for floating rate securities, the rate at period end. |
| 44 | JOHN HANCOCK SHORT DURATION CREDIT OPPORTUNITIES FUND | ANNUAL REPORT | SEE NOTES TO FINANCIAL STATEMENTS |
DERIVATIVES
FUTURES
| Open contracts | Number of
contracts | Position | Expiration
date | Notional
basis^ | Notional
value^ | Unrealized
appreciation
(depreciation) |
| 2-Year U.S. Treasury Note Futures | 170 | Long | Sep 2019 | $36,302,285 | $36,449,063 | $146,778 |
| 5-Year U.S. Treasury Note Futures | 767 | Long | Sep 2019 | 89,660,759 | 90,164,446 | 503,687 |
| 10-Year U.S. Treasury Note Futures | 192 | Short | Sep 2019 | (24,044,272) | (24,465,000) | (420,728) |
| Ultra U.S. Treasury Bond Futures | 372 | Short | Sep 2019 | (62,715,465) | (66,053,250) | (3,337,785) |
| | | | | | | $(3,108,048) |
^ Notional basis refers to the contractual amount agreed upon at inception of open contracts; notional value represents the current value of the open contract.
FORWARD FOREIGN CURRENCY CONTRACTS
| Contract to buy | Contract to sell | Counterparty (OTC) | Contractual
settlement
date | Unrealized
appreciation | Unrealized
depreciation |
| ARS | 1,797,697 | USD | 38,936 | CITI | 8/23/2019 | $866 | — |
| ARS | 11,117,283 | USD | 244,466 | JPM | 8/23/2019 | 1,680 | — |
| AUD | 9,490,000 | USD | 6,675,304 | JPM | 8/8/2019 | — | $(184,022) |
| AUD | 6,370,000 | USD | 4,395,141 | JPM | 9/3/2019 | — | (33,857) |
| BRL | 547,000 | USD | 142,217 | CITI | 8/2/2019 | 1,114 | — |
| BRL | 1,576,000 | USD | 409,149 | GSI | 8/2/2019 | 3,811 | — |
| BRL | 1,282,000 | USD | 332,952 | JPM | 8/2/2019 | 2,971 | — |
| BRL | 547,000 | USD | 144,072 | CITI | 9/4/2019 | — | (1,055) |
| BRL | 1,437,000 | USD | 378,536 | GSI | 9/4/2019 | — | (2,822) |
| BRL | 1,282,000 | USD | 337,671 | JPM | 9/4/2019 | — | (2,482) |
| CLP | 19,816,930 | USD | 29,022 | CITI | 8/30/2019 | — | (870) |
| CLP | 33,889,000 | USD | 49,658 | GSI | 8/30/2019 | — | (1,515) |
| CZK | 9,975,452 | USD | 442,861 | CITI | 9/6/2019 | — | (13,058) |
| CZK | 11,836,828 | USD | 526,070 | JPM | 9/6/2019 | — | (16,067) |
| EUR | 7,890,000 | USD | 8,932,361 | CITI | 8/5/2019 | — | (196,032) |
| EUR | 5,920,000 | USD | 6,697,030 | JPM | 8/8/2019 | — | (140,441) |
| EUR | 61,200 | USD | 68,511 | CITI | 8/23/2019 | — | (649) |
| EUR | 7,950,000 | USD | 8,874,044 | JPM | 8/26/2019 | — | (56,576) |
| EUR | 513,581 | USD | 579,707 | JPM | 9/26/2019 | — | (8,637) |
| GBP | 10,710,000 | USD | 13,280,940 | JPM | 8/29/2019 | — | (239,379) |
| HUF | 84,937,150 | USD | 299,438 | GSI | 8/28/2019 | — | (10,702) |
| HUF | 184,895,850 | USD | 651,709 | JPM | 8/28/2019 | — | (23,172) |
| MXN | 84,480,000 | USD | 4,422,096 | CITI | 8/19/2019 | — | (26,270) |
| MXN | 41,740,000 | USD | 2,182,420 | CITI | 8/26/2019 | — | (13,043) |
| MXN | 1,373,000 | USD | 71,200 | GSI | 9/26/2019 | — | (202) |
| PLN | 240,000 | USD | 62,391 | JPM | 9/6/2019 | — | (418) |
| THB | 5,924,000 | USD | 191,777 | GSI | 8/21/2019 | 926 | — |
| THB | 2,601,000 | USD | 83,315 | JPM | 8/21/2019 | 1,294 | — |
| USD | 144,442 | BRL | 547,000 | CITI | 8/2/2019 | 1,111 | — |
| USD | 416,465 | BRL | 1,576,000 | GSI | 8/2/2019 | 3,505 | — |
| SEE NOTES TO FINANCIAL STATEMENTS | ANNUAL REPORT | JOHN HANCOCK SHORT DURATION CREDIT OPPORTUNITIES FUND | 45 |
FORWARD FOREIGN CURRENCY CONTRACTS (continued)
| Contract to buy | Contract to sell | Counterparty (OTC) | Contractual
settlement
date | Unrealized
appreciation | Unrealized
depreciation |
| USD | 338,527 | BRL | 1,282,000 | JPM | 8/2/2019 | $2,603 | — |
| USD | 52,920 | BRL | 200,000 | JPM | 9/4/2019 | 628 | — |
| USD | 8,903,139 | CAD | 11,630,000 | CITI | 8/26/2019 | 86,897 | — |
| USD | 24,731 | CZK | 566,000 | CITI | 9/6/2019 | 345 | — |
| USD | 8,609,251 | EUR | 7,550,501 | JPM | 9/26/2019 | 213,570 | — |
| USD | 40,134 | HUF | 11,700,000 | JPM | 8/28/2019 | 361 | — |
| USD | 130,631 | IDR | 1,836,019,995 | JPM | 9/19/2019 | 1,276 | — |
| USD | 8,871,539 | JPY | 952,640,000 | JPM | 8/5/2019 | 112,995 | — |
| USD | 4,412,824 | MXN | 84,480,000 | JPM | 8/19/2019 | 16,998 | — |
| USD | 2,185,075 | MXN | 41,740,000 | GSI | 8/26/2019 | 15,698 | — |
| USD | 313,230 | MXN | 6,022,481 | CITI | 9/26/2019 | 1,804 | — |
| USD | 730,141 | MXN | 14,040,456 | GSI | 9/26/2019 | 4,100 | — |
| USD | 151,516 | MXN | 2,912,694 | JPM | 9/26/2019 | 899 | — |
| USD | 183,637 | PLN | 688,483 | GSI | 9/6/2019 | 5,855 | — |
| USD | 158,838 | PLN | 595,570 | JPM | 9/6/2019 | 5,048 | — |
| USD | 91,970 | RON | 385,511 | CITI | 8/9/2019 | 1,740 | — |
| USD | 112,038 | RON | 469,535 | HUS | 8/9/2019 | 2,141 | — |
| USD | 104,543 | RON | 437,934 | JPM | 8/9/2019 | 2,042 | — |
| USD | 523,107 | RUB | 33,231,500 | GSI | 9/13/2019 | 4,185 | — |
| USD | 31,389 | THB | 963,000 | JPM | 8/21/2019 | 64 | — |
| USD | 705,054 | ZAR | 10,170,551 | GSI | 8/30/2019 | — | $(1,634) |
| USD | 31,700 | ZAR | 457,000 | JPM | 8/30/2019 | — | (54) |
| ZAR | 1,159,000 | USD | 81,694 | GSI | 8/30/2019 | — | (1,162) |
| ZAR | 457,000 | USD | 32,711 | JPM | 8/30/2019 | — | (957) |
| | | | | | | $496,527 | $(975,076) |
SWAPS
| Interest rate swaps |
Counterparty (OTC)/
Centrally cleared | Notional
amount | Currency | Payments
made | Payments
received | Fixed
payment
frequency | Floating
payment
frequency | Maturity
date | Unamortized
upfront
payment paid
(received) | Unrealized
appreciation
(depreciation) | Value |
| Centrally cleared | 3,515,000 | ZAR | ZAR JIBAR SAFEX | Fixed 7.315% | Quarterly | Quarterly | Apr 2023 | $(6) | $3,184 | $3,178 |
| | | | | | | | | $(6) | $3,184 | $3,178 |
| Credit default swaps - Buyer |
Counterparty
(OTC)/
Centrally
cleared | Reference
obligation | Notional
amount | Currency | USD
notional
amount | Pay
fixed
rate | Fixed
payment
frequency | Maturity
date | Unamortized
upfront
payment
paid
(received) | Unrealized
appreciation
(depreciation) | Value |
| CITI | Republic of Argentina | 399,000 | USD | $399,000 | 5.000% | Quarterly | Jun 2024 | $34,489 | $22,596 | $57,085 |
| | | | | $399,000 | | | | $34,489 | $22,596 | $57,085 |
| 46 | JOHN HANCOCK SHORT DURATION CREDIT OPPORTUNITIES FUND | ANNUAL REPORT | SEE NOTES TO FINANCIAL STATEMENTS |
| Credit default swaps - Buyer (continued) |
Counterparty
(OTC)/
Centrally
cleared | Reference
obligation | Notional
amount | Currency | USD
notional
amount | Pay
fixed
rate | Fixed
payment
frequency | Maturity
date | Unamortized
upfront
payment
paid
(received) | Unrealized
appreciation
(depreciation) | Value |
| Centrally cleared | CDX.EM.31 | 27,750,000 | USD | $27,750,000 | 1.000% | Quarterly | Jun 2024 | $964,673 | $(233,923) | $730,750 |
| Centrally cleared | CDX.NA.HY.32 | 49,648,500 | USD | 49,648,500 | 5.000% | Quarterly | Jun 2024 | (2,972,242) | (988,881) | (3,961,123) |
| Centrally cleared | CDX.NA.IG.32 | 129,950,000 | USD | 129,950,000 | 1.000% | Quarterly | Jun 2024 | (1,914,551) | (944,929) | (2,859,480) |
| | | | | $207,348,500 | | | | $(3,922,120) | $(2,167,733) | $(6,089,853) |
| | | | | $207,747,500 | | | | $(3,887,631) | $(2,145,137) | $(6,032,768) |
| Derivatives Currency Abbreviations |
| ARS | Argentine Peso |
| AUD | Australian Dollar |
| BRL | Brazilian Real |
| CAD | Canadian Dollar |
| CLP | Chilean Peso |
| CZK | Czech Republic Koruna |
| EUR | Euro |
| GBP | Pound Sterling |
| HUF | Hungarian Forint |
| IDR | Indonesian Rupiah |
| JPY | Japanese Yen |
| MXN | Mexican Peso |
| PLN | Polish Zloty |
| RON | Romanian New Leu |
| RUB | Russian Ruble |
| THB | Thai Bhat |
| USD | U.S. Dollar |
| ZAR | South African Rand |
| Derivatives Abbreviations |
| CITI | Citibank, N.A. |
| GSI | Goldman Sachs International |
| HUS | HSBC Bank USA, N.A. |
| JIBAR | Johannesburg Interbank Agreed Rate |
| JPM | JPMorgan Chase Bank, N.A. |
| OTC | Over-the-counter |
At 7-31-19, the aggregate cost of investments for federal income tax purposes was $852,805,323. Net unrealized appreciation aggregated to $11,139,908, of which $28,800,013 related to gross unrealized appreciation and $17,660,105 related to gross unrealized depreciation.
See Notes to financial statements regarding investment transactions and other derivatives information.
| SEE NOTES TO FINANCIAL STATEMENTS | ANNUAL REPORT | JOHN HANCOCK SHORT DURATION CREDIT OPPORTUNITIES FUND | 47 |
STATEMENT OF ASSETS AND LIABILITIES 7-31-19
| Assets | |
| Unaffiliated investments, at value (Cost $859,131,539) including $1,815,764 of securities loaned | $871,710,377 |
| Affiliated investments, at value (Cost $1,850,374) | 1,851,041 |
| Total investments, at value (Cost $860,981,913) | 873,561,418 |
| Swap contracts, at value (net unamortized upfront payment of $34,489) | 57,085 |
| Receivable for centrally cleared swaps (including collateral of $9,906,533) | 3,834,710 |
| Unrealized appreciation on forward foreign currency contracts | 496,527 |
| Foreign currency, at value (Cost $332,610) | 329,092 |
| Collateral held at broker for futures contracts | 1,103,192 |
| Collateral segregated at custodian for OTC derivative contracts | 260,000 |
| Interest receivable | 6,490,092 |
| Receivable for fund shares sold | 3,897,015 |
| Receivable for investments sold | 6,160,970 |
| Receivable for securities lending income | 11,643 |
| Other assets | 87,002 |
| Total assets | 896,288,746 |
| Liabilities | |
| Unrealized depreciation on forward foreign currency contracts | 975,076 |
| Payable for futures variation margin | 767,734 |
| Due to custodian | 376,151 |
| Distributions payable | 531 |
| Payable for investments purchased | 10,200,724 |
| Payable for fund shares repurchased | 4,473,186 |
| Payable upon return of securities loaned | 1,851,908 |
| Payable to affiliates | |
| Accounting and legal services fees | 70,904 |
| Transfer agent fees | 13,489 |
| Trustees' fees | 973 |
| Other liabilities and accrued expenses | 198,875 |
| Total liabilities | 18,929,551 |
| Net assets | $877,359,195 |
| Net assets consist of | |
| Paid-in capital | $961,948,239 |
| Total distributable earnings (loss) | (84,589,044) |
| Net assets | $877,359,195 |
| |
| 48 | JOHN HANCOCK SHORT DURATION CREDIT OPPORTUNITIES FUND | ANNUAL REPORT | SEE NOTES TO FINANCIAL STATEMENTS |
STATEMENT OF ASSETS AND LIABILITIES (continued)
| Net asset value per share | |
| Based on net asset value and shares outstanding - the fund has an unlimited number of shares authorized with no par value | |
| Class A ($91,584,849 ÷ 9,569,349 shares)1 | $9.57 |
| Class C ($3,486,782 ÷ 364,352 shares)1 | $9.57 |
| Class I ($36,566,254 ÷ 3,825,941 shares) | $9.56 |
| Class R2 ($49,315 ÷ 5,155 shares) | $9.57 |
| Class R4 ($49,315 ÷ 5,155 shares) | $9.57 |
| Class R6 ($7,347,071 ÷ 767,783 shares) | $9.57 |
| Class NAV ($738,275,609 ÷ 77,105,284 shares) | $9.57 |
| Maximum offering price per share | |
| Class A (net asset value per share ÷ 97.5%)2 | $9.82 |
| 1 | Redemption price per share is equal to net asset value less any applicable contingent deferred sales charge. |
| 2 | On single retail sales of less than $100,000. On sales of $100,000 or more and on group sales the offering price is reduced. |
| SEE NOTES TO FINANCIAL STATEMENTS | ANNUAL REPORT | JOHN HANCOCK SHORT DURATION CREDIT OPPORTUNITIES FUND | 49 |
STATEMENT OF OPERATIONSFor the year ended 7-31-19
| Investment income | |
| Interest | $44,855,603 |
| Dividends | 130,233 |
| Securities lending | 61,412 |
| Less foreign taxes withheld | (48,408) |
| Total investment income | 44,998,840 |
| Expenses | |
| Investment management fees | 6,354,383 |
| Distribution and service fees | 261,647 |
| Accounting and legal services fees | 165,457 |
| Transfer agent fees | 133,568 |
| Trustees' fees | 17,066 |
| Custodian fees | 161,460 |
| State registration fees | 133,459 |
| Printing and postage | 24,905 |
| Professional fees | 129,481 |
| Other | 45,008 |
| Total expenses | 7,426,434 |
| Less expense reductions | (68,533) |
| Net expenses | 7,357,901 |
| Net investment income | 37,640,939 |
| Realized and unrealized gain (loss) | |
| Net realized gain (loss) on | |
| Unaffiliated investments and foreign currency transactions | (14,727,732) |
| Affiliated investments | 822 |
| Futures contracts | (2,630,530) |
| Forward foreign currency contracts | 1,680,678 |
| Swap contracts | (2,695,978) |
| | (18,372,740) |
| Change in net unrealized appreciation (depreciation) of | |
| Unaffiliated investments and translation of assets and liabilities in foreign currencies | 28,156,827 |
| Affiliated investments | (120) |
| Futures contracts | (3,788,315) |
| Forward foreign currency contracts | (1,597,219) |
| Swap contracts | (749,540) |
| | 22,021,633 |
| Net realized and unrealized gain | 3,648,893 |
| Increase in net assets from operations | $41,289,832 |
| | |
| 50 | JOHN HANCOCK SHORT DURATION CREDIT OPPORTUNITIES FUND | ANNUAL REPORT | SEE NOTES TO FINANCIAL STATEMENTS |
STATEMENTS OF CHANGES IN NET ASSETS
| | Year ended
7-31-19 | Year ended
7-31-18 |
| Increase (decrease) in net assets | | |
| From operations | | |
| Net investment income | $37,640,939 | $37,275,344 |
| Net realized loss | (18,372,740) | (1,739,694) |
| Change in net unrealized appreciation (depreciation) | 22,021,633 | (22,554,803) |
| Increase in net assets resulting from operations | 41,289,832 | 12,980,847 |
| Distributions to shareholders | | |
| From net investment income and net realized gain | | |
| Class A | (2,767,811) | — |
| Class C | (99,418) | — |
| Class I | (1,336,913) | — |
| Class R2 | (1,890) | — |
| Class R4 | (1,938) | — |
| Class R6 | (294,792) | — |
| Class NAV | (32,429,565) | — |
| From net investment income | | |
| Class A | — | (1,516,158) |
| Class C | — | (83,341) |
| Class I | — | (1,219,123) |
| Class R2 | — | (2,331) |
| Class R4 | — | (2,399) |
| Class R6 | — | (178,627) |
| Class NAV | — | (33,452,222) |
| Total distributions | (36,932,327) | (36,454,201) |
| From fund share transactions | (85,179,778) | (249,541,491) |
| Total decrease | (80,822,273) | (273,014,845) |
| Net assets | | |
| Beginning of year | 958,181,468 | 1,231,196,313 |
| End of year1 | $877,359,195 | $958,181,468 |
| 1 | Net assets - End of year includes undistributed net investment income of $2,841,026 at July 31, 2018. The SEC eliminated the requirement to disclose undistributed net investment income in the current reporting period. |
| SEE NOTES TO FINANCIAL STATEMENTS | ANNUAL REPORT | JOHN HANCOCK SHORT DURATION CREDIT OPPORTUNITIES FUND | 51 |
| CLASS A SHARES Period ended | 7-31-19 | 7-31-18 | 7-31-17 | 7-31-16 | 7-31-15 |
| Per share operating performance | | | | | |
| Net asset value, beginning of period | $9.51 | $9.74 | $9.57 | $9.73 | $10.25 |
| Net investment income1 | 0.35 | 0.32 | 0.29 | 0.29 | 0.31 |
| Net realized and unrealized gain (loss) on investments | 0.06 | (0.23) | 0.17 | (0.11) | (0.52) |
| Total from investment operations | 0.41 | 0.09 | 0.46 | 0.18 | (0.21) |
| Less distributions | | | | | |
| From net investment income | (0.35) | (0.32) | (0.29) | (0.34) | (0.31) |
| Net asset value, end of period | $9.57 | $9.51 | $9.74 | $9.57 | $9.73 |
| Total return (%)2,3 | 4.45 | 0.91 | 4.85 | 1.93 | (2.03) |
| Ratios and supplemental data | | | | | |
| Net assets, end of period (in millions) | $92 | $60 | $37 | $27 | $27 |
| Ratios (as a percentage of average net assets): | | | | | |
| Expenses before reductions | 1.20 | 1.18 | 1.17 | 1.17 | 1.21 |
| Expenses including reductions | 1.19 | 1.17 | 1.16 | 1.17 | 1.20 |
| Net investment income | 3.69 | 3.30 | 2.99 | 3.10 | 3.10 |
| Portfolio turnover (%) | 59 | 68 | 77 | 52 | 61 |
| 1 | Based on average daily shares outstanding. |
| 2 | Total returns would have been lower had certain expenses not been reduced during the applicable periods. |
| 3 | Does not reflect the effect of sales charges, if any. |
| 52 | JOHN HANCOCK SHORT DURATION CREDIT OPPORTUNITIES FUND | ANNUAL REPORT | SEE NOTES TO FINANCIAL STATEMENTS |
| CLASS C SHARES Period ended | 7-31-19 | 7-31-18 | 7-31-17 | 7-31-16 | 7-31-15 |
| Per share operating performance | | | | | |
| Net asset value, beginning of period | $9.51 | $9.74 | $9.57 | $9.73 | $10.25 |
| Net investment income1 | 0.29 | 0.26 | 0.24 | 0.23 | 0.23 |
| Net realized and unrealized gain (loss) on investments | 0.06 | (0.24) | 0.15 | (0.12) | (0.52) |
| Total from investment operations | 0.35 | 0.02 | 0.39 | 0.11 | (0.29) |
| Less distributions | | | | | |
| From net investment income | (0.29) | (0.25) | (0.22) | (0.27) | (0.23) |
| Net asset value, end of period | $9.57 | $9.51 | $9.74 | $9.57 | $9.73 |
| Total return (%)2,3 | 3.74 | 0.24 | 4.15 | 1.23 | (2.82) |
| Ratios and supplemental data | | | | | |
| Net assets, end of period (in millions) | $3 | $3 | $3 | $3 | $2 |
| Ratios (as a percentage of average net assets): | | | | | |
| Expenses before reductions | 1.90 | 1.88 | 1.87 | 1.88 | 2.27 |
| Expenses including reductions | 1.89 | 1.87 | 1.86 | 1.87 | 2.00 |
| Net investment income | 3.12 | 2.72 | 2.44 | 2.47 | 2.36 |
| Portfolio turnover (%) | 59 | 68 | 77 | 52 | 61 |
| 1 | Based on average daily shares outstanding. |
| 2 | Total returns would have been lower had certain expenses not been reduced during the applicable periods. |
| 3 | Does not reflect the effect of sales charges, if any. |
| SEE NOTES TO FINANCIAL STATEMENTS | ANNUAL REPORT | JOHN HANCOCK SHORT DURATION CREDIT OPPORTUNITIES FUND | 53 |
| CLASS I SHARES Period ended | 7-31-19 | 7-31-18 | 7-31-17 | 7-31-16 | 7-31-15 |
| Per share operating performance | | | | | |
| Net asset value, beginning of period | $9.49 | $9.73 | $9.56 | $9.72 | $10.24 |
| Net investment income1 | 0.38 | 0.36 | 0.33 | 0.33 | 0.34 |
| Net realized and unrealized gain (loss) on investments | 0.07 | (0.25) | 0.16 | (0.12) | (0.51) |
| Total from investment operations | 0.45 | 0.11 | 0.49 | 0.21 | (0.17) |
| Less distributions | | | | | |
| From net investment income | (0.38) | (0.35) | (0.32) | (0.37) | (0.35) |
| Net asset value, end of period | $9.56 | $9.49 | $9.73 | $9.56 | $9.72 |
| Total return (%)2 | 4.87 | 1.13 | 5.21 | 2.25 | (1.71) |
| Ratios and supplemental data | | | | | |
| Net assets, end of period (in millions) | $37 | $37 | $33 | $23 | $26 |
| Ratios (as a percentage of average net assets): | | | | | |
| Expenses before reductions | 0.91 | 0.88 | 0.86 | 0.86 | 0.88 |
| Expenses including reductions | 0.90 | 0.87 | 0.85 | 0.85 | 0.87 |
| Net investment income | 4.09 | 3.70 | 3.44 | 3.49 | 3.46 |
| Portfolio turnover (%) | 59 | 68 | 77 | 52 | 61 |
| 1 | Based on average daily shares outstanding. |
| 2 | Total returns would have been lower had certain expenses not been reduced during the applicable periods. |
| 54 | JOHN HANCOCK SHORT DURATION CREDIT OPPORTUNITIES FUND | ANNUAL REPORT | SEE NOTES TO FINANCIAL STATEMENTS |
| CLASS R2 SHARES Period ended | 7-31-19 | 7-31-18 | 7-31-17 | 7-31-16 | 7-31-151 |
| Per share operating performance | | | | | |
| Net asset value, beginning of period | $9.50 | $9.74 | $9.57 | $9.73 | $9.93 |
| Net investment income2 | 0.37 | 0.34 | 0.31 | 0.32 | 0.11 |
| Net realized and unrealized gain (loss) on investments | 0.07 | (0.24) | 0.17 | (0.13) | (0.20) |
| Total from investment operations | 0.44 | 0.10 | 0.48 | 0.19 | (0.09) |
| Less distributions | | | | | |
| From net investment income | (0.37) | (0.34) | (0.31) | (0.35) | (0.11) |
| Net asset value, end of period | $9.57 | $9.50 | $9.74 | $9.57 | $9.73 |
| Total return (%)3 | 4.74 | 0.99 | 5.05 | 2.12 | (0.87)4 |
| Ratios and supplemental data | | | | | |
| Net assets, end of period (in millions) | $—5 | $—5 | $—5 | $—5 | $—5 |
| Ratios (as a percentage of average net assets): | | | | | |
| Expenses before reductions | 1.04 | 1.03 | 1.02 | 1.02 | 1.016 |
| Expenses including reductions | 1.04 | 1.02 | 1.01 | 1.01 | 1.006 |
| Net investment income | 3.97 | 3.53 | 3.23 | 3.34 | 3.096 |
| Portfolio turnover (%) | 59 | 68 | 77 | 52 | 617 |
| 1 | The inception date for Class R2 shares is 3-27-15. |
| 2 | Based on average daily shares outstanding. |
| 3 | Total returns would have been lower had certain expenses not been reduced during the applicable periods. |
| 4 | Not annualized. |
| 5 | Less than $500,000. |
| 6 | Annualized. |
| 7 | Portfolio turnover is shown for the period from 8-1-14 to 7-31-15. |
| SEE NOTES TO FINANCIAL STATEMENTS | ANNUAL REPORT | JOHN HANCOCK SHORT DURATION CREDIT OPPORTUNITIES FUND | 55 |
| CLASS R4 SHARES Period ended | 7-31-19 | 7-31-18 | 7-31-17 | 7-31-16 | 7-31-151 |
| Per share operating performance | | | | | |
| Net asset value, beginning of period | $9.50 | $9.74 | $9.57 | $9.73 | $9.93 |
| Net investment income2 | 0.38 | 0.35 | 0.32 | 0.33 | 0.11 |
| Net realized and unrealized gain (loss) on investments | 0.07 | (0.24) | 0.17 | (0.13) | (0.19) |
| Total from investment operations | 0.45 | 0.11 | 0.49 | 0.20 | (0.08) |
| Less distributions | | | | | |
| From net investment income | (0.38) | (0.35) | (0.32) | (0.36) | (0.12) |
| Net asset value, end of period | $9.57 | $9.50 | $9.74 | $9.57 | $9.73 |
| Total return (%)3 | 4.84 | 1.09 | 5.15 | 2.22 | (0.84)4 |
| Ratios and supplemental data | | | | | |
| Net assets, end of period (in millions) | $—5 | $—5 | $—5 | $—5 | $—5 |
| Ratios (as a percentage of average net assets): | | | | | |
| Expenses before reductions | 1.04 | 1.03 | 1.02 | 1.02 | 1.016 |
| Expenses including reductions | 0.94 | 0.92 | 0.91 | 0.91 | 0.906 |
| Net investment income | 4.07 | 3.63 | 3.33 | 3.44 | 3.196 |
| Portfolio turnover (%) | 59 | 68 | 77 | 52 | 617 |
| 1 | The inception date for Class R4 shares is 3-27-15. |
| 2 | Based on average daily shares outstanding. |
| 3 | Total returns would have been lower had certain expenses not been reduced during the applicable periods. |
| 4 | Not annualized. |
| 5 | Less than $500,000. |
| 6 | Annualized. |
| 7 | Portfolio turnover is shown for the period from 8-1-14 to 7-31-15. |
| 56 | JOHN HANCOCK SHORT DURATION CREDIT OPPORTUNITIES FUND | ANNUAL REPORT | SEE NOTES TO FINANCIAL STATEMENTS |
| CLASS R6 SHARES Period ended | 7-31-19 | 7-31-18 | 7-31-17 | 7-31-16 | 7-31-151 |
| Per share operating performance | | | | | |
| Net asset value, beginning of period | $9.50 | $9.74 | $9.57 | $9.73 | $9.93 |
| Net investment income2 | 0.40 | 0.37 | 0.34 | 0.34 | 0.11 |
| Net realized and unrealized gain (loss) on investments | 0.06 | (0.25) | 0.16 | (0.12) | (0.19) |
| Total from investment operations | 0.46 | 0.12 | 0.50 | 0.22 | (0.08) |
| Less distributions | | | | | |
| From net investment income | (0.39) | (0.36) | (0.33) | (0.38) | (0.12) |
| Net asset value, end of period | $9.57 | $9.50 | $9.74 | $9.57 | $9.73 |
| Total return (%)3 | 4.99 | 1.24 | 5.33 | 2.40 | (0.78)4 |
| Ratios and supplemental data | | | | | |
| Net assets, end of period (in millions) | $7 | $6 | $2 | $1 | $—5 |
| Ratios (as a percentage of average net assets): | | | | | |
| Expenses before reductions | 0.79 | 0.78 | 0.77 | 0.77 | 0.746 |
| Expenses including reductions | 0.79 | 0.77 | 0.74 | 0.74 | 0.736 |
| Net investment income | 4.22 | 3.85 | 3.56 | 3.61 | 3.316 |
| Portfolio turnover (%) | 59 | 68 | 77 | 52 | 617 |
| 1 | The inception date for Class R6 shares is 3-27-15. |
| 2 | Based on average daily shares outstanding. |
| 3 | Total returns would have been lower had certain expenses not been reduced during the applicable periods. |
| 4 | Not annualized. |
| 5 | Less than $500,000. |
| 6 | Annualized. |
| 7 | Portfolio turnover is shown for the period from 8-1-14 to 7-31-15. |
| SEE NOTES TO FINANCIAL STATEMENTS | ANNUAL REPORT | JOHN HANCOCK SHORT DURATION CREDIT OPPORTUNITIES FUND | 57 |
| CLASS NAV SHARES Period ended | 7-31-19 | 7-31-18 | 7-31-17 | 7-31-16 | 7-31-15 |
| Per share operating performance | | | | | |
| Net asset value, beginning of period | $9.51 | $9.75 | $9.57 | $9.74 | $10.25 |
| Net investment income1 | 0.40 | 0.37 | 0.34 | 0.34 | 0.36 |
| Net realized and unrealized gain (loss) on investments | 0.05 | (0.25) | 0.17 | (0.13) | (0.51) |
| Total from investment operations | 0.45 | 0.12 | 0.51 | 0.21 | (0.15) |
| Less distributions | | | | | |
| From net investment income | (0.39) | (0.36) | (0.33) | (0.38) | (0.36) |
| Net asset value, end of period | $9.57 | $9.51 | $9.75 | $9.57 | $9.74 |
| Total return (%)2 | 5.00 | 1.25 | 5.43 | 2.27 | (1.46) |
| Ratios and supplemental data | | | | | |
| Net assets, end of period (in millions) | $738 | $853 | $1,156 | $1,326 | $1,402 |
| Ratios (as a percentage of average net assets): | | | | | |
| Expenses before reductions | 0.78 | 0.77 | 0.75 | 0.75 | 0.74 |
| Expenses including reductions | 0.77 | 0.76 | 0.74 | 0.74 | 0.73 |
| Net investment income | 4.24 | 3.81 | 3.55 | 3.61 | 3.63 |
| Portfolio turnover (%) | 59 | 68 | 77 | 52 | 61 |
| 1 | Based on average daily shares outstanding. |
| 2 | Total returns would have been lower had certain expenses not been reduced during the applicable periods. |
| 58 | JOHN HANCOCK SHORT DURATION CREDIT OPPORTUNITIES FUND | ANNUAL REPORT | SEE NOTES TO FINANCIAL STATEMENTS |
| Notes to financial statements | |
Note 1—Organization
John Hancock Short Duration Credit Opportunities Fund (the fund) is a series of John Hancock Funds II (the Trust), an open-end management investment company organized as a Massachusetts business trust and registered under the Investment Company Act of 1940, as amended (the 1940 Act). The investment objective of the fund is to seek to maximize total return, which consists of income on its investments and capital appreciation.
The fund may offer multiple classes of shares. The shares currently outstanding are detailed in the Statement of assets and liabilities. Class A and Class C shares are offered to all investors. Class I shares are offered to institutions and certain investors. Class R2 and Class R4 shares are available only to certain retirement and 529 plans. Class R6 shares are only available to certain retirement plans, institutions and other investors. Class NAV shares are offered to John Hancock affiliated funds of funds, retirement plans for employees of John Hancock and/or Manulife Financial Corporation, and certain 529 plans. Class C shares convert to Class A shares ten years after purchase (certain exclusions may apply). Shareholders of each class have exclusive voting rights to matters that affect that class. The distribution and service fees, if any, and transfer agent fees for each class may differ.
Note 2—Significant accounting policies
The financial statements have been prepared in conformity with accounting principles generally accepted in the United States of America (US GAAP), which require management to make certain estimates and assumptions as of the date of the financial statements. Actual results could differ from those estimates and those differences could be significant. The fund qualifies as an investment company under Topic 946 of Accounting Standards Codification of US GAAP.
Events or transactions occurring after the end of the fiscal period through the date that the financial statements were issued have been evaluated in the preparation of the financial statements. The following summarizes the significant accounting policies of the fund:
Security valuation. Investments are stated at value as of the scheduled close of regular trading on the New York Stock Exchange (NYSE), normally at 4:00 P.M., Eastern Time. In case of emergency or other disruption resulting in the NYSE not opening for trading or the NYSE closing at a time other than the regularly scheduled close, the net asset value (NAV) may be determined as of the regularly scheduled close of the NYSE pursuant to the fund's Valuation Policies and Procedures.
In order to value the securities, the fund uses the following valuation techniques: Debt obligations are typically valued based on the evaluated prices provided by an independent pricing vendor. Independent pricing vendors utilize matrix pricing which takes into account factors such as institutional-size trading in similar groups of securities, yield, quality, coupon rate, maturity, type of issue, trading characteristics and other market data, as well as broker supplied prices. Equity securities, including exchange-traded or closed-end funds, are typically valued at the last sale price or official closing price on the exchange or principal market where the security trades. In the event there were no sales during the day or closing prices are not available, the securities are valued using the last available bid price. Investments by the fund in open-end mutual funds, including John Hancock Collateral Trust (JHCT), are valued at their respective NAVs each business day. Futures contracts are typically valued at last traded price on the exchange on which they trade. Swaps are generally valued using evaluated prices obtained from an independent pricing vendor. Forward foreign currency contracts are valued at the prevailing forward rates which are based on foreign currency exchange spot rates and forward points supplied by an independent pricing vendor. Foreign securities and currencies are valued in U.S. dollars based on foreign currency exchange rates supplied by an independent pricing vendor.
| | ANNUAL REPORT | JOHN HANCOCK Short Duration Credit Opportunities Fund | 59 |
In certain instances, the Pricing Committee may determine to value equity securities using prices obtained from another exchange or market if trading on the exchange or market on which prices are typically obtained did not open for trading as scheduled, or if trading closed earlier than scheduled, and trading occurred as normal on another exchange or market.
Other portfolio securities and assets, for which reliable market quotations are not readily available, are valued at fair value as determined in good faith by the fund's Pricing Committee following procedures established by the Board of Trustees. The frequency with which these fair valuation procedures are used cannot be predicted and fair value of securities may differ significantly from the value that would have been used had a ready market for such securities existed. Trading in foreign securities may be completed before the scheduled daily close of trading on the NYSE. Significant events at the issuer or market level may affect the values of securities between the time when the valuation of the securities is generally determined and the close of the NYSE. If a significant event occurs, these securities may be fair valued, as determined in good faith by the fund's Pricing Committee, following procedures established by the Board of Trustees. The fund uses fair value adjustment factors provided by an independent pricing vendor to value certain foreign securities in order to adjust for events that may occur between the close of foreign exchanges or markets and the close of the NYSE.
The fund uses a three-tier hierarchy to prioritize the pricing assumptions, referred to as inputs, used in valuation techniques to measure fair value. Level 1 includes securities valued using quoted prices in active markets for identical securities, including registered investment companies. Level 2 includes securities valued using other significant observable inputs. Observable inputs may include quoted prices for similar securities, interest rates, prepayment speeds and credit risk. Prices for securities valued using these inputs are received from independent pricing vendors and brokers and are based on an evaluation of the inputs described. Level 3 includes securities valued using significant unobservable inputs when market prices are not readily available or reliable, including the fund's own assumptions in determining the fair value of investments. Factors used in determining value may include market or issuer specific events or trends, changes in interest rates and credit quality. The inputs or methodology used for valuing securities are not necessarily an indication of the risks associated with investing in those securities. Changes in valuation techniques and related inputs may result in transfers into or out of an assigned level within the disclosure hierarchy.
The following is a summary of the values by input classification of the fund's investments as of July 31, 2019, by major security category or type:
| | Total
value at
7-31-19 | Level 1
quoted
price | Level 2
significant
observable
inputs | Level 3
significant
unobservable
inputs |
| Investments in securities: | | | | |
| Assets | | | | |
| U.S. Government and Agency obligations | $7,113,439 | — | $7,113,439 | — |
| Foreign government obligations | 101,768,222 | — | 101,768,222 | — |
| Corporate bonds | 339,457,988 | — | 339,457,988 | — |
| Term loans | 159,019,802 | — | 159,019,802 | — |
| Collateralized mortgage obligations | 106,939,481 | — | 106,939,481 | — |
| Asset backed securities | 92,598,097 | — | 92,598,097 | — |
| Common stocks | 231,076 | $64,654 | 166,422 | — |
| Escrow certificates | 16,813 | — | — | $16,813 |
| 60 | JOHN HANCOCK Short Duration Credit Opportunities Fund | ANNUAL REPORT | |
| | Total
value at
7-31-19 | Level 1
quoted
price | Level 2
significant
observable
inputs | Level 3
significant
unobservable
inputs |
| Warrants | $49 | $49 | — | — |
| Securities lending collateral | 1,851,041 | 1,851,041 | — | — |
| Short-term investments | 64,565,410 | 64,047,657 | $517,753 | — |
| Total investments in securities | $873,561,418 | $65,963,401 | $807,581,204 | $16,813 |
| Derivatives: | | | | |
| Assets | | | | |
| Futures | $650,465 | $650,465 | — | — |
| Forward foreign currency contracts | 496,527 | — | $496,527 | — |
| Swap contracts | 791,013 | — | 791,013 | — |
| Liabilities | | | | |
| Futures | (3,758,513) | (3,758,513) | — | — |
| Forward foreign currency contracts | (975,076) | — | (975,076) | — |
| Swap contracts | (6,820,603) | — | (6,820,603) | — |
Term loans (Floating rate loans). The fund may invest in term loans, which are debt securities and are often rated below investment grade at the time of purchase. Term loans are generally subject to legal or contractual restrictions on resale and generally have longer settlement periods than conventional debt securities. Term loans involve special types of risk, including credit risk, interest-rate risk, counterparty risk, and risk associated with extended settlement. The liquidity of term loans, including the volume and frequency of secondary market trading in such loans, varies significantly over time and among individual loans. During periods of infrequent trading, valuing a term loan can be more difficult and buying and selling a term loan at an acceptable price can be more difficult and delayed, which could result in a loss.
The fund’s ability to receive payments of principal, interest and other amounts in connection with term loans will depend primarily on the financial condition of the borrower. The fund’s failure to receive scheduled payments on a term loan due to a default, bankruptcy or other reason would adversely affect the fund’s income and would likely reduce the value of its assets. Transactions in loan investments typically take a significant amount of time (i.e., seven days or longer) to settle. This could pose a liquidity risk to the fund and, if the fund’s exposure to such investments is substantial, could impair the fund’s ability to meet redemptions . Because term loans may not be rated by independent credit rating agencies, a decision to invest in a particular loan could depend exclusively on the subadvisor’s credit analysis of the borrower and/or term loan agents. There is greater risk that the fund may have limited rights to enforce the terms of an underlying loan than for other types of debt instruments.
Security transactions and related investment income. Investment security transactions are accounted for on a trade date plus one basis for daily NAV calculations. However, for financial reporting purposes, investment transactions are reported on trade date. Interest income is accrued as earned. Interest income includes coupon interest and amortization/accretion of premiums/discounts on debt securities. Debt obligations may be placed in a non-accrual status and related interest income may be reduced by stopping current accruals and writing off interest receivable when the collection of all or a portion of interest has become doubtful. Dividend income is recorded on the ex-date, except for dividends of foreign securities where the dividend may not be known until after the ex-date. In those cases, dividend income, net of withholding taxes, is recorded when the fund becomes aware of the dividends. Non-cash dividends, if any, are recorded at the fair market value of the securities received. Gains and losses on securities sold are determined on the basis of identified cost and may include proceeds from litigation.
| | ANNUAL REPORT | JOHN HANCOCK Short Duration Credit Opportunities Fund | 61 |
Securities lending. The fund may lend its securities to earn additional income. The fund receives collateral from the borrower in an amount not less than the market value of the loaned securities. The fund will invest its cash collateral in JHCT, an affiliate of the fund, which has a floating NAV and is registered with the Securities and Exchange Commission (SEC) as an investment company. JHCT invests in short-term money market investments. The fund will receive the benefit of any gains and bear any losses generated by JHCT with respect to the cash collateral.
The fund has the right to recall loaned securities on demand. If a borrower fails to return loaned securities when due, then the lending agent is responsible and indemnifies the fund for the lent securities. The lending agent uses the collateral received from the borrower to purchase replacement securities of the same issue, type, class and series of the loaned securities. If the value of the collateral is less than the purchase cost of replacement securities, the lending agent is responsible for satisfying the shortfall but only to the extent that the shortfall is not due to any decrease in the value of JHCT.
Although the risk of loss on securities lent is mitigated by receiving collateral from the borrower and through lending agent indemnification, the fund could experience a delay in recovering securities or could experience a lower than expected return if the borrower fails to return the securities on a timely basis. The fund receives compensation for lending its securities by retaining a portion of the return on the investment of the collateral and compensation from fees earned from borrowers of the securities. Securities lending income received by the fund is net of fees retained by the securities lending agent. Net income received from JHCT is a component of securities lending income as recorded on the Statement of operations.
Obligations to repay collateral received by the fund are shown on the Statement of assets and liabilities as Payable upon return of securities loaned and are secured by the loaned securities. As of July 31, 2019, the fund loaned securities valued at $1,815,764 and received $1,851,908 of cash collateral.
Foreign investing. Assets, including investments, and liabilities denominated in foreign currencies are translated into U.S. dollar values each day at the prevailing exchange rate. Purchases and sales of securities, income and expenses are translated into U.S. dollars at the prevailing exchange rate on the date of the transaction. The effect of changes in foreign currency exchange rates on the value of securities is reflected as a component of the realized and unrealized gains (losses) on investments. Foreign investments are subject to a decline in the value of a foreign currency versus the U.S. dollar, which reduces the dollar value of securities denominated in that currency.
Funds that invest internationally generally carry more risk than funds that invest strictly in U.S. securities. Risks can result from differences in economic and political conditions, regulations, market practices (including higher transaction costs), accounting standards and other factors.
Foreign taxes. The fund may be subject to withholding tax on income, capital gains or repatriation taxes imposed by certain countries, a portion of which may be recoverable. Foreign taxes are accrued based upon the fund’s understanding of the tax rules and rates that exist in the foreign markets in which it invests. Taxes are accrued based on gains realized by the fund as a result of certain foreign security sales. In certain circumstances, estimated taxes are accrued based on unrealized appreciation of such securities. Investment income is recorded net of foreign withholding taxes.
Line of credit. The fund may have the ability to borrow from banks for temporary or emergency purposes, including meeting redemption requests that otherwise might require the untimely sale of securities. Pursuant to the fund's custodian agreement, the custodian may loan money to the fund to make properly authorized payments. The fund is obligated to repay the custodian for any overdraft, including any related costs or expenses.
| 62 | JOHN HANCOCK Short Duration Credit Opportunities Fund | ANNUAL REPORT | |
The custodian may have a lien, security interest or security entitlement in any fund property that is not otherwise segregated or pledged, to the extent of any overdraft, and to the maximum extent permitted by law. Overdrafts at period end are presented under the caption Due to custodian in the Statement of assets and liabilities.
The fund and other affiliated funds, have entered into a syndicated line of credit agreement with Citibank, N.A. as the administrative agent that enables them to participate in a $750 million unsecured committed line of credit. Excluding commitments designated for a certain fund and subject to the needs of all other affiliated funds, the fund can borrow up to an aggregate commitment amount of $500 million, subject to asset coverage and other limitations as specified in the agreement. A commitment fee payable at the end of each calendar quarter, based on the average daily unused portion of the line of credit, is charged to each participating fund based on a combination of fixed and asset based allocations and is reflected in Other expenses on the Statement of operations. For the year ended July 31, 2019, the fund had no borrowings under the line of credit. Commitment fees for the year ended July 31, 2019 were $4,104.
Expenses. Within the John Hancock group of funds complex, expenses that are directly attributable to an individual fund are allocated to such fund. Expenses that are not readily attributable to a specific fund are allocated among all funds in an equitable manner, taking into consideration, among other things, the nature and type of expense and the fund’s relative net assets. Expense estimates are accrued in the period to which they relate and adjustments are made when actual amounts are known.
Class allocations. Income, common expenses and realized and unrealized gains (losses) are determined at the fund level and allocated daily to each class of shares based on the net assets of the class. Class-specific expenses, such as distribution and service fees, if any, and transfer agent fees, for all classes, are charged daily at the class level based on the net assets of each class and the specific expense rates applicable to each class.
Federal income taxes. The fund intends to continue to qualify as a regulated investment company by complying with the applicable provisions of the Internal Revenue Code and will not be subject to federal income tax on taxable income that is distributed to shareholders. Therefore, no federal income tax provision is required.
For federal income tax purposes, as of July 31, 2019, the fund has a short-term capital loss carryforward of $28,774,619 and a long-term capital loss carryforward of $63,079,106 available to offset future net realized capital gains. These carryforwards do not expire.
Qualified late year ordinary losses of $3,868,092 are being deferred and are treated as occurring on August 1, 2019, the first day of the fund’s next taxable year.
As of July 31, 2019, the fund had no uncertain tax positions that would require financial statement recognition, derecognition or disclosure. The fund's federal tax returns are subject to examination by the Internal Revenue Service for a period of three years.
Distribution of income and gains. Distributions to shareholders from net investment income and net realized gains, if any, are recorded on the ex-date. The fund generally declares dividends daily and pays them monthly. Capital gain distributions, if any, are typically distributed annually.
The tax character of distributions for the years ended July 31, 2019 and 2018 was as follows:
| | July 31, 2019 | July 31, 2018 |
| Ordinary income | $36,932,327 | $36,454,201 |
| | ANNUAL REPORT | JOHN HANCOCK Short Duration Credit Opportunities Fund | 63 |
Distributions paid by the fund with respect to each class of shares are calculated in the same manner, at the same time and in the same amount, except for the effect of class level expenses that may be applied differently to each class. As of July 31, 2019, there were no distributable earnings on a tax basis.
Such distributions and distributable earnings, on a tax basis, are determined in conformity with income tax regulations, which may differ from US GAAP. Distributions in excess of tax basis earnings and profits, if any, are reported in the fund's financial statements as a return of capital.
Capital accounts within the financial statements are adjusted for permanent book-tax differences. These adjustments have no impact on net assets or the results of operations. Temporary book-tax differences, if any, will reverse in a subsequent period. Book-tax differences are primarily attributable to foreign currency transactions, derivative transactions, wash sale loss deferrals and amortization and accretion on debt securities.
Note 3—Derivative instruments
The fund may invest in derivatives in order to meet its investment objective. Derivatives include a variety of different instruments that may be traded in the over-the-counter (OTC) market, on a regulated exchange or through a clearing facility. The risks in using derivatives vary depending upon the structure of the instruments, including the use of leverage, optionality, the liquidity or lack of liquidity of the contract, the creditworthiness of the counterparty or clearing organization and the volatility of the position. Some derivatives involve risks that are potentially greater than the risks associated with investing directly in the referenced securities or other referenced underlying instrument. Specifically, the fund is exposed to the risk that the counterparty to an OTC derivatives contract will be unable or unwilling to make timely settlement payments or otherwise honor its obligations. OTC derivatives transactions typically can only be closed out with the other party to the transaction.
Derivatives which are typically traded through the OTC market are regulated by the Commodity Futures Trading Commission (the CFTC). Derivative counterparty risk is managed through an ongoing evaluation of the creditworthiness of all potential counterparties and, if applicable, designated clearing organizations. The fund attempts to reduce its exposure to counterparty risk for derivatives traded in the OTC market, whenever possible, by entering into an International Swaps and Derivatives Association (ISDA) Master Agreement with each of its OTC counterparties. The ISDA gives each party to the agreement the right to terminate all transactions traded under the agreement if there is certain deterioration in the credit quality or contractual default of the other party, as defined in the ISDA. Upon an event of default or a termination of the ISDA, the non-defaulting party has the right to close out all transactions and to net amounts owed.
As defined by the ISDA, the fund may have collateral agreements with certain counterparties to mitigate counterparty risk on OTC derivatives. Subject to established minimum levels, collateral for OTC transactions is generally determined based on the net aggregate unrealized gain or loss on contracts with a particular counterparty. Collateral pledged to the fund, if any, is held in a segregated account by a third-party agent or held by the custodian bank for the benefit of the fund and can be in the form of cash or debt securities issued by the U.S. government or related agencies; collateral posted by the fund, if any, for OTC transactions is held in a segregated account at the fund's custodian and is noted in the accompanying Fund's investments, or if cash is posted, on the Statement of assets and liabilities. The fund's risk of loss due to counterparty risk is equal to the asset value of outstanding contracts offset by collateral received.
Certain derivatives are traded or cleared on an exchange or central clearinghouse. Exchange-traded or centrally-cleared transactions generally present less counterparty risk to a fund than OTC transactions. The exchange or clearinghouse stands between the fund and the broker to the contract and therefore, credit risk is generally limited to the failure of the exchange or clearinghouse and the clearing member.
| 64 | JOHN HANCOCK Short Duration Credit Opportunities Fund | ANNUAL REPORT | |
Centrally-cleared swap contracts are subject to clearinghouse rules, including initial and variation margin requirements, daily settlement of obligations and the clearinghouse guarantee of payments to the broker. There is, however, still counterparty risk due to the potential insolvency of the broker with respect to any margin held in the brokers’ customer accounts. While clearing members are required to segregate customer assets from their own assets, in the event of insolvency, there may be a shortfall in the amount of margin held by the broker for its clients. Collateral or margin requirements for centrally-cleared derivatives are set by the broker or applicable clearinghouse. Margin for centrally-cleared transactions is detailed in the Statement of assets and liabilities as Receivable/Payable for centrally-cleared swaps. Securities pledged by the fund for centrally-cleared transactions, if any, are identified in the Fund's investments.
Futures. A futures contract is a contractual agreement to buy or sell a particular currency or financial instrument at a pre-determined price in the future. Risks related to the use of futures contracts include possible illiquidity of the futures markets and contract prices that can be highly volatile and imperfectly correlated to movements in the underlying financial instrument and potential losses in excess of the amounts recognized on the Statement of assets and liabilities. Use of long futures contracts subjects the fund to the risk of loss up to the notional value of the futures contracts. Use of short futures contracts subjects the fund to unlimited risk of loss.
Upon entering into a futures contract, the fund is required to deposit initial margin with the broker in the form of cash or securities. The amount of required margin is generally based on a percentage of the contract value; this amount is the initial margin for the trade. The margin deposit must then be maintained at the established level over the life of the contract. Payable for futures variation margin is included on the Statement of assets and liabilities. Futures contracts are marked-to-market daily and an appropriate payable or receivable for the change in value (variation margin) and unrealized gain or loss is recorded by the fund. When the contract is closed, the fund records a realized gain or loss equal to the difference between the value of the contract at the time it was opened and the value at the time it was closed. Collateral or margin requirements are set by the broker or applicable clearinghouse. Collateral is detailed in the Statement of assets and liabilities as Collateral held at broker for futures contracts. Securities pledged by the fund, if any, are identified in the Fund's investments.
During the year ended July 31, 2019, the fund used futures contracts to manage duration of the fund. The fund held futures contracts with USD notional values ranging from $127.5 million to $217.1 million, as measured at each quarter end.
Forward foreign currency contracts. A forward foreign currency contract is an agreement between two parties to buy and sell specific currencies at a price that is set on the date of the contract. The forward contract calls for delivery of the currencies on a future date that is specified in the contract. Risks related to the use of forwards include the possible failure of counterparties to meet the terms of the forward agreement, the failure of the counterparties to timely post collateral if applicable, and the risk that currency movements will not favor the fund thereby reducing the fund’s total return, and the potential for losses in excess of the amounts recognized on the Statement of assets and liabilities.
The market value of a forward foreign currency contract fluctuates with changes in foreign currency exchange rates. Forward foreign currency contracts are marked-to-market daily and the change in value is recorded by the fund as an unrealized gain or loss. Realized gains or losses, equal to the difference between the value of the contract at the time it was opened and the value at the time it was closed, are recorded upon delivery or receipt of the currency or settlement with the counterparty.
| | ANNUAL REPORT | JOHN HANCOCK Short Duration Credit Opportunities Fund | 65 |
During the year ended July 31, 2019, the fund used forward foreign currency contracts to manage against anticipated changes in currency exchange rates and gain exposure to foreign currencies. The fund held forward foreign currency contracts with USD notional values ranging from $86.2 million to $147.7 million, as measured at each quarter end.
Swaps. Swap agreements are agreements between the fund and counterparty to exchange cash flows, assets, foreign currencies or market-linked returns at specified intervals. Swap agreements are privately negotiated in the OTC market (OTC swaps) or may be executed on a registered commodities exchange (centrally cleared swaps). Swaps are marked-to-market daily and the change in value is recorded as a component of unrealized appreciation/depreciation of swap contracts. The value of the swap will typically impose collateral posting obligations on the party that is considered out-of-the-money on the swap.
Upfront payments made/received by the fund, if any, are amortized/accreted for financial reporting purposes, with the unamortized/unaccreted portion included in the Statement of assets and liabilities. A termination payment by the counterparty or the fund is recorded as realized gain or loss, as well as the net periodic payments received or paid by the fund.
Entering into swap agreements involves, to varying degrees, elements of credit, market and documentation risk that may provide outcomes that are in excess of the amounts recognized on the Statement of assets and liabilities. Such risks involve the possibility that there will be no liquid market for the swap, or that a counterparty may default on its obligation or delay payment under the swap terms. The counterparty may disagree or contest the terms of the swap. In addition to interest rate risk, market risks may also impact the swap. The fund may also suffer losses if it is unable to terminate or assign outstanding swaps or reduce its exposure through offsetting transactions.
Interest rate swaps. Interest rate swaps represent an agreement between the fund and a counterparty to exchange cash flows based on the difference between two interest rates applied to a notional amount. The payment flows are usually netted against each other, with the difference being paid by one party to the other. The fund settles accrued net interest receivable or payable under the swap contracts at specified, future intervals.
During the year ended July 31, 2019, the fund used interest rate swap contracts to gain exposure to treasuries markets. The notional values at the period end are representative of the fund's exposure throughout the period. No interest rate swap positions were entered into or closed during the year ended July 31, 2019.
Credit default swaps. Credit default swaps (CDS) involve the exchange of a fixed rate premium (paid by the Buyer), for protection against the loss in value of an underlying debt instrument, referenced entity or index, in the event of a defined credit event (such as payment default or bankruptcy). Under the terms of the swap, one party acts as a “guarantor” (the Seller), receiving the premium and agreeing to contingent payments that are specified within the credit default agreement. The fund may enter into CDS in which it may act as either Buyer or Seller. By acting as the Seller, the fund may incur economic leverage since it would be obligated to pay the Buyer the notional amount of the contract in the event of a default. The amount of loss in such case could be significant, but would typically be reduced by any recovery value on the underlying credit.
Credit default swaps — Buyer
During the year ended July 31, 2019, the fund used credit default swap contracts as a buyer to manage against potential credit events. The fund held credit default swaps with total USD notional amounts ranging from $58.3 milllion to $207.7 milllion, as measured at each quarter end.
| 66 | JOHN HANCOCK Short Duration Credit Opportunities Fund | ANNUAL REPORT | |
Currency swaps. A currency swap is an agreement between a fund and a counterparty to exchange cash flows based on the notional difference among two or more currencies.
During the year ended July 31, 2019, the fund used currency swaps to manage against anticipated currency exchange rates. The fund held currency swaps with total USD notional amounts ranging up to $670,000, as measured at each quarter end. There were no open currency swaps as of July 31, 2019.
Fair value of derivative instruments by risk category
The table below summarizes the fair value of derivatives held by the fund at July 31, 2019 by risk category:
| Risk | Statement of
assets and
liabilities location | Financial
instruments
location | Assets
derivatives
fair value | Liabilities
derivatives
fair value |
| Interest rate | Receivable/payable for futures variation margin | Futures1 | $650,465 | $(3,758,513) |
| Foreign currency | Unrealized appreciation / depreciation on forward foreign currency contracts | Forward foreign currency contracts | 496,527 | (975,076) |
| Credit | Swap contracts, at value | Credit default swaps2 | 787,835 | (6,820,603) |
| Interest rate | Swap contracts, at value | Interest rate swaps2 | 3,178 | — |
| | | | $1,938,005 | $(11,554,192) |
| 1 | Reflects cumulative appreciation/depreciation on futures as disclosed in the Fund's investments. Only the year end variation margin is separately disclosed on the Statement of assets and liabilities. |
| 2 | Reflects cumulative value of swap contracts. Receivable/payable for centrally cleared swaps, which includes value and margin, and Swap contracts, at value, which represents OTC swaps, are shown separately on the Statement of assets and liabilities. |
For financial reporting purposes, the fund does not offset OTC derivative assets or liabilities that are subject to master netting arrangements, as defined by the ISDAs, in the Statement of assets and liabilities. In the event of default by the counterparty or a termination of the agreement, the ISDA allows an offset of amounts across the various transactions between the fund and the applicable counterparty.
Effect of derivative instruments on the Statement of operations
The table below summarizes the net realized gain (loss) included in the net increase (decrease) in net assets from operations, classified by derivative instrument and risk category, for the year ended July 31, 2019:
| | Statement of operations location - Net realized gain (loss) on: |
| Risk | Futures contracts | Forward foreign
currency contracts | Swap contracts | Total |
| Interest rate | $(2,630,530) | — | $601 | $(2,629,929) |
| Foreign currency | — | $1,680,678 | 5,776 | 1,686,454 |
| Credit | — | — | (2,702,355) | (2,702,355) |
| Total | $(2,630,530) | $1,680,678 | $(2,695,978) | $(3,645,830) |
The table below summarizes the net change in unrealized appreciation (depreciation) included in the net increase (decrease) in net assets from operations, classified by derivative instrument and risk category, for the year ended July 31, 2019:
| | ANNUAL REPORT | JOHN HANCOCK Short Duration Credit Opportunities Fund | 67 |
| | Statement of operations location - Change in net unrealized appreciation (depreciation) of: |
| Risk | Futures contracts | Forward foreign
currency contracts | Swap contracts | Total |
| Interest rate | $(3,788,315) | — | $5,850 | $(3,782,465) |
| Foreign currency | — | $(1,597,219) | (45,774) | (1,642,993) |
| Credit | — | — | (709,616) | (709,616) |
| Total | $(3,788,315) | $(1,597,219) | $(749,540) | $(6,135,074) |
Note 4—Guarantees and indemnifications
Under the Trust's organizational documents, its Officers and Trustees are indemnified against certain liabilities arising out of the performance of their duties to the Trust, including the fund. Additionally, in the normal course of business, the fund enters into contracts with service providers that contain general indemnification clauses. The fund's maximum exposure under these arrangements is unknown, as this would involve future claims that may be made against the fund that have not yet occurred. The risk of material loss from such claims is considered remote.
Note 5—Fees and transactions with affiliates
John Hancock Investment Management LLC (the Advisor) serves as investment advisor for the fund. John Hancock Investment Management Distributors LLC (the Distributor), an affiliate of the Advisor, serves as principal underwriter of the fund. The Advisor and the Distributor are indirect, wholly owned subsidiaries of Manulife Financial Corporation (MFC). Prior to June 28, 2019, the Advisor was known as John Hancock Advisers, LLC and the Distributor was known as John Hancock Funds, LLC.
Management fee. The fund has an investment management agreement with the Advisor under which the fund pays a daily management fee to the Advisor equivalent on an annual basis to the sum of: a) 0.740% of the first $250 million of the fund’s aggregate daily net assets, b) 0.700% of the next $500 million of the fund’s aggregate daily net assets and c) 0.675% of the fund’s aggregate daily net assets in excess of $750 million. Aggregate net assets include the net assets of the fund and Short Duration Opportunities Fund, a sub-fund of John Hancock Worldwide Investors, PLC. The fund has a subadvisory agreement with Stone Harbor Investment Partners LP. The fund is not responsible for payment of the subadvisory fees.
The Advisor has contractually agreed to waive a portion of its management fee and/or reimburse expenses for certain funds of the John Hancock group of funds complex, including the fund (the participating portfolios). This waiver is based upon aggregate net assets of all the participating portfolios. The amount of the reimbursement is calculated daily and allocated among all the participating portfolios in proportion to the daily net assets of each fund. During the year ended July 31, 2019, this waiver amounted to 0.01% of the fund’s average daily net assets. This arrangement expires on July 31, 2021, unless renewed by mutual agreement of the fund and the Advisor based upon a determination that this is appropriate under the circumstances at that time.
For the year ended July 31, 2019, the expense reductions described above amounted to the following:
| Class | Expense reduction |
| Class A | $5,633 |
| Class C | 248 |
| Class I | 2,534 |
| Class R2 | 4 |
| Class | Expense reduction |
| Class R4 | $4 |
| Class R6 | 540 |
| Class NAV | 59,522 |
| Total | $68,485 |
Expenses waived or reimbursed in the current fiscal period are not subject to recapture in future fiscal periods.
| 68 | JOHN HANCOCK Short Duration Credit Opportunities Fund | ANNUAL REPORT | |
The investment management fees, including the impact of the waivers and reimbursements as described above, incurred for the year ended July 31, 2019, were equivalent to a net annual effective rate of 0.70% of the fund's average daily net assets.
Accounting and legal services. Pursuant to a service agreement, the fund reimburses the Advisor for all expenses associated with providing the administrative, financial, legal, compliance, accounting and recordkeeping services to the fund, including the preparation of all tax returns, periodic reports to shareholders and regulatory reports, among other services. These expenses are allocated to each share class based on its relative net assets at the time the expense was incurred. These accounting and legal services fees incurred for the year ended July 31, 2019 amounted to an annual rate of 0.02% of the fund's average daily net assets.
Distribution and service plans. The fund has a distribution agreement with the Distributor. The fund has adopted distribution and service plans pursuant to Rule 12b-1 under the 1940 Act, to pay the Distributor for services provided as the distributor of shares of the fund. In addition, under a service plan for certain classes as indicated in the below table, the fund pays for certain other services. The fund may pay up to the following contractual rates of distribution and service fees under these arrangements, expressed as an annual percentage of average daily net assets for each class of the fund's shares:
| Class | Rule 12b-1 Fee | Service fee |
| Class A | 0.30% | — |
| Class C | 1.00% | — |
| Class R2 | 0.25% | 0.25% |
| Class R4 | 0.25% | 0.10% |
The fund's Distributor has contractually agreed to waive 0.10% of Rule12b-1 fees for Class R4 shares. The current waiver agreement expires on November 30, 2019, unless renewed by mutual agreement of the fund and the Distributor based upon a determination that this is appropriate under the circumstances at the time. This contractual waiver amounted to $48 for Class R4 shares for the year ended July 31, 2019.
Sales charges. Class A shares are assessed up-front sales charges, which resulted in payments to the Distributor amounting to $81,463 for the year ended July 31, 2019. Of this amount, $15,153 was retained and used for printing prospectuses, advertising, sales literature and other purposes, $66,270 was paid as sales commissions to broker-dealers and $40 was paid as sales commissions to sales personnel of Signator Investors, Inc., which had been a broker-dealer affiliate of the Advisor through November 2, 2018.
Class A and Class C shares may be subject to contingent deferred sales charges (CDSCs). Certain Class A shares that are acquired through purchases of $1 million or more and are redeemed within one year of purchase are subject to a 1.00% sales charge. Class C shares that are redeemed within one year of purchase are subject to a 1.00% CDSC. CDSCs are applied to the lesser of the current market value at the time of redemption or the original purchase cost of the shares being redeemed. Proceeds from CDSCs are used to compensate the Distributor for providing distribution-related services in connection with the sale of these shares. During the year ended July 31, 2019, CDSCs received by the Distributor amounted to $40,340 and $318 for Class A and Class C shares, respectively.
Transfer agent fees. The John Hancock group of funds has a complex-wide transfer agent agreement with John Hancock Signature Services, Inc. (Signature Services), an affiliate of the Advisor. The transfer agent fees paid to Signature Services are determined based on the cost to Signature Services (Signature Services Cost) of providing recordkeeping services. It also includes out-of-pocket expenses, including payments made to third-parties for recordkeeping services provided to their clients who invest in one or more John Hancock funds. In addition,
| | ANNUAL REPORT | JOHN HANCOCK Short Duration Credit Opportunities Fund | 69 |
Signature Services Cost may be reduced by certain fees that Signature Services receives in connection with retirement and small accounts. Signature Services Cost is calculated monthly and allocated, as applicable, to five categories of share classes: Retail Share and Institutional Share Classes of Non-Municipal Bond Funds, Class R6 Shares, Retirement Share Classes and Municipal Bond Share Classes. Within each of these categories, the applicable costs are allocated to the affected John Hancock affiliated funds and/or classes, based on the relative average daily net assets.
Class level expenses. Class level expenses for the year ended July 31, 2019 were as follows:
| Class | Distribution and service fees | Transfer agent fees |
| Class A | $228,670 | $86,740 |
| Class C | 32,735 | 3,726 |
| Class I | — | 42,155 |
| Class R2 | 121 | 7 |
| Class R4 | 121 | 6 |
| Class R6 | — | 934 |
| Total | $261,647 | $133,568 |
Trustee expenses. The fund compensates each Trustee who is not an employee of the Advisor or its affiliates. The costs of paying Trustee compensation and expenses are allocated to the fund based on its net assets relative to other funds within the John Hancock group of funds complex.
Interfund lending program. Pursuant to an Exemptive Order issued by the SEC, the fund, along with certain other funds advised by the Advisor or its affiliates, may participate in an interfund lending program. This program provides an alternative credit facility allowing the funds to borrow from, or lend money to, other participating affiliated funds. At period end, no interfund loans were outstanding. The fund's activity in this program during the period for which loans were outstanding was as follows:
Borrower
or Lender | Weighted Average
Loan Balance | Days
Outstanding | Weighted Average
Interest Rate | Interest Income
(Expense) |
| Lender | $ 19,343,537 | 1 | 2.345% | $1,260 |
Note 6—Fund share transactions
Transactions in fund shares for the years ended July 31, 2019 and 2018 were as follows:
| | Year Ended 7-31-19 | Year Ended 7-31-18 |
| | Shares | Amount | Shares | Amount |
| Class A shares | | | | |
| Sold | 29,124,465 | $274,068,707 | 19,831,798 | $191,178,440 |
| Distributions reinvested | 293,922 | 2,764,553 | 157,070 | 1,512,531 |
| Repurchased | (26,151,005) | (246,142,687) | (17,515,859) | (168,888,558) |
| Net increase | 3,267,382 | $30,690,573 | 2,473,009 | $23,802,413 |
| 70 | JOHN HANCOCK Short Duration Credit Opportunities Fund | ANNUAL REPORT | |
| | Year Ended 7-31-19 | Year Ended 7-31-18 |
| | Shares | Amount | Shares | Amount |
| Class C shares | | | | |
| Sold | 282,031 | $2,625,288 | 120,685 | $1,165,086 |
| Distributions reinvested | 10,495 | 98,720 | 8,610 | 83,028 |
| Repurchased | (230,749) | (2,167,776) | (157,948) | (1,519,087) |
| Net increase (decrease) | 61,777 | $556,232 | (28,653) | $(270,973) |
| Class I shares | | | | |
| Sold | 2,432,520 | $22,874,522 | 2,831,553 | $27,316,995 |
| Distributions reinvested | 142,342 | 1,336,777 | 126,145 | 1,214,012 |
| Repurchased | (2,597,210) | (24,310,601) | (2,457,164) | (23,718,030) |
| Net increase (decrease) | (22,348) | $(99,302) | 500,534 | $4,812,977 |
| Class R2 shares | | | | |
| Repurchased | — | — | (4,915) | $(47,676) |
| Net decrease | — | — | (4,915) | $(47,676) |
| Class R4 shares | | | | |
| Repurchased | — | — | (4,915) | $(47,676) |
| Net decrease | — | — | (4,915) | $(47,676) |
| Class R6 shares | | | | |
| Sold | 334,168 | $3,131,878 | 642,720 | $6,232,112 |
| Distributions reinvested | 31,347 | 294,714 | 18,522 | 178,188 |
| Repurchased | (253,398) | (2,385,308) | (182,873) | (1,769,214) |
| Net increase | 112,117 | $1,041,284 | 478,369 | $4,641,086 |
| Class NAV shares | | | | |
| Sold | 4,655,528 | $43,672,987 | 8,003,156 | $76,241,555 |
| Distributions reinvested | 3,448,225 | 32,429,565 | 3,465,576 | 33,452,222 |
| Repurchased | (20,640,275) | (193,471,117) | (40,437,426) | (392,125,419) |
| Net decrease | (12,536,522) | $(117,368,565) | (28,968,694) | $(282,431,642) |
| Total net decrease | (9,117,594) | $(85,179,778) | (25,555,265) | $(249,541,491) |
Affiliates of the fund owned 100% of shares of Class R2, Class R4 and Class NAV, respectively, on July 31, 2019. Such concentration of shareholders’ capital could have a material effect on the fund if such shareholders redeem from the fund.
Note 7—Purchase and sale of securities
Purchases and sales of securities, other than short-term investments, amounted to $498,165,855 and $611,468,732, respectively, for the year ended July 31, 2019.
| | ANNUAL REPORT | JOHN HANCOCK Short Duration Credit Opportunities Fund | 71 |
Note 8—Investment by affiliated funds
Certain investors in the fund are affiliated funds that are managed by the Advisor and its affiliates. The affiliated funds do not invest in the fund for the purpose of exercising management or control; however, this investment may represent a significant portion of the fund's net assets. At July 31, 2019, funds within the John Hancock group of funds complex held 84.2% of the fund's net assets. The following portfolios had an affiliate ownership of 5% or more of the fund's net assets:
| Portfolio | Affiliated Concentration |
| John Hancock Funds II Multimanager Lifestyle Balanced Portfolio | 31.6% |
| John Hancock Funds II Multimanager Lifestyle Growth Portfolio | 13.9% |
| John Hancock Funds II Multimanager Lifestyle Moderate Portfolio | 11.1% |
| John Hancock Funds II Multimanager Lifestyle Conservative Portfolio | 9.9% |
| John Hancock Funds II Alternative Asset Allocation Fund | 7.1% |
Note 9—Investment in affiliated underlying funds
The fund may invest in affiliated underlying funds that are managed by the Advisor and its affiliates. Information regarding the fund's fiscal year to date purchases and sales of the affiliated underlying funds as well as income and capital gains earned by the fund, if any, is as follows:
| | | | | | Dividends and distributions |
| Affiliate | Beginning
share
amount | Shares
purchased | Shares
sold | Ending
share
amount | Income
distributions
received | Capital gain
distributions
received | Realized
gain
(loss) | Change in
unrealized
appreciation
(depreciation) | Ending
value |
| John Hancock Collateral Trust * | 756,689 | 2,240,060 | (2,811,769) | 184,980 | — | — | $822 | $(120) | $1,851,041 |
| * | Refer to the Securities lending note within Note 2 for details regarding this investment. |
Note 10—New accounting pronouncement
In March 2017, the Financial Accounting Standards Board issued Accounting Standards Update (ASU) 2017-08, Premium Amortization on Purchased Callable Debt Securities, which shortens the premium amortization period for purchased non contingently callable debt securities. The standard is effective for annual periods beginning after December 15, 2018 and interim periods within those fiscal years. Management has performed an analysis and has determined that the ASU will not have a material impact to the fund.
| 72 | JOHN HANCOCK Short Duration Credit Opportunities Fund | ANNUAL REPORT | |
Report of Independent Registered Public Accounting Firm
To the Board of Trustees of John Hancock Funds II and Shareholders of John Hancock Short Duration Credit Opportunities Fund
Opinion on the Financial Statements
We have audited the accompanying statement of assets and liabilities, including the Fund’s investments, of John Hancock Short Duration Credit Opportunities Fund (one of the funds constituting John Hancock Funds II, referred to hereafter as the "Fund") as of July 31, 2019, the related statement of operations for the year ended July 31, 2019, the statements of changes in net assets for each of the two years in the period ended July 31, 2019, including the related notes, and the financial highlights for each of the periods indicated therein (collectively referred to as the “financial statements”). In our opinion, the financial statements present fairly, in all material respects, the financial position of the Fund as of July 31, 2019, the results of its operations for the year then ended, the changes in its net assets for each of the two years in the period ended July 31, 2019 and the financial highlights for each of the periods indicated therein in conformity with accounting principles generally accepted in the United States of America.
Basis for Opinion
These financial statements are the responsibility of the Fund’s management. Our responsibility is to express an opinion on the Fund’s financial statements based on our audits. We are a public accounting firm registered with the Public Company Accounting Oversight Board (United States) (PCAOB) and are required to be independent with respect to the Fund in accordance with the U.S. federal securities laws and the applicable rules and regulations of the Securities and Exchange Commission and the PCAOB.
We conducted our audits of these financial statements in accordance with the standards of the PCAOB. Those standards require that we plan and perform the audit to obtain reasonable assurance about whether the financial statements are free of material misstatement, whether due to error or fraud.
Our audits included performing procedures to assess the risks of material misstatement of the financial statements, whether due to error or fraud, and performing procedures that respond to those risks. Such procedures included examining, on a test basis, evidence regarding the amounts and disclosures in the financial statements. Our audits also included evaluating the accounting principles used and significant estimates made by management, as well as evaluating the overall presentation of the financial statements. Our procedures included confirmation of securities owned as of July 31, 2019 by correspondence with the custodian, transfer agent, agent banks, and brokers; when replies were not received from agent banks and brokers, we performed other auditing procedures. We believe that our audits provide a reasonable basis for our opinion.
/s/ PricewaterhouseCoopers LLP
Boston, Massachusetts
September 20, 2019
We have served as the auditor of one or more investment companies in the John Hancock group of funds since 1988.
| | ANNUAL REPORT | JOHN HANCOCK SHORT DURATION CREDIT OPPORTUNITIES FUND | 73 |
TAX INFORMATION
Unaudited
For federal income tax purposes, the following information is furnished with respect to the distributions of the fund, if any, paid during its taxable year ended July 31, 2019.
The fund reports the maximum amount allowable of its net taxable income as eligible for the corporate dividends-received deduction.
The fund reports the maximum amount allowable of its net taxable income as qualified dividend income as provided in the Jobs and Growth Tax Relief Reconciliation Act of 2003.
The fund reports the maximum amount allowable of its Section 199A dividends as defined in Proposed Treasury Regulation §1.199A-3(d).
Eligible shareholders will be mailed a 2019 Form 1099-DIV in early 2020. This will reflect the tax character of all distributions paid in calendar year 2019.
Please consult a tax advisor regarding the tax consequences of your investment in the fund.
| 74 | JOHN HANCOCK SHORT DURATION CREDIT OPPORTUNITIES FUND | ANNUAL REPORT | |
CONTINUATION OF INVESTMENT ADVISORY AND SUBADVISORY AGREEMENTS
Evaluation of Advisory and Subadvisory Agreements by the Board of Trustees
This section describes the evaluation by the Board of Trustees (the Board) of John Hancock Funds II (the Trust) of the Advisory Agreement (the Advisory Agreement) with John Hancock Investment Management LLC (the Advisor, formerly known as "John Hancock Advisers, LLC") and the Subadvisory Agreement (the Subadvisory Agreement) with Stone Harbor Investment Partners LP (the Subadvisor) for John Hancock Short Duration Credit Opportunities Fund (the fund). The Advisory Agreement and Subadvisory Agreement are collectively referred to as the Agreements. Prior to the June 23-26, 2019 in-person meeting at which the Agreements were approved, the Board also discussed and considered information regarding the proposed continuation of the Agreements at an in-person meeting held on May 28-30, 2019.
Approval of Advisory and Subadvisory Agreements
At in-person meetings held on June 23-26, 2019, the Board, including the Trustees who are not parties to any Agreement or considered to be interested persons of the Trust under the Investment Company Act of 1940, as amended (the 1940 Act) (the Independent Trustees), reapproved for an annual period the continuation of the Advisory Agreement between the Trust and the Advisor and the Subadvisory Agreement between the Advisor and the Subadvisor with respect to the fund.
In considering the Advisory Agreement and the Subadvisory Agreement, the Board received in advance of the meetings a variety of materials relating to the fund, the Advisor and the Subadvisor, including comparative performance, fee and expense information for a peer group of similar funds prepared by an independent third-party provider of fund data, performance information for an applicable benchmark index; and, with respect to the Subadvisor, comparative performance information for comparably managed accounts, as applicable, and other information provided by the Advisor and the Subadvisor regarding the nature, extent and quality of services provided by the Advisor and the Subadvisor under their respective Agreements, as well as information regarding the Advisor's revenues and costs of providing services to the fund and any compensation paid to affiliates of the Advisor. At the meetings at which the renewal of the Advisory Agreement and Subadvisory Agreement are considered, particular focus is given to information concerning fund performance, comparability of fees and total expenses, and profitability. However, the Board notes that the evaluation process with respect to the Advisor and the Subadvisor is an ongoing one. In this regard, the Board also took into account discussions with management and information provided to the Board (including its various committees) at prior meetings with respect to the services provided by the Advisor and the Subadvisor to the fund, including quarterly performance reports prepared by management containing reviews of investment results and prior presentations from the Subadvisor with respect to the fund. The information received and considered by the Board in connection with the May and June meetings and throughout the year was both written and oral. The Board also considered the nature, quality, and extent of non-advisory services, if any, to be provided to the fund by the Advisor's affiliates, including distribution services. The Board considered the Advisory Agreement and the Subadvisory Agreement separately in the course of its review. In doing so, the Board noted the respective roles of the Advisor and Subadvisor in providing services to the fund.
Throughout the process, the Board asked questions of and requested additional information from management. The Board is assisted by counsel for the Trust and the Independent Trustees are also separately assisted by independent legal counsel throughout the process. The Independent Trustees also received a memorandum from their independent legal counsel discussing the legal standards for their consideration of the proposed continuation of the Agreements
ANNUAL REPORT | JOHN HANCOCK SHORT DURATION CREDIT OPPORTUNITIES FUND 75
and discussed the proposed continuation of the Agreements in private sessions with their independent legal counsel at which no representatives of management were present.
Approval of Advisory Agreement
In approving the Advisory Agreement with respect to the fund, the Board, including the Independent Trustees, considered a variety of factors, including those discussed below. The Board also considered other factors (including conditions and trends prevailing generally in the economy, the securities markets, and the industry) and did not treat any single factor as determinative, and each Trustee may have attributed different weights to different factors. The Board's conclusions may be based in part on its consideration of the advisory and subadvisory arrangements in prior years and on the Board's ongoing regular review of fund performance and operations throughout the year.
Nature, extent, and quality of services. Among the information received by the Board from the Advisor relating to the nature, extent, and quality of services provided to the fund, the Board reviewed information provided by the Advisor relating to its operations and personnel, descriptions of its organizational and management structure, and information regarding the Advisor's compliance and regulatory history, including its Form ADV. The Board also noted that on a regular basis it receives and reviews information from the Trust's Chief Compliance Officer (CCO) regarding the fund's compliance policies and procedures established pursuant to Rule 38a-1 under the 1940 Act. The Board observed that the scope of services provided by the Advisor, and of the undertakings required of the Advisor in connection with those services, including maintaining and monitoring its own and the fund's compliance programs, risk management programs, liquidity management programs and cybersecurity programs, had expanded over time as a result of regulatory, market and other developments. The Board considered that the Advisor is responsible for the management of the day-to-day operations of the fund, including, but not limited to, general supervision of and coordination of the services provided by the Subadvisor, and is also responsible for monitoring and reviewing the activities of the Subadvisor and third-party service providers. The Board also considered the significant risks assumed by the Advisor in connection with the services provided to the fund including entrepreneurial risk in sponsoring new funds and ongoing risks including investment, operational, enterprise, litigation, regulatory and compliance risks with respect to all funds.
In considering the nature, extent, and quality of the services provided by the Advisor, the Trustees also took into account their knowledge of the Advisor's management and the quality of the performance of the Advisor's duties, through Board meetings, discussions and reports during the preceding year and through each Trustee's experience as a Trustee of the Trust and of the other trusts in the John Hancock group of funds complex (the John Hancock Fund Complex).
In the course of their deliberations regarding the Advisory Agreement, the Board considered, among other things:
| | | | | | | | | |
| | | | | (a) | | | the skills and competency with which the Advisor has in the past managed the Trust's affairs and its subadvisory relationship, the Advisor's oversight and monitoring of the Subadvisor's investment performance and compliance programs, such as the Subadvisor's compliance with fund policies and objectives, review of brokerage matters, including with respect to trade allocation and best execution and the Advisor's timeliness in responding to performance issues; | |
| | | | | (b) | | | the background, qualifications and skills of the Advisor's personnel; | |
| | | | | (c) | | | the Advisor's compliance policies and procedures and its responsiveness to regulatory changes and fund industry developments; | |
ANNUAL REPORT | JOHN HANCOCK SHORT DURATION CREDIT OPPORTUNITIES FUND 76
| | | | | | | | | |
| | | | | (d) | | | the Advisor's administrative capabilities, including its ability to supervise the other service providers for the fund, as well as the Advisor's oversight of any securities lending activity, its monitoring of class action litigation and collection of class action settlements on behalf of the fund, and bringing loss recovery actions on behalf of the fund; | |
| | | | | (e) | | | the financial condition of the Advisor and whether it has the financial wherewithal to provide a high level and quality of services to the fund; | |
| | | | | (f) | | | the Advisor's initiatives intended to improve various aspects of the Trust's operations and investor experience with the fund; and | |
| | | | | (g) | | | the Advisor's reputation and experience in serving as an investment advisor to the Trust and the benefit to shareholders of investing in funds that are part of a family of funds offering a variety of investments. | |
The Board concluded that the Advisor may reasonably be expected to continue to provide a high quality of services under the Advisory Agreement with respect to the fund.
Investment performance. In considering the fund's performance, the Board noted that it reviews at its regularly scheduled meetings information about the fund's performance results. In connection with the consideration of the Advisory Agreement, the Board:
| | | |
| | (a) | reviewed information prepared by management regarding the fund's performance; |
| | (b) | considered the comparative performance of an applicable benchmark index; |
| | (c) | considered the performance of comparable funds, if any, as included in the report prepared by an independent third-party provider of fund data; and |
| | (d) | took into account the Advisor's analysis of the fund's performance and its plans and recommendations regarding the Trust's subadvisory arrangements generally. |
The Board noted that while it found the data provided by the independent third-party generally useful it recognized its limitations, including in particular that the data may vary depending on the end date selected and the results of the performance comparisons may vary depending on the selection of the peer group. The Board noted that the fund outperformed its benchmark index for the three-year period and underperformed its benchmark index for the one-and five-year periods ended December 31, 2018. The Board also noted that the fund underperformed its peer group average for the one-, three- and five-year periods ended December 31, 2018. The Board took into account management's discussion of the fund's performance, including the favorable performance relative to the benchmark for the three-year period. The Board concluded that the fund's performance is being monitored and reasonably addressed, where appropriate.
Fees and expenses. The Board reviewed comparative information prepared by an independent third-party provider of fund data, including, among other data, the fund's contractual and net management fees (and subadvisory fees, to the extent available) and total expenses as compared to similarly situated investment companies deemed to be comparable to the fund in light of the nature, extent and quality of the management and advisory and subadvisory services provided by the Advisor and the Subadvisor. The Board considered the fund's ranking within a smaller group of peer funds chosen by the independent third-party provider, as well as the fund's ranking within a broader group of funds. In comparing the fund's contractual and net management fees to those of comparable funds, the Board noted that such fees include both advisory and administrative costs. The Board noted that net management fees are higher than the peer group median and net total expenses for the fund are equal to the peer group median.
ANNUAL REPORT | JOHN HANCOCK SHORT DURATION CREDIT OPPORTUNITIES FUND 77
The Board took into account management's discussion of the fund's expenses. The Board also took into account management's discussion with respect to the overall management fee and the fees of the Subadvisor, including the amount of the advisory fee retained by the Advisor after payment of the subadvisory fee, in each case in light of the services rendered for those amounts and the risks undertaken by the Advisor. The Board also noted that the Advisor pays the subadvisory fee, and that such fees are negotiated at arm's length with respect to the Subadvisor. In addition, the Board took into account that management had agreed to implement an overall fee waiver across the complex, including the fund, which is discussed further below. The Board also noted actions taken over the past several years to reduce the fund's operating expenses. The Board also noted that, in addition, the Advisor is currently waiving fees and/or reimbursing expenses with respect to the fund and that the fund has breakpoints in its contractual management fee schedule that reduces management fees as assets increase. The Board reviewed information provided by the Advisor concerning the investment advisory fee charged by the Advisor or one of its advisory affiliates to other clients (including other funds in the John Hancock Fund Complex) having similar investment mandates, if any. The Board considered any differences between the Advisor's and Subadvisor's services to the fund and the services they provide to other comparable clients or funds. The Board concluded that the advisory fee paid with respect to the fund is reasonable in light of the nature, extent and quality of the services provided to the fund under the Advisory Agreement.
Profitability/Fall out benefits. In considering the costs of the services to be provided and the profits to be realized by the Advisor and its affiliates from the Advisor's relationship with the Trust, the Board:
| | | | | | | | | |
| | | | | (a) | | | reviewed financial information of the Advisor; | |
| | | | | (b) | | | reviewed and considered information presented by the Advisor regarding the net profitability to the Advisor and its affiliates with respect to the fund; | |
| | | | | (c) | | | received and reviewed profitability information with respect to the John Hancock Fund Complex as a whole; | |
| | | | | (d) | | | received information with respect to the Advisor's allocation methodologies used in preparing the profitability data and considered that the Advisor hired an independent third-party consultant to provide an analysis of the Advisor's allocation methodologies; | |
| | | | | (e) | | | considered that the John Hancock insurance companies that are affiliates of the Advisor, as shareholders of the Trust directly or through their separate accounts, receive certain tax credits or deductions relating to foreign taxes paid and dividends received by certain funds of the Trust and noted that these tax benefits, which are not available to participants in qualified retirement plans under applicable income tax law, are reflected in the profitability information reviewed by the Board; | |
| | | | | (f) | | | considered that the Advisor also provides administrative services to the fund on a cost basis pursuant to an administrative services agreement; | |
| | | | | (g) | | | noted that affiliates of the Advisor provide transfer agency services and distribution services to the fund, and that the fund's distributor also receives Rule 12b-1 payments to support distribution of the fund; | |
| | | | | (h) | | | noted that affiliates of the Advisor provide transfer agency services and placement services to the fund; | |
| | | | | (i) | | | noted that the Advisor also derives reputational and other indirect benefits from providing advisory services to the fund; | |
| | | | | (j) | | | noted that the subadvisory fee for the fund is paid by the Advisor and is negotiated as arm's length; | |
| | | | | (k) | | | considered the Advisor's ongoing costs and expenditures necessary to improve services, meet new regulatory and compliance requirements, and adapt to other challenges impacting the fund industry; and | |
ANNUAL REPORT | JOHN HANCOCK SHORT DURATION CREDIT OPPORTUNITIES FUND 78
| | | | | | | | | |
| | | | | (l) | | | considered that the Advisor should be entitled to earn a reasonable level of profits in exchange for the level of services it provides to the fund and the risks that it assumes as Advisor, including entrepreneurial, operational, reputational, litigation and regulatory risk. | |
Based upon its review, the Board concluded that the level of profitability, if any, of the Advisor and its affiliates from their relationship with the fund was reasonable and not excessive.
Economies of scale. In considering the extent to which economies of scale would be realized as the fund grows and whether fee levels reflect these economies of scale for the benefit of fund shareholders, the Board:
| | | |
| | (a) | considered that the Advisor has contractually agreed to waive a portion of its management fee for certain funds of the John Hancock Fund Complex, including the fund (the participating portfolios) or otherwise reimburse the expenses of the participating portfolios (the reimbursement). This waiver is based upon aggregate net assets of all the participating portfolios. The amount of the reimbursement is calculated daily and allocated among all the participating portfolios in proportion to the daily net assets of each fund; |
| | (b) | reviewed the fund's advisory fee structure and concluded that: (i) the fund's fee structure contains breakpoints at the subadvisory fee level and that such breakpoints are reflected as breakpoints in the advisory fees for the fund; and (ii) although economies of scale cannot be measured with precision, these arrangements permit shareholders of the fund to benefit from economies of scale if the fund grows. The Board also took into account management's discussion of the fund's advisory fee structure; and |
| | (c) | the Board also considered the effect of the fund's growth in size on its performance and fees. The Board also noted that if the fund's assets increase over time, the fund may realize other economies of scale. |
Approval of Subadvisory Agreement
In making its determination with respect to approval of the Subadvisory Agreement, the Board reviewed:
| | | |
| | (1) | information relating to the Subadvisor's business, including current subadvisory services to the Trust (and other funds in the John Hancock Fund Complex); |
| | (2) | the historical and current performance of the fund and comparative performance information relating to an applicable benchmark index and comparable funds; and |
| | (3) | the subadvisory fee for the fund, including any breakpoints, and to the extent available, comparable fee information prepared by an independent third party provider of fund data. |
Nature, extent, and quality of services. With respect to the services provided by the Subadvisor, the Board received information provided to the Board by the Subadvisor, including the Subadvisor's Form ADV, as well as took into account information presented throughout the past year. The Board considered the Subadvisor's current level of staffing and its overall resources, as well as received information relating to the Subadvisor's compensation program. The Board reviewed the Subadvisor's history and investment experience, as well as information regarding the qualifications, background, and responsibilities of the Subadvisor's investment and compliance personnel who provide services to the fund. The Board also considered, among other things, the Subadvisor's compliance program and any disciplinary history. The Board also considered the Subadvisor's risk assessment and monitoring process. The Board reviewed the Subadvisor's regulatory history, including whether it was involved in any regulatory actions or investigations as well as material litigation, and any settlements and amelioratory actions undertaken, as appropriate. The Board noted that the Advisor conducts regular, periodic reviews of the Subadvisor and its operations, including
ANNUAL REPORT | JOHN HANCOCK SHORT DURATION CREDIT OPPORTUNITIES FUND 79
regarding investment processes and organizational and staffing matters. The Board also noted that the Trust's CCO and his staff conduct regular, periodic compliance reviews with the Subadvisor and present reports to the Independent Trustees regarding the same, which includes evaluating the regulatory compliance systems of the Subadvisor and procedures reasonably designed to assure compliance with the federal securities laws. The Board also took into account the financial condition of the Subadvisor.
The Board considered the Subadvisor's investment process and philosophy. The Board took into account that the Subadvisor's responsibilities include the development and maintenance of an investment program for the fund that is consistent with the fund's investment objective, the selection of investment securities and the placement of orders for the purchase and sale of such securities, as well as the implementation of compliance controls related to performance of these services. The Board also received information with respect to the Subadvisor's brokerage policies and practices, including with respect to best execution and soft dollars.
Subadvisor compensation. In considering the cost of services to be provided by the Subadvisor and the profitability to the Subadvisor of its relationship with the fund, the Board noted that the fees under the Subadvisory Agreement are paid by the Advisor and not the fund. The Board also relied on the ability of the Advisor to negotiate the Subadvisory Agreement with the Subadvisor, which is not affiliated with the Advisor, and the fees thereunder at arm's length. As a result, the costs of the services to be provided and the profits to be realized by the Subadvisor from its relationship with the Trust were not a material factor in the Board's consideration of the Subadvisory Agreement. The Board also received information regarding the nature and scope (including their significance to the Advisor and its affiliates and to the Subadvisor) of any material relationships with respect to the Subadvisor, which include arrangements in which the Subadvisor or its affiliates provide advisory, distribution, or management services in connection with financial products sponsored by the Advisor or its affiliates, and may include other registered investment companies, a 529 education savings plan, managed separate accounts and exempt group annuity contracts sold to qualified plans. The Board also received information and took into account any other potential conflicts of interest the Advisor might have in connection with the Subadvisory Agreement.
In addition, the Board considered other potential indirect benefits that the Subadvisor and its affiliates may receive from the Subadvisor's relationship with the fund, such as the opportunity to provide advisory services to additional funds in the John Hancock Fund Complex and reputational benefits.
Subadvisory fees. The Board considered that the fund pays an advisory fee to the Advisor and that, in turn, the Advisor pays a subadvisory fee to the Subadvisor. As noted above, the Board also considered the fund's subadvisory fees as compared to similarly situated investment companies deemed to be comparable to the fund as included in the report prepared by the independent third party provider of fund data, to the extent available. The Board noted that the fund's subadvisory fees are lower than the peer group median. The Board also took into account the subadvisory fees paid by the Advisor to the Subadvisor with respect to the fund and compared them to fees charged by the Subadvisor to manage other subadvised portfolios and portfolios not subject to regulation under the 1940 Act, as applicable.
Subadvisor performance. As noted above, the Board considered the fund's performance as compared to the fund's peer group and the benchmark index and noted that the Board reviews information about the fund's performance results at its regularly scheduled meetings. The Board noted the Advisor's expertise and resources in monitoring the performance, investment style and risk-adjusted performance of the Subadvisor. The Board was mindful of the Advisor's focus on the Subadvisor's performance. The Board also noted the Subadvisor's long-term performance record for similar accounts, as applicable.
ANNUAL REPORT | JOHN HANCOCK SHORT DURATION CREDIT OPPORTUNITIES FUND 80
The Board's decision to approve the Subadvisory Agreement was based on a number of determinations, including the following:
| | | |
| | (1) | the Subadvisor has extensive experience and demonstrated skills as a manager; |
| | (2) | the performance is being monitored and reasonably addressed, where appropriate; |
| | (3) | the subadvisory fee is reasonable in relation to the level and quality of services being provided; and |
| | (4) | noted that the subadvisory fees are paid by the Advisor not the fund and that the subadvisory fee breakpoints are reflected as breakpoints in the advisory fees for the fund in order to permit shareholders to benefit from economies of scale if the fund grows. |
| * * * |
Based on the Board's evaluation of all factors that the Board deemed to be material, including those factors described above, the Board, including the Independent Trustees, concluded that renewal of the Advisory Agreement and the Subadvisory Agreement would be in the best interest of the fund and its shareholders. Accordingly, the Board, and the Independent Trustees voting separately, approved the Advisory Agreement and Subadvisory Agreement for an additional one-year period.
ANNUAL REPORT | JOHN HANCOCK SHORT DURATION CREDIT OPPORTUNITIES FUND 81
This chart provides information about the Trustees and Officers who oversee your John Hancock fund. Officers elected by the Trustees manage the day-to-day operations of the fund and execute policies formulated by the Trustees.
Independent Trustees
| | | |
Name, year of birth
Position(s) held with Trust
Principal occupation(s) and other
directorships during past 5 years | Trustee
of the
Trust
since1 | Number of John
Hancock funds
overseen by
Trustee |
| Hassell H. McClellan, Born: 1945 | 2005 | 213 |
Trustee and Chairperson of the Board
Director/Trustee, Virtus Funds (since 2008); Director, The Barnes Group (since 2010); Associate Professor, The Wallace E. Carroll School of Management, Boston College (retired 2013). Trustee (since 2005) and Chairperson of the Board (since 2017) of various trusts within the John Hancock Fund Complex. |
| | | |
| Charles L. Bardelis,2 Born: 1941 | 2005 | 213 |
Trustee
Director, Island Commuter Corp. (marine transport). Trustee of various trusts within the John Hancock Fund Complex (since 1988). |
| | | |
| James R. Boyle,Born: 1959 | 2015 | 213 |
Trustee
Chief Executive Officer, Foresters Financial (since 2018); Chairman and Chief Executive Officer, Zillion Group, Inc. (formerly HealthFleet, Inc.) (healthcare) (2014-2018); Executive Vice President and Chief Executive Officer, U.S. Life Insurance Division of Genworth Financial, Inc. (insurance) (January 2014-July 2014); Senior Executive Vice President, Manulife Financial, President and Chief Executive Officer, John Hancock (1999-2012); Chairman and Director, John Hancock Investment Management LLC, John Hancock Investment Management Distributors LLC, and John Hancock Variable Trust Advisers LLC (2005-2010). Trustee of various trusts within the John Hancock Fund Complex (2005-2014 and since 2015). |
| | | |
| Peter S. Burgess,2 Born: 1942 | 2005 | 213 |
Trustee
Consultant (financial, accounting, and auditing matters) (since 1999); Certified Public Accountant; Partner, Arthur Andersen (independent public accounting firm) (prior to 1999); Director, Lincoln Educational Services Corporation (since 2004); Director, Symetra Financial Corporation (2010-2016); Director, PMA Capital Corporation (2004-2010). Trustee of various trusts within the John Hancock Fund Complex (since 2005). |
| | | |
| William H. Cunningham, Born: 1944 | 2012 | 213 |
Trustee
Professor, University of Texas, Austin, Texas (since 1971); former Chancellor, University of Texas System and former President of the University of Texas, Austin, Texas; Chairman (since 2009) and Director (since 2006), Lincoln National Corporation (insurance); Director, Southwest Airlines (since 2000); former Director, LIN Television (2009-2014). Trustee of various trusts within the John Hancock Fund Complex (since 1986). |
| | | |
| Grace K. Fey, Born: 1946 | 2008 | 213 |
Trustee
Chief Executive Officer, Grace Fey Advisors (since 2007); Director and Executive Vice President, Frontier Capital Management Company (1988-2007); Director, Fiduciary Trust (since 2009). Trustee of various trusts within the John Hancock Fund Complex (since 2008). |
ANNUAL REPORT | JOHN HANCOCK SHORT DURATION CREDIT OPPORTUNITIES FUND 82
Independent Trustees (continued)
| | | |
Name, year of birth
Position(s) held with Trust
Principal occupation(s) and other
directorships during past 5 years | Trustee
of the
Trust
since1 | Number of John
Hancock funds
overseen by
Trustee |
| Theron S. Hoffman,4 Born: 1947 | 2008 | 213 |
Trustee
Chief Executive Officer, T. Hoffman Associates, LLC (consulting firm) (since 2003); Director, The Todd Organization (consulting firm) (2003-2010); President, Westport Resources Management (investment management consulting firm) (2006-2008); Board Member, Senior Managing Director, Partner, and Operating Head, Putnam Investments (2000-2003); Executive Vice President, The Thomson Corp. (financial and legal information publishing) (1997-2000). Trustee of various trusts within the John Hancock Fund Complex (since 2008). |
| | | |
| Deborah C. Jackson, Born: 1952 | 2012 | 213 |
Trustee
President, Cambridge College, Cambridge, Massachusetts (since 2011); Board of Directors, National Association of Corporate Directors/New England (since 2015); Board of Directors, Association of Independent Colleges and Universities of Massachusetts (since 2014); Chief Executive Officer, American Red Cross of Massachusetts Bay (2002-2011); Board of Directors of Eastern Bank Corporation (since 2001); Board of Directors of Eastern Bank Charitable Foundation (since 2001); Board of Directors of American Student Assistance Corporation (1996-2009); Board of Directors of Boston Stock Exchange (2002-2008); Board of Directors of Harvard Pilgrim Healthcare (health benefits company) (2007-2011). Trustee of various trusts within the John Hancock Fund Complex (since 2008). |
| | | |
| James M. Oates,2Born: 1946 | 2005 | 213 |
Trustee
Managing Director, Wydown Group (financial consulting firm) (since 1994); Chairman and Director, Emerson Investment Management, Inc. (2000-2015); Independent Chairman, Hudson Castle Group, Inc. (formerly IBEX Capital Markets, Inc.) (financial services company) (1997-2011); Director, Stifel Financial (since 1996); Director, Investor Financial Services Corporation (1995-2007); Director, Connecticut River Bancorp (1998-2014); Director/Trustee, Virtus Funds (since 1988). Trustee (since 2004) and Chairperson of the Board (2005-2016) of various trusts within the John Hancock Fund Complex. |
| | | |
| Steven R. Pruchansky, Born: 1944 | 2012 | 213 |
Trustee and Vice Chairperson of the Board
Managing Director, Pru Realty (since 2017); Chairman and Chief Executive Officer, Greenscapes of Southwest Florida, Inc. (2000-2014); Director and President, Greenscapes of Southwest Florida, Inc. (until 2000); Member, Board of Advisors, First American Bank (until 2010); Managing Director, Jon James, LLC (real estate) (since 2000); Partner, Right Funding, LLC (2014-2017); Director, First Signature Bank & Trust Company (until 1991); Director, Mast Realty Trust (until 1994); President, Maxwell Building Corp. (until 1991). Trustee (since 1992), Chairperson of the Board (2011-2012), and Vice Chairperson of the Board (since 2012) of various trusts within the John Hancock Fund Complex. |
| | | |
| Gregory A. Russo, Born: 1949 | 2012 | 213 |
Trustee
Director and Audit Committee Chairman (since 2012), and Member, Audit Committee and Finance Committee (since 2011), NCH Healthcare System, Inc. (holding company for multi-entity healthcare system); Director and Member (2012-2018) and Finance Committee Chairman (2014-2018), The Moorings, Inc. (nonprofit continuing care community); Vice Chairman, Risk & Regulatory Matters, KPMG LLP (KPMG) (2002-2006); Vice Chairman, Industrial Markets, KPMG (1998-2002); Chairman and Treasurer, Westchester County, New York, Chamber of Commerce (1986-1992); Director, Treasurer, and Chairman of Audit and Finance Committees, Putnam Hospital Center (1989-1995); Director and Chairman of Fundraising Campaign, United Way of Westchester and Putnam Counties, New York (1990-1995). Trustee of various trusts within the John Hancock Fund Complex (since 2008). |
ANNUAL REPORT | JOHN HANCOCK SHORT DURATION CREDIT OPPORTUNITIES FUND 83
Non-Independent Trustees3
| | | |
Name, year of birth
Position(s) held with Trust
Principal occupation(s) and other
directorships during past 5 years | Trustee
of the
Trust
since1 | Number of John
Hancock funds
overseen by
Trustee |
| Andrew G. Arnott, Born: 1971 | 2017 | 213 |
President and Non-Independent Trustee
Head of Wealth and Asset Management, United States and Europe, for John Hancock and Manulife (since 2018); Executive Vice President, John Hancock Financial Services (since 2009, including prior positions); Director and Executive Vice President, John Hancock Investment Management LLC (since 2005, including prior positions); Director and Executive Vice President, John Hancock Variable Trust Advisers LLC (since 2006, including prior positions); President, John Hancock Investment Management Distributors LLC (since 2004, including prior positions); President of various trusts within the John Hancock Fund Complex (since 2007, including prior positions). Trustee of various trusts within the John Hancock Fund Complex (since 2017). |
| | | |
| Marianne Harrison, Born: 1963 | 2018 | 213 |
Non-Independent Trustee
President and CEO, John Hancock (since 2017); President and CEO, Manulife Canadian Division (2013-2017); Member, Board of Directors, American Council of Life Insurers (ACLI) (since 2018); Member, Board of Directors, Communitech, an industry-led innovation center that fosters technology companies in Canada (since 2017); Member, Board of Directors, Manulife Assurance Canada (2015-2017); Board Member, St. Mary's General Hospital Foundation (2014-2017); Member, Board of Directors, Manulife Bank of Canada (2013-2017); Member, Standing Committee of the Canadian Life & Health Assurance Association (2013-2017); Member, Board of Directors, John Hancock USA, John Hancock Life & Health, John Hancock New York (2012-2013). Trustee of various trusts within the John Hancock Fund Complex (since 2018). |
Principal officers who are not Trustees
| | |
Name, year of birth
Position(s) held with Trust
Principal occupation(s)
during past 5 years | Officer
of the
Trust
since |
| Francis V. Knox, Jr.,Born: 1947 | 2005 |
Chief Compliance Officer
Vice President, John Hancock Financial Services (since 2005); Chief Compliance Officer, various trusts within the John Hancock Fund Complex, John Hancock Investment Management LLC, and John Hancock Variable Trust Advisers LLC (since 2005). |
| | |
| Charles A. Rizzo, Born: 1957 | 2007 |
Chief Financial Officer
Vice President, John Hancock Financial Services (since 2008); Senior Vice President, John Hancock Investment Management LLC and John Hancock Variable Trust Advisers LLC (since 2008); Chief Financial Officer of various trusts within the John Hancock Fund Complex (since 2007). |
| | |
| Salvatore Schiavone, Born: 1965 | 2009 |
Treasurer
Assistant Vice President, John Hancock Financial Services (since 2007); Vice President, John Hancock Investment Management LLC and John Hancock Variable Trust Advisers LLC (since 2007); Treasurer of various trusts within the John Hancock Fund Complex (since 2007, including prior positions). |
ANNUAL REPORT | JOHN HANCOCK SHORT DURATION CREDIT OPPORTUNITIES FUND 84
Principal officers who are notTrustees (continued)
| | | |
Name, year of birth
Position(s) held with Trust
Principal occupation(s)
during past 5 years | Officer
of the
Trust
since |
| Christopher (Kit) Sechler,Born: 1973 | 2018 |
Chief Legal Officer and Secretary
Vice President and Deputy Chief Counsel, John Hancock Investments (since 2015); Assistant Vice President and Senior Counsel (2009-2015), John Hancock Investment Management; Chief Legal Officer and Secretary of various trusts within the John Hancock Fund Complex (since 2018); Assistant Secretary of John Hancock Investment Management LLC and John Hancock Variable Trust Advisers LLC (since 2009). |
The business address for all Trustees and Officers is 200 Berkeley Street, Boston, Massachusetts 02116-5023.
The Statement of Additional Information of the fund includes additional information about members of the Board of Trustees of the Trust and is available without charge, upon request, by calling 800-225-5291.
| 1 | Each Trustee holds office until his or her successor is elected and qualified, or until the Trustee's death, retirement, resignation, or removal. Mr. Boyle has served as Trustee at various times prior to the date listed in the table. |
| 2 | Member of the Audit Committee. |
| 3 | The Trustee is a Non-Independent Trustee due to current or former positions with the Advisor and certain affiliates. |
| 4 | Mr. Hoffman retired as Trustee effective August 31, 2019. |
ANNUAL REPORT | JOHN HANCOCK SHORT DURATION CREDIT OPPORTUNITIES FUND 85
| | |
Trustees
Hassell H. McClellan,Chairperson
Steven R. Pruchansky,Vice Chairperson
Andrew G. Arnott†
Charles L. Bardelis*
James R. Boyle
Peter S. Burgess*
William H. Cunningham
Grace K. Fey
Marianne Harrison†
Theron S. Hoffman#
Deborah C. Jackson
James M. Oates*
Gregory A. Russo
Officers
Andrew G. Arnott
President
Francis V. Knox, Jr.
Chief Compliance Officer
Charles A. Rizzo
Chief Financial Officer
Salvatore Schiavone
Treasurer
Christopher (Kit) Sechler**
Secretary and Chief Legal Officer
| Investment advisor
John Hancock Investment Management LLC
Subadvisor
Stone Harbor Investment Partners LP
Portfolio Managers
James E. Craige
Roger M. Lavan
Catherine M. Nolan
Peter J. Wilby
David A. Oliver
Matthew Kearns
Hunter C. Schwarz
David A. Torchia
William W. Perry
Stuart W. Sclater-Booth
Kumaran K. Damodaran
Principal distributor
John Hancock Investment Management Distributors LLC
Custodian
State Street Bank and Trust Company
Transfer agent
John Hancock Signature Services, Inc.
Legal counsel
K&L Gates LLP
Independent registered public accounting firm
PricewaterhouseCoopers LLP
|
* Member of the Audit Committee
† Non-Independent Trustee
** Effective 9-13-18
# Retired effective 8-31-19
The fund's proxy voting policies and procedures, as well as the fund proxy voting record for the most recent twelve-month period ended June 30, are available free of charge on the Securities and Exchange Commission (SEC) website at sec.gov or on our website.
All of the fund's holdings as of the end of the third month of every fiscal quarter are filed with the SEC on Form N-PORT within 60 days of the end of the fiscal quarter. The fund's Form N-PORT filings are available on our website and the SEC's website, sec.gov.
We make this information on your fund, as well asmonthly portfolio holdings, and other fund details available on our website at jhinvestments.com or by calling 800-225-5291.
| | | | |
| | You can also contact us: |
| | 800-225-5291
jhinvestments.com | Regular mail:
John Hancock Signature Services, Inc.
P.O. Box 55913
Boston, MA 02205-5913
| Express mail:
John Hancock Signature Services, Inc.
2000 Crown Colony Drive
Suite 55913
Quincy, MA 02169-0953
|
ANNUAL REPORT | JOHN HANCOCK SHORT DURATION CREDIT OPPORTUNITIES FUND 86
John Hancock family of funds
| | | |
DOMESTIC EQUITY FUNDS
Blue Chip Growth
Classic Value
Disciplined Value
Disciplined Value Mid Cap
Equity Income
Financial Industries
Fundamental All Cap Core
Fundamental Large Cap Core
New Opportunities
Regional Bank
Small Cap Core
Small Cap Growth
Small Cap Value
U.S. Global Leaders Growth
U.S. Quality Growth
Value Equity
GLOBAL AND INTERNATIONAL EQUITY FUNDS
Disciplined Value International
Emerging Markets
Emerging Markets Equity
Fundamental Global Franchise
Global Equity
Global Shareholder Yield
Global Thematic Opportunities
International Dynamic Growth
International Growth
International Small Company
| | INCOME FUNDS
Bond
California Tax-Free Income
Emerging Markets Debt
Floating Rate Income
Government Income
High Yield
High Yield Municipal Bond
Income
Investment Grade Bond
Money Market
Short Duration Bond
Short Duration Credit Opportunities
Spectrum Income
Strategic Income Opportunities
Tax-Free Bond
ALTERNATIVE AND SPECIALTY FUNDS
Absolute Return Currency
Alternative Asset Allocation
Disciplined Alternative Yield
Diversified Macro
Global Absolute Return Strategies
Infrastructure
Seaport Long/Short
|
A fund's investment objectives, risks, charges, and expenses should be considered carefully before investing. The prospectus contains this and other important information about the fund. To obtain a prospectus, contact your financial professional, call John Hancock Investment Management at 800-225-5291, or visit our website at jhinvestments.com. Please read the prospectus carefully before investing or sending money.
| | | |
ASSET ALLOCATION
Balanced
Income Allocation
Multi-Index Lifetime Portfolios
Multi-Index Preservation Portfolios
Multimanager Lifestyle Portfolios
Multimanager Lifetime Portfolios
Retirement Income 2040
EXCHANGE-TRADED FUNDS
John Hancock Multifactor Consumer Discretionary ETF
John Hancock Multifactor Consumer Staples ETF
John Hancock Multifactor Developed International ETF
John Hancock Multifactor Emerging Markets ETF
John Hancock Multifactor Energy ETF
John Hancock Multifactor Financials ETF
John Hancock Multifactor Healthcare ETF
John Hancock Multifactor Industrials ETF
John Hancock Multifactor Large Cap ETF
John Hancock Multifactor Materials ETF
John Hancock Multifactor Media and
Communications ETF
John Hancock Multifactor Mid Cap ETF
John Hancock Multifactor Small Cap ETF
John Hancock Multifactor Technology ETF
John Hancock Multifactor Utilities ETF
| | ENVIRONMENTAL, SOCIAL, AND
GOVERNANCE FUNDS
ESG All Cap Core
ESG Core Bond
ESG International Equity
ESG Large Cap Core
CLOSED-END FUNDS
Financial Opportunities
Hedged Equity & Income
Income Securities Trust
Investors Trust
Preferred Income
Preferred Income II
Preferred Income III
Premium Dividend
Tax-Advantaged Dividend Income
Tax-Advantaged Global Shareholder Yield
|
John Hancock Multifactor ETF shares are bought and sold at market price (not NAV), and are not individually redeemed
from the fund. Brokerage commissions will reduce returns.
John Hancock ETFs are distributed by Foreside Fund Services, LLC, and are subadvised by Dimensional Fund Advisors LP.
Foreside is not affiliated with John Hancock Investment Management Distributors, LLC or Dimensional Fund Advisors LP.
Dimensional Fund Advisors LP receives compensation from John Hancock in connection with licensing rights to the
John Hancock Dimensional indexes. Dimensional Fund Advisors LP does not sponsor, endorse, or sell, and makes no
representation as to the advisability of investing in, John Hancock Multifactor ETFs.
John Hancock Investment Management
A trusted brand
John Hancock Investment Management is a premier asset manager
representing one of America's most trusted brands, with a heritage of
financial stewardship dating back to 1862. Helping our shareholders
pursue their financial goals is at the core of everything we do. It's why
we support the role of professional financial advice and operate with
the highest standards of conduct and integrity.
A better way to invest
We serve investors globally through a unique multimanager approach:
We search the world to find proven portfolio teams with specialized
expertise for every strategy we offer, then we apply robust investment
oversight to ensure they continue to meet our uncompromising
standards and serve the best interests of our shareholders.
Results for investors
Our unique approach to asset management enables us to provide
a diverse set of investments backed by some of the world's best
managers, along with strong risk-adjusted returns across asset classes.
John Hancock Investment Management Distributors, LLC n Member FINRA, SIPC
200 Berkeley Street n Boston, MA 02116-5010 n 800-225-5291 n jhinvestments.com
This report is for the information of the shareholders of John Hancock Short Duration Credit Opportunities Fund. It is not authorized for distribution to prospective investors unless preceded or accompanied by a prospectus.
John Hancock
Absolute Return Currency Fund
Annual report 7/31/19
Beginning on January 1, 2021, as permitted by regulations adopted by the Securities and Exchange Commission, paper copies of the Fund's shareholder reports like this one will no longer be sent by mail, unless you specifically request paper copies of the reports from the Fund or from your financial intermediary. Instead, the reports will be made available on a website, and you will be notified by mail each time a report is posted and provided with a website link to access the report.
If you already elected to receive shareholder reports electronically, you will not be affected by this change, and you do not need to take any action. You may elect to receive shareholder reports and other communications electronically by calling John Hancock Investment Management at 800-225-5291 (Class A and Class C shares) or 888-972-8696 (Class I, Class R2, Class R4, Class R6, and Class NAV shares) or by contacting your financial intermediary.
You may elect to receive all reports in paper, free of charge, at any time. You can inform John Hancock Investment Management or your financial intermediary that you wish to continue receiving paper copies of your shareholder reports by following the instructions listed above. Your election to receive reports in paper will apply to all funds held with John Hancock Investment Management or your financial intermediary.

A message to shareholders
Dear shareholder,
It was a rather volatile time for capital markets during the 12 months ended July 31, 2019, with investor uncertainty surrounding trade relations between the United States and China and the broader health of the global economy leading to some dramatic swings in performance. The trend in longer-term yields was decidedly downward, with the 10-year U.S. Treasury finishing the period at just above 2%—a level we haven't seen since late 2016. In July, the U.S. Federal Reserve stepped in with a reduction in short-term interest rates in an attempt to offer a measure of stimulus to jittery markets, and investors greeted the news favorably. The commodity markets were mixed, with oil and some other natural resources down but gold, historically a strong performer in times of uncertainty, up sharply.
While the economic fundamentals in the United States appear fairly solid, with a strong labor market and a confident consumer base, there are sure to be patches of market turbulence as the year goes on, particularly as the threat of a recession looms. As always, your best resource in unpredictable markets is your financial advisor, who can help position your portfolio so that it's sufficiently diversified to meet your long-term objectives and to withstand the inevitable bouts of market volatility along the way.
On behalf of everyone at John Hancock Investment Management, I'd like to take this opportunity to welcome new shareholders and thank existing shareholders for the continued trust you've placed in us.
Sincerely,
Andrew G. Arnott
President and CEO,
John Hancock Investment Management
Head of Wealth and Asset Management,
United States and Europe
This commentary reflects the CEO's views as of this report's period end and are subject to change at any time. Diversification does not guarantee investment returns and does not eliminate risk of loss. All investments entail risks, including the possible loss of principal. For more up-to-date information, you can visit our website at jhinvestments.com.
.
John Hancock
Absolute Return Currency Fund
Table of contents
| | | |
| 2 | | Your fund at a glance |
| 4 | | Discussion of fund performance |
| 6 | | A look at performance |
| 8 | | Your expenses |
| 10 | | Fund's investments |
| 13 | | Financial statements |
| 16 | | Financial highlights |
| 23 | | Notes to financial statements |
| 32 | | Report of independent registered public accounting firm |
| 33 | | Tax information |
| 34 | | Continuation of investment advisory and subadvisory agreements |
| 41 | | Trustees and Officers |
| 45 | | More information |
ANNUAL REPORT | JOHN HANCOCK ABSOLUTE RETURN CURRENCY FUND 1
INVESTMENT OBJECTIVE
The fund seeks to achieve absolute return from investments in currency markets.
AVERAGE ANNUAL TOTAL RETURNS AS OF 7/31/19 (%)
* Formerly known as Citigroup 1-Month U.S. Treasury Bill Index
The FTSE 1-Month U.S. Treasury Bill Index is an unmanaged index representing monthly return equivalents of yield averages of the last one-month Treasury Bill issue.
It is not possible to invest directly in an index. Index figures do not reflect expenses or sales charges, which would result in lower returns.
Figures from Morningstar, Inc. include reinvested distributions and do not take into account sales charges. Actual load-adjusted performance is lower. Since-inception returns for the Morningstar fund category average are not available.
The past performance shown here reflects reinvested distributions and the beneficial effect of any expense reductions, and does not guarantee future results. Performance of the other share classes will vary based on the difference in the fees and expenses of those classes. Shares will fluctuate in value and, when redeemed, may be worth more or less than their original cost. Current month-end performance may be lower or higher than the performance cited, and can be found at jhinvestments.com or by calling 800-225-5291. For further information on the fund's objectives, risks, and strategy, see the fund's prospectus.
ANNUAL REPORT | JOHN HANCOCK ABSOLUTE RETURN CURRENCY FUND 2
PERFORMANCE HIGHLIGHTS OVER THE LAST TWELVE MONTHS
Market conditions were generally positive over the period
Although the financial markets experienced elevated volatility in late 2018 due to concerns about economic growth and U.S. trade policy, asset prices staged a recovery in the first half of 2019.
The fund outperformed its benchmark, the FTSE 1-Month U.S. Treasury Bill Index
The fund produced a positive total return and narrowly outpaced its cash benchmark.
The fund's positioning in the British pound, Norwegian krone, and U.S. dollar contributed to performance
In contrast, the fund's positioning in the Canadian dollar, euro, and Singapore dollar detracted.
CURRENCY ALLOCATION AS OF 7/31/19 (%)
A note about risks
The fund is subject to various risks as described in the fund's prospectus. For more information, please refer to the "Principal risks" section of the prospectus.
ANNUAL REPORT | JOHN HANCOCK ABSOLUTE RETURN CURRENCY FUND 3
Discussion of fund performance
What elements of the fund's positioning helped and hurt results during the 12 months ended July 31, 2019?
The fund produced a positive total return and outperformed its cash benchmark, the FTSE 1-Month U.S. Treasury Bill Index. Consistent with our objective of providing diversification relative to traditional assets, the fund delivered the best results during the stock market sell-off in the fourth quarter of 2018. However, this period of relative strength was offset to some extent by a weaker showing in April and May of 2019, when a long position in the New Zealand dollar pressured performance.
The fund's positioning in the British pound made the largest contribution to performance. The fund adopted a long position in the pound in the first half of the period, at which time the currency was trending higher. We moved the fund to a neutral stance as the March Brexit deadline approached, and then we rotated to a short position due to a deteriorating trade outlook. The pound indeed declined over the next several months amid mounting concerns about the U.K. economy, causing the short position to rise in value.
A short position in the Norwegian krone in late 2018 also contributed to performance, as the currency came under pressure from falling energy prices.
The fund's positioning in the U.S. dollar helped the fund's performance. The fund held a long position in the dollar in the first half of the period, which allowed it to capitalize on the currency's rally in the fourth calendar quarter. We subsequently established a short position in December, shortly before the dollar depreciated due to the prolonged government shutdown and indications that the U.S. Federal Reserve might cut interest rates in 2019.
A long position in the Canadian dollar in late 2018, which was based on the belief that inflation pressures would support the currency, detracted from performance. The markets began to price in a pause in the Bank of Canada's monetary tightening, offsetting the effect of higher inflation and causing the currency to weaken.
A long position in the euro also hurt results. This position reflected our assessment that the euro was trading well below its fair value, but the currency nonetheless struggled amid slowing growth and rising political risks in Europe. A short position in the Singapore dollar, which was based on the country's weak trade fundamentals,
ANNUAL REPORT | JOHN HANCOCK ABSOLUTE RETURN CURRENCY FUND 4
was another key detractor. Data released in the first quarter confirmed that Singapore's trade outlook was softening, but investors were more focused on the relatively hawkish expectations regarding the country's monetary policy.
How was the fund positioned at the close of the period?
The fund had some defensive elements to its positioning, with a short in the Australian dollar, which tends to perform well when investors are embracing risk, and a long position in the yen, which typically rallies when market participants are seeking safe havens. We achieved some diversification through a long position in the New Zealand dollar, which generally benefits during times of elevated investor risk appetites. The fund was also long in the British pound and short in the Norwegian krone, Singapore dollar, U.S. dollar, Swedish krona, and Australian dollar. It held a relatively neutral position in the Canadian dollar.
MANAGED BY
| | |
 | Dori S. Levanoni
On the fund since 2010
Investing since 1991 |
 | Jeppe F. Ladekarl
On the fund since 2012
Investing since 1995 |

The views expressed in this report are exclusively those of Dori S. Levanoni, First Quadrant LP, and are subject to change. They are not meant as investment advice. Please note that the holdings discussed in this report may not have been held by the fund for the entire period. Portfolio composition is subject to review in accordance with the fund's investment strategy and may vary in the future. Current and future portfolio holdings are subject to risk.
ANNUAL REPORT | JOHN HANCOCK ABSOLUTE RETURN CURRENCY FUND 5
TOTAL RETURNS FOR THE PERIOD ENDED JULY 31, 2019
| | | | | | | | |
Average annual total returns (%)
with maximum sales charge | | Cumulative total returns (%)
with maximum sales charge |
| | 1-year | 5-year | Since
inception1 | | | 5-year | Since
inception1 |
| Class A | -0.69 | -1.73 | -0.46 | | | -8.36 | -4.10 |
| Class C2 | 0.75 | -1.84 | -0.53 | | | -8.85 | -4.63 |
| Class I3 | 2.67 | -0.82 | 0.24 | | | -4.06 | 2.14 |
| Class R22,3 | 2.53 | -1.02 | -0.07 | | | -5.02 | -0.62 |
| Class R42,3 | 2.62 | -0.92 | -0.01 | | | -4.51 | -0.08 |
| Class R62,3 | 2.87 | -0.69 | 0.28 | | | -3.41 | 2.54 |
| Class NAV3 | 2.85 | -0.69 | 0.40 | | | -3.40 | 3.61 |
| Index† | 2.31 | 0.85 | 0.50 | | | 4.33 | 4.55 |
Performance figures assume all distributions have been reinvested. Figures reflect maximum sales charges on Class A shares of 3.00% and the applicable contingent deferred sales charge (CDSC) on Class C shares. Class C shares sold within one year of purchase are subject to a 1% CDSC. Sales charges are not applicable to Class I, Class R2, Class R4, Class R6, and Class NAV shares.
The expense ratios of the fund, both net (including any fee waivers and/or expense limitations) and gross (excluding any fee waivers and/or expense limitations), are set forth according to the most recent publicly available prospectuses for the fund and may differ from those disclosed in the Financial highlights tables in this report. Net expenses reflect contractual expense limitations in effect until November 30, 2019 and are subject to change. Had the contractual fee waivers and expense limitations not been in place, gross expenses would apply. The expense ratios are as follows:
| | | | | | | | |
| | Class A | Class C | Class I | Class R2 | Class R4 | Class R6 | Class NAV |
| Gross (%) | 1.34 | 2.04 | 1.05 | 1.45 | 1.30 | 0.95 | 0.93 |
| Net (%) | 1.33 | 2.03 | 1.04 | 1.44 | 1.19 | 0.94 | 0.92 |
Please refer to the most recent prospectus and annual or semiannual report for more information on expenses and any expense limitation arrangements for each class.
The returns reflect past results and should not be considered indicative of future performance. The return and principal value of an investment will fluctuate so that shares, when redeemed, may be worth more or less than their original cost. Due to market volatility and other factors, the fund's current performance may be higher or lower than the performance shown. For current to the most recent month-end performance data, please call 800-225-5291 or visit the fund's website at jhinvestments.com.
The performance table above and the chart on the next page do not reflect the deduction of taxes that a shareholder would pay on fund distributions or the redemption of fund shares. The fund's performance results reflect any applicable fee waivers or expense reductions, without which the expenses would increase and results would have been less favorable.
| † | Index is the FTSE 1-Month U.S. Treasury Bill Index. |
See the following page for footnotes.
ANNUAL REPORT | JOHN HANCOCK ABSOLUTE RETURN CURRENCY FUND 6
This chart and table show what happened to a hypothetical $10,000 investment in John Hancock Absolute Return Currency Fund for the share classes and periods indicated, assuming all distributions were reinvested. For comparison, we've shown the same investment in the FTSE 1-Month U.S. Treasury Bill Index.
| | | | | |
| | Start date | With maximum
sales charge ($) | Without
sales charge ($) | Index ($) |
| Class C2,4 | 8-2-10 | 9,537 | 9,537 | 10,455 |
| Class I3 | 8-2-10 | 10,214 | 10,214 | 10,455 |
| Class R22,3 | 8-2-10 | 9,938 | 9,938 | 10,455 |
| Class R42,3 | 8-2-10 | 9,992 | 9,992 | 10,455 |
| Class R62,3 | 8-2-10 | 10,254 | 10,254 | 10,455 |
| Class NAV3 | 8-2-10 | 10,361 | 10,361 | 10,455 |
The FTSE 1-Month U.S. Treasury Bill Index is an unmanaged index representing monthly return equivalents of yield averages of the last one-month Treasury Bill issue.
It is not possible to invest directly in an index. Index figures do not reflect expenses or sales charges, which would result in lower returns.
Footnotes related to performance pages
| 1 | From 8-2-10. |
| 2 | Class C shares were first offered on 8-28-14; Class R2 and Class R4 shares were first offered on 3-27-15; Class R6 shares were first offered on 11-1-11. Returns prior to these dates are those of Class A shares (first offered on 8-2-10) that have not been adjusted for class-specific expenses; otherwise, returns would vary. |
| 3 | For certain types of investors as described in the fund's prospectuses. |
| 4 | The contingent deferred sales charge is not applicable. |
ANNUAL REPORT | JOHN HANCOCK ABSOLUTE RETURN CURRENCY FUND 7
These examples are intended to help you understand your ongoing operating expenses of investing in the fund so you can compare these costs with the ongoing costs of investing in other mutual funds.
Understanding fund expenses
As a shareholder of the fund, you incur two types of costs:
■Transaction costs,which include sales charges (loads) on purchases or redemptions (varies by share class), minimum account fee charge, etc.
■Ongoing operating expenses, including management fees, distribution and service fees (if applicable), and other fund expenses.
We are presenting only your ongoing operating expenses here.
Actual expenses/actual returns
The first line of each share class in the table on the following page is intended to provide information about the fund’s actual ongoing operating expenses, and is based on the fund’s actual return. It assumes an account value of $1,000.00 on February 1, 2019, with the same investment held until July 31, 2019.
Together with the value of your account, you may use this information to estimate the operating expenses that you paid over the period. Simply divide your account value at July 31, 2019, by $1,000.00, then multiply it by the “expenses paid” for your share class from the table. For example, for an account value of $8,600.00, the operating expenses should be calculated as follows:
Hypothetical example for comparison purposes
The second line of each share class in the table on the following page allows you to compare the fund’s ongoing operating expenses with those of any other fund. It provides an example of the fund’s hypothetical account values and hypothetical expenses based on each class’s actual expense ratio and an assumed 5% annualized return before expenses (which is not the class’s actual return). It assumes an account value of $1,000.00 on February 1, 2019, with the same investment held until July 31, 2019. Look in any other fund shareholder report to find its hypothetical example and you will be able to compare these expenses. Please remember that these hypothetical account values and expenses may not be used to estimate the actual ending account balance or expenses you paid for the period.
| 8 | JOHN HANCOCK ABSOLUTE RETURN CURRENCY FUND | ANNUAL REPORT | |
Remember, these examples do not include any transaction costs, therefore, these examples will not help you to determine the relative total costs of owning different funds. If transaction costs were included, your expenses would have been higher. See the prospectuses for details regarding transaction costs.
SHAREHOLDER EXPENSE EXAMPLE CHART
| | | Account
value on
2-1-2019 | Ending
value on
7-31-2019 | Expenses
paid during
period ended
7-31-20191 | Annualized
expense
ratio |
| Class A | Actual expenses/actual returns | $1,000.00 | $987.60 | $6.70 | 1.36% |
| | Hypothetical example | 1,000.00 | 1,018.10 | 6.81 | 1.36% |
| Class C | Actual expenses/actual returns | 1,000.00 | 985.30 | 10.14 | 2.06% |
| | Hypothetical example | 1,000.00 | 1,014.60 | 10.29 | 2.06% |
| Class I | Actual expenses/actual returns | 1,000.00 | 989.10 | 5.23 | 1.06% |
| | Hypothetical example | 1,000.00 | 1,019.50 | 5.31 | 1.06% |
| Class R2 | Actual expenses/actual returns | 1,000.00 | 989.10 | 6.56 | 1.33% |
| | Hypothetical example | 1,000.00 | 1,018.20 | 6.66 | 1.33% |
| Class R4 | Actual expenses/actual returns | 1,000.00 | 989.10 | 5.38 | 1.09% |
| | Hypothetical example | 1,000.00 | 1,019.40 | 5.46 | 1.09% |
| Class R6 | Actual expenses/actual returns | 1,000.00 | 991.30 | 4.69 | 0.95% |
| | Hypothetical example | 1,000.00 | 1,020.10 | 4.76 | 0.95% |
| Class NAV | Actual expenses/actual returns | 1,000.00 | 991.40 | 4.64 | 0.94% |
| | Hypothetical example | 1,000.00 | 1,020.10 | 4.71 | 0.94% |
| 1 | Expenses are equal to the annualized expense ratio, multiplied by the average account value over the period, multiplied by 181/365 (to reflect the one-half year period). |
| | ANNUAL REPORT | JOHN HANCOCK ABSOLUTE RETURN CURRENCY FUND | 9 |
AS OF 7-31-19
| | Yield* (%) | Maturity date | | Par value^ | Value |
| Short-term investments 100.1% | | | | | $1,041,473,658 |
| (Cost $1,041,330,016) | | | | | |
| U.S. Government 93.7% | | | | | 974,885,918 |
| U.S. Treasury Bill (A) | 1.970 | 12-05-19 | | 370,000,000 | 367,374,061 |
| U.S. Treasury Bill (A) | 2.105 | 11-07-19 | | 230,000,000 | 228,723,673 |
| U.S. Treasury Bill (A) | 2.303 | 10-10-19 | | 240,000,000 | 239,045,201 |
| U.S. Treasury Bill (A) | 2.376 | 09-12-19 | | 100,000,000 | 99,773,861 |
| U.S. Treasury Bill | 2.377 | 08-15-19 | | 40,000,000 | 39,969,122 |
| | | Yield (%) | | Shares | Value |
| Money market funds 6.4% | | | | | 66,587,740 |
|
| State Street Institutional Treasury Plus Money Market Fund, Premier Class | 2.2121(B) | | 66,587,740 | 66,587,740 |
|
| Total investments (Cost $1,041,330,016) 100.1% | | | $1,041,473,658 |
| Other assets and liabilities, net (0.1%) | | | | (1,475,730) |
| Total net assets 100.0% | | | | | $1,039,997,928 |
| The percentage shown for each investment category is the total value of the category as a percentage of the net assets of the fund. |
| ^All par values are denominated in U.S. dollars unless otherwise indicated. |
| Security Abbreviations and Legend |
| (A) | All or a portion of this security is segregated at the custodian as collateral for certain derivatives. |
| (B) | The rate shown is the annualized seven-day yield as of 7-31-19. |
| * | Yield represents either the annualized yield at the date of purchase, the stated coupon rate or, for floating rate securities, the rate at period end. |
| 10 | JOHN HANCOCK ABSOLUTE RETURN CURRENCY FUND | ANNUAL REPORT | SEE NOTES TO FINANCIAL STATEMENTS |
DERIVATIVES
FORWARD FOREIGN CURRENCY CONTRACTS
| Contract to buy | Contract to sell | Counterparty (OTC) | Contractual
settlement
date | Unrealized
appreciation | Unrealized
depreciation |
| AUD | 211,959,646 | USD | 147,884,642 | CITI | 9/18/2019 | — | $(2,699,694) |
| AUD | 211,959,646 | USD | 147,885,463 | DB | 9/18/2019 | — | (2,700,515) |
| AUD | 211,959,646 | USD | 147,983,513 | MSCS | 9/18/2019 | — | (2,798,565) |
| CAD | 244,124,776 | USD | 185,409,553 | CITI | 9/18/2019 | — | (269,679) |
| CAD | 244,124,776 | USD | 185,434,086 | DB | 9/18/2019 | — | (294,211) |
| CAD | 244,124,776 | USD | 185,485,681 | MSCS | 9/18/2019 | — | (345,806) |
| EUR | 337,754,217 | USD | 383,897,944 | CITI | 9/18/2019 | — | (8,585,497) |
| EUR | 344,586,940 | USD | 393,591,167 | DB | 9/18/2019 | — | (10,686,197) |
| EUR | 280,582,586 | USD | 318,995,541 | MSCS | 9/18/2019 | — | (7,212,205) |
| GBP | 215,661,422 | USD | 271,286,582 | CITI | 9/18/2019 | — | (8,413,732) |
| GBP | 183,125,704 | USD | 229,756,537 | DB | 9/18/2019 | — | (6,541,950) |
| GBP | 215,661,422 | USD | 271,299,136 | MSCS | 9/18/2019 | — | (8,426,285) |
| JPY | 13,838,341,636 | USD | 128,837,398 | CITI | 9/18/2019 | — | (1,187,324) |
| JPY | 13,838,341,636 | USD | 128,837,392 | DB | 9/18/2019 | — | (1,187,321) |
| JPY | 13,838,341,636 | USD | 128,836,920 | MSCS | 9/18/2019 | — | (1,186,847) |
| NOK | 655,187,713 | USD | 76,030,028 | CITI | 9/18/2019 | — | (1,956,532) |
| NOK | 655,187,713 | USD | 76,029,946 | DB | 9/18/2019 | — | (1,956,450) |
| NOK | 655,187,713 | USD | 76,029,715 | MSCS | 9/18/2019 | — | (1,956,220) |
| NZD | 530,494,949 | USD | 350,923,585 | CITI | 9/18/2019 | — | (2,257,581) |
| NZD | 665,696,825 | USD | 440,715,829 | DB | 9/18/2019 | — | (3,188,850) |
| NZD | 665,696,825 | USD | 444,473,804 | MSCS | 9/18/2019 | — | (6,946,823) |
| SEK | 1,574,648,062 | USD | 167,756,213 | CITI | 9/18/2019 | — | (4,199,090) |
| SEK | 1,574,648,062 | USD | 167,903,750 | DB | 9/18/2019 | — | (4,346,628) |
| SEK | 1,574,648,062 | USD | 167,944,776 | MSCS | 9/18/2019 | — | (4,387,653) |
| SGD | 362,649,024 | USD | 265,393,640 | CITI | 9/18/2019 | — | (1,302,379) |
| SGD | 118,239,144 | USD | 87,080,739 | DB | 9/18/2019 | — | (975,656) |
| SGD | 118,239,144 | USD | 87,095,530 | MSCS | 9/18/2019 | — | (990,449) |
| USD | 205,157,786 | AUD | 292,964,905 | CITI | 9/18/2019 | $4,487,078 | — |
| USD | 205,145,128 | AUD | 292,964,905 | DB | 9/18/2019 | 4,474,411 | — |
| USD | 205,108,840 | AUD | 292,964,905 | MSCS | 9/18/2019 | 4,438,125 | — |
| USD | 196,378,293 | CAD | 260,871,289 | CITI | 9/18/2019 | — | (1,461,839) |
| USD | 196,230,125 | CAD | 260,871,289 | DB | 9/18/2019 | — | (1,610,003) |
| USD | 197,315,352 | CAD | 260,871,289 | MSCS | 9/18/2019 | — | (524,779) |
| USD | 101,241,717 | EUR | 89,249,756 | CITI | 9/18/2019 | 2,067,400 | — |
| USD | 108,783,251 | EUR | 96,082,479 | DB | 9/18/2019 | 2,016,413 | — |
| USD | 35,916,382 | EUR | 32,078,125 | MSCS | 9/18/2019 | 271,174 | — |
| USD | 211,944,376 | GBP | 167,301,753 | CITI | 9/18/2019 | 8,017,831 | — |
| USD | 170,427,621 | GBP | 134,766,035 | DB | 9/18/2019 | 6,159,335 | — |
| USD | 212,294,307 | GBP | 167,301,753 | MSCS | 9/18/2019 | 8,367,763 | — |
| USD | 49,637,049 | JPY | 5,333,651,258 | CITI | 9/18/2019 | 437,442 | — |
| USD | 49,637,061 | JPY | 5,333,651,258 | DB | 9/18/2019 | 437,454 | — |
| SEE NOTES TO FINANCIAL STATEMENTS | ANNUAL REPORT | JOHN HANCOCK ABSOLUTE RETURN CURRENCY FUND | 11 |
FORWARD FOREIGN CURRENCY CONTRACTS (continued)
| Contract to buy | Contract to sell | Counterparty (OTC) | Contractual
settlement
date | Unrealized
appreciation | Unrealized
depreciation |
| USD | 49,639,844 | JPY | 5,333,651,258 | MSCS | 9/18/2019 | $440,238 | — |
| USD | 357,563,444 | NOK | 3,087,496,122 | CITI | 9/18/2019 | 8,500,684 | — |
| USD | 358,132,570 | NOK | 3,087,496,122 | DB | 9/18/2019 | 9,069,807 | — |
| USD | 358,957,081 | NOK | 3,087,496,122 | MSCS | 9/18/2019 | 9,894,321 | — |
| USD | 73,989,665 | NZD | 110,303,949 | CITI | 9/18/2019 | 1,492,767 | — |
| USD | 163,608,373 | NZD | 245,505,825 | DB | 9/18/2019 | 2,250,499 | — |
| USD | 163,612,565 | NZD | 245,505,825 | MSCS | 9/18/2019 | 2,254,693 | — |
| USD | 224,040,984 | SEK | 2,087,070,466 | CITI | 9/18/2019 | 7,259,058 | — |
| USD | 223,789,193 | SEK | 2,087,070,466 | DB | 9/18/2019 | 7,007,269 | — |
| USD | 224,038,776 | SEK | 2,087,070,466 | MSCS | 9/18/2019 | 7,256,847 | — |
| USD | 415,786,358 | SGD | 566,123,632 | CITI | 9/18/2019 | 3,519,145 | — |
| USD | 235,238,140 | SGD | 321,713,752 | DB | 9/18/2019 | 957,102 | — |
| USD | 235,239,001 | SGD | 321,713,752 | MSCS | 9/18/2019 | 957,962 | — |
| | | | | | | $102,034,818 | $(100,596,760) |
| Derivatives Currency Abbreviations |
| AUD | Australian Dollar |
| CAD | Canadian Dollar |
| EUR | Euro |
| GBP | Pound Sterling |
| JPY | Japanese Yen |
| NOK | Norwegian Krone |
| NZD | New Zealand Dollar |
| SEK | Swedish Krona |
| SGD | Singapore Dollar |
| USD | U.S. Dollar |
| Derivatives Abbreviations |
| CITI | Citibank, N.A. |
| DB | Deutsche Bank AG |
| MSCS | Morgan Stanley Capital Services LLC |
| OTC | Over-the-counter |
At 7-31-19, the aggregate cost of investments for federal income tax purposes was $1,040,602,347. Net unrealized appreciation aggregated to $2,309,369, of which $2,384,157 related to gross unrealized appreciation and $74,788 related to gross unrealized depreciation.
See Notes to financial statements regarding investment transactions and other derivatives information.
| 12 | JOHN HANCOCK ABSOLUTE RETURN CURRENCY FUND | ANNUAL REPORT | SEE NOTES TO FINANCIAL STATEMENTS |
STATEMENT OF ASSETS AND LIABILITIES 7-31-19
| Assets | |
| Unaffiliated investments, at value (Cost $1,041,330,016) | $1,041,473,658 |
| Unrealized appreciation on forward foreign currency contracts | 102,034,818 |
| Interest receivable | 138,649 |
| Receivable for fund shares sold | 396,024 |
| Other assets | 79,339 |
| Total assets | 1,144,122,488 |
| Liabilities | |
| Unrealized depreciation on forward foreign currency contracts | 100,596,760 |
| Payable for fund shares repurchased | 3,170,965 |
| Payable to affiliates | |
| Accounting and legal services fees | 92,781 |
| Transfer agent fees | 65,610 |
| Distribution and service fees | 9 |
| Trustees' fees | 1,473 |
| Other liabilities and accrued expenses | 196,962 |
| Total liabilities | 104,124,560 |
| Net assets | $1,039,997,928 |
| Net assets consist of | |
| Paid-in capital | $1,203,448,998 |
| Total distributable earnings (loss) | (163,451,070) |
| Net assets | $1,039,997,928 |
| |
| Net asset value per share | |
| Based on net asset value and shares outstanding - the fund has an unlimited number of shares authorized with no par value | |
| Class A ($12,944,409 ÷ 1,475,813 shares)1 | $8.77 |
| Class C ($430,355 ÷ 49,309 shares)1 | $8.73 |
| Class I ($624,314,663 ÷ 68,955,065 shares) | $9.05 |
| Class R2 ($91,295 ÷ 10,093 shares) | $9.05 |
| Class R4 ($46,074 ÷ 5,071 shares) | $9.09 |
| Class R6 ($1,090,291 ÷ 119,194 shares) | $9.15 |
| Class NAV ($401,080,841 ÷ 43,710,119 shares) | $9.18 |
| Maximum offering price per share | |
| Class A (net asset value per share ÷ 97%)2 | $9.04 |
| 1 | Redemption price per share is equal to net asset value less any applicable contingent deferred sales charge. |
| 2 | On single retail sales of less than $100,000. On sales of $100,000 or more and on group sales the offering price is reduced. |
| SEE NOTES TO FINANCIAL STATEMENTS | ANNUAL REPORT | JOHN HANCOCK ABSOLUTE RETURN CURRENCY FUND | 13 |
STATEMENT OF OPERATIONSFor the year ended 7-31-19
| Investment income | |
| Interest | $28,857,595 |
| Expenses | |
| Investment management fees | 11,219,629 |
| Distribution and service fees | 51,995 |
| Accounting and legal services fees | 236,959 |
| Transfer agent fees | 885,630 |
| Trustees' fees | 25,116 |
| Custodian fees | 180,724 |
| State registration fees | 107,766 |
| Printing and postage | 59,784 |
| Professional fees | 129,297 |
| Other | 43,820 |
| Total expenses | 12,940,720 |
| Less expense reductions | (97,419) |
| Net expenses | 12,843,301 |
| Net investment income | 16,014,294 |
| Realized and unrealized gain (loss) | |
| Net realized gain (loss) on | |
| Unaffiliated investments and foreign currency transactions | 6,812,586 |
| Forward foreign currency contracts | (455,019) |
| | 6,357,567 |
| Change in net unrealized appreciation (depreciation) of | |
| Unaffiliated investments | 175,319 |
| Forward foreign currency contracts | 18,265,361 |
| | 18,440,680 |
| Net realized and unrealized gain | 24,798,247 |
| Increase in net assets from operations | $40,812,541 |
| | |
| 14 | JOHN HANCOCK ABSOLUTE RETURN CURRENCY FUND | ANNUAL REPORT | SEE NOTES TO FINANCIAL STATEMENTS |
STATEMENTS OF CHANGES IN NET ASSETS
| | Year ended
7-31-19 | Year ended
7-31-18 |
| Increase (decrease) in net assets | | |
| From operations | | |
| Net investment income | $16,014,294 | $7,435,861 |
| Net realized gain (loss) | 6,357,567 | (183,777,455) |
| Change in net unrealized appreciation (depreciation) | 18,440,680 | 6,194,269 |
| Increase (decrease) in net assets resulting from operations | 40,812,541 | (170,147,325) |
| Distributions to shareholders | | |
| From net investment income and net realized gain | | |
| Class A | (51,210) | — |
| Class I | (4,347,079) | — |
| Class R2 | (333) | — |
| Class R4 | (275) | — |
| Class R6 | (36,867) | — |
| Class NAV | (4,065,435) | — |
| Total distributions | (8,501,199) | — |
| From fund share transactions | (468,800,538) | 229,182,945 |
| Total increase (decrease) | (436,489,196) | 59,035,620 |
| Net assets | | |
| Beginning of year | 1,476,487,124 | 1,417,451,504 |
| End of year1 | $1,039,997,928 | $1,476,487,124 |
| 1 | Net assets - End of year includes undistributed net investment income of $5,028,481 at July 31, 2018. The SEC eliminated the requirement to disclose undistributed net investment income in the current reporting period. |
| SEE NOTES TO FINANCIAL STATEMENTS | ANNUAL REPORT | JOHN HANCOCK ABSOLUTE RETURN CURRENCY FUND | 15 |
| CLASS A SHARES Period ended | 7-31-19 | 7-31-18 | 7-31-17 | 7-31-16 | 7-31-15 |
| Per share operating performance | | | | | |
| Net asset value, beginning of period | $8.59 | $9.54 | $9.11 | $8.23 | $9.63 |
| Net investment income (loss)1 | 0.08 | 0.01 | (0.08) | (0.10) | (0.12) |
| Net realized and unrealized gain (loss) on investments | 0.13 | (0.96) | 0.51 | 0.98 | (0.98) |
| Total from investment operations | 0.21 | (0.95) | 0.43 | 0.88 | (1.10) |
| Less distributions | | | | | |
| From net investment income | (0.03) | — | — | — | — |
| From net realized gain | — | — | — | — | (0.30) |
| Total distributions | (0.03) | — | — | — | (0.30) |
| Net asset value, end of period | $8.77 | $8.59 | $9.54 | $9.11 | $8.23 |
| Total return (%)2,3 | 2.43 | (10.05) | 4.83 | 10.56 | (11.51) |
| Ratios and supplemental data | | | | | |
| Net assets, end of period (in millions) | $13 | $17 | $22 | $21 | $22 |
| Ratios (as a percentage of average net assets): | | | | | |
| Expenses before reductions | 1.35 | 1.33 | 1.35 | 1.37 | 1.37 |
| Expenses including reductions | 1.35 | 1.32 | 1.34 | 1.36 | 1.35 |
| Net investment income (loss) | 0.92 | 0.06 | (0.83) | (1.13) | (1.29) |
| Portfolio turnover (%)4 | 0 | 0 | 0 | 0 | 0 |
| 1 | Based on average daily shares outstanding. |
| 2 | Total returns would have been lower had certain expenses not been reduced during the applicable periods. |
| 3 | Does not reflect the effect of sales charges, if any. |
| 4 | The calculation of portfolio turnover excludes amounts from securities whose maturities or expiration dates at the time of acquisition were one year or less, which represents a significant amount of the investments held by the fund. As a result, the portfolio turnover is 0%. |
| 16 | JOHN HANCOCK ABSOLUTE RETURN CURRENCY FUND | ANNUAL REPORT | SEE NOTES TO FINANCIAL STATEMENTS |
| CLASS C SHARES Period ended | 7-31-19 | 7-31-18 | 7-31-17 | 7-31-16 | 7-31-151 |
| Per share operating performance | | | | | |
| Net asset value, beginning of period | $8.58 | $9.60 | $9.23 | $8.40 | $10.01 |
| Net investment income (loss)2 | 0.02 | (0.06) | (0.15) | (0.16) | (0.18) |
| Net realized and unrealized gain (loss) on investments | 0.13 | (0.96) | 0.52 | 0.99 | (1.13) |
| Total from investment operations | 0.15 | (1.02) | 0.37 | 0.83 | (1.31) |
| Less distributions | | | | | |
| From net realized gain | — | — | — | — | (0.30) |
| Net asset value, end of period | $8.73 | $8.58 | $9.60 | $9.23 | $8.40 |
| Total return (%)3,4 | 1.75 | (10.62) | 4.01 | 9.88 | (13.29)5 |
| Ratios and supplemental data | | | | | |
| Net assets, end of period (in millions) | $—6 | $1 | $1 | $1 | $—6 |
| Ratios (as a percentage of average net assets): | | | | | |
| Expenses before reductions | 2.05 | 2.03 | 2.05 | 2.07 | 3.047 |
| Expenses including reductions | 2.05 | 2.02 | 2.04 | 2.06 | 2.257 |
| Net investment income (loss) | 0.21 | (0.67) | (1.52) | (1.81) | (2.19)7 |
| Portfolio turnover (%)8 | 0 | 0 | 0 | 0 | 0 |
| 1 | The inception date for Class C shares is 8-28-14. |
| 2 | Based on average daily shares outstanding. |
| 3 | Total returns would have been lower had certain expenses not been reduced during the applicable periods. |
| 4 | Does not reflect the effect of sales charges, if any. |
| 5 | Not annualized. |
| 6 | Less than $500,000. |
| 7 | Annualized. |
| 8 | The calculation of portfolio turnover excludes amounts from securities whose maturities or expiration dates at the time of acquisition were one year or less, which represents a significant amount of the investments held by the fund. As a result, the portfolio turnover is 0%. |
| SEE NOTES TO FINANCIAL STATEMENTS | ANNUAL REPORT | JOHN HANCOCK ABSOLUTE RETURN CURRENCY FUND | 17 |
| CLASS I SHARES Period ended | 7-31-19 | 7-31-18 | 7-31-17 | 7-31-16 | 7-31-15 |
| Per share operating performance | | | | | |
| Net asset value, beginning of period | $8.87 | $9.82 | $9.35 | $8.42 | $9.81 |
| Net investment income (loss)1 | 0.11 | 0.04 | (0.05) | (0.07) | (0.09) |
| Net realized and unrealized gain (loss) on investments | 0.13 | (0.99) | 0.52 | 1.00 | (1.00) |
| Total from investment operations | 0.24 | (0.95) | 0.47 | 0.93 | (1.09) |
| Less distributions | | | | | |
| From net investment income | (0.06) | — | — | — | — |
| From net realized gain | — | — | — | — | (0.30) |
| Total distributions | (0.06) | — | — | — | (0.30) |
| Net asset value, end of period | $9.05 | $8.87 | $9.82 | $9.35 | $8.42 |
| Total return (%)2 | 2.67 | (9.77) | 5.13 | 11.05 | (11.29) |
| Ratios and supplemental data | | | | | |
| Net assets, end of period (in millions) | $624 | $720 | $397 | $210 | $371 |
| Ratios (as a percentage of average net assets): | | | | | |
| Expenses before reductions | 1.07 | 1.04 | 1.04 | 1.05 | 1.03 |
| Expenses including reductions | 1.06 | 1.03 | 1.03 | 1.04 | 1.02 |
| Net investment income (loss) | 1.21 | 0.42 | (0.49) | (0.82) | (0.96) |
| Portfolio turnover (%)3 | 0 | 0 | 0 | 0 | 0 |
| 1 | Based on average daily shares outstanding. |
| 2 | Total returns would have been lower had certain expenses not been reduced during the applicable periods. |
| 3 | The calculation of portfolio turnover excludes amounts from securities whose maturities or expiration dates at the time of acquisition were one year or less, which represents a significant amount of the investments held by the fund. As a result, the portfolio turnover is 0%. |
| 18 | JOHN HANCOCK ABSOLUTE RETURN CURRENCY FUND | ANNUAL REPORT | SEE NOTES TO FINANCIAL STATEMENTS |
| CLASS R2 SHARES Period ended | 7-31-19 | 7-31-18 | 7-31-17 | 7-31-16 | 7-31-151 |
| Per share operating performance | | | | | |
| Net asset value, beginning of period | $8.86 | $9.83 | $9.38 | $8.46 | $8.70 |
| Net investment income (loss)2 | 0.09 | 0.01 | (0.07) | (0.09) | (0.03) |
| Net realized and unrealized gain (loss) on investments | 0.14 | (0.98) | 0.52 | 1.01 | (0.21) |
| Total from investment operations | 0.23 | (0.97) | 0.45 | 0.92 | (0.24) |
| Less distributions | | | | | |
| From net investment income | (0.04) | — | — | — | — |
| Net asset value, end of period | $9.05 | $8.86 | $9.83 | $9.38 | $8.46 |
| Total return (%)3 | 2.53 | (9.96) | 4.90 | 10.87 | (2.76)4 |
| Ratios and supplemental data | | | | | |
| Net assets, end of period (in millions) | $—5 | $—5 | $—5 | $—5 | $—5 |
| Ratios (as a percentage of average net assets): | | | | | |
| Expenses before reductions | 1.32 | 1.27 | 1.20 | 1.23 | 1.186 |
| Expenses including reductions | 1.31 | 1.26 | 1.20 | 1.22 | 1.166 |
| Net investment income (loss) | 0.98 | 0.07 | (0.68) | (0.98) | (1.08)6 |
| Portfolio turnover (%)7 | 0 | 0 | 0 | 0 | 0 |
| 1 | The inception date for Class R2 shares is 3-27-15. |
| 2 | Based on average daily shares outstanding. |
| 3 | Total returns would have been lower had certain expenses not been reduced during the applicable periods. |
| 4 | Not annualized. |
| 5 | Less than $500,000. |
| 6 | Annualized. |
| 7 | The calculation of portfolio turnover excludes amounts from securities whose maturities or expiration dates at the time of acquisition were one year or less, which represents a significant amount of the investments held by the fund. As a result, the portfolio turnover is 0%. |
| SEE NOTES TO FINANCIAL STATEMENTS | ANNUAL REPORT | JOHN HANCOCK ABSOLUTE RETURN CURRENCY FUND | 19 |
| CLASS R4 SHARES Period ended | 7-31-19 | 7-31-18 | 7-31-17 | 7-31-16 | 7-31-151 |
| Per share operating performance | | | | | |
| Net asset value, beginning of period | $8.90 | $9.86 | $9.39 | $8.47 | $8.70 |
| Net investment income (loss)2 | 0.11 | 0.02 | (0.06) | (0.08) | (0.03) |
| Net realized and unrealized gain (loss) on investments | 0.13 | (0.98) | 0.53 | 1.00 | (0.20) |
| Total from investment operations | 0.24 | (0.96) | 0.47 | 0.92 | (0.23) |
| Less distributions | | | | | |
| From net investment income | (0.05) | — | — | — | — |
| Net asset value, end of period | $9.09 | $8.90 | $9.86 | $9.39 | $8.47 |
| Total return (%)3 | 2.62 | (9.83) | 5.11 | 10.86 | (2.64)4 |
| Ratios and supplemental data | | | | | |
| Net assets, end of period (in millions) | $—5 | $—5 | $—5 | $—5 | $—5 |
| Ratios (as a percentage of average net assets): | | | | | |
| Expenses before reductions | 1.20 | 1.19 | 1.19 | 1.21 | 1.186 |
| Expenses including reductions | 1.10 | 1.08 | 1.09 | 1.10 | 1.066 |
| Net investment income (loss) | 1.19 | 0.21 | (0.57) | (0.87) | (0.98)6 |
| Portfolio turnover (%)7 | 0 | 0 | 0 | 0 | 0 |
| 1 | The inception date for Class R4 shares is 3-27-15. |
| 2 | Based on average daily shares outstanding. |
| 3 | Total returns would have been lower had certain expenses not been reduced during the applicable periods. |
| 4 | Not annualized. |
| 5 | Less than $500,000. |
| 6 | Annualized. |
| 7 | The calculation of portfolio turnover excludes amounts from securities whose maturities or expiration dates at the time of acquisition were one year or less, which represents a significant amount of the investments held by the fund. As a result, the portfolio turnover is 0%. |
| 20 | JOHN HANCOCK ABSOLUTE RETURN CURRENCY FUND | ANNUAL REPORT | SEE NOTES TO FINANCIAL STATEMENTS |
| CLASS R6 SHARES Period ended | 7-31-19 | 7-31-18 | 7-31-17 | 7-31-16 | 7-31-15 |
| Per share operating performance | | | | | |
| Net asset value, beginning of period | $8.96 | $9.91 | $9.42 | $8.48 | $9.86 |
| Net investment income (loss)1 | 0.10 | 0.05 | (0.03) | (0.06) | (0.08) |
| Net realized and unrealized gain (loss) on investments | 0.16 | (1.00) | 0.52 | 1.00 | (1.00) |
| Total from investment operations | 0.26 | (0.95) | 0.49 | 0.94 | (1.08) |
| Less distributions | | | | | |
| From net investment income | (0.07) | — | — | — | — |
| From net realized gain | — | — | — | — | (0.30) |
| Total distributions | (0.07) | — | — | — | (0.30) |
| Net asset value, end of period | $9.15 | $8.96 | $9.91 | $9.42 | $8.48 |
| Total return (%)2 | 2.87 | (9.59) | 5.20 | 11.08 | (11.13) |
| Ratios and supplemental data | | | | | |
| Net assets, end of period (in millions) | $1 | $119 | $137 | $38 | $37 |
| Ratios (as a percentage of average net assets): | | | | | |
| Expenses before reductions | 0.95 | 0.94 | 0.95 | 0.96 | 0.94 |
| Expenses including reductions | 0.95 | 0.92 | 0.92 | 0.93 | 0.90 |
| Net investment income (loss) | 1.06 | 0.48 | (0.32) | (0.71) | (0.84) |
| Portfolio turnover (%)3 | 0 | 0 | 0 | 0 | 0 |
| 1 | Based on average daily shares outstanding. |
| 2 | Total returns would have been lower had certain expenses not been reduced during the applicable periods. |
| 3 | The calculation of portfolio turnover excludes amounts from securities whose maturities or expiration dates at the time of acquisition were one year or less, which represents a significant amount of the investments held by the fund. As a result, the portfolio turnover is 0%. |
| SEE NOTES TO FINANCIAL STATEMENTS | ANNUAL REPORT | JOHN HANCOCK ABSOLUTE RETURN CURRENCY FUND | 21 |
| CLASS NAV SHARES Period ended | 7-31-19 | 7-31-18 | 7-31-17 | 7-31-16 | 7-31-15 |
| Per share operating performance | | | | | |
| Net asset value, beginning of period | $8.99 | $9.94 | $9.45 | $8.50 | $9.89 |
| Net investment income (loss)1 | 0.12 | 0.04 | (0.04) | (0.06) | (0.08) |
| Net realized and unrealized gain (loss) on investments | 0.14 | (0.99) | 0.53 | 1.01 | (1.01) |
| Total from investment operations | 0.26 | (0.95) | 0.49 | 0.95 | (1.09) |
| Less distributions | | | | | |
| From net investment income | (0.07) | — | — | — | — |
| From net realized gain | — | — | — | — | (0.30) |
| Total distributions | (0.07) | — | — | — | (0.30) |
| Net asset value, end of period | $9.18 | $8.99 | $9.94 | $9.45 | $8.50 |
| Total return (%)2 | 2.85 | (9.56) | 5.19 | 11.05 | (11.10) |
| Ratios and supplemental data | | | | | |
| Net assets, end of period (in millions) | $401 | $620 | $860 | $779 | $886 |
| Ratios (as a percentage of average net assets): | | | | | |
| Expenses before reductions | 0.94 | 0.92 | 0.93 | 0.94 | 0.91 |
| Expenses including reductions | 0.93 | 0.92 | 0.92 | 0.93 | 0.90 |
| Net investment income (loss) | 1.33 | 0.47 | (0.41) | (0.71) | (0.84) |
| Portfolio turnover (%)3 | 0 | 0 | 0 | 0 | 0 |
| 1 | Based on average daily shares outstanding. |
| 2 | Total returns would have been lower had certain expenses not been reduced during the applicable periods. |
| 3 | The calculation of portfolio turnover excludes amounts from securities whose maturities or expiration dates at the time of acquisition were one year or less, which represents a significant amount of the investments held by the fund. As a result, the portfolio turnover is 0%. |
| 22 | JOHN HANCOCK ABSOLUTE RETURN CURRENCY FUND | ANNUAL REPORT | SEE NOTES TO FINANCIAL STATEMENTS |
| Notes to financial statements | |
Note 1—Organization
John Hancock Absolute Return Currency Fund (the fund) is a series of John Hancock Funds II (the Trust), an open-end management investment company organized as a Massachusetts business trust and registered under the Investment Company Act of 1940, as amended (the 1940 Act). The investment objective of the fund is to seek to achieve absolute return from investments in currency markets.
The fund may offer multiple classes of shares. The shares currently outstanding are detailed in the Statement of assets and liabilities. Class A and Class C shares are offered to all investors. Class I shares are offered to institutions and certain investors. Class R2 and Class R4 shares are available only to certain retirement and 529 plans. Class R6 shares are only available to certain retirement plans, institutions and other investors. Class NAV shares are offered to John Hancock affiliated funds of funds, retirement plans for employees of John Hancock and/or Manulife Financial Corporation, and certain 529 plans. Class C shares convert to Class A shares ten years after purchase (certain exclusions may apply). Shareholders of each class have exclusive voting rights to matters that affect that class. The distribution and service fees, if any, and transfer agent fees for each class may differ.
Note 2—Significant accounting policies
The financial statements have been prepared in conformity with accounting principles generally accepted in the United States of America (US GAAP), which require management to make certain estimates and assumptions as of the date of the financial statements. Actual results could differ from those estimates and those differences could be significant. The fund qualifies as an investment company under Topic 946 of Accounting Standards Codification of US GAAP.
Events or transactions occurring after the end of the fiscal period through the date that the financial statements were issued have been evaluated in the preparation of the financial statements. The following summarizes the significant accounting policies of the fund:
Security valuation. Investments are stated at value as of the scheduled close of regular trading on the New York Stock Exchange (NYSE), normally at 4:00 P.M., Eastern Time. In case of emergency or other disruption resulting in the NYSE not opening for trading or the NYSE closing at a time other than the regularly scheduled close, the net asset value (NAV) may be determined as of the regularly scheduled close of the NYSE pursuant to the fund's Valuation Policies and Procedures.
In order to value the securities, the fund uses the following valuation techniques: Investments by the fund in open-end mutual funds are valued at their respective NAVs each business day. Debt obligations are typically valued based on the evaluated prices provided by an independent pricing vendor. Independent pricing vendors utilize matrix pricing which takes into account factors such as institutional-size trading in similar groups of securities, yield, quality, coupon rate, maturity, type of issue, trading characteristics and other market data, as well as broker supplied prices. Forward foreign currency contracts are valued at the prevailing forward rates which are based on foreign currency exchange spot rates and forward points supplied by an independent pricing vendor.
Other portfolio securities and assets, for which reliable market quotations are not readily available, are valued at fair value as determined in good faith by the fund's Pricing Committee following procedures established by the Board of Trustees. The frequency with which these fair valuation procedures are used cannot be predicted and fair value of securities may differ significantly from the value that would have been used had a ready market for such securities existed.
The fund uses a three-tier hierarchy to prioritize the pricing assumptions, referred to as inputs, used in valuation techniques to measure fair value. Level 1 includes securities valued using quoted prices in active markets for identical securities, including registered investment companies. Level 2 includes securities valued using other
| | ANNUAL REPORT | JOHN HANCOCK Absolute Return Currency Fund | 23 |
significant observable inputs. Observable inputs may include quoted prices for similar securities, interest rates, prepayment speeds and credit risk. Prices for securities valued using these inputs are received from independent pricing vendors and brokers and are based on an evaluation of the inputs described. Level 3 includes securities valued using significant unobservable inputs when market prices are not readily available or reliable, including the fund's own assumptions in determining the fair value of investments. Factors used in determining value may include market or issuer specific events or trends, changes in interest rates and credit quality. The inputs or methodology used for valuing securities are not necessarily an indication of the risks associated with investing in those securities. Changes in valuation techniques and related inputs may result in transfers into or out of an assigned level within the disclosure hierarchy.
The following is a summary of the values by input classification of the fund's investments as of July 31, 2019, by major security category or type:
| | Total
value at
7-31-19 | Level 1
quoted
price | Level 2
significant
observable
inputs | Level 3
significant
unobservable
inputs |
| Investments in securities: | | | | |
| Assets | | | | |
| Short-term investments | $1,041,473,658 | $66,587,740 | $974,885,918 | — |
| Total investments in securities | $1,041,473,658 | $66,587,740 | $974,885,918 | — |
| Derivatives: | | | | |
| Assets | | | | |
| Forward foreign currency contracts | $102,034,818 | — | $102,034,818 | — |
| Liabilities | | | | |
| Forward foreign currency contracts | (100,596,760) | — | (100,596,760) | — |
Security transactions and related investment income. Investment security transactions are accounted for on a trade date plus one basis for daily NAV calculations. However, for financial reporting purposes, investment transactions are reported on trade date. Interest income is accrued as earned. Interest income includes coupon interest and amortization/accretion of premiums/discounts on debt securities. Debt obligations may be placed in a non-accrual status and related interest income may be reduced by stopping current accruals and writing off interest receivable when the collection of all or a portion of interest has become doubtful. Gains and losses on securities sold are determined on the basis of identified cost and may include proceeds from litigation.
Line of credit. The fund may have the ability to borrow from banks for temporary or emergency purposes, including meeting redemption requests that otherwise might require the untimely sale of securities. Pursuant to the fund's custodian agreement, the custodian may loan money to the fund to make properly authorized payments. The fund is obligated to repay the custodian for any overdraft, including any related costs or expenses. The custodian may have a lien, security interest or security entitlement in any fund property that is not otherwise segregated or pledged, to the extent of any overdraft, and to the maximum extent permitted by law.
The fund and other affiliated funds, have entered into a syndicated line of credit agreement with Citibank, N.A. as the administrative agent that enables them to participate in a $750 million unsecured committed line of credit. Excluding commitments designated for a certain fund and subject to the needs of all other affiliated funds, the fund can borrow up to an aggregate commitment amount of $500 million, subject to asset coverage and other limitations as specified in the agreement. A commitment fee payable at the end of each calendar quarter, based on
| 24 | JOHN HANCOCK Absolute Return Currency Fund | ANNUAL REPORT | |
the average daily unused portion of the line of credit, is charged to each participating fund based on a combination of fixed and asset based allocations and is reflected in Other expenses on the Statement of operations. For the year ended July 31, 2019, the fund had no borrowings under the line of credit. Commitment fees for the year ended July 31, 2019 were $4,886.
Expenses. Within the John Hancock group of funds complex, expenses that are directly attributable to an individual fund are allocated to such fund. Expenses that are not readily attributable to a specific fund are allocated among all funds in an equitable manner, taking into consideration, among other things, the nature and type of expense and the fund’s relative net assets. Expense estimates are accrued in the period to which they relate and adjustments are made when actual amounts are known.
Class allocations. Income, common expenses and realized and unrealized gains (losses) are determined at the fund level and allocated daily to each class of shares based on the net assets of the class. Class-specific expenses, such as distribution and service fees, if any, and transfer agent fees, for all classes, are charged daily at the class level based on the net assets of each class and the specific expense rates applicable to each class.
Federal income taxes. The fund intends to continue to qualify as a regulated investment company by complying with the applicable provisions of the Internal Revenue Code and will not be subject to federal income tax on taxable income that is distributed to shareholders. Therefore, no federal income tax provision is required.
For federal income tax purposes, as of July 31, 2019, the fund has a short-term capital loss carryforward of $78,472,279 and a long-term capital loss carryforward of $99,829,736 available to offset future net realized capital gains. These carryforwards do not expire.
As of July 31, 2019, the fund had no uncertain tax positions that would require financial statement recognition, derecognition or disclosure. The fund's federal tax returns are subject to examination by the Internal Revenue Service for a period of three years.
Distribution of income and gains. Distributions to shareholders from net investment income and net realized gains, if any, are recorded on the ex-date. The fund generally declares and pays dividends annually. Capital gain distributions, if any, are typically distributed annually.
The tax character of distributions for the years ended July 31, 2019 and 2018 was as follows:
| | July 31, 2019 | July 31, 2018 |
| Ordinary income | $8,501,199 | — |
Distributions paid by the fund with respect to each class of shares are calculated in the same manner, at the same time and in the same amount, except for the effect of class level expenses that may be applied differently to each class. As of July 31, 2019, the components of distributable earnings on a tax basis consisted of $12,541,576 of undistributed ordinary income.
Such distributions and distributable earnings, on a tax basis, are determined in conformity with income tax regulations, which may differ from US GAAP. Distributions in excess of tax basis earnings and profits, if any, are reported in the fund's financial statements as a return of capital.
Capital accounts within the financial statements are adjusted for permanent book-tax differences. These adjustments have no impact on net assets or the results of operations. Temporary book-tax differences, if any, will reverse in a subsequent period. Book-tax differences are primarily attributable to derivative transactions.
| | ANNUAL REPORT | JOHN HANCOCK Absolute Return Currency Fund | 25 |
Note 3—Derivative instruments
The fund may invest in derivatives in order to meet its investment objective. Derivatives include a variety of different instruments that may be traded in the over-the-counter (OTC) market, on a regulated exchange or through a clearing facility. The risks in using derivatives vary depending upon the structure of the instruments, including the use of leverage, optionality, the liquidity or lack of liquidity of the contract, the creditworthiness of the counterparty or clearing organization and the volatility of the position. Some derivatives involve risks that are potentially greater than the risks associated with investing directly in the referenced securities or other referenced underlying instrument. Specifically, the fund is exposed to the risk that the counterparty to an OTC derivatives contract will be unable or unwilling to make timely settlement payments or otherwise honor its obligations. OTC derivatives transactions typically can only be closed out with the other party to the transaction.
Derivatives which are typically traded through the OTC market are regulated by the Commodity Futures Trading Commission (the CFTC). Derivative counterparty risk is managed through an ongoing evaluation of the creditworthiness of all potential counterparties and, if applicable, designated clearing organizations. The fund attempts to reduce its exposure to counterparty risk for derivatives traded in the OTC market, whenever possible, by entering into an International Swaps and Derivatives Association (ISDA) Master Agreement with each of its OTC counterparties. The ISDA gives each party to the agreement the right to terminate all transactions traded under the agreement if there is certain deterioration in the credit quality or contractual default of the other party, as defined in the ISDA. Upon an event of default or a termination of the ISDA, the non-defaulting party has the right to close out all transactions and to net amounts owed.
As defined by the ISDA, the fund may have collateral agreements with certain counterparties to mitigate counterparty risk on OTC derivatives. Subject to established minimum levels, collateral for OTC transactions is generally determined based on the net aggregate unrealized gain or loss on contracts with a particular counterparty. Collateral pledged to the fund, if any, is held in a segregated account by a third-party agent or held by the custodian bank for the benefit of the fund and can be in the form of cash or debt securities issued by the U.S. government or related agencies; collateral posted by the fund, if any, for OTC transactions is held in a segregated account at the fund's custodian and is noted in the accompanying Fund's investments, or if cash is posted, on the Statement of assets and liabilities. The fund's risk of loss due to counterparty risk is equal to the asset value of outstanding contracts offset by collateral received.
Forward foreign currency contracts. A forward foreign currency contract is an agreement between two parties to buy and sell specific currencies at a price that is set on the date of the contract. The forward contract calls for delivery of the currencies on a future date that is specified in the contract. Risks related to the use of forwards include the possible failure of counterparties to meet the terms of the forward agreement, the failure of the counterparties to timely post collateral if applicable, and the risk that currency movements will not favor the fund thereby reducing the fund’s total return, and the potential for losses in excess of the amounts recognized on the Statement of assets and liabilities.
The market value of a forward foreign currency contract fluctuates with changes in foreign currency exchange rates. Forward foreign currency contracts are marked-to-market daily and the change in value is recorded by the fund as an unrealized gain or loss. Realized gains or losses, equal to the difference between the value of the contract at the time it was opened and the value at the time it was closed, are recorded upon delivery or receipt of the currency or settlement with the counterparty.
During the year ended July 31, 2019, the fund used forward foreign currency contracts to gain exposure to foreign currencies. The fund held forward foreign currency contracts with USD notional values ranging from $10.9 billion to $24.3 billion, as measured at each quarter end.
| 26 | JOHN HANCOCK Absolute Return Currency Fund | ANNUAL REPORT | |
Fair value of derivative instruments by risk category
The table below summarizes the fair value of derivatives held by the fund at July 31, 2019 by risk category:
| Risk | Statement of
assets and
liabilities location | Financial
instruments
location | Assets
derivatives
fair value | Liabilities
derivatives
fair value |
| Foreign currency | Unrealized appreciation / depreciation on forward foreign currency contracts | Forward foreign currency contracts | $102,034,818 | $(100,596,760) |
For financial reporting purposes, the fund does not offset OTC derivative assets or liabilities that are subject to master netting arrangements, as defined by the ISDAs, in the Statement of assets and liabilities. In the event of default by the counterparty or a termination of the agreement, the ISDA allows an offset of amounts across the various transactions between the fund and the applicable counterparty. The tables below reflect the fund's exposure to OTC derivative transactions and exposure to counterparties subject to an ISDA:
| OTC Financial Instruments | Asset | Liability |
| Forward foreign currency contracts | $102,034,818 | ($100,596,760) |
| Totals | $102,034,818 | ($100,596,760) |
| Counterparty | Total Market
Value of OTC
Derivatives | Collateral
Posted by
Counterparty | Collateral
Posted by
Fund | Net
Exposure |
| Citibank, N.A. | $3,448,058 | $2,929,000 | — | $519,058 |
| Deutsche Bank AG | (1,115,491) | — | $1,115,491 | — |
| Morgan Stanley Capital Services LLC | (894,509) | — | 894,509 | — |
| Total | $1,438,058 | $2,929,000 | $2,010,000 | $519,058 |
Effect of derivative instruments on the Statement of operations
The table below summarizes the net realized gain (loss) included in the net increase (decrease) in net assets from operations, classified by derivative instrument and risk category, for the year ended July 31, 2019:
| | Statement of operations location - Net realized gain (loss) on: |
| Risk | Forward foreign
currency contracts |
| Foreign currency | $(455,019) |
The table below summarizes the net change in unrealized appreciation (depreciation) included in the net increase (decrease) in net assets from operations, classified by derivative instrument and risk category, for the year ended July 31, 2019:
| | Statement of operations location - Change in net unrealized appreciation (depreciation) of: |
| Risk | Forward foreign
currency contracts |
| Foreign currency | $18,265,361 |
| | ANNUAL REPORT | JOHN HANCOCK Absolute Return Currency Fund | 27 |
Note 4—Guarantees and indemnifications
Under the Trust's organizational documents, its Officers and Trustees are indemnified against certain liabilities arising out of the performance of their duties to the Trust, including the fund. Additionally, in the normal course of business, the fund enters into contracts with service providers that contain general indemnification clauses. The fund's maximum exposure under these arrangements is unknown, as this would involve future claims that may be made against the fund that have not yet occurred. The risk of material loss from such claims is considered remote.
Note 5—Fees and transactions with affiliates
John Hancock Investment Management LLC (the Advisor) serves as investment advisor for the fund. John Hancock Investment Management Distributors LLC (the Distributor), an affiliate of the Advisor, serves as principal underwriter of the fund. The Advisor and the Distributor are indirect, wholly owned subsidiaries of Manulife Financial Corporation (MFC). Prior to June 28, 2019, the Advisor was known as John Hancock Advisers, LLC and the Distributor was known as John Hancock Funds, LLC.
Management fee. The fund has an investment management agreement with the Advisor under which the fund pays a daily management fee to the Advisor, on an annual basis, equal to the sum of: a) 0.95% of the first $250 million of the fund’s average daily net assets; b) 0.90% of the next $250 million of the fund’s average daily net assets; c) 0.85% of the next $2 billion of the fund's average daily net assets; d) 0.83% of the next $1.5 billion of the fund's average daily net assets; and e) 0.81% of the fund’s average daily net assets in excess of $4 billion. The Advisor has a subadvisory agreement with First Quadrant, L.P. The fund is not responsible for payment of the subadvisory fees.
The Advisor has contractually agreed to waive a portion of its management fee and/or reimburse expenses for certain funds of the John Hancock group of funds complex, including the fund (the participating portfolios). This waiver is based upon aggregate net assets of all the participating portfolios. The amount of the reimbursement is calculated daily and allocated among all the participating portfolios in proportion to the daily net assets of each fund. During the year ended July 31, 2019, this waiver amounted to 0.01% of the fund’s average daily net assets. This arrangement expires on July 31, 2021, unless renewed by mutual agreement of the fund and the Advisor based upon a determination that this is appropriate under the circumstances at that time.
For the year ended July 31, 2019, the expense reductions described above amounted to the following:
| Class | Expense reduction |
| Class A | $1,160 |
| Class C | 45 |
| Class I | 51,825 |
| Class R2 | 7 |
| Class | Expense reduction |
| Class R4 | $4 |
| Class R6 | 2,540 |
| Class NAV | 41,792 |
| Total | $97,373 |
Expenses waived or reimbursed in the current fiscal period are not subject to recapture in future fiscal periods.
The investment management fees, including the impact of the waivers and reimbursements as described above, incurred for the year ended July 31, 2019, were equivalent to a net annual effective rate of 0.87% of the fund's average daily net assets.
Accounting and legal services. Pursuant to a service agreement, the fund reimburses the Advisor for all expenses associated with providing the administrative, financial, legal, compliance, accounting and recordkeeping services to the fund, including the preparation of all tax returns, periodic reports to shareholders and regulatory
| 28 | JOHN HANCOCK Absolute Return Currency Fund | ANNUAL REPORT | |
reports, among other services. These expenses are allocated to each share class based on its relative net assets at the time the expense was incurred. These accounting and legal services fees incurred for the year ended July 31, 2019 amounted to an annual rate of 0.02% of the fund's average daily net assets.
Distribution and service plans. The fund has a distribution agreement with the Distributor. The fund has adopted distribution and service plans pursuant to Rule 12b-1 under the 1940 Act, to pay the Distributor for services provided as the distributor of shares of the fund. In addition, under a service plan for certain classes as indicated in the below table, the fund pays for certain other services. The fund may pay up to the following contractual rates of distribution and service fees under these arrangements, expressed as an annual percentage of average daily net assets for each class of the fund's shares:
| Class | Rule 12b-1 Fee | Service fee |
| Class A | 0.30% | — |
| Class C | 1.00% | — |
| Class R2 | 0.25% | 0.25% |
| Class R4 | 0.25% | 0.10% |
The fund's Distributor has contractually agreed to waive 0.10% of Rule12b-1 fees for Class R4 shares. The current waiver agreement expires on November 30, 2019, unless renewed by mutual agreement of the fund and the Distributor based upon a determination that this is appropriate under the circumstances at the time. This contractual waiver amounted to $46 for Class R4 shares for the year ended July 31, 2019.
Sales charges. Class A shares are assessed up-front sales charges, which resulted in payments to the Distributor amounting to $2,055 for the year ended July 31, 2019. Of this amount, $326 was retained and used for printing prospectuses, advertising, sales literature and other purposes, $1,729 was paid as sales commissions to broker-dealers and $0 was paid as sales commissions to sales personnel of Signator Investors, Inc., which had been a broker-dealer affiliate of the Advisor through November 2, 2018.
Class A and Class C shares may be subject to contingent deferred sales charges (CDSCs). Certain Class A shares that are acquired through purchases of $1 million or more and are redeemed within one year of purchase are subject to a 1.00% sales charge. Class C shares that are redeemed within one year of purchase are subject to a 1.00% CDSC. CDSCs are applied to the lesser of the current market value at the time of redemption or the original purchase cost of the shares being redeemed. Proceeds from CDSCs are used to compensate the Distributor for providing distribution-related services in connection with the sale of these shares. During the year ended July 31, 2019, there were no CDSCs received by the Distributor for Class A and Class C shares.
Transfer agent fees. The John Hancock group of funds has a complex-wide transfer agent agreement with John Hancock Signature Services, Inc. (Signature Services), an affiliate of the Advisor. The transfer agent fees paid to Signature Services are determined based on the cost to Signature Services (Signature Services Cost) of providing recordkeeping services. It also includes out-of-pocket expenses, including payments made to third-parties for recordkeeping services provided to their clients who invest in one or more John Hancock funds. In addition, Signature Services Cost may be reduced by certain fees that Signature Services receives in connection with retirement and small accounts. Signature Services Cost is calculated monthly and allocated, as applicable, to five categories of share classes: Retail Share and Institutional Share Classes of Non-Municipal Bond Funds, Class R6 Shares, Retirement Share Classes and Municipal Bond Share Classes. Within each of these categories, the applicable costs are allocated to the affected John Hancock affiliated funds and/or classes, based on the relative average daily net assets.
| | ANNUAL REPORT | JOHN HANCOCK Absolute Return Currency Fund | 29 |
Class level expenses. Class level expenses for the year ended July 31, 2019 were as follows:
| Class | Distribution and service fees | Transfer agent fees |
| Class A | $45,606 | $17,164 |
| Class C | 5,953 | 671 |
| Class I | — | 863,689 |
| Class R2 | 321 | 11 |
| Class R4 | 115 | 6 |
| Class R6 | — | 4,089 |
| Total | $51,995 | $885,630 |
Trustee expenses. The fund compensates each Trustee who is not an employee of the Advisor or its affiliates. The costs of paying Trustee compensation and expenses are allocated to the fund based on its net assets relative to other funds within the John Hancock group of funds complex.
Interfund lending program. Pursuant to an Exemptive Order issued by the SEC, the fund, along with certain other funds advised by the Advisor or its affiliates, may participate in an interfund lending program. This program provides an alternative credit facility allowing the funds to borrow from, or lend money to, other participating affiliated funds. At period end, no interfund loans were outstanding. The fund's activity in this program during the period for which loans were outstanding was as follows:
Borrower
or Lender | Weighted Average
Loan Balance | Days
Outstanding | Weighted Average
Interest Rate | Interest Income
(Expense) |
| Lender | $ 16,573,075 | 3 | 2.355% | $3,252 |
Note 6—Fund share transactions
Transactions in fund shares for the years ended July 31, 2019 and 2018 were as follows:
| | Year Ended 7-31-19 | Year Ended 7-31-18 |
| | Shares | Amount | Shares | Amount |
| Class A shares | | | | |
| Sold | 287,180 | $2,526,884 | 353,042 | $3,180,337 |
| Distributions reinvested | 5,725 | 51,184 | — | — |
| Repurchased | (814,913) | (7,157,233) | (627,972) | (5,731,787) |
| Net decrease | (522,008) | $(4,579,165) | (274,930) | $(2,551,450) |
| Class C shares | | | | |
| Sold | 17,082 | $148,445 | 11,461 | $104,875 |
| Repurchased | (49,551) | (434,067) | (50,821) | (464,317) |
| Net decrease | (32,469) | $(285,622) | (39,360) | $(359,442) |
| Class I shares | | | | |
| Sold | 14,812,383 | $134,090,580 | 66,849,909 | $637,832,091 |
| Distributions reinvested | 156,112 | 1,437,790 | — | — |
| Repurchased | (27,134,695) | (246,234,464) | (26,203,856) | (242,564,415) |
| Net increase (decrease) | (12,166,200) | $(110,706,094) | 40,646,053 | $395,267,676 |
| 30 | JOHN HANCOCK Absolute Return Currency Fund | ANNUAL REPORT | |
| | Year Ended 7-31-19 | Year Ended 7-31-18 |
| | Shares | Amount | Shares | Amount |
| Class R2 shares | | | | |
| Sold | 1,080 | $9,798 | 1,409 | $13,132 |
| Distributions reinvested | 17 | 154 | — | — |
| Repurchased | — | — | (6,407) | (62,324) |
| Net increase (decrease) | 1,097 | $9,952 | (4,998) | $(49,192) |
| Class R4 shares | | | | |
| Repurchased | — | — | (6,423) | $(62,560) |
| Net decrease | — | — | (6,423) | $(62,560) |
| Class R6 shares | | | | |
| Sold | 382,242 | $3,471,676 | 13,232,160 | $126,016,207 |
| Distributions reinvested | 3,907 | 36,296 | — | — |
| Repurchased | (13,576,726) | (124,240,236) | (13,771,177) | (128,115,729) |
| Net decrease | (13,190,577) | $(120,732,264) | (539,017) | $(2,099,522) |
| Class NAV shares | | | | |
| Sold | 383,886 | $3,534,200 | 9,780,973 | $93,045,197 |
| Distributions reinvested | 435,738 | 4,065,435 | — | — |
| Repurchased | (26,057,932) | (240,106,980) | (27,342,806) | (254,007,762) |
| Net decrease | (25,238,308) | $(232,507,345) | (17,561,833) | $(160,962,565) |
| Total net increase (decrease) | (51,148,465) | $(468,800,538) | 22,219,492 | $229,182,945 |
Affiliates of the fund owned 50%, 100% and 100% of shares of Class R2, Class R4 and Class NAV, respectively, on July 31, 2019. Such concentration of shareholders’ capital could have a material effect on the fund if such shareholders redeem from the fund.
Note 7—Purchase and sale of securities
For the year ended July 31, 2019, all purchases and sales of investments were short-term.
Note 8—Investment by affiliated funds
Certain investors in the fund are affiliated funds that are managed by the Advisor and its affiliates. The affiliated funds do not invest in the fund for the purpose of exercising management or control; however, this investment may represent a significant portion of the fund's net assets. At July 31, 2019, funds within the John Hancock group of funds complex held 38.6% of the fund's net assets. The following portfolios had an affiliate ownership of 5% or more of the fund's net assets:
| Fund | Affiliated Concentration |
| John Hancock Funds II Multimanager Lifestyle Balanced Portfolio | 9.2% |
| John Hancock Funds II Multimanager Lifestyle Growth Portfolio | 8.7% |
| | ANNUAL REPORT | JOHN HANCOCK Absolute Return Currency Fund | 31 |
Report of Independent Registered Public Accounting Firm
To the Board of Trustees of John Hancock Funds II and Shareholders of John Hancock Absolute Return Currency Fund
Opinion on the Financial Statements
We have audited the accompanying statement of assets and liabilities, including the Fund’s investments, of John Hancock Absolute Return Currency Fund (one of the funds constituting John Hancock Funds II, referred to hereafter as the "Fund") as of July 31, 2019, the related statement of operations for the year ended July 31, 2019, the statements of changes in net assets for each of the two years in the period ended July 31, 2019, including the related notes, and the financial highlights for each of the periods indicated therein (collectively referred to as the “financial statements”). In our opinion, the financial statements present fairly, in all material respects, the financial position of the Fund as of July 31, 2019, the results of its operations for the year then ended, the changes in its net assets for each of the two years in the period ended July 31, 2019 and the financial highlights for each of the periods indicated therein in conformity with accounting principles generally accepted in the United States of America.
Basis for Opinion
These financial statements are the responsibility of the Fund’s management. Our responsibility is to express an opinion on the Fund’s financial statements based on our audits. We are a public accounting firm registered with the Public Company Accounting Oversight Board (United States) (PCAOB) and are required to be independent with respect to the Fund in accordance with the U.S. federal securities laws and the applicable rules and regulations of the Securities and Exchange Commission and the PCAOB.
We conducted our audits of these financial statements in accordance with the standards of the PCAOB. Those standards require that we plan and perform the audit to obtain reasonable assurance about whether the financial statements are free of material misstatement, whether due to error or fraud.
Our audits included performing procedures to assess the risks of material misstatement of the financial statements, whether due to error or fraud, and performing procedures that respond to those risks. Such procedures included examining, on a test basis, evidence regarding the amounts and disclosures in the financial statements. Our audits also included evaluating the accounting principles used and significant estimates made by management, as well as evaluating the overall presentation of the financial statements. Our procedures included confirmation of securities owned as of July 31, 2019 by correspondence with the custodian, transfer agent, and brokers; when replies were not received from brokers, we performed other auditing procedures. We believe that our audits provide a reasonable basis for our opinion.
/s/ PricewaterhouseCoopers LLP
Boston, Massachusetts
September 20, 2019
We have served as the auditor of one or more investment companies in the John Hancock group of funds since 1988.
| 32 | JOHN HANCOCK ABSOLUTE RETURN CURRENCY FUND | ANNUAL REPORT | |
TAX INFORMATION
Unaudited
For federal income tax purposes, the following information is furnished with respect to the distributions of the fund, if any, paid during its taxable year ended July 31, 2019.
The fund reports the maximum amount allowable of its net taxable income as eligible for the corporate dividends-received deduction.
The fund reports the maximum amount allowable of its net taxable income as qualified dividend income as provided in the Jobs and Growth Tax Relief Reconciliation Act of 2003.
The fund reports the maximum amount allowable of its Section 199A dividends as defined in Proposed Treasury Regulation §1.199A-3(d).
Eligible shareholders will be mailed a 2019 Form 1099-DIV in early 2020. This will reflect the tax character of all distributions paid in calendar year 2019.
Please consult a tax advisor regarding the tax consequences of your investment in the fund.
| | ANNUAL REPORT | JOHN HANCOCK ABSOLUTE RETURN CURRENCY FUND | 33 |
CONTINUATION OF INVESTMENT ADVISORY AND SUBADVISORY AGREEMENTS
Evaluation of Advisory and Subadvisory Agreements by the Board of Trustees
This section describes the evaluation by the Board of Trustees (the Board) of John Hancock Funds II (the Trust) of the Advisory Agreement (the Advisory Agreement) with John Hancock Investment Management LLC (the Advisor, formerly known as "John Hancock Advisers, LLC") and the Subadvisory Agreement (the Subadvisory Agreement) with First Quadrant, L.P. (the Subadvisor) for John Hancock Absolute Return Currency Fund (the fund). The Advisory Agreement and Subadvisory Agreement are collectively referred to as the Agreements. Prior to the June 23-26, 2019 in-person meeting at which the Agreements were approved, the Board also discussed and considered information regarding the proposed continuation of the Agreements at an in-person meeting held on May 28-30, 2019.
Approval of Advisory and Subadvisory Agreements
At in-person meetings held on June 23-26, 2019, the Board, including the Trustees who are not parties to any Agreement or considered to be interested persons of the Trust under the Investment Company Act of 1940, as amended (the 1940 Act) (the Independent Trustees), reapproved for an annual period the continuation of the Advisory Agreement between the Trust and the Advisor and the Subadvisory Agreement between the Advisor and the Subadvisor with respect to the fund.
In considering the Advisory Agreement and the Subadvisory Agreement, the Board received in advance of the meetings a variety of materials relating to the fund, the Advisor and the Subadvisor, including comparative performance, fee and expense information for a peer group of similar funds prepared by an independent third-party provider of fund data, performance information for an applicable benchmark index; and, with respect to the Subadvisor, comparative performance information for comparably managed accounts, as applicable, and other information provided by the Advisor and the Subadvisor regarding the nature, extent and quality of services provided by the Advisor and the Subadvisor under their respective Agreements, as well as information regarding the Advisor's revenues and costs of providing services to the fund and any compensation paid to affiliates of the Advisor. At the meetings at which the renewal of the Advisory Agreement and Subadvisory Agreement are considered, particular focus is given to information concerning fund performance, comparability of fees and total expenses, and profitability. However, the Board notes that the evaluation process with respect to the Advisor and the Subadvisor is an ongoing one. In this regard, the Board also took into account discussions with management and information provided to the Board (including its various committees) at prior meetings with respect to the services provided by the Advisor and the Subadvisor to the fund, including quarterly performance reports prepared by management containing reviews of investment results and prior presentations from the Subadvisor with respect to the fund. The information received and considered by the Board in connection with the May and June meetings and throughout the year was both written and oral. The Board also considered the nature, quality, and extent of non-advisory services, if any, to be provided to the fund by the Advisor's affiliates, including distribution services. The Board considered the Advisory Agreement and the Subadvisory Agreement separately in the course of its review. In doing so, the Board noted the respective roles of the Advisor and Subadvisor in providing services to the fund.
Throughout the process, the Board asked questions of and requested additional information from management. The Board is assisted by counsel for the Trust and the Independent Trustees are also separately assisted by independent legal counsel throughout the process. The Independent Trustees also received a memorandum from their independent legal counsel discussing the legal standards for their consideration of the proposed continuation of the Agreements and discussed the proposed continuation of the Agreements in private sessions with their independent legal counsel at which no representatives of management were present.
ANNUAL REPORT | JOHN HANCOCK ABSOLUTE RETURN CURRENCY FUND 34
Approval of Advisory Agreement
In approving the Advisory Agreement with respect to the fund, the Board, including the Independent Trustees, considered a variety of factors, including those discussed below. The Board also considered other factors (including conditions and trends prevailing generally in the economy, the securities markets, and the industry) and did not treat any single factor as determinative, and each Trustee may have attributed different weights to different factors. The Board's conclusions may be based in part on its consideration of the advisory and subadvisory arrangements in prior years and on the Board's ongoing regular review of fund performance and operations throughout the year.
Nature, extent, and quality of services. Among the information received by the Board from the Advisor relating to the nature, extent, and quality of services provided to the fund, the Board reviewed information provided by the Advisor relating to its operations and personnel, descriptions of its organizational and management structure, and information regarding the Advisor's compliance and regulatory history, including its Form ADV. The Board also noted that on a regular basis it receives and reviews information from the Trust's Chief Compliance Officer (CCO) regarding the fund's compliance policies and procedures established pursuant to Rule 38a-1 under the 1940 Act. The Board observed that the scope of services provided by the Advisor, and of the undertakings required of the Advisor in connection with those services, including maintaining and monitoring its own and the fund's compliance programs, risk management programs, liquidity management programs and cybersecurity programs, had expanded over time as a result of regulatory, market and other developments. The Board considered that the Advisor is responsible for the management of the day-to-day operations of the fund, including, but not limited to, general supervision of and coordination of the services provided by the Subadvisor, and is also responsible for monitoring and reviewing the activities of the Subadvisor and other third-party service providers. The Board also considered the significant risks assumed by the Advisor in connection with the services provided to the fund including entrepreneurial risk in sponsoring new funds and ongoing risks including investment, operational, enterprise, litigation, regulatory and compliance risks with respect to all funds.
In considering the nature, extent, and quality of the services provided by the Advisor, the Trustees also took into account their knowledge of the Advisor's management and the quality of the performance of the Advisor's duties, through Board meetings, discussions and reports during the preceding year and through each Trustee's experience as a Trustee of the Trust and of the other trusts in the John Hancock group of funds complex (the John Hancock Fund Complex).
In the course of their deliberations regarding the Advisory Agreement, the Board considered, among other things:
| | | | | | | | | |
| | | | | (a) | | | the skills and competency with which the Advisor has in the past managed the Trust's affairs and its subadvisory relationship, the Advisor's oversight and monitoring of the Subadvisor's investment performance and compliance programs, such as the Subadvisor's compliance with fund policies and objectives, review of brokerage matters, including with respect to trade allocation and best execution and the Advisor's timeliness in responding to performance issues; | |
| | | | | (b) | | | the background, qualifications and skills of the Advisor's personnel; | |
| | | | | (c) | | | the Advisor's compliance policies and procedures and its responsiveness to regulatory changes and fund industry developments; | |
| | | | | (d) | | | the Advisor's administrative capabilities, including its ability to supervise the other service providers for the fund, as well as the Advisor's oversight of any securities lending activity, its monitoring of class action litigation and collection of class action settlements on behalf of the fund, and bringing loss recovery actions on behalf of the fund; | |
ANNUAL REPORT | JOHN HANCOCK ABSOLUTE RETURN CURRENCY FUND 35
| | | | | | | | | |
| | | | | (e) | | | the financial condition of the Advisor and whether it has the financial wherewithal to provide a high level and quality of services to the fund; and | |
| | | | | (f) | | | the Advisor's reputation and experience in serving as an investment advisor to the Trust and the benefit to shareholders of investing in funds that are part of a family of funds offering a variety of investments. | |
The Board concluded that the Advisor may reasonably be expected to continue to provide a high quality of services under the Advisory Agreement with respect to the fund.
Investment performance. In considering the fund's performance, the Board noted that it reviews at its regularly scheduled meetings information about the fund's performance results. In connection with the consideration of the Advisory Agreement, the Board:
| | | |
| | (a) | reviewed information prepared by management regarding the fund's performance; |
| | (b) | considered the comparative performance of an applicable benchmark index; |
| | (c) | considered the performance of comparable funds, if any, as included in the report prepared by an independent third-party provider of fund data; and |
| | (d) | took into account the Advisor's analysis of the fund's performance and its plans and recommendations regarding the Trust's subadvisory arrangements generally. |
The Board noted that while it found the data provided by the independent third-party generally useful it recognized its limitations, including in particular that the data may vary depending on the end date selected and the results of the performance comparisons may vary depending on the selection of the peer group. The Board noted that the fund underperformed its benchmark index for the one- and five-year periods and outperformed its benchmark index for the three-year period ended December 31, 2018. The Board also noted that the fund underperformed its peer group average for the one-year period and outperformed its peer group average for the three- and five-year periods ended December 31, 2018. The Board took into account management's discussion of the fund's performance, including the favorable performance relative to the benchmark for the three-year period and to the peer group for the three- and five-year periods. The Board concluded that the fund's performance has generally been in line with or outperformed the historical performance of the fund's benchmark index and peer group average.
Fees and expenses. The Board reviewed comparative information prepared by an independent third-party provider of fund data, including, among other data, the fund's contractual and net management fees (and subadvisory fees, to the extent available) and total expenses as compared to similarly situated investment companies deemed to be comparable to the fund in light of the nature, extent and quality of the management and advisory and subadvisory services provided by the Advisor and the Subadvisor. The Board considered the fund's ranking within a smaller group of peer funds chosen by the independent third-party provider, as well as the fund's ranking within a broader group of funds. In comparing the fund's contractual and net management fees to those of comparable funds, the Board noted that such fees include both advisory and administrative costs. The Board noted that net management fees for the fund are equal to the peer group median and that net total expenses for the fund are lower than the peer group median.
The Board took into account management's discussion of the fund's expenses. The Board also took into account management's discussion with respect to the overall management fee and the fees of the Subadvisor, including the amount of the advisory fee retained by the Advisor after payment of the subadvisory fee, in each case in light of the services rendered for those amounts and the risks undertaken by the Advisor. The Board also noted that the Advisor pays the subadvisory fee, and that such fees are negotiated at arm's length with respect to the Subadvisor. In addition, the Board took into account that management had agreed to implement an overall fee waiver across the complex,
ANNUAL REPORT | JOHN HANCOCK ABSOLUTE RETURN CURRENCY FUND 36
including the fund, which is discussed further below. The Board also noted actions taken over the past several years to reduce the fund's operating expenses. The Board also noted that, in addition, the Advisor is currently waiving fees and/or reimbursing expenses with respect to the fund and that the fund has breakpoints in its contractual management fee schedule that reduces management fees as assets increase. The Board reviewed information provided by the Advisor concerning the investment advisory fee charged by the Advisor or one of its advisory affiliates to other clients (including other funds in the John Hancock Fund Complex) having similar investment mandates, if any. The Board considered any differences between the Advisor's and Subadvisor's services to the fund and the services they provide to other comparable clients or funds. The Board concluded that the advisory fee paid with respect to the fund is reasonable in light of the nature, extent and quality of the services provided to the fund under the Advisory Agreement.
Profitability/Fall out benefits. In considering the costs of the services to be provided and the profits to be realized by the Advisor and its affiliates from the Advisor's relationship with the Trust, the Board:
| | | |
| | (a) | reviewed financial information of the Advisor; |
| | (b) | reviewed and considered information presented by the Advisor regarding the net profitability to the Advisor and its affiliates with respect to the fund; |
| | (c) | received and reviewed profitability information with respect to the John Hancock Fund Complex as a whole and with respect to the fund; |
| | (d) | received information with respect to the Advisor's allocation methodologies used in preparing the profitability data and considered that the Advisor hired an independent third-party consultant to provide an analysis of the Advisor's allocation methodologies; |
| | (e) | considered that the John Hancock insurance companies that are affiliates of the Advisor, as shareholders of the Trust directly or through their separate accounts, receive certain tax credits or deductions relating to foreign taxes paid and dividends received by certain funds of the Trust and noted that these tax benefits, which are not available to participants in qualified retirement plans under applicable income tax law, are reflected in the profitability information reviewed by the Board; |
| | (f) | considered that the Advisor also provides administrative services to the fund on a cost basis pursuant to an administrative services agreement; |
| | (g) | noted that affiliates of the Advisor provide transfer agency services and distribution services to the fund, and that the fund's distributor also receives Rule 12b-1 payments to support distribution of the fund; |
| | (h) | noted that affiliates of the Advisor provide transfer agency services and placement services to the fund; |
| | (i) | noted that the Advisor also derives reputational and other indirect benefits from providing advisory services to the fund; |
| | (j) | noted that the subadvisory fee for the fund is paid by the Advisor and is negotiated as arm's length; |
| | (k) | considered the Advisor's ongoing costs and expenditures necessary to improve services, meet new regulatory and compliance requirements, and adapt to other challenges impacting the fund industry; and |
| | (l) | considered that the Advisor should be entitled to earn a reasonable level of profits in exchange for the level of services it provides to the fund and the risks that it assumes as Advisor, including entrepreneurial, operational, reputational, litigation and regulatory risk. |
Based upon its review, the Board concluded that the level of profitability, if any, of the Advisor and its affiliates from their relationship with the fund was reasonable and not excessive.
ANNUAL REPORT | JOHN HANCOCK ABSOLUTE RETURN CURRENCY FUND 37
Economies of scale. In considering the extent to which economies of scale would be realized as the fund grows and whether fee levels reflect these economies of scale for the benefit of fund shareholders, the Board:
| | | |
| | (a) | considered that the Advisor has contractually agreed to waive a portion of its management fee for certain funds of the John Hancock Fund Complex, including the fund (the participating portfolios) or otherwise reimburse the expenses of the participating portfolios (the reimbursement). This waiver is based upon aggregate net assets of all the participating portfolios. The amount of the reimbursement is calculated daily and allocated among all the participating portfolios in proportion to the daily net assets of each fund; |
| | (b) | reviewed the fund's advisory fee structure and concluded that: (i) the fund's fee structure contains breakpoints at the subadvisory fee level and that such breakpoints are reflected as breakpoints in the advisory fees for the fund; and (ii) although economies of scale cannot be measured with precision, these arrangements permit shareholders of the fund to benefit from economies of scale if the fund grows. The Board also took into account management's discussion of the fund's advisory fee structure; and |
| | (c) | the Board also considered the effect of the fund's growth in size on its performance and fees. The Board also noted that if the fund's assets increase over time, the fund may realize other economies of scale. |
Approval of Subadvisory Agreement
In making its determination with respect to approval of the Subadvisory Agreement, the Board reviewed:
| | | |
| | (1) | information relating to the Subadvisor's business, including current subadvisory services to the Trust (and other funds in the John Hancock Fund Complex); |
| | (2) | the historical and current performance of the fund and comparative performance information relating to an applicable benchmark index and comparable funds; and |
| | (3) | the subadvisory fee for the fund, including any breakpoints, and to the extent available, comparable fee information prepared by an independent third party provider of fund data. |
Nature, extent, and quality of services. With respect to the services provided by the Subadvisor, the Board received information provided to the Board by the Subadvisor, including the Subadvisor's Form ADV, as well as took into account information presented throughout the past year. The Board considered the Subadvisor's current level of staffing and its overall resources, as well as received information relating to the Subadvisor's compensation program. The Board reviewed the Subadvisor's history and investment experience, as well as information regarding the qualifications, background, and responsibilities of the Subadvisor's investment and compliance personnel who provide services to the fund. The Board also considered, among other things, the Subadvisor's compliance program and any disciplinary history. The Board also considered the Subadvisor's risk assessment and monitoring process. The Board reviewed the Subadvisor's regulatory history, including whether it was involved in any regulatory actions or investigations as well as material litigation, and any settlements and amelioratory actions undertaken, as appropriate. The Board noted that the Advisor conducts regular, periodic reviews of the Subadvisor and its operations, including regarding investment processes and organizational and staffing matters. The Board also noted that the Trust's CCO and his staff conduct regular, periodic compliance reviews with the Subadvisor and present reports to the Independent Trustees regarding the same, which includes evaluating the regulatory compliance systems of the Subadvisor and procedures reasonably designed to assure compliance with the federal securities laws. The Board also took into account the financial condition of the Subadvisor.
ANNUAL REPORT | JOHN HANCOCK ABSOLUTE RETURN CURRENCY FUND 38
The Board considered the Subadvisor's investment process and philosophy. The Board took into account that the Subadvisor's responsibilities include the development and maintenance of an investment program for the fund that is consistent with the fund's investment objective, the selection of investment securities and the placement of orders for the purchase and sale of such securities, as well as the implementation of compliance controls related to performance of these services. The Board also received information with respect to the Subadvisor's brokerage policies and practices, including with respect to best execution and soft dollars.
Subadvisor compensation. In considering the cost of services to be provided by the Subadvisor and the profitability to the Subadvisor of its relationship with the fund, the Board noted that the fees under the Subadvisory Agreement are paid by the Advisor and not the fund. The Board also relied on the ability of the Advisor to negotiate the Subadvisory Agreement with the Subadvisor, which is not affiliated with the Advisor, and the fees thereunder at arm's length. As a result, the costs of the services to be provided and the profits to be realized by the Subadvisor from its relationship with the Trust were not a material factor in the Board's consideration of the Subadvisory Agreement. The Board also received information regarding the nature and scope (including their significance to the Advisor and its affiliates and to the Subadvisor) of any material relationships with respect to the Subadvisor, which include arrangements in which the Subadvisor or its affiliates provide advisory, distribution, or management services in connection with financial products sponsored by the Advisor or its affiliates, and may include other registered investment companies, a 529 education savings plan, managed separate accounts and exempt group annuity contracts sold to qualified plans. The Board also received information and took into account any other potential conflicts of interest the Advisor might have in connection with the Subadvisory Agreement.
In addition, the Board considered other potential indirect benefits that the Subadvisor and its affiliates may receive from the Subadvisor's relationship with the fund, such as the opportunity to provide advisory services to additional funds in the John Hancock Fund Complex and reputational benefits.
Subadvisory fees. The Board considered that the fund pays an advisory fee to the Advisor and that, in turn, the Advisor pays a subadvisory fee to the Subadvisor. As noted above, the Board also considered the fund's subadvisory fees as compared to similarly situated investment companies deemed to be comparable to the fund as included in the report prepared by the independent third party provider of fund data, to the extent available. The Board noted that the limited size of the Lipper peer group was not sufficient for comparative purposes. The Board noted that the limited size of the Lipper peer group was not sufficient for comparative purposes. The Board also took into account the subadvisory fees paid by the Advisor to the Subadvisor with respect to the fund and compared them to fees charged by the Subadvisor to manage other subadvised portfolios and portfolios not subject to regulation under the 1940 Act, as applicable.
Subadvisor performance. As noted above, the Board considered the fund's performance as compared to the fund's peer group and the benchmark index and noted that the Board reviews information about the fund's performance results at its regularly scheduled meetings. The Board noted the Advisor's expertise and resources in monitoring the performance, investment style and risk-adjusted performance of the Subadvisor. The Board was mindful of the Advisor's focus on the Subadvisor's performance. The Board also noted the Subadvisor's long-term performance record for similar accounts, as applicable.
The Board's decision to approve the Subadvisory Agreement was based on a number of determinations, including the following:
| | | | | | | | | |
| | | | | (1) | | | the Subadvisor has extensive experience and demonstrated skills as a manager; | |
| | | | | (2) | | | the performance of the fund has generally been in line with or outperformed the historical performance of the fund's benchmark index and peer group; | |
ANNUAL REPORT | JOHN HANCOCK ABSOLUTE RETURN CURRENCY FUND 39
| | | | | | | | | |
| | | | | (3) | | | the subadvisory fee is reasonable in relation to the level and quality of services being provided; and | |
| | | | | (4) | | | noted that the subadvisory fees are paid by the Advisor not the fund and that the subadvisory fee breakpoints are reflected as breakpoints in the advisory fees for the fund in order to permit shareholders to benefit from economies of scale if the fund grows. | |
| | * * * | |
Based on the Board's evaluation of all factors that the Board deemed to be material, including those factors described above, the Board, including the Independent Trustees, concluded that renewal of the Advisory Agreement and the Subadvisory Agreement would be in the best interest of the fund and its shareholders. Accordingly, the Board, and the Independent Trustees voting separately, approved the Advisory Agreement and Subadvisory Agreement for an additional one-year period.
ANNUAL REPORT | JOHN HANCOCK ABSOLUTE RETURN CURRENCY FUND 40
This chart provides information about the Trustees and Officers who oversee your John Hancock fund. Officers elected by the Trustees manage the day-to-day operations of the fund and execute policies formulated by the Trustees.
Independent Trustees
| | | |
Name, year of birth
Position(s) held with Trust
Principal occupation(s) and other
directorships during past 5 years | Trustee
of the
Trust
since1 | Number of John
Hancock funds
overseen by
Trustee |
| Hassell H. McClellan, Born: 1945 | 2005 | 213 |
Trustee and Chairperson of the Board
Director/Trustee, Virtus Funds (since 2008); Director, The Barnes Group (since 2010); Associate Professor, The Wallace E. Carroll School of Management, Boston College (retired 2013). Trustee (since 2005) and Chairperson of the Board (since 2017) of various trusts within the John Hancock Fund Complex. |
| | | |
| Charles L. Bardelis,2 Born: 1941 | 2005 | 213 |
Trustee
Director, Island Commuter Corp. (marine transport). Trustee of various trusts within the John Hancock Fund Complex (since 1988). |
| | | |
| James R. Boyle,Born: 1959 | 2015 | 213 |
Trustee
Chief Executive Officer, Foresters Financial (since 2018); Chairman and Chief Executive Officer, Zillion Group, Inc. (formerly HealthFleet, Inc.) (healthcare) (2014-2018); Executive Vice President and Chief Executive Officer, U.S. Life Insurance Division of Genworth Financial, Inc. (insurance) (January 2014-July 2014); Senior Executive Vice President, Manulife Financial, President and Chief Executive Officer, John Hancock (1999-2012); Chairman and Director, John Hancock Investment Management LLC, John Hancock Investment Management Distributors LLC, and John Hancock Variable Trust Advisers LLC (2005-2010). Trustee of various trusts within the John Hancock Fund Complex (2005-2014 and since 2015). |
| | | |
| Peter S. Burgess,2 Born: 1942 | 2005 | 213 |
Trustee
Consultant (financial, accounting, and auditing matters) (since 1999); Certified Public Accountant; Partner, Arthur Andersen (independent public accounting firm) (prior to 1999); Director, Lincoln Educational Services Corporation (since 2004); Director, Symetra Financial Corporation (2010-2016); Director, PMA Capital Corporation (2004-2010). Trustee of various trusts within the John Hancock Fund Complex (since 2005). |
| | | |
| William H. Cunningham, Born: 1944 | 2012 | 213 |
Trustee
Professor, University of Texas, Austin, Texas (since 1971); former Chancellor, University of Texas System and former President of the University of Texas, Austin, Texas; Chairman (since 2009) and Director (since 2006), Lincoln National Corporation (insurance); Director, Southwest Airlines (since 2000); former Director, LIN Television (2009-2014). Trustee of various trusts within the John Hancock Fund Complex (since 1986). |
| | | |
| Grace K. Fey, Born: 1946 | 2008 | 213 |
Trustee
Chief Executive Officer, Grace Fey Advisors (since 2007); Director and Executive Vice President, Frontier Capital Management Company (1988-2007); Director, Fiduciary Trust (since 2009). Trustee of various trusts within the John Hancock Fund Complex (since 2008). |
ANNUAL REPORT | JOHN HANCOCK ABSOLUTE RETURN CURRENCY FUND 41
Independent Trustees (continued)
| | | |
Name, year of birth
Position(s) held with Trust
Principal occupation(s) and other
directorships during past 5 years | Trustee
of the
Trust
since1 | Number of John
Hancock funds
overseen by
Trustee |
| Theron S. Hoffman,4 Born: 1947 | 2008 | 213 |
Trustee
Chief Executive Officer, T. Hoffman Associates, LLC (consulting firm) (since 2003); Director, The Todd Organization (consulting firm) (2003-2010); President, Westport Resources Management (investment management consulting firm) (2006-2008); Board Member, Senior Managing Director, Partner, and Operating Head, Putnam Investments (2000-2003); Executive Vice President, The Thomson Corp. (financial and legal information publishing) (1997-2000). Trustee of various trusts within the John Hancock Fund Complex (since 2008). |
| | | |
| Deborah C. Jackson, Born: 1952 | 2012 | 213 |
Trustee
President, Cambridge College, Cambridge, Massachusetts (since 2011); Board of Directors, National Association of Corporate Directors/New England (since 2015); Board of Directors, Association of Independent Colleges and Universities of Massachusetts (since 2014); Chief Executive Officer, American Red Cross of Massachusetts Bay (2002-2011); Board of Directors of Eastern Bank Corporation (since 2001); Board of Directors of Eastern Bank Charitable Foundation (since 2001); Board of Directors of American Student Assistance Corporation (1996-2009); Board of Directors of Boston Stock Exchange (2002-2008); Board of Directors of Harvard Pilgrim Healthcare (health benefits company) (2007-2011). Trustee of various trusts within the John Hancock Fund Complex (since 2008). |
| | | |
| James M. Oates,2Born: 1946 | 2005 | 213 |
Trustee
Managing Director, Wydown Group (financial consulting firm) (since 1994); Chairman and Director, Emerson Investment Management, Inc. (2000-2015); Independent Chairman, Hudson Castle Group, Inc. (formerly IBEX Capital Markets, Inc.) (financial services company) (1997-2011); Director, Stifel Financial (since 1996); Director, Investor Financial Services Corporation (1995-2007); Director, Connecticut River Bancorp (1998-2014); Director/Trustee, Virtus Funds (since 1988). Trustee (since 2004) and Chairperson of the Board (2005-2016) of various trusts within the John Hancock Fund Complex. |
| | | |
| Steven R. Pruchansky, Born: 1944 | 2012 | 213 |
Trustee and Vice Chairperson of the Board
Managing Director, Pru Realty (since 2017); Chairman and Chief Executive Officer, Greenscapes of Southwest Florida, Inc. (2000-2014); Director and President, Greenscapes of Southwest Florida, Inc. (until 2000); Member, Board of Advisors, First American Bank (until 2010); Managing Director, Jon James, LLC (real estate) (since 2000); Partner, Right Funding, LLC (2014-2017); Director, First Signature Bank & Trust Company (until 1991); Director, Mast Realty Trust (until 1994); President, Maxwell Building Corp. (until 1991). Trustee (since 1992), Chairperson of the Board (2011-2012), and Vice Chairperson of the Board (since 2012) of various trusts within the John Hancock Fund Complex. |
| | | |
| Gregory A. Russo, Born: 1949 | 2012 | 213 |
Trustee
Director and Audit Committee Chairman (since 2012), and Member, Audit Committee and Finance Committee (since 2011), NCH Healthcare System, Inc. (holding company for multi-entity healthcare system); Director and Member (2012-2018) and Finance Committee Chairman (2014-2018), The Moorings, Inc. (nonprofit continuing care community); Vice Chairman, Risk & Regulatory Matters, KPMG LLP (KPMG) (2002-2006); Vice Chairman, Industrial Markets, KPMG (1998-2002); Chairman and Treasurer, Westchester County, New York, Chamber of Commerce (1986-1992); Director, Treasurer, and Chairman of Audit and Finance Committees, Putnam Hospital Center (1989-1995); Director and Chairman of Fundraising Campaign, United Way of Westchester and Putnam Counties, New York (1990-1995). Trustee of various trusts within the John Hancock Fund Complex (since 2008). |
ANNUAL REPORT | JOHN HANCOCK ABSOLUTE RETURN CURRENCY FUND 42
Non-Independent Trustees3
| | | |
Name, year of birth
Position(s) held with Trust
Principal occupation(s) and other
directorships during past 5 years | Trustee
of the
Trust
since1 | Number of John
Hancock funds
overseen by
Trustee |
| Andrew G. Arnott, Born: 1971 | 2017 | 213 |
President and Non-Independent Trustee
Head of Wealth and Asset Management, United States and Europe, for John Hancock and Manulife (since 2018); Executive Vice President, John Hancock Financial Services (since 2009, including prior positions); Director and Executive Vice President, John Hancock Investment Management LLC (since 2005, including prior positions); Director and Executive Vice President, John Hancock Variable Trust Advisers LLC (since 2006, including prior positions); President, John Hancock Investment Management Distributors LLC (since 2004, including prior positions); President of various trusts within the John Hancock Fund Complex (since 2007, including prior positions). Trustee of various trusts within the John Hancock Fund Complex (since 2017). |
| | | |
| Marianne Harrison, Born: 1963 | 2018 | 213 |
Non-Independent Trustee
President and CEO, John Hancock (since 2017); President and CEO, Manulife Canadian Division (2013-2017); Member, Board of Directors, American Council of Life Insurers (ACLI) (since 2018); Member, Board of Directors, Communitech, an industry-led innovation center that fosters technology companies in Canada (since 2017); Member, Board of Directors, Manulife Assurance Canada (2015-2017); Board Member, St. Mary's General Hospital Foundation (2014-2017); Member, Board of Directors, Manulife Bank of Canada (2013-2017); Member, Standing Committee of the Canadian Life & Health Assurance Association (2013-2017); Member, Board of Directors, John Hancock USA, John Hancock Life & Health, John Hancock New York (2012-2013). Trustee of various trusts within the John Hancock Fund Complex (since 2018). |
Principal officers who are not Trustees
| | |
Name, year of birth
Position(s) held with Trust
Principal occupation(s)
during past 5 years | Officer
of the
Trust
since |
| Francis V. Knox, Jr.,Born: 1947 | 2005 |
Chief Compliance Officer
Vice President, John Hancock Financial Services (since 2005); Chief Compliance Officer, various trusts within the John Hancock Fund Complex, John Hancock Investment Management LLC, and John Hancock Variable Trust Advisers LLC (since 2005). |
| | |
| Charles A. Rizzo, Born: 1957 | 2007 |
Chief Financial Officer
Vice President, John Hancock Financial Services (since 2008); Senior Vice President, John Hancock Investment Management LLC and John Hancock Variable Trust Advisers LLC (since 2008); Chief Financial Officer of various trusts within the John Hancock Fund Complex (since 2007). |
| | |
| Salvatore Schiavone, Born: 1965 | 2009 |
Treasurer
Assistant Vice President, John Hancock Financial Services (since 2007); Vice President, John Hancock Investment Management LLC and John Hancock Variable Trust Advisers LLC (since 2007); Treasurer of various trusts within the John Hancock Fund Complex (since 2007, including prior positions). |
ANNUAL REPORT | JOHN HANCOCK ABSOLUTE RETURN CURRENCY FUND 43
Principal officers who are notTrustees (continued)
| | | |
Name, year of birth
Position(s) held with Trust
Principal occupation(s)
during past 5 years | Officer
of the
Trust
since |
| Christopher (Kit) Sechler,Born: 1973 | 2018 |
Chief Legal Officer and Secretary
Vice President and Deputy Chief Counsel, John Hancock Investments (since 2015); Assistant Vice President and Senior Counsel (2009-2015), John Hancock Investment Management; Chief Legal Officer and Secretary of various trusts within the John Hancock Fund Complex (since 2018); Assistant Secretary of John Hancock Investment Management LLC and John Hancock Variable Trust Advisers LLC (since 2009). |
The business address for all Trustees and Officers is 200 Berkeley Street, Boston, Massachusetts 02116-5023.
The Statement of Additional Information of the fund includes additional information about members of the Board of Trustees of the Trust and is available without charge, upon request, by calling 800-225-5291.
| 1 | Each Trustee holds office until his or her successor is elected and qualified, or until the Trustee's death, retirement, resignation, or removal. Mr. Boyle has served as Trustee at various times prior to the date listed in the table. |
| 2 | Member of the Audit Committee. |
| 3 | The Trustee is a Non-Independent Trustee due to current or former positions with the Advisor and certain affiliates. |
| 4 | Mr. Hoffman retired as Trustee effective August 31, 2019. |
ANNUAL REPORT | JOHN HANCOCK ABSOLUTE RETURN CURRENCY FUND 44
| | |
Trustees
Hassell H. McClellan,Chairperson
Steven R. Pruchansky,Vice Chairperson
Andrew G. Arnott†
Charles L. Bardelis*
James R. Boyle
Peter S. Burgess*
William H. Cunningham
Grace K. Fey
Marianne Harrison†
Theron S. Hoffman#
Deborah C. Jackson
James M. Oates*
Gregory A. Russo
Officers
Andrew G. Arnott
President
Francis V. Knox, Jr.
Chief Compliance Officer
Charles A. Rizzo
Chief Financial Officer
Salvatore Schiavone
Treasurer
Christopher (Kit) Sechler**
Secretary and Chief Legal Officer
| Investment advisor
John Hancock Investment Management LLC
Subadvisor
First Quadrant, L.P.
Portfolio Managers
Dori S. Levanoni
Jeppe F. Ladekarl
Principal distributor
John Hancock Investment Management Distributors LLC
Custodian
State Street Bank and Trust Company
Transfer agent
John Hancock Signature Services, Inc.
Legal counsel
K&L Gates LLP
Independent registered public accounting firm
PricewaterhouseCoopers LLP
|
* Member of the Audit Committee
† Non-Independent Trustee
** Effective 9-13-18
# Retired effective 8-31-19
The fund's proxy voting policies and procedures, as well as the fund proxy voting record for the most recent twelve-month period ended June 30, are available free of charge on the Securities and Exchange Commission (SEC) website at sec.gov or on our website.
All of the fund's holdings as of the end of the third month of every fiscal quarter are filed with the SEC on Form N-PORT within 60 days of the end of the fiscal quarter. The fund's Form N-PORT filings are available on our website and the SEC's website, sec.gov.
We make this information on your fund, as well asmonthly portfolio holdings, and other fund details available on our website at jhinvestments.com or by calling 800-225-5291.
| | | | |
| | You can also contact us: |
| | 800-225-5291
jhinvestments.com | Regular mail:
John Hancock Signature Services, Inc.
P.O. Box 55913
Boston, MA 02205-5913
| Express mail:
John Hancock Signature Services, Inc.
2000 Crown Colony Drive
Suite 55913
Quincy, MA 02169-0953
|
ANNUAL REPORT | JOHN HANCOCK ABSOLUTE RETURN CURRENCY FUND 45
John Hancock family of funds
| | | |
DOMESTIC EQUITY FUNDS
Blue Chip Growth
Classic Value
Disciplined Value
Disciplined Value Mid Cap
Equity Income
Financial Industries
Fundamental All Cap Core
Fundamental Large Cap Core
New Opportunities
Regional Bank
Small Cap Core
Small Cap Growth
Small Cap Value
U.S. Global Leaders Growth
U.S. Quality Growth
Value Equity
GLOBAL AND INTERNATIONAL EQUITY FUNDS
Disciplined Value International
Emerging Markets
Emerging Markets Equity
Fundamental Global Franchise
Global Equity
Global Shareholder Yield
Global Thematic Opportunities
International Dynamic Growth
International Growth
International Small Company
| | INCOME FUNDS
Bond
California Tax-Free Income
Emerging Markets Debt
Floating Rate Income
Government Income
High Yield
High Yield Municipal Bond
Income
Investment Grade Bond
Money Market
Short Duration Bond
Short Duration Credit Opportunities
Spectrum Income
Strategic Income Opportunities
Tax-Free Bond
ALTERNATIVE AND SPECIALTY FUNDS
Absolute Return Currency
Alternative Asset Allocation
Disciplined Alternative Yield
Diversified Macro
Infrastructure
Multi-Asset Absolute Return
Seaport Long/Short
|
A fund's investment objectives, risks, charges, and expenses should be considered carefully before investing. The prospectus contains this and other important information about the fund. To obtain a prospectus, contact your financial professional, call John Hancock Investment Management at 800-225-5291, or visit our website at jhinvestments.com. Please read the prospectus carefully before investing or sending money.
| | | |
ASSET ALLOCATION
Balanced
Income Allocation
Multi-Index Lifetime Portfolios
Multi-Index Preservation Portfolios
Multimanager Lifestyle Portfolios
Multimanager Lifetime Portfolios
Retirement Income 2040
EXCHANGE-TRADED FUNDS
John Hancock Multifactor Consumer Discretionary ETF
John Hancock Multifactor Consumer Staples ETF
John Hancock Multifactor Developed International ETF
John Hancock Multifactor Emerging Markets ETF
John Hancock Multifactor Energy ETF
John Hancock Multifactor Financials ETF
John Hancock Multifactor Healthcare ETF
John Hancock Multifactor Industrials ETF
John Hancock Multifactor Large Cap ETF
John Hancock Multifactor Materials ETF
John Hancock Multifactor Media and
Communications ETF
John Hancock Multifactor Mid Cap ETF
John Hancock Multifactor Small Cap ETF
John Hancock Multifactor Technology ETF
John Hancock Multifactor Utilities ETF
| | ENVIRONMENTAL, SOCIAL, AND
GOVERNANCE FUNDS
ESG All Cap Core
ESG Core Bond
ESG International Equity
ESG Large Cap Core
CLOSED-END FUNDS
Financial Opportunities
Hedged Equity & Income
Income Securities Trust
Investors Trust
Preferred Income
Preferred Income II
Preferred Income III
Premium Dividend
Tax-Advantaged Dividend Income
Tax-Advantaged Global Shareholder Yield
|
John Hancock Multifactor ETF shares are bought and sold at market price (not NAV), and are not individually redeemed
from the fund. Brokerage commissions will reduce returns.
John Hancock ETFs are distributed by Foreside Fund Services, LLC, and are subadvised by Dimensional Fund Advisors LP.
Foreside is not affiliated with John Hancock Investment Management Distributors, LLC or Dimensional Fund Advisors LP.
Dimensional Fund Advisors LP receives compensation from John Hancock in connection with licensing rights to the
John Hancock Dimensional indexes. Dimensional Fund Advisors LP does not sponsor, endorse, or sell, and makes no
representation as to the advisability of investing in, John Hancock Multifactor ETFs.
John Hancock Investment Management
A trusted brand
John Hancock Investment Management is a premier asset manager
representing one of America's most trusted brands, with a heritage of
financial stewardship dating back to 1862. Helping our shareholders
pursue their financial goals is at the core of everything we do. It's why
we support the role of professional financial advice and operate with
the highest standards of conduct and integrity.
A better way to invest
We serve investors globally through a unique multimanager approach:
We search the world to find proven portfolio teams with specialized
expertise for every strategy we offer, then we apply robust investment
oversight to ensure they continue to meet our uncompromising
standards and serve the best interests of our shareholders.
Results for investors
Our unique approach to asset management enables us to provide
a diverse set of investments backed by some of the world's best
managers, along with strong risk-adjusted returns across asset classes.
John Hancock Investment Management Distributors, LLC n Member FINRA, SIPC
200 Berkeley Street n Boston, MA 02116-5010 n 800-225-5291 n jhinvestments.com
This report is for the information of the shareholders of John Hancock Absolute Return Currency Fund. It is not authorized for distribution to prospective investors unless preceded or accompanied by a prospectus.
John Hancock
Fundamental All Cap Core Fund
Annual report 7/31/19
Beginning on January 1, 2021, as permitted by regulations adopted by the Securities and Exchange Commission, paper copies of the Fund's shareholder reports like this one will no longer be sent by mail, unless you specifically request paper copies of the reports from the Fund or from your financial intermediary. Instead, the reports will be made available on a website, and you will be notified by mail each time a report is posted and provided with a website link to access the report.
If you already elected to receive shareholder reports electronically, you will not be affected by this change, and you do not need to take any action. You may elect to receive shareholder reports and other communications electronically by calling John Hancock Investment Management at 800-225-5291 (Class A and Class C shares) or 888-972-8696 (Class I, Class R2, Class R4, and Class R6 shares) or by contacting your financial intermediary.
You may elect to receive all reports in paper, free of charge, at any time. You can inform John Hancock Investment Management or your financial intermediary that you wish to continue receiving paper copies of your shareholder reports by following the instructions listed above. Your election to receive reports in paper will apply to all funds held with John Hancock Investment Management or your financial intermediary.

A message to shareholders
Dear shareholder,
It was a rather volatile time for stock markets in the United States during the 12 months ended July 31, 2019, with investor uncertainty surrounding trade with China and the broader health of the global economy leading to some dramatic swings in performance. In July, the U.S. Federal Reserve stepped in with a reduction in short-term interest rates in an attempt to offer a measure of stimulus to jittery markets, and the end result for equity investors over the entire 12-month span was a modest gain.
While the economic fundamentals in the United States appear fairly solid, with a strong labor market and a confident consumer base, there are sure to be patches of market turbulence as the year goes on, particularly as the threat of a recession looms. As always, your best resource in unpredictable markets is your financial advisor, who can help position your portfolio so that it's sufficiently diversified to meet your long-term objectives and to withstand the inevitable bouts of market volatility along the way.
On behalf of everyone at John Hancock Investment Management, I'd like to take this opportunity to welcome new shareholders and thank existing shareholders for the continued trust you've placed in us.
Sincerely,
Andrew G. Arnott
President and CEO,
John Hancock Investment Management
Head of Wealth and Asset Management,
United States and Europe
This commentary reflects the CEO's views as of this report's period end and are subject to change at any time. Diversification does not guarantee investment returns and does not eliminate risk of loss. All investments entail risks, including the possible loss of principal. For more up-to-date information, you can visit our website at jhinvestments.com.
John Hancock
Fundamental All Cap Core Fund
Table of contents
| | | |
| 2 | | Your fund at a glance |
| 4 | | Discussion of fund performance |
| 6 | | A look at performance |
| 8 | | Your expenses |
| 10 | | Fund's investments |
| 13 | | Financial statements |
| 16 | | Financial highlights |
| 22 | | Notes to financial statements |
| 31 | | Report of independent registered public accounting firm |
| 32 | | Tax information |
| 33 | | Continuation of investment advisory and subadvisory agreements |
| 40 | | Trustees and Officers |
| 44 | | More information |
ANNUAL REPORT | JOHN HANCOCK FUNDAMENTAL ALL CAP CORE FUND 1
INVESTMENT OBJECTIVE
The fund seeks long-term capital appreciation.
AVERAGE ANNUAL TOTAL RETURNS AS OF 7/31/19 (%)
The Russell 3000 Index is an unmanaged index of the 3,000 largest U.S. companies based on total market capitalization, which represents approximately 98% of the investable U.S. equity market.
It is not possible to invest directly in an index. Index figures do not reflect expenses or sales charges, which would result in lower returns.
Figures from Morningstar, Inc. include reinvested distributions and do not take into account sales charges. Actual load-adjusted performance is lower. Since-inception returns for the Morningstar fund category average are not available.
The past performance shown here reflects reinvested distributions and the beneficial effect of any expense reductions, and does not guarantee future results. Performance of the other share classes will vary based on the difference in the fees and expenses of those classes. Shares will fluctuate in value and, when redeemed, may be worth more or less than their original cost. Current month-end performance may be lower or higher than the performance cited, and can be found at jhinvestments.com or by calling 800-225-5291. For further information on the fund's objectives, risks, and strategy, see the fund's prospectus.
ANNUAL REPORT | JOHN HANCOCK FUNDAMENTAL ALL CAP CORE FUND 2
PERFORMANCE HIGHLIGHTS OVER THE LAST TWELVE MONTHS
U.S. stock market continued to climb
Despite headwinds from trade conflicts and decelerating global economic growth, U.S. stocks powered higher, buoyed in part by expectations that the U.S. Federal Reserve would cut its short-term interest-rate target.
The fund underperformed its benchmark
Stock picking in industrials and financials were the most significant causes for the fund's lag of its benchmark, the Russell 3000 Index.
Materials and real estate had a positive impact
Underexposure to the weak-performing materials sector and stock picks in real estate gave a small boost to the fund's relative performance.
SECTOR COMPOSITION AS OF 7/31/19 (%)
A note about risks
The fund is subject to various risks as described in the fund's prospectus. For more information, please refer to the "Principal risks" section of the prospectus.
ANNUAL REPORT | JOHN HANCOCK FUNDAMENTAL ALL CAP CORE FUND 3
Discussion of fund performance
What factors influenced the U.S. stock market during the 12 months ended July 31, 2019?
Positive U.S. economic growth and better-than-expected corporate earnings drove the stock market to a new high in September 2018. However, the combination of rising interest rates, decelerating global growth, mounting trade risks, and a partial U.S. government shutdown sent the stock market into a nosedive in the fourth quarter.
Equities rebounded early in the new year, buoyed by signs the U.S. Federal Reserve (Fed) was on hold with further interest-rate increases, the end of the federal government shutdown, and signs of progress resolving the trade dispute with China. Favorable first-quarter economic and corporate earnings growth also helped. However, the market slumped again in May 2019, amid concern that escalating trade tensions would stall the record-long U.S. economic expansion. Expectations that the Fed might cut its short-term interest-rate target subsequently triggered an equity market rebound, setting the markets to new highs.
How did the fund perform for the one-year period?
The fund underperformed its benchmark, the Russell 3000 Index. Stock picks in the industrials and financials sectors detracted most from relative performance, with an added loss from a sizable underweighting in information technology, which was offset by stock selection in that sector. Bottom-up security selection remained focused on financially sound companies with competitive advantages, the ability to
TOP 10 HOLDINGS AS OF 7/31/19 (%)
| | |
| Amazon.com, Inc. | 7.1 |
| Facebook, Inc., Class A | 5.8 |
| Lennar Corp., A Shares | 4.9 |
| Apple, Inc. | 4.7 |
| Citigroup, Inc. | 4.7 |
| Polaris Industries, Inc. | 4.5 |
| Bank of America Corp. | 4.5 |
| Alphabet, Inc., Class A | 4.4 |
| Anheuser-Busch InBev SA, ADR | 3.4 |
| Morgan Stanley | 3.0 |
| TOTAL | 47.0 |
| As a percentage of net assets. |
| Cash and cash equivalents are not included. |
ANNUAL REPORT | JOHN HANCOCK FUNDAMENTAL ALL CAP CORE FUND 4
generate substantial cash flow over sustained periods, and attractive stock prices relative to our estimates of intrinsic value.
The largest detractor was diversified industrials conglomerate General Electric Company (GE), which declined markedly due largely to disappointing results in the company's power generation business. We reduced the fund's exposure last fall because we think GE's turnaround will take longer than originally anticipated. Another disappointment was oil field equipment and services company National Oilwell Varco, Inc., which saw its stock sink as continued low oil prices caused exploration and production companies to rein in their spending.
The fund gained some ground from having almost no exposure to materials, one of the weakest-performing sectors in the index for the period. Stock picks in real estate, consumer staples, and information technology also helped. The biggest individual standout was cloud-based software company Workday, Inc., which benefited from more companies shifting to cloud-based platforms to help reduce costs and increase efficiency. Timely trading in consumer technology leader Apple, Inc. also contributed.
How was the fund positioned at period end?
We're finding the most attractive valuations among companies with economically sensitive and secular growth profiles, which suggests to us that many investors are skeptical about the U.S. economy continuing its record-long expansion and the stock market's ability to keep on climbing. The fund ended the period with sizable overweights in the consumer discretionary and communication services sectors and reduced stakes in the interest-rate sensitive financials sector and economically sensitive industrials sector.
MANAGED BY
| | |
 | Emory W. (Sandy) Sanders, Jr., CFA
On the fund since 2011
Investing since 1997 |
 | Jonathan T. White, CFA
On the fund since 2015
Investing since 1997 |

The views expressed in this report are exclusively those of Emory W. (Sandy) Sanders, Jr., CFA, Manulife Investment Management, and are subject to change. They are not meant as investment advice. Please note that the holdings discussed in this report may not have been held by the fund for the entire period. Portfolio composition is subject to review in accordance with the fund's investment strategy and may vary in the future. Current and future portfolio holdings are subject to risk.
ANNUAL REPORT | JOHN HANCOCK FUNDAMENTAL ALL CAP CORE FUND 5
TOTAL RETURNS FOR THE PERIOD ENDED JULY 31, 2019
| | | | | | | | |
Average annual total returns (%)
with maximum sales charge | | Cumulative total returns (%)
with maximum sales charge |
| | 1-year | 5-year | Since
inception1 | | | 5-year | Since
inception1 |
| Class A | -2.53 | 9.14 | 11.37 | | | 54.87 | 140.99 |
| Class C3 | 0.98 | 9.52 | 11.59 | | | 57.57 | 144.86 |
| Class I2 | 2.94 | 10.63 | 12.48 | | | 65.71 | 161.24 |
| Class R22,3 | 2.53 | 10.33 | 12.11 | | | 63.45 | 154.34 |
| Class R42,3 | 2.84 | 10.49 | 12.21 | | | 64.65 | 156.21 |
| Class R62,3 | 3.04 | 10.67 | 12.32 | | | 66.00 | 158.30 |
| Index† | 7.05 | 10.96 | 12.18 | | | 68.19 | 155.71 |
Performance figures assume all distributions have been reinvested. Figures reflect maximum sales charges on Class A shares of 5.00% and the applicable contingent deferred sales charge (CDSC) on Class C shares. Class C shares sold within one year of purchase are subject to a 1% CDSC. Sales charges are not applicable to Class I, Class R2, Class R4, and Class R6 shares.
The expense ratios of the fund, both net (including any fee waivers and/or expense limitations) and gross (excluding any fee waivers and/or expense limitations), are set forth according to the most recent publicly available prospectus for the fund and may differ from those disclosed in the Financial highlights tables in this report. Net expenses reflect contractual expense limitations in effect until November 30, 2019 and are subject to change. Had the contractual fee waivers and expense limitations not been in place, gross expenses would apply. The expense ratios are as follows:
| | | | | | | |
| | Class A | Class C | Class I | Class R2 | Class R4 | Class R6 | |
| Gross (%) | 1.35 | 2.05 | 1.05 | 1.44 | 1.29 | 0.94 | |
| Net (%) | 1.26 | 1.96 | 0.96 | 1.35 | 1.10 | 0.85 | |
Please refer to the most recent prospectus and annual or semiannual report for more information on expenses and any expense limitation arrangements for each class.
The returns reflect past results and should not be considered indicative of future performance. The return and principal value of an investment will fluctuate so that shares, when redeemed, may be worth more or less than their original cost. Due to market volatility and other factors, the fund's current performance may be higher or lower than the performance shown. For current to the most recent month-end performance data, please call 800-225-5291 or visit the fund's website at jhinvestments.com.
The performance table above and the chart on the next page do not reflect the deduction of taxes that a shareholder would pay on fund distributions or the redemption of fund shares. The fund's performance results reflect any applicable fee waivers or expense reductions, without which the expenses would increase and results would have been less favorable.
| † | Index is the Russell 3000 Index. |
See the following page for footnotes.
ANNUAL REPORT | JOHN HANCOCK FUNDAMENTAL ALL CAP CORE FUND 6
This chart and table show what happened to a hypothetical $10,000 investment in John Hancock Fundamental All Cap Core Fund for the share classes and periods indicated, assuming all distributions were reinvested. For comparison, we've shown the same investment in the Russell 3000 Index.
| | | | | |
| | Start date | With maximum
sales charge ($) | Without
sales charge ($) | Index ($) |
| Class C4 | 6-1-11 | 24,486 | 24,486 | 25,571 |
| Class I2 | 6-1-11 | 26,124 | 26,124 | 25,571 |
| Class R22,3 | 6-1-11 | 25,434 | 25,434 | 25,571 |
| Class R42,3 | 6-1-11 | 25,621 | 25,621 | 25,571 |
| Class R62,3 | 6-1-11 | 25,830 | 25,830 | 25,571 |
The Russell 3000 Index is an unmanaged index of the 3,000 largest U.S. companies based on total market capitalization, which represents approximately 98% of the investable U.S. equity market.
It is not possible to invest directly in an index. Index figures do not reflect expenses or sales charges, which would result in lower returns.
Footnotes related to performance pages
| 1 | From 6-1-11. |
| 2 | For certain types of investors as described in the fund's prospectus. |
| 3 | Class C shares were first offered on 6-27-14; Class R2, Class R4 and Class R6 shares were first offered on 3-27-15. Returns prior to these dates are those of Class A shares (first offered on 6-1-11) that have not been adjusted for class-specific expenses; otherwise, returns would vary. |
| 4 | The contingent deferred sales charge is not applicable. |
ANNUAL REPORT | JOHN HANCOCK FUNDAMENTAL ALL CAP CORE FUND 7
These examples are intended to help you understand your ongoing operating expenses of investing in the fund so you can compare these costs with the ongoing costs of investing in other mutual funds.
Understanding fund expenses
As a shareholder of the fund, you incur two types of costs:
■Transaction costs,which include sales charges (loads) on purchases or redemptions (varies by share class), minimum account fee charge, etc.
■Ongoing operating expenses, including management fees, distribution and service fees (if applicable), and other fund expenses.
We are presenting only your ongoing operating expenses here.
Actual expenses/actual returns
The first line of each share class in the table on the following page is intended to provide information about the fund’s actual ongoing operating expenses, and is based on the fund’s actual return. It assumes an account value of $1,000.00 on February 1, 2019, with the same investment held until July 31, 2019.
Together with the value of your account, you may use this information to estimate the operating expenses that you paid over the period. Simply divide your account value at July 31, 2019, by $1,000.00, then multiply it by the “expenses paid” for your share class from the table. For example, for an account value of $8,600.00, the operating expenses should be calculated as follows:
Hypothetical example for comparison purposes
The second line of each share class in the table on the following page allows you to compare the fund’s ongoing operating expenses with those of any other fund. It provides an example of the fund’s hypothetical account values and hypothetical expenses based on each class’s actual expense ratio and an assumed 5% annualized return before expenses (which is not the class’s actual return). It assumes an account value of $1,000.00 on February 1, 2019, with the same investment held until July 31, 2019. Look in any other fund shareholder report to find its hypothetical example and you will be able to compare these expenses. Please remember that these hypothetical account values and expenses may not be used to estimate the actual ending account balance or expenses you paid for the period.
| 8 | JOHN HANCOCK FUNDAMENTAL ALL CAP CORE FUND | ANNUAL REPORT | |
Remember, these examples do not include any transaction costs, therefore, these examples will not help you to determine the relative total costs of owning different funds. If transaction costs were included, your expenses would have been higher. See the prospectus for details regarding transaction costs.
SHAREHOLDER EXPENSE EXAMPLE CHART
| | | Account
value on
2-1-2019 | Ending
value on
7-31-2019 | Expenses
paid during
period ended
7-31-20191 | Annualized
expense
ratio |
| Class A | Actual expenses/actual returns | $1,000.00 | $1,107.10 | $6.69 | 1.28% |
| | Hypothetical example | 1,000.00 | 1,018.40 | 6.41 | 1.28% |
| Class C | Actual expenses/actual returns | 1,000.00 | 1,103.60 | 10.33 | 1.98% |
| | Hypothetical example | 1,000.00 | 1,015.00 | 9.89 | 1.98% |
| Class I | Actual expenses/actual returns | 1,000.00 | 1,109.70 | 5.13 | 0.98% |
| | Hypothetical example | 1,000.00 | 1,019.90 | 4.91 | 0.98% |
| Class R2 | Actual expenses/actual returns | 1,000.00 | 1,106.90 | 7.16 | 1.37% |
| | Hypothetical example | 1,000.00 | 1,018.00 | 6.85 | 1.37% |
| Class R4 | Actual expenses/actual returns | 1,000.00 | 1,108.80 | 5.59 | 1.07% |
| | Hypothetical example | 1,000.00 | 1,019.50 | 5.36 | 1.07% |
| Class R6 | Actual expenses/actual returns | 1,000.00 | 1,110.10 | 4.60 | 0.88% |
| | Hypothetical example | 1,000.00 | 1,020.40 | 4.41 | 0.88% |
| 1 | Expenses are equal to the annualized expense ratio, multiplied by the average account value over the period, multiplied by 181/365 (to reflect the one-half year period). |
| | ANNUAL REPORT | JOHN HANCOCK FUNDAMENTAL ALL CAP CORE FUND | 9 |
AS OF 7-31-19
| | | | | Shares | Value |
| Common stocks 95.5% | | | | | $84,922,291 |
| (Cost $67,348,550) | | | | | |
| Communication services 17.0% | | | 15,146,438 |
| Entertainment 2.7% | | | |
| Liberty Media Corp.-Liberty Formula One, Series C (A) | | | 60,968 | 2,400,920 |
| Interactive media and services 14.3% | | | |
| Alphabet, Inc., Class A (A) | | | 3,191 | 3,887,276 |
| CarGurus, Inc. (A) | | | 58,183 | 2,168,480 |
| Facebook, Inc., Class A (A) | | | 26,710 | 5,187,884 |
| Twitter, Inc. (A) | | | 35,497 | 1,501,878 |
| Consumer discretionary 22.6% | | | 20,098,980 |
| Household durables 8.7% | | | |
| Lennar Corp., A Shares | | | 91,019 | 4,329,774 |
| NVR, Inc. (A) | | | 409 | 1,367,753 |
| Tempur Sealy International, Inc. (A) | | | 25,274 | 2,027,480 |
| Internet and direct marketing retail 7.1% | | | |
| Amazon.com, Inc. (A) | | | 3,401 | 6,348,916 |
| Leisure products 4.5% | | | |
| Polaris Industries, Inc. | | | 42,726 | 4,044,870 |
| Specialty retail 1.5% | | | |
| Group 1 Automotive, Inc. | | | 15,487 | 1,300,289 |
| Textiles, apparel and luxury goods 0.8% | | | |
| Salvatore Ferragamo SpA | | | 32,419 | 679,898 |
| Consumer staples 5.3% | | | 4,704,208 |
| Beverages 4.4% | | | |
| Anheuser-Busch InBev SA, ADR | | | 29,541 | 2,983,050 |
| Diageo PLC, ADR | | | 5,619 | 937,699 |
| Food products 0.9% | | | |
| The Hain Celestial Group, Inc. (A) | | | 35,988 | 783,459 |
| Energy 6.2% | | | 5,517,591 |
| Energy equipment and services 2.8% | | | |
| Baker Hughes, a GE Company | | | 52,140 | 1,323,835 |
| National Oilwell Varco, Inc. | | | 23,523 | 560,318 |
| Schlumberger, Ltd. | | | 14,391 | 575,208 |
| Oil, gas and consumable fuels 3.4% | | | |
| Cheniere Energy, Inc. (A) | | | 27,658 | 1,801,919 |
| Kinder Morgan, Inc. | | | 25,738 | 530,718 |
| Suncor Energy, Inc. | | | 25,282 | 725,593 |
| 10 | JOHN HANCOCK FUNDAMENTAL ALL CAP CORE FUND | ANNUAL REPORT | SEE NOTES TO FINANCIAL STATEMENTS |
| | | | | Shares | Value |
| Financials 17.0% | | | $15,068,082 |
| Banks 9.7% | | | |
| Bank of America Corp. | | | 131,607 | 4,037,703 |
| Citigroup, Inc. | | | 58,372 | 4,153,752 |
| First Hawaiian, Inc. | | | 16,948 | 453,528 |
| Capital markets 5.5% | | | |
| Affiliated Managers Group, Inc. | | | 4,734 | 406,130 |
| Morgan Stanley | | | 59,246 | 2,640,002 |
| The Goldman Sachs Group, Inc. | | | 8,132 | 1,790,097 |
| Consumer finance 1.8% | | | |
| American Express Company | | | 6,342 | 788,755 |
| Synchrony Financial | | | 22,244 | 798,115 |
| Health care 6.0% | | | 5,297,727 |
| Biotechnology 3.7% | | | |
| Alnylam Pharmaceuticals, Inc. (A) | | | 5,979 | 463,911 |
| Amgen, Inc. | | | 13,043 | 2,433,563 |
| Moderna, Inc. (A) | | | 31,056 | 406,834 |
| Health care equipment and supplies 1.4% | | | |
| Hologic, Inc. (A) | | | 23,605 | 1,209,756 |
| Health care providers and services 0.9% | | | |
| Anthem, Inc. | | | 2,660 | 783,663 |
| Industrials 7.8% | | | 6,932,394 |
| Electrical equipment 1.7% | | | |
| Regal Beloit Corp. | | | 9,015 | 717,774 |
| Sensata Technologies Holding PLC (A) | | | 17,472 | 828,697 |
| Industrial conglomerates 2.5% | | | |
| General Electric Company | | | 214,564 | 2,242,194 |
| Machinery 0.6% | | | |
| The Manitowoc Company, Inc. (A) | | | 24,983 | 448,445 |
| Wabtec Corp. | | | 1,136 | 88,244 |
| Professional services 2.0% | | | |
| IHS Markit, Ltd. (A) | | | 27,119 | 1,747,006 |
| Trading companies and distributors 1.0% | | | |
| United Rentals, Inc. (A) | | | 6,796 | 860,034 |
| Information technology 10.4% | | | 9,273,877 |
| Semiconductors and semiconductor equipment 1.5% | | | |
| Analog Devices, Inc. | | | 4,753 | 558,287 |
| NVIDIA Corp. | | | 4,377 | 738,487 |
| Software 3.3% | | | |
| salesforce.com, Inc. (A) | | | 8,278 | 1,278,951 |
| Workday, Inc., Class A (A) | | | 8,467 | 1,693,231 |
| SEE NOTES TO FINANCIAL STATEMENTS | ANNUAL REPORT | JOHN HANCOCK FUNDAMENTAL ALL CAP CORE FUND | 11 |
| | | | | Shares | Value |
| Information technology (continued) | | | |
| Technology hardware, storage and peripherals 5.6% | | | |
| Apple, Inc. | | | 19,763 | $4,210,310 |
| Samsung Electronics Company, Ltd. | | | 20,980 | 794,611 |
| Real estate 3.2% | | | 2,882,994 |
| Equity real estate investment trusts 2.5% | | | |
| American Tower Corp. | | | 10,614 | 2,246,135 |
| Real estate management and development 0.7% | | | |
| Five Point Holdings LLC, Class A (A) | | | 81,544 | 636,859 |
|
| | Yield* (%) | Maturity date | | Par value^ | Value |
| Short-term investments 4.6% | | | | | $4,083,221 |
| (Cost $4,083,221) | | | | | |
| U.S. Government Agency 1.5% | | | | | 1,303,000 |
| Federal Agricultural Mortgage Corp. Discount Note | 2.150 | 08-01-19 | | 386,000 | 386,000 |
| Federal Home Loan Bank Discount Note | 2.150 | 08-01-19 | | 917,000 | 917,000 |
| | | Yield (%) | | Shares | Value |
| Money market funds 0.9% | | | | | 834,221 |
| State Street Institutional U.S. Government Money Market Fund, Premier Class | 2.2608(B) | | 834,221 | 834,221 |
| | | | | Par value^ | Value |
| Repurchase agreement 2.2% | | | | | 1,946,000 |
| Barclays Tri-Party Repurchase Agreement dated 7-31-19 at 2.520% to be repurchased at $1,946,136 on 8-1-19, collateralized by $1,636,500 U.S. Treasury Bonds, 3.625% due 2-15-44 (valued at $1,985,133, including interest) | | | | 1,946,000 | 1,946,000 |
|
| Total investments (Cost $71,431,771) 100.1% | | | $89,005,512 |
| Other assets and liabilities, net (0.1%) | | | | (89,303) |
| Total net assets 100.0% | | | | | $88,916,209 |
| The percentage shown for each investment category is the total value of the category as a percentage of the net assets of the fund. |
| ^All par values are denominated in U.S. dollars unless otherwise indicated. |
| Security Abbreviations and Legend |
| ADR | American Depositary Receipt |
| (A) | Non-income producing security. |
| (B) | The rate shown is the annualized seven-day yield as of 7-31-19. |
| * | Yield represents either the annualized yield at the date of purchase, the stated coupon rate or, for floating rate securities, the rate at period end. |
At 7-31-19, the aggregate cost of investments for federal income tax purposes was $71,573,724. Net unrealized appreciation aggregated to $17,431,788, of which $19,989,930 related to gross unrealized appreciation and $2,558,142 related to gross unrealized depreciation.
| 12 | JOHN HANCOCK FUNDAMENTAL ALL CAP CORE FUND | ANNUAL REPORT | SEE NOTES TO FINANCIAL STATEMENTS |
STATEMENT OF ASSETS AND LIABILITIES 7-31-19
| Assets | |
| Unaffiliated investments, at value (Cost $71,431,771) | $89,005,512 |
| Foreign currency, at value (Cost $1,697) | 1,681 |
| Dividends and interest receivable | 35,981 |
| Receivable for fund shares sold | 113,343 |
| Receivable from affiliates | 601 |
| Other assets | 48,417 |
| Total assets | 89,205,535 |
| Liabilities | |
| Payable for investments purchased | 116,102 |
| Payable for fund shares repurchased | 78,873 |
| Payable to affiliates | |
| Accounting and legal services fees | 6,898 |
| Transfer agent fees | 7,823 |
| Distribution and service fees | 15 |
| Trustees' fees | 72 |
| Other liabilities and accrued expenses | 79,543 |
| Total liabilities | 289,326 |
| Net assets | $88,916,209 |
| Net assets consist of | |
| Paid-in capital | $72,470,374 |
| Total distributable earnings (loss) | 16,445,835 |
| Net assets | $88,916,209 |
| |
| Net asset value per share | |
| Based on net asset value and shares outstanding - the fund has an unlimited number of shares authorized with no par value | |
| Class A ($49,066,416 ÷ 2,650,420 shares)1 | $18.51 |
| Class C ($5,977,786 ÷ 334,055 shares)1 | $17.89 |
| Class I ($20,016,028 ÷ 1,063,833 shares) | $18.82 |
| Class R2 ($71,818 ÷ 3,853 shares) | $18.64 |
| Class R4 ($8,823 ÷ 471 shares) | $18.752 |
| Class R6 ($13,775,338 ÷ 730,561 shares) | $18.86 |
| Maximum offering price per share | |
| Class A (net asset value per share ÷ 95%)3 | $19.48 |
| 1 | Redemption price per share is equal to net asset value less any applicable contingent deferred sales charge. |
| 2 | Net asset value, offering price and redemption price per share of $18.75 is calculated using Net assets of $8,822.85 and Shares outstanding of 470.625. |
| 3 | On single retail sales of less than $50,000. On sales of $50,000 or more and on group sales the offering price is reduced. |
| SEE NOTES TO FINANCIAL STATEMENTS | ANNUAL REPORT | JOHN HANCOCK FUNDAMENTAL ALL CAP CORE FUND | 13 |
STATEMENT OF OPERATIONS For the year ended 7-31-19
| Investment income | |
| Dividends | $1,004,468 |
| Non-cash dividends | 88,685 |
| Interest | 53,322 |
| Less foreign taxes withheld | (18,703) |
| Total investment income | 1,127,772 |
| Expenses | |
| Investment management fees | 589,031 |
| Distribution and service fees | 199,095 |
| Accounting and legal services fees | 16,160 |
| Transfer agent fees | 89,451 |
| Trustees' fees | 1,650 |
| Custodian fees | 22,594 |
| State registration fees | 92,870 |
| Printing and postage | 32,499 |
| Professional fees | 51,853 |
| Other | 20,507 |
| Total expenses | 1,115,710 |
| Less expense reductions | (71,522) |
| Net expenses | 1,044,188 |
| Net investment income | 83,584 |
| Realized and unrealized gain (loss) | |
| Net realized gain (loss) on | |
| Unaffiliated investments and foreign currency transactions | 2,022,390 |
| | 2,022,390 |
| Change in net unrealized appreciation (depreciation) of | |
| Unaffiliated investments and translation of assets and liabilities in foreign currencies | (800,956) |
| | (800,956) |
| Net realized and unrealized gain | 1,221,434 |
| Increase in net assets from operations | $1,305,018 |
| | |
| 14 | JOHN HANCOCK FUNDAMENTAL ALL CAP CORE FUND | ANNUAL REPORT | SEE NOTES TO FINANCIAL STATEMENTS |
STATEMENTS OF CHANGES IN NET ASSETS
| | Year ended
7-31-19 | Year ended
7-31-18 |
| Increase (decrease) in net assets | | |
| From operations | | |
| Net investment income (loss) | $83,584 | $(147,332) |
| Net realized gain | 2,022,390 | 4,797,395 |
| Change in net unrealized appreciation (depreciation) | (800,956) | 8,809,351 |
| Increase in net assets resulting from operations | 1,305,018 | 13,459,414 |
| Distributions to shareholders | | |
| From net investment income and net realized gain | | |
| Class A | (3,534,019) | — |
| Class C | (472,321) | — |
| Class I | (1,809,069) | — |
| Class R2 | (3,456) | — |
| Class R4 | (386) | — |
| Class R6 | (959,836) | — |
| From net investment income | | |
| Class I | — | (49,116) |
| Class R2 | — | (52) |
| Class R4 | — | (1,224) |
| Class R6 | — | (19,235) |
| From net realized gain | | |
| Class A | — | (2,573,481) |
| Class C | — | (320,001) |
| Class I | — | (1,684,737) |
| Class R2 | — | (4,196) |
| Class R4 | — | (55,469) |
| Class R6 | — | (498,178) |
| Total distributions | (6,779,087) | (5,205,689) |
| From fund share transactions | (3,766,980) | 20,036,890 |
| Total increase (decrease) | (9,241,049) | 28,290,615 |
| Net assets | | |
| Beginning of year | 98,157,258 | 69,866,643 |
| End of year1 | $88,916,209 | $98,157,258 |
| 1 | Net assets - End of year includes undistributed net investment income of $0 at July 31, 2018. The SEC eliminated the requirement to disclose undistributed net investment income in the current reporting period. |
| SEE NOTES TO FINANCIAL STATEMENTS | ANNUAL REPORT | JOHN HANCOCK FUNDAMENTAL ALL CAP CORE FUND | 15 |
| CLASS A SHARES Period ended | 7-31-19 | 7-31-18 | 7-31-17 | 7-31-16 | 7-31-15 |
| Per share operating performance | | | | | |
| Net asset value, beginning of period | $19.84 | $17.95 | $14.97 | $16.16 | $14.33 |
| Net investment income (loss)1 | —2 | (0.05) | 0.03 | —2 | (0.04) |
| Net realized and unrealized gain (loss) on investments | 0.12 | 3.08 | 2.97 | (0.40) | 2.27 |
| Total from investment operations | 0.12 | 3.03 | 3.00 | (0.40) | 2.23 |
| Less distributions | | | | | |
| From net investment income | — | — | (0.02) | — | — |
| From net realized gain | (1.45) | (1.14) | — | (0.79) | (0.40) |
| Total distributions | (1.45) | (1.14) | (0.02) | (0.79) | (0.40) |
| Net asset value, end of period | $18.51 | $19.84 | $17.95 | $14.97 | $16.16 |
| Total return (%)3,4 | 2.60 | 17.14 | 20.07 | (2.43) | 15.77 |
| Ratios and supplemental data | | | | | |
| Net assets, end of period (in millions) | $49 | $49 | $38 | $30 | $23 |
| Ratios (as a percentage of average net assets): | | | | | |
| Expenses before reductions | 1.36 | 1.33 | 1.35 | 1.28 | 1.30 |
| Expenses including reductions | 1.28 | 1.28 | 1.26 | 1.27 | 1.29 |
| Net investment income (loss) | 0.01 | (0.25) | 0.18 | (0.03) | (0.29) |
| Portfolio turnover (%) | 21 | 23 | 52 | 40 | 42 |
| 1 | Based on average daily shares outstanding. |
| 2 | Less than $0.005 per share. |
| 3 | Total returns would have been lower had certain expenses not been reduced during the applicable periods. |
| 4 | Does not reflect the effect of sales charges, if any. |
| 16 | JOHN HANCOCK FUNDAMENTAL ALL CAP CORE FUND | ANNUAL REPORT | SEE NOTES TO FINANCIAL STATEMENTS |
| CLASS C SHARES Period ended | 7-31-19 | 7-31-18 | 7-31-17 | 7-31-16 | 7-31-15 |
| Per share operating performance | | | | | |
| Net asset value, beginning of period | $19.36 | $17.67 | $14.81 | $16.11 | $14.37 |
| Net investment loss1 | (0.12) | (0.18) | (0.09) | (0.11) | (0.16) |
| Net realized and unrealized gain (loss) on investments | 0.10 | 3.01 | 2.95 | (0.40) | 2.30 |
| Total from investment operations | (0.02) | 2.83 | 2.86 | (0.51) | 2.14 |
| Less distributions | | | | | |
| From net realized gain | (1.45) | (1.14) | — | (0.79) | (0.40) |
| Net asset value, end of period | $17.89 | $19.36 | $17.67 | $14.81 | $16.11 |
| Total return (%)2,3 | 1.90 | 16.25 | 19.31 | (3.14) | 15.09 |
| Ratios and supplemental data | | | | | |
| Net assets, end of period (in millions) | $6 | $6 | $5 | $3 | $2 |
| Ratios (as a percentage of average net assets): | | | | | |
| Expenses before reductions | 2.06 | 2.03 | 2.05 | 1.98 | 2.69 |
| Expenses including reductions | 1.98 | 1.98 | 1.96 | 1.97 | 2.00 |
| Net investment loss | (0.69) | (0.95) | (0.54) | (0.74) | (1.06) |
| Portfolio turnover (%) | 21 | 23 | 52 | 40 | 42 |
| 1 | Based on average daily shares outstanding. |
| 2 | Total returns would have been lower had certain expenses not been reduced during the applicable periods. |
| 3 | Does not reflect the effect of sales charges, if any. |
| SEE NOTES TO FINANCIAL STATEMENTS | ANNUAL REPORT | JOHN HANCOCK FUNDAMENTAL ALL CAP CORE FUND | 17 |
| CLASS I SHARES Period ended | 7-31-19 | 7-31-18 | 7-31-17 | 7-31-16 | 7-31-15 |
| Per share operating performance | | | | | |
| Net asset value, beginning of period | $20.08 | $18.13 | $15.12 | $16.27 | $14.39 |
| Net investment income1 | 0.06 | 0.01 | 0.07 | 0.04 | 0.01 |
| Net realized and unrealized gain (loss) on investments | 0.13 | 3.11 | 3.01 | (0.39) | 2.29 |
| Total from investment operations | 0.19 | 3.12 | 3.08 | (0.35) | 2.30 |
| Less distributions | | | | | |
| From net investment income | — | (0.03) | (0.07) | (0.01) | (0.02) |
| From net realized gain | (1.45) | (1.14) | — | (0.79) | (0.40) |
| Total distributions | (1.45) | (1.17) | (0.07) | (0.80) | (0.42) |
| Net asset value, end of period | $18.82 | $20.08 | $18.13 | $15.12 | $16.27 |
| Total return (%)2 | 2.94 | 17.50 | 20.40 | (2.08) | 16.20 |
| Ratios and supplemental data | �� | | | | |
| Net assets, end of period (in millions) | $20 | $29 | $21 | $8 | $11 |
| Ratios (as a percentage of average net assets): | | | | | |
| Expenses before reductions | 1.08 | 1.03 | 1.04 | 0.97 | 1.05 |
| Expenses including reductions | 0.99 | 0.98 | 0.95 | 0.95 | 0.94 |
| Net investment income | 0.31 | 0.03 | 0.42 | 0.27 | 0.07 |
| Portfolio turnover (%) | 21 | 23 | 52 | 40 | 42 |
| 1 | Based on average daily shares outstanding. |
| 2 | Total returns would have been lower had certain expenses not been reduced during the applicable periods. |
| 18 | JOHN HANCOCK FUNDAMENTAL ALL CAP CORE FUND | ANNUAL REPORT | SEE NOTES TO FINANCIAL STATEMENTS |
| CLASS R2 SHARES Period ended | 7-31-19 | 7-31-18 | 7-31-17 | 7-31-16 | 7-31-151 |
| Per share operating performance | | | | | |
| Net asset value, beginning of period | $19.98 | $18.09 | $15.09 | $16.26 | $15.12 |
| Net investment income (loss)2 | — | (0.05) | 0.06 | 0.02 | (0.01) |
| Net realized and unrealized gain (loss) on investments | 0.11 | 3.09 | 2.99 | (0.40) | 1.15 |
| Total from investment operations | 0.11 | 3.04 | 3.05 | (0.38) | 1.14 |
| Less distributions | | | | | |
| From net investment income | — | (0.01) | (0.05) | — | — |
| From net realized gain | (1.45) | (1.14) | — | (0.79) | — |
| Total distributions | (1.45) | (1.15) | (0.05) | (0.79) | — |
| Net asset value, end of period | $18.64 | $19.98 | $18.09 | $15.09 | $16.26 |
| Total return (%)3 | 2.53 | 17.09 | 20.25 | (2.28) | 7.544 |
| Ratios and supplemental data | | | | | |
| Net assets, end of period (in millions) | $—5 | $—5 | $—5 | $—5 | $—5 |
| Ratios (as a percentage of average net assets): | | | | | |
| Expenses before reductions | 1.46 | 1.35 | 1.20 | 1.12 | 1.106 |
| Expenses including reductions | 1.38 | 1.30 | 1.11 | 1.11 | 1.106 |
| Net investment income (loss) | — | (0.28) | 0.35 | 0.13 | (0.19)6 |
| Portfolio turnover (%) | 21 | 23 | 52 | 40 | 427 |
| 1 | The inception date for Class R2 shares is 3-27-15. |
| 2 | Based on average daily shares outstanding. |
| 3 | Total returns would have been lower had certain expenses not been reduced during the applicable periods. |
| 4 | Not annualized. |
| 5 | Less than $500,000. |
| 6 | Annualized. |
| 7 | Portfolio turnover is shown for the period from 8-1-14 to 7-31-15. |
| SEE NOTES TO FINANCIAL STATEMENTS | ANNUAL REPORT | JOHN HANCOCK FUNDAMENTAL ALL CAP CORE FUND | 19 |
| CLASS R4 SHARES Period ended | 7-31-19 | 7-31-18 | 7-31-17 | 7-31-16 | 7-31-151 |
| Per share operating performance | | | | | |
| Net asset value, beginning of period | $20.03 | $18.11 | $15.10 | $16.27 | $15.12 |
| Net investment income (loss)2 | 0.03 | (0.02) | 0.07 | 0.03 | (0.01) |
| Net realized and unrealized gain (loss) on investments | 0.14 | 3.11 | 3.00 | (0.40) | 1.16 |
| Total from investment operations | 0.17 | 3.09 | 3.07 | (0.37) | 1.15 |
| Less distributions | | | | | |
| From net investment income | — | (0.03) | (0.06) | (0.01) | — |
| From net realized gain | (1.45) | (1.14) | — | (0.79) | — |
| Total distributions | (1.45) | (1.17) | (0.06) | (0.80) | — |
| Net asset value, end of period | $18.75 | $20.03 | $18.11 | $15.10 | $16.27 |
| Total return (%)3 | 2.84 | 17.31 | 20.42 | (2.24) | 7.614 |
| Ratios and supplemental data | | | | | |
| Net assets, end of period (in millions) | $—5 | $1 | $—5 | $—5 | $—5 |
| Ratios (as a percentage of average net assets): | | | | | |
| Expenses before reductions | 1.31 | 1.27 | 1.19 | 1.12 | 1.106 |
| Expenses including reductions | 1.13 | 1.12 | 1.01 | 1.01 | 1.006 |
| Net investment income (loss) | 0.15 | (0.12) | 0.45 | 0.23 | (0.09)6 |
| Portfolio turnover (%) | 21 | 23 | 52 | 40 | 427 |
| 1 | The inception date for Class R4 shares is 3-27-15. |
| 2 | Based on average daily shares outstanding. |
| 3 | Total returns would have been lower had certain expenses not been reduced during the applicable periods. |
| 4 | Not annualized. |
| 5 | Less than $500,000. |
| 6 | Annualized. |
| 7 | Portfolio turnover is shown for the period from 8-1-14 to 7-31-15. |
| 20 | JOHN HANCOCK FUNDAMENTAL ALL CAP CORE FUND | ANNUAL REPORT | SEE NOTES TO FINANCIAL STATEMENTS |
| CLASS R6 SHARES Period ended | 7-31-19 | 7-31-18 | 7-31-17 | 7-31-16 | 7-31-151 |
| Per share operating performance | | | | | |
| Net asset value, beginning of period | $20.10 | $18.14 | $15.12 | $16.28 | $15.12 |
| Net investment income2 | 0.07 | 0.02 | 0.09 | 0.07 | —3 |
| Net realized and unrealized gain (loss) on investments | 0.14 | 3.12 | 3.01 | (0.42) | 1.16 |
| Total from investment operations | 0.21 | 3.14 | 3.10 | (0.35) | 1.16 |
| Less distributions | | | | | |
| From net investment income | — | (0.04) | (0.08) | (0.02) | — |
| From net realized gain | (1.45) | (1.14) | — | (0.79) | — |
| Total distributions | (1.45) | (1.18) | (0.08) | (0.81) | — |
| Net asset value, end of period | $18.86 | $20.10 | $18.14 | $15.12 | $16.28 |
| Total return (%)4 | 3.04 | 17.62 | 20.59 | (2.10) | 7.675 |
| Ratios and supplemental data | | | | | |
| Net assets, end of period (in millions) | $14 | $13 | $6 | $3 | $—6 |
| Ratios (as a percentage of average net assets): | | | | | |
| Expenses before reductions | 0.96 | 0.93 | 0.95 | 0.86 | 0.857 |
| Expenses including reductions | 0.88 | 0.88 | 0.85 | 0.84 | 0.837 |
| Net investment income | 0.39 | 0.13 | 0.52 | 0.49 | 0.017 |
| Portfolio turnover (%) | 21 | 23 | 52 | 40 | 428 |
| 1 | The inception date for Class R6 shares is 3-27-15. |
| 2 | Based on average daily shares outstanding. |
| 3 | Less than $0.005 per share. |
| 4 | Total returns would have been lower had certain expenses not been reduced during the applicable periods. |
| 5 | Not annualized. |
| 6 | Less than $500,000. |
| 7 | Annualized. |
| 8 | Portfolio turnover is shown for the period from 8-1-14 to 7-31-15. |
| SEE NOTES TO FINANCIAL STATEMENTS | ANNUAL REPORT | JOHN HANCOCK FUNDAMENTAL ALL CAP CORE FUND | 21 |
| Notes to financial statements | |
Note 1—Organization
John Hancock Fundamental All Cap Core Fund (the fund) is a series of John Hancock Funds II (the Trust), an open-end management investment company organized as a Massachusetts business trust and registered under the Investment Company Act of 1940, as amended (the 1940 Act). The investment objective of the fund is to seek long-term capital appreciation.
The fund may offer multiple classes of shares. The shares currently outstanding are detailed in the Statement of assets and liabilities. Class A and Class C shares are offered to all investors. Class I shares are offered to institutions and certain investors. Class R2 and Class R4 shares are available only to certain retirement and 529 plans. Class R6 shares are only available to certain retirement plans, institutions and other investors. Class C shares convert to Class A shares ten years after purchase (certain exclusions may apply). Shareholders of each class have exclusive voting rights to matters that affect that class. The distribution and service fees, if any, and transfer agent fees for each class may differ.
Note 2—Significant accounting policies
The financial statements have been prepared in conformity with accounting principles generally accepted in the United States of America (US GAAP), which require management to make certain estimates and assumptions as of the date of the financial statements. Actual results could differ from those estimates and those differences could be significant. The fund qualifies as an investment company under Topic 946 of Accounting Standards Codification of US GAAP.
Events or transactions occurring after the end of the fiscal period through the date that the financial statements were issued have been evaluated in the preparation of the financial statements. The following summarizes the significant accounting policies of the fund:
Security valuation. Investments are stated at value as of the scheduled close of regular trading on the New York Stock Exchange (NYSE), normally at 4:00 P.M., Eastern Time. In case of emergency or other disruption resulting in the NYSE not opening for trading or the NYSE closing at a time other than the regularly scheduled close, the net asset value (NAV) may be determined as of the regularly scheduled close of the NYSE pursuant to the fund's Valuation Policies and Procedures.
In order to value the securities, the fund uses the following valuation techniques: Equity securities, including exchange-traded or closed-end funds, are typically valued at the last sale price or official closing price on the exchange or principal market where the security trades. In the event there were no sales during the day or closing prices are not available, the securities are valued using the last available bid price. Investments by the fund in open-end mutual funds are valued at their respective NAVs each business day. Debt obligations are typically valued based on the evaluated prices provided by an independent pricing vendor. Independent pricing vendors utilize matrix pricing which takes into account factors such as institutional-size trading in similar groups of securities, yield, quality, coupon rate, maturity, type of issue, trading characteristics and other market data, as well as broker supplied prices. Foreign securities and currencies are valued in U.S. dollars based on foreign currency exchange rates supplied by an independent pricing vendor.
In certain instances, the Pricing Committee may determine to value equity securities using prices obtained from another exchange or market if trading on the exchange or market on which prices are typically obtained did not open for trading as scheduled, or if trading closed earlier than scheduled, and trading occurred as normal on another exchange or market.
| 22 | JOHN HANCOCK Fundamental All Cap Core Fund | ANNUAL REPORT | |
Other portfolio securities and assets, for which reliable market quotations are not readily available, are valued at fair value as determined in good faith by the fund's Pricing Committee following procedures established by the Board of Trustees. The frequency with which these fair valuation procedures are used cannot be predicted and fair value of securities may differ significantly from the value that would have been used had a ready market for such securities existed. Trading in foreign securities may be completed before the scheduled daily close of trading on the NYSE. Significant events at the issuer or market level may affect the values of securities between the time when the valuation of the securities is generally determined and the close of the NYSE. If a significant event occurs, these securities may be fair valued, as determined in good faith by the fund's Pricing Committee, following procedures established by the Board of Trustees. The fund uses fair value adjustment factors provided by an independent pricing vendor to value certain foreign securities in order to adjust for events that may occur between the close of foreign exchanges or markets and the close of the NYSE.
The fund uses a three-tier hierarchy to prioritize the pricing assumptions, referred to as inputs, used in valuation techniques to measure fair value. Level 1 includes securities valued using quoted prices in active markets for identical securities, including registered investment companies. Level 2 includes securities valued using other significant observable inputs. Observable inputs may include quoted prices for similar securities, interest rates, prepayment speeds and credit risk. Prices for securities valued using these inputs are received from independent pricing vendors and brokers and are based on an evaluation of the inputs described. Level 3 includes securities valued using significant unobservable inputs when market prices are not readily available or reliable, including the fund's own assumptions in determining the fair value of investments. Factors used in determining value may include market or issuer specific events or trends, changes in interest rates and credit quality. The inputs or methodology used for valuing securities are not necessarily an indication of the risks associated with investing in those securities. Changes in valuation techniques and related inputs may result in transfers into or out of an assigned level within the disclosure hierarchy.
The following is a summary of the values by input classification of the fund's investments as of July 31, 2019, by major security category or type:
| | Total
value at
7-31-19 | Level 1
quoted
price | Level 2
significant
observable
inputs | Level 3
significant
unobservable
inputs |
| Investments in securities: | | | | |
| Assets | | | | |
| Common stocks | | | | |
| Communication services | $15,146,438 | $15,146,438 | — | — |
| Consumer discretionary | 20,098,980 | 19,419,082 | $679,898 | — |
| Consumer staples | 4,704,208 | 4,704,208 | — | — |
| Energy | 5,517,591 | 5,517,591 | — | — |
| Financials | 15,068,082 | 15,068,082 | — | — |
| Health care | 5,297,727 | 5,297,727 | — | — |
| Industrials | 6,932,394 | 6,932,394 | — | — |
| Information technology | 9,273,877 | 8,479,266 | 794,611 | — |
| Real estate | 2,882,994 | 2,882,994 | — | — |
| Short-term investments | 4,083,221 | 834,221 | 3,249,000 | — |
| Total investments in securities | $89,005,512 | $84,282,003 | $4,723,509 | — |
| | ANNUAL REPORT | JOHN HANCOCK Fundamental All Cap Core Fund | 23 |
Repurchase agreements. The fund may enter into repurchase agreements. When the fund enters into a repurchase agreement, it receives collateral that is held in a segregated account by the fund's custodian, or for tri-party repurchase agreements, collateral is held at a third-party custodian bank in a segregated account for the benefit of the fund. The collateral amount is marked-to-market and monitored on a daily basis to ensure that the collateral held is in an amount not less than the principal amount of the repurchase agreement plus any accrued interest. Collateral received by the fund for repurchase agreements is disclosed in the Fund's investments as part of the caption related to the repurchase agreement.
Repurchase agreements are typically governed by the terms and conditions of the Master Repurchase Agreement and/or Global Master Repurchase Agreement (collectively, MRA). Upon an event of default, the non-defaulting party may close out all transactions traded under the MRA and net amounts owed. Absent an event of default, assets and liabilities resulting from repurchase agreements are not offset in the Statement of assets and liabilities. In the event of a default by the counterparty, realization of the collateral proceeds could be delayed, during which time the collateral value may decline or the counterparty may have insufficient assets to pay back claims resulting from close-out of the transactions.
Security transactions and related investment income. Investment security transactions are accounted for on a trade date plus one basis for daily NAV calculations. However, for financial reporting purposes, investment transactions are reported on trade date. Interest income is accrued as earned. Interest income includes coupon interest and amortization/accretion of premiums/discounts on debt securities. Debt obligations may be placed in a non-accrual status and related interest income may be reduced by stopping current accruals and writing off interest receivable when the collection of all or a portion of interest has become doubtful. Dividend income is recorded on the ex-date, except for dividends of foreign securities where the dividend may not be known until after the ex-date. In those cases, dividend income, net of withholding taxes, is recorded when the fund becomes aware of the dividends. Non-cash dividends, if any, are recorded at the fair market value of the securities received. Gains and losses on securities sold are determined on the basis of identified cost and may include proceeds from litigation.
Real estate investment trusts. The fund may invest in real estate investment trusts (REITs). Distributions from REITs may be recorded as income and subsequently characterized by the REIT at the end of the fiscal year as a reduction of cost of investments and/or as a realized gain. As a result, the fund will estimate the components of distributions from these securities. Such estimates are revised when the actual components of the distributions are known.
Foreign investing. Assets, including investments, and liabilities denominated in foreign currencies are translated into U.S. dollar values each day at the prevailing exchange rate. Purchases and sales of securities, income and expenses are translated into U.S. dollars at the prevailing exchange rate on the date of the transaction. The effect of changes in foreign currency exchange rates on the value of securities is reflected as a component of the realized and unrealized gains (losses) on investments. Foreign investments are subject to a decline in the value of a foreign currency versus the U.S. dollar, which reduces the dollar value of securities denominated in that currency.
Funds that invest internationally generally carry more risk than funds that invest strictly in U.S. securities. Risks can result from differences in economic and political conditions, regulations, market practices (including higher transaction costs), accounting standards and other factors.
Foreign taxes. The fund may be subject to withholding tax on income, capital gains or repatriation taxes imposed by certain countries, a portion of which may be recoverable. Foreign taxes are accrued based upon the fund’s understanding of the tax rules and rates that exist in the foreign markets in which it invests. Taxes are
| 24 | JOHN HANCOCK Fundamental All Cap Core Fund | ANNUAL REPORT | |
accrued based on gains realized by the fund as a result of certain foreign security sales. In certain circumstances, estimated taxes are accrued based on unrealized appreciation of such securities. Investment income is recorded net of foreign withholding taxes.
Line of credit. The fund may have the ability to borrow from banks for temporary or emergency purposes, including meeting redemption requests that otherwise might require the untimely sale of securities. Pursuant to the fund's custodian agreement, the custodian may loan money to the fund to make properly authorized payments. The fund is obligated to repay the custodian for any overdraft, including any related costs or expenses. The custodian may have a lien, security interest or security entitlement in any fund property that is not otherwise segregated or pledged, to the extent of any overdraft, and to the maximum extent permitted by law.
The fund and other affiliated funds, have entered into a syndicated line of credit agreement with Citibank, N.A. as the administrative agent that enables them to participate in a $750 million unsecured committed line of credit. Excluding commitments designated for a certain fund and subject to the needs of all other affiliated funds, the fund can borrow up to an aggregate commitment amount of $500 million, subject to asset coverage and other limitations as specified in the agreement. A commitment fee payable at the end of each calendar quarter, based on the average daily unused portion of the line of credit, is charged to each participating fund based on a combination of fixed and asset based allocations and is reflected in Other expenses on the Statement of operations. For the year ended July 31, 2019, the fund had no borrowings under the line of credit. Commitment fees for the year ended July 31, 2019 were $2,223.
Expenses. Within the John Hancock group of funds complex, expenses that are directly attributable to an individual fund are allocated to such fund. Expenses that are not readily attributable to a specific fund are allocated among all funds in an equitable manner, taking into consideration, among other things, the nature and type of expense and the fund’s relative net assets. Expense estimates are accrued in the period to which they relate and adjustments are made when actual amounts are known.
Class allocations. Income, common expenses and realized and unrealized gains (losses) are determined at the fund level and allocated daily to each class of shares based on the net assets of the class. Class-specific expenses, such as distribution and service fees, if any, and transfer agent fees, for all classes, are charged daily at the class level based on the net assets of each class and the specific expense rates applicable to each class.
Federal income taxes. The fund intends to continue to qualify as a regulated investment company by complying with the applicable provisions of the Internal Revenue Code and will not be subject to federal income tax on taxable income that is distributed to shareholders. Therefore, no federal income tax provision is required.
Net capital losses of $985,832 that are the result of security transactions occurring after October 31, 2018, are treated as occurring on August 1, 2019, the first day of the fund's next taxable year.
As of July 31, 2019, the fund had no uncertain tax positions that would require financial statement recognition, derecognition or disclosure. The fund's federal tax returns are subject to examination by the Internal Revenue Service for a period of three years.
Distribution of income and gains. Distributions to shareholders from net investment income and net realized gains, if any, are recorded on the ex-date. The fund generally declares and pays dividends annually. Capital gain distributions, if any, are typically distributed annually.
The tax character of distributions for the years ended July 31, 2019 and 2018 was as follows:
| | ANNUAL REPORT | JOHN HANCOCK Fundamental All Cap Core Fund | 25 |
| | July 31, 2019 | July 31, 2018 |
| Ordinary income | $853,819 | $110,649 |
| Long-term capital gains | 5,925,268 | 5,095,040 |
| Total | $6,779,087 | $5,205,689 |
Distributions paid by the fund with respect to each class of shares are calculated in the same manner, at the same time and in the same amount, except for the effect of class level expenses that may be applied differently to each class. As of July 31, 2019, there were no distributable earnings on a tax basis.
Such distributions and distributable earnings, on a tax basis, are determined in conformity with income tax regulations, which may differ from US GAAP. Distributions in excess of tax basis earnings and profits, if any, are reported in the fund's financial statements as a return of capital.
Capital accounts within the financial statements are adjusted for permanent book-tax differences. These adjustments have no impact on net assets or the results of operations. Temporary book-tax differences, if any, will reverse in a subsequent period. Book-tax differences are primarily attributable to wash sale loss deferrals.
Note 3—Guarantees and indemnifications
Under the Trust's organizational documents, its Officers and Trustees are indemnified against certain liabilities arising out of the performance of their duties to the Trust, including the fund. Additionally, in the normal course of business, the fund enters into contracts with service providers that contain general indemnification clauses. The fund's maximum exposure under these arrangements is unknown, as this would involve future claims that may be made against the fund that have not yet occurred. The risk of material loss from such claims is considered remote.
Note 4—Fees and transactions with affiliates
John Hancock Investment Management LLC (the Advisor) serves as investment advisor for the fund. John Hancock Investment Management Distributors LLC (the Distributor), an affiliate of the Advisor, serves as principal underwriter of the fund. The Advisor and the Distributor are indirect, wholly owned subsidiaries of Manulife Financial Corporation (MFC). Prior to June 28, 2019, the Advisor was known as John Hancock Advisers, LLC and the Distributor was known as John Hancock Funds, LLC.
Management fee. The fund has an investment management agreement with the Advisor under which the fund pays a daily management fee to the Advisor equivalent, on an annual basis, to the sum of: a) 0.675% of the first $2.5 billion of the fund’s aggregate average daily net assets together with the net assets of Fundamental All Cap Core Trust, a series of John Hancock Variable Insurance Trust (combined aggregate average daily net assets); and b) 0.650% of the combined aggregate average daily net assets in excess of $2.5 billion. The Advisor has a subadvisory agreement with Manulife Investment Management (US) LLC a division of Manulife Asset Management (US) LLC, an indirectly owned subsidiary of MFC and an affiliate of the Advisor. Prior to May 7, 2019, Manulife Investment Management (US) LLC was known as John Hancock Asset Management a division of Manulife Asset Management (US) LLC. The fund is not responsible for payment of the subadvisory fees.
The Advisor has contractually agreed to waive a portion of its management fee and/or reimburse expenses for certain funds of the John Hancock group of funds complex, including the fund (the participating portfolios). This waiver is based upon aggregate net assets of all the participating portfolios. The amount of the reimbursement is calculated daily and allocated among all the participating portfolios in proportion to the daily net assets of each fund. During the year ended July 31, 2019, this waiver amounted to 0.01% of the fund’s average daily net assets. This arrangement expires on July 31, 2021, unless renewed by mutual agreement of the fund and the Advisor based upon a determination that this is appropriate under the circumstances at that time.
| 26 | JOHN HANCOCK Fundamental All Cap Core Fund | ANNUAL REPORT | |
Effective July 1, 2019, the Advisor has contractually agreed to reduce its management fee or, if necessary, make payment to the fund in an amount equal to the amount by which expenses of the fund exceed 0.84% of average daily net assets of the fund. For purposes of this agreement, “expenses of the fund” means all fund expenses, excluding taxes; brokerage commissions; interest expense; litigation and indemnification expenses and other extraordinary expenses not incurred in the ordinary course of the fund’s business; class-specific expenses; borrowing costs; prime brokerage fees; acquired fund fees and expenses paid indirectly; and short dividend expense. This agreement expires on November 30, 2020, unless renewed by mutual agreement of the fund and the advisor based upon a determination that this is appropriate under the circumstances at that time. Prior to July 1, 2019, the Advisor voluntarily agreed to reduce its management fee, or if necessary make payment to the fund,in an amount equal to the amount by which the expenses of the fund, excluding management fees, exceed 0.20% of the average net assets of the fund.
For the year ended July 31, 2019, the expense reductions described above amounted to the following:
| Class | Expense reduction |
| Class A | $38,147 |
| Class C | 4,804 |
| Class I | 18,029 |
| Class R2 | 82 |
| Class | Expense reduction |
| Class R4 | $144 |
| Class R6 | 10,028 |
| Total | $71,234 |
Expenses waived or reimbursed in the current fiscal period are not subject to recapture in future fiscal periods.
The investment management fees, including the impact of the waivers and reimbursements as described above, incurred for the year ended July 31, 2019, were equivalent to a net annual effective rate of 0.59% of the fund's average daily net assets.
Accounting and legal services. Pursuant to a service agreement, the fund reimburses the Advisor for all expenses associated with providing the administrative, financial, legal, compliance, accounting and recordkeeping services to the fund, including the preparation of all tax returns, periodic reports to shareholders and regulatory reports, among other services. These expenses are allocated to each share class based on its relative net assets at the time the expense was incurred. These accounting and legal services fees incurred for the year ended July 31, 2019 amounted to an annual rate of 0.02% of the fund's average daily net assets.
Distribution and service plans. The fund has a distribution agreement with the Distributor. The fund has adopted distribution and service plans pursuant to Rule 12b-1 under the 1940 Act, to pay the Distributor for services provided as the distributor of shares of the fund. In addition, under a service plan for certain classes as indicated in the below table, the fund pays for certain other services. The fund may pay up to the following contractual rates of distribution and service fees under these arrangements, expressed as an annual percentage of average daily net assets for each class of the fund's shares:
| Class | Rule 12b-1 Fee | Service fee |
| Class A | 0.30% | — |
| Class C | 1.00% | — |
| Class R2 | 0.25% | 0.25% |
| Class R4 | 0.25% | 0.10% |
The fund's Distributor has contractually agreed to waive 0.10% of Rule12b-1 fees for Class R4 shares. The current waiver agreement expires on November 30, 2019, unless renewed by mutual agreement of the fund and the Distributor based upon a determination that this is appropriate under the circumstances at the time. This contractual waiver amounted to $288 for Class R4 shares for the year ended July 31, 2019.
| | ANNUAL REPORT | JOHN HANCOCK Fundamental All Cap Core Fund | 27 |
Sales charges. Class A shares are assessed up-front sales charges, which resulted in payments to the Distributor amounting to $56,905 for the year ended July 31, 2019. Of this amount, $9,300 was retained and used for printing prospectuses, advertising, sales literature and other purposes, $46,385 was paid as sales commissions to broker-dealers and $1,220 was paid as sales commissions to sales personnel of Signator Investors, Inc., which had been a broker-dealer affiliate of the Advisor through November 2, 2018.
Class A and Class C shares may be subject to contingent deferred sales charges (CDSCs). Certain Class A shares that are acquired through purchases of $1 million or more and are redeemed within one year of purchase are subject to a 1.00% sales charge. Class C shares that are redeemed within one year of purchase are subject to a 1.00% CDSC. CDSCs are applied to the lesser of the current market value at the time of redemption or the original purchase cost of the shares being redeemed. Proceeds from CDSCs are used to compensate the Distributor for providing distribution-related services in connection with the sale of these shares. During the year ended July 31, 2019, CDSCs received by the Distributor amounted to $159 and $620 for Class A and Class C shares, respectively.
Transfer agent fees. The John Hancock group of funds has a complex-wide transfer agent agreement with John Hancock Signature Services, Inc. (Signature Services), an affiliate of the Advisor. The transfer agent fees paid to Signature Services are determined based on the cost to Signature Services (Signature Services Cost) of providing recordkeeping services. It also includes out-of-pocket expenses, including payments made to third-parties for recordkeeping services provided to their clients who invest in one or more John Hancock funds. In addition, Signature Services Cost may be reduced by certain fees that Signature Services receives in connection with retirement and small accounts. Signature Services Cost is calculated monthly and allocated, as applicable, to five categories of share classes: Retail Share and Institutional Share Classes of Non-Municipal Bond Funds, Class R6 Shares, Retirement Share Classes and Municipal Bond Share Classes. Within each of these categories, the applicable costs are allocated to the affected John Hancock affiliated funds and/or classes, based on the relative average daily net assets.
Class level expenses. Class level expenses for the year ended July 31, 2019 were as follows:
| Class | Distribution and service fees | Transfer agent fees |
| Class A | $138,837 | $52,461 |
| Class C | 58,653 | 6,644 |
| Class I | — | 28,709 |
| Class R2 | 598 | 16 |
| Class R4 | 1,007 | 38 |
| Class R6 | — | 1,583 |
| Total | $199,095 | $89,451 |
Trustee expenses. The fund compensates each Trustee who is not an employee of the Advisor or its affiliates. The costs of paying Trustee compensation and expenses are allocated to the fund based on its net assets relative to other funds within the John Hancock group of funds complex.
Note 5—Fund share transactions
Transactions in fund shares for the years ended July 31, 2019 and 2018 were as follows:
| 28 | JOHN HANCOCK Fundamental All Cap Core Fund | ANNUAL REPORT | |
| | Year Ended 7-31-19 | Year Ended 7-31-18 |
| | Shares | Amount | Shares | Amount |
| Class A shares | | | | |
| Sold | 485,174 | $8,551,348 | 759,938 | $14,646,498 |
| Distributions reinvested | 242,630 | 3,532,684 | 135,097 | 2,572,241 |
| Repurchased | (541,969) | (9,643,487) | (548,351) | (10,544,267) |
| Net increase | 185,835 | $2,440,545 | 346,684 | $6,674,472 |
| Class C shares | | | | |
| Sold | 80,406 | $1,391,400 | 118,563 | $2,234,524 |
| Distributions reinvested | 33,427 | 472,321 | 17,149 | 320,001 |
| Repurchased | (112,432) | (1,891,904) | (67,111) | (1,262,712) |
| Net increase (decrease) | 1,401 | $(28,183) | 68,601 | $1,291,813 |
| Class I shares | | | | |
| Sold | 310,492 | $5,604,929 | 999,600 | $19,254,792 |
| Distributions reinvested | 122,463 | 1,808,778 | 90,027 | 1,731,228 |
| Repurchased | (793,473) | (14,234,036) | (797,401) | (15,526,258) |
| Net increase (decrease) | (360,518) | $(6,820,329) | 292,226 | $5,459,762 |
| Class R2 shares | | | | |
| Sold | 2,017 | $36,622 | 12,703 | $245,305 |
| Distributions reinvested | 208 | 3,057 | 65 | 1,246 |
| Repurchased | (11,206) | (204,732) | (6,672) | (130,678) |
| Net increase (decrease) | (8,981) | $(165,053) | 6,096 | $115,873 |
| Class R4 shares | | | | |
| Sold | 1,162 | $22,771 | 48,432 | $918,794 |
| Distributions reinvested | 26 | 385 | 2,801 | 53,800 |
| Repurchased | (50,283) | (906,304) | (8,281) | (162,318) |
| Net increase (decrease) | (49,095) | $(883,148) | 42,952 | $810,276 |
| Class R6 shares | | | | |
| Sold | 253,064 | $4,496,549 | 315,298 | $6,150,653 |
| Distributions reinvested | 64,898 | 959,837 | 26,893 | 517,413 |
| Repurchased | (233,224) | (3,767,198) | (49,479) | (983,372) |
| Net increase | 84,738 | $1,689,188 | 292,712 | $5,684,694 |
| Total net increase (decrease) | (146,620) | $(3,766,980) | 1,049,271 | $20,036,890 |
Affiliates of the fund owned 58% of shares of Class R6 on July 31, 2019. Such concentration of shareholders’ capital could have a material effect on the fund if such shareholders redeem from the fund.
Note 6—Purchase and sale of securities
Purchases and sales of securities, other than short-term investments, amounted to $17,813,026 and $30,289,280, respectively, for the year ended July 31, 2019.
| | ANNUAL REPORT | JOHN HANCOCK Fundamental All Cap Core Fund | 29 |
Note 7—Industry or sector risk
The fund may invest a large percentage of its assets in one or more particular industries or sectors of the economy. If a large percentage of the fund’s assets are economically tied to a single or small number of industries or sectors of the economy, the fund will be less diversified than a more broadly diversified fund, and it may cause the fund to underperform if that industry or sector underperforms. In addition, focusing on a particular industry or sector may make the fund’s NAV more volatile. Further, a fund that invests in particular industries or sectors is particularly susceptible to the impact of market, economic, regulatory and other factors affecting those industries or sectors.
| 30 | JOHN HANCOCK Fundamental All Cap Core Fund | ANNUAL REPORT | |
Report of Independent Registered Public Accounting Firm
To the Board of Trustees of John Hancock Funds II and Shareholders of John Hancock Fundamental All Cap Core Fund
Opinion on the Financial Statements
We have audited the accompanying statement of assets and liabilities, including the Fund’s investments, of John Hancock Fundamental All Cap Core Fund (one of the funds constituting John Hancock Funds II, referred to hereafter as the "Fund") as of July 31, 2019, the related statement of operations for the year ended July 31, 2019, the statements of changes in net assets for each of the two years in the period ended July 31, 2019, including the related notes, and the financial highlights for each of the periods indicated therein (collectively referred to as the “financial statements”). In our opinion, the financial statements present fairly, in all material respects, the financial position of the Fund as of July 31, 2019, the results of its operations for the year then ended, the changes in its net assets for each of the two years in the period ended July 31, 2019 and the financial highlights for each of the periods indicated therein in conformity with accounting principles generally accepted in the United States of America.
Basis for Opinion
These financial statements are the responsibility of the Fund’s management. Our responsibility is to express an opinion on the Fund’s financial statements based on our audits. We are a public accounting firm registered with the Public Company Accounting Oversight Board (United States) (PCAOB) and are required to be independent with respect to the Fund in accordance with the U.S. federal securities laws and the applicable rules and regulations of the Securities and Exchange Commission and the PCAOB.
We conducted our audits of these financial statements in accordance with the standards of the PCAOB. Those standards require that we plan and perform the audit to obtain reasonable assurance about whether the financial statements are free of material misstatement, whether due to error or fraud.
Our audits included performing procedures to assess the risks of material misstatement of the financial statements, whether due to error or fraud, and performing procedures that respond to those risks. Such procedures included examining, on a test basis, evidence regarding the amounts and disclosures in the financial statements. Our audits also included evaluating the accounting principles used and significant estimates made by management, as well as evaluating the overall presentation of the financial statements. Our procedures included confirmation of securities owned as of July 31, 2019 by correspondence with the custodian, transfer agent, and brokers; when replies were not received from brokers, we performed other auditing procedures. We believe that our audits provide a reasonable basis for our opinion.
/s/ PricewaterhouseCoopers LLP
Boston, Massachusetts
September 20, 2019
We have served as the auditor of one or more investment companies in the John Hancock group of funds since 1988.
| | ANNUAL REPORT | JOHN HANCOCK FUNDAMENTAL ALL CAP CORE FUND | 31 |
TAX INFORMATION
Unaudited
For federal income tax purposes, the following information is furnished with respect to the distributions of the fund, if any, paid during its taxable year ended July 31, 2019.
The fund reports the maximum amount allowable of its net taxable income as eligible for the corporate dividends-received deduction.
The fund reports the maximum amount allowable of its net taxable income as qualified dividend income as provided in the Jobs and Growth Tax Relief Reconciliation Act of 2003.
The fund paid $5,925,268 in long term capital gain dividends.
The fund reports the maximum amount allowable of its Section 199A dividends as defined in Proposed Treasury Regulation §1.199A-3(d).
Eligible shareholders will be mailed a 2019 Form 1099-DIV in early 2020. This will reflect the tax character of all distributions paid in calendar year 2019.
Please consult a tax advisor regarding the tax consequences of your investment in the fund.
| 32 | JOHN HANCOCK FUNDAMENTAL ALL CAP CORE FUND | ANNUAL REPORT | |
CONTINUATION OF INVESTMENT ADVISORY AND SUBADVISORY AGREEMENTS
Evaluation of Advisory and Subadvisory Agreements by the Board of Trustees
This section describes the evaluation by the Board of Trustees (the Board) of John Hancock Funds II (the Trust) of the Advisory Agreement (the Advisory Agreement) with John Hancock Investment Management LLC (the Advisor, formerly known as "John Hancock Advisers, LLC") and the Subadvisory Agreement (the Subadvisory Agreement) with Manulife Investment Management (US) LLC (the Subadvisor formerly known as "John Hancock Asset Management a division of Manulife Asset Management (US) LLC") for John Hancock Fundamental All Cap Core Fund (the fund). The Advisory Agreement and Subadvisory Agreement are collectively referred to as the Agreements. Prior to the June 23-26, 2019 in-person meeting at which the Agreements were approved, the Board also discussed and considered information regarding the proposed continuation of the Agreements at an in-person meeting held on May 28-30, 2019.
Approval of Advisory and Subadvisory Agreements
At in-person meetings held on June 23-26, 2019, the Board, including the Trustees who are not parties to any Agreement or considered to be interested persons of the Trust under the Investment Company Act of 1940, as amended (the 1940 Act) (the Independent Trustees), reapproved for an annual period the continuation of the Advisory Agreement between the Trust and the Advisor and the Subadvisory Agreement between the Advisor and the Subadvisor with respect to the fund.
In considering the Advisory Agreement and the Subadvisory Agreement, the Board received in advance of the meetings a variety of materials relating to the fund, the Advisor and the Subadvisor, including comparative performance, fee and expense information for a peer group of similar funds prepared by an independent third-party provider of fund data, performance information for an applicable benchmark index; and, with respect to the Subadvisor, comparative performance information for comparably managed accounts, as applicable, and other information provided by the Advisor and the Subadvisor regarding the nature, extent and quality of services provided by the Advisor and the Subadvisor under their respective Agreements, as well as information regarding the Advisor's revenues and costs of providing services to the fund and any compensation paid to affiliates of the Advisor. At the meetings at which the renewal of the Advisory Agreement and Subadvisory Agreement are considered, particular focus is given to information concerning fund performance, comparability of fees and total expenses, and profitability. However, the Board notes that the evaluation process with respect to the Advisor and the Subadvisor is an ongoing one. In this regard, the Board also took into account discussions with management and information provided to the Board (including its various committees)at prior meetings with respect to the services provided by the Advisor and the Subadvisor to the fund, including quarterly performance reports prepared by management containing reviews of investment results and prior presentations from the Subadvisor with respect to the fund. The information received and considered by the Board in connection with the May and June meetings and throughout the year was both written and oral. The Board noted the affiliation of the Subadvisor with the Advisor, noting any potential conflicts of interest. The Board also considered the nature, quality, and extent of non-advisory services, if any, to be provided to the fund by the Advisor's affiliates, including distribution services. The Board considered the Advisory Agreement and the Subadvisory Agreement separately in the course of its review. In doing so, the Board noted the respective roles of the Advisor and Subadvisor in providing services to the fund.
Throughout the process, the Board asked questions of and requested additional information from management. The Board is assisted by counsel for the Trust and the Independent Trustees are also separately assisted by independent legal counsel throughout the process. The Independent Trustees also received a memorandum from their independent
ANNUAL REPORT | JOHN HANCOCK FUNDAMENTAL ALL CAP CORE FUND 33
legal counsel discussing the legal standards for their consideration of the proposed continuation of the Agreements and discussed the proposed continuation of the Agreements in private sessions with their independent legal counsel at which no representatives of management were present.
Approval of Advisory Agreement
In approving the Advisory Agreement with respect to the fund, the Board, including the Independent Trustees, considered a variety of factors, including those discussed below. The Board also considered other factors (including conditions and trends prevailing generally in the economy, the securities markets, and the industry) and did not treat any single factor as determinative, and each Trustee may have attributed different weights to different factors. The Board's conclusions may be based in part on its consideration of the advisory and subadvisory arrangements in prior years and on the Board's ongoing regular review of fund performance and operations throughout the year.
Nature, extent, and quality of services. Among the information received by the Board from the Advisor relating to the nature, extent, and quality of services provided to the fund, the Board reviewed information provided by the Advisor relating to its operations and personnel, descriptions of its organizational and management structure, and information regarding the Advisor's compliance and regulatory history, including its Form ADV. The Board also noted that on a regular basis it receives and reviews information from the Trust's Chief Compliance Officer (CCO) regarding the fund's compliance policies and procedures established pursuant to Rule 38a-1 under the 1940 Act. The Board observed that the scope of services provided by the Advisor, and of the undertakings required of the Advisor in connection with those services, including maintaining and monitoring its own and the fund's compliance programs, risk management programs, liquidity management programs and cybersecurity programs, had expanded over time as a result of regulatory, market and other developments. The Board considered that the Advisor is responsible for the management of the day-to-day operations of the fund, including, but not limited to, general supervision of and coordination of the services provided by the Subadvisor, and is also responsible for monitoring and reviewing the activities of the Subadvisor and third-party service providers. The Board also considered the significant risks assumed by the Advisor in connection with the services provided to the fund including entrepreneurial risk in sponsoring new funds and ongoing risks including investment, operational, enterprise, litigation, regulatory and compliance risks with respect to all funds.
In considering the nature, extent, and quality of the services provided by the Advisor, the Trustees also took into account their knowledge of the Advisor's management and the quality of the performance of the Advisor's duties, through Board meetings, discussions and reports during the preceding year and through each Trustee's experience as a Trustee of the Trust and of the other trusts in the John Hancock group of funds complex (the John Hancock Fund Complex).
In the course of their deliberations regarding the Advisory Agreement, the Board considered, among other things:
| | | | | | | | | |
| | | | | (a) | | | the skills and competency with which the Advisor has in the past managed the Trust's affairs and its subadvisory relationship, the Advisor's oversight and monitoring of the Subadvisor's investment performance and compliance programs, such as the Subadvisor's compliance with fund policies and objectives, review of brokerage matters, including with respect to trade allocation and best execution and the Advisor's timeliness in responding to performance issues; | |
| | | | | (b) | | | the background, qualifications and skills of the Advisor's personnel; | |
| | | | | (c) | | | the Advisor's compliance policies and procedures and its responsiveness to regulatory changes and fund industry developments; | |
ANNUAL REPORT | JOHN HANCOCK FUNDAMENTAL ALL CAP CORE FUND 34
| | | | | | | | | |
| | | | | (d) | | | the Advisor's administrative capabilities, including its ability to supervise the other service providers for the fund, as well as the Advisor's oversight of any securities lending activity, its monitoring of class action litigation and collection of class action settlements on behalf of the fund, and bringing loss recovery actions on behalf of the fund; | |
| | | | | (e) | | | the financial condition of the Advisor and whether it has the financial wherewithal to provide a high level and quality of services to the fund; | |
| | | | | (f) | | | the Advisor's initiatives intended to improve various aspects of the Trust's operations and investor experience with the fund; and | |
| | | | | (g) | | | the Advisor's reputation and experience in serving as an investment advisor to the Trust and the benefit to shareholders of investing in funds that are part of a family of funds offering a variety of investments. | |
The Board concluded that the Advisor may reasonably be expected to continue to provide a high quality of services under the Advisory Agreement with respect to the fund.
Investment performance. In considering the fund's performance, the Board noted that it reviews at its regularly scheduled meetings information about the fund's performance results. In connection with the consideration of the Advisory Agreement, the Board:
| | | |
| | (a) | reviewed information prepared by management regarding the fund's performance; |
| | (b) | considered the comparative performance of an applicable benchmark index; |
| | (c) | considered the performance of comparable funds, if any, as included in the report prepared by an independent third-party provider of fund data; and |
| | (d) | took into account the Advisor's analysis of the fund's performance and its plans and recommendations regarding the Trust's subadvisory arrangements generally. |
The Board noted that while it found the data provided by the independent third-party generally useful it recognized its limitations, including in particular that the data may vary depending on the end date selected and the results of the performance comparisons may vary depending on the selection of the peer group. The Board noted that the fund underperformed its benchmark index and peer group average for the one-, three- and five- year periods ended December 31, 2018. The Board took into account management's discussion of the fund's performance. The Board concluded that the fund's performance is being monitored and reasonably addressed, where appropriate.
Fees and expenses. The Board reviewed comparative information prepared by an independent third-party provider of fund data, including, among other data, the fund's contractual and net management fees (and subadvisory fees, to the extent available) and total expenses as compared to similarly situated investment companies deemed to be comparable to the fund in light of the nature, extent and quality of the management and advisory and subadvisory services provided by the Advisor and the Subadvisor. The Board considered the fund's ranking within a smaller group of peer funds chosen by the independent third-party provider, as well as the fund's ranking within a broader group of funds. In comparing the fund's contractual and net management fees to those of comparable funds, the Board noted that such fees include both advisory and administrative costs. The Board noted that net management fees and net total expenses for the fund are higher than the peer group median.
The Board took into account management's discussion of the fund's expenses, including actions management is planning to propose to reduce the fund's expenses. The Board also took into account management's discussion with respect to the overall management fee and the fees of the Subadvisor, including the amount of the advisory fee
ANNUAL REPORT | JOHN HANCOCK FUNDAMENTAL ALL CAP CORE FUND 35
retained by the Advisor after payment of the subadvisory fee, in each case in light of the services rendered for those amounts and the risks undertaken by the Advisor. The Board also noted that the Advisor pays the subadvisory fee. In addition, the Board took into account that management had agreed to implement an overall fee waiver across the complex, including the fund, which is discussed further below. The Board also noted actions taken over the past several years to reduce the fund's operating expenses. The Board also noted that, in addition, the Advisor is currently waiving fees and/or reimbursing expenses with respect to the fund and that the fund has breakpoints in its contractual management fee schedule that reduces management fees as assets increase. The Board reviewed information provided by the Advisor concerning the investment advisory fee charged by the Advisor or one of its advisory affiliates to other clients (including other funds in the John Hancock Fund Complex) having similar investment mandates, if any. The Board considered any differences between the Advisor's and Subadvisor's services to the fund and the services they provide to other comparable clients or funds. The Board concluded that the advisory fee paid with respect to the fund is reasonable in light of the nature, extent and quality of the services provided to the fund under the Advisory Agreement.
Profitability/Fall out benefits. In considering the costs of the services to be provided and the profits to be realized by the Advisor and its affiliates (including the Subadvisor) from the Advisor's relationship with the Trust, the Board:
| | | | | | | | | |
| | | | | (a) | | | reviewed financial information of the Advisor; | |
| | | | | (b) | | | reviewed and considered information presented by the Advisor regarding the net profitability to the Advisor and its affiliates with respect to the fund; | |
| | | | | (c) | | | received and reviewed profitability information with respect to the John Hancock Fund Complex as a whole and with respect to the fund; | |
| | | | | (d) | | | received information with respect to the Advisor's allocation methodologies used in preparing the profitability data and considered that the Advisor hired an independent third-party consultant to provide an analysis of the Advisor's allocation methodologies; | |
| | | | | (e) | | | considered that the John Hancock insurance companies that are affiliates of the Advisor, as shareholders of the Trust directly or through their separate accounts, receive certain tax credits or deductions relating to foreign taxes paid and dividends received by certain funds of the Trust and noted that these tax benefits, which are not available to participants in qualified retirement plans under applicable income tax law, are reflected in the profitability information reviewed by the Board; | |
| | | | | (f) | | | considered that the Advisor also provides administrative services to the fund on a cost basis pursuant to an administrative services agreement; | |
| | | | | (g) | | | noted that affiliates of the Advisor provide transfer agency services and distribution services to the fund, and that the fund's distributor also receives Rule 12b-1 payments to support distribution of the fund; | |
| | | | | (h) | | | noted that the fund's Subadvisor is an affiliate of the Advisor; | |
| | | | | (i) | | | noted that affiliates of the Advisor provide transfer agency services and placement services to the fund; | |
| | | | | (j) | | | noted that the Advisor also derives reputational and other indirect benefits from providing advisory services to the fund; | |
| | | | | (k) | | | noted that the subadvisory fee for the fund is paid by the Advisor; | |
| | | | | (l) | | | considered the Advisor's ongoing costs and expenditures necessary to improve services, meet new regulatory and compliance requirements, and adapt to other challenges impacting the fund industry; and | |
ANNUAL REPORT | JOHN HANCOCK FUNDAMENTAL ALL CAP CORE FUND 36
| | | | | | | | | |
| | | | | (m) | | | considered that the Advisor should be entitled to earn a reasonable level of profits in exchange for the level of services it provides to the fund and the risks that it assumes as Advisor, including entrepreneurial, operational, reputational, litigation and regulatory risk. | |
Based upon its review, the Board concluded that the level of profitability, if any, of the Advisor and its affiliates (including the Subadvisor) from their relationship with the fund was reasonable and not excessive.
Economies of scale. In considering the extent to which economies of scale would be realized as the fund grows and whether fee levels reflect these economies of scale for the benefit of fund shareholders, the Board:
| | | |
| | (a) | considered that the Advisor has contractually agreed to waive a portion of its management fee for certain funds of the John Hancock Fund Complex, including the fund (the participating portfolios) or otherwise reimburse the expenses of the participating portfolios (the reimbursement). This waiver is based upon aggregate net assets of all the participating portfolios. The amount of the reimbursement is calculated daily and allocated among all the participating portfolios in proportion to the daily net assets of each fund; |
| | (b) | reviewed the fund's advisory fee structure and concluded that: (i) the fund's fee structure contains breakpoints at the subadvisory fee level and that such breakpoints are reflected as breakpoints in the advisory fees for the fund; and (ii) although economies of scale cannot be measured with precision, these arrangements permit shareholders of the fund to benefit from economies of scale if the fund grows. The Board also took into account management's discussion of the fund's advisory fee structure; and |
| | (c) | the Board also considered the effect of the fund's growth in size on its performance and fees. The Board also noted that if the fund's assets increase over time, the fund may realize other economies of scale. |
Approval of Subadvisory Agreement
In making its determination with respect to approval of the Subadvisory Agreement, the Board reviewed:
| | | |
| | (1) | information relating to the Subadvisor's business, including current subadvisory services to the Trust (and other funds in the John Hancock Fund Complex); |
| | (2) | the historical and current performance of the fund and comparative performance information relating to an applicable benchmark index and comparable funds; and |
| | (3) | the subadvisory fee for the fund, including any breakpoints, and to the extent available, comparable fee information prepared by an independent third party provider of fund data. |
Nature, extent, and quality of services. With respect to the services provided by the Subadvisor, the Board received information provided to the Board by the Subadvisor, including the Subadvisor's Form ADV, as well as took into account information presented throughout the past year. The Board considered the Subadvisor's current level of staffing and its overall resources, as well as received information relating to the Subadvisor's compensation program. The Board reviewed the Subadvisor's history and investment experience, as well as information regarding the qualifications, background, and responsibilities of the Subadvisor's investment and compliance personnel who provide services to the fund. The Board also considered, among other things, the Subadvisor's compliance program and any disciplinary history. The Board also considered the Subadvisor's risk assessment and monitoring process. The Board reviewed the Subadvisor's regulatory history, including whether it was involved in any regulatory actions or investigations as well as material litigation, and any settlements and amelioratory actions undertaken, as appropriate. The Board noted that the Advisor conducts regular, periodic reviews of the Subadvisor and its operations, including
ANNUAL REPORT | JOHN HANCOCK FUNDAMENTAL ALL CAP CORE FUND 37
regarding investment processes and organizational and staffing matters. The Board also noted that the Trust's CCO and his staff conduct regular, periodic compliance reviews with the Subadvisor and present reports to the Independent Trustees regarding the same, which includes evaluating the regulatory compliance systems of the Subadvisor and procedures reasonably designed to assure compliance with the federal securities laws. The Board also took into account the financial condition of the Subadvisor.
The Board considered the Subadvisor's investment process and philosophy. The Board took into account that the Subadvisor's responsibilities include the development and maintenance of an investment program for the fund that is consistent with the fund's investment objective, the selection of investment securities and the placement of orders for the purchase and sale of such securities, as well as the implementation of compliance controls related to performance of these services. The Board also received information with respect to the Subadvisor's brokerage policies and practices, including with respect to best execution and soft dollars.
Subadvisor compensation. In considering the cost of services to be provided by the Subadvisor and the profitability to the Subadvisor of its relationship with the fund, the Board noted that the fees under the Subadvisory Agreement are paid by the Advisor and not the fund. The Board also received information and took into account any other potential conflicts of interest the Advisor might have in connection with the Subadvisory Agreement.
In addition, the Board considered other potential indirect benefits that the Subadvisor and its affiliates may receive from the Subadvisor's relationship with the fund, such as the opportunity to provide advisory services to additional funds in the John Hancock Fund Complex and reputational benefits.
Subadvisory fees. The Board considered that the fund pays an advisory fee to the Advisor and that, in turn, the Advisor pays a subadvisory fee to the Subadvisor. As noted above, the Board also considered the fund's subadvisory fees as compared to similarly situated investment companies deemed to be comparable to the fund as included in the report prepared by the independent third party provider of fund data, to the extent available. The Board noted that the limited size of the Lipper peer group was not sufficient for comparative purposes. The Board also took into account the subadvisory fees paid by the Advisor to the Subadvisor with respect to the fund and compared them to fees charged by the Subadvisor to manage other subadvised portfolios and portfolios not subject to regulation under the 1940 Act, as applicable.
Subadvisor performance. As noted above, the Board considered the fund's performance as compared to the fund's peer group and the benchmark index and noted that the Board reviews information about the fund's performance results at its regularly scheduled meetings. The Board noted the Advisor's expertise and resources in monitoring the performance, investment style and risk-adjusted performance of the Subadvisor. The Board was mindful of the Advisor's focus on the Subadvisor's performance. The Board also noted the Subadvisor's long-term performance record for similar accounts, as applicable.
The Board's decision to approve the Subadvisory Agreement was based on a number of determinations, including the following:
| | | | | | | | | |
| | | | | (1) | | | the Subadvisor has extensive experience and demonstrated skills as a manager; | |
| | | | | (2) | | | the performance of the fund is being monitored and reasonably addressed, where appropriate; | |
| | | | | (3) | | | the subadvisory fee is reasonable in relation to the level and quality of services being provided; and | |
| | | | | (4) | | | noted that the subadvisory fees are paid by the Advisor not the fund and that the subadvisory fee breakpoints are reflected as breakpoints in the advisory fees for the fund in order to permit shareholders to benefit from economies of scale if the fund grows. | |
ANNUAL REPORT | JOHN HANCOCK FUNDAMENTAL ALL CAP CORE FUND 38
Based on the Board's evaluation of all factors that the Board deemed to be material, including those factors described above, the Board, including the Independent Trustees, concluded that renewal of the Advisory Agreement and the Subadvisory Agreement would be in the best interest of the fund and its shareholders. Accordingly, the Board, and the Independent Trustees voting separately, approved the Advisory Agreement and Subadvisory Agreement for an additional one-year period.
ANNUAL REPORT | JOHN HANCOCK FUNDAMENTAL ALL CAP CORE FUND 39
This chart provides information about the Trustees and Officers who oversee your John Hancock fund. Officers elected by the Trustees manage the day-to-day operations of the fund and execute policies formulated by the Trustees.
Independent Trustees
| | | |
Name, year of birth
Position(s) held with Trust
Principal occupation(s) and other
directorships during past 5 years | Trustee
of the
Trust
since1 | Number of John
Hancock funds
overseen by
Trustee |
| Hassell H. McClellan, Born: 1945 | 2005 | 213 |
Trustee and Chairperson of the Board
Director/Trustee, Virtus Funds (since 2008); Director, The Barnes Group (since 2010); Associate Professor, The Wallace E. Carroll School of Management, Boston College (retired 2013). Trustee (since 2005) and Chairperson of the Board (since 2017) of various trusts within the John Hancock Fund Complex. |
| | | |
| Charles L. Bardelis,2 Born: 1941 | 2005 | 213 |
Trustee
Director, Island Commuter Corp. (marine transport). Trustee of various trusts within the John Hancock Fund Complex (since 1988). |
| | | |
| James R. Boyle,Born: 1959 | 2015 | 213 |
Trustee
Chief Executive Officer, Foresters Financial (since 2018); Chairman and Chief Executive Officer, Zillion Group, Inc. (formerly HealthFleet, Inc.) (healthcare) (2014-2018); Executive Vice President and Chief Executive Officer, U.S. Life Insurance Division of Genworth Financial, Inc. (insurance) (January 2014-July 2014); Senior Executive Vice President, Manulife Financial, President and Chief Executive Officer, John Hancock (1999-2012); Chairman and Director, John Hancock Investment Management LLC, John Hancock Investment Management Distributors LLC, and John Hancock Variable Trust Advisers LLC (2005-2010). Trustee of various trusts within the John Hancock Fund Complex (2005-2014 and since 2015). |
| | | |
| Peter S. Burgess,2 Born: 1942 | 2005 | 213 |
Trustee
Consultant (financial, accounting, and auditing matters) (since 1999); Certified Public Accountant; Partner, Arthur Andersen (independent public accounting firm) (prior to 1999); Director, Lincoln Educational Services Corporation (since 2004); Director, Symetra Financial Corporation (2010-2016); Director, PMA Capital Corporation (2004-2010). Trustee of various trusts within the John Hancock Fund Complex (since 2005). |
| | | |
| William H. Cunningham, Born: 1944 | 2012 | 213 |
Trustee
Professor, University of Texas, Austin, Texas (since 1971); former Chancellor, University of Texas System and former President of the University of Texas, Austin, Texas; Chairman (since 2009) and Director (since 2006), Lincoln National Corporation (insurance); Director, Southwest Airlines (since 2000); former Director, LIN Television (2009-2014). Trustee of various trusts within the John Hancock Fund Complex (since 1986). |
| | | |
| Grace K. Fey, Born: 1946 | 2008 | 213 |
Trustee
Chief Executive Officer, Grace Fey Advisors (since 2007); Director and Executive Vice President, Frontier Capital Management Company (1988-2007); Director, Fiduciary Trust (since 2009). Trustee of various trusts within the John Hancock Fund Complex (since 2008). |
ANNUAL REPORT | JOHN HANCOCK FUNDAMENTAL ALL CAP CORE FUND 40
Independent Trustees (continued)
| | | |
Name, year of birth
Position(s) held with Trust
Principal occupation(s) and other
directorships during past 5 years | Trustee
of the
Trust
since1 | Number of John
Hancock funds
overseen by
Trustee |
| Theron S. Hoffman,4 Born: 1947 | 2008 | 213 |
Trustee
Chief Executive Officer, T. Hoffman Associates, LLC (consulting firm) (since 2003); Director, The Todd Organization (consulting firm) (2003-2010); President, Westport Resources Management (investment management consulting firm) (2006-2008); Board Member, Senior Managing Director, Partner, and Operating Head, Putnam Investments (2000-2003); Executive Vice President, The Thomson Corp. (financial and legal information publishing) (1997-2000). Trustee of various trusts within the John Hancock Fund Complex (since 2008). |
| | | |
| Deborah C. Jackson, Born: 1952 | 2012 | 213 |
Trustee
President, Cambridge College, Cambridge, Massachusetts (since 2011); Board of Directors, National Association of Corporate Directors/New England (since 2015); Board of Directors, Association of Independent Colleges and Universities of Massachusetts (since 2014); Chief Executive Officer, American Red Cross of Massachusetts Bay (2002-2011); Board of Directors of Eastern Bank Corporation (since 2001); Board of Directors of Eastern Bank Charitable Foundation (since 2001); Board of Directors of American Student Assistance Corporation (1996-2009); Board of Directors of Boston Stock Exchange (2002-2008); Board of Directors of Harvard Pilgrim Healthcare (health benefits company) (2007-2011). Trustee of various trusts within the John Hancock Fund Complex (since 2008). |
| | | |
| James M. Oates,2Born: 1946 | 2005 | 213 |
Trustee
Managing Director, Wydown Group (financial consulting firm) (since 1994); Chairman and Director, Emerson Investment Management, Inc. (2000-2015); Independent Chairman, Hudson Castle Group, Inc. (formerly IBEX Capital Markets, Inc.) (financial services company) (1997-2011); Director, Stifel Financial (since 1996); Director, Investor Financial Services Corporation (1995-2007); Director, Connecticut River Bancorp (1998-2014); Director/Trustee, Virtus Funds (since 1988). Trustee (since 2004) and Chairperson of the Board (2005-2016) of various trusts within the John Hancock Fund Complex. |
| | | |
| Steven R. Pruchansky, Born: 1944 | 2012 | 213 |
Trustee and Vice Chairperson of the Board
Managing Director, Pru Realty (since 2017); Chairman and Chief Executive Officer, Greenscapes of Southwest Florida, Inc. (2000-2014); Director and President, Greenscapes of Southwest Florida, Inc. (until 2000); Member, Board of Advisors, First American Bank (until 2010); Managing Director, Jon James, LLC (real estate) (since 2000); Partner, Right Funding, LLC (2014-2017); Director, First Signature Bank & Trust Company (until 1991); Director, Mast Realty Trust (until 1994); President, Maxwell Building Corp. (until 1991). Trustee (since 1992), Chairperson of the Board (2011-2012), and Vice Chairperson of the Board (since 2012) of various trusts within the John Hancock Fund Complex. |
| | | |
| Gregory A. Russo, Born: 1949 | 2012 | 213 |
Trustee
Director and Audit Committee Chairman (since 2012), and Member, Audit Committee and Finance Committee (since 2011), NCH Healthcare System, Inc. (holding company for multi-entity healthcare system); Director and Member (2012-2018) and Finance Committee Chairman (2014-2018), The Moorings, Inc. (nonprofit continuing care community); Vice Chairman, Risk & Regulatory Matters, KPMG LLP (KPMG) (2002-2006); Vice Chairman, Industrial Markets, KPMG (1998-2002); Chairman and Treasurer, Westchester County, New York, Chamber of Commerce (1986-1992); Director, Treasurer, and Chairman of Audit and Finance Committees, Putnam Hospital Center (1989-1995); Director and Chairman of Fundraising Campaign, United Way of Westchester and Putnam Counties, New York (1990-1995). Trustee of various trusts within the John Hancock Fund Complex (since 2008). |
ANNUAL REPORT | JOHN HANCOCK FUNDAMENTAL ALL CAP CORE FUND 41
Non-Independent Trustees3
| | | |
Name, year of birth
Position(s) held with Trust
Principal occupation(s) and other
directorships during past 5 years | Trustee
of the
Trust
since1 | Number of John
Hancock funds
overseen by
Trustee |
| Andrew G. Arnott, Born: 1971 | 2017 | 213 |
President and Non-Independent Trustee
Head of Wealth and Asset Management, United States and Europe, for John Hancock and Manulife (since 2018); Executive Vice President, John Hancock Financial Services (since 2009, including prior positions); Director and Executive Vice President, John Hancock Investment Management LLC (since 2005, including prior positions); Director and Executive Vice President, John Hancock Variable Trust Advisers LLC (since 2006, including prior positions); President, John Hancock Investment Management Distributors LLC (since 2004, including prior positions); President of various trusts within the John Hancock Fund Complex (since 2007, including prior positions). Trustee of various trusts within the John Hancock Fund Complex (since 2017). |
| | | |
| Marianne Harrison, Born: 1963 | 2018 | 213 |
Non-Independent Trustee
President and CEO, John Hancock (since 2017); President and CEO, Manulife Canadian Division (2013-2017); Member, Board of Directors, American Council of Life Insurers (ACLI) (since 2018); Member, Board of Directors, Communitech, an industry-led innovation center that fosters technology companies in Canada (since 2017); Member, Board of Directors, Manulife Assurance Canada (2015-2017); Board Member, St. Mary's General Hospital Foundation (2014-2017); Member, Board of Directors, Manulife Bank of Canada (2013-2017); Member, Standing Committee of the Canadian Life & Health Assurance Association (2013-2017); Member, Board of Directors, John Hancock USA, John Hancock Life & Health, John Hancock New York (2012-2013). Trustee of various trusts within the John Hancock Fund Complex (since 2018). |
Principal officers who are not Trustees
| | |
Name, year of birth
Position(s) held with Trust
Principal occupation(s)
during past 5 years | Officer
of the
Trust
since |
| Francis V. Knox, Jr.,Born: 1947 | 2005 |
Chief Compliance Officer
Vice President, John Hancock Financial Services (since 2005); Chief Compliance Officer, various trusts within the John Hancock Fund Complex, John Hancock Investment Management LLC, and John Hancock Variable Trust Advisers LLC (since 2005). |
| | |
| Charles A. Rizzo, Born: 1957 | 2007 |
Chief Financial Officer
Vice President, John Hancock Financial Services (since 2008); Senior Vice President, John Hancock Investment Management LLC and John Hancock Variable Trust Advisers LLC (since 2008); Chief Financial Officer of various trusts within the John Hancock Fund Complex (since 2007). |
| | |
| Salvatore Schiavone, Born: 1965 | 2009 |
Treasurer
Assistant Vice President, John Hancock Financial Services (since 2007); Vice President, John Hancock Investment Management LLC and John Hancock Variable Trust Advisers LLC (since 2007); Treasurer of various trusts within the John Hancock Fund Complex (since 2007, including prior positions). |
ANNUAL REPORT | JOHN HANCOCK FUNDAMENTAL ALL CAP CORE FUND 42
Principal officers who are notTrustees (continued)
| | | |
Name, year of birth
Position(s) held with Trust
Principal occupation(s)
during past 5 years | Officer
of the
Trust
since |
| Christopher (Kit) Sechler,Born: 1973 | 2018 |
Chief Legal Officer and Secretary
Vice President and Deputy Chief Counsel, John Hancock Investments (since 2015); Assistant Vice President and Senior Counsel (2009-2015), John Hancock Investment Management; Chief Legal Officer and Secretary of various trusts within the John Hancock Fund Complex (since 2018); Assistant Secretary of John Hancock Investment Management LLC and John Hancock Variable Trust Advisers LLC (since 2009). |
The business address for all Trustees and Officers is 200 Berkeley Street, Boston, Massachusetts 02116-5023.
The Statement of Additional Information of the fund includes additional information about members of the Board of Trustees of the Trust and is available without charge, upon request, by calling 800-225-5291.
| 1 | Each Trustee holds office until his or her successor is elected and qualified, or until the Trustee's death, retirement, resignation, or removal. Mr. Boyle has served as Trustee at various times prior to the date listed in the table. |
| 2 | Member of the Audit Committee. |
| 3 | The Trustee is a Non-Independent Trustee due to current or former positions with the Advisor and certain affiliates. |
| 4 | Mr. Hoffman retired as Trustee effective August 31, 2019. |
ANNUAL REPORT | JOHN HANCOCK FUNDAMENTAL ALL CAP CORE FUND 43
| | |
Trustees
Hassell H. McClellan,Chairperson
Steven R. Pruchansky,Vice Chairperson
Andrew G. Arnott†
Charles L. Bardelis*
James R. Boyle
Peter S. Burgess*
William H. Cunningham
Grace K. Fey
Marianne Harrison†
Theron S. Hoffman#
Deborah C. Jackson
James M. Oates*
Gregory A. Russo
Officers
Andrew G. Arnott
President
Francis V. Knox, Jr.
Chief Compliance Officer
Charles A. Rizzo
Chief Financial Officer
Salvatore Schiavone
Treasurer
Christopher (Kit) Sechler**
Secretary and Chief Legal Officer
| Investment advisor
John Hancock Investment Management LLC
Subadvisor
Manulife Investment Management (US) LLC
Portfolio Managers
Emory W. (Sandy) Sanders, Jr., CFA
Jonathan T. White, CFA
Principal distributor
John Hancock Investment Management Distributors LLC
Custodian
State Street Bank and Trust Company
Transfer agent
John Hancock Signature Services, Inc.
Legal counsel
K&L Gates LLP
Independent registered public accounting firm
PricewaterhouseCoopers LLP
|
* Member of the Audit Committee
† Non-Independent Trustee
** Effective 9-13-18
# Retired effective 8-31-19
The fund's proxy voting policies and procedures, as well as the fund proxy voting record for the most recent twelve-month period ended June 30, are available free of charge on the Securities and Exchange Commission (SEC) website at sec.gov or on our website.
All of the fund's holdings as of the end of the third month of every fiscal quarter are filed with the SEC on Form N-PORT within 60 days of the end of the fiscal quarter. The fund's Form N-PORT filings are available on our website and the SEC's website, sec.gov.
We make this information on your fund, as well asmonthly portfolio holdings, and other fund details available on our website at jhinvestments.com or by calling 800-225-5291.
| | | | |
| | You can also contact us: |
| | 800-225-5291
jhinvestments.com | Regular mail:
John Hancock Signature Services, Inc.
P.O. Box 55913
Boston, MA 02205-5913
| Express mail:
John Hancock Signature Services, Inc.
2000 Crown Colony Drive
Suite 55913
Quincy, MA 02169-0953
|
ANNUAL REPORT | JOHN HANCOCK FUNDAMENTAL ALL CAP CORE FUND 44
John Hancock family of funds
| | | |
DOMESTIC EQUITY FUNDS
Blue Chip Growth
Classic Value
Disciplined Value
Disciplined Value Mid Cap
Equity Income
Financial Industries
Fundamental All Cap Core
Fundamental Large Cap Core
New Opportunities
Regional Bank
Small Cap Core
Small Cap Growth
Small Cap Value
U.S. Global Leaders Growth
U.S. Quality Growth
Value Equity
GLOBAL AND INTERNATIONAL EQUITY FUNDS
Disciplined Value International
Emerging Markets
Emerging Markets Equity
Fundamental Global Franchise
Global Equity
Global Shareholder Yield
Global Thematic Opportunities
International Dynamic Growth
International Growth
International Small Company
| | INCOME FUNDS
Bond
California Tax-Free Income
Emerging Markets Debt
Floating Rate Income
Government Income
High Yield
High Yield Municipal Bond
Income
Investment Grade Bond
Money Market
Short Duration Bond
Short Duration Credit Opportunities
Spectrum Income
Strategic Income Opportunities
Tax-Free Bond
ALTERNATIVE AND SPECIALTY FUNDS
Absolute Return Currency
Alternative Asset Allocation
Disciplined Alternative Yield
Diversified Macro
Infrastructure
Multi-Asset Absolute Return
Seaport Long/Short
|
A fund's investment objectives, risks, charges, and expenses should be considered carefully before investing. The prospectus contains this and other important information about the fund. To obtain a prospectus, contact your financial professional, call John Hancock Investment Management at 800-225-5291, or visit our website at jhinvestments.com. Please read the prospectus carefully before investing or sending money.
| | | |
ASSET ALLOCATION
Balanced
Income Allocation
Multi-Index Lifetime Portfolios
Multi-Index Preservation Portfolios
Multimanager Lifestyle Portfolios
Multimanager Lifetime Portfolios
Retirement Income 2040
EXCHANGE-TRADED FUNDS
John Hancock Multifactor Consumer Discretionary ETF
John Hancock Multifactor Consumer Staples ETF
John Hancock Multifactor Developed International ETF
John Hancock Multifactor Emerging Markets ETF
John Hancock Multifactor Energy ETF
John Hancock Multifactor Financials ETF
John Hancock Multifactor Healthcare ETF
John Hancock Multifactor Industrials ETF
John Hancock Multifactor Large Cap ETF
John Hancock Multifactor Materials ETF
John Hancock Multifactor Media and
Communications ETF
John Hancock Multifactor Mid Cap ETF
John Hancock Multifactor Small Cap ETF
John Hancock Multifactor Technology ETF
John Hancock Multifactor Utilities ETF
| | ENVIRONMENTAL, SOCIAL, AND
GOVERNANCE FUNDS
ESG All Cap Core
ESG Core Bond
ESG International Equity
ESG Large Cap Core
CLOSED-END FUNDS
Financial Opportunities
Hedged Equity & Income
Income Securities Trust
Investors Trust
Preferred Income
Preferred Income II
Preferred Income III
Premium Dividend
Tax-Advantaged Dividend Income
Tax-Advantaged Global Shareholder Yield
|
John Hancock Multifactor ETF shares are bought and sold at market price (not NAV), and are not individually redeemed
from the fund. Brokerage commissions will reduce returns.
John Hancock ETFs are distributed by Foreside Fund Services, LLC, and are subadvised by Dimensional Fund Advisors LP.
Foreside is not affiliated with John Hancock Investment Management Distributors, LLC or Dimensional Fund Advisors LP.
Dimensional Fund Advisors LP receives compensation from John Hancock in connection with licensing rights to the
John Hancock Dimensional indexes. Dimensional Fund Advisors LP does not sponsor, endorse, or sell, and makes no
representation as to the advisability of investing in, John Hancock Multifactor ETFs.
John Hancock Investment Management
A trusted brand
John Hancock Investment Management is a premier asset manager
representing one of America's most trusted brands, with a heritage of
financial stewardship dating back to 1862. Helping our shareholders
pursue their financial goals is at the core of everything we do. It's why
we support the role of professional financial advice and operate with
the highest standards of conduct and integrity.
A better way to invest
We serve investors globally through a unique multimanager approach:
We search the world to find proven portfolio teams with specialized
expertise for every strategy we offer, then we apply robust investment
oversight to ensure they continue to meet our uncompromising
standards and serve the best interests of our shareholders.
Results for investors
Our unique approach to asset management enables us to provide
a diverse set of investments backed by some of the world's best
managers, along with strong risk-adjusted returns across asset classes.
John Hancock Investment Management Distributors, LLC n Member FINRA, SIPC
200 Berkeley Street n Boston, MA 02116-5010 n 800-225-5291 n jhinvestments.com
This report is for the information of the shareholders of John Hancock Fundamental All Cap Core Fund. It is not authorized for distribution to prospective investors unless preceded or accompanied by a prospectus.
John Hancock
Diversified Strategies Fund
Annual report 7/31/19
Beginning on January 1, 2021, as permitted by regulations adopted by the Securities and Exchange Commission, paper copies of the Fund's shareholder reports like this one will no longer be sent by mail, unless you specifically request paper copies of the reports from the Fund or from your financial intermediary. Instead, the reports will be made available on a website, and you will be notified by mail each time a report is posted and provided with a website link to access the report.
If you already elected to receive shareholder reports electronically, you will not be affected by this change, and you do not need to take any action. You may elect to receive shareholder reports and other communications electronically by calling John Hancock Investment Management at 800-225-5291 (Class A shares) or 888-972-8696 (Class I shares) or by contacting your financial intermediary.
You may elect to receive all reports in paper, free of charge, at any time. You can inform John Hancock Investment Management or your financial intermediary that you wish to continue receiving paper copies of your shareholder reports by following the instructions listed above. Your election to receive reports in paper will apply to all funds held with John Hancock Investment Management or your financial intermediary.
A message to shareholders
Dear shareholder,
It was a rather volatile time for capital markets during the 12 months ended July 31, 2019, with investor uncertainty surrounding trade relations between the United States and China and the broader health of the global economy leading to some dramatic swings in performance. The trend in longer-term yields was decidedly downward, with the 10-year U.S. Treasury finishing the period at just above 2%—a level we haven't seen since late 2016. In July, the U.S. Federal Reserve stepped in with a reduction in short-term interest rates in an attempt to offer a measure of stimulus to jittery markets, and investors greeted the news favorably. The commodity markets were mixed, with oil and some other natural resources down but gold, historically a strong performer in times of uncertainty, up sharply.
While the economic fundamentals in the United States appear fairly solid, with a strong labor market and a confident consumer base, there are sure to be patches of market turbulence as the year goes on, particularly as the threat of a recession looms. As always, your best resource in unpredictable markets is your financial advisor, who can help position your portfolio so that it's sufficiently diversified to meet your long-term objectives and to withstand the inevitable bouts of market volatility along the way.
On behalf of everyone at John Hancock Investment Management, I'd like to take this opportunity to welcome new shareholders and thank existing shareholders for the continued trust you've placed in us.
Sincerely,
Andrew G. Arnott
President and CEO,
John Hancock Investment Management
Head of Wealth and Asset Management,
United States and Europe
This commentary reflects the CEO's views as of this report's period end and are subject to change at any time. Diversification does not guarantee investment returns and does not eliminate risk of loss. All investments entail risks, including the possible loss of principal. For more up-to-date information, you can visit our website at jhinvestments.com.
John Hancock
Diversified Strategies Fund
Table of contents
| | | |
| 2 | | Your fund at a glance |
| 4 | | Discussion of fund performance |
| 6 | | A look at performance |
| 8 | | Your expenses |
| 10 | | Fund's investments |
| 15 | | Financial statements |
| 18 | | Financial highlights |
| 20 | | Notes to financial statements |
| 32 | | Report of independent registered public accounting firm |
| 33 | | Tax information |
| 34 | | Continuation of investment advisory and subadvisory agreements |
| 41 | | Trustees and Officers |
| 45 | | More information |
ANNUAL REPORT | JOHN HANCOCK DIVERSIFIED STRATEGIES FUND 1
INVESTMENT OBJECTIVE
The fund seeks long-term total return.
AVERAGE ANNUAL TOTAL RETURNS AS OF 7/31/19 (%)
The Bloomberg Barclays U.S. Aggregate Bond Index is an unmanaged index of dollar-denominated and non-convertible investment-grade debt issues.
The S&P 500 Index is an unmanaged index that includes 500 widely traded common stocks.
The Blended Index is 70% Bloomberg Barclays U.S. Aggregate Bond Index and 30% S&P 500 Index.
It is not possible to invest directly in an index. Index figures do not reflect expenses or sales charges, which would result in lower returns.
Figures from Morningstar, Inc. include reinvested distributions and do not take into account sales charges. Actual load-adjusted performance is lower. Since-inception returns for the Morningstar fund category average are not available.
The past performance shown here reflects reinvested distributions and the beneficial effect of any expense reductions, and does not guarantee future results. Performance of the other share classes will vary based on the difference in the fees and expenses of those classes. Shares will fluctuate in value and, when redeemed, may be worth more or less than their original cost. Current month-end performance may be lower or higher than the performance cited, and can be found at jhinvestments.com or by calling 800-225-5291. For further information on the fund's objectives, risks, and strategy, see the fund's prospectus.
ANNUAL REPORT | JOHN HANCOCK DIVERSIFIED STRATEGIES FUND 2
PERFORMANCE HIGHLIGHTS OVER THE LAST TWELVE MONTHS
The fund lagged its blended benchmark
Although the fund posted a positive return, it underperformed its blended benchmark for the period.
Currency was a detractor
The fund's foreign exchange positions in aggregate hindered results, weighed down by a flagging long euro position set against an appreciating U.S. dollar.
Fixed income was the top contributor
Global interest rates declined, driving up bond prices around the world, and the fund's positioning in credit spread sectors drove its total return.
PORTFOLIO COMPOSITION AS OF 7/31/19 (%)
A note about risks
The fund is subject to various risks as described in the fund's prospectus. For more information, please refer to the "Principal risks" section of the prospectus.
ANNUAL REPORT | JOHN HANCOCK DIVERSIFIED STRATEGIES FUND 3
Discussion of fund performance
How would you describe the macroeconomic and market backdrop during the 12 months ended July 31, 2019?
Most fixed-income markets across different regions and sectors produced positive returns. The yield on the 10-year U.S. Treasury note declined roughly 90 basis points, driving up bond prices (bond yields and bond prices move inversely). U.S. corporate bonds, emerging-market debt, and U.S. preferred securities led the way. Global stock markets saw much more dispersion. U.S. equities were positive on balance, yet large- and mid-cap growth stocks posted double-digit percentage gains, while small-cap core and value stocks saw mid-single digit declines. Many non-U.S. markets suffered losses, with Brazil, Russia, and Switzerland being among the most prominent exceptions.
In foreign exchange markets, the Australian dollar, the British pound, and the euro were relative laggards, while the Japanese yen, many emerging-market currencies, and the U.S. dollar fared better. Oil and many other commodity markets fell; the price for gold, which staged an impressive rally, was a notable exception.
As widely expected, the U.S. Federal Reserve cut interest rates on the last day of the period, its first such move since 2008.
How did the fund perform in this environment?
The fund posted a positive return, but significantly underperformed its blended benchmark, the Bloomberg Barclays U.S. Aggregate Bond Index (70%) and the S&P 500 Index (30%). The fund's foreign exchange positions hindered results overall, weighed down by a flagging long euro position, set against the U.S. dollar, which appreciated
PORTFOLIO ALLOCATION AS OF 7/31/19 (%)
| | | |
| Foreign government obligations | 5.2 |
| Affiliated investment companies | 2.8 |
| Unaffiliated investment companies | 2.0 |
| Purchased options | 1.5 |
| Short-term investments and other | 88.5 |
| | Commercial paper | 58.7 |
| | U.S. Government | 20.0 |
| | Money market funds | 3.0 |
| | Other assets and liabilities, net | 6.8 |
| TOTAL | 100.0 |
| As a percentage of net assets. | |
ANNUAL REPORT | JOHN HANCOCK DIVERSIFIED STRATEGIES FUND 4
relative to most of its major developed-market peers. The fund's equity hedge positions served as a modest drag on performance. A number of relative value strategies also weighed on results; they included those long Chinese versus emerging-market equities; long Japanese versus U.S. equities; long U.S. communication services versus information technology equities; long U.K versus U.S. equities; and long energy versus U.S. broad-market equities.
What elements of the fund's positioning helped results?
Fixed-income positioning contributed over half of the fund's total return for the period. Allocations to U.S. credit spread sectors and emerging-market debt were among the bond positions that drove results.
Equity exposure was also additive on balance, albeit to a lesser extent. A long oil equity position, initiated in early January 2019 and closed two months later, contributed to performance, as did a long allocation to U.K. stocks, initiated in March 2019. Later in the spring, a tactical relative value position, setting long exposure to emerging-market equities against the U.S. market, also accrued gains for the fund.
In the currency markets, short exposure to the Swedish krona, offset by long positions in the Norwegian krone, in one case, and the euro, in the other, was helpful, too.
MANAGED BY
| |
| Managed by a team of portfolio managers from Manulife Investment Management |
The views expressed in this report are exclusively those of Nathan W. Thooft, CFA, Manulife Investment Management, and are subject to change. They are not meant as investment advice. Please note that the holdings discussed in this report may not have been held by the fund for the entire period. Portfolio composition is subject to review in accordance with the fund's investment strategy and may vary in the future. Current and future portfolio holdings are subject to risk.
ANNUAL REPORT | JOHN HANCOCK DIVERSIFIED STRATEGIES FUND 5
TOTAL RETURNS FOR THE PERIOD ENDED JULY 31, 2019
| | | | | | | | |
Average annual total returns (%)
with maximum sales charge | | Cumulative total returns (%)
with maximum sales charge |
| | 1-year | 5-year | Since
inception1 | | | 5-year | Since
inception1 |
| Class A | -3.80 | 0.33 | 3.23 | | | 1.66 | 28.27 |
| Class I2 | 1.47 | 1.70 | 4.27 | | | 8.78 | 38.77 |
| Index1† | 8.08 | 3.05 | 2.84 | | | 16.19 | 24.51 |
| Index2† | 7.99 | 11.34 | 15.17 | | | 71.08 | 202.65 |
| Index3† | 8.45 | 5.64 | 6.57 | | | 31.60 | 64.65 |
Performance figures assume all distributions have been reinvested. Figures reflect maximum sales charges on Class A shares of 5.00%. Sales charges are not applicable to Class I shares.
The expense ratios of the fund, both net (including any fee waivers and/or expense limitations) and gross (excluding any fee waivers and/or expense limitations), are set forth according to the most recent publicly available prospectuses for the fund and may differ from those disclosed in the Financial highlights tables in this report. Net expenses reflect contractual expense limitations in effect until July 31, 2021 and are subject to change. Had the contractual fee waivers and expense limitations not been in place, gross expenses would apply. The expense ratios are as follows:
| | | |
| | Class A | Class I |
| Gross (%) | 1.95 | 1.65 |
| Net (%) | 1.94 | 1.64 |
Please refer to the most recent prospectus and annual or semiannual report for more information on expenses and any expense limitation arrangements for each class.
The returns reflect past results and should not be considered indicative of future performance. The return and principal value of an investment will fluctuate so that shares, when redeemed, may be worth more or less than their original cost. Due to market volatility and other factors, the fund's current performance may be higher or lower than the performance shown. For current to the most recent month-end performance data, please call 800-225-5291 or visit the fund's website at jhinvestments.com.
The performance table above and the chart on the next page do not reflect the deduction of taxes that a shareholder would pay on fund distributions or the redemption of fund shares. The fund's performance results reflect any applicable fee waivers or expense reductions, without which the expenses would increase and results would have been less favorable.
| † | Index 1 is the Bloomberg Barclays U.S. Aggregate Bond Index; Index 2 is the S&P 500 Index; Index 3 is 70% Bloomberg Barclays U.S. Aggregate Bond Index and 30% S&P 500 Index. |
See the following page for footnotes.
ANNUAL REPORT | JOHN HANCOCK DIVERSIFIED STRATEGIES FUND 6
This chart and table show what happened to a hypothetical $10,000 investment in John Hancock Diversified Strategies Fund for the share classes and periods indicated, assuming all distributions were reinvested. For comparison, we've shown the same investment in two separate indexes and a blended index.
| | | | | | | |
| | Start date | With maximum
sales charge ($) | Without sales
charge ($) | Index 1 ($) | Index 2 ($) | Index 3 ($) |
| Class I2 | 9-30-11 | 13,877 | 13,877 | 12,451 | 30,265 | 16,465 |
The Bloomberg Barclays U.S. Aggregate Bond Index is an unmanaged index of dollar-denominated and non-convertible investment-grade debt issues.
The S&P 500 Index is an unmanaged index that includes 500 widely traded common stocks.
The Blended Index is 70% Bloomberg Barclays U.S. Aggregate Bond Index and 30% S&P 500 Index.
It is not possible to invest directly in an index. Index figures do not reflect expenses or sales charges, which would result in lower returns.
Footnotes related to performance pages
| 1 | From 9-30-11. |
| 2 | For certain types of investors as described in the fund's prospectuses. |
ANNUAL REPORT | JOHN HANCOCK DIVERSIFIED STRATEGIES FUND 7
These examples are intended to help you understand your ongoing operating expenses of investing in the fund so you can compare these costs with the ongoing costs of investing in other mutual funds.
Understanding fund expenses
As a shareholder of the fund, you incur two types of costs:
■Transaction costs,which include sales charges (loads) on purchases or redemptions (varies by share class), minimum account fee charge, etc.
■Ongoing operating expenses, including management fees, distribution and service fees (if applicable), and other fund expenses.
We are presenting only your ongoing operating expenses here.
Actual expenses/actual returns
The first line of each share class in the table on the following page is intended to provide information about the fund’s actual ongoing operating expenses, and is based on the fund’s actual return. It assumes an account value of $1,000.00 on February 1, 2019, with the same investment held until July 31, 2019.
Together with the value of your account, you may use this information to estimate the operating expenses that you paid over the period. Simply divide your account value at July 31, 2019, by $1,000.00, then multiply it by the “expenses paid” for your share class from the table. For example, for an account value of $8,600.00, the operating expenses should be calculated as follows:
Hypothetical example for comparison purposes
The second line of each share class in the table on the following page allows you to compare the fund’s ongoing operating expenses with those of any other fund. It provides an example of the fund’s hypothetical account values and hypothetical expenses based on each class’s actual expense ratio and an assumed 5% annualized return before expenses (which is not the class’s actual return). It assumes an account value of $1,000.00 on February 1, 2019, with the same investment held until July 31, 2019. Look in any other fund shareholder report to find its hypothetical example and you will be able to compare these expenses. Please remember that these hypothetical account values and expenses may not be used to estimate the actual ending account balance or expenses you paid for the period.
| 8 | JOHN HANCOCK DIVERSIFIED STRATEGIES FUND | ANNUAL REPORT | |
Remember, these examples do not include any transaction costs, therefore, these examples will not help you to determine the relative total costs of owning different funds. If transaction costs were included, your expenses would have been higher. See the prospectus for details regarding transaction costs.
SHAREHOLDER EXPENSE EXAMPLE CHART
| | | Account
value on
2-1-2019 | Ending
value on
7-31-2019 | Expenses
paid during
period ended
7-31-20191 | Annualized
expense
ratio |
| Class A | Actual expenses/actual returns | $1,000.00 | $1,027.00 | $8.54 | 1.70% |
| | Hypothetical example | 1,000.00 | 1,016.40 | 8.50 | 1.70% |
| Class I | Actual expenses/actual returns | 1,000.00 | 1,028.00 | 6.99 | 1.39% |
| | Hypothetical example | 1,000.00 | 1,017.90 | 6.95 | 1.39% |
| 1 | Expenses are equal to the annualized expense ratio, multiplied by the average account value over the period, multiplied by 181/365 (to reflect the one-half year period). |
| | ANNUAL REPORT | JOHN HANCOCK DIVERSIFIED STRATEGIES FUND | 9 |
AS OF 7-31-19
| | Rate (%) | Maturity date | | Par value^ | Value |
| Foreign government obligations 5.2% | | | | $530,268 |
| (Cost $500,999) | | | | | |
| Indonesia 5.2% | | | | | 530,268 |
Republic of Indonesia
Bond | 8.250 | 05-15-29 | IDR | 7,000,000,000 | 530,268 |
|
| | | | | Shares | Value |
| Affiliated investment companies (A) 2.8% | | | $284,081 |
| (Cost $274,393) | | | | | |
| Fixed income 2.8% | | | 284,081 |
|
| Asia Pacific Total Return Bond, Class NAV, JHF II (MIM US) (B) | | | | 28,494 | 284,081 |
| Unaffiliated investment companies 2.0% | | | $210,307 |
| (Cost $202,259) | | | | | |
| Exchange-traded funds 2.0% | | | 210,307 |
| iShares JPMorgan USD Emerging Markets Bond ETF | | | | 1,850 | 210,307 |
| | | | | Contracts/Notional amount | Value |
| Purchased options 1.5% | | | | | $153,478 |
| (Cost $187,265) | | | | | |
| Calls 0.1% | | | | | 8,231 |
| Over the Counter Option on the NOK vs. SEK (Expiration Date: 10-23-19; Strike Price: NOK 1.11; Counterparty: Morgan Stanley Company, Inc.) (C)(D) | | | | 20,000,000 | 8,231 |
| Puts 1.4% | | | | | 145,247 |
| Exchange Traded Option on 1-Year Eurodollar Mid-Curve Futures (Expiration Date: 9-13-19; Strike Price: $97.50; Notional Amount: 125,000) (C) | | | | 50 | 156 |
| Exchange Traded Option on 1-Year Eurodollar Mid-Curve Futures (Expiration Date: 9-13-19; Strike Price: $97.63; Notional Amount: 125,000) (C) | | | | 50 | 156 |
| Exchange Traded Option on Euro-BTP Italian Government Bond Futures (Expiration Date: 8-23-19; Strike Price: EUR 136.00; Notional Amount: 2,000,000) (C) | | | | 20 | 4,455 |
| Exchange Traded Option on S&P 500 Index (Expiration Date: 12-20-19; Strike Price: $2,800.00; Notional Amount: 400) (C) | | | | 4 | 22,800 |
| 10 | JOHN HANCOCK DIVERSIFIED STRATEGIES FUND | ANNUAL REPORT | SEE NOTES TO FINANCIAL STATEMENTS |
| | | | | Contracts/Notional amount | Value |
| Puts (continued) | | | | | |
| Over the Counter Option on the EUR vs. NOK (Expiration Date: 10-11-19; Strike Price: EUR 9.60; Counterparty: Goldman Sachs Bank & Company LLC) (C)(D) | | | | 2,000,000 | $4,641 |
| Over the Counter Option on the EUR vs. NOK (Expiration Date: 10-11-19; Strike Price: EUR 9.65; Counterparty: Goldman Sachs Bank & Company LLC) (C)(D) | | | | 2,000,000 | 6,669 |
| Over the Counter Option on the EUR vs. SEK (Expiration Date: 9-26-19; Strike Price: EUR 10.50; Counterparty: Citibank NA) (C)(D) | | | | 2,000,000 | 3,976 |
| Over the Counter Option on the EUR vs. USD (Expiration Date: 10-23-19; Strike Price: EUR 1.14; Counterparty: HSBC Bank USA) (C)(D) | | | | 1,200,000 | 29,375 |
| Over the Counter Option on the EUR vs. USD (Expiration Date: 12-20-19; Strike Price: EUR 1.12; Counterparty: HSBC Bank PLC) (C)(D) | | | | 1,500,000 | 23,619 |
| Over the Counter Option on the EUR vs. USD (Expiration Date: 1-6-20; Strike Price: EUR 1.10; Counterparty: HSBC Bank USA) (C)(D) | | | | 1,500,000 | 12,095 |
| Over the Counter Option on the EUR vs. USD (Expiration Date: 4-16-20; Strike Price: EUR 1.13; Counterparty: Goldman Sachs Bank USA) (C)(D) | | | | 1,200,000 | 25,831 |
| Over the Counter Option on the USD vs. JPY (Expiration Date: 11-4-19; Strike Price: $106.50; Counterparty: Goldman Sachs Bank USA) (C)(D) | | | | 1,500,000 | 10,521 |
| Over the Counter Option on the USD vs. NOK (Expiration Date: 9-20-19; Strike Price: $8.40; Counterparty: Citibank NA) (C)(D) | | | | 1,500,000 | 953 |
|
| | Yield* (%) | Maturity date | | Par value^ | Value |
| Short-term investments 81.7% | | | | | $8,370,479 |
| (Cost $8,371,413) | | | | | |
| Commercial paper 58.7% | | | | | 6,013,802 |
| Apple, Inc. | 2.400 | 08-06-19 | | 475,000 | 474,817 |
| CAFCO LLC | 2.300 | 08-23-19 | | 475,000 | 474,314 |
| Gotham Funding Corp. | 2.300 | 08-19-19 | | 475,000 | 474,412 |
| Henkel of America, Inc. | 2.380 | 09-10-19 | | 475,000 | 473,769 |
| John Deere Canada ULC | 2.320 | 08-13-19 | | 475,000 | 474,616 |
| SEE NOTES TO FINANCIAL STATEMENTS | ANNUAL REPORT | JOHN HANCOCK DIVERSIFIED STRATEGIES FUND | 11 |
| | Yield* (%) | Maturity date | | Par value^ | Value |
| Commercial paper (continued) | | | | | |
| Manhattan Asset Funding Company LLC | 2.380 | 08-21-19 | | 475,000 | $474,359 |
| Pfizer, Inc. | 2.200 | 09-09-19 | | 475,000 | 473,835 |
| Philip Morris International, Inc. | 2.170 | 08-07-19 | | 475,000 | 474,797 |
| The Boeing Company | 2.420 | 08-14-19 | | 475,000 | 474,576 |
| The University of Chicago | 2.270 | 09-04-19 | | 475,000 | 473,937 |
| The Walt Disney Company | 2.220 | 09-20-19 | | 475,000 | 473,508 |
| Thunder Bay Funding LLC | 2.270 | 08-08-19 | | 325,000 | 324,830 |
| University of California | 2.500 | 10-08-19 | | 475,000 | 472,032 |
| U.S. Government 20.0% | | | | | 2,047,589 |
| U.S. Treasury Bill | 2.059 | 08-22-19 | | 2,050,000 | 2,047,589 |
| | | Yield (%) | | Shares | Value |
| Money market funds 3.0% | | | | | 309,088 |
|
| State Street Institutional U.S. Government Money Market Fund, Premier Class | 2.2608(E) | | 309,088 | 309,088 |
|
| Total investments (Cost $9,536,329) 93.2% | | | $9,548,613 |
| Other assets and liabilities, net 6.8% | | | | 692,451 |
| Total net assets 100.0% | | | | | $10,241,064 |
| The percentage shown for each investment category is the total value of the category as a percentage of the net assets of the fund. |
| ^All par values are denominated in U.S. dollars unless otherwise indicated. |
| Currency Abbreviations |
| EUR | Euro |
| IDR | Indonesian Rupiah |
| NOK | Norwegian Krone |
| SEK | Swedish Krona |
| Security Abbreviations and Legend |
| JHF II | John Hancock Funds II |
| MIM US | Manulife Investment Management (US) LLC |
| (A) | The underlying funds' subadvisor is shown parenthetically. |
| (B) | The subadvisor is an affiliate of the advisor. |
| (C) | Non-income producing security. |
| (D) | For this type of option, notional amounts are equivalent to number of contracts. |
| (E) | The rate shown is the annualized seven-day yield as of 7-31-19. |
| * | Yield represents either the annualized yield at the date of purchase, the stated coupon rate or, for floating rate securities, the rate at period end. |
| 12 | JOHN HANCOCK DIVERSIFIED STRATEGIES FUND | ANNUAL REPORT | SEE NOTES TO FINANCIAL STATEMENTS |
DERIVATIVES
FUTURES
| Open contracts | Number of
contracts | Position | Expiration
date | Notional
basis^ | Notional
value^ | Unrealized
appreciation
(depreciation) |
| 10-Year Japan Government Bond Futures | 2 | Long | Sep 2019 | $2,824,915 | $2,827,466 | $2,551 |
| 10-Year U.S. Treasury Note Futures | 25 | Long | Sep 2019 | 3,189,893 | 3,185,547 | (4,346) |
| CME E-mini Financial Sector Futures | 4 | Long | Sep 2019 | 350,811 | 348,200 | (2,611) |
| FTSE 100 Index Futures | 5 | Long | Sep 2019 | 446,407 | 459,036 | 12,629 |
| MSCI China Free Index Futures | 8 | Long | Sep 2019 | 330,465 | 333,880 | 3,415 |
| S&P 500 Index E-Mini Futures | 6 | Long | Sep 2019 | 903,303 | 893,850 | (9,453) |
| Euro STOXX 50 Index Futures | 11 | Short | Sep 2019 | (426,065) | (421,568) | 4,497 |
| MSCI Emerging Markets Index Futures | 6 | Short | Sep 2019 | (309,405) | (307,680) | 1,725 |
| Russell 2000 E-Mini Index Futures | 4 | Short | Sep 2019 | (315,153) | (315,340) | (187) |
| Ultra U.S. Treasury Bond Futures | 6 | Short | Sep 2019 | (1,064,611) | (1,065,375) | (764) |
| | | | | | | $7,456 |
^ Notional basis refers to the contractual amount agreed upon at inception of open contracts; notional value represents the current value of the open contract.
FORWARD FOREIGN CURRENCY CONTRACTS
| Contract to buy | Contract to sell | Counterparty (OTC) | Contractual
settlement
date | Unrealized
appreciation | Unrealized
depreciation |
| CAD | 1,000,000 | NOK | 6,678,592 | MSCS | 8/28/2019 | $3,445 | — |
| EUR | 500,000 | GBP | 457,849 | CITI | 8/28/2019 | — | $(2,849) |
| EUR | 2,000,000 | SEK | 21,154,446 | UBS | 8/28/2019 | 24,695 | — |
| EUR | 2,400,000 | USD | 2,675,769 | CITI | 8/28/2019 | — | (13,469) |
| GBP | 454,034 | EUR | 500,000 | HUS | 8/28/2019 | — | (1,796) |
| NOK | 6,599,148 | CAD | 1,000,000 | MSCS | 8/28/2019 | — | (12,422) |
| USD | 1,500,000 | CNY | 10,341,375 | JPM | 8/28/2019 | 2,405 | — |
| | | | | | | $30,545 | $(30,536) |
WRITTEN OPTIONS
| Foreign currency options |
| Description | Counterparty (OTC) | | Exercise
price | Expiration
date | Notional
amount* | Premium | Value |
| Calls | | | | | | | |
| Euro versus Norwegian Krone | GSI | EUR | 10.00 | Oct 2019 | 2,000,000 | $16,781 | $(9,934) |
| Euro versus U.S. Dollar | HSBC | EUR | 1.19 | Dec 2019 | 1,500,000 | 10,979 | (1,924) |
| Euro versus U.S. Dollar | HUS | EUR | 1.20 | Jan 2020 | 1,500,000 | 5,264 | (1,685) |
| Euro versus U.S. Dollar | GSI | EUR | 1.20 | Apr 2020 | 1,200,000 | 17,792 | (4,907) |
| Norwegian Krone versus Swedish Krona | MSI | NOK | 1.14 | Oct 2019 | 20,000,000 | 2,319 | (1,292) |
| | | | | | | $53,135 | $(19,742) |
| Puts | | | | | | | |
| SEE NOTES TO FINANCIAL STATEMENTS | ANNUAL REPORT | JOHN HANCOCK DIVERSIFIED STRATEGIES FUND | 13 |
| Foreign currency options (continued) |
| Description | Counterparty (OTC) | | Exercise
price | Expiration
date | Notional
amount* | Premium | Value |
| Euro versus Norwegian Krone | GSI | EUR | 9.25 | Oct 2019 | 2,000,000 | $7,171 | $(197) |
| Euro versus U.S. Dollar | HUS | EUR | 1.09 | Oct 2019 | 1,200,000 | 11,989 | (4,121) |
| U.S. Dollar versus Japanese Yen | GSI | USD | 103.50 | Nov 2019 | 1,500,000 | 7,256 | (3,860) |
| U.S. Dollar versus Norwegian Krone | CITI | USD | 8.20 | Sep 2019 | 1,500,000 | 5,965 | (159) |
| | | | | | | $32,381 | $(8,337) |
| | | | | | | $85,516 | $(28,079) |
| * For this type of option, notional amounts are equivalent to number of contracts. |
| Derivatives Currency Abbreviations |
| CAD | Canadian Dollar |
| CNY | Chinese Yuan Renminbi |
| EUR | Euro |
| GBP | Pound Sterling |
| NOK | Norwegian Krone |
| SEK | Swedish Krona |
| USD | U.S. Dollar |
| Derivatives Abbreviations |
| CITI | Citibank, N.A. |
| GSI | Goldman Sachs International |
| HSBC | HSBC Bank PLC |
| HUS | HSBC Bank USA, N.A. |
| JPM | JPMorgan Chase Bank, N.A. |
| MSCS | Morgan Stanley Capital Services LLC |
| MSI | Morgan Stanley & Co. International PLC |
| OTC | Over-the-counter |
| UBS | UBS AG |
At 7-31-19, the aggregate cost of investments for federal income tax purposes was $9,450,441. Net unrealized appreciation aggregated to $77,558, of which $149,075 related to gross unrealized appreciation and $71,517 related to gross unrealized depreciation.
See Notes to financial statements regarding investment transactions and other derivatives information.
| 14 | JOHN HANCOCK DIVERSIFIED STRATEGIES FUND | ANNUAL REPORT | SEE NOTES TO FINANCIAL STATEMENTS |
STATEMENT OF ASSETS AND LIABILITIES 7-31-19
| Assets | |
| Unaffiliated investments, at value (Cost $9,261,936) | $9,264,532 |
| Affiliated investments, at value (Cost $274,393) | 284,081 |
| Total investments, at value (Cost $9,536,329) | 9,548,613 |
| Unrealized appreciation on forward foreign currency contracts | 30,545 |
| Foreign currency, at value (Cost $306,343) | 302,491 |
| Collateral held at broker for futures contracts | 450,000 |
| Collateral segregated at custodian for OTC derivative contracts | 27,332 |
| Dividends and interest receivable | 11,505 |
| Receivable for investments sold | 21,027 |
| Receivable from affiliates | 1,028 |
| Other assets | 2,463 |
| Total assets | 10,395,004 |
| Liabilities | |
| Unrealized depreciation on forward foreign currency contracts | 30,536 |
| Written options, at value (Premiums received $85,516) | 28,079 |
| Payable for futures variation margin | 19,282 |
| Payable for investments purchased | 5,422 |
| Payable to affiliates | |
| Accounting and legal services fees | 811 |
| Transfer agent fees | 1,058 |
| Trustees' fees | 96 |
| Other liabilities and accrued expenses | 68,656 |
| Total liabilities | 153,940 |
| Net assets | $10,241,064 |
| Net assets consist of | |
| Paid-in capital | $10,145,279 |
| Total distributable earnings (loss) | 95,785 |
| Net assets | $10,241,064 |
| |
| Net asset value per share | |
| Based on net asset value and shares outstanding - the fund has an unlimited number of shares authorized with no par value | |
| Class A ($4,969,428 ÷ 623,959 shares)1 | $7.96 |
| Class I ($5,271,636 ÷ 656,145 shares) | $8.03 |
| Maximum offering price per share | |
| Class A (net asset value per share ÷ 95%)2 | $8.38 |
| 1 | Redemption price per share is equal to net asset value less any applicable contingent deferred sales charge. |
| 2 | On single retail sales of less than $50,000. On sales of $50,000 or more and on group sales the offering price is reduced. |
| SEE NOTES TO FINANCIAL STATEMENTS | ANNUAL REPORT | JOHN HANCOCK DIVERSIFIED STRATEGIES FUND | 15 |
STATEMENT OF OPERATIONSFor the year ended 7-31-19
| Investment income | |
| Interest | $239,168 |
| Dividends | 1,659 |
| Less foreign taxes withheld | (2,735) |
| Total investment income | 238,092 |
| Expenses | |
| Investment management fees | 102,294 |
| Distribution and service fees | 14,660 |
| Accounting and legal services fees | 1,828 |
| Transfer agent fees | 12,315 |
| Trustees' fees | 290 |
| Custodian fees | 34,631 |
| Printing and postage | 13,942 |
| Professional fees | 51,620 |
| Other | 15,969 |
| Total expenses | 247,549 |
| Less expense reductions | (89,929) |
| Net expenses | 157,620 |
| Net investment income | 80,472 |
| Realized and unrealized gain (loss) | |
| Net realized gain (loss) on | |
| Unaffiliated investments and foreign currency transactions | (148,239) |
| Affiliated investments | 18 |
| Futures contracts | (40,428) |
| Forward foreign currency contracts | (29,012) |
| Written options | 176,528 |
| Swap contracts | 81,731 |
| | 40,598 |
| Change in net unrealized appreciation (depreciation) of | |
| Unaffiliated investments and translation of assets and liabilities in foreign currencies | 19,753 |
| Affiliated investments | 9,688 |
| Futures contracts | 9,090 |
| Forward foreign currency contracts | (1,623) |
| Written options | (20,730) |
| | 16,178 |
| Net realized and unrealized gain | 56,776 |
| Increase in net assets from operations | $137,248 |
| | |
| 16 | JOHN HANCOCK DIVERSIFIED STRATEGIES FUND | ANNUAL REPORT | SEE NOTES TO FINANCIAL STATEMENTS |
STATEMENTS OF CHANGES IN NET ASSETS
| | Year ended
7-31-19 | Year ended
7-31-18 |
| Increase (decrease) in net assets | | |
| From operations | | |
| Net investment income | $80,472 | $137,175 |
| Net realized gain | 40,598 | 2,950,225 |
| Change in net unrealized appreciation (depreciation) | 16,178 | (2,503,267) |
| Increase in net assets resulting from operations | 137,248 | 584,133 |
| Distributions to shareholders | | |
| From net investment income and net realized gain | | |
| Class A | (1,082,050) | — |
| Class I | (1,230,106) | — |
| From net investment income | | |
| Class A | — | (168,105) |
| Class I | — | (205,847) |
| Total distributions | (2,312,156) | (373,952) |
| From fund share transactions | 1,902,415 | (31,994,575) |
| Total decrease | (272,493) | (31,784,394) |
| Net assets | | |
| Beginning of year | 10,513,557 | 42,297,951 |
| End of year1 | $10,241,064 | $10,513,557 |
| 1 | Net assets - End of year includes undistributed net investment income of $(85,379) at July 31, 2018. The SEC eliminated the requirement to disclose undistributed net investment income in the current reporting period. |
| SEE NOTES TO FINANCIAL STATEMENTS | ANNUAL REPORT | JOHN HANCOCK DIVERSIFIED STRATEGIES FUND | 17 |
| CLASS A SHARES Period ended | 7-31-19 | 7-31-18 | 7-31-17 | 7-31-16 | 7-31-15 |
| Per share operating performance | | | | | |
| Net asset value, beginning of period | $10.13 | $10.50 | $10.09 | $10.43 | $10.92 |
| Net investment income1 | 0.05 | 0.07 | 0.12 | 0.17 | 0.21 |
| Net realized and unrealized gain (loss) on investments | 0.01 | (0.08) | 0.45 | (0.27) | (0.10) |
| Total from investment operations | 0.06 | (0.01) | 0.57 | (0.10) | 0.11 |
| Less distributions | | | | | |
| From net investment income | — | (0.36) | (0.16) | (0.23) | (0.32) |
| From net realized gain | (2.23) | — | — | (0.01) | (0.28) |
| Total distributions | (2.23) | (0.36) | (0.16) | (0.24) | (0.60) |
| Net asset value, end of period | $7.96 | $10.13 | $10.50 | $10.09 | $10.43 |
| Total return (%)2,3 | 1.23 | (0.17) | 5.74 | (0.96) | 1.07 |
| Ratios and supplemental data | | | | | |
| Net assets, end of period (in millions) | $5 | $5 | $32 | $30 | $31 |
| Ratios (as a percentage of average net assets): | | | | | |
| Expenses before reductions4 | 2.57 | 1.89 | 1.71 | 1.77 | 1.66 |
| Expenses including reductions4 | 1.70 | 1.70 | 1.70 | 1.70 | 1.66 |
| Net investment income | 0.63 | 0.62 | 1.22 | 1.67 | 1.93 |
| Portfolio turnover (%) | 173 | 171 | 73 | 55 | 62 |
| 1 | Based on average daily shares outstanding. |
| 2 | Total returns would have been lower had certain expenses not been reduced during the applicable periods. |
| 3 | Does not reflect the effect of sales charges, if any. |
| 4 | Ratios do not include expense indirectly incurred from underlying funds and can vary based on the mix of underlying funds held by the fund. |
| 18 | JOHN HANCOCK DIVERSIFIED STRATEGIES FUND | ANNUAL REPORT | SEE NOTES TO FINANCIAL STATEMENTS |
| CLASS I SHARES Period ended | 7-31-19 | 7-31-18 | 7-31-17 | 7-31-16 | 7-31-15 |
| Per share operating performance | | | | | |
| Net asset value, beginning of period | $10.18 | $10.52 | $10.12 | $10.46 | $10.95 |
| Net investment income1 | 0.08 | 0.05 | 0.16 | 0.20 | 0.24 |
| Net realized and unrealized gain (loss) on investments | —2 | —2 | 0.43 | (0.27) | (0.10) |
| Total from investment operations | 0.08 | 0.05 | 0.59 | (0.07) | 0.14 |
| Less distributions | | | | | |
| From net investment income | — | (0.39) | (0.19) | (0.26) | (0.35) |
| From net realized gain | (2.23) | — | — | (0.01) | (0.28) |
| Total distributions | (2.23) | (0.39) | (0.19) | (0.27) | (0.63) |
| Net asset value, end of period | $8.03 | $10.18 | $10.52 | $10.12 | $10.46 |
| Total return (%)3 | 1.47 | 0.32 | 5.94 | (0.63) | 1.40 |
| Ratios and supplemental data | | | | | |
| Net assets, end of period (in millions) | $5 | $6 | $10 | $10 | $9 |
| Ratios (as a percentage of average net assets): | | | | | |
| Expenses before reductions4 | 2.28 | 1.59 | 1.40 | 1.45 | 1.35 |
| Expenses including reductions4 | 1.39 | 1.39 | 1.39 | 1.39 | 1.35 |
| Net investment income | 0.93 | 0.66 | 1.53 | 1.98 | 2.24 |
| Portfolio turnover (%) | 173 | 171 | 73 | 55 | 62 |
| 1 | Based on average daily shares outstanding. |
| 2 | Less than $0.005 per share. |
| 3 | Total returns would have been lower had certain expenses not been reduced during the applicable periods. |
| 4 | Ratios do not include expense indirectly incurred from underlying funds and can vary based on the mix of underlying funds held by the fund. |
| SEE NOTES TO FINANCIAL STATEMENTS | ANNUAL REPORT | JOHN HANCOCK DIVERSIFIED STRATEGIES FUND | 19 |
| Notes to financial statements | |
Note 1—Organization
John Hancock Diversified Strategies Fund (the fund) is a series of John Hancock Funds II (the Trust), an open-end management investment company organized as a Massachusetts business trust and registered under the Investment Company Act of 1940, as amended (the 1940 Act). The investment objective of the fund is to seek long-term total return.
The fund may offer multiple classes of shares. The shares currently outstanding are detailed in the Statement of assets and liabilities. Class A shares are offered to all investors. Class I shares are offered to institutions and certain investors. Shareholders of each class have exclusive voting rights to matters that affect that class. The distribution and service fees, if any, and transfer agent fees for each class may differ.
Note 2—Significant accounting policies
The financial statements have been prepared in conformity with accounting principles generally accepted in the United States of America (US GAAP), which require management to make certain estimates and assumptions as of the date of the financial statements. Actual results could differ from those estimates and those differences could be significant. The fund qualifies as an investment company under Topic 946 of Accounting Standards Codification of US GAAP.
Events or transactions occurring after the end of the fiscal period through the date that the financial statements were issued have been evaluated in the preparation of the financial statements. The following summarizes the significant accounting policies of the fund:
Security valuation. Investments are stated at value as of the scheduled close of regular trading on the New York Stock Exchange (NYSE), normally at 4:00 P.M., Eastern Time. In case of emergency or other disruption resulting in the NYSE not opening for trading or the NYSE closing at a time other than the regularly scheduled close, the net asset value (NAV) may be determined as of the regularly scheduled close of the NYSE pursuant to the fund's Valuation Policies and Procedures.
In order to value the securities, the fund uses the following valuation techniques: Debt obligations are typically valued based on the evaluated prices provided by an independent pricing vendor. Independent pricing vendors utilize matrix pricing which takes into account factors such as institutional-size trading in similar groups of securities, yield, quality, coupon rate, maturity, type of issue, trading characteristics and other market data, as well as broker supplied prices. Equity securities, including exchange-traded or closed-end funds, are typically valued at the last sale price or official closing price on the exchange or principal market where the security trades. In the event there were no sales during the day or closing prices are not available, the securities are valued using the last available bid price. Investments by the fund in open-end mutual funds are valued at their respective NAVs each business day. Options listed on an exchange are valued at the mid-price of the last quoted bid and ask prices from the primary exchange where the option trades. Unlisted options are valued using evaluated prices obtained from an independent pricing vendor. Futures contracts are typically valued at last traded price on the exchange on which they trade. Forward foreign currency contracts are valued at the prevailing forward rates which are based on foreign currency exchange spot rates and forward points supplied by an independent pricing vendor. Foreign securities and currencies are valued in U.S. dollars based on foreign currency exchange rates supplied by an independent pricing vendor.
| 20 | JOHN HANCOCK Diversified Strategies Fund | ANNUAL REPORT | |
Other portfolio securities and assets, for which reliable market quotations are not readily available, are valued at fair value as determined in good faith by the fund's Pricing Committee following procedures established by the Board of Trustees. The frequency with which these fair valuation procedures are used cannot be predicted and fair value of securities may differ significantly from the value that would have been used had a ready market for such securities existed.
The fund uses a three-tier hierarchy to prioritize the pricing assumptions, referred to as inputs, used in valuation techniques to measure fair value. Level 1 includes securities valued using quoted prices in active markets for identical securities, including registered investment companies. Level 2 includes securities valued using other significant observable inputs. Observable inputs may include quoted prices for similar securities, interest rates, prepayment speeds and credit risk. Prices for securities valued using these inputs are received from independent pricing vendors and brokers and are based on an evaluation of the inputs described. Level 3 includes securities valued using significant unobservable inputs when market prices are not readily available or reliable, including the fund's own assumptions in determining the fair value of investments. Factors used in determining value may include market or issuer specific events or trends, changes in interest rates and credit quality. The inputs or methodology used for valuing securities are not necessarily an indication of the risks associated with investing in those securities. Changes in valuation techniques and related inputs may result in transfers into or out of an assigned level within the disclosure hierarchy.
The following is a summary of the values by input classification of the fund's investments as of July 31, 2019, by major security category or type:
| | Total
value at
7-31-19 | Level 1
quoted
price | Level 2
significant
observable
inputs | Level 3
significant
unobservable
inputs |
| Investments in securities: | | | | |
| Assets | | | | |
| Foreign government obligations | $530,268 | — | $530,268 | — |
| Affiliated investment companies | 284,081 | $284,081 | — | — |
| Unaffiliated investment companies | 210,307 | 210,307 | — | — |
| Purchased options | 153,478 | 27,567 | 125,911 | — |
| Short-term investments | 8,370,479 | 309,088 | 8,061,391 | — |
| Total investments in securities | $9,548,613 | $831,043 | $8,717,570 | — |
| Derivatives: | | | | |
| Assets | | | | |
| Futures | $24,817 | $24,817 | — | — |
| Forward foreign currency contracts | 30,545 | — | $30,545 | — |
| Liabilities | | | | |
| Futures | (17,361) | (17,361) | — | — |
| Forward foreign currency contracts | (30,536) | — | (30,536) | — |
| Written options | (28,079) | — | (28,079) | — |
Security transactions and related investment income. Investment security transactions are accounted for on a trade date plus one basis for daily NAV calculations. However, for financial reporting purposes, investment transactions are reported on trade date. Interest income is accrued as earned. Interest income includes coupon interest and amortization/accretion of premiums/discounts on debt securities. Debt obligations may be placed in a non-accrual status and related interest income may be reduced by stopping current accruals and writing off
| | ANNUAL REPORT | JOHN HANCOCK Diversified Strategies Fund | 21 |
interest receivable when the collection of all or a portion of interest has become doubtful. Dividend income is recorded on the ex-date, except for dividends of foreign securities where the dividend may not be known until after the ex-date. In those cases, dividend income, net of withholding taxes, is recorded when the fund becomes aware of the dividends. Non-cash dividends, if any, are recorded at the fair market value of the securities received. Gains and losses on securities sold are determined on the basis of identified cost and may include proceeds from litigation.
Foreign investing. Assets, including investments, and liabilities denominated in foreign currencies are translated into U.S. dollar values each day at the prevailing exchange rate. Purchases and sales of securities, income and expenses are translated into U.S. dollars at the prevailing exchange rate on the date of the transaction. The effect of changes in foreign currency exchange rates on the value of securities is reflected as a component of the realized and unrealized gains (losses) on investments. Foreign investments are subject to a decline in the value of a foreign currency versus the U.S. dollar, which reduces the dollar value of securities denominated in that currency.
Funds that invest internationally generally carry more risk than funds that invest strictly in U.S. securities. Risks can result from differences in economic and political conditions, regulations, market practices (including higher transaction costs), accounting standards and other factors.
Foreign taxes. The fund may be subject to withholding tax on income, capital gains or repatriation taxes imposed by certain countries, a portion of which may be recoverable. Foreign taxes are accrued based upon the fund’s understanding of the tax rules and rates that exist in the foreign markets in which it invests. Taxes are accrued based on gains realized by the fund as a result of certain foreign security sales. In certain circumstances, estimated taxes are accrued based on unrealized appreciation of such securities. Investment income is recorded net of foreign withholding taxes.
Line of credit. The fund may have the ability to borrow from banks for temporary or emergency purposes, including meeting redemption requests that otherwise might require the untimely sale of securities. Pursuant to the fund's custodian agreement, the custodian may loan money to the fund to make properly authorized payments. The fund is obligated to repay the custodian for any overdraft, including any related costs or expenses. The custodian may have a lien, security interest or security entitlement in any fund property that is not otherwise segregated or pledged, to the extent of any overdraft, and to the maximum extent permitted by law.
The fund and other affiliated funds, have entered into a syndicated line of credit agreement with Citibank, N.A. as the administrative agent that enables them to participate in a $750 million unsecured committed line of credit. Excluding commitments designated for a certain fund and subject to the needs of all other affiliated funds, the fund can borrow up to an aggregate commitment amount of $500 million, subject to asset coverage and other limitations as specified in the agreement. A commitment fee payable at the end of each calendar quarter, based on the average daily unused portion of the line of credit, is charged to each participating fund based on a combination of fixed and asset based allocations and is reflected in Other expenses on the Statement of operations. For the year ended July 31, 2019, the fund had no borrowings under the line of credit. Commitment fees for the year ended July 31, 2019 were $2,046.
Expenses. Within the John Hancock group of funds complex, expenses that are directly attributable to an individual fund are allocated to such fund. Expenses that are not readily attributable to a specific fund are allocated among all funds in an equitable manner, taking into consideration, among other things, the nature and type of expense and the fund’s relative net assets. Expense estimates are accrued in the period to which they relate and adjustments are made when actual amounts are known.
| 22 | JOHN HANCOCK Diversified Strategies Fund | ANNUAL REPORT | |
Class allocations. Income, common expenses and realized and unrealized gains (losses) are determined at the fund level and allocated daily to each class of shares based on the net assets of the class. Class-specific expenses, such as distribution and service fees, if any, and transfer agent fees, for all classes, are charged daily at the class level based on the net assets of each class and the specific expense rates applicable to each class.
Federal income taxes. The fund intends to continue to qualify as a regulated investment company by complying with the applicable provisions of the Internal Revenue Code and will not be subject to federal income tax on taxable income that is distributed to shareholders. Therefore, no federal income tax provision is required.
For federal income tax purposes, as of July 31, 2019, the fund has a short-term capital loss carryforward of $39,601 and a long-term capital loss carryforward of $4,612 available to offset future net realized capital gains. These carryforwards do not expire.
As of July 31, 2019, the fund had no uncertain tax positions that would require financial statement recognition, derecognition or disclosure. The fund's federal tax returns are subject to examination by the Internal Revenue Service for a period of three years.
Distribution of income and gains. Distributions to shareholders from net investment income and net realized gains, if any, are recorded on the ex-date. The fund generally declares and pays dividends annually. Capital gain distributions, if any, are typically distributed annually.
The tax character of distributions for the years ended July 31, 2019 and 2018 was as follows:
| | July 31, 2019 | July 31, 2018 |
| Ordinary income | — | $373,952 |
| Long-term capital gains | $2,312,156 | — |
| Total | $2,312,156 | $373,952 |
Distributions paid by the fund with respect to each class of shares are calculated in the same manner, at the same time and in the same amount, except for the effect of class level expenses that may be applied differently to each class. As of July 31, 2019, the components of distributable earnings on a tax basis consisted of $66,204 of undistributed ordinary income.
Such distributions and distributable earnings, on a tax basis, are determined in conformity with income tax regulations, which may differ from US GAAP. Distributions in excess of tax basis earnings and profits, if any, are reported in the fund's financial statements as a return of capital.
Capital accounts within the financial statements are adjusted for permanent book-tax differences. These adjustments have no impact on net assets or the results of operations. Temporary book-tax differences, if any, will reverse in a subsequent period. Book-tax differences are primarily attributable to foreign currency transactions.
Note 3—Derivative instruments
The fund may invest in derivatives in order to meet its investment objective. Derivatives include a variety of different instruments that may be traded in the over-the-counter (OTC) market, on a regulated exchange or through a clearing facility. The risks in using derivatives vary depending upon the structure of the instruments, including the use of leverage, optionality, the liquidity or lack of liquidity of the contract, the creditworthiness of the counterparty or clearing organization and the volatility of the position. Some derivatives involve risks that are potentially greater than the risks associated with investing directly in the referenced securities or other referenced
| | ANNUAL REPORT | JOHN HANCOCK Diversified Strategies Fund | 23 |
underlying instrument. Specifically, the fund is exposed to the risk that the counterparty to an OTC derivatives contract will be unable or unwilling to make timely settlement payments or otherwise honor its obligations. OTC derivatives transactions typically can only be closed out with the other party to the transaction.
Derivatives which are typically traded through the OTC market are regulated by the Commodity Futures Trading Commission (the CFTC). Derivative counterparty risk is managed through an ongoing evaluation of the creditworthiness of all potential counterparties and, if applicable, designated clearing organizations. The fund attempts to reduce its exposure to counterparty risk for derivatives traded in the OTC market, whenever possible, by entering into an International Swaps and Derivatives Association (ISDA) Master Agreement with each of its OTC counterparties. The ISDA gives each party to the agreement the right to terminate all transactions traded under the agreement if there is certain deterioration in the credit quality or contractual default of the other party, as defined in the ISDA. Upon an event of default or a termination of the ISDA, the non-defaulting party has the right to close out all transactions and to net amounts owed.
As defined by the ISDA, the fund may have collateral agreements with certain counterparties to mitigate counterparty risk on OTC derivatives. Subject to established minimum levels, collateral for OTC transactions is generally determined based on the net aggregate unrealized gain or loss on contracts with a particular counterparty. Collateral pledged to the fund, if any, is held in a segregated account by a third-party agent or held by the custodian bank for the benefit of the fund and can be in the form of cash or debt securities issued by the U.S. government or related agencies; collateral posted by the fund, if any, for OTC transactions is held in a segregated account at the fund's custodian and is noted in the accompanying Fund's investments, or if cash is posted, on the Statement of assets and liabilities. The fund's risk of loss due to counterparty risk is equal to the asset value of outstanding contracts offset by collateral received.
Certain derivatives are traded or cleared on an exchange or central clearinghouse. Exchange-traded or centrally-cleared transactions generally present less counterparty risk to a fund than OTC transactions. The exchange or clearinghouse stands between the fund and the broker to the contract and therefore, credit risk is generally limited to the failure of the exchange or clearinghouse and the clearing member.
Futures. A futures contract is a contractual agreement to buy or sell a particular currency or financial instrument at a pre-determined price in the future. Risks related to the use of futures contracts include possible illiquidity of the futures markets and contract prices that can be highly volatile and imperfectly correlated to movements in the underlying financial instrument and potential losses in excess of the amounts recognized on the Statement of assets and liabilities. Use of long futures contracts subjects the fund to the risk of loss up to the notional value of the futures contracts. Use of short futures contracts subjects the fund to unlimited risk of loss.
Upon entering into a futures contract, the fund is required to deposit initial margin with the broker in the form of cash or securities. The amount of required margin is generally based on a percentage of the contract value; this amount is the initial margin for the trade. The margin deposit must then be maintained at the established level over the life of the contract. Payable for futures variation margin is included on the Statement of assets and liabilities. Futures contracts are marked-to-market daily and an appropriate payable or receivable for the change in value (variation margin) and unrealized gain or loss is recorded by the fund. When the contract is closed, the fund records a realized gain or loss equal to the difference between the value of the contract at the time it was opened and the value at the time it was closed. Collateral or margin requirements are set by the broker or applicable clearinghouse. Collateral is detailed in the Statement of assets and liabilities as Collateral held at broker for futures contracts. Securities pledged by the fund, if any, are identified in the Fund's investments.
During the year ended July 31, 2019, the fund used futures contracts to manage against anticipated changes in
| 24 | JOHN HANCOCK Diversified Strategies Fund | ANNUAL REPORT | |
securities markets, gain exposure to certain securities markets, as a substitute for securities purchased and to maintain diversity of the portfolio. The fund held futures contracts with USD notional values ranging from $5.0 million to $22.1 million, as measured at each quarter end.
Forward foreign currency contracts. A forward foreign currency contract is an agreement between two parties to buy and sell specific currencies at a price that is set on the date of the contract. The forward contract calls for delivery of the currencies on a future date that is specified in the contract. Risks related to the use of forwards include the possible failure of counterparties to meet the terms of the forward agreement, the failure of the counterparties to timely post collateral if applicable, and the risk that currency movements will not favor the fund thereby reducing the fund’s total return, and the potential for losses in excess of the amounts recognized on the Statement of assets and liabilities.
The market value of a forward foreign currency contract fluctuates with changes in foreign currency exchange rates. Forward foreign currency contracts are marked-to-market daily and the change in value is recorded by the fund as an unrealized gain or loss. Realized gains or losses, equal to the difference between the value of the contract at the time it was opened and the value at the time it was closed, are recorded upon delivery or receipt of the currency or settlement with the counterparty.
During the year ended July 31, 2019, the fund used forward foreign currency contracts to manage against anticipated changes in currency exchange rates, gain exposure to foreign currencies and as a substitute for securities purchased. The fund held forward foreign currency contracts with USD notional values ranging from $4.0 million to $16.2 million, as measured at each quarter end.
Options. There are two types of options, put options and call options. Options are traded either OTC or on an exchange. A call option gives the purchaser of the option the right to buy (and the seller the obligation to sell) the underlying instrument at the exercise price. A put option gives the purchaser of the option the right to sell (and the writer the obligation to buy) the underlying instrument at the exercise price. Writing puts and buying calls may increase the fund’s exposure to changes in the value of the underlying instrument. Buying puts and writing calls may decrease the fund’s exposure to such changes. Risks related to the use of options include the loss of premiums, possible illiquidity of the options markets, trading restrictions imposed by an exchange and movements in underlying security values, and for written options, potential losses in excess of the amounts recognized on the Statement of assets and liabilities. In addition, OTC options are subject to the risks of all OTC derivatives contracts.
When the fund purchases an option, the premium paid is included in the Fund's investments and subsequently “marked-to-market” to reflect current market value. If the purchased option expires, the fund realizes a loss equal to the cost of the option. If the fund exercises a call option, the cost of the securities acquired by exercising the call is increased by the premium paid to buy the call. If the fund exercises a put option, it realizes a gain or loss from the sale of the underlying security and the proceeds from such sale are decreased by the premium paid. If the fund enters into a closing sale transaction, it realizes a gain or loss, depending on whether proceeds from the closing sale are greater or less than the original cost. When the fund writes an option, the premium received is included as a liability and subsequently “marked-to-market” to reflect the current market value of the option written. Premiums received from writing options that expire unexercised are recorded as realized gains. Premiums received from writing options which are exercised or are closed are added to or offset against the proceeds or amount paid on the transaction to determine the realized gain or loss. If a put option on a security is exercised, the premium received reduces the cost basis of the securities purchased by the fund.
During the year ended July 31, 2019, the fund used purchased options contracts to manage against anticipated currency exchange rates, to gain exposure to foreign currency and as a substitute for securities purchased. The fund held purchased options contracts with market values ranging from $87,000 to $178,000, as measured at
| | ANNUAL REPORT | JOHN HANCOCK Diversified Strategies Fund | 25 |
each quarter end.
During the year ended July 31, 2019, the fund wrote option contracts to manage against anticipated currency exchange rates, to gain exposure to foreign currency and as a substitute for securities purchased. The fund held written option contracts with market values ranging from $14,000 to $81,000, as measured at each quarter end.
Swaps. Swap agreements are agreements between the fund and counterparty to exchange cash flows, assets, foreign currencies or market-linked returns at specified intervals. Swap agreements are privately negotiated in the OTC market (OTC swaps) or may be executed on a registered commodities exchange (centrally cleared swaps). Swaps are marked-to-market daily and the change in value is recorded as a component of unrealized appreciation/depreciation of swap contracts. The value of the swap will typically impose collateral posting obligations on the party that is considered out-of-the-money on the swap.
Upfront payments made/received by the fund, if any, are amortized/accreted for financial reporting purposes, with the unamortized/unaccreted portion included in the Statement of assets and liabilities. A termination payment by the counterparty or the fund is recorded as realized gain or loss, as well as the net periodic payments received or paid by the fund.
Entering into swap agreements involves, to varying degrees, elements of credit, market and documentation risk that may provide outcomes that are in excess of the amounts recognized on the Statement of assets and liabilities. Such risks involve the possibility that there will be no liquid market for the swap, or that a counterparty may default on its obligation or delay payment under the swap terms. The counterparty may disagree or contest the terms of the swap. In addition to interest rate risk, market risks may also impact the swap. The fund may also suffer losses if it is unable to terminate or assign outstanding swaps or reduce its exposure through offsetting transactions.
Interest rate swaps. Interest rate swaps represent an agreement between the fund and a counterparty to exchange cash flows based on the difference between two interest rates applied to a notional amount. The payment flows are usually netted against each other, with the difference being paid by one party to the other. The fund settles accrued net interest receivable or payable under the swap contracts at specified, future intervals.
During the year ended ended July 31, 2019, the fund used interest rate swaps to manage against anticipated interest rate changes, gain exposure to certain securities markets and as a temporary substitute for securities purchased. The fund held interest rate swaps with total USD notional amounts ranging up to $22.5 million, as measured at each quarter end.
Fair value of derivative instruments by risk category
The table below summarizes the fair value of derivatives held by the fund at July 31, 2019 by risk category:
| Risk | Statement of
assets and
liabilities location | Financial
instruments
location | Assets
derivatives
fair value | Liabilities
derivatives
fair value |
| Interest rate | Receivable/payable for futures variation margin | Futures1 | $2,551 | $(5,110) |
| Equity | Receivable/payable for futures variation margin | Futures1 | 22,266 | (12,251) |
| Foreign currency | Unrealized appreciation / depreciation on forward foreign currency contracts | Forward foreign currency contracts | 30,545 | (30,536) |
| Interest rate | Unaffiliated investments, at value2 | Purchased options | 4,767 | — |
| Foreign currency | Unaffiliated investments, at value2 | Purchased options | 125,911 | — |
| Equity | Unaffiliated investments, at value2 | Purchased options | 22,800 | — |
| 26 | JOHN HANCOCK Diversified Strategies Fund | ANNUAL REPORT | |
| Risk | Statement of
assets and
liabilities location | Financial
instruments
location | Assets
derivatives
fair value | Liabilities
derivatives
fair value |
| Foreign currency | Written options, at value | Written options | — | $(28,079) |
| | | | $208,840 | $(75,976) |
| 1 | Reflects cumulative appreciation/depreciation on futures as disclosed in the Fund's investments. Only the year end variation margin is separately disclosed on the Statement of assets and liabilities. |
| 2 | Purchased options are included in the Fund's investments. |
For financial reporting purposes, the fund does not offset OTC derivative assets or liabilities that are subject to master netting arrangements, as defined by the ISDAs, in the Statement of assets and liabilities. In the event of default by the counterparty or a termination of the agreement, the ISDA allows an offset of amounts across the various transactions between the fund and the applicable counterparty. The tables below reflect the fund's exposure to OTC derivative transactions and exposure to counterparties subject to an ISDA:
| OTC Financial Instruments | Asset | Liability |
| Forward foreign currency contracts | $30,545 | ($30,536) |
| Purchased options | 125,911 | - |
| Written options | - | (28,079) |
| Totals | $156,456 | ($58,615) |
| Counterparty | Total Market
Value of OTC
Derivatives | Collateral
Posted by
Counterparty | Collateral
Posted by
Fund | Net
Exposure |
| Citibank, N.A. | ($11,548) | — | — | ($11,548) |
| Goldman Sachs International | 28,764 | — | — | 28,764 |
| HSBC Bank PLC | 23,619 | — | — | 23,619 |
| HSBC Bank USA, N.A. | 31,944 | — | — | 31,944 |
| JPMorgan Chase Bank, N.A. | 2,405 | — | — | 2,405 |
| Morgan Stanley Capital Services Inc | 6,939 | — | — | 6,939 |
| Morgan Stanley & Co. International PLC | (8,977) | — | — | (8,977) |
| UBS AG | 24,695 | — | — | 24,695 |
| Total | $97,841 | — | — | $97,841 |
Effect of derivative instruments on the Statement of operations
The table below summarizes the net realized gain (loss) included in the net increase (decrease) in net assets from operations, classified by derivative instrument and risk category, for the year ended July 31, 2019:
| | Statement of operations location - Net realized gain (loss) on: |
| Risk | Unaffiliated
investments and
foreign currency
transactions1 | Futures contracts | Forward foreign
currency contracts | Written options | Swap contracts | Total |
| Interest rate | $14,038 | $96,039 | — | $24,653 | $81,731 | $216,461 |
| Foreign currency | (171,333) | — | $(29,012) | 147,178 | — | (53,167) |
| Credit | — | (136,467) | — | — | — | (136,467) |
| | ANNUAL REPORT | JOHN HANCOCK Diversified Strategies Fund | 27 |
| | Statement of operations location - Net realized gain (loss) on: |
| Risk | Unaffiliated
investments and
foreign currency
transactions1 | Futures contracts | Forward foreign
currency contracts | Written options | Swap contracts | Total |
| Equity | $(20,665) | — | — | $4,697 | — | (15,968) |
| Total | $(177,960) | $(40,428) | $(29,012) | $176,528 | $81,731 | $10,859 |
| 1 | Realized gain/loss associated with purchased options is included in this caption on the Statement of operations. |
The table below summarizes the net change in unrealized appreciation (depreciation) included in the net increase (decrease) in net assets from operations, classified by derivative instrument and risk category, for the year ended July 31, 2019:
| | Statement of operations location - Change in net unrealized appreciation (depreciation) of: |
| Risk | Unaffiliated
investments and
translation of assets
and liabilities in
foreign currencies1 | Futures contracts | Forward foreign
currency contracts | Written options | Total |
| Interest rate | $(7,866) | $767 | — | — | $(7,099) |
| Foreign currency | 9,992 | — | $(1,623) | $(20,730) | (12,361) |
| Equity | (7,951) | 8,323 | — | — | 372 |
| Total | $(5,825) | $9,090 | $(1,623) | $(20,730) | $(19,088) |
| 1 | Change in unrealized appreciation/depreciation associated with purchased options is included in this caption on the Statement of operations. |
Note 4—Guarantees and indemnifications
Under the Trust's organizational documents, its Officers and Trustees are indemnified against certain liabilities arising out of the performance of their duties to the Trust, including the fund. Additionally, in the normal course of business, the fund enters into contracts with service providers that contain general indemnification clauses. The fund's maximum exposure under these arrangements is unknown, as this would involve future claims that may be made against the fund that have not yet occurred. The risk of material loss from such claims is considered remote.
Note 5—Fees and transactions with affiliates
John Hancock Investment Management LLC (the Advisor) serves as investment advisor for the fund. John Hancock Investment Management Distributors LLC (the Distributor), an affiliate of the Advisor, serves as principal underwriter of the fund. The Advisor and the Distributor are indirect, wholly owned subsidiaries of Manulife Financial Corporation (MFC). Prior to June 28, 2019, the Advisor was known as John Hancock Advisers, LLC and the Distributor was known as John Hancock Funds, LLC.
Management fee. The fund has an investment management agreement with the Advisor under which the fund pays a daily management fee to the Advisor equivalent on an annual basis to the sum of: (a) 1.00% of the first $500 million of the fund’s average daily net assets and (b) 0.95% of the fund’s average daily net assets in excess of $500 million. The Advisor has a subadvisory agreement with Manulife Investment Management (US) LLC, an indirectly owned subsidiary of MFC and an affiliate of the Advisor. Prior to May 7, 2019, Manulife Investment Management (US) LLC was known as John Hancock Asset Management, a division of Manulife Asset Management (US) LLC. The fund is not responsible for payment of the subadvisory fees.
| 28 | JOHN HANCOCK Diversified Strategies Fund | ANNUAL REPORT | |
The Advisor has contractually agreed to waive a portion of its management fee and/or reimburse expenses for certain funds of the John Hancock group of funds complex, including the fund (the participating portfolios). This waiver is based upon aggregate net assets of all the participating portfolios. The amount of the reimbursement is calculated daily and allocated among all the participating portfolios in proportion to the daily net assets of each fund. During the year ended July 31, 2019, this waiver amounted to 0.01% of the fund’s average daily net assets. This arrangement expires on July 31, 2021, unless renewed by mutual agreement of the fund and the Advisor based upon a determination that this is appropriate under the circumstances at that time.
The Advisor voluntarily agreed to reduce its management fee or, if necessary, make payments to Class A and Class I shares, in an amount equal to the amount by which the expenses of Class A and Class I shares exceed 1.70% and 1.39%, respectively, of average annual net assets (on an annualized basis). For purposes of this agreement, expenses mean all fund level and class specific operating expenses, excluding: (a) taxes, (b) brokerage commissions, (c) interest expense, (d) litigation and indemnification expenses and other extraordinary expenses not incurred in the ordinary course of the fund’s business, (e) underlying fund expenses (acquired fund fees), and (f) short dividend expense. This agreement may be terminated at anytime by the Advisor upon notice to the fund.
For the year ended July 31, 2019, the expense reductions described above amounted to the following:
| Class | Expense reduction |
| Class A | $42,367 |
| Class I | 47,562 |
| Total | $89,929 |
Expenses waived or reimbursed in the current fiscal period are not subject to recapture in future fiscal periods.
The investment management fees, including the impact of the waivers and reimbursements as described above, incurred for the year ended July 31, 2019, were equivalent to a net annual effective rate of 0.12% of the fund's average daily net assets.
Accounting and legal services. Pursuant to a service agreement, the fund reimburses the Advisor for all expenses associated with providing the administrative, financial, legal, compliance, accounting and recordkeeping services to the fund, including the preparation of all tax returns, periodic reports to shareholders and regulatory reports, among other services. These expenses are allocated to each share class based on its relative net assets at the time the expense was incurred. These accounting and legal services fees incurred for the year ended July 31, 2019 amounted to an annual rate of 0.02% of the fund's average daily net assets.
Distribution and service plans. The fund has a distribution agreement with the Distributor. The fund has adopted distribution and service plans pursuant to Rule 12b-1 under the 1940 Act, to pay the Distributor for services provided as the distributor of shares of the fund. The fund may pay up to the following contractual rates of distribution and service fees under these arrangements, expressed as an annual percentage of average daily net assets for each class of the fund's shares:
| Class | Rule 12b-1 Fee |
| Class A | 0.30% |
Sales charges. Class A shares may be subject to up-front sales charges. For the year ended July 31, 2019, no sales charges were assessed.
| | ANNUAL REPORT | JOHN HANCOCK Diversified Strategies Fund | 29 |
Class A shares may be subject to contingent deferred sales charges (CDSCs). Certain Class A shares that are acquired through purchases of $1 million or more and are redeemed within one year of purchase are subject to a 1.00% sales charge. CDSCs are applied to the lesser of the current market value at the time of redemption or the original purchase cost of the shares being redeemed. Proceeds from CDSCs are used to compensate the Distributor for providing distribution-related services in connection with the sale of these shares. During the year ended July 31, 2019, there were no CDSCs received by the Distributor for Class A shares.
Transfer agent fees. The John Hancock group of funds has a complex-wide transfer agent agreement with John Hancock Signature Services, Inc. (Signature Services), an affiliate of the Advisor. The transfer agent fees paid to Signature Services are determined based on the cost to Signature Services (Signature Services Cost) of providing recordkeeping services. It also includes out-of-pocket expenses, including payments made to third-parties for recordkeeping services provided to their clients who invest in one or more John Hancock funds. In addition, Signature Services Cost may be reduced by certain fees that Signature Services receives in connection with retirement and small accounts. Signature Services Cost is calculated monthly and allocated, as applicable, to five categories of share classes: Retail Share and Institutional Share Classes of Non-Municipal Bond Funds, Class R6 Shares, Retirement Share Classes and Municipal Bond Share Classes. Within each of these categories, the applicable costs are allocated to the affected John Hancock affiliated funds and/or classes, based on the relative average daily net assets.
Class level expenses. Class level expenses for the year ended July 31, 2019 were as follows:
| Class | Distribution and service fees | Transfer agent fees |
| Class A | $14,660 | $5,539 |
| Class I | — | 6,776 |
| Total | $14,660 | $12,315 |
Trustee expenses. The fund compensates each Trustee who is not an employee of the Advisor or its affiliates. The costs of paying Trustee compensation and expenses are allocated to the fund based on its net assets relative to other funds within the John Hancock group of funds complex.
Interfund lending program. Pursuant to an Exemptive Order issued by the SEC, the fund, along with certain other funds advised by the Advisor or its affiliates, may participate in an interfund lending program. This program provides an alternative credit facility allowing the funds to borrow from, or lend money to, other participating affiliated funds. At period end, no interfund loans were outstanding. The fund's activity in this program during the period for which loans were outstanding was as follows:
Borrower
or Lender | Weighted Average
Loan Balance | Days
Outstanding | Weighted Average
Interest Rate | Interest Income
(Expense) |
| Lender | $500,000 | 1 | 1.910% | $27 |
Note 6—Fund share transactions
Transactions in fund shares for the years ended July 31, 2019 and 2018 were as follows:
| 30 | JOHN HANCOCK Diversified Strategies Fund | ANNUAL REPORT | |
| | Year Ended 7-31-19 | Year Ended 7-31-18 |
| | Shares | Amount | Shares | Amount |
| Class A shares | | | | |
| Sold | — | — | 468,051 | $5,000,000 |
| Distributions reinvested | 139,619 | $1,082,050 | 16,289 | 168,105 |
| Repurchased | — | — | (3,048,222) | (32,562,941) |
| Net increase (decrease) | 139,619 | $1,082,050 | (2,563,882) | $(27,394,836) |
| Class I shares | | | | |
| Sold | 6,568 | $51,574 | 476,551 | $5,103,441 |
| Distributions reinvested | 157,706 | 1,230,106 | 19,927 | 205,847 |
| Repurchased | (58,934) | (461,315) | (924,521) | (9,909,027) |
| Net increase (decrease) | 105,340 | $820,365 | (428,043) | $(4,599,739) |
| Total net increase (decrease) | 244,959 | $1,902,415 | (2,991,925) | $(31,994,575) |
Affiliates of the fund owned 100% of shares of Class A and Class I on July 31, 2019. Such concentration of shareholders’ capital could have a material effect on the fund if such shareholders redeem from the fund.
Note 7—Purchase and sale of securities
Purchases and sales of securities, other than short-term investments, amounted to $1,466,844 and $640,946, respectively, for the year ended July 31, 2019.
Note 8—Investment in affiliated underlying funds
The fund may invest in affiliated underlying funds that are managed by the Advisor and its affiliates. Information regarding the fund's fiscal year to date purchases and sales of the affiliated underlying funds as well as income and capital gains earned by the fund, if any, is as follows:
| | | | | | Dividends and distributions |
| Affiliate | Beginning
share
amount | Shares
purchased | Shares
sold | Ending
share
amount | Income
distributions
received | Capital gain
distributions
received | Realized
gain
(loss) | Change in
unrealized
appreciation
(depreciation) | Ending
value |
| Asia Pacific Total Return Bond | — | 28,557 | (63) | 28,494 | — | — | $18 | $9,688 | $284,081 |
| | ANNUAL REPORT | JOHN HANCOCK Diversified Strategies Fund | 31 |
Report of Independent Registered Public Accounting Firm
To the Board of Trustees of John Hancock Funds II and Shareholders of John Hancock Diversified Strategies Fund
Opinion on the Financial Statements
We have audited the accompanying statement of assets and liabilities, including the Fund’s investments, of John Hancock Diversified Strategies Fund (one of the funds constituting John Hancock Funds II, referred to hereafter as the "Fund") as of July 31, 2019, the related statement of operations for the year ended July 31, 2019, the statements of changes in net assets for each of the two years in the period ended July 31, 2019, including the related notes, and the financial highlights for each of the five years in the period ended July 31, 2019 (collectively referred to as the “financial statements”). In our opinion, the financial statements present fairly, in all material respects, the financial position of the Fund as of July 31, 2019, the results of its operations for the year then ended, the changes in its net assets for each of the two years in the period ended July 31, 2019 and the financial highlights for each of the five years in the period ended July 31, 2019 in conformity with accounting principles generally accepted in the United States of America.
Basis for Opinion
These financial statements are the responsibility of the Fund’s management. Our responsibility is to express an opinion on the Fund’s financial statements based on our audits. We are a public accounting firm registered with the Public Company Accounting Oversight Board (United States) (PCAOB) and are required to be independent with respect to the Fund in accordance with the U.S. federal securities laws and the applicable rules and regulations of the Securities and Exchange Commission and the PCAOB.
We conducted our audits of these financial statements in accordance with the standards of the PCAOB. Those standards require that we plan and perform the audit to obtain reasonable assurance about whether the financial statements are free of material misstatement, whether due to error or fraud.
Our audits included performing procedures to assess the risks of material misstatement of the financial statements, whether due to error or fraud, and performing procedures that respond to those risks. Such procedures included examining, on a test basis, evidence regarding the amounts and disclosures in the financial statements. Our audits also included evaluating the accounting principles used and significant estimates made by management, as well as evaluating the overall presentation of the financial statements. Our procedures included confirmation of securities owned as of July 31, 2019 by correspondence with the custodian, transfer agent, and brokers; when replies were not received from brokers, we performed other auditing procedures. We believe that our audits provide a reasonable basis for our opinion.
/s/ PricewaterhouseCoopers LLP
Boston, Massachusetts
September 20, 2019
We have served as the auditor of one or more investment companies in the John Hancock group of funds since 1988.
| 32 | JOHN HANCOCK DIVERSIFIED STRATEGIES FUND | ANNUAL REPORT | |
TAX INFORMATION
Unaudited
For federal income tax purposes, the following information is furnished with respect to the distributions of the fund, if any, paid during its taxable year ended July 31, 2019.
The fund reports the maximum amount allowable of its net taxable income as eligible for the corporate dividends-received deduction.
The fund reports the maximum amount allowable of its net taxable income as qualified dividend income as provided in the Jobs and Growth Tax Relief Reconciliation Act of 2003.
The fund paid $2,312,150 in long term capital gain dividends.
The fund reports the maximum amount allowable of its Section 199A dividends as defined in Proposed Treasury Regulation §1.199A-3(d).
Eligible shareholders will be mailed a 2019 Form 1099-DIV in early 2020. This will reflect the tax character of all distributions paid in calendar year 2019.
Please consult a tax advisor regarding the tax consequences of your investment in the fund.
| | ANNUAL REPORT | JOHN HANCOCK DIVERSIFIED STRATEGIES FUND | 33 |
CONTINUATION OF INVESTMENT ADVISORY AND SUBADVISORY AGREEMENTS
Evaluation of Advisory and Subadvisory Agreements by the Board of Trustees
This section describes the evaluation by the Board of Trustees (the Board) of John Hancock Funds II (the Trust) of the Advisory Agreement (the Advisory Agreement) with John Hancock Investment Management LLC (the Advisor, formerly known as "John Hancock Advisers, LLC") and the Subadvisory Agreement (the Subadvisory Agreement) with Manulife Investment Management (US) LLC (the Subadvisor, formerly known as "John Hancock Asset Management a division of Manulife Asset Management (US) LLC") for John Hancock Diversified Strategies Fund (the fund). The Advisory Agreement and Subadvisory Agreement are collectively referred to as the Agreements. Prior to the June 23-26, 2019 in-person meeting at which the Agreements were approved, the Board also discussed and considered information regarding the proposed continuation of the Agreements at an in-person meeting held on May 28-30, 2019.
Approval of Advisory and Subadvisory Agreements
At in-person meetings held on June 23-26, 2019, the Board, including the Trustees who are not parties to any Agreement or considered to be interested persons of the Trust under the Investment Company Act of 1940, as amended (the 1940 Act) (the Independent Trustees), reapproved for an annual period the continuation of the Advisory Agreement between the Trust and the Advisor and the Subadvisory Agreement between the Advisor and the Subadvisor with respect to the fund.
In considering the Advisory Agreement and the Subadvisory Agreement, the Board received in advance of the meetings a variety of materials relating to the fund, the Advisor and the Subadvisor, including comparative performance, fee and expense information for a peer group of similar funds prepared by an independent third-party provider of fund data, performance information for an applicable benchmark index; and, with respect to the Subadvisor, comparative performance information for comparably managed accounts, as applicable, and other information provided by the Advisor and the Subadvisor regarding the nature, extent and quality of services provided by the Advisor and the Subadvisor under their respective Agreements, as well as information regarding the Advisor's revenues and costs of providing services to the fund and any compensation paid to affiliates of the Advisor. At the meetings at which the renewal of the Advisory Agreement and Subadvisory Agreement are considered, particular focus is given to information concerning fund performance, comparability of fees and total expenses, and profitability. However, the Board notes that the evaluation process with respect to the Advisor and the Subadvisor is an ongoing one. In this regard, the Board also took into account discussions with management and information provided to the Board (including its various committees) at prior meetings with respect to the services provided by the Advisor and the Subadvisor to the fund, including quarterly performance reports prepared by management containing reviews of investment results and prior presentations from the Subadvisor with respect to the fund. The information received and considered by the Board in connection with the May and June meetings and throughout the year was both written and oral. The Board noted the affiliation of the Subadvisor with the Advisor, noting any potential conflicts of interest. The Board also considered the nature, quality, and extent of non-advisory services, if any, to be provided to the fund by the Advisor's affiliates, including distribution services. The Board considered the Advisory Agreement and the Subadvisory Agreement separately in the course of its review. In doing so, the Board noted the respective roles of the Advisor and Subadvisor in providing services to the fund.
Throughout the process, the Board asked questions of and requested additional information from management. The Board is assisted by counsel for the Trust and the Independent Trustees are also separately assisted by independent legal counsel throughout the process. The Independent Trustees also received a memorandum from their independent
ANNUAL REPORT | JOHN HANCOCK DIVERSIFIED STRATEGIES FUND 34
legal counsel discussing the legal standards for their consideration of the proposed continuation of the Agreements and discussed the proposed continuation of the Agreements in private sessions with their independent legal counsel at which no representatives of management were present.
Approval of Advisory Agreement
In approving the Advisory Agreement with respect to the fund, the Board, including the Independent Trustees, considered a variety of factors, including those discussed below. The Board also considered other factors (including conditions and trends prevailing generally in the economy, the securities markets, and the industry) and did not treat any single factor as determinative, and each Trustee may have attributed different weights to different factors. The Board's conclusions may be based in part on its consideration of the advisory and subadvisory arrangements in prior years and on the Board's ongoing regular review of fund performance and operations throughout the year.
Nature, extent, and quality of services. Among the information received by the Board from the Advisor relating to the nature, extent, and quality of services provided to the fund, the Board reviewed information provided by the Advisor relating to its operations and personnel, descriptions of its organizational and management structure, and information regarding the Advisor's compliance and regulatory history, including its Form ADV. The Board also noted that on a regular basis it receives and reviews information from the Trust's Chief Compliance Officer (CCO) regarding the fund's compliance policies and procedures established pursuant to Rule 38a-1 under the 1940 Act. The Board observed that the scope of services provided by the Advisor, and of the undertakings required of the Advisor in connection with those services, including maintaining and monitoring its own and the fund's compliance programs, risk management programs, liquidity management programs and cybersecurity programs, had expanded over time as a result of regulatory, market and other developments. The Board considered that the Advisor is responsible for the management of the day-to-day operations of the fund, including, but not limited to, general supervision of and coordination of the services provided by the Subadvisor, and is also responsible for monitoring and reviewing the activities of the Subadvisor and third-party service providers. The Board also considered the significant risks assumed by the Advisor in connection with the services provided to the fund including entrepreneurial risk in sponsoring new funds and ongoing risks including investment, operational, enterprise, litigation, regulatory and compliance risks with respect to all funds.
In considering the nature, extent, and quality of the services provided by the Advisor, the Trustees also took into account their knowledge of the Advisor's management and the quality of the performance of the Advisor's duties, through Board meetings, discussions and reports during the preceding year and through each Trustee's experience as a Trustee of the Trust and of the other trusts in the John Hancock group of funds complex (the John Hancock Fund Complex).
In the course of their deliberations regarding the Advisory Agreement, the Board considered, among other things:
| | | | | | | | | |
| | | | | (a) | | | the skills and competency with which the Advisor has in the past managed the Trust's affairs and its subadvisory relationship, the Advisor's oversight and monitoring of the Subadvisor's investment performance and compliance programs, such as the Subadvisor's compliance with fund policies and objectives, review of brokerage matters, including with respect to trade allocation and best execution and the Advisor's timeliness in responding to performance issues; | |
| | | | | (b) | | | the background, qualifications and skills of the Advisor's personnel; | |
| | | | | (c) | | | the Advisor's compliance policies and procedures and its responsiveness to regulatory changes and fund industry developments; | |
ANNUAL REPORT | JOHN HANCOCK DIVERSIFIED STRATEGIES FUND 35
| | | | | | | | | |
| | | | | (d) | | | the Advisor's administrative capabilities, including its ability to supervise the other service providers for the fund, as well as the Advisor's oversight of any securities lending activity, its monitoring of class action litigation and collection of class action settlements on behalf of the fund, and bringing loss recovery actions on behalf of the fund; | |
| | | | | (e) | | | the financial condition of the Advisor and whether it has the financial wherewithal to provide a high level and quality of services to the fund; | |
| | | | | (f) | | | the Advisor's initiatives intended to improve various aspects of the Trust's operations and investor experience with the fund; and | |
| | | | | (g) | | | the Advisor's reputation and experience in serving as an investment advisor to the Trust and the benefit to shareholders of investing in funds that are part of a family of funds offering a variety of investments. | |
The Board concluded that the Advisor may reasonably be expected to continue to provide a high quality of services under the Advisory Agreement with respect to the fund.
Investment performance. In considering the fund's performance, the Board noted that it reviews at its regularly scheduled meetings information about the fund's performance results. In connection with the consideration of the Advisory Agreement, the Board:
| | | |
| | (a) | reviewed information prepared by management regarding the fund's performance; |
| | (b) | considered the comparative performance of an applicable benchmark index; |
| | (c) | considered the performance of comparable funds, if any, as included in the report prepared by an independent third-party provider of fund data; and |
| | (d) | took into account the Advisor's analysis of the fund's performance and its plans and recommendations regarding the Trust's subadvisory arrangements generally. |
The Board noted that while it found the data provided by the independent third-party generally useful it recognized its limitations, including in particular that the data may vary depending on the end date selected and the results of the performance comparisons may vary depending on the selection of the peer group. The Board noted that the fund underperformed its benchmark index for the one-, three- and five-year periods ended December 31, 2018. The Board also noted that the fund outperformed its peer group average for the one- and five-year periods and underperformed its peer group average for the three-year period ended December 31, 2018. The Board took into account management's discussion of the fund's performance, including the favorable performance relative to the peer group for the one- and five year periods. The Board concluded that the fund's performance is being monitored and reasonably addressed, where appropriate.
Fees and expenses. The Board reviewed comparative information prepared by an independent third-party provider of fund data, including, among other data, the fund's contractual and net management fees (and subadvisory fees, to the extent available) and total expenses as compared to similarly situated investment companies deemed to be comparable to the fund in light of the nature, extent and quality of the management and advisory and subadvisory services provided by the Advisor and the Subadvisor. The Board considered the fund's ranking within a smaller group of peer funds chosen by the independent third-party provider, as well as the fund's ranking within a broader group of funds. In comparing the fund's contractual and net management fees to those of comparable funds, the Board noted that such fees include both advisory and administrative costs. The Board noted that net management fees and net total expenses for the fund are lower than the peer group median.
ANNUAL REPORT | JOHN HANCOCK DIVERSIFIED STRATEGIES FUND 36
The Board took into account management's discussion with respect to the overall management fee and the fees of the Subadvisor, including the amount of the advisory fee retained by the Advisor after payment of the subadvisory fee, in each case in light of the services rendered for those amounts and the risks undertaken by the Advisor. The Board also noted that the Advisor pays the subadvisory fee. In addition, the Board took into account that management had agreed to implement an overall fee waiver across the complex, including the fund, which is discussed further below. The Board also noted actions taken over the past several years to reduce the fund's operating expenses. The Board also noted that, in addition, the Advisor is currently waiving fees and/or reimbursing expenses with respect to the fund and that the fund has breakpoints in its contractual management fee schedule that reduces management fees as assets increase. The Board reviewed information provided by the Advisor concerning the investment advisory fee charged by the Advisor or one of its advisory affiliates to other clients (including other funds in the John Hancock Fund Complex) having similar investment mandates, if any. The Board considered any differences between the Advisor's and Subadvisor's services to the fund and the services they provide to other comparable clients or funds. The Board concluded that the advisory fee paid with respect to the fund is reasonable in light of the nature, extent and quality of the services provided to the fund under the Advisory Agreement.
Profitability/Fall out benefits. In considering the costs of the services to be provided and the profits to be realized by the Advisor and its affiliates (including the Subadvisor) from the Advisor's relationship with the Trust, the Board:
| | | | | | | | | |
| | | | | (a) | | | reviewed financial information of the Advisor; | |
| | | | | (b) | | | reviewed and considered information presented by the Advisor regarding the net profitability to the Advisor and its affiliates with respect to the fund; | |
| | | | | (c) | | | received and reviewed profitability information with respect to the John Hancock Fund Complex as a whole and with respect to the fund; | |
| | | | | (d) | | | received information with respect to the Advisor's allocation methodologies used in preparing the profitability data and considered that the Advisor hired an independent third-party consultant to provide an analysis of the Advisor's allocation methodologies; | |
| | | | | (e) | | | considered that the John Hancock insurance companies that are affiliates of the Advisor, as shareholders of the Trust directly or through their separate accounts, receive certain tax credits or deductions relating to foreign taxes paid and dividends received by certain funds of the Trust and noted that these tax benefits, which are not available to participants in qualified retirement plans under applicable income tax law, are reflected in the profitability information reviewed by the Board; | |
| | | | | (f) | | | considered that the Advisor also provides administrative services to the fund on a cost basis pursuant to an administrative services agreement; | |
| | | | | (g) | | | noted that affiliates of the Advisor provide transfer agency services and distribution services to the fund, and that the fund's distributor also receives Rule 12b-1 payments to support distribution of the fund; | |
| | | | | (h) | | | noted that the fund's Subadvisor is an affiliate of the Advisor; | |
| | | | | (i) | | | noted that affiliates of the Advisor provide transfer agency services and placement services to the fund; | |
| | | | | (j) | | | noted that the Advisor also derives reputational and other indirect benefits from providing advisory services to the fund; | |
| | | | | (k) | | | noted that the subadvisory fee for the fund is paid by the Advisor; | |
| | | | | (l) | | | considered the Advisor's ongoing costs and expenditures necessary to improve services, meet new regulatory and compliance requirements, and adapt to other challenges impacting the fund industry; and | |
ANNUAL REPORT | JOHN HANCOCK DIVERSIFIED STRATEGIES FUND 37
| | | | | | | | | |
| | | | | (m) | | | considered that the Advisor should be entitled to earn a reasonable level of profits in exchange for the level of services it provides to the fund and the risks that it assumes as Advisor, including entrepreneurial, operational, reputational, litigation and regulatory risk. | |
Based upon its review, the Board concluded that the level of profitability, if any, of the Advisor and its affiliates (including the Subadvisor) from their relationship with the fund was reasonable and not excessive.
Economies of scale. In considering the extent to which economies of scale would be realized as the fund grows and whether fee levels reflect these economies of scale for the benefit of fund shareholders, the Board:
| | | |
| | (a) | considered that the Advisor has contractually agreed to waive a portion of its management fee for certain funds of the John Hancock Fund Complex, including the fund (the participating portfolios) or otherwise reimburse the expenses of the participating portfolios (the reimbursement). This waiver is based upon aggregate net assets of all the participating portfolios. The amount of the reimbursement is calculated daily and allocated among all the participating portfolios in proportion to the daily net assets of each fund; |
| | (b) | reviewed the fund's advisory fee structure and concluded that: (i) the fund's fee structure contains breakpoints at the subadvisory fee level and that such breakpoints are reflected as breakpoints in the advisory fees for the fund; and (ii) although economies of scale cannot be measured with precision, these arrangements permit shareholders of the fund to benefit from economies of scale if the fund grows. The Board also took into account management's discussion of the fund's advisory fee structure; and |
| | (c) | the Board also considered the effect of the fund's growth in size on its performance and fees. The Board also noted that if the fund's assets increase over time, the fund may realize other economies of scale. |
Approval of Subadvisory Agreement
In making its determination with respect to approval of the Subadvisory Agreement, the Board reviewed:
| | | |
| | (1) | information relating to the Subadvisor's business, including current subadvisory services to the Trust (and other funds in the John Hancock Fund Complex); |
| | (2) | the historical and current performance of the fund and comparative performance information relating to an applicable benchmark index and comparable funds; and |
| | (3) | the subadvisory fee for the fund, including any breakpoints, and to the extent available, comparable fee information prepared by an independent third party provider of fund data. |
Nature, extent, and quality of services. With respect to the services provided by the Subadvisor, the Board received information provided to the Board by the Subadvisor, including the Subadvisor's Form ADV, as well as took into account information presented throughout the past year. The Board considered the Subadvisor's current level of staffing and its overall resources, as well as received information relating to the Subadvisor's compensation program. The Board reviewed the Subadvisor's history and investment experience, as well as information regarding the qualifications, background, and responsibilities of the Subadvisor's investment and compliance personnel who provide services to the fund. The Board also considered, among other things, the Subadvisor's compliance program and any disciplinary history. The Board also considered the Subadvisor's risk assessment and monitoring process. The Board reviewed the Subadvisor's regulatory history, including whether it was involved in any regulatory actions or investigations as well as material litigation, and any settlements and amelioratory actions undertaken, as appropriate.
ANNUAL REPORT | JOHN HANCOCK DIVERSIFIED STRATEGIES FUND 38
The Board noted that the Advisor conducts regular, periodic reviews of the Subadvisor and its operations, including regarding investment processes and organizational and staffing matters. The Board also noted that the Trust's CCO and his staff conduct regular, periodic compliance reviews with the Subadvisor and present reports to the Independent Trustees regarding the same, which includes evaluating the regulatory compliance systems of the Subadvisor and procedures reasonably designed to assure compliance with the federal securities laws. The Board also took into account the financial condition of the Subadvisor.
The Board considered the Subadvisor's investment process and philosophy. The Board took into account that the Subadvisor's responsibilities include the development and maintenance of an investment program for the fund that is consistent with the fund's investment objective, the selection of investment securities and the placement of orders for the purchase and sale of such securities, as well as the implementation of compliance controls related to performance of these services. The Board also received information with respect to the Subadvisor's brokerage policies and practices, including with respect to best execution and soft dollars.
Subadvisor compensation. In considering the cost of services to be provided by the Subadvisor and the profitability to the Subadvisor of its relationship with the fund, the Board noted that the fees under the Subadvisory Agreement are paid by the Advisor and not the fund. The Board also received information and took into account any other potential conflicts of interest the Advisor might have in connection with the Subadvisory Agreement.
In addition, the Board considered other potential indirect benefits that the Subadvisor and its affiliates may receive from the Subadvisor's relationship with the fund, such as the opportunity to provide advisory services to additional funds in the John Hancock Fund Complex and reputational benefits.
Subadvisory fees. The Board considered that the fund pays an advisory fee to the Advisor and that, in turn, the Advisor pays a subadvisory fee to the Subadvisor. As noted above, the Board also considered the fund's subadvisory fees as compared to similarly situated investment companies deemed to be comparable to the fund as included in the report prepared by the independent third party provider of fund data, to the extent available. The Board noted that the limited size of the Lipper peer group was not sufficient for comparative purposes. The Board also took into account the subadvisory fees paid by the Advisor to the Subadvisor with respect to the fund and compared them to fees charged by the Subadvisor to manage other subadvised portfolios and portfolios not subject to regulation under the 1940 Act, as applicable.
Subadvisor performance. As noted above, the Board considered the fund's performance as compared to the fund's peer group and the benchmark index and noted that the Board reviews information about the fund's performance results at its regularly scheduled meetings. The Board noted the Advisor's expertise and resources in monitoring the performance, investment style and risk-adjusted performance of the Subadvisor. The Board was mindful of the Advisor's focus on the Subadvisor's performance. The Board also noted the Subadvisor's long-term performance record for similar accounts, as applicable.
The Board's decision to approve the Subadvisory Agreement was based on a number of determinations, including the following:
| | | | | | | | | |
| | | | | (1) | | | the Subadvisor has extensive experience and demonstrated skills as a manager; | |
| | | | | (2) | | | the performance of the fund is being monitored and reasonably addressed, where appropriate; | |
| | | | | (3) | | | the subadvisory fee is reasonable in relation to the level and quality of services being provided; and | |
| | | | | (4) | | | noted that the subadvisory fees are paid by the Advisor not the fund and that the subadvisory fee breakpoints are reflected as breakpoints in the advisory fees for the fund in order to permit shareholders to benefit from economies of scale if the fund grows. | |
ANNUAL REPORT | JOHN HANCOCK DIVERSIFIED STRATEGIES FUND 39
Based on the Board's evaluation of all factors that the Board deemed to be material, including those factors described above, the Board, including the Independent Trustees, concluded that renewal of the Advisory Agreement and the Subadvisory Agreement would be in the best interest of the fund and its shareholders. Accordingly, the Board, and the Independent Trustees voting separately, approved the Advisory Agreement and Subadvisory Agreement for an additional one-year period.
ANNUAL REPORT | JOHN HANCOCK DIVERSIFIED STRATEGIES FUND 40
This chart provides information about the Trustees and Officers who oversee your John Hancock fund. Officers elected by the Trustees manage the day-to-day operations of the fund and execute policies formulated by the Trustees.
Independent Trustees
| | | |
Name, year of birth
Position(s) held with Trust
Principal occupation(s) and other
directorships during past 5 years | Trustee
of the
Trust
since1 | Number of John
Hancock funds
overseen by
Trustee |
| Hassell H. McClellan, Born: 1945 | 2005 | 213 |
Trustee and Chairperson of the Board
Director/Trustee, Virtus Funds (since 2008); Director, The Barnes Group (since 2010); Associate Professor, The Wallace E. Carroll School of Management, Boston College (retired 2013). Trustee (since 2005) and Chairperson of the Board (since 2017) of various trusts within the John Hancock Fund Complex. |
| | | |
| Charles L. Bardelis,2 Born: 1941 | 2005 | 213 |
Trustee
Director, Island Commuter Corp. (marine transport). Trustee of various trusts within the John Hancock Fund Complex (since 1988). |
| | | |
| James R. Boyle,Born: 1959 | 2015 | 213 |
Trustee
Chief Executive Officer, Foresters Financial (since 2018); Chairman and Chief Executive Officer, Zillion Group, Inc. (formerly HealthFleet, Inc.) (healthcare) (2014-2018); Executive Vice President and Chief Executive Officer, U.S. Life Insurance Division of Genworth Financial, Inc. (insurance) (January 2014-July 2014); Senior Executive Vice President, Manulife Financial, President and Chief Executive Officer, John Hancock (1999-2012); Chairman and Director, John Hancock Investment Management LLC, John Hancock Investment Management Distributors LLC, and John Hancock Variable Trust Advisers LLC (2005-2010). Trustee of various trusts within the John Hancock Fund Complex (2005-2014 and since 2015). |
| | | |
| Peter S. Burgess,2 Born: 1942 | 2005 | 213 |
Trustee
Consultant (financial, accounting, and auditing matters) (since 1999); Certified Public Accountant; Partner, Arthur Andersen (independent public accounting firm) (prior to 1999); Director, Lincoln Educational Services Corporation (since 2004); Director, Symetra Financial Corporation (2010-2016); Director, PMA Capital Corporation (2004-2010). Trustee of various trusts within the John Hancock Fund Complex (since 2005). |
| | | |
| William H. Cunningham, Born: 1944 | 2012 | 213 |
Trustee
Professor, University of Texas, Austin, Texas (since 1971); former Chancellor, University of Texas System and former President of the University of Texas, Austin, Texas; Chairman (since 2009) and Director (since 2006), Lincoln National Corporation (insurance); Director, Southwest Airlines (since 2000); former Director, LIN Television (2009-2014). Trustee of various trusts within the John Hancock Fund Complex (since 1986). |
| | | |
| Grace K. Fey, Born: 1946 | 2008 | 213 |
Trustee
Chief Executive Officer, Grace Fey Advisors (since 2007); Director and Executive Vice President, Frontier Capital Management Company (1988-2007); Director, Fiduciary Trust (since 2009). Trustee of various trusts within the John Hancock Fund Complex (since 2008). |
ANNUAL REPORT | JOHN HANCOCK DIVERSIFIED STRATEGIES FUND 41
Independent Trustees (continued)
| | | |
Name, year of birth
Position(s) held with Trust
Principal occupation(s) and other
directorships during past 5 years | Trustee
of the
Trust
since1 | Number of John
Hancock funds
overseen by
Trustee |
| Theron S. Hoffman,4 Born: 1947 | 2008 | 213 |
Trustee
Chief Executive Officer, T. Hoffman Associates, LLC (consulting firm) (since 2003); Director, The Todd Organization (consulting firm) (2003-2010); President, Westport Resources Management (investment management consulting firm) (2006-2008); Board Member, Senior Managing Director, Partner, and Operating Head, Putnam Investments (2000-2003); Executive Vice President, The Thomson Corp. (financial and legal information publishing) (1997-2000). Trustee of various trusts within the John Hancock Fund Complex (since 2008). |
| | | |
| Deborah C. Jackson, Born: 1952 | 2012 | 213 |
Trustee
President, Cambridge College, Cambridge, Massachusetts (since 2011); Board of Directors, National Association of Corporate Directors/New England (since 2015); Board of Directors, Association of Independent Colleges and Universities of Massachusetts (since 2014); Chief Executive Officer, American Red Cross of Massachusetts Bay (2002-2011); Board of Directors of Eastern Bank Corporation (since 2001); Board of Directors of Eastern Bank Charitable Foundation (since 2001); Board of Directors of American Student Assistance Corporation (1996-2009); Board of Directors of Boston Stock Exchange (2002-2008); Board of Directors of Harvard Pilgrim Healthcare (health benefits company) (2007-2011). Trustee of various trusts within the John Hancock Fund Complex (since 2008). |
| | | |
| James M. Oates,2Born: 1946 | 2005 | 213 |
Trustee
Managing Director, Wydown Group (financial consulting firm) (since 1994); Chairman and Director, Emerson Investment Management, Inc. (2000-2015); Independent Chairman, Hudson Castle Group, Inc. (formerly IBEX Capital Markets, Inc.) (financial services company) (1997-2011); Director, Stifel Financial (since 1996); Director, Investor Financial Services Corporation (1995-2007); Director, Connecticut River Bancorp (1998-2014); Director/Trustee, Virtus Funds (since 1988). Trustee (since 2004) and Chairperson of the Board (2005-2016) of various trusts within the John Hancock Fund Complex. |
| | | |
| Steven R. Pruchansky, Born: 1944 | 2012 | 213 |
Trustee and Vice Chairperson of the Board
Managing Director, Pru Realty (since 2017); Chairman and Chief Executive Officer, Greenscapes of Southwest Florida, Inc. (2000-2014); Director and President, Greenscapes of Southwest Florida, Inc. (until 2000); Member, Board of Advisors, First American Bank (until 2010); Managing Director, Jon James, LLC (real estate) (since 2000); Partner, Right Funding, LLC (2014-2017); Director, First Signature Bank & Trust Company (until 1991); Director, Mast Realty Trust (until 1994); President, Maxwell Building Corp. (until 1991). Trustee (since 1992), Chairperson of the Board (2011-2012), and Vice Chairperson of the Board (since 2012) of various trusts within the John Hancock Fund Complex. |
| | | |
| Gregory A. Russo, Born: 1949 | 2012 | 213 |
Trustee
Director and Audit Committee Chairman (since 2012), and Member, Audit Committee and Finance Committee (since 2011), NCH Healthcare System, Inc. (holding company for multi-entity healthcare system); Director and Member (2012-2018) and Finance Committee Chairman (2014-2018), The Moorings, Inc. (nonprofit continuing care community); Vice Chairman, Risk & Regulatory Matters, KPMG LLP (KPMG) (2002-2006); Vice Chairman, Industrial Markets, KPMG (1998-2002); Chairman and Treasurer, Westchester County, New York, Chamber of Commerce (1986-1992); Director, Treasurer, and Chairman of Audit and Finance Committees, Putnam Hospital Center (1989-1995); Director and Chairman of Fundraising Campaign, United Way of Westchester and Putnam Counties, New York (1990-1995). Trustee of various trusts within the John Hancock Fund Complex (since 2008). |
ANNUAL REPORT | JOHN HANCOCK DIVERSIFIED STRATEGIES FUND 42
Non-Independent Trustees3
| | | |
Name, year of birth
Position(s) held with Trust
Principal occupation(s) and other
directorships during past 5 years | Trustee
of the
Trust
since1 | Number of John
Hancock funds
overseen by
Trustee |
| Andrew G. Arnott, Born: 1971 | 2017 | 213 |
President and Non-Independent Trustee
Head of Wealth and Asset Management, United States and Europe, for John Hancock and Manulife (since 2018); Executive Vice President, John Hancock Financial Services (since 2009, including prior positions); Director and Executive Vice President, John Hancock Investment Management LLC (since 2005, including prior positions); Director and Executive Vice President, John Hancock Variable Trust Advisers LLC (since 2006, including prior positions); President, John Hancock Investment Management Distributors LLC (since 2004, including prior positions); President of various trusts within the John Hancock Fund Complex (since 2007, including prior positions). Trustee of various trusts within the John Hancock Fund Complex (since 2017). |
| | | |
| Marianne Harrison, Born: 1963 | 2018 | 213 |
Non-Independent Trustee
President and CEO, John Hancock (since 2017); President and CEO, Manulife Canadian Division (2013-2017); Member, Board of Directors, American Council of Life Insurers (ACLI) (since 2018); Member, Board of Directors, Communitech, an industry-led innovation center that fosters technology companies in Canada (since 2017); Member, Board of Directors, Manulife Assurance Canada (2015-2017); Board Member, St. Mary's General Hospital Foundation (2014-2017); Member, Board of Directors, Manulife Bank of Canada (2013-2017); Member, Standing Committee of the Canadian Life & Health Assurance Association (2013-2017); Member, Board of Directors, John Hancock USA, John Hancock Life & Health, John Hancock New York (2012-2013). Trustee of various trusts within the John Hancock Fund Complex (since 2018). |
Principal officers who are not Trustees
| | |
Name, year of birth
Position(s) held with Trust
Principal occupation(s)
during past 5 years | Officer
of the
Trust
since |
| Francis V. Knox, Jr.,Born: 1947 | 2005 |
Chief Compliance Officer
Vice President, John Hancock Financial Services (since 2005); Chief Compliance Officer, various trusts within the John Hancock Fund Complex, John Hancock Investment Management LLC, and John Hancock Variable Trust Advisers LLC (since 2005). |
| | |
| Charles A. Rizzo, Born: 1957 | 2007 |
Chief Financial Officer
Vice President, John Hancock Financial Services (since 2008); Senior Vice President, John Hancock Investment Management LLC and John Hancock Variable Trust Advisers LLC (since 2008); Chief Financial Officer of various trusts within the John Hancock Fund Complex (since 2007). |
| | |
| Salvatore Schiavone, Born: 1965 | 2009 |
Treasurer
Assistant Vice President, John Hancock Financial Services (since 2007); Vice President, John Hancock Investment Management LLC and John Hancock Variable Trust Advisers LLC (since 2007); Treasurer of various trusts within the John Hancock Fund Complex (since 2007, including prior positions). |
ANNUAL REPORT | JOHN HANCOCK DIVERSIFIED STRATEGIES FUND 43
Principal officers who are notTrustees (continued)
| | | |
Name, year of birth
Position(s) held with Trust
Principal occupation(s)
during past 5 years | Officer
of the
Trust
since |
| Christopher (Kit) Sechler,Born: 1973 | 2018 |
Chief Legal Officer and Secretary
Vice President and Deputy Chief Counsel, John Hancock Investments (since 2015); Assistant Vice President and Senior Counsel (2009-2015), John Hancock Investment Management; Chief Legal Officer and Secretary of various trusts within the John Hancock Fund Complex (since 2018); Assistant Secretary of John Hancock Investment Management LLC and John Hancock Variable Trust Advisers LLC (since 2009). |
The business address for all Trustees and Officers is 200 Berkeley Street, Boston, Massachusetts 02116-5023.
The Statement of Additional Information of the fund includes additional information about members of the Board of Trustees of the Trust and is available without charge, upon request, by calling 800-225-5291.
| 1 | Each Trustee holds office until his or her successor is elected and qualified, or until the Trustee's death, retirement, resignation, or removal. Mr. Boyle has served as Trustee at various times prior to the date listed in the table. |
| 2 | Member of the Audit Committee. |
| 3 | The Trustee is a Non-Independent Trustee due to current or former positions with the Advisor and certain affiliates. |
| 4 | Mr. Hoffman retired as Trustee effective August 31, 2019. |
ANNUAL REPORT | JOHN HANCOCK DIVERSIFIED STRATEGIES FUND 44
| | |
Trustees
Hassell H. McClellan,Chairperson
Steven R. Pruchansky,Vice Chairperson
Andrew G. Arnott†
Charles L. Bardelis*
James R. Boyle
Peter S. Burgess*
William H. Cunningham
Grace K. Fey
Marianne Harrison†
Theron S. Hoffman#
Deborah C. Jackson
James M. Oates*
Gregory A. Russo
Officers
Andrew G. Arnott
President
Francis V. Knox, Jr.
Chief Compliance Officer
Charles A. Rizzo
Chief Financial Officer
Salvatore Schiavone
Treasurer
Christopher (Kit) Sechler**
Secretary and Chief Legal Officer
| Investment advisor
John Hancock Investment Management LLC
Subadvisor
Manulife Investment Management (US) LLC
Portfolio Managers
Christopher Fellingham
Andrew Graham
Mark Holden, CFA
Nathan Thooft, CFA
Christopher Walsh, CFA
Principal distributor
John Hancock Investment Management Distributors LLC
Custodian
State Street Bank and Trust Company
Transfer agent
John Hancock Signature Services, Inc.
Legal counsel
K&L Gates LLP
Independent registered public accounting firm
PricewaterhouseCoopers LLP
|
* Member of the Audit Committee
† Non-Independent Trustee
** Effective 9-13-18
# Retired effective 8-31-19
The fund's proxy voting policies and procedures, as well as the fund proxy voting record for the most recent twelve-month period ended June 30, are available free of charge on the Securities and Exchange Commission (SEC) website at sec.gov or on our website.
All of the fund's holdings as of the end of the third month of every fiscal quarter are filed with the SEC on Form N-PORT within 60 days of the end of the fiscal quarter. The fund's Form N-PORT filings are available on our website and the SEC's website, sec.gov.
We make this information on your fund, as well asmonthly portfolio holdings, and other fund details available on our website at jhinvestments.com or by calling 800-225-5291.
| | | | |
| | You can also contact us: |
| | 800-225-5291
jhinvestments.com | Regular mail:
John Hancock Signature Services, Inc.
P.O. Box 55913
Boston, MA 02205-5913
| Express mail:
John Hancock Signature Services, Inc.
2000 Crown Colony Drive
Suite 55913
Quincy, MA 02169-0953
|
ANNUAL REPORT | JOHN HANCOCK DIVERSIFIED STRATEGIES FUND 45
John Hancock family of funds
| | | |
DOMESTIC EQUITY FUNDS
Blue Chip Growth
Classic Value
Disciplined Value
Disciplined Value Mid Cap
Equity Income
Financial Industries
Fundamental All Cap Core
Fundamental Large Cap Core
New Opportunities
Regional Bank
Small Cap Core
Small Cap Growth
Small Cap Value
U.S. Global Leaders Growth
U.S. Quality Growth
Value Equity
GLOBAL AND INTERNATIONAL EQUITY FUNDS
Disciplined Value International
Emerging Markets
Emerging Markets Equity
Fundamental Global Franchise
Global Equity
Global Shareholder Yield
Global Thematic Opportunities
International Dynamic Growth
International Growth
International Small Company
| | INCOME FUNDS
Bond
California Tax-Free Income
Emerging Markets Debt
Floating Rate Income
Government Income
High Yield
High Yield Municipal Bond
Income
Investment Grade Bond
Money Market
Short Duration Bond
Short Duration Credit Opportunities
Spectrum Income
Strategic Income Opportunities
Tax-Free Bond
ALTERNATIVE AND SPECIALTY FUNDS
Absolute Return Currency
Alternative Asset Allocation
Disciplined Alternative Yield
Diversified Macro
Infrastructure
Multi-Asset Absolute Return
Seaport Long/Short
|
A fund's investment objectives, risks, charges, and expenses should be considered carefully before investing. The prospectus contains this and other important information about the fund. To obtain a prospectus, contact your financial professional, call John Hancock Investment Management at 800-225-5291, or visit our website at jhinvestments.com. Please read the prospectus carefully before investing or sending money.
| | | |
ASSET ALLOCATION
Balanced
Income Allocation
Multi-Index Lifetime Portfolios
Multi-Index Preservation Portfolios
Multimanager Lifestyle Portfolios
Multimanager Lifetime Portfolios
Retirement Income 2040
EXCHANGE-TRADED FUNDS
John Hancock Multifactor Consumer Discretionary ETF
John Hancock Multifactor Consumer Staples ETF
John Hancock Multifactor Developed International ETF
John Hancock Multifactor Emerging Markets ETF
John Hancock Multifactor Energy ETF
John Hancock Multifactor Financials ETF
John Hancock Multifactor Healthcare ETF
John Hancock Multifactor Industrials ETF
John Hancock Multifactor Large Cap ETF
John Hancock Multifactor Materials ETF
John Hancock Multifactor Media and
Communications ETF
John Hancock Multifactor Mid Cap ETF
John Hancock Multifactor Small Cap ETF
John Hancock Multifactor Technology ETF
John Hancock Multifactor Utilities ETF
| | ENVIRONMENTAL, SOCIAL, AND
GOVERNANCE FUNDS
ESG All Cap Core
ESG Core Bond
ESG International Equity
ESG Large Cap Core
CLOSED-END FUNDS
Financial Opportunities
Hedged Equity & Income
Income Securities Trust
Investors Trust
Preferred Income
Preferred Income II
Preferred Income III
Premium Dividend
Tax-Advantaged Dividend Income
Tax-Advantaged Global Shareholder Yield
|
John Hancock Multifactor ETF shares are bought and sold at market price (not NAV), and are not individually redeemed
from the fund. Brokerage commissions will reduce returns.
John Hancock ETFs are distributed by Foreside Fund Services, LLC, and are subadvised by Dimensional Fund Advisors LP.
Foreside is not affiliated with John Hancock Investment Management Distributors, LLC or Dimensional Fund Advisors LP.
Dimensional Fund Advisors LP receives compensation from John Hancock in connection with licensing rights to the
John Hancock Dimensional indexes. Dimensional Fund Advisors LP does not sponsor, endorse, or sell, and makes no
representation as to the advisability of investing in, John Hancock Multifactor ETFs.
John Hancock Investment Management
A trusted brand
John Hancock Investment Management is a premier asset manager
representing one of America's most trusted brands, with a heritage of
financial stewardship dating back to 1862. Helping our shareholders
pursue their financial goals is at the core of everything we do. It's why
we support the role of professional financial advice and operate with
the highest standards of conduct and integrity.
A better way to invest
We serve investors globally through a unique multimanager approach:
We search the world to find proven portfolio teams with specialized
expertise for every strategy we offer, then we apply robust investment
oversight to ensure they continue to meet our uncompromising
standards and serve the best interests of our shareholders.
Results for investors
Our unique approach to asset management enables us to provide
a diverse set of investments backed by some of the world's best
managers, along with strong risk-adjusted returns across asset classes.
John Hancock Investment Management Distributors, LLC n Member FINRA, SIPC
200 Berkeley Street n Boston, MA 02116-5010 n 800-225-5291 n jhinvestments.com
This report is for the information of the shareholders of John Hancock Diversified Strategies Fund. It is not authorized for distribution to prospective investors unless preceded or accompanied by a prospectus.
John Hancock
Global Absolute Return Strategies Fund
Annual report 7/31/19
Beginning on January 1, 2021, as permitted by regulations adopted by the Securities and Exchange Commission, paper copies of the Fund's shareholder reports like this one will no longer be sent by mail, unless you specifically request paper copies of the reports from the Fund or from your financial intermediary. Instead, the reports will be made available on a website, and you will be notified by mail each time a report is posted and provided with a website link to access the report.
If you already elected to receive shareholder reports electronically, you will not be affected by this change, and you do not need to take any action. You may elect to receive shareholder reports and other communications electronically by calling John Hancock Investment Management at 800-225-5291 (Class A and Class C shares) or 888-972-8696 (Class I, Class R2, Class R6, and Class NAV shares) or by contacting your financial intermediary.
You may elect to receive all reports in paper, free of charge, at any time. You can inform John Hancock Investment Management or your financial intermediary that you wish to continue receiving paper copies of your shareholder reports by following the instructions listed above. Your election to receive reports in paper will apply to all funds held with John Hancock Investment Management or your financial intermediary.
A message to shareholders
Dear shareholder,
It was a rather volatile time for capital markets during the 12 months ended July 31, 2019, with investor uncertainty surrounding trade relations between the United States and China and the broader health of the global economy leading to some dramatic swings in performance. The trend in longer-term yields was decidedly downward, with the 10-year U.S. Treasury finishing the period at just above 2%, triggering an inverted yield curve shortly after period end. In July, the U.S. Federal Reserve stepped in with a reduction in short-term interest rates in an attempt to offer a measure of stimulus to jittery markets, and investors greeted the news favorably. The commodity markets were mixed, with oil and some other natural resources down but gold, historically a strong performer in times of uncertainty, up sharply.
While the economic fundamentals in the United States appear fairly solid, with a strong labor market and a confident consumer base, there are sure to be patches of market turbulence as the year goes on, particularly as the threat of a recession looms. As always, your best resource in unpredictable markets is your financial advisor, who can help position your portfolio so that it's sufficiently diversified to meet your long-term objectives and to withstand the inevitable bouts of market volatility along the way.
On behalf of everyone at John Hancock Investment Management, I'd like to take this opportunity to welcome new shareholders and thank existing shareholders for the continued trust you've placed in us.
Sincerely,
Andrew G. Arnott
President and CEO,
John Hancock Investment Management
Head of Wealth and Asset Management,
United States and Europe
This commentary reflects the CEO's views as of this report's period end and are subject to change at any time. Diversification does not guarantee investment returns and does not eliminate risk of loss. All investments entail risks, including the possible loss of principal. For more up-to-date information, you can visit our website at jhinvestments.com.
.
John Hancock
Global Absolute Return Strategies Fund
Table of contents
| | | |
| 2 | | Your fund at a glance |
| 5 | | Discussion of fund performance |
| 7 | | A look at performance |
| 9 | | Your expenses |
| 11 | | Fund's investments |
| 36 | | Financial statements |
| 40 | | Financial highlights |
| 46 | | Notes to financial statements |
| 62 | | Report of independent registered public accounting firm |
| 63 | | Tax information |
| 64 | | Continuation of investment advisory and subadvisory agreements |
| 73 | | Trustees and Officers |
| 77 | | More information |
ANNUAL REPORT | JOHN HANCOCK GLOBAL ABSOLUTE RETURN STRATEGIES FUND 1
INVESTMENT OBJECTIVE
The fund seeks long-term total return.
AVERAGE ANNUAL TOTAL RETURNS AS OF 7/31/19 (%)
The ICE Bank of America Merrill Lynch U.S. Dollar 6-Month Deposit Offered Rate Constant Maturity Index tracks the average interest rate at which a selection of banks in London are prepared to lend to one another in U.S. dollars with a constant maturity of 6 months.
The MSCI World Index is a free float-adjusted market-capitalization-weighted index that is designed to measure equity market performance of global developed markets, and is included here as a broad measure of market performance.
It is not possible to invest directly in an index. Index figures do not reflect expenses or sales charges, which would result in lower returns.
Figures from Morningstar, Inc. include reinvested distributions and do not take into account sales charges. Actual load-adjusted performance is lower. Since-inception returns for the Morningstar fund category average are not available.
The past performance shown here reflects reinvested distributions and the beneficial effect of any expense reductions, and does not guarantee future results. Performance of the other share classes will vary based on the difference in the fees and expenses of those classes. Shares will fluctuate in value and, when redeemed, may be worth more or less than their original cost. Current month-end performance may be lower or higher than the performance cited, and can be found at jhinvestments.com or by calling 800-225-5291. For further information on the fund's objectives, risks, and strategy, see the fund's prospectus.
ANNUAL REPORT | JOHN HANCOCK GLOBAL ABSOLUTE RETURN STRATEGIES FUND 2
PERFORMANCE HIGHLIGHTS OVER THE LAST TWELVE MONTHS
The fund was up
The fund posted a positive total return, finishing ahead of its cash benchmark, the ICE BofA ML USD 6-Month Deposit Offered Rate Constant Maturity Index, and the global equity market.
Credit and duration contributed
Global interest rates declined driving up bond prices around the world, and the fund's European forward-start interest-rate strategy was among those driving total returns.
Equity exposure detracted
The fund's equity allocations across emerging markets, global oil majors, and continental European companies weighed down performance for the period.
PORTFOLIO COMPOSITION AS OF 7/31/19 (%)
A note about risks
The fund is subject to various risks as described in the fund's prospectus. For more information, please refer to the "Principal risks" section of the prospectus.
ANNUAL REPORT | JOHN HANCOCK GLOBAL ABSOLUTE RETURN STRATEGIES FUND 3
PORTFOLIO ALLOCATION AS OF 7/31/19 (%)
| | | |
| Foreign government obligations | 28.6 |
| Common stocks | 12.8 |
| | Energy | 3.3 |
| | Financials | 1.8 |
| | Health care | 1.5 |
| | Industrials | 1.1 |
| | Consumer staples | 1.1 |
| | Consumer discretionary | 1.0 |
| | Information technology | 1.0 |
| | Communication services | 0.7 |
| | Materials | 0.6 |
| | Utilities | 0.5 |
| | Real estate | 0.2 |
| U.S. Government | 7.8 |
| Corporate bonds | 7.0 |
| Purchased options | 0.8 |
| Short-term investments and other | 43.0 |
| | Time deposits | 20.8 |
| | Money market funds | 10.6 |
| | Commercial paper | 3.7 |
| | U.S. Government | 3.1 |
| | Certificate of deposit | 1.8 |
| | Other assets and liabilities, net | 3.0 |
| TOTAL | 100.0 |
| As a percentage of net assets. | |
ANNUAL REPORT | JOHN HANCOCK GLOBAL ABSOLUTE RETURN STRATEGIES FUND 4
Discussion of fund performance
Note: Effective August 28, 2019, John Hancock Global Absolute Return Strategies Fund was renamed John Hancock Multi-Asset Absolute Return Fund and will be managed by Nordea Investment Management North America, Inc. The interview below is with the fund's previous manager, Aberdeen Standard Investments Inc.
How would you describe the macroeconomic and market backdrop during the 12 months ended July 31, 2019?
Most fixed-income markets across different regions and sectors produced positive returns during the period. Global stock markets saw much more dispersion. U.S. equities were positive on balance, yet large- and mid-cap growth stocks posted double-digit percentage gains, while small-cap core and value stocks saw mid-single-digit declines. Many non-U.S. markets suffered losses, with Brazil, Russia, and Switzerland being among the most prominent exceptions.
In foreign exchange markets, the Australian dollar, the British pound, and the euro were relative laggards, while the Japanese yen, many emerging-market currencies, and the U.S. dollar fared better. Oil and many other commodity markets fell; the price for gold, which staged an impressive rally, was a notable exception. As widely expected, the U.S. Federal Reserve cut interest rates on the last day of the period, its first such move since 2008.
COUNTRY COMPOSITION AS OF 7/31/19 (%)
| | |
| United States | 33.1 |
| France | 17.4 |
| Mexico | 8.7 |
| United Kingdom | 4.9 |
| Germany | 4.7 |
| Belgium | 3.8 |
| Canada | 3.3 |
| Sweden | 2.9 |
| Japan | 2.5 |
| Indonesia | 1.9 |
| Other countries | 16.8 |
| TOTAL | 100.0 |
| As a percentage of net assets. | |
ANNUAL REPORT | JOHN HANCOCK GLOBAL ABSOLUTE RETURN STRATEGIES FUND 5
What fund strategies contributed to and detracted from performance?
Supportive measures from global central banks provided a favorable environment for duration exposure. In particular, the fund's European forward-start interest rates, U.S. real yields, Canadian interest rates, and European yield curve flattener strategies delivered positive returns. Credit markets moved higher, too, as expectations further policy relaxation lifted sentiment. This boosted the fund's emerging-market income, Brazilian government bonds, and high-yield credit positions.
Conversely, the fund's European and emerging-market equity allocations detracted from performance, as did its global equity oil majors strategy as global trade tensions tempered expectations for oil demand. Elsewhere, the fund's short Australian banks strategy was hurt by surprise election results and expectations that Australia's central bank would make renewed efforts to stimulate the economy.
Can you tell us about a recent change made to the fund based on market conditions?
Shortly before the close of the period, we reduced the fund's European interest-rate exposure and opened the Canadian interest-rate position. Given recent strong economic data in Canada, most market participants seem to expect fewer rate cuts there in comparison with the more extensive anticipated cuts elsewhere.
Can you tell us about a recent change to the fund's management?
Effective April 5, 2019, I replaced portfolio manager Guy Stern, who retired.
MANAGED BY
| | |
 | Aymeric N. Forest, CFA
On the fund since 2019
Investing since 1997 |
The views expressed in this report are exclusively those of Aymeric N. Forest, CFA, Aberdeen Standard Investments Inc., and are subject to change. They are not meant as investment advice. Please note that the holdings discussed in this report may not have been held by the fund for the entire period. Portfolio composition is subject to review in accordance with the fund's investment strategy and may vary in the future. Current and future portfolio holdings are subject to risk.
ANNUAL REPORT | JOHN HANCOCK GLOBAL ABSOLUTE RETURN STRATEGIES FUND 6
TOTAL RETURNS FOR THE PERIOD ENDED JULY 31, 2019
| | | | | | | | |
Average annual total returns (%)
with maximum sales charge | | Cumulative total returns (%)
with maximum sales charge |
| | 1-year | 5-year | Since
inception1 | | | 5-year | Since
inception1 |
| Class A | -1.06 | -0.09 | 1.77 | | | -0.43 | 14.29 |
| Class C2 | 2.42 | 0.25 | 1.80 | | | 1.27 | 14.57 |
| Class I3 | 4.40 | 1.24 | 2.80 | | | 6.38 | 23.39 |
| Class R22,3 | 4.07 | 0.80 | 2.28 | | | 4.04 | 18.76 |
| Class R62,3 | 4.59 | 1.37 | 2.87 | | | 7.05 | 24.03 |
| Class NAV3 | 4.59 | 1.37 | 2.90 | | | 7.04 | 24.35 |
| Index 1† | 2.83 | 1.26 | 1.03 | | | 6.45 | 8.12 |
| Index 2† | 3.62 | 7.05 | 11.21 | | | 40.60 | 124.65 |
Performance figures assume all distributions have been reinvested. Figures reflect maximum sales charges on Class A shares of 5.00% and the applicable contingent deferred sales charge (CDSC) on Class C shares. Class C shares sold within one year of purchase are subject to a 1% CDSC. Sales charges are not applicable to Class I, Class R2, Class R6, and Class NAV shares.
The expense ratios of the fund, both net (including any fee waivers and/or expense limitations) and gross (excluding any fee waivers and/or expense limitations), are set forth according to the most recent publicly available prospectuses for the fund and may differ from those disclosed in the Financial highlights tables in this report. Net expenses reflect contractual expense limitations in effect until July 31, 2021 and are subject to change.Had the contractual fee waivers and expense limitations not been in place, gross expenses would apply. The expense ratios are as follows:
| | | | | | | |
| | Class A | Class C | Class I | Class R2 | Class R6 | Class NAV |
| Gross (%) | 1.65 | 2.35 | 1.35 | 1.76 | 1.26 | 1.24 |
| Net (%) | 1.64 | 2.34 | 1.34 | 1.75 | 1.25 | 1.23 |
Please refer to the most recent prospectuses and annual or semiannual report for more information on expenses and any expense limitation arrangements for each class.
The returns reflect past results and should not be considered indicative of future performance. The return and principal value of an investment will fluctuate so that shares, when redeemed, may be worth more or less than their original cost. Due to market volatility and other factors, the fund's current performance may be higher or lower than the performance shown. For current to the most recent month-end performance data, please call 800-225-5291 or visit the fund's website at jhinvestments.com.
The performance table above and the chart on the next page do not reflect the deduction of taxes that a shareholder would pay on fund distributions or the redemption of fund shares. The fund's performance results reflect any applicable fee waivers or expense reductions, without which the expenses would increase and results would have been less favorable.
| † | Index 1 is The ICE Bank of America Merrill Lynch U.S. Dollar 6-Month Deposit Offered Rate Constant Maturity Index; Index 2 is the MSCI World Index. |
See the following page for footnotes.
ANNUAL REPORT | JOHN HANCOCK GLOBAL ABSOLUTE RETURN STRATEGIES FUND 7
This chart and table show what happened to a hypothetical $10,000 investment in John Hancock Global Absolute Return Strategies Fund for the share classes and periods indicated, assuming all distributions were reinvested. For comparison, we've shown the same investment in two separate indexes.
| | | | | | |
| | Start date | With maximum
sales charge ($) | Without
sales charge ($) | Index 1 ($) | Index 2 ($) |
| Class C2,4 | 12-19-11 | 11,457 | 11,457 | 10,812 | 22,465 |
| Class I3 | 12-19-11 | 12,339 | 12,339 | 10,812 | 22,465 |
| Class R22,3 | 12-19-11 | 11,876 | 11,876 | 10,812 | 22,465 |
| Class R62,3 | 12-19-11 | 12,403 | 12,403 | 10,812 | 22,465 |
| Class NAV3 | 12-19-11 | 12,435 | 12,435 | 10,812 | 22,465 |
The ICE Bank of America Merrill Lynch U.S. Dollar 6-Month Deposit Offered Rate Constant Maturity Index tracks the average interest rate at which a selection of banks in London are prepared to lend to one another in U.S. dollars with a constant maturity of 6 months.
The MSCI World Index is a free float-adjusted market-capitalization-weighted index that is designed to measure equity market performance of global developed markets and is included here as a broad measure of market performance.
It is not possible to invest directly in an index. Index figures do not reflect expenses or sales charges, which would result in lower returns.
Footnotes related to performance pages
| 1 | From 12-19-11. |
| 2 | Class C shares were first offered on 8-1-12; Class R2 and Class R6 shares were first offered on 3-1-12. Returns prior to these dates are those of Class A shares (first offered on 12-19-11) that have not been adjusted for class-specific expenses; otherwise, returns would vary. |
| 3 | For certain types of investors as described in the fund's prospectuses. |
| 4 | The contingent deferred sales charge is not applicable. |
ANNUAL REPORT | JOHN HANCOCK GLOBAL ABSOLUTE RETURN STRATEGIES FUND 8
These examples are intended to help you understand your ongoing operating expenses of investing in the fund so you can compare these costs with the ongoing costs of investing in other mutual funds.
Understanding fund expenses
As a shareholder of the fund, you incur two types of costs:
■Transaction costs,which include sales charges (loads) on purchases or redemptions (varies by share class), minimum account fee charge, etc.
■Ongoing operating expenses, including management fees, distribution and service fees (if applicable), and other fund expenses.
We are presenting only your ongoing operating expenses here.
Actual expenses/actual returns
The first line of each share class in the table on the following page is intended to provide information about the fund’s actual ongoing operating expenses, and is based on the fund’s actual return. It assumes an account value of $1,000.00 on February 1, 2019, with the same investment held until July 31, 2019.
Together with the value of your account, you may use this information to estimate the operating expenses that you paid over the period. Simply divide your account value at July 31, 2019, by $1,000.00, then multiply it by the “expenses paid” for your share class from the table. For example, for an account value of $8,600.00, the operating expenses should be calculated as follows:
Hypothetical example for comparison purposes
The second line of each share class in the table on the following page allows you to compare the fund’s ongoing operating expenses with those of any other fund. It provides an example of the fund’s hypothetical account values and hypothetical expenses based on each class’s actual expense ratio and an assumed 5% annualized return before expenses (which is not the class’s actual return). It assumes an account value of $1,000.00 on February 1, 2019, with the same investment held until July 31, 2019. Look in any other fund shareholder report to find its hypothetical example and you will be able to compare these expenses. Please remember that these hypothetical account values and expenses may not be used to estimate the actual ending account balance or expenses you paid for the period.
| | ANNUAL REPORT | JOHN HANCOCK GLOBAL ABSOLUTE RETURN STRATEGIES FUND | 9 |
Remember, these examples do not include any transaction costs, therefore, these examples will not help you to determine the relative total costs of owning different funds. If transaction costs were included, your expenses would have been higher. See the prospectuses for details regarding transaction costs.
SHAREHOLDER EXPENSE EXAMPLE CHART
| | | Account
value on
2-1-2019 | Ending
value on
7-31-2019 | Expenses
paid during
period ended
7-31-20191 | Annualized
expense
ratio |
| Class A | Actual expenses/actual returns | $1,000.00 | $1,045.60 | $8.67 | 1.71% |
| | Hypothetical example | 1,000.00 | 1,016.30 | 8.55 | 1.71% |
| Class C | Actual expenses/actual returns | 1,000.00 | 1,042.60 | 12.26 | 2.42% |
| | Hypothetical example | 1,000.00 | 1,012.80 | 12.08 | 2.42% |
| Class I | Actual expenses/actual returns | 1,000.00 | 1,047.10 | 7.21 | 1.42% |
| | Hypothetical example | 1,000.00 | 1,017.80 | 7.10 | 1.42% |
| Class R2 | Actual expenses/actual returns | 1,000.00 | 1,044.80 | 9.28 | 1.83% |
| | Hypothetical example | 1,000.00 | 1,015.70 | 9.15 | 1.83% |
| Class R6 | Actual expenses/actual returns | 1,000.00 | 1,047.90 | 6.65 | 1.31% |
| | Hypothetical example | 1,000.00 | 1,018.30 | 6.56 | 1.31% |
| Class NAV | Actual expenses/actual returns | 1,000.00 | 1,048.00 | 6.50 | 1.28% |
| | Hypothetical example | 1,000.00 | 1,018.40 | 6.41 | 1.28% |
| 1 | Expenses are equal to the annualized expense ratio, multiplied by the average account value over the period, multiplied by 181/365 (to reflect the one-half year period). |
| 10 | JOHN HANCOCK GLOBAL ABSOLUTE RETURN STRATEGIES FUND | ANNUAL REPORT | |
AS OF 7-31-19
| | Rate (%) | Maturity date | | Par value^ | Value |
| U.S. Government and Agency obligations 7.8% | $64,136,465 |
| (Cost $59,395,405) | | | | | |
| United States 7.8% | | | | | 64,136,465 |
| U.S. Treasury | | | | | |
| Treasury Inflation Protected Security | 0.625 | 02-15-43 | | 5,939,700 | 6,478,638 |
| Treasury Inflation Protected Security | 0.750 | 02-15-42 | | 5,967,300 | 6,852,205 |
| Treasury Inflation Protected Security | 0.750 | 02-15-45 | | 5,945,100 | 6,461,025 |
| Treasury Inflation Protected Security | 0.875 | 02-15-47 | | 7,117,600 | 7,772,165 |
| Treasury Inflation Protected Security | 1.000 | 02-15-46 | | 5,405,700 | 6,182,681 |
| Treasury Inflation Protected Security | 1.000 | 02-15-48 | | 4,836,700 | 5,339,475 |
| Treasury Inflation Protected Security | 1.000 | 02-15-49 | | 301,300 | 328,108 |
| Treasury Inflation Protected Security | 1.375 | 02-15-44 | | 5,925,600 | 7,459,515 |
| Treasury Inflation Protected Security | 2.125 | 02-15-40 | | 3,900,700 | 5,955,616 |
| Treasury Inflation Protected Security | 2.125 | 02-15-41 | | 6,181,000 | 9,380,151 |
|
| Treasury Inflation Protected Security (A) | 3.375 | 04-15-32 | | 975,600 | 1,926,886 |
| Foreign government obligations 28.6% | | | | $234,499,754 |
| (Cost $220,545,483) | | | | | |
| Argentina 0.1% | | | | | 481,493 |
Republic of Argentina
Bond (Argentina Blended Historical Policy Rate) (B) | 62.815 | 06-21-20 | ARS | 20,268,054 | 481,493 |
| Brazil 1.7% | | | | | 14,377,119 |
| Federative Republic of Brazil | | | | | |
| Note | 10.000 | 01-01-23 | BRL | 40,460,000 | 11,843,102 |
| Note | 10.000 | 01-01-25 | BRL | 3,889,000 | 1,169,581 |
| Note | 10.000 | 01-01-27 | BRL | 4,446,000 | 1,364,436 |
| Chile 0.2% | | | | | 1,551,144 |
Republic of Chile
Bond | 4.500 | 03-01-21 | CLP | 1,035,000,000 | 1,551,144 |
| Colombia 1.1% | | | | | 8,956,175 |
| Republic of Colombia | | | | | |
| Bond | 7.500 | 08-26-26 | COP | 3,460,100,000 | 1,171,225 |
| Bond | 7.750 | 09-18-30 | COP | 8,685,400,000 | 3,021,376 |
| Bond | 10.000 | 07-24-24 | COP | 12,931,900,000 | 4,763,574 |
| Costa Rica 0.1% | | | | | 744,443 |
Republic of Costa Rica
Bond | 10.350 | 06-19-30 | CRC | 415,000,000 | 744,443 |
| Czech Republic 0.1% | | | | | 1,080,013 |
| Czech Republic | | | | | |
| Bond | 2.000 | 10-13-33 | CZK | 17,310,000 | 785,259 |
| Bond | 4.200 | 12-04-36 | CZK | 4,990,000 | 294,754 |
| SEE NOTES TO FINANCIAL STATEMENTS | ANNUAL REPORT | JOHN HANCOCK GLOBAL ABSOLUTE RETURN STRATEGIES FUND | 11 |
| | Rate (%) | Maturity date | | Par value^ | Value |
| France 8.5% | | | | | $69,592,719 |
| Government of France | | | | | |
| Bond (C) | 1.500 | 05-25-50 | EUR | 31,067,800 | 41,463,375 |
| Bond (C) | 2.000 | 05-25-48 | EUR | 18,931,000 | 28,129,344 |
| Hungary 0.4% | | | | | 3,213,744 |
Republic of Hungary
Bond | 1.000 | 09-23-20 | HUF | 937,430,000 | 3,213,744 |
| Indonesia 1.9% | | | | | 15,786,260 |
| Republic of Indonesia | | | | | |
| Bond | 5.625 | 05-15-23 | IDR | 7,191,000,000 | 496,183 |
| Bond | 7.000 | 05-15-22 | IDR | 24,379,000,000 | 1,764,555 |
| Bond | 7.000 | 05-15-27 | IDR | 61,104,000,000 | 4,315,685 |
| Bond | 7.500 | 08-15-32 | IDR | 16,061,000,000 | 1,128,693 |
| Bond | 7.500 | 05-15-38 | IDR | 9,271,000,000 | 645,180 |
| Bond | 8.125 | 05-15-24 | IDR | 5,183,000,000 | 389,683 |
| Bond | 8.250 | 05-15-36 | IDR | 15,469,000,000 | 1,156,506 |
| Bond | 8.375 | 09-15-26 | IDR | 28,847,000,000 | 2,194,035 |
| Bond | 8.375 | 03-15-34 | IDR | 48,771,000,000 | 3,695,740 |
| Malaysia 0.8% | | | | | 6,762,122 |
| Government of Malaysia | | | | | |
| Bond | 3.757 | 04-20-23 | MYR | 4,790,000 | 1,175,539 |
| Bond | 3.844 | 04-15-33 | MYR | 2,567,000 | 622,837 |
| Bond | 4.059 | 09-30-24 | MYR | 10,503,000 | 2,613,011 |
| Bond | 4.181 | 07-15-24 | MYR | 4,113,000 | 1,028,770 |
| Bond | 4.935 | 09-30-43 | MYR | 4,858,000 | 1,321,965 |
| Mexico 8.6% | | | | | 70,242,458 |
| Government of Mexico | | | | | |
| Bond | 6.500 | 06-09-22 | MXN | 38,013,900 | 1,942,793 |
| Bond | 7.500 | 06-03-27 | MXN | 34,834,900 | 1,820,640 |
| Bond | 7.750 | 11-13-42 | MXN | 69,220,800 | 3,552,037 |
| Bond | 8.000 | 12-07-23 | MXN | 165,570,300 | 8,860,770 |
| Bond | 8.000 | 11-07-47 | MXN | 190,063,400 | 9,998,592 |
| Bond | 8.500 | 05-31-29 | MXN | 34,600,300 | 1,927,650 |
| Bond | 8.500 | 11-18-38 | MXN | 101,969,000 | 5,657,161 |
| Bond | 10.000 | 12-05-24 | MXN | 533,596,600 | 31,139,683 |
| Bond | 10.000 | 11-20-36 | MXN | 84,824,000 | 5,343,132 |
| Peru 0.5% | | | | | 3,891,388 |
| Republic of Peru | | | | | |
| Bond (C) | 5.940 | 02-12-29 | PEN | 7,723,000 | 2,609,946 |
| Bond | 6.900 | 08-12-37 | PEN | 3,475,000 | 1,281,442 |
| Philippines 0.4% | | | | | 3,402,626 |
| Republic of Philippines | | | | | |
| Bond | 5.750 | 04-12-25 | PHP | 98,980,000 | 2,046,623 |
| Bond | 6.250 | 03-22-28 | PHP | 33,450,000 | 726,795 |
| 12 | JOHN HANCOCK GLOBAL ABSOLUTE RETURN STRATEGIES FUND | ANNUAL REPORT | SEE NOTES TO FINANCIAL STATEMENTS |
| | Rate (%) | Maturity date | | Par value^ | Value |
| Philippines (continued) | | | | | |
| Bond | 6.250 | 01-14-36 | PHP | 11,000,000 | $251,388 |
| Bond | 6.875 | 01-10-29 | PHP | 16,560,000 | 377,820 |
| Poland 1.0% | | | | | 8,172,348 |
| Republic of Poland | | | | | |
| Bond | 1.500 | 04-25-20 | PLN | 13,470,000 | 3,483,010 |
| Bond | 2.500 | 04-25-24 | PLN | 2,224,000 | 591,128 |
| Bond | 5.250 | 10-25-20 | PLN | 13,400,000 | 3,622,607 |
| Bond | 5.500 | 10-25-19 | PLN | 1,825,000 | 475,603 |
| Romania 0.0% | | | | | 102,863 |
Government of Romania
Bond | 5.000 | 02-12-29 | RON | 420,000 | 102,863 |
| South Africa 1.1% | | | | | 9,102,501 |
| Republic of South Africa | | | | | |
| Bond | 6.250 | 03-31-36 | ZAR | 10,383,000 | 521,630 |
| Bond | 8.000 | 01-31-30 | ZAR | 35,191,000 | 2,286,047 |
| Bond | 8.250 | 03-31-32 | ZAR | 5,414,000 | 346,046 |
| Bond | 8.750 | 02-28-48 | ZAR | 34,835,000 | 2,145,617 |
| Bond | 9.000 | 01-31-40 | ZAR | 15,663,000 | 1,009,574 |
| Bond | 10.500 | 12-21-26 | ZAR | 35,902,000 | 2,793,587 |
| Thailand 1.3% | | | | | 10,323,279 |
| Kingdom of Thailand | | | | | |
| Bond | 1.250 | 03-12-28 | THB | 232,975,000 | 7,738,537 |
| Bond | 3.650 | 12-17-21 | THB | 36,563,000 | 1,242,829 |
| Bond | 3.775 | 06-25-32 | THB | 34,262,000 | 1,341,913 |
| Turkey 0.5% | | | | | 4,271,929 |
| Republic of Turkey | | | | | |
| Bond | 7.100 | 03-08-23 | TRY | 7,405,000 | 1,033,595 |
| Bond | 9.500 | 01-12-22 | TRY | 2,442,000 | 385,924 |
| Bond | 11.000 | 02-24-27 | TRY | 5,403,000 | 794,815 |
| Bond | 12.200 | 01-18-23 | TRY | 12,482,000 | 2,057,595 |
| Uruguay 0.3% | | | | | 2,445,130 |
|
Republic of Uruguay
Bond | 4.375 | 12-15-28 | UYU | 42,416,393 | 2,445,130 |
| Corporate bonds 7.0% | | | | $57,412,136 |
| (Cost $56,453,493) | | | | | |
| Australia 0.1% | | | | | 547,474 |
| BHP Billiton Finance, Ltd. (6.500% to 10-22-22, then 5 Year British Pound Swap Rate + 4.817%) | 6.500 | 10-22-77 | GBP | 225,000 | 311,246 |
| Mineral Resources, Ltd. (C) | 8.125 | 05-01-27 | | 225,000 | 236,228 |
| Austria 0.0% | | | | | 271,659 |
| Sappi Papier Holding GmbH | 4.000 | 04-01-23 | EUR | 240,000 | 271,659 |
| SEE NOTES TO FINANCIAL STATEMENTS | ANNUAL REPORT | JOHN HANCOCK GLOBAL ABSOLUTE RETURN STRATEGIES FUND | 13 |
| | Rate (%) | Maturity date | | Par value^ | Value |
| Canada 0.1% | | | | | $1,069,810 |
| Clearwater Seafoods, Inc. (C) | 6.875 | 05-01-25 | | 400,000 | 405,000 |
| Entertainment One, Ltd. (C) | 4.625 | 07-15-26 | GBP | 160,000 | 199,904 |
| First Quantum Minerals, Ltd. (C) | 7.500 | 04-01-25 | | 475,000 | 464,906 |
| Cayman Islands 0.1% | | | | | 645,750 |
| UPCB Finance IV, Ltd. (C) | 5.375 | 01-15-25 | | 630,000 | 645,750 |
| Colombia 0.1% | | | | | 428,426 |
| Tecnoglass, Inc. (C) | 8.200 | 01-31-22 | | 399,000 | 428,426 |
| Denmark 0.2% | | | | | 1,576,721 |
| Danske Bank A/S (5.875% to 4-6-22, then 7 Year Euro Swap Rate + 5.471%) (D) | 5.875 | 04-06-22 | EUR | 225,000 | 263,709 |
| DKT Finance ApS (C) | 9.375 | 06-17-23 | | 1,213,000 | 1,313,012 |
| France 0.2% | | | | | 1,753,697 |
| Casino Guichard Perrachon SA | 4.561 | 01-25-23 | EUR | 200,000 | 192,293 |
| Credit Agricole SA (7.875% to 1-23-24, then 5 Year U.S. Swap Rate + 4.898%) (C)(D) | 7.875 | 01-23-24 | | 680,000 | 750,120 |
| Crown European Holdings SA | 2.250 | 02-01-23 | EUR | 295,000 | 345,521 |
| La Financiere Atalian SASU | 4.000 | 05-15-24 | EUR | 115,000 | 88,212 |
| SPCM SA (C) | 4.875 | 09-15-25 | | 373,000 | 377,551 |
| Germany 0.2% | | | | | 1,267,888 |
| Aareal Bank AG (7.625% to 4-30-20, then 1 Year Euro Swap Rate + 7.180%) (D) | 7.625 | 04-30-20 | EUR | 200,000 | 229,434 |
| Nidda Healthcare Holding GmbH | 3.500 | 09-30-24 | EUR | 220,000 | 252,781 |
| Tele Columbus AG (C) | 3.875 | 05-02-25 | EUR | 290,000 | 297,947 |
| Unitymedia Hessen GmbH & Company KG | 4.000 | 01-15-25 | EUR | 425,000 | 487,726 |
| India 0.0% | | | | | 301,940 |
| Vedanta Resources, Ltd. (C) | 6.375 | 07-30-22 | | 303,000 | 301,940 |
| Ireland 0.2% | | | | | 1,590,680 |
| Ardagh Packaging Finance PLC (C) | 4.250 | 09-15-22 | | 200,000 | 203,100 |
| Ardagh Packaging Finance PLC (C) | 4.625 | 05-15-23 | | 200,000 | 205,000 |
| Ardagh Packaging Finance PLC | 6.750 | 05-15-24 | EUR | 235,000 | 275,142 |
| C&W Senior Financing DAC (C) | 6.875 | 09-15-27 | | 291,000 | 304,473 |
| Perrigo Finance Unlimited Company | 4.375 | 03-15-26 | | 300,000 | 304,109 |
| Smurfit Kappa Acquisitions ULC | 4.125 | 01-30-20 | EUR | 265,000 | 298,856 |
| Israel 0.0% | | | | | 145,350 |
| Teva Pharmaceutical Finance Company BV | 3.650 | 11-10-21 | | 153,000 | 145,350 |
| 14 | JOHN HANCOCK GLOBAL ABSOLUTE RETURN STRATEGIES FUND | ANNUAL REPORT | SEE NOTES TO FINANCIAL STATEMENTS |
| | Rate (%) | Maturity date | | Par value^ | Value |
| Italy 0.2% | | | | | $1,319,374 |
| Telecom Italia Finance SA | 7.750 | 01-24-33 | EUR | 221,000 | 355,782 |
| Telecom Italia SpA (C) | 5.303 | 05-30-24 | | 372,000 | 392,925 |
| UniCredit SpA | 6.950 | 10-31-22 | EUR | 255,000 | 335,759 |
| Wind Tre SpA | 2.625 | 01-20-23 | EUR | 210,000 | 234,908 |
| Luxembourg 0.2% | | | | | 1,705,849 |
| Cirsa Finance International Sarl (C) | 6.250 | 12-20-23 | EUR | 328,000 | 390,485 |
| Cirsa Finance International Sarl (C) | 7.875 | 12-20-23 | | 352,000 | 371,547 |
| Dufry Finance SCA | 4.500 | 08-01-23 | EUR | 175,000 | 198,530 |
| Lincoln Financing Sarl (C) | 3.625 | 04-01-24 | EUR | 202,000 | 230,421 |
| Lincoln Financing Sarl (Greater of 3 month EURIBOR + 3.875% or 3.875%) (B)(C) | 3.875 | 04-01-24 | EUR | 131,000 | 145,922 |
| Matterhorn Telecom SA | 3.875 | 05-01-22 | EUR | 330,000 | 368,944 |
| Mexico 0.1% | | | | | 970,018 |
| Cemex SAB de CV (C) | 5.700 | 01-11-25 | | 270,000 | 277,088 |
| Petroleos Mexicanos | 7.190 | 09-12-24 | MXN | 16,047,300 | 692,930 |
| Netherlands 0.5% | | | | | 3,861,624 |
| Cimpress NV (C) | 7.000 | 06-15-26 | | 429,000 | 430,073 |
| Energizer Gamma Acquisition BV (C) | 4.625 | 07-15-26 | EUR | 310,000 | 357,927 |
| InterXion Holding NV (C) | 4.750 | 06-15-25 | EUR | 385,000 | 463,451 |
| OCI NV | 5.000 | 04-15-23 | EUR | 335,000 | 389,388 |
| OI European Group BV (C) | 4.000 | 03-15-23 | | 502,000 | 504,510 |
| Teva Pharmaceutical Finance Netherlands II BV | 1.250 | 03-31-23 | EUR | 160,000 | 154,292 |
| Teva Pharmaceutical Finance Netherlands II BV | 3.250 | 04-15-22 | EUR | 145,000 | 154,034 |
| Teva Pharmaceutical Finance Netherlands III BV | 6.750 | 03-01-28 | | 611,000 | 546,845 |
| Trivium Packaging Finance BV (C) | 3.750 | 08-15-26 | EUR | 100,000 | 114,575 |
| Ziggo Bond Company BV (C) | 4.625 | 01-15-25 | EUR | 439,000 | 500,647 |
| Ziggo Bond Company BV | 7.125 | 05-15-24 | EUR | 84,463 | 97,591 |
| Ziggo BV | 4.250 | 01-15-27 | EUR | 125,000 | 148,291 |
| Norway 0.0% | | | | | 420,523 |
| Nassa Topco AS | 2.875 | 04-06-24 | EUR | 360,000 | 420,523 |
| Sweden 0.1% | | | | | 515,800 |
| Intrum AB (C) | 3.500 | 07-15-26 | EUR | 217,000 | 241,629 |
| Verisure Holding AB (C) | 3.500 | 05-15-23 | EUR | 238,000 | 274,171 |
| Switzerland 0.0% | | | | | 300,336 |
| Credit Suisse Group AG (6.250% to 12-18-24, then 5 Year U.S. Swap Rate + 3.455%) (D) | 6.250 | 12-18-24 | | 285,000 | 300,336 |
| SEE NOTES TO FINANCIAL STATEMENTS | ANNUAL REPORT | JOHN HANCOCK GLOBAL ABSOLUTE RETURN STRATEGIES FUND | 15 |
| | Rate (%) | Maturity date | | Par value^ | Value |
| United Kingdom 0.4% | | | | | $3,544,166 |
| Arqiva Broadcast Finance PLC | 6.750 | 09-30-23 | GBP | 370,000 | 480,023 |
| CYBG PLC (8.000% to 12-8-22, then 5 Year British Pound Swap Rate + 6.250%) (D) | 8.000 | 12-08-22 | GBP | 200,000 | 233,491 |
| Jaguar Land Rover Automotive PLC | 4.500 | 01-15-26 | EUR | 115,000 | 110,554 |
| KCA Deutag UK Finance PLC (C) | 9.625 | 04-01-23 | | 434,000 | 295,120 |
| Pinnacle Bidco PLC | 6.375 | 02-15-25 | GBP | 250,000 | 320,200 |
| TalkTalk Telecom Group PLC | 5.375 | 01-15-22 | GBP | 250,000 | 310,948 |
| Tesco Property Finance 2 PLC | 6.052 | 10-13-39 | GBP | 219,760 | 353,353 |
| The Royal Bank of Scotland Group PLC (8.625% to 8-15-21, then 5 Year U.S. Swap Rate + 7.598%) (D) | 8.625 | 08-15-21 | | 700,000 | 744,625 |
| Virgin Media Finance PLC (C) | 6.000 | 10-15-24 | | 520,000 | 540,150 |
| Virgin Media Secured Finance PLC (6.000% to 1-15-21, then 11.000% thereafter) (C) | 6.000 | 01-15-25 | GBP | 115,000 | 155,702 |
| United States 4.3% | | | | | 35,175,051 |
| ACI Worldwide, Inc. (C) | 5.750 | 08-15-26 | | 418,000 | 433,665 |
| Alliance Data Systems Corp. (C) | 5.375 | 08-01-22 | | 681,000 | 690,153 |
| Ally Financial, Inc. | 3.875 | 05-21-24 | | 74,000 | 76,220 |
| Ally Financial, Inc. | 5.750 | 11-20-25 | | 478,000 | 533,568 |
| Avantor, Inc. | 4.750 | 10-01-24 | EUR | 467,000 | 552,947 |
| Avis Budget Car Rental LLC (C) | 5.750 | 07-15-27 | | 208,000 | 210,080 |
| Bank of America Corp. (6.300% to 3-10-26, then 3 month LIBOR + 4.553%) (D) | 6.300 | 03-10-26 | | 264,000 | 295,680 |
| Bausch Health Americas, Inc. (C) | 8.500 | 01-31-27 | | 69,000 | 75,993 |
| Bausch Health Companies, Inc. (C) | 5.500 | 11-01-25 | | 236,000 | 245,440 |
| Bausch Health Companies, Inc. (C) | 7.000 | 03-15-24 | | 736,000 | 776,480 |
| Berry Global, Inc. (C) | 4.875 | 07-15-26 | | 248,000 | 257,920 |
| Bruin E&P Partners LLC (C) | 8.875 | 08-01-23 | | 509,000 | 380,478 |
| Builders FirstSource, Inc. (C) | 5.625 | 09-01-24 | | 393,000 | 406,755 |
| Builders FirstSource, Inc. (C) | 6.750 | 06-01-27 | | 13,000 | 13,683 |
| Calpine Corp. (C) | 5.250 | 06-01-26 | | 275,000 | 277,756 |
| CCO Holdings LLC (C) | 5.375 | 06-01-29 | | 115,000 | 119,169 |
| CCO Holdings LLC (C) | 5.875 | 04-01-24 | | 244,000 | 253,455 |
| Cedar Fair LP (C) | 5.250 | 07-15-29 | | 232,000 | 240,120 |
| CEMEX Finance LLC (C) | 6.000 | 04-01-24 | | 490,000 | 502,863 |
| Century Communities, Inc. | 5.875 | 07-15-25 | | 264,000 | 265,320 |
| Century Communities, Inc. (C) | 6.750 | 06-01-27 | | 105,000 | 108,413 |
| CenturyLink, Inc. | 5.625 | 04-01-20 | | 307,000 | 311,027 |
| Charter Communications Operating LLC | 6.384 | 10-23-35 | | 581,000 | 685,915 |
| Cheniere Corpus Christi Holdings LLC | 7.000 | 06-30-24 | | 692,000 | 787,164 |
| Cheniere Energy Partners LP | 5.250 | 10-01-25 | | 302,000 | 312,954 |
| Clean Harbors, Inc. (C) | 4.875 | 07-15-27 | | 238,000 | 245,407 |
| 16 | JOHN HANCOCK GLOBAL ABSOLUTE RETURN STRATEGIES FUND | ANNUAL REPORT | SEE NOTES TO FINANCIAL STATEMENTS |
| | Rate (%) | Maturity date | | Par value^ | Value |
| United States (continued) | | | | | |
| Clean Harbors, Inc. (C) | 5.125 | 07-15-29 | | 33,000 | $34,784 |
| Colfax Corp. (C) | 6.000 | 02-15-24 | | 106,000 | 112,261 |
| Colfax Corp. (C) | 6.375 | 02-15-26 | | 204,000 | 218,345 |
| Commercial Metals Company | 5.750 | 04-15-26 | | 489,000 | 503,670 |
| CommScope, Inc. (C) | 6.000 | 03-01-26 | | 340,000 | 343,723 |
| CommScope, Inc. (C) | 8.250 | 03-01-27 | | 106,000 | 104,410 |
| Consolidated Communications, Inc. | 6.500 | 10-01-22 | | 506,000 | 458,748 |
| CSC Holdings LLC (C) | 6.500 | 02-01-29 | | 389,000 | 428,873 |
| CSC Holdings LLC (C) | 10.875 | 10-15-25 | | 497,000 | 566,118 |
| Cumulus Media New Holdings, Inc. (C) | 6.750 | 07-01-26 | | 228,000 | 232,845 |
| CyrusOne LP | 5.375 | 03-15-27 | | 178,000 | 189,125 |
| DaVita, Inc. | 5.125 | 07-15-24 | | 207,000 | 207,776 |
| Dell International LLC (C) | 5.300 | 10-01-29 | | 634,000 | 674,206 |
| Dell International LLC (C) | 5.875 | 06-15-21 | | 437,000 | 444,554 |
| Delta Air Lines, Inc. | 4.375 | 04-19-28 | | 309,000 | 324,149 |
| Diamondback Energy, Inc. | 5.375 | 05-31-25 | | 501,000 | 526,050 |
| DISH DBS Corp. | 5.000 | 03-15-23 | | 434,000 | 418,810 |
| Encompass Health Corp. | 5.750 | 11-01-24 | | 388,000 | 392,373 |
| Energy Transfer Operating LP | 5.875 | 01-15-24 | | 218,000 | 242,009 |
| Energy Transfer Operating LP | 7.500 | 10-15-20 | | 199,000 | 210,189 |
| ESH Hospitality, Inc. (C) | 5.250 | 05-01-25 | | 353,000 | 363,149 |
| GCI LLC (C) | 6.625 | 06-15-24 | | 175,000 | 186,375 |
| General Motors Financial Company, Inc. (5.750% to 9-30-27, then 3 month LIBOR + 3.598%) (D) | 5.750 | 09-30-27 | | 293,000 | 273,223 |
| GLP Capital LP | 5.375 | 04-15-26 | | 248,000 | 269,854 |
| Graham Holdings Company (C) | 5.750 | 06-01-26 | | 88,000 | 93,738 |
| Gray Television, Inc. (C) | 7.000 | 05-15-27 | | 349,000 | 381,719 |
| Harland Clarke Holdings Corp. (C) | 8.375 | 08-15-22 | | 43,000 | 36,335 |
| HCA, Inc. | 7.500 | 11-15-95 | | 841,000 | 899,870 |
| International Game Technology PLC (C) | 3.500 | 07-15-24 | EUR | 258,000 | 309,106 |
| International Game Technology PLC (C) | 3.500 | 06-15-26 | EUR | 153,000 | 178,560 |
| IQVIA, Inc. | 3.250 | 03-15-25 | EUR | 215,000 | 244,227 |
| Iron Mountain, Inc. (C) | 5.250 | 03-15-28 | | 348,000 | 349,740 |
| j2 Cloud Services LLC (C) | 6.000 | 07-15-25 | | 583,000 | 615,357 |
| Lennar Corp. | 4.750 | 11-29-27 | | 854,000 | 896,700 |
| MDC Holdings, Inc. | 6.000 | 01-15-43 | | 521,000 | 513,185 |
| Meredith Corp. | 6.875 | 02-01-26 | | 516,000 | 545,670 |
| MGM Resorts International | 5.500 | 04-15-27 | | 288,000 | 305,364 |
| Moss Creek Resources Holdings, Inc. (C) | 7.500 | 01-15-26 | | 622,000 | 486,715 |
| MPT Operating Partnership LP | 4.000 | 08-19-22 | EUR | 215,000 | 263,291 |
| NBM US Holdings, Inc. (C) | 7.000 | 05-14-26 | | 311,000 | 320,797 |
| Netflix, Inc. | 5.875 | 11-15-28 | | 561,000 | 614,996 |
| Netflix, Inc. (C) | 6.375 | 05-15-29 | | 159,000 | 178,032 |
| SEE NOTES TO FINANCIAL STATEMENTS | ANNUAL REPORT | JOHN HANCOCK GLOBAL ABSOLUTE RETURN STRATEGIES FUND | 17 |
| | Rate (%) | Maturity date | | Par value^ | Value |
| United States (continued) | | | | | |
| New Enterprise Stone & Lime Company, Inc. (C) | 6.250 | 03-15-26 | | 313,000 | $320,356 |
| Nine Energy Service, Inc. (C) | 8.750 | 11-01-23 | | 170,000 | 166,175 |
| Novelis Corp. (C) | 5.875 | 09-30-26 | | 118,000 | 122,278 |
| Novelis Corp. (C) | 6.250 | 08-15-24 | | 495,000 | 518,522 |
| NRG Energy, Inc. (C) | 5.250 | 06-15-29 | | 115,000 | 121,158 |
| NRG Energy, Inc. | 7.250 | 05-15-26 | | 263,000 | 283,940 |
| Oasis Petroleum, Inc. | 6.875 | 03-15-22 | | 387,000 | 385,200 |
| Oasis Petroleum, Inc. | 6.875 | 01-15-23 | | 81,000 | 79,684 |
| Parsley Energy LLC (C) | 5.375 | 01-15-25 | | 302,000 | 305,793 |
| Parsley Energy LLC (C) | 5.625 | 10-15-27 | | 45,000 | 46,463 |
| Pitney Bowes, Inc. | 3.875 | 10-01-21 | | 43,000 | 41,826 |
| Post Holdings, Inc. (C) | 5.000 | 08-15-26 | | 424,000 | 433,010 |
| Qwest Capital Funding, Inc. | 6.875 | 07-15-28 | | 254,000 | 233,045 |
| Qwest Capital Funding, Inc. | 7.750 | 02-15-31 | | 254,000 | 234,950 |
| SM Energy Company | 6.750 | 09-15-26 | | 429,000 | 386,100 |
| Sprint Corp. | 7.625 | 02-15-25 | | 490,000 | 542,690 |
| Sprint Corp. | 7.875 | 09-15-23 | | 382,000 | 424,498 |
| Staples, Inc. (C) | 7.500 | 04-15-26 | | 413,000 | 422,293 |
| Steel Dynamics, Inc. | 4.125 | 09-15-25 | | 255,000 | 256,048 |
| Steel Dynamics, Inc. | 5.000 | 12-15-26 | | 248,000 | 259,160 |
| SunCoke Energy Partners LP (C) | 7.500 | 06-15-25 | | 305,000 | 302,316 |
| Tenet Healthcare Corp. | 4.500 | 04-01-21 | | 131,000 | 133,129 |
| Tenet Healthcare Corp. | 4.625 | 07-15-24 | | 451,000 | 459,456 |
| Tennant Company | 5.625 | 05-01-25 | | 317,000 | 328,888 |
| The Goodyear Tire & Rubber Company | 5.000 | 05-31-26 | | 305,000 | 304,283 |
| T-Mobile USA, Inc. | 6.500 | 01-15-26 | | 446,000 | 474,856 |
| USA Compression Partners LP (C) | 6.875 | 09-01-27 | | 227,000 | 236,060 |
| Versum Materials, Inc. (C) | 5.500 | 09-30-24 | | 255,000 | 272,850 |
| Viking Cruises, Ltd. (C) | 6.250 | 05-15-25 | | 433,000 | 445,990 |
| Vistra Operations Company LLC (C) | 5.625 | 02-15-27 | | 280,000 | 295,400 |
| Western Midstream Operating LP | 4.500 | 03-01-28 | | 48,000 | 47,780 |
| Western Midstream Operating LP | 4.750 | 08-15-28 | | 123,000 | 123,442 |
| WMG Acquisition Corp. (C) | 3.625 | 10-15-26 | EUR | 183,000 | 216,623 |
| WMG Acquisition Corp. (C) | 5.500 | 04-15-26 | | 114,000 | 117,990 |
| WPX Energy, Inc. | 8.250 | 08-01-23 | | 711,000 | 799,875 |
| Wyndham Destinations, Inc. | 4.500 | 04-01-27 | | 344,000 | 365,930 |
| Wyndham Destinations, Inc. | 5.100 | 10-01-25 | | 239,000 | 261,657 |
|
| ZF North America Capital, Inc. (C) | 4.750 | 04-29-25 | | 375,000 | 387,691 |
| Convertible bonds 0.0% | | | | | $110,872 |
| (Cost $114,286) | | | | | |
| Italy 0.0% | | | | | 110,872 |
| Telecom Italia SpA | 1.125 | 03-26-22 | EUR | 100,000 | 110,872 |
|
| 18 | JOHN HANCOCK GLOBAL ABSOLUTE RETURN STRATEGIES FUND | ANNUAL REPORT | SEE NOTES TO FINANCIAL STATEMENTS |
| | | | | Shares | Value |
| Common stocks 12.8% | | | | | $105,187,972 |
| (Cost $93,071,758) | | | | | |
| Belgium 0.0% | | | | | 288,651 |
| Umicore SA | | | 9,221 | 288,651 |
| Canada 0.1% | | | | | 743,304 |
| Alimentation Couche-Tard, Inc., Class B | | | 5,630 | 345,103 |
| Restaurant Brands International, Inc. | | | 5,403 | 398,201 |
| China 0.0% | | | | | 253,626 |
| Tianhe Chemicals Group, Ltd. (C)(E)(F) | | | 4,848,409 | 253,626 |
| Denmark 0.2% | | | | | 1,941,940 |
| Coloplast A/S, B Shares | | | 6,403 | 747,843 |
| Novo Nordisk A/S, B Shares | | | 24,867 | 1,194,097 |
| Finland 0.2% | | | | | 1,769,431 |
| Kesko OYJ, B Shares | | | 5,658 | 342,637 |
| Kone OYJ, B Shares | | | 14,126 | 804,809 |
| Nordea Bank ABP | | | 55,788 | 357,895 |
| Sampo OYJ, A Shares | | | 6,360 | 264,090 |
| France 1.2% | | | | | 9,884,961 |
| Airbus SE | | | 7,070 | 999,424 |
| AXA SA | | | 50,767 | 1,278,735 |
| Cie Generale des Etablissements Michelin SCA | | | 5,821 | 643,498 |
| LVMH Moet Hennessy Louis Vuitton SE | | | 2,880 | 1,189,614 |
| Orange SA | | | 52,399 | 776,685 |
| Thales SA | | | 2,958 | 333,290 |
| TOTAL SA | | | 80,170 | 4,155,236 |
| Vivendi SA | | | 18,307 | 508,479 |
| Germany 0.6% | | | | | 4,840,224 |
| Allianz SE | | | 2,604 | 604,153 |
| Bayer AG | | | 12,266 | 794,459 |
| Covestro AG (C) | | | 6,825 | 307,816 |
| Deutsche Post AG | | | 19,747 | 642,303 |
| RWE AG | | | 23,123 | 624,759 |
| Siemens AG | | | 9,662 | 1,051,550 |
| TUI AG | | | 22,556 | 223,969 |
| Vonovia SE | | | 12,109 | 591,215 |
| Hong Kong 0.0% | | | | | 0 |
| China Metal Recycling Holdings, Ltd. (E)(F) | | | 1,799,400 | 0 |
| Ireland 0.2% | | | | | 1,757,314 |
| Allegion PLC | | | 3,299 | 341,578 |
| CRH PLC | | | 14,653 | 487,659 |
| SEE NOTES TO FINANCIAL STATEMENTS | ANNUAL REPORT | JOHN HANCOCK GLOBAL ABSOLUTE RETURN STRATEGIES FUND | 19 |
| | | | | Shares | Value |
| Ireland (continued) | | | | | |
| Flutter Entertainment PLC | | | 4,441 | $350,783 |
| Medtronic PLC | | | 3,330 | 339,460 |
| Ryanair Holdings PLC, ADR (F) | | | 3,828 | 237,834 |
| Israel 0.0% | | | | | 223,124 |
| Nice, Ltd., ADR (F) | | | 1,461 | 223,124 |
| Italy 0.6% | | | | | 4,859,885 |
| Enel SpA | | | 196,825 | 1,346,410 |
| Eni SpA | | | 165,193 | 2,580,536 |
| FinecoBank Banca Fineco SpA | | | 27,333 | 271,909 |
| Mediobanca Banca di Credito Finanziario SpA | | | 65,997 | 661,030 |
| Netherlands 0.8% | | | | | 6,710,662 |
| Akzo Nobel NV | | | 7,986 | 753,516 |
| ASML Holding NV | | | 5,859 | 1,305,530 |
| Koninklijke KPN NV | | | 171,182 | 488,118 |
| Royal Dutch Shell PLC, A Shares | | | 48,577 | 1,529,958 |
| Royal Dutch Shell PLC, A Shares (London Stock Exchange) | | | 83,928 | 2,633,540 |
| Norway 0.2% | | | | | 1,725,777 |
| DNB ASA | | | 32,982 | 590,068 |
| Mowi ASA | | | 13,055 | 313,749 |
| Storebrand ASA | | | 30,470 | 205,905 |
| Telenor ASA | | | 30,403 | 616,055 |
| Portugal 0.1% | | | | | 312,001 |
| Galp Energia SGPS SA | | | 20,041 | 312,001 |
| Spain 0.6% | | | | | 4,520,966 |
| Amadeus IT Group SA | | | 4,580 | 357,914 |
| Bankinter SA | | | 118,699 | 769,972 |
| Industria de Diseno Textil SA | | | 19,314 | 577,921 |
| Repsol SA | | | 177,491 | 2,815,159 |
| Sweden 0.4% | | | | | 2,995,707 |
| Assa Abloy AB, B Shares | | | 24,114 | 553,106 |
| Atlas Copco AB, A Shares | | | 17,008 | 519,495 |
| Essity AB, B Shares | | | 25,526 | 758,201 |
| Swedish Match AB | | | 11,815 | 450,790 |
| Volvo AB, B Shares | | | 48,072 | 714,115 |
| Switzerland 1.2% | | | | | 9,707,713 |
| Nestle SA | | | 25,554 | 2,710,952 |
| Novartis AG | | | 19,244 | 1,764,653 |
| Partners Group Holding AG | | | 1,094 | 870,048 |
| Roche Holding AG | | | 7,036 | 1,883,292 |
| 20 | JOHN HANCOCK GLOBAL ABSOLUTE RETURN STRATEGIES FUND | ANNUAL REPORT | SEE NOTES TO FINANCIAL STATEMENTS |
| | | | | Shares | Value |
| Switzerland (continued) | | | | | |
| Swiss Re AG | | | 6,966 | $674,566 |
| Zurich Insurance Group AG | | | 5,187 | 1,804,202 |
| United Kingdom 2.3% | | | | | 18,901,787 |
| Anglo American PLC | | | 20,850 | 510,917 |
| AstraZeneca PLC | | | 4,022 | 347,477 |
| BAE Systems PLC | | | 109,485 | 727,390 |
| Barratt Developments PLC | | | 48,010 | 374,826 |
| Bellway PLC | | | 7,414 | 267,242 |
| BP PLC | | | 670,832 | 4,438,731 |
| British American Tobacco PLC | | | 32,363 | 1,153,178 |
| Dixons Carphone PLC | | | 91,999 | 133,330 |
| DS Smith PLC | | | 74,500 | 321,328 |
| GlaxoSmithKline PLC | | | 55,687 | 1,151,660 |
| HSBC Holdings PLC | | | 172,420 | 1,380,825 |
| Imperial Brands PLC | | | 25,357 | 643,563 |
| Inchcape PLC | | | 30,708 | 232,639 |
| Johnson Matthey PLC | | | 9,203 | 358,843 |
| National Grid PLC | | | 81,761 | 837,992 |
| Phoenix Group Holdings PLC | | | 89,818 | 755,494 |
| Prudential PLC | | | 33,055 | 680,082 |
| Reckitt Benckiser Group PLC | | | 4,173 | 322,587 |
| RELX PLC | | | 31,768 | 753,484 |
| Rio Tinto PLC | | | 16,167 | 912,975 |
| Standard Chartered PLC | | | 78,835 | 648,790 |
| The Royal Bank of Scotland Group PLC | | | 89,558 | 235,945 |
| Unilever NV | | | 17,628 | 1,021,786 |
| Vodafone Group PLC | | | 379,510 | 690,703 |
| United States 4.1% | | | | | 33,750,899 |
| Adobe, Inc. (F) | | | 1,538 | 459,647 |
| Allergan PLC | | | 1,626 | 260,973 |
| Alphabet, Inc., Class A (F) | | | 295 | 359,369 |
| Alphabet, Inc., Class C (F) | | | 571 | 694,724 |
| Amazon.com, Inc. (F) | | | 405 | 756,046 |
| American Tower Corp. | | | 3,026 | 640,362 |
| Anthem, Inc. | | | 961 | 283,120 |
| Apple, Inc. | | | 4,382 | 933,541 |
| Bank of America Corp. | | | 20,790 | 637,837 |
| Baxter International, Inc. | | | 6,280 | 527,332 |
| Booking Holdings, Inc. (F) | | | 217 | 409,394 |
| Boston Scientific Corp. (F) | | | 13,394 | 568,709 |
| Bristol-Myers Squibb Company | | | 7,516 | 333,786 |
| Broadcom, Inc. | | | 1,463 | 424,255 |
| Burlington Stores, Inc. (F) | | | 2,154 | 389,336 |
| SEE NOTES TO FINANCIAL STATEMENTS | ANNUAL REPORT | JOHN HANCOCK GLOBAL ABSOLUTE RETURN STRATEGIES FUND | 21 |
| | | | | Shares | Value |
| United States (continued) | | | | | |
| CDW Corp. | | | 1,692 | $199,927 |
| Celanese Corp. | | | 2,272 | 254,850 |
| Chevron Corp. | | | 25,791 | 3,175,130 |
| Cisco Systems, Inc. | | | 9,255 | 512,727 |
| Citigroup, Inc. | | | 5,106 | 363,343 |
| CMS Energy Corp. | | | 13,222 | 769,785 |
| Comcast Corp., Class A | | | 11,813 | 509,967 |
| Constellation Brands, Inc., Class A | | | 1,911 | 376,123 |
| Deere & Company | | | 2,655 | 439,801 |
| Dollar Tree, Inc. (F) | | | 3,347 | 340,557 |
| Electronic Arts, Inc. (F) | | | 1,898 | 175,565 |
| Eli Lilly & Company | | | 3,515 | 382,959 |
| Equinix, Inc. | | | 827 | 415,237 |
| Exxon Mobil Corp. | | | 35,110 | 2,610,780 |
| Facebook, Inc., Class A (F) | | | 1,921 | 373,116 |
| First Republic Bank | | | 4,205 | 417,809 |
| Fiserv, Inc. (F) | | | 3,510 | 370,059 |
| FLIR Systems, Inc. | | | 6,072 | 301,536 |
| Hanesbrands, Inc. | | | 8,115 | 130,570 |
| Honeywell International, Inc. | | | 1,944 | 335,262 |
| Intercontinental Exchange, Inc. | | | 5,027 | 441,672 |
| Johnson & Johnson | | | 4,539 | 591,069 |
| Kansas City Southern | | | 2,439 | 301,802 |
| L3Harris Technologies, Inc. | | | 1,230 | 255,348 |
| Lear Corp. | | | 940 | 119,173 |
| Marathon Oil Corp. | | | 15,512 | 218,254 |
| Marvell Technology Group, Ltd. | | | 15,996 | 420,055 |
| Mastercard, Inc., Class A | | | 3,599 | 979,900 |
| McDonald's Corp. | | | 2,452 | 516,685 |
| Microsoft Corp. | | | 12,299 | 1,675,985 |
| Mondelez International, Inc., Class A | | | 6,279 | 335,864 |
| Netflix, Inc. (F) | | | 1,235 | 398,893 |
| NextEra Energy, Inc. | | | 2,973 | 615,916 |
| Occidental Petroleum Corp. | | | 51,780 | 2,659,421 |
| Philip Morris International, Inc. | | | 4,311 | 360,443 |
| Raytheon Company | | | 1,434 | 261,404 |
| Schlumberger, Ltd. | | | 5,378 | 214,959 |
| Service Corp. International | | | 3,193 | 147,325 |
| Steel Dynamics, Inc. | | | 3,858 | 121,566 |
| The Charles Schwab Corp. | | | 8,912 | 385,177 |
| The Home Depot, Inc. | | | 2,220 | 474,392 |
| The TJX Companies, Inc. | | | 4,679 | 255,286 |
| UnitedHealth Group, Inc. | | | 3,128 | 778,903 |
| Verizon Communications, Inc. | | | 8,039 | 444,316 |
| 22 | JOHN HANCOCK GLOBAL ABSOLUTE RETURN STRATEGIES FUND | ANNUAL REPORT | SEE NOTES TO FINANCIAL STATEMENTS |
| | | | | Shares | Value |
| United States (continued) | | | | | |
| Wells Fargo & Company | | | 7,769 | $376,097 |
| Yum! Brands, Inc. | | | 2,377 | 267,460 |
|
| | | | | Contracts/Notional amount | Value |
| Purchased options 0.8% | | | | | $6,287,684 |
| (Cost $6,373,114) | | | | | |
| Calls 0.4% | | | | | 3,325,576 |
| Exchange Traded Option on FTSE 100 Index (Expiration Date: 12-20-19; Strike Price: GBP 7,600.00; Notional Amount: 6,580) (F) | | 658 | 1,408,342 |
| Exchange Traded Option on FTSE 100 Index (Expiration Date: 3-20-20; Strike Price: GBP 7,800.00; Notional Amount: 6,610) (F) | | 661 | 980,688 |
| Exchange Traded Option on S&P 500 Index (Expiration Date: 9-20-19; Strike Price: $2,970.00; Notional Amount: 7,000) (F) | | 70 | 453,600 |
| Exchange Traded Option on S&P 500 Index (Expiration Date: 9-20-19; Strike Price: $3,005.00; Notional Amount: 4,800) (F) | | 48 | 216,000 |
| Exchange Traded Option on S&P 500 Index (Expiration Date: 9-20-19; Strike Price: $3,010.00; Notional Amount: 4,800) (F) | | 48 | 201,120 |
| Over the Counter Option on Swiss Market Index (Expiration Date: 9-23-19; Strike Price: CHF 9,930.59 Counterparty: UBS AG) (F)(G) | | 450 | 65,826 |
| Puts 0.4% | | | | | 2,962,108 |
| Exchange Traded Option on NASDAQ 100 Stock Index (Expiration Date: 9-20-19; Strike Price: $7,800.00; Notional Amount: 2,400) (F) | | 24 | 405,840 |
| Exchange Traded Option on NASDAQ 100 Stock Index (Expiration Date: 9-20-19; Strike Price: $7,950.00; Notional Amount: 3,500) (F) | | 35 | 812,525 |
| Over the Counter Option on Swiss Market Index (Expiration Date: 9-23-19; Strike Price: CHF 9,797.05; Counterparty: BNP Paribas SA) (F)(G) | | 1,350 | 168,701 |
| Over the Counter Option on the EUR vs. USD (Expiration Date: 4-8-20; Strike Price: EUR 1.12; Counterparty: Deutsche Bank AG) (F)(G) | | 93,020,000 | 1,575,042 |
|
| | Yield* (%) | Maturity date | | Par value^ | Value |
| Short-term investments 40.0% | | | | $327,869,545 |
| (Cost $327,869,422) | | | | | |
| Certificate of deposit 1.8% | | | | | 15,000,000 |
| Nationwide Building Society | 2.400 | 08-05-19 | | 15,000,000 | 15,000,000 |
| Commercial paper 3.7% | | | | | 29,983,706 |
| Bank of China, Ltd. | 2.490 | 08-22-19 | | 10,000,000 | 9,984,928 |
| Swedbank AB | 2.573 | 08-01-19 | | 20,000,000 | 19,998,778 |
| Time deposits 20.8% | | | | | 171,064,492 |
| Bank of Montreal | 2.430 | 08-07-19 | | 25,220,747 | 25,220,747 |
| BNP Paribas SA | 2.320 | 08-01-19 | | 30,205,563 | 30,205,563 |
| DZ Bank AG | 2.380 | 08-01-19 | | 32,696,737 | 32,696,737 |
| ING Bank NV | 2.300 | 08-01-19 | | 519,403 | 519,403 |
| KBC Bank NV | 2.370 | 08-01-19 | | 31,142,071 | 31,142,071 |
| Natixis SA | 2.350 | 08-01-19 | | 31,003,076 | 31,003,076 |
| SEE NOTES TO FINANCIAL STATEMENTS | ANNUAL REPORT | JOHN HANCOCK GLOBAL ABSOLUTE RETURN STRATEGIES FUND | 23 |
| | Yield* (%) | Maturity date | | Par value^ | Value |
| Time deposits (continued) | | | | | |
| Sumitomo Mitsui Financial Group, Inc. | 2.450 | 08-19-19 | | 20,276,895 | $20,276,895 |
| U.S. Government 3.1% | | | | | 25,201,507 |
| U.S. Treasury Bill (A) | 1.960 | 10-24-19 | | 15,000,000 | 14,929,090 |
| U.S. Treasury Bill (A) | 2.420 | 09-12-19 | | 10,295,700 | 10,272,417 |
| | | Yield (%) | | Shares | Value |
| Money market funds 10.6% | | | | | 86,619,840 |
|
| Federated Government Obligations Fund, Institutional Class | 2.2100(H) | | 86,619,840 | 86,619,840 |
|
| Total investments (Cost $763,822,961) 97.0% | | | $795,504,428 |
| Other assets and liabilities, net 3.0% | | | 24,995,308 |
| Total net assets 100.0% | | | | | $820,499,736 |
| The percentage shown for each investment category is the total value of the category as a percentage of the net assets of the fund. |
| ^All par values are denominated in U.S. dollars unless otherwise indicated. |
| Currency Abbreviations |
| ARS | Argentine Peso |
| BRL | Brazilian Real |
| CHF | Swiss Franc |
| CLP | Chilean Peso |
| COP | Colombian Peso |
| CRC | Costa Rican Colon |
| CZK | Czech Republic Koruna |
| EUR | Euro |
| GBP | Pound Sterling |
| HUF | Hungarian Forint |
| IDR | Indonesian Rupiah |
| MXN | Mexican Peso |
| MYR | Malaysian Ringgit |
| PEN | Peruvian Nuevo Sol |
| PHP | Philippine Peso |
| PLN | Polish Zloty |
| RON | Romanian New Leu |
| THB | Thai Bhat |
| TRY | Turkish Lira |
| UYU | Uruguayan Peso |
| ZAR | South African Rand |
| Security Abbreviations and Legend |
| ADR | American Depositary Receipt |
| EURIBOR | Euro Interbank Offered Rate |
| LIBOR | London Interbank Offered Rate |
| (A) | All or a portion of this security is segregated at the custodian as collateral for certain derivatives. |
| (B) | Variable rate obligation. The coupon rate shown represents the rate at period end. |
| 24 | JOHN HANCOCK GLOBAL ABSOLUTE RETURN STRATEGIES FUND | ANNUAL REPORT | SEE NOTES TO FINANCIAL STATEMENTS |
| (C) | These securities are exempt from registration under Rule 144A of the Securities Act of 1933. Such securities may be resold, normally to qualified institutional buyers, in transactions exempt from registration. Rule 144A securities amounted to $101,212,347 or 12.3% of the fund's net assets as of 7-31-19. |
| (D) | Perpetual bonds have no stated maturity date. Date shown as maturity date is next call date. |
| (E) | Security is valued using significant unobservable inputs and is classified as Level 3 in the fair value hierarchy. |
| (F) | Non-income producing security. |
| (G) | For this type of option, notional amounts are equivalent to number of contracts. |
| (H) | The rate shown is the annualized seven-day yield as of 7-31-19. |
| * | Yield represents either the annualized yield at the date of purchase, the stated coupon rate or, for floating rate securities, the rate at period end. |
| SEE NOTES TO FINANCIAL STATEMENTS | ANNUAL REPORT | JOHN HANCOCK GLOBAL ABSOLUTE RETURN STRATEGIES FUND | 25 |
DERIVATIVES
FUTURES
| Open contracts | Number of
contracts | Position | Expiration
date | Notional
basis^ | Notional
value^ | Unrealized
appreciation
(depreciation) |
| Mini MSCI Emerging Markets Index Futures | 338 | Long | Sep 2019 | $17,819,505 | $17,327,570 | $(491,935) |
| NASDAQ 100 Index E-Mini Futures | 28 | Long | Sep 2019 | 4,352,179 | 4,401,180 | 49,001 |
| S&P 500 Index E-Mini Futures | 211 | Long | Sep 2019 | 30,532,941 | 31,433,725 | 900,784 |
| 30-Year U.S. Treasury Bond Futures | 151 | Short | Sep 2019 | (23,190,472) | (23,499,375) | (308,903) |
| Euro STOXX 50 Index Futures | 774 | Short | Sep 2019 | (29,064,240) | (29,526,026) | (461,786) |
| Euro-BUND Futures | 961 | Short | Sep 2019 | (182,006,926) | (186,319,149) | (4,312,223) |
| FTSE 100 Index Futures | 237 | Short | Sep 2019 | (21,317,513) | (21,647,902) | (330,389) |
| OMXS30 Index Futures | 271 | Short | Aug 2019 | (4,569,353) | (4,469,076) | 100,277 |
| Ultra U.S. Treasury Bond Futures | 76 | Short | Sep 2019 | (13,263,193) | (13,485,250) | (222,057) |
| | | | | | | $(5,077,231) |
^ Notional basis refers to the contractual amount agreed upon at inception of open contracts; notional value represents the current value of the open contract.
FORWARD FOREIGN CURRENCY CONTRACTS
| Contract to buy | Contract to sell | Counterparty (OTC) | Contractual
settlement
date | Unrealized
appreciation | Unrealized
depreciation |
| ARS | 13,800,000 | USD | 310,574 | BARC | 8/30/2019 | — | $(8,786) |
| ARS | 36,470,000 | USD | 809,451 | NWM | 8/30/2019 | — | (11,898) |
| AUD | 32,700,000 | USD | 22,515,683 | NWM | 8/22/2019 | — | (136,146) |
| BRL | 4,390,000 | USD | 1,166,312 | HSBC | 8/30/2019 | — | (18,245) |
| CAD | 6,860,000 | JPY | 557,067,329 | HSBC | 8/14/2019 | $73,779 | — |
| CAD | 13,140,000 | JPY | 1,066,746,853 | HSBC | 8/19/2019 | 141,260 | — |
| CAD | 143,553 | USD | 107,999 | BNP | 9/20/2019 | 875 | — |
| CHF | 28,200,000 | USD | 29,070,307 | NWM | 8/29/2019 | — | (643,211) |
| CHF | 3,485,391 | USD | 3,530,623 | BNP | 9/16/2019 | — | (10,764) |
| CHF | 2,284,230 | USD | 2,319,800 | MLI | 9/20/2019 | — | (12,036) |
| CHF | 651,849 | USD | 664,479 | MSI | 9/20/2019 | — | (5,914) |
| CHF | 4,757,724 | USD | 4,853,196 | UBS | 9/20/2019 | — | (46,455) |
| CLP | 835,000,000 | USD | 1,228,176 | BARC | 8/30/2019 | — | (41,964) |
| CNY | 36,000,000 | USD | 5,212,104 | HSBC | 8/23/2019 | 5,516 | — |
| CZK | 221,560,000 | USD | 9,725,796 | JPM | 8/30/2019 | — | (180,520) |
| DKK | 4,933,098 | USD | 750,645 | MLI | 9/16/2019 | — | (16,446) |
| DKK | 7,558,910 | USD | 1,147,443 | BNP | 9/20/2019 | — | (22,071) |
| EUR | 100,033 | USD | 112,000 | UBS | 8/2/2019 | — | (1,264) |
| EUR | 3,000,000 | USD | 3,377,947 | MLI | 8/15/2019 | — | (53,281) |
| EUR | 31,800,000 | USD | 36,326,666 | GSI | 8/29/2019 | — | (1,043,454) |
| EUR | 5,700,000 | USD | 6,476,426 | NWM | 9/6/2019 | — | (147,927) |
| EUR | 3,100,000 | USD | 3,509,398 | MLI | 9/12/2019 | — | (65,922) |
| EUR | 7,382,531 | USD | 8,383,959 | BARC | 9/16/2019 | — | (180,816) |
| EUR | 46,421 | USD | 52,740 | CITI | 9/16/2019 | — | (1,159) |
| 26 | JOHN HANCOCK GLOBAL ABSOLUTE RETURN STRATEGIES FUND | ANNUAL REPORT | SEE NOTES TO FINANCIAL STATEMENTS |
FORWARD FOREIGN CURRENCY CONTRACTS (continued)
| Contract to buy | Contract to sell | Counterparty (OTC) | Contractual
settlement
date | Unrealized
appreciation | Unrealized
depreciation |
| EUR | 487,213 | USD | 553,054 | JPM | 9/16/2019 | — | $(11,684) |
| EUR | 12,696,810 | USD | 14,350,917 | MSI | 9/16/2019 | — | (242,780) |
| EUR | 43,372 | USD | 49,739 | BNP | 9/20/2019 | — | (1,531) |
| EUR | 351,541 | USD | 398,348 | BARC | 9/20/2019 | — | (7,606) |
| EUR | 11,206,905 | USD | 12,696,386 | MSI | 9/20/2019 | — | (239,763) |
| EUR | 1,688,622 | USD | 1,921,943 | UBS | 9/20/2019 | — | (45,017) |
| EUR | 2,700,000 | USD | 3,050,166 | RBCD | 9/23/2019 | — | (48,357) |
| GBP | 429,445 | USD | 538,823 | BARC | 9/16/2019 | — | (15,381) |
| GBP | 2,004,077 | USD | 2,515,429 | JPM | 9/16/2019 | — | (72,697) |
| GBP | 5,086,148 | USD | 6,462,811 | NWM | 9/16/2019 | — | (263,401) |
| GBP | 26,625 | USD | 33,883 | SG | 9/16/2019 | — | (1,430) |
| GBP | 948,006 | USD | 1,206,338 | BNP | 9/20/2019 | — | (50,608) |
| GBP | 7,478,297 | USD | 9,403,532 | DB | 9/20/2019 | — | (286,615) |
| GBP | 272,989 | USD | 343,212 | MSI | 9/20/2019 | — | (10,407) |
| GBP | 493,134 | USD | 630,841 | SG | 9/20/2019 | — | (29,653) |
| GBP | 2,600,000 | USD | 3,243,685 | CITI | 9/23/2019 | — | (73,521) |
| HUF | 546,000,000 | USD | 1,881,087 | JPM | 8/30/2019 | — | (24,586) |
| IDR | 13,200,000,000 | USD | 903,831 | DB | 8/15/2019 | $33,765 | — |
| IDR | 33,800,000,000 | USD | 2,298,382 | JPM | 8/15/2019 | 102,432 | — |
| INR | 420,000,000 | USD | 5,983,844 | BNP | 8/14/2019 | 101,804 | — |
| INR | 1,960,000,000 | USD | 27,781,715 | CITI | 8/29/2019 | 499,352 | — |
| INR | 196,800,000 | USD | 2,846,646 | MSI | 8/30/2019 | — | (7,790) |
| INR | 1,170,000,000 | USD | 16,754,976 | BNP | 9/23/2019 | 66,291 | — |
| INR | 1,190,000,000 | USD | 16,945,532 | NWM | 9/23/2019 | 163,279 | — |
| JPY | 561,364,090 | CAD | 6,860,000 | CITI | 8/14/2019 | — | (34,246) |
| JPY | 961,097,303 | CAD | 11,858,000 | JPM | 8/19/2019 | — | (141,954) |
| JPY | 999,742,728 | CAD | 12,342,000 | MLI | 8/19/2019 | — | (153,114) |
| JPY | 1,213,884,150 | CAD | 15,000,000 | BNP | 8/27/2019 | — | (191,877) |
| JPY | 1,416,922,500 | CAD | 17,500,000 | NWM | 8/27/2019 | — | (217,185) |
| JPY | 1,416,360,750 | CAD | 17,500,000 | UBS | 8/27/2019 | — | (222,359) |
| JPY | 2,620,000,000 | USD | 24,450,037 | UBS | 9/12/2019 | — | (290,588) |
| KRW | 20,400,000,000 | USD | 17,539,712 | BNP | 8/9/2019 | — | (310,260) |
| KRW | 27,300,000,000 | USD | 23,261,957 | HSBC | 8/9/2019 | — | (204,896) |
| KZT | 356,400,000 | USD | 922,594 | NWM | 8/29/2019 | — | (386) |
| MXN | 33,000,000 | USD | 1,709,975 | RBCD | 8/15/2019 | 8,064 | — |
| MXN | 10,000,000 | USD | 522,935 | GSI | 8/30/2019 | — | (3,703) |
| MXN | 270,000,000 | USD | 13,988,491 | BARC | 9/17/2019 | — | (9,416) |
| MXN | 11,731,859 | USD | 603,635 | HSBC | 9/17/2019 | 3,775 | — |
| MXN | 328,687,169 | USD | 16,907,423 | CITI | 9/18/2019 | 107,463 | — |
| MXN | 179,000,000 | USD | 9,179,686 | BARC | 9/19/2019 | 85,004 | — |
| MXN | 161,000,000 | USD | 8,275,453 | HSBC | 9/19/2019 | 57,593 | — |
| MXN | 112,706,198 | USD | 5,814,535 | JPM | 9/19/2019 | 18,917 | — |
| SEE NOTES TO FINANCIAL STATEMENTS | ANNUAL REPORT | JOHN HANCOCK GLOBAL ABSOLUTE RETURN STRATEGIES FUND | 27 |
FORWARD FOREIGN CURRENCY CONTRACTS (continued)
| Contract to buy | Contract to sell | Counterparty (OTC) | Contractual
settlement
date | Unrealized
appreciation | Unrealized
depreciation |
| MXN | 33,580,972 | USD | 1,727,267 | MLI | 9/19/2019 | $10,818 | — |
| MYR | 15,000,000 | USD | 3,592,202 | MSI | 8/15/2019 | 40,553 | — |
| NOK | 379,000,000 | EUR | 39,110,158 | DB | 8/30/2019 | — | $(568,269) |
| NOK | 4,748,532 | USD | 550,462 | JPM | 9/20/2019 | — | (13,564) |
| NOK | 7,890,287 | USD | 924,163 | NWM | 9/20/2019 | — | (32,039) |
| PLN | 2,000,000 | USD | 528,490 | DB | 8/30/2019 | — | (12,115) |
| PLN | 5,009,617 | USD | 1,320,829 | GSI | 8/30/2019 | — | (27,407) |
| RUB | 182,000,000 | USD | 2,746,009 | BARC | 8/15/2019 | 107,380 | — |
| RUB | 108,000,000 | USD | 1,657,586 | NWM | 8/15/2019 | 35,634 | — |
| RUB | 499,152,777 | USD | 7,887,527 | UBS | 8/30/2019 | — | (81,163) |
| SEK | 12,113,036 | USD | 1,291,399 | JPM | 9/16/2019 | — | (33,275) |
| SEK | 32,436,005 | USD | 3,446,109 | JPM | 9/20/2019 | — | (76,177) |
| SEK | 18,473,662 | USD | 1,978,399 | NWM | 9/20/2019 | — | (59,082) |
| TRY | 4,140,000 | USD | 710,665 | DB | 8/29/2019 | 22,396 | — |
| TWD | 332,000,000 | USD | 10,688,335 | SG | 8/8/2019 | — | (12,201) |
| TWD | 83,000,000 | USD | 2,673,281 | UBS | 8/8/2019 | — | (4,247) |
| USD | 1,114,140 | ARS | 50,270,000 | NWM | 8/30/2019 | 14,799 | — |
| USD | 7,945,462 | AUD | 11,445,000 | CITI | 8/22/2019 | 112,624 | — |
| USD | 6,808,405 | AUD | 9,810,000 | JPM | 8/22/2019 | 94,544 | — |
| USD | 7,945,039 | AUD | 11,445,000 | NWM | 8/22/2019 | 112,201 | — |
| USD | 25,917,648 | AUD | 37,010,000 | HSBC | 8/30/2019 | 580,398 | — |
| USD | 337,947 | CAD | 449,314 | MLI | 9/20/2019 | — | (2,821) |
| USD | 28,233,881 | CHF | 28,200,000 | CITI | 8/29/2019 | — | (193,215) |
| USD | 18,235,692 | CHF | 17,972,569 | DB | 9/16/2019 | 85,389 | — |
| USD | 2,382,930 | CHF | 2,341,555 | GSI | 9/16/2019 | 18,219 | — |
| USD | 98,247 | CHF | 96,483 | NWM | 9/16/2019 | 810 | — |
| USD | 5,205,170 | CNY | 36,000,000 | BARC | 8/23/2019 | — | (12,450) |
| USD | 2,705,316 | DKK | 17,828,536 | DB | 9/16/2019 | 51,873 | — |
| USD | 20,435 | DKK | 133,959 | JPM | 9/16/2019 | 498 | — |
| USD | 1,505,286 | DKK | 9,871,067 | CITI | 9/20/2019 | 35,679 | — |
| USD | 3,370,968 | EUR | 3,000,000 | MLI | 8/15/2019 | 46,302 | — |
| USD | 13,353,955 | EUR | 11,881,800 | BNP | 8/29/2019 | 170,682 | — |
| USD | 22,801,571 | EUR | 20,318,200 | DB | 8/29/2019 | 257,818 | — |
| USD | 2,562,927 | EUR | 2,294,219 | DB | 8/30/2019 | 17,196 | — |
| USD | 3,960,136 | EUR | 3,460,000 | DB | 9/6/2019 | 118,627 | — |
| USD | 28,214,107 | EUR | 25,090,000 | NWM | 9/6/2019 | 357,612 | — |
| USD | 2,611,041 | EUR | 2,300,000 | MLI | 9/12/2019 | 56,203 | — |
| USD | 2,273,646 | EUR | 2,000,000 | RBCD | 9/12/2019 | 52,049 | — |
| USD | 57,422,011 | EUR | 50,692,823 | DB | 9/16/2019 | 1,094,380 | — |
| USD | 173,994 | EUR | 153,030 | JPM | 9/16/2019 | 3,955 | — |
| USD | 235,591 | EUR | 206,921 | NWM | 9/16/2019 | 5,669 | — |
| USD | 112,980 | EUR | 100,960 | CITI | 9/20/2019 | 762 | — |
| 28 | JOHN HANCOCK GLOBAL ABSOLUTE RETURN STRATEGIES FUND | ANNUAL REPORT | SEE NOTES TO FINANCIAL STATEMENTS |
FORWARD FOREIGN CURRENCY CONTRACTS (continued)
| Contract to buy | Contract to sell | Counterparty (OTC) | Contractual
settlement
date | Unrealized
appreciation | Unrealized
depreciation |
| USD | 130,811 | EUR | 117,000 | MLI | 9/20/2019 | $764 | — |
| USD | 112,434 | EUR | 100,033 | UBS | 9/20/2019 | 1,246 | — |
| USD | 3,291,854 | EUR | 2,900,000 | BNP | 9/23/2019 | 67,689 | — |
| USD | 6,647,179 | EUR | 5,800,000 | MLI | 9/23/2019 | 198,849 | — |
| USD | 2,930,400 | EUR | 2,600,000 | RBCD | 9/23/2019 | 39,769 | — |
| USD | 86,281,527 | EUR | 75,933,000 | SG | 9/23/2019 | 1,860,658 | — |
| USD | 175,433 | GBP | 137,625 | CITI | 9/16/2019 | 7,684 | — |
| USD | 39,059,699 | GBP | 30,635,971 | MLI | 9/16/2019 | 1,718,093 | — |
| USD | 201,425 | GBP | 160,000 | BNP | 9/20/2019 | 6,366 | — |
| USD | 10,886,716 | GBP | 8,610,000 | CITI | 9/23/2019 | 388,598 | — |
| USD | 3,968,457 | HKD | 31,000,000 | HSBC | 9/23/2019 | 6,930 | — |
| USD | 1,901,833 | HUF | 550,000,000 | CITI | 8/30/2019 | 31,731 | — |
| USD | 3,220,391 | IDR | 47,000,000,000 | DB | 8/15/2019 | — | $(118,019) |
| USD | 5,959,027 | INR | 420,000,000 | NWM | 8/14/2019 | — | (126,620) |
| USD | 39,818 | JPY | 4,296,761 | HSBC | 8/14/2019 | 285 | — |
| USD | 24,313,514 | JPY | 2,620,000,000 | NWM | 9/12/2019 | 154,065 | — |
| USD | 25,941,115 | KRW | 30,300,000,000 | BARC | 8/9/2019 | 350,310 | — |
| USD | 15,050,862 | KRW | 17,400,000,000 | CITI | 8/9/2019 | 355,152 | — |
| USD | 27,672,319 | KRW | 32,800,000,000 | HSBC | 8/22/2019 | 10,046 | — |
| USD | 5,674,330 | KRW | 6,700,000,000 | BNP | 8/30/2019 | 28,830 | — |
| USD | 27,894,003 | KRW | 32,800,000,000 | MLI | 9/18/2019 | 247,309 | — |
| USD | 2,167,073 | KRW | 2,500,000,000 | SG | 9/23/2019 | 59,515 | — |
| USD | 12,695,130 | KRW | 14,980,000,000 | DB | 10/18/2019 | 55,516 | — |
| USD | 12,745,889 | KRW | 15,000,000,000 | MLI | 10/18/2019 | 89,399 | — |
| USD | 1,696,741 | MXN | 33,000,000 | BNP | 8/15/2019 | — | (21,298) |
| USD | 3,350,997 | MXN | 64,290,750 | HSBC | 8/30/2019 | 12,812 | — |
| USD | 14,122,073 | MXN | 281,731,859 | HSBC | 9/17/2019 | — | (464,412) |
| USD | 16,496,795 | MXN | 328,687,169 | MLI | 9/18/2019 | — | (518,091) |
| USD | 2,632,266 | MXN | 51,200,000 | DB | 9/19/2019 | — | (17,746) |
| USD | 2,030,572 | MXN | 39,500,000 | GSI | 9/19/2019 | — | (13,871) |
| USD | 19,242,262 | MXN | 384,887,169 | MLI | 9/19/2019 | — | (678,747) |
| USD | 549,769 | MXN | 10,700,000 | SG | 9/19/2019 | — | (4,042) |
| USD | 3,604,383 | MYR | 15,000,000 | MSI | 8/15/2019 | — | (28,372) |
| USD | 25,703,301 | NOK | 220,900,000 | NWM | 8/30/2019 | 740,151 | — |
| USD | 12,465 | NOK | 107,576 | DB | 9/16/2019 | 303 | — |
| USD | 447,963 | NOK | 3,786,788 | CITI | 9/20/2019 | 19,806 | — |
| USD | 507,479 | NOK | 4,304,933 | JPM | 9/20/2019 | 20,737 | — |
| USD | 2,260,534 | NOK | 19,511,561 | SG | 9/20/2019 | 54,436 | — |
| USD | 2,016,230 | PEN | 6,640,000 | HSBC | 8/28/2019 | 8,584 | — |
| USD | 2,389,004 | PHP | 122,400,000 | BNP | 8/30/2019 | — | (11,569) |
| USD | 4,386,251 | RUB | 290,000,000 | NWM | 8/15/2019 | — | (160,359) |
| USD | 35,831 | SEK | 335,794 | MLI | 9/16/2019 | 954 | — |
| SEE NOTES TO FINANCIAL STATEMENTS | ANNUAL REPORT | JOHN HANCOCK GLOBAL ABSOLUTE RETURN STRATEGIES FUND | 29 |
FORWARD FOREIGN CURRENCY CONTRACTS (continued)
| Contract to buy | Contract to sell | Counterparty (OTC) | Contractual
settlement
date | Unrealized
appreciation | Unrealized
depreciation |
| USD | 11,376,120 | SEK | 106,490,244 | MSI | 9/16/2019 | $315,478 | — |
| USD | 13,145,266 | TWD | 415,000,000 | BARC | 8/8/2019 | — | $(199,901) |
| USD | 13,167,497 | TWD | 415,000,000 | BARC | 8/14/2019 | — | (176,855) |
| USD | 13,168,333 | TWD | 415,000,000 | BARC | 8/20/2019 | — | (175,204) |
| USD | 13,150,932 | TWD | 415,000,000 | BARC | 8/29/2019 | — | (191,382) |
| USD | 25,807,075 | TWD | 801,000,000 | MLI | 8/30/2019 | 55,064 | — |
| USD | 2,677,199 | TWD | 83,000,000 | UBS | 8/30/2019 | 8,763 | — |
| USD | 6,831,185 | ZAR | 100,000,000 | MLI | 8/15/2019 | — | (128,961) |
| USD | 2,096,975 | ZAR | 29,490,000 | MSI | 8/30/2019 | 48,352 | — |
| ZAR | 100,000,000 | USD | 6,875,389 | JPM | 8/15/2019 | 84,757 | — |
| | | | | | | $12,023,240 | $(10,024,564) |
WRITTEN OPTIONS
| Options on index |
Counterparty (OTC)/
Exchange-
traded | Name of
issuer | | Exercise
price | Expiration
date | Number of
contracts | Notional
amount | Premium | Value |
| Calls | | | | | | | | |
| BNP | Swiss Market Index | CHF | 9,797.05 | Sep 2019 | 660 | 660 | $151,792 | $(150,837) |
| BNP | Swiss Market Index | CHF | 9,797.05 | Sep 2019 | 690 | 690 | 158,907 | (157,693) |
| | | | | | | | $310,699 | $(308,530) |
| Exchange-traded | NASDAQ 100 Stock Index | USD | 7,800.00 | Sep 2019 | 24 | 2,400 | 546,913 | (538,080) |
| Exchange-traded | NASDAQ 100 Stock Index | USD | 7,950.00 | Sep 2019 | 35 | 3,500 | 709,382 | (511,175) |
| | | | | | | | $1,256,295 | $(1,049,255) |
| Puts | | | | | | | | |
| UBS | Swiss Market Index | CHF | 9,930.59 | Sep 2019 | 450 | 450 | $72,768 | $(79,734) |
| | | | | | | | $72,768 | $(79,734) |
| Exchange-traded | S&P 500 Index | USD | 2,970.00 | Sep 2019 | 70 | 7,000 | 458,364 | (382,900) |
| Exchange-traded | S&P 500 Index | USD | 3,005.00 | Sep 2019 | 48 | 4,800 | 286,707 | (289,680) |
| Exchange-traded | S&P 500 Index | USD | 3,010.00 | Sep 2019 | 48 | 4,800 | 292,707 | (333,360) |
| | | | | | | | $1,037,778 | $(1,005,940) |
| | | | | | | | $2,677,540 | $(2,443,459) |
| 30 | JOHN HANCOCK GLOBAL ABSOLUTE RETURN STRATEGIES FUND | ANNUAL REPORT | SEE NOTES TO FINANCIAL STATEMENTS |
SWAPS
| Interest rate swaps |
Counterparty (OTC)/
Centrally cleared | Notional
amount | Currency | Payments
made | Payments
received | Fixed
payment
frequency | Floating
payment
frequency | Maturity
date | Unamortized
upfront
payment paid
(received) | Unrealized
appreciation
(depreciation) | Value |
| Centrally cleared | 122,752,493 | CAD | 3 month CDOR | Fixed 1.837% | Semi-Annual | Semi-Annual | Jul 2022 | — | $190,277 | $190,277 |
| Centrally cleared | 61,646,829 | CAD | 3 month CDOR | Fixed 1.789% | Semi-Annual | Semi-Annual | Jul 2022 | — | 52,025 | 52,025 |
| Centrally cleared | 72,400,304 | CAD | 3 month CDOR | Fixed 1.805% | Semi-Annual | Semi-Annual | Jul 2022 | — | 78,385 | 78,385 |
| Centrally cleared | 36,200,374 | CAD | 3 month CDOR | Fixed 1.830% | Semi-Annual | Semi-Annual | Jul 2022 | — | 52,951 | 52,951 |
| Centrally cleared | 650,000,000 | INR | 1 day MIBOR | Fixed 7.253% | Semi-Annual | Semi-Annual | Oct 2023 | — | 730,557 | 730,557 |
| Centrally cleared | 325,000,000 | INR | Fixed 7.253% | 1 day MIBOR | Semi-Annual | Semi-Annual | Oct 2023 | $(189,060) | (176,219) | (365,279) |
| Centrally cleared | 112,250,000 | USD | 3 month LIBOR | Fixed 2.505% | Semi-Annual | Quarterly | Mar 2024 | — | 4,184,276 | 4,184,276 |
| Centrally cleared | 37,390,080 | USD | Fixed 2.505% | 3 month LIBOR | Semi-Annual | Quarterly | Mar 2024 | (1,026,656) | (367,112) | (1,393,768) |
| Centrally cleared | 17,120,000 | USD | Fixed 2.505% | 3 month LIBOR | Semi-Annual | Quarterly | Mar 2024 | (471,740) | (166,432) | (638,172) |
| Centrally cleared | 17,976,000 | USD | Fixed 2.505% | 3 month LIBOR | Semi-Annual | Quarterly | Mar 2024 | (489,900) | (180,181) | (670,081) |
| Centrally cleared | 34,513,920 | USD | Fixed 2.505% | 3 month LIBOR | Semi-Annual | Quarterly | Mar 2024 | (933,469) | (353,086) | (1,286,555) |
| Centrally cleared | 269,400,000 | USD | 3 month LIBOR | Fixed 2.513% | Semi-Annual | Quarterly | Mar 2024 | — | 10,132,890 | 10,132,890 |
| Centrally cleared | 67,350,000 | USD | 3 month LIBOR | Fixed 2.498% | Semi-Annual | Quarterly | Mar 2024 | — | 2,489,427 | 2,489,427 |
| Centrally cleared | 71,100,000 | USD | 3 month LIBOR | Fixed 2.454% | Semi-Annual | Quarterly | Apr 2024 | — | 2,540,455 | 2,540,455 |
| Centrally cleared | 27,200,000 | EUR | 6 month EURIBOR | Fixed 1.616% | Annual | Semi-Annual | Apr 2039 | — | 2,066,886 | 2,066,886 |
| Centrally cleared | 21,600,000 | EUR | 6 month EURIBOR | Fixed 1.551% | Annual | Semi-Annual | May 2039 | — | 1,487,936 | 1,487,936 |
| Centrally cleared | 21,600,000 | EUR | 6 month EURIBOR | Fixed 1.544% | Annual | Semi-Annual | May 2039 | — | 1,471,530 | 1,471,530 |
| Centrally cleared | 57,720,000 | USD | Fixed 2.834% | 3 month LIBOR | Semi-Annual | Quarterly | Mar 2049 | — | (9,109,844) | (9,109,844) |
| Centrally cleared | 2,991,207 | USD | 3 month LIBOR | Fixed 2.834% | Semi-Annual | Quarterly | Mar 2049 | 312,726 | 159,371 | 472,097 |
| Centrally cleared | 1,369,600 | USD | 3 month LIBOR | Fixed 2.834% | Semi-Annual | Quarterly | Mar 2049 | 147,897 | 68,265 | 216,162 |
| Centrally cleared | 1,438,080 | USD | 3 month LIBOR | Fixed 2.834% | Semi-Annual | Quarterly | Mar 2049 | 153,945 | 73,025 | 226,970 |
| Centrally cleared | 2,761,113 | USD | 3 month LIBOR | Fixed 2.834% | Semi-Annual | Quarterly | Mar 2049 | 298,830 | 136,952 | 435,782 |
| Centrally cleared | 14,430,000 | USD | Fixed 2.825% | 3 month LIBOR | Semi-Annual | Quarterly | Mar 2049 | — | (2,250,282) | (2,250,282) |
| Centrally cleared | 14,500,000 | USD | Fixed 2.777% | 3 month LIBOR | Semi-Annual | Quarterly | Apr 2049 | — | (2,104,495) | (2,104,495) |
| | | | | | | | | $(2,197,427) | $11,207,557 | $9,010,130 |
| Credit default swaps - Buyer |
Counterparty
(OTC)/
Centrally
cleared | Reference
obligation | Notional
amount | Currency | USD
notional
amount | Pay
fixed
rate | Fixed
payment
frequency | Maturity
date | Unamortized
upfront
payment
paid
(received) | Unrealized
appreciation
(depreciation) | Value |
| Centrally cleared | CDX.NA.HY.32 | 12,761,100 | USD | $12,761,100 | 5.000% | Quarterly | Jun 2024 | $(719,950) | $(298,173) | $(1,018,123) |
| | | | | $12,761,100 | | | | $(719,950) | $(298,173) | $(1,018,123) |
| SEE NOTES TO FINANCIAL STATEMENTS | ANNUAL REPORT | JOHN HANCOCK GLOBAL ABSOLUTE RETURN STRATEGIES FUND | 31 |
| Credit default swaps - Seller |
Counterparty
(OTC)/
Centrally
cleared | Reference
obligation | Implied
credit
spread | Notional
amount | Currency | USD
notional
amount | Received
fixed
rate | Fixed
payment
frequency | Maturity
date | Unamortized
upfront
payment
paid
(received) | Unrealized
appreciation
(depreciation) | Value |
| Centrally cleared | CDX.NA.HY.32 | 3.252% | 12,761,100 | USD | $12,761,100 | 5.000% | Quarterly | Jun 2024 | $788,404 | $229,719 | $1,018,123 |
| Centrally cleared | CDX.NA.HY.32 | 3.252% | 21,087,000 | USD | 21,087,000 | 5.000% | Quarterly | Jun 2024 | 1,293,721 | 388,670 | 1,682,391 |
| Centrally cleared | CDX.NA.HY.32 | 3.252% | 6,930,000 | USD | 6,930,000 | 5.000% | Quarterly | Jun 2024 | 432,760 | 120,139 | 552,899 |
| Centrally cleared | iTraxx Europe Crossover Series 31 Version 1 | 2.527% | 25,637,394 | EUR | 29,152,285 | 5.000% | Quarterly | Jun 2024 | 3,160,145 | 175,445 | 3,335,590 |
| Centrally cleared | iTraxx Europe Crossover Series 31 Version 1 | 2.527% | 5,762,606 | EUR | 6,552,660 | 5.000% | Quarterly | Jun 2024 | 726,048 | 23,704 | 749,752 |
| Centrally cleared | iTraxx Europe Series 31 Version 1 | 0.521% | 123,700,000 | EUR | 141,426,383 | 1.000% | Quarterly | Jun 2024 | 2,518,952 | 1,003,071 | 3,522,023 |
| | | | | | $217,909,428 | | | | $8,920,030 | $1,940,748 | $10,860,778 |
| Inflation swaps |
Counterparty (OTC)/
Centrally cleared | Notional
amount | Currency | USD notional
amount | Payments
made | Payments
received | Fixed
payment
frequency | Floating
payment
frequency | Maturity date | Unamortized
upfront
payment paid
(received) | Unrealized
appreciation
(depreciation) | Value |
| Centrally cleared | 16,550,000 | GBP | $20,917,594 | GBP - Non-revised RPI | Fixed 3.665% | At Maturity | At Maturity | Dec 2028 | — | $22,558 | $22,558 |
| Centrally cleared | 3,972,000 | GBP | 5,020,222 | GBP - Non-revised RPI | Fixed 3.683% | At Maturity | At Maturity | Dec 2028 | — | 16,490 | 16,490 |
| Centrally cleared | 7,944,000 | GBP | 10,040,445 | GBP - Non-revised RPI | Fixed 3.683% | At Maturity | At Maturity | Dec 2028 | — | 32,980 | 32,980 |
| Centrally cleared | 16,550,000 | GBP | 20,872,746 | GBP - Non-revised RPI | Fixed 3.685% | At Maturity | At Maturity | Dec 2028 | — | 75,306 | 75,306 |
| Centrally cleared | 3,972,000 | GBP | 5,038,499 | Fixed 3.683% | GBP - Non-revised RPI | At Maturity | At Maturity | Dec 2028 | $(37,535) | 21,045 | (16,490) |
| Centrally cleared | 7,944,000 | GBP | 10,076,998 | Fixed 3.683% | GBP - Non-revised RPI | At Maturity | At Maturity | Dec 2028 | (73,819) | 40,839 | (32,980) |
| Centrally cleared | 16,550,000 | GBP | 20,993,746 | Fixed 3.685% | GBP - Non-revised RPI | At Maturity | At Maturity | Dec 2028 | (193,931) | 118,625 | (75,306) |
| Centrally cleared | 12,774,000 | GBP | 16,269,503 | GBP - Non-revised RPI | Fixed 3.594% | At Maturity | At Maturity | Jan 2029 | — | (155,859) | (155,859) |
| Centrally cleared | 1,730,000 | GBP | 2,208,943 | GBP - Non-revised RPI | Fixed 3.595% | At Maturity | At Maturity | Jan 2029 | — | (20,835) | (20,835) |
| Centrally cleared | 5,540,000 | GBP | 7,136,049 | GBP - Non-revised RPI | Fixed 3.593% | At Maturity | At Maturity | Jan 2029 | — | (68,471) | (68,471) |
| Centrally cleared | 5,540,000 | GBP | 7,136,049 | GBP - Non-revised RPI | Fixed 3.585% | At Maturity | At Maturity | Jan 2029 | — | (75,476) | (75,476) |
| Centrally cleared | 5,540,000 | GBP | 7,259,100 | GBP - Non-revised RPI | Fixed 3.490% | At Maturity | At Maturity | Jan 2029 | — | (158,288) | (158,288) |
| 32 | JOHN HANCOCK GLOBAL ABSOLUTE RETURN STRATEGIES FUND | ANNUAL REPORT | SEE NOTES TO FINANCIAL STATEMENTS |
| Inflation swaps (continued) |
Counterparty (OTC)/
Centrally cleared | Notional
amount | Currency | USD notional
amount | Payments
made | Payments
received | Fixed
payment
frequency | Floating
payment
frequency | Maturity date | Unamortized
upfront
payment paid
(received) | Unrealized
appreciation
(depreciation) | Value |
| Centrally cleared | 5,540,000 | GBP | $7,259,100 | GBP - Non-revised RPI | Fixed 3.490% | At Maturity | At Maturity | Jan 2029 | — | $(158,288) | $(158,288) |
| Centrally cleared | 5,707,739 | GBP | 7,360,456 | GBP - Non-revised RPI | Fixed 3.500% | At Maturity | At Maturity | Feb 2029 | — | (173,618) | (173,618) |
| Centrally cleared | 5,540,000 | GBP | 7,174,307 | GBP - Non-revised RPI | Fixed 3.523% | At Maturity | At Maturity | Feb 2029 | — | (148,962) | (148,962) |
| Centrally cleared | 5,540,000 | GBP | 7,174,307 | GBP - Non-revised RPI | Fixed 3.523% | At Maturity | At Maturity | Feb 2029 | — | (148,962) | (148,962) |
| Centrally cleared | 10,614,230 | GBP | 13,651,567 | GBP - Non-revised RPI | Fixed 3.540% | At Maturity | At Maturity | Feb 2029 | — | (256,211) | (256,211) |
| Centrally cleared | 5,838,031 | GBP | 7,528,475 | GBP - Non-revised RPI | Fixed 3.520% | At Maturity | At Maturity | Feb 2029 | — | (159,267) | (159,267) |
| Centrally cleared | 2,613,750 | GBP | 3,433,813 | GBP - Non-revised RPI | Fixed 3.530% | At Maturity | At Maturity | Mar 2029 | — | (86,064) | (86,064) |
| Centrally cleared | 1,722,000 | GBP | 2,240,758 | GBP - Non-revised RPI | Fixed 3.530% | At Maturity | At Maturity | Mar 2029 | — | (56,701) | (56,701) |
| Centrally cleared | 1,722,000 | GBP | 2,240,758 | GBP - Non-revised RPI | Fixed 3.528% | At Maturity | At Maturity | Mar 2029 | — | (57,377) | (57,377) |
| Centrally cleared | 1,722,000 | GBP | 2,240,758 | GBP - Non-revised RPI | Fixed 3.528% | At Maturity | At Maturity | Mar 2029 | — | (57,377) | (57,377) |
| Centrally cleared | 2,798,250 | GBP | 3,641,232 | GBP - Non-revised RPI | Fixed 3.530% | At Maturity | At Maturity | Mar 2029 | — | (92,139) | (92,139) |
| Centrally cleared | 1,722,000 | GBP | 2,262,277 | GBP - Non-revised RPI | Fixed 3.530% | At Maturity | At Maturity | Mar 2029 | — | (56,701) | (56,701) |
| Centrally cleared | 2,050,000 | GBP | 2,673,204 | GBP - Non-revised RPI | Fixed 3.535% | At Maturity | At Maturity | Apr 2029 | — | (66,510) | (66,510) |
| Centrally cleared | 2,050,000 | GBP | 2,673,204 | GBP - Non-revised RPI | Fixed 3.535% | At Maturity | At Maturity | Apr 2029 | — | (66,510) | (66,510) |
| | | | $204,524,110 | | | | | | $(305,285) | $(1,735,773) | $(2,041,058) |
| Variance swaps | |
Counterparty
(OTC) | Reference
entity | Currency | Notional
amount | USD
notional
amount | Pay/
receive
volatility | Volatility
strike
rate | Payment
frequency | Maturity
date | Unamortized
upfront
payment
paid
(received) | Unrealized
appreciation
(depreciation) | Value |
| BNP | Euro STOXX 50 Index | EUR | 41,500 | $50,815 | Receive | 21.700% | At Maturity | Dec 2019 | — | $(301,026) | $(301,026) |
| BNP | S&P 500 Index | USD | 50,700 | 50,700 | Pay | 20.200% | At Maturity | Dec 2019 | — | 209,275 | 209,275 |
| BNP | Euro STOXX 50 Index | EUR | 54,500 | 66,733 | Receive | 22.500% | At Maturity | Dec 2019 | — | (428,796) | (428,796) |
| BNP | S&P 500 Index | USD | 68,400 | 68,400 | Pay | 20.750% | At Maturity | Dec 2019 | — | 311,641 | 311,641 |
| BNP | Euro STOXX 50 Index | EUR | 83,100 | 102,517 | Receive | 21.650% | At Maturity | Dec 2019 | — | (601,702) | (601,702) |
| BNP | S&P 500 Index | USD | 103,000 | 103,000 | Pay | 19.700% | At Maturity | Dec 2019 | — | 385,768 | 385,768 |
| SEE NOTES TO FINANCIAL STATEMENTS | ANNUAL REPORT | JOHN HANCOCK GLOBAL ABSOLUTE RETURN STRATEGIES FUND | 33 |
| Variance swaps (continued) | |
Counterparty
(OTC) | Reference
entity | Currency | Notional
amount | USD
notional
amount | Pay/
receive
volatility | Volatility
strike
rate | Payment
frequency | Maturity
date | Unamortized
upfront
payment
paid
(received) | Unrealized
appreciation
(depreciation) | Value |
| BNP | Euro STOXX 50 Index | EUR | 83,500 | 102,926 | Receive | 21.700% | At Maturity | Dec 2019 | — | $(606,156) | $(606,156) |
| BNP | S&P 500 Index | USD | 103,000 | 103,000 | Pay | 19.800% | At Maturity | Dec 2019 | — | 391,769 | 391,769 |
| BNP | Euro STOXX 50 Index | EUR | 84,800 | 104,579 | Receive | 22.700% | At Maturity | Dec 2019 | — | (683,463) | (683,463) |
| BNP | S&P 500 Index | USD | 105,000 | 105,000 | Pay | 21.000% | At Maturity | Dec 2019 | — | 502,134 | 502,134 |
| BNP | Euro STOXX 50 Index | EUR | 127,000 | 156,298 | Receive | 21.400% | At Maturity | Dec 2019 | — | (894,529) | (894,529) |
| BNP | S&P 500 Index | USD | 156,000 | 156,000 | Pay | 19.300% | At Maturity | Dec 2019 | — | 536,694 | 536,694 |
| BNP | Euro STOXX 50 Index | EUR | 79,900 | 98,836 | Receive | 21.600% | At Maturity | Dec 2019 | — | (573,818) | (573,818) |
| BNP | S&P 500 Index | USD | 99,600 | 99,600 | Pay | 19.500% | At Maturity | Dec 2019 | — | 355,809 | 355,809 |
| JPM | Euro STOXX 50 Index | EUR | 82,400 | 100,825 | Receive | 22.900% | At Maturity | Dec 2019 | — | (674,938) | (674,938) |
| JPM | S&P 500 Index | USD | 101,000 | 101,000 | Pay | 21.500% | At Maturity | Dec 2019 | — | 519,443 | 519,443 |
| JPM | Euro STOXX 50 Index | EUR | 83,300 | 101,926 | Receive | 23.200% | At Maturity | Dec 2019 | — | (701,041) | (701,041) |
| JPM | S&P 500 Index | USD | 102,000 | 102,000 | Pay | 21.700% | At Maturity | Dec 2019 | — | 539,875 | 539,875 |
| JPM | Euro STOXX 50 Index | EUR | 83,400 | 102,503 | Receive | 23.150% | At Maturity | Dec 2019 | — | (699,673) | (699,673) |
| JPM | S&P 500 Index | USD | 102,000 | 102,000 | Pay | 21.500% | At Maturity | Dec 2019 | — | 525,801 | 525,801 |
| JPM | Euro STOXX 50 Index | EUR | 41,700 | 51,251 | Receive | 23.050% | At Maturity | Dec 2019 | — | (346,717) | (346,717) |
| JPM | S&P 500 Index | USD | 51,400 | 51,400 | Pay | 21.500% | At Maturity | Dec 2019 | — | 264,963 | 264,963 |
| JPM | Euro STOXX 50 Index | EUR | 168,000 | 207,261 | Receive | 22.900% | At Maturity | Dec 2019 | — | (1,379,559) | (1,379,559) |
| JPM | S&P 500 Index | USD | 207,000 | 207,000 | Pay | 20.900% | At Maturity | Dec 2019 | — | 974,797 | 974,797 |
| MSI | Euro STOXX 50 Index | EUR | 65,900 | 81,067 | Receive | 21.500% | At Maturity | Dec 2019 | — | (467,880) | (467,880) |
| MSI | S&P 500 Index | USD | 81,500 | 81,500 | Pay | 19.400% | At Maturity | Dec 2019 | — | 283,440 | 283,440 |
| | | | | $2,658,137 | | | | | — | $(2,557,889) | $(2,557,889) |
| Derivatives Currency Abbreviations |
| ARS | Argentine Peso |
| AUD | Australian Dollar |
| BRL | Brazilian Real |
| CAD | Canadian Dollar |
| CHF | Swiss Franc |
| CLP | Chilean Peso |
| CNY | Chinese Yuan Renminbi |
| CZK | Czech Republic Koruna |
| DKK | Danish Krone |
| EUR | Euro |
| 34 | JOHN HANCOCK GLOBAL ABSOLUTE RETURN STRATEGIES FUND | ANNUAL REPORT | SEE NOTES TO FINANCIAL STATEMENTS |
| GBP | Pound Sterling |
| HKD | Hong Kong Dollar |
| HUF | Hungarian Forint |
| IDR | Indonesian Rupiah |
| INR | Indian Rupee |
| JPY | Japanese Yen |
| KRW | Korean Won |
| KZT | Kazakhstan Tenge |
| MXN | Mexican Peso |
| MYR | Malaysian Ringgit |
| NOK | Norwegian Krone |
| PEN | Peruvian Nuevo Sol |
| PHP | Philippine Peso |
| PLN | Polish Zloty |
| RUB | Russian Ruble |
| SEK | Swedish Krona |
| TRY | Turkish Lira |
| TWD | New Taiwan Dollar |
| USD | U.S. Dollar |
| ZAR | South African Rand |
| Derivatives Abbreviations |
| BARC | Barclays Bank PLC |
| BNP | BNP Paribas |
| CDOR | Canadian Dollar Offered Rate |
| CITI | Citibank, N.A. |
| DB | Deutsche Bank AG |
| EURIBOR | Euro Interbank Offered Rate |
| GSI | Goldman Sachs International |
| HSBC | HSBC Bank PLC |
| JPM | JPMorgan Chase Bank, N.A. |
| LIBOR | London Interbank Offered Rate |
| MIBOR | Mumbai Interbank Offered Rate |
| MLI | Merrill Lynch International |
| MSI | Morgan Stanley & Co. International PLC |
| NWM | NatWest Markets PLC |
| OTC | Over-the-counter |
| RBCD | RBC Dominion Securities, Inc. |
| RPI | Retail Price Index |
| SG | Societe Generale |
| UBS | UBS AG |
At 7-31-19, the aggregate cost of investments for federal income tax purposes was $772,555,958. Net unrealized appreciation aggregated to $31,680,294, of which $48,985,377 related to gross unrealized appreciation and $17,305,083 related to gross unrealized depreciation.
See Notes to financial statements regarding investment transactions and other derivatives information.
| SEE NOTES TO FINANCIAL STATEMENTS | ANNUAL REPORT | JOHN HANCOCK GLOBAL ABSOLUTE RETURN STRATEGIES FUND | 35 |
STATEMENT OF ASSETS AND LIABILITIES 7-31-19
| Assets | |
| Unaffiliated investments, at value (Cost $763,822,961) | $795,504,428 |
| Swap contracts, at value | 5,801,409 |
| Receivable for centrally cleared swaps | 339,834 |
| Unrealized appreciation on forward foreign currency contracts | 12,023,240 |
| Cash | 959 |
| Foreign currency, at value (Cost $183,696) | 183,466 |
| Collateral held at broker for futures contracts | 9,543,479 |
| Collateral segregated at custodian for OTC derivative contracts | 17,246,484 |
| Dividends and interest receivable | 6,853,347 |
| Receivable for fund shares sold | 7,593,785 |
| Receivable for investments sold | 166,512 |
| Other assets | 130,348 |
| Total assets | 855,387,291 |
| Liabilities | |
| Unrealized depreciation on forward foreign currency contracts | 10,024,564 |
| Written options, at value (Premiums received $2,677,540) | 2,443,459 |
| Swap contracts, at value | 8,359,298 |
| Payable for futures variation margin | 1,343,411 |
| Payable for investments purchased | 1,623,638 |
| Payable for fund shares repurchased | 10,559,811 |
| Payable to affiliates | |
| Accounting and legal services fees | 81,817 |
| Transfer agent fees | 71,507 |
| Distribution and service fees | 144 |
| Trustees' fees | 2,912 |
| Other liabilities and accrued expenses | 376,994 |
| Total liabilities | 34,887,555 |
| Net assets | $820,499,736 |
| Net assets consist of | |
| Paid-in capital | $1,261,863,192 |
| Total distributable earnings (loss) | (441,363,456) |
| Net assets | $820,499,736 |
| |
| 36 | JOHN HANCOCK Global Absolute Return Strategies Fund | ANNUAL REPORT | SEE NOTES TO FINANCIAL STATEMENTS |
STATEMENT OF ASSETS AND LIABILITIES (continued)
| Net asset value per share | |
| Based on net asset value and shares outstanding - the fund has an unlimited number of shares authorized with no par value | |
| Class A ($51,043,583 ÷ 4,843,873 shares)1 | $10.54 |
| Class C ($52,422,427 ÷ 5,096,337 shares)1 | $10.29 |
| Class I ($534,889,936 ÷ 50,131,236 shares) | $10.67 |
| Class R2 ($721,148 ÷ 68,745 shares) | $10.49 |
| Class R6 ($149,873,458 ÷ 13,990,257 shares) | $10.71 |
| Class NAV ($31,549,184 ÷ 2,945,066 shares) | $10.71 |
| Maximum offering price per share | |
| Class A (net asset value per share ÷ 95%)2 | $11.09 |
| 1 | Redemption price per share is equal to net asset value less any applicable contingent deferred sales charge. |
| 2 | On single retail sales of less than $50,000. On sales of $50,000 or more and on group sales the offering price is reduced. |
| SEE NOTES TO FINANCIAL STATEMENTS | ANNUAL REPORT | JOHN HANCOCK Global Absolute Return Strategies Fund | 37 |
STATEMENT OF OPERATIONSFor the year ended 7-31-19
| Investment income | |
| Interest | $54,233,746 |
| Dividends | 19,519,397 |
| Less foreign taxes withheld | (1,423,598) |
| Total investment income | 72,329,545 |
| Expenses | |
| Investment management fees | 24,154,803 |
| Distribution and service fees | 918,038 |
| Accounting and legal services fees | 362,402 |
| Transfer agent fees | 1,910,322 |
| Trustees' fees | 42,280 |
| Custodian fees | 654,756 |
| State registration fees | 110,237 |
| Printing and postage | 77,695 |
| Professional fees | 261,659 |
| Other | 181,162 |
| Total expenses | 28,673,354 |
| Less expense reductions | (156,893) |
| Net expenses | 28,516,461 |
| Net investment income | 43,813,084 |
| Realized and unrealized gain (loss) | |
| Net realized gain (loss) on | |
| Unaffiliated investments and foreign currency transactions | (25,227,963) |
| Futures contracts | 38,247,463 |
| Forward foreign currency contracts | 90,184,721 |
| Written options | (56,754,007) |
| Swap contracts | 8,901,318 |
| | 55,351,532 |
| Change in net unrealized appreciation (depreciation) of | |
| Unaffiliated investments and translation of assets and liabilities in foreign currencies | (81,867,068) |
| Futures contracts | 2,565,807 |
| Forward foreign currency contracts | (28,284,274) |
| Written options | 4,905,579 |
| Swap contracts | 11,371,193 |
| | (91,308,763) |
| Net realized and unrealized loss | (35,957,231) |
| Increase in net assets from operations | $7,855,853 |
| | |
| 38 | JOHN HANCOCK Global Absolute Return Strategies Fund | ANNUAL REPORT | SEE NOTES TO FINANCIAL STATEMENTS |
STATEMENTS OF CHANGES IN NET ASSETS
| | Year ended
7-31-19 | Year ended
7-31-18 |
| Increase (decrease) in net assets | | |
| From operations | | |
| Net investment income | $43,813,084 | $78,343,833 |
| Net realized gain | 55,351,532 | 17,460,419 |
| Change in net unrealized appreciation (depreciation) | (91,308,763) | (156,110,529) |
| Increase (decrease) in net assets resulting from operations | 7,855,853 | (60,306,277) |
| From fund share transactions | (2,996,015,289) | (1,598,894,831) |
| Total decrease | (2,988,159,436) | (1,659,201,108) |
| Net assets | | |
| Beginning of year | 3,808,659,172 | 5,467,860,280 |
| End of year | $820,499,736 | $3,808,659,172 |
| SEE NOTES TO FINANCIAL STATEMENTS | ANNUAL REPORT | JOHN HANCOCK Global Absolute Return Strategies Fund | 39 |
| CLASS A SHARES Period ended | 7-31-19 | 7-31-18 | 7-31-17 | 7-31-16 | 7-31-15 |
| Per share operating performance | | | | | |
| Net asset value, beginning of period | $10.12 | $10.30 | $9.94 | $11.27 | $11.25 |
| Net investment income1 | 0.20 | 0.14 | 0.06 | 0.04 | 0.03 |
| Net realized and unrealized gain (loss) on investments | 0.22 | (0.32) | 0.30 | (0.69) | 0.53 |
| Total from investment operations | 0.42 | (0.18) | 0.36 | (0.65) | 0.56 |
| Less distributions | | | | | |
| From net investment income | — | — | — | (0.68) | (0.54) |
| Net asset value, end of period | $10.54 | $10.12 | $10.30 | $9.94 | $11.27 |
| Total return (%)2,3 | 4.15 | (1.75) | 3.62 | (6.00) | 5.15 |
| Ratios and supplemental data | | | | | |
| Net assets, end of period (in millions) | $51 | $114 | $194 | $1,047 | $1,080 |
| Ratios (as a percentage of average net assets): | | | | | |
| Expenses before reductions | 1.69 | 1.65 | 1.65 | 1.64 | 1.67 |
| Expenses including reductions | 1.69 | 1.64 | 1.64 | 1.63 | 1.66 |
| Net investment income | 2.02 | 1.35 | 0.57 | 0.34 | 0.23 |
| Portfolio turnover (%) | 50 | 59 | 59 | 80 | 80 |
| 1 | Based on average daily shares outstanding. |
| 2 | Total returns would have been lower had certain expenses not been reduced during the applicable periods. |
| 3 | Does not reflect the effect of sales charges, if any. |
| 40 | JOHN HANCOCK Global Absolute Return Strategies Fund | ANNUAL REPORT | SEE NOTES TO FINANCIAL STATEMENTS |
| CLASS C SHARES Period ended | 7-31-19 | 7-31-18 | 7-31-17 | 7-31-16 | 7-31-15 |
| Per share operating performance | | | | | |
| Net asset value, beginning of period | $9.95 | $10.19 | $9.91 | $11.23 | $11.21 |
| Net investment income (loss)1 | 0.13 | 0.06 | —2 | (0.04) | (0.05) |
| Net realized and unrealized gain (loss) on investments | 0.21 | (0.30) | 0.28 | (0.67) | 0.53 |
| Total from investment operations | 0.34 | (0.24) | 0.28 | (0.71) | 0.48 |
| Less distributions | | | | | |
| From net investment income | — | — | — | (0.61) | (0.46) |
| Net asset value, end of period | $10.29 | $9.95 | $10.19 | $9.91 | $11.23 |
| Total return (%)3,4 | 3.42 | (2.36) | 2.83 | (6.61) | 4.43 |
| Ratios and supplemental data | | | | | |
| Net assets, end of period (in millions) | $52 | $91 | $162 | $309 | $293 |
| Ratios (as a percentage of average net assets): | | | | | |
| Expenses before reductions | 2.39 | 2.35 | 2.35 | 2.34 | 2.37 |
| Expenses including reductions | 2.39 | 2.34 | 2.34 | 2.33 | 2.36 |
| Net investment income (loss) | 1.35 | 0.61 | (0.05) | (0.35) | (0.45) |
| Portfolio turnover (%) | 50 | 59 | 59 | 80 | 80 |
| 1 | Based on average daily shares outstanding. |
| 2 | Less than $0.005 per share. |
| 3 | Total returns would have been lower had certain expenses not been reduced during the applicable periods. |
| 4 | Does not reflect the effect of sales charges, if any. |
| SEE NOTES TO FINANCIAL STATEMENTS | ANNUAL REPORT | JOHN HANCOCK Global Absolute Return Strategies Fund | 41 |
| CLASS I SHARES Period ended | 7-31-19 | 7-31-18 | 7-31-17 | 7-31-16 | 7-31-15 |
| Per share operating performance | | | | | |
| Net asset value, beginning of period | $10.22 | $10.36 | $9.97 | $11.30 | $11.29 |
| Net investment income1 | 0.22 | 0.17 | 0.10 | 0.07 | 0.06 |
| Net realized and unrealized gain (loss) on investments | 0.23 | (0.31) | 0.29 | (0.68) | 0.53 |
| Total from investment operations | 0.45 | (0.14) | 0.39 | (0.61) | 0.59 |
| Less distributions | | | | | |
| From net investment income | — | — | — | (0.72) | (0.58) |
| Net asset value, end of period | $10.67 | $10.22 | $10.36 | $9.97 | $11.30 |
| Total return (%)2 | 4.40 | (1.35) | 3.91 | (5.67) | 5.38 |
| Ratios and supplemental data | | | | | |
| Net assets, end of period (in millions) | $535 | $2,413 | $3,481 | $5,316 | $5,093 |
| Ratios (as a percentage of average net assets): | | | | | |
| Expenses before reductions | 1.41 | 1.35 | 1.33 | 1.32 | 1.36 |
| Expenses including reductions | 1.40 | 1.35 | 1.33 | 1.31 | 1.34 |
| Net investment income | 2.21 | 1.66 | 1.01 | 0.67 | 0.56 |
| Portfolio turnover (%) | 50 | 59 | 59 | 80 | 80 |
| 1 | Based on average daily shares outstanding. |
| 2 | Total returns would have been lower had certain expenses not been reduced during the applicable periods. |
| 42 | JOHN HANCOCK Global Absolute Return Strategies Fund | ANNUAL REPORT | SEE NOTES TO FINANCIAL STATEMENTS |
| CLASS R2 SHARES Period ended | 7-31-19 | 7-31-18 | 7-31-17 | 7-31-16 | 7-31-15 |
| Per share operating performance | | | | | |
| Net asset value, beginning of period | $10.08 | $10.27 | $9.92 | $11.25 | $11.24 |
| Net investment income (loss)1 | 0.20 | 0.12 | 0.08 | 0.01 | (0.01) |
| Net realized and unrealized gain (loss) on investments | 0.21 | (0.31) | 0.27 | (0.66) | 0.53 |
| Total from investment operations | 0.41 | (0.19) | 0.35 | (0.65) | 0.52 |
| Less distributions | | | | | |
| From net investment income | — | — | — | (0.68) | (0.51) |
| Net asset value, end of period | $10.49 | $10.08 | $10.27 | $9.92 | $11.25 |
| Total return (%)2 | 4.07 | (1.85) | 3.53 | (6.08) | 4.75 |
| Ratios and supplemental data | | | | | |
| Net assets, end of period (in millions) | $1 | $1 | $2 | $3 | $5 |
| Ratios (as a percentage of average net assets): | | | | | |
| Expenses before reductions | 1.78 | 1.75 | 1.72 | 1.75 | 1.99 |
| Expenses including reductions | 1.77 | 1.74 | 1.71 | 1.74 | 1.97 |
| Net investment income (loss) | 1.99 | 1.17 | 0.78 | 0.09 | (0.06) |
| Portfolio turnover (%) | 50 | 59 | 59 | 80 | 80 |
| 1 | Based on average daily shares outstanding. |
| 2 | Total returns would have been lower had certain expenses not been reduced during the applicable periods. |
| SEE NOTES TO FINANCIAL STATEMENTS | ANNUAL REPORT | JOHN HANCOCK Global Absolute Return Strategies Fund | 43 |
| CLASS R6 SHARES Period ended | 7-31-19 | 7-31-18 | 7-31-17 | 7-31-16 | 7-31-15 |
| Per share operating performance | | | | | |
| Net asset value, beginning of period | $10.24 | $10.38 | $9.97 | $11.30 | $11.29 |
| Net investment income1 | 0.24 | 0.19 | 0.11 | 0.09 | 0.09 |
| Net realized and unrealized gain (loss) on investments | 0.23 | (0.33) | 0.30 | (0.69) | 0.51 |
| Total from investment operations | 0.47 | (0.14) | 0.41 | (0.60) | 0.60 |
| Less distributions | | | | | |
| From net investment income | — | — | — | (0.73) | (0.59) |
| Net asset value, end of period | $10.71 | $10.24 | $10.38 | $9.97 | $11.30 |
| Total return (%)2 | 4.59 | (1.35) | 4.11 | (5.55) | 5.51 |
| Ratios and supplemental data | | | | | |
| Net assets, end of period (in millions) | $150 | $546 | $693 | $639 | $557 |
| Ratios (as a percentage of average net assets): | | | | | |
| Expenses before reductions | 1.29 | 1.26 | 1.24 | 1.23 | 1.26 |
| Expenses including reductions | 1.29 | 1.24 | 1.22 | 1.20 | 1.23 |
| Net investment income | 2.33 | 1.79 | 1.08 | 0.81 | 0.77 |
| Portfolio turnover (%) | 50 | 59 | 59 | 80 | 80 |
| 1 | Based on average daily shares outstanding. |
| 2 | Total returns would have been lower had certain expenses not been reduced during the applicable periods. |
| 44 | JOHN HANCOCK Global Absolute Return Strategies Fund | ANNUAL REPORT | SEE NOTES TO FINANCIAL STATEMENTS |
| CLASS NAV SHARES Period ended | 7-31-19 | 7-31-18 | 7-31-17 | 7-31-16 | 7-31-15 |
| Per share operating performance | | | | | |
| Net asset value, beginning of period | $10.23 | $10.37 | $9.96 | $11.29 | $11.28 |
| Net investment income1 | 0.21 | 0.19 | 0.11 | 0.08 | 0.08 |
| Net realized and unrealized gain (loss) on investments | 0.27 | (0.33) | 0.30 | (0.68) | 0.52 |
| Total from investment operations | 0.48 | (0.14) | 0.41 | (0.60) | 0.60 |
| Less distributions | | | | | |
| From net investment income | — | — | — | (0.73) | (0.59) |
| Net asset value, end of period | $10.71 | $10.23 | $10.37 | $9.96 | $11.29 |
| Total return (%)2 | 4.59 | (1.35) | 4.12 | (5.56) | 5.51 |
| Ratios and supplemental data | | | | | |
| Net assets, end of period (in millions) | $32 | $643 | $936 | $1,119 | $1,260 |
| Ratios (as a percentage of average net assets): | | | | | |
| Expenses before reductions | 1.28 | 1.24 | 1.22 | 1.21 | 1.24 |
| Expenses including reductions | 1.27 | 1.23 | 1.22 | 1.20 | 1.23 |
| Net investment income | 2.07 | 1.81 | 1.12 | 0.75 | 0.68 |
| Portfolio turnover (%) | 50 | 59 | 59 | 80 | 80 |
| 1 | Based on average daily shares outstanding. |
| 2 | Total returns would have been lower had certain expenses not been reduced during the applicable periods. |
| SEE NOTES TO FINANCIAL STATEMENTS | ANNUAL REPORT | JOHN HANCOCK Global Absolute Return Strategies Fund | 45 |
| Notes to financial statements | |
Note 1—Organization
John Hancock Global Absolute Return Strategies Fund (the fund) is a series of John Hancock Funds II (the Trust), an open-end management investment company organized as a Massachusetts business trust and registered under the Investment Company Act of 1940, as amended (the 1940 Act). The investment objective of the fund is to seek long-term total return.
The fund may offer multiple classes of shares. The shares currently outstanding are detailed in the Statement of assets and liabilities. Class A and Class C shares are offered to all investors. Class I shares are offered to institutions and certain investors. Class R2 shares are available only to certain retirement and 529 plans. Class R6 shares are only available to certain retirement plans, institutions and other investors. Class NAV shares are offered to John Hancock affiliated funds of funds, retirement plans for employees of John Hancock and/or Manulife Financial Corporation, and certain 529 plans. Class C shares convert to Class A shares ten years after purchase (certain exclusions may apply). Shareholders of each class have exclusive voting rights to matters that affect that class. The distribution and service fees, if any, and transfer agent fees for each class may differ.
Note 2—Significant accounting policies
The financial statements have been prepared in conformity with accounting principles generally accepted in the United States of America (US GAAP), which require management to make certain estimates and assumptions as of the date of the financial statements. Actual results could differ from those estimates and those differences could be significant. The fund qualifies as an investment company under Topic 946 of Accounting Standards Codification of US GAAP.
Events or transactions occurring after the end of the fiscal period through the date that the financial statements were issued have been evaluated in the preparation of the financial statements. The following summarizes the significant accounting policies of the fund:
Security valuation. Investments are stated at value as of the scheduled close of regular trading on the New York Stock Exchange (NYSE), normally at 4:00 P.M., Eastern Time. In case of emergency or other disruption resulting in the NYSE not opening for trading or the NYSE closing at a time other than the regularly scheduled close, the net asset value (NAV) may be determined as of the regularly scheduled close of the NYSE pursuant to the fund's Valuation Policies and Procedures.
In order to value the securities, the fund uses the following valuation techniques: Debt obligations are typically valued based on the evaluated prices provided by an independent pricing vendor. Independent pricing vendors utilize matrix pricing which takes into account factors such as institutional-size trading in similar groups of securities, yield, quality, coupon rate, maturity, type of issue, trading characteristics and other market data, as well as broker supplied prices. Equity securities, including exchange-traded or closed-end funds, are typically valued at the last sale price or official closing price on the exchange or principal market where the security trades. In the event there were no sales during the day or closing prices are not available, the securities are valued using the last available bid price. Investments by the fund in open-end mutual funds are valued at their respective NAVs each business day. Options listed on an exchange are valued at the mid-price of the last quoted bid and ask prices from the primary exchange where the option trades. Unlisted options are valued using evaluated prices obtained from an independent pricing vendor. Futures contracts are typically valued at last traded price on the exchange on which they trade. Foreign equity index futures that trade in the electronic trading market subsequent to the close of regular trading may be valued at the last traded price in the electronic trading market as of 4:00 P.M. ET, or may be fair valued based on fair value adjustment factors provided by an independent pricing vendor in order to adjust for events that may occur between the close of foreign exchanges or markets and the close of the NYSE. Swaps are generally valued using evaluated prices obtained from an independent pricing vendor. Forward foreign currency
| 46 | JOHN HANCOCK Global Absolute Return Strategies Fund | ANNUAL REPORT | |
contracts are valued at the prevailing forward rates which are based on foreign currency exchange spot rates and forward points supplied by an independent pricing vendor. Foreign securities and currencies are valued in U.S. dollars based on foreign currency exchange rates supplied by an independent pricing vendor.
In certain instances, the Pricing Committee may determine to value equity securities using prices obtained from another exchange or market if trading on the exchange or market on which prices are typically obtained did not open for trading as scheduled, or if trading closed earlier than scheduled, and trading occurred as normal on another exchange or market.
Other portfolio securities and assets, for which reliable market quotations are not readily available, are valued at fair value as determined in good faith by the fund's Pricing Committee following procedures established by the Board of Trustees. The frequency with which these fair valuation procedures are used cannot be predicted and fair value of securities may differ significantly from the value that would have been used had a ready market for such securities existed. Trading in foreign securities may be completed before the scheduled daily close of trading on the NYSE. Significant events at the issuer or market level may affect the values of securities between the time when the valuation of the securities is generally determined and the close of the NYSE. If a significant event occurs, these securities may be fair valued, as determined in good faith by the fund's Pricing Committee, following procedures established by the Board of Trustees. The fund uses fair value adjustment factors provided by an independent pricing vendor to value certain foreign securities in order to adjust for events that may occur between the close of foreign exchanges or markets and the close of the NYSE.
The fund uses a three-tier hierarchy to prioritize the pricing assumptions, referred to as inputs, used in valuation techniques to measure fair value. Level 1 includes securities valued using quoted prices in active markets for identical securities, including registered investment companies. Level 2 includes securities valued using other significant observable inputs. Observable inputs may include quoted prices for similar securities, interest rates, prepayment speeds and credit risk. Prices for securities valued using these inputs are received from independent pricing vendors and brokers and are based on an evaluation of the inputs described. Level 3 includes securities valued using significant unobservable inputs when market prices are not readily available or reliable, including the fund's own assumptions in determining the fair value of investments. Factors used in determining value may include market or issuer specific events or trends, changes in interest rates and credit quality. The inputs or methodology used for valuing securities are not necessarily an indication of the risks associated with investing in those securities. Changes in valuation techniques and related inputs may result in transfers into or out of an assigned level within the disclosure hierarchy.
The following is a summary of the values by input classification of the fund's investments as of July 31, 2019, by major security category or type:
| | Total
value at
7-31-19 | Level 1
quoted
price | Level 2
significant
observable
inputs | Level 3
significant
unobservable
inputs |
| Investments in securities: | | | | |
| Assets | | | | |
| U.S. Government and Agency obligations | $64,136,465 | — | $64,136,465 | — |
| Foreign government obligations | 234,499,754 | — | 234,499,754 | — |
| Corporate bonds | 57,412,136 | — | 57,412,136 | — |
| Convertible bonds | 110,872 | — | 110,872 | — |
| Common stocks | 105,187,972 | $35,636,199 | 69,298,147 | $253,626 |
| | ANNUAL REPORT | JOHN HANCOCK Global Absolute Return Strategies Fund | 47 |
| | Total
value at
7-31-19 | Level 1
quoted
price | Level 2
significant
observable
inputs | Level 3
significant
unobservable
inputs |
| Purchased options | $6,287,684 | $4,478,115 | $1,809,569 | — |
| Short-term investments | 327,869,545 | 86,619,840 | 241,249,705 | — |
| Total investments in securities | $795,504,428 | $126,734,154 | $668,516,648 | $253,626 |
| Derivatives: | | | | |
| Assets | | | | |
| Futures | $1,050,062 | $949,785 | $100,277 | — |
| Forward foreign currency contracts | 12,023,240 | — | 12,023,240 | — |
| Swap contracts | 43,638,127 | — | 43,638,127 | — |
| Liabilities | | | | |
| Futures | (6,127,293) | (6,127,293) | — | — |
| Forward foreign currency contracts | (10,024,564) | — | (10,024,564) | — |
| Written options | (2,443,459) | (2,055,195) | (388,264) | — |
| Swap contracts | (29,384,289) | — | (29,384,289) | — |
Security transactions and related investment income. Investment security transactions are accounted for on a trade date plus one basis for daily NAV calculations. However, for financial reporting purposes, investment transactions are reported on trade date. Interest income is accrued as earned. Interest income includes coupon interest and amortization/accretion of premiums/discounts on debt securities. Debt obligations may be placed in a non-accrual status and related interest income may be reduced by stopping current accruals and writing off interest receivable when the collection of all or a portion of interest has become doubtful. Dividend income is recorded on the ex-date, except for dividends of foreign securities where the dividend may not be known until after the ex-date. In those cases, dividend income, net of withholding taxes, is recorded when the fund becomes aware of the dividends. Non-cash dividends, if any, are recorded at the fair market value of the securities received. Gains and losses on securities sold are determined on the basis of identified cost and may include proceeds from litigation.
Inflation-indexed bonds. Inflation-indexed bonds are securities that generally have a lower coupon interest rate fixed at issuance but whose principal value is periodically adjusted based on a rate of inflation, such as the Consumer Price Index. Over the life of an inflation-indexed bond, interest is paid on the inflation adjusted principal value as described above. Increases in the principal amount of these securities are recorded as interest income. Decreases in the principal amount of these securities may reduce interest income to the extent of income previously recorded. If these decreases are in excess of income previously recorded, an adjustment to the cost of the security is made.
Real estate investment trusts. The fund may invest in real estate investment trusts (REITs). Distributions from REITs may be recorded as income and subsequently characterized by the REIT at the end of the fiscal year as a reduction of cost of investments and/or as a realized gain. As a result, the fund will estimate the components of distributions from these securities. Such estimates are revised when the actual components of the distributions are known.
Foreign investing. Assets, including investments, and liabilities denominated in foreign currencies are translated into U.S. dollar values each day at the prevailing exchange rate. Purchases and sales of securities, income and expenses are translated into U.S. dollars at the prevailing exchange rate on the date of the transaction. The effect of changes in foreign currency exchange rates on the value of securities is reflected as a component of the realized and unrealized gains (losses) on investments. Foreign investments are subject to a decline in the value of a foreign
| 48 | JOHN HANCOCK Global Absolute Return Strategies Fund | ANNUAL REPORT | |
currency versus the U.S. dollar, which reduces the dollar value of securities denominated in that currency.
Funds that invest internationally generally carry more risk than funds that invest strictly in U.S. securities. Risks can result from differences in economic and political conditions, regulations, market practices (including higher transaction costs), accounting standards and other factors.
Foreign taxes. The fund may be subject to withholding tax on income, capital gains or repatriation taxes imposed by certain countries, a portion of which may be recoverable. Foreign taxes are accrued based upon the fund’s understanding of the tax rules and rates that exist in the foreign markets in which it invests. Taxes are accrued based on gains realized by the fund as a result of certain foreign security sales. In certain circumstances, estimated taxes are accrued based on unrealized appreciation of such securities. Investment income is recorded net of foreign withholding taxes.
Line of credit. The fund may have the ability to borrow from banks for temporary or emergency purposes, including meeting redemption requests that otherwise might require the untimely sale of securities. Pursuant to the fund's custodian agreement, the custodian may loan money to the fund to make properly authorized payments. The fund is obligated to repay the custodian for any overdraft, including any related costs or expenses. The custodian may have a lien, security interest or security entitlement in any fund property that is not otherwise segregated or pledged, to the extent of any overdraft, and to the maximum extent permitted by law.
The fund and other affiliated funds, have entered into a syndicated line of credit agreement with Citibank, N.A. as the administrative agent that enables them to participate in a $750 million unsecured committed line of credit. Excluding commitments designated for a certain fund and subject to the needs of all other affiliated funds, the fund can borrow up to an aggregate commitment amount of $500 million, subject to asset coverage and other limitations as specified in the agreement. A commitment fee payable at the end of each calendar quarter, based on the average daily unused portion of the line of credit, is charged to each participating fund based on a combination of fixed and asset based allocations and is reflected in Other expenses on the Statement of operations. For the year ended July 31, 2019, the fund had no borrowings under the line of credit. Commitment fees for the year ended July 31, 2019 were $6,044.
Expenses. Within the John Hancock group of funds complex, expenses that are directly attributable to an individual fund are allocated to such fund. Expenses that are not readily attributable to a specific fund are allocated among all funds in an equitable manner, taking into consideration, among other things, the nature and type of expense and the fund’s relative net assets. Expense estimates are accrued in the period to which they relate and adjustments are made when actual amounts are known.
Class allocations. Income, common expenses and realized and unrealized gains (losses) are determined at the fund level and allocated daily to each class of shares based on the net assets of the class. Class-specific expenses, such as distribution and service fees, if any, and transfer agent fees, for all classes, are charged daily at the class level based on the net assets of each class and the specific expense rates applicable to each class.
Federal income taxes. The fund intends to continue to qualify as a regulated investment company by complying with the applicable provisions of the Internal Revenue Code and will not be subject to federal income tax on taxable income that is distributed to shareholders. Therefore, no federal income tax provision is required.
For federal income tax purposes, as of July 31, 2019, the fund has a short-term capital loss carryforward of $589,233,065 available to offset future net realized capital gains. This carryforward does not expire.
| | ANNUAL REPORT | JOHN HANCOCK Global Absolute Return Strategies Fund | 49 |
As of July 31, 2019, the fund had no uncertain tax positions that would require financial statement recognition, derecognition or disclosure. The fund's federal tax returns are subject to examination by the Internal Revenue Service for a period of three years.
Distribution of income and gains. Distributions to shareholders from net investment income and net realized gains, if any, are recorded on the ex-date. The fund generally declares and pays dividends annually. Capital gain distributions, if any, are typically distributed annually.
There were no distributions for the years ended July 31, 2019 and 2018.
Distributions paid by the fund with respect to each class of shares are calculated in the same manner, at the same time and in the same amount, except for the effect of class level expenses that may be applied differently to each class. As of July 31, 2019, the components of distributable earnings on a tax basis consisted of $116,292,726 of undistributed ordinary income.
Such distributions and distributable earnings, on a tax basis, are determined in conformity with income tax regulations, which may differ from US GAAP. Distributions in excess of tax basis earnings and profits, if any, are reported in the fund's financial statements as a return of capital.
Capital accounts within the financial statements are adjusted for permanent book-tax differences. These adjustments have no impact on net assets or the results of operations. Temporary book-tax differences, if any, will reverse in a subsequent period. Book-tax differences are primarily attributable to foreign currency transactions, investments in passive foreign investment companies, wash sale loss deferrals, derivative transactions, amortization and accretion on debt securities, and treasury inflation protected securities.
Note 3—Derivative instruments
The fund may invest in derivatives in order to meet its investment objective. Derivatives include a variety of different instruments that may be traded in the over-the-counter (OTC) market, on a regulated exchange or through a clearing facility. The risks in using derivatives vary depending upon the structure of the instruments, including the use of leverage, optionality, the liquidity or lack of liquidity of the contract, the creditworthiness of the counterparty or clearing organization and the volatility of the position. Some derivatives involve risks that are potentially greater than the risks associated with investing directly in the referenced securities or other referenced underlying instrument. Specifically, the fund is exposed to the risk that the counterparty to an OTC derivatives contract will be unable or unwilling to make timely settlement payments or otherwise honor its obligations. OTC derivatives transactions typically can only be closed out with the other party to the transaction.
Derivatives which are typically traded through the OTC market are regulated by the Commodity Futures Trading Commission (the CFTC). Derivative counterparty risk is managed through an ongoing evaluation of the creditworthiness of all potential counterparties and, if applicable, designated clearing organizations. The fund attempts to reduce its exposure to counterparty risk for derivatives traded in the OTC market, whenever possible, by entering into an International Swaps and Derivatives Association (ISDA) Master Agreement with each of its OTC counterparties. The ISDA gives each party to the agreement the right to terminate all transactions traded under the agreement if there is certain deterioration in the credit quality or contractual default of the other party, as defined in the ISDA. Upon an event of default or a termination of the ISDA, the non-defaulting party has the right to close out all transactions and to net amounts owed.
As defined by the ISDA, the fund may have collateral agreements with certain counterparties to mitigate counterparty risk on OTC derivatives. Subject to established minimum levels, collateral for OTC transactions is generally determined based on the net aggregate unrealized gain or loss on contracts with a particular
| 50 | JOHN HANCOCK Global Absolute Return Strategies Fund | ANNUAL REPORT | |
counterparty. Collateral pledged to the fund, if any, is held in a segregated account by a third-party agent or held by the custodian bank for the benefit of the fund and can be in the form of cash or debt securities issued by the U.S. government or related agencies; collateral posted by the fund, if any, for OTC transactions is held in a segregated account at the fund's custodian and is noted in the accompanying Fund's investments, or if cash is posted, on the Statement of assets and liabilities. The fund's risk of loss due to counterparty risk is equal to the asset value of outstanding contracts offset by collateral received.
Certain derivatives are traded or cleared on an exchange or central clearinghouse. Exchange-traded or centrally-cleared transactions generally present less counterparty risk to a fund than OTC transactions. The exchange or clearinghouse stands between the fund and the broker to the contract and therefore, credit risk is generally limited to the failure of the exchange or clearinghouse and the clearing member.
Centrally-cleared swap contracts are subject to clearinghouse rules, including initial and variation margin requirements, daily settlement of obligations and the clearinghouse guarantee of payments to the broker. There is, however, still counterparty risk due to the potential insolvency of the broker with respect to any margin held in the brokers’ customer accounts. While clearing members are required to segregate customer assets from their own assets, in the event of insolvency, there may be a shortfall in the amount of margin held by the broker for its clients. Collateral or margin requirements for centrally-cleared derivatives are set by the broker or applicable clearinghouse. Margin for centrally-cleared transactions is detailed in the Statement of assets and liabilities as Receivable/Payable for centrally-cleared swaps. Securities pledged by the fund for centrally-cleared transactions, if any, are identified in the Fund's investments.
Futures. A futures contract is a contractual agreement to buy or sell a particular currency or financial instrument at a pre-determined price in the future. Risks related to the use of futures contracts include possible illiquidity of the futures markets and contract prices that can be highly volatile and imperfectly correlated to movements in the underlying financial instrument and potential losses in excess of the amounts recognized on the Statement of assets and liabilities. Use of long futures contracts subjects the fund to the risk of loss up to the notional value of the futures contracts. Use of short futures contracts subjects the fund to unlimited risk of loss.
Upon entering into a futures contract, the fund is required to deposit initial margin with the broker in the form of cash or securities. The amount of required margin is generally based on a percentage of the contract value; this amount is the initial margin for the trade. The margin deposit must then be maintained at the established level over the life of the contract. Payable for futures variation margin is included on the Statement of assets and liabilities. Futures contracts are marked-to-market daily and an appropriate payable or receivable for the change in value (variation margin) and unrealized gain or loss is recorded by the fund. When the contract is closed, the fund records a realized gain or loss equal to the difference between the value of the contract at the time it was opened and the value at the time it was closed. Collateral or margin requirements are set by the broker or applicable clearinghouse. Collateral is detailed in the Statement of assets and liabilities as Collateral held at broker for futures contracts. Securities pledged by the fund, if any, are identified in the Fund's investments.
During the year ended July 31, 2019, the fund used futures contracts to manage against anticipated changes in securities markets and interest rates, gain exposure to certain securities markets and foreign bond markets, and maintain diversity of the fund. The fund held futures contracts with USD notional values ranging from $332.1 million to $3.6 billion, as measured at each quarter end.
Forward foreign currency contracts. A forward foreign currency contract is an agreement between two parties to buy and sell specific currencies at a price that is set on the date of the contract. The forward contract calls for delivery of the currencies on a future date that is specified in the contract. Risks related to the use of forwards include the possible failure of counterparties to meet the terms of the forward agreement, the failure of
| | ANNUAL REPORT | JOHN HANCOCK Global Absolute Return Strategies Fund | 51 |
the counterparties to timely post collateral if applicable, and the risk that currency movements will not favor the fund thereby reducing the fund’s total return, and the potential for losses in excess of the amounts recognized on the Statement of assets and liabilities.
The market value of a forward foreign currency contract fluctuates with changes in foreign currency exchange rates. Forward foreign currency contracts are marked-to-market daily and the change in value is recorded by the fund as an unrealized gain or loss. Realized gains or losses, equal to the difference between the value of the contract at the time it was opened and the value at the time it was closed, are recorded upon delivery or receipt of the currency or settlement with the counterparty.
During the year ended July 31, 2019, the fund used forward foreign currency contracts to manage against anticipated changes in current exchange rates, gain exposure to foreign currencies and maintain diversity of the fund. The fund held forward foreign currency contracts with USD notional values ranging from $1.3 billion to $5.0 billion, as measured at each quarter end.
Options. There are two types of options, put options and call options. Options are traded either OTC or on an exchange. A call option gives the purchaser of the option the right to buy (and the seller the obligation to sell) the underlying instrument at the exercise price. A put option gives the purchaser of the option the right to sell (and the writer the obligation to buy) the underlying instrument at the exercise price. Writing puts and buying calls may increase the fund’s exposure to changes in the value of the underlying instrument. Buying puts and writing calls may decrease the fund’s exposure to such changes. Risks related to the use of options include the loss of premiums, possible illiquidity of the options markets, trading restrictions imposed by an exchange and movements in underlying security values, and for written options, potential losses in excess of the amounts recognized on the Statement of assets and liabilities. In addition, OTC options are subject to the risks of all OTC derivatives contracts.
When the fund purchases an option, the premium paid is included in the Fund's investments and subsequently “marked-to-market” to reflect current market value. If the purchased option expires, the fund realizes a loss equal to the cost of the option. If the fund exercises a call option, the cost of the securities acquired by exercising the call is increased by the premium paid to buy the call. If the fund exercises a put option, it realizes a gain or loss from the sale of the underlying security and the proceeds from such sale are decreased by the premium paid. If the fund enters into a closing sale transaction, it realizes a gain or loss, depending on whether proceeds from the closing sale are greater or less than the original cost. When the fund writes an option, the premium received is included as a liability and subsequently “marked-to-market” to reflect the current market value of the option written. Premiums received from writing options that expire unexercised are recorded as realized gains. Premiums received from writing options which are exercised or are closed are added to or offset against the proceeds or amount paid on the transaction to determine the realized gain or loss. If a put option on a security is exercised, the premium received reduces the cost basis of the securities purchased by the fund.
During the year ended July 31, 2019, the fund used purchased options contracts to manage against anticipated currency exchange rates and changes in securities markets, gain exposure to foreign currency exchange rates and certain securities markets, and maintain diversity of the fund. The fund held purchased options contracts with market values ranging from $6.3 million to $93.7 million, as measured at each quarter end.
During the year ended July 31, 2019, the fund wrote option contracts to manage against anticipated changes in securities markets and gain exposure to certain securities markets. The fund held written option contracts with market values ranging from $2.4 million to $68.2 million, as measured at each quarter end.
| 52 | JOHN HANCOCK Global Absolute Return Strategies Fund | ANNUAL REPORT | |
Swaps. Swap agreements are agreements between the fund and counterparty to exchange cash flows, assets, foreign currencies or market-linked returns at specified intervals. Swap agreements are privately negotiated in the OTC market (OTC swaps) or may be executed on a registered commodities exchange (centrally cleared swaps). Swaps are marked-to-market daily and the change in value is recorded as a component of unrealized appreciation/depreciation of swap contracts. The value of the swap will typically impose collateral posting obligations on the party that is considered out-of-the-money on the swap.
Upfront payments made/received by the fund, if any, are amortized/accreted for financial reporting purposes, with the unamortized/unaccreted portion included in the Statement of assets and liabilities. A termination payment by the counterparty or the fund is recorded as realized gain or loss, as well as the net periodic payments received or paid by the fund.
Entering into swap agreements involves, to varying degrees, elements of credit, market and documentation risk that may provide outcomes that are in excess of the amounts recognized on the Statement of assets and liabilities. Such risks involve the possibility that there will be no liquid market for the swap, or that a counterparty may default on its obligation or delay payment under the swap terms. The counterparty may disagree or contest the terms of the swap. In addition to interest rate risk, market risks may also impact the swap. The fund may also suffer losses if it is unable to terminate or assign outstanding swaps or reduce its exposure through offsetting transactions.
Interest rate swaps. Interest rate swaps represent an agreement between the fund and a counterparty to exchange cash flows based on the difference between two interest rates applied to a notional amount. The payment flows are usually netted against each other, with the difference being paid by one party to the other. The fund settles accrued net interest receivable or payable under the swap contracts at specified, future intervals.
During the year ended July 31, 2019, the fund used interest rate swap contracts to manage duration of the fund, manage against anticipated interest rate changes, maintain diversity of the fund and gain exposure to treasuries markets. The fund held interest rate swaps with total USD notional amounts ranging from $1.0 billion to $11.1 billion, as measured at each quarter end.
Credit default swaps. Credit default swaps (CDS) involve the exchange of a fixed rate premium (paid by the Buyer), for protection against the loss in value of an underlying debt instrument, referenced entity or index, in the event of a defined credit event (such as payment default or bankruptcy). Under the terms of the swap, one party acts as a “guarantor” (the Seller), receiving the premium and agreeing to contingent payments that are specified within the credit default agreement. The fund may enter into CDS in which it may act as either Buyer or Seller. By acting as the Seller, the fund may incur economic leverage since it would be obligated to pay the Buyer the notional amount of the contract in the event of a default. The amount of loss in such case could be significant, but would typically be reduced by any recovery value on the underlying credit.
Credit default swaps — Buyer
During the year ended July 31, 2019, the fund used credit default swap contracts as a buyer to manage against potential credit events. The fund held credit default swaps with total USD notional amounts ranging from $12.8 million to $118.0 million, as measured at each quarter end.
Credit default swaps — Seller
Implied credit spreads are utilized in determining the market value of CDS agreements in which the fund is the Seller at period end. The implied credit spread generally represents the yield of the instrument above a credit-risk free rate, such as the U.S. Treasury Bond Yield, and may include upfront payments required to be made to enter
| | ANNUAL REPORT | JOHN HANCOCK Global Absolute Return Strategies Fund | 53 |
into the agreement. It also serves as an indicator of the current status of the payment/performance risk and represents the likelihood or risk of default for the credit derivative. Wider credit spreads represent a deterioration of the referenced entity’s creditworthiness and an increased risk of default or other credit event occurring as defined under the terms of the agreement.
For CDS agreements where implied credit spreads are not reported or available, the average credit rating on the underlying index is shown. Increasing market values, in absolute terms when compared to the notional amount of the swap, represent a deterioration of the referenced entity’s creditworthiness and a greater likelihood of a credit event occurring. This is also represented by a decrease in the average credit rating of the underlying index. The maximum potential amount of future payments (undiscounted) that a fund as the Seller could be required to make under any CDS agreement equals the notional amount of the agreement.
During the year ended July 31, 2019, the fund used credit default swap contracts as a seller to take a long position in the exposure of the benchmark credit. The fund held credit default swaps with total USD notional amounts ranging up to $313.3 million, as measured at each quarter end.
Inflation swaps. In an inflation swap, one party pays a fixed rate on a notional principal amount while the other party pays a floating rate linked to an inflation index on that same notional amount. The party paying the floating rate pays the inflation adjusted rate multiplied by the notional principal amount. If the average inflation rate over the term of the swap is the same as the fixed rate of the swap, the two legs will have the same value and the swap will break even.
During the year ended July 31, 2019, the fund used inflation swaps to manage inflation duration of the fund, manage against changes in inflation, and maintain diversity of the fund. The fund held inflation swaps with total USD notional amounts ranging up to $204.5 million, as measured at each quarter end.
Total Return Swaps. The fund may enter into total return swap contracts to obtain synthetic exposure to a specific reference asset or index without owning, taking physical custody of, or short selling the underlying assets. Total return swaps are commitments where one party pays a fixed or variable rate premium (the Buyer) in exchange for a market-linked return (the Seller). The Seller pays the total return of a specific reference asset or index and in return receives interest payments from the Buyer. To the extent the total return of the underlying asset or index exceeds or falls short of the offsetting interest rate obligation, the Buyer will receive or make a payment to the Seller. The fund may enter into total return swaps in which it may act as either the Buyer or the Seller. Total return swap contracts are subject to the risk associated with the investment in the underlying reference asset or index. The risk in the case of short total return swap contracts is unlimited based on the potential for unlimited increases in the market value of the underlying reference asset or index.
During the year ended July 31, 2019, the fund used total return swaps to manage against anticipated changes in securities, gain exposure to certain securities markets, and to maintain diversity of the fund. The fund held total return swaps with total USD notional amounts ranging up to $116.9 million, as measured at each quarter. There were no open total return swaps as of July 31, 2019.
Variance swaps. Variance swap agreements involve two parties agreeing to exchange cash flows based on the measured variance (or square of volatility) of a specified underlying asset. One party agrees to exchange a “fixed rate” or strike price payment for the “floating rate” or realized price variance on the underlying asset with respect to the notional amount. At inception, the strike price is generally chosen such that the fair value of the swap is zero. At the maturity date, a net cash flow is exchanged, where the payoff amount is equivalent to the difference between the realized price variance of the underlying asset and the strike price multiplied by the notional amount. As a receiver of the realized price variance, the fund would receive the payoff amount when the realized price
| 54 | JOHN HANCOCK Global Absolute Return Strategies Fund | ANNUAL REPORT | |
variance of the underlying asset is greater than the strike price and would owe the payoff amount when the price variance is less than the strike price. As a payer of the realized price variance the fund would owe the payoff amount when the realized price variance of the underlying asset is greater than the strike price and would receive the payoff amount when the variance is less than the strike price.
During the year ended July 31, 2019, the fund used variance swaps to maintain diversity of the fund and manage against volatility and anticipated changes in securities markets. The fund held variance swaps with total USD notional amounts ranging from $2.7 million to $13.2 million, as measured at each quarter end.
Fair value of derivative instruments by risk category
The table below summarizes the fair value of derivatives held by the fund at July 31, 2019 by risk category:
| Risk | Statement of
assets and
liabilities location | Financial
instruments
location | Assets
derivatives
fair value | Liabilities
derivatives
fair value |
| Interest rate | Receivable/payable for futures variation margin | Futures1 | — | $(4,843,183) |
| Equity | Receivable/payable for futures variation margin | Futures1 | $1,050,062 | (1,284,110) |
| Foreign currency | Unrealized appreciation / depreciation on forward foreign currency contracts | Forward foreign currency contracts | 12,023,240 | (10,024,564) |
| Foreign currency | Unaffiliated investments, at value2 | Purchased options | 1,575,042 | — |
| Equity | Unaffiliated investments, at value2 | Purchased options | 4,712,642 | — |
| Equity | Written options, at value | Written options | — | (2,443,459) |
| Credit | Swap contracts, at value | Credit default swaps3 | 10,860,778 | (1,018,123) |
| Equity | Swap contracts, at value | Variance swaps3 | 5,801,409 | (8,359,298) |
| Interest rate | Swap contracts, at value | Interest rate swaps3 | 26,828,606 | (17,818,476) |
| Interest rate | Swap contracts, at value | Inflation swaps3 | 147,334 | (2,188,392) |
| | | | $62,999,113 | $(47,979,605) |
| 1 | Reflects cumulative appreciation/depreciation on futures as disclosed in the Fund's investments. Only the year end variation margin is separately disclosed on the Statement of assets and liabilities. |
| 2 | Purchased options are included in the Fund's investments. |
| 3 | Reflects cumulative value of swap contracts. Receivable/payable for centrally cleared swaps, which includes value and margin, and Swap contracts, at value, which represents OTC swaps, are shown separately on the Statement of assets and liabilities. |
For financial reporting purposes, the fund does not offset OTC derivative assets or liabilities that are subject to master netting arrangements, as defined by the ISDAs, in the Statement of assets and liabilities. In the event of default by the counterparty or a termination of the agreement, the ISDA allows an offset of amounts across the various transactions between the fund and the applicable counterparty. The tables below reflect the fund's exposure to OTC derivative transactions and exposure to counterparties subject to an ISDA:
| OTC Financial Instruments | Asset | Liability |
| Forward foreign currency contracts | $12,023,240 | $(10,024,564) |
| Purchased options | 1,809,569 | — |
| Written options | — | (388,264) |
| Variance swaps | 5,801,409 | (8,359,298) |
| | ANNUAL REPORT | JOHN HANCOCK Global Absolute Return Strategies Fund | 55 |
| OTC Financial Instruments | Asset | Liability |
| Total | $19,634,218 | $(18,772,126) |
| Counterparty | Total Market
Value of OTC
Derivatives | Collateral
Posted by
Counterparty | Collateral
Posted by
Fund | Net
Exposure |
| Barclays Bank PLC | ($477,067) | — | $462,589 | ($14,478) |
| BNP Paribas | (1,713,670) | — | 1,627,335 | (86,335) |
| Citibank, N.A. | 1,256,710 | $1,090,000 | — | 166,710 |
| Deutsche Bank AG | 2,309,541 | 1,718,766 | — | 590,775 |
| Goldman Sachs International | (1,070,216) | — | 825,274 | (244,942) |
| HSBC Bank PLC | 213,425 | — | 78,917 | 292,342 |
| JPMorgan Chase Bank, N.A. | (1,205,666) | — | 735,228 | (470,438) |
| Merrill Lynch International | 794,336 | — | — | 794,336 |
| Morgan Stanley & Co. International PLC | (315,083) | — | 272,910 | (42,173) |
| NatWest Markets PLC | (214,034) | — | 214,034 | — |
| RBC Dominion Securities, Inc. | 51,525 | — | — | 51,525 |
| Societe Generale | 1,927,283 | 1,250,000 | — | 677,283 |
| UBS AG | (694,992) | — | 679,815 | (15,177) |
| Total | $862,092 | $4,058,766 | $4,896,102 | $1,699,428 |
Effect of derivative instruments on the Statement of operations
The table below summarizes the net realized gain (loss) included in the net increase (decrease) in net assets from operations, classified by derivative instrument and risk category, for the year ended July 31, 2019:
| | Statement of operations location - Net realized gain (loss) on: |
| Risk | Unaffiliated
investments and
foreign currency
transactions1 | Futures contracts | Forward foreign
currency contracts | Written options | Swap contracts | Total |
| Interest rate | — | $562,197 | — | — | $32,214,460 | $32,776,657 |
| Foreign currency | $5,434,514 | — | $90,184,721 | $2,333,431 | — | 97,952,666 |
| Credit | — | — | — | — | 2,217,671 | 2,217,671 |
| Equity | (15,423,250) | 37,685,266 | — | (59,087,438) | (25,530,813) | (62,356,235) |
| Total | $(9,988,736) | $38,247,463 | $90,184,721 | $(56,754,007) | $8,901,318 | $70,590,759 |
| 1 | Realized gain/loss associated with purchased options is included in this caption on the Statement of operations. |
The table below summarizes the net change in unrealized appreciation (depreciation) included in the net increase (decrease) in net assets from operations, classified by derivative instrument and risk category, for the year ended July 31, 2019:
| 56 | JOHN HANCOCK Global Absolute Return Strategies Fund | ANNUAL REPORT | |
| | Statement of operations location - Change in net unrealized appreciation (depreciation) of: |
| Risk | Unaffiliated
investments and
translation of assets
and liabilities in
foreign currencies1 | Futures contracts | Forward foreign
currency contracts | Written options | Swap contracts | Total |
| Interest rate | — | $(12,455,489) | — | — | $4,896,208 | $(7,559,281) |
| Foreign currency | $(4,415,996) | — | $(28,284,274) | $(2,250,312) | — | (34,950,582) |
| Credit | — | — | — | — | 3,501,798 | 3,501,798 |
| Equity | 15,173,850 | 15,021,296 | — | 7,155,891 | 2,973,187 | 40,324,224 |
| Total | $10,757,854 | $2,565,807 | $(28,284,274) | $4,905,579 | $11,371,193 | $1,316,159 |
| 1 | Change in unrealized appreciation/depreciation associated with purchased options is included in this caption on the Statement of operations. |
Note 4—Guarantees and indemnifications
Under the Trust's organizational documents, its Officers and Trustees are indemnified against certain liabilities arising out of the performance of their duties to the Trust, including the fund. Additionally, in the normal course of business, the fund enters into contracts with service providers that contain general indemnification clauses. The fund's maximum exposure under these arrangements is unknown, as this would involve future claims that may be made against the fund that have not yet occurred. The risk of material loss from such claims is considered remote.
Note 5—Fees and transactions with affiliates
John Hancock Investment Management LLC (the Advisor) serves as investment advisor for the fund. John Hancock Investment Management Distributors LLC (the Distributor), an affiliate of the Advisor, serves as principal underwriter of the fund. The Advisor and the Distributor are indirect, wholly owned subsidiaries of Manulife Financial Corporation (MFC). Prior to June 28, 2019, the Advisor was known as John Hancock Advisers, LLC and the Distributor was known as John Hancock Funds, LLC.
Management fee. The fund has an investment management agreement with the Advisor under which the fund pays a daily management fee to the Advisor equivalent on an annual basis to the sum of: (a) 1.300% of the first $200 million of the fund’s average daily net assets; and (b) 1.250% of the next $300 million of the fund’s average daily net assets provided that net assets are less than or equal to $500 million. If net assets exceed $500 million, the following rates apply; (a) 1.200% of the first $3.0 billion of the fund’s average daily net assets; (b) 1.150% of the next $2.5 billion of the fund’s average daily net assets; (c) 1.120% of the next $1.5 billion of the fund’s average daily net assets; (d) 1.100% of the next $3.0 billion of the fund’s average daily net assets; and (e) 1.070% of the fund’s average daily net assets in excess of $10.0 billion. The Advisor has a subadvisory agreement with Standard Life Investments (Corporate Funds) Limited. Effective January 1, 2019, Standard Life Investments (USA) Limited was replaced by Aberdeen Standard Investments Inc. as the fund's sub-subadvisor. The fund is not responsible for payment of the sub-subadvisory fees.
The Advisor has contractually agreed to waive a portion of its management fee and/or reimburse expenses for certain funds of the John Hancock group of funds complex, including the fund (the participating portfolios). This waiver is based upon aggregate net assets of all the participating portfolios. The amount of the reimbursement is calculated daily and allocated among all the participating portfolios in proportion to the daily net assets of each
| | ANNUAL REPORT | JOHN HANCOCK Global Absolute Return Strategies Fund | 57 |
fund. During the year ended July 31, 2019, this waiver amounted to 0.01% of the fund’s average daily net assets. This arrangement expires on July 31, 2021, unless renewed by mutual agreement of the fund and the Advisor based upon a determination that this is appropriate under the circumstances at that time.
For the year ended July 31, 2019, the expense reductions described above amounted to the following:
| Class | Expense reduction |
| Class A | $6,150 |
| Class C | 5,174 |
| Class I | 103,180 |
| Class R2 | 82 |
| Class | Expense reduction |
| Class R6 | $20,570 |
| Class NAV | 21,737 |
| Total | $156,893 |
Expenses waived or reimbursed in the current fiscal period are not subject to recapture in future fiscal periods.
The investment management fees, including the impact of the waivers and reimbursements as described above, incurred for the year ended July 31, 2019, were equivalent to a net annual effective rate of 1.19% of the fund's average daily net assets.
Accounting and legal services. Pursuant to a service agreement, the fund reimburses the Advisor for all expenses associated with providing the administrative, financial, legal, compliance, accounting and recordkeeping services to the fund, including the preparation of all tax returns, periodic reports to shareholders and regulatory reports, among other services. These expenses are allocated to each share class based on its relative net assets at the time the expense was incurred. These accounting and legal services fees incurred for the year ended July 31, 2019 amounted to an annual rate of 0.02% of the fund's average daily net assets.
Distribution and service plans. The fund has a distribution agreement with the Distributor. The fund has adopted distribution and service plans pursuant to Rule 12b-1 under the 1940 Act, to pay the Distributor for services provided as the distributor of shares of the fund. In addition, under a service plan for certain classes as indicated in the below table, the fund pays for certain other services. The fund may pay up to the following contractual rates of distribution and service fees under these arrangements, expressed as an annual percentage of average daily net assets for each class of the fund's shares:
| Class | Rule 12b-1 Fee | Service fee |
| Class A | 0.30% | — |
| Class C | 1.00% | — |
| Class R2 | 0.25% | 0.25% |
Sales charges. Class A shares are assessed up-front sales charges, which resulted in payments to the Distributor amounting to $14,165 for the year ended July 31, 2019. Of this amount, $2,299 was retained and used for printing prospectuses, advertising, sales literature and other purposes, $11,841 was paid as sales commissions to broker-dealers and $25 was paid as sales commissions to sales personnel of Signator Investors, Inc., which had been a broker-dealer affiliate of the Advisor through November 2, 2018.
Class A and Class C shares may be subject to contingent deferred sales charges (CDSCs). Certain Class A shares that are acquired through purchases of $1 million or more and are redeemed within one year of purchase are subject to a 1.00% sales charge. Class C shares that are redeemed within one year of purchase are subject to a 1.00% CDSC. CDSCs are applied to the lesser of the current market value at the time of redemption or the original purchase cost of the shares being redeemed. Proceeds from CDSCs are used to compensate the Distributor for providing distribution-related services in connection with the sale of these shares. During the year ended July 31, 2019, CDSCs received by the Distributor amounted to $379 and $867 for Class A and Class C shares, respectively.
| 58 | JOHN HANCOCK Global Absolute Return Strategies Fund | ANNUAL REPORT | |
Transfer agent fees. The John Hancock group of funds has a complex-wide transfer agent agreement with John Hancock Signature Services, Inc. (Signature Services), an affiliate of the Advisor. The transfer agent fees paid to Signature Services are determined based on the cost to Signature Services (Signature Services Cost) of providing recordkeeping services. It also includes out-of-pocket expenses, including payments made to third-parties for recordkeeping services provided to their clients who invest in one or more John Hancock funds. In addition, Signature Services Cost may be reduced by certain fees that Signature Services receives in connection with retirement and small accounts. Signature Services Cost is calculated monthly and allocated, as applicable, to five categories of share classes: Retail Share and Institutional Share Classes of Non-Municipal Bond Funds, Class R6 Shares, Retirement Share Classes and Municipal Bond Share Classes. Within each of these categories, the applicable costs are allocated to the affected John Hancock affiliated funds and/or classes, based on the relative average daily net assets.
Class level expenses. Class level expenses for the year ended July 31, 2019 were as follows:
| Class | Distribution and service fees | Transfer agent fees |
| Class A | $239,815 | $89,826 |
| Class C | 673,041 | 75,834 |
| Class I | — | 1,709,599 |
| Class R2 | 5,182 | 141 |
| Class R6 | — | 34,922 |
| Total | $918,038 | $1,910,322 |
Trustee expenses. The fund compensates each Trustee who is not an employee of the Advisor or its affiliates. The costs of paying Trustee compensation and expenses are allocated to the fund based on its net assets relative to other funds within the John Hancock group of funds complex.
Note 6—Fund share transactions
Transactions in fund shares for the years ended July 31, 2019 and 2018 were as follows:
| | Year Ended 7-31-19 | Year Ended 7-31-18 |
| | Shares | Amount | Shares | Amount |
| Class A shares | | | | |
| Sold | 625,188 | $6,274,834 | 3,221,196 | $33,164,797 |
| Repurchased | (7,014,344) | (70,656,381) | (10,782,153) | (110,919,648) |
| Net decrease | (6,389,156) | $(64,381,547) | (7,560,957) | $(77,754,851) |
| Class C shares | | | | |
| Sold | 60,123 | $597,810 | 294,718 | $3,003,179 |
| Repurchased | (4,113,011) | (40,562,259) | (7,028,211) | (71,340,546) |
| Net decrease | (4,052,888) | $(39,964,449) | (6,733,493) | $(68,337,367) |
| Class I shares | | | | |
| Sold | 19,544,689 | $197,475,809 | 52,684,709 | $547,836,699 |
| Repurchased | (205,587,752) | (2,086,260,407) | (152,436,892) | (1,578,042,859) |
| Net decrease | (186,043,063) | $(1,888,784,598) | (99,752,183) | $(1,030,206,160) |
| | ANNUAL REPORT | JOHN HANCOCK Global Absolute Return Strategies Fund | 59 |
| | Year Ended 7-31-19 | Year Ended 7-31-18 |
| | Shares | Amount | Shares | Amount |
| Class R2 shares | | | | |
| Sold | 15,686 | $158,107 | 19,791 | $203,145 |
| Repurchased | (77,295) | (781,172) | (112,283) | (1,154,045) |
| Net decrease | (61,609) | $(623,065) | (92,492) | $(950,900) |
| Class R6 shares | | | | |
| Sold | 1,684,518 | $17,501,312 | 13,103,168 | $134,902,273 |
| Repurchased | (41,036,851) | (416,128,560) | (26,517,261) | (274,041,157) |
| Net decrease | (39,352,333) | $(398,627,248) | (13,414,093) | $(139,138,884) |
| Class NAV shares | | | | |
| Sold | 58,894 | $607,546 | 704,761 | $7,340,189 |
| Repurchased | (59,948,659) | (604,241,928) | (28,183,844) | (289,846,858) |
| Net decrease | (59,889,765) | $(603,634,382) | (27,479,083) | $(282,506,669) |
| Total net decrease | (295,788,814) | $(2,996,015,289) | (155,032,301) | $(1,598,894,831) |
Affiliates of the fund owned 100% of shares of Class NAV on July 31, 2019. Such concentration of shareholders’ capital could have a material effect on the fund if such shareholders redeem from the fund.
Note 7—Purchase and sale of securities
Purchases and sales of securities, other than short-term investments and U.S. Treasury obligations , amounted to $499,741,312 and $2,412,573,419, respectively, for the year ended July 31, 2019. Purchases and sales of U.S. Treasury obligations aggregated $148,469,425 and $333,606,945, respectively, for the year ended July 31, 2019.
Note 8—Investment by affiliated funds
Certain investors in the fund are affiliated funds that are managed by the Advisor and its affiliates. The affiliated funds do not invest in the fund for the purpose of exercising management or control; however, this investment may represent a significant portion of the fund's net assets. At July 31, 2019, there were no affiliated funds with an ownership of 5% or more of the fund's net assets.
Note 9—New accounting pronouncement
In March 2017, the Financial Accounting Standards Board issued Accounting Standards Update (ASU) 2017-08, Premium Amortization on Purchased Callable Debt Securities, which shortens the premium amortization period for purchased non contingently callable debt securities. The standard is effective for annual periods beginning after December 15, 2018 and interim periods within those fiscal years. Management has performed an analysis and has determined that the ASU will not have a material impact to the fund.
Note 10—Subsequent Events
Effective on August 28, 2019, Nordea Investment Management North America, Inc. (NIMNAI) will replace Standard Life Investments (Corporate Funds) Limited (Standard Life) as subadvisor to the fund, and the fund’s name is changing to John Hancock Multi-Asset Absolute Return Fund.
| 60 | JOHN HANCOCK Global Absolute Return Strategies Fund | ANNUAL REPORT | |
On August 22, 2019 the fund declared the following income distributions:
| Class | Total
amount | Per share
amount |
| Class A | $7,249,302 | $1.5559 |
| Class C | 7,396,250 | 1.4849 |
| Class I | 74,709,636 | 1.5873 |
| Class | Total
amount | Per share
amount |
| Class R2 | $106,878 | $1.5488 |
| Class R6 | 22,147,213 | 1.5975 |
| Class NAV | 4,683,945 | 1.5985 |
| | ANNUAL REPORT | JOHN HANCOCK Global Absolute Return Strategies Fund | 61 |
Report of Independent Registered Public Accounting Firm
To the Board of Trustees of John Hancock Funds II and Shareholders of John Hancock Global Absolute Return Strategies Fund
Opinion on the Financial Statements
We have audited the accompanying statement of assets and liabilities, including the Fund’s investments, of John Hancock Global Absolute Return Strategies Fund (one of the funds constituting John Hancock Funds II, referred to hereafter as the "Fund") as of July 31, 2019, the related statement of operations for the year ended July 31, 2019, the statements of changes in net assets for each of the two years in the period ended July 31, 2019, including the related notes, and the financial highlights for each of the five years in the period ended July 31, 2019 (collectively referred to as the “financial statements”). In our opinion, the financial statements present fairly, in all material respects, the financial position of the Fund as of July 31, 2019, the results of its operations for the year then ended, the changes in its net assets for each of the two years in the period ended July 31, 2019 and the financial highlights for each of the five years in the period ended July 31, 2019 in conformity with accounting principles generally accepted in the United States of America.
Basis for Opinion
These financial statements are the responsibility of the Fund’s management. Our responsibility is to express an opinion on the Fund’s financial statements based on our audits. We are a public accounting firm registered with the Public Company Accounting Oversight Board (United States) (PCAOB) and are required to be independent with respect to the Fund in accordance with the U.S. federal securities laws and the applicable rules and regulations of the Securities and Exchange Commission and the PCAOB.
We conducted our audits of these financial statements in accordance with the standards of the PCAOB. Those standards require that we plan and perform the audit to obtain reasonable assurance about whether the financial statements are free of material misstatement, whether due to error or fraud.
Our audits included performing procedures to assess the risks of material misstatement of the financial statements, whether due to error or fraud, and performing procedures that respond to those risks. Such procedures included examining, on a test basis, evidence regarding the amounts and disclosures in the financial statements. Our audits also included evaluating the accounting principles used and significant estimates made by management, as well as evaluating the overall presentation of the financial statements. Our procedures included confirmation of securities owned as of July 31, 2019 by correspondence with the custodian, transfer agent and brokers; when replies were not received from brokers, we performed other auditing procedures. We believe that our audits provide a reasonable basis for our opinion.
/s/ PricewaterhouseCoopers LLP
Boston, Massachusetts
September 20, 2019
We have served as the auditor of one or more investment companies in the John Hancock group of funds since 1988.
| 62 | JOHN HANCOCK GLOBAL ABSOLUTE RETURN STRATEGIES FUND | ANNUAL REPORT | |
TAX INFORMATION
Unaudited
For federal income tax purposes, the following information is furnished with respect to the distributions of the fund, if any, paid during its taxable year ended July 31, 2019.
The fund reports the maximum amount allowable of its net taxable income as eligible for the corporate dividends-received deduction.
The fund reports the maximum amount allowable of its net taxable income as qualified dividend income as provided in the Jobs and Growth Tax Relief Reconciliation Act of 2003.
The fund reports the maximum amount allowable of its Section 199A dividends as defined in Proposed Treasury Regulation §1.199A-3(d).
Eligible shareholders will be mailed a 2019 Form 1099-DIV in early 2020. This will reflect the tax character of all distributions paid in calendar year 2019.
Please consult a tax advisor regarding the tax consequences of your investment in the fund.
| | ANNUAL REPORT | JOHN HANCOCK GLOBAL ABSOLUTE RETURN STRATEGIES FUND | 63 |
CONTINUATION OF INVESTMENT ADVISORY AND SUBADVISORY AGREEMENTS
Evaluation of Advisory and Subadvisory Agreements by the Board of Trustees
This section describes the evaluation by the Board of Trustees (the Board) of John Hancock Funds II (the Trust) of the Advisory Agreement (the Advisory Agreement) with John Hancock Investment Management LLC (the Advisor, formerly known as "John Hancock Advisers LLC") and the Subadvisory Agreement (the Subadvisory Agreement) with Standard Life Investments (Corporate Funds) Limited (SLI or the Subadvisor) for John Hancock Global Absolute Return Strategies Fund (the fund). The Advisory Agreement and Subadvisory Agreement are collectively referred to as the Agreements. Prior to the June 23-26, 2019 in-person meeting at which the Agreements were approved, the Board also discussed and considered information regarding the proposed continuation of the Agreements at an in-person meeting held on May 28-30, 2019.
Approval of Advisory and Subadvisory Agreements
At in-person meetings held on June 23-26, 2019, the Board, including the Trustees who are not parties to any Agreement or considered to be interested persons of the Trust under the Investment Company Act of 1940, as amended (the 1940 Act) (the Independent Trustees), reapproved for an annual period the continuation of the Advisory Agreement between the Trust and the Advisor and the Subadvisory Agreement between the Advisor and the Subadvisor with respect to the fund.
In considering the Advisory Agreement and the Subadvisory Agreement, the Board received in advance of the meetings a variety of materials relating to the fund, the Advisor and the Subadvisor, including comparative performance, fee and expense information for a peer group of similar funds prepared by an independent third-party provider of fund data, performance information for an applicable benchmark index; and, with respect to the Subadvisor, comparative performance information for comparably managed accounts, as applicable, and other information provided by the Advisor and the Subadvisor regarding the nature, extent and quality of services provided by the Advisor and the Subadvisor under their respective Agreements, as well as information regarding the Advisor's revenues and costs of providing services to the fund and any compensation paid to affiliates of the Advisor. At the meetings at which the renewal of the Advisory Agreement and Subadvisory Agreement are considered, particular focus is given to information concerning fund performance, comparability of fees and total expenses, and profitability. However, the Board notes that the evaluation process with respect to the Advisor and the Subadvisor is an ongoing one. In this regard, the Board also took into account discussions with management and information provided to the Board (including its various committees) at prior meetings with respect to the services provided by the Advisor and the Subadvisor to the fund, including quarterly performance reports prepared by management containing reviews of investment results and prior presentations from the Subadvisor with respect to the fund. The information received and considered by the Board in connection with the May and June meetings and throughout the year was both written and oral. The Board also considered the nature, quality, and extent of non-advisory services, if any, to be provided to the fund by the Advisor's affiliates, including distribution services. The Board considered the Advisory Agreement and the Subadvisory Agreement separately in the course of its review. In doing so, the Board noted the respective roles of the Advisor and Subadvisor in providing services to the fund.
Throughout the process, the Board asked questions of and requested additional information from management. The Board is assisted by counsel for the Trust and the Independent Trustees are also separately assisted by independent legal counsel throughout the process. The Independent Trustees also received a memorandum from their independent legal counsel discussing the legal standards for their consideration of the proposed continuation of the Agreements
ANNUAL REPORT | JOHN HANCOCK GLOBAL ABSOLUTE RETURN STRATEGIES FUND 64
and discussed the proposed continuation of the Agreements in private sessions with their independent legal counsel at which no representatives of management were present.
Approval of Advisory Agreement
In approving the Advisory Agreement with respect to the fund, the Board, including the Independent Trustees, considered a variety of factors, including those discussed below. The Board also considered other factors (including conditions and trends prevailing generally in the economy, the securities markets, and the industry) and did not treat any single factor as determinative, and each Trustee may have attributed different weights to different factors. The Board's conclusions may be based in part on its consideration of the advisory and subadvisory arrangements in prior years and on the Board's ongoing regular review of fund performance and operations throughout the year.
Nature, extent, and quality of services. Among the information received by the Board from the Advisor relating to the nature, extent, and quality of services provided to the fund, the Board reviewed information provided by the Advisor relating to its operations and personnel, descriptions of its organizational and management structure, and information regarding the Advisor's compliance and regulatory history, including its Form ADV. The Board also noted that on a regular basis it receives and reviews information from the Trust's Chief Compliance Officer (CCO) regarding the fund's compliance policies and procedures established pursuant to Rule 38a-1 under the 1940 Act. The Board observed that the scope of services provided by the Advisor, and of the undertakings required of the Advisor in connection with those services, including maintaining and monitoring its own and the fund's compliance programs, risk management programs, liquidity management programs and cybersecurity programs, had expanded over time as a result of regulatory, market and other developments. The Board considered that the Advisor is responsible for the management of the day-to-day operations of the fund, including, but not limited to, general supervision of and coordination of the services provided by the Subadvisor, and is also responsible for monitoring and reviewing the activities of the Subadvisor and third-party service providers. The Board also considered the significant risks assumed by the Advisor in connection with the services provided to the fund including entrepreneurial risk in sponsoring new funds and ongoing risks including investment, operational, enterprise, litigation, regulatory and compliance risks with respect to all funds.
In considering the nature, extent, and quality of the services provided by the Advisor, the Trustees also took into account their knowledge of the Advisor's management and the quality of the performance of the Advisor's duties, through Board meetings, discussions and reports during the preceding year and through each Trustee's experience as a Trustee of the Trust and of the other trusts in the John Hancock group of funds complex (the John Hancock Fund Complex).
In the course of their deliberations regarding the Advisory Agreement, the Board considered, among other things:
| | | | | | | | | |
| | | | | (a) | | | the skills and competency with which the Advisor has in the past managed the Trust's affairs and its subadvisory relationship, the Advisor's oversight and monitoring of the Subadvisor's investment performance and compliance programs, such as the Subadvisor's compliance with fund policies and objectives, review of brokerage matters, including with respect to trade allocation and best execution and the Advisor's timeliness in responding to performance issues; | |
| | | | | (b) | | | the background, qualifications and skills of the Advisor's personnel; | |
| | | | | (c) | | | the Advisor's compliance policies and procedures and its responsiveness to regulatory changes and fund industry developments; | |
ANNUAL REPORT | JOHN HANCOCK GLOBAL ABSOLUTE RETURN STRATEGIES FUND 65
| | | | | | | | | |
| | | | | (d) | | | the Advisor's administrative capabilities, including its ability to supervise the other service providers for the fund, as well as the Advisor's oversight of any securities lending activity, its monitoring of class action litigation and collection of class action settlements on behalf of the fund, and bringing loss recovery actions on behalf of the fund; | |
| | | | | (e) | | | the financial condition of the Advisor and whether it has the financial wherewithal to provide a high level and quality of services to the fund; | |
| | | | | (f) | | | the Advisor's initiatives intended to improve various aspects of the Trust's operations and investor experience with the fund; and | |
| | | | | (g) | | | the Advisor's reputation and experience in serving as an investment advisor to the Trust and the benefit to shareholders of investing in funds that are part of a family of funds offering a variety of investments. | |
The Board concluded that the Advisor may reasonably be expected to continue to provide a high quality of services under the Advisory Agreement with respect to the fund.
Investment performance. In considering the fund's performance, the Board noted that it reviews at its regularly scheduled meetings information about the fund's performance results. In connection with the consideration of the Advisory Agreement, the Board:
| | | |
| | (a) | reviewed information prepared by management regarding the fund's performance; |
| | (b) | considered the comparative performance of an applicable benchmark index; |
| | (c) | considered the performance of comparable funds, if any, as included in the report prepared by an independent third-party provider of fund data; and |
| | (d) | took into account the Advisor's analysis of the fund's performance and its plans and recommendations regarding the Trust's subadvisory arrangements generally. |
The Board noted that while it found the data provided by the independent third-party generally useful it recognized its limitations, including in particular that the data may vary depending on the end date selected and the results of the performance comparisons may vary depending on the selection of the peer group. The Board noted that the fund underperformed its benchmark index and its peer group average for the one-, three- and five-year periods ended December 31, 2018. The Board took into account management's discussion of the fund's performance and the fund's investment strategy. The Board concluded that the fund's performance is being monitored and reasonably addressed, where appropriate, and noted potential actions management is considering taking with respect to the fund.
Fees and expenses. The Board reviewed comparative information prepared by an independent third-party provider of fund data, including, among other data, the fund's contractual and net management fees (and subadvisory fees, to the extent available) and total expenses as compared to similarly situated investment companies deemed to be comparable to the fund in light of the nature, extent and quality of the management and advisory and subadvisory services provided by the Advisor and the Subadvisor. The Board considered the fund's ranking within a smaller group of peer funds chosen by the independent third-party provider, as well as the fund's ranking within a broader group of funds. In comparing the fund's contractual and net management fees to those of comparable funds, the Board noted that such fees include both advisory and administrative costs. The Board noted that net management fees for the fund are equal to the peer group median and that net total expenses for the fund are higher than the peer group median.
The Board took into account management's discussion of the fund's expenses. The Board also took into account management's discussion with respect to the overall management fee and the fees of the Subadvisor, including the
ANNUAL REPORT | JOHN HANCOCK GLOBAL ABSOLUTE RETURN STRATEGIES FUND 66
amount of the advisory fee retained by the Advisor after payment of the subadvisory fee, in each case in light of the services rendered for those amounts and the risks undertaken by the Advisor. The Board also noted that the Advisor pays the subadvisory fee, and that such fees are negotiated at arm's length with respect to the Subadvisor. In addition, the Board took into account that management had agreed to implement an overall fee waiver across the complex, including the fund, which is discussed further below. The Board also noted actions taken over the past several years to reduce the fund's operating expenses. The Board also noted that, in addition, the Advisor is currently waiving fees and/or reimbursing expenses with respect to the fund and that the fund has breakpoints in its contractual management fee schedule that reduces management fees as assets increase. The Board reviewed information provided by the Advisor concerning the investment advisory fee charged by the Advisor or one of its advisory affiliates to other clients (including other funds in the John Hancock Fund Complex) having similar investment mandates, if any. The Board considered any differences between the Advisor's and Subadvisor's services to the fund and the services they provide to other comparable clients or funds. The Board concluded that the advisory fee paid with respect to the fund is reasonable in light of the nature, extent and quality of the services provided to the fund under the Advisory Agreement.
Profitability/Fall out benefits. In considering the costs of the services to be provided and the profits to be realized by the Advisor and its affiliates from the Advisor's relationship with the Trust, the Board:
| | | | | | | | | |
| | | | | (a) | | | reviewed financial information of the Advisor; | |
| | | | | (b) | | | reviewed and considered information presented by the Advisor regarding the net profitability to the Advisor and its affiliates with respect to the fund; | |
| | | | | (c) | | | received and reviewed profitability information with respect to the John Hancock Fund Complex as a whole and with respect to the fund; | |
| | | | | (d) | | | received information with respect to the Advisor's allocation methodologies used in preparing the profitability data and considered that the Advisor hired an independent third-party consultant to provide an analysis of the Advisor's allocation methodologies; | |
| | | | | (e) | | | considered that the John Hancock insurance companies that are affiliates of the Advisor, as shareholders of the Trust directly or through their separate accounts, receive certain tax credits or deductions relating to foreign taxes paid and dividends received by certain funds of the Trust and noted that these tax benefits, which are not available to participants in qualified retirement plans under applicable income tax law, are reflected in the profitability information reviewed by the Board; | |
| | | | | (f) | | | considered that the Advisor also provides administrative services to the fund on a cost basis pursuant to an administrative services agreement; | |
| | | | | (g) | | | noted that affiliates of the Advisor provide transfer agency services and distribution services to the fund, and that the fund's distributor also receives Rule 12b-1 payments to support distribution of the fund; | |
| | | | | (h) | | | noted that affiliates of the Advisor provide transfer agency services and placement services to the fund; | |
| | | | | (i) | | | noted that the Advisor also derives reputational and other indirect benefits from providing advisory services to the fund; | |
| | | | | (j) | | | noted that the subadvisory fee for the fund is paid by the Advisor and is negotiated as arm's length; | |
| | | | | (k) | | | considered the Advisor's ongoing costs and expenditures necessary to improve services, meet new regulatory and compliance requirements, and adapt to other challenges impacting the fund industry; and | |
ANNUAL REPORT | JOHN HANCOCK GLOBAL ABSOLUTE RETURN STRATEGIES FUND 67
| | | | | | | | | |
| | | | | (l) | | | considered that the Advisor should be entitled to earn a reasonable level of profits in exchange for the level of services it provides to the fund and the risks that it assumes as Advisor, including entrepreneurial, operational, reputational, litigation and regulatory risk. | |
Based upon its review, the Board concluded that the level of profitability, if any, of the Advisor and its affiliates from their relationship with the fund was reasonable and not excessive.
Economies of scale. In considering the extent to which economies of scale would be realized as the fund grows and whether fee levels reflect these economies of scale for the benefit of fund shareholders, the Board:
| | | |
| | (a) | considered that the Advisor has contractually agreed to waive a portion of its management fee for certain funds of the John Hancock Fund Complex, including the fund (the participating portfolios) or otherwise reimburse the expenses of the participating portfolios (the reimbursement). This waiver is based upon aggregate net assets of all the participating portfolios. The amount of the reimbursement is calculated daily and allocated among all the participating portfolios in proportion to the daily net assets of each fund; |
| | (b) | reviewed the fund's advisory fee structure and concluded that: (i) the fund's fee structure contains breakpoints at the subadvisory fee level and that such breakpoints are reflected as breakpoints in the advisory fees for the fund; and (ii) although economies of scale cannot be measured with precision, these arrangements permit shareholders of the fund to benefit from economies of scale if the fund grows. The Board also took into account management's discussion of the fund's advisory fee structure; and |
| | (c) | the Board also considered the effect of the fund's growth in size on its performance and fees. The Board also noted that if the fund's assets increase over time, the fund may realize other economies of scale. |
Approval of Subadvisory Agreement
In making its determination with respect to approval of the Subadvisory Agreement, the Board reviewed:
| | | |
| | (1) | information relating to the Subadvisor's business, including current subadvisory services to the Trust (and other funds in the John Hancock Fund Complex); |
| | (2) | the historical and current performance of the fund and comparative performance information relating to an applicable benchmark index and comparable funds; and |
| | (3) | the subadvisory fee for the fund, including any breakpoints, and to the extent available, comparable fee information prepared by an independent third party provider of fund data. |
Nature, extent, and quality of services. With respect to the services provided by the Subadvisor, the Board received information provided to the Board by the Subadvisor, including the Subadvisor's Form ADV, as well as took into account information presented throughout the past year. The Board considered the Subadvisor's current level of staffing and its overall resources, as well as received information relating to the Subadvisor's compensation program. The Board reviewed the Subadvisor's history and investment experience, as well as information regarding the qualifications, background, and responsibilities of the Subadvisor's investment and compliance personnel who provide services to the fund. The Board also considered, among other things, the Subadvisor's compliance program and any disciplinary history. The Board also considered the Subadvisor's risk assessment and monitoring process. The Board reviewed the Subadvisor's regulatory history, including whether it was involved in any regulatory actions or investigations as well as material litigation, and any settlements and amelioratory actions undertaken, as appropriate. The Board noted that the Advisor conducts regular, periodic reviews of the Subadvisor and its operations, including
ANNUAL REPORT | JOHN HANCOCK GLOBAL ABSOLUTE RETURN STRATEGIES FUND 68
regarding investment processes and organizational and staffing matters. The Board also noted that the Trust's CCO and his staff conduct regular, periodic compliance reviews with the Subadvisor and present reports to the Independent Trustees regarding the same, which includes evaluating the regulatory compliance systems of the Subadvisor and procedures reasonably designed to assure compliance with the federal securities laws. The Board also took into account the financial condition of the Subadvisor.
The Board considered the Subadvisor's investment process and philosophy. The Board took into account that the Subadvisor's responsibilities include the development and maintenance of an investment program for the fund that is consistent with the fund's investment objective, the selection of investment securities and the placement of orders for the purchase and sale of such securities, as well as the implementation of compliance controls related to performance of these services. The Board also received information with respect to the Subadvisor's brokerage policies and practices, including with respect to best execution and soft dollars.
Subadvisor compensation. In considering the cost of services to be provided by the Subadvisor and the profitability to the Subadvisor of its relationship with the fund, the Board noted that the fees under the Subadvisory Agreement are paid by the Advisor and not the fund. The Board also relied on the ability of the Advisor to negotiate the Subadvisory Agreement with the Subadvisor, which is not affiliated with the Advisor, and the fees thereunder at arm's length. As a result, the costs of the services to be provided and the profits to be realized by the Subadvisor from its relationship with the Trust were not a material factor in the Board's consideration of the Subadvisory Agreement. The Board also received information regarding the nature and scope (including their significance to the Advisor and its affiliates and to the Subadvisor) of any material relationships with respect to the Subadvisor, which include arrangements in which the Subadvisor or its affiliates provide advisory, distribution, or management services in connection with financial products sponsored by the Advisor or its affiliates, and may include other registered investment companies, a 529 education savings plan, managed separate accounts and exempt group annuity contracts sold to qualified plans. The Board also received information and took into account any other potential conflicts of interest the Advisor might have in connection with the Subadvisory Agreement.
In addition, the Board considered other potential indirect benefits that the Subadvisor and its affiliates may receive from the Subadvisor's relationship with the fund, such as the opportunity to provide advisory services to additional funds in the John Hancock Fund Complex and reputational benefits.
Subadvisory fees. The Board considered that the fund pays an advisory fee to the Advisor and that, in turn, the Advisor pays a subadvisory fee to the Subadvisor. As noted above, the Board also considered the fund's subadvisory fees as compared to similarly situated investment companies deemed to be comparable to the fund as included in the report prepared by the independent third party provider of fund data, to the extent available. The Board noted that the limited size of the Lipper peer group was not sufficient for comparative purposes. The Board noted that the limited size of the Lipper peer group was not sufficient for comparative purposes. The Board also took into account the subadvisory fees paid by the Advisor to the Subadvisor with respect to the fund and compared them to fees charged by the Subadvisor to manage other subadvised portfolios and portfolios not subject to regulation under the 1940 Act, as applicable.
Subadvisor performance. As noted above, the Board considered the fund's performance as compared to the fund's peer group and the benchmark index and noted that the Board reviews information about the fund's performance results at its regularly scheduled meetings. The Board noted the Advisor's expertise and resources in monitoring the performance, investment style and risk-adjusted performance of the Subadvisor. The Board was mindful of the Advisor's focus on the Subadvisor's performance. The Board also noted the Subadvisor's long-term performance record for similar accounts, as applicable.
ANNUAL REPORT | JOHN HANCOCK GLOBAL ABSOLUTE RETURN STRATEGIES FUND 69
The Board's decision to approve the Subadvisory Agreement was based on a number of determinations, including the following:
| | | |
| | (1) | the Subadvisor has extensive experience and demonstrated skills as a manager; |
| | (2) | the performance of the fund is being monitored and reasonably addressed, where appropriate; |
| | (3) | the subadvisory fee is reasonable in relation to the level and quality of services being provided; and |
| | (4) | noted that the subadvisory fees are paid by the Advisor not the fund and that the subadvisory fee breakpoints are reflected as breakpoints in the advisory fees for the fund in order to permit shareholders to benefit from economies of scale if the fund grows. |
| * * * |
Based on the Board's evaluation of all factors that the Board deemed to be material, including those factors described above, the Board, including the Independent Trustees, concluded that renewal of the Advisory Agreement and the Subadvisory Agreement would be in the best interest of the fund and its shareholders. Accordingly, the Board, and the Independent Trustees voting separately, approved the Advisory Agreement and Subadvisory Agreement for an additional one-year period.
Initial Board Consideration ofNordea Investment Management North America, Inc. Subadvisory Agreement
At its in-person meeting held on June 23-26, 2019, the Board, including the Independent Trustees, approved the Nordea Investment Management North America, Inc. (NIMNAI) Subadvisory Agreement (the NIMNAI Subadvisory Agreement) between the Advisor and NIMNAI (the Subadvisor) with respect to the Fund.
In considering the NIMNAI Subadvisory Agreement, the Board received in advance of the meeting a variety of materials relating to the Fund and NIMNAI including comparative performance, fee and expense information of NIMNAI and SLI; performance information for relevant indices; and other pertinent information, such as comparative performance information for comparably managed accounts, as applicable; and other information provided by NIMNAI regarding the nature, extent and quality of services to be provided by NIMNAI under the NIMNAI Subadvisory Agreement. The Board also took into account discussions with management and information provided to the Board with respect to the services to be provided by NIMNAI to the Fund. The Board also received an in-person presentation from NIMNAI regarding its firm and the proposed strategy for the Fund, during which the Board had the opportunity to ask questions of NIMNAI. The information received and considered by the Board was both written and oral.
Throughout the process, the Board asked questions of and requested additional information from management. The Board was assisted by counsel for the Trust and the Independent Trustees were also separately assisted by independent legal counsel throughout the process. The Independent Trustees also received a memorandum from their independent legal counsel discussing the legal standards for their consideration of the proposed NIMNAI Subadvisory Agreement and discussed the approval of the Agreement in private sessions with their independent legal counsel at which no representatives of management were present.
In approving the NIMNAI Subadvisory Agreement, the Board, including the Independent Trustees, considered a variety of factors, including those discussed below. The Board also considered other factors (including conditions and trends prevailing generally in the economy, the securities markets and the industry) and did not treat any single factor as determinative, and each Trustee may have attributed different weights to different factors.
ANNUAL REPORT | JOHN HANCOCK GLOBAL ABSOLUTE RETURN STRATEGIES FUND 70
Approval of NIMNAI Subadvisory Agreement
In making its determination with respect to approval of the NIMNAI Subadvisory Agreement, the Board reviewed (i) information relating to NIMNAI's business; (ii) the historical performance of the Fund under the management of SLI, which included comparative performance information of the Fund and the Fund's previous benchmark index and the performance of a comparable composite managed by NIMNAI; (iii) the subadvisory fee for the Fund; and (iv) information relating to the nature and scope of any material relationships and their significance to the Fund's Advisor and the Subadvisor. The Board also considered that the subadvisory fee rates for the Fund under the NIMNAI Subadvisory Agreement: (i) are lower or equal to the rates under the SLI Subadvisory Agreement depending on the Fund's level of assets; (ii) are paid by the Advisor not the Fund; (iii) are a product of arms-length negotiation between the Advisor and NIMNAI; and (iv) are reasonable. In addition, approval of the NIMNAI Subadvisory Agreement will not result in any increase in the advisory fees for the Fund and an amendment to the Fund's advisory agreement will have the effect of reducing the Fund's the advisory fees at all asset levels.
Nature, extent, and quality of services. With respect to the services to be provided to the Fund by NIMNAI, the Board received information provided to the Board by NIMNAI, which included an in-person presentation from NIMNAI regarding its firm and proposed investment strategy for the Fund. The Board considered NIMNAI's current level of staffing and its overall resources. The Board reviewed NIMNAI's history and investment experience, as well as information regarding the qualifications, background, and responsibilities of NIMNAI's investment and compliance personnel who will provide services to the Fund. The Board also considered, among other things, NIMNAI's compliance program and any disciplinary history. The Board also considered NIMNAI's risk assessment and monitoring processes. The Board reviewed NIMNAI's regulatory history, including whether it was currently involved in any regulatory actions or investigations as well as material litigation, and any settlements and mitigating actions undertaken, as appropriate. The Board noted that the Advisor would conduct regular periodic reviews of NIMNAI and its operations in regard to the Fund, including regarding investment processes and organizational and staffing matters. The Board also noted that the Trust's Chief Compliance Officer and his staff would conduct regular, periodic compliance reviews with NIMNAI and present reports to the Independent Trustees regarding the same, which includes evaluating the regulatory compliance systems of NIMNAI and procedures reasonably designed by it to assure compliance with the federal securities laws. The Board also took into account the financial condition of NIMNAI.
The Board considered NIMNAI's investment process and philosophy. The Board took into account that NIMNAI's responsibilities will include the development and maintenance of an investment program for the Fund that is consistent with the Fund's investment objective, the selection of investment securities and the placement of orders for the purchase and sale of such securities, as well as the implementation of compliance controls related to performance of these services. The Board also received information with respect to NIMNAI's brokerage policies and practices, including with respect to best execution and soft dollars.
Subadvisor compensation. In considering the cost of services to be provided by NIMNAI and the profitability to NIMNAI of its relationship with the Fund, the Board noted that the fees under the NIMNAI Subadvisory Agreement are paid by the Advisor and not the Fund. The Board also noted that there will be no increase in the advisory fees paid by the Fund as a consequence of the execution of the NIMNAI Subadvisory Agreement and that a proposed amendment to the Fund's advisory agreement will have the effect of reducing the Fund's the advisory fees at all asset levels. The Board noted that the subadvisory fees under the NIMNAI Subadvisory Agreement would be lower than or equal to the fees under the SLI Subadvisory Agreement depending on the Fund's level of assets.
The Board also relied on the ability of the Advisor to negotiate the NIMNAI Subadvisory Agreement with NIMNAI, which is not affiliated with the Advisor, and the fees thereunder at arm's length. As a result, the costs of the services to
ANNUAL REPORT | JOHN HANCOCK GLOBAL ABSOLUTE RETURN STRATEGIES FUND 71
be provided and the profits to be realized by NIMNAI from its relationship with the Trust were not a material factor in the Board's consideration of the NIMNAI Subadvisory Agreement.
The Board also received information and took into account any other potential conflicts of interest the Advisor might have in connection with the NIMNAI Subadvisory Agreement.
In addition, the Board considered other potential indirect benefits that NIMNAI and its affiliates may receive from NIMNAI's relationship with the Fund, such as the opportunity to provide advisory services to additional funds in the John Hancock fund complex and reputational benefits.
Subadvisory fees. The Board considered that the Fund pays an advisory fee to the Advisor and that, in turn, the Advisor pays a subadvisory fee to NIMNAI. The Board also considered that the subadvisory fee to be paid to NIMNAI for managing the Fund is lower or equal to the fee previously paid to SLI at all asset levels. The Board also took into account that the Fund's advisory fee was also being amended and would result in advisory fee rates that are lower than the current advisory fee rates. The Board also considered, as available, the Fund's subadvisory fees as compared to comparable investment companies.
Subadvisor performance. As noted above, the Board considered the Fund's performance as compared to the Fund's benchmark index under the management of SLI and noted that the Board reviews information about the Fund's performance results at its regularly scheduled meetings. The Board noted the Advisor's expertise and resources in monitoring the performance, investment style, and risk-adjusted performance of NIMNAI. The Board also noted NIMNAI's long-term performance record for similar accounts.
The Board's decision to approve the NIMNAI Subadvisory Agreement was based on a number of determinations, such as information relating to NIMNAI's business, including the historical performance of the Fund under the management of SLI, which included comparative performance information of the Fund and a composite managed by NIMNAI; NIMNAI has extensive experience and demonstrated skills as a manager; and that the subadvisory fee rates for the Fund under the NIMNAI Subadvisory Agreement:
| | | |
| | (1) | are lower than or equal to the rates under the SLI Subadvisory Agreement at all asset levels; |
| | (2) | are reasonable in relation to the level and quality of services to be provided under the NIMNAI Subadvisory Agreement; |
| | (3) | are paid by the Advisor not the Fund; |
| | (4) | have breakpoints that are reflected as breakpoints in the advisory fees for the Fund in order to permit shareholders to benefit from economies of scale if the Fund grows; and |
| | (5) | are a product of arms-length negotiation between the Advisor and NIMNAI. In addition, the Board considered that approval of the NIMNAI Subadvisory Agreement will not result in any increase in the advisory fees for the Fund and the advisory fees will be lower for the Fund at all asset levels. |
ANNUAL REPORT | JOHN HANCOCK GLOBAL ABSOLUTE RETURN STRATEGIES FUND 72
This chart provides information about the Trustees and Officers who oversee your John Hancock fund. Officers elected by the Trustees manage the day-to-day operations of the fund and execute policies formulated by the Trustees.
Independent Trustees
| | | |
Name, year of birth
Position(s) held with Trust
Principal occupation(s) and other
directorships during past 5 years | Trustee
of the
Trust
since1 | Number of John
Hancock funds
overseen by
Trustee |
| Hassell H. McClellan, Born: 1945 | 2005 | 213 |
Trustee and Chairperson of the Board
Director/Trustee, Virtus Funds (since 2008); Director, The Barnes Group (since 2010); Associate Professor, The Wallace E. Carroll School of Management, Boston College (retired 2013). Trustee (since 2005) and Chairperson of the Board (since 2017) of various trusts within the John Hancock Fund Complex. |
| | | |
| Charles L. Bardelis,2 Born: 1941 | 2005 | 213 |
Trustee
Director, Island Commuter Corp. (marine transport). Trustee of various trusts within the John Hancock Fund Complex (since 1988). |
| | | |
| James R. Boyle,Born: 1959 | 2015 | 213 |
Trustee
Chief Executive Officer, Foresters Financial (since 2018); Chairman and Chief Executive Officer, Zillion Group, Inc. (formerly HealthFleet, Inc.) (healthcare) (2014-2018); Executive Vice President and Chief Executive Officer, U.S. Life Insurance Division of Genworth Financial, Inc. (insurance) (January 2014-July 2014); Senior Executive Vice President, Manulife Financial, President and Chief Executive Officer, John Hancock (1999-2012); Chairman and Director, John Hancock Investment Management LLC, John Hancock Investment Management Distributors LLC, and John Hancock Variable Trust Advisers LLC (2005-2010). Trustee of various trusts within the John Hancock Fund Complex (2005-2014 and since 2015). |
| | | |
| Peter S. Burgess,2 Born: 1942 | 2005 | 213 |
Trustee
Consultant (financial, accounting, and auditing matters) (since 1999); Certified Public Accountant; Partner, Arthur Andersen (independent public accounting firm) (prior to 1999); Director, Lincoln Educational Services Corporation (since 2004); Director, Symetra Financial Corporation (2010-2016); Director, PMA Capital Corporation (2004-2010). Trustee of various trusts within the John Hancock Fund Complex (since 2005). |
| | | |
| William H. Cunningham, Born: 1944 | 2012 | 213 |
Trustee
Professor, University of Texas, Austin, Texas (since 1971); former Chancellor, University of Texas System and former President of the University of Texas, Austin, Texas; Chairman (since 2009) and Director (since 2006), Lincoln National Corporation (insurance); Director, Southwest Airlines (since 2000); former Director, LIN Television (2009-2014). Trustee of various trusts within the John Hancock Fund Complex (since 1986). |
| | | |
| Grace K. Fey, Born: 1946 | 2008 | 213 |
Trustee
Chief Executive Officer, Grace Fey Advisors (since 2007); Director and Executive Vice President, Frontier Capital Management Company (1988-2007); Director, Fiduciary Trust (since 2009). Trustee of various trusts within the John Hancock Fund Complex (since 2008). |
ANNUAL REPORT | JOHN HANCOCK GLOBAL ABSOLUTE RETURN STRATEGIES FUND 73
Independent Trustees (continued)
| | | |
Name, year of birth
Position(s) held with Trust
Principal occupation(s) and other
directorships during past 5 years | Trustee
of the
Trust
since1 | Number of John
Hancock funds
overseen by
Trustee |
| Theron S. Hoffman,4 Born: 1947 | 2008 | 213 |
Trustee
Chief Executive Officer, T. Hoffman Associates, LLC (consulting firm) (since 2003); Director, The Todd Organization (consulting firm) (2003-2010); President, Westport Resources Management (investment management consulting firm) (2006-2008); Board Member, Senior Managing Director, Partner, and Operating Head, Putnam Investments (2000-2003); Executive Vice President, The Thomson Corp. (financial and legal information publishing) (1997-2000). Trustee of various trusts within the John Hancock Fund Complex (since 2008). |
| | | |
| Deborah C. Jackson, Born: 1952 | 2012 | 213 |
Trustee
President, Cambridge College, Cambridge, Massachusetts (since 2011); Board of Directors, National Association of Corporate Directors/New England (since 2015); Board of Directors, Association of Independent Colleges and Universities of Massachusetts (since 2014); Chief Executive Officer, American Red Cross of Massachusetts Bay (2002-2011); Board of Directors of Eastern Bank Corporation (since 2001); Board of Directors of Eastern Bank Charitable Foundation (since 2001); Board of Directors of American Student Assistance Corporation (1996-2009); Board of Directors of Boston Stock Exchange (2002-2008); Board of Directors of Harvard Pilgrim Healthcare (health benefits company) (2007-2011). Trustee of various trusts within the John Hancock Fund Complex (since 2008). |
| | | |
| James M. Oates,2Born: 1946 | 2005 | 213 |
Trustee
Managing Director, Wydown Group (financial consulting firm) (since 1994); Chairman and Director, Emerson Investment Management, Inc. (2000-2015); Independent Chairman, Hudson Castle Group, Inc. (formerly IBEX Capital Markets, Inc.) (financial services company) (1997-2011); Director, Stifel Financial (since 1996); Director, Investor Financial Services Corporation (1995-2007); Director, Connecticut River Bancorp (1998-2014); Director/Trustee, Virtus Funds (since 1988). Trustee (since 2004) and Chairperson of the Board (2005-2016) of various trusts within the John Hancock Fund Complex. |
| | | |
| Steven R. Pruchansky, Born: 1944 | 2012 | 213 |
Trustee and Vice Chairperson of the Board
Managing Director, Pru Realty (since 2017); Chairman and Chief Executive Officer, Greenscapes of Southwest Florida, Inc. (2000-2014); Director and President, Greenscapes of Southwest Florida, Inc. (until 2000); Member, Board of Advisors, First American Bank (until 2010); Managing Director, Jon James, LLC (real estate) (since 2000); Partner, Right Funding, LLC (2014-2017); Director, First Signature Bank & Trust Company (until 1991); Director, Mast Realty Trust (until 1994); President, Maxwell Building Corp. (until 1991). Trustee (since 1992), Chairperson of the Board (2011-2012), and Vice Chairperson of the Board (since 2012) of various trusts within the John Hancock Fund Complex. |
| | | |
| Gregory A. Russo, Born: 1949 | 2012 | 213 |
Trustee
Director and Audit Committee Chairman (since 2012), and Member, Audit Committee and Finance Committee (since 2011), NCH Healthcare System, Inc. (holding company for multi-entity healthcare system); Director and Member (2012-2018) and Finance Committee Chairman (2014-2018), The Moorings, Inc. (nonprofit continuing care community); Vice Chairman, Risk & Regulatory Matters, KPMG LLP (KPMG) (2002-2006); Vice Chairman, Industrial Markets, KPMG (1998-2002); Chairman and Treasurer, Westchester County, New York, Chamber of Commerce (1986-1992); Director, Treasurer, and Chairman of Audit and Finance Committees, Putnam Hospital Center (1989-1995); Director and Chairman of Fundraising Campaign, United Way of Westchester and Putnam Counties, New York (1990-1995). Trustee of various trusts within the John Hancock Fund Complex (since 2008). |
ANNUAL REPORT | JOHN HANCOCK GLOBAL ABSOLUTE RETURN STRATEGIES FUND 74
Non-Independent Trustees3
| | | |
Name, year of birth
Position(s) held with Trust
Principal occupation(s) and other
directorships during past 5 years | Trustee
of the
Trust
since1 | Number of John
Hancock funds
overseen by
Trustee |
| Andrew G. Arnott, Born: 1971 | 2017 | 213 |
President and Non-Independent Trustee
Head of Wealth and Asset Management, United States and Europe, for John Hancock and Manulife (since 2018); Executive Vice President, John Hancock Financial Services (since 2009, including prior positions); Director and Executive Vice President, John Hancock Investment Management LLC (since 2005, including prior positions); Director and Executive Vice President, John Hancock Variable Trust Advisers LLC (since 2006, including prior positions); President, John Hancock Investment Management Distributors LLC (since 2004, including prior positions); President of various trusts within the John Hancock Fund Complex (since 2007, including prior positions). Trustee of various trusts within the John Hancock Fund Complex (since 2017). |
| | | |
| Marianne Harrison, Born: 1963 | 2018 | 213 |
Non-Independent Trustee
President and CEO, John Hancock (since 2017); President and CEO, Manulife Canadian Division (2013-2017); Member, Board of Directors, American Council of Life Insurers (ACLI) (since 2018); Member, Board of Directors, Communitech, an industry-led innovation center that fosters technology companies in Canada (since 2017); Member, Board of Directors, Manulife Assurance Canada (2015-2017); Board Member, St. Mary's General Hospital Foundation (2014-2017); Member, Board of Directors, Manulife Bank of Canada (2013-2017); Member, Standing Committee of the Canadian Life & Health Assurance Association (2013-2017); Member, Board of Directors, John Hancock USA, John Hancock Life & Health, John Hancock New York (2012-2013). Trustee of various trusts within the John Hancock Fund Complex (since 2018). |
Principal officers who are not Trustees
| | |
Name, year of birth
Position(s) held with Trust
Principal occupation(s)
during past 5 years | Officer
of the
Trust
since |
| Francis V. Knox, Jr.,Born: 1947 | 2005 |
Chief Compliance Officer
Vice President, John Hancock Financial Services (since 2005); Chief Compliance Officer, various trusts within the John Hancock Fund Complex, John Hancock Investment Management LLC, and John Hancock Variable Trust Advisers LLC (since 2005). |
| | |
| Charles A. Rizzo, Born: 1957 | 2007 |
Chief Financial Officer
Vice President, John Hancock Financial Services (since 2008); Senior Vice President, John Hancock Investment Management LLC and John Hancock Variable Trust Advisers LLC (since 2008); Chief Financial Officer of various trusts within the John Hancock Fund Complex (since 2007). |
| | |
| Salvatore Schiavone, Born: 1965 | 2009 |
Treasurer
Assistant Vice President, John Hancock Financial Services (since 2007); Vice President, John Hancock Investment Management LLC and John Hancock Variable Trust Advisers LLC (since 2007); Treasurer of various trusts within the John Hancock Fund Complex (since 2007, including prior positions). |
ANNUAL REPORT | JOHN HANCOCK GLOBAL ABSOLUTE RETURN STRATEGIES FUND 75
Principal officers who are notTrustees (continued)
| | | |
Name, year of birth
Position(s) held with Trust
Principal occupation(s)
during past 5 years | Officer
of the
Trust
since |
| Christopher (Kit) Sechler,Born: 1973 | 2018 |
Chief Legal Officer and Secretary
Vice President and Deputy Chief Counsel, John Hancock Investments (since 2015); Assistant Vice President and Senior Counsel (2009-2015), John Hancock Investment Management; Chief Legal Officer and Secretary of various trusts within the John Hancock Fund Complex (since 2018); Assistant Secretary of John Hancock Investment Management LLC and John Hancock Variable Trust Advisers LLC (since 2009). |
The business address for all Trustees and Officers is 200 Berkeley Street, Boston, Massachusetts 02116-5023.
The Statement of Additional Information of the fund includes additional information about members of the Board of Trustees of the Trust and is available without charge, upon request, by calling 800-225-5291.
| 1 | Each Trustee holds office until his or her successor is elected and qualified, or until the Trustee's death, retirement, resignation, or removal. Mr. Boyle has served as Trustee at various times prior to the date listed in the table. |
| 2 | Member of the Audit Committee. |
| 3 | The Trustee is a Non-Independent Trustee due to current or former positions with the Advisor and certain affiliates. |
| 4 | Mr. Hoffman retired as Trustee effective August 31, 2019. |
ANNUAL REPORT | JOHN HANCOCK GLOBAL ABSOLUTE RETURN STRATEGIES FUND 76
| | |
Trustees
Hassell H. McClellan,Chairperson
Steven R. Pruchansky,Vice Chairperson
Andrew G. Arnott†
Charles L. Bardelis*
James R. Boyle
Peter S. Burgess*
William H. Cunningham
Grace K. Fey
Marianne Harrison†
Theron S. Hoffman ¡ ‰
Deborah C. Jackson
James M. Oates*
Gregory A. Russo
Officers
Andrew G. Arnott
President
Francis V. Knox, Jr.
Chief Compliance Officer
Charles A. Rizzo
Chief Financial Officer
Salvatore Schiavone
Treasurer
Christopher (Kit) Sechler**
Secretary and Chief Legal Officer
| Investment advisor
John Hancock Investment Management LLC
Subadvisor
Nordea Investment Management North America, Inc.#
Portfolio Manager
Dr. Asbjørn Trolle Hansen#
Dr. Claus Vorm#
Kurt Kongsted#
Principal distributor
John Hancock Investment Management Distributors LLC
Custodian
Citibank, N.A.
Transfer agent
John Hancock Signature Services, Inc.
Legal counsel
K&L Gates LLP
Independent registered public accounting firm
PricewaterhouseCoopers LLP
|
* Member of the Audit Committee
† Non-Independent Trustee
** Effective 9-13-18
# Effective 8-28-19. Prior to that date, Standard Life Investments (Corporate Funds) Limited served as Subadvisor and
Aymeric Forest as Portfolio Manager.
¡ ‰Retired effective 8-31-19
The fund's proxy voting policies and procedures, as well as the fund proxy voting record for the most recent twelve-month period ended June 30, are available free of charge on the Securities and Exchange Commission (SEC) website at sec.gov or on our website.
All of the fund's holdings as of the end of the third month of every fiscal quarter are filed with the SEC on Form N-PORT within 60 days of the end of the fiscal quarter. The fund's Form N-PORT filings are available on our website and the SEC's website, sec.gov.
We make this information on your fund, as well asmonthly portfolio holdings, and other fund details available on our website at jhinvestments.com or by calling 800-225-5291.
| | | | |
| | You can also contact us: |
| | 800-225-5291
jhinvestments.com | Regular mail:
John Hancock Signature Services, Inc.
P.O. Box 55913
Boston, MA 02205-5913
| Express mail:
John Hancock Signature Services, Inc.
2000 Crown Colony Drive
Suite 55913
Quincy, MA 02169-0953
|
ANNUAL REPORT | JOHN HANCOCK GLOBAL ABSOLUTE RETURN STRATEGIES FUND 77
John Hancock family of funds
| | | |
DOMESTIC EQUITY FUNDS
Blue Chip Growth
Classic Value
Disciplined Value
Disciplined Value Mid Cap
Equity Income
Financial Industries
Fundamental All Cap Core
Fundamental Large Cap Core
New Opportunities
Regional Bank
Small Cap Core
Small Cap Growth
Small Cap Value
U.S. Global Leaders Growth
U.S. Quality Growth
Value Equity
GLOBAL AND INTERNATIONAL EQUITY FUNDS
Disciplined Value International
Emerging Markets
Emerging Markets Equity
Fundamental Global Franchise
Global Equity
Global Shareholder Yield
Global Thematic Opportunities
International Dynamic Growth
International Growth
International Small Company
| | INCOME FUNDS
Bond
California Tax-Free Income
Emerging Markets Debt
Floating Rate Income
Government Income
High Yield
High Yield Municipal Bond
Income
Investment Grade Bond
Money Market
Short Duration Bond
Short Duration Credit Opportunities
Spectrum Income
Strategic Income Opportunities
Tax-Free Bond
ALTERNATIVE AND SPECIALTY FUNDS
Absolute Return Currency
Alternative Asset Allocation
Disciplined Alternative Yield
Diversified Macro
Infrastructure
Multi-Asset Absolute Return
Seaport Long/Short
|
A fund's investment objectives, risks, charges, and expenses should be considered carefully before investing. The prospectus contains this and other important information about the fund. To obtain a prospectus, contact your financial professional, call John Hancock Investment Management at 800-225-5291, or visit our website at jhinvestments.com. Please read the prospectus carefully before investing or sending money.
| | | |
ASSET ALLOCATION
Balanced
Income Allocation
Multi-Index Lifetime Portfolios
Multi-Index Preservation Portfolios
Multimanager Lifestyle Portfolios
Multimanager Lifetime Portfolios
Retirement Income 2040
EXCHANGE-TRADED FUNDS
John Hancock Multifactor Consumer Discretionary ETF
John Hancock Multifactor Consumer Staples ETF
John Hancock Multifactor Developed International ETF
John Hancock Multifactor Emerging Markets ETF
John Hancock Multifactor Energy ETF
John Hancock Multifactor Financials ETF
John Hancock Multifactor Healthcare ETF
John Hancock Multifactor Industrials ETF
John Hancock Multifactor Large Cap ETF
John Hancock Multifactor Materials ETF
John Hancock Multifactor Media and
Communications ETF
John Hancock Multifactor Mid Cap ETF
John Hancock Multifactor Small Cap ETF
John Hancock Multifactor Technology ETF
John Hancock Multifactor Utilities ETF
| | ENVIRONMENTAL, SOCIAL, AND
GOVERNANCE FUNDS
ESG All Cap Core
ESG Core Bond
ESG International Equity
ESG Large Cap Core
CLOSED-END FUNDS
Financial Opportunities
Hedged Equity & Income
Income Securities Trust
Investors Trust
Preferred Income
Preferred Income II
Preferred Income III
Premium Dividend
Tax-Advantaged Dividend Income
Tax-Advantaged Global Shareholder Yield
|
John Hancock Multifactor ETF shares are bought and sold at market price (not NAV), and are not individually redeemed
from the fund. Brokerage commissions will reduce returns.
John Hancock ETFs are distributed by Foreside Fund Services, LLC, and are subadvised by Dimensional Fund Advisors LP.
Foreside is not affiliated with John Hancock Investment Management Distributors, LLC or Dimensional Fund Advisors LP.
Dimensional Fund Advisors LP receives compensation from John Hancock in connection with licensing rights to the
John Hancock Dimensional indexes. Dimensional Fund Advisors LP does not sponsor, endorse, or sell, and makes no
representation as to the advisability of investing in, John Hancock Multifactor ETFs.
John Hancock Investment Management
A trusted brand
John Hancock Investment Management is a premier asset manager
representing one of America's most trusted brands, with a heritage of
financial stewardship dating back to 1862. Helping our shareholders
pursue their financial goals is at the core of everything we do. It's why
we support the role of professional financial advice and operate with
the highest standards of conduct and integrity.
A better way to invest
We serve investors globally through a unique multimanager approach:
We search the world to find proven portfolio teams with specialized
expertise for every strategy we offer, then we apply robust investment
oversight to ensure they continue to meet our uncompromising
standards and serve the best interests of our shareholders.
Results for investors
Our unique approach to asset management enables us to provide
a diverse set of investments backed by some of the world's best
managers, along with strong risk-adjusted returns across asset classes.
John Hancock Investment Management Distributors, LLC n Member FINRA, SIPC
200 Berkeley Street n Boston, MA 02116-5010 n 800-225-5291 n jhinvestments.com
This report is for the information of the shareholders of John Hancock Global Absolute Return Strategies Fund. It is not authorized for distribution to prospective investors unless preceded or accompanied by a prospectus.
ITEM 2. CODE OF ETHICS.
| (a) | As of the end of the fiscal year July 31, 2019 the registrant has adopted a code of ethics, as defined in Item 2 of Form N-CSR, that applies to its principal executive officer and principal financial officer. A copy of the code of ethics is filed as an exhibit to this Form N-CSR. |
| (b) | Not applicable |
| (c) | Not applicable |
| (d) | Not applicable |
| (e) | Not applicable |
| (f)(1) A copy of the code of ethics is filed as an exhibit to this Form N-CSR. |
(f)(2)Not applicable.
(f)(3)The Registrant will provide a copy of the Code of Ethics to any person without charge, upon request by calling the following toll free number (800) 344-1029.
ITEM 3. AUDIT COMMITTEE FINANCIAL EXPERT.
The Board of Trustees has determined that at least one member of its audit committee is an “audit committee financial expert”. Peter S. Burgess is the audit committee financial expert and is “independent”, pursuant to general instructions on Form N-CSR Item 3.
ITEM 4. PRINCIPAL ACCOUNTANT FEES AND SERVICES.
| (a) | AUDIT FEES: |
| | | 2019: | | $377,756 |
| | 2018: | | $453,077 |
| | | |
| | These fees represent aggregate fees billed for the last two fiscal years (the “Reporting Periods”) for professional services rendered by the principal accountant for the audits of the Registrant’s annual financial statements or services that are normally provided by the accountant in connection with statutory and regulatory filing or engagements for such Reporting Periods. |
| (b) | AUDIT RELATED FEES: |
| | | 2019: | | $2,880 |
| | 2018: | | $3,780 |
| | | |
| | These fees represent the aggregate fees billed for the Reporting Periods for assurance and related services by the principal accountant that are reasonably related to the performance of the audit of the Registrant’s financial statements and are not reported under paragraph (a) of this Item. Such fees relate to professional services rendered by the principal accountant for separate reports in connection with service provider internal controls reviews. Additionally, amounts billed to control affiliates were $113,000 and $110,200 for the fiscal years ended July 31, 2019 and 2018, respectively. |
| (c) | TAX FEES: |
| | | 2019: | | $19,365 |
| | 2018: | | $26,250 |
| | | |
| | These fees represent aggregate fees billed for the Reporting Periods for professional services rendered by the principal accountant for tax compliance, tax advice and tax planning. The tax services provided by the principal accountant related to the review of the Registrant’s federal and state tax returns and tax distribution requirements. |
| (d) | ALL OTHER FEES: |
| | | 2019: | | $420 |
| | 2018: | | $1,638 |
| | | |
| | These fees represent all other fees billed to the Registrant for products and services provided by the principal accountant. These fees were billed to the Registrant and were approved by the Registrant’s audit committee. |
| (e) | (1) Audit Committee Pre-Approval Policies and Procedures: |
| | | |
| | The Trust’s Audit Committee must pre-approve all audit and non-audit services provided by the independent registered public accounting firm (the “Auditor”) relating to the operations or financial reporting of the funds. Prior to the commencement of any audit or non-audit services to a fund, the Audit Committee reviews the services to determine whether they are appropriate and permissible under applicable law. |
| | |
| | The Trust’s Audit Committee has adopted policies and procedures to, among other purposes, provide a framework for the Committee’s consideration of audit-related and non-audit services by the Auditor. The policies and procedures require that any audit-related and non-audit service provided by the Auditor and any non-audit service provided by the Auditor to a fund service provider that relates directly to the operations and financial reporting of a fund are subject to approval by the Audit Committee before such service is provided. Audit-related services provided by the Auditor that are expected to exceed $25,000 per instance/per fund are subject to specific pre-approval by the Audit Committee. Tax services provided by the Auditor that are expected to exceed $30,000 per instance/per fund are subject to specific pre-approval by the Audit Committee. |
| | All audit services, as well as the audit-related and non-audit services that are expected to exceed the amounts stated above, must be approved in advance of provision of the service by formal resolution of the Audit Committee. At the regularly scheduled Audit Committee meetings, the Committee reviews a report summarizing the services, including fees, provided by the Auditor. |
| | |
| | (2) Amount approved by the Audit Committee pursuant paragraph (c) (7) (i) (C) of Rule 2-01 of Regulation S-X: None. |
| | |
| (f) | Not applicable. |
| | | |
| (g) | The aggregate non-audit fees billed by the registrant’s principal accountant for services rendered to the registrant and rendered to the registrant’s control affiliates for each of the last two fiscal years of the registrant were $901,334 for the fiscal year ended July 31, 2019 and $4,176,050 for the fiscal year ended July 31, 2018. |
| | |
| (h) | The audit committee of the registrant has considered the non-audit services provided by the registrant’s principal accountant to the control affiliates and has determined that the services that were non pre-approved are compatible with maintaining the principal accountant’s independence. |
ITEM 5. AUDIT COMMITTEE OF LISTED REGISTRANTS.
Peter S. Burgess – Chairman
Charles L. Bardelis
Theron S. Hoffman
ITEM 6. SCHEDULE OF INVESTMENTS.
(a) This schedule is included as part of the Report to shareholders filed under Item 1 of this form.
(b) Not applicable.
ITEM 7. DISCLOSURE OF PROXY VOTING POLICIES AND PROCEDURES FOR CLOSED-END MANAGEMENT INVESTMENT COMPANIES.
Not applicable.
ITEM 8. PORTFOLIO MANAGERS OF CLOSED-END MANAGEMENT INVESTMENT COMPANIES.
Not applicable.
ITEM 9. PURCHASE OF EQUITY SECURITIES BY CLOSED-END MANAGEMENT INVESTMENT COMPANIES AND AFFILIATED PURCHASERS.
Not applicable.
ITEM 10. SUBMISSION OF MATTERS TO VOTE OF SECURITY HOLDERS.
No material changes.
ITEM 11. CONTROLS AND PROCEDURES.
(a) Based upon their evaluation of the registrant's disclosure controls and procedures as conducted within 90 days of the filing date of this Form N-CSR, the registrant's principal executive officer and principal financial officer have concluded that those disclosure controls and procedures provide reasonable assurance that the material information required to be disclosed by the registrant on this report is recorded, processed, summarized and reported within the time periods specified in the Securities and Exchange Commission's rules and forms.
(b) There were no changes in the registrant's internal control over financial reporting that occurred during the period covered by this report that have materially affected, or are reasonably likely to materially affect, the registrant's internal control over financial reporting.
ITEM 12. DISCLOSURE OF SECURITIES LENDING ACTIVITIES FOR CLOSED-END MANAGEMENT INVESTMENTCOMPANIES.
Not applicable.
ITEM 13. EXHIBITS.
(a)(1) Code of Ethics for Covered Officers is attached.
(a)(2) Separate certifications for the registrant's principal executive officer and principal financial officer, as required by Section 302 of the Sarbanes-Oxley Act of 2002 and Rule 30a-2(a) under the Investment Company Act of 1940, are attached.
(b)(1) Separate certifications for the registrant's principal executive officer and principal financial officer, as required by 18 U.S.C. Section 1350, as adopted pursuant to Section 906 of the Sarbanes-Oxley Act of 2002, and Rule 30a-2(b) under the Investment Company Act of 1940, are attached. The certifications furnished pursuant to this paragraph are not deemed to be "filed" for purposes of Section 18 of the Securities Exchange Act of 1934, or otherwise subject to the liability of that section. Such certifications are not deemed to be incorporated by reference into any filing under the Securities Act of 1933 or the Securities Exchange Act of 1934, except to the extent that the Registrant specifically incorporates them by reference.
(c)(1) Submission of Matters to a Vote of Security Holders is attached. See attached “John Hancock Funds – Nominating, Governance and Administration Committee Charter”.
SIGNATURES
Pursuant to the requirements of the Securities Exchange Act of 1934 and the Investment Company Act of 1940, the registrant has duly caused this report to be signed on its behalf by the undersigned, thereunto duly authorized.
| JOHN HANCOCK FUNDS II |
| |
| |
| /s/ Andrew Arnott |
| Andrew Arnott |
| President |
| Date: September 20, 2019 |
Pursuant to the requirements of the Securities Exchange Act of 1934 and the Investment Company Act of 1940, this report has been signed below by the following persons on behalf of the registrant and in the capacities and on the dates indicated.
| |
| /s/ Andrew Arnott |
| Andrew Arnott |
| President |
| Date: September 20, 2019 |
| |
| |
| |
| /s/ Charles A. Rizzo |
| Charles A. Rizzo |
| Chief Financial Officer |
| Date: September 20, 2019 |