UNITED STATES
SECURITIES AND EXCHANGE COMMISSION
Washington, D.C. 20549
FORM N-CSR
CERTIFIED SHAREHOLDER REPORT OF REGISTERED MANAGEMENT INVESTMENT COMPANIES
Investment Company Act file number 811-21779
JOHN HANCOCK FUNDS II
---------------------------------------------------------
(Exact name of registrant as specified in charter)
200 BERKLEY STREET, BOSTON, MA 02116
-------------------------------------------------------------
(Address of principal executive offices) (Zip code)
SALVATORE SCHIAVONE, 200 Berkeley Street, BOSTON, MA 02116
------------------------------------------------------------------------------------------
(Name and address of agent for service)
Registrant's telephone number, including area code: (617) 663-4497
--------------
Date of fiscal year end: August 31
------
Date of reporting period: August 31, 2020
-------
ITEM 1. REPORTS TO STOCKHOLDERS.
The Registrant prepared seven annual reports to shareholders for the period ended August 31, 2020. The first report applies to the Alternative Asset Allocation Fund, the second report applies to the Floating Rate Income Fund, the third report applies to the Multi-Asset High Income Fund (formerly Income Allocation Fund), the fourth report applies to the New Opportunities Fund, the fifth report applies to the Strategic Income Opportunities Fund, the sixth report applies to the 16 of the Registrant’s Funds, and the seventh applies to 5 of the Registrant’s Funds.
John Hancock
Alternative Asset Allocation Fund
Annual report 8/31/2020
Beginning on January 1, 2021, as permitted by regulations adopted by the Securities and Exchange Commission, paper copies of the fund's shareholder reports like this one will no longer be sent by mail, unless you specifically request paper copies of the reports from the fund or from your financial intermediary. Instead, the reports will be made available on a website, and you will be notified by mail each time a report is posted and provided with a website link to access the report.
If you already elected to receive shareholder reports electronically, you will not be affected by this change, and you do not need to take any action. You may elect to receive shareholder reports and other communications electronically by calling John Hancock Investment Management at 800-225-5291 (Class A and Class C shares) or 888-972-8696 (Class I and Class R Suite) or by contacting your financial intermediary.
You may elect to receive all reports in paper, free of charge, at any time. You can inform John Hancock Investment Management or your financial intermediary that you wish to continue receiving paper copies of your shareholder reports by following the instructions listed above. Your election to receive reports in paper will apply to all funds held with John Hancock Investment Management or your financial intermediary.

A message to shareholders
Dear shareholder,
Despite the heightened fears over the coronavirus (COVID-19), which sent markets tumbling during the latter half of February and early March, global financial markets delivered positive returns for the 12-month period ended August 31, 2020. In response to the first-quarter sell-off, the U.S. Federal Reserve acted quickly, lowering interest rates to near zero and reinstating quantitative easing, as well as announcing its plans to shore up short-term debt. Many other nations followed suit and credit spreads rebounded off their highs as liquidity concerns eased.
Of course, it would be a mistake to consider the market's turnaround a trustworthy signal of assured or swift economic recovery. While there has been economic growth in much of the developed world, the pace has slowed in many areas as spending remains far below prepandemic levels.
From an investment perspective, we continue to think that maintaining a focus on long-term objectives while pursuing a risk-aware strategy is a prudent way forward. Above all, we believe the counsel of a trusted financial professional continues to matter now more than ever. Periods of heightened uncertainty are precisely the time to review your financial goals and follow a plan that helps you make the most of what continues to be a challenging situation.
On behalf of everyone at John Hancock Investment Management, I'd like to take this opportunity to welcome new shareholders and thank existing shareholders for the continued trust you've placed in us.
Sincerely,
Andrew G. Arnott
President and CEO,
John Hancock Investment Management
Head of Wealth and Asset Management,
United States and Europe
This commentary reflects the CEO's views as of this report's period end and are subject to change at any time. Diversification does not guarantee investment returns and does not eliminate risk of loss. All investments entail risks, including the possible loss of principal. For more up-to-date information, you can visit our website at jhinvestments.com.
John Hancock
Alternative Asset Allocation Fund
Table of contents
| | | |
| 2 | | Your fund at a glance |
| 4 | | Manager's discussion of fund performance |
| 6 | | A look at performance |
| 8 | | Your expenses |
| 10 | | Fund's investments |
| 12 | | Financial statements |
| 16 | | Financial highlights |
| 22 | | Notes to financial statements |
| 31 | | Report of independent registered public accounting firm |
| 32 | | Tax information |
| 33 | | Continuation of investment advisory and subadvisory agreements |
| 40 | | Statement regarding liquidity risk management |
| 43 | | Trustees and Officers |
| 47 | | More information |
ANNUAL REPORT | JOHN HANCOCK ALTERNATIVE ASSET ALLOCATION FUND 1
INVESTMENT OBJECTIVE
The fund seeks long-term growth of capital.
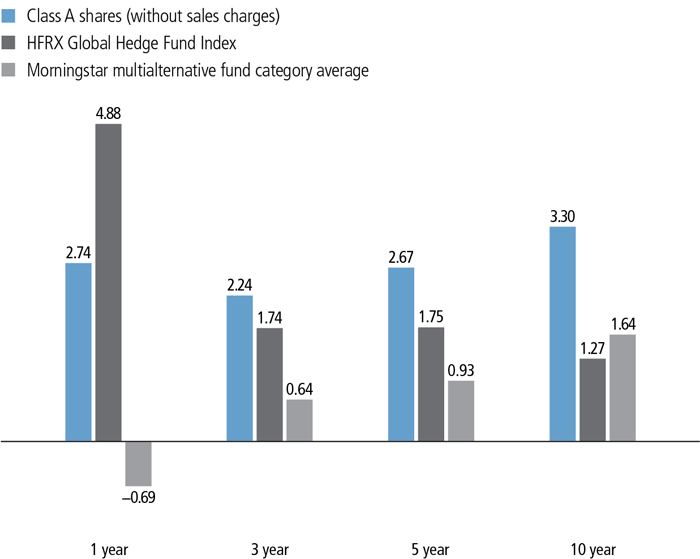
AVERAGE ANNUAL TOTAL RETURNS AS OF 8/31/2020 (%)
The HFRX Global Hedge Fund Index is composed of all eligible hedge fund strategies including four principal strategies: equity hedge, event driven, macro/managed futures, and relative value arbitrage.
It is not possible to invest directly in an index. Index figures do not reflect expenses or sales charges, which would result in lower returns.
The fund's Morningstar category average is a group of funds with similar investment objectives and strategies and is the equal-weighted return of all funds per category. Morningstar places funds in certain categories based on their historical portfolio holdings. Figures from Morningstar, Inc. include reinvested distributions and do not take into account sales charges. Actual load-adjusted performance is lower. Since-inception returns for the Morningstar fund category average are not available.
The past performance shown here reflects reinvested distributions and the beneficial effect of any expense reductions, and does not guarantee future results. Performance of the other share classes will vary based on the difference in the fees and expenses of those classes. Shares will fluctuate in value and, when redeemed, may be worth more or less than their original cost. Current month-end performance may be lower or higher than the performance cited, and can be found at jhinvestments.com or by calling 800-225-5291. For further information on the fund's objectives, risks, and strategy, see the fund's prospectus.
ANNUAL REPORT | JOHN HANCOCK ALTERNATIVE ASSET ALLOCATION FUND 2
PERFORMANCE HIGHLIGHTS OVER THE LAST TWELVE MONTHS
Financial assets experienced elevated volatility
Higher-risk asset categories—after performing well through mid-February—sold off sharply in response to the economic slowdown caused by the coronavirus pandemic, but they regained the lost ground from April onward.
The fund delivered a positive return, but it underperformed its benchmark, the HFRX Global Hedge Fund Index
Absolute return strategies, while experiencing more limited downside than the broader financial markets in the February-March sell-off, detracted for the full period.
The Alternative Investment Approaches portfolio contributed
This segment of the portfolio, where the underlying managers use opportunistic techniques, was a positive driver of performance.
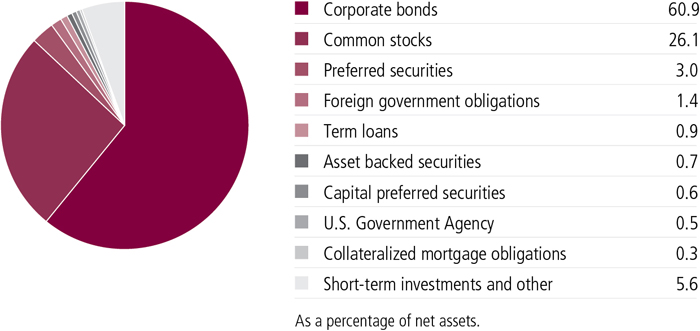
ASSET ALLOCATION AS OF 8/31/2020 (%)
| | | |
| Affiliated investment companies | 74.8 |
| | Absolute return strategies | 35.3 |
| | Alternative investment approaches | 32.4 |
| | Alternative markets | 7.1 |
| Unaffiliated investment companies | 25.1 |
| | Absolute return strategies | 11.8 |
| | Alternative investment approaches | 9.4 |
| | Alternative markets | 3.9 |
| Short-term investments and other | 0.1 |
As a percentage of net assets.
A note about risks
The fund may be subject to various risks as described in the fund's prospectus. A widespread health crisis such as a global pandemic could cause substantial market volatility, exchange trading suspensions and closures, impact the ability to complete redemptions, and affect fund performance. For example, the novel coronavirus disease (COVID-19) has resulted in significant disruptions to global business activity. The impact of a health crisis and other epidemics and pandemics that may arise in the future, could affect the global economy in ways that cannot necessarily be foreseen at the present time. A health crisis may exacerbate other pre-existing political, social, and economic risks. Any such impact could adversely affect the fund's performance, resulting in losses to your investment. For more information, please refer to the "Principal risks" section of the prospectus.
ANNUAL REPORT | JOHN HANCOCK ALTERNATIVE ASSET ALLOCATION FUND 3
Manager's discussion of fund performance
What elements of the fund's positioning helped and hurt absolute performance during the period ended August 31, 2020?
The Alternative Investment Approaches portfolio, where the underlying managers use opportunistic techniques, accounted for the majority of the fund's positive return. Both Seaport Long/Short Fund (Wellington) and Hedged Equity Fund (JPMorgan) delivered robust gains due to their net long positions in equities. In addition, Short Duration Credit Opportunities Fund (Stone Harbor) and Strategic Income Opportunities Fund (MIM US)—both of which use a flexible approach to fixed-income investing—benefited from the strength in the credit-sensitive segments of the bond market. The Alternative Investment Approaches portfolio had a weighting of approximately 42% of total fund assets as of the end of August.
The Alternative Markets portfolio, which includes asset classes where the drivers of performance are often unrelated to those of traditional investments, was an additional contributor. This segment of the fund was invested in global infrastructure stocks, gold, real estate securities, and commodity futures. The majority of the portfolio's positive absolute return came from DB Gold Fund (Invesco), which benefited from the combination of a weaker U.S. dollar, investors' search for safe havens, and negative real interest rates in much of the developed world. The Alternative Markets portfolio was weighted at 11% as of period end.
Absolute Return strategies (those designed to generate positive performance across a variety of scenarios) detracted from results. These strategies typically have a low correlation to equities and other riskier segments of the financial markets, which was a headwind given the gains for stocks and the bond market's credit sectors over the full period. An allocation to Absolute Return Currency Fund (First Quadrant) added value, as did positions in merger arbitrage portfolios. However, holdings in Alternative Risk Premia Fund (Unigestion) and Diversified Macro Fund (Graham) detracted. At the close of the period, the Absolute Return portfolio's weighting stood at approximately 47%.
What changes did you make to the portfolio?
We continued to rotate the fund's holdings in an effort to optimize the investment mix and capitalize on what we see as the most compelling risk/return opportunities on a longer-term basis. We added Alternative Risk Premia Fund to the Absolute
ANNUAL REPORT | JOHN HANCOCK ALTERNATIVE ASSET ALLOCATION FUND 4
Return portfolio, and we funded the purchase by eliminating Disciplined Alternative Yield Fund (Boston Partners) and closing out smaller positions in both commodity-related ETFs and non-U.S. REITs. We also continued to reduce the fund's position in strategies where we saw lower upside potential and/or diversification benefits. These shifts illustrate the fund's evolution, as we continue to seek a performance profile with low correlation to traditional equities and fixed income.
How was the fund positioned at period end?
While most segments of the financial markets performed well during the past 12 months, uncertainty remained prevalent and the major asset categories appear to be on track for muted returns in the coming years. Global equities have surged close to all-time highs even as earnings have fallen, indicating a sharp increase in valuations. At the same time, the near-zero level of global interest rates means that core bonds may offer little in terms of either yield or potential price appreciation. With this as background, we have sought to position the fund to act as a third lever for investors seeking a source of total return with a lower correlation to traditional equity and fixed-income investments.
MANAGED BY
| |
| Nathan W. Thooft, CFA, Manulife IM (US) |
| Christopher Walsh, CFA, Manulife IM (US) |

The views expressed in this report are exclusively those of Nathan W. Thooft, CFA, Manulife Investment Management, and are subject to change. They are not meant as investment advice. Please note that the holdings discussed in this report may not have been held by the fund for the entire period. Portfolio composition is subject to review in accordance with the fund's investment strategy and may vary in the future. Current and future portfolio holdings are subject to risk.
ANNUAL REPORT | JOHN HANCOCK ALTERNATIVE ASSET ALLOCATION FUND 5
TOTAL RETURNS FOR THE PERIOD ENDED AUGUST 31, 2020
| | | | | | | | |
Average annual total returns (%)
with maximum sales charge | | Cumulative total returns (%)
with maximum sales charge |
| | 1-year | 5-year | 10-year1 | | | 5-year | 10-year1 |
| Class A | -2.39 | 1.62 | 2.77 | | | 8.37 | 31.42 |
| Class C2 | 1.04 | 1.96 | 2.64 | | | 10.18 | 29.73 |
| Class I2,3 | 3.04 | 2.96 | 3.62 | | | 15.73 | 42.69 |
| Class R22,3 | 2.65 | 2.56 | 3.18 | | | 13.46 | 36.77 |
| Class R42,3 | 2.91 | 2.83 | 3.40 | | | 14.96 | 39.69 |
| Class R62,3 | 3.15 | 3.09 | 3.66 | | | 16.42 | 43.23 |
| Index † | 4.88 | 1.75 | 1.27 | | | 9.07 | 13.48 |
Performance figures assume all distributions are reinvested. Figures reflect maximum sales charges on Class A shares of 5% and the applicable contingent deferred sales charge (CDSC) on Class C shares. Class C shares held for less than one year are subject to a 1% CDSC. Sales charges are not applicable to Class I, Class R2, Class R4, and Class R6 shares.
The expense ratios of the fund, both net (including any fee waivers and/or expense limitations) and gross (excluding any fee waivers and/or expense limitations), are set forth according to the most recent publicly available prospectuses for the fund and may differ from those disclosed in the Financial highlights tables in this report. Net expenses reflect contractual expense limitations in effect until December 31, 2020 and are subject to change. Had the contractual fee waivers and expense limitations not been in place, gross expenses would apply. The following expense ratios include expenses of the affiliated underlying funds in which the fund invests. The expense ratios are as follows:
| | | | | | | |
| | Class A | Class C | Class I | Class R2 | Class R4 | Class R6 |
| Gross (%) | 1.78 | 2.48 | 1.48 | 1.87 | 1.72 | 1.37 |
| Net (%) | 1.70 | 2.40 | 1.40 | 1.79 | 1.54 | 1.29 |
Please refer to the most recent prospectus and annual or semiannual report for more information on expenses and any expense limitation arrangements for each class.
The returns reflect past results and should not be considered indicative of future performance. The return and principal value of an investment will fluctuate so that shares, when redeemed, may be worth more or less than their original cost. Due to market volatility and other factors, the fund's current performance may be higher or lower than the performance shown. For current to the most recent month-end performance data, please call 800-225-5291 or visit the fund's website at jhinvestments.com.
The performance table above and the chart on the next page do not reflect the deduction of taxes that a shareholder would pay on fund distributions or the redemption of fund shares. The fund's performance results reflect any applicable fee waivers or expense reductions, without which the expenses would increase and results would have been less favorable.
| † | Index is the HFRX Global Hedge Fund Index. |
See the following page for footnotes.
ANNUAL REPORT | JOHN HANCOCK ALTERNATIVE ASSET ALLOCATION FUND 6
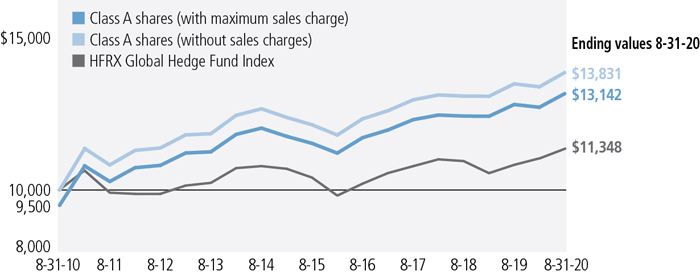
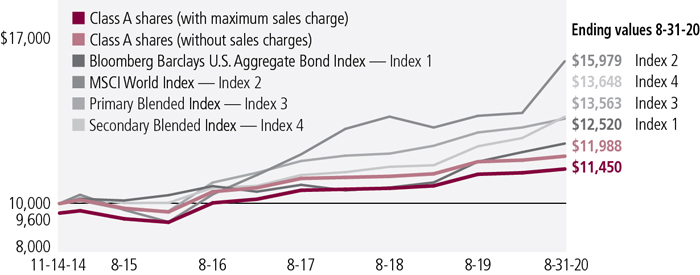
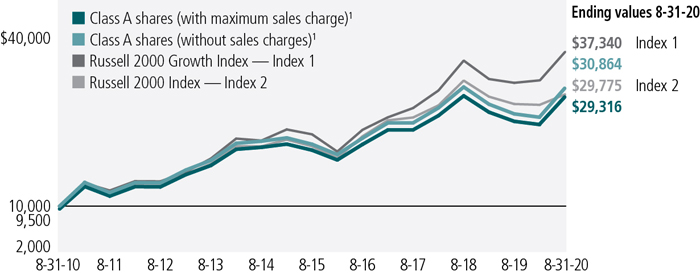
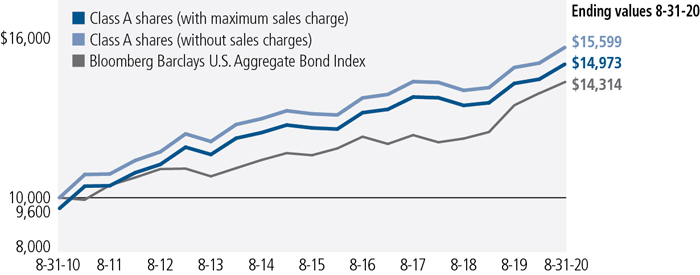
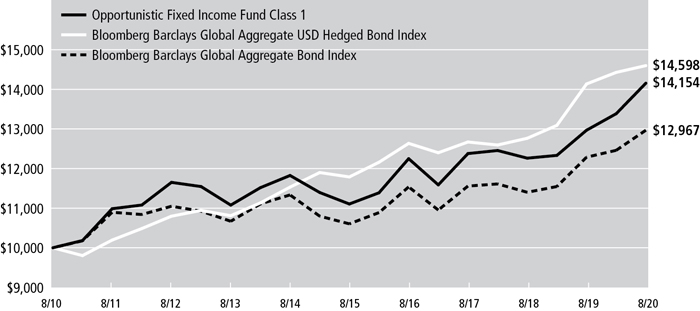
This chart and table show what happened to a hypothetical $10,000 investment in John Hancock Alternative Asset Allocation Fund for the share classes and periods indicated, assuming all distributions were reinvested. For comparison, we've shown the same investment in the HFRX Global Hedge Fund Index.
| | | | | |
| | Start date | With maximum
sales charge ($) | Without
sales charge ($) | Index ($) |
| Class C2,.4 | 8-31-10 | 12,973 | 12,973 | 11,348 |
| Class I2,3 | 8-31-10 | 14,269 | 14,269 | 11,348 |
| Class R22,3 | 8-31-10 | 13,677 | 13,677 | 11,348 |
| Class R42,3 | 8-31-10 | 13,969 | 13,969 | 11,348 |
| Class R62,3 | 8-31-10 | 14,323 | 14,323 | 11,348 |
The HFRX Global Hedge Fund Index is composed of all eligible hedge fund strategies, including four principal strategies: equity hedge, event driven, macro/managed futures, and relative value arbitrage.
It is not possible to invest directly in an index. Index figures do not reflect expenses or sales charges, which would result in lower returns.
Footnotes related to performance pages
| 1 | Performance information prior to 12-20-10 reflects an allocation to a different mix of underlying funds, and would have been different if the fund's investments had been allocated to its current mix of underlying funds. |
| 2 | Class C shares were first offered on 6-14-11; Class I shares were first offered on 12-31-10; Class R2 shares were first offered on 3-1-12; Class R4 shares were first offered on 6-27-13; Class R6 shares were first offered on 9-1-11. Returns prior to these dates are those of Class A shares that have not been adjusted for class-specific expenses; otherwise, returns would vary. |
| 3 | For certain types of investors, as described in the fund's prospectus. |
| 4 | The contingent deferred sales charge is not applicable. |
ANNUAL REPORT | JOHN HANCOCK ALTERNATIVE ASSET ALLOCATION FUND 7
These examples are intended to help you understand your ongoing operating expenses of investing in the fund so you can compare these costs with the ongoing costs of investing in other mutual funds.
Understanding fund expenses
As a shareholder of the fund, you incur two types of costs:
■Transaction costs, which include sales charges (loads) on purchases or redemptions (varies by share class), minimum account fee charge, etc.
■Ongoing operating expenses, including management fees, distribution and service fees (if applicable), and other fund expenses.
We are presenting only your ongoing operating expenses here.
Actual expenses/actual returns
The first line of each share class in the table on the following page is intended to provide information about the fund’s actual ongoing operating expenses, and is based on the fund’s actual return. It assumes an account value of $1,000.00 on March 1, 2020, with the same investment held until August 31, 2020.
Together with the value of your account, you may use this information to estimate the operating expenses that you paid over the period. Simply divide your account value at August 31, 2020, by $1,000.00, then multiply it by the “expenses paid” for your share class from the table. For example, for an account value of $8,600.00, the operating expenses should be calculated as follows:
Hypothetical example for comparison purposes
The second line of each share class in the table on the following page allows you to compare the fund’s ongoing operating expenses with those of any other fund. It provides an example of the fund’s hypothetical account values and hypothetical expenses based on each class’s actual expense ratio and an assumed 5% annualized return before expenses (which is not the class’s actual return). It assumes an account value of $1,000.00 on March 1, 2020, with the same investment held until August 31, 2020. Look in any other fund shareholder report to find its hypothetical example and you will be able to compare these expenses. Please remember that these hypothetical account values and expenses may not be used to estimate the actual ending account balance or expenses you paid for the period.
| 8 | JOHN HANCOCK ALTERNATIVE ASSET ALLOCATION FUND | ANNUAL REPORT | |
Remember, these examples do not include any transaction costs, therefore, these examples will not help you to determine the relative total costs of owning different funds. If transaction costs were included, your expenses would have been higher. See the prospectus for details regarding transaction costs.
SHAREHOLDER EXPENSE EXAMPLE CHART
| | | Account
value on
3-1-2020 | Ending
value on
8-31-2020 | Expenses
paid during
period ended
8-31-20201 | Annualized
expense
ratio2 |
| Class A | Actual expenses/actual returns | $1,000.00 | $1,034.80 | $3.43 | 0.67% |
| | Hypothetical example | 1,000.00 | 1,021.80 | 3.41 | 0.67% |
| Class C | Actual expenses/actual returns | 1,000.00 | 1,031.10 | 6.99 | 1.37% |
| | Hypothetical example | 1,000.00 | 1,018.20 | 6.95 | 1.37% |
| Class I | Actual expenses/actual returns | 1,000.00 | 1,035.50 | 1.89 | 0.37% |
| | Hypothetical example | 1,000.00 | 1,023.30 | 1.88 | 0.37% |
| Class R2 | Actual expenses/actual returns | 1,000.00 | 1,034.10 | 3.83 | 0.75% |
| | Hypothetical example | 1,000.00 | 1,021.40 | 3.81 | 0.75% |
| Class R4 | Actual expenses/actual returns | 1,000.00 | 1,035.50 | 2.51 | 0.49% |
| | Hypothetical example | 1,000.00 | 1,022.70 | 2.49 | 0.49% |
| Class R6 | Actual expenses/actual returns | 1,000.00 | 1,036.20 | 1.28 | 0.25% |
| | Hypothetical example | 1,000.00 | 1,023.90 | 1.27 | 0.25% |
| 1 | Expenses are equal to the annualized expense ratio, multiplied by the average account value over the period, multiplied by 184/366 (to reflect the one-half year period). |
| 2 | Ratios do not include fees and expenses indirectly incurred by the underlying funds and can vary based on mixed of underlying funds held by the fund. |
| | ANNUAL REPORT | JOHN HANCOCK ALTERNATIVE ASSET ALLOCATION FUND | 9 |
AS OF 8-31-20
| | | | | Shares | Value |
| Affiliated investment companies (A) 74.8% | | | $346,180,079 |
| (Cost $337,236,242) | | | | | |
| Absolute return strategies 35.3% | | | 163,177,706 |
| Absolute Return Currency, Class NAV, JHF II (First Quadrant) | | | | 2,171,854 | 23,151,965 |
| Alternative Risk Premia, Class NAV, JHIT (Unigestion) | | | | 3,199,338 | 26,554,507 |
| Credit Suisse Managed Futures Strategy Fund (B) | | | | 2,427,291 | 23,059,268 |
| Diversified Macro, Class NAV, JHIT (Graham) | | | | 3,910,520 | 37,189,046 |
| Multi-Asset Absolute Return, Class NAV, JHF II (NIMNAI) (C) | | | | 5,772,551 | 53,222,920 |
| Alternative investment approaches 32.4% | | | 149,922,776 |
| Seaport Long/Short, Class NAV, JHIT (Wellington) | | | | 4,927,628 | 60,117,066 |
| Short Duration Credit Opportunities, Class NAV, JHF II (Stone Harbor) | | | | 3,688,812 | 35,265,044 |
| Strategic Income Opportunities, Class NAV, JHF II (MIM US) (D) | | | | 4,962,754 | 54,540,666 |
| Alternative markets 7.1% | | | 33,079,597 |
| Infrastructure, Class NAV, JHIT (Wellington) | | | | 1,805,414 | 22,603,789 |
|
| Invesco DB Gold Fund (B) | | | | 181,211 | 10,475,808 |
| Unaffiliated investment companies 25.1% | | | $116,311,050 |
| (Cost $108,908,551) | | | | | |
| Absolute return strategies 11.8% | | | 54,474,802 |
| IQ Merger Arbitrage ETF (C) | | | | 550,783 | 17,801,307 |
| The Arbitrage Fund, Class I | | | | 2,688,673 | 36,673,495 |
| Alternative investment approaches 9.4% | | | 43,783,062 |
| JPMorgan Hedged Equity Fund | | | | 1,900,307 | 43,783,062 |
| Alternative markets 3.9% | | | 18,053,186 |
| Invesco Optimum Yield Diversified Commodity Strategy No. K-1 ETF (E) | | | | 865,699 | 12,301,583 |
| Vanguard Real Estate ETF (E) | | | | 70,356 | 5,751,603 |
| | | Yield (%) | | Shares | Value |
| Short-term investments 1.2% | | | | | $5,286,668 |
| (Cost $5,280,309) | | | | | |
| Short-term funds 1.2% | | | | | 5,286,668 |
| John Hancock Collateral Trust (F) | 0.2611(G) | | 495,545 | 4,960,751 |
| State Street Institutional U.S. Government Money Market Fund, Premier Class | 0.0399(G) | | 325,917 | 325,917 |
|
| Total investments (Cost $451,425,102) 101.1% | | | $467,777,797 |
| Other assets and liabilities, net (1.1%) | | | | (5,002,992) |
| Total net assets 100.0% | | | | | $462,774,805 |
| 10 | JOHN HANCOCK ALTERNATIVE ASSET ALLOCATION FUND | ANNUAL REPORT | SEE NOTES TO FINANCIAL STATEMENTS |
| The percentage shown for each investment category is the total value of the category as a percentage of the net assets of the fund. |
| Security Abbreviations and Legend |
| JHF II | John Hancock Funds II |
| JHIT | John Hancock Investment Trust |
| (A) | The underlying funds' subadvisor is shown parenthetically. |
| (B) | The fund owns 5% or more of the outstanding voting shares of the issuer and the security is considered an affiliate of the fund. For more information on this security refer to the Notes to financial statements. |
| (C) | Non-income producing. |
| (D) | The subadvisor is an affiliate of the advisor. |
| (E) | All or a portion of this security is on loan as of 8-31-20. |
| (F) | Investment is an affiliate of the fund, the advisor and/or subadvisor. This security represents the investment of cash collateral received for securities lending. |
| (G) | The rate shown is the annualized seven-day yield as of 8-31-20. |
At 8-31-20, the aggregate cost of investments for federal income tax purposes was $463,567,942. Net unrealized appreciation aggregated to $4,209,855, of which $14,051,698 related to gross unrealized appreciation and $9,841,843 related to gross unrealized depreciation.
| Subadvisors of Affiliated Underlying Funds | |
| First Quadrant, L.P. | (First Quadrant) |
| Graham Capital Management, L.P. | (Graham) |
| Manulife Investment Management (US) LLC | (MIM US) |
| Nordea Investment Management North America, Inc. | (NIMNAI) |
| Stone Harbor Investment Partners LP | (Stone Harbor) |
| Unigestion (UK) Limited | (Unigestion) |
| Wellington Management Company LLP | (Wellington) |
| SEE NOTES TO FINANCIAL STATEMENTS | ANNUAL REPORT | JOHN HANCOCK ALTERNATIVE ASSET ALLOCATION FUND | 11 |
STATEMENT OF ASSETS AND LIABILITIES 8-31-20
| Assets | |
| Unaffiliated investments, at value (Cost $109,234,468) including $4,820,712 of securities loaned | $116,636,967 |
| Affiliated investments, at value (Cost $342,190,634) | 351,140,830 |
| Total investments, at value (Cost $451,425,102) | 467,777,797 |
| Dividends and interest receivable | 172,405 |
| Receivable for fund shares sold | 533,321 |
| Receivable for investments sold | 143,513 |
| Receivable for securities lending income | 1,929 |
| Other assets | 44,706 |
| Total assets | 468,673,671 |
| Liabilities | |
| Due to custodian | 30,414 |
| Payable for investments purchased | 455,806 |
| Payable for fund shares repurchased | 298,169 |
| Payable upon return of securities loaned | 4,951,650 |
| Payable to affiliates | |
| Accounting and legal services fees | 28,348 |
| Transfer agent fees | 47,674 |
| Distribution and service fees | 198 |
| Trustees' fees | 256 |
| Other liabilities and accrued expenses | 86,351 |
| Total liabilities | 5,898,866 |
| Net assets | $462,774,805 |
| Net assets consist of | |
| Paid-in capital | $503,845,499 |
| Total distributable earnings (loss) | (41,070,694) |
| Net assets | $462,774,805 |
| |
| 12 | JOHN HANCOCK Alternative Asset Allocation Fund | ANNUAL REPORT | SEE NOTES TO FINANCIAL STATEMENTS |
STATEMENT OF ASSETS AND LIABILITIES (continued)
| Net asset value per share | |
| Based on net asset value and shares outstanding - the fund has an unlimited number of shares authorized with no par value | |
| Class A ($61,844,200 ÷ 4,244,887 shares)1 | $14.57 |
| Class C ($30,827,081 ÷ 2,114,847 shares)1 | $14.58 |
| Class I ($347,266,274 ÷ 23,796,707 shares) | $14.59 |
| Class R2 ($907,486 ÷ 62,384 shares) | $14.55 |
| Class R4 ($58,260 ÷ 3,990 shares) | $14.60 |
| Class R6 ($21,871,504 ÷ 1,497,740 shares) | $14.60 |
| Maximum offering price per share | |
| Class A (net asset value per share ÷ 95%)2 | $15.34 |
| 1 | Redemption price per share is equal to net asset value less any applicable contingent deferred sales charge. |
| 2 | On single retail sales of less than $50,000. On sales of $50,000 or more and on group sales the offering price is reduced. |
| SEE NOTES TO FINANCIAL STATEMENTS | ANNUAL REPORT | JOHN HANCOCK ALTERNATIVE ASSET ALLOCATION FUND | 13 |
STATEMENT OF OPERATIONS For the year ended 8-31-20
| Investment income | |
| Income distributions received from affiliated investments | $5,587,111 |
| Dividends | 1,071,832 |
| Interest | 56,033 |
| Securities lending | 25,924 |
| Total investment income | 6,740,900 |
| Expenses | |
| Investment management fees | 1,922,959 |
| Distribution and service fees | 574,003 |
| Accounting and legal services fees | 95,333 |
| Transfer agent fees | 626,389 |
| Trustees' fees | 8,999 |
| Custodian fees | 47,936 |
| State registration fees | 101,294 |
| Printing and postage | 62,510 |
| Professional fees | 57,345 |
| Other | 38,382 |
| Total expenses | 3,535,150 |
| Less expense reductions | (1,115,295) |
| Net expenses | 2,419,855 |
| Net investment income | 4,321,045 |
| Realized and unrealized gain (loss) | |
| Net realized gain (loss) on | |
| Unaffiliated investments | 175,952 |
| Affiliated investments | (4,595,944) |
| Capital gain distributions received from unaffiliated investments | 780,190 |
| Capital gain distributions received from affiliated investments | 9,639,956 |
| | 6,000,154 |
| Change in net unrealized appreciation (depreciation) of | |
| Unaffiliated investments | 3,740,693 |
| Affiliated investments | (2,939,131) |
| | 801,562 |
| Net realized and unrealized gain | 6,801,716 |
| Increase in net assets from operations | $11,122,761 |
| 14 | JOHN HANCOCK Alternative Asset Allocation Fund | ANNUAL REPORT | SEE NOTES TO FINANCIAL STATEMENTS |
STATEMENTS OF CHANGES IN NET ASSETS
| | Year ended
8-31-20 | Year ended
8-31-19 |
| Increase (decrease) in net assets | | |
| From operations | | |
| Net investment income | $4,321,045 | $11,584,852 |
| Net realized gain (loss) | 6,000,154 | (8,139,442) |
| Change in net unrealized appreciation (depreciation) | 801,562 | 13,005,662 |
| Increase in net assets resulting from operations | 11,122,761 | 16,451,072 |
| Distributions to shareholders | | |
| From earnings | | |
| Class A | (2,347,118) | (1,639,841) |
| Class C | (1,030,673) | (598,120) |
| Class I | (15,281,356) | (9,760,461) |
| Class R2 | (44,843) | (43,758) |
| Class R4 | (1,208) | (4,113) |
| Class R6 | (800,607) | (649,346) |
| Total distributions | (19,505,805) | (12,695,639) |
| From fund share transactions | (96,498,367) | (119,232,261) |
| Total decrease | (104,881,411) | (115,476,828) |
| Net assets | | |
| Beginning of year | 567,656,216 | 683,133,044 |
| End of year | $462,774,805 | $567,656,216 |
| SEE NOTES TO FINANCIAL STATEMENTS | ANNUAL REPORT | JOHN HANCOCK ALTERNATIVE ASSET ALLOCATION FUND | 15 |
| CLASS A SHARES Period ended | 8-31-20 | 8-31-19 | 8-31-18 | 8-31-17 | 8-31-16 |
| Per share operating performance | | | | | |
| Net asset value, beginning of period | $14.66 | $14.51 | $14.55 | $13.96 | $14.12 |
| Net investment income1,2 | 0.09 | 0.25 | 0.13 | 0.10 | 0.22 |
| Net realized and unrealized gain (loss) on investments | 0.31 | 0.17 | 0.01 | 0.60 | — 3 |
| Total from investment operations | 0.40 | 0.42 | 0.14 | 0.70 | 0.22 |
| Less distributions | | | | | |
| From net investment income | (0.27) | (0.17) | (0.11) | (0.08) | (0.21) |
| From net realized gain | (0.22) | (0.10) | (0.07) | (0.03) | (0.17) |
| Total distributions | (0.49) | (0.27) | (0.18) | (0.11) | (0.38) |
| Net asset value, end of period | $14.57 | $14.66 | $14.51 | $14.55 | $13.96 |
| Total return (%)4,5 | 2.74 | 3.05 | 0.95 | 5.03 | 1.60 |
| Ratios and supplemental data | | | | | |
| Net assets, end of period (in millions) | $62 | $73 | $95 | $136 | $278 |
| Ratios (as a percentage of average net assets): | | | | | |
| Expenses before reductions6 | 0.88 | 0.77 | 0.72 | 0.72 | 0.73 |
| Expenses including reductions6 | 0.66 | 0.64 | 0.59 | 0.59 | 0.59 |
| Net investment income2 | 0.63 | 1.73 | 0.86 | 0.71 | 1.56 |
| Portfolio turnover (%) | 37 | 39 | 18 | 10 | 17 |
| 1 | Based on average daily shares outstanding. |
| 2 | Net investment income is affected by the timing and frequency of the declaration of dividends by the underlying funds in which the fund invests. |
| 3 | Less than $0.005 per share. |
| 4 | Total returns would have been lower had certain expenses not been reduced during the applicable periods. |
| 5 | Does not reflect the effect of sales charges, if any. |
| 6 | Ratios do not include expenses indirectly incurred from underlying funds and can vary based on the mix of underlying funds held by the fund. |
| 16 | JOHN HANCOCK Alternative Asset Allocation Fund | ANNUAL REPORT | SEE NOTES TO FINANCIAL STATEMENTS |
| CLASS C SHARES Period ended | 8-31-20 | 8-31-19 | 8-31-18 | 8-31-17 | 8-31-16 |
| Per share operating performance | | | | | |
| Net asset value, beginning of period | $14.67 | $14.51 | $14.56 | $13.97 | $14.12 |
| Net investment income (loss)1,2 | (0.01) | 0.15 | 0.02 | — 3 | 0.12 |
| Net realized and unrealized gain (loss) on investments | 0.31 | 0.18 | 0.01 | 0.60 | 0.01 |
| Total from investment operations | 0.30 | 0.33 | 0.03 | 0.60 | 0.13 |
| Less distributions | | | | | |
| From net investment income | (0.17) | (0.07) | (0.01) | — | (0.11) |
| From net realized gain | (0.22) | (0.10) | (0.07) | (0.01) | (0.17) |
| Total distributions | (0.39) | (0.17) | (0.08) | (0.01) | (0.28) |
| Net asset value, end of period | $14.58 | $14.67 | $14.51 | $14.56 | $13.97 |
| Total return (%)4,5 | 2.04 | 2.37 | 0.19 | 4.30 | 0.94 |
| Ratios and supplemental data | | | | | |
| Net assets, end of period (in millions) | $31 | $42 | $57 | $72 | $99 |
| Ratios (as a percentage of average net assets): | | | | | |
| Expenses before reductions6 | 1.58 | 1.47 | 1.42 | 1.42 | 1.43 |
| Expenses including reductions6 | 1.36 | 1.34 | 1.29 | 1.29 | 1.29 |
| Net investment income (loss)2 | (0.06) | 1.02 | 0.17 | — 7 | 0.85 |
| Portfolio turnover (%) | 37 | 39 | 18 | 10 | 17 |
| 1 | Based on average daily shares outstanding. |
| 2 | Net investment income is affected by the timing and frequency of the declaration of dividends by the underlying funds in which the fund invests. |
| 3 | Less than $0.005 per share. |
| 4 | Total returns would have been lower had certain expenses not been reduced during the applicable periods. |
| 5 | Does not reflect the effect of sales charges, if any. |
| 6 | Ratios do not include expenses indirectly incurred from underlying funds and can vary based on the mix of underlying funds held by the fund. |
| 7 | Less than 0.005%. |
| SEE NOTES TO FINANCIAL STATEMENTS | ANNUAL REPORT | JOHN HANCOCK ALTERNATIVE ASSET ALLOCATION FUND | 17 |
| CLASS I SHARES Period ended | 8-31-20 | 8-31-19 | 8-31-18 | 8-31-17 | 8-31-16 |
| Per share operating performance | | | | | |
| Net asset value, beginning of period | $14.68 | $14.53 | $14.58 | $13.99 | $14.15 |
| Net investment income1,2 | 0.14 | 0.29 | 0.17 | 0.14 | 0.26 |
| Net realized and unrealized gain (loss) on investments | 0.30 | 0.18 | — 3 | 0.60 | — 3 |
| Total from investment operations | 0.44 | 0.47 | 0.17 | 0.74 | 0.26 |
| Less distributions | | | | | |
| From net investment income | (0.31) | (0.22) | (0.15) | (0.12) | (0.25) |
| From net realized gain | (0.22) | (0.10) | (0.07) | (0.03) | (0.17) |
| Total distributions | (0.53) | (0.32) | (0.22) | (0.15) | (0.42) |
| Net asset value, end of period | $14.59 | $14.68 | $14.53 | $14.58 | $13.99 |
| Total return (%)4 | 3.04 | 3.39 | 1.18 | 5.34 | 1.93 |
| Ratios and supplemental data | | | | | |
| Net assets, end of period (in millions) | $347 | $423 | $510 | $495 | $433 |
| Ratios (as a percentage of average net assets): | | | | | |
| Expenses before reductions5 | 0.58 | 0.49 | 0.42 | 0.40 | 0.42 |
| Expenses including reductions5 | 0.36 | 0.35 | 0.30 | 0.28 | 0.28 |
| Net investment income2 | 0.95 | 2.04 | 1.16 | 1.01 | 1.88 |
| Portfolio turnover (%) | 37 | 39 | 18 | 10 | 17 |
| 1 | Based on average daily shares outstanding. |
| 2 | Net investment income is affected by the timing and frequency of the declaration of dividends by the underlying funds in which the fund invests. |
| 3 | Less than $0.005 per share. |
| 4 | Total returns would have been lower had certain expenses not been reduced during the applicable periods. |
| 5 | Ratios do not include expenses indirectly incurred from underlying funds and can vary based on the mix of underlying funds held by the fund. |
| 18 | JOHN HANCOCK Alternative Asset Allocation Fund | ANNUAL REPORT | SEE NOTES TO FINANCIAL STATEMENTS |
| CLASS R2 SHARES Period ended | 8-31-20 | 8-31-19 | 8-31-18 | 8-31-17 | 8-31-16 |
| Per share operating performance | | | | | |
| Net asset value, beginning of period | $14.64 | $14.49 | $14.53 | $13.95 | $14.11 |
| Net investment income1,2 | 0.08 | 0.24 | 0.11 | 0.08 | 0.20 |
| Net realized and unrealized gain (loss) on investments | 0.31 | 0.17 | 0.01 | 0.60 | 0.01 |
| Total from investment operations | 0.39 | 0.41 | 0.12 | 0.68 | 0.21 |
| Less distributions | | | | | |
| From net investment income | (0.26) | (0.16) | (0.09) | (0.07) | (0.20) |
| From net realized gain | (0.22) | (0.10) | (0.07) | (0.03) | (0.17) |
| Total distributions | (0.48) | (0.26) | (0.16) | (0.10) | (0.37) |
| Net asset value, end of period | $14.55 | $14.64 | $14.49 | $14.53 | $13.95 |
| Total return (%)3 | 2.65 | 2.95 | 0.85 | 4.87 | 1.51 |
| Ratios and supplemental data | | | | | |
| Net assets, end of period (in millions) | $1 | $2 | $3 | $4 | $7 |
| Ratios (as a percentage of average net assets): | | | | | |
| Expenses before reductions4 | 0.96 | 0.87 | 0.83 | 0.82 | 0.81 |
| Expenses including reductions4 | 0.75 | 0.74 | 0.70 | 0.69 | 0.67 |
| Net investment income2 | 0.54 | 1.67 | 0.78 | 0.60 | 1.43 |
| Portfolio turnover (%) | 37 | 39 | 18 | 10 | 17 |
| 1 | Based on average daily shares outstanding. |
| 2 | Net investment income is affected by the timing and frequency of the declaration of dividends by the underlying funds in which the fund invests. |
| 3 | Total returns would have been lower had certain expenses not been reduced during the applicable periods. |
| 4 | Ratios do not include expenses indirectly incurred from underlying funds and can vary based on the mix of underlying funds held by the fund. |
| SEE NOTES TO FINANCIAL STATEMENTS | ANNUAL REPORT | JOHN HANCOCK ALTERNATIVE ASSET ALLOCATION FUND | 19 |
| CLASS R4 SHARES Period ended | 8-31-20 | 8-31-19 | 8-31-18 | 8-31-17 | 8-31-16 |
| Per share operating performance | | | | | |
| Net asset value, beginning of period | $14.69 | $14.54 | $14.58 | $13.99 | $14.15 |
| Net investment income1,2 | 0.07 | 0.27 | 0.15 | 0.12 | 0.14 |
| Net realized and unrealized gain (loss) on investments | 0.35 | 0.18 | 0.01 | 0.60 | 0.10 |
| Total from investment operations | 0.42 | 0.45 | 0.16 | 0.72 | 0.24 |
| Less distributions | | | | | |
| From net investment income | (0.29) | (0.20) | (0.13) | (0.10) | (0.23) |
| From net realized gain | (0.22) | (0.10) | (0.07) | (0.03) | (0.17) |
| Total distributions | (0.51) | (0.30) | (0.20) | (0.13) | (0.40) |
| Net asset value, end of period | $14.60 | $14.69 | $14.54 | $14.58 | $13.99 |
| Total return (%)3 | 2.91 | 3.22 | 1.10 | 5.18 | 1.79 |
| Ratios and supplemental data | | | | | |
| Net assets, end of period (in millions) | $— 4 | $— 4 | $1 | $5 | $4 |
| Ratios (as a percentage of average net assets): | | | | | |
| Expenses before reductions5 | 0.81 | 0.73 | 0.67 | 0.66 | 0.67 |
| Expenses including reductions5 | 0.50 | 0.50 | 0.44 | 0.44 | 0.43 |
| Net investment income2 | 0.45 | 1.76 | 1.05 | 0.85 | 1.00 |
| Portfolio turnover (%) | 37 | 39 | 18 | 10 | 17 |
| 1 | Based on average daily shares outstanding. |
| 2 | Net investment income is affected by the timing and frequency of the declaration of dividends by the underlying funds in which the fund invests. |
| 3 | Total returns would have been lower had certain expenses not been reduced during the applicable periods. |
| 4 | Less than $500,000. |
| 5 | Ratios do not include expenses indirectly incurred from underlying funds and can vary based on the mix of underlying funds held by the fund. |
| 20 | JOHN HANCOCK Alternative Asset Allocation Fund | ANNUAL REPORT | SEE NOTES TO FINANCIAL STATEMENTS |
| CLASS R6 SHARES Period ended | 8-31-20 | 8-31-19 | 8-31-18 | 8-31-17 | 8-31-16 |
| Per share operating performance | | | | | |
| Net asset value, beginning of period | $14.69 | $14.54 | $14.58 | $13.99 | $14.15 |
| Net investment income1,2 | 0.14 | 0.32 | 0.18 | 0.16 | 0.21 |
| Net realized and unrealized gain (loss) on investments | 0.32 | 0.16 | 0.02 | 0.60 | 0.07 |
| Total from investment operations | 0.46 | 0.48 | 0.20 | 0.76 | 0.28 |
| Less distributions | | | | | |
| From net investment income | (0.33) | (0.23) | (0.17) | (0.14) | (0.27) |
| From net realized gain | (0.22) | (0.10) | (0.07) | (0.03) | (0.17) |
| Total distributions | (0.55) | (0.33) | (0.24) | (0.17) | (0.44) |
| Net asset value, end of period | $14.60 | $14.69 | $14.54 | $14.58 | $13.99 |
| Total return (%)3 | 3.15 | 3.49 | 1.34 | 5.45 | 2.05 |
| Ratios and supplemental data | | | | | |
| Net assets, end of period (in millions) | $22 | $26 | $18 | $15 | $16 |
| Ratios (as a percentage of average net assets): | | | | | |
| Expenses before reductions4 | 0.46 | 0.37 | 0.32 | 0.31 | 0.32 |
| Expenses including reductions4 | 0.25 | 0.24 | 0.20 | 0.18 | 0.17 |
| Net investment income2 | 1.01 | 2.23 | 1.26 | 1.11 | 1.52 |
| Portfolio turnover (%) | 37 | 39 | 18 | 10 | 17 |
| 1 | Based on average daily shares outstanding. |
| 2 | Net investment income is affected by the timing and frequency of the declaration of dividends by the underlying funds in which the fund invests. |
| 3 | Total returns would have been lower had certain expenses not been reduced during the applicable periods. |
| 4 | Ratios do not include expenses indirectly incurred from underlying funds and can vary based on the mix of underlying funds held by the fund. |
| SEE NOTES TO FINANCIAL STATEMENTS | ANNUAL REPORT | JOHN HANCOCK ALTERNATIVE ASSET ALLOCATION FUND | 21 |
Notes to financial statements
Note 1—Organization
John Hancock Alternative Asset Allocation Fund (the fund) is a series of John Hancock Funds II (the Trust), an open-end management investment company organized as a Massachusetts business trust and registered under the Investment Company Act of 1940, as amended (the 1940 Act). The investment objective of the fund is to seek long-term growth of capital.
The fund operates as a “fund of funds", investing in affiliated underlying funds of the Trust, other series of the Trust, other funds in John Hancock group of funds complex, non-John Hancock funds and certain other permitted investments.
The fund may offer multiple classes of shares. The shares currently outstanding are detailed in the Statement of assets and liabilities. Class A and Class C shares are offered to all investors. Class I shares are offered to institutions and certain investors. Class R2 and Class R4 shares are available only to certain retirement and 529 plans. Class R6 shares are only available to certain retirement plans, institutions and other investors. Class C shares convert to Class A shares ten years after purchase (certain exclusions may apply). Shareholders of each class have exclusive voting rights to matters that affect that class. The distribution and service fees, if any, and transfer agent fees for each class may differ.
The accounting policies of the John Hancock underlying funds in which the fund invests are outlined in the underlying funds’ shareholder reports, which include the underlying funds’ financial statements, available without charge by calling 800-344-1029 or visiting jhinvestments.com, on the Securities and Exchange Commission (SEC) website at sec.gov or at the SEC’s public reference room in Washington, D.C. The underlying funds are not covered by this report.
Note 2—Significant accounting policies
The financial statements have been prepared in conformity with accounting principles generally accepted in the United States of America (US GAAP), which require management to make certain estimates and assumptions as of the date of the financial statements. Actual results could differ from those estimates and those differences could be significant. The fund qualifies as an investment company under Topic 946 of Accounting Standards Codification of US GAAP.
Events or transactions occurring after the end of the fiscal period through the date that the financial statements were issued have been evaluated in the preparation of the financial statements. The following summarizes the significant accounting policies of the fund:
Security valuation. Investments are stated at value as of the scheduled close of regular trading on the New York Stock Exchange (NYSE), normally at 4:00 P.M., Eastern Time. In case of emergency or other disruption resulting in the NYSE not opening for trading or the NYSE closing at a time other than the regularly scheduled close, the net asset value (NAV) may be determined as of the regularly scheduled close of the NYSE pursuant to the fund's Valuation Policies and Procedures.
In order to value the securities, the fund uses the following valuation techniques: Investments by the fund in underlying affiliated funds and other open end mutual funds, including John Hancock Collateral Trust (JHCT), are valued at their respective NAVs each business day. ETFs held by the fund are valued at the last sale price or official closing price on the exchange or principal market where the security trades. In the event there were no sales during the day or closing prices are not available, the securities are valued using the last available bid price.
In certain instances, the Pricing Committee may determine to value equity securities using prices obtained from another exchange or market if trading on the exchange or market on which prices are typically obtained did not open for trading as scheduled, or if trading closed earlier than scheduled, and trading occurred as normal on another exchange or market.
| 22 | JOHN HANCOCK Alternative Asset Allocation Fund | ANNUAL REPORT | |
Other portfolio securities and assets, for which reliable market quotations are not readily available, are valued at fair value as determined in good faith by the fund's Pricing Committee following procedures established by the Board of Trustees. The frequency with which these fair valuation procedures are used cannot be predicted and fair value of securities may differ significantly from the value that would have been used had a ready market for such securities existed.
The fund uses a three-tier hierarchy to prioritize the pricing assumptions, referred to as inputs, used in valuation techniques to measure fair value. Level 1 includes securities valued using quoted prices in active markets for identical securities, including registered investment companies. Level 2 includes securities valued using other significant observable inputs. Observable inputs may include quoted prices for similar securities, interest rates, prepayment speeds and credit risk. Prices for securities valued using these inputs are received from independent pricing vendors and brokers and are based on an evaluation of the inputs described. Level 3 includes securities valued using significant unobservable inputs when market prices are not readily available or reliable, including the fund's own assumptions in determining the fair value of investments. Factors used in determining value may include market or issuer specific events or trends, changes in interest rates and credit quality. The inputs or methodology used for valuing securities are not necessarily an indication of the risks associated with investing in those securities. Changes in valuation techniques and related inputs may result in transfers into or out of an assigned level within the disclosure hierarchy.
As of August 31, 2020, all investments are categorized as Level 1 under the hierarchy described above.
Security transactions and related investment income. Investment security transactions are accounted for on a trade date plus one basis for daily NAV calculations. However, for financial reporting purposes, investment transactions are reported on trade date. Interest income is accrued as earned. Interest income includes coupon interest and amortization/accretion of premiums/discounts on debt securities. Debt obligations may be placed in a non-accrual status and related interest income may be reduced by stopping current accruals and writing off interest receivable when the collection of all or a portion of interest has become doubtful. Income and capital gain distributions from underlying funds are recorded on ex-date. Dividend income is recorded on the ex-date, except for dividends of certain foreign securities where the dividend may not be known until after the ex-date. In those cases, dividend income, net of withholding taxes, is recorded when the fund becomes aware of the dividends. Non-cash dividends, if any, are recorded at the fair market value of the securities received. Gains and losses on securities sold are determined on the basis of identified cost and may include proceeds from litigation. Return of capital distributions from underlying funds, if any, are treated as a reduction of cost.
Securities lending. The fund may lend its securities to earn additional income. The fund receives collateral from the borrower in an amount not less than the market value of the loaned securities. The fund will invest its cash collateral in JHCT, an affiliate of the fund, which has a floating NAV and is registered with the SEC as an investment company. JHCT invests in short-term money market investments. The fund will receive the benefit of any gains and bear any losses generated by JHCT with respect to the cash collateral.
The fund has the right to recall loaned securities on demand. If a borrower fails to return loaned securities when due, then the lending agent is responsible and indemnifies the fund for the lent securities. The lending agent uses the collateral received from the borrower to purchase replacement securities of the same issue, type, class and series of the loaned securities. If the value of the collateral is less than the purchase cost of replacement securities, the lending agent is responsible for satisfying the shortfall but only to the extent that the shortfall is not due to any decrease in the value of JHCT.
Although the risk of loss on securities lent is mitigated by receiving collateral from the borrower and through lending agent indemnification, the fund could experience a delay in recovering securities or could experience a lower than expected return if the borrower fails to return the securities on a timely basis. The fund receives compensation for lending its securities by retaining a portion of the return on the investment of the collateral and
| | ANNUAL REPORT | JOHN HANCOCK ALTERNATIVE ASSET ALLOCATION FUND | 23 |
compensation from fees earned from borrowers of the securities. Securities lending income received by the fund is net of fees retained by the securities lending agent. Net income received from JHCT is a component of securities lending income as recorded on the Statement of operations.
Obligations to repay collateral received by the fund are shown on the Statement of assets and liabilities as Payable upon return of securities loaned and are secured by the loaned securities. As of August 31, 2020, the fund loaned securities valued at $4,820,712 and received $4,951,650 of cash collateral.
Overdraft. The fund may have the ability to borrow from banks for temporary or emergency purposes, including meeting redemption requests that otherwise might require the untimely sale of securities. Pursuant to the fund's custodian agreement, the custodian may loan money to the fund to make properly authorized payments. The fund is obligated to repay the custodian for any overdraft, including any related costs or expenses. The custodian may have a lien, security interest or security entitlement in any fund property that is not otherwise segregated or pledged, to the extent of any overdraft, and to the maximum extent permitted by law. Overdrafts at period end are presented under the caption Due to custodian in the Statement of assets and liabilities.
Line of credit. Effective June 25, 2020, the fund and other affiliated funds have entered into a syndicated line of credit agreement with Citibank, N.A. as the administrative agent that enables them to participate in a $1 billion unsecured committed line of credit. Excluding commitments designated for a certain fund and subject to the needs of all other affiliated funds, the fund can borrow up to an aggregate commitment amount of $850 million, subject to asset coverage and other limitations as specified in the agreement. Each participating fund paid an upfront fee in connection with this line of credit agreement, which is charged based on a combination of fixed and asset based allocations and amortized over 365 days. Prior to June 25, 2020, the fund and other affiliated funds had a similar agreement that enabled them to participate in a $750 million unsecured committed line of credit. A commitment fee payable at the end of each calendar quarter, based on the average daily unused portion of the line of credit, is charged to each participating fund based on a combination of fixed and asset based allocations and is reflected in Other expenses on the Statement of operations. For the year ended August 31, 2020, the fund had no borrowings under the line of credit. Commitment fees for the year ended August 31, 2020 were $4,072.
Expenses. Within the John Hancock group of funds complex, expenses that are directly attributable to an individual fund are allocated to such fund. Expenses that are not readily attributable to a specific fund are allocated among all funds in an equitable manner, taking into consideration, among other things, the nature and type of expense and the fund’s relative net assets. Expense estimates are accrued in the period to which they relate and adjustments are made when actual amounts are known.
Class allocations. Income, common expenses and realized and unrealized gains (losses) are determined at the fund level and allocated daily to each class of shares based on the net assets of the class. Class-specific expenses, such as distribution and service fees, if any, and transfer agent fees, for all classes, are charged daily at the class level based on the net assets of each class and the specific expense rates applicable to each class.
Federal income taxes. The fund intends to continue to qualify as a regulated investment company by complying with the applicable provisions of the Internal Revenue Code and will not be subject to federal income tax on taxable income that is distributed to shareholders. Therefore, no federal income tax provision is required.
For federal income tax purposes, as of August 31, 2020, the fund has a short-term capital loss carryforward of $12,159,629 and a long-term capital loss carryforward of $33,120,920 available to offset future net realized capital gains. These carryforwards do not expire.
As of August 31, 2020, the fund had no uncertain tax positions that would require financial statement recognition, derecognition or disclosure. The fund's federal tax returns are subject to examination by the Internal Revenue Service for a period of three years.
| 24 | JOHN HANCOCK Alternative Asset Allocation Fund | ANNUAL REPORT | |
Distribution of income and gains. Distributions to shareholders from net investment income and net realized gains, if any, are recorded on the ex-date. The fund generally declares and pays dividends annually. Capital gain distributions, if any, are typically distributed annually.
The tax character of distributions for the years ended August 31, 2020 and 2019 was as follows:
| | August 31, 2020 | August 31, 2019 |
| Ordinary income | $19,505,805 | $12,695,639 |
Distributions paid by the fund with respect to each class of shares are calculated in the same manner, at the same time and in the same amount, except for the effect of class level expenses that may be applied differently to each class. As of August 31, 2020, there were no distributable earnings on a tax basis.
Such distributions and distributable earnings, on a tax basis, are determined in conformity with income tax regulations, which may differ from US GAAP. Distributions in excess of tax basis earnings and profits, if any, are reported in the fund's financial statements as a return of capital. Short-term gains from underlying funds are treated as ordinary income for tax purposes.
Capital accounts within the financial statements are adjusted for permanent book-tax differences. These adjustments have no impact on net assets or the results of operations. Temporary book-tax differences, if any, will reverse in a subsequent period. Book-tax differences are primarily attributable to partnerships and wash sale loss deferrals.
Note 3—Guarantees and indemnifications
Under the Trust's organizational documents, its Officers and Trustees are indemnified against certain liabilities arising out of the performance of their duties to the Trust, including the fund. Additionally, in the normal course of business, the fund enters into contracts with service providers that contain general indemnification clauses. The fund's maximum exposure under these arrangements is unknown, as this would involve future claims that may be made against the fund that have not yet occurred. The risk of material loss from such claims is considered remote.
Note 4—Fees and transactions with affiliates
John Hancock Investment Management LLC (the Advisor) serves as investment advisor for the fund. John Hancock Investment Management Distributors LLC (the Distributor), an affiliate of the Advisor, serves as principal underwriter of the fund. The Advisor and the Distributor are indirect, principally owned subsidiaries of Manulife Financial Corporation.
Management fee. The fund pays the Advisor a management fee for its services to the fund. Manulife Investment Management (US) LLC, a division of Manulife Asset Management (US) LLC, acts as the fund’s sole subadvisor. The fund is not responsible for payment of the subadvisory fees.
The management fee has two components: (1) a fee on assets invested in a fund of the Trust or John Hancock Funds III (JHF III); and (2) a fee on assets invested in investments other than a fund of the Trust or JHF III (Other assets).
Management fees are determined in accordance with the following schedule:
| | First $5.0 billion of net assets | Excess over $5.0 billion of net assets |
| Assets in a fund of the Trust or JHF III | 0.100% | 0.075% |
| Other assets | 0.550% | 0.525% |
| | ANNUAL REPORT | JOHN HANCOCK ALTERNATIVE ASSET ALLOCATION FUND | 25 |
The Advisor has contractually agreed to reduce its management fee and/or make payment to the fund in an amount equal to the amount by which “Other expenses” of the fund exceed 0.04% of the average net assets of the fund. “Other expenses” means all of the expenses of the fund, excluding: advisory fees, taxes, brokerage commissions, interest expense, litigation and indemnification expenses and other extraordinary expenses not incurred in the ordinary course of the fund’s business, class specific expenses, underlying fund expenses (acquired fund fees), and short dividend expense. The current expense limitation agreement expires on December 31, 2020, unless renewed by mutual agreement of the fund and the Advisor based upon a determination that this is appropriate under the circumstances at that time.
The Advisor has contractually agreed to reduce its management fee by 0.05% of the fund’s average daily net assets up to $5 billion, and by 0.025% of the fund’s average daily net assets over $5 billion. The current expense limitation agreement expires on December 31, 2020, unless renewed by mutual agreement of the fund and the Advisor based upon a determination that this is appropriate under the circumstances at that time.
The Advisor has voluntarily agreed to waive its management fee for the fund so that the aggregate advisory fee retained by the Advisor with respect to both the fund and its underlying investments (after payment of subadvisory fees) does not exceed 0.55% of the fund’s first $5 billion of average daily net assets and 0.525% of the fund’s average daily net assets in excess of $5 billion. The Advisor may terminate this voluntary waiver at any time upon notice to the Trust.
For the year ended August 31, 2020, the expense reductions described above amounted to the following:
| Class | Expense reduction |
| Class A | $144,362 |
| Class C | 78,670 |
| Class I | 841,626 |
| Class R2 | 2,997 |
| Class | Expense reduction |
| Class R4 | $216 |
| Class R6 | 47,315 |
| Total | $1,115,186 |
Expenses waived or reimbursed in the current fiscal period are not subject to recapture in future fiscal periods.
The investment management fees, including the impact of the waivers and reimbursements as described above, incurred for the year ended August 31, 2020, were equivalent to a net annual effective rate of 0.16% of the fund's average daily net assets.
Accounting and legal services. Pursuant to a service agreement, the fund reimburses the Advisor for all expenses associated with providing the administrative, financial, legal, compliance, accounting and recordkeeping services to the fund, including the preparation of all tax returns, periodic reports to shareholders and regulatory reports, among other services. These expenses are allocated to each share class based on its relative net assets at the time the expense was incurred. These accounting and legal services fees incurred, for the year ended August 31, 2020, amounted to an annual rate of 0.02% of the fund's average daily net assets.
Distribution and service plans. The fund has a distribution agreement with the Distributor. The fund has adopted distribution and service plans for certain classes as detailed below pursuant to Rule 12b-1 under the 1940 Act, to pay the Distributor for services provided as the distributor of shares of the fund. In addition, under a service plan for certain classes as detailed below, the fund pays for certain other services. The fund may pay up to the following contractual rates of distribution and service fees under these arrangements, expressed as an annual percentage of average daily net assets for each class of the fund's shares:
| Class | Rule 12b-1 Fee | Service fee |
| Class A | 0.30% | — |
| Class C | 1.00% | — |
| Class R2 | 0.25% | 0.25% |
| Class R4 | 0.25% | 0.10% |
| 26 | JOHN HANCOCK Alternative Asset Allocation Fund | ANNUAL REPORT | |
The fund's Distributor has contractually agreed to waive 0.10% of Rule12b-1 fees for Class R4 shares. The current waiver agreement expires on December 31, 2020, unless renewed by mutual agreement of the fund and the Distributor based upon a determination that this is appropriate under the circumstances at the time. This contractual waiver amounted to $109 for Class R4 shares for the year ended August 31, 2020.
Sales charges. Class A shares are assessed up-front sales charges, which resulted in payments to the Distributor amounting to $54,949 for the year ended August 31, 2020. Of this amount, $8,961 was retained and used for printing prospectuses, advertising, sales literature and other purposes and $45,988 was paid as sales commissions to broker-dealers.
Class A and Class C shares may be subject to contingent deferred sales charges (CDSCs). Certain Class A shares that are acquired through purchases of $1 million or more and are redeemed within one year of purchase are subject to a 1.00% sales charge. Class C shares that are redeemed within one year of purchase are subject to a 1.00% CDSC. CDSCs are applied to the lesser of the current market value at the time of redemption or the original purchase cost of the shares being redeemed. Proceeds from CDSCs are used to compensate the Distributor for providing distribution-related services in connection with the sale of these shares. During the year ended August 31, 2020, CDSCs received by the Distributor amounted to $1,609 and $257 for Class A and Class C shares, respectively.
Transfer agent fees. The John Hancock group of funds has a complex-wide transfer agent agreement with John Hancock Signature Services, Inc. (Signature Services), an affiliate of the Advisor. The transfer agent fees paid to Signature Services are determined based on the cost to Signature Services (Signature Services Cost) of providing recordkeeping services. It also includes out-of-pocket expenses, including payments made to third-parties for recordkeeping services provided to their clients who invest in one or more John Hancock funds. In addition, Signature Services Cost may be reduced by certain fees that Signature Services receives in connection with retirement and small accounts. Signature Services Cost is calculated monthly and allocated, as applicable, to five categories of share classes: Retail Share and Institutional Share Classes of Non-Municipal Bond Funds, Class R6 Shares, Retirement Share Classes and Municipal Bond Share Classes. Within each of these categories, the applicable costs are allocated to the affected John Hancock affiliated funds and/or classes, based on the relative average daily net assets.
Class level expenses. Class level expenses for the year ended August 31, 2020 were as follows:
| Class | Distribution and service fees | Transfer agent fees |
| Class A | $200,756 | $84,456 |
| Class C | 365,796 | 46,164 |
| Class I | — | 492,631 |
| Class R2 | 7,070 | 190 |
| Class R4 | 381 | 14 |
| Class R6 | — | 2,934 |
| Total | $574,003 | $626,389 |
Trustee expenses. The fund compensates each Trustee who is not an employee of the Advisor or its affiliates. The costs of paying Trustee compensation and expenses are allocated to the fund based on its net assets relative to other funds within the John Hancock group of funds complex.
| | ANNUAL REPORT | JOHN HANCOCK ALTERNATIVE ASSET ALLOCATION FUND | 27 |
Note 5—Fund share transactions
Transactions in fund shares for the years ended August 31, 2020 and 2019 were as follows:
| | Year Ended 8-31-20 | Year Ended 8-31-19 |
| | Shares | Amount | Shares | Amount |
| Class A shares | | | | |
| Sold | 532,714 | $7,649,230 | 795,055 | $11,305,156 |
| Distributions reinvested | 154,878 | 2,244,177 | 115,120 | 1,574,839 |
| Repurchased | (1,445,757) | (20,620,988) | (2,428,928) | (34,635,963) |
| Net decrease | (758,165) | $(10,727,581) | (1,518,753) | $(21,755,968) |
| Class C shares | | | | |
| Sold | 42,781 | $618,193 | 96,697 | $1,388,854 |
| Distributions reinvested | 68,875 | 1,002,820 | 42,160 | 579,700 |
| Repurchased | (888,201) | (12,690,671) | (1,146,343) | (16,394,140) |
| Net decrease | (776,545) | $(11,069,658) | (1,007,486) | $(14,425,586) |
| Class I shares | | | | |
| Sold | 6,847,511 | $97,633,578 | 9,148,547 | $130,782,292 |
| Distributions reinvested | 942,827 | 13,652,128 | 620,211 | 8,484,484 |
| Repurchased | (12,832,637) | (180,420,235) | (16,047,812) | (228,661,790) |
| Net decrease | (5,042,299) | $(69,134,529) | (6,279,054) | $(89,395,014) |
| Class R2 shares | | | | |
| Sold | 18,549 | $264,201 | 31,389 | $448,503 |
| Distributions reinvested | 2,864 | 41,474 | 2,947 | 40,280 |
| Repurchased | (118,578) | (1,709,278) | (54,897) | (777,693) |
| Net decrease | (97,165) | $(1,403,603) | (20,561) | $(288,910) |
| Class R4 shares | | | | |
| Sold | 6,520 | $94,845 | 6,916 | $98,951 |
| Distributions reinvested | 83 | 1,208 | 300 | 4,113 |
| Repurchased | (20,027) | (289,651) | (86,274) | (1,248,855) |
| Net decrease | (13,424) | $(193,598) | (79,058) | $(1,145,791) |
| Class R6 shares | | | | |
| Sold | 521,425 | $7,378,383 | 1,309,202 | $18,559,247 |
| Distributions reinvested | 55,291 | 800,607 | 47,502 | 649,346 |
| Repurchased | (842,680) | (12,148,388) | (801,314) | (11,429,585) |
| Net increase (decrease) | (265,964) | $(3,969,398) | 555,390 | $7,779,008 |
| Total net decrease | (6,953,562) | $(96,498,367) | (8,349,522) | $(119,232,261) |
Note 6—Purchase and sale of securities
Purchases and sales of securities, other than short-term investments, amounted to $190,209,024 and $285,595,633, respectively, for the year ended August 31, 2020.
| 28 | JOHN HANCOCK Alternative Asset Allocation Fund | ANNUAL REPORT | |
Note 7—Investment in affiliated underlying funds
The fund invests primarily in affiliated underlying funds that are managed by the Advisor and its affiliates. The fund does not invest in the affiliated underlying funds for the purpose of exercising management or control; however, the fund's investment may represent a significant portion of each underlying funds’ net assets. At August 31, 2020, the fund held 5% or more of the net assets of the underlying funds shown below:
| Portfolio | Underlying fund's net assets |
| JHF Alternative Risk Premia Fund | 21.4% |
| JHF Diversified Macro Fund | 15.2% |
| JHF II Multi-Asset Absolute Return Fund | 11.4% |
| JHF Seaport Long/Short Fund | 8.3% |
| JHF II Absolute Return Currency Fund | 6.7% |
| JHF II Short Duration Credit Opportunities Fund | 5.2% |
| JHF Infrastructure Fund | 5.2% |
Information regarding the fund's fiscal year to date purchases and sales of the affiliated underlying funds as well as income and capital gains earned by the fund, if any, is as follows:
| | | | | | | | Dividends and distributions |
| Affiliate | Ending
share
amount | Beginning
value | Cost of
purchases | Proceeds
from shares
sold | Realized
gain
(loss) | Change in
unrealized
appreciation
(depreciation) | Income
distributions
received | Capital gain
distributions
received | Ending
value |
| Absolute Return Currency | 2,171,854 | $40,391,711 | $7,039,037 | $(27,879,140) | $32,401 | $3,567,956 | $714,019 | — | $23,151,965 |
| Alternative Risk Premia | 3,199,338 | — | 35,838,829 | (3,587,184) | (495,944) | (5,201,194) | 12,260 | — | 26,554,507 |
| Disciplined Alternative Yield | — | 66,558,006 | 7,831,656 | (69,333,617) | (2,983,177) | (2,072,868) | 604,346 | $7,227,310 | — |
| Diversified Macro | 3,910,520 | 45,326,846 | 5,401,892 | (9,592,077) | (748,960) | (3,198,655) | — | 1,592,220 | 37,189,046 |
| Infrastructure | 1,805,414 | 26,629,522 | 7,304,301 | (10,693,410) | 755,443 | (1,392,067) | 475,090 | 820,426 | 22,603,789 |
| John Hancock Collateral Trust* | 495,545 | 885,879 | 121,267,839 | (117,201,618) | 2,265 | 6,386 | 25,924 | — | 4,960,751 |
| Multi-Asset Absolute Return | 5,772,551 | 28,253,887 | 38,317,095 | (13,258,189) | (2,189,640) | 2,099,767 | — | — | 53,222,920 |
| Seaport Long/Short | 4,927,628 | 50,138,430 | 28,085,715 | (21,062,263) | 1,898,875 | 1,056,309 | 697,955 | — | 60,117,066 |
| Short Duration Credit Opportunities | 3,688,812 | 62,204,274 | 1,959,535 | (29,223,111) | (1,534,348) | 1,858,694 | 1,051,675 | — | 35,265,044 |
| Strategic Income Opportunities | 4,962,754 | 74,789,294 | 4,915,625 | (26,492,842) | (593,576) | 1,922,165 | 1,407,455 | — | 54,540,666 |
| | | | | | $(5,856,661) | $(1,353,507) | $4,988,724 | $9,639,956 | $317,605,754 |
| * | Refer to the Securities lending note within Note 2 for details regarding this investment. |
Note 8—Transactions in securities of affiliated issuers
Affiliated issuers, as defined by the 1940 Act, are those in which the fund's holdings of an issuer represent 5% or more of the outstanding voting securities of the issuer. A summary of the fund's transactions in the securities of these issuers during the year ended August 31, 2020, is set forth below:
| | ANNUAL REPORT | JOHN HANCOCK ALTERNATIVE ASSET ALLOCATION FUND | 29 |
| | | | | | | | Dividends and distributions |
| Affiliate | Ending
share
amount | Beginning
value | Cost of
purchases | Proceeds
from shares
sold | Realized
gain
(loss) | Change in
unrealized
appreciation
(depreciation) | Income
distributions
received | Capital gain
distributions
received | Ending
value |
| | | | | | | | | | |
| Credit Suisse Managed Futures Strategy Fund | 2,427,291 | $24,056,171 | $9,172,788 | $(7,610,079) | $(186,296) | $(2,373,316) | $428,413 | — | $23,059,268 |
| Invesco DB Gold Fund | 181,211 | 10,651,123 | 4,253,006 | (6,663,026) | 1,447,013 | 787,692 | 195,898 | — | 10,475,808 |
| | | | | | $1,260,717 | $(1,585,624) | $624,311 | — | $33,535,076 |
Note 9—Coronavirus (COVID-19) pandemic
The novel COVID-19 disease has resulted in significant disruptions to global business activity. A widespread health crisis such as a global pandemic could cause substantial market volatility, exchange trading suspensions and closures, impact the ability to complete redemptions, and affect fund performance.
| 30 | JOHN HANCOCK Alternative Asset Allocation Fund | ANNUAL REPORT | |
Report of Independent Registered Public Accounting Firm
To the Board of Trustees of John Hancock Funds II and Shareholders of John Hancock Alternative Asset Allocation Fund
Opinion on the Financial Statements
We have audited the accompanying statement of assets and liabilities, including the fund’s investments, of John Hancock Alternative Asset Allocation Fund (one of the funds constituting John Hancock Funds II, referred to hereafter as the "Fund") as of August 31, 2020, the related statement of operations for the year ended August 31, 2020, the statements of changes in net assets for each of the two years in the period ended August 31, 2020, including the related notes, and the financial highlights for each of the five years in the period ended August 31, 2020 (collectively referred to as the “financial statements”). In our opinion, the financial statements present fairly, in all material respects, the financial position of the Fund as of August 31, 2020, the results of its operations for the year then ended, the changes in its net assets for each of the two years in the period ended August 31, 2020 and the financial highlights for each of the five years in the period ended August 31, 2020 in conformity with accounting principles generally accepted in the United States of America.
Basis for Opinion
These financial statements are the responsibility of the Fund’s management. Our responsibility is to express an opinion on the Fund’s financial statements based on our audits. We are a public accounting firm registered with the Public Company Accounting Oversight Board (United States) (PCAOB) and are required to be independent with respect to the Fund in accordance with the U.S. federal securities laws and the applicable rules and regulations of the Securities and Exchange Commission and the PCAOB.
We conducted our audits of these financial statements in accordance with the standards of the PCAOB. Those standards require that we plan and perform the audit to obtain reasonable assurance about whether the financial statements are free of material misstatement, whether due to error or fraud.
Our audits included performing procedures to assess the risks of material misstatement of the financial statements, whether due to error or fraud, and performing procedures that respond to those risks. Such procedures included examining, on a test basis, evidence regarding the amounts and disclosures in the financial statements. Our audits also included evaluating the accounting principles used and significant estimates made by management, as well as evaluating the overall presentation of the financial statements. Our procedures included confirmation of securities owned as of August 31, 2020 by correspondence with the custodian, transfer agents and brokers. We believe that our audits provide a reasonable basis for our opinion.
/s/ PricewaterhouseCoopers LLP
Boston, Massachusetts
October 22, 2020
We have served as the auditor of one or more investment companies in the John Hancock group of funds since 1988.
| | ANNUAL REPORT | JOHN HANCOCK ALTERNATIVE ASSET ALLOCATION FUND | 31 |
Tax information (Unaudited)
For federal income tax purposes, the following information is furnished with respect to the distributions of the fund, if any, paid during its taxable year ended August 31, 2020.
The fund reports the maximum amount allowable of its net taxable income as eligible for the corporate dividends-received deduction.
The fund reports the maximum amount allowable of its net taxable income as qualified dividend income as provided in the Jobs and Growth Tax Relief Reconciliation Act of 2003.
The fund reports the maximum amount allowable of its Section 199A dividends as defined in Proposed Treasury Regulation §1.199A-3(d).
Eligible shareholders will be mailed a 2020 Form 1099-DIV in early 2021. This will reflect the tax character of all distributions paid in calendar year 2020.
Please consult a tax advisor regarding the tax consequences of your investment in the fund.
| 32 | JOHN HANCOCK Alternative Asset Allocation Fund | ANNUAL REPORT | |
CONTINUATION OF INVESTMENT ADVISORY AND SUBADVISORY AGREEMENTS
Evaluation of Advisory and Subadvisory Agreements by the Board of Trustees
This section describes the evaluation by the Board of Trustees (the Board) of John Hancock Funds II (the Trust) of the Advisory Agreement (the Advisory Agreement) with John Hancock Investment Management, LLC (the Advisor) and the Subadvisory Agreement (the Subadvisory Agreement) with Manulife Investment Management (US) LLC (the Subadvisor) for John Hancock Alternative Asset Allocation Fund (the fund). The Advisory Agreement and Subadvisory Agreement are collectively referred to as the Agreements. Prior to the June 23-25, 2020 telephonic1 meeting at which the Agreements were approved, the Board also discussed and considered information regarding the proposed continuation of the Agreements at the telephonic meeting held on May 26-27, 2020.
Approval of Advisory and Subadvisory Agreements
At telephonic meetings held on June 23-25, 2020, the Board, including the Trustees who are not parties to any Agreement or considered to be interested persons of the Trust under the Investment Company Act of 1940, as amended (the 1940 Act) (the Independent Trustees), reapproved for an annual period the continuation of the Advisory Agreement between the Trust and the Advisor and the Subadvisory Agreement between the Advisor and the Subadvisor with respect to the fund.
In considering the Advisory Agreement and the Subadvisory Agreement, the Board received in advance of the meetings a variety of materials relating to the fund, the Advisor and the Subadvisor, including comparative performance, fee and expense information for a peer group of similar funds prepared by an independent third-party provider of fund data, performance information for an applicable benchmark index; and, with respect to the Subadvisor, comparative performance information for comparably managed accounts, as applicable, and other information provided by the Advisor and the Subadvisor regarding the nature, extent and quality of services provided by the Advisor and the Subadvisor under their respective Agreements, as well as information regarding the Advisor's revenues and costs of providing services to the fund and any compensation paid to affiliates of the Advisor. At the meetings at which the renewal of the Advisory Agreement and Subadvisory Agreement are considered, particular focus is given to information concerning fund performance, comparability of fees and total expenses, and profitability. However, the Board notes that the evaluation process with respect to the Advisor and the Subadvisor is an ongoing one. In this regard, the Board also took into account discussions with management and information provided to the Board (including its various committees) at prior meetings with respect to the services provided by the Advisor and the Subadvisor to the fund, including quarterly performance reports prepared by management containing reviews of investment results and prior presentations from the Subadvisor with respect to the fund. The information received and considered by the Board in connection with the May and June meetings and throughout the year was both written and
____________________
1On March 25, 2020, as a result of health and safety measures put in place to combat the global COVID-19 pandemic, the Securities and Exchange Commission issued an exemptive order (the "Order") pursuant to Sections 6(c) and 38(a) of the Investment Company Act of 1940, as amended (the "1940 Act"), that temporarily exempts registered investment management companies from the in-person voting requirements under the 1940 Act, subject to certain requirements, including that votes taken pursuant to the Order are ratified at the next in-person meeting. The Board determined that reliance on the Order was necessary or appropriate due to the circumstances related to current or potential effects of COVID-19 and therefore, the Board's May and June meetings were held telephonically in reliance on the Order.
ANNUAL REPORT | JOHN HANCOCK ALTERNATIVE ASSET ALLOCATION FUND 33
oral. The Board noted the affiliation of the Subadvisor with the Advisor, noting any potential conflicts of interest. The Board also considered the nature, quality, and extent of non-advisory services, if any, to be provided to the fund by the Advisor's affiliates, including distribution services. The Board considered the Advisory Agreement and the Subadvisory Agreement separately in the course of its review. In doing so, the Board noted the respective roles of the Advisor and Subadvisor in providing services to the fund.
Throughout the process, the Board asked questions of and requested additional information from management. The Board is assisted by counsel for the Trust and the Independent Trustees are also separately assisted by independent legal counsel throughout the process. The Independent Trustees also received a memorandum from their independent legal counsel discussing the legal standards for their consideration of the proposed continuation of the Agreements and discussed the proposed continuation of the Agreements in private sessions with their independent legal counsel at which no representatives of management were present.
Approval of Advisory Agreement
In approving the Advisory Agreement with respect to the fund, the Board, including the Independent Trustees, considered a variety of factors, including those discussed below. The Board also considered other factors (including conditions and trends prevailing generally in the economy, the securities markets, and the industry) and did not treat any single factor as determinative, and each Trustee may have attributed different weights to different factors. The Board's conclusions may be based in part on its consideration of the advisory and subadvisory arrangements in prior years and on the Board's ongoing regular review of fund performance and operations throughout the year.
Nature, extent, and quality of services. Among the information received by the Board from the Advisor relating to the nature, extent, and quality of services provided to the fund, the Board reviewed information provided by the Advisor relating to its operations and personnel, descriptions of its organizational and management structure, and information regarding the Advisor's compliance and regulatory history, including its Form ADV. The Board also noted that on a regular basis it receives and reviews information from the Trust's Chief Compliance Officer (CCO) regarding the fund's compliance policies and procedures established pursuant to Rule 38a-1 under the 1940 Act. The Board observed that the scope of services provided by the Advisor, and of the undertakings required of the Advisor in connection with those services, including maintaining and monitoring its own and the fund's compliance programs, risk management programs, liquidity management programs and cybersecurity programs, had expanded over time as a result of regulatory, market and other developments. The Board considered that the Advisor is responsible for the management of the day-to-day operations of the fund, including, but not limited to, general supervision of and coordination of the services provided by the Subadvisor, and is also responsible for monitoring and reviewing the activities of the Subadvisor and third-party service providers. The Board also considered the significant risks assumed by the Advisor in connection with the services provided to the fund including entrepreneurial risk in sponsoring new funds and ongoing risks including investment, operational, enterprise, litigation, regulatory and compliance risks with respect to all funds.
In considering the nature, extent, and quality of the services provided by the Advisor, the Trustees also took into account their knowledge of the Advisor's management and the quality of the performance of the Advisor's duties, through Board meetings, discussions and reports during the preceding year and through each Trustee's experience as a Trustee of the Trust and of the other trusts in the John Hancock group of funds complex (the John Hancock Fund Complex).
ANNUAL REPORT | JOHN HANCOCK ALTERNATIVE ASSET ALLOCATION FUND 34
In the course of their deliberations regarding the Advisory Agreement, the Board considered, among other things:
| | | |
| | (a) | the skills and competency with which the Advisor has in the past managed the Trust's affairs and its subadvisory relationship, the Advisor's oversight and monitoring of the Subadvisor's investment performance and compliance programs, such as the Subadvisor's compliance with fund policies and objectives, review of brokerage matters, including with respect to trade allocation and best execution and the Advisor's timeliness in responding to performance issues; |
| | (b) | the background, qualifications and skills of the Advisor's personnel; |
| | (c) | the Advisor's compliance policies and procedures and its responsiveness to regulatory changes and fund industry developments; |
| | (d) | the Advisor's administrative capabilities, including its ability to supervise the other service providers for the fund, as well as the Advisor's oversight of any securities lending activity, its monitoring of class action litigation and collection of class action settlements on behalf of the fund, and bringing loss recovery actions on behalf of the fund; |
| | (e) | the financial condition of the Advisor and whether it has the financial wherewithal to provide a high level and quality of services to the fund; |
| | (f) | the Advisor's initiatives intended to improve various aspects of the Trust's operations and investor experience with the fund; and |
| | (g) | the Advisor's reputation and experience in serving as an investment advisor to the Trust and the benefit to shareholders of investing in funds that are part of a family of funds offering a variety of investments. |
The Board concluded that the Advisor may reasonably be expected to continue to provide a high quality of services under the Advisory Agreement with respect to the fund.
Investment performance. In considering the fund's performance, the Board noted that it reviews at its regularly scheduled meetings information about the fund's performance results. In connection with the consideration of the Advisory Agreement, the Board:
| | | |
| | (a) | reviewed information prepared by management regarding the fund's performance; |
| | (b) | considered the comparative performance of an applicable benchmark index; |
| | (c) | considered the performance of comparable funds, if any, as included in the report prepared by an independent third-party provider of fund data; and |
| | (d) | took into account the Advisor's analysis of the fund's performance; and its plans and recommendations regarding the Trust's subadvisory arrangements generally. |
The Board noted that while it found the data provided by the independent third-party generally useful it recognized its limitations, including in particular that the data may vary depending on the end date selected and that the results of the performance comparisons may vary depending on the selection of the peer group. The Board noted that the fund outperformed its benchmark index and peer group median for the one-, three-, five-, and ten-year periods ended December 31, 2019. The Board took into account management's discussion of the fund's performance, including the favorable performance relative to the peer group median and benchmark index for the one-, three-, five-, and ten-year periods. The Board concluded that the fund's performance has generally been in line with or outperformed the historical performance of comparable funds and the fund's benchmark index.
ANNUAL REPORT | JOHN HANCOCK ALTERNATIVE ASSET ALLOCATION FUND 35
Fees and expenses. The Board reviewed comparative information prepared by an independent third-party provider of fund data, including, among other data, the fund's contractual and net management fees (and subadvisory fees, to the extent available) and total expenses as compared to similarly situated investment companies deemed to be comparable to the fund in light of the nature, extent and quality of the management and advisory and subadvisory services provided by the Advisor and the Subadvisor. The Board considered the fund's ranking within a smaller group of peer funds chosen by the independent third-party provider, as well as the fund's ranking within a broader group of funds. In comparing the fund's contractual and net management fees to those of comparable funds, the Board noted that such fees include both advisory and administrative costs. The Board noted that net management fees and net total expenses for the fund are lower than the peer group median.
The Board took into account management's discussion with respect to the overall management fee and the fees of the Subadvisor, including the amount of the advisory fee retained by the Advisor after payment of the subadvisory fees, in each case in light of the services rendered for those amounts and the risk undertaken by the Advisor. The Board also noted that the Advisor pays the subadvisory fees. In addition, the Board took into account that management had agreed to implement an overall fee waiver across the complex, which is discussed further below. The Board also noted that, in addition, the Advisor is currently waiving fees and/or reimbursing expenses with respect to the fund and that the fund has breakpoints in its contractual management fee schedule that reduces management fees as assets increase. The Board also noted that the fund's distributor, an affiliate of the Advisor, has agreed to waive a portion of its Rule 12b-1 fee for a share class of the fund. The Board reviewed information provided by the Advisor concerning the investment advisory fee charged by the Advisor or one of its advisory affiliates to other clients (including other funds in the John Hancock Fund Complex) having similar investment mandates, if any. The Board considered any differences between the Advisor's and Subadvisor's services to the fund and the services they provide to other comparable clients or funds. The Board concluded that the advisory fee paid with respect to the fund is reasonable in light of the nature, extent and quality of the services provided to the fund under the Advisory Agreement.
In addition, the Trustees reviewed the advisory fee to be paid to the Advisor for the fund, and concluded that such fee is based on services provided that are in addition to, rather than duplicative of, the services provided pursuant to the advisory agreements for the underlying funds of the fund, and that the additional services are necessary because of the differences between the investment policies, strategies and techniques of the fund and those of its underlying funds.
Profitability/indirect benefits. In considering the costs of the services to be provided and the profits to be realized by the Advisor and its affiliates (including the Subadvisor) from the Advisor's relationship with the Trust, the Board:
| | | | | | | | | |
| | | | | (a) | | | reviewed financial information of the Advisor; | |
| | | | | (b) | | | reviewed and considered information presented by the Advisor regarding the net profitability to the Advisor and its affiliates with respect to the fund; | |
| | | | | (c) | | | received and reviewed profitability information with respect to the John Hancock Fund Complex as a whole and with respect to the fund; | |
| | | | | (d) | | | received information with respect to the Advisor's allocation methodologies used in preparing the profitability data and considered that the Advisor hired an independent third-party consultant to provide an analysis of the Advisor's allocation methodologies; | |
ANNUAL REPORT | JOHN HANCOCK ALTERNATIVE ASSET ALLOCATION FUND 36
| | | | | | | | | |
| | | | | (e) | | | considered that the John Hancock insurance companies that are affiliates of the Advisor, as shareholders of the Trust directly or through their separate accounts, receive certain tax credits or deductions relating to foreign taxes paid and dividends received by certain funds of the Trust and noted that these tax benefits, which are not available to participants in qualified retirement plans under applicable income tax law, are reflected in the profitability information reviewed by the Board; | |
| | | | | (f) | | | considered that the Advisor also provides administrative services to the fund on a cost basis pursuant to an administrative services agreement; | |
| | | | | (g) | | | noted that affiliates of the Advisor provide transfer agency services and distribution services to the fund, and that the fund's distributor also receives Rule 12b-1 payments to support distribution of the fund; | |
| | | | | (h) | | | noted that the fund's Subadvisor is an affiliate of the Advisor; | |
| | | | | (i) | | | noted that the Advisor also derives reputational and other indirect benefits from providing advisory services to the fund; | |
| | | | | (j) | | | noted that the subadvisory fees for the fund are paid by the Advisor; | |
| | | | | (k) | | | with respect to the fund, the Board noted that the advisory fee is in addition to the fees received by the Advisor and its affiliates with regard to the affiliated underlying funds in which the funds may invest; | |
| | | | | (l) | | | considered the Advisor's ongoing costs and expenditures necessary to improve services, meet new regulatory and compliance requirements, and adapt to other challenges impacting the fund industry; and | |
| | | | | (m) | | | considered that the Advisor should be entitled to earn a reasonable level of profits in exchange for the level of services it provides to the fund and the risks that it assumes as Advisor, including entrepreneurial, operational, reputational, litigation and regulatory risk. | |
Based upon its review, the Board concluded that the level of profitability, if any, of the Advisor and its affiliates (including the Subadvisor) from their relationship with the fund was reasonable and not excessive.
Economies of scale. In considering the extent to which economies of scale would be realized as the fund grows and whether fee levels reflect these economies of scale for the benefit of fund shareholders, the Board:
| | | |
| | (a) | considered that with respect to the John Hancock underlying funds in which the fund invests, the Advisor has contractually agreed to waive a portion of its management fee such funds and for each of the other John Hancock funds in the complex (except as discussed below) with respect to the John Hancock underlying funds in which the fund invests (the participating portfolios) or otherwise reimburse the expenses of the participating portfolios (the reimbursement). This waiver is based upon aggregate net assets of all the participating portfolios. The funds that are not participating portfolios are each of the funds of funds of the Trust and John Hancock Variable Insurance Trust. The funds of funds also benefit from such overall management fee waiver through their investment in underlying funds that include certain of the participating portfolios, which are subject to reimbursement; |
| | (b) | reviewed the fund's advisory fee structure and concluded that: (i) the fund's fee structure contains breakpoints in the advisory fees for the fund; and (ii) although economies of scale cannot be measured with precision, these arrangements permit shareholders of the fund to benefit from economies of scale if the fund grows. The Board also took into account management's discussion of the fund's advisory fee structure; and |
| | (c) | the Board also considered the effect of the fund's growth in size on its performance and fees. The Board also noted that if the fund's assets increase over time, the fund may realize other economies of scale. |
ANNUAL REPORT | JOHN HANCOCK ALTERNATIVE ASSET ALLOCATION FUND 37
Approval of Subadvisory Agreement
In making its determination with respect to approval of the Subadvisory Agreement, the Board reviewed:
| | | |
| | (1) | information relating to the Subadvisor's business, including current subadvisory services to the Trust (and other funds in the John Hancock Fund Complex); |
| | (2) | the historical and current performance of the fund and comparative performance information relating to an applicable benchmark index and comparable funds; and |
| | (3) | the subadvisory fees for the fund and to the extent available, comparable fee information prepared by an independent third party provider of fund data. |
Nature, extent, and quality of services. With respect to the services provided by the Subadvisor, the Board received information provided to the Board by the Subadvisor, including the Subadvisor's respective Form ADV, as well as took into account information presented throughout the past year. The Board considered the Subadvisor's current level of staffing and its overall resources, as well as received information relating to the Subadvisor's compensation program. The Board reviewed the Subadvisor's history and investment experience, as well as information regarding the qualifications, background, and responsibilities of the Subadvisor's investment and compliance personnel who provide services to the fund. The Board also considered, among other things, the Subadvisor's compliance program and any disciplinary history. The Board also considered the Subadvisor's risk assessment and monitoring process. The Board reviewed the Subadvisor's regulatory history, including whether it was involved in any regulatory actions or investigations as well as material litigation, and any settlements and amelioratory actions undertaken, as appropriate. The Board noted that the Advisor conducts regular, periodic reviews of the Subadvisor and its operations, including regarding investment processes and organizational and staffing matters. The Board also noted that the Trust's CCO and his staff conduct regular, periodic compliance reviews with the Subadvisor and present reports to the Independent Trustees regarding the same, which includes evaluating the regulatory compliance systems of the Subadvisor and procedures reasonably designed to assure compliance with the federal securities laws. The Board also took into account the financial condition of the Subadvisor.
The Board considered the Subadvisor's investment process and philosophy. The Board took into account that the Subadvisor's responsibilities include the development and maintenance of an investment program for the fund that is consistent with the fund's investment objective, the selection of investment securities and the placement of orders for the purchase and sale of such securities, as well as the implementation of compliance controls related to performance of these services. The Board also received information with respect to the Subadvisor's brokerage policies and practices, including with respect to best execution and soft dollars.
Subadvisor compensation. In considering the cost of services to be provided by the Subadvisor and the profitability to the Subadvisor of its relationship with the fund, the Board noted that the fees under each Subadvisory Agreement are paid by the Advisor and not the fund. The Board also received information and took into account any other potential conflicts of interest the Advisor might have in connection with the Subadvisory Agreement.
In addition, the Board considered other potential indirect benefits that the Subadvisor and its affiliates may receive from the Subadvisor's relationship with the fund, such as the opportunity to provide advisory services to additional funds in the John Hancock Fund Complex and reputational benefits.
Subadvisory fees. The Board considered that the fund pays an advisory fee to the Advisor and that, in turn, the Advisor pays a subadvisory fee to the Subadvisor. As noted above, the Board also considered the fund's subadvisory fees as compared to similarly situated investment companies deemed to be comparable to the fund as included in the report prepared by the independent third party provider of fund data, to the extent available. The Board noted that the
ANNUAL REPORT | JOHN HANCOCK ALTERNATIVE ASSET ALLOCATION FUND 38
limited size of the Lipper peer group was not sufficient for comparative purposes. The Board also took into account the subadvisory fees paid by the Advisor to the Subadvisor with respect to the fund and compared them to fees charged by the Subadvisor to manage other subadvised portfolios and portfolios not subject to regulation under the 1940 Act, as applicable.
Subadvisor performance. As noted above, the Board considered the fund's performance as compared to the fund's peer group median and the benchmark index and noted that the Board reviews information about the fund's performance results at its regularly scheduled meetings. The Board noted the Advisor's expertise and resources in monitoring the performance, investment style and risk-adjusted performance of the Subadvisor. The Board was mindful of the Advisor's focus on the Subadvisor's performance. The Board also noted the Subadvisor's long-term performance record for similar accounts, as applicable.
The Board's decision to approve the Subadvisory Agreement was based on a number of determinations, including the following:
| | | |
| | (1) | the Subadvisor has extensive experience and demonstrated skills as a manager; |
| | (2) | the fund's performance has generally been in line with or outperformed the historical performance of comparable funds and the fund's benchmark index; |
| | (3) | the subadvisory fees are reasonable in relation to the level and quality of services being provided under the Subadvisory Agreement; and |
| | (4) | noted that the subadvisory fees are paid by the Advisor not the fund. |
In addition, the Trustees reviewed the subadvisory fees to be paid to the Subadvisor for the fund and concluded that the subadvisory fees to be paid to the Subadvisor are based on services provided that are in addition to, rather than duplicative of, the services provided pursuant to the subadvisory agreements for the underlying funds of the fund, and that the additional services are necessary because of the differences between the investment policies, strategies and techniques of the fund and those of its underlying funds.
* * *
Based on the Board's evaluation of all factors that the Board deemed to be material, including those factors described above, the Board, including the Independent Trustees, concluded that renewal of the Advisory Agreement and the Subadvisory Agreement would be in the best interest of the fund and its shareholders. Accordingly, the Board, and the Independent Trustees voting separately, approved the Advisory Agreement and Subadvisory Agreement for an additional one-year period.
ANNUAL REPORT | JOHN HANCOCK ALTERNATIVE ASSET ALLOCATION FUND 39
STATEMENT REGARDING LIQUIDITY RISK MANAGEMENT
Operation of the Liquidity Risk Management Program
This section describes operation and effectiveness of the Liquidity Risk Management Program (LRMP) established in accordance with Rule 22e-4 under the Investment Company Act of 1940, as amended (the Liquidity Rule). The Board of Trustees (the Board) of each Fund in the John Hancock Group of Funds (each a Fund and collectively, the Funds) that is subject to the requirements of the Liquidity Rule has appointed John Hancock Investment Management LLC and John Hancock Variable Trust Advisers LLC (together, the Advisor) to serve as Administrator of the LRMP with respect to each of the Funds, including Alternative Asset Allocation Fund, subject to the oversight of the Board. In order to provide a mechanism and process to perform the functions necessary to administer the LRMP, the Advisor established the Liquidity Risk Management Committee (the Committee). The Funds' subadvisor, Manulife Investment Management (US) LLC, (the Subadvisor) executes the day-to-day investment management and security-level activities of the Fund in accordance with the requirements of the LRMP, subject to the supervision of the Advisor and the Board.
The Committee holds monthly meetings to: (1) review the day-to-day operations of the LRMP; (2) review and approve month end liquidity classifications; (3) review quarterly testing and determinations, as applicable; and (4) review other LRMP related material. The Committee also conducts daily, monthly, quarterly, and annual quantitative and qualitative assessments of each subadvisor to a Fund that is subject to the requirements of the Liquidity Rule and is a part of the LRMP to monitor investment performance issues, risks and trends. In addition, the Committee may conduct ad-hoc reviews and meetings with subadvisors as issues and trends are identified, including potential liquidity and valuation issues.
The Committee provided the Board at a meeting held on March 15-17, 2020 with a written report which addressed the Committee's assessment of the adequacy and effectiveness of the implementation and operation of the LRMP and any material changes to the LRMP. The report, which covered the period December 1, 2018 through December 31, 2019, included an assessment of important aspects of the LRMP including, but not limited to:
| • | Operation of the Fund's Redemption-In-Kind Procedures; |
| • | Highly Liquid Investment Minimum (HLIM) determination; |
| • | Compliance with the 15% limit on illiquid investments; |
| • | Reasonably Anticipated Trade Size (RATS) determination; |
| • | Security-level liquidity classifications; and |
| • | Liquidity risk assessment. |
The report also covered material liquidity matters which occurred or were reported during this period applicable to the Fund, if any, and the Committee's actions to address such matters.
Redemption-In-Kind Procedures
Rule 22e-4 requires any fund that engages in or reserves the right to engage in in-kind redemptions to adopt and implement written policies and procedures regarding in-kind redemptions as part of the management of its liquidity risk. These procedures address the process for redeeming in kind, as well as the circumstances under which the Fund would consider redeeming in kind. Anticipated large redemption activity will be evaluated to identify situations where redeeming in securities instead of cash may be appropriate.
ANNUAL REPORT | JOHN HANCOCK ALTERNATIVE ASSET ALLOCATION FUND 40
As part of its annual assessment of the LRMP, the Committee reviewed the implementation and operation of the Redemption-In-Kind Procedures and determined they are operating in a manner that such procedures are adequate and effective to manage in-kind redemptions on behalf of the Fund as part of the LRMP.
Highly Liquid Investment Minimum determination
The Committee uses an HLIM model to determine a Fund's HLIM. This process incorporates the Fund's investment strategy, historical redemptions, liquidity classification rollup percentages and cash balances, redemption policy, access to funding sources, distribution channels and client concentrations. If the Fund falls below its established HLIM for a period greater than 7 consecutive calendar days, the Committee prepares a report to the Board within one business day following the seventh consecutive calendar day with an explanation of how the Fund plans to restore its HLIM within a reasonable period of time.
Based on the HLIM model, the Committee has determined that the Fund qualifies as a Primarily Highly Liquid Fund (PHLF). It is therefore not required to establish a HLIM. The Fund is tested quarterly to confirm its PHLF status.
As part of its annual assessment of the LRMP, the Committee reviewed the policies and procedures in place with respect to HLIM and PHLF determinations, and determined that such policies and procedures are operating in a manner that is adequate and effective as part of the LRMP.
Compliance with the 15% limit on illiquid investments
Rule 22e-4 sets an aggregate illiquid investment limit of 15% for a fund. Funds are prohibited from acquiring an illiquid investment if this results in greater than 15% of its net assets being classified as illiquid. When applying this limit, the Committee defines "illiquid investment" to mean any investment that the Fund reasonably expects cannot be sold or disposed of in current market conditions in seven calendar days or less without the sale or disposition significantly changing the market value of the investment. If a 15% illiquid investment limit breach occurs for longer than 1 business day, the Fund is required to notify the Board and provide a plan on how to bring illiquid investments within the 15% threshold, and after 7 days confidentially notify the Securities and Exchange Commission (the SEC).
In February 2019, as a result of extended security markets closures in connection with the Chinese New Year in certain countries, the SEC released guidance, and the Committee approved and adopted an Extended Market Holiday Policy to plan for and monitor known Extended Market Holidays (defined as all expected market holiday closures spanning four or more calendar days).
As part of its annual assessment of the LRMP, the Committee reviewed the policies and procedures in place with respect to the 15% illiquid investment limit and determined such policies and procedures are operating in a manner that is adequate and effective as part of the LMRP.
Reasonably Anticipated Trade Size determination
In order to assess the liquidity risk of a Fund, the Committee considers the impact on the Fund that redemptions of a RATS would have under both normal and reasonably foreseeable stressed conditions. Modelling the Fund's RATS requires quantifying cash flow volatility and analyzing distribution channel concentration and redemption risk. The model is designed to estimate the amount of assets that the Fund could reasonably anticipate trading on a given day, during both normal and reasonably foreseeable stressed conditions, to satisfy redemption requests.
ANNUAL REPORT | JOHN HANCOCK ALTERNATIVE ASSET ALLOCATION FUND 41
As part of its annual assessment of the LRMP, the Committee reviewed the policies and procedures in place with respect to RATS determinations and determined that such policies and procedures are operating in a manner that is adequate and effective at making RATS determinations as part of the LRMP.
Security-level liquidity classifications
When classifying the liquidity of portfolio securities, the Fund adheres to the liquidity classification procedures established by the Advisor. In assigning a liquidity classification to Fund portfolio holdings, the following key inputs, among others, are considered: the Fund's RATS, feedback from the applicable Subadvisor on market-, trading- and investment-specific considerations, an assessment of current market conditions and fund portfolio holdings, and a value impact standard. The Subadvisor also provides position-level data to the Committee for use in monthly classification reconciliation in order to identify any classifications that may need to be changed as a result of the above considerations.
As part of its annual assessment of the LRMP, the Committee reviewed the policies and procedures in place with respect to security-level liquidity classifications and determined that such policies and procedures are operating in a manner that is adequate and effective as part of the LRMP.
Liquidity risk assessment
The Committee periodically reviews and assesses, the Fund's liquidity risk, including its investment strategy and liquidity of portfolio investments during both normal and reasonably foreseeable stressed conditions (including whether the investment strategy is appropriate for an open-end fund, the extent to which the strategy involves a relatively concentrated portfolio or large positions in particular issuers, and the use of borrowings for investment purposes and derivatives), cash flow analysis during both normal and reasonably foreseeable stressed conditions, and holdings of cash and cash equivalents, as well as borrowing arrangements and other funding sources.
The Committee also monitors global events, such as the COVID-19 Coronavirus, that could impact the markets and liquidity of portfolio investments and their classifications.
As part of its annual assessment of the LRMP, the Committee reviewed Fund-Level Liquidity Risk Assessment Reports for each of the Funds and determined that the investment strategy for each Fund continues to be appropriate for an open-ended structure.
Adequacy and Effectiveness
Based on the review and assessment conducted by the Committee, the Committee has determined that the LRMP has been implemented, and is operating in a manner that is adequate and effective at assessing and managing the liquidity risk of each Fund.
ANNUAL REPORT | JOHN HANCOCK ALTERNATIVE ASSET ALLOCATION FUND 42
This chart provides information about the Trustees and Officers who oversee your John Hancock fund. Officers elected by the Trustees manage the day-to-day operations of the fund and execute policies formulated by the Trustees.
Independent Trustees
| | | |
Name, year of birth
Position(s) held with Trust
Principal occupation(s) and other
directorships during past 5 years | Trustee
of the
Trust
since1 | Number of John
Hancock funds
overseen by
Trustee |
| Hassell H. McClellan, Born: 1945 | 2005 | 195 |
Trustee and Chairperson of the Board
Director/Trustee, Virtus Funds (since 2008); Director, The Barnes Group (since 2010); Associate Professor, The Wallace E. Carroll School of Management, Boston College (retired 2013). Trustee (since 2005) and Chairperson of the Board (since 2017) of various trusts within the John Hancock Fund Complex. |
| | | |
| Charles L. Bardelis,2 Born: 1941 | 2005 | 195 |
Trustee
Director, Island Commuter Corp. (marine transport). Trustee of various trusts within the John Hancock Fund Complex (since 1988). |
| | | |
| James R. Boyle, Born: 1959 | 2015 | 195 |
Trustee
Chief Executive Officer, Foresters Financial (since 2018); Chairman and Chief Executive Officer, Zillion Group, Inc. (formerly HealthFleet, Inc.) (healthcare) (2014-2018); Executive Vice President and Chief Executive Officer, U.S. Life Insurance Division of Genworth Financial, Inc. (insurance) (January 2014-July 2014); Senior Executive Vice President, Manulife Financial, President and Chief Executive Officer, John Hancock (1999-2012); Chairman and Director, John Hancock Investment Management LLC, John Hancock Investment Management Distributors LLC, and John Hancock Variable Trust Advisers LLC (2005-2010). Trustee of various trusts within the John Hancock Fund Complex (2005-2014 and since 2015). |
| | | |
| Peter S. Burgess,2 Born: 1942 | 2005 | 195 |
Trustee
Consultant (financial, accounting, and auditing matters) (since 1999); Certified Public Accountant; Partner, Arthur Andersen (independent public accounting firm) (prior to 1999); Director, Lincoln Educational Services Corporation (since 2004); Director, Symetra Financial Corporation (2010-2016); Director, PMA Capital Corporation (2004-2010). Trustee of various trusts within the John Hancock Fund Complex (since 2005). |
| | | |
| William H. Cunningham, Born: 1944 | 2012 | 195 |
Trustee
Professor, University of Texas, Austin, Texas (since 1971); former Chancellor, University of Texas System and former President of the University of Texas, Austin, Texas; Chairman (since 2009) and Director (since 2006), Lincoln National Corporation (insurance); Director, Southwest Airlines (since 2000); former Director, LIN Television (2009-2014). Trustee of various trusts within the John Hancock Fund Complex (since 1986). |
| | | |
| Grace K. Fey, Born: 1946 | 2008 | 195 |
Trustee
Chief Executive Officer, Grace Fey Advisors (since 2007); Director and Executive Vice President, Frontier Capital Management Company (1988-2007); Director, Fiduciary Trust (since 2009). Trustee of various trusts within the John Hancock Fund Complex (since 2008). |
ANNUAL REPORT | JOHN HANCOCK ALTERNATIVE ASSET ALLOCATION FUND 43
Independent Trustees (continued)
| | | |
Name, year of birth
Position(s) held with Trust
Principal occupation(s) and other
directorships during past 5 years | Trustee
of the
Trust
since1 | Number of John
Hancock funds
overseen by
Trustee |
| Deborah C. Jackson, Born: 1952 | 2012 | 195 |
Trustee
President, Cambridge College, Cambridge, Massachusetts (since 2011); Board of Directors, Massachusetts Women's Forum (since 2018); Board of Directors, National Association of Corporate Directors/New England (since 2015); Board of Directors, Association of Independent Colleges and Universities of Massachusetts (2014-2017); Chief Executive Officer, American Red Cross of Massachusetts Bay (2002-2011); Board of Directors of Eastern Bank Corporation (since 2001); Board of Directors of Eastern Bank Charitable Foundation (since 2001); Board of Directors of American Student Assistance Corporation (1996-2009); Board of Directors of Boston Stock Exchange (2002-2008); Board of Directors of Harvard Pilgrim Healthcare (health benefits company) (2007-2011). Trustee of various trusts within the John Hancock Fund Complex (since 2008). |
| | | |
| James M. Oates,2 Born: 1946 | 2005 | 195 |
Trustee
Managing Director, Wydown Group (financial consulting firm) (since 1994); Chairman and Director, Emerson Investment Management, Inc. (2000-2015); Independent Chairman, Hudson Castle Group, Inc. (formerly IBEX Capital Markets, Inc.) (financial services company) (1997-2011); Director, Stifel Financial (since 1996); Director, Investor Financial Services Corporation (1995-2007); Director, Connecticut River Bancorp (1998-2014); Director/Trustee, Virtus Funds (since 1988). Trustee (since 2004) and Chairperson of the Board (2005-2016) of various trusts within the John Hancock Fund Complex. |
| | | |
| Steven R. Pruchansky, Born: 1944 | 2012 | 195 |
Trustee and Vice Chairperson of the Board
Managing Director, Pru Realty (since 2017); Chairman and Chief Executive Officer, Greenscapes of Southwest Florida, Inc. (2014-2020); Director and President, Greenscapes of Southwest Florida, Inc. (until 2000); Member, Board of Advisors, First American Bank (until 2010); Managing Director, Jon James, LLC (real estate) (since 2000); Partner, Right Funding, LLC (2014-2017); Director, First Signature Bank & Trust Company (until 1991); Director, Mast Realty Trust (until 1994); President, Maxwell Building Corp. (until 1991). Trustee (since 1992), Chairperson of the Board (2011-2012), and Vice Chairperson of the Board (since 2012) of various trusts within the John Hancock Fund Complex. |
| | | |
| Frances G. Rathke,2,* Born: 1960 | 2020 | 195 |
Trustee
Director, Northern New England Energy Corporation (since 2017); Director, Audit Committee Chair and Compensation Committee Member, Green Mountain Power Corporation (since 2016); Director, Treasurer and Finance & Audit Committee Chair, Flynn Center for Performing Arts (since 2016); Director, Audit Committee Chair and Compensation Committee Member, Planet Fitness (since 2016); Director, Citizen Cider, Inc. (high-end hard cider and hard seltzer company) (since 2016); Chief Financial Officer and Treasurer, Keurig Green Mountain, Inc. (2003-retired 2015); Independent Financial Consultant, Frances Rathke Consulting (strategic and financial consulting services) (2001-2003); Chief Financial Officer and Secretary, Ben & Jerry's Homemade, Inc. (1989-2000, including prior positions); Senior Manager, Coopers & Lybrand, LLC (independent public accounting firm) (1982-1989). Trustee of various trusts within the John Hancock Fund Complex (since 2020). |
ANNUAL REPORT | JOHN HANCOCK ALTERNATIVE ASSET ALLOCATION FUND 44
Independent Trustees (continued)
| | | |
Name, year of birth
Position(s) held with Trust
Principal occupation(s) and other
directorships during past 5 years | Trustee
of the
Trust
since1 | Number of John
Hancock funds
overseen by
Trustee |
| Gregory A. Russo, Born: 1949 | 2012 | 195 |
Trustee
Director and Audit Committee Chairman (2012-2020), and Member, Audit Committee and Finance Committee (2011-2020), NCH Healthcare System, Inc. (holding company for multi-entity healthcare system); Director and Member (2012-2018) and Finance Committee Chairman (2014-2018), The Moorings, Inc. (nonprofit continuing care community); Vice Chairman, Risk & Regulatory Matters, KPMG LLP (KPMG) (2002-2006); Vice Chairman, Industrial Markets, KPMG (1998-2002); Chairman and Treasurer, Westchester County, New York, Chamber of Commerce (1986-1992); Director, Treasurer, and Chairman of Audit and Finance Committees, Putnam Hospital Center (1989-1995); Director and Chairman of Fundraising Campaign, United Way of Westchester and Putnam Counties, New York (1990-1995). Trustee of various trusts within the John Hancock Fund Complex (since 2008). |
Non-Independent Trustees3
| | | |
Name, year of birth
Position(s) held with Trust
Principal occupation(s) and other
directorships during past 5 years | Trustee
of the
Trust
since1 | Number of John
Hancock funds
overseen by
Trustee |
| Andrew G. Arnott, Born: 1971 | 2017 | 195 |
President and Non-Independent Trustee
Head of Wealth and Asset Management, United States and Europe, for John Hancock and Manulife (since 2018); Executive Vice President, John Hancock Financial Services (since 2009, including prior positions); Director and Executive Vice President, John Hancock Investment Management LLC (since 2005, including prior positions); Director and Executive Vice President, John Hancock Variable Trust Advisers LLC (since 2006, including prior positions); President, John Hancock Investment Management Distributors LLC (since 2004, including prior positions); President of various trusts within the John Hancock Fund Complex (since 2007, including prior positions). Trustee of various trusts within the John Hancock Fund Complex (since 2017). |
| | | |
| Marianne Harrison, Born: 1963 | 2018 | 195 |
Non-Independent Trustee
President and CEO, John Hancock (since 2017); President and CEO, Manulife Canadian Division (2013-2017); Member, Board of Directors, CAE Inc. (since 2019); Member, Board of Directors, MA Competitive Partnership Board (since 2018); Member, Board of Directors, American Council of Life Insurers (ACLI) (since 2018); Member, Board of Directors, Communitech, an industry-led innovation center that fosters technology companies in Canada (2017-2019); Member, Board of Directors, Manulife Assurance Canada (2015-2017); Board Member, St. Mary's General Hospital Foundation (2014-2017); Member, Board of Directors, Manulife Bank of Canada (2013-2017); Member, Standing Committee of the Canadian Life & Health Assurance Association (2013-2017); Member, Board of Directors, John Hancock USA, John Hancock Life & Health, John Hancock New York (2012-2013). Trustee of various trusts within the John Hancock Fund Complex (since 2018). |
ANNUAL REPORT | JOHN HANCOCK ALTERNATIVE ASSET ALLOCATION FUND 45
Principal officers who are not Trustees
| | |
Name, year of birth
Position(s) held with Trust
Principal occupation(s)
during past 5 years | Officer
of the
Trust
since |
| Charles A. Rizzo, Born: 1957 | 2007 |
Chief Financial Officer
Vice President, John Hancock Financial Services (since 2008); Senior Vice President, John Hancock Investment Management LLC and John Hancock Variable Trust Advisers LLC (since 2008); Chief Financial Officer of various trusts within the John Hancock Fund Complex (since 2007). |
| | |
| Salvatore Schiavone, Born: 1965 | 2009 |
Treasurer
Assistant Vice President, John Hancock Financial Services (since 2007); Vice President, John Hancock Investment Management LLC and John Hancock Variable Trust Advisers LLC (since 2007); Treasurer of various trusts within the John Hancock Fund Complex (since 2007, including prior positions). |
| | |
| Christopher (Kit) Sechler, Born: 1973 | 2018 |
Chief Legal Officer and Secretary
Vice President and Deputy Chief Counsel, John Hancock Investments (since 2015); Assistant Vice President and Senior Counsel (2009-2015), John Hancock Investment Management; Chief Legal Officer and Secretary of various trusts within the John Hancock Fund Complex (since 2018); Assistant Secretary of John Hancock Investment Management LLC and John Hancock Variable Trust Advisers LLC (since 2009). |
| | |
| Trevor Swanberg, Born: 1979 | 2020 |
Chief Compliance Officer
Chief Compliance Officer, various trusts within the John Hancock Fund Complex, John Hancock Investment Management LLC, and John Hancock Variable Trust Advisers LLC (since 2020); Deputy Chief Compliance Officer, various trusts within the John Hancock Fund Complex (2018-2020); Deputy Chief Compliance Officer, John Hancock Investment Management LLC and John Hancock Variable Trust Advisers LLC (2019-2020); Assistant Chief Compliance Officer, various trusts within the John Hancock Fund Complex (2016-2018); Assistant Chief Compliance Officer, John Hancock Investment Management LLC and John Hancock Variable Trust Advisers LLC (2016-2019); Vice President, State Street Global Advisors (2015-2016). |
The business address for all Trustees and Officers is 200 Berkeley Street, Boston, Massachusetts 02116-5023.
The Statement of Additional Information of the fund includes additional information about members of the Board of Trustees of the Trust and is available without charge, upon request, by calling 800-225-5291.
| | |
| 1 | Each Trustee holds office until his or her successor is elected and qualified, or until the Trustee's death, retirement, resignation, or removal. Mr. Boyle has served as Trustee at various times prior to the date listed in the table. |
| 2 | Member of the Audit Committee. |
| 3 | The Trustee is a Non-Independent Trustee due to current or former positions with the Advisor and certain affiliates. |
| * | Appointed as Independent Trustee effective as of September 15, 2020. |
ANNUAL REPORT | JOHN HANCOCK ALTERNATIVE ASSET ALLOCATION FUND 46
| | |
Trustees
Hassell H. McClellan, Chairperson
Steven R. Pruchansky, Vice Chairperson
Andrew G. Arnott†
Charles L. Bardelis*
James R. Boyle
Peter S. Burgess*
William H. Cunningham
Grace K. Fey
Marianne Harrison†
Deborah C. Jackson
James M. Oates*
Frances G. Rathke*,1
Gregory A. Russo
Officers
Andrew G. Arnott
President
Charles A. Rizzo
Chief Financial Officer
Salvatore Schiavone
Treasurer
Christopher (Kit) Sechler
Secretary and Chief Legal Officer
Trevor Swanberg2
Chief Compliance Officer
| Investment advisor
John Hancock Investment Management LLC
Subadvisor
Manulife Investment Management (US) LLC
Portfolio Managers
Nathan W. Thooft, CFA
Christopher Walsh, CFA
Principal distributor
John Hancock Investment Management Distributors LLC
Custodian
State Street Bank and Trust Company
Transfer agent
John Hancock Signature Services, Inc.
Legal counsel
K&L Gates LLP
Independent registered public accounting firm
PricewaterhouseCoopers LLP
|
* Member of the Audit Committee
† Non-Independent Trustee
1 Appointed as Independent Trustee effective as of September 15, 2020
2 Effective July 31, 2020
The fund's proxy voting policies and procedures, as well as the fund proxy voting record for the most recent twelve-month period ended June 30, are available free of charge on the Securities and Exchange Commission (SEC) website at sec.gov or on our website.
All of the fund's holdings as of the end of the third month of every fiscal quarter are filed with the SEC on Form N-PORT within 60 days of the end of the fiscal quarter. The fund's Form N-PORT filings are available on our website and the SEC's website, sec.gov.
We make this information on your fund, as well as monthly portfolio holdings, and other fund details available on our website at jhinvestments.com or by calling 800-225-5291.
| | | | |
| | You can also contact us: |
| | 800-225-5291
jhinvestments.com | Regular mail:
John Hancock Signature Services, Inc.
PO Box 219909
Kansas City, MO 64121-9909
| Express mail:
John Hancock Signature Services, Inc.
430 W 7th Street
Suite 219909
Kansas City, MO 64105-1407
|
ANNUAL REPORT | JOHN HANCOCK ALTERNATIVE ASSET ALLOCATION FUND 47
John Hancock family of funds
| | | |
DOMESTIC EQUITY FUNDS
Blue Chip Growth
Classic Value
Disciplined Value
Disciplined Value Mid Cap
Equity Income
Financial Industries
Fundamental All Cap Core
Fundamental Large Cap Core
New Opportunities
Regional Bank
Small Cap Core
Small Cap Growth
Small Cap Value
U.S. Global Leaders Growth
U.S. Quality Growth
GLOBAL AND INTERNATIONAL EQUITY FUNDS
Disciplined Value International
Emerging Markets
Emerging Markets Equity
Fundamental Global Franchise
Global Equity
Global Shareholder Yield
Global Thematic Opportunities
International Dynamic Growth
International Growth
International Small Company
| | INCOME FUNDS
Bond
California Tax-Free Income
Emerging Markets Debt
Floating Rate Income
Government Income
High Yield
High Yield Municipal Bond
Income
Investment Grade Bond
Money Market
Short Duration Bond
Short Duration Credit Opportunities
Strategic Income Opportunities
Tax-Free Bond
ALTERNATIVE AND SPECIALTY FUNDS
Absolute Return Currency
Alternative Asset Allocation
Alternative Risk Premia
Diversified Macro
Infrastructure
Multi-Asset Absolute Return
Seaport Long/Short
|
A fund's investment objectives, risks, charges, and expenses should be considered carefully before investing. The prospectus contains this and other important information about the fund. To obtain a prospectus, contact your financial professional, call John Hancock Investment Management at 800-225-5291, or visit our website at jhinvestments.com. Please read the prospectus carefully before investing or sending money.
| | | |
ASSET ALLOCATION
Balanced
Multi-Asset High Income
Multi-Index Lifetime Portfolios
Multi-Index Preservation Portfolios
Multimanager Lifestyle Portfolios
Multimanager Lifetime Portfolios
Retirement Income 2040
EXCHANGE-TRADED FUNDS
John Hancock Multifactor Consumer Discretionary ETF
John Hancock Multifactor Consumer Staples ETF
John Hancock Multifactor Developed International ETF
John Hancock Multifactor Emerging Markets ETF
John Hancock Multifactor Energy ETF
John Hancock Multifactor Financials ETF
John Hancock Multifactor Healthcare ETF
John Hancock Multifactor Industrials ETF
John Hancock Multifactor Large Cap ETF
John Hancock Multifactor Materials ETF
John Hancock Multifactor Media and
Communications ETF
John Hancock Multifactor Mid Cap ETF
John Hancock Multifactor Small Cap ETF
John Hancock Multifactor Technology ETF
John Hancock Multifactor Utilities ETF
| | ENVIRONMENTAL, SOCIAL, AND
GOVERNANCE FUNDS
ESG All Cap Core
ESG Core Bond
ESG International Equity
ESG Large Cap Core
CLOSED-END FUNDS
Financial Opportunities
Hedged Equity & Income
Income Securities Trust
Investors Trust
Preferred Income
Preferred Income II
Preferred Income III
Premium Dividend
Tax-Advantaged Dividend Income
Tax-Advantaged Global Shareholder Yield
|
John Hancock Multifactor ETF shares are bought and sold at market price (not NAV), and are not individually redeemed
from the fund. Brokerage commissions will reduce returns.
John Hancock ETFs are distributed by Foreside Fund Services, LLC, and are subadvised by Dimensional Fund Advisors LP.
Foreside is not affiliated with John Hancock Investment Management Distributors LLC or Dimensional Fund Advisors LP.
Dimensional Fund Advisors LP receives compensation from John Hancock in connection with licensing rights to the
John Hancock Dimensional indexes. Dimensional Fund Advisors LP does not sponsor, endorse, or sell, and makes no
representation as to the advisability of investing in, John Hancock Multifactor ETFs.
John Hancock Investment Management
A trusted brand
John Hancock Investment Management is a premier asset manager
with a heritage of financial stewardship dating back to 1862. Helping
our shareholders pursue their financial goals is at the core of
everything we do. It's why we support the role of professional financial
advice and operate with the highest standards of conduct and integrity.
A better way to invest
We serve investors globally through a unique multimanager approach:
We search the world to find proven portfolio teams with specialized
expertise for every strategy we offer, then we apply robust investment
oversight to ensure they continue to meet our uncompromising
standards and serve the best interests of our shareholders.
Results for investors
Our unique approach to asset management enables us to provide
a diverse set of investments backed by some of the world's best
managers, along with strong risk-adjusted returns across asset classes.
John Hancock Investment Management Distributors LLC n Member FINRA, SIPC
200 Berkeley Street n Boston, MA 02116-5010 n 800-225-5291 n jhinvestments.com
This report is for the information of the shareholders of John Hancock Alternative Asset Allocation Fund. It is not authorized for distribution to prospective investors unless preceded or accompanied by a prospectus.
| | |
| MF1324469 | 345A 8/20
10/2020 |
John Hancock
Floating Rate Income Fund
Annual report 8/31/2020
Beginning on January 1, 2021, as permitted by regulations adopted by the Securities and Exchange Commission, paper copies of the fund's shareholder reports like this one will no longer be sent by mail, unless you specifically request paper copies of the reports from the fund or from your financial intermediary. Instead, the reports will be made available on a website, and you will be notified by mail each time a report is posted and provided with a website link to access the report.
If you already elected to receive shareholder reports electronically, you will not be affected by this change, and you do not need to take any action. You may elect to receive shareholder reports and other communications electronically by calling John Hancock Investment Management at 800-225-5291 (Class A, Class B and Class C shares) or 888-972-8696 (Class I and Class R Suite) or by contacting your financial intermediary.
You may elect to receive all reports in paper, free of charge, at any time. You can inform John Hancock Investment Management or your financial intermediary that you wish to continue receiving paper copies of your shareholder reports by following the instructions listed above. Your election to receive reports in paper will apply to all funds held with John Hancock Investment Management or your financial intermediary.

A message to shareholders
Dear shareholder,
Despite heightened fears over the coronavirus (COVID-19), which sent markets tumbling during the latter half of February and early March, global financial markets delivered positive returns for the 12-month period ended August 31, 2020.
During the first-quarter sell-off, many investors reacted by exiting higher-risk assets and moving into cash, leading to a liquidity crunch in the fixed-income markets. In response to the sell-off, the U.S. Federal Reserve acted quickly, lowering interest rates to near zero and reinstating quantitative easing, as well as announcing its plans to shore up short-term debt. Many other nations followed suit and credit spreads rebounded off their highs as liquidity concerns eased.
The continued spread of COVID-19, trade disputes, rising unemployment, and other geopolitical tensions may continue to create uncertainty among businesses and investors. Your financial professional can help position your portfolio so that it's sufficiently diversified to seek to meet your long-term objectives and to withstand the inevitable bouts of market volatility along the way.
On behalf of everyone at John Hancock Investment Management, I'd like to take this opportunity to welcome new shareholders and thank existing shareholders for the continued trust you've placed in us.
Sincerely,
Andrew G. Arnott
President and CEO,
John Hancock Investment Management
Head of Wealth and Asset Management,
United States and Europe
This commentary reflects the CEO's views as of this report's period end and are subject to change at any time. Diversification does not guarantee investment returns and does not eliminate risk of loss. All investments entail risks, including the possible loss of principal. For more up-to-date information, you can visit our website at jhinvestments.com.
John Hancock
Floating Rate Income Fund
Table of contents
| | | |
| 2 | | Your fund at a glance |
| 5 | | Manager's discussion of fund performance |
| 7 | | A look at performance |
| 9 | | Your expenses |
| 11 | | Fund's investments |
| 37 | | Financial statements |
| 40 | | Financial highlights |
| 47 | | Notes to financial statements |
| 58 | | Report of independent registered public accounting firm |
| 59 | | Tax information |
| 60 | | Continuation of investment advisory and subadvisory agreements |
| 67 | | Statement regarding liquidity risk management |
| 70 | | Trustees and Officers |
| 74 | | More information |
ANNUAL REPORT | JOHN HANCOCK FLOATING RATE INCOME FUND 1
INVESTMENT OBJECTIVE
The fund seeks a high level of current income.
AVERAGE ANNUAL TOTAL RETURNS AS OF 8/31/2020 (%)
The S&P/LSTA Leveraged Loan Index tracks returns in the leveraged loan market and captures a broad cross-section of the U.S. leveraged loan market, including dollar-denominated, U.S.-syndicated loans to overseas issuers.
It is not possible to invest directly in an index. Index figures do not reflect expenses or sales charges, which would result in lower returns.
The fund's Morningstar category average is a group of funds with similar investment objectives and strategies and is the equal-weighted return of all funds per category. Morningstar places funds in certain categories based on their historical portfolio holdings. Figures from Morningstar, Inc. include reinvested distributions and do not take into account sales charges. Actual load-adjusted performance is lower.
The past performance shown here reflects reinvested distributions and the beneficial effect of any expense reductions, and does not guarantee future results. Performance of the other share classes will vary based on the difference in the fees and expenses of those classes. Shares will fluctuate in value and, when redeemed, may be worth more or less than their original cost. Current month-end performance may be lower or higher than the performance cited, and can be found at jhinvestments.com or by calling 800-225-5291. For further information on the fund's objectives, risks, and strategy, see the fund's prospectus.
ANNUAL REPORT | JOHN HANCOCK FLOATING RATE INCOME FUND 2
PERFORMANCE HIGHLIGHTS OVER THE LAST TWELVE MONTHS
Bank loans positive despite significant drawdown in 2020
The U.S. bank loan market declined over 13% in the first quarter of 2020 amid the COVID-19 pandemic, but loans still eked out a positive return over the full period.
High-yield corporate bonds outperformed loans
High-yield bonds outperformed bank loans in the period as favorable technicals and a lower rate environment benefited the high-yield asset class.
The fund underperformed the S&P/LSTA Leveraged Loan Index
The fund's underweight to outperforming BB-rated debt was a detractor, but it benefited from an underweight to CCC credits.
PORTFOLIO COMPOSITION AS OF 8/31/2020 (%)
ANNUAL REPORT | JOHN HANCOCK FLOATING RATE INCOME FUND 3
SECTOR COMPOSITION AS OF 8/31/2020 (%)
QUALITY COMPOSITION AS OF 8/31/2020 (%)
A note about risks
The fund may be subject to various risks as described in the fund's prospectus. A widespread health crisis such as a global pandemic could cause substantial market volatility, exchange trading suspensions and closures, impact the ability to complete redemptions, and affect fund performance. For example, the novel coronavirus disease (COVID-19) has resulted in significant disruptions to global business activity. The impact of a health crisis and other epidemics and pandemics that may arise in the future, could affect the global economy in ways that cannot necessarily be foreseen at the present time. A health crisis may exacerbate other pre-existing political, social, and economic risks. Any such impact could adversely affect the fund's performance, resulting in losses to your investment. For more information, please refer to the "Principal risks" section of the prospectus.
ANNUAL REPORT | JOHN HANCOCK FLOATING RATE INCOME FUND 4
Manager's discussion of fund performance
Can you discuss the performance of the bank loan market during the 12 months ended August 31, 2020?
The fund's benchmark, the S&P/LSTA Leveraged Loan Index, delivered a positive return of for the reporting period, despite the significant drawdown that occurred in the first quarter of 2020. The drawdown in loans, which at its lowest eclipsed a 20% year-to-date loss, was offset by the pre-COVID-19 rally in credit and the substantial recovery in pricing since the first quarter. U.S. Federal Reserve stimulus and improved market sentiment has led to an increase in liquidity, which benefited loans and other high-yield credit sectors following the COVID-19 selloff. However, many industries—such as transportation, retail, and energy—that are directly or indirectly exposed to COVID-19 continue to lag the broader market.
What contributed to the fund's underperformance of the benchmark?
From a quality standpoint, the underweight to BB-rated debt was the top detractor from performance as BBs outperformed all other quality segments in the period. At the industry level, metals and mining, technology, and gaming/leisure were the largest detractors from relative returns.
What positioning decisions aided fund performance?
The fund's performance was aided by its underweight to CCC credits, which underperformed higher-quality debt. The fund's off-benchmark exposure to high-yield bonds was also beneficial, as high yield performed well during the period. From an industry perspective, the fund's underweight to the energy sector was the top contributor to returns.
COUNTRY COMPOSITION AS OF 8/31/2020 (%)
| | |
| United States | 82.1 |
| Luxembourg | 4.8 |
| France | 2.5 |
| Canada | 2.0 |
| Netherlands | 1.7 |
| United Kingdom | 1.5 |
| Ireland | 1.0 |
| Germany | 1.0 |
| Other countries | 3.4 |
| TOTAL | 100.0 |
| As a percentage of net assets. | |
ANNUAL REPORT | JOHN HANCOCK FLOATING RATE INCOME FUND 5
Based on your outlook for the bank loan market, how was the fund positioned at the end of the period?
We have seen a significant recovery in assets since the drawdown in March 2020, though we believe there remains a large swath of good companies in strong competitive positions that are still priced at what we view as attractive discounts. As we look forward, we anticipate that volatility will remain elevated in the coming months, which should present even more attractive entry points and trading opportunities. For these reasons we remain underweight many of the most COVID-19-sensitive industries, such as retail, airlines, and energy. In instances where we invest in industries most impacted by COVID-19, we are focusing on senior positions in companies with strong balance sheets.
From a quality perspective, the fund continues to be underweight BB-rated loans, which generally offer lower coupons and have limited potential price upside. Instead, we favor B-rated credits and select CCC opportunities, which we view as mispriced and, in some cases, misrated. The downgrade wave, which peaked in April, created such opportunities. Collateralized loan obligations (CLOs), which are major buyers of leveraged loans, operate within ratings constraints and are often incentivized to sell CCC names irrespective of their fundamental views. Given the fund is less ratings sensitive, we were able to take advantage of this negative technical and selectively invest in credits we believe were mispriced and can provide attractive upside potential for portfolio. Overall, we believe today is a great time to be investing in leveraged loans and that the fund is well positioned to deliver attractive returns in the current environment.
MANAGED BY
| |
| Kim Harris, BCSF Advisors, LP (Bain Capital Credit) |
| Nate Whittier, BCSF Advisors, LP (Bain Capital Credit) |
| Andrew Carlino, BCSF Advisors, LP (Bain Capital Credit) |

The views expressed in this report are exclusively those of the portfolio management team BCSF Advisors, LP (Bain Capital Credit), and are subject to change. They are not meant as investment advice. Please note that the holdings discussed in this report may not have been held by the fund for the entire period. Portfolio composition is subject to review in accordance with the fund's investment strategy and may vary in the future. Current and future portfolio holdings are subject to risk.
ANNUAL REPORT | JOHN HANCOCK FLOATING RATE INCOME FUND 6
TOTAL RETURNS FOR THE PERIOD ENDED AUGUST 31, 2020
| | | | | | | | | | | | |
Average annual total returns (%)
with maximum sales charge | | Cumulative total returns (%)
with maximum sales charge | | SEC 30-day
yield (%)
subsidized | | SEC 30-day
yield (%)
unsubsidized1 |
| | 1-year | 5-year | 10-year | | | 5-year | 10-year | | as of
8-31-20 | | as of
8-31-20 |
| Class A | -2.36 | 2.27 | 3.22 | | | 11.88 | 37.29 | | 3.64 | | 3.45 |
| Class B | -5.51 | 1.70 | 2.73 | | | 8.78 | 30.91 | | 2.97 | | 2.78 |
| Class C | -1.69 | 2.04 | 2.75 | | | 10.63 | 31.11 | | 2.98 | | 2.79 |
| Class I2 | 0.34 | 3.08 | 3.81 | | | 16.36 | 45.40 | | 3.95 | | 3.78 |
| Class R62,3 | 0.33 | 3.16 | 3.76 | | | 16.85 | 44.67 | | 4.03 | | 3.85 |
| Class 12 | 0.29 | 3.12 | 3.88 | | | 16.60 | 46.36 | | 4.07 | | 3.90 |
| Class NAV2 | 0.34 | 3.17 | 3.93 | | | 16.88 | 47.08 | | 4.07 | | 3.89 |
| Index† | 0.91 | 3.74 | 4.34 | | | 20.17 | 52.89 | | — | | — |
Performance figures assume all distributions are reinvested. Figures reflect maximum sales charges on Class A shares of 2.5%, and the applicable contingent deferred sales charge (CDSC) on Class B and Class C shares. The returns for Class A shares have been adjusted to reflect the reduction in the maximum sales charge from 3.0% to 2.5%, effective 2-3-14. The Class B shares' CDSC declines annually between years 1 to 6 according to the following schedule: 5%, 4%, 3%, 3%, 2%, and 1%. No sales charge will be assessed after the sixth year. Class C shares held for less than one year are subject to a 1% CDSC. Sales charges are not applicable to Class I, Class R6, Class 1, and Class NAV shares.
The expense ratios of the fund, both net (including any fee waivers and/or expense limitations) and gross (excluding any fee waivers and/or expense limitations), are set forth according to the most recent publicly available prospectuses for the fund and may differ from those disclosed in the Financial highlights tables in this report. Net expenses reflect contractual expense limitations in effect until December 31, 2020 and are subject to change. Had the contractual fee waivers and expense limitations not been in place, gross expenses would apply. The expense ratios are as follows:
| | | | | | | | |
| | Class A | Class B | Class C | Class I | Class R6 | Class 1 | Class NAV |
| Gross (%) | 1.16 | 1.91 | 1.91 | 0.91 | 0.80 | 0.84 | 0.79 |
| Net (%) | 1.01 | 1.76 | 1.76 | 0.78 | 0.67 | 0.71 | 0.67 |
Please refer to the most recent prospectus and annual or semiannual report for more information on expenses and any expense limitation arrangements for each class.
The returns reflect past results and should not be considered indicative of future performance. The return and principal value of an investment will fluctuate so that shares, when redeemed, may be worth more or less than their original cost. Due to market volatility and other factors, the fund's current performance may be higher or lower than the performance shown. For current to the most recent month-end performance data, please call 800-225-5291 or visit the fund's website at jhinvestments.com.
The performance table above and the chart on the next page do not reflect the deduction of taxes that a shareholder would pay on fund distributions or the redemption of fund shares. The fund's performance results reflect any applicable fee waivers or expense reductions, without which the expenses would increase and results would have been less favorable.
| † | Index is the S&P/LSTA Leveraged Loan Index. |
See the following page for footnotes.
ANNUAL REPORT | JOHN HANCOCK FLOATING RATE INCOME FUND 7
This chart and table show what happened to a hypothetical $10,000 investment in John Hancock Floating Rate Income Fund for the share classes and periods indicated, assuming all distributions were reinvested. For comparison, we've shown the same investment in the S&P/LSTA Leveraged Loan Index.
| | | | | |
| | Start date | With maximum
sales charge ($) | Without
sales charge ($) | Index ($) |
| Class B4 | 8-31-10 | 13,091 | 13,091 | 15,289 |
| Class C4 | 8-31-10 | 13,111 | 13,111 | 15,289 |
| Class I2 | 8-31-10 | 14,540 | 14,540 | 15,289 |
| Class R62,3 | 8-31-10 | 14,467 | 14,467 | 15,289 |
| Class 12 | 8-31-10 | 14,636 | 14,636 | 15,289 |
| Class NAV2 | 8-31-10 | 14,708 | 14,708 | 15,289 |
The values shown in the chart for "Class A shares with maximum sales charge" have been adjusted to reflect the reduction in the Class A maximum sales charge from 3.0% to 2.5%, which became effective on 2-3-14.
S&P/LSTA Leveraged Loan Index tracks returns in the leveraged loan market and captures a broad cross-section of the U.S. leveraged loan market, including dollar-denominated, U.S.-syndicated loans to overseas issuers.
It is not possible to invest directly in an index. Index figures do not reflect expenses or sales charges, which would result in lower returns.
Footnotes related to performance pages
| 1 | Unsubsidized yields reflect what the yields would have been without the effect of reimbursements and waivers. |
| 2 | For certain types of investors, as described in the fund's prospectuses. |
| 3 | Class R6 shares were first offered on 9-1-11. Returns prior to this date are those of Class C shares that have not been adjusted for class-specific expenses; otherwise, returns would vary. |
| 4 | The contingent deferred sales charge is not applicable. |
ANNUAL REPORT | JOHN HANCOCK FLOATING RATE INCOME FUND 8
These examples are intended to help you understand your ongoing operating expenses of investing in the fund so you can compare these costs with the ongoing costs of investing in other mutual funds.
Understanding fund expenses
As a shareholder of the fund, you incur two types of costs:
■Transaction costs, which include sales charges (loads) on purchases or redemptions (varies by share class), minimum account fee charge, etc.
■Ongoing operating expenses, including management fees, distribution and service fees (if applicable), and other fund expenses.
We are presenting only your ongoing operating expenses here.
Actual expenses/actual returns
The first line of each share class in the table on the following page is intended to provide information about the fund’s actual ongoing operating expenses, and is based on the fund’s actual return. It assumes an account value of $1,000.00 on March 1, 2020, with the same investment held until August 31, 2020.
Together with the value of your account, you may use this information to estimate the operating expenses that you paid over the period. Simply divide your account value at August 31, 2020, by $1,000.00, then multiply it by the “expenses paid” for your share class from the table. For example, for an account value of $8,600.00, the operating expenses should be calculated as follows:
Hypothetical example for comparison purposes
The second line of each share class in the table on the following page allows you to compare the fund’s ongoing operating expenses with those of any other fund. It provides an example of the fund’s hypothetical account values and hypothetical expenses based on each class’s actual expense ratio and an assumed 5% annualized return before expenses (which is not the class’s actual return). It assumes an account value of $1,000.00 on March 1, 2020, with the same investment held until August 31, 2020. Look in any other fund shareholder report to find its hypothetical example and you will be able to compare these expenses. Please remember that these hypothetical account values and expenses may not be used to estimate the actual ending account balance or expenses you paid for the period.
| | ANNUAL REPORT | JOHN HANCOCK FLOATING RATE INCOME FUND | 9 |
Remember, these examples do not include any transaction costs, therefore, these examples will not help you to determine the relative total costs of owning different funds. If transaction costs were included, your expenses would have been higher. See the prospectuses for details regarding transaction costs.
SHAREHOLDER EXPENSE EXAMPLE CHART
| | | Account
value on
3-1-2020 | Ending
value on
8-31-2020 | Expenses
paid during
period ended
8-31-20201 | Annualized
expense
ratio |
| Class A | Actual expenses/actual returns | $1,000.00 | $ 991.60 | $5.01 | 1.00% |
| | Hypothetical example | 1,000.00 | 1,020.10 | 5.08 | 1.00% |
| Class B | Actual expenses/actual returns | 1,000.00 | 987.80 | 8.74 | 1.75% |
| | Hypothetical example | 1,000.00 | 1,016.30 | 8.87 | 1.75% |
| Class C | Actual expenses/actual returns | 1,000.00 | 986.70 | 8.74 | 1.75% |
| | Hypothetical example | 1,000.00 | 1,016.30 | 8.87 | 1.75% |
| Class I | Actual expenses/actual returns | 1,000.00 | 992.70 | 3.86 | 0.77% |
| | Hypothetical example | 1,000.00 | 1,021.30 | 3.91 | 0.77% |
| Class R6 | Actual expenses/actual returns | 1,000.00 | 993.30 | 3.31 | 0.66% |
| | Hypothetical example | 1,000.00 | 1,021.80 | 3.35 | 0.66% |
| Class 1 | Actual expenses/actual returns | 1,000.00 | 993.00 | 3.51 | 0.70% |
| | Hypothetical example | 1,000.00 | 1,021.60 | 3.56 | 0.70% |
| Class NAV | Actual expenses/actual returns | 1,000.00 | 993.30 | 3.31 | 0.66% |
| | Hypothetical example | 1,000.00 | 1,021.80 | 3.35 | 0.66% |
| 1 | Expenses are equal to the annualized expense ratio, multiplied by the average account value over the period, multiplied by 184/366 (to reflect the one-half year period). |
| 10 | JOHN HANCOCK FLOATING RATE INCOME FUND | ANNUAL REPORT | |
AS OF 8-31-20
| | Rate (%) | Maturity date | | Par value^ | Value |
| Term loans (A) 90.1% | | | | | $702,372,687 |
| (Cost $728,356,318) | | | | | |
| Communication services 14.4% | 112,584,495 |
| Diversified telecommunication services 5.2% |
| CenturyLink, Inc., 2020 Term Loan B (1 month LIBOR + 2.250%) | 2.406 | 03-15-27 | | 4,582,301 | 4,420,958 |
| Cincinnati Bell, Inc., 2017 Term Loan (1 month LIBOR + 3.250%) | 4.250 | 10-02-24 | | 2,833,371 | 2,830,424 |
| Crown Subsea Communications Holding, Inc., Term Loan B (1 month LIBOR + 6.000%) | 6.156 | 11-02-25 | | 953,823 | 945,477 |
| Cyxtera DC Holdings, Inc., Term Loan B (1 month LIBOR + 3.000%) | 4.000 | 05-01-24 | | 2,429,210 | 2,113,413 |
| Eircom Finco Sarl, 2019 EUR Term Loan B (1 month EURIBOR + 3.250%) | 3.250 | 05-15-26 | EUR | 1,800,000 | 2,118,044 |
| Frontier Communications Corp., 2017 Term Loan B1 (B) | 0.000 | 06-15-24 | | 7,525,255 | 7,583,576 |
| Intelsat Jackson Holdings SA, 2017 Term Loan B5 (B) | 0.000 | 01-02-24 | | 3,627,551 | 3,662,702 |
| Intelsat Jackson Holdings SA, 2020 DIP Term Loan (3 month LIBOR + 5.500%) | 6.500 | 07-13-22 | | 136,944 | 139,227 |
| Iridium Satellite LLC, Term Loan (1 month LIBOR + 3.750%) | 4.750 | 11-04-26 | | 1,843,632 | 1,847,098 |
| Level 3 Financing, Inc., 2019 Term Loan B (1 month LIBOR + 1.750%) | 1.906 | 03-01-27 | | 4,498,066 | 4,352,824 |
| Masmovil Holdphone SA, 2019 EUR Term Loan B (6 month EURIBOR + 2.625%) | 2.625 | 05-07-26 | EUR | 2,400,488 | 2,843,739 |
| Radiate Holdco LLC, 1st Lien Term Loan (1 month LIBOR + 3.000%) | 3.750 | 02-01-24 | | 4,876,492 | 4,794,518 |
| Telesat LLC, Term Loan B5 (1 month LIBOR + 2.750%) | 2.910 | 12-07-26 | | 1,489,461 | 1,438,566 |
| Zayo Group Holdings, Inc., USD Term Loan (1 month LIBOR + 3.000%) | 3.156 | 03-09-27 | | 1,574,160 | 1,526,636 |
| Entertainment 0.7% |
| Technicolor SA, 2017 USD Term Loan B (B) | 0.000 | 12-06-23 | | 3,645,309 | 1,736,078 |
| Technicolor SA, 2020 EUR Delayed Draw Term Loan B2 (C) | TBD | 06-30-24 | EUR | 330,379 | 406,085 |
| Technicolor SA, 2020 EUR Super Senior Term Loan (6 month EURIBOR + 6.000% or 6.000% PIK) | 6.000 | 06-03-24 | EUR | 281,804 | 345,818 |
| Technicolor SA, 2020 PIK USD New Money Term Loan (6 month LIBOR + 6.000% or 6.000% PIK) | 6.340 | 06-03-24 | | 84,942 | 87,596 |
| SEE NOTES TO FINANCIAL STATEMENTS | ANNUAL REPORT | JOHN HANCOCK FLOATING RATE INCOME FUND | 11 |
| | Rate (%) | Maturity date | | Par value^ | Value |
| Communication services (continued) | |
| Entertainment (continued) |
| Technicolor SA, EUR Term Loan B (B) | 0.000 | 12-06-23 | EUR | 530,772 | $303,239 |
| William Morris Endeavor Entertainment LLC, 2018 1st Lien Term Loan (1 month LIBOR + 2.750%) | 2.910 | 05-18-25 | | 2,733,482 | 2,207,287 |
| Interactive media and services 2.1% |
| Ancestry.com Operations, Inc., 2019 Extended Term Loan B (1 month LIBOR + 4.250%) | 4.410 | 08-27-26 | | 4,418,278 | 4,409,441 |
| MH Sub I LLC, 2017 1st Lien Term Loan (3 month LIBOR + 3.500%) | 4.572 | 09-13-24 | | 5,713,831 | 5,559,900 |
| MH Sub I LLC, 2020 Incremental Term Loan (1 month LIBOR + 3.750%) | 4.750 | 09-13-24 | | 668,670 | 660,733 |
| National CineMedia LLC, 2018 Term Loan B (1 month LIBOR + 3.000%) | 4.000 | 06-20-25 | | 386,254 | 307,416 |
| Rackspace Hosting, Inc., 2017 Incremental 1st Lien Term Loan (2 and 3 month LIBOR + 3.000%) | 4.000 | 11-03-23 | | 3,530,637 | 3,488,729 |
| The Knot Worldwide, Inc., 1st Lien Term Loan (1 month LIBOR + 4.500%) | 4.808 | 12-19-25 | | 2,373,517 | 2,266,709 |
| Media 5.3% |
| Advantage Sales & Marketing, Inc., 2014 1st Lien Term Loan (3 month LIBOR + 3.250%) | 4.250 | 07-23-21 | | 1,683,229 | 1,599,068 |
| Alchemy Copyrights LLC, Term Loan B (Prime rate + 2.250%) | 5.500 | 08-16-27 | | 475,956 | 473,576 |
| Altice Financing SA, 2017 USD Term Loan B (1 month LIBOR + 2.750%) | 2.912 | 07-15-25 | | 4,167,730 | 3,966,804 |
| Altice France SA, USD Term Loan B12 (1 month LIBOR + 3.688%) | 4.438 | 01-31-26 | | 2,506,188 | 2,456,064 |
| AppLovin Corp., 2018 Term Loan B (1 month LIBOR + 3.500%) | 3.656 | 08-15-25 | | 1,732,148 | 1,715,364 |
| AppLovin Corp., 2020 Incremental Term Loan B (1 month LIBOR + 4.000%) | 4.156 | 08-15-25 | | 305,592 | 301,772 |
| CSC Holdings LLC, 2017 Term Loan B1 (1 month LIBOR + 2.250%) | 2.408 | 07-17-25 | | 2,199,313 | 2,119,588 |
| CSC Holdings LLC, 2018 Incremental Term Loan (1 month LIBOR + 2.250%) | 2.408 | 01-15-26 | | 1,549,465 | 1,493,297 |
| CSC Holdings LLC, 2019 Term Loan B5 (1 month LIBOR + 2.500%) | 2.658 | 04-15-27 | | 4,559,081 | 4,406,033 |
| iHeartCommunications, Inc., 2020 Term Loan (1 month LIBOR + 3.000%) | 3.156 | 05-01-26 | | 388,733 | 368,184 |
| 12 | JOHN HANCOCK FLOATING RATE INCOME FUND | ANNUAL REPORT | SEE NOTES TO FINANCIAL STATEMENTS |
| | Rate (%) | Maturity date | | Par value^ | Value |
| Communication services (continued) | |
| Media (continued) |
| Lorca Finco PLC, EUR Term Loan B (C) | TBD | 07-01-27 | EUR | 375,177 | $438,553 |
| Mediaocean LLC, Term Loan B (1 month LIBOR + 3.750%) | 3.906 | 08-18-25 | | 1,371,443 | 1,356,014 |
| Newco Financing Partnership, 2020 USD Term Loan B1 (C) | TBD | 01-31-29 | | 585,644 | 579,934 |
| Recorded Books, Inc., 2018 Term Loan B (1 month LIBOR + 4.250%) | 4.408 | 08-29-25 | | 896,433 | 881,866 |
| Research Now Group LLC, 2017 1st Lien Term Loan (6 month LIBOR + 5.500%) | 6.500 | 12-20-24 | | 3,270,843 | 3,090,685 |
| Sinclair Television Group, Inc., Term Loan B2B (1 month LIBOR + 2.500%) | 2.660 | 09-30-26 | | 1,016,035 | 987,586 |
| Tele Columbus AG, 2018 EUR Term Loan A2 (6 month EURIBOR + 3.000%) | 3.000 | 10-15-24 | EUR | 1,657,943 | 1,898,892 |
| Telenet Financing USD LLC, 2020 USD Term Loan AR (1 month LIBOR + 2.000%) | 2.162 | 04-30-28 | | 3,364,642 | 3,234,262 |
| Terrier Media Buyer, Inc., Term Loan B (1 month LIBOR + 4.250%) | 4.406 | 12-17-26 | | 704,307 | 689,559 |
| Townsquare Media, Inc., Term Loan B (C) | TBD | 04-01-22 | | 165,662 | 156,620 |
| UPC Broadband Holding BV, 2020 EUR Term Loan B (6 month EURIBOR + 2.500%) | 2.500 | 04-30-29 | EUR | 663,626 | 773,003 |
| UPC Financing Partnership, 2020 USD Term Loan B (1 month LIBOR + 2.250%) | 2.412 | 04-30-28 | | 1,153,790 | 1,121,772 |
| UPC Financing Partnership, 2020 USD Term Loan B2 (C) | TBD | 01-31-29 | | 585,644 | 579,934 |
| WideOpenWest Finance LLC, 2017 Term Loan B (1 month LIBOR + 3.250%) | 4.250 | 08-18-23 | | 3,423,790 | 3,365,482 |
| Ziggo Financing Partnership, USD Term Loan I (1 month LIBOR + 2.500%) | 2.662 | 04-30-28 | | 3,753,885 | 3,624,864 |
| Wireless telecommunication services 1.1% |
| Matterhorn Telecom SA, 2020 EUR Term Loan B (3 month EURIBOR + 2.875%) | 2.875 | 09-15-26 | EUR | 1,392,778 | 1,605,977 |
| SBA Senior Finance II LLC, 2018 Term Loan B (1 month LIBOR + 1.750%) | 1.910 | 04-11-25 | | 5,536,156 | 5,401,240 |
| T-Mobile USA, Inc., 2020 Term Loan (1 month LIBOR + 3.000%) | 3.156 | 04-01-27 | | 1,499,076 | 1,502,269 |
| SEE NOTES TO FINANCIAL STATEMENTS | ANNUAL REPORT | JOHN HANCOCK FLOATING RATE INCOME FUND | 13 |
| | Rate (%) | Maturity date | | Par value^ | Value |
| Consumer discretionary 12.8% | $99,444,401 |
| Auto components 0.5% |
| IXS Holdings, Inc., 2020 Term Loan B (3 month LIBOR + 5.000%) | 6.000 | 03-05-27 | | 1,535,679 | 1,493,448 |
| Truck Hero, Inc., 1st Lien Term Loan (1 month LIBOR + 3.750%) | 3.906 | 04-22-24 | | 2,763,621 | 2,661,892 |
| Automobiles 1.5% |
| BBD Bidco, Ltd., GBP Term Loan B1 (6 month GBP LIBOR + 4.750%) | 5.451 | 11-13-26 | GBP | 2,103,138 | 2,677,830 |
| Drive Chassis Holdco LLC, 2019 2nd Lien Term Loan (3 month LIBOR + 8.250%) | 8.518 | 04-10-26 | | 3,303,662 | 3,055,887 |
| OEConnection LLC, 2019 Term Loan B (3 month LIBOR + 4.000%) | 5.072 | 09-25-26 | | 1,545,272 | 1,483,461 |
| Thor Industries, Inc., EUR Term Loan B (1 month EURIBOR + 4.000%) | 4.000 | 02-01-26 | EUR | 822,564 | 966,275 |
| Thor Industries, Inc., USD Term Loan B (1 month LIBOR + 3.750%) | 3.938 | 02-01-26 | | 530,090 | 523,463 |
| Wheel Pros, Inc., 1st Lien Term Loan (1 month LIBOR + 4.750%) | 5.452 | 04-04-25 | | 2,816,030 | 2,679,931 |
| Distributors 0.8% |
| Northwest Fiber LLC, Term Loan B (1 month LIBOR + 5.500%) | 5.656 | 05-21-27 | | 3,736,009 | 3,726,669 |
| Polyconcept North America Holdings, Inc., USD 2016 Term Loan B (3 month LIBOR + 4.500%) | 5.500 | 08-16-23 | | 2,974,389 | 2,342,331 |
| Diversified consumer services 2.4% |
| Cambium Learning Group, Inc., Term Loan B (3 month LIBOR + 4.500%) | 4.808 | 12-18-25 | | 3,001,619 | 2,979,107 |
| Midas Intermediate Holdco II LLC, Incremental Term Loan B (3 month LIBOR + 2.750%) | 3.750 | 08-18-21 | | 2,902,615 | 2,584,953 |
| PCI Gaming Authority, Term Loan (1 month LIBOR + 2.500%) | 2.656 | 05-29-26 | | 1,891,892 | 1,829,876 |
| Safe Fleet Holdings LLC, 2018 1st Lien Term Loan (6 month LIBOR + 3.000%) | 4.000 | 02-03-25 | | 1,778,277 | 1,666,388 |
| SRS Distribution, Inc., 2018 1st Lien Term Loan (3 month LIBOR + 3.000%) | 4.072 | 05-23-25 | | 6,079,139 | 5,900,595 |
| Verisure Holding AB, 2020 EUR Term Loan B (3 month EURIBOR + 4.000%) | 4.000 | 07-20-26 | EUR | 706,977 | 840,406 |
| Verisure Holding AB, EUR Term Loan B1E (6 month EURIBOR + 3.000%) | 3.000 | 10-20-22 | EUR | 2,785,890 | 3,293,192 |
| 14 | JOHN HANCOCK FLOATING RATE INCOME FUND | ANNUAL REPORT | SEE NOTES TO FINANCIAL STATEMENTS |
| | Rate (%) | Maturity date | | Par value^ | Value |
| Consumer discretionary (continued) | |
| Hotels, restaurants and leisure 4.2% |
| Aimbridge Acquisition Company, Inc., 2019 Term Loan B (1 month LIBOR + 3.750%) | 3.906 | 02-02-26 | | 2,859,025 | $2,465,909 |
| Aristocrat International Pty, Ltd., 2018 1st Lien Term Loan (3 month LIBOR + 1.750%) | 2.021 | 10-19-24 | | 2,380,635 | 2,322,453 |
| Aristocrat International Pty, Ltd., 2020 Incremental Term Loan B (3 month LIBOR + 3.750%) | 4.750 | 10-19-24 | | 305,849 | 306,614 |
| Caesars Resort Collection LLC, 2017 1st Lien Term Loan B (1 month LIBOR + 2.750%) | 2.906 | 12-23-24 | | 2,079,523 | 1,950,863 |
| Caesars Resort Collection LLC, 2020 Term Loan B1 (3 month LIBOR + 4.500%) | 4.726 | 07-21-25 | | 652,814 | 632,009 |
| Carrols Restaurant Group, Inc., Term Loan B (1 and 3 month LIBOR + 3.250%) | 3.482 | 04-30-26 | | 1,819,940 | 1,693,199 |
| CityCenter Holdings LLC, 2017 Term Loan B (1 month LIBOR + 2.250%) | 3.000 | 04-18-24 | | 2,033,851 | 1,925,264 |
| Connect Finco SARL, Term Loan B (1 month LIBOR + 4.500%) | 5.500 | 12-11-26 | | 2,682,155 | 2,606,733 |
| HNVR Holdco, Ltd., EUR Term Loan B (6 month EURIBOR + 4.250%) | 4.250 | 09-12-23 | EUR | 1,605,335 | 1,369,744 |
| HNVR Holdco, Ltd., Term Loan C (6 month EURIBOR + 4.500%) | 4.500 | 09-12-25 | EUR | 2,352,406 | 2,007,180 |
| Hurtigruten Group AS, EUR Term Loan B (6 month EURIBOR + 3.750%) | 3.750 | 02-24-25 | EUR | 1,777,599 | 1,608,389 |
| IRB Holding Corp., 2020 Term Loan B (3 month LIBOR + 2.750%) | 3.750 | 02-05-25 | | 1,900,354 | 1,827,665 |
| Lakeland Tours LLC, 2017 1st Lien Term Loan B (3 month LIBOR + 4.250%) | 5.250 | 12-15-24 | | 1,215,673 | 608,845 |
| Lakeland Tours LLC, 2020 DIP Lender New Money Term Loan (3 month LIBOR + 12.000%) | 13.250 | 01-20-21 | | 193,645 | 186,867 |
| Motion Finco LLC, Delayed Draw Term Loan B2 (6 month LIBOR + 3.250%) | 4.322 | 11-12-26 | | 102,546 | 94,770 |
| Motion Finco LLC, USD Term Loan B1 (6 month LIBOR + 3.250%) | 4.322 | 11-12-26 | | 780,242 | 721,076 |
| Motion Finco Sarl, EUR Term Loan B (6 month EURIBOR + 3.000%) | 3.000 | 11-12-26 | EUR | 686,801 | 744,920 |
| New Red Finance, Term Loan B4 (1 month LIBOR + 1.750%) | 1.906 | 11-19-26 | | 3,851,582 | 3,702,333 |
| Scientific Games International, Inc., 2018 Term Loan B5 (1, 3 and 6 month LIBOR + 2.750%) | 3.472 | 08-14-24 | | 2,565,526 | 2,393,739 |
| SEE NOTES TO FINANCIAL STATEMENTS | ANNUAL REPORT | JOHN HANCOCK FLOATING RATE INCOME FUND | 15 |
| | Rate (%) | Maturity date | | Par value^ | Value |
| Consumer discretionary (continued) | |
| Hotels, restaurants and leisure (continued) |
| Station Casinos LLC, 2020 Term Loan B (1 month LIBOR + 2.250%) | 2.500 | 02-08-27 | | 423,743 | $400,788 |
| Travel Leaders Group LLC, 2018 Term Loan B (1 month LIBOR + 4.000%) | 4.156 | 01-25-24 | | 2,498,453 | 1,773,902 |
| Wyndham Hotels & Resorts, Inc., Term Loan B (1 month LIBOR + 1.750%) | 1.906 | 05-30-25 | | 1,833,801 | 1,760,834 |
| Household durables 0.6% |
| Acproducts, Inc., 2020 Term Loan B (3 month LIBOR + 6.500%) | 7.500 | 08-18-25 | | 2,841,870 | 2,843,660 |
| LSFX Flavum Bidco SA, 2020 EUR Term Loan (C) | TBD | 02-12-27 | EUR | 1,410,972 | 1,536,453 |
| Leisure products 0.8% |
| Abe Investment Holdings, Inc., 2019 EUR Term Loan B (1 month EURIBOR + 5.000%) | 5.000 | 02-19-26 | EUR | 841,432 | 934,256 |
| Abe Investment Holdings, Inc., 2019 USD Term Loan B (1 month LIBOR + 4.500%) | 4.688 | 02-19-26 | | 2,478,968 | 2,343,145 |
| Hayward Industries, Inc., 1st Lien Term Loan (1 month LIBOR + 3.500%) | 3.656 | 08-05-24 | | 2,891,292 | 2,840,694 |
| Specialty retail 1.8% |
| Ascena Retail Group, Inc., 2015 Term Loan B (B) | 0.000 | 08-21-22 | | 3,325,984 | 1,183,950 |
| CWGS Group LLC, 2016 Term Loan (1 month LIBOR + 2.750%) | 3.500 | 11-08-23 | | 1,677,934 | 1,623,670 |
| Douglas GmbH, 2017 EUR Term Loan B1 (6 month EURIBOR + 3.500%) | 3.500 | 08-12-22 | EUR | 196,061 | 199,557 |
| Douglas GmbH, 2017 EUR Term Loan B2 (6 month EURIBOR + 3.500%) | 3.500 | 08-12-22 | EUR | 45,753 | 46,569 |
| Douglas GmbH, 2017 EUR Term Loan B3 (6 month EURIBOR + 3.500%) | 3.500 | 08-12-22 | EUR | 181,496 | 184,733 |
| Douglas GmbH, 2017 EUR Term Loan B4 (6 month EURIBOR + 3.500%) | 3.500 | 08-12-22 | EUR | 105,409 | 107,289 |
| Douglas GmbH, 2017 EUR Term Loan B5 (6 month EURIBOR + 3.500%) | 3.500 | 08-12-22 | EUR | 15,566 | 15,844 |
| Douglas GmbH, 2017 EUR Term Loan B6 (6 month EURIBOR + 3.500%) | 3.500 | 08-12-22 | EUR | 68,895 | 70,124 |
| Douglas GmbH, 2017 EUR Term Loan B7 (6 month EURIBOR + 3.500%) | 3.500 | 08-12-22 | EUR | 54,760 | 55,736 |
| Douglas GmbH, 2017 EUR Term Loan B8 (6 month EURIBOR + 3.250%) | 3.250 | 08-12-22 | EUR | 846,330 | 847,868 |
| Eyemart Express LLC, 2017 Term Loan B (1 month LIBOR + 3.000%) | 3.156 | 08-04-24 | | 1,270,989 | 1,223,327 |
| 16 | JOHN HANCOCK FLOATING RATE INCOME FUND | ANNUAL REPORT | SEE NOTES TO FINANCIAL STATEMENTS |
| | Rate (%) | Maturity date | | Par value^ | Value |
| Consumer discretionary (continued) | |
| Specialty retail (continued) |
| Harbor Freight Tools USA, Inc., 2018 Term Loan B (1 month LIBOR + 2.500%) | 3.250 | 08-18-23 | | 3,306,299 | $3,251,381 |
| Mavis Tire Express Services Corp., 2018 1st Lien Term Loan (3 month LIBOR + 3.250%) | 3.558 | 03-20-25 | | 5,078,304 | 4,867,554 |
| Textiles, apparel and luxury goods 0.2% |
| Calceus Acquisition, Inc., Term Loan B (1 month LIBOR + 5.500%) | 5.756 | 02-12-25 | | 1,496,196 | 1,458,791 |
| Consumer staples 3.1% | 24,139,387 |
| Beverages 0.2% |
| Refresco Holding BV, EUR Term Loan B1 (3 month EURIBOR + 3.250%) | 3.250 | 03-28-25 | EUR | 1,425,082 | 1,670,334 |
| Food and staples retailing 0.9% |
| Casino Guichard Perrachon SA, EUR Term Loan B (3 month EURIBOR + 5.500%) | 5.500 | 01-31-24 | EUR | 2,874,451 | 3,242,353 |
| H-Food Holdings LLC, 2018 Term Loan B (1 month LIBOR + 3.688%) | 3.844 | 05-23-25 | | 3,772,522 | 3,664,062 |
| Food products 1.0% |
| Cookie Acquisition SASU, EUR Term Loan (3 month EURIBOR + 4.000%) | 4.000 | 02-15-27 | EUR | 1,563,396 | 1,785,921 |
| Froneri Lux FinCo SARL, 2020 EUR Term Loan (3 month EURIBOR + 2.625%) | 2.625 | 01-31-27 | EUR | 1,752,602 | 2,028,473 |
| Froneri US, Inc., 2020 USD Term Loan (1 month LIBOR + 2.250%) | 2.406 | 01-31-27 | | 621,457 | 597,817 |
| Upfield BV, 2018 EUR Term Loan B1 (1 and 6 month EURIBOR + 3.500%) | 3.500 | 07-02-25 | EUR | 3,100,258 | 3,579,010 |
| Household products 0.5% |
| KIK Custom Products, Inc., 2015 Term Loan B (3 month LIBOR + 4.000%) | 5.000 | 05-15-23 | | 1,954,742 | 1,935,195 |
| Reynolds Consumer Products LLC, Term Loan (1 month LIBOR + 1.750%) | 1.906 | 02-04-27 | | 890,587 | 875,189 |
| Reynolds Group Holdings, Inc., USD 2017 Term Loan (1 month LIBOR + 2.750%) | 2.906 | 02-05-23 | | 1,130,743 | 1,113,375 |
| Personal products 0.5% |
| Coty, Inc., 2018 USD Term Loan B (1 month LIBOR + 2.250%) | 2.405 | 04-07-25 | | 2,058,183 | 1,803,483 |
| SEE NOTES TO FINANCIAL STATEMENTS | ANNUAL REPORT | JOHN HANCOCK FLOATING RATE INCOME FUND | 17 |
| | Rate (%) | Maturity date | | Par value^ | Value |
| Consumer staples (continued) | |
| Personal products (continued) |
| Sunshine Luxembourg VII Sarl, USD Term Loan B1 (6 month LIBOR + 4.250%) | 5.322 | 10-01-26 | | 1,850,727 | $1,844,175 |
| Energy 1.4% | 10,961,598 |
| Energy equipment and services 0.2% |
| Keane Group Holdings LLC, 2018 1st Lien Term Loan (1 month LIBOR + 3.500%) | 4.500 | 05-25-25 | | 1,372,000 | 1,188,495 |
| Traverse Midstream Partners LLC, 2017 Term Loan (1 month LIBOR + 4.000%) | 5.000 | 09-27-24 | | 619,012 | 564,465 |
| Oil, gas and consumable fuels 1.2% |
| Delek US Holdings, Inc., 2018 Term Loan B (1 month LIBOR + 2.250%) | 2.406 | 03-31-25 | | 2,333,118 | 2,196,888 |
| Granite Acquisition, Inc., Term Loan B (3 month LIBOR + 3.500%) | 4.500 | 12-19-21 | | 1,013,655 | 1,005,627 |
| Lower Cadence Holdings LLC, Term Loan B (1 month LIBOR + 4.000%) | 4.000 | 05-22-26 | | 1,201,428 | 1,102,310 |
| Lucid Energy Group II Borrower LLC, 2018 1st Lien Term Loan (1 month LIBOR + 3.000%) | 4.000 | 02-17-25 | | 598,290 | 505,256 |
| Murray Energy Corp., 2018 Term Loan B2 (B) | 0.000 | 10-17-22 | | 7,312,904 | 95,068 |
| Northriver Midstream Finance LP, 2018 Term Loan B (3 month LIBOR + 3.250%) | 3.552 | 10-01-25 | | 1,901,218 | 1,840,455 |
| Quicksilver Resources, Inc., New 2nd Lien Term Loan (B)(D) | 0.000 | 06-21-21 | | 20,001,303 | 20,001 |
| Ultra Resources, Inc., 1st Lien Term Loan (B) | 0.000 | 04-12-24 | | 3,320,364 | 2,394,813 |
| Ultra Resources, Inc., 2020 DIP Term Loan (C) | TBD | 11-19-20 | | 48,220 | 48,220 |
| Financials 6.0% | 47,096,628 |
| Capital markets 2.0% |
| AqGen Ascensus, Inc., 2017 Repriced Term Loan (3 month LIBOR + 4.000%) | 5.072 | 12-03-22 | | 4,386,774 | 4,384,054 |
| AqGen Ascensus, Inc., 2020 Term Loan (C) | TBD | 12-13-26 | | 381,003 | 378,146 |
| Emerald TopCo, Inc., Term Loan (1 and 3 month LIBOR + 3.500%) | 3.760 | 07-24-26 | | 1,196,325 | 1,161,931 |
| ION Trading Finance, Ltd., USD Incremental Term Loan B (3 month LIBOR + 4.000%) | 5.072 | 11-21-24 | | 4,763,224 | 4,648,382 |
| 18 | JOHN HANCOCK FLOATING RATE INCOME FUND | ANNUAL REPORT | SEE NOTES TO FINANCIAL STATEMENTS |
| | Rate (%) | Maturity date | | Par value^ | Value |
| Financials (continued) | |
| Capital markets (continued) |
| Jane Street Group LLC, 2020 Term Loan (1 month LIBOR + 3.000%) | 3.156 | 01-31-25 | | 3,838,256 | $3,780,682 |
| Sequa Mezzanine Holdings LLC, 2020 Extended Term Loan (3 month LIBOR + 6.750%) | 7.750 | 11-28-23 | | 1,654,015 | 1,565,111 |
| Consumer finance 0.1% |
| Fiserv Investment Solutions, Inc., 2020 Term Loan B (3 month LIBOR + 4.750%) | 5.020 | 02-18-27 | | 640,636 | 636,363 |
| Diversified financial services 1.6% |
| Advisor Group Holdings, Inc., 2019 Term Loan B (1 month LIBOR + 5.000%) | 5.156 | 07-31-26 | | 2,950,357 | 2,850,783 |
| Citadel Securities LP, 2020 Term Loan B (1 month LIBOR + 2.750%) | 2.906 | 02-27-26 | | 3,985,303 | 3,950,432 |
| Crown Finance US, Inc., 2018 USD Term Loan (3 month LIBOR + 2.250%) | 3.322 | 02-28-25 | | 2,493,567 | 1,948,099 |
| GT Polaris, Inc., Term Loan B (C) | TBD | 08-04-27 | | 653,022 | 647,308 |
| Marnix SAS, 2019 EUR Term Loan B (6 month EURIBOR + 3.500%) | 3.500 | 11-19-26 | EUR | 1,576,303 | 1,822,297 |
| Nexus Buyer LLC, Term Loan B (1 month LIBOR + 3.750%) | 3.912 | 11-09-26 | | 1,052,739 | 1,045,896 |
| Insurance 1.5% |
| Alliant Holdings Intermediate LLC, 2018 Term Loan B (1 month LIBOR + 2.750%) | 2.906 | 05-09-25 | | 1,646,167 | 1,590,379 |
| Alliant Holdings Intermediate LLC, Term Loan B (1 month LIBOR + 3.250%) | 3.433 | 05-09-25 | | 1,024,502 | 997,978 |
| Amerilife Holdings LLC, 2020 Delayed Draw Term Loan (3 month LIBOR + 4.000%) | 4.158 | 03-18-27 | | 66,073 | 64,917 |
| Amerilife Holdings LLC, 2020 Term Loan (1 month LIBOR + 4.000%) | 4.156 | 03-18-27 | | 1,955,837 | 1,921,610 |
| Asurion LLC, 2017 Term Loan B4 (1 month LIBOR + 3.000%) | 3.156 | 08-04-22 | | 3,484,425 | 3,443,762 |
| Asurion LLC, 2018 Term Loan B6 (1 month LIBOR + 3.000%) | 3.156 | 11-03-23 | | 513,499 | 504,087 |
| Cross Financial Corp., Term Loan (C) | TBD | 08-20-27 | | 644,160 | 640,939 |
| HUB International, Ltd., 2018 Term Loan B (3 month LIBOR + 3.000%) | 3.263 | 04-25-25 | | 3,144,768 | 3,059,985 |
| Mortgage real estate investment trusts 0.8% |
| Apollo Commercial Real Estate Finance, Inc., Term Loan B (1 month LIBOR + 2.750%) | 2.912 | 05-15-26 | | 818,023 | 775,077 |
| SEE NOTES TO FINANCIAL STATEMENTS | ANNUAL REPORT | JOHN HANCOCK FLOATING RATE INCOME FUND | 19 |
| | Rate (%) | Maturity date | | Par value^ | Value |
| Financials (continued) | |
| Mortgage real estate investment trusts (continued) |
| Blackstone Mortgage Trust, Inc., 2020 Term Loan B (1 month LIBOR + 4.750%) | 5.750 | 04-23-26 | | 1,753,286 | $1,740,136 |
| Claros Mortgage Trust, Inc., Term Loan B (1 month LIBOR + 3.250%) | 3.405 | 08-09-26 | | 2,316,062 | 2,188,678 |
| KREF Holdings X LLC, Term Loan B (C) | TBD | 08-05-27 | | 1,363,229 | 1,349,596 |
| Health care 13.7% | 106,423,467 |
| Biotechnology 0.2% |
| Grifols Worldwide Operations USA, Inc., USD 2019 Term Loan B (1 week LIBOR + 2.000%) | 2.113 | 11-15-27 | | 1,232,009 | 1,206,001 |
| Health care equipment and supplies 1.2% |
| Auris Luxembourg III Sarl, 2019 USD Term Loan B2 (1 month LIBOR + 3.750%) | 3.906 | 02-27-26 | | 2,467,887 | 2,255,032 |
| Ortho-Clinical Diagnostics SA, 2018 Term Loan B (1 month LIBOR + 3.250%) | 3.406 | 06-30-25 | | 1,613,135 | 1,553,143 |
| Ortho-Clinical Diagnostics SA, EUR Term Loan B (3 month EURIBOR + 3.500%) | 3.500 | 06-30-25 | EUR | 1,378,841 | 1,574,144 |
| Solenis International LLC, 2018 1st Lien Term Loan (1 and 3 month LIBOR + 4.000%) | 4.256 | 06-26-25 | | 2,434,623 | 2,388,585 |
| Solenis International LLC, 2018 2nd Lien Term Loan (3 month LIBOR + 8.500%) | 8.756 | 06-26-26 | | 2,100,000 | 1,883,028 |
| Health care providers and services 6.3% |
| 21st Century Oncology Holdings, Inc., 2020 EUR Term Loan B4 (3 month EURIBOR + 4.750%) | 4.750 | 05-14-27 | EUR | 1,782,202 | 2,082,490 |
| 21st Century Oncology Holdings, Inc., 2020 USD Term Loan B5 (C) | TBD | 05-14-27 | | 526,385 | 498,750 |
| Bio Lam LCD SELAS, 2020 EUR Add On Term Loan B (C) | TBD | 04-25-26 | EUR | 1,226,561 | 1,416,146 |
| Da Vinci Purchaser Corp., 2019 Term Loan (3 month LIBOR + 4.000%) | 5.238 | 01-08-27 | | 1,129,439 | 1,121,443 |
| DaVita, Inc., 2020 Term Loan B (1 month LIBOR + 1.750%) | 1.906 | 08-12-26 | | 1,698,188 | 1,661,524 |
| Dentalcorp Health Services ULC, 1st Lien Term Loan (1 month LIBOR + 3.750%) | 4.750 | 06-06-25 | | 4,735,962 | 4,428,124 |
| Ensemble RCM LLC, Term Loan (3 month LIBOR + 3.750%) | 4.011 | 08-03-26 | | 1,674,031 | 1,657,709 |
| 20 | JOHN HANCOCK FLOATING RATE INCOME FUND | ANNUAL REPORT | SEE NOTES TO FINANCIAL STATEMENTS |
| | Rate (%) | Maturity date | | Par value^ | Value |
| Health care (continued) | |
| Health care providers and services (continued) |
| eResearchTechnology, Inc., 2020 1st Lien Term Loan (1 month LIBOR + 4.500%) | 5.500 | 02-04-27 | | 3,239,807 | $3,229,019 |
| HCA, Inc., Term Loan B12 (1 month LIBOR + 1.750%) | 1.906 | 03-13-25 | | 1,774,717 | 1,759,472 |
| Jaguar Holding Company II, 2018 Term Loan (1 month LIBOR + 2.500%) | 3.500 | 08-18-22 | | 3,879,542 | 3,869,843 |
| MED ParentCo LP, 1st Lien Delayed Draw Term Loan (1 month LIBOR + 4.250%) | 4.406 | 08-31-26 | | 208,419 | 195,047 |
| MED ParentCo LP, 1st Lien Term Loan (1 month LIBOR + 4.250%) | 4.406 | 08-31-26 | | 1,187,874 | 1,111,648 |
| MPH Acquisition Holdings LLC, 2016 Term Loan B (3 month LIBOR + 2.750%) | 3.750 | 06-07-23 | | 2,042,057 | 2,019,084 |
| National Mentor Holdings, Inc., 2019 Term Loan B (1 month LIBOR + 4.250%) | 4.410 | 03-09-26 | | 3,130,138 | 3,097,272 |
| National Mentor Holdings, Inc., 2019 Term Loan C (1 month LIBOR + 4.250%) | 4.410 | 03-09-26 | | 142,519 | 141,022 |
| Option Care Health, Inc., Term Loan B (1 month LIBOR + 4.500%) | 4.656 | 08-06-26 | | 2,455,040 | 2,444,803 |
| Pathway Vet Alliance LLC, 2020 Term Loan (1 month LIBOR + 4.000%) | 4.156 | 03-31-27 | | 1,777,743 | 1,742,740 |
| PetVet Care Centers LLC, 2018 1st Lien Term Loan (1 month LIBOR + 2.750%) | 2.906 | 02-14-25 | | 4,698,711 | 4,526,926 |
| Select Medical Corp., 2017 Term Loan B (1 month LIBOR + 2.500%) | 2.680 | 03-06-25 | | 2,311,885 | 2,244,447 |
| Team Health Holdings, Inc., 1st Lien Term Loan (1 month LIBOR + 2.750%) | 3.750 | 02-06-24 | | 1,204,466 | 1,000,213 |
| U.S. Anesthesia Partners, Inc., 2017 Term Loan (3 month LIBOR + 3.000%) | 4.000 | 06-23-24 | | 1,670,396 | 1,608,591 |
| Upstream Newco, Inc., 2019 Term Loan (1 month LIBOR + 4.500%) | 4.656 | 11-20-26 | | 1,770,790 | 1,666,756 |
| Versant Health Holdco, Inc., 1st Lien Term Loan B (1 month LIBOR + 3.000%) | 4.000 | 12-02-24 | | 3,749,739 | 3,661,845 |
| VetCor Professional Practices LLC, 2018 1st Lien Term Loan (3 month LIBOR + 3.000%) | 4.072 | 07-02-25 | | 2,050,769 | 1,968,738 |
| Health care technology 2.3% |
| Bioclinica-Synowledge Holdings Corp., 1st Lien Term Loan (1 month LIBOR + 4.250%) | 5.250 | 10-20-23 | | 3,975,681 | 3,810,014 |
| SEE NOTES TO FINANCIAL STATEMENTS | ANNUAL REPORT | JOHN HANCOCK FLOATING RATE INCOME FUND | 21 |
| | Rate (%) | Maturity date | | Par value^ | Value |
| Health care (continued) | |
| Health care technology (continued) |
| Change Healthcare Holdings LLC, 2017 Term Loan B (1 and 3 month LIBOR + 2.500%) | 3.500 | 03-01-24 | | 2,305,507 | $2,260,042 |
| GHX Ultimate Parent Corp., 2017 1st Lien Term Loan (3 month LIBOR + 3.250%) | 4.250 | 06-28-24 | | 2,938,676 | 2,879,902 |
| Netsmart Technologies, Inc., Term Loan D1 (3 month LIBOR + 3.750%) | 4.750 | 04-19-23 | | 4,087,028 | 4,005,288 |
| VVC Holding Corp., 2019 Term Loan B (3 month LIBOR + 4.500%) | 4.818 | 02-11-26 | | 4,803,035 | 4,758,030 |
| Life sciences tools and services 0.8% |
| Packaging Coordinators Midco, Inc., 1st Lien Term Loan (3 month LIBOR + 4.000%) | 5.080 | 06-30-23 | | 3,289,680 | 3,281,456 |
| PAREXEL International Corp., Term Loan B (1 month LIBOR + 2.750%) | 2.906 | 09-27-24 | | 1,346,350 | 1,299,564 |
| Syneos Health, Inc., 2018 Term Loan B (1 month LIBOR + 1.750%) | 1.906 | 08-01-24 | | 1,536,492 | 1,496,159 |
| Pharmaceuticals 2.9% |
| AI Sirona Luxembourg Acquisition Sarl, EUR 1st Lien Term Loan B (1 month EURIBOR + 4.000%) | 4.000 | 09-29-25 | EUR | 1,440,813 | 1,666,626 |
| Amneal Pharmaceuticals LLC, 2018 Term Loan B (1 month LIBOR + 3.500%) | 3.688 | 05-04-25 | | 4,872,605 | 4,565,046 |
| Bausch Health Americas, Inc., 2018 Term Loan B (1 month LIBOR + 3.000%) | 3.183 | 06-02-25 | | 6,422,730 | 6,313,030 |
| Curium Bidco Sarl, USD Term Loan B (6 month LIBOR + 3.750%) | 4.822 | 07-09-26 | | 1,524,971 | 1,509,721 |
| Elanco Animal Health, Inc., Term Loan B (1 month LIBOR + 1.750%) | 1.906 | 08-01-27 | | 1,213,300 | 1,188,524 |
| Endo International PLC, 2017 Term Loan B (3 month LIBOR + 4.250%) | 5.000 | 04-29-24 | | 2,805,334 | 2,699,544 |
| McAfee LLC, 2018 USD Term Loan B (1 month LIBOR + 3.750%) | 3.906 | 09-30-24 | | 2,316,260 | 2,292,240 |
| RPI 2019 Intermediate Finance Trust, 2020 Term Loan B1 (1 week LIBOR + 1.750%) | 1.906 | 02-11-27 | | 1,541,144 | 1,534,887 |
| RPI Intermediate Finance Trust, 2020 Term Loan B1 (1 month LIBOR + 1.750%) | 1.906 | 02-11-27 | | 854,079 | 849,809 |
| 22 | JOHN HANCOCK FLOATING RATE INCOME FUND | ANNUAL REPORT | SEE NOTES TO FINANCIAL STATEMENTS |
| | Rate (%) | Maturity date | | Par value^ | Value |
| Industrials 12.8% | $99,462,738 |
| Aerospace and defense 1.7% |
| Bleriot US Bidco, Inc., Delayed Draw Term Loan (3 month LIBOR + 4.750%) | 5.058 | 10-31-26 | | 155,932 | 153,658 |
| Bleriot US Bidco, Inc., Term Loan B (3 month LIBOR + 4.750%) | 5.058 | 10-31-26 | | 997,963 | 983,413 |
| Maxar Technologies, Ltd., Term Loan B (1 month LIBOR + 2.750%) | 2.906 | 10-04-24 | | 1,178,668 | 1,136,436 |
| Standard Aero, Ltd., 2020 CAD Term Loan B2 (3 month LIBOR + 3.500%) | 3.808 | 04-06-26 | | 1,147,664 | 1,013,766 |
| The NORDAM Group, Inc., Term Loan B (1 month LIBOR + 4.500% and 5.500%) | 5.688 | 04-09-26 | | 2,048,487 | 1,700,244 |
| TransDigm, Inc., 2020 Term Loan E (1 month LIBOR + 2.250%) | 2.406 | 05-30-25 | | 950,347 | 900,321 |
| TransDigm, Inc., 2020 Term Loan F (1 month LIBOR + 2.250%) | 2.406 | 12-09-25 | | 3,864,407 | 3,658,512 |
| TransDigm, Inc., 2020 Term Loan G (1 month LIBOR + 2.250%) | 2.406 | 08-22-24 | | 1,091,648 | 1,035,090 |
| WP CPP Holdings LLC, 2018 Term Loan (1 and 3 month LIBOR + 3.500%) | 4.500 | 04-30-25 | | 3,307,390 | 2,827,818 |
| Air freight and logistics 0.3% |
| XPO Logistics, Inc., 2018 Term Loan B (1 month LIBOR + 2.000%) | 2.156 | 02-24-25 | | 2,051,577 | 2,009,622 |
| Airlines 0.3% |
| Allegiant Travel Company, 2020 Term Loan (3 month LIBOR + 3.000%) | 3.254 | 02-05-24 | | 733,445 | 679,353 |
| WestJet Airlines, Ltd., Term Loan B (6 month LIBOR + 3.000%) | 4.000 | 12-11-26 | | 1,682,423 | 1,393,265 |
| Building products 2.0% |
| Cornerstone Building Brands, Inc., 2018 Term Loan (1 month LIBOR + 3.750%) | 3.918 | 04-12-25 | | 2,280,439 | 2,234,830 |
| LSF10 XL Bidco SCA, EUR Term Loan B3 (C) | TBD | 10-12-26 | EUR | 1,228,877 | 1,370,543 |
| Resideo Funding, Inc., Term Loan B (3 month LIBOR + 2.250%) | 2.560 | 10-24-25 | | 891,142 | 863,294 |
| Specialty Building Products Holdings LLC, 2018 Term Loan B (1 month LIBOR + 5.750%) | 5.906 | 10-01-25 | | 2,159,118 | 2,142,924 |
| The AZEK Company LLC, 2017 Term Loan (3 month LIBOR + 3.750%) | 4.750 | 05-05-24 | | 3,204,221 | 3,193,198 |
| Wilsonart LLC, 2017 Term Loan B (3 month LIBOR + 3.250%) | 4.250 | 12-19-23 | | 5,893,628 | 5,817,482 |
| SEE NOTES TO FINANCIAL STATEMENTS | ANNUAL REPORT | JOHN HANCOCK FLOATING RATE INCOME FUND | 23 |
| | Rate (%) | Maturity date | | Par value^ | Value |
| Industrials (continued) | |
| Commercial services and supplies 3.1% |
| American Builders & Contractors Supply Company, Inc., 2019 Term Loan (1 month LIBOR + 2.000%) | 2.156 | 01-15-27 | | 2,627,979 | $2,556,525 |
| AVSC Holding Corp., 2018 1st Lien Term Loan (1, 3 and 6 month LIBOR + 3.250%) | 4.250 | 03-03-25 | | 2,240,913 | 1,611,217 |
| AVSC Holding Corp., Incremental Term Loan B (3 and 6 month LIBOR + 4.500%) | 5.500 | 10-15-26 | | 162,449 | 116,963 |
| Camelot Finance SA, Term Loan B (1 month LIBOR + 3.000%) | 3.156 | 10-30-26 | | 1,423,441 | 1,396,751 |
| Comet Bidco, Ltd., 2018 USD Term Loan B (6 month LIBOR + 5.000%) | 6.000 | 09-30-24 | | 3,661,600 | 2,810,278 |
| IAA, Inc., Term Loan B (1 month LIBOR + 2.250%) | 2.438 | 06-28-26 | | 1,205,409 | 1,187,327 |
| Illuminate Buyer LLC, Term Loan (3 month LIBOR + 4.000%) | 4.308 | 06-16-27 | | 587,618 | 584,092 |
| Intrado Corp., 2017 Term Loan (3 month LIBOR + 4.000%) | 5.000 | 10-10-24 | | 1,543,857 | 1,377,738 |
| MHI Holdings LLC, Term Loan B (1 month LIBOR + 5.000%) | 5.156 | 09-21-26 | | 2,030,323 | 2,002,406 |
| Nielsen Finance LLC, 2020 USD Term Loan B5 (1 month LIBOR + 3.750%) | 4.750 | 06-04-25 | | 515,340 | 516,628 |
| Nielsen Finance LLC, USD Term Loan B4 (1 month LIBOR + 2.000%) | 2.155 | 10-04-23 | | 1,870,432 | 1,825,074 |
| Sterling Midco Holdings, Inc., 1st Lien Term Loan (3 month LIBOR + 3.500%) | 4.500 | 06-19-24 | | 3,414,894 | 2,976,285 |
| Tempo Acquisition LLC, Non-Extended Term Loan (1 month LIBOR + 2.750%) | 2.906 | 05-01-24 | | 5,587,515 | 5,461,796 |
| Construction and engineering 0.5% |
| Amentum Government Services Holdings LLC, Term Loan B (1 month LIBOR + 4.000%) | 4.156 | 02-01-27 | | 1,072,660 | 1,068,637 |
| Sabre Industries, Inc., 2019 Term Loan B (6 month LIBOR + 3.250%) | 4.244 | 04-15-26 | | 1,108,356 | 1,101,428 |
| USIC Holdings, Inc., 2017 Term Loan B (1 month LIBOR + 3.250%) | 4.250 | 12-08-23 | | 1,832,395 | 1,778,944 |
| Electrical equipment 0.3% |
| 1a Smart Start LLC, 2020 Term Loan (Prime rate + 3.750%) | 7.000 | 08-18-27 | | 711,023 | 711,023 |
| Brookfield WEC Holdings, Inc., 2020 Term Loan (1 month LIBOR + 3.000%) | 3.750 | 08-01-25 | | 1,900,949 | 1,866,998 |
| 24 | JOHN HANCOCK FLOATING RATE INCOME FUND | ANNUAL REPORT | SEE NOTES TO FINANCIAL STATEMENTS |
| | Rate (%) | Maturity date | | Par value^ | Value |
| Industrials (continued) | |
| Machinery 2.1% |
| AI Alpine US Bidco, Inc., 2018 USD Term Loan B (3 and 6 month LIBOR + 3.000%) | 4.209 | 10-31-25 | | 882,213 | $793,991 |
| Crosby US Acquisition Corp., Term Loan B (1 month LIBOR + 4.750%) | 4.933 | 06-26-26 | | 1,573,392 | 1,463,255 |
| Gardner Denver, Inc., 2020 USD Term Loan B2 (1 month LIBOR + 1.750%) | 1.906 | 03-01-27 | | 822,121 | 796,044 |
| Granite US Holdings Corp., Term Loan B (3 month LIBOR + 5.250%) | 6.322 | 09-30-26 | | 2,248,178 | 2,169,492 |
| Ingersoll-Rand Services Company, 2020 USD Spinco Term Loan (1 month LIBOR + 1.750%) | 1.906 | 03-01-27 | | 2,078,611 | 2,012,677 |
| Pro Mach Group, Inc., 2018 Term Loan B (1 month LIBOR + 2.750%) | 2.920 | 03-07-25 | | 2,968,471 | 2,832,099 |
| Shape Technologies Group, Inc., Term Loan (1 month LIBOR + 3.000%) | 3.183 | 04-21-25 | | 2,236,683 | 1,628,305 |
| Star US Bidco LLC, Term Loan B (1 month LIBOR + 4.250%) | 5.250 | 03-17-27 | | 1,712,214 | 1,613,762 |
| Titan Acquisitionco New Zealand, Ltd., 2020 Term Loan (3 month LIBOR + 4.000%) | 4.308 | 05-01-26 | | 2,745,694 | 2,622,138 |
| Professional services 0.7% |
| Cast & Crew Payroll LLC, 2019 1st Lien Term Loan (1 month LIBOR + 3.750%) | 3.906 | 02-09-26 | | 2,013,743 | 1,892,919 |
| STG-Fairway Holdings LLC, Term Loan B (3 month LIBOR + 3.250%) | 4.322 | 01-31-27 | | 1,539,293 | 1,481,569 |
| Stiphout Finance LLC, USD 1st Lien Term Loan (1 month LIBOR + 3.000%) | 4.000 | 10-26-22 | | 2,454,167 | 2,368,271 |
| Road and rail 0.7% |
| Genesee & Wyoming, Inc., Term Loan (3 month LIBOR + 2.000%) | 2.308 | 12-30-26 | | 1,286,405 | 1,264,613 |
| Uber Technologies, Inc., 2018 Term Loan (1 month LIBOR + 4.000%) | 5.000 | 04-04-25 | | 3,932,000 | 3,884,973 |
| Trading companies and distributors 0.9% |
| ASP Unifrax Holdings, Inc., EUR Term Loan B (3 month EURIBOR + 3.750%) | 3.750 | 12-12-25 | EUR | 3,166,937 | 3,153,343 |
| ASP Unifrax Holdings, Inc., Term Loan B (6 month LIBOR + 3.750%) | 4.822 | 12-12-25 | | 1,054,039 | 901,530 |
| GYP Holdings III Corp., 2018 Term Loan B (1 month LIBOR + 2.750%) | 2.906 | 06-01-25 | | 2,681,194 | 2,634,273 |
| SEE NOTES TO FINANCIAL STATEMENTS | ANNUAL REPORT | JOHN HANCOCK FLOATING RATE INCOME FUND | 25 |
| | Rate (%) | Maturity date | | Par value^ | Value |
| Industrials (continued) | |
| Transportation infrastructure 0.2% |
| Dynasty Acquisition Company, Inc., 2020 Term Loan B1 (3 month LIBOR + 3.500%) | 3.808 | 04-06-26 | | 2,134,655 | $1,885,605 |
| Information technology 19.2% | 149,732,903 |
| Communications equipment 1.1% |
| CommScope, Inc., 2019 Term Loan B (1 month LIBOR + 3.250%) | 3.406 | 04-06-26 | | 2,565,325 | 2,506,681 |
| Datto, Inc., 2019 Term Loan B (1 month LIBOR + 4.250%) | 4.406 | 04-02-26 | | 2,088,202 | 2,082,334 |
| MLN US Holdco LLC, 2018 1st Lien Term Loan (1 month LIBOR + 4.500%) | 4.655 | 11-30-25 | | 785,797 | 664,493 |
| Plantronics, Inc., 2018 Term Loan B (1 and 3 month LIBOR + 2.500%) | 2.776 | 07-02-25 | | 3,717,294 | 3,465,336 |
| Electronic equipment, instruments and components 1.8% |
| C&D Technologies, Inc., Term Loan B (1 month LIBOR + 5.750%) | 5.906 | 12-20-25 | | 2,574,919 | 2,175,807 |
| Celestica, Inc., 2018 1st Lien Term Loan B (1 month LIBOR + 2.125%) | 2.295 | 06-27-25 | | 1,042,626 | 1,003,527 |
| Everest Bidco SASU, 2018 EUR Term Loan (3 month EURIBOR + 3.250%) | 3.250 | 07-04-25 | EUR | 3,174,985 | 3,555,210 |
| Excelitas Technologies Corp., 2018 Add On Term Loan B (3 month LIBOR + 3.500%) | 4.500 | 12-02-24 | | 838,980 | 823,249 |
| Excelitas Technologies Corp., USD 2017 1st Lien Term Loan (3 month LIBOR + 3.500%) | 4.500 | 12-02-24 | | 2,881,956 | 2,827,919 |
| Mirion Technologies, Inc., 2019 Term Loan B (3 month LIBOR + 4.000%) | 5.072 | 03-06-26 | | 1,533,448 | 1,518,588 |
| Robertshaw US Holding Corp., 2018 1st Lien Term Loan (1 month LIBOR + 3.500% and 3 month LIBOR + 3.250%) | 4.250 | 02-28-25 | | 2,206,932 | 1,842,789 |
| IT services 4.4% |
| Cardtronics USA, Inc., Term Loan B (1 month LIBOR + 4.000%) | 5.000 | 06-29-27 | | 731,612 | 729,330 |
| Genuine Financial Holdings LLC, 2018 1st Lien Term Loan (1 month LIBOR + 3.750%) | 3.906 | 07-12-25 | | 1,954,758 | 1,789,581 |
| Go Daddy Operating Company LLC, 2017 Repriced Term Loan (1 month LIBOR + 1.750%) | 1.906 | 02-15-24 | | 4,121,485 | 4,048,329 |
| GTT Communications, Inc., 2018 USD Term Loan B (1 month LIBOR + 2.750%) | 2.910 | 05-31-25 | | 4,511,580 | 3,549,576 |
| 26 | JOHN HANCOCK FLOATING RATE INCOME FUND | ANNUAL REPORT | SEE NOTES TO FINANCIAL STATEMENTS |
| | Rate (%) | Maturity date | | Par value^ | Value |
| Information technology (continued) | |
| IT services (continued) |
| KBR, Inc., 2020 Term Loan B (1 month LIBOR + 2.750%) | 2.906 | 02-05-27 | | 2,753,564 | $2,736,354 |
| Masergy Holdings, Inc., 2017 1st Lien Term Loan (3 month LIBOR + 3.250%) | 4.250 | 12-15-23 | | 1,067,750 | 1,035,717 |
| Milano Acquisition Corp., Term Loan (C) | TBD | 08-13-27 | | 3,461,137 | 3,430,852 |
| Park Place Technologies LLC, 1st Lien Term Loan (1 month LIBOR + 4.000%) | 5.000 | 03-28-25 | | 1,210,734 | 1,183,493 |
| Presidio Holdings, Inc., 2020 Term Loan B (3 month LIBOR + 3.500%) | 3.770 | 01-22-27 | | 836,182 | 821,549 |
| Sabre GLBL, Inc., 2018 Term Loan B (1 month LIBOR + 2.000%) | 2.156 | 02-22-24 | | 745,146 | 691,257 |
| TGG TS Acquisition Company, 2018 Term Loan B (1 month LIBOR + 6.500%) | 6.670 | 12-15-25 | | 1,422,864 | 1,369,507 |
| TNS, Inc., 2013 Term Loan B (1 month LIBOR + 4.000%) | 4.160 | 08-14-22 | | 3,323,446 | 3,281,903 |
| Travelport Finance Luxembourg Sarl, 2019 Term Loan (3 month LIBOR + 5.000%) | 6.072 | 05-29-26 | | 3,304,088 | 2,200,820 |
| Verscend Holding Corp., 2018 Term Loan B (1 month LIBOR + 4.500%) | 4.656 | 08-27-25 | | 3,313,115 | 3,285,517 |
| WEX, Inc., Term Loan B3 (1 month LIBOR + 2.250%) | 2.406 | 05-15-26 | | 4,179,815 | 4,037,241 |
| Semiconductors and semiconductor equipment 0.6% |
| Cohu, Inc., 2018 Term Loan B (1 month LIBOR + 3.000%) | 3.156 | 10-01-25 | | 734,132 | 699,870 |
| Microchip Technology, Inc., 2018 Term Loan B (1 month LIBOR + 2.000%) | 2.170 | 05-29-25 | | 3,308,574 | 3,244,487 |
| ON Semiconductor Corp., 2019 Term Loan B (1 month LIBOR + 2.000%) | 2.156 | 09-19-26 | | 940,004 | 925,321 |
| Software 10.2% |
| Avaya, Inc., 2018 Term Loan B (1 month LIBOR + 4.250%) | 4.412 | 12-15-24 | | 3,640,393 | 3,532,710 |
| Barracuda Networks, Inc., 1st Lien Term Loan (3 month LIBOR + 3.250%) | 4.250 | 02-12-25 | | 3,642,307 | 3,596,778 |
| Boxer Parent Company, Inc., 2018 USD Term Loan B (1 month LIBOR + 4.250%) | 4.406 | 10-02-25 | | 4,254,213 | 4,170,916 |
| BY Crown Parent LLC, Term Loan B1 (1 month LIBOR + 3.000%) | 4.000 | 01-31-26 | | 3,396,255 | 3,368,677 |
| SEE NOTES TO FINANCIAL STATEMENTS | ANNUAL REPORT | JOHN HANCOCK FLOATING RATE INCOME FUND | 27 |
| | Rate (%) | Maturity date | | Par value^ | Value |
| Information technology (continued) | |
| Software (continued) |
| Castle US Holding Corp., USD Term Loan B (3 month LIBOR + 3.750%) | 4.058 | 01-29-27 | | 2,018,044 | $1,939,845 |
| Cornerstone OnDemand, Inc., Term Loan B (1 month LIBOR + 4.250%) | 4.433 | 04-22-27 | | 2,172,022 | 2,166,049 |
| Dcert Buyer, Inc., 2019 Term Loan B (1 month LIBOR + 4.000%) | 4.156 | 10-16-26 | | 2,133,465 | 2,105,474 |
| Dedalus Finance GmbH, EUR Term Loan B (C) | TBD | 07-16-27 | EUR | 2,617,085 | 3,045,021 |
| DiscoverOrg LLC, 2019 1st Lien Term Loan (1 month LIBOR + 3.750%) | 3.906 | 02-02-26 | | 2,610,522 | 2,584,417 |
| Epicor Software Corp., 2020 2nd Lien Term Loan (1 month LIBOR + 7.750%) | 8.750 | 07-30-28 | | 763,420 | 785,048 |
| Epicor Software Corp., 2020 Term Loan (1 month LIBOR + 4.250%) | 5.250 | 07-30-27 | | 2,275,067 | 2,274,794 |
| Greeneden US Holdings II LLC, 2018 USD Term Loan B (1 month LIBOR + 3.250%) | 3.406 | 12-01-23 | | 3,691,824 | 3,627,993 |
| MA FinanceCo LLC, 2020 USD Term Loan B (3 month LIBOR + 4.250%) | 5.250 | 06-05-25 | | 1,760,342 | 1,753,741 |
| MA FinanceCo LLC, USD Term Loan B3 (1 month LIBOR + 2.500%) | 2.656 | 06-21-24 | | 495,297 | 471,770 |
| Mavenir Systems, Inc., 2018 Term Loan B (3 month LIBOR + 6.000%) | 7.000 | 05-08-25 | | 1,843,621 | 1,839,012 |
| Mitchell International, Inc., 2020 Add-On Term Loan (1 month LIBOR + 4.250%) | 4.750 | 11-29-24 | | 2,179,283 | 2,124,801 |
| Monotype Imaging Holdings, Inc., Term Loan (3 month LIBOR + 5.500%) | 6.500 | 10-09-26 | | 1,669,122 | 1,533,506 |
| nThrive, Inc., 2016 1st Lien Term Loan (1 month LIBOR + 4.500%) | 5.500 | 10-20-22 | | 2,287,783 | 2,059,005 |
| Project Alpha Intermediate Holding, Inc., 2017 Term Loan B (3 month LIBOR + 3.500%) | 4.500 | 04-26-24 | | 2,998,983 | 2,976,491 |
| Project Boost Purchaser LLC, 2019 Term Loan B (1 month LIBOR + 3.500%) | 3.656 | 06-01-26 | | 2,572,142 | 2,475,687 |
| Quest Software US Holdings, Inc., 2018 1st Lien Term Loan (3 month LIBOR + 4.250%) | 4.511 | 05-16-25 | | 2,392,988 | 2,339,648 |
| Salient CRGT, Inc., 2017 Term Loan (3 month LIBOR + 6.500%) | 7.568 | 02-28-22 | | 2,952,772 | 2,687,022 |
| Seattle SpinCo, Inc., USD Term Loan B3 (1 month LIBOR + 2.500%) | 2.656 | 06-21-24 | | 3,344,863 | 3,185,982 |
| 28 | JOHN HANCOCK FLOATING RATE INCOME FUND | ANNUAL REPORT | SEE NOTES TO FINANCIAL STATEMENTS |
| | Rate (%) | Maturity date | | Par value^ | Value |
| Information technology (continued) | |
| Software (continued) |
| SolarWinds Holdings, Inc., 2018 Term Loan B (1 month LIBOR + 2.750%) | 2.906 | 02-05-24 | | 4,449,178 | $4,386,622 |
| Sophia LP, 2017 Term Loan B (3 month LIBOR + 3.250%) | 4.250 | 09-30-22 | | 1,556,040 | 1,549,815 |
| SS&C Technologies, Inc., 2018 Term Loan B3 (1 month LIBOR + 1.750%) | 1.906 | 04-16-25 | | 1,143,838 | 1,109,134 |
| SS&C Technologies, Inc., 2018 Term Loan B4 (1 month LIBOR + 1.750%) | 1.906 | 04-16-25 | | 803,626 | 779,244 |
| SS&C Technologies, Inc., 2018 Term Loan B5 (1 month LIBOR + 1.750%) | 1.906 | 04-16-25 | | 3,200,970 | 3,106,766 |
| Surf Holdings LLC, USD Term Loan (3 month LIBOR + 3.500%) | 3.827 | 03-05-27 | | 1,974,067 | 1,925,268 |
| The Ultimate Software Group, Inc., 2020 Incremental Term Loan B (3 month LIBOR + 4.000%) | 4.750 | 05-04-26 | | 2,033,110 | 2,029,308 |
| The Ultimate Software Group, Inc., Term Loan B (1 month LIBOR + 3.750%) | 3.906 | 05-04-26 | | 1,676,334 | 1,662,622 |
| Upland Software, Inc., 2019 Term Loan (1 month LIBOR + 3.750%) | 3.906 | 08-06-26 | | 2,213,289 | 2,174,557 |
| VS Buyer LLC, Term Loan B (1 month LIBOR + 3.250%) | 3.406 | 02-28-27 | | 1,803,447 | 1,774,141 |
| Weld North Education LLC, Term Loan B (3 month LIBOR + 4.250%) | 4.560 | 02-15-25 | | 2,697,221 | 2,656,763 |
| Technology hardware, storage and peripherals 1.1% |
| Dell International LLC, 2019 Term Loan B (1 month LIBOR + 2.000%) | 2.750 | 09-19-25 | | 3,556,152 | 3,529,480 |
| Electronics For Imaging, Inc., Term Loan (1 month LIBOR + 5.000%) | 5.161 | 07-23-26 | | 3,136,519 | 2,477,850 |
| HCP Acquisition LLC, 2017 Term Loan B (1 month LIBOR + 3.000%) | 4.000 | 05-16-24 | | 2,420,984 | 2,400,309 |
| Materials 6.0% | 46,965,757 |
| Chemicals 2.2% |
| Ascend Performance Materials Operations LLC, 2019 Term Loan B (3 month LIBOR + 5.250%) | 6.250 | 08-27-26 | | 3,659,838 | 3,629,351 |
| Innophos Holdings, Inc., 2020 Term Loan B (1 month LIBOR + 3.750%) | 3.906 | 02-04-27 | | 999,986 | 987,486 |
| Nouryon USA LLC, 2018 USD Term Loan B (1 month LIBOR + 3.000%) | 3.164 | 10-01-25 | | 5,049,504 | 4,895,645 |
| SEE NOTES TO FINANCIAL STATEMENTS | ANNUAL REPORT | JOHN HANCOCK FLOATING RATE INCOME FUND | 29 |
| | Rate (%) | Maturity date | | Par value^ | Value |
| Materials (continued) | |
| Chemicals (continued) |
| Plaskolite PPC Intermediate II LLC, 1st Lien Term Loan (2 month LIBOR + 4.250%) | 5.250 | 12-15-25 | | 2,145,981 | $2,103,963 |
| Rohm Holding GmbH, USD Term Loan B (6 month LIBOR + 5.000%) | 5.316 | 07-31-26 | | 1,408,608 | 1,223,728 |
| Root Bidco Sarl, EUR Term Loan B (C) | TBD | 08-11-27 | EUR | 2,248,062 | 2,629,070 |
| SCIH Salt Holdings, Inc., Term Loan B (3 month LIBOR + 4.500%) | 5.500 | 03-16-27 | | 887,279 | 883,951 |
| Univar Solutions USA, Inc., 2019 USD Term Loan B5 (1 month LIBOR + 2.000%) | 2.156 | 07-01-26 | | 829,424 | 804,541 |
| Construction materials 0.2% |
| Quikrete Holdings, Inc., 2016 1st Lien Term Loan (1 month LIBOR + 2.500%) | 2.656 | 02-01-27 | | 2,054,760 | 1,999,713 |
| Containers and packaging 3.2% |
| Ball Metalpack Finco LLC, 2018 1st Lien Term Loan B (3 month LIBOR + 4.500%) | 4.756 | 07-31-25 | | 706,149 | 671,548 |
| Berry Global, Inc., 2019 Term Loan Y (1 month LIBOR + 2.000%) | 2.155 | 07-01-26 | | 2,269,641 | 2,198,443 |
| Graham Packaging Company, Inc., Term Loan (1 month LIBOR + 3.750%) | 4.500 | 08-04-27 | | 2,360,465 | 2,355,744 |
| LABL, Inc., 2019 EUR Term Loan (1 month EURIBOR + 5.000%) | 5.000 | 07-01-26 | EUR | 1,723,600 | 2,006,733 |
| LTI Holdings, Inc., 2018 Add On 1st Lien Term Loan (1 month LIBOR + 3.500%) | 3.667 | 09-06-25 | | 4,546,361 | 4,216,022 |
| LTI Holdings, Inc., 2019 Term Loan (1 month LIBOR + 4.750%) | 4.917 | 07-24-26 | | 494,679 | 461,288 |
| Mauser Packaging Solutions Holding Company, 2017 Term Loan B (3 month LIBOR + 3.250%) | 3.523 | 04-03-24 | | 4,555,009 | 4,320,426 |
| NPC International, Inc., 1st Lien Term Loan (B) | 0.000 | 04-19-24 | | 1,731,271 | 1,214,054 |
| NPC International, Inc., 2020 Incremental Priority Term Loan (1 month LIBOR + 1.500%) | 3.000 | 01-21-21 | | 144,340 | 143,618 |
| Plaze, Inc., 2019 Term Loan B (3 month LIBOR + 3.500%) | 4.572 | 08-03-26 | | 3,646,476 | 3,518,850 |
| Proampac PG Borrower LLC, 2016 1st Lien Term Loan (1, 2 and 3 month LIBOR + 3.500%) | 4.500 | 11-20-23 | | 1,686,855 | 1,660,287 |
| Trident TPI Holdings, Inc., 2017 USD Term Loan B1 (3 month LIBOR + 3.000%) | 4.072 | 10-17-24 | | 2,274,250 | 2,235,588 |
| 30 | JOHN HANCOCK FLOATING RATE INCOME FUND | ANNUAL REPORT | SEE NOTES TO FINANCIAL STATEMENTS |
| | Rate (%) | Maturity date | | Par value^ | Value |
| Materials (continued) | |
| Metals and mining 0.2% |
| WireCo WorldGroup, Inc., 1st Lien Term Loan (2 month LIBOR + 5.000%) | 6.072 | 09-30-23 | | 1,747,130 | $1,490,371 |
| Paper and forest products 0.2% |
| Asplundh Tree Expert LLC, Term Loan (C) | TBD | 08-18-27 | | 1,314,929 | 1,315,337 |
| Real estate 0.7% | 5,561,313 |
| Equity real estate investment trusts 0.7% |
| Iron Mountain, Inc., 2018 Term Loan B (1 month LIBOR + 1.750%) | 1.906 | 01-02-26 | | 1,622,551 | 1,567,790 |
|
| VICI Properties 1 LLC, Replacement Term Loan B (1 month LIBOR + 1.750%) | 1.933 | 12-20-24 | | 4,154,511 | 3,993,523 |
| Corporate bonds 9.0% | | | | | $70,447,066 |
| (Cost $76,264,247) | | | | | |
| Communication services 2.0% | | | | | 15,675,759 |
| Diversified telecommunication services 0.2% | | | |
| Zayo Group Holdings, Inc. (E) | 4.000 | 03-01-27 | | 920,000 | 909,650 |
| Zayo Group Holdings, Inc. (E) | 6.125 | 03-01-28 | | 836,000 | 863,170 |
| Entertainment 0.2% | | | |
| Cinemark USA, Inc. (E) | 8.750 | 05-01-25 | | 961,000 | 1,030,673 |
| Interactive media and services 0.2% | | | |
| National CineMedia LLC (E) | 5.875 | 04-15-28 | | 1,934,000 | 1,566,540 |
| Media 1.4% | | | |
| CCO Holdings LLC (E) | 5.000 | 02-01-28 | | 1,000,000 | 1,057,500 |
| iHeartCommunications, Inc. | 6.375 | 05-01-26 | | 772,000 | 802,880 |
| MDC Partners, Inc. (E) | 6.500 | 05-01-24 | | 1,112,000 | 1,061,960 |
| Sinclair Television Group, Inc. (E) | 5.125 | 02-15-27 | | 745,000 | 724,513 |
| United Group BV (E) | 3.625 | 02-15-28 | EUR | 1,680,000 | 1,931,910 |
| United Group BV (Greater of 3 month EURIBOR + 3.250% or 3.250%) (E)(F) | 3.250 | 02-15-26 | EUR | 734,000 | 850,455 |
| WMG Acquisition Corp. (E) | 3.000 | 02-15-31 | | 2,095,000 | 2,084,525 |
| Ziggo Bond Company BV (E) | 5.125 | 02-28-30 | | 1,154,000 | 1,223,240 |
| Ziggo Bond Company BV (E) | 6.000 | 01-15-27 | | 1,300,000 | 1,368,250 |
| Wireless telecommunication services 0.0% | | | |
| Sprint Communications, Inc. | 11.500 | 11-15-21 | | 180,000 | 200,493 |
| Consumer discretionary 2.4% | | | | | 18,509,164 |
| Diversified consumer services 0.3% | | | |
| Midas Intermediate Holdco II LLC (E) | 7.875 | 10-01-22 | | 1,250,000 | 1,013,088 |
| Verisure Holding AB (E) | 3.875 | 07-15-26 | EUR | 756,000 | 908,898 |
| SEE NOTES TO FINANCIAL STATEMENTS | ANNUAL REPORT | JOHN HANCOCK FLOATING RATE INCOME FUND | 31 |
| | Rate (%) | Maturity date | | Par value^ | Value |
Consumer
discretionary (continued) | | | | | |
| Hotels, restaurants and leisure 1.2% | | | |
| Colt Merger Sub, Inc. (E) | 6.250 | 07-01-25 | | 1,164,000 | $1,232,036 |
| Connect Finco SARL (E) | 6.750 | 10-01-26 | | 1,184,000 | 1,222,480 |
| International Game Technology PLC (E) | 5.250 | 01-15-29 | | 1,470,000 | 1,506,750 |
| IRB Holding Corp. (E) | 7.000 | 06-15-25 | | 373,000 | 398,178 |
| MGM Resorts International | 6.750 | 05-01-25 | | 1,238,000 | 1,324,660 |
| Scientific Games International, Inc. (E) | 5.000 | 10-15-25 | | 913,000 | 903,304 |
| Stonegate Pub Company Financing PLC (E) | 8.250 | 07-31-25 | GBP | 1,985,000 | 2,536,812 |
| Specialty retail 0.6% | | | |
| Burlington Coat Factory Warehouse Corp. (E) | 6.250 | 04-15-25 | | 946,000 | 1,006,308 |
| F-Brasile SpA (E) | 7.375 | 08-15-26 | | 2,812,000 | 2,242,561 |
| Maxeda DIY Holding BV | 6.125 | 07-15-22 | EUR | 1,215,000 | 1,391,924 |
| Party City Holdings, Inc. (Greater of 6 month LIBOR + 5.000% or 5.750%) (E)(F) | 5.750 | 07-15-25 | | 364,563 | 227,852 |
| Textiles, apparel and luxury goods 0.3% | | | |
| The William Carter Company (E) | 5.500 | 05-15-25 | | 744,000 | 793,283 |
| Wolverine Escrow LLC (E) | 9.000 | 11-15-26 | | 2,339,000 | 1,801,030 |
| Consumer staples 0.3% | | | | | 2,417,930 |
| Food and staples retailing 0.2% | | | |
| US Foods, Inc. (E) | 6.250 | 04-15-25 | | 1,214,000 | 1,286,840 |
| Personal products 0.1% | | | |
| Sally Holdings LLC (E) | 8.750 | 04-30-25 | | 1,019,000 | 1,131,090 |
| Energy 0.0% | | | | | 13 |
| Oil, gas and consumable fuels 0.0% | | | |
| Murray Energy Corp. (9.000% Cash and 3.000% PIK) (B)(E) | 12.000 | 04-15-24 | | 1,279,956 | 13 |
| Financials 0.7% | | | | | 5,096,896 |
| Capital markets 0.3% | | | |
| AG Issuer LLC (E) | 6.250 | 03-01-28 | | 1,938,000 | 1,967,070 |
| Diversified financial services 0.3% | | | |
| Advisor Group Holdings, Inc. (E) | 10.750 | 08-01-27 | | 550,000 | 561,000 |
| Garfunkelux Holdco 3 SA | 7.500 | 08-01-22 | EUR | 683,000 | 777,670 |
| Garfunkelux Holdco 3 SA | 8.500 | 11-01-22 | GBP | 649,000 | 826,863 |
| Thrifts and mortgage finance 0.1% | | | |
| Ladder Capital Finance Holdings LLLP (E) | 4.250 | 02-01-27 | | 1,051,000 | 964,293 |
| 32 | JOHN HANCOCK FLOATING RATE INCOME FUND | ANNUAL REPORT | SEE NOTES TO FINANCIAL STATEMENTS |
| | Rate (%) | Maturity date | | Par value^ | Value |
| Health care 0.7% | | | | | $5,770,432 |
| Health care providers and services 0.4% | | | |
| Jaguar Holding Company II (E) | 5.000 | 06-15-28 | | 506,000 | 536,360 |
| MEDNAX, Inc. (E) | 6.250 | 01-15-27 | | 778,000 | 824,680 |
| MPH Acquisition Holdings LLC (E) | 7.125 | 06-01-24 | | 707,000 | 717,817 |
| Select Medical Corp. (E) | 6.250 | 08-15-26 | | 1,285,000 | 1,380,437 |
| Pharmaceuticals 0.3% | | | |
| Par Pharmaceutical, Inc. (E) | 7.500 | 04-01-27 | | 2,165,000 | 2,311,138 |
| Industrials 1.3% | | | | | 10,502,170 |
| Aerospace and defense 0.4% | | | |
| Spirit AeroSystems, Inc. (E) | 7.500 | 04-15-25 | | 1,002,000 | 1,011,389 |
| SSL Robotics LLC (E) | 9.750 | 12-31-23 | | 1,176,000 | 1,328,880 |
| TransDigm, Inc. (E) | 6.250 | 03-15-26 | | 202,000 | 213,152 |
| TransDigm, Inc. (E) | 8.000 | 12-15-25 | | 262,000 | 284,925 |
| Building products 0.2% | | | |
| Builders FirstSource, Inc. (E) | 6.750 | 06-01-27 | | 381,000 | 415,290 |
| Resideo Funding, Inc. (E) | 6.125 | 11-01-26 | | 1,170,000 | 1,178,775 |
| Commercial services and supplies 0.1% | | | |
| Anagram International, Inc. (5.000% Cash and 5.000% PIK) (E) | 10.000 | 08-15-26 | | 197,063 | 165,533 |
| VistaJet Malta Finance PLC (E) | 10.500 | 06-01-24 | | 938,000 | 844,200 |
| Construction and engineering 0.1% | | | |
| Novafives SAS (Greater of 3 month EURIBOR + 4.500% or 4.500%) (F) | 4.500 | 06-15-25 | EUR | 1,332,000 | 1,144,471 |
| Marine 0.1% | | | |
| Naviera Armas SA (Greater of 3 month EURIBOR + 4.250% or 4.250%) (F) | 4.250 | 11-15-24 | EUR | 1,811,000 | 1,073,015 |
| Professional services 0.2% | | | |
| La Financiere Atalian SASU | 4.000 | 05-15-24 | EUR | 1,114,000 | 1,130,116 |
| La Financiere Atalian SASU | 5.125 | 05-15-25 | EUR | 100,000 | 101,440 |
| La Financiere Atalian SASU | 6.625 | 05-15-25 | GBP | 117,000 | 132,934 |
| Trading companies and distributors 0.2% | | | |
| Beacon Roofing Supply, Inc. (E) | 4.500 | 11-15-26 | | 1,435,000 | 1,478,050 |
| Information technology 0.4% | | | | | 2,932,599 |
| IT services 0.3% | | | |
| Presidio Holdings, Inc. (E) | 4.875 | 02-01-27 | | 1,510,000 | 1,547,750 |
| Sabre GLBL, Inc. (E) | 5.250 | 11-15-23 | | 911,000 | 904,168 |
| Sabre GLBL, Inc. (E) | 9.250 | 04-15-25 | | 64,000 | 71,200 |
| Software 0.1% | | | |
| BY Crown Parent LLC (E) | 4.250 | 01-31-26 | | 401,000 | 409,481 |
| SEE NOTES TO FINANCIAL STATEMENTS | ANNUAL REPORT | JOHN HANCOCK FLOATING RATE INCOME FUND | 33 |
| | Rate (%) | Maturity date | | Par value^ | Value |
| Materials 0.9% | | | | | $7,153,424 |
| Chemicals 0.3% | | | |
| Venator Finance Sarl (E) | 9.500 | 07-01-25 | | 2,341,000 | 2,458,050 |
| Containers and packaging 0.6% | | | |
| Ardagh Packaging Finance PLC (E) | 5.250 | 04-30-25 | | 553,000 | 586,819 |
| Intelligent Packaging, Ltd., Finco, Inc. (E) | 6.000 | 09-15-28 | | 1,245,000 | 1,269,900 |
| LABL Escrow Issuer LLC (E) | 6.750 | 07-15-26 | | 1,591,000 | 1,706,348 |
| LABL Escrow Issuer LLC (E) | 10.500 | 07-15-27 | | 1,025,000 | 1,124,938 |
| Metals and mining 0.0% | | | |
| Midwest Vanadium Pty, Ltd. (B)(E) | 11.500 | 02-15-18 | | 5,668,325 | 7,369 |
| Real estate 0.3% | | | | | 2,388,679 |
| Equity real estate investment trusts 0.3% | | | |
| VICI Properties LP (E) | 3.750 | 02-15-27 | | 312,000 | 311,220 |
| VICI Properties LP (E) | 4.125 | 08-15-30 | | 104,000 | 104,229 |
| VICI Properties LP (E) | 4.250 | 12-01-26 | | 1,092,000 | 1,116,570 |
| VICI Properties LP (E) | 4.625 | 12-01-29 | | 429,000 | 446,160 |
| XHR LP (E) | 6.375 | 08-15-25 | | 400,000 | 410,500 |
|
| | | | | Shares | Value |
| Common stocks 0.0% | | | | | $238,262 |
| (Cost $11,933,215) | | | | | |
| Consumer discretionary 0.0% | | | | | 101,649 |
| Specialty retail 0.0% | | | |
| Party City Holdco, Inc. (G) | | | 37,098 | 101,649 |
| Energy 0.0% | | | | | 136,613 |
| Energy equipment and services 0.0% | | | |
| Hercules Offshore, Inc. (D)(G) | | | 196,736 | 136,613 |
|
| | | Yield (%) | | Shares | Value |
| Short-term investments 3.6% | | | | | $27,947,298 |
| (Cost $27,947,298) | | | | | |
| Short-term funds 3.6% | | | | | 27,947,298 |
| State Street Institutional U.S. Government Money Market Fund, Premier Class | 0.0399(H) | | 27,947,298 | 27,947,298 |
|
| Total investments (Cost $844,501,078) 102.7% | | | | $801,005,313 |
| Other assets and liabilities, net (2.7%) | | | | (21,216,696) |
| Total net assets 100.0% | | | | | $779,788,617 |
| The percentage shown for each investment category is the total value of the category as a percentage of the net assets of the fund. |
| ^All par values are denominated in U.S. dollars unless otherwise indicated. |
| 34 | JOHN HANCOCK FLOATING RATE INCOME FUND | ANNUAL REPORT | SEE NOTES TO FINANCIAL STATEMENTS |
| Currency Abbreviations |
| EUR | Euro |
| GBP | Pound Sterling |
| Security Abbreviations and Legend |
| EURIBOR | Euro Interbank Offered Rate |
| LIBOR | London Interbank Offered Rate |
| PIK | Pay-in-Kind Security - Represents a payment-in-kind which may pay interest in additional par and/or cash. Rates shown are the current rate and most recent payment rate. |
| (A) | Term loans are variable rate obligations. The coupon rate shown represents the rate at period end. |
| (B) | Non-income producing - Issuer is in default. |
| (C) | This position represents an unsettled loan commitment at period end. Certain details associated with this purchase are not known prior to the settlement date, including coupon rate, which is disclosed as TBD (To Be Determined). |
| (D) | Security is valued using significant unobservable inputs and is classified as Level 3 in the fair value hierarchy. Refer to Note 2 to the financial statements. |
| (E) | These securities are exempt from registration under Rule 144A of the Securities Act of 1933. Such securities may be resold, normally to qualified institutional buyers, in transactions exempt from registration. |
| (F) | Variable rate obligation. The coupon rate shown represents the rate at period end. |
| (G) | Non-income producing security. |
| (H) | The rate shown is the annualized seven-day yield as of 8-31-20. |
| SEE NOTES TO FINANCIAL STATEMENTS | ANNUAL REPORT | JOHN HANCOCK FLOATING RATE INCOME FUND | 35 |
DERIVATIVES
FORWARD FOREIGN CURRENCY CONTRACTS
| Contract to buy | Contract to sell | Counterparty (OTC) | Contractual
settlement
date | Unrealized
appreciation | Unrealized
depreciation |
| USD | 61,081,114 | EUR | 54,550,000 | CITI | 9/18/2020 | — | $(4,039,068) |
| USD | 4,616,958 | GBP | 3,530,000 | CITI | 10/30/2020 | — | (103,340) |
| | | | | | | — | $(4,142,408) |
| Derivatives Currency Abbreviations |
| EUR | Euro |
| GBP | Pound Sterling |
| USD | U.S. Dollar |
| Derivatives Abbreviations |
| CITI | Citibank, N.A. |
| OTC | Over-the-counter |
At 8-31-20, the aggregate cost of investments for federal income tax purposes was $840,968,620. Net unrealized depreciation aggregated to $44,105,715, of which $9,021,038 related to gross unrealized appreciation and $53,126,753 related to gross unrealized depreciation.
See Notes to financial statements regarding investment transactions and other derivatives information.
| 36 | JOHN HANCOCK FLOATING RATE INCOME FUND | ANNUAL REPORT | SEE NOTES TO FINANCIAL STATEMENTS |
STATEMENT OF ASSETS AND LIABILITIES 8-31-20
| Assets | |
| Unaffiliated investments, at value (Cost $844,501,078) | $801,005,313 |
| Foreign currency, at value (Cost $2,070,101) | 2,089,924 |
| Collateral segregated at custodian for OTC derivative contracts | 3,828,440 |
| Interest receivable | 3,879,538 |
| Receivable for fund shares sold | 369,047 |
| Receivable for investments sold | 9,263,074 |
| Receivable from affiliates | 11,279 |
| Other assets | 53,604 |
| Total assets | 820,500,219 |
| Liabilities | |
| Unrealized depreciation on forward foreign currency contracts | 4,142,408 |
| Distributions payable | 32,535 |
| Payable for investments purchased | 36,003,320 |
| Payable for fund shares repurchased | 452,388 |
| Payable to affiliates | |
| Accounting and legal services fees | 45,289 |
| Transfer agent fees | 19,251 |
| Trustees' fees | 423 |
| Other liabilities and accrued expenses | 15,988 |
| Total liabilities | 40,711,602 |
| Net assets | $779,788,617 |
| Net assets consist of | |
| Paid-in capital | $1,177,954,777 |
| Total distributable earnings (loss) | (398,166,160) |
| Net assets | $779,788,617 |
| |
| Net asset value per share | |
| Based on net asset value and shares outstanding - the fund has an unlimited number of shares authorized with no par value | |
| Class A ($88,561,335 ÷ 11,222,416 shares)1 | $7.89 |
| Class B ($1,884,357 ÷ 238,690 shares)1 | $7.89 |
| Class C ($39,354,342 ÷ 4,965,978 shares)1 | $7.92 |
| Class I ($48,817,326 ÷ 6,190,929 shares) | $7.89 |
| Class R6 ($1,541,795 ÷ 195,354 shares) | $7.89 |
| Class 1 ($16,318,413 ÷ 2,070,227 shares) | $7.88 |
| Class NAV ($583,311,049 ÷ 73,902,170 shares) | $7.89 |
| Maximum offering price per share | |
| Class A (net asset value per share ÷ 97.5%)2 | $8.09 |
| 1 | Redemption price per share is equal to net asset value less any applicable contingent deferred sales charge. |
| 2 | On single retail sales of less than $100,000. On sales of $100,000 or more and on group sales the offering price is reduced. |
| SEE NOTES TO FINANCIAL STATEMENTS | ANNUAL REPORT | JOHN HANCOCK Floating Rate Income Fund | 37 |
STATEMENT OF OPERATIONS For the year ended 8-31-20
| Investment income | |
| Interest | $41,793,161 |
| Securities lending | 14,018 |
| Total investment income | 41,807,179 |
| Expenses | |
| Investment management fees | 5,203,481 |
| Distribution and service fees | 815,529 |
| Line of credit fees | 408,883 |
| Accounting and legal services fees | 129,455 |
| Transfer agent fees | 261,259 |
| Trustees' fees | 13,097 |
| Custodian fees | 127,728 |
| State registration fees | 94,108 |
| Printing and postage | 49,236 |
| Professional fees | 8,058 1 |
| Other | 76,199 |
| Total expenses | 7,187,033 |
| Less expense reductions | (1,191,694) |
| Net expenses | 5,995,339 |
| Net investment income | 35,811,840 |
| Realized and unrealized gain (loss) | |
| Net realized gain (loss) on | |
| Unaffiliated investments and foreign currency transactions | (29,804,071) |
| Affiliated investments | 436 |
| Forward foreign currency contracts | 2,869,233 |
| | (26,934,402) |
| Change in net unrealized appreciation (depreciation) of | |
| Unaffiliated investments and translation of assets and liabilities in foreign currencies | 3,253,067 |
| Affiliated investments | (783) |
| Forward foreign currency contracts | (6,728,507) |
| | (3,476,223) |
| Net realized and unrealized loss | (30,410,625) |
| Increase in net assets from operations | $5,401,215 |
| |
| 1 | During the year ended August 31, 2020, Floating Rate Income Fund received a reimbursement of legal fees. See Note 10 to the Financial statements. Professional fees incurred by the fund for the year ended August 31, 2020 prior to these reimbursements were $115,487. |
| 38 | JOHN HANCOCK Floating Rate Income Fund | ANNUAL REPORT | SEE NOTES TO FINANCIAL STATEMENTS |
STATEMENTS OF CHANGES IN NET ASSETS
| | Year ended
8-31-20 | Year ended
8-31-19 |
| Increase (decrease) in net assets | | |
| From operations | | |
| Net investment income | $35,811,840 | $53,726,042 |
| Net realized loss | (26,934,402) | (27,885,003) |
| Change in net unrealized appreciation (depreciation) | (3,476,223) | 3,560,607 |
| Increase in net assets resulting from operations | 5,401,215 | 29,401,646 |
| Distributions to shareholders | | |
| From earnings | | |
| Class A | (4,729,634) | (5,343,492) |
| Class B | (136,316) | (263,936) |
| Class C | (2,280,483) | (3,399,225) |
| Class I | (2,862,988) | (6,031,201) |
| Class R6 | (110,598) | (267,170) |
| Class 1 | (1,084,098) | (1,480,774) |
| Class NAV | (28,237,238) | (36,075,340) |
| Total distributions | (39,441,355) | (52,861,138) |
| From fund share transactions | (113,248,087) | (330,154,576) |
| Total decrease | (147,288,227) | (353,614,068) |
| Net assets | | |
| Beginning of year | 927,076,844 | 1,280,690,912 |
| End of year | $779,788,617 | $927,076,844 |
| SEE NOTES TO FINANCIAL STATEMENTS | ANNUAL REPORT | JOHN HANCOCK Floating Rate Income Fund | 39 |
| CLASS A SHARES Period ended | 8-31-20 | 8-31-19 | 8-31-18 | 8-31-17 | 8-31-16 |
| Per share operating performance | | | | | |
| Net asset value, beginning of period | $8.28 | $8.43 | $8.45 | $8.48 | $8.71 |
| Net investment income1 | 0.36 | 0.40 | 0.34 | 0.37 | 0.43 |
| Net realized and unrealized gain (loss) on investments | (0.36) | (0.16) | — 2 | — | (0.24) |
| Total from investment operations | — | 0.24 | 0.34 | 0.37 | 0.19 |
| Less distributions | | | | | |
| From net investment income | (0.39) | (0.39) | (0.36) | (0.40) | (0.42) |
| From net realized gain | — | — | — | — | — |
| Total distributions | (0.39) | (0.39) | (0.36) | (0.40) | (0.42) |
| Net asset value, end of period | $7.89 | $8.28 | $8.43 | $8.45 | $8.48 |
| Total return (%)3,4 | 0.11 | 2.96 | 4.05 | 4.46 | 2.38 |
| Ratios and supplemental data | | | | | |
| Net assets, end of period (in millions) | $89 | $109 | $117 | $138 | $165 |
| Ratios (as a percentage of average net assets): | | | | | |
| Expenses before reductions | 1.17 5 | 1.16 | 1.13 | 1.17 | 1.16 |
| Expenses including reductions | 0.99 5 | 1.06 | 1.13 | 1.16 | 1.14 |
| Net investment income | 4.49 | 4.77 | 4.03 | 4.31 | 5.12 |
| Portfolio turnover (%) | 81 | 120 | 71 | 66 | 35 |
| 1 | Based on average daily shares outstanding. |
| 2 | Less than $0.005 per share. |
| 3 | Total returns would have been lower had certain expenses not been reduced during the applicable periods. |
| 4 | Does not reflect the effect of sales charges, if any. |
| 5 | Includes reimbursement of legal fees of 0.01%. See Note 10 to the Financial statements. |
| 40 | JOHN HANCOCK Floating Rate Income Fund | ANNUAL REPORT | SEE NOTES TO FINANCIAL STATEMENTS |
| CLASS B SHARES Period ended | 8-31-20 | 8-31-19 | 8-31-18 | 8-31-17 | 8-31-16 |
| Per share operating performance | | | | | |
| Net asset value, beginning of period | $8.29 | $8.44 | $8.45 | $8.49 | $8.71 |
| Net investment income1 | 0.30 | 0.33 | 0.28 | 0.31 | 0.37 |
| Net realized and unrealized gain (loss) on investments | (0.37) | (0.15) | — 2 | (0.01) | (0.23) |
| Total from investment operations | (0.07) | 0.18 | 0.28 | 0.30 | 0.14 |
| Less distributions | | | | | |
| From net investment income | (0.33) | (0.33) | (0.29) | (0.34) | (0.36) |
| From net realized gain | — | — | — | — | — |
| Total distributions | (0.33) | (0.33) | (0.29) | (0.34) | (0.36) |
| Net asset value, end of period | $7.89 | $8.29 | $8.44 | $8.45 | $8.49 |
| Total return (%)3,4 | (0.76) | 2.19 | 3.40 | 3.60 | 1.79 |
| Ratios and supplemental data | | | | | |
| Net assets, end of period (in millions) | $2 | $5 | $9 | $15 | $18 |
| Ratios (as a percentage of average net assets): | | | | | |
| Expenses before reductions | 1.92 5 | 1.91 | 1.88 | 1.88 | 1.86 |
| Expenses including reductions | 1.74 5 | 1.81 | 1.88 | 1.87 | 1.84 |
| Net investment income | 3.79 | 3.96 | 3.27 | 3.61 | 4.45 |
| Portfolio turnover (%) | 81 | 120 | 71 | 66 | 35 |
| 1 | Based on average daily shares outstanding. |
| 2 | Less than $0.005 per share. |
| 3 | Total returns would have been lower had certain expenses not been reduced during the applicable periods. |
| 4 | Does not reflect the effect of sales charges, if any. |
| 5 | Includes reimbursement of legal fees of 0.01%. See Note 10 to the Financial statements. |
| SEE NOTES TO FINANCIAL STATEMENTS | ANNUAL REPORT | JOHN HANCOCK Floating Rate Income Fund | 41 |
| CLASS C SHARES Period ended | 8-31-20 | 8-31-19 | 8-31-18 | 8-31-17 | 8-31-16 |
| Per share operating performance | | | | | |
| Net asset value, beginning of period | $8.32 | $8.47 | $8.49 | $8.52 | $8.74 |
| Net investment income1 | 0.30 | 0.33 | 0.28 | 0.31 | 0.37 |
| Net realized and unrealized gain (loss) on investments | (0.37) | (0.15) | (0.01) | 0.01 | (0.23) |
| Total from investment operations | (0.07) | 0.18 | 0.27 | 0.32 | 0.14 |
| Less distributions | | | | | |
| From net investment income | (0.33) | (0.33) | (0.29) | (0.35) | (0.36) |
| From net realized gain | — | — | — | — | — |
| Total distributions | (0.33) | (0.33) | (0.29) | (0.35) | (0.36) |
| Net asset value, end of period | $7.92 | $8.32 | $8.47 | $8.49 | $8.52 |
| Total return (%)2,3 | (0.74) | 2.20 | 3.28 | 3.73 | 1.80 |
| Ratios and supplemental data | | | | | |
| Net assets, end of period (in millions) | $39 | $71 | $102 | $128 | $141 |
| Ratios (as a percentage of average net assets): | | | | | |
| Expenses before reductions | 1.92 4 | 1.91 | 1.88 | 1.88 | 1.86 |
| Expenses including reductions | 1.74 4 | 1.81 | 1.88 | 1.87 | 1.84 |
| Net investment income | 3.77 | 3.99 | 3.29 | 3.60 | 4.45 |
| Portfolio turnover (%) | 81 | 120 | 71 | 66 | 35 |
| 1 | Based on average daily shares outstanding. |
| 2 | Total returns would have been lower had certain expenses not been reduced during the applicable periods. |
| 3 | Does not reflect the effect of sales charges, if any. |
| 4 | Includes reimbursement of legal fees of 0.01%. See Note 10 to the Financial statements. |
| 42 | JOHN HANCOCK Floating Rate Income Fund | ANNUAL REPORT | SEE NOTES TO FINANCIAL STATEMENTS |
| CLASS I SHARES Period ended | 8-31-20 | 8-31-19 | 8-31-18 | 8-31-17 | 8-31-16 |
| Per share operating performance | | | | | |
| Net asset value, beginning of period | $8.28 | $8.43 | $8.45 | $8.48 | $8.70 |
| Net investment income1 | 0.38 | 0.41 | 0.36 | 0.39 | 0.45 |
| Net realized and unrealized gain (loss) on investments | (0.36) | (0.15) | — 2 | 0.01 | (0.23) |
| Total from investment operations | 0.02 | 0.26 | 0.36 | 0.40 | 0.22 |
| Less distributions | | | | | |
| From net investment income | (0.41) | (0.41) | (0.38) | (0.43) | (0.44) |
| From net realized gain | — | — | — | — | — |
| Total distributions | (0.41) | (0.41) | (0.38) | (0.43) | (0.44) |
| Net asset value, end of period | $7.89 | $8.28 | $8.43 | $8.45 | $8.48 |
| Total return (%)3 | 0.34 | 3.19 | 4.31 | 4.78 | 2.82 |
| Ratios and supplemental data | | | | | |
| Net assets, end of period (in millions) | $49 | $66 | $152 | $166 | $158 |
| Ratios (as a percentage of average net assets): | | | | | |
| Expenses before reductions | 0.92 4 | 0.92 | 0.89 | 0.87 | 0.84 |
| Expenses including reductions | 0.76 4 | 0.83 | 0.88 | 0.85 | 0.83 |
| Net investment income | 4.72 | 4.94 | 4.29 | 4.57 | 5.45 |
| Portfolio turnover (%) | 81 | 120 | 71 | 66 | 35 |
| 1 | Based on average daily shares outstanding. |
| 2 | Less than $0.005 per share. |
| 3 | Total returns would have been lower had certain expenses not been reduced during the applicable periods. |
| 4 | Includes reimbursement of legal fees of 0.01%. See Note 10 to the Financial statements. |
| SEE NOTES TO FINANCIAL STATEMENTS | ANNUAL REPORT | JOHN HANCOCK Floating Rate Income Fund | 43 |
| CLASS R6 SHARES Period ended | 8-31-20 | 8-31-19 | 8-31-18 | 8-31-17 | 8-31-16 |
| Per share operating performance | | | | | |
| Net asset value, beginning of period | $8.29 | $8.43 | $8.45 | $8.48 | $8.71 |
| Net investment income1 | 0.39 | 0.42 | 0.37 | 0.40 | 0.45 |
| Net realized and unrealized gain (loss) on investments | (0.37) | (0.14) | — 2 | 0.01 | (0.23) |
| Total from investment operations | 0.02 | 0.28 | 0.37 | 0.41 | 0.22 |
| Less distributions | | | | | |
| From net investment income | (0.42) | (0.42) | (0.39) | (0.44) | (0.45) |
| From net realized gain | — | — | — | — | — |
| Total distributions | (0.42) | (0.42) | (0.39) | (0.44) | (0.45) |
| Net asset value, end of period | $7.89 | $8.29 | $8.43 | $8.45 | $8.48 |
| Total return (%)3 | 0.33 | 3.44 | 4.41 | 4.88 | 2.82 |
| Ratios and supplemental data | | | | | |
| Net assets, end of period (in millions) | $2 | $3 | $6 | $— 4 | $— 4 |
| Ratios (as a percentage of average net assets): | | | | | |
| Expenses before reductions | 0.81 5 | 0.81 | 0.79 | 0.77 | 0.75 |
| Expenses including reductions | 0.65 5 | 0.71 | 0.78 | 0.76 | 0.72 |
| Net investment income | 4.88 | 5.06 | 4.45 | 4.66 | 5.38 |
| Portfolio turnover (%) | 81 | 120 | 71 | 66 | 35 |
| 1 | Based on average daily shares outstanding. |
| 2 | Less than $0.005 per share. |
| 3 | Total returns would have been lower had certain expenses not been reduced during the applicable periods. |
| 4 | Less than $500,000. |
| 5 | Includes reimbursement of legal fees of 0.01%. See Note 10 to the Financial statements. |
| 44 | JOHN HANCOCK Floating Rate Income Fund | ANNUAL REPORT | SEE NOTES TO FINANCIAL STATEMENTS |
| CLASS 1 SHARES Period ended | 8-31-20 | 8-31-19 | 8-31-18 | 8-31-17 | 8-31-16 |
| Per share operating performance | | | | | |
| Net asset value, beginning of period | $8.28 | $8.42 | $8.44 | $8.47 | $8.70 |
| Net investment income1 | 0.38 | 0.42 | 0.37 | 0.40 | 0.46 |
| Net realized and unrealized gain (loss) on investments | (0.36) | (0.14) | (0.01) | — | (0.24) |
| Total from investment operations | 0.02 | 0.28 | 0.36 | 0.40 | 0.22 |
| Less distributions | | | | | |
| From net investment income | (0.42) | (0.42) | (0.38) | (0.43) | (0.45) |
| From net realized gain | — | — | — | — | — |
| Total distributions | (0.42) | (0.42) | (0.38) | (0.43) | (0.45) |
| Net asset value, end of period | $7.88 | $8.28 | $8.42 | $8.44 | $8.47 |
| Total return (%)2 | 0.29 | 3.39 | 4.37 | 4.84 | 2.76 |
| Ratios and supplemental data | | | | | |
| Net assets, end of period (in millions) | $16 | $27 | $30 | $30 | $23 |
| Ratios (as a percentage of average net assets): | | | | | |
| Expenses before reductions | 0.85 3 | 0.84 | 0.83 | 0.81 | 0.78 |
| Expenses including reductions | 0.69 3 | 0.75 | 0.82 | 0.80 | 0.77 |
| Net investment income | 4.82 | 5.07 | 4.36 | 4.63 | 5.54 |
| Portfolio turnover (%) | 81 | 120 | 71 | 66 | 35 |
| 1 | Based on average daily shares outstanding. |
| 2 | Total returns would have been lower had certain expenses not been reduced during the applicable periods. |
| 3 | Includes reimbursement of legal fees of 0.01%. See Note 10 to the Financial statements. |
| SEE NOTES TO FINANCIAL STATEMENTS | ANNUAL REPORT | JOHN HANCOCK Floating Rate Income Fund | 45 |
| CLASS NAV SHARES Period ended | 8-31-20 | 8-31-19 | 8-31-18 | 8-31-17 | 8-31-16 |
| Per share operating performance | | | | | |
| Net asset value, beginning of period | $8.29 | $8.44 | $8.45 | $8.48 | $8.71 |
| Net investment income1 | 0.38 | 0.42 | 0.37 | 0.40 | 0.46 |
| Net realized and unrealized gain (loss) on investments | (0.36) | (0.15) | 0.01 | 0.01 | (0.24) |
| Total from investment operations | 0.02 | 0.27 | 0.38 | 0.41 | 0.22 |
| Less distributions | | | | | |
| From net investment income | (0.42) | (0.42) | (0.39) | (0.44) | (0.45) |
| From net realized gain | — | — | — | — | — |
| Total distributions | (0.42) | (0.42) | (0.39) | (0.44) | (0.45) |
| Net asset value, end of period | $7.89 | $8.29 | $8.44 | $8.45 | $8.48 |
| Total return (%)2 | 0.34 | 3.32 | 4.55 | 4.89 | 2.82 |
| Ratios and supplemental data | | | | | |
| Net assets, end of period (in millions) | $583 | $648 | $865 | $1,202 | $1,518 |
| Ratios (as a percentage of average net assets): | | | | | |
| Expenses before reductions | 0.80 3 | 0.79 | 0.78 | 0.76 | 0.73 |
| Expenses including reductions | 0.65 3 | 0.71 | 0.77 | 0.75 | 0.72 |
| Net investment income | 4.80 | 5.08 | 4.41 | 4.71 | 5.55 |
| Portfolio turnover (%) | 81 | 120 | 71 | 66 | 35 |
| 1 | Based on average daily shares outstanding. |
| 2 | Total returns would have been lower had certain expenses not been reduced during the applicable periods. |
| 3 | Includes reimbursement of legal fees of 0.01%. See Note 10 to the Financial statements. |
| 46 | JOHN HANCOCK Floating Rate Income Fund | ANNUAL REPORT | SEE NOTES TO FINANCIAL STATEMENTS |
Notes to financial statements
Note 1—Organization
John Hancock Floating Rate Income Fund (the fund) is a series of John Hancock Funds II (the Trust), an open-end management investment company organized as a Massachusetts business trust and registered under the Investment Company Act of 1940, as amended (the 1940 Act). The investment objective of the fund is to seek a high level of current income.
The fund may offer multiple classes of shares. The shares currently outstanding are detailed in the Statement of assets and liabilities. Class A and Class C shares are offered to all investors. Class B shares are closed to new investors. Class I shares are offered to institutions and certain investors. Class R6 shares are only available to certain retirement plans, institutions and other investors. Class 1 shares are offered only to certain affiliates of Manulife Financial Corporation. Class NAV shares are offered to John Hancock affiliated funds of funds, retirement plans for employees of John Hancock and/or Manulife Financial Corporation, and certain 529 plans. Class B shares convert to Class A shares eight years after purchase. Class C shares convert to Class A shares ten years after purchase (certain exclusions may apply). Shareholders of each class have exclusive voting rights to matters that affect that class. The distribution and service fees, if any, and transfer agent fees for each class may differ.
Note 2—Significant accounting policies
The financial statements have been prepared in conformity with accounting principles generally accepted in the United States of America (US GAAP), which require management to make certain estimates and assumptions as of the date of the financial statements. Actual results could differ from those estimates and those differences could be significant. The fund qualifies as an investment company under Topic 946 of Accounting Standards Codification of US GAAP.
Events or transactions occurring after the end of the fiscal period through the date that the financial statements were issued have been evaluated in the preparation of the financial statements. The following summarizes the significant accounting policies of the fund:
Security valuation. Investments are stated at value as of the scheduled close of regular trading on the New York Stock Exchange (NYSE), normally at 4:00 P.M., Eastern Time. In case of emergency or other disruption resulting in the NYSE not opening for trading or the NYSE closing at a time other than the regularly scheduled close, the net asset value (NAV) may be determined as of the regularly scheduled close of the NYSE pursuant to the fund's Valuation Policies and Procedures.
In order to value the securities, the fund uses the following valuation techniques: Debt obligations are typically valued based on evaluated prices provided by an independent pricing vendor. Independent pricing vendors utilize matrix pricing, which takes into account factors such as institutional-size trading in similar groups of securities, yield, quality, coupon rate, maturity, type of issue, trading characteristics and other market data, as well as broker supplied prices. Equity securities, including exchange-traded or closed-end funds, are typically valued at the last sale price or official closing price on the exchange or principal market where the security trades. In the event there were no sales during the day or closing prices are not available, the securities are valued using the last available bid price. Investments by the fund in open-end mutual funds are valued at their respective NAVs each business day. Forward foreign currency contracts are valued at the prevailing forward rates which are based on foreign currency exchange spot rates and forward points supplied by an independent pricing vendor. Foreign securities and currencies are valued in U.S. dollars based on foreign currency exchange rates supplied by an independent pricing vendor.
In certain instances, the Pricing Committee may determine to value equity securities using prices obtained from another exchange or market if trading on the exchange or market on which prices are typically obtained did not open for trading as scheduled, or if trading closed earlier than scheduled, and trading occurred as normal on another exchange or market.
| | ANNUAL REPORT | JOHN HANCOCK Floating Rate Income Fund | 47 |
Other portfolio securities and assets, for which reliable market quotations are not readily available, are valued at fair value as determined in good faith by the fund's Pricing Committee following procedures established by the Board of Trustees. The frequency with which these fair valuation procedures are used cannot be predicted and fair value of securities may differ significantly from the value that would have been used had a ready market for such securities existed.
The fund uses a three-tier hierarchy to prioritize the pricing assumptions, referred to as inputs, used in valuation techniques to measure fair value. Level 1 includes securities valued using quoted prices in active markets for identical securities, including registered investment companies. Level 2 includes securities valued using other significant observable inputs. Observable inputs may include quoted prices for similar securities, interest rates, prepayment speeds and credit risk. Prices for securities valued using these inputs are received from independent pricing vendors and brokers and are based on an evaluation of the inputs described. Level 3 includes securities valued using significant unobservable inputs when market prices are not readily available or reliable, including the fund's own assumptions in determining the fair value of investments. Factors used in determining value may include market or issuer specific events or trends, changes in interest rates and credit quality. The inputs or methodology used for valuing securities are not necessarily an indication of the risks associated with investing in those securities. Changes in valuation techniques and related inputs may result in transfers into or out of an assigned level within the disclosure hierarchy.
The following is a summary of the values by input classification of the fund's investments as of August 31, 2020, by major security category or type:
| | Total
value at
8-31-20 | Level 1
quoted
price | Level 2
significant
observable
inputs | Level 3
significant
unobservable
inputs |
| Investments in securities: | | | | |
| Assets | | | | |
| Term loans | $702,372,687 | — | $702,352,686 | $20,001 |
| Corporate bonds | 70,447,066 | — | 70,447,066 | — |
| Common stocks | 238,262 | $101,649 | — | 136,613 |
| Short-term investments | 27,947,298 | 27,947,298 | — | — |
| Total investments in securities | $801,005,313 | $28,048,947 | $772,799,752 | $156,614 |
| Derivatives: | | | | |
| Liabilities | | | | |
| Forward foreign currency contracts | $(4,142,408) | — | $(4,142,408) | — |
Term loans (Floating rate loans). The fund may invest in term loans, which are debt securities and are often rated below investment grade at the time of purchase. Term loans are generally subject to legal or contractual restrictions on resale and generally have longer settlement periods than conventional debt securities. Term loans involve special types of risk, including credit risk, interest-rate risk, counterparty risk, and risk associated with extended settlement. The liquidity of term loans, including the volume and frequency of secondary market trading in such loans, varies significantly over time and among individual loans. During periods of infrequent trading, valuing a term loan can be more difficult and buying and selling a term loan at an acceptable price can be more difficult and delayed, which could result in a loss.
The fund's ability to receive payments of principal, interest and other amounts in connection with term loans will depend primarily on the financial condition of the borrower. The fund's failure to receive scheduled payments on a term loan due to a default, bankruptcy or other reason would adversely affect the fund's income and would likely reduce the value of its assets. Transactions in loan investments typically take a significant amount of time (i.e., seven days or longer) to settle. This could pose a liquidity risk to the fund and, if the fund's exposure to such investments is substantial, it could impair the fund's ability to meet redemptions. Because term loans may not be
| 48 | JOHN HANCOCK Floating Rate Income Fund | ANNUAL REPORT | |
rated by independent credit rating agencies, a decision to invest in a particular loan could depend exclusively on the subadvisor’s credit analysis of the borrower and/or term loan agents. There is greater risk that the fund may have limited rights to enforce the terms of an underlying loan than for other types of debt instruments.
At August 31, 2020, the fund had $724,146 in unfunded loan commitments outstanding.
Security transactions and related investment income. Investment security transactions are accounted for on a trade date plus one basis for daily NAV calculations. However, for financial reporting purposes, investment transactions are reported on trade date. Interest income is accrued as earned. Interest income includes coupon interest and amortization/accretion of premiums/discounts on debt securities. Debt obligations may be placed in a non-accrual status and related interest income may be reduced by stopping current accruals and writing off interest receivable when the collection of all or a portion of interest has become doubtful. Gains and losses on securities sold are determined on the basis of identified cost and may include proceeds from litigation.
Securities lending. The fund may lend its securities to earn additional income. The fund receives collateral from the borrower in an amount not less than the market value of the loaned securities. The fund will invest its cash collateral in John Hancock Collateral Trust (JHCT), an affiliate of the fund, which has a floating NAV and is registered with the Securities and Exchange Commission (SEC) as an investment company. JHCT invests in short-term money market investments. The fund will receive the benefit of any gains and bear any losses generated by JHCT with respect to the cash collateral.
The fund has the right to recall loaned securities on demand. If a borrower fails to return loaned securities when due, then the lending agent is responsible and indemnifies the fund for the lent securities. The lending agent uses the collateral received from the borrower to purchase replacement securities of the same issue, type, class and series of the loaned securities. If the value of the collateral is less than the purchase cost of replacement securities, the lending agent is responsible for satisfying the shortfall but only to the extent that the shortfall is not due to any decrease in the value of JHCT.
Although the risk of loss on securities lent is mitigated by receiving collateral from the borrower and through lending agent indemnification, the fund could experience a delay in recovering securities or could experience a lower than expected return if the borrower fails to return the securities on a timely basis. The fund receives compensation for lending its securities by retaining a portion of the return on the investment of the collateral and compensation from fees earned from borrowers of the securities. Securities lending income received by the fund is net of fees retained by the securities lending agent. Net income received from JHCT is a component of securities lending income as recorded on the Statement of operations. As of August 31, 2020, there were no securities on loan.
Foreign investing. Assets, including investments, and liabilities denominated in foreign currencies are translated into U.S. dollar values each day at the prevailing exchange rate. Purchases and sales of securities, income and expenses are translated into U.S. dollars at the prevailing exchange rate on the date of the transaction. The effect of changes in foreign currency exchange rates on the value of securities is reflected as a component of the realized and unrealized gains (losses) on investments. Foreign investments are subject to a decline in the value of a foreign currency versus the U.S. dollar, which reduces the dollar value of securities denominated in that currency.
Funds that invest internationally generally carry more risk than funds that invest strictly in U.S. securities. Risks can result from differences in economic and political conditions, regulations, market practices (including higher transaction costs), accounting standards and other factors.
Overdraft. The fund may have the ability to borrow from banks for temporary or emergency purposes, including meeting redemption requests that otherwise might require the untimely sale of securities. Pursuant to the fund's custodian agreement, the custodian may loan money to the fund to make properly authorized payments. The fund is obligated to repay the custodian for any overdraft, including any related costs or expenses. The custodian may have a lien, security interest or security entitlement in any fund property that is not otherwise segregated or pledged, to the extent of any overdraft, and to the maximum extent permitted by law.
| | ANNUAL REPORT | JOHN HANCOCK Floating Rate Income Fund | 49 |
Line of credit. Effective June 25, 2020, the fund and other affiliated funds have entered into a syndicated line of credit agreement with Citibank, N.A. as the administrative agent that enables them to participate in a $1 billion unsecured committed line of credit. Subject to the needs of all other affiliated funds, the fund can borrow up to an aggregate commitment amount of $300 million ($150 million is dedicated to the fund), subject to asset coverage and other limitations as specified in the agreement. Each participating fund paid an upfront fee in connection with this line of credit agreement, which is charged based on a combination of fixed and asset based allocations and amortized over 365 days. Prior to June 25, 2020, the fund and other affiliated funds had a similar agreement that enabled them to participate in a $750 million unsecured committed line of credit. A commitment fee payable at the end of each calendar quarter, based on the average daily unused portion of the line of credit, is charged to each participating fund based on a combination of fixed and asset based allocations and is reflected in Line of credit fees on the Statement of operations. For the year ended August 31, 2020, the fund had no borrowings under the line of credit. Commitment fees, including upfront fees of $28,210, for the year ended August 31, 2020, were $408,883.
Expenses. Within the John Hancock group of funds complex, expenses that are directly attributable to an individual fund are allocated to such fund. Expenses that are not readily attributable to a specific fund are allocated among all funds in an equitable manner, taking into consideration, among other things, the nature and type of expense and the fund’s relative net assets. Expense estimates are accrued in the period to which they relate and adjustments are made when actual amounts are known.
Class allocations. Income, common expenses and realized and unrealized gains (losses) are determined at the fund level and allocated daily to each class of shares based on the net assets of the class. Class-specific expenses, such as distribution and service fees, if any, and transfer agent fees, for all classes, are charged daily at the class level based on the net assets of each class and the specific expense rates applicable to each class.
Change in accounting principle. Accounting Standards Update (ASU) 2017-08, Premium Amortization on Purchased Callable Debt Securities, shortens the premium amortization period for purchased non contingently callable debt securities and is effective for public companies with fiscal years beginning after December 15, 2018. Adoption of the ASU did not have a material impact to the fund.
Federal income taxes. The fund intends to continue to qualify as a regulated investment company by complying with the applicable provisions of the Internal Revenue Code and will not be subject to federal income tax on taxable income that is distributed to shareholders. Therefore, no federal income tax provision is required.
For federal income tax purposes, as of August 31, 2020, the fund has a short-term capital loss carryforward of $40,133,048 and a long-term capital loss carryforward of $312,075,341 available to offset future net realized capital gains. These carryforwards do not expire.
Qualified late year ordinary losses of $1,574,130 are treated as occurring on September 1, 2020, the first day of the fund’s next taxable year.
As of August 31, 2020, the fund had no uncertain tax positions that would require financial statement recognition, derecognition or disclosure. The fund's federal tax returns are subject to examination by the Internal Revenue Service for a period of three years.
Distribution of income and gains. Distributions to shareholders from net investment income and net realized gains, if any, are recorded on the ex-date. The fund generally declares dividends daily and pays them monthly. Capital gain distributions, if any, are typically distributed annually.
The tax character of distributions for the years ended August 31, 2020 and 2019 was as follows:
| | August 31, 2020 | August 31, 2019 |
| Ordinary income | $39,441,355 | $52,861,138 |
| 50 | JOHN HANCOCK Floating Rate Income Fund | ANNUAL REPORT | |
Distributions paid by the fund with respect to each class of shares are calculated in the same manner, at the same time and in the same amount, except for the effect of class level expenses that may be applied differently to each class. As of August 31, 2020, there were no distributable earnings on a tax basis.
Such distributions and distributable earnings, on a tax basis, are determined in conformity with income tax regulations, which may differ from US GAAP. Distributions in excess of tax basis earnings and profits, if any, are reported in the fund's financial statements as a return of capital.
Capital accounts within the financial statements are adjusted for permanent book-tax differences. These adjustments have no impact on net assets or the results of operations. Temporary book-tax differences, if any, will reverse in a subsequent period. Book-tax differences are primarily attributable to foreign currency transactions, derivative transactions and wash sale loss deferrals.
Note 3—Derivative instruments
The fund may invest in derivatives in order to meet its investment objective. Derivatives include a variety of different instruments that may be traded in the over-the-counter (OTC) market, on a regulated exchange or through a clearing facility. The risks in using derivatives vary depending upon the structure of the instruments, including the use of leverage, optionality, the liquidity or lack of liquidity of the contract, the creditworthiness of the counterparty or clearing organization and the volatility of the position. Some derivatives involve risks that are potentially greater than the risks associated with investing directly in the referenced securities or other referenced underlying instrument. Specifically, the fund is exposed to the risk that the counterparty to an OTC derivatives contract will be unable or unwilling to make timely settlement payments or otherwise honor its obligations. OTC derivatives transactions typically can only be closed out with the other party to the transaction.
Derivatives which are typically traded through the OTC market are regulated by the Commodity Futures Trading Commission (the CFTC). Derivative counterparty risk is managed through an ongoing evaluation of the creditworthiness of all potential counterparties and, if applicable, designated clearing organizations. The fund attempts to reduce its exposure to counterparty risk for derivatives traded in the OTC market, whenever possible, by entering into an International Swaps and Derivatives Association (ISDA) Master Agreement with each of its OTC counterparties. The ISDA gives each party to the agreement the right to terminate all transactions traded under the agreement if there is certain deterioration in the credit quality or contractual default of the other party, as defined in the ISDA. Upon an event of default or a termination of the ISDA, the non-defaulting party has the right to close out all transactions and to net amounts owed.
As defined by the ISDA, the fund may have collateral agreements with certain counterparties to mitigate counterparty risk on OTC derivatives. Subject to established minimum levels, collateral for OTC transactions is generally determined based on the net aggregate unrealized gain or loss on contracts with a particular counterparty. Collateral pledged to the fund, if any, is held in a segregated account by a third-party agent or held by the custodian bank for the benefit of the fund and can be in the form of cash or debt securities issued by the U.S. government or related agencies; collateral posted by the fund, if any, for OTC transactions is held in a segregated account at the fund's custodian and is noted in the accompanying Fund's investments, or if cash is posted, on the Statement of assets and liabilities. The fund's risk of loss due to counterparty risk is equal to the asset value of outstanding contracts offset by collateral received.
Forward foreign currency contracts. A forward foreign currency contract is an agreement between two parties to buy and sell specific currencies at a price that is set on the date of the contract. The forward contract calls for delivery of the currencies on a future date that is specified in the contract. Forwards are typically traded OTC. Risks related to the use of forwards include the possible failure of counterparties to meet the terms of the forward agreement, the failure of the counterparties to timely post collateral if applicable, and the risk that currency movements will not favor the fund thereby reducing the fund's total return, and the potential for losses in excess of the amounts recognized on the Statement of assets and liabilities.
The market value of a forward foreign currency contract fluctuates with changes in foreign currency exchange
| | ANNUAL REPORT | JOHN HANCOCK Floating Rate Income Fund | 51 |
rates. Forward foreign currency contracts are marked-to-market daily and the change in value is recorded by the fund as an unrealized gain or loss. Realized gains or losses, equal to the difference between the value of the contract at the time it was opened and the value at the time it was closed, are recorded upon delivery or receipt of the currency or settlement with the counterparty.
During the year ended August 31, 2020, the fund used forward foreign currency contracts to manage against anticipated currency exchange rate changes and to gain exposure to foreign currencies. The fund held forward foreign currency contracts with USD notional values ranging from $65.7 million to $81.9 million, as measured at each quarter end.
Fair value of derivative instruments by risk category
The table below summarizes the fair value of derivatives held by the fund at August 31, 2020 by risk category:
| Risk | Statement of assets
and liabilities
location | Financial
instruments
location | Assets
derivatives
fair value | Liabilities
derivatives
fair value |
| Currency | Unrealized appreciation / depreciation on forward foreign currency contracts | Forward foreign currency contracts | — | $(4,142,408) |
Effect of derivative instruments on the Statement of operations
The table below summarizes the net realized gain (loss) included in the net increase (decrease) in net assets from operations, classified by derivative instrument and risk category, for the year ended August 31, 2020:
| | Statement of operations location - Net realized gain (loss) on: |
| Risk | Forward foreign
currency contracts |
| Currency | $2,869,233 |
The table below summarizes the net change in unrealized appreciation (depreciation) included in the net increase (decrease) in net assets from operations, classified by derivative instrument and risk category, for the year ended August 31, 2020:
| | Statement of operations location - Change in net unrealized appreciation (depreciation) of: |
| Risk | Forward foreign
currency contracts |
| Currency | $(6,728,507) |
Note 4—Guarantees and indemnifications
Under the Trust's organizational documents, its Officers and Trustees are indemnified against certain liabilities arising out of the performance of their duties to the Trust, including the fund. Additionally, in the normal course of business, the fund enters into contracts with service providers that contain general indemnification clauses. The fund's maximum exposure under these arrangements is unknown, as this would involve future claims that may be made against the fund that have not yet occurred. The risk of material loss from such claims is considered remote.
Note 5—Fees and transactions with affiliates
John Hancock Investment Management LLC (the Advisor) serves as investment advisor for the fund. John Hancock Investment Management Distributors LLC (the Distributor), an affiliate of the Advisor, serves as principal underwriter of the fund. The Advisor and the Distributor are indirect, principally owned subsidiaries of Manulife Financial Corporation.
| 52 | JOHN HANCOCK Floating Rate Income Fund | ANNUAL REPORT | |
Management fee. The fund has an investment management agreement with the Advisor under which the fund pays a daily management fee to the Advisor equivalent on an annual basis to the sum of: (a) 0.680% of the first $1.10 billion of the fund’s average daily net assets; (b) 0.630% of the next $1.90 billion of the fund’s average daily net assets; (c) 0.605% of the next $1.50 billion of the fund’s average daily net assets; (d) 0.590% of the next $1.50 billion of the fund’s average daily net assets and (e) 0.570% of the fund’s average daily net assets in excess of $6.00 billion. The Advisor has a subadvisory agreement with BCSF Advisors, LP (Bain Capital Credit). The fund is not responsible for payment of the subadvisory fees.
The Advisor has contractually agreed to waive a portion of its management fee and/or reimburse expenses for certain funds of the John Hancock group of funds complex, including the fund (the participating portfolios). This waiver is based upon aggregate net assets of all the participating portfolios. The amount of the reimbursement is calculated daily and allocated among all the participating portfolios in proportion to the daily net assets of each fund. During the year ended August 31, 2020, this waiver amounted to 0.01% of the fund’s average daily net assets. This arrangement expires on July 31, 2022, unless renewed by mutual agreement of the fund and the Advisor based upon a determination that this is appropriate under the circumstances at that time.
The Advisor has contractually agreed to reduce its management fee or, if necessary, make payment to the fund in an amount equal to the amount by which expenses of the fund exceed 0.66% of average net assets of the fund. For purposes of this agreement, “expenses of the fund” means all fund expenses, excluding 12b-1 fees, service fee, transfer agent fee, interest expense, acquired fund fees, short dividend expense, litigation and indemnification expenses, taxes and other extraordinary expenses not incurred in the ordinary course of business, and all other Class Level Expenses. This agreement expires on December 31, 2020, unless renewed by mutual agreement of the fund and the Advisor based upon determination that this is appropriate under the circumstances at that time.
The Advisor has contractually agreed to reduce its management fee or, if necessary, make payment to the fund in an amount equal to the amount by which expenses of Class A, Class B, Class C, Class I, Class R6, Class 1 and Class NAV shares exceed 1.00%, 1.75%, 1.75%, 0.77%, 0.66%, 0.70% and 0.66%, respectively, of average net assets attributable to the applicable class. For purposes of this agreement, “expenses of Class A, Class B, Class C, Class I, Class R6, Class 1 and Class NAV shares” means all expenses of the fund plus class specific expenses, excluding interest expense, acquired fund fees, short dividend expense, litigation and indemnification expenses, taxes and other extraordinary expenses not incurred in the ordinary course of business. This agreement expires on December 31, 2020, unless renewed by mutual agreement of the fund and the Advisor based upon determination that this is appropriate under the circumstances at that time.
For the year ended August 31, 2020, the expense reductions described above amounted to the following:
| Class | Expense reduction |
| Class A | $174,147 |
| Class B | 5,729 |
| Class C | 97,571 |
| Class I | 88,994 |
| Class | Expense reduction |
| Class R6 | $3,287 |
| Class 1 | 31,862 |
| Class NAV | 790,104 |
| Total | $1,191,694 |
Expenses waived or reimbursed in the current fiscal period are not subject to recapture in future fiscal periods.
The investment management fees, including the impact of the waivers and reimbursements as described above, incurred for the year ended August 31, 2020, were equivalent to a net annual effective rate of 0.52% of the fund's average daily net assets.
Accounting and legal services. Pursuant to a service agreement, the fund reimburses the Advisor for all expenses associated with providing the administrative, financial, legal, compliance, accounting and recordkeeping services to the fund, including the preparation of all tax returns, periodic reports to shareholders and regulatory
| | ANNUAL REPORT | JOHN HANCOCK Floating Rate Income Fund | 53 |
reports, among other services. These expenses are allocated to each share class based on its relative net assets at the time the expense was incurred. These accounting and legal services fees incurred, for the year ended August 31, 2020, amounted to an annual rate of 0.02% of the fund's average daily net assets.
Distribution and service plans. The fund has a distribution agreement with the Distributor. The fund has adopted distribution and service plans for certain classes as detailed below pursuant to Rule 12b-1 under the 1940 Act, to pay the Distributor for services provided as the distributor of shares of the fund. The fund may pay up to the following contractual rates of distribution and service fees under these arrangements, expressed as an annual percentage of average daily net assets for each class of the fund's shares:
| Class | Rule 12b-1 Fee |
| Class A | 0.25% |
| Class B | 1.00% |
| Class C | 1.00% |
| Class 1 | 0.05% |
Sales charges. Class A shares are assessed up-front sales charges, which resulted in payments to the Distributor amounting to $34,040 for the year ended August 31, 2020. Of this amount, $7,249 was retained and used for printing prospectuses, advertising, sales literature and other purposes and $26,791 was paid as sales commissions to broker-dealers.
Class A, Class B and Class C shares may be subject to contingent deferred sales charges (CDSCs). Certain Class A shares that are acquired through purchases of $250,000 or more and are redeemed within one year of purchase are subject to a 0.50% sales charge. Class B shares that are redeemed within six years of purchase are subject to CDSCs, at declining rates, beginning at 5.00%. Class C shares that are redeemed within one year of purchase are subject to a 1.00% CDSC. CDSCs are applied to the lesser of the current market value at the time of redemption or the original purchase cost of the shares being redeemed. Proceeds from CDSCs are used to compensate the Distributor for providing distribution-related services in connection with the sale of these shares. During the year ended August 31, 2020, CDSCs received by the Distributor amounted to $7,505, $45 and $1,006 for Class A, Class B and Class C shares, respectively.
Transfer agent fees. The John Hancock group of funds has a complex-wide transfer agent agreement with John Hancock Signature Services, Inc. (Signature Services), an affiliate of the Advisor. The transfer agent fees paid to Signature Services are determined based on the cost to Signature Services (Signature Services Cost) of providing recordkeeping services. It also includes out-of-pocket expenses, including payments made to third-parties for recordkeeping services provided to their clients who invest in one or more John Hancock funds. In addition, Signature Services Cost may be reduced by certain fees that Signature Services receives in connection with retirement and small accounts. Signature Services Cost is calculated monthly and allocated, as applicable, to five categories of share classes: Retail Share and Institutional Share Classes of Non-Municipal Bond Funds, Class R6 Shares, Retirement Share Classes and Municipal Bond Share Classes. Within each of these categories, the applicable costs are allocated to the affected John Hancock affiliated funds and/or classes, based on the relative average daily net assets.
Class level expenses. Class level expenses for the year ended August 31, 2020 were as follows:
| Class | Distribution and service fees | Transfer agent fees |
| Class A | $238,068 | $120,163 |
| Class B | 31,678 | 3,998 |
| Class C | 535,582 | 67,581 |
| Class I | — | 69,240 |
| Class R6 | — | 277 |
| 54 | JOHN HANCOCK Floating Rate Income Fund | ANNUAL REPORT | |
| Class | Distribution and service fees | Transfer agent fees |
| Class 1 | $10,201 | — |
| Total | $815,529 | $261,259 |
Trustee expenses. The fund compensates each Trustee who is not an employee of the Advisor or its affiliates. The costs of paying Trustee compensation and expenses are allocated to the fund based on its net assets relative to other funds within the John Hancock group of funds complex.
Note 6—Fund share transactions
Transactions in fund shares for the years ended August 31, 2020 and 2019 were as follows:
| | Year Ended 8-31-20 | Year Ended 8-31-19 |
| | Shares | Amount | Shares | Amount |
| Class A shares | | | | |
| Sold | 3,491,651 | $27,784,410 | 8,433,786 | $70,069,747 |
| Distributions reinvested | 559,074 | 4,433,509 | 612,616 | 5,082,431 |
| Repurchased | (5,933,098) | (46,722,649) | (9,768,727) | (81,121,847) |
| Net decrease | (1,882,373) | $(14,504,730) | (722,325) | $(5,969,669) |
| Class B shares | | | | |
| Sold | 978 | $7,761 | 2,664 | $22,682 |
| Distributions reinvested | 15,354 | 122,476 | 27,731 | 230,040 |
| Repurchased | (329,442) | (2,611,589) | (539,292) | (4,482,071) |
| Net decrease | (313,110) | $(2,481,352) | (508,897) | $(4,229,349) |
| Class C shares | | | | |
| Sold | 169,972 | $1,384,517 | 645,446 | $5,383,788 |
| Distributions reinvested | 263,617 | 2,104,192 | 374,998 | 3,122,400 |
| Repurchased | (3,977,415) | (31,493,230) | (4,600,289) | (38,325,555) |
| Net decrease | (3,543,826) | $(28,004,521) | (3,579,845) | $(29,819,367) |
| Class I shares | | | | |
| Sold | 3,104,591 | $24,247,908 | 9,105,406 | $75,891,988 |
| Distributions reinvested | 345,976 | 2,746,502 | 716,889 | 5,942,963 |
| Repurchased | (5,174,641) | (40,552,509) | (19,883,942) | (164,853,257) |
| Net decrease | (1,724,074) | $(13,558,099) | (10,061,647) | $(83,018,306) |
| Class R6 shares | | | | |
| Sold | 45,202 | $359,918 | 291,528 | $2,429,462 |
| Distributions reinvested | 13,895 | 110,598 | 32,220 | 267,134 |
| Repurchased | (234,624) | (1,865,442) | (632,841) | (5,231,587) |
| Net decrease | (175,527) | $(1,394,926) | (309,093) | $(2,534,991) |
| | ANNUAL REPORT | JOHN HANCOCK Floating Rate Income Fund | 55 |
| | Year Ended 8-31-20 | Year Ended 8-31-19 |
| | Shares | Amount | Shares | Amount |
| Class 1 shares | | | | |
| Sold | 515,103 | $3,991,150 | 811,739 | $6,758,759 |
| Distributions reinvested | 136,543 | 1,084,098 | 178,724 | 1,480,774 |
| Repurchased | (1,784,909) | (13,847,295) | (1,386,874) | (11,512,445) |
| Net decrease | (1,133,263) | $(8,772,047) | (396,411) | $(3,272,912) |
| Class NAV shares | | | | |
| Sold | 12,819,970 | $97,112,499 | 2,032,562 | $16,864,516 |
| Distributions reinvested | 3,562,889 | 28,237,238 | 4,348,380 | 36,075,340 |
| Repurchased | (20,688,357) | (169,882,149) | (30,732,931) | (254,249,838) |
| Net decrease | (4,305,498) | $(44,532,412) | (24,351,989) | $(201,309,982) |
| Total net decrease | (13,077,671) | $(113,248,087) | (39,930,207) | $(330,154,576) |
Affiliates of the fund owned 100% of shares of Class 1 and Class NAV on August 31, 2020. Such concentration of shareholders’ capital could have a material effect on the fund if such shareholders redeem from the fund.
Note 7—Purchase and sale of securities
Purchases and sales of securities, other than short-term investments, amounted to $614,479,561 and $696,336,495, respectively, for the year ended August 31, 2020.
Note 8—Investment by affiliated funds
Certain investors in the fund are affiliated funds that are managed by the Advisor and its affiliates. The affiliated funds do not invest in the fund for the purpose of exercising management or control; however, this investment may represent a significant portion of the fund's net assets. At August 31, 2020, funds within the John Hancock group of funds complex held 74.8% of the fund's net assets. The following fund(s) had an affiliate ownership of 5% or more of the fund's net assets:
| Fund | Affiliated Concentration |
| John Hancock Funds II Multimanager Lifestyle Balanced Portfolio | 28.1% |
| John Hancock Funds II Multimanager Lifestyle Growth Portfolio | 15.5% |
| John Hancock Funds II Multimanager Lifestyle Conservative Portfolio | 13.7% |
| John Hancock Funds II Multimanager Lifestyle Moderate Portfolio | 12.6% |
Note 9—Investment in affiliated underlying funds
The fund may invest in affiliated underlying funds that are managed by the Advisor and its affiliates. Information regarding the fund's fiscal year to date purchases and sales of the affiliated underlying funds as well as income and capital gains earned by the fund, if any, is as follows:
| | | | | | | | Dividends and distributions |
| Affiliate | Ending
share
amount | Beginning
value | Cost of
purchases | Proceeds
from shares
sold | Realized
gain
(loss) | Change in
unrealized
appreciation
(depreciation) | Income
distributions
received | Capital gain
distributions
received | Ending
value |
| John Hancock Collateral Trust* | — | $2,576,293 | $7,039,220 | $(9,615,166) | $436 | $(783) | $14,018 | — | — |
| 56 | JOHN HANCOCK Floating Rate Income Fund | ANNUAL REPORT | |
| * | Refer to the Securities lending note within Note 2 for details regarding this investment. |
Note 10—Other matters
In or around May 2015, certain John Hancock Funds, including Floating Rate Income Fund, were served with a complaint brought by the Motors Liquidation Avoidance Action Trust (the “Motors Trust”). The complaint sought disgorgement of certain amounts paid to the Term Loan Lenders as holders of indebtedness issued by General Motors pursuant to a $1.5 billion term loan, dated as of November 29, 2006 (as amended, the “Term Loan”). The litigation has now been settled resulting in no payments by the fund. As part of the settlement, the fund received payment of $107,429 representing reimbursement of approximately 73% of the legal fees incurred.
Note 11—LIBOR discontinuation risk
LIBOR (London Interbank Offered Rate) is a measure of the average interest rate at which major global banks can borrow from one another. Following allegations of rate manipulation and concerns regarding its thin liquidity, in July 2017, the U.K. Financial Conduct Authority, which regulates LIBOR, announced that it will stop encouraging banks to provide the quotations needed to sustain LIBOR after 2021. This event will likely cause LIBOR to cease to be published. Before then, it is expected that market participants will transition to the use of different reference or benchmark rates. However, although regulators have suggested alternative rates, there is currently no definitive information regarding the future utilization of LIBOR or of any replacement rate.
It is uncertain what impact the discontinuation of LIBOR will have on the use of LIBOR as a reference rate for securities in which the fund invests. It is expected that market participants will amend financial instruments referencing LIBOR to include fallback provisions and other measures that contemplate the discontinuation of LIBOR or other similar market disruption events, but neither the effect of the transition process nor the viability of such measures is known. In addition, there are obstacles to converting certain longer term securities and transactions to a new benchmark or benchmarks and the effectiveness of one alternative reference rate versus multiple alternative reference rates in new or existing financial instruments and products has not been determined. As market participants transition away from LIBOR, LIBOR's usefulness may deteriorate, which could occur prior to the end of 2021. The transition process may lead to increased volatility and illiquidity in markets that currently rely on LIBOR to determine interest rates. LIBOR's deterioration may adversely affect the liquidity and/or market value of securities that use LIBOR as a benchmark interest rate.
Note 12—Coronavirus (COVID-19) pandemic
The novel COVID-19 disease has resulted in significant disruptions to global business activity. A widespread health crisis such as a global pandemic could cause substantial market volatility, exchange trading suspensions and closures, impact the ability to complete redemptions, and affect fund performance.
| | ANNUAL REPORT | JOHN HANCOCK Floating Rate Income Fund | 57 |
Report of Independent Registered Public Accounting Firm
To the Board of Trustees of John Hancock Funds II and Shareholders of John Hancock Floating Rate Income Fund
Opinion on the Financial Statements
We have audited the accompanying statement of assets and liabilities, including the fund’s investments, of John Hancock Floating Rate Income Fund (one of the funds constituting John Hancock Funds II, referred to hereafter as the "Fund") as of August 31, 2020, the related statement of operations for the year ended August 31, 2020, the statements of changes in net assets for each of the two years in the period ended August 31, 2020, including the related notes, and the financial highlights for each of the five years in the period ended August 31, 2020 (collectively referred to as the “financial statements”). In our opinion, the financial statements present fairly, in all material respects, the financial position of the Fund as of August 31, 2020, the results of its operations for the year then ended, the changes in its net assets for each of the two years in the period ended August 31, 2020 and the financial highlights for each of the five years in the period ended August 31, 2020 in conformity with accounting principles generally accepted in the United States of America.
Basis for Opinion
These financial statements are the responsibility of the Fund’s management. Our responsibility is to express an opinion on the Fund’s financial statements based on our audits. We are a public accounting firm registered with the Public Company Accounting Oversight Board (United States) (PCAOB) and are required to be independent with respect to the Fund in accordance with the U.S. federal securities laws and the applicable rules and regulations of the Securities and Exchange Commission and the PCAOB.
We conducted our audits of these financial statements in accordance with the standards of the PCAOB. Those standards require that we plan and perform the audit to obtain reasonable assurance about whether the financial statements are free of material misstatement, whether due to error or fraud.
Our audits included performing procedures to assess the risks of material misstatement of the financial statements, whether due to error or fraud, and performing procedures that respond to those risks. Such procedures included examining, on a test basis, evidence regarding the amounts and disclosures in the financial statements. Our audits also included evaluating the accounting principles used and significant estimates made by management, as well as evaluating the overall presentation of the financial statements. Our procedures included confirmation of securities owned as of August 31, 2020 by correspondence with the custodian, transfer agent, agent banks and brokers; when replies were not received from agent banks, we performed other auditing procedures. We believe that our audits provide a reasonable basis for our opinion.
/s/ PricewaterhouseCoopers LLP
Boston, Massachusetts
October 22, 2020
We have served as the auditor of one or more investment companies in the John Hancock group of funds since 1988.
| 58 | JOHN HANCOCK FLOATING RATE INCOME FUND | ANNUAL REPORT | |
Tax information (Unaudited)
For federal income tax purposes, the following information is furnished with respect to the distributions of the fund, if any, paid during its taxable year ended August 31, 2020.
The fund reports the maximum amount allowable of its net taxable income as eligible for the corporate dividends-received deduction.
The fund reports the maximum amount allowable of its net taxable income as qualified dividend income as provided in the Jobs and Growth Tax Relief Reconciliation Act of 2003.
The fund reports the maximum amount allowable of its Section 199A dividends as defined in Proposed Treasury Regulation §1.199A-3(d).
Eligible shareholders will be mailed a 2020 Form 1099-DIV in early 2021. This will reflect the tax character of all distributions paid in calendar year 2020.
Please consult a tax advisor regarding the tax consequences of your investment in the fund.
| | ANNUAL REPORT | JOHN HANCOCK FLOATING RATE INCOME FUND | 59 |
CONTINUATION OF INVESTMENT ADVISORY AND SUBADVISORY AGREEMENTS
Evaluation of Advisory and Subadvisory Agreements by the Board of Trustees
This section describes the evaluation by the Board of Trustees (the Board) of John Hancock Funds II (the Trust) of the Advisory Agreement (the Advisory Agreement) with John Hancock Investment Management LLC (the Advisor) and the Subadvisory Agreement (the Subadvisory Agreement) with Bain Capital Credit (the Subadvisor), for John Hancock Floating Rate Income Fund (the fund). The Advisory Agreement and Subadvisory Agreement are collectively referred to as the Agreements. Prior to the June 23-25, 2020 telephonic1 meeting at which the Agreements were approved, the Board also discussed and considered information regarding the proposed continuation of the Agreements at the telephonic meeting held on May 26-27, 2020
Approval of Advisory and Subadvisory Agreements
At telephonic meetings held on June 23-25, 2020, the Board, including the Trustees who are not parties to any Agreement or considered to be interested persons of the Trust under the Investment Company Act of 1940, as amended (the 1940 Act) (the Independent Trustees), reapproved for an annual period the continuation of the Advisory Agreement between the Trust and the Advisor and the Subadvisory Agreement between the Advisor and the Subadvisor with respect to the fund.
In considering the Advisory Agreement and the Subadvisory Agreement, the Board received in advance of the meetings a variety of materials relating to the fund, the Advisor and the Subadvisor, including comparative performance, fee and expense information for a peer group of similar funds prepared by an independent third-party provider of fund data, performance information for an applicable benchmark index; and, with respect to the Subadvisor, comparative performance information for comparably managed accounts, as applicable, and other information provided by the Advisor and the Subadvisor regarding the nature, extent and quality of services provided by the Advisor and the Subadvisor under their respective Agreements, as well as information regarding the Advisor's revenues and costs of providing services to the fund and any compensation paid to affiliates of the Advisor. At the meetings at which the renewal of the Advisory Agreement and Subadvisory Agreement are considered, particular focus is given to information concerning fund performance, comparability of fees and total expenses, and profitability. However, the Board notes that the evaluation process with respect to the Advisor and the Subadvisor is an ongoing one. In this regard, the Board also took into account discussions with management and information provided to the Board (including its various committees) at prior meetings with respect to the services provided by the Advisor and the Subadvisor to the fund, including quarterly performance reports prepared by management containing reviews of investment results and prior presentations from the Subadvisor with respect to the fund. The information received and considered by the Board in connection with the May and June meetings and throughout the year was both written and oral. The Board also considered the nature, quality, and extent of non-advisory services, if any, to be provided to the
____________________
1On March 25, 2020, as a result of health and safety measures put in place to combat the global COVID-19 pandemic, the Securities and Exchange Commission issued an exemptive order (the "Order") pursuant to Sections 6(c) and 38(a) of the Investment Company Act of 1940, as amended (the "1940 Act"), that temporarily exempts registered investment management companies from the in-person voting requirements under the 1940 Act, subject to certain requirements, including that votes taken pursuant to the Order are ratified at the next in-person meeting. The Board determined that reliance on the Order was necessary or appropriate due to the circumstances related to current or potential effects of COVID-19 and therefore, the Board's May and June meetings were held telephonically in reliance on the Order.
ANNUAL REPORT | JOHN HANCOCK FLOATING RATE INCOME FUND 60
fund by the Advisor's affiliates, including distribution services. The Board considered the Advisory Agreement and the Subadvisory Agreement separately in the course of its review. In doing so, the Board noted the respective roles of the Advisor and Subadvisor in providing services to the fund.
Throughout the process, the Board asked questions of and requested additional information from management. The Board is assisted by counsel for the Trust and the Independent Trustees are also separately assisted by independent legal counsel throughout the process. The Independent Trustees also received a memorandum from their independent legal counsel discussing the legal standards for their consideration of the proposed continuation of the Agreements and discussed the proposed continuation of the Agreements in private sessions with their independent legal counsel at which no representatives of management were present.
Approval of Advisory Agreement
In approving the Advisory Agreement with respect to the fund, the Board, including the Independent Trustees, considered a variety of factors, including those discussed below. The Board also considered other factors (including conditions and trends prevailing generally in the economy, the securities markets, and the industry) and did not treat any single factor as determinative, and each Trustee may have attributed different weights to different factors. The Board's conclusions may be based in part on its consideration of the advisory and subadvisory arrangements in prior years and on the Board's ongoing regular review of fund performance and operations throughout the year.
Nature, extent, and quality of services. Among the information received by the Board from the Advisor relating to the nature, extent, and quality of services provided to the fund, the Board reviewed information provided by the Advisor relating to its operations and personnel, descriptions of its organizational and management structure, and information regarding the Advisor's compliance and regulatory history, including its Form ADV. The Board also noted that on a regular basis it receives and reviews information from the Trust's Chief Compliance Officer (CCO) regarding the fund's compliance policies and procedures established pursuant to Rule 38a-1 under the 1940 Act. The Board observed that the scope of services provided by the Advisor, and of the undertakings required of the Advisor in connection with those services, including maintaining and monitoring its own and the fund's compliance programs, risk management programs, liquidity management programs and cybersecurity programs, had expanded over time as a result of regulatory, market and other developments. The Board considered that the Advisor is responsible for the management of the day-to-day operations of the fund, including, but not limited to, general supervision of and coordination of the services provided by the Subadvisor, and is also responsible for monitoring and reviewing the activities of the Subadvisor and other third-party service providers. The Board also considered the significant risks assumed by the Advisor in connection with the services provided to the fund including entrepreneurial risk in sponsoring new funds and ongoing risks including investment, operational, enterprise, litigation, regulatory and compliance risks with respect to all funds.
In considering the nature, extent, and quality of the services provided by the Advisor, the Trustees also took into account their knowledge of the Advisor's management and the quality of the performance of the Advisor's duties, through Board meetings, discussions and reports during the preceding year and through each Trustee's experience as a Trustee of the Trust and of the other trusts in the John Hancock group of funds complex (the John Hancock Fund Complex).
In the course of their deliberations regarding the Advisory Agreement, the Board considered, among other things:
| (a) | the skills and competency with which the Advisor has in the past managed the Trust's affairs and its subadvisory relationship, the Advisor's oversight and monitoring of the Subadvisor's investment performance and compliance programs, such as the Subadvisor's compliance with fund policies and |
ANNUAL REPORT | JOHN HANCOCK FLOATING RATE INCOME FUND 61
| | objectives, review of brokerage matters, including with respect to trade allocation and best execution and the Advisor's timeliness in responding to performance issues; |
| (b) | the background, qualifications and skills of the Advisor's personnel; |
| (c) | the Advisor's compliance policies and procedures and its responsiveness to regulatory changes and fund industry developments; |
| (d) | the Advisor's administrative capabilities, including its ability to supervise the other service providers for the fund, as well as the Advisor's oversight of any securities lending activity, its monitoring of class action litigation and collection of class action settlements on behalf of the fund, and bringing loss recovery actions on behalf of the fund; |
| (e) | the financial condition of the Advisor and whether it has the financial wherewithal to provide a high level and quality of services to the fund; |
| (f) | the Advisor's initiatives intended to improve various aspects of the Trust's operations and investor experience with the fund; and |
| (g) | the Advisor's reputation and experience in serving as an investment advisor to the Trust and the benefit to shareholders of investing in funds that are part of a family of funds offering a variety of investments. |
The Board concluded that the Advisor may reasonably be expected to continue to provide a high quality of services under the Advisory Agreement with respect to the fund.
Investment performance. In considering the fund's performance, the Board noted that it reviews at its regularly scheduled meetings information about the fund's performance results. In connection with the consideration of the Advisory Agreement, the Board:
| (a) | reviewed information prepared by management regarding the fund's performance; |
| (b) | considered the comparative performance of an applicable benchmark index; |
| (c) | considered the performance of comparable funds, if any, as included in the report prepared by an independent third-party provider of fund data; and |
| (d) | took into account the Advisor's analysis of the fund's performance and its plans and recommendations regarding the Trust's subadvisory arrangements generally. |
The Board noted that while it found the data provided by the independent third-party generally useful it recognized its limitations, including in particular that the data may vary depending on the end date selected and the results of the performance comparisons may vary depending on the selection of the peer group. The Board noted that the fund outperformed its benchmark index and peer group median for the one-year period ended December 31, 2019. The Board also noted that the fund underperformed its benchmark index and peer group median for the three-, five- and ten-year periods ended December 31, 2019.The Board took into account management's discussion of the fund's performance, including favorable performance relative to the benchmark index and peer group median for the one-year period. The Board also took into account management's discussion of the factors that contributed to the fund's performance for the benchmark index and peer group median for the three, five-, and ten-year periods including the impact of past and current market conditions on the fund's strategy and management's outlook for the fund. The Board also noted that the fund's longer term performance in part reflects that of the previous subadvisor. The Board concluded that the fund's performance is being monitored and reasonably addressed, where appropriate.
ANNUAL REPORT | JOHN HANCOCK FLOATING RATE INCOME FUND 62
Fees and expenses. The Board reviewed comparative information prepared by an independent third-party provider of fund data, including, among other data, the fund's contractual and net management fees (and subadvisory fees, to the extent available) and total expenses as compared to similarly situated investment companies deemed to be comparable to the fund in light of the nature, extent and quality of the management and advisory and subadvisory services provided by the Advisor and the Subadvisor. The Board considered the fund's ranking within a smaller group of peer funds chosen by the independent third-party provider, as well as the fund's ranking within a broader group of funds. In comparing the fund's contractual and net management fees to those of comparable funds, the Board noted that such fees include both advisory and administrative costs. The Board noted that net management fees for the fund are lower than the peer group median and net total expenses for the fund are higher than the peer group median.
The Board took into account management's discussion of the fund's expenses. The Board also noted recent actions taken to reduce the fund's fees and expenses and that the fund's lower fees and expenses were not fully reflected in the comparative information provided by the independent third-party. The Board also took into account management's discussion with respect to the overall management fee, the fees of the Subadvisor, including the amount of the advisory fee retained by the Advisor after payment of the subadvisory fee, in each case in light of the services rendered for those amounts and the risks undertaken by the Advisor. The Board also noted that the Advisor pays the subadvisory fee, and that such fees are negotiated at arm's length with respect to the Subadvisor. In addition, the Board took into account that management had agreed to implement an overall fee waiver across the complex, including the fund, which is discussed further below. The Board also noted actions taken over the past several years to reduce the fund's operating expenses. The Board also noted that, in addition, the Advisor is currently waiving fees and/or reimbursing expenses with respect to the fund and that the fund has breakpoints in its contractual management fee schedule that reduces management fees as assets increase. The Board reviewed information provided by the Advisor concerning the investment advisory fee charged by the Advisor or one of its advisory affiliates to other clients (including other funds in the John Hancock Fund Complex) having similar investment mandates, if any. The Board considered any differences between the Advisor's and Subadvisor's services to the fund and the services they provide to other comparable clients or funds. The Board concluded that the advisory fee paid with respect to the fund is reasonable in light of the nature, extent and quality of the services provided to the fund under the Advisory Agreement.
Profitability/indirect benefits. In considering the costs of the services to be provided and the profits to be realized by the Advisor and its affiliates from the Advisor's relationship with the Trust, the Board:
| (a) | reviewed financial information of the Advisor; |
| (b) | reviewed and considered information presented by the Advisor regarding the net profitability to the Advisor and its affiliates with respect to the fund; |
| (c) | received and reviewed profitability information with respect to the John Hancock Fund Complex as a whole and with respect to the fund; |
| (d) | received information with respect to the Advisor's allocation methodologies used in preparing the profitability data and considered that the Advisor hired an independent third-party consultant to provide an analysis of the Advisor's allocation methodologies; |
| (e) | considered that the John Hancock insurance companies that are affiliates of the Advisor, as shareholders of the Trust directly or through their separate accounts, receive certain tax credits or deductions relating to foreign taxes paid and dividends received by certain funds of the Trust and noted that these tax |
ANNUAL REPORT | JOHN HANCOCK FLOATING RATE INCOME FUND 63
| | benefits, which are not available to participants in qualified retirement plans under applicable income tax law, are reflected in the profitability information reviewed by the Board; |
| (f) | considered that the Advisor also provides administrative services to the fund on a cost basis pursuant to an administrative services agreement; |
| (g) | noted that affiliates of the Advisor provide transfer agency services and distribution services to the fund, and that the fund's distributor also receives Rule 12b-1 payments to support distribution of the fund; |
| (h) | noted that the Advisor also derives reputational and other indirect benefits from providing advisory services to the fund; |
| (i) | noted that the subadvisory fee for the fund is paid by the Advisor and is negotiated at arm's length; |
| (j) | considered the Advisor's ongoing costs and expenditures necessary to improve services, meet new regulatory and compliance requirements, and adapt to other challenges impacting the fund industry; and |
| (k) | considered that the Advisor should be entitled to earn a reasonable level of profits in exchange for the level of services it provides to the fund and the risks that it assumes as Advisor, including entrepreneurial, operational, reputational, litigation and regulatory risk. |
Based upon its review, the Board concluded that the level of profitability, if any, of the Advisor and its affiliates from their relationship with the fund was reasonable and not excessive.
Economies of scale. In considering the extent to which economies of scale would be realized as the fund grows and whether fee levels reflect these economies of scale for the benefit of fund shareholders, the Board:
| (a) | considered that the Advisor has contractually agreed to waive a portion of its management fee for certain funds of the John Hancock Fund Complex, including the fund (the participating portfolios) or otherwise reimburse the expenses of the participating portfolios (the reimbursement). This waiver is based upon aggregate net assets of all the participating portfolios. The amount of the reimbursement is calculated daily and allocated among all the participating portfolios in proportion to the daily net assets of each fund; |
| (b) | reviewed the fund's advisory fee structure and concluded that: (i) the fund's fee structure contains breakpoints at the subadvisory fee level and that such breakpoints are reflected as breakpoints in the advisory fees for the fund; and (ii) although economies of scale cannot be measured with precision, these arrangements permit shareholders of the fund to benefit from economies of scale if the fund grows. The Board also took into account management's discussion of the fund's advisory fee structure; and |
| (c) | the Board also considered the effect of the fund's growth in size on its performance and fees. The Board also noted that if the fund's assets increase over time, the fund may realize other economies of scale. |
Approval of Subadvisory Agreement
In making its determination with respect to approval of the Subadvisory Agreement, the Board reviewed:
| (1) | information relating to the Subadvisor's business, including current subadvisory services to the Trust (and other funds in the John Hancock Fund Complex); |
| (2) | the historical and current performance of the fund and comparative performance information relating to an applicable benchmark index and comparable funds; |
ANNUAL REPORT | JOHN HANCOCK FLOATING RATE INCOME FUND 64
| (3) | the subadvisory fee for the fund, including any breakpoints, and to the extent available, comparable fee information prepared by an independent third party provider of fund data; and |
| (4) | information relating to the nature and scope of any material relationships and their significance to the Trust's Advisor and Subadvisor. |
Nature, extent, and quality of services. With respect to the services provided by the Subadvisor, the Board received information provided to the Board by the Subadvisor, including the Subadvisor's Form ADV, as well as took into account information presented throughout the past year. The Board considered the Subadvisor's current level of staffing and its overall resources, as well as received information relating to the Subadvisor's compensation program. The Board reviewed the Subadvisor's history and investment experience, as well as information regarding the qualifications, background, and responsibilities of the Subadvisor's investment and compliance personnel who provide services to the fund. The Board also considered, among other things, the Subadvisor's compliance program and any disciplinary history. The Board also considered the Subadvisor's risk assessment and monitoring process. The Board reviewed the Subadvisor's regulatory history, including whether it was involved in any regulatory actions or investigations as well as material litigation, and any settlements and amelioratory actions undertaken, as appropriate. The Board noted that the Advisor conducts regular, periodic reviews of the Subadvisor and its operations, including regarding investment processes and organizational and staffing matters. The Board also noted that the Trust's CCO and his staff conduct regular, periodic compliance reviews with the Subadvisor and present reports to the Independent Trustees regarding the same, which includes evaluating the regulatory compliance systems of the Subadvisor and procedures reasonably designed to assure compliance with the federal securities laws. The Board also took into account the financial condition of the Subadvisor.
The Board considered the Subadvisor's investment process and philosophy. The Board took into account that the Subadvisor's responsibilities include the development and maintenance of an investment program for the fund that is consistent with the fund's investment objective, the selection of investment securities and the placement of orders for the purchase and sale of such securities, as well as the implementation of compliance controls related to performance of these services. The Board also received information with respect to the Subadvisor's brokerage policies and practices, including with respect to best execution and soft dollars.
Subadvisor compensation. In considering the cost of services to be provided by the Subadvisor and the profitability to the Subadvisor of its relationship with the fund, the Board noted that the fees under the Subadvisory Agreement are paid by the Advisor and not the fund.
The Board also relied on the ability of the Advisor to negotiate the Subadvisory Agreement with the Subadvisor, which is not affiliated with the Advisor, and the fees thereunder at arm's length. As a result, the costs of the services to be provided and the profits to be realized by the Subadvisor from its relationship with the Trust were not a material factor in the Board's consideration of the Subadvisory Agreement.
The Board also received information regarding the nature and scope (including their significance to the Advisor and its affiliates and to the Subadvisor) of any material relationships with respect to the Subadvisor, which include arrangements in which the Subadvisor or its affiliates provide advisory, distribution, or management services in connection with financial products sponsored by the Advisor or its affiliates, and may include other registered investment companies, a 529 education savings plan, managed separate accounts and exempt group annuity contracts sold to qualified plans. The Board also received information and took into account any other potential conflicts of interest the Advisor might have in connection with the Subadvisory Agreement.
ANNUAL REPORT | JOHN HANCOCK FLOATING RATE INCOME FUND 65
In addition, the Board considered other potential indirect benefits that the Subadvisor and its affiliates may receive from the Subadvisor's relationship with the fund, such as the opportunity to provide advisory services to additional funds in the John Hancock Fund Complex and reputational benefits.
Subadvisory fees. The Board considered that the fund pays an advisory fee to the Advisor and that, in turn, the Advisor pays a subadvisory fee to the Subadvisor. As noted above, the Board also considered the fund's subadvisory fees as compared to similarly situated investment companies deemed to be comparable to the fund as included in the report prepared by the independent third party provider of fund data, to the extent available. The Board noted that the subadvisory fees for the fund are lower than the peer group median. The Board also took into account the subadvisory fees paid by the Advisor to the Subadvisor with respect to the fund and compared them to fees charged by the Subadvisor to manage other subadvised portfolios and portfolios not subject to regulation under the 1940 Act, as applicable.
Subadvisor performance. As noted above, the Board considered the fund's performance as compared to the fund's peer group median and the benchmark index and noted that the Board reviews information about the fund's performance results at its regularly scheduled meetings. The Board noted the Advisor's expertise and resources in monitoring the performance, investment style and risk-adjusted performance of the Subadvisor. The Board was mindful of the Advisor's focus on the Subadvisor's performance. The Board also noted the Subadvisor's long-term performance record for similar accounts, as applicable.
The Board's decision to approve the Subadvisory Agreement was based on a number of determinations, including the following:
| (1) | the Subadvisor has extensive experience and demonstrated skills as a manager; |
| (2) | the performance of the fund is being monitored and reasonably addressed, where appropriate; |
| (3) | the subadvisory fee is reasonable in relation to the level and quality of services being provided under the Subadvisory Agreement; and |
| (4) | noted that the subadvisory fees are paid by the Advisor not the fund and that the subadvisory fee breakpoints are reflected as breakpoints in the advisory fees for the fund in order to permit shareholders to benefit from economies of scale if the fund grows. |
* * *
Based on the Board's evaluation of all factors that the Board deemed to be material, including those factors described above, the Board, including the Independent Trustees, concluded that renewal of the Advisory Agreement and the Subadvisory Agreement would be in the best interest of the fund and its shareholders. Accordingly, the Board, and the Independent Trustees voting separately, approved the Advisory Agreement and Subadvisory Agreement for an additional one-year period.
ANNUAL REPORT | JOHN HANCOCK FLOATING RATE INCOME FUND 66
STATEMENT REGARDING LIQUIDITY RISK MANAGEMENT
Operation of the Liquidity Risk Management Program
This section describes operation and effectiveness of the Liquidity Risk Management Program (LRMP) established in accordance with Rule 22e-4 under the Investment Company Act of 1940, as amended (the Liquidity Rule). The Board of Trustees (the Board) of each Fund in the John Hancock Group of Funds (each a Fund and collectively, the Funds) that is subject to the requirements of the Liquidity Rule has appointed John Hancock Investment Management LLC and John Hancock Variable Trust Advisers LLC (together, the Advisor) to serve as Administrator of the LRMP with respect to each of the Funds, including Floating Rate Income Fund, subject to the oversight of the Board. In order to provide a mechanism and process to perform the functions necessary to administer the LRMP, the Advisor established the Liquidity Risk Management Committee (the Committee). The Funds' subadvisor, Bain Capital Credit, LP, (the Subadvisor) executes the day-to-day investment management and security-level activities of the Fund in accordance with the requirements of the LRMP, subject to the supervision of the Advisor and the Board.
The Committee holds monthly meetings to: (1) review the day-to-day operations of the LRMP; (2) review and approve month end liquidity classifications; (3) review quarterly testing and determinations, as applicable; and (4) review other LRMP related material. The Committee also conducts daily, monthly, quarterly, and annual quantitative and qualitative assessments of each subadvisor to a Fund that is subject to the requirements of the Liquidity Rule and is a part of the LRMP to monitor investment performance issues, risks and trends. In addition, the Committee may conduct ad-hoc reviews and meetings with subadvisors as issues and trends are identified, including potential liquidity and valuation issues.
The Committee provided the Board at a meeting held on March 15-17, 2020 with a written report which addressed the Committee's assessment of the adequacy and effectiveness of the implementation and operation of the LRMP and any material changes to the LRMP. The report, which covered the period December 1, 2018 through December 31, 2019, included an assessment of important aspects of the LRMP including, but not limited to:
| • | Operation of the Fund's Redemption-In-Kind Procedures; |
| • | Highly Liquid Investment Minimum (HLIM) determination; |
| • | Compliance with the 15% limit on illiquid investments; |
| • | Reasonably Anticipated Trade Size (RATS) determination; |
| • | Security-level liquidity classifications; and |
| • | Liquidity risk assessment. |
The report also covered material liquidity matters which occurred or were reported during this period applicable to the Fund, if any, and the Committee's actions to address such matters.
Redemption-In-Kind Procedures
Rule 22e-4 requires any fund that engages in or reserves the right to engage in in-kind redemptions to adopt and implement written policies and procedures regarding in-kind redemptions as part of the management of its liquidity risk. These procedures address the process for redeeming in kind, as well as the circumstances under which the Fund would consider redeeming in kind. Anticipated large redemption activity will be evaluated to identify situations where redeeming in securities instead of cash may be appropriate.
ANNUAL REPORT | JOHN HANCOCK FLOATING RATE INCOME FUND 67
As part of its annual assessment of the LRMP, the Committee reviewed the implementation and operation of the Redemption-In-Kind Procedures and determined they are operating in a manner that such procedures are adequate and effective to manage in-kind redemptions on behalf of the Fund as part of the LRMP.
Highly Liquid Investment Minimum determination
The Committee uses an HLIM model to determine a Fund's HLIM. This process incorporates the Fund's investment strategy, historical redemptions, liquidity classification rollup percentages and cash balances, redemption policy, access to funding sources, distribution channels and client concentrations. If the Fund falls below its established HLIM for a period greater than 7 consecutive calendar days, the Committee prepares a report to the Board within one business day following the seventh consecutive calendar day with an explanation of how the Fund plans to restore its HLIM within a reasonable period of time.
As part of its annual assessment of the LRMP, the Committee reviewed the policies and procedures in place with respect to HLIM and Primarily Highly Liquid Fund (PHLF) determinations, and determined that such policies and procedures are operating in a manner that is adequate and effective as part of the LRMP.
Compliance with the 15% limit on illiquid investments
Rule 22e-4 sets an aggregate illiquid investment limit of 15% for a fund. Funds are prohibited from acquiring an illiquid investment if this results in greater than 15% of its net assets being classified as illiquid. When applying this limit, the Committee defines "illiquid investment" to mean any investment that the Fund reasonably expects cannot be sold or disposed of in current market conditions in seven calendar days or less without the sale or disposition significantly changing the market value of the investment. If a 15% illiquid investment limit breach occurs for longer than 1 business day, the Fund is required to notify the Board and provide a plan on how to bring illiquid investments within the 15% threshold, and after 7 days confidentially notify the Securities and Exchange Commission (the SEC).
In February 2019, as a result of extended security markets closures in connection with the Chinese New Year in certain countries, the SEC released guidance, and the Committee approved and adopted an Extended Market Holiday Policy to plan for and monitor known Extended Market Holidays (defined as all expected market holiday closures spanning four or more calendar days).
As part of its annual assessment of the LRMP, the Committee reviewed the policies and procedures in place with respect to the 15% illiquid investment limit and determined such policies and procedures are operating in a manner that is adequate and effective as part of the LMRP.
Reasonably Anticipated Trade Size determination
In order to assess the liquidity risk of a Fund, the Committee considers the impact on the Fund that redemptions of a RATS would have under both normal and reasonably foreseeable stressed conditions. Modelling the Fund's RATS requires quantifying cash flow volatility and analyzing distribution channel concentration and redemption risk. The model is designed to estimate the amount of assets that the Fund could reasonably anticipate trading on a given day, during both normal and reasonably foreseeable stressed conditions, to satisfy redemption requests.
As part of its annual assessment of the LRMP, the Committee reviewed the policies and procedures in place with respect to RATS determinations and determined that such policies and procedures are operating in a manner that is adequate and effective at making RATS determinations as part of the LRMP.
ANNUAL REPORT | JOHN HANCOCK FLOATING RATE INCOME FUND 68
Security-level liquidity classifications
When classifying the liquidity of portfolio securities, the Fund adheres to the liquidity classification procedures established by the Advisor. In assigning a liquidity classification to Fund portfolio holdings, the following key inputs, among others, are considered: the Fund's RATS, feedback from the applicable Subadvisor on market-, trading- and investment-specific considerations, an assessment of current market conditions and fund portfolio holdings, and a value impact standard. The Subadvisor also provides position-level data to the Committee for use in monthly classification reconciliation in order to identify any classifications that may need to be changed as a result of the above considerations.
As part of its annual assessment of the LRMP, the Committee reviewed the policies and procedures in place with respect to security-level liquidity classifications and determined that such policies and procedures are operating in a manner that is adequate and effective as part of the LRMP.
Liquidity risk assessment
The Committee periodically reviews and assesses, the Fund's liquidity risk, including its investment strategy and liquidity of portfolio investments during both normal and reasonably foreseeable stressed conditions (including whether the investment strategy is appropriate for an open-end fund, the extent to which the strategy involves a relatively concentrated portfolio or large positions in particular issuers, and the use of borrowings for investment purposes and derivatives), cash flow analysis during both normal and reasonably foreseeable stressed conditions, and holdings of cash and cash equivalents, as well as borrowing arrangements and other funding sources.
The Committee also monitors global events, such as the COVID-19 Coronavirus, that could impact the markets and liquidity of portfolio investments and their classifications.
As part of its annual assessment of the LRMP, the Committee reviewed Fund-Level Liquidity Risk Assessment Reports for each of the Funds and determined that the investment strategy for each Fund continues to be appropriate for an open-ended structure.
Adequacy and Effectiveness
Based on the review and assessment conducted by the Committee, the Committee has determined that the LRMP has been implemented, and is operating in a manner that is adequate and effective at assessing and managing the liquidity risk of each Fund.
ANNUAL REPORT | JOHN HANCOCK FLOATING RATE INCOME FUND 69
This chart provides information about the Trustees and Officers who oversee your John Hancock fund. Officers elected by the Trustees manage the day-to-day operations of the fund and execute policies formulated by the Trustees.
Independent Trustees
| | | |
Name, year of birth
Position(s) held with Trust
Principal occupation(s) and other
directorships during past 5 years | Trustee
of the
Trust
since1 | Number of John
Hancock funds
overseen by
Trustee |
| Hassell H. McClellan, Born: 1945 | 2005 | 195 |
Trustee and Chairperson of the Board
Director/Trustee, Virtus Funds (since 2008); Director, The Barnes Group (since 2010); Associate Professor, The Wallace E. Carroll School of Management, Boston College (retired 2013). Trustee (since 2005) and Chairperson of the Board (since 2017) of various trusts within the John Hancock Fund Complex. |
| | | |
| Charles L. Bardelis,2 Born: 1941 | 2005 | 195 |
Trustee
Director, Island Commuter Corp. (marine transport). Trustee of various trusts within the John Hancock Fund Complex (since 1988). |
| | | |
| James R. Boyle, Born: 1959 | 2015 | 195 |
Trustee
Chief Executive Officer, Foresters Financial (since 2018); Chairman and Chief Executive Officer, Zillion Group, Inc. (formerly HealthFleet, Inc.) (healthcare) (2014-2018); Executive Vice President and Chief Executive Officer, U.S. Life Insurance Division of Genworth Financial, Inc. (insurance) (January 2014-July 2014); Senior Executive Vice President, Manulife Financial, President and Chief Executive Officer, John Hancock (1999-2012); Chairman and Director, John Hancock Investment Management LLC, John Hancock Investment Management Distributors LLC, and John Hancock Variable Trust Advisers LLC (2005-2010). Trustee of various trusts within the John Hancock Fund Complex (2005-2014 and since 2015). |
| | | |
| Peter S. Burgess,2 Born: 1942 | 2005 | 195 |
Trustee
Consultant (financial, accounting, and auditing matters) (since 1999); Certified Public Accountant; Partner, Arthur Andersen (independent public accounting firm) (prior to 1999); Director, Lincoln Educational Services Corporation (since 2004); Director, Symetra Financial Corporation (2010-2016); Director, PMA Capital Corporation (2004-2010). Trustee of various trusts within the John Hancock Fund Complex (since 2005). |
| | | |
| William H. Cunningham, Born: 1944 | 2012 | 195 |
Trustee
Professor, University of Texas, Austin, Texas (since 1971); former Chancellor, University of Texas System and former President of the University of Texas, Austin, Texas; Chairman (since 2009) and Director (since 2006), Lincoln National Corporation (insurance); Director, Southwest Airlines (since 2000); former Director, LIN Television (2009-2014). Trustee of various trusts within the John Hancock Fund Complex (since 1986). |
| | | |
| Grace K. Fey, Born: 1946 | 2008 | 195 |
Trustee
Chief Executive Officer, Grace Fey Advisors (since 2007); Director and Executive Vice President, Frontier Capital Management Company (1988-2007); Director, Fiduciary Trust (since 2009). Trustee of various trusts within the John Hancock Fund Complex (since 2008). |
ANNUAL REPORT | JOHN HANCOCK FLOATING RATE INCOME FUND 70
Independent Trustees (continued)
| | | |
Name, year of birth
Position(s) held with Trust
Principal occupation(s) and other
directorships during past 5 years | Trustee
of the
Trust
since1 | Number of John
Hancock funds
overseen by
Trustee |
| Deborah C. Jackson, Born: 1952 | 2012 | 195 |
Trustee
President, Cambridge College, Cambridge, Massachusetts (since 2011); Board of Directors, Massachusetts Women's Forum (since 2018); Board of Directors, National Association of Corporate Directors/New England (since 2015); Board of Directors, Association of Independent Colleges and Universities of Massachusetts (2014-2017); Chief Executive Officer, American Red Cross of Massachusetts Bay (2002-2011); Board of Directors of Eastern Bank Corporation (since 2001); Board of Directors of Eastern Bank Charitable Foundation (since 2001); Board of Directors of American Student Assistance Corporation (1996-2009); Board of Directors of Boston Stock Exchange (2002-2008); Board of Directors of Harvard Pilgrim Healthcare (health benefits company) (2007-2011). Trustee of various trusts within the John Hancock Fund Complex (since 2008). |
| | | |
| James M. Oates,2 Born: 1946 | 2005 | 195 |
Trustee
Managing Director, Wydown Group (financial consulting firm) (since 1994); Chairman and Director, Emerson Investment Management, Inc. (2000-2015); Independent Chairman, Hudson Castle Group, Inc. (formerly IBEX Capital Markets, Inc.) (financial services company) (1997-2011); Director, Stifel Financial (since 1996); Director, Investor Financial Services Corporation (1995-2007); Director, Connecticut River Bancorp (1998-2014); Director/Trustee, Virtus Funds (since 1988). Trustee (since 2004) and Chairperson of the Board (2005-2016) of various trusts within the John Hancock Fund Complex. |
| | | |
| Steven R. Pruchansky, Born: 1944 | 2012 | 195 |
Trustee and Vice Chairperson of the Board
Managing Director, Pru Realty (since 2017); Chairman and Chief Executive Officer, Greenscapes of Southwest Florida, Inc. (2014-2020); Director and President, Greenscapes of Southwest Florida, Inc. (until 2000); Member, Board of Advisors, First American Bank (until 2010); Managing Director, Jon James, LLC (real estate) (since 2000); Partner, Right Funding, LLC (2014-2017); Director, First Signature Bank & Trust Company (until 1991); Director, Mast Realty Trust (until 1994); President, Maxwell Building Corp. (until 1991). Trustee (since 1992), Chairperson of the Board (2011-2012), and Vice Chairperson of the Board (since 2012) of various trusts within the John Hancock Fund Complex. |
| | | |
| Frances G. Rathke,2,* Born: 1960 | 2020 | 195 |
Trustee
Director, Northern New England Energy Corporation (since 2017); Director, Audit Committee Chair and Compensation Committee Member, Green Mountain Power Corporation (since 2016); Director, Treasurer and Finance & Audit Committee Chair, Flynn Center for Performing Arts (since 2016); Director, Audit Committee Chair and Compensation Committee Member, Planet Fitness (since 2016); Director, Citizen Cider, Inc. (high-end hard cider and hard seltzer company) (since 2016); Chief Financial Officer and Treasurer, Keurig Green Mountain, Inc. (2003-retired 2015); Independent Financial Consultant, Frances Rathke Consulting (strategic and financial consulting services) (2001-2003); Chief Financial Officer and Secretary, Ben & Jerry's Homemade, Inc. (1989-2000, including prior positions); Senior Manager, Coopers & Lybrand, LLC (independent public accounting firm) (1982-1989). Trustee of various trusts within the John Hancock Fund Complex (since 2020). |
ANNUAL REPORT | JOHN HANCOCK FLOATING RATE INCOME FUND 71
Independent Trustees (continued)
| | | |
Name, year of birth
Position(s) held with Trust
Principal occupation(s) and other
directorships during past 5 years | Trustee
of the
Trust
since1 | Number of John
Hancock funds
overseen by
Trustee |
| Gregory A. Russo, Born: 1949 | 2012 | 195 |
Trustee
Director and Audit Committee Chairman (2012-2020), and Member, Audit Committee and Finance Committee (2011-2020), NCH Healthcare System, Inc. (holding company for multi-entity healthcare system); Director and Member (2012-2018) and Finance Committee Chairman (2014-2018), The Moorings, Inc. (nonprofit continuing care community); Vice Chairman, Risk & Regulatory Matters, KPMG LLP (KPMG) (2002-2006); Vice Chairman, Industrial Markets, KPMG (1998-2002); Chairman and Treasurer, Westchester County, New York, Chamber of Commerce (1986-1992); Director, Treasurer, and Chairman of Audit and Finance Committees, Putnam Hospital Center (1989-1995); Director and Chairman of Fundraising Campaign, United Way of Westchester and Putnam Counties, New York (1990-1995). Trustee of various trusts within the John Hancock Fund Complex (since 2008). |
Non-Independent Trustees3
| | | |
Name, year of birth
Position(s) held with Trust
Principal occupation(s) and other
directorships during past 5 years | Trustee
of the
Trust
since1 | Number of John
Hancock funds
overseen by
Trustee |
| Andrew G. Arnott, Born: 1971 | 2017 | 195 |
President and Non-Independent Trustee
Head of Wealth and Asset Management, United States and Europe, for John Hancock and Manulife (since 2018); Executive Vice President, John Hancock Financial Services (since 2009, including prior positions); Director and Executive Vice President, John Hancock Investment Management LLC (since 2005, including prior positions); Director and Executive Vice President, John Hancock Variable Trust Advisers LLC (since 2006, including prior positions); President, John Hancock Investment Management Distributors LLC (since 2004, including prior positions); President of various trusts within the John Hancock Fund Complex (since 2007, including prior positions). Trustee of various trusts within the John Hancock Fund Complex (since 2017). |
| | | |
| Marianne Harrison, Born: 1963 | 2018 | 195 |
Non-Independent Trustee
President and CEO, John Hancock (since 2017); President and CEO, Manulife Canadian Division (2013-2017); Member, Board of Directors, CAE Inc. (since 2019); Member, Board of Directors, MA Competitive Partnership Board (since 2018); Member, Board of Directors, American Council of Life Insurers (ACLI) (since 2018); Member, Board of Directors, Communitech, an industry-led innovation center that fosters technology companies in Canada (2017-2019); Member, Board of Directors, Manulife Assurance Canada (2015-2017); Board Member, St. Mary's General Hospital Foundation (2014-2017); Member, Board of Directors, Manulife Bank of Canada (2013-2017); Member, Standing Committee of the Canadian Life & Health Assurance Association (2013-2017); Member, Board of Directors, John Hancock USA, John Hancock Life & Health, John Hancock New York (2012-2013). Trustee of various trusts within the John Hancock Fund Complex (since 2018). |
ANNUAL REPORT | JOHN HANCOCK FLOATING RATE INCOME FUND 72
Principal officers who are not Trustees
| | |
Name, year of birth
Position(s) held with Trust
Principal occupation(s)
during past 5 years | Officer
of the
Trust
since |
| Charles A. Rizzo, Born: 1957 | 2007 |
Chief Financial Officer
Vice President, John Hancock Financial Services (since 2008); Senior Vice President, John Hancock Investment Management LLC and John Hancock Variable Trust Advisers LLC (since 2008); Chief Financial Officer of various trusts within the John Hancock Fund Complex (since 2007). |
| | |
| Salvatore Schiavone, Born: 1965 | 2009 |
Treasurer
Assistant Vice President, John Hancock Financial Services (since 2007); Vice President, John Hancock Investment Management LLC and John Hancock Variable Trust Advisers LLC (since 2007); Treasurer of various trusts within the John Hancock Fund Complex (since 2007, including prior positions). |
| | |
| Christopher (Kit) Sechler, Born: 1973 | 2018 |
Chief Legal Officer and Secretary
Vice President and Deputy Chief Counsel, John Hancock Investments (since 2015); Assistant Vice President and Senior Counsel (2009-2015), John Hancock Investment Management; Chief Legal Officer and Secretary of various trusts within the John Hancock Fund Complex (since 2018); Assistant Secretary of John Hancock Investment Management LLC and John Hancock Variable Trust Advisers LLC (since 2009). |
| | |
| Trevor Swanberg, Born: 1979 | 2020 |
Chief Compliance Officer
Chief Compliance Officer, various trusts within the John Hancock Fund Complex, John Hancock Investment Management LLC, and John Hancock Variable Trust Advisers LLC (since 2020); Deputy Chief Compliance Officer, various trusts within the John Hancock Fund Complex (2018-2020); Deputy Chief Compliance Officer, John Hancock Investment Management LLC and John Hancock Variable Trust Advisers LLC (2019-2020); Assistant Chief Compliance Officer, various trusts within the John Hancock Fund Complex (2016-2018); Assistant Chief Compliance Officer, John Hancock Investment Management LLC and John Hancock Variable Trust Advisers LLC (2016-2019); Vice President, State Street Global Advisors (2015-2016). |
The business address for all Trustees and Officers is 200 Berkeley Street, Boston, Massachusetts 02116-5023.
The Statement of Additional Information of the fund includes additional information about members of the Board of Trustees of the Trust and is available without charge, upon request, by calling 800-225-5291.
| | |
| 1 | Each Trustee holds office until his or her successor is elected and qualified, or until the Trustee's death, retirement, resignation, or removal. Mr. Boyle has served as Trustee at various times prior to the date listed in the table. |
| 2 | Member of the Audit Committee. |
| 3 | The Trustee is a Non-Independent Trustee due to current or former positions with the Advisor and certain affiliates. |
| * | Appointed as Independent Trustee effective as of September 15, 2020. |
ANNUAL REPORT | JOHN HANCOCK FLOATING RATE INCOME FUND 73
| | |
Trustees
Hassell H. McClellan, Chairperson
Steven R. Pruchansky, Vice Chairperson
Andrew G. Arnott†
Charles L. Bardelis*
James R. Boyle
Peter S. Burgess*
William H. Cunningham
Grace K. Fey
Marianne Harrison†
Deborah C. Jackson
James M. Oates*
Frances G. Rathke*,1
Gregory A. Russo
Officers
Andrew G. Arnott
President
Charles A. Rizzo
Chief Financial Officer
Salvatore Schiavone
Treasurer
Christopher (Kit) Sechler
Secretary and Chief Legal Officer
Trevor Swanberg2
Chief Compliance Officer
| Investment advisor
John Hancock Investment Management LLC
Subadvisor
BCSF Advisors, LP ("Bain Capital Credit")
Portfolio Managers
Andrew Carlino
Kim Harris
Nate Whittier
Principal distributor
John Hancock Investment Management Distributors LLC
Custodian
State Street Bank and Trust Company
Transfer agent
John Hancock Signature Services, Inc.
Legal counsel
K&L Gates LLP
Independent registered public accounting firm
PricewaterhouseCoopers LLC
|
* Member of the Audit Committee
† Non-Independent Trustee
1 Appointed as Independent Trustee effective as of September 15, 2020
2 Effective July 31, 2020
The fund's proxy voting policies and procedures, as well as the fund proxy voting record for the most recent twelve-month period ended June 30, are available free of charge on the Securities and Exchange Commission (SEC) website at sec.gov or on our website.
All of the fund's holdings as of the end of the third month of every fiscal quarter are filed with the SEC on Form N-PORT within 60 days of the end of the fiscal quarter. The fund's Form N-PORT filings are available on our website and the SEC's website, sec.gov.
We make this information on your fund, as well as monthly portfolio holdings, and other fund details available on our website at jhinvestments.com or by calling 800-225-5291.
| | | | |
| | You can also contact us: |
| | 800-225-5291
jhinvestments.com | Regular mail:
John Hancock Signature Services, Inc.
PO Box 219909
Kansas City, MO 64121-9909
| Express mail:
John Hancock Signature Services, Inc.
430 W 7th Street
Suite 219909
Kansas City, MO 64105-1407
|
ANNUAL REPORT | JOHN HANCOCK FLOATING RATE INCOME FUND 74
John Hancock family of funds
| | | |
DOMESTIC EQUITY FUNDS
Blue Chip Growth
Classic Value
Disciplined Value
Disciplined Value Mid Cap
Equity Income
Financial Industries
Fundamental All Cap Core
Fundamental Large Cap Core
New Opportunities
Regional Bank
Small Cap Core
Small Cap Growth
Small Cap Value
U.S. Global Leaders Growth
U.S. Quality Growth
GLOBAL AND INTERNATIONAL EQUITY FUNDS
Disciplined Value International
Emerging Markets
Emerging Markets Equity
Fundamental Global Franchise
Global Equity
Global Shareholder Yield
Global Thematic Opportunities
International Dynamic Growth
International Growth
International Small Company
| | INCOME FUNDS
Bond
California Tax-Free Income
Emerging Markets Debt
Floating Rate Income
Government Income
High Yield
High Yield Municipal Bond
Income
Investment Grade Bond
Money Market
Short Duration Bond
Short Duration Credit Opportunities
Strategic Income Opportunities
Tax-Free Bond
ALTERNATIVE AND SPECIALTY FUNDS
Absolute Return Currency
Alternative Asset Allocation
Alternative Risk Premia
Diversified Macro
Infrastructure
Multi-Asset Absolute Return
Seaport Long/Short
|
A fund's investment objectives, risks, charges, and expenses should be considered carefully before investing. The prospectus contains this and other important information about the fund. To obtain a prospectus, contact your financial professional, call John Hancock Investment Management at 800-225-5291, or visit our website at jhinvestments.com. Please read the prospectus carefully before investing or sending money.
| | | |
ASSET ALLOCATION
Balanced
Multi-Asset High Income
Multi-Index Lifetime Portfolios
Multi-Index Preservation Portfolios
Multimanager Lifestyle Portfolios
Multimanager Lifetime Portfolios
Retirement Income 2040
EXCHANGE-TRADED FUNDS
John Hancock Multifactor Consumer Discretionary ETF
John Hancock Multifactor Consumer Staples ETF
John Hancock Multifactor Developed International ETF
John Hancock Multifactor Emerging Markets ETF
John Hancock Multifactor Energy ETF
John Hancock Multifactor Financials ETF
John Hancock Multifactor Healthcare ETF
John Hancock Multifactor Industrials ETF
John Hancock Multifactor Large Cap ETF
John Hancock Multifactor Materials ETF
John Hancock Multifactor Media and
Communications ETF
John Hancock Multifactor Mid Cap ETF
John Hancock Multifactor Small Cap ETF
John Hancock Multifactor Technology ETF
John Hancock Multifactor Utilities ETF
| | ENVIRONMENTAL, SOCIAL, AND
GOVERNANCE FUNDS
ESG All Cap Core
ESG Core Bond
ESG International Equity
ESG Large Cap Core
CLOSED-END FUNDS
Financial Opportunities
Hedged Equity & Income
Income Securities Trust
Investors Trust
Preferred Income
Preferred Income II
Preferred Income III
Premium Dividend
Tax-Advantaged Dividend Income
Tax-Advantaged Global Shareholder Yield
|
John Hancock Multifactor ETF shares are bought and sold at market price (not NAV), and are not individually redeemed
from the fund. Brokerage commissions will reduce returns.
John Hancock ETFs are distributed by Foreside Fund Services, LLC, and are subadvised by Dimensional Fund Advisors LP.
Foreside is not affiliated with John Hancock Investment Management Distributors LLC or Dimensional Fund Advisors LP.
Dimensional Fund Advisors LP receives compensation from John Hancock in connection with licensing rights to the
John Hancock Dimensional indexes. Dimensional Fund Advisors LP does not sponsor, endorse, or sell, and makes no
representation as to the advisability of investing in, John Hancock Multifactor ETFs.
John Hancock Investment Management
A trusted brand
John Hancock Investment Management is a premier asset manager
with a heritage of financial stewardship dating back to 1862. Helping
our shareholders pursue their financial goals is at the core of
everything we do. It's why we support the role of professional financial
advice and operate with the highest standards of conduct and integrity.
A better way to invest
We serve investors globally through a unique multimanager approach:
We search the world to find proven portfolio teams with specialized
expertise for every strategy we offer, then we apply robust investment
oversight to ensure they continue to meet our uncompromising
standards and serve the best interests of our shareholders.
Results for investors
Our unique approach to asset management enables us to provide
a diverse set of investments backed by some of the world's best
managers, along with strong risk-adjusted returns across asset classes.
John Hancock Investment Management Distributors LLC n Member FINRA, SIPC
200 Berkeley Street n Boston, MA 02116-5010 n 800-225-5291 n jhinvestments.com
This report is for the information of the shareholders of John Hancock Floating Rate Income Fund. It is not authorized for distribution to prospective investors unless preceded or accompanied by a prospectus.
John Hancock
Multi-Asset High Income Fund
(formerly Income Allocation Fund)
Annual report 8/31/2020
Beginning on January 1, 2021, as permitted by regulations adopted by the Securities and Exchange Commission, paper copies of the fund's shareholder reports like this one will no longer be sent by mail, unless you specifically request paper copies of the reports from the fund or from your financial intermediary. Instead, the reports will be made available on a website, and you will be notified by mail each time a report is posted and provided with a website link to access the report.
If you already elected to receive shareholder reports electronically, you will not be affected by this change, and you do not need to take any action. You may elect to receive shareholder reports and other communications electronically by calling John Hancock Investment Management at 800-225-5291 (Class A and Class C shares) or 888-972-8696 (Class I and Class R Suite) or by contacting your financial intermediary.
You may elect to receive all reports in paper, free of charge, at any time. You can inform John Hancock Investment Management or your financial intermediary that you wish to continue receiving paper copies of your shareholder reports by following the instructions listed above. Your election to receive reports in paper will apply to all funds held with John Hancock Investment Management or your financial intermediary.

A message to shareholders
Dear shareholder,
Despite the heightened fears over the coronavirus (COVID-19), which sent markets tumbling during the latter half of February and early March, global financial markets delivered positive returns for the 12-month period ended August 31, 2020. In response to the first-quarter sell-off, the U.S. Federal Reserve acted quickly, lowering interest rates to near zero and reinstating quantitative easing, as well as announcing its plans to shore up short-term debt. Many other nations followed suit and credit spreads rebounded off their highs as liquidity concerns eased.
Of course, it would be a mistake to consider the market's turnaround a trustworthy signal of assured or swift economic recovery. While there has been economic growth in much of the developed world, the pace has slowed in many areas as spending remains far below prepandemic levels.
From an investment perspective, we continue to think that maintaining a focus on long-term objectives while pursuing a risk-aware strategy is a prudent way forward. Above all, we believe the counsel of a trusted financial professional continues to matter now more than ever. Periods of heightened uncertainty are precisely the time to review your financial goals and follow a plan that helps you make the most of what continues to be a challenging situation.
On behalf of everyone at John Hancock Investment Management, I'd like to take this opportunity to welcome new shareholders and thank existing shareholders for the continued trust you've placed in us.
Sincerely,
Andrew G. Arnott
President and CEO,
John Hancock Investment Management
Head of Wealth and Asset Management,
United States and Europe
This commentary reflects the CEO's views as of this report's period end and are subject to change at any time. Diversification does not guarantee investment returns and does not eliminate risk of loss. All investments entail risks, including the possible loss of principal. For more up-to-date information, you can visit our website at jhinvestments.com.
John Hancock
Multi-Asset High Income Fund
Table of contents
| | | |
| 2 | | Your fund at a glance |
| 5 | | Manager's discussion of fund performance |
| 7 | | A look at performance |
| 9 | | Your expenses |
| 11 | | Fund's investments |
| 33 | | Financial statements |
| 36 | | Financial highlights |
| 41 | | Notes to financial statements |
| 54 | | Report of independent registered public accounting firm |
| 55 | | Tax information |
| 56 | | Continuation of investment advisory and subadvisory agreements |
| 63 | | Statement regarding liquidity risk management |
| 66 | | Trustees and Officers |
| 70 | | More information |
ANNUAL REPORT | JOHN HANCOCK MULTI-ASSET HIGH INCOME FUND 1
INVESTMENT OBJECTIVE
The fund seeks to provide a high level of current income with consideration for capital appreciation and preservation.
AVERAGE ANNUAL TOTAL RETURNS AS OF 8/31/2020 (%)
The Blended Index comprises 20% MSCI USA High Dividend Yield Index, 10% MSCI World ex-USA High Dividend Yield Index, 25% Bloomberg Barclays US Aggregate Credit - Corporate Investment Grade Index and 45% Bloomberg Barclays Global High Yield (USD Hedged) Index.
It is not possible to invest in an index. Index figures do not reflect expenses or sales charges, which would result in lower returns.
The fund's Morningstar category average is a group of funds with similar investment objectives and strategies and is the equal-weighted return of all funds per category. Morningstar places funds in certain categories based on their historical portfolio holdings. Figures from Morningstar, Inc. include reinvested distributions and do not take into account sales charges. Actual load-adjusted performance is lower. Since-inception returns for the Morningstar fund category average are not available.
The past performance shown here reflects reinvested distributions and the beneficial effect of any expense reductions, and does not guarantee future results. Performance of the other share classes will vary based on the difference in the fees and expenses of those classes. Shares will fluctuate in value and, when redeemed, may be worth more or less than their original cost. Current month-end performance may be lower or higher than the performance cited, and can be found at jhinvestments.com or by calling 800-225-5291. For further information on the fund's objectives, risks, and strategy, see the fund's prospectus.
ANNUAL REPORT | JOHN HANCOCK MULTI-ASSET HIGH INCOME FUND 2
PERFORMANCE HIGHLIGHTS OVER THE LAST TWELVE MONTHS
Financial assets experienced elevated volatility
After performing well through mid-February, higher-risk asset categories sold off sharply in response to the economic slowdown caused by the coronavirus before regaining the lost ground from April onward.
The fund's strategy changed
The fund's name changed from John Hancock Income Allocation Fund to John Hancock Multi-Asset High Income Fund on April 17, 2020, and it adopted a new investment approach in early June.
The fund underperformed its primary blended benchmark
The bulk of the shortfall occurred prior to the strategy shift, primarily as a result of a value tilt in equities and positions in credit-sensitive investments within the fixed-income portfolio.
COUNTRY COMPOSITION AS OF 8/31/2020 (%)
| | |
| United States | 64.1 |
| Luxembourg | 2.9 |
| Japan | 2.8 |
| United Kingdom | 2.3 |
| Mexico | 2.3 |
| Netherlands | 2.2 |
| China | 1.6 |
| Ireland | 1.6 |
| Canada | 1.6 |
| Hong Kong | 1.4 |
| Other countries | 17.2 |
| TOTAL | 100.0 |
| As a percentage of net assets. | |
ANNUAL REPORT | JOHN HANCOCK MULTI-ASSET HIGH INCOME FUND 3
PORTFOLIO COMPOSITION AS OF 8/31/2020 (%)
A note about risks
The fund may be subject to various risks as described in the fund's prospectus. A widespread health crisis such as a global pandemic could cause substantial market volatility, exchange trading suspensions and closures, impact the ability to complete redemptions, and affect fund performance. For example, the novel coronavirus disease (COVID-19) has resulted in significant disruptions to global business activity. The impact of a health crisis and other epidemics and pandemics that may arise in the future, could affect the global economy in ways that cannot necessarily be foreseen at the present time. A health crisis may exacerbate other pre-existing political, social, and economic risks. Any such impact could adversely affect the fund's performance, resulting in losses to your investment. For more information, please refer to the "Principal risks" section of the prospectus.
ANNUAL REPORT | JOHN HANCOCK MULTI-ASSET HIGH INCOME FUND 4
Manager's discussion of fund performance
On April 17, 2020, John Hancock Income Allocation Fund was renamed John Hancock Multi-Asset High Income Fund.
Can you describe investment conditions during the 12 months ended August 31, 2020?
The markets generally performed well from the beginning of the period through mid-February. During this time, stocks and the credit-sensitive segments of the bond market—investment-grade corporates, high-yield bonds, and emerging-markets debt—benefited from the combination of positive economic growth, accommodative central bank policies, and signs that the United States and China would resolve their trade dispute. This favorable environment changed abruptly mid-way through the first quarter of 2020, when the spread of COVID-19 prompted governments to shut down large portions of their economies in an effort to contain the virus. The sudden shift toward an outlook characterized by slower growth and weaker corporate earnings led to a rapid downturn in stocks and higher-risk segments of the bond market, together with an impressive rally in U.S. Treasuries. The backdrop shifted yet again in late March, when world governments and central banks responded to the crisis with an unprecedented level of fiscal and monetary stimulus. These actions, in conjunction with the gradual re-opening of the various world economies through the summer, led to a rebound in stocks and credit-sensitive fixed-income investments.
How would you describe the change to the fund's approach?
The Income Allocation Fund was a fund of funds that held equity and fixed-income
| | | | | |
TOP 5 EQUITY HOLDINGS
AS OF 8/31/20 (%) | | TOP 5 BOND ISSUERS
AS OF 8/31/20 (%) |
| NiSource, Inc. | 0.6 | | Petroleos Mexicanos | 0.9 |
| United Parcel Service, Inc., Class B | 0.6 | | DaVita, Inc. | 0.7 |
| QUALCOMM, Inc. | 0.5 | | CCO Holdings LLC | 0.7 |
| CH Robinson Worldwide, Inc. | 0.4 | | Huntington Bancshares, Inc. | 0.7 |
| The Progressive Corp. | 0.4 | | Rede D'or Finance Sarl | 0.7 |
| TOTAL | 2.5 | | TOTAL | 3.7 |
| As a percentage of net assets. | | As a percentage of net assets. |
| Cash and cash equivalents are not included. | | Cash and cash equivalents are not included. |
ANNUAL REPORT | JOHN HANCOCK MULTI-ASSET HIGH INCOME FUND 5
funds with target weightings of 30% and 70%, respectively. In response to the low-yield environment, the fund changed to an approach designed to provide higher income. We initiated the new strategy on June 4, 2020. As of period end, the fund had three segments. First, it had an allocation to equities through a passively managed, quantitative approach designed to identify higher-quality, higher-yielding stocks globally. Second, it used options with the intention of increasing income and limiting the volatility of the fund's yield. Third, the fund had a multisector fixed-income segment that was invested in the global credit sectors and had significant allocations to emerging-market debt and high-yield bonds.
What factors drove performance in the period?
Prior to the strategy change, the fund underperformed its blended benchmark. Most of the shortfall occurred in the first calendar quarter, when the fund lagged in the broader sell-off in the financial markets. Overall, a value tilt and small positions in master limited partnerships and real estate investment trusts detracted from results on the equity side. Within fixed income, positions in term loans and emerging-market debt weighed on returns. Following the change, the fund outperformed its blended benchmark. During this time, its positioning in equities, options, and fixed income all contributed positively.
MANAGED BY
| |
| John F. Addeo, CFA, Manulife IM (US) |
| Geoffrey Kelley, CFA, Manulife IM (US) |
| Caryn E. Rothman, CFA, Manulife IM (US) |
| Nathan W. Thooft, CFA, Manulife IM (US) |
| Christopher Walsh, CFA, Manulife IM (US) |
The views expressed in this report are exclusively those of Nathan W. Thooft, CFA, Manulife Investment Management, and are subject to change. They are not meant as investment advice. Please note that the holdings discussed in this report may not have been held by the fund for the entire period. Portfolio composition is subject to review in accordance with the fund's investment strategy and may vary in the future. Current and future portfolio holdings are subject to risk.
ANNUAL REPORT | JOHN HANCOCK MULTI-ASSET HIGH INCOME FUND 6
TOTAL RETURNS FOR THE PERIOD ENDED AUGUST 31, 2020
| | | | | | | | | | | | |
Average annual total returns (%)
with maximum sales charge | | Cumulative total returns (%)
with maximum sales charge | | SEC 30-day
yield (%)
subsidized | | SEC 30-day
yield (%)
unsubsidized1 |
| | 1-year | 5-year | Since
inception2 | | | 5-year | Since
inception2 | | as of
8-31-20 | | as of
8-31-20 |
| Class A | -2.67 | 3.16 | 2.36 | | | 16.83 | 14.50 | | 3.24 | | 2.80 |
| Class C | 0.24 | 3.40 | 2.44 | | | 18.18 | 14.98 | | 2.63 | | 2.18 |
| Class I3 | 2.28 | 4.44 | 3.50 | | | 24.27 | 22.08 | | 3.63 | | 3.17 |
| Class R63 | 2.46 | 4.56 | 3.62 | | | 24.98 | 22.88 | | 3.73 | | 3.27 |
| Class NAV3,4 | 1.45 | 3.44 | 2.47 | | | 18.43 | 15.22 | | 3.75 | | 3.29 |
| Index 1† | 6.47 | 4.33 | 3.95 | | | 23.60 | 25.20 | | — | | — |
| Index 2† | 16.79 | 10.42 | 8.42 | | | 64.15 | 59.79 | | — | | — |
| Index 3† | 4.46 | 6.83 | 5.40 | | | 39.12 | 35.63 | | — | | — |
| Index 4† | 10.03 | 6.37 | 5.51 | | | 36.18 | 36.48 | | — | | — |
Performance figures assume all distributions have been reinvested. Figures reflect maximum sales charges on Class A shares of 4.50% and the applicable contingent deferred sales charge (CDSC) on Class C shares. The returns for Class A shares have been adjusted to reflect the increase in the maximum sales charge from 4% to 4.5%, effective 6-4-20. Class C shares sold within one year of purchase are subject to a 1% CDSC. Sales charges are not applicable to Class I and Class R6 shares.
The expense ratios of the fund, both net (including any fee waivers and/or expense limitations) and gross (excluding any fee waivers and/or expense limitations), are set forth according to the most recent publicly available prospectus for the fund and may differ from those disclosed in the Financial highlights tables in this report. Net expenses reflect contractual expense limitations in effect until December 31, 2020 and are subject to change. Had the contractual fee waivers and expense limitations not been in place, gross expenses would apply. The following expense ratios include the expenses of the underlying funds in which the fund invests. The expense ratios are as follows:
| | | | | | |
| | Class A | Class C | Class I | Class R6 | Class NAV | |
| Gross (%) | 4.65 | 5.40 | 4.40 | 4.29 | 4.28 | |
| Net (%) | 0.89 | 1.64 | 0.64 | 0.53 | 0.52 | |
Please refer to the most recent prospectus and annual or semiannual report for more information on expenses and any expense limitation arrangements for each class.
The returns reflect past results and should not be considered indicative of future performance. The return and principal value of an investment will fluctuate so that shares, when redeemed, may be worth more or less than their original cost. Due to market volatility and other factors, the fund's current performance may be higher or lower than the performance shown. For current to the most recent month-end performance data, please call 800-225-5291 or visit the fund's website at jhinvestments.com.
The performance table above and the chart on the next page do not reflect the deduction of taxes that a shareholder would pay on fund distributions or the redemption of fund shares. The fund's performance results reflect any applicable fee waivers or expense reductions, without which the expenses would increase and results would have been less favorable.
| † | Index 1 is the Bloomberg Barclays U.S. Aggregate Bond Index; Index 2 is the MSCI World Index; Index 3 is 20% MSCI USA High Dividend Yield Index, 10% MSCI World ex-USA High Dividend Yield Index, 25% Bloomberg Barclays US Aggregate Credit - Corporate Investment Grade Index and 45% Bloomberg Barclays Global High Yield (USD Hedged) Index; Index 4 is 70% Bloomberg Barclays U.S. Aggregate Bond Index and 30% MSCI World Index. |
See the following page for footnotes.
ANNUAL REPORT | JOHN HANCOCK MULTI-ASSET HIGH INCOME FUND 7
This chart and table show what happened to a hypothetical $10,000 investment in John Hancock Multi-Asset High Income Fund for the share classes and periods indicated, assuming all distributions were reinvested. For comparison, we've shown the same investment in two blended indexes and two separate indexes.
| | | | | | | | |
| | Start date | With maximum
sales charge ($) | Without
sales charge ($) | Index 1 ($) | Index 2 ($) | Index 3 ($) | Index 4 ($) |
| Class C5 | 11-14-14 | 11,498 | 11,498 | 12,520 | 15,979 | 13,563 | 13,648 |
| Class I3 | 11-14-14 | 12,208 | 12,208 | 12,520 | 15,979 | 13,563 | 13,648 |
| Class R63 | 11-14-14 | 12,288 | 12,288 | 12,520 | 15,979 | 13,563 | 13,648 |
| Class NAV3,4 | 11-14-14 | 11,522 | 11,522 | 12,520 | 15,979 | 13,563 | 13,648 |
The Bloomberg Barclays U.S. Aggregate Bond Index is an unmanaged index of dollar-denominated and non-convertible investment-grade debt issue.
The MSCI World Index (gross of foreign withholding tax on dividends) is a free float-adjusted market capitalization weighted index that is designed to measure the equity market performance of developed markets.
The Primary Blended Index comprises 20% MSCI USA High Dividend Yield Index, 10% MSCI World ex-USA High Dividend Yield Index, 25% Bloomberg Barclays US Aggregate Credit - Corporate Investment Grade Index and 45% Bloomberg Barclays Global High Yield (USD Hedged) Index
The Secondary Blended Index comprises 70% Bloomberg Barclays U.S. Aggregate Bond Index and 30% MSCI World Index.
Prior to June 4, 2020, the fund's custom blended benchmark was the Secondary Blended Index. Effective June 4, 2020, the fund's custom blended benchmark was the Primary Blended Index. The Primary Blended Index better reflects the universe of investment opportunities based on the fund's current investment strategy.
It is not possible to invest in an index. Index figures do not reflect expenses or sales charges, which would result in lower returns.
Footnotes related to performance pages
| 1 | Unsubsidized yield reflects what the yield would have been without the effect of reimbursements and waivers. |
| 2 | From 11-14-14. |
| 3 | For certain types of investors, as described in the fund's prospectus. |
| 4 | Class NAV shares were first offered on 6-4-20. Returns prior to this date are those of Class A shares (first offered on 11-14-14) that have not been adjusted for class-specific expenses; otherwise, returns would vary. |
| 5 | The contingent deferred sales charge is not applicable. |
ANNUAL REPORT | JOHN HANCOCK MULTI-ASSET HIGH INCOME FUND 8
These examples are intended to help you understand your ongoing operating expenses of investing in the fund so you can compare these costs with the ongoing costs of investing in other mutual funds.
Understanding fund expenses
As a shareholder of the fund, you incur two types of costs:
■Transaction costs, which include sales charges (loads) on purchases or redemptions (varies by share class), minimum account fee charge, etc.
■Ongoing operating expenses, including management fees, distribution and service fees (if applicable), and other fund expenses.
We are presenting only your ongoing operating expenses here.
Actual expenses/actual returns
The first line of each share class in the table on the following page is intended to provide information about the fund’s actual ongoing operating expenses, and is based on the fund’s actual return. It assumes an account value of $1,000.00 on March 1, 2020, with the same investment held until August 31, 2020.
Together with the value of your account, you may use this information to estimate the operating expenses that you paid over the period. Simply divide your account value at August 31, 2020, by $1,000.00, then multiply it by the “expenses paid” for your share class from the table. For example, for an account value of $8,600.00, the operating expenses should be calculated as follows:
Hypothetical example for comparison purposes
The second line of each share class in the table on the following page allows you to compare the fund’s ongoing operating expenses with those of any other fund. It provides an example of the fund’s hypothetical account values and hypothetical expenses based on each class’s actual expense ratio and an assumed 5% annualized return before expenses (which is not the class’s actual return). It assumes an account value of $1,000.00 on March 1, 2020, with the same investment held until August 31, 2020. Look in any other fund shareholder report to find its hypothetical example and you will be able to compare these expenses. Please remember that these hypothetical account values and expenses may not be used to estimate the actual ending account balance or expenses you paid for the period.
| | ANNUAL REPORT | JOHN HANCOCK MULTI-ASSET HIGH INCOME FUND | 9 |
Remember, these examples do not include any transaction costs, therefore, these examples will not help you to determine the relative total costs of owning different funds. If transaction costs were included, your expenses would have been higher. See the prospectus for details regarding transaction costs.
SHAREHOLDER EXPENSE EXAMPLE CHART
| | | Account
value on
3-1-2020 | Ending
value on
8-31-2020 | Expenses
paid during
period ended
8-31-20201 | Annualized
expense
ratio2 |
| Class A | Actual expenses/actual returns | $1,000.00 | $1,014.10 | $4.15 | 0.82% |
| | Hypothetical example | 1,000.00 | 1,021.00 | 4.17 | 0.82% |
| Class C | Actual expenses/actual returns | 1,000.00 | 1,010.00 | 7.78 | 1.54% |
| | Hypothetical example | 1,000.00 | 1,017.40 | 7.81 | 1.54% |
| Class I | Actual expenses/actual returns | 1,000.00 | 1,015.70 | 2.79 | 0.55% |
| | Hypothetical example | 1,000.00 | 1,022.40 | 2.80 | 0.55% |
| Class R6 | Actual expenses/actual returns | 1,000.00 | 1,017.10 | 2.18 | 0.43% |
| | Hypothetical example | 1,000.00 | 1,023.00 | 2.19 | 0.43% |
| Class NAV | Actual expenses/actual returns3 | 1,000.00 | 1,012.20 | 1.20 | 0.49% |
| | Hypothetical example | 1,000.00 | 1,022.70 | 2.49 | 0.49% |
| 1 | Expenses are equal to the annualized expense ratio, multiplied by the average account value over the period, multiplied by 184/366 (to reflect the one-half year period). |
| 2 | Ratios do not include expense indirectly incurred from underlying funds and can vary based on the mix of underlying funds held by the fund. |
| 3 | The inception date for Class NAV shares is 6-4-2020. Actual Expenses are equal to the class' annualized expense ratio, multiplied by the average account value over the period, multiplied by 88/366 (to reflect the period). |
| 10 | JOHN HANCOCK MULTI-ASSET HIGH INCOME FUND | ANNUAL REPORT | |
AS OF 8-31-20
| | Rate (%) | Maturity date | | Par value^ | Value |
| U.S. Government and Agency obligations 0.5% | | | | $760,900 |
| (Cost $761,985) | | | | | |
| U.S. Government Agency 0.5% | | | | 760,900 |
| Federal National Mortgage Association | 2.500 | 04-13-21 | | 750,000 | 760,900 |
|
| Foreign government obligations 1.4% | | | | $2,033,263 |
| (Cost $1,920,995) | | | | | |
| Chile 0.3% | | | | | 363,975 |
Republic of Chile
Bond | 2.450 | 01-31-31 | | 345,000 | 363,975 |
| Costa Rica 0.4% | | | | | 648,200 |
Republic of Costa Rica
Bond (A) | 6.125 | 02-19-31 | | 700,000 | 648,200 |
| Egypt 0.3% | | | | | 416,008 |
Arab Republic of Egypt
Bond (A) | 8.875 | 05-29-50 | | 400,000 | 416,008 |
| Israel 0.2% | | | | | 275,325 |
State of Israel
Bond | 3.375 | 01-15-50 | | 250,000 | 275,325 |
| Saudi Arabia 0.2% | | | | | 329,755 |
Kingdom of Saudi Arabia
Bond (A) | 4.500 | 04-22-60 | | 265,000 | 329,755 |
|
| Corporate bonds 60.9% | | | $90,306,783 |
| (Cost $87,719,472) | | | | | |
| Communication services 10.1% | | | 14,963,247 |
| Diversified telecommunication services 3.0% | | | |
| C&W Senior Financing DAC (A) | 6.875 | 09-15-27 | | 440,000 | 460,790 |
| Cable Onda SA (A) | 4.500 | 01-30-30 | | 900,000 | 964,800 |
| Cellnex Telecom SA | 1.875 | 06-26-29 | EUR | 400,000 | 483,945 |
| Kenbourne Invest SA (A) | 6.875 | 11-26-24 | | 450,000 | 468,000 |
| Liquid Telecommunications Financing PLC (A) | 8.500 | 07-13-22 | | 285,000 | 290,101 |
| Network i2i, Ltd. (5.650% to 1-15-25, then 5 Year CMT + 4.274%) (B) | 5.650 | 01-15-25 | | 200,000 | 201,100 |
| PPF Telecom Group BV | 3.125 | 03-27-26 | EUR | 325,000 | 390,094 |
| Sable International Finance, Ltd. (A) | 5.750 | 09-07-27 | | 425,000 | 447,780 |
| Telecom Italia Capital SA | 6.000 | 09-30-34 | | 400,000 | 486,000 |
| Zayo Group Holdings, Inc. (A) | 4.000 | 03-01-27 | | 220,000 | 217,525 |
| Entertainment 1.0% | | | |
| Lions Gate Capital Holdings LLC (A) | 6.375 | 02-01-24 | | 515,000 | 526,588 |
| SEE NOTES TO FINANCIAL STATEMENTS | ANNUAL REPORT | JOHN HANCOCK MULTI-ASSET HIGH INCOME FUND | 11 |
| | Rate (%) | Maturity date | | Par value^ | Value |
| Communication services (continued) | | | |
| Entertainment (continued) | | | |
| Netflix, Inc. (A) | 4.875 | 06-15-30 | | 800,000 | $927,000 |
| Interactive media and services 0.4% | | | |
| ANGI Group LLC (A) | 3.875 | 08-15-28 | | 110,000 | 111,428 |
| Match Group Holdings II LLC (A) | 4.125 | 08-01-30 | | 270,000 | 282,825 |
| TripAdvisor, Inc. (A) | 7.000 | 07-15-25 | | 120,000 | 126,600 |
| Media 3.7% | | | |
| Altice France Holding SA (A) | 6.000 | 02-15-28 | | 550,000 | 550,000 |
| CCO Holdings LLC (A) | 4.500 | 08-15-30 | | 300,000 | 318,375 |
| CCO Holdings LLC (A) | 4.500 | 05-01-32 | | 650,000 | 688,929 |
| Comcast Corp. | 3.999 | 11-01-49 | | 600,000 | 724,551 |
| CSC Holdings LLC (A) | 4.625 | 12-01-30 | | 670,000 | 685,216 |
| Globo Comunicacao e Participacoes SA (A) | 4.875 | 01-22-30 | | 500,000 | 492,505 |
| iHeartCommunications, Inc. (A) | 4.750 | 01-15-28 | | 220,000 | 210,672 |
| iHeartCommunications, Inc. | 8.375 | 05-01-27 | | 250,000 | 251,250 |
| LCPR Senior Secured Financing DAC (A) | 6.750 | 10-15-27 | | 420,000 | 450,450 |
| MDC Partners, Inc. (A) | 6.500 | 05-01-24 | | 325,000 | 310,375 |
| Virgin Media Finance PLC (A) | 5.000 | 07-15-30 | | 400,000 | 411,880 |
| VTR Comunicaciones SpA (A) | 5.125 | 01-15-28 | | 230,000 | 240,350 |
| WMG Acquisition Corp. (A) | 3.000 | 02-15-31 | | 225,000 | 223,875 |
| Wireless telecommunication services 2.0% | | | |
| Millicom International Cellular SA (A) | 6.250 | 03-25-29 | | 415,000 | 459,766 |
| Oztel Holdings SPC, Ltd. (A) | 5.625 | 10-24-23 | | 320,000 | 323,498 |
| SoftBank Group Corp. | 5.125 | 09-19-27 | | 265,000 | 278,115 |
| SoftBank Group Corp. (6.875% to 7-19-27, then 5 Year ICE Swap Rate + 4.854%) (B) | 6.875 | 07-19-27 | | 500,000 | 494,316 |
| Telefonica Celular del Paraguay SA (A) | 5.875 | 04-15-27 | | 500,000 | 528,750 |
| T-Mobile USA, Inc. (A) | 4.375 | 04-15-40 | | 400,000 | 481,064 |
| Turkcell Iletisim Hizmetleri AS (A) | 5.750 | 10-15-25 | | 450,000 | 454,734 |
| Consumer discretionary 8.4% | | | 12,421,469 |
| Automobiles 0.7% | | | |
| Ford Motor Credit Company LLC | 4.063 | 11-01-24 | | 465,000 | 471,612 |
| General Motors Financial Company, Inc. (6.500% to 9-30-28, then 3 month LIBOR + 3.436%) (B) | 6.500 | 09-30-28 | | 500,000 | 505,751 |
| Diversified consumer services 0.8% | | | |
| GEMS MENASA Cayman, Ltd. (A) | 7.125 | 07-31-26 | | 325,000 | 313,625 |
| Sotheby's (A) | 7.375 | 10-15-27 | | 500,000 | 510,000 |
| Stena International SA (A) | 6.125 | 02-01-25 | | 400,000 | 380,000 |
| 12 | JOHN HANCOCK MULTI-ASSET HIGH INCOME FUND | ANNUAL REPORT | SEE NOTES TO FINANCIAL STATEMENTS |
| | Rate (%) | Maturity date | | Par value^ | Value |
| Consumer discretionary (continued) | | | |
| Hotels, restaurants and leisure 4.6% | | | |
| Colt Merger Sub, Inc. (A) | 5.750 | 07-01-25 | | 110,000 | $115,225 |
| Connect Finco SARL (A) | 6.750 | 10-01-26 | | 700,000 | 722,750 |
| ESH Hospitality, Inc. (A) | 5.250 | 05-01-25 | | 485,000 | 492,275 |
| Hilton Domestic Operating Company, Inc. (A) | 5.750 | 05-01-28 | | 425,000 | 449,438 |
| International Game Technology PLC (A) | 5.250 | 01-15-29 | | 110,000 | 112,750 |
| International Game Technology PLC (A) | 6.500 | 02-15-25 | | 400,000 | 435,000 |
| Marriott International, Inc. | 5.750 | 05-01-25 | | 425,000 | 477,129 |
| MGM Resorts International | 6.750 | 05-01-25 | | 425,000 | 454,750 |
| New Red Finance, Inc. (A) | 4.375 | 01-15-28 | | 450,000 | 462,375 |
| Resorts World Las Vegas LLC (A) | 4.625 | 04-16-29 | | 500,000 | 472,220 |
| Sazka Group AS (A) | 3.875 | 02-15-27 | EUR | 450,000 | 469,446 |
| Studio City Finance, Ltd. (A) | 6.500 | 01-15-28 | | 200,000 | 209,100 |
| Twin River Worldwide Holdings, Inc. (A) | 6.750 | 06-01-27 | | 470,000 | 465,300 |
| Wyndham Destinations, Inc. | 6.350 | 10-01-25 | | 550,000 | 577,500 |
| Wyndham Destinations, Inc. (A) | 6.625 | 07-31-26 | | 280,000 | 296,100 |
| Wyndham Hotels & Resorts, Inc. (A) | 4.375 | 08-15-28 | | 75,000 | 75,578 |
| Yum! Brands, Inc. (A) | 4.750 | 01-15-30 | | 420,000 | 463,050 |
| Household durables 0.3% | | | |
| Turkiye Sise ve Cam Fabrikalari AS (A) | 6.950 | 03-14-26 | | 435,000 | 445,353 |
| Internet and direct marketing retail 0.9% | | | |
| Expedia Group, Inc. (A) | 6.250 | 05-01-25 | | 400,000 | 439,396 |
| Prosus NV (A) | 2.031 | 08-03-32 | EUR | 170,000 | 204,192 |
| Prosus NV (A) | 3.680 | 01-21-30 | | 620,000 | 673,865 |
| Multiline retail 0.3% | | | |
| Nordstrom, Inc. (A) | 8.750 | 05-15-25 | | 450,000 | 496,600 |
| Specialty retail 0.4% | | | |
| Abercrombie & Fitch Management Company (A) | 8.750 | 07-15-25 | | 100,000 | 102,500 |
| AutoNation, Inc. | 4.750 | 06-01-30 | | 425,000 | 497,889 |
| Textiles, apparel and luxury goods 0.4% | | | |
| Hanesbrands, Inc. (A) | 5.375 | 05-15-25 | | 430,000 | 458,595 |
| SD International Sukuk, Ltd. | 6.300 | 05-09-22 | | 200,000 | 172,105 |
| Consumer staples 2.7% | | | 4,010,860 |
| Food and staples retailing 0.4% | | | |
| Walmart, Inc. | 3.700 | 06-26-28 | | 520,000 | 616,339 |
| Food products 1.9% | | | |
| JBS Investments II GmbH (A) | 5.750 | 01-15-28 | | 500,000 | 528,755 |
| Kraft Heinz Foods Company (A) | 4.250 | 03-01-31 | | 330,000 | 364,612 |
| SEE NOTES TO FINANCIAL STATEMENTS | ANNUAL REPORT | JOHN HANCOCK MULTI-ASSET HIGH INCOME FUND | 13 |
| | Rate (%) | Maturity date | | Par value^ | Value |
| Consumer staples (continued) | | | |
| Food products (continued) | | | |
| Kraft Heinz Foods Company | 4.625 | 01-30-29 | | 300,000 | $339,624 |
| NBM US Holdings, Inc. (A) | 7.000 | 05-14-26 | | 700,000 | 745,843 |
| Post Holdings, Inc. (A) | 5.750 | 03-01-27 | | 300,000 | 316,875 |
| Simmons Foods, Inc. (A) | 5.750 | 11-01-24 | | 300,000 | 307,410 |
| TBLA International Pte, Ltd. | 7.000 | 01-24-23 | | 200,000 | 187,118 |
| Household products 0.2% | | | |
| Edgewell Personal Care Company (A) | 5.500 | 06-01-28 | | 300,000 | 320,253 |
| Personal products 0.2% | | | |
| Walnut Bidco PLC (A) | 9.125 | 08-01-24 | | 275,000 | 284,031 |
| Energy 5.7% | | | 8,475,807 |
| Energy equipment and services 0.6% | | | |
| Honghua Group, Ltd. | 6.375 | 08-01-22 | | 200,000 | 198,525 |
| Inkia Energy, Ltd. (A) | 5.875 | 11-09-27 | | 500,000 | 529,125 |
| USA Compression Partners LP | 6.875 | 09-01-27 | | 225,000 | 232,875 |
| Oil, gas and consumable fuels 5.1% | | | |
| Aker BP ASA (A) | 3.750 | 01-15-30 | | 380,000 | 377,929 |
| Bayan Resources Tbk PT | 6.125 | 01-24-23 | | 200,000 | 194,773 |
| Cheniere Energy Partners LP | 4.500 | 10-01-29 | | 445,000 | 462,609 |
| Energy Transfer Operating LP | 4.200 | 04-15-27 | | 300,000 | 313,394 |
| Energy Transfer Operating LP (7.125% to 5-15-30, then 5 Year CMT + 5.306%) (B) | 7.125 | 05-15-30 | | 630,000 | 549,927 |
| Greenko Solar Mauritius, Ltd. | 5.950 | 07-29-26 | | 200,000 | 207,968 |
| HPCL-Mittal Energy, Ltd. | 5.450 | 10-22-26 | | 200,000 | 202,335 |
| Indika Energy Capital III Pte, Ltd. | 5.875 | 11-09-24 | | 200,000 | 188,556 |
| Leviathan Bond, Ltd. (A) | 6.750 | 06-30-30 | | 410,000 | 426,482 |
| Medco Bell Pte, Ltd. | 6.375 | 01-30-27 | | 200,000 | 188,000 |
| MEG Energy Corp. (A) | 7.125 | 02-01-27 | | 255,000 | 243,976 |
| MPLX LP (6.875% to 2-15-23, then 3 month LIBOR + 4.652%) (B) | 6.875 | 02-15-23 | | 525,000 | 467,250 |
| Occidental Petroleum Corp. | 6.375 | 09-01-28 | | 135,000 | 136,536 |
| Occidental Petroleum Corp. | 6.625 | 09-01-30 | | 135,000 | 138,713 |
| Parkland Corp. (A) | 5.875 | 07-15-27 | | 350,000 | 373,625 |
| Petrobras Global Finance BV (A) | 5.093 | 01-15-30 | | 450,000 | 468,450 |
| Petrobras Global Finance BV | 6.750 | 06-03-50 | | 430,000 | 479,386 |
| Petroleos Mexicanos | 6.625 | 06-15-35 | | 1,035,000 | 913,367 |
| Petroleos Mexicanos | 7.470 | 11-12-26 | MXN | 12,562,500 | 449,589 |
| The Oil and Gas Holding Company BSCC (A) | 7.500 | 10-25-27 | | 450,000 | 494,952 |
| Transportadora de Gas del Sur SA (A) | 6.750 | 05-02-25 | | 275,000 | 237,465 |
| 14 | JOHN HANCOCK MULTI-ASSET HIGH INCOME FUND | ANNUAL REPORT | SEE NOTES TO FINANCIAL STATEMENTS |
| | Rate (%) | Maturity date | | Par value^ | Value |
| Financials 8.8% | | | $13,106,824 |
| Banks 5.5% | | | |
| Banco BTG Pactual SA (A) | 5.750 | 09-28-22 | | 215,000 | 223,600 |
| Banco do Brasil SA (A) | 4.875 | 04-19-23 | | 340,000 | 364,228 |
| Bank of America Corp. (6.100% to 3-17-25, then 3 month LIBOR + 3.898%) (B) | 6.100 | 03-17-25 | | 850,000 | 953,743 |
| Citizens Financial Group, Inc. (5.650% to 10-6-25, then 5 Year CMT + 5.313%) (B) | 5.650 | 10-06-25 | | 800,000 | 858,000 |
| Credit Agricole SA (8.125% to 12-23-25, then 5 Year U.S. Swap Rate + 6.185%) (A)(B) | 8.125 | 12-23-25 | | 385,000 | 456,322 |
| Freedom Mortgage Corp. (A) | 8.250 | 04-15-25 | | 325,000 | 333,938 |
| Huntington Bancshares, Inc. (5.625% to 7-15-30, then 10 Year CMT + 4.945%) (B) | 5.625 | 07-15-30 | | 900,000 | 1,005,750 |
| ING Groep NV (6.500% to 4-16-25, then 5 Year U.S. Swap Rate + 4.446%) (B) | 6.500 | 04-16-25 | | 440,000 | 468,160 |
| Itau Unibanco Holding SA (A) | 3.250 | 01-24-25 | | 450,000 | 461,138 |
| JPMorgan Chase & Co. (6.750% to 2-1-24, then 3 month LIBOR + 3.780%) (B) | 6.750 | 02-01-24 | | 820,000 | 916,350 |
| Kasikornbank PCL (3.343% to 10-2-26, then 5 Year CMT + 1.700%) | 3.343 | 10-02-31 | | 200,000 | 199,923 |
| Nanyang Commercial Bank, Ltd. (5.000% to 6-2-22, then 5 Year CMT + 3.205%) (B) | 5.000 | 06-02-22 | | 200,000 | 200,508 |
| Natwest Group PLC (8.625% to 8-15-21, then 5 Year U.S. Swap Rate + 7.598%) (B) | 8.625 | 08-15-21 | | 400,000 | 420,468 |
| Regions Financial Corp. (5.750% to 6-15-25, then 5 Year CMT + 5.430%) (B) | 5.750 | 06-15-25 | | 885,000 | 960,225 |
| Societe Generale SA (7.375% to 9-13-21, then 5 Year U.S. Swap Rate + 6.238%) (A)(B) | 7.375 | 09-13-21 | | 350,000 | 362,548 |
| Capital markets 1.0% | | | |
| Credit Suisse Group AG (7.500% to 7-17-23, then 5 Year U.S. Swap Rate + 4.600%) (A)(B) | 7.500 | 07-17-23 | | 500,000 | 539,300 |
| The Charles Schwab Corp. (5.375% to 6-1-25, then 5 Year CMT + 4.971%) (B) | 5.375 | 06-01-25 | | 845,000 | 927,388 |
| Consumer finance 0.2% | | | |
| OneMain Finance Corp. | 8.875 | 06-01-25 | | 200,000 | 225,500 |
| Diversified financial services 0.9% | | | |
| Allied Universal Holdco LLC (A) | 6.625 | 07-15-26 | | 330,000 | 353,925 |
| SEE NOTES TO FINANCIAL STATEMENTS | ANNUAL REPORT | JOHN HANCOCK MULTI-ASSET HIGH INCOME FUND | 15 |
| | Rate (%) | Maturity date | | Par value^ | Value |
| Financials (continued) | | | |
| Diversified financial services (continued) | | | |
| GE Capital International Funding Company | 4.418 | 11-15-35 | | 300,000 | $309,744 |
| Gogo Intermediate Holdings LLC (A) | 9.875 | 05-01-24 | | 285,000 | 296,400 |
| Operadora de Servicios Mega SA de CV (A) | 8.250 | 02-11-25 | | 500,000 | 440,000 |
| Insurance 1.2% | | | |
| Athene Holding, Ltd. | 6.150 | 04-03-30 | | 320,000 | 386,770 |
| Brighthouse Financial, Inc. | 5.625 | 05-15-30 | | 420,000 | 488,371 |
| Markel Corp. (6.000% to 6-1-25, then 5 Year CMT + 5.662%) (B) | 6.000 | 06-01-25 | | 890,000 | 954,525 |
| Health care 5.6% | | | 8,216,068 |
| Health care providers and services 4.1% | | | |
| AmerisourceBergen Corp. | 2.800 | 05-15-30 | | 870,000 | 938,855 |
| Centene Corp. | 3.375 | 02-15-30 | | 515,000 | 535,600 |
| CVS Health Corp. | 3.250 | 08-15-29 | | 400,000 | 443,684 |
| DaVita, Inc. (A) | 3.750 | 02-15-31 | | 440,000 | 434,289 |
| DaVita, Inc. (A) | 4.625 | 06-01-30 | | 600,000 | 630,750 |
| Encompass Health Corp. | 4.750 | 02-01-30 | | 440,000 | 459,056 |
| HCA, Inc. | 3.500 | 09-01-30 | | 400,000 | 419,491 |
| MEDNAX, Inc. (A) | 6.250 | 01-15-27 | | 500,000 | 530,000 |
| Rede D'or Finance Sarl (A) | 4.500 | 01-22-30 | | 1,000,000 | 980,000 |
| Select Medical Corp. (A) | 6.250 | 08-15-26 | | 330,000 | 354,509 |
| US Renal Care, Inc. (A) | 10.625 | 07-15-27 | | 250,000 | 270,000 |
| Health care technology 0.2% | | | |
| Change Healthcare Holdings LLC (A) | 5.750 | 03-01-25 | | 260,000 | 265,200 |
| Pharmaceuticals 1.3% | | | |
| Bausch Health Americas, Inc. (A) | 9.250 | 04-01-26 | | 500,000 | 554,365 |
| Bausch Health Companies, Inc. (A) | 5.750 | 08-15-27 | | 325,000 | 349,063 |
| Takeda Pharmaceutical Company, Ltd. | 3.375 | 07-09-60 | | 575,000 | 593,887 |
| Upjohn, Inc. (A) | 4.000 | 06-22-50 | | 420,000 | 457,319 |
| Industrials 6.6% | | | 9,843,120 |
| Aerospace and defense 0.8% | | | |
| The Boeing Company | 5.705 | 05-01-40 | | 675,000 | 782,616 |
| TransDigm, Inc. (A) | 6.250 | 03-15-26 | | 325,000 | 342,943 |
| Air freight and logistics 0.6% | | | |
| Rumo Luxembourg Sarl (A) | 5.250 | 01-10-28 | | 250,000 | 263,490 |
| United Parcel Service, Inc. | 4.450 | 04-01-30 | | 250,000 | 314,303 |
| XPO Logistics, Inc. (A) | 6.250 | 05-01-25 | | 270,000 | 288,225 |
| Building products 0.4% | | | |
| Builders FirstSource, Inc. (A) | 5.000 | 03-01-30 | | 500,000 | 533,750 |
| 16 | JOHN HANCOCK MULTI-ASSET HIGH INCOME FUND | ANNUAL REPORT | SEE NOTES TO FINANCIAL STATEMENTS |
| | Rate (%) | Maturity date | | Par value^ | Value |
| Industrials (continued) | | | |
| Commercial services and supplies 1.3% | | | |
| APX Group, Inc. | 7.625 | 09-01-23 | | 500,000 | $511,250 |
| Cimpress PLC (A) | 7.000 | 06-15-26 | | 500,000 | 497,500 |
| Garda World Security Corp. (A) | 9.500 | 11-01-27 | | 250,000 | 271,250 |
| Prime Security Services Borrower LLC (A) | 3.375 | 08-31-27 | | 215,000 | 214,228 |
| The Brink's Company (A) | 5.500 | 07-15-25 | | 100,000 | 105,500 |
| Vertical Holdco GmbH (A) | 6.625 | 07-15-28 | EUR | 130,000 | 161,931 |
| Williams Scotsman International, Inc. (A) | 4.625 | 08-15-28 | | 105,000 | 106,116 |
| Construction and engineering 0.9% | | | |
| Ellaktor Value PLC (A) | 6.375 | 12-15-24 | EUR | 550,000 | 501,288 |
| IHS Netherlands Holdco BV (A) | 8.000 | 09-18-27 | | 400,000 | 420,000 |
| MasTec, Inc. (A) | 4.500 | 08-15-28 | | 180,000 | 183,600 |
| Picasso Finance Sub, Inc. (A) | 6.125 | 06-15-25 | | 260,000 | 278,200 |
| Machinery 0.1% | | | |
| HTA Group, Ltd. (A) | 7.000 | 12-18-25 | | 205,000 | 218,489 |
| Professional services 0.4% | | | |
| CoStar Group, Inc. (A) | 2.800 | 07-15-30 | | 295,000 | 310,136 |
| IHS Markit, Ltd. (A) | 4.000 | 03-01-26 | | 250,000 | 281,940 |
| Road and rail 0.6% | | | |
| Uber Technologies, Inc. (A) | 8.000 | 11-01-26 | | 850,000 | 900,652 |
| Trading companies and distributors 1.4% | | | |
| AerCap Ireland Capital DAC | 4.875 | 01-16-24 | | 350,000 | 360,818 |
| Air Lease Corp. | 2.875 | 01-15-26 | | 410,000 | 407,370 |
| Ashtead Capital, Inc. (A) | 4.250 | 11-01-29 | | 450,000 | 474,210 |
| Ashtead Capital, Inc. (A) | 4.375 | 08-15-27 | | 435,000 | 452,400 |
| GATX Corp. | 4.000 | 06-30-30 | | 400,000 | 456,660 |
| Transportation infrastructure 0.1% | | | |
| Adani Ports & Special Economic Zone, Ltd. | 4.375 | 07-03-29 | | 200,000 | 204,255 |
| Information technology 2.9% | | | 4,333,907 |
| Communications equipment 0.0% | | | |
| Motorola Solutions, Inc. | 2.300 | 11-15-30 | | 80,000 | 79,750 |
| IT services 0.8% | | | |
| 21Vianet Group, Inc. | 7.875 | 10-15-21 | | 200,000 | 204,005 |
| Gartner, Inc. (A) | 4.500 | 07-01-28 | | 115,000 | 120,175 |
| HT Global IT Solutions Holdings, Ltd. | 7.000 | 07-14-21 | | 200,000 | 202,500 |
| Sixsigma Networks Mexico SA de CV (A) | 7.500 | 05-02-25 | | 700,000 | 649,250 |
| Semiconductors and semiconductor equipment 0.5% | | | |
| Broadcom, Inc. | 4.750 | 04-15-29 | | 400,000 | 467,905 |
| Micron Technology, Inc. | 5.327 | 02-06-29 | | 225,000 | 268,644 |
| SEE NOTES TO FINANCIAL STATEMENTS | ANNUAL REPORT | JOHN HANCOCK MULTI-ASSET HIGH INCOME FUND | 17 |
| | Rate (%) | Maturity date | | Par value^ | Value |
| Information technology (continued) | | | |
| Software 0.6% | | | |
| BY Crown Parent LLC (A) | 4.250 | 01-31-26 | | 120,000 | $122,538 |
| Microsoft Corp. | 3.300 | 02-06-27 | | 700,000 | 800,809 |
| Technology hardware, storage and peripherals 1.0% | | | |
| Apple, Inc. | 3.000 | 11-13-27 | | 700,000 | 793,580 |
| CDW LLC | 3.250 | 02-15-29 | | 135,000 | 137,886 |
| Seagate HDD Cayman (A) | 4.125 | 01-15-31 | | 450,000 | 486,865 |
| Materials 4.0% | | | 5,943,950 |
| Chemicals 1.3% | | | |
| Chandra Asri Petrochemical Tbk PT | 4.950 | 11-08-24 | | 200,000 | 193,259 |
| Cydsa SAB de CV (A) | 6.250 | 10-04-27 | | 450,000 | 468,567 |
| ICL Group, Ltd. (A) | 6.375 | 05-31-38 | | 400,000 | 498,516 |
| The Scotts Miracle-Gro Company | 4.500 | 10-15-29 | | 450,000 | 481,473 |
| UPL Corp, Ltd. (5.250% to 2-27-25, then 5 Year CMT + 3.865%) (B) | 5.250 | 02-27-25 | | 200,000 | 193,100 |
| Construction materials 0.7% | | | |
| Cemex SAB de CV (A) | 7.375 | 06-05-27 | | 435,000 | 471,431 |
| Standard Industries, Inc. (A) | 5.000 | 02-15-27 | | 210,000 | 219,280 |
| Wienerberger AG | 2.750 | 06-04-25 | EUR | 300,000 | 367,545 |
| Containers and packaging 0.3% | | | |
| Ardagh Packaging Finance PLC (A) | 5.250 | 08-15-27 | | 340,000 | 353,729 |
| Graham Packaging Company, Inc. (A) | 7.125 | 08-15-28 | | 120,000 | 126,050 |
| Metals and mining 1.7% | | | |
| Anglo American Capital PLC (A) | 4.000 | 09-11-27 | | 430,000 | 473,607 |
| China Hongqiao Group, Ltd. | 7.125 | 07-22-22 | | 200,000 | 192,500 |
| First Quantum Minerals, Ltd. (A) | 7.500 | 04-01-25 | | 450,000 | 459,014 |
| Freeport-McMoRan, Inc. | 4.250 | 03-01-30 | | 220,000 | 231,136 |
| Gold Fields Orogen Holdings BVI, Ltd. (A) | 6.125 | 05-15-29 | | 475,000 | 567,863 |
| JSW Steel, Ltd. | 5.950 | 04-18-24 | | 200,000 | 206,021 |
| Novelis Corp. (A) | 4.750 | 01-30-30 | | 435,000 | 440,859 |
| Real estate 2.8% | | | 4,074,793 |
| Equity real estate investment trusts 1.3% | | | |
| GLP Capital LP | 4.000 | 01-15-30 | | 500,000 | 518,800 |
| GLP Capital LP | 5.250 | 06-01-25 | | 270,000 | 292,054 |
| SBA Communications Corp. (A) | 3.875 | 02-15-27 | | 250,000 | 259,488 |
| VICI Properties LP (A) | 4.125 | 08-15-30 | | 265,000 | 265,583 |
| VICI Properties LP (A) | 4.625 | 12-01-29 | | 465,000 | 483,600 |
| Real estate management and development 1.5% | | | |
| Central China Real Estate, Ltd. | 7.250 | 07-16-24 | | 200,000 | 198,758 |
| China SCE Group Holdings, Ltd. | 7.375 | 04-09-24 | | 200,000 | 204,521 |
| Greenland Global Investment, Ltd. | 6.750 | 03-03-24 | | 400,000 | 403,096 |
| 18 | JOHN HANCOCK MULTI-ASSET HIGH INCOME FUND | ANNUAL REPORT | SEE NOTES TO FINANCIAL STATEMENTS |
| | Rate (%) | Maturity date | | Par value^ | Value |
| Real estate (continued) | | | |
| Real estate management and development (continued) | | | |
| Hopson Development Holdings, Ltd. | 7.500 | 06-27-22 | | 200,000 | $203,002 |
| KWG Group Holdings, Ltd. | 7.875 | 09-01-23 | | 200,000 | 210,254 |
| Redsun Properties Group, Ltd. | 9.700 | 04-16-23 | | 200,000 | 205,039 |
| Sunac China Holdings, Ltd. | 7.500 | 02-01-24 | | 200,000 | 205,764 |
| Yanlord Land HK Company, Ltd. | 6.750 | 04-23-23 | | 200,000 | 207,041 |
| Yuzhou Group Holdings Company, Ltd. | 8.375 | 10-30-24 | | 200,000 | 210,008 |
| Zhenro Properties Group, Ltd. | 8.650 | 01-21-23 | | 200,000 | 207,785 |
| Utilities 3.3% | | | 4,916,738 |
| Electric utilities 1.4% | | | |
| Engie Energia Chile SA (A) | 3.400 | 01-28-30 | | 440,000 | 477,400 |
| Israel Electric Corp., Ltd. (A) | 4.250 | 08-14-28 | | 325,000 | 368,120 |
| Southern California Edison Company (6.250% to 2-1-22, then 3 month LIBOR + 4.199%) (B) | 6.250 | 02-01-22 | | 450,000 | 446,835 |
| Vistra Operations Company LLC (A) | 4.300 | 07-15-29 | | 425,000 | 461,784 |
| Vistra Operations Company LLC (A) | 5.625 | 02-15-27 | | 330,000 | 348,975 |
| Gas utilities 0.5% | | | |
| AmeriGas Partners LP | 5.750 | 05-20-27 | | 400,000 | 450,560 |
| Promigas SA ESP (A) | 3.750 | 10-16-29 | | 350,000 | 344,754 |
| Independent power and renewable electricity producers 0.8% | | | |
| Calpine Corp. (A) | 4.625 | 02-01-29 | | 280,000 | 286,278 |
| Colbun SA (A) | 3.150 | 03-06-30 | | 450,000 | 487,688 |
| Concord New Energy Group, Ltd. | 7.900 | 01-23-21 | | 200,000 | 197,449 |
| ReNew Power Pvt, Ltd. | 6.450 | 09-27-22 | | 200,000 | 204,960 |
| Multi-utilities 0.6% | | | |
| Cheniere Corpus Christi Holdings LLC | 7.000 | 06-30-24 | | 310,000 | 361,189 |
|
| Sempra Energy (4.875% to 10-15-25, then 5 Year CMT + 4.550%) (B) | 4.875 | 10-15-25 | | 460,000 | 480,746 |
| Capital preferred securities 0.6% | | | $914,778 |
| (Cost $913,413) | | | | | |
| Financials 0.6% | | | 914,778 |
| Banks 0.6% | | | |
|
| Wachovia Capital Trust III (Greater of 3 month LIBOR + 0.930% or 5.570%) (B)(C) | 5.570 | 10-02-20 | | 910,000 | 914,778 |
| SEE NOTES TO FINANCIAL STATEMENTS | ANNUAL REPORT | JOHN HANCOCK MULTI-ASSET HIGH INCOME FUND | 19 |
| | Rate (%) | Maturity date | | Par value^ | Value |
|
| Term loans (D) 0.9% | | | | | $1,337,122 |
| (Cost $1,332,208) | | | | | |
| Communication services 0.3% | 448,011 |
| Interactive media and services 0.3% |
| Ancestry.com Operations, Inc., Non-Extended Term Loan B (1 month LIBOR + 3.750%) | 4.750 | 10-19-23 | | 448,850 | 448,011 |
| Financials 0.3% | 494,101 |
| Diversified financial services 0.3% |
| Refinitiv US Holdings, Inc., 2018 USD Term Loan (1 month LIBOR + 3.250%) | 3.411 | 10-01-25 | | 498,734 | 494,101 |
| Health care 0.3% | 395,010 |
| Health care providers and services 0.3% |
|
| Gentiva Health Services, Inc. 2020 Term Loan (1 month LIBOR + 3.250%) | 3.438 | 07-02-25 | | 399,000 | 395,010 |
| Collateralized mortgage obligations 0.3% | | | | $466,946 |
| (Cost $455,784) | | | | | |
| Commercial and residential 0.3% | | | 466,946 |
BX Commercial Mortgage Trust
Series 2019-XL, CLass F (1 month LIBOR + 2.000%) (A)(C) | 2.162 | 10-15-36 | | 474,649 | 466,946 |
|
| Asset backed securities 0.7% | | | | | $1,066,564 |
| (Cost $1,055,522) | | | | | |
| Asset backed securities 0.7% | | | | | 1,066,564 |
Arbys Funding LLC
Series 2020-1A, Class A2 (A) | 3.237 | 07-30-50 | | 70,000 | 71,821 |
Driven Brands Funding LLC
Series 2019-1A, Class A2 (A) | 4.641 | 04-20-49 | | 536,825 | 574,698 |
Five Guys Funding LLC
Series 2017-1A, Class A2 (A) | 4.600 | 07-25-47 | | 74,438 | 74,921 |
Jack in the Box Funding LLC
Series 2019-1A, Class A23 (A) | 4.970 | 08-25-49 | | 124,063 | 131,480 |
Sonic Capital LLC
Series 2020-1A, Class A2II (A) | 4.336 | 01-20-50 | | 200,990 | 213,644 |
|
| | | | | Shares | Value |
| Common stocks 26.1% | | | | | $38,653,964 |
| (Cost $37,667,960) | | | | | |
| Communication services 1.5% | | | 2,276,913 |
| Diversified telecommunication services 1.1% | | | |
| BCE, Inc. | | | 5,311 | 228,263 |
| HKT Trust & HKT, Ltd. | | | 144,000 | 205,766 |
| 20 | JOHN HANCOCK MULTI-ASSET HIGH INCOME FUND | ANNUAL REPORT | SEE NOTES TO FINANCIAL STATEMENTS |
| | | | | Shares | Value |
| Communication services (continued) | | | |
| Diversified telecommunication services (continued) | | | |
| Koninklijke KPN NV | | | 82,114 | $215,483 |
| Singapore Telecommunications, Ltd. | | | 116,600 | 196,821 |
| Telenor ASA | | | 14,341 | 233,396 |
| Verizon Communications, Inc. | | | 9,198 | 545,165 |
| Media 0.4% | | | |
| Eutelsat Communications SA | | | 22,765 | 228,249 |
| Shaw Communications, Inc., Class B | | | 13,257 | 247,892 |
| Singapore Press Holdings, Ltd. | | | 219,700 | 175,878 |
| Consumer discretionary 0.5% | | | 707,471 |
| Automobiles 0.3% | | | |
| Nissan Motor Company, Ltd. | | | 59,100 | 238,184 |
| Subaru Corp. | | | 10,300 | 214,040 |
| Multiline retail 0.2% | | | |
| Wesfarmers, Ltd. | | | 7,305 | 255,247 |
| Consumer staples 4.2% | | | 6,209,079 |
| Beverages 0.7% | | | |
| PepsiCo, Inc. | | | 3,801 | 532,368 |
| The Coca-Cola Company | | | 11,230 | 556,222 |
| Food and staples retailing 0.5% | | | |
| Walgreens Boots Alliance, Inc. | | | 11,975 | 455,290 |
| Wm Morrison Supermarkets PLC | | | 91,200 | 233,376 |
| Food products 1.8% | | | |
| Campbell Soup Company | | | 10,226 | 537,990 |
| Conagra Brands, Inc. | | | 15,007 | 575,669 |
| General Mills, Inc. | | | 8,338 | 533,215 |
| Ingredion, Inc. | | | 6,140 | 493,902 |
| Kellogg Company | | | 7,762 | 550,403 |
| Household products 0.8% | | | |
| The Clorox Company | | | 2,457 | 549,140 |
| The Procter & Gamble Company | | | 4,260 | 589,286 |
| Tobacco 0.4% | | | |
| British American Tobacco PLC | | | 5,618 | 189,355 |
| Imperial Brands PLC | | | 11,522 | 192,240 |
| Japan Tobacco, Inc. | | | 11,800 | 220,623 |
| Energy 0.1% | | | 104,329 |
| Oil, gas and consumable fuels 0.1% | | | |
| Enbridge, Inc. | | | 3,261 | 104,329 |
| SEE NOTES TO FINANCIAL STATEMENTS | ANNUAL REPORT | JOHN HANCOCK MULTI-ASSET HIGH INCOME FUND | 21 |
| | | | | Shares | Value |
| Financials 2.9% | | | $4,321,354 |
| Banks 1.5% | | | |
| BOC Hong Kong Holdings, Ltd. | | | 70,500 | 199,982 |
| Commonwealth Bank of Australia | | | 4,567 | 229,548 |
| DBS Group Holdings, Ltd. | | | 13,700 | 209,952 |
| Hang Seng Bank, Ltd. | | | 13,500 | 212,186 |
| Oversea-Chinese Banking Corp., Ltd. | | | 32,400 | 206,222 |
| Resona Holdings, Inc. | | | 61,700 | 226,797 |
| Sumitomo Mitsui Financial Group, Inc. | | | 7,300 | 214,658 |
| The PNC Financial Services Group, Inc. | | | 4,981 | 553,887 |
| United Overseas Bank, Ltd. | | | 13,900 | 199,309 |
| Capital markets 0.4% | | | |
| BlackRock, Inc. | | | 918 | 545,466 |
| Insurance 1.0% | | | |
| Admiral Group PLC | | | 7,360 | 256,802 |
| Assicurazioni Generali SpA | | | 13,573 | 210,840 |
| The Progressive Corp. | | | 6,435 | 611,582 |
| Tokio Marine Holdings, Inc. | | | 4,800 | 221,535 |
| Zurich Insurance Group AG | | | 602 | 222,588 |
| Health care 2.0% | | | 2,973,053 |
| Biotechnology 0.3% | | | |
| Gilead Sciences, Inc. | | | 6,661 | 444,622 |
| Health care providers and services 0.6% | | | |
| Cardinal Health, Inc. | | | 10,011 | 508,158 |
| CVS Health Corp. | | | 5,960 | 370,235 |
| Pharmaceuticals 1.1% | | | |
| Bristol-Myers Squibb Company | | | 8,589 | 534,236 |
| Johnson & Johnson | | | 3,550 | 544,606 |
| Pfizer, Inc. | | | 15,115 | 571,196 |
| Industrials 3.4% | | | 4,987,512 |
| Air freight and logistics 1.0% | | | |
| CH Robinson Worldwide, Inc. | | | 6,461 | 635,116 |
| United Parcel Service, Inc., Class B | | | 4,877 | 797,958 |
| Electrical equipment 0.5% | | | |
| Eaton Corp. PLC | | | 5,760 | 588,096 |
| Emerson Electric Company | | | 3,004 | 208,688 |
| Industrial conglomerates 0.4% | | | |
| 3M Company | | | 3,207 | 522,805 |
| Machinery 1.0% | | | |
| Caterpillar, Inc. | | | 3,966 | 564,401 |
| Cummins, Inc. | | | 2,872 | 595,222 |
| Komatsu, Ltd. | | | 5,200 | 113,217 |
| 22 | JOHN HANCOCK MULTI-ASSET HIGH INCOME FUND | ANNUAL REPORT | SEE NOTES TO FINANCIAL STATEMENTS |
| | | | | Shares | Value |
| Industrials (continued) | | | |
| Machinery (continued) | | | |
| Mitsubishi Heavy Industries, Ltd. | | | 9,000 | $223,438 |
| Trading companies and distributors 0.5% | | | |
| Mitsubishi Corp. | | | 10,100 | 239,064 |
| Mitsui & Company, Ltd. | | | 14,700 | 265,122 |
| Sumitomo Corp. | | | 18,000 | 234,385 |
| Information technology 1.9% | | | 2,862,666 |
| IT services 0.7% | | | |
| IBM Corp. | | | 4,264 | 525,794 |
| Paychex, Inc. | | | 6,769 | 517,625 |
| Semiconductors and semiconductor equipment 1.2% | | | |
| Broadcom, Inc. | | | 1,616 | 560,994 |
| Maxim Integrated Products, Inc. | | | 8,255 | 564,972 |
| QUALCOMM, Inc. | | | 5,821 | 693,281 |
| Materials 1.9% | | | 2,753,837 |
| Chemicals 1.0% | | | |
| BASF SE | | | 3,667 | 223,931 |
| Covestro AG (A) | | | 5,513 | 262,827 |
| ICL Group, Ltd. | | | 67,198 | 249,642 |
| Mitsui Chemicals, Inc. | | | 10,300 | 241,587 |
| RPM International, Inc. | | | 6,658 | 564,399 |
| Containers and packaging 0.5% | | | |
| International Paper Company | | | 5,439 | 197,273 |
| Packaging Corp. of America | | | 5,003 | 506,504 |
| Metals and mining 0.4% | | | |
| Fortescue Metals Group, Ltd. | | | 21,162 | 270,480 |
| Rio Tinto PLC | | | 3,814 | 237,194 |
| Real estate 1.7% | | | 2,509,091 |
| Equity real estate investment trusts 1.6% | | | |
| CapitaLand Mall Trust | | | 144,100 | 207,261 |
| Crown Castle International Corp. | | | 3,012 | 491,709 |
| Equity Residential | | | 8,535 | 481,801 |
| Extra Space Storage, Inc. | | | 5,376 | 572,813 |
| Public Storage | | | 2,639 | 560,524 |
| Real estate management and development 0.1% | | | |
| Daito Trust Construction Company, Ltd. | | | 2,200 | 194,983 |
| Utilities 6.0% | | | 8,948,659 |
| Electric utilities 3.4% | | | |
| Alliant Energy Corp. | | | 10,398 | 563,052 |
| American Electric Power Company, Inc. | | | 6,185 | 487,564 |
| SEE NOTES TO FINANCIAL STATEMENTS | ANNUAL REPORT | JOHN HANCOCK MULTI-ASSET HIGH INCOME FUND | 23 |
| | | | | Shares | Value |
| Utilities (continued) | | | |
| Electric utilities (continued) | | | |
| AusNet Services | | | 185,305 | $248,546 |
| Duke Energy Corp. | | | 6,081 | 488,548 |
| Enel SpA | | | 25,234 | 228,499 |
| Entergy Corp. | | | 5,173 | 512,851 |
| FirstEnergy Corp. | | | 12,659 | 361,921 |
| Fortum OYJ | | | 10,685 | 226,160 |
| Pinnacle West Capital Corp. | | | 6,877 | 504,428 |
| Power Assets Holdings, Ltd. | | | 38,500 | 220,351 |
| Red Electrica Corp. SA | | | 11,322 | 216,682 |
| The Southern Company | | | 9,277 | 484,074 |
| Xcel Energy, Inc. | | | 7,957 | 552,813 |
| Gas utilities 0.3% | | | |
| Naturgy Energy Group SA | | | 11,094 | 214,168 |
| Snam SpA | | | 42,131 | 215,763 |
| Multi-utilities 2.2% | | | |
| AGL Energy, Ltd. | | | 17,567 | 191,509 |
| Consolidated Edison, Inc. | | | 7,037 | 502,020 |
| Dominion Energy, Inc. | | | 4,500 | 451,980 |
| DTE Energy Company | | | 2,240 | 265,821 |
| National Grid PLC | | | 19,078 | 213,675 |
| Public Service Enterprise Group, Inc. | | | 10,169 | 531,229 |
| Sempra Energy | | | 4,165 | 515,002 |
| WEC Energy Group, Inc. | | | 5,731 | 539,172 |
| Water utilities 0.1% | | | |
|
| United Utilities Group PLC | | | 19,370 | 212,831 |
| Preferred securities 3.0% | | | | | $4,418,098 |
| (Cost $4,225,865) | | | | | |
| Health care 0.4% | | | | | 569,018 |
| Health care equipment and supplies 0.4% | | | |
| Becton, Dickinson and Company, 6.000% | | 5,160 | 275,699 |
| Boston Scientific Corp., 5.500% | | 2,510 | 293,319 |
| Information technology 0.3% | | | | | 430,570 |
| Semiconductors and semiconductor equipment 0.3% | | | |
| Broadcom, Inc., 8.000% | | 350 | 430,570 |
| Real estate 0.3% | | | | | 464,394 |
| Equity real estate investment trusts 0.3% | | | |
| American Homes 4 Rent, Series G, 5.875% | | 17,465 | 464,394 |
| 24 | JOHN HANCOCK MULTI-ASSET HIGH INCOME FUND | ANNUAL REPORT | SEE NOTES TO FINANCIAL STATEMENTS |
| | | | | Shares | Value |
| Utilities 2.0% | | | | | $2,954,116 |
| Electric utilities 0.8% | | | |
| American Electric Power Company, Inc., 6.125% | | 3,841 | 186,250 |
| NextEra Energy, Inc., 5.279% | | 10,000 | 476,100 |
| SCE Trust II, 5.100% | | 20,000 | 493,600 |
| Multi-utilities 1.2% | | | |
| CenterPoint Energy, Inc., 7.000% | | 13,000 | 488,150 |
| DTE Energy Company, 6.250% | | 10,300 | 475,860 |
| NiSource, Inc. (6.500% to 3-15-24, then 5 Year CMT + 3.632%) | | 30,600 | 834,156 |
|
| | Yield* (%) | Maturity date | | Par value^ | Value |
| Short-term investments 4.7% | | | | | $7,007,186 |
| (Cost $7,006,461) | | | | | |
| Commercial paper 1.7% | | | | | 2,599,584 |
| Australia & New Zealand Banking Group, Ltd. | 0.100 | 10-01-20 | | 750,000 | 749,929 |
| BASF SE | 0.400 | 09-15-20 | | 600,000 | 599,955 |
| Salt River Project Agricultural Improvement and Power District | 0.140 | 09-17-20 | | 500,000 | 499,965 |
| Swedbank AB | 0.210 | 11-20-20 | | 750,000 | 749,735 |
| U.S. Government 1.6% | | | | | 2,398,907 |
| U.S. Treasury Bill (E) | 0.179 | 02-25-21 | | 1,400,000 | 1,399,191 |
| U.S. Treasury Bill (E) | 0.182 | 12-03-20 | | 1,000,000 | 999,716 |
| | | Yield (%) | | Shares | Value |
| Short-term funds 1.4% | | | | | 2,008,695 |
| State Street Institutional U.S. Government Money Market Fund, Premier Class | 0.0399(F) | | 2,008,695 | 2,008,695 |
|
| Total investments (Cost $143,059,665) 99.1% | | | $146,965,604 |
| Other assets and liabilities, net 0.9% | | | | 1,311,825 |
| Total net assets 100.0% | | | | | $148,277,429 |
| The percentage shown for each investment category is the total value of the category as a percentage of the net assets of the fund. |
| ^All par values are denominated in U.S. dollars unless otherwise indicated. |
| Currency Abbreviations |
| EUR | Euro |
| MXN | Mexican Peso |
| Security Abbreviations and Legend |
| CMT | Constant Maturity Treasury |
| ICE | Intercontinental Exchange |
| LIBOR | London Interbank Offered Rate |
| (A) | These securities are exempt from registration under Rule 144A of the Securities Act of 1933. Such securities may be resold, normally to qualified institutional buyers, in transactions exempt from registration. Rule 144A securities amounted to $54,832,848 or 37.0% of the fund's net assets as of 8-31-20. |
| SEE NOTES TO FINANCIAL STATEMENTS | ANNUAL REPORT | JOHN HANCOCK MULTI-ASSET HIGH INCOME FUND | 25 |
| (B) | Perpetual bonds have no stated maturity date. Date shown as maturity date is next call date. |
| (C) | Variable rate obligation. The coupon rate shown represents the rate at period end. |
| (D) | Term loans are variable rate obligations. The coupon rate shown represents the rate at period end. |
| (E) | All or a portion of this security is segregated at the custodian as collateral for certain derivatives. |
| (F) | The rate shown is the annualized seven-day yield as of 8-31-20. |
| * | Yield represents either the annualized yield at the date of purchase, the stated coupon rate or, for floating rate securities, the rate at period end. |
| 26 | JOHN HANCOCK MULTI-ASSET HIGH INCOME FUND | ANNUAL REPORT | SEE NOTES TO FINANCIAL STATEMENTS |
DERIVATIVES
FORWARD FOREIGN CURRENCY CONTRACTS
| Contract to buy | Contract to sell | Counterparty (OTC) | Contractual
settlement
date | Unrealized
appreciation | Unrealized
depreciation |
| EUR | 20,000 | USD | 22,428 | RBC | 9/16/2020 | $1,446 | — |
| USD | 174,101 | EUR | 148,000 | GSI | 9/16/2020 | — | $(2,569) |
| USD | 525,353 | EUR | 463,855 | JPM | 9/16/2020 | — | (28,357) |
| USD | 607,308 | EUR | 517,400 | RBC | 9/16/2020 | — | (10,320) |
| USD | 448,183 | MXN | 9,810,000 | JPM | 9/17/2020 | 697 | — |
| USD | 16,585 | MXN | 370,000 | SSB | 9/17/2020 | — | (293) |
| | | | | | | $2,143 | $(41,539) |
WRITTEN OPTIONS
| Options on securities |
Counterparty (OTC)/
Exchange-traded | Name of issuer | | Exercise
price | Expiration
date | Number of
contracts | Notional
amount | Premium | Value |
| Calls | | | | | | | |
| Exchange-traded | Communication Services Select Sector SPDR Fund | USD | 60.50 | Sep 2020 | 26 | 2,600 | $1,390 | $(7,995) |
| Exchange-traded | Consumer Staples Select Sector SPDR Fund | USD | 64.00 | Sep 2020 | 73 | 7,300 | 3,318 | (12,732) |
| Exchange-traded | Consumer Staples Select Sector SPDR Fund | USD | 65.50 | Sep 2020 | 60 | 6,000 | 2,188 | (5,970) |
| Exchange-traded | Energy Select Sector SPDR Fund | USD | 39.00 | Sep 2020 | 3 | 300 | 160 | (6) |
| Exchange-traded | Energy Select Sector SPDR Fund | USD | 38.00 | Sep 2020 | 2 | 200 | 121 | (72) |
| Exchange-traded | Financial Select Sector SPDR Fund | USD | 25.50 | Sep 2020 | 50 | 5,000 | 1,073 | (575) |
| Exchange-traded | Financial Select Sector SPDR Fund | USD | 25.50 | Sep 2020 | 55 | 5,500 | 1,291 | (2,283) |
| Exchange-traded | Health Care Select Sector SPDR Fund | USD | 110.00 | Sep 2020 | 24 | 2,400 | 1,787 | (468) |
| Exchange-traded | Health Care Select Sector SPDR Fund | USD | 110.00 | Sep 2020 | 19 | 1,900 | 959 | (1,834) |
| Exchange-traded | Industrial Select Sector SPDR Fund | USD | 75.00 | Sep 2020 | 42 | 4,200 | 3,085 | (12,075) |
| Exchange-traded | Industrial Select Sector SPDR Fund | USD | 79.00 | Sep 2020 | 39 | 3,900 | 3,801 | (4,388) |
| Exchange-traded | iShares MSCI Australia ETF | USD | 21.00 | Sep 2020 | 8 | 800 | 228 | (280) |
| Exchange-traded | iShares MSCI Australia ETF | USD | 22.00 | Sep 2020 | 78 | 7,800 | 270 | (390) |
| Exchange-traded | iShares MSCI Japan ETF | USD | 59.50 | Sep 2020 | 5 | 500 | 182 | (140) |
| SEE NOTES TO FINANCIAL STATEMENTS | ANNUAL REPORT | JOHN HANCOCK MULTI-ASSET HIGH INCOME FUND | 27 |
| Options on securities (continued) |
Counterparty (OTC)/
Exchange-traded | Name of issuer | | Exercise
price | Expiration
date | Number of
contracts | Notional
amount | Premium | Value |
| Calls (continued) | | | | | | | |
| Exchange-traded | iShares U.S. Real Estate ETF | USD | 84.50 | Sep 2020 | 2 | 200 | $179 | $(18) |
| Exchange-traded | iShares U.S. Real Estate ETF | USD | 83.00 | Sep 2020 | 37 | 3,700 | 2,940 | (4,366) |
| Exchange-traded | Materials Select Sector SPDR Fund | USD | 63.00 | Sep 2020 | 16 | 1,600 | 1,063 | (1,208) |
| Exchange-traded | Materials Select Sector SPDR Fund | USD | 64.50 | Sep 2020 | 16 | 1,600 | 871 | (1,096) |
| Exchange-traded | Technology Select Sector SPDR Fund | USD | 120.00 | Sep 2020 | 20 | 2,000 | 1,409 | (8,100) |
| Exchange-traded | Technology Select Sector SPDR Fund | USD | 125.00 | Sep 2020 | 18 | 1,800 | 1,574 | (4,374) |
| Exchange-traded | Utilities Select Sector SPDR Fund | USD | 63.00 | Sep 2020 | 89 | 8,900 | 3,334 | (134) |
| Exchange-traded | Utilities Select Sector SPDR Fund | USD | 61.00 | Sep 2020 | 76 | 7,600 | 3,683 | (3,002) |
| | | | | | | | $34,906 | $(71,506) |
| Puts |
| Exchange-traded | Communication Services Select Sector SPDR Fund | USD | 55.50 | Sep 2020 | 26 | 2,600 | $2,040 | $(4,290) |
| Exchange-traded | Communication Services Select Sector SPDR Fund | USD | 59.00 | Sep 2020 | 25 | 2,500 | 1,587 | (1,188) |
| Exchange-traded | Consumer Discretionary Select Sector SPDR Fund | USD | 131.50 | Sep 2020 | 11 | 1,100 | 1,963 | (39) |
| Exchange-traded | Consumer Discretionary Select Sector SPDR Fund | USD | 142.00 | Sep 2020 | 11 | 1,100 | 1,611 | (1,254) |
| Exchange-traded | Consumer Staples Select Sector SPDR Fund | USD | 61.00 | Sep 2020 | 19 | 1,900 | 1,111 | (67) |
| Exchange-traded | Consumer Staples Select Sector SPDR Fund | USD | 63.00 | Sep 2020 | 19 | 1,900 | 883 | (418) |
| Exchange-traded | Energy Select Sector SPDR Fund | USD | 34.00 | Sep 2020 | 18 | 1,800 | 1,610 | (171) |
| Exchange-traded | Energy Select Sector SPDR Fund | USD | 34.00 | Sep 2020 | 18 | 1,800 | 890 | (999) |
| Exchange-traded | Financial Select Sector SPDR Fund | USD | 23.00 | Sep 2020 | 76 | 7,600 | 2,695 | (114) |
| Exchange-traded | Financial Select Sector SPDR Fund | USD | 23.50 | Sep 2020 | 75 | 7,500 | 2,210 | (1,275) |
| Exchange-traded | Health Care Select Sector SPDR Fund | USD | 102.00 | Sep 2020 | 19 | 1,900 | 1,985 | (48) |
| 28 | JOHN HANCOCK MULTI-ASSET HIGH INCOME FUND | ANNUAL REPORT | SEE NOTES TO FINANCIAL STATEMENTS |
| Options on securities (continued) |
Counterparty (OTC)/
Exchange-traded | Name of issuer | | Exercise
price | Expiration
date | Number of
contracts | Notional
amount | Premium | Value |
| Puts (continued) |
| Exchange-traded | Health Care Select Sector SPDR Fund | USD | 103.00 | Sep 2020 | 19 | 1,900 | $1,510 | $(1,007) |
| Exchange-traded | Industrial Select Sector SPDR Fund | USD | 68.50 | Sep 2020 | 19 | 1,900 | 1,871 | (48) |
| Exchange-traded | Industrial Select Sector SPDR Fund | USD | 74.00 | Sep 2020 | 18 | 1,800 | 1,520 | (882) |
| Exchange-traded | iShares MSCI Emerging Markets ETF | USD | 42.00 | Sep 2020 | 134 | 13,400 | 7,566 | (402) |
| Exchange-traded | iShares MSCI Emerging Markets ETF | USD | 43.50 | Sep 2020 | 131 | 13,100 | 5,694 | (6,681) |
| Exchange-traded | iShares MSCI Japan ETF | USD | 56.50 | Sep 2020 | 50 | 5,000 | 2,323 | (2,025) |
| Exchange-traded | iShares U.S. Real Estate ETF | USD | 78.00 | Sep 2020 | 6 | 600 | 891 | (30) |
| Exchange-traded | iShares U.S. Real Estate ETF | USD | 78.00 | Sep 2020 | 6 | 600 | 483 | (267) |
| Exchange-traded | Materials Select Sector SPDR Fund | USD | 57.50 | Sep 2020 | 6 | 600 | 537 | (15) |
| Exchange-traded | Materials Select Sector SPDR Fund | USD | 60.00 | Sep 2020 | 6 | 600 | 351 | (297) |
| Exchange-traded | Technology Select Sector SPDR Fund | USD | 106.00 | Sep 2020 | 28 | 2,800 | 3,933 | (42) |
| Exchange-traded | Technology Select Sector SPDR Fund | USD | 113.00 | Sep 2020 | 27 | 2,700 | 3,819 | (1,728) |
| Exchange-traded | Utilities Select Sector SPDR Fund | USD | 58.00 | Sep 2020 | 8 | 800 | 492 | (132) |
| Exchange-traded | Utilities Select Sector SPDR Fund | USD | 57.00 | Sep 2020 | 8 | 800 | 372 | (336) |
| | | | | | | | $49,947 | $(23,755) |
| | | | | | | | $84,853 | $(95,261) |
| Options on index |
Counterparty (OTC)/
Exchange-
traded | Name of
issuer | | Exercise
price | Expiration
date | Number of
contracts | Notional
amount | Premium | Value |
| Calls | | | | | | | | |
| GSI | EURO STOXX Banks Index | EUR | 63.00 | Sep 2020 | 106 | 106 | $151 | $(64) |
| GSI | EURO STOXX Chemicals Index | EUR | 1,196.00 | Sep 2020 | 20 | 20 | 230 | (118) |
| GSI | EURO STOXX Technology Index | EUR | 696.00 | Sep 2020 | 29 | 29 | 293 | (83) |
| SEE NOTES TO FINANCIAL STATEMENTS | ANNUAL REPORT | JOHN HANCOCK MULTI-ASSET HIGH INCOME FUND | 29 |
| Options on index (continued) |
Counterparty (OTC)/
Exchange-
traded | Name of
issuer | | Exercise
price | Expiration
date | Number of
contracts | Notional
amount | Premium | Value |
| GSI | EURO STOXX Utilities Index | EUR | 365.00 | Sep 2020 | 34 | 34 | $144 | $(2) |
| GSI | FTSE 100 Index | GBP | 6,132.00 | Sep 2020 | 11 | 11 | 762 | (86) |
| UBS | Nikkei 225 Index | JPY | 22,750.00 | Sep 2020 | 1,807 | 1,807 | 3,633 | (7,897) |
| | | | | | | | $5,213 | $(8,250) |
| Exchange-traded | EURO STOXX Banks Index | EUR | 65.00 | Sep 2020 | 18 | 900 | 872 | (1,128) |
| Exchange-traded | EURO STOXX Chemicals Index | EUR | 1,220.00 | Sep 2020 | 1 | 50 | 517 | (304) |
| Exchange-traded | EURO STOXX Technology Index | EUR | 705.00 | Sep 2020 | 2 | 100 | 728 | (585) |
| Exchange-traded | EURO STOXX Utilities Index | EUR | 370.00 | Sep 2020 | 8 | 400 | 1,071 | (239) |
| Exchange-traded | FTSE 100 Index | GBP | 6,275.00 | Sep 2020 | 2 | 20 | 1,173 | (314) |
| | | | | | | | $4,361 | $(2,570) |
| Puts | | | | | | | | |
| GSI | EURO STOXX Automobiles & Parts Index | EUR | 353.00 | Sep 2020 | 103 | 103 | $637 | $(1) |
| GSI | EURO STOXX Banks Index | EUR | 56.00 | Sep 2020 | 1,060 | 1,060 | 1,775 | (27) |
| GSI | EURO STOXX Chemicals Index | EUR | 1,123.00 | Sep 2020 | 38 | 38 | 674 | (46) |
| GSI | EURO STOXX Health Care Index | EUR | 827.00 | Sep 2020 | 37 | 37 | 415 | (586) |
| GSI | EURO STOXX Industrial Goods & Services Index | EUR | 782.00 | Sep 2020 | 59 | 59 | 433 | (3) |
| GSI | EURO STOXX Oil & Gas Index | EUR | 206.00 | Sep 2020 | 96 | 96 | 351 | (18) |
| GSI | EURO STOXX Personal & Household Goods Index | EUR | 981.00 | Sep 2020 | 50 | 50 | 750 | (37) |
| GSI | EURO STOXX Technology Index | EUR | 642.00 | Sep 2020 | 49 | 49 | 540 | (35) |
| GSI | EURO STOXX Telecommunications Index | EUR | 240.00 | Sep 2020 | 54 | 54 | 167 | (35) |
| GSI | EURO STOXX Utilities Index | EUR | 344.00 | Sep 2020 | 68 | 68 | 299 | (86) |
| GSI | FTSE 100 Index | GBP | 5,750.00 | Sep 2020 | 19 | 19 | 2,062 | (221) |
| | | | | | | | $8,103 | $(1,095) |
| 30 | JOHN HANCOCK MULTI-ASSET HIGH INCOME FUND | ANNUAL REPORT | SEE NOTES TO FINANCIAL STATEMENTS |
| Options on index (continued) |
Counterparty (OTC)/
Exchange-
traded | Name of
issuer | | Exercise
price | Expiration
date | Number of
contracts | Notional
amount | Premium | Value |
| Exchange-traded | EURO STOXX Automobiles & Parts Index | EUR | 380.00 | Sep 2020 | 2 | 100 | $763 | $(597) |
| Exchange-traded | EURO STOXX Banks Index | EUR | 58.00 | Sep 2020 | 21 | 1,050 | 1,141 | (1,034) |
| Exchange-traded | EURO STOXX Chemicals Index | EUR | 1,130.00 | Sep 2020 | 1 | 50 | 370 | (603) |
| Exchange-traded | EURO STOXX Health Care Index | EUR | 815.00 | Sep 2020 | 1 | 50 | 317 | (916) |
| Exchange-traded | EURO STOXX Industrial Goods & Services Index | EUR | 830.00 | Sep 2020 | 1 | 50 | 482 | (698) |
| Exchange-traded | EURO STOXX Oil & Gas Index | EUR | 215.00 | Sep 2020 | 2 | 100 | 209 | (286) |
| Exchange-traded | EURO STOXX Personal & Household Goods Index | EUR | 1,000.00 | Sep 2020 | 1 | 50 | 499 | (603) |
| Exchange-traded | EURO STOXX Technology Index | EUR | 650.00 | Sep 2020 | 1 | 50 | 311 | (430) |
| Exchange-traded | EURO STOXX Telecommunications Index | EUR | 245.00 | Sep 2020 | 1 | 50 | 104 | (233) |
| Exchange-traded | EURO STOXX Utilities Index | EUR | 340.00 | Sep 2020 | 1 | 50 | 128 | (203) |
| Exchange-traded | FTSE 100 Index | GBP | 5,900.00 | Sep 2020 | 2 | 20 | 1,578 | (2,486) |
| | | | | | | | $5,902 | $(8,089) |
| | | | | | | | $23,579 | $(20,004) |
| Derivatives Currency Abbreviations |
| EUR | Euro |
| GBP | Pound Sterling |
| JPY | Japanese Yen |
| MXN | Mexican Peso |
| USD | U.S. Dollar |
| Derivatives Abbreviations |
| GSI | Goldman Sachs International |
| JPM | JPMorgan Chase Bank, N.A. |
| OTC | Over-the-counter |
| RBC | Royal Bank of Canada |
| SSB | State Street Bank and Trust Company |
| UBS | UBS AG |
| SEE NOTES TO FINANCIAL STATEMENTS | ANNUAL REPORT | JOHN HANCOCK MULTI-ASSET HIGH INCOME FUND | 31 |
At 8-31-20, the aggregate cost of investments for federal income tax purposes was $143,052,866. Net unrealized appreciation aggregated to $3,758,077, of which $5,251,019 related to gross unrealized appreciation and $1,492,942 related to gross unrealized depreciation.
See Notes to financial statements regarding investment transactions and other derivatives information.
| 32 | JOHN HANCOCK MULTI-ASSET HIGH INCOME FUND | ANNUAL REPORT | SEE NOTES TO FINANCIAL STATEMENTS |
STATEMENT OF ASSETS AND LIABILITIES 8-31-20
| Assets | |
| Unaffiliated investments, at value (Cost $143,059,665) | $146,965,604 |
| Unrealized appreciation on forward foreign currency contracts | 2,143 |
| Foreign currency, at value (Cost $34,175) | 34,470 |
| Dividends and interest receivable | 1,469,110 |
| Receivable for fund shares sold | 13 |
| Receivable from affiliates | 17,635 |
| Other assets | 17,299 |
| Total assets | 148,506,274 |
| Liabilities | |
| Unrealized depreciation on forward foreign currency contracts | 41,539 |
| Written options, at value (Premiums received $108,432) | 115,265 |
| Payable for investments purchased | 2,378 |
| Payable for fund shares repurchased | 1,900 |
| Payable to affiliates | |
| Accounting and legal services fees | 6,245 |
| Transfer agent fees | 646 |
| Trustees' fees | 80 |
| Other liabilities and accrued expenses | 60,792 |
| Total liabilities | 228,845 |
| Net assets | $148,277,429 |
| Net assets consist of | |
| Paid-in capital | $147,955,085 |
| Total distributable earnings (loss) | 322,344 |
| Net assets | $148,277,429 |
| |
| Net asset value per share | |
| Based on net asset value and shares outstanding - the fund has an unlimited number of shares authorized with no par value | |
| Class A ($4,791,460 ÷ 485,831 shares)1 | $9.86 |
| Class C ($696,844 ÷ 71,032 shares)1 | $9.81 |
| Class I ($469,319 ÷ 47,512 shares) | $9.88 |
| Class R6 ($248,343 ÷ 25,122 shares) | $9.89 |
| Class NAV ($142,071,463 ÷ 13,762,173 shares) | $10.32 |
| Maximum offering price per share | |
| Class A (net asset value per share ÷ 95.5%)2 | $10.32 |
| 1 | Redemption price per share is equal to net asset value less any applicable contingent deferred sales charge. |
| 2 | On single retail sales of less than $50,000. On sales of $50,000 or more and on group sales the offering price is reduced. |
| SEE NOTES TO FINANCIAL STATEMENTS | ANNUAL REPORT | JOHN HANCOCK Multi-Asset High Income Fund | 33 |
STATEMENT OF OPERATIONS For the year ended 8-31-20
| Investment income | |
| Interest | $1,057,966 |
| Dividends | 457,804 |
| Income distributions received from affiliated investments | 139,738 |
| Securities lending | 2,045 |
| Less foreign taxes withheld | (11,849) |
| Total investment income | 1,645,704 |
| Expenses | |
| Investment management fees | 161,747 |
| Distribution and service fees | 20,906 |
| Accounting and legal services fees | 6,446 |
| Transfer agent fees | 7,374 |
| Trustees' fees | 332 |
| Custodian fees | 48,238 |
| State registration fees | 62,173 |
| Printing and postage | 23,608 |
| Professional fees | 141,798 |
| Other | 10,604 |
| Total expenses | 483,226 |
| Less expense reductions | (264,834) |
| Net expenses | 218,392 |
| Net investment income | 1,427,312 |
| Realized and unrealized gain (loss) | |
| Net realized gain (loss) on | |
| Unaffiliated investments and foreign currency transactions | (12,716) |
| Affiliated investments | (32,594) |
| Capital gain distributions received from affiliated investments | 19,641 |
| Futures contracts | 2,027 |
| Written options | 126,283 |
| | 102,641 |
| Change in net unrealized appreciation (depreciation) of | |
| Unaffiliated investments and translation of assets and liabilities in foreign currencies | 3,869,492 |
| Affiliated investments | (90,090) |
| Futures contracts | 283 |
| Forward foreign currency contracts | (39,396) |
| Written options | (6,833) |
| | 3,733,456 |
| Net realized and unrealized gain | 3,836,097 |
| Increase in net assets from operations | $5,263,409 |
| 34 | JOHN HANCOCK Multi-Asset High Income Fund | ANNUAL REPORT | SEE NOTES TO FINANCIAL STATEMENTS |
STATEMENTS OF CHANGES IN NET ASSETS
| | Year ended
8-31-20 | Year ended
8-31-19 |
| Increase (decrease) in net assets | | |
| From operations | | |
| Net investment income | $1,427,312 | $186,616 |
| Net realized gain (loss) | 102,641 | (47,176) |
| Change in net unrealized appreciation (depreciation) | 3,733,456 | 183,504 |
| Increase in net assets resulting from operations | 5,263,409 | 322,944 |
| Distributions to shareholders | | |
| From earnings | | |
| Class A | (104,227) | (149,223) |
| Class C | (12,352) | (20,264) |
| Class I | (8,018) | (11,271) |
| Class R6 | (5,497) | (5,900) |
| Class NAV | (631,175) | — |
| Total distributions | (761,269) | (186,658) |
| From fund share transactions | 137,699,737 | (234,379) |
| Total increase (decrease) | 142,201,877 | (98,093) |
| Net assets | | |
| Beginning of year | 6,075,552 | 6,173,645 |
| End of year | $148,277,429 | $6,075,552 |
| SEE NOTES TO FINANCIAL STATEMENTS | ANNUAL REPORT | JOHN HANCOCK Multi-Asset High Income Fund | 35 |
| CLASS A SHARES Period ended | 8-31-20 | 8-31-19 | 8-31-18 | 8-31-17 | 8-31-16 |
| Per share operating performance | | | | | |
| Net asset value, beginning of period | $9.88 | $9.67 | $9.93 | $9.75 | $9.55 |
| Net investment income1,2 | 0.30 | 0.31 | 0.32 | 0.29 | 0.31 |
| Net realized and unrealized gain (loss) on investments | (0.11) 3 | 0.21 | (0.24) | 0.21 | 0.34 |
| Total from investment operations | 0.19 | 0.52 | 0.08 | 0.50 | 0.65 |
| Less distributions | | | | | |
| From net investment income | (0.21) | (0.31) | (0.34) | (0.32) | (0.43) |
| From net realized gain | — | — | — 4 | — 4 | (0.02) |
| Total distributions | (0.21) | (0.31) | (0.34) | (0.32) | (0.45) |
| Net asset value, end of period | $9.86 | $9.88 | $9.67 | $9.93 | $9.75 |
| Total return (%)5,6 | 1.96 | 5.52 | 0.80 | 5.30 | 7.13 |
| Ratios and supplemental data | | | | | |
| Net assets, end of period (in millions) | $5 | $5 | $5 | $6 | $3 |
| Ratios (as a percentage of average net assets): | | | | | |
| Expenses before reductions7 | 1.59 | 3.88 | 2.28 | 2.77 | 4.17 |
| Expenses including reductions7 | 0.90 | 0.62 | 0.62 | 0.63 | 0.62 |
| Net investment income2 | 2.98 | 3.20 | 3.26 | 2.96 | 3.33 |
| Portfolio turnover (%) | 42 | 29 | 50 | 17 | 34 |
| 1 | Based on average daily shares outstanding. |
| 2 | Net investment income is affected by the timing and frequency of the declaration of dividends by the underlying funds in which the fund invests. |
| 3 | The amount shown for a share outstanding does not correspond with the aggregate net gain (loss) on investments for the period due to the timing of the sales and repurchases of shares in relation to fluctuating market values of the investments of the portfolio. |
| 4 | Less than $0.005 per share. |
| 5 | Total returns would have been lower had certain expenses not been reduced during the applicable periods. |
| 6 | Does not reflect the effect of sales charges, if any. |
| 7 | Ratios do not include expenses indirectly incurred from underlying funds and can vary based on the mix of underlying funds held by the fund. |
| 36 | JOHN HANCOCK Multi-Asset High Income Fund | ANNUAL REPORT | SEE NOTES TO FINANCIAL STATEMENTS |
| CLASS C SHARES Period ended | 8-31-20 | 8-31-19 | 8-31-18 | 8-31-17 | 8-31-16 |
| Per share operating performance | | | | | |
| Net asset value, beginning of period | $9.85 | $9.64 | $9.90 | $9.72 | $9.53 |
| Net investment income1,2 | 0.23 | 0.24 | 0.25 | 0.22 | 0.24 |
| Net realized and unrealized gain (loss) on investments | (0.11) 3 | 0.21 | (0.24) | 0.22 | 0.35 |
| Total from investment operations | 0.12 | 0.45 | 0.01 | 0.44 | 0.59 |
| Less distributions | | | | | |
| From net investment income | (0.16) | (0.24) | (0.27) | (0.26) | (0.38) |
| From net realized gain | — | — | — 4 | — 4 | (0.02) |
| Total distributions | (0.16) | (0.24) | (0.27) | (0.26) | (0.40) |
| Net asset value, end of period | $9.81 | $9.85 | $9.64 | $9.90 | $9.72 |
| Total return (%)5,6 | 1.24 | 4.80 | 0.09 | 4.58 | 6.41 |
| Ratios and supplemental data | | | | | |
| Net assets, end of period (in millions) | $1 | $1 | $1 | $2 | $1 |
| Ratios (as a percentage of average net assets): | | | | | |
| Expenses before reductions7 | 2.30 | 4.58 | 2.98 | 3.47 | 4.86 |
| Expenses including reductions7 | 1.62 | 1.32 | 1.32 | 1.33 | 1.32 |
| Net investment income2 | 2.27 | 2.51 | 2.54 | 2.30 | 2.58 |
| Portfolio turnover (%) | 42 | 29 | 50 | 17 | 34 |
| 1 | Based on average daily shares outstanding. |
| 2 | Net investment income is affected by the timing and frequency of the declaration of dividends by the underlying funds in which the fund invests. |
| 3 | The amount shown for a share outstanding does not correspond with the aggregate net gain (loss) on investments for the period due to the timing of the sales and repurchases of shares in relation to fluctuating market values of the investments of the portfolio. |
| 4 | Less than $0.005 per share. |
| 5 | Total returns would have been lower had certain expenses not been reduced during the applicable periods. |
| 6 | Does not reflect the effect of sales charges, if any. |
| 7 | Ratios do not include expenses indirectly incurred from underlying funds and can vary based on the mix of underlying funds held by the fund. |
| SEE NOTES TO FINANCIAL STATEMENTS | ANNUAL REPORT | JOHN HANCOCK Multi-Asset High Income Fund | 37 |
| CLASS I SHARES Period ended | 8-31-20 | 8-31-19 | 8-31-18 | 8-31-17 | 8-31-16 |
| Per share operating performance | | | | | |
| Net asset value, beginning of period | $9.89 | $9.67 | $9.93 | $9.76 | $9.55 |
| Net investment income1,2 | 0.33 | 0.34 | 0.36 | 0.32 | 0.33 |
| Net realized and unrealized gain (loss) on investments | (0.11) 3 | 0.22 | (0.25) | 0.20 | 0.36 |
| Total from investment operations | 0.22 | 0.56 | 0.11 | 0.52 | 0.69 |
| Less distributions | | | | | |
| From net investment income | (0.23) | (0.34) | (0.37) | (0.35) | (0.46) |
| From net realized gain | — | — | — 4 | — 4 | (0.02) |
| Total distributions | (0.23) | (0.34) | (0.37) | (0.35) | (0.48) |
| Net asset value, end of period | $9.88 | $9.89 | $9.67 | $9.93 | $9.76 |
| Total return (%)5 | 2.28 | 5.94 | 1.11 | 5.51 | 7.51 |
| Ratios and supplemental data | | | | | |
| Net assets, end of period (in millions) | $— 6 | $— 6 | $— 6 | $3 | $2 |
| Ratios (as a percentage of average net assets): | | | | | |
| Expenses before reductions7 | 1.30 | 3.60 | 1.98 | 2.46 | 3.86 |
| Expenses including reductions7 | 0.62 | 0.34 | 0.32 | 0.31 | 0.31 |
| Net investment income2 | 3.29 | 3.50 | 3.59 | 3.32 | 3.48 |
| Portfolio turnover (%) | 42 | 29 | 50 | 17 | 34 |
| 1 | Based on average daily shares outstanding. |
| 2 | Net investment income is affected by the timing and frequency of the declaration of dividends by the underlying funds in which the fund invests. |
| 3 | The amount shown for a share outstanding does not correspond with the aggregate net gain (loss) on investments for the period due to the timing of the sales and repurchases of shares in relation to fluctuating market values of the investments of the portfolio. |
| 4 | Less than $0.005 per share. |
| 5 | Total returns would have been lower had certain expenses not been reduced during the applicable periods. |
| 6 | Less than $500,000. |
| 7 | Ratios do not include expenses indirectly incurred from underlying funds and can vary based on the mix of underlying funds held by the fund. |
| 38 | JOHN HANCOCK Multi-Asset High Income Fund | ANNUAL REPORT | SEE NOTES TO FINANCIAL STATEMENTS |
| CLASS R6 SHARES Period ended | 8-31-20 | 8-31-19 | 8-31-18 | 8-31-17 | 8-31-16 |
| Per share operating performance | | | | | |
| Net asset value, beginning of period | $9.89 | $9.68 | $9.94 | $9.76 | $9.55 |
| Net investment income1,2 | 0.35 | 0.34 | 0.37 | 0.33 | 0.34 |
| Net realized and unrealized gain (loss) on investments | (0.11) 3 | 0.22 | (0.25) | 0.21 | 0.35 |
| Total from investment operations | 0.24 | 0.56 | 0.12 | 0.54 | 0.69 |
| Less distributions | | | | | |
| From net investment income | (0.24) | (0.35) | (0.38) | (0.36) | (0.46) |
| From net realized gain | — | — | — 4 | — 4 | (0.02) |
| Total distributions | (0.24) | (0.35) | (0.38) | (0.36) | (0.48) |
| Net asset value, end of period | $9.89 | $9.89 | $9.68 | $9.94 | $9.76 |
| Total return (%)5 | 2.46 | 5.94 | 1.20 | 5.73 | 7.62 |
| Ratios and supplemental data | | | | | |
| Net assets, end of period (in millions) | $— 6 | $— 6 | $— 6 | $1 | $1 |
| Ratios (as a percentage of average net assets): | | | | | |
| Expenses before reductions7 | 1.19 | 3.48 | 1.88 | 2.37 | 3.76 |
| Expenses including reductions7 | 0.50 | 0.22 | 0.22 | 0.22 | 0.20 |
| Net investment income2 | 3.45 | 3.53 | 3.69 | 3.42 | 3.57 |
| Portfolio turnover (%) | 42 | 29 | 50 | 17 | 34 |
| 1 | Based on average daily shares outstanding. |
| 2 | Net investment income is affected by the timing and frequency of the declaration of dividends by the underlying funds in which the fund invests. |
| 3 | The amount shown for a share outstanding does not correspond with the aggregate net gain (loss) on investments for the period due to the timing of the sales and repurchases of shares in relation to fluctuating market values of the investments of the portfolio. |
| 4 | Less than $0.005 per share. |
| 5 | Total returns would have been lower had certain expenses not been reduced during the applicable periods. |
| 6 | Less than $500,000. |
| 7 | Ratios do not include expenses indirectly incurred from underlying funds and can vary based on the mix of underlying funds held by the fund. |
| SEE NOTES TO FINANCIAL STATEMENTS | ANNUAL REPORT | JOHN HANCOCK Multi-Asset High Income Fund | 39 |
| CLASS NAV SHARES Period ended | 8-31-20 1 |
| Per share operating performance | |
| Net asset value, beginning of period | $10.00 |
| Net investment income2 | 0.09 |
| Net realized and unrealized gain (loss) on investments | 0.28 |
| Total from investment operations | 0.37 |
| Less distributions | |
| From net investment income | (0.05) |
| Net asset value, end of period | $10.32 |
| Total return (%)3 | 3.67 4 |
| Ratios and supplemental data | |
| Net assets, end of period (in millions) | $142 |
| Ratios (as a percentage of average net assets): | |
| Expenses before reductions | 1.17 5 |
| Expenses including reductions | 0.49 5 |
| Net investment income | 3.77 5 |
| Portfolio turnover (%) | 42 6 |
| 1 | The inception date for Class NAV shares is 6-4-20. |
| 2 | Based on average daily shares outstanding. |
| 3 | Total returns would have been lower had certain expenses not been reduced during the applicable periods. |
| 4 | Not annualized. |
| 5 | Annualized. |
| 6 | The portfolio turnover is shown for the period from 9-1-19 to 8-31-20. |
| 40 | JOHN HANCOCK Multi-Asset High Income Fund | ANNUAL REPORT | SEE NOTES TO FINANCIAL STATEMENTS |
Notes to financial statements
Note 1—Organization
John Hancock Multi-Asset High Income Fund (formerly known as John Hancock Income Allocation Fund) (the fund) is a series of John Hancock Funds II (the Trust), an open-end management investment company organized as a Massachusetts business trust and registered under the Investment Company Act of 1940, as amended (the 1940 Act). The investment objective of the fund is to seek to provide a high level of current income with consideration for capital appreciation and preservation.
Effective April 17, 2020, the fund changed its name to John Hancock Multi-Asset High Income Fund in connection with changes to the fund's principal investment strategies.
Prior to June 4, 2020, the fund operated as a "fund of funds", investing in affiliated underlying funds of the Trust, other series of the Trust, other funds in John Hancock group of funds complex, non-John Hancock funds and certain other permitted investments.
Class NAV was offered effective June 4, 2020.
The fund may offer multiple classes of shares. The shares currently outstanding are detailed in the Statement of assets and liabilities. Class A and Class C shares are offered to all investors. Class I shares are offered to institutions and certain investors. Class R6 shares are only available to certain retirement plans, institutions and other investors. Class NAV shares are offered to John Hancock affiliated funds of funds, retirement plans for employees of John Hancock and/or Manulife Financial Corporation, and certain 529 plans. Class C shares convert to Class A shares ten years after purchase (certain exclusions may apply). Shareholders of each class have exclusive voting rights to matters that affect that class. The distribution and service fees, if any, and transfer agent fees for each class may differ.
Note 2—Significant accounting policies
The financial statements have been prepared in conformity with accounting principles generally accepted in the United States of America (US GAAP), which require management to make certain estimates and assumptions as of the date of the financial statements. Actual results could differ from those estimates and those differences could be significant. The fund qualifies as an investment company under Topic 946 of Accounting Standards Codification of US GAAP.
Events or transactions occurring after the end of the fiscal period through the date that the financial statements were issued have been evaluated in the preparation of the financial statements. The following summarizes the significant accounting policies of the fund:
Security valuation. Investments are stated at value as of the scheduled close of regular trading on the New York Stock Exchange (NYSE), normally at 4:00 P.M., Eastern Time. In case of emergency or other disruption resulting in the NYSE not opening for trading or the NYSE closing at a time other than the regularly scheduled close, the net asset value (NAV) may be determined as of the regularly scheduled close of the NYSE pursuant to the fund's Valuation Policies and Procedures.
In order to value the securities, the fund uses the following valuation techniques: Debt obligations are typically valued based on evaluated prices provided by an independent pricing vendor. Independent pricing vendors utilize matrix pricing, which takes into account factors such as institutional-size trading in similar groups of securities, yield, quality, coupon rate, maturity, type of issue, trading characteristics and other market data, as well as broker supplied prices. Equity securities, including exchange-traded or closed-end funds, are typically valued at the last sale price or official closing price on the exchange or principal market where the security trades. In the event there were no sales during the day or closing prices are not available, the securities are valued using the last available bid price. Investments in affiliated underlying funds and/or other open-end management investment companies, other than exchange-traded funds (ETFs), are valued at their respective NAVs each business day. Exchange-traded options are valued at the mid-price of the last quoted bid and ask prices from the exchange where the option trades. Unlisted options are valued using evaluated prices obtained from an independent pricing vendor. Forward
| | ANNUAL REPORT | JOHN HANCOCK Multi-Asset High Income Fund | 41 |
foreign currency contracts are valued at the prevailing forward rates which are based on foreign currency exchange spot rates and forward points supplied by an independent pricing vendor. Foreign securities and currencies are valued in U.S. dollars based on foreign currency exchange rates supplied by an independent pricing vendor.
In certain instances, the Pricing Committee may determine to value equity securities using prices obtained from another exchange or market if trading on the exchange or market on which prices are typically obtained did not open for trading as scheduled, or if trading closed earlier than scheduled, and trading occurred as normal on another exchange or market.
Other portfolio securities and assets, for which reliable market quotations are not readily available, are valued at fair value as determined in good faith by the fund's Pricing Committee following procedures established by the Board of Trustees. The frequency with which these fair valuation procedures are used cannot be predicted and fair value of securities may differ significantly from the value that would have been used had a ready market for such securities existed. Trading in foreign securities may be completed before the scheduled daily close of trading on the NYSE. Significant events at the issuer or market level may affect the values of securities between the time when the valuation of the securities is generally determined and the close of the NYSE. If a significant event occurs, these securities may be fair valued, as determined in good faith by the fund's Pricing Committee, following procedures established by the Board of Trustees. The fund uses fair value adjustment factors provided by an independent pricing vendor to value certain foreign securities in order to adjust for events that may occur between the close of foreign exchanges or markets and the close of the NYSE.
The fund uses a three-tier hierarchy to prioritize the pricing assumptions, referred to as inputs, used in valuation techniques to measure fair value. Level 1 includes securities valued using quoted prices in active markets for identical securities, including registered investment companies. Level 2 includes securities valued using other significant observable inputs. Observable inputs may include quoted prices for similar securities, interest rates, prepayment speeds and credit risk. Prices for securities valued using these inputs are received from independent pricing vendors and brokers and are based on an evaluation of the inputs described. Level 3 includes securities valued using significant unobservable inputs when market prices are not readily available or reliable, including the fund's own assumptions in determining the fair value of investments. Factors used in determining value may include market or issuer specific events or trends, changes in interest rates and credit quality. The inputs or methodology used for valuing securities are not necessarily an indication of the risks associated with investing in those securities. Changes in valuation techniques and related inputs may result in transfers into or out of an assigned level within the disclosure hierarchy.
The following is a summary of the values by input classification of the fund's investments as of August 31, 2020, by major security category or type:
| | Total
value at
8-31-20 | Level 1
quoted
price | Level 2
significant
observable
inputs | Level 3
significant
unobservable
inputs |
| Investments in securities: | | | | |
| Assets | | | | |
| U.S. Government and Agency obligations | $760,900 | — | $760,900 | — |
| Foreign government obligations | 2,033,263 | — | 2,033,263 | — |
| Corporate bonds | 90,306,783 | — | 90,306,783 | — |
| Capital preferred securities | 914,778 | — | 914,778 | — |
| Term loans | 1,337,122 | — | 1,337,122 | — |
| Collateralized mortgage obligations | 466,946 | — | 466,946 | — |
| Asset backed securities | 1,066,564 | — | 1,066,564 | — |
| 42 | JOHN HANCOCK Multi-Asset High Income Fund | ANNUAL REPORT | |
| | Total
value at
8-31-20 | Level 1
quoted
price | Level 2
significant
observable
inputs | Level 3
significant
unobservable
inputs |
| Common stocks | 38,653,964 | $28,093,572 | 10,560,392 | — |
| Preferred securities | 4,418,098 | 4,418,098 | — | — |
| Short-term investments | 7,007,186 | 2,008,695 | 4,998,491 | — |
| Total investments in securities | $146,965,604 | $34,520,365 | $112,445,239 | — |
| Derivatives: | | | | |
| Assets | | | | |
| Forward foreign currency contracts | $2,143 | — | $2,143 | — |
| Liabilities | | | | |
| Forward foreign currency contracts | (41,539) | — | (41,539) | — |
| Written options | (115,265) | $(105,920) | (9,345) | — |
Real estate investment trusts. The fund may invest in real estate investment trusts (REITs). Distributions from REITs may be recorded as income and subsequently characterized by the REIT at the end of the fiscal year as a reduction of cost of investments and/or as a realized gain. As a result, the fund will estimate the components of distributions from these securities. Such estimates are revised when the actual components of the distributions are known.
Security transactions and related investment income. Investment security transactions are accounted for on a trade date plus one basis for daily NAV calculations. However, for financial reporting purposes, investment transactions are reported on trade date. Interest income is accrued as earned. Interest income includes coupon interest and amortization/accretion of premiums/discounts on debt securities. Debt obligations may be placed in a non-accrual status and related interest income may be reduced by stopping current accruals and writing off interest receivable when the collection of all or a portion of interest has become doubtful. Dividend income is recorded on the ex-date, except for dividends of certain foreign securities where the dividend may not be known until after the ex-date. In those cases, dividend income, net of withholding taxes, is recorded when the fund becomes aware of the dividends. Non-cash dividends, if any, are recorded at the fair market value of the securities received. Gains and losses on securities sold are determined on the basis of identified cost and may include proceeds from litigation.
Securities lending. The fund may lend its securities to earn additional income. The fund receives collateral from the borrower in an amount not less than the market value of the loaned securities. The fund will invest its cash collateral in John Hancock Collateral Trust (JHCT), an affiliate of the fund, which has a floating NAV and is registered with the SEC as an investment company. JHCT invests in short-term money market investments. The fund will receive the benefit of any gains and bear any losses generated by JHCT with respect to the cash collateral.
The fund has the right to recall loaned securities on demand. If a borrower fails to return loaned securities when due, then the lending agent is responsible and indemnifies the fund for the lent securities. The lending agent uses the collateral received from the borrower to purchase replacement securities of the same issue, type, class and series of the loaned securities. If the value of the collateral is less than the purchase cost of replacement securities, the lending agent is responsible for satisfying the shortfall but only to the extent that the shortfall is not due to any decrease in the value of JHCT.
Although the risk of loss on securities lent is mitigated by receiving collateral from the borrower and through lending agent indemnification, the fund could experience a delay in recovering securities or could experience a lower than expected return if the borrower fails to return the securities on a timely basis. The fund receives compensation for lending its securities by retaining a portion of the return on the investment of the collateral and
| | ANNUAL REPORT | JOHN HANCOCK Multi-Asset High Income Fund | 43 |
compensation from fees earned from borrowers of the securities. Securities lending income received by the fund is net of fees retained by the securities lending agent. Net income received from JHCT is a component of securities lending income as recorded on the Statement of operations. As of August 31, 2020, there were no securities on loan.
Foreign investing. Assets, including investments, and liabilities denominated in foreign currencies are translated into U.S. dollar values each day at the prevailing exchange rate. Purchases and sales of securities, income and expenses are translated into U.S. dollars at the prevailing exchange rate on the date of the transaction. The effect of changes in foreign currency exchange rates on the value of securities is reflected as a component of the realized and unrealized gains (losses) on investments. Foreign investments are subject to a decline in the value of a foreign currency versus the U.S. dollar, which reduces the dollar value of securities denominated in that currency.
Funds that invest internationally generally carry more risk than funds that invest strictly in U.S. securities. Risks can result from differences in economic and political conditions, regulations, market practices (including higher transaction costs), accounting standards and other factors.
Foreign taxes. The fund may be subject to withholding tax on income, capital gains or repatriation taxes imposed by certain countries, a portion of which may be recoverable. Foreign taxes are accrued based upon the fund's understanding of the tax rules and rates that exist in the foreign markets in which it invests. Taxes are accrued based on gains realized by the fund as a result of certain foreign security sales. In certain circumstances, estimated taxes are accrued based on unrealized appreciation of such securities. Investment income is recorded net of foreign withholding taxes.
Overdraft. The fund may have the ability to borrow from banks for temporary or emergency purposes, including meeting redemption requests that otherwise might require the untimely sale of securities. Pursuant to the fund's custodian agreement, the custodian may loan money to the fund to make properly authorized payments. The fund is obligated to repay the custodian for any overdraft, including any related costs or expenses. The custodian may have a lien, security interest or security entitlement in any fund property that is not otherwise segregated or pledged, to the extent of any overdraft, and to the maximum extent permitted by law.
Line of credit. Effective June 25, 2020, the fund and other affiliated funds have entered into a syndicated line of credit agreement with Citibank, N.A. as the administrative agent that enables them to participate in a $1 billion unsecured committed line of credit. Excluding commitments designated for a certain fund and subject to the needs of all other affiliated funds, the fund can borrow up to an aggregate commitment amount of $850 million, subject to asset coverage and other limitations as specified in the agreement. Each participating fund paid an upfront fee in connection with this line of credit agreement, which is charged based on a combination of fixed and asset based allocations and amortized over 365 days. Prior to June 25, 2020, the fund and other affiliated funds had a similar agreement that enabled them to participate in a $750 million unsecured committed line of credit. A commitment fee payable at the end of each calendar quarter, based on the average daily unused portion of the line of credit, is charged to each participating fund based on a combination of fixed and asset based allocations and is reflected in Other expenses on the Statement of operations. For the year ended August 31, 2020, the fund had no borrowings under the line of credit. Commitment fees for the year ended August 31, 2020 were $2,589.
Expenses. Within the John Hancock group of funds complex, expenses that are directly attributable to an individual fund are allocated to such fund. Expenses that are not readily attributable to a specific fund are allocated among all funds in an equitable manner, taking into consideration, among other things, the nature and type of expense and the fund’s relative net assets. Expense estimates are accrued in the period to which they relate and adjustments are made when actual amounts are known.
Class allocations. Income, common expenses and realized and unrealized gains (losses) are determined at the fund level and allocated daily to each class of shares based on the net assets of the class. Class-specific expenses, such as distribution and service fees, if any, and transfer agent fees, for all classes, are charged daily at the class level based on the net assets of each class and the specific expense rates applicable to each class.
| 44 | JOHN HANCOCK Multi-Asset High Income Fund | ANNUAL REPORT | |
Federal income taxes. The fund intends to continue to qualify as a regulated investment company by complying with the applicable provisions of the Internal Revenue Code and will not be subject to federal income tax on taxable income that is distributed to shareholders. Therefore, no federal income tax provision is required.
For federal income tax purposes, as of August 31, 2020, the fund has a short-term capital loss carryforward of $4,044,252 and a long-term capital loss carryforward of $187,972 available to offset future net realized capital gains. These carryforwards do not expire.
Due to certain Internal Revenue Code rules, utilization of the capital loss carryforwards may be limited in future years.
As of August 31, 2020, the fund had no uncertain tax positions that would require financial statement recognition, derecognition or disclosure. The fund's federal tax returns are subject to examination by the Internal Revenue Service for a period of three years.
Distribution of income and gains. Distributions to shareholders from net investment income and net realized gains, if any, are recorded on the ex-date. The fund generally declares and pays dividends monthly. Capital gain distributions, if any, are typically distributed annually.
The tax character of distributions for the years ended August 31, 2020 and 2019 was as follows:
| | August 31, 2020 | August 31, 2019 |
| Ordinary income | $761,269 | $186,658 |
Distributions paid by the fund with respect to each class of shares are calculated in the same manner, at the same time and in the same amount, except for the effect of class level expenses that may be applied differently to each class. As of August 31, 2020, the components of distributable earnings on a tax basis consisted of $794,754 of undistributed ordinary income.
Such distributions and distributable earnings, on a tax basis, are determined in conformity with income tax regulations, which may differ from US GAAP. Distributions in excess of tax basis earnings and profits, if any, are reported in the fund's financial statements as a return of capital.
Capital accounts within the financial statements are adjusted for permanent book-tax differences. These adjustments have no impact on net assets or the results of operations. Temporary book-tax differences, if any, will reverse in a subsequent period. Book-tax differences are primarily attributable to amortization and accretion on debt securities.
Note 3—Derivative instruments
The fund may invest in derivatives in order to meet its investment objective. Derivatives include a variety of different instruments that may be traded in the over-the-counter (OTC) market, on a regulated exchange or through a clearing facility. The risks in using derivatives vary depending upon the structure of the instruments, including the use of leverage, optionality, the liquidity or lack of liquidity of the contract, the creditworthiness of the counterparty or clearing organization and the volatility of the position. Some derivatives involve risks that are potentially greater than the risks associated with investing directly in the referenced securities or other referenced underlying instrument. Specifically, the fund is exposed to the risk that the counterparty to an OTC derivatives contract will be unable or unwilling to make timely settlement payments or otherwise honor its obligations. OTC derivatives transactions typically can only be closed out with the other party to the transaction.
Derivatives which are typically traded through the OTC market are regulated by the Commodity Futures Trading Commission (the CFTC). Derivative counterparty risk is managed through an ongoing evaluation of the creditworthiness of all potential counterparties and, if applicable, designated clearing organizations. The fund attempts to reduce its exposure to counterparty risk for derivatives traded in the OTC market, whenever possible, by entering into an International Swaps and Derivatives Association (ISDA) Master Agreement with each of its OTC
| | ANNUAL REPORT | JOHN HANCOCK Multi-Asset High Income Fund | 45 |
counterparties. The ISDA gives each party to the agreement the right to terminate all transactions traded under the agreement if there is certain deterioration in the credit quality or contractual default of the other party, as defined in the ISDA. Upon an event of default or a termination of the ISDA, the non-defaulting party has the right to close out all transactions and to net amounts owed.
As defined by the ISDA, the fund may have collateral agreements with certain counterparties to mitigate counterparty risk on OTC derivatives. Subject to established minimum levels, collateral for OTC transactions is generally determined based on the net aggregate unrealized gain or loss on contracts with a particular counterparty. Collateral pledged to the fund, if any, is held in a segregated account by a third-party agent or held by the custodian bank for the benefit of the fund and can be in the form of cash or debt securities issued by the U.S. government or related agencies; collateral posted by the fund, if any, for OTC transactions is held in a segregated account at the fund's custodian and is noted in the accompanying Fund's investments, or if cash is posted, on the Statement of assets and liabilities. The fund's risk of loss due to counterparty risk is equal to the asset value of outstanding contracts offset by collateral received.
Certain derivatives are traded or cleared on an exchange or central clearinghouse. Exchange-traded or centrally-cleared transactions generally present less counterparty risk to a fund than OTC transactions. The exchange or clearinghouse stands between the fund and the broker to the contract and therefore, credit risk is generally limited to the failure of the exchange or clearinghouse and the clearing member.
Futures. A futures contract is a contractual agreement to buy or sell a particular currency or financial instrument at a pre-determined price in the future. Futures are traded on an exchange and cleared through a central clearinghouse. Risks related to the use of futures contracts include possible illiquidity of the futures markets and contract prices that can be highly volatile and imperfectly correlated to movements in the underlying financial instrument and potential losses in excess of the amounts recognized on the Statement of assets and liabilities. Use of long futures contracts subjects the fund to the risk of loss up to the notional value of the futures contracts. Use of short futures contracts subjects the fund to unlimited risk of loss.
Upon entering into a futures contract, the fund is required to deposit initial margin with the broker in the form of cash or securities. The amount of required margin is set by the broker and is generally based on a percentage of the contract value. The margin deposit must then be maintained at the established level over the life of the contract. Cash that has been pledged by the fund is detailed in the Statement of assets and liabilities as Collateral held at broker for futures contracts. Securities pledged by the fund, if any, are identified in the Fund's investments. Subsequent payments, referred to as variation margin, are made or received by the fund periodically and are based on changes in the market value of open futures contracts. Futures contracts are marked-to-market daily and unrealized gain or loss is recorded by the fund. When the contract is closed, the fund records a realized gain or loss equal to the difference between the value of the contract at the time it was opened and the value at the time it was closed.
During the year ended August 31, 2020, the fund used futures contracts to manage against anticipated interest rate changes and gain exposure to certain bond markets. The fund held futures contracts with USD notional values ranging up to $130,000 as measured at each quarter end. There were no open futures contracts as of August 31, 2020.
Forward foreign currency contracts. A forward foreign currency contract is an agreement between two parties to buy and sell specific currencies at a price that is set on the date of the contract. The forward contract calls for delivery of the currencies on a future date that is specified in the contract. Forwards are typically traded OTC. Risks related to the use of forwards include the possible failure of counterparties to meet the terms of the forward agreement, the failure of the counterparties to timely post collateral if applicable, and the risk that currency movements will not favor the fund thereby reducing the fund's total return, and the potential for losses in excess of the amounts recognized on the Statement of assets and liabilities.
The market value of a forward foreign currency contract fluctuates with changes in foreign currency exchange
| 46 | JOHN HANCOCK Multi-Asset High Income Fund | ANNUAL REPORT | |
rates. Forward foreign currency contracts are marked-to-market daily and the change in value is recorded by the fund as an unrealized gain or loss. Realized gains or losses, equal to the difference between the value of the contract at the time it was opened and the value at the time it was closed, are recorded upon delivery or receipt of the currency or settlement with the counterparty.
During the year ended August 31, 2020, the fund used forward foreign currency contracts to manage against anticipated changes in currency exchange rates. The fund held forward foreign currency contracts with USD notional values ranging up to $1.8 million as measured at each quarter end.
Options. There are two types of options, put options and call options. Options are traded either OTC or on an exchange. A call option gives the purchaser of the option the right to buy (and the seller the obligation to sell) the underlying instrument at the exercise price. A put option gives the purchaser of the option the right to sell (and the writer the obligation to buy) the underlying instrument at the exercise price. Writing puts and buying calls may increase the fund's exposure to changes in the value of the underlying instrument. Buying puts and writing calls may decrease the fund's exposure to such changes. Risks related to the use of options include the loss of premiums, possible illiquidity of the options markets, trading restrictions imposed by an exchange and movements in underlying security values, and for written options, potential losses in excess of the amounts recognized on the Statement of assets and liabilities. In addition, OTC options are subject to the risks of all OTC derivatives contracts.
When the fund purchases an option, the premium paid is included in the Fund's investments and subsequently “marked-to-market” to reflect current market value. If the purchased option expires, the fund realizes a loss equal to the cost of the option. If the fund exercises a call option, the cost of the securities acquired by exercising the call is increased by the premium paid to buy the call. If the fund exercises a put option, it realizes a gain or loss from the sale of the underlying security and the proceeds from such sale are decreased by the premium paid. If the fund enters into a closing sale transaction, it realizes a gain or loss, depending on whether proceeds from the closing sale are greater or less than the original cost. When the fund writes an option, the premium received is included as a liability and subsequently “marked-to-market” to reflect the current market value of the option written. Premiums received from writing options that expire unexercised are recorded as realized gains. Premiums received from writing options which are exercised or are closed are added to or offset against the proceeds or amount paid on the transaction to determine the realized gain or loss. If a put option on a security is exercised, the premium received reduces the cost basis of the securities purchased by the fund.
During the year ended August 31, 2020, the fund wrote option contracts to manage against changes in certain securities markets and to gain exposure to certain securities markets.. The fund held written option contracts with market values ranging up to $115,000 as measured at each quarter end.
Fair value of derivative instruments by risk category
The table below summarizes the fair value of derivatives held by the fund at August 31, 2020 by risk category:
| Risk | Statement of assets
and liabilities
location | Financial
instruments
location | Assets
derivatives
fair value | Liabilities
derivatives
fair value |
| Currency | Unrealized appreciation / depreciation on forward foreign currency contracts | Forward foreign currency contracts | $2,143 | $(41,539) |
| Equity | Written options, at value | Written options | — | (115,265) |
| | | | $2,143 | $(156,804) |
For financial reporting purposes, the fund does not offset OTC derivative assets or liabilities that are subject to master netting arrangements, as defined by the ISDAs, in the Statement of assets and liabilities. In the event of default by the counterparty or a termination of the agreement, the ISDA allows an offset of amounts across the various transactions between the fund and the applicable counterparty.
| | ANNUAL REPORT | JOHN HANCOCK Multi-Asset High Income Fund | 47 |
Effect of derivative instruments on the Statement of operations
The table below summarizes the net realized gain (loss) included in the net increase (decrease) in net assets from operations, classified by derivative instrument and risk category, for the year ended August 31, 2020:
| | Statement of operations location - Net realized gain (loss) on: |
| Risk | Futures contracts | Written options | Total |
| Interest rate | $2,027 | — | $2,027 |
| Equity | — | $126,283 | 126,283 |
| Total | $2,027 | $126,283 | $128,310 |
The table below summarizes the net change in unrealized appreciation (depreciation) included in the net increase (decrease) in net assets from operations, classified by derivative instrument and risk category, for the year ended August 31, 2020:
| | Statement of operations location - Change in net unrealized appreciation (depreciation) of: |
| Risk | Futures contracts | Forward foreign
currency contracts | Written options | Total |
| Interest rate | $283 | — | — | $283 |
| Currency | — | $(39,396) | — | (39,396) |
| Equity | — | — | $(6,833) | (6,833) |
| Total | $283 | $(39,396) | $(6,833) | $(45,946) |
Note 4—Guarantees and indemnifications
Under the Trust's organizational documents, its Officers and Trustees are indemnified against certain liabilities arising out of the performance of their duties to the Trust, including the fund. Additionally, in the normal course of business, the fund enters into contracts with service providers that contain general indemnification clauses. The fund's maximum exposure under these arrangements is unknown, as this would involve future claims that may be made against the fund that have not yet occurred. The risk of material loss from such claims is considered remote.
Note 5—Fees and transactions with affiliates
John Hancock Investment Management LLC (the Advisor) serves as investment advisor for the fund. John Hancock Investment Management Distributors LLC (the Distributor), an affiliate of the Advisor, serves as principal underwriter of the fund. The Advisor and the Distributor are indirect, principally owned subsidiaries of Manulife Financial Corporation.
Management fee. The fund has an investment management agreement with the Advisor. The Advisor has a subadvisory agreement with Manulife Investment Management (US) LLC, an indirectly owned subsidiary of MFC and an affiliate of the Advisor. The fund is not responsible for payment of the subadvisory fees.
The management fee has two components: (1) a fee on assets invested in a fund of the Trust or John Hancock Funds III (JHF III); and (2) a fee on assets invested in investments other than a fund of the Trust or JHF III (Other assets).
| 48 | JOHN HANCOCK Multi-Asset High Income Fund | ANNUAL REPORT | |
The management fees are determined in accordance with the following schedule:
| | First $5.0 billion of net assets | Excess over $5.0 billion of net assets |
| Assets in a fund of the Trust or JHF III | 0.200% | 0.175% |
| | | |
| | First $1.5 billion of net assets | Excess over $1.5 billion of net assets |
| Other assets | 0.420% | 0.410% |
Prior to June 4, 2020, the management fees were determined in accordance with the following schedule:
| | First $5.0 billion of aggregate net assets | Excess over $5.0 billion of aggregate net assets |
| Assets in a fund of the Trust or JHF III | 0.200% | 0.175% |
| Other assets | 0.650% | 0.625% |
Effective June 4, 2020, the Advisor has contractually agreed to reduce its management fee or make payments to the fund if other expenses of the fund exceed 0.52% of average net assets. Expenses excluded from this waiver include taxes, brokerage commissions, interest expense, litigation and indemnification expenses, and other extraordinary expenses not incurred in the ordinary course of the fund’s business, class specific expenses, underlying fund expenses (acquired fund fees) and short dividend expense. The current expense limitation agreement expires on December 31, 2021, unless renewed by mutual agreement of the fund and the Advisor based upon a determination that this is appropriate under the circumstances at that time.
Effective January 1, 2020, the Advisor has contractually agreed to reduce its management fee or make payments to the fund if other expenses of the fund exceed 0.14% of average net assets. Expenses excluded from this waiver include management fees, taxes, brokerage commissions, interest expense, litigation and indemnification expenses, and other extraordinary expenses not incurred in the ordinary course of the fund’s business, class specific expenses, underlying fund expenses (acquired fund fees) and short dividend expense. The expense limitation agreement expires on December 31, 2020. Prior to January 1, 2020, the Advisor contractually agreed to reduce its management fee, or if necessary make payment to the fund, in an amount equal to the amount by which the expenses of the fund, excluding management fees, exceed 0.04% of the average net assets of the fund.
The Advisor has contractually agreed to waive its management fees so that the aggregate management fee amount retained by the Advisor, with respect to both the fund and its underlying investments, after payment of subadvisory fees for the fund does not exceed 0.45% of the fund’s average net assets. The current expense limitation agreement expires on December 31, 2020, unless renewed by mutual agreement of the fund and the Advisor based upon a determination that this is appropriate under the circumstances at that time.
For the year ended August 31, 2020, the expense reductions described above amounted to the following:
| Class | Expense reduction |
| Class A | $141,004 |
| Class C | 22,015 |
| Class I | 10,427 |
| Class | Expense reduction |
| Class R6 | $6,469 |
| Class NAV | 84,919 |
| Total | $264,834 |
Expenses waived or reimbursed in the current fiscal period are not subject to recapture in future fiscal periods.
The investment management fees, including the impact of the waivers and reimbursements as described above, incurred for the year ended August 31, 2020, were equivalent to a net annual effective rate of 0.00% of the fund's average daily net assets.
| | ANNUAL REPORT | JOHN HANCOCK Multi-Asset High Income Fund | 49 |
Accounting and legal services. Pursuant to a service agreement, the fund reimburses the Advisor for all expenses associated with providing the administrative, financial, legal, compliance, accounting and recordkeeping services to the fund, including the preparation of all tax returns, periodic reports to shareholders and regulatory reports, among other services. These expenses are allocated to each share class based on its relative net assets at the time the expense was incurred. These accounting and legal services fees incurred, for the year ended August 31, 2020, amounted to an annual rate of 0.02% of the fund's average daily net assets.
Distribution and service plans. The fund has a distribution agreement with the Distributor. The fund has adopted distribution and service plans for certain classes as detailed below pursuant to Rule 12b-1 under the 1940 Act, to pay the Distributor for services provided as the distributor of shares of the fund. The fund may pay up to the following contractual rates of distribution and service fees under these arrangements, expressed as an annual percentage of average daily net assets for each class of the fund's shares:
| Class | Rule 12b-1 Fee |
| Class A | 0.25% |
| Class C | 1.00% |
Prior to June 4, 2020, Rule 12b-1 fee payable by the fund’s Class A shares was 0.30%.
Sales charges. Class A shares are assessed up-front sales charges, which resulted in payments to the Distributor amounting to $977 for the year ended August 31, 2020. Of this amount, $166 was retained and used for printing prospectuses, advertising, sales literature and other purposes and $811 was paid as sales commissions to broker-dealers.
Class A and Class C shares may be subject to contingent deferred sales charges (CDSCs). Certain Class A shares that are acquired through purchases of $1 million or more and are redeemed within one year of purchase are subject to a 1.00% sales charge. Class C shares that are redeemed within one year of purchase are subject to a 1.00% CDSC. CDSCs are applied to the lesser of the current market value at the time of redemption or the original purchase cost of the shares being redeemed. Proceeds from CDSCs are used to compensate the Distributor for providing distribution-related services in connection with the sale of these shares. During the year ended August 31, 2020, CDSCs received by the Distributor amounted to $2 for Class C shares. There were no CDSCs received by the Distributor for Class A shares.
Transfer agent fees. The John Hancock group of funds has a complex-wide transfer agent agreement with John Hancock Signature Services, Inc. (Signature Services), an affiliate of the Advisor. The transfer agent fees paid to Signature Services are determined based on the cost to Signature Services (Signature Services Cost) of providing recordkeeping services. It also includes out-of-pocket expenses, including payments made to third-parties for recordkeeping services provided to their clients who invest in one or more John Hancock funds. In addition, Signature Services Cost may be reduced by certain fees that Signature Services receives in connection with retirement and small accounts. Signature Services Cost is calculated monthly and allocated, as applicable, to five categories of share classes: Retail Share and Institutional Share Classes of Non-Municipal Bond Funds, Class R6 Shares, Retirement Share Classes and Municipal Bond Share Classes. Within each of these categories, the applicable costs are allocated to the affected John Hancock affiliated funds and/or classes, based on the relative average daily net assets.
Class level expenses. Class level expenses for the year ended August 31, 2020 were as follows:
| Class | Distribution and service fees | Transfer agent fees |
| Class A | $13,624 | $5,968 |
| Class C | 7,282 | 919 |
| Class I | — | 457 |
| Class R6 | — | 30 |
| 50 | JOHN HANCOCK Multi-Asset High Income Fund | ANNUAL REPORT | |
| Class | Distribution and service fees | Transfer agent fees |
| Total | $20,906 | $7,374 |
Trustee expenses. The fund compensates each Trustee who is not an employee of the Advisor or its affiliates. The costs of paying Trustee compensation and expenses are allocated to the fund based on its net assets relative to other funds within the John Hancock group of funds complex.
Note 6—Fund share transactions
Transactions in fund shares for the years ended August 31, 2020 and 2019 were as follows:
| | Year Ended 8-31-20 | Year Ended 8-31-19 |
| | Shares | Amount | Shares | Amount |
| Class A shares | | | | |
| Sold | 139,101 | $1,352,247 | 91,909 | $877,445 |
| Distributions reinvested | 10,475 | 104,086 | 15,609 | 149,203 |
| Repurchased | (143,455) | (1,405,860) | (132,006) | (1,268,049) |
| Net increase (decrease) | 6,121 | $50,473 | (24,488) | $(241,401) |
| Class C shares | | | | |
| Sold | 11,927 | $118,009 | 26,389 | $253,592 |
| Distributions reinvested | 1,156 | 11,480 | 1,991 | 18,933 |
| Repurchased | (24,558) | (234,363) | (38,724) | (366,644) |
| Net decrease | (11,475) | $(104,874) | (10,344) | $(94,119) |
| Class I shares | | | | |
| Sold | 22,750 | $221,017 | 13,655 | $129,770 |
| Distributions reinvested | 808 | 8,018 | 1,180 | 11,271 |
| Repurchased | (6,136) | (59,312) | (13,720) | (132,570) |
| Net increase | 17,422 | $169,723 | 1,115 | $8,471 |
| Class R6 shares | | | | |
| Sold | 7,031 | $68,941 | 9,234 | $88,679 |
| Distributions reinvested | 419 | 4,165 | 414 | 3,991 |
| Repurchased | (4,943) | (49,824) | — | — |
| Net increase | 2,507 | $23,282 | 9,648 | $92,670 |
| Class NAV shares1 | | | | |
| Sold | 13,756,654 | $137,507,164 | — | — |
| Distributions reinvested | 62,259 | 631,175 | — | — |
| Repurchased | (56,740) | (577,206) | — | — |
| Net increase | 13,762,173 | $137,561,133 | — | — |
| Total net increase (decrease) | 13,776,748 | $137,699,737 | (24,069) | $(234,379) |
| 1 | The inception date for Class NAV shares is 6-4-20. |
| | ANNUAL REPORT | JOHN HANCOCK Multi-Asset High Income Fund | 51 |
Affiliates of the fund owned 95% and 100% of shares of Class R6 and Class NAV on August 31, 2020. Such concentration of shareholders’ capital could have a material effect on the fund if such shareholders redeem from the fund.
Note 7—Purchase and sale of securities
Purchases and sales of securities, other than short-term investments, amounted to $144,861,934 and $15,117,160, respectively, for the year ended August 31, 2020.
Note 8—Investment by affiliated funds
Certain investors in the fund are affiliated funds that are managed by the Advisor and its affiliates. The affiliated funds do not invest in the fund for the purpose of exercising management or control; however, this investment may represent a significant portion of the fund's net assets. At August 31, 2020, funds within the John Hancock group of funds complex held 95.8% of the fund's net assets. The following fund(s) had an affiliate ownership of 5% or more of the fund's net assets:
| Portfolio | Affiliated Concentration |
| John Hancock Funds II Multimanager Lifestyle Balanced Portfolio | 33.1% |
| John Hancock Funds II Multimanager Lifestyle Conservative Portfolio | 32.8% |
| John Hancock Funds II Multimanager Lifestyle Moderate Portfolio | 29.9% |
Note 9—Investment in affiliated underlying funds
The fund invests primarily in affiliated underlying funds that are managed by the Advisor and its affiliates. The fund does not invest in the affiliated underlying funds for the purpose of exercising management or control; however, the fund's investment may represent a significant portion of each underlying funds’ net assets. At August 31, 2020, the fund did not hold 5% or more of the net assets of any underlying funds.
Information regarding the fund's fiscal year to date purchases and sales of the affiliated underlying funds as well as income and capital gains earned by the fund, if any, is as follows:
| | | | | | | | Dividends and distributions |
| Affiliate | Ending
share
amount | Beginning
value | Cost of
purchases | Proceeds
from shares
sold | Realized
gain
(loss) | Change in
unrealized
appreciation
(depreciation) | Income
distributions
received | Capital gain
distributions
received | Ending
value |
| Bond | — | $1,398,561 | $351,781 | $(1,753,336) | $72,233 | $(69,239) | $35,268 | $8,619 | — |
| Emerging Markets Debt | — | 498,669 | 128,361 | (602,367) | (16,295) | (8,368) | 19,464 | — | — |
| Floating Rate Income | — | 242,857 | 54,670 | (280,689) | (19,133) | 2,295 | 10,164 | — | — |
| Global Equity | — | 274,288 | 70,419 | (341,181) | 1,438 | (4,964) | 5,412 | 1,342 | — |
| Global Shareholder Yield | — | 563,815 | 163,604 | (687,452) | (41,807) | 1,840 | 11,563 | 9,680 | — |
| High Yield | — | 334,515 | 93,390 | (410,999) | (16,443) | (463) | 14,438 | — | — |
| John Hancock Collateral Trust* | — | 50,150 | 7,295,898 | (7,346,316) | 268 | — | 2,045 | — | — |
| Short Duration Credit Opportunities | — | 260,431 | 51,884 | (305,158) | (9,008) | 1,851 | 7,022 | — | — |
| Strategic Income Opportunities | — | 1,338,627 | 266,510 | (1,596,560) | (108) | (8,469) | 24,541 | — | — |
| U.S. High Yield Bond | — | 285,320 | 81,618 | (358,626) | (3,739) | (4,573) | 11,866 | — | — |
| | | | | | $(32,594) | $(90,090) | $141,783 | $19,641 | — |
| 52 | JOHN HANCOCK Multi-Asset High Income Fund | ANNUAL REPORT | |
| * | Refer to the Securities lending note within Note 2 for details regarding this investment. |
Note 10—LIBOR discontinuation risk
LIBOR (London Interbank Offered Rate) is a measure of the average interest rate at which major global banks can borrow from one another. Following allegations of rate manipulation and concerns regarding its thin liquidity, in July 2017, the U.K. Financial Conduct Authority, which regulates LIBOR, announced that it will stop encouraging banks to provide the quotations needed to sustain LIBOR after 2021. This event will likely cause LIBOR to cease to be published. Before then, it is expected that market participants will transition to the use of different reference or benchmark rates. However, although regulators have suggested alternative rates, there is currently no definitive information regarding the future utilization of LIBOR or of any replacement rate.
It is uncertain what impact the discontinuation of LIBOR will have on the use of LIBOR as a reference rate for securities in which the fund invests. It is expected that market participants will amend financial instruments referencing LIBOR to include fallback provisions and other measures that contemplate the discontinuation of LIBOR or other similar market disruption events, but neither the effect of the transition process nor the viability of such measures is known. In addition, there are obstacles to converting certain longer term securities and transactions to a new benchmark or benchmarks and the effectiveness of one alternative reference rate versus multiple alternative reference rates in new or existing financial instruments and products has not been determined. As market participants transition away from LIBOR, LIBOR's usefulness may deteriorate, which could occur prior to the end of 2021. The transition process may lead to increased volatility and illiquidity in markets that currently rely on LIBOR to determine interest rates. LIBOR's deterioration may adversely affect the liquidity and/or market value of securities that use LIBOR as a benchmark interest rate.
Note 11—Coronavirus (COVID-19) pandemic
The novel COVID-19 disease has resulted in significant disruptions to global business activity. A widespread health crisis such as a global pandemic could cause substantial market volatility, exchange trading suspensions and closures, impact the ability to complete redemptions, and affect fund performance.
| | ANNUAL REPORT | JOHN HANCOCK Multi-Asset High Income Fund | 53 |
Report of Independent Registered Public Accounting Firm
To the Board of Trustees of John Hancock Funds II and Shareholders of John Hancock Multi-Asset High Income Fund
Opinion on the Financial Statements
We have audited the accompanying statement of assets and liabilities, including the fund’s investments, of John Hancock Multi-Asset High Income Fund (one of the funds constituting John Hancock Funds II, referred to hereafter as the "Fund") as of August 31, 2020, the related statement of operations for the year ended August 31, 2020, the statements of changes in net assets for each of the two years in the period ended August 31,2020, including the related notes, and the financial highlights for each of the periods indicated therein (collectively referred to as the “financial statements”). In our opinion, the financial statements present fairly, in all material respects, the financial position of the Fund as of August 31, 2020, the results of its operations for the year then ended, the changes in its net assets for each of the two years in the period ended August 31, 2020 and the financial highlights for each of the periods indicated therein in conformity with accounting principles generally accepted in the United States of America.
Basis for Opinion
These financial statements are the responsibility of the Fund’s management. Our responsibility is to express an opinion on the Fund’s financial statements based on our audits. We are a public accounting firm registered with the Public Company Accounting Oversight Board (United States) (PCAOB) and are required to be independent with respect to the Fund in accordance with the U.S. federal securities laws and the applicable rules and regulations of the Securities and Exchange Commission and the PCAOB.
We conducted our audits of these financial statements in accordance with the standards of the PCAOB. Those standards require that we plan and perform the audit to obtain reasonable assurance about whether the financial statements are free of material misstatement, whether due to error or fraud.
Our audits included performing procedures to assess the risks of material misstatement of the financial statements, whether due to error or fraud, and performing procedures that respond to those risks. Such procedures included examining, on a test basis, evidence regarding the amounts and disclosures in the financial statements. Our audits also included evaluating the accounting principles used and significant estimates made by management, as well as evaluating the overall presentation of the financial statements. Our procedures included confirmation of securities owned as of August 31, 2020 by correspondence with the custodian, transfer agent, agent banks and brokers; when replies were not received from agent banks and brokers, we performed other auditing procedures. We believe that our audits provide a reasonable basis for our opinion.
/s/ PricewaterhouseCoopers LLP
Boston, Massachusetts
October 22, 2020
We have served as the auditor of one or more investment companies in the John Hancock group of funds since 1988.
| 54 | JOHN HANCOCK MULTI-ASSET HIGH INCOME FUND | ANNUAL REPORT | |
Tax information (Unaudited)
For federal income tax purposes, the following information is furnished with respect to the distributions of the fund, if any, paid during its taxable year ended August 31, 2020.
The fund reports the maximum amount allowable of its net taxable income as eligible for the corporate dividends-received deduction.
The fund reports the maximum amount allowable of its net taxable income as qualified dividend income as provided in the Jobs and Growth Tax Relief Reconciliation Act of 2003.
The fund reports the maximum amount allowable of its Section 199A dividends as defined in Proposed Treasury Regulation §1.199A-3(d).
Eligible shareholders will be mailed a 2020 Form 1099-DIV in early 2021. This will reflect the tax character of all distributions paid in calendar year 2020.
Please consult a tax advisor regarding the tax consequences of your investment in the fund.
| | ANNUAL REPORT | JOHN HANCOCK MULTI-ASSET HIGH INCOME FUND | 55 |
CONTINUATION OF INVESTMENT ADVISORY AND SUBADVISORY AGREEMENTS
Evaluation of Advisory and Subadvisory Agreements by the Board of Trustees
This section describes the evaluation by the Board of Trustees (the Board) of John Hancock Funds II (the Trust) of the Advisory Agreement (the Advisory Agreement) with John Hancock Investment Management LLC (the Advisor) and the Subadvisory Agreement (the Subadvisory Agreement) with Manulife Investment Management (US) LLC (the Subadvisor), for John Hancock Multi-Asset High Income Fund (the fund, formerly, John Hancock Income Allocation Fund). The Advisory Agreement and Subadvisory Agreement are collectively referred to as the Agreements. Prior to the June 23-25, 2020 telephonic1 meeting at which the Agreements were approved, the Board also discussed and considered information regarding the proposed continuation of the Agreements at the telephonic meeting held on May 26-27, 2020. Approval of Advisory and Subadvisory Agreements.
At telephonic meetings held on June 23-25, 2020, the Board, including the Trustees who are not parties to any Agreement or considered to be interested persons of the Trust under the Investment Company Act of 1940, as amended (the 1940 Act) (the Independent Trustees, reapproved for an annual period the continuation of the Advisory Agreement between the Trust and the Advisor and the Subadvisory Agreement between the Advisor and the Subadvisor with respect to the fund.
In considering the Advisory Agreement and the Subadvisory Agreement, the Board received in advance of the meetings a variety of materials relating to the fund, the Advisor and the Subadvisor, including comparative performance, fee and expense information for a peer group of similar funds prepared by an independent third-party provider of fund data, performance information for an applicable benchmark index; and, with respect to the Subadvisor, comparative performance information for comparably managed accounts, as applicable, and other information provided by the Advisor and the Subadvisor regarding the nature, extent and quality of services provided by the Advisor and the Subadvisor under their respective Agreements, as well as information regarding the Advisor's revenues and costs of providing services to the fund and any compensation paid to affiliates of the Advisor. At the meetings at which the renewal of the Advisory Agreement and Subadvisory Agreement are considered, particular focus is given to information concerning fund performance, comparability of fees and total expenses, and profitability. However, the Board notes that the evaluation process with respect to the Advisor and the Subadvisor is an ongoing one. In this regard, the Board also took into account discussions with management and information provided to the Board (including its various committees) at prior meetings with respect to the services provided by the Advisor and the Subadvisor to the fund, including quarterly performance reports prepared by management containing reviews of investment results and prior presentations from the Subadvisor with respect to the fund. The information received and considered by the Board in connection with the May and June meetings and throughout the year was both written and
____________________
1On March 25, 2020, as a result of health and safety measures put in place to combat the global COVID-19 pandemic, the Securities and Exchange Commission issued an exemptive order (the "Order") pursuant to Sections 6(c) and 38(a) of the Investment Company Act of 1940, as amended (the "1940 Act"), that temporarily exempts registered investment management companies from the in-person voting requirements under the 1940 Act, subject to certain requirements, including that votes taken pursuant to the Order are ratified at the next in-person meeting. The Board determined that reliance on the Order was necessary or appropriate due to the circumstances related to current or potential effects of COVID-19 and therefore, the Board's May and June meetings were held telephonically in reliance on the Order.
ANNUAL REPORT | JOHN HANCOCK MULTI-ASSET HIGH INCOME FUND 56
oral. The Board noted the affiliation of the Subadvisor with the Advisor, noting any potential conflicts of interest. The Board also considered the nature, quality, and extent of non-advisory services, if any, to be provided to the fund by the Advisor's affiliates, including distribution services. The Board considered the Advisory Agreement and the Subadvisory Agreement separately in the course of its review. In doing so, the Board noted the respective roles of the Advisor and Subadvisor in providing services to the fund.
Throughout the process, the Board asked questions of and requested additional information from management. The Board is assisted by counsel for the Trust and the Independent Trustees are also separately assisted by independent legal counsel throughout the process. The Independent Trustees also received a memorandum from their independent legal counsel discussing the legal standards for their consideration of the proposed continuation of the Agreements and discussed the proposed continuation of the Agreements in private sessions with their independent legal counsel at which no representatives of management were present.
Approval of Advisory Agreement
In approving the Advisory Agreement with respect to the fund, the Board, including the Independent Trustees, considered a variety of factors, including those discussed below. The Board also considered other factors (including conditions and trends prevailing generally in the economy, the securities markets, and the industry) and did not treat any single factor as determinative, and each Trustee may have attributed different weights to different factors. The Board's conclusions may be based in part on its consideration of the advisory and subadvisory arrangements in prior years and on the Board's ongoing regular review of fund performance and operations throughout the year.
Nature, extent, and quality of services. Among the information received by the Board from the Advisor relating to the nature, extent, and quality of services provided to the fund, the Board reviewed information provided by the Advisor relating to its operations and personnel, descriptions of its organizational and management structure, and information regarding the Advisor's compliance and regulatory history, including its Form ADV. The Board also noted that on a regular basis it receives and reviews information from the Trust's Chief Compliance Officer (CCO) regarding the fund's compliance policies and procedures established pursuant to Rule 38a-1 under the 1940 Act. The Board observed that the scope of services provided by the Advisor, and of the undertakings required of the Advisor in connection with those services, including maintaining and monitoring its own and the fund's compliance programs, risk management programs, liquidity management programs and cybersecurity programs, had expanded over time as a result of regulatory, market and other developments.. The Board considered that the Advisor is responsible for the management of the day-to-day operations of the fund, including, but not limited to, general supervision of and coordination of the services provided by the Subadvisor, and is also responsible for monitoring and reviewing the activities of the Subadvisor and third-party service providers. The Board also considered the significant risks assumed by the Advisor in connection with the services provided to the fund including entrepreneurial risk in sponsoring new funds and ongoing risks including investment, operational, enterprise, litigation, regulatory and compliance risks with respect to all funds.
In considering the nature, extent, and quality of the services provided by the Advisor, the Trustees also took into account their knowledge of the Advisor's management and the quality of the performance of the Advisor's duties, through Board meetings, discussions and reports during the preceding year and through each Trustee's experience as a Trustee of the Trust and of the other trusts in the John Hancock group of funds complex (the John Hancock Fund Complex).
In the course of their deliberations regarding the Advisory Agreement, the Board considered, among other things:
ANNUAL REPORT | JOHN HANCOCK MULTI-ASSET HIGH INCOME FUND 57
| (a) | the skills and competency with which the Advisor has in the past managed the Trust's affairs and its subadvisory relationship, the Advisor's oversight and monitoring of the Subadvisor's investment performance and compliance programs, such as the Subadvisor's compliance with fund policies and objectives, review of brokerage matters, including with respect to trade allocation and best execution and the Advisor's timeliness in responding to performance issues; |
| (b) | the background, qualifications and skills of the Advisor's personnel; |
| (c) | the Advisor's compliance policies and procedures and its responsiveness to regulatory changes and fund industry developments; |
| (d) | the Advisor's administrative capabilities, including its ability to supervise the other service providers for the fund, as well as the Advisor's oversight of any securities lending activity, its monitoring of class action litigation and collection of class action settlements on behalf of the fund, and bringing loss recovery actions on behalf of the fund; |
| (e) | the financial condition of the Advisor and whether it has the financial wherewithal to provide a high level and quality of services to the fund; |
| (f) | the Advisor's initiatives intended to improve various aspects of the Trust's operations and investor experience with the fund; and |
| (g) | the Advisor's reputation and experience in serving as an investment advisor to the Trust and the benefit to shareholders of investing in funds that are part of a family of funds offering a variety of investments. |
The Board concluded that the Advisor may reasonably be expected to continue to provide a high quality of services under the Advisory Agreement with respect to the fund.
Investment performance. In considering the fund's performance, the Board noted that it reviews at its regularly scheduled meetings information about the fund's performance results. In connection with the consideration of the Advisory Agreement, the Board:
| (a) | reviewed information prepared by management regarding the fund's performance; |
| (b) | considered the comparative performance of an applicable benchmark index; |
| (c) | considered the performance of comparable funds, if any, as included in the report prepared by an independent third-party provider of fund data; and |
| (d) | took into account the Advisor's analysis of the fund's performance and its plans and recommendations regarding the Trust's subadvisory arrangements generally. |
The Board noted that while it found the data provided by the independent third-party generally useful it recognized its limitations, including in particular that the data may vary depending on the end date selected and that the results of the performance comparisons may vary depending on the selection of the peer group. The Board noted that the fund outperformed its peer group median for the one-, three-, and five-year periods ended December 31, 2019. The Board also noted that the fund underperformed its benchmark index for the one-, three-, and five-year periods ended December 31, 2019. The Board took into account management's discussion of the fund's performance, including the favorable performance relative to the peer group median for the one-, three-, and five-year periods. The Board also noted that it recently approved changes to the Fund's principal investment strategies. The Board concluded that the fund's performance has generally been in line with or outperformed the historical performance of comparable funds.
ANNUAL REPORT | JOHN HANCOCK MULTI-ASSET HIGH INCOME FUND 58
Fees and expenses. The Board reviewed comparative information prepared by an independent third-party provider of fund data, including, among other data, the fund's contractual and net management fees (and subadvisory fees, to the extent available) and total expenses as compared to similarly situated investment companies deemed to be comparable to the fund in light of the nature, extent and quality of the management and advisory and subadvisory services provided by the Advisor and the Subadvisor. The Board considered the fund's ranking within a smaller group of peer funds chosen by the independent third-party provider, as well as the fund's ranking within a broader group of funds. In comparing the fund's contractual and net management fees to those of comparable funds, the Board noted that such fees include both advisory and administrative costs. The Board noted that the Advisor waived the fund's management fee and that net total expenses for the fund are higher than the peer group median. The Board also noted that it recently approved a new fund level expense cap through December 31, 2021.
The Board took into account management's discussion of the fund's expenses. The Board also took into account management's discussion with respect to overall management fee and the fees of the Subadvisor, including the amount of the advisory fee retained by the Advisor after payment of the subadvisory fee, in each case in light of the services rendered for those amounts and the risks undertaken by the Advisor. The Board also noted that the Advisor pays the subadvisory fee. In addition, the Board took into account that management had agreed to implement an overall fee waiver across the complex, including the fund, which is discussed further below. The Board also noted actions taken over the past several years to reduce the fund's operating expenses. The Board also noted that, in addition, the Advisor is currently waiving fees and/or reimbursing expenses with respect to the fund and that the fund has breakpoints in its contractual management fee schedule that reduces management fees as assets increase. The Board reviewed information provided by the Advisor concerning the investment advisory fee charged by the Advisor or one of its advisory affiliates to other clients (including other funds in the John Hancock Fund Complex) having similar investment mandates, if any. The Board considered any differences between the Advisor's and Subadvisor's services to the fund and the services they provide to other comparable clients or funds. The Board concluded that the advisory fee paid with respect to the fund is reasonable in light of the nature, extent and quality of the services provided to the fund under the Advisory Agreement.
Profitability/indirect benefits. In considering the costs of the services to be provided and the profits to be realized by the Advisor and its affiliates from the Advisor's relationship with the Trust, the Board:
| (a) | reviewed financial information of the Advisor; |
| (b) | reviewed and considered information presented by the Advisor regarding the net profitability to the Advisor and its affiliates with respect to the fund; |
| (c) | received and reviewed profitability information with respect to the John Hancock Fund Complex as a whole and with respect to the fund; |
| (d) | received information with respect to the Advisor's allocation methodologies used in preparing the profitability data and considered that the Advisor hired an independent third-party consultant to provide an analysis of the Advisor's allocation methodologies; |
| (e) | considered that the John Hancock insurance companies that are affiliates of the Advisor, as shareholders of the Trust directly or through their separate accounts, receive certain tax credits or deductions relating to foreign taxes paid and dividends received by certain funds of the Trust and noted that these tax benefits, which are not available to participants in qualified retirement plans under applicable income tax law, are reflected in the profitability information reviewed by the Board; |
ANNUAL REPORT | JOHN HANCOCK MULTI-ASSET HIGH INCOME FUND 59
| (f) | considered that the Advisor also provides administrative services to the fund on a cost basis pursuant to an administrative services agreement; |
| (g) | noted that affiliates of the Advisor provide transfer agency services and distribution services to the fund, and that the fund's distributor also receives Rule 12b-1 payments to support distribution of the fund; |
| (h) | noted that the fund's Subadvisor is an affiliate of the Advisor; |
| (i) | noted that the Advisor also derives reputational and other indirect benefits from providing advisory services to the fund; |
| (j) | noted that the subadvisory fee for the fund is paid by the Advisor; and |
| (k) | considered the Advisor's ongoing costs and expenditures necessary to improve services, meet new regulatory and compliance requirements, and adapt to other challenges impacting the fund industry; |
| (l) | considered that the Advisor should be entitled to earn a reasonable level of profits in exchange for the level of services it provides to the fund and the risks that it assumes as Advisor including entrepreneurial, operational, reputational, litigation and regulatory risk. |
Based upon its review, the Board concluded that the level of profitability, if any, of the Advisor and its affiliates from their relationship with the fund was reasonable and not excessive.
Economies of scale. In considering the extent to which economies of scale would be realized as the fund grows and whether fee levels reflect these economies of scale for the benefit of fund shareholders, the Board:
| (a) | considered that the Advisor has contractually agreed to waive a portion of its management fee for certain funds of the John Hancock Fund Complex, including the fund (the participating portfolios) or otherwise reimburse the expenses of the participating portfolios (the reimbursement). This waiver is based upon aggregate net assets of all the participating portfolios. The amount of the reimbursement is calculated daily and allocated among all the participating portfolios in proportion to the daily net assets of each fund;; |
| (b) | reviewed the fund's advisory fee structure and concluded that: (i) the fund's fee structure contains breakpoints at the subadvisory fee level and that certain breakpoints are reflected as breakpoints in the advisory fees for the fund; and (ii) although economies of scale cannot be measured with precision, these arrangements permit shareholders of the fund to benefit from economies of scale if the fund grows. The Board also took into account management's discussion of the fund's advisory fee structure; and |
| (c) | the Board also considered the effect of the fund's growth in size on its performance and fees. The Board also noted that if the fund's assets increase over time, the fund may realize other economies of scale. |
Approval of Subadvisory Agreement
In making its determination with respect to approval of the Subadvisory Agreement, the Board reviewed:
| | | | | | | | | |
| | | | | (1) | | | information relating to the Subadvisor's business, including current subadvisory services to the Trust (and other funds in the John Hancock Fund Complex); | |
| | | | | (2) | | | the historical and current performance of the fund and comparative performance information relating to an applicable benchmark index and comparable funds; and | |
ANNUAL REPORT | JOHN HANCOCK MULTI-ASSET HIGH INCOME FUND 60
| | | | | | | | | |
| | | | | (3) | | | the subadvisory fee for the fund, including any breakpoints, and to the extent available, comparable fee information prepared by an independent third party provider of fund data. | |
Nature, extent, and quality of services. With respect to the services provided by the Subadvisor, the Board received information provided to the Board by the Subadvisor, including the Subadvisor's Form ADV, as well as took into account information presented throughout the past year. The Board considered the Subadvisor's current level of staffing and its overall resources, as well as received information relating to the Subadvisor's compensation program. The Board reviewed the Subadvisor's history and investment experience, as well as information regarding the qualifications, background, and responsibilities of the Subadvisor's investment and compliance personnel who provide services to the fund. The Board also considered, among other things, the Subadvisor's compliance program and any disciplinary history. The Board also considered the Subadvisor's risk assessment and monitoring process. The Board reviewed the Subadvisor's regulatory history, including whether it was involved in any regulatory actions or investigations as well as material litigation, and any settlements and amelioratory actions undertaken, as appropriate. The Board noted that the Advisor conducts regular, periodic reviews of the Subadvisor and its operations, including regarding investment processes and organizational and staffing matters. The Board also noted that the Trust's CCO and his staff conduct regular, periodic compliance reviews with the Subadvisor and present reports to the Independent Trustees regarding the same, which includes evaluating the regulatory compliance systems of the Subadvisor and procedures reasonably designed to assure compliance with the federal securities laws. The Board also took into account the financial condition of the Subadvisor.
The Board considered the Subadvisor's investment process and philosophy. The Board took into account that the Subadvisor's responsibilities include the development and maintenance of an investment program for the fund that is consistent with the fund's investment objective, the selection of investment securities and the placement of orders for the purchase and sale of such securities, as well as the implementation of compliance controls related to performance of these services. The Board also received information with respect to the Subadvisor's brokerage policies and practices, including with respect to best execution and soft dollars.
Subadvisor compensation. In considering the cost of services to be provided by the Subadvisor and the profitability to the Subadvisor of its relationship with the fund, the Board noted that the fees under the Subadvisory Agreement are paid by the Advisor and not the fund. The Board also received information and took into account any other potential conflicts of interest the Advisor might have in connection with the Subadvisory Agreement.
In addition, the Board considered other potential indirect benefits that the Subadvisor and its affiliates may receive from the Subadvisor's relationship with the fund, such as the opportunity to provide advisory services to additional funds in the John Hancock Fund Complex and reputational benefits.
Subadvisory fees. The Board considered that the fund pays an advisory fee to the Advisor and that, in turn, the Advisor pays a subadvisory fee to the Subadvisor. As noted above, the Board also considered the fund's subadvisory fees as compared to similarly situated investment companies deemed to be comparable to the fund as included in the report prepared by the independent third party provider of fund data, to the extent available. The Board noted that the limited size of the Lipper peer group was not sufficient for comparative purposes. The Board also took into account the subadvisory fees paid by the Advisor to the Subadvisor with respect to the fund and compared them to fees charged by the Subadvisor to manage other subadvised portfolios and portfolios not subject to regulation under the 1940 Act, as applicable.
Subadvisor performance. As noted above, the Board considered the fund's performance as compared to the fund's peer group median and the benchmark index and noted that the Board reviews information about the fund's
ANNUAL REPORT | JOHN HANCOCK MULTI-ASSET HIGH INCOME FUND 61
performance results at its regularly scheduled meetings. The Board noted the Advisor's expertise and resources in monitoring the performance, investment style and risk-adjusted performance of the Subadvisor. The Board was mindful of the Advisor's focus on the Subadvisor's performance. The Board also noted the Subadvisor's long-term performance record for similar accounts, as applicable.
The Board's decision to approve the Subadvisory Agreement was based on a number of determinations, including the following:
| | | |
| | (1) | the Subadvisor has extensive experience and demonstrated skills as a manager; |
| | (2) | the performance of the fund has generally been in line with or outperformed the historical performance of comparable funds; |
| | (3) | the subadvisory fee is reasonable in relation to the level and quality of services being provided under the Subadvisory Agreement; and |
| | (4) | noted that the subadvisory fees are paid by the Advisor not the fund and that the subadvisory fee breakpoints are reflected as breakpoints in the advisory fees for the fund in order to permit shareholders to benefit from economies of scale if the fund grows. |
* * *
Based on the Board's evaluation of all factors that the Board deemed to be material, including those factors described above, the Board, including the Independent Trustees, concluded that renewal of the Advisory Agreement and the Subadvisory Agreement would be in the best interest of the fund and its shareholders. Accordingly, the Board, and the Independent Trustees voting separately, approved the Advisory Agreement and Subadvisory Agreement for an additional one-year period.
ANNUAL REPORT | JOHN HANCOCK MULTI-ASSET HIGH INCOME FUND 62
STATEMENT REGARDING LIQUIDITY RISK MANAGEMENT
Operation of the Liquidity Risk Management Program
This section describes operation and effectiveness of the Liquidity Risk Management Program (LRMP) established in accordance with Rule 22e-4 under the Investment Company Act of 1940, as amended (the Liquidity Rule). The Board of Trustees (the Board) of each Fund in the John Hancock Group of Funds (each a Fund and collectively, the Funds) that is subject to the requirements of the Liquidity Rule has appointed John Hancock Investment Management LLC and John Hancock Variable Trust Advisers LLC (together, the Advisor) to serve as Administrator of the LRMP with respect to each of the Funds, including Multi-Asset High Income Fund (formerly Income Allocation Fund), subject to the oversight of the Board. In order to provide a mechanism and process to perform the functions necessary to administer the LRMP, the Advisor established the Liquidity Risk Management Committee (the Committee). The Funds' subadvisor, Manulife Investment Management (US) LLC, (the Subadvisor) executes the day-to-day investment management and security-level activities of the Fund in accordance with the requirements of the LRMP, subject to the supervision of the Advisor and the Board.
The Committee holds monthly meetings to: (1) review the day-to-day operations of the LRMP; (2) review and approve month end liquidity classifications; (3) review quarterly testing and determinations, as applicable; and (4) review other LRMP related material. The Committee also conducts daily, monthly, quarterly, and annual quantitative and qualitative assessments of each subadvisor to a Fund that is subject to the requirements of the Liquidity Rule and is a part of the LRMP to monitor investment performance issues, risks and trends. In addition, the Committee may conduct ad-hoc reviews and meetings with subadvisors as issues and trends are identified, including potential liquidity and valuation issues.
The Committee provided the Board at a meeting held on March 15-17, 2020 with a written report which addressed the Committee's assessment of the adequacy and effectiveness of the implementation and operation of the LRMP and any material changes to the LRMP. The report, which covered the period December 1, 2018 through December 31, 2019, included an assessment of important aspects of the LRMP including, but not limited to:
| • | Operation of the Fund's Redemption-In-Kind Procedures; |
| • | Highly Liquid Investment Minimum (HLIM) determination; |
| • | Compliance with the 15% limit on illiquid investments; |
| • | Reasonably Anticipated Trade Size (RATS) determination; |
| • | Security-level liquidity classifications; and |
| • | Liquidity risk assessment. |
The report also covered material liquidity matters which occurred or were reported during this period applicable to the Fund, if any, and the Committee's actions to address such matters.
Redemption-In-Kind Procedures
Rule 22e-4 requires any fund that engages in or reserves the right to engage in in-kind redemptions to adopt and implement written policies and procedures regarding in-kind redemptions as part of the management of its liquidity risk. These procedures address the process for redeeming in kind, as well as the circumstances under which the Fund would consider redeeming in kind. Anticipated large redemption activity will be evaluated to identify situations where redeeming in securities instead of cash may be appropriate.
ANNUAL REPORT | JOHN HANCOCK MULTI-ASSET HIGH INCOME FUND 63
As part of its annual assessment of the LRMP, the Committee reviewed the implementation and operation of the Redemption-In-Kind Procedures and determined they are operating in a manner that such procedures are adequate and effective to manage in-kind redemptions on behalf of the Fund as part of the LRMP.
Highly Liquid Investment Minimum determination
The Committee uses an HLIM model to determine a Fund's HLIM. This process incorporates the Fund's investment strategy, historical redemptions, liquidity classification rollup percentages and cash balances, redemption policy, access to funding sources, distribution channels and client concentrations. If the Fund falls below its established HLIM for a period greater than 7 consecutive calendar days, the Committee prepares a report to the Board within one business day following the seventh consecutive calendar day with an explanation of how the Fund plans to restore its HLIM within a reasonable period of time.
Based on the HLIM model, the Committee has determined that the Fund qualifies as a Primarily Highly Liquid Fund (PHLF). It is therefore not required to establish a HLIM. The Fund is tested quarterly to confirm its PHLF status.
As part of its annual assessment of the LRMP, the Committee reviewed the policies and procedures in place with respect to HLIM and PHLF determinations, and determined that such policies and procedures are operating in a manner that is adequate and effective as part of the LRMP.
Compliance with the 15% limit on illiquid investments
Rule 22e-4 sets an aggregate illiquid investment limit of 15% for a fund. Funds are prohibited from acquiring an illiquid investment if this results in greater than 15% of its net assets being classified as illiquid. When applying this limit, the Committee defines "illiquid investment" to mean any investment that the Fund reasonably expects cannot be sold or disposed of in current market conditions in seven calendar days or less without the sale or disposition significantly changing the market value of the investment. If a 15% illiquid investment limit breach occurs for longer than 1 business day, the Fund is required to notify the Board and provide a plan on how to bring illiquid investments within the 15% threshold, and after 7 days confidentially notify the Securities and Exchange Commission (the SEC).
In February 2019, as a result of extended security markets closures in connection with the Chinese New Year in certain countries, the SEC released guidance, and the Committee approved and adopted an Extended Market Holiday Policy to plan for and monitor known Extended Market Holidays (defined as all expected market holiday closures spanning four or more calendar days).
As part of its annual assessment of the LRMP, the Committee reviewed the policies and procedures in place with respect to the 15% illiquid investment limit and determined such policies and procedures are operating in a manner that is adequate and effective as part of the LMRP.
Reasonably Anticipated Trade Size determination
In order to assess the liquidity risk of a Fund, the Committee considers the impact on the Fund that redemptions of a RATS would have under both normal and reasonably foreseeable stressed conditions. Modelling the Fund's RATS requires quantifying cash flow volatility and analyzing distribution channel concentration and redemption risk. The model is designed to estimate the amount of assets that the Fund could reasonably anticipate trading on a given day, during both normal and reasonably foreseeable stressed conditions, to satisfy redemption requests.
ANNUAL REPORT | JOHN HANCOCK MULTI-ASSET HIGH INCOME FUND 64
As part of its annual assessment of the LRMP, the Committee reviewed the policies and procedures in place with respect to RATS determinations and determined that such policies and procedures are operating in a manner that is adequate and effective at making RATS determinations as part of the LRMP.
Security-level liquidity classifications
When classifying the liquidity of portfolio securities, the Fund adheres to the liquidity classification procedures established by the Advisor. In assigning a liquidity classification to Fund portfolio holdings, the following key inputs, among others, are considered: the Fund's RATS, feedback from the applicable Subadvisor on market-, trading- and investment-specific considerations, an assessment of current market conditions and fund portfolio holdings, and a value impact standard. The Subadvisor also provides position-level data to the Committee for use in monthly classification reconciliation in order to identify any classifications that may need to be changed as a result of the above considerations.
As part of its annual assessment of the LRMP, the Committee reviewed the policies and procedures in place with respect to security-level liquidity classifications and determined that such policies and procedures are operating in a manner that is adequate and effective as part of the LRMP.
Liquidity risk assessment
The Committee periodically reviews and assesses, the Fund's liquidity risk, including its investment strategy and liquidity of portfolio investments during both normal and reasonably foreseeable stressed conditions (including whether the investment strategy is appropriate for an open-end fund, the extent to which the strategy involves a relatively concentrated portfolio or large positions in particular issuers, and the use of borrowings for investment purposes and derivatives), cash flow analysis during both normal and reasonably foreseeable stressed conditions, and holdings of cash and cash equivalents, as well as borrowing arrangements and other funding sources.
The Committee also monitors global events, such as the COVID-19 Coronavirus, that could impact the markets and liquidity of portfolio investments and their classifications.
As part of its annual assessment of the LRMP, the Committee reviewed Fund-Level Liquidity Risk Assessment Reports for each of the Funds and determined that the investment strategy for each Fund continues to be appropriate for an open-ended structure.
Adequacy and Effectiveness
Based on the review and assessment conducted by the Committee, the Committee has determined that the LRMP has been implemented, and is operating in a manner that is adequate and effective at assessing and managing the liquidity risk of each Fund.
ANNUAL REPORT | JOHN HANCOCK MULTI-ASSET HIGH INCOME FUND 65
This chart provides information about the Trustees and Officers who oversee your John Hancock fund. Officers elected by the Trustees manage the day-to-day operations of the fund and execute policies formulated by the Trustees.
Independent Trustees
| | | |
Name, year of birth
Position(s) held with Trust
Principal occupation(s) and other
directorships during past 5 years | Trustee
of the
Trust
since1 | Number of John
Hancock funds
overseen by
Trustee |
| Hassell H. McClellan, Born: 1945 | 2005 | 195 |
Trustee and Chairperson of the Board
Director/Trustee, Virtus Funds (since 2008); Director, The Barnes Group (since 2010); Associate Professor, The Wallace E. Carroll School of Management, Boston College (retired 2013). Trustee (since 2005) and Chairperson of the Board (since 2017) of various trusts within the John Hancock Fund Complex. |
| | | |
| Charles L. Bardelis,2 Born: 1941 | 2005 | 195 |
Trustee
Director, Island Commuter Corp. (marine transport). Trustee of various trusts within the John Hancock Fund Complex (since 1988). |
| | | |
| James R. Boyle, Born: 1959 | 2015 | 195 |
Trustee
Chief Executive Officer, Foresters Financial (since 2018); Chairman and Chief Executive Officer, Zillion Group, Inc. (formerly HealthFleet, Inc.) (healthcare) (2014-2018); Executive Vice President and Chief Executive Officer, U.S. Life Insurance Division of Genworth Financial, Inc. (insurance) (January 2014-July 2014); Senior Executive Vice President, Manulife Financial, President and Chief Executive Officer, John Hancock (1999-2012); Chairman and Director, John Hancock Investment Management LLC, John Hancock Investment Management Distributors LLC, and John Hancock Variable Trust Advisers LLC (2005-2010). Trustee of various trusts within the John Hancock Fund Complex (2005-2014 and since 2015). |
| | | |
| Peter S. Burgess,2 Born: 1942 | 2005 | 195 |
Trustee
Consultant (financial, accounting, and auditing matters) (since 1999); Certified Public Accountant; Partner, Arthur Andersen (independent public accounting firm) (prior to 1999); Director, Lincoln Educational Services Corporation (since 2004); Director, Symetra Financial Corporation (2010-2016); Director, PMA Capital Corporation (2004-2010). Trustee of various trusts within the John Hancock Fund Complex (since 2005). |
| | | |
| William H. Cunningham, Born: 1944 | 2012 | 195 |
Trustee
Professor, University of Texas, Austin, Texas (since 1971); former Chancellor, University of Texas System and former President of the University of Texas, Austin, Texas; Chairman (since 2009) and Director (since 2006), Lincoln National Corporation (insurance); Director, Southwest Airlines (since 2000); former Director, LIN Television (2009-2014). Trustee of various trusts within the John Hancock Fund Complex (since 1986). |
| | | |
| Grace K. Fey, Born: 1946 | 2008 | 195 |
Trustee
Chief Executive Officer, Grace Fey Advisors (since 2007); Director and Executive Vice President, Frontier Capital Management Company (1988-2007); Director, Fiduciary Trust (since 2009). Trustee of various trusts within the John Hancock Fund Complex (since 2008). |
ANNUAL REPORT | JOHN HANCOCK MULTI-ASSET HIGH INCOME FUND 66
Independent Trustees (continued)
| | | |
Name, year of birth
Position(s) held with Trust
Principal occupation(s) and other
directorships during past 5 years | Trustee
of the
Trust
since1 | Number of John
Hancock funds
overseen by
Trustee |
| Deborah C. Jackson, Born: 1952 | 2012 | 195 |
Trustee
President, Cambridge College, Cambridge, Massachusetts (since 2011); Board of Directors, Massachusetts Women's Forum (since 2018); Board of Directors, National Association of Corporate Directors/New England (since 2015); Board of Directors, Association of Independent Colleges and Universities of Massachusetts (2014-2017); Chief Executive Officer, American Red Cross of Massachusetts Bay (2002-2011); Board of Directors of Eastern Bank Corporation (since 2001); Board of Directors of Eastern Bank Charitable Foundation (since 2001); Board of Directors of American Student Assistance Corporation (1996-2009); Board of Directors of Boston Stock Exchange (2002-2008); Board of Directors of Harvard Pilgrim Healthcare (health benefits company) (2007-2011). Trustee of various trusts within the John Hancock Fund Complex (since 2008). |
| | | |
| James M. Oates,2 Born: 1946 | 2005 | 195 |
Trustee
Managing Director, Wydown Group (financial consulting firm) (since 1994); Chairman and Director, Emerson Investment Management, Inc. (2000-2015); Independent Chairman, Hudson Castle Group, Inc. (formerly IBEX Capital Markets, Inc.) (financial services company) (1997-2011); Director, Stifel Financial (since 1996); Director, Investor Financial Services Corporation (1995-2007); Director, Connecticut River Bancorp (1998-2014); Director/Trustee, Virtus Funds (since 1988). Trustee (since 2004) and Chairperson of the Board (2005-2016) of various trusts within the John Hancock Fund Complex. |
| | | |
| Steven R. Pruchansky, Born: 1944 | 2012 | 195 |
Trustee and Vice Chairperson of the Board
Managing Director, Pru Realty (since 2017); Chairman and Chief Executive Officer, Greenscapes of Southwest Florida, Inc. (2014-2020); Director and President, Greenscapes of Southwest Florida, Inc. (until 2000); Member, Board of Advisors, First American Bank (until 2010); Managing Director, Jon James, LLC (real estate) (since 2000); Partner, Right Funding, LLC (2014-2017); Director, First Signature Bank & Trust Company (until 1991); Director, Mast Realty Trust (until 1994); President, Maxwell Building Corp. (until 1991). Trustee (since 1992), Chairperson of the Board (2011-2012), and Vice Chairperson of the Board (since 2012) of various trusts within the John Hancock Fund Complex. |
| | | |
| Frances G. Rathke,2,* Born: 1960 | 2020 | 195 |
Trustee
Director, Northern New England Energy Corporation (since 2017); Director, Audit Committee Chair and Compensation Committee Member, Green Mountain Power Corporation (since 2016); Director, Treasurer and Finance & Audit Committee Chair, Flynn Center for Performing Arts (since 2016); Director, Audit Committee Chair and Compensation Committee Member, Planet Fitness (since 2016); Director, Citizen Cider, Inc. (high-end hard cider and hard seltzer company) (since 2016); Chief Financial Officer and Treasurer, Keurig Green Mountain, Inc. (2003-retired 2015); Independent Financial Consultant, Frances Rathke Consulting (strategic and financial consulting services) (2001-2003); Chief Financial Officer and Secretary, Ben & Jerry's Homemade, Inc. (1989-2000, including prior positions); Senior Manager, Coopers & Lybrand, LLC (independent public accounting firm) (1982-1989). Trustee of various trusts within the John Hancock Fund Complex (since 2020). |
ANNUAL REPORT | JOHN HANCOCK MULTI-ASSET HIGH INCOME FUND 67
Independent Trustees (continued)
| | | |
Name, year of birth
Position(s) held with Trust
Principal occupation(s) and other
directorships during past 5 years | Trustee
of the
Trust
since1 | Number of John
Hancock funds
overseen by
Trustee |
| Gregory A. Russo, Born: 1949 | 2012 | 195 |
Trustee
Director and Audit Committee Chairman (2012-2020), and Member, Audit Committee and Finance Committee (2011-2020), NCH Healthcare System, Inc. (holding company for multi-entity healthcare system); Director and Member (2012-2018) and Finance Committee Chairman (2014-2018), The Moorings, Inc. (nonprofit continuing care community); Vice Chairman, Risk & Regulatory Matters, KPMG LLP (KPMG) (2002-2006); Vice Chairman, Industrial Markets, KPMG (1998-2002); Chairman and Treasurer, Westchester County, New York, Chamber of Commerce (1986-1992); Director, Treasurer, and Chairman of Audit and Finance Committees, Putnam Hospital Center (1989-1995); Director and Chairman of Fundraising Campaign, United Way of Westchester and Putnam Counties, New York (1990-1995). Trustee of various trusts within the John Hancock Fund Complex (since 2008). |
Non-Independent Trustees3
| | | |
Name, year of birth
Position(s) held with Trust
Principal occupation(s) and other
directorships during past 5 years | Trustee
of the
Trust
since1 | Number of John
Hancock funds
overseen by
Trustee |
| Andrew G. Arnott, Born: 1971 | 2017 | 195 |
President and Non-Independent Trustee
Head of Wealth and Asset Management, United States and Europe, for John Hancock and Manulife (since 2018); Executive Vice President, John Hancock Financial Services (since 2009, including prior positions); Director and Executive Vice President, John Hancock Investment Management LLC (since 2005, including prior positions); Director and Executive Vice President, John Hancock Variable Trust Advisers LLC (since 2006, including prior positions); President, John Hancock Investment Management Distributors LLC (since 2004, including prior positions); President of various trusts within the John Hancock Fund Complex (since 2007, including prior positions). Trustee of various trusts within the John Hancock Fund Complex (since 2017). |
| | | |
| Marianne Harrison, Born: 1963 | 2018 | 195 |
Non-Independent Trustee
President and CEO, John Hancock (since 2017); President and CEO, Manulife Canadian Division (2013-2017); Member, Board of Directors, CAE Inc. (since 2019); Member, Board of Directors, MA Competitive Partnership Board (since 2018); Member, Board of Directors, American Council of Life Insurers (ACLI) (since 2018); Member, Board of Directors, Communitech, an industry-led innovation center that fosters technology companies in Canada (2017-2019); Member, Board of Directors, Manulife Assurance Canada (2015-2017); Board Member, St. Mary's General Hospital Foundation (2014-2017); Member, Board of Directors, Manulife Bank of Canada (2013-2017); Member, Standing Committee of the Canadian Life & Health Assurance Association (2013-2017); Member, Board of Directors, John Hancock USA, John Hancock Life & Health, John Hancock New York (2012-2013). Trustee of various trusts within the John Hancock Fund Complex (since 2018). |
ANNUAL REPORT | JOHN HANCOCK MULTI-ASSET HIGH INCOME FUND 68
Principal officers who are not Trustees
| | |
Name, year of birth
Position(s) held with Trust
Principal occupation(s)
during past 5 years | Officer
of the
Trust
since |
| Charles A. Rizzo, Born: 1957 | 2007 |
Chief Financial Officer
Vice President, John Hancock Financial Services (since 2008); Senior Vice President, John Hancock Investment Management LLC and John Hancock Variable Trust Advisers LLC (since 2008); Chief Financial Officer of various trusts within the John Hancock Fund Complex (since 2007). |
| | |
| Salvatore Schiavone, Born: 1965 | 2009 |
Treasurer
Assistant Vice President, John Hancock Financial Services (since 2007); Vice President, John Hancock Investment Management LLC and John Hancock Variable Trust Advisers LLC (since 2007); Treasurer of various trusts within the John Hancock Fund Complex (since 2007, including prior positions). |
| | |
| Christopher (Kit) Sechler, Born: 1973 | 2018 |
Chief Legal Officer and Secretary
Vice President and Deputy Chief Counsel, John Hancock Investments (since 2015); Assistant Vice President and Senior Counsel (2009-2015), John Hancock Investment Management; Chief Legal Officer and Secretary of various trusts within the John Hancock Fund Complex (since 2018); Assistant Secretary of John Hancock Investment Management LLC and John Hancock Variable Trust Advisers LLC (since 2009). |
| | |
| Trevor Swanberg, Born: 1979 | 2020 |
Chief Compliance Officer
Chief Compliance Officer, various trusts within the John Hancock Fund Complex, John Hancock Investment Management LLC, and John Hancock Variable Trust Advisers LLC (since 2020); Deputy Chief Compliance Officer, various trusts within the John Hancock Fund Complex (2018-2020); Deputy Chief Compliance Officer, John Hancock Investment Management LLC and John Hancock Variable Trust Advisers LLC (2019-2020); Assistant Chief Compliance Officer, various trusts within the John Hancock Fund Complex (2016-2018); Assistant Chief Compliance Officer, John Hancock Investment Management LLC and John Hancock Variable Trust Advisers LLC (2016-2019); Vice President, State Street Global Advisors (2015-2016). |
The business address for all Trustees and Officers is 200 Berkeley Street, Boston, Massachusetts 02116-5023.
The Statement of Additional Information of the fund includes additional information about members of the Board of Trustees of the Trust and is available without charge, upon request, by calling 800-225-5291.
| | |
| 1 | Each Trustee holds office until his or her successor is elected and qualified, or until the Trustee's death, retirement, resignation, or removal. Mr. Boyle has served as Trustee at various times prior to the date listed in the table. |
| 2 | Member of the Audit Committee. |
| 3 | The Trustee is a Non-Independent Trustee due to current or former positions with the Advisor and certain affiliates. |
| * | Appointed as Independent Trustee effective as of September 15, 2020. |
ANNUAL REPORT | JOHN HANCOCK MULTI-ASSET HIGH INCOME FUND 69
| | |
Trustees
Hassell H. McClellan, Chairperson
Steven R. Pruchansky, Vice Chairperson
Andrew G. Arnott†
Charles L. Bardelis*
James R. Boyle
Peter S. Burgess*
William H. Cunningham
Grace K. Fey
Marianne Harrison†
Deborah C. Jackson
James M. Oates*
Frances G. Rathke*,1
Gregory A. Russo
Officers
Andrew G. Arnott
President
Charles A. Rizzo
Chief Financial Officer
Salvatore Schiavone
Treasurer
Christopher (Kit) Sechler
Secretary and Chief Legal Officer
Trevor Swanberg2
Chief Compliance Officer
| Investment advisor
John Hancock Investment Management LLC
Subadvisor
Manulife Investment Management (US) LLC
Portfolio Managers
John F. Addeo, CFA
Geoffrey Kelley, CFA
Caryn E. Rothman, CFA
Nathan W. Thooft, CFA
Christopher Walsh, CFA
Principal distributor
John Hancock Investment Management Distributors LLC
Custodian
State Street Bank and Trust Company
Transfer agent
John Hancock Signature Services, Inc.
Legal counsel
K&L Gates LLP
Independent registered public accounting firm
PricewaterhouseCoopers LLP
|
* Member of the Audit Committee
† Non-Independent Trustee
1 Appointed as Independent Trustee effective as of September 15, 2020
2 Effective July 31, 2020
The fund's proxy voting policies and procedures, as well as the fund proxy voting record for the most recent twelve-month period ended June 30, are available free of charge on the Securities and Exchange Commission (SEC) website at sec.gov or on our website.
All of the fund's holdings as of the end of the third month of every fiscal quarter are filed with the SEC on Form N-PORT within 60 days of the end of the fiscal quarter. The fund's Form N-PORT filings are available on our website and the SEC's website, sec.gov.
We make this information on your fund, as well as monthly portfolio holdings, and other fund details available on our website at jhinvestments.com or by calling 800-225-5291.
| | | | |
| | You can also contact us: |
| | 800-225-5291
jhinvestments.com | Regular mail:
John Hancock Signature Services, Inc.
PO Box 219909
Kansas City, MO 64121-9909
| Express mail:
John Hancock Signature Services, Inc.
430 W 7th Street
Suite 219909
Kansas City, MO 64105-1407
|
ANNUAL REPORT | JOHN HANCOCK MULTI-ASSET HIGH INCOME FUND 70
John Hancock family of funds
| | | |
DOMESTIC EQUITY FUNDS
Blue Chip Growth
Classic Value
Disciplined Value
Disciplined Value Mid Cap
Equity Income
Financial Industries
Fundamental All Cap Core
Fundamental Large Cap Core
New Opportunities
Regional Bank
Small Cap Core
Small Cap Growth
Small Cap Value
U.S. Global Leaders Growth
U.S. Quality Growth
GLOBAL AND INTERNATIONAL EQUITY FUNDS
Disciplined Value International
Emerging Markets
Emerging Markets Equity
Fundamental Global Franchise
Global Equity
Global Shareholder Yield
Global Thematic Opportunities
International Dynamic Growth
International Growth
International Small Company
| | INCOME FUNDS
Bond
California Tax-Free Income
Emerging Markets Debt
Floating Rate Income
Government Income
High Yield
High Yield Municipal Bond
Income
Investment Grade Bond
Money Market
Short Duration Bond
Short Duration Credit Opportunities
Strategic Income Opportunities
Tax-Free Bond
ALTERNATIVE AND SPECIALTY FUNDS
Absolute Return Currency
Alternative Asset Allocation
Alternative Risk Premia
Diversified Macro
Infrastructure
Multi-Asset Absolute Return
Seaport Long/Short
|
A fund's investment objectives, risks, charges, and expenses should be considered carefully before investing. The prospectus contains this and other important information about the fund. To obtain a prospectus, contact your financial professional, call John Hancock Investment Management at 800-225-5291, or visit our website at jhinvestments.com. Please read the prospectus carefully before investing or sending money.
| | | |
ASSET ALLOCATION
Balanced
Multi-Asset High Income
Multi-Index Lifetime Portfolios
Multi-Index Preservation Portfolios
Multimanager Lifestyle Portfolios
Multimanager Lifetime Portfolios
Retirement Income 2040
EXCHANGE-TRADED FUNDS
John Hancock Multifactor Consumer Discretionary ETF
John Hancock Multifactor Consumer Staples ETF
John Hancock Multifactor Developed International ETF
John Hancock Multifactor Emerging Markets ETF
John Hancock Multifactor Energy ETF
John Hancock Multifactor Financials ETF
John Hancock Multifactor Healthcare ETF
John Hancock Multifactor Industrials ETF
John Hancock Multifactor Large Cap ETF
John Hancock Multifactor Materials ETF
John Hancock Multifactor Media and
Communications ETF
John Hancock Multifactor Mid Cap ETF
John Hancock Multifactor Small Cap ETF
John Hancock Multifactor Technology ETF
John Hancock Multifactor Utilities ETF
| | ENVIRONMENTAL, SOCIAL, AND
GOVERNANCE FUNDS
ESG All Cap Core
ESG Core Bond
ESG International Equity
ESG Large Cap Core
CLOSED-END FUNDS
Financial Opportunities
Hedged Equity & Income
Income Securities Trust
Investors Trust
Preferred Income
Preferred Income II
Preferred Income III
Premium Dividend
Tax-Advantaged Dividend Income
Tax-Advantaged Global Shareholder Yield
|
John Hancock Multifactor ETF shares are bought and sold at market price (not NAV), and are not individually redeemed
from the fund. Brokerage commissions will reduce returns.
John Hancock ETFs are distributed by Foreside Fund Services, LLC, and are subadvised by Dimensional Fund Advisors LP.
Foreside is not affiliated with John Hancock Investment Management Distributors LLC or Dimensional Fund Advisors LP.
Dimensional Fund Advisors LP receives compensation from John Hancock in connection with licensing rights to the
John Hancock Dimensional indexes. Dimensional Fund Advisors LP does not sponsor, endorse, or sell, and makes no
representation as to the advisability of investing in, John Hancock Multifactor ETFs.
John Hancock Investment Management
A trusted brand
John Hancock Investment Management is a premier asset manager
with a heritage of financial stewardship dating back to 1862. Helping
our shareholders pursue their financial goals is at the core of
everything we do. It's why we support the role of professional financial
advice and operate with the highest standards of conduct and integrity.
A better way to invest
We serve investors globally through a unique multimanager approach:
We search the world to find proven portfolio teams with specialized
expertise for every strategy we offer, then we apply robust investment
oversight to ensure they continue to meet our uncompromising
standards and serve the best interests of our shareholders.
Results for investors
Our unique approach to asset management enables us to provide
a diverse set of investments backed by some of the world's best
managers, along with strong risk-adjusted returns across asset classes.
John Hancock Investment Management Distributors LLC n Member FINRA, SIPC
200 Berkeley Street n Boston, MA 02116-5010 n 800-225-5291 n jhinvestments.com
This report is for the information of the shareholders of John Hancock Multi-Asset High Income Fund. It is not authorized for distribution to prospective investors unless preceded or accompanied by a prospectus.
John Hancock
New Opportunities Fund
Annual report 8/31/2020
Beginning on January 1, 2021, as permitted by regulations adopted by the Securities and Exchange Commission, paper copies of the fund's shareholder reports like this one will no longer be sent by mail, unless you specifically request paper copies of the reports from the fund or from your financial intermediary. Instead, the reports will be made available on a website, and you will be notified by mail each time a report is posted and provided with a website link to access the report.
If you already elected to receive shareholder reports electronically, you will not be affected by this change, and you do not need to take any action. You may elect to receive shareholder reports and other communications electronically by calling John Hancock Investment Management at 800-225-5291 (Class A and Class C shares) or 888-972-8696 (Class I and Class R Suite) or by contacting your financial intermediary.
You may elect to receive all reports in paper, free of charge, at any time. You can inform John Hancock Investment Management or your financial intermediary that you wish to continue receiving paper copies of your shareholder reports by following the instructions listed above. Your election to receive reports in paper will apply to all funds held with John Hancock Investment Management or your financial intermediary.

A message to shareholders
Dear shareholder,
Despite heightened fears over the coronavirus (COVID-19), which sent markets tumbling during the latter half of February and early March, global financial markets delivered positive returns for the 12-month period ended August 31, 2020. In response to the pandemic-led shock, the U.S. Federal Reserve and the government worked quickly to shore up the economy, and by the end of the first quarter, equity markets began to rise. This comeback gathered momentum, particularly for large-cap U.S. growth stocks, during the remainder of the period.
Of course, it would be a mistake to consider this market turnaround a trustworthy signal of assured or swift economic recovery. While there has been economic growth in most of the United States, the pace has slowed in many areas as interest rates remain low and spending remains far below prepandemic levels.
From an investment perspective, we continue to think that maintaining a focus on long-term objectives while pursuing a risk-aware strategy is a prudent way forward. Above all, we believe the counsel of a trusted financial professional continues to matter now more than ever. Periods of heightened uncertainty are precisely the time to review your financial goals and follow a plan that helps you make the most of what continues to be a challenging situation.
On behalf of everyone at John Hancock Investment Management, I'd like to take this opportunity to welcome new shareholders and thank existing shareholders for the continued trust you've placed in us.
Sincerely,
Andrew G. Arnott
President and CEO,
John Hancock Investment Management
Head of Wealth and Asset Management,
United States and Europe
This commentary reflects the CEO's views as of this report's period end and are subject to change at any time. Diversification does not guarantee investment returns and does not eliminate risk of loss. All investments entail risks, including the possible loss of principal. For more up-to-date information, you can visit our website at jhinvestments.com.
John Hancock
New Opportunities Fund
Table of contents
| | | |
| 2 | | Your fund at a glance |
| 4 | | Manager's discussion of fund performance |
| 6 | | A look at performance |
| 8 | | Your expenses |
| 10 | | Fund's investments |
| 14 | | Financial statements |
| 17 | | Financial highlights |
| 26 | | Notes to financial statements |
| 35 | | Report of independent registered public accounting firm |
| 36 | | Tax information |
| 37 | | Continuation of investment advisory and subadvisory agreements |
| 44 | | Statement regarding liquidity risk management |
| 47 | | Trustees and Officers |
| 51 | | More information |
ANNUAL REPORT | JOHN HANCOCK NEW OPPORTUNITIES FUND 1
INVESTMENT OBJECTIVE
The fund seeks long-term capital appreciation.
AVERAGE ANNUAL TOTAL RETURNS AS OF 8/31/2020 (%)
The Russell 2000 Growth Index tracks the performance of publicly traded small-cap companies in the United States with higher price-to-book ratios and higher forecasted growth values.
It is not possible to invest directly in an index. Index figures do not reflect expenses or sales charges, which would result in lower returns.
The fund's Morningstar category average is a group of funds with similar investment objectives and strategies and is the equal-weighted return of all funds per category. Morningstar places funds in certain categories based on their historical portfolio holdings. Figures from Morningstar, Inc. include reinvested distributions and do not take into account sales charges. Actual load-adjusted performance is lower.
| 1 | Class A shares were first offered on 5-27-15. The returns prior to this date are those of Class NAV shares that have not been adjusted for class-specific expenses; otherwise, returns would vary. Class NAV shares ceased operations on 3-13-19. |
The past performance shown here reflects reinvested distributions and the beneficial effect of any expense reductions, and does not guarantee future results. Performance of the other share classes will vary based on the difference in the fees and expenses of those classes. Shares will fluctuate in value and, when redeemed, may be worth more or less than their original cost. Current month-end performance may be lower or higher than the performance cited, and can be found at jhinvestments.com or by calling 800-225-5291. For further information on the fund's objectives, risks, and strategy, see the fund's prospectus.
ANNUAL REPORT | JOHN HANCOCK NEW OPPORTUNITIES FUND 2
PERFORMANCE HIGHLIGHTS OVER THE LAST TWELVE MONTHS
Small-cap stocks performed well in the 12-month period
Despite the dramatic sell-off in February and March of 2020, the Russell 2000 Growth Index closed the period with a robust gain.
The fund performed closely in line with the index
Although our primary focus is on individual stock picking, sector allocations—specifically, zero weightings in utilities and communications services—contributed to relative performance.
Stock selection had a mixed effect
Our investment process added the most value in the real estate, information technology, and healthcare sectors, but the benefit was largely offset by a weaker showing in industrials, financials, and consumer discretionary.
SECTOR COMPOSITION AS OF 8/31/2020 (%)
A note about risks
The fund may be subject to various risks as described in the fund's prospectus. A widespread health crisis such as a global pandemic could cause substantial market volatility, exchange trading suspensions and closures, impact the ability to complete redemptions, and affect fund performance. For example, the novel coronavirus disease (COVID-19) has resulted in significant disruptions to global business activity. The impact of a health crisis and other epidemics and pandemics that may arise in the future, could affect the global economy in ways that cannot necessarily be foreseen at the present time. A health crisis may exacerbate other pre-existing political, social, and economic risks. Any such impact could adversely affect the fund's performance, resulting in losses to your investment. For more information, please refer to the "Principal risks" section of the prospectus.
ANNUAL REPORT | JOHN HANCOCK NEW OPPORTUNITIES FUND 3
Manager's discussion of fund performance
Effective September 6, 2019, John Hancock New Opportunities Fund is managed solely by GW&K Investment Management. Prior to this date, the fund was managed by portfolio management teams at GW&K, Dimensional Fund Advisors L.P., and Brandywine Global Investment Management LLC.
Can you describe investment conditions during the 12 months ended August 31, 2020?
U.S. equities, after performing well in the first five months of the period, sold off sharply through February and most of March in response to the emergence of COVID-19. The major indexes reached a low on March 23, at which point they began to regain ground thanks to the combination of fiscal stimulus, aggressive policy accommodation by the U.S. Federal Reserve, and optimism that the economy would gradually reopen. After a long, steady rally, the Russell 2000 Growth Index recaptured its previous high in late August and finished the full period with a solid gain.
What elements of the fund's positioning helped and hurt results?
Although lower-quality stocks were the key driver of returns in the small-cap growth space, the fund was able to overcome this potential headwind through individual stock selection. The strongest results were in the real estate sector, led by positions in two defensive businesses that were mostly unaffected by the concerns surrounding COVID-19: QTS Realty Trust, Inc. and Easterly Government Properties, Inc. QTS, a data-center real estate investment trust, benefited from growing demand for cloud computing services. Easterly, which proved largely immune to the shifting business environment
TOP 10 HOLDINGS AS OF 8/31/2020 (%)
| | |
| HubSpot, Inc. | 2.4 |
| Fox Factory Holding Corp. | 2.4 |
| Catalent, Inc. | 2.3 |
| Ritchie Brothers Auctioneers, Inc. | 2.2 |
| Emergent BioSolutions, Inc. | 2.1 |
| SiteOne Landscape Supply, Inc. | 2.1 |
| Grand Canyon Education, Inc. | 2.1 |
| Paylocity Holding Corp. | 2.0 |
| QTS Realty Trust, Inc., Class A | 2.0 |
| Horizon Therapeutics PLC | 1.9 |
| TOTAL | 21.5 |
| As a percentage of net assets. |
| Cash and cash equivalents are not included. |
ANNUAL REPORT | JOHN HANCOCK NEW OPPORTUNITIES FUND 4
given that it primarily leases its properties to government agencies, also delivered a strong return.
Information technology was another area of strength for the fund. HubSpot, Inc. was the top contributor in the sector as rising demand for its software-as-a-service offerings fueled impressive fundamental results. A pair of holdings from the semiconductor and semiconductor equipment industry, Entegris, Inc. and MACOM Technology Solutions Holdings, Inc., were also notable contributors. HubSpot and Entegris were not in the benchmark.
On the negative side, stock selection in financials detracted from performance. The shortfall was primarily the result of holdings in regional banks that were hurt by the combination of slowing growth and a declining margin between the rates at which they borrow and lend. We maintained the fund's positions in this area, as we remain confident in the fundamentals of the companies held in the portfolio.
Selection in the industrials sector also weighed on results, with two out-of-benchmark companies linked to the aviation industry—AAR Corp. and Woodward Inc.—representing the largest detractors. We maintained the position in Woodward, but we sold AAR from the portfolio. Outside of these two areas, the energy company Matador Resources Company was a key detractor. Matador, like many smaller players in the domestic exploration and production industry, was hurt by falling energy prices. Believing the increasingly difficult business environment would feed through to the company's balance sheet, we sold the position.
What was your overall view on the investment backdrop at the close of the period?
Macroeconomic factors were the key driver of market performance in the past year, and that could well remain the case given the potential for headlines surrounding fiscal policies, a COVID-19 vaccine, and the U.S. elections. However, our virtual meetings with company management teams have revealed a continued sense of cautious optimism in the business community.
MANAGED BY
| |
| New Opportunities Fund is managed by a team of portfolio managers at GW&K Investment Management. |

The views expressed in this report are exclusively those of the investment management team at GW&K, and are subject to change. They are not meant as investment advice. Please note that the holdings discussed in this report may not have been held by the fund for the entire period. Portfolio composition is subject to review in accordance with the fund's investment strategy and may vary in the future. Current and future portfolio holdings are subject to risk.
ANNUAL REPORT | JOHN HANCOCK NEW OPPORTUNITIES FUND 5
TOTAL RETURNS FOR THE PERIOD ENDED AUGUST 31, 2020
| | | | | | | | |
Average annual total returns (%)
with maximum sales charge | | Cumulative total returns (%)
with maximum sales charge |
| | 1-year | 5-year | 10-year | | | 5-year | 10-year |
| Class A1 | 11.33 | 6.94 | 11.36 | | | 39.87 | 193.16 |
| Class C1 | 15.33 | 7.28 | 11.51 | | | 42.08 | 197.36 |
| Class I1,2 | 17.49 | 8.36 | 12.10 | | | 49.42 | 213.44 |
| Class R11,2 | 16.73 | 7.78 | 11.79 | | | 45.43 | 204.71 |
| Class R21,2 | 17.23 | 8.14 | 11.99 | | | 47.92 | 210.17 |
| Class R31,2 | 16.98 | 7.90 | 11.85 | | | 46.25 | 206.43 |
| Class R41,2 | 17.45 | 8.30 | 12.07 | | | 49.01 | 212.48 |
| Class R61,2 | 17.62 | 8.46 | 12.16 | | | 50.08 | 214.96 |
| Class 12 | 17.62 | 8.44 | 12.12 | | | 49.92 | 213.82 |
| Index 1† | 17.28 | 10.45 | 14.08 | | | 64.40 | 273.40 |
| Index 2† | 6.02 | 7.65 | 11.53 | | | 44.57 | 197.75 |
Performance figures assume all distributions are reinvested. Figures reflect maximum sales charges on Class A shares of 5% and the applicable contingent deferred sales charge (CDSC) on Class C shares. Class C shares held for less than one year are subject to a 1% CDSC. Sales charges are not applicable to Class I, Class R1, Class R2, Class R3, Class R4, Class R6 and Class 1.
The expense ratios of the fund, both net (including any fee waivers and/or expense limitations) and gross (excluding any fee waivers and/or expense limitations), are set forth according to the most recent publicly available prospectuses for the fund and may differ from those disclosed in the Financial highlights tables in this report. Net expenses reflect contractual expense limitations in effect until December 31, 2020 and are subject to change. Had the contractual fee waivers and expense limitations not been in place, gross expenses would apply. The expense ratios are as follows:
| | | | | | | | | | |
| | Class A | Class C | Class I | Class R1 | Class R2 | Class R3 | Class R4 | Class R6 | Class 1 | |
| Gross (%) | 1.20 | 1.95 | 0.95 | 1.59 | 1.34 | 1.49 | 1.19 | 0.84 | 0.88 | |
| Net (%) | 1.19 | 1.94 | 0.94 | 1.58 | 1.33 | 1.48 | 1.08 | 0.83 | 0.87 | |
Please refer to the most recent prospectus and annual or semiannual report for more information on expenses and any expense limitation arrangements for each class.
The returns reflect past results and should not be considered indicative of future performance. The return and principal value of an investment will fluctuate so that shares, when redeemed, may be worth more or less than their original cost. Due to market volatility and other factors, the fund's current performance may be higher or lower than the performance shown. For current to the most recent month-end performance data, please call 800-225-5291 or visit the fund's website at jhinvestments.com.
The performance table above and the chart on the next page do not reflect the deduction of taxes that a shareholder would pay on fund distributions or the redemption of fund shares. The fund's performance results reflect any applicable fee waivers or expense reductions, without which the expenses would increase and results would have been less favorable.
| † | Index 1 is the Russell 2000 Growth Index; Index 2 is the Russell 2000 Index. |
See the following page for footnotes.
ANNUAL REPORT | JOHN HANCOCK NEW OPPORTUNITIES FUND 6
This chart and table show what happened to a hypothetical $10,000 investment in John Hancock New Opportunities Fund for the share classes and periods indicated, assuming all distributions were reinvested. For comparison, we've shown the same investment in two separate indexes.
| | | | | | |
| | Start date | With maximum
sales charge ($) | Without
sales charge ($) | Index 1 ($) | Index 2 ($) |
| Class C1,3 | 8-31-10 | 29,736 | 29,736 | 37,340 | 29,775 |
| Class I1,2 | 8-31-10 | 31,344 | 31,344 | 37,340 | 29,775 |
| Class R11,2 | 8-31-10 | 30,471 | 30,471 | 37,340 | 29,775 |
| Class R21,2 | 8-31-10 | 31,017 | 31,017 | 37,340 | 29,775 |
| Class R31,2 | 8-31-10 | 30,643 | 30,643 | 37,340 | 29,775 |
| Class R41,2 | 8-31-10 | 31,248 | 31,248 | 37,340 | 29,775 |
| Class R61,2 | 8-31-10 | 31,496 | 31,496 | 37,340 | 29,775 |
| Class 12 | 8-31-10 | 31,382 | 31,382 | 37,340 | 29,775 |
The Russell 2000 Growth Index tracks the performance of publicly traded small-cap companies in the United States with higher price-to-book ratios and higher forecasted growth values.
The Russell 2000 Index is an unmanaged index composed of 2,000 U.S. small capitalization stocks.
It is not possible to invest directly in an index. Index figures do not reflect expenses or sales charges, which would result in lower returns.
Prior to September 6, 2019, the fund's primary benchmark was the Russell 2000 Index. Effective September 6, 2019, the fund's primary benchmark index is the Russell 2000 Growth Index. The Russell 2000 Growth Index better reflects the universe of investment opportunities based on the fund's current investment strategy.
Footnotes related to performance pages
| 1 | Class A, Class C, Class I, Class R1, Class R2, Class R3, Class R4, and Class R6 shares were first offered on 5-27-15. The returns prior to this date are those of Class NAV shares that have not been adjusted for class-specific expenses; otherwise, returns would vary. Class NAV shares ceased operations on 3-13-19. |
| 2 | For certain type of investors as described in the fund's prospectuses. |
| 3 | The contingent deferred sales charge is not applicable. |
ANNUAL REPORT | JOHN HANCOCK NEW OPPORTUNITIES FUND 7
These examples are intended to help you understand your ongoing operating expenses of investing in the fund so you can compare these costs with the ongoing costs of investing in other mutual funds.
Understanding fund expenses
As a shareholder of the fund, you incur two types of costs:
■Transaction costs, which include sales charges (loads) on purchases or redemptions (varies by share class), minimum account fee charge, etc.
■Ongoing operating expenses, including management fees, distribution and service fees (if applicable), and other fund expenses.
We are presenting only your ongoing operating expenses here.
Actual expenses/actual returns
The first line of each share class in the table on the following page is intended to provide information about the fund’s actual ongoing operating expenses, and is based on the fund’s actual return. It assumes an account value of $1,000.00 on March 1, 2020, with the same investment held until August 31, 2020.
Together with the value of your account, you may use this information to estimate the operating expenses that you paid over the period. Simply divide your account value at August 31, 2020, by $1,000.00, then multiply it by the “expenses paid” for your share class from the table. For example, for an account value of $8,600.00, the operating expenses should be calculated as follows:
Hypothetical example for comparison purposes
The second line of each share class in the table on the following page allows you to compare the fund’s ongoing operating expenses with those of any other fund. It provides an example of the fund’s hypothetical account values and hypothetical expenses based on each class’s actual expense ratio and an assumed 5% annualized return before expenses (which is not the class’s actual return). It assumes an account value of $1,000.00 on March 1, 2020, with the same investment held until August 31, 2020. Look in any other fund shareholder report to find its hypothetical example and you will be able to compare these expenses. Please remember that these hypothetical account values and expenses may not be used to estimate the actual ending account balance or expenses you paid for the period.
| 8 | JOHN HANCOCK NEW OPPORTUNITIES FUND | ANNUAL REPORT | |
Remember, these examples do not include any transaction costs, therefore, these examples will not help you to determine the relative total costs of owning different funds. If transaction costs were included, your expenses would have been higher. See the prospectuses for details regarding transaction costs.
SHAREHOLDER EXPENSE EXAMPLE CHART
| | | Account
value on
3-1-2020 | Ending
value on
8-31-2020 | Expenses
paid during
period ended
8-31-20201 | Annualized
expense
ratio |
| Class A | Actual expenses/actual returns | $1,000.00 | $1,199.00 | $ 6.96 | 1.26% |
| | Hypothetical example | 1,000.00 | 1,018.80 | 6.39 | 1.26% |
| Class C | Actual expenses/actual returns | 1,000.00 | 1,194.70 | 11.09 | 2.01% |
| | Hypothetical example | 1,000.00 | 1,015.00 | 10.18 | 2.01% |
| Class I | Actual expenses/actual returns | 1,000.00 | 1,200.30 | 5.59 | 1.01% |
| | Hypothetical example | 1,000.00 | 1,020.10 | 5.13 | 1.01% |
| Class R1 | Actual expenses/actual returns | 1,000.00 | 1,196.20 | 9.11 | 1.65% |
| | Hypothetical example | 1,000.00 | 1,016.80 | 8.36 | 1.65% |
| Class R2 | Actual expenses/actual returns | 1,000.00 | 1,198.80 | 6.69 | 1.21% |
| | Hypothetical example | 1,000.00 | 1,019.10 | 6.14 | 1.21% |
| Class R3 | Actual expenses/actual returns | 1,000.00 | 1,198.10 | 7.85 | 1.42% |
| | Hypothetical example | 1,000.00 | 1,018.00 | 7.20 | 1.42% |
| Class R4 | Actual expenses/actual returns | 1,000.00 | 1,199.90 | 5.75 | 1.04% |
| | Hypothetical example | 1,000.00 | 1,019.90 | 5.28 | 1.04% |
| Class R6 | Actual expenses/actual returns | 1,000.00 | 1,201.10 | 4.92 | 0.89% |
| | Hypothetical example | 1,000.00 | 1,020.70 | 4.52 | 0.89% |
| Class 1 | Actual expenses/actual returns | 1,000.00 | 1,200.80 | 5.14 | 0.93% |
| | Hypothetical example | 1,000.00 | 1,020.50 | 4.72 | 0.93% |
| 1 | Expenses are equal to the annualized expense ratio, multiplied by the average account value over the period, multiplied by 184/366 (to reflect the one-half year period). |
| | ANNUAL REPORT | JOHN HANCOCK NEW OPPORTUNITIES FUND | 9 |
AS OF 8-31-20
| | | | | Shares | Value |
| Common stocks 99.2% | | | | | $316,480,539 |
| (Cost $237,768,752) | | | | | |
| Consumer discretionary 14.4% | | | 45,879,682 |
| Auto components 3.2% | | | |
| Dorman Products, Inc. (A) | | | 32,681 | 2,767,754 |
| Fox Factory Holding Corp. (A) | | | 75,224 | 7,583,331 |
| Distributors 1.7% | | | |
| Pool Corp. | | | 16,396 | 5,375,265 |
| Diversified consumer services 2.1% | | | |
| Grand Canyon Education, Inc. (A) | | | 69,940 | 6,577,158 |
| Hotels, restaurants and leisure 2.6% | | | |
| Churchill Downs, Inc. | | | 28,238 | 4,934,873 |
| Chuy's Holdings, Inc. (A) | | | 156,858 | 3,488,522 |
| Multiline retail 1.0% | | | |
| Ollie's Bargain Outlet Holdings, Inc. (A) | | | 34,482 | 3,294,410 |
| Specialty retail 3.2% | | | |
| Five Below, Inc. (A) | | | 45,023 | 4,927,767 |
| Lithia Motors, Inc., Class A | | | 20,544 | 5,114,634 |
| Textiles, apparel and luxury goods 0.6% | | | |
| Oxford Industries, Inc. | | | 36,664 | 1,815,968 |
| Consumer staples 1.8% | | | 5,614,970 |
| Food and staples retailing 1.8% | | | |
| Performance Food Group Company (A) | | | 101,506 | 3,705,984 |
| PriceSmart, Inc. | | | 29,034 | 1,908,986 |
| Financials 5.6% | | | 17,889,278 |
| Banks 2.2% | | | |
| Ameris Bancorp | | | 104,078 | 2,551,993 |
| Atlantic Union Bankshares Corp. | | | 76,272 | 1,774,087 |
| Pinnacle Financial Partners, Inc. | | | 70,834 | 2,829,818 |
| Capital markets 2.1% | | | |
| Houlihan Lokey, Inc. | | | 79,967 | 4,686,066 |
| Stifel Financial Corp. | | | 37,734 | 1,913,491 |
| Consumer finance 0.9% | | | |
| Encore Capital Group, Inc. (A) | | | 65,640 | 3,015,502 |
| Diversified financial services 0.0% | | | |
| NewStar Financial, Inc. (A)(B) | | | 16,196 | 1,646 |
| Insurance 0.4% | | | |
| Heritage Insurance Holdings, Inc. | | | 85,569 | 1,116,675 |
| 10 | JOHN HANCOCK NEW OPPORTUNITIES FUND | ANNUAL REPORT | SEE NOTES TO FINANCIAL STATEMENTS |
| | | | | Shares | Value |
| Health care 32.9% | | | $104,932,610 |
| Biotechnology 12.1% | | | |
| Aimmune Therapeutics, Inc. (A) | | | 164,303 | 5,622,449 |
| Amicus Therapeutics, Inc. (A) | | | 242,588 | 3,541,785 |
| Arena Pharmaceuticals, Inc. (A) | | | 57,825 | 4,037,342 |
| Biohaven Pharmaceutical Holding Company, Ltd. (A) | | | 51,792 | 3,283,095 |
| Emergent BioSolutions, Inc. (A) | | | 59,100 | 6,740,355 |
| Global Blood Therapeutics, Inc. (A) | | | 50,387 | 3,163,296 |
| Oyster Point Pharma, Inc. (A) | | | 83,939 | 1,910,452 |
| Retrophin, Inc. (A) | | | 183,666 | 3,598,017 |
| Veracyte, Inc. (A) | | | 120,643 | 4,018,618 |
| Vericel Corp. (A) | | | 181,753 | 2,880,785 |
| Health care equipment and supplies 8.2% | | | |
| AtriCure, Inc. (A) | | | 91,452 | 4,090,648 |
| Cardiovascular Systems, Inc. (A) | | | 98,044 | 3,203,097 |
| CryoLife, Inc. (A) | | | 150,857 | 3,050,329 |
| Globus Medical, Inc., Class A (A) | | | 61,246 | 3,461,624 |
| Haemonetics Corp. (A) | | | 21,591 | 1,935,849 |
| ICU Medical, Inc. (A) | | | 18,251 | 3,654,580 |
| Integra LifeSciences Holdings Corp. (A) | | | 65,184 | 3,115,143 |
| Quidel Corp. (A) | | | 20,008 | 3,520,608 |
| Health care providers and services 3.3% | | | |
| Acadia Healthcare Company, Inc. (A) | | | 47,542 | 1,469,523 |
| HealthEquity, Inc. (A) | | | 76,890 | 4,419,637 |
| LHC Group, Inc. (A) | | | 22,881 | 4,769,316 |
| MedCath Corp. (A)(B) | | | 4,104 | 2,052 |
| Health care technology 0.8% | | | |
| HMS Holdings Corp. (A) | | | 86,948 | 2,424,980 |
| Life sciences tools and services 1.8% | | | |
| Syneos Health, Inc. (A) | | | 90,174 | 5,689,979 |
| Pharmaceuticals 6.7% | | | |
| Catalent, Inc. (A) | | | 77,926 | 7,208,155 |
| GW Pharmaceuticals PLC, ADR (A) | | | 30,154 | 3,134,508 |
| Horizon Therapeutics PLC (A) | | | 81,704 | 6,137,604 |
| Supernus Pharmaceuticals, Inc. (A) | | | 113,104 | 2,487,157 |
| Zogenix, Inc. (A) | | | 99,773 | 2,361,627 |
| Industrials 16.7% | | | 53,202,450 |
| Building products 1.6% | | | |
| Gibraltar Industries, Inc. (A) | | | 63,932 | 3,992,234 |
| JELD-WEN Holding, Inc. (A) | | | 58,526 | 1,231,972 |
| Commercial services and supplies 2.2% | | | |
| Ritchie Brothers Auctioneers, Inc. | | | 122,229 | 7,144,285 |
| SEE NOTES TO FINANCIAL STATEMENTS | ANNUAL REPORT | JOHN HANCOCK NEW OPPORTUNITIES FUND | 11 |
| | | | | Shares | Value |
| Industrials (continued) | | | |
| Construction and engineering 0.5% | | | |
| Dycom Industries, Inc. (A) | | | 24,620 | $1,514,376 |
| Electrical equipment 0.5% | | | |
| Thermon Group Holdings, Inc. (A) | | | 107,072 | 1,409,068 |
| Machinery 6.5% | | | |
| Alamo Group, Inc. | | | 23,828 | 2,642,525 |
| Helios Technologies, Inc. | | | 40,825 | 1,678,316 |
| John Bean Technologies Corp. | | | 33,755 | 3,460,225 |
| RBC Bearings, Inc. (A) | | | 32,360 | 4,272,814 |
| The Shyft Group, Inc. | | | 250,572 | 5,003,923 |
| Woodward, Inc. | | | 43,990 | 3,769,503 |
| Professional services 2.5% | | | |
| Exponent, Inc. | | | 64,449 | 5,185,244 |
| Forrester Research, Inc. (A) | | | 73,840 | 2,618,366 |
| Road and rail 0.8% | | | |
| Knight-Swift Transportation Holdings, Inc. | | | 58,754 | 2,670,957 |
| Trading companies and distributors 2.1% | | | |
| SiteOne Landscape Supply, Inc. (A) | | | 52,848 | 6,608,642 |
| Information technology 19.9% | | | 63,672,976 |
| Communications equipment 0.9% | | | |
| Viavi Solutions, Inc. (A) | | | 220,525 | 2,940,701 |
| Electronic equipment, instruments and components 0.8% | | | |
| Rogers Corp. (A) | | | 23,346 | 2,645,335 |
| IT services 2.3% | | | |
| CACI International, Inc., Class A (A) | | | 15,683 | 3,672,802 |
| Virtusa Corp. (A) | | | 92,195 | 3,645,390 |
| Semiconductors and semiconductor equipment 4.7% | | | |
| Cabot Microelectronics Corp. | | | 18,758 | 2,856,656 |
| Entegris, Inc. | | | 59,240 | 3,962,564 |
| MACOM Technology Solutions Holdings, Inc. (A) | | | 76,483 | 2,725,089 |
| Power Integrations, Inc. | | | 52,515 | 2,939,265 |
| Silicon Laboratories, Inc. (A) | | | 23,770 | 2,434,286 |
| Software 11.2% | | | |
| Bottomline Technologies DE, Inc. (A) | | | 46,744 | 2,226,417 |
| Cerence, Inc. (A) | | | 75,949 | 4,040,487 |
| HubSpot, Inc. (A) | | | 25,350 | 7,596,804 |
| Mimecast, Ltd. (A) | | | 124,226 | 6,116,888 |
| Paylocity Holding Corp. (A) | | | 43,858 | 6,458,091 |
| Rapid7, Inc. (A) | | | 86,575 | 5,590,148 |
| The Descartes Systems Group, Inc. (A) | | | 62,708 | 3,822,053 |
| 12 | JOHN HANCOCK NEW OPPORTUNITIES FUND | ANNUAL REPORT | SEE NOTES TO FINANCIAL STATEMENTS |
| | | | | Shares | Value |
| Materials 3.3% | | | $10,439,033 |
| Chemicals 3.3% | | | |
| Avient Corp. | | | 139,946 | 3,571,422 |
| Balchem Corp. | | | 38,691 | 3,780,111 |
| Quaker Chemical Corp. | | | 16,250 | 3,087,500 |
| Real estate 4.6% | | | 14,849,540 |
| Equity real estate investment trusts 4.6% | | | |
| Easterly Government Properties, Inc. | | | 123,239 | 2,981,151 |
| QTS Realty Trust, Inc., Class A | | | 92,490 | 6,272,672 |
| STAG Industrial, Inc. | | | 173,242 | 5,595,717 |
|
| | | Yield (%) | | Shares | Value |
| Short-term investments 0.9% | | | | | $2,964,678 |
| (Cost $2,964,678) | | | | | |
| Short-term funds 0.9% | | | | | 2,964,678 |
| State Street Institutional Treasury Money Market Fund, Premier Class | 0.0335(C) | | 2,964,678 | 2,964,678 |
|
| Total investments (Cost $240,733,430) 100.1% | | | $319,445,217 |
| Other assets and liabilities, net (0.1%) | | | | (186,655) |
| Total net assets 100.0% | | | | | $319,258,562 |
| The percentage shown for each investment category is the total value of the category as a percentage of the net assets of the fund. |
| Security Abbreviations and Legend |
| ADR | American Depositary Receipt |
| (A) | Non-income producing security. |
| (B) | Security is valued using significant unobservable inputs and is classified as Level 3 in the fair value hierarchy. Refer to Note 2 to the financial statements. |
| (C) | The rate shown is the annualized seven-day yield as of 8-31-20. |
At 8-31-20, the aggregate cost of investments for federal income tax purposes was $241,393,310. Net unrealized appreciation aggregated to $78,051,907, of which $89,242,512 related to gross unrealized appreciation and $11,190,605 related to gross unrealized depreciation.
| SEE NOTES TO FINANCIAL STATEMENTS | ANNUAL REPORT | JOHN HANCOCK NEW OPPORTUNITIES FUND | 13 |
STATEMENT OF ASSETS AND LIABILITIES 8-31-20
| Assets | |
| Unaffiliated investments, at value (Cost $240,733,430) | $319,445,217 |
| Dividends and interest receivable | 97,849 |
| Receivable for fund shares sold | 25,131 |
| Other assets | 71,120 |
| Total assets | 319,639,317 |
| Liabilities | |
| Due to custodian | 5,869 |
| Payable for fund shares repurchased | 213,635 |
| Payable to affiliates | |
| Accounting and legal services fees | 17,962 |
| Transfer agent fees | 30,543 |
| Distribution and service fees | 101 |
| Trustees' fees | 164 |
| Other liabilities and accrued expenses | 112,481 |
| Total liabilities | 380,755 |
| Net assets | $319,258,562 |
| Net assets consist of | |
| Paid-in capital | $250,006,546 |
| Total distributable earnings (loss) | 69,252,016 |
| Net assets | $319,258,562 |
| |
| Net asset value per share | |
| Based on net asset value and shares outstanding - the fund has an unlimited number of shares authorized with no par value | |
| Class A ($271,757,071 ÷ 10,792,754 shares)1 | $25.18 |
| Class C ($3,585,447 ÷ 148,668 shares)1 | $24.12 |
| Class I ($9,907,245 ÷ 391,670 shares) | $25.29 |
| Class R1 ($449,280 ÷ 18,056 shares) | $24.88 |
| Class R2 ($55,959 ÷ 2,219 shares) | $25.21 2 |
| Class R3 ($88,069 ÷ 3,518 shares) | $25.04 3 |
| Class R4 ($59,543 ÷ 2,356 shares) | $25.27 |
| Class R6 ($225,531 ÷ 8,907 shares) | $25.32 |
| Class 1 ($33,130,417 ÷ 1,297,842 shares) | $25.53 |
| Maximum offering price per share | |
| Class A (net asset value per share ÷ 95%)4 | $26.51 |
| 1 | Redemption price per share is equal to net asset value less any applicable contingent deferred sales charge. |
| 2 | Net asset value, offering price and redemption price per share of $25.21 is calculated using Net assets of $55,958.71 and Shares outstanding of 2,219.288. |
| 3 | Net asset value, offering price and redemption price per share of $25.04 is calculated using Net assets of $88,068.69 and Shares outstanding of 3,517.697. |
| 4 | On single retail sales of less than $50,000. On sales of $50,000 or more and on group sales the offering price is reduced. |
| 14 | JOHN HANCOCK New Opportunities Fund | ANNUAL REPORT | SEE NOTES TO FINANCIAL STATEMENTS |
STATEMENT OF OPERATIONS For the year ended 8-31-20
| Investment income | |
| Dividends | $1,478,916 |
| Interest | 52,039 |
| Less foreign taxes withheld | (16,086) |
| Total investment income | 1,514,869 |
| Expenses | |
| Investment management fees | 2,186,041 |
| Distribution and service fees | 685,575 |
| Accounting and legal services fees | 51,537 |
| Transfer agent fees | 333,849 |
| Trustees' fees | 5,156 |
| Custodian fees | 65,797 |
| State registration fees | 118,357 |
| Printing and postage | 69,412 |
| Professional fees | 126,249 |
| Other | 26,752 |
| Total expenses | 3,668,725 |
| Less expense reductions | (116,836) |
| Net expenses | 3,551,889 |
| Net investment loss | (2,037,020) |
| Realized and unrealized gain (loss) | |
| Net realized gain (loss) on | |
| Unaffiliated investments | 1,134,565 |
| | 1,134,565 |
| Change in net unrealized appreciation (depreciation) of | |
| Unaffiliated investments | 48,313,193 |
| | 48,313,193 |
| Net realized and unrealized gain | 49,447,758 |
| Increase in net assets from operations | $47,410,738 |
| SEE NOTES TO FINANCIAL STATEMENTS | ANNUAL REPORT | JOHN HANCOCK NEW OPPORTUNITIES FUND | 15 |
STATEMENTS OF CHANGES IN NET ASSETS
| | Year ended
8-31-20 | Year ended
8-31-19 |
| Increase (decrease) in net assets | | |
| From operations | | |
| Net investment income (loss) | $(2,037,020) | $854,313 |
| Net realized gain | 1,134,565 | 23,214,100 |
| Change in net unrealized appreciation (depreciation) | 48,313,193 | (109,920,422) |
| Increase (decrease) in net assets resulting from operations | 47,410,738 | (85,852,009) |
| Distributions to shareholders | | |
| From earnings | | |
| Class A | (8,902,622) | (46,343,706) |
| Class C | (142,651) | (1,235,586) |
| Class I | (342,902) | (1,987,882) |
| Class R1 | (13,318) | (57,184) |
| Class R2 | (1,716) | (9,002) |
| Class R3 | (2,771) | (12,095) |
| Class R4 | (1,758) | (7,668) |
| Class R51 | — | (7,341) |
| Class R6 | (4,472) | (237,404) |
| Class 1 | (1,162,716) | (7,701,038) |
| Class NAV1 | — | (25,256,897) |
| Total distributions | (10,574,926) | (82,855,803) |
| From fund share transactions | (38,433,584) | (130,280,622) |
| Total decrease | (1,597,772) | (298,988,434) |
| Net assets | | |
| Beginning of year | 320,856,334 | 619,844,768 |
| End of year | $319,258,562 | $320,856,334 |
| 1 | Class R5 and Class NAV shares were fully redeemed on 10-29-19 and 03-13-19, respectively. |
| 16 | JOHN HANCOCK New Opportunities Fund | ANNUAL REPORT | SEE NOTES TO FINANCIAL STATEMENTS |
| CLASS A SHARES Period ended | 8-31-20 | 8-31-19 | 8-31-18 | 8-31-17 | 8-31-16 |
| Per share operating performance | | | | | |
| Net asset value, beginning of period | $22.20 | $31.99 | $27.28 | $24.38 | $25.43 |
| Net investment income (loss)1 | (0.16) | 0.02 | 0.01 | 0.01 | 0.01 |
| Net realized and unrealized gain (loss) on investments | 3.92 | (5.49) | 6.75 | 2.98 | 1.15 |
| Total from investment operations | 3.76 | (5.47) | 6.76 | 2.99 | 1.16 |
| Less distributions | | | | | |
| From net investment income | — | (0.01) | (0.03) | (0.02) | — |
| From net realized gain | (0.78) | (4.31) | (2.02) | (0.07) | (2.21) |
| Total distributions | (0.78) | (4.32) | (2.05) | (0.09) | (2.21) |
| Net asset value, end of period | $25.18 | $22.20 | $31.99 | $27.28 | $24.38 |
| Total return (%)2,3 | 17.20 | (15.32) | 25.66 | 12.27 | 5.17 |
| Ratios and supplemental data | | | | | |
| Net assets, end of period (in millions) | $272 | $264 | $352 | $297 | $299 |
| Ratios (as a percentage of average net assets): | | | | | |
| Expenses before reductions | 1.26 | 1.42 | 1.40 | 1.42 | 1.54 |
| Expenses including reductions | 1.22 | 1.20 | 1.20 | 1.21 | 1.22 |
| Net investment income (loss) | (0.72) | 0.08 | 0.02 | 0.05 | 0.06 |
| Portfolio turnover (%) | 25 | 73 | 52 | 41 | 49 4 |
| 1 | Based on average daily shares outstanding. |
| 2 | Total returns would have been lower had certain expenses not been reduced during the applicable periods. |
| 3 | Does not reflect the effect of sales charges, if any. |
| 4 | Excludes merger activity. |
| SEE NOTES TO FINANCIAL STATEMENTS | ANNUAL REPORT | JOHN HANCOCK NEW OPPORTUNITIES FUND | 17 |
| CLASS C SHARES Period ended | 8-31-20 | 8-31-19 | 8-31-18 | 8-31-17 | 8-31-16 |
| Per share operating performance | | | | | |
| Net asset value, beginning of period | $21.45 | $31.27 | $26.86 | $24.15 | $25.39 |
| Net investment loss1 | (0.31) | (0.15) | (0.19) | (0.17) | (0.15) |
| Net realized and unrealized gain (loss) on investments | 3.76 | (5.36) | 6.62 | 2.95 | 1.12 |
| Total from investment operations | 3.45 | (5.51) | 6.43 | 2.78 | 0.97 |
| Less distributions | | | | | |
| From net realized gain | (0.78) | (4.31) | (2.02) | (0.07) | (2.21) |
| Net asset value, end of period | $24.12 | $21.45 | $31.27 | $26.86 | $24.15 |
| Total return (%)2,3 | 16.33 | (15.90) | 24.76 | 11.52 | 4.38 |
| Ratios and supplemental data | | | | | |
| Net assets, end of period (in millions) | $4 | $4 | $9 | $20 | $21 |
| Ratios (as a percentage of average net assets): | | | | | |
| Expenses before reductions | 2.01 | 2.13 | 2.10 | 2.12 | 2.24 |
| Expenses including reductions | 1.97 | 1.91 | 1.90 | 1.91 | 1.93 |
| Net investment loss | (1.47) | (0.63) | (0.68) | (0.65) | (0.64) |
| Portfolio turnover (%) | 25 | 73 | 52 | 41 | 49 4 |
| 1 | Based on average daily shares outstanding. |
| 2 | Total returns would have been lower had certain expenses not been reduced during the applicable periods. |
| 3 | Does not reflect the effect of sales charges, if any. |
| 4 | Excludes merger activity. |
| 18 | JOHN HANCOCK New Opportunities Fund | ANNUAL REPORT | SEE NOTES TO FINANCIAL STATEMENTS |
| CLASS I SHARES Period ended | 8-31-20 | 8-31-19 | 8-31-18 | 8-31-17 | 8-31-16 |
| Per share operating performance | | | | | |
| Net asset value, beginning of period | $22.24 | $32.07 | $27.33 | $24.41 | $25.45 |
| Net investment income (loss)1 | (0.10) | 0.09 | 0.09 | 0.10 | 0.09 |
| Net realized and unrealized gain (loss) on investments | 3.93 | (5.51) | 6.78 | 2.98 | 1.15 |
| Total from investment operations | 3.83 | (5.42) | 6.87 | 3.08 | 1.24 |
| Less distributions | | | | | |
| From net investment income | — | (0.10) | (0.11) | (0.09) | (0.07) |
| From net realized gain | (0.78) | (4.31) | (2.02) | (0.07) | (2.21) |
| Total distributions | (0.78) | (4.41) | (2.13) | (0.16) | (2.28) |
| Net asset value, end of period | $25.29 | $22.24 | $32.07 | $27.33 | $24.41 |
| Total return (%)2 | 17.49 | (15.08) | 26.06 | 12.61 | 5.50 |
| Ratios and supplemental data | | | | | |
| Net assets, end of period (in millions) | $10 | $10 | $15 | $11 | $9 |
| Ratios (as a percentage of average net assets): | | | | | |
| Expenses before reductions | 1.01 | 1.14 | 1.11 | 1.11 | 1.23 |
| Expenses including reductions | 0.97 | 0.90 | 0.90 | 0.90 | 0.92 |
| Net investment income (loss) | (0.46) | 0.38 | 0.32 | 0.38 | 0.37 |
| Portfolio turnover (%) | 25 | 73 | 52 | 41 | 49 3 |
| 1 | Based on average daily shares outstanding. |
| 2 | Total returns would have been lower had certain expenses not been reduced during the applicable periods. |
| 3 | Excludes merger activity. |
| SEE NOTES TO FINANCIAL STATEMENTS | ANNUAL REPORT | JOHN HANCOCK NEW OPPORTUNITIES FUND | 19 |
| CLASS R1 SHARES Period ended | 8-31-20 | 8-31-19 | 8-31-18 | 8-31-17 | 8-31-16 |
| Per share operating performance | | | | | |
| Net asset value, beginning of period | $22.03 | $31.86 | $27.24 | $24.35 | $25.42 |
| Net investment loss1 | (0.24) | (0.07) | (0.09) | (0.01) | (0.02) |
| Net realized and unrealized gain (loss) on investments | 3.87 | (5.45) | 6.74 | 2.97 | 1.16 |
| Total from investment operations | 3.63 | (5.52) | 6.65 | 2.96 | 1.14 |
| Less distributions | | | | | |
| From net investment income | — | — | (0.01) | — | — |
| From net realized gain | (0.78) | (4.31) | (2.02) | (0.07) | (2.21) |
| Total distributions | (0.78) | (4.31) | (2.03) | (0.07) | (2.21) |
| Net asset value, end of period | $24.88 | $22.03 | $31.86 | $27.24 | $24.35 |
| Total return (%)2 | 16.73 | (15.60) | 25.23 | 12.16 | 5.09 |
| Ratios and supplemental data | | | | | |
| Net assets, end of period (in millions) | $— 3 | $— 3 | $— 3 | $— 3 | $— 3 |
| Ratios (as a percentage of average net assets): | | | | | |
| Expenses before reductions | 1.65 | 1.77 | 1.72 | 1.52 | 1.64 |
| Expenses including reductions | 1.61 | 1.55 | 1.52 | 1.31 | 1.42 |
| Net investment loss | (1.11) | (0.27) | (0.29) | (0.04) | (0.07) |
| Portfolio turnover (%) | 25 | 73 | 52 | 41 | 49 4 |
| 1 | Based on average daily shares outstanding. |
| 2 | Total returns would have been lower had certain expenses not been reduced during the applicable periods. |
| 3 | Less than $500,000. |
| 4 | Excludes merger activity. |
| 20 | JOHN HANCOCK New Opportunities Fund | ANNUAL REPORT | SEE NOTES TO FINANCIAL STATEMENTS |
| CLASS R2 SHARES Period ended | 8-31-20 | 8-31-19 | 8-31-18 | 8-31-17 | 8-31-16 |
| Per share operating performance | | | | | |
| Net asset value, beginning of period | $22.22 | $32.02 | $27.30 | $24.41 | $25.44 |
| Net investment income (loss)1 | (0.15) | 0.04 | 0.04 | 0.03 | 0.04 |
| Net realized and unrealized gain (loss) on investments | 3.92 | (5.49) | 6.76 | 2.98 | 1.16 |
| Total from investment operations | 3.77 | (5.45) | 6.80 | 3.01 | 1.20 |
| Less distributions | | | | | |
| From net investment income | — | (0.04) | (0.06) | (0.05) | (0.02) |
| From net realized gain | (0.78) | (4.31) | (2.02) | (0.07) | (2.21) |
| Total distributions | (0.78) | (4.35) | (2.08) | (0.12) | (2.23) |
| Net asset value, end of period | $25.21 | $22.22 | $32.02 | $27.30 | $24.41 |
| Total return (%)2 | 17.23 | (15.23) | 25.78 | 12.34 | 5.34 |
| Ratios and supplemental data | | | | | |
| Net assets, end of period (in millions) | $— 3 | $— 3 | $— 3 | $— 3 | $— 3 |
| Ratios (as a percentage of average net assets): | | | | | |
| Expenses before reductions | 1.22 | 1.33 | 1.29 | 1.33 | 1.39 |
| Expenses including reductions | 1.18 | 1.11 | 1.09 | 1.12 | 1.17 |
| Net investment income (loss) | (0.67) | 0.18 | 0.14 | 0.13 | 0.17 |
| Portfolio turnover (%) | 25 | 73 | 52 | 41 | 49 4 |
| 1 | Based on average daily shares outstanding. |
| 2 | Total returns would have been lower had certain expenses not been reduced during the applicable periods. |
| 3 | Less than $500,000. |
| 4 | Excludes merger activity. |
| SEE NOTES TO FINANCIAL STATEMENTS | ANNUAL REPORT | JOHN HANCOCK NEW OPPORTUNITIES FUND | 21 |
| CLASS R3 SHARES Period ended | 8-31-20 | 8-31-19 | 8-31-18 | 8-31-17 | 8-31-16 |
| Per share operating performance | | | | | |
| Net asset value, beginning of period | $22.12 | $31.92 | $27.23 | $24.35 | $25.42 |
| Net investment loss1 | (0.20) | (0.03) | (0.03) | (0.01) | (0.02) |
| Net realized and unrealized gain (loss) on investments | 3.90 | (5.46) | 6.74 | 2.96 | 1.16 |
| Total from investment operations | 3.70 | (5.49) | 6.71 | 2.95 | 1.14 |
| Less distributions | | | | | |
| From net investment income | — | — | — 2 | — | — |
| From net realized gain | (0.78) | (4.31) | (2.02) | (0.07) | (2.21) |
| Total distributions | (0.78) | (4.31) | (2.02) | (0.07) | (2.21) |
| Net asset value, end of period | $25.04 | $22.12 | $31.92 | $27.23 | $24.35 |
| Total return (%)3 | 16.98 | (15.46) | 25.50 | 12.12 | 5.09 |
| Ratios and supplemental data | | | | | |
| Net assets, end of period (in millions) | $— 4 | $— 4 | $— 4 | $— 4 | $— 4 |
| Ratios (as a percentage of average net assets): | | | | | |
| Expenses before reductions | 1.46 | 1.61 | 1.53 | 1.53 | 1.64 |
| Expenses including reductions | 1.42 | 1.39 | 1.33 | 1.32 | 1.42 |
| Net investment loss | (0.92) | (0.11) | (0.10) | (0.06) | (0.07) |
| Portfolio turnover (%) | 25 | 73 | 52 | 41 | 49 5 |
| 1 | Based on average daily shares outstanding. |
| 2 | Less than $0.005 per share. |
| 3 | Total returns would have been lower had certain expenses not been reduced during the applicable periods. |
| 4 | Less than $500,000. |
| 5 | Excludes merger activity. |
| 22 | JOHN HANCOCK New Opportunities Fund | ANNUAL REPORT | SEE NOTES TO FINANCIAL STATEMENTS |
| CLASS R4 SHARES Period ended | 8-31-20 | 8-31-19 | 8-31-18 | 8-31-17 | 8-31-16 |
| Per share operating performance | | | | | |
| Net asset value, beginning of period | $22.23 | $32.05 | $27.34 | $24.41 | $25.44 |
| Net investment income (loss)1 | (0.11) | 0.08 | 0.08 | 0.12 | 0.07 |
| Net realized and unrealized gain (loss) on investments | 3.93 | (5.51) | 6.75 | 2.95 | 1.16 |
| Total from investment operations | 3.82 | (5.43) | 6.83 | 3.07 | 1.23 |
| Less distributions | | | | | |
| From net investment income | — | (0.08) | (0.10) | (0.07) | (0.05) |
| From net realized gain | (0.78) | (4.31) | (2.02) | (0.07) | (2.21) |
| Total distributions | (0.78) | (4.39) | (2.12) | (0.14) | (2.26) |
| Net asset value, end of period | $25.27 | $22.23 | $32.05 | $27.34 | $24.41 |
| Total return (%)2 | 17.45 | (15.11) | 25.92 | 12.55 | 5.46 |
| Ratios and supplemental data | | | | | |
| Net assets, end of period (in millions) | $— 3 | $— 3 | $— 3 | $1 | $— 3 |
| Ratios (as a percentage of average net assets): | | | | | |
| Expenses before reductions | 1.15 | 1.28 | 1.35 | 1.27 | 1.39 |
| Expenses including reductions | 1.01 | 0.96 | 0.96 | 0.95 | 1.07 |
| Net investment income (loss) | (0.51) | 0.33 | 0.27 | 0.46 | 0.28 |
| Portfolio turnover (%) | 25 | 73 | 52 | 41 | 49 4 |
| 1 | Based on average daily shares outstanding. |
| 2 | Total returns would have been lower had certain expenses not been reduced during the applicable periods. |
| 3 | Less than $500,000. |
| 4 | Excludes merger activity. |
| SEE NOTES TO FINANCIAL STATEMENTS | ANNUAL REPORT | JOHN HANCOCK NEW OPPORTUNITIES FUND | 23 |
| CLASS R6 SHARES Period ended | 8-31-20 | 8-31-19 | 8-31-18 | 8-31-17 | 8-31-16 |
| Per share operating performance | | | | | |
| Net asset value, beginning of period | $22.24 | $32.07 | $27.34 | $24.40 | $25.46 |
| Net investment income (loss)1 | (0.08) | 0.11 | 0.12 | 0.12 | 0.10 |
| Net realized and unrealized gain (loss) on investments | 3.94 | (5.51) | 6.77 | 2.99 | 1.14 |
| Total from investment operations | 3.86 | (5.40) | 6.89 | 3.11 | 1.24 |
| Less distributions | | | | | |
| From net investment income | — | (0.12) | (0.14) | (0.10) | (0.09) |
| From net realized gain | (0.78) | (4.31) | (2.02) | (0.07) | (2.21) |
| Total distributions | (0.78) | (4.43) | (2.16) | (0.17) | (2.30) |
| Net asset value, end of period | $25.32 | $22.24 | $32.07 | $27.34 | $24.40 |
| Total return (%)2 | 17.62 | (14.99) | 26.16 | 12.73 | 5.52 |
| Ratios and supplemental data | | | | | |
| Net assets, end of period (in millions) | $— 3 | $— 3 | $2 | $2 | $2 |
| Ratios (as a percentage of average net assets): | | | | | |
| Expenses before reductions | 0.90 | 1.03 | 1.00 | 1.02 | 1.14 |
| Expenses including reductions | 0.86 | 0.81 | 0.80 | 0.80 | 0.90 |
| Net investment income (loss) | (0.36) | 0.45 | 0.42 | 0.46 | 0.41 |
| Portfolio turnover (%) | 25 | 73 | 52 | 41 | 49 4 |
| 1 | Based on average daily shares outstanding. |
| 2 | Total returns would have been lower had certain expenses not been reduced during the applicable periods. |
| 3 | Less than $500,000. |
| 4 | Excludes merger activity. |
| 24 | JOHN HANCOCK New Opportunities Fund | ANNUAL REPORT | SEE NOTES TO FINANCIAL STATEMENTS |
| CLASS 1 SHARES Period ended | 8-31-20 | 8-31-19 | 8-31-18 | 8-31-17 | 8-31-16 |
| Per share operating performance | | | | | |
| Net asset value, beginning of period | $22.42 | $32.29 | $27.51 | $24.56 | $25.59 |
| Net investment income (loss)1 | (0.09) | 0.11 | 0.11 | 0.11 | 0.09 |
| Net realized and unrealized gain (loss) on investments | 3.98 | (5.56) | 6.82 | 3.01 | 1.17 |
| Total from investment operations | 3.89 | (5.45) | 6.93 | 3.12 | 1.26 |
| Less distributions | | | | | |
| From net investment income | — | (0.11) | (0.13) | (0.10) | (0.08) |
| From net realized gain | (0.78) | (4.31) | (2.02) | (0.07) | (2.21) |
| Total distributions | (0.78) | (4.42) | (2.15) | (0.17) | (2.29) |
| Net asset value, end of period | $25.53 | $22.42 | $32.29 | $27.51 | $24.56 |
| Total return (%)2 | 17.62 | (15.04) | 26.10 | 12.71 | 5.56 |
| Ratios and supplemental data | | | | | |
| Net assets, end of period (in millions) | $33 | $42 | $59 | $56 | $55 |
| Ratios (as a percentage of average net assets): | | | | | |
| Expenses before reductions | 0.94 | 1.06 | 1.04 | 1.05 | 1.17 |
| Expenses including reductions | 0.90 | 0.84 | 0.84 | 0.84 | 0.95 |
| Net investment income (loss) | (0.39) | 0.44 | 0.38 | 0.43 | 0.40 |
| Portfolio turnover (%) | 25 | 73 | 52 | 41 | 49 3 |
| 1 | Based on average daily shares outstanding. |
| 2 | Total returns would have been lower had certain expenses not been reduced during the applicable periods. |
| 3 | Excludes merger activity. |
| SEE NOTES TO FINANCIAL STATEMENTS | ANNUAL REPORT | JOHN HANCOCK NEW OPPORTUNITIES FUND | 25 |
Notes to financial statements
Note 1—Organization
John Hancock New Opportunities Fund (the fund) is a series of John Hancock Funds II (the Trust), an open-end management investment company organized as a Massachusetts business trust and registered under the Investment Company Act of 1940, as amended (the 1940 Act). The investment objective of the fund is to seek long-term capital appreciation.
The fund may offer multiple classes of shares. The shares currently outstanding are detailed in the Statement of assets and liabilities. Class A and Class C shares are offered to all investors. Class I shares are offered to institutions and certain investors. Class R1, Class R2, Class R3 and Class R4 shares are available only to certain retirement and 529 plans. Class R6 shares are only available to certain retirement plans, institutions and other investors. Class 1 shares are offered only to certain affiliates of Manulife Financial Corporation. Class C shares convert to Class A shares ten years after purchase (certain exclusions may apply). Shareholders of each class have exclusive voting rights to matters that affect that class. The distribution and service fees, if any, and transfer agent fees for each class may differ.
All Class R5 shares were redeemed on October 29, 2019.
On June 25, 2020, the Board of Trustees approved redesignations of the following share classes, on or about the dates indicated below:
| Redesignation | Expected effective date |
| Class R1 shares as Class R2 shares | October 23, 2020 |
| Class R3 shares as Class R2 shares | October 9, 2020 |
As a result of the redesignations, the existing Class R1 and Class R3 shares will be terminated, and shareholders currently in these classes will become shareholders of the respective classes identified above, in each case with the same or lower net total expenses.
Effective after the close of business on August 31, 2020, Class R1 and Class R3 were closed to new investors.
Note 2—Significant accounting policies
The financial statements have been prepared in conformity with accounting principles generally accepted in the United States of America (US GAAP), which require management to make certain estimates and assumptions as of the date of the financial statements. Actual results could differ from those estimates and those differences could be significant. The fund qualifies as an investment company under Topic 946 of Accounting Standards Codification of US GAAP.
Events or transactions occurring after the end of the fiscal period through the date that the financial statements were issued have been evaluated in the preparation of the financial statements. The following summarizes the significant accounting policies of the fund:
Security valuation. Investments are stated at value as of the scheduled close of regular trading on the New York Stock Exchange (NYSE), normally at 4:00 P.M., Eastern Time. In case of emergency or other disruption resulting in the NYSE not opening for trading or the NYSE closing at a time other than the regularly scheduled close, the net asset value (NAV) may be determined as of the regularly scheduled close of the NYSE pursuant to the fund's Valuation Policies and Procedures.
In order to value the securities, the fund uses the following valuation techniques: Equity securities, including exchange-traded or closed-end funds, are typically valued at the last sale price or official closing price on the exchange or principal market where the security trades. In the event there were no sales during the day or closing prices are not available, the securities are valued using the last available bid price. Investments by the fund in open-end mutual funds are valued at their respective NAVs each business day.
| 26 | JOHN HANCOCK New Opportunities Fund | ANNUAL REPORT | |
In certain instances, the Pricing Committee may determine to value equity securities using prices obtained from another exchange or market if trading on the exchange or market on which prices are typically obtained did not open for trading as scheduled, or if trading closed earlier than scheduled, and trading occurred as normal on another exchange or market.
Other portfolio securities and assets, for which reliable market quotations are not readily available, are valued at fair value as determined in good faith by the fund's Pricing Committee following procedures established by the Board of Trustees. The frequency with which these fair valuation procedures are used cannot be predicted and fair value of securities may differ significantly from the value that would have been used had a ready market for such securities existed.
The fund uses a three-tier hierarchy to prioritize the pricing assumptions, referred to as inputs, used in valuation techniques to measure fair value. Level 1 includes securities valued using quoted prices in active markets for identical securities, including registered investment companies. Level 2 includes securities valued using other significant observable inputs. Observable inputs may include quoted prices for similar securities, interest rates, prepayment speeds and credit risk. Prices for securities valued using these inputs are received from independent pricing vendors and brokers and are based on an evaluation of the inputs described. Level 3 includes securities valued using significant unobservable inputs when market prices are not readily available or reliable, including the fund's own assumptions in determining the fair value of investments. Factors used in determining value may include market or issuer specific events or trends, changes in interest rates and credit quality. The inputs or methodology used for valuing securities are not necessarily an indication of the risks associated with investing in those securities. Changes in valuation techniques and related inputs may result in transfers into or out of an assigned level within the disclosure hierarchy.
The following is a summary of the values by input classification of the fund's investments as of August 31, 2020, by major security category or type:
| | Total
value at
8-31-20 | Level 1
quoted
price | Level 2
significant
observable
inputs | Level 3
significant
unobservable
inputs |
| Investments in securities: | | | | |
| Assets | | | | |
| Common stocks | | | | |
| Consumer discretionary | $45,879,682 | $45,879,682 | — | — |
| Consumer staples | 5,614,970 | 5,614,970 | — | — |
| Financials | 17,889,278 | 17,887,632 | — | $1,646 |
| Health care | 104,932,610 | 104,930,558 | — | 2,052 |
| Industrials | 53,202,450 | 53,202,450 | — | — |
| Information technology | 63,672,976 | 63,672,976 | — | — |
| Materials | 10,439,033 | 10,439,033 | — | — |
| Real estate | 14,849,540 | 14,849,540 | — | — |
| Short-term investments | 2,964,678 | 2,964,678 | — | — |
| Total investments in securities | $319,445,217 | $319,441,519 | — | $3,698 |
Real estate investment trusts. The fund may invest in real estate investment trusts (REITs). Distributions from REITs may be recorded as income and subsequently characterized by the REIT at the end of the fiscal year as a reduction of cost of investments and/or as a realized gain. As a result, the fund will estimate the components of distributions from these securities. Such estimates are revised when the actual components of the distributions are known.
| | ANNUAL REPORT | JOHN HANCOCK NEW OPPORTUNITIES FUND | 27 |
Security transactions and related investment income. Investment security transactions are accounted for on a trade date plus one basis for daily NAV calculations. However, for financial reporting purposes, investment transactions are reported on trade date. Interest income is accrued as earned. Dividend income is recorded on the ex-date, except for dividends of certain foreign securities where the dividend may not be known until after the ex-date. In those cases, dividend income, net of withholding taxes, is recorded when the fund becomes aware of the dividends. Non-cash dividends, if any, are recorded at the fair market value of the securities received. Gains and losses on securities sold are determined on the basis of identified cost and may include proceeds from litigation.
Foreign taxes. The fund may be subject to withholding tax on income, capital gains or repatriation taxes imposed by certain countries, a portion of which may be recoverable. Foreign taxes are accrued based upon the fund's understanding of the tax rules and rates that exist in the foreign markets in which it invests. Taxes are accrued based on gains realized by the fund as a result of certain foreign security sales. In certain circumstances, estimated taxes are accrued based on unrealized appreciation of such securities. Investment income is recorded net of foreign withholding taxes.
Overdraft. The fund may have the ability to borrow from banks for temporary or emergency purposes, including meeting redemption requests that otherwise might require the untimely sale of securities. Pursuant to the fund's custodian agreement, the custodian may loan money to the fund to make properly authorized payments. The fund is obligated to repay the custodian for any overdraft, including any related costs or expenses. The custodian may have a lien, security interest or security entitlement in any fund property that is not otherwise segregated or pledged, to the extent of any overdraft, and to the maximum extent permitted by law. Overdrafts at period end are presented under the caption Due to custodian in the Statement of assets and liabilities.
Line of credit. Effective June 25, 2020, the fund and other affiliated funds have entered into a syndicated line of credit agreement with Citibank, N.A. as the administrative agent that enables them to participate in a $1 billion unsecured committed line of credit. Excluding commitments designated for a certain fund and subject to the needs of all other affiliated funds, the fund can borrow up to an aggregate commitment amount of $850 million, subject to asset coverage and other limitations as specified in the agreement. Each participating fund paid an upfront fee in connection with this line of credit agreement, which is charged based on a combination of fixed and asset based allocations and amortized over 365 days. Prior to June 25, 2020, the fund and other affiliated funds had a similar agreement that enabled them to participate in a $750 million unsecured committed line of credit. A commitment fee payable at the end of each calendar quarter, based on the average daily unused portion of the line of credit, is charged to each participating fund based on a combination of fixed and asset based allocations and is reflected in Other expenses on the Statement of operations. For the year ended August 31, 2020, the fund had no borrowings under the line of credit. Commitment fees for the year ended August 31, 2020 were $3,420.
Expenses. Within the John Hancock group of funds complex, expenses that are directly attributable to an individual fund are allocated to such fund. Expenses that are not readily attributable to a specific fund are allocated among all funds in an equitable manner, taking into consideration, among other things, the nature and type of expense and the fund’s relative net assets. Expense estimates are accrued in the period to which they relate and adjustments are made when actual amounts are known.
Class allocations. Income, common expenses and realized and unrealized gains (losses) are determined at the fund level and allocated daily to each class of shares based on the net assets of the class. Class-specific expenses, such as distribution and service fees, if any, and transfer agent fees, for all classes, are charged daily at the class level based on the net assets of each class and the specific expense rates applicable to each class.
Federal income taxes. The fund intends to continue to qualify as a regulated investment company by complying with the applicable provisions of the Internal Revenue Code and will not be subject to federal income tax on taxable income that is distributed to shareholders. Therefore, no federal income tax provision is required.
| 28 | JOHN HANCOCK New Opportunities Fund | ANNUAL REPORT | |
For federal income tax purposes, as of August 31, 2020, the fund has a short-term capital loss carryforward of $5,244,533 and a long-term capital loss carryforward of $2,081,209 available to offset future net realized capital gains. This carryforward does not expire.
Qualified late year ordinary losses of $1,474,147 are treated as occurring on September 1, 2020, the first day of the fund’s next taxable year.
As of August 31, 2020, the fund had no uncertain tax positions that would require financial statement recognition, derecognition or disclosure. The fund's federal tax returns are subject to examination by the Internal Revenue Service for a period of three years.
Distribution of income and gains. Distributions to shareholders from net investment income and net realized gains, if any, are recorded on the ex-date. The fund generally declares and pays dividends annually. Capital gain distributions, if any, are typically distributed annually.
The tax character of distributions for the years ended August 31, 2020 and 2019 was as follows:
| | August 31, 2020 | August 31, 2019 |
| Ordinary income | — | $24,400,236 |
| Long-term capital gains | $10,574,926 | 58,455,567 |
| Total | $10,574,926 | $82,855,803 |
Distributions paid by the fund with respect to each class of shares are calculated in the same manner, at the same time and in the same amount, except for the effect of class level expenses that may be applied differently to each class. As of August 31, 2020, there were no distributable earnings on a tax basis.
Such distributions and distributable earnings, on a tax basis, are determined in conformity with income tax regulations, which may differ from US GAAP. Distributions in excess of tax basis earnings and profits, if any, are reported in the fund's financial statements as a return of capital.
Capital accounts within the financial statements are adjusted for permanent book-tax differences. These adjustments have no impact on net assets or the results of operations. Temporary book-tax differences, if any, will reverse in a subsequent period. Book-tax differences are primarily attributable to wash sale loss deferrals.
Note 3—Guarantees and indemnifications
Under the Trust's organizational documents, its Officers and Trustees are indemnified against certain liabilities arising out of the performance of their duties to the Trust, including the fund. Additionally, in the normal course of business, the fund enters into contracts with service providers that contain general indemnification clauses. The fund's maximum exposure under these arrangements is unknown, as this would involve future claims that may be made against the fund that have not yet occurred. The risk of material loss from such claims is considered remote.
Note 4—Fees and transactions with affiliates
John Hancock Investment Management LLC (the Advisor) serves as investment advisor for the fund. John Hancock Investment Management Distributors LLC (the Distributor), an affiliate of the Advisor, serves as principal underwriter of the fund. The Advisor and the Distributor are indirect, principally owned subsidiaries of Manulife Financial Corporation.
Management fee. Effective September 6, 2019, the fund has an investment management agreement with the Advisor under which the fund pays a monthly management fee to the Advisor equivalent on an annual basis to the sum of: (a) 0.770% of the first $50 million of the fund’s aggregate daily net assets; (b) 0.740% of the next $50 million of the fund’s aggregate daily net assets; (c) 0.720% of the next $300 million of the fund’s aggregate daily net assets and (d) 0.720% on all asset levels when aggregate net assets exceed $400 million. Aggregate net
| | ANNUAL REPORT | JOHN HANCOCK NEW OPPORTUNITIES FUND | 29 |
assets include the net assets of the fund and a portion of the net assets of Small Cap Opportunities Trust, a series of John Hancock Variable Investment Trust, managed by GW&K Investment Management, LLC. Prior to September 6, 2019, the fund paid a monthly management fee to the Advisor equivalent on an annual basis to the sum of: (a) 0.900% of the first $2 billion of the fund’s aggregate daily net assets; and (b) 0.850% of the fund’s aggregate daily net assets in excess of $2 billion. Aggregate net assets included the net assets of the fund and Small Cap Opportunities Trust, a series of John Hancock Variable Investment Trust. The Advisor has a subadvisory agreement GW&K Investment Management, LLC. Prior to September 6, 2019, the fund also had subadvisory agreements with Brandywine Global Investment Management, LLC and Dimensional Fund Advisors LP. The fund is not responsible for payment of the subadvisory fees.
The Advisor has contractually agreed to waive a portion of its management fee and/or reimburse expenses for certain funds of the John Hancock group of funds complex, including the fund (the participating portfolios). This waiver is based upon aggregate net assets of all the participating portfolios. The amount of the reimbursement is calculated daily and allocated among all the participating portfolios in proportion to the daily net assets of each fund. During the year ended August 31, 2020, this waiver amounted to 0.01% of the fund’s average daily net assets. This arrangement expires on July 31, 2022, unless renewed by mutual agreement of the fund and the Advisor based upon a determination that this is appropriate under the circumstances at that time.
The Advisor had contractually agreed to reduce its management fee or, if necessary, make payment to the fund in an amount equal to the amount by which expenses of the fund exceeded 0.79% of average daily net assets of the fund. For the purpose of this agreement, “expenses of the fund” meant all fund expenses, excluding taxes, brokerage commissions, interest expense, litigation and indemnification expenses and other extraordinary expenses not incurred in the ordinary course of the fund’s business, class specific expenses, acquired fund fees, borrowing costs, prime brokerage fees and short dividend expense. This agreement expired on December 31, 2019.
The Advisor had contractually agreed to reduce its management fee or, if necessary, make payment to the fund in an amount equal to the amount by which expenses of Class A, Class C and Class I shares exceeded 1.21%, 1.91% and 0.90%, respectively, of average net assets attributable to the applicable class. For purposes of this agreement, “expenses of Class A, Class C and Class I shares” meant all expenses of the fund plus class specific expenses, excluding taxes, brokerage commissions, interest expense, litigation and indemnification expenses and other extraordinary expenses not incurred in the ordinary course of the fund’s business, acquired fund fees, borrowing costs, prime brokerage fees and short dividend expense. This agreement expired on December 31, 2019.
Prior to September 6, 2019, the Advisor had contractually agreed to waive its management fee so that the amount retained by the Advisor after payment of the subadvisory fees did not exceed 0.45% of the fund’s average daily net assets.
For the year ended August 31, 2020, the expense reductions described above amounted to the following:
| Class | Expense reduction |
| Class A | $97,149 |
| Class C | 1,563 |
| Class I | 4,155 |
| Class R1 | 144 |
| Class R2 | 19 |
| Class R3 | 29 |
| Class | Expense reduction |
| Class R4 | $19 |
| Class R5 | 5 |
| Class R6 | 35 |
| Class 1 | 13,667 |
| Total | $116,785 |
Expenses waived or reimbursed in the current fiscal period are not subject to recapture in future fiscal periods.
| 30 | JOHN HANCOCK New Opportunities Fund | ANNUAL REPORT | |
The investment management fees, including the impact of the waivers and reimbursements as described above, incurred for the year ended August 31, 2020, were equivalent to a net annual effective rate of 0.69% of the fund's average daily net assets.
Accounting and legal services. Pursuant to a service agreement, the fund reimburses the Advisor for all expenses associated with providing the administrative, financial, legal, compliance, accounting and recordkeeping services to the fund, including the preparation of all tax returns, periodic reports to shareholders and regulatory reports, among other services. These expenses are allocated to each share class based on its relative net assets at the time the expense was incurred. These accounting and legal services fees incurred, for the year ended August 31, 2020, amounted to an annual rate of 0.02% of the fund's average daily net assets.
Distribution and service plans. The fund has a distribution agreement with the Distributor. The fund has adopted distribution and service plans for certain classes as detailed below pursuant to Rule 12b-1 under the 1940 Act, to pay the Distributor for services provided as the distributor of shares of the fund. In addition, under a service plan for certain classes as detailed below, the fund pays for certain other services. The fund may pay up to the following contractual rates of distribution and service fees under these arrangements, expressed as an annual percentage of average daily net assets for each class of the fund's shares:
| Class | Rule 12b-1 Fee | Service fee |
| Class A | 0.25% | — |
| Class C | 1.00% | — |
| Class R1 | 0.50% | 0.25% |
| Class R2 | 0.25% | 0.25% |
| Class R3 | 0.50% | 0.15% |
| Class R4 | 0.25% | 0.10% |
| Class R5 | — | 0.05% |
| Class 1 | 0.05% | — |
The fund's Distributor has contractually agreed to waive 0.10% of Rule12b-1 fees for Class R4 shares. The current waiver agreement expires on December 31, 2020, unless renewed by mutual agreement of the fund and the Distributor based upon a determination that this is appropriate under the circumstances at the time. This contractual waiver amounted to $51 for Class R4 shares for the year ended August 31, 2020. Class R5 shares were fully redeemed on October 29, 2019.
Sales charges. Class A shares are assessed up-front sales charges, which resulted in payments to the Distributor amounting to $49,121 for the year ended August 31, 2020. Of this amount, $7,381 was retained and used for printing prospectuses, advertising, sales literature and other purposes and $41,740 was paid as sales commissions to broker-dealers.
Class A and Class C shares may be subject to contingent deferred sales charges (CDSCs). Certain Class A shares that are acquired through purchases of $1 million or more and are redeemed within one year of purchase are subject to a 1.00% sales charge. Class C shares that are redeemed within one year of purchase are subject to a 1.00% CDSC. CDSCs are applied to the lesser of the current market value at the time of redemption or the original purchase cost of the shares being redeemed. Proceeds from CDSCs are used to compensate the Distributor for providing distribution-related services in connection with the sale of these shares. During the year ended August 31, 2020, CDSCs received by the Distributor amounted to $662 and $238 for Class A and Class C shares, respectively.
Transfer agent fees. The John Hancock group of funds has a complex-wide transfer agent agreement with John Hancock Signature Services, Inc. (Signature Services), an affiliate of the Advisor. The transfer agent fees paid to Signature Services are determined based on the cost to Signature Services (Signature Services Cost) of providing recordkeeping services. It also includes out-of-pocket expenses, including payments made to third-parties for
| | ANNUAL REPORT | JOHN HANCOCK NEW OPPORTUNITIES FUND | 31 |
recordkeeping services provided to their clients who invest in one or more John Hancock funds. In addition, Signature Services Cost may be reduced by certain fees that Signature Services receives in connection with retirement and small accounts. Signature Services Cost is calculated monthly and allocated, as applicable, to five categories of share classes: Retail Share and Institutional Share Classes of Non-Municipal Bond Funds, Class R6 Shares, Retirement Share Classes and Municipal Bond Share Classes. Within each of these categories, the applicable costs are allocated to the affected John Hancock affiliated funds and/or classes, based on the relative average daily net assets.
Class level expenses. Class level expenses for the year ended August 31, 2020 were as follows:
| Class | Distribution and service fees | Transfer agent fees |
| Class A | $628,275 | $317,068 |
| Class C | 37,050 | 4,678 |
| Class I | — | 12,010 |
| Class R1 | 2,902 | 52 |
| Class R2 | 156 | 6 |
| Class R3 | 429 | 10 |
| Class R4 | 128 | 7 |
| Class R5 | — | 1 |
| Class R6 | — | 17 |
| Class 1 | 16,635 | — |
| Total | $685,575 | $333,849 |
Trustee expenses. The fund compensates each Trustee who is not an employee of the Advisor or its affiliates. The costs of paying Trustee compensation and expenses are allocated to the fund based on its net assets relative to other funds within the John Hancock group of funds complex.
Note 5—Fund share transactions
Transactions in fund shares for the years ended August 31, 2020 and 2019 were as follows:
| | Year Ended 8-31-20 | Year Ended 8-31-19 |
| | Shares | Amount | Shares | Amount |
| Class A shares | | | | |
| Sold | 184,862 | $3,971,741 | 383,317 | $9,046,488 |
| Distributions reinvested | 357,663 | 8,383,614 | 2,181,016 | 42,813,326 |
| Repurchased | (1,629,114) | (35,567,362) | (1,678,654) | (39,690,836) |
| Net increase (decrease) | (1,086,589) | $(23,212,007) | 885,679 | $12,168,978 |
| Class C shares | | | | |
| Sold | 14,622 | $297,262 | 23,624 | $554,379 |
| Distributions reinvested | 6,174 | 139,358 | 48,347 | 921,498 |
| Repurchased | (79,309) | (1,677,851) | (160,639) | (3,613,473) |
| Net decrease | (58,513) | $(1,241,231) | (88,668) | $(2,137,596) |
| 32 | JOHN HANCOCK New Opportunities Fund | ANNUAL REPORT | |
| | Year Ended 8-31-20 | Year Ended 8-31-19 |
| | Shares | Amount | Shares | Amount |
| Class I shares | | | | |
| Sold | 68,728 | $1,528,769 | 117,637 | $2,874,371 |
| Distributions reinvested | 14,120 | 331,814 | 97,633 | 1,916,539 |
| Repurchased | (136,157) | (2,924,634) | (233,649) | (5,508,527) |
| Net decrease | (53,309) | $(1,064,051) | (18,379) | $(717,617) |
| Class R1 shares | | | | |
| Sold | 633 | $12,929 | 1,091 | $25,594 |
| Distributions reinvested | 573 | 13,318 | 2,928 | 57,184 |
| Repurchased | (312) | (6,804) | (41) | (1,082) |
| Net increase | 894 | $19,443 | 3,978 | $81,696 |
| Class R2 shares | | | | |
| Sold | 102 | $2,216 | 197 | $5,167 |
| Distributions reinvested | 18 | 422 | 91 | 1,780 |
| Repurchased | (156) | (3,366) | — | — |
| Net increase (decrease) | (36) | $(728) | 288 | $6,947 |
| Class R3 shares | | | | |
| Sold | 562 | $12,936 | 901 | $22,061 |
| Distributions reinvested | 63 | 1,473 | 251 | 4,922 |
| Repurchased | (764) | (17,454) | (72) | (1,682) |
| Net increase (decrease) | (139) | $(3,045) | 1,080 | $25,301 |
| Class R4 shares | | | | |
| Sold | 87 | $1,775 | 507 | $11,986 |
| Distributions reinvested | 20 | 466 | 20 | 382 |
| Repurchased | (15) | (348) | — | (1) |
| Net increase | 92 | $1,893 | 527 | $12,367 |
| Class R5 shares1 | | | | |
| Repurchased | (1,655) | $(37,673) | — | — |
| Net decrease | (1,655) | $(37,673) | — | — |
| Class R6 shares | | | | |
| Sold | 6,798 | $155,516 | 2,846 | $68,092 |
| Distributions reinvested | 190 | 4,472 | 12,100 | 237,404 |
| Repurchased | (835) | (18,440) | (69,059) | (1,673,446) |
| Net increase (decrease) | 6,153 | $141,548 | (54,113) | $(1,367,950) |
| | ANNUAL REPORT | JOHN HANCOCK NEW OPPORTUNITIES FUND | 33 |
| | Year Ended 8-31-20 | Year Ended 8-31-19 |
| | Shares | Amount | Shares | Amount |
| Class 1 shares | | | | |
| Sold | 80,115 | $1,727,699 | 121,720 | $3,026,397 |
| Distributions reinvested | 49,039 | 1,162,716 | 389,335 | 7,701,038 |
| Repurchased | (712,426) | (15,928,148) | (469,339) | (11,534,099) |
| Net increase (decrease) | (583,272) | $(13,037,733) | 41,716 | $(806,664) |
| Class NAV shares1 | | | | |
| Sold | — | — | 93,479 | $2,437,091 |
| Distributions reinvested | — | — | 1,287,304 | 25,256,897 |
| Repurchased | — | — | (7,059,277) | (165,240,072) |
| Net decrease | — | — | (5,678,494) | $(137,546,084) |
| Total net decrease | (1,776,374) | $(38,433,584) | (4,906,386) | $(130,280,622) |
| 1 | Class R5 and Class NAV shares were fully redeemed on 10-29-19 and 03-13-19, respectively. |
Affiliates of the fund owned shares of the following classes on August 31, 2020. Such concentration of shareholders' capital could have a material effect on the fund if such shareholders redeem from the fund.
| Fund | % by Class |
| Class R2 | 75% |
| Class R3 | 47% |
| Class R4 | 70% |
| Class 1 | 100% |
Note 6—Purchase and sale of securities
Purchases and sales of securities, other than short-term investments, amounted to $74,911,387 and $118,848,913, respectively, for the year ended August 31, 2020.
Note 7—Coronavirus (COVID-19) pandemic
The novel COVID-19 disease has resulted in significant disruptions to global business activity. A widespread health crisis such as a global pandemic could cause substantial market volatility, exchange trading suspensions and closures, impact the ability to complete redemptions, and affect fund performance.
| 34 | JOHN HANCOCK New Opportunities Fund | ANNUAL REPORT | |
Report of Independent Registered Public Accounting Firm
To the Board of Trustees of John Hancock Funds II and Shareholders of John Hancock New Opportunities Fund
Opinion on the Financial Statements
We have audited the accompanying statement of assets and liabilities, including the fund’s investments, of John Hancock New Opportunities Fund (one of the funds constituting John Hancock Funds II, referred to hereafter as the "Fund") as of August 31, 2020, the related statement of operations for the year ended August 31, 2020, the statements of changes in net assets for each of the two years in the period ended August 31, 2020, including the related notes, and the financial highlights for each of the five years in the period ended August 31, 2020 (collectively referred to as the “financial statements”). In our opinion, the financial statements present fairly, in all material respects, the financial position of the Fund as of August 31, 2020, the results of its operations for the year then ended, the changes in its net assets for each of the two years in the period ended August 31, 2020 and the financial highlights for each of the five years in the period ended August 31, 2020 in conformity with accounting principles generally accepted in the United States of America.
Basis for Opinion
These financial statements are the responsibility of the Fund’s management. Our responsibility is to express an opinion on the Fund’s financial statements based on our audits. We are a public accounting firm registered with the Public Company Accounting Oversight Board (United States) (PCAOB) and are required to be independent with respect to the Fund in accordance with the U.S. federal securities laws and the applicable rules and regulations of the Securities and Exchange Commission and the PCAOB.
We conducted our audits of these financial statements in accordance with the standards of the PCAOB. Those standards require that we plan and perform the audit to obtain reasonable assurance about whether the financial statements are free of material misstatement, whether due to error or fraud.
Our audits included performing procedures to assess the risks of material misstatement of the financial statements, whether due to error or fraud, and performing procedures that respond to those risks. Such procedures included examining, on a test basis, evidence regarding the amounts and disclosures in the financial statements. Our audits also included evaluating the accounting principles used and significant estimates made by management, as well as evaluating the overall presentation of the financial statements. Our procedures included confirmation of securities owned as of August 31, 2020 by correspondence with the custodian and transfer agent. We believe that our audits provide a reasonable basis for our opinion.
/s/ PricewaterhouseCoopers LLP
Boston, Massachusetts
October 22, 2020
We have served as the auditor of one or more investment companies in the John Hancock group of funds since 1988.
| | ANNUAL REPORT | JOHN HANCOCK NEW OPPORTUNITIES FUND | 35 |
Tax information (Unaudited)
For federal income tax purposes, the following information is furnished with respect to the distributions of the fund, if any, paid during its taxable year ended August 31, 2020.
The fund reports the maximum amount allowable of its net taxable income as eligible for the corporate dividends-received deduction.
The fund reports the maximum amount allowable of its net taxable income as qualified dividend income as provided in the Jobs and Growth Tax Relief Reconciliation Act of 2003.
The fund paid $10,574,926 in long term capital gain dividends.
The fund reports the maximum amount allowable of its Section 199A dividends as defined in Proposed Treasury Regulation §1.199A-3(d).
Eligible shareholders will be mailed a 2020 Form 1099-DIV in early 2021. This will reflect the tax character of all distributions paid in calendar year 2020.
Please consult a tax advisor regarding the tax consequences of your investment in the fund.
| 36 | JOHN HANCOCK New Opportunities Fund | ANNUAL REPORT | |
CONTINUATION OF INVESTMENT ADVISORY AND SUBADVISORY AGREEMENTS
Evaluation of Advisory and Subadvisory Agreements by the Board of Trustees
This section describes the evaluation by the Board of Trustees (the Board) of John Hancock Funds II (the Trust) of the Advisory Agreement (the Advisory Agreement) with John Hancock Investment Management LLC (the Advisor) and the Subadvisory Agreement (the Subadvisory Agreement) with Gannett Welsh & Kotler, LLC (GW&K)(the Subadvisor) for John Hancock New Opportunities Fund (the fund). The Advisory Agreement and Subadvisory Agreement are collectively referred to as the Agreements. Prior to the June 23-25, 2020 telephonic1 meeting at which the Agreements were approved, the Board also discussed and considered information regarding the proposed continuation of the Agreements at the telephonic meeting held on May 26-27, 2020.
Approval of Advisory and Subadvisory Agreements
At telephonic meetings held on June 23-25, 2020, the Board, including the Trustees who are not parties to any Agreement or considered to be interested persons of the Trust under the Investment Company Act of 1940, as amended (the 1940 Act) (the Independent Trustees), reapproved for an annual period the continuation of the Advisory Agreement between the Trust and the Advisor and the Subadvisory Agreement between the Advisor and the Subadvisor with respect to the fund.
In considering the Advisory Agreement and the Subadvisory Agreement, the Board received in advance of the meetings a variety of materials relating to the fund, the Advisor and the Subadvisor, including comparative performance, fee and expense information for a peer group of similar funds prepared by an independent third-party provider of fund data, performance information for an applicable benchmark index; and, with respect to the Subadvisor, comparative performance information for comparably managed accounts, as applicable, and other information provided by the Advisor and the Subadvisor regarding the nature, extent and quality of services provided by the Advisor and the Subadvisor under their respective Agreements, as well as information regarding the Advisor's revenues and costs of providing services to the fund and any compensation paid to affiliates of the Advisor. At the meetings at which the renewal of the Advisory Agreement and Subadvisory Agreement are considered, particular focus is given to information concerning fund performance, comparability of fees and total expenses, and profitability. However, the Board notes that the evaluation process with respect to the Advisor and the Subadvisor is an ongoing one. In this regard, the Board also took into account discussions with management and information provided to the Board (including its various committees) at prior meetings with respect to the services provided by the Advisor and the Subadvisor to the fund, including quarterly performance reports prepared by management containing reviews of investment results and prior presentations from the Subadvisor with respect to the fund. The information received and considered by the Board in connection with the May and June meetings and throughout the year was both written and oral. The Board also considered the nature, quality, and extent of non-advisory services, if any, to be provided to the
____________________
1On March 25, 2020, as a result of health and safety measures put in place to combat the global COVID-19 pandemic, the Securities and Exchange Commission issued an exemptive order (the "Order") pursuant to Sections 6(c) and 38(a) of the Investment Company Act of 1940, as amended (the "1940 Act"), that temporarily exempts registered investment management companies from the in-person voting requirements under the 1940 Act, subject to certain requirements, including that votes taken pursuant to the Order are ratified at the next in-person meeting. The Board determined that reliance on the Order was necessary or appropriate due to the circumstances related to current or potential effects of COVID-19 and therefore, the Board's May and June meetings were held telephonically in reliance on the Order.
ANNUAL REPORT | JOHN HANCOCK NEW OPPORTUNITIES FUND 37
fund by the Advisor's affiliates, including distribution services. The Board considered the Advisory Agreement and the Subadvisory Agreement separately in the course of its review. In doing so, the Board noted the respective roles of the Advisor and Subadvisor in providing services to the fund.
Throughout the process, the Board asked questions of and requested additional information from management. The Board is assisted by counsel for the Trust and the Independent Trustees are also separately assisted by independent legal counsel throughout the process. The Independent Trustees also received a memorandum from their independent legal counsel discussing the legal standards for their consideration of the proposed continuation of the Agreements and discussed the proposed continuation of the Agreements in private sessions with their independent legal counsel at which no representatives of management were present.
Approval of Advisory Agreement
In approving the Advisory Agreement with respect to the fund, the Board, including the Independent Trustees, considered a variety of factors, including those discussed below. The Board also considered other factors (including conditions and trends prevailing generally in the economy, the securities markets, and the industry) and did not treat any single factor as determinative, and each Trustee may have attributed different weights to different factors. The Board's conclusions may be based in part on its consideration of the advisory and subadvisory arrangements in prior years and on the Board's ongoing regular review of fund performance and operations throughout the year.
Nature, extent, and quality of services. Among the information received by the Board from the Advisor relating to the nature, extent, and quality of services provided to the fund, the Board reviewed information provided by the Advisor relating to its operations and personnel, descriptions of its organizational and management structure, and information regarding the Advisor's compliance and regulatory history, including its Form ADV. The Board also noted that on a regular basis it receives and reviews information from the Trust's Chief Compliance Officer (CCO) regarding the fund's compliance policies and procedures established pursuant to Rule 38a-1 under the 1940 Act. The Board observed that the scope of services provided by the Advisor, and of the undertakings required of the Advisor in connection with those services, including maintaining and monitoring its own and the fund's compliance programs, risk management programs, liquidity management programs and cybersecurity programs, had expanded over time as a result of regulatory, market and other developments. The Board considered that the Advisor is responsible for the management of the day-to-day operations of the fund, including, but not limited to, general supervision of and coordination of the services provided by the Subadvisor, and is also responsible for monitoring and reviewing the activities of the Subadvisor and other third-party service providers. The Board also considered the significant risks assumed by the Advisor in connection with the services provided to the fund including entrepreneurial risk in sponsoring new funds and ongoing risks including investment, operational, enterprise, litigation, regulatory and compliance risks with respect to all funds.
In considering the nature, extent, and quality of the services provided by the Advisor, the Trustees also took into account their knowledge of the Advisor's management and the quality of the performance of the Advisor's duties, through Board meetings, discussions and reports during the preceding year and through each Trustee's experience as a Trustee of the Trust and of the other trusts in the John Hancock group of funds complex (the John Hancock Fund Complex).
In the course of their deliberations regarding the Advisory Agreement, the Board considered, among other things:
| (a) | the skills and competency with which the Advisor has in the past managed the Trust's affairs and its subadvisory relationship, the Advisor's oversight and monitoring of the Subadvisor's investment performance and compliance programs, such as the Subadvisor's compliance with fund policies and |
ANNUAL REPORT | JOHN HANCOCK NEW OPPORTUNITIES FUND 38
| | objectives, review of brokerage matters, including with respect to trade allocation and best execution and the Advisor's timeliness in responding to performance issues; |
| (b) | the background, qualifications and skills of the Advisor's personnel; |
| (c) | the Advisor's compliance policies and procedures and its responsiveness to regulatory changes and fund industry developments; |
| (d) | the Advisor's administrative capabilities, including its ability to supervise the other service providers for the fund, as well as the Advisor's oversight of any securities lending activity, its monitoring of class action litigation and collection of class action settlements on behalf of the fund, and bringing loss recovery actions on behalf of the fund; |
| (e) | the financial condition of the Advisor and whether it has the financial wherewithal to provide a high level and quality of services to the fund; |
| (f) | the Advisor's initiatives intended to improve various aspects of the Trust's operations and investor experience with the fund; and |
| (g) | the Advisor's reputation and experience in serving as an investment advisor to the Trust and the benefit to shareholders of investing in funds that are part of a family of funds offering a variety of investments. |
The Board concluded that the Advisor may reasonably be expected to continue to provide a high quality of services under the Advisory Agreement with respect to the fund.
Investment performance. In considering the fund's performance, the Board noted that it reviews at its regularly scheduled meetings information about the fund's performance results. In connection with the consideration of the Advisory Agreement, the Board:
| (a) | reviewed information prepared by management regarding the fund's performance; |
| (b) | considered the comparative performance of an applicable benchmark index; |
| (c) | considered the performance of comparable funds, if any, as included in the report prepared by an independent third-party provider of fund data; and |
| (d) | took into account the Advisor's analysis of the fund's performance and its plans and recommendations regarding the Trust's subadvisory arrangements generally. |
The Board noted that while it found the data provided by the independent third-party generally useful it recognized its limitations, including in particular that the data may vary depending on the end date selected and that the results of the performance comparisons may vary depending on the selection of the peer group. The Board noted that the fund underperformed its benchmark index and peer group median for the one-, three-, five- and ten-year periods ended December 31, 2019. The Board took into account management's discussion of the factors that contributed to the fund's performance for the benchmark index and peer group median for the one-, three-, five-, and ten-year periods including the impact of past and current market conditions on the fund's strategy and management's outlook for the fund. The Board also took into account recent actions taken to address the fund's performance, including the conversion of the Fund from a multi-managed fund to a single subadvisor fund effective September 6, 2019. In connection with this change, the Board noted that the fund's longer term performance in part reflects that of the previous subadvisers. The Board concluded that the fund's performance is being monitored and reasonably addressed, where appropriate.
ANNUAL REPORT | JOHN HANCOCK NEW OPPORTUNITIES FUND 39
Fees and expenses. The Board reviewed comparative information prepared by an independent third-party provider of fund data, including, among other data, the fund's contractual and net management fees (and subadvisory fees, to the extent available) and total expenses as compared to similarly situated investment companies deemed to be comparable to the fund in light of the nature, extent and quality of the management and advisory and subadvisory services provided by the Advisor and Subadvisor. The Board considered the fund's ranking within a smaller group of peer funds chosen by the independent third-party provider, as well as the fund's ranking within a broader group of funds. In comparing the fund's contractual and net management fees to those of comparable funds, the Board noted that such fees include both advisory and administrative costs. The Board noted that net management fees and total expenses for the fund are lower than the peer group median.
The Board took into account management's discussion with respect to overall management fee and the fees of the Subadvisor, including the amount of the advisory fee retained by the Advisor after payment of the subadvisory fees, in each case in light of the services rendered for those amounts and the risks undertaken by the Advisor. The Board also noted that the Advisor pays the subadvisory fees, and that such fees are negotiated at arm's length with respect to the Subadvisor. In addition, the Board took into account that management had agreed to implement an overall fee waiver across the complex, including the fund, which is discussed further below. The Board also noted actions taken over the past several years to reduce the fund's operating expenses. The Board also noted that, in addition, the Advisor is currently waiving fees and/or reimbursing expenses with respect to the fund and that the fund has breakpoints in its contractual management fee schedule that reduces management fees as assets increase. The Board reviewed information provided by the Advisor concerning the investment advisory fee charged by the Advisor or one of its advisory affiliates to other clients (including other funds in the John Hancock Fund Complex) having similar investment mandates, if any. The Board considered any differences between the Advisor's and Subadvisor's services to the fund and the services they provide to other comparable clients or funds. The Board concluded that the advisory fee paid with respect to the fund is reasonable in light of the nature, extent and quality of the services provided to the fund under the Advisory Agreement.
Profitability/indirect benefits. In considering the costs of the services to be provided and the profits to be realized by the Advisor and its affiliates from the Advisor's relationship with the Trust, the Board:
| (a) | reviewed financial information of the Advisor; |
| (b) | reviewed and considered information presented by the Advisor regarding the net profitability to the Advisor and its affiliates with respect to the fund; |
| (c) | received and reviewed profitability information with respect to the John Hancock Fund Complex as a whole and with respect to the fund; |
| (d) | received information with respect to the Advisor's allocation methodologies used in preparing the profitability data and considered that the Advisor hired an independent third-party consultant to provide an analysis of the Advisor's allocation methodologies; |
| (e) | considered that the John Hancock insurance companies that are affiliates of the Advisor, as shareholders of the Trust directly or through their separate accounts, receive certain tax credits or deductions relating to foreign taxes paid and dividends received by certain funds of the Trust and noted that these tax benefits, which are not available to participants in qualified retirement plans under applicable income tax law, are reflected in the profitability information reviewed by the Board; |
| (f) | considered that the Advisor also provides administrative services to the fund on a cost basis pursuant to an administrative services agreement; |
ANNUAL REPORT | JOHN HANCOCK NEW OPPORTUNITIES FUND 40
| (g) | noted that affiliates of the Advisor provide transfer agency services and distribution services to the fund, and that the fund's distributor also receives Rule 12b-1 payments to support distribution of the fund; |
| (h) | noted that the Advisor also derives reputational and other indirect benefits from providing advisory services to the fund; |
| (i) | noted that the subadvisory fee for the fund is paid by the Advisor and is negotiated at arm's length; |
| (j) | considered the Advisor's ongoing costs and expenditures necessary to improve services, meet new regulatory and compliance requirements, and adapt to other challenges impacting the fund industry; and |
| (k) | considered that the Advisor should be entitled to earn a reasonable level of profits in exchange for the level of services it provides to the fund and the risks that it assumes as Advisor including entrepreneurial, operational, reputational, litigation and regulatory risk. |
Based upon its review, the Board concluded that the level of profitability, if any, of the Advisor and its affiliates from their relationship with the fund was reasonable and not excessive.
Economies of scale. In considering the extent to which economies of scale would be realized as the fund grows and whether fee levels reflect these economies of scale for the benefit of fund shareholders, the Board:
| (a) | considered that the Advisor has contractually agreed to waive a portion of its management fee for certain funds of the John Hancock Fund Complex, including the fund (the participating portfolios) or otherwise reimburse the expenses of the participating portfolios (the reimbursement). This waiver is based upon aggregate net assets of all the participating portfolios. The amount of the reimbursement is calculated daily and allocated among all the participating portfolios in proportion to the daily net assets of each fund; |
| (b) | reviewed the fund's advisory fee structure and concluded that: (i) the fund's fee structure contains breakpoints at the subadvisory fee level and that such breakpoints are reflected as breakpoints in the advisory fees for the fund; and (ii) although economies of scale cannot be measured with precision, these arrangements permit shareholders of the fund to benefit from economies of scale if the fund grows. The Board also took into account management's discussion of the fund's advisory fee structure; and |
| (c) | the Board also considered the effect of the fund's growth in size on its performance and fees. The Board also noted that if the fund's assets increase over time, the fund may realize other economies of scale. |
Approval of Subadvisory Agreement
In making its determination with respect to approval of the Subadvisory Agreement, the Board reviewed:
| (1) | information relating to the Subadvisor's businesses, including current subadvisory services to the Trust (and other funds in the John Hancock Fund Complex); |
| (2) | the historical and current performance of the fund and comparative performance information relating to an applicable benchmark index and comparable funds; |
| (3) | the subadvisory fees for the fund, including any breakpoints, and to the extent available, comparable fee information prepared by an independent third party provider of fund data; and |
| (4) | information relating to the nature and scope of any material relationships and their significant to the Trust's Advisor and Subadvisor. |
ANNUAL REPORT | JOHN HANCOCK NEW OPPORTUNITIES FUND 41
Nature, extent, and quality of services. With respect to the services provided by the Subadvisor, the Board received information provided to the Board by the Subadvisor, including the Subadvisor's Form ADV, as well as took into account information presented throughout the past year. The Board considered the Subadvisor's current level of staffing and its overall resources, as well as received information relating to the Subadvisor's compensation program. The Board reviewed the Subadvisor's history and investment experience, as well as information regarding the qualifications, background, and responsibilities of the Subadvisor's investment and compliance personnel who provide services to the fund. The Board also considered, among other things, the Subadvisor's compliance program and any disciplinary history. The Board also considered the Subadvisor's risk assessment and monitoring process. The Board reviewed the Subadvisor's regulatory history, including whether it was involved in any regulatory actions or investigations as well as material litigation, and any settlements and amelioratory actions undertaken, as appropriate. The Board noted that the Advisor conducts regular, periodic reviews of the Subadvisor and its operations, including regarding investment processes and organizational and staffing matters. The Board also noted that the Trust's CCO and his staff conduct regular, periodic compliance reviews with the Subadvisor and present reports to the Independent Trustees regarding the same, which includes evaluating the regulatory compliance systems of the Subadvisor and procedures reasonably designed to assure compliance with the federal securities laws. The Board also took into account the financial condition of the Subadvisor.
The Board considered the Subadvisor's investment process and philosophy. The Board took into account that the Subadvisor's responsibilities include the development and maintenance of an investment program for the fund that is consistent with the fund's investment objective, the selection of investment securities and the placement of orders for the purchase and sale of such securities, as well as the implementation of compliance controls related to performance of these services. The Board also received information with respect to the Subadvisor's brokerage policies and practices, including with respect to best execution and soft dollars.
Subadvisor compensation. In considering the cost of services to be provided by the Subadvisor and the profitability to the Subadvisor of its relationship with the fund, the Board noted that the fees under the Subadvisory Agreement are paid by the Advisor and not the��fund.
The Board also relied on the ability of the Advisor to negotiate the Subadvisory Agreement with the Subadvisor, which is not affiliated with the Advisor, and the fees thereunder at arm's length. As a result, the costs of the services to be provided and the profits to be realized by the Subadvisor from its relationship with the Trust were not a material factor in the Board's consideration of the Subadvisory Agreement.
The Board also received information regarding the nature and scope (including their significance to the Advisor and its affiliates and to the Subadvisor) of any material relationships with respect to the Subadvisor, which include arrangements in which the Subadvisor or its affiliates provide advisory, distribution, or management services in connection with financial products sponsored by the Advisor or its affiliates, and may include other registered investment companies, a 529 education savings plan, managed separate accounts and exempt group annuity contracts sold to qualified plans. The Board also received information and took into account any other potential conflicts of interest the Advisor might have in connection with the Subadvisory Agreement.
In addition, the Board considered other potential indirect benefits that the Subadvisor and its affiliates may receive from the Subadvisor's relationship with the fund, such as the opportunity to provide advisory services to additional funds in the John Hancock Fund Complex and reputational benefits.
Subadvisory fees. The Board considered that the fund pays an advisory fee to the Advisor and that, in turn, the Advisor pays a subadvisory fee to the Subadvisor. As noted above, the Board also considered the fund's subadvisory fees as compared to similarly situated investment companies deemed to be comparable to the fund as included in the report
ANNUAL REPORT | JOHN HANCOCK NEW OPPORTUNITIES FUND 42
prepared by the independent third party provider of fund data, to the extent available. The Board noted that the limited size of the Lipper peer group was not sufficient for comparative purposes. The Board also took into account the subadvisory fees paid by the Advisor to the Subadvisor with respect to the fund and compared them to fees charged by the Subadvisor to manage other subadvised portfolios and portfolios not subject to regulation under the 1940 Act, as applicable.
Subadvisor performance. As noted above, the Board considered the fund's performance as compared to the fund's peer group median and the benchmark index and noted that the Board reviews information about the fund's performance results at its regularly scheduled meetings. The Board noted the Advisor's expertise and resources in monitoring the performance, investment style and risk-adjusted performance of the Subadvisor. The Board was mindful of the Advisor's focus on the Subadvisor's performance. The Board also noted the Subadvisor's long-term performance record for similar accounts, as applicable.
The Board's decision to approve the Subadvisory Agreement was based on a number of determinations, including the following:
| (1) | the Subadvisor has extensive experience and demonstrated skills as a manager; |
| (2) | the performance of the fund is being monitored and reasonably addressed, where appropriate; |
| (3) | the subadvisory fees are reasonable in relation to the level and quality of services being provided; and |
| (4) | noted that the subadvisory fees are paid by the Advisor not the fund and that the subadvisory fee breakpoints are reflected as breakpoints in the advisory fees for the fund in order to permit shareholders to benefit from economies of scale if the fund grows. |
* * *
Based on the Board's evaluation of all factors that the Board deemed to be material, including those factors described above, the Board, including the Independent Trustees, concluded that renewal of the Advisory Agreement and the Subadvisory Agreement would be in the best interest of the fund and its shareholders. Accordingly, the Board, and the Independent Trustees voting separately, approved the Advisory Agreement and Subadvisory Agreement for an additional one-year period.
ANNUAL REPORT | JOHN HANCOCK NEW OPPORTUNITIES FUND 43
STATEMENT REGARDING LIQUIDITY RISK MANAGEMENT
Operation of the Liquidity Risk Management Program
This section describes operation and effectiveness of the Liquidity Risk Management Program (LRMP) established in accordance with Rule 22e-4 under the Investment Company Act of 1940, as amended (the Liquidity Rule). The Board of Trustees (the Board) of each Fund in the John Hancock Group of Funds (each a Fund and collectively, the Funds) that is subject to the requirements of the Liquidity Rule has appointed John Hancock Investment Management LLC and John Hancock Variable Trust Advisers LLC (together, the Advisor) to serve as Administrator of the LRMP with respect to each of the Funds, including New Opportunities Fund, subject to the oversight of the Board. In order to provide a mechanism and process to perform the functions necessary to administer the LRMP, the Advisor established the Liquidity Risk Management Committee (the Committee). The Fund's subadvisor, GW&K Investment Management, LLC (the Subadvisor) executes the day-to-day investment management and security-level activities of the Fund in accordance with the requirements of the LRMP, subject to the supervision of the Advisor and the Board.
The Committee holds monthly meetings to: (1) review the day-to-day operations of the LRMP; (2) review and approve month end liquidity classifications; (3) review quarterly testing and determinations, as applicable; and (4) review other LRMP related material. The Committee also conducts daily, monthly, quarterly, and annual quantitative and qualitative assessments of each subadvisor to a Fund that is subject to the requirements of the Liquidity Rule and is a part of the LRMP to monitor investment performance issues, risks and trends. In addition, the Committee may conduct ad-hoc reviews and meetings with subadvisors as issues and trends are identified, including potential liquidity and valuation issues.
The Committee provided the Board at a meeting held on March 15-17, 2020 with a written report which addressed the Committee's assessment of the adequacy and effectiveness of the implementation and operation of the LRMP and any material changes to the LRMP. The report, which covered the period December 1, 2018 through December 31, 2019, included an assessment of important aspects of the LRMP including, but not limited to:
| • | Operation of the Fund's Redemption-In-Kind Procedures; |
| • | Highly Liquid Investment Minimum (HLIM) determination; |
| • | Compliance with the 15% limit on illiquid investments; |
| • | Reasonably Anticipated Trade Size (RATS) determination; |
| • | Security-level liquidity classifications; and |
| • | Liquidity risk assessment. |
The report also covered material liquidity matters which occurred or were reported during this period applicable to the Fund, if any, and the Committee's actions to address such matters.
Redemption-In-Kind Procedures
Rule 22e-4 requires any fund that engages in or reserves the right to engage in in-kind redemptions to adopt and implement written policies and procedures regarding in-kind redemptions as part of the management of its liquidity risk. These procedures address the process for redeeming in kind, as well as the circumstances under which the Fund would consider redeeming in kind. Anticipated large redemption activity will be evaluated to identify situations where redeeming in securities instead of cash may be appropriate.
ANNUAL REPORT | JOHN HANCOCK NEW OPPORTUNITIES FUND 44
As part of its annual assessment of the LRMP, the Committee reviewed the implementation and operation of the Redemption-In-Kind Procedures and determined they are operating in a manner that such procedures are adequate and effective to manage in-kind redemptions on behalf of the Fund as part of the LRMP.
Highly Liquid Investment Minimum determination
The Committee uses an HLIM model to determine a Fund's HLIM. This process incorporates the Fund's investment strategy, historical redemptions, liquidity classification rollup percentages and cash balances, redemption policy, access to funding sources, distribution channels and client concentrations. If the Fund falls below its established HLIM for a period greater than 7 consecutive calendar days, the Committee prepares a report to the Board within one business day following the seventh consecutive calendar day with an explanation of how the Fund plans to restore its HLIM within a reasonable period of time.
Based on the HLIM model, the Committee has determined that the Fund qualifies as a Primarily Highly Liquid Fund (PHLF). It is therefore not required to establish a HLIM. The Fund is tested quarterly to confirm its PHLF status.
As part of its annual assessment of the LRMP, the Committee reviewed the policies and procedures in place with respect to HLIM and PHLF determinations, and determined that such policies and procedures are operating in a manner that is adequate and effective as part of the LRMP.
Compliance with the 15% limit on illiquid investments
Rule 22e-4 sets an aggregate illiquid investment limit of 15% for a fund. Funds are prohibited from acquiring an illiquid investment if this results in greater than 15% of its net assets being classified as illiquid. When applying this limit, the Committee defines "illiquid investment" to mean any investment that the Fund reasonably expects cannot be sold or disposed of in current market conditions in seven calendar days or less without the sale or disposition significantly changing the market value of the investment. If a 15% illiquid investment limit breach occurs for longer than 1 business day, the Fund is required to notify the Board and provide a plan on how to bring illiquid investments within the 15% threshold, and after 7 days confidentially notify the Securities and Exchange Commission (the SEC).
In February 2019, as a result of extended security markets closures in connection with the Chinese New Year in certain countries, the SEC released guidance, and the Committee approved and adopted an Extended Market Holiday Policy to plan for and monitor known Extended Market Holidays (defined as all expected market holiday closures spanning four or more calendar days).
As part of its annual assessment of the LRMP, the Committee reviewed the policies and procedures in place with respect to the 15% illiquid investment limit and determined such policies and procedures are operating in a manner that is adequate and effective as part of the LMRP.
Reasonably Anticipated Trade Size determination
In order to assess the liquidity risk of a Fund, the Committee considers the impact on the Fund that redemptions of a RATS would have under both normal and reasonably foreseeable stressed conditions. Modelling the Fund's RATS requires quantifying cash flow volatility and analyzing distribution channel concentration and redemption risk. The model is designed to estimate the amount of assets that the Fund could reasonably anticipate trading on a given day, during both normal and reasonably foreseeable stressed conditions, to satisfy redemption requests.
ANNUAL REPORT | JOHN HANCOCK NEW OPPORTUNITIES FUND 45
As part of its annual assessment of the LRMP, the Committee reviewed the policies and procedures in place with respect to RATS determinations and determined that such policies and procedures are operating in a manner that is adequate and effective at making RATS determinations as part of the LRMP.
Security-level liquidity classifications
When classifying the liquidity of portfolio securities, the Fund adheres to the liquidity classification procedures established by the Advisor. In assigning a liquidity classification to Fund portfolio holdings, the following key inputs, among others, are considered: the Fund's RATS, feedback from the applicable Subadvisor on market-, trading- and investment-specific considerations, an assessment of current market conditions and fund portfolio holdings, and a value impact standard. The Subadvisor also provides position-level data to the Committee for use in monthly classification reconciliation in order to identify any classifications that may need to be changed as a result of the above considerations.
As part of its annual assessment of the LRMP, the Committee reviewed the policies and procedures in place with respect to security-level liquidity classifications and determined that such policies and procedures are operating in a manner that is adequate and effective as part of the LRMP.
Liquidity risk assessment
The Committee periodically reviews and assesses, the Fund's liquidity risk, including its investment strategy and liquidity of portfolio investments during both normal and reasonably foreseeable stressed conditions (including whether the investment strategy is appropriate for an open-end fund, the extent to which the strategy involves a relatively concentrated portfolio or large positions in particular issuers, and the use of borrowings for investment purposes and derivatives), cash flow analysis during both normal and reasonably foreseeable stressed conditions, and holdings of cash and cash equivalents, as well as borrowing arrangements and other funding sources.
The Committee also monitors global events, such as the COVID-19 Coronavirus, that could impact the markets and liquidity of portfolio investments and their classifications.
As part of its annual assessment of the LRMP, the Committee reviewed Fund-Level Liquidity Risk Assessment Reports for each of the Funds and determined that the investment strategy for each Fund continues to be appropriate for an open-ended structure.
Adequacy and Effectiveness
Based on the review and assessment conducted by the Committee, the Committee has determined that the LRMP has been implemented, and is operating in a manner that is adequate and effective at assessing and managing the liquidity risk of each Fund.
ANNUAL REPORT | JOHN HANCOCK NEW OPPORTUNITIES FUND 46
This chart provides information about the Trustees and Officers who oversee your John Hancock fund. Officers elected by the Trustees manage the day-to-day operations of the fund and execute policies formulated by the Trustees.
Independent Trustees
| | | |
Name, year of birth
Position(s) held with Trust
Principal occupation(s) and other
directorships during past 5 years | Trustee
of the
Trust
since1 | Number of John
Hancock funds
overseen by
Trustee |
| Hassell H. McClellan, Born: 1945 | 2005 | 195 |
Trustee and Chairperson of the Board
Director/Trustee, Virtus Funds (since 2008); Director, The Barnes Group (since 2010); Associate Professor, The Wallace E. Carroll School of Management, Boston College (retired 2013). Trustee (since 2005) and Chairperson of the Board (since 2017) of various trusts within the John Hancock Fund Complex. |
| | | |
| Charles L. Bardelis,2 Born: 1941 | 2005 | 195 |
Trustee
Director, Island Commuter Corp. (marine transport). Trustee of various trusts within the John Hancock Fund Complex (since 1988). |
| | | |
| James R. Boyle, Born: 1959 | 2015 | 195 |
Trustee
Chief Executive Officer, Foresters Financial (since 2018); Chairman and Chief Executive Officer, Zillion Group, Inc. (formerly HealthFleet, Inc.) (healthcare) (2014-2018); Executive Vice President and Chief Executive Officer, U.S. Life Insurance Division of Genworth Financial, Inc. (insurance) (January 2014-July 2014); Senior Executive Vice President, Manulife Financial, President and Chief Executive Officer, John Hancock (1999-2012); Chairman and Director, John Hancock Investment Management LLC, John Hancock Investment Management Distributors LLC, and John Hancock Variable Trust Advisers LLC (2005-2010). Trustee of various trusts within the John Hancock Fund Complex (2005-2014 and since 2015). |
| | | |
| Peter S. Burgess,2 Born: 1942 | 2005 | 195 |
Trustee
Consultant (financial, accounting, and auditing matters) (since 1999); Certified Public Accountant; Partner, Arthur Andersen (independent public accounting firm) (prior to 1999); Director, Lincoln Educational Services Corporation (since 2004); Director, Symetra Financial Corporation (2010-2016); Director, PMA Capital Corporation (2004-2010). Trustee of various trusts within the John Hancock Fund Complex (since 2005). |
| | | |
| William H. Cunningham, Born: 1944 | 2012 | 195 |
Trustee
Professor, University of Texas, Austin, Texas (since 1971); former Chancellor, University of Texas System and former President of the University of Texas, Austin, Texas; Chairman (since 2009) and Director (since 2006), Lincoln National Corporation (insurance); Director, Southwest Airlines (since 2000); former Director, LIN Television (2009-2014). Trustee of various trusts within the John Hancock Fund Complex (since 1986). |
| | | |
| Grace K. Fey, Born: 1946 | 2008 | 195 |
Trustee
Chief Executive Officer, Grace Fey Advisors (since 2007); Director and Executive Vice President, Frontier Capital Management Company (1988-2007); Director, Fiduciary Trust (since 2009). Trustee of various trusts within the John Hancock Fund Complex (since 2008). |
ANNUAL REPORT | JOHN HANCOCK NEW OPPORTUNITIES FUND 47
Independent Trustees (continued)
| | | |
Name, year of birth
Position(s) held with Trust
Principal occupation(s) and other
directorships during past 5 years | Trustee
of the
Trust
since1 | Number of John
Hancock funds
overseen by
Trustee |
| Deborah C. Jackson, Born: 1952 | 2012 | 195 |
Trustee
President, Cambridge College, Cambridge, Massachusetts (since 2011); Board of Directors, Massachusetts Women's Forum (since 2018); Board of Directors, National Association of Corporate Directors/New England (since 2015); Board of Directors, Association of Independent Colleges and Universities of Massachusetts (2014-2017); Chief Executive Officer, American Red Cross of Massachusetts Bay (2002-2011); Board of Directors of Eastern Bank Corporation (since 2001); Board of Directors of Eastern Bank Charitable Foundation (since 2001); Board of Directors of American Student Assistance Corporation (1996-2009); Board of Directors of Boston Stock Exchange (2002-2008); Board of Directors of Harvard Pilgrim Healthcare (health benefits company) (2007-2011). Trustee of various trusts within the John Hancock Fund Complex (since 2008). |
| | | |
| James M. Oates,2 Born: 1946 | 2005 | 195 |
Trustee
Managing Director, Wydown Group (financial consulting firm) (since 1994); Chairman and Director, Emerson Investment Management, Inc. (2000-2015); Independent Chairman, Hudson Castle Group, Inc. (formerly IBEX Capital Markets, Inc.) (financial services company) (1997-2011); Director, Stifel Financial (since 1996); Director, Investor Financial Services Corporation (1995-2007); Director, Connecticut River Bancorp (1998-2014); Director/Trustee, Virtus Funds (since 1988). Trustee (since 2004) and Chairperson of the Board (2005-2016) of various trusts within the John Hancock Fund Complex. |
| | | |
| Steven R. Pruchansky, Born: 1944 | 2012 | 195 |
Trustee and Vice Chairperson of the Board
Managing Director, Pru Realty (since 2017); Chairman and Chief Executive Officer, Greenscapes of Southwest Florida, Inc. (2014-2020); Director and President, Greenscapes of Southwest Florida, Inc. (until 2000); Member, Board of Advisors, First American Bank (until 2010); Managing Director, Jon James, LLC (real estate) (since 2000); Partner, Right Funding, LLC (2014-2017); Director, First Signature Bank & Trust Company (until 1991); Director, Mast Realty Trust (until 1994); President, Maxwell Building Corp. (until 1991). Trustee (since 1992), Chairperson of the Board (2011-2012), and Vice Chairperson of the Board (since 2012) of various trusts within the John Hancock Fund Complex. |
| | | |
| Frances G. Rathke,2,* Born: 1960 | 2020 | 195 |
Trustee
Director, Northern New England Energy Corporation (since 2017); Director, Audit Committee Chair and Compensation Committee Member, Green Mountain Power Corporation (since 2016); Director, Treasurer and Finance & Audit Committee Chair, Flynn Center for Performing Arts (since 2016); Director, Audit Committee Chair and Compensation Committee Member, Planet Fitness (since 2016); Director, Citizen Cider, Inc. (high-end hard cider and hard seltzer company) (since 2016); Chief Financial Officer and Treasurer, Keurig Green Mountain, Inc. (2003-retired 2015); Independent Financial Consultant, Frances Rathke Consulting (strategic and financial consulting services) (2001-2003); Chief Financial Officer and Secretary, Ben & Jerry's Homemade, Inc. (1989-2000, including prior positions); Senior Manager, Coopers & Lybrand, LLC (independent public accounting firm) (1982-1989). Trustee of various trusts within the John Hancock Fund Complex (since 2020). |
ANNUAL REPORT | JOHN HANCOCK NEW OPPORTUNITIES FUND 48
Independent Trustees (continued)
| | | |
Name, year of birth
Position(s) held with Trust
Principal occupation(s) and other
directorships during past 5 years | Trustee
of the
Trust
since1 | Number of John
Hancock funds
overseen by
Trustee |
| Gregory A. Russo, Born: 1949 | 2012 | 195 |
Trustee
Director and Audit Committee Chairman (2012-2020), and Member, Audit Committee and Finance Committee (2011-2020), NCH Healthcare System, Inc. (holding company for multi-entity healthcare system); Director and Member (2012-2018) and Finance Committee Chairman (2014-2018), The Moorings, Inc. (nonprofit continuing care community); Vice Chairman, Risk & Regulatory Matters, KPMG LLP (KPMG) (2002-2006); Vice Chairman, Industrial Markets, KPMG (1998-2002); Chairman and Treasurer, Westchester County, New York, Chamber of Commerce (1986-1992); Director, Treasurer, and Chairman of Audit and Finance Committees, Putnam Hospital Center (1989-1995); Director and Chairman of Fundraising Campaign, United Way of Westchester and Putnam Counties, New York (1990-1995). Trustee of various trusts within the John Hancock Fund Complex (since 2008). |
Non-Independent Trustees3
| | | |
Name, year of birth
Position(s) held with Trust
Principal occupation(s) and other
directorships during past 5 years | Trustee
of the
Trust
since1 | Number of John
Hancock funds
overseen by
Trustee |
| Andrew G. Arnott, Born: 1971 | 2017 | 195 |
President and Non-Independent Trustee
Head of Wealth and Asset Management, United States and Europe, for John Hancock and Manulife (since 2018); Executive Vice President, John Hancock Financial Services (since 2009, including prior positions); Director and Executive Vice President, John Hancock Investment Management LLC (since 2005, including prior positions); Director and Executive Vice President, John Hancock Variable Trust Advisers LLC (since 2006, including prior positions); President, John Hancock Investment Management Distributors LLC (since 2004, including prior positions); President of various trusts within the John Hancock Fund Complex (since 2007, including prior positions). Trustee of various trusts within the John Hancock Fund Complex (since 2017). |
| | | |
| Marianne Harrison, Born: 1963 | 2018 | 195 |
Non-Independent Trustee
President and CEO, John Hancock (since 2017); President and CEO, Manulife Canadian Division (2013-2017); Member, Board of Directors, CAE Inc. (since 2019); Member, Board of Directors, MA Competitive Partnership Board (since 2018); Member, Board of Directors, American Council of Life Insurers (ACLI) (since 2018); Member, Board of Directors, Communitech, an industry-led innovation center that fosters technology companies in Canada (2017-2019); Member, Board of Directors, Manulife Assurance Canada (2015-2017); Board Member, St. Mary's General Hospital Foundation (2014-2017); Member, Board of Directors, Manulife Bank of Canada (2013-2017); Member, Standing Committee of the Canadian Life & Health Assurance Association (2013-2017); Member, Board of Directors, John Hancock USA, John Hancock Life & Health, John Hancock New York (2012-2013). Trustee of various trusts within the John Hancock Fund Complex (since 2018). |
ANNUAL REPORT | JOHN HANCOCK NEW OPPORTUNITIES FUND 49
Principal officers who are not Trustees
| | |
Name, year of birth
Position(s) held with Trust
Principal occupation(s)
during past 5 years | Officer
of the
Trust
since |
| Charles A. Rizzo, Born: 1957 | 2007 |
Chief Financial Officer
Vice President, John Hancock Financial Services (since 2008); Senior Vice President, John Hancock Investment Management LLC and John Hancock Variable Trust Advisers LLC (since 2008); Chief Financial Officer of various trusts within the John Hancock Fund Complex (since 2007). |
| | |
| Salvatore Schiavone, Born: 1965 | 2009 |
Treasurer
Assistant Vice President, John Hancock Financial Services (since 2007); Vice President, John Hancock Investment Management LLC and John Hancock Variable Trust Advisers LLC (since 2007); Treasurer of various trusts within the John Hancock Fund Complex (since 2007, including prior positions). |
| | |
| Christopher (Kit) Sechler, Born: 1973 | 2018 |
Chief Legal Officer and Secretary
Vice President and Deputy Chief Counsel, John Hancock Investments (since 2015); Assistant Vice President and Senior Counsel (2009-2015), John Hancock Investment Management; Chief Legal Officer and Secretary of various trusts within the John Hancock Fund Complex (since 2018); Assistant Secretary of John Hancock Investment Management LLC and John Hancock Variable Trust Advisers LLC (since 2009). |
| | |
| Trevor Swanberg, Born: 1979 | 2020 |
Chief Compliance Officer
Chief Compliance Officer, various trusts within the John Hancock Fund Complex, John Hancock Investment Management LLC, and John Hancock Variable Trust Advisers LLC (since 2020); Deputy Chief Compliance Officer, various trusts within the John Hancock Fund Complex (2018-2020); Deputy Chief Compliance Officer, John Hancock Investment Management LLC and John Hancock Variable Trust Advisers LLC (2019-2020); Assistant Chief Compliance Officer, various trusts within the John Hancock Fund Complex (2016-2018); Assistant Chief Compliance Officer, John Hancock Investment Management LLC and John Hancock Variable Trust Advisers LLC (2016-2019); Vice President, State Street Global Advisors (2015-2016). |
The business address for all Trustees and Officers is 200 Berkeley Street, Boston, Massachusetts 02116-5023.
The Statement of Additional Information of the fund includes additional information about members of the Board of Trustees of the Trust and is available without charge, upon request, by calling 800-225-5291.
| | |
| 1 | Each Trustee holds office until his or her successor is elected and qualified, or until the Trustee's death, retirement, resignation, or removal. Mr. Boyle has served as Trustee at various times prior to the date listed in the table. |
| 2 | Member of the Audit Committee. |
| 3 | The Trustee is a Non-Independent Trustee due to current or former positions with the Advisor and certain affiliates. |
| * | Appointed as Independent Trustee effective as of September 15, 2020. |
ANNUAL REPORT | JOHN HANCOCK NEW OPPORTUNITIES FUND 50
| | |
Trustees
Hassell H. McClellan, Chairperson
Steven R. Pruchansky, Vice Chairperson
Andrew G. Arnott†
Charles L. Bardelis*
James R. Boyle
Peter S. Burgess*
William H. Cunningham
Grace K. Fey
Marianne Harrison†
Deborah C. Jackson
James M. Oates*
Frances G. Rathke*,1
Gregory A. Russo
Officers
Andrew G. Arnott
President
Charles A. Rizzo
Chief Financial Officer
Salvatore Schiavone
Treasurer
Christopher (Kit) Sechler
Secretary and Chief Legal Officer
Trevor Swanberg2
Chief Compliance Officer
| Investment advisor
John Hancock Investment Management LLC
Subadvisor
GW & K Investment Management, LLC
Portfolio Managers
Joseph C. Craigen, CFA
Daniel L. Miller, CFA
Principal distributor
John Hancock Investment Management Distributors LLC
Custodian
State Street Bank and Trust Company
Transfer agent
John Hancock Signature Services, Inc.
Legal counsel
K&L Gates LLP
Independent registered public accounting firm
PricewaterhouseCoopers LLP
|
* Member of the Audit Committee
† Non-Independent Trustee
1 Appointed as Independent Trustee effective as of September 15, 2020
2 Effective July 31, 2020
The fund's proxy voting policies and procedures, as well as the fund proxy voting record for the most recent twelve-month period ended June 30, are available free of charge on the Securities and Exchange Commission (SEC) website at sec.gov or on our website.
All of the fund's holdings as of the end of the third month of every fiscal quarter are filed with the SEC on Form N-PORT within 60 days of the end of the fiscal quarter. The fund's Form N-PORT filings are available on our website and the SEC's website, sec.gov.
We make this information on your fund, as well as monthly portfolio holdings, and other fund details available on our website at jhinvestments.com or by calling 800-225-5291.
| | | | |
| | You can also contact us: |
| | 800-225-5291
jhinvestments.com | Regular mail:
John Hancock Signature Services, Inc.
PO Box 219909
Kansas City, MO 64121-9909
| Express mail:
John Hancock Signature Services, Inc.
430 W 7th Street
Suite 219909
Kansas City, MO 64105-1407
|
ANNUAL REPORT | JOHN HANCOCK NEW OPPORTUNITIES FUND 51
John Hancock family of funds
| | | |
DOMESTIC EQUITY FUNDS
Blue Chip Growth
Classic Value
Disciplined Value
Disciplined Value Mid Cap
Equity Income
Financial Industries
Fundamental All Cap Core
Fundamental Large Cap Core
New Opportunities
Regional Bank
Small Cap Core
Small Cap Growth
Small Cap Value
U.S. Global Leaders Growth
U.S. Quality Growth
GLOBAL AND INTERNATIONAL EQUITY FUNDS
Disciplined Value International
Emerging Markets
Emerging Markets Equity
Fundamental Global Franchise
Global Equity
Global Shareholder Yield
Global Thematic Opportunities
International Dynamic Growth
International Growth
International Small Company
| | INCOME FUNDS
Bond
California Tax-Free Income
Emerging Markets Debt
Floating Rate Income
Government Income
High Yield
High Yield Municipal Bond
Income
Investment Grade Bond
Money Market
Short Duration Bond
Short Duration Credit Opportunities
Strategic Income Opportunities
Tax-Free Bond
ALTERNATIVE AND SPECIALTY FUNDS
Absolute Return Currency
Alternative Asset Allocation
Alternative Risk Premia
Diversified Macro
Infrastructure
Multi-Asset Absolute Return
Seaport Long/Short
|
A fund's investment objectives, risks, charges, and expenses should be considered carefully before investing. The prospectus contains this and other important information about the fund. To obtain a prospectus, contact your financial professional, call John Hancock Investment Management at 800-225-5291, or visit our website at jhinvestments.com. Please read the prospectus carefully before investing or sending money.
| | | |
ASSET ALLOCATION
Balanced
Multi-Asset High Income
Multi-Index Lifetime Portfolios
Multi-Index Preservation Portfolios
Multimanager Lifestyle Portfolios
Multimanager Lifetime Portfolios
Retirement Income 2040
EXCHANGE-TRADED FUNDS
John Hancock Multifactor Consumer Discretionary ETF
John Hancock Multifactor Consumer Staples ETF
John Hancock Multifactor Developed International ETF
John Hancock Multifactor Emerging Markets ETF
John Hancock Multifactor Energy ETF
John Hancock Multifactor Financials ETF
John Hancock Multifactor Healthcare ETF
John Hancock Multifactor Industrials ETF
John Hancock Multifactor Large Cap ETF
John Hancock Multifactor Materials ETF
John Hancock Multifactor Media and
Communications ETF
John Hancock Multifactor Mid Cap ETF
John Hancock Multifactor Small Cap ETF
John Hancock Multifactor Technology ETF
John Hancock Multifactor Utilities ETF
| | ENVIRONMENTAL, SOCIAL, AND
GOVERNANCE FUNDS
ESG All Cap Core
ESG Core Bond
ESG International Equity
ESG Large Cap Core
CLOSED-END FUNDS
Financial Opportunities
Hedged Equity & Income
Income Securities Trust
Investors Trust
Preferred Income
Preferred Income II
Preferred Income III
Premium Dividend
Tax-Advantaged Dividend Income
Tax-Advantaged Global Shareholder Yield
|
John Hancock Multifactor ETF shares are bought and sold at market price (not NAV), and are not individually redeemed
from the fund. Brokerage commissions will reduce returns.
John Hancock ETFs are distributed by Foreside Fund Services, LLC, and are subadvised by Dimensional Fund Advisors LP.
Foreside is not affiliated with John Hancock Investment Management Distributors LLC or Dimensional Fund Advisors LP.
Dimensional Fund Advisors LP receives compensation from John Hancock in connection with licensing rights to the
John Hancock Dimensional indexes. Dimensional Fund Advisors LP does not sponsor, endorse, or sell, and makes no
representation as to the advisability of investing in, John Hancock Multifactor ETFs.
John Hancock Investment Management
A trusted brand
John Hancock Investment Management is a premier asset manager
with a heritage of financial stewardship dating back to 1862. Helping
our shareholders pursue their financial goals is at the core of
everything we do. It's why we support the role of professional financial
advice and operate with the highest standards of conduct and integrity.
A better way to invest
We serve investors globally through a unique multimanager approach:
We search the world to find proven portfolio teams with specialized
expertise for every strategy we offer, then we apply robust investment
oversight to ensure they continue to meet our uncompromising
standards and serve the best interests of our shareholders.
Results for investors
Our unique approach to asset management enables us to provide
a diverse set of investments backed by some of the world's best
managers, along with strong risk-adjusted returns across asset classes.
John Hancock Investment Management Distributors LLC n Member FINRA, SIPC
200 Berkeley Street n Boston, MA 02116-5010 n 800-225-5291 n jhinvestments.com
This report is for the information of the shareholders of John Hancock New Opportunities Fund. It is not authorized for distribution to prospective investors unless preceded or accompanied by a prospectus.
John Hancock
Strategic Income Opportunities Fund
Annual report 8/31/2020
Beginning on January 1, 2021, as permitted by regulations adopted by the Securities and Exchange Commission, paper copies of the fund's shareholder reports like this one will no longer be sent by mail, unless you specifically request paper copies of the reports from the fund or from your financial intermediary. Instead, the reports will be made available on a website, and you will be notified by mail each time a report is posted and provided with a website link to access the report.
If you already elected to receive shareholder reports electronically, you will not be affected by this change, and you do not need to take any action. You may elect to receive shareholder reports and other communications electronically by calling John Hancock Investment Management at 800-225-5291 (Class A and Class C shares) or 888-972-8696 (Class I and Class R Suite) or by contacting your financial intermediary.
You may elect to receive all reports in paper, free of charge, at any time. You can inform John Hancock Investment Management or your financial intermediary that you wish to continue receiving paper copies of your shareholder reports by following the instructions listed above. Your election to receive reports in paper will apply to all funds held with John Hancock Investment Management or your financial intermediary.
A message to shareholders
Dear shareholder,
Despite heightened fears over the coronavirus (COVID-19), which sent markets tumbling during the latter half of February and early March, global financial markets delivered positive returns for the 12-month period ended August 31, 2020.
During the first-quarter sell-off, many investors reacted by exiting higher-risk assets and moving into cash, leading to a liquidity crunch in the fixed-income markets. In response to the sell-off, the U.S. Federal Reserve acted quickly, lowering interest rates to near zero and reinstating quantitative easing, as well as announcing its plans to shore up short-term debt. Many other nations followed suit and credit spreads rebounded off their highs as liquidity concerns eased.
The continued spread of COVID-19, trade disputes, rising unemployment, and other geopolitical tensions may continue to create uncertainty among businesses and investors. Your financial professional can help position your portfolio so that it's sufficiently diversified to seek to meet your long-term objectives and to withstand the inevitable bouts of market volatility along the way.
On behalf of everyone at John Hancock Investment Management, I'd like to take this opportunity to welcome new shareholders and thank existing shareholders for the continued trust you've placed in us.
Sincerely,
Andrew G. Arnott
President and CEO,
John Hancock Investment Management
Head of Wealth and Asset Management,
United States and Europe
This commentary reflects the CEO's views as of this report's period end and are subject to change at any time. Diversification does not guarantee investment returns and does not eliminate risk of loss. All investments entail risks, including the possible loss of principal. For more up-to-date information, you can visit our website at jhinvestments.com.
John Hancock
Strategic Income Opportunities Fund
Table of contents
| | | |
| 2 | | Your fund at a glance |
| 5 | | Manager's discussion of fund performance |
| 7 | | A look at performance |
| 9 | | Your expenses |
| 11 | | Fund's investments |
| 35 | | Financial statements |
| 39 | | Financial highlights |
| 45 | | Notes to financial statements |
| 60 | | Report of independent registered public accounting firm |
| 61 | | Tax information |
| 62 | | Continuation of investment advisory and subadvisory agreements |
| 69 | | Statement regarding liquidity risk management |
| 72 | | Trustees and Officers |
| 76 | | More information |
ANNUAL REPORT | JOHN HANCOCK STRATEGIC INCOME OPPORTUNITIES FUND 1
INVESTMENT OBJECTIVE
The fund seeks to maximize total return consisting of current income and capital appreciation.
AVERAGE ANNUAL TOTAL RETURNS AS OF 8/31/2020 (%)
The Bloomberg Barclays U.S. Aggregate Bond Index is an unmanaged index of dollar-denominated and non-convertible investment-grade debt issues.
It is not possible to invest directly in an index. Index figures do not reflect expenses or sales charges, which would result in lower returns.
The fund's Morningstar category average is a group of funds with similar investment objectives and strategies and is the equal-weighted return of all funds per category. Morningstar places funds in certain categories based on their historical portfolio holdings. Figures from Morningstar, Inc. include reinvested distributions and do not take into account sales charges. Actual load-adjusted performance is lower.
The past performance shown here reflects reinvested distributions and the beneficial effect of any expense reductions, and does not guarantee future results. Performance of the other share classes will vary based on the difference in the fees and expenses of those classes. Shares will fluctuate in value and, when redeemed, may be worth more or less than their original cost. Current month-end performance may be lower or higher than the performance cited, and can be found at jhinvestments.com or by calling 800-225-5291. For further information on the fund's objectives, risks, and strategy, see the fund's prospectus.
ANNUAL REPORT | JOHN HANCOCK STRATEGIC INCOME OPPORTUNITIES FUND 2
PERFORMANCE HIGHLIGHTS OVER THE LAST TWELVE MONTHS
Bonds performed well despite pandemic-related volatility
U.S. bonds generated solid gains in a period characterized by extraordinary volatility, due in large part to the COVID-19 pandemic.
The fund underperformed its benchmark
The fund produced a positive return but trailed the performance of its benchmark, the Bloomberg Barclays U.S. Aggregate Bond Index.
Sector allocation detracted the most
An out-of-index position in high-yield corporate bonds, which underperformed during the period, was the largest detractor.
PORTFOLIO COMPOSITION AS OF 8/31/2020 (%)
ANNUAL REPORT | JOHN HANCOCK STRATEGIC INCOME OPPORTUNITIES FUND 3
QUALITY COMPOSITION AS OF 8/31/2020 (%)
A note about risks
The fund may be subject to various risks as described in the fund's prospectus. A widespread health crisis such as a global pandemic could cause substantial market volatility, exchange trading suspensions and closures, impact the ability to complete redemptions, and affect fund performance. For example, the novel coronavirus disease (COVID-19) has resulted in significant disruptions to global business activity. The impact of a health crisis and other epidemics and pandemics that may arise in the future, could affect the global economy in ways that cannot necessarily be foreseen at the present time. A health crisis may exacerbate other pre-existing political, social, and economic risks. Any such impact could adversely affect the fund's performance, resulting in losses to your investment. For more information, please refer to the "Principal risks" section of the prospectus.
ANNUAL REPORT | JOHN HANCOCK STRATEGIC INCOME OPPORTUNITIES FUND 4
Manager's discussion of fund performance
Can you describe the bond market environment during the 12 months ended August 31, 2020?
The broad U.S. bond market posted solid gains in an unprecedented and volatile 12 months. At the beginning of the period, bond market volatility was driven by the continuing trade conflict between the United States and China and uncertainty regarding the outcome of Brexit. However, 2020 brought a different source of volatility—the COVID-19 pandemic, which sent shock waves through the financial markets and led to a broad disruption in global economic activity. Central banks, including the U.S. Federal Reserve (Fed), swiftly slashed interest rates and implemented new waves of quantitative easing. In addition, global governments stepped in with fiscal stimulus programs to aid individuals and small businesses facing economic hardship.
Reflecting the Fed's interest rate cuts, U.S. bond yields declined sharply, leading to positive bond market returns. Sector returns were widely divergent, however—U.S. Treasury bonds and investment-grade corporate securities delivered the best returns, benefiting from a flight to quality, while high-yield corporate bonds posted modest gains.
How did the fund perform?
The fund trailed the performance of its benchmark, the Bloomberg Barclays U.S. Aggregate Bond Index. A position in high-yield corporate bonds, which constituted more than 20% of the portfolio but are not represented in the benchmark, was a key factor in the overall underperformance.
| | | | | | | | | | | | | | | |
| | NET CURRENCY EXPOSURE
AS OF 8/31/20 (%) | | | | | | COUNTRY COMPOSITION
AS OF 8/31/20 (%) | |
| | United States Dollar | | | 81.0 | | | | | | United States | | | 64.5 | |
| | Euro | | | 8.5 | | | | | | Indonesia | | | 4.4 | |
| | Canadian Dollar | | | 3.0 | | | | | | Canada | | | 4.4 | |
| | Indonesian Rupiah | | | 2.5 | | | | | | Supranational | | | 2.3 | |
| | Japanese Yen | | | 2.0 | | | | | | Luxembourg | | | 2.2 | |
| | Norwegian Krone | | | 2.0 | | | | | | Norway | | | 1.9 | |
| | Malaysian Ringgit | | | 1.4 | | | | | | Singapore | | | 1.8 | |
| | Other Currencies | | | 0.8 | | | | | | Netherlands | | | 1.8 | |
| | Singapore Dollar | | | (1.2 | ) | | | | | Portugal | | | 1.6 | |
| | TOTAL | | | 100.0 | | | | | | Malaysia | | | 1.4 | |
| | | | | | | | | | | Other countries | | | 13.7 | |
| | | | | | | | | | | TOTAL | | | 100.0 | |
| | As a percentage of net assets. | | | | | | As a percentage of net assets. | |
| | Net currency exposure, after taking into account the effects of forward foreign currency exchange contracts. | | | | | | | |
ANNUAL REPORT | JOHN HANCOCK STRATEGIC INCOME OPPORTUNITIES FUND 5
The fund's duration positioning also detracted from performance versus the index, as the fund's shorter duration (a measure of interest-rate sensitivity) hindered performance in a declining interest rate environment. However, we mitigated the underperformance through some tactical adjustments—we lengthened the fund's duration in early 2020, before the pandemic-driven rally, and then shortened it back to previous levels after the substantial decline in interest rates.
On the positive side, the fund's foreign currency exposure added value, particularly in the latter half of the period. We increased the fund's currency exposure to more than 20% of the portfolio in early 2020 after a prolonged period of U.S. dollar outperformance. The Fed rate cuts and U.S. economic weakness brought about by the pandemic weighed on the dollar, contributing to the favorable performance of our foreign currency positions.
Did you make any changes to the portfolio in response to the pandemic?
We took advantage of market dislocations to selectively increase the fund's position in high-yield corporate bonds, with an emphasis on the higher-quality part of the sector. We also reduced the fund's exposure to emerging markets given their uncertain outlook. As mentioned before, we shortened the fund's duration as there is little room for rates to fall further. Finally, we added to the fund's foreign currency exposure, particularly in developed-market currencies such as the euro, the Canadian dollar, and the Norwegian krone; however, we have trimmed these positions toward the end of the period after a spate of strong performance.
MANAGED BY
| |
| Daniel S. Janis III, Manulife IM (US) |
| Thomas C. Goggins, Manulife IM (US) |
| Kisoo Park, Manulife IM (US) |
| Christopher M. Chapman, CFA, Manulife IM (US) |
The views expressed in this report are exclusively those of Daniel S. Janis III, Manulife Investment Management, and are subject to change. They are not meant as investment advice. Please note that the holdings discussed in this report may not have been held by the fund for the entire period. Portfolio composition is subject to review in accordance with the fund's investment strategy and may vary in the future. Current and future portfolio holdings are subject to risk.
ANNUAL REPORT | JOHN HANCOCK STRATEGIC INCOME OPPORTUNITIES FUND 6
TOTAL RETURNS FOR THE PERIOD ENDED AUGUST 31, 2020
| | | | | | | | | | | | |
Average annual total returns (%)
with maximum sales charge | | Cumulative total returns (%)
with maximum sales charge | | SEC 30-day
yield (%)
subsidized | | SEC 30-day
yield (%)
unsubsidized1 |
| | 1-year | 5-year | 10-year | | | 5-year | 10-year | | as of
8-31-20 | | as of
8-31-20 |
| Class A | 0.85 | 2.67 | 4.12 | | | 14.09 | 49.73 | | 1.62 | | 1.59 |
| Class C | 3.38 | 2.81 | 3.83 | | | 14.87 | 45.58 | | 0.99 | | 0.96 |
| Class I2 | 5.42 | 3.84 | 4.88 | | | 20.75 | 61.03 | | 1.98 | | 1.95 |
| Class R22,3 | 4.92 | 3.44 | 4.56 | | | 18.41 | 56.23 | | 1.61 | | 1.58 |
| Class R62,3 | 5.54 | 3.95 | 4.97 | | | 21.40 | 62.38 | | 2.09 | | 2.06 |
| Class NAV2 | 5.56 | 3.97 | 5.00 | | | 21.46 | 62.92 | | 2.10 | | 2.07 |
| Index† | 6.47 | 4.33 | 3.65 | | | 23.60 | 43.14 | | — | | — |
Performance figures assume all distributions are reinvested. Figures reflect maximum sales charges on Class A shares of 4.0%, and the applicable contingent deferred sales charge (CDSC) on Class C shares. The returns for Class A shares have been adjusted to reflect the reduction in the maximum sales charge from 4.5% to 4.0%, effective 2-3-14. Class C shares sold within one year of purchase are subject to a 1% CDSC. Sales charges are not applicable to Class I, Class R2, Class R6, and Class NAV shares.
The expense ratios of the fund, both net (including any fee waivers and/or expense limitations) and gross (excluding any fee waivers and/or expense limitations), are set forth according to the most recent publicly available prospectuses for the fund and may differ from those disclosed in the Financial highlights tables in this report.Net expenses reflect contractual expense limitations in effect until December 31, 2020 and are subject to change. Had the contractual fee waivers and expense limitations not been in place, gross expenses would apply. The expense ratios are as follows:
| | | | | | | |
| | Class A | Class C | Class I | Class R2 | Class R6 | Class NAV |
| Gross (%) | 1.11 | 1.81 | 0.81 | 1.20 | 0.70 | 0.69 |
| Net (%) | 1.08 | 1.78 | 0.78 | 1.17 | 0.67 | 0.66 |
Please refer to the most recent prospectus and annual or semiannual report for more information on expenses and any expense limitation arrangements for each class.
The returns reflect past results and should not be considered indicative of future performance. The return and principal value of an investment will fluctuate so that shares, when redeemed, may be worth more or less than their original cost. Due to market volatility and other factors, the fund's current performance may be higher or lower than the performance shown. For current to the most recent month-end performance data, please call 800-225-5291 or visit the fund's website at jhinvestments.com.
The performance table above and the chart on the next page do not reflect the deduction of taxes that a shareholder would pay on fund distributions or the redemption of fund shares. The fund's performance results reflect any applicable fee waivers or expense reductions, without which the expenses would increase and results would have been less favorable.
| † | Index is the Bloomberg Barclays U.S. Aggregate Bond Index. |
See the following page for footnotes.
ANNUAL REPORT | JOHN HANCOCK STRATEGIC INCOME OPPORTUNITIES FUND 7
This chart and table show what happened to a hypothetical $10,000 investment in John Hancock Strategic Income Opportunities Fund for the share classes and periods indicated, assuming all distributions were reinvested. For comparison, we've shown the same investment in the Bloomberg Barclays U.S. Aggregate Bond Index.
| | | | | |
| | Start date | With maximum
sales charge ($) | Without
sales charge ($) | Index ($) |
| Class C4 | 8-31-10 | 14,558 | 14,558 | 14,314 |
| Class I2 | 8-31-10 | 16,103 | 16,103 | 14,314 |
| Class R22,3 | 8-31-10 | 15,623 | 15,623 | 14,314 |
| Class R62,3 | 8-31-10 | 16,238 | 16,238 | 14,314 |
| Class NAV2 | 8-31-10 | 16,292 | 16,292 | 14,314 |
The values shown in the chart for "Class A shares with maximum sales charge" have been adjusted to reflect the reduction in the Class A maximum sales charge from 4.5% to 4.0%, which became effective on 2-3-14.
The Bloomberg Barclays U.S. Aggregate Bond Index is an unmanaged index of dollar-denominated and non-convertible investment-grade debt issues.
It is not possible to invest directly in an index. Index figures do not reflect sales charges or foreign currency impact, which would result in lower returns.
Footnotes related to performance pages
| 1 | Unsubsidized yield reflects what the yield would have been without the effect of reimbursements and waivers. |
| 2 | For certain types of investors, as described in the fund's prospectuses. |
| 3 | Class R2 shares were first offered on 3-1-12; Class R6 shares were first offered on 9-1-11. The returns prior to these dates are those of Class NAV shares that have not been adjusted for class-specific expenses; otherwise, returns would vary. |
| 4 | The contingent deferred sales charge is not applicable. |
ANNUAL REPORT | JOHN HANCOCK STRATEGIC INCOME OPPORTUNITIES FUND 8
These examples are intended to help you understand your ongoing operating expenses of investing in the fund so you can compare these costs with the ongoing costs of investing in other mutual funds.
Understanding fund expenses
As a shareholder of the fund, you incur two types of costs:
■Transaction costs, which include sales charges (loads) on purchases or redemptions (varies by share class), minimum account fee charge, etc.
■Ongoing operating expenses, including management fees, distribution and service fees (if applicable), and other fund expenses.
We are presenting only your ongoing operating expenses here.
Actual expenses/actual returns
The first line of each share class in the table on the following page is intended to provide information about the fund’s actual ongoing operating expenses, and is based on the fund’s actual return. It assumes an account value of $1,000.00 on March 1, 2020, with the same investment held until August 31, 2020.
Together with the value of your account, you may use this information to estimate the operating expenses that you paid over the period. Simply divide your account value at August 31, 2020, by $1,000.00, then multiply it by the “expenses paid” for your share class from the table. For example, for an account value of $8,600.00, the operating expenses should be calculated as follows:
| | ANNUAL REPORT | JOHN HANCOCK STRATEGIC INCOME OPPORTUNITIES FUND | 9 |
Remember, these examples do not include any transaction costs, therefore, these examples will not help you to determine the relative total costs of owning different funds. If transaction costs were included, your expenses would have been higher. See the prospectuses for details regarding transaction costs.
SHAREHOLDER EXPENSE EXAMPLE CHART
| | | Account
value on
3-1-2020 | Ending
value on
8-31-2020 | Expenses
paid during
period ended
8-31-20201 | Annualized
expense
ratio |
| Class A | Actual expenses/actual returns | $1,000.00 | $1,038.50 | $5.53 | 1.08% |
| | Hypothetical example | 1,000.00 | 1,019.70 | 5.48 | 1.08% |
| Class C | Actual expenses/actual returns | 1,000.00 | 1,035.80 | 9.11 | 1.78% |
| | Hypothetical example | 1,000.00 | 1,016.20 | 9.02 | 1.78% |
| Class I | Actual expenses/actual returns | 1,000.00 | 1,041.00 | 4.00 | 0.78% |
| | Hypothetical example | 1,000.00 | 1,021.20 | 3.96 | 0.78% |
| Class R2 | Actual expenses/actual returns | 1,000.00 | 1,038.10 | 5.89 | 1.15% |
| | Hypothetical example | 1,000.00 | 1,019.40 | 5.84 | 1.15% |
| Class R6 | Actual expenses/actual returns | 1,000.00 | 1,040.60 | 3.39 | 0.66% |
| | Hypothetical example | 1,000.00 | 1,021.80 | 3.35 | 0.66% |
| Class NAV | Actual expenses/actual returns | 1,000.00 | 1,040.70 | 3.33 | 0.65% |
| | Hypothetical example | 1,000.00 | 1,021.90 | 3.30 | 0.65% |
| 1 | Expenses are equal to the annualized expense ratio, multiplied by the average account value over the period, multiplied by 184/366 (to reflect the one-half year period). |
| 10 | JOHN HANCOCK STRATEGIC INCOME OPPORTUNITIES FUND | ANNUAL REPORT | |
AS OF 8-31-20
| | Rate (%) | Maturity date | | Par value^ | Value |
| U.S. Government and Agency obligations 8.5% | | | $396,137,187 |
| (Cost $333,937,905) | | | | | |
| U.S. Government 8.5% | | | | 396,137,187 |
| U.S. Treasury | | | | | |
| Bond | 2.000 | 02-15-50 | | 18,000,000 | 20,258,438 |
| Bond | 2.750 | 11-15-42 | | 47,440,000 | 60,313,659 |
| Bond | 3.000 | 02-15-49 | | 62,535,000 | 85,064,700 |
| Bond | 3.125 | 02-15-43 | | 8,482,000 | 11,419,555 |
| Bond | 4.375 | 02-15-38 | | 40,125,000 | 61,497,832 |
| Note | 0.250 | 06-30-25 | | 18,000,000 | 17,990,156 |
| Note | 1.125 | 02-28-22 | | 7,840,000 | 7,954,231 |
| Note | 2.000 | 11-15-26 | | 12,370,000 | 13,569,793 |
| Note | 2.375 | 02-29-24 | | 9,515,000 | 10,240,519 |
| Note | 2.375 | 04-30-26 | | 13,800,000 | 15,360,586 |
| Note | 2.375 | 05-15-29 | | 36,715,000 | 42,159,146 |
| Note | 2.625 | 02-15-29 | | 19,455,000 | 22,684,074 |
|
| Treasury Inflation Protected Security | 0.125 | 01-15-30 | | 24,719,909 | 27,624,498 |
| Foreign government obligations 17.6% | | | | $821,090,695 |
| (Cost $799,981,015) | | | | | |
| Australia 0.4% | | | | | 16,279,824 |
| Commonwealth of Australia | 0.250 | 11-21-24 | AUD | 7,240,000 | 5,314,862 |
| New South Wales Treasury Corp. | 1.000 | 02-08-24 | AUD | 14,565,000 | 10,964,962 |
| Austria 0.3% | | | | | 13,604,242 |
| Republic of Austria (A) | 0.500 | 02-20-29 | EUR | 10,675,000 | 13,604,242 |
| Canada 2.3% | | | | | 107,154,850 |
| Canada Housing Trust No. 1 (A) | 1.950 | 12-15-25 | CAD | 38,175,000 | 31,195,884 |
| Export Development Canada | 2.400 | 06-07-21 | AUD | 4,145,000 | 3,106,813 |
| Government of Canada | 1.500 | 09-01-24 | CAD | 30,820,000 | 24,719,561 |
| Province of Ontario | 2.900 | 06-02-28 | CAD | 13,400,000 | 11,654,153 |
| Province of Ontario | 3.450 | 06-02-45 | CAD | 11,995,000 | 11,652,443 |
| Province of Quebec | 0.200 | 04-07-25 | EUR | 9,160,000 | 11,133,641 |
| Province of Quebec | 1.500 | 12-15-23 | GBP | 5,130,000 | 7,100,689 |
| Province of Quebec | 3.000 | 09-01-23 | CAD | 8,000,000 | 6,591,666 |
| China 0.1% | | | | | 2,541,786 |
| Republic of China | 1.990 | 04-09-25 | CNY | 18,140,000 | 2,541,786 |
| Colombia 0.3% | | | | | 12,836,520 |
| Republic of Colombia | 4.000 | 02-26-24 | | 12,000,000 | 12,836,520 |
| Greece 0.4% | | | | | 19,891,018 |
| Republic of Greece (A) | 1.500 | 06-18-30 | EUR | 7,335,000 | 9,069,785 |
| SEE NOTES TO FINANCIAL STATEMENTS | ANNUAL REPORT | JOHN HANCOCK STRATEGIC INCOME OPPORTUNITIES FUND | 11 |
| | Rate (%) | Maturity date | | Par value^ | Value |
| Greece (continued) | | | | | |
| Republic of Greece (A) | 2.000 | 04-22-27 | EUR | 8,435,000 | $10,821,233 |
| India 0.1% | | | | | 5,133,879 |
| Republic of India | 6.450 | 10-07-29 | INR | 373,000,000 | 5,133,879 |
| Indonesia 3.1% | | | | | 145,586,341 |
| Perusahaan Penerbit SBSN Indonesia III (A) | 4.150 | 03-29-27 | | 10,060,000 | 11,351,100 |
| Republic of Indonesia (A) | 2.150 | 07-18-24 | EUR | 6,000,000 | 7,489,520 |
| Republic of Indonesia (A) | 2.625 | 06-14-23 | EUR | 11,010,000 | 13,827,972 |
| Republic of Indonesia | 3.850 | 10-15-30 | | 7,180,000 | 8,227,490 |
| Republic of Indonesia | 6.125 | 05-15-28 | IDR | 61,045,000,000 | 4,056,238 |
| Republic of Indonesia | 6.500 | 06-15-25 | IDR | 386,733,000,000 | 27,655,112 |
| Republic of Indonesia | 6.625 | 05-15-33 | IDR | 93,981,000,000 | 6,146,628 |
| Republic of Indonesia | 7.000 | 05-15-27 | IDR | 72,700,000,000 | 5,173,057 |
| Republic of Indonesia | 7.000 | 09-15-30 | IDR | 243,389,000,000 | 16,863,828 |
| Republic of Indonesia | 7.500 | 08-15-32 | IDR | 23,093,000,000 | 1,616,969 |
| Republic of Indonesia | 7.500 | 06-15-35 | IDR | 61,272,000,000 | 4,245,808 |
| Republic of Indonesia | 7.500 | 05-15-38 | IDR | 62,856,000,000 | 4,335,821 |
| Republic of Indonesia | 8.125 | 05-15-24 | IDR | 45,206,000,000 | 3,383,659 |
| Republic of Indonesia | 8.250 | 05-15-29 | IDR | 57,894,000,000 | 4,345,678 |
| Republic of Indonesia | 8.375 | 03-15-24 | IDR | 83,418,000,000 | 6,287,740 |
| Republic of Indonesia | 8.375 | 09-15-26 | IDR | 81,815,000,000 | 6,276,130 |
| Republic of Indonesia | 8.750 | 05-15-31 | IDR | 111,458,000,000 | 8,582,730 |
| Republic of Indonesia | 9.000 | 03-15-29 | IDR | 73,235,000,000 | 5,720,861 |
| Ireland 0.5% | | | | | 22,165,469 |
| Republic of Ireland | 3.400 | 03-18-24 | EUR | 16,300,000 | 22,165,469 |
| Italy 0.8% | | | | | 37,011,086 |
| Republic of Italy (A) | 1.850 | 07-01-25 | EUR | 19,430,000 | 24,660,471 |
| Republic of Italy (A) | 4.750 | 08-01-23 | EUR | 9,120,000 | 12,350,615 |
| Japan 1.0% | | | | | 46,388,498 |
| Government of Japan | 0.100 | 06-20-25 | JPY | 4,873,050,000 | 46,388,498 |
| Malaysia 1.4% | | | | | 65,452,549 |
| Government of Malaysia | 3.733 | 06-15-28 | MYR | 24,975,000 | 6,485,463 |
| Government of Malaysia | 3.828 | 07-05-34 | MYR | 22,120,000 | 5,731,369 |
| Government of Malaysia | 3.844 | 04-15-33 | MYR | 57,566,000 | 14,956,519 |
| Government of Malaysia | 3.882 | 03-14-25 | MYR | 36,535,000 | 9,436,438 |
| Government of Malaysia | 3.899 | 11-16-27 | MYR | 43,417,000 | 11,409,644 |
| Government of Malaysia | 4.059 | 09-30-24 | MYR | 37,710,000 | 9,745,963 |
| Government of Malaysia | 4.160 | 07-15-21 | MYR | 31,363,000 | 7,687,153 |
| Mexico 0.2% | | | | | 9,474,504 |
| Government of Mexico | 7.750 | 05-29-31 | MXN | 183,470,000 | 9,474,504 |
| 12 | JOHN HANCOCK STRATEGIC INCOME OPPORTUNITIES FUND | ANNUAL REPORT | SEE NOTES TO FINANCIAL STATEMENTS |
| | Rate (%) | Maturity date | | Par value^ | Value |
| Norway 1.0% | | | | | $46,463,027 |
| Kingdom of Norway (A) | 2.000 | 05-24-23 | NOK | 196,500,000 | 23,528,140 |
| Kingdom of Norway (A) | 3.750 | 05-25-21 | NOK | 195,085,000 | 22,934,887 |
| Philippines 0.8% | | | | | 35,159,498 |
| Republic of the Philippines | 0.875 | 05-17-27 | EUR | 17,540,000 | 20,822,486 |
| Republic of the Philippines | 4.950 | 01-15-21 | PHP | 215,590,000 | 4,463,031 |
| Republic of the Philippines | 6.250 | 01-14-36 | PHP | 373,000,000 | 9,873,981 |
| Portugal 1.6% | | | | | 75,236,970 |
| Republic of Portugal (A) | 0.475 | 10-18-30 | EUR | 21,270,000 | 25,495,515 |
| Republic of Portugal (A) | 0.700 | 10-15-27 | EUR | 4,525,000 | 5,615,765 |
| Republic of Portugal (A) | 3.850 | 04-15-21 | EUR | 17,380,000 | 21,315,099 |
| Republic of Portugal (A) | 5.125 | 10-15-24 | | 19,575,000 | 22,810,591 |
| Qatar 0.3% | | | | | 14,184,640 |
| State of Qatar (A) | 4.000 | 03-14-29 | | 6,955,000 | 8,133,789 |
| State of Qatar (A) | 4.817 | 03-14-49 | | 4,425,000 | 6,050,851 |
| Saudi Arabia 0.1% | | | | | 6,031,628 |
| Kingdom of Saudi Arabia (A) | 2.900 | 10-22-25 | | 5,690,000 | 6,031,628 |
| Singapore 0.9% | | | | | 43,765,918 |
| Republic of Singapore | 1.750 | 04-01-22 | SGD | 28,740,000 | 21,617,229 |
| Republic of Singapore | 1.875 | 03-01-50 | SGD | 26,057,000 | 22,148,689 |
| Spain 0.5% | | | | | 22,441,070 |
| Kingdom of Spain (A) | 0.250 | 07-30-24 | EUR | 9,125,000 | 11,114,391 |
| Kingdom of Spain (A) | 0.800 | 07-30-27 | EUR | 9,040,000 | 11,326,679 |
| Sweden 0.4% | | | | | 20,914,797 |
| Kingdom of Sweden (A) | 0.125 | 04-24-23 | EUR | 17,240,000 | 20,914,797 |
| United Arab Emirates 0.8% | | | | | 38,046,422 |
| Government of Abu Dhabi (A) | 0.750 | 09-02-23 | | 5,855,000 | 5,847,775 |
| Government of Abu Dhabi (A) | 1.700 | 03-02-31 | | 9,705,000 | 9,644,499 |
| Government of Abu Dhabi (A) | 2.500 | 04-16-25 | | 8,005,000 | 8,484,900 |
| Government of Abu Dhabi (A) | 3.125 | 04-16-30 | | 7,880,000 | 8,817,436 |
| Government of Abu Dhabi (A) | 3.875 | 04-16-50 | | 4,315,000 | 5,251,812 |
| United Kingdom 0.3% | | | | | 15,326,159 |
| Government of United Kingdom | 0.500 | 07-22-22 | GBP | 10,345,000 | 13,974,561 |
|
| Government of United Kingdom | 3.750 | 09-07-20 | GBP | 1,010,000 | 1,351,598 |
| Corporate bonds 54.3% | | | | | $2,532,538,620 |
| (Cost $2,430,640,957) | | | | | |
| Communication services 8.4% | | | | 389,963,064 |
| Diversified telecommunication services 0.8% | | | |
| Cellnex Telecom SA | 1.875 | 06-26-29 | EUR | 3,500,000 | 4,234,517 |
| SEE NOTES TO FINANCIAL STATEMENTS | ANNUAL REPORT | JOHN HANCOCK STRATEGIC INCOME OPPORTUNITIES FUND | 13 |
| | Rate (%) | Maturity date | | Par value^ | Value |
| Communication services (continued) | | | | |
| Diversified telecommunication services (continued) | | | |
| GCI LLC (A) | 6.625 | 06-15-24 | | 17,005,000 | $17,940,275 |
| Verizon Communications, Inc. | 4.329 | 09-21-28 | | 10,654,000 | 12,906,350 |
| Entertainment 1.2% | | | |
| Lions Gate Capital Holdings LLC (A) | 5.875 | 11-01-24 | | 5,635,000 | 5,677,263 |
| Lions Gate Capital Holdings LLC (A) | 6.375 | 02-01-24 | | 16,135,000 | 16,498,038 |
| Live Nation Entertainment, Inc. (A) | 4.750 | 10-15-27 | | 8,025,000 | 7,591,128 |
| Netflix, Inc. (A) | 3.625 | 06-15-25 | | 12,500,000 | 13,187,500 |
| Netflix, Inc. (A) | 5.375 | 11-15-29 | | 9,335,000 | 11,225,338 |
| Interactive media and services 0.7% | | | |
| Alphabet, Inc. | 1.100 | 08-15-30 | | 7,995,000 | 7,950,788 |
| ANGI Group LLC (A) | 3.875 | 08-15-28 | | 6,920,000 | 7,009,822 |
| Match Group Holdings II LLC (A) | 4.125 | 08-01-30 | | 7,915,000 | 8,290,963 |
| TripAdvisor, Inc. (A) | 7.000 | 07-15-25 | | 8,295,000 | 8,751,225 |
| Twitter, Inc. (A) | 3.875 | 12-15-27 | | 2,269,000 | 2,394,249 |
| Media 5.2% | | | |
| Altice Financing SA (A) | 7.500 | 05-15-26 | | 16,020,000 | 17,096,544 |
| Altice France SA (A) | 7.375 | 05-01-26 | | 5,705,000 | 6,056,713 |
| CCO Holdings LLC (A) | 4.500 | 08-15-30 | | 9,050,000 | 9,604,313 |
| CCO Holdings LLC (A) | 4.750 | 03-01-30 | | 12,410,000 | 13,332,684 |
| CCO Holdings LLC (A) | 5.125 | 05-01-27 | | 16,345,000 | 17,407,752 |
| CCO Holdings LLC (A) | 5.750 | 02-15-26 | | 4,575,000 | 4,794,875 |
| Charter Communications Operating LLC | 5.125 | 07-01-49 | | 15,905,000 | 18,547,460 |
| Charter Communications Operating LLC | 5.750 | 04-01-48 | | 7,045,000 | 8,799,920 |
| CSC Holdings LLC (A) | 4.625 | 12-01-30 | | 7,420,000 | 7,588,508 |
| CSC Holdings LLC (A) | 5.375 | 02-01-28 | | 10,225,000 | 10,904,707 |
| CSC Holdings LLC (A) | 5.500 | 05-15-26 | | 4,536,000 | 4,758,083 |
| CSC Holdings LLC (A) | 5.500 | 04-15-27 | | 12,580,000 | 13,416,067 |
| CSC Holdings LLC (A) | 5.750 | 01-15-30 | | 21,015,000 | 22,906,350 |
| CSC Holdings LLC | 5.875 | 09-15-22 | | 8,930,000 | 9,465,800 |
| CSC Holdings LLC (A) | 7.500 | 04-01-28 | | 13,955,000 | 15,664,488 |
| DISH DBS Corp. | 5.875 | 07-15-22 | | 9,270,000 | 9,784,485 |
| LCPR Senior Secured Financing DAC (A) | 6.750 | 10-15-27 | | 15,810,000 | 16,956,225 |
| Sirius XM Radio, Inc. (A) | 5.375 | 07-15-26 | | 7,830,000 | 8,192,138 |
| Virgin Media Finance PLC (A) | 5.000 | 07-15-30 | | 7,640,000 | 7,866,908 |
| Virgin Media Secured Finance PLC (A) | 5.500 | 05-15-29 | | 2,515,000 | 2,719,344 |
| WMG Acquisition Corp. (A) | 5.500 | 04-15-26 | | 16,304,000 | 16,956,160 |
| 14 | JOHN HANCOCK STRATEGIC INCOME OPPORTUNITIES FUND | ANNUAL REPORT | SEE NOTES TO FINANCIAL STATEMENTS |
| | Rate (%) | Maturity date | | Par value^ | Value |
| Communication services (continued) | | | | |
| Wireless telecommunication services 0.5% | | | |
| T-Mobile USA, Inc. (A) | 3.750 | 04-15-27 | | 6,760,000 | $7,644,952 |
| T-Mobile USA, Inc. | 4.500 | 02-01-26 | | 7,775,000 | 8,026,210 |
| T-Mobile USA, Inc. | 6.500 | 01-15-26 | | 7,465,000 | 7,814,922 |
| Consumer discretionary 5.6% | | | | 260,144,027 |
| Automobiles 1.0% | | | |
| BMW Finance NV | 1.000 | 11-14-24 | EUR | 4,785,000 | 5,922,599 |
| Ford Motor Company | 8.500 | 04-21-23 | | 9,865,000 | 10,904,820 |
| Ford Motor Credit Company LLC | 2.979 | 08-03-22 | | 4,400,000 | 4,369,750 |
| Ford Motor Credit Company LLC | 3.087 | 01-09-23 | | 2,905,000 | 2,887,280 |
| Ford Motor Credit Company LLC | 3.350 | 11-01-22 | | 4,100,000 | 4,093,973 |
| Ford Motor Credit Company LLC | 3.370 | 11-17-23 | | 8,195,000 | 8,237,696 |
| Ford Motor Credit Company LLC | 4.250 | 09-20-22 | | 3,320,000 | 3,372,290 |
| General Motors Company | 6.125 | 10-01-25 | | 6,990,000 | 8,202,906 |
| Diversified consumer services 0.7% | | | |
| Duke University | 2.682 | 10-01-44 | | 14,330,000 | 15,271,585 |
| Graham Holdings Company (A) | 5.750 | 06-01-26 | | 8,885,000 | 9,418,100 |
| University of Notre Dame du Lac | 1.637 | 02-15-30 | | 5,560,000 | 5,677,117 |
| Hotels, restaurants and leisure 2.7% | | | |
| ESH Hospitality, Inc. (A)(B) | 5.250 | 05-01-25 | | 11,765,000 | 11,941,475 |
| Hilton Worldwide Finance LLC | 4.625 | 04-01-25 | | 7,730,000 | 7,807,300 |
| KFC Holding Company/Pizza Hut Holdings LLC/Taco Bell of America LLC (A) | 5.000 | 06-01-24 | | 7,943,000 | 8,195,429 |
| KFC Holding Company/Pizza Hut Holdings LLC/Taco Bell of America LLC (A) | 5.250 | 06-01-26 | | 16,567,000 | 17,188,263 |
| New Red Finance, Inc. (A) | 3.875 | 01-15-28 | | 11,545,000 | 11,833,625 |
| New Red Finance, Inc. (A) | 4.250 | 05-15-24 | | 14,920,000 | 15,199,750 |
| New Red Finance, Inc. (A) | 5.000 | 10-15-25 | | 17,080,000 | 17,539,623 |
| New Red Finance, Inc. (A) | 5.750 | 04-15-25 | | 6,695,000 | 7,146,913 |
| Wyndham Hotels & Resorts, Inc. (A) | 4.375 | 08-15-28 | | 6,920,000 | 6,973,284 |
| Yum! Brands, Inc. (A) | 4.750 | 01-15-30 | | 19,625,000 | 21,636,563 |
| Household durables 0.6% | | | |
| Lennar Corp. | 4.500 | 04-30-24 | | 4,245,000 | 4,552,763 |
| Lennar Corp. | 4.750 | 11-29-27 | | 18,295,000 | 20,856,300 |
| Lennar Corp. | 5.875 | 11-15-24 | | 3,190,000 | 3,564,825 |
| Internet and direct marketing retail 0.6% | | | |
| Expedia Group, Inc. | 3.800 | 02-15-28 | | 16,295,000 | 16,263,760 |
| Expedia Group, Inc. | 5.000 | 02-15-26 | | 5,137,000 | 5,428,814 |
| Expedia Group, Inc. (A) | 6.250 | 05-01-25 | | 5,150,000 | 5,657,224 |
| SEE NOTES TO FINANCIAL STATEMENTS | ANNUAL REPORT | JOHN HANCOCK STRATEGIC INCOME OPPORTUNITIES FUND | 15 |
| | Rate (%) | Maturity date | | Par value^ | Value |
| Consumer staples 2.6% | | | | $120,719,199 |
| Beverages 0.2% | | | |
| Diageo Finance PLC | 1.875 | 03-27-27 | EUR | 1,536,000 | 2,039,595 |
| Molson Coors Beverage Company | 1.250 | 07-15-24 | EUR | 4,750,000 | 5,685,966 |
| Food products 2.3% | | | |
| JBS Investments II GmbH (A) | 7.000 | 01-15-26 | | 11,145,000 | 12,050,197 |
| Kraft Heinz Foods Company | 3.000 | 06-01-26 | | 15,280,000 | 15,931,026 |
| Kraft Heinz Foods Company (A) | 3.750 | 04-01-30 | | 2,265,000 | 2,419,724 |
| Kraft Heinz Foods Company (A) | 3.875 | 05-15-27 | | 2,905,000 | 3,106,247 |
| Kraft Heinz Foods Company | 3.950 | 07-15-25 | | 3,645,000 | 3,964,495 |
| Kraft Heinz Foods Company (A) | 4.250 | 03-01-31 | | 8,845,000 | 9,772,708 |
| NBM US Holdings, Inc. (A) | 7.000 | 05-14-26 | | 2,929,000 | 3,120,820 |
| Post Holdings, Inc. (A) | 5.000 | 08-15-26 | | 15,995,000 | 16,599,611 |
| Post Holdings, Inc. (A) | 5.500 | 12-15-29 | | 3,230,000 | 3,540,726 |
| Post Holdings, Inc. (A) | 5.625 | 01-15-28 | | 14,510,000 | 15,511,916 |
| Post Holdings, Inc. (A) | 5.750 | 03-01-27 | | 21,395,000 | 22,598,469 |
| Personal products 0.1% | | | |
| Natura Cosmeticos SA (A)(B) | 5.375 | 02-01-23 | | 4,245,000 | 4,377,699 |
| Energy 5.6% | | | | 259,287,353 |
| Oil, gas and consumable fuels 5.6% | | | |
| Aker BP ASA (A) | 3.750 | 01-15-30 | | 11,235,000 | 11,173,755 |
| Aker BP ASA (A) | 4.750 | 06-15-24 | | 8,220,000 | 8,467,294 |
| Aker BP ASA (A) | 5.875 | 03-31-25 | | 590,000 | 618,100 |
| Enbridge, Inc. | 4.250 | 12-01-26 | | 16,420,000 | 18,977,072 |
| Enterprise Products Operating LLC | 3.125 | 07-31-29 | | 15,990,000 | 17,447,367 |
| EOG Resources, Inc. | 4.375 | 04-15-30 | | 4,995,000 | 5,975,712 |
| Indika Energy Capital III Pte, Ltd. (A)(B) | 5.875 | 11-09-24 | | 13,160,000 | 12,406,988 |
| Kinder Morgan, Inc. | 4.300 | 06-01-25 | | 5,250,000 | 5,959,824 |
| Medco Oak Tree Pte, Ltd. (A) | 7.375 | 05-14-26 | | 13,090,000 | 13,277,693 |
| Occidental Petroleum Corp. | 2.700 | 08-15-22 | | 3,735,000 | 3,672,159 |
| Occidental Petroleum Corp. | 2.900 | 08-15-24 | | 5,405,000 | 4,972,600 |
| Occidental Petroleum Corp. | 3.500 | 06-15-25 | | 5,345,000 | 4,863,950 |
| Occidental Petroleum Corp. | 3.500 | 08-15-29 | | 7,480,000 | 6,432,800 |
| Pertamina Persero PT (A) | 3.650 | 07-30-29 | | 3,440,000 | 3,663,600 |
| Pertamina Persero PT (A) | 4.300 | 05-20-23 | | 9,830,000 | 10,517,409 |
| Petrobras Global Finance BV (A) | 5.093 | 01-15-30 | | 24,014,000 | 24,998,574 |
| Petrobras Global Finance BV | 5.750 | 02-01-29 | | 10,230,000 | 11,242,770 |
| Petrobras Global Finance BV | 5.999 | 01-27-28 | | 2,760,000 | 3,060,840 |
| Petrobras Global Finance BV | 6.900 | 03-19-49 | | 13,075,000 | 15,087,635 |
| Petroleos del Peru SA (A) | 5.625 | 06-19-47 | | 8,126,000 | 9,913,720 |
| Saudi Arabian Oil Company (A) | 3.500 | 04-16-29 | | 9,115,000 | 10,023,017 |
| 16 | JOHN HANCOCK STRATEGIC INCOME OPPORTUNITIES FUND | ANNUAL REPORT | SEE NOTES TO FINANCIAL STATEMENTS |
| | Rate (%) | Maturity date | | Par value^ | Value |
| Energy (continued) | | | | |
| Oil, gas and consumable fuels (continued) | | | |
| Saudi Arabian Oil Company (A) | 4.250 | 04-16-39 | | 7,050,000 | $8,178,625 |
| Saudi Arabian Oil Company (A) | 4.375 | 04-16-49 | | 5,805,000 | 7,013,854 |
| Suncor Energy, Inc. | 3.100 | 05-15-25 | | 5,940,000 | 6,505,258 |
| The Williams Companies, Inc. | 3.750 | 06-15-27 | | 4,015,000 | 4,431,738 |
| The Williams Companies, Inc. | 4.500 | 11-15-23 | | 6,110,000 | 6,751,613 |
| The Williams Companies, Inc. | 4.550 | 06-24-24 | | 10,278,000 | 11,543,819 |
| TransCanada PipeLines, Ltd. | 4.250 | 05-15-28 | | 5,195,000 | 6,057,398 |
| Valero Energy Corp. (B) | 3.400 | 09-15-26 | | 5,490,000 | 6,052,169 |
| Financials 13.5% | | | | 628,485,213 |
| Banks 9.0% | | | |
| Asian Development Bank | 5.000 | 03-09-22 | AUD | 11,300,000 | 8,922,223 |
| Banco Actinver SA (A) | 4.800 | 12-18-32 | | 2,360,000 | 1,657,900 |
| Banco Actinver SA (A) | 9.500 | 12-18-32 | MXN | 138,600,000 | 4,623,800 |
| Bank of America Corp. (1.319% to 6-19-25, then SOFR + 1.150%) | 1.319 | 06-19-26 | | 13,450,000 | 13,619,814 |
| Bank of America Corp. (2.884% to 10-22-29, then 3 month LIBOR + 1.190%) | 2.884 | 10-22-30 | | 5,645,000 | 6,135,285 |
| Bank of America Corp. | 6.110 | 01-29-37 | | 5,134,000 | 7,356,991 |
| Bank of America NA | 6.000 | 10-15-36 | | 1,656,000 | 2,390,994 |
| BNG Bank NV | 0.250 | 06-07-24 | EUR | 6,700,000 | 8,184,898 |
| CIT Group, Inc. (5.800% to 6-15-22, then 3 month LIBOR + 3.972%) (C) | 5.800 | 06-15-22 | | 2,085,000 | 1,690,810 |
| Citigroup, Inc. (3 month EURIBOR + 0.500%) (D) | 0.111 | 03-21-23 | EUR | 10,835,000 | 12,936,388 |
| Citigroup, Inc. (3 month BBSW + 1.550%) (D) | 1.650 | 05-04-21 | AUD | 13,996,000 | 10,393,888 |
| Citigroup, Inc. (1.678% to 5-15-23, then SOFR + 1.667%) | 1.678 | 05-15-24 | | 10,495,000 | 10,761,688 |
| Citigroup, Inc. | 4.125 | 07-25-28 | | 7,335,000 | 8,424,113 |
| Credit Agricole SA (7.875% to 1-23-24, then 5 Year U.S. Swap Rate + 4.898%) (A)(C) | 7.875 | 01-23-24 | | 2,020,000 | 2,254,764 |
| European Investment Bank (SONIA + 0.350%) (D) | 0.408 | 06-29-23 | GBP | 6,180,000 | 8,295,729 |
| European Investment Bank | 1.500 | 05-12-22 | NOK | 117,270,000 | 13,682,850 |
| First Horizon Bank | 5.750 | 05-01-30 | | 10,785,000 | 12,193,462 |
| International Bank for Reconstruction & Development | 1.900 | 01-16-25 | CAD | 15,730,000 | 12,703,270 |
| SEE NOTES TO FINANCIAL STATEMENTS | ANNUAL REPORT | JOHN HANCOCK STRATEGIC INCOME OPPORTUNITIES FUND | 17 |
| | Rate (%) | Maturity date | | Par value^ | Value |
| Financials (continued) | | | | |
| Banks (continued) | | | |
| International Bank for Reconstruction & Development | 2.800 | 01-13-21 | AUD | 10,970,000 | $8,166,159 |
| International Bank for Reconstruction & Development | 3.375 | 01-25-22 | NZD | 13,998,000 | 9,842,929 |
| International Bank for Reconstruction & Development | 3.500 | 01-22-21 | NZD | 13,130,000 | 8,952,055 |
| International Bank for Reconstruction & Development | 4.625 | 10-06-21 | NZD | 12,620,000 | 8,906,432 |
| International Bank for Reconstruction & Development | 7.450 | 08-20-21 | IDR | 32,325,000,000 | 2,265,691 |
| International Finance Corp. (E) | 0.375 | 09-10-25 | NZD | 12,980,000 | 8,685,127 |
| JPMorgan Chase & Co. (2.005% to 3-13-25, then SOFR + 1.585%) | 2.005 | 03-13-26 | | 4,645,000 | 4,844,687 |
| JPMorgan Chase & Co. (2.083% to 4-22-25, then SOFR + 1.850%) | 2.083 | 04-22-26 | | 16,805,000 | 17,634,529 |
| KfW | 2.125 | 08-15-23 | EUR | 15,415,000 | 19,863,867 |
| Lloyds Banking Group PLC (7.500% to 9-27-25, then 5 Year U.S. Swap Rate + 4.496%) (B)(C) | 7.500 | 09-27-25 | | 13,530,000 | 14,885,706 |
| National Bank of Canada (A) | 2.150 | 10-07-22 | | 7,805,000 | 8,069,045 |
| Natwest Group PLC (6.000% to 12-29-25, then 5 Year CMT + 5.625%) (C) | 6.000 | 12-29-25 | | 9,350,000 | 9,849,945 |
| Nordea Eiendomskreditt AS (3 month NIBOR + 0.300%) (D) | 0.660 | 06-21-23 | NOK | 88,000,000 | 10,115,613 |
| Nordea Eiendomskreditt AS (3 month NIBOR + 0.340%) (D) | 0.710 | 06-19-24 | NOK | 110,000,000 | 12,651,190 |
| Nordic Investment Bank | 1.500 | 01-24-22 | NOK | 58,000,000 | 6,733,403 |
| Popular, Inc. | 6.125 | 09-14-23 | | 17,095,000 | 18,184,806 |
| Societe Generale SA (8.000% to 9-29-25, then 5 Year ICE Swap Rate + 5.873%) (A)(C) | 8.000 | 09-29-25 | | 6,640,000 | 7,553,000 |
| Synovus Financial Corp. (5.750% to 12-15-20, then 3 month LIBOR + 4.182%) | 5.750 | 12-15-25 | | 18,875,000 | 18,780,625 |
| Truist Financial Corp. | 3.875 | 03-19-29 | | 7,330,000 | 8,490,376 |
| U.S. Bancorp | 0.850 | 06-07-24 | EUR | 31,085,000 | 38,107,811 |
| U.S. Bancorp | 3.375 | 02-05-24 | | 5,956,000 | 6,512,261 |
| U.S. Bank NA | 2.800 | 01-27-25 | | 6,638,000 | 7,242,609 |
| Wells Fargo & Company (3 month BBSW + 1.320%) (D) | 1.422 | 07-27-21 | AUD | 9,035,000 | 6,707,647 |
| 18 | JOHN HANCOCK STRATEGIC INCOME OPPORTUNITIES FUND | ANNUAL REPORT | SEE NOTES TO FINANCIAL STATEMENTS |
| | Rate (%) | Maturity date | | Par value^ | Value |
| Financials (continued) | | | | |
| Banks (continued) | | | |
| Wells Fargo & Company | 3.250 | 04-27-22 | AUD | 12,300,000 | $9,420,201 |
| Zions Bancorp NA (5.800% to 6-15-23, then 3 month LIBOR + 3.800%) (C) | 5.800 | 06-15-23 | | 2,254,000 | 2,163,220 |
| Capital markets 1.4% | | | |
| Deutsche Bank AG (6.000% to 10-30-25, then 5 Year CMT + 4.524%) (C) | 6.000 | 10-30-25 | | 21,000,000 | 18,873,750 |
| MSCI, Inc. (A) | 3.625 | 09-01-30 | | 3,820,000 | 4,007,409 |
| MSCI, Inc. (A) | 3.875 | 02-15-31 | | 7,110,000 | 7,509,938 |
| MSCI, Inc. (A) | 4.000 | 11-15-29 | | 4,680,000 | 5,007,600 |
| MSCI, Inc. (A) | 4.750 | 08-01-26 | | 2,990,000 | 3,109,600 |
| Stifel Financial Corp. | 4.000 | 05-15-30 | | 8,325,000 | 8,926,263 |
| The Goldman Sachs Group, Inc. | 1.375 | 05-15-24 | EUR | 7,713,000 | 9,452,253 |
| The Goldman Sachs Group, Inc. | 2.000 | 11-01-28 | EUR | 2,510,000 | 3,303,918 |
| The Goldman Sachs Group, Inc. | 3.375 | 03-27-25 | EUR | 1,960,000 | 2,640,003 |
| Diversified financial services 1.6% | | | |
| Berkshire Hathaway Finance Corp. | 2.375 | 06-19-39 | GBP | 7,150,000 | 10,698,332 |
| Berkshire Hathaway, Inc. | 0.000 | 03-12-25 | EUR | 10,945,000 | 13,006,726 |
| European Financial Stability Facility | 0.125 | 10-17-23 | EUR | 13,115,000 | 15,965,123 |
| European Financial Stability Facility | 1.875 | 05-23-23 | EUR | 2,500,000 | 3,184,022 |
| GE Capital Funding LLC (A) | 4.400 | 05-15-30 | | 8,105,000 | 8,542,946 |
| Swiss Insured Brazil Power Finance Sarl (A) | 9.850 | 07-16-32 | BRL | 109,135,000 | 22,709,483 |
| Insurance 1.2% | | | |
| American International Group, Inc. (8.175% to 5-15-38, then 3 month LIBOR + 4.195%) | 8.175 | 05-15-58 | | 18,365,000 | 26,229,416 |
| Chubb INA Holdings, Inc. | 0.300 | 12-15-24 | EUR | 9,990,000 | 11,932,330 |
| DB Insurance Company, Ltd. | 3.492 | 05-25-24 | KRW | 10,000,000,000 | 8,802,836 |
| DB Insurance Company, Ltd. | 3.865 | 05-25-27 | KRW | 10,000,000,000 | 9,103,789 |
| Thrifts and mortgage finance 0.3% | | | |
| Nationstar Mortgage Holdings, Inc. (A) | 6.000 | 01-15-27 | | 13,790,000 | 14,621,675 |
| Health care 5.4% | | | | 254,155,390 |
| Health care equipment and supplies 0.7% | | | |
| Becton Dickinson Euro Finance Sarl | 1.208 | 06-04-26 | EUR | 8,910,000 | 10,812,981 |
| DH Europe Finance II Sarl | 0.450 | 03-18-28 | EUR | 18,445,000 | 21,846,146 |
| Health care providers and services 2.6% | | | |
| Ascension Health | 2.532 | 11-15-29 | | 6,475,000 | 7,244,523 |
| SEE NOTES TO FINANCIAL STATEMENTS | ANNUAL REPORT | JOHN HANCOCK STRATEGIC INCOME OPPORTUNITIES FUND | 19 |
| | Rate (%) | Maturity date | | Par value^ | Value |
| Health care (continued) | | | | |
| Health care providers and services (continued) | | | |
| Banner Health | 2.338 | 01-01-30 | | 7,345,000 | $7,697,453 |
| Centene Corp. | 3.375 | 02-15-30 | | 7,775,000 | 8,086,000 |
| Centene Corp. (A) | 5.250 | 04-01-25 | | 3,065,000 | 3,179,938 |
| HCA, Inc. | 3.500 | 09-01-30 | | 31,781,000 | 33,329,615 |
| HCA, Inc. | 4.125 | 06-15-29 | | 15,255,000 | 17,555,378 |
| HCA, Inc. | 5.375 | 02-01-25 | | 15,280,000 | 17,207,572 |
| Rede D'or Finance Sarl (A) | 4.500 | 01-22-30 | | 7,890,000 | 7,732,200 |
| Select Medical Corp. (A) | 6.250 | 08-15-26 | | 20,250,000 | 21,753,968 |
| Life sciences tools and services 0.4% | | | |
| Thermo Fisher Scientific, Inc. | 0.500 | 03-01-28 | EUR | 6,585,000 | 7,919,578 |
| Thermo Fisher Scientific, Inc. | 0.750 | 09-12-24 | EUR | 3,288,000 | 4,028,203 |
| Thermo Fisher Scientific, Inc. | 1.400 | 01-23-26 | EUR | 4,947,000 | 6,273,783 |
| Pharmaceuticals 1.7% | | | |
| Allergan Funding SCS | 1.250 | 06-01-24 | EUR | 6,760,000 | 8,101,066 |
| Allergan Funding SCS | 2.625 | 11-15-28 | EUR | 3,795,000 | 4,949,983 |
| Bausch Health Companies, Inc. (A) | 5.000 | 01-30-28 | | 14,605,000 | 14,385,925 |
| Bausch Health Companies, Inc. (A) | 5.250 | 01-30-30 | | 24,810,000 | 24,660,892 |
| Bausch Health Companies, Inc. (A) | 5.500 | 11-01-25 | | 5,520,000 | 5,697,744 |
| Bausch Health Companies, Inc. (A) | 5.875 | 05-15-23 | | 1,356,000 | 1,356,000 |
| Bausch Health Companies, Inc. (A) | 6.125 | 04-15-25 | | 2,766,000 | 2,845,523 |
| Bausch Health Companies, Inc. (A) | 6.250 | 02-15-29 | | 10,585,000 | 11,065,030 |
| Bausch Health Companies, Inc. (A) | 9.000 | 12-15-25 | | 5,870,000 | 6,425,889 |
| Industrials 4.3% | | | | 203,116,781 |
| Aerospace and defense 0.6% | | | |
| Airbus SE | 1.625 | 06-09-30 | EUR | 2,740,000 | 3,352,349 |
| The Boeing Company | 5.040 | 05-01-27 | | 11,170,000 | 12,290,755 |
| The Boeing Company | 5.150 | 05-01-30 | | 10,560,000 | 11,823,668 |
| Airlines 0.8% | | | |
| Delta Air Lines 2020-1 Class A Pass Through Trust | 2.500 | 06-10-28 | | 6,040,000 | 5,341,286 |
| Delta Air Lines 2020-1 Class AA Pass Through Trust | 2.000 | 06-10-28 | | 6,185,000 | 6,000,246 |
| Delta Air Lines, Inc. | 2.900 | 10-28-24 | | 7,330,000 | 6,730,772 |
| Delta Air Lines, Inc. | 3.400 | 04-19-21 | | 6,685,000 | 6,700,566 |
| Delta Air Lines, Inc. (A) | 7.000 | 05-01-25 | | 12,595,000 | 13,788,050 |
| 20 | JOHN HANCOCK STRATEGIC INCOME OPPORTUNITIES FUND | ANNUAL REPORT | SEE NOTES TO FINANCIAL STATEMENTS |
| | Rate (%) | Maturity date | | Par value^ | Value |
| Industrials (continued) | | | | |
| Building products 0.2% | | | |
| Owens Corning | 3.950 | 08-15-29 | | 6,190,000 | $7,001,366 |
| Commercial services and supplies 0.2% | | | |
| Cimpress PLC (A) | 7.000 | 06-15-26 | | 10,985,000 | 10,930,075 |
| Construction and engineering 0.6% | | | |
| AECOM | 5.125 | 03-15-27 | | 9,802,000 | 10,748,383 |
| AECOM | 5.875 | 10-15-24 | | 9,935,000 | 11,065,106 |
| HC2 Holdings, Inc. (A) | 11.500 | 12-01-21 | | 6,506,000 | 6,066,845 |
| Marine 0.2% | | | |
| Pelabuhan Indonesia II PT (A) | 4.250 | 05-05-25 | | 10,110,000 | 10,994,625 |
| Professional services 0.1% | | | |
| CoStar Group, Inc. (A) | 2.800 | 07-15-30 | | 5,780,000 | 6,076,572 |
| Road and rail 0.5% | | | |
| Indian Railway Finance Corp., Ltd. (A) | 3.249 | 02-13-30 | | 7,580,000 | 7,677,327 |
| Uber Technologies, Inc. (A) | 8.000 | 11-01-26 | | 13,455,000 | 14,256,783 |
| Trading companies and distributors 0.7% | | | |
| BOC Aviation, Ltd. (3 month LIBOR + 1.050%) (A)(D) | 1.301 | 05-02-21 | | 3,715,000 | 3,701,700 |
| BOC Aviation, Ltd. (A) | 2.750 | 09-18-22 | | 11,775,000 | 12,027,927 |
| United Rentals North America, Inc. | 4.000 | 07-15-30 | | 7,765,000 | 8,114,425 |
| United Rentals North America, Inc. | 4.875 | 01-15-28 | | 7,050,000 | 7,495,701 |
| Transportation infrastructure 0.4% | | | |
| Adani Ports & Special Economic Zone, Ltd. (A) | 3.950 | 01-19-22 | | 4,968,000 | 5,079,654 |
| Adani Ports & Special Economic Zone, Ltd. (A) | 4.200 | 08-04-27 | | 3,885,000 | 3,980,817 |
| Jasa Marga Persero Tbk PT (A) | 7.500 | 12-11-20 | IDR | 114,350,000,000 | 7,659,333 |
| JSL Europe SA (A) | 7.750 | 07-26-24 | | 4,070,000 | 4,212,450 |
| Information technology 1.9% | | | | 90,926,537 |
| IT services 0.5% | | | |
| Fidelity National Information Services, Inc. | 1.000 | 12-03-28 | EUR | 4,800,000 | 5,851,577 |
| Fidelity National Information Services, Inc. | 1.500 | 05-21-27 | EUR | 9,625,000 | 12,223,204 |
| Fiserv, Inc. | 1.125 | 07-01-27 | EUR | 3,495,000 | 4,299,435 |
| Semiconductors and semiconductor equipment 0.6% | | | |
| Broadcom Corp. | 3.875 | 01-15-27 | | 3,955,000 | 4,382,666 |
| Broadcom, Inc. | 4.150 | 11-15-30 | | 10,705,000 | 12,039,755 |
| Broadcom, Inc. | 4.750 | 04-15-29 | | 11,240,000 | 13,148,140 |
| SEE NOTES TO FINANCIAL STATEMENTS | ANNUAL REPORT | JOHN HANCOCK STRATEGIC INCOME OPPORTUNITIES FUND | 21 |
| | Rate (%) | Maturity date | | Par value^ | Value |
| Information technology (continued) | | | | |
| Software 0.3% | | | |
| Camelot Finance SA (A) | 4.500 | 11-01-26 | | 4,330,000 | $4,480,338 |
| SS&C Technologies, Inc. (A) | 5.500 | 09-30-27 | | 11,675,000 | 12,505,093 |
| Technology hardware, storage and peripherals 0.5% | | | |
| Apple, Inc. | 0.875 | 05-24-25 | EUR | 9,831,000 | 12,271,739 |
| Dell International LLC (A) | 8.350 | 07-15-46 | | 7,209,000 | 9,724,590 |
| Materials 2.6% | | | | 120,412,718 |
| Chemicals 0.2% | | | |
| Braskem Netherlands Finance BV (A) | 4.500 | 01-10-28 | | 2,154,000 | 2,102,843 |
| Ecolab, Inc. | 1.000 | 01-15-24 | EUR | 4,270,000 | 5,256,301 |
| Construction materials 0.1% | | | |
| St. Mary's Cement, Inc. (A) | 5.750 | 01-28-27 | | 4,140,000 | 4,678,200 |
| Containers and packaging 1.8% | | | |
| Ball Corp. | 2.875 | 08-15-30 | | 5,485,000 | 5,472,933 |
| Ball Corp. | 4.000 | 11-15-23 | | 16,060,000 | 17,063,750 |
| Ball Corp. | 4.875 | 03-15-26 | | 9,415,000 | 10,544,800 |
| Ball Corp. | 5.250 | 07-01-25 | | 14,545,000 | 16,483,412 |
| Berry Global, Inc. (A) | 5.625 | 07-15-27 | | 7,670,000 | 8,111,025 |
| Crown Americas LLC | 4.250 | 09-30-26 | | 1,490,000 | 1,584,049 |
| Crown Americas LLC | 4.500 | 01-15-23 | | 11,554,000 | 12,131,931 |
| Crown Cork & Seal Company, Inc. | 7.375 | 12-15-26 | | 11,568,000 | 13,679,160 |
| Metals and mining 0.5% | | | |
| Freeport-McMoRan, Inc. | 4.375 | 08-01-28 | | 10,240,000 | 10,758,298 |
| Indonesia Asahan Aluminium Persero PT (A) | 4.750 | 05-15-25 | | 11,455,000 | 12,546,016 |
| Real estate 1.6% | | | | 73,030,097 |
| Equity real estate investment trusts 1.6% | | | |
| American Tower Corp. | 1.950 | 05-22-26 | EUR | 3,650,000 | 4,700,534 |
| Crown Castle International Corp. | 3.800 | 02-15-28 | | 10,355,000 | 11,820,381 |
| Equinix, Inc. | 2.150 | 07-15-30 | | 8,034,000 | 8,238,626 |
| Equinix, Inc. | 3.200 | 11-18-29 | | 6,305,000 | 6,955,109 |
| SBA Communications Corp. (A) | 3.875 | 02-15-27 | | 19,505,000 | 20,245,215 |
| SBA Communications Corp. | 4.875 | 09-01-24 | | 1,067,000 | 1,096,022 |
| SBA Tower Trust (A) | 2.836 | 01-15-25 | | 6,217,000 | 6,495,742 |
| VICI Properties LP (A) | 4.125 | 08-15-30 | | 8,940,000 | 8,959,668 |
| VICI Properties LP (A) | 4.625 | 12-01-29 | | 4,345,000 | 4,518,800 |
| Utilities 2.8% | | | | 132,298,241 |
| Electric utilities 2.2% | | | |
| DPL, Inc. (A) | 4.125 | 07-01-25 | | 13,920,000 | 14,685,600 |
| EDP Finance BV | 0.375 | 09-16-26 | EUR | 1,315,000 | 1,569,714 |
| 22 | JOHN HANCOCK STRATEGIC INCOME OPPORTUNITIES FUND | ANNUAL REPORT | SEE NOTES TO FINANCIAL STATEMENTS |
| | Rate (%) | Maturity date | | Par value^ | Value |
| Utilities (continued) | | | | |
| Electric utilities (continued) | | | |
| Israel Electric Corp., Ltd. (A) | 5.000 | 11-12-24 | | 7,220,000 | $8,113,042 |
| Israel Electric Corp., Ltd. (A) | 6.875 | 06-21-23 | | 4,565,000 | 5,218,888 |
| NRG Energy, Inc. (A) | 5.250 | 06-15-29 | | 9,810,000 | 10,692,900 |
| NRG Energy, Inc. | 6.625 | 01-15-27 | | 21,110,000 | 22,591,922 |
| Perusahaan Perseroan Persero PT Perusahaan Listrik Negara (A) | 4.125 | 05-15-27 | | 12,660,000 | 13,878,525 |
| Vistra Operations Company LLC (A) | 3.550 | 07-15-24 | | 12,720,000 | 13,500,689 |
| Vistra Operations Company LLC (A) | 5.000 | 07-31-27 | | 3,315,000 | 3,515,491 |
| Vistra Operations Company LLC (A) | 5.625 | 02-15-27 | | 7,175,000 | 7,587,563 |
| Gas utilities 0.0% | | | |
| Southern Gas Networks PLC | 4.875 | 12-21-20 | GBP | 805,000 | 1,091,343 |
| Independent power and renewable electricity producers 0.5% | | | |
| Adani Green Energy UP, Ltd. (A) | 6.250 | 12-10-24 | | 5,330,000 | 5,725,465 |
| Greenko Dutch BV (A) | 5.250 | 07-24-24 | | 10,740,000 | 10,941,375 |
| Greenko Solar Mauritius, Ltd. (A) | 5.550 | 01-29-25 | | 5,260,000 | 5,341,530 |
| Multi-utilities 0.1% | | | |
| E.ON SE | 0.375 | 09-29-27 | EUR | 3,200,000 | 3,861,847 |
|
| Engie SA | 0.375 | 06-21-27 | EUR | 3,300,000 | 3,982,347 |
| Convertible bonds 2.0% | | | | | $91,707,078 |
| (Cost $77,067,839) | | | | | |
| Communication services 1.0% | | | 43,594,830 |
| Diversified telecommunication services 0.4% | | | |
| GCI Liberty, Inc. (A) | 1.750 | 09-30-46 | | 9,870,000 | 16,512,510 |
| Interactive media and services 0.4% | | | |
| Match Group Financeco 2, Inc. (A) | 0.875 | 06-15-26 | | 11,715,000 | 16,944,603 |
| Media 0.2% | | | |
| DISH Network Corp. | 3.375 | 08-15-26 | | 5,520,000 | 5,444,232 |
| Liberty Broadband Corp. (A) | 2.750 | 09-30-50 | | 4,415,000 | 4,693,485 |
| Consumer discretionary 0.3% | | | 14,742,936 |
| Household durables 0.3% | | | |
| Sony Corp. | 0.000 | 09-30-22 | JPY | 940,000,000 | 14,742,936 |
| Industrials 0.2% | | | 9,134,774 |
| Airlines 0.2% | | | |
| American Airlines Group, Inc. | 6.500 | 07-01-25 | | 9,485,000 | 9,134,774 |
| SEE NOTES TO FINANCIAL STATEMENTS | ANNUAL REPORT | JOHN HANCOCK STRATEGIC INCOME OPPORTUNITIES FUND | 23 |
| | Rate (%) | Maturity date | | Par value^ | Value |
| Information technology 0.2% | | | $10,328,863 |
| Software 0.2% | | | |
| Avaya Holdings Corp. | 2.250 | 06-15-23 | | 11,220,000 | 10,328,863 |
| Utilities 0.3% | | | 13,905,675 |
| Electric utilities 0.3% | | | |
|
| NRG Energy, Inc. | 2.750 | 06-01-48 | | 13,080,000 | 13,905,675 |
| Capital preferred securities 1.3% | | | | $58,354,684 |
| (Cost $58,012,035) | | | | | |
| Financials 1.3% | | | | | 58,354,684 |
| Banks 1.3% | | | |
| First Maryland Capital I (3 month LIBOR + 1.000%) (D) | 1.275 | 01-15-27 | | 13,280,000 | 12,267,672 |
| First Maryland Capital II (3 month LIBOR + 0.850%) (D) | 1.101 | 02-01-27 | | 12,524,000 | 11,415,821 |
| USB Capital IX (Greater of 3 month LIBOR + 1.020% or 3.500%) (C)(D) | 3.500 | 10-02-20 | | 18,552,000 | 16,534,470 |
|
| Wachovia Capital Trust III (Greater of 3 month LIBOR + 0.930% or 5.570%) (C)(D) | 5.570 | 10-02-20 | | 18,042,000 | 18,136,721 |
| Municipal bonds 1.8% | | | | | $82,974,783 |
| (Cost $81,097,764) | | | | | |
| Bay Area Toll Authority (California) | 2.574 | 04-01-31 | | 5,710,000 | 6,237,433 |
| Commonwealth of Massachusetts | 2.514 | 07-01-41 | | 7,255,000 | 7,399,229 |
| County of Miami-Dade Aviation Revenue (Florida) | 2.599 | 10-01-31 | | 2,840,000 | 2,816,343 |
| Port of Morrow (Oregon) | 2.543 | 09-01-40 | | 10,310,000 | 10,443,411 |
| Richland County School District No. 1 (South Carolina) | 1.780 | 03-01-28 | | 7,750,000 | 8,002,728 |
| Richland County School District No. 1 (South Carolina) | 1.870 | 03-01-29 | | 4,970,000 | 5,132,320 |
| Scottsdale Municipal Property Corp. (Arizona) | 2.900 | 07-01-39 | | 3,030,000 | 3,160,745 |
| State of Hawaii | 1.295 | 08-01-29 | | 8,780,000 | 8,704,755 |
| Texas Transportation Commission | 2.562 | 04-01-42 | | 6,355,000 | 6,484,960 |
| Texas Transportation Commission | 4.000 | 10-01-33 | | 5,380,000 | 6,808,121 |
| Texas Transportation Commission | 1.533 | 10-01-29 | | 7,165,000 | 7,383,461 |
| University of Texas | 2.439 | 08-15-49 | | 7,440,000 | 7,677,708 |
|
| West Contra Costa Unified School District (California) | 2.392 | 08-01-29 | | 2,620,000 | 2,723,569 |
| 24 | JOHN HANCOCK STRATEGIC INCOME OPPORTUNITIES FUND | ANNUAL REPORT | SEE NOTES TO FINANCIAL STATEMENTS |
| | Rate (%) | Maturity date | | Par value^ | Value |
|
| Term loans (F) 0.0% | | | | | $423,143 |
| (Cost $410,299) | | | | | |
| Consumer discretionary 0.0% | | | 423,143 |
| Auto components 0.0% | | | | |
|
| American Tire Distributors, Inc., Exit FILO Term Loan (3 month LIBOR + 6.000%) | 7.000 | 09-01-23 | | 440,774 | 423,143 |
| Collateralized mortgage obligations 2.4% | | | | $110,346,850 |
| (Cost $108,650,470) | | | | | |
| Commercial and residential 2.3% | | | | 108,761,747 |
| Arroyo Mortgage Trust | |
| Series 2019-1, Class A1 (A)(G) | 3.805 | 01-25-49 | | 10,023,747 | 10,298,495 |
| Series 2019-2, Class A1 (A)(G) | 3.347 | 04-25-49 | | 14,610,535 | 14,963,639 |
| Series 2019-3, Class A1 (A)(G) | 2.962 | 10-25-48 | | 8,221,045 | 8,401,610 |
| BX Commercial Mortgage Trust | |
| Series 2018-BIOA, Class E (1 month LIBOR + 1.951%) (A)(D) | 2.113 | 03-15-37 | | 13,569,000 | 13,093,259 |
| Series 2019-XL, Class A (1 month LIBOR + 0.920%) (A)(D) | 1.082 | 10-15-36 | | 17,936,982 | 17,915,478 |
| Series 2020-BXLP, Class A (1 month LIBOR + 0.800%) (A)(D) | 0.962 | 12-15-36 | | 7,767,890 | 7,741,186 |
CSMC Trust
Series 2019-NQM1, Class A1 (A) | 2.656 | 10-25-59 | | 6,363,695 | 6,461,283 |
DBGS Mortgage Trust
Series 2018-BIOD, Class B (1 month LIBOR + 0.888%) (A)(D) | 1.050 | 05-15-35 | | 8,835,883 | 8,692,459 |
| HarborView Mortgage Loan Trust | |
| Series 2005-9, Class 2A1A (1 month LIBOR + 0.340%) (D) | 0.498 | 06-20-35 | | 1,752,810 | 1,704,530 |
| Series 2007-3, Class ES IO (A) | 0.350 | 05-19-47 | | 5,197,138 | 79,902 |
| Series 2007-4, Class ES IO | 0.350 | 07-19-47 | | 5,644,320 | 74,428 |
| Series 2007-6, Class ES IO (A) | 0.343 | 08-19-37 | | 5,038,948 | 70,749 |
JPMorgan Chase Commercial Mortgage Securities Trust
Series 2016-NINE, Class A (A)(G) | 2.949 | 09-06-38 | | 570,000 | 614,110 |
Morgan Stanley Mortgage Loan Trust
Series 2004-9, Class 1A (G) | 5.472 | 11-25-34 | | 1,287,080 | 1,396,365 |
One Bryant Park Trust
Series 2019-OBP, Class A (A) | 2.516 | 09-15-54 | | 13,505,000 | 14,394,657 |
| WaMu Mortgage Pass Through Certificates | |
| SEE NOTES TO FINANCIAL STATEMENTS | ANNUAL REPORT | JOHN HANCOCK STRATEGIC INCOME OPPORTUNITIES FUND | 25 |
| | Rate (%) | Maturity date | | Par value^ | Value |
| Commercial and residential (continued) | | | | |
| Series 2005-AR2, Class 2A2B (1 month LIBOR + 0.380%) (D) | 0.555 | 01-25-45 | | 1,336,986 | $1,275,900 |
| Series 2005-AR8, Class 2AB2 (1 month LIBOR + 0.840%) (D) | 1.015 | 07-25-45 | | 1,643,243 | 1,583,697 |
| U.S. Government Agency 0.1% | | | | 1,585,103 |
| Federal Home Loan Mortgage Corp. | |
| Series 2015-DNA1, Class M2 (1 month LIBOR + 1.850%) (D) | 2.025 | 10-25-27 | | 193,560 | 193,560 |
|
| Series 2017-DNA3, Class M1 (1 month LIBOR + 0.750%) (D) | 0.925 | 03-25-30 | | 1,393,225 | 1,391,543 |
| Asset backed securities 2.6% | | | | $122,708,718 |
| (Cost $117,865,953) | | | | | |
| Asset backed securities 2.6% | | | | 122,708,718 |
AMSR Trust
Series 2019-SFR1, Class A (A) | 2.774 | 01-19-39 | | 13,845,000 | 14,606,496 |
Bravo Mortgage Asset Trust
Series 2006-1A, Class A2 (1 month LIBOR + 0.240%) (A)(D) | 0.415 | 07-25-36 | | 2,437,890 | 2,423,455 |
| DB Master Finance LLC | | | | | |
| Series 2017-1A, Class A2I (A) | 3.629 | 11-20-47 | | 7,678,125 | 7,898,641 |
| Series 2019-1A, Class A2I (A) | 3.787 | 05-20-49 | | 10,404,900 | 10,845,443 |
| Series 2019-1A, Class A2II (A) | 4.021 | 05-20-49 | | 5,796,450 | 6,145,396 |
| Domino's Pizza Master Issuer LLC | | | | | |
| Series 2015-1A, Class A2II (A) | 4.474 | 10-25-45 | | 5,827,200 | 6,195,887 |
| Series 2017-1A, Class A2I (3 month LIBOR + 1.250%) (A)(D) | 1.495 | 07-25-47 | | 14,130,425 | 14,121,805 |
Driven Brands Funding LLC
Series 2015-1A, Class A2 (A) | 5.216 | 07-20-45 | | 5,754,053 | 5,980,302 |
GSAA Home Equity Trust
Series 2005-MTR1, Class A4 (1 month LIBOR + 0.370%) (D) | 0.545 | 10-25-35 | | 1,501,696 | 1,474,344 |
Home Partners of America Trust
Series 2018-1, Class D (1 month LIBOR + 1.450%) (A)(D) | 1.612 | 07-17-37 | | 7,715,000 | 7,585,248 |
Home Partners of America Trust
Series 2019-1, Class B (A) | 3.157 | 09-17-39 | | 4,815,715 | 4,940,442 |
Jack In The Box Funding LLC
Series 2019-1A, Class A2II (A) | 4.476 | 08-25-49 | | 6,962,388 | 7,290,943 |
Mill City Mortgage Loan Trust
Series 2018-3, Class A1 (A)(G) | 3.500 | 08-25-58 | | 11,305,727 | 12,005,513 |
| 26 | JOHN HANCOCK STRATEGIC INCOME OPPORTUNITIES FUND | ANNUAL REPORT | SEE NOTES TO FINANCIAL STATEMENTS |
| | Rate (%) | Maturity date | | Par value^ | Value |
| Asset backed securities (continued) | | | | |
MVW Owner Trust
Series 2018-1A, Class A (A) | 3.450 | 01-21-36 | | 4,746,143 | $4,912,186 |
Taco Bell Funding LLC
Series 2016-1A, Class A23 (A) | 4.970 | 05-25-46 | | 15,131,700 | 16,282,617 |
|
| | | | | Shares | Value |
| Common stocks 1.8% | | | | | $84,951,822 |
| (Cost $109,148,181) | | | | | |
| Communication services 0.0% | | | 0 |
| Media 0.0% | | |
| Vertis Holdings, Inc. (H)(I) | | | 110,794 | 0 |
| Financials 0.7% | | | 34,531,409 |
| Banks 0.4% | | |
| Citigroup, Inc. | | | 94,940 | 4,853,333 |
| JPMorgan Chase & Co. | | | 72,645 | 7,278,303 |
| U.S. Bancorp | | | 245,135 | 8,922,914 |
| Capital markets 0.3% | | |
| Deutsche Bank AG (I) | | | 1,414,151 | 13,476,859 |
| Industrials 0.6% | | | 27,572,453 |
| Aerospace and defense 0.4% | | |
| The Boeing Company | | | 110,235 | 18,940,565 |
| Airlines 0.1% | | |
| Delta Air Lines, Inc. | | | 206,277 | 6,363,645 |
| Construction and engineering 0.1% | | |
| HC2 Holdings, Inc. (B)(I) | | | 907,297 | 2,268,243 |
| Real estate 0.1% | | | 5,120,300 |
| Equity real estate investment trusts 0.1% | | |
| Americold Realty Trust | | | 133,515 | 5,120,300 |
| Utilities 0.4% | | | 17,727,660 |
| Multi-utilities 0.4% | | |
|
| Dominion Energy, Inc. | | | 176,500 | 17,727,660 |
| Preferred securities 4.4% | | | | | $202,531,043 |
| (Cost $205,755,058) | | | | | |
| Communication services 0.1% | | | 5,444,983 |
| Media 0.1% | | | | |
| 2020 Cash Mandatory Exchangeable Trust, 5.250% (A)(I) | | | 4,970 | 5,444,983 |
| SEE NOTES TO FINANCIAL STATEMENTS | ANNUAL REPORT | JOHN HANCOCK STRATEGIC INCOME OPPORTUNITIES FUND | 27 |
| | | | | Shares | Value |
| Financials 1.0% | | | $43,429,900 |
| Banks 1.0% | | | | |
| First Horizon Bank (Greater of 3 month LIBOR + 0.850% or 3.750%), 3.750% (A)(D) | | | 22,722 | 16,587,060 |
| U.S. Bancorp (Greater of 3 month LIBOR + 1.020% or 3.500%), 3.500% (D) | | | 16,425 | 14,240,475 |
| Valley National Bancorp (5.500% to 9-30-22, then 3 month LIBOR + 3.578%) | | | 272,325 | 6,647,453 |
| Wells Fargo & Company (5.850% to 9-15-23, then 3 month LIBOR + 3.090%) | | | 228,245 | 5,954,912 |
| Health care 0.3% | | | 15,027,177 |
| Health care equipment and supplies 0.3% | | | | |
| Becton, Dickinson and Company, 6.000% (B) | | | 113,050 | 6,040,262 |
| Danaher Corp., 5.000% | | | 7,335 | 8,986,915 |
| Industrials 0.5% | | | 21,537,789 |
| Machinery 0.5% | | | | |
| Fortive Corp., 5.000% | | | 23,545 | 21,537,789 |
| Information technology 0.3% | | | 13,815,146 |
| Semiconductors and semiconductorequipment 0.3% | | | | |
| Broadcom, Inc., 8.000% (B) | | | 11,230 | 13,815,146 |
| Utilities 2.2% | | | 103,276,048 |
| Electric utilities 1.6% | | | | |
| American Electric Power Company, Inc., 6.125% (B) | | | 287,600 | 13,850,816 |
| NextEra Energy, Inc., 4.872% | | | 471,900 | 25,860,120 |
| NextEra Energy, Inc., 5.279% | | | 421,350 | 20,060,474 |
| The Southern Company, 6.750% | | | 382,000 | 17,190,000 |
| Gas utilities 0.1% | | | | |
| South Jersey Industries, Inc., 7.250% (B) | | | 128,700 | 4,813,380 |
| Multi-utilities 0.5% | | | | |
| CenterPoint Energy, Inc., 7.000% | | | 155,450 | 5,837,148 |
| DTE Energy Company, 6.250% | | | 339,050 | 15,664,110 |
|
| | | | | Contracts/
Notional amount | Value |
| Purchased options 0.0% | | | | | $2,484,952 |
| (Cost $458,500) | | | | | |
| Puts 0.0% | | | | 2,484,952 |
| Over the Counter Option on the USD vs. CAD (Expiration Date: 11-6-20; Strike Price: $1.35; Counterparty: Canadian Imperial Bank of Commerce) (I)(J) | | 71,380,000 | 2,484,952 |
|
| 28 | JOHN HANCOCK STRATEGIC INCOME OPPORTUNITIES FUND | ANNUAL REPORT | SEE NOTES TO FINANCIAL STATEMENTS |
| | Yield* (%) | Maturity date | | Par value^ | Value |
| Short-term investments 1.7% | | | | $81,929,487 |
| (Cost $81,934,308) | | | | | |
| U.S. Government Agency 0.3% | | | 13,235,000 |
| Federal Agricultural Mortgage Corp. Discount Note | 0.010 | 09-01-20 | | 2,548,000 | 2,548,000 |
| Federal Home Loan Bank Discount Note | 0.010 | 09-01-20 | | 10,687,000 | 10,687,000 |
| | | Yield (%) | | Shares | Value |
| Short-term funds 0.8% | | | | | 40,443,487 |
| John Hancock Collateral Trust (K) | | 0.2611(L) | | 4,040,026 | 40,443,487 |
| | | | | Par value^ | Value |
| Repurchase agreement 0.6% | | | | 28,251,000 |
| Barclays Tri-Party Repurchase Agreement dated 8-31-20 at 0.070% to be repurchased at $22,328,043 on 9-1-20, collateralized by $22,803,400 U.S. Treasury Notes, 0.250% due 8-31-25 (valued at $22,774,645) | | | 22,328,000 | 22,328,000 |
| Repurchase Agreement with State Street Corp. dated 8-31-20 at 0.000% to be repurchased at $5,923,000 on 9-1-20, collateralized by $5,123,200 U.S. Treasury Notes, 2.875% due 8-15-28 (valued at $6,041,575) | | | 5,923,000 | 5,923,000 |
|
| Total investments (Cost $4,404,960,284) 98.4% | | | $4,588,179,062 |
| Other assets and liabilities, net 1.6% | | | 72,473,288 |
| Total net assets 100.0% | | | $4,660,652,350 |
| The percentage shown for each investment category is the total value of the category as a percentage of the net assets of the fund. |
| ^All par values are denominated in U.S. dollars unless otherwise indicated. |
| Currency Abbreviations |
| AUD | Australian Dollar |
| BRL | Brazilian Real |
| CAD | Canadian Dollar |
| CNY | Chinese Yuan Renminbi |
| EUR | Euro |
| GBP | Pound Sterling |
| IDR | Indonesian Rupiah |
| INR | Indian Rupee |
| JPY | Japanese Yen |
| KRW | Korean Won |
| MXN | Mexican Peso |
| MYR | Malaysian Ringgit |
| NOK | Norwegian Krone |
| NZD | New Zealand Dollar |
| PHP | Philippine Peso |
| SGD | Singapore Dollar |
| SEE NOTES TO FINANCIAL STATEMENTS | ANNUAL REPORT | JOHN HANCOCK STRATEGIC INCOME OPPORTUNITIES FUND | 29 |
| Security Abbreviations and Legend |
| BBSW | Bank Bill Swap Rate |
| CMT | Constant Maturity Treasury |
| EURIBOR | Euro Interbank Offered Rate |
| ICE | Intercontinental Exchange |
| IO | Interest-Only Security - (Interest Tranche of Stripped Mortgage Pool). Rate shown is the annualized yield at the end of the period. |
| LIBOR | London Interbank Offered Rate |
| NIBOR | Norwegian Interbank Offered Rate |
| SOFR | Secured Overnight Financing Rate |
| SONIA | Sterling Overnight Interbank Average Rate |
| (A) | These securities are exempt from registration under Rule 144A of the Securities Act of 1933. Such securities may be resold, normally to qualified institutional buyers, in transactions exempt from registration. Rule 144A securities amounted to $1,779,137,850 or 38.2% of the fund's net assets as of 8-31-20. |
| (B) | All or a portion of this security is on loan as of 8-31-20. |
| (C) | Perpetual bonds have no stated maturity date. Date shown as maturity date is next call date. |
| (D) | Variable rate obligation. The coupon rate shown represents the rate at period end. |
| (E) | Security purchased or sold on a when-issued or delayed delivery basis. |
| (F) | Term loans are variable rate obligations. The coupon rate shown represents the rate at period end. |
| (G) | Variable or floating rate security, the interest rate of which adjusts periodically based on a weighted average of interest rates and prepayments on the underlying pool of assets. The interest rate shown is the current rate as of period end. |
| (H) | Security is valued using significant unobservable inputs and is classified as Level 3 in the fair value hierarchy. Refer to Note 2 to the financial statements. |
| (I) | Non-income producing security. |
| (J) | For this type of option, notional amounts are equivalent to number of contracts. |
| (K) | Investment is an affiliate of the fund, the advisor and/or subadvisor. This security represents the investment of cash collateral received for securities lending. |
| (L) | The rate shown is the annualized seven-day yield as of 8-31-20. |
| * | Yield represents either the annualized yield at the date of purchase, the stated coupon rate or, for floating rate securities, the rate at period end. |
| 30 | JOHN HANCOCK STRATEGIC INCOME OPPORTUNITIES FUND | ANNUAL REPORT | SEE NOTES TO FINANCIAL STATEMENTS |
DERIVATIVES
FUTURES
| Open contracts | Number of
contracts | Position | Expiration
date | Notional
basis^ | Notional
value^ | Unrealized
appreciation
(depreciation) |
| Euro-BTP Italian Government Bond Futures | 257 | Long | Sep 2020 | $45,150,866 | $44,841,290 | $(309,576) |
| 10-Year U.S. Treasury Note Futures | 2,968 | Short | Dec 2020 | (413,100,202) | (413,294,000) | (193,798) |
| German Euro BUND Futures | 214 | Short | Sep 2020 | (45,265,489) | (44,833,802) | 431,687 |
| U.S. Treasury Long Bond Futures | 2,208 | Short | Dec 2020 | (390,525,562) | (387,987,000) | 2,538,562 |
| | | | | | | $2,466,875 |
^ Notional basis refers to the contractual amount agreed upon at inception of open contracts; notional value represents the current value of the open contract.
FORWARD FOREIGN CURRENCY CONTRACTS
| Contract to buy | Contract to sell | Counterparty (OTC) | Contractual
settlement
date | Unrealized
appreciation | Unrealized
depreciation |
| AUD | 60,970,000 | CAD | 57,995,467 | ANZ | 9/16/2020 | $505,559 | — |
| AUD | 30,487,500 | CAD | 29,052,647 | JPM | 9/16/2020 | 212,522 | — |
| AUD | 15,240,000 | CAD | 14,529,054 | NAB | 9/16/2020 | 101,401 | — |
| CAD | 43,693,920 | AUD | 45,723,750 | ANZ | 9/16/2020 | — | $(225,117) |
| CAD | 29,301,628 | AUD | 30,487,500 | GSI | 9/16/2020 | — | (21,627) |
| CAD | 29,296,201 | AUD | 30,487,500 | HUS | 9/16/2020 | — | (25,788) |
| CAD | 93,451,350 | EUR | 60,627,500 | SSB | 9/16/2020 | — | (722,666) |
| CAD | 12,169,000 | JPY | 976,542,972 | CITI | 9/16/2020 | 108,321 | — |
| CAD | 6,089,500 | JPY | 488,715,595 | JPM | 9/16/2020 | 53,800 | — |
| CAD | 12,169,000 | JPY | 976,222,835 | MSCS | 9/16/2020 | 111,344 | — |
| CAD | 30,445,000 | JPY | 2,427,745,190 | TD | 9/16/2020 | 416,596 | — |
| CAD | 40,058,408 | USD | 30,484,375 | CIBC | 9/16/2020 | 228,463 | — |
| CAD | 63,249,035 | USD | 47,685,238 | CITI | 9/16/2020 | 807,887 | — |
| CAD | 20,137,789 | USD | 15,244,375 | GSI | 9/16/2020 | 195,296 | — |
| CAD | 20,459,247 | USD | 15,240,000 | HUS | 9/16/2020 | 446,134 | — |
| CAD | 270,501,783 | USD | 200,582,738 | JPM | 9/16/2020 | 6,811,364 | — |
| CAD | 184,400,449 | USD | 137,650,000 | MSCS | 9/16/2020 | 3,730,087 | — |
| CAD | 207,474,634 | USD | 153,150,744 | RBC | 9/16/2020 | 5,920,353 | — |
| CAD | 20,714,291 | USD | 15,236,250 | SCB | 9/16/2020 | 645,427 | — |
| CAD | 82,498,380 | USD | 60,973,125 | SSB | 9/16/2020 | 2,278,501 | — |
| CAD | 63,987,035 | USD | 48,675,000 | TD | 9/16/2020 | 383,951 | — |
| EUR | 60,627,500 | CAD | 92,599,109 | JPM | 9/16/2020 | 1,376,081 | — |
| EUR | 15,200,000 | GBP | 13,612,664 | BNY | 9/16/2020 | — | (53,979) |
| EUR | 15,237,500 | GBP | 13,651,551 | HUS | 9/16/2020 | — | (61,201) |
| EUR | 30,475,000 | GBP | 27,394,997 | JPM | 9/16/2020 | — | (245,257) |
| EUR | 15,333,750 | GBP | 13,704,139 | SCB | 9/16/2020 | — | (16,610) |
| EUR | 45,712,500 | GBP | 41,322,870 | SSB | 9/16/2020 | — | (675,868) |
| EUR | 15,365,000 | NOK | 161,774,782 | UBS | 9/16/2020 | — | (179,484) |
| SEE NOTES TO FINANCIAL STATEMENTS | ANNUAL REPORT | JOHN HANCOCK STRATEGIC INCOME OPPORTUNITIES FUND | 31 |
FORWARD FOREIGN CURRENCY CONTRACTS (continued)
| Contract to buy | Contract to sell | Counterparty (OTC) | Contractual
settlement
date | Unrealized
appreciation | Unrealized
depreciation |
| EUR | 15,365,000 | SEK | 157,986,280 | CIBC | 9/16/2020 | $73,728 | — |
| EUR | 21,701,616 | USD | 25,463,482 | ANZ | 9/16/2020 | 442,059 | — |
| EUR | 104,979,298 | USD | 122,811,871 | CITI | 9/16/2020 | 2,503,479 | — |
| EUR | 164,901,541 | USD | 189,850,539 | GSI | 9/16/2020 | 6,994,885 | — |
| EUR | 110,121,043 | USD | 126,263,235 | HUS | 9/16/2020 | 5,189,893 | — |
| EUR | 181,914,273 | USD | 207,543,714 | JPM | 9/16/2020 | 9,610,056 | — |
| EUR | 96,510,387 | USD | 110,977,181 | MSCS | 9/16/2020 | 4,228,705 | — |
| EUR | 21,797,958 | USD | 25,812,837 | RBC | 9/16/2020 | 207,710 | — |
| EUR | 30,447,500 | USD | 36,008,127 | SCB | 9/16/2020 | 337,507 | — |
| EUR | 55,694,163 | USD | 63,176,533 | SSB | 9/16/2020 | 3,306,418 | — |
| EUR | 66,145,642 | USD | 77,729,449 | UBS | 9/16/2020 | 1,229,589 | — |
| GBP | 27,583,675 | EUR | 30,571,250 | HUS | 9/16/2020 | 382,601 | — |
| GBP | 13,832,709 | EUR | 15,237,500 | SCB | 9/16/2020 | 303,388 | — |
| GBP | 41,443,926 | EUR | 45,808,750 | SSB | 9/16/2020 | 722,809 | — |
| GBP | 15,322,500 | USD | 20,037,846 | HUS | 9/16/2020 | 446,439 | — |
| GBP | 30,908,333 | USD | 40,318,659 | SCB | 9/16/2020 | 1,001,954 | — |
| JPY | 2,454,373,454 | CAD | 30,395,000 | GSI | 9/16/2020 | — | $(126,807) |
| JPY | 1,228,150,996 | CAD | 15,222,500 | SSB | 9/16/2020 | — | (73,465) |
| JPY | 1,228,569,919 | CAD | 15,222,500 | TD | 9/16/2020 | — | (69,509) |
| JPY | 2,114,322,745 | NZD | 30,438,596 | CITI | 9/16/2020 | — | (537,018) |
| JPY | 3,253,495,190 | USD | 30,470,000 | GSI | 9/16/2020 | 253,332 | — |
| JPY | 1,626,238,746 | USD | 15,235,000 | HUS | 9/16/2020 | 121,861 | — |
| JPY | 6,447,355,932 | USD | 60,878,500 | SCB | 9/16/2020 | 5,025 | — |
| NOK | 162,163,498 | EUR | 15,365,000 | HUS | 9/16/2020 | 223,987 | — |
| NOK | 285,271,590 | USD | 30,416,667 | MSCS | 9/16/2020 | 2,242,876 | — |
| NOK | 143,824,098 | USD | 15,208,333 | SSB | 9/16/2020 | 1,257,482 | — |
| NZD | 30,467,105 | JPY | 2,104,338,587 | ANZ | 9/16/2020 | 650,504 | — |
| NZD | 12,922,969 | USD | 8,581,782 | JPM | 9/10/2020 | 122,987 | — |
| NZD | 38,997,895 | USD | 25,398,905 | ANZ | 9/16/2020 | 869,442 | — |
| SEK | 160,217,339 | EUR | 15,365,000 | JPM | 9/16/2020 | 184,245 | — |
| SGD | 78,201,478 | USD | 56,546,041 | CITI | 9/16/2020 | 931,471 | — |
| SGD | 26,309,271 | USD | 18,848,680 | GSI | 9/16/2020 | 488,440 | — |
| SGD | 26,120,501 | USD | 18,848,680 | UBS | 9/16/2020 | 349,696 | — |
| USD | 41,122,400 | AUD | 59,340,539 | RBC | 9/16/2020 | — | (2,646,494) |
| USD | 24,983,779 | BRL | 122,940,182 | CITI | 9/16/2020 | 2,552,688 | — |
| USD | 16,222,619 | CAD | 21,321,031 | BOA | 9/16/2020 | — | (124,246) |
| USD | 76,691,875 | CAD | 103,725,676 | CIBC | 9/16/2020 | — | (2,834,748) |
| USD | 45,605,000 | CAD | 61,402,268 | CITI | 9/16/2020 | — | (1,472,206) |
| USD | 60,965,000 | CAD | 81,276,327 | GSI | 9/16/2020 | — | (1,349,675) |
| USD | 121,929,375 | CAD | 163,731,520 | HUS | 9/16/2020 | — | (3,603,814) |
| USD | 61,447,500 | CAD | 83,317,882 | JPM | 9/16/2020 | — | (2,432,439) |
| 32 | JOHN HANCOCK STRATEGIC INCOME OPPORTUNITIES FUND | ANNUAL REPORT | SEE NOTES TO FINANCIAL STATEMENTS |
FORWARD FOREIGN CURRENCY CONTRACTS (continued)
| Contract to buy | Contract to sell | Counterparty (OTC) | Contractual
settlement
date | Unrealized
appreciation | Unrealized
depreciation |
| USD | 47,660,238 | CAD | 62,538,638 | MSCS | 9/16/2020 | — | $(288,225) |
| USD | 139,990,982 | CAD | 187,849,090 | RBC | 9/16/2020 | — | (4,033,183) |
| USD | 93,378,363 | CAD | 124,049,384 | SSB | 9/16/2020 | — | (1,730,476) |
| USD | 16,222,619 | CAD | 21,490,996 | TD | 9/16/2020 | — | (254,558) |
| USD | 1,921,056 | EUR | 1,630,259 | ANZ | 9/16/2020 | — | (25,008) |
| USD | 12,932,696 | EUR | 10,899,433 | CIBC | 9/16/2020 | — | (78,120) |
| USD | 200,497,722 | EUR | 171,904,496 | CITI | 9/16/2020 | — | (4,707,233) |
| USD | 138,999,670 | EUR | 118,770,902 | GSI | 9/16/2020 | — | (2,778,924) |
| USD | 69,251,171 | EUR | 59,070,195 | HUS | 9/16/2020 | — | (1,261,800) |
| USD | 115,033,882 | EUR | 99,232,259 | JPM | 9/16/2020 | — | (3,421,142) |
| USD | 328,746,170 | EUR | 285,064,636 | MSCS | 9/16/2020 | — | (11,539,729) |
| USD | 262,435,182 | EUR | 226,157,871 | SSB | 9/16/2020 | — | (7,532,835) |
| USD | 29,823,945 | EUR | 26,277,592 | UBS | 9/16/2020 | — | (1,544,007) |
| USD | 40,349,965 | GBP | 30,645,000 | GSI | 9/16/2020 | — | (618,604) |
| USD | 20,057,130 | GBP | 15,285,000 | SCB | 9/16/2020 | — | (377,022) |
| USD | 16,256,674 | GBP | 12,770,924 | SSB | 9/16/2020 | — | (816,469) |
| USD | 45,716,243 | JPY | 4,848,892,307 | HUS | 9/16/2020 | — | (72,707) |
| USD | 4,795 | JPY | 510,827 | JPM | 9/16/2020 | — | (28) |
| USD | 30,053,090 | JPY | 3,198,923,690 | SSB | 9/16/2020 | — | (154,913) |
| USD | 14,259,900 | MXN | 314,151,911 | RBC | 9/17/2020 | — | (70,233) |
| USD | 30,416,667 | NOK | 282,498,524 | SSB | 9/16/2020 | — | (1,925,399) |
| USD | 15,208,333 | NOK | 139,610,219 | UBS | 9/16/2020 | — | (775,052) |
| USD | 27,346,158 | NZD | 41,976,744 | ANZ | 9/16/2020 | — | (928,694) |
| USD | 10,083,926 | NZD | 15,210,000 | CITI | 9/16/2020 | — | (161,283) |
| USD | 5,578,200 | NZD | 8,399,930 | JPM | 9/16/2020 | — | (79,856) |
| USD | 35,593,967 | NZD | 54,231,447 | MSCS | 9/16/2020 | — | (935,453) |
| USD | 10,028,435 | NZD | 15,210,000 | SSB | 9/16/2020 | — | (216,773) |
| USD | 141,002,982 | SGD | 195,715,664 | CITI | 9/16/2020 | — | (2,846,592) |
| USD | 47,119,168 | SGD | 64,017,515 | GSI | 9/16/2020 | $66,765 | — |
| USD | 4,519,416 | SGD | 6,301,448 | SSB | 9/16/2020 | — | (112,102) |
| | | | | | | $71,635,108 | $(66,784,438) |
| Derivatives Currency Abbreviations |
| AUD | Australian Dollar |
| BRL | Brazilian Real |
| CAD | Canadian Dollar |
| EUR | Euro |
| GBP | Pound Sterling |
| JPY | Japanese Yen |
| MXN | Mexican Peso |
| NOK | Norwegian Krone |
| NZD | New Zealand Dollar |
| SEE NOTES TO FINANCIAL STATEMENTS | ANNUAL REPORT | JOHN HANCOCK STRATEGIC INCOME OPPORTUNITIES FUND | 33 |
| SEK | Swedish Krona |
| SGD | Singapore Dollar |
| USD | U.S. Dollar |
| Derivatives Abbreviations |
| ANZ | Australia and New Zealand Banking Group Limited |
| BNY | The Bank of New York Mellon |
| BOA | Bank of America, N.A. |
| CIBC | Canadian Imperial Bank of Commerce |
| CITI | Citibank, N.A. |
| GSI | Goldman Sachs International |
| HUS | HSBC Bank USA, N.A. |
| JPM | JPMorgan Chase Bank, N.A. |
| MSCS | Morgan Stanley Capital Services LLC |
| NAB | National Australia Bank Ltd. |
| OTC | Over-the-counter |
| RBC | Royal Bank of Canada |
| SCB | Standard Chartered Bank |
| SSB | State Street Bank and Trust Company |
| TD | The Toronto-Dominion Bank |
| UBS | UBS AG |
At 8-31-20, the aggregate cost of investments for federal income tax purposes was $4,451,028,449. Net unrealized appreciation aggregated to $144,468,158, of which $227,535,419 related to gross unrealized appreciation and $83,067,261 related to gross unrealized depreciation.
See Notes to financial statements regarding investment transactions and other derivatives information.
| 34 | JOHN HANCOCK STRATEGIC INCOME OPPORTUNITIES FUND | ANNUAL REPORT | SEE NOTES TO FINANCIAL STATEMENTS |
STATEMENT OF ASSETS AND LIABILITIES 8-31-20
| Assets | |
| Unaffiliated investments, at value (Cost $4,364,511,976) including $39,516,672 of securities loaned | $4,547,735,575 |
| Affiliated investments, at value (Cost $40,448,308) | 40,443,487 |
| Total investments, at value (Cost $4,404,960,284) | 4,588,179,062 |
| Unrealized appreciation on forward foreign currency contracts | 71,635,108 |
| Receivable for futures variation margin | 363,205 |
| Cash | 581 |
| Foreign currency, at value (Cost $2,454,110) | 2,481,864 |
| Collateral held at broker for futures contracts | 16,946,412 |
| Collateral segregated at custodian for OTC derivative contracts | 12,120,000 |
| Dividends and interest receivable | 36,371,563 |
| Receivable for fund shares sold | 3,565,185 |
| Receivable for investments sold | 114,557,268 |
| Receivable for securities lending income | 21,716 |
| Other assets | 146,995 |
| Total assets | 4,846,388,959 |
| Liabilities | |
| Unrealized depreciation on forward foreign currency contracts | 66,784,438 |
| Distributions payable | 125,472 |
| Foreign capital gains tax payable | 7,739 |
| Payable for investments purchased | 64,984,693 |
| Payable for delayed delivery securities purchased | 8,704,909 |
| Payable for fund shares repurchased | 3,662,007 |
| Payable upon return of securities loaned | 40,410,106 |
| Payable to affiliates | |
| Accounting and legal services fees | 279,274 |
| Transfer agent fees | 266,443 |
| Distribution and service fees | 1,200 |
| Trustees' fees | 2,527 |
| Other liabilities and accrued expenses | 507,801 |
| Total liabilities | 185,736,609 |
| Net assets | $4,660,652,350 |
| Net assets consist of | |
| Paid-in capital | $4,760,181,865 |
| Total distributable earnings (loss) | (99,529,515) |
| Net assets | $4,660,652,350 |
| |
| SEE NOTES TO FINANCIAL STATEMENTS | ANNUAL REPORT | JOHN HANCOCK Strategic Income Opportunities Fund | 35 |
STATEMENT OF ASSETS AND LIABILITIES (continued)
| Net asset value per share | |
| Based on net asset value and shares outstanding - the fund has an unlimited number of shares authorized with no par value | |
| Class A ($332,449,675 ÷ 30,244,805 shares)1 | $10.99 |
| Class C ($147,413,307 ÷ 13,409,854 shares)1 | $10.99 |
| Class I ($1,960,908,551 ÷ 178,379,259 shares) | $10.99 |
| Class R2 ($5,977,324 ÷ 543,350 shares) | $11.00 |
| Class R6 ($232,206,550 ÷ 21,109,109 shares) | $11.00 |
| Class NAV ($1,981,696,943 ÷ 180,354,628 shares) | $10.99 |
| Maximum offering price per share | |
| Class A (net asset value per share ÷ 96%)2 | $11.45 |
| 1 | Redemption price per share is equal to net asset value less any applicable contingent deferred sales charge. |
| 2 | On single retail sales of less than $100,000. On sales of $100,000 or more and on group sales the offering price is reduced. |
| 36 | JOHN HANCOCK Strategic Income Opportunities Fund | ANNUAL REPORT | SEE NOTES TO FINANCIAL STATEMENTS |
STATEMENT OF OPERATIONS For the year ended 8-31-20
| Investment income | |
| Interest | $160,572,914 |
| Dividends | 15,024,520 |
| Securities lending | 321,668 |
| Less foreign taxes withheld | (1,238,987) |
| Total investment income | 174,680,115 |
| Expenses | |
| Investment management fees | 31,828,678 |
| Distribution and service fees | 2,732,007 |
| Accounting and legal services fees | 876,238 |
| Transfer agent fees | 3,354,098 |
| Trustees' fees | 85,717 |
| Custodian fees | 1,019,381 |
| State registration fees | 139,016 |
| Printing and postage | 78,445 |
| Professional fees | 207,748 |
| Other | 256,504 |
| Total expenses | 40,577,832 |
| Less expense reductions | (1,356,004) |
| Net expenses | 39,221,828 |
| Net investment income | 135,458,287 |
| Realized and unrealized gain (loss) | |
| Net realized gain (loss) on | |
| Unaffiliated investments and foreign currency transactions | (28,844,871) |
| Affiliated investments | 15,822 |
| Futures contracts | 8,628,067 |
| Forward foreign currency contracts | 52,350,930 |
| Written options | 1,019,449 |
| | 33,169,397 |
| Change in net unrealized appreciation (depreciation) of | |
| Unaffiliated investments and translation of assets and liabilities in foreign currencies | 63,337,187 |
| Affiliated investments | 1,412 |
| Futures contracts | 5,536,929 |
| Forward foreign currency contracts | (21,728,974) |
| | 47,146,554 |
| Net realized and unrealized gain | 80,315,951 |
| Increase in net assets from operations | $215,774,238 |
| SEE NOTES TO FINANCIAL STATEMENTS | ANNUAL REPORT | JOHN HANCOCK Strategic Income Opportunities Fund | 37 |
STATEMENTS OF CHANGES IN NET ASSETS
| | Year ended
8-31-20 | Year ended
8-31-19 |
| Increase (decrease) in net assets | | |
| From operations | | |
| Net investment income | $135,458,287 | $204,676,794 |
| Net realized gain (loss) | 33,169,397 | (296,285,647) |
| Change in net unrealized appreciation (depreciation) | 47,146,554 | 418,122,419 |
| Increase in net assets resulting from operations | 215,774,238 | 326,513,566 |
| Distributions to shareholders | | |
| From earnings | | |
| Class A | (6,241,408) | (10,765,205) |
| Class C | (2,151,856) | (5,358,059) |
| Class I | (47,650,876) | (89,828,701) |
| Class R2 | (183,293) | (428,768) |
| Class R6 | (9,228,322) | (30,825,594) |
| Class NAV | (47,150,108) | (62,949,837) |
| Total distributions | (112,605,863) | (200,156,164) |
| From fund share transactions | (911,850,896) | (2,012,363,901) |
| Total decrease | (808,682,521) | (1,886,006,499) |
| Net assets | | |
| Beginning of year | 5,469,334,871 | 7,355,341,370 |
| End of year | $4,660,652,350 | $5,469,334,871 |
| 38 | JOHN HANCOCK Strategic Income Opportunities Fund | ANNUAL REPORT | SEE NOTES TO FINANCIAL STATEMENTS |
| CLASS A SHARES Period ended | 8-31-20 | 8-31-19 | 8-31-18 | 8-31-17 | 8-31-16 |
| Per share operating performance | | | | | |
| Net asset value, beginning of period | $10.67 | $10.36 | $10.93 | $10.72 | $10.80 |
| Net investment income1 | 0.25 | 0.32 | 0.32 | 0.29 | 0.26 |
| Net realized and unrealized gain (loss) on investments | 0.28 | 0.30 | (0.55) | 0.17 | 0.21 |
| Total from investment operations | 0.53 | 0.62 | (0.23) | 0.46 | 0.47 |
| Less distributions | | | | | |
| From net investment income | (0.21) | (0.31) | (0.34) | (0.25) | (0.28) |
| From net realized gain | — | — | — | — | (0.27) |
| Total distributions | (0.21) | (0.31) | (0.34) | (0.25) | (0.55) |
| Net asset value, end of period | $10.99 | $10.67 | $10.36 | $10.93 | $10.72 |
| Total return (%)2,3 | 5.01 | 6.10 | (2.28) | 4.44 | 4.52 |
| Ratios and supplemental data | | | | | |
| Net assets, end of period (in millions) | $332 | $331 | $429 | $543 | $1,138 |
| Ratios (as a percentage of average net assets): | | | | | |
| Expenses before reductions | 1.12 | 1.11 | 1.09 | 1.10 | 1.11 |
| Expenses including reductions | 1.09 | 1.08 | 1.06 | 1.07 | 1.08 |
| Net investment income | 2.40 | 3.09 | 2.99 | 2.73 | 2.42 |
| Portfolio turnover (%) | 73 | 84 | 63 | 42 | 44 |
| 1 | Based on average daily shares outstanding. |
| 2 | Total returns would have been lower had certain expenses not been reduced during the applicable periods. |
| 3 | Does not reflect the effect of sales charges, if any. |
| SEE NOTES TO FINANCIAL STATEMENTS | ANNUAL REPORT | JOHN HANCOCK Strategic Income Opportunities Fund | 39 |
| CLASS C SHARES Period ended | 8-31-20 | 8-31-19 | 8-31-18 | 8-31-17 | 8-31-16 |
| Per share operating performance | | | | | |
| Net asset value, beginning of period | $10.67 | $10.36 | $10.93 | $10.72 | $10.80 |
| Net investment income1 | 0.18 | 0.25 | 0.25 | 0.22 | 0.18 |
| Net realized and unrealized gain (loss) on investments | 0.27 | 0.29 | (0.56) | 0.16 | 0.21 |
| Total from investment operations | 0.45 | 0.54 | (0.31) | 0.38 | 0.39 |
| Less distributions | | | | | |
| From net investment income | (0.13) | (0.23) | (0.26) | (0.17) | (0.20) |
| From net realized gain | — | — | — | — | (0.27) |
| Total distributions | (0.13) | (0.23) | (0.26) | (0.17) | (0.47) |
| Net asset value, end of period | $10.99 | $10.67 | $10.36 | $10.93 | $10.72 |
| Total return (%)2,3 | 4.38 | 5.36 | (2.97) | 3.72 | 3.79 |
| Ratios and supplemental data | | | | | |
| Net assets, end of period (in millions) | $147 | $202 | $284 | $375 | $447 |
| Ratios (as a percentage of average net assets): | | | | | |
| Expenses before reductions | 1.82 | 1.81 | 1.79 | 1.80 | 1.81 |
| Expenses including reductions | 1.79 | 1.78 | 1.76 | 1.77 | 1.78 |
| Net investment income | 1.71 | 2.40 | 2.29 | 2.07 | 1.72 |
| Portfolio turnover (%) | 73 | 84 | 63 | 42 | 44 |
| 1 | Based on average daily shares outstanding. |
| 2 | Total returns would have been lower had certain expenses not been reduced during the applicable periods. |
| 3 | Does not reflect the effect of sales charges, if any. |
| 40 | JOHN HANCOCK Strategic Income Opportunities Fund | ANNUAL REPORT | SEE NOTES TO FINANCIAL STATEMENTS |
| CLASS I SHARES Period ended | 8-31-20 | 8-31-19 | 8-31-18 | 8-31-17 | 8-31-16 |
| Per share operating performance | | | | | |
| Net asset value, beginning of period | $10.67 | $10.36 | $10.93 | $10.73 | $10.80 |
| Net investment income1 | 0.29 | 0.35 | 0.35 | 0.33 | 0.29 |
| Net realized and unrealized gain (loss) on investments | 0.27 | 0.30 | (0.55) | 0.15 | 0.22 |
| Total from investment operations | 0.56 | 0.65 | (0.20) | 0.48 | 0.51 |
| Less distributions | | | | | |
| From net investment income | (0.24) | (0.34) | (0.37) | (0.28) | (0.31) |
| From net realized gain | — | — | — | — | (0.27) |
| Total distributions | (0.24) | (0.34) | (0.37) | (0.28) | (0.58) |
| Net asset value, end of period | $10.99 | $10.67 | $10.36 | $10.93 | $10.73 |
| Total return (%)2 | 5.42 | 6.41 | (2.00) | 4.67 | 4.94 |
| Ratios and supplemental data | | | | | |
| Net assets, end of period (in millions) | $1,961 | $2,315 | $3,441 | $3,873 | $2,500 |
| Ratios (as a percentage of average net assets): | | | | | |
| Expenses before reductions | 0.82 | 0.82 | 0.79 | 0.79 | 0.79 |
| Expenses including reductions | 0.79 | 0.79 | 0.76 | 0.76 | 0.76 |
| Net investment income | 2.70 | 3.38 | 3.28 | 3.10 | 2.73 |
| Portfolio turnover (%) | 73 | 84 | 63 | 42 | 44 |
| 1 | Based on average daily shares outstanding. |
| 2 | Total returns would have been lower had certain expenses not been reduced during the applicable periods. |
| SEE NOTES TO FINANCIAL STATEMENTS | ANNUAL REPORT | JOHN HANCOCK Strategic Income Opportunities Fund | 41 |
| CLASS R2 SHARES Period ended | 8-31-20 | 8-31-19 | 8-31-18 | 8-31-17 | 8-31-16 |
| Per share operating performance | | | | | |
| Net asset value, beginning of period | $10.68 | $10.37 | $10.94 | $10.73 | $10.80 |
| Net investment income1 | 0.25 | 0.31 | 0.31 | 0.29 | 0.25 |
| Net realized and unrealized gain (loss) on investments | 0.27 | 0.30 | (0.55) | 0.16 | 0.22 |
| Total from investment operations | 0.52 | 0.61 | (0.24) | 0.45 | 0.47 |
| Less distributions | | | | | |
| From net investment income | (0.20) | (0.30) | (0.33) | (0.24) | (0.27) |
| From net realized gain | — | — | — | — | (0.27) |
| Total distributions | (0.20) | (0.30) | (0.33) | (0.24) | (0.54) |
| Net asset value, end of period | $11.00 | $10.68 | $10.37 | $10.94 | $10.73 |
| Total return (%)2 | 4.92 | 6.01 | (2.36) | 4.32 | 4.52 |
| Ratios and supplemental data | | | | | |
| Net assets, end of period (in millions) | $6 | $12 | $16 | $19 | $19 |
| Ratios (as a percentage of average net assets): | | | | | |
| Expenses before reductions | 1.19 | 1.19 | 1.19 | 1.20 | 1.16 |
| Expenses including reductions | 1.17 | 1.17 | 1.16 | 1.17 | 1.13 |
| Net investment income | 2.34 | 3.01 | 2.89 | 2.68 | 2.37 |
| Portfolio turnover (%) | 73 | 84 | 63 | 42 | 44 |
| 1 | Based on average daily shares outstanding. |
| 2 | Total returns would have been lower had certain expenses not been reduced during the applicable periods. |
| 42 | JOHN HANCOCK Strategic Income Opportunities Fund | ANNUAL REPORT | SEE NOTES TO FINANCIAL STATEMENTS |
| CLASS R6 SHARES Period ended | 8-31-20 | 8-31-19 | 8-31-18 | 8-31-17 | 8-31-16 |
| Per share operating performance | | | | | |
| Net asset value, beginning of period | $10.67 | $10.37 | $10.94 | $10.73 | $10.80 |
| Net investment income1 | 0.30 | 0.37 | 0.36 | 0.35 | 0.30 |
| Net realized and unrealized gain (loss) on investments | 0.28 | 0.28 | (0.55) | 0.15 | 0.22 |
| Total from investment operations | 0.58 | 0.65 | (0.19) | 0.50 | 0.52 |
| Less distributions | | | | | |
| From net investment income | (0.25) | (0.35) | (0.38) | (0.29) | (0.32) |
| From net realized gain | — | — | — | — | (0.27) |
| Total distributions | (0.25) | (0.35) | (0.38) | (0.29) | (0.59) |
| Net asset value, end of period | $11.00 | $10.67 | $10.37 | $10.94 | $10.73 |
| Total return (%)2 | 5.54 | 6.42 | (1.89) | 4.87 | 5.06 |
| Ratios and supplemental data | | | | | |
| Net assets, end of period (in millions) | $232 | $543 | $1,464 | $998 | $31 |
| Ratios (as a percentage of average net assets): | | | | | |
| Expenses before reductions | 0.70 | 0.70 | 0.69 | 0.69 | 0.70 |
| Expenses including reductions | 0.68 | 0.68 | 0.66 | 0.66 | 0.65 |
| Net investment income | 2.82 | 3.55 | 3.42 | 3.32 | 2.86 |
| Portfolio turnover (%) | 73 | 84 | 63 | 42 | 44 |
| 1 | Based on average daily shares outstanding. |
| 2 | Total returns would have been lower had certain expenses not been reduced during the applicable periods. |
| SEE NOTES TO FINANCIAL STATEMENTS | ANNUAL REPORT | JOHN HANCOCK Strategic Income Opportunities Fund | 43 |
| CLASS NAV SHARES Period ended | 8-31-20 | 8-31-19 | 8-31-18 | 8-31-17 | 8-31-16 |
| Per share operating performance | | | | | |
| Net asset value, beginning of period | $10.66 | $10.36 | $10.93 | $10.72 | $10.79 |
| Net investment income1 | 0.30 | 0.36 | 0.36 | 0.34 | 0.30 |
| Net realized and unrealized gain (loss) on investments | 0.28 | 0.29 | (0.55) | 0.16 | 0.22 |
| Total from investment operations | 0.58 | 0.65 | (0.19) | 0.50 | 0.52 |
| Less distributions | | | | | |
| From net investment income | (0.25) | (0.35) | (0.38) | (0.29) | (0.32) |
| From net realized gain | — | — | — | — | (0.27) |
| Total distributions | (0.25) | (0.35) | (0.38) | (0.29) | (0.59) |
| Net asset value, end of period | $10.99 | $10.66 | $10.36 | $10.93 | $10.72 |
| Total return (%)2 | 5.56 | 6.54 | (1.89) | 4.79 | 5.06 |
| Ratios and supplemental data | | | | | |
| Net assets, end of period (in millions) | $1,982 | $2,067 | $1,720 | $1,847 | $1,814 |
| Ratios (as a percentage of average net assets): | | | | | |
| Expenses before reductions | 0.69 | 0.69 | 0.68 | 0.68 | 0.68 |
| Expenses including reductions | 0.66 | 0.66 | 0.65 | 0.65 | 0.65 |
| Net investment income | 2.83 | 3.45 | 3.41 | 3.20 | 2.85 |
| Portfolio turnover (%) | 73 | 84 | 63 | 42 | 44 |
| 1 | Based on average daily shares outstanding. |
| 2 | Total returns would have been lower had certain expenses not been reduced during the applicable periods. |
| 44 | JOHN HANCOCK Strategic Income Opportunities Fund | ANNUAL REPORT | SEE NOTES TO FINANCIAL STATEMENTS |
Notes to financial statements
Note 1—Organization
John Hancock Strategic Income Opportunities Fund (the fund) is a series of John Hancock Funds II (the Trust), an open-end management investment company organized as a Massachusetts business trust and registered under the Investment Company Act of 1940, as amended (the 1940 Act). The investment objective of the fund is to seek to maximize total return consisting of current income and capital appreciation.
The fund may offer multiple classes of shares. The shares currently outstanding are detailed in the Statement of assets and liabilities. Class A and Class C shares are offered to all investors. Class I shares are offered to institutions and certain investors. Class R2 shares are available only to certain retirement and 529 plans. Class R6 shares are only available to certain retirement plans, institutions and other investors. Class NAV shares are offered to John Hancock affiliated funds of funds, retirement plans for employees of John Hancock and/or Manulife Financial Corporation, and certain 529 plans. Class C shares convert to Class A shares ten years after purchase (certain exclusions may apply). Shareholders of each class have exclusive voting rights to matters that affect that class. The distribution and service fees, if any, and transfer agent fees for each class may differ.
Note 2—Significant accounting policies
The financial statements have been prepared in conformity with accounting principles generally accepted in the United States of America (US GAAP), which require management to make certain estimates and assumptions as of the date of the financial statements. Actual results could differ from those estimates and those differences could be significant. The fund qualifies as an investment company under Topic 946 of Accounting Standards Codification of US GAAP.
Events or transactions occurring after the end of the fiscal period through the date that the financial statements were issued have been evaluated in the preparation of the financial statements. The following summarizes the significant accounting policies of the fund:
Security valuation. Investments are stated at value as of the scheduled close of regular trading on the New York Stock Exchange (NYSE), normally at 4:00 P.M., Eastern Time. In case of emergency or other disruption resulting in the NYSE not opening for trading or the NYSE closing at a time other than the regularly scheduled close, the net asset value (NAV) may be determined as of the regularly scheduled close of the NYSE pursuant to the fund's Valuation Policies and Procedures.
In order to value the securities, the fund uses the following valuation techniques: Debt obligations are typically valued based on evaluated prices provided by an independent pricing vendor. Independent pricing vendors utilize matrix pricing, which takes into account factors such as institutional-size trading in similar groups of securities, yield, quality, coupon rate, maturity, type of issue, trading characteristics and other market data, as well as broker supplied prices. Equity securities, including exchange-traded or closed-end funds, are typically valued at the last sale price or official closing price on the exchange or principal market where the security trades. In the event there were no sales during the day or closing prices are not available, the securities are valued using the last available bid price. Investments by the fund in open-end mutual funds, including John Hancock Collateral Trust (JHCT), are valued at their respective NAVs each business day. Exchange-traded options are valued at the mid-price of the last quoted bid and ask prices from the exchange where the option trades. Unlisted options are valued using evaluated prices obtained from an independent pricing vendor. Futures contracts are typically valued at the last traded price on the exchange on which they trade. Forward foreign currency contracts are valued at the prevailing forward rates which are based on foreign currency exchange spot rates and forward points supplied by an independent pricing vendor. Foreign securities and currencies are valued in U.S. dollars based on foreign currency exchange rates supplied by an independent pricing vendor.
In certain instances, the Pricing Committee may determine to value equity securities using prices obtained from another exchange or market if trading on the exchange or market on which prices are typically obtained did not open for trading as scheduled, or if trading closed earlier than scheduled, and trading occurred as normal on another exchange or market.
| | ANNUAL REPORT | JOHN HANCOCK Strategic Income Opportunities Fund | 45 |
Other portfolio securities and assets, for which reliable market quotations are not readily available, are valued at fair value as determined in good faith by the fund's Pricing Committee following procedures established by the Board of Trustees. The frequency with which these fair valuation procedures are used cannot be predicted and fair value of securities may differ significantly from the value that would have been used had a ready market for such securities existed.
The fund uses a three-tier hierarchy to prioritize the pricing assumptions, referred to as inputs, used in valuation techniques to measure fair value. Level 1 includes securities valued using quoted prices in active markets for identical securities, including registered investment companies. Level 2 includes securities valued using other significant observable inputs. Observable inputs may include quoted prices for similar securities, interest rates, prepayment speeds and credit risk. Prices for securities valued using these inputs are received from independent pricing vendors and brokers and are based on an evaluation of the inputs described. Level 3 includes securities valued using significant unobservable inputs when market prices are not readily available or reliable, including the fund's own assumptions in determining the fair value of investments. Factors used in determining value may include market or issuer specific events or trends, changes in interest rates and credit quality. The inputs or methodology used for valuing securities are not necessarily an indication of the risks associated with investing in those securities. Changes in valuation techniques and related inputs may result in transfers into or out of an assigned level within the disclosure hierarchy.
The following is a summary of the values by input classification of the fund's investments as of August 31, 2020, by major security category or type:
| | Total
value at
8-31-20 | Level 1
quoted
price | Level 2
significant
observable
inputs | Level 3
significant
unobservable
inputs |
| Investments in securities: | | | | |
| Assets | | | | |
| U.S. Government and Agency obligations | $396,137,187 | — | $396,137,187 | — |
| Foreign government obligations | 821,090,695 | — | 821,090,695 | — |
| Corporate bonds | 2,532,538,620 | — | 2,532,538,620 | — |
| Convertible bonds | 91,707,078 | — | 91,707,078 | — |
| Capital preferred securities | 58,354,684 | — | 58,354,684 | — |
| Municipal bonds | 82,974,783 | — | 82,974,783 | — |
| Term loans | 423,143 | — | 423,143 | — |
| Collateralized mortgage obligations | 110,346,850 | — | 110,346,850 | — |
| Asset backed securities | 122,708,718 | — | 122,708,718 | — |
| Common stocks | 84,951,822 | $84,951,822 | — | — |
| Preferred securities | 202,531,043 | 158,961,211 | 43,569,832 | — |
| Purchased options | 2,484,952 | — | 2,484,952 | — |
| Short-term investments | 81,929,487 | 40,443,487 | 41,486,000 | — |
| Total investments in securities | $4,588,179,062 | $284,356,520 | $4,303,822,542 | — |
| Derivatives: | | | | |
| Assets | | | | |
| Futures | $2,970,249 | $2,970,249 | — | — |
| Forward foreign currency contracts | 71,635,108 | — | $71,635,108 | — |
| Liabilities | | | | |
| 46 | JOHN HANCOCK Strategic Income Opportunities Fund | ANNUAL REPORT | |
| | Total
value at
8-31-20 | Level 1
quoted
price | Level 2
significant
observable
inputs | Level 3
significant
unobservable
inputs |
| Futures | $(503,374) | $(503,374) | — | — |
| Forward foreign currency contracts | (66,784,438) | — | $(66,784,438) | — |
Repurchase agreements. The fund may enter into repurchase agreements. When the fund enters into a repurchase agreement, it receives collateral that is held in a segregated account by the fund's custodian, or for tri-party repurchase agreements, collateral is held at a third-party custodian bank in a segregated account for the benefit of the fund. The collateral amount is marked-to-market and monitored on a daily basis to ensure that the collateral held is in an amount not less than the principal amount of the repurchase agreement plus any accrued interest. Collateral received by the fund for repurchase agreements is disclosed in the Fund's investments as part of the caption related to the repurchase agreement.
Repurchase agreements are typically governed by the terms and conditions of the Master Repurchase Agreement and/or Global Master Repurchase Agreement (collectively, MRA). Upon an event of default, the non-defaulting party may close out all transactions traded under the MRA and net amounts owed. Absent an event of default, assets and liabilities resulting from repurchase agreements are not offset in the Statement of assets and liabilities. In the event of a default by the counterparty, realization of the collateral proceeds could be delayed, during which time the collateral value may decline or the counterparty may have insufficient assets to pay claims resulting from close-out of the transactions.
When-issued/delayed-delivery securities. The fund may purchase or sell debt securities on a when-issued or delayed-delivery basis, or in a “To Be Announced” (TBA) or “forward commitment” transaction, with delivery or payment to occur at a later date beyond the normal settlement period. TBA securities resulting from these transactions are included in the portfolio or in a schedule to the portfolio (Sale Commitments Outstanding). At the time a fund enters into a commitment to purchase or sell a security, the transaction is recorded and the value of the security is reflected in its NAV. The price of such security and the date that the security will be delivered and paid for are fixed at the time the transaction is negotiated. The value of the security may vary with market fluctuations. No interest accrues until settlement takes place. At the time that the fund enters into this type of transaction, the fund is required to have sufficient cash and/or liquid securities to cover its commitments.
Certain risks may arise upon entering into when-issued or delayed-delivery securities transactions, including the potential inability of counterparties to meet the terms of their contracts, and the issuer’s failure to issue the securities due to political, economic or other factors. Additionally, losses may arise due to declines in the value of the securities purchased or increase in the value of securities sold prior to settlement date.
Mortgage and asset backed securities. The fund may invest in mortgage-related securities, such as mortgage-backed securities, and other asset-backed securities, which are debt obligations that represent interests in pools of mortgages or other income-bearing assets, such as consumer loans or receivables. Such securities often involve risks that are different from the risks associated with investing in other types of debt securities. Mortgage-backed and other asset-backed securities are subject to changes in the payment patterns of borrowers of the underlying debt. When interest rates fall, borrowers are more likely to refinance or prepay their debt before its stated maturity. This may result in the fund having to reinvest the proceeds in lower yielding securities, effectively reducing the fund's income. Conversely, if interest rates rise and borrowers repay their debt more slowly than expected, the time in which the mortgage-backed and other asset-backed securities are paid off could be extended, reducing the fund's cash available for reinvestment in higher yielding securities. The timely payment of principal and interest of certain mortgage-related securities is guaranteed with the full faith and credit of the U.S. Government. Pools created and guaranteed by non-governmental issuers, including government-sponsored corporations (e.g. FNMA), may be supported by various forms of insurance or guarantees, but there can be no assurance that private insurers or guarantors can meet their obligations under the insurance policies or guarantee
| | ANNUAL REPORT | JOHN HANCOCK Strategic Income Opportunities Fund | 47 |
arrangements. The fund is also subject to risks associated with securities with contractual cash flows including asset-backed and mortgage related securities such as collateralized mortgage obligations, mortgage pass-through securities and commercial mortgage-backed securities. The value, liquidity and related income of these securities are sensitive to changes in economic conditions, including real estate value, pre-payments, delinquencies and/or defaults, and may be adversely affected by shifts in the market’s perception of the issuers and changes in interest rates.
Real estate investment trusts. The fund may invest in real estate investment trusts (REITs). Distributions from REITs may be recorded as income and subsequently characterized by the REIT at the end of the fiscal year as a reduction of cost of investments and/or as a realized gain. As a result, the fund will estimate the components of distributions from these securities. Such estimates are revised when the actual components of the distributions are known.
Security transactions and related investment income. Investment security transactions are accounted for on a trade date plus one basis for daily NAV calculations. However, for financial reporting purposes, investment transactions are reported on trade date. Interest income is accrued as earned. Interest income includes coupon interest and amortization/accretion of premiums/discounts on debt securities. Debt obligations may be placed in a non-accrual status and related interest income may be reduced by stopping current accruals and writing off interest receivable when the collection of all or a portion of interest has become doubtful. Dividend income is recorded on the ex-date, except for dividends of certain foreign securities where the dividend may not be known until after the ex-date. In those cases, dividend income, net of withholding taxes, is recorded when the fund becomes aware of the dividends. Non-cash dividends, if any, are recorded at the fair market value of the securities received. Gains and losses on securities sold are determined on the basis of identified cost and may include proceeds from litigation.
Securities lending. The fund may lend its securities to earn additional income. The fund receives collateral from the borrower in an amount not less than the market value of the loaned securities. The fund will invest its cash collateral in JHCT, an affiliate of the fund, which has a floating NAV and is registered with the Securities and Exchange Commission (SEC) as an investment company. JHCT invests in short-term money market investments. The fund will receive the benefit of any gains and bear any losses generated by JHCT with respect to the cash collateral.
The fund has the right to recall loaned securities on demand. If a borrower fails to return loaned securities when due, then the lending agent is responsible and indemnifies the fund for the lent securities. The lending agent uses the collateral received from the borrower to purchase replacement securities of the same issue, type, class and series of the loaned securities. If the value of the collateral is less than the purchase cost of replacement securities, the lending agent is responsible for satisfying the shortfall but only to the extent that the shortfall is not due to any decrease in the value of JHCT.
Although the risk of loss on securities lent is mitigated by receiving collateral from the borrower and through lending agent indemnification, the fund could experience a delay in recovering securities or could experience a lower than expected return if the borrower fails to return the securities on a timely basis. The fund receives compensation for lending its securities by retaining a portion of the return on the investment of the collateral and compensation from fees earned from borrowers of the securities. Securities lending income received by the fund is net of fees retained by the securities lending agent. Net income received from JHCT is a component of securities lending income as recorded on the Statement of operations.
Obligations to repay collateral received by the fund are shown on the Statement of assets and liabilities as Payable upon return of securities loaned and are secured by the loaned securities. As of August 31, 2020, the fund loaned securities valued at $39,516,672 and received $40,410,106 of cash collateral.
| 48 | JOHN HANCOCK Strategic Income Opportunities Fund | ANNUAL REPORT | |
Foreign investing. Assets, including investments, and liabilities denominated in foreign currencies are translated into U.S. dollar values each day at the prevailing exchange rate. Purchases and sales of securities, income and expenses are translated into U.S. dollars at the prevailing exchange rate on the date of the transaction. The effect of changes in foreign currency exchange rates on the value of securities is reflected as a component of the realized and unrealized gains (losses) on investments. Foreign investments are subject to a decline in the value of a foreign currency versus the U.S. dollar, which reduces the dollar value of securities denominated in that currency.
Funds that invest internationally generally carry more risk than funds that invest strictly in U.S. securities. These risks are heightened for investments in emerging markets. Risks can result from differences in economic and political conditions, regulations, market practices (including higher transaction costs), accounting standards and other factors.
Foreign taxes. The fund may be subject to withholding tax on income, capital gains or repatriation taxes imposed by certain countries, a portion of which may be recoverable. Foreign taxes are accrued based upon the fund's understanding of the tax rules and rates that exist in the foreign markets in which it invests. Taxes are accrued based on gains realized by the fund as a result of certain foreign security sales. In certain circumstances, estimated taxes are accrued based on unrealized appreciation of such securities. Investment income is recorded net of foreign withholding taxes.
Overdraft. The fund may have the ability to borrow from banks for temporary or emergency purposes, including meeting redemption requests that otherwise might require the untimely sale of securities. Pursuant to the fund's custodian agreement, the custodian may loan money to the fund to make properly authorized payments. The fund is obligated to repay the custodian for any overdraft, including any related costs or expenses. The custodian may have a lien, security interest or security entitlement in any fund property that is not otherwise segregated or pledged, to the extent of any overdraft, and to the maximum extent permitted by law.
Line of credit. Effective June 25, 2020, the fund and other affiliated funds have entered into a syndicated line of credit agreement with Citibank, N.A. as the administrative agent that enables them to participate in a $1 billion unsecured committed line of credit. Excluding commitments designated for a certain fund and subject to the needs of all other affiliated funds, the fund can borrow up to an aggregate commitment amount of $850 million, subject to asset coverage and other limitations as specified in the agreement. Each participating fund paid an upfront fee in connection with this line of credit agreement, which is charged based on a combination of fixed and asset based allocations and amortized over 365 days. Prior to June 25, 2020, the fund and other affiliated funds had a similar agreement that enabled them to participate in a $750 million unsecured committed line of credit. A commitment fee payable at the end of each calendar quarter, based on the average daily unused portion of the line of credit, is charged to each participating fund based on a combination of fixed and asset based allocations and is reflected in Other expenses on the Statement of operations. For the year ended August 31, 2020, the fund had no borrowings under the line of credit. Commitment fees for the year ended August 31, 2020 were $16,989.
Expenses. Within the John Hancock group of funds complex, expenses that are directly attributable to an individual fund are allocated to such fund. Expenses that are not readily attributable to a specific fund are allocated among all funds in an equitable manner, taking into consideration, among other things, the nature and type of expense and the fund’s relative net assets. Expense estimates are accrued in the period to which they relate and adjustments are made when actual amounts are known.
Class allocations. Income, common expenses and realized and unrealized gains (losses) are determined at the fund level and allocated daily to each class of shares based on the net assets of the class. Class-specific expenses, such as distribution and service fees, if any, and transfer agent fees, for all classes, are charged daily at the class level based on the net assets of each class and the specific expense rates applicable to each class.
| | ANNUAL REPORT | JOHN HANCOCK Strategic Income Opportunities Fund | 49 |
Change in accounting principle. Accounting Standards Update (ASU) 2017-08, Premium Amortization on Purchased Callable Debt Securities, shortens the premium amortization period for purchased non contingently callable debt securities and is effective for public companies with fiscal years beginning after December 15, 2018. Adoption of the ASU did not have a material impact to the fund.
Federal income taxes. The fund intends to continue to qualify as a regulated investment company by complying with the applicable provisions of the Internal Revenue Code and will not be subject to federal income tax on taxable income that is distributed to shareholders. Therefore, no federal income tax provision is required.
For federal income tax purposes, as of August 31, 2020, the fund has a short-term capital loss carryforward of $162,239,970 and a long-term capital loss carryforward of $89,352,912 available to offset future net realized capital gains. These carryforwards do not expire.
As of August 31, 2020, the fund had no uncertain tax positions that would require financial statement recognition, derecognition or disclosure. The fund's federal tax returns are subject to examination by the Internal Revenue Service for a period of three years.
Distribution of income and gains. Distributions to shareholders from net investment income and net realized gains, if any, are recorded on the ex-date. The fund generally declares dividends daily and pays them monthly. Capital gain distributions, if any, are typically distributed annually.
The tax character of distributions for the years ended August 31, 2020 and 2019 was as follows:
| | August 31, 2020 | August 31, 2019 |
| Ordinary income | $112,605,863 | $200,156,164 |
Distributions paid by the fund with respect to each class of shares are calculated in the same manner, at the same time and in the same amount, except for the effect of class level expenses that may be applied differently to each class. As of August 31, 2020, the components of distributable earnings on a tax basis consisted of $7,577,141 of undistributed ordinary income.
Such distributions and distributable earnings, on a tax basis, are determined in conformity with income tax regulations, which may differ from US GAAP. Distributions in excess of tax basis earnings and profits, if any, are reported in the fund's financial statements as a return of capital.
Capital accounts within the financial statements are adjusted for permanent book-tax differences. These adjustments have no impact on net assets or the results of operations. Temporary book-tax differences, if any, will reverse in a subsequent period. Book-tax differences are primarily attributable to straddle loss deferrals, foreign currency transactions, derivative transactions, amortization and accretion on debt securities and contingent payment debt instruments.
Note 3—Derivative instruments
The fund may invest in derivatives in order to meet its investment objective. Derivatives include a variety of different instruments that may be traded in the over-the-counter (OTC) market, on a regulated exchange or through a clearing facility. The risks in using derivatives vary depending upon the structure of the instruments, including the use of leverage, optionality, the liquidity or lack of liquidity of the contract, the creditworthiness of the counterparty or clearing organization and the volatility of the position. Some derivatives involve risks that are potentially greater than the risks associated with investing directly in the referenced securities or other referenced underlying instrument. Specifically, the fund is exposed to the risk that the counterparty to an OTC derivatives contract will be unable or unwilling to make timely settlement payments or otherwise honor its obligations. OTC derivatives transactions typically can only be closed out with the other party to the transaction.
| 50 | JOHN HANCOCK Strategic Income Opportunities Fund | ANNUAL REPORT | |
Derivatives which are typically traded through the OTC market are regulated by the Commodity Futures Trading Commission (the CFTC). Derivative counterparty risk is managed through an ongoing evaluation of the creditworthiness of all potential counterparties and, if applicable, designated clearing organizations. The fund attempts to reduce its exposure to counterparty risk for derivatives traded in the OTC market, whenever possible, by entering into an International Swaps and Derivatives Association (ISDA) Master Agreement with each of its OTC counterparties. The ISDA gives each party to the agreement the right to terminate all transactions traded under the agreement if there is certain deterioration in the credit quality or contractual default of the other party, as defined in the ISDA. Upon an event of default or a termination of the ISDA, the non-defaulting party has the right to close out all transactions and to net amounts owed.
As defined by the ISDA, the fund may have collateral agreements with certain counterparties to mitigate counterparty risk on OTC derivatives. Subject to established minimum levels, collateral for OTC transactions is generally determined based on the net aggregate unrealized gain or loss on contracts with a particular counterparty. Collateral pledged to the fund, if any, is held in a segregated account by a third-party agent or held by the custodian bank for the benefit of the fund and can be in the form of cash or debt securities issued by the U.S. government or related agencies; collateral posted by the fund, if any, for OTC transactions is held in a segregated account at the fund's custodian and is noted in the accompanying Fund's investments, or if cash is posted, on the Statement of assets and liabilities. The fund's risk of loss due to counterparty risk is equal to the asset value of outstanding contracts offset by collateral received.
Certain derivatives are traded or cleared on an exchange or central clearinghouse. Exchange-traded or centrally-cleared transactions generally present less counterparty risk to a fund than OTC transactions. The exchange or clearinghouse stands between the fund and the broker to the contract and therefore, credit risk is generally limited to the failure of the exchange or clearinghouse and the clearing member.
Futures. A futures contract is a contractual agreement to buy or sell a particular currency or financial instrument at a pre-determined price in the future. Futures are traded on an exchange and cleared through a central clearinghouse. Risks related to the use of futures contracts include possible illiquidity of the futures markets and contract prices that can be highly volatile and imperfectly correlated to movements in the underlying financial instrument and potential losses in excess of the amounts recognized on the Statement of assets and liabilities. Use of long futures contracts subjects the fund to the risk of loss up to the notional value of the futures contracts. Use of short futures contracts subjects the fund to unlimited risk of loss.
Upon entering into a futures contract, the fund is required to deposit initial margin with the broker in the form of cash or securities. The amount of required margin is set by the broker and is generally based on a percentage of the contract value. The margin deposit must then be maintained at the established level over the life of the contract. Cash that has been pledged by the fund is detailed in the Statement of assets and liabilities as Collateral held at broker for futures contracts. Securities pledged by the fund, if any, are identified in the Fund's investments. Subsequent payments, referred to as variation margin, are made or received by the fund periodically and are based on changes in the market value of open futures contracts. Futures contracts are marked-to-market daily and unrealized gain or loss is recorded by the fund. Receivable for futures variation margin is included on the Statement of assets and liabilities. When the contract is closed, the fund records a realized gain or loss equal to the difference between the value of the contract at the time it was opened and the value at the time it was closed.
During the year ended August 31, 2020, the fund used futures contracts to manage duration of the fund. The fund held futures contracts with USD notional values ranging from $14.9 million to $891.0 million, as measured at each quarter end.
Forward foreign currency contracts. A forward foreign currency contract is an agreement between two parties to buy and sell specific currencies at a price that is set on the date of the contract. The forward contract calls for delivery of the currencies on a future date that is specified in the contract. Forwards are typically traded OTC. Risks related to the use of forwards include the possible failure of counterparties to meet the terms of the forward agreement, the failure of the counterparties to timely post collateral if applicable, and the risk that
| | ANNUAL REPORT | JOHN HANCOCK Strategic Income Opportunities Fund | 51 |
currency movements will not favor the fund thereby reducing the fund's total return, and the potential for losses in excess of the amounts recognized on the Statement of assets and liabilities.
The market value of a forward foreign currency contract fluctuates with changes in foreign currency exchange rates. Forward foreign currency contracts are marked-to-market daily and the change in value is recorded by the fund as an unrealized gain or loss. Realized gains or losses, equal to the difference between the value of the contract at the time it was opened and the value at the time it was closed, are recorded upon delivery or receipt of the currency or settlement with the counterparty.
During the year ended August 31, 2020, the fund used forward foreign currency contracts to manage against changes in foreign currency exchange rates and to gain exposure to foreign currencies. The fund held forward foreign currency contracts with USD notional values ranging from $2.0 billion to $7.8 billion, as measured at each quarter end.
Options. There are two types of options, put options and call options. Options are traded either OTC or on an exchange. A call option gives the purchaser of the option the right to buy (and the seller the obligation to sell) the underlying instrument at the exercise price. A put option gives the purchaser of the option the right to sell (and the writer the obligation to buy) the underlying instrument at the exercise price. Writing puts and buying calls may increase the fund's exposure to changes in the value of the underlying instrument. Buying puts and writing calls may decrease the fund's exposure to such changes. Risks related to the use of options include the loss of premiums, possible illiquidity of the options markets, trading restrictions imposed by an exchange and movements in underlying security values, and for written options, potential losses in excess of the amounts recognized on the Statement of assets and liabilities. In addition, OTC options are subject to the risks of all OTC derivatives contracts.
When the fund purchases an option, the premium paid is included in the Fund's investments and subsequently “marked-to-market” to reflect current market value. If the purchased option expires, the fund realizes a loss equal to the cost of the option. If the fund exercises a call option, the cost of the securities acquired by exercising the call is increased by the premium paid to buy the call. If the fund exercises a put option, it realizes a gain or loss from the sale of the underlying security and the proceeds from such sale are decreased by the premium paid. If the fund enters into a closing sale transaction, it realizes a gain or loss, depending on whether proceeds from the closing sale are greater or less than the original cost. When the fund writes an option, the premium received is included as a liability and subsequently “marked-to-market” to reflect the current market value of the option written. Premiums received from writing options that expire unexercised are recorded as realized gains. Premiums received from writing options which are exercised or are closed are added to or offset against the proceeds or amount paid on the transaction to determine the realized gain or loss. If a put option on a security is exercised, the premium received reduces the cost basis of the securities purchased by the fund.
During the year ended August 31, 2020, the fund used purchased options contracts to manage against changes in foreign currency exchange rates. The fund held purchased options contracts with market values ranging from $1.0 million to $2.5 million, as measured at each quarter end.
During the year ended August 31, 2020, the fund wrote option contracts to manage against changes in foreign currency exchange rates. The fund held written option contracts with market values ranging up to $1.5 million as measured during the year. There were no open written option contracts as of August 31, 2020.
Fair value of derivative instruments by risk category
The table below summarizes the fair value of derivatives held by the fund at August 31, 2020 by risk category:
| Risk | Statement of assets
and liabilities
location | Financial
instruments
location | Assets
derivatives
fair value | Liabilities
derivatives
fair value |
| Interest rate | Receivable/payable for futures variation margin | Futures 1 | $2,970,249 | $(503,374) |
| 52 | JOHN HANCOCK Strategic Income Opportunities Fund | ANNUAL REPORT | |
| Risk | Statement of assets
and liabilities
location | Financial
instruments
location | Assets
derivatives
fair value | Liabilities
derivatives
fair value |
| Currency | Unrealized appreciation / depreciation on forward foreign currency contracts | Forward foreign currency contracts | 71,635,108 | (66,784,438) |
| Currency | Unaffiliated investments, at value2 | Purchased options | 2,484,952 | — |
| | | | $77,090,309 | $(67,287,812) |
| 1 | Reflects cumulative appreciation/depreciation on futures as disclosed in Fund's investments. Only the year end variation margin is separately disclosed on the Statement of assets and liabilities. |
| 2 | Purchased options are included in Fund's investments. |
For financial reporting purposes, the fund does not offset OTC derivative assets or liabilities that are subject to master netting arrangements, as defined by the ISDAs, in the Statement of assets and liabilities. In the event of default by the counterparty or a termination of the agreement, the ISDA allows an offset of amounts across the various transactions between the fund and the applicable counterparty. The tables below reflect the fund's exposure to OTC derivative transactions and exposure to counterparties subject to an ISDA:
| OTC Financial Instruments | Asset | Liability |
| Forward foreign currency contracts | $71,635,108 | $(66,784,438) |
| Purchased options | 2,484,952 | — |
| Totals | $74,120,060 | $(66,784,438) |
| Counterparty | Total Market
Value of OTC
Derivatives | Collateral
Posted by
Counterparty | Collateral
Posted by
Portfolio | Net
Exposure |
| Australia and New Zealand Banking Group Limited | $1,288,745 | $1,011,646 | — | $277,099 |
| Bank of New York Mellon Corp. | (53,979) | — | — | (53,979) |
| Merrill Lynch, Pierce, Fenner & Smith Incorporated | (124,246) | — | — | (124,246) |
| Canadian Imperial Bank of Commerce | (125,725) | — | — | (125,725) |
| Citibank, N.A. | (2,820,486) | — | $2,810,000 | (10,486) |
| Goldman Sachs International | 3,103,081 | 480,000 | — | 2,623,081 |
| HSBC Bank USA, N.A. | 1,785,605 | 1,785,605 | — | — |
| JPMorgan Chase Bank, N.A. | 12,192,333 | 12,192,333 | — | — |
| Morgan Stanley Capital Services LLC | (2,450,395) | — | 2,400,000 | (50,395) |
| National Australia Bank Ltd. | 101,401 | — | — | 101,401 |
| Royal Bank of Canada | (621,847) | — | 620,000 | (1,847) |
| Standard Chartered Bank | 1,899,669 | 1,834,656 | — | 65,013 |
| State Street Bank and Trust Company | (6,395,756) | — | 5,440,000 | (955,756) |
| The Toronto-Dominion Bank | 476,480 | 250,000 | — | 226,480 |
| UBS AG | (919,258) | — | 850,000 | (69,258) |
| Totals | $7,335,622 | $17,554,240 | $12,120,000 | $1,901,382 |
| | ANNUAL REPORT | JOHN HANCOCK Strategic Income Opportunities Fund | 53 |
Effect of derivative instruments on the Statement of operations
The table below summarizes the net realized gain (loss) included in the net increase (decrease) in net assets from operations, classified by derivative instrument and risk category, for the year ended August 31, 2020:
| | Statement of operations location - Net realized gain (loss) on: |
| Risk | Unaffiliated
investments and
foreign currency
transactions1 | Futures contracts | Forward foreign
currency contracts | Written options | Total |
| Interest rate | — | $8,628,067 | — | — | $8,628,067 |
| Currency | $2,997,942 | — | $52,350,930 | $1,019,449 | 56,368,321 |
| Total | $2,997,942 | $8,628,067 | $52,350,930 | $1,019,449 | $64,996,388 |
| 1 | Realized gain/loss associated with purchased options is included in this caption on the Statement of operations. |
The table below summarizes the net change in unrealized appreciation (depreciation) included in the net increase (decrease) in net assets from operations, classified by derivative instrument and risk category, for the year ended August 31, 2020:
| | Statement of operations location - Change in net unrealized appreciation (depreciation) of: |
| Risk | Unaffiliated
investments and
translation of assets
and liabilities in
foreign currencies1 | Futures contracts | Forward foreign
currency contracts | Total |
| Interest rate | — | $5,536,929 | — | $5,536,929 |
| Currency | $1,706,312 | — | $(21,728,974) | (20,022,662) |
| Total | $1,706,312 | $5,536,929 | $(21,728,974) | $(14,485,733) |
| 1 | Change in unrealized appreciation/depreciation associated with purchased options is included in this caption on the Statement of operations. |
Note 4—Guarantees and indemnifications
Under the Trust's organizational documents, its Officers and Trustees are indemnified against certain liabilities arising out of the performance of their duties to the Trust, including the fund. Additionally, in the normal course of business, the fund enters into contracts with service providers that contain general indemnification clauses. The fund's maximum exposure under these arrangements is unknown, as this would involve future claims that may be made against the fund that have not yet occurred. The risk of material loss from such claims is considered remote.
Note 5—Fees and transactions with affiliates
John Hancock Investment Management LLC (the Advisor) serves as investment advisor for the fund. John Hancock Investment Management Distributors LLC (the Distributor), an affiliate of the Advisor, serves as principal underwriter of the fund. The Advisor and the Distributor are indirect, principally owned subsidiaries of Manulife Financial Corporation.
Management fee. The fund has an investment management agreement with the Advisor under which the fund pays a daily management fee to the Advisor equivalent on an annual basis to the sum of:(a) 0.700% of the first $500 million of the fund’s aggregate daily net assets; (b) 0.650% of the next $3 billion of the fund’s aggregate daily net assets; (c) 0.600% of the next $4 billion of the fund’s aggregate daily net assets; (d) 0.590% of the next $4.5 billion of the fund’s aggregate daily net assets; and (e) 0.575% of the fund’s aggregate daily net assets in excess of $12 billion. Aggregate net assets include the net assets of 1) the fund, 2) Strategic Income Opportunities
| 54 | JOHN HANCOCK Strategic Income Opportunities Fund | ANNUAL REPORT | |
Trust, a series of John Hancock Variable Insurance Trust and 3) Strategic Income Opportunities Fund, a sub-fund of Manulife Investment Management I PLC (formerly John Hancock Worldwide Investors, PLC). The Advisor has a subadvisory agreement with Manulife Investment Management (US) LLC, an indirectly owned subsidiary of Manulife Financial Corporation and an affiliate of the Advisor. The fund is not responsible for payment of the subadvisory fees.
The advisor contractually agrees to reduce its management fee (after giving effect to asset breakpoints) by an annual rate of 0.02% of the fund’s average daily net assets. This agreement expires on December 31, 2020, unless renewed by mutual agreement of the fund and the advisor based upon a determination that this is appropriate under the circumstances at that time.
The Advisor has contractually agreed to waive a portion of its management fee and/or reimburse expenses for certain funds of the John Hancock group of funds complex, including the fund (the participating portfolios). This waiver is based upon aggregate net assets of all the participating portfolios. The amount of the reimbursement is calculated daily and allocated among all the participating portfolios in proportion to the daily net assets of each fund. During the year ended August 31, 2020, this waiver amounted to 0.01% of the fund’s average daily net assets. This arrangement expires on July 31, 2022, unless renewed by mutual agreement of the fund and the Advisor based upon a determination that this is appropriate under the circumstances at that time.
For the year ended August 31, 2020, the expense reductions described above amounted to the following:
| Class | Expense reduction |
| Class A | $87,262 |
| Class C | 46,627 |
| Class I | 574,492 |
| Class R2 | 2,626 |
| Class | Expense reduction |
| Class R6 | $105,022 |
| Class NAV | 539,975 |
| Total | $1,356,004 |
Expenses waived or reimbursed in the current fiscal period are not subject to recapture in future fiscal periods.
The investment management fees, including the impact of the waivers and reimbursements as described above, incurred for the year ended August 31, 2020, were equivalent to a net annual effective rate of 0.61% of the fund's average daily net assets.
Accounting and legal services. Pursuant to a service agreement, the fund reimburses the Advisor for all expenses associated with providing the administrative, financial, legal, compliance, accounting and recordkeeping services to the fund, including the preparation of all tax returns, periodic reports to shareholders and regulatory reports, among other services. These expenses are allocated to each share class based on its relative net assets at the time the expense was incurred. These accounting and legal services fees incurred, for the year ended August 31, 2020, amounted to an annual rate of 0.02% of the fund's average daily net assets.
Distribution and service plans. The fund has a distribution agreement with the Distributor. The fund has adopted distribution and service plans for certain classes as detailed below pursuant to Rule 12b-1 under the 1940 Act, to pay the Distributor for services provided as the distributor of shares of the fund. In addition, under a service plan for certain classes as detailed below, the fund pays for certain other services. The fund may pay up to the following contractual rates of distribution and service fees under these arrangements, expressed as an annual percentage of average daily net assets for each class of the fund's shares:
| Class | Rule 12b-1 Fee | Service fee |
| Class A | 0.30% | — |
| Class C | 1.00% | — |
| Class R2 | 0.25% | 0.25% |
| | ANNUAL REPORT | JOHN HANCOCK Strategic Income Opportunities Fund | 55 |
Sales charges. Class A shares are assessed up-front sales charges, which resulted in payments to the Distributor amounting to $140,614 for the year ended August 31, 2020. Of this amount, $19,477 was retained and used for printing prospectuses, advertising, sales literature and other purposes and $121,137 was paid as sales commissions to broker-dealers.
Class A and Class C shares may be subject to contingent deferred sales charges (CDSCs). Certain Class A shares that are acquired through purchases of $1 million or more and are redeemed within one year of purchase are subject to a 1.00% sales charge. Class C shares that are redeemed within one year of purchase are subject to a 1.00% CDSC. CDSCs are applied to the lesser of the current market value at the time of redemption or the original purchase cost of the shares being redeemed. Proceeds from CDSCs are used to compensate the Distributor for providing distribution-related services in connection with the sale of these shares. During the year ended August 31, 2020, CDSCs received by the Distributor amounted to $5,333 and $3,031 for Class A and Class C shares, respectively.
Transfer agent fees. The John Hancock group of funds has a complex-wide transfer agent agreement with John Hancock Signature Services, Inc. (Signature Services), an affiliate of the Advisor. The transfer agent fees paid to Signature Services are determined based on the cost to Signature Services (Signature Services Cost) of providing recordkeeping services. It also includes out-of-pocket expenses, including payments made to third-parties for recordkeeping services provided to their clients who invest in one or more John Hancock funds. In addition, Signature Services Cost may be reduced by certain fees that Signature Services receives in connection with retirement and small accounts. Signature Services Cost is calculated monthly and allocated, as applicable, to five categories of share classes: Retail Share and Institutional Share Classes of Non-Municipal Bond Funds, Class R6 Shares, Retirement Share Classes and Municipal Bond Share Classes. Within each of these categories, the applicable costs are allocated to the affected John Hancock affiliated funds and/or classes, based on the relative average daily net assets.
Class level expenses. Class level expenses for the year ended August 31, 2020 were as follows:
| Class | Distribution and service fees | Transfer agent fees |
| Class A | $965,239 | $405,983 |
| Class C | 1,719,350 | 216,955 |
| Class I | — | 2,677,828 |
| Class R2 | 47,418 | 1,302 |
| Class R6 | — | 52,030 |
| Total | $2,732,007 | $3,354,098 |
Trustee expenses. The fund compensates each Trustee who is not an employee of the Advisor or its affiliates. The costs of paying Trustee compensation and expenses are allocated to the fund based on its net assets relative to other funds within the John Hancock group of funds complex.
Interfund lending program. Pursuant to an Exemptive Order issued by the SEC, the fund, along with certain other funds advised by the Advisor or its affiliates, may participate in an interfund lending program. This program provides an alternative credit facility allowing the fund to borrow from, or lend money to, other participating affiliated funds. At period end, no interfund loans were outstanding. Interest expense is included in Other expenses on the Statement of operations. The fund's activity in this program during the period for which loans were outstanding was as follows:
Borrower
or Lender | Weighted Average
Loan Balance | Days
Outstanding | Weighted Average
Interest Rate | Interest Income
(Expense) |
| Borrower | $125,500,000 | 1 | 0.560% | ($1,952) |
| Lender | $23,520,935 | 7 | 0.554% | $2,533 |
| 56 | JOHN HANCOCK Strategic Income Opportunities Fund | ANNUAL REPORT | |
Note 6—Fund share transactions
Transactions in fund shares for the years ended August 31, 2020 and 2019 were as follows:
| | Year Ended 8-31-20 | Year Ended 8-31-19 |
| | Shares | Amount | Shares | Amount |
| Class A shares | | | | |
| Sold | 7,143,144 | $75,179,043 | 6,020,521 | $61,927,546 |
| Distributions reinvested | 576,452 | 6,105,141 | 1,026,562 | 10,557,843 |
| Repurchased | (8,524,745) | (89,163,661) | (17,427,387) | (179,036,496) |
| Net decrease | (805,149) | $(7,879,477) | (10,380,304) | $(106,551,107) |
| Class C shares | | | | |
| Sold | 782,619 | $8,256,876 | 1,224,242 | $12,587,802 |
| Distributions reinvested | 186,464 | 1,973,633 | 478,415 | 4,914,576 |
| Repurchased | (6,482,601) | (68,556,342) | (10,236,549) | (105,032,496) |
| Net decrease | (5,513,518) | $(58,325,833) | (8,533,892) | $(87,530,118) |
| Class I shares | | | | |
| Sold | 67,764,666 | $690,452,016 | 78,617,400 | $806,137,051 |
| Distributions reinvested | 4,360,853 | 46,177,842 | 8,326,351 | 85,609,827 |
| Repurchased | (110,727,871) | (1,146,930,538) | (202,080,540) | (2,069,411,994) |
| Net decrease | (38,602,352) | $(410,300,680) | (115,136,789) | $(1,177,665,116) |
| Class R2 shares | | | | |
| Sold | 180,062 | $1,907,117 | 239,045 | $2,469,967 |
| Distributions reinvested | 17,079 | 180,808 | 40,599 | 417,783 |
| Repurchased | (764,400) | (8,032,530) | (756,787) | (7,842,863) |
| Net decrease | (567,259) | $(5,944,605) | (477,143) | $(4,955,113) |
| Class R6 shares | | | | |
| Sold | 8,742,964 | $93,074,444 | 36,288,073 | $370,699,820 |
| Distributions reinvested | 865,534 | 9,185,612 | 3,001,804 | 30,766,675 |
| Repurchased | (39,399,144) | (396,465,795) | (129,579,867) | (1,320,035,805) |
| Net decrease | (29,790,646) | $(294,205,739) | (90,289,990) | $(918,569,310) |
| Class NAV shares | | | | |
| Sold | 12,344,916 | $130,658,405 | 64,780,301 | $663,966,193 |
| Distributions reinvested | 4,451,376 | 47,150,108 | 6,100,993 | 62,922,576 |
| Repurchased | (30,272,485) | (313,003,075) | (43,092,160) | (443,981,906) |
| Net increase (decrease) | (13,476,193) | $(135,194,562) | 27,789,134 | $282,906,863 |
| Total net decrease | (88,755,117) | $(911,850,896) | (197,028,984) | $(2,012,363,901) |
Affiliates of the fund owned 9% and 90% of shares of Class R6 and Class NAV on August 31, 2020. Such concentration of shareholders’ capital could have a material effect on the fund if such shareholders redeem from the fund.
| | ANNUAL REPORT | JOHN HANCOCK Strategic Income Opportunities Fund | 57 |
Note 7—Purchase and sale of securities
Purchases and sales of securities, other than short-term investments and U.S. Treasury obligations, amounted to $3,348,858,342 and $3,973,943,764, respectively, for the year ended August 31, 2020. Purchases and sales of U.S. Treasury obligations aggregated $234,131,094 and $446,520,417, respectively, for the year ended August 31, 2020.
Note 8—Investment by affiliated funds
Certain investors in the fund are affiliated funds that are managed by the Advisor and its affiliates. The affiliated funds do not invest in the fund for the purpose of exercising management or control; however, this investment may represent a significant portion of the fund's net assets. At August 31, 2020, funds within the John Hancock group of funds complex held 38.3% of the fund's net assets. The following fund(s) had an affiliate ownership of 5% or more of the fund's net assets:
| Portfolio | Affiliated Concentration |
| John Hancock Funds II Multimanager Lifestyle Balanced Portfolio | 15.4% |
| John Hancock Funds II Multimanager Lifestyle Growth Portfolio | 6.6% |
| John Hancock Funds II Multimanager Lifestyle Moderate Portfolio | 5.4% |
| John Hancock Funds II Multimanager Lifestyle Conservative Portfolio | 5.2% |
Note 9—Investment in affiliated underlying funds
The fund may invest in affiliated underlying funds that are managed by the Advisor and its affiliates. Information regarding the fund's fiscal year to date purchases and sales of the affiliated underlying funds as well as income and capital gains earned by the fund, if any, is as follows:
| | | | | | | | Dividends and distributions |
| Affiliate | Ending
share
amount | Beginning
value | Cost of
purchases | Proceeds
from shares
sold | Realized
gain
(loss) | Change in
unrealized
appreciation
(depreciation) | Income
distributions
received | Capital gain
distributions
received | Ending
value |
| John Hancock Collateral Trust* | 4,040,026 | $68,339,096 | $368,162,147 | $(396,074,990) | $15,822 | $1,412 | $321,668 | — | $40,443,487 |
| * | Refer to the Securities lending note within Note 2 for details regarding this investment. |
Note 10—LIBOR discontinuation risk
LIBOR (London Interbank Offered Rate) is a measure of the average interest rate at which major global banks can borrow from one another. Following allegations of rate manipulation and concerns regarding its thin liquidity, in July 2017, the U.K. Financial Conduct Authority, which regulates LIBOR, announced that it will stop encouraging banks to provide the quotations needed to sustain LIBOR after 2021. This event will likely cause LIBOR to cease to be published. Before then, it is expected that market participants will transition to the use of different reference or benchmark rates. However, although regulators have suggested alternative rates, there is currently no definitive information regarding the future utilization of LIBOR or of any replacement rate.
It is uncertain what impact the discontinuation of LIBOR will have on the use of LIBOR as a reference rate for securities in which the fund invests. It is expected that market participants will amend financial instruments referencing LIBOR to include fallback provisions and other measures that contemplate the discontinuation of LIBOR or other similar market disruption events, but neither the effect of the transition process nor the viability of such measures is known. In addition, there are obstacles to converting certain longer term securities and transactions to a new benchmark or benchmarks and the effectiveness of one alternative reference rate versus multiple alternative reference rates in new or existing financial instruments and products has not been determined. As market participants transition away from LIBOR, LIBOR's usefulness may deteriorate, which could
| 58 | JOHN HANCOCK Strategic Income Opportunities Fund | ANNUAL REPORT | |
occur prior to the end of 2021. The transition process may lead to increased volatility and illiquidity in markets that currently rely on LIBOR to determine interest rates. LIBOR's deterioration may adversely affect the liquidity and/or market value of securities that use LIBOR as a benchmark interest rate.
Note 11—Coronavirus (COVID-19) pandemic
The novel COVID-19 disease has resulted in significant disruptions to global business activity. A widespread health crisis such as a global pandemic could cause substantial market volatility, exchange trading suspensions and closures, impact the ability to complete redemptions, and affect fund performance.
| | ANNUAL REPORT | JOHN HANCOCK Strategic Income Opportunities Fund | 59 |
Report of Independent Registered Public Accounting Firm
To the Board of Trustees of John Hancock Funds II and Shareholders of John Hancock Strategic Income Opportunities Fund
Opinion on the Financial Statements
We have audited the accompanying statement of assets and liabilities, including the fund’s investments, of John Hancock Strategic Income Opportunities Fund (one of the funds constituting John Hancock Funds II, referred to hereafter as the "Fund") as of August 31, 2020, the related statement of operations for the year ended August 31, 2020, the statements of changes in net assets for each of the two years in the period ended August 31, 2020, including the related notes, and the financial highlights for each of the five years in the period ended August 31, 2020 (collectively referred to as the “financial statements”). In our opinion, the financial statements present fairly, in all material respects, the financial position of the Fund as of August 31, 2020, the results of its operations for the year then ended, the changes in its net assets for each of the two years in the period ended August 31, 2020 and the financial highlights for each of the five years in the period ended August 31, 2020 in conformity with accounting principles generally accepted in the United States of America.
Basis for Opinion
These financial statements are the responsibility of the Fund’s management. Our responsibility is to express an opinion on the Fund’s financial statements based on our audits. We are a public accounting firm registered with the Public Company Accounting Oversight Board (United States) (PCAOB) and are required to be independent with respect to the Fund in accordance with the U.S. federal securities laws and the applicable rules and regulations of the Securities and Exchange Commission and the PCAOB.
We conducted our audits of these financial statements in accordance with the standards of the PCAOB. Those standards require that we plan and perform the audit to obtain reasonable assurance about whether the financial statements are free of material misstatement, whether due to error or fraud.
Our audits included performing procedures to assess the risks of material misstatement of the financial statements, whether due to error or fraud, and performing procedures that respond to those risks. Such procedures included examining, on a test basis, evidence regarding the amounts and disclosures in the financial statements. Our audits also included evaluating the accounting principles used and significant estimates made by management, as well as evaluating the overall presentation of the financial statements. Our procedures included confirmation of securities owned as of August 31, 2020 by correspondence with the custodian, transfer agent, agent bank and brokers; when replies were not received from the agent bank and brokers, we performed other auditing procedures. We believe that our audits provide a reasonable basis for our opinion.
/s/ PricewaterhouseCoopers LLP
Boston, Massachusetts
October 22, 2020
We have served as the auditor of one or more investment companies in the John Hancock group of funds since 1988.
| 60 | JOHN HANCOCK STRATEGIC INCOME OPPORTUNITIES FUND | ANNUAL REPORT | |
Tax information (Unaudited)
For federal income tax purposes, the following information is furnished with respect to the distributions of the fund, if any, paid during its taxable year ended August 31, 2020.
The fund reports the maximum amount allowable of its net taxable income as eligible for the corporate dividends-received deduction.
The fund reports the maximum amount allowable of its net taxable income as qualified dividend income as provided in the Jobs and Growth Tax Relief Reconciliation Act of 2003.
The fund reports the maximum amount allowable of its Section 199A dividends as defined in Proposed Treasury Regulation §1.199A-3(d).
Eligible shareholders will be mailed a 2020 Form 1099-DIV in early 2021. This will reflect the tax character of all distributions paid in calendar year 2020.
Please consult a tax advisor regarding the tax consequences of your investment in the fund.
| | ANNUAL REPORT | JOHN HANCOCK STRATEGIC INCOME OPPORTUNITIES FUND | 61 |
CONTINUATION OF INVESTMENT ADVISORY AND SUBADVISORY AGREEMENTS
EVALUATION OF ADVISORY AND SUBADVISORY AGREEMENTS BY THE BOARD OF TRUSTEES
This section describes the evaluation by the Board of Trustees (the Board) of John Hancock Funds II (the Trust) of the Advisory Agreement (the Advisory Agreement) with John Hancock Investment Management LLC (the Advisor) and the Subadvisory Agreement (the Subadvisory Agreement) with Manulife Investment Management (US) LLC (the Subadvisor) for John Hancock Strategic Income Opportunities Fund (the fund). The Advisory Agreement and Subadvisory Agreement are collectively referred to as the Agreements. Prior to the June 23-25, 2020 telephonic1 meeting at which the Agreements were approved, the Board also discussed and considered information regarding the proposed continuation of the Agreements at the telephonic meeting held on May 26-27, 2020.
Approval of Advisory and Subadvisory Agreements
At telephonic meetings held on June 23-25, 2020, the Board, including the Trustees who are not parties to any Agreement or considered to be interested persons of the Trust under the Investment Company Act of 1940, as amended (the 1940 Act) (the Independent Trustees), reapproved for an annual period the continuation of the Advisory Agreement between the Trust and the Advisor and the Subadvisory Agreement between the Advisor and the Subadvisor with respect to the fund.
In considering the Advisory Agreement and the Subadvisory Agreement, the Board received in advance of the meetings a variety of materials relating to the fund, the Advisor and the Subadvisor, including comparative performance, fee and expense information for a peer group of similar funds prepared by an independent third-party provider of fund data, performance information for an applicable benchmark index; and, with respect to the Subadvisor, comparative performance information for comparably managed accounts, as applicable, and other information provided by the Advisor and the Subadvisor regarding the nature, extent and quality of services provided by the Advisor and the Subadvisor under their respective Agreements, as well as information regarding the Advisor's revenues and costs of providing services to the fund and any compensation paid to affiliates of the Advisor. At the meetings at which the renewal of the Advisory Agreement and Subadvisory Agreement are considered, particular focus is given to information concerning fund performance, comparability of fees and total expenses, and profitability. However, the Board notes that the evaluation process with respect to the Advisor and the Subadvisor is an ongoing one. In this regard, the Board also took into account discussions with management and information provided to the Board (including its various committees) at prior meetings with respect to the services provided by the Advisor and the Subadvisor to the fund, including quarterly performance reports prepared by management containing reviews of investment results and prior presentations from the Subadvisor with respect to the fund. The information received and considered by the Board in connection with the May and June meetings and throughout the year was both written and
____________________
1On March 25, 2020, as a result of health and safety measures put in place to combat the global COVID-19 pandemic, the Securities and Exchange Commission issued an exemptive order (the "Order") pursuant to Sections 6(c) and 38(a) of the Investment Company Act of 1940, as amended (the "1940 Act"), that temporarily exempts registered investment management companies from the in-person voting requirements under the 1940 Act, subject to certain requirements, including that votes taken pursuant to the Order are ratified at the next in-person meeting. The Board determined that reliance on the Order was necessary or appropriate due to the circumstances related to current or potential effects of COVID-19 and therefore, the Board's May and June meetings were held telephonically in reliance on the Order.
ANNUAL REPORT | JOHN HANCOCK STRATEGIC INCOME OPPORTUNITIES FUND 62
oral. The Board noted the affiliation of the Subadvisor with the Advisor, noting any potential conflicts of interest. The Board also considered the nature, quality, and extent of non-advisory services, if any, to be provided to the fund by the Advisor's affiliates, including distribution services. The Board considered the Advisory Agreement and the Subadvisory Agreement separately in the course of its review. In doing so, the Board noted the respective roles of the Advisor and Subadvisor in providing services to the fund.
Throughout the process, the Board asked questions of and requested additional information from management. The Board is assisted by counsel for the Trust and the Independent Trustees are also separately assisted by independent legal counsel throughout the process. The Independent Trustees also received a memorandum from their independent legal counsel discussing the legal standards for their consideration of the proposed continuation of the Agreements and discussed the proposed continuation of the Agreements in private sessions with their independent legal counsel at which no representatives of management were present.
Approval of Advisory Agreement
In approving the Advisory Agreement with respect to the fund, the Board, including the Independent Trustees, considered a variety of factors, including those discussed below. The Board also considered other factors (including conditions and trends prevailing generally in the economy, the securities markets, and the industry) and did not treat any single factor as determinative, and each Trustee may have attributed different weights to different factors. The Board's conclusions may be based in part on its consideration of the advisory and subadvisory arrangements in prior years and on the Board's ongoing regular review of fund performance and operations throughout the year.
Nature, extent, and quality of services. Among the information received by the Board from the Advisor relating to the nature, extent, and quality of services provided to the fund, the Board reviewed information provided by the Advisor relating to its operations and personnel, descriptions of its organizational and management structure, and information regarding the Advisor's compliance and regulatory history, including its Form ADV. The Board also noted that on a regular basis it receives and reviews information from the Trust's Chief Compliance Officer (CCO) regarding the fund's compliance policies and procedures established pursuant to Rule 38a-1 under the 1940 Act. The Board observed that the scope of services provided by the Advisor, and of the undertakings required of the Advisor in connection with those services, including maintaining and monitoring its own and the fund's compliance programs, risk management programs, liquidity management programs and cybersecurity programs, had expanded over time as a result of regulatory, market and other developments. The Board considered that the Advisor is responsible for the management of the day-to-day operations of the fund, including, but not limited to, general supervision of and coordination of the services provided by the Subadvisor, and is also responsible for monitoring and reviewing the activities of the Subadvisor and third-party service providers. The Board also considered the significant risks assumed by the Advisor in connection with the services provided to the fund including entrepreneurial risk in sponsoring new funds and ongoing risks including investment, operational, enterprise, litigation, regulatory and compliance risks with respect to all funds.
In considering the nature, extent, and quality of the services provided by the Advisor, the Trustees also took into account their knowledge of the Advisor's management and the quality of the performance of the Advisor's duties, through Board meetings, discussions and reports during the preceding year and through each Trustee's experience as a Trustee of the Trust and of the other trusts in the John Hancock group of funds complex (the John Hancock Fund Complex).
ANNUAL REPORT | JOHN HANCOCK STRATEGIC INCOME OPPORTUNITIES FUND 63
In the course of their deliberations regarding the Advisory Agreement, the Board considered, among other things:
| | | |
| | (a) | the skills and competency with which the Advisor has in the past managed the Trust's affairs and its subadvisory relationship, the Advisor's oversight and monitoring of the Subadvisor's investment performance and compliance programs, such as the Subadvisor's compliance with fund policies and objectives, review of brokerage matters, including with respect to trade allocation and best execution and the Advisor's timeliness in responding to performance issues; |
| | (b) | the background, qualifications and skills of the Advisor's personnel; |
| | (c) | the Advisor's compliance policies and procedures and its responsiveness to regulatory changes and fund industry developments; |
| | (d) | the Advisor's administrative capabilities, including its ability to supervise the other service providers for the fund, as well as the Advisor's oversight of any securities lending activity, its monitoring of class action litigation and collection of class action settlements on behalf of the fund, and bringing loss recovery actions on behalf of the fund; |
| | (e) | the financial condition of the Advisor and whether it has the financial wherewithal to provide a high level and quality of services to the fund; |
| | (f) | the Advisor's initiatives intended to improve various aspects of the Trust's operations and investor experience with the fund; and |
| | (g) | the Advisor's reputation and experience in serving as an investment advisor to the Trust and the benefit to shareholders of investing in funds that are part of a family of funds offering a variety of investments. |
The Board concluded that the Advisor may reasonably be expected to continue to provide a high quality of services under the Advisory Agreement with respect to the fund.
Investment performance. In considering the fund's performance, the Board noted that it reviews at its regularly scheduled meetings information about the fund's performance results. In connection with the consideration of the Advisory Agreement, the Board:
| | | |
| | (a) | reviewed information prepared by management regarding the fund's performance; |
| | (b) | considered the comparative performance of an applicable benchmark index; |
| | (c) | considered the performance of comparable funds, if any, as included in the report prepared by an independent third-party provider of fund data; and |
| | (d) | took into account the Advisor's analysis of the fund's performance and its plans and recommendations regarding the Trust's subadvisory arrangements generally. |
The Board noted that while it found the data provided by the independent third-party generally useful it recognized its limitations, including in particular that the data may vary depending on the end date selected and that the results of the performance comparisons may vary depending on the selection of the peer group. The Board noted that the fund outperformed the benchmark index for the one-, five- and ten-year periods and underperformed the benchmark index for the three-year period ended December 31, 2019. The Board also noted that the fund outperformed the peer group median for the one- and ten-year periods and underperformed the peer group median for the three- and five-year periods ended December 31, 2019. The Board took into account management's discussion of the fund's performance, including the favorable performance relative to the benchmark index for the one-, five- and ten-year periods and to the peer group median for the one- and ten-year periods. The Board took into account management's discussion of the factors that contributed to the fund's performance for the benchmark index for the three-year period and the peer
ANNUAL REPORT | JOHN HANCOCK STRATEGIC INCOME OPPORTUNITIES FUND 64
group median for the three- and five-year periods including the impact of past and current market conditions on the fund's strategy and management's plans for the fund. The Board concluded that the fund's performance is being monitored and reasonably addressed, where appropriate.
Fees and expenses. The Board reviewed comparative information prepared by an independent third-party provider of fund data, including, among other data, the fund's contractual and net management fees (and subadvisory fees, to the extent available) and total expenses as compared to similarly situated investment companies deemed to be comparable to the fund in light of the nature, extent and quality of the management and advisory and subadvisory services provided by the Advisor and the Subadvisor. The Board considered the fund's ranking with a smaller group of peer funds chosen by the independent third-party provider, as well as the fund's ranking within a broader group of funds. In comparing the fund's contractual and net management fees to those of comparable funds, the Board noted that such fees include both advisory and administrative costs. The Board noted that net management fees and total expenses for the fund are higher than the peer group median.
The Board took into account management's discussion of the fund's expenses. The Board also took into account management's discussion with respect to the overall management fee and the fees of the Subadvisor, including the amount of the advisory fee retained by the Advisor after payment of the subadvisory fee, in each case in light of the services rendered for those amounts and the risks undertaken by the Advisor. The Board also noted that the Advisor pays the subadvisory fee. In addition, the Board took into account that management had agreed to implement an overall fee waiver across the complex, including the fund, which is discussed further below. The Board also noted that, in addition, the Advisor is currently waiving fees and/or reimbursing expenses with respect to the fund and that the fund has breakpoints in its contractual management fee schedule that reduces management fees as assets increase. The Board reviewed information provided by the Advisor concerning the investment advisory fee charged by the Advisor or one of its advisory affiliates to other clients (including other funds in the John Hancock Fund Complex) having similar investment mandates, if any. The Board considered any differences between the Advisor's and Subadvisor's services to the fund and the services they provide to other comparable clients or funds. The Board concluded that the advisory fee paid with respect to the fund is reasonable in light of the nature, extent and quality of the services provided to the fund under the Advisory Agreement.
Profitability/indirect benefits. In considering the costs of the services to be provided and the profits to be realized by the Advisor and its affiliates (including the Subadvisor) from the Advisor's relationship with the Trust, the Board:
| | | | | | | | | |
| | | | | (a) | | | reviewed financial information of the Advisor; | |
| | | | | (b) | | | reviewed and considered information presented by the Advisor regarding the net profitability to the Advisor and its affiliates with respect to the fund; | |
| | | | | (c) | | | received and reviewed profitability information with respect to the John Hancock Fund Complex as a whole and with respect to the fund; | |
| | | | | (d) | | | received information with respect to the Advisor's allocation methodologies used in preparing the profitability data and considered that the Advisor hired an independent third-party consultant to provide an analysis of the Advisor's allocation methodologies; | |
| | | | | (e) | | | considered that the John Hancock insurance companies that are affiliates of the Advisor, as shareholders of the Trust directly or through their separate accounts, receive certain tax credits or deductions relating to foreign taxes paid and dividends received by certain funds of the Trust and noted that these tax benefits, which are not available to participants in qualified retirement plans under applicable income tax law, are reflected in the profitability information reviewed by the Board; | |
ANNUAL REPORT | JOHN HANCOCK STRATEGIC INCOME OPPORTUNITIES FUND 65
| | | | | | | | | |
| | | | | (f) | | | considered that the Advisor also provides administrative services to the fund on a cost basis pursuant to an administrative services agreement; | |
| | | | | (g) | | | noted that affiliates of the Advisor provide transfer agency services and distribution services to the fund, and that the fund's distributor also receives Rule 12b-1 payments to support distribution of the fund; | |
| | | | | (h) | | | noted that the fund's Subadvisor is an affiliate of the Advisor; | |
| | | | | (i) | | | noted that the Advisor also derives reputational and other indirect benefits from providing advisory services to the fund; | |
| | | | | (j) | | | noted that the subadvisory fee for the fund is paid by the Advisor; | |
| | | | | (k) | | | considered the Advisor's ongoing costs and expenditures necessary to improve services, meet new regulatory and compliance requirements, and adapt to other challenges impacting the fund industry; and | |
| | | | | (l) | | | considered that the Advisor should be entitled to earn a reasonable level of profits in exchange for the level of services it provides to the fund and the risks that it assumes as Advisor, including entrepreneurial, operational, reputational, litigation and regulatory risk. | |
Based upon its review, the Board concluded that the level of profitability, if any, of the Advisor and its affiliates (including the Subadvisor) from their relationship with the fund was reasonable and not excessive.
Economies of scale. In considering the extent to which economies of scale would be realized as the fund grows and whether fee levels reflect these economies of scale for the benefit of fund shareholders, the Board:
| | | |
| | (a) | considered that the Advisor has contractually agreed to waive a portion of its management fee for certain funds of the John Hancock Fund Complex, including the fund (the participating portfolios) or otherwise reimburse the expenses of the participating portfolios (the reimbursement). This waiver is based upon aggregate net assets of all the participating portfolios. The amount of the reimbursement is calculated daily and allocated among all the participating portfolios in proportion to the daily net assets of each fund; |
| | (b) | reviewed the fund's advisory fee structure and concluded that: (i) the fund's fee structure contains breakpoints at the subadvisory fee level and that such breakpoints are reflected as breakpoints in the advisory fees for the fund; and (ii) although economies of scale cannot be measured with precision, these arrangements permit shareholders of the fund to benefit from economies of scale if the fund grows. The Board also took into account management's discussion of the fund's advisory fee structure; and |
| | (c) | the Board also considered the effect of the fund's growth in size on its performance and fees. The Board also noted that if the fund's assets increase over time, the fund may realize other economies of scale. |
Approval of Subadvisory Agreement
In making its determination with respect to approval of the Subadvisory Agreement, the Board reviewed:
| | | |
| | (1) | information relating to the Subadvisor's business, including current subadvisory services to the Trust (and other funds in the John Hancock Fund Complex); |
| | (2) | the historical and current performance of the fund and comparative performance information relating to an applicable benchmark index and comparable funds; and |
| | (3) | the subadvisory fee for the fund, including any breakpoints, and to the extent available, comparable fee information prepared by an independent third party provider of fund data. |
ANNUAL REPORT | JOHN HANCOCK STRATEGIC INCOME OPPORTUNITIES FUND 66
Nature, extent, and quality of services. With respect to the services provided by the Subadvisor, the Board received information provided to the Board by the Subadvisor, including the Subadvisor's Form ADV, as well as took into account information presented throughout the past year. The Board considered the Subadvisor's current level of staffing and its overall resources, as well as received information relating to the Subadvisor's compensation program. The Board reviewed the Subadvisor's history and investment experience, as well as information regarding the qualifications, background, and responsibilities of the Subadvisor's investment and compliance personnel who provide services to the fund. The Board also considered, among other things, the Subadvisor's compliance program and any disciplinary history. The Board also considered the Subadvisor's risk assessment and monitoring process. The Board reviewed the Subadvisor's regulatory history, including whether it was involved in any regulatory actions or investigations as well as material litigation, and any settlements and amelioratory actions undertaken, as appropriate. The Board noted that the Advisor conducts regular, periodic reviews of the Subadvisor and its operations, including regarding investment processes and organizational and staffing matters. The Board also noted that the Trust's CCO and his staff conduct regular, periodic compliance reviews with the Subadvisor and present reports to the Independent Trustees regarding the same, which includes evaluating the regulatory compliance systems of the Subadvisor and procedures reasonably designed to assure compliance with the federal securities laws. The Board also took into account the financial condition of the Subadvisor.
The Board considered the Subadvisor's investment process and philosophy. The Board took into account that the Subadvisor's responsibilities include the development and maintenance of an investment program for the fund that is consistent with the fund's investment objective, the selection of investment securities and the placement of orders for the purchase and sale of such securities, as well as the implementation of compliance controls related to performance of these services. The Board also received information with respect to the Subadvisor's brokerage policies and practices, including with respect to best execution and soft dollars.
Subadvisor compensation. In considering the cost of services to be provided by the Subadvisor and the profitability to the Subadvisor of its relationship with the fund, the Board noted that the fees under the Subadvisory Agreement are paid by the Advisor and not the fund. The Board also received information and took into account any other potential conflicts of interest the Advisor might have in connection with the Subadvisory Agreement.
In addition, the Board considered other potential indirect benefits that the Subadvisor and its affiliates may receive from the Subadvisor's relationship with the fund, such as the opportunity to provide advisory services to additional funds in the John Hancock Fund Complex and reputational benefits.
Subadvisory fees. The Board considered that the fund pays an advisory fee to the Advisor and that, in turn, the Advisor pays a subadvisory fee to the Subadvisor. As noted above, the Board also considered the fund's subadvisory fees as compared to similarly situated investment companies deemed to be comparable to the fund as included in the report prepared by the independent third party provider of fund data, to the extent available. The Board noted that the limited size of the Lipper peer group was not sufficient for comparative purposes. The Board also took into account the subadvisory fees paid by the Advisor to the Subadvisor with respect to the fund and compared them to fees charged by the Subadvisor to manage other subadvised portfolios and portfolios not subject to regulation under the 1940 Act, as applicable.
Subadvisor performance. As noted above, the Board considered the fund's performance as compared to the fund's peer group median and the benchmark index and noted that the Board reviews information about the fund's performance results at its regularly scheduled meetings. The Board noted the Advisor's expertise and resources in monitoring the performance, investment style and risk-adjusted performance of the Subadvisor. The Board was
ANNUAL REPORT | JOHN HANCOCK STRATEGIC INCOME OPPORTUNITIES FUND 67
mindful of the Advisor's focus on the Subadvisor's performance. The Board also noted the Subadvisor's long-term performance record for similar accounts, as applicable.
The Board's decision to approve the Subadvisory Agreement was based on a number of determinations, including the following:
| | | |
| | (1) | the Subadvisor has extensive experience and demonstrated skills as a manager; |
| | (2) | the performance of the fund is being monitored and reasonably addressed, where appropriate; |
| | (3) | the subadvisory fee is reasonable in relation to the level and quality of services being provided under the Subadvisory Agreement; and |
| | (4) | noted that the subadvisory fees are paid by the Advisor not the fund and that the subadvisory fee breakpoints are reflected as breakpoints in the advisory fees for the fund in order to permit shareholders to benefit from economies of scale if the fund grows. |
| * * * |
Based on the Board's evaluation of all factors that the Board deemed to be material, including those factors described above, the Board, including the Independent Trustees, concluded that renewal of the Advisory Agreement and the Subadvisory Agreement would be in the best interest of the fund and its shareholders. Accordingly, the Board, and the Independent Trustees voting separately, approved the Advisory Agreement and Subadvisory Agreement for an additional one-year period.
ANNUAL REPORT | JOHN HANCOCK STRATEGIC INCOME OPPORTUNITIES FUND 68
STATEMENT REGARDING LIQUIDITY RISK MANAGEMENT
Operation of the Liquidity Risk Management Program
This section describes operation and effectiveness of the Liquidity Risk Management Program (LRMP) established in accordance with Rule 22e-4 under the Investment Company Act of 1940, as amended (the Liquidity Rule). The Board of Trustees (the Board) of each Fund in the John Hancock Group of Funds (each a Fund and collectively, the Funds) that is subject to the requirements of the Liquidity Rule has appointed John Hancock Investment Management LLC and John Hancock Variable Trust Advisers LLC (together, the Advisor) to serve as Administrator of the LRMP with respect to each of the Funds, including Strategic Income Opportunities Fund, subject to the oversight of the Board. In order to provide a mechanism and process to perform the functions necessary to administer the LRMP, the Advisor established the Liquidity Risk Management Committee (the Committee). The Funds' subadvisor, Manulife Investment Management (US) LLC, (the Subadvisor) executes the day-to-day investment management and security-level activities of the Fund in accordance with the requirements of the LRMP, subject to the supervision of the Advisor and the Board.
The Committee holds monthly meetings to: (1) review the day-to-day operations of the LRMP; (2) review and approve month end liquidity classifications; (3) review quarterly testing and determinations, as applicable; and (4) review other LRMP related material. The Committee also conducts daily, monthly, quarterly, and annual quantitative and qualitative assessments of each subadvisor to a Fund that is subject to the requirements of the Liquidity Rule and is a part of the LRMP to monitor investment performance issues, risks and trends. In addition, the Committee may conduct ad-hoc reviews and meetings with subadvisors as issues and trends are identified, including potential liquidity and valuation issues.
The Committee provided the Board at a meeting held on March 15-17, 2020 with a written report which addressed the Committee's assessment of the adequacy and effectiveness of the implementation and operation of the LRMP and any material changes to the LRMP. The report, which covered the period December 1, 2018 through December 31, 2019, included an assessment of important aspects of the LRMP including, but not limited to:
| • | Operation of the Fund's Redemption-In-Kind Procedures; |
| • | Highly Liquid Investment Minimum (HLIM) determination; |
| • | Compliance with the 15% limit on illiquid investments; |
| • | Reasonably Anticipated Trade Size (RATS) determination; |
| • | Security-level liquidity classifications; and |
| • | Liquidity risk assessment. |
The report also covered material liquidity matters which occurred or were reported during this period applicable to the Fund, if any, and the Committee's actions to address such matters.
Redemption-In-Kind Procedures
Rule 22e-4 requires any fund that engages in or reserves the right to engage in in-kind redemptions to adopt and implement written policies and procedures regarding in-kind redemptions as part of the management of its liquidity risk. These procedures address the process for redeeming in kind, as well as the circumstances under which the Fund would consider redeeming in kind. Anticipated large redemption activity will be evaluated to identify situations where redeeming in securities instead of cash may be appropriate.
ANNUAL REPORT | JOHN HANCOCK STRATEGIC INCOME OPPORTUNITIES FUND 69
As part of its annual assessment of the LRMP, the Committee reviewed the implementation and operation of the Redemption-In-Kind Procedures and determined they are operating in a manner that such procedures are adequate and effective to manage in-kind redemptions on behalf of the Fund as part of the LRMP.
Highly Liquid Investment Minimum determination
The Committee uses an HLIM model to determine a Fund's HLIM. This process incorporates the Fund's investment strategy, historical redemptions, liquidity classification rollup percentages and cash balances, redemption policy, access to funding sources, distribution channels and client concentrations. If the Fund falls below its established HLIM for a period greater than 7 consecutive calendar days, the Committee prepares a report to the Board within one business day following the seventh consecutive calendar day with an explanation of how the Fund plans to restore its HLIM within a reasonable period of time.
Based on the HLIM model, the Committee has determined that the Fund qualifies as a Primarily Highly Liquid Fund (PHLF). It is therefore not required to establish a HLIM. The Fund is tested quarterly to confirm its PHLF status.
As part of its annual assessment of the LRMP, the Committee reviewed the policies and procedures in place with respect to HLIM and PHLF determinations, and determined that such policies and procedures are operating in a manner that is adequate and effective as part of the LRMP.
Compliance with the 15% limit on illiquid investments
Rule 22e-4 sets an aggregate illiquid investment limit of 15% for a fund. Funds are prohibited from acquiring an illiquid investment if this results in greater than 15% of its net assets being classified as illiquid. When applying this limit, the Committee defines "illiquid investment" to mean any investment that the Fund reasonably expects cannot be sold or disposed of in current market conditions in seven calendar days or less without the sale or disposition significantly changing the market value of the investment. If a 15% illiquid investment limit breach occurs for longer than 1 business day, the Fund is required to notify the Board and provide a plan on how to bring illiquid investments within the 15% threshold, and after 7 days confidentially notify the Securities and Exchange Commission (the SEC).
In February 2019, as a result of extended security markets closures in connection with the Chinese New Year in certain countries, the SEC released guidance, and the Committee approved and adopted an Extended Market Holiday Policy to plan for and monitor known Extended Market Holidays (defined as all expected market holiday closures spanning four or more calendar days).
As part of its annual assessment of the LRMP, the Committee reviewed the policies and procedures in place with respect to the 15% illiquid investment limit and determined such policies and procedures are operating in a manner that is adequate and effective as part of the LMRP.
Reasonably Anticipated Trade Size determination
In order to assess the liquidity risk of a Fund, the Committee considers the impact on the Fund that redemptions of a RATS would have under both normal and reasonably foreseeable stressed conditions. Modelling the Fund's RATS requires quantifying cash flow volatility and analyzing distribution channel concentration and redemption risk. The model is designed to estimate the amount of assets that the Fund could reasonably anticipate trading on a given day, during both normal and reasonably foreseeable stressed conditions, to satisfy redemption requests.
ANNUAL REPORT | JOHN HANCOCK STRATEGIC INCOME OPPORTUNITIES FUND 70
As part of its annual assessment of the LRMP, the Committee reviewed the policies and procedures in place with respect to RATS determinations and determined that such policies and procedures are operating in a manner that is adequate and effective at making RATS determinations as part of the LRMP.
Security-level liquidity classifications
When classifying the liquidity of portfolio securities, the Fund adheres to the liquidity classification procedures established by the Advisor. In assigning a liquidity classification to Fund portfolio holdings, the following key inputs, among others, are considered: the Fund's RATS, feedback from the applicable Subadvisor on market-, trading- and investment-specific considerations, an assessment of current market conditions and fund portfolio holdings, and a value impact standard. The Subadvisor also provides position-level data to the Committee for use in monthly classification reconciliation in order to identify any classifications that may need to be changed as a result of the above considerations.
As part of its annual assessment of the LRMP, the Committee reviewed the policies and procedures in place with respect to security-level liquidity classifications and determined that such policies and procedures are operating in a manner that is adequate and effective as part of the LRMP.
Liquidity risk assessment
The Committee periodically reviews and assesses, the Fund's liquidity risk, including its investment strategy and liquidity of portfolio investments during both normal and reasonably foreseeable stressed conditions (including whether the investment strategy is appropriate for an open-end fund, the extent to which the strategy involves a relatively concentrated portfolio or large positions in particular issuers, and the use of borrowings for investment purposes and derivatives), cash flow analysis during both normal and reasonably foreseeable stressed conditions, and holdings of cash and cash equivalents, as well as borrowing arrangements and other funding sources.
The Committee also monitors global events, such as the COVID-19 Coronavirus, that could impact the markets and liquidity of portfolio investments and their classifications.
As part of its annual assessment of the LRMP, the Committee reviewed Fund-Level Liquidity Risk Assessment Reports for each of the Funds and determined that the investment strategy for each Fund continues to be appropriate for an open-ended structure.
Adequacy and Effectiveness
Based on the review and assessment conducted by the Committee, the Committee has determined that the LRMP has been implemented, and is operating in a manner that is adequate and effective at assessing and managing the liquidity risk of each Fund.
ANNUAL REPORT | JOHN HANCOCK STRATEGIC INCOME OPPORTUNITIES FUND 71
This chart provides information about the Trustees and Officers who oversee your John Hancock fund. Officers elected by the Trustees manage the day-to-day operations of the fund and execute policies formulated by the Trustees.
Independent Trustees
| | | |
Name, year of birth
Position(s) held with Trust
Principal occupation(s) and other
directorships during past 5 years | Trustee
of the
Trust
since1 | Number of John
Hancock funds
overseen by
Trustee |
| Hassell H. McClellan, Born: 1945 | 2005 | 195 |
Trustee and Chairperson of the Board
Director/Trustee, Virtus Funds (since 2008); Director, The Barnes Group (since 2010); Associate Professor, The Wallace E. Carroll School of Management, Boston College (retired 2013). Trustee (since 2005) and Chairperson of the Board (since 2017) of various trusts within the John Hancock Fund Complex. |
| | | |
| Charles L. Bardelis,2 Born: 1941 | 2005 | 195 |
Trustee
Director, Island Commuter Corp. (marine transport). Trustee of various trusts within the John Hancock Fund Complex (since 1988). |
| | | |
| James R. Boyle, Born: 1959 | 2015 | 195 |
Trustee
Chief Executive Officer, Foresters Financial (since 2018); Chairman and Chief Executive Officer, Zillion Group, Inc. (formerly HealthFleet, Inc.) (healthcare) (2014-2018); Executive Vice President and Chief Executive Officer, U.S. Life Insurance Division of Genworth Financial, Inc. (insurance) (January 2014-July 2014); Senior Executive Vice President, Manulife Financial, President and Chief Executive Officer, John Hancock (1999-2012); Chairman and Director, John Hancock Investment Management LLC, John Hancock Investment Management Distributors LLC, and John Hancock Variable Trust Advisers LLC (2005-2010). Trustee of various trusts within the John Hancock Fund Complex (2005-2014 and since 2015). |
| | | |
| Peter S. Burgess,2 Born: 1942 | 2005 | 195 |
Trustee
Consultant (financial, accounting, and auditing matters) (since 1999); Certified Public Accountant; Partner, Arthur Andersen (independent public accounting firm) (prior to 1999); Director, Lincoln Educational Services Corporation (since 2004); Director, Symetra Financial Corporation (2010-2016); Director, PMA Capital Corporation (2004-2010). Trustee of various trusts within the John Hancock Fund Complex (since 2005). |
| | | |
| William H. Cunningham, Born: 1944 | 2012 | 195 |
Trustee
Professor, University of Texas, Austin, Texas (since 1971); former Chancellor, University of Texas System and former President of the University of Texas, Austin, Texas; Chairman (since 2009) and Director (since 2006), Lincoln National Corporation (insurance); Director, Southwest Airlines (since 2000); former Director, LIN Television (2009-2014). Trustee of various trusts within the John Hancock Fund Complex (since 1986). |
| | | |
| Grace K. Fey, Born: 1946 | 2008 | 195 |
Trustee
Chief Executive Officer, Grace Fey Advisors (since 2007); Director and Executive Vice President, Frontier Capital Management Company (1988-2007); Director, Fiduciary Trust (since 2009). Trustee of various trusts within the John Hancock Fund Complex (since 2008). |
ANNUAL REPORT | JOHN HANCOCK STRATEGIC INCOME OPPORTUNITIES FUND 72
Independent Trustees (continued)
| | | |
Name, year of birth
Position(s) held with Trust
Principal occupation(s) and other
directorships during past 5 years | Trustee
of the
Trust
since1 | Number of John
Hancock funds
overseen by
Trustee |
| Deborah C. Jackson, Born: 1952 | 2012 | 195 |
Trustee
President, Cambridge College, Cambridge, Massachusetts (since 2011); Board of Directors, Massachusetts Women's Forum (since 2018); Board of Directors, National Association of Corporate Directors/New England (since 2015); Board of Directors, Association of Independent Colleges and Universities of Massachusetts (2014-2017); Chief Executive Officer, American Red Cross of Massachusetts Bay (2002-2011); Board of Directors of Eastern Bank Corporation (since 2001); Board of Directors of Eastern Bank Charitable Foundation (since 2001); Board of Directors of American Student Assistance Corporation (1996-2009); Board of Directors of Boston Stock Exchange (2002-2008); Board of Directors of Harvard Pilgrim Healthcare (health benefits company) (2007-2011). Trustee of various trusts within the John Hancock Fund Complex (since 2008). |
| | | |
| James M. Oates,2 Born: 1946 | 2005 | 195 |
Trustee
Managing Director, Wydown Group (financial consulting firm) (since 1994); Chairman and Director, Emerson Investment Management, Inc. (2000-2015); Independent Chairman, Hudson Castle Group, Inc. (formerly IBEX Capital Markets, Inc.) (financial services company) (1997-2011); Director, Stifel Financial (since 1996); Director, Investor Financial Services Corporation (1995-2007); Director, Connecticut River Bancorp (1998-2014); Director/Trustee, Virtus Funds (since 1988). Trustee (since 2004) and Chairperson of the Board (2005-2016) of various trusts within the John Hancock Fund Complex. |
| | | |
| Steven R. Pruchansky, Born: 1944 | 2012 | 195 |
Trustee and Vice Chairperson of the Board
Managing Director, Pru Realty (since 2017); Chairman and Chief Executive Officer, Greenscapes of Southwest Florida, Inc. (2014-2020); Director and President, Greenscapes of Southwest Florida, Inc. (until 2000); Member, Board of Advisors, First American Bank (until 2010); Managing Director, Jon James, LLC (real estate) (since 2000); Partner, Right Funding, LLC (2014-2017); Director, First Signature Bank & Trust Company (until 1991); Director, Mast Realty Trust (until 1994); President, Maxwell Building Corp. (until 1991). Trustee (since 1992), Chairperson of the Board (2011-2012), and Vice Chairperson of the Board (since 2012) of various trusts within the John Hancock Fund Complex. |
| | | |
| Frances G. Rathke,2,* Born: 1960 | 2020 | 195 |
Trustee
Director, Northern New England Energy Corporation (since 2017); Director, Audit Committee Chair and Compensation Committee Member, Green Mountain Power Corporation (since 2016); Director, Treasurer and Finance & Audit Committee Chair, Flynn Center for Performing Arts (since 2016); Director, Audit Committee Chair and Compensation Committee Member, Planet Fitness (since 2016); Director, Citizen Cider, Inc. (high-end hard cider and hard seltzer company) (since 2016); Chief Financial Officer and Treasurer, Keurig Green Mountain, Inc. (2003-retired 2015); Independent Financial Consultant, Frances Rathke Consulting (strategic and financial consulting services) (2001-2003); Chief Financial Officer and Secretary, Ben & Jerry's Homemade, Inc. (1989-2000, including prior positions); Senior Manager, Coopers & Lybrand, LLC (independent public accounting firm) (1982-1989). Trustee of various trusts within the John Hancock Fund Complex (since 2020). |
ANNUAL REPORT | JOHN HANCOCK STRATEGIC INCOME OPPORTUNITIES FUND 73
Independent Trustees (continued)
| | | |
Name, year of birth
Position(s) held with Trust
Principal occupation(s) and other
directorships during past 5 years | Trustee
of the
Trust
since1 | Number of John
Hancock funds
overseen by
Trustee |
| Gregory A. Russo, Born: 1949 | 2012 | 195 |
Trustee
Director and Audit Committee Chairman (2012-2020), and Member, Audit Committee and Finance Committee (2011-2020), NCH Healthcare System, Inc. (holding company for multi-entity healthcare system); Director and Member (2012-2018) and Finance Committee Chairman (2014-2018), The Moorings, Inc. (nonprofit continuing care community); Vice Chairman, Risk & Regulatory Matters, KPMG LLP (KPMG) (2002-2006); Vice Chairman, Industrial Markets, KPMG (1998-2002); Chairman and Treasurer, Westchester County, New York, Chamber of Commerce (1986-1992); Director, Treasurer, and Chairman of Audit and Finance Committees, Putnam Hospital Center (1989-1995); Director and Chairman of Fundraising Campaign, United Way of Westchester and Putnam Counties, New York (1990-1995). Trustee of various trusts within the John Hancock Fund Complex (since 2008). |
Non-Independent Trustees3
| | | |
Name, year of birth
Position(s) held with Trust
Principal occupation(s) and other
directorships during past 5 years | Trustee
of the
Trust
since1 | Number of John
Hancock funds
overseen by
Trustee |
| Andrew G. Arnott, Born: 1971 | 2017 | 195 |
President and Non-Independent Trustee
Head of Wealth and Asset Management, United States and Europe, for John Hancock and Manulife (since 2018); Executive Vice President, John Hancock Financial Services (since 2009, including prior positions); Director and Executive Vice President, John Hancock Investment Management LLC (since 2005, including prior positions); Director and Executive Vice President, John Hancock Variable Trust Advisers LLC (since 2006, including prior positions); President, John Hancock Investment Management Distributors LLC (since 2004, including prior positions); President of various trusts within the John Hancock Fund Complex (since 2007, including prior positions). Trustee of various trusts within the John Hancock Fund Complex (since 2017). |
| | | |
| Marianne Harrison, Born: 1963 | 2018 | 195 |
Non-Independent Trustee
President and CEO, John Hancock (since 2017); President and CEO, Manulife Canadian Division (2013-2017); Member, Board of Directors, CAE Inc. (since 2019); Member, Board of Directors, MA Competitive Partnership Board (since 2018); Member, Board of Directors, American Council of Life Insurers (ACLI) (since 2018); Member, Board of Directors, Communitech, an industry-led innovation center that fosters technology companies in Canada (2017-2019); Member, Board of Directors, Manulife Assurance Canada (2015-2017); Board Member, St. Mary's General Hospital Foundation (2014-2017); Member, Board of Directors, Manulife Bank of Canada (2013-2017); Member, Standing Committee of the Canadian Life & Health Assurance Association (2013-2017); Member, Board of Directors, John Hancock USA, John Hancock Life & Health, John Hancock New York (2012-2013). Trustee of various trusts within the John Hancock Fund Complex (since 2018). |
ANNUAL REPORT | JOHN HANCOCK STRATEGIC INCOME OPPORTUNITIES FUND 74
Principal officers who are not Trustees
| | |
Name, year of birth
Position(s) held with Trust
Principal occupation(s)
during past 5 years | Officer
of the
Trust
since |
| Charles A. Rizzo, Born: 1957 | 2007 |
Chief Financial Officer
Vice President, John Hancock Financial Services (since 2008); Senior Vice President, John Hancock Investment Management LLC and John Hancock Variable Trust Advisers LLC (since 2008); Chief Financial Officer of various trusts within the John Hancock Fund Complex (since 2007). |
| | |
| Salvatore Schiavone, Born: 1965 | 2009 |
Treasurer
Assistant Vice President, John Hancock Financial Services (since 2007); Vice President, John Hancock Investment Management LLC and John Hancock Variable Trust Advisers LLC (since 2007); Treasurer of various trusts within the John Hancock Fund Complex (since 2007, including prior positions). |
| | |
| Christopher (Kit) Sechler, Born: 1973 | 2018 |
Chief Legal Officer and Secretary
Vice President and Deputy Chief Counsel, John Hancock Investments (since 2015); Assistant Vice President and Senior Counsel (2009-2015), John Hancock Investment Management; Chief Legal Officer and Secretary of various trusts within the John Hancock Fund Complex (since 2018); Assistant Secretary of John Hancock Investment Management LLC and John Hancock Variable Trust Advisers LLC (since 2009). |
| | |
| Trevor Swanberg, Born: 1979 | 2020 |
Chief Compliance Officer
Chief Compliance Officer, various trusts within the John Hancock Fund Complex, John Hancock Investment Management LLC, and John Hancock Variable Trust Advisers LLC (since 2020); Deputy Chief Compliance Officer, various trusts within the John Hancock Fund Complex (2018-2020); Deputy Chief Compliance Officer, John Hancock Investment Management LLC and John Hancock Variable Trust Advisers LLC (2019-2020); Assistant Chief Compliance Officer, various trusts within the John Hancock Fund Complex (2016-2018); Assistant Chief Compliance Officer, John Hancock Investment Management LLC and John Hancock Variable Trust Advisers LLC (2016-2019); Vice President, State Street Global Advisors (2015-2016). |
The business address for all Trustees and Officers is 200 Berkeley Street, Boston, Massachusetts 02116-5023.
The Statement of Additional Information of the fund includes additional information about members of the Board of Trustees of the Trust and is available without charge, upon request, by calling 800-225-5291.
| | |
| 1 | Each Trustee holds office until his or her successor is elected and qualified, or until the Trustee's death, retirement, resignation, or removal. Mr. Boyle has served as Trustee at various times prior to the date listed in the table. |
| 2 | Member of the Audit Committee. |
| 3 | The Trustee is a Non-Independent Trustee due to current or former positions with the Advisor and certain affiliates. |
| * | Appointed as Independent Trustee effective as of September 15, 2020. |
ANNUAL REPORT | JOHN HANCOCK STRATEGIC INCOME OPPORTUNITIES FUND 75
| | |
Trustees
Hassell H. McClellan, Chairperson
Steven R. Pruchansky, Vice Chairperson
Andrew G. Arnott†
Charles L. Bardelis*
James R. Boyle
Peter S. Burgess*
William H. Cunningham
Grace K. Fey
Marianne Harrison†
Deborah C. Jackson
James M. Oates*
Frances G. Rathke*,1
Gregory A. Russo
Officers
Andrew G. Arnott
President
Charles A. Rizzo
Chief Financial Officer
Salvatore Schiavone
Treasurer
Christopher (Kit) Sechler
Secretary and Chief Legal Officer
Trevor Swanberg2
Chief Compliance Officer
| Investment advisor
John Hancock Investment Management LLC
Subadvisor
Manulife Investment Management (US) LLC
Portfolio Managers
Christopher M. Chapman, CFA
Thomas C. Goggins
Daniel S. Janis III
Kisoo Park
Principal distributor
John Hancock Investment Management Distributors LLC
Custodian
State Street Bank and Trust Company
Transfer agent
John Hancock Signature Services, Inc.
Legal counsel
K&L Gates LLP
Independent registered public accounting firm
PricewaterhouseCoopers LLP
|
* Member of the Audit Committee
† Non-Independent Trustee
1 Appointed as Independent Trustee effective as of September 15, 2020
2 Effective July 31, 2020
The fund's proxy voting policies and procedures, as well as the fund proxy voting record for the most recent twelve-month period ended June 30, are available free of charge on the Securities and Exchange Commission (SEC) website at sec.gov or on our website.
All of the fund's holdings as of the end of the third month of every fiscal quarter are filed with the SEC on Form N-PORT within 60 days of the end of the fiscal quarter. The fund's Form N-PORT filings are available on our website and the SEC's website, sec.gov.
We make this information on your fund, as well as monthly portfolio holdings, and other fund details available on our website at jhinvestments.com or by calling 800-225-5291.
| | | | |
| | You can also contact us: |
| | 800-225-5291
jhinvestments.com | Regular mail:
John Hancock Signature Services, Inc.
PO Box 219909
Kansas City, MO 64121-9909
| Express mail:
John Hancock Signature Services, Inc.
430 W 7th Street
Suite 219909
Kansas City, MO 64105-1407
|
ANNUAL REPORT | JOHN HANCOCK STRATEGIC INCOME OPPORTUNITIES FUND 76
John Hancock family of funds
| | | |
DOMESTIC EQUITY FUNDS
Blue Chip Growth
Classic Value
Disciplined Value
Disciplined Value Mid Cap
Equity Income
Financial Industries
Fundamental All Cap Core
Fundamental Large Cap Core
New Opportunities
Regional Bank
Small Cap Core
Small Cap Growth
Small Cap Value
U.S. Global Leaders Growth
U.S. Quality Growth
GLOBAL AND INTERNATIONAL EQUITY FUNDS
Disciplined Value International
Emerging Markets
Emerging Markets Equity
Fundamental Global Franchise
Global Equity
Global Shareholder Yield
Global Thematic Opportunities
International Dynamic Growth
International Growth
International Small Company
| | INCOME FUNDS
Bond
California Tax-Free Income
Emerging Markets Debt
Floating Rate Income
Government Income
High Yield
High Yield Municipal Bond
Income
Investment Grade Bond
Money Market
Short Duration Bond
Short Duration Credit Opportunities
Strategic Income Opportunities
Tax-Free Bond
ALTERNATIVE AND SPECIALTY FUNDS
Absolute Return Currency
Alternative Asset Allocation
Alternative Risk Premia
Diversified Macro
Infrastructure
Multi-Asset Absolute Return
Seaport Long/Short
|
A fund's investment objectives, risks, charges, and expenses should be considered carefully before investing. The prospectus contains this and other important information about the fund. To obtain a prospectus, contact your financial professional, call John Hancock Investment Management at 800-225-5291, or visit our website at jhinvestments.com. Please read the prospectus carefully before investing or sending money.
| | | |
ASSET ALLOCATION
Balanced
Multi-Asset High Income
Multi-Index Lifetime Portfolios
Multi-Index Preservation Portfolios
Multimanager Lifestyle Portfolios
Multimanager Lifetime Portfolios
Retirement Income 2040
EXCHANGE-TRADED FUNDS
John Hancock Multifactor Consumer Discretionary ETF
John Hancock Multifactor Consumer Staples ETF
John Hancock Multifactor Developed International ETF
John Hancock Multifactor Emerging Markets ETF
John Hancock Multifactor Energy ETF
John Hancock Multifactor Financials ETF
John Hancock Multifactor Healthcare ETF
John Hancock Multifactor Industrials ETF
John Hancock Multifactor Large Cap ETF
John Hancock Multifactor Materials ETF
John Hancock Multifactor Media and
Communications ETF
John Hancock Multifactor Mid Cap ETF
John Hancock Multifactor Small Cap ETF
John Hancock Multifactor Technology ETF
John Hancock Multifactor Utilities ETF
| | ENVIRONMENTAL, SOCIAL, AND
GOVERNANCE FUNDS
ESG All Cap Core
ESG Core Bond
ESG International Equity
ESG Large Cap Core
CLOSED-END FUNDS
Financial Opportunities
Hedged Equity & Income
Income Securities Trust
Investors Trust
Preferred Income
Preferred Income II
Preferred Income III
Premium Dividend
Tax-Advantaged Dividend Income
Tax-Advantaged Global Shareholder Yield
|
John Hancock Multifactor ETF shares are bought and sold at market price (not NAV), and are not individually redeemed
from the fund. Brokerage commissions will reduce returns.
John Hancock ETFs are distributed by Foreside Fund Services, LLC, and are subadvised by Dimensional Fund Advisors LP.
Foreside is not affiliated with John Hancock Investment Management Distributors LLC or Dimensional Fund Advisors LP.
Dimensional Fund Advisors LP receives compensation from John Hancock in connection with licensing rights to the
John Hancock Dimensional indexes. Dimensional Fund Advisors LP does not sponsor, endorse, or sell, and makes no
representation as to the advisability of investing in, John Hancock Multifactor ETFs.
John Hancock Investment Management
A trusted brand
John Hancock Investment Management is a premier asset manager
with a heritage of financial stewardship dating back to 1862. Helping
our shareholders pursue their financial goals is at the core of
everything we do. It's why we support the role of professional financial
advice and operate with the highest standards of conduct and integrity.
A better way to invest
We serve investors globally through a unique multimanager approach:
We search the world to find proven portfolio teams with specialized
expertise for every strategy we offer, then we apply robust investment
oversight to ensure they continue to meet our uncompromising
standards and serve the best interests of our shareholders.
Results for investors
Our unique approach to asset management enables us to provide
a diverse set of investments backed by some of the world's best
managers, along with strong risk-adjusted returns across asset classes.
John Hancock Investment Management Distributors LLC n Member FINRA, SIPC
200 Berkeley Street n Boston, MA 02116-5010 n 800-225-5291 n jhinvestments.com
This report is for the information of the shareholders of John Hancock Strategic Income Opportunities Fund. It is not authorized for distribution to prospective investors unless preceded or accompanied by a prospectus.

John Hancock Funds II
Annual report — table of contents
Manager’s commentary and fund performance (See below for each fund’s page #) | | 3 |
Shareholder expense example | | 20 |
Portfolio of investments (See below for each fund’s page #) | | 22 |
Statements of assets and liabilities | | 104 |
Statements of operations | | 108 |
Statements of changes in net assets | | 112 |
Notes to financial statements | | 119 |
Report of independent registered public accounting firm | | 144 |
Federal tax information | | 145 |
Evaluation of advisory and subadvisory agreements by the Board of Trustees | | 146 |
Statement regarding liquidity risk management | | 155 |
Trustees and officers information | | 157 |
Fund
| | | | Manager’s commentary and
fund performance | | Portfolio of
investments |
|---|
Capital Appreciation Fund | | | | | 4 | | | | 22 | |
Capital Appreciation Value Fund | | | | | 5 | | | | 23 | |
| | | | | 6 | | | | 29 | |
International Strategic Equity Allocation Fund | | | | | 7 | | | | 32 | |
| | | | | 8 | | | | 48 | |
| | | | | 9 | | | | 50 | |
| | | | | 10 | | | | 51 | |
Multi-Index Lifestyle Aggressive Portfolio | | | | | 11 | | | | 53 | |
Multi-Index Lifestyle Balanced Portfolio | | | | | 12 | | | | 54 | |
Multi-Index Lifestyle Conservative Portfolio | | | | | 13 | | | | 54 | |
Multi-Index Lifestyle Growth Portfolio | | | | | 14 | | | | 55 | |
Multi-Index Lifestyle Moderate Portfolio | | | | | 15 | | | | 56 | |
Real Estate Securities Fund | | | | | 16 | | | | 56 | |
Science & Technology Fund | | | | | 17 | | | | 57 | |
Strategic Equity Allocation Fund | | | | | 18 | | | | 58 | |
U.S. Sector Rotation Fund
(formerly U.S. Strategic Equity Allocation) | | | | | 19 | | | | 96 | |
2
John Hancock Funds II
Manager’s commentary and fund performance
Fund performance
In the following pages we have set forth information regarding the performance of certain funds of John Hancock Funds II (the Trust). There are several ways to evaluate a fund’s historical performance. One can look at the total percentage change in value, the average annual percentage change, or the growth of a hypothetical $10,000 investment. With respect to all performance information presented, it is important to understand that past performance does not guarantee future results. Return and principal fluctuate, and shares, when redeemed, may be worth more or less than their original cost.
Performance tables
The performance tables show two types of total return information: cumulative and average annual total returns. A cumulative total return is an expression of a fund’s total change in share value in percentage terms over a set period of time—one, five, and ten years (or since the fund’s inception if less than the applicable period). An average annual total return takes the fund’s cumulative total return for a time period greater than one year and shows what would have happened if the fund had performed at a constant rate each year. The tables show all cumulative and average annual total returns, net of fees and expenses of the Trust, but do not reflect the expenses of any insurance company separate accounts (including a possible contingent deferred sales charge) that may invest in the funds, as applicable. If these were included, performance would be lower.
Graph—Change in value of $10,000 investment and comparative indexes
The performance graph for each fund (or portfolio), shows the change in value of a $10,000 investment over the life or ten-year period of each fund (or portfolio) whichever is shorter. Each fund’s (or portfolio’s) performance is compared with the performance of one or more broad-based securities indexes as a “benchmark.” All performance information includes the reinvestment of dividends and capital gain distributions, as well as the deduction of ongoing management fees and fund (or portfolio) operating expenses. The benchmarks used for comparison are unmanaged and include reinvestment of dividends and capital gains distributions, if any, but do not reflect any fees or expenses. Funds (or portfolios), that invest in multiple asset classes are compared with a customized benchmark. This benchmark comprises a set percentage allocation from each of the asset classes in which the fund invests.
Portfolio manager’s commentary
Finally, we have provided a commentary by each portfolio manager regarding each fund’s (or portfolio’s) performance during the period ended August 31, 2020. The views expressed are those of the portfolio managers as of August 31, 2020, and are subject to change based on market and other conditions. Information about a fund’s (or portfolio’s) holdings, asset allocation, or country diversification is historical and is no indication of future fund composition, which will vary. Information provided in this report should not be considered a recommendation to purchase or sell securities. The funds (or portfolios) are not insured by the Federal Deposit Insurance Corp., are not deposits or other obligations of, or guaranteed by, banks, and are subject to investment risks, including loss of principal amount invested. For a more detailed discussion of the risks associated with the funds (or portfolios), see the funds’ prospectuses.
Standard & Poor’s, Standard & Poor’s 500, “S&P 500,” and “S&P MidCap 400 Index” are trademarks of S&P Global, Inc. “Russell 1000,” “Russell 2000,” “Russell 3000,” and “Russell Midcap” are trademarks of Frank Russell Company. “EAFE” and “MSCI” are trademarks of MSCI, Inc. “Bloomberg Barclays” is a registered trademark of Bloomberg LP. “Lipper” is a registered trademark of Reuters S.A. None of the funds in the Trust is sponsored, endorsed, managed, advised, sold, or promoted by any of these companies, and none of these companies makes any representation regarding the advisability of investing in the Trust.
3
Capital Appreciation Fund
Subadvisor: Jennison Associates LLC
Portfolio Managers: Blair A. Boyer, Michael A. Del Balso, Rebecca Irwin, Natasha Kuhlkin, CFA, Kathleen A. McCarragher, Spiros “Sig” Segalas
INVESTMENT OBJECTIVE & POLICIES > The fund seeks long-term growth of capital. Under normal market conditions, the fund invests at least 65% of the fund’s total assets in equity and equity-related securities of companies that, at the time of investment, exceed $1 billion in market capitalization and that the subadvisor believes to have above-average growth prospects.
CHANGE IN VALUE OF $10,000 INVESTMENT AND COMPARATIVE INDEX
| Sector Composition* | | | | % of Total |
|---|
| | | | | 43.1 | |
| | | | | 24.9 | |
| | | | | 14.9 | |
| | | | | 7.5 | |
| | | | | 2.5 | |
| | | | | 2.3 | |
| | | | | 2.1 | |
| | | | | 0.5 | |
| | | | | 2.2 | |
* As a percentage of total investments.
PORTFOLIO MANAGERS’ COMMENTARY
Performance > For the year ended August 31, 2020, the Capital Appreciation Fund Class NAV shares returned 63.0% and the Russell 1000 Growth Index returned 44.34%.
Environment > Markets were extremely volatile in the period, unsettled by U.S.-China trade discord and the spread of the coronavirus. Stocks peaked at new highs, then dropped dramatically as the viral outbreak spread around the globe, disrupting markets and life everywhere. Markets rebounded rapidly in the period’s final months, but the pandemic’s economic damage continued to accumulate.
Holdings in consumer discretionary, information technology, and communication services — the fund’s three biggest sectors — were strong contributors to outperformance as both stock selection and overweights relative to the benchmark were beneficial.
In consumer discretionary, Tesla, Inc. surged on impressive financial results made possible by solid production, increased capacity, and strong execution. Amazon.com, Inc. continues to benefit from economies of scale and its platform-based business model. Its web services business is an additional driver of revenue and profit. Amazon’s secular growth profile looks even stronger in the current environment, as social-distancing and shelter-in-place directives are drawing renewed attention to the value, utility, and resilience of e-commerce and cloud-computing business models.
In information technology, recognition of the importance of digital commerce in times of restricted personal mobility benefited Shopify, Inc., (not held in the benchmark) which provides cloud-based infrastructure tools that enable omni-channel ecommerce. With its huge installed base, Apple, Inc. has been benefiting from rapid growth in service business subscriptions. Favorable prospects for upcoming product cycles also boosted the stock. With people around the world working from home, the advantage of housing mission-critical software applications and services on the cloud is now uncontestable. In addition to a strong and stable enterprise business, Microsoft Corp. has a differentiated hybrid cloud strategy that is leading to an increase in its share of technology capital spending. Adobe, Inc. offers content creation and digital marketing applications and services that are transforming businesses operations. The increased demand for cloud storage has led to robust data center spending by chipmaker NVIDIA Corp.’s largest customers.
In communication services, Netflix, Inc. continues to enhance its long-term competitive position with the industry’s largest commitment of investment dollars in exclusive and original content.
In industrials, the position in The Boeing Company detracted from performance and was eliminated, as the 737 jet recertification process took longer than anticipated and COVID-19-restricted air travel compromised the financial health of airlines. Positions in commercial aircraft manufacturers Airbus SE and Safran SA were closed, as well.
| | | | | | | | | | | | |
|---|
PERFORMANCE TABLE1,2
|
|
|
| Average Annual Total Return
|
| Cumulative Total Return
|
|
|---|
Periods Ending August 31, 2020 | | | | | 1-year | | | | 5-year | | | | 10-year | | | | 5-year | | | | 10-year | |
Capital Appreciation Fund Class 1 | | | | | 62.93 | | | | 22.42 | | | | 20.17 | | | | 175.01 | | | | 527.96 | |
Capital Appreciation Fund Class NAV | | | | | 63.00 | | | | 22.49 | | | | 20.23 | | | | 175.71 | | | | 530.98 | |
Russell 1000 Growth Index3,4 | | | | | 44.34 | | | | 20.66 | | | | 19.02 | | | | 155.74 | | | | 470.34 | |
| 1 | | Performance does not reflect the deduction of taxes on fund distributions or redemptions of fund shares. Past performance does not guarantee future results. |
| 2 | | Since inception, a portion of the Capital Appreciation Fund expenses was reimbursed. If such expenses had not been reimbursed, returns would be lower. |
| 3 | | The Russell 1000 Growth Index is an unmanaged index composed of the Russell 1000 Index securities that have a greater-than-average growth orientation. |
| 4 | | It is not possible to invest directly in an index. Index figures do not reflect expenses or sales charges, which would result in lower returns. |
The expense ratios of the fund, both net (including any fee waivers or expense limitations) and gross (excluding any fee waivers or expense limitations), are set forth according to the most recent publicly available prospectuses for the fund and may differ from the expense ratios disclosed in the financial highlights tables in this report. For Class 1 and Class NAV shares the gross expenses are 0.79% and 0.74%, respectively, and the net expenses are 0.78% and 0.73%, respectively. Net expenses reflect contractual expense limitations in effect until July 31, 2022 and are subject to change. Had the contractual fee waivers and expense limitations not been in place, gross expenses would apply.
4
Capital Appreciation Value Fund
Subadvisor: T. Rowe Price Associates, Inc.
Portfolio Manager: David R. Giroux, MD, CFA
INVESTMENT OBJECTIVE & POLICIES > The fund seeks long-term capital appreciation. Common stocks typically constitute at least 50% of the fund’s total assets. The remaining assets are generally invested in other securities, including convertible securities, corporate and government debt, bank loans, foreign securities, futures, and options.
CHANGE IN VALUE OF $10,000 INVESTMENT AND COMPARATIVE INDEX
| Portfolio Composition* | | | | % of Total |
|---|
| | | | | 67.6 | |
| | | | | 10.4 | |
| | | | | 9.9 | |
| | | | | 3.2 | |
Short-term investments and other | | | | | 8.9 | |
* As a percentage of net assets.
PORTFOLIO MANAGER’S COMMENTARY
Performance > For the year ended August 31, 2020, the Capital Appreciation Value Fund Class NAV shares returned 13.38% and the S&P 500 Index returned 21.94%.
Environment > Overall, U.S. stocks posted positive returns for the 12-month period ended August 31, 2020. Shares overcame historic volatility in early 2020, which was spurred by the economic fallout of the coronavirus pandemic.
In late 2019, markets were periodically volatile as investors vacillated between optimism from generally positive economic data and corporate earnings and worries about slowing global growth, geopolitical discord, and tense trade negotiations between the U.S. and China. As 2019 closed, markets soared in response to a phase one trade deal between the U.S. and China. However, as the novel coronavirus spread worldwide and became a pandemic, markets experienced an acute, broad-based sell-off in February and March amid fears that panic, extreme government and individual containment measures, and more limited travel would grind economies to a halt and lead to a global recession. Despite intermittent volatility, equities staged a roaring comeback over the remainder of the period, as extraordinary monetary and fiscal stimulus measures and positive news regarding nascent treatment and vaccine development helped swing market sentiment back to positive territory.
In this environment, the S&P 500 Index posted positive returns. Sector returns diverged over the year, with information technology and consumer discretionary leading the way. The energy sector performed worst, delivering double-digit negative returns.
From an asset class perspective, the fund’s underlying equity holdings delivered a positive return but underperformed the S&P 500 Index. The fund’s bond holdings posted positive gains but slightly lagged the Bloomberg Barclays U.S. Aggregate Bond Index.
Among equities, the information technology sector was the top detractor from relative performance due to stock selection decisions. Shares of Fiserv, Inc. underperformed, as the IT services industry was among the laggards in the sector, trailing spaces such as hardware and software, which investors believe will see a less severe fallout from the pandemic-driven pullback in demand. We continue to like Fiserv for its strong track record of effectively managing mergers and acquisitions to drive growth and revenue and cost synergies. We believe the company is positioned to successfully weather this challenging period and deliver value over the long term. An overweight allocation to the utilities sector, which posted negative absolute returns, also weighed on relative results.
The financials sector was the greatest contributor to relative performance due to stock selection and a favorable average underweight allocation. In the first quarter of 2020, shares of global insurance brokerage firm Marsh & McLennan Companies, Inc. slid alongside the broader sector but held up better than peers. Returns were shielded in part by strong performance in January, when the company forecast a significant increase in operating cost savings in connection to merger synergies from its acquisition of British insurance broker Jardine Lloyd Thompson. We continue to like Marsh & McLennan for its solid management team and defensive earnings growth profile. Relative returns were also bolstered by an underweight allocation to the energy sector, which was hard hit by an oil price war and extreme supply and demand imbalances over the period.
| | | | | | | | | | | | | | | | |
|---|
PERFORMANCE TABLE1,2
|
|
|
| Average Annual Total Return
|
| Cumulative Total Return
|
|
|---|
Periods Ending August 31, 2020 | | | | | 1-year | | | | 5-year | | | | 10-year | | | | Since
Inception | | | | 5-year | | | | 10-year | | | | Since
Inception | |
Capital Appreciation Value Fund Class NAV (began 1/6/11) | | | | | 13.38 | | | | 11.45 | | | | — | | | | 11.33 | | | | 71.93 | | | | — | | | | 181.67 | |
| | | | | 21.94 | | | | 14.46 | | | | — | | | | 13.35 | | | | 96.47 | | | | — | | | | 235.06 | |
| | | | | 16.20 | | | | 10.61 | | | | — | | | | 9.76 | | | | 65.59 | | | | — | | | | 145.71 | |
| 1 | | Performance does not reflect the deduction of taxes on fund distributions or redemptions of fund shares. Past performance does not guarantee future results. |
| 2 | | Since inception, a portion of the Capital Appreciation Value Fund expenses was reimbursed. If such expenses had not been reimbursed, returns would be lower. |
| 3 | | The S&P 500 Index is an unmanaged index that includes 500 widely traded common stocks. |
| 4 | | It is not possible to invest directly in an index. Index figures do not reflect expenses or sales charges, which would result in lower returns. |
| 5 | | The Blended Index is 60% S&P 500 Index and 40% Bloomberg Barclays U.S. Aggregate Bond Index. |
The expense ratios of the fund, both net (including any fee waivers or expense limitations) and gross (excluding any fee waivers or expense limitations), are set forth according to the most recent publicly available prospectus for the fund and may differ from the expense ratios disclosed in the financial highlights tables in this report. For Class NAV shares, the gross expense is 0.85% and the net expense is 0.84%. Net expenses reflect contractual expense limitations in effect until July 31, 2022 and are subject to change. Had the contractual fee waivers and expense limitations not been in place, gross expenses would apply.
5
Health Sciences Fund
Subadvisor: T. Rowe Price Associates, Inc.
Portfolio Manager: Ziad Bakri, CFA, MD
INVESTMENT OBJECTIVE & POLICIES > The fund seeks long-term capital appreciation. Under normal market conditions, the fund invests at least 80% of its net assets (plus any borrowings for investment purposes) in common stocks of companies engaged, at the time of investment, in the research, development, production, or distribution of products or services related to healthcare, medicine, or the life sciences.
CHANGE IN VALUE OF $10,000 INVESTMENT AND COMPARATIVE INDEXES
| Industry Composition* | | | | % of Total |
|---|
| | | | | 34.8 | |
Health care equipment and supplies | | | | | 21.7 | |
| | | | | 16.2 | |
Health care providers and services | | | | | 14.8 | |
Life sciences tools and services | | | | | 9.0 | |
| | | | | 1.6 | |
| | | | | 0.3 | |
| | | | | 0.2 | |
| | | | | 0.2 | |
| | | | | 0.1 | |
Diversified financial services | | | | | 0.1 | |
Short-term investments and other | | | | | 1.0 | |
* As a percentage of net assets.
PORTFOLIO MANAGERS’ COMMENTARY
Performance > For the year ended August 31, 2020, the Health Sciences Fund Class NAV shares returned 28.39% and the Lipper Health/Biotechnology Index returned 31.57%.
Environment > Equity markets endured a tumultuous 12-month period through August 31, 2020. Following a steep coronavirus-related sell-off in the first quarter of the year, many of the U.S stock market indexes rebounded to new highs, led by outstanding gains in the tech-heavy Nasdaq Composite Index. Within the Lipper Health/Biotechnology Funds Index, every subsector recorded strong gains. The leading subsectors, life sciences and biotechnology, returned 42% and 35%, respectively, while the laggards, products and devices and services, advanced 24% and 29%, respectively. While gains of this magnitude may be unsustainable, our long-term outlook for the health care sector remains positive as fundamentals for the sector continue to improve on the back of accelerating innovation, new technology platforms, a favorable funding environment, and relative leniency from regulators.
The biotechnology subsector was the largest detractor from relative performance as both stock selection and an underweight allocation hurt relative results. Within the subsector, our position in Sage Therapeutics, Inc., which declined sharply during the period, was the largest detractor. Underweight allocations to Immunomedics, Inc. and Principia Biopharma, Inc.; (this was sold prior to year end) — both more than doubled during the year — also hurt relative returns.
The pharmaceuticals subsector was another area of relative weakness due to stock selection and an overweight allocation. An overweight position in Merck, which trailed the broader pharma segment, was a significant drag on relative returns. Positions in Amarin Corp. PLC and Tricida, Inc. also detracted from relative results as their shares struggled through the year. We appreciate the defensive nature of pharmaceutical investments and believe valuations among large-cap pharmaceuticals are not demanding.
Strong stock selection coupled with an overweight allocation to the life sciences subsector contributed to relative returns. Quidel Corp., a manufacturer of diagnostics products, was the top contributor in the group. The company’s shares rallied after it received an emergency use authorization from the U.S. Food & Drug Administration to use and market its coronavirus diagnostics test, which detects current infection. We also benefited from positions in Sartorius AG, a European biologics company, and Thermo Fisher Scientific, Inc., a U.S.-based life sciences tools company. We have seen an increase in merger and acquisition activity among life sciences companies as leading players in the health care space have looked to increase scale and expand into new verticals.
| | | | | | | | | | | | | | | | |
|---|
PERFORMANCE TABLE1,2
|
|
|
| Average Annual Total Return
|
| Cumulative Total Return
|
|
|---|
Periods Ending August 31, 2020 | | | | | 1-year | | | | 5-year | | | | 10-year | | | | Since
Inception | | | | 5-year | | | | 10-year | | | | Since
Inception | |
Health Sciences Fund Class NAV (began 9/30/11) | | | | | 28.39 | | | | 10.01 | | | | — | | | | 20.16 | | | | 61.12 | | | | — | | | | 414.90 | |
| | | | | 21.94 | | | | 14.46 | | | | — | | | | 15.55 | | | | 96.47 | | | | — | | | | 263.20 | |
Lipper Health/Biotechnology Index4,5 | | | | | 31.57 | | | | 10.18 | | | | — | | | | 19.01 | | | | 62.35 | | | | — | | | | 372.62 | |
| 1 | | Performance does not reflect the deduction of taxes on fund distributions or redemptions of fund shares. Past performance does not guarantee future results. |
| 2 | | Since inception, a portion of the Health Sciences Fund expenses was reimbursed. If such expenses were not reimbursed, returns would be lower. |
| 3 | | The S&P 500 Index is an unmanaged index that includes 500 widely traded stocks. |
| 4 | | It is not possible to invest directly in an index. Index figures do not reflect expenses or sales charges, which would result in lower returns. |
| 5 | | The Lipper Health/Biotechnology Index measures the performance of health and biotech funds. |
The expense ratios of the fund, both net (including any fee waivers or expense limitations) and gross (excluding any fee waivers or expense limitations), are set forth according to the most recent publicly available prospectus for the fund and may differ from the expense ratios disclosed in the financial highlights tables in this report. For Class NAV shares, the gross expense is 1.11% and the net expense is 1.10%. Net expenses reflect contractual expense limitations in effect until July 31, 2022 and are subject to change. Had the contractual fee waivers and expense limitations not been in place, gross expenses would apply.
6
International Strategic Equity Allocation Fund
Subadvisor: Manulife Investment Management (US) LLC
Portfolio Manager: Nathan W. Thooft, CFA, Matthew Murphy, CFA
INVESTMENT OBJECTIVE & POLICIES > The fund seeks capital appreciation. The fund seeks to achieve its investment objective by investing under normal market conditions at least 80% of its net assets (plus any borrowings for investment purposes) in equity securities of any market capitalization, including futures on indexes of equity securities. The fund invests primarily in foreign securities.
CHANGE IN VALUE OF $10,000 INVESTMENT AND COMPARATIVE INDEX
| Sector Composition* | | | | % of Total |
|---|
| | | | | 20.3 | |
| | | | | 13.0 | |
| | | | | 11.5 | |
| | | | | 10.8 | |
| | | | | 10.5 | |
| | | | | 9.3 | |
| | | | | 7.3 | |
| | | | | 6.7 | |
| | | | | 3.6 | |
| | | | | 3.2 | |
| | | | | 2.6 | |
Short-term investments and other | | | | | 1.2 | |
* As a percentage of net assets.
PORTFOLIO MANAGER’S COMMENTARY
Performance > For the year ended August 31, 2020, the International Strategic Equity Allocation Fund Class NAV shares returned 8.98% and the MSCI AC World ex-U.S.A. Index returned 8.31%.
Environment > U.S. equities posted gains over the period despite significant volatility triggered by the global spread of COVID-19. The virus proved to be highly infectious and, by the end of March, had become a global pandemic. The social distancing required to combat the pandemic led to widespread work stoppages. Unemployment soared to levels not seen since the Great Depression and the widely followed S&P 500 Index entered “bear-market” territory in March, less than a month after reaching an all-time high.
Foreign stocks in developed markets reacted similarly to their U.S. counterparts, with a steep first-quarter decline followed by an impressive recovery. Developed markets derived much less benefit from the strength of the Information Technology sector, and lagged the U.S. market. As of August 31, 2020, Information Technology sector had the largest weighting among the 11 sectors in the S&P 500 Index, and posted a relatively strong return over the period. The MSCI EAFE Index had only single-digit exposure to the Information Technology sector, and posted a much more modest return in the sector. Emerging markets equities finished stronger than those of international developed markets, but still lagged the S&P 500 Index.
In the bond market, Treasury yields were fairly stable through the end of 2019, but plunged in the first quarter of 2020, as it quickly became apparent that the U.S. economy was entering a recession. This ended the longest period of U.S. economic expansion on record. Over the period, longer-dated Treasuries strongly outperformed. Corporate debt performed relatively well, except in the first quarter, when widespread shutdowns fueled concerns about revenue and earnings.
From an asset allocation perspective, positions in certain developed markets, including an underweight position in the U.K. and an overweight position in Germany contributed to returns, as did certain emerging markets positions, including an underweight in Brazil. Conversely, underweight positions in China and Canada, as well as an overweight position in France, detracted from returns.
| | | | | | | | | | | | | | | | |
|---|
PERFORMANCE TABLE1,2
|
|
|
| Average Annual Total Return
|
| Cumulative Total Return
|
|
|---|
Periods Ending August 31, 2020 | | | | | 1-year | | | | 5-year | | | | 10-year | | | | Since
Inception | | | | 5-year | | | | 10-year | | | | Since
Inception | |
International Strategic Equity Allocation Fund Class NAV (began 10/17/16) | | | | | 8.98 | | | | — | | | | — | | | | 6.15 | | | | — | | | | — | | | | 26.00 | |
MSCI AC World ex-U.S.A. Index3,4 | | | | | 8.31 | | | | — | | | | — | | | | 6.83 | | | | — | | | | — | | | | 29.16 | |
| 1 | | Performance does not reflect the deduction of taxes on fund distributions or redemptions of fund shares. Past performance does not guarantee future results. |
| 2 | | Since inception, a portion of the International Strategic Equity Allocation Fund expenses was reimbursed. If such expenses had not been reimbursed, returns would be lower. |
| 3 | | The MSCI AC World ex-U.S.A. Index is a free-float adjusted market capitalization weighted index designed to measure the equity market performance of developed markets and emerging markets, excluding the United States. |
| 4 | | It is not possible to invest directly in an index. Index figures do not reflect expenses or sales charges, which would result in lower returns. |
The expense ratios of the fund, both net (including any fee waivers or expense limitations) and gross (excluding any fee waivers or expense limitations), are set forth according to the most recent publicly available prospectus for the fund and may differ from the expense ratios disclosed in the financial highlights tables in this report. For Class NAV shares, the gross expense is 0.71% and the net expense is 0.70%. Net expenses reflect contractual expense limitations in effect until July 31, 2022 and are subject to change. Had the contractual fee waivers and expense limitations not been in place, gross expenses would apply.
7
International Value Fund
Subadvisor: Boston Partners Global Investors, Inc. Prior to February 12, 2020, Templeton Investment Counsel, LLC served as the fund’s subadvisor.
Portfolio Managers: Joseph F. Feeney, Jr. CFA, Christopher K. Hart, CFA, Joshua M. Jones, CFA, Joshua White, CFA
INVESTMENT OBJECTIVE & POLICIES > The fund seeks long-term growth of capital. Under normal market conditions, the fund invests primarily in equity securities of companies located outside the U.S., including emerging markets.
CHANGE IN VALUE OF $10,000 INVESTMENT AND COMPARATIVE INDEX
| Sector Composition* | | | | % of Total |
|---|
| | | | | 20.1 | |
| | | | | 15.4 | |
| | | | | 11.8 | |
| | | | | 10.5 | |
| | | | | 10.0 | |
| | | | | 7.9 | |
| | | | | 7.9 | |
| | | | | 7.1 | |
| | | | | 3.7 | |
| | | | | 1.0 | |
| | | | | 1.0 | |
Short-term investments and other | | | | | 3.6 | |
* As a percentage of net assets.
PORTFOLIO MANAGERS’ COMMENTARY
Performance > For the year ended August 31, 2020, the International Value Fund Class NAV shares returned 2.22% and the MSCI EAFE Index returned 6.13%. On February 12, 2020, Boston Partners Global Investors, Inc. replaced Templeton Investment Counsel, LLC as the fund’s subadvisor.
Environment >
Templeton Investment Counsel, LLC (period from September 1, 2019 through February 11, 2020)
International equities advanced during the period under review amid accommodative central bank messaging and incrementally better economic data; however international value stocks extended their longest and deepest period of underperformance relative to growth on record.
Market gains began to deteriorate toward the end of the period as hopes of a global economic upturn were challenged by fears surrounding a highly contagious coronavirus outbreak in China.
Relative performance in the information technology sector was led by benchmark investments in electronic companies South Korean based Samsung Electronics Company, Ltd. and Taiwan based Taiwan Semiconductor Manufacturing Company, Ltd. Samsung is a multinational electronics company driven primarily by its semiconductor division. Shares of Taiwan Semiconductor (sold prior to year end), a key supplier to market leaders Apple and Qualcomm benefited similarly from improving Sino-American trade relations. Stock selection and an underweighting in the consumer staples sector also enhanced results, as did security selection in the consumer discretionary sector.
Conversely, relative performance was pressured by stock selection in the materials sector and by an overweighting in the energy sector. From the energy sector, detractors included Italy’s based Eni SpA and Royal Dutch Shell PLC and Canadian integrated oil company Husky Energy, Inc. (sold all holdings prior to year end); however, a litigation settlement from Petroleo Brasileiro SA contributed to performance. An overweighting in the communication services sector also hampered results. Luxembourg-based satellite operator SES SA (sold prior to year end) finished as the fund’s biggest detractor for the period. Its shares slumped after U.S. regulators opted for a public auction of C-band spectrum instead of the private auction favored by spectrum owners like SES, as well as telecommunications industry bidders who preferred a quicker, private process.
From a regional standpoint, stock selection in Asia supported relative performance, with out of benchmark investments in South Korea and Taiwan proving especially beneficial. In Europe, security selection in France, Germany and Switzerland also enhanced results. Conversely, out of benchmark positioning in Canada detracted from relative performance.
Boston Partners Global Investors, Inc. (period from February 12, 2020 through August 31, 2020)
International value stocks continued to underperform international growth stocks during the period under review.
Relative underperformance during the period under review was mostly driven by stock selection within industrials, consumer staples, and financials sectors. Top detractors from relative performance within the industrials sector include Leonardo SpA and Eiffage SA. Not owning a position in Nestle SA, the world’s largest food and beverage company, was the main detractor from performance within the consumer staples sector. The stock performed well over the trailing period despite slightly declining earnings estimates, and experienced earnings multiple expansion as investors flocked to its defensive attributes in the face of a viral pandemic. In the financials sector, the fund’s insurance stocks lagged the market, driven by both concerns about potential COVID-19 related claims, and indiscriminate regulatory constraints on capital return policies. Large individual detractors from performance held by the fund within the financials sector include Fairfax Financial Holdings, Ltd., Axis Capital Holdings, and Aviva PLC (sold all holdings prior to year end).
The fund’s relative performance was aided by positioning in the materials sector. Positions in Barrick Gold Corp. and Yamana Gold, Inc. continue to post strong performance as central banks around the world expand their balance sheets in an effort to offset the negative economic impact of the virus.
| | | | | | | | | | | | |
|---|
PERFORMANCE TABLE1,2
|
|
|
| Average Annual Total Return
|
| Cumulative Total Return
|
|
|---|
Periods Ending August 31, 2020 | | | | | 1-year | | | | 5-year | | | | 10-year | | | | 5-year | | | | 10-year | |
International Value Fund Class 1 | | | | | 2.16 | | | | 1.52 | | | | 3.38 | | | | 7.81 | | | | 39.45 | |
International Value Fund Class NAV | | | | | 2.22 | | | | 1.57 | | | | 3.43 | | | | 8.11 | | | | 40.13 | |
| | | | | 6.13 | | | | 4.72 | | | | 5.88 | | | | 25.94 | | | | 77.05 | |
| 1 | | Performance does not reflect the deduction of taxes on fund distributions or redemptions of fund shares. Past performance does not guarantee future results. |
| 2 | | Since inception, a portion of the International Value Fund expenses was reimbursed. If such expenses had not been reimbursed, returns would be lower. |
| 3 | | The MSCI EAFE Index (Europe, Australasia, Far East) is a free-float-adjusted market capitalization index that is designed to measure developed market equity performance. |
| 4 | | It is not possible to invest directly in an index. Index figures do not reflect expenses or sales charges, which would result in lower returns. |
The expense ratios of the fund, both net (including any fee waivers or expense limitations) and gross (excluding any fee waivers or expense limitations), are set forth according to the most recent publicly available prospectuses for the fund and may differ from the expense ratios disclosed in the financial highlights tables in this report. For Class 1 and Class NAV shares the gross expenses are 0.93% and 0.85%, respectively, and the net expenses are 0.92% and 0.84%, respectively. Net expenses reflect contractual expense limitations in effect until July 31, 2022 and are subject to change. Had the contractual fee waivers and expense limitations not been in place, gross expenses would apply.
8
Mid Cap Stock Fund
Subadvisor: Wellington Management Company LLP
Portfolio Managers: Mario E. Abularach, CFA, CMT, Stephen Mortimer
INVESTMENT OBJECTIVE & POLICIES > The fund seeks long-term growth and capital appreciation. Under normal market conditions, the fund invests at least 80% of its net assets (plus any borrowings for investment purposes) in equity securities of medium-sized companies with significant capital appreciation potential.
CHANGE IN VALUE OF $10,000 INVESTMENT AND COMPARATIVE INDEX
| Sector Composition* | | | | % of Total |
|---|
| | | | | 26.8 | |
| | | | | 22.9 | |
| | | | | 21.2 | |
| | | | | 7.9 | |
| | | | | 7.5 | |
| | | | | 7.0 | |
| | | | | 4.3 | |
| | | | | 0.2 | |
Short-term investments and other | | | | | 2.2 | |
* As a percentage of net assets.
PORTFOLIO MANAGERS’ COMMENTARY
Performance > For the year ended August 31, 2020, the Mid Cap Stock Fund Class NAV shares returned 41.47% and the Russell Midcap Growth Index returned 23.56%.
Environment > U.S. equities, as measured by the S&P 500 Index, posted positive results over the trailing twelve-month period ending August 31, 2020. U.S.-China trade tensions were volatile going into the last quarter of 2019 but eased in December after the U.S. and China reached a phase-one trade agreement. During the first quarter of 2020, the COVID-19 outbreak caused unprecedented societal and market disruptions. Volatility surged to extreme levels as states adopted extraordinary measures to fight the contagion while companies’ shuttered stores and production, withdrew earnings guidance and drew down credit lines. Later in the first quarter, the Fed and U.S. government bolstered markets with an emergency stimulus package extending roughly $2 trillion in aid that continued to drive the market’s rebound through the second quarter of 2020. U.S. and China trade tensions have escalated on several fronts in recent months after reigniting in May despite the two countries reaffirming their commitment to the phase-one trade deal. Uncertainty remains with Congress at an impasse on the next coronavirus aid package and the U.S. presidential election looming in November.
Within the fund, stock selection drove outperformance. Security selection was particularly strong in information technology, consumer staples and communication services sectors. This was slightly offset by unfavorable selection in consumer discretionary and industrials sectors.
Sector allocation, a product of the bottom-up stock selection process, also contributed to performance. Allocation effect was driven by our overweight to the health care sector but partially offset by our underweight to the information technology sector.
Top contributors to relative performance during the period included Advanced Micro Devices, a semiconductor company; Square Inc., a financial services and mobile payment company; and Spotify Technology SA, a music streaming and media services provider.
Top detractors from relative performance included Pinterest, Inc. (sold prior to year end), an image sharing and social media service; The We Company, Inc., a commercial real estate company; and Exact Sciences Corp., a molecular diagnostics company.
| | | | | | | | | | | | |
|---|
PERFORMANCE TABLE1,2
|
|
|
| Average Annual Total Return
|
| Cumulative Total Return
|
|
|---|
Periods Ending August 31, 2020 | | | | | 1-year | | | | 5-year | | | | 10-year | | | | 5-year | | | | 10-year | |
Mid Cap Stock Fund Class 1 | | | | | 41.40 | | | | 18.49 | | | | 17.47 | | | | 133.54 | | | | 400.19 | |
Mid Cap Stock Fund Class NAV | | | | | 41.47 | | | | 18.55 | | | | 17.53 | | | | 134.20 | | | | 402.81 | |
Russell Midcap Growth Index3,4 | | | | | 23.56 | | | | 14.94 | | | | 16.03 | | | | 100.63 | | | | 342.27 | |
| 1 | | Performance does not reflect the deduction of taxes on fund distributions or redemptions of fund shares. Past performance does not guarantee future results. |
| 2 | | Since inception, a portion of the Mid Cap Stock Fund expenses was reimbursed. If such expenses had not been reimbursed, returns would be lower. |
| 3 | | The Russell Midcap Growth Index is an unmanaged index that contains those stocks from the Russell Midcap Index with a greater than average growth orientation. |
| 4 | | It is not possible to invest directly in an index. Index figures do not reflect expenses or sales charges, which would result in lower returns. |
The expense ratios of the fund, both net (including any fee waivers or expense limitations) and gross (excluding any fee waivers or expense limitations), are set forth according to the most recent publicly available prospectuses for the fund and may differ from the expense ratios disclosed in the financial highlights tables in this report. For Class 1 and Class NAV shares the gross expenses are 0.92% and 0.87%, respectively, and the net expenses are 0.91% and 0.86%, respectively. Net expenses reflect contractual expense limitations in effect until July 31, 2022 and are subject to change. Had the contractual fee waivers and expense limitations not been in place, gross expenses would apply.
9
Mid Value Fund
Subadvisor: T. Rowe Price Associates, Inc.
Portfolio Manager: David J. Wallack
INVESTMENT OBJECTIVE & POLICIES > The fund seeks long-term capital appreciation. Under normal market conditions, the fund invests at least 80% of its net assets (plus any borrowings for investment purposes) in companies with market capitalizations that are within the S&P MidCap 400 Index or the Russell Midcap Value Index.
CHANGE IN VALUE OF $10,000 INVESTMENT AND COMPARATIVE INDEX
| Sector Composition* | | | | % of Total |
|---|
| | | | | 16.6 | |
| | | | | 16.5 | |
| | | | | 12.7 | |
| | | | | 11.5 | |
| | | | | 9.6 | |
| | | | | 9.0 | |
| | | | | 7.2 | |
| | | | | 5.6 | |
| | | | | 4.7 | |
| | | | | 2.8 | |
| | | | | 2.7 | |
Short-term investments and other | | | | | 1.1 | |
* As a percentage of net assets.
PORTFOLIO MANAGER’S COMMENTARY
Performance > For the year ended August 31, 2020, the Mid Value Fund Class NAV shares returned 7.40% and the Russell Midcap Value Index declined 1.30%.
Environment > While major U.S. stocks were largely positive for the one-year period ended August 31, 2020, there was significant variation across style and market capitalization. Growth substantially outpaced value, and large-caps outperformed small- and mid-cap peers. Progress in U.S.-China trade talks, and the eventual consummation of a “phase one” trade deal, lifted stocks early in the period. Starting in late February, however, evidence that the novel coronavirus might be transitioning into a global pandemic proved a watershed for the markets. In March, U.S. stocks suffered their worst declines since the financial crisis in late 2008 as the accelerating pandemic led to the shutdown of significant portions of the global economy. However, U.S. equities rebounded sharply in the following months, with market gains being driven by the Federal Reserve’s and federal government’s massive stimulus efforts, as well as slowing coronavirus infection rates in the U.S. and various other countries, which encouraged leaders to gradually lift lockdowns and reopen their economies. News of advancements in treatment and vaccine development also helped lift markets. Stocks also received a boost late in the period when Federal Reserve Chair Jerome Powell announced that the central bank will move to a policy of average inflation targeting, which will allow inflation to run above its 2% target to make up for past shortfalls.
Stock selection in the materials sector contributed the most to relative results, led by names in metals and mining. Fresnillo PLC, Franco-Nevada Corp., and Barrick Gold Corp. all benefited from a rise in gold and silver prices, as gold reached eight-year highs during the period.
Stock choices in the real estate sector also boosted relative returns. An underweight to the sector, one of the poorest performers for the benchmark, also added value. Weyerhaeuser Company, a pure-play timber real estate investment trust, rose along with the broader market late in the period due to optimism surrounding the reopening of certain parts of the U.S. economy. We continue to believe the market underappreciates the value of Weyerhaeuser’s high-quality timberland assets. We are also encouraged by steps the company has taken to ensure balance sheet flexibility amid an uncertain environment.
Health care sector added value due to an overweight position and stock picks. Shares of Patterson Companies, Inc., a specialty distributor of dental and animal health consumable products, equipment, and technology solutions, rose in 2020 on consecutive quarters of solid results reflecting strong operational execution despite COVID-19 headwinds. We believe the company is positioned to benefit from continued end market recovery and potentially from more permanent cost reductions spurred by the pandemic.
Conversely, stock selection in the communication services sector weighed on relative results. Shares of entertainment content company ViacomCBS, Inc. declined after Viacom and CBS merged in late December 2019, due to investor concerns over ongoing headwinds media companies are facing. In early 2020, the cancellation of the majority of live sports broadcasts, including the NCAA Division I Men’s Basketball Tournament usually shown on CBS, due to the coronavirus outbreak further weighed on the company.
Stock choices in the utilities sector also detracted, although this was largely offset by a favorable underweight position. Shares of Ohio-based integrated utility First Energy Corp. plunged after the company was implicated in a bribery investigation related to the passage of a bill that provided subsidies for distressed nuclear power plants owned by former FirstEnergy subsidiary, FES. While the company asserts its innocence, the scandal may create a significant near-term overhang.
| | | | | | | | | | | | |
|---|
PERFORMANCE TABLE1,2
|
|
|
| Average Annual Total Return
|
| Cumulative Total Return
|
|
|---|
Periods Ending August 31, 2020 | | | | | 1-year | | | | 5-year | | | | 10-year | | | | 5-year | | | | 10-year | |
| | | | | 7.40 | | | | 7.14 | | | | 10.51 | | | | 41.20 | | | | 171.72 | |
Russell Midcap Value Index3,4 | | | | | –1.30 | | | | 6.14 | | | | 10.94 | | | | 34.74 | | | | 182.51 | |
| 1 | | Performance does not reflect the deduction of taxes on fund distributions or redemptions of fund shares. Past performance does not guarantee future results. |
| 2 | | Since inception, a portion of the Mid Value Fund expenses was reimbursed. If such expenses had not been reimbursed, returns would be lower. |
| 3 | | The Russell Midcap Value Index is an unmanaged index that measures the performance of those Russell Midcap companies with lower price-to-book ratios and lower forecasted growth values. The stocks are also members of the Russell 1000 Value Index. |
| 4 | | It is not possible to invest directly in an index. Index figures do not reflect expenses or sales charges, which would result in lower returns. |
The expense ratios of the fund, both net (including any fee waivers or expense limitations) and gross (excluding any fee waivers or expense limitations), are set forth according to the most recent publicly available prospectus for the fund and may differ from the expense ratios disclosed in the financial highlights tables in this report. For Class NAV shares, the gross expense is 0.99% and the net expense is 0.98%. Net expenses reflect contractual expense limitations in effect until July 31, 2022 and are subject to change. Had the contractual fee waivers and expense limitations not been in place, gross expenses would apply.
10
Multi-Index Lifestyle Aggressive Portfolio
Subadvisors: Manulife Investment Management (US) LLC
Portfolio Managers: Robert E. Sykes, CFA, Nathan W. Thooft, CFA
INVESTMENT OBJECTIVE & POLICIES > The portfolio seeks long-term growth of capital. Current income is not a consideration. The portfolio operates as a fund of funds and normally invests approximately 100% of its assets in underlying funds that invest primarily in equity securities.
CHANGE IN VALUE OF $10,000 INVESTMENT AND COMPARATIVE INDEXES
| Asset Allocation* | | | | % of Total |
|---|
Affiliated investment companies | | | | | 67.1 | |
| | | | | 67.1 | |
Unaffiliated investment companies | | | | | 32.9 | |
| | | | | 32.9 | |
* As a percentage of net assets.
PORTFOLIO MANAGERS’ COMMENTARY
Performance > For the year ended August 31, 2020, the Multi-Index Lifestyle Aggressive Portfolio Class 1 shares returned 12.98% and a blend of 70% Russell 3000 Index and 30% MSCI AC World ex-U.S.A. Index returned 17.42%.
Environment > U.S. equities posted gains over the period despite significant volatility triggered by the global spread of COVID-19. The virus proved to be highly infectious and, by the end of March, had become a global pandemic. The social distancing required to combat the pandemic led to widespread work stoppages. Unemployment soared to levels not seen since the Great Depression and the widely followed S&P 500 Index entered “bear-market” territory in March, less than a month after reaching an all-time high.
Foreign stocks in developed markets reacted similarly to their U.S. counterparts, with a steep first-quarter decline followed by an impressive recovery. These markets derived much less benefit from the strength of the information technology sector, and, and lagged the U.S. market. As of August 31, 2020, information technology had the largest weighting among the 11 sectors in the S&P 500, and posted a relatively strong return over the period. The MSCI EAFE Index had only single-digit exposure to the information technology sector, and posted a much more modest return in the sector. Emerging markets equities finished stronger than those of international developed markets, but still lagged the S&P 500.
In the bond market, Treasury yields were fairly stable through the end of 2019, but plunged in the first quarter of 2020, as it quickly became apparent that the U.S. economy was entering a recession. This ended the longest period of U.S. economic expansion on record. Over the period, longer-dated Treasuries strongly outperformed. Corporate debt performed relatively well, except in the first quarter, when widespread shutdowns fueled concerns about revenue and earnings.
From an asset allocation perspective, an underweight positions in mid-cap equity contributed to returns, as did an overweight position in technology. On an individual securities basis, Strategic Equity Allocation (U.S. Large Cap sleeve) detracted and Strategic Equity Allocation (International sleeve) contributed to returns.
An underweight position in U.S. large-cap equity detracted from returns, as did overweight positions in international developed equity and real estate.
| | | | | | | | | | | | | | | | |
|---|
PERFORMANCE TABLE1,2
|
|
|
| Average Annual Total Return
|
| Cumulative Total Return
|
|
|---|
Periods Ending August 31, 2020 | | | | | 1-year | | | | 5-year | | | | 10-year | | | | Since
Inception | | | | 5-year | | | | 10-year | | | | Since
Inception | |
Multi-Index Lifestyle Aggressive Portfolio Class R6
(began 12/30/13) | | | | | 13.00 | | | | 9.89 | | | | — | | | | 7.87 | | | | 60.26 | | | | — | | | | 65.75 | |
Multi-Index Lifestyle Aggressive Portfolio Class 1
(began 12/30/13) | | | | | 12.98 | | | | 9.83 | | | | — | | | | 7.83 | | | | 59.85 | | | | — | | | | 65.40 | |
| | | | | 21.94 | | | | 14.46 | | | | — | | | | 12.37 | | | | 96.47 | | | | — | | | | 117.77 | |
| | | | | 6.13 | | | | 4.72 | | | | — | | | | 2.77 | | | | 25.94 | | | | — | | | | 20.00 | |
| | | | | 17.42 | | | | 11.43 | | | | — | | | | 9.18 | | | | 71.80 | | | | — | | | | 79.69 | |
| 1 | | Performance does not reflect the deduction of taxes on fund distributions or redemptions of fund shares. Past performance does not guarantee future results. |
| 2 | | Since inception, a portion of the Multi-Index Lifestyle Aggressive Portfolio expenses was reimbursed. If such expenses had not been reimbursed, returns would be lower. |
| 3 | | The S&P 500 Index is an unmanaged index that includes 500 widely-traded common Stocks. |
| 4 | | It is not possible to invest directly in an index. Index figures do not reflect expenses or sales charges, which would result in lower returns. |
| 5 | | The MSCI EAFE Index (Europe, Australasia, Far East) is a free-float-adjusted market capitalization index that is designed to measure developed market equity performance. |
| 6 | | The Blended Index is composed of 70% Russell 3000 Index and 30% MSCI AC World ex-U.S.A. Index. |
The expense ratios of the fund, both net (including any fee waivers or expense limitations) and gross (excluding any fee waivers or expense limitations), are set forth according to the most recent publicly available prospectuses for the fund and may differ from the expense ratios disclosed in the financial highlights tables in this report. The net expenses equal the gross expenses and are as follows: Class 1 shares — 0.68% and Class R6 shares — 0.64%.
11
Multi-Index Lifestyle Balanced Portfolio
Subadvisors: Manulife Investment Management (US) LLC
Portfolio Managers: Robert E. Sykes, CFA, Nathan W. Thooft, CFA
INVESTMENT OBJECTIVE & POLICIES > The portfolio seeks a balance between a high level of current income and growth of capital, with a greater emphasis on growth of capital. The portfolio operates as a fund of funds and normally invests approximately 60% of its assets in underlying funds that invest primarily in equity securities and approximately 40% in underlying funds that invest primarily in fixed-income securities.
CHANGE IN VALUE OF $10,000 INVESTMENT AND COMPARATIVE INDEXES
| Asset Allocation* | | | | % of Total |
|---|
Affiliated investment companies | | | | | 38.8 | |
| | | | | 38.8 | |
Unaffiliated investment companies | | | | | 61.2 | |
| | | | | 38.2 | |
| | | | | 23.0 | |
* As a percentage of net assets.
PORTFOLIO MANAGERS’ COMMENTARY
Performance > For the year ended August 31, 2020, the Multi-Index Lifestyle Balanced Portfolio Class 1 shares returned 10.36% and a blend of 42% Russell 3000 Index, 18% MSCI AC World ex-U.S.A. Index, 8% ICE Bank of America U.S. High Yield Index*, and 32% Bloomberg Barclays U.S. Aggregate Bond Index returned 13.32%.
Environment > U.S. equities posted gains over the period despite significant volatility triggered by the global spread of COVID-19. The virus proved to be highly infectious and, by the end of March, had become a global pandemic. The social distancing required to combat the pandemic led to widespread work stoppages. Unemployment soared to levels not seen since the Great Depression and the widely followed S&P 500 Index entered “bear-market” territory in March, less than a month after reaching an all-time high.
Foreign stocks in developed markets reacted similarly to their U.S. counterparts, with a steep first-quarter decline followed by an impressive recovery. These markets derived much less benefit from the strength of the information technology sector, however, and lagged the U.S. market. As of August 31, 2020, information technology had the largest weighting among the 11 sectors in the S&P 500, and posted a relatively strong return over the period. The MSCI EAFE Index had only single-digit exposure to the information technology sector, and posted a much more modest return in the sector. Emerging markets equities finished stronger than those of international developed markets, but still lagged the S&P 500.
In the bond market, Treasury yields were fairly stable through the end of 2019, but plunged in the first quarter of 2020, as it quickly became apparent that the U.S. economy was entering a recession. This ended the longest period of U.S. economic expansion on record. Over the period, longer-dated Treasuries strongly outperformed. Corporate debt performed relatively well, except in the first quarter, when widespread shutdowns fueled concerns about revenue and earnings.
From an asset allocation perspective, underweight positions in mid-cap equity and high yield bonds contributed to returns, as did an overweight position in technology. On an individual securities basis, Strategic Equity Allocation (U.S. Large Cap sleeve) detracted and Strategic Equity Allocation (International sleeve) contributed to returns.
An underweight position in U.S. large-cap equity detracted from returns, as did overweight positions in international developed equity and real estate.
| | | | | | | | | | | | | | | | |
|---|
PERFORMANCE TABLE1,2
|
|
|
| Average Annual Total Return
|
| Cumulative Total Return
|
|
|---|
Periods Ending August 31, 2020 | | | | | 1-year | | | | 5-year | | | | 10-year | | | | Since
Inception | | | | 5-year | | | | 10-year | | | | Since
Inception | |
Multi-Index Lifestyle Balanced Portfolio Class R6
(began 12/30/13) | | | | | 10.50 | | | | 7.85 | | | | — | | | | 6.43 | | | | 45.93 | | | | — | | | | 51.56 | |
Multi-Index Lifestyle Balanced Portfolio Class 1
(began 12/30/13) | | | | | 10.36 | | | | 7.79 | | | | — | | | | 6.39 | | | | 45.52 | | | | — | | | | 51.19 | |
| | | | | 21.94 | | | | 14.46 | | | | — | | | | 12.37 | | | | 96.47 | | | | — | | | | 117.77 | |
Bloomberg Barclays U.S. Aggregate Bond Index4,5 | | | | | 6.47 | | | | 4.33 | | | | — | | | | 4.21 | | | | 23.60 | | | | — | | | | 31.68 | |
| | | | | 13.32 | | | | 8.98 | | | | — | | | | 7.48 | | | | 53.69 | | | | — | | | | 61.78 | |
| 1 | | Performance does not reflect the deduction of taxes on fund distributions or redemptions of fund shares. Past performance does not guarantee future results. |
| 2 | | Since inception, a portion of the Multi-Index Lifestyle Balanced Portfolio expenses was reimbursed. If such expenses had not been reimbursed, returns would be lower. |
| 3 | | The S&P 500 Index is an unmanaged index that includes 500 widely-traded common Stocks. |
| 4 | | It is not possible to invest directly in an index. Index figures do not reflect expenses or sales charges, which would result in lower returns. |
| 5 | | The Bloomberg Barclays U.S. Aggregate Bond Index is an unmanaged index of dollar-denominated and nonconvertible investment-grade debt issues. |
| 6 | | The Blended Index is composed of 42% Russell 3000 Index, 18% MSCI AC World ex-U.S.A. Index, 8% ICE Bank of America U.S. High Yield Index*, and 32% Bloomberg Barclays U.S. Aggregate Bond Index. |
| * | | Formerly known as ICE Bank of America Merrill Lynch U.S. High Yield Master II Index. |
The expense ratios of the fund, both net (including any fee waivers or expense limitations) and gross (excluding any fee waivers or expense limitations), are set forth according to the most recent publicly available prospectuses for the fund and may differ from the expense ratios disclosed in the financial highlights tables in this report. The net expenses equal the gross expenses and are as follows: Class 1 shares — 0.71% and Class R6 shares — 0.67%.
12
Multi-Index Lifestyle Conservative Portfolio
Subadvisors: Manulife Investment Management (US) LLC
Portfolio Managers: Robert E. Sykes, CFA, Nathan W. Thooft, CFA
INVESTMENT OBJECTIVE & POLICIES > The portfolio seeks a high level of current income and with some consideration given to growth of capital. The portfolio operates as a fund of funds and normally invests approximately 80% of its assets in underlying funds that invest primarily in fixed-income securities and approximately 20% in underlying funds that invest primarily in equity securities.
CHANGE IN VALUE OF $10,000 INVESTMENT AND COMPARATIVE INDEXES
| Asset Allocation* | | | | % of Total |
|---|
Affiliated investment companies | | | | | 10.8 | |
| | | | | 10.8 | |
Unaffiliated investment companies | | | | | 88.9 | |
| | | | | 79.2 | |
| | | | | 9.7 | |
Short-term investments and other | | | | | 0.3 | |
* As a percentage of net assets.
PORTFOLIO MANAGERS’ COMMENTARY
Performance > For the year ended August 31, 2020, the Multi-Index Lifestyle Conservative Portfolio Class 1 shares returned 7.33% and a blend of 14% Russell 3000 Index, 6% MSCI AC World ex-U.S.A. Index, 16% ICE Bank of America U.S. High Yield Index*, and 64% Bloomberg Barclays U.S. Aggregate Bond Index returned 8.62%.
Environment > U.S. equities posted gains over the period despite significant volatility triggered by the global spread of COVID-19. The virus proved to be highly infectious and, by the end of March, had become a global pandemic. The social distancing required to combat the pandemic led to widespread work stoppages. Unemployment soared to levels not seen since the Great Depression and the widely followed S&P 500 Index entered “bear-market” territory in March, less than a month after reaching an all-time high.
Foreign stocks in developed markets reacted similarly to their U.S. counterparts, with a steep first-quarter decline followed by an impressive recovery. These markets derived much less benefit from the strength of the information technology sector, however, and lagged the U.S. market. As of August 31, 2020, information technology had the largest weighting among the 11 sectors in the S&P 500, and posted a relatively strong return over the period. The MSCI EAFE Index had only single-digit exposure to the information technology sector, and posted a much more modest return in the sector. Emerging markets equities finished stronger than those of international developed markets, but still lagged the S&P 500.
In the bond market, Treasury yields were fairly stable through the end of 2019, but plunged in the first quarter of 2020, as it quickly became apparent that the U.S. economy was entering a recession. This ended the longest period of U.S. economic expansion on record. Over the period, longer-dated Treasuries strongly outperformed. Corporate debt performed relatively well, except in the first quarter, when widespread shutdowns fueled concerns about revenue and earnings.
From an asset allocation perspective, underweight positions in mid-cap equity and high yield bonds contributed to returns, as did an overweight position in inflation protected securities. On an individual securities basis, Strategic Equity Allocation (U.S. Large Cap sleeve) detracted and Strategic Equity Allocation (International sleeve) contributed to returns.
An underweight position in U.S. large-cap equity detracted from returns, as did overweight positions in bank loans and real estate.
| | | | | | | | | | | | | | | | |
|---|
PERFORMANCE TABLE1,2
|
|
|
| Average Annual Total Return
|
| Cumulative Total Return
|
|
|---|
Periods Ending August 31, 2020 | | | | | 1-year | | | | 5-year | | | | 10-year | | | | Since
Inception | | | | 5-year | | | | 10-year | | | | Since
Inception | |
Multi-Index Lifestyle Conservative Portfolio Class R6
(began 12/30/13) | | | | | 7.37 | | | | 5.52 | | | | — | | | | 4.70 | | | | 30.80 | | | | — | | | | 35.90 | |
Multi-Index Lifestyle Conservative Portfolio Class 1
(began 12/30/13) | | | | | 7.33 | | | | 5.46 | | | | — | | | | 4.67 | | | | 30.47 | | | | — | | | | 35.58 | |
| | | | | 21.94 | | | | 14.46 | | | | — | | | | 12.37 | | | | 96.47 | | | | — | | | | 117.77 | |
Bloomberg Barclays U.S. Aggregate Bond Index4,5 | | | | | 6.47 | | | | 4.33 | | | | — | | | | 4.21 | | | | 23.60 | | | | — | | | | 31.68 | |
| | | | | 8.62 | | | | 6.24 | | | | — | | | | 5.51 | | | | 35.33 | | | | — | | | | 43.01 | |
| 1 | | Performance does not reflect the deduction of taxes on fund distributions or redemptions of fund shares. Past performance does not guarantee future results. |
| 2 | | Since inception, a portion of the Multi-Index Lifestyle Conservative Portfolio expenses was reimbursed. If such expenses had not been reimbursed, returns would be lower. |
| 3 | | The S&P 500 Index is an unmanaged index that includes 500 widely-traded common Stocks. |
| 4 | | It is not possible to invest directly in an index. Index figures do not reflect expense or sales charges, which would result in lower returns. |
| 5 | | The Bloomberg Barclays U.S. Aggregate Bond Index is an unmanaged index of dollar-denominated and nonconvertible investment-grade debt issues. |
| 6 | | The Blended Index is composed of 14% Russell 3000 Index, 6% MSCI AC World ex-U.S.A. Index, 16% ICE Bank of America U.S. High Yield Index*, and 64% Bloomberg Barclays U.S. Aggregate Bond Index. |
| * | | Formerly known as ICE Bank of America Merrill Lynch U.S. High Yield Master II Index. |
The expense ratios of the portfolio, both net (including any fee waivers or expense limitations) and gross (excluding any fee waivers or expense limitations), are set forth according to the most recent publicly available prospectuses for the fund and may differ from the expense ratios disclosed in the financial highlights tables in this report. For Class 1 and Class R6 shares the gross expenses are 0.74% and 0.70%, respectively, and the net expenses are 0.73% and 0.69%, respectively. Net expenses reflect contractual expense limitations in effect until December 31, 2020 and are subject to change. Had the contractual fee waivers and expense limitations not been in place, gross expenses would apply.
13
Multi-Index Lifestyle Growth Portfolio
Subadvisors: Manulife Investment Management (US) LLC
Portfolio Managers: Robert E. Sykes, CFA, Nathan W. Thooft, CFA
INVESTMENT OBJECTIVE & POLICIES > The portfolio seeks long-term growth of capital. Current income is also a consideration. The portfolio operates as a fund of funds and normally invests approximately 80% of its assets in underlying funds that invest primarily in equity securities, and approximately 20% in underlying funds that invest primarily in fixed-income securities.
CHANGE IN VALUE OF $10,000 INVESTMENT AND COMPARATIVE INDEXES
| Asset Allocation* | | | | % of Total |
|---|
Affiliated investment companies | | | | | 53.0 | |
| | | | | 53.0 | |
Unaffiliated investment companies | | | | | 46.9 | |
| | | | | 29.2 | |
| | | | | 17.7 | |
Short-term investments and other | | | | | 0.1 | |
* As a percentage of net assets.
PORTFOLIO MANAGERS’ COMMENTARY
Performance > For the year ended August 31, 2020, the Multi-Index Lifestyle Growth Portfolio Class 1 shares returned 11.86% and a blend of 56% Russell 3000 Index, 24% MSCI AC World ex-U.S.A Index, 4% ICE Bank of America U.S. High Yield Index*, and 16% Bloomberg Barclays U.S. Aggregate Bond Index returned 15.45%.
Environment > U.S. equities posted gains over the period despite significant volatility triggered by the global spread of COVID-19. The virus proved to be highly infectious and, by the end of March, had become a global pandemic. The social distancing required to combat the pandemic led to widespread work stoppages. Unemployment soared to levels not seen since the Great Depression and the widely followed S&P 500 Index entered “bear-market” territory in March, less than a month after reaching an all-time high.
Foreign stocks in developed markets reacted similarly to their U.S. counterparts, with a steep first-quarter decline followed by an impressive recovery. These markets derived much less benefit from the strength of the information technology sector, however, and lagged the U.S. market. As of August 31, 2020, information technology had the largest weighting among the 11 sectors in the S&P 500, and posted a relatively strong return over the period. The MSCI EAFE Index had only single-digit exposure to the information technology sector, and posted a much more modest return in the sector. Emerging markets equities finished stronger than those of international developed markets, but still lagged the S&P 500.
In the bond market, Treasury yields were fairly stable through the end of 2019, but plunged in the first quarter of 2020, as it quickly became apparent that the U.S. economy was entering a recession. This ended the longest period of U.S. economic expansion on record. Over the period, longer-dated Treasuries strongly outperformed. Corporate debt performed relatively well, except in the first quarter, when widespread shutdowns fueled concerns about revenue and earnings.
From an asset allocation perspective, underweight positions in mid-cap equity and high yield bonds contributed to returns, as did an overweight position in technology. On an individual securities basis, Strategic Equity Allocation (U.S. Large Cap sleeve) detracted and Strategic Equity Allocation (International sleeve) contributed to returns.
An underweight position in U.S. large-cap equity detracted from returns, as did overweight positions in international developed equity and real estate.
| | | | | | | | | | | | | | | | |
|---|
PERFORMANCE TABLE1,2
|
|
|
| Average Annual Total Return
|
| Cumulative Total Return
|
|
|---|
Periods Ending August 31, 2020 | | | | | 1-year | | | | 5-year | | | | 10-year | | | | Since
Inception | | | | 5-year | | | | 10-year | | | | Since
Inception | |
Multi-Index Lifestyle Growth Portfolio Class R6
(began 12/30/13) | | | | | 11.88 | | | | 8.88 | | | | — | | | | 7.19 | | | | 53.02 | | | | — | | | | 58.90 | |
Multi-Index Lifestyle Growth Portfolio Class 1
(began 12/30/13) | | | | | 11.86 | | | | 8.84 | | | | — | | | | 7.16 | | | | 52.72 | | | | — | | | | 58.58 | |
| | | | | 21.94 | | | | 14.46 | | | | — | | | | 12.37 | | | | 96.47 | | | | — | | | | 117.77 | |
Bloomberg Barclays U.S. Aggregate Bond Index4,5 | | | | | 6.47 | | | | 4.33 | | | | — | | | | 4.21 | | | | 23.60 | | | | — | | | | 31.68 | |
| | | | | 15.45 | | | | 10.24 | | | | — | | | | 8.36 | | | | 62.82 | | | | — | | | | 70.89 | |
| 1 | | Performance does not reflect the deduction of taxes on fund distributions or redemptions of fund shares. Past performance does not guarantee future results. |
| 2 | | Since inception, a portion of the Multi-Index Lifestyle Growth Portfolio expenses was reimbursed. If such expenses had not been reimbursed, returns would be lower. |
| 3 | | The S&P 500 Index is an unmanaged index that includes 500 widely-traded common Stocks. |
| 4 | | It is not possible to invest directly in an index. Index figures do not reflect expenses or sales charges, which would result in lower returns. |
| 5 | | The Bloomberg Barclays U.S. Aggregate Bond Index is an unmanaged index of dollar-denominated and nonconvertible investment-grade debt issues. |
| 6 | | The Blended Index is composed of 56% Russell 3000 Index, 24% MSCI AC World ex-U.S.A. Index, 4% ICE Bank of America U.S. High Yield Index*, and 16% Bloomberg Barclays U.S. Aggregate Bond Index. |
| * | | Formerly known as ICE Bank of America Merrill Lynch U.S. High Yield Master II Index. |
The expense ratios of the fund, both net (including any fee waivers or expense limitations) and gross (excluding any fee waivers or expense limitations), are set forth according to the most recent publicly available prospectuses for the fund and may differ from the expense ratios disclosed in the financial highlights tables in this report. The net expenses equal the gross expenses and are as follows: Class 1 shares — 0.69% and Class R6 shares — 0.65%.
14
Multi-Index Lifestyle Moderate Portfolio
Subadvisors: Manulife Investment Management (US) LLC
Portfolio Managers: Robert E. Sykes, CFA, Nathan W. Thooft, CFA
INVESTMENT OBJECTIVE & POLICIES > The portfolio seeks a balance between a high level of current income and growth of capital, with greater emphasis on income. The portfolio operates as a fund of funds and normally invests approximately 60% of its assets in underlying funds that invest primarily in fixed-income securities and approximately 40% in underlying funds that invest primarily in equity securities.
CHANGE IN VALUE OF $10,000 INVESTMENT AND COMPARATIVE INDEXES
| Asset Allocation* | | | | % of Total |
|---|
Affiliated investment companies | | | | | 25.4 | |
| | | | | 25.4 | |
Unaffiliated investment companies | | | | | 74.6 | |
| | | | | 59.0 | |
| | | | | 15.6 | |
* As a percentage of net assets.
PORTFOLIO MANAGERS’ COMMENTARY
Performance > For the year ended August 31, 2020, the Multi-Index Lifestyle Moderate Portfolio Class 1 shares returned 8.54% and a blend of 28% Russell 3000 Index, 12% MSCI AC World ex-U.S.A. Index, 12% ICE Bank of America U.S. High Yield Index*, and 48% Bloomberg Barclays U.S. Aggregate Bond Index returned 11.03%.
Environment > U.S. equities posted gains over the period despite significant volatility triggered by the global spread of COVID-19. The virus proved to be highly infectious and, by the end of March, had become a global pandemic. The social distancing required to combat the pandemic led to widespread work stoppages. Unemployment soared to levels not seen since the Great Depression and the widely followed S&P 500 Index entered “bear-market” territory in March, less than a month after reaching an all-time high.
Foreign stocks in developed markets reacted similarly to their U.S. counterparts, with a steep first-quarter decline followed by an impressive recovery. These markets derived much less benefit from the strength of the information technology sector, however, and lagged the U.S. market. As of August 31, 2020, information technology had the largest weighting among the 11 sectors in the S&P 500, and posted a relatively strong return over the period. The MSCI EAFE Index had only single-digit exposure to the information technology sector, and posted a much more modest return in the sector. Emerging markets equities finished stronger than those of international developed markets, but still lagged the S&P 500.
In the bond market, Treasury yields were fairly stable through the end of 2019, but plunged in the first quarter of 2020, as it quickly became apparent that the U.S. economy was entering a recession. This ended the longest period of U.S. economic expansion on record. Over the period, longer-dated Treasuries strongly outperformed. Corporate debt performed relatively well, except in the first quarter, when widespread shutdowns fueled concerns about revenue and earnings.
From an asset allocation perspective, underweight positions in mid-cap equity and high yield bonds contributed to returns, as did an overweight position in inflation protected securities. On an individual securities basis, Strategic Equity Allocation (U.S. Large Cap sleeve) detracted and Strategic Equity Allocation (International sleeve) contributed to returns.
An underweight position in U.S. large-cap equity detracted from returns, as did overweight positions in international developed equity and real estate.
| | | | | | | | | | | | | | | | |
|---|
PERFORMANCE TABLE1,2
|
|
|
| Average Annual Total Return
|
| Cumulative Total Return
|
|
|---|
Periods Ending August 31, 2020 | | | | | 1-year | | | | 5-year | | | | 10-year | | | | Since
Inception | | | | 5-year | | | | 10-year | | | | Since
Inception | |
Multi-Index Lifestyle Moderate Portfolio Class R6
(began 12/30/13) | | | | | 8.58 | | | | 6.68 | | | | — | | | | 5.52 | | | | 38.17 | | | | — | | | | 43.12 | |
Multi-Index Lifestyle Moderate Portfolio Class 1
(began 12/30/13) | | | | | 8.54 | | | | 6.64 | | | | — | | | | 5.50 | | | | 37.91 | | | | — | | | | 42.91 | |
| | | | | 21.94 | | | | 14.46 | | | | — | | | | 12.37 | | | | 96.47 | | | | — | | | | 117.77 | |
Bloomberg Barclays U.S. Aggregate Bond Index4,5 | | | | | 6.47 | | | | 4.33 | | | | — | | | | 4.21 | | | | 23.60 | | | | — | | | | 31.68 | |
| | | | | 11.03 | | | | 7.64 | | | | — | | | | 6.52 | | | | 44.51 | | | | — | | | | 52.45 | |
| 1 | | Performance does not reflect the deduction of taxes on fund distributions or redemptions of fund shares. Past performance does not predict future performance. |
| 2 | | Since inception, a portion of the Multi-Index Lifestyle Moderate Portfolio expenses was reimbursed. If such expenses had not been reimbursed, returns would be lower. |
| 3 | | The S&P 500 Index is an unmanaged index comprised of 500 widely traded U.S. common stocks. |
| 4 | | It is not possible to invest directly in an index. Index figures do not reflect expenses or sales charges, which would result in lower returns. |
| 5 | | The Bloomberg Barclays U.S. Aggregate Bond Index is an unmanaged index of dollar-denominated and non-convertible investment-grade debt issues. |
| 6 | | The Blended Index is composed of 28% Russell 3000 Index, 12% MSCI AC World ex-U.S.A. Index, 12% ICE Bank of America U.S. High Yield Index*, and 48% Bloomberg Barclays U.S. Aggregate Bond Index. |
| * | | Formerly known as ICE Bank of America Merrill Lynch U.S. High Yield Master II Index. |
The expense ratios of the portfolio, both net (including any fee waivers or expense limitations) and gross (excluding any fee waivers or expense limitations), are set forth according to the most recent publicly available prospectuses for the fund and may differ from the expense ratios disclosed in the financial highlights tables in this report. For Class 1 and Class R6 shares the gross expenses are 0.73% and 0.69%, respectively, and the net expenses are 0.72% and 0.68%, respectively. Net expenses reflect contractual expense limitations in effect until December 31, 2020 and are subject to change. Had the contractual fee waivers and expense limitations not been in place, gross expenses would apply.
15
Real Estate Securities Fund
Subadvisor: DWS Investment Management Americas Inc.
Portfolio Managers: Robert Thomas, John W. Vojticek, David W. Zonavetch, CPA
INVESTMENT OBJECTIVE & POLICIES > The fund seeks to achieve a combination of long-term capital appreciation and current income. Under normal market conditions, the fund invests at least 80% of its net assets (plus any borrowings for investment purposes) in equity securities of real estate investment trusts (REITs) and real estate companies.
CHANGE IN VALUE OF $10,000 INVESTMENT AND COMPARATIVE INDEX
| Portfolio Composition* | | | | % of Total |
|---|
| | | | | 30.4 | |
| | | | | 19.5 | |
| | | | | 16.6 | |
| | | | | 12.8 | |
| | | | | 10.2 | |
| | | | | 7.3 | |
| | | | | 2.2 | |
Short-term investments and other | | | | | 1.0 | |
* As a percentage of net assets.
PORTFOLIO MANAGERS’ COMMENTARY
Performance > For the year ended August 31, 2020, the Real Estate Securities Fund Class 1 shares declined 9.75% and the MSCI U.S. REIT Index declined 12.63%.
Environment > Over the past one-year, U.S. REITs underperformed the broader equity market (as represented by the S&P 500 Index). To start Q4 2019, the S&P capped off a solid 2019 calendar year to achieve its best annual gain in 6 years. Sustained optimism over a ‘Phase One’ U.S./China trade deal, that called for a reduction in U.S. tariffs in exchange for purchase commitments from China helped to keep global equities well-bid. The Federal Reserve held rates steady, citing a reduced probability of both a U.S./China trade war and a disorderly Brexit, despite weak U.S. manufacturing data. However, in the final days of December, tensions between the U.S. and Iran mounted leading up to the targeted killing of Iranian major general Qassem Soleimani on January 3rd, marking a volatile start to a U.S. election year, prompting a bid for safe havens, and sending oil prices soaring. However, these fears receded during the first quarter of 2020 in the wake of the global spread of COVID-19, which prompted unprecedented shutdowns in a bid to slow the spread of the outbreak. Equity markets sold off sharply. In response, the Federal Reserve promised unlimited quantitative easing and the U.S. Senate approved the largest emergency aid package in history. REITs were not spared, with the Retail, Malls, and Hotels sectors, along with the more service-oriented Net Lease sector, the hardest hit as containment efforts drastically restrict travel and consumer activity. However, markets quickly launched a recovery off of March lows, pushing steadily higher as investors bet on a swift recovery despite mixed economic data and a string of poor earnings reports. Rising tensions between the U.S. and China, a surge in new COVID-19 cases across the U.S., and cautionary comments from Federal Reserve Chairman Jerome Powell weighed on markets in June, but ticked upwards once more in July as macro data continued to improve, despite culminating in a record-breaking plunge in Q2 GDP. During the month of August, macroeconomic indicators such as break-even inflation, credit spreads, the U.S. dollar, and gold continued to move in a direction that is favorable to risk despite stimulus concerns. In a historic move, the Federal Reserve established an explicit inflation averaging framework. In response, various equity indices notched all-time highs as markets continued to exhibit resilience. For the REITs, Hotels and Malls surged on market optimism and continued re-opening progress. Data Centers and Industrial pulled back after a standout July while Office lagged as rationalization of space needs continues to pressure the sector.
For the annual reporting period ending August 31, 2020, the fund outperformed its benchmark. Relative outperformance was the result of both strong stock selection and sector allocation effects. Over the one-year period, performance was driven by positive sector allocation effects. The underweights to the Regional Malls and Hotels sectors and the overweights to the Towers and Data Centers sectors were the top contributors from an allocation perspective. Partially offsetting this was the average overweight to the traditionally defensive Net Lease sector, which was hit hard given exposure to tenants with service-oriented business models who were among the last to be allowed to reopen due to COVID-19. Stock selection was also strong, particularly amongst Office, Apartments, Healthcare, and Self Storage names. Weak selection across Industrial and Hotels partially offset this.
| | | | | | | | | | | | |
|---|
PERFORMANCE TABLE1,2
|
|
|
| Average Annual Total Return
|
| Cumulative Total Return
|
|
|---|
Periods Ending August 31, 2020 | | | | | 1-year | | | | 5-year | | | | 10-year | | | | 5-year | | | | 10-year | |
Real Estate Securities Fund Class 1 | | | | | –9.75 | | | | 7.02 | | | | 9.43 | | | | 40.41 | | | | 146.21 | |
| | | | | –12.63 | | | | 5.29 | | | | 8.72 | | | | 29.42 | | | | 130.64 | |
| 1 | | Performance does not reflect the deduction of taxes on fund distributions or redemptions of fund shares. Past performance does not guarantee future results. |
| 2 | | Since inception, a portion of the Real Estate Securities Fund expenses was reimbursed. If such expenses had not been reimbursed, returns would be lower. |
| 3 | | The MSCI U.S. REIT Index is an unmanaged index consisting of the most actively traded REITs. |
| 4 | | It is not possible to invest directly in an index. Index figures do not reflect expenses or sales charges, which would result in lower returns. |
The expense ratios of the fund, both net (including any fee waivers or expense limitations) and gross (excluding any fee waivers or expense limitations), are set forth according to the most recent publicly available prospectus for the fund and may differ from the expense ratios disclosed in the financial highlights tables in this report. For Class 1 shares the gross expenses are 0.81% and the net expenses are 0.80%. Net expenses reflect contractual expense limitations in effect until July 31, 2022 and are subject to change. Had the contractual fee waivers and expense limitations not been in place, gross expenses would apply.
16
Science & Technology Fund
Subadvisors: Allianz Global Investors U.S., LLC and T. Rowe Price Associates Inc.
Portfolio Managers: Huachen Chen (Allianz), Walter C. Price (Allianz), Michael A. Seidenberg (Allianz), Ken Allen (T. Rowe)
INVESTMENT OBJECTIVE & POLICIES > The fund seeks long-term growth of capital. Current income is incidental to the fund’s objective. Under normal market conditions, the fund invests at least 80% of its net assets (plus any borrowings for investment purposes) in the common stocks of companies expected to benefit from the development, advancement, and/or use of science and technology.
CHANGE IN VALUE OF $10,000 INVESTMENT AND COMPARATIVE INDEXES
| Sector Composition* | | | | % of Total |
|---|
| | | | | 56.8 | |
| | | | | 18.3 | |
| | | | | 17.7 | |
| | | | | 1.3 | |
| | | | | 0.4 | |
| | | | | 0.2 | |
Short-term investments and other | | | | | 5.3 | |
* As a percentage of net assets.
PORTFOLIO MANAGERS’ COMMENTARY
Performance > For the year ended August 31, 2020, the Science & Technology Fund Class NAV shares returned 47.55% and the Lipper Science & Technology Index returned 42.87%.
Environment > Overall, U.S. stocks posted robust gains for the 12-month period ended August 31, 2020. In March, U.S. stocks suffered their worst declines since the financial crisis in late 2008 as the accelerating coronavirus pandemic led to the shutdown of significant portions of the global economy, which created extraordinary market volatility on several occasions during the period. The declines brought a decisive end to the record-long bull market that began in 2009. However, stocks rebounded beginning in late March following the passage of emergency monetary and fiscal measures in response to the rapid economic contraction. Over the ensuing months, progress in the battle against the coronavirus boosted markets, with infection rates, hospitalizations, and deaths beginning to decline in many hard-hit areas of the country. The turnaround encouraged the nation’s governors to begin the gradual reopening of businesses and public facilities. Technology companies continued to demonstrate strong earnings growth and delivered stronger stock returns relative to the broad market.
Allianz Global Investors U.S. LLC
The fund has benefited from strong performance among several mid-sized, high-growth software companies including RingCentral, Inc. and Zscaler, Inc.. These companies continue to see increasing demand for innovative software services as the move to cloud computing and Software-as-a-Service solutions continues to accelerate. Additionally, not owning Cisco Systems and overweights to Advanced Micro Devices, Inc. and Tesla, Inc. helped relative performance.
Conversely, the underweight position to Apple, Inc., the benchmark’s largest position, was the largest relative detractor. The stock rose sharply due to optimism around the upcoming 5G smartphone cycle and strong growth in Apple’s services business. The fund’s overweight positions in Paycom Software, Inc. and Alteryx, Inc. detracted from relative performance, as both companies faced near term headwinds due to COVID-19. Lastly, overweight positions in semiconductor companies, Samsung Electronics Company, Ltd. and Micron Technology, Inc., also weighed on relative performance.
T. Rowe Price Associates, Inc.
IT services subsector contributed the most to relative performance due to an underweight allocation and favorable stock picks. We initiated a position in Wix.com, Ltd., a leading provider of solutions for do-it-yourself Web design, midway through the period. The company benefited from increased user engagement as social distancing measures accelerated the need for businesses to have an online presence in order to reach consumers. As a relatively low-cost provider of Web design services, Wix.com has experienced a surge in free customers, conversions to paid accounts, and increased consumption of online payments and other features. These tailwinds have more than offset customer losses stemming from the financial pressures suffered by small to mid-size businesses.
Not owning any telecom equipment names lifted the fund’s relative returns. We tend to find fewer opportunities in telecom equipment, as we believe that intense competition, commodified products, and the drag from maturing business lines make this subsector a less fertile hunting ground for sustainable businesses that are on the right side of innovation. Likewise, not owning any names within the financial services subsector aided relative results. We acknowledge that lasting behavioral shifts driven by the health crisis could boost the prospects of this subsector by accelerating the uptake of electronic payments and online shopping. However, in light of near-term uncertainties caused by the coronavirus pandemic, we prefer other areas of the market that we believe feature a more compelling risk/reward profile.
Hardware subsector detracted the most from relative performance due to security choices and an underweight allocation. In particular, not owning Apple was detrimental. Our decision to stand aside on Apple reflected what we regard as a demanding valuation and our preference for businesses that we believe can sustain higher levels of growth in the coming years.
Stock selection in the internet subsector also hurt relative results, though our overweight allocation was beneficial. Trip.com Group, Ltd. (formerly Ctrip.com International) is China’s dominant online provider of travel services. The stock sold off sharply in March as the coronavirus pandemic depressed demand for domestic and international travel. Near-term challenges aside, we value Trip.com’s potential to compound free cash flow over the long haul as demand for travel grows with household incomes in China. Shares of Booking Holdings, Inc. plunged along with the online travel market in response to the spread of the coronavirus pandemic. Although we acknowledge the massive challenges that Booking Holdings faces in the current environment, we believe that the company has the market position and the balance sheet to emerge in a stronger competitive position when travel demand ultimately recovers.
| | | | | | | | | | | | | | | | |
|---|
PERFORMANCE TABLE1,2
|
|
|
| Average Annual Total Return
|
| Cumulative Total Return
|
|
|---|
Periods Ending August 31, 2020 | | | | | 1-year | | | | 5-year | | | | 10-year | | | | Since
Inception | | | | 5-year | | | | 10-year | | | | Since
Inception | |
Science & Technology Fund Class NAV (began 2/14/13) | | | | | 47.55 | | | | 24.89 | | | | — | | | | 22.05 | | | | 203.78 | | | | — | | | | 349.75 | |
| | | | | 21.94 | | | | 14.46 | | | | — | | | | 14.00 | | | | 96.47 | | | | — | | | | 168.70 | |
Lipper Science & Technology Index4,5 | | | | | 42.87 | | | | 22.72 | | | | — | | | | 20.16 | | | | 178.29 | | | | — | | | | 299.73 | |
| 1 | | Performance does not reflect the deduction of taxes on fund distributions or redemptions of fund shares. Past performance does not guarantee future results. |
| 2 | | Since inception, a portion of the Science & Technology Fund expenses was reimbursed. If such expenses had not been reimbursed, returns would be lower. |
| 3 | | S&P 500 Index is an unmanaged index that includes 500 widely traded stocks. |
| 4 | | It is not possible to invest directly in an index. Index figures do not reflect expenses or sales charges, which would result in lower returns. |
| 5 | | The Lipper Science & Technology Index consists of the 30 largest funds in the Lipper peer category that invest primarily in the equity securities of domestic companies engaged in science and technology. |
The expense ratios of the fund, both net (including any fee waivers or expense limitations) and gross (excluding any fee waivers or expense limitations), are set forth according to the most recent publicly available prospectus for the fund and may differ from the expense ratios disclosed in the financial highlights tables in this report. For Class NAV shares, the gross expense is 1.12% and the net expense is 1.11%. Net expenses reflect contractual expense limitations in effect until July 31, 2022 and are subject to change. Had the contractual fee waivers and expense limitations not been in place, gross expenses would apply.
17
Strategic Equity Allocation Fund
Subadvisor: Manulife Investment Management (US) LLC
Portfolio Manager: Nathan W. Thooft, CFA and Matthew Murphy, CFA
INVESTMENT OBJECTIVE & POLICIES > The fund seeks capital appreciation. The fund seeks to achieve its objective by investing under normal market conditions at least 80% of its net assets (plus any borrowings for investment purposes) in U.S. and foreign equity securities of any market capitalization, including futures on indexes of equity securities.
CHANGE IN VALUE OF $10,000 INVESTMENT AND COMPARATIVE INDEXES
| Sector Composition* | | | | % of Total |
|---|
| | | | | 21.8 | |
| | | | | 15.3 | |
| | | | | 13.1 | |
| | | | | 11.5 | |
| | | | | 9.4 | |
| | | | | 9.3 | |
| | | | | 6.5 | |
| | | | | 4.2 | |
| | | | | 2.5 | |
| | | | | 2.3 | |
| | | | | 2.2 | |
Short-term investments and other | | | | | 1.9 | |
* As a percentage of net assets.
PORTFOLIO MANAGER’S COMMENTARY
Performance > For the year ended August 31, 2020, the Strategic Equity Allocation Fund Class NAV shares returned 14.54% and a blend of 70% Russell 3000 Index and 30% MSCI AC World ex-U.S.A. Index returned 17.42%.
Environment > U.S. equities posted gains over the period despite significant volatility triggered by the global spread of COVID-19. The virus proved to be highly infectious and, by the end of March, had become a global pandemic. The social distancing required to combat the pandemic led to widespread work stoppages. Unemployment soared to levels not seen since the Great Depression and the widely followed S&P 500 Index entered “bear-market” territory in March, less than a month after reaching an all-time high.
Foreign stocks in developed markets reacted similarly to their U.S. counterparts, with a steep first-quarter decline followed by an impressive recovery. However, these markets derived much less benefit from the strength of the information technology sector and lagged the U.S. market. As of August 31, 2020, information technology had the largest weighting among the 11 sectors in the S&P 500, and posted a relatively strong return over the period. The MSCI EAFE Index had only single-digit exposure to the information technology sector, and posted a much more modest return in the sector. Emerging markets equities finished stronger than those of international developed markets, but still lagged the S&P 500.
In the bond market, Treasury yields were fairly stable through the end of 2019, but plunged in the first quarter of 2020, as it quickly became apparent that the U.S. economy was entering a recession. This ended the longest period of U.S. economic expansion on record. Over the period, longer-dated Treasuries strongly outperformed. Corporate debt performed relatively well, except in the first quarter, when widespread shutdowns fueled concerns about revenue and earnings.
From an asset allocation perspective, an underweight position to U.S. mid-capitalization equities (versus large cap and small cap equities) contributed to returns. Conversely, an overweight position in international markets relative to the U.S. detracted from returns.
| | | | | | | | | | | | | | | | |
|---|
PERFORMANCE TABLE1,2
|
|
|
| Average Annual Total Return
|
| Cumulative Total Return
|
|
|---|
Periods Ending August 31, 2020 | | | | | 1-year | | | | 5-year | | | | 10-year | | | | Since
Inception | | | | 5-year | | | | 10-year | | | | Since
Inception | |
Strategic Equity Allocation Fund Class NAV (began 4/13/12) | | | | | 14.54 | | | | 9.91 | | | | — | | | | 10.18 | | | | 60.41 | | | | — | | | | 125.28 | |
| | | | | 21.94 | | | | 14.46 | | | | — | | | | 14.19 | | | | 96.47 | | | | — | | | | 203.87 | |
| | | | | 17.42 | | | | 11.43 | | | | — | | | | 11.26 | | | | 71.80 | | | | — | | | | 144.54 | |
| 1 | | Performance does not reflect the deduction of taxes on fund distributions or redemptions of fund shares. Past performance does not guarantee future results. |
| 2 | | Since inception, a portion of the Strategic Equity Allocation Fund expenses was reimbursed. If such expenses had not been reimbursed, returns would be lower. |
| 3 | | The S&P 500 Index is an unmanaged index that includes 500 widely traded common stocks. |
| 4 | | It is not possible to invest directly in an index. Index figures do not reflect expenses or sales charges, which would result in lower returns. |
| 5 | | The Blended Index is composed of 70% Russell 3000 Index and 30% MSCI AC World ex-U.S.A. Index. |
The expense ratios of the fund, both net (including any fee waivers or expense limitations) and gross (excluding any fee waivers or expense limitations), are set forth according to the most recent publicly available prospectus for the fund and may differ from the expense ratios disclosed in the financial highlights tables in this report. For Class NAV shares, the gross expense is 0.68% and the net expense is 0.67%. Net expenses reflect contractual expense limitations in effect until July 31, 2022 and are subject to change. Had the contractual fee waivers and expense limitations not been in place, gross expenses would apply.
18
U.S. Sector Rotation Fund (formerly U.S. Strategic Equity Allocation Fund)
Subadvisor: Manulife Investment Management (US) LLC
Portfolio Manager: Nathan W. Thooft, CFA and Matthew Murphy, CFA
INVESTMENT OBJECTIVE & POLICIES > The fund seeks capital appreciation. The fund seeks to achieve its objective by investing under normal market conditions at least 80% of its net assets (plus any borrowings for investment purposes) in U.S. equity securities of any market capitalization, including futures on indexes of equity securities.
CHANGE IN VALUE OF $10,000 INVESTMENT AND COMPARATIVE INDEX
| Sector Composition* | | | | % of Total |
|---|
| | | | | 30.1 | |
| | | | | 17.2 | |
| | | | | 12.5 | |
| | | | | 10.7 | |
| | | | | 8.0 | |
| | | | | 7.7 | |
| | | | | 5.1 | |
| | | | | 2.0 | |
| | | | | 1.8 | |
| | | | | 1.3 | |
| | | | | 1.3 | |
Short-term investments and other | | | | | 2.3 | |
* As a percentage of net assets.
PORTFOLIO MANAGER’S COMMENTARY
Performance > For the year ended August 31, 2020, the U.S. Sector Rotation Fund Class NAV shares returned 20.74% and the S&P 500 Index returned 21.94%
Environment > U.S. equities posted gains over the period despite significant volatility triggered by the global spread of COVID-19. The virus proved to be highly infectious and, by the end of March, had become a global pandemic. The social distancing required to combat the pandemic led to widespread work stoppages. Unemployment soared to levels not seen since the Great Depression and the widely followed S&P 500 Index entered “bear-market” territory in March, less than a month after reaching an all-time high.
Foreign stocks in developed markets reacted similarly to their U.S. counterparts, with a steep first-quarter decline followed by an impressive recovery. These markets derived much less benefit from the strength of the Information Technology sector, however, and lagged the U.S. market. As of August 31, 2020, Information Technology had the largest weighting among the 11 sectors in the S&P 500, and posted a relatively strong return over the period. The MSCI EAFE Index had only single-digit exposure to the Information Technology sector, and posted a much more modest return in the sector. Emerging markets equities finished stronger than those of international developed markets, but still lagged the S&P 500.
In the bond market, Treasury yields were fairly stable through the end of 2019, but plunged in the first quarter of 2020, as it quickly became apparent that the U.S. economy was entering a recession. This ended the longest period of U.S. economic expansion on record. Over the period, longer-dated Treasuries strongly outperformed. Corporate debt performed relatively well, except in the first quarter, when widespread shutdowns fueled concerns about revenue and earnings.
From an asset allocation perspective, underweight positions in the Consumer Staples and Financials sectors detracted from returns.
Underweight positions in the Industrials and Health Care sectors, as well as an overweight position in the Information Technology sector, contributed to returns.
| | | | | | | | | | | | | | | | |
|---|
PERFORMANCE TABLE1,2
|
|
|
| Average Annual Total Return
|
| Cumulative Total Return
|
|
|---|
Periods Ending August 31, 2020 | | | | | 1-year | | | | 5-year | | | | 10-year | | | | Since
Inception | | | | 5-year | | | | 10-year | | | | Since
Inception | |
U.S. Strategic Equity Allocation Fund Class NAV
(began 9/26/16) | | | | | 20.74 | | | | — | | | | — | | | | 14.14 | | | | — | | | | — | | | | 68.22 | |
| | | | | 21.94 | | | | — | | | | — | | | | 15.28 | | | | — | | | | — | | | | 74.88 | |
| | | | | 21.44 | | | | — | | | | — | | | | 14.74 | | | | — | | | | — | | | | 71.72 | |
| * | | Prior to September 20, 2019, the fund’s primary benchmark was the Russell 3000 Index. Effective September 20, 2019, the fund’s primary benchmark index is the S&P 500 Index. The S&P 500 Index better reflects the universe of investment opportunities based on the fund’s investment strategy. |
| 1 | | Performance does not reflect the deduction of taxes on fund distributions or redemptions of fund shares. Past performance does not guarantee future results. |
| 2 | | Since inception, a portion of the U.S. Strategic Equity Allocation Fund expenses was reimbursed. If such expenses had not been reimbursed, returns would be lower. |
| 3 | | The S&P 500 Index is an unmanaged index that includes 500 widely traded common stocks. |
| 4 | | The Russell 3000 Index is an unmanaged index of the 3,000 largest U.S. companies based on total market capitalization, which represents approximately 98% of the investable U.S. equity market. |
| 5 | | It is not possible to invest directly in an index. Index figures do not reflect expenses or sales charges, which would result in lower returns. |
The expense ratios of the fund, both net (including any fee waivers or expense limitations) and gross (excluding any fee waivers or expense limitations), are set forth according to the most recent publicly available prospectus for the fund and may differ from the expense ratios disclosed in the financial highlights tables in this report. For Class NAV shares, the gross expense is 0.65% and the net expense is 0.64%. Net expenses reflect contractual expense limitations in effect until July 31, 2022 and are subject to change. Had the contractual fee waivers and expense limitations not been in place, gross expenses would apply.
19
John Hancock Funds II
Shareholder expense example
As a shareholder of John Hancock Funds II, you incur ongoing costs, such as management fees, distribution (Rule 12b-1) fees and other expenses. In the case of Multi-Index Lifestyle Aggressive Portfolio, Multi-Index Lifestyle Balanced Portfolio, Multi-Index Lifestyle Conservative Portfolio, Multi-Index Lifestyle Growth Portfolio and Multi-Index Lifestyle Moderate Portfolio, in addition to the operating expenses which the portfolio bears directly, the portfolio indirectly bears a pro rata share of the operating expenses of the underlying funds in which the portfolio invests. Because the underlying funds have varied operating expenses and transaction costs and the portfolio may own different proportions of the underlying funds at different times, the amount of expenses incurred indirectly by the portfolio will vary. If these indirect expenses were included, your expenses paid during the period would have been higher.
These examples are intended to help you understand your ongoing costs (in dollars) of investing in a fund so you can compare these costs with the ongoing costs of investing in other mutual funds. The examples are based on an investment of $1,000 at the beginning of the period and held for the entire period (March 1, 2020 through August 31, 2020).
Actual expenses:
The first line of each share class in the following table provides information about actual account values and actual expenses. You may use the information in this line, together with the amount you invested, to estimate the expenses that you paid over the period. Simply divide your account value by $1,000 (for example, an $8,600 account value divided by $1,000 = 8.6), then multiply the result by the number in the first line under the heading entitled “Expenses paid during period ended” to estimate the expenses you paid on your account during this period.
Hypothetical example for comparison purposes:
The second line of each share class in the following table provides information about hypothetical account values and hypothetical expenses based on the actual expense ratio for the share class and an assumed annualized rate of return of 5% per year before expenses, which is not the actual return of the share class. The hypothetical account values and expenses may not be used to estimate the actual ending account balance or expenses you paid for the period. You may use this information to compare the ongoing costs of investing in a fund and other funds. To do so, compare this 5% hypothetical example with the 5% hypothetical examples that appear in the shareholder reports of the other funds. Please remember that these hypothetical account values and expenses may not be used to estimate the actual ending account balance or expenses you paid for the period.
Please note that the expenses shown in the table are meant to highlight your ongoing costs only and do not reflect any transactional costs and insurance-related charges. Therefore, the second line of each share class in the table is useful in comparing ongoing costs only, and will not help you determine the relative total costs of owning different funds. In addition, if these transactional costs were included, your costs would have been higher.
| | | Account
value on
3-1-2020 | Ending
value on
8-31-2020 | Expenses
paid during
period ended
8-31-20201 | Annualized
expense
ratio |
| Capital Appreciation Fund |
| Class 1 | Actual expenses/actual returns | $1,000.00 | $1,486.40 | $4.94 | 0.79% |
| | Hypothetical example | 1,000.00 | 1,021.20 | 4.01 | 0.79% |
| Class NAV | Actual expenses/actual returns | 1,000.00 | 1,487.40 | 4.63 | 0.74% |
| | Hypothetical example | 1,000.00 | 1,021.40 | 3.76 | 0.74% |
| Capital Appreciation Value Fund |
| Class NAV | Actual expenses/actual returns | $1,000.00 | $1,104.70 | $4.39 | 0.83% |
| | Hypothetical example | 1,000.00 | 1,021.00 | 4.22 | 0.83% |
| Health Sciences Fund |
| Class NAV | Actual expenses/actual returns | $1,000.00 | $1,204.30 | $5.82 | 1.05% |
| | Hypothetical example | 1,000.00 | 1,019.90 | 5.33 | 1.05% |
| International Strategic Equity Allocation Fund |
| Class NAV | Actual expenses/actual returns | $1,000.00 | $1,079.10 | $2.93 | 0.56% |
| | Hypothetical example | 1,000.00 | 1,022.30 | 2.85 | 0.56% |
| International Value Fund |
| Class 1 | Actual expenses/actual returns | $1,000.00 | $1,044.00 | $5.24 | 1.02% |
| | Hypothetical example | 1,000.00 | 1,020.00 | 5.18 | 1.02% |
| Class NAV | Actual expenses/actual returns | 1,000.00 | 1,044.10 | 4.98 | 0.97% |
| | Hypothetical example | 1,000.00 | 1,020.30 | 4.93 | 0.97% |
| Mid Cap Stock Fund |
| Class 1 | Actual expenses/actual returns | $1,000.00 | $1,386.30 | $5.52 | 0.92% |
| | Hypothetical example | 1,000.00 | 1,020.50 | 4.67 | 0.92% |
| Class NAV | Actual expenses/actual returns | 1,000.00 | 1,386.70 | 5.22 | 0.87% |
| | Hypothetical example | 1,000.00 | 1,020.80 | 4.42 | 0.87% |
John Hancock Funds II
Shareholder expense example
| | | Account
value on
3-1-2020 | Ending
value on
8-31-2020 | Expenses
paid during
period ended
8-31-20201 | Annualized
expense
ratio |
| Mid Value Fund |
| Class NAV | Actual expenses/actual returns | $1,000.00 | $1,075.80 | $4.90 | 0.94% |
| | Hypothetical example | 1,000.00 | 1,020.40 | 4.77 | 0.94% |
| Multi-Index Lifestyle Aggressive Portfolio |
| Class R6 | Actual expenses/actual returns | $1,000.00 | $1,125.40 | $1.39 | 0.26% 2 |
| | Hypothetical example | 1,000.00 | 1,023.80 | 1.32 | 0.26% 2 |
| Class 1 | Actual expenses/actual returns | 1,000.00 | 1,125.50 | 1.55 | 0.29% 2 |
| | Hypothetical example | 1,000.00 | 1,023.70 | 1.48 | 0.29% 2 |
| Multi-Index Lifestyle Balanced Portfolio |
| Class R6 | Actual expenses/actual returns | $1,000.00 | $1,090.40 | $1.94 | 0.37% 2 |
| | Hypothetical example | 1,000.00 | 1,023.30 | 1.88 | 0.37% 2 |
| Class 1 | Actual expenses/actual returns | 1,000.00 | 1,090.20 | 2.15 | 0.41% 2 |
| | Hypothetical example | 1,000.00 | 1,023.10 | 2.09 | 0.41% 2 |
| Multi-Index Lifestyle Conservative Portfolio |
| Class R6 | Actual expenses/actual returns | $1,000.00 | $1,051.40 | $2.63 | 0.51% 2 |
| | Hypothetical example | 1,000.00 | 1,022.60 | 2.59 | 0.51% 2 |
| Class 1 | Actual expenses/actual returns | 1,000.00 | 1,051.20 | 2.78 | 0.54% 2 |
| | Hypothetical example | 1,000.00 | 1,022.40 | 2.75 | 0.54% 2 |
| Multi-Index Lifestyle Growth Portfolio |
| Class R6 | Actual expenses/actual returns | $1,000.00 | $1,109.40 | $1.64 | 0.31% 2 |
| | Hypothetical example | 1,000.00 | 1,023.60 | 1.58 | 0.31% 2 |
| Class 1 | Actual expenses/actual returns | 1,000.00 | 1,108.50 | 1.86 | 0.35% 2 |
| | Hypothetical example | 1,000.00 | 1,023.40 | 1.78 | 0.35% 2 |
| Multi-Index Lifestyle Moderate Portfolio |
| Class R6 | Actual expenses/actual returns | $1,000.00 | $1,069.10 | $2.29 | 0.44% 2 |
| | Hypothetical example | 1,000.00 | 1,022.90 | 2.24 | 0.44% 2 |
| Class 1 | Actual expenses/actual returns | 1,000.00 | 1,068.90 | 2.50 | 0.48% 2 |
| | Hypothetical example | 1,000.00 | 1,022.70 | 2.44 | 0.48% 2 |
| Real Estate Securities Fund |
| Class 1 | Actual expenses/actual returns | $1,000.00 | $ 952.60 | $3.98 | 0.81% |
| | Hypothetical example | 1,000.00 | 1,021.10 | 4.12 | 0.81% |
| Science & Technology Fund |
| Class NAV | Actual expenses/actual returns | $1,000.00 | $1,362.90 | $6.30 | 1.06% |
| | Hypothetical example | 1,000.00 | 1,019.80 | 5.38 | 1.06% |
| Strategic Equity Allocation Fund |
| Class NAV | Actual expenses/actual returns | $1,000.00 | $1,133.90 | $2.90 | 0.54% |
| | Hypothetical example | 1,000.00 | 1,022.40 | 2.75 | 0.54% |
| U.S. Sector Rotation Fund |
| Class NAV | Actual expenses/actual returns | $1,000.00 | $1,183.70 | $2.96 | 0.54% |
| | Hypothetical example | 1,000.00 | 1,022.40 | 2.75 | 0.54% |
| 1 | Expenses are equal to the annualized expense ratio, multiplied by the average account value over the period, multiplied by 184/366 (to reflect the one-half year period). |
| 2 | Ratios do not include expenses indirectly incurred by the underlying funds and can vary based on the mix of underlying funds held by the portfolios. |
John Hancock Funds II
Portfolio of Investments — August 31, 2020 (showing percentage of total net assets)
Capital Appreciation Fund
| | | Shares or
Principal
Amount | | Value |
| COMMON STOCKS – 100.5% | | | |
| Communication services – 15.3% | | | | | |
| Entertainment – 4.6% | | | |
| Netflix, Inc. (A) | | 146,506 | | $ | 77,583,717 |
| Spotify Technology SA (A) | | 80,326 | | | 22,664,784 |
| | | | | | 100,248,501 |
| Interactive media and services – 10.7% | | | |
| Alphabet, Inc., Class A (A) | | 25,970 | | | 42,318,894 |
| Alphabet, Inc., Class C (A) | | 25,932 | | | 42,377,556 |
| Facebook, Inc., Class A (A) | | 333,591 | | | 97,808,881 |
| Match Group, Inc. (A) | | 270,455 | | | 30,204,414 |
| Tencent Holdings, Ltd. | | 310,867 | | | 21,237,922 |
| | | | | | 233,947,667 |
| | | | | | 334,196,168 |
| Consumer discretionary – 25.6% | | | | | |
| Automobiles – 7.7% | | | |
| Tesla, Inc. (A) | | 338,270 | | | 168,566,704 |
| Hotels, restaurants and leisure – 1.4% | | | |
| Chipotle Mexican Grill, Inc. (A) | | 23,589 | | | 30,908,195 |
| Internet and direct marketing retail – 9.9% | | | |
| Alibaba Group Holding, Ltd., ADR (A) | | 77,419 | | | 22,221,576 |
| Amazon.com, Inc. (A) | | 53,396 | | | 184,267,460 |
| Wayfair, Inc., Class A (A)(B) | | 34,722 | | | 10,297,156 |
| | | | | | 216,786,192 |
| Specialty retail – 2.3% | | | |
| Carvana Company (A)(B) | | 84,037 | | | 18,148,631 |
| The Home Depot, Inc. | | 110,142 | | | 31,394,876 |
| | | | | | 49,543,507 |
| Textiles, apparel and luxury goods – 4.3% | | | |
| Kering SA | | 34,475 | | | 21,152,610 |
| Lululemon Athletica, Inc. (A) | | 128,248 | | | 48,178,926 |
| NIKE, Inc., Class B | | 211,014 | | | 23,610,356 |
| | | | | | 92,941,892 |
| | | | | | 558,746,490 |
| Consumer staples – 2.6% | | | | | |
| Food and staples retailing – 1.4% | | | |
| Costco Wholesale Corp. | | 87,981 | | | 30,587,474 |
| Personal products – 1.2% | | | |
| The Estee Lauder Companies, Inc., Class A | | 118,001 | | | 26,163,182 |
| | | | | | 56,750,656 |
| Financials – 2.2% | | | | | |
| Capital markets – 2.2% | | | |
| S&P Global, Inc. | | 69,337 | | | 25,406,464 |
| The Goldman Sachs Group, Inc. | | 107,026 | | | 21,926,417 |
| | | | | | 47,332,881 |
| Health care – 7.8% | | | | | |
| Biotechnology – 1.4% | | | |
| Sarepta Therapeutics, Inc. (A) | | 43,207 | | | 6,326,369 |
| Vertex Pharmaceuticals, Inc. (A) | | 82,465 | | | 23,017,631 |
| | | | | | 29,344,000 |
| Health care equipment and supplies – 1.8% | | | |
| Danaher Corp. | | 58,342 | | | 12,045,873 |
| DexCom, Inc. (A) | | 44,597 | | | 18,972,010 |
| Intuitive Surgical, Inc. (A) | | 12,243 | | | 8,947,674 |
| | | | | | 39,965,557 |
| Health care providers and services – 0.8% | | | |
| Guardant Health, Inc. (A) | | 61,380 | | | 5,861,790 |
| Humana, Inc. | | 24,973 | | | 10,368,040 |
| | | | | | 16,229,830 |
Capital Appreciation Fund (continued)
| | | Shares or
Principal
Amount | | Value |
| COMMON STOCKS (continued) | | | |
| Health care technology – 1.0% | | | |
| Teladoc Health, Inc. (A)(B) | | 104,374 | | $ | 22,512,428 |
| Life sciences tools and services – 0.5% | | | |
| Illumina, Inc. (A) | | 30,547 | | | 10,911,999 |
| Pharmaceuticals – 2.3% | | | |
| AstraZeneca PLC, ADR | | 565,026 | | | 31,641,456 |
| Eli Lilly & Company | | 123,443 | | | 18,317,707 |
| | | | | | 49,959,163 |
| | | | | | 168,922,977 |
| Industrials – 2.3% | | | | | |
| Road and rail – 2.3% | | | |
| Uber Technologies, Inc. (A) | | 784,217 | | | 26,373,218 |
| Union Pacific Corp. | | 125,281 | | | 24,109,076 |
| | | | | | 50,482,294 |
| Information technology – 44.2% | | | | | |
| IT services – 14.4% | | | |
| Adyen NV (A)(C) | | 25,683 | | | 43,292,611 |
| Mastercard, Inc., Class A | | 180,766 | | | 64,748,574 |
| PayPal Holdings, Inc. (A) | | 238,497 | | | 48,686,778 |
| Shopify, Inc., Class A (A) | | 51,367 | | | 54,778,796 |
| Twilio, Inc., Class A (A) | | 146,783 | | | 39,596,182 |
| Visa, Inc., Class A | | 306,374 | | | 64,948,224 |
| | | | | | 316,051,165 |
| Semiconductors and semiconductor equipment – 3.8% | | | |
| NVIDIA Corp. | | 154,168 | | | 82,476,797 |
| Software – 19.5% | | | |
| Adobe, Inc. (A) | | 118,495 | | | 60,834,148 |
| Atlassian Corp. PLC, Class A (A) | | 111,055 | | | 21,295,907 |
| Coupa Software, Inc. (A) | | 76,090 | | | 24,937,737 |
| Crowdstrike Holdings, Inc., Class A (A) | | 172,582 | | | 21,698,735 |
| Microsoft Corp. | | 495,761 | | | 111,808,978 |
| RingCentral, Inc., Class A (A) | | 74,449 | | | 21,647,536 |
| salesforce.com, Inc. (A) | | 237,750 | | | 64,822,538 |
| ServiceNow, Inc. (A) | | 40,934 | | | 19,731,007 |
| Splunk, Inc. (A) | | 161,495 | | | 35,420,698 |
| The Trade Desk, Inc., Class A (A) | | 37,586 | | | 18,090,142 |
| Workday, Inc., Class A (A) | | 104,856 | | | 25,135,032 |
| | | | | | 425,422,458 |
| Technology hardware, storage and peripherals – 6.5% | | | |
| Apple, Inc. | | 1,096,708 | | | 141,519,200 |
| | | | | | 965,469,620 |
| Real estate – 0.5% | | | | | |
| Equity real estate investment trusts – 0.5% | | | |
| American Tower Corp. | | 46,992 | | | 11,708,057 |
| TOTAL COMMON STOCKS (Cost $688,429,440) | | $ | 2,193,609,143 |
| SHORT-TERM INVESTMENTS – 2.3% | | | |
| Short-term funds – 2.3% | | | | | |
| John Hancock Collateral Trust, 0.2611% (D)(E) | | 4,007,723 | | | 40,120,111 |
| State Street Institutional U.S. Government Money Market Fund, Premier Class, 0.0399% (D) | | 9,592,081 | | | 9,592,081 |
| TOTAL SHORT-TERM INVESTMENTS (Cost $49,710,836) | | $ | 49,712,192 |
Total Investments (Capital Appreciation Fund)
(Cost $738,140,276) – 102.8% | | $ | 2,243,321,335 |
| Other assets and liabilities, net – (2.8%) | | | (60,047,832) |
| TOTAL NET ASSETS – 100.0% | | $ | 2,183,273,503 |
| Security Abbreviations and Legend |
| ADR | American Depositary Receipt |
| (A) | Non-income producing security. |
| The accompanying notes are an integral part of the financial statements. | 22 | |
John Hancock Funds II
Portfolio of Investments — August 31, 2020 (showing percentage of total net assets)
Capital Appreciation Fund (continued)
| (B) | All or a portion of this security is on loan as of 8-31-20. |
| (C) | These securities are exempt from registration under Rule 144A of the Securities Act of 1933. Such securities may be resold, normally to qualified institutional buyers, in transactions exempt from registration. |
| (D) | The rate shown is the annualized seven-day yield as of 8-31-20. |
| (E) | Investment is an affiliate of the fund, the advisor and/or subadvisor. This security represents the investment of cash collateral received for securities lending. |
Capital Appreciation Value Fund
| | | Shares or
Principal
Amount | | Value |
| COMMON STOCKS – 67.6% | | | |
| Communication services – 4.8% | | | | | |
| Interactive media and services – 4.8% | | | |
| Alphabet, Inc., Class A (A) | | 1,401 | | $ | 2,282,972 |
| Alphabet, Inc., Class C (A)(B) | | 28,792 | | | 47,051,311 |
| Facebook, Inc., Class A (A) | | 69,800 | | | 20,465,360 |
| | | | | | 69,799,643 |
| Consumer discretionary – 7.6% | | | | | |
| Auto components – 0.4% | | | |
| Aptiv PLC (B) | | 69,152 | | | 5,955,370 |
| Hotels, restaurants and leisure – 3.9% | | | |
| Hilton Worldwide Holdings, Inc. (B) | | 226,652 | | | 20,480,275 |
| Marriott International, Inc., Class A | | 125,257 | | | 12,890,198 |
| Yum! Brands, Inc. (B) | | 243,117 | | | 23,302,764 |
| | | | | | 56,673,237 |
| Internet and direct marketing retail – 2.8% | | | |
| Amazon.com, Inc. (A)(B) | | 11,514 | | | 39,734,353 |
| Specialty retail – 0.5% | | | |
| Ross Stores, Inc. | | 79,057 | | | 7,200,512 |
| | | | | | 109,563,472 |
| Consumer staples – 1.3% | | | | | |
| Beverages – 1.3% | | | |
| Keurig Dr. Pepper, Inc. | | 621,138 | | | 18,528,547 |
| Financials – 8.6% | | | | | |
| Banks – 4.1% | | | |
| Bank of America Corp. | | 978,772 | | | 25,193,591 |
| The PNC Financial Services Group, Inc. | | 307,472 | | | 34,190,886 |
| | | | | | 59,384,477 |
| Capital markets – 1.8% | | | |
| CME Group, Inc. (B) | | 65,994 | | | 11,606,365 |
| Intercontinental Exchange, Inc. | | 129,059 | | | 13,709,938 |
| | | | | | 25,316,303 |
| Insurance – 2.7% | | | |
| Marsh & McLennan Companies, Inc. | | 343,623 | | | 39,485,719 |
| | | | | | 124,186,499 |
| Health care – 13.0% | | | | | |
| Health care equipment and supplies – 6.2% | | | |
| Alcon, Inc. (A) | | 102,514 | | | 5,832,729 |
| Becton, Dickinson and Company (B) | | 110,130 | | | 26,736,260 |
| Boston Scientific Corp. (A) | | 442,728 | | | 18,160,703 |
| Danaher Corp. | | 137,500 | | | 28,389,625 |
| Envista Holdings Corp. (A) | | 414,749 | | | 9,949,829 |
| | | | | | 89,069,146 |
| Health care providers and services – 4.0% | | | |
| Humana, Inc. (B) | | 81,912 | | | 34,007,405 |
| UnitedHealth Group, Inc. | | 74,790 | | | 23,375,615 |
| | | | | | 57,383,020 |
| Life sciences tools and services – 2.8% | | | |
| PerkinElmer, Inc. | | 124,167 | | | 14,616,939 |
Capital Appreciation Value Fund (continued)
| | | Shares or
Principal
Amount | | Value |
| COMMON STOCKS (continued) | | | |
| Life sciences tools and services (continued) | | | |
| Thermo Fisher Scientific, Inc. | | 60,117 | | $ | 25,788,991 |
| | | | | | 40,405,930 |
| | | | | | 186,858,096 |
| Industrials – 7.1% | | | | | |
| Aerospace and defense – 0.1% | | | |
| Teledyne Technologies, Inc. (A) | | 4,965 | | | 1,557,074 |
| Commercial services and supplies – 0.5% | | | |
| Waste Connections, Inc. | | 71,569 | | | 7,159,047 |
| Industrial conglomerates – 4.1% | | | |
| General Electric Company | | 8,162,166 | | | 51,748,132 |
| Roper Technologies, Inc. (B) | | 17,987 | | | 7,683,867 |
| | | | | | 59,431,999 |
| Machinery – 2.4% | | | |
| Fortive Corp. | | 209,564 | | | 15,111,660 |
| Ingersoll Rand, Inc. (A) | | 525,917 | | | 18,438,650 |
| | | | | | 33,550,310 |
| | | | | | 101,698,430 |
| Information technology – 15.9% | | | | | |
| Electronic equipment, instruments and components – 1.2% | | | |
| TE Connectivity, Ltd. | | 170,315 | | | 16,452,429 |
| IT services – 7.2% | | | |
| Fiserv, Inc. (A) | | 387,567 | | | 38,593,922 |
| Global Payments, Inc. (B) | | 169,024 | | | 29,853,019 |
| Mastercard, Inc., Class A | | 17,169 | | | 6,149,764 |
| Visa, Inc., Class A (B) | | 139,622 | | | 29,598,468 |
| | | | | | 104,195,173 |
| Semiconductors and semiconductor equipment – 2.1% | | | |
| NXP Semiconductors NV (B) | | 240,162 | | | 30,202,773 |
| Software – 5.4% | | | |
| Microsoft Corp. (B) | | 346,600 | | | 78,168,682 |
| | | | | | 229,019,057 |
| Materials – 0.6% | | | | | |
| Chemicals – 0.6% | | | |
| Linde PLC | | 34,517 | | | 8,620,276 |
| Utilities – 8.7% | | | | | |
| Electric utilities – 5.1% | | | |
| Alliant Energy Corp. | | 201,135 | | | 10,891,460 |
| American Electric Power Company, Inc. | | 581,579 | | | 45,845,873 |
| Exelon Corp. | | 321,577 | | | 11,869,407 |
| NextEra Energy, Inc. (B) | | 18,914 | | | 5,280,221 |
| | | | | | 73,886,961 |
| Gas utilities – 0.7% | | | |
| Atmos Energy Corp. | | 101,586 | | | 10,140,315 |
| Multi-utilities – 2.9% | | | |
| Ameren Corp. | | 311,738 | | | 24,661,593 |
| NiSource, Inc. | | 775,517 | | | 17,185,457 |
| | | | | | 41,847,050 |
| | | | | | 125,874,326 |
| TOTAL COMMON STOCKS (Cost $769,068,993) | | $ | 974,148,346 |
| PREFERRED SECURITIES – 3.2% | | | | | |
| Financials – 0.2% | | | | | |
| Banks – 0.2% | | | |
| U.S. Bancorp, 5.500% | | 10,004 | | | 280,112 |
| Wells Fargo & Company, 7.500% | | 1,667 | | | 2,301,294 |
| | | | | | 2,581,406 |
| Capital markets – 0.0% | | | |
| The Charles Schwab Corp., 5.950% | | 8,000 | | | 208,880 |
| The accompanying notes are an integral part of the financial statements. | 23 | |
John Hancock Funds II
Portfolio of Investments — August 31, 2020 (showing percentage of total net assets)
Capital Appreciation Value Fund (continued)
| | | Shares or
Principal
Amount | | Value |
| PREFERRED SECURITIES (continued) | | | | | |
| Capital markets (continued) | | | |
| The Charles Schwab Corp., 6.000% | | 8,683 | | $ | 221,069 |
| | | | | | 429,949 |
| | | | | | 3,011,355 |
| Health care – 1.0% | | | | | |
| Health care equipment and supplies – 0.3% | | | |
| Boston Scientific Corp., 5.500% | | 42,341 | | | 4,947,969 |
| Life sciences tools and services – 0.7% | | | |
| Avantor, Inc., 6.250% | | 140,151 | | | 10,285,682 |
| | | | | | 15,233,651 |
| Industrials – 0.2% | | | | | |
| Machinery – 0.2% | | | |
| Fortive Corp., 5.000% | | 3,052 | | | 2,791,817 |
| Utilities – 1.8% | | | | | |
| Electric utilities – 0.8% | | | |
| Alabama Power Company, 5.000% (C) | | 31,981 | | | 895,468 |
| American Electric Power Company, Inc., 6.125% | | 32,088 | | | 1,545,358 |
| Duke Energy Corp., 5.625% | | 87,091 | | | 2,454,224 |
| NextEra Energy, Inc., 5.279% | | 79,682 | | | 3,793,660 |
| SCE Trust III (5.750% to 3-15-24, then 3 month LIBOR + 2.990%) | | 4,172 | | | 95,873 |
| SCE Trust IV (5.375% to 9-15-25, then 3 month LIBOR + 3.132%) | | 103,538 | | | 2,383,445 |
| | | | | | 11,168,028 |
| Multi-utilities – 1.0% | | | |
| CMS Energy Corp., 5.875% | | 140,644 | | | 3,857,865 |
| CMS Energy Corp., 5.875% | | 191,300 | | | 5,274,141 |
| DTE Energy Company, 5.250% | | 94,797 | | | 2,518,756 |
| NiSource, Inc. (6.500% to 3-15-24, then 5 Year CMT + 3.632%) | | 94,440 | | | 2,574,434 |
| | | | | | 14,225,196 |
| | | | | | 25,393,224 |
| TOTAL PREFERRED SECURITIES (Cost $41,231,258) | | $ | 46,430,047 |
| CORPORATE BONDS - 10.4% | | | | | |
| Communication services - 3.2% | | | | | |
| CCO Holdings LLC | | | | | |
| 4.000%, 03/01/2023 (D) | $ | 1,235,000 | | | 1,251,981 |
| 5.000%, 02/01/2028 (D) | | 7,312,000 | | | 7,732,440 |
| 5.125%, 05/01/2027 (D) | | 4,930,000 | | | 5,250,549 |
| Netflix, Inc. | | | | | |
| 4.375%, 11/15/2026 | | 4,960,000 | | | 5,519,042 |
| 4.875%, 04/15/2028 | | 5,810,000 | | | 6,725,075 |
| 5.500%, 02/15/2022 | | 350,000 | | | 368,375 |
| 5.875%, 02/15/2025 to 11/15/2028 | | 10,243,000 | | | 12,421,903 |
| 6.375%, 05/15/2029 | | 4,450,000 | | | 5,640,375 |
Sirius XM Radio, Inc.
3.875%, 08/01/2022 (D) | | 220,000 | | | 221,925 |
| T-Mobile USA, Inc. | | | | | |
| 6.000%, 03/01/2023 | | 715,000 | | | 715,894 |
| 6.500%, 01/15/2026 | | 330,000 | | | 345,469 |
| | | | | | 46,193,028 |
| Consumer discretionary - 3.1% | | | | | |
| Cedar Fair LP | | | | | |
| 5.250%, 07/15/2029 | | 2,650,000 | | | 2,568,168 |
| 5.375%, 06/01/2024 to 04/15/2027 | | 5,389,000 | | | 5,384,199 |
Hilton Domestic Operating Company, Inc.
4.250%, 09/01/2024 | | 650,000 | | | 650,813 |
Hilton Worldwide Finance LLC
4.625%, 04/01/2025 | | 270,000 | | | 272,700 |
Capital Appreciation Value Fund (continued)
| | | Shares or
Principal
Amount | | Value |
| CORPORATE BONDS (continued) | | | | | |
| Consumer discretionary (continued) | | | | | |
KFC Holding Company/Pizza Hut
Holdings LLC/Taco Bell of America LLC | | | | | |
| 4.750%, 06/01/2027 (D) | $ | 5,315,000 | | $ | 5,580,750 |
| 5.000%, 06/01/2024 (D) | | 2,635,000 | | | 2,718,740 |
| 5.250%, 06/01/2026 (D) | | 3,838,000 | | | 3,981,925 |
Marriott International, Inc.
3.125%, 06/15/2026 | | 415,000 | | | 416,457 |
Marriott International, Inc. (3 month LIBOR + 0.650%)
0.968%, 03/08/2021 (E) | | 575,000 | | | 572,220 |
Service Corp. International
5.375%, 05/15/2024 | | 1,475,000 | | | 1,501,993 |
| Six Flags Entertainment Corp. | | | | | |
| 4.875%, 07/31/2024 (D) | | 3,930,000 | | | 3,810,921 |
| 5.500%, 04/15/2027 (D) | | 3,297,000 | | | 3,214,575 |
Six Flags Theme Parks, Inc.
7.000%, 07/01/2025 (D) | | 1,528,000 | | | 1,653,602 |
| Yum! Brands, Inc. | | | | | |
| 3.750%, 11/01/2021 | | 3,635,000 | | | 3,671,350 |
| 3.875%, 11/01/2020 to 11/01/2023 | | 3,785,000 | | | 3,846,478 |
| 4.750%, 01/15/2030 (D) | | 420,000 | | | 463,050 |
| 5.350%, 11/01/2043 | | 3,109,000 | | | 3,357,720 |
| 6.875%, 11/15/2037 | | 925,000 | | | 1,122,719 |
| | | | | | 44,788,380 |
| Energy - 0.1% | | | | | |
NuStar Logistics LP
4.800%, 09/01/2020 | | 1,020,000 | | | 1,020,000 |
| Financials - 1.0% | | | | | |
HUB International, Ltd.
7.000%, 05/01/2026 (D) | | 3,066,000 | | | 3,180,975 |
| Refinitiv US Holdings, Inc. | | | | | |
| 6.250%, 05/15/2026 (D) | | 1,620,000 | | | 1,739,475 |
| 8.250%, 11/15/2026 (D) | | 1,935,000 | | | 2,143,013 |
State Street Corp. (5.250% to 12-15-20, then 3 month LIBOR + 3.597%)
12/15/2020 (F) | | 1,550,000 | | | 1,557,750 |
The Bank of New York Mellon Corp. (3 month LIBOR + 3.420%)
3.726%, 12/20/2020 (E)(F) | | 1,450,000 | | | 1,445,985 |
The Bank of New York Mellon Corp. (4.625% to 9-20-26, then 3 month LIBOR + 3.131%)
09/20/2026 (F) | | 500,000 | | | 522,515 |
The PNC Financial Services Group, Inc. (5.000% to 11-1-26, then 3 month LIBOR + 3.300%)
11/01/2026 (F) | | 1,560,000 | | | 1,661,400 |
USI, Inc.
6.875%, 05/01/2025 (D) | | 1,205,000 | | | 1,235,125 |
| | | | | | 13,486,238 |
| Health care - 0.7% | | | | | |
Avantor Funding, Inc.
4.625%, 07/15/2028 (D) | | 2,415,000 | | | 2,554,346 |
Avantor, Inc.
6.000%, 10/01/2024 (D) | | 2,870,000 | | | 3,006,325 |
Elanco Animal Health, Inc.
4.912%, 08/27/2021 | | 1,775,000 | | | 1,817,156 |
Hologic, Inc.
4.375%, 10/15/2025 (D) | | 905,000 | | | 923,688 |
| Teleflex, Inc. | | | | | |
| 4.625%, 11/15/2027 | | 707,000 | | | 751,188 |
| 4.875%, 06/01/2026 | | 1,311,000 | | | 1,369,995 |
| | | | | | 10,422,698 |
| The accompanying notes are an integral part of the financial statements. | 24 | |
John Hancock Funds II
Portfolio of Investments — August 31, 2020 (showing percentage of total net assets)
Capital Appreciation Value Fund (continued)
| | | Shares or
Principal
Amount | | Value |
| CORPORATE BONDS (continued) | | | | | |
| Industrials - 1.1% | | | | | |
Continental Airlines 2012-1 Class A Pass Through Trust
4.150%, 04/11/2024 | $ | 871,774 | | $ | 810,750 |
General Electric Company (5.000% to 1-21-21, then 3 month LIBOR + 3.330%)
01/21/2021 (F) | | 9,941,000 | | | 7,749,407 |
Korn Ferry
4.625%, 12/15/2027 (D) | | 480,000 | | | 497,040 |
Lennox International, Inc.
3.000%, 11/15/2023 | | 510,000 | | | 540,296 |
Mileage Plus Holdings LLC
6.500%, 06/20/2027 (D) | | 935,000 | | | 974,738 |
| Sensata Technologies BV | | | | | |
| 4.875%, 10/15/2023 (D) | | 1,057,000 | | | 1,115,135 |
| 5.000%, 10/01/2025 (D) | | 975,000 | | | 1,059,533 |
| 5.625%, 11/01/2024 (D) | | 415,000 | | | 452,350 |
Sensata Technologies UK Financing Company PLC
6.250%, 02/15/2026 (D) | | 350,000 | | | 366,653 |
US Airways 2010-1 Class A Pass Through Trust
6.250%, 04/22/2023 | | 41,897 | | | 37,288 |
US Airways 2012-2 Class A Pass Through Trust
4.625%, 06/03/2025 | | 161,869 | | | 129,495 |
US Airways 2012-2 Class B Pass Through Trust
6.750%, 06/03/2021 | | 230,758 | | | 196,374 |
US Airways 2013-1 Class A Pass Through Trust
3.950%, 11/15/2025 | | 400,894 | | | 326,729 |
US Airways 2013-1 Class B Pass Through Trust
5.375%, 11/15/2021 | | 316,614 | | | 255,053 |
Welbilt, Inc.
9.500%, 02/15/2024 | | 1,692,000 | | | 1,717,380 |
Xylem, Inc.
4.875%, 10/01/2021 | | 100,000 | | | 104,608 |
| | | | | | 16,332,829 |
| Information technology - 0.6% | | | | | |
Solera LLC
10.500%, 03/01/2024 (D) | | 8,350,000 | | | 8,757,063 |
| Materials - 0.1% | | | | | |
Reynolds Group Issuer, Inc.
5.125%, 07/15/2023 (D) | | 1,000,000 | | | 1,014,700 |
| Real estate - 0.3% | | | | | |
| SBA Communications Corp. | | | | | |
| 3.875%, 02/15/2027 (D) | | 720,000 | | | 747,324 |
| 4.000%, 10/01/2022 | | 2,380,000 | | | 2,395,994 |
| 4.875%, 09/01/2024 | | 1,425,000 | | | 1,463,760 |
| | | | | | 4,607,078 |
| Utilities - 0.2% | | | | | |
NiSource, Inc. (5.650% to 6-15-23, then 5 Year CMT + 2.843%)
06/15/2023 (F) | | 2,650,000 | | | 2,636,750 |
| TOTAL CORPORATE BONDS (Cost $140,768,841) | | $ | 149,258,764 |
| CONVERTIBLE BONDS - 0.0% | | | | | |
| Communication services - 0.0% | | | | | |
Liberty Broadband Corp.
2.750%, 09/30/2050 (D) | | 654,000 | | | 695,252 |
| TOTAL CONVERTIBLE BONDS (Cost $654,000) | | $ | 695,252 |
Capital Appreciation Value Fund (continued)
| | | Shares or
Principal
Amount | | Value |
| TERM LOANS (G) – 9.9% | | | | | |
| Communication services – 0.4% | | | | | |
Delta 2 Lux Sarl, 2018 USD Term Loan (1 month LIBOR + 2.500%)
3.500%, 02/01/2024 | $ | 5,910,000 | | $ | 5,721,648 |
| Consumer discretionary – 0.3% | | | | | |
Four Seasons Hotels, Ltd., New 1st Lien Term Loan (1 month LIBOR + 2.000%)
2.156%, 11/30/2023 | | 989,948 | | | 960,557 |
Life Time, Inc., 2017 Term Loan B (1 and 3 month LIBOR + 2.750%)
3.750%, 06/10/2022 | | 2,790,577 | | | 2,609,189 |
| | | | | | 3,569,746 |
| Consumer staples – 0.3% | | | | | |
Prestige Brands, Inc., Term Loan B4 (1 month LIBOR + 2.000%)
2.156%, 01/26/2024 | | 92,289 | | | 91,425 |
Sunshine Luxembourg VII Sarl, USD Term Loan B1 (6 month LIBOR + 4.250%)
5.322%, 10/01/2026 | | 4,395,157 | | | 4,379,598 |
| | | | | | 4,471,023 |
| Financials – 5.2% | | | | | |
Alliant Holdings Intermediate LLC, 2018 Term Loan B (1 month LIBOR + 2.750%)
2.906%, 05/09/2025 | | 336,484 | | | 325,081 |
Alliant Holdings Intermediate LLC, Term Loan B
TBD 05/09/2025 (H) | | 25,000 | | | 24,353 |
AmWINS Group, Inc., 2017 Term Loan B (1 month LIBOR + 2.750%)
3.750%, 01/25/2024 | | 436,601 | | | 432,780 |
Capri Acquisitions Bidco, Ltd., USD 2017 1st Lien Term Loan (3 month LIBOR + 3.000%)
3.261%, 11/01/2024 | | 1,975,000 | | | 1,968,838 |
Emerald TopCo, Inc., Term Loan (1 and 3 month LIBOR + 3.500%)
3.760%, 07/24/2026 | | 4,129,509 | | | 4,010,786 |
HUB International, Ltd., 2018 Term Loan B (3 month LIBOR + 3.000%)
3.263%, 04/25/2025 | | 20,969,117 | | | 20,403,790 |
HUB International, Ltd., 2019 Incremental Term Loan B (3 month LIBOR + 4.000%)
5.000%, 04/25/2025 | | 5,304,931 | | | 5,299,043 |
Refinitiv US Holdings, Inc., 2018 USD Term Loan (1 month LIBOR + 3.250%)
3.406%, 10/01/2025 | | 34,844,342 | | | 34,520,638 |
Ryan Specialty Group LLC, Term Loan
TBD 06/29/2027 (H) | | 820,000 | | | 816,417 |
USI, Inc., 2017 Repriced Term Loan (3 month LIBOR + 3.000%)
3.308%, 05/16/2024 | | 6,233,671 | | | 6,055,762 |
USI, Inc., 2020 Term Loan (3 month LIBOR + 4.000%)
3.025%, 12/02/2026 | | 1,375,000 | | | 1,352,368 |
| | | | | | 75,209,856 |
| Health care – 0.6% | | | | | |
CPI Holdco LLC, 2019 Term Loan (1 month LIBOR + 4.250%)
4.406%, 11/04/2026 | | 418,950 | | | 413,713 |
Dino Grandparent, Inc., 2019 Term Loan A3 (1 month LIBOR + 2.250%)
3.025%, 02/20/2023 | | 3,450,000 | | | 3,381,000 |
| The accompanying notes are an integral part of the financial statements. | 25 | |
John Hancock Funds II
Portfolio of Investments — August 31, 2020 (showing percentage of total net assets)
Capital Appreciation Value Fund (continued)
| | | Shares or
Principal
Amount | | Value |
| TERM LOANS (G)(continued) | | | | | |
| Health care (continued) | | | | | |
Loire Finco Luxembourg Sarl, Term Loan (1 month LIBOR + 3.500%)
3.656%, 04/21/2027 | $ | 4,275,000 | | $ | 4,130,719 |
PetVet Care Centers LLC, 2018 1st Lien Term Loan
TBD 02/14/2025 (H) | | 155,000 | | | 149,333 |
PetVet Care Centers LLC, Delayed Draw Term Loan (1 month LIBOR + 4.250%)
5.250%, 02/15/2025 | | 525,000 | | | 523,688 |
PetVet Care Centers LLC, Term Loan
TBD 02/14/2025 (H) | | 75,000 | | | 73,000 |
Versant Health Holdco, Inc., 1st Lien Term Loan B (1 month LIBOR + 3.000%)
4.000%, 12/02/2024 | | 290,000 | | | 283,202 |
| | | | | | 8,954,655 |
| Industrials – 0.6% | | | | | |
Filtration Group Corp., 2018 1st Lien Term Loan (1 month LIBOR + 3.000%)
3.156%, 03/29/2025 | | 528,595 | | | 519,180 |
Gardner Denver, Inc., 2020 USD Term Loan B (1 month LIBOR + 2.750%)
2.906%, 03/01/2027 | | 395,000 | | | 390,145 |
Mileage Plus Holdings LLC, 2020 Term Loan B (3 month LIBOR + 5.250%)
6.250%, 06/25/2027 | | 2,395,000 | | | 2,420,459 |
Vertical US Newco, Inc., Term Loan B (3 month LIBOR + 4.250%)
4.570%, 07/30/2027 | | 5,200,000 | | | 5,151,276 |
Welbilt, Inc., 2018 Term Loan B (1 month LIBOR + 2.500%)
2.656%, 10/23/2025 | | 575,000 | | | 516,781 |
| | | | | | 8,997,841 |
| Information technology – 2.5% | | | | | |
Applied Systems, Inc., 2017 1st Lien Term Loan (3 month LIBOR + 3.250%)
4.250%, 09/19/2024 | | 605,000 | | | 601,836 |
CCC Information Services, Inc., 2017 1st Lien Term Loan (1 month LIBOR + 3.000%)
4.000%, 04/29/2024 | | 14,631,109 | | | 14,532,349 |
Gartner, Inc., 2016 Term Loan A (1 month LIBOR + 1.500%)
1.656%, 03/20/2022 | | 111,925 | | | 111,365 |
The Ultimate Software Group, Inc., 2020 2nd Lien Incremental Term Loan (3 month LIBOR + 6.750%)
7.500%, 05/03/2027 | | 600,000 | | | 611,250 |
The Ultimate Software Group, Inc., 2020 Incremental Term Loan B (3 month LIBOR + 4.000%)
4.750%, 05/04/2026 | | 18,100,000 | | | 18,066,153 |
The Ultimate Software Group, Inc., Term Loan B (1 month LIBOR + 3.750%)
3.906%, 05/04/2026 | | 689,788 | | | 684,145 |
Capital Appreciation Value Fund (continued)
| | | Shares or
Principal
Amount | | Value |
| TERM LOANS (G)(continued) | | | | | |
| Information technology (continued) | | | | | |
Vertafore, Inc., 2018 1st Lien Term Loan (1 month LIBOR + 3.250%)
3.406%, 07/02/2025 | $ | 1,215,000 | | $ | 1,213,931 |
| | | | | | 35,821,029 |
| Materials – 0.0% | | | | | |
HB Fuller Company, 2017 Term Loan B (1 month LIBOR + 2.000%)
2.158%, 10/20/2024 | | 403,931 | | | 393,372 |
| TOTAL TERM LOANS (Cost $143,203,066) | | $ | 143,139,170 |
| SHORT-TERM INVESTMENTS – 10.4% | | | |
| Short-term funds – 10.4% | | | | | |
| John Hancock Collateral Trust, 0.2611% (I)(J) | | 7,524 | | | 75,323 |
| State Street Institutional U.S. Government Money Market Fund, Premier Class, 0.0399% (I) | | 10,576,191 | | | 10,576,191 |
| T. Rowe Price Government Reserve Fund, 0.1398% (I) | | 139,112,011 | | | 139,112,011 |
| TOTAL SHORT-TERM INVESTMENTS (Cost $149,763,452) | | $ | 149,763,525 |
Total Investments (Capital Appreciation Value Fund)
(Cost $1,244,689,610) – 101.5% | | $ | 1,463,435,104 |
| Other assets and liabilities, net – (1.5%) | | | (21,550,146) |
| TOTAL NET ASSETS – 100.0% | | $ | 1,441,884,958 |
| Security Abbreviations and Legend |
| CMT | Constant Maturity Treasury |
| LIBOR | London Interbank Offered Rate |
| (A) | Non-income producing security. |
| (B) | All or a portion of this security is segregated at the custodian as collateral for certain derivatives. |
| (C) | All or a portion of this security is on loan as of 8-31-20. |
| (D) | These securities are exempt from registration under Rule 144A of the Securities Act of 1933. Such securities may be resold, normally to qualified institutional buyers, in transactions exempt from registration. |
| (E) | Variable rate obligation. The coupon rate shown represents the rate at period end. |
| (F) | Perpetual bonds have no stated maturity date. Date shown as maturity date is next call date. |
| (G) | Term loans are variable rate obligations. The coupon rate shown represents the rate at period end. |
| (H) | This position represents an unsettled loan commitment at period end. Certain details associated with this purchase are not known prior to the settlement date, including coupon rate, which is disclosed as TBD (To Be Determined). |
| (I) | The rate shown is the annualized seven-day yield as of 8-31-20. |
| (J) | Investment is an affiliate of the fund, the advisor and/or subadvisor. This security represents the investment of cash collateral received for securities lending. |
| The accompanying notes are an integral part of the financial statements. | 26 | |
John Hancock Funds II
Portfolio of Investments — August 31, 2020 (showing percentage of total net assets)
Capital Appreciation Value Fund (continued)
DERIVATIVES
WRITTEN OPTIONS
| Options on securities |
Counterparty (OTC)/
Exchange-traded | Name of issuer | | Exercise
price | Expiration
date | Number of
contracts | Notional
amount | Premium | Value |
| Calls | | | | | | | |
| | | | | | | | | |
| CITI | Alphabet, Inc., Class C | USD | 1,500.00 | Jan 2021 | 8 | 800 | $ 64,056 | $ (184,203) |
| CITI | Alphabet, Inc., Class C | USD | 1,500.00 | Jan 2021 | 8 | 800 | 60,376 | (184,203) |
| CITI | Alphabet, Inc., Class C | USD | 1,500.00 | Jan 2021 | 8 | 800 | 59,096 | (184,203) |
| CITI | Alphabet, Inc., Class C | USD | 1,500.00 | Jan 2021 | 5 | 500 | 31,885 | (115,127) |
| GSI | Alphabet, Inc., Class C | USD | 1,740.00 | Jan 2021 | 3 | 300 | 14,151 | (31,735) |
| GSI | Alphabet, Inc., Class C | USD | 1,740.00 | Jan 2021 | 2 | 200 | 9,374 | (21,156) |
| GSI | Alphabet, Inc., Class C | USD | 1,740.00 | Jan 2021 | 3 | 300 | 13,281 | (31,735) |
| GSI | Alphabet, Inc., Class C | USD | 1,760.00 | Jan 2021 | 3 | 300 | 12,741 | (29,431) |
| GSI | Alphabet, Inc., Class C | USD | 1,760.00 | Jan 2021 | 2 | 200 | 8,454 | (19,621) |
| GSI | Alphabet, Inc., Class C | USD | 1,760.00 | Jan 2021 | 3 | 300 | 11,991 | (29,431) |
| GSI | Alphabet, Inc., Class C | USD | 1,780.00 | Jan 2021 | 3 | 300 | 11,481 | (27,248) |
| GSI | Alphabet, Inc., Class C | USD | 1,780.00 | Jan 2021 | 2 | 200 | 7,654 | (18,166) |
| GSI | Alphabet, Inc., Class C | USD | 1,780.00 | Jan 2021 | 3 | 300 | 10,761 | (27,248) |
| GSI | Alphabet, Inc., Class C | USD | 1,800.00 | Jan 2021 | 3 | 300 | 10,341 | (25,183) |
| GSI | Alphabet, Inc., Class C | USD | 1,800.00 | Jan 2021 | 2 | 200 | 6,874 | (16,789) |
| GSI | Alphabet, Inc., Class C | USD | 1,800.00 | Jan 2021 | 3 | 300 | 9,651 | (25,183) |
| GSI | Alphabet, Inc., Class C | USD | 1,760.00 | Jan 2022 | 16 | 1,600 | 161,159 | (323,921) |
| GSI | Alphabet, Inc., Class C | USD | 1,780.00 | Jan 2022 | 16 | 1,600 | 151,699 | (311,233) |
| GSI | Alphabet, Inc., Class C | USD | 1,800.00 | Jan 2022 | 16 | 1,600 | 143,040 | (298,918) |
| CSFB | Amazon.com, Inc. | USD | 3,800.00 | Jan 2022 | 2 | 200 | 66,229 | (101,017) |
| CSFB | Amazon.com, Inc. | USD | 3,800.00 | Jan 2022 | 3 | 300 | 124,580 | (151,526) |
| CSFB | Amazon.com, Inc. | USD | 3,800.00 | Jan 2022 | 3 | 300 | 103,625 | (151,526) |
| CSFB | Amazon.com, Inc. | USD | 3,900.00 | Jan 2022 | 2 | 200 | 60,555 | (94,254) |
| CSFB | Amazon.com, Inc. | USD | 3,900.00 | Jan 2022 | 2 | 200 | 76,676 | (94,254) |
| CSFB | Amazon.com, Inc. | USD | 3,900.00 | Jan 2022 | 3 | 300 | 95,700 | (141,381) |
| CSFB | Amazon.com, Inc. | USD | 4,000.00 | Jan 2022 | 2 | 200 | 55,372 | (87,914) |
| CSFB | Amazon.com, Inc. | USD | 4,000.00 | Jan 2022 | 2 | 200 | 71,412 | (87,914) |
| CSFB | Amazon.com, Inc. | USD | 4,000.00 | Jan 2022 | 3 | 300 | 88,463 | (131,872) |
| CITI | American Electric Power Company, Inc. | USD | 105.00 | Jan 2021 | 210 | 21,000 | 32,970 | (871) |
| CITI | American Electric Power Company, Inc. | USD | 105.00 | Jan 2021 | 208 | 20,800 | 32,656 | (863) |
| CITI | American Electric Power Company, Inc. | USD | 115.00 | Jan 2021 | 115 | 11,500 | 20,299 | (43) |
| GSI | Aptiv PLC | USD | 97.50 | Jan 2021 | 43 | 4,300 | 23,904 | (19,431) |
| GSI | Aptiv PLC | USD | 97.50 | Jan 2021 | 42 | 4,200 | 28,034 | (18,979) |
| GSI | Aptiv PLC | USD | 100.00 | Jan 2021 | 43 | 4,300 | 20,470 | (16,271) |
| GSI | Aptiv PLC | USD | 100.00 | Jan 2021 | 42 | 4,200 | 24,176 | (15,893) |
| GSI | Becton, Dickinson and Company | USD | 260.00 | Jan 2021 | 24 | 2,400 | 42,154 | (22,491) |
| GSI | Becton, Dickinson and Company | USD | 270.00 | Jan 2021 | 24 | 2,400 | 33,735 | (15,910) |
| GSI | Becton, Dickinson and Company | USD | 280.00 | Jan 2021 | 17 | 1,700 | 21,513 | (7,882) |
| GSI | Becton, Dickinson and Company | USD | 280.00 | Jan 2021 | 17 | 1,700 | 23,551 | (7,882) |
| GSI | Becton, Dickinson and Company | USD | 300.00 | Jan 2021 | 16 | 1,600 | 14,972 | (3,579) |
| GSI | Becton, Dickinson and Company | USD | 300.00 | Jan 2021 | 36 | 3,600 | 32,897 | (8,052) |
| GSI | Becton, Dickinson and Company | USD | 300.00 | Jan 2021 | 52 | 5,200 | 51,963 | (11,630) |
| GSI | Becton, Dickinson and Company | USD | 300.00 | Jan 2021 | 45 | 4,500 | 54,590 | (10,065) |
| GSI | Becton, Dickinson and Company | USD | 300.00 | Jan 2021 | 17 | 1,700 | 11,439 | (3,802) |
| GSI | Becton, Dickinson and Company | USD | 300.00 | Jan 2021 | 17 | 1,700 | 12,735 | (3,802) |
| CSFB | CME Group, Inc. | USD | 170.00 | Jan 2021 | 39 | 3,900 | 42,413 | (58,592) |
| CSFB | CME Group, Inc. | USD | 170.00 | Jan 2021 | 12 | 1,200 | 13,313 | (18,028) |
| CSFB | CME Group, Inc. | USD | 175.00 | Jan 2021 | 39 | 3,900 | 32,760 | (47,658) |
| CSFB | CME Group, Inc. | USD | 175.00 | Jan 2021 | 12 | 1,200 | 11,762 | (14,664) |
| CSFB | CME Group, Inc. | USD | 180.00 | Jan 2021 | 39 | 3,900 | 29,765 | (38,087) |
| CSFB | CME Group, Inc. | USD | 180.00 | Jan 2021 | 12 | 1,200 | 9,372 | (11,719) |
| CSFB | CME Group, Inc. | USD | 185.00 | Jan 2021 | 39 | 3,900 | 22,476 | (29,919) |
| CSFB | CME Group, Inc. | USD | 185.00 | Jan 2021 | 12 | 1,200 | 7,820 | (9,206) |
| JPM | Facebook, Inc., Class A | USD | 195.00 | Jan 2021 | 48 | 4,800 | 53,813 | (493,714) |
| JPM | Facebook, Inc., Class A | USD | 200.00 | Jan 2021 | 48 | 4,800 | 45,947 | (472,437) |
| JPM | Facebook, Inc., Class A | USD | 265.00 | Jan 2021 | 38 | 3,800 | 38,076 | (184,733) |
| JPM | Facebook, Inc., Class A | USD | 265.00 | Jan 2021 | 33 | 3,300 | 32,736 | (160,426) |
| JPM | Facebook, Inc., Class A | USD | 270.00 | Jan 2021 | 38 | 3,800 | 33,706 | (173,095) |
| JPM | Facebook, Inc., Class A | USD | 270.00 | Jan 2021 | 33 | 3,300 | 28,941 | (150,319) |
| JPM | Facebook, Inc., Class A | USD | 275.00 | Jan 2021 | 38 | 3,800 | 29,716 | (161,937) |
| JPM | Facebook, Inc., Class A | USD | 275.00 | Jan 2021 | 33 | 3,300 | 25,311 | (140,629) |
| JPM | Facebook, Inc., Class A | USD | 400.00 | Jan 2022 | 170 | 17,000 | 365,959 | (388,569) |
| The accompanying notes are an integral part of the financial statements. | 27 | |
John Hancock Funds II
Portfolio of Investments — August 31, 2020 (showing percentage of total net assets)
Capital Appreciation Value Fund (continued)
| Options on securities (continued) |
Counterparty (OTC)/
Exchange-traded | Name of issuer | | Exercise
price | Expiration
date | Number of
contracts | Notional
amount | Premium | Value |
| Calls (continued) | | | | | | | |
| JPM | General Electric Company | USD | 8.00 | Jan 2021 | 1,180 | 118,000 | $ 142,898 | $ (32,789) |
| JPM | General Electric Company | USD | 8.00 | Jan 2021 | 1,127 | 112,700 | 85,212 | (31,316) |
| JPM | General Electric Company | USD | 8.00 | Jan 2021 | 1,329 | 132,900 | 98,346 | (36,929) |
| JPM | General Electric Company | USD | 9.00 | Jan 2021 | 1,127 | 112,700 | 55,730 | (17,643) |
| JPM | General Electric Company | USD | 9.00 | Jan 2021 | 1,329 | 132,900 | 63,792 | (20,806) |
| JPM | General Electric Company | USD | 15.00 | Jan 2021 | 1,312 | 131,200 | 68,224 | (2,672) |
| JPM | General Electric Company | USD | 15.00 | Jan 2021 | 1,312 | 131,200 | 74,154 | (2,672) |
| JPM | General Electric Company | USD | 15.00 | Jan 2021 | 2,441 | 244,100 | 205,410 | (4,972) |
| JPM | General Electric Company | USD | 15.00 | Jan 2021 | 1,221 | 122,100 | 104,249 | (2,487) |
| JPM | General Electric Company | USD | 15.00 | Jan 2021 | 734 | 73,400 | 64,049 | (1,495) |
| GSI | Global Payments, Inc. | USD | 185.00 | Dec 2020 | 16 | 1,600 | 22,600 | (15,935) |
| GSI | Global Payments, Inc. | USD | 185.00 | Dec 2020 | 18 | 1,800 | 26,076 | (17,927) |
| GSI | Global Payments, Inc. | USD | 195.00 | Dec 2020 | 16 | 1,600 | 16,288 | (10,267) |
| GSI | Global Payments, Inc. | USD | 195.00 | Dec 2020 | 18 | 1,800 | 19,050 | (11,550) |
| CSFB | Hilton Worldwide Holdings, Inc. | USD | 87.50 | Jan 2021 | 12 | 1,200 | 9,068 | (12,709) |
| CSFB | Hilton Worldwide Holdings, Inc. | USD | 90.00 | Jan 2021 | 12 | 1,200 | 7,981 | (11,099) |
| CITI | Hilton Worldwide Holdings, Inc. | USD | 125.00 | Jan 2021 | 33 | 3,300 | 17,849 | (1,974) |
| CITI | Hilton Worldwide Holdings, Inc. | USD | 125.00 | Jan 2021 | 1 | 100 | 551 | (60) |
| CITI | Hilton Worldwide Holdings, Inc. | USD | 130.00 | Jan 2021 | 32 | 3,200 | 12,545 | (1,133) |
| CITI | Hilton Worldwide Holdings, Inc. | USD | 130.00 | Jan 2021 | 1 | 100 | 398 | (35) |
| CSFB | Humana, Inc. | USD | 370.00 | Jan 2021 | 24 | 2,400 | 81,089 | (148,331) |
| CSFB | Humana, Inc. | USD | 380.00 | Jan 2021 | 24 | 2,400 | 70,776 | (131,143) |
| CSFB | Humana, Inc. | USD | 420.00 | Jan 2021 | 18 | 1,800 | 49,795 | (54,647) |
| CSFB | Humana, Inc. | USD | 430.00 | Jan 2021 | 18 | 1,800 | 43,207 | (45,911) |
| JPM | Ingersoll Rand, Inc. | USD | 35.00 | Dec 2020 | 169 | 16,900 | 25,666 | (41,218) |
| JPM | Ingersoll Rand, Inc. | USD | 35.00 | Dec 2020 | 169 | 16,900 | 31,603 | (41,218) |
| JPM | Intercontinental Exchange, Inc. | USD | 100.00 | Jan 2021 | 68 | 6,800 | 40,276 | (68,523) |
| JPM | Intercontinental Exchange, Inc. | USD | 105.00 | Jan 2021 | 68 | 6,800 | 27,474 | (47,216) |
| CITI | Keurig Dr. Pepper, Inc. | USD | 29.00 | Oct 2020 | 230 | 23,000 | 24,189 | (34,123) |
| CITI | Keurig Dr. Pepper, Inc. | USD | 30.00 | Oct 2020 | 236 | 23,600 | 29,354 | (21,878) |
| CITI | Keurig Dr. Pepper, Inc. | USD | 31.00 | Oct 2020 | 236 | 23,600 | 22,885 | (12,466) |
| CITI | Microsoft Corp. | USD | 165.00 | Jan 2021 | 141 | 14,100 | 179,387 | (905,434) |
| CSFB | Microsoft Corp. | USD | 165.00 | Jan 2021 | 283 | 28,300 | 191,053 | (1,817,290) |
| CSFB | Microsoft Corp. | USD | 165.00 | Jan 2021 | 270 | 27,000 | 186,840 | (1,733,810) |
| CITI | Microsoft Corp. | USD | 170.00 | Jan 2021 | 141 | 14,100 | 151,888 | (844,432) |
| JPM | Microsoft Corp. | USD | 170.00 | Jan 2021 | 355 | 35,500 | 385,887 | (2,126,052) |
| JPM | Microsoft Corp. | USD | 170.00 | Jan 2021 | 189 | 18,900 | 200,966 | (1,131,899) |
| CSFB | NextEra Energy, Inc. | USD | 310.00 | Jan 2021 | 26 | 2,600 | 21,801 | (17,008) |
| CSFB | NextEra Energy, Inc. | USD | 320.00 | Jan 2021 | 27 | 2,700 | 16,033 | (11,761) |
| JPM | NXP Semiconductors NV | USD | 115.00 | Jan 2021 | 29 | 2,900 | 29,098 | (52,876) |
| JPM | NXP Semiconductors NV | USD | 125.00 | Jan 2021 | 29 | 2,900 | 19,777 | (36,202) |
| JPM | NXP Semiconductors NV | USD | 135.00 | Jan 2021 | 28 | 2,800 | 24,565 | (22,637) |
| JPM | NXP Semiconductors NV | USD | 135.00 | Jan 2021 | 34 | 3,400 | 30,964 | (27,488) |
| JPM | NXP Semiconductors NV | USD | 135.00 | Jan 2021 | 17 | 1,700 | 15,507 | (13,744) |
| CSFB | NXP Semiconductors NV | USD | 140.00 | Jan 2021 | 37 | 3,700 | 25,907 | (23,550) |
| CSFB | NXP Semiconductors NV | USD | 140.00 | Jan 2021 | 86 | 8,600 | 63,709 | (54,738) |
| CSFB | NXP Semiconductors NV | USD | 140.00 | Jan 2021 | 204 | 20,400 | 154,550 | (129,843) |
| JPM | NXP Semiconductors NV | USD | 140.00 | Jan 2021 | 28 | 2,800 | 19,978 | (17,822) |
| JPM | NXP Semiconductors NV | USD | 140.00 | Jan 2021 | 34 | 3,400 | 25,256 | (21,641) |
| JPM | NXP Semiconductors NV | USD | 140.00 | Jan 2021 | 17 | 1,700 | 12,288 | (10,820) |
| JPM | NXP Semiconductors NV | USD | 145.00 | Jan 2021 | 28 | 2,800 | 15,951 | (13,827) |
| JPM | NXP Semiconductors NV | USD | 145.00 | Jan 2021 | 34 | 3,400 | 20,227 | (16,790) |
| JPM | NXP Semiconductors NV | USD | 145.00 | Jan 2021 | 17 | 1,700 | 9,577 | (8,395) |
| JPM | PerkinElmer, Inc. | USD | 110.00 | Dec 2020 | 6 | 600 | 3,160 | (7,833) |
| JPM | PerkinElmer, Inc. | USD | 110.00 | Dec 2020 | 39 | 3,900 | 22,054 | (50,913) |
| JPM | PerkinElmer, Inc. | USD | 115.00 | Dec 2020 | 6 | 600 | 1,551 | (6,113) |
| JPM | PerkinElmer, Inc. | USD | 115.00 | Dec 2020 | 39 | 3,900 | 8,589 | (39,733) |
| GSI | Roper Technologies, Inc. | USD | 370.00 | Nov 2020 | 23 | 2,300 | 39,250 | (147,793) |
| GSI | Roper Technologies, Inc. | USD | 390.00 | Nov 2020 | 23 | 2,300 | 21,369 | (109,888) |
| GSI | Roper Technologies, Inc. | USD | 420.00 | Nov 2020 | 23 | 2,300 | 29,256 | (61,969) |
| GSI | Roper Technologies, Inc. | USD | 440.00 | Nov 2020 | 23 | 2,300 | 16,574 | (38,006) |
| RBC | Thermo Fisher Scientific, Inc. | USD | 370.00 | Jan 2021 | 22 | 2,200 | 30,928 | (155,490) |
| RBC | Thermo Fisher Scientific, Inc. | USD | 390.00 | Jan 2021 | 23 | 2,300 | 19,048 | (126,530) |
| JPM | UnitedHealth Group, Inc. | USD | 320.00 | Jan 2021 | 23 | 2,300 | 39,425 | (46,715) |
| JPM | UnitedHealth Group, Inc. | USD | 320.00 | Jan 2021 | 3 | 300 | 4,997 | (6,093) |
| The accompanying notes are an integral part of the financial statements. | 28 | |
John Hancock Funds II
Portfolio of Investments — August 31, 2020 (showing percentage of total net assets)
Capital Appreciation Value Fund (continued)
| Options on securities (continued) |
Counterparty (OTC)/
Exchange-traded | Name of issuer | | Exercise
price | Expiration
date | Number of
contracts | Notional
amount | Premium | Value |
| Calls (continued) | | | | | | | |
| JPM | UnitedHealth Group, Inc. | USD | 320.00 | Jan 2021 | 25 | 2,500 | $ 45,247 | $ (50,777) |
| JPM | UnitedHealth Group, Inc. | USD | 320.00 | Jan 2021 | 29 | 2,900 | 58,969 | (58,902) |
| JPM | UnitedHealth Group, Inc. | USD | 320.00 | Jan 2021 | 17 | 1,700 | 36,469 | (34,529) |
| JPM | UnitedHealth Group, Inc. | USD | 320.00 | Jan 2021 | 44 | 4,400 | 83,748 | (89,368) |
| JPM | UnitedHealth Group, Inc. | USD | 330.00 | Jan 2021 | 23 | 2,300 | 31,738 | (36,674) |
| GSI | Visa, Inc., Class A | USD | 185.00 | Jan 2021 | 24 | 2,400 | 43,366 | (78,132) |
| GSI | Visa, Inc., Class A | USD | 195.00 | Jan 2021 | 24 | 2,400 | 33,143 | (60,325) |
| GSI | Visa, Inc., Class A | USD | 200.00 | Jan 2021 | 46 | 4,600 | 51,492 | (100,169) |
| GSI | Visa, Inc., Class A | USD | 210.00 | Jan 2021 | 45 | 4,500 | 35,853 | (71,329) |
| GSI | Visa, Inc., Class A | USD | 210.00 | Jan 2021 | 57 | 5,700 | 72,080 | (90,350) |
| GSI | Visa, Inc., Class A | USD | 210.00 | Jan 2021 | 23 | 2,300 | 29,671 | (36,457) |
| GSI | Visa, Inc., Class A | USD | 210.00 | Jan 2021 | 17 | 1,700 | 14,638 | (26,946) |
| GSI | Visa, Inc., Class A | USD | 210.00 | Jan 2021 | 18 | 1,800 | 16,387 | (28,532) |
| GSI | Visa, Inc., Class A | USD | 215.00 | Jan 2021 | 17 | 1,700 | 10,806 | (22,627) |
| GSI | Visa, Inc., Class A | USD | 215.00 | Jan 2021 | 18 | 1,800 | 12,230 | (23,958) |
| GSI | Visa, Inc., Class A | USD | 220.00 | Jan 2021 | 23 | 2,300 | 20,289 | (25,443) |
| GSI | Visa, Inc., Class A | USD | 220.00 | Jan 2021 | 17 | 1,700 | 9,521 | (18,806) |
| GSI | Visa, Inc., Class A | USD | 220.00 | Jan 2021 | 18 | 1,800 | 10,747 | (19,912) |
| CSFB | Visa, Inc., Class A | USD | 230.00 | Jan 2021 | 102 | 10,200 | 79,529 | (75,703) |
| CSFB | Visa, Inc., Class A | USD | 230.00 | Jan 2021 | 62 | 6,200 | 44,082 | (46,016) |
| GSI | Visa, Inc., Class A | USD | 230.00 | Jan 2021 | 24 | 2,400 | 22,625 | (17,813) |
| GSI | Visa, Inc., Class A | USD | 230.00 | Jan 2021 | 29 | 2,900 | 29,669 | (21,524) |
| CSFB | Visa, Inc., Class A | USD | 235.00 | Jan 2021 | 102 | 10,200 | 64,648 | (61,183) |
| CSFB | Visa, Inc., Class A | USD | 235.00 | Jan 2021 | 62 | 6,200 | 35,861 | (37,190) |
| CSFB | Visa, Inc., Class A | USD | 240.00 | Jan 2021 | 102 | 10,200 | 52,316 | (49,064) |
| CSFB | Visa, Inc., Class A | USD | 240.00 | Jan 2021 | 62 | 6,200 | 28,824 | (29,823) |
| GSI | Visa, Inc., Class A | USD | 240.00 | Jan 2021 | 24 | 2,400 | 15,333 | (11,544) |
| GSI | Visa, Inc., Class A | USD | 240.00 | Jan 2021 | 29 | 2,900 | 20,406 | (13,950) |
| GSI | Visa, Inc., Class A | USD | 225.00 | Jan 2022 | 23 | 2,300 | 27,416 | (48,645) |
| GSI | Visa, Inc., Class A | USD | 225.00 | Jan 2022 | 23 | 2,300 | 30,981 | (48,645) |
| GSI | Visa, Inc., Class A | USD | 225.00 | Jan 2022 | 47 | 4,700 | 61,230 | (99,405) |
| GSI | Visa, Inc., Class A | USD | 230.00 | Jan 2022 | 23 | 2,300 | 23,506 | (43,950) |
| GSI | Visa, Inc., Class A | USD | 230.00 | Jan 2022 | 23 | 2,300 | 26,956 | (43,950) |
| GSI | Visa, Inc., Class A | USD | 230.00 | Jan 2022 | 47 | 4,700 | 54,779 | (89,810) |
| BOA | Yum! Brands, Inc. | USD | 95.00 | Jan 2021 | 17 | 1,700 | 11,237 | (11,847) |
| BOA | Yum! Brands, Inc. | USD | 95.00 | Jan 2021 | 52 | 5,200 | 29,254 | (36,239) |
| BOA | Yum! Brands, Inc. | USD | 100.00 | Jan 2021 | 17 | 1,700 | 8,279 | (7,762) |
| BOA | Yum! Brands, Inc. | USD | 100.00 | Jan 2021 | 52 | 5,200 | 20,928 | (23,743) |
| CITI | Yum! Brands, Inc. | USD | 100.00 | Jan 2021 | 57 | 5,700 | 28,320 | (26,026) |
| CITI | Yum! Brands, Inc. | USD | 100.00 | Jan 2021 | 57 | 5,700 | 24,418 | (26,026) |
| CITI | Yum! Brands, Inc. | USD | 105.00 | Jan 2021 | 57 | 5,700 | 19,464 | (16,030) |
| CITI | Yum! Brands, Inc. | USD | 105.00 | Jan 2021 | 57 | 5,700 | 15,637 | (16,030) |
| | | | | | | | $7,816,907 | $(18,161,003) |
| Derivatives Currency Abbreviations |
| USD | U.S. Dollar |
| Derivatives Abbreviations |
| BOA | Bank of America, N.A. |
| CITI | Citibank, N.A. |
| CSFB | Credit Suisse First Boston International |
| GSI | Goldman Sachs International |
| JPM | JPMorgan Chase Bank, N.A. |
| OTC | Over-the-counter |
| RBC | Royal Bank of Canada |
See Notes to financial statements regarding investment transactions and other derivatives information.
Health Sciences Fund
| | | Shares or
Principal
Amount | | Value |
| COMMON STOCKS – 97.9% | | | |
| Consumer discretionary – 0.1% | | | | | |
Health Sciences Fund (continued)
| | | Shares or
Principal
Amount | | Value |
| COMMON STOCKS (continued) | | | |
| Specialty retail – 0.1% | | | |
| JAND, Inc., Class A (A)(B)(C) | | 16,938 | | $ | 415,499 |
| The accompanying notes are an integral part of the financial statements. | 29 | |
John Hancock Funds II
Portfolio of Investments — August 31, 2020 (showing percentage of total net assets)
Health Sciences Fund (continued)
| | | Shares or
Principal
Amount | | Value |
| COMMON STOCKS (continued) | | | |
| Financials – 0.4% | | | | | |
| Capital markets – 0.2% | | | |
| Churchill Capital Corp. III, Class A (C) | | 21,178 | | $ | 243,971 |
| Health Sciences Acquisitions Corp. 2 (C) | | 19,166 | | | 214,659 |
| Panacea Acquisition Corp. (C) | | 15,821 | | | 177,353 |
| Therapeutics Acquisition Corp., Class A (C) | | 23,996 | | | 308,829 |
| | | | | | 944,812 |
| Diversified financial services – 0.1% | | | |
| Arya Sciences Acquisition Corp. II (C) | | 17,589 | | | 194,886 |
| Insurance – 0.1% | | | |
| Selectquote, Inc. (C) | | 21,035 | | | 383,889 |
| | | | | | 1,523,587 |
| Health care – 97.4% | | | | | |
| Biotechnology – 34.8% | | | |
| AbbVie, Inc. | | 79,675 | | | 7,630,475 |
| Abcam PLC | | 29,900 | | | 497,828 |
| ACADIA Pharmaceuticals, Inc. (C) | | 79,067 | | | 3,130,263 |
| Acceleron Pharma, Inc. (C) | | 40,244 | | | 3,922,583 |
| Acerta Pharma BV, Class B (A)(B)(C) | | 4,892,850 | | | 467,756 |
| ADC Therapeutics SA (C) | | 5,373 | | | 237,325 |
| Adverum Biotechnologies, Inc. (C) | | 20,677 | | | 252,259 |
| Agios Pharmaceuticals, Inc. (C) | | 21,016 | | | 861,866 |
| Akero Therapeutics, Inc. (C) | | 7,654 | | | 249,520 |
| Akouos, Inc. (C) | | 14,013 | | | 314,171 |
| Alector, Inc. (C) | | 14,536 | | | 187,805 |
| Alexion Pharmaceuticals, Inc. (C) | | 46,013 | | | 5,255,605 |
| Alkermes PLC (C) | | 4,712 | | | 77,936 |
| Allogene Therapeutics, Inc. (C) | | 30,013 | | | 1,069,963 |
| Alnylam Pharmaceuticals, Inc. (C) | | 34,174 | | | 4,532,839 |
| ALX Oncology Holdings, Inc. (C) | | 5,657 | | | 228,769 |
| Amarin Corp. PLC, ADR (C) | | 53,524 | | | 415,346 |
| Amgen, Inc. | | 34,198 | | | 8,663,037 |
| Annexon, Inc. (C) | | 9,087 | | | 224,176 |
| Apellis Pharmaceuticals, Inc. (C) | | 27,719 | | | 854,577 |
| Aprea Therapeutics, Inc. (C) | | 7,366 | | | 199,619 |
| Arcturus Therapeutics Holdings, Inc. (C) | | 7,293 | | | 351,814 |
| Arcutis Biotherapeutics, Inc. (C) | | 6,408 | | | 160,649 |
| Ardelyx, Inc. (C) | | 35,520 | | | 203,885 |
| Argenx SE, ADR (C) | | 24,177 | | | 5,591,415 |
| Ascendis Pharma A/S, ADR (C) | | 26,352 | | | 3,904,839 |
| Assembly Biosciences, Inc. (C) | | 7,523 | | | 164,528 |
| Avidity Biosciences, Inc. (C) | | 6,778 | | | 195,206 |
| Avrobio, Inc. (C) | | 7,029 | | | 121,742 |
| BeiGene, Ltd., ADR (C) | | 9,787 | | | 2,364,246 |
| Biogen, Inc. (C) | | 13,287 | | | 3,821,873 |
| BioMarin Pharmaceutical, Inc. (C) | | 13,006 | | | 1,014,858 |
| BioNTech SE, ADR (C) | | 21,462 | | | 1,314,548 |
| Bluebird Bio, Inc. (C) | | 9,526 | | | 564,892 |
| Blueprint Medicines Corp. (C) | | 16,261 | | | 1,259,089 |
| Burning Rock Biotech, Ltd., ADR (C) | | 17,716 | | | 408,531 |
| CareDx, Inc. (C) | | 11,278 | | | 385,144 |
| Constellation Pharmaceuticals, Inc. (C) | | 5,400 | | | 113,670 |
| CRISPR Therapeutics AG (C) | | 10,134 | | | 947,124 |
| CureVac NV (C) | | 15,975 | | | 879,903 |
| Cyclerion Therapeutics, Inc. (C) | | 13,577 | | | 92,595 |
| Cytokinetics, Inc. (C) | | 14,700 | | | 352,212 |
| Deciphera Pharmaceuticals, Inc. (C) | | 11,850 | | | 533,369 |
| Denali Therapeutics, Inc. (C) | | 36,444 | | | 1,162,564 |
| Dicerna Pharmaceuticals, Inc. (C) | | 23,712 | | | 439,146 |
| Enanta Pharmaceuticals, Inc. (C) | | 9,752 | | | 508,957 |
| Epizyme, Inc. (C) | | 18,157 | | | 236,041 |
| Exact Sciences Corp. (C) | | 36,017 | | | 2,711,720 |
| Exelixis, Inc. (C) | | 126,037 | | | 2,800,542 |
| Fate Therapeutics, Inc. (C) | | 13,967 | | | 508,399 |
Health Sciences Fund (continued)
| | | Shares or
Principal
Amount | | Value |
| COMMON STOCKS (continued) | | | |
| Biotechnology (continued) | | | |
| FibroGen, Inc. (C) | | 37,042 | | $ | 1,660,593 |
| G1 Therapeutics, Inc. (C) | | 5,097 | | | 78,239 |
| Generation Bio Company (C) | | 17,575 | | | 548,867 |
| Global Blood Therapeutics, Inc. (C) | | 22,197 | | | 1,393,528 |
| Homology Medicines, Inc. (C) | | 14,713 | | | 156,399 |
| IGM Biosciences, Inc. (C) | | 5,499 | | | 236,457 |
| Immunomedics, Inc. (C) | | 48,140 | | | 2,145,118 |
| Incyte Corp. (C) | | 68,024 | | | 6,554,112 |
| Insmed, Inc. (C) | | 48,920 | | | 1,379,055 |
| Intellia Therapeutics, Inc. (C) | | 12,216 | | | 263,621 |
| Invitae Corp. (C) | | 10,700 | | | 374,072 |
| Ionis Pharmaceuticals, Inc. (C) | | 42,848 | | | 2,335,216 |
| Iovance Biotherapeutics, Inc. (C) | | 68,451 | | | 2,281,472 |
| IVERIC bio, Inc. (C) | | 46,792 | | | 210,096 |
| Karuna Therapeutics, Inc. (C) | | 11,423 | | | 872,717 |
| Karyopharm Therapeutics, Inc. (C) | | 17,236 | | | 262,160 |
| Kodiak Sciences, Inc. (C) | | 29,810 | | | 1,567,708 |
| Krystal Biotech, Inc. (C) | | 5,763 | | | 275,529 |
| Legend Biotech Corp., ADR (C) | | 4,996 | | | 169,864 |
| Madrigal Pharmaceuticals, Inc. (C) | | 2,400 | | | 258,480 |
| Mersana Therapeutics, Inc. (C) | | 13,741 | | | 263,278 |
| Mirati Therapeutics, Inc. (C) | | 10,603 | | | 1,583,770 |
| Moderna, Inc. (C) | | 18,398 | | | 1,193,846 |
| MorphoSys AG (C) | | 4,636 | | | 586,685 |
| Neurocrine Biosciences, Inc. (C) | | 32,744 | | | 3,812,056 |
| Nkarta, Inc. (C) | | 7,461 | | | 183,839 |
| Novavax, Inc. (C) | | 4,400 | | | 485,496 |
| Nurix Therapeutics, Inc. (C) | | 15,796 | | | 369,626 |
| Orchard Therapeutics PLC, ADR (C) | | 18,342 | | | 108,768 |
| Protagonist Therapeutics, Inc. (C) | | 15,882 | | | 355,757 |
| PTC Therapeutics, Inc. (C) | | 14,198 | | | 701,736 |
| Radius Health, Inc. (C) | | 6,335 | | | 78,427 |
| RAPT Therapeutics, Inc. (C) | | 12,256 | | | 326,010 |
| Regeneron Pharmaceuticals, Inc. (C) | | 14,454 | | | 8,960,468 |
| REGENXBIO, Inc. (C) | | 6,807 | | | 207,750 |
| Relay Therapeutics, Inc. (C) | | 7,717 | | | 310,146 |
| Replimune Group, Inc. (C) | | 8,700 | | | 234,900 |
| Rocket Pharmaceuticals, Inc. (C) | | 19,867 | | | 507,999 |
| Sage Therapeutics, Inc. (C) | | 24,901 | | | 1,305,808 |
| Sarepta Therapeutics, Inc. (C) | | 15,178 | | | 2,222,363 |
| Scholar Rock Holding Corp. (C) | | 5,170 | | | 78,067 |
| Seattle Genetics, Inc. (C) | | 36,997 | | | 5,858,105 |
| Seres Therapeutics, Inc. (C) | | 12,985 | | | 343,973 |
| Stoke Therapeutics, Inc. (C) | | 9,148 | | | 268,677 |
| Translate Bio, Inc. (C) | | 24,915 | | | 351,052 |
| Turning Point Therapeutics, Inc. (C) | | 9,893 | | | 773,435 |
| Twist Bioscience Corp. (C) | | 10,847 | | | 758,531 |
| Ultragenyx Pharmaceutical, Inc. (C) | | 35,915 | | | 3,054,930 |
| UniQure NV (C) | | 9,500 | | | 387,315 |
| Vaxart, Inc. (C) | | 24,400 | | | 144,692 |
| Vertex Pharmaceuticals, Inc. (C) | | 55,436 | | | 15,473,296 |
| Xencor, Inc. (C) | | 27,275 | | | 975,081 |
| Zai Lab, Ltd., ADR (C) | | 6,210 | | | 492,888 |
| Zeneca, Inc. (B)(C) | | 33,315 | | | 20,489 |
| Zentalis Pharmaceuticals, Inc. (C) | | 7,099 | | | 244,206 |
| Zymeworks, Inc. (C) | | 12,812 | | | 415,365 |
| | | | | | 148,849,352 |
| Health care equipment and supplies – 21.1% | | | |
| Alcon, Inc. (C) | | 21,385 | | | 1,216,740 |
| AtriCure, Inc. (C) | | 18,504 | | | 827,684 |
| Becton, Dickinson and Company | | 44,863 | | | 10,891,391 |
| Danaher Corp. | | 52,338 | | | 10,806,227 |
| DexCom, Inc. (C) | | 11,415 | | | 4,856,055 |
| DiaSorin SpA | | 10,340 | | | 1,871,747 |
| Envista Holdings Corp. (C) | | 69,005 | | | 1,655,430 |
| The accompanying notes are an integral part of the financial statements. | 30 | |
John Hancock Funds II
Portfolio of Investments — August 31, 2020 (showing percentage of total net assets)
Health Sciences Fund (continued)
| | | Shares or
Principal
Amount | | Value |
| COMMON STOCKS (continued) | | | |
| Health care equipment and supplies (continued) | | | |
| GenMark Diagnostics, Inc. (C) | | 38,687 | | $ | 501,770 |
| Hologic, Inc. (C) | | 79,202 | | | 4,729,943 |
| ICU Medical, Inc. (C) | | 4,778 | | | 956,747 |
| Inari Medical, Inc. (C) | | 4,477 | | | 357,891 |
| Insulet Corp. (C) | | 9,900 | | | 2,160,675 |
| Intuitive Surgical, Inc. (C) | | 24,275 | | | 17,741,141 |
| iRhythm Technologies, Inc. (C) | | 8,151 | | | 1,794,687 |
| Lantheus Holdings, Inc. (C) | | 27,558 | | | 369,828 |
| Nevro Corp. (C) | | 17,981 | | | 2,473,107 |
| Novocure, Ltd. (C) | | 10,400 | | | 860,600 |
| Penumbra, Inc. (C) | | 10,747 | | | 2,247,735 |
| Quidel Corp. (C) | | 16,258 | | | 2,860,758 |
| Shockwave Medical, Inc. (C) | | 9,928 | | | 630,825 |
| Stryker Corp. | | 41,950 | | | 8,312,812 |
| Tandem Diabetes Care, Inc. (C) | | 13,500 | | | 1,521,720 |
| Teleflex, Inc. | | 8,126 | | | 3,193,112 |
| The Cooper Companies, Inc. | | 6,320 | | | 1,986,882 |
| West Pharmaceutical Services, Inc. | | 15,501 | | | 4,401,664 |
| Zimmer Biomet Holdings, Inc. | | 7,774 | | | 1,095,201 |
| | | | | | 90,322,372 |
| Health care providers and services – 14.8% | | | |
| Amedisys, Inc. (C) | | 5,861 | | | 1,417,776 |
| Anthem, Inc. | | 17,197 | | | 4,841,299 |
| Centene Corp. (C) | | 124,231 | | | 7,617,845 |
| Cigna Corp. | | 35,917 | | | 6,370,598 |
| Guardant Health, Inc. (C) | | 10,172 | | | 971,426 |
| HCA Healthcare, Inc. | | 37,297 | | | 5,061,949 |
| Humana, Inc. | | 20,973 | | | 8,707,360 |
| Molina Healthcare, Inc. (C) | | 17,362 | | | 3,211,449 |
| Oak Street Health, Inc. (C) | | 6,741 | | | 300,851 |
| Option Care Health, Inc. (C) | | 17,156 | | | 199,353 |
| The Pennant Group, Inc. (C) | | 17,090 | | | 633,014 |
| UnitedHealth Group, Inc. | | 77,084 | | | 24,092,603 |
| | | | | | 63,425,523 |
| Health care technology – 1.6% | | | |
| Accolade, Inc. (C) | | 7,386 | | | 248,243 |
| Livongo Health, Inc. (C) | | 11,000 | | | 1,510,300 |
| Phreesia, Inc. (C) | | 9,252 | | | 291,808 |
| Schrodinger, Inc. (C) | | 7,390 | | | 446,799 |
| Teladoc Health, Inc. (C) | | 5,800 | | | 1,251,002 |
| Veeva Systems, Inc., Class A (C) | | 10,614 | | | 2,996,014 |
| | | | | | 6,744,166 |
| Life sciences tools and services – 9.0% | | | |
| 10X Genomics, Inc., Class A (C) | | 8,449 | | | 968,424 |
| Adaptive Biotechnologies Corp. (C) | | 12,399 | | | 515,922 |
| Agilent Technologies, Inc. | | 65,840 | | | 6,611,653 |
| Avantor, Inc. (C) | | 93,731 | | | 2,115,509 |
| Berkeley Lights, Inc. (C) | | 7,478 | | | 489,061 |
| Bio-Techne Corp. | | 3,500 | | | 894,110 |
| Bruker Corp. | | 50,069 | | | 2,103,899 |
| Evotec SE (C) | | 33,664 | | | 901,285 |
| Lonza Group AG | | 2,591 | | | 1,610,082 |
| Mettler-Toledo International, Inc. (C) | | 1,381 | | | 1,340,647 |
| Pacific Biosciences of California, Inc. (C) | | 37,481 | | | 247,375 |
| PPD, Inc. (C) | | 18,661 | | | 640,819 |
| PRA Health Sciences, Inc. (C) | | 11,408 | | | 1,219,629 |
| Quanterix Corp. (C) | | 22,551 | | | 802,816 |
| Repligen Corp. (C) | | 1,334 | | | 206,650 |
| Thermo Fisher Scientific, Inc. | | 40,061 | | | 17,185,368 |
| Wuxi Biologics Cayman, Inc. (C)(D) | | 34,500 | | | 893,206 |
| | | | | | 38,746,455 |
| Pharmaceuticals – 16.1% | | | |
| Arvinas, Inc. (C) | | 7,300 | | | 189,435 |
| Astellas Pharma, Inc. | | 87,000 | | | 1,364,869 |
Health Sciences Fund (continued)
| | | Shares or
Principal
Amount | | Value |
| COMMON STOCKS (continued) | | | |
| Pharmaceuticals (continued) | | | |
| AstraZeneca PLC, ADR | | 144,518 | | $ | 8,093,008 |
| Axsome Therapeutics, Inc. (C) | | 11,141 | | | 816,747 |
| Bayer AG | | 18,539 | | | 1,233,067 |
| Bristol-Myers Squibb Company | | 54,702 | | | 3,402,464 |
| Cara Therapeutics, Inc. (C) | | 22,024 | | | 341,372 |
| Catalent, Inc. (C) | | 20,023 | | | 1,852,128 |
| Chugai Pharmaceutical Company, Ltd. | | 38,200 | | | 1,702,079 |
| Daiichi Sankyo Company, Ltd. | | 20,500 | | | 1,828,661 |
| Eisai Company, Ltd. | | 17,800 | | | 1,554,735 |
| Elanco Animal Health, Inc. (C) | | 49,419 | | | 1,436,116 |
| Eli Lilly & Company | | 59,807 | | | 8,874,761 |
| GW Pharmaceuticals PLC, ADR (C) | | 5,591 | | | 581,184 |
| Harmony Biosciences Holdings, Inc. (C) | | 9,688 | | | 343,149 |
| Horizon Therapeutics PLC (C) | | 21,500 | | | 1,615,080 |
| Ipsen SA | | 12,753 | | | 1,317,157 |
| Kymera Therapeutics, Inc. (C) | | 9,114 | | | 290,737 |
| Merck & Company, Inc. | | 172,733 | | | 14,728,943 |
| Merck KGaA | | 14,455 | | | 1,964,648 |
| Milestone Pharmaceuticals, Inc. (C) | | 9,082 | | | 70,295 |
| MyoKardia, Inc. (C) | | 30,407 | | | 3,327,742 |
| Nektar Therapeutics (C) | | 17,298 | | | 334,543 |
| Odonate Therapeutics, Inc. (C) | | 10,301 | | | 166,361 |
| Reata Pharmaceuticals, Inc., Class A (C) | | 5,186 | | | 544,271 |
| Roche Holding AG | | 14,998 | | | 5,246,582 |
| Royalty Pharma PLC, Class A (C) | | 48,399 | | | 2,002,751 |
| Sanofi | | 29,361 | | | 2,973,939 |
| Tricida, Inc. (C) | | 16,610 | | | 175,568 |
| WaVe Life Sciences, Ltd. (C) | | 21,728 | | | 272,252 |
| Zogenix, Inc. (C) | | 10,284 | | | 243,422 |
| | | | | | 68,888,066 |
| | | | | | 416,975,934 |
| TOTAL COMMON STOCKS (Cost $304,535,739) | | $ | 418,915,020 |
| PREFERRED SECURITIES – 1.0% | | | | | |
| Consumer discretionary – 0.2% | | | | | |
| Specialty retail – 0.2% | | | |
| JAND, Inc., Series D (A)(B)(C) | | 37,822 | | | 927,796 |
| Health care – 0.6% | | | | | |
| Health care equipment and supplies – 0.6% | | | |
| Sartorius AG | | 5,945 | | | 2,523,714 |
| Information technology – 0.2% | | | | | |
| Software – 0.2% | | | |
| Doximity, Inc. (A)(B)(C) | | 63,738 | | | 1,032,556 |
| TOTAL PREFERRED SECURITIES (Cost $1,762,958) | | $ | 4,484,066 |
| RIGHTS – 0.1% | | | | | |
| Bristol-Myers Squibb Company (Expiration Date: 3-31-21) (C)(E) | | 131,655 | | | 352,835 |
| TOTAL RIGHTS (Cost $363,553) | | $ | 352,835 |
| SHORT-TERM INVESTMENTS – 1.3% | | | |
| Short-term funds – 1.3% | | | | | |
| State Street Institutional U.S. Government Money Market Fund, Premier Class, 0.0399% (F) | | 1,000,000 | | | 1,000,000 |
| T. Rowe Price Government Reserve Fund, 0.1398% (F) | | 4,665,559 | | | 4,665,559 |
| TOTAL SHORT-TERM INVESTMENTS (Cost $5,665,559) | | $ | 5,665,559 |
Total Investments (Health Sciences Fund)
(Cost $312,327,809) – 100.3% | | $ | 429,417,480 |
| Other assets and liabilities, net – (0.3%) | | | (1,344,168) |
| TOTAL NET ASSETS – 100.0% | | $ | 428,073,312 |
| The accompanying notes are an integral part of the financial statements. | 31 | |
John Hancock Funds II
Portfolio of Investments — August 31, 2020 (showing percentage of total net assets)
Health Sciences Fund (continued)
| Security Abbreviations and Legend |
| ADR | American Depositary Receipt |
| (A) | Restricted security as to resale, excluding 144A securities. For more information on this security refer to the Notes to financial statements. |
| (B) | Security is valued using significant unobservable inputs and is classified as Level 3 in the fair value hierarchy. Refer to Note 2 to the financial statements. |
| (C) | Non-income producing security. |
| (D) | These securities are exempt from registration under Rule 144A of the Securities Act of 1933. Such securities may be resold, normally to qualified institutional buyers, in transactions exempt from registration. |
| (E) | Strike price and/or expiration date not available. |
| (F) | The rate shown is the annualized seven-day yield as of 8-31-20. |
International Strategic Equity Allocation Fund
| | | Shares or
Principal
Amount | | Value |
| COMMON STOCKS - 93.0% | | | |
| Australia - 6.4% | | | | | |
| Afterpay, Ltd. (A) | | 24,716 | | $ | 1,667,564 |
| AGL Energy, Ltd. | | 73,924 | | | 805,892 |
| AMP, Ltd. (A) | | 397,352 | | | 447,897 |
| Ampol, Ltd. | | 28,890 | | | 553,308 |
| APA Group | | 136,492 | | | 1,047,110 |
| Aristocrat Leisure, Ltd. | | 66,511 | | | 1,385,564 |
| ASX, Ltd. | | 22,436 | | | 1,444,713 |
| Aurizon Holdings, Ltd. | | 226,114 | | | 723,124 |
| AusNet Services | | 214,911 | | | 288,257 |
| Australia & New Zealand Banking Group, Ltd. | | 328,019 | | | 4,419,521 |
| BHP Group PLC | | 123,436 | | | 2,809,694 |
| BHP Group, Ltd. | | 340,891 | | | 9,412,660 |
| BlueScope Steel, Ltd. | | 58,521 | | | 546,594 |
| Brambles, Ltd. | | 178,597 | | | 1,457,850 |
| CIMIC Group, Ltd. | | 11,170 | | | 173,924 |
| Coca-Cola Amatil, Ltd. | | 58,544 | | | 392,172 |
| Cochlear, Ltd. | | 7,413 | | | 1,047,553 |
| Coles Group, Ltd. | | 154,298 | | | 2,010,919 |
| Commonwealth Bank of Australia | | 204,891 | | | 10,298,298 |
| Computershare, Ltd. | | 56,341 | | | 551,558 |
| Crown Resorts, Ltd. | | 43,352 | | | 287,459 |
| CSL, Ltd. | | 52,518 | | | 11,020,421 |
| Dexus | | 126,830 | | | 824,744 |
| Evolution Mining, Ltd. | | 187,069 | | | 764,886 |
| Fortescue Metals Group, Ltd. | | 195,967 | | | 2,504,731 |
| Goodman Group | | 190,469 | | | 2,564,088 |
| Insurance Australia Group, Ltd. | | 267,974 | | | 938,990 |
| Lendlease Corp., Ltd. | | 76,524 | | | 653,671 |
| Macquarie Group, Ltd. | | 39,000 | | | 3,666,559 |
| Magellan Financial Group, Ltd. | | 14,813 | | | 646,337 |
| Medibank Pvt., Ltd. | | 319,087 | | | 642,090 |
| Mirvac Group | | 455,115 | | | 706,488 |
| National Australia Bank, Ltd. | | 369,915 | | | 4,871,357 |
| Newcrest Mining, Ltd. | | 93,447 | | | 2,200,547 |
| Northern Star Resources, Ltd. | | 85,573 | | | 862,308 |
| Oil Search, Ltd. | | 227,876 | | | 549,382 |
| Orica, Ltd. | | 46,903 | | | 599,637 |
| Origin Energy, Ltd. | | 203,809 | | | 839,184 |
| Qantas Airways, Ltd. | | 106,005 | | | 308,045 |
| QBE Insurance Group, Ltd. | | 168,558 | | | 1,304,003 |
| Ramsay Health Care, Ltd. | | 20,695 | | | 992,852 |
| REA Group, Ltd. | | 6,081 | | | 511,442 |
| Santos, Ltd. | | 204,919 | | | 856,373 |
| Scentre Group | | 606,114 | | | 1,008,898 |
| SEEK, Ltd. | | 38,580 | | | 586,078 |
| Sonic Healthcare, Ltd. | | 52,245 | | | 1,232,189 |
| South32, Ltd. | | 566,472 | | | 875,749 |
International Strategic Equity Allocation Fund (continued)
| | | Shares or
Principal
Amount | | Value |
| COMMON STOCKS (continued) | | | |
| Australia (continued) | | | | | |
| Stockland | | 275,773 | | $ | 804,119 |
| Suncorp Group, Ltd. | | 146,461 | | | 1,001,913 |
| Sydney Airport | | 128,138 | | | 538,359 |
| Tabcorp Holdings, Ltd. | | 234,462 | | | 625,476 |
| Telstra Corp., Ltd. | | 481,688 | | | 1,023,920 |
| The GPT Group | | 225,244 | | | 635,206 |
| TPG Telecom, Ltd. (A) | | 40,599 | | | 246,437 |
| Transurban Group | | 316,522 | | | 3,130,851 |
| Treasury Wine Estates, Ltd. | | 83,339 | | | 567,661 |
| Tuas, Ltd. (A) | | 20,299 | | | 7,486 |
| Vicinity Centres | | 449,099 | | | 479,006 |
| Washington H Soul Pattinson & Company, Ltd. | | 12,467 | | | 192,160 |
| Wesfarmers, Ltd. | | 131,190 | | | 4,583,972 |
| Westpac Banking Corp. | | 417,762 | | | 5,335,391 |
| WiseTech Global, Ltd. | | 16,566 | | | 343,684 |
| Woodside Petroleum, Ltd. | | 108,959 | | | 1,570,945 |
| Woolworths Group, Ltd. | | 145,908 | | | 4,275,739 |
| | | | | | 109,665,005 |
| Austria - 0.2% | | | | | |
| ANDRITZ AG | | 8,951 | | | 299,400 |
| Erste Group Bank AG | | 34,432 | | | 836,136 |
| OMV AG | | 18,138 | | | 587,134 |
| Raiffeisen Bank International AG (A) | | 18,152 | | | 324,334 |
| Verbund AG | | 8,367 | | | 449,215 |
| voestalpine AG | | 14,266 | | | 354,497 |
| | | | | | 2,850,716 |
| Belgium - 1.1% | | | | | |
| Ageas SA/NV | | 26,328 | | | 1,097,105 |
| Anheuser-Busch InBev SA/NV | | 111,535 | | | 6,482,339 |
| Colruyt SA | | 8,087 | | | 509,730 |
| Elia Group SA/NV | | 4,512 | | | 484,319 |
| Galapagos NV (A) | | 6,152 | | | 825,952 |
| Groupe Bruxelles Lambert SA | | 16,547 | | | 1,526,854 |
| KBC Group NV | | 36,535 | | | 2,086,644 |
| Proximus SADP | | 22,238 | | | 439,179 |
| Sofina SA | | 2,262 | | | 676,900 |
| Solvay SA | | 10,856 | | | 935,354 |
| Telenet Group Holding NV | | 6,679 | | | 258,970 |
| UCB SA | | 18,510 | | | 2,196,891 |
| Umicore SA (B) | | 28,841 | | | 1,323,796 |
| | | | | | 18,844,033 |
| Brazil - 1.0% | | | | | |
| Ambev SA | | 346,200 | | | 777,899 |
| Atacadao SA | | 28,900 | | | 103,130 |
| B2W Cia Digital (A) | | 15,300 | | | 313,038 |
| B3 SA - Brasil Bolsa Balcao | | 151,120 | | | 1,621,951 |
| Banco Bradesco SA | | 97,335 | | | 338,101 |
| Banco BTG Pactual SA | | 16,900 | | | 247,801 |
| Banco do Brasil SA | | 63,000 | | | 375,459 |
| Banco Santander Brasil SA | | 30,100 | | | 155,376 |
| BB Seguridade Participacoes SA | | 51,600 | | | 248,464 |
| BR Malls Participacoes SA (A) | | 57,635 | | | 97,628 |
| BRF SA (A) | | 41,700 | | | 149,111 |
| CCR SA | | 88,700 | | | 215,820 |
| Centrais Eletricas Brasileiras SA | | 23,600 | | | 152,968 |
| Cia Brasileira de Distribuicao | | 11,800 | | | 136,793 |
| Cia de Saneamento Basico do Estado de Sao Paulo | | 25,000 | | | 217,897 |
| Cia Siderurgica Nacional SA | | 50,700 | | | 140,759 |
| Cielo SA | | 89,460 | | | 74,462 |
| Cogna Educacao | | 130,900 | | | 136,192 |
| Cosan SA | | 11,600 | | | 176,271 |
| The accompanying notes are an integral part of the financial statements. | 32 | |
John Hancock Funds II
Portfolio of Investments — August 31, 2020 (showing percentage of total net assets)
International Strategic Equity Allocation Fund (continued)
| | | Shares or
Principal
Amount | | Value |
| COMMON STOCKS (continued) | | | |
| Brazil (continued) | | | | | |
| CPFL Energia SA | | 16,800 | | $ | 88,132 |
| Energisa SA | | 13,400 | | | 106,275 |
| Engie Brasil Energia SA | | 14,825 | | | 115,358 |
| Equatorial Energia SA | | 66,600 | | | 282,033 |
| Hapvida Participacoes e Investimentos SA (C) | | 16,400 | | | 193,771 |
| Hypera SA | | 27,800 | | | 160,604 |
| IRB Brasil Resseguros SA | | 52,000 | | | 67,675 |
| JBS SA | | 80,100 | | | 328,091 |
| Klabin SA | | 50,800 | | | 238,306 |
| Localiza Rent a Car SA | | 44,445 | | | 391,272 |
| Lojas Renner SA | | 58,239 | | | 462,106 |
| Magazine Luiza SA | | 53,600 | | | 912,037 |
| Multiplan Empreendimentos Imobiliarios SA | | 20,700 | | | 78,666 |
| Natura & Company Holding SA | | 55,000 | | | 495,336 |
| Notre Dame Intermedica Participacoes SA | | 35,400 | | | 478,806 |
| Petrobras Distribuidora SA | | 55,500 | | | 216,185 |
| Petroleo Brasileiro SA | | 272,600 | | | 1,110,602 |
| Porto Seguro SA | | 7,200 | | | 69,470 |
| Raia Drogasil SA | | 15,700 | | | 308,928 |
| Rumo SA (A) | | 79,900 | | | 329,605 |
| Sul America SA | | 21,596 | | | 170,214 |
| Suzano SA (A) | | 39,927 | | | 365,855 |
| TIM Participacoes SA | | 62,100 | | | 162,320 |
| Ultrapar Participacoes SA | | 53,100 | | | 188,421 |
| Vale SA | | 271,270 | | | 2,955,078 |
| WEG SA | | 61,620 | | | 726,820 |
| | | | | | 16,681,086 |
| Canada - 1.9% | | | | | |
| Agnico Eagle Mines, Ltd. | | 5,336 | | | 439,938 |
| Air Canada (A)(B) | | 3,382 | | | 45,634 |
| Algonquin Power & Utilities Corp. | | 12,187 | | | 168,928 |
| Alimentation Couche-Tard, Inc., Class B | | 19,417 | | | 633,712 |
| AltaGas, Ltd. (B) | | 6,537 | | | 84,547 |
| Atco, Ltd., Class I | | 1,928 | | | 58,741 |
| B2Gold Corp. | | 23,317 | | | 156,597 |
| Bank of Montreal | | 14,390 | | | 913,255 |
| Barrick Gold Corp. | | 39,554 | | | 1,171,746 |
| BCE, Inc. | | 3,752 | | | 161,258 |
| BlackBerry, Ltd. (A) | | 11,961 | | | 62,357 |
| Brookfield Asset Management, Inc., Class A | | 30,087 | | | 1,015,394 |
| CAE, Inc. | | 6,251 | | | 99,107 |
| Cameco Corp. (B) | | 8,999 | | | 104,247 |
| Canadian Apartment Properties REIT | | 1,991 | | | 68,689 |
| Canadian Imperial Bank of Commerce | | 10,069 | | | 799,437 |
| Canadian National Railway Company | | 15,985 | | | 1,679,690 |
| Canadian Natural Resources, Ltd. | | 26,412 | | | 520,809 |
| Canadian Pacific Railway, Ltd. | | 3,072 | | | 908,847 |
| Canadian Tire Corp., Ltd., Class A (B) | | 1,349 | | | 141,121 |
| Canadian Utilities, Ltd., Class A (B) | | 3,155 | | | 79,192 |
| Canopy Growth Corp. (A)(B) | | 5,085 | | | 83,857 |
| CCL Industries, Inc., Class B | | 3,450 | | | 127,515 |
| Cenovus Energy, Inc. | | 23,530 | | | 111,124 |
| CGI, Inc. (A) | | 5,436 | | | 381,835 |
| CI Financial Corp. | | 5,225 | | | 74,188 |
| Constellation Software, Inc. | | 450 | | | 520,946 |
| Cronos Group, Inc. (A)(B) | | 4,290 | | | 23,779 |
| Dollarama, Inc. | | 6,598 | | | 257,577 |
| Emera, Inc. (B) | | 5,547 | | | 226,456 |
| Empire Company, Ltd., Class A | | 3,953 | | | 102,890 |
| Enbridge, Inc. | | 45,133 | | | 1,443,938 |
International Strategic Equity Allocation Fund (continued)
| | | Shares or
Principal
Amount | | Value |
| COMMON STOCKS (continued) | | | |
| Canada (continued) | | | | | |
| Fairfax Financial Holdings, Ltd. | | 615 | | $ | 189,585 |
| First Capital Real Estate Investment Trust | | 2,743 | | | 28,769 |
| First Quantum Minerals, Ltd. | | 13,200 | | | 130,649 |
| Fortis, Inc. | | 10,596 | | | 423,808 |
| Franco-Nevada Corp. | | 4,203 | | | 632,118 |
| George Weston, Ltd. | | 1,772 | | | 128,014 |
| Gildan Activewear, Inc. (B) | | 4,604 | | | 89,267 |
| Great-West Lifeco, Inc. | | 7,207 | | | 147,030 |
| Hydro One, Ltd. (C) | | 7,706 | | | 159,514 |
| iA Financial Corp., Inc. | | 2,763 | | | 99,454 |
| IGM Financial, Inc. | | 2,175 | | | 53,076 |
| Imperial Oil, Ltd. | | 5,973 | | | 98,501 |
| Intact Financial Corp. | | 3,271 | | | 350,360 |
| Inter Pipeline, Ltd. | | 9,674 | | | 102,128 |
| Keyera Corp. (B) | | 5,031 | | | 91,876 |
| Kinross Gold Corp. (A) | | 28,051 | | | 249,036 |
| Kirkland Lake Gold, Ltd. | | 6,050 | | | 322,364 |
| Loblaw Companies, Ltd. | | 4,178 | | | 215,923 |
| Lundin Mining Corp. | | 15,317 | | | 95,940 |
| Magna International, Inc. | | 6,641 | | | 323,407 |
| Metro, Inc. | | 5,785 | | | 261,320 |
| National Bank of Canada | | 7,604 | | | 417,991 |
| Nutrien, Ltd. | | 12,899 | | | 477,748 |
| Onex Corp. | | 2,017 | | | 97,931 |
| Open Text Corp. (B) | | 6,200 | | | 281,207 |
| Pan American Silver Corp. | | 4,683 | | | 169,067 |
| Parkland Corp. | | 3,367 | | | 95,433 |
| Pembina Pipeline Corp. | | 12,301 | | | 304,613 |
| Power Corp. of Canada | | 13,314 | | | 265,800 |
| Quebecor, Inc., Class B | | 4,150 | | | 102,895 |
| Restaurant Brands International, Inc. | | 6,385 | | | 345,941 |
| RioCan Real Estate Investment Trust (B) | | 4,210 | | | 49,093 |
| Ritchie Bros Auctioneers, Inc. | | 2,548 | | | 149,088 |
| Rogers Communications, Inc., Class B | | 8,079 | | | 336,080 |
| Royal Bank of Canada | | 31,909 | | | 2,429,962 |
| Saputo, Inc. | | 5,671 | | | 141,476 |
| Shaw Communications, Inc., Class B | | 10,912 | | | 204,043 |
| Shopify, Inc., Class A (A)(B) | | 2,321 | | | 2,479,156 |
| SmartCentres Real Estate Investment Trust (B) | | 1,990 | | | 31,337 |
| Sun Life Financial, Inc. | | 13,882 | | | 579,397 |
| Suncor Energy, Inc. | | 34,209 | | | 548,928 |
| TC Energy Corp. | | 21,011 | | | 982,452 |
| Teck Resources, Ltd., Class B | | 10,932 | | | 126,053 |
| TELUS Corp. | | 9,932 | | | 182,901 |
| The Bank of Nova Scotia | | 27,178 | | | 1,174,550 |
| The Toronto-Dominion Bank | | 40,387 | | | 2,014,783 |
| Thomson Reuters Corp. | | 4,060 | | | 310,363 |
| TMX Group, Ltd. | | 1,317 | | | 138,450 |
| Wheaton Precious Metals Corp. (B) | | 9,952 | | | 531,496 |
| WSP Global, Inc. | | 2,620 | | | 177,747 |
| Yamana Gold, Inc. | | 21,353 | | | 132,275 |
| | | | | | 32,137,746 |
| Chile - 0.3% | | | | | |
| Aguas Andinas SA, Class A | | 457,328 | | | 137,053 |
| Antofagasta PLC | | 22,986 | | | 329,560 |
| Banco de Chile | | 7,981,879 | | | 667,201 |
| Banco de Credito e Inversiones SA | | 9,154 | | | 288,458 |
| Banco Santander Chile | | 11,520,072 | | | 443,028 |
| Cencosud SA | | 251,027 | | | 371,299 |
| Cencosud Shopping SA | | 90,085 | | | 134,533 |
| Cia Cervecerias Unidas SA | | 25,928 | | | 170,447 |
| Colbun SA | | 1,386,405 | | | 213,982 |
| The accompanying notes are an integral part of the financial statements. | 33 | |
John Hancock Funds II
Portfolio of Investments — August 31, 2020 (showing percentage of total net assets)
International Strategic Equity Allocation Fund (continued)
| | | Shares or
Principal
Amount | | Value |
| COMMON STOCKS (continued) | | | |
| Chile (continued) | | | | | |
| Empresa Nacional de Telecomunicaciones SA | | 26,603 | | $ | 161,037 |
| Empresas CMPC SA | | 197,938 | | | 411,156 |
| Empresas COPEC SA | | 68,552 | | | 502,662 |
| Enel Americas SA | | 6,015,983 | | | 865,616 |
| Enel Chile SA | | 4,858,717 | | | 373,704 |
| Falabella SA | | 132,269 | | | 416,802 |
| | | | | | 5,486,538 |
| China - 9.4% | | | | | |
| 3SBio, Inc. (A)(B)(C) | | 92,600 | | | 108,526 |
| 51job, Inc., ADR (A) | | 1,900 | | | 124,526 |
| 58.com, Inc., ADR (A) | | 6,900 | | | 381,984 |
| AAC Technologies Holdings, Inc. | | 53,100 | | | 334,365 |
| Agile Group Holdings, Ltd. | | 85,900 | | | 118,424 |
| Agricultural Bank of China, Ltd., H Shares | | 2,022,200 | | | 675,366 |
| Air China, Ltd., H Shares | | 131,300 | | | 90,277 |
| Airtac International Group | | 9,000 | | | 199,360 |
| AK Medical Holdings, Ltd. (C) | | 28,000 | | | 71,376 |
| Alibaba Group Holding, Ltd., ADR (A) | | 137,100 | | | 39,351,792 |
| A-Living Services Company, Ltd., H Shares (C) | | 31,500 | | | 162,318 |
| Aluminum Corp. of China, Ltd., H Shares (A) | | 286,600 | | | 69,865 |
| Anhui Conch Cement Company, Ltd., H Shares | | 90,100 | | | 652,274 |
| Anhui Gujing Distillery Company, Ltd., B Shares | | 7,800 | | | 98,978 |
| ANTA Sports Products, Ltd. | | 78,500 | | | 773,808 |
| Autohome, Inc., ADR | | 4,300 | | | 345,032 |
| AviChina Industry & Technology Company, Ltd., H Shares | | 186,000 | | | 115,971 |
| BAIC Motor Corp., Ltd., H Shares (C) | | 120,000 | | | 57,519 |
| Baidu, Inc., ADR (A) | | 20,000 | | | 2,491,400 |
| Bank of China, Ltd., H Shares | | 5,797,600 | | | 1,885,319 |
| Bank of Communications Company, Ltd., H Shares | | 634,900 | | | 331,549 |
| Baozun, Inc., ADR (A) | | 3,200 | | | 132,608 |
| BeiGene, Ltd., ADR (A) | | 3,200 | | | 773,024 |
| Beijing Capital International Airport Company, Ltd., H Shares | | 136,900 | | | 96,767 |
| BEST, Inc., ADR (A)(B) | | 14,200 | | | 56,800 |
| Bilibili, Inc., ADR (A)(B) | | 7,100 | | | 335,475 |
| BYD Company, Ltd., H Shares | | 46,500 | | | 484,733 |
| BYD Electronic International Company, Ltd. | | 49,400 | | | 208,909 |
| CanSino Biologics, Inc., H Shares (A)(C) | | 4,400 | | | 92,960 |
| CGN Power Company, Ltd., H Shares (C) | | 689,900 | | | 149,407 |
| China Aoyuan Group, Ltd. | | 88,000 | | | 101,290 |
| China Cinda Asset Management Company, Ltd., H Shares | | 652,200 | | | 124,426 |
| China CITIC Bank Corp., Ltd., H Shares | | 648,000 | | | 270,690 |
| China Communications Construction Company, Ltd., H Shares | | 322,500 | | | 180,774 |
| China Communications Services Corp., Ltd., H Shares | | 173,200 | | | 113,458 |
| China Conch Venture Holdings, Ltd. | | 118,300 | | | 512,198 |
| China Construction Bank Corp., H Shares | | 7,021,500 | | | 4,948,147 |
| China East Education Holdings, Ltd. (C) | | 40,000 | | | 88,186 |
| China Eastern Airlines Corp., Ltd., H Shares (B) | | 130,000 | | | 53,522 |
| China Everbright Bank Company, Ltd., H Shares | | 231,000 | | | 82,763 |
| China Evergrande Group (B) | | 134,900 | | | 314,506 |
International Strategic Equity Allocation Fund (continued)
| | | Shares or
Principal
Amount | | Value |
| COMMON STOCKS (continued) | | | |
| China (continued) | | | | | |
| China Feihe, Ltd. (C) | | 65,000 | | $ | 131,458 |
| China Galaxy Securities Company, Ltd., H Shares | | 257,500 | | | 154,974 |
| China Hongqiao Group, Ltd. | | 125,500 | | | 80,872 |
| China Huarong Asset Management Company, Ltd., H Shares (C) | | 733,600 | | | 84,135 |
| China Huishan Dairy Holdings Company, Ltd. (A)(D) | | 175,000 | | | 0 |
| China International Capital Corp., Ltd., H Shares (A)(C) | | 98,000 | | | 232,582 |
| China Lesso Group Holdings, Ltd. | | 79,000 | | | 147,107 |
| China Life Insurance Company, Ltd., H Shares | | 545,200 | | | 1,328,125 |
| China Literature, Ltd. (A)(C) | | 22,200 | | | 137,675 |
| China Longyuan Power Group Corp., Ltd., H Shares | | 231,700 | | | 146,045 |
| China Medical System Holdings, Ltd. | | 99,300 | | | 111,837 |
| China Merchants Bank Company, Ltd., H Shares | | 284,700 | | | 1,358,291 |
| China Minsheng Banking Corp., Ltd., H Shares | | 420,020 | | | 255,676 |
| China Molybdenum Company, Ltd., H Shares | | 243,100 | | | 98,554 |
| China National Building Material Company, Ltd., H Shares | | 281,700 | | | 395,390 |
| China Oilfield Services, Ltd., H Shares | | 125,700 | | | 98,504 |
| China Pacific Insurance Group Company, Ltd., H Shares | | 204,000 | | | 565,912 |
| China Petroleum & Chemical Corp., H Shares | | 1,769,300 | | | 812,360 |
| China Railway Construction Corp., Ltd., H Shares | | 143,500 | | | 110,145 |
| China Railway Group, Ltd., H Shares | | 276,600 | | | 141,865 |
| China Railway Signal & Communication Corp., Ltd., H Shares (C) | | 114,000 | | | 46,132 |
| China Reinsurance Group Corp., H Shares | | 428,000 | | | 45,765 |
| China Resources Pharmaceutical Group, Ltd. (C) | | 115,100 | | | 65,162 |
| China Shenhua Energy Company, Ltd., H Shares | | 248,000 | | | 411,829 |
| China Southern Airlines Company, Ltd., H Shares (A)(B) | | 122,800 | | | 64,629 |
| China Telecom Corp., Ltd., H Shares | | 965,100 | | | 314,833 |
| China Tower Corp., Ltd., H Shares (C) | | 3,234,000 | | | 616,075 |
| China Vanke Company, Ltd., H Shares | | 124,100 | | | 385,225 |
| China Yuhua Education Corp., Ltd. (C) | | 86,000 | | | 82,442 |
| Chongqing Rural Commercial Bank Company, Ltd., H Shares | | 176,700 | | | 71,998 |
| CIFI Holdings Group Company, Ltd. | | 230,000 | | | 195,499 |
| CITIC Securities Company, Ltd., H Shares | | 158,200 | | | 379,608 |
| CITIC, Ltd. | | 426,600 | | | 388,947 |
| CNOOC, Ltd. | | 1,303,500 | | | 1,477,134 |
| COSCO SHIPPING Energy Transportation Company, Ltd., H Shares | | 90,000 | | | 41,412 |
| COSCO SHIPPING Holdings Company, Ltd., H Shares (A) | | 186,500 | | | 93,545 |
| Country Garden Holdings Company, Ltd. | | 558,300 | | | 691,266 |
| Country Garden Services Holdings Company, Ltd. | | 99,000 | | | 689,746 |
| CRRC Corp., Ltd., H Shares | | 320,500 | | | 144,535 |
| CSPC Pharmaceutical Group, Ltd. | | 409,560 | | | 904,890 |
| Dali Foods Group Company, Ltd. (C) | | 149,000 | | | 91,192 |
| Dongfeng Motor Group Company, Ltd., H Shares | | 197,300 | | | 137,145 |
| The accompanying notes are an integral part of the financial statements. | 34 | |
John Hancock Funds II
Portfolio of Investments — August 31, 2020 (showing percentage of total net assets)
International Strategic Equity Allocation Fund (continued)
| | | Shares or
Principal
Amount | | Value |
| COMMON STOCKS (continued) | | | |
| China (continued) | | | | | |
| ENN Energy Holdings, Ltd. | | 57,500 | | $ | 637,098 |
| Fosun International, Ltd. | | 187,500 | | | 208,685 |
| Fuyao Glass Industry Group Company, Ltd., H Shares (C) | | 36,500 | | | 117,825 |
| GDS Holdings, Ltd., ADR (A)(B) | | 5,800 | | | 469,452 |
| Genscript Biotech Corp. (A) | | 76,000 | | | 146,383 |
| GF Securities Company, Ltd., H Shares | | 94,200 | | | 111,370 |
| GOME Retail Holdings, Ltd. (A)(B) | | 706,200 | | | 101,084 |
| Great Wall Motor Company, Ltd., H Shares | | 225,900 | | | 245,902 |
| Greentown Service Group Company, Ltd. | | 104,000 | | | 139,584 |
| GSX Techedu, Inc., ADR (A)(B) | | 5,600 | | | 478,240 |
| Guangzhou Automobile Group Company, Ltd., H Shares (B) | | 215,080 | | | 185,062 |
| Guangzhou R&F Properties Company, Ltd., H Shares | | 94,000 | | | 119,336 |
| Guotai Junan Securities Company, Ltd., H Shares (C) | | 42,000 | | | 65,503 |
| Haidilao International Holding, Ltd. (C) | | 58,000 | | | 373,588 |
| Haitian International Holdings, Ltd. | | 46,400 | | | 112,254 |
| Haitong Securities Company, Ltd., H Shares | | 198,900 | | | 180,586 |
| Hansoh Pharmaceutical Group Company, Ltd. (A)(C) | | 38,000 | | | 179,637 |
| Hengan International Group Company, Ltd. | | 47,600 | | | 374,801 |
| Hua Hong Semiconductor, Ltd. (A)(B)(C) | | 33,000 | | | 119,208 |
| Huaneng Power International, Inc., H Shares | | 257,700 | | | 107,288 |
| Huatai Securities Company, Ltd., H Shares (C) | | 107,500 | | | 188,432 |
| Huazhu Group, Ltd., ADR (B) | | 9,700 | | | 433,881 |
| HUYA, Inc., ADR (A)(B) | | 4,500 | | | 129,240 |
| Industrial & Commercial Bank of China, Ltd., H Shares | | 4,430,800 | | | 2,469,548 |
| Inner Mongolia Yitai Coal Company, Ltd., Class B | | 77,700 | | | 54,354 |
| Innovent Biologics, Inc. (A)(C) | | 68,500 | | | 455,114 |
| iQIYI, Inc., ADR (A)(B) | | 16,100 | | | 348,565 |
| JD.com, Inc., ADR (A) | | 62,100 | | | 4,883,544 |
| Jiangsu Expressway Company, Ltd., H Shares | | 88,900 | | | 88,948 |
| Jiangxi Copper Company, Ltd., H Shares | | 86,400 | | | 101,687 |
| JOYY, Inc., ADR (A) | | 4,200 | | | 358,848 |
| Kaisa Group Holdings, Ltd. (A) | | 178,000 | | | 89,377 |
| Kingdee International Software Group Company, Ltd. (A) | | 170,000 | | | 432,688 |
| Kingsoft Corp., Ltd. | | 60,200 | | | 321,718 |
| Koolearn Technology Holding, Ltd. (A)(B)(C) | | 17,000 | | | 81,253 |
| KWG Group Holdings, Ltd. (A) | | 92,500 | | | 175,544 |
| Legend Holdings Corp., H Shares (C) | | 42,000 | | | 61,908 |
| Lenovo Group, Ltd. | | 526,000 | | | 350,692 |
| Li Ning Company, Ltd. | | 152,000 | | | 642,034 |
| Logan Group Company, Ltd. | | 100,000 | | | 186,000 |
| Longfor Group Holdings, Ltd. (C) | | 130,900 | | | 692,529 |
| Luye Pharma Group, Ltd. (C) | | 131,000 | | | 70,805 |
| Meituan Dianping, Class B (A) | | 259,500 | | | 8,554,211 |
| Momo, Inc., ADR | | 11,000 | | | 224,400 |
| NetEase, Inc., ADR | | 6,000 | | | 2,923,260 |
| New China Life Insurance Company, Ltd., H Shares | | 60,900 | | | 242,644 |
| New Oriental Education & Technology Group, Inc., ADR (A) | | 10,400 | | | 1,524,952 |
| NIO, Inc., ADR (A)(B) | | 66,000 | | | 1,255,980 |
International Strategic Equity Allocation Fund (continued)
| | | Shares or
Principal
Amount | | Value |
| COMMON STOCKS (continued) | | | |
| China (continued) | | | | | |
| Noah Holdings, Ltd., ADR (A) | | 2,500 | | $ | 70,000 |
| PetroChina Company, Ltd., H Shares | | 1,540,700 | | | 531,678 |
| PICC Property & Casualty Company, Ltd., H Shares | | 506,950 | | | 390,936 |
| Pinduoduo, Inc., ADR (A) | | 18,800 | | | 1,672,072 |
| Ping An Healthcare and Technology Company, Ltd. (A)(B)(C) | | 27,300 | | | 397,900 |
| Ping An Insurance Group Company of China, Ltd., H Shares | | 435,300 | | | 4,647,439 |
| Poly Property Services Company, Ltd. | | 8,400 | | | 73,451 |
| Postal Savings Bank of China Company, Ltd., H Shares (C) | | 727,000 | | | 344,164 |
| Seazen Group, Ltd. (A) | | 158,000 | | | 143,318 |
| Semiconductor Manufacturing International Corp. (A) | | 242,300 | | | 765,428 |
| Shandong Weigao Group Medical Polymer Company, Ltd., H Shares | | 180,000 | | | 419,414 |
| Shanghai Electric Group Company, Ltd., H Shares (A) | | 194,000 | | | 57,004 |
| Shanghai Fosun Pharmaceutical Group Company, Ltd., H Shares | | 38,100 | | | 160,544 |
| Shanghai Lujiazui Finance & Trade Zone Development Company, Ltd., B Shares | | 79,380 | | | 68,167 |
| Shanghai Pharmaceuticals Holding Company, Ltd., H Shares | | 57,000 | | | 101,434 |
| Shenzhen Expressway Company, Ltd., H Shares | | 52,000 | | | 47,054 |
| Shenzhou International Group Holdings, Ltd. | | 60,300 | | | 970,870 |
| Shui On Land, Ltd. | | 264,500 | | | 36,142 |
| Silergy Corp. | | 5,000 | | | 317,170 |
| SINA Corp. (A) | | 4,600 | | | 187,151 |
| Sino-Ocean Group Holding, Ltd. | | 220,000 | | | 50,783 |
| Sinopec Engineering Group Company, Ltd., H Shares | | 108,000 | | | 47,845 |
| Sinopec Shanghai Petrochemical Company, Ltd., H Shares | | 239,700 | | | 49,426 |
| Sinopharm Group Company, Ltd., H Shares | | 98,300 | | | 241,370 |
| Sinotruk Hong Kong, Ltd. | | 50,500 | | | 131,065 |
| SOHO China, Ltd. (A) | | 151,200 | | | 46,575 |
| Sunac China Holdings, Ltd. | | 186,300 | | | 782,052 |
| Sunny Optical Technology Group Company, Ltd. | | 52,000 | | | 769,345 |
| TAL Education Group, ADR (A) | | 28,000 | | | 2,066,680 |
| Tencent Holdings, Ltd. | | 418,300 | | | 28,577,570 |
| Tencent Music Entertainment Group, ADR (A) | | 26,600 | | | 415,758 |
| The People's Insurance Company Group of China, Ltd., H Shares | | 609,200 | | | 198,517 |
| Tingyi Cayman Islands Holding Corp. | | 142,700 | | | 267,800 |
| Tongcheng-Elong Holdings, Ltd. (A) | | 62,000 | | | 121,345 |
| Topsports International Holdings, Ltd. (C) | | 90,000 | | | 111,142 |
| TravelSky Technology, Ltd., H Shares | | 68,500 | | | 142,249 |
| Trip.com Group, Ltd., ADR (A) | | 34,600 | | | 1,046,304 |
| Tsingtao Brewery Company, Ltd., H Shares | | 31,000 | | | 281,962 |
| Uni-President China Holdings, Ltd. | | 94,000 | | | 85,510 |
| Vipshop Holdings, Ltd., ADR (A)(B) | | 32,200 | | | 531,622 |
| Want Want China Holdings, Ltd. | | 362,500 | | | 248,464 |
| Weibo Corp., ADR (A)(B) | | 4,080 | | | 152,184 |
| Weichai Power Company, Ltd., H Shares | | 141,000 | | | 283,030 |
| WuXi AppTec Company, Ltd., H Shares (C) | | 15,636 | | | 231,149 |
| The accompanying notes are an integral part of the financial statements. | 35 | |
John Hancock Funds II
Portfolio of Investments — August 31, 2020 (showing percentage of total net assets)
International Strategic Equity Allocation Fund (continued)
| | | Shares or
Principal
Amount | | Value |
| COMMON STOCKS (continued) | | | |
| China (continued) | | | | | |
| Wuxi Biologics Cayman, Inc. (A)(C) | | 66,500 | | $ | 1,721,686 |
| Xiaomi Corp., Class B (A)(C) | | 762,400 | | | 2,361,002 |
| Xinjiang Goldwind Science & Technology Company, Ltd., H Shares | | 53,800 | | | 46,241 |
| Xinyi Solar Holdings, Ltd. | | 294,000 | | | 370,349 |
| Yangzijiang Shipbuilding Holdings, Ltd. | | 80,000 | | | 53,744 |
| Yanzhou Coal Mining Company, Ltd., H Shares | | 112,700 | | | 86,644 |
| Yihai International Holding, Ltd. (A) | | 34,000 | | | 533,506 |
| Yum China Holdings, Inc. | | 26,084 | | | 1,505,308 |
| Yuzhou Group Holdings Company, Ltd. | | 132,000 | | | 61,567 |
| Zai Lab, Ltd., ADR (A) | | 3,800 | | | 301,606 |
| Zhaojin Mining Industry Company, Ltd., H Shares | | 75,500 | | | 84,542 |
| Zhejiang Expressway Company, Ltd., H Shares | | 105,800 | | | 71,326 |
| Zhenro Properties Group, Ltd. | | 111,000 | | | 64,849 |
| ZhongAn Online P&C Insurance Company, Ltd., H Shares (A)(B)(C) | | 27,500 | | | 180,545 |
| Zhongsheng Group Holdings, Ltd. | | 41,500 | | | 258,814 |
| Zhuzhou CRRC Times Electric Company, Ltd., H Shares | | 40,000 | | | 128,270 |
| Zijin Mining Group Company, Ltd., H Shares | | 415,200 | | | 283,172 |
| Zoomlion Heavy Industry Science and Technology Company, Ltd., H Shares (A) | | 95,600 | | | 95,617 |
| ZTE Corp., H Shares | | 55,100 | | | 159,943 |
| ZTO Express Cayman, Inc., ADR | | 27,300 | | | 915,369 |
| | | | | | 160,671,413 |
| Colombia - 0.1% | | | | | |
| Bancolombia SA | | 28,631 | | | 198,986 |
| Ecopetrol SA | | 559,153 | | | 327,331 |
| Grupo de Inversiones Suramericana SA | | 26,877 | | | 150,873 |
| Interconexion Electrica SA ESP | | 50,013 | | | 279,944 |
| | | | | | 957,134 |
| Czech Republic - 0.0% | | | | | |
| CEZ AS | | 13,910 | | | 286,765 |
| Komercni banka AS (A) | | 6,524 | | | 156,865 |
| Moneta Money Bank AS (C) | | 43,728 | | | 109,995 |
| | | | | | 553,625 |
| Denmark - 2.2% | | | | | |
| A.P. Moller - Maersk A/S, Series A | | 358 | | | 508,495 |
| A.P. Moller - Maersk A/S, Series B | | 717 | | | 1,098,632 |
| Ambu A/S, Class B | | 17,939 | | | 527,961 |
| Carlsberg A/S, Class B | | 11,766 | | | 1,653,963 |
| Chr. Hansen Holding A/S | | 11,586 | | | 1,329,813 |
| Coloplast A/S, B Shares | | 13,046 | | | 2,212,881 |
| Danske Bank A/S (A) | | 75,926 | | | 1,174,801 |
| Demant A/S (A) | | 12,129 | | | 361,768 |
| DSV Panalpina A/S | | 23,253 | | | 3,630,075 |
| Genmab A/S (A) | | 7,151 | | | 2,698,613 |
| GN Store Nord A/S | | 14,076 | | | 1,020,114 |
| H Lundbeck A/S | | 7,646 | | | 250,831 |
| Novo Nordisk A/S, B Shares (B) | | 194,456 | | | 12,856,146 |
| Novozymes A/S, B Shares | | 23,457 | | | 1,386,181 |
| Orsted A/S (C) | | 20,788 | | | 2,942,763 |
| Pandora A/S | | 10,992 | | | 802,374 |
| Tryg A/S (B) | | 13,335 | | | 409,207 |
| Vestas Wind Systems A/S | | 21,871 | | | 3,306,723 |
| | | | | | 38,171,341 |
International Strategic Equity Allocation Fund (continued)
| | | Shares or
Principal
Amount | | Value |
| COMMON STOCKS (continued) | | | |
| Finland - 2.0% | | | | | |
| Elisa OYJ | | 29,542 | | $ | 1,738,710 |
| Fortum OYJ | | 92,341 | | | 1,954,492 |
| Kone OYJ, B Shares | | 70,671 | | | 6,061,350 |
| Neles OYJ | | 88 | | | 1,203 |
| Neste OYJ | | 87,950 | | | 4,708,421 |
| Nokia OYJ | | 1,175,974 | | | 5,732,780 |
| Nordea Bank ABP | | 437,543 | | | 3,527,435 |
| Orion OYJ, Class B | | 21,846 | | | 1,025,809 |
| Sampo OYJ, A Shares | | 98,070 | | | 3,950,605 |
| Stora Enso OYJ, R Shares | | 121,002 | | | 1,784,607 |
| UPM-Kymmene OYJ | | 110,995 | | | 3,368,857 |
| Wartsila OYJ ABP | | 92,275 | | | 790,021 |
| | | | | | 34,644,290 |
| France - 9.1% | | | | | |
| Accor SA (A) | | 19,889 | | | 609,672 |
| Aeroports de Paris (B) | | 3,108 | | | 324,456 |
| Air Liquide SA | | 49,717 | | | 8,244,284 |
| Airbus SE (A)(B) | | 61,783 | | | 5,080,868 |
| Alstom SA (A) | | 20,179 | | | 1,126,457 |
| Amundi SA (A)(C) | | 6,406 | | | 497,488 |
| Arkema SA | | 7,251 | | | 802,763 |
| Atos SE (A) | | 10,321 | | | 894,502 |
| AXA SA (B) | | 203,931 | | | 4,161,008 |
| BioMerieux | | 4,353 | | | 658,273 |
| BNP Paribas SA (A) | | 118,232 | | | 5,151,140 |
| Bollore SA | | 92,234 | | | 346,722 |
| Bouygues SA (A) | | 23,919 | | | 946,427 |
| Bureau Veritas SA (A) | | 30,805 | | | 699,477 |
| Capgemini SE | | 16,903 | | | 2,344,750 |
| Carrefour SA | | 63,572 | | | 1,022,597 |
| Casino Guichard Perrachon SA (A) | | 4,538 | | | 117,648 |
| Cie de Saint-Gobain (A) | | 54,389 | | | 2,198,710 |
| Cie Generale des Etablissements Michelin SCA | | 17,826 | | | 2,018,957 |
| CNP Assurances (A) | | 18,595 | | | 249,307 |
| Covivio | | 5,028 | | | 371,872 |
| Credit Agricole SA (A) | | 121,444 | | | 1,245,113 |
| Danone SA | | 64,875 | | | 4,265,944 |
| Dassault Aviation SA (A) | | 266 | | | 240,944 |
| Dassault Systemes SE | | 13,800 | | | 2,604,009 |
| Edenred | | 25,553 | | | 1,319,037 |
| Eiffage SA (A) | | 8,749 | | | 804,590 |
| Electricite de France SA | | 65,227 | | | 686,128 |
| Engie SA (A) | | 191,849 | | | 2,668,936 |
| EssilorLuxottica SA (A) | | 29,871 | | | 3,998,669 |
| Eurazeo SE (A) | | 4,117 | | | 217,322 |
| Faurecia SE (A) | | 7,957 | | | 348,388 |
| Gecina SA | | 4,807 | | | 660,949 |
| Getlink SE (A) | | 46,195 | | | 706,606 |
| Hermes International | | 3,326 | | | 2,858,457 |
| ICADE | | 3,102 | | | 200,795 |
| Iliad SA (B) | | 1,553 | | | 331,237 |
| Ingenico Group SA (A) | | 6,362 | | | 1,086,269 |
| Ipsen SA | | 3,956 | | | 408,583 |
| JCDecaux SA (A) | | 8,893 | | | 169,828 |
| Kering SA | | 7,961 | | | 4,884,566 |
| Klepierre SA (B) | | 20,629 | | | 339,591 |
| La Francaise des Jeux SAEM (C) | | 9,028 | | | 333,885 |
| Legrand SA | | 28,032 | | | 2,339,826 |
| L'Oreal SA | | 26,389 | | | 8,757,157 |
| LVMH Moet Hennessy Louis Vuitton SE | | 29,185 | | | 13,705,890 |
| Natixis SA (A) | | 99,777 | | | 275,017 |
| Orange SA | | 209,483 | | | 2,340,082 |
| The accompanying notes are an integral part of the financial statements. | 36 | |
John Hancock Funds II
Portfolio of Investments — August 31, 2020 (showing percentage of total net assets)
International Strategic Equity Allocation Fund (continued)
| | | Shares or
Principal
Amount | | Value |
| COMMON STOCKS (continued) | | | |
| France (continued) | | | | | |
| Orpea (A)(B) | | 5,418 | | $ | 649,840 |
| Pernod Ricard SA | | 22,308 | | | 3,820,893 |
| Peugeot SA (A) | | 61,788 | | | 1,065,258 |
| Publicis Groupe SA | | 22,740 | | | 795,282 |
| Remy Cointreau SA (B) | | 2,367 | | | 389,843 |
| Renault SA (A) | | 20,182 | | | 575,621 |
| Safran SA (A)(B) | | 33,735 | | | 3,895,855 |
| Sanofi | | 118,579 | | | 12,010,676 |
| Sartorius Stedim Biotech | | 2,902 | | | 1,037,200 |
| Schneider Electric SE | | 58,110 | | | 7,186,524 |
| SCOR SE (A) | | 16,705 | | | 447,691 |
| SEB SA | | 2,373 | | | 416,224 |
| Societe Generale SA (A) | | 85,340 | | | 1,381,453 |
| Sodexo SA | | 9,296 | | | 663,574 |
| Suez SA | | 36,103 | | | 623,450 |
| Teleperformance | | 6,165 | | | 1,901,078 |
| Thales SA (B) | | 11,234 | | | 877,303 |
| TOTAL SE | | 259,725 | | | 10,303,793 |
| Ubisoft Entertainment SA (A) | | 9,499 | | | 781,749 |
| Unibail-Rodamco-Westfield (Euronext Amsterdam Exchange) | | 14,525 | | | 675,911 |
| Valeo SA | | 24,047 | | | 738,469 |
| Veolia Environnement SA | | 56,552 | | | 1,364,426 |
| Vinci SA | | 54,136 | | | 5,072,051 |
| Vivendi SA | | 87,069 | | | 2,478,819 |
| Wendel SE | | 2,811 | | | 288,398 |
| Worldline SA (A)(C) | | 14,400 | | | 1,325,432 |
| | | | | | 156,432,009 |
| Germany - 8.6% | | | | | |
| adidas AG (A) | | 22,405 | | | 6,817,759 |
| Allianz SE | | 49,192 | | | 10,674,027 |
| BASF SE | | 108,115 | | | 6,602,176 |
| Bayer AG | | 115,629 | | | 7,690,695 |
| Bayerische Motoren Werke AG | | 38,991 | | | 2,809,666 |
| Beiersdorf AG | | 11,848 | | | 1,369,504 |
| Brenntag AG | | 18,174 | | | 1,138,714 |
| Carl Zeiss Meditec AG, Bearer Shares | | 4,733 | | | 534,220 |
| Commerzbank AG (A) | | 117,383 | | | 681,768 |
| Continental AG | | 12,933 | | | 1,419,004 |
| Covestro AG (C) | | 20,473 | | | 976,027 |
| Daimler AG | | 100,741 | | | 5,165,268 |
| Delivery Hero SE (A)(C) | | 15,063 | | | 1,620,479 |
| Deutsche Bank AG (A)(B) | | 231,265 | | | 2,217,477 |
| Deutsche Boerse AG | | 22,375 | | | 4,233,002 |
| Deutsche Lufthansa AG (A)(B) | | 28,086 | | | 293,838 |
| Deutsche Post AG | | 116,390 | | | 5,305,525 |
| Deutsche Telekom AG | | 392,224 | | | 6,913,725 |
| Deutsche Wohnen SE | | 40,191 | | | 2,144,092 |
| E.ON SE | | 264,037 | | | 3,127,192 |
| Evonik Industries AG | | 24,706 | | | 717,495 |
| Fraport AG Frankfurt Airport Services Worldwide (A)(B) | | 4,868 | | | 222,051 |
| Fresenius Medical Care AG & Company KGaA | | 25,087 | | | 2,131,664 |
| Fresenius SE & Company KGaA | | 49,209 | | | 2,283,496 |
| GEA Group AG | | 18,048 | | | 659,014 |
| Hannover Rueck SE | | 7,145 | | | 1,218,422 |
| HeidelbergCement AG | | 17,532 | | | 1,112,260 |
| Henkel AG & Company KGaA | | 12,217 | | | 1,099,217 |
| HOCHTIEF AG | | 2,897 | | | 256,870 |
| Infineon Technologies AG | | 147,292 | | | 4,095,647 |
| KION Group AG | | 7,642 | | | 646,622 |
| Knorr-Bremse AG | | 5,672 | | | 720,720 |
International Strategic Equity Allocation Fund (continued)
| | | Shares or
Principal
Amount | | Value |
| COMMON STOCKS (continued) | | | |
| Germany (continued) | | | | | |
| LANXESS AG | | 9,799 | | $ | 573,657 |
| LEG Immobilien AG | | 8,114 | | | 1,192,292 |
| Merck KGaA | | 15,213 | | | 2,067,664 |
| METRO AG | | 21,103 | | | 209,257 |
| MTU Aero Engines AG | | 6,270 | | | 1,164,756 |
| Muenchener Rueckversicherungs-Gesellschaft AG | | 17,026 | | | 4,917,897 |
| Nemetschek SE | | 6,783 | | | 539,268 |
| Puma SE (A) | | 9,757 | | | 808,415 |
| RWE AG | | 68,719 | | | 2,736,352 |
| SAP SE | | 122,892 | | | 20,319,494 |
| Scout24 AG (C) | | 12,645 | | | 1,176,291 |
| Siemens AG | | 90,037 | | | 12,475,990 |
| Siemens Healthineers AG (C) | | 17,637 | | | 803,518 |
| Symrise AG | | 15,126 | | | 2,091,903 |
| TeamViewer AG (A)(B)(C) | | 15,290 | | | 827,902 |
| Telefonica Deutschland Holding AG | | 121,956 | | | 337,413 |
| thyssenkrupp AG (A)(B) | | 47,559 | | | 342,553 |
| Uniper SE | | 23,662 | | | 775,513 |
| United Internet AG | | 12,047 | | | 592,954 |
| Volkswagen AG | | 3,810 | | | 686,489 |
| Vonovia SE | | 60,594 | | | 4,336,442 |
| Wirecard AG (A) | | 69 | | | 50 |
| Zalando SE (A)(C) | | 17,848 | | | 1,563,628 |
| | | | | | 147,437,334 |
| Hong Kong - 3.1% | | | | | |
| AIA Group, Ltd. | | 1,004,800 | | | 10,293,932 |
| Alibaba Health Information Technology, Ltd. (A) | | 265,100 | | | 638,953 |
| Alibaba Pictures Group, Ltd. (A)(B) | | 865,600 | | | 122,611 |
| ASM Pacific Technology, Ltd. | | 25,400 | | | 273,233 |
| Beijing Enterprises Holdings, Ltd. | | 37,500 | | | 119,143 |
| Beijing Enterprises Water Group, Ltd. (A) | | 364,500 | | | 143,206 |
| BOC Hong Kong Holdings, Ltd. | | 307,500 | | | 872,261 |
| Bosideng International Holdings, Ltd. | | 236,000 | | | 67,525 |
| Brilliance China Automotive Holdings, Ltd. | | 221,500 | | | 199,536 |
| Budweiser Brewing Company APAC, Ltd. (C) | | 142,900 | | | 481,439 |
| China Education Group Holdings, Ltd. | | 44,000 | | | 86,298 |
| China Everbright International, Ltd. | | 269,200 | | | 162,348 |
| China Everbright, Ltd. | | 69,100 | | | 106,393 |
| China Gas Holdings, Ltd. | | 190,400 | | | 521,255 |
| China Jinmao Holdings Group, Ltd. (B) | | 386,900 | | | 241,591 |
| China Mengniu Dairy Company, Ltd. (A) | | 200,900 | | | 986,598 |
| China Merchants Port Holdings Company, Ltd. | | 102,300 | | | 116,952 |
| China Mobile, Ltd. | | 448,400 | | | 3,137,866 |
| China Overseas Land & Investment, Ltd. | | 280,000 | | | 809,898 |
| China Overseas Property Holdings, Ltd. | | 95,000 | | | 85,560 |
| China Power International Development, Ltd. | | 320,000 | | | 61,885 |
| China Resources Beer Holdings Company, Ltd. | | 107,200 | | | 696,814 |
| China Resources Cement Holdings, Ltd. | | 178,000 | | | 259,222 |
| China Resources Gas Group, Ltd. | | 65,100 | | | 305,364 |
| China Resources Land, Ltd. | | 233,700 | | | 1,079,603 |
| China Resources Power Holdings Company, Ltd. | | 141,100 | | | 167,364 |
| China State Construction International Holdings, Ltd. | | 147,500 | | | 114,186 |
| China Taiping Insurance Holdings Company, Ltd. | | 119,400 | | | 189,375 |
| The accompanying notes are an integral part of the financial statements. | 37 | |
John Hancock Funds II
Portfolio of Investments — August 31, 2020 (showing percentage of total net assets)
International Strategic Equity Allocation Fund (continued)
| | | Shares or
Principal
Amount | | Value |
| COMMON STOCKS (continued) | | | |
| Hong Kong (continued) | | | | | |
| China Traditional Chinese Medicine Holdings Company, Ltd. | | 202,000 | | $ | 86,122 |
| China Unicom Hong Kong, Ltd. | | 447,300 | | | 317,118 |
| CK Asset Holdings, Ltd. | | 215,000 | | | 1,166,954 |
| CK Hutchison Holdings, Ltd. | | 224,500 | | | 1,468,261 |
| CK Infrastructure Holdings, Ltd. | | 55,000 | | | 290,693 |
| CLP Holdings, Ltd. | | 136,500 | | | 1,340,165 |
| COSCO SHIPPING Ports, Ltd. | | 127,700 | | | 72,251 |
| Dairy Farm International Holdings, Ltd. | | 27,900 | | | 116,645 |
| Far East Horizon, Ltd. | | 144,800 | | | 128,146 |
| Galaxy Entertainment Group, Ltd. | | 180,000 | | | 1,415,018 |
| Geely Automobile Holdings, Ltd. | | 429,300 | | | 913,671 |
| Guangdong Investment, Ltd. | | 214,900 | | | 335,099 |
| Haier Electronics Group Company, Ltd. | | 92,700 | | | 317,166 |
| Hang Lung Properties, Ltd. | | 168,000 | | | 473,397 |
| Hang Seng Bank, Ltd. | | 63,400 | | | 996,491 |
| Henderson Land Development Company, Ltd. | | 120,041 | | | 471,878 |
| HK Electric Investments & HK Electric Investments, Ltd. | | 218,000 | | | 221,869 |
| HKT Trust & HKT, Ltd. | | 314,000 | | | 448,683 |
| Hong Kong & China Gas Company, Ltd. | | 884,228 | | | 1,285,664 |
| Hong Kong Exchanges & Clearing, Ltd. | | 99,600 | | | 5,021,870 |
| Hongkong Land Holdings, Ltd. | | 97,000 | | | 371,168 |
| Hutchison China MediTech, Ltd., ADR (A) | | 5,000 | | | 166,100 |
| Jardine Matheson Holdings, Ltd. | | 18,200 | | | 764,298 |
| Jardine Strategic Holdings, Ltd. | | 18,400 | | | 369,192 |
| Kerry Properties, Ltd. | | 54,500 | | | 141,555 |
| Kingboard Holdings, Ltd. | | 48,700 | | | 156,551 |
| Kingboard Laminates Holdings, Ltd. | | 79,000 | | | 99,492 |
| Kunlun Energy Company, Ltd. | | 284,900 | | | 211,982 |
| Lee & Man Paper Manufacturing, Ltd. | | 96,500 | | | 57,660 |
| Link REIT (B) | | 171,200 | | | 1,361,939 |
| Melco Resorts & Entertainment, Ltd., ADR | | 18,200 | | | 355,264 |
| MTR Corp., Ltd. | | 127,500 | | | 663,197 |
| New World Development Company, Ltd. | | 127,250 | | | 659,861 |
| Nine Dragons Paper Holdings, Ltd. | | 119,900 | | | 132,827 |
| NWS Holdings, Ltd. | | 129,000 | | | 109,465 |
| PCCW, Ltd. | | 347,000 | | | 217,464 |
| Power Assets Holdings, Ltd. | | 115,000 | | | 658,192 |
| Shanghai Industrial Holdings, Ltd. | | 32,900 | | | 49,430 |
| Shenzhen International Holdings, Ltd. | | 79,000 | | | 126,658 |
| Shenzhen Investment, Ltd. | | 224,000 | | | 75,921 |
| Shimao Group Holdings, Ltd. | | 88,400 | | | 397,290 |
| Sino Biopharmaceutical, Ltd. | | 757,350 | | | 871,543 |
| Sino Land Company, Ltd. | | 261,000 | | | 303,777 |
| SJM Holdings, Ltd. | | 164,000 | | | 224,958 |
| SSY Group, Ltd. | | 110,000 | | | 69,977 |
| Sun Art Retail Group, Ltd. | | 173,700 | | | 225,975 |
| Sun Hung Kai Properties, Ltd. | | 108,500 | | | 1,455,692 |
| Swire Pacific, Ltd., Class A | | 41,500 | | | 225,984 |
| Swire Properties, Ltd. | | 96,800 | | | 262,016 |
| Techtronic Industries Company, Ltd. | | 114,000 | | | 1,443,713 |
| The Bank of East Asia, Ltd. | | 108,400 | | | 244,254 |
| The Wharf Holdings, Ltd. | | 111,000 | | | 216,268 |
| Vinda International Holdings, Ltd. | | 26,000 | | | 88,788 |
| WH Group, Ltd. (C) | | 795,000 | | | 685,215 |
| Wharf Real Estate Investment Company, Ltd. | | 139,000 | | | 577,714 |
| Yuexiu Property Company, Ltd. | | 504,000 | | | 96,116 |
| | | | | | 53,365,068 |
| Hungary - 0.1% | | | | | |
| MOL Hungarian Oil & Gas PLC (A) | | 40,957 | | | 230,136 |
International Strategic Equity Allocation Fund (continued)
| | | Shares or
Principal
Amount | | Value |
| COMMON STOCKS (continued) | | | |
| Hungary (continued) | | | | | |
| OTP Bank NYRT (A) | | 22,370 | | $ | 753,386 |
| Richter Gedeon NYRT | | 13,985 | | | 340,597 |
| | | | | | 1,324,119 |
| Indonesia - 0.4% | | | | | |
| Ace Hardware Indonesia Tbk PT | | 564,600 | | | 59,889 |
| Adaro Energy Tbk PT | | 1,196,000 | | | 88,949 |
| Astra International Tbk PT | | 1,678,200 | | | 588,863 |
| Bank Central Asia Tbk PT | | 815,700 | | | 1,756,992 |
| Bank Mandiri Persero Tbk PT | | 1,541,400 | | | 630,284 |
| Bank Negara Indonesia Persero Tbk PT | | 620,300 | | | 217,190 |
| Bank Rakyat Indonesia Persero Tbk PT | | 4,586,500 | | | 1,104,943 |
| Barito Pacific Tbk PT (A) | | 2,211,000 | | | 127,367 |
| Charoen Pokphand Indonesia Tbk PT (A) | | 611,000 | | | 264,311 |
| Gudang Garam Tbk PT (A) | | 40,000 | | | 130,423 |
| Hanjaya Mandala Sampoerna Tbk PT | | 769,700 | | | 87,127 |
| Indah Kiat Pulp & Paper Corp. Tbk PT | | 227,200 | | | 144,965 |
| Indocement Tunggal Prakarsa Tbk PT | | 122,100 | | | 99,576 |
| Indofood CBP Sukses Makmur Tbk PT | | 192,700 | | | 135,316 |
| Indofood Sukses Makmur Tbk PT | | 364,300 | | | 190,592 |
| Kalbe Farma Tbk PT | | 1,744,500 | | | 189,053 |
| Perusahaan Gas Negara Tbk PT | | 904,600 | | | 77,926 |
| Semen Indonesia Persero Tbk PT | | 245,900 | | | 178,117 |
| Telekomunikasi Indonesia Persero Tbk PT | | 4,103,100 | | | 807,360 |
| Unilever Indonesia Tbk PT | | 630,000 | | | 355,655 |
| United Tractors Tbk PT | | 138,800 | | | 219,180 |
| XL Axiata Tbk PT | | 311,100 | | | 52,075 |
| | | | | | 7,506,153 |
| Ireland - 0.7% | | | | | |
| AerCap Holdings NV (A) | | 16,400 | | | 484,948 |
| CRH PLC | | 57,964 | | | 2,161,801 |
| DCC PLC | | 5,746 | | | 510,479 |
| Experian PLC | | 53,048 | | | 1,982,017 |
| Flutter Entertainment PLC | | 16,877 | | | 2,836,826 |
| James Hardie Industries PLC, CHESS Depositary Interest | | 51,246 | | | 1,162,711 |
| Kerry Group PLC, Class A | | 11,718 | | | 1,538,794 |
| Kingspan Group PLC | | 11,104 | | | 945,352 |
| Smurfit Kappa Group PLC | | 16,667 | | | 590,197 |
| | | | | | 12,213,125 |
| Isle of Man - 0.0% | | | | | |
| GVC Holdings PLC | | 34,094 | | | 360,470 |
| Israel - 0.4% | | | | | |
| Azrieli Group, Ltd. | | 3,244 | | | 175,023 |
| Bank Hapoalim BM | | 82,227 | | | 497,506 |
| Bank Leumi Le-Israel BM | | 106,250 | | | 543,635 |
| Check Point Software Technologies, Ltd. (A) | | 8,200 | | | 1,035,332 |
| CyberArk Software, Ltd. (A) | | 2,700 | | | 298,350 |
| ICL Group, Ltd. | | 52,105 | | | 193,571 |
| Israel Discount Bank, Ltd., Class A | | 86,752 | | | 277,485 |
| Mizrahi Tefahot Bank, Ltd. | | 10,811 | | | 220,184 |
| Nice, Ltd. (A) | | 4,380 | | | 1,005,703 |
| Teva Pharmaceutical Industries, Ltd., ADR (A) | | 76,000 | | | 750,120 |
| Wix.com, Ltd. (A) | | 3,600 | | | 1,060,668 |
| | | | | | 6,057,577 |
| Italy - 1.2% | | | | | |
| Assicurazioni Generali SpA | | 80,335 | | | 1,247,899 |
| Atlantia SpA (A)(B) | | 35,735 | | | 567,358 |
| Davide Campari-Milano NV (B) | | 41,887 | | �� | 429,449 |
| DiaSorin SpA | | 1,818 | | | 329,093 |
| Enel SpA | | 587,055 | | | 5,315,878 |
| The accompanying notes are an integral part of the financial statements. | 38 | |
John Hancock Funds II
Portfolio of Investments — August 31, 2020 (showing percentage of total net assets)
International Strategic Equity Allocation Fund (continued)
| | | Shares or
Principal
Amount | | Value |
| COMMON STOCKS (continued) | | | |
| Italy (continued) | | | | | |
| Eni SpA | | 183,507 | | $ | 1,704,850 |
| Ferrari NV | | 9,093 | | | 1,775,015 |
| FinecoBank Banca Fineco SpA (A) | | 43,931 | | | 665,052 |
| Infrastrutture Wireless Italiane SpA (C) | | 17,295 | | | 168,700 |
| Intesa Sanpaolo SpA (A) | | 1,073,247 | | | 2,310,165 |
| Leonardo SpA | | 29,888 | | | 202,207 |
| Mediobanca Banca di Credito Finanziario SpA | | 44,857 | | | 390,115 |
| Moncler SpA (A) | | 13,968 | | | 541,482 |
| Nexi SpA (A)(C) | | 27,207 | | | 484,208 |
| Pirelli & C. SpA (A)(B)(C) | | 28,655 | | | 123,949 |
| Poste Italiane SpA (C) | | 37,965 | | | 348,376 |
| Prysmian SpA | | 17,411 | | | 486,577 |
| Recordati Industria Chimica e Farmaceutica SpA (B) | | 7,521 | | | 410,257 |
| Snam SpA | | 146,477 | | | 750,141 |
| Telecom Italia SpA | | 603,308 | | | 287,353 |
| Telecom Italia SpA, Savings Shares | | 435,070 | | | 205,720 |
| Terna Rete Elettrica Nazionale SpA | | 101,061 | | | 731,149 |
| UniCredit SpA (A) | | 152,767 | | | 1,502,563 |
| | | | | | 20,977,556 |
| Japan - 10.1% | | | | | |
| ABC-Mart, Inc. (B) | | 1,600 | | | 84,255 |
| Acom Company, Ltd. (B) | | 19,500 | | | 76,159 |
| Advantest Corp. | | 9,800 | | | 469,592 |
| Aeon Company, Ltd. (B) | | 32,100 | | | 796,868 |
| Aeon Mall Company, Ltd. | | 5,000 | | | 66,071 |
| AGC, Inc. | | 9,500 | | | 268,794 |
| Air Water, Inc. | | 9,100 | | | 127,723 |
| Aisin Seiki Company, Ltd. | | 8,000 | | | 274,389 |
| Ajinomoto Company, Inc. | | 22,900 | | | 427,136 |
| Alfresa Holdings Corp. | | 9,200 | | | 184,864 |
| Amada Company, Ltd. | | 16,400 | | | 145,746 |
| ANA Holdings, Inc. (A) | | 5,600 | | | 139,622 |
| Aozora Bank, Ltd. | | 5,800 | | | 103,971 |
| Asahi Group Holdings, Ltd. | | 19,100 | | | 667,520 |
| Asahi Intecc Company, Ltd. | | 9,600 | | | 284,899 |
| Asahi Kasei Corp. | | 61,900 | | | 518,551 |
| Astellas Pharma, Inc. | | 91,600 | | | 1,437,035 |
| Bandai Namco Holdings, Inc. | | 9,800 | | | 608,413 |
| Benesse Holdings, Inc. | | 3,500 | | | 89,189 |
| Bridgestone Corp. | | 26,300 | | | 832,592 |
| Brother Industries, Ltd. | | 11,000 | | | 181,983 |
| Calbee, Inc. | | 4,300 | | | 134,090 |
| Canon, Inc. | | 49,200 | | | 843,862 |
| Casio Computer Company, Ltd. (B) | | 9,600 | | | 154,657 |
| Central Japan Railway Company | | 7,100 | | | 1,064,445 |
| Chubu Electric Power Company, Inc. | | 31,600 | | | 390,461 |
| Chugai Pharmaceutical Company, Ltd. | | 33,000 | | | 1,470,383 |
| Coca-Cola Bottlers Japan Holdings, Inc. | | 6,000 | | | 99,872 |
| Concordia Financial Group, Ltd. | | 52,600 | | | 174,370 |
| Cosmos Pharmaceutical Corp. | | 1,000 | | | 176,114 |
| CyberAgent, Inc. | | 5,000 | | | 266,393 |
| Dai Nippon Printing Company, Ltd. | | 12,000 | | | 254,600 |
| Daicel Corp. | | 12,400 | | | 89,850 |
| Daifuku Company, Ltd. | | 5,000 | | | 440,196 |
| Dai-ichi Life Holdings, Inc. | | 53,500 | | | 810,640 |
| Daiichi Sankyo Company, Ltd. | | 27,900 | | | 2,488,765 |
| Daikin Industries, Ltd. | | 12,300 | | | 2,316,893 |
| Daito Trust Construction Company, Ltd. | | 3,200 | | | 283,612 |
| Daiwa House Industry Company, Ltd. | | 27,900 | | | 746,018 |
| Daiwa House REIT Investment Corp. | | 96 | | | 250,822 |
| Daiwa Securities Group, Inc. | | 71,500 | | | 322,478 |
International Strategic Equity Allocation Fund (continued)
| | | Shares or
Principal
Amount | | Value |
| COMMON STOCKS (continued) | | | |
| Japan (continued) | | | | | |
| Denso Corp. | | 21,300 | | $ | 896,086 |
| Dentsu Group, Inc. | | 10,600 | | | 277,970 |
| Disco Corp. | | 1,400 | | | 326,287 |
| East Japan Railway Company | | 14,900 | | | 969,971 |
| Eisai Company, Ltd. | | 12,400 | | | 1,083,075 |
| Electric Power Development Company, Ltd. | | 6,700 | | | 101,116 |
| ENEOS Holdings, Inc. | | 150,200 | | | 588,614 |
| FamilyMart Company, Ltd. | | 12,500 | | | 277,265 |
| FANUC Corp. | | 9,500 | | | 1,666,608 |
| Fast Retailing Company, Ltd. | | 2,900 | | | 1,729,017 |
| Fuji Electric Company, Ltd. | | 6,300 | | | 196,545 |
| FUJIFILM Holdings Corp. | | 17,700 | | | 841,910 |
| Fujitsu, Ltd. | | 9,700 | | | 1,266,239 |
| Fukuoka Financial Group, Inc. | | 8,500 | | | 140,325 |
| GLP J-REIT (A)(B) | | 179 | | | 276,410 |
| GMO Payment Gateway, Inc. | | 2,000 | | | 211,502 |
| Hakuhodo DY Holdings, Inc. | | 11,400 | | | 141,547 |
| Hamamatsu Photonics KK | | 6,900 | | | 314,278 |
| Hankyu Hanshin Holdings, Inc. | | 11,200 | | | 363,912 |
| Hikari Tsushin, Inc. | | 1,000 | | | 241,402 |
| Hino Motors, Ltd. | | 14,300 | | | 96,155 |
| Hirose Electric Company, Ltd. | | 1,600 | | | 181,078 |
| Hisamitsu Pharmaceutical Company, Inc. (B) | | 2,500 | | | 115,485 |
| Hitachi Construction Machinery Company, Ltd. | | 5,300 | | | 185,963 |
| Hitachi Metals, Ltd. | | 10,500 | | | 157,223 |
| Hitachi, Ltd. | | 47,700 | | | 1,586,907 |
| Honda Motor Company, Ltd. | | 80,300 | | | 2,044,340 |
| Hoshizaki Corp. | | 2,500 | | | 190,978 |
| Hoya Corp. | | 18,600 | | | 1,829,758 |
| Hulic Company, Ltd. | | 14,900 | | | 135,547 |
| Idemitsu Kosan Company, Ltd. | | 9,597 | | | 211,279 |
| Iida Group Holdings Company, Ltd. | | 7,300 | | | 142,484 |
| Inpex Corp. | | 50,500 | | | 320,241 |
| Isetan Mitsukoshi Holdings, Ltd. | | 16,400 | | | 90,216 |
| Isuzu Motors, Ltd. | | 27,200 | | | 268,758 |
| Ito En, Ltd. | | 2,600 | | | 157,295 |
| ITOCHU Corp. | | 66,400 | | | 1,703,976 |
| Itochu Techno-Solutions Corp. | | 4,700 | | | 170,126 |
| Japan Airlines Company, Ltd. | | 5,600 | | | 111,031 |
| Japan Airport Terminal Company, Ltd. | | 2,500 | | | 112,187 |
| Japan Exchange Group, Inc. | | 25,200 | | | 653,475 |
| Japan Post Bank Company, Ltd. | | 19,400 | | | 156,075 |
| Japan Post Holdings Company, Ltd. | | 78,300 | | | 579,135 |
| Japan Post Insurance Company, Ltd. | | 11,400 | | | 182,174 |
| Japan Prime Realty Investment Corp. | | 38 | | | 114,743 |
| Japan Real Estate Investment Corp. | | 64 | | | 358,393 |
| Japan Retail Fund Investment Corp. (B) | | 129 | | | 194,146 |
| Japan Tobacco, Inc. | | 59,100 | | | 1,104,986 |
| JFE Holdings, Inc. | | 24,000 | | | 181,518 |
| JGC Holdings Corp. | | 10,900 | | | 120,100 |
| JSR Corp. | | 10,100 | | | 215,606 |
| JTEKT Corp. | | 10,000 | | | 76,537 |
| Kajima Corp. | | 22,100 | | | 274,938 |
| Kakaku.com, Inc. | | 6,600 | | | 176,258 |
| Kamigumi Company, Ltd. | | 4,900 | | | 101,124 |
| Kansai Paint Company, Ltd. | | 8,700 | | | 206,966 |
| Kao Corp. | | 23,700 | | | 1,805,879 |
| Kawasaki Heavy Industries, Ltd. | | 7,200 | | | 101,753 |
| KDDI Corp. | | 81,200 | | | 2,360,310 |
| Keihan Holdings Company, Ltd. | | 4,700 | | | 202,658 |
| Keikyu Corp. | | 10,800 | | | 161,191 |
| The accompanying notes are an integral part of the financial statements. | 39 | |
John Hancock Funds II
Portfolio of Investments — August 31, 2020 (showing percentage of total net assets)
International Strategic Equity Allocation Fund (continued)
| | | Shares or
Principal
Amount | | Value |
| COMMON STOCKS (continued) | | | |
| Japan (continued) | | | | | |
| Keio Corp. | | 5,000 | | $ | 302,380 |
| Keisei Electric Railway Company, Ltd. | | 6,300 | | | 185,165 |
| Keyence Corp. | | 9,000 | | | 3,706,685 |
| Kikkoman Corp. | | 7,200 | | | 391,067 |
| Kintetsu Group Holdings Company, Ltd. | | 8,400 | | | 369,541 |
| Kirin Holdings Company, Ltd. | | 40,500 | | | 796,168 |
| Kobayashi Pharmaceutical Company, Ltd. | | 2,400 | | | 213,995 |
| Kobe Bussan Company, Ltd. | | 3,000 | | | 177,456 |
| Koito Manufacturing Company, Ltd. | | 5,100 | | | 246,470 |
| Komatsu, Ltd. | | 43,100 | | | 938,395 |
| Konami Holdings Corp. | | 4,600 | | | 177,120 |
| Kose Corp. | | 1,600 | | | 187,757 |
| Kubota Corp. | | 51,100 | | | 922,718 |
| Kuraray Company, Ltd. (B) | | 15,800 | | | 161,431 |
| Kurita Water Industries, Ltd. | | 4,900 | | | 153,462 |
| Kyocera Corp. | | 15,800 | | | 906,631 |
| Kyowa Kirin Company, Ltd. | | 13,300 | | | 343,711 |
| Kyushu Electric Power Company, Inc. | | 18,500 | | | 164,052 |
| Kyushu Railway Company | | 7,300 | | | 161,012 |
| Lasertec Corp. | | 3,700 | | | 279,702 |
| Lawson, Inc. (B) | | 2,400 | | | 118,628 |
| LINE Corp. (A) | | 2,900 | | | 147,797 |
| Lion Corp. | | 11,000 | | | 233,330 |
| LIXIL Group Corp. | | 13,100 | | | 240,535 |
| M3, Inc. | | 21,700 | | | 1,257,050 |
| Makita Corp. | | 11,000 | | | 508,199 |
| Marubeni Corp. | | 81,000 | | | 487,745 |
| Marui Group Company, Ltd. | | 9,300 | | | 169,694 |
| Maruichi Steel Tube, Ltd. | | 2,700 | | | 72,387 |
| Mazda Motor Corp. | | 27,900 | | | 177,581 |
| McDonald's Holdings Company Japan, Ltd. | | 3,300 | | | 161,928 |
| Mebuki Financial Group, Inc. | | 46,500 | | | 112,730 |
| Medipal Holdings Corp. | | 9,000 | | | 171,991 |
| MEIJI Holdings Company, Ltd. | | 5,600 | | | 452,798 |
| Mercari, Inc. (A) | | 4,200 | | | 190,437 |
| MINEBEA MITSUMI, Inc. | | 17,900 | | | 309,988 |
| MISUMI Group, Inc. | | 13,900 | | | 364,386 |
| Mitsubishi Chemical Holdings Corp. | | 63,100 | | | 368,484 |
| Mitsubishi Corp. | | 66,500 | | | 1,574,038 |
| Mitsubishi Electric Corp. | | 89,900 | | | 1,238,461 |
| Mitsubishi Estate Company, Ltd. | | 58,200 | | | 910,813 |
| Mitsubishi Gas Chemical Company, Inc. | | 7,900 | | | 141,070 |
| Mitsubishi Heavy Industries, Ltd. | | 15,800 | | | 392,258 |
| Mitsubishi Materials Corp. | | 5,400 | | | 113,277 |
| Mitsubishi Motors Corp. | | 32,100 | | | 76,684 |
| Mitsubishi UFJ Financial Group, Inc. | | 601,200 | | | 2,508,431 |
| Mitsubishi UFJ Lease & Finance Company, Ltd. | | 19,900 | | | 93,929 |
| Mitsui & Company, Ltd. | | 81,600 | | | 1,471,698 |
| Mitsui Chemicals, Inc. | | 9,100 | | | 213,441 |
| Mitsui Fudosan Company, Ltd. | | 45,800 | | | 828,523 |
| Miura Company, Ltd. | | 4,300 | | | 176,367 |
| Mizuho Financial Group, Inc. | | 1,186,600 | | | 1,606,310 |
| MonotaRO Company, Ltd. | | 6,100 | | | 241,321 |
| MS&AD Insurance Group Holdings, Inc. | | 22,200 | | | 615,795 |
| Murata Manufacturing Company, Ltd. | | 28,300 | | | 1,673,695 |
| Nabtesco Corp. | | 5,600 | | | 176,903 |
| Nagoya Railroad Company, Ltd. | | 9,100 | | | 254,066 |
| NEC Corp. | | 12,200 | | | 644,174 |
| Nexon Company, Ltd. | | 23,800 | | | 556,906 |
| NGK Insulators, Ltd. | | 13,000 | | | 184,720 |
| NGK Spark Plug Company, Ltd. | | 7,700 | | | 131,610 |
| NH Foods, Ltd. | | 4,100 | | | 185,731 |
International Strategic Equity Allocation Fund (continued)
| | | Shares or
Principal
Amount | | Value |
| COMMON STOCKS (continued) | | | |
| Japan (continued) | | | | | |
| Nidec Corp. | | 22,000 | | $ | 1,846,467 |
| Nihon M&A Center, Inc. | | 7,400 | | | 368,326 |
| Nikon Corp. (B) | | 14,800 | | | 115,909 |
| Nintendo Company, Ltd. | | 5,500 | | | 2,960,694 |
| Nippon Building Fund, Inc. | | 62 | | | 373,340 |
| Nippon Express Company, Ltd. | | 3,600 | | | 212,600 |
| Nippon Paint Holdings Company, Ltd. | | 7,200 | | | 618,465 |
| Nippon Prologis REIT, Inc. | | 103 | | | 337,353 |
| Nippon Shinyaku Company, Ltd. | | 2,200 | | | 181,780 |
| Nippon Steel Corp. | | 39,600 | | | 389,849 |
| Nippon Telegraph & Telephone Corp. | | 63,300 | | | 1,440,431 |
| Nippon Yusen KK | | 7,500 | | | 117,135 |
| Nissan Chemical Corp. | | 6,100 | | | 322,842 |
| Nissan Motor Company, Ltd. | | 114,100 | | | 459,845 |
| Nisshin Seifun Group, Inc. | | 9,700 | | | 160,186 |
| Nissin Foods Holdings Company, Ltd. | | 3,100 | | | 310,381 |
| Nitori Holdings Company, Ltd. | | 3,900 | | | 816,762 |
| Nitto Denko Corp. | | 7,800 | | | 473,605 |
| Nomura Holdings, Inc. | | 155,600 | | | 799,227 |
| Nomura Real Estate Holdings, Inc. | | 5,700 | | | 108,742 |
| Nomura Real Estate Master Fund, Inc. (B) | | 208 | | | 266,606 |
| Nomura Research Institute, Ltd. | | 15,700 | | | 417,447 |
| NSK, Ltd. | | 17,700 | | | 135,660 |
| NTT Data Corp. | | 31,100 | | | 355,316 |
| NTT DOCOMO, Inc. | | 57,400 | | | 1,600,598 |
| Obayashi Corp. | | 32,100 | | | 313,759 |
| Obic Company, Ltd. | | 3,400 | | | 601,928 |
| Odakyu Electric Railway Company, Ltd. | | 14,400 | | | 356,622 |
| Oji Holdings Corp. | | 42,400 | | | 191,540 |
| Olympus Corp. | | 57,400 | | | 1,136,202 |
| Omron Corp. | | 9,100 | | | 666,511 |
| Ono Pharmaceutical Company, Ltd. | | 18,200 | | | 549,805 |
| Oracle Corp. Japan | | 1,900 | | | 222,669 |
| Oriental Land Company, Ltd. | | 9,800 | | | 1,330,155 |
| ORIX Corp. | | 65,500 | | | 814,239 |
| Orix JREIT, Inc. | | 129 | | | 191,647 |
| Osaka Gas Company, Ltd. | | 18,300 | | | 358,415 |
| Otsuka Corp. | | 5,100 | | | 250,288 |
| Otsuka Holdings Company, Ltd. | | 19,200 | | | 842,659 |
| Pan Pacific International Holdings Corp. | | 20,200 | | | 475,533 |
| Panasonic Corp. | | 108,800 | | | 1,002,609 |
| Park24 Company, Ltd. | | 5,300 | | | 95,443 |
| PeptiDream, Inc. (A) | | 4,600 | | | 186,761 |
| Persol Holdings Company, Ltd. | | 8,700 | | | 135,342 |
| Pigeon Corp. | | 5,700 | | | 260,447 |
| Pola Orbis Holdings, Inc. | | 4,400 | | | 79,743 |
| Rakuten, Inc. | | 42,300 | | | 372,762 |
| Recruit Holdings Company, Ltd. | | 62,600 | | | 2,372,572 |
| Renesas Electronics Corp. (A) | | 38,000 | | | 239,168 |
| Resona Holdings, Inc. | | 103,600 | | | 380,814 |
| Ricoh Company, Ltd. | | 33,100 | | | 247,097 |
| Rinnai Corp. | | 1,800 | | | 166,508 |
| Rohm Company, Ltd. | | 4,400 | | | 283,450 |
| Ryohin Keikaku Company, Ltd. | | 11,700 | | | 182,897 |
| Santen Pharmaceutical Company, Ltd. | | 17,700 | | | 337,793 |
| SBI Holdings, Inc. | | 11,700 | | | 265,998 |
| SCSK Corp. | | 2,600 | | | 140,801 |
| Secom Company, Ltd. | | 10,300 | | | 974,766 |
| Sega Sammy Holdings, Inc. | | 8,500 | | | 98,425 |
| Seibu Holdings, Inc. | | 10,500 | | | 115,345 |
| Seiko Epson Corp. | | 13,800 | | | 164,532 |
| Sekisui Chemical Company, Ltd. | | 17,900 | | | 286,371 |
| Sekisui House, Ltd. | | 30,700 | | | 606,486 |
| Seven & i Holdings Company, Ltd. | | 37,100 | | | 1,196,916 |
| The accompanying notes are an integral part of the financial statements. | 40 | |
John Hancock Funds II
Portfolio of Investments — August 31, 2020 (showing percentage of total net assets)
International Strategic Equity Allocation Fund (continued)
| | | Shares or
Principal
Amount | | Value |
| COMMON STOCKS (continued) | | | |
| Japan (continued) | | | | | |
| Seven Bank, Ltd. | | 29,100 | | $ | 73,064 |
| SG Holdings Company, Ltd. | | 7,900 | | | 363,544 |
| Sharp Corp. | | 10,500 | | | 130,177 |
| Shimadzu Corp. | | 10,900 | | | 325,636 |
| Shimamura Company, Ltd. | | 1,100 | | | 90,799 |
| Shimano, Inc. | | 3,600 | | | 762,354 |
| Shimizu Corp. | | 27,200 | | | 208,933 |
| Shin-Etsu Chemical Company, Ltd. | | 17,400 | | | 2,114,526 |
| Shinsei Bank, Ltd. | | 7,800 | | | 91,011 |
| Shionogi & Company, Ltd. | | 13,300 | | | 738,522 |
| Shiseido Company, Ltd. | | 19,700 | | | 1,145,681 |
| Showa Denko KK | | 6,700 | | | 130,429 |
| SMC Corp. | | 2,800 | | | 1,538,652 |
| Softbank Corp. | | 94,100 | | | 1,236,504 |
| SoftBank Group Corp. | | 77,100 | | | 4,769,120 |
| Sohgo Security Services Company, Ltd. | | 3,500 | | | 163,520 |
| Sompo Holdings, Inc. | | 16,700 | | | 627,249 |
| Sony Corp. | | 62,700 | | | 4,909,686 |
| Square Enix Holdings Company, Ltd. | | 4,500 | | | 296,519 |
| Stanley Electric Company, Ltd. | | 6,500 | | | 185,594 |
| Subaru Corp. | | 30,300 | | | 629,651 |
| SUMCO Corp. | | 13,000 | | | 176,523 |
| Sumitomo Chemical Company, Ltd. | | 73,800 | | | 239,363 |
| Sumitomo Corp. | | 58,500 | | | 761,752 |
| Sumitomo Dainippon Pharma Company, Ltd. | | 8,800 | | | 111,249 |
| Sumitomo Electric Industries, Ltd. | | 37,200 | | | 436,743 |
| Sumitomo Heavy Industries, Ltd. | | 5,500 | | | 125,193 |
| Sumitomo Metal Mining Company, Ltd. | | 11,500 | | | 350,813 |
| Sumitomo Mitsui Financial Group, Inc. | | 64,100 | | | 1,884,872 |
| Sumitomo Mitsui Trust Holdings, Inc. | | 16,600 | | | 478,839 |
| Sumitomo Realty & Development Company, Ltd. | | 15,200 | | | 448,292 |
| Sumitomo Rubber Industries, Ltd. | | 8,300 | | | 79,788 |
| Sundrug Company, Ltd. | | 3,500 | | | 130,249 |
| Suntory Beverage & Food, Ltd. | | 6,800 | | | 262,439 |
| Suzuken Company, Ltd. | | 3,300 | | | 122,587 |
| Suzuki Motor Corp. | | 18,100 | | | 740,978 |
| Sysmex Corp. | | 8,200 | | | 716,231 |
| T&D Holdings, Inc. | | 27,200 | | | 284,703 |
| Taiheiyo Cement Corp. | | 6,000 | | | 152,126 |
| Taisei Corp. | | 9,400 | | | 324,449 |
| Taisho Pharmaceutical Holdings Company, Ltd. | | 1,700 | | | 104,609 |
| Taiyo Nippon Sanso Corp. | | 7,500 | | | 131,730 |
| Takeda Pharmaceutical Company, Ltd. | | 77,596 | | | 2,893,339 |
| TDK Corp. | | 6,400 | | | 663,632 |
| Teijin, Ltd. | | 8,800 | | | 137,981 |
| Terumo Corp. | | 31,800 | | | 1,293,642 |
| The Bank of Kyoto, Ltd. | | 2,800 | | | 119,200 |
| The Chiba Bank, Ltd. | | 26,400 | | | 136,741 |
| The Chugoku Electric Power Company, Inc. | | 14,200 | | | 173,197 |
| The Kansai Electric Power Company, Inc. | | 34,600 | | | 340,772 |
| The Shizuoka Bank, Ltd. | | 20,800 | | | 144,442 |
| The Yokohama Rubber Company, Ltd. | | 5,800 | | | 91,054 |
| THK Company, Ltd. | | 5,900 | | | 138,224 |
| TIS, Inc. | | 11,000 | | | 219,547 |
| Tobu Railway Company, Ltd. | | 9,400 | | | 293,760 |
| Toho Company, Ltd. | | 5,500 | | | 208,983 |
| Toho Gas Company, Ltd. | | 3,600 | | | 159,039 |
| Tohoku Electric Power Company, Inc. | | 20,800 | | | 211,049 |
| Tokio Marine Holdings, Inc. | | 31,600 | | | 1,458,438 |
| Tokyo Century Corp. | | 2,100 | | | 107,763 |
International Strategic Equity Allocation Fund (continued)
| | | Shares or
Principal
Amount | | Value |
| COMMON STOCKS (continued) | | | |
| Japan (continued) | | | | | |
| Tokyo Electric Power Company Holdings, Inc. (A) | | 71,200 | | $ | 209,621 |
| Tokyo Electron, Ltd. | | 7,400 | | | 1,898,161 |
| Tokyo Gas Company, Ltd. | | 18,500 | | | 411,931 |
| Tokyu Corp. | | 24,500 | | | 327,617 |
| Tokyu Fudosan Holdings Corp. | | 30,300 | | | 129,940 |
| Toppan Printing Company, Ltd. | | 13,000 | | | 201,757 |
| Toray Industries, Inc. | | 68,400 | | | 324,492 |
| Toshiba Corp. | | 19,000 | | | 547,485 |
| Tosoh Corp. | | 13,000 | | | 192,322 |
| TOTO, Ltd. | | 6,900 | | | 302,843 |
| Toyo Suisan Kaisha, Ltd. | | 4,400 | | | 250,172 |
| Toyoda Gosei Company, Ltd. | | 3,200 | | | 69,514 |
| Toyota Industries Corp. | | 7,200 | | | 418,232 |
| Toyota Motor Corp. | | 104,400 | | | 6,895,038 |
| Toyota Tsusho Corp. | | 10,500 | | | 305,147 |
| Trend Micro, Inc. | | 6,600 | | | 408,442 |
| Tsuruha Holdings, Inc. | | 1,800 | | | 240,910 |
| Unicharm Corp. | | 19,900 | | | 866,818 |
| United Urban Investment Corp. | | 145 | | | 161,160 |
| USS Company, Ltd. | | 10,700 | | | 180,664 |
| Welcia Holdings Company, Ltd. | | 4,600 | | | 197,061 |
| West Japan Railway Company | | 8,000 | | | 420,696 |
| Yakult Honsha Company, Ltd. | | 5,900 | | | 336,751 |
| Yamada Denki Company, Ltd. | | 35,600 | | | 191,127 |
| Yamaha Corp. | | 6,600 | | | 321,599 |
| Yamaha Motor Company, Ltd. | | 13,800 | | | 216,677 |
| Yamato Holdings Company, Ltd. | | 15,200 | | | 397,570 |
| Yamazaki Baking Company, Ltd. | | 5,900 | | | 96,221 |
| Yaskawa Electric Corp. (B) | | 11,800 | | | 423,742 |
| Yokogawa Electric Corp. | | 11,300 | | | 184,592 |
| Z Holdings Corp. | | 130,500 | | | 868,651 |
| ZOZO, Inc. | | 5,300 | | | 149,498 |
| | | | | | 173,170,328 |
| Jordan - 0.0% | | | | | |
| Hikma Pharmaceuticals PLC | | 10,095 | | | 318,552 |
| Luxembourg - 0.2% | | | | | |
| ArcelorMittal SA (A)(B) | | 75,297 | | | 948,492 |
| Aroundtown SA (A) | | 135,531 | | | 742,439 |
| Eurofins Scientific SE (A) | | 1,386 | | | 1,115,272 |
| Reinet Investments SCA | | 11,389 | | | 216,187 |
| SES SA | | 40,266 | | | 286,169 |
| Tenaris SA | | 33,996 | | | 199,178 |
| | | | | | 3,507,737 |
| Macau - 0.1% | | | | | |
| Sands China, Ltd. | | 201,200 | | | 885,698 |
| Wynn Macau, Ltd. | | 128,800 | | | 241,770 |
| | | | | | 1,127,468 |
| Malaysia - 0.5% | | | | | |
| AMMB Holdings BHD | | 133,700 | | | 93,687 |
| Axiata Group BHD | | 221,000 | | | 159,428 |
| Carlsberg Brewery Malaysia BHD | | 12,200 | | | 63,869 |
| CIMB Group Holdings BHD | | 518,400 | | | 410,391 |
| Dialog Group BHD | | 317,000 | | | 272,717 |
| DiGi.Com BHD | | 248,000 | | | 234,834 |
| Fraser & Neave Holdings BHD | | 11,700 | | | 85,923 |
| Gamuda BHD | | 141,600 | | | 115,486 |
| Genting BHD | | 172,400 | | | 145,265 |
| Genting Malaysia BHD | | 239,300 | | | 130,997 |
| Genting Plantations BHD | | 21,800 | | | 51,705 |
| HAP Seng Consolidated BHD | | 50,300 | | | 86,846 |
| Hartalega Holdings BHD | | 135,900 | | | 539,764 |
| The accompanying notes are an integral part of the financial statements. | 41 | |
John Hancock Funds II
Portfolio of Investments — August 31, 2020 (showing percentage of total net assets)
International Strategic Equity Allocation Fund (continued)
| | | Shares or
Principal
Amount | | Value |
| COMMON STOCKS (continued) | | | |
| Malaysia (continued) | | | | | |
| Hong Leong Bank BHD | | 52,600 | | $ | 176,840 |
| Hong Leong Financial Group BHD | | 18,600 | | | 55,169 |
| IHH Healthcare BHD | | 176,600 | | | 227,210 |
| IJM Corp. BHD | | 220,300 | | | 63,378 |
| IOI Corp. BHD | | 202,500 | | | 216,456 |
| Kuala Lumpur Kepong BHD | | 34,900 | | | 188,472 |
| Malayan Banking BHD | | 315,500 | | | 554,763 |
| Malaysia Airports Holdings BHD | | 86,300 | | | 105,592 |
| Maxis BHD | | 188,100 | | | 225,578 |
| MISC BHD | | 107,600 | | | 196,249 |
| Nestle Malaysia BHD | | 5,500 | | | 183,558 |
| Petronas Chemicals Group BHD | | 193,100 | | | 252,832 |
| Petronas Dagangan BHD | | 23,700 | | | 116,964 |
| Petronas Gas BHD | | 63,400 | | | 251,062 |
| PPB Group BHD | | 51,700 | | | 222,922 |
| Press Metal Aluminium Holdings BHD | | 113,700 | | | 142,083 |
| Public Bank BHD | | 234,300 | | | 923,115 |
| QL Resources BHD | | 58,700 | | | 134,937 |
| RHB Bank BHD | | 127,900 | | | 140,421 |
| Sime Darby BHD | | 220,100 | | | 115,502 |
| Sime Darby Plantation BHD | | 166,200 | | | 203,440 |
| Telekom Malaysia BHD | | 90,900 | | | 90,413 |
| Tenaga Nasional BHD | | 182,800 | | | 475,860 |
| Top Glove Corp. BHD | | 123,600 | | | 780,664 |
| Westports Holdings BHD | | 67,400 | | | 58,828 |
| YTL Corp. BHD | | 263,478 | | | 42,290 |
| | | | | | 8,535,510 |
| Mexico - 0.5% | | | | | |
| Alfa SAB de CV, Class A (B) | | 229,800 | | | 147,865 |
| America Movil SAB de CV, Series L | | 2,564,500 | | | 1,558,717 |
| Arca Continental SAB de CV | | 33,700 | | | 153,192 |
| Becle SAB de CV | | 42,200 | | | 80,882 |
| Cemex SAB de CV | | 1,154,348 | | | 370,328 |
| Coca-Cola Femsa SAB de CV (B) | | 40,300 | | | 167,686 |
| Fibra Uno Administracion SA de CV | | 239,500 | | | 187,380 |
| Fomento Economico Mexicano SAB de CV (B) | | 148,400 | | | 863,056 |
| Gruma SAB de CV, Class B | | 17,255 | | | 203,840 |
| Grupo Aeroportuario del Pacifico SAB de CV, B Shares (B) | | 29,000 | | | 225,538 |
| Grupo Aeroportuario del Sureste SAB de CV, B Shares (A)(B) | | 15,820 | | | 179,665 |
| Grupo Bimbo SAB de CV, Series A | | 122,700 | | | 227,490 |
| Grupo Carso SAB de CV, Series A1 | | 34,700 | | | 69,140 |
| Grupo Financiero Banorte SAB de CV, Series O (A) | | 197,500 | | | 678,731 |
| Grupo Financiero Inbursa SAB de CV, Series O (A)(B) | | 175,200 | | | 128,105 |
| Grupo Mexico SAB de CV, Series B | | 237,300 | | | 633,321 |
| Grupo Televisa SAB (A) | | 183,700 | | | 224,147 |
| Industrias Penoles SAB de CV | | 10,455 | | | 172,965 |
| Infraestructura Energetica Nova SAB de CV (B) | | 40,400 | | | 117,441 |
| Kimberly-Clark de Mexico SAB de CV, Class A | | 116,000 | | | 185,064 |
| Megacable Holdings SAB de CV (B) | | 22,900 | | | 66,140 |
| Orbia Advance Corp. SAB de CV | | 80,035 | | | 128,600 |
| Promotora y Operadora de Infraestructura SAB de CV (A) | | 17,420 | | | 128,982 |
| Wal-Mart de Mexico SAB de CV | | 399,200 | | | 955,949 |
| | | | | | 7,854,224 |
| Netherlands - 4.2% | | | | | |
| ABN AMRO Bank NV (C) | | 52,243 | | | 496,188 |
International Strategic Equity Allocation Fund (continued)
| | | Shares or
Principal
Amount | | Value |
| COMMON STOCKS (continued) | | | |
| Netherlands (continued) | | | | | |
| Adyen NV (A)(C) | | 2,236 | | $ | 3,769,105 |
| Aegon NV | | 223,143 | | | 617,873 |
| Akzo Nobel NV | | 24,741 | | | 2,442,016 |
| Altice Europe NV (A)(B) | | 77,148 | | | 340,608 |
| ASML Holding NV | | 52,730 | | | 19,705,462 |
| EXOR NV | | 7,860 | | | 463,569 |
| Heineken Holding NV | | 14,255 | | | 1,166,372 |
| Heineken NV | | 32,104 | | | 2,969,055 |
| ING Groep NV | | 482,595 | | | 3,938,959 |
| Just Eat Takeaway.com NV (A)(C) | | 15,032 | | | 1,672,723 |
| Koninklijke Ahold Delhaize NV | | 136,300 | | | 4,100,681 |
| Koninklijke DSM NV | | 21,353 | | | 3,419,698 |
| Koninklijke KPN NV | | 442,137 | | | 1,160,249 |
| Koninklijke Philips NV (A) | | 115,708 | | | 5,475,417 |
| Koninklijke Vopak NV | | 8,689 | | | 477,078 |
| NN Group NV | | 36,356 | | | 1,366,705 |
| Prosus NV (A) | | 60,375 | | | 6,051,498 |
| QIAGEN NV (A) | | 27,155 | | | 1,379,450 |
| Randstad NV | | 14,738 | | | 767,013 |
| Royal Dutch Shell PLC, A Shares | | 240,730 | | | 3,543,476 |
| Royal Dutch Shell PLC, B Shares | | 217,542 | | | 3,060,548 |
| Wolters Kluwer NV (B) | | 33,792 | | | 2,772,053 |
| | | | | | 71,155,796 |
| New Zealand - 0.6% | | | | | |
| a2 Milk Company, Ltd. (A) | | 174,945 | | | 2,183,417 |
| Auckland International Airport, Ltd. | | 289,068 | | | 1,286,562 |
| Fisher & Paykel Healthcare Corp., Ltd. | | 136,601 | | | 3,383,173 |
| Mercury NZ, Ltd. | | 162,174 | | | 565,834 |
| Meridian Energy, Ltd. | | 304,747 | | | 1,039,156 |
| Ryman Healthcare, Ltd. | | 95,204 | | | 858,273 |
| Spark New Zealand, Ltd. | | 437,020 | | | 1,418,796 |
| | | | | | 10,735,211 |
| Norway - 0.4% | | | | | |
| DNB ASA | | 76,330 | | | 1,222,741 |
| Equinor ASA (B) | | 80,487 | | | 1,302,417 |
| Gjensidige Forsikring ASA (A) | | 16,209 | | | 345,057 |
| Mowi ASA | | 35,303 | | | 690,618 |
| Norsk Hydro ASA (A) | | 108,064 | | | 344,684 |
| Orkla ASA | | 60,449 | | | 614,859 |
| Schibsted ASA, B Shares (A) | | 7,871 | | | 311,259 |
| Telenor ASA | | 57,887 | | | 942,097 |
| Yara International ASA | | 14,194 | | | 594,677 |
| | | | | | 6,368,409 |
| Peru - 0.1% | | | | | |
| Cia de Minas Buenaventura SAA, ADR (B) | | 22,900 | | | 322,432 |
| Credicorp, Ltd. | | 7,253 | | | 946,371 |
| Southern Copper Corp. | | 9,100 | | | 437,710 |
| | | | | | 1,706,513 |
| Philippines - 0.2% | | | | | |
| Aboitiz Equity Ventures, Inc. | | 165,230 | | | 163,660 |
| Aboitiz Power Corp. | | 122,800 | | | 67,535 |
| Ayala Corp. | | 23,630 | | | 357,352 |
| Ayala Land, Inc. | | 679,080 | | | 402,663 |
| Bank of the Philippine Islands | | 75,830 | | | 104,934 |
| BDO Unibank, Inc. | | 164,850 | | | 292,366 |
| Globe Telecom, Inc. | | 2,785 | | | 119,826 |
| GT Capital Holdings, Inc. | | 8,113 | | | 66,891 |
| International Container Terminal Services, Inc. | | 83,630 | | | 180,800 |
| JG Summit Holdings, Inc. | | 240,490 | | | 317,497 |
| Jollibee Foods Corp. | | 36,730 | | | 102,201 |
| The accompanying notes are an integral part of the financial statements. | 42 | |
John Hancock Funds II
Portfolio of Investments — August 31, 2020 (showing percentage of total net assets)
International Strategic Equity Allocation Fund (continued)
| | | Shares or
Principal
Amount | | Value |
| COMMON STOCKS (continued) | | | |
| Philippines (continued) | | | | | |
| Manila Electric Company | | 18,800 | | $ | 104,263 |
| Megaworld Corp. (A) | | 949,500 | | | 56,936 |
| Metro Pacific Investments Corp. | | 1,188,700 | | | 82,374 |
| Metropolitan Bank & Trust Company | | 151,559 | | | 104,681 |
| PLDT, Inc. | | 7,245 | | | 219,066 |
| Puregold Price Club, Inc. | | 84,800 | | | 94,365 |
| Robinsons Land Corp. | | 174,100 | | | 52,477 |
| SM Investments Corp. | | 20,225 | | | 354,679 |
| SM Prime Holdings, Inc. | | 847,100 | | | 510,078 |
| Universal Robina Corp. | | 73,870 | | | 209,491 |
| | | | | | 3,964,135 |
| Poland - 0.3% | | | | | |
| Bank Polska Kasa Opieki SA (A) | | 19,395 | | | 274,944 |
| CD Projekt SA (A) | | 7,093 | | | 843,415 |
| Cyfrowy Polsat SA (A) | | 30,255 | | | 236,180 |
| Dino Polska SA (A)(C) | | 5,160 | | | 312,905 |
| Grupa Lotos SA | | 9,694 | | | 106,250 |
| KGHM Polska Miedz SA (A) | | 14,795 | | | 548,767 |
| LPP SA (A) | | 137 | | | 267,038 |
| mBank SA (A) | | 1,568 | | | 79,799 |
| Orange Polska SA (A) | | 69,062 | | | 135,247 |
| PGE Polska Grupa Energetyczna SA (A) | | 88,801 | | | 145,129 |
| Polski Koncern Naftowy ORLEN SA | | 31,548 | | | 433,951 |
| Polskie Gornictwo Naftowe i Gazownictwo SA | | 182,945 | | | 254,364 |
| Powszechna Kasa Oszczednosci Bank Polski SA (A) | | 92,243 | | | 538,974 |
| Powszechny Zaklad Ubezpieczen SA (A) | | 64,242 | | | 473,675 |
| Santander Bank Polska SA (A) | | 3,736 | | | 153,462 |
| | | | | | 4,804,100 |
| Portugal - 0.1% | | | | | |
| EDP - Energias de Portugal SA | | 206,048 | | | 1,047,456 |
| Galp Energia SGPS SA | | 40,302 | | | 432,768 |
| Jeronimo Martins SGPS SA | | 20,133 | | | 331,329 |
| | | | | | 1,811,553 |
| Romania - 0.0% | | | | | |
| NEPI Rockcastle PLC | | 29,994 | | | 140,113 |
| Singapore - 0.3% | | | | | |
| Ascendas Real Estate Investment Trust | | 93,600 | | | 228,046 |
| BOC Aviation, Ltd. (C) | | 15,300 | | | 113,645 |
| CapitaLand Commercial Trust | | 81,800 | | | 100,857 |
| CapitaLand Mall Trust | | 78,500 | | | 112,908 |
| CapitaLand, Ltd. | | 78,700 | | | 160,015 |
| City Developments, Ltd. | | 14,000 | | | 82,497 |
| DBS Group Holdings, Ltd. | | 54,600 | | | 836,743 |
| Genting Singapore, Ltd. | | 186,500 | | | 95,801 |
| Jardine Cycle & Carriage, Ltd. | | 3,000 | | | 41,748 |
| Keppel Corp., Ltd. | | 44,700 | | | 150,322 |
| Mapletree Commercial Trust | | 65,100 | | | 91,714 |
| Mapletree Logistics Trust | | 80,700 | | | 122,617 |
| Oversea-Chinese Banking Corp., Ltd. | | 101,600 | | | 646,673 |
| Singapore Airlines, Ltd. | | 41,100 | | | 110,033 |
| Singapore Exchange, Ltd. | | 24,600 | | | 155,559 |
| Singapore Technologies Engineering, Ltd. | | 48,600 | | | 121,257 |
| Singapore Telecommunications, Ltd. | | 248,960 | | | 420,244 |
| Suntec Real Estate Investment Trust | | 59,000 | | | 60,604 |
| United Overseas Bank, Ltd. | | 35,900 | | | 514,763 |
| UOL Group, Ltd. | | 14,300 | | | 68,969 |
| Venture Corp., Ltd. | | 8,400 | | | 122,424 |
| Wilmar International, Ltd. | | 58,800 | | | 188,122 |
| | | | | | 4,545,561 |
International Strategic Equity Allocation Fund (continued)
| | | Shares or
Principal
Amount | | Value |
| COMMON STOCKS (continued) | | | |
| South Africa - 1.0% | | | | | |
| Absa Group, Ltd. | | 54,999 | | $ | 249,112 |
| Anglo American Platinum, Ltd. | | 4,137 | | | 308,136 |
| AngloGold Ashanti, Ltd. | | 31,973 | | | 947,980 |
| Aspen Pharmacare Holdings, Ltd. (A) | | 29,925 | | | 238,979 |
| Bid Corp., Ltd. | | 25,815 | | | 424,966 |
| Capitec Bank Holdings, Ltd. | | 5,403 | | | 265,189 |
| Clicks Group, Ltd. | | 19,309 | | | 261,332 |
| Discovery, Ltd. | | 30,845 | | | 219,520 |
| Exxaro Resources, Ltd. | | 19,362 | | | 156,129 |
| FirstRand, Ltd. | | 367,694 | | | 818,126 |
| Gold Fields, Ltd. | | 67,915 | | | 888,804 |
| Growthpoint Properties, Ltd. | | 232,490 | | | 167,464 |
| Impala Platinum Holdings, Ltd. | | 61,561 | | | 567,426 |
| Kumba Iron Ore, Ltd. | | 4,961 | | | 155,466 |
| Life Healthcare Group Holdings, Ltd. | | 106,562 | | | 103,735 |
| Momentum Metropolitan Holdings | | 77,730 | | | 69,243 |
| Mr. Price Group, Ltd. | | 19,694 | | | 134,210 |
| MTN Group, Ltd. | | 130,738 | | | 471,671 |
| MultiChoice Group (A) | | 34,033 | | | 193,617 |
| Naspers, Ltd., N Shares | | 34,271 | | | 6,248,794 |
| Nedbank Group, Ltd. | | 28,828 | | | 162,595 |
| Northam Platinum, Ltd. (A) | | 27,372 | | | 258,419 |
| Old Mutual, Ltd. | | 366,208 | | | 241,144 |
| Pepkor Holdings, Ltd. (C) | | 66,808 | | | 37,942 |
| Pick n Pay Stores, Ltd. | | 26,389 | | | 64,879 |
| PSG Group, Ltd. | | 13,391 | | | 35,225 |
| Rand Merchant Investment Holdings, Ltd. | | 60,259 | | | 106,514 |
| Remgro, Ltd. | | 40,766 | | | 210,067 |
| RMB Holdings, Ltd. | | 14,796 | | | 1,069 |
| Sanlam, Ltd. | | 144,944 | | | 467,126 |
| Sasol, Ltd. (A) | | 43,450 | | | 354,286 |
| Shoprite Holdings, Ltd. | | 38,618 | | | 251,917 |
| Sibanye Stillwater, Ltd. (A) | | 175,070 | | | 535,910 |
| Standard Bank Group, Ltd. | | 99,514 | | | 617,947 |
| The Bidvest Group, Ltd. | | 22,205 | | | 177,464 |
| The SPAR Group, Ltd. | | 14,743 | | | 140,421 |
| Tiger Brands, Ltd. | | 12,420 | | | 126,039 |
| Vodacom Group, Ltd. | | 49,481 | | | 372,455 |
| Woolworths Holdings, Ltd. | | 76,175 | | | 142,356 |
| | | | | | 17,193,674 |
| South Korea - 3.0% | | | | | |
| Amorepacific Corp. | | 2,419 | | | 341,429 |
| AMOREPACIFIC Group | | 2,199 | | | 94,227 |
| BGF retail Company, Ltd. | | 592 | | | 63,485 |
| BNK Financial Group, Inc. | | 21,854 | | | 93,276 |
| Celltrion Healthcare Company, Ltd. (A) | | 5,127 | | | 431,708 |
| Celltrion Pharm, Inc. (A) | | 1,223 | | | 113,990 |
| Celltrion, Inc. (A) | | 7,100 | | | 1,772,164 |
| Cheil Worldwide, Inc. | | 5,342 | | | 81,913 |
| CJ CheilJedang Corp. | | 633 | | | 216,525 |
| CJ Corp. | | 1,241 | | | 84,501 |
| CJ ENM Company, Ltd. | | 825 | | | 82,195 |
| CJ Logistics Corp. (A) | | 690 | | | 87,876 |
| Coway Company, Ltd. | | 3,625 | | | 243,267 |
| Daelim Industrial Company, Ltd. | | 2,137 | | | 156,027 |
| Daewoo Engineering & Construction Company, Ltd. (A) | | 15,279 | | | 37,804 |
| Daewoo Shipbuilding & Marine Engineering Company, Ltd. (A) | | 2,869 | | | 53,323 |
| DB Insurance Company, Ltd. | | 3,799 | | | 139,424 |
| Doosan Bobcat, Inc. | | 3,868 | | | 85,415 |
| Douzone Bizon Company, Ltd. | | 1,458 | | | 123,666 |
| E-MART, Inc. | | 1,488 | | | 150,150 |
| The accompanying notes are an integral part of the financial statements. | 43 | |
John Hancock Funds II
Portfolio of Investments — August 31, 2020 (showing percentage of total net assets)
International Strategic Equity Allocation Fund (continued)
| | | Shares or
Principal
Amount | | Value |
| COMMON STOCKS (continued) | | | |
| South Korea (continued) | | | | | |
| Fila Holdings Corp. | | 3,712 | | $ | 108,054 |
| GS Engineering & Construction Corp. | | 4,659 | | | 96,673 |
| GS Holdings Corp. | | 3,898 | | | 106,441 |
| GS Retail Company, Ltd. | | 2,066 | | | 57,221 |
| Hana Financial Group, Inc. | | 22,703 | | | 537,317 |
| Hankook Tire & Technology Company, Ltd. | | 5,706 | | | 141,370 |
| Hanmi Pharm Company, Ltd. | | 496 | | | 127,742 |
| Hanon Systems | | 14,012 | | | 151,313 |
| Helixmith Company, Ltd. (A) | | 1,815 | | | 75,191 |
| HLB, Inc. (A) | | 3,337 | | | 243,341 |
| Hotel Shilla Company, Ltd. | | 2,378 | | | 140,406 |
| Hyundai Department Store Company, Ltd. | | 1,087 | | | 49,039 |
| Hyundai Engineering & Construction Company, Ltd. | | 5,994 | | | 162,396 |
| Hyundai Glovis Company, Ltd. | | 1,436 | | | 175,566 |
| Hyundai Heavy Industries Holdings Company, Ltd. | | 746 | | | 141,653 |
| Hyundai Marine & Fire Insurance Company, Ltd. | | 4,825 | | | 89,626 |
| Hyundai Mobis Company, Ltd. | | 5,037 | | | 942,650 |
| Hyundai Motor Company | | 11,276 | | | 1,660,679 |
| Hyundai Steel Company | | 6,704 | | | 141,259 |
| Industrial Bank of Korea | | 20,639 | | | 140,213 |
| Kakao Corp. | | 4,236 | | | 1,447,364 |
| Kangwon Land, Inc. | | 8,174 | | | 141,800 |
| KB Financial Group, Inc. | | 29,823 | | | 925,277 |
| Kia Motors Corp. | | 19,904 | | | 707,912 |
| KMW Company, Ltd. (A) | | 1,953 | | | 125,374 |
| Korea Aerospace Industries, Ltd. | | 5,759 | | | 108,554 |
| Korea Electric Power Corp. (A) | | 19,385 | | | 333,961 |
| Korea Gas Corp. | | 2,214 | | | 43,896 |
| Korea Investment Holdings Company, Ltd. | | 3,284 | | | 167,895 |
| Korea Shipbuilding & Offshore Engineering Company, Ltd. (A) | | 2,955 | | | 213,725 |
| Korea Zinc Company, Ltd. | | 648 | | | 217,065 |
| Korean Air Lines Company, Ltd. (A) | | 6,094 | | | 90,220 |
| KT&G Corp. | | 8,808 | | | 615,872 |
| Kumho Petrochemical Company, Ltd. | | 1,416 | | | 119,506 |
| LG Chem, Ltd. | | 3,457 | | | 2,150,228 |
| LG Corp. | | 7,225 | | | 502,156 |
| LG Display Company, Ltd. (A) | | 17,624 | | | 216,137 |
| LG Electronics, Inc. | | 8,056 | | | 569,860 |
| LG Household & Health Care, Ltd. | | 706 | | | 874,259 |
| LG Innotek Company, Ltd. | | 1,081 | | | 131,519 |
| LG Uplus Corp. | | 16,238 | | | 163,113 |
| Lotte Chemical Corp. | | 1,305 | | | 207,807 |
| Lotte Corp. | | 2,020 | | | 50,907 |
| Lotte Shopping Company, Ltd. | | 881 | | | 56,216 |
| Medytox, Inc. | | 25 | | | 5,246 |
| Meritz Securities Company, Ltd. | | 21,768 | | | 58,606 |
| Mirae Asset Daewoo Company, Ltd. | | 23,798 | | | 185,842 |
| NAVER Corp. | | 9,268 | | | 2,509,581 |
| NCSoft Corp. | | 1,239 | | | 859,582 |
| Netmarble Corp. (A)(C) | | 1,613 | | | 225,800 |
| NH Investment & Securities Company, Ltd. | | 9,319 | | | 70,135 |
| Orion Corp. | | 1,788 | | | 211,305 |
| Ottogi Corp. | | 98 | | | 49,641 |
| Pan Ocean Company, Ltd. (A) | | 21,136 | | | 60,274 |
| Pearl Abyss Corp. (A) | | 439 | | | 67,182 |
| POSCO | | 5,601 | | | 867,013 |
| POSCO Chemical Company, Ltd. | | 1,626 | | | 121,459 |
| Posco International Corp. | | 3,975 | | | 45,412 |
International Strategic Equity Allocation Fund (continued)
| | | Shares or
Principal
Amount | | Value |
| COMMON STOCKS (continued) | | | |
| South Korea (continued) | | | | | |
| S-1 Corp. | | 1,279 | | $ | 93,848 |
| Samsung Biologics Company, Ltd. (A)(C) | | 1,246 | | | 814,055 |
| Samsung C&T Corp. | | 6,449 | | | 585,300 |
| Samsung Card Company, Ltd. | | 2,273 | | | 54,988 |
| Samsung Electro-Mechanics Company, Ltd. | | 4,234 | | | 442,450 |
| Samsung Electronics Company, Ltd. | | 359,179 | | | 16,308,935 |
| Samsung Engineering Company, Ltd. (A) | | 11,972 | | | 113,521 |
| Samsung Fire & Marine Insurance Company, Ltd. | | 2,343 | | | 368,555 |
| Samsung Heavy Industries Company, Ltd. (A) | | 35,806 | | | 155,050 |
| Samsung Life Insurance Company, Ltd. | | 5,474 | | | 281,474 |
| Samsung SDI Company, Ltd. | | 4,144 | | | 1,573,461 |
| Samsung SDS Company, Ltd. | | 2,629 | | | 347,906 |
| Samsung Securities Company, Ltd. | | 5,026 | | | 127,283 |
| Shinhan Financial Group Company, Ltd. | | 34,576 | | | 860,561 |
| Shinsegae, Inc. | | 559 | | | 95,322 |
| SK Holdings Company, Ltd. | | 2,656 | | | 477,292 |
| SK Hynix, Inc. | | 41,105 | | | 2,597,671 |
| SK Innovation Company, Ltd. | | 4,185 | | | 509,107 |
| SK Telecom Company, Ltd. | | 1,526 | | | 318,174 |
| S-Oil Corp. | | 3,385 | | | 160,534 |
| Woori Financial Group, Inc. | | 40,885 | | | 290,516 |
| Yuhan Corp. | | 3,564 | | | 200,811 |
| | | | | | 52,035,030 |
| Spain - 2.2% | | | | | |
| ACS Actividades de Construccion y Servicios SA | | 32,573 | | | 797,061 |
| Aena SME SA (A)(C) | | 8,091 | | | 1,207,951 |
| Amadeus IT Group SA | | 51,716 | | | 2,905,252 |
| Banco Bilbao Vizcaya Argentaria SA | | 799,033 | | | 2,339,963 |
| Banco Santander SA | | 1,991,932 | | | 4,434,883 |
| Bankinter SA | | 80,608 | | | 433,654 |
| CaixaBank SA | | 429,297 | | | 943,103 |
| Cellnex Telecom SA (A)(C) | | 30,030 | | | 1,929,244 |
| Enagas SA | | 29,790 | | | 729,487 |
| Endesa SA | | 38,064 | | | 1,056,643 |
| Ferrovial SA | | 58,118 | | | 1,552,916 |
| Grifols SA (B) | | 35,754 | | | 969,316 |
| Iberdrola SA | | 696,458 | | | 8,787,097 |
| Industria de Diseno Textil SA | | 130,814 | | | 3,678,117 |
| Mapfre SA | | 132,225 | | | 250,678 |
| Naturgy Energy Group SA | | 35,328 | | | 681,998 |
| Red Electrica Corp. SA | | 51,809 | | | 991,525 |
| Repsol SA | | 178,383 | | | 1,409,078 |
| Siemens Gamesa Renewable Energy SA | | 28,582 | | | 766,920 |
| Telefonica SA | | 583,663 | | | 2,299,659 |
| | | | | | 38,164,545 |
| Sweden - 3.4% | | | | | |
| Alfa Laval AB (A) | | 42,535 | | | 1,039,698 |
| Assa Abloy AB, B Shares | | 135,422 | | | 3,137,227 |
| Atlas Copco AB, A Shares | | 90,760 | | | 4,200,729 |
| Atlas Copco AB, B Shares | | 52,737 | | | 2,119,014 |
| Boliden AB | | 36,939 | | | 1,103,622 |
| Electrolux AB, Series B (B) | | 30,508 | | | 662,294 |
| Epiroc AB, A Shares | | 89,081 | | | 1,328,735 |
| Epiroc AB, B Shares | | 52,714 | | | 757,643 |
| EQT AB | | 32,247 | | | 598,635 |
| Essity AB, B Shares (A) | | 81,977 | | | 2,823,184 |
| Evolution Gaming Group AB (B)(C) | | 17,180 | | | 1,285,923 |
| Hennes & Mauritz AB, B Shares (B) | | 108,591 | | | 1,738,189 |
| Hexagon AB, B Shares (A) | | 38,041 | | | 2,762,538 |
| The accompanying notes are an integral part of the financial statements. | 44 | |
John Hancock Funds II
Portfolio of Investments — August 31, 2020 (showing percentage of total net assets)
International Strategic Equity Allocation Fund (continued)
| | | Shares or
Principal
Amount | | Value |
| COMMON STOCKS (continued) | | | |
| Sweden (continued) | | | | | |
| Husqvarna AB, B Shares | | 56,511 | | $ | 615,313 |
| ICA Gruppen AB | | 13,562 | | | 665,573 |
| Industrivarden AB, C Shares (A)(B) | | 21,505 | | | 568,302 |
| Investment AB Latour, B Shares (B) | | 20,041 | | | 448,616 |
| Investor AB, B Shares | | 61,615 | | | 3,941,233 |
| Kinnevik AB, B Shares (A) | | 32,763 | | | 1,270,796 |
| Kinnevik AB, B Shares, Redemption Shares (A) | | 32,763 | | | 26,325 |
| L E Lundbergforetagen AB, B Shares (A)(B) | | 10,307 | | | 471,910 |
| Lundin Energy AB (B) | | 25,073 | | | 613,678 |
| Nibe Industrier AB, B Shares (A) | | 42,150 | | | 1,187,500 |
| Sandvik AB (A) | | 152,625 | | | 3,005,307 |
| Securitas AB, B Shares (A)(B) | | 42,304 | | | 602,240 |
| Skandinaviska Enskilda Banken AB, A Shares (A) | | 219,742 | | | 2,179,035 |
| Skanska AB, B Shares (A) | | 45,955 | | | 934,624 |
| SKF AB, B Shares | | 51,494 | | | 1,029,955 |
| Svenska Cellulosa AB SCA, B Shares (A) | | 81,937 | | | 1,058,036 |
| Svenska Handelsbanken AB, A Shares (A) | | 209,992 | | | 2,112,512 |
| Swedbank AB, A Shares (A)(B) | | 122,137 | | | 2,075,514 |
| Swedish Match AB | | 22,953 | | | 1,743,280 |
| Tele2 AB, B Shares | | 67,385 | | | 956,473 |
| Telefonaktiebolaget LM Ericsson, B Shares | | 394,482 | | | 4,599,627 |
| Telia Company AB | | 341,087 | | | 1,314,945 |
| Volvo AB, B Shares (A) | | 201,088 | | | 3,851,729 |
| | | | | | 58,829,954 |
| Switzerland - 6.9% | | | | | |
| ABB, Ltd. | | 146,774 | | | 3,742,617 |
| Adecco Group AG | | 12,329 | | | 645,515 |
| Alcon, Inc. (A) | | 39,171 | | | 2,228,710 |
| Baloise Holding AG | | 3,749 | | | 584,046 |
| Banque Cantonale Vaudoise | | 2,395 | | | 255,774 |
| Barry Callebaut AG | | 239 | | | 529,864 |
| Chocoladefabriken Lindt & Spruengli AG | | 8 | | | 706,988 |
| Chocoladefabriken Lindt & Spruengli AG, Participation Certificates | | 86 | | | 733,171 |
| Cie Financiere Richemont SA (B) | | 41,556 | | | 2,766,777 |
| Clariant AG | | 15,903 | | | 332,072 |
| Coca-Cola HBC AG (A) | | 11,660 | | | 309,729 |
| Credit Suisse Group AG | | 194,025 | | | 2,134,923 |
| EMS-Chemie Holding AG | | 649 | | | 586,537 |
| Geberit AG | | 2,943 | | | 1,694,015 |
| Givaudan SA | | 735 | | | 3,089,259 |
| Glencore PLC (A) | | 583,745 | | | 1,435,334 |
| Julius Baer Group, Ltd. | | 17,885 | | | 857,525 |
| Kuehne + Nagel International AG (A) | | 4,282 | | | 830,239 |
| LafargeHolcim, Ltd. (A) | | 41,728 | | | 1,981,003 |
| Logitech International SA | | 13,067 | | | 967,801 |
| Lonza Group AG | | 5,929 | | | 3,684,360 |
| Nestle SA | | 236,960 | | | 28,541,154 |
| Novartis AG | | 171,058 | | | 14,742,981 |
| Partners Group Holding AG (B) | | 1,490 | | | 1,517,877 |
| Roche Holding AG | | 55,937 | | | 19,567,827 |
| Schindler Holding AG | | 1,576 | | | 415,062 |
| Schindler Holding AG, Participation Certificates | | 3,255 | | | 870,281 |
| SGS SA | | 480 | | | 1,243,879 |
| Sika AG (B) | | 11,290 | | | 2,699,522 |
| Sonova Holding AG (A) | | 4,359 | | | 1,019,168 |
| STMicroelectronics NV | | 67,083 | | | 2,028,922 |
| Straumann Holding AG | | 822 | | | 811,257 |
| Swiss Life Holding AG | | 2,569 | | | 1,038,585 |
International Strategic Equity Allocation Fund (continued)
| | | Shares or
Principal
Amount | | Value |
| COMMON STOCKS (continued) | | | |
| Switzerland (continued) | | | | | |
| Swiss Prime Site AG | | 6,028 | | $ | 543,389 |
| Swiss Re AG | | 23,604 | | | 1,900,274 |
| Swisscom AG | | 2,056 | | | 1,138,400 |
| Temenos AG | | 5,206 | | | 841,017 |
| The Swatch Group AG | | 4,073 | | | 161,075 |
| The Swatch Group AG, Bearer Shares | | 2,321 | | | 491,154 |
| UBS Group AG | | 292,367 | | | 3,556,750 |
| Vifor Pharma AG | | 3,621 | | | 535,220 |
| Zurich Insurance Group AG | | 11,962 | | | 4,422,921 |
| | | | | | 118,182,974 |
| Taiwan - 3.4% | | | | | |
| Accton Technology Corp. | | 37,000 | | | 295,065 |
| Acer, Inc. | | 214,000 | | | 170,330 |
| Advantech Company, Ltd. | | 28,269 | | | 292,788 |
| ASE Technology Holding Company, Ltd. | | 239,000 | | | 496,021 |
| Asia Cement Corp. | | 161,000 | | | 233,324 |
| Asustek Computer, Inc. | | 52,000 | | | 430,652 |
| AU Optronics Corp. (A) | | 634,000 | | | 226,013 |
| Catcher Technology Company, Ltd. | | 51,000 | | | 348,166 |
| Cathay Financial Holding Company, Ltd. | | 583,000 | | | 791,849 |
| Chailease Holding Company, Ltd. | | 90,752 | | | 400,841 |
| Chang Hwa Commercial Bank, Ltd. | | 381,528 | | | 237,742 |
| Cheng Shin Rubber Industry Company, Ltd. | | 129,000 | | | 158,339 |
| Chicony Electronics Company, Ltd. | | 43,526 | | | 131,304 |
| China Airlines, Ltd. (A) | | 186,000 | | | 54,093 |
| China Development Financial Holding Corp. | | 946,000 | | | 275,893 |
| China Life Insurance Company, Ltd. | | 201,990 | | | 141,188 |
| China Steel Corp. | | 864,000 | | | 586,219 |
| Chunghwa Telecom Company, Ltd. | | 279,000 | | | 1,031,428 |
| Compal Electronics, Inc. | | 307,000 | | | 193,357 |
| CTBC Financial Holding Company, Ltd. | | 1,286,000 | | | 831,306 |
| Delta Electronics, Inc. | | 143,000 | | | 919,688 |
| E.Sun Financial Holding Company, Ltd. | | 826,803 | | | 766,540 |
| Eclat Textile Company, Ltd. | | 14,340 | | | 189,308 |
| Eva Airways Corp. | | 169,465 | | | 66,302 |
| Evergreen Marine Corp. Taiwan, Ltd. (A) | | 173,900 | | | 103,222 |
| Far Eastern New Century Corp. | | 216,000 | | | 194,734 |
| Far EasTone Telecommunications Company, Ltd. | | 116,000 | | | 242,477 |
| Feng TAY Enterprise Company, Ltd. | | 28,920 | | | 168,343 |
| First Financial Holding Company, Ltd. | | 749,319 | | | 542,753 |
| Formosa Chemicals & Fibre Corp. | | 258,000 | | | 597,649 |
| Formosa Petrochemical Corp. | | 83,000 | | | 231,748 |
| Formosa Plastics Corp. | | 281,000 | | | 750,563 |
| Formosa Taffeta Company, Ltd. | | 56,000 | | | 60,372 |
| Foxconn Technology Company, Ltd. | | 67,000 | | | 119,169 |
| Fubon Financial Holding Company, Ltd. | | 490,000 | | | 715,476 |
| Giant Manufacturing Company, Ltd. | | 22,000 | | | 228,805 |
| Globalwafers Company, Ltd. | | 16,000 | | | 215,265 |
| Highwealth Construction Corp. | | 50,000 | | | 79,067 |
| Hiwin Technologies Corp. | | 18,227 | | | 199,910 |
| Hon Hai Precision Industry Company, Ltd. | | 915,800 | | | 2,401,859 |
| Hotai Motor Company, Ltd. | | 22,000 | | | 448,303 |
| Hua Nan Financial Holdings Company, Ltd. | | 607,251 | | | 373,801 |
| Innolux Corp. (A) | | 605,000 | | | 188,259 |
| Inventec Corp. | | 184,000 | | | 142,426 |
| Largan Precision Company, Ltd. | | 7,000 | | | 808,769 |
| Lite-On Technology Corp. | | 155,000 | | | 245,460 |
| MediaTek, Inc. | | 111,000 | | | 2,098,996 |
| Mega Financial Holding Company, Ltd. | | 797,000 | | | 795,528 |
| The accompanying notes are an integral part of the financial statements. | 45 | |
John Hancock Funds II
Portfolio of Investments — August 31, 2020 (showing percentage of total net assets)
International Strategic Equity Allocation Fund (continued)
| | | Shares or
Principal
Amount | | Value |
| COMMON STOCKS (continued) | | | |
| Taiwan (continued) | | | | | |
| Micro-Star International Company, Ltd. | | 50,000 | | $ | 230,834 |
| Nan Ya Plastics Corp. | | 378,000 | | | 793,007 |
| Nanya Technology Corp. | | 90,000 | | | 159,180 |
| Nien Made Enterprise Company, Ltd. | | 12,000 | | | 138,558 |
| Novatek Microelectronics Corp. | | 42,000 | | | 343,628 |
| Pegatron Corp. | | 144,000 | | | 306,299 |
| Phison Electronics Corp. | | 11,000 | | | 103,616 |
| Pou Chen Corp. | | 174,000 | | | 164,397 |
| Powertech Technology, Inc. | | 55,000 | | | 162,074 |
| President Chain Store Corp. | | 42,000 | | | 386,846 |
| Quanta Computer, Inc. | | 213,000 | | | 558,266 |
| Realtek Semiconductor Corp. | | 35,000 | | | 453,494 |
| Ruentex Development Company, Ltd. | | 60,840 | | | 89,603 |
| Shin Kong Financial Holding Company, Ltd. | | 816,988 | | | 231,026 |
| SinoPac Financial Holdings Company, Ltd. | | 741,601 | | | 273,099 |
| Standard Foods Corp. | | 29,600 | | | 64,299 |
| Synnex Technology International Corp. | | 98,000 | | | 145,876 |
| Taishin Financial Holding Company, Ltd. | | 714,571 | | | 322,698 |
| Taiwan Business Bank | | 406,891 | | | 138,582 |
| Taiwan Cement Corp. | | 357,983 | | | 523,406 |
| Taiwan Cooperative Financial Holding Company, Ltd. | | 679,470 | | | 464,572 |
| Taiwan High Speed Rail Corp. | | 144,000 | | | 159,201 |
| Taiwan Mobile Company, Ltd. | | 121,000 | | | 418,711 |
| Taiwan Semiconductor Manufacturing Company, Ltd. | | 1,806,816 | | | 26,334,490 |
| Tatung Company, Ltd. (A) | | 102,000 | | | 59,738 |
| The Shanghai Commercial & Savings Bank, Ltd. | | 246,000 | | | 350,983 |
| Uni-President Enterprises Corp. | | 354,000 | | | 803,968 |
| United Microelectronics Corp. | | 819,000 | | | 589,799 |
| Vanguard International Semiconductor Corp. | | 66,000 | | | 210,218 |
| Walsin Technology Corp. | | 23,000 | | | 125,488 |
| Win Semiconductors Corp. | | 25,000 | | | 244,050 |
| Winbond Electronics Corp. | | 220,000 | | | 91,152 |
| Wistron Corp. | | 209,040 | | | 226,728 |
| Wiwynn Corp. | | 6,000 | | | 160,050 |
| WPG Holdings, Ltd. | | 115,960 | | | 162,462 |
| Yageo Corp. | | 27,556 | | | 313,096 |
| Yuanta Financial Holding Company, Ltd. | | 714,480 | | | 447,913 |
| Zhen Ding Technology Holding, Ltd. | | 43,000 | | | 180,319 |
| | | | | | 58,152,436 |
| Thailand - 0.7% | | | | | |
| Advanced Info Service PCL, NVDR | | 107,300 | | | 630,251 |
| Airports of Thailand PCL, NVDR | | 386,400 | | | 698,124 |
| Asset World Corp. PCL, NVDR | | 577,900 | | | 73,660 |
| B. Grimm Power PCL, NVDR | | 70,300 | | | 104,759 |
| Bangkok Bank PCL, NVDR | | 43,100 | | | 147,836 |
| Bangkok Commercial Asset Management PCL, NVDR | | 161,300 | | | 121,104 |
| Bangkok Dusit Medical Services PCL, NVDR | | 860,700 | | | 575,438 |
| Bangkok Expressway & Metro PCL, NVDR | | 689,800 | | | 201,084 |
| Berli Jucker PCL, NVDR | | 108,200 | | | 129,077 |
| BTS Group Holdings PCL, NVDR | | 712,600 | | | 238,202 |
| Bumrungrad Hospital PCL, NVDR | | 36,000 | | | 127,950 |
| Central Pattana PCL, NVDR | | 202,500 | | | 306,945 |
| Central Retail Corp. PCL, NVDR (A) | | 163,258 | | | 156,535 |
| Charoen Pokphand Foods PCL, NVDR | | 351,000 | | | 364,239 |
| CP ALL PCL, NVDR | | 526,600 | | | 1,075,885 |
International Strategic Equity Allocation Fund (continued)
| | | Shares or
Principal
Amount | | Value |
| COMMON STOCKS (continued) | | | |
| Thailand (continued) | | | | | |
| Electricity Generating PCL, NVDR | | 26,200 | | $ | 187,202 |
| Energy Absolute PCL, NVDR | | 134,200 | | | 181,738 |
| Global Power Synergy PCL, NVDR | | 63,500 | | | 130,786 |
| Gulf Energy Development PCL, NVDR | | 192,300 | | | 194,907 |
| Home Product Center PCL, NVDR | | 533,400 | | | 256,889 |
| Indorama Ventures PCL, NVDR | | 152,600 | | | 116,441 |
| Intouch Holdings PCL, NVDR | | 202,600 | | | 355,146 |
| IRPC PCL, NVDR | | 1,001,600 | | | 75,378 |
| Kasikornbank PCL, NVDR | | 159,800 | | | 434,455 |
| Krung Thai Bank PCL, NVDR | | 315,200 | | | 97,124 |
| Krungthai Card PCL, NVDR | | 69,500 | | | 68,779 |
| Land & Houses PCL, NVDR | | 756,800 | | | 179,990 |
| Minor International PCL, NVDR (A) | | 280,700 | | | 202,406 |
| Muangthai Capital PCL, NVDR | | 66,800 | | | 106,911 |
| Osotspa PCL, NVDR | | 67,500 | | | 84,167 |
| PTT Exploration & Production PCL, NVDR | | 125,500 | | | 359,312 |
| PTT Global Chemical PCL, NVDR | | 203,900 | | | 303,421 |
| PTT PCL, NVDR | | 1,031,200 | | | 1,193,187 |
| Ratch Group PCL, NVDR | | 72,100 | | | 129,805 |
| Srisawad Corp. PCL, NVDR | | 66,300 | | | 97,492 |
| Thai Oil PCL, NVDR | | 100,600 | | | 134,289 |
| Thai Union Group PCL, NVDR | | 280,300 | | | 126,594 |
| The Siam Cement PCL, NVDR | | 70,500 | | | 802,558 |
| The Siam Commercial Bank PCL, NVDR | | 76,700 | | | 179,392 |
| TMB Bank PCL, NVDR | | 2,168,800 | | | 65,675 |
| Total Access Communication PCL, NVDR | | 64,000 | | | 73,608 |
| True Corp. PCL, NVDR | | 1,049,700 | | | 112,123 |
| | | | | | 11,200,864 |
| Turkey - 0.0% | | | | | |
| Akbank T.A.S. (A) | | 121,209 | | | 80,843 |
| Anadolu Efes Biracilik Ve Malt Sanayii AS | | 8,103 | | | 21,443 |
| Aselsan Elektronik Sanayi Ve Ticaret AS | | 27,874 | | | 61,800 |
| BIM Birlesik Magazalar AS | | 17,775 | | | 164,331 |
| Eregli Demir ve Celik Fabrikalari TAS | | 54,657 | | | 64,937 |
| Ford Otomotiv Sanayi AS | | 2,678 | | | 30,912 |
| Haci Omer Sabanci Holding AS | | 36,520 | | | 38,474 |
| KOC Holding AS | | 29,831 | | | 60,495 |
| TAV Havalimanlari Holding AS | | 7,037 | | | 14,386 |
| Tupras Turkiye Petrol Rafinerileri AS (A) | | 4,822 | | | 52,593 |
| Turk Hava Yollari AO (A) | | 21,924 | | | 31,565 |
| Turkcell Iletisim Hizmetleri AS | | 43,142 | | | 83,870 |
| Turkiye Garanti Bankasi AS (A) | | 90,374 | | | 83,210 |
| Turkiye Is Bankasi AS, Class C (A) | | 63,596 | | | 42,606 |
| Yapi ve Kredi Bankasi AS (A) | | 114,114 | | | 31,569 |
| | | | | | 863,034 |
| United Arab Emirates - 0.0% | | | | | |
| NMC Health PLC (A) | | 5,577 | | | 1,115 |
| United Kingdom - 6.6% | | | | | |
| 3i Group PLC | | 57,051 | | | 701,075 |
| Admiral Group PLC | | 11,208 | | | 391,066 |
| Anglo American PLC | | 71,742 | | | 1,763,046 |
| Ashtead Group PLC | | 26,372 | | | 914,389 |
| Associated British Foods PLC | | 20,818 | | | 562,931 |
| AstraZeneca PLC | | 76,693 | | | 8,512,977 |
| Auto Trader Group PLC (C) | | 56,027 | | | 418,853 |
| AVEVA Group PLC | | 3,758 | | | 253,871 |
| Aviva PLC | | 274,042 | | | 1,032,862 |
| BAE Systems PLC | | 187,908 | | | 1,304,477 |
| Barclays PLC | | 1,009,759 | | | 1,478,426 |
| Barratt Developments PLC | | 59,591 | | | 416,132 |
| BP PLC | | 1,183,689 | | | 4,129,647 |
| British American Tobacco PLC | | 134,095 | | | 4,519,696 |
| The accompanying notes are an integral part of the financial statements. | 46 | |
John Hancock Funds II
Portfolio of Investments — August 31, 2020 (showing percentage of total net assets)
International Strategic Equity Allocation Fund (continued)
| | | Shares or
Principal
Amount | | Value |
| COMMON STOCKS (continued) | | | |
| United Kingdom (continued) | | | | | |
| BT Group PLC | | 519,893 | | $ | 723,906 |
| Bunzl PLC | | 19,651 | | | 633,929 |
| Burberry Group PLC | | 23,652 | | | 451,591 |
| CNH Industrial NV (A) | | 73,937 | | | 585,698 |
| Coca-Cola European Partners PLC | | 25,437 | | | 1,046,987 |
| Compass Group PLC | | 104,225 | | | 1,686,572 |
| Croda International PLC | | 7,520 | | | 591,910 |
| Diageo PLC | | 136,571 | | | 4,563,012 |
| Direct Line Insurance Group PLC | | 81,477 | | | 321,999 |
| Evraz PLC | | 29,341 | | | 125,530 |
| Ferguson PLC | | 13,171 | | | 1,291,625 |
| Fiat Chrysler Automobiles NV (A) | | 79,277 | | | 878,656 |
| GlaxoSmithKline PLC | | 293,135 | | | 5,725,927 |
| Halma PLC | | 22,175 | | | 657,510 |
| Hargreaves Lansdown PLC | | 19,465 | | | 419,024 |
| HSBC Holdings PLC | | 1,187,423 | | | 5,093,201 |
| Imperial Brands PLC | | 55,327 | | | 923,115 |
| Informa PLC (A) | | 87,553 | | | 483,073 |
| InterContinental Hotels Group PLC | | 10,111 | | | 583,786 |
| Intertek Group PLC | | 9,416 | | | 737,766 |
| ITV PLC | | 211,136 | | | 168,990 |
| J Sainsbury PLC | | 103,252 | | | 253,702 |
| JD Sports Fashion PLC | | 25,501 | | | 245,409 |
| Johnson Matthey PLC | | 11,322 | | | 357,089 |
| Kingfisher PLC | | 123,178 | | | 447,948 |
| Land Securities Group PLC | | 41,055 | | | 318,203 |
| Legal & General Group PLC | | 351,790 | | | 1,011,201 |
| Lloyds Banking Group PLC | | 4,107,967 | | | 1,548,947 |
| London Stock Exchange Group PLC | | 18,406 | | | 2,174,142 |
| M&G PLC | | 151,846 | | | 350,915 |
| Melrose Industries PLC | | 284,795 | | | 379,995 |
| Mondi PLC | | 28,386 | | | 558,534 |
| National Grid PLC | | 204,848 | | | 2,294,325 |
| Natwest Group PLC | | 283,165 | | | 421,568 |
| Next PLC | | 7,748 | | | 620,826 |
| Ocado Group PLC (A) | | 27,011 | | | 899,605 |
| Pearson PLC | | 44,859 | | | 330,522 |
| Persimmon PLC | | 18,631 | | | 647,397 |
| Prudential PLC | | 152,369 | | | 2,456,409 |
| Reckitt Benckiser Group PLC | | 41,486 | | | 4,164,338 |
| RELX PLC | | 112,938 | | | 2,562,895 |
| Rentokil Initial PLC (A) | | 107,985 | | | 768,923 |
| Rio Tinto PLC | | 65,544 | | | 4,076,227 |
| Rio Tinto, Ltd. | | 42,969 | | | 3,092,062 |
| Rolls-Royce Holdings PLC (A) | | 113,288 | | | 357,730 |
| RSA Insurance Group PLC | | 61,174 | | | 365,110 |
| Schroders PLC | | 7,370 | | | 285,358 |
| Segro PLC | | 68,807 | | | 874,831 |
| Severn Trent PLC | | 13,850 | | | 429,590 |
| Smith & Nephew PLC | | 51,081 | | | 1,030,851 |
| Smiths Group PLC | | 23,146 | | | 429,605 |
| Spirax-Sarco Engineering PLC | | 4,300 | | | 585,903 |
| SSE PLC | | 60,101 | | | 1,013,001 |
| St. James's Place PLC | | 31,677 | | | 410,491 |
| Standard Chartered PLC | | 158,414 | | | 825,579 |
| Standard Life Aberdeen PLC | | 137,316 | | | 429,672 |
| Taylor Wimpey PLC | | 213,092 | | | 344,520 |
| Tesco PLC | | 572,015 | | | 1,670,429 |
| The Berkeley Group Holdings PLC | | 7,358 | | | 444,671 |
| The British Land Company PLC | | 51,312 | | | 250,429 |
| The Sage Group PLC | | 63,544 | | | 627,419 |
| Unilever NV | | 180,923 | | | 10,512,790 |
| Unilever PLC | | 68,297 | | | 4,037,866 |
| United Utilities Group PLC | | 39,699 | | | 436,202 |
International Strategic Equity Allocation Fund (continued)
| | | Shares or
Principal
Amount | | Value |
| COMMON STOCKS (continued) | | | |
| United Kingdom (continued) | | | | | |
| Vodafone Group PLC | | 1,565,102 | | $ | 2,294,830 |
| Whitbread PLC | | 11,766 | | | 396,811 |
| Wm Morrison Supermarkets PLC | | 140,409 | | | 359,301 |
| WPP PLC | | 72,392 | | | 613,146 |
| | | | | | 113,100,572 |
| United States - 0.0% | | | | | |
| Bausch Health Companies, Inc. (A) | | 7,174 | | | 119,076 |
| International Flavors & Fragrances, Inc. | | 1 | | | 111 |
| | | | | | 119,187 |
| TOTAL COMMON STOCKS (Cost $1,483,419,364) | | $ | 1,593,924,933 |
| PREFERRED SECURITIES - 1.2% | | | |
| Brazil - 0.4% | | | | | |
| Banco Bradesco SA | | 325,392 | | | 1,231,839 |
| Braskem SA, A Shares | | 13,900 | | | 54,017 |
| Centrais Eletricas Brasileiras SA, B Shares | | 18,500 | | | 121,195 |
| Cia Energetica de Minas Gerais | | 87,060 | | | 167,335 |
| Cia Paranaense de Energia, B Shares | | 7,500 | | | 84,576 |
| Gerdau SA | | 80,000 | | | 278,762 |
| Itau Unibanco Holding SA | | 355,100 | | | 1,526,441 |
| Itausa SA | | 323,060 | | | 556,075 |
| Lojas Americanas SA | | 55,200 | | | 325,144 |
| Petroleo Brasileiro SA | | 349,500 | | | 1,396,469 |
| Telefonica Brasil SA | | 32,800 | | | 286,420 |
| | | | | | 6,028,273 |
| Chile - 0.0% | | | | | |
| Embotelladora Andina SA, B Shares | | 62,450 | | | 133,014 |
| Sociedad Quimica y Minera de Chile SA, B Shares | | 20,088 | | | 627,916 |
| | | | | | 760,930 |
| Colombia - 0.0% | | | | | |
| Bancolombia SA | | 50,781 | | | 362,702 |
| Germany - 0.6% | | | | | |
| Bayerische Motoren Werke AG | | 6,666 | | | 375,872 |
| FUCHS PETROLUB SE | | 8,153 | | | 385,647 |
| Henkel AG & Company KGaA | | 20,979 | | | 2,144,857 |
| Porsche Automobil Holding SE (A) | | 18,054 | | | 1,110,260 |
| Sartorius AG | | 4,185 | | | 1,776,569 |
| Volkswagen AG | | 21,859 | | | 3,656,172 |
| | | | | | 9,449,377 |
| South Korea - 0.2% | | | | | |
| Amorepacific Corp. | | 690 | | | 34,600 |
| Hyundai Motor Company | | 1,771 | | | 128,868 |
| Hyundai Motor Company, 2nd Preferred | | 2,743 | | | 203,153 |
| LG Chem, Ltd. | | 579 | | | 182,556 |
| LG Household & Health Care, Ltd. | | 157 | | | 92,511 |
| Samsung Electronics Company, Ltd. | | 61,962 | | | 2,475,167 |
| | | | | | 3,116,855 |
| TOTAL PREFERRED SECURITIES (Cost $19,937,858) | | $ | 19,718,137 |
| EXCHANGE-TRADED FUNDS - 4.6% | | | |
| iShares MSCI India ETF (B) | | 1,149,700 | | | 38,365,489 |
| KraneShares Bosera MSCI China A ETF (B) | | 450,000 | | | 18,382,500 |
| VanEck Vectors Russia ETF | | 780,230 | | | 17,695,616 |
| Xtrackers Harvest CSI 300 China A-Shares ETF (B) | | 133,802 | | | 4,728,563 |
| TOTAL EXCHANGE-TRADED FUNDS (Cost $65,727,364) | | $ | 79,172,168 |
| The accompanying notes are an integral part of the financial statements. | 47 | |
John Hancock Funds II
Portfolio of Investments — August 31, 2020 (showing percentage of total net assets)
International Strategic Equity Allocation Fund (continued)
| | | Shares or
Principal
Amount | | Value |
| RIGHTS - 0.0% | | | | | |
| Gulf Energy Development PCL (Expiration Date: 9-21-20; Strike Price: THB 30.00) (A) | | 19,230 | | $ | 927 |
| Tabcorp Holdings, Ltd. (Expiration Date: 9-11-20; Strike Price: AUD 3.25) (A) | | 21,314 | | | 5,816 |
| TOTAL RIGHTS (Cost $0) | | $ | 6,743 |
| WARRANTS - 0.0% | | | | | |
| BTS Group Holdings PCL (Expiration Date: 2-16-21; Strike Price: THB 14.00) (A) | | 33,620 | | | 961 |
| BTS Group Holdings PCL (Expiration Date: 2-16-21; Strike Price: THB 14.00) (A) | | 1,820 | | | 52 |
| Minor International PCL (Expiration Date: 10-1-21; Strike Price: THB 48.00) (A) | | 1,000 | | | 23 |
| Minor International PCL (Expiration Date: 7-31-23; Strike Price: THB 21.60) (A) | | 12,759 | | | 4,038 |
| TOTAL WARRANTS (Cost $0) | | $ | 5,074 |
| SHORT-TERM INVESTMENTS - 4.9% | | | |
| U.S. Government Agency - 0.4% | | | | | |
| Federal Home Loan Bank Discount Note | | | | | |
| 0.030%, 09/01/2020 * | $ | 1,000,000 | | $ | 1,000,000 |
| 0.070%, 09/18/2020 * | | 1,300,000 | | | 1,299,957 |
| 0.090%, 11/09/2020 * | | 1,200,000 | | | 1,199,770 |
| 0.105%, 11/16/2020 * | | 1,000,000 | | | 999,789 |
| 0.145%, 09/16/2020 * | | 1,000,000 | | | 999,971 |
| 0.155%, 09/08/2020 * | | 1,200,000 | | | 1,199,984 |
| | | | | | 6,699,471 |
International Strategic Equity Allocation Fund (continued)
| | | Shares or
Principal
Amount | | Value |
| SHORT-TERM INVESTMENTS (continued) | | | |
| Short-term funds - 4.5% | | | | | |
| John Hancock Collateral Trust, 0.2611% (E)(F) | | 7,776,888 | | $ | 77,852,096 |
| TOTAL SHORT-TERM INVESTMENTS (Cost $84,501,466) | | $ | 84,551,567 |
Total Investments (International Strategic Equity Allocation Fund)
(Cost $1,653,586,052) - 103.7% | | $ | 1,777,378,622 |
| Other assets and liabilities, net - (3.7%) | | | (63,137,421) |
| TOTAL NET ASSETS - 100.0% | | $ | 1,714,241,201 |
| Currency Abbreviations |
| AUD | Australian Dollar |
| THB | Thai Bhat |
| Security Abbreviations and Legend |
| ADR | American Depositary Receipt |
| NVDR | Non-Voting Depositary Receipt |
| (A) | Non-income producing security. |
| (B) | All or a portion of this security is on loan as of 8-31-20. |
| (C) | These securities are exempt from registration under Rule 144A of the Securities Act of 1933. Such securities may be resold, normally to qualified institutional buyers, in transactions exempt from registration. |
| (D) | Security is valued using significant unobservable inputs and is classified as Level 3 in the fair value hierarchy. Refer to Note 2 to the financial statements. |
| (E) | The rate shown is the annualized seven-day yield as of 8-31-20. |
| (F) | Investment is an affiliate of the fund, the advisor and/or subadvisor. This security represents the investment of cash collateral received for securities lending. |
| * | Yield represents either the annualized yield at the date of purchase, the stated coupon rate or, for floating rate securities, the rate at period end. |
DERIVATIVES
FUTURES
| Open contracts | Number of
contracts | Position | Expiration
date | Notional
basis^ | Notional
value^ | Unrealized
appreciation
(depreciation) |
| Canadian Dollar Currency Futures | 9 | Long | Sep 2020 | $662,757 | $690,165 | $27,408 |
| Mini MSCI EAFE Index Futures | 136 | Long | Sep 2020 | 12,040,430 | 12,908,440 | 868,010 |
| Mini MSCI Emerging Markets Index Futures | 106 | Long | Sep 2020 | 5,178,902 | 5,825,230 | 646,328 |
| S&P/TSX 60 Index Futures | 4 | Long | Sep 2020 | 552,217 | 603,642 | 51,425 |
| | | | | | | $1,593,171 |
^ Notional basis refers to the contractual amount agreed upon at inception of open contracts; notional value represents the current value of the open contract.
See Notes to financial statements regarding investment transactions and other derivatives information.
International Value Fund
| | | Shares or
Principal
Amount | | Value |
| COMMON STOCKS - 96.4% | | | |
| Australia - 0.5% | | | | | |
| Orica, Ltd. | | 93,968 | | $ | 1,201,346 |
| Bermuda - 1.3% | | | | | |
| Everest Re Group, Ltd. | | 12,767 | | | 2,809,761 |
| Canada - 3.9% | | | | | |
| Barrick Gold Corp. | | 56,432 | | | 1,671,739 |
| Kinross Gold Corp. (A) | | 410,419 | | | 3,644,521 |
International Value Fund (continued)
| | | Shares or
Principal
Amount | | Value |
| COMMON STOCKS (continued) | | | |
| Canada (continued) | | | | | |
| Yamana Gold, Inc. | | 549,680 | | $ | 3,408,016 |
| | | | | | 8,724,276 |
| China - 1.6% | | | | | |
| Alibaba Group Holding, Ltd. (A) | | 63,100 | | | 2,271,275 |
| Topsports International Holdings, Ltd. (B) | | 1,109,000 | | | 1,369,522 |
| | | | | | 3,640,797 |
| The accompanying notes are an integral part of the financial statements. | 48 | |
John Hancock Funds II
Portfolio of Investments — August 31, 2020 (showing percentage of total net assets)
International Value Fund (continued)
| | | Shares or
Principal
Amount | | Value |
| COMMON STOCKS (continued) | | | |
| Denmark - 1.2% | | | | | |
| Novo Nordisk A/S, B Shares | | 41,441 | | $ | 2,739,805 |
| Finland - 1.7% | | | | | |
| Sampo OYJ, A Shares | | 95,524 | | | 3,848,043 |
| France - 14.3% | | | | | |
| AXA SA | | 155,469 | | | 3,172,190 |
| BNP Paribas SA (A) | | 89,586 | | | 3,903,089 |
| Capgemini SE | | 30,581 | | | 4,242,134 |
| Danone SA | | 15,193 | | | 999,036 |
| Eiffage SA (A) | | 36,444 | | | 3,351,524 |
| Imerys SA | | 18,612 | | | 757,757 |
| Peugeot SA (A) | | 142,834 | | | 2,462,535 |
| Rexel SA (A) | | 110,903 | | | 1,481,768 |
| Sanofi | | 41,453 | | | 4,198,708 |
| TOTAL SE | | 114,977 | | | 4,561,360 |
| Vinci SA | | 28,126 | | | 2,635,150 |
| | | | | | 31,765,251 |
| Germany - 6.5% | | | | | |
| Allianz SE | | 20,058 | | | 4,352,326 |
| Bayer AG | | 42,707 | | | 2,840,520 |
| Brenntag AG | | 21,522 | | | 1,348,487 |
| Deutsche Telekom AG | | 124,169 | | | 2,188,725 |
| Rheinmetall AG | | 11,386 | | | 1,055,528 |
| Siemens AG | | 18,608 | | | 2,578,420 |
| | | | | | 14,364,006 |
| Greece - 0.8% | | | | | |
| Hellenic Telecommunications Organization SA | | 101,892 | | | 1,662,653 |
| Hong Kong - 1.6% | | | | | |
| China Overseas Land & Investment, Ltd. | | 407,000 | | | 1,177,244 |
| CK Asset Holdings, Ltd. | | 183,000 | | | 993,268 |
| WH Group, Ltd. (B) | | 1,514,000 | | | 1,304,925 |
| | | | | | 3,475,437 |
| Hungary - 0.9% | | | | | |
| OTP Bank NYRT (A) | | 57,305 | | | 1,929,940 |
| India - 0.6% | | | | | |
| HDFC Bank, Ltd., ADR (A) | | 25,758 | | | 1,277,597 |
| Indonesia - 0.8% | | | | | |
| Bank Rakyat Indonesia Persero Tbk PT | | 7,221,700 | | | 1,739,795 |
| Ireland - 1.0% | | | | | |
| CRH PLC | | 56,323 | | | 2,101,929 |
| Italy - 1.8% | | | | | |
| Enel SpA | | 236,984 | | | 2,145,928 |
| Leonardo SpA | | 272,819 | | | 1,845,757 |
| | | | | | 3,991,685 |
| Japan - 20.4% | | | | | |
| Fuji Corp. | | 92,200 | | | 1,655,421 |
| Fuji Electric Company, Ltd. | | 33,800 | | | 1,054,481 |
| Hitachi, Ltd. | | 146,300 | | | 4,867,180 |
| Kamigumi Company, Ltd. | | 37,400 | | | 771,843 |
| KDDI Corp. | | 146,000 | | | 4,243,908 |
| Kinden Corp. | | 66,700 | | | 1,100,270 |
| Koito Manufacturing Company, Ltd. | | 32,100 | | | 1,551,309 |
| Kurita Water Industries, Ltd. | | 30,800 | | | 964,620 |
| Kyudenko Corp. | | 33,800 | | | 965,630 |
| NEC Corp. | | 41,700 | | | 2,201,809 |
| Nintendo Company, Ltd. | | 3,100 | | | 1,668,755 |
| Nippon Telegraph & Telephone Corp. | | 68,000 | | | 1,547,382 |
| Persol Holdings Company, Ltd. | | 54,400 | | | 846,274 |
| Rengo Company, Ltd. | | 128,800 | | | 950,459 |
| Sankyu, Inc. | | 22,200 | | | 926,120 |
| Sanwa Holdings Corp. | | 223,400 | | | 2,245,015 |
| SoftBank Group Corp. | | 15,200 | | | 940,216 |
International Value Fund (continued)
| | | Shares or
Principal
Amount | | Value |
| COMMON STOCKS (continued) | | | |
| Japan (continued) | | | | | |
| Sony Corp. | | 63,300 | | $ | 4,956,669 |
| Sumitomo Mitsui Financial Group, Inc. | | 74,100 | | | 2,178,924 |
| Taiheiyo Cement Corp. | | 48,500 | | | 1,229,689 |
| Taisei Corp. | | 47,300 | | | 1,632,600 |
| Taiyo Yuden Company, Ltd. | | 69,700 | | | 1,875,184 |
| Tokyo Electron, Ltd. | | 6,300 | | | 1,616,002 |
| TS Tech Company, Ltd. | | 39,500 | | | 1,155,452 |
| Zenkoku Hosho Company, Ltd. | | 58,500 | | | 2,069,982 |
| | | | | | 45,215,194 |
| Macau - 0.7% | | | | | |
| Wynn Macau, Ltd. | | 771,600 | | | 1,448,368 |
| Netherlands - 5.8% | | | | | |
| Aalberts NV | | 39,716 | | | 1,494,814 |
| ING Groep NV | | 409,290 | | | 3,340,641 |
| Koninklijke Ahold Delhaize NV | | 57,962 | | | 1,743,828 |
| Koninklijke KPN NV | | 528,599 | | | 1,387,141 |
| NN Group NV | | 49,094 | | | 1,845,555 |
| NXP Semiconductors NV | | 11,624 | | | 1,461,834 |
| Royal Dutch Shell PLC, A Shares | | 110,884 | | | 1,632,181 |
| | | | | | 12,905,994 |
| Norway - 1.0% | | | | | |
| DNB ASA | | 82,059 | | | 1,314,514 |
| Yara International ASA | | 20,676 | | | 866,249 |
| | | | | | 2,180,763 |
| Singapore - 0.5% | | | | | |
| DBS Group Holdings, Ltd. | | 73,600 | | | 1,127,918 |
| South Korea - 5.0% | | | | | |
| GS Retail Company, Ltd. | | 33,715 | | | 933,788 |
| Hana Financial Group, Inc. | | 86,504 | | | 2,047,309 |
| KB Financial Group, Inc. | | 66,108 | | | 2,051,042 |
| KT Corp., ADR | | 209,718 | | | 2,063,625 |
| Samsung Electronics Company, Ltd. | | 86,889 | | | 3,945,295 |
| | | | | | 11,041,059 |
| Spain - 0.9% | | | | | |
| Amadeus IT Group SA | | 12,146 | | | 682,326 |
| Applus Services SA (A) | | 153,611 | | | 1,267,990 |
| | | | | | 1,950,316 |
| Sweden - 0.9% | | | | | |
| Husqvarna AB, B Shares | | 102,641 | | | 1,117,593 |
| Loomis AB (A) | | 37,265 | | | 935,739 |
| | | | | | 2,053,332 |
| Switzerland - 8.4% | | | | | |
| Glencore PLC (A) | | 699,185 | | | 1,719,182 |
| Novartis AG | | 73,306 | | | 6,318,027 |
| Roche Holding AG | | 13,811 | | | 4,831,351 |
| STMicroelectronics NV | | 74,607 | | | 2,256,486 |
| UBS Group AG | | 288,720 | | | 3,512,383 |
| | | | | | 18,637,429 |
| Taiwan - 0.5% | | | | | |
| Simplo Technology Company, Ltd. | | 93,000 | | | 1,060,350 |
| United Kingdom - 12.9% | | | | | |
| BAE Systems PLC | | 412,917 | | | 2,866,514 |
| BP PLC | | 570,704 | | | 1,991,069 |
| Coca-Cola European Partners PLC | | 52,904 | | | 2,177,529 |
| Direct Line Insurance Group PLC | | 487,734 | | | 1,927,537 |
| GlaxoSmithKline PLC | | 75,183 | | | 1,468,581 |
| Howden Joinery Group PLC | | 156,279 | | | 1,167,431 |
| Imperial Brands PLC | | 130,463 | | | 2,176,739 |
| Inchcape PLC | | 237,399 | | | 1,599,235 |
| Nomad Foods, Ltd. (A)(C) | | 137,837 | | | 3,399,060 |
| Persimmon PLC | | 72,990 | | | 2,536,285 |
| Redrow PLC | | 252,468 | | | 1,528,037 |
| The accompanying notes are an integral part of the financial statements. | 49 | |
John Hancock Funds II
Portfolio of Investments — August 31, 2020 (showing percentage of total net assets)
International Value Fund (continued)
| | | Shares or
Principal
Amount | | Value |
| COMMON STOCKS (continued) | | | |
| United Kingdom (continued) | | | | | |
| Smith & Nephew PLC | | 39,974 | | $ | 806,704 |
| Tesco PLC | | 1,083,430 | | | 3,163,890 |
| Unilever PLC | | 26,867 | | | 1,588,435 |
| WH Smith PLC | | 13,312 | | | 209,626 |
| | | | | | 28,606,672 |
| United States - 0.9% | | | | | |
| Applied Materials, Inc. | | 30,491 | | | 1,878,244 |
| TOTAL COMMON STOCKS (Cost $203,423,446) | | $ | 213,377,960 |
| SHORT-TERM INVESTMENTS - 2.7% | | | |
| Short-term funds - 2.7% | | | | | |
| Fidelity Institutional Money Market Government Portfolio, Institutional Class, 0.0100% (D) | | 5,910,494 | | | 5,910,494 |
| John Hancock Collateral Trust, 0.2611% (D)(E) | | 13,872 | | | 138,869 |
| TOTAL SHORT-TERM INVESTMENTS (Cost $6,049,367) | | $ | 6,049,363 |
Total Investments (International Value Fund)
(Cost $209,472,813) - 99.1% | | $ | 219,427,323 |
| Other assets and liabilities, net - 0.9% | | | 1,987,910 |
| TOTAL NET ASSETS - 100.0% | | $ | 221,415,233 |
| Security Abbreviations and Legend |
| ADR | American Depositary Receipt |
| (A) | Non-income producing security. |
| (B) | These securities are exempt from registration under Rule 144A of the Securities Act of 1933. Such securities may be resold, normally to qualified institutional buyers, in transactions exempt from registration. |
| (C) | All or a portion of this security is on loan as of 8-31-20. |
| (D) | The rate shown is the annualized seven-day yield as of 8-31-20. |
| (E) | Investment is an affiliate of the fund, the advisor and/or subadvisor. This security represents the investment of cash collateral received for securities lending. |
Mid Cap Stock Fund
| | | Shares or
Principal
Amount | | Value |
| COMMON STOCKS – 92.1% | | | |
| Communication services – 7.5% | | | | | |
| Entertainment – 4.5% | | | |
| Live Nation Entertainment, Inc. (A)(B) | | 72,238 | | $ | 4,103,118 |
| Roku, Inc. (A) | | 138,595 | | | 24,043,461 |
| Spotify Technology SA (A) | | 195,200 | | | 55,077,632 |
| | | | | | 83,224,211 |
| Interactive media and services – 3.0% | | | |
| Match Group, Inc. (A) | | 280,461 | | | 31,321,884 |
| Snap, Inc., Class A (A) | | 1,068,514 | | | 24,137,731 |
| | | | | | 55,459,615 |
| | | | | | 138,683,826 |
| Consumer discretionary – 20.0% | | | | | |
| Automobiles – 1.1% | | | |
| Thor Industries, Inc. | | 218,267 | | | 20,610,953 |
| Diversified consumer services – 2.0% | | | |
| Chegg, Inc. (A) | | 490,125 | | | 36,141,818 |
| Hotels, restaurants and leisure – 5.9% | | | |
| Aramark | | 1,053,785 | | | 29,042,315 |
| DraftKings, Inc. (A)(C) | | 714,317 | | | 24,729,096 |
| DraftKings, Inc., Class A (A) | | 308,347 | | | 10,903,150 |
| Planet Fitness, Inc., Class A (A) | | 340,092 | | | 20,674,193 |
Mid Cap Stock Fund (continued)
| | | Shares or
Principal
Amount | | Value |
| COMMON STOCKS (continued) | | | |
| Hotels, restaurants and leisure (continued) | | | |
| Vail Resorts, Inc. | | 106,266 | | $ | 23,130,920 |
| | | | | | 108,479,674 |
| Household durables – 1.6% | | | |
| Lennar Corp., A Shares | | 389,579 | | | 29,148,301 |
| Leisure products – 3.5% | | | |
| Peloton Interactive, Inc., Class A (A) | | 506,722 | | | 38,850,376 |
| Polaris, Inc. | | 243,343 | | | 24,587,377 |
| | | | | | 63,437,753 |
| Specialty retail – 5.9% | | | |
| Burlington Stores, Inc. (A) | | 260,697 | | | 51,339,060 |
| Five Below, Inc. (A) | | 261,971 | | | 28,672,726 |
| Floor & Decor Holdings, Inc., Class A (A) | | 382,583 | | | 28,020,379 |
| JAND, Inc., Class A (A)(C)(D) | | 57,523 | | | 1,411,074 |
| | | | | | 109,443,239 |
| | | | | | 367,261,738 |
| Consumer staples – 4.3% | | | | | |
| Beverages – 4.3% | | | |
| Monster Beverage Corp. (A)(B) | | 564,942 | | | 47,376,036 |
| The Boston Beer Company, Inc., Class A (A)(B) | | 36,680 | | | 32,351,026 |
| | | | | | 79,727,062 |
| Financials – 3.7% | | | | | |
| Capital markets – 3.7% | | | |
| BowX Acquisition Corp. (A) | | 1,762,700 | | | 17,662,254 |
| Churchill Capital Corp. III, Class A (A)(B) | | 1,511,249 | | | 17,409,588 |
| Churchill Capital Corp. IV (A) | | 1,739,922 | | | 17,294,825 |
| The Blackstone Group, Inc., Class A | | 301,827 | | | 15,981,740 |
| | | | | | 68,348,407 |
| Health care – 22.9% | | | | | |
| Biotechnology – 5.5% | | | |
| Apellis Pharmaceuticals, Inc. (A) | | 193,171 | | | 5,955,462 |
| Argenx SE, ADR (A)(B) | | 51,367 | | | 11,879,646 |
| Ascendis Pharma A/S, ADR (A) | | 49,569 | | | 7,345,134 |
| Exact Sciences Corp. (A) | | 466,535 | | | 35,125,420 |
| Galapagos NV (A) | | 159,158 | | | 21,368,204 |
| Galapagos NV, ADR (A)(B) | | 9,593 | | | 1,277,404 |
| Kodiak Sciences, Inc. (A)(B) | | 65,055 | | | 3,421,242 |
| Seattle Genetics, Inc. (A) | | 94,422 | | | 14,950,779 |
| | | | | | 101,323,291 |
| Health care equipment and supplies – 13.6% | | | |
| ABIOMED, Inc. (A) | | 148,885 | | | 45,800,004 |
| Align Technology, Inc. (A) | | 173,625 | | | 51,563,153 |
| DexCom, Inc. (A) | | 64,113 | | | 27,274,311 |
| Insulet Corp. (A) | | 229,417 | | | 50,070,260 |
| Novocure, Ltd. (A) | | 234,722 | | | 19,423,246 |
| Tandem Diabetes Care, Inc. (A) | | 500,941 | | | 56,466,070 |
| | | | | | 250,597,044 |
| Health care technology – 1.5% | | | |
| Veeva Systems, Inc., Class A (A) | | 98,443 | | | 27,787,506 |
| Life sciences tools and services – 1.0% | | | |
| Agilent Technologies, Inc. | | 185,042 | | | 18,581,918 |
| Pharmaceuticals – 1.3% | | | |
| Elanco Animal Health, Inc. (A) | | 643,788 | | | 18,708,479 |
| Reata Pharmaceuticals, Inc., Class A (A) | | 38,927 | | | 4,085,389 |
| | | | | | 22,793,868 |
| | | | | | 421,083,627 |
| Industrials – 7.9% | | | | | |
| Building products – 2.1% | | | |
| Trane Technologies PLC (B) | | 334,701 | | | 39,625,251 |
| The accompanying notes are an integral part of the financial statements. | 50 | |
John Hancock Funds II
Portfolio of Investments — August 31, 2020 (showing percentage of total net assets)
Mid Cap Stock Fund (continued)
| | | Shares or
Principal
Amount | | Value |
| COMMON STOCKS (continued) | | | |
| Commercial services and supplies – 1.5% | | | |
| Copart, Inc. (A) | | 268,052 | | $ | 27,695,133 |
| Machinery – 0.9% | | | |
| Fortive Corp. | | 220,357 | | | 15,889,943 |
| Professional services – 3.4% | | | |
| CoStar Group, Inc. (A) | | 73,463 | | | 62,340,702 |
| | | | | | 145,551,029 |
| Information technology – 25.8% | | | | | |
| IT services – 7.4% | | | |
| GoDaddy, Inc., Class A (A) | | 555,410 | | | 46,476,709 |
| Leidos Holdings, Inc. | | 204,397 | | | 18,495,885 |
| Square, Inc., Class A (A) | | 447,252 | | | 71,363,529 |
| | | | | | 136,336,123 |
| Semiconductors and semiconductor equipment – 4.2% | | | |
| Advanced Micro Devices, Inc. (A) | | 513,414 | | | 46,628,259 |
| Marvell Technology Group, Ltd. | | 793,726 | | | 30,780,694 |
| | | | | | 77,408,953 |
| Software – 14.2% | | | |
| 2U, Inc. (A)(B) | | 464,502 | | | 19,225,738 |
| Fair Isaac Corp. (A) | | 62,437 | | | 26,272,865 |
| Guidewire Software, Inc. (A) | | 427,409 | | | 48,002,305 |
| Paycom Software, Inc. (A) | | 9,756 | | | 2,921,532 |
| RingCentral, Inc., Class A (A) | | 47,647 | | | 13,854,318 |
| Slack Technologies, Inc., Class A (A)(B) | | 415,800 | | | 13,654,872 |
| Splunk, Inc. (A) | | 348,232 | | | 76,377,723 |
| Workday, Inc., Class A (A) | | 256,544 | | | 61,496,162 |
| | | | | | 261,805,515 |
| | | | | | 475,550,591 |
| TOTAL COMMON STOCKS (Cost $1,077,564,376) | | $ | 1,696,206,280 |
| PREFERRED SECURITIES – 2.4% | | | | | |
| Consumer discretionary – 1.2% | | | | | |
| Diversified consumer services – 0.3% | | | |
| The Honest Company, Inc., Series C (A)(C)(D) | | 142,030 | | | 4,904,296 |
| The Honest Company, Inc., Series D (A)(C)(D) | | 12,795 | | | 517,942 |
| | | | | | 5,422,238 |
| Internet and direct marketing retail – 0.7% | | | |
| Coupang LLC (A)(C)(D) | | 1,381,449 | | | 13,303,354 |
| One Kings Lane, Inc. (A)(D) | | 529,764 | | | 84,762 |
| | | | | | 13,388,116 |
| Specialty retail – 0.2% | | | |
| JAND, Inc., Series D (A)(C)(D) | | 128,449 | | | 3,150,931 |
| | | | | | 21,961,285 |
| Information technology – 1.0% | | | | | |
| Software – 1.0% | | | |
| Essence Group Holdings Corp. (A)(C)(D) | | 2,958,957 | | | 9,616,610 |
| Lookout, Inc., Series F (A)(C)(D) | | 392,767 | | | 3,110,715 |
| MarkLogic Corp., Series F (A)(C)(D) | | 580,011 | | | 5,724,709 |
| | | | | | 18,452,034 |
| Real estate – 0.2% | | | | | |
| Real estate management and development – 0.2% | | | |
| The We Company, Inc., Series D1 (A)(C)(D) | | 184,328 | | | 1,454,348 |
| The We Company, Inc., Series D2 (A)(C)(D) | | 161,782 | | | 1,276,460 |
| | | | | | 2,730,808 |
| TOTAL PREFERRED SECURITIES (Cost $32,776,728) | | $ | 43,144,127 |
Mid Cap Stock Fund (continued)
| | | Shares or
Principal
Amount | | Value |
| EXCHANGE-TRADED FUNDS – 3.3% | | | |
| iShares Russell Mid-Cap Growth ETF (B) | | 349,229 | | $ | 61,310,643 |
| TOTAL EXCHANGE-TRADED FUNDS (Cost $42,604,394) | | $ | 61,310,643 |
| SHORT-TERM INVESTMENTS – 3.9% | | | |
| Short-term funds – 2.1% | | | | | |
| John Hancock Collateral Trust, 0.2611% (E)(F) | | 3,851,954 | | | 38,560,759 |
| Repurchase agreement – 1.8% | | | | | |
| Societe Generale SA Tri-Party Repurchase Agreement dated 8-31-20 at 0.070% to be repurchased at $33,300,065 on 9-1-20, collateralized by $1,674,118 Federal National Mortgage Association, 4.000% - 4.500% due 5-1-47 to 2-1-57 (valued at $1,889,636), $17,195,700 U.S. Treasury Bonds, 2.875% due 11-15-46 (valued at $22,598,426) and $9,238,500 U.S. Treasury Notes, 1.875% due 1-31-22 (valued at $9,477,939) | $ | 33,300,000 | | | 33,300,000 |
| TOTAL SHORT-TERM INVESTMENTS (Cost $71,806,409) | | $ | 71,860,759 |
Total Investments (Mid Cap Stock Fund)
(Cost $1,224,751,907) – 101.7% | | $ | 1,872,521,809 |
| Other assets and liabilities, net – (1.7%) | | | (31,565,643) |
| TOTAL NET ASSETS – 100.0% | | $ | 1,840,956,166 |
| Security Abbreviations and Legend |
| ADR | American Depositary Receipt |
| (A) | Non-income producing security. |
| (B) | All or a portion of this security is on loan as of 8-31-20. |
| (C) | Restricted security as to resale, excluding 144A securities. For more information on this security refer to the Notes to financial statements. |
| (D) | Security is valued using significant unobservable inputs and is classified as Level 3 in the fair value hierarchy. Refer to Note 2 to the financial statements. |
| (E) | The rate shown is the annualized seven-day yield as of 8-31-20. |
| (F) | Investment is an affiliate of the fund, the advisor and/or subadvisor. This security represents the investment of cash collateral received for securities lending. |
Mid Value Fund
| | | Shares or
Principal
Amount | | Value |
| COMMON STOCKS – 98.4% | | | |
| Communication services – 5.6% | | | | | |
| Entertainment – 0.1% | | | |
| Madison Square Garden Sports Corp. (A) | | 10,200 | | $ | 1,672,800 |
| Media – 5.1% | | | |
| AMC Networks, Inc., Class A (A)(B) | | 109,821 | | | 2,667,552 |
| DISH Network Corp., Class A (A) | | 195,619 | | | 6,948,387 |
| Fox Corp., Class A | | 123,630 | | | 3,444,332 |
| News Corp., Class A | | 2,103,395 | | | 31,803,332 |
| Scholastic Corp. (B) | | 212,340 | | | 4,777,650 |
| ViacomCBS, Inc., Class B | | 637,967 | | | 17,767,381 |
| | | | | | 67,408,634 |
| Wireless telecommunication services – 0.4% | | | |
| Telephone & Data Systems, Inc. | | 210,425 | | | 4,867,130 |
| | | | | | 73,948,564 |
| Consumer discretionary – 2.7% | | | | | |
| Diversified consumer services – 0.8% | | | |
| Strategic Education, Inc. | | 106,426 | | | 10,916,115 |
| The accompanying notes are an integral part of the financial statements. | 51 | |
John Hancock Funds II
Portfolio of Investments — August 31, 2020 (showing percentage of total net assets)
Mid Value Fund (continued)
| | | Shares or
Principal
Amount | | Value |
| COMMON STOCKS (continued) | | | |
| Hotels, restaurants and leisure – 0.4% | | | |
| Compass Group PLC | | 370,380 | | $ | 5,993,471 |
| Household durables – 0.2% | | | |
| Mohawk Industries, Inc. (A) | | 22,900 | | | 2,114,357 |
| Multiline retail – 0.3% | | | |
| Nordstrom, Inc. (B) | | 252,029 | | | 4,032,464 |
| Specialty retail – 0.2% | | | |
| Tiffany & Company | | 19,945 | | | 2,443,263 |
| Textiles, apparel and luxury goods – 0.8% | | | |
| Ralph Lauren Corp. | | 153,913 | | | 10,593,832 |
| | | | | | 36,093,502 |
| Consumer staples – 8.7% | | | | | |
| Beverages – 0.7% | | | |
| Carlsberg A/S, Class B | | 61,145 | | | 8,595,236 |
| Food and staples retailing – 1.7% | | | |
| Sysco Corp. | | 313,412 | | | 18,848,598 |
| The Kroger Company | | 116,317 | | | 4,150,191 |
| | | | | | 22,998,789 |
| Food products – 6.3% | | | |
| Archer-Daniels-Midland Company | | 92,007 | | | 4,118,233 |
| Bunge, Ltd. | | 752,876 | | | 34,346,203 |
| Campbell Soup Company | | 75,492 | | | 3,971,634 |
| Flowers Foods, Inc. | | 1,226,827 | | | 30,008,188 |
| The Kraft Heinz Company (B) | | 301,141 | | | 10,551,981 |
| Tootsie Roll Industries, Inc. | | 21,300 | | | 681,387 |
| | | | | | 83,677,626 |
| | | | | | 115,271,651 |
| Energy – 12.5% | | | | | |
| Energy equipment and services – 1.8% | | | |
| Frank's International NV (A) | | 1,811,375 | | | 4,184,276 |
| National Oilwell Varco, Inc. | | 419,900 | | | 5,038,800 |
| Schlumberger NV | | 390,088 | | | 7,415,573 |
| SEACOR Holdings, Inc. (A) | | 107,248 | | | 3,390,109 |
| SEACOR Marine Holdings, Inc. (A)(B) | | 195,011 | | | 522,629 |
| Tidewater, Inc. (A)(B) | | 489,217 | | | 3,360,921 |
| | | | | | 23,912,308 |
| Oil, gas and consumable fuels – 10.7% | | | |
| Apache Corp. | | 187,927 | | | 2,781,320 |
| Cameco Corp. | | 1,453,017 | | | 16,811,407 |
| Canadian Natural Resources, Ltd. | | 824,320 | | | 16,214,374 |
| EQT Corp. | | 2,144,545 | | | 34,033,929 |
| Equinor ASA | | 333,553 | | | 5,397,458 |
| Equitrans Midstream Corp. | | 1,005,507 | | | 10,336,612 |
| Hess Corp. | | 245,306 | | | 11,293,888 |
| Imperial Oil, Ltd. (B) | | 1,626,845 | | | 26,729,063 |
| NAC Kazatomprom JSC, GDR | | 335,343 | | | 5,134,370 |
| NAC Kazatomprom JSC, GDR | | 21,217 | | | 324,849 |
| Ovintiv, Inc. (B) | | 906,199 | | | 10,040,685 |
| Peabody Energy Corp. | | 673,732 | | | 1,758,441 |
| | | | | | 140,856,396 |
| | | | | | 164,768,704 |
| Financials – 16.6% | | | | | |
| Banks – 2.6% | | | |
| Fifth Third Bancorp | | 880,856 | | | 18,198,485 |
| Popular, Inc. | | 52,741 | | | 1,953,527 |
| Westamerica Bancorporation | | 235,303 | | | 14,320,541 |
| | | | | | 34,472,553 |
| Capital markets – 5.5% | | | |
| Lazard, Ltd., Class A | | 587,116 | | | 18,593,964 |
| Northern Trust Corp. | | 232,913 | | | 19,073,246 |
| State Street Corp. | | 451,403 | | | 30,736,030 |
Mid Value Fund (continued)
| | | Shares or
Principal
Amount | | Value |
| COMMON STOCKS (continued) | | | |
| Capital markets (continued) | | | |
| TD Ameritrade Holding Corp. | | 114,373 | | $ | 4,389,636 |
| | | | | | 72,792,876 |
| Consumer finance – 0.6% | | | |
| Ally Financial, Inc. (B) | | 340,175 | | | 7,783,204 |
| Diversified financial services – 1.1% | | | |
| Groupe Bruxelles Lambert SA | | 162,861 | | | 15,027,842 |
| Insurance – 6.2% | | | |
| Brighthouse Financial, Inc. (A) | | 305,435 | | | 9,273,007 |
| Brown & Brown, Inc. | | 371,009 | | | 17,214,818 |
| CNA Financial Corp. | | 402,546 | | | 12,949,905 |
| Kemper Corp. (B) | | 139,125 | | | 10,804,448 |
| Loews Corp. | | 581,139 | | | 20,839,645 |
| Marsh & McLennan Companies, Inc. | | 87,952 | | | 10,106,564 |
| | | | | | 81,188,387 |
| Thrifts and mortgage finance – 0.6% | | | |
| Capitol Federal Financial, Inc. | | 840,394 | | | 7,849,280 |
| | | | | | 219,114,142 |
| Health care – 16.5% | | | | | |
| Biotechnology – 1.7% | | | |
| Alkermes PLC (A) | | 495,716 | | | 8,199,143 |
| BioMarin Pharmaceutical, Inc. (A) | | 65,100 | | | 5,079,753 |
| Incyte Corp. (A) | | 73,197 | | | 7,052,531 |
| Ionis Pharmaceuticals, Inc. (A) | | 33,100 | | | 1,803,950 |
| | | | | | 22,135,377 |
| Health care equipment and supplies – 5.5% | | | |
| Alcon, Inc. (A) | | 24,039 | | | 1,367,745 |
| Baxter International, Inc. | | 159,858 | | | 13,918,836 |
| Dentsply Sirona, Inc. | | 408,172 | | | 18,314,678 |
| Hologic, Inc. (A) | | 323,765 | | | 19,335,246 |
| Zimmer Biomet Holdings, Inc. | | 145,421 | | | 20,486,910 |
| | | | | | 73,423,415 |
| Health care providers and services – 7.3% | | | |
| Cardinal Health, Inc. | | 584,031 | | | 29,645,414 |
| Covetrus, Inc. (A) | | 500,213 | | | 11,459,880 |
| Patterson Companies, Inc. | | 1,010,908 | | | 29,326,441 |
| Select Medical Holdings Corp. (A) | | 1,287,499 | | | 25,840,105 |
| | | | | | 96,271,840 |
| Pharmaceuticals – 2.0% | | | |
| Jazz Pharmaceuticals PLC (A) | | 33,717 | | | 4,531,228 |
| Perrigo Company PLC | | 362,028 | | | 18,934,064 |
| Royalty Pharma PLC, Class A (A) | | 76,108 | | | 3,149,349 |
| | | | | | 26,614,641 |
| | | | | | 218,445,273 |
| Industrials – 9.6% | | | | | |
| Aerospace and defense – 1.8% | | | |
| Textron, Inc. | | 609,000 | | | 24,012,870 |
| Air freight and logistics – 1.9% | | | |
| CH Robinson Worldwide, Inc. | | 206,212 | | | 20,270,640 |
| Expeditors International of Washington, Inc. | | 57,743 | | | 5,103,904 |
| | | | | | 25,374,544 |
| Airlines – 0.9% | | | |
| Southwest Airlines Company | | 312,163 | | | 11,731,086 |
| Commercial services and supplies – 0.6% | | | |
| Cintas Corp. | | 24,729 | | | 8,240,692 |
| Machinery – 3.1% | | | |
| AGCO Corp. | | 162,688 | | | 11,567,117 |
| CNH Industrial NV (A)(B) | | 594,247 | | | 4,707,392 |
| PACCAR, Inc. | | 184,435 | | | 15,831,900 |
| The accompanying notes are an integral part of the financial statements. | 52 | |
John Hancock Funds II
Portfolio of Investments — August 31, 2020 (showing percentage of total net assets)
Mid Value Fund (continued)
| | | Shares or
Principal
Amount | | Value |
| COMMON STOCKS (continued) | | | |
| Machinery (continued) | | | |
| Xylem, Inc. | | 108,990 | | $ | 8,738,818 |
| | | | | | 40,845,227 |
| Road and rail – 1.3% | | | |
| JB Hunt Transport Services, Inc. | | 82,674 | | | 11,619,004 |
| Kansas City Southern | | 8,995 | | | 1,637,450 |
| Ryder System, Inc. | | 92,443 | | | 3,780,919 |
| | | | | | 17,037,373 |
| | | | | | 127,241,792 |
| Information technology – 2.8% | | | | | |
| Electronic equipment, instruments and components – 0.9% | | | |
| National Instruments Corp. | | 351,471 | | | 12,614,294 |
| IT services – 0.5% | | | |
| Cognizant Technology Solutions Corp., Class A | | 102,824 | | | 6,874,813 |
| Semiconductors and semiconductor equipment – 1.4% | | | |
| Applied Materials, Inc. | | 293,239 | | | 18,063,522 |
| | | | | | 37,552,629 |
| Materials – 11.5% | | | | | |
| Chemicals – 2.3% | | | |
| Corteva, Inc. | | 500,807 | | | 14,298,040 |
| PPG Industries, Inc. | | 43,497 | | | 5,237,039 |
| Westlake Chemical Corp. | | 184,938 | | | 10,970,522 |
| | | | | | 30,505,601 |
| Construction materials – 1.0% | | | |
| Summit Materials, Inc., Class A (A) | | 324,022 | | | 4,824,688 |
| Vulcan Materials Company | | 68,790 | | | 8,254,800 |
| | | | | | 13,079,488 |
| Metals and mining – 8.2% | | | |
| Barrick Gold Corp. | | 536,716 | | | 15,913,629 |
| Cia de Minas Buenaventura SAA, ADR (B) | | 1,087,800 | | | 15,316,224 |
| Franco-Nevada Corp. | | 164,238 | | | 24,700,861 |
| Freeport-McMoRan, Inc. | | 1,249,070 | | | 19,497,983 |
| Fresnillo PLC | | 1,503,541 | | | 25,529,780 |
| Gold Fields, Ltd., ADR (B) | | 550,422 | | | 7,171,999 |
| | | | | | 108,130,476 |
| | | | | | 151,715,565 |
| Real estate – 7.2% | | | | | |
| Equity real estate investment trusts – 6.8% | | | |
| Equity Commonwealth | | 264,278 | | | 8,295,686 |
| Equity Residential | | 156,089 | | | 8,811,224 |
| Federal Realty Investment Trust | | 27,642 | | | 2,190,352 |
| Rayonier, Inc. | | 791,297 | | | 23,169,176 |
| Regency Centers Corp. | | 230,351 | | | 9,147,238 |
| Weyerhaeuser Company | | 1,253,139 | | | 37,982,638 |
| | | | | | 89,596,314 |
| Real estate management and development – 0.4% | | | |
| The St. Joe Company (A)(B) | | 249,596 | | | 5,793,123 |
| | | | | | 95,389,437 |
| Utilities – 4.7% | | | | | |
| Electric utilities – 3.1% | | | |
| FirstEnergy Corp. | | 697,504 | | | 19,941,639 |
| PG&E Corp. (A) | | 2,232,506 | | | 20,673,006 |
| | | | | | 40,614,645 |
| Gas utilities – 0.7% | | | |
| National Fuel Gas Company | | 200,829 | | | 9,165,836 |
Mid Value Fund (continued)
| | | Shares or
Principal
Amount | | Value |
| COMMON STOCKS (continued) | | | |
| Multi-utilities – 0.9% | | | |
| CenterPoint Energy, Inc. | | 603,719 | | $ | 12,116,640 |
| | | | | | 61,897,121 |
| TOTAL COMMON STOCKS (Cost $1,104,179,612) | | $ | 1,301,438,380 |
| PREFERRED SECURITIES – 0.3% | | | | | |
| Consumer staples – 0.3% | | | | | |
| Food products – 0.3% | | | |
| Bunge, Ltd., 4.875% | | 34,849 | | | 3,310,655 |
| TOTAL PREFERRED SECURITIES (Cost $3,872,698) | | $ | 3,310,655 |
| CORPORATE BONDS - 0.2% | | | | | |
| Energy - 0.2% | | | | | |
Weatherford International, Ltd.
11.000%, 12/01/2024 (C) | $ | 4,371,000 | | | 2,928,570 |
| TOTAL CORPORATE BONDS (Cost $3,115,858) | | $ | 2,928,570 |
| SHORT-TERM INVESTMENTS – 3.9% | | | |
| Short-term funds – 3.9% | | | | | |
| John Hancock Collateral Trust, 0.2611% (D)(E) | | 3,770,767 | | | 37,748,016 |
| State Street Institutional U.S. Government Money Market Fund, Premier Class, 0.0399% (D) | | 2,000,000 | | | 2,000,000 |
| T. Rowe Price Government Reserve Fund, 0.1398% (D) | | 11,740,938 | | | 11,740,938 |
| TOTAL SHORT-TERM INVESTMENTS (Cost $51,460,352) | | $ | 51,488,954 |
Total Investments (Mid Value Fund)
(Cost $1,162,628,520) – 102.8% | | $ | 1,359,166,559 |
| Other assets and liabilities, net – (2.8%) | | | (37,158,896) |
| TOTAL NET ASSETS – 100.0% | | $ | 1,322,007,663 |
| Security Abbreviations and Legend |
| ADR | American Depositary Receipt |
| GDR | Global Depositary Receipt |
| (A) | Non-income producing security. |
| (B) | All or a portion of this security is on loan as of 8-31-20. |
| (C) | These securities are exempt from registration under Rule 144A of the Securities Act of 1933. Such securities may be resold, normally to qualified institutional buyers, in transactions exempt from registration. |
| (D) | The rate shown is the annualized seven-day yield as of 8-31-20. |
| (E) | Investment is an affiliate of the fund, the advisor and/or subadvisor. This security represents the investment of cash collateral received for securities lending. |
Multi-Index Lifestyle Aggressive Portfolio
| | | Shares or
Principal
Amount | | Value |
| AFFILIATED INVESTMENT COMPANIES (A) - 67.1% | | | |
| Equity - 67.1% | | | |
| Strategic Equity Allocation, Class NAV, JHF II (MIM US) (B) | 20,999,475 | | $ | 259,553,516 |
| TOTAL AFFILIATED INVESTMENT COMPANIES (Cost $251,759,476) | | $ | 259,553,516 |
| UNAFFILIATED INVESTMENT COMPANIES - 32.9% | | | |
| Exchange-traded funds - 32.9% | | | |
| Financial Select Sector SPDR Fund | 223,189 | | | 5,593,116 |
| iShares Global Infrastructure ETF (C) | 22,607 | | | 898,402 |
| iShares MSCI Global Min Vol Factor ETF | 154,895 | | | 14,414,529 |
| Schwab U.S. Large-Cap Growth ETF | 48,117 | | | 5,779,333 |
| Vanguard Dividend Appreciation ETF | 83,426 | | | 10,894,601 |
| The accompanying notes are an integral part of the financial statements. | 53 | |
John Hancock Funds II
Portfolio of Investments — August 31, 2020 (showing percentage of total net assets)
Multi-Index Lifestyle Aggressive Portfolio (continued)
| | | Shares or
Principal
Amount | | Value |
| UNAFFILIATED INVESTMENT COMPANIES (continued) | | | |
| Exchange-traded funds (continued) | | | |
| Vanguard Energy ETF | 63,806 | | $ | 3,055,669 |
| Vanguard FTSE All World ex-US Small-Cap ETF | 35,845 | | | 3,858,714 |
| Vanguard FTSE Developed Markets ETF | 7,662 | | | 320,808 |
| Vanguard FTSE Emerging Markets ETF | 325,298 | | | 14,374,918 |
| Vanguard Global ex-U.S. Real Estate ETF | 17,968 | | | 893,010 |
| Vanguard Health Care ETF | 32,133 | | | 6,666,634 |
| Vanguard Information Technology ETF | 17,383 | | | 5,704,231 |
| Vanguard Materials ETF | 14,489 | | | 1,952,972 |
| Vanguard Mid-Cap ETF | 159,993 | | | 28,773,141 |
| Vanguard Real Estate ETF (C) | 31,678 | | | 2,589,677 |
| Vanguard S&P 500 ETF | 6,131 | | | 1,968,174 |
| Vanguard Small-Cap ETF | 122,284 | | | 19,377,123 |
| TOTAL UNAFFILIATED INVESTMENT COMPANIES (Cost $108,613,866) | | $ | 127,115,052 |
| SHORT-TERM INVESTMENTS - 0.7% | | | |
| Short-term funds - 0.7% | | | | | |
| John Hancock Collateral Trust, 0.2611% (D)(E) | 264,601 | | | 2,648,837 |
| State Street Institutional U.S. Government Money Market Fund, Premier Class, 0.0399% (D) | 89,787 | | | 89,787 |
| TOTAL SHORT-TERM INVESTMENTS (Cost $2,738,681) | | $ | 2,738,624 |
| Total Investments (Multi-Index Lifestyle Aggressive Portfolio) (Cost $363,112,023) - 100.7% | | | $ | 389,407,192 |
| Other assets and liabilities, net - (0.7%) | | | | (2,689,153) |
| TOTAL NET ASSETS - 100.0% | | | | $ | 386,718,039 |
| Security Abbreviations and Legend |
| JHF II | John Hancock Funds II |
| MIM US | Manulife Investment Management (US) LLC |
| (A) | The underlying funds' subadvisor is shown parenthetically. |
| (B) | The subadvisor is an affiliate of the advisor. |
| (C) | All or a portion of this security is on loan as of 8-31-20. |
| (D) | The rate shown is the annualized seven-day yield as of 8-31-20. |
| (E) | Investment is an affiliate of the fund, the advisor and/or subadvisor. This security represents the investment of cash collateral received for securities lending. |
Multi-Index Lifestyle Balanced Portfolio
| | | Shares or
Principal
Amount | | Value |
| AFFILIATED INVESTMENT COMPANIES (A) - 38.8% | | | |
| Equity - 38.8% | | | |
| Strategic Equity Allocation, Class NAV, JHF II (MIM US) (B) | 29,477,187 | | $ | 364,338,030 |
| TOTAL AFFILIATED INVESTMENT COMPANIES (Cost $343,050,888) | | $ | 364,338,030 |
| UNAFFILIATED INVESTMENT COMPANIES - 61.2% | | | |
| Exchange-traded funds - 58.4% | | | |
| Financial Select Sector SPDR Fund | 348,425 | | | 8,731,531 |
| Invesco Senior Loan ETF (C) | 1,120,040 | | | 24,495,275 |
| iShares Global Infrastructure ETF (C) | 40,652 | | | 1,615,510 |
| iShares JP Morgan USD Emerging Markets Bond ETF | 405,819 | | | 46,092,922 |
| iShares MSCI Global Min Vol Factor ETF | 495,249 | | | 46,087,872 |
| iShares Preferred & Income Securities ETF | 192,340 | | | 7,058,878 |
| Schwab U.S. Large-Cap Growth ETF | 59,692 | | | 7,169,606 |
| VanEck Vectors J.P. Morgan EM Local Currency Bond ETF (C) | 302,750 | | | 9,536,625 |
| Vanguard Dividend Appreciation ETF | 241,037 | | | 31,477,022 |
Multi-Index Lifestyle Balanced Portfolio (continued)
| | | Shares or
Principal
Amount | | Value |
| UNAFFILIATED INVESTMENT COMPANIES (continued) | | | |
| Exchange-traded funds (continued) | | | |
| Vanguard Energy ETF | 113,682 | | $ | 5,444,231 |
| Vanguard FTSE All World ex-US Small-Cap ETF | 21,057 | | | 2,266,786 |
| Vanguard FTSE Developed Markets ETF | 35,147 | | | 1,471,605 |
| Vanguard FTSE Emerging Markets ETF | 271,776 | | | 12,009,781 |
| Vanguard Global ex-U.S. Real Estate ETF | 33,311 | | | 1,655,557 |
| Vanguard Health Care ETF (C) | 56,074 | | | 11,633,673 |
| Vanguard Information Technology ETF (C) | 27,199 | | | 8,925,352 |
| Vanguard Intermediate-Term Corporate Bond ETF | 1,008,709 | | | 97,229,459 |
| Vanguard Materials ETF | 25,299 | | | 3,410,052 |
| Vanguard Mid-Cap ETF | 211,065 | | | 37,957,930 |
| Vanguard Real Estate ETF (C) | 56,691 | | | 4,634,489 |
| Vanguard S&P 500 ETF | 14,682 | | | 4,713,216 |
| Vanguard Short-Term Bond ETF | 57,809 | | | 4,807,396 |
| Vanguard Short-Term Corporate Bond ETF | 157,812 | | | 13,112,599 |
| Vanguard Small-Cap ETF | 165,180 | | | 26,174,423 |
| Vanguard Total Bond Market ETF | 734,161 | | | 64,943,882 |
| Xtrackers USD High Yield Corporate Bond ETF | 1,338,413 | | | 65,261,018 |
| | | | | | 547,916,690 |
| Fixed income - 2.8% | | | |
| Fidelity Inflation Protected Bond Index Fund | 2,389,040 | | | 26,327,224 |
| TOTAL UNAFFILIATED INVESTMENT COMPANIES (Cost $526,202,210) | | $ | 574,243,914 |
| SHORT-TERM INVESTMENTS - 4.1% | | | |
| Short-term funds - 4.1% | | | | | |
| John Hancock Collateral Trust, 0.2611% (D)(E) | 3,817,957 | | | 38,220,426 |
| State Street Institutional U.S. Government Money Market Fund, Premier Class, 0.0399% (D) | 1,053 | | | 1,053 |
| TOTAL SHORT-TERM INVESTMENTS (Cost $38,215,278) | | $ | 38,221,479 |
| Total Investments (Multi-Index Lifestyle Balanced Portfolio) (Cost $907,468,376) - 104.1% | | | $ | 976,803,423 |
| Other assets and liabilities, net - (4.1%) | | | | (38,877,838) |
| TOTAL NET ASSETS - 100.0% | | | | $ | 937,925,585 |
| Security Abbreviations and Legend |
| JHF II | John Hancock Funds II |
| MIM US | Manulife Investment Management (US) LLC |
| (A) | The underlying funds' subadvisor is shown parenthetically. |
| (B) | The subadvisor is an affiliate of the advisor. |
| (C) | All or a portion of this security is on loan as of 8-31-20. |
| (D) | The rate shown is the annualized seven-day yield as of 8-31-20. |
| (E) | Investment is an affiliate of the fund, the advisor and/or subadvisor. This security represents the investment of cash collateral received for securities lending. |
Multi-Index Lifestyle Conservative Portfolio
| | | Shares or
Principal
Amount | | Value |
| AFFILIATED INVESTMENT COMPANIES (A) - 10.8% | | | |
| Equity - 10.8% | | | |
| Strategic Equity Allocation, Class NAV, JHF II (MIM US) (B) | 1,754,830 | | $ | 21,689,704 |
| TOTAL AFFILIATED INVESTMENT COMPANIES (Cost $18,561,667) | | $ | 21,689,704 |
| UNAFFILIATED INVESTMENT COMPANIES - 88.9% | | | |
| Exchange-traded funds - 82.8% | | | |
| Invesco Senior Loan ETF (C) | 451,667 | | | 9,877,957 |
| iShares Global Infrastructure ETF | 5,389 | | | 214,159 |
| The accompanying notes are an integral part of the financial statements. | 54 | |
John Hancock Funds II
Portfolio of Investments — August 31, 2020 (showing percentage of total net assets)
Multi-Index Lifestyle Conservative Portfolio (continued)
| | | Shares or
Principal
Amount | | Value |
| UNAFFILIATED INVESTMENT COMPANIES (continued) | | | |
| Exchange-traded funds (continued) | | | |
| iShares JP Morgan USD Emerging Markets Bond ETF | 118,102 | | $ | 13,414,025 |
| iShares MSCI Global Min Vol Factor ETF | 63,980 | | | 5,953,979 |
| iShares Preferred & Income Securities ETF | 81,637 | | | 2,996,078 |
| VanEck Vectors J.P. Morgan EM Local Currency Bond ETF | 83,144 | | | 2,619,036 |
| Vanguard Dividend Appreciation ETF | 32,831 | | | 4,287,400 |
| Vanguard Energy ETF | 17,412 | | | 833,861 |
| Vanguard FTSE Developed Markets ETF | 61,565 | | | 2,577,727 |
| Vanguard FTSE Emerging Markets ETF | 4,093 | | | 180,870 |
| Vanguard Global ex-U.S. Real Estate ETF | 4,565 | | | 226,881 |
| Vanguard Intermediate-Term Corporate Bond ETF | 516,569 | | | 49,792,085 |
| Vanguard Materials ETF | 3,539 | | | 477,022 |
| Vanguard Mid-Cap ETF | 10,075 | | | 1,811,888 |
| Vanguard Real Estate ETF | 7,970 | | | 651,548 |
| Vanguard S&P 500 ETF | 2,212 | | | 710,096 |
| Vanguard Short-Term Bond ETF | 27,609 | | | 2,295,964 |
| Vanguard Short-Term Corporate Bond ETF | 86,391 | | | 7,178,228 |
| Vanguard Small-Cap ETF | 9,384 | | | 1,486,989 |
| Vanguard Total Bond Market ETF | 420,146 | | | 37,166,115 |
| Xtrackers USD High Yield Corporate Bond ETF | 440,962 | | | 21,501,307 |
| | | | | | 166,253,215 |
| Fixed income - 6.1% | | | |
| Fidelity Inflation Protected Bond Index Fund | 1,111,085 | | | 12,244,153 |
| TOTAL UNAFFILIATED INVESTMENT COMPANIES (Cost $168,519,576) | | $ | 178,497,368 |
| SHORT-TERM INVESTMENTS - 5.0% | | | |
| Short-term funds - 5.0% | | | | | |
| John Hancock Collateral Trust, 0.2611% (D)(E) | 955,380 | | | 9,564,027 |
| State Street Institutional U.S. Government Money Market Fund, Premier Class, 0.0399% (D) | 437,836 | | | 437,836 |
| TOTAL SHORT-TERM INVESTMENTS (Cost $10,002,158) | | $ | 10,001,863 |
| Total Investments (Multi-Index Lifestyle Conservative Portfolio) (Cost $197,083,401) - 104.7% | | | $ | 210,188,935 |
| Other assets and liabilities, net - (4.7%) | | | | (9,513,083) |
| TOTAL NET ASSETS - 100.0% | | | | $ | 200,675,852 |
| Security Abbreviations and Legend |
| JHF II | John Hancock Funds II |
| MIM US | Manulife Investment Management (US) LLC |
| (A) | The underlying funds' subadvisor is shown parenthetically. |
| (B) | The subadvisor is an affiliate of the advisor. |
| (C) | All or a portion of this security is on loan as of 8-31-20. |
| (D) | The rate shown is the annualized seven-day yield as of 8-31-20. |
| (E) | Investment is an affiliate of the fund, the advisor and/or subadvisor. This security represents the investment of cash collateral received for securities lending. |
Multi-Index Lifestyle Growth Portfolio
| | | Shares or
Principal
Amount | | Value |
| AFFILIATED INVESTMENT COMPANIES (A) - 53.0% | | | |
| Equity - 53.0% | | | |
| Strategic Equity Allocation, Class NAV, JHF II (MIM US) (B) | 38,340,876 | | $ | 473,893,226 |
| TOTAL AFFILIATED INVESTMENT COMPANIES (Cost $458,641,517) | | $ | 473,893,226 |
Multi-Index Lifestyle Growth Portfolio (continued)
| | | Shares or
Principal
Amount | | Value |
| UNAFFILIATED INVESTMENT COMPANIES - 46.9% | | | |
| Exchange-traded funds - 45.9% | | | |
| Financial Select Sector SPDR Fund | 429,190 | | $ | 10,755,501 |
| Invesco Senior Loan ETF (C) | 549,898 | | | 12,026,269 |
| iShares Global Infrastructure ETF | 46,992 | | | 1,867,462 |
| iShares JP Morgan USD Emerging Markets Bond ETF | 169,152 | | | 19,212,284 |
| iShares MSCI Global Min Vol Factor ETF | 453,583 | | | 42,210,434 |
| Schwab U.S. Large-Cap Growth ETF | 76,289 | | | 9,163,072 |
| VanEck Vectors J.P. Morgan EM Local Currency Bond ETF (C) | 108,231 | | | 3,409,277 |
| Vanguard Dividend Appreciation ETF | 227,184 | | | 29,667,959 |
| Vanguard Energy ETF (C) | 127,750 | | | 6,117,948 |
| Vanguard FTSE All World ex-US Small-Cap ETF | 20,064 | | | 2,159,890 |
| Vanguard FTSE Developed Markets ETF (C) | 183,427 | | | 7,680,088 |
| Vanguard FTSE Emerging Markets ETF | 549,023 | | | 24,261,326 |
| Vanguard Global ex-U.S. Real Estate ETF | 38,795 | | | 1,928,112 |
| Vanguard Health Care ETF | 67,326 | | | 13,968,125 |
| Vanguard Information Technology ETF (C) | 33,997 | | | 11,156,116 |
| Vanguard Intermediate-Term Corporate Bond ETF | 482,060 | | | 46,465,763 |
| Vanguard Materials ETF | 28,818 | | | 3,884,378 |
| Vanguard Mid-Cap ETF | 288,621 | | | 51,905,599 |
| Vanguard Real Estate ETF (C) | 65,832 | | | 5,381,766 |
| Vanguard S&P 500 ETF | 14,189 | | | 4,554,953 |
| Vanguard Short-Term Bond ETF | 28,694 | | | 2,386,193 |
| Vanguard Short-Term Corporate Bond ETF | 61,263 | | | 5,090,343 |
| Vanguard Small-Cap ETF | 216,580 | | | 34,319,267 |
| Vanguard Total Bond Market ETF | 323,681 | | | 28,632,821 |
| Xtrackers USD High Yield Corporate Bond ETF | 663,601 | | | 32,357,185 |
| | | | | | 410,562,131 |
| Fixed income - 1.0% | | | |
| Fidelity Inflation Protected Bond Index Fund | 817,193 | | | 9,005,464 |
| TOTAL UNAFFILIATED INVESTMENT COMPANIES (Cost $375,220,917) | | $ | 419,567,595 |
| SHORT-TERM INVESTMENTS - 3.4% | | | |
| Short-term funds - 3.4% | | | | | |
| John Hancock Collateral Trust, 0.2611% (D)(E) | 2,991,179 | | | 29,943,797 |
| State Street Institutional U.S. Government Money Market Fund, Premier Class, 0.0399% (D) | 483,679 | | | 483,679 |
| TOTAL SHORT-TERM INVESTMENTS (Cost $30,427,473) | | $ | 30,427,476 |
| Total Investments (Multi-Index Lifestyle Growth Portfolio) (Cost $864,289,907) - 103.3% | | | $ | 923,888,297 |
| Other assets and liabilities, net - (3.3%) | | | | (29,298,314) |
| TOTAL NET ASSETS - 100.0% | | | | $ | 894,589,983 |
| Security Abbreviations and Legend |
| JHF II | John Hancock Funds II |
| MIM US | Manulife Investment Management (US) LLC |
| (A) | The underlying funds' subadvisor is shown parenthetically. |
| (B) | The subadvisor is an affiliate of the advisor. |
| (C) | All or a portion of this security is on loan as of 8-31-20. |
| (D) | The rate shown is the annualized seven-day yield as of 8-31-20. |
| (E) | Investment is an affiliate of the fund, the advisor and/or subadvisor. This security represents the investment of cash collateral received for securities lending. |
| The accompanying notes are an integral part of the financial statements. | 55 | |
John Hancock Funds II
Portfolio of Investments — August 31, 2020 (showing percentage of total net assets)
Multi-Index Lifestyle Moderate Portfolio
| | | Shares or
Principal
Amount | | Value |
| AFFILIATED INVESTMENT COMPANIES (A) - 25.4% | | | |
| Equity - 25.4% | | | |
| Strategic Equity Allocation, Class NAV, JHF II (MIM US) (B) | 5,317,759 | | $ | 65,727,502 |
| TOTAL AFFILIATED INVESTMENT COMPANIES (Cost $59,934,898) | | $ | 65,727,502 |
| UNAFFILIATED INVESTMENT COMPANIES - 74.6% | | | |
| Exchange-traded funds - 70.4% | | | |
| Invesco Senior Loan ETF (C) | 444,010 | | | 9,710,499 |
| iShares Global Infrastructure ETF | 9,063 | | | 360,164 |
| iShares JP Morgan USD Emerging Markets Bond ETF | 137,966 | | | 15,670,178 |
| iShares MSCI Global Min Vol Factor ETF | 145,506 | | | 13,540,788 |
| iShares Preferred & Income Securities ETF | 78,899 | | | 2,895,593 |
| VanEck Vectors J.P. Morgan EM Local Currency Bond ETF | 98,074 | | | 3,089,331 |
| Vanguard Dividend Appreciation ETF | 70,415 | | | 9,195,495 |
| Vanguard Energy ETF | 25,493 | | | 1,220,860 |
| Vanguard FTSE Developed Markets ETF | 73,549 | | | 3,079,497 |
| Vanguard FTSE Emerging Markets ETF | 4,013 | | | 177,334 |
| Vanguard Global ex-U.S. Real Estate ETF | 7,572 | | | 376,328 |
| Vanguard Intermediate-Term Corporate Bond ETF | 483,230 | | | 46,578,540 |
| Vanguard Materials ETF | 5,274 | | | 710,882 |
| Vanguard Mid-Cap ETF | 31,781 | | | 5,715,495 |
| Vanguard Real Estate ETF (C) | 12,803 | �� | | 1,046,645 |
| Vanguard S&P 500 ETF | 4,726 | | | 1,517,141 |
| Vanguard Short-Term Bond ETF | 17,458 | | | 1,451,807 |
| Vanguard Short-Term Corporate Bond ETF | 81,345 | | | 6,758,956 |
| Vanguard Small-Cap ETF | 20,486 | | | 3,246,212 |
| Vanguard Total Bond Market ETF | 373,015 | | | 32,996,907 |
| Xtrackers USD High Yield Corporate Bond ETF | 463,555 | | | 22,602,942 |
| | | | | | 181,941,594 |
| Fixed income - 4.2% | | | |
| Fidelity Inflation Protected Bond Index Fund | 970,475 | | | 10,694,638 |
| TOTAL UNAFFILIATED INVESTMENT COMPANIES (Cost $180,325,180) | | $ | 192,636,232 |
| SHORT-TERM INVESTMENTS - 3.2% | | | |
| Short-term funds - 3.2% | | | | | |
| John Hancock Collateral Trust, 0.2611% (D)(E) | 782,081 | | | 7,829,181 |
| State Street Institutional U.S. Government Money Market Fund, Premier Class, 0.0399% (D) | 543,149 | | | 543,149 |
| TOTAL SHORT-TERM INVESTMENTS (Cost $8,372,327) | | $ | 8,372,330 |
| Total Investments (Multi-Index Lifestyle Moderate Portfolio) (Cost $248,632,405) - 103.2% | | | $ | 266,736,064 |
| Other assets and liabilities, net - (3.2%) | | | | (8,314,868) |
| TOTAL NET ASSETS - 100.0% | | | | $ | 258,421,196 |
| Security Abbreviations and Legend |
| JHF II | John Hancock Funds II |
| MIM US | Manulife Investment Management (US) LLC |
| (A) | The underlying funds' subadvisor is shown parenthetically. |
| (B) | The subadvisor is an affiliate of the advisor. |
| (C) | All or a portion of this security is on loan as of 8-31-20. |
| (D) | The rate shown is the annualized seven-day yield as of 8-31-20. |
| (E) | Investment is an affiliate of the fund, the advisor and/or subadvisor. This security represents the investment of cash collateral received for securities lending. |
Real Estate Securities Fund
| | | Shares or
Principal
Amount | | Value |
| COMMON STOCKS – 99.0% | | | | | |
| Real estate – 99.0% | | | | | |
Equity real estate investment trusts –
99.0% | | | | | |
| Diversified REITs – 2.2% | | | | | |
| Essential Properties Realty Trust, Inc. | | 390,443 | | $ | 6,625,818 |
| Health care REITs – 10.2% | | | | | |
| Healthcare Trust of America, Inc., Class A | | 118,168 | | | 3,118,454 |
| Medical Properties Trust, Inc. | | 231,802 | | | 4,306,881 |
| Omega Healthcare Investors, Inc. | | 191,805 | | | 5,940,201 |
| Sabra Health Care REIT, Inc. | | 221,458 | | | 3,284,222 |
| Welltower, Inc. | | 249,167 | | | 14,332,086 |
| | | | | | 30,981,844 |
| Industrial REITs – 16.6% | | | | | |
| EastGroup Properties, Inc. | | 68,176 | | | 9,078,316 |
| Prologis, Inc. | | 330,034 | | | 33,617,261 |
| Rexford Industrial Realty, Inc. | | 164,058 | | | 7,871,503 |
| | | | | | 50,567,080 |
| Office REITs – 7.3% | | | | | |
| Alexandria Real Estate Equities, Inc. | | 86,016 | | | 14,483,374 |
| Cousins Properties, Inc. | | 54,929 | | | 1,639,631 |
| Highwoods Properties, Inc. | | 167,113 | | | 6,226,630 |
| | | | | | 22,349,635 |
| Residential REITs – 19.5% | | | | | |
| American Homes 4 Rent, Class A | | 227,882 | | | 6,526,540 |
| Equity LifeStyle Properties, Inc. | | 135,857 | | | 9,005,961 |
| Essex Property Trust, Inc. | | 36,120 | | | 7,820,341 |
| Invitation Homes, Inc. | | 371,398 | | | 10,633,125 |
| Mid-America Apartment Communities, Inc. | | 90,007 | | | 10,541,620 |
| Sun Communities, Inc. | | 55,798 | | | 8,318,366 |
| UDR, Inc. | | 181,765 | | | 6,327,240 |
| | | | | | 59,173,193 |
| Retail REITs – 12.8% | | | | | |
| Agree Realty Corp. | | 110,533 | | | 7,396,868 |
| Kimco Realty Corp. | | 586,560 | | | 7,032,854 |
| NETSTREIT Corp. (A)(B) | | 114,546 | | | 2,100,774 |
| Realty Income Corp. | | 145,777 | | | 9,042,547 |
| Regency Centers Corp. | | 135,895 | | | 5,396,390 |
| Simon Property Group, Inc. | | 117,884 | | | 7,998,429 |
| | | | | | 38,967,862 |
| Specialized REITs – 30.4% | | | | | |
| American Tower Corp. | | 15,633 | | | 3,894,962 |
| CyrusOne, Inc. | | 83,337 | | | 6,961,140 |
| Digital Realty Trust, Inc. | | 79,387 | | | 12,356,587 |
| Equinix, Inc. | | 37,675 | | | 29,754,962 |
| Extra Space Storage, Inc. | | 120,267 | | | 12,814,449 |
| Gaming and Leisure Properties, Inc. | | 320,231 | | | 11,640,397 |
| Life Storage, Inc. | | 95,285 | | | 10,045,898 |
| SBA Communications Corp. | | 15,995 | | | 4,895,590 |
| | | | | | 92,363,985 |
| | | | | | 301,029,417 |
| TOTAL COMMON STOCKS (Cost $238,019,536) | | $ | 301,029,417 |
| The accompanying notes are an integral part of the financial statements. | 56 | |
John Hancock Funds II
Portfolio of Investments — August 31, 2020 (showing percentage of total net assets)
Real Estate Securities Fund (continued)
| | | Shares or
Principal
Amount | | Value |
| SHORT-TERM INVESTMENTS – 1.1% | | | |
| Short-term funds – 1.1% | | | | | |
| John Hancock Collateral Trust, 0.2611% (C)(D) | | 107,994 | | $ | 1,081,100 |
| State Street Institutional U.S. Government Money Market Fund, Premier Class, 0.0399% (C) | | 2,429,902 | | | 2,429,902 |
| TOTAL SHORT-TERM INVESTMENTS (Cost $3,511,002) | | | $ | 3,511,002 |
Total Investments (Real Estate Securities Fund)
(Cost $241,530,538) – 100.1% | | | | $ | 304,540,419 |
| Other assets and liabilities, net – (0.1%) | | | | (344,528) |
| TOTAL NET ASSETS – 100.0% | | | | $ | 304,195,891 |
| Security Abbreviations and Legend |
| (A) | Non-income producing security. |
| (B) | All or a portion of this security is on loan as of 8-31-20. |
| (C) | The rate shown is the annualized seven-day yield as of 8-31-20. |
| (D) | Investment is an affiliate of the fund, the advisor and/or subadvisor. This security represents the investment of cash collateral received for securities lending. |
Science & Technology Fund
| | | Shares or
Principal
Amount | | Value |
| COMMON STOCKS – 93.9% | | | |
| Communication services – 17.3% | | | | | |
| Entertainment – 1.4% | | | |
| Activision Blizzard, Inc. | | 15,155 | | $ | 1,265,746 |
| NetEase, Inc., ADR | | 2,045 | | | 996,344 |
| Netflix, Inc. (A) | | 1,655 | | | 876,422 |
| Spotify Technology SA (A) | | 620 | | | 174,939 |
| Take-Two Interactive Software, Inc. (A) | | 1,075 | | | 184,029 |
| Zynga, Inc., Class A (A)(B) | | 156,670 | | | 1,419,430 |
| | | | | | 4,916,910 |
| Interactive media and services – 15.7% | | | |
| 58.com, Inc., ADR (A) | | 104,330 | | | 5,775,709 |
| Alphabet, Inc., Class C (A) | | 10,632 | | | 17,374,602 |
| Baidu, Inc., ADR (A) | | 21,248 | | | 2,646,863 |
| Facebook, Inc., Class A (A) | | 78,281 | | | 22,951,986 |
| Mail.Ru Group, Ltd., GDR (A) | | 208,425 | | | 6,288,968 |
| NAVER Corp. | | 4,647 | | | 1,258,310 |
| Pinterest, Inc., Class A (A) | | 6,795 | | | 249,988 |
| Tencent Holdings, Ltd. | | 6,200 | | | 423,574 |
| | | | | | 56,970,000 |
| Media – 0.2% | | | |
| News Corp., Class A | | 60,467 | | | 914,261 |
| | | | | | 62,801,171 |
| Consumer discretionary – 18.3% | | | | | |
| Automobiles – 0.4% | | | |
| Tesla, Inc. (A) | | 3,025 | | | 1,507,418 |
| Internet and direct marketing retail – 17.9% | | | |
| Alibaba Group Holding, Ltd., ADR (A) | | 17,441 | | | 5,006,090 |
| Amazon.com, Inc. (A) | | 5,604 | | | 19,339,180 |
| Booking Holdings, Inc. (A) | | 5,569 | | | 10,639,296 |
| Delivery Hero SE (A)(C) | | 24,769 | | | 2,664,659 |
| Etsy, Inc. (A) | | 16,612 | | | 1,988,456 |
| Expedia Group, Inc. | | 3,325 | | | 326,349 |
| JD.com, Inc., ADR (A) | | 5,590 | | | 439,598 |
| Naspers, Ltd., N Shares | | 16,159 | | | 2,946,347 |
| Tongcheng-Elong Holdings, Ltd. (A) | | 645,600 | | | 1,263,553 |
| Trip.com Group, Ltd., ADR (A) | | 311,885 | | | 9,431,402 |
Science & Technology Fund (continued)
| | | Shares or
Principal
Amount | | Value |
| COMMON STOCKS (continued) | | | |
| Internet and direct marketing retail (continued) | | | |
| Zalando SE (A)(C) | | 124,436 | | $ | 10,901,619 |
| | | | | | 64,946,549 |
| | | | | | 66,453,967 |
| Health care – 1.3% | | | | | |
| Health care equipment and supplies – 0.9% | | | |
| Intuitive Surgical, Inc. (A) | | 4,349 | | | 3,178,423 |
| Health care technology – 0.4% | | | |
| Veeva Systems, Inc., Class A (A) | | 5,350 | | | 1,510,145 |
| | | | | | 4,688,568 |
| Industrials – 0.2% | | | | | |
| Aerospace and defense – 0.2% | | | |
| The Boeing Company | | 3,651 | | | 627,315 |
| Electrical equipment – 0.0% | | | |
| Bloom Energy Corp., Class A (A) | | 11,295 | | | 176,880 |
| | | | | | 804,195 |
| Information technology – 56.8% | | | | | |
| Communications equipment – 0.1% | | | |
| F5 Networks, Inc. (A) | | 1,095 | | | 144,901 |
| Telefonaktiebolaget LM Ericsson, ADR (B) | | 21,825 | | | 254,261 |
| | | | | | 399,162 |
| Electronic equipment, instruments and components – 1.0% | | | |
| Amphenol Corp., Class A | | 5,125 | | | 562,725 |
| Cognex Corp. | | 5,215 | | | 360,826 |
| Flex, Ltd. (A) | | 42,080 | | | 456,989 |
| IPG Photonics Corp. (A) | | 2,760 | | | 446,375 |
| Samsung SDI Company, Ltd. | | 4,918 | | | 1,867,344 |
| | | | | | 3,694,259 |
| IT services – 10.9% | | | |
| Adyen NV (A)(C) | | 345 | | | 581,550 |
| Akamai Technologies, Inc. (A) | | 2,100 | | | 244,503 |
| Fidelity National Information Services, Inc. | | 9,482 | | | 1,430,360 |
| Fiserv, Inc. (A) | | 13,110 | | | 1,305,494 |
| Global Payments, Inc. | | 8,294 | | | 1,464,886 |
| Mastercard, Inc., Class A | | 4,630 | | | 1,658,420 |
| MongoDB, Inc. (A)(B) | | 15,725 | | | 3,676,505 |
| Okta, Inc. (A) | | 28,995 | | | 6,244,653 |
| PayPal Holdings, Inc. (A) | | 27,130 | | | 5,538,318 |
| Shopify, Inc., Class A (A) | | 2,445 | | | 2,607,397 |
| Square, Inc., Class A (A) | | 31,340 | | | 5,000,610 |
| Twilio, Inc., Class A (A) | | 29,825 | | | 8,045,592 |
| Wix.com, Ltd. (A) | | 5,362 | | | 1,579,806 |
| | | | | | 39,378,094 |
| Semiconductors and semiconductor equipment – 14.6% | | | |
| Advanced Micro Devices, Inc. (A) | | 46,550 | | | 4,227,671 |
| Applied Materials, Inc. | | 80,401 | | | 4,952,702 |
| ASML Holding NV, NYRS | | 1,250 | | | 467,725 |
| Cree, Inc. (A)(B) | | 9,430 | | | 595,033 |
| KLA Corp. | | 1,405 | | | 288,222 |
| Lam Research Corp. | | 9,880 | | | 3,323,039 |
| Marvell Technology Group, Ltd. | | 29,370 | | | 1,138,969 |
| Maxim Integrated Products, Inc. | | 57,156 | | | 3,911,757 |
| Micron Technology, Inc. (A) | | 217,849 | | | 9,914,308 |
| NVIDIA Corp. | | 16,497 | | | 8,825,565 |
| NXP Semiconductors NV | | 4,590 | | | 577,238 |
| Qorvo, Inc. (A) | | 4,965 | | | 636,861 |
| QUALCOMM, Inc. | | 62,982 | | | 7,501,156 |
| Skyworks Solutions, Inc. | | 19,190 | | | 2,779,672 |
| STMicroelectronics NV, NYRS (B) | | 30,430 | | | 920,508 |
| Taiwan Semiconductor Manufacturing Company, Ltd., ADR | | 8,935 | | | 708,099 |
| Teradyne, Inc. | | 14,425 | | | 1,225,692 |
| The accompanying notes are an integral part of the financial statements. | 57 | |
John Hancock Funds II
Portfolio of Investments — August 31, 2020 (showing percentage of total net assets)
Science & Technology Fund (continued)
| | | Shares or
Principal
Amount | | Value |
| COMMON STOCKS (continued) | | | |
| Semiconductors and semiconductor equipment (continued) | | | |
| Texas Instruments, Inc. | | 6,125 | | $ | 870,669 |
| | | | | | 52,864,886 |
| Software – 21.3% | | | |
| Alteryx, Inc., Class A (A) | | 7,075 | | | 854,872 |
| Atlassian Corp. PLC, Class A (A) | | 24,260 | | | 4,652,098 |
| Autodesk, Inc. (A) | | 1,370 | | | 336,609 |
| Avalara, Inc. (A) | | 1,260 | | | 166,837 |
| Citrix Systems, Inc. | | 29,166 | | | 4,234,903 |
| Cloudflare, Inc., Class A (A) | | 4,565 | | | 174,657 |
| Coupa Software, Inc. (A) | | 1,055 | | | 345,766 |
| Crowdstrike Holdings, Inc., Class A (A) | | 41,150 | | | 5,173,790 |
| Datadog, Inc., Class A (A) | | 5,735 | | | 479,159 |
| DocuSign, Inc. (A) | | 10,515 | | | 2,344,845 |
| HubSpot, Inc. (A) | | 10,980 | | | 3,290,486 |
| Intuit, Inc. | | 4,963 | | | 1,714,171 |
| Microsoft Corp. | | 53,746 | | | 12,121,335 |
| NortonLifeLock, Inc. | | 68,235 | | | 1,604,887 |
| Palo Alto Networks, Inc. (A) | | 1,340 | | | 344,929 |
| Paycom Software, Inc. (A) | | 17,966 | | | 5,380,098 |
| RingCentral, Inc., Class A (A) | | 20,280 | | | 5,896,816 |
| salesforce.com, Inc. (A) | | 44,666 | | | 12,178,185 |
| ServiceNow, Inc. (A) | | 860 | | | 414,537 |
| Slack Technologies, Inc., Class A (A)(B) | | 52,710 | | | 1,730,996 |
| Splunk, Inc. (A) | | 7,745 | | | 1,698,711 |
| TeamViewer AG (A)(C) | | 30,560 | | | 1,654,728 |
| Varonis Systems, Inc. (A) | | 6,180 | | | 763,415 |
| Workday, Inc., Class A (A) | | 9,404 | | | 2,254,233 |
| Zendesk, Inc. (A) | | 3,505 | | | 337,812 |
| Zoom Video Communications, Inc., Class A (A) | | 8,075 | | | 2,625,183 |
| Zscaler, Inc. (A) | | 31,845 | | | 4,564,662 |
| | | | | | 77,338,720 |
| Technology hardware, storage and peripherals – 8.9% | | | |
| Apple, Inc. | | 145,300 | | | 18,749,512 |
| Pure Storage, Inc., Class A (A)(B) | | 405,980 | | | 6,195,255 |
| Samsung Electronics Company, Ltd. | | 164,781 | | | 7,482,069 |
| | | | | | 32,426,836 |
| | | | | | 206,101,957 |
| Real estate – 0.0% | | | | | |
| Equity real estate investment trusts – 0.0% | | | |
| Equinix, Inc. | | 230 | | | 181,649 |
| TOTAL COMMON STOCKS (Cost $229,845,444) | | $ | 341,031,507 |
| PREFERRED SECURITIES – 0.5% | | | | | |
| Communication services – 0.3% | | | | | |
| Media – 0.3% | | | |
| Airbnb, Inc., Series E (A)(D)(E) | | 16,398 | | | 1,235,097 |
| Industrials – 0.2% | | | | | |
| Road and rail – 0.2% | | | |
| DiDi Chuxing, Inc. (A)(D)(E) | | 16,798 | | | 684,435 |
| TOTAL PREFERRED SECURITIES (Cost $1,987,267) | | $ | 1,919,532 |
| EXCHANGE-TRADED FUNDS – 0.2% | | | |
| iShares Expanded Tech Sector ETF | | 1,600 | | | 523,551 |
| TOTAL EXCHANGE-TRADED FUNDS (Cost $397,914) | | $ | 523,551 |
| TERM LOANS (F) – 0.1% | | | | | |
| Communication services – 0.1% | | | | | |
Airbnb, Inc., Term Loan (1 and 3 month LIBOR + 7.500%)
8.500%, 04/17/2025 | $ | 320,000 | | | 337,600 |
| TOTAL TERM LOANS (Cost $312,358) | | $ | 337,600 |
Science & Technology Fund (continued)
| | | Shares or
Principal
Amount | | Value |
| SHORT-TERM INVESTMENTS – 8.2% | | | |
| Short-term funds – 6.3% | | | | | |
| John Hancock Collateral Trust, 0.2611% (G)(H) | | 737,546 | | $ | 7,383,356 |
| State Street Institutional U.S. Government Money Market Fund, Premier Class, 0.0399% (G) | | 2,452,520 | | | 2,452,520 |
| T. Rowe Price Government Reserve Fund, 0.1398% (G) | | 13,155,970 | | | 13,155,970 |
| | | | | | 22,991,846 |
| Repurchase agreement – 1.9% | | | | | |
| Repurchase Agreement with State Street Corp. dated 8-31-20 at 0.000% to be repurchased at $6,724,000 on 9-1-20, collateralized by $6,821,200 U.S. Treasury Notes, 0.375% due 3-31-22 (valued at $6,858,537) | $ | 6,724,000 | | | 6,724,000 |
| TOTAL SHORT-TERM INVESTMENTS (Cost $29,713,457) | | $ | 29,715,846 |
Total Investments (Science & Technology Fund)
(Cost $262,256,440) – 102.9% | | $ | 373,528,036 |
| Other assets and liabilities, net – (2.9%) | | | (10,368,324) |
| TOTAL NET ASSETS – 100.0% | | $ | 363,159,712 |
| Security Abbreviations and Legend |
| ADR | American Depositary Receipt |
| GDR | Global Depositary Receipt |
| LIBOR | London Interbank Offered Rate |
| NYRS | New York Registry Shares |
| (A) | Non-income producing security. |
| (B) | All or a portion of this security is on loan as of 8-31-20. |
| (C) | These securities are exempt from registration under Rule 144A of the Securities Act of 1933. Such securities may be resold, normally to qualified institutional buyers, in transactions exempt from registration. |
| (D) | Restricted security as to resale, excluding 144A securities. For more information on this security refer to the Notes to financial statements. |
| (E) | Security is valued using significant unobservable inputs and is classified as Level 3 in the fair value hierarchy. Refer to Note 2 to the financial statements. |
| (F) | Term loans are variable rate obligations. The coupon rate shown represents the rate at period end. |
| (G) | The rate shown is the annualized seven-day yield as of 8-31-20. |
| (H) | Investment is an affiliate of the fund, the advisor and/or subadvisor. This security represents the investment of cash collateral received for securities lending. |
Strategic Equity Allocation Fund
| | | Shares or
Principal
Amount | | Value |
| COMMON STOCKS – 96.0% | | | |
| Communication services – 9.4% | | | | | |
| Diversified telecommunication services – 1.3% | | | |
| Alaska Communications Systems Group, Inc. | | 7,707 | | $ | 17,264 |
| Altice Europe NV (A) | | 123,118 | | | 543,568 |
| Anterix, Inc. (A) | | 1,790 | | | 78,295 |
| AT&T, Inc. | | 637,324 | | | 18,998,628 |
| ATN International, Inc. | | 1,496 | | | 86,768 |
| Bandwidth, Inc., Class A (A) | | 2,512 | | | 395,590 |
| BCE, Inc. | | 5,987 | | | 257,317 |
| BT Group PLC | | 829,621 | | | 1,155,169 |
| Cellnex Telecom SA (A)(B) | | 47,921 | | | 3,078,642 |
| CenturyLink, Inc. | | 88,359 | | | 949,859 |
| The accompanying notes are an integral part of the financial statements. | 58 | |
John Hancock Funds II
Portfolio of Investments — August 31, 2020 (showing percentage of total net assets)
Strategic Equity Allocation Fund (continued)
| | | Shares or
Principal
Amount | | Value |
| COMMON STOCKS (continued) | | | |
| Diversified telecommunication services (continued) | | | |
| China Telecom Corp., Ltd., H Shares | | 1,541,296 | | $ | 502,799 |
| China Tower Corp., Ltd., H Shares (B) | | 5,162,400 | | | 983,434 |
| China Unicom Hong Kong, Ltd. | | 713,816 | | | 506,067 |
| Chunghwa Telecom Company, Ltd. | | 444,479 | | | 1,643,182 |
| Cincinnati Bell, Inc. (A) | | 6,593 | | | 99,291 |
| Cogent Communications Holdings, Inc. | | 5,524 | | | 371,544 |
| Consolidated Communications Holdings, Inc. (A) | | 9,728 | | | 75,684 |
| Deutsche Telekom AG | | 625,894 | | | 11,032,654 |
| Elisa OYJ | | 47,142 | | | 2,774,575 |
| HKT Trust & HKT, Ltd. | | 501,322 | | | 716,353 |
| Iliad SA | | 2,479 | | | 528,744 |
| Infrastrutture Wireless Italiane SpA (B) | | 27,596 | | | 269,180 |
| Iridium Communications, Inc. (A)(C) | | 15,434 | | | 432,306 |
| Koninklijke KPN NV | | 705,544 | | | 1,851,482 |
| LG Uplus Corp. | | 25,915 | | | 260,320 |
| Liberty Latin America, Ltd., Class A (A)(C) | | 7,210 | | | 70,658 |
| Liberty Latin America, Ltd., Class C (A) | | 13,739 | | | 131,070 |
| Nippon Telegraph & Telephone Corp. | | 101,100 | | | 2,300,591 |
| Ooma, Inc. (A) | | 2,999 | | | 40,906 |
| Orange Polska SA (A) | | 110,226 | | | 215,859 |
| Orange SA | | 334,282 | | | 3,734,193 |
| ORBCOMM, Inc. (A) | | 10,815 | | | 43,368 |
| PCCW, Ltd. | | 554,000 | | | 347,191 |
| Proximus SADP | | 35,487 | | | 700,835 |
| Singapore Telecommunications, Ltd. | | 106,650 | | | 180,025 |
| Singapore Telecommunications, Ltd. | | 229,178 | | | 385,300 |
| Spark New Zealand, Ltd. | | 697,366 | | | 2,264,013 |
| Swisscom AG | | 3,280 | | | 1,816,125 |
| Telecom Italia SpA | | 963,136 | | | 458,738 |
| Telecom Italia SpA, Savings Shares | | 693,600 | | | 327,965 |
| Telefonica Deutschland Holding AG | | 194,625 | | | 538,466 |
| Telefonica SA | | 931,387 | | | 3,669,720 |
| Telekom Malaysia BHD | | 145,218 | | | 144,440 |
| Telekomunikasi Indonesia Persero Tbk PT | | 6,547,560 | | | 1,288,352 |
| Telenor ASA | | 92,369 | | | 1,503,282 |
| Telia Company AB | | 544,308 | | | 2,098,393 |
| Telstra Corp., Ltd. | | 768,676 | | | 1,633,967 |
| TELUS Corp. | | 15,848 | | | 291,846 |
| TPG Telecom, Ltd. (A)(C) | | 68,136 | | | 413,588 |
| True Corp. PCL, NVDR | | 1,675,000 | | | 178,914 |
| United Internet AG | | 19,222 | | | 946,111 |
| Verizon Communications, Inc. | | 370,140 | | | 21,938,198 |
| Vonage Holdings Corp. (A) | | 30,365 | | | 347,679 |
| | | | | | 95,618,508 |
| Entertainment – 1.4% | | | |
| Activision Blizzard, Inc. | | 107,460 | | | 8,975,059 |
| Alibaba Pictures Group, Ltd. (A) | | 1,390,500 | | | 196,963 |
| AMC Entertainment Holdings, Inc., Class A (C) | | 7,327 | | | 43,083 |
| Bilibili, Inc., ADR (A)(C) | | 11,300 | | | 533,925 |
| Bollore SA | | 147,196 | | | 553,334 |
| CD Projekt SA (A) | | 11,318 | | | 1,345,800 |
| Cinemark Holdings, Inc. | | 42,835 | | | 627,533 |
| Electronic Arts, Inc. (A) | | 40,264 | | | 5,615,620 |
| Eros International PLC (A)(C) | | 10,274 | | | 31,952 |
| Glu Mobile, Inc. (A) | | 17,058 | | | 135,441 |
| HUYA, Inc., ADR (A)(C) | | 7,100 | | | 203,912 |
| IMAX Corp. (A) | | 6,632 | | | 101,934 |
| iQIYI, Inc., ADR (A)(C) | | 25,800 | | | 558,570 |
| Konami Holdings Corp. (C) | | 7,300 | | | 281,081 |
| Liberty Media Corp.-Liberty Braves, Class A (A) | | 1,906 | | | 37,339 |
Strategic Equity Allocation Fund (continued)
| | | Shares or
Principal
Amount | | Value |
| COMMON STOCKS (continued) | | | |
| Entertainment (continued) | | | |
| Liberty Media Corp.-Liberty Braves, Class C (A) | | 4,312 | | $ | 83,782 |
| Live Nation Entertainment, Inc. (A) | | 19,815 | | | 1,125,492 |
| NCSoft Corp. | | 1,977 | | | 1,371,584 |
| NetEase, Inc., ADR | | 9,504 | | | 4,630,444 |
| Netflix, Inc. (A) | | 61,340 | | | 32,483,210 |
| Netmarble Corp. (A)(B) | | 2,573 | | | 360,188 |
| Nexon Company, Ltd. | | 38,000 | | | 889,177 |
| Nintendo Company, Ltd. | | 8,739 | | | 4,704,270 |
| Pearl Abyss Corp. (A) | | 700 | | | 107,124 |
| Square Enix Holdings Company, Ltd. | | 7,200 | | | 474,430 |
| Take-Two Interactive Software, Inc. (A) | | 15,892 | | | 2,720,551 |
| Tencent Music Entertainment Group, ADR (A) | | 42,400 | | | 662,712 |
| The Marcus Corp. | | 3,187 | | | 49,940 |
| The Walt Disney Company | | 251,920 | | | 33,220,690 |
| Toho Company, Ltd. | | 8,700 | | | 330,573 |
| Ubisoft Entertainment SA (A) | | 15,159 | | | 1,247,560 |
| Vivendi SA | | 138,939 | | | 3,955,552 |
| World Wrestling Entertainment, Inc., Class A | | 12,473 | | | 549,685 |
| | | | | | 108,208,510 |
| Interactive media and services – 5.2% | | | |
| 58.com, Inc., ADR (A) | | 11,100 | | | 614,496 |
| Alphabet, Inc., Class A (A) | | 58,248 | | | 94,916,863 |
| Alphabet, Inc., Class C (A) | | 56,775 | | | 92,780,570 |
| Auto Trader Group PLC (B) | | 89,403 | | | 668,366 |
| Autohome, Inc., ADR | | 6,900 | | | 553,656 |
| Baidu, Inc., ADR (A) | | 32,000 | | | 3,986,240 |
| CarGurus, Inc. (A) | | 11,345 | | | 276,591 |
| Cars.com, Inc. (A) | | 9,104 | | | 79,023 |
| Eventbrite, Inc., Class A (A)(C) | | 8,462 | | | 90,967 |
| EverQuote, Inc., Class A (A) | | 1,841 | | | 65,356 |
| Facebook, Inc., Class A (A) | | 466,789 | | | 136,862,535 |
| JOYY, Inc., ADR (A) | | 6,800 | | | 580,992 |
| Kakaku.com, Inc. | | 10,500 | | | 280,411 |
| Kakao Corp. | | 6,759 | | | 2,309,426 |
| Liberty TripAdvisor Holdings, Inc., Class A (A) | | 10,803 | | | 30,248 |
| LINE Corp. (A) | | 4,700 | | | 239,534 |
| Momo, Inc., ADR | | 17,500 | | | 357,000 |
| NAVER Corp. | | 14,789 | | | 4,004,549 |
| QuinStreet, Inc. (A) | | 6,338 | | | 83,345 |
| REA Group, Ltd. | | 9,704 | | | 816,155 |
| Scout24 AG (B) | | 20,178 | | | 1,877,049 |
| SEEK, Ltd. | | 61,559 | | | 935,157 |
| SINA Corp. (A) | | 7,300 | | | 297,001 |
| Tencent Holdings, Ltd. | | 667,512 | | | 45,603,321 |
| The Meet Group, Inc. (A) | | 9,111 | | | 57,399 |
| TripAdvisor, Inc. | | 27,133 | | | 634,098 |
| TrueCar, Inc. (A) | | 14,558 | | | 68,859 |
| Twitter, Inc. (A) | | 152,319 | | | 6,181,105 |
| Weibo Corp., ADR (A) | | 6,400 | | | 238,720 |
| Yelp, Inc. (A) | | 26,812 | | | 619,893 |
| Z Holdings Corp. | | 208,207 | | | 1,385,894 |
| | | | | | 397,494,819 |
| Media – 0.9% | | | |
| AMC Networks, Inc., Class A (A) | | 15,996 | | | 388,543 |
| Boston Omaha Corp., Class A (A) | | 1,637 | | | 26,699 |
| Cable One, Inc. | | 1,417 | | | 2,607,748 |
| Cardlytics, Inc. (A)(C) | | 3,396 | | | 257,587 |
| Central European Media Enterprises, Ltd., Class A (A) | | 11,861 | | | 49,164 |
| Charter Communications, Inc., Class A (A) | | 20,764 | | | 12,782,526 |
| Cheil Worldwide, Inc. | | 8,523 | | | 130,690 |
| The accompanying notes are an integral part of the financial statements. | 59 | |
John Hancock Funds II
Portfolio of Investments — August 31, 2020 (showing percentage of total net assets)
Strategic Equity Allocation Fund (continued)
| | | Shares or
Principal
Amount | | Value |
| COMMON STOCKS (continued) | | | |
| Media (continued) | | | |
| China Literature, Ltd. (A)(B) | | 35,400 | | $ | 219,536 |
| Comcast Corp., Class A | | 627,514 | | | 28,118,902 |
| comScore, Inc. (A) | | 8,391 | | | 22,068 |
| CyberAgent, Inc. | | 7,900 | | | 420,901 |
| Cyfrowy Polsat SA (A) | | 48,277 | | | 376,865 |
| Daily Journal Corp. (A) | | 141 | | | 38,803 |
| Dentsu Group, Inc. | | 16,944 | | | 444,332 |
| Discovery, Inc., Series A (A)(C) | | 22,051 | | | 486,555 |
| Discovery, Inc., Series C (A) | | 43,581 | | | 870,313 |
| DISH Network Corp., Class A (A) | | 35,428 | | | 1,258,403 |
| Entercom Communications Corp., Class A | | 17,130 | | | 25,695 |
| Fox Corp., Class A | | 47,206 | | | 1,315,159 |
| Fox Corp., Class B | | 21,942 | | | 609,988 |
| Gannett Company, Inc. | | 18,734 | | | 32,410 |
| Gray Television, Inc. (A) | | 11,701 | | | 181,600 |
| Grupo Televisa SAB (A) | | 293,197 | | | 357,753 |
| Hakuhodo DY Holdings, Inc. | | 18,200 | | | 225,978 |
| Hemisphere Media Group, Inc. (A) | | 2,692 | | | 23,959 |
| iHeartMedia, Inc., Class A (A)(C) | | 7,929 | | | 73,105 |
| Informa PLC (A) | | 139,709 | | | 770,840 |
| ITV PLC | | 336,869 | | | 269,624 |
| JCDecaux SA (A) | | 14,194 | | | 271,061 |
| John Wiley & Sons, Inc., Class A | | 11,764 | | | 372,331 |
| Loral Space & Communications, Inc. | | 1,793 | | | 42,261 |
| Megacable Holdings SAB de CV | | 36,600 | | | 105,709 |
| Meredith Corp. (C) | | 5,259 | | | 73,626 |
| MSG Networks, Inc., Class A (A)(C) | | 5,230 | | | 50,940 |
| MultiChoice Group (A) | | 54,307 | | | 308,958 |
| National CineMedia, Inc. | | 8,900 | | | 32,129 |
| News Corp., Class A | | 53,566 | | | 809,918 |
| News Corp., Class B (C) | | 16,789 | | | 253,010 |
| Omnicom Group, Inc. | | 29,523 | | | 1,596,899 |
| Pearson PLC | | 71,581 | | | 527,408 |
| Publicis Groupe SA (C) | | 36,285 | | | 1,268,992 |
| Quebecor, Inc., Class B | | 6,626 | | | 164,285 |
| Saga Communications, Inc., Class A | | 659 | | | 14,828 |
| Schibsted ASA, B Shares (A) | | 12,562 | | | 496,765 |
| Scholastic Corp. | | 3,928 | | | 88,380 |
| SES SA | | 64,248 | | | 456,610 |
| Shaw Communications, Inc., Class B | | 17,415 | | | 325,643 |
| Sinclair Broadcast Group, Inc., Class A (C) | | 6,791 | | | 141,321 |
| TechTarget, Inc. (A) | | 3,074 | | | 121,976 |
| TEGNA, Inc. | | 87,366 | | | 1,093,822 |
| Telenet Group Holding NV | | 10,659 | | | 413,291 |
| The EW Scripps Company, Class A | | 7,474 | | | 83,111 |
| The Interpublic Group of Companies, Inc. | | 53,680 | | | 953,357 |
| The New York Times Company, Class A (C) | | 38,859 | | | 1,683,760 |
| Tribune Publishing Company | | 2,282 | | | 25,901 |
| ViacomCBS, Inc., Class B | | 74,478 | | | 2,074,212 |
| WideOpenWest, Inc. (A) | | 7,175 | | | 41,256 |
| WPP PLC | | 115,518 | | | 978,410 |
| | | | | | 67,255,916 |
| Wireless telecommunication services – 0.6% | | | |
| Advanced Info Service PCL, NVDR | | 171,200 | | | 1,005,582 |
| America Movil SAB de CV, Series L | | 4,092,400 | | | 2,487,383 |
| Axiata Group BHD | | 352,753 | | | 254,473 |
| Boingo Wireless, Inc. (A) | | 5,893 | | | 76,550 |
| China Mobile, Ltd. | | 715,470 | | | 5,006,797 |
| DiGi.Com BHD | | 395,720 | | | 374,712 |
| Empresa Nacional de Telecomunicaciones SA | | 42,470 | | | 257,085 |
| Far EasTone Telecommunications Company, Ltd. | | 185,595 | | | 387,953 |
| Globe Telecom, Inc. | | 4,445 | | | 191,247 |
Strategic Equity Allocation Fund (continued)
| | | Shares or
Principal
Amount | | Value |
| COMMON STOCKS (continued) | | | |
| Wireless telecommunication services (continued) | | | |
| Gogo, Inc. (A)(C) | | 8,314 | | $ | 42,734 |
| Intouch Holdings PCL, NVDR (C) | | 323,300 | | | 566,725 |
| KDDI Corp. | | 129,567 | | | 3,766,233 |
| Maxis BHD | | 300,260 | | | 360,085 |
| MTN Group, Ltd. | | 208,630 | | | 752,687 |
| NTT DOCOMO, Inc. | | 91,600 | | | 2,554,264 |
| PLDT, Inc. | | 11,560 | | | 349,538 |
| Rogers Communications, Inc., Class B | | 12,893 | | | 536,339 |
| Shenandoah Telecommunications Company | | 6,304 | | | 348,611 |
| SK Telecom Company, Ltd. | | 2,434 | | | 507,493 |
| Softbank Corp. | | 150,200 | | | 1,973,675 |
| SoftBank Group Corp. | | 123,152 | | | 7,617,720 |
| Spok Holdings, Inc. | | 2,941 | | | 31,880 |
| Taiwan Mobile Company, Ltd. | | 192,000 | | | 664,401 |
| Tele2 AB, B Shares | | 107,518 | | | 1,526,127 |
| Telephone & Data Systems, Inc. | | 26,288 | | | 608,041 |
| TIM Participacoes SA | | 99,089 | | | 259,004 |
| T-Mobile US, Inc. (A) | | 52,081 | | | 6,076,811 |
| Total Access Communication PCL, NVDR | | 102,100 | | | 117,428 |
| Turkcell Iletisim Hizmetleri AS | | 68,865 | | | 133,877 |
| Vodacom Group, Ltd. | | 78,952 | | | 594,290 |
| Vodafone Group PLC | | 2,497,554 | | | 3,662,020 |
| XL Axiata Tbk PT | | 496,800 | | | 83,160 |
| | | | | | 43,174,925 |
| | | | | | 711,752,678 |
| Consumer discretionary – 15.2% | | | | | |
| Auto components – 0.5% | | | |
| Adient PLC (A) | | 35,074 | | | 608,183 |
| Aisin Seiki Company, Ltd. | | 12,700 | | | 435,592 |
| American Axle & Manufacturing Holdings, Inc. (A) | | 14,878 | | | 115,751 |
| Aptiv PLC | | 122,312 | | | 10,533,509 |
| BorgWarner, Inc. | | 94,596 | | | 3,839,652 |
| Bridgestone Corp. | | 42,000 | | | 1,329,614 |
| Cheng Shin Rubber Industry Company, Ltd. | | 205,730 | | | 252,520 |
| Cie Generale des Etablissements Michelin SCA | | 28,445 | | | 3,221,667 |
| Continental AG | | 20,638 | | | 2,264,401 |
| Cooper Tire & Rubber Company | | 6,583 | | | 227,574 |
| Cooper-Standard Holdings, Inc. (A) | | 2,432 | | | 44,068 |
| Dana, Inc. | | 57,839 | | | 806,854 |
| Delphi Technologies PLC (A) | | 23,254 | | | 403,922 |
| Denso Corp. | | 34,016 | | | 1,431,045 |
| Dorman Products, Inc. (A) | | 3,457 | | | 292,773 |
| Faurecia SE (A) | | 12,698 | | | 555,969 |
| Fox Factory Holding Corp. (A) | | 5,058 | | | 509,897 |
| Fuyao Glass Industry Group Company, Ltd., H Shares (B) | | 57,900 | | | 186,906 |
| Gentex Corp. | | 65,943 | | | 1,783,758 |
| Gentherm, Inc. (A) | | 4,244 | | | 191,956 |
| Hankook Tire & Technology Company, Ltd. | | 9,105 | | | 225,582 |
| Hanon Systems | | 22,362 | | | 241,483 |
| Hyundai Mobis Company, Ltd. | | 8,038 | | | 1,504,271 |
| JTEKT Corp. | | 16,000 | | | 122,459 |
| Koito Manufacturing Company, Ltd. | | 8,176 | | | 395,124 |
| LCI Industries | | 3,211 | | | 364,866 |
| Lear Corp. | | 14,684 | | | 1,672,948 |
| Magna International, Inc. | | 10,599 | | | 516,156 |
| Modine Manufacturing Company (A) | | 6,951 | | | 47,058 |
| Motorcar Parts of America, Inc. (A) | | 2,598 | | | 45,231 |
| NGK Spark Plug Company, Ltd. | | 12,300 | | | 210,234 |
| Pirelli & C. SpA (A)(B)(C) | | 45,712 | | | 197,730 |
| Standard Motor Products, Inc. | | 2,698 | | | 122,597 |
| The accompanying notes are an integral part of the financial statements. | 60 | |
John Hancock Funds II
Portfolio of Investments — August 31, 2020 (showing percentage of total net assets)
Strategic Equity Allocation Fund (continued)
| | | Shares or
Principal
Amount | | Value |
| COMMON STOCKS (continued) | | | |
| Auto components (continued) | | | |
| Stanley Electric Company, Ltd. (C) | | 10,300 | | $ | 294,095 |
| Stoneridge, Inc. (A) | | 3,496 | | | 70,619 |
| Sumitomo Electric Industries, Ltd. | | 59,400 | | | 697,380 |
| Sumitomo Rubber Industries, Ltd. | | 13,200 | | | 126,892 |
| Tenneco, Inc., Class A (A)(C) | | 7,073 | | | 57,503 |
| The Goodyear Tire & Rubber Company | | 93,024 | | | 892,565 |
| The Yokohama Rubber Company, Ltd. | | 9,300 | | | 146,000 |
| Toyoda Gosei Company, Ltd. | | 5,100 | | | 110,788 |
| Toyota Industries Corp. | | 11,529 | | | 669,694 |
| Valeo SA | | 38,376 | | | 1,178,507 |
| Visteon Corp. (A) | | 11,113 | | | 838,254 |
| Workhorse Group, Inc. (A)(C) | | 8,472 | | | 153,428 |
| XPEL, Inc. (A) | | 2,266 | | | 56,423 |
| | | | | | 39,993,498 |
| Automobiles – 1.1% | | | |
| Astra International Tbk PT | | 2,677,808 | | | 939,616 |
| BAIC Motor Corp., Ltd., H Shares (B) | | 191,700 | | | 91,886 |
| Bayerische Motoren Werke AG | | 62,218 | | | 4,483,404 |
| Brilliance China Automotive Holdings, Ltd. | | 352,300 | | | 317,366 |
| BYD Company, Ltd., H Shares | | 74,694 | | | 778,637 |
| Daimler AG | | 160,757 | | | 8,242,479 |
| Dongfeng Motor Group Company, Ltd., H Shares | | 315,680 | | | 219,431 |
| Ferrari NV | | 14,511 | | | 2,832,654 |
| Fiat Chrysler Automobiles NV (A) | | 126,508 | | | 1,402,140 |
| Ford Motor Company | | 1,782,428 | | | 12,156,159 |
| Ford Otomotiv Sanayi AS | | 4,263 | | | 49,208 |
| Geely Automobile Holdings, Ltd. | | 684,000 | | | 1,455,743 |
| General Motors Company | | 574,652 | | | 17,026,939 |
| Great Wall Motor Company, Ltd., H Shares | | 360,250 | | | 392,147 |
| Guangzhou Automobile Group Company, Ltd., H Shares | | 341,346 | | | 293,706 |
| Harley-Davidson, Inc. | | 41,249 | | | 1,143,010 |
| Honda Motor Company, Ltd. | | 128,127 | | | 3,261,955 |
| Hyundai Motor Company | | 17,995 | | | 2,650,223 |
| Isuzu Motors, Ltd. | | 43,300 | | | 427,839 |
| Kia Motors Corp. | | 31,762 | | | 1,129,657 |
| Mazda Motor Corp. | | 44,480 | | | 283,112 |
| Mitsubishi Motors Corp. | | 51,200 | | | 122,313 |
| NIO, Inc., ADR (A)(C) | | 105,300 | | | 2,003,859 |
| Nissan Motor Company, Ltd. | | 182,125 | | | 733,998 |
| Peugeot SA (A) | | 98,595 | | | 1,699,837 |
| Renault SA (A) | | 32,206 | | | 918,566 |
| Subaru Corp. | | 48,400 | | | 1,005,778 |
| Suzuki Motor Corp. | | 28,900 | | | 1,183,108 |
| Thor Industries, Inc. | | 14,865 | | | 1,403,702 |
| Toyota Motor Corp. | | 166,600 | | | 11,002,996 |
| Volkswagen AG | | 6,079 | | | 1,095,322 |
| Winnebago Industries, Inc. | | 4,068 | | | 219,591 |
| Yamaha Motor Company, Ltd. | | 22,000 | | | 345,427 |
| | | | | | 81,311,808 |
| Distributors – 0.1% | | | |
| Core-Mark Holding Company, Inc. | | 5,879 | | | 196,476 |
| Funko, Inc., Class A (A)(C) | | 3,556 | | | 20,767 |
| Genuine Parts Company | | 33,281 | | | 3,143,058 |
| Jardine Cycle & Carriage, Ltd. | | 4,854 | | | 67,549 |
| LKQ Corp. (A) | | 70,126 | | | 2,225,799 |
| Pool Corp. | | 10,755 | | | 3,525,919 |
| Weyco Group, Inc. | | 934 | | | 16,812 |
| | | | | | 9,196,380 |
| Diversified consumer services – 0.2% | | | |
| Adtalem Global Education, Inc. (A) | | 20,764 | | | 689,365 |
Strategic Equity Allocation Fund (continued)
| | | Shares or
Principal
Amount | | Value |
| COMMON STOCKS (continued) | | | |
| Diversified consumer services (continued) | | | |
| American Public Education, Inc. (A) | | 1,946 | | $ | 61,182 |
| Aspen Group, Inc. (A) | | 2,859 | | | 36,538 |
| Benesse Holdings, Inc. | | 5,600 | | | 142,702 |
| Carriage Services, Inc. | | 2,248 | | | 49,771 |
| China East Education Holdings, Ltd. (B) | | 64,000 | | | 141,097 |
| China Education Group Holdings, Ltd. | | 70,000 | | | 137,292 |
| China Yuhua Education Corp., Ltd. (B) | | 136,000 | | | 130,374 |
| Cogna Educacao | | 208,780 | | | 217,221 |
| Collectors Universe, Inc. | | 1,317 | | | 58,593 |
| Franchise Group, Inc. (C) | | 2,558 | | | 62,824 |
| Graham Holdings Company, Class B | | 1,151 | | | 492,570 |
| Grand Canyon Education, Inc. (A) | | 12,741 | | | 1,198,164 |
| GSX Techedu, Inc., ADR (A)(C) | | 9,000 | | | 768,600 |
| H&R Block, Inc. | | 25,734 | | | 373,143 |
| Houghton Mifflin Harcourt Company (A) | | 15,620 | | | 35,301 |
| K12, Inc. (A) | | 5,222 | | | 194,311 |
| Koolearn Technology Holding, Ltd. (A)(B)(C) | | 27,500 | | | 131,438 |
| Laureate Education, Inc., Class A (A) | | 14,099 | | | 176,519 |
| New Oriental Education & Technology Group, Inc., ADR (A) | | 16,600 | | | 2,434,058 |
| OneSpaWorld Holdings, Ltd. | | 6,414 | | | 44,449 |
| Perdoceo Education Corp. (A)(C) | | 9,106 | | | 130,853 |
| Regis Corp. (A) | | 3,306 | | | 24,431 |
| Service Corp. International | | 47,973 | | | 2,189,967 |
| Strategic Education, Inc. | | 8,858 | | | 908,565 |
| TAL Education Group, ADR (A) | | 44,662 | | | 3,296,502 |
| Universal Technical Institute, Inc. (A) | | 4,144 | | | 29,215 |
| Vivint Smart Home, Inc. (A)(C) | | 9,196 | | | 163,229 |
| WW International, Inc. (A) | | 18,742 | | | 440,062 |
| | | | | | 14,758,336 |
| Hotels, restaurants and leisure – 1.5% | | | |
| Accel Entertainment, Inc. (A) | | 5,691 | | | 67,495 |
| Accor SA (A) | | 31,735 | | | 972,799 |
| Aristocrat Leisure, Ltd. | | 106,135 | | | 2,211,013 |
| Asset World Corp. PCL, NVDR | | 922,200 | | | 117,545 |
| BBX Capital Corp. | | 1,833 | | | 28,228 |
| BJ's Restaurants, Inc. | | 2,530 | | | 79,746 |
| Bloomin' Brands, Inc. | | 11,592 | | | 166,229 |
| Boyd Gaming Corp. | | 32,174 | | | 861,620 |
| Brinker International, Inc. | | 5,770 | | | 259,881 |
| Caesars Entertainment, Inc. (A) | | 57,110 | | | 2,615,638 |
| Carnival Corp. (C) | | 63,332 | | | 1,043,711 |
| Carrols Restaurant Group, Inc. (A) | | 5,294 | | | 35,258 |
| Century Casinos, Inc. (A) | | 4,200 | | | 25,830 |
| Chipotle Mexican Grill, Inc. (A) | | 3,430 | | | 4,494,260 |
| Choice Hotels International, Inc. | | 8,497 | | | 843,667 |
| Churchill Downs, Inc. | | 14,414 | | | 2,518,991 |
| Chuy's Holdings, Inc. (A) | | 2,337 | | | 51,975 |
| Compass Group PLC | | 166,318 | | | 2,691,350 |
| Cracker Barrel Old Country Store, Inc. (C) | | 9,521 | | | 1,273,053 |
| Crown Resorts, Ltd. | | 69,179 | | | 458,713 |
| Darden Restaurants, Inc. | | 17,362 | | | 1,504,765 |
| Dave & Buster's Entertainment, Inc. | | 6,185 | | | 102,857 |
| Del Taco Restaurants, Inc. (A) | | 4,405 | | | 37,046 |
| Denny's Corp. (A) | | 7,242 | | | 82,993 |
| Dine Brands Global, Inc. | | 2,090 | | | 124,480 |
| Domino's Pizza, Inc. | | 5,229 | | | 2,138,452 |
| Dunkin' Brands Group, Inc. | | 22,112 | | | 1,682,281 |
| El Pollo Loco Holdings, Inc. (A) | | 2,390 | | | 42,709 |
| Everi Holdings, Inc. (A) | | 10,899 | | | 84,576 |
| Evolution Gaming Group AB (B) | | 27,415 | | | 2,052,012 |
| Fiesta Restaurant Group, Inc. (A) | | 2,772 | | | 27,775 |
| Flutter Entertainment PLC | | 18,173 | | | 3,054,679 |
| Galaxy Entertainment Group, Ltd. | | 287,000 | | | 2,256,167 |
| The accompanying notes are an integral part of the financial statements. | 61 | |
John Hancock Funds II
Portfolio of Investments — August 31, 2020 (showing percentage of total net assets)
Strategic Equity Allocation Fund (continued)
| | | Shares or
Principal
Amount | | Value |
| COMMON STOCKS (continued) | | | |
| Hotels, restaurants and leisure (continued) | | | |
| GAN, Ltd. (A) | | 996 | | $ | 20,468 |
| Genting BHD | | 275,000 | | | 231,716 |
| Genting Malaysia BHD | | 381,760 | | | 208,981 |
| Genting Singapore, Ltd. | | 297,600 | | | 152,870 |
| Golden Entertainment, Inc. (A) | | 2,567 | | | 32,960 |
| GVC Holdings PLC | | 54,405 | | | 575,211 |
| Haidilao International Holding, Ltd. (B)(C) | | 92,000 | | | 592,587 |
| Hilton Grand Vacations, Inc. (A)(C) | | 11,154 | | | 244,384 |
| Hilton Worldwide Holdings, Inc. | | 37,064 | | | 3,349,103 |
| Huazhu Group, Ltd., ADR (C) | | 15,400 | | | 688,842 |
| InterContinental Hotels Group PLC | | 16,135 | | | 931,593 |
| International Game Technology PLC (C) | | 12,946 | | | 144,089 |
| Jack in the Box, Inc. (C) | | 9,079 | | | 748,019 |
| Jollibee Foods Corp. | | 58,630 | | | 163,138 |
| Kangwon Land, Inc. | | 13,043 | | | 226,266 |
| La Francaise des Jeux SAEM (B) | | 14,406 | | | 532,783 |
| Las Vegas Sands Corp. | | 44,921 | | | 2,277,944 |
| Lindblad Expeditions Holdings, Inc. (A) | | 3,786 | | | 37,500 |
| Marriott International, Inc., Class A | | 35,977 | | | 3,702,393 |
| Marriott Vacations Worldwide Corp. | | 15,120 | | | 1,431,410 |
| McDonald's Corp. | | 99,397 | | | 21,223,247 |
| McDonald's Holdings Company Japan, Ltd. | | 5,200 | | | 255,159 |
| Melco Resorts & Entertainment, Ltd., ADR | | 29,000 | | | 566,080 |
| MGM Resorts International | | 65,933 | | | 1,483,493 |
| Minor International PCL, NVDR (A) | | 447,900 | | | 322,970 |
| Monarch Casino & Resort, Inc. (A) | | 1,709 | | | 78,631 |
| Nathan's Famous, Inc. | | 435 | | | 22,816 |
| Noodles & Company (A) | | 4,407 | | | 33,537 |
| Norwegian Cruise Line Holdings, Ltd. (A) | | 36,497 | | | 624,464 |
| Oriental Land Company, Ltd. (C) | | 15,700 | | | 2,130,963 |
| Papa John's International, Inc. | | 10,230 | | | 1,005,507 |
| Penn National Gaming, Inc. (A) | | 52,345 | | | 2,674,830 |
| RCI Hospitality Holdings, Inc. | | 1,333 | | | 25,487 |
| Red Robin Gourmet Burgers, Inc. (A) | | 1,959 | | | 21,745 |
| Red Rock Resorts, Inc., Class A | | 8,755 | | | 149,492 |
| Restaurant Brands International, Inc. (C) | | 10,187 | | | 551,934 |
| Royal Caribbean Cruises, Ltd. | | 22,952 | | | 1,580,016 |
| Ruth's Hospitality Group, Inc. | | 3,680 | | | 37,812 |
| Sands China, Ltd. | | 321,252 | | | 1,414,175 |
| Scientific Games Corp. (A)(C) | | 22,350 | | | 462,310 |
| SeaWorld Entertainment, Inc. (A) | | 6,716 | | | 137,006 |
| Shake Shack, Inc., Class A (A)(C) | | 4,602 | | | 314,087 |
| Six Flags Entertainment Corp. | | 21,209 | | | 460,872 |
| SJM Holdings, Ltd. | | 262,384 | | | 359,910 |
| Sodexo SA | | 14,834 | | | 1,058,895 |
| Starbucks Corp. | | 156,149 | | | 13,189,906 |
| Tabcorp Holdings, Ltd. | | 374,090 | | | 997,961 |
| Texas Roadhouse, Inc. | | 26,141 | | | 1,646,622 |
| The Cheesecake Factory, Inc. (C) | | 5,608 | | | 165,604 |
| The Wendy's Company | | 47,976 | | | 1,004,617 |
| Twin River Worldwide Holdings, Inc. | | 2,447 | | | 58,557 |
| Whitbread PLC | | 18,776 | | | 633,221 |
| Wingstop, Inc. | | 3,876 | | | 633,338 |
| Wyndham Destinations, Inc. | | 22,926 | | | 664,625 |
| Wyndham Hotels & Resorts, Inc. | | 25,069 | | | 1,312,613 |
| Wynn Macau, Ltd. | | 205,750 | | | 386,212 |
| Wynn Resorts, Ltd. | | 12,978 | | | 1,134,926 |
| Yum China Holdings, Inc. | | 41,608 | | | 2,401,198 |
| Yum! Brands, Inc. | | 40,236 | | | 3,856,621 |
| | | | | | 115,381,510 |
| Household durables – 0.7% | | | |
| Barratt Developments PLC | | 95,081 | | | 663,960 |
| Beazer Homes USA, Inc. (A) | | 3,833 | | | 46,916 |
| Casio Computer Company, Ltd. | | 15,300 | | | 246,485 |
Strategic Equity Allocation Fund (continued)
| | | Shares or
Principal
Amount | | Value |
| COMMON STOCKS (continued) | | | |
| Household durables (continued) | | | |
| Cavco Industries, Inc. (A) | | 1,143 | | $ | 218,210 |
| Century Communities, Inc. (A) | | 3,813 | | | 136,048 |
| Coway Company, Ltd. | | 5,785 | | | 388,220 |
| D.R. Horton, Inc. | | 59,700 | | | 4,260,789 |
| Electrolux AB, Series B | | 48,685 | | | 1,056,897 |
| Ethan Allen Interiors, Inc. | | 3,340 | | | 47,562 |
| Garmin, Ltd. | | 26,198 | | | 2,714,375 |
| GoPro, Inc., Class A (A) | | 17,084 | | | 78,416 |
| Green Brick Partners, Inc. (A) | | 3,309 | | | 47,120 |
| Haier Electronics Group Company, Ltd. | | 147,200 | | | 503,633 |
| Hamilton Beach Brands Holding Company, Class B | | 765 | | | 16,715 |
| Helen of Troy, Ltd. (A) | | 10,105 | | | 2,089,916 |
| Hooker Furniture Corp. | | 1,742 | | | 42,940 |
| Husqvarna AB, B Shares | | 90,182 | | | 981,934 |
| Iida Group Holdings Company, Ltd. | | 11,600 | | | 226,412 |
| Installed Building Products, Inc. (A) | | 3,006 | | | 260,981 |
| iRobot Corp. (A)(C) | | 3,614 | | | 267,544 |
| KB Home | | 34,935 | | | 1,249,276 |
| La-Z-Boy, Inc. | | 5,863 | | | 190,548 |
| Legacy Housing Corp. (A) | | 1,249 | | | 19,072 |
| Leggett & Platt, Inc. | | 23,875 | | | 978,875 |
| Lennar Corp., A Shares | | 49,558 | | | 3,707,930 |
| LG Electronics, Inc. | | 12,856 | | | 909,399 |
| LGI Homes, Inc. (A) | | 2,917 | | | 326,296 |
| M/I Homes, Inc. (A) | | 3,646 | | | 155,174 |
| MDC Holdings, Inc. | | 6,611 | | | 286,785 |
| Meritage Homes Corp. (A) | | 4,860 | | | 466,706 |
| Mohawk Industries, Inc. (A) | | 10,735 | | | 991,163 |
| Newell Brands, Inc. | | 68,882 | | | 1,100,734 |
| Nien Made Enterprise Company, Ltd. | | 19,300 | | | 222,848 |
| Nikon Corp. | | 23,600 | | | 184,828 |
| NVR, Inc. (A) | | 624 | | | 2,601,044 |
| Panasonic Corp. | | 173,520 | | | 1,599,014 |
| Persimmon PLC | | 29,728 | | | 1,032,996 |
| PulteGroup, Inc. | | 45,487 | | | 2,028,265 |
| Purple Innovation, Inc. (A) | | 1,932 | | | 36,534 |
| Rinnai Corp. | | 2,800 | | | 259,012 |
| SEB SA | | 3,786 | | | 664,067 |
| Sekisui Chemical Company, Ltd. | | 28,600 | | | 457,553 |
| Sekisui House, Ltd. | | 49,000 | | | 968,007 |
| Sharp Corp. | | 16,740 | | | 207,539 |
| Skyline Champion Corp. (A) | | 7,179 | | | 204,889 |
| Sonos, Inc. (A) | | 10,412 | | | 146,497 |
| Sony Corp. | | 100,000 | | | 7,830,433 |
| Tatung Company, Ltd. (A) | | 166,000 | | | 97,220 |
| Taylor Morrison Home Corp. (A) | | 51,352 | | | 1,208,313 |
| Taylor Wimpey PLC | | 340,017 | | | 549,726 |
| Tempur Sealy International, Inc. (A) | | 11,658 | | | 997,225 |
| The Berkeley Group Holdings PLC | | 11,742 | | | 709,610 |
| The Lovesac Company (A) | | 1,269 | | | 33,590 |
| Toll Brothers, Inc. | | 31,125 | | | 1,314,098 |
| TopBuild Corp. (A) | | 13,633 | | | 2,096,755 |
| TRI Pointe Group, Inc. (A) | | 51,985 | | | 877,507 |
| Tupperware Brands Corp. | | 6,931 | | | 112,906 |
| Turtle Beach Corp. (A) | | 1,887 | | | 36,929 |
| Universal Electronics, Inc. (A) | | 1,820 | | | 74,766 |
| VOXX International Corp. (A) | | 2,997 | | | 18,821 |
| Whirlpool Corp. | | 11,218 | | | 1,993,663 |
| | | | | | 53,241,686 |
| Internet and direct marketing retail – 5.7% | | | |
| 1-800-Flowers.com, Inc., Class A (A) | | 3,278 | | | 98,111 |
| Alibaba Group Holding, Ltd., ADR (A) | | 218,756 | | | 62,789,535 |
| Amazon.com, Inc. (A) | | 81,552 | | | 281,432,690 |
| B2W Cia Digital (A) | | 24,500 | | | 501,270 |
| The accompanying notes are an integral part of the financial statements. | 62 | |
John Hancock Funds II
Portfolio of Investments — August 31, 2020 (showing percentage of total net assets)
Strategic Equity Allocation Fund (continued)
| | | Shares or
Principal
Amount | | Value |
| COMMON STOCKS (continued) | | | |
| Internet and direct marketing retail (continued) | | | |
| Baozun, Inc., ADR (A)(C) | | 5,100 | | $ | 211,344 |
| Booking Holdings, Inc. (A) | | 7,967 | | | 15,220,555 |
| CarParts.com, Inc. (A) | | 3,006 | | | 42,234 |
| CJ ENM Company, Ltd. | | 1,318 | | | 131,312 |
| Delivery Hero SE (A)(B) | | 24,037 | | | 2,585,910 |
| eBay, Inc. | | 128,568 | | | 7,042,955 |
| Etsy, Inc. (A) | | 31,959 | | | 3,825,492 |
| Expedia Group, Inc. | | 26,367 | | | 2,587,921 |
| Groupon, Inc. (A) | | 3,062 | | | 97,463 |
| GrubHub, Inc. (A) | | 24,763 | | | 1,791,603 |
| JD.com, Inc., ADR (A) | | 99,000 | | | 7,785,360 |
| Just Eat Takeaway.com NV (A)(B)(C) | | 23,987 | | | 2,669,222 |
| Liquidity Services, Inc. (A) | | 4,168 | | | 30,051 |
| Magnite, Inc. (A) | | 13,584 | | | 99,842 |
| Meituan Dianping, Class B (A) | | 414,100 | | | 13,650,473 |
| Mercari, Inc. (A)(C) | | 6,700 | | | 303,792 |
| Naspers, Ltd., N Shares | | 54,687 | | | 9,971,339 |
| Ocado Group PLC (A) | | 43,101 | | | 1,435,478 |
| Overstock.com, Inc. (A) | | 5,298 | | | 463,575 |
| PetMed Express, Inc. (C) | | 2,547 | | | 88,534 |
| Pinduoduo, Inc., ADR (A) | | 30,000 | | | 2,668,200 |
| Prosus NV (A) | | 96,343 | | | 9,656,668 |
| Quotient Technology, Inc. (A) | | 11,412 | | | 99,399 |
| Rakuten, Inc. | | 67,542 | | | 595,203 |
| Shutterstock, Inc. | | 2,515 | | | 126,555 |
| Stamps.com, Inc. (A) | | 2,161 | | | 538,824 |
| Stitch Fix, Inc., Class A (A)(C) | | 7,379 | | | 178,203 |
| The RealReal, Inc. (A) | | 8,253 | | | 132,543 |
| Tongcheng-Elong Holdings, Ltd. (A) | | 99,200 | | | 194,152 |
| Trip.com Group, Ltd., ADR (A) | | 55,300 | | | 1,672,272 |
| Vipshop Holdings, Ltd., ADR (A) | | 51,400 | | | 848,614 |
| Waitr Holdings, Inc. (A) | | 10,770 | | | 43,403 |
| Zalando SE (A)(B) | | 28,482 | | | 2,495,258 |
| ZOZO, Inc. | | 8,500 | | | 239,761 |
| | | | | | 434,345,116 |
| Leisure products – 0.1% | | | |
| Acushnet Holdings Corp. | | 4,468 | | | 157,676 |
| American Outdoor Brands, Inc. (A) | | 1,789 | | | 27,246 |
| Bandai Namco Holdings, Inc. | | 15,700 | | | 974,702 |
| Brunswick Corp. | | 21,309 | | | 1,318,814 |
| Callaway Golf Company | | 12,256 | | | 255,660 |
| Clarus Corp. | | 3,496 | | | 44,019 |
| Escalade, Inc. | | 1,583 | | | 28,700 |
| Giant Manufacturing Company, Ltd. | | 34,661 | | | 360,482 |
| Hasbro, Inc. | | 22,994 | | | 1,815,146 |
| HLB, Inc. (A) | | 5,326 | | | 388,383 |
| Johnson Outdoors, Inc., Class A | | 701 | | | 60,083 |
| Malibu Boats, Inc., Class A (A) | | 2,718 | | | 140,928 |
| MasterCraft Boat Holdings, Inc. (A) | | 2,538 | | | 53,070 |
| Mattel, Inc. (A)(C) | | 93,418 | | | 1,003,776 |
| Nautilus, Inc. (A) | | 4,053 | | | 48,028 |
| Polaris, Inc. | | 15,504 | | | 1,566,524 |
| Sega Sammy Holdings, Inc. | | 13,500 | | | 156,321 |
| Shimano, Inc. | | 5,800 | | | 1,228,236 |
| Smith & Wesson Brands, Inc. (A) | | 7,156 | | | 130,669 |
| Sturm Ruger & Company, Inc. | | 2,172 | | | 153,908 |
| Vista Outdoor, Inc. (A) | | 7,716 | | | 149,768 |
| Yamaha Corp. | | 10,500 | | | 511,635 |
| YETI Holdings, Inc. (A) | | 9,707 | | | 498,746 |
| | | | | | 11,072,520 |
| Multiline retail – 1.1% | | | |
| Big Lots, Inc. | | 5,145 | | | 242,587 |
| Canadian Tire Corp., Ltd., Class A (C) | | 2,152 | | | 225,124 |
| Central Retail Corp. PCL, NVDR (A) | | 260,575 | | | 249,844 |
| Dillard's, Inc., Class A (C) | | 1,027 | | | 31,026 |
Strategic Equity Allocation Fund (continued)
| | | Shares or
Principal
Amount | | Value |
| COMMON STOCKS (continued) | | | |
| Multiline retail (continued) | | | |
| Dollar General Corp. | | 104,892 | | $ | 21,175,597 |
| Dollar Tree, Inc. (A) | | 98,854 | | | 9,516,675 |
| Dollarama, Inc. | | 10,531 | | | 411,116 |
| Falabella SA | | 211,102 | | | 665,217 |
| Hyundai Department Store Company, Ltd. | | 1,735 | | | 78,273 |
| Isetan Mitsukoshi Holdings, Ltd. | | 26,140 | | | 143,795 |
| Kohl's Corp. (C) | | 65,731 | | | 1,404,014 |
| Lojas Renner SA | | 93,025 | | | 738,121 |
| Lotte Shopping Company, Ltd. | | 1,406 | | | 89,716 |
| Macy's, Inc. (C) | | 40,947 | | | 285,401 |
| Magazine Luiza SA | | 85,500 | | | 1,454,834 |
| Marui Group Company, Ltd. (C) | | 14,900 | | | 271,876 |
| Next PLC | | 12,364 | | | 990,689 |
| Nordstrom, Inc. (C) | | 29,173 | | | 466,768 |
| Ollie's Bargain Outlet Holdings, Inc. (A) | | 15,228 | | | 1,454,883 |
| Pan Pacific International Holdings Corp. | | 32,300 | | | 760,382 |
| Ryohin Keikaku Company, Ltd. | | 18,700 | | | 292,323 |
| Shinsegae, Inc. | | 893 | | | 152,276 |
| Target Corp. | | 208,354 | | | 31,505,208 |
| Wesfarmers, Ltd. | | 209,336 | | | 7,314,503 |
| Woolworths Holdings, Ltd. | | 121,584 | | | 227,216 |
| | | | | | 80,147,464 |
| Specialty retail – 2.8% | | | |
| Aaron's, Inc. | | 27,035 | | | 1,510,986 |
| ABC-Mart, Inc. | | 2,567 | | | 135,176 |
| Abercrombie & Fitch Company, Class A | | 8,243 | | | 107,241 |
| Ace Hardware Indonesia Tbk PT | | 901,000 | | | 95,573 |
| Advance Auto Parts, Inc. | | 17,164 | | | 2,682,905 |
| American Eagle Outfitters, Inc. (C) | | 61,662 | | | 777,558 |
| America's Car-Mart, Inc. (A) | | 812 | | | 81,606 |
| Asbury Automotive Group, Inc. (A) | | 2,522 | | | 266,802 |
| At Home Group, Inc. (A)(C) | | 6,598 | | | 126,088 |
| AutoNation, Inc. (A) | | 15,501 | | | 881,387 |
| AutoZone, Inc. (A) | | 5,799 | | | 6,937,402 |
| Bed Bath & Beyond, Inc. (C) | | 16,726 | | | 203,723 |
| Best Buy Company, Inc. | | 56,460 | | | 6,261,979 |
| Boot Barn Holdings, Inc. (A)(C) | | 3,789 | | | 106,963 |
| Caleres, Inc. | | 5,209 | | | 40,682 |
| Camping World Holdings, Inc., Class A (C) | | 4,319 | | | 125,510 |
| CarMax, Inc. (A) | | 40,423 | | | 4,322,431 |
| Chico's FAS, Inc. | | 17,067 | | | 21,846 |
| Citi Trends, Inc. | | 1,570 | | | 30,348 |
| Conn's, Inc. (A)(C) | | 2,401 | | | 30,685 |
| Designer Brands, Inc., Class A | | 8,312 | | | 58,600 |
| Dick's Sporting Goods, Inc. | | 17,546 | | | 949,590 |
| Fast Retailing Company, Ltd. | | 4,600 | | | 2,742,579 |
| Five Below, Inc. (A) | | 15,009 | | | 1,642,735 |
| Foot Locker, Inc. | | 28,058 | | | 850,999 |
| GameStop Corp., Class A (A)(C) | | 7,746 | | | 51,743 |
| Genesco, Inc. (A) | | 1,962 | | | 38,259 |
| GOME Retail Holdings, Ltd. (A)(C) | | 1,127,541 | | | 161,394 |
| Group 1 Automotive, Inc. (C) | | 2,286 | | | 197,602 |
| GrowGeneration Corp. (A)(C) | | 4,018 | | | 64,107 |
| Guess?, Inc. | | 5,846 | | | 67,229 |
| Haverty Furniture Companies, Inc. | | 2,323 | | | 49,062 |
| Hennes & Mauritz AB, B Shares | | 173,286 | | | 2,773,743 |
| Hibbett Sports, Inc. (A) | | 2,221 | | | 74,115 |
| Hikari Tsushin, Inc. | | 1,600 | | | 386,243 |
| Home Product Center PCL, NVDR | | 851,200 | | | 409,943 |
| Hotai Motor Company, Ltd. | | 35,000 | | | 713,209 |
| Hotel Shilla Company, Ltd. | | 3,796 | | | 224,130 |
| Hudson, Ltd., Class A (A) | | 5,792 | | | 43,672 |
| Industria de Diseno Textil SA | | 208,750 | | | 5,869,470 |
| JD Sports Fashion PLC | | 40,694 | | | 391,618 |
| The accompanying notes are an integral part of the financial statements. | 63 | |
John Hancock Funds II
Portfolio of Investments — August 31, 2020 (showing percentage of total net assets)
Strategic Equity Allocation Fund (continued)
| | | Shares or
Principal
Amount | | Value |
| COMMON STOCKS (continued) | | | |
| Specialty retail (continued) | | | |
| Kingfisher PLC | | 196,578 | | $ | 714,870 |
| L Brands, Inc. | | 57,968 | | | 1,704,259 |
| Lithia Motors, Inc., Class A | | 8,819 | | | 2,195,578 |
| Lowe's Companies, Inc. | | 187,531 | | | 30,884,480 |
| Lumber Liquidators Holdings, Inc. (A) | | 3,871 | | | 92,865 |
| MarineMax, Inc. (A) | | 2,799 | | | 82,319 |
| Monro, Inc. | | 4,338 | | | 199,938 |
| Mr. Price Group, Ltd. | | 31,424 | | | 214,146 |
| Murphy USA, Inc. (A) | | 10,980 | | | 1,480,763 |
| National Vision Holdings, Inc. (A) | | 10,559 | | | 396,702 |
| Nitori Holdings Company, Ltd. | | 6,300 | | | 1,319,384 |
| O'Reilly Automotive, Inc. (A) | | 18,437 | | | 8,584,820 |
| Pepkor Holdings, Ltd. (B) | | 106,611 | | | 60,547 |
| Petrobras Distribuidora SA | | 88,500 | | | 344,728 |
| Rent-A-Center, Inc. | | 6,342 | | | 194,699 |
| RH (A)(C) | | 6,657 | | | 2,200,471 |
| Ross Stores, Inc. | | 88,272 | | | 8,039,814 |
| Sally Beauty Holdings, Inc. (A) | | 45,187 | | | 504,287 |
| Shimamura Company, Ltd. | | 1,700 | | | 140,325 |
| Shoe Carnival, Inc. | | 1,320 | | | 43,402 |
| Signet Jewelers, Ltd. | | 6,921 | | | 119,526 |
| Sleep Number Corp. (A) | | 3,570 | | | 171,360 |
| Sonic Automotive, Inc., Class A (C) | | 3,157 | | | 133,415 |
| Sportsman's Warehouse Holdings, Inc. (A) | | 5,656 | | | 88,771 |
| The Buckle, Inc. (C) | | 3,865 | | | 72,430 |
| The Cato Corp., Class A | | 3,175 | | | 25,400 |
| The Children's Place, Inc. | | 1,883 | | | 37,594 |
| The Gap, Inc. | | 52,878 | | | 919,548 |
| The Home Depot, Inc. | | 267,142 | | | 76,146,156 |
| The Michaels Companies, Inc. (A)(C) | | 9,831 | | | 110,599 |
| The ODP Corp. | | 6,854 | | | 160,247 |
| The TJX Companies, Inc. | | 297,533 | | | 16,301,833 |
| Tiffany & Company | | 27,127 | | | 3,323,058 |
| Tilly's, Inc., Class A | | 3,271 | | | 20,738 |
| Topsports International Holdings, Ltd. (B) | | 144,000 | | | 177,828 |
| Tractor Supply Company | | 28,721 | | | 4,274,546 |
| Ulta Beauty, Inc. (A) | | 13,987 | | | 3,247,502 |
| Urban Outfitters, Inc. (A) | | 27,999 | | | 659,096 |
| USS Company, Ltd. | | 17,100 | | | 288,724 |
| Williams-Sonoma, Inc. | | 20,940 | | | 1,837,694 |
| Winmark Corp. | | 395 | | | 61,008 |
| Yamada Denki Company, Ltd. | | 56,800 | | | 304,944 |
| Zhongsheng Group Holdings, Ltd. | | 66,100 | | | 412,231 |
| Zumiez, Inc. (A) | | 2,796 | | | 71,801 |
| | | | | | 210,871,379 |
| Textiles, apparel and luxury goods – 1.4% | | | |
| adidas AG (A) | | 35,753 | | | 10,879,541 |
| ANTA Sports Products, Ltd. | | 126,000 | | | 1,242,035 |
| Bosideng International Holdings, Ltd. | | 376,000 | | | 107,582 |
| Burberry Group PLC | | 37,748 | | | 720,724 |
| Carter's, Inc. | | 11,744 | | | 935,057 |
| Cie Financiere Richemont SA | | 66,313 | | | 4,415,082 |
| Columbia Sportswear Company | | 7,656 | | | 655,124 |
| Crocs, Inc. (A) | | 8,743 | | | 348,933 |
| Deckers Outdoor Corp. (A) | | 11,190 | | | 2,281,305 |
| Eclat Textile Company, Ltd. | | 22,957 | | | 303,064 |
| EssilorLuxottica SA (A) | | 47,666 | | | 6,380,808 |
| Feng TAY Enterprise Company, Ltd. | | 46,796 | | | 272,399 |
| Fila Holdings Corp. | | 5,923 | | | 172,414 |
| Formosa Taffeta Company, Ltd. | | 89,000 | | | 95,948 |
| Fossil Group, Inc. (A) | | 6,457 | | | 41,551 |
| G-III Apparel Group, Ltd. (A) | | 5,864 | | | 64,856 |
| Gildan Activewear, Inc. (C) | | 7,351 | | | 142,528 |
| Hanesbrands, Inc. | | 62,808 | | | 960,334 |
| Hermes International | | 5,307 | | | 4,560,996 |
Strategic Equity Allocation Fund (continued)
| | | Shares or
Principal
Amount | | Value |
| COMMON STOCKS (continued) | | | |
| Textiles, apparel and luxury goods (continued) | | | |
| Kering SA | | 12,703 | | $ | 7,794,100 |
| Kontoor Brands, Inc. | | 6,753 | | | 149,241 |
| Lakeland Industries, Inc. (A) | | 1,026 | | | 20,961 |
| Li Ning Company, Ltd. | | 243,000 | | | 1,026,409 |
| LPP SA (A) | | 218 | | | 424,922 |
| LVMH Moet Hennessy Louis Vuitton SE | | 46,572 | | | 21,871,265 |
| Moncler SpA (A) | | 22,290 | | | 864,095 |
| Movado Group, Inc. | | 2,297 | | | 25,060 |
| NIKE, Inc., Class B | | 223,776 | | | 25,038,297 |
| Oxford Industries, Inc. | | 2,139 | | | 105,945 |
| Pandora A/S | | 17,540 | | | 1,280,354 |
| Pou Chen Corp. | | 276,971 | | | 261,686 |
| Puma SE (A) | | 15,570 | | | 1,290,053 |
| PVH Corp. | | 12,802 | | | 713,840 |
| Ralph Lauren Corp. | | 8,622 | | | 593,452 |
| Rocky Brands, Inc. | | 1,032 | | | 24,851 |
| Shenzhou International Group Holdings, Ltd. | | 96,300 | | | 1,550,493 |
| Skechers U.S.A., Inc., Class A (A) | | 36,671 | | | 1,094,629 |
| Steven Madden, Ltd. | | 10,739 | | | 227,237 |
| Superior Group of Companies, Inc. | | 1,650 | | | 38,181 |
| Tapestry, Inc. | | 49,823 | | | 733,893 |
| The Swatch Group AG | | 6,486 | | | 256,502 |
| The Swatch Group AG, Bearer Shares | | 3,705 | | | 784,026 |
| Under Armour, Inc., Class A (A) | | 34,004 | | | 333,579 |
| Under Armour, Inc., Class C (A) | | 35,472 | | | 313,927 |
| Unifi, Inc. (A) | | 1,907 | | | 23,323 |
| VF Corp. | | 57,542 | | | 3,783,387 |
| Wolverine World Wide, Inc. | | 10,410 | | | 260,042 |
| | | | | | 105,464,031 |
| | | | | | 1,155,783,728 |
| Consumer staples – 6.4% | | | | | |
| Beverages – 1.1% | | | |
| Ambev SA | | 552,405 | | | 1,241,235 |
| Anadolu Efes Biracilik Ve Malt Sanayii AS | | 12,872 | | | 34,063 |
| Anheuser-Busch InBev SA/NV | | 177,978 | | | 10,343,992 |
| Anhui Gujing Distillery Company, Ltd., B Shares | | 12,500 | | | 158,618 |
| Arca Continental SAB de CV | | 53,742 | | | 244,297 |
| Asahi Group Holdings, Ltd. | | 30,361 | | | 1,061,077 |
| Becle SAB de CV | | 67,200 | | | 128,798 |
| Brown-Forman Corp., Class B | | 12,812 | | | 937,454 |
| Budweiser Brewing Company APAC, Ltd. (B) | | 228,100 | | | 768,482 |
| Carlsberg A/S, Class B | | 18,775 | | | 2,639,227 |
| Carlsberg Brewery Malaysia BHD | | 19,500 | | | 102,085 |
| Celsius Holdings, Inc. (A) | | 4,620 | | | 89,720 |
| China Resources Beer Holdings Company, Ltd. | | 169,699 | | | 1,103,065 |
| Cia Cervecerias Unidas SA | | 41,365 | | | 271,927 |
| Coca-Cola Amatil, Ltd. | | 93,425 | | | 625,831 |
| Coca-Cola Bottlers Japan Holdings, Inc. | | 9,600 | | | 159,796 |
| Coca-Cola Consolidated, Inc. (C) | | 618 | | | 168,899 |
| Coca-Cola European Partners PLC | | 40,541 | | | 1,668,668 |
| Coca-Cola Femsa SAB de CV | | 64,358 | | | 267,791 |
| Coca-Cola HBC AG (A) | | 18,609 | | | 494,316 |
| Constellation Brands, Inc., Class A | | 11,800 | | | 2,176,864 |
| Craft Brew Alliance, Inc. (A)(C) | | 1,650 | | | 25,773 |
| Davide Campari-Milano NV | | 66,842 | | | 685,304 |
| Diageo PLC | | 217,933 | | | 7,281,386 |
| Fomento Economico Mexicano SAB de CV | | 236,786 | | | 1,377,086 |
| Fraser & Neave Holdings BHD | | 18,700 | | | 137,330 |
| Heineken Holding NV | | 22,747 | | | 1,861,210 |
| Heineken NV | | 51,230 | | | 4,737,886 |
| The accompanying notes are an integral part of the financial statements. | 64 | |
John Hancock Funds II
Portfolio of Investments — August 31, 2020 (showing percentage of total net assets)
Strategic Equity Allocation Fund (continued)
| | | Shares or
Principal
Amount | | Value |
| COMMON STOCKS (continued) | | | |
| Beverages (continued) | | | |
| Ito En, Ltd. | | 4,200 | | $ | 254,092 |
| Kirin Holdings Company, Ltd. (C) | | 64,527 | | | 1,268,502 |
| MGP Ingredients, Inc. | | 1,724 | | | 61,288 |
| Molson Coors Beverage Company, Class B | | 13,212 | | | 497,300 |
| Monster Beverage Corp. (A) | | 26,264 | | | 2,202,499 |
| National Beverage Corp. (A)(C) | | 1,547 | | | 125,802 |
| NewAge, Inc. (A)(C) | | 12,498 | | | 27,121 |
| Osotspa PCL, NVDR | | 107,600 | | | 134,168 |
| PepsiCo, Inc. | | 97,477 | | | 13,652,629 |
| Pernod Ricard SA | | 35,598 | | | 6,097,213 |
| Primo Water Corp. | | 20,386 | | | 278,880 |
| Remy Cointreau SA | | 3,778 | | | 622,235 |
| Suntory Beverage & Food, Ltd. | | 10,900 | | | 420,675 |
| The Boston Beer Company, Inc., Class A (A) | | 2,600 | | | 2,293,148 |
| The Coca-Cola Company | | 271,558 | | | 13,450,268 |
| Treasury Wine Estates, Ltd. | | 132,988 | | | 905,843 |
| Tsingtao Brewery Company, Ltd., H Shares | | 49,700 | | | 452,048 |
| | | | | | 83,535,891 |
| Food and staples retailing – 0.9% | | | |
| Aeon Company, Ltd. (C) | | 51,300 | | | 1,273,498 |
| Alimentation Couche-Tard, Inc., Class B | | 30,985 | | | 1,011,256 |
| Atacadao SA | | 46,100 | | | 164,508 |
| Berli Jucker PCL, NVDR | | 172,600 | | | 205,903 |
| BGF retail Company, Ltd. | | 946 | | | 101,447 |
| Bid Corp., Ltd. | | 41,193 | | | 678,119 |
| BIM Birlesik Magazalar AS | | 28,365 | | | 262,236 |
| BJ's Wholesale Club Holdings, Inc. (A) | | 51,140 | | | 2,271,127 |
| Carrefour SA | | 101,444 | | | 1,631,796 |
| Casey's General Stores, Inc. | | 9,908 | | | 1,762,138 |
| Casino Guichard Perrachon SA (A) | | 7,242 | | | 187,750 |
| Cencosud SA | | 400,593 | | | 592,525 |
| Cia Brasileira de Distribuicao | | 18,800 | | | 217,941 |
| Clicks Group, Ltd. | | 30,817 | | | 417,084 |
| Coles Group, Ltd. | | 246,212 | | | 3,208,806 |
| Colruyt SA | | 12,903 | | | 813,288 |
| Cosmos Pharmaceutical Corp. | | 1,600 | | | 281,783 |
| Costco Wholesale Corp. | | 19,478 | | | 6,771,721 |
| CP ALL PCL, NVDR | | 840,400 | | | 1,717,004 |
| Dairy Farm International Holdings, Ltd. | | 44,500 | | | 186,047 |
| Dino Polska SA (A)(B) | | 8,233 | | | 499,253 |
| E-MART, Inc. | | 2,376 | | | 239,755 |
| Empire Company, Ltd., Class A | | 6,310 | | | 164,239 |
| FamilyMart Company, Ltd. | | 19,900 | | | 441,405 |
| George Weston, Ltd. | | 2,827 | | | 204,231 |
| Grocery Outlet Holding Corp. (A) | | 17,251 | | | 709,534 |
| GS Retail Company, Ltd. | | 3,299 | | | 91,371 |
| HF Foods Group, Inc. (A) | | 4,800 | | | 38,112 |
| ICA Gruppen AB | | 21,642 | | | 1,062,110 |
| Ingles Markets, Inc., Class A | | 1,918 | | | 77,487 |
| J Sainsbury PLC | | 164,785 | | | 404,894 |
| Jeronimo Martins SGPS SA | | 32,131 | | | 528,781 |
| Kobe Bussan Company, Ltd. | | 4,800 | | | 283,930 |
| Koninklijke Ahold Delhaize NV | | 217,496 | | | 6,543,538 |
| Lawson, Inc. (C) | | 3,900 | | | 192,770 |
| Loblaw Companies, Ltd. | | 6,668 | | | 344,608 |
| METRO AG | | 33,667 | | | 333,843 |
| Metro, Inc. | | 9,229 | | | 416,892 |
| Natural Grocers by Vitamin Cottage, Inc. | | 1,405 | | | 16,467 |
| Performance Food Group Company (A) | | 17,175 | | | 627,059 |
| Pick n Pay Stores, Ltd. | | 42,108 | | | 103,525 |
| President Chain Store Corp. | | 66,274 | | | 610,424 |
| PriceSmart, Inc. | | 2,981 | | | 196,001 |
| Puregold Price Club, Inc. | | 135,400 | | | 150,672 |
Strategic Equity Allocation Fund (continued)
| | | Shares or
Principal
Amount | | Value |
| COMMON STOCKS (continued) | | | |
| Food and staples retailing (continued) | | | |
| Raia Drogasil SA | | 25,086 | | $ | 493,615 |
| Rite Aid Corp. (A)(C) | | 7,183 | | | 93,523 |
| Seven & i Holdings Company, Ltd. | | 59,146 | | | 1,908,161 |
| Shoprite Holdings, Ltd. | | 61,624 | | | 401,992 |
| SpartanNash Company | | 4,660 | | | 93,107 |
| Sprouts Farmers Market, Inc. (A) | | 31,719 | | | 740,639 |
| Sun Art Retail Group, Ltd. | | 277,300 | | | 360,753 |
| Sundrug Company, Ltd. | | 5,600 | | | 208,399 |
| Sysco Corp. | | 22,394 | | | 1,346,775 |
| Tesco PLC | | 912,778 | | | 2,665,530 |
| The Andersons, Inc. (C) | | 4,229 | | | 74,980 |
| The Chefs' Warehouse, Inc. (A) | | 3,334 | | | 49,377 |
| The Kroger Company | | 34,684 | | | 1,237,525 |
| The SPAR Group, Ltd. | | 23,522 | | | 224,038 |
| Tsuruha Holdings, Inc. | | 2,900 | | | 388,133 |
| United Natural Foods, Inc. (A) | | 7,017 | | | 126,657 |
| Village Super Market, Inc., Class A | | 1,218 | | | 30,986 |
| Walgreens Boots Alliance, Inc. | | 32,507 | | | 1,235,916 |
| Wal-Mart de Mexico SAB de CV | | 636,900 | | | 1,525,160 |
| Walmart, Inc. | | 62,466 | | | 8,673,404 |
| Weis Markets, Inc. | | 1,257 | | | 61,882 |
| Welcia Holdings Company, Ltd. | | 7,400 | | | 317,012 |
| Wm Morrison Supermarkets PLC | | 224,078 | | | 573,404 |
| Woolworths Group, Ltd. | | 232,830 | | | 6,822,925 |
| | | | | | 67,690,771 |
| Food products – 1.5% | | | |
| a2 Milk Company, Ltd. (A) | | 279,165 | | | 3,484,139 |
| Ajinomoto Company, Inc. | | 36,600 | | | 682,670 |
| Alico, Inc. | | 815 | | | 26,341 |
| Archer-Daniels-Midland Company | | 39,026 | | | 1,746,804 |
| Associated British Foods PLC | | 33,222 | | | 898,338 |
| B&G Foods, Inc. (C) | | 8,292 | | | 258,213 |
| Barry Callebaut AG | | 382 | | | 846,894 |
| BRF SA (A) | | 66,610 | | | 238,184 |
| Calavo Growers, Inc. | | 2,177 | | | 138,174 |
| Calbee, Inc. | | 6,800 | | | 212,048 |
| Cal-Maine Foods, Inc. (A) | | 4,133 | | | 159,492 |
| Campbell Soup Company | | 11,888 | | | 625,428 |
| Charoen Pokphand Foods PCL, NVDR | | 560,200 | | | 581,328 |
| Charoen Pokphand Indonesia Tbk PT (A) | | 975,003 | | | 421,773 |
| China Feihe, Ltd. (B) | | 104,000 | | | 210,332 |
| China Huishan Dairy Holdings Company, Ltd. (A)(D) | | 280,500 | | | 0 |
| China Mengniu Dairy Company, Ltd. (A) | | 320,353 | | | 1,573,218 |
| Chocoladefabriken Lindt & Spruengli AG | | 13 | | | 1,148,856 |
| Chocoladefabriken Lindt & Spruengli AG, Participation Certificates | | 137 | | | 1,167,958 |
| CJ CheilJedang Corp. | | 1,010 | | | 345,482 |
| Conagra Brands, Inc. | | 34,219 | | | 1,312,641 |
| Dali Foods Group Company, Ltd. (B) | | 237,800 | | | 145,540 |
| Danone SA | | 103,524 | | | 6,807,381 |
| Darling Ingredients, Inc. (A) | | 65,213 | | | 2,084,860 |
| Farmer Brothers Company (A) | | 2,476 | | | 15,574 |
| Flowers Foods, Inc. | | 51,848 | | | 1,268,202 |
| Fresh Del Monte Produce, Inc. | | 4,084 | | | 94,708 |
| Freshpet, Inc. (A) | | 5,076 | | | 576,634 |
| General Mills, Inc. | | 42,583 | | | 2,723,183 |
| Genting Plantations BHD | | 34,900 | | | 82,775 |
| Gruma SAB de CV, Class B | | 27,533 | | | 325,257 |
| Grupo Bimbo SAB de CV, Series A | | 195,800 | | | 363,020 |
| Hormel Foods Corp. | | 19,689 | | | 1,003,745 |
| Hostess Brands, Inc. (A) | | 16,023 | | | 205,735 |
| Indofood CBP Sukses Makmur Tbk PT | | 307,600 | | | 216,001 |
| Indofood Sukses Makmur Tbk PT | | 581,417 | | | 304,181 |
| Ingredion, Inc. | | 18,036 | | | 1,450,816 |
| The accompanying notes are an integral part of the financial statements. | 65 | |
John Hancock Funds II
Portfolio of Investments — August 31, 2020 (showing percentage of total net assets)
Strategic Equity Allocation Fund (continued)
| | | Shares or
Principal
Amount | | Value |
| COMMON STOCKS (continued) | | | |
| Food products (continued) | | | |
| IOI Corp. BHD | | 323,200 | | $ | 345,474 |
| J&J Snack Foods Corp. | | 1,960 | | | 266,462 |
| JBS SA | | 127,781 | | | 523,392 |
| John B. Sanfilippo & Son, Inc. | | 1,144 | | | 91,108 |
| Kellogg Company | | 17,574 | | | 1,246,172 |
| Kerry Group PLC, Class A | | 16,134 | | | 2,118,704 |
| Kerry Group PLC, Class A (London Stock Exchange) | | 2,564 | | | 338,195 |
| Kikkoman Corp. | | 11,400 | | | 619,189 |
| Kuala Lumpur Kepong BHD | | 55,800 | | | 301,339 |
| Lamb Weston Holdings, Inc. | | 10,260 | | | 644,841 |
| Lancaster Colony Corp. | | 7,801 | | | 1,386,394 |
| Landec Corp. (A) | | 3,696 | | | 37,847 |
| Limoneira Company | | 2,383 | | | 34,482 |
| McCormick & Company, Inc. | | 8,686 | | | 1,791,053 |
| MEIJI Holdings Company, Ltd. | | 9,000 | | | 727,711 |
| Mondelez International, Inc., Class A | | 100,284 | | | 5,858,591 |
| Mowi ASA (C) | | 56,333 | | | 1,102,019 |
| Nestle Malaysia BHD | | 8,800 | | | 293,693 |
| Nestle SA | | 378,126 | | | 45,544,194 |
| NH Foods, Ltd. | | 6,500 | | | 294,452 |
| Nisshin Seifun Group, Inc. | | 15,500 | | | 255,968 |
| Nissin Foods Holdings Company, Ltd. | | 5,017 | | | 502,317 |
| Orion Corp. | | 2,853 | | | 337,165 |
| Orkla ASA | | 96,463 | | | 981,175 |
| Ottogi Corp. | | 157 | | | 79,526 |
| Pilgrim's Pride Corp. (A) | | 13,954 | | | 223,264 |
| Post Holdings, Inc. (A) | | 17,258 | | | 1,519,049 |
| PPB Group BHD | | 82,620 | | | 356,244 |
| QL Resources BHD | | 93,700 | | | 215,393 |
| Sanderson Farms, Inc. | | 7,960 | | | 931,002 |
| Saputo, Inc. | | 9,050 | | | 225,773 |
| Seneca Foods Corp., Class A (A) | | 951 | | | 45,039 |
| Sime Darby Plantation BHD | | 265,200 | | | 324,623 |
| Standard Foods Corp. | | 47,402 | | | 102,969 |
| Thai Union Group PCL, NVDR | | 447,400 | | | 202,062 |
| The Hain Celestial Group, Inc. (A) | | 21,141 | | | 693,213 |
| The Hershey Company | | 10,355 | | | 1,539,167 |
| The J.M. Smucker Company | | 8,012 | | | 962,882 |
| The Kraft Heinz Company | | 43,778 | | | 1,533,981 |
| The Simply Good Foods Company (A) | | 11,194 | | | 278,171 |
| Tiger Brands, Ltd. | | 19,820 | | | 201,135 |
| Tingyi Cayman Islands Holding Corp. | | 229,100 | | | 429,944 |
| Tootsie Roll Industries, Inc. (C) | | 6,653 | | | 212,829 |
| Toyo Suisan Kaisha, Ltd. | | 7,000 | | | 398,000 |
| TreeHouse Foods, Inc. (A) | | 15,197 | | | 650,584 |
| Tyson Foods, Inc., Class A | | 20,676 | | | 1,298,453 |
| Uni-President China Holdings, Ltd. | | 150,900 | | | 137,271 |
| Uni-President Enterprises Corp. | | 564,805 | | | 1,282,726 |
| Universal Robina Corp. | | 117,870 | | | 334,272 |
| Want Want China Holdings, Ltd. | | 577,912 | | | 396,110 |
| WH Group, Ltd. (B) | | 1,268,770 | | | 1,093,560 |
| Wilmar International, Ltd. | | 93,900 | | | 300,419 |
| Yakult Honsha Company, Ltd. | | 9,400 | | | 536,518 |
| Yamazaki Baking Company, Ltd. | | 9,500 | | | 154,932 |
| Yihai International Holding, Ltd. (A) | | 54,500 | | | 855,178 |
| | | | | | 116,902,151 |
| Household products – 1.7% | | | |
| Central Garden & Pet Company (A) | | 1,698 | | | 69,092 |
| Central Garden & Pet Company, Class A (A) | | 4,679 | | | 173,872 |
| Church & Dwight Company, Inc. | | 51,960 | | | 4,979,327 |
| Colgate-Palmolive Company | | 180,994 | | | 14,345,584 |
| Energizer Holdings, Inc. | | 17,145 | | | 793,642 |
| Essity AB, B Shares (A) | | 130,814 | | | 4,505,067 |
Strategic Equity Allocation Fund (continued)
| | | Shares or
Principal
Amount | | Value |
| COMMON STOCKS (continued) | | | |
| Household products (continued) | | | |
| Henkel AG & Company KGaA | | 19,493 | | $ | 1,753,877 |
| Kimberly-Clark Corp. | | 71,962 | | | 11,352,725 |
| Kimberly-Clark de Mexico SAB de CV, Class A | | 185,135 | | | 295,360 |
| Lion Corp. | | 17,600 | | | 373,327 |
| Oil-Dri Corp. of America | | 859 | | | 30,082 |
| Pigeon Corp. | | 9,000 | | | 411,232 |
| Reckitt Benckiser Group PLC | | 66,201 | | | 6,645,183 |
| The Clorox Company | | 26,435 | | | 5,908,223 |
| The Procter & Gamble Company | | 523,129 | | | 72,364,435 |
| Unicharm Corp. | | 31,688 | | | 1,380,288 |
| Unilever Indonesia Tbk PT | | 1,005,225 | | | 567,481 |
| Vinda International Holdings, Ltd. | | 42,000 | | | 143,427 |
| WD-40 Company | | 1,768 | | | 361,344 |
| | | | | | 126,453,568 |
| Personal products – 0.8% | | | |
| Amorepacific Corp. | | 3,861 | | | 544,959 |
| AMOREPACIFIC Group | | 3,510 | | | 150,403 |
| Beiersdorf AG | | 18,906 | | | 2,185,340 |
| BellRing Brands, Inc. Class A (A) | | 5,213 | | | 101,341 |
| Coty, Inc., Class A | | 62,891 | | | 225,150 |
| Edgewell Personal Care Company (A) | | 21,770 | | | 625,017 |
| elf Beauty, Inc. (A) | | 3,490 | | | 68,160 |
| Hengan International Group Company, Ltd. | | 76,100 | | | 599,209 |
| Inter Parfums, Inc. | | 2,343 | | | 104,662 |
| Kao Corp. | | 37,800 | | | 2,880,261 |
| Kobayashi Pharmaceutical Company, Ltd. | | 3,900 | | | 347,742 |
| Kose Corp. | | 2,600 | | | 305,105 |
| LG Household & Health Care, Ltd. | | 1,126 | | | 1,394,355 |
| Lifevantage Corp. (A) | | 2,024 | | | 30,400 |
| L'Oreal SA | | 42,109 | | | 13,973,856 |
| Medifast, Inc. | | 1,480 | | | 240,826 |
| Natura & Company Holding SA | | 87,780 | | | 790,557 |
| Nu Skin Enterprises, Inc., Class A | | 13,976 | | | 660,646 |
| Pola Orbis Holdings, Inc. | | 7,100 | | | 128,676 |
| Shiseido Company, Ltd. | | 31,400 | | | 1,826,110 |
| The Estee Lauder Companies, Inc., Class A | | 47,495 | | | 10,530,591 |
| Unilever NV | | 288,703 | | | 16,775,555 |
| Unilever PLC | | 108,984 | | | 6,443,340 |
| USANA Health Sciences, Inc. (A) | | 1,526 | | | 119,654 |
| Veru, Inc. (A) | | 7,259 | | | 20,107 |
| | | | | | 61,072,022 |
| Tobacco – 0.4% | | | |
| Altria Group, Inc. | | 130,558 | | | 5,710,607 |
| British American Tobacco PLC | | 213,978 | | | 7,212,133 |
| Gudang Garam Tbk PT (A) | | 63,782 | | | 207,966 |
| Hanjaya Mandala Sampoerna Tbk PT | | 1,227,900 | | | 138,994 |
| Imperial Brands PLC | | 88,284 | | | 1,472,987 |
| Japan Tobacco, Inc. | | 94,200 | | | 1,761,246 |
| KT&G Corp. | | 14,053 | | | 982,612 |
| Philip Morris International, Inc. | | 109,394 | | | 8,728,547 |
| Swedish Match AB | | 36,628 | | | 2,781,895 |
| Turning Point Brands, Inc. | | 1,199 | | | 34,651 |
| Universal Corp. | | 3,161 | | | 137,219 |
| Vector Group, Ltd. | | 17,560 | | | 176,829 |
| | | | | | 29,345,686 |
| | | | | | 485,000,089 |
| Energy – 2.2% | | | | | |
| Energy equipment and services – 0.1% | | | |
| Archrock, Inc. | | 17,184 | | | 112,727 |
| Aspen Aerogels, Inc. (A) | | 3,295 | | | 28,008 |
| Baker Hughes Company | | 71,624 | | | 1,022,791 |
| Cactus, Inc., Class A | | 6,314 | | | 139,476 |
| The accompanying notes are an integral part of the financial statements. | 66 | |
John Hancock Funds II
Portfolio of Investments — August 31, 2020 (showing percentage of total net assets)
Strategic Equity Allocation Fund (continued)
| | | Shares or
Principal
Amount | | Value |
| COMMON STOCKS (continued) | | | |
| Energy equipment and services (continued) | | | |
| ChampionX Corp. (A) | | 74,549 | | $ | 763,382 |
| China Oilfield Services, Ltd., H Shares | | 199,700 | | | 156,494 |
| Dialog Group BHD | | 506,012 | | | 435,325 |
| DMC Global, Inc. (C) | | 1,998 | | | 70,789 |
| Dril-Quip, Inc. (A) | | 4,564 | | | 151,205 |
| Exterran Corp. (A) | | 3,939 | | | 18,119 |
| Frank's International NV (A) | | 21,167 | | | 48,896 |
| Halliburton Company | | 95,927 | | | 1,552,099 |
| Helix Energy Solutions Group, Inc. (A) | | 19,200 | | | 68,736 |
| Liberty Oilfield Services, Inc., Class A (C) | | 8,699 | | | 56,109 |
| Matrix Service Company (A) | | 3,833 | | | 35,417 |
| Maxeon Solar Technologies, Ltd. (A) | | 1,266 | | | 26,315 |
| Nabors Industries, Ltd. | | 967 | | | 38,661 |
| National Oilwell Varco, Inc. | | 42,452 | | | 509,424 |
| Newpark Resources, Inc. (A) | | 13,445 | | | 26,218 |
| NexTier Oilfield Solutions, Inc. (A) | | 21,723 | | | 54,742 |
| Oceaneering International, Inc. (A) | | 13,348 | | | 71,946 |
| Oil States International, Inc. (A) | | 8,310 | | | 36,481 |
| Patterson-UTI Energy, Inc. | | 24,301 | | | 93,559 |
| ProPetro Holding Corp. (A) | | 10,838 | | | 68,063 |
| RPC, Inc. (A) | | 7,961 | | | 24,918 |
| Schlumberger NV | | 151,751 | | | 2,884,787 |
| SEACOR Holdings, Inc. (A) | | 2,584 | | | 81,680 |
| Select Energy Services, Inc., Class A (A) | | 8,356 | | | 39,858 |
| Solaris Oilfield Infrastructure, Inc., Class A | | 4,190 | | | 32,598 |
| TechnipFMC PLC | | 45,990 | | | 354,123 |
| Tenaris SA | | 54,265 | | | 317,932 |
| Tidewater, Inc. (A) | | 6,037 | | | 41,474 |
| Transocean, Ltd. (A)(C) | | 232,578 | | | 283,745 |
| U.S. Silica Holdings, Inc. | | 10,213 | | | 45,550 |
| | | | | | 9,691,647 |
| Oil, gas and consumable fuels – 2.1% | | | |
| Adaro Energy Tbk PT | | 1,908,345 | | | 141,928 |
| Ampol, Ltd. | | 46,106 | | | 883,033 |
| Antero Midstream Corp. | | 75,707 | | | 512,536 |
| Antero Resources Corp. (A) | | 32,256 | | | 103,864 |
| Apache Corp. | | 41,271 | | | 610,811 |
| Arch Resources, Inc. | | 2,024 | | | 76,244 |
| Ardmore Shipping Corp. | | 4,983 | | | 18,437 |
| Berry Corp. | | 9,626 | | | 37,926 |
| Bonanza Creek Energy, Inc. (A) | | 2,676 | | | 53,627 |
| BP PLC | | 1,888,840 | | | 6,589,740 |
| Brigham Minerals, Inc., Class A | | 4,314 | | | 50,948 |
| Cabot Oil & Gas Corp. | | 43,583 | | | 826,770 |
| Cameco Corp. (C) | | 14,370 | | | 166,467 |
| Canadian Natural Resources, Ltd. | | 42,144 | | | 831,022 |
| Cenovus Energy, Inc. | | 37,544 | | | 177,308 |
| Chesapeake Energy Corp. (A) | | 1,502 | | | 5,993 |
| Chevron Corp. | | 204,145 | | | 17,133,890 |
| China Petroleum & Chemical Corp., H Shares | | 2,822,139 | | | 1,295,762 |
| China Shenhua Energy Company, Ltd., H Shares | | 395,900 | | | 657,431 |
| Cimarex Energy Company | | 27,495 | | | 763,811 |
| Clean Energy Fuels Corp. (A) | | 18,607 | | | 49,122 |
| CNOOC, Ltd. | | 2,080,116 | | | 2,357,198 |
| CNX Resources Corp. (A) | | 74,817 | | | 819,994 |
| Concho Resources, Inc. | | 21,508 | | | 1,117,986 |
| ConocoPhillips | | 117,265 | | | 4,443,171 |
| CONSOL Energy, Inc. (A) | | 3,775 | | | 19,517 |
| Contango Oil & Gas Company (A) | | 12,658 | | | 20,506 |
| Cosan SA | | 18,494 | | | 281,030 |
| COSCO SHIPPING Energy Transportation Company, Ltd., H Shares | | 143,300 | | | 65,937 |
| CVR Energy, Inc. | | 3,946 | | | 65,859 |
Strategic Equity Allocation Fund (continued)
| | | Shares or
Principal
Amount | | Value |
| COMMON STOCKS (continued) | | | |
| Oil, gas and consumable fuels (continued) | | | |
| Delek US Holdings, Inc. | | 8,238 | | $ | 129,584 |
| Devon Energy Corp. | | 41,848 | | | 454,888 |
| DHT Holdings, Inc. | | 14,256 | | | 75,414 |
| Diamond S Shipping, Inc. (A) | | 3,682 | | | 30,156 |
| Diamondback Energy, Inc. | | 17,256 | | | 672,294 |
| Dorian LPG, Ltd. (A) | | 4,646 | | | 39,212 |
| Ecopetrol SA | | 892,173 | | | 522,283 |
| Empresas COPEC SA | | 109,404 | | | 802,213 |
| Enbridge, Inc. | | 72,016 | | | 2,304,004 |
| ENEOS Holdings, Inc. | | 239,750 | | | 939,548 |
| Energy Fuels, Inc. (A) | | 16,946 | | | 30,842 |
| Eni SpA | | 292,824 | | | 2,720,454 |
| EOG Resources, Inc. | | 63,644 | | | 2,885,619 |
| EQT Corp. | | 68,819 | | | 1,092,158 |
| Equinor ASA | | 128,440 | | | 2,078,379 |
| Equitrans Midstream Corp. | | 109,448 | | | 1,125,125 |
| Exxaro Resources, Ltd. | | 30,894 | | | 249,119 |
| Exxon Mobil Corp. | | 462,335 | | | 18,465,660 |
| Falcon Minerals Corp. | | 6,887 | | | 19,352 |
| Formosa Petrochemical Corp. | | 132,900 | | | 371,077 |
| Frontline, Ltd. (C) | | 15,321 | | | 121,955 |
| Galp Energia SGPS SA | | 64,318 | | | 690,656 |
| Golar LNG, Ltd. | | 12,096 | | | 125,194 |
| Green Plains, Inc. (A)(C) | | 4,785 | | | 64,023 |
| Grupa Lotos SA | | 15,469 | | | 169,546 |
| GS Holdings Corp. | | 6,220 | | | 169,846 |
| Gulfport Energy Corp. (A) | | 23,098 | | | 16,300 |
| Hess Corp. | | 28,548 | | | 1,314,350 |
| HollyFrontier Corp. | | 16,285 | | | 388,723 |
| Idemitsu Kosan Company, Ltd. (C) | | 15,228 | | | 335,246 |
| Imperial Oil, Ltd. | | 9,527 | | | 157,110 |
| Inner Mongolia Yitai Coal Company, Ltd., Class B | | 123,900 | | | 86,672 |
| Inpex Corp. | | 80,600 | | | 511,117 |
| Inter Pipeline, Ltd. | | 15,434 | | | 162,936 |
| International Seaways, Inc. | | 3,289 | | | 55,781 |
| IRPC PCL, NVDR (C) | | 1,598,800 | | | 120,321 |
| Keyera Corp. (C) | | 8,027 | | | 146,589 |
| Kinder Morgan, Inc. | | 212,665 | | | 2,939,030 |
| Koninklijke Vopak NV | | 13,865 | | | 761,273 |
| Kosmos Energy, Ltd. | | 54,133 | | | 79,576 |
| Lundin Energy AB | | 40,011 | | | 979,294 |
| Magnolia Oil & Gas Corp., Class A (A) | | 17,161 | | | 110,517 |
| Marathon Oil Corp. | | 86,416 | | | 456,276 |
| Marathon Petroleum Corp. | | 71,103 | | | 2,521,312 |
| Matador Resources Company (A)(C) | | 14,706 | | | 143,089 |
| MOL Hungarian Oil & Gas PLC (A)(C) | | 65,368 | | | 367,300 |
| Murphy Oil Corp. (C) | | 39,335 | | | 540,463 |
| Neste OYJ | | 140,344 | | | 7,513,366 |
| Noble Energy, Inc. | | 52,454 | | | 521,917 |
| Nordic American Tankers, Ltd. (C) | | 18,850 | | | 82,186 |
| Occidental Petroleum Corp. | | 98,415 | | | 1,253,807 |
| Oil Search, Ltd. | | 363,623 | | | 876,651 |
| OMV AG | | 28,943 | | | 936,899 |
| ONEOK, Inc. | | 48,103 | | | 1,321,870 |
| Origin Energy, Ltd. | | 325,209 | | | 1,339,047 |
| Overseas Shipholding Group, Inc., Class A (A) | | 9,744 | | | 20,560 |
| Ovintiv, Inc. | | 34,434 | | | 381,529 |
| Par Pacific Holdings, Inc. (A) | | 5,442 | | | 47,237 |
| Parkland Corp. (C) | | 5,374 | | | 152,319 |
| PBF Energy, Inc., Class A | | 40,287 | | | 344,857 |
| PDC Energy, Inc. (A) | | 13,340 | | | 201,968 |
| Peabody Energy Corp. | | 8,839 | | | 23,070 |
| Pembina Pipeline Corp. | | 19,627 | | | 486,029 |
| The accompanying notes are an integral part of the financial statements. | 67 | |
John Hancock Funds II
Portfolio of Investments — August 31, 2020 (showing percentage of total net assets)
Strategic Equity Allocation Fund (continued)
| | | Shares or
Principal
Amount | | Value |
| COMMON STOCKS (continued) | | | |
| Oil, gas and consumable fuels (continued) | | | |
| Penn Virginia Corp. (A)(C) | | 2,097 | | $ | 23,948 |
| PetroChina Company, Ltd., H Shares | | 2,459,239 | | | 848,655 |
| Petroleo Brasileiro SA | | 435,009 | | | 1,772,274 |
| Petronas Dagangan BHD | | 37,900 | | | 187,043 |
| Phillips 66 | | 47,749 | | | 2,791,884 |
| Pioneer Natural Resources Company | | 18,027 | | | 1,873,546 |
| Polski Koncern Naftowy ORLEN SA (C) | | 50,342 | | | 692,467 |
| Polskie Gornictwo Naftowe i Gazownictwo SA (C) | | 291,898 | | | 405,851 |
| PTT Exploration & Production PCL, NVDR | | 200,300 | | | 573,468 |
| PTT PCL, NVDR | | 1,645,500 | | | 1,903,983 |
| Range Resources Corp. | | 28,447 | | | 212,215 |
| Renewable Energy Group, Inc. (A) | | 5,006 | | | 167,351 |
| Repsol SA | | 284,655 | | | 2,248,545 |
| REX American Resources Corp. (A) | | 769 | | | 47,509 |
| Royal Dutch Shell PLC, A Shares | | 384,114 | | | 5,654,023 |
| Royal Dutch Shell PLC, B Shares | | 347,164 | | | 4,884,149 |
| Santos, Ltd. | | 326,994 | | | 1,366,533 |
| Scorpio Tankers, Inc. (C) | | 6,728 | | | 79,660 |
| SFL Corp., Ltd. | | 12,019 | | | 105,527 |
| SK Innovation Company, Ltd. | | 6,678 | | | 812,381 |
| SM Energy Company | | 15,222 | | | 36,989 |
| S-Oil Corp. | | 5,404 | | | 256,286 |
| Southwestern Energy Company (A) | | 71,861 | | | 199,774 |
| Suncor Energy, Inc. | | 54,590 | | | 875,968 |
| TC Energy Corp. | | 33,525 | | | 1,567,593 |
| Tellurian, Inc. (A)(C) | | 21,635 | | | 20,095 |
| Thai Oil PCL, NVDR | | 160,500 | | | 214,248 |
| The Williams Companies, Inc. | | 132,659 | | | 2,754,001 |
| TOTAL SE | | 414,451 | | | 16,442,129 |
| Tupras Turkiye Petrol Rafinerileri AS (A) | | 7,694 | | | 83,917 |
| Ultrapar Participacoes SA | | 84,702 | | | 300,558 |
| United Tractors Tbk PT | | 221,537 | | | 349,831 |
| Uranium Energy Corp. (A) | | 26,843 | | | 30,869 |
| Valero Energy Corp. | | 44,580 | | | 2,344,462 |
| W&T Offshore, Inc. (A) | | 13,455 | | | 30,005 |
| Washington H. Soul Pattinson & Company, Ltd. (C) | | 19,897 | | | 306,682 |
| Whiting Petroleum Corp. (A)(C) | | 13,403 | | | 10,716 |
| Woodside Petroleum, Ltd. | | 173,877 | | | 2,506,915 |
| World Fuel Services Corp. | | 25,314 | | | 668,290 |
| WPX Energy, Inc. (A) | | 109,970 | | | 611,433 |
| Yanzhou Coal Mining Company, Ltd., H Shares | | 180,010 | | | 138,392 |
| | | | | | 160,623,221 |
| | | | | | 170,314,868 |
| Financials – 11.3% | | | | | |
| Banks – 4.9% | | | |
| 1st Source Corp. | | 2,032 | | | 70,002 |
| ABN AMRO Bank NV (B) | | 83,354 | | | 791,672 |
| Absa Group, Ltd. | | 87,772 | | | 397,553 |
| ACNB Corp. | | 1,360 | | | 28,587 |
| Agricultural Bank of China, Ltd., H Shares | | 3,226,400 | | | 1,077,539 |
| Akbank T.A.S. (A) | | 193,220 | | | 128,872 |
| Allegiance Bancshares, Inc. | | 2,530 | | | 64,313 |
| Altabancorp | | 2,233 | | | 46,044 |
| Amalgamated Bank, Class A | | 2,064 | | | 24,293 |
| Amerant Bancorp, Inc. (A) | | 3,076 | | | 40,449 |
| American National Bankshares, Inc. | | 1,413 | | | 31,849 |
| Ameris Bancorp | | 8,694 | | | 213,177 |
| Ames National Corp. | | 1,213 | | | 24,199 |
| AMMB Holdings BHD | | 213,300 | | | 149,465 |
| Aozora Bank, Ltd. | | 9,370 | | | 167,967 |
| Arrow Financial Corp. | | 1,793 | | | 51,369 |
Strategic Equity Allocation Fund (continued)
| | | Shares or
Principal
Amount | | Value |
| COMMON STOCKS (continued) | | | |
| Banks (continued) | | | |
| Associated Banc-Corp. | | 41,383 | | $ | 556,188 |
| Atlantic Capital Bancshares, Inc. (A) | | 3,148 | | | 36,312 |
| Atlantic Union Bankshares Corp. | | 10,150 | | | 236,089 |
| Auburn National Bancorporation, Inc. | | 402 | | | 16,394 |
| Australia & New Zealand Banking Group, Ltd. | | 523,432 | | | 7,052,393 |
| Banc of California, Inc. | | 6,011 | | | 66,061 |
| BancFirst Corp. (C) | | 2,498 | | | 109,912 |
| Banco Bilbao Vizcaya Argentaria SA | | 1,275,076 | | | 3,734,062 |
| Banco Bradesco SA | | 155,276 | | | 539,363 |
| Banco de Chile | | 12,736,593 | | | 1,064,645 |
| Banco de Credito e Inversiones SA | | 14,607 | | | 460,291 |
| Banco do Brasil SA | | 100,594 | | | 599,506 |
| Banco Espirito Santo SA (A) | | 322,715 | | | 516 |
| Banco Santander Brasil SA | | 48,126 | | | 248,426 |
| Banco Santander Chile | | 18,384,194 | | | 707,003 |
| Banco Santander SA | | 3,178,634 | | | 7,077,002 |
| Bancolombia SA | | 45,705 | | | 317,650 |
| BancorpSouth Bank | | 39,007 | | | 841,771 |
| Bangkok Bank PCL, NVDR (C) | | 68,700 | | | 235,645 |
| Bank Central Asia Tbk PT | | 1,301,730 | | | 2,803,885 |
| Bank First Corp. (C) | | 852 | | | 53,165 |
| Bank Hapoalim BM | | 131,205 | | | 793,843 |
| Bank Leumi Le-Israel BM | | 169,547 | | | 867,498 |
| Bank Mandiri Persero Tbk PT | | 2,459,756 | | | 1,005,802 |
| Bank Negara Indonesia Persero Tbk PT | | 989,853 | | | 346,585 |
| Bank of America Corp. | | 929,336 | | | 23,921,109 |
| Bank of China, Ltd., H Shares | | 9,252,122 | | | 3,008,693 |
| Bank of Communications Company, Ltd., H Shares | | 1,012,976 | | | 528,983 |
| Bank of Hawaii Corp. | | 10,775 | | | 593,056 |
| Bank of Marin Bancorp | | 1,835 | | | 58,408 |
| Bank of Montreal | | 22,961 | | | 1,457,210 |
| Bank of the Philippine Islands | | 121,007 | | | 167,450 |
| Bank OZK | | 32,554 | | | 750,044 |
| Bank Polska Kasa Opieki SA (A)(C) | | 30,947 | | | 438,705 |
| Bank Rakyat Indonesia Persero Tbk PT | | 7,319,010 | | | 1,763,237 |
| Bankinter SA | | 128,639 | | | 692,052 |
| BankUnited, Inc. | | 11,916 | | | 278,596 |
| Banner Corp. | | 4,539 | | | 163,949 |
| Banque Cantonale Vaudoise | | 3,822 | | | 408,170 |
| Bar Harbor Bankshares | | 2,173 | | | 44,025 |
| Barclays PLC | | 1,611,326 | | | 2,359,191 |
| BayCom Corp. (A) | | 2,003 | | | 23,205 |
| BCB Bancorp, Inc. | | 2,588 | | | 21,079 |
| BDO Unibank, Inc. | | 263,070 | | | 466,562 |
| Berkshire Hills Bancorp, Inc. | | 6,044 | | | 55,484 |
| BNK Financial Group, Inc. | | 34,845 | | | 148,724 |
| BNP Paribas SA (A) | | 188,669 | | | 8,219,972 |
| BOC Hong Kong Holdings, Ltd. | | 490,500 | | | 1,391,363 |
| Boston Private Financial Holdings, Inc. | | 10,894 | | | 64,710 |
| Bridge Bancorp, Inc. | | 2,273 | | | 45,483 |
| Brookline Bancorp, Inc. | | 10,377 | | | 99,619 |
| Bryn Mawr Bank Corp. | | 2,617 | | | 71,025 |
| Business First Bancshares, Inc. | | 1,886 | | | 27,290 |
| Byline Bancorp, Inc. | | 3,368 | | | 42,572 |
| C&F Financial Corp. | | 597 | | | 19,086 |
| Cadence BanCorp (C) | | 16,514 | | | 156,883 |
| CaixaBank SA | | 685,085 | | | 1,505,036 |
| California Bancorp, Inc. (A) | | 1,447 | | | 18,825 |
| Cambridge Bancorp | | 918 | | | 50,343 |
| Camden National Corp. | | 1,964 | | | 64,134 |
| Canadian Imperial Bank of Commerce (C) | | 16,066 | | | 1,275,574 |
| Capital City Bank Group, Inc. | | 2,037 | | | 41,290 |
| Capitec Bank Holdings, Ltd. | | 8,624 | | | 423,302 |
| The accompanying notes are an integral part of the financial statements. | 68 | |
John Hancock Funds II
Portfolio of Investments — August 31, 2020 (showing percentage of total net assets)
Strategic Equity Allocation Fund (continued)
| | | Shares or
Principal
Amount | | Value |
| COMMON STOCKS (continued) | | | |
| Banks (continued) | | | |
| Capstar Financial Holdings, Inc. | | 2,735 | | $ | 27,870 |
| Carter Bank & Trust | | 3,482 | | | 24,687 |
| Cathay General Bancorp | | 30,132 | | | 743,959 |
| CB Financial Services, Inc. | | 979 | | | 18,209 |
| CBTX, Inc. | | 2,427 | | | 38,225 |
| Central Pacific Financial Corp. | | 3,714 | | | 57,530 |
| Central Valley Community Bancorp | | 1,991 | | | 23,952 |
| Century Bancorp, Inc., Class A | | 440 | | | 30,998 |
| Chang Hwa Commercial Bank, Ltd. | | 609,175 | | | 379,595 |
| Chemung Financial Corp. | | 684 | | | 19,638 |
| China CITIC Bank Corp., Ltd., H Shares | | 1,034,400 | | | 432,102 |
| China Construction Bank Corp., H Shares | | 11,204,296 | | | 7,895,819 |
| China Everbright Bank Company, Ltd., H Shares | | 367,595 | | | 131,703 |
| China Merchants Bank Company, Ltd., H Shares | | 454,674 | | | 2,169,228 |
| China Minsheng Banking Corp., Ltd., H Shares | | 670,700 | | | 408,270 |
| ChoiceOne Financial Services, Inc. | | 1,217 | | | 34,697 |
| Chongqing Rural Commercial Bank Company, Ltd., H Shares | | 282,800 | | | 115,229 |
| CIMB Group Holdings BHD | | 827,100 | | | 654,772 |
| CIT Group, Inc. | | 39,348 | | | 773,975 |
| Citigroup, Inc. | | 247,784 | | | 12,666,718 |
| Citizens & Northern Corp. | | 1,593 | | | 27,304 |
| Citizens Financial Group, Inc. | | 50,778 | | | 1,313,627 |
| Citizens Holding Company | | 969 | | | 20,766 |
| City Holding Company | | 1,936 | | | 123,865 |
| Civista Bancshares, Inc. | | 2,483 | | | 33,148 |
| CNB Financial Corp. | | 2,248 | | | 35,856 |
| Codorus Valley Bancorp, Inc. | | 1,320 | | | 17,028 |
| Colony Bankcorp, Inc. | | 1,680 | | | 18,480 |
| Columbia Banking System, Inc. | | 9,360 | | | 261,238 |
| Comerica, Inc. | | 16,549 | | | 654,182 |
| Commerce Bancshares, Inc. | | 27,032 | | | 1,610,296 |
| Commerzbank AG (A) | | 187,325 | | | 1,087,999 |
| Commonwealth Bank of Australia | | 326,953 | | | 16,433,418 |
| Community Bank System, Inc. | | 6,602 | | | 397,242 |
| Community Bankers Trust Corp. | | 4,271 | | | 21,910 |
| Community Trust Bancorp, Inc. | | 1,991 | | | 64,250 |
| Concordia Financial Group, Ltd. | | 83,900 | | | 278,131 |
| ConnectOne Bancorp, Inc. (C) | | 4,941 | | | 74,708 |
| County Bancorp, Inc. | | 988 | | | 19,068 |
| Credicorp, Ltd. | | 11,500 | | | 1,500,520 |
| Credit Agricole SA (A) | | 193,800 | | | 1,986,954 |
| CrossFirst Bankshares, Inc. (A) | | 6,543 | | | 60,392 |
| CTBC Financial Holding Company, Ltd. | | 2,052,090 | | | 1,326,527 |
| Cullen/Frost Bankers, Inc. | | 15,329 | | | 1,064,752 |
| Customers Bancorp, Inc. (A) | | 3,884 | | | 49,599 |
| CVB Financial Corp. | | 16,676 | | | 303,670 |
| Danske Bank A/S (A) | | 121,158 | | | 1,874,675 |
| DBS Group Holdings, Ltd. | | 87,072 | | | 1,334,375 |
| Dime Community Bancshares, Inc. | | 3,997 | | | 51,561 |
| DNB ASA | | 121,804 | | | 1,951,195 |
| E.Sun Financial Holding Company, Ltd. | | 1,320,083 | | | 1,223,866 |
| Eagle Bancorp Montana, Inc. | | 1,313 | | | 23,148 |
| Eagle Bancorp, Inc. | | 4,223 | | | 121,538 |
| East West Bancorp, Inc. | | 38,102 | | | 1,401,392 |
| Enterprise Bancorp, Inc. | | 1,175 | | | 25,533 |
| Enterprise Financial Services Corp. | | 3,134 | | | 93,738 |
| Equity Bancshares, Inc., Class A (A) | | 2,168 | | | 34,471 |
| Erste Group Bank AG | | 54,947 | | | 1,334,319 |
| Esquire Financial Holdings, Inc. (A) | | 1,265 | | | 20,873 |
| Evans Bancorp, Inc. | | 875 | | | 19,950 |
| Farmers & Merchants Bancorp, Inc. | | 1,123 | | | 24,201 |
Strategic Equity Allocation Fund (continued)
| | | Shares or
Principal
Amount | | Value |
| COMMON STOCKS (continued) | | | |
| Banks (continued) | | | |
| Farmers National Banc Corp. | | 3,851 | | $ | 44,903 |
| FB Financial Corp. (C) | | 4,173 | | | 112,671 |
| Fidelity D&D Bancorp, Inc. | | 652 | | | 29,483 |
| Fifth Third Bancorp | | 84,734 | | | 1,750,604 |
| Financial Institutions, Inc. | | 2,358 | | | 40,628 |
| FinecoBank Banca Fineco SpA (A) | | 70,105 | | | 1,061,292 |
| First Bancorp (North Carolina) | | 3,794 | | | 77,587 |
| First Bancorp (Puerto Rico) | | 28,371 | | | 162,566 |
| First Busey Corp. | | 6,305 | | | 112,324 |
| First Business Financial Services, Inc. | | 1,482 | | | 22,971 |
| First Capital, Inc. | | 506 | | | 30,901 |
| First Choice Bancorp | | 1,670 | | | 23,631 |
| First Commonwealth Financial Corp. | | 12,686 | | | 104,025 |
| First Community Bankshares, Inc. | | 2,440 | | | 46,946 |
| First Community Corp. | | 1,562 | | | 19,806 |
| First Financial Bancorp | | 12,671 | | | 173,846 |
| First Financial Bankshares, Inc. | | 55,015 | | | 1,665,579 |
| First Financial Corp. | | 1,773 | | | 60,973 |
| First Financial Holding Company, Ltd. | | 1,195,252 | | | 865,754 |
| First Foundation, Inc. | | 5,187 | | | 78,791 |
| First Horizon National Corp. (C) | | 182,087 | | | 1,738,931 |
| First Internet Bancorp | | 1,509 | | | 22,046 |
| First Interstate BancSystem, Inc., Class A | | 5,475 | | | 179,580 |
| First Merchants Corp. | | 6,985 | | | 178,676 |
| First Mid Bancshares, Inc. | | 2,004 | | | 52,184 |
| First Midwest Bancorp, Inc. | | 14,905 | | | 185,716 |
| First Republic Bank | | 20,408 | | | 2,304,267 |
| First Savings Financial Group, Inc. | | 376 | | | 16,356 |
| First United Corp. | | 1,312 | | | 15,022 |
| Flushing Financial Corp. | | 3,740 | | | 45,366 |
| FNB Corp. | | 86,998 | | | 652,485 |
| Franklin Financial Services Corp. | | 833 | | | 19,859 |
| Fukuoka Financial Group, Inc. | | 13,600 | | | 224,520 |
| Fulton Financial Corp. | | 64,374 | | | 629,578 |
| German American Bancorp, Inc. | | 3,135 | | | 88,877 |
| Glacier Bancorp, Inc. | | 36,267 | | | 1,272,428 |
| Great Southern Bancorp, Inc. | | 1,442 | | | 55,575 |
| Great Western Bancorp, Inc. | | 7,365 | | | 102,594 |
| Grupo Financiero Banorte SAB de CV, Series O (A) | | 315,150 | | | 1,083,049 |
| Grupo Financiero Inbursa SAB de CV, Series O (A) | | 279,600 | | | 204,442 |
| Guaranty Bancshares, Inc. | | 1,167 | | | 30,867 |
| Hana Financial Group, Inc. | | 36,224 | | | 857,321 |
| Hancock Whitney Corp. | | 34,523 | | | 690,805 |
| Hang Seng Bank, Ltd. (C) | | 101,095 | | | 1,588,961 |
| Hanmi Financial Corp. | | 4,340 | | | 41,360 |
| HarborOne Bancorp, Inc. | | 7,273 | | | 62,911 |
| Hawthorn Bancshares, Inc. | | 32 | | | 586 |
| HBT Financial, Inc. | | 1,498 | | | 17,751 |
| Heartland Financial USA, Inc. | | 4,560 | | | 157,001 |
| Heritage Commerce Corp. | | 7,869 | | | 54,532 |
| Heritage Financial Corp. | | 4,666 | | | 93,040 |
| Hilltop Holdings, Inc. | | 9,396 | | | 193,558 |
| Home BancShares, Inc. | | 61,310 | | | 993,835 |
| HomeTrust Bancshares, Inc. | | 2,431 | | | 34,107 |
| Hong Leong Bank BHD | | 84,000 | | | 282,405 |
| Hong Leong Financial Group BHD | | 29,600 | | | 87,796 |
| Hope Bancorp, Inc. | | 15,390 | | | 130,199 |
| Horizon Bancorp, Inc. (C) | | 5,754 | | | 64,330 |
| Howard Bancorp, Inc. (A) | | 2,382 | | | 23,367 |
| HSBC Holdings PLC | | 1,894,824 | | | 8,127,414 |
| Hua Nan Financial Holdings Company, Ltd. | | 968,493 | | | 596,168 |
| Huntington Bancshares, Inc. | | 120,717 | | | 1,135,947 |
| The accompanying notes are an integral part of the financial statements. | 69 | |
John Hancock Funds II
Portfolio of Investments — August 31, 2020 (showing percentage of total net assets)
Strategic Equity Allocation Fund (continued)
| | | Shares or
Principal
Amount | | Value |
| COMMON STOCKS (continued) | | | |
| Banks (continued) | | | |
| Independent Bank Corp. (Massachusetts) | | 4,259 | | $ | 267,678 |
| Independent Bank Corp. (Michigan) | | 3,105 | | | 46,296 |
| Independent Bank Group, Inc. | | 4,853 | | | 225,665 |
| Industrial & Commercial Bank of China, Ltd., H Shares | | 7,069,623 | | | 3,940,319 |
| Industrial Bank of Korea | | 32,913 | | | 223,598 |
| ING Groep NV | | 770,077 | | | 6,285,421 |
| International Bancshares Corp. | | 21,925 | | | 692,392 |
| Intesa Sanpaolo SpA (A) | | 1,712,625 | | | 3,686,439 |
| Investar Holding Corp. | | 1,690 | | | 22,984 |
| Investors Bancorp, Inc. | | 29,913 | | | 231,826 |
| Israel Discount Bank, Ltd., Class A | | 138,430 | | | 442,782 |
| Japan Post Bank Company, Ltd. (C) | | 31,000 | | | 249,398 |
| JPMorgan Chase & Co. | | 362,666 | | | 36,335,507 |
| Kasikornbank PCL, NVDR | | 255,000 | | | 693,279 |
| KB Financial Group, Inc. | | 47,586 | | | 1,476,384 |
| KBC Group NV | | 58,300 | | | 3,329,733 |
| KeyCorp | | 116,097 | | | 1,430,315 |
| Komercni banka AS (A) | | 10,416 | | | 250,445 |
| Krung Thai Bank PCL, NVDR | | 502,700 | | | 154,899 |
| Lakeland Bancorp, Inc. | | 6,504 | | | 69,138 |
| Lakeland Financial Corp. | | 3,056 | | | 139,629 |
| Landmark Bancorp, Inc. | | 863 | | | 18,132 |
| LCNB Corp. | | 2,082 | | | 30,522 |
| Live Oak Bancshares, Inc. | | 3,868 | | | 85,792 |
| Lloyds Banking Group PLC | | 6,555,201 | | | 2,471,685 |
| M&T Bank Corp. | | 15,268 | | | 1,576,574 |
| Macatawa Bank Corp. | | 4,652 | | | 34,053 |
| Malayan Banking BHD | | 503,333 | | | 885,041 |
| mBank SA (A)(C) | | 2,503 | | | 127,384 |
| Mebuki Financial Group, Inc. | | 74,200 | | | 179,883 |
| Mediobanca Banca di Credito Finanziario SpA (C) | | 71,577 | | | 622,497 |
| Mega Financial Holding Company, Ltd. | | 1,271,275 | | | 1,268,926 |
| Mercantile Bank Corp. | | 2,239 | | | 48,900 |
| Meridian Corp. | | 1,135 | | | 16,650 |
| Metrocity Bankshares, Inc. | | 2,487 | | | 33,923 |
| Metropolitan Bank & Trust Company | | 241,964 | | | 167,123 |
| Metropolitan Bank Holding Corp. (A) | | 1,057 | | | 32,735 |
| Mid Penn Bancorp, Inc. | | 923 | | | 17,759 |
| Middlefield Banc Corp. | | 1,114 | | | 21,166 |
| Midland States Bancorp, Inc. | | 3,021 | | | 44,137 |
| MidWestOne Financial Group, Inc. | | 2,140 | | | 40,639 |
| Mitsubishi UFJ Financial Group, Inc. | | 959,300 | | | 4,002,557 |
| Mizrahi Tefahot Bank, Ltd. | | 17,251 | | | 351,346 |
| Mizuho Financial Group, Inc. | | 1,893,600 | | | 2,563,381 |
| Moneta Money Bank AS (B) | | 69,821 | | | 175,630 |
| MVB Financial Corp. | | 1,306 | | | 18,545 |
| National Australia Bank, Ltd. | | 590,289 | | | 7,773,428 |
| National Bank Holdings Corp., Class A | | 3,738 | | | 106,309 |
| National Bank of Canada (C) | | 12,135 | | | 667,060 |
| National Bankshares, Inc. | | 847 | | | 21,031 |
| Natwest Group PLC | | 451,880 | | | 672,743 |
| NBT Bancorp, Inc. | | 5,498 | | | 167,524 |
| Nedbank Group, Ltd. | | 46,001 | | | 259,454 |
| Nicolet Bankshares, Inc. (A) | | 1,232 | | | 73,945 |
| Nordea Bank ABP | | 698,216 | | | 5,628,958 |
| Northrim BanCorp, Inc. | | 1,116 | | | 30,032 |
| Norwood Financial Corp. | | 785 | | | 19,429 |
| OceanFirst Financial Corp. | | 7,650 | | | 119,417 |
| OFG Bancorp | | 6,667 | | | 85,604 |
| Old National Bancorp | | 21,003 | | | 293,622 |
| Old Second Bancorp, Inc. | | 4,748 | | | 38,791 |
| Origin Bancorp, Inc. | | 2,994 | | | 70,898 |
| Orrstown Financial Services, Inc. | | 1,970 | | | 27,127 |
Strategic Equity Allocation Fund (continued)
| | | Shares or
Principal
Amount | | Value |
| COMMON STOCKS (continued) | | | |
| Banks (continued) | | | |
| OTP Bank NYRT (A) | | 35,698 | | $ | 1,202,250 |
| Oversea-Chinese Banking Corp., Ltd. | | 162,078 | | | 1,031,609 |
| Pacific Premier Bancorp, Inc. | | 11,033 | | | 249,235 |
| PacWest Bancorp | | 31,368 | | | 598,501 |
| Park National Corp. (C) | | 1,821 | | | 163,726 |
| Parke Bancorp, Inc. | | 1,884 | | | 23,173 |
| PCB Bancorp | | 2,412 | | | 23,035 |
| Peapack-Gladstone Financial Corp. | | 2,606 | | | 44,302 |
| Penns Woods Bancorp, Inc. | | 920 | | | 19,090 |
| Peoples Bancorp, Inc. | | 2,478 | | | 52,385 |
| Peoples Financial Services Corp. | | 885 | | | 32,249 |
| People's United Financial, Inc. | | 50,546 | | | 534,777 |
| Pinnacle Financial Partners, Inc. | | 19,200 | | | 767,040 |
| Plumas Bancorp | | 905 | | | 17,883 |
| Postal Savings Bank of China Company, Ltd., H Shares (B) | | 1,160,300 | | | 549,289 |
| Powszechna Kasa Oszczednosci Bank Polski SA (A) | | 147,192 | | | 860,040 |
| Preferred Bank | | 1,820 | | | 68,068 |
| Premier Financial Bancorp, Inc. | | 2,309 | | | 29,601 |
| Prosperity Bancshares, Inc. | | 24,953 | | | 1,360,438 |
| Public Bank BHD | | 373,862 | | | 1,472,972 |
| QCR Holdings, Inc. | | 2,012 | | | 60,300 |
| Raiffeisen Bank International AG (A) | | 28,966 | | | 517,556 |
| RBB Bancorp | | 2,556 | | | 33,151 |
| Red River Bancshares, Inc. | | 753 | | | 32,771 |
| Regions Financial Corp. | | 113,908 | | | 1,316,776 |
| Reliant Bancorp, Inc. | | 2,347 | | | 34,032 |
| Renasant Corp. | | 7,132 | | | 180,939 |
| Republic Bancorp, Inc., Class A | | 1,284 | | | 39,496 |
| Resona Holdings, Inc. | | 165,300 | | | 607,611 |
| RHB Bank BHD | | 204,041 | | | 224,016 |
| Richmond Mutual Bancorporation, Inc. | | 2,103 | | | 23,806 |
| Royal Bank of Canada | | 50,916 | | | 3,877,400 |
| S&T Bancorp, Inc. | | 4,935 | | | 99,662 |
| Salisbury Bancorp, Inc. | | 492 | | | 17,569 |
| Sandy Spring Bancorp, Inc. | | 5,834 | | | 139,549 |
| Santander Bank Polska SA (A) | | 5,963 | | | 244,939 |
| SB Financial Group, Inc. | | 1,267 | | | 17,535 |
| Seacoast Banking Corp. of Florida (A) | | 6,679 | | | 135,183 |
| Select Bancorp, Inc. (A) | | 3,096 | | | 23,684 |
| ServisFirst Bancshares, Inc. | | 6,352 | | | 232,801 |
| Seven Bank, Ltd. | | 46,500 | | | 116,752 |
| Shinhan Financial Group Company, Ltd. | | 55,169 | | | 1,373,099 |
| Shinsei Bank, Ltd. | | 12,400 | | | 144,684 |
| Shore Bancshares, Inc. | | 2,357 | | | 22,981 |
| Sierra Bancorp | | 2,182 | | | 38,992 |
| Signature Bank | | 14,426 | | | 1,399,755 |
| Silvergate Capital Corp., Class A (A) | | 2,209 | | | 32,980 |
| Simmons First National Corp., Class A | | 14,004 | | | 239,048 |
| SinoPac Financial Holdings Company, Ltd. | | 1,182,772 | | | 435,562 |
| Skandinaviska Enskilda Banken AB, A Shares (A) | | 350,650 | | | 3,477,162 |
| SmartFinancial, Inc. | | 1,733 | | | 23,863 |
| Societe Generale SA (A) | | 136,183 | | | 2,204,488 |
| South State Corp. | | 9,114 | | | 507,468 |
| Southern First Bancshares, Inc. (A) | | 1,222 | | | 31,650 |
| Southern National Bancorp of Virginia, Inc. | | 3,208 | | | 27,428 |
| Southside Bancshares, Inc. | | 3,858 | | | 106,307 |
| Spirit of Texas Bancshares, Inc. (A) | | 2,154 | | | 26,925 |
| Standard Bank Group, Ltd. | | 158,810 | | | 986,153 |
| Standard Chartered PLC | | 252,804 | | | 1,317,488 |
| Sterling Bancorp | | 52,366 | | | 611,111 |
| Stock Yards Bancorp, Inc. | | 2,641 | | | 113,378 |
| The accompanying notes are an integral part of the financial statements. | 70 | |
John Hancock Funds II
Portfolio of Investments — August 31, 2020 (showing percentage of total net assets)
Strategic Equity Allocation Fund (continued)
| | | Shares or
Principal
Amount | | Value |
| COMMON STOCKS (continued) | | | |
| Banks (continued) | | | |
| Sumitomo Mitsui Financial Group, Inc. | | 102,379 | | $ | 3,010,472 |
| Sumitomo Mitsui Trust Holdings, Inc. | | 26,438 | | | 762,623 |
| Summit Financial Group, Inc. | | 1,405 | | | 20,724 |
| SVB Financial Group (A) | | 6,131 | | | 1,565,735 |
| Svenska Handelsbanken AB, A Shares (A) | | 335,095 | | | 3,371,041 |
| Swedbank AB, A Shares (A) | | 194,901 | | | 3,312,017 |
| Synovus Financial Corp. | | 39,663 | | | 867,430 |
| Taishin Financial Holding Company, Ltd. | | 1,140,075 | | | 514,854 |
| Taiwan Business Bank | | 649,222 | | | 221,116 |
| Taiwan Cooperative Financial Holding Company, Ltd. | | 1,085,176 | | | 741,963 |
| TCF Financial Corp. | | 40,962 | | | 1,101,059 |
| Texas Capital Bancshares, Inc. (A) | | 20,238 | | | 655,509 |
| The Bancorp, Inc. (A) | | 6,939 | | | 65,921 |
| The Bank of East Asia, Ltd. | | 172,893 | | | 389,574 |
| The Bank of Kyoto, Ltd. | | 4,500 | | | 191,572 |
| The Bank of Nova Scotia (C) | | 43,367 | | | 1,874,189 |
| The Bank of NT Butterfield & Son, Ltd. | | 6,689 | | | 168,563 |
| The Chiba Bank, Ltd. | | 42,200 | | | 218,578 |
| The First Bancorp, Inc. | | 1,740 | | | 37,027 |
| The First Bancshares, Inc. | | 2,791 | | | 59,839 |
| The First of Long Island Corp. | | 3,156 | | | 48,492 |
| The PNC Financial Services Group, Inc. | | 50,497 | | | 5,615,266 |
| The Shanghai Commercial & Savings Bank, Ltd. | | 392,000 | | | 559,289 |
| The Shizuoka Bank, Ltd. | | 33,200 | | | 230,551 |
| The Siam Commercial Bank PCL, NVDR | | 122,400 | | | 286,278 |
| The Toronto-Dominion Bank | | 64,449 | | | 3,215,162 |
| TMB Bank PCL, NVDR | | 3,458,600 | | | 104,732 |
| Tompkins Financial Corp. | | 1,786 | | | 118,197 |
| Towne Bank | | 8,564 | | | 151,840 |
| TriCo Bancshares | | 3,349 | | | 92,734 |
| TriState Capital Holdings, Inc. (A) | | 3,766 | | | 52,347 |
| Triumph Bancorp, Inc. (A) | | 2,927 | | | 83,595 |
| Truist Financial Corp. | | 160,378 | | | 6,224,270 |
| Trustmark Corp. | | 25,268 | | | 593,293 |
| Turkiye Garanti Bankasi AS (A) | | 144,197 | | | 132,767 |
| Turkiye Is Bankasi AS, Class C (A) | | 101,440 | | | 67,959 |
| U.S. Bancorp | | 163,146 | | | 5,938,514 |
| UMB Financial Corp. | | 17,042 | | | 915,496 |
| Umpqua Holdings Corp. | | 59,303 | | | 668,938 |
| UniCredit SpA (A) | | 243,776 | | | 2,397,702 |
| United Bankshares, Inc. | | 50,321 | | | 1,315,391 |
| United Community Banks, Inc. | | 10,190 | | | 184,643 |
| United Overseas Bank, Ltd. | | 57,357 | | | 822,431 |
| Unity Bancorp, Inc. | | 1,520 | | | 20,186 |
| Univest Financial Corp. | | 3,823 | | | 61,512 |
| Valley National Bancorp | | 157,334 | | | 1,181,578 |
| Veritex Holdings, Inc. | | 6,279 | | | 112,896 |
| Washington Trust Bancorp, Inc. | | 2,218 | | | 74,037 |
| Webster Financial Corp. | | 24,282 | | | 667,755 |
| Wells Fargo & Company | | 444,074 | | | 10,724,387 |
| WesBanco, Inc. | | 8,457 | | | 187,915 |
| West Bancorporation, Inc. | | 2,458 | | | 43,261 |
| Westamerica Bancorporation | | 3,344 | | | 203,516 |
| Westpac Banking Corp. | | 666,641 | | | 8,513,915 |
| Wintrust Financial Corp. | | 15,503 | | | 674,691 |
| Woori Financial Group, Inc. | | 65,228 | | | 463,489 |
| Yapi ve Kredi Bankasi AS (A) | | 182,246 | | | 50,417 |
| Zions Bancorp NA | | 19,504 | | | 627,249 |
| | | | | | 373,586,519 |
| Capital markets – 2.2% | | | |
| 3i Group PLC | | 91,042 | | | 1,118,770 |
| Affiliated Managers Group, Inc. | | 12,721 | | | 873,297 |
| Ameriprise Financial, Inc. | | 14,477 | | | 2,269,994 |
Strategic Equity Allocation Fund (continued)
| | | Shares or
Principal
Amount | | Value |
| COMMON STOCKS (continued) | | | |
| Capital markets (continued) | | | |
| Amundi SA (A)(B) | | 10,222 | | $ | 793,840 |
| Artisan Partners Asset Management, Inc., Class A | | 7,089 | | | 274,415 |
| Assetmark Financial Holdings, Inc. (A) | | 2,198 | | | 53,082 |
| ASX, Ltd. | | 35,804 | | | 2,305,512 |
| B. Riley Financial, Inc. | | 2,568 | | | 68,771 |
| B3 SA - Brasil Bolsa Balcao | | 241,176 | | | 2,588,509 |
| Banco BTG Pactual SA | | 27,000 | | | 395,895 |
| Bangkok Commercial Asset Management PCL, NVDR | | 257,400 | | | 193,256 |
| BGC Partners, Inc., Class A | | 40,213 | | | 101,337 |
| BlackRock, Inc. | | 18,255 | | | 10,846,938 |
| Blucora, Inc. (A) | | 6,474 | | | 77,235 |
| Brightsphere Investment Group, Inc. | | 8,110 | | | 112,405 |
| Brookfield Asset Management, Inc., Class A | | 48,014 | | | 1,620,406 |
| Cboe Global Markets, Inc. | | 12,984 | | | 1,191,801 |
| China Cinda Asset Management Company, Ltd., H Shares | | 1,040,100 | | | 198,429 |
| China Everbright, Ltd. | | 108,984 | | | 167,802 |
| China Galaxy Securities Company, Ltd., H Shares | | 410,600 | | | 247,116 |
| China Huarong Asset Management Company, Ltd., H Shares (B) | | 1,171,200 | | | 134,322 |
| China International Capital Corp., Ltd., H Shares (A)(B) | | 156,200 | | | 370,707 |
| CI Financial Corp. | | 8,331 | | | 118,289 |
| CITIC Securities Company, Ltd., H Shares | | 252,600 | | | 606,124 |
| CME Group, Inc. | | 42,435 | | | 7,463,043 |
| Cohen & Steers, Inc. | | 3,196 | | | 193,358 |
| Cowen, Inc., Class A (C) | | 3,617 | | | 65,432 |
| Credit Suisse Group AG | | 309,602 | | | 3,406,655 |
| Daiwa Securities Group, Inc. | | 114,018 | | | 514,242 |
| Deutsche Bank AG (A) | | 369,038 | | | 3,538,521 |
| Deutsche Boerse AG | | 35,706 | | | 6,755,042 |
| Diamond Hill Investment Group, Inc. | | 434 | | | 53,777 |
| Donnelley Financial Solutions, Inc. (A) | | 4,203 | | | 45,813 |
| E*TRADE Financial Corp. | | 26,159 | | | 1,415,202 |
| Eaton Vance Corp. | | 30,681 | | | 1,258,535 |
| Ellington Financial, Inc. | | 5,462 | | | 68,057 |
| EQT AB | | 51,459 | | | 955,287 |
| Evercore, Inc., Class A | | 10,916 | | | 675,482 |
| FactSet Research Systems, Inc. | | 10,199 | | | 3,573,730 |
| Federated Hermes, Inc. | | 38,466 | | | 919,722 |
| Focus Financial Partners, Inc., Class A (A) | | 4,163 | | | 147,329 |
| Franklin Resources, Inc. | | 32,825 | | | 691,295 |
| GF Securities Company, Ltd., H Shares | | 150,400 | | | 177,813 |
| Greenhill & Company, Inc. | | 2,146 | | | 24,078 |
| Guotai Junan Securities Company, Ltd., H Shares (B) | | 67,300 | | | 104,961 |
| Haitong Securities Company, Ltd., H Shares | | 317,900 | | | 288,629 |
| Hamilton Lane, Inc., Class A | | 2,895 | | | 211,653 |
| Hargreaves Lansdown PLC | | 31,061 | | | 668,648 |
| Hong Kong Exchanges & Clearing, Ltd. | | 158,877 | | | 8,010,632 |
| Houlihan Lokey, Inc. | | 5,744 | | | 336,598 |
| Huatai Securities Company, Ltd., H Shares (B) | | 171,700 | | | 300,965 |
| IGM Financial, Inc. (C) | | 3,469 | | | 84,654 |
| Interactive Brokers Group, Inc., Class A | | 20,669 | | | 1,095,870 |
| Intercontinental Exchange, Inc. | | 64,758 | | | 6,879,242 |
| Invesco, Ltd. | | 44,531 | | | 454,216 |
| Janus Henderson Group PLC | | 41,331 | | | 856,378 |
| Japan Exchange Group, Inc. | | 40,098 | | | 1,039,804 |
| Julius Baer Group, Ltd. | | 28,539 | | | 1,368,347 |
| The accompanying notes are an integral part of the financial statements. | 71 | |
John Hancock Funds II
Portfolio of Investments — August 31, 2020 (showing percentage of total net assets)
Strategic Equity Allocation Fund (continued)
| | | Shares or
Principal
Amount | | Value |
| COMMON STOCKS (continued) | | | |
| Capital markets (continued) | | | |
| Korea Investment Holdings Company, Ltd. | | 5,240 | | $ | 267,896 |
| London Stock Exchange Group PLC | | 29,372 | | | 3,469,447 |
| Macquarie Group, Ltd. | | 62,234 | | | 5,850,886 |
| Magellan Financial Group, Ltd. | | 23,637 | | | 1,031,355 |
| MarketAxess Holdings, Inc. | | 4,486 | | | 2,179,927 |
| Meritz Securities Company, Ltd. | | 34,687 | | | 93,388 |
| Mirae Asset Daewoo Company, Ltd. | | 37,957 | | | 296,412 |
| Moelis & Company, Class A | | 6,899 | | | 220,147 |
| Moody's Corp. | | 19,082 | | | 5,622,320 |
| Morgan Stanley | | 141,712 | | | 7,405,869 |
| MSCI, Inc. | | 10,061 | | | 3,755,469 |
| Nasdaq, Inc. | | 13,591 | | | 1,826,902 |
| Natixis SA (A) | | 159,204 | | | 438,818 |
| NH Investment & Securities Company, Ltd. | | 14,859 | | | 111,829 |
| Noah Holdings, Ltd., ADR (A) | | 4,000 | | | 112,000 |
| Nomura Holdings, Inc. | | 248,200 | | | 1,274,859 |
| Northern Trust Corp. | | 24,621 | | | 2,016,214 |
| Oppenheimer Holdings, Inc., Class A | | 1,357 | | | 33,152 |
| Partners Group Holding AG | | 2,378 | | | 2,422,489 |
| Piper Sandler Companies | | 2,275 | | | 171,649 |
| PJT Partners, Inc., Class A (C) | | 3,069 | | | 181,623 |
| Raymond James Financial, Inc. | | 14,433 | | | 1,092,867 |
| Reinet Investments SCA | | 18,170 | | | 344,905 |
| S&P Global, Inc. | | 28,508 | | | 10,445,901 |
| Safeguard Scientifics, Inc. | | 3,221 | | | 20,099 |
| Samsung Securities Company, Ltd. | | 8,014 | | | 202,954 |
| SBI Holdings, Inc. | | 18,664 | | | 424,323 |
| Schroders PLC | | 11,762 | | | 455,409 |
| Sculptor Capital Management, Inc. | | 2,550 | | | 32,564 |
| SEI Investments Company | | 33,464 | | | 1,752,175 |
| Silvercrest Asset Management Group, Inc., Class A | | 1,629 | | | 20,428 |
| Singapore Exchange, Ltd. | | 39,200 | | | 247,883 |
| St. James's Place PLC | | 50,556 | | | 655,135 |
| Standard Life Aberdeen PLC | | 219,108 | | | 685,601 |
| State Street Corp. | | 41,651 | | | 2,836,017 |
| Stifel Financial Corp. | | 27,162 | | | 1,377,385 |
| StoneX Group, Inc. (A) | | 2,141 | | | 121,395 |
| T. Rowe Price Group, Inc. | | 26,928 | | | 3,748,647 |
| The Bank of New York Mellon Corp. | | 95,353 | | | 3,526,154 |
| The Charles Schwab Corp. | | 135,593 | | | 4,817,619 |
| The Goldman Sachs Group, Inc. | | 36,626 | | | 7,503,569 |
| TMX Group, Ltd. | | 2,102 | | | 220,973 |
| UBS Group AG | | 466,532 | | | 5,675,528 |
| Virtus Investment Partners, Inc. | | 962 | | | 136,508 |
| Waddell & Reed Financial, Inc., Class A (C) | | 8,308 | | | 130,851 |
| Westwood Holdings Group, Inc. | | 1,284 | | | 14,612 |
| WisdomTree Investments, Inc. | | 19,672 | | | 73,573 |
| | | | | | 165,716,988 |
| Consumer finance – 0.3% | | | |
| Acom Company, Ltd. | | 31,200 | | | 121,854 |
| American Express Company | | 78,113 | | | 7,935,500 |
| Capital One Financial Corp. | | 53,881 | | | 3,719,405 |
| Curo Group Holdings Corp. | | 2,527 | | | 19,458 |
| Discover Financial Services | | 36,248 | | | 1,924,044 |
| Encore Capital Group, Inc. (A) | | 4,072 | | | 187,068 |
| Enova International, Inc. (A) | | 3,888 | | | 66,407 |
| EZCORP, Inc., Class A (A) | | 6,559 | | | 35,287 |
| FirstCash, Inc. | | 16,470 | | | 984,083 |
| Green Dot Corp., Class A (A) | | 6,677 | | | 347,605 |
| Krungthai Card PCL, NVDR | | 111,000 | | | 109,848 |
| LendingClub Corp. (A) | | 9,306 | | | 49,601 |
| LendingTree, Inc. (A)(C) | | 2,076 | | | 641,359 |
Strategic Equity Allocation Fund (continued)
| | | Shares or
Principal
Amount | | Value |
| COMMON STOCKS (continued) | | | |
| Consumer finance (continued) | | | |
| Muangthai Capital PCL, NVDR | | 106,600 | | $ | 170,610 |
| Navient Corp. | | 70,868 | | | 644,190 |
| Nelnet, Inc., Class A | | 2,286 | | | 149,710 |
| Oportun Financial Corp. (A) | | 2,661 | | | 33,396 |
| PRA Group, Inc. (A) | | 5,925 | | | 276,549 |
| Regional Management Corp. (A) | | 1,275 | | | 23,320 |
| Samsung Card Company, Ltd. | | 3,627 | | | 87,744 |
| SLM Corp. | | 101,011 | | | 771,724 |
| Srisawad Corp. PCL, NVDR | | 105,900 | | | 155,722 |
| Synchrony Financial | | 63,550 | | | 1,576,676 |
| World Acceptance Corp. (A)(C) | | 666 | | | 60,599 |
| | | | | | 20,091,759 |
| Diversified financial services – 1.0% | | | |
| Alerus Financial Corp. | | 2,281 | | | 46,966 |
| AMP, Ltd. (A) | | 634,081 | | | 714,739 |
| Banco Latinoamericano de Comercio Exterior SA, Class E | | 3,946 | | | 48,062 |
| Berkshire Hathaway, Inc., Class B (A) | | 230,056 | | | 50,161,410 |
| Cannae Holdings, Inc. (A) | | 11,047 | | | 416,803 |
| Chailease Holding Company, Ltd. | | 145,335 | | | 641,927 |
| Eurazeo SE (A) | | 6,572 | | | 346,914 |
| EXOR NV | | 12,544 | | | 739,825 |
| Far East Horizon, Ltd. | | 231,300 | | | 204,697 |
| FirstRand, Ltd. | | 586,763 | | | 1,305,557 |
| Groupe Bruxelles Lambert SA | | 26,403 | | | 2,436,311 |
| Grupo de Inversiones Suramericana SA | | 42,903 | | | 240,835 |
| Haci Omer Sabanci Holding AS | | 58,217 | | | 61,333 |
| Industrivarden AB, C Shares (A) | | 34,321 | | | 906,983 |
| Investor AB, B Shares | | 98,319 | | | 6,289,021 |
| Jefferies Financial Group, Inc. | | 60,811 | | | 1,066,625 |
| Kinnevik AB, B Shares (A) | | 52,281 | | | 2,027,851 |
| Kinnevik AB, B Shares, Redemption Shares (A) | | 52,281 | | | 42,007 |
| L E Lundbergforetagen AB, B Shares (A) | | 16,447 | | | 753,032 |
| M&G PLC | | 242,281 | | | 559,906 |
| Metro Pacific Investments Corp. | | 1,896,900 | | | 131,451 |
| Mitsubishi UFJ Lease & Finance Company, Ltd. | | 31,800 | | | 150,098 |
| NewStar Financial, Inc. (A)(D) | | 5,608 | | | 570 |
| Onex Corp. | | 3,218 | | | 156,243 |
| ORIX Corp. | | 104,600 | | | 1,300,295 |
| PSG Group, Ltd. (C) | | 21,382 | | | 56,245 |
| Remgro, Ltd. | | 65,075 | | | 335,331 |
| Sofina SA | | 3,610 | | | 1,080,290 |
| Tokyo Century Corp. (C) | | 3,400 | | | 174,473 |
| Wendel SE | | 4,488 | | | 460,454 |
| Yuanta Financial Holding Company, Ltd. | | 1,140,034 | | | 714,695 |
| | | | | | 73,570,949 |
| Insurance – 2.8% | | | |
| Admiral Group PLC | | 17,886 | | | 624,070 |
| Aegon NV | | 356,040 | | | 985,862 |
| Aflac, Inc. | | 86,462 | | | 3,140,300 |
| Ageas SA/NV | | 42,013 | | | 1,750,714 |
| AIA Group, Ltd. | | 1,603,509 | | | 16,427,545 |
| Alleghany Corp. | | 3,854 | | | 2,137,274 |
| Allianz SE | | 78,498 | | | 17,033,106 |
| Ambac Financial Group, Inc. (A) | | 5,999 | | | 75,767 |
| American Equity Investment Life Holding Company | | 11,919 | | | 284,983 |
| American Financial Group, Inc. | | 20,081 | | | 1,342,415 |
| American International Group, Inc. | | 103,788 | | | 3,024,382 |
| AMERISAFE, Inc. | | 2,477 | | | 165,290 |
| Aon PLC, Class A | | 27,847 | | | 5,569,122 |
| Argo Group International Holdings, Ltd. | | 4,277 | | | 158,848 |
| Arthur J. Gallagher & Company | | 22,850 | | | 2,406,105 |
| The accompanying notes are an integral part of the financial statements. | 72 | |
John Hancock Funds II
Portfolio of Investments — August 31, 2020 (showing percentage of total net assets)
Strategic Equity Allocation Fund (continued)
| | | Shares or
Principal
Amount | | Value |
| COMMON STOCKS (continued) | | | |
| Insurance (continued) | | | |
| Assicurazioni Generali SpA | | 128,187 | | $ | 1,991,225 |
| Assurant, Inc. | | 7,188 | | | 873,773 |
| Aviva PLC | | 519,229 | | | 1,956,960 |
| AXA SA | | 325,424 | | | 6,639,970 |
| Baloise Holding AG | | 5,983 | | | 932,074 |
| BB Seguridade Participacoes SA | | 82,308 | | | 396,328 |
| Brighthouse Financial, Inc. (A) | | 25,272 | | | 767,258 |
| Brown & Brown, Inc. | | 63,345 | | | 2,939,208 |
| BRP Group, Inc., Class A (A) | | 2,763 | | | 76,010 |
| Cathay Financial Holding Company, Ltd. | | 929,890 | | | 1,263,006 |
| China Development Financial Holding Corp. | | 1,510,000 | | | 440,379 |
| China Life Insurance Company, Ltd. | | 322,703 | | | 225,565 |
| China Life Insurance Company, Ltd., H Shares | | 870,076 | | | 2,119,531 |
| China Pacific Insurance Group Company, Ltd., H Shares | | 325,579 | | | 903,181 |
| China Reinsurance Group Corp., H Shares | | 681,300 | | | 72,849 |
| China Taiping Insurance Holdings Company, Ltd. | | 190,600 | | | 302,301 |
| Chubb, Ltd. | | 54,390 | | | 6,798,750 |
| Cincinnati Financial Corp. | | 18,183 | | | 1,443,912 |
| Citizens, Inc. (A) | | 6,439 | | | 37,668 |
| CNO Financial Group, Inc. | | 57,543 | | | 937,951 |
| CNP Assurances (A) | | 29,668 | | | 397,766 |
| Crawford & Company, Class A | | 2,585 | | | 17,733 |
| Dai-ichi Life Holdings, Inc. | | 85,400 | | | 1,293,992 |
| DB Insurance Company, Ltd. | | 6,062 | | | 222,477 |
| Direct Line Insurance Group PLC | | 130,029 | | | 513,875 |
| Discovery, Ltd. | | 49,233 | | | 350,384 |
| Donegal Group, Inc., Class A | | 1,572 | | | 22,684 |
| eHealth, Inc. (A) | | 3,334 | | | 210,442 |
| Employers Holdings, Inc. | | 3,890 | | | 126,736 |
| Enstar Group, Ltd. (A) | | 1,559 | | | 279,045 |
| Everest Re Group, Ltd. | | 4,819 | | | 1,060,566 |
| Fairfax Financial Holdings, Ltd. | | 982 | | | 302,720 |
| FBL Financial Group, Inc., Class A | | 1,364 | | | 50,536 |
| FedNat Holding Company | | 1,928 | | | 16,369 |
| First American Financial Corp. | | 30,005 | | | 1,577,363 |
| Fubon Financial Holding Company, Ltd. | | 782,659 | | | 1,142,804 |
| Genworth Financial, Inc., Class A (A) | | 201,825 | | | 609,512 |
| Gjensidige Forsikring ASA (A) | | 25,867 | | | 550,656 |
| Global Indemnity Group LLC, Class A | | 1,162 | | | 26,993 |
| Globe Life, Inc. | | 11,800 | | | 973,264 |
| Goosehead Insurance, Inc., Class A | | 1,690 | | | 173,664 |
| Great-West Lifeco, Inc. | | 11,497 | | | 234,550 |
| Greenlight Capital Re, Ltd., Class A (A) | | 4,436 | | | 32,250 |
| Hannover Rueck SE | | 11,402 | | | 1,944,365 |
| HCI Group, Inc. | | 813 | | | 44,487 |
| Heritage Insurance Holdings, Inc. | | 3,357 | | | 43,809 |
| Horace Mann Educators Corp. | | 5,432 | | | 212,174 |
| Hyundai Marine & Fire Insurance Company, Ltd. | | 7,698 | | | 142,994 |
| iA Financial Corp., Inc. | | 4,409 | | | 158,702 |
| Insurance Australia Group, Ltd. | | 427,618 | | | 1,498,387 |
| Intact Financial Corp. | | 5,221 | | | 559,226 |
| Investors Title Company | | 197 | | | 26,804 |
| IRB Brasil Resseguros SA | | 83,000 | | | 108,020 |
| James River Group Holdings, Ltd. | | 3,869 | | | 188,459 |
| Japan Post Holdings Company, Ltd. | | 124,900 | | | 923,805 |
| Japan Post Insurance Company, Ltd. | | 18,100 | | | 289,241 |
| Kemper Corp. | | 16,517 | | | 1,282,710 |
| Kinsale Capital Group, Inc. | | 2,718 | | | 563,251 |
| Legal & General Group PLC | | 561,350 | | | 1,613,562 |
| Lincoln National Corp. | | 23,283 | | | 839,352 |
Strategic Equity Allocation Fund (continued)
| | | Shares or
Principal
Amount | | Value |
| COMMON STOCKS (continued) | | | |
| Insurance (continued) | | | |
| Loews Corp. | | 29,165 | | $ | 1,045,857 |
| Mapfre SA | | 210,984 | | | 399,995 |
| Marsh & McLennan Companies, Inc. | | 61,483 | | | 7,065,012 |
| MBIA, Inc. (A)(C) | | 9,324 | | | 75,618 |
| Medibank Pvt., Ltd. | | 509,180 | | | 1,024,608 |
| Mercury General Corp. | | 7,305 | | | 326,753 |
| MetLife, Inc. | | 92,962 | | | 3,575,319 |
| Momentum Metropolitan Holdings | | 124,052 | | | 110,507 |
| MS&AD Insurance Group Holdings, Inc. | | 35,468 | | | 983,829 |
| Muenchener Rueckversicherungs-Gesellschaft AG | | 27,169 | | | 7,847,690 |
| National General Holdings Corp. | | 8,887 | | | 302,602 |
| National Western Life Group, Inc., Class A | | 355 | | | 78,096 |
| New China Life Insurance Company, Ltd., H Shares | | 97,100 | | | 386,875 |
| NI Holdings, Inc. (A) | | 1,447 | | | 23,615 |
| NN Group NV | | 58,010 | | | 2,180,735 |
| Old Mutual, Ltd. | | 584,315 | | | 384,765 |
| Old Republic International Corp. | | 76,952 | | | 1,239,697 |
| Palomar Holdings, Inc. (A) | | 2,519 | | | 283,010 |
| PICC Property & Casualty Company, Ltd., H Shares | | 809,848 | | | 624,517 |
| Ping An Insurance Group Company of China, Ltd., H Shares | | 694,110 | | | 7,410,596 |
| Porto Seguro SA | | 11,423 | | | 110,216 |
| Poste Italiane SpA (B) | | 60,561 | | | 555,724 |
| Power Corp. of Canada | | 21,244 | | | 424,115 |
| Powszechny Zaklad Ubezpieczen SA (A) | | 102,508 | | | 755,821 |
| Primerica, Inc. | | 10,982 | | | 1,371,103 |
| Principal Financial Group, Inc. | | 30,692 | | | 1,292,440 |
| ProAssurance Corp. | | 7,139 | | | 109,369 |
| Protective Insurance Corp., Class B | | 1,475 | | | 21,181 |
| Prudential Financial, Inc. | | 47,598 | | | 3,225,716 |
| Prudential PLC | | 243,146 | | | 3,919,848 |
| QBE Insurance Group, Ltd. | | 268,980 | | | 2,080,889 |
| Rand Merchant Investment Holdings, Ltd. | | 96,168 | | | 169,987 |
| Reinsurance Group of America, Inc. | | 18,264 | | | 1,674,444 |
| RenaissanceRe Holdings, Ltd. | | 13,546 | | | 2,488,942 |
| RLI Corp. (C) | | 15,909 | | | 1,492,105 |
| RSA Insurance Group PLC | | 97,640 | | | 582,751 |
| Safety Insurance Group, Inc. | | 1,915 | | | 138,646 |
| Sampo OYJ, A Shares | | 156,495 | | | 6,304,191 |
| Samsung Fire & Marine Insurance Company, Ltd. | | 3,739 | | | 588,146 |
| Samsung Life Insurance Company, Ltd. | | 8,735 | | | 449,154 |
| Sanlam, Ltd. | | 231,302 | | | 745,441 |
| SCOR SE (A) | | 26,655 | | | 714,352 |
| Selective Insurance Group, Inc. | | 23,785 | | | 1,422,581 |
| Shin Kong Financial Holding Company, Ltd. | | 1,303,694 | | | 368,655 |
| Sompo Holdings, Inc. | | 26,560 | | | 997,589 |
| Sony Financial Holdings, Inc. (C) | | 12,100 | | | 296,688 |
| State Auto Financial Corp. | | 2,407 | | | 37,140 |
| Stewart Information Services Corp. | | 3,038 | | | 129,631 |
| Sul America SA | | 34,494 | | | 271,872 |
| Sun Life Financial, Inc. (C) | | 22,157 | | | 924,773 |
| Suncorp Group, Ltd. | | 233,704 | | | 1,598,727 |
| Swiss Life Holding AG | | 4,099 | | | 1,657,128 |
| Swiss Re AG | | 37,668 | | | 3,032,517 |
| T&D Holdings, Inc. | | 43,400 | | | 454,268 |
| The Allstate Corp. | | 37,852 | | | 3,520,236 |
| The Hanover Insurance Group, Inc. | | 10,233 | | | 1,048,780 |
| The Hartford Financial Services Group, Inc. | | 43,150 | | | 1,745,418 |
| The accompanying notes are an integral part of the financial statements. | 73 | |
John Hancock Funds II
Portfolio of Investments — August 31, 2020 (showing percentage of total net assets)
Strategic Equity Allocation Fund (continued)
| | | Shares or
Principal
Amount | | Value |
| COMMON STOCKS (continued) | | | |
| Insurance (continued) | | | |
| The People's Insurance Company Group of China, Ltd., H Shares | | 972,900 | | $ | 317,033 |
| The Progressive Corp. | | 70,530 | | | 6,703,171 |
| The Travelers Companies, Inc. | | 30,467 | | | 3,535,391 |
| Third Point Reinsurance, Ltd. (A) | | 10,653 | | | 91,190 |
| Tiptree, Inc. | | 3,902 | | | 22,007 |
| Tokio Marine Holdings, Inc. | | 50,514 | | | 2,331,377 |
| Trupanion, Inc. (A)(C) | | 3,951 | | | 247,846 |
| Tryg A/S | | 21,276 | | | 652,889 |
| United Fire Group, Inc. | | 2,795 | | | 70,378 |
| United Insurance Holdings Corp. | | 2,962 | | | 22,422 |
| Universal Insurance Holdings, Inc. (C) | | 3,624 | | | 67,225 |
| Unum Group | | 24,513 | | | 453,000 |
| W.R. Berkley Corp. | | 17,014 | | | 1,055,719 |
| Watford Holdings, Ltd. (A) | | 2,387 | | | 38,192 |
| Willis Towers Watson PLC | | 15,513 | | | 3,188,387 |
| ZhongAn Online P&C Insurance Company, Ltd., H Shares (A)(B) | | 43,900 | | | 288,215 |
| Zurich Insurance Group AG | | 19,088 | | | 7,057,738 |
| | | | | | 215,101,871 |
| Mortgage real estate investment trusts – 0.0% | | | |
| Anworth Mortgage Asset Corp. | | 14,316 | | | 24,767 |
| Apollo Commercial Real Estate Finance, Inc. | | 20,203 | | | 180,615 |
| Arbor Realty Trust, Inc. | | 13,406 | | | 151,756 |
| Ares Commercial Real Estate Corp. | | 4,228 | | | 42,111 |
| Arlington Asset Investment Corp., Class A | | 5,849 | | | 15,909 |
| ARMOUR Residential REIT, Inc. | | 8,425 | | | 81,638 |
| Blackstone Mortgage Trust, Inc., Class A | | 17,884 | | | 425,103 |
| Broadmark Realty Capital, Inc. | | 16,711 | | | 163,768 |
| Capstead Mortgage Corp. | | 12,679 | | | 78,229 |
| Cherry Hill Mortgage Investment Corp. | | 2,280 | | | 21,797 |
| Chimera Investment Corp. | | 24,860 | | | 221,005 |
| Colony Credit Real Estate, Inc. | | 11,117 | | | 66,924 |
| Dynex Capital, Inc. | | 3,054 | | | 48,375 |
| Granite Point Mortgage Trust, Inc. | | 7,406 | | | 49,176 |
| Great Ajax Corp. | | 2,946 | | | 26,868 |
| Hannon Armstrong Sustainable Infrastructure Capital, Inc. | | 9,223 | | | 391,609 |
| Invesco Mortgage Capital, Inc. | | 24,081 | | | 72,243 |
| KKR Real Estate Finance Trust, Inc. | | 3,385 | | | 61,607 |
| Ladder Capital Corp. | | 13,888 | | | 103,466 |
| MFA Financial, Inc. | | 59,082 | | | 158,340 |
| New York Mortgage Trust, Inc. | | 50,119 | | | 132,314 |
| Orchid Island Capital, Inc. | | 9,118 | | | 46,593 |
| PennyMac Mortgage Investment Trust | | 13,065 | | | 223,934 |
| Ready Capital Corp. | | 4,995 | | | 51,099 |
| Redwood Trust, Inc. | | 15,279 | | | 105,883 |
| TPG RE Finance Trust, Inc. | | 7,980 | | | 70,384 |
| Two Harbors Investment Corp. | | 35,802 | | | 195,121 |
| Western Asset Mortgage Capital Corp. | | 7,289 | | | 16,546 |
| | | | | | 3,227,180 |
| Thrifts and mortgage finance – 0.1% | | | |
| Axos Financial, Inc. (A) | | 7,573 | | | 187,659 |
| Bridgewater Bancshares, Inc. (A) | | 3,523 | | | 34,244 |
| Capitol Federal Financial, Inc. | | 16,878 | | | 157,641 |
| Columbia Financial, Inc. (A) | | 6,248 | | | 66,666 |
| ESSA Bancorp, Inc. | | 1,697 | | | 21,722 |
| Essent Group, Ltd. | | 43,980 | | | 1,570,086 |
| Federal Agricultural Mortgage Corp., Class C | | 1,177 | | | 80,213 |
| Flagstar Bancorp, Inc. | | 4,640 | | | 145,789 |
| FS Bancorp, Inc. | | 701 | | | 27,774 |
| Home Bancorp, Inc. | | 1,303 | | | 31,480 |
| HomeStreet, Inc. | | 3,122 | | | 85,449 |
Strategic Equity Allocation Fund (continued)
| | | Shares or
Principal
Amount | | Value |
| COMMON STOCKS (continued) | | | |
| Thrifts and mortgage finance (continued) | | | |
| Kearny Financial Corp. | | 10,385 | | $ | 80,588 |
| Luther Burbank Corp. | | 2,427 | | | 22,547 |
| Merchants Bancorp | | 1,215 | | | 24,762 |
| Meridian Bancorp, Inc. | | 6,454 | | | 75,125 |
| Meta Financial Group, Inc. | | 4,467 | | | 86,124 |
| MMA Capital Holdings, Inc. (A) | | 803 | | | 18,854 |
| Mr. Cooper Group, Inc. (A) | | 9,950 | | | 182,334 |
| New York Community Bancorp, Inc. | | 124,935 | | | 1,130,662 |
| NMI Holdings, Inc., Class A (A) | | 8,832 | | | 151,469 |
| Northfield Bancorp, Inc. | | 6,265 | | | 60,520 |
| Northwest Bancshares, Inc. | | 15,213 | | | 153,803 |
| PCSB Financial Corp. | | 2,562 | | | 32,486 |
| PennyMac Financial Services, Inc. | | 6,044 | | | 318,640 |
| Premier Financial Corp. | | 5,076 | | | 92,764 |
| Provident Financial Services, Inc. | | 10,071 | | | 132,736 |
| Radian Group, Inc. | | 24,973 | | | 385,583 |
| Riverview Bancorp, Inc. | | 3,872 | | | 15,991 |
| Southern Missouri Bancorp, Inc. | | 1,311 | | | 31,044 |
| Standard AVB Financial Corp. | | 808 | | | 14,908 |
| Territorial Bancorp, Inc. | | 1,300 | | | 27,508 |
| The Hingham Institution for Savings | | 204 | | | 37,405 |
| Timberland Bancorp, Inc. | | 1,369 | | | 23,944 |
| TrustCo Bank Corp. | | 13,102 | | | 78,088 |
| Walker & Dunlop, Inc. | | 3,707 | | | 203,069 |
| Washington Federal, Inc. | | 30,075 | | | 705,259 |
| Waterstone Financial, Inc. | | 3,027 | | | 46,888 |
| WSFS Financial Corp. | | 6,576 | | | 192,677 |
| | | | | | 6,734,501 |
| | | | | | 858,029,767 |
| Health care – 9.3% | | | | | |
| Biotechnology – 1.2% | | | |
| 3SBio, Inc. (A)(B) | | 147,800 | | | 173,219 |
| AbbVie, Inc. | | 86,983 | | | 8,330,362 |
| Abeona Therapeutics, Inc. (A) | | 8,546 | | | 20,083 |
| Achillion Pharmaceuticals, Inc. (A)(D) | | 17,157 | | | 23,243 |
| ADMA Biologics, Inc. (A)(C) | | 8,480 | | | 21,624 |
| Aduro Biotech, Inc. (A) | | 9,626 | | | 29,841 |
| Adverum Biotechnologies, Inc. (A) | | 9,620 | | | 117,364 |
| Aeglea BioTherapeutics, Inc. (A) | | 5,731 | | | 41,693 |
| Affimed NV (A) | | 10,107 | | | 34,869 |
| Agenus, Inc. (A)(C) | | 18,597 | | | 80,990 |
| Aimmune Therapeutics, Inc. (A) | | 6,182 | | | 211,548 |
| Akcea Therapeutics, Inc. (A) | | 2,269 | | | 41,477 |
| Akebia Therapeutics, Inc. (A) | | 17,185 | | | 178,896 |
| Akero Therapeutics, Inc. (A) | | 1,517 | | | 49,454 |
| Albireo Pharma, Inc. (A) | | 1,846 | | | 51,356 |
| Alder Biopharmaceuticals, Inc. (A)(C)(D) | | 9,683 | | | 14,518 |
| Alector, Inc. (A)(C) | | 6,100 | | | 78,812 |
| Alexion Pharmaceuticals, Inc. (A) | | 10,899 | | | 1,244,884 |
| Allakos, Inc. (A)(C) | | 3,199 | | | 286,566 |
| Allogene Therapeutics, Inc. (A)(C) | | 6,375 | | | 227,269 |
| Amgen, Inc. | | 29,034 | | | 7,354,893 |
| Amicus Therapeutics, Inc. (A) | | 33,397 | | | 487,596 |
| AnaptysBio, Inc. (A) | | 2,896 | | | 50,188 |
| Anavex Life Sciences Corp. (A)(C) | | 7,166 | | | 30,384 |
| Anika Therapeutics, Inc. (A) | | 1,874 | | | 71,830 |
| Apellis Pharmaceuticals, Inc. (A) | | 7,898 | | | 243,495 |
| Applied Genetic Technologies Corp. (A) | | 3,361 | | | 17,276 |
| Applied Therapeutics, Inc. (A) | | 1,765 | | | 42,537 |
| Aprea Therapeutics, Inc. (A) | | 970 | | | 26,287 |
| Aravive, Inc. (A) | | 1,710 | | | 9,747 |
| Arcturus Therapeutics Holdings, Inc. (A) | | 1,734 | | | 83,648 |
| Arcus Biosciences, Inc. (A) | | 4,339 | | | 103,268 |
| Arcutis Biotherapeutics, Inc. (A) | | 1,261 | | | 31,613 |
| Ardelyx, Inc. (A) | | 9,859 | | | 56,591 |
| The accompanying notes are an integral part of the financial statements. | 74 | |
John Hancock Funds II
Portfolio of Investments — August 31, 2020 (showing percentage of total net assets)
Strategic Equity Allocation Fund (continued)
| | | Shares or
Principal
Amount | | Value |
| COMMON STOCKS (continued) | | | |
| Biotechnology (continued) | | | |
| Arena Pharmaceuticals, Inc. (A) | | 7,398 | | $ | 516,528 |
| Arrowhead Pharmaceuticals, Inc. (A) | | 40,576 | | | 1,713,930 |
| Assembly Biosciences, Inc. (A) | | 4,107 | | | 89,820 |
| Atara Biotherapeutics, Inc. (A)(C) | | 7,649 | | | 103,109 |
| Athenex, Inc. (A)(C) | | 9,772 | | | 112,280 |
| Athersys, Inc. (A)(C) | | 23,165 | | | 50,500 |
| Atreca, Inc., Class A (A) | | 2,860 | | | 40,669 |
| Avid Bioservices, Inc. (A) | | 7,728 | | | 64,838 |
| Avrobio, Inc. (A) | | 4,105 | | | 71,099 |
| Beam Therapeutics, Inc. (A)(C) | | 1,661 | | | 41,708 |
| BeiGene, Ltd., ADR (A) | | 5,100 | | | 1,232,007 |
| Beyondspring, Inc. (A) | | 1,920 | | | 23,866 |
| BioCryst Pharmaceuticals, Inc. (A)(C) | | 20,519 | | | 85,154 |
| Biogen, Inc. (A) | | 8,054 | | | 2,316,653 |
| Biohaven Pharmaceutical Holding Company, Ltd. (A) | | 6,192 | | | 392,511 |
| BioSpecifics Technologies Corp. (A)(C) | | 859 | | | 55,406 |
| Bioxcel Therapeutics, Inc. (A) | | 1,400 | | | 57,050 |
| Black Diamond Therapeutics, Inc. (A)(C) | | 1,623 | | | 46,694 |
| Blueprint Medicines Corp. (A) | | 7,121 | | | 551,379 |
| BrainStorm Cell Therapeutics, Inc. (A) | | 3,743 | | | 47,199 |
| Bridgebio Pharma, Inc. (A) | | 9,573 | | | 285,850 |
| Cabaletta Bio, Inc. (A) | | 1,943 | | | 20,499 |
| Calithera Biosciences, Inc. (A) | | 8,950 | | | 36,069 |
| CareDx, Inc. (A) | | 5,621 | | | 191,957 |
| CASI Pharmaceuticals, Inc. (A) | | 7,912 | | | 13,530 |
| Castle Biosciences, Inc. (A) | | 1,373 | | | 62,787 |
| Catabasis Pharmaceuticals, Inc. (A) | | 2,792 | | | 18,427 |
| Catalyst Biosciences, Inc. (A) | | 2,659 | | | 13,880 |
| Catalyst Pharmaceuticals, Inc. (A) | | 13,054 | | | 42,817 |
| Celltrion, Inc. (A) | | 11,330 | | | 2,827,974 |
| Cellular Biomedicine Group, Inc. (A) | | 1,810 | | | 33,630 |
| CEL-SCI Corp. (A)(C) | | 4,353 | | | 56,284 |
| ChemoCentryx, Inc. (A) | | 5,841 | | | 312,494 |
| Chimerix, Inc. (A) | | 7,207 | | | 20,252 |
| Cidara Therapeutics, Inc. (A) | | 5,117 | | | 16,272 |
| Clovis Oncology, Inc. (A)(C) | | 9,610 | | | 50,068 |
| Coherus Biosciences, Inc. (A) | | 7,611 | | | 144,381 |
| Concert Pharmaceuticals, Inc. (A) | | 3,993 | | | 38,413 |
| Constellation Pharmaceuticals, Inc. (A) | | 3,574 | | | 75,233 |
| Corbus Pharmaceuticals Holdings, Inc. (A)(C) | | 8,913 | | | 82,757 |
| Cortexyme, Inc. (A)(C) | | 2,080 | | | 91,458 |
| Crinetics Pharmaceuticals, Inc. (A) | | 3,639 | | | 58,333 |
| CSL, Ltd. | | 83,804 | | | 17,585,492 |
| Cue Biopharma, Inc. (A) | | 3,678 | | | 65,726 |
| Cyclerion Therapeutics, Inc. (A) | | 3,136 | | | 21,388 |
| Cytokinetics, Inc. (A)(C) | | 7,377 | | | 176,753 |
| CytomX Therapeutics, Inc. (A) | | 6,110 | | | 44,603 |
| Deciphera Pharmaceuticals, Inc. (A) | | 4,915 | | | 221,224 |
| Denali Therapeutics, Inc. (A) | | 8,283 | | | 264,228 |
| DermTech, Inc. (A) | | 1,279 | | | 15,054 |
| Dicerna Pharmaceuticals, Inc. (A) | | 8,570 | | | 158,716 |
| Dyadic International, Inc. (A) | | 2,932 | | | 23,309 |
| Dynavax Technologies Corp. (A)(C) | | 11,854 | | | 70,887 |
| Eagle Pharmaceuticals, Inc. (A) | | 1,461 | | | 57,972 |
| Editas Medicine, Inc. (A) | | 7,324 | | | 258,025 |
| Eidos Therapeutics, Inc. (A) | | 1,455 | | | 62,972 |
| Eiger BioPharmaceuticals, Inc. (A) | | 3,289 | | | 36,738 |
| Emergent BioSolutions, Inc. (A) | | 17,836 | | | 2,034,196 |
| Enanta Pharmaceuticals, Inc. (A) | | 2,530 | | | 132,041 |
| Epizyme, Inc. (A)(C) | | 11,769 | | | 152,997 |
| Esperion Therapeutics, Inc. (A)(C) | | 3,411 | | | 123,137 |
| Exelixis, Inc. (A) | | 82,582 | | | 1,834,972 |
| Exicure, Inc. (A) | | 8,616 | | | 17,146 |
Strategic Equity Allocation Fund (continued)
| | | Shares or
Principal
Amount | | Value |
| COMMON STOCKS (continued) | | | |
| Biotechnology (continued) | | | |
| Fate Therapeutics, Inc. (A)(C) | | 8,235 | | $ | 299,754 |
| Fennec Pharmaceuticals, Inc. (A)(C) | | 3,284 | | | 17,996 |
| FibroGen, Inc. (A) | | 10,914 | | | 489,275 |
| Five Prime Therapeutics, Inc. (A) | | 3,900 | | | 16,653 |
| Flexion Therapeutics, Inc. (A)(C) | | 4,599 | | | 53,624 |
| Fortress Biotech, Inc. (A) | | 8,498 | | | 33,610 |
| Frequency Therapeutics, Inc. (A)(C) | | 3,748 | | | 72,486 |
| G1 Therapeutics, Inc. (A)(C) | | 4,535 | | | 69,612 |
| Galapagos NV (A) | | 9,816 | | | 1,317,875 |
| Genmab A/S (A) | | 11,410 | | | 4,305,854 |
| Geron Corp. (A)(C) | | 25,529 | | | 52,334 |
| Gilead Sciences, Inc. | | 61,893 | | | 4,131,358 |
| Gossamer Bio, Inc. (A) | | 6,612 | | | 91,907 |
| Grifols SA | | 57,054 | | | 1,546,778 |
| Gritstone Oncology, Inc. (A) | | 4,286 | | | 14,187 |
| Halozyme Therapeutics, Inc. (A) | | 17,814 | | | 516,517 |
| Harpoon Therapeutics, Inc. (A) | | 1,465 | | | 20,158 |
| Helixmith Company, Ltd. (A) | | 2,897 | | | 120,015 |
| Heron Therapeutics, Inc. (A) | | 11,567 | | | 165,408 |
| Homology Medicines, Inc. (A) | | 4,541 | | | 48,271 |
| Hookipa Pharma, Inc. (A) | | 1,883 | | | 16,834 |
| Ideaya Biosciences, Inc. (A) | | 1,721 | | | 20,824 |
| IGM Biosciences, Inc. (A)(C) | | 943 | | | 40,549 |
| ImmunoGen, Inc. (A) | | 22,807 | | | 84,386 |
| Immunovant, Inc. (A) | | 2,554 | | | 86,734 |
| Incyte Corp. (A) | | 8,905 | | | 857,997 |
| Innovent Biologics, Inc. (A)(B) | | 109,500 | | | 727,518 |
| Inovio Pharmaceuticals, Inc. (A)(C) | | 18,877 | | | 226,335 |
| Insmed, Inc. (A)(C) | | 13,312 | | | 375,265 |
| Intellia Therapeutics, Inc. (A)(C) | | 5,810 | | | 125,380 |
| Intercept Pharmaceuticals, Inc. (A)(C) | | 3,408 | | | 169,991 |
| Invitae Corp. (A) | | 15,156 | | | 529,854 |
| Ironwood Pharmaceuticals, Inc. (A) | | 21,090 | | | 213,009 |
| IVERIC bio, Inc. (A) | | 6,223 | | | 27,941 |
| Jounce Therapeutics, Inc. (A) | | 2,497 | | | 12,085 |
| Kadmon Holdings, Inc. (A) | | 21,377 | | | 106,885 |
| KalVista Pharmaceuticals, Inc. (A) | | 1,986 | | | 26,017 |
| Karuna Therapeutics, Inc. (A) | | 2,039 | | | 155,780 |
| Karyopharm Therapeutics, Inc. (A) | | 9,244 | | | 140,601 |
| Keros Therapeutics, Inc. (A) | | 938 | | | 50,221 |
| Kezar Life Sciences, Inc. (A) | | 3,755 | | | 18,249 |
| Kindred Biosciences, Inc. (A) | | 5,640 | | | 27,974 |
| Kiniksa Pharmaceuticals, Ltd., Class A (A) | | 2,540 | | | 44,882 |
| Kodiak Sciences, Inc. (A) | | 3,790 | | | 199,316 |
| Krystal Biotech, Inc. (A) | | 1,587 | | | 75,874 |
| Kura Oncology, Inc. (A) | | 7,026 | | | 174,877 |
| Ligand Pharmaceuticals, Inc. (A)(C) | | 6,212 | | | 633,624 |
| MacroGenics, Inc. (A) | | 6,322 | | | 182,959 |
| Madrigal Pharmaceuticals, Inc. (A)(C) | | 1,155 | | | 124,394 |
| Magenta Therapeutics, Inc. (A) | | 2,477 | | | 18,008 |
| MannKind Corp. (A)(C) | | 29,264 | | | 50,919 |
| MediciNova, Inc. (A)(C) | | 6,053 | | | 31,718 |
| Medytox, Inc. | | 45 | | | 9,442 |
| MEI Pharma, Inc. (A) | | 14,051 | | | 38,219 |
| MeiraGTx Holdings PLC (A) | | 2,816 | | | 36,636 |
| Mersana Therapeutics, Inc. (A) | | 6,040 | | | 115,726 |
| Minerva Neurosciences, Inc. (A) | | 4,829 | | | 15,356 |
| Mirati Therapeutics, Inc. (A)(C) | | 4,823 | | | 720,412 |
| Molecular Templates, Inc. (A) | | 3,269 | | | 37,953 |
| Momenta Pharmaceuticals, Inc. (A) | | 15,478 | | | 807,487 |
| Morphic Holding, Inc. (A) | | 1,845 | | | 48,893 |
| Myriad Genetics, Inc. (A) | | 9,451 | | | 126,360 |
| NantKwest, Inc. (A)(C) | | 3,868 | | | 28,236 |
| Natera, Inc. (A) | | 9,165 | | | 583,902 |
| Neoleukin Therapeutics, Inc. (A) | | 4,029 | | | 51,209 |
| The accompanying notes are an integral part of the financial statements. | 75 | |
John Hancock Funds II
Portfolio of Investments — August 31, 2020 (showing percentage of total net assets)
Strategic Equity Allocation Fund (continued)
| | | Shares or
Principal
Amount | | Value |
| COMMON STOCKS (continued) | | | |
| Biotechnology (continued) | | | |
| Neubase Therapeutics, Inc. (A) | | 2,571 | | $ | 20,645 |
| NextCure, Inc. (A) | | 2,170 | | | 19,508 |
| Novavax, Inc. (A)(C) | | 7,646 | | | 843,660 |
| Nymox Pharmaceutical Corp. (A)(C) | | 5,801 | | | 14,619 |
| Oncocyte Corp. (A) | | 6,165 | | | 7,706 |
| OPKO Health, Inc. (A)(C) | | 52,719 | | | 170,810 |
| Orgenesis, Inc. (A) | | 2,747 | | | 14,477 |
| ORIC Pharmaceuticals, Inc. (A) | | 1,172 | | | 29,359 |
| Ovid therapeutics, Inc. (A) | | 5,884 | | | 33,774 |
| Oyster Point Pharma, Inc. (A) | | 692 | | | 15,750 |
| Passage Bio, Inc. (A) | | 1,811 | | | 29,990 |
| PDL BioPharma, Inc. (A) | | 15,772 | | | 52,836 |
| PeptiDream, Inc. (A) | | 7,400 | | | 300,442 |
| Pfenex, Inc. (A) | | 4,823 | | | 60,432 |
| Pieris Pharmaceuticals, Inc. (A) | | 7,301 | | | 20,881 |
| Precigen, Inc. (A)(C) | | 9,096 | | | 55,031 |
| Precision BioSciences, Inc. (A) | | 6,176 | | | 34,833 |
| Prevail Therapeutics, Inc. (A) | | 1,983 | | | 24,292 |
| Principia Biopharma, Inc. (A) | | 3,862 | | | 386,239 |
| Protagonist Therapeutics, Inc. (A) | | 3,023 | | | 67,715 |
| Prothena Corp. PLC (A) | | 4,211 | | | 54,575 |
| PTC Therapeutics, Inc. (A) | | 8,113 | | | 400,985 |
| Puma Biotechnology, Inc. (A)(C) | | 4,190 | | | 43,115 |
| Radius Health, Inc. (A)(C) | | 6,046 | | | 74,849 |
| RAPT Therapeutics, Inc. (A) | | 1,486 | | | 39,528 |
| Regeneron Pharmaceuticals, Inc. (A) | | 4,978 | | | 3,086,012 |
| REGENXBIO, Inc. (A) | | 4,497 | | | 137,248 |
| Replimune Group, Inc. (A) | | 2,316 | | | 62,532 |
| Retrophin, Inc. (A) | | 5,526 | | | 108,254 |
| REVOLUTION Medicines, Inc. (A) | | 1,956 | | | 55,433 |
| Rhythm Pharmaceuticals, Inc. (A) | | 4,481 | | | 132,234 |
| Rigel Pharmaceuticals, Inc. (A) | | 23,696 | | | 59,003 |
| Rocket Pharmaceuticals, Inc. (A)(C) | | 4,504 | | | 115,167 |
| Rubius Therapeutics, Inc. (A) | | 5,135 | | | 24,725 |
| Sangamo Therapeutics, Inc. (A)(C) | | 15,257 | | | 168,361 |
| Savara, Inc. (A) | | 6,721 | | | 9,813 |
| Scholar Rock Holding Corp. (A) | | 3,057 | | | 46,161 |
| Selecta Biosciences, Inc. (A)(C) | | 9,568 | | | 24,877 |
| Seres Therapeutics, Inc. (A) | | 6,171 | | | 163,470 |
| Sorrento Therapeutics, Inc. (A)(C) | | 23,106 | | | 185,079 |
| Spectrum Pharmaceuticals, Inc. (A) | | 15,957 | | | 67,179 |
| Spero Therapeutics, Inc. (A) | | 2,094 | | | 22,762 |
| SpringWorks Therapeutics, Inc. (A) | | 2,815 | | | 125,014 |
| Stemline Therapeutics, Inc. (A)(C)(D) | | 5,969 | | | 1,970 |
| Stoke Therapeutics, Inc. (A) | | 1,649 | | | 48,431 |
| Sutro Biopharma, Inc. (A) | | 2,569 | | | 25,716 |
| Syndax Pharmaceuticals, Inc. (A) | | 3,615 | | | 58,961 |
| Syros Pharmaceuticals, Inc. (A)(C) | | 5,606 | | | 74,280 |
| TCR2 Therapeutics, Inc. (A) | | 2,309 | | | 46,688 |
| TG Therapeutics, Inc. (A) | | 12,704 | | | 315,123 |
| Translate Bio, Inc. (A) | | 6,667 | | | 93,938 |
| Turning Point Therapeutics, Inc. (A) | | 3,658 | | | 285,982 |
| Twist Bioscience Corp. (A) | | 3,945 | | | 275,874 |
| Ultragenyx Pharmaceutical, Inc. (A)(C) | | 7,449 | | | 633,612 |
| United Therapeutics Corp. (A) | | 11,852 | | | 1,267,690 |
| UNITY Biotechnology, Inc. (A)(C) | | 4,612 | | | 14,482 |
| UroGen Pharma, Ltd. (A)(C) | | 2,618 | | | 65,686 |
| Vanda Pharmaceuticals, Inc. (A)(C) | | 7,113 | | | 73,193 |
| Vaxart, Inc. (A) | | 6,063 | | | 35,954 |
| VBI Vaccines, Inc. (A)(C) | | 22,990 | | | 97,937 |
| Veracyte, Inc. (A) | | 6,620 | | | 220,512 |
| Verastem, Inc. (A)(C) | | 22,166 | | | 27,929 |
| Vericel Corp. (A) | | 5,969 | | | 94,609 |
| Vertex Pharmaceuticals, Inc. (A) | | 12,797 | | | 3,571,899 |
| Viela Bio, Inc. (A) | | 2,641 | | | 88,975 |
Strategic Equity Allocation Fund (continued)
| | | Shares or
Principal
Amount | | Value |
| COMMON STOCKS (continued) | | | |
| Biotechnology (continued) | | | |
| Viking Therapeutics, Inc. (A)(C) | | 8,762 | | $ | 58,618 |
| Vir Biotechnology, Inc. (A)(C) | | 6,089 | | | 246,483 |
| Voyager Therapeutics, Inc. (A) | | 3,535 | | | 41,678 |
| X4 Pharmaceuticals, Inc. (A) | | 2,322 | | | 19,458 |
| XBiotech, Inc. (A)(C) | | 1,902 | | | 35,986 |
| Xencor, Inc. (A) | | 7,311 | | | 261,368 |
| XOMA Corp. (A)(C) | | 894 | | | 17,004 |
| Y-mAbs Therapeutics, Inc. (A) | | 3,961 | | | 170,442 |
| Zai Lab, Ltd., ADR (A) | | 6,100 | | | 484,157 |
| Zentalis Pharmaceuticals, Inc. (A) | | 1,361 | | | 46,818 |
| ZIOPHARM Oncology, Inc. (A)(C) | | 28,405 | | | 79,818 |
| | | | | | 93,201,911 |
| Health care equipment and supplies – 2.4% | | | |
| Abbott Laboratories | | 173,538 | | | 18,997,205 |
| ABIOMED, Inc. (A) | | 4,411 | | | 1,356,912 |
| Accelerate Diagnostics, Inc. (A)(C) | | 4,141 | | | 50,437 |
| Accuray, Inc. (A) | | 12,944 | | | 30,160 |
| AK Medical Holdings, Ltd. (B) | | 44,000 | | | 112,162 |
| Alcon, Inc. (A) | | 62,507 | | | 3,556,455 |
| Align Technology, Inc. (A) | | 7,032 | | | 2,088,363 |
| Alphatec Holdings, Inc. (A) | | 6,324 | | | 37,881 |
| Ambu A/S, Class B (C) | | 28,626 | | | 842,488 |
| AngioDynamics, Inc. (A) | | 5,085 | | | 47,621 |
| Antares Pharma, Inc. (A) | | 22,126 | | | 62,617 |
| Apyx Medical Corp. (A) | | 4,869 | | | 22,349 |
| Asahi Intecc Company, Ltd. | | 15,300 | | | 454,058 |
| Aspira Women's Health, Inc. (A) | | 6,567 | | | 18,814 |
| AtriCure, Inc. (A) | | 5,136 | | | 229,733 |
| Atrion Corp. | | 188 | | | 118,763 |
| Avanos Medical, Inc. (A) | | 19,137 | | | 620,039 |
| Axogen, Inc. (A) | | 5,026 | | | 59,659 |
| Axonics Modulation Technologies, Inc. (A) | | 3,991 | | | 168,660 |
| Baxter International, Inc. | | 49,921 | | | 4,346,621 |
| Becton, Dickinson and Company | | 28,930 | | | 7,023,336 |
| BioLife Solutions, Inc. (A) | | 1,098 | | | 23,409 |
| BioMerieux | | 6,946 | | | 1,050,397 |
| BioSig Technologies, Inc. (A)(C) | | 3,029 | | | 22,445 |
| Boston Scientific Corp. (A) | | 140,167 | | | 5,749,650 |
| Cantel Medical Corp. | | 14,979 | | | 786,098 |
| Cardiovascular Systems, Inc. (A) | | 4,580 | | | 149,629 |
| Carl Zeiss Meditec AG, Bearer Shares | | 7,553 | | | 852,520 |
| Cerus Corp. (A) | | 21,398 | | | 136,305 |
| Cochlear, Ltd. | | 11,830 | | | 1,671,731 |
| Co-Diagnostics, Inc. (A)(C) | | 3,468 | | | 37,801 |
| Coloplast A/S, B Shares | | 20,816 | | | 3,530,838 |
| CONMED Corp. | | 3,568 | | | 307,954 |
| CryoLife, Inc. (A) | | 4,871 | | | 98,492 |
| CryoPort, Inc. (A)(C) | | 4,424 | | | 245,444 |
| Cutera, Inc. (A) | | 2,420 | | | 39,615 |
| CytoSorbents Corp. (A) | | 4,677 | | | 39,474 |
| Danaher Corp. | | 61,734 | | | 12,746,219 |
| Demant A/S (A) | | 19,354 | | | 577,266 |
| Dentsply Sirona, Inc. | | 21,494 | | | 964,436 |
| DexCom, Inc. (A) | | 9,055 | | | 3,852,088 |
| DiaSorin SpA | | 2,901 | | | 525,139 |
| Edwards Lifesciences Corp. (A) | | 60,794 | | | 5,218,557 |
| Electromed, Inc. (A) | | 1,019 | | | 12,615 |
| Fisher & Paykel Healthcare Corp., Ltd. | | 217,977 | | | 5,398,593 |
| FONAR Corp. (A) | | 964 | | | 24,457 |
| GenMark Diagnostics, Inc. (A) | | 8,935 | | | 115,887 |
| Glaukos Corp. (A)(C) | | 5,562 | | | 266,030 |
| Globus Medical, Inc., Class A (A) | | 20,376 | | | 1,151,652 |
| GN Store Nord A/S | | 22,461 | | | 1,627,790 |
| Haemonetics Corp. (A) | | 13,569 | | | 1,216,597 |
| Hartalega Holdings BHD | | 216,800 | | | 861,079 |
| The accompanying notes are an integral part of the financial statements. | 76 | |
John Hancock Funds II
Portfolio of Investments — August 31, 2020 (showing percentage of total net assets)
Strategic Equity Allocation Fund (continued)
| | | Shares or
Principal
Amount | | Value |
| COMMON STOCKS (continued) | | | |
| Health care equipment and supplies (continued) | | | |
| Heska Corp. (A) | | 927 | | $ | 96,037 |
| Hill-Rom Holdings, Inc. | | 17,923 | | | 1,680,998 |
| Hologic, Inc. (A) | | 25,332 | | | 1,512,827 |
| Hoya Corp. | | 29,700 | | | 2,921,710 |
| ICU Medical, Inc. (A) | | 5,217 | | | 1,044,652 |
| IDEXX Laboratories, Inc. (A) | | 8,333 | | | 3,258,703 |
| Inogen, Inc. (A)(C) | | 2,447 | | | 73,973 |
| Integer Holdings Corp. (A) | | 4,290 | | | 297,125 |
| Integra LifeSciences Holdings Corp. (A) | | 18,964 | | | 906,290 |
| IntriCon Corp. (A) | | 1,353 | | | 16,425 |
| Intuitive Surgical, Inc. (A) | | 11,441 | | | 8,361,540 |
| Invacare Corp. | | 4,765 | | | 32,307 |
| iRadimed Corp. (A) | | 906 | | | 19,207 |
| iRhythm Technologies, Inc. (A) | | 3,550 | | | 781,639 |
| Koninklijke Philips NV (A) | | 184,701 | | | 8,740,261 |
| Lantheus Holdings, Inc. (A) | | 8,682 | | | 116,512 |
| LeMaitre Vascular, Inc. (C) | | 2,250 | | | 72,630 |
| LivaNova PLC (A) | | 19,503 | | | 914,691 |
| Masimo Corp. (A) | | 13,407 | | | 3,003,168 |
| Medtronic PLC | | 131,571 | | | 14,139,935 |
| Meridian Bioscience, Inc. (A) | | 5,609 | | | 79,311 |
| Merit Medical Systems, Inc. (A) | | 7,127 | | | 349,936 |
| Mesa Laboratories, Inc. (C) | | 525 | | | 129,108 |
| Misonix, Inc. (A) | | 2,149 | | | 28,345 |
| Natus Medical, Inc. (A) | | 4,470 | | | 81,175 |
| Neogen Corp. (A) | | 6,922 | | | 527,456 |
| Nevro Corp. (A) | | 4,396 | | | 604,626 |
| NuVasive, Inc. (A) | | 20,544 | | | 1,070,959 |
| Olympus Corp. | | 91,524 | | | 1,811,668 |
| OraSure Technologies, Inc. (A) | | 8,229 | | | 96,444 |
| Orthofix Medical, Inc. (A) | | 2,506 | | | 76,032 |
| OrthoPediatrics Corp. (A)(C) | | 1,589 | | | 80,086 |
| Penumbra, Inc. (A) | | 8,903 | | | 1,862,062 |
| Pulse Biosciences, Inc. (A) | | 2,014 | | | 19,918 |
| Quidel Corp. (A) | | 10,292 | | | 1,810,980 |
| Quotient, Ltd. (A) | | 8,073 | | | 40,849 |
| Repro-Med Systems, Inc. (A) | | 3,326 | | | 28,903 |
| ResMed, Inc. | | 14,193 | | | 2,565,811 |
| Rockwell Medical, Inc. (A)(C) | | 10,548 | | | 13,818 |
| SeaSpine Holdings Corp. (A) | | 3,735 | | | 49,713 |
| Shandong Weigao Group Medical Polymer Company, Ltd., H Shares | | 289,200 | | | 673,859 |
| Shockwave Medical, Inc. (A) | | 3,529 | | | 224,233 |
| SI-BONE, Inc. (A) | | 3,447 | | | 75,214 |
| Siemens Healthineers AG (B)(C) | | 28,143 | | | 1,282,161 |
| Sientra, Inc. (A) | | 6,578 | | | 25,260 |
| Silk Road Medical, Inc. (A) | | 4,176 | | | 254,652 |
| Smith & Nephew PLC | | 81,515 | | | 1,645,023 |
| Sonova Holding AG (A) | | 6,957 | | | 1,626,599 |
| STAAR Surgical Company (A) | | 5,936 | | | 284,631 |
| Stereotaxis, Inc. (A) | | 6,234 | | | 21,944 |
| STERIS PLC | | 8,334 | | | 1,330,440 |
| Straumann Holding AG | | 1,312 | | | 1,294,851 |
| Stryker Corp. | | 31,625 | | | 6,266,810 |
| Surgalign Holdings, Inc. (A) | | 8,366 | | | 18,573 |
| Surmodics, Inc. (A) | | 1,795 | | | 81,224 |
| Sysmex Corp. | | 13,100 | | | 1,144,222 |
| Tactile Systems Technology, Inc. (A) | | 2,425 | | | 93,193 |
| Teleflex, Inc. | | 4,555 | | | 1,789,887 |
| Terumo Corp. | | 50,746 | | | 2,064,376 |
| The Cooper Companies, Inc. | | 4,820 | | | 1,515,312 |
| Top Glove Corp. BHD | | 197,200 | | | 1,245,524 |
| TransMedics Group, Inc. (A) | | 2,717 | | | 48,444 |
| Utah Medical Products, Inc. | | 479 | | | 39,350 |
| Vapotherm, Inc. (A) | | 2,530 | | | 78,708 |
Strategic Equity Allocation Fund (continued)
| | | Shares or
Principal
Amount | | Value |
| COMMON STOCKS (continued) | | | |
| Health care equipment and supplies (continued) | | | |
| Varex Imaging Corp. (A) | | 5,004 | | $ | 55,494 |
| Varian Medical Systems, Inc. (A) | | 8,910 | | | 1,547,400 |
| ViewRay, Inc. (A) | | 15,492 | | | 42,138 |
| West Pharmaceutical Services, Inc. | | 7,221 | | | 2,050,475 |
| Wright Medical Group NV (A)(C) | | 16,856 | | | 509,557 |
| Zimmer Biomet Holdings, Inc. | | 20,289 | | | 2,858,314 |
| Zynex, Inc. (A) | | 2,198 | | | 32,530 |
| | | | | | 179,082,768 |
| Health care providers and services – 1.5% | | | |
| 1Life Healthcare, Inc. (A) | | 2,812 | | | 82,026 |
| Acadia Healthcare Company, Inc. (A) | | 23,952 | | | 740,356 |
| AdaptHealth Corp. (A) | | 1,067 | | | 22,652 |
| Addus HomeCare Corp. (A) | | 1,818 | | | 170,274 |
| Alfresa Holdings Corp. | | 14,700 | | | 295,381 |
| Amedisys, Inc. (A) | | 8,720 | | | 2,109,368 |
| AmerisourceBergen Corp. | | 14,567 | | | 1,413,436 |
| AMN Healthcare Services, Inc. (A) | | 6,101 | | | 328,478 |
| Anthem, Inc. | | 24,735 | | | 6,963,397 |
| Apollo Medical Holdings, Inc. (A) | | 1,355 | | | 25,596 |
| Bangkok Dusit Medical Services PCL, NVDR | | 1,373,500 | | | 918,281 |
| BioTelemetry, Inc. (A)(C) | | 4,415 | | | 174,746 |
| Brookdale Senior Living, Inc. (A) | | 24,620 | | | 67,705 |
| Bumrungrad Hospital PCL, NVDR | | 57,500 | | | 204,364 |
| Cardinal Health, Inc. | | 28,646 | | | 1,454,071 |
| Celltrion Healthcare Company, Ltd. (A) | | 8,182 | | | 688,947 |
| Centene Corp. (A) | | 56,817 | | | 3,484,018 |
| Chemed Corp. | | 4,275 | | | 2,210,645 |
| Cigna Corp. | | 36,200 | | | 6,420,794 |
| Community Health Systems, Inc. (A) | | 11,931 | | | 61,683 |
| CorVel Corp. (A) | | 1,172 | | | 97,299 |
| Covetrus, Inc. (A) | | 12,954 | | | 296,776 |
| Cross Country Healthcare, Inc. (A) | | 5,220 | | | 33,356 |
| CVS Health Corp. | | 128,236 | | | 7,966,020 |
| DaVita, Inc. (A)(C) | | 8,365 | | | 725,747 |
| Encompass Health Corp. | | 26,769 | | | 1,746,410 |
| Fresenius Medical Care AG & Company KGaA | | 40,032 | | | 3,401,563 |
| Fresenius SE & Company KGaA | | 78,525 | | | 3,643,888 |
| Fulgent Genetics, Inc. (A) | | 1,359 | | | 40,172 |
| Hanger, Inc. (A) | | 4,919 | | | 97,199 |
| Hapvida Participacoes e Investimentos SA (B) | | 26,100 | | | 308,379 |
| HCA Healthcare, Inc. | | 25,836 | | | 3,506,462 |
| HealthEquity, Inc. (A) | | 28,380 | | | 1,631,282 |
| Henry Schein, Inc. (A) | | 14,006 | | | 930,559 |
| Humana, Inc. | | 12,970 | | | 5,384,755 |
| IHH Healthcare BHD | | 282,009 | | | 362,827 |
| InfuSystem Holdings, Inc. (A) | | 2,089 | | | 30,395 |
| Laboratory Corp. of America Holdings (A) | | 9,536 | | | 1,675,952 |
| LHC Group, Inc. (A) | | 11,970 | | | 2,495,027 |
| Life Healthcare Group Holdings, Ltd. | | 170,098 | | | 165,586 |
| Magellan Health, Inc. (A) | | 3,074 | | | 231,964 |
| McKesson Corp. | | 15,879 | | | 2,436,474 |
| Medipal Holdings Corp. | | 14,400 | | | 275,185 |
| MEDNAX, Inc. (A) | | 33,946 | | | 630,717 |
| Molina Healthcare, Inc. (A) | | 15,942 | | | 2,948,792 |
| National HealthCare Corp. | | 1,612 | | | 102,684 |
| National Research Corp. | | 1,807 | | | 101,192 |
| NMC Health PLC (A) | | 8,800 | | | 1,760 |
| Notre Dame Intermedica Participacoes SA | | 56,600 | | | 765,549 |
| Option Care Health, Inc. (A) | | 4,504 | | | 52,336 |
| Orpea (A) | | 8,646 | | | 1,037,013 |
| Owens & Minor, Inc. (C) | | 8,194 | | | 135,857 |
| Patterson Companies, Inc. | | 34,355 | | | 996,639 |
| The accompanying notes are an integral part of the financial statements. | 77 | |
John Hancock Funds II
Portfolio of Investments — August 31, 2020 (showing percentage of total net assets)
Strategic Equity Allocation Fund (continued)
| | | Shares or
Principal
Amount | | Value |
| COMMON STOCKS (continued) | | | |
| Health care providers and services (continued) | | | |
| PetIQ, Inc. (A)(C) | | 2,737 | | $ | 96,288 |
| Progyny, Inc. (A) | | 3,491 | | | 99,668 |
| Quest Diagnostics, Inc. | | 13,120 | | | 1,459,469 |
| R1 RCM, Inc. (A) | | 14,044 | | | 203,638 |
| RadNet, Inc. (A)(C) | | 5,659 | | | 81,603 |
| Ramsay Health Care, Ltd. | | 33,026 | | | 1,584,436 |
| Ryman Healthcare, Ltd. | | 151,909 | | | 1,369,473 |
| Select Medical Holdings Corp. (A) | | 14,230 | | | 285,596 |
| Shanghai Pharmaceuticals Holding Company, Ltd., H Shares | | 91,000 | | | 161,938 |
| Sharps Compliance Corp. (A) | | 2,346 | | | 17,912 |
| Sinopharm Group Company, Ltd., H Shares | | 156,700 | | | 384,767 |
| Sonic Healthcare, Ltd. | | 83,374 | | | 1,966,361 |
| Surgery Partners, Inc. (A) | | 3,057 | | | 58,358 |
| Suzuken Company, Ltd. | | 5,300 | | | 196,882 |
| Tenet Healthcare Corp. (A) | | 41,903 | | | 1,180,827 |
| The Ensign Group, Inc. | | 6,710 | | | 392,803 |
| The Joint Corp. (A) | | 1,942 | | | 34,684 |
| The Pennant Group, Inc. (A) | | 3,436 | | | 127,269 |
| The Providence Service Corp. (A) | | 1,587 | | | 146,940 |
| Tivity Health, Inc. (A)(C) | | 5,790 | | | 94,724 |
| Triple-S Management Corp., Class B (A)(C) | | 3,043 | | | 56,600 |
| UnitedHealth Group, Inc. | | 93,044 | | | 29,080,902 |
| Universal Health Services, Inc., Class B | | 7,620 | | | 840,867 |
| US Physical Therapy, Inc. | | 1,680 | | | 149,352 |
| Viemed Healthcare, Inc. (A)(C) | | 4,716 | | | 51,263 |
| | | | | | 112,214,654 |
| Health care technology – 0.1% | | | |
| Alibaba Health Information Technology, Ltd. (A) | | 421,100 | | | 1,014,948 |
| Allscripts Healthcare Solutions, Inc. (A) | | 21,406 | | | 191,156 |
| Cerner Corp. | | 29,859 | | | 2,190,755 |
| Computer Programs & Systems, Inc. | | 1,780 | | | 48,701 |
| Evolent Health, Inc., Class A (A)(C) | | 10,120 | | | 145,020 |
| Health Catalyst, Inc. (A)(C) | | 4,255 | | | 132,671 |
| HealthStream, Inc. (A) | | 3,422 | | | 70,887 |
| HMS Holdings Corp. (A) | | 11,543 | | | 321,934 |
| Icad, Inc. (A) | | 2,837 | | | 30,725 |
| Inovalon Holdings, Inc., Class A (A) | | 9,710 | | | 240,274 |
| Inspire Medical Systems, Inc. (A) | | 3,436 | | | 410,430 |
| M3, Inc. | | 34,600 | | | 2,004,327 |
| NantHealth, Inc. (A) | | 3,828 | | | 12,173 |
| NextGen Healthcare, Inc. (A) | | 7,351 | | | 97,474 |
| Omnicell, Inc. (A) | | 5,565 | | | 371,074 |
| OptimizeRx Corp. (A) | | 2,097 | | | 42,276 |
| Phreesia, Inc. (A)(C) | | 3,757 | | | 118,496 |
| Ping An Healthcare and Technology Company, Ltd. (A)(B)(C) | | 43,500 | | | 634,016 |
| Schrodinger, Inc. (A) | | 1,811 | | | 109,493 |
| Simulations Plus, Inc. (C) | | 1,642 | | | 97,830 |
| Tabula Rasa HealthCare, Inc. (A) | | 2,695 | | | 136,367 |
| Vocera Communications, Inc. (A) | | 4,197 | | | 117,474 |
| | | | | | 8,538,501 |
| Life sciences tools and services – 1.0% | | | |
| Agilent Technologies, Inc. | | 41,118 | | | 4,129,070 |
| Bio-Rad Laboratories, Inc., Class A (A) | | 2,846 | | | 1,447,447 |
| Bio-Techne Corp. | | 10,293 | | | 2,629,450 |
| Charles River Laboratories International, Inc. (A) | | 13,327 | | | 2,917,947 |
| ChromaDex Corp. (A) | | 5,983 | | | 29,616 |
| Codexis, Inc. (A) | | 7,158 | | | 98,780 |
| Eurofins Scientific SE (A) | | 2,211 | | | 1,779,129 |
| Fluidigm Corp. (A) | | 9,728 | | | 76,365 |
Strategic Equity Allocation Fund (continued)
| | | Shares or
Principal
Amount | | Value |
| COMMON STOCKS (continued) | | | |
| Life sciences tools and services (continued) | | | |
| Genscript Biotech Corp. (A) | | 121,400 | | $ | 233,828 |
| Harvard Bioscience, Inc. (A) | | 6,083 | | | 20,378 |
| Illumina, Inc. (A) | | 19,575 | | | 6,992,582 |
| IQVIA Holdings, Inc. (A) | | 23,649 | | | 3,872,524 |
| Lonza Group AG | | 9,461 | | | 5,879,190 |
| Luminex Corp. | | 5,599 | | | 149,437 |
| Medpace Holdings, Inc. (A) | | 3,582 | | | 464,908 |
| Mettler-Toledo International, Inc. (A) | | 3,184 | | | 3,090,964 |
| NanoString Technologies, Inc. (A) | | 4,978 | | | 201,509 |
| NeoGenomics, Inc. (A) | | 13,584 | | | 529,097 |
| Pacific Biosciences of California, Inc. (A) | | 19,566 | | | 129,136 |
| PerkinElmer, Inc. | | 14,833 | | | 1,746,141 |
| Personalis, Inc. (A) | | 2,746 | | | 62,664 |
| PRA Health Sciences, Inc. (A) | | 17,134 | | | 1,831,796 |
| QIAGEN NV (A) | | 43,334 | | | 2,201,336 |
| Quanterix Corp. (A) | | 2,539 | | | 90,388 |
| Repligen Corp. (A) | | 12,677 | | | 1,963,794 |
| Samsung Biologics Company, Ltd. (A)(B) | | 1,989 | | | 1,299,481 |
| Sartorius Stedim Biotech | | 4,630 | | | 1,654,809 |
| Syneos Health, Inc. (A) | | 16,831 | | | 1,062,036 |
| Thermo Fisher Scientific, Inc. | | 52,593 | | | 22,561,345 |
| Waters Corp. (A) | | 8,244 | | | 1,782,847 |
| WuXi AppTec Company, Ltd., H Shares (B) | | 24,872 | | | 367,685 |
| Wuxi Biologics Cayman, Inc. (A)(B) | | 106,200 | | | 2,749,520 |
| | | | | | 74,045,199 |
| Pharmaceuticals – 3.1% | | | |
| AcelRx Pharmaceuticals, Inc. (A)(C) | | 12,548 | | | 15,685 |
| Aerie Pharmaceuticals, Inc. (A)(C) | | 4,921 | | | 54,131 |
| Agile Therapeutics, Inc. (A)(C) | | 9,484 | | | 30,349 |
| AMAG Pharmaceuticals, Inc. (A)(C) | | 4,372 | | | 45,294 |
| Amneal Pharmaceuticals, Inc. (A) | | 13,180 | | | 54,170 |
| Amphastar Pharmaceuticals, Inc. (A) | | 4,730 | | | 96,397 |
| ANI Pharmaceuticals, Inc. (A) | | 1,303 | | | 40,862 |
| Aquestive Therapeutics, Inc. (A)(C) | | 2,957 | | | 23,242 |
| Arvinas, Inc. (A) | | 3,879 | | | 100,660 |
| Aspen Pharmacare Holdings, Ltd. (A) | | 47,752 | | | 381,343 |
| Astellas Pharma, Inc. | | 146,200 | | | 2,293,608 |
| AstraZeneca PLC | | 122,384 | | | 13,584,651 |
| Axsome Therapeutics, Inc. (A) | | 3,638 | | | 266,702 |
| Bausch Health Companies, Inc. (A)(C) | | 11,450 | | | 190,051 |
| Bayer AG | | 184,513 | | | 12,272,335 |
| BioDelivery Sciences International, Inc. (A) | | 12,148 | | | 47,499 |
| Bristol-Myers Squibb Company | | 107,769 | | | 6,703,232 |
| Canopy Growth Corp. (A)(C) | | 8,115 | | | 133,824 |
| CanSino Biologics, Inc., H Shares (A)(B) | | 7,000 | | | 147,890 |
| Cara Therapeutics, Inc. (A) | | 5,476 | | | 84,878 |
| Catalent, Inc. (A) | | 43,783 | | | 4,049,928 |
| Celltrion Pharm, Inc. (A) | | 1,951 | | | 181,843 |
| Chiasma, Inc. (A) | | 5,221 | | | 28,663 |
| China Medical System Holdings, Ltd. | | 158,500 | | | 178,512 |
| China Resources Pharmaceutical Group, Ltd. (B) | | 183,500 | | | 103,886 |
| China Traditional Chinese Medicine Holdings Company, Ltd. | | 322,400 | | | 137,454 |
| Chugai Pharmaceutical Company, Ltd. | | 52,700 | | | 2,348,156 |
| Collegium Pharmaceutical, Inc. (A) | | 4,556 | | | 86,837 |
| Corcept Therapeutics, Inc. (A)(C) | | 12,673 | | | 160,947 |
| CorMedix, Inc. (A) | | 3,807 | | | 17,779 |
| Cronos Group, Inc. (A)(C) | | 6,847 | | | 37,953 |
| CSPC Pharmaceutical Group, Ltd. | | 654,120 | | | 1,445,224 |
| Cymabay Therapeutics, Inc. (A) | | 9,707 | | | 62,804 |
| Daiichi Sankyo Company, Ltd. | | 44,500 | | | 3,969,533 |
| Durect Corp. (A) | | 26,570 | | | 46,099 |
| The accompanying notes are an integral part of the financial statements. | 78 | |
John Hancock Funds II
Portfolio of Investments — August 31, 2020 (showing percentage of total net assets)
Strategic Equity Allocation Fund (continued)
| | | Shares or
Principal
Amount | | Value |
| COMMON STOCKS (continued) | | | |
| Pharmaceuticals (continued) | | | |
| Eisai Company, Ltd. | | 19,754 | | $ | 1,725,407 |
| Elanco Animal Health, Inc. (A)(D) | | 6,772 | | | 0 |
| Eli Lilly & Company | | 40,113 | | | 5,952,368 |
| Endo International PLC (A) | | 29,898 | | | 89,993 |
| Evofem Biosciences, Inc. (A)(C) | | 6,780 | | | 22,510 |
| Evolus, Inc. (A)(C) | | 3,187 | | | 12,302 |
| Fulcrum Therapeutics, Inc. (A) | | 1,760 | | | 12,795 |
| GlaxoSmithKline PLC | | 467,766 | | | 9,137,023 |
| H Lundbeck A/S | | 12,200 | | | 400,228 |
| Hanmi Pharm Company, Ltd. | | 791 | | | 203,717 |
| Hansoh Pharmaceutical Group Company, Ltd. (A)(B) | | 60,000 | | | 283,637 |
| Harrow Health, Inc. (A) | | 3,500 | | | 24,115 |
| Hikma Pharmaceuticals PLC | | 16,109 | | | 508,324 |
| Hisamitsu Pharmaceutical Company, Inc. | | 4,000 | | | 184,776 |
| Hutchison China MediTech, Ltd., ADR (A) | | 8,000 | | | 265,760 |
| Hypera SA | | 44,379 | | | 256,383 |
| IMARA, Inc. (A) | | 681 | | | 15,826 |
| Innoviva, Inc. (A)(C) | | 8,440 | | | 98,832 |
| Intersect ENT, Inc. (A) | | 4,438 | | | 89,115 |
| Intra-Cellular Therapies, Inc. (A) | | 7,255 | | | 132,186 |
| Ipsen SA | | 6,314 | | | 652,123 |
| Johnson & Johnson | | 125,482 | | | 19,250,194 |
| Kala Pharmaceuticals, Inc. (A) | | 5,296 | | | 47,134 |
| Kalbe Farma Tbk PT | | 2,783,810 | | | 301,683 |
| Kyowa Kirin Company, Ltd. | | 21,228 | | | 548,594 |
| Lannett Company, Inc. (A) | | 4,442 | | | 23,365 |
| Liquidia Technologies, Inc. (A) | | 2,820 | | | 14,438 |
| Luye Pharma Group, Ltd. (B)(C) | | 209,100 | | | 113,017 |
| Mallinckrodt PLC (A)(C) | | 11,640 | | | 18,391 |
| Marinus Pharmaceuticals, Inc. (A) | | 11,855 | | | 22,999 |
| Menlo Therapeutics, Inc. (A) | | 15,060 | | | 23,042 |
| Merck & Company, Inc. | | 120,220 | | | 10,251,159 |
| Merck KGaA | | 24,277 | | | 3,299,602 |
| Mylan NV (A) | | 24,621 | | | 403,292 |
| MyoKardia, Inc. (A) | | 6,521 | | | 713,658 |
| Nektar Therapeutics (A) | | 47,932 | | | 927,005 |
| NGM Biopharmaceuticals, Inc. (A)(C) | | 3,129 | | | 58,356 |
| Nippon Shinyaku Company, Ltd. | | 3,600 | | | 297,457 |
| Novartis AG | | 272,964 | | | 23,525,947 |
| Novo Nordisk A/S, B Shares | | 310,300 | | | 20,514,969 |
| Ocular Therapeutix, Inc. (A)(C) | | 6,943 | | | 60,404 |
| Odonate Therapeutics, Inc. (A) | | 1,759 | | | 28,408 |
| Omeros Corp. (A)(C) | | 6,949 | | | 83,041 |
| Ono Pharmaceutical Company, Ltd. | | 29,100 | | | 879,083 |
| Optinose, Inc. (A) | | 4,517 | | | 20,552 |
| Orion OYJ, Class B | | 34,861 | | | 1,636,951 |
| Otsuka Holdings Company, Ltd. | | 30,700 | | | 1,347,375 |
| Pacira BioSciences, Inc. (A) | | 5,450 | | | 340,734 |
| Paratek Pharmaceuticals, Inc. (A) | | 5,856 | | | 26,938 |
| Perrigo Company PLC | | 6,493 | | | 339,584 |
| Pfizer, Inc. | | 264,570 | | | 9,998,100 |
| Phathom Pharmaceuticals, Inc. (A)(C) | | 1,437 | | | 52,824 |
| Phibro Animal Health Corp., Class A | | 2,752 | | | 59,058 |
| Prestige Consumer Healthcare, Inc. (A) | | 20,088 | | | 731,806 |
| Provention Bio, Inc. (A)(C) | | 5,625 | | | 73,350 |
| Recordati Industria Chimica e Farmaceutica SpA | | 12,000 | | | 654,580 |
| Relmada Therapeutics, Inc. (A)(C) | | 1,860 | | | 66,365 |
| Revance Therapeutics, Inc. (A) | | 7,489 | | | 218,903 |
| Richter Gedeon NYRT | | 22,318 | | | 543,543 |
| Roche Holding AG | | 89,261 | | | 31,225,175 |
| Sanofi | | 189,222 | | | 19,166,059 |
| Santen Pharmaceutical Company, Ltd. | | 28,200 | | | 538,178 |
| Satsuma Pharmaceuticals, Inc. (A) | | 1,262 | | | 29,064 |
Strategic Equity Allocation Fund (continued)
| | | Shares or
Principal
Amount | | Value |
| COMMON STOCKS (continued) | | | |
| Pharmaceuticals (continued) | | | |
| Shanghai Fosun Pharmaceutical Group Company, Ltd., H Shares | | 61,000 | | $ | 257,038 |
| Shionogi & Company, Ltd. | | 21,163 | | | 1,175,138 |
| SIGA Technologies, Inc. (A) | | 7,346 | | | 51,055 |
| Sino Biopharmaceutical, Ltd. | | 1,209,525 | | | 1,391,897 |
| SSY Group, Ltd. | | 175,300 | | | 111,518 |
| Strongbridge Biopharma PLC (A) | | 5,473 | | | 21,016 |
| Sumitomo Dainippon Pharma Company, Ltd. | | 14,100 | | | 178,251 |
| Supernus Pharmaceuticals, Inc. (A) | | 6,469 | | | 142,253 |
| Taisho Pharmaceutical Holdings Company, Ltd. | | 2,700 | | | 166,144 |
| Takeda Pharmaceutical Company, Ltd. | | 123,828 | | | 4,617,198 |
| Teva Pharmaceutical Industries, Ltd., ADR (A) | | 121,236 | | | 1,196,599 |
| TherapeuticsMD, Inc. (A)(C) | | 32,668 | | | 47,695 |
| Theravance Biopharma, Inc. (A) | | 6,121 | | | 112,198 |
| Tricida, Inc. (A) | | 3,770 | | | 39,849 |
| UCB SA | | 29,536 | | | 3,505,540 |
| Verrica Pharmaceuticals, Inc. (A) | | 1,887 | | | 17,342 |
| Vifor Pharma AG | | 5,779 | | | 854,194 |
| WaVe Life Sciences, Ltd. (A) | | 2,904 | | | 36,387 |
| Yuhan Corp. | | 5,689 | | | 320,543 |
| Zoetis, Inc. | | 22,621 | | | 3,621,622 |
| Zogenix, Inc. (A) | | 7,337 | | | 173,667 |
| | | | | | 236,001,362 |
| | | | | | 703,084,395 |
| Industrials – 11.5% | | | | | |
| Aerospace and defense – 1.1% | | | |
| AAR Corp. | | 4,474 | | | 90,285 |
| Aerojet Rocketdyne Holdings, Inc. (A) | | 9,572 | | | 395,994 |
| AeroVironment, Inc. (A) | | 2,839 | | | 216,871 |
| Airbus SE (A) | | 98,590 | | | 8,107,800 |
| Aselsan Elektronik Sanayi Ve Ticaret AS | | 44,460 | | | 98,573 |
| Astronics Corp. (A) | | 3,358 | | | 30,356 |
| AviChina Industry & Technology Company, Ltd., H Shares | | 296,300 | | | 184,743 |
| Axon Enterprise, Inc. (A) | | 16,111 | | | 1,380,390 |
| BAE Systems PLC | | 299,854 | | | 2,081,610 |
| CAE, Inc. | | 9,975 | | | 158,150 |
| Cubic Corp. (C) | | 4,128 | | | 194,346 |
| Curtiss-Wright Corp. | | 11,216 | | | 1,147,621 |
| Dassault Aviation SA (A) | | 424 | | | 384,062 |
| Ducommun, Inc. (A) | | 1,449 | | | 54,149 |
| General Dynamics Corp. | | 28,371 | | | 4,237,209 |
| Hexcel Corp. | | 22,484 | | | 885,645 |
| Howmet Aerospace, Inc. | | 46,859 | | | 820,970 |
| Huntington Ingalls Industries, Inc. | | 4,942 | | | 748,812 |
| Kaman Corp. | | 3,631 | | | 167,934 |
| Korea Aerospace Industries, Ltd. | | 9,191 | | | 173,246 |
| Kratos Defense & Security Solutions, Inc. (A) | | 13,903 | | | 271,804 |
| L3Harris Technologies, Inc. | | 26,358 | | | 4,763,945 |
| Leonardo SpA | | 47,689 | | | 322,641 |
| Lockheed Martin Corp. | | 30,132 | | | 11,759,314 |
| Maxar Technologies, Inc. (C) | | 7,930 | | | 183,580 |
| Mercury Systems, Inc. (A) | | 14,973 | | | 1,134,055 |
| Moog, Inc., Class A | | 3,892 | | | 234,649 |
| MTU Aero Engines AG | | 10,005 | | | 1,858,600 |
| National Presto Industries, Inc. | | 647 | | | 58,185 |
| Northrop Grumman Corp. | | 18,930 | | | 6,485,607 |
| PAE, Inc. (A) | | 7,830 | | | 69,178 |
| Park Aerospace Corp. | | 2,708 | | | 30,032 |
| Parsons Corp. (A) | | 2,894 | | | 96,254 |
| Raytheon Technologies Corp. | | 179,584 | | | 10,954,624 |
| The accompanying notes are an integral part of the financial statements. | 79 | |
John Hancock Funds II
Portfolio of Investments — August 31, 2020 (showing percentage of total net assets)
Strategic Equity Allocation Fund (continued)
| | | Shares or
Principal
Amount | | Value |
| COMMON STOCKS (continued) | | | |
| Aerospace and defense (continued) | | | |
| Rolls-Royce Holdings PLC (A) | | 180,798 | | $ | 570,903 |
| Safran SA (A) | | 53,831 | | | 6,216,641 |
| Singapore Technologies Engineering, Ltd. | | 77,700 | | | 193,862 |
| Teledyne Technologies, Inc. (A) | | 4,477 | | | 1,404,032 |
| Textron, Inc. | | 27,795 | | | 1,095,957 |
| Thales SA | | 17,927 | | | 1,399,987 |
| The Boeing Company | | 65,460 | | | 11,247,337 |
| TransDigm Group, Inc. | | 6,140 | | | 3,067,974 |
| Triumph Group, Inc. | | 6,892 | | | 49,829 |
| Vectrus, Inc. (A)(C) | | 1,506 | | | 65,375 |
| | | | | | 85,093,131 |
| Air freight and logistics – 0.9% | | | |
| Air Transport Services Group, Inc. (A) | | 7,762 | | | 197,310 |
| Atlas Air Worldwide Holdings, Inc. (A) | | 3,400 | | | 191,726 |
| BEST, Inc., ADR (A) | | 22,700 | | | 90,800 |
| CH Robinson Worldwide, Inc. | | 33,350 | | | 3,278,305 |
| Deutsche Post AG | | 185,727 | | | 8,466,212 |
| DSV Panalpina A/S | | 37,106 | | | 5,792,692 |
| Echo Global Logistics, Inc. (A) | | 3,566 | | | 97,423 |
| Expeditors International of Washington, Inc. | | 41,231 | | | 3,644,408 |
| FedEx Corp. | | 59,546 | | | 13,090,593 |
| Forward Air Corp. | | 3,705 | | | 218,558 |
| Hub Group, Inc., Class A (A) | | 4,332 | | | 233,235 |
| Hyundai Glovis Company, Ltd. | | 2,292 | | | 280,221 |
| Radiant Logistics, Inc. (A) | | 6,225 | | | 32,868 |
| SG Holdings Company, Ltd. | | 12,500 | | | 575,228 |
| United Parcel Service, Inc., Class B | | 174,442 | | | 28,542,200 |
| XPO Logistics, Inc. (A) | | 24,540 | | | 2,166,146 |
| Yamato Holdings Company, Ltd. | | 24,300 | | | 635,588 |
| ZTO Express Cayman, Inc., ADR | | 43,600 | | | 1,461,908 |
| | | | | | 68,995,421 |
| Airlines – 0.2% | | | |
| Air Canada (A)(C) | | 5,398 | | | 72,837 |
| Air China, Ltd., H Shares | | 208,966 | | | 143,678 |
| Alaska Air Group, Inc. | | 30,369 | | | 1,182,873 |
| Allegiant Travel Company | | 1,740 | | | 223,764 |
| American Airlines Group, Inc. (C) | | 123,104 | | | 1,606,507 |
| ANA Holdings, Inc. (A) | | 9,000 | | | 224,392 |
| China Airlines, Ltd. (A) | | 298,000 | | | 86,665 |
| China Eastern Airlines Corp., Ltd., H Shares (C) | | 206,400 | | | 84,976 |
| China Southern Airlines Company, Ltd., H Shares (A)(C) | | 196,900 | | | 103,628 |
| Delta Air Lines, Inc. | | 140,636 | | | 4,338,621 |
| Deutsche Lufthansa AG (A)(C) | | 44,817 | | | 468,880 |
| Eva Airways Corp. | | 270,066 | | | 105,662 |
| Hawaiian Holdings, Inc. | | 6,224 | | | 83,651 |
| Japan Airlines Company, Ltd. | | 8,900 | | | 176,461 |
| JetBlue Airways Corp. (A) | | 72,630 | | | 836,698 |
| Korean Air Lines Company, Ltd. (A) | | 9,732 | | | 144,079 |
| Qantas Airways, Ltd. | | 169,177 | | | 491,620 |
| Singapore Airlines, Ltd. | | 65,640 | | | 175,731 |
| SkyWest, Inc. | | 6,543 | | | 220,172 |
| Southwest Airlines Company | | 132,875 | | | 4,993,443 |
| Spirit Airlines, Inc. (A)(C) | | 11,449 | | | 204,708 |
| Turk Hava Yollari AO (A) | | 34,857 | | | 50,185 |
| United Airlines Holdings, Inc. (A) | | 62,599 | | | 2,253,564 |
| | | | | | 18,272,795 |
| Building products – 1.0% | | | |
| A. O. Smith Corp. | | 49,917 | | | 2,444,435 |
| AAON, Inc. | | 5,356 | | | 304,917 |
| Advanced Drainage Systems, Inc. | | 6,473 | | | 359,122 |
| AGC, Inc. | | 15,184 | | | 429,618 |
Strategic Equity Allocation Fund (continued)
| | | Shares or
Principal
Amount | | Value |
| COMMON STOCKS (continued) | | | |
| Building products (continued) | | | |
| Allegion PLC | | 34,075 | | $ | 3,523,014 |
| Alpha Pro Tech, Ltd. (A)(C) | | 1,661 | | | 23,304 |
| American Woodmark Corp. (A) | | 2,234 | | | 195,475 |
| Apogee Enterprises, Inc. | | 3,478 | | | 72,795 |
| Assa Abloy AB, B Shares | | 216,100 | | | 5,006,236 |
| Builders FirstSource, Inc. (A) | | 46,814 | | | 1,433,445 |
| Caesarstone, Ltd. | | 3,220 | | | 35,533 |
| Carrier Global Corp. | | 300,838 | | | 8,980,014 |
| China Lesso Group Holdings, Ltd. | | 126,000 | | | 234,626 |
| Cie de Saint-Gobain (A) | | 86,792 | | | 3,508,632 |
| Cornerstone Building Brands, Inc. (A) | | 6,022 | | | 47,935 |
| CSW Industrials, Inc. | | 1,805 | | | 130,411 |
| Daikin Industries, Ltd. | | 19,600 | | | 3,691,959 |
| Fortune Brands Home & Security, Inc. | | 51,621 | | | 4,340,294 |
| Geberit AG | | 4,697 | | | 2,703,631 |
| Gibraltar Industries, Inc. (A) | | 4,308 | | | 269,013 |
| Griffon Corp. | | 4,845 | | | 105,282 |
| Insteel Industries, Inc. | | 2,567 | | | 47,335 |
| JELD-WEN Holding, Inc. (A) | | 9,009 | | | 189,639 |
| Johnson Controls International PLC | | 274,853 | | | 11,194,763 |
| Kingspan Group PLC | | 18,080 | | | 1,549,437 |
| Lennox International, Inc. | | 9,373 | | | 2,627,533 |
| LIXIL Group Corp. | | 20,900 | | | 383,753 |
| Masco Corp. | | 97,457 | | | 5,681,743 |
| Masonite International Corp. (A) | | 3,202 | | | 292,311 |
| Nibe Industrier AB, B Shares (A) | | 67,262 | | | 1,894,984 |
| Owens Corning | | 29,041 | | | 1,964,333 |
| Patrick Industries, Inc. | | 2,944 | | | 165,482 |
| PGT Innovations, Inc. (A) | | 7,650 | | | 138,695 |
| Quanex Building Products Corp. | | 4,486 | | | 75,410 |
| Resideo Technologies, Inc. (A) | | 16,292 | | | 217,661 |
| Simpson Manufacturing Company, Inc. | | 5,664 | | | 556,998 |
| TOTO, Ltd. (C) | | 11,100 | | | 487,181 |
| Trane Technologies PLC | | 88,387 | | | 10,464,137 |
| Trex Company, Inc. (A) | | 15,579 | | | 2,328,905 |
| UFP Industries, Inc. | | 7,820 | | | 464,117 |
| | | | | | 78,564,108 |
| Commercial services and supplies – 0.5% | | | |
| ABM Industries, Inc. | | 8,779 | | | 334,831 |
| ACCO Brands Corp. | | 12,264 | | | 79,471 |
| Advanced Disposal Services, Inc. (A) | | 9,506 | | | 286,416 |
| A-Living Services Company, Ltd., H Shares (B) | | 50,500 | | | 260,225 |
| Brady Corp., Class A | | 6,297 | | | 295,266 |
| Brambles, Ltd. | | 285,002 | | | 2,326,410 |
| BrightView Holdings, Inc. (A) | | 4,221 | | | 51,834 |
| Casella Waste Systems, Inc., Class A (A) | | 6,017 | | | 337,855 |
| CECO Environmental Corp. (A) | | 4,747 | | | 40,231 |
| China Everbright International, Ltd. | | 429,500 | | | 259,020 |
| Cimpress PLC (A)(C) | | 2,340 | | | 216,918 |
| Cintas Corp. | | 11,739 | | | 3,911,904 |
| Clean Harbors, Inc. (A) | | 13,770 | | | 841,347 |
| Copart, Inc. (A) | | 28,777 | | | 2,973,240 |
| Country Garden Services Holdings Company, Ltd. | | 157,400 | | | 1,096,626 |
| Covanta Holding Corp. | | 15,593 | | | 147,198 |
| Dai Nippon Printing Company, Ltd. | | 19,100 | | | 405,239 |
| Deluxe Corp. | | 5,555 | | | 157,762 |
| Ennis, Inc. | | 3,642 | | | 66,758 |
| Greentown Service Group Company, Ltd. | | 167,000 | | | 224,139 |
| Harsco Corp. (A) | | 10,360 | | | 146,594 |
| Healthcare Services Group, Inc. | | 29,838 | | | 620,630 |
| Heritage-Crystal Clean, Inc. (A) | | 2,187 | | | 32,105 |
| Herman Miller, Inc. | | 23,587 | | | 562,078 |
| HNI Corp. | | 17,094 | | | 544,444 |
| The accompanying notes are an integral part of the financial statements. | 80 | |
John Hancock Funds II
Portfolio of Investments — August 31, 2020 (showing percentage of total net assets)
Strategic Equity Allocation Fund (continued)
| | | Shares or
Principal
Amount | | Value |
| COMMON STOCKS (continued) | | | |
| Commercial services and supplies (continued) | | | |
| IAA, Inc. (A) | | 36,480 | | $ | 1,908,634 |
| Interface, Inc. | | 7,738 | | | 58,499 |
| KAR Auction Services, Inc. | | 51,713 | | | 896,703 |
| Kimball International, Inc., Class B | | 5,046 | | | 56,566 |
| Knoll, Inc. | | 6,697 | | | 86,190 |
| Matthews International Corp., Class A | | 4,046 | | | 88,607 |
| McGrath RentCorp | | 3,179 | | | 210,958 |
| MSA Safety, Inc. | | 9,625 | | | 1,212,269 |
| Park24 Company, Ltd. | | 8,500 | | | 153,069 |
| PICO Holdings, Inc. (A) | | 3,154 | | | 28,039 |
| Pitney Bowes, Inc. | | 22,984 | | | 126,182 |
| Rentokil Initial PLC (A) | | 172,330 | | | 1,227,096 |
| Republic Services, Inc. | | 29,262 | | | 2,713,173 |
| Ritchie Bros Auctioneers, Inc. | | 4,068 | | | 238,026 |
| Rollins, Inc. | | 19,631 | | | 1,082,453 |
| S-1 Corp. | | 2,042 | | | 149,834 |
| Secom Company, Ltd. | | 16,494 | | | 1,560,950 |
| Securitas AB, B Shares (A) | | 67,511 | | | 961,086 |
| Sohgo Security Services Company, Ltd. | | 5,600 | | | 261,632 |
| SP Plus Corp. (A) | | 3,104 | | | 63,663 |
| Steelcase, Inc., Class A | | 11,389 | | | 119,015 |
| Stericycle, Inc. (A) | | 24,618 | | | 1,578,260 |
| Team, Inc. (A) | | 4,547 | | | 28,964 |
| Tetra Tech, Inc. | | 21,567 | | | 1,990,850 |
| The Brink's Company | | 20,195 | | | 976,630 |
| Toppan Printing Company, Ltd. | | 20,700 | | | 321,259 |
| UniFirst Corp. | | 1,964 | | | 378,306 |
| US Ecology, Inc. | | 4,106 | | | 152,456 |
| Viad Corp. | | 2,745 | | | 58,825 |
| VSE Corp. | | 1,254 | | | 36,404 |
| Waste Management, Inc. | | 54,079 | | | 6,165,006 |
| | | | | | 41,108,145 |
| Construction and engineering – 0.5% | | | |
| ACS Actividades de Construccion y Servicios SA | | 51,978 | | | 1,271,905 |
| AECOM (A) | | 43,110 | | | 1,703,276 |
| Aegion Corp. (A) | | 4,109 | | | 66,504 |
| Ameresco, Inc., Class A (A) | | 3,232 | | | 110,340 |
| API Group Corp. (A)(B)(C) | | 18,147 | | | 256,599 |
| Arcosa, Inc. | | 6,320 | | | 292,553 |
| Argan, Inc. | | 1,927 | | | 81,570 |
| Bouygues SA (A)(C) | | 38,170 | | | 1,510,315 |
| China Communications Construction Company, Ltd., H Shares | | 514,865 | | | 288,602 |
| China Communications Services Corp., Ltd., H Shares | | 277,200 | | | 181,585 |
| China Conch Venture Holdings, Ltd. | | 188,900 | | | 817,871 |
| China Railway Construction Corp., Ltd., H Shares | | 229,100 | | | 175,849 |
| China Railway Group, Ltd., H Shares | | 441,200 | | | 226,287 |
| China State Construction International Holdings, Ltd. | | 235,900 | | | 182,620 |
| CIMIC Group, Ltd. | | 17,829 | | | 277,609 |
| Comfort Systems USA, Inc. | | 4,723 | | | 239,314 |
| Construction Partners, Inc., Class A (A) | | 2,503 | | | 46,781 |
| Daelim Industrial Company, Ltd. | | 3,410 | | | 248,970 |
| Daewoo Engineering & Construction Company, Ltd. (A) | | 24,378 | | | 60,317 |
| Dycom Industries, Inc. (A) | | 12,553 | | | 772,135 |
| Eiffage SA (A) | | 13,962 | | | 1,284,001 |
| EMCOR Group, Inc. | | 21,854 | | | 1,639,269 |
| Ferrovial SA | | 92,740 | | | 2,478,025 |
| Fluor Corp. | | 56,255 | | | 535,548 |
| Gamuda BHD | | 225,900 | | | 184,240 |
| Granite Construction, Inc. | | 6,220 | | | 115,630 |
Strategic Equity Allocation Fund (continued)
| | | Shares or
Principal
Amount | | Value |
| COMMON STOCKS (continued) | | | |
| Construction and engineering (continued) | | | |
| Great Lakes Dredge & Dock Corp. (A) | | 8,462 | | $ | 79,289 |
| GS Engineering & Construction Corp. | | 7,432 | | | 154,212 |
| HC2 Holdings, Inc. (A)(C) | | 6,237 | | | 15,593 |
| HOCHTIEF AG | | 4,622 | | | 409,823 |
| Hyundai Engineering & Construction Company, Ltd. | | 9,565 | | | 259,146 |
| IES Holdings, Inc. (A) | | 1,149 | | | 33,126 |
| IJM Corp. BHD | | 351,600 | | | 101,151 |
| Jacobs Engineering Group, Inc. | | 25,021 | | | 2,258,646 |
| JGC Holdings Corp. | | 17,400 | | | 191,720 |
| Kajima Corp. | | 35,300 | | | 439,155 |
| MasTec, Inc. (A) | | 23,086 | | | 1,066,804 |
| MYR Group, Inc. (A) | | 2,180 | | | 84,606 |
| Northwest Pipe Company (A) | | 1,421 | | | 40,257 |
| NV5 Global, Inc. (A) | | 1,412 | | | 73,099 |
| Obayashi Corp. | | 51,200 | | | 500,451 |
| Primoris Services Corp. | | 6,311 | | | 120,288 |
| Quanta Services, Inc. | | 26,472 | | | 1,356,690 |
| Samsung Engineering Company, Ltd. (A) | | 19,105 | | | 181,157 |
| Shimizu Corp. | | 43,400 | | | 333,372 |
| Sinopec Engineering Group Company, Ltd., H Shares | | 172,600 | | | 76,464 |
| Skanska AB, B Shares (A) | | 73,331 | | | 1,491,391 |
| Sterling Construction Company, Inc. (A) | | 3,853 | | | 54,481 |
| Taisei Corp. | | 15,000 | | | 517,738 |
| Tutor Perini Corp. (A) | | 5,424 | | | 68,071 |
| Valmont Industries, Inc. | | 5,751 | | | 730,665 |
| Vinci SA | | 86,388 | | | 8,093,797 |
| WillScot Mobile Mini Holdings Corp. (A) | | 21,187 | | | 379,247 |
| WSP Global, Inc. (C) | | 4,182 | | | 283,716 |
| | | | | | 34,441,870 |
| Electrical equipment – 1.3% | | | |
| ABB, Ltd. | | 234,208 | | | 5,972,111 |
| Acuity Brands, Inc. | | 10,675 | | | 1,166,671 |
| Allied Motion Technologies, Inc. | | 1,054 | | | 44,890 |
| American Superconductor Corp. (A) | | 3,385 | | | 42,516 |
| AMETEK, Inc. | | 80,938 | | | 8,150,457 |
| Atkore International Group, Inc. (A) | | 6,223 | | | 166,341 |
| AZZ, Inc. | | 3,446 | | | 119,680 |
| Bloom Energy Corp., Class A (A) | | 11,267 | | | 176,441 |
| Eaton Corp. PLC | | 141,110 | | | 14,407,331 |
| Emerson Electric Company | | 210,775 | | | 14,642,539 |
| Encore Wire Corp. | | 2,680 | | | 138,315 |
| EnerSys | | 16,967 | | | 1,221,285 |
| FuelCell Energy, Inc. (A)(C) | | 28,222 | | | 80,150 |
| Fuji Electric Company, Ltd. (C) | | 10,000 | | | 311,977 |
| Generac Holdings, Inc. (A) | | 16,879 | | | 3,206,672 |
| Hubbell, Inc. | | 14,596 | | | 2,115,252 |
| Legrand SA | | 44,733 | | | 3,733,866 |
| LSI Industries, Inc. | | 3,819 | | | 26,198 |
| Melrose Industries PLC | | 454,452 | | | 606,361 |
| Mitsubishi Electric Corp. | | 143,518 | | | 1,977,100 |
| Neoplux Company, Ltd. (A) | | 255 | | | 515 |
| Nidec Corp. | | 35,100 | | | 2,945,954 |
| nVent Electric PLC | | 42,081 | | | 804,589 |
| Plug Power, Inc. (A)(C) | | 42,416 | | | 550,560 |
| Powell Industries, Inc. | | 1,248 | | | 33,684 |
| Preformed Line Products Company | | 476 | | | 25,899 |
| Prysmian SpA | | 27,783 | | | 776,442 |
| Regal Beloit Corp. | | 10,912 | | | 1,078,760 |
| Rockwell Automation, Inc. | | 40,860 | | | 9,419,456 |
| Schneider Electric SE | | 91,260 | | | 11,286,253 |
| Schneider Electric SE (Euronext London Exchange) | | 1,474 | | | 185,833 |
| The accompanying notes are an integral part of the financial statements. | 81 | |
John Hancock Funds II
Portfolio of Investments — August 31, 2020 (showing percentage of total net assets)
Strategic Equity Allocation Fund (continued)
| | | Shares or
Principal
Amount | | Value |
| COMMON STOCKS (continued) | | | |
| Electrical equipment (continued) | | | |
| Shanghai Electric Group Company, Ltd., H Shares (A) | | 309,436 | | $ | 90,924 |
| Siemens Gamesa Renewable Energy SA | | 45,609 | | | 1,223,796 |
| Sunrun, Inc. (A) | | 36,839 | | | 2,083,430 |
| Thermon Group Holdings, Inc. (A) | | 4,458 | | | 58,667 |
| TPI Composites, Inc. (A) | | 4,034 | | | 123,884 |
| Vestas Wind Systems A/S | | 34,900 | | | 5,276,604 |
| Vicor Corp. (A) | | 2,338 | | | 203,476 |
| Vivint Solar, Inc. (A)(C) | | 6,550 | | | 202,264 |
| WEG SA | | 98,298 | | | 1,159,445 |
| Xinjiang Goldwind Science & Technology Company, Ltd., H Shares | | 86,000 | | | 73,917 |
| Zhuzhou CRRC Times Electric Company, Ltd., H Shares | | 63,900 | | | 204,911 |
| | | | | | 96,115,416 |
| Industrial conglomerates – 0.8% | | | |
| 3M Company | | 41,319 | | | 6,735,823 |
| Aboitiz Equity Ventures, Inc. | | 263,660 | | | 261,154 |
| Alfa SAB de CV, Class A | | 366,600 | | | 235,889 |
| Ayala Corp. | | 37,705 | | | 570,205 |
| Carlisle Companies, Inc. | | 14,788 | | | 1,936,489 |
| CITIC, Ltd. | | 680,333 | | | 620,284 |
| CJ Corp. | | 1,982 | | | 134,956 |
| CK Hutchison Holdings, Ltd. | | 358,472 | | | 2,344,456 |
| DCC PLC | | 9,170 | | | 814,665 |
| Far Eastern New Century Corp. | | 345,133 | | | 311,154 |
| Fosun International, Ltd. | | 299,500 | | | 333,339 |
| General Electric Company | | 628,357 | | | 3,983,783 |
| Grupo Carso SAB de CV, Series A1 | | 55,400 | | | 110,385 |
| GT Capital Holdings, Inc. | | 12,938 | | | 106,672 |
| HAP Seng Consolidated BHD | | 80,200 | | | 138,470 |
| Honeywell International, Inc. | | 50,417 | | | 8,346,534 |
| Investment AB Latour, B Shares (C) | | 31,980 | | | 715,870 |
| Jardine Matheson Holdings, Ltd. | | 29,132 | | | 1,223,380 |
| Jardine Strategic Holdings, Ltd. | | 29,400 | | | 589,904 |
| JG Summit Holdings, Inc. | | 383,810 | | | 506,710 |
| Keihan Holdings Company, Ltd. | | 7,500 | | | 323,390 |
| Keppel Corp., Ltd. | | 71,331 | | | 239,879 |
| KOC Holding AS | | 47,595 | | | 96,519 |
| LG Corp. | | 11,528 | | | 801,226 |
| Lotte Corp. | | 3,223 | | | 81,224 |
| NWS Holdings, Ltd. | | 206,230 | | | 174,999 |
| Raven Industries, Inc. | | 4,718 | | | 117,242 |
| Roper Technologies, Inc. | | 7,499 | | | 3,203,498 |
| Samsung C&T Corp. | | 10,291 | | | 933,992 |
| Shanghai Industrial Holdings, Ltd. | | 52,270 | | | 78,532 |
| Siemens AG | | 143,674 | | | 19,908,272 |
| Sime Darby BHD | | 351,200 | | | 184,300 |
| SK Holdings Company, Ltd. | | 4,238 | | | 761,582 |
| SM Investments Corp. | | 32,275 | | | 565,995 |
| Smiths Group PLC | | 36,932 | | | 685,480 |
| The Bidvest Group, Ltd. | | 35,431 | | | 283,167 |
| Toshiba Corp. | | 30,400 | | | 875,975 |
| | | | | | 59,335,394 |
| Machinery – 2.6% | | | |
| AGCO Corp. | | 16,734 | | | 1,189,787 |
| Airtac International Group | | 14,000 | | | 310,115 |
| Alamo Group, Inc. | | 1,280 | | | 141,952 |
| Albany International Corp., Class A | | 4,007 | | | 207,963 |
| Alfa Laval AB (A) | | 67,874 | | | 1,659,067 |
| Alstom SA (A) | | 32,201 | | | 1,797,569 |
| Altra Industrial Motion Corp. | | 8,460 | | | 330,363 |
| Amada Company, Ltd. | | 26,100 | | | 231,950 |
| ANDRITZ AG | | 14,284 | | | 477,783 |
| Astec Industries, Inc. | | 2,966 | | | 156,368 |
Strategic Equity Allocation Fund (continued)
| | | Shares or
Principal
Amount | | Value |
| COMMON STOCKS (continued) | | | |
| Machinery (continued) | | | |
| Atlas Copco AB, A Shares | | 144,830 | | $ | 6,703,294 |
| Atlas Copco AB, B Shares | | 84,152 | | | 3,381,292 |
| Barnes Group, Inc. | | 6,146 | | | 243,382 |
| Blue Bird Corp. (A) | | 2,174 | | | 24,740 |
| Caterpillar, Inc. | | 114,854 | | | 16,344,873 |
| Chart Industries, Inc. (A) | | 4,765 | | | 313,156 |
| CIRCOR International, Inc. (A)(C) | | 2,703 | | | 80,144 |
| CNH Industrial NV (A) | | 117,990 | | | 934,671 |
| Colfax Corp. (A) | | 22,624 | | | 752,927 |
| Columbus McKinnon Corp. | | 3,104 | | | 112,908 |
| Crane Company | | 13,271 | | | 750,342 |
| CRRC Corp., Ltd., H Shares | | 511,700 | | | 230,759 |
| Cummins, Inc. | | 31,306 | | | 6,488,169 |
| Daewoo Shipbuilding & Marine Engineering Company, Ltd. (A) | | 4,579 | | | 85,105 |
| Daifuku Company, Ltd. | | 8,000 | | | 704,313 |
| Deere & Company | | 66,391 | | | 13,946,093 |
| Donaldson Company, Inc. | | 33,966 | | | 1,710,528 |
| Doosan Bobcat, Inc. | | 6,171 | | | 136,271 |
| Douglas Dynamics, Inc. | | 2,962 | | | 113,711 |
| Dover Corp. | | 30,546 | | | 3,355,173 |
| Energy Recovery, Inc. (A) | | 5,130 | | | 43,656 |
| Enerpac Tool Group Corp. | | 7,061 | | | 146,869 |
| EnPro Industries, Inc. | | 2,701 | | | 158,063 |
| Epiroc AB, A Shares | | 142,158 | | | 2,120,432 |
| Epiroc AB, B Shares | | 84,111 | | | 1,208,903 |
| ESCO Technologies, Inc. | | 3,329 | | | 299,344 |
| Evoqua Water Technologies Corp. (A) | | 11,293 | | | 231,055 |
| FANUC Corp. | | 15,200 | | | 2,666,573 |
| Federal Signal Corp. | | 7,772 | | | 249,637 |
| Flowserve Corp. | | 27,614 | | | 819,584 |
| Fortive Corp. | | 62,905 | | | 4,536,080 |
| Franklin Electric Company, Inc. | | 6,005 | | | 356,457 |
| GEA Group AG | | 28,802 | | | 1,051,694 |
| Gencor Industries, Inc. (A) | | 1,568 | | | 19,772 |
| Graco, Inc. | | 44,864 | | | 2,603,009 |
| Graham Corp. | | 1,636 | | | 21,481 |
| Haitian International Holdings, Ltd. | | 74,200 | | | 179,510 |
| Helios Technologies, Inc. | | 3,877 | | | 159,383 |
| Hillenbrand, Inc. | | 9,704 | | | 307,714 |
| Hino Motors, Ltd. | | 22,800 | | | 153,309 |
| Hitachi Construction Machinery Company, Ltd. | | 8,500 | | | 298,243 |
| Hiwin Technologies Corp. | | 30,044 | | | 329,518 |
| Hoshizaki Corp. | | 4,000 | | | 305,565 |
| Hurco Companies, Inc. | | 999 | | | 28,252 |
| Hyster-Yale Materials Handling, Inc. (C) | | 1,350 | | | 54,459 |
| Hyundai Heavy Industries Holdings Company, Ltd. | | 1,189 | | | 225,772 |
| IDEX Corp. | | 15,999 | | | 2,883,500 |
| Illinois Tool Works, Inc. | | 61,009 | | | 12,052,328 |
| Ingersoll Rand, Inc. (A) | | 73,376 | | | 2,572,563 |
| ITT, Inc. | | 23,240 | | | 1,459,704 |
| John Bean Technologies Corp. | | 4,096 | | | 419,881 |
| Kadant, Inc. | | 1,463 | | | 170,352 |
| Kawasaki Heavy Industries, Ltd. | | 11,500 | | | 162,522 |
| Kennametal, Inc. | | 33,207 | | | 963,667 |
| KION Group AG | | 12,194 | | | 1,031,789 |
| Knorr-Bremse AG | | 9,051 | | | 1,150,080 |
| Komatsu, Ltd. | | 68,800 | | | 1,497,947 |
| Kone OYJ, B Shares | | 112,773 | | | 9,672,411 |
| Korea Shipbuilding & Offshore Engineering Company, Ltd. (A) | | 4,716 | | | 341,092 |
| Kubota Corp. | | 81,500 | | | 1,471,653 |
| Kurita Water Industries, Ltd. | | 7,789 | | | 243,942 |
| The accompanying notes are an integral part of the financial statements. | 82 | |
John Hancock Funds II
Portfolio of Investments — August 31, 2020 (showing percentage of total net assets)
Strategic Equity Allocation Fund (continued)
| | | Shares or
Principal
Amount | | Value |
| COMMON STOCKS (continued) | | | |
| Machinery (continued) | | | |
| LB Foster Company, Class A (A) | | 1,611 | | $ | 24,084 |
| Lincoln Electric Holdings, Inc. | | 15,993 | | | 1,546,683 |
| Lindsay Corp. | | 1,394 | | | 139,302 |
| Luxfer Holdings PLC | | 3,948 | | | 56,141 |
| Lydall, Inc. (A) | | 2,485 | | | 46,668 |
| Makita Corp. | | 17,600 | | | 813,117 |
| Meritor, Inc. (A)(C) | | 9,073 | | | 206,501 |
| Miller Industries, Inc. | | 1,504 | | | 47,180 |
| MINEBEA MITSUMI, Inc. | | 28,600 | | | 495,288 |
| MISUMI Group, Inc. | | 22,300 | | | 584,590 |
| Mitsubishi Heavy Industries, Ltd. | | 25,140 | | | 624,137 |
| Miura Company, Ltd. | | 6,900 | | | 283,007 |
| Mueller Industries, Inc. | | 7,401 | | | 219,810 |
| Mueller Water Products, Inc., Class A | | 20,496 | | | 221,357 |
| Nabtesco Corp. | | 8,900 | | | 281,150 |
| Navistar International Corp. (A) | | 6,547 | | | 209,373 |
| NGK Insulators, Ltd. | | 20,700 | | | 294,131 |
| NN, Inc. | | 6,139 | | | 27,932 |
| Nordson Corp. | | 13,824 | | | 2,578,038 |
| NSK, Ltd. | | 28,200 | | | 216,136 |
| Omega Flex, Inc. | | 382 | | | 50,325 |
| Oshkosh Corp. | | 18,331 | | | 1,411,670 |
| Otis Worldwide Corp. | | 86,388 | | | 5,433,805 |
| PACCAR, Inc. | | 73,365 | | | 6,297,652 |
| Parker-Hannifin Corp. | | 27,239 | | | 5,611,506 |
| Park-Ohio Holdings Corp. | | 1,342 | | | 21,230 |
| Pentair PLC | | 35,169 | | | 1,587,529 |
| Proto Labs, Inc. (A) | | 3,494 | | | 513,618 |
| RBC Bearings, Inc. (A) | | 3,224 | | | 425,697 |
| REV Group, Inc. | | 3,864 | | | 29,946 |
| Rexnord Corp. | | 13,840 | | | 400,806 |
| Samsung Heavy Industries Company, Ltd. (A) | | 57,138 | | | 247,423 |
| Sandvik AB (A) | | 243,552 | | | 4,795,728 |
| Schindler Holding AG | | 2,513 | | | 661,834 |
| Schindler Holding AG, Participation Certificates | | 5,195 | | | 1,388,973 |
| Sinotruk Hong Kong, Ltd. | | 80,600 | | | 209,185 |
| SKF AB, B Shares | | 82,170 | | | 1,643,519 |
| SMC Corp. | | 4,496 | | | 2,470,634 |
| Snap-on, Inc. | | 11,534 | | | 1,710,146 |
| Spirax-Sarco Engineering PLC | | 6,862 | | | 934,989 |
| SPX Corp. (A) | | 5,625 | | | 235,294 |
| SPX FLOW, Inc. (A) | | 5,604 | | | 243,662 |
| Standex International Corp. | | 1,611 | | | 93,180 |
| Stanley Black & Decker, Inc. | | 32,707 | | | 5,275,639 |
| Sumitomo Heavy Industries, Ltd. | | 8,800 | | | 200,308 |
| Techtronic Industries Company, Ltd. | | 182,000 | | | 2,304,872 |
| Tennant Company | | 2,352 | | | 156,337 |
| Terex Corp. | | 25,999 | | | 508,800 |
| The ExOne Company (A)(C) | | 1,834 | | | 22,411 |
| The Gorman-Rupp Company | | 2,291 | | | 73,197 |
| The Greenbrier Companies, Inc. | | 4,265 | | | 115,965 |
| The Manitowoc Company, Inc. (A) | | 4,789 | | | 45,112 |
| The Middleby Corp. (A) | | 14,967 | | | 1,465,269 |
| The Shyft Group, Inc. | | 4,477 | | | 89,406 |
| The Timken Company | | 18,193 | | | 985,879 |
| The Toro Company | | 28,861 | | | 2,172,656 |
| THK Company, Ltd. | | 9,500 | | | 222,564 |
| TriMas Corp. (A) | | 5,639 | | | 142,554 |
| Trinity Industries, Inc. | | 25,385 | | | 519,631 |
| Volvo AB, B Shares (A) | | 320,879 | | | 6,146,255 |
| Wabash National Corp. | | 6,942 | | | 84,762 |
| Wabtec Corp. | | 38,360 | | | 2,552,858 |
| Wartsila OYJ ABP | | 147,244 | | | 1,260,648 |
Strategic Equity Allocation Fund (continued)
| | | Shares or
Principal
Amount | | Value |
| COMMON STOCKS (continued) | | | |
| Machinery (continued) | | | |
| Watts Water Technologies, Inc., Class A | | 3,545 | | $ | 339,434 |
| Weichai Power Company, Ltd., H Shares | | 224,980 | | | 451,603 |
| Welbilt, Inc. (A) | | 17,309 | | | 127,740 |
| Woodward, Inc. | | 15,265 | | | 1,308,058 |
| Xylem, Inc. | | 38,179 | | | 3,061,192 |
| Yangzijiang Shipbuilding Holdings, Ltd. | | 127,600 | | | 85,721 |
| Yaskawa Electric Corp. (C) | | 18,900 | | | 678,705 |
| Zoomlion Heavy Industry Science and Technology Company, Ltd., H Shares (A) | | 152,600 | | | 152,627 |
| | | | | | 193,465,712 |
| Marine – 0.1% | | | |
| A.P. Moller - Maersk A/S, Series A | | 571 | | | 811,035 |
| A.P. Moller - Maersk A/S, Series B | | 1,144 | | | 1,752,906 |
| COSCO SHIPPING Holdings Company, Ltd., H Shares (A) | | 298,300 | | | 149,621 |
| Costamare, Inc. | | 6,554 | | | 33,098 |
| Evergreen Marine Corp. Taiwan, Ltd. (A) | | 278,748 | | | 165,456 |
| Genco Shipping & Trading, Ltd. | | 2,639 | | | 18,763 |
| Kirby Corp. (A) | | 16,168 | | | 686,170 |
| Kuehne + Nagel International AG (A) | | 6,833 | | | 1,324,853 |
| Matson, Inc. | | 5,673 | | | 227,317 |
| MISC BHD | | 171,700 | | | 313,159 |
| Nippon Yusen KK | | 12,000 | | | 187,417 |
| Pan Ocean Company, Ltd. (A) | | 33,742 | | | 96,223 |
| | | | | | 5,766,018 |
| Professional services – 0.6% | | | |
| 51job, Inc., ADR (A)(C) | | 3,100 | | | 203,174 |
| Acacia Research Corp. (A) | | 7,436 | | | 28,220 |
| Adecco Group AG | | 19,672 | | | 1,029,975 |
| ASGN, Inc. (A) | | 20,804 | | | 1,493,103 |
| Barrett Business Services, Inc. | | 1,017 | | | 58,549 |
| Bureau Veritas SA (A) | | 49,160 | | | 1,116,260 |
| CBIZ, Inc. (A) | | 6,610 | | | 160,755 |
| CoreLogic, Inc. | | 21,385 | | | 1,419,964 |
| CRA International, Inc. | | 1,067 | | | 45,358 |
| Equifax, Inc. | | 16,907 | | | 2,844,941 |
| Experian PLC | | 84,653 | | | 3,162,850 |
| Exponent, Inc. | | 6,713 | | | 540,094 |
| Forrester Research, Inc. (A) | | 1,516 | | | 53,757 |
| Franklin Covey Company (A) | | 1,773 | | | 34,999 |
| FTI Consulting, Inc. (A) | | 9,990 | | | 1,146,452 |
| GP Strategies Corp. (A) | | 2,193 | | | 21,184 |
| Heidrick & Struggles International, Inc. | | 2,580 | | | 55,805 |
| Huron Consulting Group, Inc. (A) | | 2,979 | | | 129,229 |
| ICF International, Inc. | | 2,404 | | | 164,217 |
| IHS Markit, Ltd. | | 55,563 | | | 4,440,595 |
| Insperity, Inc. | | 14,568 | | | 981,446 |
| Intertek Group PLC | | 15,026 | | | 1,177,317 |
| Kelly Services, Inc., Class A | | 4,495 | | | 85,360 |
| Kforce, Inc. | | 2,648 | | | 90,932 |
| Korn Ferry | | 7,214 | | | 220,027 |
| ManpowerGroup, Inc. | | 15,633 | | | 1,146,055 |
| Nielsen Holdings PLC | | 49,654 | | | 758,713 |
| Nihon M&A Center, Inc. | | 11,700 | | | 582,353 |
| Persol Holdings Company, Ltd. | | 13,900 | | | 216,235 |
| Randstad NV | | 23,516 | | | 1,223,853 |
| Recruit Holdings Company, Ltd. | | 99,900 | | | 3,786,260 |
| Red Violet, Inc. (A) | | 1,030 | | | 21,414 |
| RELX PLC | | 180,223 | | | 4,089,770 |
| Resources Connection, Inc. | | 4,241 | | | 52,122 |
| Robert Half International, Inc. | | 15,962 | | | 849,178 |
| SGS SA | | 766 | | | 1,985,022 |
| Teleperformance | | 9,838 | | | 3,033,717 |
| Thomson Reuters Corp. | | 6,481 | | | 495,435 |
| The accompanying notes are an integral part of the financial statements. | 83 | |
John Hancock Funds II
Portfolio of Investments — August 31, 2020 (showing percentage of total net assets)
Strategic Equity Allocation Fund (continued)
| | | Shares or
Principal
Amount | | Value |
| COMMON STOCKS (continued) | | | |
| Professional services (continued) | | | |
| TriNet Group, Inc. (A) | | 5,407 | | $ | 366,811 |
| TrueBlue, Inc. (A) | | 4,764 | | | 80,607 |
| Upwork, Inc. (A) | | 12,246 | | | 186,507 |
| Verisk Analytics, Inc. | | 22,600 | | | 4,218,742 |
| Willdan Group, Inc. (A) | | 1,472 | | | 41,481 |
| Wolters Kluwer NV | | 53,924 | | | 4,423,554 |
| | | | | | 48,262,392 |
| Road and rail – 1.3% | | | |
| ArcBest Corp. | | 3,389 | | | 114,616 |
| Aurizon Holdings, Ltd. | | 360,833 | | | 1,153,962 |
| Avis Budget Group, Inc. (A)(C) | | 21,360 | | | 728,590 |
| BTS Group Holdings PCL, NVDR (C) | | 1,136,900 | | | 380,033 |
| Canadian National Railway Company | | 25,508 | | | 2,680,359 |
| Canadian Pacific Railway, Ltd. | | 4,902 | | | 1,450,249 |
| Central Japan Railway Company | | 11,288 | | | 1,692,318 |
| CJ Logistics Corp. (A) | | 1,101 | | | 140,220 |
| Covenant Logistics Group, Inc. (A) | | 1,960 | | | 35,927 |
| CSX Corp. | | 189,640 | | | 14,499,874 |
| Daseke, Inc. (A) | | 6,776 | | | 41,672 |
| East Japan Railway Company | | 23,700 | | | 1,542,840 |
| Hankyu Hanshin Holdings, Inc. | | 17,900 | | | 581,610 |
| Heartland Express, Inc. | | 6,091 | | | 125,992 |
| Hertz Global Holdings, Inc. (A)(C) | | 12,313 | | | 17,977 |
| JB Hunt Transport Services, Inc. | | 20,902 | | | 2,937,567 |
| Kansas City Southern | | 23,541 | | | 4,285,404 |
| Keikyu Corp. | | 17,200 | | | 256,712 |
| Keio Corp. | | 8,020 | | | 485,017 |
| Keisei Electric Railway Company, Ltd. | | 10,135 | | | 297,880 |
| Kintetsu Group Holdings Company, Ltd. | | 13,400 | | | 589,505 |
| Knight-Swift Transportation Holdings, Inc. | | 32,927 | | | 1,496,861 |
| Kyushu Railway Company | | 11,600 | | | 255,855 |
| Landstar System, Inc. | | 10,333 | | | 1,375,219 |
| Localiza Rent a Car SA | | 71,045 | | | 625,445 |
| Marten Transport, Ltd. | | 7,990 | | | 145,098 |
| MTR Corp., Ltd. (C) | | 203,368 | | | 1,057,828 |
| Nagoya Railroad Company, Ltd. | | 14,600 | | | 407,622 |
| Nippon Express Company, Ltd. | | 5,780 | | | 341,341 |
| Norfolk Southern Corp. | | 63,467 | | | 13,488,642 |
| Odakyu Electric Railway Company, Ltd. | | 23,000 | | | 569,605 |
| Old Dominion Freight Line, Inc. | | 23,377 | | | 4,726,362 |
| Rumo SA (A) | | 127,500 | | | 525,965 |
| Ryder System, Inc. | | 14,471 | | | 591,864 |
| Saia, Inc. (A) | | 3,451 | | | 463,124 |
| Seibu Holdings, Inc. | | 16,800 | | | 184,553 |
| Tobu Railway Company, Ltd. | | 14,900 | | | 465,641 |
| Tokyu Corp. | | 39,093 | | | 522,756 |
| U.S. Xpress Enterprises, Inc., Class A (A) | | 3,555 | | | 34,021 |
| Union Pacific Corp. | | 168,112 | | | 32,351,473 |
| Werner Enterprises, Inc. | | 23,406 | | | 1,076,910 |
| West Japan Railway Company | | 12,700 | | | 667,855 |
| | | | | | 95,412,364 |
| Trading companies and distributors – 0.4% | | | |
| AerCap Holdings NV (A) | | 26,100 | | | 771,777 |
| Alta Equipment Group, Inc. (A) | | 2,579 | | | 21,535 |
| Applied Industrial Technologies, Inc. (C) | | 5,053 | | | 304,241 |
| Ashtead Group PLC | | 42,083 | | | 1,459,126 |
| Beacon Roofing Supply, Inc. (A) | | 7,208 | | | 244,279 |
| BMC Stock Holdings, Inc. (A) | | 8,835 | | | 352,693 |
| BOC Aviation, Ltd. (B) | | 24,400 | | | 181,238 |
| Brenntag AG | | 29,000 | | | 1,817,036 |
| Bunzl PLC | | 31,360 | | | 1,011,650 |
| CAI International, Inc. (A) | | 2,247 | | | 49,007 |
| DXP Enterprises, Inc. (A) | | 2,280 | | | 43,867 |
| EVI Industries, Inc. (A)(C) | | 738 | | | 18,125 |
| Fastenal Company | | 70,093 | | | 3,424,744 |
Strategic Equity Allocation Fund (continued)
| | | Shares or
Principal
Amount | | Value |
| COMMON STOCKS (continued) | | | |
| Trading companies and distributors (continued) | | | |
| Ferguson PLC | | 21,018 | | $ | 2,061,138 |
| Foundation Building Materials, Inc. (A) | | 2,794 | | | 45,347 |
| GATX Corp. | | 13,934 | | | 931,906 |
| GMS, Inc. (A) | | 5,449 | | | 144,344 |
| H&E Equipment Services, Inc. | | 4,242 | | | 85,943 |
| Herc Holdings, Inc. (A) | | 3,214 | | | 131,613 |
| ITOCHU Corp. | | 105,937 | | | 2,718,585 |
| Lawson Products, Inc. (A) | | 681 | | | 24,448 |
| Marubeni Corp. | | 129,300 | | | 778,585 |
| Mitsubishi Corp. | | 106,200 | | | 2,513,726 |
| Mitsui & Company, Ltd. | | 130,200 | | | 2,348,221 |
| MonotaRO Company, Ltd. | | 9,800 | | | 387,696 |
| MRC Global, Inc. (A) | | 10,639 | | | 60,536 |
| MSC Industrial Direct Company, Inc., Class A | | 12,233 | | | 806,155 |
| NOW, Inc. (A) | | 14,563 | | | 105,873 |
| Posco International Corp. | | 6,347 | | | 72,511 |
| Rush Enterprises, Inc., Class A | | 3,143 | | | 151,870 |
| Rush Enterprises, Inc., Class B | | 983 | | | 41,080 |
| SiteOne Landscape Supply, Inc. (A) | | 5,459 | | | 682,648 |
| Sumitomo Corp. | | 93,355 | | | 1,215,612 |
| Systemax, Inc. | | 1,681 | | | 37,301 |
| Textainer Group Holdings, Ltd. (A) | | 7,024 | | | 82,462 |
| Titan Machinery, Inc. (A) | | 2,734 | | | 36,909 |
| Toyota Tsusho Corp. | | 16,693 | | | 485,126 |
| Transcat, Inc. (A) | | 1,156 | | | 33,998 |
| Triton International, Ltd. | | 6,661 | | | 240,196 |
| United Rentals, Inc. (A) | | 8,816 | | | 1,560,873 |
| Univar Solutions, Inc. (A) | | 37,297 | | | 678,432 |
| Veritiv Corp. (A) | | 1,949 | | | 33,874 |
| W.W. Grainger, Inc. | | 5,300 | | | 1,936,779 |
| Watsco, Inc. | | 8,822 | | | 2,161,302 |
| WESCO International, Inc. (A) | | 5,461 | | | 255,848 |
| | | | | | 32,550,255 |
| Transportation infrastructure – 0.2% | | | |
| Aena SME SA (A)(B) | | 12,910 | | | 1,927,412 |
| Aeroports de Paris | | 4,959 | | | 517,690 |
| Airports of Thailand PCL, NVDR (C) | | 616,500 | | | 1,113,854 |
| Atlantia SpA (A) | | 57,024 | | | 905,363 |
| Auckland International Airport, Ltd. | | 461,257 | | | 2,052,926 |
| Bangkok Expressway & Metro PCL, NVDR | | 1,101,200 | | | 321,012 |
| Beijing Capital International Airport Company, Ltd., H Shares | | 218,211 | | | 154,241 |
| CCR SA | | 141,615 | | | 344,570 |
| China Merchants Port Holdings Company, Ltd. | | 162,031 | | | 185,238 |
| COSCO SHIPPING Ports, Ltd. | | 205,108 | | | 116,048 |
| Fraport AG Frankfurt Airport Services Worldwide (A)(C) | | 7,767 | | | 354,288 |
| Getlink SE (A) | | 73,716 | | | 1,127,575 |
| Grupo Aeroportuario del Pacifico SAB de CV, B Shares | | 46,300 | | | 360,083 |
| Grupo Aeroportuario del Sureste SAB de CV, B Shares (A) | | 25,250 | | | 286,760 |
| International Container Terminal Services, Inc. | | 133,460 | | | 288,527 |
| Japan Airport Terminal Company, Ltd. | | 4,000 | | | 179,500 |
| Jiangsu Expressway Company, Ltd., H Shares | | 142,055 | | | 142,132 |
| Kamigumi Company, Ltd. | | 7,800 | | | 160,973 |
| Malaysia Airports Holdings BHD | | 137,622 | | | 168,387 |
| Promotora y Operadora de Infraestructura SAB de CV (A) | | 27,750 | | | 205,468 |
| The accompanying notes are an integral part of the financial statements. | 84 | |
John Hancock Funds II
Portfolio of Investments — August 31, 2020 (showing percentage of total net assets)
Strategic Equity Allocation Fund (continued)
| | | Shares or
Principal
Amount | | Value |
| COMMON STOCKS (continued) | | | |
| Transportation infrastructure (continued) | | | |
| Shenzhen Expressway Company, Ltd., H Shares | | 82,000 | | $ | 74,201 |
| Shenzhen International Holdings, Ltd. | | 125,500 | | | 201,209 |
| Sydney Airport | | 204,485 | | | 859,123 |
| Taiwan High Speed Rail Corp. | | 229,632 | | | 253,873 |
| TAV Havalimanlari Holding AS | | 11,127 | | | 22,747 |
| Transurban Group | | 505,091 | | | 4,996,061 |
| Westports Holdings BHD | | 107,500 | | | 93,827 |
| Zhejiang Expressway Company, Ltd., H Shares | | 168,982 | | | 113,921 |
| | | | | | 17,527,009 |
| | | | | | 874,910,030 |
| Information technology – 21.7% | | | | | |
| Communications equipment – 0.8% | | | |
| Acacia Communications, Inc. (A) | | 5,069 | | | 342,056 |
| Accton Technology Corp. | | 59,000 | | | 470,509 |
| ADTRAN, Inc. | | 6,410 | | | 71,087 |
| Applied Optoelectronics, Inc. (A) | | 2,743 | | | 31,901 |
| Arista Networks, Inc. (A) | | 7,463 | | | 1,667,607 |
| BYD Electronic International Company, Ltd. | | 78,800 | | | 333,240 |
| CalAmp Corp. (A) | | 4,699 | | | 38,391 |
| Calix, Inc. (A) | | 6,386 | | | 124,208 |
| Casa Systems, Inc. (A) | | 4,521 | | | 20,571 |
| Ciena Corp. (A) | | 41,375 | | | 2,348,859 |
| Cisco Systems, Inc. | | 588,800 | | | 24,859,136 |
| Clearfield, Inc. (A) | | 1,511 | | | 26,594 |
| Comtech Telecommunications Corp. | | 3,232 | | | 53,651 |
| Digi International, Inc. (A) | | 3,975 | | | 54,140 |
| Extreme Networks, Inc. (A)(C) | | 15,666 | | | 68,460 |
| F5 Networks, Inc. (A) | | 8,455 | | | 1,118,850 |
| Genasys, Inc. (A) | | 4,924 | | | 24,620 |
| Harmonic, Inc. (A)(C) | | 12,668 | | | 74,741 |
| Infinera Corp. (A) | | 20,477 | | | 149,277 |
| Inseego Corp. (A)(C) | | 8,922 | | | 102,425 |
| InterDigital, Inc. | | 12,328 | | | 753,857 |
| Juniper Networks, Inc. | | 46,005 | | | 1,150,125 |
| KMW Company, Ltd. (A) | | 3,117 | | | 200,097 |
| KVH Industries, Inc. (A) | | 2,678 | | | 24,075 |
| Lumentum Holdings, Inc. (A) | | 20,170 | | | 1,734,620 |
| Motorola Solutions, Inc. | | 23,612 | | | 3,653,957 |
| NETGEAR, Inc. (A) | | 3,878 | | | 129,331 |
| NetScout Systems, Inc. (A) | | 26,412 | | | 611,174 |
| Nokia OYJ | | 1,876,546 | | | 9,148,041 |
| PCTEL, Inc. (A) | | 2,826 | | | 17,917 |
| Plantronics, Inc. (C) | | 4,522 | | | 55,892 |
| Resonant, Inc. (A) | | 7,246 | | | 19,347 |
| Ribbon Communications, Inc. (A) | | 9,192 | | | 39,342 |
| Telefonaktiebolaget LM Ericsson, B Shares | | 629,495 | | | 7,339,857 |
| ViaSat, Inc. (A) | | 15,732 | | | 625,504 |
| Viavi Solutions, Inc. (A) | | 29,879 | | | 398,436 |
| ZTE Corp., H Shares | | 87,915 | | | 255,197 |
| | | | | | 58,137,092 |
| Electronic equipment, instruments and components – 1.1% | | | |
| AAC Technologies Holdings, Inc. (C) | | 84,600 | | | 532,717 |
| Akoustis Technologies, Inc. (A)(C) | | 4,244 | | | 33,655 |
| Amphenol Corp., Class A | | 41,081 | | | 4,510,694 |
| Arlo Technologies, Inc. (A) | | 11,204 | | | 64,199 |
| Arrow Electronics, Inc. (A) | | 21,185 | | | 1,664,294 |
| AU Optronics Corp. (A) | | 1,011,851 | | | 360,712 |
| Avnet, Inc. | | 26,596 | | | 731,656 |
| Badger Meter, Inc. | | 3,792 | | | 233,928 |
| Belden, Inc. | | 16,084 | | | 541,709 |
| Benchmark Electronics, Inc. | | 4,704 | | | 92,245 |
Strategic Equity Allocation Fund (continued)
| | | Shares or
Principal
Amount | | Value |
| COMMON STOCKS (continued) | | | |
Electronic equipment, instruments and
components (continued) | | | |
| CDW Corp. | | 19,760 | | $ | 2,245,724 |
| China Railway Signal & Communication Corp., Ltd., H Shares (B) | | 182,500 | | | 73,851 |
| Cognex Corp. | | 46,235 | | | 3,199,000 |
| Coherent, Inc. (A) | | 6,531 | | | 735,782 |
| Corning, Inc. | | 105,379 | | | 3,420,602 |
| CTS Corp. | | 4,161 | | | 86,965 |
| Daktronics, Inc. | | 5,863 | | | 25,914 |
| Delta Electronics, Inc. | | 227,898 | | | 1,465,700 |
| ePlus, Inc. (A) | | 1,745 | | | 133,876 |
| Fabrinet (A) | | 4,773 | | | 333,060 |
| FARO Technologies, Inc. (A)(C) | | 2,326 | | | 131,419 |
| Fitbit, Inc., Class A (A) | | 31,289 | | | 198,998 |
| FLIR Systems, Inc. | | 18,166 | | | 670,325 |
| Foxconn Technology Company, Ltd. | | 107,180 | | | 190,634 |
| Halma PLC | | 35,389 | | | 1,049,313 |
| Hamamatsu Photonics KK | | 11,000 | | | 501,022 |
| Hexagon AB, B Shares (A) | | 60,703 | | | 4,408,251 |
| Hirose Electric Company, Ltd. | | 2,530 | | | 286,330 |
| Hitachi, Ltd. | | 76,100 | | | 2,531,732 |
| Hon Hai Precision Industry Company, Ltd. | | 1,461,172 | | | 3,832,198 |
| II-VI, Inc. (A) | | 37,776 | | | 1,681,032 |
| Ingenico Group SA (A) | | 10,153 | | | 1,733,562 |
| Innolux Corp. (A) | | 965,300 | | | 300,375 |
| Insight Enterprises, Inc. (A) | | 4,541 | | | 271,575 |
| Intellicheck, Inc. (A) | | 2,333 | | | 14,698 |
| IPG Photonics Corp. (A) | | 4,933 | | | 797,814 |
| Iteris, Inc. (A) | | 6,279 | | | 28,695 |
| Itron, Inc. (A) | | 5,261 | | | 313,398 |
| Jabil, Inc. | | 36,934 | | | 1,261,296 |
| Keyence Corp. | | 14,306 | | | 5,891,977 |
| Keysight Technologies, Inc. (A) | | 25,968 | | | 2,558,367 |
| Kimball Electronics, Inc. (A) | | 3,332 | | | 44,932 |
| Kingboard Holdings, Ltd. | | 77,600 | | | 249,454 |
| Kingboard Laminates Holdings, Ltd. | | 126,000 | | | 158,684 |
| Knowles Corp. (A) | | 11,583 | | | 174,440 |
| Kyocera Corp. | | 25,300 | | | 1,451,757 |
| Largan Precision Company, Ltd. | | 11,590 | | | 1,339,090 |
| LG Display Company, Ltd. (A) | | 28,132 | | | 345,004 |
| LG Innotek Company, Ltd. | | 1,725 | | | 209,871 |
| Littelfuse, Inc. | | 6,538 | | | 1,182,332 |
| Luna Innovations, Inc. (A) | | 4,247 | | | 27,181 |
| Methode Electronics, Inc. | | 4,677 | | | 132,406 |
| MTS Systems Corp. | | 2,665 | | | 65,026 |
| Murata Manufacturing Company, Ltd. | | 45,097 | | | 2,667,089 |
| Napco Security Technologies, Inc. (A) | | 1,592 | | | 39,657 |
| National Instruments Corp. | | 31,652 | | | 1,135,990 |
| nLight, Inc. (A) | | 4,563 | | | 106,592 |
| Novanta, Inc. (A) | | 4,472 | | | 479,264 |
| Omron Corp. | | 14,567 | | | 1,066,929 |
| OSI Systems, Inc. (A) | | 2,221 | | | 174,904 |
| PAR Technology Corp. (A)(C) | | 2,143 | | | 80,020 |
| PC Connection, Inc. | | 1,454 | | | 64,398 |
| Plexus Corp. (A) | | 3,737 | | | 284,274 |
| Powerfleet, Inc. (A) | | 4,184 | | | 23,514 |
| Research Frontiers, Inc. (A) | | 4,095 | | | 9,500 |
| Rogers Corp. (A) | | 2,439 | | | 276,363 |
| Samsung Electro-Mechanics Company, Ltd. | | 6,756 | | | 705,997 |
| Samsung SDI Company, Ltd. | | 6,614 | | | 2,511,308 |
| Sanmina Corp. (A) | | 8,770 | | | 248,191 |
| ScanSource, Inc. (A) | | 3,379 | | | 83,428 |
| Shimadzu Corp. | | 17,400 | | | 519,822 |
| The accompanying notes are an integral part of the financial statements. | 85 | |
John Hancock Funds II
Portfolio of Investments — August 31, 2020 (showing percentage of total net assets)
Strategic Equity Allocation Fund (continued)
| | | Shares or
Principal
Amount | | Value |
| COMMON STOCKS (continued) | | | |
Electronic equipment, instruments and
components (continued) | | | |
| Sunny Optical Technology Group Company, Ltd. | | 82,950 | | $ | 1,227,253 |
| SYNNEX Corp. | | 11,090 | | | 1,410,094 |
| Synnex Technology International Corp. | | 156,544 | | | 233,021 |
| TDK Corp. | | 10,200 | | | 1,057,663 |
| TE Connectivity, Ltd. | | 45,796 | | | 4,423,894 |
| Trimble, Inc. (A) | | 67,260 | | | 3,525,097 |
| TTM Technologies, Inc. (A)(C) | | 12,970 | | | 148,636 |
| Venture Corp., Ltd. | | 13,400 | | | 195,295 |
| Vishay Intertechnology, Inc. | | 52,975 | | | 847,070 |
| Vishay Precision Group, Inc. (A) | | 1,728 | | | 43,044 |
| Walsin Technology Corp. | | 37,000 | | | 201,871 |
| WPG Holdings, Ltd. | | 185,360 | | | 259,692 |
| Wrap Technologies, Inc. (A)(C) | | 1,839 | | | 15,999 |
| Yageo Corp. | | 43,726 | | | 496,823 |
| Yokogawa Electric Corp. | | 18,000 | | | 294,041 |
| Zebra Technologies Corp., Class A (A) | | 7,371 | | | 2,112,013 |
| Zhen Ding Technology Holding, Ltd. | | 68,817 | | | 288,581 |
| | | | | | 81,776,798 |
| IT services – 3.7% | | | |
| Accenture PLC, Class A | | 89,857 | | | 21,559,390 |
| Adyen NV (A)(B) | | 3,569 | | | 6,016,093 |
| Afterpay, Ltd. (A) | | 39,439 | | | 2,660,909 |
| Akamai Technologies, Inc. (A) | | 22,890 | | | 2,665,083 |
| Alliance Data Systems Corp. | | 11,415 | | | 514,931 |
| Amadeus IT Group SA | | 82,525 | | | 4,636,025 |
| Atos SE (A) | | 16,469 | | | 1,427,342 |
| Automatic Data Processing, Inc. | | 60,622 | | | 8,431,914 |
| Brightcove, Inc. (A) | | 5,628 | | | 62,583 |
| Broadridge Financial Solutions, Inc. | | 16,196 | | | 2,225,330 |
| CACI International, Inc., Class A (A) | | 6,756 | | | 1,582,188 |
| Capgemini SE | | 26,973 | | | 3,741,650 |
| Cardtronics PLC, Class A (A) | | 4,786 | | | 103,904 |
| Cass Information Systems, Inc. (C) | | 1,918 | | | 75,109 |
| CGI, Inc. (A) | | 8,675 | | | 609,348 |
| Cielo SA | | 142,624 | | | 118,712 |
| Cognizant Technology Solutions Corp., Class A | | 76,253 | | | 5,098,276 |
| Computershare, Ltd. | | 89,901 | | | 880,099 |
| Conduent, Inc. (A)(C) | | 22,130 | | | 74,799 |
| CSG Systems International, Inc. | | 4,287 | | | 182,498 |
| DXC Technology Company | | 35,795 | | | 715,184 |
| Edenred | | 40,776 | | | 2,104,849 |
| Endurance International Group Holdings, Inc. (A)(C) | | 9,074 | | | 59,072 |
| EVERTEC, Inc. | | 7,895 | | | 276,483 |
| Evo Payments, Inc., Class A (A) | | 5,397 | | | 155,056 |
| ExlService Holdings, Inc. (A) | | 4,413 | | | 281,064 |
| Fidelity National Information Services, Inc. | | 87,150 | | | 13,146,578 |
| Fiserv, Inc. (A) | | 79,325 | | | 7,899,184 |
| FleetCor Technologies, Inc. (A) | | 11,821 | | | 2,972,390 |
| Fujitsu, Ltd. | | 15,400 | | | 2,010,317 |
| Gartner, Inc. (A) | | 12,579 | | | 1,633,006 |
| GDS Holdings, Ltd., ADR (A)(C) | | 9,200 | | | 744,648 |
| Global Payments, Inc. | | 42,191 | | | 7,451,774 |
| GMO Payment Gateway, Inc. | | 3,200 | | | 338,403 |
| GreenSky, Inc., Class A (A) | | 8,492 | | | 36,940 |
| Grid Dynamics Holdings, Inc. (A) | | 3,156 | | | 23,418 |
| GTT Communications, Inc. (A)(C) | | 4,354 | | | 21,683 |
| i3 Verticals, Inc., Class A (A) | | 1,993 | | | 55,585 |
| IBM Corp. | | 125,244 | | | 15,443,838 |
| International Money Express, Inc. (A) | | 1,854 | | | 31,370 |
| Itochu Techno-Solutions Corp. | | 7,500 | | | 271,478 |
| Jack Henry & Associates, Inc. | | 10,807 | | | 1,787,694 |
Strategic Equity Allocation Fund (continued)
| | | Shares or
Principal
Amount | | Value |
| COMMON STOCKS (continued) | | | |
| IT services (continued) | | | |
| KBR, Inc. | | 56,947 | | $ | 1,423,106 |
| Leidos Holdings, Inc. | | 18,834 | | | 1,704,289 |
| Limelight Networks, Inc. (A) | | 15,363 | | | 87,108 |
| LiveRamp Holdings, Inc. (A) | | 26,204 | | | 1,463,231 |
| ManTech International Corp., Class A | | 3,541 | | | 265,044 |
| Mastercard, Inc., Class A | | 124,667 | | | 44,654,473 |
| MAXIMUS, Inc. | | 24,485 | | | 1,898,812 |
| MoneyGram International, Inc. (A) | | 8,751 | | | 25,553 |
| NEC Corp. | | 19,400 | | | 1,024,342 |
| Nexi SpA (A)(B) | | 43,417 | | | 772,703 |
| NIC, Inc. | | 8,633 | | | 184,574 |
| Nomura Research Institute, Ltd. | | 25,100 | | | 667,383 |
| NTT Data Corp. | | 49,600 | | | 566,677 |
| Obic Company, Ltd. | | 5,500 | | | 973,708 |
| Otsuka Corp. | | 8,200 | | | 402,424 |
| Paychex, Inc. | | 45,033 | | | 3,443,674 |
| PayPal Holdings, Inc. (A) | | 165,624 | | | 33,810,483 |
| Paysign, Inc. (A) | | 4,179 | | | 26,913 |
| Perficient, Inc. (A) | | 4,270 | | | 183,226 |
| Perspecta, Inc. | | 55,011 | | | 1,142,578 |
| Repay Holdings Corp. (A) | | 4,822 | | | 121,997 |
| Sabre Corp. | | 74,197 | | | 518,637 |
| Samsung SDS Company, Ltd. | | 4,195 | | | 555,140 |
| Science Applications International Corp. | | 13,303 | | | 1,110,268 |
| SCSK Corp. | | 4,100 | | | 222,033 |
| ServiceSource International, Inc. (A) | | 13,162 | | | 19,809 |
| Shopify, Inc., Class A (A) | | 3,703 | | | 3,955,327 |
| Sykes Enterprises, Inc. (A) | | 5,098 | | | 168,769 |
| The Hackett Group, Inc. | | 3,473 | | | 43,795 |
| The Western Union Company | | 57,963 | | | 1,367,347 |
| TIS, Inc. | | 17,600 | | | 351,275 |
| TravelSky Technology, Ltd., H Shares | | 108,900 | | | 226,145 |
| TTEC Holdings, Inc. | | 2,391 | | | 135,546 |
| Tucows, Inc., Class A (A)(C) | | 1,249 | | | 78,962 |
| Unisys Corp. (A) | | 8,129 | | | 94,784 |
| VeriSign, Inc. (A) | | 14,342 | | | 3,080,662 |
| Verra Mobility Corp. (A) | | 17,670 | | | 186,684 |
| Virtusa Corp. (A) | | 3,797 | | | 150,133 |
| Visa, Inc., Class A | | 237,979 | | | 50,449,168 |
| WEX, Inc. (A) | | 11,717 | | | 1,871,322 |
| Wix.com, Ltd. (A) | | 5,700 | | | 1,679,391 |
| Worldline SA (A)(B) | | 22,977 | | | 2,114,899 |
| | | | | | 283,348,591 |
| Semiconductors and semiconductor equipment – 5.3% | | | |
| Advanced Energy Industries, Inc. (A) | | 4,967 | | | 368,154 |
| Advanced Micro Devices, Inc. (A) | | 225,538 | | | 20,483,361 |
| Advantest Corp. (C) | | 15,700 | | | 752,305 |
| Alpha & Omega Semiconductor, Ltd. (A) | | 2,843 | | | 38,523 |
| Ambarella, Inc. (A) | | 4,320 | | | 227,664 |
| Amkor Technology, Inc. (A) | | 13,025 | | | 158,840 |
| Analog Devices, Inc. | | 70,948 | | | 8,292,402 |
| Applied Materials, Inc. | | 176,488 | | | 10,871,661 |
| ASE Technology Holding Company, Ltd. | | 381,422 | | | 791,603 |
| ASM Pacific Technology, Ltd. | | 40,600 | | | 436,743 |
| ASML Holding NV | | 84,143 | | | 31,444,761 |
| Atomera, Inc. (A)(C) | | 2,090 | | | 26,564 |
| Axcelis Technologies, Inc. (A) | | 4,258 | | | 100,617 |
| AXT, Inc. (A) | | 5,545 | | | 31,274 |
| Broadcom, Inc. | | 76,988 | | | 26,726,384 |
| Brooks Automation, Inc. | | 9,519 | | | 491,466 |
| Cabot Microelectronics Corp. | | 11,621 | | | 1,769,762 |
| CEVA, Inc. (A) | | 2,884 | | | 121,849 |
| Cirrus Logic, Inc. (A) | | 15,720 | | | 952,475 |
| Cohu, Inc. (C) | | 5,428 | | | 93,362 |
| Cree, Inc. (A) | | 29,127 | | | 1,837,914 |
| The accompanying notes are an integral part of the financial statements. | 86 | |
John Hancock Funds II
Portfolio of Investments — August 31, 2020 (showing percentage of total net assets)
Strategic Equity Allocation Fund (continued)
| | | Shares or
Principal
Amount | | Value |
| COMMON STOCKS (continued) | | | |
| Semiconductors and semiconductor equipment (continued) | | | |
| CyberOptics Corp. (A) | | 979 | | $ | 31,377 |
| Diodes, Inc. (A) | | 5,531 | | | 270,245 |
| Disco Corp. | | 2,300 | | | 536,042 |
| DSP Group, Inc. (A) | | 2,975 | | | 42,662 |
| Enphase Energy, Inc. (A) | | 21,917 | | | 1,692,650 |
| First Solar, Inc. (A) | | 20,535 | | | 1,572,776 |
| FormFactor, Inc. (A) | | 9,985 | | | 260,908 |
| Globalwafers Company, Ltd. | | 26,000 | | | 349,805 |
| GSI Technology, Inc. (A) | | 2,627 | | | 16,708 |
| Hua Hong Semiconductor, Ltd. (A)(B) | | 53,100 | | | 191,816 |
| Ichor Holdings, Ltd. (A) | | 2,908 | | | 73,165 |
| Impinj, Inc. (A)(C) | | 2,230 | | | 54,524 |
| Infineon Technologies AG | | 235,037 | | | 6,535,530 |
| Intel Corp. | | 815,347 | | | 41,541,930 |
| KLA Corp. | | 29,858 | | | 6,125,070 |
| Lam Research Corp. | | 27,954 | | | 9,402,048 |
| Lasertec Corp. | | 5,900 | | | 446,010 |
| Lattice Semiconductor Corp. (A) | | 17,597 | | | 503,274 |
| MACOM Technology Solutions Holdings, Inc. (A)(C) | | 6,168 | | | 219,766 |
| Maxim Integrated Products, Inc. | | 51,345 | | | 3,514,052 |
| MaxLinear, Inc. (A) | | 8,794 | | | 214,134 |
| MediaTek, Inc. | | 176,752 | | | 3,342,355 |
| Microchip Technology, Inc. | | 47,244 | | | 5,182,667 |
| Micron Technology, Inc. (A) | | 214,175 | | | 9,747,104 |
| MKS Instruments, Inc. | | 14,776 | | | 1,766,175 |
| Monolithic Power Systems, Inc. | | 11,205 | | | 2,993,192 |
| Nanya Technology Corp. | | 144,196 | | | 255,035 |
| NeoPhotonics Corp. (A) | | 6,363 | | | 42,378 |
| Novatek Microelectronics Corp. | | 67,900 | | | 555,532 |
| NVE Corp. | | 662 | | | 35,371 |
| NVIDIA Corp. | | 118,458 | | | 63,372,661 |
| Onto Innovation, Inc. (A) | | 6,216 | | | 194,188 |
| PDF Solutions, Inc. (A) | | 3,889 | | | 80,502 |
| Phison Electronics Corp. | | 16,884 | | | 159,041 |
| Photronics, Inc. (A) | | 8,233 | | | 82,577 |
| Pixelworks, Inc. (A) | | 5,652 | | | 12,887 |
| Power Integrations, Inc. | | 7,676 | | | 429,626 |
| Powertech Technology, Inc. | | 87,199 | | | 256,958 |
| Qorvo, Inc. (A) | | 22,094 | | | 2,833,997 |
| QUALCOMM, Inc. | | 216,629 | | | 25,800,514 |
| Rambus, Inc. (A) | | 14,859 | | | 199,556 |
| Realtek Semiconductor Corp. | | 56,584 | | | 733,157 |
| Renesas Electronics Corp. (A) | | 60,700 | | | 382,039 |
| Rohm Company, Ltd. | | 6,900 | | | 444,502 |
| Semiconductor Manufacturing International Corp. (A)(C) | | 386,399 | | | 1,220,638 |
| Semtech Corp. (A) | | 25,987 | | | 1,524,138 |
| Silergy Corp. | | 9,000 | | | 570,905 |
| Silicon Laboratories, Inc. (A) | | 17,424 | | | 1,784,392 |
| SiTime Corp. (A) | | 690 | | | 45,457 |
| SK Hynix, Inc. | | 65,592 | | | 4,145,150 |
| Skyworks Solutions, Inc. | | 32,128 | | | 4,653,741 |
| SMART Global Holdings, Inc. (A) | | 1,833 | | | 46,192 |
| SolarEdge Technologies, Inc. (A) | | 13,365 | | | 2,955,670 |
| STMicroelectronics NV | | 107,047 | | | 3,237,641 |
| SUMCO Corp. | | 20,800 | | | 282,437 |
| SunPower Corp. (A)(C) | | 10,131 | | | 113,366 |
| Synaptics, Inc. (A) | | 13,601 | | | 1,160,573 |
| Taiwan Semiconductor Manufacturing Company, Ltd. | | 2,883,915 | | | 42,033,275 |
| Teradyne, Inc. | | 44,640 | | | 3,793,061 |
| Texas Instruments, Inc. | | 176,737 | | | 25,123,165 |
| Tokyo Electron, Ltd. | | 11,715 | | | 3,004,992 |
| Ultra Clean Holdings, Inc. (A) | | 5,170 | | | 126,768 |
Strategic Equity Allocation Fund (continued)
| | | Shares or
Principal
Amount | | Value |
| COMMON STOCKS (continued) | | | |
| Semiconductors and semiconductor equipment (continued) | | | |
| United Microelectronics Corp. | | 1,307,774 | | $ | 941,786 |
| Universal Display Corp. | | 11,417 | | | 2,003,684 |
| Vanguard International Semiconductor Corp. | | 105,302 | | | 335,399 |
| Veeco Instruments, Inc. (A) | | 6,463 | | | 76,845 |
| Win Semiconductors Corp. | | 40,000 | | | 390,480 |
| Winbond Electronics Corp. | | 351,000 | | | 145,428 |
| Xilinx, Inc. | | 46,826 | | | 4,877,396 |
| Xinyi Solar Holdings, Ltd. | | 471,000 | | | 593,315 |
| | | | | | 403,700,084 |
| Software – 6.2% | | | |
| 8x8, Inc. (A) | | 13,375 | | | 225,770 |
| A10 Networks, Inc. (A) | | 8,353 | | | 71,418 |
| ACI Worldwide, Inc. (A) | | 46,228 | | | 1,358,179 |
| Adobe, Inc. (A) | | 68,613 | | | 35,225,228 |
| Agilysys, Inc. (A) | | 2,512 | | | 63,729 |
| Alarm.com Holdings, Inc. (A) | | 5,940 | | | 355,628 |
| Altair Engineering, Inc., Class A (A) | | 5,536 | | | 232,623 |
| American Software, Inc., Class A | | 4,020 | | | 56,923 |
| ANSYS, Inc. (A) | | 12,235 | | | 4,147,787 |
| Appfolio, Inc., Class A (A) | | 2,098 | | | 352,527 |
| Appian Corp. (A)(C) | | 4,306 | | | 263,699 |
| Autodesk, Inc. (A) | | 31,216 | | | 7,669,771 |
| Avaya Holdings Corp. (A) | | 12,239 | | | 189,949 |
| AVEVA Group PLC | | 5,996 | | | 405,057 |
| Benefitfocus, Inc. (A) | | 3,999 | | | 41,350 |
| Blackbaud, Inc. | | 19,843 | | | 1,266,976 |
| BlackBerry, Ltd. (A) | | 19,074 | | | 99,439 |
| Blackline, Inc. (A)(C) | | 6,574 | | | 574,370 |
| Bottomline Technologies DE, Inc. (A) | | 5,691 | | | 271,062 |
| Box, Inc., Class A (A) | | 19,317 | | | 379,193 |
| Cadence Design Systems, Inc. (A) | | 39,759 | | | 4,409,671 |
| CDK Global, Inc. | | 32,727 | | | 1,525,733 |
| Cerence, Inc. (A) | | 4,815 | | | 256,158 |
| Ceridian HCM Holding, Inc. (A) | | 27,338 | | | 2,173,918 |
| ChannelAdvisor Corp. (A) | | 3,698 | | | 62,200 |
| Check Point Software Technologies, Ltd. (A) | | 13,100 | | | 1,654,006 |
| Citrix Systems, Inc. | | 16,526 | | | 2,399,575 |
| Cloudera, Inc. (A)(C) | | 26,863 | | | 354,860 |
| CommVault Systems, Inc. (A) | | 16,929 | | | 731,841 |
| Constellation Software, Inc. | | 719 | | | 832,355 |
| Cornerstone OnDemand, Inc. (A) | | 7,958 | | | 280,679 |
| CyberArk Software, Ltd. (A) | | 4,300 | | | 475,150 |
| Dassault Systemes SE | | 22,022 | | | 4,155,484 |
| Digimarc Corp. (A) | | 1,731 | | | 27,661 |
| Digital Turbine, Inc. (A) | | 10,903 | | | 263,744 |
| Domo, Inc., Class B (A) | | 3,370 | | | 137,226 |
| Douzone Bizon Company, Ltd. | | 2,327 | | | 197,374 |
| Ebix, Inc. (C) | | 3,534 | | | 81,529 |
| eGain Corp. (A) | | 2,981 | | | 39,886 |
| Envestnet, Inc. (A) | | 6,954 | | | 577,112 |
| Fair Isaac Corp. (A) | | 7,810 | | | 3,286,370 |
| Fortinet, Inc. (A) | | 19,107 | | | 2,522,220 |
| GTY Technology Holdings, Inc. (A) | | 6,588 | | | 21,510 |
| Intelligent Systems Corp. (A) | | 999 | | | 37,552 |
| Intuit, Inc. | | 37,136 | | | 12,826,403 |
| j2 Global, Inc. (A) | | 18,254 | | | 1,277,597 |
| Kingdee International Software Group Company, Ltd. (A) | | 270,800 | | | 689,247 |
| Kingsoft Corp., Ltd. | | 96,000 | | | 513,039 |
| LivePerson, Inc. (A)(C) | | 8,000 | | | 477,280 |
| LogMeIn, Inc. | | 13,134 | | | 1,130,049 |
| Manhattan Associates, Inc. (A) | | 17,099 | | | 1,662,878 |
| Microsoft Corp. | | 1,079,950 | | | 243,561,124 |
| The accompanying notes are an integral part of the financial statements. | 87 | |
John Hancock Funds II
Portfolio of Investments — August 31, 2020 (showing percentage of total net assets)
Strategic Equity Allocation Fund (continued)
| | | Shares or
Principal
Amount | | Value |
| COMMON STOCKS (continued) | | | |
| Software (continued) | | | |
| MicroStrategy, Inc., Class A (A) | | 1,012 | | $ | 146,173 |
| Mimecast, Ltd. (A) | | 7,402 | | | 364,474 |
| Mitek Systems, Inc. (A) | | 5,440 | | | 69,034 |
| MobileIron, Inc. (A) | | 13,178 | | | 86,052 |
| Model N, Inc. (A) | | 4,453 | | | 175,092 |
| Nemetschek SE | | 10,823 | | | 860,462 |
| Nice, Ltd. (A) | | 6,989 | | | 1,604,761 |
| NortonLifeLock, Inc. | | 77,175 | | | 1,815,156 |
| OneSpan, Inc. (A) | | 4,398 | | | 94,777 |
| Ontrak, Inc. (A)(C) | | 1,084 | | | 79,078 |
| Open Text Corp. | | 9,895 | | | 448,797 |
| Oracle Corp. | | 296,405 | | | 16,960,294 |
| Oracle Corp. Japan | | 3,000 | | | 351,582 |
| Paycom Software, Inc. (A) | | 6,870 | | | 2,057,290 |
| Paylocity Holding Corp. (A) | | 9,686 | | | 1,426,264 |
| Ping Identity Holding Corp. (A) | | 2,093 | | | 72,146 |
| Progress Software Corp. | | 5,888 | | | 223,096 |
| PROS Holdings, Inc. (A) | | 5,171 | | | 201,669 |
| PTC, Inc. (A) | | 28,040 | | | 2,563,136 |
| Q2 Holdings, Inc. (A) | | 6,492 | | | 631,607 |
| QAD, Inc., Class A | | 1,547 | | | 70,358 |
| Qualys, Inc. (A) | | 13,471 | | | 1,429,812 |
| Rapid7, Inc. (A) | | 6,607 | | | 426,614 |
| Rosetta Stone, Inc. (A) | | 3,190 | | | 96,912 |
| Sailpoint Technologies Holdings, Inc. (A) | | 11,549 | | | 453,067 |
| salesforce.com, Inc. (A) | | 128,311 | | | 34,983,994 |
| SAP SE | | 196,103 | | | 32,424,617 |
| Sapiens International Corp. NV (C) | | 3,354 | | | 112,493 |
| ServiceNow, Inc. (A) | | 27,158 | | | 13,090,699 |
| ShotSpotter, Inc. (A) | | 1,149 | | | 34,424 |
| Smith Micro Software, Inc. (A) | | 4,840 | | | 18,586 |
| Sprout Social, Inc., Class A (A) | | 1,067 | | | 41,346 |
| SPS Commerce, Inc. (A) | | 4,607 | | | 368,007 |
| SVMK, Inc. (A) | | 15,659 | | | 389,753 |
| Synchronoss Technologies, Inc. (A) | | 6,183 | | | 27,143 |
| Synopsys, Inc. (A) | | 21,474 | | | 4,752,196 |
| TeamViewer AG (A)(B) | | 24,398 | | | 1,321,075 |
| Telenav, Inc. (A) | | 4,886 | | | 22,427 |
| Temenos AG | | 8,307 | | | 1,341,976 |
| Tenable Holdings, Inc. (A) | | 8,002 | | | 301,195 |
| Teradata Corp. (A) | | 29,218 | | | 711,458 |
| The Sage Group PLC | | 101,401 | | | 1,001,206 |
| Trend Micro, Inc. | | 10,500 | | | 649,794 |
| Tyler Technologies, Inc. (A) | | 5,663 | | | 1,955,491 |
| Upland Software, Inc. (A) | | 3,006 | | | 117,895 |
| Varonis Systems, Inc. (A) | | 4,087 | | | 504,867 |
| Verint Systems, Inc. (A) | | 8,388 | | | 398,933 |
| Veritone, Inc. (A) | | 3,089 | | | 25,546 |
| VirnetX Holding Corp. (C) | | 8,460 | | | 42,046 |
| WiseTech Global, Ltd. | | 26,436 | | | 548,450 |
| Workiva, Inc. (A) | | 5,049 | | | 297,891 |
| Xperi Holding Corp. | | 14,035 | | | 175,859 |
| Yext, Inc. (A)(C) | | 13,315 | | | 264,436 |
| Zix Corp. (A) | | 7,444 | | | 45,111 |
| Zuora, Inc., Class A (A) | | 12,911 | | | 175,460 |
| | | | | | 470,744,186 |
| Technology hardware, storage and peripherals – 4.6% | | | |
| 3D Systems Corp. (A)(C) | | 15,173 | | | 83,300 |
| Acer, Inc. | | 341,008 | | | 271,420 |
| Advantech Company, Ltd. | | 44,834 | | | 464,357 |
| Apple, Inc. | | 2,262,676 | | | 291,975,664 |
| Asustek Computer, Inc. | | 82,354 | | | 682,036 |
| Avid Technology, Inc. (A) | | 4,313 | | | 34,935 |
| Brother Industries, Ltd. | | 17,500 | | | 289,518 |
| Canon, Inc. | | 78,496 | | | 1,346,337 |
Strategic Equity Allocation Fund (continued)
| | | Shares or
Principal
Amount | | Value |
| COMMON STOCKS (continued) | | | |
| Technology hardware, storage and peripherals (continued) | | | |
| Catcher Technology Company, Ltd. | | 81,475 | | $ | 556,213 |
| Chicony Electronics Company, Ltd. | | 69,224 | | | 208,827 |
| Compal Electronics, Inc. | | 489,148 | | | 308,078 |
| Diebold Nixdorf, Inc. (A)(C) | | 9,420 | | | 78,563 |
| FUJIFILM Holdings Corp. | | 28,315 | | | 1,346,817 |
| Hewlett Packard Enterprise Company | | 178,377 | | | 1,724,906 |
| HP, Inc. | | 198,535 | | | 3,881,359 |
| Immersion Corp. (A) | | 2,992 | | | 28,454 |
| Intevac, Inc. (A) | | 3,655 | | | 21,930 |
| Inventec Corp. | | 293,495 | | | 227,180 |
| Legend Holdings Corp., H Shares (B)(C) | | 67,100 | | | 98,905 |
| Lenovo Group, Ltd. | | 839,764 | | | 559,883 |
| Lite-On Technology Corp. | | 248,018 | | | 392,765 |
| Logitech International SA | | 20,850 | | | 1,544,245 |
| Micro-Star International Company, Ltd. | | 79,300 | | | 366,103 |
| NCR Corp. (A) | | 34,416 | | | 703,463 |
| NetApp, Inc. | | 30,708 | | | 1,455,252 |
| Pegatron Corp. | | 229,500 | | | 488,163 |
| Quanta Computer, Inc. | | 339,000 | | | 888,506 |
| Quantum Corp. (A) | | 4,230 | | | 23,096 |
| Ricoh Company, Ltd. (C) | | 52,800 | | | 394,161 |
| Samsung Electronics Company, Ltd. | | 573,151 | | | 26,024,575 |
| Seagate Technology PLC | | 31,355 | | | 1,504,726 |
| Seiko Epson Corp. | | 22,069 | | | 263,120 |
| Super Micro Computer, Inc. (A)(C) | | 5,827 | | | 159,602 |
| Western Digital Corp. | | 41,610 | | | 1,598,656 |
| Wistron Corp. | | 332,580 | | | 360,721 |
| Wiwynn Corp. | | 9,000 | | | 240,075 |
| Xerox Holdings Corp. | | 25,427 | | | 479,553 |
| Xiaomi Corp., Class B (A)(B) | | 1,216,500 | | | 3,767,259 |
| | | | | | 344,842,723 |
| | | | | | 1,642,549,474 |
| Materials – 4.2% | | | | | |
| Chemicals – 2.1% | | | |
| AdvanSix, Inc. (A) | | 3,830 | | | 48,756 |
| Air Liquide SA | | 79,336 | | | 13,155,879 |
| Air Products & Chemicals, Inc. | | 25,530 | | | 7,461,398 |
| Air Water, Inc. | | 14,500 | | | 203,515 |
| Akzo Nobel NV | | 39,480 | | | 3,896,814 |
| Albemarle Corp. | | 12,290 | | | 1,118,513 |
| American Vanguard Corp. | | 3,917 | | | 55,426 |
| Amyris, Inc. (A) | | 9,494 | | | 31,140 |
| Arkema SA | | 11,572 | | | 1,281,148 |
| Asahi Kasei Corp. | | 98,700 | | | 826,833 |
| Ashland Global Holdings, Inc. | | 16,280 | | | 1,199,673 |
| Avient Corp. | | 36,575 | | | 933,394 |
| Balchem Corp. | | 4,229 | | | 413,173 |
| Barito Pacific Tbk PT (A) | | 3,528,400 | | | 203,258 |
| BASF SE | | 172,521 | | | 10,535,245 |
| Cabot Corp. | | 15,202 | | | 562,626 |
| Celanese Corp. | | 13,667 | | | 1,382,417 |
| CF Industries Holdings, Inc. | | 24,715 | | | 806,450 |
| Chase Corp. | | 966 | | | 94,253 |
| Chr. Hansen Holding A/S | | 18,488 | | | 2,122,007 |
| Clariant AG | | 25,384 | | | 530,045 |
| Corteva, Inc. | | 86,510 | | | 2,469,861 |
| Covestro AG (B) | | 32,671 | | | 1,557,558 |
| Croda International PLC | | 12,001 | | | 944,612 |
| Daicel Corp. | | 19,800 | | | 143,470 |
| Dow, Inc. | | 85,627 | | | 3,863,490 |
| DuPont de Nemours, Inc. | | 84,824 | | | 4,729,786 |
| Eastman Chemical Company | | 15,709 | | | 1,148,485 |
| Ecolab, Inc. | | 28,587 | | | 5,633,926 |
| EMS-Chemie Holding AG (C) | | 1,036 | | | 936,289 |
| Evonik Industries AG | | 39,419 | | | 1,144,783 |
| The accompanying notes are an integral part of the financial statements. | 88 | |
John Hancock Funds II
Portfolio of Investments — August 31, 2020 (showing percentage of total net assets)
Strategic Equity Allocation Fund (continued)
| | | Shares or
Principal
Amount | | Value |
| COMMON STOCKS (continued) | | | |
| Chemicals (continued) | | | |
| Ferro Corp. (A)(C) | | 10,723 | | $ | 133,716 |
| FMC Corp. | | 14,964 | | | 1,599,053 |
| Formosa Chemicals & Fibre Corp. | | 411,471 | | | 953,159 |
| Formosa Plastics Corp. | | 448,040 | | | 1,196,733 |
| FutureFuel Corp. | | 3,481 | | | 42,120 |
| GCP Applied Technologies, Inc. (A) | | 6,464 | | | 168,452 |
| Givaudan SA | | 1,172 | | | 4,925,998 |
| Hawkins, Inc. | | 1,315 | | | 66,039 |
| HB Fuller Company | | 6,725 | | | 323,943 |
| ICL Group, Ltd. | | 83,128 | | | 308,822 |
| Indorama Ventures PCL, NVDR | | 243,500 | | | 185,802 |
| Ingevity Corp. (A) | | 16,551 | | | 929,670 |
| Innospec, Inc. | | 3,209 | | | 239,680 |
| International Flavors & Fragrances, Inc. (C) | | 12,352 | | | 1,529,054 |
| Johnson Matthey PLC | | 18,070 | | | 569,914 |
| JSR Corp. | | 16,000 | | | 341,554 |
| Kansai Paint Company, Ltd. | | 13,900 | | | 330,669 |
| Koninklijke DSM NV | | 34,074 | | | 5,456,992 |
| Koppers Holdings, Inc. (A) | | 2,781 | | | 66,911 |
| Kraton Corp. (A) | | 4,135 | | | 58,055 |
| Kronos Worldwide, Inc. | | 3,129 | | | 39,081 |
| Kumho Petrochemical Company, Ltd. | | 2,260 | | | 190,737 |
| Kuraray Company, Ltd. | | 25,200 | | | 257,473 |
| LANXESS AG | | 15,638 | | | 915,490 |
| LG Chem, Ltd. | | 5,516 | | | 3,430,910 |
| Linde PLC | | 60,709 | | | 15,161,466 |
| Livent Corp. (A)(C) | | 19,410 | | | 164,597 |
| Lotte Chemical Corp. | | 2,082 | | | 331,535 |
| LyondellBasell Industries NV, Class A | | 29,703 | | | 1,944,952 |
| Minerals Technologies, Inc. | | 13,663 | | | 693,397 |
| Mitsubishi Chemical Holdings Corp. | | 100,750 | | | 588,347 |
| Mitsubishi Gas Chemical Company, Inc. | | 12,500 | | | 223,212 |
| Mitsui Chemicals, Inc. | | 14,500 | | | 340,098 |
| Nan Ya Plastics Corp. | | 603,610 | | | 1,266,313 |
| NewMarket Corp. | | 1,944 | | | 724,121 |
| Nippon Paint Holdings Company, Ltd. (C) | | 11,500 | | | 987,826 |
| Nissan Chemical Corp. | | 9,800 | | | 518,664 |
| Nitto Denko Corp. | | 12,544 | | | 761,654 |
| Novozymes A/S, B Shares | | 37,431 | | | 2,211,967 |
| Nutrien, Ltd. | | 20,583 | | | 762,345 |
| Olin Corp. | | 42,508 | | | 478,215 |
| Orbia Advance Corp. SAB de CV | | 127,780 | | | 205,317 |
| Orica, Ltd. | | 74,856 | | | 957,006 |
| Orion Engineered Carbons SA | | 7,979 | | | 96,945 |
| Petronas Chemicals Group BHD | | 308,245 | | | 403,595 |
| PPG Industries, Inc. | | 27,272 | | | 3,283,549 |
| PQ Group Holdings, Inc. (A) | | 5,100 | | | 59,415 |
| PTT Global Chemical PCL, NVDR | | 325,300 | | | 484,075 |
| Quaker Chemical Corp. (C) | | 1,735 | | | 329,650 |
| Rayonier Advanced Materials, Inc. (A) | | 8,841 | | | 27,938 |
| RPM International, Inc. | | 34,871 | | | 2,956,015 |
| Sasol, Ltd. (A) | | 69,337 | | | 565,366 |
| Sensient Technologies Corp. | | 16,928 | | | 934,764 |
| Shin-Etsu Chemical Company, Ltd. | | 27,837 | | | 3,382,877 |
| Showa Denko KK | | 10,600 | | | 206,350 |
| Sika AG | | 18,016 | | | 4,307,757 |
| Sinopec Shanghai Petrochemical Company, Ltd., H Shares (C) | | 382,199 | | | 78,809 |
| Solvay SA | | 17,323 | | | 1,492,556 |
| Stepan Company | | 2,804 | | | 323,273 |
| Sumitomo Chemical Company, Ltd. | | 117,800 | | | 382,072 |
| Symrise AG | | 24,138 | | | 3,338,260 |
| Taiyo Nippon Sanso Corp. | | 11,900 | | | 209,012 |
| Teijin, Ltd. | | 14,100 | | | 221,083 |
Strategic Equity Allocation Fund (continued)
| | | Shares or
Principal
Amount | | Value |
| COMMON STOCKS (continued) | | | |
| Chemicals (continued) | | | |
| The Chemours Company | | 44,223 | | $ | 913,647 |
| The Mosaic Company | | 40,309 | | | 734,833 |
| The Scotts Miracle-Gro Company | | 10,612 | | | 1,788,440 |
| The Sherwin-Williams Company | | 9,342 | | | 6,268,949 |
| Toray Industries, Inc. | | 109,200 | | | 518,048 |
| Tosoh Corp. | | 20,700 | | | 306,235 |
| Trecora Resources (A) | | 3,934 | | | 23,643 |
| Tredegar Corp. | | 3,547 | | | 60,051 |
| Trinseo SA | | 5,091 | | | 126,817 |
| Tronox Holdings PLC, Class A | | 11,987 | | | 107,404 |
| Umicore SA | | 46,022 | | | 2,112,407 |
| Valvoline, Inc. | | 49,827 | | | 1,016,471 |
| Yara International ASA | | 22,651 | | | 948,994 |
| | | | | | 160,024,582 |
| Construction materials – 0.3% | | | |
| Anhui Conch Cement Company, Ltd., H Shares | | 143,610 | | | 1,039,656 |
| Asia Cement Corp. | | 256,687 | | | 371,995 |
| Cemex SAB de CV | | 1,842,188 | | | 590,995 |
| China National Building Material Company, Ltd., H Shares | | 450,900 | | | 632,875 |
| China Resources Cement Holdings, Ltd. | | 283,900 | | | 413,444 |
| CRH PLC | | 92,498 | | | 3,449,777 |
| Eagle Materials, Inc. | | 11,207 | | | 916,396 |
| Forterra, Inc. (A) | | 2,636 | | | 34,927 |
| HeidelbergCement AG | | 27,977 | | | 1,774,915 |
| Indocement Tunggal Prakarsa Tbk PT | | 194,820 | | | 158,882 |
| James Hardie Industries PLC, CHESS Depositary Interest | | 81,777 | | | 1,855,422 |
| LafargeHolcim, Ltd. (A) | | 66,586 | | | 3,161,116 |
| Martin Marietta Materials, Inc. | | 7,195 | | | 1,459,650 |
| POSCO Chemical Company, Ltd. | | 2,594 | | | 193,766 |
| Semen Indonesia Persero Tbk PT | | 392,492 | | | 284,300 |
| Summit Materials, Inc., Class A (A) | | 15,468 | | | 230,319 |
| Taiheiyo Cement Corp. | | 9,600 | | | 243,402 |
| Taiwan Cement Corp. | | 570,544 | | | 834,192 |
| The Siam Cement PCL, NVDR | | 112,400 | | | 1,279,538 |
| U.S. Concrete, Inc. (A) | | 2,177 | | | 58,104 |
| United States Lime & Minerals, Inc. | | 303 | | | 27,915 |
| Vulcan Materials Company | | 15,309 | | | 1,837,080 |
| | | | | | 20,848,666 |
| Containers and packaging – 0.2% | | | |
| Amcor PLC | | 182,001 | | | 2,012,931 |
| AptarGroup, Inc. | | 17,285 | | | 2,046,371 |
| Avery Dennison Corp. | | 9,629 | | | 1,111,090 |
| Ball Corp. | | 37,685 | | | 3,028,743 |
| CCL Industries, Inc., Class B | | 5,507 | | | 203,544 |
| Greif, Inc., Class A | | 10,344 | | | 381,176 |
| Greif, Inc., Class B | | 824 | | | 33,809 |
| International Paper Company | | 45,435 | | | 1,647,927 |
| Klabin SA | | 81,042 | | | 380,173 |
| Myers Industries, Inc. | | 4,865 | | | 74,435 |
| O-I Glass, Inc. | | 62,824 | | | 683,525 |
| Packaging Corp. of America | | 10,964 | | | 1,109,995 |
| Ranpak Holdings Corp. (A) | | 4,085 | | | 36,520 |
| Sealed Air Corp. | | 17,995 | | | 707,204 |
| Silgan Holdings, Inc. | | 20,900 | | | 795,454 |
| Smurfit Kappa Group PLC | | 26,598 | | | 941,868 |
| Sonoco Products Company | | 27,018 | | | 1,432,765 |
| UFP Technologies, Inc. (A) | | 980 | | | 40,386 |
| Westrock Company | | 29,970 | | | 908,990 |
| | | | | | 17,576,906 |
| Metals and mining – 1.4% | | | |
| 1911 Gold Corp. (A) | | 2,060 | | | 1,249 |
| The accompanying notes are an integral part of the financial statements. | 89 | |
John Hancock Funds II
Portfolio of Investments — August 31, 2020 (showing percentage of total net assets)
Strategic Equity Allocation Fund (continued)
| | | Shares or
Principal
Amount | | Value |
| COMMON STOCKS (continued) | | | |
| Metals and mining (continued) | | | |
| Agnico Eagle Mines, Ltd. | | 8,515 | | $ | 702,038 |
| Alcoa Corp. (A) | | 24,636 | | | 360,178 |
| Allegheny Technologies, Inc. (A) | | 50,810 | | | 423,247 |
| Aluminum Corp. of China, Ltd., H Shares (A) | | 458,880 | | | 111,861 |
| Anglo American Platinum, Ltd. (C) | | 6,600 | | | 491,587 |
| Anglo American PLC | | 114,478 | | | 2,813,262 |
| AngloGold Ashanti, Ltd. | | 51,020 | | | 1,512,711 |
| Antofagasta PLC | | 36,683 | | | 525,937 |
| ArcelorMittal SA (A) | | 120,157 | | | 1,513,583 |
| Arconic Corp. (A) | | 13,072 | | | 290,852 |
| B2Gold Corp. | | 37,207 | | | 249,882 |
| Barrick Gold Corp. | | 63,116 | | | 1,869,745 |
| BHP Group PLC | | 196,970 | | | 4,483,482 |
| BHP Group, Ltd. | | 543,973 | | | 15,020,136 |
| BlueScope Steel, Ltd. | | 93,386 | | | 872,237 |
| Boliden AB | | 58,943 | | | 1,761,032 |
| Caledonia Mining Corp. PLC | | 1,662 | | | 30,215 |
| Carpenter Technology Corp. | | 6,286 | | | 132,195 |
| Century Aluminum Company (A) | | 6,943 | | | 68,527 |
| China Hongqiao Group, Ltd. | | 199,800 | | | 128,751 |
| China Molybdenum Company, Ltd., H Shares | | 388,500 | | | 157,499 |
| China Steel Corp. | | 1,379,958 | | | 936,294 |
| Cia de Minas Buenaventura SAA, ADR | | 36,500 | | | 513,920 |
| Cia Siderurgica Nacional SA | | 80,866 | | | 224,509 |
| Cleveland-Cliffs, Inc. (C) | | 51,877 | | | 341,351 |
| Coeur Mining, Inc. (A) | | 31,896 | | | 269,840 |
| Commercial Metals Company | | 47,559 | | | 992,556 |
| Compass Minerals International, Inc. | | 13,599 | | | 774,191 |
| Eregli Demir ve Celik Fabrikalari TAS | | 87,164 | | | 103,558 |
| Evolution Mining, Ltd. | | 298,521 | | | 1,220,590 |
| Evraz PLC | | 46,823 | | | 200,322 |
| First Quantum Minerals, Ltd. (C) | | 21,064 | | | 208,484 |
| Fortescue Metals Group, Ltd. | | 312,705 | | | 3,996,801 |
| Franco-Nevada Corp. | | 6,707 | | | 1,008,711 |
| Freeport-McMoRan, Inc. | | 167,844 | | | 2,620,045 |
| Glencore PLC (A) | | 931,580 | | | 2,290,593 |
| Gold Fields, Ltd. | | 108,377 | | | 1,418,330 |
| Gold Resource Corp. | | 9,030 | | | 35,939 |
| Grupo Mexico SAB de CV, Series B | | 378,600 | | | 1,010,430 |
| Haynes International, Inc. | | 1,799 | | | 33,713 |
| Hecla Mining Company | | 68,363 | | | 411,545 |
| Hitachi Metals, Ltd. | | 16,800 | | | 251,557 |
| Hyundai Steel Company | | 10,704 | | | 225,542 |
| Impala Platinum Holdings, Ltd. | | 98,234 | | | 905,452 |
| Industrias Penoles SAB de CV | | 16,680 | | | 275,949 |
| JFE Holdings, Inc. | | 38,300 | | | 289,673 |
| Jiangxi Copper Company, Ltd., H Shares | | 137,825 | | | 162,210 |
| Kaiser Aluminum Corp. | | 2,091 | | | 134,409 |
| KGHM Polska Miedz SA (A) | | 23,608 | | | 875,652 |
| Kinross Gold Corp. (A) | | 44,768 | | | 397,450 |
| Kirkland Lake Gold, Ltd. | | 9,653 | | | 514,343 |
| Korea Zinc Company, Ltd. | | 1,033 | | | 346,030 |
| Kumba Iron Ore, Ltd. | | 7,914 | | | 248,006 |
| Lundin Mining Corp. (C) | | 24,452 | | | 153,159 |
| Maruichi Steel Tube, Ltd. | | 4,400 | | | 117,964 |
| Materion Corp. | | 2,692 | | | 146,956 |
| Mitsubishi Materials Corp. | | 8,700 | | | 182,502 |
| Newcrest Mining, Ltd. | | 149,120 | | | 3,511,567 |
| Newmont Corp. | | 92,776 | | | 6,241,969 |
| Nippon Steel Corp. | | 63,278 | | | 622,950 |
| Norsk Hydro ASA (A) | | 172,489 | | | 550,175 |
| Northam Platinum, Ltd. (A) | | 43,677 | | | 412,355 |
| Northern Star Resources, Ltd. | | 136,558 | | | 1,376,077 |
Strategic Equity Allocation Fund (continued)
| | | Shares or
Principal
Amount | | Value |
| COMMON STOCKS (continued) | | | |
| Metals and mining (continued) | | | |
| Novagold Resources, Inc. (A) | | 30,889 | | $ | 327,115 |
| Nucor Corp. | | 34,810 | | | 1,582,463 |
| Pan American Silver Corp. | | 7,472 | | | 269,756 |
| POSCO | | 8,938 | | | 1,383,568 |
| Press Metal Aluminium Holdings BHD | | 181,500 | | | 226,807 |
| Reliance Steel & Aluminum Company | | 17,138 | | | 1,797,262 |
| Rio Tinto PLC | | 104,588 | | | 6,504,369 |
| Rio Tinto, Ltd. | | 68,565 | | | 4,933,958 |
| Royal Gold, Inc. | | 17,661 | | | 2,407,548 |
| Schnitzer Steel Industries, Inc., Class A | | 3,479 | | | 68,675 |
| Sibanye Stillwater, Ltd. (A) | | 279,353 | | | 855,132 |
| South32, Ltd. | | 903,939 | | | 1,397,462 |
| Southern Copper Corp. (C) | | 14,500 | | | 697,450 |
| Steel Dynamics, Inc. | | 56,641 | | | 1,672,042 |
| Sumitomo Metal Mining Company, Ltd. | | 18,300 | | | 558,250 |
| SunCoke Energy, Inc. | | 11,592 | | | 41,499 |
| Teck Resources, Ltd., Class B | | 17,446 | | | 201,164 |
| thyssenkrupp AG (A) | | 75,892 | | | 546,628 |
| TimkenSteel Corp. (A) | | 6,475 | | | 24,411 |
| United States Steel Corp. (C) | | 81,647 | | | 639,296 |
| Vale SA | | 432,871 | | | 4,715,477 |
| voestalpine AG | | 22,770 | | | 565,815 |
| Warrior Met Coal, Inc. | | 6,732 | | | 104,144 |
| Wheaton Precious Metals Corp. | | 15,881 | | | 848,139 |
| Worthington Industries, Inc. | | 14,718 | | | 611,239 |
| Yamana Gold, Inc. | | 34,068 | | | 211,040 |
| Zhaojin Mining Industry Company, Ltd., H Shares | | 120,600 | | | 135,044 |
| Zijin Mining Group Company, Ltd., H Shares | | 662,329 | | | 451,717 |
| | | | | | 103,851,345 |
| Paper and forest products – 0.2% | | | |
| Boise Cascade Company | | 5,092 | | | 233,214 |
| Clearwater Paper Corp. (A) | | 2,157 | | | 72,605 |
| Domtar Corp. | | 22,042 | | | 628,638 |
| Empresas CMPC SA | | 315,892 | | | 656,170 |
| Indah Kiat Pulp & Paper Corp. Tbk PT | | 362,600 | | | 231,358 |
| Lee & Man Paper Manufacturing, Ltd. | | 154,500 | | | 92,316 |
| Louisiana-Pacific Corp. | | 44,947 | | | 1,480,554 |
| Mondi PLC | | 45,301 | | | 891,356 |
| Neenah, Inc. | | 2,223 | | | 98,434 |
| Nine Dragons Paper Holdings, Ltd. | | 191,200 | | | 211,814 |
| Oji Holdings Corp. | | 67,700 | | | 305,832 |
| P.H. Glatfelter Company | | 5,893 | | | 88,336 |
| Schweitzer-Mauduit International, Inc. | | 4,072 | | | 123,504 |
| Stora Enso OYJ, R Shares | | 193,092 | | | 2,847,840 |
| Suzano SA (A) | | 63,667 | | | 583,387 |
| Svenska Cellulosa AB SCA, B Shares (A) | | 130,741 | | | 1,688,231 |
| UPM-Kymmene OYJ | | 177,120 | | | 5,375,863 |
| Verso Corp., Class A | | 4,698 | | | 61,591 |
| | | | | | 15,671,043 |
| | | | | | 317,972,542 |
| Real estate – 2.5% | | | | | |
| Equity real estate investment trusts – 1.8% | | | |
| Acadia Realty Trust | | 11,203 | | | 127,042 |
| Agree Realty Corp. | | 6,878 | | | 460,276 |
| Alexander & Baldwin, Inc. | | 9,659 | | | 116,970 |
| Alexander's, Inc. | | 280 | | | 71,420 |
| Alexandria Real Estate Equities, Inc. | | 8,963 | | | 1,509,190 |
| Alpine Income Property Trust, Inc. | | 1,110 | | | 16,106 |
| American Assets Trust, Inc. | | 6,607 | | | 168,809 |
| American Campus Communities, Inc. | | 37,056 | | | 1,256,198 |
| American Finance Trust, Inc. | | 14,304 | | | 97,768 |
| American Tower Corp. | | 31,487 | | | 7,844,986 |
| The accompanying notes are an integral part of the financial statements. | 90 | |
John Hancock Funds II
Portfolio of Investments — August 31, 2020 (showing percentage of total net assets)
Strategic Equity Allocation Fund (continued)
| | | Shares or
Principal
Amount | | Value |
| COMMON STOCKS (continued) | | | |
| Equity real estate investment trusts (continued) | | | |
| Apartment Investment & Management Company, A Shares | | 10,576 | | $ | 381,053 |
| Armada Hoffler Properties, Inc. | | 7,447 | | | 75,215 |
| Ascendas Real Estate Investment Trust | | 149,500 | | | 364,240 |
| AvalonBay Communities, Inc. | | 9,995 | | | 1,579,810 |
| Bluerock Residential Growth REIT, Inc. | | 3,559 | | | 26,372 |
| Boston Properties, Inc. | | 10,263 | | | 891,547 |
| Brixmor Property Group, Inc. | | 79,832 | | | 942,018 |
| BRT Apartments Corp. | | 1,797 | | | 23,990 |
| Camden Property Trust | | 26,224 | | | 2,384,811 |
| Canadian Apartment Properties REIT | | 3,176 | | | 109,572 |
| CapitaLand Commercial Trust | | 130,500 | | | 160,902 |
| CapitaLand Mall Trust | | 125,300 | | | 180,221 |
| CareTrust REIT, Inc. | | 12,575 | | | 243,578 |
| CatchMark Timber Trust, Inc., Class A | | 6,821 | | | 67,733 |
| Chatham Lodging Trust | | 6,615 | | | 45,776 |
| City Office REIT, Inc. | | 6,260 | | | 50,330 |
| Clipper Realty, Inc. | | 2,384 | | | 15,901 |
| Colony Capital, Inc. | | 63,945 | | | 173,291 |
| Columbia Property Trust, Inc. | | 14,992 | | | 176,906 |
| Community Healthcare Trust, Inc. | | 2,750 | | | 128,425 |
| CoreCivic, Inc. | | 15,608 | | | 145,310 |
| CorEnergy Infrastructure Trust, Inc. | | 2,066 | | | 18,470 |
| CorePoint Lodging, Inc. | | 6,363 | | | 36,142 |
| CoreSite Realty Corp. | | 10,854 | | | 1,329,072 |
| Corporate Office Properties Trust | | 30,206 | | | 744,276 |
| Cousins Properties, Inc. | | 40,001 | | | 1,194,030 |
| Covivio | | 8,023 | | | 593,385 |
| Crown Castle International Corp. | | 29,601 | | | 4,832,363 |
| CyrusOne, Inc. | | 31,023 | | | 2,591,351 |
| Daiwa House REIT Investment Corp. | | 154 | | | 402,361 |
| Dexus | | 202,377 | | | 1,316,008 |
| DiamondRock Hospitality Company | | 26,463 | | | 140,254 |
| Digital Realty Trust, Inc. | | 19,057 | | | 2,966,222 |
| Diversified Healthcare Trust | | 31,330 | | | 119,054 |
| Douglas Emmett, Inc. | | 44,394 | | | 1,239,480 |
| Duke Realty Corp. | | 26,165 | | | 1,008,661 |
| Easterly Government Properties, Inc. | | 9,766 | | | 236,240 |
| EastGroup Properties, Inc. | | 15,528 | | | 2,067,708 |
| EPR Properties | | 20,865 | | | 674,148 |
| Equinix, Inc. | | 6,287 | | | 4,965,347 |
| Equity Residential | | 24,845 | | | 1,402,500 |
| Essential Properties Realty Trust, Inc. | | 11,985 | | | 203,385 |
| Essex Property Trust, Inc. | | 4,646 | | | 1,005,905 |
| Extra Space Storage, Inc. | | 9,169 | | | 976,957 |
| Farmland Partners, Inc. | | 4,037 | | | 27,008 |
| Federal Realty Investment Trust | | 4,996 | | | 395,883 |
| Fibra Uno Administracion SA de CV | | 382,000 | | | 298,868 |
| First Capital Real Estate Investment Trust | | 4,375 | | | 45,885 |
| First Industrial Realty Trust, Inc. | | 34,257 | | | 1,461,061 |
| Four Corners Property Trust, Inc. | | 9,224 | | | 232,906 |
| Franklin Street Properties Corp. | | 13,956 | | | 61,825 |
| Front Yard Residential Corp. | | 6,680 | | | 65,130 |
| Gecina SA | | 7,670 | | | 1,054,606 |
| Getty Realty Corp. | | 4,345 | | | 127,265 |
| Gladstone Commercial Corp. | | 4,481 | | | 87,872 |
| Gladstone Land Corp. | | 2,733 | | | 43,017 |
| Global Medical REIT, Inc. | | 5,437 | | | 69,539 |
| Global Net Lease, Inc. | | 11,804 | | | 206,570 |
| GLP J-REIT (A) | | 285 | | | 440,095 |
| Goodman Group | | 303,939 | | | 4,091,616 |
| Growthpoint Properties, Ltd. | | 370,913 | | | 267,171 |
| Healthcare Realty Trust, Inc. | | 53,838 | | | 1,553,226 |
| Healthpeak Properties, Inc. | | 38,233 | | | 1,056,760 |
| Hersha Hospitality Trust | | 5,178 | | | 33,295 |
Strategic Equity Allocation Fund (continued)
| | | Shares or
Principal
Amount | | Value |
| COMMON STOCKS (continued) | | | |
| Equity real estate investment trusts (continued) | | | |
| Highwoods Properties, Inc. | | 27,976 | | $ | 1,042,386 |
| Host Hotels & Resorts, Inc. | | 50,071 | | | 562,297 |
| Hudson Pacific Properties, Inc. | | 41,282 | | | 969,301 |
| ICADE | | 4,950 | | | 320,418 |
| Independence Realty Trust, Inc. | | 12,242 | | | 143,354 |
| Industrial Logistics Properties Trust | | 8,299 | | | 179,009 |
| Innovative Industrial Properties, Inc. | | 2,182 | | | 268,582 |
| Investors Real Estate Trust | | 1,582 | | | 112,480 |
| Iron Mountain, Inc. | | 20,450 | | | 615,341 |
| iStar, Inc. | | 9,693 | | | 119,999 |
| Japan Prime Realty Investment Corp. | | 61 | | | 184,193 |
| Japan Real Estate Investment Corp. | | 103 | | | 576,789 |
| Japan Retail Fund Investment Corp. | | 205 | | | 308,527 |
| JBG SMITH Properties | | 31,661 | | | 876,060 |
| Jernigan Capital, Inc. | | 3,104 | | | 53,513 |
| Kilroy Realty Corp. | | 28,510 | | | 1,668,405 |
| Kimco Realty Corp. | | 30,720 | | | 368,333 |
| Kite Realty Group Trust | | 10,818 | | | 121,594 |
| Klepierre SA | | 32,916 | | | 541,859 |
| Lamar Advertising Company, Class A | | 23,251 | | | 1,609,667 |
| Land Securities Group PLC | | 65,520 | | | 507,820 |
| Lexington Realty Trust | | 33,249 | | | 378,041 |
| Life Storage, Inc. | | 12,633 | | | 1,331,897 |
| Link REIT | | 273,225 | | | 2,173,573 |
| LTC Properties, Inc. | | 5,065 | | | 184,822 |
| Mack-Cali Realty Corp. | | 36,332 | | | 458,873 |
| Mapletree Commercial Trust | | 103,800 | | | 146,235 |
| Mapletree Logistics Trust | | 128,800 | | | 195,700 |
| Medical Properties Trust, Inc. | | 142,277 | | | 2,643,507 |
| Mid-America Apartment Communities, Inc. | | 8,122 | | | 951,249 |
| Mirvac Group | | 726,231 | | | 1,127,349 |
| Monmouth Real Estate Investment Corp. | | 12,254 | | | 177,806 |
| National Health Investors, Inc. | | 5,591 | | | 348,040 |
| National Retail Properties, Inc. | | 46,309 | | | 1,641,191 |
| National Storage Affiliates Trust | | 8,055 | | | 276,367 |
| New Senior Investment Group, Inc. | | 11,739 | | | 51,417 |
| NexPoint Residential Trust, Inc. | | 2,833 | | | 117,286 |
| Nippon Building Fund, Inc. | | 99 | | | 596,140 |
| Nippon Prologis REIT, Inc. | | 164 | | | 537,145 |
| Nomura Real Estate Master Fund, Inc. | | 332 | | | 425,544 |
| Office Properties Income Trust | | 6,284 | | | 149,811 |
| Omega Healthcare Investors, Inc. | | 61,104 | | | 1,892,391 |
| One Liberty Properties, Inc. | | 2,318 | | | 44,413 |
| Orix JREIT, Inc. | | 205 | | | 304,556 |
| Park Hotels & Resorts, Inc. | | 63,444 | | | 602,084 |
| Pebblebrook Hotel Trust | | 52,337 | | | 660,493 |
| Physicians Realty Trust | | 80,881 | | | 1,467,990 |
| Piedmont Office Realty Trust, Inc., Class A | | 16,431 | | | 251,559 |
| Plymouth Industrial REIT, Inc. | | 2,243 | | | 29,944 |
| PotlatchDeltic Corp. | | 26,600 | | | 1,224,664 |
| Preferred Apartment Communities, Inc., Class A | | 6,452 | | | 42,583 |
| Prologis, Inc. | | 52,459 | | | 5,343,474 |
| PS Business Parks, Inc. | | 7,997 | | | 1,009,221 |
| Public Storage | | 10,677 | | | 2,267,795 |
| QTS Realty Trust, Inc., Class A | | 7,817 | | | 530,149 |
| Rayonier, Inc. | | 37,288 | | | 1,091,793 |
| Realty Income Corp. | | 24,391 | | | 1,512,974 |
| Regency Centers Corp. | | 12,048 | | | 478,426 |
| Retail Opportunity Investments Corp. | | 15,106 | | | 168,130 |
| Retail Properties of America, Inc., Class A | | 28,261 | | | 178,327 |
| Retail Value, Inc. | | 2,353 | | | 29,907 |
| Rexford Industrial Realty, Inc. | | 34,022 | | | 1,632,376 |
| RioCan Real Estate Investment Trust | | 6,708 | | | 78,222 |
| The accompanying notes are an integral part of the financial statements. | 91 | |
John Hancock Funds II
Portfolio of Investments — August 31, 2020 (showing percentage of total net assets)
Strategic Equity Allocation Fund (continued)
| | | Shares or
Principal
Amount | | Value |
| COMMON STOCKS (continued) | | | |
| Equity real estate investment trusts (continued) | | | |
| RLJ Lodging Trust | | 21,642 | | $ | 204,300 |
| RPT Realty | | 10,726 | | | 62,854 |
| Ryman Hospitality Properties, Inc. | | 6,640 | | | 253,382 |
| Sabra Health Care REIT, Inc. | | 82,216 | | | 1,219,263 |
| Safehold, Inc. | | 2,245 | | | 124,530 |
| Saul Centers, Inc. | | 1,596 | | | 44,720 |
| SBA Communications Corp. | | 7,929 | | | 2,426,829 |
| Scentre Group | | 967,173 | | | 1,609,891 |
| Segro PLC | | 109,801 | | | 1,396,033 |
| Seritage Growth Properties, Class A (A) | | 4,719 | | | 66,208 |
| Service Properties Trust | | 66,066 | | | 542,402 |
| Simon Property Group, Inc. | | 21,716 | | | 1,473,431 |
| SITE Centers Corp. | | 20,248 | | | 152,062 |
| SL Green Realty Corp. | | 5,437 | | | 254,234 |
| SmartCentres Real Estate Investment Trust | | 3,174 | | | 49,982 |
| Spirit Realty Capital, Inc. | | 27,721 | | | 984,373 |
| STAG Industrial, Inc. | | 19,526 | | | 630,690 |
| Stockland | | 440,050 | | | 1,283,130 |
| STORE Capital Corp. | | 59,918 | | | 1,620,183 |
| Summit Hotel Properties, Inc. | | 13,839 | | | 81,512 |
| Sunstone Hotel Investors, Inc. | | 28,078 | | | 233,890 |
| Suntec Real Estate Investment Trust | | 94,200 | | | 96,762 |
| Tanger Factory Outlet Centers, Inc. | | 11,971 | | | 68,115 |
| Taubman Centers, Inc. | | 16,590 | | | 635,397 |
| Terreno Realty Corp. | | 8,654 | | | 516,125 |
| The British Land Company PLC | | 81,882 | | | 399,624 |
| The GEO Group, Inc. | | 48,017 | | | 535,870 |
| The GPT Group | | 359,424 | | | 1,013,604 |
| The Macerich Company | | 49,907 | | | 395,763 |
| UDR, Inc. | | 20,946 | | | 729,130 |
| UMH Properties, Inc. | | 5,005 | | | 72,773 |
| Unibail-Rodamco-Westfield | | 15,687 | | | 729,986 |
| Unibail-Rodamco-Westfield (Euronext Amsterdam Exchange) | | 7,490 | | | 348,543 |
| United Urban Investment Corp. | | 232 | | | 257,856 |
| Uniti Group, Inc. | | 25,381 | | | 249,241 |
| Universal Health Realty Income Trust | | 1,699 | | | 113,357 |
| Urban Edge Properties | | 45,072 | | | 475,960 |
| Urstadt Biddle Properties, Inc., Class A | | 4,086 | | | 38,000 |
| Ventas, Inc. | | 26,498 | | | 1,091,983 |
| Vicinity Centres | | 716,617 | | | 764,338 |
| Vornado Realty Trust | | 11,266 | | | 403,661 |
| Washington Real Estate Investment Trust | | 10,782 | | | 236,557 |
| Weingarten Realty Investors | | 32,428 | | | 566,517 |
| Welltower, Inc. | | 29,652 | | | 1,705,583 |
| Weyerhaeuser Company | | 53,000 | | | 1,606,430 |
| Whitestone REIT | | 5,653 | | | 36,349 |
| Xenia Hotels & Resorts, Inc. | | 15,073 | | | 135,356 |
| | | | | | 135,358,853 |
| Real estate management and development – 0.7% | | | |
| Aeon Mall Company, Ltd. | | 8,000 | | | 105,714 |
| Agile Group Holdings, Ltd. | | 136,600 | | | 188,320 |
| Aroundtown SA (A) | | 216,277 | | | 1,184,771 |
| Ayala Land, Inc. | | 1,083,670 | | | 642,566 |
| Azrieli Group, Ltd. | | 5,175 | | | 279,205 |
| BR Malls Participacoes SA (A) | | 91,919 | | | 155,701 |
| CapitaLand, Ltd. | | 125,700 | | | 255,576 |
| CBRE Group, Inc., Class A (A) | | 23,805 | | | 1,119,549 |
| Cencosud Shopping SA | | 143,765 | | | 214,698 |
| Central Pattana PCL, NVDR | | 323,100 | | | 489,747 |
| China Aoyuan Group, Ltd. | | 141,000 | | | 162,293 |
| China Evergrande Group (C) | | 216,035 | | | 503,664 |
| China Jinmao Holdings Group, Ltd. | | 616,400 | | | 384,897 |
| China Overseas Land & Investment, Ltd. | | 447,297 | | | 1,293,802 |
| China Overseas Property Holdings, Ltd. | | 150,000 | | | 135,094 |
Strategic Equity Allocation Fund (continued)
| | | Shares or
Principal
Amount | | Value |
| COMMON STOCKS (continued) | | | |
| Real estate management and development (continued) | | | |
| China Resources Land, Ltd. | | 372,705 | | $ | 1,721,751 |
| China Vanke Company, Ltd., H Shares | | 198,100 | | | 614,931 |
| CIFI Holdings Group Company, Ltd. | | 366,700 | | | 311,694 |
| City Developments, Ltd. | | 22,400 | | | 131,995 |
| CK Asset Holdings, Ltd. | | 342,698 | | | 1,860,059 |
| Country Garden Holdings Company, Ltd. | | 890,167 | | | 1,102,170 |
| CTO Realty Growth, Inc. | | 758 | | | 31,965 |
| Cushman & Wakefield PLC (A) | | 14,547 | | | 168,891 |
| Daito Trust Construction Company, Ltd. | | 5,000 | | | 443,143 |
| Daiwa House Industry Company, Ltd. | | 44,500 | | | 1,189,884 |
| Dalian Wanda Commercial Properties Company, Ltd., H Shares (A)(B) | | 37,400 | | | 254,796 |
| Deutsche Wohnen SE | | 64,134 | | | 3,421,405 |
| eXp World Holdings, Inc. (A) | | 3,220 | | | 143,226 |
| Forestar Group, Inc. (A) | | 2,367 | | | 42,062 |
| FRP Holdings, Inc. (A) | | 983 | | | 40,382 |
| Griffin Industrial Realty, Inc. | | 480 | | | 25,526 |
| Guangzhou R&F Properties Company, Ltd., H Shares | | 149,800 | | | 190,176 |
| Hang Lung Properties, Ltd. | | 268,000 | | | 755,181 |
| Henderson Land Development Company, Ltd. | | 192,376 | | | 756,225 |
| Highwealth Construction Corp. | | 79,687 | | | 126,012 |
| Hongkong Land Holdings, Ltd. | | 154,800 | | | 592,337 |
| Hulic Company, Ltd. | | 23,700 | | | 215,601 |
| Jones Lang LaSalle, Inc. | | 13,904 | | | 1,432,668 |
| Kaisa Group Holdings, Ltd. (A) | | 284,800 | | | 143,002 |
| Kennedy-Wilson Holdings, Inc. | | 15,968 | | | 228,183 |
| Kerry Properties, Ltd. | | 86,768 | | | 225,366 |
| KWG Group Holdings, Ltd. (A) | | 148,000 | | | 280,871 |
| Land & Houses PCL, NVDR | | 1,207,300 | | | 287,133 |
| LEG Immobilien AG | | 12,948 | | | 1,902,619 |
| Lendlease Corp., Ltd. | | 122,116 | | | 1,043,119 |
| Logan Group Company, Ltd. | | 159,500 | | | 296,669 |
| Longfor Group Holdings, Ltd. (B) | | 208,800 | | | 1,104,659 |
| Marcus & Millichap, Inc. (A) | | 3,030 | | | 85,476 |
| Megaworld Corp. (A) | | 1,515,700 | | | 90,887 |
| Mitsubishi Estate Company, Ltd. | | 92,900 | | | 1,453,858 |
| Mitsui Fudosan Company, Ltd. | | 73,104 | | | 1,322,452 |
| Multiplan Empreendimentos Imobiliarios SA | | 33,001 | | | 125,414 |
| NEPI Rockcastle PLC | | 47,861 | | | 223,576 |
| New World Development Company, Ltd. | | 203,064 | | | 1,052,998 |
| Newmark Group, Inc., Class A | | 18,946 | | | 83,931 |
| Nomura Real Estate Holdings, Inc. | | 9,200 | | | 175,514 |
| Poly Property Services Company, Ltd. | | 13,400 | | | 117,171 |
| Rafael Holdings, Inc., Class B (A) | | 1,424 | | | 24,806 |
| RE/MAX Holdings, Inc., Class A (C) | | 2,364 | | | 83,071 |
| Realogy Holdings Corp. (A) | | 15,182 | | | 168,217 |
| Redfin Corp. (A) | | 12,597 | | | 599,239 |
| Robinsons Land Corp. | | 277,900 | | | 83,765 |
| Ruentex Development Company, Ltd. | | 97,620 | | | 143,772 |
| Seazen Group, Ltd. (A) | | 252,800 | | | 229,308 |
| Shanghai Lujiazui Finance & Trade Zone Development Company, Ltd., B Shares | | 126,651 | | | 108,761 |
| Shenzhen Investment, Ltd. | | 356,900 | | | 120,966 |
| Shimao Group Holdings, Ltd. | | 141,200 | | | 634,585 |
| Shui On Land, Ltd. | | 421,400 | | | 57,581 |
| Sino Land Company, Ltd. | | 414,075 | | | 481,941 |
| Sino-Ocean Group Holding, Ltd. | | 350,858 | | | 80,989 |
| SM Prime Holdings, Inc. | | 1,351,900 | | | 814,041 |
| SOHO China, Ltd. (A) | | 241,000 | | | 74,236 |
| Sumitomo Realty & Development Company, Ltd. | | 24,283 | | | 716,175 |
| Sun Hung Kai Properties, Ltd. | | 173,000 | | | 2,321,057 |
| The accompanying notes are an integral part of the financial statements. | 92 | |
John Hancock Funds II
Portfolio of Investments — August 31, 2020 (showing percentage of total net assets)
Strategic Equity Allocation Fund (continued)
| | | Shares or
Principal
Amount | | Value |
| COMMON STOCKS (continued) | | | |
| Real estate management and development (continued) | | | |
| Sunac China Holdings, Ltd. | | 297,700 | | $ | 1,249,689 |
| Swire Pacific, Ltd., Class A | | 66,000 | | | 359,396 |
| Swire Properties, Ltd. | | 154,600 | | | 418,468 |
| Swiss Prime Site AG | | 9,618 | | | 867,005 |
| Tejon Ranch Company (A) | | 2,946 | | | 42,157 |
| The RMR Group, Inc., Class A | | 2,060 | | | 58,133 |
| The St. Joe Company (A) | | 4,370 | | | 101,428 |
| The Wharf Holdings, Ltd. | | 278,125 | | | 541,888 |
| Tokyu Fudosan Holdings Corp. | | 48,300 | | | 207,133 |
| UOL Group, Ltd. | | 22,800 | | | 109,964 |
| Vonovia SE | | 96,691 | | | 6,919,767 |
| Wharf Real Estate Investment Company, Ltd. | | 321,125 | | | 1,334,664 |
| Yuexiu Property Company, Ltd. | | 803,500 | | | 153,232 |
| Yuzhou Group Holdings Company, Ltd. | | 210,600 | | | 98,227 |
| Zhenro Properties Group, Ltd. | | 177,000 | | | 103,408 |
| | | | | | 52,237,644 |
| | | | | | 187,596,497 |
| Utilities – 2.3% | | | | | |
| Electric utilities – 1.2% | | | |
| ALLETE, Inc. | | 20,736 | | | 1,118,915 |
| Alliant Energy Corp. | | 15,523 | | | 840,570 |
| American Electric Power Company, Inc. | | 30,832 | | | 2,430,487 |
| AusNet Services | | 342,953 | | | 459,997 |
| Centrais Eletricas Brasileiras SA | | 37,600 | | | 243,712 |
| CEZ AS | | 22,198 | | | 457,628 |
| Chubu Electric Power Company, Inc. | | 50,500 | | | 623,997 |
| CK Infrastructure Holdings, Ltd. | | 87,500 | | | 462,465 |
| CLP Holdings, Ltd. | | 217,500 | | | 2,135,427 |
| CPFL Energia SA | | 26,900 | | | 141,116 |
| Duke Energy Corp. | | 45,718 | | | 3,672,984 |
| Edison International | | 23,513 | | | 1,233,962 |
| EDP - Energias de Portugal SA | | 328,795 | | | 1,671,452 |
| Electricite de France SA | | 104,083 | | | 1,094,861 |
| Elia Group SA/NV | | 7,199 | | | 772,745 |
| Emera, Inc. (C) | | 8,852 | | | 361,382 |
| Endesa SA | | 60,743 | | | 1,686,209 |
| Enel Americas SA | | 9,599,464 | | | 1,381,229 |
| Enel Chile SA | | 7,752,271 | | | 596,260 |
| Enel SpA | | 936,786 | | | 8,482,778 |
| Energisa SA | | 21,300 | | | 168,930 |
| Entergy Corp. | | 12,453 | | | 1,234,590 |
| Equatorial Energia SA | | 106,190 | | | 449,687 |
| Evergy, Inc. | | 14,106 | | | 750,721 |
| Eversource Energy | | 20,931 | | | 1,793,996 |
| Exelon Corp. | | 60,621 | | | 2,237,521 |
| FirstEnergy Corp. | | 33,706 | | | 963,655 |
| Fortis, Inc. | | 16,908 | | | 676,268 |
| Fortum OYJ | | 147,350 | | | 3,118,824 |
| Hawaiian Electric Industries, Inc. | | 29,392 | | | 1,017,257 |
| HK Electric Investments & HK Electric Investments, Ltd. | | 348,000 | | | 354,176 |
| Hydro One, Ltd. (B) | | 12,298 | | | 254,568 |
| Iberdrola SA | | 1,111,375 | | | 14,022,078 |
| IDACORP, Inc. | | 13,587 | | | 1,221,471 |
| Interconexion Electrica SA ESP | | 79,801 | | | 446,681 |
| Korea Electric Power Corp. (A) | | 30,934 | | | 532,924 |
| Kyushu Electric Power Company, Inc. (C) | | 29,500 | | | 261,596 |
| Manila Electric Company | | 29,990 | | | 166,321 |
| Mercury NZ, Ltd. | | 258,777 | | | 902,886 |
| MGE Energy, Inc. | | 4,633 | | | 301,099 |
| NextEra Energy, Inc. | | 30,451 | | | 8,501,006 |
| NRG Energy, Inc. | | 15,188 | | | 522,619 |
| OGE Energy Corp. | | 53,905 | | | 1,717,413 |
| Orsted A/S (B) | | 33,171 | | | 4,695,705 |
Strategic Equity Allocation Fund (continued)
| | | Shares or
Principal
Amount | | Value |
| COMMON STOCKS (continued) | | | |
| Electric utilities (continued) | | | |
| Otter Tail Corp. | | 5,319 | | $ | 206,643 |
| PGE Polska Grupa Energetyczna SA (A)(C) | | 141,705 | | | 231,591 |
| Pinnacle West Capital Corp. | | 6,999 | | | 513,377 |
| PNM Resources, Inc. | | 31,848 | | | 1,391,121 |
| Portland General Electric Company | | 11,700 | | | 446,355 |
| Power Assets Holdings, Ltd. | | 183,500 | | | 1,050,245 |
| PPL Corp. | | 47,829 | | | 1,321,515 |
| Red Electrica Corp. SA | | 82,674 | | | 1,582,227 |
| SSE PLC | | 95,905 | | | 1,616,469 |
| Tenaga Nasional BHD | | 291,736 | | | 759,439 |
| Terna Rete Elettrica Nazionale SpA | | 161,268 | | | 1,166,734 |
| The Chugoku Electric Power Company, Inc. | | 22,600 | | | 275,652 |
| The Kansai Electric Power Company, Inc. | | 55,200 | | | 543,659 |
| The Southern Company | | 65,695 | | | 3,427,965 |
| Tohoku Electric Power Company, Inc. | | 33,200 | | | 336,866 |
| Tokyo Electric Power Company Holdings, Inc. (A) | | 113,700 | | | 334,746 |
| Verbund AG (C) | | 13,352 | | | 716,856 |
| Xcel Energy, Inc. | | 32,664 | | | 2,269,331 |
| | | | | | 94,370,959 |
| Gas utilities – 0.3% | | | |
| AltaGas, Ltd. | | 10,428 | | | 134,872 |
| APA Group | | 217,817 | | | 1,671,000 |
| Atmos Energy Corp. | | 7,610 | | | 759,630 |
| Beijing Enterprises Holdings, Ltd. | | 59,714 | | | 189,720 |
| Brookfield Infrastructure Corp., Class A (C) | | 4,187 | | | 209,015 |
| Chesapeake Utilities Corp. | | 2,134 | | | 174,561 |
| China Gas Holdings, Ltd. | | 303,800 | | | 831,707 |
| China Resources Gas Group, Ltd. | | 104,100 | | | 488,301 |
| Enagas SA | | 47,538 | | | 1,164,097 |
| ENN Energy Holdings, Ltd. | | 91,800 | | | 1,017,141 |
| Hong Kong & China Gas Company, Ltd. | | 1,410,738 | | | 2,051,206 |
| Infraestructura Energetica Nova SAB de CV | | 64,535 | | | 187,600 |
| Korea Gas Corp. | | 3,531 | | | 70,008 |
| Kunlun Energy Company, Ltd. | | 454,490 | | | 338,166 |
| National Fuel Gas Company | | 24,334 | | | 1,110,604 |
| Naturgy Energy Group SA | | 56,374 | | | 1,088,289 |
| New Jersey Resources Corp. | | 38,242 | | | 1,152,614 |
| Northwest Natural Holding Company | | 3,992 | | | 204,031 |
| ONE Gas, Inc. | | 21,040 | | | 1,559,485 |
| Osaka Gas Company, Ltd. | | 29,200 | | | 571,897 |
| Perusahaan Gas Negara Tbk PT | | 1,444,269 | | | 124,415 |
| Petronas Gas BHD | | 101,199 | | | 400,745 |
| RGC Resources, Inc. | | 994 | | | 23,180 |
| Snam SpA | | 233,727 | | | 1,196,970 |
| South Jersey Industries, Inc. | | 12,125 | | | 268,569 |
| Southwest Gas Holdings, Inc. | | 22,025 | | | 1,384,712 |
| Spire, Inc. | | 20,285 | | | 1,180,790 |
| Toho Gas Company, Ltd. (C) | | 5,745 | | | 253,799 |
| Tokyo Gas Company, Ltd. | | 29,500 | | | 656,862 |
| UGI Corp. | | 56,085 | | | 1,936,615 |
| | | | | | 22,400,601 |
Independent power and renewable electricity producers –
0.1% | | | |
| Aboitiz Power Corp. | | 195,900 | | | 107,738 |
| Atlantic Power Corp. (A) | | 15,343 | | | 31,760 |
| B. Grimm Power PCL, NVDR | | 112,200 | | | 167,197 |
| Brookfield Renewable Corp., Class A | | 5,459 | | | 277,972 |
| CGN Power Company, Ltd., H Shares (B) | | 1,101,700 | | | 238,588 |
| China Common Rich Renewable Energy Investments, Ltd. (A)(D) | | 1,136,000 | | | 31,514 |
| The accompanying notes are an integral part of the financial statements. | 93 | |
John Hancock Funds II
Portfolio of Investments — August 31, 2020 (showing percentage of total net assets)
Strategic Equity Allocation Fund (continued)
| | | Shares or
Principal
Amount | | Value |
| COMMON STOCKS (continued) | | | |
Independent power and renewable electricity
producers (continued) | | | |
| China Longyuan Power Group Corp., Ltd., H Shares | | 369,300 | | $ | 232,777 |
| China Power International Development, Ltd. | | 509,900 | | | 98,609 |
| China Resources Power Holdings Company, Ltd. | | 224,332 | | | 266,089 |
| Clearway Energy, Inc., Class A | | 4,367 | | | 105,463 |
| Clearway Energy, Inc., Class C | | 10,639 | | | 271,401 |
| Colbun SA | | 2,212,265 | | | 341,447 |
| Electric Power Development Company, Ltd. | | 10,700 | | | 161,483 |
| Electricity Generating PCL, NVDR | | 41,800 | | | 298,665 |
| Energy Absolute PCL, NVDR | | 214,200 | | | 290,076 |
| Engie Brasil Energia SA | | 23,583 | | | 183,507 |
| Global Power Synergy PCL, NVDR | | 101,400 | | | 208,845 |
| Gulf Energy Development PCL, NVDR | | 306,800 | | | 310,959 |
| Huaneng Power International, Inc., H Shares | | 411,864 | | | 171,472 |
| Meridian Energy, Ltd. | | 486,274 | | | 1,658,142 |
| Ormat Technologies, Inc. (C) | | 5,182 | | | 315,428 |
| Ratch Group PCL, NVDR | | 115,000 | | | 207,039 |
| Sunnova Energy International, Inc. (A) | | 4,306 | | | 102,138 |
| The AES Corp. | | 41,370 | | | 734,318 |
| Uniper SE (C) | | 37,757 | | | 1,237,475 |
| | | | | | 8,050,102 |
| Multi-utilities – 0.6% | | | |
| AGL Energy, Ltd. | | 117,964 | | | 1,285,998 |
| Algonquin Power & Utilities Corp. | | 19,445 | | | 269,533 |
| Ameren Corp. | | 15,360 | | | 1,215,130 |
| Atco, Ltd., Class I | | 3,077 | | | 93,748 |
| Avista Corp. | | 8,792 | | | 324,073 |
| Black Hills Corp. | | 25,079 | | | 1,406,430 |
| Canadian Utilities, Ltd., Class A | | 5,035 | | | 126,382 |
| CenterPoint Energy, Inc. | | 33,887 | | | 680,112 |
| CMS Energy Corp. | | 17,808 | | | 1,077,206 |
| Consolidated Edison, Inc. | | 20,786 | | | 1,482,873 |
| Dominion Energy, Inc. | | 52,213 | | | 4,095,588 |
| DTE Energy Company | | 11,983 | | | 1,422,023 |
| E.ON SE | | 421,336 | | | 4,990,221 |
| Engie SA (A) | | 306,146 | | | 4,259,010 |
| MDU Resources Group, Inc. | | 54,000 | | | 1,275,480 |
| National Grid PLC | | 326,889 | | | 3,661,184 |
| NiSource, Inc. | | 23,818 | | | 527,807 |
| NorthWestern Corp. | | 20,194 | | | 1,042,818 |
| Public Service Enterprise Group, Inc. | | 31,457 | | | 1,643,314 |
| RWE AG | | 109,657 | | | 4,366,492 |
| Sempra Energy | | 18,200 | | | 2,250,430 |
| Suez SA | | 57,618 | | | 994,989 |
| Unitil Corp. | | 1,959 | | | 82,670 |
| Veolia Environnement SA | | 90,249 | | | 2,177,438 |
| WEC Energy Group, Inc. | | 19,624 | | | 1,846,226 |
| YTL Corp. BHD | | 420,497 | | | 67,492 |
| | | | | | 42,664,667 |
| Water utilities – 0.1% | | | |
| Aguas Andinas SA, Class A | | 729,881 | | | 218,732 |
| American States Water Company | | 4,782 | | | 363,815 |
| American Water Works Company, Inc. | | 11,262 | | | 1,591,771 |
| Artesian Resources Corp., Class A | | 1,280 | | | 45,043 |
| Beijing Enterprises Water Group, Ltd. (A) | | 579,700 | | | 227,754 |
| Cadiz, Inc. (A) | | 2,922 | | | 30,564 |
| California Water Service Group | | 6,372 | | | 288,906 |
| Cia de Saneamento Basico do Estado de Sao Paulo | | 39,998 | | | 348,618 |
| Consolidated Water Company, Ltd. | | 2,484 | | | 29,883 |
Strategic Equity Allocation Fund (continued)
| | | Shares or
Principal
Amount | | Value |
| COMMON STOCKS (continued) | | | |
| Water utilities (continued) | | | |
| Essential Utilities, Inc. | | 60,049 | | $ | 2,552,083 |
| Global Water Resources, Inc. | | 2,357 | | | 26,045 |
| Guangdong Investment, Ltd. | | 341,980 | | | 533,257 |
| Middlesex Water Company | | 2,211 | | | 141,791 |
| Pure Cycle Corp. (A) | | 3,446 | | | 33,633 |
| Severn Trent PLC | | 22,103 | | | 685,573 |
| SJW Group | | 3,472 | | | 217,104 |
| The York Water Company | | 1,809 | | | 82,508 |
| United Utilities Group PLC | | 63,355 | | | 696,124 |
| | | | | | 8,113,204 |
| | | | | | 175,599,533 |
| TOTAL COMMON STOCKS (Cost $6,222,173,385) | | $ | 7,282,593,601 |
| PREFERRED SECURITIES – 0.4% | | | | | |
| Communication services – 0.0% | | | | | |
| Diversified telecommunication services – 0.0% | | | |
| Telefonica Brasil SA | | 52,354 | | | 457,172 |
| Consumer discretionary – 0.1% | | | | | |
| Automobiles – 0.1% | | | |
| Bayerische Motoren Werke AG | | 10,636 | | | 599,728 |
| Hyundai Motor Company | | 2,825 | | | 205,562 |
| Hyundai Motor Company, 2nd Preferred | | 4,376 | | | 324,097 |
| Porsche Automobil Holding SE (A) | | 28,805 | | | 1,771,415 |
| Volkswagen AG | | 34,882 | | | 5,834,438 |
| | | | | | 8,735,240 |
| Multiline retail – 0.0% | | | |
| Lojas Americanas SA | | 88,126 | | | 519,088 |
| | | | | | 9,254,328 |
| Consumer staples – 0.1% | | | | | |
| Beverages – 0.0% | | | |
| Embotelladora Andina SA, B Shares | | 99,657 | | | 212,263 |
| Household products – 0.1% | | | |
| Henkel AG & Company KGaA | | 33,478 | | | 3,422,745 |
| Personal products – 0.0% | | | |
| Amorepacific Corp. | | 1,102 | | | 55,260 |
| LG Household & Health Care, Ltd. | | 251 | | | 147,900 |
| | | | | | 203,160 |
| | | | | | 3,838,168 |
| Energy – 0.0% | | | | | |
| Oil, gas and consumable fuels – 0.0% | | | |
| Petroleo Brasileiro SA | | 557,733 | | | 2,228,489 |
| Financials – 0.1% | | | | | |
| Banks – 0.1% | | | |
| Banco Bradesco SA | | 519,244 | | | 1,965,706 |
| Bancolombia SA | | 81,065 | | | 579,005 |
| Itau Unibanco Holding SA | | 566,667 | | | 2,435,887 |
| Itausa SA | | 515,559 | | | 887,418 |
| | | | | | 5,868,016 |
| Health care – 0.0% | | | | | |
| Health care equipment and supplies – 0.0% | | | |
| Sartorius AG | | 6,678 | | | 2,834,880 |
| Information technology – 0.1% | | | | | |
| Technology hardware, storage and peripherals – 0.1% | | | |
| Samsung Electronics Company, Ltd. | | 98,880 | | | 3,949,910 |
| Materials – 0.0% | | | | | |
| Chemicals – 0.0% | | | |
| Braskem SA, A Shares | | 22,183 | | | 86,205 |
| FUCHS PETROLUB SE | | 13,009 | | | 615,344 |
| LG Chem, Ltd. | | 924 | | | 291,333 |
| The accompanying notes are an integral part of the financial statements. | 94 | |
John Hancock Funds II
Portfolio of Investments — August 31, 2020 (showing percentage of total net assets)
Strategic Equity Allocation Fund (continued)
| | | Shares or
Principal
Amount | | Value |
| PREFERRED SECURITIES (continued) | | | | | |
| Chemicals (continued) | | | |
| Sociedad Quimica y Minera de Chile SA, B Shares | | 32,055 | | $ | 1,001,984 |
| | | | | | 1,994,866 |
| Metals and mining – 0.0% | | | |
| Gerdau SA | | 127,683 | | | 444,915 |
| | | | | | 2,439,781 |
| Utilities – 0.0% | | | | | |
| Electric utilities – 0.0% | | | |
| Centrais Eletricas Brasileiras SA, B Shares | | 29,579 | | | 193,774 |
| Cia Energetica de Minas Gerais | | 112,075 | | | 215,415 |
| Cia Paranaense de Energia, B Shares | | 12,000 | | | 135,322 |
| | | | | | 544,511 |
| TOTAL PREFERRED SECURITIES (Cost $31,552,557) | | $ | 31,415,255 |
| EXCHANGE-TRADED FUNDS – 1.7% | | | |
| iShares MSCI India ETF (C) | | 1,828,684 | | | 61,023,185 |
| iShares MSCI Russia ETF (C) | | 247,450 | | | 8,690,444 |
| KraneShares Bosera MSCI China A ETF (C) | | 339,628 | | | 13,873,804 |
| VanEck Vectors Russia ETF | | 826,305 | | | 18,740,597 |
| Xtrackers Harvest CSI 300 China A-Shares ETF (C) | | 645,503 | | | 22,812,076 |
| TOTAL EXCHANGE-TRADED FUNDS (Cost $103,437,144) | | $ | 125,140,106 |
| RIGHTS – 0.0% | | | | | |
| Gulf Energy Development PCL, NVDR (Expiration Date: 9-15-20; Strike Price: THB 30.00) (A) | | 30,680 | | | 1,479 |
| Pan American Silver Corp. (Expiration Date: 2-22-29) (A)(E) | | 37,553 | | | 28,916 |
| Tabcorp Holdings, Ltd. (Expiration Date: 9-11-20; Strike Price: AUD 3.25) (A) | | 34,008 | | | 9,281 |
| TOTAL RIGHTS (Cost $11,142) | | $ | 39,676 |
| WARRANTS – 0.0% | | | | | |
| BTS Group Holdings PCL (Expiration Date: 2-16-21; Strike Price: THB 14.00) (A) | | 2,410 | | | 69 |
| BTS Group Holdings PCL (Expiration Date: 2-16-21; Strike Price: THB 14.00) (A) | | 63,720 | | | 1,822 |
| Minor International PCL (Expiration Date: 10-1-21; Strike Price: THB 48.00) (A) | | 1,847 | | | 43 |
| Minor International PCL (Expiration Date: 7-31-23) (A)(E) | | 20,359 | | | 6,443 |
| Occidental Petroleum Corp. (Expiration Date: 8-3-27; Strike Price: $22.00) (A)(C) | | 18,750 | | | 62,522 |
| TOTAL WARRANTS (Cost $105,942) | | $ | 70,899 |
Strategic Equity Allocation Fund (continued)
| | | Shares or
Principal
Amount | | Value |
| SHORT-TERM INVESTMENTS – 3.2% | | | |
| U.S. Government Agency – 1.0% | | | | | |
| Federal Home Loan Bank Discount Note | | | | | |
| 0.030%, 09/01/2020 * | $ | 5,000,000 | | $ | 5,000,000 |
| 0.060%, 10/01/2020 * | | 20,000,000 | | | 19,998,500 |
| 0.090%, 11/25/2020 * | | 15,000,000 | | | 14,996,458 |
| 0.110%, 09/14/2020 * | | 20,000,000 | | | 19,999,494 |
| 0.130%, 10/09/2020 * | | 9,900,000 | | | 9,899,060 |
| 0.135%, 09/02/2020 * | | 3,000,000 | | | 2,999,994 |
| | | | | | 72,893,506 |
| Short-term funds – 1.9% | | | | | |
| John Hancock Collateral Trust, 0.2611% (F)(G) | | 14,397,110 | | | 144,125,146 |
| Repurchase agreement – 0.3% | | | | | |
| Repurchase Agreement with State Street Corp. dated 8-31-20 at 0.000% to be repurchased at $20,778,000 on 9-1-20, collateralized by $19,559,300 U.S. Treasury Inflation Indexed Notes, 0.125% due 4-15-22 (valued at $21,193,758) | $ | 20,778,000 | | | 20,778,000 |
| TOTAL SHORT-TERM INVESTMENTS (Cost $237,639,158) | | $ | 237,796,652 |
Total Investments (Strategic Equity Allocation Fund)
(Cost $6,594,919,328) – 101.3% | | $ | 7,677,056,189 |
| Other assets and liabilities, net – (1.3%) | | | (94,924,802) |
| TOTAL NET ASSETS – 100.0% | | $ | 7,582,131,387 |
| Currency Abbreviations |
| AUD | Australian Dollar |
| THB | Thai Bhat |
| Security Abbreviations and Legend |
| ADR | American Depositary Receipt |
| NVDR | Non-Voting Depositary Receipt |
| (A) | Non-income producing security. |
| (B) | These securities are exempt from registration under Rule 144A of the Securities Act of 1933. Such securities may be resold, normally to qualified institutional buyers, in transactions exempt from registration. |
| (C) | All or a portion of this security is on loan as of 8-31-20. |
| (D) | Security is valued using significant unobservable inputs and is classified as Level 3 in the fair value hierarchy. Refer to Note 2 to the financial statements. |
| (E) | Strike price and/or expiration date not available. |
| (F) | The rate shown is the annualized seven-day yield as of 8-31-20. |
| (G) | Investment is an affiliate of the fund, the advisor and/or subadvisor. This security represents the investment of cash collateral received for securities lending. |
| * | Yield represents either the annualized yield at the date of purchase, the stated coupon rate or, for floating rate securities, the rate at period end. |
DERIVATIVES
FUTURES
| Open contracts | Number of
contracts | Position | Expiration
date | Notional
basis^ | Notional
value^ | Unrealized
appreciation
(depreciation) |
| Canadian Dollar Currency Futures | 16 | Long | Sep 2020 | $1,182,975 | $1,228,320 | $45,345 |
| Mini MSCI EAFE Index Futures | 266 | Long | Sep 2020 | 24,216,870 | 25,271,330 | 1,054,460 |
| Mini MSCI Emerging Markets Index Futures | 189 | Long | Sep 2020 | 10,086,009 | 10,398,780 | 312,771 |
| Russell 2000 E-Mini Index Futures | 85 | Long | Sep 2020 | 5,926,447 | 6,635,525 | 709,078 |
| S&P 500 Index E-Mini Futures | 514 | Long | Sep 2020 | 77,833,635 | 89,757,250 | 11,923,615 |
| The accompanying notes are an integral part of the financial statements. | 95 | |
John Hancock Funds II
Portfolio of Investments — August 31, 2020 (showing percentage of total net assets)
Strategic Equity Allocation Fund (continued)
FUTURES (continued)
| Open contracts | Number of
contracts | Position | Expiration
date | Notional
basis^ | Notional
value^ | Unrealized
appreciation
(depreciation) |
| S&P Mid 400 Index E-Mini Futures | 71 | Long | Sep 2020 | 12,381,592 | 13,673,180 | $1,291,588 |
| S&P/TSX 60 Index Futures | 7 | Long | Sep 2020 | 992,324 | 1,061,525 | 69,201 |
| | | | | | | $15,406,058 |
^ Notional basis refers to the contractual amount agreed upon at inception of open contracts; notional value represents the current value of the open contract.
FORWARD FOREIGN CURRENCY CONTRACTS
| Contract to buy | Contract to sell | Counterparty (OTC) | Contractual
settlement
date | Unrealized
appreciation | Unrealized
depreciation |
| JPY | 5,043,000,000 | USD | 47,247,773 | SSB | 9/15/2020 | $373,454 | — |
| USD | 46,335,473 | JPY | 5,043,000,000 | CIBC | 9/15/2020 | — | $(1,285,754) |
| | | | | | | $373,454 | $(1,285,754) |
| Derivatives Currency Abbreviations |
| JPY | Japanese Yen |
| USD | U.S. Dollar |
| Derivatives Abbreviations |
| CIBC | Canadian Imperial Bank of Commerce |
| OTC | Over-the-counter |
| SSB | State Street Bank and Trust Company |
See Notes to financial statements regarding investment transactions and other derivatives information.
U.S. Sector Rotation Fund
| | | Shares or
Principal
Amount | | Value |
| COMMON STOCKS – 97.7% | | | |
| Communication services – 12.5% | | | | | |
| Diversified telecommunication services – 1.0% | | | |
| AT&T, Inc. | | 200,070 | | $ | 5,964,087 |
| CenturyLink, Inc. | | 27,737 | | | 298,173 |
| Verizon Communications, Inc. | | 116,195 | | | 6,886,878 |
| | | | | | 13,149,138 |
| Entertainment – 2.1% | | | |
| Activision Blizzard, Inc. | | 33,734 | | | 2,817,464 |
| Electronic Arts, Inc. (A) | | 12,640 | | | 1,762,901 |
| Live Nation Entertainment, Inc. (A) | | 6,220 | | | 353,296 |
| Netflix, Inc. (A) | | 19,256 | | | 10,197,207 |
| Take-Two Interactive Software, Inc. (A) | | 4,989 | | | 854,067 |
| The Walt Disney Company | | 79,083 | | | 10,428,675 |
| | | | | | 26,413,610 |
| Interactive media and services – 8.0% | | | |
| Alphabet, Inc., Class A (A) | | 18,285 | | | 29,795,956 |
| Alphabet, Inc., Class C (A) | | 17,823 | | | 29,125,990 |
| Facebook, Inc., Class A (A) | | 146,535 | | | 42,964,062 |
| Twitter, Inc. (A) | | 47,816 | | | 1,940,373 |
| | | | | | 103,826,381 |
| Media – 1.2% | | | |
| Charter Communications, Inc., Class A (A) | | 6,518 | | | 4,012,546 |
| Comcast Corp., Class A | | 196,990 | | | 8,827,122 |
| Discovery, Inc., Series A (A) | | 6,918 | | | 152,646 |
| Discovery, Inc., Series C (A) | | 13,683 | | | 273,250 |
| DISH Network Corp., Class A (A) | | 11,122 | | | 395,053 |
| Fox Corp., Class A | | 14,819 | | | 412,857 |
| Fox Corp., Class B | | 6,888 | | | 191,486 |
| News Corp., Class A | | 16,815 | | | 254,243 |
| News Corp., Class B (B) | | 5,272 | | | 79,449 |
| Omnicom Group, Inc. | | 9,268 | | | 501,306 |
| The Interpublic Group of Companies, Inc. | | 16,851 | | | 299,274 |
U.S. Sector Rotation Fund (continued)
| | | Shares or
Principal
Amount | | Value |
| COMMON STOCKS (continued) | | | |
| Media (continued) | | | |
| ViacomCBS, Inc., Class B | | 23,380 | | $ | 651,133 |
| | | | | | 16,050,365 |
| Wireless telecommunication services – 0.2% | | | |
| T-Mobile US, Inc. (A) | | 16,349 | | | 1,907,601 |
| | | | | | 161,347,095 |
| Consumer discretionary – 17.2% | | | | | |
| Auto components – 0.4% | | | |
| Aptiv PLC | | 38,397 | | | 3,306,750 |
| BorgWarner, Inc. | | 29,696 | | | 1,205,361 |
| | | | | | 4,512,111 |
| Automobiles – 0.7% | | | |
| Ford Motor Company | | 559,542 | | | 3,816,076 |
| General Motors Company | | 180,396 | | | 5,345,133 |
| | | | | | 9,161,209 |
| Distributors – 0.1% | | | |
| Genuine Parts Company | | 10,448 | | | 986,709 |
| LKQ Corp. (A) | | 22,014 | | | 698,724 |
| | | | | | 1,685,433 |
| Diversified consumer services – 0.0% | | | |
| H&R Block, Inc. | | 8,078 | | | 117,131 |
| Hotels, restaurants and leisure – 1.5% | | | |
| Carnival Corp. (B) | | 19,881 | | | 327,639 |
| Chipotle Mexican Grill, Inc. (A) | | 1,077 | | | 1,411,172 |
| Darden Restaurants, Inc. | | 5,450 | | | 472,352 |
| Domino's Pizza, Inc. | | 1,642 | | | 671,512 |
| Hilton Worldwide Holdings, Inc. | | 11,635 | | | 1,051,339 |
| Las Vegas Sands Corp. | | 14,102 | | | 715,112 |
| Marriott International, Inc., Class A | | 11,294 | | | 1,162,266 |
| McDonald's Corp. | | 31,203 | | | 6,662,465 |
| MGM Resorts International | | 20,698 | | | 465,705 |
| Norwegian Cruise Line Holdings, Ltd. (A) | | 11,457 | | | 196,029 |
| The accompanying notes are an integral part of the financial statements. | 96 | |
John Hancock Funds II
Portfolio of Investments — August 31, 2020 (showing percentage of total net assets)
U.S. Sector Rotation Fund (continued)
| | | Shares or
Principal
Amount | | Value |
| COMMON STOCKS (continued) | | | |
| Hotels, restaurants and leisure (continued) | | | |
| Royal Caribbean Cruises, Ltd. | | 7,205 | | $ | 495,992 |
| Starbucks Corp. | | 49,019 | | | 4,140,635 |
| Wynn Resorts, Ltd. | | 4,074 | | | 356,271 |
| Yum! Brands, Inc. | | 12,631 | | | 1,210,681 |
| | | | | | 19,339,170 |
| Household durables – 0.5% | | | |
| D.R. Horton, Inc. | | 18,741 | | | 1,337,545 |
| Garmin, Ltd. | | 8,224 | | | 852,089 |
| Hamilton Beach Brands Holding Company, Class B | | 294 | | | 6,424 |
| Leggett & Platt, Inc. | | 7,495 | | | 307,295 |
| Lennar Corp., A Shares | | 15,557 | | | 1,163,975 |
| Mohawk Industries, Inc. (A) | | 3,370 | | | 311,152 |
| Newell Brands, Inc. | | 21,624 | | | 345,552 |
| NVR, Inc. (A) | | 196 | | | 816,995 |
| PulteGroup, Inc. | | 14,279 | | | 636,701 |
| Whirlpool Corp. | | 3,522 | | | 625,930 |
| | | | | | 6,403,658 |
| Internet and direct marketing retail – 7.4% | | | |
| Amazon.com, Inc. (A) | | 25,601 | | | 88,348,018 |
| Booking Holdings, Inc. (A) | | 2,501 | | | 4,778,035 |
| eBay, Inc. | | 40,360 | | | 2,210,921 |
| Expedia Group, Inc. | | 8,277 | | | 812,388 |
| | | | | | 96,149,362 |
| Leisure products – 0.1% | | | |
| Hasbro, Inc. | | 7,218 | | | 569,789 |
| Multiline retail – 1.5% | | | |
| Dollar General Corp. | | 32,928 | | | 6,647,505 |
| Dollar Tree, Inc. (A) | | 31,032 | | | 2,987,451 |
| Kohl's Corp. | | 20,634 | | | 440,742 |
| Target Corp. | | 65,407 | | | 9,890,192 |
| | | | | | 19,965,890 |
| Specialty retail – 4.2% | | | |
| Advance Auto Parts, Inc. | | 5,388 | | | 842,198 |
| AutoZone, Inc. (A) | | 1,821 | | | 2,178,481 |
| Best Buy Company, Inc. | | 17,724 | | | 1,965,769 |
| CarMax, Inc. (A) | | 12,690 | | | 1,356,942 |
| L Brands, Inc. | | 18,197 | | | 534,992 |
| Lowe's Companies, Inc. | | 58,870 | | | 9,695,300 |
| O'Reilly Automotive, Inc. (A) | | 5,788 | | | 2,695,066 |
| Ross Stores, Inc. | | 27,711 | | | 2,523,918 |
| The Gap, Inc. | | 16,599 | | | 288,657 |
| The Home Depot, Inc. | | 83,862 | | | 23,904,024 |
| The TJX Companies, Inc. | | 93,402 | | | 5,117,496 |
| Tiffany & Company | | 8,516 | | | 1,043,210 |
| Tractor Supply Company | | 9,016 | | | 1,341,851 |
| Ulta Beauty, Inc. (A) | | 4,391 | | | 1,019,502 |
| | | | | | 54,507,406 |
| Textiles, apparel and luxury goods – 0.8% | | | |
| Hanesbrands, Inc. | | 19,717 | | | 301,473 |
| NIKE, Inc., Class B | | 70,248 | | | 7,860,049 |
| PVH Corp. | | 4,019 | | | 224,099 |
| Ralph Lauren Corp. | | 2,706 | | | 186,254 |
| Tapestry, Inc. | | 15,640 | | | 230,377 |
| Under Armour, Inc., Class A (A) | | 10,675 | | | 104,722 |
| Under Armour, Inc., Class C (A) | | 11,135 | | | 98,545 |
| VF Corp. | | 18,064 | | | 1,187,708 |
| | | | | | 10,193,227 |
| | | | | | 222,604,386 |
| Consumer staples – 5.1% | | | | | |
| Beverages – 0.8% | | | |
| Brown-Forman Corp., Class B | | 4,022 | | | 294,290 |
U.S. Sector Rotation Fund (continued)
| | | Shares or
Principal
Amount | | Value |
| COMMON STOCKS (continued) | | | |
| Beverages (continued) | | | |
| Constellation Brands, Inc., Class A | | 3,704 | | $ | 683,314 |
| Molson Coors Beverage Company, Class B | | 4,147 | | | 156,093 |
| Monster Beverage Corp. (A) | | 8,245 | | | 691,426 |
| PepsiCo, Inc. | | 30,600 | | | 4,285,836 |
| The Coca-Cola Company | | 85,248 | | | 4,222,333 |
| | | | | | 10,333,292 |
| Food and staples retailing – 0.5% | | | |
| Costco Wholesale Corp. | | 6,115 | | | 2,125,941 |
| Sysco Corp. | | 7,030 | | | 422,784 |
| The Kroger Company | | 10,888 | | | 388,484 |
| Walgreens Boots Alliance, Inc. | | 10,205 | | | 387,994 |
| Walmart, Inc. | | 19,610 | | | 2,722,849 |
| | | | | | 6,048,052 |
| Food products – 0.5% | | | |
| Archer-Daniels-Midland Company | | 12,251 | | | 548,355 |
| Campbell Soup Company | | 3,732 | | | 196,341 |
| Conagra Brands, Inc. | | 10,742 | | | 412,063 |
| General Mills, Inc. | | 13,368 | | | 854,884 |
| Hormel Foods Corp. | | 6,181 | | | 315,107 |
| Kellogg Company | | 5,517 | | | 391,210 |
| Lamb Weston Holdings, Inc. | | 3,221 | | | 202,440 |
| McCormick & Company, Inc. | | 2,727 | | | 562,307 |
| Mondelez International, Inc., Class A | | 31,481 | | | 1,839,120 |
| The Hershey Company | | 3,251 | | | 483,229 |
| The J.M. Smucker Company | | 2,515 | | | 302,253 |
| The Kraft Heinz Company | | 13,743 | | | 481,555 |
| Tyson Foods, Inc., Class A | | 6,491 | | | 407,635 |
| | | | | | 6,996,499 |
| Household products – 2.6% | | | |
| Church & Dwight Company, Inc. | | 16,311 | | | 1,563,083 |
| Colgate-Palmolive Company | | 56,818 | | | 4,503,395 |
| Kimberly-Clark Corp. | | 22,590 | | | 3,563,798 |
| The Clorox Company | | 8,299 | | | 1,854,827 |
| The Procter & Gamble Company | | 164,222 | | | 22,716,829 |
| | | | | | 34,201,932 |
| Personal products – 0.3% | | | |
| Coty, Inc., Class A | | 19,743 | | | 70,680 |
| The Estee Lauder Companies, Inc., Class A | | 14,910 | | | 3,305,845 |
| | | | | | 3,376,525 |
| Tobacco – 0.4% | | | |
| Altria Group, Inc. | | 40,985 | | | 1,792,684 |
| Philip Morris International, Inc. | | 34,341 | | | 2,740,068 |
| | | | | | 4,532,752 |
| | | | | | 65,489,052 |
| Energy – 1.8% | | | | | |
| Energy equipment and services – 0.2% | | | |
| Baker Hughes Company | | 22,485 | | | 321,086 |
| Halliburton Company | | 30,113 | | | 487,228 |
| National Oilwell Varco, Inc. | | 13,327 | | | 159,924 |
| Schlumberger NV | | 47,638 | | | 905,598 |
| TechnipFMC PLC | | 14,437 | | | 111,165 |
| | | | | | 1,985,001 |
| Oil, gas and consumable fuels – 1.6% | | | |
| Apache Corp. | | 12,956 | | | 191,749 |
| Cabot Oil & Gas Corp. | | 13,681 | | | 259,529 |
| Chevron Corp. | | 64,086 | | | 5,378,738 |
| Concho Resources, Inc. | | 6,752 | | | 350,969 |
| ConocoPhillips | | 36,812 | | | 1,394,807 |
| Devon Energy Corp. | | 13,137 | | | 142,799 |
| Diamondback Energy, Inc. | | 5,417 | | | 211,046 |
| EOG Resources, Inc. | | 19,979 | | | 905,848 |
| The accompanying notes are an integral part of the financial statements. | 97 | |
John Hancock Funds II
Portfolio of Investments — August 31, 2020 (showing percentage of total net assets)
U.S. Sector Rotation Fund (continued)
| | | Shares or
Principal
Amount | | Value |
| COMMON STOCKS (continued) | | | |
| Oil, gas and consumable fuels (continued) | | | |
| Exxon Mobil Corp. | | 145,137 | | $ | 5,796,772 |
| Hess Corp. | | 8,962 | | | 412,610 |
| HollyFrontier Corp. | | 5,112 | | | 122,023 |
| Kinder Morgan, Inc. | | 66,760 | | | 922,623 |
| Marathon Oil Corp. | | 27,127 | | | 143,231 |
| Marathon Petroleum Corp. | | 22,321 | | | 791,503 |
| Noble Energy, Inc. | | 16,466 | | | 163,837 |
| Occidental Petroleum Corp. | | 30,894 | | | 393,590 |
| ONEOK, Inc. | | 15,100 | | | 414,948 |
| Phillips 66 | | 14,989 | | | 876,407 |
| Pioneer Natural Resources Company | | 5,659 | | | 588,140 |
| The Williams Companies, Inc. | | 41,644 | | | 864,529 |
| Valero Energy Corp. | | 13,995 | | | 735,997 |
| | | | | | 21,061,695 |
| | | | | | 23,046,696 |
| Financials – 8.0% | | | | | |
| Banks – 2.8% | | | |
| Bank of America Corp. | | 291,739 | | | 7,509,362 |
| Citigroup, Inc. | | 77,785 | | | 3,976,369 |
| Citizens Financial Group, Inc. | | 15,940 | | | 412,368 |
| Comerica, Inc. | | 5,195 | | | 205,358 |
| Fifth Third Bancorp | | 26,600 | | | 549,556 |
| First Republic Bank | | 6,407 | | | 723,414 |
| Huntington Bancshares, Inc. | | 37,897 | | | 356,611 |
| JPMorgan Chase & Co. | | 113,849 | | | 11,406,531 |
| KeyCorp | | 36,445 | | | 449,002 |
| M&T Bank Corp. | | 4,793 | | | 494,925 |
| People's United Financial, Inc. | | 15,868 | | | 167,883 |
| Regions Financial Corp. | | 35,758 | | | 413,362 |
| SVB Financial Group (A) | | 1,925 | | | 491,607 |
| The PNC Financial Services Group, Inc. | | 15,852 | | | 1,762,742 |
| Truist Financial Corp. | | 50,346 | | | 1,953,928 |
| U.S. Bancorp | | 51,215 | | | 1,864,226 |
| Wells Fargo & Company | | 139,405 | | | 3,366,631 |
| Zions Bancorp NA | | 6,123 | | | 196,916 |
| | | | | | 36,300,791 |
| Capital markets – 2.1% | | | |
| Ameriprise Financial, Inc. | | 4,545 | | | 712,656 |
| BlackRock, Inc. | | 5,731 | | | 3,405,303 |
| Cboe Global Markets, Inc. | | 4,076 | | | 374,136 |
| CME Group, Inc. | | 13,321 | | | 2,342,764 |
| E*TRADE Financial Corp. | | 8,212 | | | 444,269 |
| Franklin Resources, Inc. | | 10,305 | | | 217,023 |
| Intercontinental Exchange, Inc. | | 20,329 | | | 2,159,550 |
| Invesco, Ltd. | | 13,979 | | | 142,586 |
| MarketAxess Holdings, Inc. | | 1,408 | | | 684,204 |
| Moody's Corp. | | 5,990 | | | 1,764,894 |
| Morgan Stanley | | 44,486 | | | 2,324,838 |
| MSCI, Inc. | | 3,158 | | | 1,178,787 |
| Nasdaq, Inc. | | 4,267 | | | 573,570 |
| Northern Trust Corp. | | 7,729 | | | 632,928 |
| Raymond James Financial, Inc. | | 4,531 | | | 343,087 |
| S&P Global, Inc. | | 8,949 | | | 3,279,093 |
| State Street Corp. | | 13,075 | | | 890,277 |
| T. Rowe Price Group, Inc. | | 8,453 | | | 1,176,742 |
| The Bank of New York Mellon Corp. | | 29,933 | | | 1,106,922 |
| The Charles Schwab Corp. | | 42,565 | | | 1,512,334 |
| The Goldman Sachs Group, Inc. | | 11,498 | | | 2,355,595 |
| | | | | | 27,621,558 |
| Consumer finance – 0.4% | | | |
| American Express Company | | 24,521 | | | 2,491,088 |
| Capital One Financial Corp. | | 16,914 | | | 1,167,573 |
| Discover Financial Services | | 11,379 | | | 603,997 |
U.S. Sector Rotation Fund (continued)
| | | Shares or
Principal
Amount | | Value |
| COMMON STOCKS (continued) | | | |
| Consumer finance (continued) | | | |
| Synchrony Financial | | 19,950 | | $ | 494,960 |
| | | | | | 4,757,618 |
| Diversified financial services – 1.2% | | | |
| Berkshire Hathaway, Inc., Class B (A) | | 72,219 | | | 15,746,631 |
| NewStar Financial, Inc. (A)(C) | | 2,317 | | | 235 |
| | | | | | 15,746,866 |
| Insurance – 1.5% | | | |
| Aflac, Inc. | | 27,142 | | | 985,797 |
| American International Group, Inc. | | 32,581 | | | 949,410 |
| Aon PLC, Class A | | 8,742 | | | 1,748,313 |
| Arthur J. Gallagher & Company | | 7,173 | | | 755,317 |
| Assurant, Inc. | | 2,257 | | | 274,361 |
| Chubb, Ltd. | | 17,074 | | | 2,134,250 |
| Cincinnati Financial Corp. | | 5,708 | | | 453,272 |
| Everest Re Group, Ltd. | | 1,513 | | | 332,981 |
| Globe Life, Inc. | | 3,704 | | | 305,506 |
| Lincoln National Corp. | | 7,309 | | | 263,489 |
| Loews Corp. | | 9,156 | | | 328,334 |
| Marsh & McLennan Companies, Inc. | | 19,301 | | | 2,217,878 |
| MetLife, Inc. | | 29,183 | | | 1,122,378 |
| Principal Financial Group, Inc. | | 9,635 | | | 405,730 |
| Prudential Financial, Inc. | | 14,942 | | | 1,012,619 |
| The Allstate Corp. | | 11,882 | | | 1,105,026 |
| The Hartford Financial Services Group, Inc. | | 13,546 | | | 547,936 |
| The Progressive Corp. | | 22,141 | | | 2,104,281 |
| The Travelers Companies, Inc. | | 9,564 | | | 1,109,807 |
| Unum Group | | 7,695 | | | 142,204 |
| W.R. Berkley Corp. | | 5,341 | | | 331,409 |
| Willis Towers Watson PLC | | 4,870 | | | 1,000,931 |
| | | | | | 19,631,229 |
| | | | | | 104,058,062 |
| Health care – 7.7% | | | | | |
| Biotechnology – 0.7% | | | |
| AbbVie, Inc. | | 27,306 | | | 2,615,096 |
| Alexion Pharmaceuticals, Inc. (A) | | 3,421 | | | 390,747 |
| Amgen, Inc. | | 9,114 | | | 2,308,758 |
| Biogen, Inc. (A) | | 2,528 | | | 727,154 |
| Gilead Sciences, Inc. | | 19,430 | | | 1,296,953 |
| Incyte Corp. (A) | | 2,795 | | | 269,298 |
| Regeneron Pharmaceuticals, Inc. (A) | | 1,563 | | | 968,951 |
| Vertex Pharmaceuticals, Inc. (A) | | 4,017 | | | 1,121,225 |
| | | | | | 9,698,182 |
| Health care equipment and supplies – 2.7% | | | |
| Abbott Laboratories | | 54,477 | | | 5,963,597 |
| ABIOMED, Inc. (A) | | 1,385 | | | 426,054 |
| Align Technology, Inc. (A) | | 2,207 | | | 655,435 |
| Baxter International, Inc. | | 15,671 | | | 1,364,474 |
| Becton, Dickinson and Company | | 9,082 | | | 2,204,837 |
| Boston Scientific Corp. (A) | | 44,001 | | | 1,804,921 |
| Danaher Corp. | | 19,380 | | | 4,001,389 |
| Dentsply Sirona, Inc. | | 6,747 | | | 302,738 |
| DexCom, Inc. (A) | | 2,843 | | | 1,209,441 |
| Edwards Lifesciences Corp. (A) | | 19,085 | | | 1,638,256 |
| Hologic, Inc. (A) | | 7,952 | | | 474,893 |
| IDEXX Laboratories, Inc. (A) | | 2,616 | | | 1,023,013 |
| Intuitive Surgical, Inc. (A) | | 3,592 | | | 2,625,177 |
| Medtronic PLC | | 41,303 | | | 4,438,833 |
| ResMed, Inc. | | 4,456 | | | 805,556 |
| STERIS PLC | | 2,616 | | | 417,618 |
| Stryker Corp. | | 9,928 | | | 1,967,332 |
| Teleflex, Inc. | | 1,430 | | | 561,919 |
| The Cooper Companies, Inc. | | 1,513 | | | 475,657 |
| The accompanying notes are an integral part of the financial statements. | 98 | |
John Hancock Funds II
Portfolio of Investments — August 31, 2020 (showing percentage of total net assets)
U.S. Sector Rotation Fund (continued)
| | | Shares or
Principal
Amount | | Value |
| COMMON STOCKS (continued) | | | |
| Health care equipment and supplies (continued) | | | |
| Varian Medical Systems, Inc. (A) | | 2,797 | | $ | 485,755 |
| West Pharmaceutical Services, Inc. | | 2,267 | | | 643,737 |
| Zimmer Biomet Holdings, Inc. | | 6,369 | | | 897,265 |
| | | | | | 34,387,897 |
| Health care providers and services – 1.8% | | | |
| AmerisourceBergen Corp. | | 4,573 | | | 443,718 |
| Anthem, Inc. | | 7,765 | | | 2,186,003 |
| Cardinal Health, Inc. | | 8,993 | | | 456,485 |
| Centene Corp. (A) | | 17,836 | | | 1,093,704 |
| Cigna Corp. | | 11,364 | | | 2,015,633 |
| CVS Health Corp. | | 40,256 | | | 2,500,703 |
| DaVita, Inc. (A) | | 2,626 | | | 227,832 |
| HCA Healthcare, Inc. | | 8,111 | | | 1,100,825 |
| Henry Schein, Inc. (A) | | 4,397 | | | 292,137 |
| Humana, Inc. | | 4,072 | | | 1,690,572 |
| Laboratory Corp. of America Holdings (A) | | 2,994 | | | 526,196 |
| McKesson Corp. | | 4,985 | | | 764,898 |
| Quest Diagnostics, Inc. | | 4,119 | | | 458,198 |
| UnitedHealth Group, Inc. | | 29,208 | | | 9,128,960 |
| Universal Health Services, Inc., Class B | | 2,392 | | | 263,957 |
| | | | | | 23,149,821 |
| Health care technology – 0.0% | | | |
| Cerner Corp. | | 9,373 | | | 687,697 |
| Life sciences tools and services – 1.1% | | | |
| Agilent Technologies, Inc. | | 12,908 | | | 1,296,221 |
| Bio-Rad Laboratories, Inc., Class A (A) | | 893 | | | 454,171 |
| Illumina, Inc. (A) | | 6,145 | | | 2,195,117 |
| IQVIA Holdings, Inc. (A) | | 7,424 | | | 1,215,680 |
| Mettler-Toledo International, Inc. (A) | | 999 | | | 969,809 |
| PerkinElmer, Inc. | | 4,656 | | | 548,104 |
| Thermo Fisher Scientific, Inc. | | 16,510 | | | 7,082,460 |
| Waters Corp. (A) | | 2,588 | | | 559,681 |
| | | | | | 14,321,243 |
| Pharmaceuticals – 1.4% | | | |
| Bristol-Myers Squibb Company | | 33,831 | | | 2,104,288 |
| Elanco Animal Health, Inc. (A)(C) | | 2,471 | | | 0 |
| Eli Lilly & Company | | 12,592 | | | 1,868,527 |
| Johnson & Johnson | | 39,392 | | | 6,043,127 |
| Merck & Company, Inc. | | 37,740 | | | 3,218,090 |
| Mylan NV (A) | | 7,726 | | | 126,552 |
| Perrigo Company PLC | | 2,038 | | | 106,587 |
| Pfizer, Inc. | | 83,054 | | | 3,138,611 |
| Zoetis, Inc. | | 7,101 | | | 1,136,870 |
| | | | | | 17,742,652 |
| | | | | | 99,987,492 |
| Industrials – 10.7% | | | | | |
| Aerospace and defense – 1.4% | | | |
| General Dynamics Corp. | | 8,906 | | | 1,330,111 |
| Howmet Aerospace, Inc. | | 14,710 | | | 257,719 |
| Huntington Ingalls Industries, Inc. | | 1,551 | | | 235,008 |
| L3Harris Technologies, Inc. | | 8,274 | | | 1,495,443 |
| Lockheed Martin Corp. | | 9,459 | | | 3,691,469 |
| Northrop Grumman Corp. | | 5,942 | | | 2,035,789 |
| Raytheon Technologies Corp. | | 56,375 | | | 3,438,875 |
| Teledyne Technologies, Inc. (A) | | 1,405 | | | 440,622 |
| Textron, Inc. | | 8,726 | | | 344,066 |
| The Boeing Company | | 20,549 | | | 3,530,729 |
| TransDigm Group, Inc. | | 1,928 | | | 963,364 |
| | | | | | 17,763,195 |
| Air freight and logistics – 1.2% | | | |
| CH Robinson Worldwide, Inc. | | 10,469 | | | 1,029,103 |
| Expeditors International of Washington, Inc. | | 12,943 | | | 1,144,032 |
U.S. Sector Rotation Fund (continued)
| | | Shares or
Principal
Amount | | Value |
| COMMON STOCKS (continued) | | | |
| Air freight and logistics (continued) | | | |
| FedEx Corp. | | 18,693 | | $ | 4,109,469 |
| United Parcel Service, Inc., Class B | | 54,761 | | | 8,959,995 |
| | | | | | 15,242,599 |
| Airlines – 0.3% | | | |
| Alaska Air Group, Inc. | | 9,533 | | | 371,310 |
| American Airlines Group, Inc. (B) | | 38,652 | | | 504,409 |
| Delta Air Lines, Inc. | | 44,149 | | | 1,361,997 |
| Southwest Airlines Company | | 41,712 | | | 1,567,537 |
| United Airlines Holdings, Inc. (A) | | 19,651 | | | 707,436 |
| | | | | | 4,512,689 |
| Building products – 1.1% | | | |
| A. O. Smith Corp. | | 15,670 | | | 767,360 |
| Allegion PLC | | 10,697 | | | 1,105,963 |
| Carrier Global Corp. | | 94,440 | | | 2,819,034 |
| Fortune Brands Home & Security, Inc. | | 16,205 | | | 1,362,516 |
| Johnson Controls International PLC | | 86,282 | | | 3,514,266 |
| Masco Corp. | | 30,594 | | | 1,783,630 |
| Trane Technologies PLC | | 27,747 | | | 3,284,967 |
| | | | | | 14,637,736 |
| Commercial services and supplies – 0.4% | | | |
| Cintas Corp. | | 3,685 | | | 1,227,989 |
| Copart, Inc. (A) | | 9,034 | | | 933,393 |
| Republic Services, Inc. | | 9,186 | | | 851,726 |
| Rollins, Inc. | | 6,163 | | | 339,828 |
| Waste Management, Inc. | | 16,977 | | | 1,935,378 |
| | | | | | 5,288,314 |
| Construction and engineering – 0.1% | | | |
| Jacobs Engineering Group, Inc. | | 7,855 | | | 709,071 |
| Quanta Services, Inc. | | 8,310 | | | 425,888 |
| | | | | | 1,134,959 |
| Electrical equipment – 1.1% | | | |
| AMETEK, Inc. | | 25,408 | | | 2,558,586 |
| Eaton Corp. PLC | | 44,298 | | | 4,522,826 |
| Emerson Electric Company | | 66,167 | | | 4,596,621 |
| Rockwell Automation, Inc. | | 12,827 | | | 2,957,008 |
| | | | | | 14,635,041 |
| Industrial conglomerates – 0.5% | | | |
| 3M Company | | 12,971 | | | 2,114,532 |
| General Electric Company | | 197,255 | | | 1,250,597 |
| Honeywell International, Inc. | | 15,827 | | | 2,620,160 |
| Roper Technologies, Inc. | | 2,354 | | | 1,005,605 |
| | | | | | 6,990,894 |
| Machinery – 2.3% | | | |
| Caterpillar, Inc. | | 36,055 | | | 5,130,987 |
| Cummins, Inc. | | 9,828 | | | 2,036,853 |
| Deere & Company | | 20,841 | | | 4,377,860 |
| Dover Corp. | | 9,589 | | | 1,053,256 |
| Flowserve Corp. | | 8,669 | | | 257,296 |
| Fortive Corp. | | 19,747 | | | 1,423,956 |
| IDEX Corp. | | 5,022 | | | 905,115 |
| Illinois Tool Works, Inc. | | 19,152 | | | 3,783,478 |
| Ingersoll Rand, Inc. (A) | | 23,034 | | | 807,572 |
| Otis Worldwide Corp. | | 27,119 | | | 1,705,785 |
| PACCAR, Inc. | | 23,031 | | | 1,976,981 |
| Parker-Hannifin Corp. | | 8,551 | | | 1,761,592 |
| Pentair PLC | | 11,040 | | | 498,346 |
| Snap-on, Inc. | | 3,621 | | | 536,886 |
| Stanley Black & Decker, Inc. | | 10,267 | | | 1,656,067 |
| Wabtec Corp. | | 12,042 | | | 801,395 |
| Xylem, Inc. | | 11,985 | | | 960,957 |
| | | | | | 29,674,382 |
| The accompanying notes are an integral part of the financial statements. | 99 | |
John Hancock Funds II
Portfolio of Investments — August 31, 2020 (showing percentage of total net assets)
U.S. Sector Rotation Fund (continued)
| | | Shares or
Principal
Amount | | Value |
| COMMON STOCKS (continued) | | | |
| Professional services – 0.3% | | | |
| Equifax, Inc. | | 5,308 | | $ | 893,177 |
| IHS Markit, Ltd. | | 17,442 | | | 1,393,965 |
| Nielsen Holdings PLC | | 15,587 | | | 238,169 |
| Robert Half International, Inc. | | 5,011 | | | 266,585 |
| Verisk Analytics, Inc. | | 7,095 | | | 1,324,424 |
| | | | | | 4,116,320 |
| Road and rail – 1.8% | | | |
| CSX Corp. | | 59,532 | | | 4,551,817 |
| JB Hunt Transport Services, Inc. | | 6,562 | | | 922,223 |
| Kansas City Southern | | 7,390 | | | 1,345,276 |
| Norfolk Southern Corp. | | 19,924 | | | 4,234,448 |
| Old Dominion Freight Line, Inc. | | 7,339 | | | 1,483,799 |
| Union Pacific Corp. | | 52,774 | | | 10,155,829 |
| | | | | | 22,693,392 |
| Trading companies and distributors – 0.2% | | | |
| Fastenal Company | | 22,004 | | | 1,075,115 |
| United Rentals, Inc. (A) | | 2,768 | | | 490,074 |
| W.W. Grainger, Inc. | | 1,664 | | | 608,076 |
| | | | | | 2,173,265 |
| | | | | | 138,862,786 |
| Information technology – 30.1% | | | | | |
| Communications equipment – 0.8% | | | |
| Arista Networks, Inc. (A) | | 2,343 | | | 523,543 |
| Cisco Systems, Inc. | | 184,837 | | | 7,803,818 |
| F5 Networks, Inc. (A) | | 2,654 | | | 351,204 |
| Juniper Networks, Inc. | | 14,442 | | | 361,050 |
| Motorola Solutions, Inc. | | 7,412 | | | 1,147,007 |
| | | | | | 10,186,622 |
| Electronic equipment, instruments and components – 0.5% | | | |
| Amphenol Corp., Class A | | 12,896 | | | 1,415,981 |
| CDW Corp. | | 6,203 | | | 704,971 |
| Corning, Inc. | | 33,081 | | | 1,073,809 |
| FLIR Systems, Inc. | | 5,703 | | | 210,441 |
| IPG Photonics Corp. (A) | | 1,549 | | | 250,520 |
| Keysight Technologies, Inc. (A) | | 8,152 | | | 803,135 |
| TE Connectivity, Ltd. | | 14,376 | | | 1,388,722 |
| Zebra Technologies Corp., Class A (A) | | 2,314 | | | 663,030 |
| | | | | | 6,510,609 |
| IT services – 5.6% | | | |
| Accenture PLC, Class A | | 28,208 | | | 6,767,945 |
| Akamai Technologies, Inc. (A) | | 7,186 | | | 836,666 |
| Automatic Data Processing, Inc. | | 19,031 | | | 2,647,022 |
| Broadridge Financial Solutions, Inc. | | 5,084 | | | 698,542 |
| Cognizant Technology Solutions Corp., Class A | | 23,937 | | | 1,600,428 |
| DXC Technology Company | | 11,237 | | | 224,515 |
| Fidelity National Information Services, Inc. | | 27,358 | | | 4,126,954 |
| Fiserv, Inc. (A) | | 24,902 | | | 2,479,741 |
| FleetCor Technologies, Inc. (A) | | 3,711 | | | 933,131 |
| Gartner, Inc. (A) | | 3,949 | | | 512,659 |
| Global Payments, Inc. | | 13,245 | | | 2,339,332 |
| IBM Corp. | | 39,317 | | | 4,848,179 |
| Jack Henry & Associates, Inc. | | 3,393 | | | 561,270 |
| Leidos Holdings, Inc. | | 5,912 | | | 534,977 |
| Mastercard, Inc., Class A | | 39,136 | | | 14,018,124 |
| Paychex, Inc. | | 14,137 | | | 1,081,056 |
| PayPal Holdings, Inc. (A) | | 51,993 | | | 10,613,851 |
| The Western Union Company | | 18,196 | | | 429,244 |
| VeriSign, Inc. (A) | | 4,502 | | | 967,030 |
| Visa, Inc., Class A | | 74,707 | | | 15,837,137 |
| | | | | | 72,057,803 |
U.S. Sector Rotation Fund (continued)
| | | Shares or
Principal
Amount | | Value |
| COMMON STOCKS (continued) | | | |
| Semiconductors and semiconductor equipment – 6.5% | | | |
| Advanced Micro Devices, Inc. (A) | | 70,801 | | $ | 6,430,147 |
| Analog Devices, Inc. | | 22,272 | | | 2,603,151 |
| Applied Materials, Inc. | | 55,403 | | | 3,412,825 |
| Broadcom, Inc. | | 24,168 | | | 8,389,921 |
| Intel Corp. | | 255,955 | | | 13,040,907 |
| KLA Corp. | | 9,373 | | | 1,922,777 |
| Lam Research Corp. | | 8,775 | | | 2,951,384 |
| Maxim Integrated Products, Inc. | | 16,118 | | | 1,103,116 |
| Microchip Technology, Inc. | | 14,831 | | | 1,626,961 |
| Micron Technology, Inc. (A) | | 67,234 | | | 3,059,819 |
| NVIDIA Corp. | | 37,186 | | | 19,893,766 |
| Qorvo, Inc. (A) | | 6,936 | | | 889,681 |
| QUALCOMM, Inc. | | 68,005 | | | 8,099,396 |
| Skyworks Solutions, Inc. | | 10,086 | | | 1,460,957 |
| Texas Instruments, Inc. | | 55,482 | | | 7,886,766 |
| Xilinx, Inc. | | 14,700 | | | 1,531,152 |
| | | | | | 84,302,726 |
| Software – 9.4% | | | |
| Adobe, Inc. (A) | | 21,539 | | | 11,057,907 |
| ANSYS, Inc. (A) | | 3,841 | | | 1,302,137 |
| Autodesk, Inc. (A) | | 9,799 | | | 2,407,614 |
| Cadence Design Systems, Inc. (A) | | 12,481 | | | 1,384,268 |
| Citrix Systems, Inc. | | 5,188 | | | 753,298 |
| Fortinet, Inc. (A) | | 5,998 | | | 791,766 |
| Intuit, Inc. | | 11,658 | | | 4,026,557 |
| Microsoft Corp. | | 339,020 | | | 76,459,181 |
| NortonLifeLock, Inc. | | 24,227 | | | 569,819 |
| Oracle Corp. | | 93,048 | | | 5,324,207 |
| Paycom Software, Inc. (A) | | 2,157 | | | 645,935 |
| salesforce.com, Inc. (A) | | 40,279 | | | 10,982,069 |
| ServiceNow, Inc. (A) | | 8,525 | | | 4,109,221 |
| Synopsys, Inc. (A) | | 6,741 | | | 1,491,783 |
| Tyler Technologies, Inc. (A) | | 1,778 | | | 613,961 |
| | | | | | 121,919,723 |
| Technology hardware, storage and peripherals – 7.3% | | | |
| Apple, Inc. | | 710,304 | | | 91,657,628 |
| Hewlett Packard Enterprise Company | | 55,997 | | | 541,491 |
| HP, Inc. | | 62,324 | | | 1,218,434 |
| NetApp, Inc. | | 9,640 | | | 456,840 |
| Seagate Technology PLC | | 9,843 | | | 472,366 |
| Western Digital Corp. | | 13,062 | | | 501,842 |
| Xerox Holdings Corp. | | 7,982 | | | 150,541 |
| | | | | | 94,999,142 |
| | | | | | 389,976,625 |
| Materials – 2.0% | | | | | |
| Chemicals – 1.4% | | | |
| Air Products & Chemicals, Inc. | | 8,014 | | | 2,342,172 |
| Albemarle Corp. | | 3,858 | | | 351,117 |
| Celanese Corp. | | 4,290 | | | 433,934 |
| CF Industries Holdings, Inc. | | 7,759 | | | 253,176 |
| Corteva, Inc. | | 27,157 | | | 775,332 |
| Dow, Inc. | | 26,880 | | | 1,212,826 |
| DuPont de Nemours, Inc. | | 26,628 | | | 1,484,777 |
| Eastman Chemical Company | | 4,932 | | | 360,579 |
| Ecolab, Inc. | | 8,974 | | | 1,768,596 |
| FMC Corp. | | 4,697 | | | 501,921 |
| International Flavors & Fragrances, Inc. (B) | | 3,877 | | | 479,934 |
| Linde PLC | | 19,058 | | | 4,759,545 |
| LyondellBasell Industries NV, Class A | | 9,325 | | | 610,601 |
| PPG Industries, Inc. | | 8,561 | | | 1,030,744 |
| The Mosaic Company | | 12,654 | | | 230,682 |
| The accompanying notes are an integral part of the financial statements. | 100 | |
John Hancock Funds II
Portfolio of Investments — August 31, 2020 (showing percentage of total net assets)
U.S. Sector Rotation Fund (continued)
| | | Shares or
Principal
Amount | | Value |
| COMMON STOCKS (continued) | | | |
| Chemicals (continued) | | | |
| The Sherwin-Williams Company | | 2,933 | | $ | 1,968,190 |
| | | | | | 18,564,126 |
| Construction materials – 0.1% | | | |
| Martin Marietta Materials, Inc. | | 2,259 | | | 458,283 |
| Vulcan Materials Company | | 4,806 | | | 576,720 |
| | | | | | 1,035,003 |
| Containers and packaging – 0.3% | | | |
| Amcor PLC | | 57,135 | | | 631,913 |
| Avery Dennison Corp. | | 3,023 | | | 348,824 |
| Ball Corp. | | 11,830 | | | 950,777 |
| International Paper Company | | 14,263 | | | 517,319 |
| Packaging Corp. of America | | 3,442 | | | 348,468 |
| Sealed Air Corp. | | 5,649 | | | 222,006 |
| Westrock Company | | 9,408 | | | 285,345 |
| | | | | | 3,304,652 |
| Metals and mining – 0.2% | | | |
| Freeport-McMoRan, Inc. | | 52,690 | | | 822,491 |
| Newmont Corp. | | 29,124 | | | 1,959,463 |
| Nucor Corp. | | 10,928 | | | 496,787 |
| | | | | | 3,278,741 |
| | | | | | 26,182,522 |
| Real estate – 1.3% | | | | | |
| Equity real estate investment trusts – 1.3% | | | |
| Alexandria Real Estate Equities, Inc. | | 2,814 | | | 473,821 |
| American Tower Corp. | | 9,884 | | | 2,462,599 |
| Apartment Investment & Management Company, A Shares | | 3,320 | | | 119,620 |
| AvalonBay Communities, Inc. | | 3,138 | | | 495,992 |
| Boston Properties, Inc. | | 3,222 | | | 279,895 |
| Crown Castle International Corp. | | 9,292 | | | 1,516,919 |
| Digital Realty Trust, Inc. | | 5,982 | | | 931,098 |
| Duke Realty Corp. | | 8,214 | | | 316,650 |
| Equinix, Inc. | | 1,974 | | | 1,559,026 |
| Equity Residential | | 7,799 | | | 440,254 |
| Essex Property Trust, Inc. | | 1,459 | | | 315,888 |
| Extra Space Storage, Inc. | | 2,878 | | | 306,651 |
| Federal Realty Investment Trust | | 1,568 | | | 124,248 |
| Healthpeak Properties, Inc. | | 12,002 | | | 331,735 |
| Host Hotels & Resorts, Inc. | | 15,718 | | | 176,513 |
| Iron Mountain, Inc. | | 6,420 | | | 193,178 |
| Kimco Realty Corp. | | 9,644 | | | 115,632 |
| Mid-America Apartment Communities, Inc. | | 2,550 | | | 298,656 |
| Prologis, Inc. | | 16,468 | | | 1,677,430 |
| Public Storage | | 3,352 | | | 711,965 |
| Realty Income Corp. | | 7,657 | | | 474,964 |
| Regency Centers Corp. | | 3,782 | | | 150,183 |
| SBA Communications Corp. | | 2,489 | | | 761,808 |
| Simon Property Group, Inc. | | 6,817 | | | 462,533 |
| SL Green Realty Corp. | | 1,707 | | | 79,819 |
| UDR, Inc. | | 6,575 | | | 228,876 |
| Ventas, Inc. | | 8,318 | | | 342,785 |
| Vornado Realty Trust | | 3,537 | | | 126,731 |
| Welltower, Inc. | | 9,308 | | | 535,396 |
| Weyerhaeuser Company | | 16,638 | | | 504,298 |
| | | | | | 16,515,163 |
| Real estate management and development – 0.0% | | | |
| CBRE Group, Inc., Class A (A) | | 7,473 | | | 351,455 |
| | | | | | 16,866,618 |
| Utilities – 1.3% | | | | | |
| Electric utilities – 0.8% | | | |
| Alliant Energy Corp. | | 4,873 | | | 263,873 |
| American Electric Power Company, Inc. | | 9,679 | | | 762,996 |
U.S. Sector Rotation Fund (continued)
| | | Shares or
Principal
Amount | | Value |
| COMMON STOCKS (continued) | | | |
| Electric utilities (continued) | | | |
| Duke Energy Corp. | | 14,352 | | $ | 1,153,040 |
| Edison International | | 7,381 | | | 387,355 |
| Entergy Corp. | | 3,909 | | | 387,538 |
| Evergy, Inc. | | 4,428 | | | 235,658 |
| Eversource Energy | | 6,571 | | | 563,200 |
| Exelon Corp. | | 19,031 | | | 702,434 |
| FirstEnergy Corp. | | 10,581 | | | 302,511 |
| NextEra Energy, Inc. | | 9,559 | | | 2,668,586 |
| NRG Energy, Inc. | | 4,767 | | | 164,032 |
| Pinnacle West Capital Corp. | | 2,197 | | | 161,150 |
| PPL Corp. | | 15,015 | | | 414,864 |
| The Southern Company | | 20,623 | | | 1,076,108 |
| Xcel Energy, Inc. | | 10,254 | | | 712,397 |
| | | | | | 9,955,742 |
| Gas utilities – 0.0% | | | |
| Atmos Energy Corp. | | 2,389 | | | 238,470 |
Independent power and renewable electricity producers –
0.0% | | | |
| The AES Corp. | | 12,987 | | | 230,519 |
| Multi-utilities – 0.4% | | | |
| Ameren Corp. | | 4,822 | | | 381,468 |
| CenterPoint Energy, Inc. | | 10,637 | | | 213,485 |
| CMS Energy Corp. | | 5,590 | | | 338,139 |
| Consolidated Edison, Inc. | | 6,525 | | | 465,494 |
| Dominion Energy, Inc. | | 16,391 | | | 1,285,710 |
| DTE Energy Company | | 3,762 | | | 446,437 |
| NiSource, Inc. | | 7,476 | | | 165,668 |
| Public Service Enterprise Group, Inc. | | 9,875 | | | 515,870 |
| Sempra Energy | | 5,713 | | | 706,412 |
| WEC Energy Group, Inc. | | 6,161 | | | 579,627 |
| | | | | | 5,098,310 |
| Water utilities – 0.1% | | | |
| American Water Works Company, Inc. | | 3,535 | | | 499,637 |
| | | | | | 16,022,678 |
| TOTAL COMMON STOCKS (Cost $1,036,324,943) | | $ | 1,264,444,012 |
| RIGHTS – 0.0% | | | | | |
| Pan American Silver Corp. (Expiration Date: 2-22-29) (A)(D) | | 13,589 | | | 10,464 |
| TOTAL RIGHTS (Cost $4,020) | | $ | 10,464 |
| WARRANTS – 0.0% | | | | | |
| Occidental Petroleum Corp. (Expiration Date: 8-3-27; Strike Price: $22.00) (A)(B) | | 6,037 | | | 20,264 |
| TOTAL WARRANTS (Cost $34,110) | | $ | 20,264 |
| SHORT-TERM INVESTMENTS – 2.1% | | | |
| U.S. Government Agency – 0.7% | | | | | |
Federal Home Loan Bank Discount Note
0.090%, 11/25/2020 * | $ | 10,000,000 | | | 9,997,639 |
| Short-term funds – 0.1% | | | | | |
| John Hancock Collateral Trust, 0.2611% (E)(F) | | 94,697 | | | 947,987 |
| The accompanying notes are an integral part of the financial statements. | 101 | |
John Hancock Funds II
Portfolio of Investments — August 31, 2020 (showing percentage of total net assets)
U.S. Sector Rotation Fund (continued)
| | | Shares or
Principal
Amount | | Value |
| SHORT-TERM INVESTMENTS (continued) | | | |
| Repurchase agreement – 1.3% | | | | | |
| Repurchase Agreement with State Street Corp. dated 8-31-20 at 0.000% to be repurchased at $16,846,000 on 9-1-20, collateralized by $15,857,800 U.S. Treasury Inflation Indexed Notes, 0.125% due 4-15-22 (valued at $17,182,945) | $ | 16,846,000 | | $ | 16,846,000 |
| TOTAL SHORT-TERM INVESTMENTS (Cost $27,790,429) | | $ | 27,791,626 |
Total Investments (U.S. Sector Rotation Fund)
(Cost $1,064,153,502) – 99.8% | | $ | 1,292,266,366 |
| Other assets and liabilities, net – 0.2% | | | 2,617,346 |
| TOTAL NET ASSETS – 100.0% | | $ | 1,294,883,712 |
U.S. Sector Rotation Fund (continued)
| Security Abbreviations and Legend |
| (A) | Non-income producing security. |
| (B) | All or a portion of this security is on loan as of 8-31-20. |
| (C) | Security is valued using significant unobservable inputs and is classified as Level 3 in the fair value hierarchy. Refer to Note 2 to the financial statements. |
| (D) | Strike price and/or expiration date not available. |
| (E) | The rate shown is the annualized seven-day yield as of 8-31-20. |
| (F) | Investment is an affiliate of the fund, the advisor and/or subadvisor. This security represents the investment of cash collateral received for securities lending. |
| * | Yield represents either the annualized yield at the date of purchase, the stated coupon rate or, for floating rate securities, the rate at period end. |
DERIVATIVES
FUTURES
| Open contracts | Number of
contracts | Position | Expiration
date | Notional
basis^ | Notional
value^ | Unrealized
appreciation
(depreciation) |
| S&P 500 Index E-Mini Futures | 181 | Long | Sep 2020 | $29,406,409 | $31,607,125 | $2,200,716 |
| | | | | | | $2,200,716 |
^ Notional basis refers to the contractual amount agreed upon at inception of open contracts; notional value represents the current value of the open contract.
See Notes to financial statements regarding investment transactions and other derivatives information.
| The accompanying notes are an integral part of the financial statements. | 102 | |
John Hancock Funds II
Portfolio of Investments — August 31, 2020 (showing percentage of total net assets)
The following funds had the following country composition as a percentage of net assets, unless otherwise indicated, on 8-31-20:
Capital Appreciation Fund (as a percentage of total investments)
| United States | 87.2% |
| Canada | 4.6% |
| China | 1.9% |
| Netherlands | 1.9% |
| United Kingdom | 1.4% |
| Sweden | 1.0% |
| Australia | 1.0% |
| France | 1.0% |
| TOTAL | 100.0% |
Health Sciences Fund
| United States | 86.8% |
| Germany | 2.2% |
| United Kingdom | 2.2% |
| Switzerland | 2.2% |
| Japan | 1.5% |
| Netherlands | 1.4% |
| France | 1.0% |
| China | 1.0% |
| Other countries | 1.7% |
| TOTAL | 100.0% |
Mid Value Fund
| United States | 82.4% |
| Canada | 7.6% |
| Ireland | 2.4% |
| Mexico | 1.9% |
| Peru | 1.2% |
| Belgium | 1.1% |
| Other countries | 3.4% |
| TOTAL | 100.0% |
Science & Technology Fund
| United States | 79.7% |
| China | 7.2% |
| Germany | 4.2% |
| South Korea | 2.9% |
| Russia | 1.7% |
| Australia | 1.3% |
| Other countries | 3.0% |
| TOTAL | 100.0% |
Strategic Equity Allocation Fund
| United States | 64.5% |
| Japan | 3.7% |
| China | 3.4% |
| Germany | 3.3% |
| France | 3.3% |
| United Kingdom | 2.8% |
| Switzerland | 2.7% |
| Australia | 2.3% |
| Netherlands | 1.5% |
| Sweden | 1.2% |
| Other countries | 11.3% |
| TOTAL | 100.0% |
The accompanying notes are an integral part of the financial statements.
John Hancock Funds II
Statements of assets and liabilities — August 31, 2020
| Assets | Capital Appreciation Fund | Capital Appreciation Value Fund | Health Sciences Fund | International Strategic Equity Allocation Fund |
| Unaffiliated investments, at value (including securities loaned) | $2,203,201,224 | $1,463,359,781 | $429,417,480 | $1,699,526,526 |
| Affiliated investments, at value | 40,120,111 | 75,323 | — | 77,852,096 |
| Total investments, at value | 2,243,321,335 | 1,463,435,104 | 429,417,480 | 1,777,378,622 |
| Cash | — | — | — | 335,624 |
| Foreign currency, at value | — | 7 | 12,295 | 2,544,501 |
| Collateral held at broker for futures contracts | — | — | — | 6,278,129 |
| Dividends and interest receivable | 1,257,174 | 4,223,015 | 289,279 | 5,945,455 |
| Receivable for fund shares sold | 50,427 | 2,896 | — | — |
| Receivable for investments sold | 1,641,164 | 4,127,026 | 1,006,327 | — |
| Receivable for securities lending income | 6,647 | 4,993 | — | 62,801 |
| Other assets | 28,790 | 26,552 | 6,232 | 53,867 |
| Total assets | 2,246,305,537 | 1,471,819,593 | 430,731,613 | 1,792,598,999 |
| Liabilities | | | | |
| Written options, at value | — | 18,161,003 | — | — |
| Payable for futures variation margin | — | — | — | 247,964 |
| Payable for investments purchased | 1,566,527 | 11,506,401 | 2,552,196 | 34 |
| Payable for fund shares repurchased | 21,177,518 | — | — | — |
| Payable upon return of securities loaned | 40,050,961 | 68,520 | — | 77,807,287 |
| Payable to affiliates | | | | |
| Accounting and legal services fees | 116,507 | 83,130 | 24,066 | 98,744 |
| Trustees' fees | 1,097 | 768 | 231 | 921 |
| Other liabilities and accrued expenses | 119,424 | 114,813 | 81,808 | 202,848 |
| Total liabilities | 63,032,034 | 29,934,635 | 2,658,301 | 78,357,798 |
| Net assets | $2,183,273,503 | $1,441,884,958 | $428,073,312 | $1,714,241,201 |
| Net assets consist of | | | | |
| Paid-in capital | $409,301,009 | $1,026,698,359 | $298,239,721 | $1,690,783,956 |
| Total distributable earnings (loss) | 1,773,972,494 | 415,186,599 | 129,833,591 | 23,457,245 |
| Net assets | $2,183,273,503 | $1,441,884,958 | $428,073,312 | $1,714,241,201 |
| Unaffiliated investments, including repurchase agreements, at cost | $698,021,521 | $1,244,614,360 | $312,327,809 | $1,575,784,018 |
| Affiliated investments, at cost | $40,118,755 | $75,250 | — | $77,802,034 |
| Foreign currency, at cost | — | $7 | $12,401 | $2,480,091 |
| Premiums received on written options | — | $7,816,907 | — | — |
| Securities loaned, at value | $39,247,272 | $67,128 | — | $74,889,939 |
| Net asset value per share | | | | |
| The funds have an unlimited number of shares authorized with no par value. Net asset value is calculated by dividing the net assets of each class of shares by the number of outstanding shares in the class. |
| Class 1 | | | | |
| Net assets | $809,883,758 | — | — | — |
| Shares outstanding | 35,195,358 | — | — | — |
| Net asset value, offering price and redemption price per share | $23.01 | — | — | — |
| Class NAV | | | | |
| Net assets | $1,373,389,745 | $1,441,884,958 | $428,073,312 | $1,714,241,201 |
| Shares outstanding | 59,452,292 | 120,989,017 | 76,465,537 | 179,467,851 |
| Net asset value, offering price and redemption price per share | $23.10 | $11.92 | $5.60 | $9.55 |
The accompanying notes are an integral part of the financial statements.
John Hancock Funds II
Statements of assets and liabilities — August 31, 2020
| Assets | International Value Fund | Mid Cap Stock Fund | Mid Value Fund | Multi-Index Lifestyle Aggressive Portfolio |
| Unaffiliated investments, at value (including securities loaned) | $219,288,454 | $1,800,661,050 | $1,321,418,543 | $127,204,839 |
| Affiliated investments, at value | 138,869 | 38,560,759 | 37,748,016 | 262,202,353 |
| Repurchase agreements, at value | — | 33,300,000 | — | — |
| Total investments, at value | 219,427,323 | 1,872,521,809 | 1,359,166,559 | 389,407,192 |
| Cash | — | 256 | — | — |
| Foreign currency, at value | 755,136 | 29,718 | 22,918 | — |
| Dividends and interest receivable | 1,171,399 | 337,245 | 2,640,443 | 9 |
| Receivable for fund shares sold | 169,314 | 472,608 | 14,917 | 108,111 |
| Receivable for investments sold | 377,203 | 8,154,336 | 2,094,034 | 47,545 |
| Receivable for securities lending income | 1,552 | 12,154 | 18,599 | 816 |
| Other assets | 18,623 | 216,689 | 18,273 | 5,059 |
| Total assets | 221,920,550 | 1,881,744,815 | 1,363,975,743 | 389,568,732 |
| Liabilities | | | | |
| Due to custodian | 361 | — | — | — |
| Payable for investments purchased | 129,909 | 1,665,531 | 3,945,621 | 135,615 |
| Payable for fund shares repurchased | 72,957 | 445,077 | 93,623 | 33 |
| Payable upon return of securities loaned | 138,875 | 38,445,718 | 37,744,070 | 2,649,310 |
| Payable to affiliates | | | | |
| Investment management fees | — | — | — | 51 |
| Accounting and legal services fees | 13,017 | 104,585 | 74,623 | 21,665 |
| Transfer agent fees | — | — | — | 82 |
| Trustees' fees | 121 | 980 | 701 | 201 |
| Other liabilities and accrued expenses | 150,077 | 126,758 | 109,442 | 43,736 |
| Total liabilities | 505,317 | 40,788,649 | 41,968,080 | 2,850,693 |
| Net assets | $221,415,233 | $1,840,956,166 | $1,322,007,663 | $386,718,039 |
| Net assets consist of | | | | |
| Paid-in capital | $207,963,588 | $888,411,486 | $1,142,561,998 | $365,671,188 |
| Total distributable earnings (loss) | 13,451,645 | 952,544,680 | 179,445,665 | 21,046,851 |
| Net assets | $221,415,233 | $1,840,956,166 | $1,322,007,663 | $386,718,039 |
| Unaffiliated investments, including repurchase agreements, at cost | $209,333,940 | $1,186,245,498 | $1,124,909,106 | $108,703,653 |
| Affiliated investments, at cost | $138,873 | $38,506,409 | $37,719,414 | $254,408,370 |
| Foreign currency, at cost | $742,015 | $27,664 | $22,738 | — |
| Securities loaned, at value | $134,915 | $37,675,546 | $37,908,063 | $2,597,109 |
| Net asset value per share | | | | |
| The funds have an unlimited number of shares authorized with no par value. Net asset value is calculated by dividing the net assets of each class of shares by the number of outstanding shares in the class. |
| Class R6 | | | | |
| Net assets | — | — | — | $7,684,766 |
| Shares outstanding | — | — | — | 643,807 |
| Net asset value, offering price and redemption price per share | — | — | — | $11.94 |
| Class 1 | | | | |
| Net assets | $94,267,460 | $547,418,622 | — | $379,033,273 |
| Shares outstanding | 7,087,280 | 19,735,903 | — | 31,783,132 |
| Net asset value, offering price and redemption price per share | $13.30 | $27.74 | — | $11.93 |
| Class NAV | | | | |
| Net assets | $127,147,773 | $1,293,537,544 | $1,322,007,663 | — |
| Shares outstanding | 9,588,940 | 45,957,755 | 88,659,552 | — |
| Net asset value, offering price and redemption price per share | $13.26 | $28.15 | $14.91 | — |
The accompanying notes are an integral part of the financial statements.
John Hancock Funds II
Statements of assets and liabilities — August 31, 2020
| Assets | Multi-Index Lifestyle Balanced Portfolio | Multi-Index Lifestyle Conservative Portfolio | Multi-Index Lifestyle Growth Portfolio | Multi-Index Lifestyle Moderate Portfolio |
| Unaffiliated investments, at value (including securities loaned) | $574,244,967 | $178,935,204 | $420,051,274 | $193,179,381 |
| Affiliated investments, at value | 402,558,456 | 31,253,731 | 503,837,023 | 73,556,683 |
| Total investments, at value | 976,803,423 | 210,188,935 | 923,888,297 | 266,736,064 |
| Dividends and interest receivable | 4,218 | 1,891 | 1,469 | 1,710 |
| Receivable for fund shares sold | — | 539,248 | 1,225,223 | 112,158 |
| Receivable for investments sold | 1,476,271 | 19,973 | 239,455 | 92,084 |
| Receivable for securities lending income | 7,092 | 1,115 | 1,932 | 1,264 |
| Receivable from affiliates | — | 287 | — | 172 |
| Other assets | 7,740 | 3,499 | 6,629 | 3,789 |
| Total assets | 978,298,744 | 210,754,948 | 925,363,005 | 266,947,241 |
| Liabilities | | | | |
| Due to custodian | 209,231 | — | — | — |
| Payable for investments purchased | 256,273 | 459,603 | 726,830 | 637,572 |
| Payable for fund shares repurchased | 1,476,920 | — | 493 | 13 |
| Payable upon return of securities loaned | 38,325,630 | 9,564,750 | 29,944,047 | 7,829,550 |
| Payable to affiliates | | | | |
| Accounting and legal services fees | 54,844 | 11,254 | 51,333 | 15,219 |
| Transfer agent fees | 75 | 22 | 80 | 14 |
| Trustees' fees | 508 | 104 | 477 | 140 |
| Other liabilities and accrued expenses | 49,678 | 43,363 | 49,762 | 43,537 |
| Total liabilities | 40,373,159 | 10,079,096 | 30,773,022 | 8,526,045 |
| Net assets | $937,925,585 | $200,675,852 | $894,589,983 | $258,421,196 |
| Net assets consist of | | | | |
| Paid-in capital | $869,143,518 | $188,157,518 | $833,932,867 | $241,319,520 |
| Total distributable earnings (loss) | 68,782,067 | 12,518,334 | 60,657,116 | 17,101,676 |
| Net assets | $937,925,585 | $200,675,852 | $894,589,983 | $258,421,196 |
| Unaffiliated investments, including repurchase agreements, at cost | $526,203,263 | $168,957,412 | $375,704,596 | $180,868,329 |
| Affiliated investments, at cost | $381,265,113 | $28,125,989 | $488,585,311 | $67,764,076 |
| Securities loaned, at value | $37,481,461 | $9,301,188 | $29,209,048 | $7,622,138 |
| Net asset value per share | | | | |
| The funds have an unlimited number of shares authorized with no par value. Net asset value is calculated by dividing the net assets of each class of shares by the number of outstanding shares in the class. |
| Class R6 | | | | |
| Net assets | $6,942,641 | $1,995,623 | $7,412,511 | $1,271,028 |
| Shares outstanding | 595,572 | 178,395 | 619,369 | 111,482 |
| Net asset value, offering price and redemption price per share | $11.66 | $11.19 | $11.97 | $11.40 |
| Class 1 | | | | |
| Net assets | $930,982,944 | $198,680,229 | $887,177,472 | $257,150,168 |
| Shares outstanding | 79,883,877 | 17,765,881 | 74,250,892 | 22,559,461 |
| Net asset value, offering price and redemption price per share | $11.65 | $11.18 | $11.95 | $11.40 |
The accompanying notes are an integral part of the financial statements.
John Hancock Funds II
Statements of assets and liabilities — August 31, 2020
| Assets | Real Estate Securities Fund | Science & Technology Fund | Strategic Equity Allocation Fund | U.S. Sector Rotation Fund |
| Unaffiliated investments, at value (including securities loaned) | $303,459,319 | $359,420,680 | $7,512,153,043 | $1,274,472,379 |
| Affiliated investments, at value | 1,081,100 | 7,383,356 | 144,125,146 | 947,987 |
| Repurchase agreements, at value | — | 6,724,000 | 20,778,000 | 16,846,000 |
| Total investments, at value | 304,540,419 | 373,528,036 | 7,677,056,189 | 1,292,266,366 |
| Unrealized appreciation on forward foreign currency contracts | — | — | 373,454 | — |
| Cash | — | 916 | 2,464 | 36,327 |
| Foreign currency, at value | — | 241,273 | 4,700,717 | — |
| Collateral held at broker for futures contracts | — | — | 39,234,053 | 3,347,400 |
| Collateral segregated at custodian for OTC derivative contracts | — | — | 1,532,000 | — |
| Dividends and interest receivable | 415,757 | 126,182 | 16,064,281 | 1,765,751 |
| Receivable for fund shares sold | — | — | 3,811,680 | 14,827 |
| Receivable for investments sold | 1,390,846 | 1,453,829 | 20,245 | — |
| Receivable for securities lending income | 293 | 1,248 | 114,148 | 691 |
| Other assets | 7,419 | 6,219 | 182,645 | 26,117 |
| Total assets | 306,354,734 | 375,357,703 | 7,743,091,876 | 1,297,457,479 |
| Liabilities | | | | |
| Unrealized depreciation on forward foreign currency contracts | — | — | 1,285,754 | — |
| Payable for futures variation margin | — | — | 937,602 | 107,752 |
| Payable for investments purchased | 685,520 | 3,198,832 | 1,492,714 | 5,136 |
| Payable for fund shares repurchased | 307,777 | 1,527,992 | 12,282,172 | 1,324,797 |
| Payable upon return of securities loaned | 1,081,100 | 7,378,189 | 144,000,634 | 944,982 |
| Payable to affiliates | | | | |
| Accounting and legal services fees | 18,576 | 19,255 | 430,236 | 72,314 |
| Trustees' fees | 167 | 183 | 3,963 | 666 |
| Other liabilities and accrued expenses | 65,703 | 73,540 | 527,414 | 118,120 |
| Total liabilities | 2,158,843 | 12,197,991 | 160,960,489 | 2,573,767 |
| Net assets | $304,195,891 | $363,159,712 | $7,582,131,387 | $1,294,883,712 |
| Net assets consist of | | | | |
| Paid-in capital | $261,807,963 | $212,340,501 | $6,433,992,355 | $1,035,099,568 |
| Total distributable earnings (loss) | 42,387,928 | 150,819,211 | 1,148,139,032 | 259,784,144 |
| Net assets | $304,195,891 | $363,159,712 | $7,582,131,387 | $1,294,883,712 |
| Unaffiliated investments, including repurchase agreements, at cost | $240,449,438 | $254,875,473 | $6,450,951,819 | $1,063,206,948 |
| Affiliated investments, at cost | $1,081,100 | $7,380,967 | $143,967,509 | $946,554 |
| Foreign currency, at cost | — | $225,646 | $4,580,728 | — |
| Securities loaned, at value | $1,042,977 | $7,227,889 | $146,636,621 | $923,097 |
| Net asset value per share | | | | |
| The funds have an unlimited number of shares authorized with no par value. Net asset value is calculated by dividing the net assets of each class of shares by the number of outstanding shares in the class. |
| Class 1 | | | | |
| Net assets | $304,195,891 | — | — | — |
| Shares outstanding | 25,238,032 | — | — | — |
| Net asset value, offering price and redemption price per share | $12.05 | — | — | — |
| Class NAV | | | | |
| Net assets | — | $363,159,712 | $7,582,131,387 | $1,294,883,712 |
| Shares outstanding | — | 69,510,288 | 613,337,168 | 120,295,900 |
| Net asset value, offering price and redemption price per share | — | $5.22 | $12.36 | $10.76 |
The accompanying notes are an integral part of the financial statements.
John Hancock Funds II
Statements of operations — For the year ended August 31, 2020
| Investment income | Capital Appreciation Fund | Capital Appreciation Value Fund | Health Sciences Fund | International Strategic Equity Allocation Fund |
| Dividends | $9,643,136 | $13,023,446 | $2,515,901 | $43,606,485 |
| Interest | 78,483 | 16,220,500 | 31,900 | 531,023 |
| Securities lending | 297,673 | 42,663 | — | 629,421 |
| Less foreign taxes withheld | (59,542) | (55,480) | (53,155) | (4,566,569) |
| Non-cash dividends | — | — | — | 2,817,477 |
| Total investment income | 9,959,750 | 29,231,129 | 2,494,646 | 43,017,837 |
| Expenses | | | | |
| Investment management fees | 12,528,683 | 11,910,813 | 3,343,291 | 10,245,136 |
| Distribution and service fees | 296,023 | — | — | — |
| Accounting and legal services fees | 312,556 | 250,915 | 56,100 | 275,192 |
| Trustees' fees | 28,984 | 24,948 | 4,912 | 27,663 |
| Custodian fees | 214,625 | 185,981 | 55,868 | 620,339 |
| Printing and postage | 12,706 | 12,706 | 12,706 | 12,285 |
| Professional fees | 81,609 | 85,008 | 80,808 | 117,771 |
| Other | 73,687 | 64,796 | 20,290 | 51,495 |
| Total expenses | 13,548,873 | 12,535,167 | 3,573,975 | 11,349,881 |
| Less expense reductions | (126,338) | (588,165) | (192,712) | (2,168,728) |
| Net expenses | 13,422,535 | 11,947,002 | 3,381,263 | 9,181,153 |
| Net investment income (loss) | (3,462,785) | 17,284,127 | (886,617) | 33,836,684 |
| Realized and unrealized gain (loss) | | | | |
| Net realized gain (loss) on | | | | |
| Unaffiliated investments and foreign currency transactions | 317,198,707 | 209,994,910 | 19,376,248 | (23,234,686) |
| Affiliated investments | 59,634 | 6,726 | — | 1,985 |
| Futures contracts | — | — | — | 6,451,699 |
| Written options | — | 5,716,897 | — | — |
| | 317,258,341 | 215,718,533 | 19,376,248 | (16,781,002) |
| Change in net unrealized appreciation (depreciation) of | | | | |
| Unaffiliated investments and translation of assets and liabilities in foreign currencies | 609,817,205 | (50,352,612) | 74,906,432 | 132,548,853 |
| Affiliated investments | (2,215) | 73 | — | 50,062 |
| Futures contracts | — | — | — | 1,978,395 |
| Written options | — | (487,053) | — | — |
| | 609,814,990 | (50,839,592) | 74,906,432 | 134,577,310 |
| Net realized and unrealized gain (loss) | 927,073,331 | 164,878,941 | 94,282,680 | 117,796,308 |
| Increase in net assets from operations | $923,610,546 | $182,163,068 | $93,396,063 | $151,632,992 |
The accompanying notes are an integral part of the financial statements.
John Hancock Funds II
Statements of operations — For the year ended August 31, 2020
| Investment income | International Value Fund | Mid Cap Stock Fund | Mid Value Fund | Multi-Index Lifestyle Aggressive Portfolio |
| Dividends | $6,715,813 | $4,660,911 | $25,542,862 | $2,436,172 |
| Interest | 116,520 | 394,054 | 159,738 | 1,816 |
| Securities lending | 41,681 | 1,488,859 | 272,752 | 28,579 |
| Income distributions received from affiliated investments | — | — | — | 5,177,603 |
| Less foreign taxes withheld | (640,523) | (28,628) | (452,107) | — |
| Total investment income | 6,233,491 | 6,515,196 | 25,523,245 | 7,644,170 |
| Expenses | | | | |
| Investment management fees | 1,804,040 | 13,288,323 | 11,448,051 | 669,443 |
| Distribution and service fees | 53,182 | 217,926 | — | 172,076 |
| Accounting and legal services fees | 32,214 | 276,560 | 212,543 | 64,013 |
| Transfer agent fees | — | — | — | 745 |
| Trustees' fees | 3,237 | 26,519 | 20,337 | 6,052 |
| Custodian fees | 122,483 | 191,953 | 172,315 | 43,895 |
| State registration fees | — | — | — | 4,538 |
| Printing and postage | 12,731 | 11,736 | 12,706 | 12,640 |
| Professional fees | 160,074 | 98,803 | 75,412 | 43,502 |
| Other | 26,958 | 65,517 | 44,141 | 16,107 |
| Total expenses | 2,214,919 | 14,177,337 | 11,985,505 | 1,033,011 |
| Less expense reductions | (16,359) | (113,492) | (625,681) | (13,016) |
| Net expenses | 2,198,560 | 14,063,845 | 11,359,824 | 1,019,995 |
| Net investment income (loss) | 4,034,931 | (7,548,649) | 14,163,421 | 6,624,175 |
| Realized and unrealized gain (loss) | | | | |
| Net realized gain (loss) on | | | | |
| Unaffiliated investments and foreign currency transactions | 5,314,678 | 378,064,446 | 19,100,313 | 5,659,863 |
| Affiliated investments | 5,348 | 59,390 | (4,097) | (5,108,238) |
| Capital gain distributions received from affiliated investments | — | — | — | 2,568,488 |
| | 5,320,026 | 378,123,836 | 19,096,216 | 3,120,113 |
| Change in net unrealized appreciation (depreciation) of | | | | |
| Unaffiliated investments and translation of assets and liabilities in foreign currencies | (1,617,824) | 229,156,026 | 87,790,109 | 4,449,526 |
| Affiliated investments | (44) | 54,311 | 26,504 | 30,501,110 |
| | (1,617,868) | 229,210,337 | 87,816,613 | 34,950,636 |
| Net realized and unrealized gain (loss) | 3,702,158 | 607,334,173 | 106,912,829 | 38,070,749 |
| Increase in net assets from operations | $7,737,089 | $599,785,524 | $121,076,250 | $44,694,924 |
The accompanying notes are an integral part of the financial statements.
John Hancock Funds II
Statements of operations — For the year ended August 31, 2020
| Investment income | Multi-Index Lifestyle Balanced Portfolio | Multi-Index Lifestyle Conservative Portfolio | Multi-Index Lifestyle Growth Portfolio | Multi-Index Lifestyle Moderate Portfolio |
| Dividends | $15,869,618 | $5,043,069 | $10,428,065 | $5,806,008 |
| Interest | 6,922 | 2,620 | 5,349 | 2,559 |
| Securities lending | 370,107 | 120,886 | 208,077 | 127,969 |
| Income distributions received from affiliated investments | 7,720,163 | 436,120 | 9,856,695 | 1,454,913 |
| Total investment income | 23,966,810 | 5,602,695 | 20,498,186 | 7,391,449 |
| Expenses | | | | |
| Investment management fees | 2,854,476 | 817,296 | 2,140,648 | 964,179 |
| Distribution and service fees | 445,814 | 91,787 | 416,193 | 127,162 |
| Accounting and legal services fees | 165,407 | 33,429 | 154,417 | 46,601 |
| Transfer agent fees | 857 | 105 | 884 | 160 |
| Trustees' fees | 15,121 | 3,199 | 14,256 | 4,442 |
| Custodian fees | 43,895 | 43,895 | 43,895 | 43,895 |
| State registration fees | 4,747 | 5,734 | 4,362 | 3,748 |
| Printing and postage | 21,834 | 12,677 | 22,311 | 12,657 |
| Professional fees | 57,030 | 39,479 | 55,588 | 41,271 |
| Other | 33,864 | 11,944 | 28,994 | 14,225 |
| Total expenses | 3,643,045 | 1,059,545 | 2,881,548 | 1,258,340 |
| Less expense reductions | — | (57,197) | — | (36,828) |
| Net expenses | 3,643,045 | 1,002,348 | 2,881,548 | 1,221,512 |
| Net investment income | 20,323,765 | 4,600,347 | 17,616,638 | 6,169,937 |
| Realized and unrealized gain (loss) | | | | |
| Net realized gain (loss) on | | | | |
| Unaffiliated investments and foreign currency transactions | 19,964,750 | 2,858,771 | 17,608,924 | 5,797,187 |
| Affiliated investments | (9,699,054) | (1,447,594) | (10,481,040) | (3,230,501) |
| Capital gain distributions received from affiliated investments | 3,829,702 | 216,349 | 4,889,677 | 721,748 |
| | 14,095,398 | 1,627,526 | 12,017,561 | 3,288,434 |
| Change in net unrealized appreciation (depreciation) of | | | | |
| Unaffiliated investments and translation of assets and liabilities in foreign currencies | 6,656,869 | 2,870,185 | 7,404,813 | 544,609 |
| Affiliated investments | 49,859,281 | 3,958,437 | 59,581,560 | 10,891,470 |
| | 56,516,150 | 6,828,622 | 66,986,373 | 11,436,079 |
| Net realized and unrealized gain (loss) | 70,611,548 | 8,456,148 | 79,003,934 | 14,724,513 |
| Increase in net assets from operations | $90,935,313 | $13,056,495 | $96,620,572 | $20,894,450 |
The accompanying notes are an integral part of the financial statements.
John Hancock Funds II
Statements of operations — For the year ended August 31, 2020
| Investment income | Real Estate Securities Fund | Science & Technology Fund | Strategic Equity Allocation Fund | U.S. Sector Rotation Fund |
| Dividends | $9,802,706 | $2,814,346 | $169,310,098 | $26,503,615 |
| Interest | 17,308 | 178,944 | 1,840,773 | 251,317 |
| Securities lending | 5,062 | 61,553 | 2,210,812 | 53,785 |
| Less foreign taxes withheld | — | (65,739) | (7,400,009) | (80) |
| Non-cash dividends | — | 1,263,249 | — | — |
| Total investment income | 9,825,076 | 4,252,353 | 165,961,674 | 26,808,637 |
| Expenses | | | | |
| Investment management fees | 2,582,527 | 2,982,450 | 45,012,076 | 7,725,734 |
| Distribution and service fees | 184,466 | — | — | — |
| Accounting and legal services fees | 63,083 | 50,314 | 1,229,873 | 213,489 |
| Trustees' fees | 6,697 | 4,918 | 122,327 | 21,655 |
| Custodian fees | 56,317 | 80,450 | 1,370,497 | 180,513 |
| Printing and postage | 12,706 | 12,706 | 12,706 | 12,706 |
| Professional fees | 56,697 | 66,569 | 232,158 | 97,480 |
| Other | 26,313 | 16,473 | 203,090 | 54,157 |
| Total expenses | 2,988,806 | 3,213,880 | 48,182,727 | 8,305,734 |
| Less expense reductions | (26,416) | (130,478) | (9,528,290) | (1,634,950) |
| Net expenses | 2,962,390 | 3,083,402 | 38,654,437 | 6,670,784 |
| Net investment income | 6,862,686 | 1,168,951 | 127,307,237 | 20,137,853 |
| Realized and unrealized gain (loss) | | | | |
| Net realized gain (loss) on | | | | |
| Unaffiliated investments and foreign currency transactions | (11,883,621) | 47,746,446 | 126,740,449 | 72,368,270 |
| Affiliated investments | 383 | 3,537 | (17,783) | 1,669 |
| Futures contracts | — | — | 1,709,101 | 1,620,080 |
| Forward foreign currency contracts | — | — | (458,974) | — |
| | (11,883,238) | 47,749,983 | 127,972,793 | 73,990,019 |
| Change in net unrealized appreciation (depreciation) of | | | | |
| Unaffiliated investments and translation of assets and liabilities in foreign currencies | (36,773,366) | 72,343,083 | 793,113,840 | 149,673,970 |
| Affiliated investments | — | 2,384 | 147,562 | 1,123 |
| Futures contracts | — | — | 18,271,808 | 3,290,456 |
| Forward foreign currency contracts | — | — | (912,300) | — |
| | (36,773,366) | 72,345,467 | 810,620,910 | 152,965,549 |
| Net realized and unrealized gain (loss) | (48,656,604) | 120,095,450 | 938,593,703 | 226,955,568 |
| Increase (decrease) in net assets from operations | $(41,793,918) | $121,264,401 | $1,065,900,940 | $247,093,421 |
The accompanying notes are an integral part of the financial statements.
John Hancock Funds II
Statements of changes in net assets
| | Capital Appreciation Fund | Capital Appreciation Value Fund | Health Sciences Fund |
| Increase (decrease) in net assets | Year ended
8-31-20 | Year ended
8-31-19 | Year ended
8-31-20 | Year ended
8-31-19 | Year ended
8-31-20 | Year ended
8-31-19 |
| From operations | | | | | | |
| Net investment income (loss) | $(3,462,785) | $167,684 | $17,284,127 | $27,273,402 | $(886,617) | $(473,891) |
| Net realized gain | 317,258,341 | 161,879,822 | 215,718,533 | 153,187,665 | 19,376,248 | 11,280,327 |
| Change in net unrealized appreciation (depreciation) | 609,814,990 | (150,945,084) | (50,839,592) | (28,230,103) | 74,906,432 | (23,699,008) |
| Increase (decrease) in net assets resulting from operations | 923,610,546 | 11,102,422 | 182,163,068 | 152,230,964 | 93,396,063 | (12,892,572) |
| Distributions to shareholders | | | | | | |
| From earnings | | | | | | |
| Class 1 | (56,812,578) | (94,592,357) | — | — | — | — |
| Class NAV | (118,001,591) | (183,726,482) | (163,904,965) | (198,551,204) | (10,491,735) | (16,432,088) |
| Total distributions | (174,814,169) | (278,318,839) | (163,904,965) | (198,551,204) | (10,491,735) | (16,432,088) |
| From fund share transactions | | | | | | |
| From fund share transactions | (302,337,259) | 188,522,934 | (183,411,560) | (131,905,276) | 73,156,528 | (8,101,801) |
| Total increase (decrease) | 446,459,118 | (78,693,483) | (165,153,457) | (178,225,516) | 156,060,856 | (37,426,461) |
| Net assets | | | | | | |
| Beginning of year | 1,736,814,385 | 1,815,507,868 | 1,607,038,415 | 1,785,263,931 | 272,012,456 | 309,438,917 |
| End of year | $2,183,273,503 | $1,736,814,385 | $1,441,884,958 | $1,607,038,415 | $428,073,312 | $272,012,456 |
| | International Strategic Equity Allocation Fund | International Value Fund | Mid Cap Stock Fund |
| Increase (decrease) in net assets | Year ended
8-31-20 | Year ended
8-31-19 | Year ended
8-31-20 | Year ended
8-31-19 | Year ended
8-31-20 | Year ended
8-31-19 |
| From operations | | | | | | |
| Net investment income (loss) | $33,836,684 | $46,062,409 | $4,034,931 | $8,865,157 | $(7,548,649) | $(7,991,067) |
| Net realized gain (loss) | (16,781,002) | (84,375,610) | 5,320,026 | 27,995,017 | 378,123,836 | 156,022,196 |
| Change in net unrealized appreciation (depreciation) | 134,577,310 | (33,038,621) | (1,617,868) | (105,120,709) | 229,210,337 | (70,269,123) |
| Increase (decrease) in net assets resulting from operations | 151,632,992 | (71,351,822) | 7,737,089 | (68,260,535) | 599,785,524 | 77,762,006 |
| Distributions to shareholders | | | | | | |
| From earnings | | | | | | |
| Class 1 | — | — | (9,006,651) | (3,239,198) | (51,552,722) | (64,739,364) |
| Class NAV | (48,976,734) | (260,793,663) | (9,863,048) | (19,064,587) | (139,556,442) | (185,441,862) |
| Total distributions | (48,976,734) | (260,793,663) | (18,869,699) | (22,303,785) | (191,109,164) | (250,181,226) |
| From fund share transactions | | | | | | |
| From fund share transactions | (22,035,645) | 133,266,961 | (11,192,310) | (774,957,085) | (158,836,130) | 34,142,711 |
| Issued in reorganization | — | — | — | — | — | 24,403,159 |
| Fund share transactions | (22,035,645) | 133,266,961 | (11,192,310) | (774,957,085) | (158,836,130) | 58,545,870 |
| Total increase (decrease) | 80,620,613 | (198,878,524) | (22,324,920) | (865,521,405) | 249,840,230 | (113,873,350) |
| Net assets | | | | | | |
| Beginning of year | 1,633,620,588 | 1,832,499,112 | 243,740,153 | 1,109,261,558 | 1,591,115,936 | 1,704,989,286 |
| End of year | $1,714,241,201 | $1,633,620,588 | $221,415,233 | $243,740,153 | $1,840,956,166 | $1,591,115,936 |
The accompanying notes are an integral part of the financial statements.
John Hancock Funds II
Statements of changes in net assets
| | Mid Value Fund | Multi-Index Lifestyle Aggressive Portfolio | Multi-Index Lifestyle Balanced Portfolio |
| Increase (decrease) in net assets | Year ended
8-31-20 | Year ended
8-31-19 | Year ended
8-31-20 | Year ended
8-31-19 | Year ended
8-31-20 | Year ended
8-31-19 |
| From operations | | | | | | |
| Net investment income | $14,163,421 | $19,303,493 | $6,624,175 | $5,230,494 | $20,323,765 | $20,058,873 |
| Net realized gain | 19,096,216 | 9,688,613 | 3,120,113 | 20,418,742 | 14,095,398 | 27,974,987 |
| Change in net unrealized appreciation (depreciation) | 87,816,613 | (153,090,823) | 34,950,636 | (28,066,671) | 56,516,150 | (17,902,425) |
| Increase (decrease) in net assets resulting from operations | 121,076,250 | (124,098,717) | 44,694,924 | (2,417,435) | 90,935,313 | 30,131,435 |
| Distributions to shareholders | | | | | | |
| From earnings | | | | | | |
| Class R6 | — | — | (380,187) | (326,422) | (408,113) | (356,263) |
| Class 1 | — | — | (32,109,372) | (31,418,938) | (58,929,731) | (61,891,267) |
| Class NAV | (34,817,897) | (101,535,887) | — | — | — | — |
| Total distributions | (34,817,897) | (101,535,887) | (32,489,559) | (31,745,360) | (59,337,844) | (62,247,530) |
| From fund share transactions | | | | | | |
| From fund share transactions | 5,201,638 | 16,774,061 | 34,910,880 | 45,895,143 | 9,348,321 | 59,371,272 |
| Total increase (decrease) | 91,459,991 | (208,860,543) | 47,116,245 | 11,732,348 | 40,945,790 | 27,255,177 |
| Net assets | | | | | | |
| Beginning of year | 1,230,547,672 | 1,439,408,215 | 339,601,794 | 327,869,446 | 896,979,795 | 869,724,618 |
| End of year | $1,322,007,663 | $1,230,547,672 | $386,718,039 | $339,601,794 | $937,925,585 | $896,979,795 |
| | Multi-Index Lifestyle Conservative Portfolio | Multi-Index Lifestyle Growth Portfolio | Multi-Index Lifestyle Moderate Portfolio |
| Increase (decrease) in net assets | Year ended
8-31-20 | Year ended
8-31-19 | Year ended
8-31-20 | Year ended
8-31-19 | Year ended
8-31-20 | Year ended
8-31-19 |
| From operations | | | | | | |
| Net investment income | $4,600,347 | $4,493,169 | $17,616,638 | $15,239,646 | $6,169,937 | $6,252,148 |
| Net realized gain | 1,627,526 | 960,434 | 12,017,561 | 39,895,442 | 3,288,434 | 4,573,989 |
| Change in net unrealized appreciation (depreciation) | 6,828,622 | 6,190,858 | 66,986,373 | (43,224,083) | 11,436,079 | 2,777,145 |
| Increase in net assets resulting from operations | 13,056,495 | 11,644,461 | 96,620,572 | 11,911,005 | 20,894,450 | 13,603,282 |
| Distributions to shareholders | | | | | | |
| From earnings | | | | | | |
| Class R6 | (16,807) | (3,952) | (503,695) | (438,039) | (61,085) | (53,451) |
| Class 1 | (7,258,629) | (6,753,201) | (66,128,412) | (63,603,024) | (13,975,893) | (13,629,279) |
| Total distributions | (7,275,436) | (6,757,153) | (66,632,107) | (64,041,063) | (14,036,978) | (13,682,730) |
| From fund share transactions | | | | | | |
| From fund share transactions | 10,695,540 | 22,980,029 | 35,322,267 | 120,071,681 | (11,599,900) | 22,829,438 |
| Total increase (decrease) | 16,476,599 | 27,867,337 | 65,310,732 | 67,941,623 | (4,742,428) | 22,749,990 |
| Net assets | | | | | | |
| Beginning of year | 184,199,253 | 156,331,916 | 829,279,251 | 761,337,628 | 263,163,624 | 240,413,634 |
| End of year | $200,675,852 | $184,199,253 | $894,589,983 | $829,279,251 | $258,421,196 | $263,163,624 |
The accompanying notes are an integral part of the financial statements.
John Hancock Funds II
Statements of changes in net assets
| | Real Estate Securities Fund | Science & Technology Fund | Strategic Equity Allocation Fund |
| Increase (decrease) in net assets | Year ended
8-31-20 | Year ended
8-31-19 | Year ended
8-31-20 | Year ended
8-31-19 | Year ended
8-31-20 | Year ended
8-31-19 |
| From operations | | | | | | |
| Net investment income (loss) | $6,862,686 | $9,057,353 | $1,168,951 | $(908,470) | $127,307,237 | $154,713,158 |
| Net realized gain (loss) | (11,883,238) | 20,387,808 | 47,749,983 | 19,965,025 | 127,972,793 | 102,651,681 |
| Change in net unrealized appreciation (depreciation) | (36,773,366) | 34,474,373 | 72,345,467 | (10,988,711) | 810,620,910 | (383,128,086) |
| Increase (decrease) in net assets resulting from operations | (41,793,918) | 63,919,534 | 121,264,401 | 8,067,844 | 1,065,900,940 | (125,763,247) |
| Distributions to shareholders | | | | | | |
| From earnings | | | | | | |
| Class 1 | (34,226,630) | (16,428,402) | — | — | — | — |
| Class NAV | — | — | (25,176,071) | (77,599,763) | (243,595,412) | (1,038,737,526) |
| Total distributions | (34,226,630) | (16,428,402) | (25,176,071) | (77,599,763) | (243,595,412) | (1,038,737,526) |
| From fund share transactions | | | | | | |
| From fund share transactions | (53,273,095) | (34,907,359) | (16,965,217) | 101,198,431 | (569,005,474) | 803,092,859 |
| Total increase (decrease) | (129,293,643) | 12,583,773 | 79,123,113 | 31,666,512 | 253,300,054 | (361,407,914) |
| Net assets | | | | | | |
| Beginning of year | 433,489,534 | 420,905,761 | 284,036,599 | 252,370,087 | 7,328,831,333 | 7,690,239,247 |
| End of year | $304,195,891 | $433,489,534 | $363,159,712 | $284,036,599 | $7,582,131,387 | $7,328,831,333 |
| | U.S. Sector Rotation Fund |
| Increase (decrease) in net assets | Year ended
8-31-20 | Year ended
8-31-19 |
| From operations | | |
| Net investment income | $20,137,853 | $25,826,558 |
| Net realized gain | 73,990,019 | 103,791,284 |
| Change in net unrealized appreciation (depreciation) | 152,965,549 | (134,682,857) |
| Increase (decrease) in net assets resulting from operations | 247,093,421 | (5,065,015) |
| Distributions to shareholders | | |
| From earnings | | |
| Class NAV | (127,843,285) | (347,530,083) |
| Total distributions | (127,843,285) | (347,530,083) |
| From fund share transactions | | |
| From fund share transactions | (321,321,113) | 135,353,560 |
| Total decrease | (202,070,977) | (217,241,538) |
| Net assets | | |
| Beginning of year | 1,496,954,689 | 1,714,196,227 |
| End of year | $1,294,883,712 | $1,496,954,689 |
The accompanying notes are an integral part of the financial statements.
John Hancock Funds II
Financial highlights
| Per share operating performance for a share outstanding throughout each period | | Ratios and supplemental data | |
| | | | Income (loss) from investment operations | | | Less distributions | | | | Ratios to average net assets | | |
| Period ended | Net asset
value,
beginning
of period ($) | | Net
investment
income
(loss) ($)1 | Net realized and
unrealized
gain (loss)
on investments ($) | Total from
investment
operations ($) | From net
investment
income ($) | From net
realized
gain ($) | Total
distributions ($) | Net asset
value,
end of
period ($) | Total
return
(%)2 | Expenses
before
reductions
(%) | Expenses
including
reductions
(%) | Net
investment
income
(loss) (%) | Net
assets,
end of
period
(in millions) | Portfolio
turnover
(%) |
| Capital Appreciation Fund | |
| Class 1 | |
| 08-31-2020 | 15.66 | | (0.04) | 9.09 | 9.05 | — | (1.70) | (1.70) | 23.01 | 62.93 | 0.80 | 0.79 | (0.23) | 810 | 47 |
| 08-31-2019 | 18.80 | | — 3 | (0.46) | (0.46) | (0.02) | (2.66) | (2.68) | 15.66 | 0.84 | 0.80 | 0.79 | (0.03) | 584 | 50 |
| 08-31-2018 | 18.56 | | 0.02 | 4.25 | 4.27 | (0.01) | (4.02) | (4.03) | 18.80 | 26.71 | 0.79 | 0.78 | 0.11 | 687 | 39 |
| 08-31-2017 | 16.60 | | 0.01 | 3.89 | 3.90 | (0.01) | (1.93) | (1.94) | 18.56 | 26.53 | 0.79 | 0.78 | 0.07 | 582 | 45 |
| 08-31-2016 | 18.12 | | 0.01 | 0.83 | 0.84 | — 3 | (2.36) | (2.36) | 16.60 | 4.41 | 0.79 | 0.78 | 0.05 | 551 | 32 |
| Class NAV | |
| 08-31-2020 | 15.71 | | (0.03) | 9.12 | 9.09 | — 3 | (1.70) | (1.70) | 23.10 | 63.00 | 0.75 | 0.74 | (0.18) | 1,373 | 47 |
| 08-31-2019 | 18.85 | | — 3 | (0.45) | (0.45) | (0.03) | (2.66) | (2.69) | 15.71 | 0.89 | 0.75 | 0.74 | 0.03 | 1,153 | 50 |
| 08-31-2018 | 18.60 | | 0.03 | 4.26 | 4.29 | (0.02) | (4.02) | (4.04) | 18.85 | 26.76 | 0.74 | 0.73 | 0.15 | 1,128 | 39 |
| 08-31-2017 | 16.63 | | 0.02 | 3.90 | 3.92 | (0.02) | (1.93) | (1.95) | 18.60 | 26.62 | 0.74 | 0.73 | 0.11 | 1,222 | 45 |
| 08-31-2016 | 18.15 | | 0.02 | 0.83 | 0.85 | (0.01) | (2.36) | (2.37) | 16.63 | 4.45 | 0.74 | 0.73 | 0.10 | 1,413 | 32 |
| 1. Based on average daily shares outstanding. 2. Total returns would have been lower had certain expenses not been reduced during the applicable periods. 3. Less than $0.005 per share. | |
| Capital Appreciation Value Fund | |
| Class NAV | |
| 08-31-2020 | 11.75 | | 0.14 | 1.33 | 1.47 | (0.20) | (1.10) | (1.30) | 11.92 | 13.38 | 0.87 | 0.83 | 1.20 | 1,442 | 79 |
| 08-31-2019 | 12.27 | | 0.19 | 0.76 | 0.95 | (0.33) | (1.14) | (1.47) | 11.75 | 10.07 | 0.85 | 0.81 | 1.66 | 1,607 | 63 |
| 08-31-2018 | 12.26 | | 0.27 | 1.06 | 1.33 | (0.18) | (1.14) | (1.32) | 12.27 | 11.61 | 0.85 | 0.81 | 2.28 | 1,785 | 78 |
| 08-31-2017 | 11.62 | | 0.18 | 1.06 | 1.24 | (0.20) | (0.40) | (0.60) | 12.26 | 11.26 | 0.85 | 0.81 | 1.51 | 1,880 | 61 |
| 08-31-2016 | 11.86 | | 0.16 | 1.03 | 1.19 | (0.18) | (1.25) | (1.43) | 11.62 | 10.94 | 0.85 | 0.81 | 1.39 | 2,101 | 64 |
| 1. Based on average daily shares outstanding. 2. Total returns would have been lower had certain expenses not been reduced during the applicable periods. | |
| Health Sciences Fund | |
| Class NAV | |
| 08-31-2020 | 4.53 | | (0.01) | 1.27 | 1.26 | — | (0.19) | (0.19) | 5.60 | 28.39 | 1.11 | 1.05 | (0.28) | 428 | 47 |
| 08-31-2019 | 5.10 | | (0.01) | (0.28) | (0.29) | — | (0.28) | (0.28) | 4.53 | (4.87) | 1.11 | 1.05 | (0.17) | 272 | 42 |
| 08-31-2018 | 5.01 | | (0.01) | 0.95 | 0.94 | — | (0.85) | (0.85) | 5.10 | 22.04 | 1.10 | 1.04 | (0.30) | 309 | 46 |
| 08-31-2017 | 5.59 | | (0.01) | 0.74 | 0.73 | — | (1.31) | (1.31) | 5.01 | 18.48 | 1.14 | 1.07 | (0.27) | 320 | 131 |
| 08-31-2016 | 18.69 | | (0.03) | (0.64) | (0.67) | (0.02) | (12.41) | (12.43) | 5.59 | (8.77) | 1.10 | 1.04 | (0.32) | 216 | 46 |
| 1. Based on average daily shares outstanding. 2. Total returns would have been lower had certain expenses not been reduced during the applicable periods. | |
| International Strategic Equity Allocation Fund | |
| Class NAV | |
| 08-31-2020 | 9.01 | | 0.19 | 0.62 | 0.81 | (0.27) | — | (0.27) | 9.55 | 8.98 | 0.69 | 0.56 | 2.07 | 1,714 | 76 |
| 08-31-2019 | 11.21 | | 0.26 | (0.85) | (0.59) | (0.26) | (1.35) | (1.61) | 9.01 | (3.97) | 0.69 | 0.56 | 2.74 | 1,634 | 57 |
| 08-31-2018 | 11.78 | | 0.25 | (0.01) | 0.24 | (0.29) | (0.52) | (0.81) | 11.21 | 1.81 | 0.68 | 0.55 | 2.15 | 1,832 | 94 |
| 08-31-2017 3 | 10.00 | | 0.23 | 1.59 | 1.82 | (0.03) | (0.01) | (0.04) | 11.78 | 18.26 4 | 0.69 5 | 0.56 5 | 2.43 5 | 2,049 | 112 |
| 1. Based on average daily shares outstanding. 2. Total returns would have been lower had certain expenses not been reduced during the applicable periods. 3. Period from 10-17-16 (commencement of operations) to 8-31-17. 4. Not annualized. 5. Annualized. | |
| International Value Fund | |
| Class 1 | |
| 08-31-2020 | 14.03 | | 0.23 | 0.19 | 0.42 | (0.36) | (0.79) | (1.15) | 13.30 | 2.16 | 0.99 | 0.99 | 1.70 | 94 | 164 3 |
| 08-31-2019 | 16.45 | | 0.35 | (2.44) | (2.09) | (0.33) | — | (0.33) | 14.03 | (12.73) | 0.93 | 0.92 | 2.32 | 126 | 36 |
| 08-31-2018 | 16.82 | | 0.29 | (0.27) | 0.02 | (0.39) | — | (0.39) | 16.45 | 0.06 | 0.91 | 0.90 | 1.72 | 169 | 29 |
| 08-31-2017 | 14.80 | | 0.29 | 2.09 | 2.38 | (0.36) | — | (0.36) | 16.82 | 16.35 | 0.91 | 0.90 | 1.85 | 206 | 31 |
| 08-31-2016 | 14.53 | | 0.29 | 0.25 | 0.54 | (0.27) | — | (0.27) | 14.80 | 3.86 | 0.90 | 0.90 | 2.06 | 186 | 24 |
| Class NAV | |
| 08-31-2020 | 13.99 | | 0.24 | 0.18 | 0.42 | (0.36) | (0.79) | (1.15) | 13.26 | 2.22 | 0.94 | 0.94 | 1.82 | 127 | 164 3 |
| 08-31-2019 | 16.41 | | 0.17 | (2.25) | (2.08) | (0.34) | — | (0.34) | 13.99 | (12.71) | 0.88 | 0.87 | 1.11 | 118 | 36 |
| 08-31-2018 | 16.77 | | 0.31 | (0.27) | 0.04 | (0.40) | — | (0.40) | 16.41 | 0.17 | 0.86 | 0.85 | 1.81 | 940 | 29 |
| 08-31-2017 | 14.76 | | 0.29 | 2.08 | 2.37 | (0.36) | — | (0.36) | 16.77 | 16.38 | 0.86 | 0.85 | 1.85 | 987 | 31 |
| 08-31-2016 | 14.49 | | 0.28 | 0.27 | 0.55 | (0.28) | — | (0.28) | 14.76 | 3.93 | 0.85 | 0.85 | 2.06 | 1,347 | 24 |
| 1. Based on average daily shares outstanding. 2. Total returns would have been lower had certain expenses not been reduced during the applicable periods. 3. Increase in portfolio turnover rate resulted from repositioning of the portfolio during the period in accordance with investment policy changes approved by the Board of Trustees. | |
The accompanying notes are an integral part of the financial statements.
John Hancock Funds II
Financial highlights
| Per share operating performance for a share outstanding throughout each period | | Ratios and supplemental data | |
| | | | Income (loss) from investment operations | | | Less distributions | | | | Ratios to average net assets | | |
| Period ended | Net asset
value,
beginning
of period ($) | | Net
investment
income
(loss) ($)1 | Net realized and
unrealized
gain (loss)
on investments ($) | Total from
investment
operations ($) | From net
investment
income ($) | From net
realized
gain ($) | Total
distributions ($) | Net asset
value,
end of
period ($) | Total
return
(%)2 | Expenses
before
reductions
(%) | Expenses
including
reductions
(%) | Net
investment
income
(loss) (%) | Net
assets,
end of
period
(in millions) | Portfolio
turnover
(%) |
| Mid Cap Stock Fund | |
| Class 1 | |
| 08-31-2020 | 22.24 | | (0.11) | 8.38 | 8.27 | — | (2.77) | (2.77) | 27.74 | 41.40 | 0.92 | 0.92 | (0.51) | 547 | 86 |
| 08-31-2019 | 25.90 | | (0.12) | 0.28 | 0.16 | — | (3.82) | (3.82) | 22.24 | 5.71 | 0.92 | 0.92 | (0.54) | 438 | 61 3 |
| 08-31-2018 | 22.14 | | (0.10) | 6.01 | 5.91 | — | (2.15) | (2.15) | 25.90 | 28.68 | 0.92 | 0.91 | (0.44) | 447 | 67 |
| 08-31-2017 | 18.86 | | (0.03) | 3.40 | 3.37 | — | (0.09) | (0.09) | 22.14 | 17.86 | 0.92 | 0.91 | (0.16) | 365 | 89 |
| 08-31-2016 | 20.57 | | (0.04) | 0.61 | 0.57 | — | (2.28) | (2.28) | 18.86 | 3.02 | 0.92 | 0.91 | (0.23) | 340 | 79 |
| Class NAV | |
| 08-31-2020 | 22.52 | | (0.10) | 8.50 | 8.40 | — | (2.77) | (2.77) | 28.15 | 41.47 | 0.87 | 0.87 | (0.46) | 1,294 | 86 |
| 08-31-2019 | 26.16 | | (0.11) | 0.29 | 0.18 | — | (3.82) | (3.82) | 22.52 | 5.74 | 0.87 | 0.87 | (0.49) | 1,153 | 61 3 |
| 08-31-2018 | 22.33 | | (0.09) | 6.07 | 5.98 | — | (2.15) | (2.15) | 26.16 | 28.75 | 0.87 | 0.86 | (0.39) | 1,258 | 67 |
| 08-31-2017 | 19.01 | | (0.02) | 3.43 | 3.41 | — | (0.09) | (0.09) | 22.33 | 17.99 | 0.87 | 0.86 | (0.12) | 1,245 | 89 |
| 08-31-2016 | 20.71 | | (0.03) | 0.61 | 0.58 | — | (2.28) | (2.28) | 19.01 | 3.06 | 0.87 | 0.86 | (0.18) | 1,147 | 79 |
| 1. Based on average daily shares outstanding. 2. Total returns would have been lower had certain expenses not been reduced during the applicable periods. 3. Excludes merger activity. | |
| Mid Value Fund | |
| Class NAV | |
| 08-31-2020 | 14.27 | | 0.17 | 0.90 | 1.07 | (0.26) | (0.17) | (0.43) | 14.91 | 7.40 | 0.99 | 0.94 | 1.18 | 1,322 | 45 |
| 08-31-2019 | 17.08 | | 0.22 | (1.81) | (1.59) | (0.15) | (1.07) | (1.22) | 14.27 | (8.82) | 0.99 | 0.94 | 1.48 | 1,231 | 42 |
| 08-31-2018 | 16.00 | | 0.12 | 1.90 | 2.02 | (0.13) | (0.81) | (0.94) | 17.08 | 12.96 | 0.99 | 0.94 | 0.72 | 1,439 | 39 |
| 08-31-2017 | 15.88 | | 0.16 | 1.52 | 1.68 | (0.14) | (1.42) | (1.56) | 16.00 | 10.83 | 0.99 | 0.94 | 0.98 | 1,224 | 55 |
| 08-31-2016 | 15.45 | | 0.17 | 1.94 | 2.11 | (0.20) | (1.48) | (1.68) | 15.88 | 15.18 | 0.99 | 0.93 | 1.17 | 922 | 56 |
| 1. Based on average daily shares outstanding. 2. Total returns would have been lower had certain expenses not been reduced during the applicable periods. | |
| Multi-Index Lifestyle Aggressive Portfolio | |
| Class R6 | |
| 08-31-2020 | 11.57 | | 0.16 3 | 1.32 | 1.48 | (0.23) | (0.88) | (1.11) | 11.94 | 13.00 | 0.26 4 | 0.26 4 | 1.48 3 | 8 | 21 |
| 08-31-2019 | 13.12 | | 0.19 3 | (0.50) | (0.31) | (0.20) | (1.04) | (1.24) | 11.57 | (0.88) | 0.25 4 | 0.25 4 | 1.62 3 | 4 | 14 |
| 08-31-2018 | 12.31 | | 0.12 3 | 1.42 | 1.54 | (0.21) | (0.52) | (0.73) | 13.12 | 12.73 | 0.26 4 | 0.25 4 | 0.93 3 | 4 | 15 |
| 08-31-2017 | 10.94 | | 0.18 3 | 1.54 | 1.72 | (0.19) | (0.16) | (0.35) | 12.31 | 16.07 | 0.27 4 | 0.25 4 | 1.57 3 | — 5 | 13 |
| 08-31-2016 | 10.19 | | 0.16 3 | 0.78 | 0.94 | (0.15) | (0.04) | (0.19) | 10.94 | 9.34 | 0.32 4 | 0.26 4 | 1.44 3 | — 5 | 14 |
| Class 1 | |
| 08-31-2020 | 11.56 | | 0.21 3 | 1.27 | 1.48 | (0.23) | (0.88) | (1.11) | 11.93 | 12.98 | 0.30 4 | 0.29 4 | 1.90 3 | 379 | 21 |
| 08-31-2019 | 13.12 | | 0.19 3 | (0.51) | (0.32) | (0.20) | (1.04) | (1.24) | 11.56 | (1.01) | 0.29 4 | 0.29 4 | 1.61 3 | 336 | 14 |
| 08-31-2018 | 12.31 | | 0.19 3 | 1.34 | 1.53 | (0.20) | (0.52) | (0.72) | 13.12 | 12.69 | 0.29 4 | 0.29 4 | 1.52 3 | 324 | 15 |
| 08-31-2017 | 10.94 | | 0.16 3 | 1.55 | 1.71 | (0.18) | (0.16) | (0.34) | 12.31 | 16.04 | 0.31 4 | 0.29 4 | 1.37 3 | 245 | 13 |
| 08-31-2016 | 10.19 | | 0.13 3 | 0.81 | 0.94 | (0.15) | (0.04) | (0.19) | 10.94 | 9.30 | 0.35 4 | 0.29 4 | 1.42 3 | 105 | 14 |
| 1. Based on average daily shares outstanding. 2. Total returns would have been lower had certain expenses not been reduced during the applicable periods. 3. Net investment income is affected by the timing and frequency of the declaration of dividends by the underlying funds in which the portfolio invests. 4. Ratios do not include expenses indirectly incurred from underlying funds and can vary based on the mix of underlying funds held by the portfolio. 5. Less than $500,000. | |
| Multi-Index Lifestyle Balanced Portfolio | |
| Class R6 | |
| 08-31-2020 | 11.26 | | 0.25 3 | 0.90 | 1.15 | (0.27) | (0.48) | (0.75) | 11.66 | 10.50 | 0.37 4 | 0.37 4 | 2.23 3 | 7 | 42 |
| 08-31-2019 | 11.79 | | 0.26 3 | 0.03 | 0.29 | (0.26) | (0.56) | (0.82) | 11.26 | 3.26 | 0.36 4 | 0.36 4 | 2.32 3 | 6 | 21 |
| 08-31-2018 | 11.48 | | 0.21 3 | 0.63 | 0.84 | (0.24) | (0.29) | (0.53) | 11.79 | 7.38 | 0.36 4 | 0.36 4 | 1.86 3 | 5 | 17 |
| 08-31-2017 | 10.78 | | 0.23 3 | 0.80 | 1.03 | (0.23) | (0.10) | (0.33) | 11.48 | 9.79 | 0.36 4 | 0.36 4 | 2.14 3 | — 5 | 22 |
| 08-31-2016 | 10.17 | | 0.26 3 | 0.59 | 0.85 | (0.22) | (0.02) | (0.24) | 10.78 | 8.49 | 0.37 4 | 0.37 4 | 2.38 3 | — 5 | 11 |
| Class 1 | |
| 08-31-2020 | 11.26 | | 0.25 3 | 0.88 | 1.13 | (0.26) | (0.48) | (0.74) | 11.65 | 10.36 | 0.41 4 | 0.41 4 | 2.26 3 | 931 | 42 |
| 08-31-2019 | 11.78 | | 0.25 3 | 0.05 | 0.30 | (0.26) | (0.56) | (0.82) | 11.26 | 3.31 | 0.40 4 | 0.40 4 | 2.30 3 | 891 | 21 |
| 08-31-2018 | 11.48 | | 0.24 3 | 0.58 | 0.82 | (0.23) | (0.29) | (0.52) | 11.78 | 7.25 | 0.40 4 | 0.40 4 | 2.06 3 | 865 | 17 |
| 08-31-2017 | 10.78 | | 0.21 3 | 0.81 | 1.02 | (0.22) | (0.10) | (0.32) | 11.48 | 9.75 | 0.40 4 | 0.40 4 | 1.90 3 | 719 | 22 |
| 08-31-2016 | 10.17 | | 0.20 3 | 0.64 | 0.84 | (0.21) | (0.02) | (0.23) | 10.78 | 8.44 | 0.41 4 | 0.41 4 | 2.09 3 | 350 | 11 |
| 1. Based on average daily shares outstanding. 2. Total returns would have been lower had certain expenses not been reduced during the applicable periods. 3. Net investment income is affected by the timing and frequency of the declaration of dividends by the underlying funds in which the portfolio invests. 4. Ratios do not include expenses indirectly incurred from underlying funds and can vary based on the mix of underlying funds held by the portfolio. 5. Less than $500,000. | |
The accompanying notes are an integral part of the financial statements.
John Hancock Funds II
Financial highlights
| Per share operating performance for a share outstanding throughout each period | | Ratios and supplemental data | |
| | | | Income (loss) from investment operations | | | Less distributions | | | | Ratios to average net assets | | |
| Period ended | Net asset
value,
beginning
of period ($) | | Net
investment
income
(loss) ($)1 | Net realized and
unrealized
gain (loss)
on investments ($) | Total from
investment
operations ($) | From net
investment
income ($) | From net
realized
gain ($) | Total
distributions ($) | Net asset
value,
end of
period ($) | Total
return
(%)2 | Expenses
before
reductions
(%) | Expenses
including
reductions
(%) | Net
investment
income
(loss) (%) | Net
assets,
end of
period
(in millions) | Portfolio
turnover
(%) |
| Multi-Index Lifestyle Conservative Portfolio | |
| Class R6 | |
| 08-31-2020 | 10.84 | | 0.21 3 | 0.56 | 0.77 | (0.27) | (0.15) | (0.42) | 11.19 | 7.37 | 0.54 4 | 0.51 4 | 2.02 3 | 2 | 57 |
| 08-31-2019 | 10.57 | | 0.24 3 | 0.47 | 0.71 | (0.28) | (0.16) | (0.44) | 10.84 | 7.09 | 0.51 4 | 0.50 4 | 2.35 3 | — 5 | 21 |
| 08-31-2018 | 10.75 | | 0.28 3 | (0.11) | 0.17 | (0.25) | (0.10) | (0.35) | 10.57 | 1.61 | 0.53 4 | 0.50 4 | 2.62 3 | — 5 | 24 |
| 08-31-2017 | 10.65 | | 0.24 3 | 0.17 | 0.41 | (0.24) | (0.07) | (0.31) | 10.75 | 3.95 | 0.55 4 | 0.50 4 | 2.32 3 | — 5 | 36 |
| 08-31-2016 | 10.13 | | 0.30 3 | 0.47 | 0.77 | (0.24) | (0.01) | (0.25) | 10.65 | 7.71 | 0.60 4 | 0.50 4 | 2.72 3 | — 5 | 21 |
| Class 1 | |
| 08-31-2020 | 10.83 | | 0.27 3 | 0.50 | 0.77 | (0.27) | (0.15) | (0.42) | 11.18 | 7.33 | 0.57 4 | 0.54 4 | 2.50 3 | 199 | 57 |
| 08-31-2019 | 10.56 | | 0.28 3 | 0.43 | 0.71 | (0.28) | (0.16) | (0.44) | 10.83 | 7.05 | 0.55 4 | 0.54 4 | 2.73 3 | 184 | 21 |
| 08-31-2018 | 10.74 | | 0.25 3 | (0.09) | 0.16 | (0.24) | (0.10) | (0.34) | 10.56 | 1.57 | 0.57 4 | 0.54 4 | 2.41 3 | 156 | 24 |
| 08-31-2017 | 10.65 | | 0.23 3 | 0.16 | 0.39 | (0.23) | (0.07) | (0.30) | 10.74 | 3.82 | 0.59 4 | 0.54 4 | 2.19 3 | 130 | 36 |
| 08-31-2016 | 10.13 | | 0.22 3 | 0.54 | 0.76 | (0.23) | (0.01) | (0.24) | 10.65 | 7.68 | 0.63 4 | 0.53 4 | 2.43 3 | 74 | 21 |
| 1. Based on average daily shares outstanding. 2. Total returns would have been lower had certain expenses not been reduced during the applicable periods. 3. Net investment income is affected by the timing and frequency of the declaration of dividends by the underlying funds in which the portfolio invests. 4. Ratios do not include expenses indirectly incurred from underlying funds and can vary based on the mix of underlying funds held by the portfolio. 5. Less than $500,000. | |
| Multi-Index Lifestyle Growth Portfolio | |
| Class R6 | |
| 08-31-2020 | 11.56 | | 0.23 3 | 1.11 | 1.34 | (0.26) | (0.67) | (0.93) | 11.97 | 11.88 | 0.31 4 | 0.31 4 | 2.07 3 | 7 | 32 |
| 08-31-2019 | 12.56 | | 0.23 3 | (0.21) | 0.02 | (0.23) | (0.79) | (1.02) | 11.56 | 1.30 | 0.30 4 | 0.30 4 | 1.99 3 | 6 | 13 |
| 08-31-2018 | 12.02 | | 0.17 3 | 1.00 | 1.17 | (0.22) | (0.41) | (0.63) | 12.56 | 9.85 | 0.30 4 | 0.30 4 | 1.44 3 | 5 | 16 |
| 08-31-2017 | 10.97 | | 0.22 3 | 1.15 | 1.37 | (0.20) | (0.12) | (0.32) | 12.02 | 12.82 | 0.31 4 | 0.31 4 | 1.90 3 | 1 | 15 |
| 08-31-2016 | 10.25 | | 0.22 3 | 0.69 | 0.91 | (0.16) | (0.03) | (0.19) | 10.97 | 8.95 | 0.32 4 | 0.32 4 | 2.01 3 | 1 | 11 |
| Class 1 | |
| 08-31-2020 | 11.54 | | 0.24 3 | 1.10 | 1.34 | (0.26) | (0.67) | (0.93) | 11.95 | 11.86 | 0.34 4 | 0.34 4 | 2.10 3 | 887 | 32 |
| 08-31-2019 | 12.54 | | 0.22 3 | (0.20) | 0.02 | (0.23) | (0.79) | (1.02) | 11.54 | 1.27 | 0.34 4 | 0.34 4 | 1.96 3 | 823 | 13 |
| 08-31-2018 | 12.01 | | 0.22 3 | 0.93 | 1.15 | (0.21) | (0.41) | (0.62) | 12.54 | 9.75 | 0.34 4 | 0.34 4 | 1.83 3 | 756 | 16 |
| 08-31-2017 | 10.96 | | 0.19 3 | 1.18 | 1.37 | (0.20) | (0.12) | (0.32) | 12.01 | 12.78 | 0.34 4 | 0.34 4 | 1.67 3 | 611 | 15 |
| 08-31-2016 | 10.24 | | 0.16 3 | 0.75 | 0.91 | (0.16) | (0.03) | (0.19) | 10.96 | 8.92 | 0.36 4 | 0.35 4 | 1.71 3 | 277 | 11 |
| 1. Based on average daily shares outstanding. 2. Total returns would have been lower had certain expenses not been reduced during the applicable periods. 3. Net investment income is affected by the timing and frequency of the declaration of dividends by the underlying funds in which the portfolio invests. 4. Ratios do not include expenses indirectly incurred from underlying funds and can vary based on the mix of underlying funds held by the portfolio. | |
| Multi-Index Lifestyle Moderate Portfolio | |
| Class R6 | |
| 08-31-2020 | 11.08 | | 0.26 3 | 0.66 | 0.92 | (0.28) | (0.32) | (0.60) | 11.40 | 8.58 | 0.46 4 | 0.44 4 | 2.35 3 | 1 | 48 |
| 08-31-2019 | 11.15 | | 0.28 3 | 0.28 | 0.56 | (0.29) | (0.34) | (0.63) | 11.08 | 5.58 | 0.44 4 | 0.44 4 | 2.56 3 | 1 | 21 |
| 08-31-2018 | 11.08 | | 0.26 3 | 0.21 | 0.47 | (0.24) | (0.16) | (0.40) | 11.15 | 4.37 | 0.45 4 | 0.44 4 | 2.37 3 | 1 | 20 |
| 08-31-2017 | 10.67 | | 0.25 3 | 0.45 | 0.70 | (0.23) | (0.06) | (0.29) | 11.08 | 6.75 | 0.47 4 | 0.44 4 | 2.30 3 | 1 | 24 |
| 08-31-2016 | 10.12 | | 0.26 3 | 0.55 | 0.81 | (0.24) | (0.02) | (0.26) | 10.67 | 8.17 | 0.51 4 | 0.44 4 | 2.53 3 | 1 | 15 |
| Class 1 | |
| 08-31-2020 | 11.08 | | 0.26 3 | 0.66 | 0.92 | (0.28) | (0.32) | (0.60) | 11.40 | 8.54 | 0.49 4 | 0.48 4 | 2.41 3 | 257 | 48 |
| 08-31-2019 | 11.14 | | 0.27 3 | 0.29 | 0.56 | (0.28) | (0.34) | (0.62) | 11.08 | 5.64 | 0.48 4 | 0.48 4 | 2.55 3 | 262 | 21 |
| 08-31-2018 | 11.07 | | 0.25 3 | 0.22 | 0.47 | (0.24) | (0.16) | (0.40) | 11.14 | 4.34 | 0.49 4 | 0.48 4 | 2.28 3 | 239 | 20 |
| 08-31-2017 | 10.67 | | 0.23 3 | 0.46 | 0.69 | (0.23) | (0.06) | (0.29) | 11.07 | 6.61 | 0.50 4 | 0.47 4 | 2.10 3 | 198 | 24 |
| 08-31-2016 | 10.12 | | 0.22 3 | 0.59 | 0.81 | (0.24) | (0.02) | (0.26) | 10.67 | 8.13 | 0.55 4 | 0.47 4 | 2.37 3 | 88 | 15 |
| 1. Based on average daily shares outstanding. 2. Total returns would have been lower had certain expenses not been reduced during the applicable periods. 3. Net investment income is affected by the timing and frequency of the declaration of dividends by the underlying funds in which the portfolio invests. 4. Ratios do not include expenses indirectly incurred from underlying funds and can vary based on the mix of underlying funds held by the portfolio. | |
| Real Estate Securities Fund | |
| Class 1 | |
| 08-31-2020 | 14.55 | | 0.24 | (1.55) | (1.31) | (0.29) | (0.90) | (1.19) | 12.05 | (9.75) | 0.81 | 0.80 | 1.86 | 304 | 133 |
| 08-31-2019 | 12.97 | | 0.29 | 1.82 | 2.11 | (0.26) | (0.27) | (0.53) | 14.55 | 17.35 | 0.81 | 0.80 | 2.25 | 433 | 132 |
| 08-31-2018 | 13.12 | | 0.26 | 0.49 | 0.75 | (0.17) | (0.73) | (0.90) | 12.97 | 6.20 | 0.81 | 0.80 | 2.11 | 421 | 158 |
| 08-31-2017 | 14.95 | | 0.28 | (0.52) | (0.24) | (0.50) | (1.09) | (1.59) | 13.12 | (0.86) | 0.79 | 0.79 | 2.09 | 502 | 159 |
| 08-31-2016 | 13.39 | | 0.45 3 | 2.79 | 3.24 | (0.27) | (1.41) | (1.68) | 14.95 | 25.93 | 0.79 | 0.78 | 3.20 3 | 665 | 141 |
| 1. Based on average daily shares outstanding. 2. Total returns would have been lower had certain expenses not been reduced during the applicable periods. 3. Net investment income (loss) per share and ratio of net investment income (loss) to average net assets reflect a special dividend received by the fund, which amounted to $0.12 and 0.88%, respectively. | |
The accompanying notes are an integral part of the financial statements.
John Hancock Funds II
Financial highlights
| Per share operating performance for a share outstanding throughout each period | | Ratios and supplemental data | |
| | | | Income (loss) from investment operations | | | Less distributions | | | | Ratios to average net assets | | |
| Period ended | Net asset
value,
beginning
of period ($) | | Net
investment
income
(loss) ($)1 | Net realized and
unrealized
gain (loss)
on investments ($) | Total from
investment
operations ($) | From net
investment
income ($) | From net
realized
gain ($) | Total
distributions ($) | Net asset
value,
end of
period ($) | Total
return
(%)2 | Expenses
before
reductions
(%) | Expenses
including
reductions
(%) | Net
investment
income
(loss) (%) | Net
assets,
end of
period
(in millions) | Portfolio
turnover
(%) |
| Science & Technology Fund | |
| Class NAV | |
| 08-31-2020 | 3.87 | | 0.02 3 | 1.69 | 1.71 | — | (0.36) | (0.36) | 5.22 | 47.55 | 1.10 | 1.06 | 0.40 3 | 363 | 116 |
| 08-31-2019 | 5.99 | | (0.01) | (0.32) | (0.33) | — | (1.79) | (1.79) | 3.87 | 3.19 | 1.10 | 1.06 | (0.36) | 284 | 110 |
| 08-31-2018 | 13.85 | | (0.03) | 2.33 | 2.30 | — | (10.16) | (10.16) | 5.99 | 30.59 | 1.10 | 1.05 | (0.47) | 252 | 108 |
| 08-31-2017 | 11.75 | | (0.02) | 3.17 | 3.15 | (0.02) | (1.03) | (1.05) | 13.85 | 29.39 | 1.07 | 1.03 | (0.13) | 355 | 93 |
| 08-31-2016 | 12.56 | | 0.02 | 2.03 | 2.05 | — | (2.86) | (2.86) | 11.75 | 18.08 | 1.07 | 1.02 | 0.18 | 766 | 98 |
| 1. Based on average daily shares outstanding. 2. Total returns would have been lower had certain expenses not been reduced during the applicable periods. 3. Net investment income (loss) per share and ratio of net investment income (loss) to average net assets reflect a special dividend received by the fund, which amounted to $0.04 and 1.00%, respectively. | |
| Strategic Equity Allocation Fund | |
| Class NAV | |
| 08-31-2020 | 11.14 | | 0.20 | 1.41 | 1.61 | (0.26) | (0.13) | (0.39) | 12.36 | 14.54 | 0.67 | 0.54 | 1.77 | 7,582 | 96 |
| 08-31-2019 | 13.46 | | 0.24 | (0.75) | (0.51) | (0.23) | (1.58) | (1.81) | 11.14 | (1.78) | 0.67 | 0.54 | 2.12 | 7,329 | 80 |
| 08-31-2018 | 13.99 | | 0.22 | 1.42 | 1.64 | (0.26) | (1.91) | (2.17) | 13.46 | 12.48 | 0.66 | 0.54 | 1.64 | 7,690 | 115 |
| 08-31-2017 | 13.14 | | 0.24 | 1.85 | 2.09 | (0.24) | (1.00) | (1.24) | 13.99 | 17.12 | 0.66 | 0.53 | 1.78 | 7,636 | 67 |
| 08-31-2016 | 12.88 | | 0.23 | 0.79 | 1.02 | (0.21) | (0.55) | (0.76) | 13.14 | 8.25 | 0.67 | 0.53 | 1.83 | 7,139 | 47 |
| 1. Based on average daily shares outstanding. 2. Total returns would have been lower had certain expenses not been reduced during the applicable periods. | |
| U.S. Sector Rotation Fund | |
| Class NAV | |
| 08-31-2020 | 9.86 | | 0.16 | 1.79 | 1.95 | (0.19) | (0.86) | (1.05) | 10.76 | 20.74 | 0.67 | 0.54 | 1.63 | 1,295 | 113 |
| 08-31-2019 | 13.13 | | 0.17 | (0.72) | (0.55) | (0.19) | (2.53) | (2.72) | 9.86 | (0.34) | 0.66 | 0.53 | 1.66 | 1,497 | 92 |
| 08-31-2018 | 11.57 | | 0.15 | 2.14 | 2.29 | (0.17) | (0.56) | (0.73) | 13.13 | 20.43 | 0.66 | 0.53 | 1.26 | 1,714 | 128 |
| 08-31-2017 3 | 10.00 | | 0.15 | 1.46 | 1.61 | (0.04) | — | (0.04) | 11.57 | 16.08 4 | 0.66 5 | 0.53 5 | 1.45 5 | 1,955 | 119 |
| 1. Based on average daily shares outstanding. 2. Total returns would have been lower had certain expenses not been reduced during the applicable periods. 3. Period from 9-26-16 (commencement of operations) to 8-31-17. 4. Not annualized. 5. Annualized. | |
The accompanying notes are an integral part of the financial statements.
John Hancock Funds II
Notes to financial statements
1. Organization
John Hancock Funds II (the Trust) is an open-end management investment company organized as a Massachusetts business trust. The Trust is registered under the Investment Company Act of 1940, as amended (the 1940 Act). It is a series company with multiple investment series, sixteen of which are presented in this report (the funds).
Multi-Index Lifestyle Aggressive Portfolio, Multi-Index Lifestyle Balanced Portfolio, Multi-Index Lifestyle Conservative Portfolio, Multi-Index Lifestyle Growth Portfolio and Multi-Index Lifestyle Moderate Portfolio (collectively, the Multi-Index Lifestyle Portfolios) operate as “funds of funds,” investing in shares of mutual funds (underlying funds). The accounting policies of the underlying funds in which the Multi-Index Lifestyle Portfolios invest are outlined in the underlying funds’ shareholder reports, which include the underlying funds’ financial statements. These are available on the Securities and Exchange Commission (SEC) website at sec.gov. John Hancock underlying funds' shareholder reports are also available without charge by calling 800-344-1029 or visiting jhinvestments.com. The underlying funds are not covered by this report.
The funds may offer multiple classes of shares. The shares currently offered by a specific fund are detailed in the Statements of assets and liabilities. Class R6 shares are only available to certain retirement plans, institutions and other investors. Class 1 shares are offered only to certain affiliates of Manulife Financial Corporation. Class NAV shares are offered to John Hancock affiliated funds of funds, retirement plans for employees of John Hancock and/or Manulife Financial Corporation, and certain 529 plans. Shareholders of each class have exclusive voting rights to matters that affect that class. The distribution and service fees, if any, and transfer agent fees for each class may differ.
Prior to September 20, 2019, U.S. Sector Rotation Fund was known as U.S. Strategic Equity Allocation Fund.
2. Significant accounting policies
The financial statements have been prepared in conformity with accounting principles generally accepted in the United States of America (US GAAP), which require management to make certain estimates and assumptions as of the date of the financial statements. Actual results could differ from those estimates and those differences could be significant. The funds qualify as investment companies under Topic 946 of Accounting Standards Codification of US GAAP.
Events or transactions occurring after the end of the fiscal period through the date that the financial statements were issued have been evaluated in the preparation of the financial statements. The following summarizes the significant accounting policies of the funds:
Security valuation. Investments are stated at value as of the scheduled close of regular trading on the New York Stock Exchange (NYSE), normally at 4:00 P.M., Eastern Time. In case of emergency or other disruption resulting in the NYSE not opening for trading or the NYSE closing at a time other than the regularly scheduled close, the net asset value (NAV) may be determined as of the regularly scheduled close of the NYSE pursuant to the funds' Valuation Policies and Procedures.
In order to value the securities, the funds use the following valuation techniques: Equity securities, including exchange-traded or closed-end funds, are typically valued at the last sale price or official closing price on the exchange or principal market where the security trades. In the event there were no sales during the day or closing prices are not available, the securities are valued using the last available bid price. Investments in open-end mutual funds, including John Hancock Collateral Trust (JHCT), are valued at their respective NAVs each business day. Debt obligations typically are valued based on evaluated prices provided by an independent pricing vendor. Independent pricing vendors utilize matrix pricing, which takes into account factors such as institutional-size trading in similar groups of securities, yield, quality, coupon rate, maturity, type of issue, trading characteristics and other market data, as well as broker supplied prices. Exchange-traded options are valued at the mid-price of the last quoted bid and ask prices from the exchange where the option trades. Unlisted options are generally valued using evaluated prices obtained from an independent pricing vendor. Futures contracts are typically valued at the last traded price on the exchange on which they trade. Foreign equity index futures that trade in the electronic trading market subsequent to the close of regular trading may be valued at the last traded price in the electronic trading market as of 4:00 P.M. ET, or may be fair valued based on fair value adjustment factors provided by an independent pricing vendor in order to adjust for events that may occur between the close of foreign exchanges or markets and the close of the NYSE. Forward foreign currency contracts are valued at the prevailing forward rates which are based on foreign currency exchange spot rates and forward points supplied by an independent pricing vendor. Foreign securities and currencies are valued in U.S. dollars based on foreign currency exchange rates supplied by an independent pricing vendor.
In certain instances, the Pricing Committee may determine to value equity securities using prices obtained from another exchange or market if trading on the exchange or market on which prices are typically obtained did not open for trading as scheduled, or if trading closed earlier than scheduled, and trading occurred as normal on another exchange or market.
Other portfolio securities and assets, for which reliable market quotations are not readily available, are valued at fair value as determined in good faith by the funds' Pricing Committee following procedures established by the Board of Trustees. The frequency with which these fair valuation procedures are used cannot be predicted and fair value of securities may differ significantly from the value that would have been used had a ready market for such securities existed. Trading in foreign securities may be completed before the scheduled daily close of trading on the NYSE. Significant events at the issuer or market level may affect the values of securities between the time when the valuation of the securities is generally determined and the close of the NYSE. If a significant event occurs, these securities may be fair valued, as determined in good faith by the funds' Pricing Committee, following procedures established by the Board of Trustees. The funds use fair value adjustment factors provided by an independent pricing vendor to value certain foreign securities in order to adjust for events that may occur between the close of foreign exchanges or markets and the close of the NYSE.
The funds use a three-tier hierarchy to prioritize the pricing assumptions, referred to as inputs, used in valuation techniques to measure fair value. Level 1 includes securities valued using quoted prices in active markets for identical securities, including registered investment companies. Level 2 includes securities valued using other significant observable inputs. Observable inputs may include quoted prices for similar securities, interest rates, prepayment speeds and credit risk. Prices for securities valued using these inputs are received from independent pricing vendors and brokers and are based on an evaluation of the inputs described. Level 3 includes securities valued using significant unobservable inputs when market prices are not readily available or reliable, including the funds' own assumptions in determining the fair value of investments. Factors used in determining value may include market or
Significant accounting policies, continued
issuer specific events or trends, changes in interest rates and credit quality. The inputs or methodology used for valuing securities are not necessarily an indication of the risks associated with investing in those securities. Changes in valuation techniques and related inputs may result in transfers into or out of an assigned level within the disclosure hierarchy.
The following is a summary of the values by input classification of the funds' investments as of August 31, 2020, by major security category or type:
| | Total
value at
8-31-20 | Level 1
quoted
price | Level 2
significant
observable
inputs | Level 3
significant
unobservable
inputs |
| Capital Appreciation Fund |
| Investments in securities: | | | | |
| Assets | | | | |
| Common stocks | | | | |
| Communication services | $334,196,168 | $312,958,246 | $21,237,922 | — |
| Consumer discretionary | 558,746,490 | 537,593,880 | 21,152,610 | — |
| Consumer staples | 56,750,656 | 56,750,656 | — | — |
| Financials | 47,332,881 | 47,332,881 | — | — |
| Health care | 168,922,977 | 168,922,977 | — | — |
| Industrials | 50,482,294 | 50,482,294 | — | — |
| Information technology | 965,469,620 | 922,177,009 | 43,292,611 | — |
| Real estate | 11,708,057 | 11,708,057 | — | — |
| Short-term investments | 49,712,192 | 49,712,192 | — | — |
| Total investments in securities | $2,243,321,335 | $2,157,638,192 | $85,683,143 | — |
| |
| Capital Appreciation Value Fund |
| Investments in securities: | | | | |
| Assets | | | | |
| Common stocks | | | | |
| Communication services | $69,799,643 | $69,799,643 | — | — |
| Consumer discretionary | 109,563,472 | 109,563,472 | — | — |
| Consumer staples | 18,528,547 | 18,528,547 | — | — |
| Financials | 124,186,499 | 124,186,499 | — | — |
| Health care | 186,858,096 | 181,025,367 | $5,832,729 | — |
| Industrials | 101,698,430 | 101,698,430 | — | — |
| Information technology | 229,019,057 | 229,019,057 | — | — |
| Materials | 8,620,276 | 8,620,276 | — | — |
| Utilities | 125,874,326 | 125,874,326 | — | — |
| Preferred securities | | | | |
| Financials | 3,011,355 | 3,011,355 | — | — |
| Health care | 15,233,651 | 15,233,651 | — | — |
| Industrials | 2,791,817 | — | 2,791,817 | — |
| Utilities | 25,393,224 | 25,393,224 | — | — |
| Corporate bonds | 149,258,764 | — | 149,258,764 | — |
| Convertible bonds | 695,252 | — | 695,252 | — |
| Term loans | 143,139,170 | — | 143,139,170 | — |
| Short-term investments | 149,763,525 | 149,763,525 | — | — |
| Total investments in securities | $1,463,435,104 | $1,161,717,372 | $301,717,732 | — |
| Derivatives: | | | | |
| Liabilities | | | | |
| Written options | $(18,161,003) | — | $(18,161,003) | — |
| |
| Health Sciences Fund |
| Investments in securities: | | | | |
| Assets | | | | |
| Common stocks | | | | |
| Consumer discretionary | $415,499 | — | — | $415,499 |
| Financials | 1,523,587 | $1,523,587 | — | — |
| Health care | 416,975,934 | 389,724,379 | $26,763,310 | 488,245 |
| Preferred securities | | | | |
| Consumer discretionary | 927,796 | — | — | 927,796 |
| Health care | 2,523,714 | — | 2,523,714 | — |
Significant accounting policies, continued
| | Total
value at
8-31-20 | Level 1
quoted
price | Level 2
significant
observable
inputs | Level 3
significant
unobservable
inputs |
| Health Sciences Fund (continued) |
| Information technology | $1,032,556 | — | — | $1,032,556 |
| Rights | 352,835 | $352,835 | — | — |
| Short-term investments | 5,665,559 | 5,665,559 | — | — |
| Total investments in securities | $429,417,480 | $397,266,360 | $29,287,024 | $2,864,096 |
| |
| International Strategic Equity Allocation Fund |
| Investments in securities: | | | | |
| Assets | | | | |
| Common stocks | | | | |
| Australia | $109,665,005 | — | $109,665,005 | — |
| Austria | 2,850,716 | — | 2,850,716 | — |
| Belgium | 18,844,033 | — | 18,844,033 | — |
| Brazil | 16,681,086 | $16,681,086 | — | — |
| Canada | 32,137,746 | 32,137,746 | — | — |
| Chile | 5,486,538 | 5,156,978 | 329,560 | — |
| China | 160,671,413 | 65,887,057 | 94,784,356 | — |
| Colombia | 957,134 | 957,134 | — | — |
| Czech Republic | 553,625 | — | 553,625 | — |
| Denmark | 38,171,341 | — | 38,171,341 | — |
| Finland | 34,644,290 | — | 34,644,290 | — |
| France | 156,432,009 | — | 156,432,009 | — |
| Germany | 147,437,334 | — | 147,437,334 | — |
| Hong Kong | 53,365,068 | 521,364 | 52,843,704 | — |
| Hungary | 1,324,119 | — | 1,324,119 | — |
| Indonesia | 7,506,153 | — | 7,506,153 | — |
| Ireland | 12,213,125 | 484,948 | 11,728,177 | — |
| Isle of Man | 360,470 | — | 360,470 | — |
| Israel | 6,057,577 | 3,144,470 | 2,913,107 | — |
| Italy | 20,977,556 | — | 20,977,556 | — |
| Japan | 173,170,328 | — | 173,170,328 | — |
| Jordan | 318,552 | — | 318,552 | — |
| Luxembourg | 3,507,737 | — | 3,507,737 | — |
| Macau | 1,127,468 | — | 1,127,468 | — |
| Malaysia | 8,535,510 | — | 8,535,510 | — |
| Mexico | 7,854,224 | 7,854,224 | — | — |
| Netherlands | 71,155,796 | — | 71,155,796 | — |
| New Zealand | 10,735,211 | — | 10,735,211 | — |
| Norway | 6,368,409 | — | 6,368,409 | — |
| Peru | 1,706,513 | 1,706,513 | — | — |
| Philippines | 3,964,135 | — | 3,964,135 | — |
| Poland | 4,804,100 | — | 4,804,100 | — |
| Portugal | 1,811,553 | — | 1,811,553 | — |
| Romania | 140,113 | — | 140,113 | — |
| Singapore | 4,545,561 | — | 4,545,561 | — |
| South Africa | 17,193,674 | — | 17,193,674 | — |
| South Korea | 52,035,030 | — | 52,035,030 | — |
| Spain | 38,164,545 | — | 38,164,545 | — |
| Sweden | 58,829,954 | — | 58,829,954 | — |
| Switzerland | 118,182,974 | — | 118,182,974 | — |
| Taiwan | 58,152,436 | — | 58,152,436 | — |
| Thailand | 11,200,864 | — | 11,200,864 | — |
| Turkey | 863,034 | — | 863,034 | — |
| United Arab Emirates | 1,115 | — | 1,115 | — |
| United Kingdom | 113,100,572 | 1,046,987 | 112,053,585 | — |
| United States | 119,187 | 119,187 | — | — |
Significant accounting policies, continued
| | Total
value at
8-31-20 | Level 1
quoted
price | Level 2
significant
observable
inputs | Level 3
significant
unobservable
inputs |
| International Strategic Equity Allocation Fund (continued) |
| Preferred securities | | | | |
| Brazil | $6,028,273 | $6,028,273 | — | — |
| Chile | 760,930 | 760,930 | — | — |
| Colombia | 362,702 | 362,702 | — | — |
| Germany | 9,449,377 | — | $9,449,377 | — |
| South Korea | 3,116,855 | — | 3,116,855 | — |
| Exchange-traded funds | 79,172,168 | 79,172,168 | — | — |
| Rights | 6,743 | 5,816 | 927 | — |
| Warrants | 5,074 | 5,074 | — | — |
| Short-term investments | 84,551,567 | 77,852,096 | 6,699,471 | — |
| Total investments in securities | $1,777,378,622 | $299,884,753 | $1,477,493,869 | — |
| Derivatives: | | | | |
| Assets | | | | |
| Futures | $1,593,171 | $1,593,171 | — | — |
| |
| International Value Fund |
| Investments in securities: | | | | |
| Assets | | | | |
| Common stocks | | | | |
| Australia | $1,201,346 | — | $1,201,346 | — |
| Bermuda | 2,809,761 | $2,809,761 | — | — |
| Canada | 8,724,276 | 8,724,276 | — | — |
| China | 3,640,797 | — | 3,640,797 | — |
| Denmark | 2,739,805 | — | 2,739,805 | — |
| Finland | 3,848,043 | — | 3,848,043 | — |
| France | 31,765,251 | — | 31,765,251 | — |
| Germany | 14,364,006 | — | 14,364,006 | — |
| Greece | 1,662,653 | — | 1,662,653 | — |
| Hong Kong | 3,475,437 | — | 3,475,437 | — |
| Hungary | 1,929,940 | — | 1,929,940 | — |
| India | 1,277,597 | 1,277,597 | — | — |
| Indonesia | 1,739,795 | — | 1,739,795 | — |
| Ireland | 2,101,929 | — | 2,101,929 | — |
| Italy | 3,991,685 | — | 3,991,685 | — |
| Japan | 45,215,194 | — | 45,215,194 | — |
| Macau | 1,448,368 | — | 1,448,368 | — |
| Netherlands | 12,905,994 | 1,461,834 | 11,444,160 | — |
| Norway | 2,180,763 | — | 2,180,763 | — |
| Singapore | 1,127,918 | — | 1,127,918 | — |
| South Korea | 11,041,059 | 2,063,625 | 8,977,434 | — |
| Spain | 1,950,316 | — | 1,950,316 | — |
| Sweden | 2,053,332 | — | 2,053,332 | — |
| Switzerland | 18,637,429 | — | 18,637,429 | — |
| Taiwan | 1,060,350 | — | 1,060,350 | — |
| United Kingdom | 28,606,672 | 5,576,589 | 23,030,083 | — |
| United States | 1,878,244 | 1,878,244 | — | — |
| Short-term investments | 6,049,363 | 6,049,363 | — | — |
| Total investments in securities | $219,427,323 | $29,841,289 | $189,586,034 | — |
| |
Significant accounting policies, continued
| | Total
value at
8-31-20 | Level 1
quoted
price | Level 2
significant
observable
inputs | Level 3
significant
unobservable
inputs |
| Mid Cap Stock Fund |
| Investments in securities: | | | | |
| Assets | | | | |
| Common stocks | | | | |
| Communication services | $138,683,826 | $138,683,826 | — | — |
| Consumer discretionary | 367,261,738 | 341,121,568 | $24,729,096 | $1,411,074 |
| Consumer staples | 79,727,062 | 79,727,062 | — | — |
| Financials | 68,348,407 | 68,348,407 | — | — |
| Health care | 421,083,627 | 399,715,423 | 21,368,204 | — |
| Industrials | 145,551,029 | 145,551,029 | — | — |
| Information technology | 475,550,591 | 475,550,591 | — | — |
| Preferred securities | 43,144,127 | — | — | 43,144,127 |
| Exchange-traded funds | 61,310,643 | 61,310,643 | — | — |
| Short-term investments | 71,860,759 | 38,560,759 | 33,300,000 | — |
| Total investments in securities | $1,872,521,809 | $1,748,569,308 | $79,397,300 | $44,555,201 |
| |
| Mid Value Fund |
| Investments in securities: | | | | |
| Assets | | | | |
| Common stocks | | | | |
| Communication services | $73,948,564 | $73,948,564 | — | — |
| Consumer discretionary | 36,093,502 | 30,100,031 | $5,993,471 | — |
| Consumer staples | 115,271,651 | 106,676,415 | 8,595,236 | — |
| Energy | 164,768,704 | 153,912,027 | 10,856,677 | — |
| Financials | 219,114,142 | 204,086,300 | 15,027,842 | — |
| Health care | 218,445,273 | 217,077,528 | 1,367,745 | — |
| Industrials | 127,241,792 | 122,534,400 | 4,707,392 | — |
| Information technology | 37,552,629 | 37,552,629 | — | — |
| Materials | 151,715,565 | 126,185,785 | 25,529,780 | — |
| Real estate | 95,389,437 | 95,389,437 | — | — |
| Utilities | 61,897,121 | 61,897,121 | — | — |
| Preferred securities | 3,310,655 | 3,310,655 | — | — |
| Corporate bonds | 2,928,570 | — | 2,928,570 | — |
| Short-term investments | 51,488,954 | 51,488,954 | — | — |
| Total investments in securities | $1,359,166,559 | $1,284,159,846 | $75,006,713 | — |
| |
| Multi-Index Lifestyle Aggressive Portfolio |
| Investments in securities: | | | | |
| Assets | | | | |
| Affiliated investment companies | $259,553,516 | $259,553,516 | — | — |
| Unaffiliated investment companies | 127,115,052 | 127,115,052 | — | — |
| Short-term investments | 2,738,624 | 2,738,624 | — | — |
| Total investments in securities | $389,407,192 | $389,407,192 | — | — |
| |
| Multi-Index Lifestyle Balanced Portfolio |
| Investments in securities: | | | | |
| Assets | | | | |
| Affiliated investment companies | $364,338,030 | $364,338,030 | — | — |
| Unaffiliated investment companies | 574,243,914 | 574,243,914 | — | — |
| Short-term investments | 38,221,479 | 38,221,479 | — | — |
| Total investments in securities | $976,803,423 | $976,803,423 | — | — |
| |
Significant accounting policies, continued
| | Total
value at
8-31-20 | Level 1
quoted
price | Level 2
significant
observable
inputs | Level 3
significant
unobservable
inputs |
| Multi-Index Lifestyle Conservative Portfolio |
| Investments in securities: | | | | |
| Assets | | | | |
| Affiliated investment companies | $21,689,704 | $21,689,704 | — | — |
| Unaffiliated investment companies | 178,497,368 | 178,497,368 | — | — |
| Short-term investments | 10,001,863 | 10,001,863 | — | — |
| Total investments in securities | $210,188,935 | $210,188,935 | — | — |
| |
| Multi-Index Lifestyle Growth Portfolio |
| Investments in securities: | | | | |
| Assets | | | | |
| Affiliated investment companies | $473,893,226 | $473,893,226 | — | — |
| Unaffiliated investment companies | 419,567,595 | 419,567,595 | — | — |
| Short-term investments | 30,427,476 | 30,427,476 | — | — |
| Total investments in securities | $923,888,297 | $923,888,297 | — | — |
| |
| Multi-Index Lifestyle Moderate Portfolio |
| Investments in securities: | | | | |
| Assets | | | | |
| Affiliated investment companies | $65,727,502 | $65,727,502 | — | — |
| Unaffiliated investment companies | 192,636,232 | 192,636,232 | — | — |
| Short-term investments | 8,372,330 | 8,372,330 | — | — |
| Total investments in securities | $266,736,064 | $266,736,064 | — | — |
| |
| Real Estate Securities Fund |
| Investments in securities: | | | | |
| Assets | | | | |
| Common stocks | $301,029,417 | $301,029,417 | — | — |
| Short-term investments | 3,511,002 | 3,511,002 | — | — |
| Total investments in securities | $304,540,419 | $304,540,419 | — | — |
| |
| Science & Technology Fund |
| Investments in securities: | | | | |
| Assets | | | | |
| Common stocks | | | | |
| Communication services | $62,801,171 | $54,830,319 | $7,970,852 | — |
| Consumer discretionary | 66,453,967 | 48,677,789 | 17,776,178 | — |
| Health care | 4,688,568 | 4,688,568 | — | — |
| Industrials | 804,195 | 804,195 | — | — |
| Information technology | 206,101,957 | 194,516,266 | 11,585,691 | — |
| Real estate | 181,649 | 181,649 | — | — |
| Preferred securities | 1,919,532 | — | — | $1,919,532 |
| Exchange-traded funds | 523,551 | 523,551 | — | — |
| Term loans | 337,600 | — | 337,600 | — |
| Short-term investments | 29,715,846 | 22,991,846 | 6,724,000 | — |
| Total investments in securities | $373,528,036 | $327,214,183 | $44,394,321 | $1,919,532 |
| |
Significant accounting policies, continued
| | Total
value at
8-31-20 | Level 1
quoted
price | Level 2
significant
observable
inputs | Level 3
significant
unobservable
inputs |
| Strategic Equity Allocation Fund |
| Investments in securities: | | | | |
| Assets | | | | |
| Common stocks | | | | |
| Communication services | $711,752,678 | $546,792,195 | $164,960,483 | — |
| Consumer discretionary | 1,155,783,728 | 904,901,583 | 250,882,145 | — |
| Consumer staples | 485,000,089 | 248,146,249 | 236,853,840 | — |
| Energy | 170,314,868 | 96,322,779 | 73,992,089 | — |
| Financials | 858,029,767 | 463,036,262 | 394,992,935 | $570 |
| Health care | 703,084,395 | 424,833,020 | 278,211,644 | 39,731 |
| Industrials | 874,910,030 | 571,133,079 | 303,776,951 | — |
| Information technology | 1,642,549,474 | 1,362,532,952 | 280,016,522 | — |
| Materials | 317,972,542 | 138,807,929 | 179,164,613 | — |
| Real estate | 187,596,497 | 115,617,356 | 71,979,141 | — |
| Utilities | 175,599,533 | 83,336,457 | 92,231,562 | 31,514 |
| Preferred securities | | | | |
| Communication services | 457,172 | 457,172 | — | — |
| Consumer discretionary | 9,254,328 | 519,088 | 8,735,240 | — |
| Consumer staples | 3,838,168 | 212,263 | 3,625,905 | — |
| Energy | 2,228,489 | 2,228,489 | — | — |
| Financials | 5,868,016 | 5,868,016 | — | — |
| Health care | 2,834,880 | — | 2,834,880 | — |
| Information technology | 3,949,910 | — | 3,949,910 | — |
| Materials | 2,439,781 | 1,533,104 | 906,677 | — |
| Utilities | 544,511 | 544,511 | — | — |
| Exchange-traded funds | 125,140,106 | 125,140,106 | — | — |
| Rights | 39,676 | 38,197 | 1,479 | — |
| Warrants | 70,899 | 70,899 | — | — |
| Short-term investments | 237,796,652 | 144,125,146 | 93,671,506 | — |
| Total investments in securities | $7,677,056,189 | $5,236,196,852 | $2,440,787,522 | $71,815 |
| Derivatives: | | | | |
| Assets | | | | |
| Futures | $15,406,058 | $15,406,058 | — | — |
| Forward foreign currency contracts | 373,454 | — | $373,454 | — |
| Liabilities | | | | |
| Forward foreign currency contracts | (1,285,754) | — | (1,285,754) | — |
| |
| U.S. Sector Rotation Fund |
| Investments in securities: | | | | |
| Assets | | | | |
| Common stocks | | | | |
| Communication services | $161,347,095 | $161,347,095 | — | — |
| Consumer discretionary | 222,604,386 | 222,597,962 | $6,424 | — |
| Consumer staples | 65,489,052 | 65,489,052 | — | — |
| Energy | 23,046,696 | 23,046,696 | — | — |
| Financials | 104,058,062 | 104,057,827 | — | $235 |
| Health care | 99,987,492 | 99,987,492 | — | — |
| Industrials | 138,862,786 | 138,862,786 | — | — |
| Information technology | 389,976,625 | 389,976,625 | — | — |
| Materials | 26,182,522 | 26,182,522 | — | — |
| Real estate | 16,866,618 | 16,866,618 | — | — |
| Utilities | 16,022,678 | 16,022,678 | — | — |
| Rights | 10,464 | 10,464 | — | — |
| Warrants | 20,264 | 20,264 | — | — |
Significant accounting policies, continued
| | Total
value at
8-31-20 | Level 1
quoted
price | Level 2
significant
observable
inputs | Level 3
significant
unobservable
inputs |
| U.S. Sector Rotation Fund (continued) |
| Short-term investments | $27,791,626 | $947,987 | $26,843,639 | — |
| Total investments in securities | $1,292,266,366 | $1,265,416,068 | $26,850,063 | $235 |
| Derivatives: | | | | |
| Assets | | | | |
| Futures | $2,200,716 | $2,200,716 | — | — |
The following is a reconciliation of Level 3 assets for which significant unobservable inputs were used to determine fair value. Transfers into or out of Level 3, if any, represent the beginning value of any security or instrument where a change in the level has occurred from the beginning to the end of the period and in all cases were transferred into or out of Level 2.
| Mid Cap Stock Fund | Common
stocks | Preferred
securities | Total |
| Balance as of 8-31-19 | $7,241,730 | $56,410,566 | $63,652,296 |
| Realized gain (loss) | (27,360) | 1,289,303 | 1,261,943 |
| Change in unrealized appreciation (depreciation) | (2,057,262) | (9,959,737) | (12,016,999) |
| Purchases | — | — | — |
| Sales | (79,341) | (4,596,005) | (4,675,346) |
| Transfers into Level 3 | — | — | — |
| Transfers out of Level 3 | (3,666,693) | — | (3,666,693) |
| Balance as of 8-31-20 | $1,411,074 | $43,144,127 | $44,555,201 |
| Change in unrealized at period end1 | $449,864 | $(9,959,737) | $(9,509,873) |
| | |
| 1 | Change in unrealized appreciation (depreciation) attributable to Level 3 securities held at period end. This balance is included in change in unrealized appreciation (depreciation) on the Statements of operations. |
The valuation techniques and significant amounts of unobservable inputs used in the fair value measurement of the funds' Level 3 securities are outlined in the table below:
| Mid Cap Stock Fund | Fair Value
at period end | Valuation technique | Significant
unobservable inputs | Input/Range* |
| Common Stocks | $ 1,411,074 | Transactions Indicative of Value | Prior/recent transactions | $24.53 |
| | $ 1,411,074 | | | |
| | | | | |
| Preferred Securities | $ 2,730,808 | Transactions Indicative of Value and
Option Model | Adjusted prior/recent transactions
Probability of default
OPM - Volatility
Discount | $12.52
30%
40%
10% |
| | $ 22,919,964 | Market Comparable | EV to revenue multiple
Discount | 1.81x - 1.98x (weighted average 1.88x)
17.5% |
| | $ 3,150,931 | Transactions Indicative of Value | Prior/recent transactions | $24.53 |
| | $ 5,724,709 | Transactions Indicative of Value | Expected transaction value
Discount | 11.61
15% |
| | $ 8,532,953 | Market Comparable | EV to revenue multiple
Discount
OPM - Volatility | 3.87x - 6.67x (weighted average 4.89x)
25%
30% - 40% (weighted average 33.6%) |
| | $ 84,762 | Recovery Value | Expected future value
Discount | 0.355
55% |
| | $ 43,144,127 | | | |
| | | | | |
| Total | $44,555,201 | | | |
*A weighted average is an average in which each input in the grouping is assigned a weighting before summing to a single average value. The weighting of the input is determined based on a security’s fair value as a percentage of the total fair value.
A change to unobservable inputs of the funds' Level 3 securities as of August 31, 2020, could have resulted in changes to the fair value measurement, as follows:
| Significant Unobservable Input | Impact to Valuation
if input had increased | Impact to Valuation
if input had decreased |
| Adjusted prior/recent transactions or prior/recent transactions | Increase | Decrease |
Significant accounting policies, continued
| Significant Unobservable Input | Impact to Valuation
if input had increased | Impact to Valuation
if input had decreased |
| Discount | Decrease | Increase |
| Enterprise value (“EV”) to revenue multiple | Increase | Decrease |
| Expected transaction value or expected future value | Increase | Decrease |
| Options Pricing Method (OPM) - Volatility | Variable | Variable |
| Probability of default | Decrease | Increase |
Repurchase agreements. The funds may enter into repurchase agreements. When the funds enter into a repurchase agreement, they receive collateral that is held in a segregated account by the funds' custodian, or for tri-party repurchase agreements, collateral is held at a third-party custodian bank in a segregated account for the benefit of the funds. The collateral amount is marked-to-market and monitored on a daily basis to ensure that the collateral held is in an amount not less than the principal amount of the repurchase agreement plus any accrued interest. Collateral received by the fund for repurchase agreements is disclosed in the Portfolio of investments as part of the caption related to the repurchase agreement.
Repurchase agreements are typically governed by the terms and conditions of the Master Repurchase Agreement and/or Global Master Repurchase Agreement (collectively, MRA). Upon an event of default, the non-defaulting party may close out all transactions traded under the MRA and net amounts owed. Absent an event of default, assets and liabilities resulting from repurchase agreements are not offset in the Statements of assets and liabilities. In the event of a default by the counterparty, realization of the collateral proceeds could be delayed, during which time the collateral value may decline or the counterparty may have insufficient assets to pay claims resulting from close-out of the transactions.
Real estate investment trusts. The funds may invest in real estate investment trusts (REITs). Distributions from REITs may be recorded as income and subsequently characterized by the REIT at the end of the fiscal year as a reduction of cost of investments and/or as a realized gain. As a result, the funds will estimate the components of distributions from these securities. Such estimates are revised when the actual components of the distributions are known.
Security transactions and related investment income. Investment security transactions are accounted for on a trade date plus one basis for daily NAV calculations. However, for financial reporting purposes, investment transactions are reported on trade date. Interest income is accrued as earned. Interest income includes coupon interest and amortization/accretion of premiums/discounts on debt securities. Debt obligations may be placed in a non-accrual status and related interest income may be reduced by stopping current accruals and writing off interest receivable when the collection of all or a portion of interest has become doubtful. Income and capital gain distributions from underlying funds are recorded on ex-date. Dividend income is recorded on the ex-date, except for dividends of certain foreign securities where the dividend may not be known until after the ex-date. In those cases, dividend income, net of withholding taxes, is recorded when the fund becomes aware of the dividends. Non-cash dividends, if any, are recorded at the fair market value of the securities received. Distributions received on securities that represent a tax return of capital and/or capital gain, if any, are recorded as a reduction of cost of investments and/or as a realized gain, if amounts are estimable. Gains and losses on securities sold are determined on the basis of identified cost and may include proceeds from litigation. Return of capital distributions from underlying funds, if any, are treated as a reduction of cost.
Securities lending. The funds may lend their securities to earn additional income. The funds receive collateral from the borrower in an amount not less than the market value of the loaned securities. The funds will invest their cash collateral in JHCT, an affiliate of the funds, which has a floating NAV and is registered with the Securities and Exchange Commission (SEC) as an investment company. JHCT invests in short-term money market investments. Each fund will receive the benefit of any gains and bear any losses generated by JHCT with respect to the cash collateral.
The funds have the right to recall loaned securities on demand. If a borrower fails to return loaned securities when due, then the lending agent is responsible and indemnifies the funds for the lent securities. The lending agent uses the collateral received from the borrower to purchase replacement securities of the same issue, type, class and series of the loaned securities. If the value of the collateral is less than the purchase cost of replacement securities, the lending agent is responsible for satisfying the shortfall but only to the extent that the shortfall is not due to any decrease in the value of JHCT.
Although the risk of loss on securities lent is mitigated by receiving collateral from the borrower and through lending agent indemnification, the funds could experience a delay in recovering securities or could experience a lower than expected return if the borrower fails to return the securities on a timely basis. The funds receive compensation for lending their securities by retaining a portion of the return on the investment of the collateral and compensation from fees earned from borrowers of the securities. Securities lending income received by the funds is net of fees retained by the securities lending agent. Net income received from JHCT is a component of securities lending income as recorded on the Statements of operations.
Obligations to repay collateral received by the funds are shown on the Statements of assets and liabilities as Payable upon return of securities loaned and are secured by the loaned securities. The following table summarizes the values of securities loaned by the funds and the corresponding cash collateral received at August 31, 2020:
| Fund | Market value of securities on loan | Cash collateral received |
| Capital Appreciation Fund | $39,247,272 | $40,050,961 |
| Capital Appreciation Value Fund | 67,128 | 68,520 |
| International Strategic Equity Allocation Fund | 74,889,939 | 77,807,287 |
| International Value Fund | 134,915 | 138,875 |
| Mid Cap Stock Fund | 37,675,546 | 38,445,718 |
| Mid Value Fund | 37,908,063 | 37,744,070 |
| Multi-Index Lifestyle Aggressive Portfolio | 2,597,109 | 2,649,310 |
| Multi-Index Lifestyle Balanced Portfolio | 37,481,461 | 38,325,630 |
| Multi-Index Lifestyle Conservative Portfolio | 9,301,188 | 9,564,750 |
| Multi-Index Lifestyle Growth Portfolio | 29,209,048 | 29,944,047 |
| Multi-Index Lifestyle Moderate Portfolio | 7,622,138 | 7,829,550 |
| Real Estate Securities Fund | 1,042,977 | 1,081,100 |
| Science & Technology Fund | 7,227,889 | 7,378,189 |
Significant accounting policies, continued
| Fund | Market value of securities on loan | Cash collateral received |
| Strategic Equity Allocation Fund | $146,636,621 | $144,000,634 |
| U.S. Sector Rotation Fund | 923,097 | 944,982 |
In addition, non-cash collateral of approximately $1,014,918, $154,091 and $9,644,994 in the form of U.S. Treasuries was pledged to Mid Value Fund, Multi-Index Lifestyle Balanced Portfolio and Strategic Equity Allocation Fund, respectively. This non-cash collateral is not reflected in the funds' net assets, however could be sold by the securities lending agent in the event of default by the borrower.
Foreign investing. Assets, including investments, and liabilities denominated in foreign currencies are translated into U.S. dollar values each day at the prevailing exchange rate. Purchases and sales of securities, income and expenses are translated into U.S. dollars at the prevailing exchange rate on the date of the transaction. The effect of changes in foreign currency exchange rates on the value of securities is reflected as a component of the realized and unrealized gains (losses) on investments. Foreign investments are subject to a decline in the value of a foreign currency versus the U.S. dollar, which reduces the dollar value of securities denominated in that currency.
Funds that invest internationally generally carry more risk than funds that invest strictly in U.S. securities. These risks are heightened for investments in emerging markets. Risks can result from differences in economic and political conditions, regulations, market practices (including higher transaction costs), accounting standards and other factors.
Foreign taxes. The funds may be subject to withholding tax on income, capital gains or repatriation taxes imposed by certain countries, a portion of which may be recoverable. Foreign taxes are accrued based upon the funds' understanding of the tax rules and rates that exist in the foreign markets in which it invests. Taxes are accrued based on gains realized by the funds as a result of certain foreign security sales. In certain circumstances, estimated taxes are accrued based on unrealized appreciation of such securities. Investment income is recorded net of foreign withholding taxes.
Overdraft. The funds may have the ability to borrow from banks for temporary or emergency purposes, including meeting redemption requests that otherwise might require the untimely sale of securities. Pursuant to the funds' custodian agreement, the custodian may loan money to the funds to make properly authorized payments. The funds are obligated to repay the custodian for any overdraft, including any related costs or expenses. The custodian may have a lien, security interest or security entitlement in any fund property that is not otherwise segregated or pledged, to the extent of any overdraft, and to the maximum extent permitted by law. Overdrafts at period end, if any, are presented under the caption Due to custodian in the Statements of assets and liabilities.
Line of credit. Effective June 25, 2020, the funds and other affiliated funds, excluding Real Estate Securities Fund, have entered into a syndicated line of credit agreement with Citibank, N.A. as the administrative agent that enables them to participate in a $1 billion unsecured committed line of credit. Excluding commitments designated for a certain fund and subject to the needs of all other affiliated funds, a fund can borrow up to an aggregate commitment amount of $850 million, subject to asset coverage and other limitations as specified in the agreement. Each participating fund paid an upfront fee in connection with this line of credit agreement, which is charged based on a combination of fixed and asset based allocations and amortized over 365 days. Prior to June 25, 2020, the funds and other affiliated funds had a similar agreement that enabled them to participate in a $750 million unsecured committed line of credit.
Real Estate Securities Fund and other affiliated funds have entered into a separate unsecured $50 million line of credit agreement with BNP Paribas. Subject to the needs of other affiliated funds, Real Estate Securities Fund can borrow up to the $50 million, subject to asset coverage and other limitations as specified in the agreement.
A commitment fee payable at the end of each calendar quarter, based on the average daily unused portion of each line of credit, is charged to each participating fund based on a combination of fixed and asset based allocations and is reflected in Other expenses on the Statements of operations. For the year ended August 31, 2020, the funds had no borrowings under the line of credit.
Commitment fees for the year ended August 31, 2020 were as follows:
| Fund | Commitment fee |
| Capital Appreciation Fund | $7,761 |
| Capital Appreciation Value Fund | 6,690 |
| Health Sciences Fund | 3,549 |
| International Strategic Equity Allocation Fund | 7,267 |
| International Value Fund | 3,218 |
| Mid Cap Stock Fund | 7,702 |
| Mid Value Fund | 5,978 |
| Multi-Index Lifestyle Aggressive Portfolio | 3,569 |
| Multi-Index Lifestyle Balanced Portfolio | 5,166 |
| Multi-Index Lifestyle Conservative Portfolio | 3,109 |
| Multi-Index Lifestyle Growth Portfolio | 4,976 |
| Multi-Index Lifestyle Moderate Portfolio | 3,311 |
| Real Estate Securities Fund | 7,772 |
| Science & Technology Fund | 3,410 |
| Strategic Equity Allocation Fund | 23,319 |
| U.S. Sector Rotation Fund | 6,127 |
Expenses. Within the John Hancock group of funds complex, expenses that are directly attributable to an individual fund are allocated to such fund. Expenses that are not readily attributable to a specific fund are allocated among all funds in an equitable manner, taking into consideration, among other things, the nature and type of expense and the fund’s relative net assets. Expense estimates are accrued in the period to which they relate and adjustments are made when actual amounts are known.
Significant accounting policies, continued
Class allocations. Income, common expenses and realized and unrealized gains (losses) are determined at the fund level and allocated daily to each class of shares based on the net assets of the class. Class-specific expenses, such as distribution and service fees, if any, and transfer agent fees, for all classes, are charged daily at the class level based on the net assets of each class and the specific expense rates applicable to each class.
Federal income taxes. Each fund intends to continue to qualify as a regulated investment company by complying with the applicable provisions of the Internal Revenue Code and will not be subject to federal income tax on taxable income that is distributed to shareholders. Therefore, no federal income tax provision is required.
For federal income tax purposes, as of August 31, 2020, certain funds have capital loss carryforwards available to offset future net realized capital gains. The following table details the capital loss carryforwards available as of August 31, 2020:
| | No Expiration Date |
| Fund | Short Term | Long Term |
| International Strategic Equity Allocation Fund | $62,084,083 | $36,686,610 |
As of August 31, 2020, the funds had no uncertain tax positions that would require financial statement recognition, derecognition or disclosure. The funds' federal tax returns are subject to examination by the Internal Revenue Service for a period of three years.
For federal income tax purposes, the costs of investments owned on August 31, 2020, including short-term investments, were as follows:
| Fund | Aggregate
cost | Unrealized
appreciation | Unrealized
(depreciation) | Net unrealized
appreciation/
(depreciation) |
| Capital Appreciation Fund | $748,131,687 | $1,495,459,444 | $(269,796) | $1,495,189,648 |
| Capital Appreciation Value Fund | 1,250,472,312 | 224,156,414 | (29,354,625) | 194,801,789 |
| Health Sciences Fund | 317,088,977 | 117,654,186 | (5,325,683) | 112,328,503 |
| International Strategic Equity Allocation Fund | 1,679,532,904 | 205,611,766 | (106,172,877) | 99,438,889 |
| International Value Fund | 213,340,791 | 19,200,924 | (13,114,392) | 6,086,532 |
| Mid Cap Stock Fund | 1,232,016,183 | 666,277,358 | (25,771,732) | 640,505,626 |
| Mid Value Fund | 1,211,599,667 | 234,787,644 | (87,220,752) | 147,566,892 |
| Multi-Index Lifestyle Aggressive Portfolio | 376,738,521 | 15,551,874 | (2,883,203) | 12,668,671 |
| Multi-Index Lifestyle Balanced Portfolio | 929,078,022 | 53,951,652 | (6,226,251) | 47,725,401 |
| Multi-Index Lifestyle Conservative Portfolio | 200,880,557 | 10,260,304 | (951,926) | 9,308,378 |
| Multi-Index Lifestyle Growth Portfolio | 885,448,722 | 44,633,737 | (6,194,162) | 38,439,575 |
| Multi-Index Lifestyle Moderate Portfolio | 255,515,793 | 12,788,548 | (1,568,277) | 11,220,271 |
| Real Estate Securities Fund | 255,718,660 | 51,957,823 | (3,136,064) | 48,821,759 |
| Science & Technology Fund | 270,042,926 | 104,937,609 | (1,452,499) | 103,485,110 |
| Strategic Equity Allocation Fund | 6,857,518,290 | 1,098,555,254 | (264,523,597) | 834,031,657 |
| U.S. Sector Rotation Fund | 1,122,862,678 | 187,397,772 | (15,793,368) | 171,604,404 |
Distribution of income and gains. Distributions to shareholders from net investment income and net realized gains, if any, are recorded on the ex-date. Multi-Index Lifestyle Balanced Portfolio, Multi-Index Lifestyle Conservative Portfolio and Multi-Index Lifestyle Moderate Portfolio generally declare and pay dividends from net investment income quarterly. All other funds generally declare and pay dividends from net investment income annually. All funds generally declare and pay capital gain distributions, if any, annually.
The tax character of distributions for the year ended August 31, 2020 was as follows:
| Fund | Ordinary
Income | Long Term
Capital Gains | Total |
| Capital Appreciation Fund | $178,388 | $174,635,781 | $174,814,169 |
| Capital Appreciation Value Fund | 25,746,373 | 138,158,592 | 163,904,965 |
| Health Sciences Fund | — | 10,491,735 | 10,491,735 |
| International Strategic Equity Allocation Fund | 48,976,734 | — | 48,976,734 |
| International Value Fund | 7,190,844 | 11,678,855 | 18,869,699 |
| Mid Cap Stock Fund | — | 191,109,164 | 191,109,164 |
| Mid Value Fund | 20,551,466 | 14,266,431 | 34,817,897 |
| Multi-Index Lifestyle Aggressive Portfolio | 6,590,524 | 25,899,035 | 32,489,559 |
| Multi-Index Lifestyle Balanced Portfolio | 20,671,800 | 38,666,044 | 59,337,844 |
| Multi-Index Lifestyle Conservative Portfolio | 4,728,563 | 2,546,873 | 7,275,436 |
| Multi-Index Lifestyle Growth Portfolio | 18,647,355 | 47,984,752 | 66,632,107 |
| Multi-Index Lifestyle Moderate Portfolio | 6,352,822 | 7,684,156 | 14,036,978 |
| Real Estate Securities Fund | 18,539,980 | 15,686,650 | 34,226,630 |
| Science & Technology Fund | — | 25,176,071 | 25,176,071 |
| Strategic Equity Allocation Fund | 162,822,804 | 80,772,608 | 243,595,412 |
| U.S. Sector Rotation Fund | 23,166,684 | 104,676,601 | 127,843,285 |
The tax character of distributions for the year ended August 31, 2019 was as follows:
| Fund | Ordinary
Income | Long Term
Capital Gains | Total |
| Capital Appreciation Fund | $11,919,725 | $266,399,114 | $278,318,839 |
Significant accounting policies, continued
| Fund | Ordinary
Income | Long Term
Capital Gains | Total |
| Capital Appreciation Value Fund | $44,516,205 | $154,034,999 | $198,551,204 |
| Health Sciences Fund | — | 16,432,088 | 16,432,088 |
| International Strategic Equity Allocation Fund | 41,415,757 | 219,377,906 | 260,793,663 |
| International Value Fund | 22,303,785 | — | 22,303,785 |
| Mid Cap Stock Fund | 59,418,099 | 190,763,127 | 250,181,226 |
| Mid Value Fund | 31,551,690 | 69,984,197 | 101,535,887 |
| Multi-Index Lifestyle Aggressive Portfolio | 6,082,583 | 25,662,777 | 31,745,360 |
| Multi-Index Lifestyle Balanced Portfolio | 21,518,874 | 40,728,656 | 62,247,530 |
| Multi-Index Lifestyle Conservative Portfolio | 4,490,140 | 2,267,013 | 6,757,153 |
| Multi-Index Lifestyle Growth Portfolio | 16,222,008 | 47,819,055 | 64,041,063 |
| Multi-Index Lifestyle Moderate Portfolio | 6,532,885 | 7,149,845 | 13,682,730 |
| Real Estate Securities Fund | 8,152,614 | 8,275,788 | 16,428,402 |
| Science & Technology Fund | 15,409,629 | 62,190,134 | 77,599,763 |
| Strategic Equity Allocation Fund | 165,817,425 | 872,920,101 | 1,038,737,526 |
| U.S. Sector Rotation Fund | 48,217,685 | 299,312,398 | 347,530,083 |
Distributions paid by the funds with respect to each class of shares are calculated in the same manner, at the same time and in the same amount, except for the effect of class level expenses that may be applied differently to each class. As of August 31, 2020, the components of distributable earnings on a tax basis were as follows:
| Fund | Undistributed
Ordinary Income | Undistributed
Long Term
Capital Gains | | Post-October
Deferral |
| Capital Appreciation Fund | $21,756,663 | $257,019,222 | | — |
| Capital Appreciation Value Fund | 31,533,015 | 188,879,133 | | — |
| Health Sciences Fund | 350,043 | 17,146,049 | | — |
| International Strategic Equity Allocation Fund | 22,503,825 | — | | — |
| International Value Fund | 2,044,844 | 5,275,794 | | — |
| Mid Cap Stock Fund | 144,469,886 | 167,395,149 | | — |
| Mid Value Fund | 9,155,563 | 22,695,971 | | — |
| Multi-Index Lifestyle Aggressive Portfolio | 451,306 | 7,926,874 | | — |
| Multi-Index Lifestyle Balanced Portfolio | 2,337,779 | 18,718,887 | | — |
| Multi-Index Lifestyle Conservative Portfolio | 660,501 | 2,549,455 | | — |
| Multi-Index Lifestyle Growth Portfolio | 4,203,779 | 18,013,762 | | — |
| Multi-Index Lifestyle Moderate Portfolio | 731,545 | 5,149,860 | | — |
| Real Estate Securities Fund | 1,961,635 | — | | $8,395,466 |
| Science & Technology Fund | 7,217,236 | 40,101,082 | | — |
| Strategic Equity Allocation Fund | 78,231,037 | 235,322,442 | | — |
| U.S. Sector Rotation Fund | 12,972,677 | 75,207,063 | | — |
Such distributions and distributable earnings, on a tax basis, are determined in conformity with income tax regulations, which may differ from US GAAP. Distributions in excess of tax basis earnings and profits, if any, are reported in the funds' financial statements as a return of capital. Short-term gains from underlying funds are treated as ordinary income for tax purposes.
Capital accounts within the financial statements are adjusted for permanent book-tax differences. These adjustments have no impact on net assets or the results of operations. Temporary book-tax differences, if any, will reverse in a subsequent period. Book-tax differences are primarily attributable to net operating losses, foreign currency transactions, investments in passive foreign investment companies, wash sale loss deferrals, characterization of distributions, derivative transactions and amortization and accretion on debt securities.
3. Derivative instruments
The funds may invest in derivatives in order to meet their investment objective. Derivatives include a variety of different instruments that may be traded in the over-the-counter (OTC) market, on a regulated exchange or through a clearing facility. The risks in using derivatives vary depending upon the structure of the instruments, including the use of leverage, optionality, the liquidity or lack of liquidity of the contract, the creditworthiness of the counterparty or clearing organization and the volatility of the position. Some derivatives involve risks that are potentially greater than the risks associated with investing directly in the referenced securities or other referenced underlying instrument. Specifically, the funds are exposed to the risk that the counterparty to an OTC derivatives contract will be unable or unwilling to make timely settlement payments or otherwise honor its obligations. OTC derivatives transactions typically can only be closed out with the other party to the transaction.
Derivatives which are typically traded through the OTC market are regulated by the Commodity Futures Trading Commission (the CFTC). Derivative counterparty risk is managed through an ongoing evaluation of the creditworthiness of all potential counterparties and, if applicable, designated clearing organizations. The funds attempt to reduce their exposure to counterparty risk for derivatives traded in the OTC market, whenever possible, by entering into an International Swaps and Derivatives Association (ISDA) Master Agreement with each of their OTC counterparties. The ISDA gives each party to the agreement the right to terminate all transactions traded under the agreement if there is certain deterioration in the credit quality or contractual default of the other party, as defined in the ISDA. Upon an event of default or a termination of the ISDA, the non-defaulting party has the right to close out all transactions and to net amounts owed.
Derivative instruments, continued
As defined by the ISDA, the funds may have collateral agreements with certain counterparties to mitigate counterparty risk on OTC derivatives. Subject to established minimum levels, collateral for OTC transactions is generally determined based on the net aggregate unrealized gain or loss on contracts with a particular counterparty. Collateral pledged to the funds, if any, are held in a segregated account by a third-party agent or held by the custodian bank for the benefit of the funds and can be in the form of cash or debt securities issued by the U.S. government or related agencies; collateral posted by the funds, if any, for OTC transactions is held in a segregated account at the funds' custodian and is noted in the accompanying portfolio of investments, or if cash is posted, on the Statements of assets and liabilities. The funds' risk of loss due to counterparty risk is equal to the asset value of outstanding contracts offset by collateral received.
Certain derivatives are traded or cleared on an exchange or central clearinghouse. Exchange-traded or centrally-cleared transactions generally present less counterparty risk to a fund than OTC transactions. The exchange or clearinghouse stands between the funds and the broker to the contract and therefore, credit risk is generally limited to the failure of the exchange or clearinghouse and the clearing member.
Futures. A futures contract is a contractual agreement to buy or sell a particular currency or financial instrument at a pre-determined price in the future. Futures are traded on an exchange and cleared through a central clearinghouse. Risks related to the use of futures contracts include possible illiquidity of the futures markets and contract prices that can be highly volatile and imperfectly correlated to movements in the underlying financial instrument and potential losses in excess of the amounts recognized on the Statements of assets and liabilities. Use of long futures contracts subjects the funds to the risk of loss up to the notional value of the futures contracts. Use of short futures contracts subjects the funds to unlimited risk of loss.
Upon entering into a futures contract, the fund is required to deposit initial margin with the broker in the form of cash or securities. The amount of required margin is set by the broker and is generally based on a percentage of the contract value. The margin deposit must then be maintained at the established level over the life of the contract. Cash that has been pledged by a fund is detailed in the Statements of assets and liabilities as Collateral held at broker for futures contracts. Securities pledged by the funds, if any, are identified in the Portfolio of investments. Subsequent payments, referred to as variation margin, are made or received by a fund periodically and are based on changes in the market value of open futures contracts. Futures contracts are marked-to-market daily and unrealized gain or loss is recorded by the fund. Receivable/Payable for futures variation margin is included in the Statements of assets and liabilities. When the contract is closed, a fund records a realized gain or loss equal to the difference between the value of the contract at the time it was opened and the value at the time it was closed.
The following table details how the funds used futures contracts during the year ended August 31, 2020. In addition, the table summarizes the range of notional contract amounts held by the funds, as measured at each quarter end:
| Fund | Reason | USD Notional range |
| International Strategic Equity Allocation Fund | To manage against changes in foreign currency exchange rates, manage against change in certain securities markets and gain exposure to certain securities markets. | $20.0 million to $96.5 million |
| Strategic Equity Allocation Fund | To manage against changes in foreign currency exchange rates, manage against change in certain securities markets and gain exposure to certain securities markets. | $148.0 million to $251.7 million |
| U.S. Sector Rotation Fund | To gain exposure to certain securities markets and to manage against changes in certain securities markets. | $26.9 million to $41.7 million |
Forward foreign currency contracts. A forward foreign currency contract is an agreement between two parties to buy and sell specific currencies at a price that is set on the date of the contract. The forward contract calls for delivery of the currencies on a future date that is specified in the contract. Forwards are typically traded OTC. Risks related to the use of forwards include the possible failure of counterparties to meet the terms of the forward agreement, the failure of the counterparties to timely post collateral if applicable, and the risk that currency movements will not favor the funds thereby reducing the funds' total return, and the potential for losses in excess of the amounts recognized on the Statements of assets and liabilities.
The market value of a forward foreign currency contract fluctuates with changes in foreign currency exchange rates. Forward foreign currency contracts are marked-to-market daily and the change in value is recorded by the fund as an unrealized gain or loss. Realized gains or losses, equal to the difference between the value of the contract at the time it was opened and the value at the time it was closed, are recorded upon delivery or receipt of the currency or settlement with the counterparty.
The following table details how the funds used forward foreign currency contracts during the year ended August 31, 2020. In addition, the table summarizes the range of notional contract amounts held by the funds, as measured at each quarter end:
| Fund | Reason | USD Notional range |
| Strategic Equity Allocation Fund | To manage against anticipated changes in currency exchange rates. | up to $93.6 million |
Options. There are two types of options, put options and call options. Options are traded either OTC or on an exchange. A call option gives the purchaser of the option the right to buy (and the seller the obligation to sell) the underlying instrument at the exercise price. A put option gives the purchaser of the option the right to sell (and the writer the obligation to buy) the underlying instrument at the exercise price. Writing puts and buying calls may increase the funds' exposure to changes in the value of the underlying instrument. Buying puts and writing calls may decrease the funds' exposure to such changes. Risks related to the use of options include the loss of premiums, possible illiquidity of the options markets, trading restrictions imposed by an exchange and movements in underlying security values, and for written options, potential losses in excess of the amounts recognized on the Statements of assets and liabilities. In addition, OTC options are subject to the risks of all OTC derivatives contracts.
When a fund purchases an option, the premium paid is included in the Portfolio of investments and subsequently “marked-to-market” to reflect current market value. If the purchased option expires, a fund realizes a loss equal to the cost of the option. If a fund exercises a call option, the cost of the securities acquired by exercising the call is increased by the premium paid to buy the call. If a fund exercises a put option, it realizes a gain or loss from the sale of the underlying security and the proceeds from such sale are decreased by the premium paid. If a fund enters into a closing sale transaction, it realizes a gain or loss, depending on whether proceeds from the closing sale are greater or less than the original cost. When a fund writes an option, the premium received is included as a liability and subsequently “marked-to-market” to reflect the current market value of the option written. Premiums received from writing options that expire unexercised are recorded as realized gains. Premiums received from writing options which are exercised or are closed are added to or offset against the proceeds or amount paid on the transaction to determine the realized gain or loss. If a put option on a security is exercised, the premium received reduces the cost basis of the securities purchased by a fund.
Derivative instruments, continued
The following table details how the funds used written options contracts during the year ended August 31, 2020. In addition, the table summarizes the range of notional contract amounts held by the funds, as measured at each quarter end:
| Fund | Reason | Market value range |
| Capital Appreciation Value Fund | To manage against changes in certain securities markets and to generate potential income from options premiums. | $3.3 million to $18.2 million |
Fair value of derivative instruments by risk category
The table below summarizes the fair value of derivatives held by the funds at August 31, 2020 by risk category:
| Fund | Risk | Statements of
assets and
liabilities location | Financial
instruments
location | Assets
derivatives
fair value | Liabilities
derivatives
fair value |
| Capital Appreciation Value Fund | Equity | Written options, at value | Written options | — | $(18,161,003) |
| | | | | — | $(18,161,003) |
| International Strategic Equity Allocation Fund | Currency | Receivable/payable for futures variation margin | Futures 1 | $27,408 | — |
| | Equity | Receivable/payable for futures variation margin | Futures 1 | 1,565,763 | — |
| | | | | $1,593,171 | — |
| Strategic Equity Allocation Fund | Currency | Receivable/payable for futures variation margin | Futures 1 | $45,345 | — |
| | Equity | Receivable/payable for futures variation margin | Futures 1 | 15,360,713 | — |
| | Currency | Unrealized appreciation / depreciation on forward foreign currency contracts | Forward foreign currency contracts | 373,454 | $(1,285,754) |
| | | | | $15,779,512 | $(1,285,754) |
| U.S. Sector Rotation Fund | Equity | Receivable/payable for futures variation margin | Futures 1 | $2,200,716 | — |
| | | | | $2,200,716 | — |
| | |
| 1 | Reflects cumulative appreciation/depreciation on futures as disclosed in the Portfolio of investments. Only the year end variation margin is separately disclosed on the Statements of assets and liabilities. |
For financial reporting purposes, the funds do not offset OTC derivative assets or liabilities that are subject to master netting arrangements, as defined by the ISDAs, in the Statements of assets and liabilities. In the event of default by the counterparty or a termination of the agreement, the ISDA allows an offset of amounts across the various transactions between the fund and the applicable counterparty.
Effect of derivative instruments on the Statements of operations
The table below summarizes the net realized gain (loss) included in the net increase (decrease) in net assets from operations, classified by derivative instrument and risk category, for the year ended August 31, 2020:
| | | Statements of operations location - Net realized gain (loss) on: |
| Fund | Risk | Futures contracts | Forward foreign
currency contracts | Written options | Total |
| Capital Appreciation Value Fund | Equity | — | — | $5,716,897 | $5,716,897 |
| | Total | — | — | $5,716,897 | $5,716,897 |
| International Strategic Equity Allocation Fund | Currency | $(557,863) | — | — | $(557,863) |
| | Equity | 7,009,562 | — | — | 7,009,562 |
| | Total | $6,451,699 | — | — | $6,451,699 |
| Strategic Equity Allocation Fund | Currency | — | $(458,974) | — | $(458,974) |
| | Equity | $1,709,101 | — | — | 1,709,101 |
| | Total | $1,709,101 | $(458,974) | — | $1,250,127 |
| U.S. Sector Rotation Fund | Equity | $1,620,080 | — | — | $1,620,080 |
| | Total | $1,620,080 | — | — | $1,620,080 |
The table below summarizes the net change in unrealized appreciation (depreciation) included in the net increase (decrease) in net assets from operations, classified by derivative instrument and risk category, for the year ended August 31, 2020:
| | | Statements of operations location - Change in net unrealized appreciation (depreciation) of: |
| Fund | Risk | Futures contracts | Forward foreign
currency contracts | Written options | Total |
| Capital Appreciation Value Fund | Equity | — | — | $(487,053) | $(487,053) |
| | Total | — | — | $(487,053) | $(487,053) |
| International Strategic Equity Allocation Fund | Currency | $28,776 | — | — | $28,776 |
| | Equity | 1,949,619 | — | — | 1,949,619 |
| | Total | $1,978,395 | — | — | $1,978,395 |
Derivative instruments, continued
| | | Statements of operations location - Change in net unrealized appreciation (depreciation) of: |
| Fund | Risk | Futures contracts | Forward foreign
currency contracts | Written options | Total |
| Strategic Equity Allocation Fund | Currency | $62,282 | $(912,300) | — | $(850,018) |
| | Equity | 18,209,526 | — | — | 18,209,526 |
| | Total | $18,271,808 | $(912,300) | — | $17,359,508 |
| U.S. Sector Rotation Fund | Equity | $3,290,456 | — | — | $3,290,456 |
| | Total | $3,290,456 | — | — | $3,290,456 |
4. Guarantees and indemnifications
Under the Trust's organizational documents, its Officers and Trustees are indemnified against certain liabilities arising out of the performance of their duties to the Trust, including the funds. Additionally, in the normal course of business, the Trust enters into contracts with service providers that contain general indemnification clauses. The Trust's maximum exposure under these arrangements is unknown, as this would involve future claims that may be made against the Trust that have not yet occurred. The risk of material loss from such claims is considered remote.
5. Fees and transactions with affiliates
John Hancock Investment Management LLC (the Advisor) serves as investment advisor for the funds. John Hancock Investment Management Distributors LLC (the Distributor), an affiliate of the Advisor, serves as principal underwriter of the funds. The Advisor and the Distributor are indirect, principally owned subsidiaries of Manulife Financial Corporation.
Management fee. The funds have an investment management agreement with the Advisor under which the funds pay a monthly management fee to the Advisor equivalent on an annual basis as detailed below. Aggregate net assets generally include the net assets of the funds and the net assets of a similar fund of John Hancock Variable Insurance Trust (JHVIT), unless otherwise noted below. JHVIT funds are advised by an affiliate of the Advisor, John Hancock Variable Trust Advisers LLC, and are distributed by an affiliate of the Advisor, John Hancock Distributors, LLC.
• Capital Appreciation Fund — a) 0.800% of the first $500 million of aggregate net assets; b) 0.700% of the next $500 million of aggregate net assets; and c) 0.670% of the excess over $1 billion of aggegate net assets.
• Capital Appreciation Value Fund — If net assets are less than $500 million, then the following fee schedule shall apply: a) 0.950% of the first $250 million of aggregate net assets; and b) 0.850% of the excess over $250 million of aggregate net assets. If net assets equal or exceed $500 million but are less than $2 billion, then the following fee schedule shall apply: a) 0.850% of the first $1 billion of aggregate net assets; and b) 0.800% of the excess over $1 billion of aggregate net assets. If net assets equal or exceed $2 billion but are less than $3 billion, then the following fee schedule shall apply: a) 0.850% of the first $500 million of aggregate net assets; and b) 0.800% of the excess over $500 million of aggregate net assets. If net assets equal or exceed $3 billion, then the management fee to be paid is 0.800% of aggregate net assets.
• Health Sciences Fund — a) 1.050% of the first $500 million of aggregate net assets; and b) 1.000% of the next $250 million of aggregate net assets; and c) 0.950% of excess over $750 million of aggregate net assets. When aggregate net assets exceed $750 million, the management fee is 0.950% of aggregate net assets.
• International Strategic Equity Allocation Fund, Strategic Equity Allocation Fund and U.S. Sector Rotation Fund — Aggregate net assets include these three funds and JHVIT Strategic Equity Allocation. The management fee paid is as follows: a) 0.675% of the first $2.5 billion of aggregate net assets; and b) 0.650% of the next $5 billion of aggregate net assets; and c) 0.625% of the next $2.5 billion of aggregate net assets; and d) 0.600% of the next $5 billion of aggregate net assets; e) 0.595% of the next $10 billion of aggregate net assets; and f) 0.590% of the excess over $25 billion of aggregate net assets.
• International Value Fund — Aggregate net assets are the aggregate net assets of the fund, JHVIT Disciplined Value International Trust (formerly JHVIT International Value Trust), Disciplined Value International Fund, a series of John Hancock Investment Trust, and Manulife Global Disciplined Value (Ex-U.S.) Fund, a sub-fund of Manulife Investment Management I, PLC. If aggregate net assets are less than $300 million, then the management fee rate is 0.825% of all aggregate net assets. If aggregate net assets equal or exceed $300 million but are less than $2.5 billion, then the management fee rate is 0.775% of all aggregate net assets. If aggregate net assets exceed $2.5 billion, then the following fee schedule shall apply: a) 0.775% of the first $2.5 billion of aggregate net assets; and b) 0.750% of the next $500 million of aggregate net assets; and c) 0.725% of the excess over $3 billion of aggregate net assets. Prior to February 12, 2020, aggregate net assets were the aggregate net assets of the fund, JHVIT Disciplined Value International Trust, JHVIT Global Trust and JHVIT Mutual Shares Trust. The management fee paid was as follows: a) 0.950% of the first $150 million of aggregate net assets; b) 0.850% of the next $150 million of aggregate net assets; and c) 0.800% of the excess over $300 million of aggregate net assets. When aggregate net assets exceeded $300 million, then the management fee rate was 0.800% of aggregate net assets.
• Mid Cap Stock Fund — a) 0.875% of the first $200 million of aggregate net assets; b) 0.850% of the next $300 million of aggregate net assets; and c) 0.825% of the excess over $500 million of aggregate net assets.
• Mid Value Fund — a) 1.050% of the first $20 million of aggregate net assets; b) 0.950% of the next $30 million of aggregate net assets; and c) 0.950% of the excess over $50 million of aggregate net assets. When aggregate net assets exceed $50 million, then the management fee rate is 0.950% of aggregate net assets.
• Multi-Index Lifestyle Portfolios — The management fee has two components: (a) a fee on assets invested in a fund of John Hancock Funds II (JHF II) or John Hancock Funds III (JHF III); and (b) a fee on assets invested in investments other than a fund of JHF II or JHF III (other assets). Aggregate net assets include assets of the portfolios, JHVIT Lifestyle Portfolios and Managed Volatility Portfolios, and JHF II Multimanager Lifestyle Portfolios. The fee on assets invested in a fund of JHF II or JHF III is equivalent to the sum of: a) 0.050% for the first $7.5 billion of aggregate net assets; and b) 0.040% of the excess over $7.5 billion of aggregate net assets. The fee on other assets is equivalent to the sum of: a) 0.500% of the first $7.5 billion of aggregate net assets and b) 0.490% of the excess over $7.5 billion of aggregate net assets.
• Real Estate Securities Fund — 0.700% of aggregate net assets.
Fees and transactions with affiliates, continued
• Science & Technology Fund — a) 1.050% of the first $500 million of aggregate net assets; and (b) 1.000% of the excess over $500 million of aggregate net assets.
The organizations described below act as the subadvisors to the Trust and its funds pursuant to Subadvisory Agreements with the Advisor. Fund management is allocated among the following managers:
| Fund | Subadvisor(s) |
| Science & Technology Fund | Allianz Global Investors U.S. LLC; T. Rowe Price Associates, Inc. |
| International Value Fund | Boston Partners Global Investors, Inc.1 |
| Real Estate Securities Fund | DWS Investment Management Americas, Inc. and RREEF America LLC |
| Capital Appreciation Fund | Jennison Associates LLC |
International Strategic Equity Allocation Fund
Multi-Index Lifestyle Aggressive Portfolio
Multi-Index Lifestyle Balanced Portfolio
Multi-Index Lifestyle Conservative Portfolio
Multi-Index Lifestyle Growth Portfolio
Multi-Index Lifestyle Moderate Portfolio
Strategic Equity Allocation Fund
U.S. Sector Rotation Fund | Manulife Investment Management (US) LLC2 |
Capital Appreciation Value Fund
Health Sciences Fund
Mid Value Fund | T. Rowe Price Associates, Inc. |
| Mid Cap Stock Fund | Wellington Management Company LLP |
1 Effective February 12, 2020, Templeton Investment Counsel, LLC was replaced by Boston Partners Global Investors, Inc. as the portfolio's subadvisor.
2 An affiliate of the Advisor.
The funds are not responsible for payment of the subadvisory fees.
Expense reimbursements. The Advisor has voluntarily agreed to waive a portion of its management fee if certain expenses of the respective funds exceed the percentage of average net assets as detailed below. Expenses excluded from this waiver are taxes, brokerage commissions, interest expense, litigation and indemnification expenses and other extraordinary expenses not incurred in the ordinary course of the funds’ business, management fees, class specific expenses, acquired fund fees and short dividends. This expense reduction will continue in effect until terminated by the Advisor.
| Fund | Expense
limitation as a
percentage of
average net
assets |
| Capital Appreciation Fund | 0.20% |
| Capital Appreciation Value Fund | 0.20% |
| Health Sciences Fund | 0.20% |
| International Strategic Equity Allocation Fund | 0.25% |
| International Value Fund | 0.25% |
| Mid Cap Stock Fund | 0.20% |
| Fund | Expense
limitation as a
percentage of
average net
assets |
| Mid Value Fund | 0.20% |
| Real Estate Securities Fund | 0.20% |
| Science & Technology Fund | 0.20% |
| Strategic Equity Allocation Fund | 0.20% |
| U.S. Sector Rotation Fund | 0.20% |
The Advisor has contractually agreed to waive a portion of its management fee and/or reimburse expenses for certain funds of the John Hancock group of funds complex, including the fund (the participating portfolios). This waiver is based upon aggregate net assets of all the participating portfolios. The amount of the reimbursement is calculated daily and allocated among all the participating portfolios in proportion to the daily net assets of each fund. During the year ended August 31, 2020, this waiver amounted to 0.01% of the fund’s average daily net assets. This arrangement expires on July 31, 2022, unless renewed by mutual agreement of the fund and the Advisor based upon a determination that this is appropriate under the circumstances at that time.
The Advisor has contractually agreed to waive its management fee on International Value Fund so that the amount retained by the Advisor after payment of the subadvisory fees for the fund does not exceed 0.45% of the fund’s average net assets. The current expense limitation agreement expires on December 31, 2020, unless renewed by mutual agreement of the fund and the advisor based upon a determination that this is appropriate under the circumstances at that time.
The Advisor has contractually agreed to waive all or a portion of its management fee and/or reimburse or pay operating expenses of each Multi-Index Lifestyle Portfolio in an amount equal to the amount by which the expenses of the portfolio exceed 0.05% of the average net assets, excluding taxes, brokerage commissions, interest expense, litigation and indemnification expenses and other extraordinary expenses not incurred in the ordinary course of the portfolios’ business, acquired fund fees, short dividend expense, management fees, and class specific expenses. This expense limitation shall continue in effect until December 31, 2020, unless renewed by mutual agreement of the portfolios and the Advisor.
The Advisor has voluntarily agreed to waive its management fee on International Strategic Equity Allocation Fund, Strategic Equity Allocation Fund and U.S. Sector Rotation Fund so that the amount retained by the Advisor after payment of the subadvisory fees for the fund does not exceed 0.45% of the funds’ average net assets. This voluntary expense reimbursement may be terminated at any time by the Advisor on notice to the Trust.
The Advisor has voluntarily agreed to waive a portion of its management fees for the funds subadvised by T. Rowe Price Associates, Inc. which include Capital Appreciation Value Fund, Health Sciences Fund, Mid Value Fund, and Science & Technology Fund. This voluntary waiver equals the amount by which the subadvisory fee paid to T. Rowe Price Associates, Inc. is reduced. This voluntary expense reimbursement may terminate at any time.
Effective August 1, 2020, the Advisor has voluntarily agreed to waive its management fee on Science & Technology Fund so that the amount retained by the Advisor after payment of the subadvisory fees for the fund does not exceed 0.45% of the funds’ average net assets. This voluntary expense reimbursement may be terminated at any time by the Advisor on notice to the Trust.
Fees and transactions with affiliates, continued
The Advisor has voluntarily agreed to waive its advisory fee for each Multi-Index Lifestyle Portfolio so that the aggregate advisory fee retained by the Advisor with respect to both the portfolio and its underlying investments after payment of subadvisory fees does not exceed 0.50% of the funds’ first $7.5 billion of average annual net assets and 0.49% of the funds’ average annual net assets in excess of $7.5 billion. The advisor may terminate this voluntary waiver at any time upon notice to the funds.
For the year ended August 31, 2020, the expense reductions described above amounted to the following:
| Expense Reimbursement by Class |
| Fund | Class R6 | Class 1 | Class NAV | Total |
| Capital Appreciation Fund | — | $42,094 | $84,244 | $126,338 |
| Capital Appreciation Value Fund | — | — | 588,165 | 588,165 |
| Health Sciences Fund | — | — | 192,712 | 192,712 |
| International Strategic Equity Allocation Fund | — | — | 2,168,728 | 2,168,728 |
| International Value Fund | — | 7,612 | 8,747 | 16,359 |
| Mid Cap Stock Fund | — | 31,025 | 82,467 | 113,492 |
| Mid Value Fund | — | — | 625,681 | 625,681 |
| Multi-Index Lifestyle Aggressive Portfolio | $259 | 12,757 | — | 13,016 |
| Multi-Index Lifestyle Conservative Portfolio | 305 | 56,892 | — | 57,197 |
| Multi-Index Lifestyle Moderate Portfolio | 180 | 36,648 | — | 36,828 |
| Real Estate Securities Fund | — | 26,416 | — | 26,416 |
| Science & Technology Fund | — | — | 130,478 | 130,478 |
| Strategic Equity Allocation Fund | — | — | 9,528,290 | 9,528,290 |
| U.S. Sector Rotation Fund | — | — | 1,634,950 | 1,634,950 |
Expenses waived or reimbursed in the current fiscal period are not subject to recapture in future fiscal periods.
The investment management fees, including the impact of the waivers and reimbursements as described above, incurred for the year ended August 31, 2020, were equivalent to a net annual effective rate of the funds' average daily net assets as follows:
| Fund | Net Annual Effective Rate |
| Capital Appreciation Fund | 0.70% |
| Capital Appreciation Value Fund | 0.78% |
| Health Sciences Fund | 0.98% |
| International Strategic Equity Allocation Fund | 0.49% |
| International Value Fund | 0.78% |
| Mid Cap Stock Fund | 0.83% |
| Mid Value Fund | 0.90% |
| Multi-Index Lifestyle Aggressive Portfolio | 0.19% |
| Fund | Net Annual Effective Rate |
| Multi-Index Lifestyle Balanced Portfolio | 0.32% |
| Multi-Index Lifestyle Conservative Portfolio | 0.41% |
| Multi-Index Lifestyle Growth Portfolio | 0.26% |
| Multi-Index Lifestyle Moderate Portfolio | 0.36% |
| Real Estate Securities Fund | 0.69% |
| Science & Technology Fund | 0.98% |
| Strategic Equity Allocation Fund | 0.49% |
| U.S. Sector Rotation Fund | 0.49% |
Accounting and legal services. Pursuant to a service agreement, the funds reimburse the Advisor for all expenses associated with providing the administrative, financial, legal, compliance, accounting and recordkeeping services to the funds, including the preparation of all tax returns, periodic reports to shareholders and regulatory reports, among other services. These expenses are allocated to each share class based on its relative net assets at the time the expense was incurred. These accounting and legal services fees incurred, for the year ended August 31, 2020, amounted to an annual rate of 0.02% of the funds' average daily net assets.
Distribution and service plans. The funds have a distribution agreement with the Distributor. The funds have adopted distribution and service plans for certain classes as detailed below pursuant to Rule 12b-1 under the 1940 Act, to pay the Distributor for services provided as the distributor of shares of the funds. The funds may pay up to the following contractual rates of distribution and service fees under these arrangements, expressed as an annual percentage of average daily net assets for each class of the funds' shares:
| Class | Rule 12b-1 Fee |
| Class 1 | 0.05% |
Transfer agent fees. The John Hancock group of funds has a complex-wide transfer agent agreement with John Hancock Signature Services, Inc. (Signature Services), an affiliate of the Advisor. The transfer agent fees paid to Signature Services are determined based on the cost to Signature Services (Signature Services Cost) of providing recordkeeping services. It also includes out-of-pocket expenses, including payments made to third-parties for recordkeeping services provided to their clients who invest in one or more John Hancock funds. In addition, Signature Services Cost may be reduced by certain fees that Signature Services receives in connection with retirement and small accounts. Signature Services Cost is calculated monthly and allocated, as applicable, to five categories of share classes: Retail Share and Institutional Share Classes of Non-Municipal Bond Funds, Class R6 Shares, Retirement Share Classes and Municipal Bond Share Classes. Within each of these categories, the applicable costs are allocated to the affected John Hancock affiliated funds and/or classes, based on the relative average daily net assets.
Class level expenses.Class level expenses for the year ended August 31, 2020 were as follows:
| Fund | Class | Distribution and service fees | Transfer agent fees |
| Capital Appreciation Fund | Class 1 | $296,023 | — |
| | Total | $296,023 | — |
| International Value Fund | Class 1 | $53,182 | — |
| | Total | $53,182 | — |
Fees and transactions with affiliates, continued
| Fund | Class | Distribution and service fees | Transfer agent fees |
| Mid Cap Stock Fund | Class 1 | $217,926 | — |
| | Total | $217,926 | — |
| Multi-Index Lifestyle Aggressive Portfolio | Class R6 | — | $745 |
| | Class 1 | $172,076 | — |
| | Total | $172,076 | $745 |
| Multi-Index Lifestyle Balanced Portfolio | Class R6 | — | $857 |
| | Class 1 | $445,814 | — |
| | Total | $445,814 | $857 |
| Multi-Index Lifestyle Conservative Portfolio | Class R6 | — | $105 |
| | Class 1 | $91,787 | — |
| | Total | $91,787 | $105 |
| Multi-Index Lifestyle Growth Portfolio | Class R6 | — | $884 |
| | Class 1 | $416,193 | — |
| | Total | $416,193 | $884 |
| Multi-Index Lifestyle Moderate Portfolio | Class R6 | — | $160 |
| | Class 1 | $127,162 | — |
| | Total | $127,162 | $160 |
| Real Estate Securities Fund | Class 1 | $184,466 | — |
| | Total | $184,466 | — |
Trustee expenses. The funds compensate each Trustee who is not an employee of the Advisor or its affiliates. The costs of paying Trustee compensation and expenses are allocated to each fund based on their net assets relative to other funds within the John Hancock group of funds complex.
Interfund lending program. Pursuant to an Exemptive Order issued by the SEC, the funds, along with certain other funds advised by the Advisor or its affiliates, may participate in an interfund lending program. This program provides an alternative credit facility allowing the funds to borrow from, or lend money to, other participating affiliated funds. At period end, no interfund loans were outstanding. Interest expense is included in Other expenses on the Statements of operations. The funds' activity in this program during the period for which loans were outstanding was as follows:
| Fund | Borrower
or Lender | Weighted Average
Loan Balance | Days
Outstanding | Weighted Average
Interest Rate | Interest Income
(Expense) |
| Capital Appreciation Fund | Borrower | $13,643,817 | 6 | 1.300% | $(2,955) |
| International Strategic Equity Allocation Fund | Borrower | 3,100,000 | 1 | 1.545% | (133) |
| Multi-Index Lifestyle Balanced Portfolio | Borrower | 10,250,000 | 2 | 1.567% | (893) |
| Multi-Index Lifestyle Growth Portfolio | Borrower | 3,150,000 | 2 | 1.567% | (274) |
| Capital Appreciation Fund | Lender | 5,483,333 | 6 | 1.317% | 1,204 |
| Capital Appreciation Value Fund | Lender | 21,983,742 | 8 | 0.870% | 4,249 |
| Health Sciences Fund | Lender | 3,025,833 | 4 | 1.070% | 360 |
| Mid Cap Stock Fund | Lender | 22,134,620 | 4 | 0.802% | 1,972 |
| Mid Value Fund | Lender | 4,215,978 | 8 | 0.821% | 769 |
| Science & Technology Fund | Lender | 6,177,711 | 4 | 1.029% | 706 |
| Strategic Equity Allocation Fund | Lender | 7,800,000 | 2 | 0.805% | 349 |
6. Fund share transactions
Transactions in funds' shares for the years ended August 31, 2020 and 2019 were as follows:
| Capital Appreciation Fund | Year Ended 8-31-20 | Year Ended 8-31-19 |
| | Shares | Amount | Shares | Amount |
| Class 1 shares | | | | |
| Sold | 2,789,335 | $50,640,671 | 659,621 | $10,868,208 |
| Distributions reinvested | 3,644,168 | 56,812,578 | 7,430,664 | 94,592,357 |
| Repurchased | (8,528,160) | (134,517,859) | (7,372,687) | (113,680,615) |
| Net increase (decrease) | (2,094,657) | $(27,064,610) | 717,598 | $(8,220,050) |
| Class NAV shares | | | | |
| Sold | 4,999,054 | $80,082,988 | 19,030,365 | $325,951,570 |
| Distributions reinvested | 7,540,038 | 118,001,591 | 14,387,352 | 183,726,482 |
| Repurchased | (26,447,455) | (473,357,228) | (19,909,514) | (312,935,068) |
| Net increase (decrease) | (13,908,363) | $(275,272,649) | 13,508,203 | $196,742,984 |
| Total net increase (decrease) | (16,003,020) | $(302,337,259) | 14,225,801 | $188,522,934 |
Fund share transactions, continued
| Capital Appreciation Value Fund | Year Ended 8-31-20 | Year Ended 8-31-19 |
| | Shares | Amount | Shares | Amount |
| Class NAV shares | | | | |
| Sold | 2,451,623 | $26,674,762 | 3,528,204 | $40,074,942 |
| Distributions reinvested | 14,779,528 | 163,904,965 | 20,157,483 | 198,551,204 |
| Repurchased | (33,016,784) | (373,991,287) | (32,434,022) | (370,531,422) |
| Net decrease | (15,785,633) | $(183,411,560) | (8,748,335) | $(131,905,276) |
| Total net decrease | (15,785,633) | $(183,411,560) | (8,748,335) | $(131,905,276) |
| Health Sciences Fund | Year Ended 8-31-20 | Year Ended 8-31-19 |
| | Shares | Amount | Shares | Amount |
| Class NAV shares | | | | |
| Sold | 25,414,746 | $117,089,257 | 7,679,171 | $34,013,118 |
| Distributions reinvested | 2,106,774 | 10,491,735 | 4,191,859 | 16,432,088 |
| Repurchased | (11,107,953) | (54,424,464) | (12,486,593) | (58,547,007) |
| Net increase (decrease) | 16,413,567 | $73,156,528 | (615,563) | $(8,101,801) |
| Total net increase (decrease) | 16,413,567 | $73,156,528 | (615,563) | $(8,101,801) |
| International Strategic Equity Allocation Fund | Year Ended 8-31-20 | Year Ended 8-31-19 |
| | Shares | Amount | Shares | Amount |
| Class NAV shares | | | | |
| Sold | 10,655,190 | $92,421,757 | 6,614,176 | $63,373,855 |
| Distributions reinvested | 5,043,948 | 48,976,734 | 31,573,083 | 260,793,663 |
| Repurchased | (17,456,302) | (163,434,136) | (20,499,255) | (190,900,557) |
| Net increase (decrease) | (1,757,164) | $(22,035,645) | 17,688,004 | $133,266,961 |
| Total net increase (decrease) | (1,757,164) | $(22,035,645) | 17,688,004 | $133,266,961 |
| International Value Fund | Year Ended 8-31-20 | Year Ended 8-31-19 |
| | Shares | Amount | Shares | Amount |
| Class 1 shares | | | | |
| Sold | 185,344 | $2,418,431 | 337,642 | $5,136,956 |
| Distributions reinvested | 611,449 | 9,006,651 | 228,757 | 3,239,198 |
| Repurchased | (2,659,012) | (36,542,567) | (1,879,815) | (28,355,098) |
| Net decrease | (1,862,219) | $(25,117,485) | (1,313,416) | $(19,978,944) |
| Class NAV shares | | | | |
| Sold | 1,648,143 | $20,021,637 | 1,577,002 | $23,694,626 |
| Distributions reinvested | 671,870 | 9,863,048 | 1,351,140 | 19,064,587 |
| Repurchased | (1,183,751) | (15,959,510) | (51,781,258) | (797,737,354) |
| Net increase (decrease) | 1,136,262 | $13,925,175 | (48,853,116) | $(754,978,141) |
| Total net decrease | (725,957) | $(11,192,310) | (50,166,532) | $(774,957,085) |
| Mid Cap Stock Fund | Year Ended 8-31-20 | Year Ended 8-31-19 |
| | Shares | Amount | Shares | Amount |
| Class 1 shares | | | | |
| Sold | 1,627,719 | $37,366,386 | 1,590,063 | $35,169,709 |
| Distributions reinvested | 2,537,043 | 51,552,722 | 3,855,829 | 64,739,364 |
| Repurchased | (4,142,181) | (87,074,848) | (2,970,307) | (63,445,438) |
| Net increase | 22,581 | $1,844,260 | 2,475,585 | $36,463,635 |
| Class NAV shares | | | | |
| Sold | 4,541,586 | $91,200,433 | 2,064,538 | $44,825,098 |
| Issued in reorganization (Note ) | — | — | 1,098,683 | 24,403,159 |
| Distributions reinvested | 6,771,298 | 139,556,442 | 10,914,765 | 185,441,862 |
| Repurchased | (16,538,736) | (391,437,265) | (11,002,507) | (232,587,884) |
| Net increase (decrease) | (5,225,852) | $(160,680,390) | 3,075,479 | $22,082,235 |
| Total net increase (decrease) | (5,203,271) | $(158,836,130) | 5,551,064 | $58,545,870 |
| Mid Value Fund | Year Ended 8-31-20 | Year Ended 8-31-19 |
| | Shares | Amount | Shares | Amount |
| Class NAV shares | | | | |
| Sold | 12,211,063 | $151,259,098 | 5,731,177 | $83,364,648 |
| Distributions reinvested | 2,274,193 | 34,817,897 | 7,628,541 | 101,535,887 |
| Repurchased | (12,044,058) | (180,875,357) | (11,401,030) | (168,126,474) |
| Net increase | 2,441,198 | $5,201,638 | 1,958,688 | $16,774,061 |
| Total net increase | 2,441,198 | $5,201,638 | 1,958,688 | $16,774,061 |
Fund share transactions, continued
| Multi-Index Lifestyle Aggressive Portfolio | Year Ended 8-31-20 | Year Ended 8-31-19 |
| | Shares | Amount | Shares | Amount |
| Class R6 shares | | | | |
| Sold | 378,043 | $4,475,585 | 43,277 | $498,740 |
| Distributions reinvested | 32,522 | 380,187 | 32,448 | 326,422 |
| Repurchased | (70,663) | (691,740) | (55,542) | (658,450) |
| Net increase | 339,902 | $4,164,032 | 20,183 | $166,712 |
| Class 1 shares | | | | |
| Sold | 4,728,827 | $52,459,355 | 4,377,332 | $50,813,098 |
| Distributions reinvested | 2,746,738 | 32,109,372 | 3,123,155 | 31,418,938 |
| Repurchased | (4,767,458) | (53,821,879) | (3,140,442) | (36,503,605) |
| Net increase | 2,708,107 | $30,746,848 | 4,360,045 | $45,728,431 |
| Total net increase | 3,048,009 | $34,910,880 | 4,380,228 | $45,895,143 |
| Multi-Index Lifestyle Balanced Portfolio | Year Ended 8-31-20 | Year Ended 8-31-19 |
| | Shares | Amount | Shares | Amount |
| Class R6 shares | | | | |
| Sold | 166,963 | $1,875,279 | 46,205 | $516,028 |
| Distributions reinvested | 36,411 | 408,113 | 34,982 | 356,263 |
| Repurchased | (100,993) | (1,072,533) | (4,540) | (48,691) |
| Net increase | 102,381 | $1,210,859 | 76,647 | $823,600 |
| Class 1 shares | | | | |
| Sold | 9,575,689 | $104,881,845 | 10,600,350 | $117,247,628 |
| Distributions reinvested | 5,253,097 | 58,929,731 | 6,086,235 | 61,891,267 |
| Repurchased | (14,132,815) | (155,674,114) | (10,887,677) | (120,591,223) |
| Net increase | 695,971 | $8,137,462 | 5,798,908 | $58,547,672 |
| Total net increase | 798,352 | $9,348,321 | 5,875,555 | $59,371,272 |
| Multi-Index Lifestyle Conservative Portfolio | Year Ended 8-31-20 | Year Ended 8-31-19 |
| | Shares | Amount | Shares | Amount |
| Class R6 shares | | | | |
| Sold | 169,318 | $1,828,060 | 25,147 | $259,880 |
| Distributions reinvested | 1,396 | 14,772 | 172 | 1,828 |
| Repurchased | (14,685) | (152,469) | (2,983) | (31,908) |
| Net increase | 156,029 | $1,690,363 | 22,336 | $229,800 |
| Class 1 shares | | | | |
| Sold | 4,450,921 | $47,947,739 | 3,245,428 | $33,943,916 |
| Distributions reinvested | 678,231 | 7,258,629 | 667,118 | 6,753,201 |
| Repurchased | (4,348,981) | (46,201,191) | (1,729,603) | (17,946,888) |
| Net increase | 780,171 | $9,005,177 | 2,182,943 | $22,750,229 |
| Total net increase | 936,200 | $10,695,540 | 2,205,279 | $22,980,029 |
| Multi-Index Lifestyle Growth Portfolio | Year Ended 8-31-20 | Year Ended 8-31-19 |
| | Shares | Amount | Shares | Amount |
| Class R6 shares | | | | |
| Sold | 110,049 | $1,267,418 | 73,347 | $842,497 |
| Distributions reinvested | 43,385 | 503,695 | 43,199 | 438,039 |
| Repurchased | (37,797) | (419,806) | (16,426) | (184,667) |
| Net increase | 115,637 | $1,351,307 | 100,120 | $1,095,869 |
| Class 1 shares | | | | |
| Sold | 9,042,830 | $101,427,034 | 10,941,267 | $125,625,346 |
| Distributions reinvested | 5,705,644 | 66,128,412 | 6,284,884 | 63,603,024 |
| Repurchased | (11,850,974) | (133,584,486) | (6,158,025) | (70,252,558) |
| Net increase | 2,897,500 | $33,970,960 | 11,068,126 | $118,975,812 |
| Total net increase | 3,013,137 | $35,322,267 | 11,168,246 | $120,071,681 |
| Multi-Index Lifestyle Moderate Portfolio | Year Ended 8-31-20 | Year Ended 8-31-19 |
| | Shares | Amount | Shares | Amount |
| Class R6 shares | | | | |
| Sold | 18,265 | $201,287 | 11,120 | $119,556 |
| Distributions reinvested | 5,584 | 61,085 | 5,247 | 53,451 |
| Repurchased | (10,722) | (121,003) | (317) | (3,423) |
| Net increase | 13,127 | $141,369 | 16,050 | $169,584 |
Fund share transactions, continued
| Multi-Index Lifestyle Moderate Portfolio , Cont'd | Year Ended 8-31-20 | Year Ended 8-31-19 |
| | Shares | Amount | Shares | Amount |
| Class 1 shares | | | | |
| Sold | 3,762,025 | $40,994,351 | 3,959,082 | $42,560,307 |
| Distributions reinvested | 1,275,548 | 13,975,893 | 1,339,142 | 13,629,279 |
| Repurchased | (6,134,119) | (66,711,513) | (3,132,869) | (33,529,732) |
| Net increase (decrease) | (1,096,546) | $(11,741,269) | 2,165,355 | $22,659,854 |
| Total net increase (decrease) | (1,083,419) | $(11,599,900) | 2,181,405 | $22,829,438 |
| Real Estate Securities Fund | Year Ended 8-31-20 | Year Ended 8-31-19 |
| | Shares | Amount | Shares | Amount |
| Class 1 shares | | | | |
| Sold | 1,617,849 | $23,208,581 | 1,334,399 | $17,975,699 |
| Distributions reinvested | 2,571,497 | 34,226,630 | 1,419,914 | 16,428,402 |
| Repurchased | (8,749,714) | (110,708,306) | (5,419,890) | (69,311,460) |
| Net decrease | (4,560,368) | $(53,273,095) | (2,665,577) | $(34,907,359) |
| Total net decrease | (4,560,368) | $(53,273,095) | (2,665,577) | $(34,907,359) |
| Science & Technology Fund | Year Ended 8-31-20 | Year Ended 8-31-19 |
| | Shares | Amount | Shares | Amount |
| Class NAV shares | | | | |
| Sold | 5,874,600 | $23,646,809 | 21,844,302 | $87,505,672 |
| Distributions reinvested | 6,590,594 | 25,176,071 | 25,953,098 | 77,599,763 |
| Repurchased | (16,383,638) | (65,788,097) | (16,478,950) | (63,907,004) |
| Net increase (decrease) | (3,918,444) | $(16,965,217) | 31,318,450 | $101,198,431 |
| Total net increase (decrease) | (3,918,444) | $(16,965,217) | 31,318,450 | $101,198,431 |
| Strategic Equity Allocation Fund | Year Ended 8-31-20 | Year Ended 8-31-19 |
| | Shares | Amount | Shares | Amount |
| Class NAV shares | | | | |
| Sold | 59,137,203 | $614,062,153 | 44,961,697 | $519,426,105 |
| Distributions reinvested | 20,435,857 | 243,595,412 | 106,756,169 | 1,038,737,526 |
| Repurchased | (124,168,522) | (1,426,663,039) | (65,156,903) | (755,070,772) |
| Net increase (decrease) | (44,595,462) | $(569,005,474) | 86,560,963 | $803,092,859 |
| Total net increase (decrease) | (44,595,462) | $(569,005,474) | 86,560,963 | $803,092,859 |
| U.S. Sector Rotation Fund | Year Ended 8-31-20 | Year Ended 8-31-19 |
| | Shares | Amount | Shares | Amount |
| Class NAV shares | | | | |
| Sold | 6,354,741 | $58,504,318 | 9,756,848 | $101,975,614 |
| Distributions reinvested | 13,005,421 | 127,843,285 | 41,720,298 | 347,530,083 |
| Repurchased | (50,884,883) | (507,668,716) | (30,176,253) | (314,152,137) |
| Net increase (decrease) | (31,524,721) | $(321,321,113) | 21,300,893 | $135,353,560 |
| Total net increase (decrease) | (31,524,721) | $(321,321,113) | 21,300,893 | $135,353,560 |
Affiliates of the Trust owned 3% of shares of Class R6 of Multi-Index Lifestyle Conservative Portfolio on August 31, 2020. Affiliates of the Trust also owned 100% of Class 1 and Class NAV, respectively, with the exception of Capital Appreciation Fund and International Value Fund, where affiliates held 77% and 0% of Class NAV, respectively, on August 31, 2020. Such concentration of shareholders’ capital could have a material effect on the fund if such shareholders redeem from the fund.
7. Purchase and sale of securities
Purchases and sales of securities, other than short-term investments, amounted to the following for the year ended August 31, 2020:
| | | |
| Fund | Purchases | Sales |
| Capital Appreciation Fund | $841,593,582 | $1,295,140,977 |
| Capital Appreciation Value Fund | 1,043,669,802 | 1,381,670,335 |
| Health Sciences Fund | 210,683,438 | 150,718,213 |
| International Strategic Equity Allocation Fund | 1,212,231,744 | 1,198,952,244 |
| International Value Fund | 356,626,859 | 368,931,833 |
| Mid Cap Stock Fund | 1,350,840,575 | 1,721,412,658 |
| Mid Value Fund | 584,041,894 | 527,416,429 |
| Multi-Index Lifestyle Aggressive Portfolio | 85,888,429 | 74,459,298 |
| Multi-Index Lifestyle Balanced Portfolio | 375,619,075 | 402,623,685 |
| Multi-Index Lifestyle Conservative Portfolio | 113,099,345 | 105,386,582 |
| Multi-Index Lifestyle Growth Portfolio | 272,652,668 | 282,278,168 |
Purchase and sale of securities, continued
| | | |
| Fund | Purchases | Sales |
| Multi-Index Lifestyle Moderate Portfolio | $124,070,648 | $142,897,188 |
| Real Estate Securities Fund | 489,815,077 | 569,739,309 |
| Science & Technology Fund | 317,665,291 | 360,474,062 |
| Strategic Equity Allocation Fund | 6,692,948,319 | 7,275,711,218 |
| U.S. Sector Rotation Fund | 1,364,418,648 | 1,783,845,311 |
8. Industry or sector risk
Certain funds generally invest a large percentage of their assets in one or more particular industries or sectors of the economy. If a large percentage of a fund's assets are economically tied to a single or small number of industries or sectors of the economy, the fund will be less diversified than a more broadly diversified fund, and it may cause the fund to underperform if that industry or sector underperforms. In addition, focusing on a particular industry or sector may make the fund’s NAV more volatile. Further, a fund that invests in particular industries or sectors is particularly susceptible to the impact of market, economic, regulatory and other factors affecting those industries or sectors. Financial services companies can be hurt by economic declines, changes in interest rates, and regulatory and market impacts.
9. Investment in affiliated underlying funds
John Hancock Multi-Index Lifestyle Portfolios invest in affiliated underlying funds that are managed by the Advisor and its affiliates. The funds do not invest in the affiliated underlying funds for the purpose of exercising management or control; however, the funds' investment may represent a significant portion of each underlying funds’ net assets. At August 31, 2020, the following funds held 5% or more of the net assets of the underlying funds shown below:
| Portfolio | Affiliated Class NAV | Percentage of
underlying fund
net assets |
| Multi-Index Lifestyle Growth Portfolio | Strategic Equity Allocation Fund | 6.3% |
Information regarding the funds' fiscal year to date purchases and sales of the affiliated underlying funds as well as income and capital gains earned by the funds, if any, is as follows:
| | | | | | | | Dividends and distributions |
| Affiliate | Ending
share
amount | Beginning
value | Cost of
purchases | Proceeds
from shares
sold | Realized
gain
(loss) | Change in
unrealized
appreciation
(depreciation) | Income
distributions
received | Capital gain
distributions
received | Ending
value |
| Capital Appreciation Fund |
| John Hancock Collateral Trust* | 4,007,723 | $25,457,039 | $749,449,517 | $(734,843,864) | $59,634 | $(2,215) | $297,673 | — | $40,120,111 |
| Capital Appreciation Value Fund |
| John Hancock Collateral Trust* | 7,524 | — | $159,898,698 | $(159,830,174) | $6,726 | $73 | $42,663 | — | $75,323 |
| International Strategic Equity Allocation Fund |
| John Hancock Collateral Trust* | 7,776,888 | — | $494,095,624 | $(416,295,575) | $1,985 | $50,062 | $629,421 | — | $77,852,096 |
| International Value Fund |
| John Hancock Collateral Trust* | 13,872 | $937,826 | $52,658,631 | $(53,462,892) | $5,348 | $(44) | $41,681 | — | $138,869 |
| Mid Cap Stock Fund |
| John Hancock Collateral Trust* | 3,851,954 | $26,551,791 | $852,284,248 | $(840,388,981) | $59,390 | $54,311 | $1,488,859 | — | $38,560,759 |
| Mid Value Fund |
| John Hancock Collateral Trust* | 3,770,767 | $10,825,459 | $485,766,685 | $(458,866,535) | $(4,097) | $26,504 | $272,752 | — | $37,748,016 |
| Multi-Index Lifestyle Aggressive Portfolio |
| John Hancock Collateral Trust* | 264,601 | — | $249,761,804 | $(247,118,183) | $5,273 | $(57) | $28,579 | — | $2,648,837 |
| Strategic Equity Allocation | 20,999,475 | $226,266,576 | 35,900,142 | (28,000,858) | (5,113,511) | 30,501,167 | 5,177,603 | $2,568,488 | 259,553,516 |
| | | | | | $(5,108,238) | $30,501,110 | $5,206,182 | $2,568,488 | $262,202,353 |
Investment in affiliated underlying funds, continued
| | | | | | | | Dividends and distributions |
| Affiliate | Ending
share
amount | Beginning
value | Cost of
purchases | Proceeds
from shares
sold | Realized
gain
(loss) | Change in
unrealized
appreciation
(depreciation) | Income
distributions
received | Capital gain
distributions
received | Ending
value |
| Multi-Index Lifestyle Balanced Portfolio |
| John Hancock Collateral Trust* | 3,817,957 | $53,581,782 | $888,343,972 | $(903,588,707) | $(120,661) | $4,040 | $370,107 | — | $38,220,426 |
| Strategic Equity Allocation | 29,477,187 | 343,540,970 | 51,175,062 | (70,654,850) | (9,578,393) | 49,855,241 | 7,720,163 | $3,829,702 | 364,338,030 |
| | | | | | $(9,699,054) | $49,859,281 | $8,090,270 | $3,829,702 | $402,558,456 |
| Multi-Index Lifestyle Conservative Portfolio |
| John Hancock Collateral Trust* | 955,380 | $12,589,826 | $246,334,774 | $(249,341,946) | $(18,632) | $5 | $120,886 | — | $9,564,027 |
| Strategic Equity Allocation | 1,754,830 | 20,951,644 | 8,926,496 | (10,717,906) | (1,428,962) | 3,958,432 | 436,120 | $216,349 | 21,689,704 |
| | | | | | $(1,447,594) | $3,958,437 | $557,006 | $216,349 | $31,253,731 |
| Multi-Index Lifestyle Growth Portfolio |
| John Hancock Collateral Trust* | 2,991,179 | $16,547,429 | $703,811,061 | $(690,423,554) | $8,865 | $(4) | $208,077 | — | $29,943,797 |
| Strategic Equity Allocation | 38,340,876 | 434,224,242 | 53,964,806 | (63,387,481) | (10,489,905) | 59,581,564 | 9,856,695 | $4,889,677 | 473,893,226 |
| | | | | | $(10,481,040) | $59,581,560 | $10,064,772 | $4,889,677 | $503,837,023 |
| Multi-Index Lifestyle Moderate Portfolio |
| John Hancock Collateral Trust* | 782,081 | $12,169,739 | $388,933,786 | $(393,282,388) | $7,979 | $65 | $127,969 | — | $7,829,181 |
| Strategic Equity Allocation | 5,317,759 | 66,838,092 | 15,456,632 | (24,220,147) | (3,238,480) | 10,891,405 | 1,454,913 | $721,748 | 65,727,502 |
| | | | | | $(3,230,501) | $10,891,470 | $1,582,882 | $721,748 | $73,556,683 |
| Real Estate Securities Fund |
| John Hancock Collateral Trust* | 107,994 | — | $33,116,266 | $(32,035,549) | $383 | — | $5,062 | — | $1,081,100 |
| Science & Technology Fund |
| John Hancock Collateral Trust* | 737,546 | $9,739,733 | $104,928,303 | $(107,290,601) | $3,537 | $2,384 | $61,553 | — | $7,383,356 |
| Strategic Equity Allocation Fund |
| John Hancock Collateral Trust* | 14,397,110 | $80,031,817 | $1,323,224,818 | (1,259,261,268) | $(17,783) | $147,562 | $2,210,812 | — | $144,125,146 |
| U.S. Sector Rotation Fund |
| John Hancock Collateral Trust* | 94,697 | $4,141,717 | $44,900,571 | $(48,097,093) | $1,669 | $1,123 | $53,785 | — | $947,987 |
| * | Refer to the Securities lending note within Note 2 for details regarding this investment. |
10. Investment by affiliated funds
Certain investors in the funds are affiliated funds that are managed by the Advisor and its affiliates. The affiliated funds do not invest in the funds for the purpose of exercising management or control; however, this investment may represent a significant portion of the funds' net assets. The following fund(s) had an affiliate ownership of 5% or more of the funds' net assets:
| Fund | Affiliated Concentration |
| Capital Appreciation Fund | 48.3% |
| Capital Appreciation Value Fund | 99.0% |
| Health Sciences Fund | 100.0% |
| International Strategic Equity Allocation Fund | 100.0% |
| Mid Cap Stock Fund | 70.3% |
Investment by affiliated funds, continued
| Fund | Affiliated Concentration |
| Mid Value Fund | 100.0% |
| Science & Technology Fund | 99.9% |
| Strategic Equity Allocation Fund | 100.0% |
| U.S. Sector Rotation Fund | 100.0% |
11. Interfund trading
The funds are permitted to purchase or sell securities from or to certain other affiliated funds, as set forth in Rule 17a-7 of the 1940 Act, under specified conditions outlined in procedures adopted by the Board of Trustees of the Trust. The procedures have been designed to ensure that any purchase or sale of securities by the funds from or to another fund that is or could be considered an affiliate complies with Rule 17a-7 of the 1940 Act. Further, as defined under the procedures, each transaction is effected at the current market price. Pursuant to these procedures, for the year ended August 31, 2020, the funds engaged in securities purchases and sales with affiliated funds, some of which have different fiscal reporting periods, as follows:
| Fund | Purchases | Sales |
| Capital Appreciation Value Fund | $2,947,594 | $2,877,772 |
| Mid Value Fund | — | 1,171,588 |
12. Restricted securities
The funds may hold restricted securities which are restricted as to resale and the funds have limited rights to registration under the Securities Act of 1933. Disposal may involve time-consuming negotiations and expenses, and prompt sale at an acceptable price may be difficult to achieve. The following table summarizes the restricted securities held at August 31, 2020:
Issuer,
Description | Original
acquisition date | Acquisition
cost | Beginning
share
amount | Shares
purchased | Shares
sold | Ending
share
amount | Value as a
percentage of
net assets | Ending
value |
| Health Sciences Fund | | | | | | | | |
| Acerta Pharma BV, Class B | 2-8-16 | $146,475 | 4,892,850 | — | — | 4,892,850 | 0.1% | $467,756 |
| Doximity, Inc. | 4-10-14 | 307,268 | 63,738 | — | — | 63,738 | 0.2% | 1,032,556 |
| JAND, Inc., Class A | 4-23-15 | 194,538 | 16,938 | — | — | 16,938 | 0.1% | 415,499 |
| JAND, Inc., Series D | 4-23-15 | 434,397 | 37,822 | — | — | 37,822 | 0.2% | 927,796 |
| | | | | | | | | $2,843,607 |
| Mid Cap Stock Fund | | | | | | | | |
| Coupang LLC | 11-20-14 | $4,300,618 | 2,300,670 | — | (919,221) | 1,381,449 | 0.7% | $13,303,354 |
| DraftKings, Inc. | 12-4-14 | 3,025,630 | 819,041 | 4,973 | (109,697) | 714,317 | 1.3% | 24,729,096 |
| Essence Group Holdings Corp. | 5-1-14 | 5,083,384 | 2,958,957 | — | — | 2,958,957 | 0.5% | 9,616,610 |
| JAND, Inc., Class A | 4-23-15 | 635,744 | 57,523 | — | — | 57,523 | 0.1% | 1,411,074 |
| JAND, Inc., Series D | 4-23-15 | 1,419,614 | 128,449 | — | — | 128,449 | 0.2% | 3,150,931 |
| Lookout, Inc., Series F | 7-31-14 | 4,276,874 | 392,767 | — | — | 392,767 | 0.2% | 3,110,715 |
| MarkLogic Corp., Series F | 4-27-15 | 6,431,120 | 580,011 | — | — | 580,011 | 0.3% | 5,724,709 |
| The Honest Company, Inc., Series C | 8-20-14 | 3,966,620 | 142,030 | — | — | 142,030 | 0.3% | 4,904,296 |
| The Honest Company, Inc., Series D | 8-3-15 | 490,560 | 12,795 | — | — | 12,795 | 0.0%* | 517,942 |
| The We Company, Inc., Series D1 | 12-8-14 | 3,335,927 | 184,328 | — | — | 184,328 | 0.1% | 1,454,348 |
| The We Company, Inc., Series D2 | 12-8-14 | 3,472,011 | 161,782 | — | — | 161,782 | 0.1% | 1,276,460 |
| | | | | | | | | $69,199,535 |
| Science & Technology Fund | | | | | | | | |
| Airbnb, Inc., Series E | 7-14-15 | $1,526,562 | 16,398 | — | — | 16,398 | 0.3% | $1,235,097 |
| DiDi Chuxing, Inc. | 10-19-15 | 460,705 | 16,798 | — | — | 16,798 | 0.2% | 684,435 |
| | | | | | | | | $1,919,532 |
13. Reorganization
Fiscal year ended August 31, 2019, fund's mergers:
On August 9, 2019, the shareholders of John Hancock Funds II Small Cap Stock Fund (the Acquired Fund) voted to approve an Agreement and Plan of Reorganization (the Agreement) which provided for an exchange of shares of Mid Cap Stock Fund (the Acquiring Fund) with a value equal to the net assets transferred.
The Agreement provided for (a) the acquisition of all the assets, subject to all of the liabilities, of the Acquired Fund in exchange for shares of the Acquiring Fund with a value equal to the net assets transferred; (b) the liquidation of the Acquired Fund; and (c) the distribution to Acquired Fund’s shareholders of such Acquiring Fund’s shares. The reorganization was intended to consolidate the Acquired Fund with a fund with a similar objective and achieve economies of scale. As a result of the reorganization, the Acquiring Fund is the legal and accounting survivor.
Reorganization, continued
The reorganization did not qualify as a tax-free reorganization for federal income tax purposes; however, it is not expected to be a taxable event for contract owners. Thus, the investments were transferred to the Acquiring Fund at market value. All distributable amounts of net income and realized gains from the Acquired Fund were distributed prior to the reorganization. In addition, the expenses of the reorganization were borne by the Acquired Fund. The effective time of the reorganization occurred immediately after the close of regularly scheduled trading on the New York Stock Exchange (NYSE) on August 23, 2019. The following outlines the reorganization:
Acquiring
Fund | Acquired
Fund | Net Asset
Value of the
Acquired
Fund | Shares
Redeemed
by the
Acquired
Fund | Shares
Issued
by the
Acquiring
Fund | Acquiring
Fund
Net Assets
Prior to
Combination | Acquiring
Fund
Total Net
Assets After
Combination |
| Mid Cap Stock Fund | Small Cap Stock Fund | $24,403,159 | 2,727,995 | 1,098,683 | $1,571,513,969 | $1,595,917,128 |
See Note 6 for capital shares issued in connection with the above referenced reorganizations.
14. LIBOR discontinuation risk
LIBOR (London Interbank Offered Rate) is a measure of the average interest rate at which major global banks can borrow from one another. Following allegations of rate manipulation and concerns regarding its thin liquidity, in July 2017, the U.K. Financial Conduct Authority, which regulates LIBOR, announced that it will stop encouraging banks to provide the quotations needed to sustain LIBOR after 2021. This event will likely cause LIBOR to cease to be published. Before then, it is expected that market participants will transition to the use of different reference or benchmark rates. However, although regulators have suggested alternative rates, there is currently no definitive information regarding the future utilization of LIBOR or of any replacement rate.
It is uncertain what impact the discontinuation of LIBOR will have on the use of LIBOR as a reference rate for securities in which the funds invest. It is expected that market participants will amend financial instruments referencing LIBOR to include fallback provisions and other measures that contemplate the discontinuation of LIBOR or other similar market disruption events, but neither the effect of the transition process nor the viability of such measures is known. In addition, there are obstacles to converting certain longer term securities and transactions to a new benchmark or benchmarks and the effectiveness of one alternative reference rate versus multiple alternative reference rates in new or existing financial instruments and products has not been determined. As market participants transition away from LIBOR, LIBOR's usefulness may deteriorate, which could occur prior to the end of 2021. The transition process may lead to increased volatility and illiquidity in markets that currently rely on LIBOR to determine interest rates. LIBOR's deterioration may adversely affect the liquidity and/or market value of securities that use LIBOR as a benchmark interest rate.
15. Coronavirus (COVID-19) pandemic
The novel COVID-19 disease has resulted in significant disruptions to global business activity. A widespread health crisis such as a global pandemic could cause substantial market volatility, exchange trading suspensions and closures, impact the ability to complete redemptions, and affect fund performance.
16. Other matters
Strategic Equity Allocation Fund and other affiliates have been named as defendants in a lawsuit related to The Jones Group, a fashion company. It is alleged that in 2014, The Jones Group consummated a series of transactions that rendered it insolvent, increased debt, significantly decreased its assets, and distributed more than $1 billion to its shareholders, all to the detriment of the company and its creditors. Equivalent lawsuits have been filed in California, New Jersey, Texas, Illinois and Florida. The total amounts at issue for Strategic Equity Allocation Fund is approximately $178,000.
On March 30, 2020, the plaintiffs filed a Motion for Transfer of Actions to the District of Massachusetts. The plaintiffs were seeking to consolidate 13 actions in 6 different federal districts against 188 defendants in a Multidistrict Panel in Massachusetts. $550 million is being sought from these 188 defendants. On April 27, 2020, the shareholder defendants filed their response to plaintiffs’ Motion to Transfer. On June 2, 2020, the United States Judicial Panel on Multidistrict Litigation issued a Transfer Order sending all the cases to the Southern District of New York. Accordingly, the litigation will be governed by Second Circuit precedent.
On June 12, 2020, a Scheduling Order was issued. On June 29, 2020, a global Motion to Dismiss Under the Safe Harbor of Section 546(e) of the Bankruptcy Code was filed by the defendants. On August 27, 2020, the Motion to Dismiss was granted.
At this time, the fund cannot predict the outcome of these proceedings. If the proceeding were to be decided in a manner adverse to the fund or if the fund enters into a settlement agreement with the plaintiffs, depending upon the circumstances, the payment of such judgement or settlement could have an adverse effect on the fund’s net asset value.
17. Subsequent events
On June 25, 2020, the Board of Trustees approved International Value Fund to merge into Disciplined Value International Fund, a series of John Hancock Investment Trust. The merger took place on October 16, 2020. This was a tax free merger.
Report of Independent Registered Public Accounting Firm
To the Board of Trustees of John Hancock Funds II and Shareholders of John Hancock Capital Appreciation Fund, John Hancock Capital Appreciation Value Fund, John Hancock Health Sciences Fund, John Hancock International Strategic Equity Allocation Fund, John Hancock International Value Fund, John Hancock Mid Cap Stock Fund, John Hancock Mid Value Fund, John Hancock Multi-Index Lifestyle Aggressive Portfolio, John Hancock Multi-Index Lifestyle Balanced Portfolio, John Hancock Multi-Index Lifestyle Conservative Portfolio, John Hancock Multi-Index Lifestyle Growth Portfolio, John Hancock Multi-Index Lifestyle Moderate Portfolio, John Hancock Real Estate Securities Fund, John Hancock Science & Technology Fund, John Hancock Strategic Equity Allocation Fund and John Hancock U.S. Sector Rotation Fund
Opinions on the Financial Statements
We have audited the accompanying statements of assets and liabilities, including the portfolio of investments, of John Hancock Capital Appreciation Fund, John Hancock Capital Appreciation Value Fund, John Hancock Health Sciences Fund, John Hancock International Strategic Equity Allocation Fund, John Hancock International Value Fund, John Hancock Mid Cap Stock Fund, John Hancock Mid Value Fund, John Hancock Multi-Index Lifestyle Aggressive Portfolio, John Hancock Multi-Index Lifestyle Balanced Portfolio, John Hancock Multi-Index Lifestyle Conservative Portfolio, John Hancock Multi-Index Lifestyle Growth Portfolio, John Hancock Multi-Index Lifestyle Moderate Portfolio, John Hancock Real Estate Securities Fund, John Hancock Science & Technology Fund, John Hancock Strategic Equity Allocation Fund and John Hancock U.S. Sector Rotation Fund (sixteen of the funds constituting John Hancock Funds II, hereafter collectively referred to as the "Funds") as of August 31, 2020, the related statements of operations for the year ended August 31, 2020, the statements of changes in net assets for each of the two years in the period ended August 31, 2020, including the related notes, and the financial highlights for each of the periods indicated therein (collectively referred to as the “financial statements”). In our opinion, the financial statements present fairly, in all material respects, the financial position of each of the Funds as of August 31, 2020, the results of each of their operations for the year then ended, the changes in each of their net assets for each of the two years in the period ended August 31, 2020 and each of the financial highlights for each of the periods indicated therein in conformity with accounting principles generally accepted in the United States of America.
Basis for Opinions
These financial statements are the responsibility of the Funds’ management. Our responsibility is to express an opinion on the Funds’ financial statements based on our audits. We are a public accounting firm registered with the Public Company Accounting Oversight Board (United States) (PCAOB) and are required to be independent with respect to the Funds in accordance with the U.S. federal securities laws and the applicable rules and regulations of the Securities and Exchange Commission and the PCAOB.
We conducted our audits of these financial statements in accordance with the standards of the PCAOB. Those standards require that we plan and perform the audit to obtain reasonable assurance about whether the financial statements are free of material misstatement, whether due to error or fraud.
Our audits included performing procedures to assess the risks of material misstatement of the financial statements, whether due to error or fraud, and performing procedures that respond to those risks. Such procedures included examining, on a test basis, evidence regarding the amounts and disclosures in the financial statements. Our audits also included evaluating the accounting principles used and significant estimates made by management, as well as evaluating the overall presentation of the financial statements. Our procedures included confirmation of securities owned as of August 31, 2020 by correspondence with the custodians, transfer agents, agent banks and brokers; when replies were not received from agent banks and brokers, we performed other auditing procedures. We believe that our audits provide a reasonable basis for our opinions.
/s/ PricewaterhouseCoopers LLP
Boston, Massachusetts
October 22, 2020
We have served as the auditor of one or more investment companies in the John Hancock group of funds since 1988.
John Hancock Funds II
Federal tax information (Unaudited)
For federal income tax purposes, the following information is furnished with respect to the distributions of the funds, if any, paid during its taxable year ended August 31, 2020.
Dividend Received Deduction The funds report the maximum amount allowable of their net taxable income as eligible for the corporate dividends-received deduction.
Qualified Dividend Income The funds report the maximum amount allowable of their net taxable income as qualified dividend income as provided in the Jobs and Growth Tax Relief Reconciliation Act of 2003.
Each fund reports the maximum amount allowable of its Section 199A dividends as defined in Proposed Treasury Regulation §1.199A-3(d).
Foreign Tax Credit The following table details the income derived from foreign sources and the amounts the funds intend to pass through as foreign tax credits for the year ended August 31, 2020:
| Fund | Foreign sourced income | Foreign tax credit |
| International Strategic Equity Allocation Fund | $45,235,676 | $3,917,081 |
| International Value Fund | 6,616,998 | 526,904 |
| Multi-Index Lifestyle Growth Portfolio | 1,298,443 | 104,377 |
Long Term Capital Gains The funds below paid the following amounts in capital gain dividends.
| Fund | Long term capital gains |
| Capital Appreciation Fund | $174,635,781 |
| Capital Appreciation Value Fund | 138,158,592 |
| Health Sciences Fund | 10,491,735 |
| International Value Fund | 11,678,855 |
| Mid Cap Stock Fund | 191,109,164 |
| Mid Value Fund | 14,266,431 |
| Multi-Index Lifestyle Aggressive Portfolio | 25,899,035 |
| Multi-Index Lifestyle Balanced Portfolio | 38,666,044 |
| Multi-Index Lifestyle Conservative Portfolio | 2,546,873 |
| Multi-Index Lifestyle Growth Portfolio | 47,984,752 |
| Multi-Index Lifestyle Moderate Portfolio | 7,684,156 |
| Real Estate Securities Fund | 15,686,650 |
| Science & Technology Fund | 25,176,071 |
| Strategic Equity Allocation Fund | 80,772,608 |
| U.S. Sector Rotation Fund | 104,676,601 |
Eligible shareholders will be mailed a 2020 Form 1099-DIV in early 2021. This will reflect the tax character of all distributions paid in calendar year 2020.
Please consult a tax advisor regarding the tax consequences of your investment in the fund.
Evaluation of advisory and subadvisory agreements by the board of trustees
This section describes the evaluation by the Board of Trustees (the “Board”) of John Hancock Funds II (the “Trust”) of the Advisory Agreement (the “Advisory Agreement”) with John Hancock Investment Management LLC (the “Advisor” , formerly known as “John Hancock Advisers, LLC”) and each of the Subadvisory Agreements (collectively, the “Subadvisory Agreements”) with respect to each of the portfolios of the Trust included in this report (the “Funds”). The Advisory Agreement and Subadvisory Agreements are collectively referred to as the Agreements. Prior to the June 23-25, 2020 telephonic1 meeting at which the Agreements were approved, the Board also discussed and considered information regarding the proposed continuation of the Agreements at the telephonic meeting held on May 26-27, 2020.
Approval of Advisory and Subadvisory Agreements
At telephonic meetings held on June 23-25, 2020, the Board, including the Trustees who are not parties to any Agreement or considered to be interested persons of the Trust under the Investment Company Act of 1940, as amended (the 1940 Act) (the “Independent Trustees”), reapproved for an annual period, the continuation of the Advisory Agreement between the Trust and the Advisor and the applicable Subadvisory Agreements between the Advisor and the investment subadvisors (each, “Subadvisor” and collectively, the “Subadvisors”) with respect to each of the Funds identified below in Appendix A.
In considering the Advisory Agreement and the Subadvisory Agreements with respect to each Fund, the Board received in advance of the meetings a variety of materials relating to each Fund, the Advisor and each Subadvisor, including comparative performance, fee and expense information for peer groups of similar funds prepared by an independent third-party provider of fund data; performance information for the Funds’ benchmark indices; and, with respect to each Subadvisor, comparative performance information for comparably managed accounts, as applicable; and other information provided by the Advisor and the Subadvisors regarding the nature, extent and quality of services provided by the Advisor and the Subadvisors under their respective Agreements, as well as information regarding the Advisor’s revenues and costs of providing services to the Funds and any compensation paid to affiliates of the Advisor. At the meetings at which the renewal of the Advisory Agreement and Subadvisory Agreements are considered, particular focus is given to information concerning Fund performance, comparability of fees and total expenses, and profitability. However, the Board notes that the evaluation process with respect to the Advisor and the Subadvisors is an ongoing one. In this regard, the Board also took into account discussions with management and information provided to the Board (including its various committees) at prior meetings with respect to the services provided by the Advisor and the Subadvisors to the Funds, including quarterly performance reports prepared by management containing reviews of investment results, and prior presentations from the Subadvisors with respect to the Funds they manage. The information received and considered by the Board in connection with the May and June meetings and throughout the year was both written and oral. The Board noted the affiliation of certain of the Subadvisors with the Advisor, noting any potential conflicts of interest. The Board also considered the nature, quality, and extent of the services, if any, to be provided to the Funds by the Advisor’s affiliates, including distribution services. The Board considered the Advisory Agreement and the Subadvisory Agreement separately in the course of its review. In doing so, the Board noted the respective roles of the Advisor and Subadvisor in providing services to the Funds. In addition, although the Board approved the renewal of the Agreements for all the Funds at the June meeting, the Board considered each Fund separately.
Throughout the process, the Board asked questions of and requested additional information from management. The Board is assisted by counsel for the Trust and the Independent Trustees are also separately assisted by independent legal counsel throughout the process. The Independent Trustees also received a memorandum from their independent legal counsel discussing the legal standards for their consideration of the proposed continuation of the Agreements and discussed the proposed continuation of the Agreements in private sessions with their independent legal counsel at which no representatives of management were present.
Approval of Advisory Agreement
In approving the Advisory Agreement with respect to each Fund, the Board, including the Independent Trustees, considered a variety of factors, including those discussed below. The Board also considered other factors (including conditions and trends prevailing generally in the economy, the securities markets and the industry) and did not treat any single factor as determinative, and each Trustee may have attributed different weights to different factors. The Board’s conclusions may be based in part on its consideration of the advisory and subadvisory arrangements in prior years and on the Board’s ongoing regular review of Fund performance and operations throughout the year.
Nature, Extent and Quality of Services. Among the information received by the Board from the Advisor relating to the nature, extent and quality of services provided to the Funds, the Board reviewed information provided by the Advisor relating to its operations and personnel, descriptions of its organizational and management structure, and information regarding the Advisor’s compliance and regulatory history, including its Form ADV. The Board also noted that on a regular basis it receives and reviews information from the Trust’s Chief Compliance Officer (“CCO”) regarding the Funds’ compliance policies and procedures established pursuant to Rule 38a-1 under the 1940 Act. The Board observed that the scope of services provided by the Advisor, and of the undertakings required of the Advisor in connection with those services, including maintaining and monitoring its own and the fund’s compliance programs, risk management programs, liquidity management programs and cybersecurity programs, had expanded over time as a result of regulatory, market and other developments. The Board considered that the Advisor is responsible for the management of the day-to-day operations of the Funds, including but not limited to, general supervision of and coordination of the services provided by the Subadvisors, and is also responsible for monitoring and reviewing the activities of the Subadvisors and other third-party service providers. The Board also considered the significant risk assumed by the Advisor in connection with the services provided to the Funds including entrepreneurial risk in sponsoring new Funds and ongoing risks including investment, operational, enterprise, litigation, regulatory and compliance risks with respect to all Funds.
In considering the nature, extent and quality of the services provided by the Advisor, the Trustees also took into account their knowledge of the Advisor’s management and the quality of the performance of the Advisor’s duties, through Board meetings, discussions and reports during the preceding year and through each Trustee’s experience as a Trustee of the Trust and of the other trusts in the complex (John Hancock Fund Complex).
In the course of their deliberations regarding the Advisory Agreement, the Board considered, among other things:
(a) the skills and competency with which the Advisor has in the past managed the Trust’s affairs and its subadvisory relationships, the Advisor’s oversight and monitoring of the Subadvisors’ investment performance and compliance programs, such as the Subadvisors’ compliance with fund policies and objectives, review of brokerage matters including with respect to trade allocation and best execution, and the Advisor’s timeliness in responding to performance issues;
(b) the background, qualifications and skills of the Advisor’s personnel;
1 | |
On March 25, 2020, as a result of health and safety measures put in place to combat the global COVID-19 pandemic, the Securities and Exchange Commission issued an exemptive order (the “Order”) pursuant to Sections 6(c) and 38(a) of the Investment Company Act of 1940, as amended (the “1940 Act”), that temporarily exempts registered investment management companies from the in-person voting requirements under the 1940 Act, subject to certain requirements, including that votes taken pursuant to the Order are ratified at the next in-person meeting. The Board determined that reliance on the Order was necessary or appropriate due to the circumstances related to current or potential effects of COVID-19 and therefore, the Board’s May and June meetings were held telephonically in reliance on the Order. |
146
Evaluation of advisory and subadvisory agreements by the board of trustees
(c) the Advisor’s compliance policies and procedures and its responsiveness to regulatory changes and fund industry developments;
(d) the Advisor’s administrative capabilities, including its ability to supervise the other service providers for the Funds, as well as the Advisor’s oversight of any securities lending activity, its monitoring of class action litigation and collection of class action settlements on behalf of the fund, and bringing loss recovery actions on behalf of the Fund;
(e) the financial condition of the Advisor and whether it has the financial wherewithal to provide a high level and quality of services to the Funds;
(f) the Advisor’s initiative intended to improve various aspects of the Trust’s operations and investor experience with the Funds; and
(g) the Advisor’s reputation and experience in serving as an investment adviser to the Trust and the benefit to shareholders of investing in funds that are part of a family of funds offering a variety of investments.
The Board concluded that the Advisor may reasonably be expected to continue to provide a high quality of services under the Advisory Agreement with respect to the Funds.
Investment Performance. In considering each Fund’s performance, the Board noted that it reviews at its regularly scheduled meetings information about the Funds’ performance results. In connection with the consideration of the Advisory Agreement, the Board:
(a) reviewed information prepared by management regarding the Funds’ performance;
(b) considered the comparative performance of each Fund’s respective benchmark index;
(c) considered the performance of comparable funds, if any, as included in the report prepared by an independent third-party provider of fund data; and
(d) took into account the Advisor’s analysis of each Fund’s performance and its plans and recommendations regarding the Trust’s subadvisory arrangements generally and with respect to particular Funds.
The Board noted that while it found the data provided by the independent third-party generally useful it recognized its limitations, including in particular that the data may vary depending on the end date selected and that the results of the performance comparisons may vary depending on the selection of the peer group. The Board reviewed Fund performance against each Fund’s respective benchmark and peer group median and also concluded that the performance of each of the Funds has generally been in line with or generally outperformed the historical performance of comparable funds and/or each Fund’s respective benchmark, with certain exceptions noted in Appendix A. In such cases, the Board concluded that such performance is being monitored and reasonably addressed, where appropriate.
Fees and Expenses. The Board reviewed comparative information prepared by an independent third-party provider of fund data including, among other data, each Fund’s contractual and net management fees (and subadvisory fees, to the extent available) and total expenses as compared to similarly situated investment companies deemed to be comparable to the Fund in light of the nature, extent and quality of the management and advisory and subadvisory services provided by the Advisor and the Subadvisor. The Board considered each Fund’s ranking within a smaller group of peer funds chosen by the independent third-party provider, as well as the Fund’s ranking within broader groups of funds. In comparing each Fund’s contractual and net management fees to that of comparable funds, the Board noted that such fees include both advisory and administrative costs.
The Board took into account management’s discussion of the Funds’ expenses. The Board took into account management’s discussion with respect to the overall management fee and the fees of the Subadvisor, including the amount of the advisory fee retained by the Advisor after payment of the subadvisory fee, in each case in light of the services rendered for those amounts and the risks undertaken by the Advisor. The Board also noted that the Advisor pays the subadvisory fees of the Funds, and that such fees are negotiated at arm’s length with respect to the unaffiliated Subadvisors. The Board also took into account that management had agreed to implement an overall fee waiver across the complex, which is discussed further below. The Board also noted management’s discussion of the Funds’ expenses, as well as any actions taken over the past several years to reduce the Funds’ operating expenses. The Board reviewed information provided by the Advisor concerning investment advisory fee charged by the Advisor or one of its advisory affiliates to other clients (including other funds in the complex) having similar investment mandates, if any. The Board considered any differences between the Advisor’s and each Subadvisor’s services to a Fund and the services they provide to other comparable clients or funds. The Board concluded that the advisory fee paid with respect to each of the Funds is reasonable in light of the nature, extent and quality of the services provided to the Funds under the Advisory Agreement.
In addition, in the case of the Multi-Index Lifestyle Funds (each a “Fund of Funds”), the Trustees reviewed the advisory fee to be paid to the Advisor for each Fund of Funds, and concluded that such fee is based on services provided that are in addition to, rather than duplicative of, the services provided pursuant to the advisory agreements for the underlying funds of the Fund of Funds, and that the additional services are necessary because of the differences between the investment policies, strategies and techniques of a Fund of Funds and those of its underlying funds.
Profitability/indirect benefits. In considering the costs of the services to be provided and the profits to be realized by the Advisor and its affiliates (including the Subadvisors that are affiliated with the Advisor) from the Advisor’s relationship with the Trust, the Board:
(a) reviewed financial information of the Advisor;
(b) reviewed and considered information presented by the Advisor regarding the net profitability to the Advisor and its affiliates, of each Fund;
(c) received and reviewed profitability information with respect to the John Hancock fund complex as a whole and with respect to each Fund;
(d) received information with respect to the Advisor’s allocation methodologies used in preparing the profitability data and considered that the Advisor hired an independent third-party consultant to provide an analysis of the Advisor’s allocation methodologies;
(e) considered that the John Hancock insurance companies that are affiliates of the Advisor, as shareholders of the Trust directly or through their separate accounts, receive certain tax credits or deductions relating to foreign taxes paid and dividends received by certain Funds of the Trust and noted that these tax benefits, which are not available to participants in qualified retirement plans under applicable income tax law, are reflected in the profitability analysis reviewed by the Board;
(f) considered that the Advisor also provides administrative services to the Funds on a cost basis pursuant to an administrative services agreement;
(g) noted that certain of the Funds’ Subadvisors are affiliates of the Advisor;
(h) noted that affiliates of the Advisor provide transfer agency services and distribution services to the fund, and that the fund’s distributor also receives Rule 12b-1 payments to support distribution of the Fund;
(i) noted that the Advisor also derives reputational and other indirect benefits from providing advisory services to the Funds;
(j) noted that the subadvisory fees for the Funds are paid by the Advisor and are negotiated at arms’ length with respect to the unaffiliated Subadvisors;
(k) with respect to each Fund of Funds, the Board noted that the advisory fee is in addition to the fees received by the Advisor and its affiliates with regard to the underlying portfolios in which each Fund of Funds may invest;
147
Evaluation of advisory and subadvisory agreements by the board of trustees
(l) considered the Advisor’s ongoing costs and expenditures necessary to improve services, meet new regulatory and compliance requirements, and adapt to other challenges impacting the fund industry; and
(m) considered that the Advisor should be entitled to earn a reasonable level of profits in exchange for the level of services it provides to each Fund and the risks that it assumes as Advisor, including entrepreneurial, operational, reputational, litigation and regulatory risk.
Based upon its review, the Board concluded that the level of profitability, if any, of the Advisor and its affiliates (including any Subadvisors that are affiliated with the Advisor), from their relationship with each Fund was reasonable and not excessive.
Economies of Scale. In considering the extent to which a Fund may realize any economies of scale and whether fee levels reflect these economies of scale for the benefit of Fund shareholders, the Board:
(a) considered that the Advisor has contractually agreed to waive a portion of its management fee for certain funds of the John Hancock Fund Complex, including the fund (the participating portfolios) or otherwise reimburse the expenses of the participating portfolios (the reimbursement). This waiver is based upon aggregate net assets of all the participating portfolios. The amount of the reimbursement is calculated daily and allocated among all the participating portfolios in proportion to the daily net assets of each fund. The Multi-Index Lifestyle Funds benefit from the waiver through their investment, to the extent that they invest in participating portfolios and;
(b) reviewed the Trust’s advisory fee structure and the incorporation therein of any subadvisory fee breakpoints in the advisory fees charged and concluded that (i) most of the Funds’ fee structures contain breakpoints at the subadvisory fee level and that such breakpoints are reflected as breakpoints in the advisory fees for Funds and (ii) although economies of scale cannot be measured with precision, these arrangements permit shareholders of Funds with advisory fee breakpoints to benefit from economies of scale if those Funds grow. The Board also took into account management’s discussion of the Funds’ advisory fee structure, including with respect to those Funds that did not currently have breakpoints; and
(c) considered the effect of the Funds’ growth in size on their performance and fees. The Board also noted that if the Funds’ assets increase over time, the Funds may realize other economies of scale.
Approval of Subadvisory Agreements
In making its determination with respect to approval of the Subadvisory Agreements, the Board reviewed:
| (1) | | information relating to each Subadvisor’s business, including current subadvisory services to the Trust (and other funds in the John Hancock family of funds); |
| (2) | | the historical and current performance of each Fund and comparative performance information relating to the Fund’s benchmark and comparable funds; |
| (3) | | the subadvisory fee for each Fund, and comparative fee information, where available, prepared by an independent third party provider of fund data; and |
| (4) | | information relating to the nature and scope of any material relationships and their significance to the Trust’s Advisor and unaffiliated Subadvisors. |
Nature, Extent and Quality of Services. With respect to the services provided by each of the Subadvisors with respect to each Fund, the Board received information provided to the Board by each Subadvisor, including each Subadvisor’s Form ADV, as well as took into account information presented throughout the past year. The Board considered each Subadvisor’s current level of staffing and its overall resources, as well as received information relating to a Subadvisor’s compensation program. The Board reviewed each Subadvisor’s history and investment experience, as well as information regarding the qualifications, background and responsibilities of each Subadvisor’s investment and compliance personnel who provide services to the Funds. The Board also considered, among other things, each Subadvisor’s compliance program and any disciplinary history. The Board also considered each Subadvisor’s risk assessment and monitoring process. The Board reviewed each Subadvisor’s regulatory history, including whether it was involved in any regulatory actions or investigations as well as material litigation, and any settlements and amelioratory actions undertaken, as appropriate. The Board noted that the Advisor conducts regular, periodic reviews of each Subadvisor and its operations, including regarding investment processes and organizational and staffing matters. The Board also noted that the CCO and his staff conduct regular, periodic compliance reviews with each of the Subadvisors and present reports to the Independent Trustees regarding the same, which includes evaluating the regulatory compliance systems of the Subadvisors and procedures reasonably designed by them to assure compliance with the federal securities laws. The Board also took into account the financial condition of each Subadvisor.
The Board considered each Subadvisor’s investment process and philosophy. The Board took into account that each Subadvisor’s responsibilities include the development and maintenance of an investment program for the applicable Fund that is consistent with the Fund’s investment objective, the selection of investment securities and the placement of orders for the purchase and sale of such securities, as well as the implementation of compliance controls related to performance of these services. The Board also received information with respect to each Subadvisor’s brokerage policies and practices, including with respect to best execution and soft dollars.
Subadvisor Compensation. In considering the cost of services to be provided by each Subadvisor and the profitability to that Subadvisor of its relationship with the Fund, the Board noted that the fees under the Subadvisory Agreements are paid by the Advisor and not the Funds. The Board also received information and took into account any other potential conflicts of interest the Advisor might have in connection with the Subadvisory Agreements.
The Board also relied on the ability of the Advisor to negotiate each Subadvisory Agreement with Subadvisors that are not affiliated with the Advisor and the fees thereunder at arm’s length. As a result, the costs of the services to be provided and the profits to be realized by unaffiliated Subadvisors from their relationship with the Trust were not a material factor in the Board’s consideration of the Subadvisory Agreements.
The Board also received information regarding the nature and scope (including their significance to the Advisor and its affiliates and to unaffiliated Subadvisors) of any material relationships with respect to the unaffiliated Subadvisors, which include arrangements in which unaffiliated Subadvisors or their affiliates provide advisory, distribution or management services in connection with financial products sponsored by the Trust’s Advisor or its affiliates, and may include shares of the Trust, other registered investment companies, a 529 education savings plan, managed separate accounts and exempt group annuity contracts sold to qualified plans.
In addition, the Board considered other potential indirect benefits that the Subadvisors and their affiliates may receive from a Subadvisor’s relationship with the Fund, such as the opportunity to provide advisory services to additional funds in the John Hancock fund complex and reputational benefits.
Subadvisory Fees. The Board considered that the Fund pays an advisory fee to the Advisor and that, in turn, the Advisor pays subadvisory fees to each Subadvisor. As noted above, the Board also considered, if available, each Fund’s subadvisory fees as compared to similarly situated investment companies deemed to be comparable to the Fund as included in the report prepared by the independent third party provider of fund data, to the extent applicable. The Board noted that the limited size of the Lipper peer group was not sufficient for comparative purposes. The Board also took into account the subadvisory fees paid by the Advisor to a Subadvisor with respect to the Funds to fees charged by each Fund’s Subadvisor to manage other subadvised portfolios and portfolios not subject to regulation under the 1940 Act, as applicable.
148
Evaluation of advisory and subadvisory agreements by the board of trustees
Subadvisor Performance. As noted above, the Board considered each Fund’s performance as compared to the Fund’s respective peer group median and the benchmark index and noted that the Board reviews information about the Fund’s performance results at its regularly scheduled meetings. The Board noted the Advisor’s expertise and resources in monitoring the performance, investment style, and risk-adjusted performance of each Subadvisor. The Board was mindful of the Advisor’s focus on each Subadvisor’s performance. The Board also noted each Subadvisor’s long-term performance record for similar accounts, as applicable.
The Board’s decision to approve the Subadvisory Agreements with respect to each Fund was based on a number of determinations, including the following:
| (1) | | each Subadvisor has extensive experience and demonstrated skills as a manager; |
| (2) | | although not without variation, the performance of each Fund managed by a Subadvisor generally has been in line with or outperformed the historical performance of comparable funds and/or each Fund’s respective benchmark, with the exceptions noted in Appendix A (with respect to such exceptions, the Board concluded that performance is being monitored and reasonably addressed); |
| (3) | | the subadvisory fees are reasonable in relation to the level and quality of services being provided under the Subadvisory Agreements; and |
| (4) | | the subadvisory fees are paid by the Advisor and not the Funds, and that the fee structure for certain of the Funds contains breakpoints, certain breakpoints are reflected as breakpoints in the advisory fees for the Funds in order to permit shareholders to benefit from economies of scale if those Funds grow. |
In addition, in the case of each Fund of Funds, the Trustees reviewed the subadvisory fee to be paid to the Subadvisor for the Fund of Funds and concluded that the subadvisory fee to be paid to the Subadvisor with respect to each Fund of Funds is based on services provided that are in addition to, rather than duplicative of, the services provided pursuant to the subadvisory agreements for the underlying portfolios of the Fund of Funds and that the additional services are necessary because of the differences between the investment policies, strategies and techniques of a Fund of Funds and those of its underlying portfolios. Additional information relating to each Fund’s fees and expenses and performance that the Board considered in approving the Advisory Agreement and Subadvisory Agreements for a particular Fund is set forth in Appendix A.
Based on the Board’s evaluation of all factors that the Board deemed to be material, including those factors described above, the Board, including the Independent Trustees, concluded that renewal of the Advisory Agreement and each of the Subadvisory Agreements with respect to each Fund would be in the best interest of each of the respective Funds and its shareholders. Accordingly, the Board, and the Independent Trustees voting separately, approved the Advisory Agreement and Subadvisory Agreements with respect to each Fund for an additional one-year period.
149
Appendix A
Portfolio
(subadvisors)
|
|
|
| Performance of fund,
as of 12.31.2019
|
| Fees and expenses
|
| Comments
|
|---|
| |
JHF II Capital Appreciation Fund
(Jennison Associates LLC) | | | | Benchmark Index — The fund outperformed for the three-year period and underperformed for the one-, five-, and ten-year periods.
Lipper Category — The fund outperformed the median for the one-, three-, five-, and ten-year periods. | | Subadvisory fee comparative data not provided due to limited size of Lipper peer group for this purpose.
Net management fees for this fund are higher than the peer group median.
Total expenses for this fund are lower than the peer group median. | | The Board took into account management’s discussion of the fund’s performance, including the favorable performance relative to benchmark index for the three-year period and to the peer group median for the one-, three-, five-, and ten-year periods.
The Board took into account management’s discussion of the fund’s expenses. |
| |
JHF II Capital Appreciation Value Fund
(T. Rowe Price Associates, Inc.) | | | | Benchmark Index — The fund outperformed for the one-, three- and five-year periods.
Lipper Category — The fund outperformed the median for the one-, three- and five-year periods. | | Subadvisory fee comparative data not provided due to limited size of Lipper peer group for this purpose.
Net management fees for this fund are higher than the peer group median.
Total expenses for this fund are equal to the peer group median. | | The Board took into account management’s discussion of the fund’s performance, including the favorable performance relative to the benchmark index and peer group median for the one-, three- and five-year periods.
The Board took into account management’s discussion of the fund’s expenses. |
| |
JHF II Health Sciences Fund
(T. Rowe Price Associates, Inc.) | | | | Benchmark Index — The fund outperformed for the one- and five-year periods, and underperformed for the three-year period.
Lipper Category — The fund outperformed the median for the one-, three- and five-year periods. | | Subadvisor fee comparative data not provided due to limited size of Lipper peer group for this purpose.
Net management fees for this fund are higher than the peer group median.
Total expenses for this fund are higher than the peer group median. | | The Board took into account management’s discussion of the fund’s performance, including the favorable performance relative to the benchmark index for the one- and five-year periods and to the peer group median for the one-, three- and five-year periods.
The Board took into account management’s discussion of the fund’s expenses. |
| |
JHF II International Strategic Equity Allocation Fund
(Manulife Investment Management (US)) | | | | Benchmark Index — The fund underperformed for the one- and three-year periods.
Lipper Category — The fund underperformed the median for the one- and three-year periods. | | Subadvisor fee comparative data not provided due to limited size of Lipper peer group for this purpose.
Net management fees for this fund are lower than the peer group median.
Total expenses for this fund are lower than the peer group median. | | The Board took into account management’s discussion of the factors that contributed to the fund’s performance for the benchmark index and peer group median for the one- and three-year periods including the impact of past and current market conditions on the fund’s strategy and management’s outlook for the fund.
The Board concluded that the fund’s performance is being monitored and reasonably addressed, where appropriate. |
150
Appendix A
Portfolio
(subadvisors)
|
|
|
| Performance of fund,
as of 12.31.2019
|
| Fees and expenses
|
| Comments
|
|---|
| |
JHF II International Value Fund
(Templeton Investment Counsel, LLC) | | | | Benchmark Index — The fund underperformed for the one-, three-, five-, and ten-year periods.
Lipper Category — The fund underperformed the median for the one-, three-, five-, and ten-year periods. | | Subadvisor fee comparative data not provided due to limited size of Lipper peer group for this purpose.
Net management fees for this fund are higher than the peer group median.
Total expenses for this fund are lower than the peer group median. | | The Board took into account management’s discussion of the factors that contributed to the fund’s performance for the benchmark index and peer group median for the one-, three-, five-, and ten-year periods including the impact of past and current market conditions on the fund’s strategy and management’s outlook for the fund.
The Board concluded that the fund’s performance is being monitored and reasonably addressed, where appropriate.
The Board noted that the fund’s longer term performance in part reflects that of the previous subadvisor.
The Board took into account management’s discussion of the fund’s expenses. |
| |
JHF II Mid Cap Stock Fund
(Wellington Management Company, LLP) | | | | Benchmark Index — The fund outperformed for the three- and five-year periods and underperformed for the one- and ten-year periods.
Lipper Category — The fund outperformed the median for the one-, three-, five-, and ten-year periods. | | Subadvisor fee comparative data not provided due to limited size of Lipper peer group for this purpose.
Net management fees for this fund are higher than the peer group median.
Total expenses for this fund are lower than the peer group median. | | The Board took into account management’s discussion of the fund’s performance, including the favorable performance relative to the benchmark for the three- and five-year periods and to the peer group median for the one-, three-, five- and ten-year periods.
The Board took into account management’s discussion of the fund’s expenses. |
151
Appendix A
Portfolio
(subadvisors)
|
|
|
| Performance of fund,
as of 12.31.2019
|
| Fees and expenses
|
| Comments
|
|---|
| |
JHF II Mid Value Fund
(T. Rowe Price Associates, Inc.) | | | | Benchmark Index — The fund underperformed for the one-, three-, five- and ten-year periods.
Lipper Category — The fund outperformed the median for the five-year period and underperformed the median for the one-, three- and ten-year periods. | | Subadvisor fee comparative data not provided due to limited size of Lipper peer group for this purpose.
Net management fees for this fund are higher than the peer group median.
Total expenses for this fund are equal to the peer group median. | | The Board took into account management’s discussion of the fund’s performance, including the favorable performance relative to peer group median for the five-year period.
The Board took into account management’s discussion of the factors that contributed to the fund’s performance for the benchmark index for the one-, three-, five- and ten-year periods and the peer group median for the one-, three-, and ten-year periods including the impact of past and current market conditions on the fund’s strategy and management’s outlook for the fund.
The Board concluded that the fund’s performance is being monitored and reasonably addressed, where appropriate.
The Board took into account management’s discussion of the fund’s expenses. |
| |
Multi-Index Lifestyle Aggressive Portfolio
(Manulife Investment Management (US)) | | | | Benchmark Index — The fund underperformed for the one-, three- and five-year periods.
Lipper Category — The fund outperformed the median for the one-, three- and five-year periods. | | Subadvisory fee comparative data not provided due to limited size of Lipper peer group for this purpose.
Net management fees for this fund are higher than the peer group median.
Total expenses for this fund are lower than the peer group median. | | The Board took into account management’s discussion of the fund’s performance, including the favorable performance relative to the peer group median for the one-, three- and five-year periods.
The Board took into account management’s discussion of the fund’s expenses. |
| |
Multi-Index Lifestyle Balanced Portfolio
(Manulife Investment Management (US)) | | | | Benchmark Index — The fund underperformed for the one-, three- and five-year periods.
Lipper Category — The fund outperformed the median for the one- and five-year periods and performed in-line with the median for the three-year period. | | Subadvisory fee comparative data not provided due to limited size of Lipper peer group for this purpose.
Net management fees for this fund are higher than the peer group median.
Total expenses for this fund are lower than the peer group median. | | The Board took into account management’s discussion of the fund’s performance, including the favorable performance relative to the peer group median for the one- and five-year periods.
The Board took into account management’s discussion of the fund’s expenses. |
152
Appendix A
Portfolio
(subadvisors)
|
|
|
| Performance of fund,
as of 12.31.2019
|
| Fees and expenses
|
| Comments
|
|---|
| |
Multi-Index Lifestyle Conservative Portfolio
(Manulife Investment Management (US)) | | | | Benchmark Index — The fund underperformed for the one-, three- and five-year periods.
Lipper Category — The fund outperformed the median for the one-, three-, and five-year periods. | | Subadvisory fee comparative data not provided due to limited size of Lipper peer group for this purpose.
Net management fees for this fund are higher than the peer group median.
Total expenses for this fund are lower than the peer group median. | | The Board took into account management’s discussion of the fund’s performance including the favorable performance relative to the peer group median for the one-, three- and five-year periods.
The Board took into account management’s discussion of the fund’s expenses. |
| |
Multi-Index Lifestyle Growth Portfolio
(Manulife Investment Management (US)) | | | | Benchmark Index — The fund underperformed for the one-, three- and five-year periods.
Lipper Category — The fund outperformed the median for the one-, three- and five-year periods. | | Subadvisory fee comparative data not provided due to limited size of Lipper peer group for this purpose.
Net management fees for this fund are higher than the peer group median.
Total expenses for this fund are lower than the peer group median. | | The Board took into account management’s discussion of the fund’s performance, including the favorable performance relative to the peer group median for the one-, three- and five-year periods.
The Board took into account management’s discussion of the fund’s expenses. |
| |
Multi-Index Lifestyle Moderate Portfolio
(Manulife Investment Management (US)) | | | | Benchmark Index — The fund underperformed for the one-, three- and five-year periods.
Lipper Category — The fund outperformed the median for the one-, three- and five-year periods. | | Subadvisory fee comparative data not provided due to limited size of Lipper peer group for this purpose.
Net management fees for this fund are higher than the peer group median.
Total expenses for this fund are lower than the peer group median. | | The Board took into account management’s discussion of the fund’s performance, including the favorable performance relative to the peer group median for the one-, three- and five-year periods.
The Board took into account management’s discussion of the fund’s expenses. |
| |
JHF II Real Estate Securities Fund
(Deutsche Investment Management Americas Inc./RREEF America LLC) | | | | Benchmark Index — The fund outperformed for the one-, three-, five-, and ten-year periods.
Lipper Category — The fund outperformed the median for the one-, three-, five-, and ten-year periods. | | Subadvisory fee comparative data not provided due to limited size of Lipper peer group for this purpose.
Net management fees for this fund are lower than the peer group median.
Total expenses for this fund are lower than the peer group median. | | The Board took into account management’s discussion of the fund’s performance, including the favorable performance relative to the benchmark index and peer group median for the one-, three-, five- and ten-year periods. |
153
Appendix A
Portfolio
(subadvisors)
|
|
|
| Performance of fund,
as of 12.31.2019
|
| Fees and expenses
|
| Comments
|
|---|
| |
JHF II Science & Technology Fund
(Allianz Global Investors U.S. LLC)
(T. Rowe Price Associates, Inc.) | | | | Benchmark Index — The fund outperformed for the three- and five-year periods and underperformed for the one-year period.
Lipper Category — The fund outperformed the median for the three-year periods and underperformed for the one- and five-year periods. | | Subadvisor fee comparative data not provided due to limited size of Lipper peer group for this purpose.
Net management fees for this fund are higher than the peer group median.
Total expenses for this fund are higher than the peer group median. | | The Board took into account management’s discussion of the fund’s performance, including the favorable performance relative to the benchmark index for the three- and five-year periods and to the peer group median for the three-year period.
The Board took into account management’s discussion of the fund’s expenses. |
| |
JHF II U.S. Sector Rotation Fund (formerly known as “U.S. Strategic Equity Allocation Fund”)
(Manulife Investment Management (US)) | | | | Benchmark Index — The fund underperformed for the one- and three-year periods.
Lipper Category — The fund outperformed the median for the one- and three- periods. | | Subadvisor fee comparative data not provided due to limited size of Lipper peer group for this purpose.
Net management fees for this fund are lower than the peer group median.
Total expenses for this fund are lower than the peer group median. | | The Board took into account management’s discussion of the fund’s performance, including the favorable performance relative to the peer group for the one- and three- year periods. |
154
Statement regarding liquidity risk management
Operation of the Liquidity Risk Management Program
This section describes operation and effectiveness of the Liquidity Risk Management Program (LRMP) established in accordance with Rule 22e-4 under the Investment Company Act of 1940, as amended (the Liquidity Rule). The Board of Trustees (the Board) of each Fund in the John Hancock Group of Funds (each a Fund and collectively, the Funds) that is subject to the requirements of the Liquidity Rule has appointed John Hancock Investment Management LLC and John Hancock Variable Trust Advisers LLC (together, the Advisor) to serve as Administrator of the LRMP with respect to each of the Funds, including Capital Appreciation Fund, Capital Appreciation Value Fund, Health Sciences Fund, International Strategic Equity Allocation Fund, International Value Fund, Mid Cap Stock Fund, Mid Value Fund, Multi-Index Lifestyle Aggressive Portfolio, Multi-Index Lifestyle Balanced Portfolio, Multi-Index Lifestyle Conservative Portfolio, Multi-Index Lifestyle Growth Portfolio, Multi-Index Lifestyle Moderate Portfolio, Real Estate Securities Fund, Science & Technology Fund, Strategic Equity Allocation Fund, and U.S. Sector Rotation Fund (formerly U.S. Strategic Equity Allocation), subject to the oversight of the Board. In order to provide a mechanism and process to perform the functions necessary to administer the LRMP, the Advisor established the Liquidity Risk Management Committee (the Committee). The Funds’ subadvisor(s), Jennison Associates LLC, T. Rowe Price Associates, Inc., Manulife Investment Management (US) LLC, Boston Partners Global Investors, Inc., Wellington Management Company, LLP, DWS Investment Management Americas Inc., and Allianz Global Investors U.S., LLC (the Subadvisor), execute the day-to-day investment management and security-level activities of the Fund in accordance with the requirements of the LRMP, subject to the supervision of the Advisor and the Board.
The Committee holds monthly meetings to: (1) review the day-to-day operations of the LRMP; (2) review and approve month end liquidity classifications; (3) review quarterly testing and determinations, as applicable; and (4) review other LRMP related material. The Committee also conducts daily, monthly, quarterly, and annual quantitative and qualitative assessments of each subadvisor to a Fund that is subject to the requirements of the Liquidity Rule and is a part of the LRMP to monitor investment performance issues, risks and trends. In addition, the Committee may conduct ad-hoc reviews and meetings with subadvisors as issues and trends are identified, including potential liquidity and valuation issues.
The Committee provided the Board at a meeting held on March 15-17, 2020 with a written report which addressed the Committee’s assessment of the adequacy and effectiveness of the implementation and operation of the LRMP and any material changes to the LRMP. The report, which covered the period December 1, 2018 through December 31, 2019, included an assessment of important aspects of the LRMP including, but not limited to:
| • | | Operation of the Fund’s Redemption-In-Kind Procedures; |
| • | | Highly Liquid Investment Minimum (HLIM) determination; |
| • | | Compliance with the 15% limit on illiquid investments; |
| • | | Reasonably Anticipated Trade Size (RATS) determination; |
| • | | Security-level liquidity classifications; and |
| • | | Liquidity risk assessment. |
The report also covered material liquidity matters which occurred or were reported during this period applicable to the Fund, if any, and the Committee’s actions to address such matters.
Redemption-In-Kind Procedures
Rule 22e-4 requires any fund that engages in or reserves the right to engage in in-kind redemptions to adopt and implement written policies and procedures regarding in-kind redemptions as part of the management of its liquidity risk. These procedures address the process for redeeming in kind, as well as the circumstances under which the Fund would consider redeeming in kind. Anticipated large redemption activity will be evaluated to identify situations where redeeming in securities instead of cash may be appropriate.
As part of its annual assessment of the LRMP, the Committee reviewed the implementation and operation of the Redemption-In-Kind Procedures and determined they are operating in a manner that such procedures are adequate and effective to manage in-kind redemptions on behalf of the Fund as part of the LRMP.
Highly Liquid Investment Minimum determination
The Committee uses an HLIM model to determine a Fund’s HLIM. This process incorporates the Fund’s investment strategy, historical redemptions, liquidity classification rollup percentages and cash balances, redemption policy, access to funding sources, distribution channels and client concentrations. If the Fund falls below its established HLIM for a period greater than 7 consecutive calendar days, the Committee prepares a report to the Board within one business day following the seventh consecutive calendar day with an explanation of how the Fund plans to restore its HLIM within a reasonable period of time.
Based on the HLIM model, the Committee has determined that the Fund qualifies as a Primarily Highly Liquid Fund (PHLF). It is therefore not required to establish a HLIM. The Fund is tested quarterly to confirm its PHLF status.
As part of its annual assessment of the LRMP, the Committee reviewed the policies and procedures in place with respect to HLIM and PHLF determinations, and determined that such policies and procedures are operating in a manner that is adequate and effective as part of the LRMP.
Compliance with the 15% limit on illiquid investments
Rule 22e-4 sets an aggregate illiquid investment limit of 15% for a fund. Funds are prohibited from acquiring an illiquid investment if this results in greater than 15% of its net assets being classified as illiquid. When applying this limit, the Committee defines “illiquid investment” to mean any investment that the Fund reasonably expects cannot be sold or disposed of in current market conditions in seven calendar days or less without the sale or disposition significantly changing the market value of the investment. If a 15% illiquid investment limit breach occurs for longer than 1 business day, the Fund is required to notify the Board and provide a plan on how to bring illiquid investments within the 15% threshold, and after 7 days confidentially notify the Securities and Exchange Commission (the SEC).
In February 2019, as a result of extended security markets closures in connection with the Chinese New Year in certain countries, the SEC released guidance, and the Committee approved and adopted an Extended Market Holiday Policy to plan for and monitor known Extended Market Holidays (defined as all expected market holiday closures spanning four or more calendar days).
As part of its annual assessment of the LRMP, the Committee reviewed the policies and procedures in place with respect to the 15% illiquid investment limit and determined such policies and procedures are operating in a manner that is adequate and effective as part of the LMRP.
Reasonably Anticipated Trade Size determination
In order to assess the liquidity risk of a Fund, the Committee considers the impact on the Fund that redemptions of a RATS would have under both normal and reasonably foreseeable stressed conditions. Modelling the Fund’s RATS requires quantifying cash flow volatility and analyzing distribution channel concentration and redemption risk. The model is designed to estimate the amount of assets that the Fund could reasonably anticipate trading on a given day, during both normal and reasonably foreseeable stressed conditions, to satisfy redemption requests.
155
Statement regarding liquidity risk management
As part of its annual assessment of the LRMP, the Committee reviewed the policies and procedures in place with respect to RATS determinations and determined that such policies and procedures are operating in a manner that is adequate and effective at making RATS determinations as part of the LRMP.
Security-level liquidity classifications
When classifying the liquidity of portfolio securities, the Fund adheres to the liquidity classification procedures established by the Advisor. In assigning a liquidity classification to Fund portfolio holdings, the following key inputs, among others, are considered: the Fund’s RATS, feedback from the applicable Subadvisor on market-, trading- and investment-specific considerations, an assessment of current market conditions and fund portfolio holdings, and a value impact standard. The Subadvisor also provides position-level data to the Committee for use in monthly classification reconciliation in order to identify any classifications that may need to be changed as a result of the above considerations.
As part of its annual assessment of the LRMP, the Committee reviewed the policies and procedures in place with respect to security-level liquidity classifications and determined that such policies and procedures are operating in a manner that is adequate and effective as part of the LRMP.
Liquidity risk assessment
The Committee periodically reviews and assesses, the Fund’s liquidity risk, including its investment strategy and liquidity of portfolio investments during both normal and reasonably foreseeable stressed conditions (including whether the investment strategy is appropriate for an open-end fund, the extent to which the strategy involves a relatively concentrated portfolio or large positions in particular issuers, and the use of borrowings for investment purposes and derivatives), cash flow analysis during both normal and reasonably foreseeable stressed conditions, and holdings of cash and cash equivalents, as well as borrowing arrangements and other funding sources.
The Committee also monitors global events, such as the COVID-19 Coronavirus, that could impact the markets and liquidity of portfolio investments and their classifications.
As part of its annual assessment of the LRMP, the Committee reviewed Fund-Level Liquidity Risk Assessment Reports for each of the Funds and determined that the investment strategy for each Fund continues to be appropriate for an open-ended structure.
Adequacy and Effectiveness
Based on the review and assessment conducted by the Committee, the Committee has determined that the LRMP has been implemented, and is operating in a manner that is adequate and effective at assessing and managing the liquidity risk of each Fund.
156
Trustees and officers information
This chart provides information about the Trustees and Officers of John Hancock Funds II who oversee your John Hancock funds. Officers elected by the Trustees manage the day-to-day operations of the Funds and execute policies formulated by the Trustees.
INDEPENDENT TRUSTEES
| Name, Year of Birth | | | | Position with the Trust1 | | Principal Occupation(s) and
Other Directorships During Past Five Years |
|---|
Hassell H. McClellan
Born: 1945 | | | | Trustee (since 2005)
and Chairperson of the
Board (since 2017) | | Director/Trustee, Virtus Funds (since 2008); Director, The Barnes Group (since 2010); Associate Professor, The Wallace E. Carroll School of Management, Boston College (retired 2013).
Trustee (since 2005) and Chairperson of the Board (since 2017) of various trusts within the John Hancock Fund Complex. |
Charles L. Bardelis2
Born: 1941 | | | | | | Director, Island Commuter Corp. (marine transport).
Trustee of various trusts within the John Hancock Fund Complex (since 1988). |
| | | | | | Chief Executive Officer, Foresters Financial (since 2018); Chairman and Chief Executive Officer, Zillion Group, Inc. (formerly HealthFleet, Inc.) (healthcare) (2014–2018); Executive Vice President and Chief Executive Officer, U.S. Life Insurance Division of Genworth Financial, Inc. (insurance) (January 2014–July 2014); Senior Executive Vice President, Manulife Financial, President and Chief Executive Officer, John Hancock (1999–2012); Chairman and Director, John Hancock Investment Management LLC, John Hancock Investment Management Distributors LLC, and John Hancock Variable Trust Advisers LLC (2005–2010).
Trustee of various trusts within the John Hancock Fund Complex (2005–2014 and since 2015). |
Peter S. Burgess2
Born: 1942 | | | | | | Consultant (financial, accounting, and auditing matters) (since 1999); Certified Public Accountant; Partner, Arthur Andersen (independent public accounting firm) (prior to 1999); Director, Lincoln Educational Services Corporation (since 2004); Director, Symetra Financial Corporation (2010–2016); Director, PMA Capital Corporation (2004–2010).
Trustee of various trusts within the John Hancock Fund Complex (since 2005). |
William H. Cunningham
Born: 1944 | | | | Trustee
(since 2012 and 2005-2006) | | Professor, University of Texas, Austin, Texas (since 1971); former Chancellor, University of Texas System and former President of the University of Texas, Austin, Texas; Chairman (since 2009) and Director (since 2006), Lincoln National Corporation (insurance); Director, Southwest Airlines (since 2000); former Director, LIN Television (2009–2014).
Trustee of various trusts within the John Hancock Fund Complex (since 1986). |
| | | | | | Chief Executive Officer, Grace Fey Advisors (since 2007); Director and Executive Vice President, Frontier Capital Management Company (1988–2007); Director, Fiduciary Trust (since 2009).
Trustee of various trusts within the John Hancock Fund Complex (since 2008). |
157
Trustees and officers information
| Name, Year of Birth | | | | Position with the Trust1 | | Principal Occupation(s) and
Other Directorships During Past Five Years |
|---|
Deborah C. Jackson
Born: 1952 | | | | | | President, Cambridge College, Cambridge, Massachusetts (since 2011); Board of Directors, Massachusetts Women’s Forum (since 2018); Board of Directors, National Association of Corporate Directors/New England (since 2015); Board of Directors, Association of Independent Colleges and Universities of Massachusetts (2014–2017); Chief Executive Officer, American Red Cross of Massachusetts Bay (2002–2011); Board of Directors of Eastern Bank Corporation (since 2001); Board of Directors of Eastern Bank Charitable Foundation (since 2001); Board of Directors of American Student Assistance Corporation (1996–2009); Board of Directors of Boston Stock Exchange (2002–2008); Board of Directors of Harvard Pilgrim Healthcare (health benefits company) (2007–2011).
Trustee of various trusts within the John Hancock Fund Complex (since 2008). |
James M. Oates2
Born: 1946 | | | | | | Managing Director, Wydown Group (financial consulting firm) (since 1994); Chairman and Director, Emerson Investment Management, Inc. (2000–2015); Independent Chairman, Hudson Castle Group, Inc. (formerly IBEX Capital Markets, Inc.) (financial services company) (1997–2011); Director, Stifel Financial (since 1996); Director, Investor Financial Services Corporation (1995–2007); Director, Connecticut River Bancorp (1998–2014); Director/Trustee, Virtus Funds (since 1988).
Trustee (since 2004) and Chairperson of the Board (2005–2016) of various trusts within the John Hancock Fund Complex. |
Steven R. Pruchansky
Born: 1944 | | | | Trustee and Vice Chairperson
of the Board
(since 2012) | | Managing Director, Pru Realty (since 2017); Chairman and Chief Executive Officer, Greenscapes of Southwest Florida, Inc. (2000–2014); Director and President, Greenscapes of Southwest Florida, Inc. (until 2000); Member, Board of Advisors, First American Bank (until 2010); Managing Director, Jon James, LLC (real estate) (since 2000); Partner, Right Funding, LLC (2014–2017); Director, First Signature Bank & Trust Company (until 1991); Director, Mast Realty Trust (until 1994); President, Maxwell Building Corp. (until 1991).
Trustee (since 1992), Chairperson of the Board (2011–2012), and Vice Chairperson of the Board (since 2012) of various trusts within the John Hancock Fund Complex. |
Frances G. Rathke2,*
Born: 1960 | | | | | | Director, Northern New England Energy Corporation (since 2017); Director, Audit Committee Chair and Compensation Committee Member, Green Mountain Power Corporation (since 2016); Director, Treasurer and Finance & Audit Committee Chair, Flynn Center for Performing Arts (since 2016); Director, Audit Committee Chair and Compensation Committee Member, Planet Fitness (since 2016); Director, Citizen Cider, Inc. (high-end hard cider and hard seltzer company) (since 2016); Chief Financial Officer and Treasurer, Keurig Green Mountain, Inc. (2003–retired 2015); Independent Financial Consultant, Frances Rathke Consulting (strategic and financial consulting services) (2001–2003); Chief Financial Officer and Secretary, Ben & Jerry’s Homemade, Inc. (1989–2000, including prior positions); Senior Manager, Coopers & Lybrand, LLC (independent public accounting firm) (1982–1989). Trustee of various trusts within the John Hancock Fund Complex (since 2020). |
158
Trustees and officers information
| Name, Year of Birth | | | | Position with the Trust1 | | Principal Occupation(s) and
Other Directorships During Past Five Years |
|---|
Gregory A Russo
Born: 1949 | | | | | | Director and Audit Committee Chairman (since 2012), and Member, Audit Committee and Finance Committee (2011–2020), NCH Healthcare System, Inc. (holding company for multi-entity healthcare system); Director and Member (2012–2018), and Finance Committee Chairman (2014–2018), The Moorings, Inc. (nonprofit continuing care community); Vice Chairman, Risk & Regulatory Matters, KPMG LLP (KPMG) (2002–2006); Vice Chairman, Industrial Markets, KPMG (1998–2002); Chairman and Treasurer, Westchester County, New York, Chamber of Commerce (1986–1992); Director, Treasurer and Chairman of Audit and Finance Committees, Putnam Hospital Center (1989–1995); Director and Chairman of Fundraising Campaign, United Way of Westchester and Putnam Counties, New York (1990–1995).
Trustee of various trusts within the John Hancock Fund Complex (since 2008). |
NON-INDEPENDENT TRUSTEES3
| Name, Year of Birth | | | | Position with the Trust1 | | Principal Occupation(s) and
Other Directorships During Past Five Years |
|---|
Andrew G. Arnott
Born: 1971 | | | | President and Non-Independent Trustee
(Since 2017) | | Head of Wealth and Asset Management, United States and Europe, for John Hancock and Manulife (since 2018); Executive Vice President, John Hancock Financial Services (since 2009, including prior positions); Director and Executive Vice President, John Hancock Investment Management LLC (since 2005, including prior positions); Director and Executive Vice President, John Hancock Variable Trust Advisers LLC (since 2006, including prior positions); President, John Hancock Investment Management Distributors LLC (since 2004, including prior positions); President of various trusts within the John Hancock Fund Complex (since 2007, including prior positions).
Trustee of various trusts within the John Hancock Fund Complex (since 2017). |
Marianne Harrison
Born: 1963 | | | | Non-Independent Trustee
(since 2018) | | President and CEO, John Hancock (since 2017); President and CEO, Manulife Canadian Division (2013–2017); Member, Board of Directors, CAE Inc. (since 2019); Member, Board of Directors, MA Competitive Partnership Board (since 2018); Member, Board of Directors, American Council of Life Insurers (ACLI) (since 2018); Member, Board of Directors, Communitech, an industry-led innovation center that fosters technology companies in Canada (2017–2019); Member, Board of Directors, Manulife Assurance Canada (2015–2017); Board Member, St. Mary’s General Hospital Foundation (2014–2017); Member, Board of Directors, Manulife Bank of Canada (2013–2017); Member, Standing Committee of the Canadian Life & Health Assurance Association (2013–2017); Member, Board of Directors, John Hancock USA, John Hancock Life & Health, John Hancock New York (2012–2013).
Trustee of various trusts within the John Hancock Fund Complex (since 2018). |
159
Trustees and officers information
PRINCIPAL OFFICERS WHO ARE NOT TRUSTEES
| Name, Year of Birth | | | | Position with the Trust | | Principal Occupation(s) and
Other Directorships During Past Five Years |
|---|
Charles A. Rizzo
Born: 1957 | | | | Chief Financial Officer
(since 2007) | | Vice President, John Hancock Financial Services (since 2008); Senior Vice President, John Hancock Investment Management LLC and John Hancock Variable Trust Advisers LLC (since 2008); Chief Financial Officer of various trusts within the John Hancock Fund Complex (since 2007). |
Salvatore Schiavone
Born: 1965 | | | | Treasurer
(2007-2009 and since 2010, including prior positions) | | Assistant Vice President, John Hancock Financial Services (since 2007); Vice President, John Hancock Investment Management LLC and John Hancock Variable Trust Advisers LLC (since 2007); Treasurer of various trusts within the John Hancock Fund Complex (since 2007, including prior positions). |
Christopher (Kit) Sechler
Born: 1973 | | | | Chief Legal Officer and
Secretary
(since 2018) | | Vice President and Deputy Chief Counsel, John Hancock Investments (since 2015); Assistant Vice President and Senior Counsel (2009–2015), John Hancock Investment Management; Chief Legal Officer and Secretary of various trusts within the John Hancock Fund Complex (since 2018); Assistant Secretary of John Hancock Investment Management LLC and John Hancock Variable Trust Advisers LLC (since 2009). |
Trevor Swanberg
Born: 1979 | | | | Chief Compliance Officer
(since 2020) | | Chief Compliance Officer, various trusts within the John Hancock Fund Complex, John Hancock Investment Management LLC, and John Hancock Variable Trust Advisers LLC (since 2020); Deputy Chief Compliance Officer, various trusts within the John Hancock Fund Complex (2018–2020); Deputy Chief Compliance Officer, John Hancock Investment Management LLC and John Hancock Variable Trust Advisers LLC (2019–2020); Assistant Chief Compliance Officer, various trusts within the John Hancock Fund Complex (2016–2018); Assistant Chief Compliance Officer, John Hancock Investment Management LLC and John Hancock Variable Trust Advisers LLC (2016–2019); Vice President, State Street Global Advisors (2015–2016). |
| 1 | | Each Trustee holds office until his or her successor is elected and qualified, or until the Trustee’s death, retirement, resignation, or removal.Mr. Boyle has served as Trustee at various times prior to the date listed in the table. |
| 2 | | Member of the Audit Committee. |
| 3 | | The Trustee is a Non-Independent Trustee due to current or former positions with the Advisor and certain affiliates. |
| * | | Appointed as Independent Trustee effective as of September 15, 2020. |
The business address for all Trustees and Officers is 200 Berkeley Street, Boston, Massachusetts 02116-5010.
The Statement of Additional Information of the fund includes additional information about members of the Board of Trustees of the Trust and is available without charge, upon request, by calling 1-800-225-5291.
160
John Hancock Funds II
For more information
The Statement of Additional Information, a separate document with supplemental information not contained in the prospectus, includes additional information on the Board of Trustees and can be obtained without charge by calling 800-344-1029 or on the Securities and Exchange Commission (SEC) website at sec.gov.
PROXY VOTING POLICY A description of the trust’s proxy voting policies and procedures and information regarding how the trust voted proxies relating to portfolio securities during the most recent twelve-month period ended June 30 is available without charge, upon request, by calling 800-344-1029 or on the SEC website at sec.gov.
QUARTERLY PORTFOLIO DISCLOSURE The Trust’s complete schedule of portfolio holdings as of the end of the third month of every fiscal quarter are filed with the SEC on Form N-PORT within 60 days of the end of the fiscal quarter. N-PORT filings are available on our website and the SEC’s website, sec.gov.
The report is certified under the Sarbanes-Oxley Act, which requires mutual funds and other public companies to affirm that, to the best of their knowledge, the information in their financial reports is fairly and accurately stated in all material respects.
161

John Hancock Funds II
Annual report — table of contents
Manager’s commentary and fund performance (See below for each fund’s page #) | | 3 |
Shareholder expense example | | 9 |
Portfolio of investments (See below for each fund’s page #) | | 10 |
Statements of assets and liabilities | | 48 |
Statements of operations | | 50 |
Statements of changes in net assets | | 52 |
Notes to financial statements | | 54 |
Report of independent registered public accounting firm | | 70 |
Federal tax information | | 71 |
Evaluation of advisory and subadvisory agreements by the Board of Trustees | | 72 |
Statement regarding liquidity risk management | | 78 |
Trustees and officers information | | 80 |
Fund
| | | | Manager’s commentary and
fund performance | | Portfolio of
investments |
|---|
Asia Pacific Total Return Bond Fund | | | | | 4 | | | | 10 | |
| | | | | 5 | | | | 12 | |
| | | | | 6 | | | | 24 | |
Opportunistic Fixed Income Fund
(formerly Global Bond Fund) | | | | | 7 | | | | 31 | |
U.S. High Yield Bond Fund | | | | | 8 | | | | 41 | |
2
John Hancock Funds II
Manager’s commentary and fund performance
Fund performance
In the following pages we have set forth information regarding the performance of certain funds of John Hancock Funds II (the Trust). There are several ways to evaluate a fund’s historical performance. One can look at the total percentage change in value, the average annual percentage change, or the growth of a hypothetical $10,000 investment. With respect to all performance information presented, it is important to understand that past performance does not guarantee future results. Return and principal fluctuate, and shares, when redeemed, may be worth more or less than their original cost.
Performance tables
The performance tables show two types of total return information: cumulative and average annual total returns. A cumulative total return is an expression of a fund’s total change in share value in percentage terms over a set period of time—one, five, and ten years (or since the fund��s inception if less than the applicable period). An average annual total return takes the fund’s cumulative total return for a time period greater than one year and shows what would have happened if the fund had performed at a constant rate each year. The tables show all cumulative and average annual total returns, net of fees and expenses of the Trust, but do not reflect the expenses of any insurance company separate accounts (including a possible contingent deferred sales charge) that may invest in the funds, as applicable. If these were included, performance would be lower.
Graph—Change in value of $10,000 investment and comparative indexes
The performance graph for each fund (or portfolio), shows the change in value of a $10,000 investment over the life or ten-year period of each fund (or portfolio) whichever is shorter. Each fund’s (or portfolio’s) performance is compared with the performance of one or more broad-based securities indexes as a “benchmark.” All performance information includes the reinvestment of dividends and capital gain distributions, as well as the deduction of ongoing management fees and fund (or portfolio) operating expenses. The benchmarks used for comparison are unmanaged and include reinvestment of dividends and capital gains distributions, if any, but do not reflect any fees or expenses. Funds (or portfolios), that invest in multiple asset classes are compared with a customized benchmark. This benchmark comprises a set percentage allocation from each of the asset classes in which the fund invests.
Portfolio manager’s commentary
Finally, we have provided a commentary by each portfolio manager regarding each fund’s (or portfolio’s) performance during the period ended August 31, 2020. The views expressed are those of the portfolio managers as of August 31, 2020, and are subject to change based on market and other conditions. Information about a fund’s (or portfolio’s) holdings, asset allocation, or country diversification is historical and is no indication of future fund composition, which will vary. Information provided in this report should not be considered a recommendation to purchase or sell securities. The funds (or portfolios) are not insured by the Federal Deposit Insurance Corp., are not deposits or other obligations of, or guaranteed by, banks, and are subject to investment risks, including loss of principal amount invested. For a more detailed discussion of the risks associated with the funds (or portfolios), see the funds’ prospectuses.
“Bloomberg Barclays” is a registered trademark of Bloomberg LP. “J.P. Morgan” is a registered trademark of J.P. Morgan Securities LLC (the Investable Index Business). “FTSE” is a trading name of FTSE International Limited. BofA Securities, Inc. and its derivative and related logos are trademarks of Bank of America Corporation.
3
Asia Pacific Total Return Bond Fund
Subadvisor: Manulife Investment Management (US) LLC
Portfolio Managers: Neal Capecci, Endre Pedersen, Jimond Wong, CFA, CPA
INVESTMENT OBJECTIVE & POLICIES > The fund seeks to maximize total return. The fund seeks to generate capital appreciation and income by investing at least 80% of net assets (plus borrowings for investment purposes) in a diversified portfolio of bonds issued by governments, government agencies, international organizations issuing supranational bonds, and corporate issuers in Asia and the Asian region, including Australia and New Zealand.
CHANGE IN VALUE OF $10,000 INVESTMENT AND COMPARATIVE INDEXES
| Portfolio Composition* | | | | % of Total |
|---|
| | | | | 53.3 | |
Foreign government obligations | | | | | 43.3 | |
Short-term investments and other | | | | | 3.4 | |
* As a percentage of net assets.
PORTFOLIO MANAGERS’ COMMENTARY
Performance > For the year ended August 31, 2020, the Asia Pacific Total Return Bond Fund Class NAV shares returned 5.94% and a blend of 50% J.P. Morgan Asia Credit Index and 50% J.P. Morgan Emerging Local Markets Plus Asia Index returned 5.22%.
Environment > Over the period, market sentiment was mainly driven by COVID-19 developments. In early 2020, global financial markets experienced significant selloffs as the pandemic spread globally. Unprecedented monetary and fiscal stimulus and the gradual lifting of lockdown measures triggered strong rebounds in most global risk assets subsequently.
The Federal Reserve (“Fed”) cut the federal funds rate four times to a target range of 0.0% to 0.25% and launched a new quantitative easing program to purchase Treasuries, mortgage-backed securities and corporate bonds. In late August, Fed Chair Powell announced a major policy shift to “average inflation targeting”, allowing the Fed to run inflation above the 2% target for a sustained period before hiking rates.
In China, Caixin’s manufacturing Purchasing Managers’ Index ended the period at 53.1, the highest level since January 2011. The government set a target of creating nine million new jobs in urban areas and announced the issuance of $14 billion special pandemic bonds to support economic recovery. In July, U.S.-China tensions escalated as each country ordered the other to close its consulates.
Indian government bond yields moved lower amid monetary easing, and the Reserve Bank of India signaled it would keep interest rates steady for some time amid inflation uncertainties.
Indonesian government bond yields trended lower amid monetary easing, and Bank Indonesia indicated it would be on standby to purchase additional government debt until 2021.
Asian credit markets posted positive returns owing to positive carry and lower U.S. Treasury yields. Asian high-yield corporate bonds outperformed Asian investment-grade credit. Most Asian currencies appreciated against the U.S. dollar amid risk-on sentiment in Q2 2020. The Philippine peso was among the better-performing Asian currencies.
The fund’s overweight exposure to Indonesian bonds contributed to performance amid falling local bond yields. Its exposure to U.S.-dollar-denominated Asian credit also contributed as this segment outperformed the broader Asian bond market.
The fund’s exposure to selective Asian high-yield corporate bonds detracted from performance, particularly in Indonesian and Indian commodity companies.
We increased the fund’s exposure to U.S.-dollar-denominated Asian corporate bonds as credit spreads widened to more attractive levels. We also took profit from some U.S.-dollar-denominated Asian corporate bonds and offshore Chinese bonds amid strong performance.
| | | | | | | | | | | | | | | | |
|---|
PERFORMANCE TABLE1,2
|
|
|
| Average Annual Total Return
|
| Cumulative Total Return
|
|
|---|
Periods Ending August 31, 2020 | | | | | 1-year | | | | 5-year | | | | 10-year | | | | Since
Inception | | | | 5-year | | | | 10-year | | | | Since
Inception | |
Asia Pacific Total Return Bond Fund Class NAV (began 1/16/13) | | | | | 5.94 | | | | 5.22 | | | | — | | | | 2.75 | | | | 28.95 | | | | — | | | | 22.97 | |
J.P. Morgan Asia Credit Index3,4 | | | | | 5.95 | | | | 5.61 | | | | — | | | | 4.72 | | | | 31.39 | | | | — | | | | 42.14 | |
J.P. Morgan Emerging Local Markets Plus Asia Index4,5 | | | | | 4.39 | | | | 2.92 | | | | — | | | | 0.65 | | | | 15.49 | | | | — | | | | 5.04 | |
| | | | | 5.22 | | | | 4.29 | | | | — | | | | 2.69 | | | | 23.34 | | | | — | | | | 22.42 | |
| 1 | | Performance does not reflect the deduction of taxes on fund distributions or redemptions of fund shares. Past performance does not guarantee future results. |
| 2 | | Since inception, a portion of the Asia Pacific Total Return Bond Fund expenses was reimbursed. If such expenses had not been reimbursed, returns would be lower. |
| 3 | | The J.P. Morgan Asia Credit Index measures the performance of Asia ex Japan U.S.D. denominated bond market. |
| 4 | | It is not possible to invest directly in an index. Index figures do not reflect expenses or sales charges, which would result in lower returns. |
| 5 | | The J.P. Morgan Emerging Local Markets Plus Asia Index tracks total returns for local-currency-denominated money market instruments in over 20 emerging markets countries. |
| 6 | | The Blended Index is 50% J.P. Morgan Asia Credit Index and 50% J.P. Morgan Emerging Local Markets Plus Asia Index. |
The expense ratios of the fund, both net (including any fee waivers or expense limitations) and gross (excluding any fee waivers or expense limitations), are set forth according to the most recent publicly available prospectuses for the fund and may differ from the expense ratios disclosed in the financial highlights tables in this report. For Class NAV shares the gross expense is 0.82% and the net expense is 0.81%. Net expense reflect contractual expense limitations in effect until July 31, 2022 and are subject to change. Had the contractual fee waivers and expense limitations not been in place, gross expense would apply.
4
Core Bond Fund
Subadvisor: Wells Capital Management, Incorporated
Portfolio Managers: Maulik Bhansali, CFA, Thomas O’Connor, CFA, Jarad Vasquez
INVESTMENT OBJECTIVE & POLICIES > The fund seeks total return consisting of income and capital appreciation. Under normal market conditions, the fund invests at least 80% of its net assets (plus any borrowings for investment purposes) in a broad range of investment grade debt securities, including U.S. Government obligations, corporate bonds, mortgage-backed and other asset-backed securities, and money market instruments.
CHANGE IN VALUE OF $10,000 INVESTMENT AND COMPARATIVE INDEX
| Portfolio Composition* | | | | % of Total |
|---|
| | | | | 29.7 | |
| | | | | 28.8 | |
| | | | | 17.5 | |
| | | | | 8.3 | |
Collateralized mortgage obligations | | | | | 7.1 | |
Foreign government obligations | | | | | 1.2 | |
| | | | | 0.4 | |
| | | | | 7.0 | |
* As a percentage of total investments.
PORTFOLIO MANAGERS’ COMMENTARY
Performance > For the year ended August 31, 2020, the Core Bond Fund Class NAV shares returned 6.90% and the Bloomberg Barclays U.S. Aggregate Bond Index returned 6.47%.
Environment > After years of steady expansion, the U.S. economy received a traumatic shock in 2020 with the arrival of the COVID-19 virus. Public reaction and government-ordered lockdowns resulted in a collapse in economic activity with the second quarter of 2020 recording a nearly 10% drop in GDP. Unemployment swiftly soared to double digits. Most areas of consumption declined precipitously. Travel and leisure services bore the brunt of the disruption. Spurred by a negative demand shock, prices for many goods declined during the March-April period, pushing most inflation indicators substantially lower.
The Federal Reserve responded to the pandemic with a dramatic easing of monetary policy, setting overnight rate targets to near zero, as well as purchasing bonds for its own account. A host of credit support measures were put in place to improve the functioning of teetering financial markets. In their actions and rhetoric the monetary authorities made it clear that an aggressive posture to support the economic and financial markets would be in place as long as needed. Fiscal policy also responded swiftly to the pandemic in the form of relief payments to the general public as well as extended unemployment benefits. These measures more than offset the loss of income associated with unemployment increases and other wage losses for many people.
Economic activity probably bottomed in late April, and by the end of May both consumption and employment were turning around. Substantial job gains occurred while claims for unemployment insurance began to subside. Prices generally stabilized, with oil rallying from distressed levels and core inflation measures rebounding from their crisis lows. Stock indices hit new all-time highs over the course of the summer, while Treasury yields remained extremely low. Finally, credit spreads, which widened sharply in the March-April period, narrowed substantially in the ensuing few months.
Security selection in credit led excess returns during the 12-month period, particularly within the communications, utilities, healthcare and consumer subsectors but with good contributions across almost all subsectors. Security selection and positioning within agency pass-through securities was a significant contributor, with higher-coupon, call-protected specified pools leading the contributions. Sector overweights to credit, mortgage-backed securities (MBS) and asset-backed securities (ABS) were also additive, as spreads tightened significantly toward the end of this 12-month period.
Security selection in ABS was a detractor, driven by our exposure to student loan and rental car ABS which did not keep pace with the high quality fixed-rate auto and cards ABS that’s within the ABS index. Security selection in commercial mortgage-backed securities (CMBS) was a small detractor, although this was offset entirely by the sector effect. While credit selection overall was positive, we had several significant detractors in the energy and pipelines subsectors. Security selection in collateralized mortgage obligations (CMOs) was also very small detractor.
| | | | | | | | | | | | |
|---|
PERFORMANCE TABLE1,2
|
|
|
| Average Annual Total Return
|
| Cumulative Total Return
|
|
|---|
Periods Ending August 31, 2020 | | | | | 1-year | | | | 5-year | | | | 10-year | | | | 5-year | | | | 10-year | |
| | | | | 6.76 | | | | 4.08 | | | | 3.77 | | | | 22.14 | | | | 44.77 | |
| | | | | 6.90 | | | | 4.14 | | | | 3.82 | | | | 22.49 | | | | 45.46 | |
Bloomberg Barclays U.S. Aggregate Bond Index3,4 | | | | | 6.47 | | | | 4.33 | | | | 3.65 | | | | 23.60 | | | | 43.14 | |
| 1 | | Performance does not reflect the deduction of taxes on fund distributions or redemptions of fund shares. Past performance does not guarantee future results. |
| 2 | | Since inception, a portion of the Core Bond Fund expenses was reimbursed. If such expenses had not been reimbursed, returns would be lower. |
| 3 | | The Bloomberg Barclays U.S. Aggregate Bond Index is an unmanaged index of dollar-denominated and nonconvertible investment-grade debt issues. |
| 4 | | It is not possible to invest directly in an index. Index figures do not reflect expenses or sales charges, which would result in lower returns. |
The expense ratios of the fund, both net (including any fee waivers or expense limitations) and gross (excluding any fee waivers or expense limitations), are set forth according to the most recent publicly available prospectuses for the fund and may differ from the expense ratios disclosed in the financial highlights tables in this report. For Class 1 and Class NAV shares the gross expenses are 0.66% and 0.61%, respectively, and the net expenses are 0.65% and 0.60%, respectively. Net expenses reflect contractual expense limitations in effect until July 31, 2022 and are subject to change. Had the contractual fee waivers and expense limitations not been in place, gross expenses would apply.
5
High Yield Fund
Subadvisor: Western Asset Management Company Limited
Portfolio Managers: Michael C. Buchanan, CFA, Walter E. Kilcullen, S. Kenneth Leech
INVESTMENT OBJECTIVE & POLICIES > The fund seeks to realize an above-average total return over a market cycle of three to five years, consistent with reasonable risk. Under normal market conditions, the fund invests at least 80% of its net assets (plus any borrowings for investment purposes) at the time of investment in high yield securities.
CHANGE IN VALUE OF $10,000 INVESTMENT AND COMPARATIVE INDEX
| Portfolio Composition* | | | | % of Total |
|---|
| | | | | 84.9 | |
| | | | | 6.4 | |
| | | | | 4.2 | |
| | | | | 1.1 | |
Foreign government obligations | | | | | 1.0 | |
| | | | | 0.7 | |
| | | | | 0.7 | |
Short-term investments and other | | | | | 1.0 | |
* As a percentage of net assets.
PORTFOLIO MANAGERS’ COMMENTARY
Performance > For the year ended August 31, 2020, the High Yield Fund Class 1 shares returned 4.01% and the Bloomberg Barclays U.S. High Yield 2% Issuer Capped Index returned 4.65%.
Environment > High yield was trading at relatively historical tight spreads at the beginning of the period before widening substantially in the 1st quarter of 2020 due to the COVID-19 pandemic. The high-yield market, however, has roared back from the depths of late March following the announcements from the Fed that it would buy bonds downgraded due to the COVID-19 pandemic (“fallen angels”) and high-yield ETFs as well as a reopening of many parts of the US economy.
High-yield market technicals were also very supportive during the rally in Q2 and Q3. As mentioned, the Fed committed to buying high-yield ETFs and then pivoted to purchasing separate securities. Mutual fund inflows have been significant, with August marking the fifth consecutive month of inflows. Issuance has more than kept up with demand, with $101 billion in net new issuance and $150 billion in fallen angel volume having entered the market so far this year. High-yield companies are doing everything they can to bolster liquidity, which has included drawing $117 billion on their revolving lines of credit.
Asset class allocation detracted from relative performance given opportunistic exposure to bank loans and collateralized loan obligations (CLOs), which underperformed high-yield. Industry allocation also detracted from relative performance due in large part to underweights to the outperforming technology and consumer non-cyclical sectors. An overweight to outperforming banking sector and positioning in the underperforming REITs helped to offset some of the drag from technology and consumer non-cyclicals.
Issue selection was the largest contributor to relative returns largely due to issuer tilts within the communications, capital goods, and REITs sectors. Rating positioning also aided relative performance given the strategy’s underweight to CCCs, as higher quality outperformed during the period. Duration positioning aided relative performance given an overweight stance as rates fell significantly over the period, particularly in Q1.
The fund’s investment in U.S. Treasury futures and options and credit default swaps marginally aided performance on a standalone basis. Options used to manage the fund’s overall corporate bond exposure were a detractor for returns over the period.
| | | | | | | | | | | | |
|---|
PERFORMANCE TABLE1,2
|
|
|
| Average Annual Total Return
|
| Cumulative Total Return
|
|
|---|
Periods Ending August 31, 2020 | | | | | 1-year | | | | 5-year | | | | 10-year | | | | 5-year | | | | 10-year | |
| | | | | 4.01 | | | | 5.40 | | | | 6.01 | | | | 30.08 | | | | 79.18 | |
Bloomberg Barclays U.S. High Yield 2% Issuer Capped Index3,4 | | | | | 4.65 | | | | 6.45 | | | | 6.88 | | | | 36.67 | | | | 94.57 | |
| 1 | | Performance does not reflect the deduction of taxes on fund distributions or redemptions of fund shares. Past performance does not guarantee future results. |
| 2 | | Since inception, a portion of the High Yield Fund expenses was reimbursed. If such expenses had not been reimbursed, returns would be lower. |
| 3 | | The Bloomberg Barclays U.S. High Yield 2% Issuer Capped Index measures the performance of high yield corporate bonds, with a maximum allocation of 2% to any one issuer. |
| 4 | | It is not possible to invest directly in an index. Index figures do not reflect expenses or sales charges, which would result in lower returns. |
The expense ratios of the fund, both net (including any fee waivers or expense limitations) and gross (excluding any fee waivers or expense limitations), are set forth according to the most recent publicly available prospectuses for the fund and may differ from the expense ratios disclosed in the financial highlights tables in this report. For Class 1 shares the gross expense is 0.82% and the net expense is 0.81%. Net expense reflect contractual expense limitations in effect until July 31, 2022 and are subject to change. Had the contractual fee waivers and expense limitations not been in place, gross expense would apply.
6
Opportunistic Fixed Income Fund (formerly Global Bond Fund)
Subadvisor: Wellington Management Company LLP. Prior to February 28, 2020, Pacific Investment Management Company LLC served as the fund’s subadvisor.
Portfolio Managers: Brian M. Garvey, Brij S. Khurana
INVESTMENT OBJECTIVE & POLICIES > The fund seeks maximum total return, consistent with preservation of capital and prudent investment management. Under normal market conditions, the fund invests at least 80% of its net assets (plus any borrowings for investment purposes) in fixed-income instruments. Fixed Income instruments include, but are not limited to the following securities, which may be denominated in U.S. dollars or foreign currencies: sovereign debt, inflation-linked bonds, corporate and high yield credit (also known as “junk bonds”), securitized debt, bank loans and floating rate loans and emerging markets debt, convertible and hybrid securities.
CHANGE IN VALUE OF $10,000 INVESTMENT AND COMPARATIVE INDEXES
| Portfolio Composition* | | | | % of Total |
|---|
Foreign government obligations | | | | | 47.2 | |
Collateralized mortgage obligations | | | | | 9.5 | |
| | | | | 8.2 | |
| | | | | 6.7 | |
| | | | | 5.9 | |
| | | | | 4.8 | |
| | | | | 4.8 | |
| | | | | 3.5 | |
| | | | | 2.7 | |
| | | | | 0.5 | |
Short-term investments and other | | | | | 6.2 | |
* As a percentage of net assets.
PORTFOLIO MANAGERS’ COMMENTARY
Performance > For the year ended August 31, 2020, the Opportunistic Fixed Income Fund Class 1 shares returned 9.15% and the Bloomberg Barclays Global Aggregate USD Hedged Index returned 3.28%. On February 28, 2020, Wellington Management Company LLP replaced Pacific Investment Management Company LLC as the fund’s subadvisor.
Environment > Positive developments in the U.S.-China trade discussions continued to support risk sentiment and capped a year of strong risk asset returns. At the end of 2019, U.S. equities closed at new highs, credit spreads tightened, developed market yields broadly rose, curves steepened, and the dollar weakened. While global economic data largely remained mixed, there were some tentative signs of stabilization and central banks broadly held policy steady (and were still accommodative). Meanwhile, geopolitical developments — including a potential Brexit draft deal, as well as a slew of political protests across a number of countries continued to persist in various regions across the world.
Fresh economic risks in January, particularly heightened US-Iran tensions and the coronavirus outbreak, sparked an uptick in market volatility. “Safe haven” assets rallied — developed market yields fell across the board and curves flattened, while credit spreads widened and the dollar strengthened.
In March 2020, extreme risk aversion and impaired liquidity conditions led to investors exiting all other fixed income sectors seeking the safety of US Treasuries resulting in significant declines in US Treasury yields and significant appreciation for the US dollar. Later in the period, positive economic data, accommodative global monetary policies, and healthy demand for credit supported most spread sectors as countries began to gradually emerge from economic lockdowns.
Pacific Investment Management Company LLC (period from September 1, 2019 through February 27, 2020)
Overall, interest rate strategies, which were partially facilitated through the use of futures, interest rate swaps, and options, were negative for returns over the period under review. Underweight exposure to Germany and France contributed to performance as rates rose. However, these gains were tempered by losses in other positions in European core and peripheral interest rates. Spread strategies contributed to overall performance. Overweight exposure to high yield corporate credit contributed as high yield corporate spreads tightened. Furthermore, overweight positions in both agency and non-agency mortgage-backed securities (MBS) added to performance. Overall, currency positions, which were partially implemented through the use of currency forwards, contributed to performance. Losses from overweight exposure to the Japanese yen relative to the U.S. dollar were more than offset by gains from overweight positioning to the British Pound and a basket of emerging market currencies.
Wellington Management Company LLP (period from February 28, 2020 through August 31, 2020)
Developed market inflation-linked bonds within the fund’s Activist Governments theme contributed as aggressive fiscal and monetary stimulus by many of the world’s central banks increased inflation expectations. As the spread of COVID-19 negatively impacted credit markets the Targeted Asset-Backed Securities Loan Facility (TALF) was established, increasing liquidity for the purchase of AAA rated asset-backed securities (ABS). We expected the TALF program would offer opportunities in other areas of the structured credit market and additions of non-TALF eligible assets to the fund paid off. Market Neutral and Tactical strategies also contributed positively. Following the prior liquidity squeeze, we took advantage of new issue concessions across the investment grade (IG) market as well as opportunities in the US Agency MBS space as markets re-opened. Emerging market sovereign exposure within the Emerging Market Opportunities theme was a detractor amongst the strategic themes. From a sector perspective, nominal government, MBS, and inflation-linked bonds were the largest contributors to performance during the period under review; exposures within high yield detracted.
Use of derivatives in the form of credit-default swaps, bond futures, and currency forwards contributed to performance during the period under review.
| | | | | | | | | | | | |
|---|
PERFORMANCE TABLE1,2
|
|
|
| Average Annual Total Return
|
| Cumulative Total Return
|
|
|---|
Periods Ending August 31, 2020 | | | | | 1-year | | | | 5-year | | | | 10-year | | | | 5-year | | | | 10-year | |
Opportunistic Fixed Income Fund Class 1 | | | | | 9.15 | | | | 4.97 | | | | 3.53 | | | | 27.45 | | | | 41.54 | |
Bloomberg Barclays Global Aggregate USD Hedged Index3,4,5 | | | | | 3.28 | | | | 4.37 | | | | 3.86 | | | | 23.84 | | | | 45.98 | |
Bloomberg Barclays Global Aggregate Index5,6 | | | | | 5.54 | | | | 4.10 | | | | 2.63 | | | | 22.28 | | | | 29.67 | |
| 1 | | Performance does not reflect the deduction of taxes on fund distributions or redemptions of fund shares. Past performance does not guarantee future results. |
| 2 | | Since inception, a portion of the Global Bond Fund expenses was reimbursed. If such expenses had not been reimbursed, returns would be lower. |
| 3 | | Effective February 28, 2020, the fund’s benchmark changed from the Bloomberg Barclays Global Aggregate Index to the Bloomberg Barclays Global Aggregate USD Hedged Index to better reflect the universe of investment opportunities based on the fund’s revised principal investment strategies. |
| 4 | | The Bloomberg Barclays Global Aggregate USD Hedged Index measures global investment grade debt from twentyfour local currency markets. |
| 5 | | It is not possible to invest directly in an index. Index figures do not reflect expenses or sales charges, which would result in lower returns. |
| 6 | | The Bloomberg Barclays Global Aggregate Bond Index is an unmanaged index of global investment-grade debt securities. |
The expense ratios of the fund, both net (including any fee waivers or expense limitations) and gross (excluding any fee waivers or expense limitations), are set forth according to the most recent publicly available prospectuses for the fund and may differ from the expense ratios disclosed in the financial highlights tables in this report. For Class 1 shares the gross expense is 1.20 % and the net expense is 1.19%. Net expense reflect contractual expense limitations in effect until July 31, 2022 and are subject to change. Had the contractual fee waivers and expense limitations not been in place, gross expense would apply.
7
U.S. High Yield Bond Fund
Subadvisor: Wells Capital Management, Incorporated
Portfolio Managers: Chris Lee, CFA, Mike Schueller, CFA
INVESTMENT OBJECTIVE & POLICIES > The fund seeks total return with a high level of current income. Under normal market conditions, the fund invests at least 80% of its net assets (plus any borrowings for investment purposes) in U.S. corporate debt securities that are, at the time of investment, below investment grade, including preferred and other convertible securities that are below-investment-grade (sometimes referred to as “junk bonds” or high yield securities).
CHANGE IN VALUE OF $10,000 INVESTMENT AND COMPARATIVE INDEX
| Portfolio Composition* | | | | % of Total |
|---|
| | | | | 94.7 | |
| | | | | 2.9 | |
| | | | | 0.4 | |
| | | | | 0.1 | |
Short-term investments and other | | | | | 1.9 | |
* As a percentage of net assets.
PORTFOLIO MANAGERS’ COMMENTARY
Performance > For the year ended August 31, 2020, the U.S. High Yield Bond Fund Class NAV shares returned 4.67% and the ICE Bank of America U.S. High Yield Index returned 3.71%.
Environment > After years of steady expansion, the U.S. economy received a traumatic shock in 2020 with the arrival of the COVID-19 virus. Public reaction and government-ordered lockdowns resulted in a collapse in economic activity with the second quarter of 2020 recording a nearly 10% drop in GDP. Unemployment swiftly soared to double digits. Most areas of consumption declined precipitously. Travel and leisure services bore the brunt of the disruption. Spurred by a negative demand shock, prices for many goods declined during the March-April period, pushing most inflation indicators substantially lower.
The Federal Reserve responded to the pandemic with a dramatic easing of monetary policy, setting overnight rate targets to near zero, as well as purchasing bonds for its own account. A host of credit support measures were put in place to improve the functioning of teetering financial markets. In their actions and rhetoric the monetary authorities made it clear that an aggressive posture to support the economic and financial markets would be in place as long as needed. Fiscal policy also responded swiftly to the pandemic in the form of relief payments to the general public as well as extended unemployment benefits. These measures more than offset the loss of income associated with unemployment increases and other wage losses for many people.
Economic activity probably bottomed in late April, and by the end of May both consumption and employment were turning around. Substantial job gains occurred while claims for unemployment insurance began to subside. Prices generally stabilized, with oil rallying from distressed levels and core inflation measures rebounding from their crisis lows. Stock indices hit new all-time highs over the course of the summer, while Treasury yields remained extremely low. Finally, credit spreads, which widened sharply in the March-April period, narrowed substantially in the ensuing few months.
Security selection was the primary driver of outperformance. Strong selection within energy, in particular midstream and oil field services sectors contributed to relative performance. In particular, “fallen angels” Occidental Petroleum Corp. and Western Midstream Operating LP were important outperformers. Underweights to and strong selection within aerospace and leisure were also notably positive. Sector allocation was a net detractor from relative performance. While an overweight to energy was negative, strong selection within the sector more than offset the impact from allocation. Maturity allocation was slightly negative: an underweight the 7-10 year bucket was detractive. The net impact from ratings allocation was also modestly negative after adjusting for unrated issues, due largely to an underweight higher quality double-B credits, though that impact was also pared by strong selection.
| | | | | | | | | | | | |
|---|
PERFORMANCE TABLE1,2
|
|
|
| Average Annual Total Return
|
| Cumulative Total Return
|
|
|---|
Periods Ending August 31, 2020 | | | | | 1-year | | | | 5-year | | | | 10-year | | | | 5-year | | | | 10-year | |
U.S. High Yield Bond Fund Class 1 | | | | | 4.67 | | | | 5.75 | | | | 6.02 | | | | 32.23 | | | | 79.43 | |
U.S. High Yield Bond Fund Class NAV | | | | | 4.73 | | | | 5.79 | | | | 6.06 | | | | 32.48 | | | | 80.12 | |
ICE BofA U.S. High Yield Index3,4 | | | | | 3.71 | | | | 6.28 | | | | 6.70 | | | | 35.57 | | | | 91.26 | |
| 1 | | Performance does not reflect the deduction of taxes on fund distributions or redemptions of fund shares. Past performance does not guarantee future results. |
| 2 | | Since inception, a portion of the U.S. High Yield Bond Fund expenses was reimbursed. If such expenses had not been reimbursed, returns would be lower. |
| 3 | | The ICE BofA U.S. High Yield Index (formerly known as ICE BofA Merrill Lynch U.S. High Yield Master II Index) is an unmanaged index composed of U.S. currency high-yield bonds issued by U.S. and non-U.S. issuers. |
| 4 | | It is not possible to invest directly in an index. Index figures do not reflect expenses or sales charges, which would result in lower returns. |
The expense ratios of the fund, both net (including any fee waivers or expense limitations) and gross (excluding any fee waivers or expense limitations), are set forth according to the most recent publicly available prospectuses for the fund and may differ from the expense ratios disclosed in the financial highlights tables in this report. For Class 1 and Class NAV shares the gross expenses are 0.87% and 0.82%, respectively, and the net expenses are 0.86% and 0.81%, respectively. Net expenses reflect contractual expense limitations in effect until July 31, 2022 and are subject to change. Had the contractual fee waivers and expense limitations not been in place, gross expenses would apply.
8
John Hancock Funds II
Shareholder expense example
As a shareholder of John Hancock Funds II, you incur ongoing costs, such as management fees, distribution (Rule 12b-1) fees and other expenses.
These examples are intended to help you understand your ongoing costs (in dollars) of investing in a fund so you can compare these costs with the ongoing costs of investing in other mutual funds. The examples are based on an investment of $1,000 at the beginning of the period and held for the entire period (March 1, 2020 through August 31, 2020).
Actual expenses:
The first line of each share class in the following table provides information about actual account values and actual expenses. You may use the information in this line, together with the amount you invested, to estimate the expenses that you paid over the period. Simply divide your account value by $1,000 (for example, an $8,600 account value divided by $1,000 = 8.6), then multiply the result by the number in the first line under the heading entitled “Expenses paid during period ended” to estimate the expenses you paid on your account during this period.
Hypothetical example for comparison purposes:
The second line of each share class in the following table provides information about hypothetical account values and hypothetical expenses based on the actual expense ratio for the share class and an assumed annualized rate of return of 5% per year before expenses, which is not the actual return of the share class. The hypothetical account values and expenses may not be used to estimate the actual ending account balance or expenses you paid for the period. You may use this information to compare the ongoing costs of investing in the portfolio and other funds. To do so, compare this 5% hypothetical example with the 5% hypothetical examples that appear in the shareholder reports of the other funds. Please remember that these hypothetical account values and expenses may not be used to estimate the actual ending account balance or expenses you paid for the period.
Please note that the expenses shown in the table are meant to highlight your ongoing costs only and do not reflect any transactional costs and insurance-related charges. Therefore, the second line of each share class in the table is useful in comparing ongoing costs only, and will not help you determine the relative total costs of owning different funds. In addition, if these transactional costs were included, your costs would have been higher.
| | | Account
value on
3-1-2020 | Ending
value on
8-31-2020 | Expenses
paid during
period ended
8-31-20201 | Annualized
expense
ratio |
| Asia Pacific Total Return Bond Fund |
| Class NAV | Actual expenses/actual returns | $1,000.00 | $1,023.40 | $4.32 | 0.85% |
| | Hypothetical example | 1,000.00 | 1,020.90 | 4.32 | 0.85% |
| Core Bond Fund |
| Class 1 | Actual expenses/actual returns | $1,000.00 | $1,035.80 | $3.33 | 0.65% |
| | Hypothetical example | 1,000.00 | 1,021.90 | 3.30 | 0.65% |
| Class NAV | Actual expenses/actual returns | 1,000.00 | 1,036.10 | 3.07 | 0.60% |
| | Hypothetical example | 1,000.00 | 1,022.10 | 3.05 | 0.60% |
| High Yield Fund |
| Class 1 | Actual expenses/actual returns | $1,000.00 | $1,017.20 | $4.26 | 0.84% |
| | Hypothetical example | 1,000.00 | 1,020.90 | 4.27 | 0.84% |
| Opportunistic Fixed Income Fund |
| Class 1 | Actual expenses/actual returns | $1,000.00 | $1,057.50 | $4.40 | 0.85% |
| | Hypothetical example | 1,000.00 | 1,020.90 | 4.32 | 0.85% |
| U.S. High Yield Bond Fund |
| Class 1 | Actual expenses/actual returns | $1,000.00 | $1,035.60 | $4.45 | 0.87% |
| | Hypothetical example | 1,000.00 | 1,020.80 | 4.42 | 0.87% |
| Class NAV | Actual expenses/actual returns | 1,000.00 | 1,035.90 | 4.20 | 0.82% |
| | Hypothetical example | 1,000.00 | 1,021.00 | 4.17 | 0.82% |
| 1 | Expenses are equal to the annualized expense ratio, multiplied by the average account value over the period, multiplied by 184/366 (to reflect the one-half year period). |
John Hancock Funds II
Portfolio of Investments — August 31, 2020 (showing percentage of total net assets)
Asia Pacific Total Return Bond Fund
| | | Shares or
Principal
Amount | | Value |
| FOREIGN GOVERNMENT OBLIGATIONS - 43.3% | | | |
| India - 1.2% | | | | | |
Republic of India
7.590%, 01/11/2026 | INR | 150,000,000 | | $ | 2,196,458 |
| Indonesia - 16.1% | | | | | |
| Republic of Indonesia | | | | | |
| 3.700%, 10/30/2049 | $ | 1,500,000 | | | 1,624,830 |
| 3.850%, 10/15/2030 | | 2,513,000 | | | 2,879,622 |
| 4.750%, 02/11/2029 | | 2,000,000 | | | 2,395,520 |
| 6.500%, 06/15/2025 | IDR | 38,000,000,000 | | | 2,717,364 |
| 6.625%, 05/15/2033 | | 71,945,000,000 | | | 4,705,410 |
| 7.000%, 05/15/2027 to 09/15/2030 | | 74,000,000,000 | | | 5,172,127 |
| 8.250%, 05/15/2029 | | 35,000,000,000 | | | 2,627,193 |
| 8.375%, 03/15/2024 to 04/15/2039 | | 88,000,000,000 | | | 6,539,721 |
| | | | | | 28,661,787 |
| Malaysia - 7.5% | | | | | |
| Government of Malaysia | | | | | |
| 3.757%, 04/20/2023 | MYR | 26,000,000 | | | 6,548,909 |
| 4.181%, 07/15/2024 | | 18,000,000 | | | 4,657,362 |
| 4.392%, 04/15/2026 | | 8,000,000 | | | 2,143,473 |
| | | | | | 13,349,744 |
| Philippines - 2.1% | | | | | |
| Republic of the Philippines | | | | | |
| 3.625%, 09/09/2025 | PHP | 42,233,286 | | | 910,890 |
| 3.900%, 11/26/2022 | | 131,000,000 | | | 2,746,147 |
| | | | | | 3,657,037 |
| Singapore - 1.3% | | | | | |
Republic of Singapore
2.750%, 07/01/2023 | SGD | 3,000,000 | | | 2,352,201 |
| South Korea - 12.1% | | | | | |
Export-Import Bank of Korea
6.200%, 08/07/2021 | INR | 137,000,000 | | | 1,872,756 |
| Republic of Korea | | | | | |
| 1.375%, 06/10/2030 | KRW | 3,000,000,000 | | | 2,492,590 |
| 1.875%, 06/10/2029 | | 7,000,000,000 | | | 6,062,249 |
| 2.000%, 09/10/2022 | | 4,800,000,000 | | | 4,131,859 |
| 2.375%, 03/10/2023 | | 8,000,000,000 | | | 6,974,416 |
| | | | | | 21,533,870 |
| Thailand - 3.0% | | | | | |
| Kingdom of Thailand | | | | | |
| 1.200%, 07/14/2021 | THB | 129,055,200 | | | 4,130,361 |
| 1.585%, 12/17/2035 | | 40,491,000 | | | 1,289,869 |
| | | | | | 5,420,230 |
| TOTAL FOREIGN GOVERNMENT OBLIGATIONS (Cost $77,044,909) | | $ | 77,171,327 |
| CORPORATE BONDS - 53.3% | | | |
| Australia - 0.9% | | | | | |
National Australia Bank, Ltd.
2.332%, 08/21/2030 (A) | $ | 1,555,000 | | | 1,552,877 |
| China - 12.3% | | | | | |
21Vianet Group, Inc.
7.875%, 10/15/2021 | | 2,000,000 | | | 2,040,054 |
China Aoyuan Group, Ltd.
7.950%, 09/07/2021 | | 2,500,000 | | | 2,553,183 |
China Hongqiao Group, Ltd.
7.125%, 07/22/2022 | | 1,700,000 | | | 1,636,250 |
China SCE Group Holdings, Ltd.
7.375%, 04/09/2024 | | 1,500,000 | | | 1,533,906 |
Country Garden Holdings Company, Ltd.
6.150%, 09/17/2025 | | 1,500,000 | | | 1,639,174 |
Franshion Brilliant, Ltd. (4.000% to 1-3-23, then 5 Year CMT + 5.238%)
01/03/2023 (B) | | 2,000,000 | | | 2,017,844 |
Asia Pacific Total Return Bond Fund (continued)
| | | Shares or
Principal
Amount | | Value |
| CORPORATE BONDS (continued) | | | |
| China (continued) | | | | | |
Logan Group Company, Ltd.
5.750%, 01/14/2025 | $ | 1,500,000 | | $ | 1,526,669 |
Longfor Group Holdings, Ltd.
3.950%, 09/16/2029 | | 2,400,000 | | | 2,550,079 |
New Metro Global, Ltd.
6.500%, 04/23/2021 | | 1,600,000 | | | 1,617,210 |
Redsun Properties Group, Ltd.
9.700%, 04/16/2023 | | 1,276,000 | | | 1,308,147 |
Yuzhou Properties Company, Ltd.
8.300%, 05/27/2025 | | 1,300,000 | | | 1,349,137 |
Zhenro Properties Group, Ltd.
8.650%, 01/21/2023 | | 2,000,000 | | | 2,077,854 |
| | | | | | 21,849,507 |
| Hong Kong - 14.0% | | | | | |
AIA Group, Ltd.
4.875%, 03/11/2044 | | 1,488,000 | | | 1,944,727 |
Bangkok Bank PCL (3.733% to 9-25-29, then 5 Year CMT + 1.900%)
09/25/2034 (A) | | 1,053,000 | | | 1,058,410 |
Chong Hing Bank, Ltd. (3.876% to 7-26-22, then 5 Year CMT + 2.030%)
07/26/2027 | | 1,800,000 | | | 1,799,820 |
CMB Wing Lung Bank, Ltd. (3.750% to 11-22-22, then 5 Year CMT + 1.750%)
11/22/2027 | | 1,500,000 | | | 1,532,650 |
CNAC HK Finbridge Company, Ltd.
3.875%, 06/19/2029 | | 1,000,000 | | | 1,101,886 |
Coastal Emerald, Ltd. (4.300% to 8-1-24, then 5 Year CMT + 7.445%)
08/01/2024 (B) | | 2,000,000 | | | 2,061,000 |
Concord New Energy Group, Ltd.
7.900%, 01/23/2021 | | 2,000,000 | | | 1,974,493 |
Dah Sing Bank Ltd. (5.000% to 1-15-24, then 5 Year CMT + 2.550%)
01/15/2029 | | 1,000,000 | | | 1,072,720 |
Far East Horizon, Ltd. (3 month LIBOR + 2.000%)
2.298%, 07/03/2021 (C) | | 2,300,000 | | | 2,283,900 |
GET International Investment Holdings, Ltd.
3.750%, 07/18/2022 | | 1,151,000 | | | 1,177,044 |
Kasikornbank PCL (3.343% to 10-2-26, then 5 Year CMT + 1.700%)
10/02/2031 | | 1,700,000 | | | 1,699,348 |
Shanghai Commercial Bank, Ltd. (3.750% to 11-29-22, then 5 Year CMT + 1.705%)
11/29/2027 | | 900,000 | | | 924,750 |
Weichai International Hong Kong Energy Group Company, Ltd. (3.750% to 9-14-22, then 5 Year CMT + 6.084%)
09/14/2022 (B) | | 2,730,000 | | | 2,761,508 |
Yingde Gases Investment, Ltd.
6.250%, 01/19/2023 (A) | | 2,000,000 | | | 2,072,645 |
Zoomlion HK SPV Company, Ltd.
6.125%, 12/20/2022 | | 1,500,000 | | | 1,561,875 |
| | | | | | 25,026,776 |
| India - 2.5% | | | | | |
Greenko Investment Company
4.875%, 08/16/2023 | | 1,000,000 | | | 1,000,161 |
| Indian Railway Finance Corp., Ltd. | | | | | |
| 3.950%, 02/13/2050 (A) | | 1,000,000 | | | 967,820 |
| 3.950%, 02/13/2050 | | 1,500,000 | | | 1,451,730 |
| The accompanying notes are an integral part of the financial statements. | 10 | |
John Hancock Funds II
Portfolio of Investments — August 31, 2020 (showing percentage of total net assets)
Asia Pacific Total Return Bond Fund (continued)
| | | Shares or
Principal
Amount | | Value |
| CORPORATE BONDS (continued) | | | |
| India (continued) | | | | | |
ReNew Power Synthetic
6.670%, 03/12/2024 | $ | 1,000,000 | | $ | 1,045,138 |
| | | | | | 4,464,849 |
| Indonesia - 5.8% | | | | | |
Adaro Indonesia PT
4.250%, 10/31/2024 (A) | | 2,217,000 | | | 2,183,745 |
Bayan Resources Tbk PT
6.125%, 01/24/2023 (A) | | 2,157,000 | | | 2,100,622 |
Chandra Asri Petrochemical Tbk PT
4.950%, 11/08/2024 | | 2,000,000 | | | 1,932,586 |
Jasa Marga Persero Tbk PT
7.500%, 12/11/2020 (A) | IDR | 11,300,000,000 | | | 756,891 |
Perusahaan Perseroan Persero PT Perusahaan Listrik Negara
6.150%, 05/21/2048 | $ | 2,500,000 | | | 3,281,250 |
| | | | | | 10,255,094 |
| Isle of Man - 1.4% | | | | | |
Gohl Capital, Ltd.
4.250%, 01/24/2027 | | 2,500,000 | | | 2,510,647 |
| Malaysia - 2.5% | | | | | |
Press Metal Labuan, Ltd.
4.800%, 10/30/2022 | | 2,800,000 | | | 2,710,618 |
SD International Sukuk, Ltd.
6.300%, 05/09/2022 | | 2,000,000 | | | 1,721,046 |
| | | | | | 4,431,664 |
| Mauritius - 1.1% | | | | | |
UPL Corp., Ltd.
4.500%, 03/08/2028 | | 2,000,000 | | | 2,045,448 |
| Singapore - 5.6% | | | | | |
| Indika Energy Capital III Pte, Ltd. | | | | | |
| 5.875%, 11/09/2024 (A) | | 1,200,000 | | | 1,131,336 |
| 5.875%, 11/09/2024 | | 1,800,000 | | | 1,697,004 |
Medco Oak Tree Pte, Ltd.
7.375%, 05/14/2026 (A) | | 1,500,000 | | | 1,521,508 |
Singapore Post, Ltd. (4.250% to 3-2-22, then 10 Year Singapore Swap Offered Rate + 3.692%)
03/02/2022 (B) | SGD | 5,000,000 | | | 3,787,305 |
TBLA International Pte, Ltd.
7.000%, 01/24/2023 | $ | 2,000,000 | | | 1,871,183 |
| | | | | | 10,008,336 |
| South Korea - 2.0% | | | | | |
The Korea Development Bank
7.000%, 11/30/2022 (A) | IDR | 52,000,000,000 | | | 3,612,415 |
Asia Pacific Total Return Bond Fund (continued)
| | | Shares or
Principal
Amount | | Value |
| CORPORATE BONDS (continued) | | | |
| Supranational - 2.8% | | | | | |
Asian Development Bank
6.450%, 08/08/2021 | INR | 360,000,000 | | $ | 4,961,721 |
| United States - 2.4% | | | | | |
Incitec Pivot Finance LLC
3.950%, 08/03/2027 | $ | 2,225,000 | | | 2,350,063 |
| Resorts World Las Vegas LLC | | | | | |
| 4.625%, 04/16/2029 (A) | | 1,500,000 | | | 1,416,660 |
| 4.625%, 04/16/2029 | | 600,000 | | | 566,664 |
| | | | | | 4,333,387 |
| TOTAL CORPORATE BONDS (Cost $93,985,835) | | $ | 95,052,721 |
| SHORT-TERM INVESTMENTS - 0.7% | | | |
| Short-term funds - 0.7% | | | | | |
| Federated Government Obligations Fund, Institutional Class, 0.0186% (D) | | 1,256,006 | | | 1,256,006 |
| TOTAL SHORT-TERM INVESTMENTS (Cost $1,256,006) | | $ | 1,256,006 |
Total Investments (Asia Pacific Total Return Bond Fund)
(Cost $172,286,750) - 97.3% | | $ | 173,480,054 |
| Other assets and liabilities, net - 2.7% | | | 4,822,986 |
| TOTAL NET ASSETS - 100.0% | | $ | 178,303,040 |
| Currency Abbreviations |
| IDR | Indonesian Rupiah |
| INR | Indian Rupee |
| KRW | Korean Won |
| MYR | Malaysian Ringgit |
| PHP | Philippine Peso |
| SGD | Singapore Dollar |
| THB | Thai Bhat |
| Security Abbreviations and Legend |
| CMT | Constant Maturity Treasury |
| LIBOR | London Interbank Offered Rate |
| (A) | These securities are exempt from registration under Rule 144A of the Securities Act of 1933. Such securities may be resold, normally to qualified institutional buyers, in transactions exempt from registration. Rule 144A securities amounted to $18,374,929 or 10.3% of the fund's net assets as of 8-31-20. |
| (B) | Perpetual bonds have no stated maturity date. Date shown as maturity date is next call date. |
| (C) | Variable rate obligation. The coupon rate shown represents the rate at period end. |
| (D) | The rate shown is the annualized seven-day yield as of 8-31-20. |
DERIVATIVES
FUTURES
| Open contracts | Number of
contracts | Position | Expiration
date | Notional
basis^ | Notional
value^ | Unrealized
appreciation
(depreciation) |
| 10-Year U.S. Treasury Note Futures | 180 | Short | Dec 2020 | $(24,960,560) | $(25,048,125) | $(87,565) |
| | | | | | | $(87,565) |
^ Notional basis refers to the contractual amount agreed upon at inception of open contracts; notional value represents the current value of the open contract.
See Notes to financial statements regarding investment transactions and other derivatives information.
| The accompanying notes are an integral part of the financial statements. | 11 | |
John Hancock Funds II
Portfolio of Investments — August 31, 2020 (showing percentage of total net assets)
Core Bond Fund
| | | Shares or
Principal
Amount | | Value |
U.S. GOVERNMENT AND AGENCY OBLIGATIONS –
53.9% | | | |
| U.S. Government – 20.0% | | | | | |
| U.S. Treasury Bonds | | | | | |
| 1.125%, 05/15/2040 to 08/15/2040 | $ | 50,848,000 | | $ | 49,855,842 |
| 1.250%, 05/15/2050 | | 11,923,000 | | | 11,244,879 |
| 1.375%, 08/15/2050 | | 12,298,000 | | | 11,975,178 |
| 2.500%, 02/15/2045 | | 19,551,000 | | | 23,889,642 |
| 2.750%, 11/15/2042 | | 40,285,000 | | | 51,217,027 |
| 2.875%, 05/15/2043 | | 33,130,000 | | | 42,947,351 |
| 3.125%, 08/15/2044 | | 11,528,000 | | | 15,582,163 |
| U.S. Treasury Notes | | | | | |
| 0.125%, 05/31/2022 to 08/15/2023 | | 143,807,000 | | | 143,714,869 |
| 0.250%, 06/15/2023 to 07/31/2025 | | 35,526,000 | | | 35,530,228 |
| 0.375%, 07/31/2027 | | 15,760,000 | | | 15,639,338 |
| 0.625%, 08/15/2030 | | 17,223,000 | | | 17,080,372 |
| 1.375%, 01/31/2021 to 05/31/2021 | | 91,017,000 | | | 91,670,868 |
| 2.125%, 05/15/2022 | | 626,000 | | | 647,054 |
| 2.250%, 04/30/2021 | | 12,711,000 | | | 12,887,266 |
| 2.375%, 03/15/2022 | | 6,494,000 | | | 6,715,963 |
| 3.125%, 05/15/2021 | | 11,840,000 | | | 12,085,125 |
| | | | | | 542,683,165 |
| U.S. Government Agency – 33.9% | | | | | |
| Federal Home Loan Mortgage Corp. | | | | | |
| 3.000%, 02/01/2050 | | 500,488 | | | 533,081 |
| 3.500%, 02/01/2048 to 11/01/2049 | | 14,493,254 | | | 15,573,212 |
| 4.000%, 01/01/2035 to 11/01/2049 | | 47,000,629 | | | 51,507,367 |
| 4.500%, 06/01/2039 to 08/01/2049 | | 16,046,318 | | | 17,939,173 |
| 5.000%, 05/01/2048 to 03/01/2049 | | 13,400,511 | | | 15,110,850 |
| Federal National Mortgage Association | | | | | |
| 1.500%, TBA (A) | | 21,900,000 | | | 22,378,513 |
| 2.000%, TBA (A) | | 133,000,000 | | | 137,211,008 |
| 2.500%, TBA (A) | | 91,000,000 | | | 95,429,551 |
| 2.678%, (12 month LIBOR + 1.586%), 01/01/2046 (B) | | 7,145,207 | | | 7,422,990 |
| 2.767%, (12 month LIBOR + 1.579%), 06/01/2045 (B) | | 2,001,446 | | | 2,074,962 |
| 3.000%, 01/01/2043 to 02/01/2050 | | 3,912,889 | | | 4,199,084 |
| 3.500%, 09/01/2032 to 11/01/2049 | | 14,774,333 | | | 15,737,934 |
| 4.000%, 09/01/2033 to 12/01/2049 | | 98,994,768 | | | 109,494,440 |
| 4.500%, 05/01/2034 to 01/01/2059 | | 85,753,760 | | | 96,244,323 |
| 5.000%, 07/01/2044 to 11/01/2049 | | 87,218,785 | | | 98,781,382 |
| 5.500%, 12/01/2048 to 06/01/2049 | | 10,577,332 | | | 12,021,983 |
Government National
Mortgage Association | | | | | |
| 2.000%, TBA (A) | | 56,900,000 | | | 58,673,289 |
| 2.500%, TBA (A) | | 33,300,000 | | | 35,027,234 |
| 3.000%, 02/20/2050 to 03/20/2050 | | 12,486,545 | | | 13,354,345 |
| 3.500%, 01/20/2048 to 08/20/2049 | | 6,566,615 | | | 7,218,485 |
| 4.000%, 06/20/2047 to 07/20/2049 | | 48,691,889 | | | 52,713,839 |
| 4.500%, 08/15/2047 to 05/20/2049 | | 14,039,583 | | | 15,476,095 |
| 5.000%, 12/20/2039 to 03/20/2049 | | 31,682,532 | | | 34,741,625 |
| | | | | | 918,864,765 |
| TOTAL U.S. GOVERNMENT AND AGENCY OBLIGATIONS (Cost $1,443,505,217) | | $ | 1,461,547,930 |
| FOREIGN GOVERNMENT OBLIGATIONS – 1.3% | | | |
| Bermuda – 0.0% | | | | | |
Government of Bermuda
3.375%, 08/20/2050 (C) | | 994,000 | | | 1,040,221 |
| Colombia – 0.1% | | | | | |
Republic of Colombia
3.125%, 04/15/2031 | | 2,208,000 | | | 2,294,134 |
| Indonesia – 0.1% | | | | | |
Republic of Indonesia
4.450%, 04/15/2070 | | 1,323,000 | | | 1,622,699 |
Core Bond Fund (continued)
| | | Shares or
Principal
Amount | | Value |
| FOREIGN GOVERNMENT OBLIGATIONS (continued) | | | |
| Israel – 0.1% | | | | | |
| State of Israel | | | | | |
| 3.375%, 01/15/2050 | $ | 818,000 | | $ | 900,863 |
| 4.500%, 12/31/2099 | | 913,000 | | | 1,253,624 |
| | | | | | 2,154,487 |
| Japan – 0.1% | | | | | |
Japan Bank for International Cooperation
1.750%, 10/17/2024 | | 2,264,000 | | | 2,377,092 |
| Mexico – 0.4% | | | | | |
| Government of Mexico | | | | | |
| 3.250%, 04/16/2030 | | 1,669,000 | | | 1,723,243 |
| 3.900%, 04/27/2025 | | 2,219,000 | | | 2,440,900 |
| 4.500%, 04/22/2029 | | 3,790,000 | | | 4,265,645 |
| 4.600%, 02/10/2048 | | 946,000 | | | 1,038,472 |
| 4.750%, 03/08/2044 | | 1,124,000 | | | 1,258,318 |
| 5.000%, 04/27/2051 | | 1,087,000 | | | 1,251,952 |
| | | | | | 11,978,530 |
| Paraguay – 0.1% | | | | | |
| Republic of Paraguay | | | | | |
| 4.950%, 04/28/2031 (C) | | 1,390,000 | | | 1,605,450 |
| 5.400%, 03/30/2050 (C) | | 1,740,000 | | | 2,190,677 |
| | | | | | 3,796,127 |
| Peru – 0.1% | | | | | |
| Republic of Peru | | | | | |
| 2.392%, 01/23/2026 | | 1,415,000 | | | 1,487,165 |
| 2.783%, 01/23/2031 | | 425,000 | | | 462,188 |
| | | | | | 1,949,353 |
| Qatar – 0.1% | | | | | |
State of Qatar
3.400%, 04/16/2025 (C) | | 3,436,000 | | | 3,767,677 |
| United Arab Emirates – 0.2% | | | | | |
Government of Abu Dhabi
2.500%, 04/16/2025 (C) | | 4,838,000 | | | 5,128,038 |
| TOTAL FOREIGN GOVERNMENT OBLIGATIONS (Cost $32,911,028) | | $ | 36,108,358 |
| CORPORATE BONDS – 32.8% | | | |
| Communication services – 3.0% | | | | | |
| Activision Blizzard, Inc. | | | | | |
| 1.350%, 09/15/2030 | | 900,000 | | | 877,565 |
| 2.500%, 09/15/2050 | | 1,038,000 | | | 973,773 |
| Alphabet, Inc. | | | | | |
| 1.900%, 08/15/2040 | | 602,000 | | | 585,334 |
| 2.250%, 08/15/2060 | | 1,204,000 | | | 1,143,566 |
| AT&T, Inc. | | | | | |
| 1.650%, 02/01/2028 | | 1,346,000 | | | 1,364,181 |
| 2.250%, 02/01/2032 | | 1,790,000 | | | 1,814,323 |
| 2.300%, 06/01/2027 | | 2,717,000 | | | 2,881,249 |
| 2.750%, 06/01/2031 | | 2,717,000 | | | 2,878,390 |
| 3.000%, 06/30/2022 | | 2,085,000 | | | 2,176,392 |
| 3.100%, 02/01/2043 | | 430,000 | | | 426,742 |
| 3.300%, 02/01/2052 | | 1,660,000 | | | 1,643,539 |
| 3.500%, 06/01/2041 | | 905,000 | | | 958,184 |
| 3.650%, 06/01/2051 | | 424,000 | | | 442,696 |
| 3.850%, 06/01/2060 | | 905,000 | | | 959,672 |
| 4.500%, 03/09/2048 | | 1,586,000 | | | 1,857,618 |
| 4.850%, 03/01/2039 | | 824,000 | | | 996,132 |
| 5.150%, 02/15/2050 | | 788,000 | | | 1,007,300 |
| 5.250%, 03/01/2037 | | 486,000 | | | 612,003 |
| 5.350%, 12/15/2043 | | 408,000 | | | 510,087 |
| 5.375%, 10/15/2041 | | 654,000 | | | 815,236 |
| Charter Communications Operating LLC | | | | | |
| 4.464%, 07/23/2022 | | 807,000 | | | 859,931 |
| 4.800%, 03/01/2050 | | 2,549,000 | | | 2,898,604 |
| The accompanying notes are an integral part of the financial statements. | 12 | |
John Hancock Funds II
Portfolio of Investments — August 31, 2020 (showing percentage of total net assets)
Core Bond Fund (continued)
| | | Shares or
Principal
Amount | | Value |
| CORPORATE BONDS (continued) | | | |
| Communication services (continued) | | | | | |
| Comcast Corp. | | | | | |
| 1.950%, 01/15/2031 | $ | 2,318,000 | | $ | 2,385,191 |
| 2.450%, 08/15/2052 | | 896,000 | | | 852,767 |
| 2.650%, 08/15/2062 | | 987,000 | | | 946,580 |
| 2.800%, 01/15/2051 | | 961,000 | | | 967,222 |
| 3.100%, 04/01/2025 | | 1,729,000 | | | 1,916,815 |
| 3.700%, 04/15/2024 | | 1,637,000 | | | 1,817,542 |
| 3.750%, 04/01/2040 | | 2,065,000 | | | 2,435,462 |
| 3.950%, 10/15/2025 | | 1,480,000 | | | 1,706,213 |
| 4.150%, 10/15/2028 | | 2,122,000 | | | 2,570,509 |
| 4.600%, 10/15/2038 | | 2,073,000 | | | 2,657,076 |
| The Walt Disney Company | | | | | |
| 3.500%, 05/13/2040 | | 1,034,000 | | | 1,162,131 |
| 3.600%, 01/13/2051 | | 928,000 | | | 1,049,189 |
| 3.800%, 05/13/2060 | | 644,000 | | | 748,294 |
Time Warner Cable LLC
6.550%, 05/01/2037 | | 583,000 | | | 777,880 |
| T-Mobile USA, Inc. | | | | | |
| 1.500%, 02/15/2026 (C) | | 2,260,000 | | | 2,292,612 |
| 2.050%, 02/15/2028 (C) | | 2,975,000 | | | 3,047,263 |
| 2.550%, 02/15/2031 (C) | | 2,047,000 | | | 2,140,425 |
| 3.500%, 04/15/2025 (C) | | 3,678,000 | | | 4,063,454 |
| 3.750%, 04/15/2027 (C) | | 2,795,000 | | | 3,160,893 |
| Verizon Communications, Inc. | | | | | |
| 3.000%, 03/22/2027 | | 850,000 | | | 948,876 |
| 3.500%, 11/01/2024 | | 1,975,000 | | | 2,195,868 |
| 4.016%, 12/03/2029 | | 1,019,000 | | | 1,222,785 |
| 4.272%, 01/15/2036 | | 362,000 | | | 442,618 |
| 4.400%, 11/01/2034 | | 1,774,000 | | | 2,213,661 |
| 4.522%, 09/15/2048 | | 1,103,000 | | | 1,443,013 |
| ViacomCBS, Inc. | | | | | |
| 4.200%, 05/19/2032 | | 2,664,000 | | | 3,023,453 |
| 4.375%, 03/15/2043 | | 246,000 | | | 262,140 |
| 4.600%, 01/15/2045 | | 158,000 | | | 171,553 |
| 4.750%, 05/15/2025 | | 1,403,000 | | | 1,619,572 |
| 4.950%, 05/19/2050 | | 31,000 | | | 35,983 |
| 5.850%, 09/01/2043 | | 593,000 | | | 738,509 |
Vodafone Group PLC
4.250%, 09/17/2050 | | 1,606,000 | | | 1,864,349 |
| | | | | | 81,562,415 |
| Consumer discretionary – 2.8% | | | | | |
Advance Auto Parts, Inc.
3.900%, 04/15/2030 | | 4,442,000 | | | 4,889,107 |
| Amazon.com, Inc. | | | | | |
| 1.500%, 06/03/2030 | | 3,604,000 | | | 3,678,739 |
| 2.500%, 06/03/2050 | | 991,000 | | | 996,829 |
| 2.700%, 06/03/2060 | | 901,000 | | | 919,797 |
AutoNation, Inc.
4.750%, 06/01/2030 | | 917,000 | | | 1,074,269 |
AutoZone, Inc.
1.650%, 01/15/2031 | | 1,804,000 | | | 1,780,640 |
Best Buy Company, Inc.
4.450%, 10/01/2028 | | 860,000 | | | 1,016,606 |
BorgWarner, Inc.
2.650%, 07/01/2027 | | 1,886,000 | | | 1,999,760 |
Daimler Finance North America LLC
2.125%, 03/10/2025 (C) | | 2,381,000 | | | 2,468,216 |
Dollar General Corp.
3.500%, 04/03/2030 | | 1,021,000 | | | 1,171,348 |
General Motors Company
5.400%, 04/01/2048 | | 1,260,000 | | | 1,381,257 |
| General Motors Financial Company, Inc. | | | | | |
| 1.700%, 08/18/2023 | | 2,783,000 | | | 2,799,486 |
| 2.700%, 08/20/2027 | | 2,797,000 | | | 2,792,695 |
| 2.750%, 06/20/2025 | | 4,782,000 | | | 4,937,962 |
Core Bond Fund (continued)
| | | Shares or
Principal
Amount | | Value |
| CORPORATE BONDS (continued) | | | |
| Consumer discretionary (continued) | | | | | |
General Motors Financial
Company, Inc. (continued) | | | | | |
| 2.900%, 02/26/2025 | $ | 2,147,000 | | $ | 2,230,860 |
| 4.350%, 04/09/2025 | | 491,000 | | | 536,866 |
| 5.200%, 03/20/2023 | | 2,805,000 | | | 3,059,655 |
Harley-Davidson Financial Services, Inc.
3.350%, 06/08/2025 (C) | | 1,735,000 | | | 1,841,202 |
| Lowe's Companies, Inc. | | | | | |
| 3.650%, 04/05/2029 | | 595,000 | | | 688,575 |
| 4.000%, 04/15/2025 | | 917,000 | | | 1,046,558 |
| 5.000%, 04/15/2040 | | 1,034,000 | | | 1,368,263 |
| Marriott International, Inc. | | | | | |
| 4.625%, 06/15/2030 | | 1,203,000 | | | 1,316,866 |
| 5.750%, 05/01/2025 | | 1,120,000 | | | 1,257,375 |
| McDonald's Corp. | | | | | |
| 1.450%, 09/01/2025 | | 657,000 | | | 678,138 |
| 2.125%, 03/01/2030 | | 241,000 | | | 250,408 |
| 3.700%, 01/30/2026 | | 1,295,000 | | | 1,478,694 |
| NIKE, Inc. | | | | | |
| 2.400%, 03/27/2025 | | 1,250,000 | | | 1,346,566 |
| 2.750%, 03/27/2027 | | 834,000 | | | 925,200 |
| 2.850%, 03/27/2030 | | 822,000 | | | 918,964 |
| 3.375%, 03/27/2050 | | 1,019,000 | | | 1,166,230 |
O'Reilly Automotive, Inc.
4.200%, 04/01/2030 | | 881,000 | | | 1,059,429 |
| Ralph Lauren Corp. | | | | | |
| 1.700%, 06/15/2022 | | 1,468,000 | | | 1,497,026 |
| 2.950%, 06/15/2030 | | 2,405,000 | | | 2,486,372 |
| Starbucks Corp. | | | | | |
| 1.300%, 05/07/2022 | | 1,076,000 | | | 1,092,901 |
| 3.350%, 03/12/2050 | | 423,000 | | | 431,038 |
| 3.500%, 11/15/2050 | | 645,000 | | | 683,374 |
| The Home Depot, Inc. | | | | | |
| 2.500%, 04/15/2027 | | 1,046,000 | | | 1,144,699 |
| 2.700%, 04/15/2030 | | 1,052,000 | | | 1,164,839 |
| 2.950%, 06/15/2029 | | 480,000 | | | 541,161 |
| 3.125%, 12/15/2049 | | 2,406,000 | | | 2,634,142 |
| 3.350%, 04/15/2050 | | 1,728,000 | | | 1,965,966 |
The Leland Stanford Junior University
1.289%, 06/01/2027 | | 347,000 | | | 353,688 |
The Trustees of the University of Pennsylvania
3.610%, 02/15/2119 | | 954,000 | | | 1,087,006 |
| Toyota Motor Credit Corp. | | | | | |
| 1.150%, 08/13/2027 | | 1,718,000 | | | 1,720,106 |
| 1.350%, 08/25/2023 | | 1,637,000 | | | 1,679,513 |
| Yale University | | | | | |
| 0.873%, 04/15/2025 | | 1,511,000 | | | 1,528,382 |
| 1.482%, 04/15/2030 | | 1,295,000 | | | 1,316,493 |
| | | | | | 74,403,266 |
| Consumer staples – 1.5% | | | | | |
Alimentation Couche-Tard, Inc.
3.800%, 01/25/2050 (C) | | 452,000 | | | 486,211 |
| Altria Group, Inc. | | | | | |
| 2.350%, 05/06/2025 | | 369,000 | | | 392,486 |
| 3.400%, 05/06/2030 | | 1,113,000 | | | 1,225,990 |
| 3.875%, 09/16/2046 | | 742,000 | | | 770,005 |
| 4.450%, 05/06/2050 | | 1,405,000 | | | 1,605,178 |
| Anheuser-Busch Companies LLC | | | | | |
| 4.700%, 02/01/2036 | | 1,535,000 | | | 1,830,740 |
| 4.900%, 02/01/2046 | | 247,000 | | | 303,759 |
| Anheuser-Busch InBev Worldwide, Inc. | | | | | |
| 4.150%, 01/23/2025 | | 1,782,000 | | | 2,027,461 |
| 4.600%, 04/15/2048 | | 1,131,000 | | | 1,345,292 |
| The accompanying notes are an integral part of the financial statements. | 13 | |
John Hancock Funds II
Portfolio of Investments — August 31, 2020 (showing percentage of total net assets)
Core Bond Fund (continued)
| | | Shares or
Principal
Amount | | Value |
| CORPORATE BONDS (continued) | | | |
| Consumer staples (continued) | | | | | |
| Bacardi, Ltd. | | | | | |
| 4.700%, 05/15/2028 (C) | $ | 1,537,000 | | $ | 1,789,683 |
| 5.300%, 05/15/2048 (C) | | 1,097,000 | | | 1,412,867 |
| BAT Capital Corp. | | | | | |
| 3.557%, 08/15/2027 | | 1,690,000 | | | 1,847,302 |
| 4.700%, 04/02/2027 | | 1,810,000 | | | 2,096,790 |
| 4.906%, 04/02/2030 | | 924,000 | | | 1,098,704 |
| Bunge, Ltd. Finance Corp. | | | | | |
| 1.630%, 08/17/2025 | | 2,234,000 | | | 2,246,412 |
| 3.750%, 09/25/2027 | | 1,277,000 | | | 1,386,176 |
| Constellation Brands, Inc. | | | | | |
| 3.200%, 02/15/2023 | | 414,000 | | | 438,838 |
| 3.700%, 12/06/2026 | | 695,000 | | | 800,164 |
| 3.750%, 05/01/2050 | | 1,360,000 | | | 1,493,849 |
| 4.400%, 11/15/2025 | | 124,000 | | | 144,648 |
| Costco Wholesale Corp. | | | | | |
| 1.600%, 04/20/2030 | | 5,105,000 | | | 5,225,785 |
| 1.750%, 04/20/2032 | | 1,315,000 | | | 1,353,980 |
Dollar General Corp.
4.125%, 04/03/2050 | | 194,000 | | | 232,414 |
General Mills, Inc.
2.875%, 04/15/2030 | | 604,000 | | | 664,130 |
Hormel Foods Corp.
1.800%, 06/11/2030 | | 1,892,000 | | | 1,960,238 |
Ingredion, Inc.
3.900%, 06/01/2050 | | 817,000 | | | 932,218 |
Keurig Dr Pepper, Inc.
3.800%, 05/01/2050 | | 883,000 | | | 1,019,633 |
| Mars, Inc. | | | | | |
| 1.625%, 07/16/2032 (C) | | 2,185,000 | | | 2,168,000 |
| 2.450%, 07/16/2050 (C) | | 546,000 | | | 521,692 |
| Sysco Corp. | | | | | |
| 2.400%, 02/15/2030 | | 882,000 | | | 878,898 |
| 6.600%, 04/01/2050 | | 445,000 | | | 613,855 |
| Walmart, Inc. | | | | | |
| 3.050%, 07/08/2026 | | 795,000 | | | 896,599 |
| 4.050%, 06/29/2048 | | 22,000 | | | 28,379 |
| | | | | | 41,238,376 |
| Energy – 2.3% | | | | | |
| BP Capital Markets America, Inc. | | | | | |
| 1.749%, 08/10/2030 | | 1,719,000 | | | 1,704,681 |
| 2.772%, 11/10/2050 | | 2,064,000 | | | 1,946,206 |
| 3.194%, 04/06/2025 | | 2,104,000 | | | 2,317,655 |
| 3.543%, 04/06/2027 | | 2,120,000 | | | 2,388,430 |
Concho Resources, Inc.
2.400%, 02/15/2031 | | 1,075,000 | | | 1,052,012 |
| Devon Energy Corp. | | | | | |
| 5.000%, 06/15/2045 | | 447,000 | | | 444,749 |
| 5.600%, 07/15/2041 | | 683,000 | | | 713,988 |
Diamondback Energy, Inc.
3.250%, 12/01/2026 | | 1,674,000 | | | 1,716,979 |
| Ecopetrol SA | | | | | |
| 5.875%, 05/28/2045 | | 901,000 | | | 1,022,455 |
| 6.875%, 04/29/2030 | | 429,000 | | | 516,409 |
| Enbridge, Inc. | | | | | |
| 2.500%, 01/15/2025 | | 4,006,000 | | | 4,223,951 |
| 3.125%, 11/15/2029 | | 1,833,000 | | | 1,973,506 |
| Energy Transfer Operating LP | | | | | |
| 6.050%, 06/01/2041 | | 394,000 | | | 397,664 |
| 6.125%, 12/15/2045 | | 331,000 | | | 336,043 |
| Enterprise Products Operating LLC | | | | | |
| 2.800%, 01/31/2030 | | 718,000 | | | 766,303 |
| 3.200%, 02/15/2052 | | 1,347,000 | | | 1,275,878 |
| 3.700%, 01/31/2051 | | 791,000 | | | 801,616 |
| 3.950%, 01/31/2060 | | 875,000 | | | 885,531 |
Core Bond Fund (continued)
| | | Shares or
Principal
Amount | | Value |
| CORPORATE BONDS (continued) | | | |
| Energy (continued) | | | | | |
Enterprise Products
Operating LLC (continued) | | | | | |
| 4.200%, 01/31/2050 | $ | 320,000 | | $ | 348,136 |
| Equinor ASA | | | | | |
| 1.750%, 01/22/2026 | | 1,297,000 | | | 1,358,597 |
| 3.250%, 11/18/2049 | | 622,000 | | | 666,765 |
Magellan Midstream Partners LP
3.250%, 06/01/2030 | | 1,731,000 | | | 1,870,513 |
Marathon Oil Corp.
4.400%, 07/15/2027 | | 1,661,000 | | | 1,703,126 |
| Marathon Petroleum Corp. | | | | | |
| 3.625%, 09/15/2024 | | 2,230,000 | | | 2,404,151 |
| 4.500%, 04/01/2048 | | 216,000 | | | 230,468 |
| 4.700%, 05/01/2025 | | 1,582,000 | | | 1,805,876 |
| 4.750%, 12/15/2023 | | 677,000 | | | 750,218 |
| MPLX LP | | | | | |
| 1.750%, 03/01/2026 | | 1,344,000 | | | 1,343,593 |
| 2.650%, 08/15/2030 | | 1,805,000 | | | 1,787,821 |
| Noble Energy, Inc. | | | | | |
| 3.850%, 01/15/2028 | | 399,000 | | | 452,591 |
| 3.900%, 11/15/2024 | | 922,000 | | | 1,022,706 |
| 4.200%, 10/15/2049 | | 756,000 | | | 915,615 |
| 4.950%, 08/15/2047 | | 624,000 | | | 817,191 |
Oleoducto Central SA
4.000%, 07/14/2027 (C) | | 553,000 | | | 576,226 |
ONEOK, Inc.
3.400%, 09/01/2029 | | 173,000 | | | 170,067 |
| Petroleos Mexicanos | | | | | |
| 2.378%, 04/15/2025 | | 437,500 | | | 453,806 |
| 2.460%, 12/15/2025 | | 1,870,550 | | | 1,946,829 |
Pioneer Natural Resources Company
1.900%, 08/15/2030 | | 2,254,000 | | | 2,179,663 |
| Plains All American Pipeline LP | | | | | |
| 3.550%, 12/15/2029 | | 1,710,000 | | | 1,701,964 |
| 4.900%, 02/15/2045 | | 366,000 | | | 349,585 |
Schlumberger Finance Canada, Ltd.
2.650%, 11/20/2022 (C) | | 854,000 | | | 886,265 |
| Suncor Energy, Inc. | | | | | |
| 2.800%, 05/15/2023 | | 2,232,000 | | | 2,352,300 |
| 3.100%, 05/15/2025 | | 1,796,000 | | | 1,966,910 |
Sunoco Logistics Partners Operations LP
5.300%, 04/01/2044 | | 569,000 | | | 538,495 |
Tengizchevroil Finance Company International, Ltd.
2.625%, 08/15/2025 (C) | | 1,406,000 | | | 1,428,935 |
| The Williams Companies, Inc. | | | | | |
| 3.900%, 01/15/2025 | | 599,000 | | | 659,488 |
| 5.400%, 03/04/2044 | | 848,000 | | | 989,215 |
| Total Capital International SA | | | | | |
| 2.986%, 06/29/2041 | | 703,000 | | | 732,118 |
| 3.127%, 05/29/2050 | | 1,323,000 | | | 1,385,281 |
Transcontinental Gas Pipe Line
Company LLC | | | | | |
| 3.250%, 05/15/2030 (C) | | 895,000 | | | 976,533 |
| 3.950%, 05/15/2050 (C) | | 1,433,000 | | | 1,553,974 |
| | | | | | 62,809,077 |
| Financials – 9.2% | | | | | |
Affiliated Managers Group, Inc.
3.300%, 06/15/2030 | | 2,703,000 | | | 2,893,923 |
American Financial Group, Inc.
5.250%, 04/02/2030 | | 2,179,000 | | | 2,656,523 |
| American International Group, Inc. | | | | | |
| 3.400%, 06/30/2030 | | 1,908,000 | | | 2,112,634 |
| 4.200%, 04/01/2028 | | 1,270,000 | | | 1,481,474 |
| 4.500%, 07/16/2044 | | 1,131,000 | | | 1,326,693 |
| The accompanying notes are an integral part of the financial statements. | 14 | |
John Hancock Funds II
Portfolio of Investments — August 31, 2020 (showing percentage of total net assets)
Core Bond Fund (continued)
| | | Shares or
Principal
Amount | | Value |
| CORPORATE BONDS (continued) | | | |
| Financials (continued) | | | | | |
American International
Group, Inc. (continued) | | | | | |
| 4.750%, 04/01/2048 | $ | 1,755,000 | | $ | 2,137,418 |
Arch Capital Group, Ltd.
3.635%, 06/30/2050 | | 1,123,000 | | | 1,197,961 |
Ares Capital Corp.
3.875%, 01/15/2026 | | 2,696,000 | | | 2,735,854 |
Asian Development Bank
0.625%, 04/07/2022 | | 3,258,000 | | | 3,278,195 |
Athene Holding, Ltd.
6.150%, 04/03/2030 | | 2,656,000 | | | 3,210,189 |
| Banco Santander SA | | | | | |
| 2.746%, 05/28/2025 | | 1,600,000 | | | 1,700,670 |
| 3.490%, 05/28/2030 | | 800,000 | | | 876,645 |
| Bank of America Corp. | | | | | |
| 4.125%, 01/22/2024 | | 282,000 | | | 315,350 |
| 4.183%, 11/25/2027 | | 2,395,000 | | | 2,761,108 |
| Bank of America Corp. (1.898% to 7-23-30, then SOFR + 1.530%) 07/23/2031 | | 2,146,000 | | | 2,165,096 |
| Bank of America Corp. (2.456% to 10-22-24, then 3 month LIBOR + 0.870%) 10/22/2025 | | 2,341,000 | | | 2,480,262 |
| Bank of America Corp. (2.592% to 4-29-30, then SOFR + 2.150%) 04/29/2031 | | 879,000 | | | 935,338 |
| Bank of America Corp. (3.004% to 12-20-22, then 3 month LIBOR + 0.790%) 12/20/2023 | | 4,489,000 | | | 4,730,889 |
| Bank of America Corp. (3.093% to 10-1-24, then 3 month LIBOR + 1.090%) 10/01/2025 | | 3,211,000 | | | 3,487,129 |
| Bank of America Corp. (3.419% to 12-20-27, then 3 month LIBOR + 1.040%) 12/20/2028 | | 5,783,000 | | | 6,462,494 |
| Bank of America Corp. (4.271% to 7-23-28, then 3 month LIBOR + 1.310%) 07/23/2029 | | 4,261,000 | | | 5,034,050 |
| Barclays PLC (2.645% to 6-24-30, then 1 Year CMT + 1.900%) 06/24/2031 | | 1,213,000 | | | 1,231,591 |
| Barclays PLC (5.088% to 6-20-29, then 3 month LIBOR + 3.054%) 06/20/2030 | | 3,021,000 | | | 3,507,419 |
| BNP Paribas SA (2.219% to 6-9-25, then SOFR + 2.070%) 06/09/2026 (C) | | 2,695,000 | | | 2,810,367 |
| BNP Paribas SA (2.819% to 11-19-24, then 3 month LIBOR + 1.111%) 11/19/2025 (C) | | 4,984,000 | | | 5,307,862 |
| BNP Paribas SA (3.052% to 1-13-30, then SOFR + 1.507%) 01/13/2031 (C) | | 977,000 | | | 1,054,696 |
Brighthouse Financial, Inc.
4.700%, 06/22/2047 | | 948,000 | | | 910,360 |
| Brookfield Finance, Inc. | | | | | |
| 3.900%, 01/25/2028 | | 1,725,000 | | | 1,951,802 |
| 4.350%, 04/15/2030 | | 2,216,000 | | | 2,574,624 |
Citigroup, Inc.
3.200%, 10/21/2026 | | 1,682,000 | | | 1,872,589 |
| Citigroup, Inc. (2.572% to 6-3-30, then SOFR + 2.107%) 06/03/2031 | | 3,470,000 | | | 3,666,777 |
| Citigroup, Inc. (2.976% to 11-5-29, then SOFR + 1.422%) 11/05/2030 | | 2,414,000 | | | 2,621,168 |
| Citigroup, Inc. (3.106% to 4-8-25, then SOFR + 2.750%) 04/08/2026 | | 9,718,000 | | | 10,543,576 |
| Citigroup, Inc. (4.412% to 3-31-30, then SOFR + 3.910%) 03/31/2031 | | 5,419,000 | | | 6,581,308 |
Core Bond Fund (continued)
| | | Shares or
Principal
Amount | | Value |
| CORPORATE BONDS (continued) | | | |
| Financials (continued) | | | | | |
Credit Suisse Group AG
3.574%, 01/09/2023 (C) | $ | 2,651,000 | | $ | 2,752,534 |
| Credit Suisse Group AG (2.193% to 6-5-25, then SOFR + 2.044%) 06/05/2026 (C) | | 3,289,000 | | | 3,400,266 |
| Credit Suisse Group AG (2.593% to 9-11-24, then SOFR + 1.560%) 09/11/2025 (C) | | 608,000 | | | 636,449 |
| Credit Suisse Group AG (2.997% to 12-14-22, then 3 month LIBOR + 1.200%) 12/14/2023 (C) | | 1,471,000 | | | 1,536,562 |
Credit Suisse Group Funding Guernsey, Ltd.
3.800%, 06/09/2023 | | 1,326,000 | | | 1,432,149 |
Danske Bank A/S
5.000%, 01/12/2022 (C) | | 2,133,000 | | | 2,248,527 |
| Danske Bank A/S (3.001% to 9-20-21, then 3 month LIBOR + 1.249%) 09/20/2022 (C) | | 4,164,000 | | | 4,251,652 |
| Danske Bank A/S (3.244% to 12-20-24, then 3 month LIBOR + 1.591%) 12/20/2025 (C) | | 3,884,000 | | | 4,167,362 |
Element Fleet Management Corp.
3.850%, 06/15/2025 (C) | | 1,735,000 | | | 1,831,098 |
Fidelity National Financial, Inc.
3.400%, 06/15/2030 | | 1,406,000 | | | 1,515,855 |
| GE Capital Funding LLC | | | | | |
| 3.450%, 05/15/2025 (C) | | 3,629,000 | | | 3,849,771 |
| 4.400%, 05/15/2030 (C) | | 742,000 | | | 782,093 |
GE Capital International Funding Company
4.418%, 11/15/2035 | | 2,983,000 | | | 3,079,884 |
| HSBC Holdings PLC (1.645% to 4-18-25, then SOFR + 1.538%) 04/18/2026 | | 3,855,000 | | | 3,885,364 |
| HSBC Holdings PLC (2.357% to 8-18-30, then SOFR + 1.947%) 08/18/2031 | | 1,299,000 | | | 1,313,375 |
Inter-American Development Bank
0.875%, 04/03/2025 | | 3,341,000 | | | 3,410,561 |
| Intercontinental Exchange, Inc. | | | | | |
| 1.850%, 09/15/2032 | | 1,803,000 | | | 1,825,471 |
| 2.650%, 09/15/2040 | | 631,000 | | | 638,696 |
JPMorgan Chase & Co.
2.950%, 10/01/2026 | | 250,000 | | | 276,915 |
| JPMorgan Chase & Co. (1.514% to 6-1-23, then SOFR + 1.455%) 06/01/2024 | | 8,646,000 | | | 8,841,792 |
| JPMorgan Chase & Co. (2.182% to 6-1-27, then SOFR + 1.890%) 06/01/2028 | | 2,593,000 | | | 2,711,557 |
| JPMorgan Chase & Co. (2.956% to 5-13-30, then SOFR + 2.515%) 05/13/2031 | | 3,592,000 | | | 3,856,358 |
| JPMorgan Chase & Co. (3.207% to 4-1-22, then 3 month LIBOR + 0.695%) 04/01/2023 | | 2,760,000 | | | 2,878,362 |
| JPMorgan Chase & Co. (4.493% to 3-24-30, then SOFR + 3.790%) 03/24/2031 | | 1,029,000 | | | 1,265,561 |
Landwirtschaftliche Rentenbank
0.500%, 05/27/2025 | | 5,186,000 | | | 5,207,750 |
| Lloyds Banking Group PLC (1.326% to 6-15-22, then 1 Year CMT + 1.100%) 06/15/2023 | | 1,762,000 | | | 1,778,897 |
| The accompanying notes are an integral part of the financial statements. | 15 | |
John Hancock Funds II
Portfolio of Investments — August 31, 2020 (showing percentage of total net assets)
Core Bond Fund (continued)
| | | Shares or
Principal
Amount | | Value |
| CORPORATE BONDS (continued) | | | |
| Financials (continued) | | | | | |
| Lloyds Banking Group PLC (3.870% to 7-9-24, then 1 Year CMT + 3.500%) 07/09/2025 | $ | 4,678,000 | | $ | 5,143,642 |
MDGH - GMTN BV
2.875%, 11/07/2029 (C) | | 1,474,000 | | | 1,586,640 |
National Australia Bank, Ltd.
2.332%, 08/21/2030 (C) | | 2,428,000 | | | 2,424,684 |
| Nationwide Building Society (4.363% to 8-1-23, then 3 month LIBOR + 1.392%) 08/01/2024 (C) | | 1,634,000 | | | 1,788,861 |
Nationwide Financial Services, Inc.
3.900%, 11/30/2049 (C) | | 2,035,000 | | | 2,082,420 |
Nationwide Mutual Insurance Company
4.350%, 04/30/2050 (C) | | 1,155,000 | | | 1,265,721 |
| Natwest Group PLC (3.754% to 11-1-24, then 5 Year CMT + 2.100%) 11/01/2029 | | 1,384,000 | | | 1,460,424 |
| Nomura Holdings, Inc. | | | | | |
| 2.648%, 01/16/2025 | | 1,545,000 | | | 1,628,568 |
| 2.679%, 07/16/2030 | | 1,281,000 | | | 1,329,620 |
| 3.103%, 01/16/2030 | | 4,147,000 | | | 4,439,398 |
| S&P Global, Inc. | | | | | |
| 1.250%, 08/15/2030 | | 864,000 | | | 852,948 |
| 2.300%, 08/15/2060 | | 1,031,000 | | | 950,215 |
| Santander Holdings USA, Inc. | | | | | |
| 3.244%, 10/05/2026 | | 1,933,000 | | | 2,055,709 |
| 3.400%, 01/18/2023 | | 622,000 | | | 652,569 |
| 3.450%, 06/02/2025 | | 3,640,000 | | | 3,922,447 |
| 4.400%, 07/13/2027 | | 865,000 | | | 964,742 |
| 4.500%, 07/17/2025 | | 191,000 | | | 211,224 |
| Santander UK Group Holdings PLC (1.532% to 8-21-25, then 1 Year CMT + 1.250%) 08/21/2026 | | 5,593,000 | | | 5,593,533 |
Scentre Group Trust 1
3.625%, 01/28/2026 (C) | | 1,339,000 | | | 1,430,480 |
Societe Generale SA
2.625%, 10/16/2024 to 01/22/2025 (C) | | 4,385,000 | | | 4,586,667 |
| Societe Generale SA (3.653% to 7-8-30, then 5 Year CMT + 3.000%) 07/08/2035 (C) | | 1,136,000 | | | 1,166,527 |
SVB Financial Group
3.125%, 06/05/2030 | | 692,000 | | | 768,623 |
Swedish Export Credit
0.750%, 04/06/2023 | | 4,416,000 | | | 4,462,275 |
The Andrew W. Mellon Foundation
0.947%, 08/01/2027 | | 1,032,000 | | | 1,035,266 |
| The Goldman Sachs Group, Inc. | | | | | |
| 3.500%, 04/01/2025 to 11/16/2026 | | 9,492,000 | | | 10,541,837 |
| 3.850%, 01/26/2027 | | 1,405,000 | | | 1,599,842 |
| 4.000%, 03/03/2024 | | 364,000 | | | 403,278 |
| 6.750%, 10/01/2037 | | 1,437,000 | | | 2,099,403 |
| The Goldman Sachs Group, Inc. (3.272% to 9-29-24, then 3 month LIBOR + 1.201%) 09/29/2025 | | 414,000 | | | 450,944 |
| The Royal Bank of Scotland Group PLC (2.359% to 5-22-23, then 1 Year CMT + 2.150%) 05/22/2024 | | 695,000 | | | 719,514 |
| The Royal Bank of Scotland Group PLC (3.073% to 5-22-27, then 1 Year CMT + 2.550%) 05/22/2028 | | 1,258,000 | | | 1,346,079 |
| The Royal Bank of Scotland Group PLC (4.445% to 5-8-29, then 3 month LIBOR + 1.871%) 05/08/2030 | | 1,280,000 | | | 1,503,755 |
| Trust Fibra Uno | | | | | |
| 4.869%, 01/15/2030 (C) | | 1,186,000 | | | 1,203,790 |
Core Bond Fund (continued)
| | | Shares or
Principal
Amount | | Value |
| CORPORATE BONDS (continued) | | | |
| Financials (continued) | | | | | |
| Trust Fibra Uno (continued) | | | | | |
| 6.390%, 01/15/2050 (C) | $ | 721,000 | | $ | 744,072 |
| UBS Group AG (1.364% to 1-30-26, then 1 Year CMT + 1.080%) 01/30/2027 (C) | | 2,699,000 | | | 2,723,203 |
| UBS Group AG (2.859% to 8-15-22, then 3 month LIBOR + 0.954%) 08/15/2023 (C) | | 4,185,000 | | | 4,353,958 |
US Bancorp
1.375%, 07/22/2030 | | 648,000 | | | 641,577 |
| | | | | | 248,123,350 |
| Health care – 4.0% | | | | | |
Abbott Laboratories
3.750%, 11/30/2026 | | 1,066,000 | | | 1,247,045 |
| AbbVie, Inc. | | | | | |
| 2.300%, 11/21/2022 (C) | | 4,936,000 | | | 5,129,379 |
| 2.600%, 11/21/2024 (C) | | 2,106,000 | | | 2,257,023 |
| 2.900%, 11/06/2022 | | 2,726,000 | | | 2,868,079 |
| 2.950%, 11/21/2026 (C) | | 846,000 | | | 930,456 |
| 3.200%, 11/21/2029 (C) | | 3,569,000 | | | 3,950,067 |
| 3.750%, 11/14/2023 | | 228,000 | | | 249,823 |
| 3.800%, 03/15/2025 (C) | | 3,519,000 | | | 3,933,942 |
| 4.050%, 11/21/2039 (C) | | 983,000 | | | 1,146,519 |
| 4.250%, 11/14/2028 | | 635,000 | | | 755,910 |
| 4.250%, 11/21/2049 (C) | | 2,230,000 | | | 2,684,069 |
| 4.450%, 05/14/2046 | | 623,000 | | | 750,979 |
Aetna, Inc.
3.875%, 08/15/2047 | | 671,000 | | | 778,987 |
| Amgen, Inc. | | | | | |
| 2.300%, 02/25/2031 | | 1,357,000 | | | 1,424,645 |
| 3.150%, 02/21/2040 | | 928,000 | | | 979,829 |
| Anthem, Inc. | | | | | |
| 2.250%, 05/15/2030 | | 2,242,000 | | | 2,324,720 |
| 3.125%, 05/15/2050 | | 901,000 | | | 945,328 |
| 3.650%, 12/01/2027 | | 1,160,000 | | | 1,331,822 |
AstraZeneca PLC
0.700%, 04/08/2026 | | 2,592,000 | | | 2,568,862 |
Biogen, Inc.
3.150%, 05/01/2050 | | 829,000 | | | 838,935 |
| Bristol-Myers Squibb Company | | | | | |
| 3.200%, 06/15/2026 | | 1,710,000 | | | 1,944,181 |
| 3.400%, 07/26/2029 | | 1,113,000 | | | 1,298,850 |
| 3.450%, 11/15/2027 | | 1,221,000 | | | 1,402,570 |
| 3.875%, 08/15/2025 | | 942,000 | | | 1,084,410 |
| 3.900%, 02/20/2028 | | 1,309,000 | | | 1,526,531 |
| 4.250%, 10/26/2049 | | 689,000 | | | 914,589 |
| 4.350%, 11/15/2047 | | 406,000 | | | 541,255 |
| Cigna Corp. | | | | | |
| 3.400%, 09/17/2021 to 03/01/2027 | | 3,924,000 | | | 4,227,463 |
| 3.875%, 10/15/2047 | | 1,796,000 | | | 2,019,306 |
| 4.375%, 10/15/2028 | | 425,000 | | | 508,610 |
| CVS Health Corp. | | | | | |
| 1.300%, 08/21/2027 | | 2,253,000 | | | 2,238,823 |
| 2.700%, 08/21/2040 | | 628,000 | | | 611,530 |
| 3.000%, 08/15/2026 | | 913,000 | | | 1,001,716 |
| 3.700%, 03/09/2023 | | 974,000 | | | 1,048,427 |
| 4.780%, 03/25/2038 | | 652,000 | | | 798,657 |
Danaher Corp.
3.350%, 09/15/2025 | | 848,000 | | | 948,396 |
| DH Europe Finance II Sarl | | | | | |
| 2.050%, 11/15/2022 | | 1,352,000 | | | 1,398,146 |
| 2.200%, 11/15/2024 | | 2,316,000 | | | 2,454,813 |
| 2.600%, 11/15/2029 | | 2,911,000 | | | 3,166,541 |
| 3.400%, 11/15/2049 | | 705,000 | | | 821,085 |
| The accompanying notes are an integral part of the financial statements. | 16 | |
John Hancock Funds II
Portfolio of Investments — August 31, 2020 (showing percentage of total net assets)
Core Bond Fund (continued)
| | | Shares or
Principal
Amount | | Value |
| CORPORATE BONDS (continued) | | | |
| Health care (continued) | | | | | |
| Eli Lilly & Company | | | | | |
| 2.250%, 05/15/2050 | $ | 1,282,000 | | $ | 1,214,985 |
| 2.500%, 09/15/2060 | | 1,288,000 | | | 1,221,888 |
HCA, Inc.
5.250%, 06/15/2049 | | 451,000 | | | 563,310 |
| Johnson & Johnson | | | | | |
| 1.300%, 09/01/2030 | | 863,000 | | | 872,245 |
| 2.100%, 09/01/2040 | | 302,000 | | | 301,041 |
| 2.450%, 09/01/2060 | | 430,000 | | | 419,663 |
| Merck & Company, Inc. | | | | | |
| 1.450%, 06/24/2030 | | 1,780,000 | | | 1,805,427 |
| 2.350%, 06/24/2040 | | 619,000 | | | 628,945 |
| 2.450%, 06/24/2050 | | 619,000 | | | 617,394 |
| 3.700%, 02/10/2045 | | 589,000 | | | 715,350 |
Perrigo Finance Unlimited Company
4.900%, 12/15/2044 | | 737,000 | | | 795,371 |
| Pfizer, Inc. | | | | | |
| 2.550%, 05/28/2040 | | 1,289,000 | | | 1,345,685 |
| 2.700%, 05/28/2050 | | 396,000 | | | 410,932 |
| 2.800%, 03/11/2022 | | 813,000 | | | 844,004 |
| Regeneron Pharmaceuticals, Inc. | | | | | |
| 1.750%, 09/15/2030 | | 3,438,000 | | | 3,352,579 |
| 2.800%, 09/15/2050 | | 1,289,000 | | | 1,225,606 |
| Royalty Pharma PLC | | | | | |
| 0.750%, 09/02/2023 (C) | | 1,295,000 | | | 1,294,290 |
| 1.200%, 09/02/2025 (C) | | 1,295,000 | | | 1,291,311 |
| 3.550%, 09/02/2050 (C) | | 604,000 | | | 578,859 |
Shire Acquisitions Investments Ireland DAC
2.875%, 09/23/2023 | | 1,759,000 | | | 1,873,005 |
| Stryker Corp. | | | | | |
| 1.150%, 06/15/2025 | | 1,812,000 | | | 1,840,747 |
| 1.950%, 06/15/2030 | | 1,649,000 | | | 1,691,304 |
| 2.900%, 06/15/2050 | | 1,270,000 | | | 1,319,163 |
| Takeda Pharmaceutical Company, Ltd. | | | | | |
| 2.050%, 03/31/2030 | | 2,164,000 | | | 2,196,763 |
| 3.175%, 07/09/2050 | | 1,428,000 | | | 1,450,945 |
| 3.375%, 07/09/2060 | | 588,000 | | | 607,314 |
| 4.400%, 11/26/2023 | | 1,642,000 | | | 1,834,902 |
Thermo Fisher Scientific, Inc.
4.497%, 03/25/2030 | | 3,156,000 | | | 3,924,782 |
| UnitedHealth Group, Inc. | | | | | |
| 2.000%, 05/15/2030 | | 483,000 | | | 505,658 |
| 2.750%, 05/15/2040 | | 1,078,000 | | | 1,136,973 |
| 3.125%, 05/15/2060 | | 448,000 | | | 487,627 |
| 3.500%, 08/15/2039 | | 289,000 | | | 334,876 |
| 3.700%, 12/15/2025 | | 913,000 | | | 1,049,752 |
| 3.750%, 10/15/2047 | | 728,000 | | | 868,986 |
| 3.875%, 08/15/2059 | | 463,000 | | | 576,091 |
Upjohn, Inc.
4.000%, 06/22/2050 (C) | | 863,000 | | | 939,681 |
| | | | | | 109,189,772 |
| Industrials – 2.1% | | | | | |
Adani Ports & Special Economic Zone, Ltd.
4.200%, 08/04/2027 (C) | | 1,556,000 | | | 1,594,376 |
| AerCap Ireland Capital DAC | | | | | |
| 3.500%, 05/26/2022 | | 828,000 | | | 832,510 |
| 3.950%, 02/01/2022 | | 458,000 | | | 463,780 |
| 4.450%, 04/03/2026 | | 526,000 | | | 530,173 |
| 4.625%, 07/01/2022 | | 389,000 | | | 398,608 |
| 4.875%, 01/16/2024 | | 899,000 | | | 926,788 |
| 6.500%, 07/15/2025 | | 1,747,000 | | | 1,900,054 |
Aviation Capital Group LLC
5.500%, 12/15/2024 (C) | | 2,256,000 | | | 2,320,040 |
Core Bond Fund (continued)
| | | Shares or
Principal
Amount | | Value |
| CORPORATE BONDS (continued) | | | |
| Industrials (continued) | | | | | |
Burlington Northern Santa Fe LLC
3.050%, 02/15/2051 | $ | 605,000 | | $ | 665,377 |
Crowley Conro LLC
4.181%, 08/15/2043 | | 840,187 | | | 1,053,441 |
| CSX Corp. | | | | | |
| 4.300%, 03/01/2048 | | 108,000 | | | 136,129 |
| 4.750%, 11/15/2048 | | 587,000 | | | 787,777 |
| Deere & Company | | | | | |
| 2.750%, 04/15/2025 | | 1,765,000 | | | 1,931,333 |
| 3.750%, 04/15/2050 | | 777,000 | | | 953,334 |
General Dynamics Corp.
4.250%, 04/01/2040 | | 352,000 | | | 441,473 |
| General Electric Company | | | | | |
| 3.100%, 01/09/2023 | | 296,000 | | | 312,037 |
| 3.450%, 05/01/2027 | | 2,518,000 | | | 2,673,293 |
| 3.625%, 05/01/2030 | | 1,292,000 | | | 1,330,082 |
| 5.875%, 01/14/2038 | | 141,000 | | | 162,828 |
Highwoods Realty LP
2.600%, 02/01/2031 | | 989,000 | | | 982,617 |
Hutama Karya Persero PT
3.750%, 05/11/2030 (C) | | 933,000 | | | 1,020,702 |
International Lease Finance Corp.
5.875%, 08/15/2022 | | 646,000 | | | 699,831 |
| John Deere Capital Corp. | | | | | |
| 0.550%, 07/05/2022 | | 2,589,000 | | | 2,602,125 |
| 1.200%, 04/06/2023 | | 1,994,000 | | | 2,037,897 |
| 1.750%, 03/09/2027 | | 1,195,000 | | | 1,249,815 |
| Northrop Grumman Corp. | | | | | |
| 2.550%, 10/15/2022 | | 2,677,000 | | | 2,800,349 |
| 2.930%, 01/15/2025 | | 120,000 | | | 130,931 |
| 3.250%, 08/01/2023 to 01/15/2028 | | 3,994,000 | | | 4,397,912 |
| 4.030%, 10/15/2047 | | 879,000 | | | 1,070,474 |
| 5.150%, 05/01/2040 | | 1,319,000 | | | 1,783,073 |
| Raytheon Technologies Corp. | | | | | |
| 3.650%, 08/16/2023 | | 173,000 | | | 188,347 |
| 3.950%, 08/16/2025 | | 1,219,000 | | | 1,394,419 |
| 4.450%, 11/16/2038 | | 1,135,000 | | | 1,399,682 |
| Southwest Airlines Company | | | | | |
| 4.750%, 05/04/2023 | | 1,809,000 | | | 1,930,061 |
| 5.125%, 06/15/2027 | | 2,714,000 | | | 2,959,931 |
| The Boeing Company | | | | | |
| 2.700%, 02/01/2027 | | 990,000 | | | 960,610 |
| 2.950%, 02/01/2030 | | 897,000 | | | 874,370 |
| 3.750%, 02/01/2050 | | 962,000 | | | 860,495 |
| 5.150%, 05/01/2030 | | 437,000 | | | 489,294 |
| Union Pacific Corp. | | | | | |
| 2.150%, 02/05/2027 | | 1,339,000 | | | 1,425,965 |
| 2.400%, 02/05/2030 | | 1,657,000 | | | 1,790,286 |
| 2.950%, 03/01/2022 | | 1,500,000 | | | 1,558,074 |
| 3.150%, 03/01/2024 | | 718,000 | | | 777,304 |
| 3.250%, 02/05/2050 | | 2,128,000 | | | 2,331,403 |
| 3.750%, 02/05/2070 | | 269,000 | | | 303,241 |
| 4.300%, 03/01/2049 | | 222,000 | | | 285,484 |
| | | | | | 57,718,125 |
| Information technology – 2.8% | | | | | |
Adobe, Inc.
2.300%, 02/01/2030 | | 1,294,000 | | | 1,397,848 |
| Apple, Inc. | | | | | |
| 2.050%, 09/11/2026 | | 2,715,000 | | | 2,918,805 |
| 2.550%, 08/20/2060 | | 1,978,000 | | | 1,931,873 |
| 2.650%, 05/11/2050 | | 1,641,000 | | | 1,685,778 |
| 3.200%, 05/13/2025 | | 622,000 | | | 697,357 |
| 4.250%, 02/09/2047 | | 740,000 | | | 972,287 |
Broadcom Corp.
3.875%, 01/15/2027 | | 2,051,000 | | | 2,272,781 |
| The accompanying notes are an integral part of the financial statements. | 17 | |
John Hancock Funds II
Portfolio of Investments — August 31, 2020 (showing percentage of total net assets)
Core Bond Fund (continued)
| | | Shares or
Principal
Amount | | Value |
| CORPORATE BONDS (continued) | | | |
| Information technology (continued) | | | | | |
| Broadcom, Inc. | | | | | |
| 3.150%, 11/15/2025 | $ | 4,738,000 | | $ | 5,129,070 |
| 4.150%, 11/15/2030 | | 2,688,000 | | | 3,023,154 |
| 4.250%, 04/15/2026 | | 1,451,000 | | | 1,645,188 |
| 4.700%, 04/15/2025 | | 2,132,000 | | | 2,436,424 |
| Dell International LLC | | | | | |
| 4.900%, 10/01/2026 (C) | | 431,000 | | | 487,651 |
| 5.300%, 10/01/2029 (C) | | 869,000 | | | 991,100 |
| 6.100%, 07/15/2027 (C) | | 863,000 | | | 1,015,647 |
| Fiserv, Inc. | | | | | |
| 3.200%, 07/01/2026 | | 1,451,000 | | | 1,626,478 |
| 3.500%, 07/01/2029 | | 1,553,000 | | | 1,766,310 |
| 4.200%, 10/01/2028 | | 144,000 | | | 171,240 |
Flex, Ltd.
4.875%, 05/12/2030 | | 2,254,000 | | | 2,565,470 |
HP, Inc.
2.200%, 06/17/2025 | | 2,731,000 | | | 2,885,495 |
| IBM Corp. | | | | | |
| 3.300%, 05/15/2026 | | 457,000 | | | 518,774 |
| 4.150%, 05/15/2039 | | 655,000 | | | 802,861 |
Intel Corp.
4.600%, 03/25/2040 | | 860,000 | | | 1,139,395 |
KLA Corp.
3.300%, 03/01/2050 | | 1,152,000 | | | 1,221,602 |
Micron Technology, Inc.
2.497%, 04/24/2023 | | 2,673,000 | | | 2,791,221 |
| Microsoft Corp. | | | | | |
| 2.525%, 06/01/2050 | | 691,000 | | | 722,915 |
| 2.675%, 06/01/2060 | | 1,094,000 | | | 1,149,592 |
| 2.875%, 02/06/2024 | | 516,000 | | | 556,853 |
| 4.100%, 02/06/2037 | | 857,000 | | | 1,103,069 |
| NVIDIA Corp. | | | | | |
| 2.850%, 04/01/2030 | | 1,341,000 | | | 1,494,730 |
| 3.500%, 04/01/2050 | | 3,043,000 | | | 3,439,792 |
| NXP BV | | | | | |
| 2.700%, 05/01/2025 (C) | | 858,000 | | | 914,718 |
| 3.150%, 05/01/2027 (C) | | 1,460,000 | | | 1,595,208 |
| 3.400%, 05/01/2030 (C) | | 987,000 | | | 1,092,721 |
| 3.875%, 06/18/2026 (C) | | 3,001,000 | | | 3,385,279 |
| 4.300%, 06/18/2029 (C) | | 1,133,000 | | | 1,318,560 |
| Oracle Corp. | | | | | |
| 2.625%, 02/15/2023 | | 1,121,000 | | | 1,178,886 |
| 2.800%, 04/01/2027 | | 2,585,000 | | | 2,835,628 |
| 2.950%, 11/15/2024 | | 599,000 | | | 653,883 |
| 3.800%, 11/15/2037 | | 612,000 | | | 708,581 |
| 3.850%, 04/01/2060 | | 1,427,000 | | | 1,646,377 |
| 4.000%, 11/15/2047 | | 1,303,000 | | | 1,531,991 |
| PayPal Holdings, Inc. | | | | | |
| 1.350%, 06/01/2023 | | 2,336,000 | | | 2,390,251 |
| 1.650%, 06/01/2025 | | 3,270,000 | | | 3,394,627 |
ServiceNow, Inc.
1.400%, 09/01/2030 | | 1,802,000 | | | 1,769,687 |
Texas Instruments, Inc.
1.375%, 03/12/2025 | | 1,072,000 | | | 1,111,494 |
| | | | | | 76,088,651 |
| Materials – 0.9% | | | | | |
| Barrick North America Finance LLC | | | | | |
| 5.700%, 05/30/2041 | | 1,034,000 | | | 1,457,560 |
| 5.750%, 05/01/2043 | | 392,000 | | | 570,254 |
DuPont de Nemours, Inc.
4.205%, 11/15/2023 | | 139,000 | | | 153,569 |
| Georgia-Pacific LLC | | | | | |
| 1.750%, 09/30/2025 (C) | | 2,856,000 | | | 2,985,295 |
| 2.100%, 04/30/2027 (C) | | 1,378,000 | | | 1,451,161 |
| 2.300%, 04/30/2030 (C) | | 1,453,000 | | | 1,541,710 |
Core Bond Fund (continued)
| | | Shares or
Principal
Amount | | Value |
| CORPORATE BONDS (continued) | | | |
| Materials (continued) | | | | | |
International Paper Company
4.400%, 08/15/2047 | $ | 850,000 | | $ | 1,020,757 |
Newmont Corp.
2.250%, 10/01/2030 | | 1,354,000 | | | 1,413,580 |
| Nucor Corp. | | | | | |
| 2.000%, 06/01/2025 | | 903,000 | | | 947,205 |
| 2.700%, 06/01/2030 | | 903,000 | | | 971,248 |
| Nutrien, Ltd. | | | | | |
| 2.950%, 05/13/2030 | | 1,160,000 | | | 1,262,281 |
| 5.000%, 04/01/2049 | | 1,309,000 | | | 1,705,493 |
| Reliance Steel & Aluminum Company | | | | | |
| 1.300%, 08/15/2025 | | 713,000 | | | 714,510 |
| 2.150%, 08/15/2030 | | 1,855,000 | | | 1,836,381 |
| Steel Dynamics, Inc. | | | | | |
| 2.400%, 06/15/2025 | | 655,000 | | | 689,523 |
| 3.250%, 01/15/2031 | | 655,000 | | | 703,254 |
Teck Resources, Ltd.
3.900%, 07/15/2030 (C) | | 969,000 | | | 992,930 |
| The Dow Chemical Company | | | | | |
| 2.100%, 11/15/2030 | | 2,590,000 | | | 2,556,653 |
| 3.600%, 11/15/2050 | | 914,000 | | | 936,182 |
| | | | | | 23,909,546 |
| Real estate – 1.2% | | | | | |
Agree LP
2.900%, 10/01/2030 | | 628,000 | | | 644,201 |
| Crown Castle International Corp. | | | | | |
| 3.300%, 07/01/2030 | | 2,430,000 | | | 2,696,797 |
| 4.000%, 03/01/2027 | | 422,000 | | | 484,844 |
| Equinix, Inc. | | | | | |
| 2.625%, 11/18/2024 | | 1,142,000 | | | 1,222,111 |
| 2.900%, 11/18/2026 | | 2,383,000 | | | 2,601,187 |
Federal Realty Investment Trust
3.950%, 01/15/2024 | | 1,343,000 | | | 1,456,014 |
| GLP Capital LP | | | | | |
| 4.000%, 01/15/2030 | | 701,000 | | | 727,358 |
| 5.300%, 01/15/2029 | | 856,000 | | | 946,719 |
Healthpeak Properties, Inc.
2.875%, 01/15/2031 | | 850,000 | | | 906,801 |
Kilroy Realty LP
2.500%, 11/15/2032 | | 1,076,000 | | | 1,053,224 |
Kimco Realty Corp.
1.900%, 03/01/2028 | | 896,000 | | | 881,317 |
| Mid-America Apartments LP | | | | | |
| 1.700%, 02/15/2031 | | 795,000 | | | 781,395 |
| 3.600%, 06/01/2027 | | 126,000 | | | 141,435 |
| 3.750%, 06/15/2024 | | 1,984,000 | | | 2,157,170 |
| 3.950%, 03/15/2029 | | 852,000 | | | 988,074 |
| 4.000%, 11/15/2025 | | 1,038,000 | | | 1,179,260 |
| 4.300%, 10/15/2023 | | 868,000 | | | 948,927 |
Realty Income Corp.
3.250%, 01/15/2031 | | 1,935,000 | | | 2,150,209 |
Regency Centers LP
2.950%, 09/15/2029 | | 1,843,000 | | | 1,899,063 |
| Spirit Realty LP | | | | | |
| 3.200%, 02/15/2031 | | 1,999,000 | | | 1,952,250 |
| 3.400%, 01/15/2030 | | 1,021,000 | | | 1,016,284 |
| 4.000%, 07/15/2029 | | 491,000 | | | 514,234 |
| 4.450%, 09/15/2026 | | 97,000 | | | 104,938 |
| STORE Capital Corp. | | | | | |
| 4.500%, 03/15/2028 | | 3,190,000 | | | 3,370,276 |
| 4.625%, 03/15/2029 | | 1,080,000 | | | 1,151,451 |
VEREIT Operating Partnership LP
3.400%, 01/15/2028 | | 905,000 | | | 936,603 |
| | | | | | 32,912,142 |
| The accompanying notes are an integral part of the financial statements. | 18 | |
John Hancock Funds II
Portfolio of Investments — August 31, 2020 (showing percentage of total net assets)
Core Bond Fund (continued)
| | | Shares or
Principal
Amount | | Value |
| CORPORATE BONDS (continued) | | | |
| Utilities – 3.0% | | | | | |
Alabama Power Company
3.450%, 10/01/2049 | $ | 1,178,000 | | $ | 1,347,077 |
Ameren Corp.
3.500%, 01/15/2031 | | 404,000 | | | 463,079 |
Arizona Public Service Company
3.150%, 05/15/2025 | | 1,718,000 | | | 1,894,785 |
| Black Hills Corp. | | | | | |
| 3.050%, 10/15/2029 | | 1,452,000 | | | 1,581,272 |
| 3.875%, 10/15/2049 | | 762,000 | | | 870,733 |
CenterPoint Energy Houston Electric LLC
2.900%, 07/01/2050 | | 585,000 | | | 624,002 |
CenterPoint Energy Resources Corp.
4.100%, 09/01/2047 | | 828,000 | | | 950,003 |
| CenterPoint Energy, Inc. | | | | | |
| 2.500%, 09/01/2022 to 09/01/2024 | | 2,018,000 | | | 2,142,635 |
| 2.950%, 03/01/2030 | | 719,000 | | | 790,507 |
Consumers Energy Company
2.500%, 05/01/2060 | | 718,000 | | | 694,764 |
| Dominion Energy, Inc. | | | | | |
| 2.000%, 08/15/2021 | | 1,193,000 | | | 1,209,095 |
| 2.850%, 08/15/2026 | | 1,099,000 | | | 1,213,530 |
DTE Electric Company
2.950%, 03/01/2050 | | 1,873,000 | | | 1,984,218 |
| DTE Energy Company | | | | | |
| 1.050%, 06/01/2025 | | 1,720,000 | | | 1,728,579 |
| 2.529%, 10/01/2024 | | 227,000 | | | 241,783 |
| 2.950%, 03/01/2030 | | 1,135,000 | | | 1,226,953 |
| 3.800%, 03/15/2027 | | 1,708,000 | | | 1,922,053 |
| Duke Energy Corp. | | | | | |
| 1.800%, 09/01/2021 | | 1,786,000 | | | 1,810,135 |
| 2.450%, 06/01/2030 | | 1,394,000 | | | 1,470,312 |
| 2.650%, 09/01/2026 | | 1,107,000 | | | 1,208,364 |
Duke Energy Ohio, Inc.
2.125%, 06/01/2030 | | 1,297,000 | | | 1,370,976 |
Duke Energy Progress LLC
2.500%, 08/15/2050 | | 1,031,000 | | | 1,013,101 |
Evergy Kansas Central, Inc.
3.450%, 04/15/2050 | | 2,293,000 | | | 2,625,651 |
Evergy Metro, Inc.
2.250%, 06/01/2030 | | 1,729,000 | | | 1,842,120 |
| Evergy, Inc. | | | | | |
| 2.450%, 09/15/2024 | | 1,584,000 | | | 1,680,754 |
| 2.900%, 09/15/2029 | | 1,125,000 | | | 1,216,641 |
Exelon Corp.
4.700%, 04/15/2050 | | 1,566,000 | | | 2,010,679 |
| FirstEnergy Corp. | | | | | |
| 1.600%, 01/15/2026 | | 10,000 | | | 9,907 |
| 3.900%, 07/15/2027 | | 1,584,000 | | | 1,736,715 |
| 4.250%, 03/15/2023 | | 1,723,000 | | | 1,827,499 |
Interstate Power & Light Company
3.500%, 09/30/2049 | | 650,000 | | | 731,326 |
ITC Holdings Corp.
2.700%, 11/15/2022 | | 1,706,000 | | | 1,781,497 |
Metropolitan Edison Company
4.300%, 01/15/2029 (C) | | 1,339,000 | | | 1,576,493 |
MidAmerican Energy Company
3.650%, 08/01/2048 | | 901,000 | | | 1,090,022 |
| Mississippi Power Company | | | | | |
| 3.950%, 03/30/2028 | | 2,081,000 | | | 2,380,420 |
| 4.250%, 03/15/2042 | | 1,250,000 | | | 1,475,881 |
| NextEra Energy Capital Holdings, Inc. | | | | | |
| 2.250%, 06/01/2030 | | 2,701,000 | | | 2,829,211 |
| 2.750%, 05/01/2025 | | 1,449,000 | | | 1,575,799 |
Core Bond Fund (continued)
| | | Shares or
Principal
Amount | | Value |
| CORPORATE BONDS (continued) | | | |
| Utilities (continued) | | | | | |
NiSource, Inc.
0.950%, 08/15/2025 | $ | 2,253,000 | | $ | 2,258,644 |
Oncor Electric Delivery Company LLC
3.700%, 11/15/2028 | | 1,295,000 | | | 1,524,304 |
| Pacific Gas & Electric Company | | | | | |
| 2.100%, 08/01/2027 | | 1,697,000 | | | 1,656,185 |
| 2.500%, 02/01/2031 | | 2,324,000 | | | 2,258,177 |
| 3.300%, 12/01/2027 (D) | | 1,300,000 | | | 1,336,976 |
| 3.300%, 08/01/2040 | | 571,000 | | | 539,063 |
| 3.950%, 12/01/2047 (D) | | 598,000 | | | 561,969 |
| 4.500%, 07/01/2040 | | 430,000 | | | 451,039 |
| 4.550%, 07/01/2030 | | 1,889,000 | | | 2,086,915 |
Pennsylvania Electric Company
3.250%, 03/15/2028 (C) | | 718,000 | | | 779,422 |
| PPL Capital Funding, Inc. | | | | | |
| 3.100%, 05/15/2026 | | 2,059,000 | | | 2,289,744 |
| 3.400%, 06/01/2023 | | 244,000 | | | 260,083 |
| 4.125%, 04/15/2030 | | 2,202,000 | | | 2,601,407 |
| 5.000%, 03/15/2044 | | 1,135,000 | | | 1,446,767 |
| Public Service Electric & Gas Company | | | | | |
| 2.050%, 08/01/2050 | | 344,000 | | | 313,995 |
| 2.700%, 05/01/2050 | | 1,882,000 | | | 1,951,937 |
| Southern California Edison Company | | | | | |
| 2.850%, 08/01/2029 | | 862,000 | | | 916,337 |
| 4.125%, 03/01/2048 | | 1,382,000 | | | 1,527,554 |
| 4.650%, 10/01/2043 | | 406,000 | | | 470,175 |
Southern Company Gas Capital Corp.
1.750%, 01/15/2031 | | 1,726,000 | | | 1,709,023 |
Trans-Allegheny Interstate Line Company
3.850%, 06/01/2025 (C) | | 595,000 | | | 653,625 |
| | | | | | 81,741,912 |
| TOTAL CORPORATE BONDS (Cost $837,011,780) | | | $ | 889,696,632 |
| MUNICIPAL BONDS – 0.4% | | | | | |
County of Clark Department of Aviation (Nevada)
6.820%, 07/01/2045 | | 1,115,000 | | | 1,827,184 |
Los Angeles Community College District (California)
6.750%, 08/01/2049 | | 925,000 | | | 1,698,938 |
North Texas Tollway Authority
6.718%, 01/01/2049 | | 1,390,000 | | | 2,499,262 |
Port Authority of New York & New Jersey
4.458%, 10/01/2062 | | 3,060,000 | | | 3,996,911 |
The Ohio State University
4.800%, 06/01/2111 | | 600,000 | | | 891,336 |
University of Texas
2.439%, 08/15/2049 | | 765,000 | | | 789,442 |
| TOTAL MUNICIPAL BONDS (Cost $9,401,268) | | $ | 11,703,073 |
| COLLATERALIZED MORTGAGE OBLIGATIONS – 8.1% | | | |
| Commercial and residential – 4.0% | | | | | |
Angel Oak Mortgage Trust
Series 2020-2, Class A1A
2.531%, 01/26/2065 (C)(E) | | 1,970,960 | | | 2,005,194 |
Angel Oak Mortgage Trust I LLC
Series 2019-2, Class A1
3.628%, 03/25/2049 (C)(E) | | 1,047,491 | | | 1,068,635 |
Angel Oak Mortgage Trust LLC
Series 2020-5, Class A1
1.373%, 05/25/2065 (C)(E) | | 1,117,000 | | | 1,116,999 |
| The accompanying notes are an integral part of the financial statements. | 19 | |
John Hancock Funds II
Portfolio of Investments — August 31, 2020 (showing percentage of total net assets)
Core Bond Fund (continued)
| | | Shares or
Principal
Amount | | Value |
COLLATERALIZED MORTGAGE
OBLIGATIONS (continued) | | | |
Commercial and
residential (continued) | | | | | |
| Benchmark Mortgage Trust | | | | | |
Series 2018-B1, Class ASB,
3.602%, 01/15/2051 (E) | $ | 532,000 | | $ | 593,818 |
Series 2020-B18, Class A5,
1.925%, 07/15/2053 | | 1,330,000 | | | 1,365,898 |
| Bunker Hill Loan Depositary Trust | | | | | |
Series 2019-1, Class A1,
3.613%, 10/26/2048 (C) | | 1,352,584 | | | 1,388,337 |
Series 2019-2, Class A1,
2.879%, 07/25/2049 (C) | | 2,408,440 | | | 2,458,705 |
| CD Mortgage Trust | | | | | |
Series 2016-CD1, Class A1,
1.443%, 08/10/2049 | | 132,772 | | | 132,873 |
Series 2017-CD4, Class A4,
3.514%, 05/10/2050 (E) | | 4,839,000 | | | 5,455,267 |
Series 2017-CD4, Class ASB,
3.317%, 05/10/2050 | | 702,000 | | | 765,391 |
Series 2017-CD6, Class ASB,
3.332%, 11/13/2050 | | 1,764,000 | | | 1,940,983 |
| CFCRE Commercial Mortgage Trust | | | | | |
Series 2016-C3, Class A1,
1.793%, 01/10/2048 | | 99,417 | | | 99,489 |
Series 2017-C8, Class A1,
1.965%, 06/15/2050 | | 86,050 | | | 86,058 |
Series 2017-C8, Class ASB,
3.367%, 06/15/2050 | | 733,000 | | | 797,103 |
Citigroup Commercial Mortgage Trust
Series 2016-P5, Class A1
1.410%, 10/10/2049 | | 779,593 | | | 779,984 |
| COLT Mortgage Loan Trust | | | | | |
Series 2019-1, Class A1,
3.705%, 03/25/2049 (C)(E) | | 486,446 | | | 492,420 |
Series 2019-2, Class A1,
3.337%, 05/25/2049 (C)(E) | | 1,656,804 | | | 1,673,077 |
Series 2019-4, Class A1,
2.579%, 11/25/2049 (C)(E) | | 2,023,917 | | | 2,036,482 |
Series 2020-2, Class A1,
1.853%, 03/25/2065 (C)(E) | | 2,017,909 | | | 2,025,560 |
Commercial Mortgage Trust (Cantor
Fitzgerald/Deutsche Bank AG) | | | | | |
Series 2013-CR6, Class A4,
3.101%, 03/10/2046 | | 3,716,000 | | | 3,847,671 |
Series 2015-LC21, Class A4,
3.708%, 07/10/2048 | | 753,000 | | | 830,768 |
Series 2015-LC23, Class A4,
3.774%, 10/10/2048 | | 1,507,000 | | | 1,687,764 |
Series 2016-COR1, Class ASB,
2.972%, 10/10/2049 | | 562,000 | | | 599,817 |
| CSAIL Commercial Mortgage Trust | | | | | |
Series 2015-C2, Class A4,
3.504%, 06/15/2057 | | 6,737,176 | | | 7,337,698 |
Series 2015-C4, Class A4,
3.808%, 11/15/2048 | | 898,000 | | | 999,662 |
Series 2016-C5, Class ASB,
3.533%, 11/15/2048 | | 279,000 | | | 296,793 |
| DBJPM Mortgage Trust | | | | | |
Series 2017-C6, Class ASB,
3.121%, 06/10/2050 | | 416,000 | | | 451,097 |
Series 2020-C9, Class A5,
1.926%, 09/15/2053 | | 1,773,000 | | | 1,823,615 |
GCAT Trust
Series 2019-NQM1, Class A1
2.985%, 02/25/2059 (C) | | 891,833 | | | 902,302 |
Core Bond Fund (continued)
| | | Shares or
Principal
Amount | | Value |
COLLATERALIZED MORTGAGE
OBLIGATIONS (continued) | | | |
Commercial and
residential (continued) | | | | | |
| GS Mortgage Securities Trust | | | | | |
Series 2014-GC18, Class A3,
3.801%, 01/10/2047 | $ | 565,161 | | $ | 602,788 |
Series 2014-GC18, Class A4,
4.074%, 01/10/2047 | | 2,580,000 | | | 2,796,755 |
Series 2015-GC28, Class A5,
3.396%, 02/10/2048 | | 1,593,000 | | | 1,733,650 |
Series 2015-GC34, Class A4,
3.506%, 10/10/2048 | | 1,606,000 | | | 1,774,973 |
Impact Funding Affordable Multifamily Housing Mortgage Loan Trust
Series 2010-1, Class A1
5.314%, 01/25/2051 (C) | | 3,077,241 | | | 3,297,096 |
JPMBB Commercial Mortgage
Securities Trust | | | | | |
Series 2014-C23, Class A4,
3.670%, 09/15/2047 | | 793,000 | | | 852,015 |
Series 2014-C26, Class A4,
3.494%, 01/15/2048 | | 1,460,000 | | | 1,591,108 |
Series 2015-C28, Class A3,
2.912%, 10/15/2048 | | 2,889,381 | | | 3,061,537 |
Series 2015-C29, Class A4,
3.611%, 05/15/2048 | | 1,130,000 | | | 1,244,150 |
Series 2015-C33, Class A4,
3.770%, 12/15/2048 | | 437,000 | | | 488,890 |
JPMCC Commercial Mortgage Securities Trust
Series 2017-JP6, Class ASB
3.283%, 07/15/2050 | | 781,000 | | | 850,880 |
JPMDB Commercial Mortgage
Securities Trust | | | | | |
Series 2017-C5, Class ASB,
3.492%, 03/15/2050 | | 281,000 | | | 307,492 |
Series 2018-C8, Class ASB,
4.145%, 06/15/2051 | | 841,000 | | | 967,266 |
Series 2020-COR7, Class A5,
2.180%, 05/13/2053 | | 888,000 | | | 927,476 |
Morgan Stanley Bank of America Merrill
Lynch Trust | | | | | |
Series 2013-C10, Class A4,
4.218%, 07/15/2046 (E) | | 260,000 | | | 278,055 |
Series 2015-C20, Class A4,
3.249%, 02/15/2048 | | 231,000 | | | 249,514 |
Series 2015-C25, Class ASB,
3.383%, 10/15/2048 | | 842,000 | | | 889,520 |
Series 2015-C27, Class A4,
3.753%, 12/15/2047 | | 226,000 | | | 249,889 |
| Morgan Stanley Capital I Trust | | | | | |
Series 2016-UB11, Class A1,
1.445%, 08/15/2049 | | 178,236 | | | 178,234 |
Series 2016-UB11, Class ASB,
2.606%, 08/15/2049 | | 646,000 | | | 678,761 |
Series 2020-HR8, Class A4,
2.041%, 07/15/2053 | | 1,331,000 | | | 1,366,145 |
| New Residential Mortgage Loan Trust | | | | | |
Series 2019-NQM2, Class A1,
3.600%, 04/25/2049 (C)(E) | | 1,130,390 | | | 1,152,549 |
Series 2019-NQM4, Class A1,
2.492%, 09/25/2059 (C)(E) | | 1,894,409 | | | 1,930,065 |
SG Residential Mortgage Trust
Series 2019-3, Class A1
2.703%, 09/25/2059 (C)(E) | | 1,879,345 | | | 1,894,983 |
| The accompanying notes are an integral part of the financial statements. | 20 | |
John Hancock Funds II
Portfolio of Investments — August 31, 2020 (showing percentage of total net assets)
Core Bond Fund (continued)
| | | Shares or
Principal
Amount | | Value |
COLLATERALIZED MORTGAGE
OBLIGATIONS (continued) | | | |
Commercial and
residential (continued) | | | | | |
| Starwood Mortgage Residential Trust | | | | | |
Series 2019-INV1, Class A1,
2.610%, 09/27/2049 (C)(E) | $ | 2,071,100 | | $ | 2,095,588 |
Series 2020-1, Class A1,
2.275%, 02/25/2050 (C)(E) | | 3,693,509 | | | 3,753,367 |
Series 2020-3, Class A1,
1.486%, 04/25/2065 (C)(E) | | 2,838,811 | | | 2,837,230 |
| Verus Securitization Trust | | | | | |
Series 2019-1, Class A1,
3.836%, 02/25/2059 (C)(E) | | 1,168,177 | | | 1,190,033 |
Series 2019-2, Class A1,
3.211%, 05/25/2059 (C)(E) | | 3,264,567 | | | 3,329,100 |
Series 2019-3, Class A1,
2.784%, 07/25/2059 (C) | | 3,979,305 | | | 4,043,033 |
Series 2019-4, Class A1,
2.642%, 11/25/2059 (C) | | 5,550,021 | | | 5,671,841 |
Series 2019-INV1, Class A1,
3.402%, 12/25/2059 (C)(E) | | 1,125,255 | | | 1,151,294 |
Series 2019-INV2, Class A1,
2.913%, 07/25/2059 (C)(E) | | 2,145,473 | | | 2,186,565 |
Series 2019-INV3, Class A1,
2.692%, 11/25/2059 (C)(E) | | 2,580,574 | | | 2,613,261 |
Series 2020-1, Class A1,
2.417%, 01/25/2060 (C)(E) | | 1,271,706 | | | 1,297,515 |
Series 2020-2, Class A1,
2.226%, 05/25/2060 (C)(E) | | 3,257,606 | | | 3,276,328 |
Visio Trust
Series 2019-1, Class A1
3.572%, 06/25/2054 (C)(E) | | 1,166,487 | | | 1,182,287 |
| | | | | | 109,050,693 |
| U.S. Government Agency – 4.1% | | | | | |
| Federal Home Loan Mortgage Corp. | | | | | |
Series 264, Class 30,
3.000%, 07/15/2042 | | 4,135,768 | | | 4,459,122 |
Series 343, Class F4 (1 month LIBOR + 0.350%),
2.852%, 10/15/2037 (B) | | 2,467,606 | | | 2,456,082 |
Series 4205, Class PA,
1.750%, 05/15/2043 | | 1,662,622 | | | 1,717,653 |
Series 4426, Class QC,
1.750%, 07/15/2037 | | 2,740,816 | | | 2,836,670 |
Series 4705, Class A,
4.500%, 09/15/2042 | | 1,109,201 | | | 1,150,761 |
Series 4742, Class PA,
3.000%, 10/15/2047 | | 4,106,158 | | | 4,347,299 |
Series 4763, Class CA,
3.000%, 09/15/2038 | | 493,639 | | | 534,127 |
Series 4767, Class KA,
3.000%, 03/15/2048 | | 785,752 | | | 854,389 |
Series 4786, Class DP,
4.500%, 07/15/2042 | | 452,085 | | | 456,324 |
Series 4846, Class PF (1 month LIBOR + 0.350%),
0.512%, 12/15/2048 (B) | | 729,883 | | | 731,145 |
Series 4880, Class DA,
3.000%, 05/15/2050 | | 3,569,175 | | | 3,844,413 |
Series 4988, Class AF (1 month LIBOR + 0.350%),
0.521%, 10/15/2037 (B) | | 8,185,342 | | | 8,183,397 |
| Federal National Mortgage Association | | | | | |
Series 1998-61, Class PL,
6.000%, 11/25/2028 | | 201,970 | | | 229,843 |
Core Bond Fund (continued)
| | | Shares or
Principal
Amount | | Value |
COLLATERALIZED MORTGAGE
OBLIGATIONS (continued) | | | |
| U.S. Government Agency (continued) | | | | | |
Federal National
Mortgage Association (continued) | | | | | |
Series 2012-151, Class NX,
1.500%, 01/25/2043 | $ | 2,139,298 | | $ | 2,213,222 |
Series 2013-11, Class AP,
1.500%, 01/25/2043 | | 5,307,926 | | | 5,436,698 |
Series 2013-30, Class CA,
1.500%, 04/25/2043 | | 488,975 | | | 500,510 |
Series 2013-43, Class BP,
1.750%, 05/25/2043 | | 2,376,114 | | | 2,474,870 |
Series 2014-73, Class MA,
2.500%, 11/25/2044 | | 1,464,180 | | | 1,563,906 |
Series 2015-84, Class PA,
1.700%, 08/25/2033 | | 6,829,531 | | | 7,070,758 |
Series 2016-48, Class MA,
2.000%, 06/25/2038 | | 8,891,858 | | | 9,227,678 |
Series 2016-57, Class PC,
1.750%, 06/25/2046 | | 13,190,394 | | | 13,657,750 |
Series 2017-13, Class PA,
3.000%, 08/25/2046 | | 1,562,671 | | | 1,674,012 |
Series 2017-42, Class H,
3.000%, 11/25/2043 | | 1,738,673 | | | 1,800,905 |
Series 2017-M7, Class A2,
2.961%, 02/25/2027 (E) | | 633,000 | | | 699,046 |
Series 2018-14, Class KC,
3.000%, 03/25/2048 | | 2,232,945 | | | 2,415,252 |
Series 2018-15, Class AB,
3.000%, 03/25/2048 | | 647,609 | | | 699,757 |
Series 2018-8, Class KL,
2.500%, 03/25/2047 | | 2,076,655 | | | 2,181,641 |
Series 2019-25, Class PA,
3.000%, 05/25/2048 | | 4,177,202 | | | 4,488,602 |
Series 2019-35, Class MB,
3.000%, 07/25/2049 | | 2,995,962 | | | 3,232,585 |
Series 2019-8, Class GA,
3.000%, 03/25/2049 | | 7,089,562 | | | 7,454,260 |
Series 414, Class A35,
3.500%, 10/25/2042 | | 2,024,334 | | | 2,171,563 |
Government National
Mortgage Association | | | | | |
Series 2012-141, Class WA,
4.539%, 11/16/2041 (E) | | 450,128 | | | 497,559 |
Series 2017-167, Class BQ,
2.500%, 08/20/2044 | | 1,877,228 | | | 1,947,206 |
Series 2019-132, Class NA,
3.500%, 09/20/2049 | | 4,669,911 | | | 4,863,084 |
Series 2019-31, Class JC,
3.500%, 03/20/2049 | | 2,422,078 | | | 2,558,571 |
| | | | | | 110,630,660 |
| TOTAL COLLATERALIZED MORTGAGE OBLIGATIONS (Cost $211,359,188) | | $ | 219,681,353 |
| ASSET BACKED SECURITIES – 9.5% | | | |
Americredit Automobile
Receivables Trust | | | | | |
Series 2020-1, Class A2A
1.100%, 03/20/2023 | | 567,000 | | | 569,019 |
Series 2020-2, Class A2A
0.600%, 12/18/2023 | | 4,325,000 | | | 4,329,047 |
Avis Budget Rental Car Funding
AESOP LLC | | | | | |
Series 2017-1A, Class A
3.070%, 09/20/2023 (C) | | 939,000 | | | 959,507 |
| The accompanying notes are an integral part of the financial statements. | 21 | |
John Hancock Funds II
Portfolio of Investments — August 31, 2020 (showing percentage of total net assets)
Core Bond Fund (continued)
| | | Shares or
Principal
Amount | | Value |
| ASSET BACKED SECURITIES (continued) | | | |
Avis Budget Rental Car Funding
AESOP LLC (continued) | | | | | |
Series 2019-3A, Class A
2.360%, 03/20/2026 (C) | $ | 1,615,000 | | $ | 1,648,927 |
Series 2020-2A, Class A
2.020%, 02/20/2027 (C) | | 5,849,000 | | | 5,862,623 |
| Capital One Multi-Asset Execution Trust | | | | | |
Series 2016-A2, Class A2 (1 month LIBOR + 0.630%)
0.792%, 02/15/2024 (B) | | 3,814,000 | | | 3,828,010 |
Series 2016-A7, Class A7 (1 month LIBOR + 0.510%)
0.672%, 09/16/2024 (B) | | 2,272,000 | | | 2,282,359 |
| CNH Equipment Trust | | | | | |
Series 2020-A, Class A3
1.160%, 06/16/2025 | | 1,960,000 | | | 1,987,026 |
Series 2020-A, Class A4
1.510%, 04/15/2027 | | 551,000 | | | 567,181 |
| College Ave Student Loans LLC | | | | | |
Series 2017-A, Class A1 (1 month LIBOR + 1.650%)
1.825%, 11/26/2046 (B)(C) | | 943,465 | | | 938,484 |
Series 2018-A, Class A2
4.130%, 12/26/2047 (C) | | 1,071,563 | | | 1,166,711 |
Series 2019-A, Class A2
3.280%, 12/28/2048 (C) | | 1,079,168 | | | 1,139,110 |
Ford Credit Auto Lease Trust
Series 2020-B, Class A3
0.620%, 08/15/2023 | | 4,941,000 | | | 4,960,533 |
| Ford Credit Auto Owner Trust | | | | | |
Series 2018-1, Class A
3.190%, 07/15/2031 (C) | | 7,349,000 | | | 8,111,997 |
Series 2018-2, Class A
3.470%, 01/15/2030 (C) | | 4,408,000 | | | 4,770,376 |
Series 2019-1, Class A
3.520%, 07/15/2030 (C) | | 3,514,000 | | | 3,852,902 |
Series 2020-1, Class A
2.040%, 08/15/2031 (C) | | 7,009,000 | | | 7,398,976 |
Series 2020-A, Class A3
1.040%, 08/15/2024 | | 2,036,000 | | | 2,061,570 |
Series 2020-B, Class A4
0.790%, 11/15/2025 | | 1,756,000 | | | 1,775,350 |
GM Financial Automobile Leasing Trust
Series 2020-2, Class A4
1.010%, 07/22/2024 | | 512,000 | | | 518,735 |
GM Financial Consumer Automobile Receivables Trust
Series 2020-2, Class A3
1.490%, 12/16/2024 | | 389,000 | | | 397,895 |
| Mercedes-Benz Auto Receivables Trust | | | | | |
Series 2020-1, Class A3
0.550%, 02/18/2025 | | 3,411,000 | | | 3,427,664 |
Series 2020-1, Class A4
0.770%, 10/15/2026 | | 898,000 | | | 906,977 |
| Navient Private Education Loan Trust | | | | | |
Series 2016-AA, Class A2B (1 month LIBOR + 2.150%)
2.312%, 12/15/2045 (B)(C) | | 677,854 | | | 688,819 |
Series 2018-BA, Class A2A
3.610%, 12/15/2059 (C) | | 1,307,546 | | | 1,356,573 |
Navient Private Education Refi
Loan Trust | | | | | |
Series 2018-A, Class A2
3.190%, 02/18/2042 (C) | | 6,751,719 | | | 6,887,057 |
Series 2018-CA, Class A2
3.520%, 06/16/2042 (C) | | 748,492 | | | 769,464 |
Core Bond Fund (continued)
| | | Shares or
Principal
Amount | | Value |
| ASSET BACKED SECURITIES (continued) | | | |
Navient Private Education Refi
Loan Trust (continued) | | | | | |
Series 2018-DA, Class A2A
4.000%, 12/15/2059 (C) | $ | 3,186,000 | | $ | 3,365,458 |
Series 2019-CA, Class A2
3.130%, 02/15/2068 (C) | | 3,693,000 | | | 3,822,567 |
Series 2019-D, Class A2A
3.010%, 12/15/2059 (C) | | 5,091,000 | | | 5,347,904 |
Series 2019-D, Class A2B (1 month LIBOR + 1.050%)
1.212%, 12/15/2059 (B)(C) | | 2,053,000 | | | 2,053,085 |
Series 2019-FA, Class A2
2.600%, 08/15/2068 (C) | | 5,329,000 | | | 5,504,202 |
Series 2019-GA, Class A
2.400%, 10/15/2068 (C) | | 4,663,831 | | | 4,774,260 |
Series 2020-A, Class A2A
2.460%, 11/15/2068 (C) | | 3,338,000 | | | 3,465,125 |
Series 2020-A, Class A2B (1 month LIBOR + 0.900%)
1.062%, 11/15/2068 (B)(C) | | 2,393,000 | | | 2,379,262 |
Series 2020-BA, Class A2
2.120%, 01/15/2069 (C) | | 2,124,000 | | | 2,155,364 |
Series 2020-CA, Class A2A
2.150%, 11/15/2068 (C) | | 2,018,000 | | | 2,048,724 |
Series 2020-DA, Class A
1.690%, 05/15/2069 (C) | | 2,113,009 | | | 2,136,415 |
Series 2020-EA, Class A
1.690%, 05/15/2069 (C) | | 1,176,916 | | | 1,190,282 |
Series 2020-FA, Class A
1.220%, 07/15/2069 (C) | | 1,245,000 | | | 1,246,792 |
| Navient Student Loan Trust | | | | | |
Series 2016-3A, Class A2 (1 month LIBOR + 0.850%)
1.025%, 06/25/2065 (B)(C) | | 112,724 | | | 112,741 |
Series 2018-EA, Class A2
4.000%, 12/15/2059 (C) | | 1,964,000 | | | 2,041,826 |
Series 2019-BA, Class A2A
3.390%, 12/15/2059 (C) | | 3,938,000 | | | 4,138,809 |
Series 2020-1A, Class A1B (1 month LIBOR + 1.050%)
1.199%, 06/25/2069 (B)(C) | | 5,534,000 | | | 5,582,729 |
| Nelnet Student Loan Trust | | | | | |
Series 2004-3, Class A5 (3 month LIBOR + 0.180%)
1.171%, 10/27/2036 (B) | | 602,855 | | | 590,756 |
Series 2004-4, Class A5 (3 month LIBOR + 0.160%)
0.405%, 01/25/2037 (B) | | 1,849,442 | | | 1,786,556 |
Series 2005-1, Class A5 (3 month LIBOR + 0.110%)
0.355%, 10/25/2033 (B) | | 7,116,119 | | | 6,818,836 |
Series 2005-2, Class A5 (3 month LIBOR + 0.100%)
0.406%, 03/23/2037 (B) | | 9,263,305 | | | 8,888,995 |
Series 2005-3, Class A5 (3 month LIBOR + 0.120%)
0.426%, 12/24/2035 (B) | | 5,800,315 | | | 5,599,839 |
Series 2005-4, Class A4 (3 month LIBOR + 0.180%)
0.486%, 03/22/2032 (B) | | 621,419 | | | 582,504 |
Series 2012-2A, Class A (1 month LIBOR + 0.800%)
0.975%, 12/26/2033 (B)(C) | | 4,064,146 | | | 4,017,847 |
Series 2014-1A, Class A (1 month LIBOR + 0.570%)
0.745%, 09/25/2041 (B)(C) | | 563,456 | | | 546,822 |
| The accompanying notes are an integral part of the financial statements. | 22 | |
John Hancock Funds II
Portfolio of Investments — August 31, 2020 (showing percentage of total net assets)
Core Bond Fund (continued)
| | | Shares or
Principal
Amount | | Value |
| ASSET BACKED SECURITIES (continued) | | | |
| Santander Drive Auto Receivables Trust | | | | | |
Series 2020-1, Class A3
2.030%, 02/15/2024 | $ | 1,025,000 | | $ | 1,045,953 |
Series 2020-2, Class A2A
0.620%, 05/15/2023 | | 4,990,000 | | | 4,993,739 |
Santander Revolving Auto Loan Trust
Series 2019-A, Class A
2.510%, 01/26/2032 (C) | | 6,020,000 | | | 6,415,910 |
SLC Student Loan Trust
Series 2008-1, Class A4A (3 month LIBOR + 1.600%)
1.913%, 12/15/2032 (B) | | 1,590,814 | | | 1,584,906 |
| SLM Student Loan Trust | | | | | |
Series 2003-1, Class A5C (3 month LIBOR + 0.750%)
1.063%, 12/15/2032 (B)(C) | | 889,290 | | | 824,624 |
Series 2007-2, Class A4 (3 month LIBOR + 0.060%)
0.305%, 07/25/2022 (B) | | 2,231,336 | | | 2,088,224 |
Series 2010-1, Class A (1 month LIBOR + 0.400%)
0.575%, 03/25/2025 (B) | | 347,572 | | | 330,810 |
Series 2012-1, Class A3 (1 month LIBOR + 0.950%)
1.125%, 09/25/2028 (B) | | 3,217,373 | | | 3,068,175 |
Series 2012-2, Class A (1 month LIBOR + 0.700%)
0.875%, 01/25/2029 (B) | | 2,967,818 | | | 2,789,752 |
Series 2012-6, Class A3 (1 month LIBOR + 0.750%)
0.925%, 05/26/2026 (B) | | 577,481 | | | 554,519 |
Series 2013-4, Class A (1 month LIBOR + 0.550%)
0.725%, 06/25/2043 (B) | | 4,521,672 | | | 4,414,768 |
| SMB Private Education Loan Trust | | | | | |
Series 2015-A, Class A2B (1 month LIBOR + 1.000%)
1.162%, 06/15/2027 (B)(C) | | 719,025 | | | 720,181 |
Series 2015-C, Class A2B (1 month LIBOR + 1.400%)
1.562%, 07/15/2027 (B)(C) | | 278,457 | | | 279,370 |
Series 2016-A, Class A2A
2.700%, 05/15/2031 (C) | | 1,871,988 | | | 1,913,819 |
Series 2016-B, Class A2A
2.430%, 02/17/2032 (C) | | 308,076 | | | 314,324 |
Series 2016-C, Class A2B (1 month LIBOR + 1.100%)
1.262%, 09/15/2034 (B)(C) | | 950,364 | | | 949,430 |
Series 2018-C, Class A2A
3.630%, 11/15/2035 (C) | | 1,826,415 | | | 1,921,367 |
Series 2019-A, Class A2A
3.440%, 07/15/2036 (C) | | 5,194,000 | | | 5,457,681 |
Series 2020-BA, Class A1A
1.290%, 07/15/2053 (C) | | 5,366,000 | | | 5,359,286 |
Series 2020-PTA, Class A2A
1.600%, 09/15/2054 (C) | | 11,177,000 | | | 11,252,236 |
| SoFi Professional Loan Program LLC | | | | | |
Series 2016-A, Class A2
2.760%, 12/26/2036 (C) | | 793,909 | | | 801,662 |
Series 2016-D, Class A1 (1 month LIBOR + 0.950%)
1.125%, 01/25/2039 (B)(C) | | 76,311 | | | 76,271 |
Series 2016-E, Class A1 (1 month LIBOR + 0.850%)
1.025%, 07/25/2039 (B)(C) | | 166,897 | | | 166,447 |
Core Bond Fund (continued)
| | | Shares or
Principal
Amount | | Value |
| ASSET BACKED SECURITIES (continued) | | | |
SoFi Professional Loan
Program LLC (continued) | | | | | |
Series 2017-A, Class A1 (1 month LIBOR + 0.700%)
0.875%, 03/26/2040 (B)(C) | $ | 294,211 | | $ | 293,892 |
Series 2017-C, Class A1 (1 month LIBOR + 0.600%)
0.775%, 07/25/2040 (B)(C) | | 421,673 | | | 420,130 |
Series 2017-D, Class A2FX
2.650%, 09/25/2040 (C) | | 934,662 | | | 957,608 |
Series 2017-E, Class A1 (1 month LIBOR + 0.500%)
0.675%, 11/26/2040 (B)(C) | | 118,286 | | | 118,067 |
Series 2017-E, Class A2B
2.720%, 11/26/2040 (C) | | 3,091,987 | | | 3,142,236 |
Series 2018-A, Class A2B
2.950%, 02/25/2042 (C) | | 1,487,000 | | | 1,537,381 |
Series 2020-A, Class A2FX
2.540%, 05/15/2046 (C) | | 4,799,000 | | | 4,988,678 |
Series 2020-C, Class AFX
1.950%, 02/15/2046 (C) | | 3,885,924 | | | 3,963,819 |
SoFi Professional Loan Program Trust
Series 2018-B, Class A2FX
3.340%, 08/25/2047 (C) | | 11,367,000 | | | 11,736,661 |
Triton Container Finance VIII LLC
Series 2020-1A, Class A
2.110%, 09/20/2045 (C) | | 2,095,000 | | | 2,094,728 |
| Verizon Owner Trust | | | | | |
Series 2019-C, Class A1A
1.940%, 04/22/2024 | | 2,176,000 | | | 2,231,383 |
Series 2020-A, Class A1A
1.850%, 07/22/2024 | | 5,078,000 | | | 5,215,875 |
Series 2020-B, Class A
0.470%, 02/20/2025 | | 7,126,000 | | | 7,123,378 |
| Volkswagen Auto Loan Enhanced Trust | | | | | |
Series 2020-1, Class A3
0.980%, 11/20/2024 | | 2,639,000 | | | 2,670,581 |
Series 2020-1, Class A4
1.260%, 08/20/2026 | | 925,000 | | | 947,594 |
| TOTAL ASSET BACKED SECURITIES (Cost $253,690,108) | | | $ | 258,126,057 |
| SHORT-TERM INVESTMENTS – 8.0% | | | |
| Short-term funds – 8.0% | | | | | |
| State Street Institutional U.S. Government Money Market Fund, Premier Class, 0.0399% (F) | | 217,020,553 | | | 217,020,553 |
| TOTAL SHORT-TERM INVESTMENTS (Cost $217,020,553) | | $ | 217,020,553 |
Total Investments (Core Bond Fund)
(Cost $3,004,899,142) – 114.0% | | $ | 3,093,883,956 |
| Other assets and liabilities, net – (14.0%) | | | | (380,273,464) |
| TOTAL NET ASSETS – 100.0% | | | | $ | 2,713,610,492 |
| Security Abbreviations and Legend |
| CMT | Constant Maturity Treasury |
| LIBOR | London Interbank Offered Rate |
| SOFR | Secured Overnight Financing Rate |
| TBA | To Be Announced. A forward mortgage-backed securities trade issued by a U.S. Government Agency, to be delivered at an agreed-upon future settlement date. |
| (A) | Security purchased or sold on a when-issued or delayed delivery basis. |
| (B) | Variable rate obligation. The coupon rate shown represents the rate at period end. |
| The accompanying notes are an integral part of the financial statements. | 23 | |
John Hancock Funds II
Portfolio of Investments — August 31, 2020 (showing percentage of total net assets)
Core Bond Fund (continued)
| (C) | These securities are exempt from registration under Rule 144A of the Securities Act of 1933. Such securities may be resold, normally to qualified institutional buyers, in transactions exempt from registration. Rule 144A securities amounted to $379,642,404 or 14.0% of the fund's net assets as of 8-31-20. |
| (D) | Non-income producing - Issuer is in default. |
| (E) | Variable or floating rate security, the interest rate of which adjusts periodically based on a weighted average of interest rates and prepayments on the underlying pool of assets. The interest rate shown is the current rate as of period end. |
| (F) | The rate shown is the annualized seven-day yield as of 8-31-20. |
High Yield Fund
| | | Shares or
Principal
Amount | | Value |
| FOREIGN GOVERNMENT OBLIGATIONS – 1.0% | | | |
| Argentina – 0.5% | | | | | |
Provincia de Buenos Aires
7.875%, 06/15/2027 (A) | $ | 870,000 | | $ | 408,909 |
| Republic of Argentina | | | | | |
| 5.625%, 01/26/2022 (A) | | 470,000 | | | 223,250 |
| 6.875%, 01/26/2027 (A) | | 430,000 | | | 190,709 |
| 7.500%, 04/22/2026 (A) | | 330,000 | | | 150,153 |
| | | | | | 973,021 |
| Brazil – 0.5% | | | | | |
Federative Republic of Brazil
10.000%, 01/01/2021 to 01/01/2027 | BRL | 4,205,000 | | | 875,466 |
| Indonesia – 0.0% | | | | | |
Republic of Indonesia
8.375%, 03/15/2034 | IDR | 543,000,000 | | | 40,461 |
| TOTAL FOREIGN GOVERNMENT OBLIGATIONS (Cost $3,428,169) | | $ | 1,888,948 |
| CORPORATE BONDS – 84.9% | | | |
| Communication services – 13.8% | | | | | |
Allen Media LLC
10.500%, 02/15/2028 (B) | $ | 950,000 | | | 940,795 |
Altice France Holding SA
10.500%, 05/15/2027 (B) | | 290,000 | | | 332,413 |
Altice France SA
7.375%, 05/01/2026 (B) | | 2,530,000 | | | 2,685,955 |
| CCO Holdings LLC | | | | | |
| 4.250%, 02/01/2031 (B) | | 100,000 | | | 104,472 |
| 4.500%, 05/01/2032 (B) | | 260,000 | | | 275,571 |
| 5.125%, 05/01/2027 (B) | | 1,270,000 | | | 1,352,575 |
| 5.750%, 02/15/2026 (B) | | 215,000 | | | 225,333 |
CenturyLink, Inc.
4.000%, 02/15/2027 (B) | | 370,000 | | | 375,968 |
Charter Communications Operating LLC
6.484%, 10/23/2045 | | 250,000 | | | 333,955 |
Clear Channel International BV
6.625%, 08/01/2025 (B) | | 380,000 | | | 393,300 |
Cogent Communications Group, Inc.
5.375%, 03/01/2022 (B) | | 430,000 | | | 442,900 |
CSC Holdings LLC
6.500%, 02/01/2029 (B) | | 1,370,000 | | | 1,543,819 |
DISH DBS Corp.
7.750%, 07/01/2026 | | 2,150,000 | | | 2,461,750 |
| iHeartCommunications, Inc. | | | | | |
| 4.750%, 01/15/2028 (B) | | 280,000 | | | 268,128 |
| 5.250%, 08/15/2027 (B) | | 780,000 | | | 778,050 |
Intelsat Jackson Holdings SA
8.000%, 02/15/2024 (A)(B) | | 330,000 | | | 336,600 |
Lions Gate Capital Holdings LLC
5.875%, 11/01/2024 (B) | | 1,000,000 | | | 1,007,500 |
| Match Group Holdings II LLC | | | | | |
| 4.625%, 06/01/2028 (B) | | 660,000 | | | 694,987 |
| 5.000%, 12/15/2027 (B) | | 400,000 | | | 426,500 |
High Yield Fund (continued)
| | | Shares or
Principal
Amount | | Value |
| CORPORATE BONDS (continued) | | | |
| Communication services (continued) | | | | | |
| Netflix, Inc. | | | | | |
| 4.875%, 06/15/2030 (B) | $ | 500,000 | | $ | 579,375 |
| 5.375%, 11/15/2029 (B) | | 770,000 | | | 925,925 |
| 6.375%, 05/15/2029 | | 490,000 | | | 621,075 |
Sprint Capital Corp.
8.750%, 03/15/2032 | | 1,260,000 | | | 1,903,151 |
Sprint Communications, Inc.
11.500%, 11/15/2021 | | 841,000 | | | 936,748 |
| Sprint Corp. | | | | | |
| 7.625%, 02/15/2025 | | 40,000 | | | 47,900 |
| 7.875%, 09/15/2023 | | 1,470,000 | | | 1,709,794 |
Telecom Italia SpA
5.303%, 05/30/2024 (B) | | 600,000 | | | 662,376 |
Time Warner Cable LLC
7.300%, 07/01/2038 | | 680,000 | | | 965,731 |
Twitter, Inc.
3.875%, 12/15/2027 (B) | | 480,000 | | | 506,496 |
| Univision Communications, Inc. | | | | | |
| 5.125%, 02/15/2025 (B) | | 430,000 | | | 432,688 |
| 9.500%, 05/01/2025 (B) | | 650,000 | | | 711,750 |
UPC Holding BV
5.500%, 01/15/2028 (B) | | 370,000 | | | 386,221 |
Virgin Media Secured Finance PLC
5.500%, 08/15/2026 to 05/15/2029 (B) | | 1,940,000 | | | 2,058,301 |
Virgin Media Vendor Financing Notes IV DAC
5.000%, 07/15/2028 (B) | | 510,000 | | | 528,590 |
| | | | | | 27,956,692 |
| Consumer discretionary – 15.0% | | | | | |
American Axle & Manufacturing, Inc.
6.500%, 04/01/2027 | | 670,000 | | | 688,425 |
| American News Company LLC (8.500% Cash or 10.000% PIK) 8.500%, 09/01/2026 (B) | | 1,054,618 | | | 1,154,807 |
Boyne USA, Inc.
7.250%, 05/01/2025 (B) | | 1,130,000 | | | 1,197,800 |
Brinker International, Inc.
5.000%, 10/01/2024 (B) | | 420,000 | | | 417,900 |
Carriage Services, Inc.
6.625%, 06/01/2026 (B) | | 730,000 | | | 771,975 |
Century Communities, Inc.
5.875%, 07/15/2025 | | 1,040,000 | | | 1,081,600 |
Colt Merger Sub, Inc.
6.250%, 07/01/2025 (B) | | 390,000 | | | 412,796 |
ESH Hospitality, Inc.
4.625%, 10/01/2027 (B) | | 420,000 | | | 419,992 |
Fontainebleau Las Vegas Holdings LLC
11.000%, 06/15/2015 (A)(B) | | 2,983,778 | | | 298 |
| Ford Motor Company | | | | | |
| 8.500%, 04/21/2023 | | 20,000 | | | 22,108 |
| 9.000%, 04/22/2025 | | 1,060,000 | | | 1,240,481 |
| Ford Motor Credit Company LLC | | | | | |
| 3.087%, 01/09/2023 | | 1,250,000 | | | 1,242,375 |
| 3.096%, 05/04/2023 | | 790,000 | | | 784,075 |
| 5.125%, 06/16/2025 | | 500,000 | | | 525,365 |
Golden Nugget, Inc.
8.750%, 10/01/2025 (B) | | 660,000 | | | 491,700 |
| Hanesbrands, Inc. | | | | | |
| 4.875%, 05/15/2026 (B) | | 550,000 | | | 598,802 |
| 5.375%, 05/15/2025 (B) | | 190,000 | | | 202,635 |
Hilton Domestic Operating
Company, Inc. | | | | | |
| 5.375%, 05/01/2025 (B) | | 410,000 | | | 429,803 |
| 5.750%, 05/01/2028 (B) | | 290,000 | | | 306,675 |
| The accompanying notes are an integral part of the financial statements. | 24 | |
John Hancock Funds II
Portfolio of Investments — August 31, 2020 (showing percentage of total net assets)
High Yield Fund (continued)
| | | Shares or
Principal
Amount | | Value |
| CORPORATE BONDS (continued) | | | |
| Consumer discretionary (continued) | | | | | |
Hilton Worldwide Finance LLC
4.625%, 04/01/2025 | $ | 240,000 | | $ | 242,400 |
Installed Building Products, Inc.
5.750%, 02/01/2028 (B) | | 500,000 | | | 527,500 |
International Game Technology PLC
5.250%, 01/15/2029 (B) | | 720,000 | | | 738,000 |
IRB Holding Corp.
7.000%, 06/15/2025 (B) | | 370,000 | | | 394,975 |
| L Brands, Inc. | | | | | |
| 5.250%, 02/01/2028 | | 1,080,000 | | | 1,036,800 |
| 6.875%, 07/01/2025 (B) | | 290,000 | | | 313,774 |
| 9.375%, 07/01/2025 (B) | | 370,000 | | | 430,976 |
| Lennar Corp. | | | | | |
| 4.750%, 11/29/2027 | | 150,000 | | | 171,000 |
| 5.875%, 11/15/2024 | | 640,000 | | | 715,200 |
Levi Strauss & Company
5.000%, 05/01/2025 | | 160,000 | | | 163,600 |
| Marston's Issuer PLC (3 month GBP LIBOR + 2.550%) 2.632%, 07/15/2035 (C) | GBP | 380,000 | | | 388,950 |
Melco Resorts Finance, Ltd.
5.375%, 12/04/2029 (B) | $ | 340,000 | | | 348,160 |
MGM Growth Properties Operating Partnership LP
4.500%, 09/01/2026 | | 310,000 | | | 325,500 |
Michaels Stores, Inc.
8.000%, 07/15/2027 (B)(D) | | 360,000 | | | 363,600 |
Mohegan Gaming & Entertainment
7.875%, 10/15/2024 (B) | | 1,060,000 | | | 1,003,025 |
| NCL Corp., Ltd. | | | | | |
| 3.625%, 12/15/2024 (B) | | 450,000 | | | 308,813 |
| 10.250%, 02/01/2026 (B) | | 720,000 | | | 723,600 |
| 12.250%, 05/15/2024 (B) | | 800,000 | | | 891,000 |
| Party City Holdings, Inc. (Greater of 6 month LIBOR + 5.000% or 5.750%) 5.750%, 07/15/2025 (B)(C) | | 145,825 | | | 91,141 |
PetSmart, Inc.
8.875%, 06/01/2025 (B) | | 320,000 | | | 332,160 |
Sands China, Ltd.
5.400%, 08/08/2028 | | 200,000 | | | 226,600 |
Scientific Games International, Inc.
7.000%, 05/15/2028 (B) | | 860,000 | | | 842,989 |
Service Corp. International
3.375%, 08/15/2030 | | 220,000 | | | 224,125 |
Silversea Cruise Finance, Ltd.
7.250%, 02/01/2025 (B) | | 632,000 | | | 634,632 |
Speedway Motorsports LLC
4.875%, 11/01/2027 (B) | | 280,000 | | | 266,000 |
Sugarhouse HSP Gaming Prop Mezz LP
5.875%, 05/15/2025 (B) | | 380,000 | | | 368,600 |
The ServiceMaster Company LLC
5.125%, 11/15/2024 (B) | | 400,000 | | | 408,000 |
| The William Carter Company | | | | | |
| 5.500%, 05/15/2025 (B) | | 250,000 | | | 266,560 |
| 5.625%, 03/15/2027 (B) | | 390,000 | | | 414,328 |
TopBuild Corp.
5.625%, 05/01/2026 (B) | | 560,000 | | | 582,943 |
| Viking Cruises, Ltd. | | | | | |
| 5.875%, 09/15/2027 (B) | | 570,000 | | | 404,700 |
| 13.000%, 05/15/2025 (B) | | 1,000,000 | | | 1,110,000 |
VOC Escrow, Ltd.
5.000%, 02/15/2028 (B) | | 990,000 | | | 821,700 |
WW International, Inc.
8.625%, 12/01/2025 (B) | | 900,000 | | | 947,250 |
High Yield Fund (continued)
| | | Shares or
Principal
Amount | | Value |
| CORPORATE BONDS (continued) | | | |
| Consumer discretionary (continued) | | | | | |
Wyndham Hotels & Resorts, Inc.
4.375%, 08/15/2028 (B) | $ | 330,000 | | $ | 332,541 |
Wynn Macau, Ltd.
5.125%, 12/15/2029 (B) | | 300,000 | | | 294,750 |
Wynn Resorts Finance LLC
7.750%, 04/15/2025 (B) | | 600,000 | | | 630,000 |
| | | | | | 30,275,504 |
| Consumer staples – 3.1% | | | | | |
Altria Group, Inc.
5.950%, 02/14/2049 | | 410,000 | | | 554,066 |
Cott Holdings, Inc.
5.500%, 04/01/2025 (B) | | 530,000 | | | 547,888 |
| Kraft Heinz Foods Company | | | | | |
| 3.875%, 05/15/2027 (B) | | 30,000 | | | 32,078 |
| 4.250%, 03/01/2031 (B) | | 170,000 | | | 187,830 |
| 5.200%, 07/15/2045 | | 510,000 | | | 577,922 |
| 5.500%, 06/01/2050 (B) | | 520,000 | | | 612,163 |
Lamb Weston Holdings, Inc.
4.875%, 11/01/2026 to 05/15/2028 (B) | | 470,000 | | | 497,743 |
Sally Holdings LLC
5.625%, 12/01/2025 | | 780,000 | | | 791,700 |
Simmons Foods, Inc.
5.750%, 11/01/2024 (B) | | 940,000 | | | 963,218 |
SunOpta Foods, Inc.
9.500%, 10/09/2022 (B) | | 920,000 | | | 939,550 |
TreeHouse Foods, Inc.
4.000%, 09/01/2028 (E) | | 470,000 | | | 478,314 |
| | | | | | 6,182,472 |
| Energy – 11.4% | | | | | |
Antero Midstream Partners LP
5.375%, 09/15/2024 | | 250,000 | | | 230,625 |
| Apache Corp. | | | | | |
| 4.875%, 11/15/2027 | | 310,000 | | | 316,770 |
| 5.100%, 09/01/2040 | | 610,000 | | | 593,341 |
Berry Petroleum Company LLC
7.000%, 02/15/2026 (B) | | 390,000 | | | 319,800 |
Blue Racer Midstream LLC
6.625%, 07/15/2026 (B) | | 1,190,000 | | | 1,047,200 |
| Cenovus Energy, Inc. | | | | | |
| 3.000%, 08/15/2022 | | 520,000 | | | 528,394 |
| 5.375%, 07/15/2025 | | 290,000 | | | 295,088 |
| 5.400%, 06/15/2047 | | 60,000 | | | 53,606 |
| 6.750%, 11/15/2039 | | 140,000 | | | 145,045 |
CNX Midstream Partners LP
6.500%, 03/15/2026 (B) | | 310,000 | | | 310,459 |
| Comstock Resources, Inc. | | | | | |
| 7.500%, 05/15/2025 (B) | | 280,000 | | | 277,861 |
| 9.750%, 08/15/2026 | | 600,000 | | | 641,760 |
| Continental Resources, Inc. | | | | | |
| 3.800%, 06/01/2024 | | 230,000 | | | 226,771 |
| 4.375%, 01/15/2028 | | 270,000 | | | 259,200 |
| DCP Midstream Operating LP | | | | | |
| 6.450%, 11/03/2036 (B) | | 310,000 | | | 310,000 |
| 6.750%, 09/15/2037 (B) | | 700,000 | | | 700,000 |
| Endeavor Energy Resources LP | | | | | |
| 5.500%, 01/30/2026 (B) | | 270,000 | | | 269,781 |
| 5.750%, 01/30/2028 (B) | | 50,000 | | | 51,125 |
| 6.625%, 07/15/2025 (B) | | 350,000 | | | 365,096 |
| EQM Midstream Partners LP | | | | | |
| 5.500%, 07/15/2028 | | 620,000 | | | 642,419 |
| 6.000%, 07/01/2025 (B) | | 260,000 | | | 275,925 |
| 6.500%, 07/01/2027 (B) | | 240,000 | | | 262,800 |
| 6.500%, 07/15/2048 | | 250,000 | | | 252,350 |
EQT Corp.
7.875%, 02/01/2025 | | 710,000 | | | 815,030 |
| The accompanying notes are an integral part of the financial statements. | 25 | |
John Hancock Funds II
Portfolio of Investments — August 31, 2020 (showing percentage of total net assets)
High Yield Fund (continued)
| | | Shares or
Principal
Amount | | Value |
| CORPORATE BONDS (continued) | | | |
| Energy (continued) | | | | | |
| MEG Energy Corp. | | | | | |
| 7.000%, 03/31/2024 (B) | $ | 259,000 | | $ | 257,058 |
| 7.125%, 02/01/2027 (B) | | 1,300,000 | | | 1,243,801 |
Montage Resources Corp.
8.875%, 07/15/2023 | | 500,000 | | | 511,250 |
| NGPL PipeCo LLC | | | | | |
| 4.375%, 08/15/2022 (B) | | 460,000 | | | 476,885 |
| 4.875%, 08/15/2027 (B) | | 300,000 | | | 328,444 |
Oasis Petroleum, Inc.
6.875%, 03/15/2022 to 01/15/2023 | | 1,411,000 | | | 271,961 |
| Occidental Petroleum Corp. | | | | | |
| 2.700%, 02/15/2023 | | 420,000 | | | 403,931 |
| 2.900%, 08/15/2024 | | 860,000 | | | 791,200 |
| 8.875%, 07/15/2030 | | 510,000 | | | 576,300 |
| Occidental Petroleum Corp. (3 month LIBOR + 1.450%) 1.730%, 08/15/2022 (C) | | 110,000 | | | 103,997 |
Pattern Energy Operations LP
4.500%, 08/15/2028 (B) | | 80,000 | | | 84,200 |
| Petrobras Global Finance BV | | | | | |
| 5.750%, 02/01/2029 | | 40,000 | | | 43,960 |
| 6.850%, 06/05/2115 | | 580,000 | | | 637,783 |
Precision Drilling Corp.
7.125%, 01/15/2026 (B) | | 870,000 | | | 591,600 |
| Range Resources Corp. | | | | | |
| 5.000%, 03/15/2023 | | 350,000 | | | 348,681 |
| 9.250%, 02/01/2026 (B) | | 520,000 | | | 547,560 |
Shelf Drilling Holdings, Ltd.
8.250%, 02/15/2025 (B) | | 910,000 | | | 318,500 |
Targa Resources Partners LP
4.875%, 02/01/2031 (B) | | 610,000 | | | 614,606 |
The Williams Companies, Inc.
7.500%, 01/15/2031 | | 650,000 | | | 865,474 |
Vesta Energy Corp.
8.125%, 07/24/2023 (B) | CAD | 920,000 | | | 352,666 |
Viper Energy Partners LP
5.375%, 11/01/2027 (B) | $ | 260,000 | | | 267,800 |
| Western Midstream Operating LP | | | | | |
| 3.950%, 06/01/2025 | | 80,000 | | | 79,775 |
| 4.000%, 07/01/2022 | | 260,000 | | | 264,550 |
| 4.100%, 02/01/2025 | | 1,230,000 | | | 1,227,073 |
| 5.500%, 08/15/2048 | | 610,000 | | | 545,950 |
| WPX Energy, Inc. | | | | | |
| 5.250%, 10/15/2027 | | 410,000 | | | 407,827 |
| 5.875%, 06/15/2028 | | 610,000 | | | 619,150 |
| 8.250%, 08/01/2023 | | 1,040,000 | | | 1,168,856 |
| | | | | | 23,141,284 |
| Financials – 8.7% | | | | | |
Allied Universal Holdco LLC
6.625%, 07/15/2026 (B) | | 1,170,000 | | | 1,254,825 |
Ally Financial, Inc.
8.000%, 11/01/2031 | | 350,000 | | | 475,468 |
| Barclays PLC (5.088% to 6-20-29, then 3 month LIBOR + 3.054%) 06/20/2030 | | 1,470,000 | | | 1,706,689 |
| Barclays PLC (8.000% to 12-15-20, then 5 Year Euro Swap Rate + 6.750%) 12/15/2020 (F) | EUR | 540,000 | | | 656,395 |
| Barclays PLC (8.000% to 6-15-24, then 5 Year CMT + 5.672%) 06/15/2024 (F) | $ | 600,000 | | | 656,353 |
| BNP Paribas SA (7.375% to 8-19-25, then 5 Year U.S. Swap Rate + 5.150%) 08/19/2025 (B)(F) | | 350,000 | | | 398,790 |
High Yield Fund (continued)
| | | Shares or
Principal
Amount | | Value |
| CORPORATE BONDS (continued) | | | |
| Financials (continued) | | | | | |
CIT Group, Inc.
5.250%, 03/07/2025 | $ | 170,000 | | $ | 185,300 |
| Credit Agricole SA (8.125% to 12-23-25, then 5 Year U.S. Swap Rate + 6.185%) 12/23/2025 (B)(F) | | 600,000 | | | 711,151 |
| Credit Suisse Group AG (6.375% to 8-21-26, then 5 Year CMT + 4.822%) 08/21/2026 (B)(F) | | 840,000 | | | 913,500 |
DAE Funding LLC
5.750%, 11/15/2023 (B) | | 1,030,000 | | | 1,024,850 |
Donnelley Financial Solutions, Inc.
8.250%, 10/15/2024 | | 680,000 | | | 707,200 |
FirstCash, Inc.
4.625%, 09/01/2028 (B) | | 710,000 | | | 729,660 |
| HSBC Holdings PLC (6.375% to 3-30-25, then 5 Year ICE Swap Rate + 4.368%) 03/30/2025 (F) | | 200,000 | | | 212,600 |
| HSBC Holdings PLC (6.500% to 3-23-28, then 5 Year ICE Swap Rate + 3.606%) 03/23/2028 (F) | | 720,000 | | | 775,800 |
Intesa Sanpaolo SpA
5.017%, 06/26/2024 (B) | | 200,000 | | | 215,637 |
Ladder Capital Finance Holdings LLLP
4.250%, 02/01/2027 (B) | | 530,000 | | | 486,275 |
MGIC Investment Corp.
5.250%, 08/15/2028 | | 300,000 | | | 314,691 |
| Natwest Group PLC (8.625% to 8-15-21, then 5 Year U.S. Swap Rate + 7.598%) 08/15/2021 (F) | | 670,000 | | | 704,284 |
NatWest Markets NV
7.750%, 05/15/2023 | | 520,000 | | | 590,370 |
Navient Corp.
5.000%, 03/15/2027 | | 330,000 | | | 318,734 |
NMI Holdings, Inc.
7.375%, 06/01/2025 (B) | | 720,000 | | | 777,319 |
Quicken Loans LLC
5.250%, 01/15/2028 (B) | | 890,000 | | | 948,967 |
StoneX Group, Inc.
8.625%, 06/15/2025 (B) | | 300,000 | | | 324,750 |
| UBS Group AG (7.000% to 1-31-24, then 5 Year U.S. Swap Rate + 4.344%) 01/31/2024 (B)(F) | | 810,000 | | | 877,838 |
| UniCredit SpA (5.459% to 6-30-30, then 5 Year ICE Swap Rate + 4.750%) 06/30/2035 (B) | | 790,000 | | | 817,070 |
| UniCredit SpA (7.296% to 4-2-29, then 5 Year ICE Swap Rate + 4.914%) 04/02/2034 (B) | | 690,000 | | | 808,928 |
| | | | | | 17,593,444 |
| Health care – 7.7% | | | | | |
AdaptHealth LLC
6.125%, 08/01/2028 (B) | | 500,000 | | | 523,750 |
Air Methods Corp.
8.000%, 05/15/2025 (B) | | 860,000 | | | 724,550 |
Bausch Health Americas, Inc.
9.250%, 04/01/2026 (B) | | 471,000 | | | 522,212 |
| Bausch Health Companies, Inc. | | | | | |
| 6.250%, 02/15/2029 (B) | | 1,990,000 | | | 2,080,247 |
| 9.000%, 12/15/2025 (B) | | 1,080,000 | | | 1,182,276 |
| Centene Corp. | | | | | |
| 3.375%, 02/15/2030 | | 250,000 | | | 260,000 |
| 5.375%, 06/01/2026 to 08/15/2026 (B) | | 960,000 | | | 1,015,688 |
| Community Health Systems, Inc. | | | | | |
| 6.625%, 02/15/2025 (B) | | 940,000 | | | 958,800 |
| 8.000%, 03/15/2026 (B) | | 400,000 | | | 414,500 |
| The accompanying notes are an integral part of the financial statements. | 26 | |
John Hancock Funds II
Portfolio of Investments — August 31, 2020 (showing percentage of total net assets)
High Yield Fund (continued)
| | | Shares or
Principal
Amount | | Value |
| CORPORATE BONDS (continued) | | | |
| Health care (continued) | | | | | |
HCA, Inc.
5.625%, 09/01/2028 | $ | 1,000,000 | | $ | 1,189,315 |
HLF Financing Sarl LLC
7.250%, 08/15/2026 (B) | | 610,000 | | | 637,450 |
LifePoint Health, Inc.
4.375%, 02/15/2027 (B) | | 530,000 | | | 527,350 |
MPH Acquisition Holdings LLC
7.125%, 06/01/2024 (B) | | 620,000 | | | 629,486 |
Par Pharmaceutical, Inc.
7.500%, 04/01/2027 (B) | | 710,000 | | | 757,925 |
Radiology Partners, Inc.
9.250%, 02/01/2028 (B) | | 490,000 | | | 520,625 |
RegionalCare Hospital Partners Holdings, Inc.
9.750%, 12/01/2026 (B) | | 480,000 | | | 520,171 |
| Tenet Healthcare Corp. | | | | | |
| 4.625%, 06/15/2028 (B) | | 790,000 | | | 819,625 |
| 6.750%, 06/15/2023 | | 550,000 | | | 585,750 |
| 7.500%, 04/01/2025 (B) | | 650,000 | | | 713,180 |
Teva Pharmaceutical Finance Company LLC
6.150%, 02/01/2036 | | 250,000 | | | 260,000 |
US Renal Care, Inc.
10.625%, 07/15/2027 (B) | | 750,000 | | | 810,000 |
| | | | | | 15,652,900 |
| Industrials – 8.2% | | | | | |
Ahern Rentals, Inc.
7.375%, 05/15/2023 (B) | | 530,000 | | | 219,950 |
| Anagram International, Inc. (5.000% Cash and 5.000% PIK) 10.000%, 08/15/2026 (B) | | 78,825 | | | 66,213 |
Builders FirstSource, Inc.
5.000%, 03/01/2030 (B) | | 230,000 | | | 245,525 |
BWX Technologies, Inc.
5.375%, 07/15/2026 (B) | | 560,000 | | | 586,600 |
CD&R Smokey Buyer, Inc.
6.750%, 07/15/2025 (B) | | 220,000 | | | 235,400 |
Clark Equipment Company
5.875%, 06/01/2025 (B) | | 280,000 | | | 294,350 |
Continental Airlines 2000-1 Class B Pass Through Trust
8.388%, 11/01/2020 | | 143 | | | 137 |
Delta Air Lines, Inc.
7.375%, 01/15/2026 | | 620,000 | | | 645,122 |
FXI Holdings, Inc.
7.875%, 11/01/2024 (B) | | 767,000 | | | 743,990 |
| GFL Environmental, Inc. | | | | | |
| 3.750%, 08/01/2025 (B) | | 370,000 | | | 372,294 |
| 5.125%, 12/15/2026 (B) | | 160,000 | | | 168,934 |
| 8.500%, 05/01/2027 (B) | | 818,000 | | | 889,878 |
| Global Aircraft Leasing Company, Ltd. (6.500% Cash or 7.250% PIK) 6.500%, 09/15/2024 (B) | | 2,570,000 | | | 1,515,144 |
Mileage Plus Holdings LLC
6.500%, 06/20/2027 (B) | | 550,000 | | | 573,375 |
Park-Ohio Industries, Inc.
6.625%, 04/15/2027 | | 100,000 | | | 90,538 |
| Prime Security Services Borrower LLC | | | | | |
| 5.750%, 04/15/2026 (B) | | 1,280,000 | | | 1,414,400 |
| 6.250%, 01/15/2028 (B) | | 1,060,000 | | | 1,113,000 |
Sensata Technologies, Inc.
4.375%, 02/15/2030 (B) | | 420,000 | | | 443,100 |
Signature Aviation US Holdings, Inc.
5.375%, 05/01/2026 (B) | | 790,000 | | | 813,700 |
High Yield Fund (continued)
| | | Shares or
Principal
Amount | | Value |
| CORPORATE BONDS (continued) | | | |
| Industrials (continued) | | | | | |
Standard Industries, Inc.
4.750%, 01/15/2028 (B) | $ | 320,000 | | $ | 336,800 |
Surgery Center Holdings, Inc.
10.000%, 04/15/2027 (B) | | 110,000 | | | 119,108 |
The Boeing Company
5.150%, 05/01/2030 | | 430,000 | | | 481,456 |
| TransDigm, Inc. | | | | | |
| 6.250%, 03/15/2026 (B) | | 630,000 | | | 664,782 |
| 8.000%, 12/15/2025 (B) | | 370,000 | | | 402,375 |
| United Rentals North America, Inc. | | | | | |
| 5.250%, 01/15/2030 | | 850,000 | | | 944,006 |
| 5.500%, 05/15/2027 | | 490,000 | | | 524,227 |
Vertical US Newco, Inc.
5.250%, 07/15/2027 (B) | | 790,000 | | | 822,588 |
Waste Pro USA, Inc.
5.500%, 02/15/2026 (B) | | 580,000 | | | 595,788 |
XPO CNW, Inc.
6.700%, 05/01/2034 | | 620,000 | | | 659,060 |
XPO Logistics, Inc.
6.250%, 05/01/2025 (B) | | 540,000 | | | 576,450 |
| | | | | | 16,558,290 |
| Information technology – 4.4% | | | | | |
Alliance Data Systems Corp.
4.750%, 12/15/2024 (B) | | 600,000 | | | 573,000 |
Amkor Technology, Inc.
6.625%, 09/15/2027 (B) | | 780,000 | | | 848,250 |
Black Knight InfoServ LLC
3.625%, 09/01/2028 (B) | | 540,000 | | | 546,923 |
BY Crown Parent LLC
4.250%, 01/31/2026 (B) | | 230,000 | | | 234,865 |
| CDK Global, Inc. | | | | | |
| 5.250%, 05/15/2029 (B) | | 20,000 | | | 21,818 |
| 5.875%, 06/15/2026 | | 270,000 | | | 283,600 |
| CDW LLC | | | | | |
| 3.250%, 02/15/2029 | | 520,000 | | | 531,118 |
| 4.250%, 04/01/2028 | | 440,000 | | | 459,800 |
CommScope Technologies LLC
5.000%, 03/15/2027 (B) | | 250,000 | | | 248,125 |
CommScope, Inc.
8.250%, 03/01/2027 (B) | | 1,370,000 | | | 1,483,011 |
Entegris, Inc.
4.375%, 04/15/2028 (B) | | 470,000 | | | 489,975 |
Fair Isaac Corp.
4.000%, 06/15/2028 (B) | | 420,000 | | | 434,700 |
j2 Cloud Services LLC
6.000%, 07/15/2025 (B) | | 760,000 | | | 791,350 |
Level 3 Financing, Inc.
5.250%, 03/15/2026 | | 430,000 | | | 448,318 |
Microchip Technology, Inc.
4.250%, 09/01/2025 (B) | | 350,000 | | | 364,448 |
NCR Corp.
5.250%, 10/01/2030 (B) | | 240,000 | | | 243,122 |
ON Semiconductor Corp.
3.875%, 09/01/2028 (B) | | 500,000 | | | 521,740 |
Open Text Holdings, Inc.
4.125%, 02/15/2030 (B) | | 400,000 | | | 414,708 |
| | | | | | 8,938,871 |
| Materials – 6.9% | | | | | |
Alcoa Nederland Holding BV
7.000%, 09/30/2026 (B) | | 280,000 | | | 299,600 |
| ARD Finance SA (6.500% Cash or 7.250% PIK) 6.500%, 06/30/2027 (B) | | 540,000 | | | 553,500 |
| Ardagh Packaging Finance PLC | | | | | |
| 5.250%, 08/15/2027 (B) | | 520,000 | | | 540,998 |
| 6.000%, 02/15/2025 (B) | | 800,000 | | | 834,500 |
| The accompanying notes are an integral part of the financial statements. | 27 | |
John Hancock Funds II
Portfolio of Investments — August 31, 2020 (showing percentage of total net assets)
High Yield Fund (continued)
| | | Shares or
Principal
Amount | | Value |
| CORPORATE BONDS (continued) | | | |
| Materials (continued) | | | | | |
Ball Corp.
2.875%, 08/15/2030 | $ | 1,050,000 | | $ | 1,047,690 |
| BHP Billiton Finance USA, Ltd. (6.750% to 10-20-25, then 5 Year U.S. Swap Rate + 5.093%) 10/19/2075 (B) | | 460,000 | | | 549,631 |
| Cascades, Inc. | | | | | |
| 5.125%, 01/15/2026 (B) | | 10,000 | | | 10,520 |
| 5.375%, 01/15/2028 (B) | | 610,000 | | | 649,681 |
| First Quantum Minerals, Ltd. | | | | | |
| 6.500%, 03/01/2024 (B) | | 200,000 | | | 199,000 |
| 7.250%, 04/01/2023 (B) | | 644,000 | | | 654,465 |
| 7.500%, 04/01/2025 (B) | | 246,000 | | | 250,927 |
Flex Acquisition Company, Inc.
7.875%, 07/15/2026 (B) | | 460,000 | | | 482,627 |
| Freeport-McMoRan, Inc. | | | | | |
| 4.625%, 08/01/2030 | | 280,000 | | | 299,247 |
| 5.450%, 03/15/2043 | | 1,620,000 | | | 1,821,755 |
Greif, Inc.
6.500%, 03/01/2027 (B) | | 1,009,000 | | | 1,074,585 |
Hudbay Minerals, Inc.
7.625%, 01/15/2025 (B) | | 390,000 | | | 404,625 |
Mercer International, Inc.
7.375%, 01/15/2025 | | 220,000 | | | 226,050 |
Midwest Vanadium Pty, Ltd.
11.500%, 02/15/2018 (A)(B) | | 1,953,148 | | | 2,539 |
Northwest Acquisitions ULC
7.125%, 11/01/2022 (A)(B) | | 1,140,000 | | | 18,240 |
Olin Corp.
5.000%, 02/01/2030 | | 560,000 | | | 540,400 |
Pactiv LLC
7.950%, 12/15/2025 | | 1,200,000 | | | 1,326,000 |
Summit Materials LLC
5.250%, 01/15/2029 (B) | | 890,000 | | | 932,346 |
Teck Resources, Ltd.
5.200%, 03/01/2042 | | 970,000 | | | 962,812 |
U.S. Concrete, Inc.
6.375%, 06/01/2024 | | 260,000 | | | 268,424 |
| | | | | | 13,950,162 |
| Real estate – 5.0% | | | | | |
| CoreCivic, Inc. | | | | | |
| 4.625%, 05/01/2023 | | 120,000 | | | 114,000 |
| 5.000%, 10/15/2022 | | 370,000 | | | 364,450 |
Diversified Healthcare Trust
9.750%, 06/15/2025 | | 680,000 | | | 759,900 |
Five Point Operating Company LP
7.875%, 11/15/2025 (B) | | 1,240,000 | | | 1,246,200 |
| Forestar Group, Inc. | | | | | |
| 5.000%, 03/01/2028 (B) | | 700,000 | | | 707,266 |
| 8.000%, 04/15/2024 (B) | | 660,000 | | | 700,425 |
Iron Mountain, Inc.
5.000%, 07/15/2028 (B) | | 520,000 | | | 539,500 |
| MPT Operating Partnership LP | | | | | |
| 4.625%, 08/01/2029 | | 380,000 | | | 405,635 |
| 5.000%, 10/15/2027 | | 720,000 | | | 761,400 |
Realogy Group LLC
7.625%, 06/15/2025 (B) | | 670,000 | | | 704,753 |
| The GEO Group, Inc. | | | | | |
| 5.875%, 10/15/2024 | | 850,000 | | | 667,250 |
| 6.000%, 04/15/2026 | | 1,500,000 | | | 1,150,268 |
The Howard Hughes Corp.
5.375%, 08/01/2028 (B) | | 410,000 | | | 416,175 |
VICI Properties LP
4.125%, 08/15/2030 (B) | | 1,080,000 | | | 1,082,376 |
High Yield Fund (continued)
| | | Shares or
Principal
Amount | | Value |
| CORPORATE BONDS (continued) | | | |
| Real estate (continued) | | | | | |
XHR LP
6.375%, 08/15/2025 (B) | $ | 370,000 | | $ | 379,713 |
| | | | | | 9,999,311 |
| Utilities – 0.7% | | | | | |
Calpine Corp.
5.000%, 02/01/2031 (B) | | 600,000 | | | 627,132 |
| Talen Energy Supply LLC | | | | | |
| 6.625%, 01/15/2028 (B) | | 510,000 | | | 511,232 |
| 10.500%, 01/15/2026 (B) | | 400,000 | | | 321,000 |
| | | | | | 1,459,364 |
| TOTAL CORPORATE BONDS (Cost $171,302,339) | | | $ | 171,708,294 |
| CONVERTIBLE BONDS – 1.1% | | | |
| Communication services – 0.5% | | | | | |
| DISH Network Corp. | | | | | |
| 2.375%, 03/15/2024 | | 830,000 | | | 780,669 |
| 3.375%, 08/15/2026 | | 220,000 | | | 216,980 |
Live Nation Entertainment, Inc.
2.000%, 02/15/2025 (B) | | 170,000 | | | 152,150 |
| | | | | | 1,149,799 |
| Energy – 0.1% | | | | | |
Cheniere Energy, Inc.
4.250%, 03/15/2045 | | 360,000 | | | 240,516 |
| Financials – 0.2% | | | | | |
Apollo Commercial Real Estate Finance, Inc.
4.750%, 08/23/2022 | | 450,000 | | | 413,688 |
| Information technology – 0.3% | | | | | |
Alteryx, Inc.
1.000%, 08/01/2026 | | 100,000 | | | 101,343 |
Vishay Intertechnology, Inc.
2.250%, 06/15/2025 | | 460,000 | | | 448,580 |
| | | | | | 549,923 |
| TOTAL CONVERTIBLE BONDS (Cost $2,443,184) | | | $ | 2,353,926 |
| TERM LOANS (G) – 6.4% | | | |
| Communication services – 0.5% | | | | | |
| Allen Media LLC, 2020 Term Loan B (3 month LIBOR + 5.500%) 5.808%, 02/10/2027 | | 609,203 | | | 585,596 |
| iHeartCommunications, Inc., 2020 Term Loan (1 month LIBOR + 3.000%) 3.156%, 05/01/2026 | | 443,624 | | | 420,174 |
| | | | | | 1,005,770 |
| Consumer discretionary – 1.3% | | | | | |
| Clarios Global LP, USD Term Loan B (1 month LIBOR + 3.500%) 3.658%, 04/30/2026 | | 575,650 | | | 563,596 |
| Equinox Holdings, Inc., 2020 Term Loan B2 (3 month LIBOR + 9.000%) 10.000%, 03/08/2024 | | 420,000 | | | 413,700 |
| Michaels Stores, Inc., 2018 Term Loan B (1 and 3 month LIBOR + 2.500%) 3.534%, 01/30/2023 | | 268,460 | | | 257,386 |
| Mohegan Gaming & Entertainment, 2016 Term Loan B (1 and 3 month LIBOR + 4.375%) 5.375%, 10/13/2023 | | 696,295 | | | 628,016 |
| Spencer Spirit IH LLC, Term Loan B (3 month LIBOR + 6.000%) 6.245%, 06/19/2026 | | 789,871 | | | 696,406 |
| | | | | | 2,559,104 |
| The accompanying notes are an integral part of the financial statements. | 28 | |
John Hancock Funds II
Portfolio of Investments — August 31, 2020 (showing percentage of total net assets)
High Yield Fund (continued)
| | | Shares or
Principal
Amount | | Value |
| TERM LOANS (G) (continued) | | | |
| Energy – 0.2% | | | | | |
Chesapeake Energy Corp., 2019 Last Out Term Loan
0.000%, 06/24/2024 (A) | $ | 630,000 | | $ | 411,075 |
Permian Production Partners LLC, Term Loan
0.000%, 05/20/2024 (A) | | 807,500 | | | 40,375 |
| | | | | | 451,450 |
| Financials – 0.8% | | | | | |
| Acrisure LLC, 2020 Term Loan B (1 month LIBOR + 3.500%) 3.656%, 02/15/2027 | | 538,650 | | | 515,870 |
| Amerilife Holdings LLC, 2020 Delayed Draw Term Loan (3 month LIBOR + 4.000%) 4.158%, 03/18/2027 | | 10,909 | | | 10,718 |
| Amerilife Holdings LLC, 2020 Term Loan (1 month LIBOR + 4.000%) 4.156%, 03/18/2027 | | 159,545 | | | 156,753 |
| Duff + Phelps Corp., 2020 2nd Lien Term Loan (1 month LIBOR + 8.000%) 9.000%, 04/07/2028 | | 620,000 | | | 613,800 |
| Jane Street Group LLC, 2020 Term Loan (1 month LIBOR + 3.000%) 3.156%, 01/31/2025 | | 415,795 | | | 409,558 |
| | | | | | 1,706,699 |
| Health care – 1.5% | | | | | |
| Eyecare Partners LLC, 2020 2nd Lien Term Loan (3 month LIBOR + 8.250%) 8.558%, 02/18/2028 | | 430,000 | | | 365,500 |
| Eyecare Partners LLC, 2020 Term Loan (3 month LIBOR + 3.750%) 4.822%, 02/18/2027 | | 469,095 | | | 435,747 |
| McAfee LLC, 2018 USD Term Loan B (1 month LIBOR + 3.750%) 3.906%, 09/30/2024 | | 821,637 | | | 813,117 |
| Option Care Health, Inc., Term Loan B (1 month LIBOR + 4.500%) 4.656%, 08/06/2026 | | 766,150 | | | 762,955 |
| US Renal Care, Inc., 2019 Term Loan B (1 month LIBOR + 5.000%) 5.156%, 06/26/2026 | | 621,534 | | | 605,735 |
| | | | | | 2,983,054 |
| Industrials – 1.5% | | | | | |
| Cornerstone Building Brands, Inc., 2018 Term Loan (1 month LIBOR + 3.750%) 3.918%, 04/12/2025 | | 661,276 | | | 648,051 |
| Delta Air Lines, Inc., 2020 Term Loan B (3 month LIBOR + 4.750%) 5.750%, 04/29/2023 | | 1,310,000 | | | 1,304,616 |
| JetBlue Airways Corp., Term Loan (3 month LIBOR + 5.250%) 6.250%, 06/17/2024 | | 640,000 | | | 637,280 |
| Mileage Plus Holdings LLC, 2020 Term Loan B (3 month LIBOR + 5.250%) 6.250%, 06/25/2027 | | 480,000 | | | 485,102 |
| | | | | | 3,075,049 |
| Information technology – 0.4% | | | | | |
| Global Tel*Link Corp., 2018 1st Lien Term Loan (1 month LIBOR + 4.250%) 4.406%, 11/29/2025 | | 811,240 | | | 703,977 |
High Yield Fund (continued)
| | | Shares or
Principal
Amount | | Value |
| TERM LOANS (G) (continued) | | | |
| Real estate – 0.2% | | | | | |
| CoreCivic, Inc., 2019 Term Loan (1 month LIBOR + 4.500%) 5.500%, 12/18/2024 | $ | 507,000 | | $ | 498,548 |
| TOTAL TERM LOANS (Cost $14,305,305) | | | $ | 12,983,651 |
| ASSET BACKED SECURITIES – 4.2% | | | |
Benefit Street Partners CLO XI, Ltd.
Series 2017-12A, Class C (3 month LIBOR + 3.050%)
3.325%, 10/15/2030 (B)(C) | | 250,000 | | | 221,802 |
| BlueMountain CLO, Ltd. | | | | | |
Series 2012-2A, Class ER2 (3 month LIBOR + 5.750%)
6.003%, 11/20/2028 (B)(C) | | 500,000 | | | 394,786 |
Series 2016-2A, Class DR (3 month LIBOR + 7.790%)
8.043%, 08/20/2032 (B)(C) | | 375,000 | | | 323,367 |
Bowman Park CLO, Ltd.
Series 2014-1A, Class D1R (3 month LIBOR + 3.350%)
3.606%, 11/23/2025 (B)(C) | | 500,000 | | | 500,055 |
Cook Park CLO, Ltd.
Series 2018-1A, Class E (3 month LIBOR + 5.400%)
5.673%, 04/17/2030 (B)(C) | | 250,000 | | | 215,977 |
Cumberland Park CLO, Ltd.
Series 2015-2A, Class ER (3 month LIBOR + 5.650%)
5.922%, 07/20/2028 (B)(C) | | 250,000 | | | 221,459 |
| Greenwood Park CLO, Ltd. | | | | | |
Series 2018-1A, Class D (3 month LIBOR + 2.500%)
2.775%, 04/15/2031 (B)(C) | | 530,000 | | | 489,584 |
Series 2018-1A, Class E (3 month LIBOR + 4.950%)
5.225%, 04/15/2031 (B)(C) | | 750,000 | | | 626,396 |
Greywolf CLO IV, Ltd.
Series 2019-1A, Class C (3 month LIBOR + 3.950%)
4.223%, 04/17/2030 (B)(C) | | 430,000 | | | 422,580 |
Halsey Point CLO I, Ltd.
Series 2019-1A, Class E (3 month LIBOR + 7.700%)
7.972%, 01/20/2033 (B)(C) | | 600,000 | | | 554,153 |
Jackson Mill CLO, Ltd.
Series 2015-1A, Class DR (3 month LIBOR + 2.800%)
3.075%, 04/15/2027 (B)(C) | | 250,000 | | | 223,063 |
LCM XXII, Ltd.
Series 2022-A, Class DR (3 month LIBOR + 5.500%)
5.772%, 10/20/2028 (B)(C) | | 500,000 | | | 402,370 |
Madison Park Funding XIII, Ltd.
Series 2014-13A, Class DR2 (3 month LIBOR + 2.850%)
3.122%, 04/19/2030 (B)(C) | | 1,000,000 | | | 917,174 |
Oaktree CLO, Ltd.
Series 2019-1A, Class D (3 month LIBOR + 3.800%)
4.058%, 04/22/2030 (B)(C) | | 250,000 | | | 218,387 |
OZLM XI, Ltd.
Series 2015-11A, Class CR (3 month LIBOR + 3.600%)
3.868%, 10/30/2030 (B)(C) | | 1,000,000 | | | 939,836 |
| The accompanying notes are an integral part of the financial statements. | 29 | |
John Hancock Funds II
Portfolio of Investments — August 31, 2020 (showing percentage of total net assets)
High Yield Fund (continued)
| | | Shares or
Principal
Amount | | Value |
| ASSET BACKED SECURITIES (continued) | | | |
Shackleton CLO, Ltd.
Series 2013-3A, Class DR (3 month LIBOR + 3.020%)
3.295%, 07/15/2030 (B)(C) | $ | 500,000 | | $ | 439,138 |
TCI-Symphony CLO, Ltd.
Series 2016-1A, Class DR (3 month LIBOR + 3.000%)
3.266%, 10/13/2029 (B)(C) | | 540,000 | | | 490,947 |
Thayer Park CLO, Ltd.
Series 2017-1A, Class C (3 month LIBOR + 3.700%)
3.972%, 04/20/2029 (B)(C) | | 250,000 | | | 250,014 |
Voya CLO, Ltd.
Series 2017-1A, Class C (3 month LIBOR + 3.330%)
3.603%, 04/17/2030 (B)(C) | | 500,000 | | | 455,249 |
Zais CLO 16, Ltd.
Series 2020-16A, Class D1 (3 month LIBOR + 5.480%)
5.721%, 10/20/2031 (B)(C) | | 250,000 | | | 235,000 |
| TOTAL ASSET BACKED SECURITIES (Cost $9,254,940) | | | $ | 8,541,337 |
| COMMON STOCKS – 0.7% | | | | |
| Communication services – 0.0% | | | | | |
| New Cotai, Inc., Class B (H)(I)(J) | | 11 | | | 0 |
| Consumer discretionary – 0.0% | | | | | |
| Party City Holdco, Inc. (J) | | 14,839 | | | 40,659 |
| Energy – 0.7% | | | | | |
| Berry Corp. | | 211,334 | | | 832,656 |
| Hercules Offshore, Inc. (I)(J) | | 120,022 | | | 83,343 |
| KCAD Holdings I, Ltd. (H)(I)(J) | | 752,218,031 | | | 752 |
| Montage Resources Corp. (D)(J) | | 66,492 | | | 343,099 |
| MWO Holdings LLC (H)(I)(J) | | 1,134 | | | 65,851 |
| | | | | | 1,325,701 |
| TOTAL COMMON STOCKS (Cost $22,151,699) | | $ | 1,366,360 |
| PREFERRED SECURITIES – 0.7% | | | | |
| Financials – 0.7% | | | | | |
| B. Riley Financial, Inc., 6.875% (D) | | 16,425 | | | 408,983 |
| GMAC Capital Trust I (3 month LIBOR + 5.785%), 6.065% (C) | | 43,100 | | | 1,057,243 |
| TOTAL PREFERRED SECURITIES (Cost $1,531,225) | | $ | 1,466,226 |
| SHORT-TERM INVESTMENTS – 0.1% | | | |
| Short-term funds – 0.1% | | | | | |
| John Hancock Collateral Trust, 0.2611% (K)(L) | | 27,237 | | | 272,666 |
| TOTAL SHORT-TERM INVESTMENTS (Cost $272,661) | | $ | 272,666 |
Total Investments (High Yield Fund)
(Cost $224,689,522) – 99.1% | | $ | 200,581,408 |
| Other assets and liabilities, net – 0.9% | | | | 1,752,746 |
| TOTAL NET ASSETS – 100.0% | | | | $ | 202,334,154 |
High Yield Fund (continued)
| Currency Abbreviations |
| BRL | Brazilian Real |
| CAD | Canadian Dollar |
| EUR | Euro |
| GBP | Pound Sterling |
| IDR | Indonesian Rupiah |
| Security Abbreviations and Legend |
| CMT | Constant Maturity Treasury |
| ICE | Intercontinental Exchange |
| LIBOR | London Interbank Offered Rate |
| PIK | Pay-in-Kind Security - Represents a payment-in-kind which may pay interest in additional par and/or cash. Rates shown are the current rate and most recent payment rate. |
| (A) | Non-income producing - Issuer is in default. |
| (B) | These securities are exempt from registration under Rule 144A of the Securities Act of 1933. Such securities may be resold, normally to qualified institutional buyers, in transactions exempt from registration. Rule 144A securities amounted to $120,691,342 or 59.6% of the fund's net assets as of 8-31-20. |
| (C) | Variable rate obligation. The coupon rate shown represents the rate at period end. |
| (D) | All or a portion of this security is on loan as of 8-31-20. |
| (E) | Security purchased or sold on a when-issued or delayed delivery basis. |
| (F) | Perpetual bonds have no stated maturity date. Date shown as maturity date is next call date. |
| (G) | Term loans are variable rate obligations. The coupon rate shown represents the rate at period end. |
| (H) | Restricted security as to resale, excluding 144A securities. For more information on this security refer to the Notes to financial statements. |
| (I) | Security is valued using significant unobservable inputs and is classified as Level 3 in the fair value hierarchy. Refer to Note 2 to the financial statements. |
| (J) | Non-income producing security. |
| (K) | The rate shown is the annualized seven-day yield as of 8-31-20. |
| (L) | Investment is an affiliate of the fund, the advisor and/or subadvisor. This security represents the investment of cash collateral received for securities lending. |
DERIVATIVES
FUTURES
| Open contracts | Number of
contracts | Position | Expiration
date | Notional
basis^ | Notional
value^ | Unrealized
appreciation
(depreciation) |
| 5-Year U.S. Treasury Note Futures | 156 | Long | Dec 2020 | $19,636,484 | $19,660,875 | $24,391 |
| 10-Year U.S. Treasury Note Futures | 36 | Short | Dec 2020 | (5,017,729) | (5,013,000) | 4,729 |
| | | | | | | $29,120 |
| The accompanying notes are an integral part of the financial statements. | 30 | |
John Hancock Funds II
Portfolio of Investments — August 31, 2020 (showing percentage of total net assets)
High Yield Fund (continued)
FUTURES (continued)
^ Notional basis refers to the contractual amount agreed upon at inception of open contracts; notional value represents the current value of the open contract.
FORWARD FOREIGN CURRENCY CONTRACTS
| Contract to buy | Contract to sell | Counterparty (OTC) | Contractual
settlement
date | Unrealized
appreciation | Unrealized
depreciation |
| CAD | 3,311,221 | USD | 2,518,914 | BNP | 10/16/2020 | $19,991 | — |
| GBP | 587,667 | USD | 733,537 | JPM | 10/16/2020 | 52,246 | — |
| MXN | 3,526,523 | USD | 153,576 | JPM | 10/16/2020 | 6,723 | — |
| USD | 2,886,532 | CAD | 3,950,827 | BNP | 10/16/2020 | — | $(142,797) |
| USD | 980,363 | EUR | 869,743 | BNP | 10/16/2020 | — | (58,552) |
| | | | | | | $78,960 | $(201,349) |
SWAPS
| Credit default swaps - Seller |
Counterparty
(OTC)/
Centrally
cleared | Reference
obligation | Implied
credit
spread | Notional
amount | Currency | USD
notional
amount | Received
fixed
rate | Fixed
payment
frequency | Maturity
date | Unamortized
upfront
payment
paid
(received) | Unrealized
appreciation
(depreciation) | Value |
| Centrally cleared | Ford Motor Credit Company LLC | 2.470% | 643,000 | USD | $643,000 | 5.000% | Quarterly | Jun 2023 | $(38,122) | $88,278 | $50,156 |
| | | | | | $643,000 | | | | $(38,122) | $88,278 | $50,156 |
| Derivatives Currency Abbreviations |
| CAD | Canadian Dollar |
| EUR | Euro |
| GBP | Pound Sterling |
| MXN | Mexican Peso |
| USD | U.S. Dollar |
| Derivatives Abbreviations |
| BNP | BNP Paribas |
| JPM | JPMorgan Chase Bank, N.A. |
| OTC | Over-the-counter |
See Notes to financial statements regarding investment transactions and other derivatives information.
Opportunistic Fixed Income Fund
| | | Shares or
Principal
Amount | | Value |
U.S. GOVERNMENT AND AGENCY
OBLIGATIONS - 8.3% | | | | | |
| U.S. Government - 4.8% | | | | | |
U.S. Treasury Inflation
Protected Securities | | | | | |
| 0.125%, 01/15/2030 (A) | $ | 616,119 | | $ | 688,513 |
| 0.250%, 07/15/2029 to 02/15/2050 | | 704,743 | | | 803,819 |
| 0.750%, 02/15/2045 | | 32,837 | | | 42,071 |
| 0.875%, 02/15/2047 | | 202,876 | | | 271,648 |
| 1.000%, 02/15/2048 | | 125,429 | | | 174,312 |
| | | | | | 1,980,363 |
| U.S. Government Agency - 3.5% | | | | | |
| Federal National Mortgage Association | | | | | |
| 2.000%, TBA (B) | | 1,258,000 | | | 1,296,057 |
| 2.500%, TBA (B) | | 126,000 | | | 132,630 |
| | | | | | 1,428,687 |
| TOTAL U.S. GOVERNMENT AND AGENCY OBLIGATIONS (Cost $3,281,287) | | $ | 3,409,050 |
| FOREIGN GOVERNMENT OBLIGATIONS - 47.2% | | | |
| Argentina - 0.2% | | | | | |
Republic of Argentina
5.000%, 01/15/2027 (C) | EUR | 200,000 | | | 102,303 |
Opportunistic Fixed Income Fund (continued)
| | | Shares or
Principal
Amount | | Value |
| FOREIGN GOVERNMENT OBLIGATIONS (continued) | | | |
| Australia - 2.2% | | | | | |
Commonwealth of Australia
3.000%, 03/21/2047 | AUD | 965,000 | | $ | 887,930 |
| Brazil - 0.4% | | | | | |
Federative Republic of Brazil
10.000%, 01/01/2025 | BRL | 745,000 | | | 159,374 |
| Canada - 5.9% | | | | | |
| Government of Canada | | | | | |
| 3.000%, 12/01/2036 | CAD | 399,540 | | | 477,019 |
| 4.000%, 12/01/2031 | | 240,158 | | | 284,668 |
| 4.250%, 12/01/2026 | | 1,639,869 | | | 1,674,719 |
| | | | | | 2,436,406 |
| Chile - 0.1% | | | | | |
Republic of Chile
5.000%, 03/01/2035 | CLP | 30,000,000 | | | 49,490 |
| Colombia - 0.3% | | | | | |
Republic of Colombia
6.000%, 04/28/2028 | COP | 381,300,000 | | | 106,803 |
| Czech Republic - 0.2% | | | | | |
Czech Republic
0.250%, 02/10/2027 | CZK | 1,990,000 | | | 86,191 |
| The accompanying notes are an integral part of the financial statements. | 31 | |
John Hancock Funds II
Portfolio of Investments — August 31, 2020 (showing percentage of total net assets)
Opportunistic Fixed Income Fund (continued)
| | | Shares or
Principal
Amount | | Value |
| FOREIGN GOVERNMENT OBLIGATIONS (continued) | | | |
| Germany - 6.9% | | | | | |
Federal Republic of Germany, Inflation
Linked Bond | | | | | |
| 0.100%, 04/15/2026 | EUR | 1,164,834 | | $ | 1,490,481 |
| 0.500%, 04/15/2030 | | 976,810 | | | 1,371,294 |
| | | | | | 2,861,775 |
| Greece - 0.7% | | | | | |
Republic of Greece, GDP-Linked Note
4.404%, 10/15/2042 (D)* | | 73,510,000 | | | 280,714 |
| Hungary - 0.2% | | | | | |
Republic of Hungary
2.750%, 12/22/2026 | HUF | 19,990,000 | | | 71,037 |
| Iceland - 1.5% | | | | | |
Republic of Iceland
5.000%, 11/15/2028 | ISK | 70,880,000 | | | 600,717 |
| Indonesia - 4.4% | | | | | |
| Republic of Indonesia | | | | | |
| 8.250%, 05/15/2029 | IDR | 4,125,000,000 | | | 309,633 |
| 8.375%, 03/15/2034 | | 18,127,000,000 | | | 1,350,703 |
| 9.000%, 03/15/2029 | | 2,191,000,000 | | | 171,153 |
| | | | | | 1,831,489 |
| Israel - 1.1% | | | | | |
| State of Israel | | | | | |
| 1.000%, 03/31/2030 | ILS | 730,000 | | | 225,478 |
| 3.750%, 03/31/2047 | | 475,000 | | | 210,875 |
| | | | | | 436,353 |
| Japan - 5.6% | | | | | |
Government of Japan
0.400%, 03/20/2050 | JPY | 14,950,000 | | | 133,334 |
Government of Japan, CPI Linked Bond
0.100%, 03/10/2028 | | 229,130,274 | | | 2,172,427 |
| | | | | | 2,305,761 |
| Malaysia - 0.3% | | | | | |
Government of Malaysia
3.955%, 09/15/2025 | MYR | 490,000 | | | 127,869 |
| Mexico - 2.7% | | | | | |
| Government of Mexico | | | | | |
| 7.500%, 06/03/2027 | MXN | 3,587,500 | | | 181,862 |
| 8.000%, 11/07/2047 | | 18,023,600 | | | 919,111 |
| | | | | | 1,100,973 |
| New Zealand - 1.0% | | | | | |
Government of New Zealand
1.500%, 05/15/2031 | NZD | 560,000 | | | 411,770 |
| Peru - 0.2% | | | | | |
Republic of Peru
6.950%, 08/12/2031 | PEN | 190,000 | | | 67,507 |
| Poland - 0.4% | | | | | |
Republic of Poland
2.250%, 10/25/2024 | PLN | 550,000 | | | 159,535 |
| Romania - 0.5% | | | | | |
| Republic of Romania | | | | | |
| 3.875%, 10/29/2035 | EUR | 110,000 | | | 143,288 |
| 4.750%, 02/24/2025 | RON | 240,000 | | | 62,118 |
| | | | | | 205,406 |
| Russia - 4.0% | | | | | |
Government of Russia
7.750%, 09/16/2026 | RUB | 9,610,000 | | | 145,221 |
Government of Russia, Inflation Linked Bond
2.500%, 02/02/2028 | | 111,377,826 | | | 1,496,911 |
| | | | | | 1,642,132 |
Opportunistic Fixed Income Fund (continued)
| | | Shares or
Principal
Amount | | Value |
| FOREIGN GOVERNMENT OBLIGATIONS (continued) | | | |
| South Africa - 0.3% | | | | | |
Republic of South Africa
7.000%, 02/28/2031 | ZAR | 2,610,000 | | $ | 126,348 |
| South Korea - 5.8% | | | | | |
Republic of Korea
1.375%, 12/10/2029 | KRW | 2,557,340,000 | | | 2,125,853 |
Republic of Korea, Inflation Linked Bond
1.750%, 06/10/2028 | | 314,818,644 | | | 283,140 |
| | | | | | 2,408,993 |
| Spain - 0.4% | | | | | |
Kingdom of Spain
2.700%, 10/31/2048 (E) | EUR | 115,000 | | | 186,496 |
| Thailand - 1.8% | | | | | |
Kingdom of Thailand
2.875%, 12/17/2028 | THB | 20,410,000 | | | 735,943 |
| Turkey - 0.1% | | | | | |
Republic of Turkey
9.000%, 07/24/2024 | TRY | 400,000 | | | 47,024 |
| Uruguay - 0.0% | | | | | |
Republic of Uruguay
8.500%, 03/15/2028 | UYU | 150,000 | | | 3,540 |
| TOTAL FOREIGN GOVERNMENT OBLIGATIONS (Cost $19,502,521) | | $ | 19,439,879 |
| CORPORATE BONDS - 6.7% | | | |
| Finland - 0.6% | | | | | |
Nokia OYJ
6.625%, 05/15/2039 | $ | 180,000 | | | 230,400 |
| Luxembourg - 0.2% | | | | | |
Codere Finance 2 Luxembourg SA
6.750%, 11/01/2021 | EUR | 110,000 | | | 79,275 |
| United States - 5.9% | | | | | |
Altria Group, Inc.
3.125%, 06/15/2031 | | 170,000 | | | 228,663 |
| Antero Midstream Partners LP | | | | | |
| 5.375%, 09/15/2024 | $ | 80,000 | | | 73,800 |
| 5.750%, 03/01/2027 (E) | | 70,000 | | | 62,475 |
Aramark Services, Inc.
6.375%, 05/01/2025 (E) | | 40,000 | | | 41,900 |
Booking Holdings, Inc.
4.625%, 04/13/2030 | | 25,000 | | | 30,170 |
Boyd Gaming Corp.
8.625%, 06/01/2025 (E) | | 65,000 | | | 71,663 |
Broadcom, Inc.
4.300%, 11/15/2032 | | 40,000 | | | 46,107 |
Carnival Corp.
11.500%, 04/01/2023 (E) | | 44,000 | | | 49,084 |
Centennial Resource Production LLC
5.375%, 01/15/2026 (E) | | 260,000 | | | 109,200 |
Citigroup, Inc. (4.700% to 1-30-25, then SOFR + 3.234%)
01/30/2025 (F) | | 79,000 | | | 78,605 |
Diamondback Energy, Inc.
4.750%, 05/31/2025 | | 5,000 | | | 5,486 |
EnLink Midstream Partners LP
4.850%, 07/15/2026 | | 250,000 | | | 218,420 |
Flex, Ltd.
4.875%, 05/12/2030 | | 30,000 | | | 34,146 |
General Motors Company
6.750%, 04/01/2046 | | 110,000 | | | 133,413 |
JetBlue 2020-1 Class A Pass Through Trust
4.000%, 11/15/2032 | | 60,000 | | | 61,650 |
| The accompanying notes are an integral part of the financial statements. | 32 | |
John Hancock Funds II
Portfolio of Investments — August 31, 2020 (showing percentage of total net assets)
Opportunistic Fixed Income Fund (continued)
| | | Shares or
Principal
Amount | | Value |
| CORPORATE BONDS (continued) | | | |
| United States (continued) | | | | | |
JPMorgan Chase & Co. (4.600% to 2-1-25, then SOFR + 3.125%)
02/01/2025 (F) | $ | 100,000 | | $ | 100,375 |
Lennar Corp.
4.750%, 11/29/2027 | | 35,000 | | | 39,900 |
Matador Resources Company
5.875%, 09/15/2026 | | 120,000 | | | 104,400 |
McKesson Corp.
4.750%, 05/30/2029 | | 35,000 | | | 42,706 |
MSCI, Inc.
3.875%, 02/15/2031 (E) | | 40,000 | | | 42,250 |
PDC Energy, Inc.
5.750%, 05/15/2026 | | 100,000 | | | 102,300 |
Post Holdings, Inc.
4.625%, 04/15/2030 (E) | | 40,000 | | | 41,750 |
Presidio Holdings, Inc.
8.250%, 02/01/2028 (E) | | 40,000 | | | 41,800 |
Reynolds American, Inc.
5.850%, 08/15/2045 | | 130,000 | | | 160,597 |
Sysco Corp.
6.600%, 04/01/2040 | | 30,000 | | | 39,955 |
The Boeing Company
5.040%, 05/01/2027 | | 200,000 | | | 220,067 |
The Dun & Bradstreet Corp.
10.250%, 02/15/2027 (E) | | 24,000 | | | 27,360 |
TransDigm, Inc.
6.250%, 03/15/2026 (E) | | 40,000 | | | 42,208 |
Viper Energy Partners LP
5.375%, 11/01/2027 (E) | | 40,000 | | | 41,200 |
Wells Fargo & Company (5.875% to 6-15-25, then 3 month LIBOR + 3.990%)
06/15/2025 (F) | | 51,000 | | | 56,292 |
Westinghouse Air Brake Technologies Corp.
3.200%, 06/15/2025 | | 20,000 | | | 21,050 |
Yum! Brands, Inc.
7.750%, 04/01/2025 (E) | | 65,000 | | | 72,556 |
| | | | | | 2,441,548 |
| TOTAL CORPORATE BONDS (Cost $2,774,844) | | $ | 2,751,223 |
| CONVERTIBLE BONDS - 0.5% | | | |
| United States - 0.5% | | | | | |
| Bandwidth, Inc., 0.250%, 03/01/2026 (E) | | 5,000 | | | 9,058 |
| Etsy, Inc., 0.125%, 10/01/2026 (E) | | 5,000 | | | 7,632 |
| FTI Consulting, Inc., 2.000%, 08/15/2023 | | 5,000 | | | 6,446 |
| Health Catalyst, Inc., 2.500%, 04/15/2025 (E) | | 8,000 | | | 9,973 |
| NuVasive, Inc., 0.375%, 03/15/2025 (E) | | 20,000 | | | 18,026 |
| Oasis Petroleum, Inc., 2.625%, 09/15/2023 | | 70,000 | | | 12,250 |
| Penn National Gaming, Inc., 2.750%, 05/15/2026 | | 10,000 | | | 23,290 |
| Pioneer Natural Resources Company, 0.250%, 05/15/2025 (E) | | 15,000 | | | 18,214 |
| Proofpoint, Inc., 0.250%, 08/15/2024 | | 4,000 | | | 4,056 |
| Southwest Airlines Company, 1.250%, 05/01/2025 | | 15,000 | | | 19,910 |
| Splunk, Inc., 1.125%, 06/15/2027 (E) | | 10,000 | | | 11,685 |
| Square, Inc., 0.125%, 03/01/2025 (E) | | 15,000 | | | 22,776 |
| The Middleby Corp., 1.000%, 09/01/2025 (E) | | 10,000 | | | 10,347 |
Opportunistic Fixed Income Fund (continued)
| | | Shares or
Principal
Amount | | Value |
| CONVERTIBLE BONDS (continued) | | | |
| United States (continued) | | | | | |
| Workday, Inc., 0.250%, 10/01/2022 | $ | 10,000 | | $ | 16,788 |
| | | | | | 190,451 |
| TOTAL CONVERTIBLE BONDS (Cost $198,914) | | $ | 190,451 |
| MUNICIPAL BONDS - 2.7% | | | | | |
| United States - 2.7% | | | | | |
Chicago Transit Authority (Illinois)
3.552%, 12/01/2034 | | 95,000 | | | 99,976 |
Chicago Transit Authority (Illinois)
3.912%, 12/01/2040 | | 10,000 | | | 10,546 |
Chicago Transit Authority, Series A (Illinois)
6.899%, 12/01/2040 | | 10,000 | | | 14,310 |
City of Austin Airport System Revenue (Texas)
5.000%, 11/15/2032 | | 25,000 | | | 31,572 |
City of Austin Airport System Revenue (Texas)
5.000%, 11/15/2044 | | 60,000 | | | 72,897 |
City of Tampa (Florida)
3.089%, 09/01/2036 (G) | | 20,000 | | | 12,204 |
Commonwealth of Massachusetts
2.514%, 07/01/2041 | | 130,000 | | | 132,584 |
County of Broward Port Facilities Revenue (Florida)
5.000%, 09/01/2033 | | 20,000 | | | 24,765 |
County of Broward Port Facilities Revenue (Florida)
5.000%, 09/01/2029 | | 20,000 | | | 25,740 |
County of Broward Port Facilities Revenue (Florida)
5.000%, 09/01/2028 | | 30,000 | | | 36,560 |
Dallas/Fort Worth International Airport (Texas)
3.089%, 11/01/2040 | | 30,000 | | | 30,279 |
District of Columbia
3.432%, 04/01/2042 | | 85,000 | | | 91,078 |
Great Lakes Water Authority Sewage Disposal System Revenue (Michigan)
3.056%, 07/01/2039 | | 10,000 | | | 10,985 |
Greater Orlando Aviation Authority (Florida)
5.000%, 10/01/2028 | | 35,000 | | | 41,547 |
Iowa Finance Authority
3.250%, 07/01/2050 | | 10,000 | | | 11,058 |
Metropolitan Transportation Authority (New York)
5.000%, 11/15/2050 | | 25,000 | | | 27,574 |
Metropolitan Transportation Authority (New York)
5.175%, 11/15/2049 | | 50,000 | | | 58,013 |
New York City Transitional Finance Authority
4.000%, 05/01/2045 | | 20,000 | | | 23,137 |
Orange County Convention Center (Florida)
5.000%, 10/01/2031 | | 15,000 | | | 17,208 |
Port Authority of New York & New Jersey
4.000%, 03/15/2030 | | 50,000 | | | 58,006 |
Port Authority of New York & New Jersey
5.000%, 09/15/2033 | | 30,000 | | | 36,563 |
Port of Seattle (Washington)
5.000%, 04/01/2039 | | 40,000 | | | 48,154 |
| The accompanying notes are an integral part of the financial statements. | 33 | |
John Hancock Funds II
Portfolio of Investments — August 31, 2020 (showing percentage of total net assets)
Opportunistic Fixed Income Fund (continued)
| | | Shares or
Principal
Amount | | Value |
| MUNICIPAL BONDS (continued) | | | | | |
| United States (continued) | | | | | |
Port of Seattle (Washington)
5.000%, 10/01/2031 | $ | 30,000 | | $ | 34,679 |
San Francisco City & County Airport Commission
5.000%, 05/01/2050 | | 75,000 | | | 90,319 |
San Francisco City & County Airport Commission (California)
4.000%, 05/01/2039 | | 15,000 | | | 17,333 |
San Francisco City & County Airport Commission (California)
2.958%, 05/01/2051 | | 20,000 | | | 19,843 |
Triborough Bridge & Tunnel Authority (New York)
5.000%, 11/15/2054 | | 30,000 | | | 37,724 |
| TOTAL MUNICIPAL BONDS (Cost $1,065,732) | | $ | 1,114,654 |
| TERM LOANS (H) - 8.2% | | | |
| Luxembourg - 0.2% | | | | | |
| Delta 2 Lux Sarl, 2018 USD Term Loan (1 month LIBOR + 2.500%), 3.500%, 02/01/2024 | | 100,000 | | | 96,813 |
| Netherlands - 0.2% | | | | | |
| Telenet Financing USD LLC, 2020 USD Term Loan AR (1 month LIBOR + 2.000%), 2.162%, 04/30/2028 | | 100,000 | | | 96,125 |
| United States - 7.8% | | | | | |
| Acrisure LLC, 2020 Term Loan B (1 month LIBOR + 3.500%), 3.656%, 02/15/2027 | | 99,750 | | | 95,532 |
| AlixPartners LLP, 2017 Term Loan B (1 month LIBOR + 2.500%), 2.656%, 04/04/2024 | | 99,486 | | | 97,198 |
| Asurion LLC, 2017 2nd Lien Term Loan (1 month LIBOR + 6.500%), 6.656%, 08/04/2025 | | 93,939 | | | 94,080 |
| Asurion LLC, 2017 Term Loan B4 (1 month LIBOR + 3.000%), 3.156%, 08/04/2022 | | 99,364 | | | 98,205 |
| Bass Pro Group LLC, Term Loan B (3 month LIBOR + 5.000%), 6.072%, 09/25/2024 | | 99,744 | | | 99,339 |
| Berlin Packaging LLC, 2018 1st Lien Term Loan (1 and 3 month LIBOR + 3.000%), 3.162%, 11/07/2025 | | 99,492 | | | 96,508 |
| Boyd Gaming Corp., Term Loan B3 (1 week LIBOR + 2.250%), 2.363%, 09/15/2023 | | 99,590 | | | 96,626 |
| Caesars Resort Collection LLC, 2020 Term Loan B1 (3 month LIBOR + 4.500%), 4.726%, 07/21/2025 | | 110,000 | | | 106,494 |
| Core & Main LP, 2017 Term Loan B (3 and 6 month LIBOR + 2.750%), 3.750%, 08/01/2024 | | 99,489 | | | 97,126 |
| Dcert Buyer, Inc., 2019 Term Loan B (1 month LIBOR + 4.000%), 4.156%, 10/16/2026 | | 99,750 | | | 98,441 |
| Deerfield Dakota Holding LLC, 2020 USD Term Loan B (1 month LIBOR + 3.750%), 4.750%, 04/09/2027 | | 220,000 | | | 219,175 |
| Diamond BC BV, USD Term Loan (1 and 3 month LIBOR + 3.000%), 3.260%, 09/06/2024 | | 99,744 | | | 93,947 |
| Elanco Animal Health, Inc., Term Loan B, TBD 08/01/2027 (I) | | 100,000 | | | 97,958 |
Opportunistic Fixed Income Fund (continued)
| | | Shares or
Principal
Amount | | Value |
| TERM LOANS (H) (continued) | | | |
| United States (continued) | | | | | |
| Element Solutions, Inc., 2019 Term Loan B1 (1 month LIBOR + 2.000%), 2.156%, 01/31/2026 | $ | 99,749 | | $ | 97,443 |
| Go Daddy Operating Company LLC, 2020 Term Loan B3, TBD 08/10/2027 (I) | | 100,000 | | | 99,075 |
| Gray Television, Inc., 2018 Term Loan C (1 month LIBOR + 2.500%), 2.656%, 01/02/2026 | | 100,000 | | | 97,847 |
| HUB International, Ltd., 2018 Term Loan B (3 month LIBOR + 3.000%), 3.263%, 04/25/2025 | | 99,492 | | | 96,810 |
| HUB International, Ltd., 2019 Incremental Term Loan B (3 month LIBOR + 4.000%), 5.000%, 04/25/2025 | | 99,749 | | | 99,639 |
| ION Media Networks, Inc., 2019 Term Loan B (1 month LIBOR + 3.000%), 3.188%, 12/18/2024 | | 99,499 | | | 97,011 |
| Momentive Performance Materials USA LLC, Term Loan B (1 month LIBOR + 3.250%), 3.410%, 05/15/2024 | | 99,748 | | | 94,636 |
| MPH Acquisition Holdings LLC, 2016 Term Loan B (3 month LIBOR + 2.750%), 3.750%, 06/07/2023 | | 100,000 | | | 98,875 |
| Navistar, Inc., 2017 1st Lien Term Loan B (1 month LIBOR + 3.500%), 3.660%, 11/06/2024 | | 99,490 | | | 96,817 |
| NEP Group, Inc., 2018 1st Lien Term Loan (1 month LIBOR + 3.250%), 3.406%, 10/20/2025 | | 99,747 | | | 83,645 |
| Quikrete Holdings, Inc., 2016 1st Lien Term Loan (1 month LIBOR + 2.500%), 2.656%, 02/01/2027 | | 99,500 | | | 96,834 |
| Science Applications International Corp., 2020 Incremental Term Loan B (1 month LIBOR + 2.250%), 2.406%, 03/12/2027 | | 62,250 | | | 61,783 |
| SCIH Salt Holdings, Inc., Term Loan B (3 month LIBOR + 4.500%), 5.500%, 03/16/2027 | | 100,000 | | | 99,625 |
| Sedgwick Claims Management Services, Inc., 2018 Term Loan B (1 month LIBOR + 3.250%), 3.406%, 12/31/2025 | | 99,495 | | | 96,095 |
| SS&C Technologies, Inc., 2018 Term Loan B3 (1 month LIBOR + 1.750%), 1.906%, 04/16/2025 | | 56,827 | | | 55,103 |
| SS&C Technologies, Inc., 2018 Term Loan B4 (1 month LIBOR + 1.750%), 1.906%, 04/16/2025 | | 39,925 | | | 38,714 |
| The Dun & Bradstreet Corp., Term Loan (1 month LIBOR + 3.750%), 3.920%, 02/06/2026 | | 99,750 | | | 99,451 |
| The Ultimate Software Group, Inc., 2020 Incremental Term Loan B (3 month LIBOR + 4.000%), 4.750%, 05/04/2026 | | 100,000 | | | 99,813 |
| TransDigm, Inc., 2020 Term Loan E (1 month LIBOR + 2.250%), 2.406%, 05/30/2025 | | 99,500 | | | 94,262 |
| The accompanying notes are an integral part of the financial statements. | 34 | |
John Hancock Funds II
Portfolio of Investments — August 31, 2020 (showing percentage of total net assets)
Opportunistic Fixed Income Fund (continued)
| | | Shares or
Principal
Amount | | Value |
| TERM LOANS (H) (continued) | | | |
| United States (continued) | | | | | |
| WW International, Inc., 2017 Term Loan B (1 month LIBOR + 4.750%), 5.500%, 11/29/2024 | $ | 97,006 | | $ | 96,400 |
| | | | | | 3,190,507 |
| TOTAL TERM LOANS (Cost $3,278,043) | | $ | 3,383,445 |
| COLLATERALIZED MORTGAGE OBLIGATIONS - 9.5% | | | |
| Commercial and residential - 5.9% | | | | | |
| Arroyo Mortgage Trust | | | | | |
Series 2018-1, Class A1,
3.763%, 04/25/2048 (E)(J) | | 76,440 | | | 78,481 |
Series 2019-1, Class A1,
3.805%, 01/25/2049 (E)(J) | | 76,926 | | | 79,034 |
Bunker Hill Loan Depositary Trust, Series 2019-1, Class A1,
3.613%, 10/26/2048 (E) | | 76,323 | | | 78,341 |
| BX Commercial Mortgage Trust | | | | | |
Series 2018-IND, Class A (1 month LIBOR + 0.750%),
0.912%, 11/15/2035 (E)(K) | | 42,754 | | | 42,594 |
Series 2019-XL, Class A (1 month LIBOR + 0.920%),
1.082%, 10/15/2036 (E)(K) | | 94,930 | | | 94,816 |
Series 2019-XL, Class B (1 month LIBOR + 1.080%),
1.242%, 10/15/2036 (E)(K) | | 94,930 | | | 94,514 |
Series 2019-XL, Class C (1 month LIBOR + 1.250%),
1.412%, 10/15/2036 (E)(K) | | 94,930 | | | 94,340 |
CAMB Commercial Mortgage Trust, Series 2019-LIFE, Class A (1 month LIBOR + 1.070%),
1.232%, 12/15/2037 (E)(K) | | 100,000 | | | 99,939 |
CFCRE Commercial Mortgage Trust, Series 2011-C2, Class C,
5.931%, 12/15/2047 (E)(J) | | 100,000 | | | 100,443 |
| COLT Mortgage Loan Trust | | | | | |
Series 2019-1, Class A1,
3.705%, 03/25/2049 (E)(J) | | 41,827 | | | 42,341 |
Series 2019-2, Class A1,
3.337%, 05/25/2049 (E)(J) | | 67,698 | | | 68,363 |
Series 2019-4, Class A1,
2.579%, 11/25/2049 (E)(J) | | 65,204 | | | 65,608 |
Commercial Mortgage Trust (Cantor
Fitzgerald/Deutsche Bank AG) | | | | | |
Series 2013-CR13, Class A4,
4.194%, 11/10/2046 (J) | | 30,000 | | | 32,808 |
Series 2014-CR16, Class AM,
4.278%, 04/10/2047 | | 45,000 | | | 49,170 |
CSAIL Commercial Mortgage Trust, Series 2015-C3, Class A4,
3.718%, 08/15/2048 | | 38,000 | | | 41,967 |
| FREMF Mortgage Trust | | | | | |
Series 2015-K45, Class C,
3.713%, 04/25/2048 (E)(J) | | 25,000 | | | 26,048 |
Series 2015-K49, Class B,
3.848%, 10/25/2048 (E)(J) | | 75,000 | | | 80,752 |
Series 2016-K60, Class B,
3.657%, 12/25/2049 (E)(J) | | 11,000 | | | 11,891 |
Series 2017-K63, Class C,
4.004%, 02/25/2050 (E)(J) | | 35,000 | | | 36,539 |
| GS Mortgage Securities Trust | | | | | |
Series 2016-GS4, Class A4,
3.442%, 11/10/2049 (J) | | 34,000 | | | 37,528 |
Opportunistic Fixed Income Fund (continued)
| | | Shares or
Principal
Amount | | Value |
COLLATERALIZED MORTGAGE
OBLIGATIONS (continued) | | | |
Commercial and
residential (continued) | | | | | |
| GS Mortgage Securities Trust (continued) | | | | | |
Series 2020-GC45, Class A1,
2.019%, 02/13/2053 | $ | 24,076 | | $ | 24,638 |
JPMorgan Chase Commercial Mortgage Securities Trust, Series 2020-NNN, Class BFX,
3.065%, 01/16/2037 (E) | | 45,000 | | | 45,136 |
JPMorgan Mortgage Trust, Series 2019-7, Class A11 (1 month LIBOR + 0.900%),
1.075%, 02/25/2050 (E)(K) | | 57,653 | | | 57,364 |
KKR Industrial Portfolio Trust, Series 2020-AIP, Class A (1 month LIBOR + 1.037%),
1.199%, 03/15/2037 (E)(K) | | 98,030 | | | 97,846 |
Metlife Securitization Trust, Series 2018-1A, Class A,
3.750%, 03/25/2057 (E)(J) | | 90,002 | | | 96,297 |
Morgan Stanley Bank of America Merrill
Lynch Trust | | | | | |
Series 2013-C8, Class B,
3.694%, 12/15/2048 (J) | | 45,000 | | | 46,253 |
Series 2013-C8, Class C,
4.191%, 12/15/2048 (J) | | 65,000 | | | 64,762 |
Morgan Stanley Capital I Trust, Series 2018-SUN, Class B (1 month LIBOR + 1.450%),
1.612%, 07/15/2035 (E)(K) | | 25,000 | | | 24,043 |
MSCG Trust, Series 2018-SELF, Class A (1 month LIBOR + 0.900%),
1.062%, 10/15/2037 (E)(K) | | 75,000 | | | 74,342 |
New Residential Mortgage Loan Trust, Series 2020-NPL1, Class A1,
4.335%, 07/25/2060 (E) | | 97,847 | | | 97,799 |
PRPM LLC, Series 2019-GS1, Class A1,
3.500%, 10/25/2024 (E)(J) | | 87,381 | | | 86,996 |
| Verus Securitization Trust | | | | | |
Series 2019-1, Class A1,
3.836%, 02/25/2059 (E)(J) | | 49,457 | | | 50,382 |
Series 2020-1, Class A1,
2.417%, 01/25/2060 (E) | | 86,925 | | | 88,689 |
Wells Fargo Mortgage Backed Securities Trust, Series 2019-3, Class A1,
3.500%, 07/25/2049 (E)(J) | | 54,795 | | | 56,122 |
| WF-RBS Commercial Mortgage Trust | | | | | |
Series 2011-C4, Class C,
5.390%, 06/15/2044 (E)(J) | | 90,000 | | | 87,246 |
Series 2011-C5, Class C,
5.844%, 11/15/2044 (E)(J) | | 100,000 | | | 100,685 |
Series 2013-C13, Class A4,
3.001%, 05/15/2045 | | 65,000 | | | 68,090 |
| | | | | | 2,422,207 |
| U.S. Government Agency - 3.6% | | | | | |
| Federal Home Loan Mortgage Corp. | | | | | |
Series 2017-DNA2, Class M1 (1 month LIBOR + 1.200%),
1.375%, 10/25/2029 (K) | | 43,287 | | | 43,287 |
Series 2018-DNA1, Class M2 (1 month LIBOR + 1.800%),
1.975%, 07/25/2030 (K) | | 87,412 | | | 84,784 |
Series 2018-HQA1, Class M2 (1 month LIBOR + 2.300%),
2.475%, 09/25/2030 (K) | | 27,909 | | | 27,349 |
| The accompanying notes are an integral part of the financial statements. | 35 | |
John Hancock Funds II
Portfolio of Investments — August 31, 2020 (showing percentage of total net assets)
Opportunistic Fixed Income Fund (continued)
| | | Shares or
Principal
Amount | | Value |
COLLATERALIZED MORTGAGE
OBLIGATIONS (continued) | | | |
| U.S. Government Agency (continued) | | | | | |
Federal Home Loan
Mortgage Corp. (continued) | | | | | |
Series 2020-DNA1, Class M1 (1 month LIBOR + 0.700%),
0.875%, 01/25/2050 (E)(K) | $ | 32,501 | | $ | 32,450 |
Series 2020-DNA1, Class M2 (1 month LIBOR + 1.700%),
1.875%, 01/25/2050 (E)(K) | | 50,000 | | | 48,747 |
Series 2020-HQA1, Class M1 (1 month LIBOR + 0.750%),
0.925%, 01/25/2050 (E)(K) | | 11,150 | | | 11,129 |
Series 2020-HQA2, Class M1 (1 month LIBOR + 1.100%),
1.275%, 03/25/2050 (E)(K) | | 49,836 | | | 49,776 |
Series 2020-HQA2, Class M2 (1 month LIBOR + 3.100%),
3.275%, 03/25/2050 (E)(K) | | 75,000 | | | 73,967 |
Series 2020-HQA3, Class B1 (1 month LIBOR + 5.750%),
5.925%, 07/25/2050 (E)(K) | | 45,000 | | | 45,000 |
Series 2020-HQA3, Class M2 (1 month LIBOR + 3.600%),
3.775%, 07/25/2050 (E)(K) | | 30,000 | | | 30,114 |
Series K066, Class X1 IO,
0.889%, 06/25/2027 | | 286,355 | | | 12,909 |
Series K103, Class X1 IO,
0.756%, 11/25/2029 | | 224,896 | | | 11,767 |
Series K104, Class X3 IO,
1.896%, 02/25/2047 | | 100,000 | | | 14,141 |
Series K105, Class X1 IO,
1.645%, 01/25/2030 | | 169,955 | | | 20,799 |
Series K113, Class X1 IO,
1.490%, 06/25/2030 | | 100,000 | | | 11,506 |
Series K-1515, Class X1 IO,
1.639%, 02/25/2035 | | 99,988 | | | 16,030 |
Series K737, Class X1 IO,
0.751%, 10/25/2026 | | 113,889 | | | 3,896 |
| Federal National Mortgage Association | | | | | |
Series 2015-C04, Class 1M2 (1 month LIBOR + 5.700%),
5.875%, 04/25/2028 (K) | | 61,737 | | | 64,522 |
Series 2016-C02, Class 1M2 (1 month LIBOR + 6.000%),
6.175%, 09/25/2028 (K) | | 44,079 | | | 46,596 |
Series 2017-C02, Class 2M2 (1 month LIBOR + 3.650%),
3.825%, 09/25/2029 (K) | | 81,242 | | | 82,464 |
Series 2017-C03, Class 1M2 (1 month LIBOR + 3.000%),
3.175%, 10/25/2029 (K) | | 59,130 | | | 59,474 |
Series 2017-C04, Class 2M2 (1 month LIBOR + 2.850%),
3.025%, 11/25/2029 (K) | | 65,472 | | | 65,065 |
Series 2017-C05, Class 1B1 (1 month LIBOR + 3.600%),
3.775%, 01/25/2030 (K) | | 25,000 | | | 23,147 |
Series 2017-C05, Class 1M2 (1 month LIBOR + 2.200%),
2.375%, 01/25/2030 (K) | | 47,056 | | | 46,114 |
Series 2017-C06, Class 2B1 (1 month LIBOR + 4.450%),
4.625%, 02/25/2030 (K) | | 10,000 | | | 9,399 |
Opportunistic Fixed Income Fund (continued)
| | | Shares or
Principal
Amount | | Value |
COLLATERALIZED MORTGAGE
OBLIGATIONS (continued) | | | |
| U.S. Government Agency (continued) | | | | | |
Federal National
Mortgage Association (continued) | | | | | |
Series 2017-C06, Class 2M2 (1 month LIBOR + 2.800%),
2.975%, 02/25/2030 (K) | $ | 62,734 | | $ | 62,262 |
Series 2017-C07, Class 1B1 (1 month LIBOR + 4.000%),
4.175%, 05/25/2030 (K) | | 67,000 | | | 63,647 |
Series 2018-C03, Class 1M2 (1 month LIBOR + 2.150%),
2.325%, 10/25/2030 (K) | | 61,005 | | | 59,707 |
Series 2018-R07, Class 1B1 (1 month LIBOR + 4.350%),
4.525%, 04/25/2031 (E)(K) | | 115,000 | | | 109,638 |
Series 2019-HRP1, Class M2 (1 month LIBOR + 2.150%),
2.325%, 11/25/2039 (E)(K) | | 47,228 | | | 42,485 |
Series 2019-R04, Class 2M2 (1 month LIBOR + 2.100%),
2.275%, 06/25/2039 (E)(K) | | 17,963 | | | 17,838 |
Series 2019-R06, Class 2M2 (1 month LIBOR + 2.100%),
2.275%, 09/25/2039 (E)(K) | | 17,356 | | | 17,259 |
Series 2020-R01, Class 1M1 (1 month LIBOR + 0.800%),
0.975%, 01/25/2040 (E)(K) | | 66,616 | | | 66,280 |
Series 2020-R01, Class 1M2 (1 month LIBOR + 2.050%),
2.225%, 01/25/2040 (E)(K) | | 55,000 | | | 52,797 |
Series 2020-R02, Class 2B1 (1 month LIBOR + 3.000%),
3.175%, 01/25/2040 (E)(K) | | 35,000 | | | 24,637 |
Series 2020-R02, Class 2M2 (1 month LIBOR + 2.000%),
2.175%, 01/25/2040 (E)(K) | | 20,000 | | | 18,998 |
| | | | | | 1,469,980 |
| TOTAL COLLATERALIZED MORTGAGE OBLIGATIONS (Cost $3,681,706) | | $ | 3,892,187 |
| ASSET BACKED SECURITIES - 4.8% | | | |
| Ally Auto Receivables Trust | | | | | |
Series 2018-2, Class A3,
2.920%, 11/15/2022 | | 94,574 | | | 95,707 |
Series 2019-4, Class A3,
1.840%, 06/17/2024 | | 120,000 | | | 122,329 |
American Credit Acceptance Receivables Trust, Series 2018-3, Class C,
3.750%, 10/15/2024 (E) | | 64,890 | | | 65,499 |
American Express Credit Account Master Trust, Series 2017-5, Class B (1 month LIBOR + 0.580%),
0.742%, 02/18/2025 (K) | | 100,000 | | | 99,782 |
AmeriCredit Automobile
Receivables Trust | | | | | |
Series 2016-1, Class D,
3.590%, 02/08/2022 | | 80,471 | | | 80,522 |
Series 2020-2, Class B,
0.970%, 02/18/2026 | | 65,000 | | | 65,124 |
Canadian Pacer Auto Receivables Trust, Series 2018-1A, Class A3,
3.000%, 11/19/2021 (E) | | 43,213 | | | 43,421 |
CCG Receivables Trust, Series 2018-1, Class A2,
2.500%, 06/16/2025 (E) | | 51,388 | | | 51,589 |
| The accompanying notes are an integral part of the financial statements. | 36 | |
John Hancock Funds II
Portfolio of Investments — August 31, 2020 (showing percentage of total net assets)
Opportunistic Fixed Income Fund (continued)
| | | Shares or
Principal
Amount | | Value |
| ASSET BACKED SECURITIES (continued) | | | |
First Investors Auto Owner Trust, Series 2020-1A, Class A,
1.490%, 01/15/2025 (E) | $ | 118,321 | | $ | 119,268 |
Ford Credit Auto Lease Trust, Series 2020-B, Class A4,
0.690%, 10/15/2023 | | 15,000 | | | 15,070 |
| Ford Credit Auto Owner Trust | | | | | |
Series 2016-1, Class A,
2.310%, 08/15/2027 (E) | | 100,000 | | | 100,760 |
Series 2017-A, Class A4,
1.920%, 04/15/2022 | | 32,264 | | | 32,348 |
Series 2017-C, Class A3,
2.010%, 03/15/2022 | | 16,924 | | | 16,991 |
GM Financial Consumer Automobile
Receivables Trust | | | | | |
Series 2018-2, Class A3,
2.810%, 12/16/2022 | | 65,550 | | | 66,441 |
Series 2020-2, Class A4,
1.740%, 08/18/2025 | | 10,000 | | | 10,412 |
Hertz Vehicle Financing II LP, Series 2016-4A, Class A,
2.650%, 07/25/2022 (E) | | 51,055 | | | 51,056 |
Honda Auto Receivables Owner Trust, Series 2019-2, Class A3,
2.520%, 06/21/2023 | | 59,000 | | | 60,537 |
Mercedes-Benz Auto Lease Trust, Series 2019-A, Class A3,
3.100%, 11/15/2021 | | 40,422 | | | 40,756 |
Mill City Mortgage Loan Trust, Series 2018-3, Class A1,
3.500%, 08/25/2058 (E)(J) | | 73,058 | | | 77,580 |
Nissan Auto Receivables Owner Trust, Series 2020-A, Class A3,
1.380%, 12/16/2024 | | 15,000 | | | 15,307 |
| Santander Drive Auto Receivables Trust | | | | | |
Series 2018-5, Class C,
3.810%, 12/16/2024 | | 50,000 | | | 50,821 |
Series 2020-1, Class A3,
2.030%, 02/15/2024 | | 5,000 | | | 5,102 |
Series 2020-2, Class B,
0.960%, 11/15/2024 | | 15,000 | | | 15,036 |
Taco Bell Funding LLC, Series 2018-1A, Class A2I,
4.318%, 11/25/2048 (E) | | 98,250 | | | 100,472 |
Towd Point Mortgage Trust, Series 2017-6, Class A1,
2.750%, 10/25/2057 (E)(J) | | 60,831 | | | 63,190 |
| Toyota Auto Receivables Owner Trust | | | | | |
Series 2016-D, Class A4,
1.420%, 01/15/2022 | | 10,603 | | | 10,609 |
Series 2019-C, Class A2A,
2.000%, 04/15/2022 | | 27,836 | | | 27,989 |
Series 2020-C, Class A4,
0.570%, 10/15/2025 | | 95,000 | | | 95,175 |
Vericrest Opportunity Loan Trust, Series 2020-NPL6, Class A1A,
3.967%, 04/25/2050 (E) | | 85,250 | | | 85,477 |
| Westlake Automobile Receivables Trust | | | | | |
Series 2020-1A, Class A2,
1.440%, 09/15/2023 (E) | | 150,000 | | | 150,851 |
Series 2019-A1, Class D,
3.670%, 03/15/2024 (E) | | 50,000 | | | 51,641 |
World Omni Auto Receivables Trust, Series 2019-A, Class A3,
3.040%, 05/15/2024 | | 90,000 | | | 92,393 |
| TOTAL ASSET BACKED SECURITIES (Cost $1,954,679) | | $ | 1,979,255 |
Opportunistic Fixed Income Fund (continued)
| | | Shares or
Principal
Amount | | Value |
| PREFERRED SECURITIES - 0.0% | | | |
| United States - 0.0% | | | | | |
| Becton, Dickinson and Company, 6.000% | | 160 | | $ | 8,549 |
| TOTAL PREFERRED SECURITIES (Cost $8,288) | | $ | 8,549 |
| EXCHANGE-TRADED FUNDS - 5.9% | | | |
| iShares JP Morgan USD Emerging Markets Bond ETF | | 15,700 | | | 1,783,206 |
| SPDR Blackstone/GSO Senior Loan ETF | | 5,000 | | | 224,100 |
| SPDR Bloomberg Barclays Convertible Securities ETF | | 5,700 | | | 403,674 |
| TOTAL EXCHANGE-TRADED FUNDS (Cost $2,366,017) | | $ | 2,410,980 |
| SHORT-TERM INVESTMENTS - 10.2% | | | |
| U.S. Government - 0.6% | | | | | |
U.S. Treasury Bill
0.056%, 09/08/2020 * | $ | 250,000 | | | 249,996 |
| Short-term funds - 9.6% | | | | | |
| State Street Institutional U.S. Government Money Market Fund, Premier Class, 0.0399% (L) | | 3,961,453 | | | 3,961,453 |
| TOTAL SHORT-TERM INVESTMENTS (Cost $4,211,450) | | $ | 4,211,449 |
Total Investments (Opportunistic Fixed Income Fund)
(Cost $42,323,481) - 104.0% | | $ | 42,791,122 |
| Other assets and liabilities, net - (4.0%) | | | (1,631,484) |
| TOTAL NET ASSETS - 100.0% | | $ | 41,159,638 |
| Currency Abbreviations |
| AUD | Australian Dollar |
| BRL | Brazilian Real |
| CAD | Canadian Dollar |
| CLP | Chilean Peso |
| COP | Colombian Peso |
| CZK | Czech Republic Koruna |
| EUR | Euro |
| HUF | Hungarian Forint |
| IDR | Indonesian Rupiah |
| ILS | Israeli New Shekel |
| ISK | Icelandic Krona |
| JPY | Japanese Yen |
| KRW | Korean Won |
| MXN | Mexican Peso |
| MYR | Malaysian Ringgit |
| NZD | New Zealand Dollar |
| PEN | Peruvian Nuevo Sol |
| PLN | Polish Zloty |
| RON | Romanian New Leu |
| RUB | Russian Ruble |
| THB | Thai Bhat |
| TRY | Turkish Lira |
| UYU | Uruguayan Peso |
| ZAR | South African Rand |
| Security Abbreviations and Legend |
| CPI | Consumer Price Index |
| IO | Interest-Only Security - (Interest Tranche of Stripped Mortgage Pool). Rate shown is the annualized yield at the end of the period. |
| LIBOR | London Interbank Offered Rate |
| SOFR | Secured Overnight Financing Rate |
| TBA | To Be Announced. A forward mortgage-backed securities trade issued by a U.S. Government Agency, to be delivered at an agreed-upon future settlement date. |
| (A) | All or a portion of this security is segregated at the custodian as collateral for certain derivatives. |
| The accompanying notes are an integral part of the financial statements. | 37 | |
John Hancock Funds II
Portfolio of Investments — August 31, 2020 (showing percentage of total net assets)
Opportunistic Fixed Income Fund (continued)
| (B) | Security purchased or sold on a when-issued or delayed delivery basis. |
| (C) | Non-income producing - Issuer is in default. |
| (D) | Non-income producing security. |
| (E) | These securities are exempt from registration under Rule 144A of the Securities Act of 1933. Such securities may be resold, normally to qualified institutional buyers, in transactions exempt from registration. Rule 144A securities amounted to $4,596,563 or 11.2% of the fund's net assets as of 8-31-20. |
| (F) | Perpetual bonds have no stated maturity date. Date shown as maturity date is next call date. |
| (G) | Zero coupon bonds are issued at a discount from their principal amount in lieu of paying interest periodically. Rate shown is the effective yield at period end. |
| (H) | Term loans are variable rate obligations. The coupon rate shown represents the rate at period end. |
Opportunistic Fixed Income Fund (continued)
| (I) | This position represents an unsettled loan commitment at period end. Certain details associated with this purchase are not known prior to the settlement date, including coupon rate, which is disclosed as TBD (To Be Determined). |
| (J) | Variable or floating rate security, the interest rate of which adjusts periodically based on a weighted average of interest rates and prepayments on the underlying pool of assets. The interest rate shown is the current rate as of period end. |
| (K) | Variable rate obligation. The coupon rate shown represents the rate at period end. |
| (L) | The rate shown is the annualized seven-day yield as of 8-31-20. |
| * | Yield represents either the annualized yield at the date of purchase, the stated coupon rate or, for floating rate securities, the rate at period end. |
DERIVATIVES
FUTURES
| Open contracts | Number of
contracts | Position | Expiration
date | Notional
basis^ | Notional
value^ | Unrealized
appreciation
(depreciation) |
| 10-Year Australian Treasury Bond Futures | 3 | Long | Sep 2020 | $325,751 | $326,296 | $545 |
| 10-Year Canada Government Bond Futures | 1 | Long | Dec 2020 | 116,465 | 115,720 | (745) |
| Ultra U.S. Treasury Bond Futures | 3 | Long | Dec 2020 | 670,154 | 662,719 | (7,435) |
| 10-Year Mini Japan Government Bond Futures | 1 | Short | Sep 2020 | (143,477) | (143,058) | 419 |
| 10-Year U.S. Treasury Note Futures | 2 | Short | Dec 2020 | (277,933) | (278,500) | (567) |
| 2-Year U.S. Treasury Note Futures | 3 | Short | Dec 2020 | (662,596) | (662,836) | (240) |
| 5-Year U.S. Treasury Note Futures | 4 | Short | Dec 2020 | (503,370) | (504,125) | (755) |
| German Euro BUND Futures | 12 | Short | Sep 2020 | (2,496,977) | (2,514,520) | (17,543) |
| U.K. Long Gilt Bond Futures | 3 | Short | Dec 2020 | (542,409) | (541,424) | 985 |
| | | | | | | $(25,336) |
^ Notional basis refers to the contractual amount agreed upon at inception of open contracts; notional value represents the current value of the open contract.
FORWARD FOREIGN CURRENCY CONTRACTS
| Contract to buy | Contract to sell | Counterparty (OTC) | Contractual
settlement
date | Unrealized
appreciation | Unrealized
depreciation |
| AUD | 40,000 | USD | 29,456 | CITI | 9/30/2020 | $49 | — |
| AUD | 396,000 | USD | 286,575 | GSI | 9/30/2020 | 5,525 | — |
| BRL | 824,000 | USD | 147,869 | CITI | 9/2/2020 | 2,537 | — |
| BRL | 1,329,000 | USD | 236,692 | CITI | 9/30/2020 | 5,677 | — |
| CAD | 905,000 | USD | 688,692 | JPM | 9/30/2020 | 5,202 | — |
| CLP | 202,219,000 | USD | 260,015 | GSI | 9/30/2020 | 59 | — |
| CNY | 2,663,000 | USD | 386,010 | BARC | 9/30/2020 | 1,989 | — |
| COP | 780,500,000 | USD | 201,103 | CITI | 9/30/2020 | 7,141 | — |
| CZK | 12,303,000 | USD | 556,891 | BARC | 9/30/2020 | 2,137 | — |
| EUR | 452,406 | USD | 534,981 | JPM | 9/30/2020 | 5,240 | — |
| GBP | 161,000 | USD | 214,524 | GSI | 9/30/2020 | 737 | — |
| GBP | 271,000 | USD | 355,339 | JPM | 9/30/2020 | 6,995 | — |
| INR | 24,007,000 | USD | 320,008 | JPM | 9/30/2020 | 6,474 | — |
| JPY | 146,928,000 | USD | 1,384,149 | MSI | 9/30/2020 | 3,610 | — |
| KRW | 252,000,000 | USD | 212,363 | MSI | 9/29/2020 | — | $(172) |
| NOK | 4,855,000 | USD | 541,562 | MSI | 9/30/2020 | 14,322 | — |
| NZD | 373,000 | USD | 245,923 | MSI | 9/30/2020 | 5,320 | — |
| PHP | 24,365,000 | USD | 501,183 | CITI | 9/30/2020 | 800 | — |
| PLN | 1,999,000 | USD | 539,236 | BARC | 9/30/2020 | 3,627 | — |
| RUB | 21,638,000 | USD | 291,611 | BOA | 9/30/2020 | — | (1,212) |
| RUB | 4,410,000 | USD | 59,050 | BARC | 9/30/2020 | 136 | — |
| RUB | 44,210,000 | USD | 591,680 | GSI | 9/30/2020 | 1,654 | — |
| SEK | 4,827,000 | USD | 550,233 | MSI | 9/30/2020 | 8,002 | — |
| SGD | 1,271,000 | USD | 928,320 | JPM | 9/30/2020 | 5,872 | — |
| TRY | 2,240,000 | USD | 302,253 | BOA | 9/30/2020 | 74 | — |
| USD | 1,884,447 | AUD | 2,604,000 | GSI | 9/30/2020 | — | (36,328) |
| USD | 147,077 | BRL | 824,000 | CITI | 9/2/2020 | — | (3,329) |
| The accompanying notes are an integral part of the financial statements. | 38 | |
John Hancock Funds II
Portfolio of Investments — August 31, 2020 (showing percentage of total net assets)
Opportunistic Fixed Income Fund (continued)
FORWARD FOREIGN CURRENCY CONTRACTS (continued)
| Contract to buy | Contract to sell | Counterparty (OTC) | Contractual
settlement
date | Unrealized
appreciation | Unrealized
depreciation |
| USD | 295,707 | BRL | 1,628,000 | CITI | 10/2/2020 | — | $(1,171) |
| USD | 2,429,826 | CAD | 3,193,000 | JPM | 9/30/2020 | — | (18,355) |
| USD | 544,933 | CHF | 496,000 | JPM | 9/30/2020 | — | (4,234) |
| USD | 503,598 | CLP | 395,702,000 | MSI | 9/30/2020 | — | (5,315) |
| USD | 524,072 | COP | 2,033,974,000 | CITI | 9/30/2020 | — | (18,609) |
| USD | 32,238 | CZK | 708,000 | CITI | 9/30/2020 | $68 | — |
| USD | 4,448,652 | EUR | 3,762,000 | JPM | 9/30/2020 | — | (43,570) |
| USD | 435,323 | GBP | 332,000 | JPM | 9/30/2020 | — | (8,570) |
| USD | 529,439 | HUF | 159,465,000 | BOA | 9/30/2020 | — | (5,727) |
| USD | 1,752,999 | IDR | 25,648,135,000 | BARC | 9/30/2020 | — | (2,014) |
| USD | 35,957 | IDR | 525,280,000 | MSI | 9/30/2020 | 14 | — |
| USD | 1,211,488 | ILS | 4,119,000 | CITI | 9/30/2020 | — | (16,855) |
| USD | 2,840,865 | JPY | 301,559,000 | MSI | 9/30/2020 | — | (7,409) |
| USD | 2,925,055 | KRW | 3,471,016,000 | MSI | 9/29/2020 | 2,373 | — |
| USD | 1,164,404 | MXN | 25,612,000 | CITI | 9/30/2020 | — | (2,056) |
| USD | 38,250 | NOK | 335,000 | BOA | 9/30/2020 | — | (106) |
| USD | 120,471 | NOK | 1,080,000 | MSI | 9/30/2020 | — | (3,186) |
| USD | 390,971 | NZD | 593,000 | MSI | 9/30/2020 | — | (8,457) |
| USD | 1,891,795 | RUB | 141,354,000 | GSI | 9/30/2020 | — | (5,289) |
| USD | 756,618 | SGD | 1,029,000 | JPM | 9/30/2020 | 297 | — |
| USD | 581,665 | THB | 18,337,000 | JPM | 9/30/2020 | — | (7,455) |
| USD | 244,613 | TRY | 1,839,000 | GSI | 9/30/2020 | — | (3,593) |
| USD | 42,291 | ZAR | 709,000 | BOA | 9/30/2020 | 597 | — |
| ZAR | 3,682,000 | USD | 217,289 | MSI | 9/30/2020 | — | (763) |
| | | | | | | $96,528 | $(203,775) |
SWAPS
| Interest rate swaps |
Counterparty (OTC)/
Centrally cleared | Notional
amount | Currency | Payments
made | Payments
received | Fixed
payment
frequency | Floating
payment
frequency | Maturity
date | Unamortized
upfront
payment paid
(received) | Unrealized
appreciation
(depreciation) | Value |
| BOA | 5,770,000 | CNY | CNY CNREPOFIX Reuters | Fixed 2.340% | Quarterly | Quarterly | Sep 2025 | $(1,057) | $(15,084) | $(16,141) |
| CITI | 6,440,000 | CNY | CNY CNREPOFIX Reuters | Fixed 2.390% | Quarterly | Quarterly | Jun 2025 | — | (18,787) | (18,787) |
| CITI | 906,430,000 | COP | Fixed 4.330% | COP IBR Compounded OIS | Quarterly | Quarterly | Sep 2030 | — | 3,389 | 3,389 |
| GSI | 169,660,000 | CLP | Fixed 2.160% | CLP CLICP Bloomberg | Semi-Annual | Semi-Annual | Sep 2030 | 319 | 693 | 1,012 |
| | | | | | | | | $(738) | $(29,789) | $(30,527) |
| Centrally cleared | 1,580,000 | PLN | Fixed 0.880% | PLN WIBOR WIBO | Annual | Semi-Annual | Sep 2030 | 292 | 10,368 | 10,660 |
| | | | | | | | | $292 | $10,368 | $10,660 |
| | | | | | | | | $(446) | $(19,421) | $(19,867) |
| Credit default swaps - Buyer |
Counterparty
(OTC)/
Centrally
cleared | Reference
obligation | Notional
amount | Currency | USD
notional
amount | Pay
fixed
rate | Fixed
payment
frequency | Maturity
date | Unamortized
upfront
payment
paid
(received) | Unrealized
appreciation
(depreciation) | Value |
| CITI | Government of Malaysia | 80,000 | USD | $80,000 | 1.000% | Quarterly | Jun 2025 | $(1,358) | $(851) | $(2,209) |
| CITI | People's Republic of China | 65,000 | USD | 65,000 | 1.000% | Quarterly | Jun 2025 | (1,667) | (498) | (2,165) |
| GSI | People's Republic of China | 850,000 | USD | 850,000 | 1.000% | Quarterly | Dec 2024 | (20,695) | (6,801) | (27,496) |
| GSI | Government of Russia | 410,000 | USD | 410,000 | 1.000% | Quarterly | Jun 2025 | 12,643 | (13,513) | (870) |
| GSI | Government of Russia | 10,000 | USD | 10,000 | 1.000% | Quarterly | Jun 2025 | (10) | (9) | (19) |
| GSI | CMBX.NA.AAA.10 | 600,000 | USD | 600,000 | 0.500% | Monthly | Nov 2059 | (7,034) | (584) | (7,618) |
| JPM | Republic of Korea | 2,110,000 | USD | 2,110,000 | 1.000% | Quarterly | Dec 2024 | (62,288) | (14,592) | (76,880) |
| MSI | Government of Japan | 2,090,000 | USD | 2,090,000 | 1.000% | Quarterly | Dec 2024 | (65,715) | (14,833) | (80,548) |
| MSI | Federative Republic of Brazil | 5,000 | USD | 5,000 | 1.000% | Quarterly | Jun 2025 | 298 | (45) | 253 |
| MSI | Republic of Indonesia | 50,000 | USD | 50,000 | 1.000% | Quarterly | Jun 2025 | 461 | (699) | (238) |
| MSI | CMBX.NA.BBB-.7 | 440,000 | USD | 440,000 | 3.000% | Monthly | Jan 2047 | 10,000 | 90,324 | 100,324 |
| MSI | CMBX.NA.AAA.11 | 600,000 | USD | 600,000 | 0.500% | Monthly | Nov 2054 | (5,093) | (1,052) | (6,145) |
| MSI | CMBX.NA.BBB-.8 | 460,000 | USD | 460,000 | 3.000% | Monthly | Oct 2057 | 22,083 | 82,083 | 104,166 |
| The accompanying notes are an integral part of the financial statements. | 39 | |
John Hancock Funds II
Portfolio of Investments — August 31, 2020 (showing percentage of total net assets)
Opportunistic Fixed Income Fund (continued)
| Credit default swaps - Buyer (continued) |
Counterparty
(OTC)/
Centrally
cleared | Reference
obligation | Notional
amount | Currency | USD
notional
amount | Pay
fixed
rate | Fixed
payment
frequency | Maturity
date | Unamortized
upfront
payment
paid
(received) | Unrealized
appreciation
(depreciation) | Value |
| MSI | CMBX.NA.AAA.12 | 610,000 | USD | $610,000 | 0.500% | Monthly | Aug 2061 | $(473) | $(1,954) | $(2,427) |
| MSI | CMBX.NA.AAA.13 | 610,000 | USD | 610,000 | 0.500% | Monthly | Dec 2072 | 4,331 | (1,533) | 2,798 |
| | | | | $8,990,000 | | | | $(114,517) | $115,443 | $926 |
| Centrally cleared | CDX.NA.HY.34 | 61,380 | USD | 61,380 | 5.000% | Quarterly | Jun 2025 | 335 | (4,470) | (4,135) |
| Centrally cleared | iTraxx Europe Crossover Series 33 Version 1 | 110,000 | EUR | 123,997 | 5.000% | Quarterly | Jun 2025 | (7,191) | (4,221) | (11,412) |
| | | | | $185,377 | | | | $(6,856) | $(8,691) | $(15,547) |
| | | | | $9,175,377 | | | | $(121,373) | $106,752 | $(14,621) |
| Credit default swaps - Seller |
Counterparty
(OTC)/
Centrally
cleared | Reference
obligation | Implied
credit
spread | Notional
amount | Currency | USD
notional
amount | Received
fixed
rate | Fixed
payment
frequency | Maturity
date | Unamortized
upfront
payment
paid
(received) | Unrealized
appreciation
(depreciation) | Value |
| GSI | CDX.NA.HY.34 | 4.538% | 799,800 | USD | $799,800 | 5.000% | Quarterly | Jun 2023 | $(17,518) | $54,352 | $36,834 |
| GSI | CDX.NA.HY.34 | 4.538% | 404,550 | USD | 404,550 | 5.000% | Quarterly | Jun 2023 | (8,869) | 27,500 | 18,631 |
| GSI | CDX.NA.HY.34 | 4.538% | 399,900 | USD | 399,900 | 5.000% | Quarterly | Jun 2023 | (13,258) | 31,564 | 18,306 |
| GSI | CMBX.NA.BBB-.11 | 5.810% | 50,000 | USD | 50,000 | 3.000% | Monthly | Nov 2054 | (8,703) | 942 | (7,761) |
| GSI | CMBX.NA.BBB-.10 | 6.250% | 25,000 | USD | 25,000 | 3.000% | Monthly | Nov 2059 | (4,826) | 352 | (4,474) |
| | | | | | $1,679,250 | | | | $(53,174) | $114,710 | $61,536 |
| Centrally cleared | CDX.NA.HY.33 | 4.280% | 1,885,500 | USD | 1,885,500 | 5.000% | Quarterly | Dec 2024 | (20,798) | 145,761 | 124,963 |
| Centrally cleared | CDX.NA.HY.34 | 4.340% | 186,000 | USD | 186,000 | 5.000% | Quarterly | Jun 2025 | 316 | 12,213 | 12,529 |
| Centrally cleared | CDX.NA.IG.34 | 0.695% | 85,000 | USD | 85,000 | 1.000% | Quarterly | Jun 2025 | 1,115 | 455 | 1,570 |
| Centrally cleared | iTraxx Europe Series 33 Version 1 | 0.610% | 315,000 | EUR | 355,084 | 1.000% | Quarterly | Jun 2025 | 6,412 | 2,611 | 9,023 |
| | | | | | $2,511,584 | | | | $(12,955) | $161,040 | $148,085 |
| | | | | | $4,190,834 | | | | $(66,129) | $275,750 | $209,621 |
| Total return swaps |
Pay/
receive
total
return* | Reference
entity | Floating/
fixed
rate | Payment
frequency | Currency | Notional
amount | Maturity
date | Counterparty
(OTC) | Unamortized
upfront
payment paid
(received) | Unrealized
appreciation
(depreciation) | Value |
| Pay | iBoxx $ Liquid Investment Grade Index | 3-Month USD LIBOR | At Maturity | USD | 770,000 | Mar 2021 | GSI | $46 | $(15,038) | $(14,992) |
| Pay | iBoxx $ Liquid Leveraged Loan Index | 3-Month USD LIBOR | At Maturity | USD | 1,220,000 | Mar 2021 | MSI | 445 | 26,381 | 26,826 |
| Receive | iBoxx $ Liquid Leveraged Loan Index | 3-Month USD LIBOR | At Maturity | USD | 370,000 | Mar 2021 | BARC | (135) | 4,720 | 4,585 |
| Receive | iBoxx $ Liquid Leveraged Loan Index | 3-Month USD LIBOR | At Maturity | USD | 290,000 | Mar 2021 | BARC | (113) | 3,499 | 3,386 |
| Receive | iBoxx $ Liquid Leveraged Loan Index | 3-Month USD LIBOR | At Maturity | USD | 770,000 | Mar 2021 | JPM | (46) | 28,540 | 28,494 |
| Receive | iBoxx $ Liquid Leveraged Loan Index | 3-Month USD LIBOR | At Maturity | USD | 1,200,000 | Mar 2021 | JPM | (414) | 21,435 | 21,021 |
| Receive | iBoxx $ Liquid Leveraged Loan Index | 3-Month USD LIBOR | At Maturity | USD | 465,000 | Mar 2021 | MSI | (169) | 5,863 | 5,694 |
| Receive | iBoxx $ Liquid Leveraged Loan Index | 3-Month USD LIBOR | At Maturity | USD | 95,000 | Mar 2021 | MSI | (35) | 1,198 | 1,163 |
| | | | | | | | | $(421) | $76,598 | $76,177 |
| Derivatives Currency Abbreviations |
| AUD | Australian Dollar |
| BRL | Brazilian Real |
| CAD | Canadian Dollar |
| CHF | Swiss Franc |
| CLP | Chilean Peso |
| CNY | Chinese Yuan Renminbi |
| COP | Colombian Peso |
| The accompanying notes are an integral part of the financial statements. | 40 | |
John Hancock Funds II
Portfolio of Investments — August 31, 2020 (showing percentage of total net assets)
Opportunistic Fixed Income Fund (continued)
| CZK | Czech Republic Koruna |
| EUR | Euro |
| GBP | Pound Sterling |
| HUF | Hungarian Forint |
| IDR | Indonesian Rupiah |
| ILS | Israeli New Shekel |
| INR | Indian Rupee |
| JPY | Japanese Yen |
| KRW | Korean Won |
| MXN | Mexican Peso |
| NOK | Norwegian Krone |
| NZD | New Zealand Dollar |
| PHP | Philippine Peso |
| PLN | Polish Zloty |
| RUB | Russian Ruble |
| SEK | Swedish Krona |
| SGD | Singapore Dollar |
| THB | Thai Bhat |
| TRY | Turkish Lira |
| USD | U.S. Dollar |
| ZAR | South African Rand |
| Derivatives Abbreviations |
| BARC | Barclays Bank PLC |
| BOA | Bank of America, N.A. |
| CITI | Citibank, N.A. |
| CLICP | Sinacofi Chile Interbank Rate Average |
| CNREPOFIX | China Fixing Repo Rate |
| GSI | Goldman Sachs International |
| IBR | Colombia Overnight Interbank Rate |
| JPM | JPMorgan Chase Bank, N.A. |
| LIBOR | London Interbank Offered Rate |
| MSI | Morgan Stanley & Co. International PLC |
| OIS | Overnight Index Swap |
| OTC | Over-the-counter |
| WIBOR | Warsaw Interbank Offered Rate |
See Notes to financial statements regarding investment transactions and other derivatives information.
U.S. High Yield Bond Fund
| | | Shares or
Principal
Amount | | Value |
| CORPORATE BONDS – 94.7% | | | |
| Communication services – 15.7% | | | | | |
Block Communications, Inc.
4.875%, 03/01/2028 (A) | $ | 125,000 | | $ | 127,500 |
| CCO Holdings LLC | | | | | |
| 4.000%, 03/01/2023 (A) | | 50,000 | | | 50,688 |
| 4.500%, 08/15/2030 to 05/01/2032 (A) | | 800,000 | | | 848,626 |
| 5.000%, 02/01/2028 (A) | | 125,000 | | | 132,188 |
| 5.125%, 05/01/2027 (A) | | 250,000 | | | 266,255 |
| 5.375%, 05/01/2025 (A) | | 2,150,000 | | | 2,211,813 |
| 5.750%, 02/15/2026 (A) | | 2,700,000 | | | 2,829,762 |
| Cinemark USA, Inc. | | | | | |
| 5.125%, 12/15/2022 | | 600,000 | | | 562,500 |
| 8.750%, 05/01/2025 (A) | | 75,000 | | | 80,438 |
| CSC Holdings LLC | | | | | |
| 4.125%, 12/01/2030 (A) | | 275,000 | | | 285,450 |
| 4.625%, 12/01/2030 (A) | | 750,000 | | | 767,033 |
| 5.375%, 02/01/2028 (A) | | 375,000 | | | 399,928 |
| 5.500%, 05/15/2026 (A) | | 1,125,000 | | | 1,180,080 |
| 6.500%, 02/01/2029 (A) | | 350,000 | | | 394,406 |
| 7.500%, 04/01/2028 (A) | | 550,000 | | | 617,375 |
| Diamond Sports Group LLC | | | | | |
| 5.375%, 08/15/2026 (A) | | 125,000 | | | 97,500 |
| 6.625%, 08/15/2027 (A)(B) | | 725,000 | | | 407,813 |
U.S. High Yield Bond Fund (continued)
| | | Shares or
Principal
Amount | | Value |
| CORPORATE BONDS (continued) | | | |
| Communication services (continued) | | | | | |
| Gray Television, Inc. | | | | | |
| 5.125%, 10/15/2024 (A) | $ | 975,000 | | $ | 996,733 |
| 5.875%, 07/15/2026 (A) | | 2,000,000 | | | 2,075,000 |
| 7.000%, 05/15/2027 (A) | | 200,000 | | | 217,000 |
Intelsat Connect Finance SA
9.500%, 02/15/2023 (A)(C) | | 275,000 | | | 93,500 |
| Intelsat Jackson Holdings SA | | | | | |
| 5.500%, 08/01/2023 (B)(C) | | 3,375,000 | | | 2,244,375 |
| 8.500%, 10/15/2024 (A)(C) | | 1,100,000 | | | 748,000 |
Intelsat Luxembourg SA
8.125%, 06/01/2023 (C) | | 650,000 | | | 27,625 |
| Lamar Media Corp. | | | | | |
| 3.750%, 02/15/2028 (A) | | 700,000 | | | 699,125 |
| 4.000%, 02/15/2030 (A) | | 700,000 | | | 714,875 |
| 5.750%, 02/01/2026 | | 50,000 | | | 52,140 |
Level 3 Financing, Inc.
5.375%, 01/15/2024 | | 425,000 | | | 429,781 |
Live Nation Entertainment, Inc.
6.500%, 05/15/2027 (A) | | 150,000 | | | 163,871 |
Match Group Holdings II LLC
4.125%, 08/01/2030 (A) | | 125,000 | | | 130,938 |
Nexstar Broadcasting, Inc.
5.625%, 07/15/2027 (A) | | 2,095,000 | | | 2,210,225 |
| The accompanying notes are an integral part of the financial statements. | 41 | |
John Hancock Funds II
Portfolio of Investments — August 31, 2020 (showing percentage of total net assets)
U.S. High Yield Bond Fund (continued)
| | | Shares or
Principal
Amount | | Value |
| CORPORATE BONDS (continued) | | | |
| Communication services (continued) | | | | | |
Nielsen Finance LLC
5.000%, 04/15/2022 (A) | $ | 2,825,000 | | $ | 2,827,684 |
| Outfront Media Capital LLC | | | | | |
| 4.625%, 03/15/2030 (A) | | 1,225,000 | | | 1,185,188 |
| 5.000%, 08/15/2027 (A) | | 25,000 | | | 24,555 |
| 5.625%, 02/15/2024 | | 375,000 | | | 380,625 |
Salem Media Group, Inc.
6.750%, 06/01/2024 (A)(B) | | 2,100,000 | | | 1,806,000 |
Scripps Escrow, Inc.
5.875%, 07/15/2027 (A) | | 125,000 | | | 125,000 |
| Sprint Capital Corp. | | | | | |
| 6.875%, 11/15/2028 | | 140,000 | | | 179,094 |
| 8.750%, 03/15/2032 | | 820,000 | | | 1,238,559 |
The EW Scripps Company
5.125%, 05/15/2025 (A) | | 2,050,000 | | | 2,029,500 |
The Nielsen Company Luxembourg SARL
5.000%, 02/01/2025 (A)(B) | | 400,000 | | | 407,000 |
| T-Mobile USA, Inc. | | | | | |
| 4.500%, 02/01/2026 | | 75,000 | | | 77,423 |
| 4.750%, 02/01/2028 | | 325,000 | | | 350,188 |
| 5.125%, 04/15/2025 | | 250,000 | | | 256,281 |
| 5.375%, 04/15/2027 | | 875,000 | | | 942,813 |
| 6.375%, 03/01/2025 | | 1,550,000 | | | 1,582,938 |
Virgin Media Finance PLC
5.000%, 07/15/2030 (A) | | 475,000 | | | 489,108 |
Windstream Escrow LLC
7.750%, 08/15/2028 (A) | | 535,000 | | | 535,112 |
| | | | | | 36,499,611 |
| Consumer discretionary – 12.3% | | | | | |
| Asbury Automotive Group, Inc. | | | | | |
| 4.500%, 03/01/2028 (A) | | 360,000 | | | 368,100 |
| 4.750%, 03/01/2030 (A) | | 347,000 | | | 359,617 |
Carriage Services, Inc.
6.625%, 06/01/2026 (A) | | 1,750,000 | | | 1,850,625 |
CCM Merger, Inc.
6.000%, 03/15/2022 (A) | | 3,050,000 | | | 3,034,750 |
| Clarios Global LP | | | | | |
| 6.250%, 05/15/2026 (A) | | 100,000 | | | 106,063 |
| 6.750%, 05/15/2025 (A) | | 75,000 | | | 80,360 |
Connect Finco SARL
6.750%, 10/01/2026 (A) | | 450,000 | | | 464,625 |
Cooper Tire & Rubber Company
7.625%, 03/15/2027 | | 2,410,000 | | | 2,724,626 |
| Ford Motor Company | | | | | |
| 4.750%, 01/15/2043 | | 1,375,000 | | | 1,273,594 |
| 9.000%, 04/22/2025 | | 150,000 | | | 175,540 |
| 9.625%, 04/22/2030 | | 150,000 | | | 196,616 |
| Ford Motor Credit Company LLC | | | | | |
| 4.389%, 01/08/2026 | | 1,450,000 | | | 1,475,114 |
| 5.113%, 05/03/2029 | | 2,000,000 | | | 2,112,500 |
| 5.125%, 06/16/2025 | | 300,000 | | | 315,219 |
| Group 1 Automotive, Inc. | | | | | |
| 4.000%, 08/15/2028 (A) | | 525,000 | | | 523,803 |
| 5.000%, 06/01/2022 | | 925,000 | | | 925,000 |
Hilton Domestic Operating Company, Inc.
4.875%, 01/15/2030 | | 125,000 | | | 128,750 |
KFC Holding Company/Pizza Hut
Holdings LLC/Taco Bell of America LLC | | | | | |
| 5.000%, 06/01/2024 (A) | | 650,000 | | | 670,657 |
| 5.250%, 06/01/2026 (A) | | 650,000 | | | 674,375 |
Levi Strauss & Company
5.000%, 05/01/2025 | | 175,000 | | | 178,938 |
U.S. High Yield Bond Fund (continued)
| | | Shares or
Principal
Amount | | Value |
| CORPORATE BONDS (continued) | | | |
| Consumer discretionary (continued) | | | | | |
| Lithia Motors, Inc. | | | | | |
| 4.625%, 12/15/2027 (A) | $ | 200,000 | | $ | 211,000 |
| 5.250%, 08/01/2025 (A) | | 1,025,000 | | | 1,062,264 |
| Penske Automotive Group, Inc. | | | | | |
| 3.500%, 09/01/2025 | | 85,000 | | | 85,614 |
| 5.375%, 12/01/2024 | | 1,125,000 | | | 1,146,218 |
| 5.750%, 10/01/2022 | | 1,000,000 | | | 1,000,700 |
| Service Corp. International | | | | | |
| 4.625%, 12/15/2027 | | 425,000 | | | 457,938 |
| 5.125%, 06/01/2029 | | 1,175,000 | | | 1,301,747 |
| 7.500%, 04/01/2027 | | 450,000 | | | 544,500 |
| 8.000%, 11/15/2021 | | 2,145,000 | | | 2,295,150 |
Sonic Automotive, Inc.
6.125%, 03/15/2027 | | 350,000 | | | 366,188 |
Telesat Canada
6.500%, 10/15/2027 (A) | | 350,000 | | | 359,520 |
| The William Carter Company | | | | | |
| 5.500%, 05/15/2025 (A) | | 150,000 | | | 159,936 |
| 5.625%, 03/15/2027 (A) | | 375,000 | | | 398,393 |
Wyndham Hotels & Resorts, Inc.
5.375%, 04/15/2026 (A) | | 1,270,000 | | | 1,317,625 |
| Yum! Brands, Inc. | | | | | |
| 4.750%, 01/15/2030 (A) | | 150,000 | | | 165,375 |
| 7.750%, 04/01/2025 (A) | | 150,000 | | | 167,438 |
| | | | | | 28,678,478 |
| Consumer staples – 1.5% | | | | | |
| Albertsons Companies, Inc. | | | | | |
| 4.625%, 01/15/2027 (A) | | 150,000 | | | 158,496 |
| 4.875%, 02/15/2030 (A) | | 150,000 | | | 161,250 |
Cott Holdings, Inc.
5.500%, 04/01/2025 (A) | | 375,000 | | | 387,656 |
Darling Ingredients, Inc.
5.250%, 04/15/2027 (A) | | 500,000 | | | 530,625 |
| Pilgrim's Pride Corp. | | | | | |
| 5.750%, 03/15/2025 (A) | | 940,000 | | | 965,850 |
| 5.875%, 09/30/2027 (A) | | 125,000 | | | 132,813 |
| Prestige Brands, Inc. | | | | | |
| 5.125%, 01/15/2028 (A) | | 125,000 | | | 131,110 |
| 6.375%, 03/01/2024 (A) | | 725,000 | | | 748,410 |
Spectrum Brands, Inc.
5.750%, 07/15/2025 | | 275,000 | | | 283,938 |
| | | | | | 3,500,148 |
| Energy – 18.5% | | | | | |
Antero Midstream Partners LP
5.750%, 01/15/2028 (A) | | 1,875,000 | | | 1,657,406 |
| Apache Corp. | | | | | |
| 4.250%, 01/15/2030 | | 50,000 | | | 48,652 |
| 4.750%, 04/15/2043 | | 750,000 | | | 706,463 |
| 4.875%, 11/15/2027 | | 75,000 | | | 76,638 |
| Archrock Partners LP | | | | | |
| 6.250%, 04/01/2028 (A) | | 200,000 | | | 200,960 |
| 6.875%, 04/01/2027 (A) | | 450,000 | | | 463,500 |
| Baytex Energy Corp. | | | | | |
| 5.625%, 06/01/2024 (A) | | 1,400,000 | | | 829,500 |
| 8.750%, 04/01/2027 (A) | | 2,100,000 | | | 1,029,000 |
Bristow Group, Inc.
7.750%, 12/15/2022 (B) | | 1,600,000 | | | 1,504,000 |
Buckeye Partners LP
5.850%, 11/15/2043 | | 825,000 | | | 800,729 |
| Callon Petroleum Company | | | | | |
| 6.125%, 10/01/2024 | | 732,000 | | | 239,044 |
| 8.250%, 07/15/2025 (B) | | 1,038,000 | | | 311,400 |
Cenovus Energy, Inc.
5.375%, 07/15/2025 | | 80,000 | | | 81,403 |
| The accompanying notes are an integral part of the financial statements. | 42 | |
John Hancock Funds II
Portfolio of Investments — August 31, 2020 (showing percentage of total net assets)
U.S. High Yield Bond Fund (continued)
| | | Shares or
Principal
Amount | | Value |
| CORPORATE BONDS (continued) | | | |
| Energy (continued) | | | | | |
Cheniere Corpus Christi Holdings LLC
5.125%, 06/30/2027 | $ | 75,000 | | $ | 84,490 |
| Cheniere Energy Partners LP | | | | | |
| 4.500%, 10/01/2029 | | 350,000 | | | 363,850 |
| 5.250%, 10/01/2025 | | 3,175,000 | | | 3,248,787 |
| 5.625%, 10/01/2026 | | 400,000 | | | 419,276 |
| Denbury Resources, Inc. | | | | | |
| 7.750%, 02/15/2024 (A)(C) | | 743,000 | | | 371,500 |
| 9.000%, 05/15/2021 (A)(C) | | 1,300,000 | | | 650,000 |
| 9.250%, 03/31/2022 (A)(B)(C) | | 451,000 | | | 225,500 |
Diamond Offshore Drilling, Inc.
4.875%, 11/01/2043 (C) | | 993,000 | | | 99,300 |
EnLink Midstream LLC
5.375%, 06/01/2029 | | 1,725,000 | | | 1,520,708 |
| EnLink Midstream Partners LP | | | | | |
| 4.150%, 06/01/2025 | | 25,000 | | | 22,281 |
| 4.400%, 04/01/2024 | | 300,000 | | | 277,500 |
| 5.050%, 04/01/2045 (B) | | 1,175,000 | | | 763,750 |
| 5.450%, 06/01/2047 | | 1,175,000 | | | 768,215 |
| 5.600%, 04/01/2044 | | 750,000 | | | 495,000 |
Enviva Partners LP
6.500%, 01/15/2026 (A) | | 1,675,000 | | | 1,783,523 |
| EQM Midstream Partners LP | | | | | |
| 6.000%, 07/01/2025 (A) | | 75,000 | | | 79,594 |
| 6.500%, 07/01/2027 (A) | | 150,000 | | | 164,250 |
| 6.500%, 07/15/2048 | | 325,000 | | | 329,063 |
Harvest Midstream I LP
7.500%, 09/01/2028 (A) | | 345,000 | | | 357,123 |
| Hilcorp Energy I LP | | | | | |
| 5.000%, 12/01/2024 (A) | | 1,250,000 | | | 1,184,375 |
| 5.750%, 10/01/2025 (A) | | 1,325,000 | | | 1,245,500 |
| 6.250%, 11/01/2028 (A) | | 225,000 | | | 211,500 |
Indigo Natural Resources LLC
6.875%, 02/15/2026 (A) | | 575,000 | | | 587,938 |
| Murphy Oil Corp. | | | | | |
| 5.750%, 08/15/2025 | | 125,000 | | | 119,844 |
| 5.875%, 12/01/2027 | | 125,000 | | | 120,078 |
Murphy Oil USA, Inc.
4.750%, 09/15/2029 | | 75,000 | | | 81,081 |
New Fortress Energy, Inc.
6.750%, 09/15/2025 (A) | | 290,000 | | | 293,680 |
| NGPL PipeCo LLC | | | | | |
| 4.375%, 08/15/2022 (A) | | 225,000 | | | 233,259 |
| 7.768%, 12/15/2037 (A) | | 275,000 | | | 335,734 |
| Occidental Petroleum Corp. | | | | | |
| 4.625%, 06/15/2045 | | 1,575,000 | | | 1,244,250 |
| 6.200%, 03/15/2040 | | 500,000 | | | 475,000 |
| 6.450%, 09/15/2036 | | 3,825,000 | | | 3,750,918 |
| 6.600%, 03/15/2046 | | 375,000 | | | 372,409 |
Oceaneering International, Inc.
6.000%, 02/01/2028 | | 1,350,000 | | | 854,577 |
Pattern Energy Operations LP
4.500%, 08/15/2028 (A) | | 2,300,000 | | | 2,420,750 |
| Rockies Express Pipeline LLC | | | | | |
| 4.800%, 05/15/2030 (A) | | 725,000 | | | 714,125 |
| 6.875%, 04/15/2040 (A) | | 1,506,000 | | | 1,551,180 |
| 7.500%, 07/15/2038 (A) | | 201,000 | | | 213,060 |
| Southwestern Energy Company | | | | | |
| 6.450%, 01/23/2025 | | 15,000 | | | 15,068 |
| 7.500%, 04/01/2026 | | 250,000 | | | 251,250 |
| 7.750%, 10/01/2027 (B) | | 850,000 | | | 869,210 |
| 8.375%, 09/15/2028 | | 545,000 | | | 564,075 |
Tallgrass Energy Partners LP
5.500%, 09/15/2024 (A) | | 2,500,000 | | | 2,450,000 |
U.S. High Yield Bond Fund (continued)
| | | Shares or
Principal
Amount | | Value |
| CORPORATE BONDS (continued) | | | |
| Energy (continued) | | | | | |
Ultra Resources, Inc.
7.125%, 04/15/2025 (A)(C) | $ | 2,675,000 | | $ | 6,688 |
USA Compression Partners LP
6.875%, 04/01/2026 to 09/01/2027 | | 1,150,000 | | | 1,186,250 |
| Western Midstream Operating LP | | | | | |
| 5.050%, 02/01/2030 | | 650,000 | | | 666,380 |
| 5.300%, 03/01/2048 | | 1,100,000 | | | 982,113 |
| 6.250%, 02/01/2050 | | 50,000 | | | 50,071 |
| | | | | | 43,022,768 |
| Financials – 4.8% | | | | | |
AmWINS Group, Inc.
7.750%, 07/01/2026 (A) | | 1,175,000 | | | 1,266,063 |
| CIT Group, Inc. | | | | | |
| 4.125%, 03/09/2021 | | 40,000 | | | 40,350 |
| 6.125%, 03/09/2028 | | 50,000 | | | 58,938 |
| FirstCash, Inc. | | | | | |
| 4.625%, 09/01/2028 (A) | | 420,000 | | | 431,630 |
| 5.375%, 06/01/2024 (A) | | 1,175,000 | | | 1,206,655 |
Genworth Mortgage Holdings, Inc.
6.500%, 08/15/2025 (A) | | 110,000 | | | 115,689 |
HUB International, Ltd.
7.000%, 05/01/2026 (A) | | 500,000 | | | 518,750 |
| Ladder Capital Finance Holdings LLLP | | | | | |
| 4.250%, 02/01/2027 (A) | | 200,000 | | | 183,500 |
| 5.250%, 03/15/2022 to 10/01/2025 (A) | | 1,500,000 | | | 1,434,000 |
| LPL Holdings, Inc. | | | | | |
| 4.625%, 11/15/2027 (A) | | 250,000 | | | 260,000 |
| 5.750%, 09/15/2025 (A) | | 2,425,000 | | | 2,522,000 |
| OneMain Finance Corp. | | | | | |
| 5.375%, 11/15/2029 | | 625,000 | | | 664,844 |
| 6.125%, 03/15/2024 | | 400,000 | | | 433,708 |
| 6.625%, 01/15/2028 | | 400,000 | | | 456,604 |
| 7.125%, 03/15/2026 | | 600,000 | | | 688,497 |
| 8.250%, 10/01/2023 | | 225,000 | | | 253,125 |
USI, Inc.
6.875%, 05/01/2025 (A) | | 475,000 | | | 486,875 |
| | | | | | 11,021,228 |
| Health care – 10.2% | | | | | |
Bausch Health Americas, Inc.
8.500%, 01/31/2027 (A) | | 300,000 | | | 330,000 |
| Bausch Health Companies, Inc. | | | | | |
| 5.000%, 01/30/2028 (A) | | 250,000 | | | 246,250 |
| 5.250%, 01/30/2030 (A) | | 250,000 | | | 248,498 |
| 5.500%, 03/01/2023 to 11/01/2025 (A) | | 1,032,000 | | | 1,040,745 |
| 5.750%, 08/15/2027 (A) | | 100,000 | | | 107,404 |
| 5.875%, 05/15/2023 (A) | | 138,000 | | | 138,000 |
| 6.125%, 04/15/2025 (A) | | 1,265,000 | | | 1,301,369 |
| 6.250%, 02/15/2029 (A) | | 1,000,000 | | | 1,045,350 |
| 7.000%, 03/15/2024 to 01/15/2028 (A) | | 425,000 | | | 444,162 |
| 7.250%, 05/30/2029 (A) | | 50,000 | | | 54,875 |
Centene Corp.
5.375%, 08/15/2026 (A) | | 100,000 | | | 105,875 |
Change Healthcare Holdings LLC
5.750%, 03/01/2025 (A) | | 2,250,000 | | | 2,295,000 |
Charles River Laboratories
International, Inc. | | | | | |
| 4.250%, 05/01/2028 (A) | | 75,000 | | | 78,938 |
| 5.500%, 04/01/2026 (A) | | 250,000 | | | 263,125 |
| Community Health Systems, Inc. | | | | | |
| 6.250%, 03/31/2023 | | 200,000 | | | 200,500 |
| 6.625%, 02/15/2025 (A) | | 1,500,000 | | | 1,530,000 |
| DaVita, Inc. | | | | | |
| 3.750%, 02/15/2031 (A) | | 325,000 | | | 320,782 |
| 4.625%, 06/01/2030 (A) | | 575,000 | | | 604,469 |
| The accompanying notes are an integral part of the financial statements. | 43 | |
John Hancock Funds II
Portfolio of Investments — August 31, 2020 (showing percentage of total net assets)
U.S. High Yield Bond Fund (continued)
| | | Shares or
Principal
Amount | | Value |
| CORPORATE BONDS (continued) | | | |
| Health care (continued) | | | | | |
| Encompass Health Corp. | | | | | |
| 4.500%, 02/01/2028 | $ | 225,000 | | $ | 230,708 |
| 4.750%, 02/01/2030 | | 250,000 | | | 260,828 |
| 5.125%, 03/15/2023 | | 245,000 | | | 246,838 |
| 5.750%, 11/01/2024 to 09/15/2025 | | 65,000 | | | 66,790 |
| Hill-Rom Holdings, Inc. | | | | | |
| 4.375%, 09/15/2027 (A) | | 650,000 | | | 679,617 |
| 5.000%, 02/15/2025 (A) | | 50,000 | | | 51,633 |
| Hologic, Inc. | | | | | |
| 4.375%, 10/15/2025 (A) | | 1,300,000 | | | 1,326,845 |
| 4.625%, 02/01/2028 (A) | | 150,000 | | | 159,258 |
IQVIA, Inc.
5.000%, 10/15/2026 to 05/15/2027 (A) | | 700,000 | | | 735,245 |
MEDNAX, Inc.
5.250%, 12/01/2023 (A) | | 150,000 | | | 152,625 |
MPH Acquisition Holdings LLC
7.125%, 06/01/2024 (A) | | 2,225,000 | | | 2,259,043 |
Ortho-Clinical Diagnostics, Inc.
7.250%, 02/01/2028 (A) | | 150,000 | | | 155,250 |
| Polaris Intermediate Corp. (8.500% Cash or 9.250% PIK) 8.500%, 12/01/2022 (A)(B) | | 400,000 | | | 406,500 |
Select Medical Corp.
6.250%, 08/15/2026 (A) | | 850,000 | | | 913,130 |
Surgery Center Holdings, Inc.
6.750%, 07/01/2025 (A)(B) | | 325,000 | | | 320,125 |
| Tenet Healthcare Corp. | | | | | |
| 4.625%, 07/15/2024 | | 775,000 | | | 792,825 |
| 4.625%, 06/15/2028 (A) | | 150,000 | | | 155,625 |
| 4.875%, 01/01/2026 (A) | | 400,000 | | | 416,000 |
| 5.125%, 11/01/2027 (A) | | 100,000 | | | 105,500 |
| 7.000%, 08/01/2025 (B) | | 350,000 | | | 361,375 |
| 7.500%, 04/01/2025 (A) | | 175,000 | | | 192,010 |
Teva Pharmaceutical Finance
Netherlands III BV | | | | | |
| 4.100%, 10/01/2046 | | 500,000 | | | 427,500 |
| 6.750%, 03/01/2028 (B) | | 1,600,000 | | | 1,744,000 |
Vizient, Inc.
6.250%, 05/15/2027 (A) | | 1,125,000 | | | 1,195,313 |
| | | | | | 23,709,925 |
| Industrials – 12.7% | | | | | |
ACCO Brands Corp.
5.250%, 12/15/2024 (A) | | 25,000 | | | 25,568 |
Advanced Disposal Services, Inc.
5.625%, 11/15/2024 (A) | | 1,925,000 | | | 1,989,969 |
Air Canada
7.750%, 04/15/2021 (A) | | 550,000 | | | 550,000 |
| Allison Transmission, Inc. | | | | | |
| 4.750%, 10/01/2027 (A) | | 750,000 | | | 783,750 |
| 5.000%, 10/01/2024 (A) | | 2,625,000 | | | 2,651,329 |
| 5.875%, 06/01/2029 (A) | | 350,000 | | | 383,250 |
| Covanta Holding Corp. | | | | | |
| 5.000%, 09/01/2030 | | 80,000 | | | 82,024 |
| 5.875%, 07/01/2025 | | 500,000 | | | 521,670 |
| 6.000%, 01/01/2027 | | 475,000 | | | 497,031 |
Fortress Transportation and Infrastructure
Investors LLC | | | | | |
| 6.500%, 10/01/2025 (A) | | 1,625,000 | | | 1,576,250 |
| 9.750%, 08/01/2027 (A) | | 135,000 | | | 143,946 |
IAA, Inc.
5.500%, 06/15/2027 (A) | | 2,300,000 | | | 2,423,579 |
KAR Auction Services, Inc.
5.125%, 06/01/2025 (A) | | 3,425,000 | | | 3,450,688 |
Pike Corp.
5.500%, 09/01/2028 (A) | | 145,000 | | | 145,725 |
U.S. High Yield Bond Fund (continued)
| | | Shares or
Principal
Amount | | Value |
| CORPORATE BONDS (continued) | | | |
| Industrials (continued) | | | | | |
Prime Security Services Borrower LLC
3.375%, 08/31/2027 (A) | $ | 1,195,000 | | $ | 1,190,710 |
RBS Global, Inc.
4.875%, 12/15/2025 (A) | | 1,825,000 | | | 1,868,344 |
Ritchie Bros Auctioneers, Inc.
5.375%, 01/15/2025 (A) | | 2,525,000 | | | 2,607,063 |
Sensata Technologies BV
5.625%, 11/01/2024 (A) | | 1,600,000 | | | 1,744,000 |
Sensata Technologies UK Financing Company PLC
6.250%, 02/15/2026 (A) | | 250,000 | | | 261,895 |
Sensata Technologies, Inc.
3.750%, 02/15/2031 (A) | | 230,000 | | | 229,425 |
| Signature Aviation US Holdings, Inc. | | | | | |
| 4.000%, 03/01/2028 (A) | | 525,000 | | | 513,287 |
| 5.375%, 05/01/2026 (A) | | 1,375,000 | | | 1,416,250 |
Stevens Holding Company, Inc.
6.125%, 10/01/2026 (A) | | 1,250,000 | | | 1,346,875 |
Tempo Acquisition LLC
5.750%, 06/01/2025 (A) | | 75,000 | | | 78,563 |
TriMas Corp.
4.875%, 10/15/2025 (A) | | 1,325,000 | | | 1,346,531 |
Vertical Holdco GmbH
7.625%, 07/15/2028 (A) | | 250,000 | | | 263,750 |
Vertical US Newco, Inc.
5.250%, 07/15/2027 (A) | | 1,400,000 | | | 1,457,750 |
| | | | | | 29,549,222 |
| Information technology – 5.8% | | | | | |
Black Knight InfoServ LLC
3.625%, 09/01/2028 (A) | | 80,000 | | | 81,026 |
Cardtronics, Inc.
5.500%, 05/01/2025 (A)(B) | | 2,350,000 | | | 2,373,500 |
CDK Global, Inc.
5.250%, 05/15/2029 (A) | | 100,000 | | | 109,092 |
CommScope Technologies LLC
6.000%, 06/15/2025 (A) | | 490,000 | | | 502,353 |
CommScope, Inc.
8.250%, 03/01/2027 (A)(B) | | 450,000 | | | 487,121 |
| Dell International LLC | | | | | |
| 5.875%, 06/15/2021 (A) | | 1,207,000 | | | 1,208,883 |
| 7.125%, 06/15/2024 (A) | | 2,275,000 | | | 2,362,110 |
| Fair Isaac Corp. | | | | | |
| 4.000%, 06/15/2028 (A) | | 100,000 | | | 103,500 |
| 5.250%, 05/15/2026 (A) | | 1,425,000 | | | 1,636,328 |
Gartner, Inc.
5.125%, 04/01/2025 (A) | | 615,000 | | | 639,416 |
| Level 3 Financing, Inc. | | | | | |
| 3.625%, 01/15/2029 (A) | | 830,000 | | | 832,158 |
| 4.250%, 07/01/2028 (A) | | 425,000 | | | 437,431 |
Logan Merger Sub, Inc.
5.500%, 09/01/2027 (A) | | 150,000 | | | 154,313 |
| NCR Corp. | | | | | |
| 5.000%, 07/15/2022 | | 510,000 | | | 509,118 |
| 5.000%, 10/01/2028 (A) | | 80,000 | | | 80,600 |
| 5.250%, 10/01/2030 (A) | | 610,000 | | | 617,936 |
| 5.750%, 09/01/2027 (A) | | 50,000 | | | 52,500 |
| 8.125%, 04/15/2025 (A) | | 150,000 | | | 167,807 |
NortonLifeLock, Inc.
5.000%, 04/15/2025 (A) | | 125,000 | | | 127,500 |
ON Semiconductor Corp.
3.875%, 09/01/2028 (A) | | 25,000 | | | 26,087 |
Qorvo, Inc.
4.375%, 10/15/2029 | | 200,000 | | | 214,500 |
| The accompanying notes are an integral part of the financial statements. | 44 | |
John Hancock Funds II
Portfolio of Investments — August 31, 2020 (showing percentage of total net assets)
U.S. High Yield Bond Fund (continued)
| | | Shares or
Principal
Amount | | Value |
| CORPORATE BONDS (continued) | | | |
| Information technology (continued) | | | | | |
SS&C Technologies, Inc.
5.500%, 09/30/2027 (A) | $ | 700,000 | | $ | 749,770 |
| | | | | | 13,473,049 |
| Materials – 4.9% | | | | | |
| Ardagh Packaging Finance PLC | | | | | |
| 4.125%, 08/15/2026 (A) | | 600,000 | | | 625,920 |
| 5.250%, 04/30/2025 (A) | | 125,000 | | | 132,644 |
| Ball Corp. | | | | | |
| 4.875%, 03/15/2026 | | 250,000 | | | 280,000 |
| 5.000%, 03/15/2022 | | 175,000 | | | 185,754 |
| 5.250%, 07/01/2025 | | 75,000 | | | 84,995 |
| Berry Global, Inc. | | | | | |
| 4.875%, 07/15/2026 (A) | | 350,000 | | | 371,875 |
| 5.125%, 07/15/2023 | | 214,000 | | | 216,675 |
| 5.625%, 07/15/2027 (A) | | 100,000 | | | 105,750 |
| 6.000%, 10/15/2022 | | 320,000 | | | 320,400 |
| Clearwater Paper Corp. | | | | | |
| 4.750%, 08/15/2028 (A) | | 70,000 | | | 70,700 |
| 5.375%, 02/01/2025 (A)(B) | | 300,000 | | | 315,132 |
| Crown Americas LLC | | | | | |
| 4.250%, 09/30/2026 | | 775,000 | | | 823,918 |
| 4.750%, 02/01/2026 | | 800,000 | | | 833,960 |
| Flex Acquisition Company, Inc. | | | | | |
| 6.875%, 01/15/2025 (A) | | 800,000 | | | 815,440 |
| 7.875%, 07/15/2026 (A) | | 350,000 | | | 367,217 |
| Kaiser Aluminum Corp. | | | | | |
| 4.625%, 03/01/2028 (A) | | 275,000 | | | 272,008 |
| 6.500%, 05/01/2025 (A) | | 175,000 | | | 184,960 |
Novelis Corp.
5.875%, 09/30/2026 (A) | | 250,000 | | | 261,200 |
OI European Group BV
4.000%, 03/15/2023 (A) | | 350,000 | | | 353,574 |
Owens-Brockway Glass Container, Inc.
5.875%, 08/15/2023 (A) | | 600,000 | | | 638,250 |
Plastipak Holdings, Inc.
6.250%, 10/15/2025 (A)(B) | | 550,000 | | | 557,535 |
QVC, Inc.
4.750%, 02/15/2027 | | 600,000 | | | 638,442 |
Reynolds Group Issuer, Inc.
5.125%, 07/15/2023 (A) | | 450,000 | | | 456,615 |
Sealed Air Corp.
5.125%, 12/01/2024 (A) | | 1,165,000 | | | 1,281,500 |
| Silgan Holdings, Inc. | | | | | |
| 4.125%, 02/01/2028 | | 650,000 | | | 673,563 |
| 4.750%, 03/15/2025 | | 100,000 | | | 102,000 |
| Valvoline, Inc. | | | | | |
| 4.250%, 02/15/2030 (A) | | 325,000 | | | 344,906 |
| 4.375%, 08/15/2025 | | 125,000 | | | 129,713 |
| | | | | | 11,444,646 |
| Real estate – 4.3% | | | | | |
| CoreCivic, Inc. | | | | | |
| 4.625%, 05/01/2023 | | 300,000 | | | 285,000 |
| 5.000%, 10/15/2022 | | 800,000 | | | 788,000 |
GLP Capital LP
5.375%, 11/01/2023 | | 625,000 | | | 669,656 |
| MPT Operating Partnership LP | | | | | |
| 4.625%, 08/01/2029 | | 275,000 | | | 293,552 |
| 5.000%, 10/15/2027 | | 725,000 | | | 766,688 |
| 5.250%, 08/01/2026 | | 800,000 | | | 840,000 |
| 5.500%, 05/01/2024 | | 715,000 | | | 725,725 |
| 6.375%, 03/01/2024 | | 60,000 | | | 61,950 |
| SBA Communications Corp. | | | | | |
| 3.875%, 02/15/2027 (A) | | 300,000 | | | 311,385 |
| 4.000%, 10/01/2022 | | 525,000 | | | 528,528 |
U.S. High Yield Bond Fund (continued)
| | | Shares or
Principal
Amount | | Value |
| CORPORATE BONDS (continued) | | | |
| Real estate (continued) | | | | | |
| Service Properties Trust | | | | | |
| 3.950%, 01/15/2028 | $ | 420,000 | | $ | 361,326 |
| 4.375%, 02/15/2030 | | 500,000 | | | 432,500 |
| 4.750%, 10/01/2026 | | 225,000 | | | 207,000 |
| 4.950%, 02/15/2027 | | 925,000 | | | 848,688 |
| 5.250%, 02/15/2026 | | 375,000 | | | 354,375 |
| 7.500%, 09/15/2025 | | 85,000 | | | 92,449 |
| The GEO Group, Inc. | | | | | |
| 5.125%, 04/01/2023 | | 210,000 | | | 173,250 |
| 5.875%, 01/15/2022 to 10/15/2024 | | 1,665,000 | | | 1,511,400 |
| 6.000%, 04/15/2026 | | 975,000 | | | 747,674 |
| | | | | | 9,999,146 |
| Utilities – 4.0% | | | | | |
| NextEra Energy Operating Partners LP | | | | | |
| 4.250%, 07/15/2024 to 09/15/2024 (A) | | 825,000 | | | 880,205 |
| 4.500%, 09/15/2027 (A) | | 725,000 | | | 792,063 |
NSG Holdings LLC
7.750%, 12/15/2025 (A) | | 2,196,881 | | | 2,317,710 |
| Pacific Gas & Electric Company | | | | | |
| 2.500%, 02/01/2031 | | 300,000 | | | 291,503 |
| 3.500%, 08/01/2050 | | 300,000 | | | 279,986 |
| PG&E Corp. | | | | | |
| 5.000%, 07/01/2028 | | 150,000 | | | 149,625 |
| 5.250%, 07/01/2030 | | 150,000 | | | 149,616 |
| TerraForm Power Operating LLC | | | | | |
| 4.250%, 01/31/2023 (A) | | 2,250,000 | | | 2,329,200 |
| 4.750%, 01/15/2030 (A) | | 400,000 | | | 428,000 |
| 5.000%, 01/31/2028 (A) | | 1,525,000 | | | 1,694,481 |
| | | | | | 9,312,389 |
| TOTAL CORPORATE BONDS (Cost $216,654,233) | | | $ | 220,210,610 |
| CONVERTIBLE BONDS – 0.4% | | | |
| Communication services – 0.2% | | | | | |
DISH Network Corp.
3.375%, 08/15/2026 | | 575,000 | | | 567,108 |
| Energy – 0.2% | | | | | |
Denbury Resources, Inc.
6.375%, 12/31/2024 (A)(C) | | 531,000 | | | 82,305 |
Whiting Petroleum Corp.
1.250%, 04/01/2020 (C) | | 1,345,000 | | | 309,350 |
| | | | | | 391,655 |
| TOTAL CONVERTIBLE BONDS (Cost $2,297,615) | | | $ | 958,763 |
| TERM LOANS (D) – 2.9% | | | |
| Communication services – 1.2% | | | | | |
| Ancestry.com Operations, Inc., 2019 Extended Term Loan B (1 month LIBOR + 4.250%) 4.410%, 08/27/2026 | | 2,364,167 | | | 2,359,439 |
| Montreign Operating Company LLC, Bridge Term Loan (1 month LIBOR + 2.250%) 2.406%, 03/22/2021 | | 420,089 | | | 401,710 |
| | | | | | 2,761,149 |
| Consumer discretionary – 0.1% | | | | | |
| CCM Merger, Inc., New Term Loan B (1 month LIBOR + 2.250%) 3.000%, 08/08/2021 | | 280,065 | | | 276,004 |
| Energy – 0.2% | | | | | |
| EPIC Crude Services LP, Term Loan B (3 month LIBOR + 5.000%) 5.260%, 03/02/2026 | | 600,000 | | | 474,000 |
| The accompanying notes are an integral part of the financial statements. | 45 | |
John Hancock Funds II
Portfolio of Investments — August 31, 2020 (showing percentage of total net assets)
U.S. High Yield Bond Fund (continued)
| | | Shares or
Principal
Amount | | Value |
| TERM LOANS (D) (continued) | | | |
| Financials – 1.4% | | | | | |
| Emerald TopCo, Inc., Term Loan (1 and 3 month LIBOR + 3.500%) 3.760%, 07/24/2026 | $ | 669,938 | | $ | 650,677 |
| HUB International, Ltd., 2019 Incremental Term Loan B (3 month LIBOR + 4.000%) 5.000%, 04/25/2025 | | 447,750 | | | 447,253 |
| Nexus Buyer LLC, Term Loan B (1 month LIBOR + 3.750%) 3.912%, 11/09/2026 | | 472,625 | | | 469,553 |
| USI, Inc., 2019 Incremental Term Loan B (3 month LIBOR + 4.000%) 4.308%, 12/02/2026 | | 149,250 | | | 146,793 |
| VFH Parent LLC, 2019 Term Loan B (1 month LIBOR + 3.000%) 3.164%, 03/01/2026 | | 232,189 | | | 229,214 |
| Victory Capital Holdings, Inc., 2020 Term Loan B1 (3 month LIBOR + 2.500%) 2.799%, 07/01/2026 | | 1,281,298 | | | 1,260,477 |
| | | | | | 3,203,967 |
| Materials – 0.0% | | | | | |
| Clearwater Paper Corp., Term Loan B (3 month LIBOR + 3.250%) 4.250%, 07/26/2026 | | 109,625 | | | 109,351 |
| TOTAL TERM LOANS (Cost $6,959,692) | | | $ | 6,824,471 |
| RIGHTS – 0.1% | | | | | |
| Texas Competitive Electric Holdings Company LLC (E)(F) | | 215,025 | | | 225,776 |
| TOTAL RIGHTS (Cost $1,079,996) | | $ | 225,776 |
| ESCROW CERTIFICATES – 0.0% | | | | | |
Texas Competitive Electric Holdings Company LLC
11.500%, 10/01/2020 (E)(G) | $ | 13,200,000 | | | 19,800 |
| TOTAL ESCROW CERTIFICATES (Cost $6,477) | | $ | 19,800 |
| SHORT-TERM INVESTMENTS – 4.3% | | | |
| Short-term funds – 4.3% | | | | | |
| John Hancock Collateral Trust, 0.2611% (H)(I) | | 943,564 | | | 9,445,733 |
| State Street Institutional U.S. Government Money Market Fund, Premier Class, 0.0399% (H) | | 547,388 | | | 547,388 |
| TOTAL SHORT-TERM INVESTMENTS (Cost $9,985,128) | | $ | 9,993,121 |
Total Investments (U.S. High Yield Bond Fund)
(Cost $236,983,141) – 102.4% | | $ | 238,232,541 |
| Other assets and liabilities, net – (2.4%) | | | | (5,649,831) |
| TOTAL NET ASSETS – 100.0% | | | | $ | 232,582,710 |
| Security Abbreviations and Legend |
| LIBOR | London Interbank Offered Rate |
| PIK | Pay-in-Kind Security - Represents a payment-in-kind which may pay interest in additional par and/or cash. Rates shown are the current rate and most recent payment rate. |
| (A) | These securities are exempt from registration under Rule 144A of the Securities Act of 1933. Such securities may be resold, normally to qualified institutional buyers, in transactions exempt from registration. Rule 144A securities amounted to $147,617,876 or 63.5% of the fund's net assets as of 8-31-20. |
| (B) | All or a portion of this security is on loan as of 8-31-20. |
| (C) | Non-income producing - Issuer is in default. |
| (D) | Term loans are variable rate obligations. The coupon rate shown represents the rate at period end. |
U.S. High Yield Bond Fund (continued)
| (E) | Non-income producing security. |
| (F) | Strike price and/or expiration date not available. |
| (G) | Security is valued using significant unobservable inputs and is classified as Level 3 in the fair value hierarchy. Refer to Note 2 to the financial statements. |
| (H) | The rate shown is the annualized seven-day yield as of 8-31-20. |
| (I) | Investment is an affiliate of the fund, the advisor and/or subadvisor. This security represents the investment of cash collateral received for securities lending. |
| The accompanying notes are an integral part of the financial statements. | 46 | |
John Hancock Funds II
Portfolio of Investments — August 31, 2020 (showing percentage of total net assets)
The following fund had the following country composition as a percentage of net assets on 8-31-20:
High Yield Fund
| United States | 78.4% |
| Cayman Islands | 5.0% |
| Canada | 4.1% |
| United Kingdom | 3.5% |
| France | 1.9% |
| Italy | 1.2% |
| Other countries | 5.9% |
| TOTAL | 100.0% |
The accompanying notes are an integral part of the financial statements.
John Hancock Funds II
Statements of assets and liabilities — August 31, 2020
| Assets | Asia Pacific Total Return Bond Fund | Core Bond Fund | High Yield Fund | Opportunistic Fixed Income Fund |
| Unaffiliated investments, at value (including securities loaned) | $173,480,054 | $3,093,883,956 | $200,308,742 | $42,791,122 |
| Affiliated investments, at value | — | — | 272,666 | — |
| Total investments, at value | 173,480,054 | 3,093,883,956 | 200,581,408 | 42,791,122 |
| Swap contracts, at value | — | — | — | 376,882 |
| Receivable for centrally cleared swaps | — | — | 497,492 | — |
| Unrealized appreciation on forward foreign currency contracts | — | — | 78,960 | 96,528 |
| Receivable for futures variation margin | — | — | 80,482 | 6,920 |
| Cash | 54,200 | 23,729 | — | — |
| Foreign currency, at value | 497,671 | — | 321,308 | 24,432 |
| Collateral held at broker for futures contracts | 550,000 | — | 116,138 | — |
| Cash collateral at broker for sale commitments | — | 964,000 | — | — |
| Collateral segregated at custodian for OTC derivative contracts | — | — | 170,000 | — |
| Dividends and interest receivable | 2,265,180 | 11,832,535 | 2,807,648 | 241,808 |
| Receivable for fund shares sold | — | 3,390,552 | — | 49,566 |
| Receivable for investments sold | 1,624,000 | 7,305,558 | 256,637 | 60,431 |
| Receivable for delayed delivery securities sold | — | 665,229,236 | — | 646,848 |
| Receivable for securities lending income | — | — | 573 | — |
| Receivable from affiliates | — | — | — | 5,565 |
| Other assets | 7,836 | 31,622 | 6,750 | 9,909 |
| Total assets | 178,478,941 | 3,782,661,188 | 204,917,396 | 44,310,011 |
| Liabilities | | | | |
| Unrealized depreciation on forward foreign currency contracts | — | — | 201,349 | 203,775 |
| Swap contracts, at value | — | — | — | 268,770 |
| Payable for centrally cleared swaps | — | — | — | 8,622 |
| Payable for futures variation margin | 65,450 | — | — | — |
| Due to custodian | — | — | 161,116 | — |
| Payable for collateral on OTC derivatives | — | — | — | 150,000 |
| Payable for collateral on sale commitments | — | 3,110,000 | — | — |
| Payable for investments purchased | — | 63,955,867 | 1,206,288 | 306,752 |
| Payable for delayed delivery securities purchased | — | 1,001,012,309 | 470,000 | 2,078,039 |
| Payable for fund shares repurchased | 9 | 622,563 | 165,123 | — |
| Payable upon return of securities loaned | — | — | 272,697 | — |
| Payable to affiliates | | | | |
| Accounting and legal services fees | 11,482 | 161,524 | 12,131 | 2,423 |
| Trustees' fees | 96 | 1,480 | 111 | 22 |
| Other liabilities and accrued expenses | 98,864 | 186,953 | 94,427 | 131,970 |
| Total liabilities | 175,901 | 1,069,050,696 | 2,583,242 | 3,150,373 |
| Net assets | $178,303,040 | $2,713,610,492 | $202,334,154 | $41,159,638 |
| Net assets consist of | | | | |
| Paid-in capital | $186,678,033 | $2,507,337,353 | $311,763,230 | $45,179,239 |
| Total distributable earnings (loss) | (8,374,993) | 206,273,139 | (109,429,076) | (4,019,601) |
| Net assets | $178,303,040 | $2,713,610,492 | $202,334,154 | $41,159,638 |
| Unaffiliated investments, including repurchase agreements, at cost | $172,286,750 | $3,004,899,142 | $224,416,861 | $42,323,481 |
| Affiliated investments, at cost | — | — | $272,661 | — |
| Foreign currency, at cost | $477,205 | — | $310,205 | $25,700 |
| Net unamortized upfront payment on OTC swaps | — | — | — | $(168,850) |
| Securities loaned, at value | — | — | $266,369 | — |
| Net asset value per share | | | | |
| The funds have an unlimited number of shares authorized with no par value. Net asset value is calculated by dividing the net assets of each class of shares by the number of outstanding shares in the class. |
| Class 1 | | | | |
| Net assets | — | $207,002,140 | $202,334,154 | $41,159,638 |
| Shares outstanding | — | 14,823,298 | 25,734,544 | 2,944,195 |
| Net asset value, offering price and redemption price per share | — | $13.96 | $7.86 | $13.98 |
| Class NAV | | | | |
| Net assets | $178,303,040 | $2,506,608,352 | — | — |
| Shares outstanding | 17,744,698 | 179,780,994 | — | — |
| Net asset value, offering price and redemption price per share | $10.05 | $13.94 | — | — |
The accompanying notes are an integral part of the financial statements.
John Hancock Funds II
Statements of assets and liabilities — August 31, 2020
| Assets | U.S. High Yield Bond Fund |
| Unaffiliated investments, at value (including securities loaned) | $228,786,808 |
| Affiliated investments, at value | 9,445,733 |
| Total investments, at value | 238,232,541 |
| Dividends and interest receivable | 3,712,100 |
| Receivable for fund shares sold | 89,335 |
| Receivable for investments sold | 864,534 |
| Receivable for securities lending income | 8,436 |
| Other assets | 5,070 |
| Total assets | 242,912,016 |
| Liabilities | |
| Payable for investments purchased | 798,498 |
| Payable upon return of securities loaned | 9,444,760 |
| Payable to affiliates | |
| Accounting and legal services fees | 13,779 |
| Trustees' fees | 125 |
| Other liabilities and accrued expenses | 72,144 |
| Total liabilities | 10,329,306 |
| Net assets | $232,582,710 |
| Net assets consist of | |
| Paid-in capital | $251,583,872 |
| Total distributable earnings (loss) | (19,001,162) |
| Net assets | $232,582,710 |
| Unaffiliated investments, including repurchase agreements, at cost | $227,545,401 |
| Affiliated investments, at cost | $9,437,740 |
| Securities loaned, at value | $9,241,230 |
| Net asset value per share | |
| The funds have an unlimited number of shares authorized with no par value. Net asset value is calculated by dividing the net assets of each class of shares by the number of outstanding shares in the class. |
| Class 1 | |
| Net assets | $61,509,176 |
| Shares outstanding | 5,553,632 |
| Net asset value, offering price and redemption price per share | $11.08 |
| Class NAV | |
| Net assets | $171,073,534 |
| Shares outstanding | 15,463,443 |
| Net asset value, offering price and redemption price per share | $11.06 |
The accompanying notes are an integral part of the financial statements.
John Hancock Funds II
Statements of operations — For the year ended August 31, 2020
| Investment income | Asia Pacific Total Return Bond Fund | Core Bond Fund | High Yield Fund | Opportunistic Fixed Income Fund |
| Interest | $12,018,019 | $66,757,960 | $13,790,528 | $1,090,167 |
| Dividends | — | — | 187,213 | 67,411 |
| Securities lending | — | 4,540 | 18,986 | — |
| Less foreign taxes withheld | (419,613) | — | (328) | (24,179) |
| Total investment income | 11,598,406 | 66,762,500 | 13,996,399 | 1,133,399 |
| Expenses | | | | |
| Investment management fees | 1,798,388 | 15,758,519 | 1,536,790 | 279,596 |
| Distribution and service fees | — | 92,994 | 109,771 | 20,703 |
| Interest expense | — | — | — | 37,578 |
| Accounting and legal services fees | 42,477 | 495,170 | 36,423 | 5,023 |
| Trustees' fees | 4,794 | 48,108 | 3,765 | 584 |
| Custodian fees | 127,922 | 336,589 | 47,235 | 103,303 |
| Printing and postage | 12,930 | 12,485 | 12,485 | 15,561 |
| Professional fees | 83,423 | 129,207 | 86,360 | 212,012 |
| Other | 19,981 | 94,588 | 27,105 | 11,014 |
| Total expenses | 2,089,915 | 16,967,660 | 1,859,934 | 685,374 |
| Less expense reductions | (17,779) | (196,927) | (15,646) | (285,935) |
| Net expenses | 2,072,136 | 16,770,733 | 1,844,288 | 399,439 |
| Net investment income | 9,526,270 | 49,991,767 | 12,152,111 | 733,960 |
| Realized and unrealized gain (loss) | | | | |
| Net realized gain (loss) on | | | | |
| Unaffiliated investments and foreign currency transactions | (895,997) | 141,019,515 | (4,887,818) | 3,193,833 |
| Affiliated investments | — | (857) | (5,363) | — |
| Securities sold short | — | — | — | (14,950) |
| Futures contracts | (1,222,128) | — | 230,607 | 117,959 |
| Forward foreign currency contracts | — | — | 32,622 | (267,344) |
| Written options | — | — | (1,146,848) | 113,156 |
| Swap contracts | — | — | 219,660 | (147,113) |
| | (2,118,125) | 141,018,658 | (5,557,140) | 2,995,541 |
| Change in net unrealized appreciation (depreciation) of | | | | |
| Unaffiliated investments and translation of assets and liabilities in foreign currencies | 4,601,671 | (13,324,591) | (162,805) | (605,506) |
| Affiliated investments | — | (30) | 53 | — |
| Securities sold short | — | — | — | (1,163) |
| Futures contracts | (83,637) | — | 4,637 | (89,876) |
| Forward foreign currency contracts | — | — | (131,534) | 87,486 |
| Written options | — | — | — | (22,273) |
| Swap contracts | — | — | 88,278 | 332,670 |
| | 4,518,034 | (13,324,621) | (201,371) | (298,662) |
| Net realized and unrealized gain (loss) | 2,399,909 | 127,694,037 | (5,758,511) | 2,696,879 |
| Increase in net assets from operations | $11,926,179 | $177,685,804 | $6,393,600 | $3,430,839 |
The accompanying notes are an integral part of the financial statements.
John Hancock Funds II
Statements of operations — For the year ended August 31, 2020
| Investment income | U.S. High Yield Bond Fund |
| Interest | $13,749,908 |
| Securities lending | 114,659 |
| Total investment income | 13,864,567 |
| Expenses | |
| Investment management fees | 1,760,562 |
| Distribution and service fees | 33,311 |
| Accounting and legal services fees | 40,651 |
| Trustees' fees | 4,115 |
| Custodian fees | 47,742 |
| Printing and postage | 12,485 |
| Professional fees | (37,637) 1 |
| Other | 20,479 |
| Total expenses | 1,881,708 |
| Less expense reductions | (16,792) |
| Net expenses | 1,864,916 |
| Net investment income | 11,999,651 |
| Realized and unrealized gain (loss) | |
| Net realized gain (loss) on | |
| Unaffiliated investments and foreign currency transactions | (1,593,002) |
| Affiliated investments | (7,211) |
| | (1,600,213) |
| Change in net unrealized appreciation (depreciation) of | |
| Unaffiliated investments and translation of assets and liabilities in foreign currencies | (1,030,127) |
| Affiliated investments | 6,000 |
| | (1,024,127) |
| Net realized and unrealized gain (loss) | (2,624,340) |
| Increase in net assets from operations | $9,375,311 |
| | |
| 1 | During the year ended August 31, 2020, U.S High Yield Bond Fund received a reimbursement of legal fees. See Note 15 to the Financial statements. As a result of this reimbursement, the portfolio reflects negative professional fees in the current reporting period. Professional fees incurred by the fund for the year ended August 31, 2020 prior to these reimbursements were $69,792. |
The accompanying notes are an integral part of the financial statements.
John Hancock Funds II
Statements of changes in net assets
| | Asia Pacific Total Return Bond Fund | Core Bond Fund | High Yield Fund |
| Increase (decrease) in net assets | Year ended
8-31-20 | Year ended
8-31-19 | Year ended
8-31-20 | Year ended
8-31-19 | Year ended
8-31-20 | Year ended
8-31-19 |
| From operations | | | | | | |
| Net investment income | $9,526,270 | $12,615,853 | $49,991,767 | $58,157,740 | $12,152,111 | $18,833,797 |
| Net realized gain (loss) | (2,118,125) | (5,799,107) | 141,018,658 | 56,391,733 | (5,557,140) | (3,955,082) |
| Change in net unrealized appreciation (depreciation) | 4,518,034 | 14,826,404 | (13,324,621) | 119,059,741 | (201,371) | (2,204,231) |
| Increase in net assets resulting from operations | 11,926,179 | 21,643,150 | 177,685,804 | 233,609,214 | 6,393,600 | 12,674,484 |
| Distributions to shareholders | | | | | | |
| From earnings | | | | | | |
| Class 1 | — | — | (5,663,456) | (4,342,494) | (13,263,417) | (15,929,257) |
| Class NAV | (11,534,899) | (9,927,876) | (84,643,885) | (52,735,636) | — | (4,816,452) 1 |
| Total distributions | (11,534,899) | (9,927,876) | (90,307,341) | (57,078,130) | (13,263,417) | (20,745,709) |
| From fund share transactions | | | | | | |
| From fund share transactions | (123,796,208) | (61,348,396) | (241,509,188) | 981,800,705 | (41,216,177) | (159,645,877) |
| Total increase (decrease) | (123,404,928) | (49,633,122) | (154,130,725) | 1,158,331,789 | (48,085,994) | (167,717,102) |
| Net assets | | | | | | |
| Beginning of year | 301,707,968 | 351,341,090 | 2,867,741,217 | 1,709,409,428 | 250,420,148 | 418,137,250 |
| End of year | $178,303,040 | $301,707,968 | $2,713,610,492 | $2,867,741,217 | $202,334,154 | $250,420,148 |
| | |
| 1 | Class NAV shares were fully redeemed on 3-28-19. |
| | Opportunistic Fixed Income Fund | U.S. High Yield Bond Fund |
| Increase (decrease) in net assets | Year ended
8-31-20 | Year ended
8-31-19 | Year ended
8-31-20 | Year ended
8-31-19 |
| From operations | | | | |
| Net investment income | $733,960 | $3,243,762 | $11,999,651 | $13,484,264 |
| Net realized gain (loss) | 2,995,541 | (140,160) | (1,600,213) | (2,068,507) |
| Change in net unrealized appreciation (depreciation) | (298,662) | 1,017,544 | (1,024,127) | 2,038,468 |
| Increase in net assets resulting from operations | 3,430,839 | 4,121,146 | 9,375,311 | 13,454,225 |
| Distributions to shareholders | | | | |
| From earnings | | | | |
| Class 1 | (1,410,083) | (648,896) | (3,705,811) | (4,094,406) |
| Class NAV | — | (2,845,170) 2 | (9,390,983) | (10,019,828) |
| Total distributions | (1,410,083) | (3,494,066) | (13,096,794) | (14,114,234) |
| From fund share transactions | | | | |
| From fund share transactions | (8,155,522) | (230,201,605) | (11,103,932) | (23,515,780) |
| Total increase (decrease) | (6,134,766) | (229,574,525) | (14,825,415) | (24,175,789) |
| Net assets | | | | |
| Beginning of year | 47,294,404 | 276,868,929 | 247,408,125 | 271,583,914 |
| End of year | $41,159,638 | $47,294,404 | $232,582,710 | $247,408,125 |
| | |
| 2 | Class NAV shares were fully redeemed on 4-17-19. |
The accompanying notes are an integral part of the financial statements.
John Hancock Funds II
Financial highlights
| Per share operating performance for a share outstanding throughout each period | | Ratios and supplemental data | |
| | | | Income (loss) from investment operations | | | Less distributions | | | | Ratios to average net assets | | |
| Period ended | Net asset
value,
beginning
of period ($) | | Net
investment
income
(loss) ($)1 | Net realized and
unrealized
gain (loss)
on investments ($) | Total from
investment
operations ($) | From net
investment
income ($) | From net
realized
gain ($) | Total
distributions ($) | Net asset
value,
end of
period ($) | Total
return
(%)2 | Expenses
before
reductions
(%) | Expenses
including
reductions
(%) | Net
investment
income
(loss) (%) | Net
assets,
end of
period
(in millions) | Portfolio
turnover
(%) |
| Asia Pacific Total Return Bond Fund | |
| Class NAV | |
| 08-31-2020 | 9.86 | | 0.37 | 0.20 | 0.57 | (0.38) | — | (0.38) | 10.05 | 5.94 | 0.84 | 0.83 | 3.83 | 178 | 48 |
| 08-31-2019 | 9.49 | | 0.38 | 0.29 | 0.67 | (0.30) | — | (0.30) | 9.86 | 7.31 | 0.83 | 0.82 | 3.97 | 302 | 60 |
| 08-31-2018 | 9.80 | | 0.34 | (0.44) | (0.10) | (0.21) | — | (0.21) | 9.49 | (1.05) | 0.80 | 0.79 | 3.48 | 351 | 70 |
| 08-31-2017 | 9.64 | | 0.32 | (0.01) | 0.31 | (0.15) | — | (0.15) | 9.80 | 3.30 | 0.80 | 0.79 | 3.32 | 382 | 53 |
| 08-31-2016 | 8.94 | | 0.32 | 0.64 | 0.96 | (0.26) | — | (0.26) | 9.64 | 10.96 | 0.81 | 0.80 | 3.44 | 412 | 54 |
| 1. Based on average daily shares outstanding. 2. Total returns would have been lower had certain expenses not been reduced during the applicable periods. | |
| Core Bond Fund | |
| Class 1 | |
| 08-31-2020 | 13.50 | | 0.23 | 0.66 | 0.89 | (0.31) | (0.12) | (0.43) | 13.96 | 6.76 | 0.66 | 0.65 | 1.73 | 207 | 347 |
| 08-31-2019 | 12.66 | | 0.33 | 0.86 | 1.19 | (0.35) | — | (0.35) | 13.50 | 9.59 | 0.66 | 0.65 | 2.60 | 175 | 447 |
| 08-31-2018 | 13.15 | | 0.27 | (0.48) | (0.21) | (0.28) | — | (0.28) | 12.66 | (1.58) | 0.67 | 0.66 | 2.08 | 161 | 277 |
| 08-31-2017 | 13.49 | | 0.22 | (0.17) | 0.05 | (0.24) | (0.15) | (0.39) | 13.15 | 0.46 | 0.67 | 0.66 | 1.70 | 190 | 363 |
| 08-31-2016 | 13.01 | | 0.21 | 0.51 | 0.72 | (0.24) | — | (0.24) | 13.49 | 5.59 | 0.67 | 0.66 | 1.59 | 220 | 471 |
| Class NAV | |
| 08-31-2020 | 13.47 | | 0.24 | 0.66 | 0.90 | (0.31) | (0.12) | (0.43) | 13.94 | 6.90 | 0.61 | 0.60 | 1.81 | 2,507 | 347 |
| 08-31-2019 | 12.64 | | 0.34 | 0.84 | 1.18 | (0.35) | — | (0.35) | 13.47 | 9.58 | 0.61 | 0.60 | 2.63 | 2,693 | 447 |
| 08-31-2018 | 13.13 | | 0.27 | (0.47) | (0.20) | (0.29) | — | (0.29) | 12.64 | (1.54) | 0.62 | 0.61 | 2.14 | 1,548 | 277 |
| 08-31-2017 | 13.47 | | 0.23 | (0.17) | 0.06 | (0.25) | (0.15) | (0.40) | 13.13 | 0.51 | 0.62 | 0.61 | 1.77 | 1,615 | 363 |
| 08-31-2016 | 12.99 | | 0.22 | 0.50 | 0.72 | (0.24) | — | (0.24) | 13.47 | 5.65 | 0.62 | 0.61 | 1.64 | 1,226 | 471 |
| 1. Based on average daily shares outstanding. 2. Total returns would have been lower had certain expenses not been reduced during the applicable periods. | |
| High Yield Fund | |
| Class 1 | |
| 08-31-2020 | 8.04 | | 0.43 | (0.14) | 0.29 | (0.47) | — | (0.47) | 7.86 | 4.01 | 0.85 | 0.84 | 5.54 | 202 | 81 |
| 08-31-2019 | 8.17 | | 0.46 | (0.10) | 0.36 | (0.49) | — | (0.49) | 8.04 | 4.32 | 0.82 | 0.81 | 5.77 | 250 | 51 |
| 08-31-2018 | 8.30 | | 0.47 | (0.12) | 0.35 | (0.48) | — | (0.48) | 8.17 | 4.81 | 0.79 | 0.79 | 5.69 | 282 | 60 |
| 08-31-2017 | 8.17 | | 0.49 | 0.17 | 0.66 | (0.53) | — | (0.53) | 8.30 | 8.31 | 0.79 | 0.78 | 5.89 | 339 | 56 |
| 08-31-2016 | 8.33 | | 0.55 | (0.14) | 0.41 | (0.57) | — | (0.57) | 8.17 | 5.60 | 0.79 | 0.78 | 7.10 | 343 | 58 |
| 1. Based on average daily shares outstanding. 2. Total returns would have been lower had certain expenses not been reduced during the applicable periods. | |
| Opportunistic Fixed Income Fund | |
| Class 1 | |
| 08-31-2020 | 13.27 | | 0.23 | 0.94 | 1.17 | (0.46) | — | (0.46) | 13.98 | 9.15 | 1.66 3 | 0.96 3 | 1.77 | 41 | 224 4 |
| 08-31-2019 | 12.72 | | 0.24 | 0.48 | 0.72 | (0.17) | — | (0.17) | 13.27 | 5.75 | 1.20 3 | 1.16 3 | 2.05 | 47 | 53 |
| 08-31-2018 | 12.84 | | 0.26 | (0.38) | (0.12) | — | — | — | 12.72 | (0.93) | 0.86 | 0.85 | 2.04 | 51 | 31 |
| 08-31-2017 | 13.09 | | 0.18 | (0.08) | 0.10 | (0.31) | (0.04) | (0.35) | 12.84 | 1.05 | 0.83 | 0.82 | 1.48 | 59 | 56 |
| 08-31-2016 | 11.87 | | 0.19 | 1.03 | 1.22 | — 5 | — | — 5 | 13.09 | 10.30 | 0.82 | 0.81 | 1.55 | 66 | 71 |
| 1. Based on average daily shares outstanding. 2. Total returns would have been lower had certain expenses not been reduced during the applicable periods. 3. Includes interest expense of 0.09% and 0.26% for the year ended August 31, 2020 and the year ended August 31, 2019, respectively. 4. Increase in portfolio turnover rate resulted from repositioning of the portfolio during the period in accordance with investment policy changes approved by the Board of Trustees. 5. Less than $0.005 per share. | |
| U.S. High Yield Bond Fund | |
| Class 1 | |
| 08-31-2020 | 11.20 | | 0.55 | (0.07) | 0.48 | (0.60) | — | (0.60) | 11.08 | 4.67 | 0.83 3 | 0.83 3 | 5.05 | 62 | 82 |
| 08-31-2019 | 11.21 | | 0.58 | 0.02 | 0.60 | (0.61) | — | (0.61) | 11.20 | 5.58 | 0.87 | 0.86 | 5.25 | 73 | 41 |
| 08-31-2018 | 11.41 | | 0.58 | (0.19) | 0.39 | (0.59) | — | (0.59) | 11.21 | 3.52 | 0.86 | 0.86 | 5.14 | 75 | 51 |
| 08-31-2017 | 11.15 | | 0.61 | 0.31 | 0.92 | (0.66) | — | (0.66) | 11.41 | 8.53 | 0.88 | 0.87 | 5.42 | 84 | 68 |
| 08-31-2016 | 11.20 | | 0.64 | 0.02 | 0.66 | (0.71) | — | (0.71) | 11.15 | 6.50 | 0.85 | 0.84 | 6.01 | 80 | 59 |
| Class NAV | |
| 08-31-2020 | 11.18 | | 0.55 | (0.06) | 0.49 | (0.61) | — | (0.61) | 11.06 | 4.73 | 0.78 3 | 0.78 3 | 5.09 | 171 | 82 |
| 08-31-2019 | 11.20 | | 0.58 | 0.01 | 0.59 | (0.61) | — | (0.61) | 11.18 | 5.55 | 0.82 | 0.81 | 5.30 | 174 | 41 |
| 08-31-2018 | 11.40 | | 0.59 | (0.19) | 0.40 | (0.60) | — | (0.60) | 11.20 | 3.58 | 0.81 | 0.81 | 5.20 | 196 | 51 |
| 08-31-2017 | 11.14 | | 0.62 | 0.30 | 0.92 | (0.66) | — | (0.66) | 11.40 | 8.59 | 0.83 | 0.82 | 5.52 | 212 | 68 |
| 08-31-2016 | 11.19 | | 0.64 | 0.03 | 0.67 | (0.72) | — | (0.72) | 11.14 | 6.56 | 0.80 | 0.80 | 6.03 | 281 | 59 |
| 1. Based on average daily shares outstanding. 2. Total returns would have been lower had certain expenses not been reduced during the applicable periods. 3. Includes reimbursement of legal fees of 0.05%. See Note 15 to the Financial statements. | |
The accompanying notes are an integral part of the financial statements.
John Hancock Funds II
Notes to financial statements
1. Organization
John Hancock Funds II (the Trust) is an open-end management investment company organized as a Massachusetts business trust. The Trust is registered under the Investment Company Act of 1940, as amended (the 1940 Act). It is a series company with multiple investment series, five of which are presented in this report (the funds).
The funds may offer multiple classes of shares. The shares currently offered by a specific fund are detailed in the Statements of assets and liabilities. Class 1 shares are offered only to certain affiliates of Manulife Financial Corporation. Class NAV shares are offered to John Hancock affiliated funds of funds, retirement plans for employees of John Hancock and/or Manulife Financial Corporation, and certain 529 plans. Shareholders of each class have exclusive voting rights to matters that affect that class. The distribution and service fees, if any, and transfer agent fees for each class may differ.
Prior to February 28, 2020, Opportunistic Fixed Income Fund was known as Global Bond Fund.
2. Significant accounting policies
The financial statements have been prepared in conformity with accounting principles generally accepted in the United States of America (US GAAP), which require management to make certain estimates and assumptions as of the date of the financial statements. Actual results could differ from those estimates and those differences could be significant. The funds qualify as investment companies under Topic 946 of Accounting Standards Codification of US GAAP.
Events or transactions occurring after the end of the fiscal period through the date that the financial statements were issued have been evaluated in the preparation of the financial statements. The following summarizes the significant accounting policies of the funds:
Security valuation. Investments are stated at value as of the scheduled close of regular trading on the New York Stock Exchange (NYSE), normally at 4:00 P.M., Eastern Time. In case of emergency or other disruption resulting in the NYSE not opening for trading or the NYSE closing at a time other than the regularly scheduled close, the net asset value (NAV) may be determined as of the regularly scheduled close of the NYSE pursuant to the funds' Valuation Policies and Procedures.
In order to value the securities, the funds use the following valuation techniques: Debt obligations typically are valued based on evaluated prices provided by an independent pricing vendor. Independent pricing vendors utilize matrix pricing, which takes into account factors such as institutional-size trading in similar groups of securities, yield, quality, coupon rate, maturity, type of issue, trading characteristics and other market data, as well as broker supplied prices. Equity securities, including exchange-traded or closed-end funds, are typically valued at the last sale price or official closing price on the exchange or principal market where the security trades. In the event there were no sales during the day or closing prices are not available, the securities are valued using the last available bid price. Investments in open-end mutual funds, including John Hancock Collateral Trust (JHCT), are valued at their respective NAVs each business day. Exchange-traded options are valued at the mid-price of the last quoted bid and ask prices from the exchange where the option trades. Unlisted options are generally valued using evaluated prices obtained from an independent pricing vendor. Futures contracts are typically valued at the last traded price on the exchange on which they trade. Swaps are valued using evaluated prices obtained from an independent pricing vendor. Forward foreign currency contracts are valued at the prevailing forward rates which are based on foreign currency exchange spot rates and forward points supplied by an independent pricing vendor. Foreign securities and currencies are valued in U.S. dollars based on foreign currency exchange rates supplied by an independent pricing vendor.
In certain instances, the Pricing Committee may determine to value equity securities using prices obtained from another exchange or market if trading on the exchange or market on which prices are typically obtained did not open for trading as scheduled, or if trading closed earlier than scheduled, and trading occurred as normal on another exchange or market.
Other portfolio securities and assets, for which reliable market quotations are not readily available, are valued at fair value as determined in good faith by the funds' Pricing Committee following procedures established by the Board of Trustees. The frequency with which these fair valuation procedures are used cannot be predicted and fair value of securities may differ significantly from the value that would have been used had a ready market for such securities existed. Trading in foreign securities may be completed before the scheduled daily close of trading on the NYSE. Significant events at the issuer or market level may affect the values of securities between the time when the valuation of the securities is generally determined and the close of the NYSE. If a significant event occurs, these securities may be fair valued, as determined in good faith by the funds' Pricing Committee, following procedures established by the Board of Trustees. The funds use fair value adjustment factors provided by an independent pricing vendor to value certain foreign securities in order to adjust for events that may occur between the close of foreign exchanges or markets and the close of the NYSE.
The funds use a three-tier hierarchy to prioritize the pricing assumptions, referred to as inputs, used in valuation techniques to measure fair value. Level 1 includes securities valued using quoted prices in active markets for identical securities, including registered investment companies. Level 2 includes securities valued using other significant observable inputs. Observable inputs may include quoted prices for similar securities, interest rates, prepayment speeds and credit risk. Prices for securities valued using these inputs are received from independent pricing vendors and brokers and are based on an evaluation of the inputs described. Level 3 includes securities valued using significant unobservable inputs when market prices are not readily available or reliable, including the funds' own assumptions in determining the fair value of investments. Factors used in determining value may include market or issuer specific events or trends, changes in interest rates and credit quality. The inputs or methodology used for valuing securities are not necessarily an indication of the risks associated with investing in those securities. Changes in valuation techniques and related inputs may result in transfers into or out of an assigned level within the disclosure hierarchy.
Significant accounting policies, continued
The following is a summary of the values by input classification of the funds' investments as of August 31, 2020, by major security category or type:
| | Total
value at
8-31-20 | Level 1
quoted
price | Level 2
significant
observable
inputs | Level 3
significant
unobservable
inputs |
| Asia Pacific Total Return Bond Fund |
| Investments in securities: | | | | |
| Assets | | | | |
| Foreign government obligations | $77,171,327 | — | $77,171,327 | — |
| Corporate bonds | 95,052,721 | — | 95,052,721 | — |
| Short-term investments | 1,256,006 | $1,256,006 | — | — |
| Total investments in securities | $173,480,054 | $1,256,006 | $172,224,048 | — |
| Derivatives: | | | | |
| Liabilities | | | | |
| Futures | $(87,565) | $(87,565) | — | — |
| |
| Core Bond Fund |
| Investments in securities: | | | | |
| Assets | | | | |
| U.S. Government and Agency obligations | $1,461,547,930 | — | $1,461,547,930 | — |
| Foreign government obligations | 36,108,358 | — | 36,108,358 | — |
| Corporate bonds | 889,696,632 | — | 889,696,632 | — |
| Municipal bonds | 11,703,073 | — | 11,703,073 | — |
| Collateralized mortgage obligations | 219,681,353 | — | 219,681,353 | — |
| Asset backed securities | 258,126,057 | — | 258,126,057 | — |
| Short-term investments | 217,020,553 | $217,020,553 | — | — |
| Total investments in securities | $3,093,883,956 | $217,020,553 | $2,876,863,403 | — |
| |
| High Yield Fund |
| Investments in securities: | | | | |
| Assets | | | | |
| Foreign government obligations | $1,888,948 | — | $1,888,948 | — |
| Corporate bonds | 171,708,294 | — | 171,708,294 | — |
| Convertible bonds | 2,353,926 | — | 2,353,926 | — |
| Term loans | 12,983,651 | — | 12,983,651 | — |
| Asset backed securities | 8,541,337 | — | 8,541,337 | — |
| Common stocks | 1,366,360 | $1,216,414 | — | $149,946 |
| Preferred securities | 1,466,226 | 1,466,226 | — | — |
| Short-term investments | 272,666 | 272,666 | — | — |
| Total investments in securities | $200,581,408 | $2,955,306 | $197,476,156 | $149,946 |
| Derivatives: | | | | |
| Assets | | | | |
| Futures | $29,120 | $29,120 | — | — |
| Forward foreign currency contracts | 78,960 | — | $78,960 | — |
| Swap contracts | 50,156 | — | 50,156 | — |
| Liabilities | | | | |
| Forward foreign currency contracts | (201,349) | — | (201,349) | — |
| |
| Opportunistic Fixed Income Fund |
| Investments in securities: | | | | |
| Assets | | | | |
| U.S. Government and Agency obligations | $3,409,050 | — | $3,409,050 | — |
| Foreign government obligations | 19,439,879 | — | 19,439,879 | — |
| Corporate bonds | 2,751,223 | — | 2,751,223 | — |
| Convertible bonds | 190,451 | — | 190,451 | — |
| Municipal bonds | 1,114,654 | — | 1,114,654 | — |
| Term loans | 3,383,445 | — | 3,383,445 | — |
| Collateralized mortgage obligations | 3,892,187 | — | 3,892,187 | — |
Significant accounting policies, continued
| | Total
value at
8-31-20 | Level 1
quoted
price | Level 2
significant
observable
inputs | Level 3
significant
unobservable
inputs |
| Opportunistic Fixed Income Fund (continued) |
| Asset backed securities | $1,979,255 | — | $1,979,255 | — |
| Preferred securities | 8,549 | $8,549 | — | — |
| Exchange-traded funds | 2,410,980 | 2,410,980 | — | — |
| Short-term investments | 4,211,449 | 3,961,453 | 249,996 | — |
| Total investments in securities | $42,791,122 | $6,380,982 | $36,410,140 | — |
| Derivatives: | | | | |
| Assets | | | | |
| Futures | $1,949 | $1,949 | — | — |
| Forward foreign currency contracts | 96,528 | — | $96,528 | — |
| Swap contracts | 535,627 | — | 535,627 | — |
| Liabilities | | | | |
| Futures | (27,285) | (27,285) | — | — |
| Forward foreign currency contracts | (203,775) | — | (203,775) | — |
| Swap contracts | (284,317) | — | (284,317) | — |
| |
| U.S. High Yield Bond Fund |
| Investments in securities: | | | | |
| Assets | | | | |
| Corporate bonds | $220,210,610 | — | $220,210,610 | — |
| Convertible bonds | 958,763 | — | 958,763 | — |
| Term loans | 6,824,471 | — | 6,824,471 | — |
| Rights | 225,776 | — | 225,776 | — |
| Escrow certificates | 19,800 | — | — | $19,800 |
| Short-term investments | 9,993,121 | $9,993,121 | — | — |
| Total investments in securities | $238,232,541 | $9,993,121 | $228,219,620 | $19,800 |
Repurchase agreements. The funds may enter into repurchase agreements. When the funds enter into a repurchase agreement, they receive collateral that is held in a segregated account by the funds' custodian, or for tri-party repurchase agreements, collateral is held at a third-party custodian bank in a segregated account for the benefit of the funds. The collateral amount is marked-to-market and monitored on a daily basis to ensure that the collateral held is in an amount not less than the principal amount of the repurchase agreement plus any accrued interest. Collateral received by the fund for repurchase agreements is disclosed in the Portfolio of investments as part of the caption related to the repurchase agreement.
Repurchase agreements are typically governed by the terms and conditions of the Master Repurchase Agreement and/or Global Master Repurchase Agreement (collectively, MRA). Upon an event of default, the non-defaulting party may close out all transactions traded under the MRA and net amounts owed. Absent an event of default, assets and liabilities resulting from repurchase agreements are not offset in the Statements of assets and liabilities. In the event of a default by the counterparty, realization of the collateral proceeds could be delayed, during which time the collateral value may decline or the counterparty may have insufficient assets to pay claims resulting from close-out of the transactions.
In a reverse repurchase agreement, the funds deliver a security, as collateral, in exchange for cash to a financial institution, the counterparty, with a simultaneous agreement to repurchase the same or substantially the same security at an agreed upon price and date. The funds are entitled to receive principal and interest payments, if any, made on the security delivered to the counterparty during the term of the agreement. There were no open reverse repurchase agreement contracts at August 31, 2020.
The average borrowings by the fund and the weighted average interest rate for the period the fund entered into reverse repurchase agreements were as follows:
| Fund | Average Borrowings | Weighted average annual interest rate |
| Opportunistic Fixed Income Fund | $5,789,110 | (0.47%) |
When-issued/delayed-delivery securities. The funds may purchase or sell debt securities on a when-issued or delayed-delivery basis, or in a “To Be Announced” (TBA) or “forward commitment” transaction, with delivery or payment to occur at a later date beyond the normal settlement period. TBA securities resulting from these transactions are included in the portfolio or in a schedule to the portfolio (Sale Commitments Outstanding). At the time a fund enters into a commitment to purchase or sell a security, the transaction is recorded and the value of the security is reflected in its NAV. The price of such security and the date that the security will be delivered and paid for are fixed at the time the transaction is negotiated. The value of the security may vary with market fluctuations. No interest accrues until settlement takes place. At the time that the fund enters into this type of transaction, the fund is required to have sufficient cash and/or liquid securities to cover its commitments.
Certain risks may arise upon entering into when-issued or delayed-delivery securities transactions, including the potential inability of counterparties to meet the terms of their contracts, and the issuer’s failure to issue the securities due to political, economic or other factors. Additionally, losses may arise due to declines in the value of the securities purchased or increase in the value of securities sold prior to settlement date.
Significant accounting policies, continued
As a result, the funds have received the following amount of cash collateral from certain counterparties to these transactions which is recorded as a Payable for collateral on sale commitments:
| Fund | Counterparty | Collateral Paid/ (Received) |
| Core Bond Fund | Morgan Stanley & Co. LLC. | $(1,400,000) |
| | Citigroup, Inc. | (1,380,000) |
| | JP Morgan | (260,000) |
| | Goldman Sachs | (70,000) |
| | Total | $(3,110,000) |
Securities sold short. The funds may make short sales of securities or maintain a short position, provided that at all times when a short position is open a fund owns an equal amount of such securities or securities convertible into or exchangeable, without payment of any further consideration, for an equal amount of the securities of the same issuer as the securities sold short (a short sale “against-the-box”).
In addition, the funds may also sell a security they do not own in anticipation of a decline in the market value of that security (a short sale “not against-the-box”). To complete such a transaction, a fund must borrow the security to make delivery to the buyer. The fund is then obligated to replace the security borrowed by purchasing it at market price at the time of replacement. The price at such time may be more or less than the price at which the security was sold by the fund. Until the security is replaced, the fund is required to pay the lender any dividends or interest that accrues during the period of the loan. To borrow the security, the fund also may be required to pay a premium, which would increase the cost of the security sold. The proceeds of the short sale will be retained by the broker, to the extent necessary to meet margin requirements, until the short position is closed out.
Until a fund replaces a borrowed security, it will maintain cash or other liquid assets at such a level that will equal the current value of the security sold short; and will not be less than the market value of the security at the time it was sold short. A fund will incur a loss as a result of the short sale if the price of the security increases between the date of the short sale and the date on which the fund replaced the borrowed security. The fund will realize a gain if the security declines in price between those dates. The amount of any gain will be decreased, and the amount of any loss increased, by the amount of any premium, dividends or interest the fund may be required to pay in connection with a short sale.
Interest or short dividend expense relates to a funds' liability with respect to short sale transactions by the funds. Interest or short dividend expense is recorded as incurred.
Sale-Buybacks. Certain funds may enter into financing transactions referred to as sale-buybacks, which are governed by the terms of the MRA. A sale-buyback transaction consists of a sale of a security by a portfolio to counterparty, with a simultaneous agreement to repurchase the same or substantially the same security at an agreed-upon price and date. The fund is not entitled to receive principal and interest payments, if any, made on the security sold to the counterparty during the term of the agreement. The agreed-upon repurchase value of the securities to be repurchased by the fund are reflected as a liability on the Statements of Assets and Liabilities. The fund will recognize income represented by the price differential between the price received for the transferred security and the agreed-upon repurchase price. This is commonly referred to as the price drop. A price drop consists of the foregone interest and inflationary income adjustments, if any, the fund would have otherwise received had the security not been sold along with negotiated financing terms. Foregone interest and inflationary income adjustments, if any, are recorded as components of interest income on the Statements of Operations. Interest payments based upon negotiated financing terms made by the fund to counterparties are recorded as a component of interest expense on the Statements of Operations. In periods of increased demand for the security, the fund may receive a fee for use of the security by the counterparty, which may result in income to the fund. The average borrowings by the fund and the weighted average interest rate for the period the fund entered into sale-buybacks were as follows:
| Fund | Average Borrowing | Weighted average interest rate |
| Opportunistic Fixed Income Fund | $233,232 | (1.89%) |
Term loans (Floating rate loans). The funds may invest in term loans, which are debt securities and are often rated below investment grade at the time of purchase. Term loans are generally subject to legal or contractual restrictions on resale and generally have longer settlement periods than conventional debt securities. Term loans involve special types of risk, including credit risk, interest-rate risk, counterparty risk, and risk associated with extended settlement. The liquidity of term loans, including the volume and frequency of secondary market trading in such loans, varies significantly over time and among individual loans. During periods of infrequent trading, valuing a term loan can be more difficult and buying and selling a term loan at an acceptable price can be more difficult and delayed, which could result in a loss.
The funds' ability to receive payments of principal, interest and other amounts in connection with term loans will depend primarily on the financial condition of the borrower. The funds' failure to receive scheduled payments on a term loan due to a default, bankruptcy or other reason would adversely affect the funds' income and would likely reduce the value of its assets. Transactions in loan investments typically take a significant amount of time (i.e., seven days or longer) to settle. This could pose a liquidity risk to the funds and, if the funds' exposure to such investments is substantial, it could impair the funds' ability to meet redemptions. Because term loans may not be rated by independent credit rating agencies, a decision to invest in a particular loan could depend exclusively on the subadvisor’s credit analysis of the borrower and/or term loan agents. There is greater risk that the funds may have limited rights to enforce the terms of an underlying loan than for other types of debt instruments.
At August 31, 2020, High Yield Fund had $111,308 in unfunded loan commitments outstanding.
Inflation-indexed bonds. Inflation-indexed bonds are securities that generally have a lower coupon interest rate fixed at issuance but whose principal value is periodically adjusted based on a rate of inflation, such as the Consumer Price Index. Over the life of an inflation-indexed bond, interest is paid on the inflation adjusted principal value as described above. Increases in the principal amount of these securities are recorded as interest income. Decreases in the principal amount of these securities may reduce interest income to the extent of income previously recorded. If these decreases are in excess of income previously recorded, an adjustment to the cost of the security is made.
Mortgage and asset backed securities. The funds may invest in mortgage-related securities, such as mortgage-backed securities, and other asset-backed securities, which are debt obligations that represent interests in pools of mortgages or other income-bearing assets, such as consumer loans or receivables. Such securities often involve risks that are different from the risks associated with investing in other types of debt securities. Mortgage-backed and other asset-backed securities are subject to changes in the payment patterns of borrowers of the underlying debt. When interest rates fall, borrowers are more
Significant accounting policies, continued
likely to refinance or prepay their debt before its stated maturity. This may result in the funds having to reinvest the proceeds in lower yielding securities, effectively reducing the funds' income. Conversely, if interest rates rise and borrowers repay their debt more slowly than expected, the time in which the mortgage-backed and other asset-backed securities are paid off could be extended, reducing the funds' cash available for reinvestment in higher yielding securities. The timely payment of principal and interest of certain mortgage-related securities is guaranteed with the full faith and credit of the U.S. Government. Pools created and guaranteed by non-governmental issuers, including government-sponsored corporations (e.g. FNMA), may be supported by various forms of insurance or guarantees, but there can be no assurance that private insurers or guarantors can meet their obligations under the insurance policies or guarantee arrangements. The funds are also subject to risks associated with securities with contractual cash flows including asset-backed and mortgage related securities such as collateralized mortgage obligations, mortgage pass-through securities and commercial mortgage-backed securities. The value, liquidity and related income of these securities are sensitive to changes in economic conditions, including real estate value, pre-payments, delinquencies and/or defaults, and may be adversely affected by shifts in the market’s perception of the issuers and changes in interest rates.
Payment-in-kind bonds. The funds may invest in payment-in-kind bonds (PIK Bonds). PIK Bonds allow the issuer, at its option, to make current interest payments on the bonds either in cash or in additional bonds. The market prices of PIK Bonds are affected to a greater extent by interest rate changes and thereby tend to be more volatile than securities which pay cash interest periodically. Income on these securities is computed at the contractual rate specified and is added to the principal balance of the bond. This income is required to be distributed to shareholders. Because no cash is received at the time income accrues on these securities, the funds may need to sell other investments to make distributions.
Security transactions and related investment income. Investment security transactions are accounted for on a trade date plus one basis for daily NAV calculations. However, for financial reporting purposes, investment transactions are reported on trade date. Interest income is accrued as earned. Interest income includes coupon interest and amortization/accretion of premiums/discounts on debt securities. Debt obligations may be placed in a non-accrual status and related interest income may be reduced by stopping current accruals and writing off interest receivable when the collection of all or a portion of interest has become doubtful. Dividend income is recorded on the ex-date, except for dividends of certain foreign securities where the dividend may not be known until after the ex-date. In those cases, dividend income, net of withholding taxes, is recorded when the fund becomes aware of the dividends. Non-cash dividends, if any, are recorded at the fair market value of the securities received. Gains and losses on securities sold are determined on the basis of identified cost and may include proceeds from litigation.
Securities lending. The funds may lend their securities to earn additional income. The funds receive collateral from the borrower in an amount not less than the market value of the loaned securities. The funds will invest their cash collateral in John Hancock Collateral Trust (JHCT), an affiliate of the funds, which has a floating NAV and is registered with the Securities and Exchange Commission (SEC) as an investment company. JHCT invests in short-term money market investments. Each fund will receive the benefit of any gains and bear any losses generated by JHCT with respect to the cash collateral.
The funds have the right to recall loaned securities on demand. If a borrower fails to return loaned securities when due, then the lending agent is responsible and indemnifies the funds for the lent securities. The lending agent uses the collateral received from the borrower to purchase replacement securities of the same issue, type, class and series of the loaned securities. If the value of the collateral is less than the purchase cost of replacement securities, the lending agent is responsible for satisfying the shortfall but only to the extent that the shortfall is not due to any decrease in the value of JHCT.
Although the risk of loss on securities lent is mitigated by receiving collateral from the borrower and through lending agent indemnification, the funds could experience a delay in recovering securities or could experience a lower than expected return if the borrower fails to return the securities on a timely basis. The funds receive compensation for lending their securities by retaining a portion of the return on the investment of the collateral and compensation from fees earned from borrowers of the securities. Securities lending income received by the funds is net of fees retained by the securities lending agent. Net income received from JHCT is a component of securities lending income as recorded on the Statements of operations.
Obligations to repay collateral received by the funds are shown on the Statements of assets and liabilities as Payable upon return of securities loaned and are secured by the loaned securities. The following table summarizes the values of securities loaned by the funds and the corresponding cash collateral received at August 31, 2020:
| Fund | Market value of securities on loan | Cash collateral received |
| High Yield Fund | $266,369 | $272,697 |
| U.S. High Yield Bond Fund | 9,241,230 | 9,444,760 |
Foreign investing. Assets, including investments, and liabilities denominated in foreign currencies are translated into U.S. dollar values each day at the prevailing exchange rate. Purchases and sales of securities, income and expenses are translated into U.S. dollars at the prevailing exchange rate on the date of the transaction. The effect of changes in foreign currency exchange rates on the value of securities is reflected as a component of the realized and unrealized gains (losses) on investments. Foreign investments are subject to a decline in the value of a foreign currency versus the U.S. dollar, which reduces the dollar value of securities denominated in that currency.
Funds that invest internationally generally carry more risk than funds that invest strictly in U.S. securities. These risks are heightened for investments in emerging markets. Risks can result from differences in economic and political conditions, regulations, market practices (including higher transaction costs), accounting standards and other factors.
Foreign taxes. The funds may be subject to withholding tax on income, capital gains or repatriation taxes imposed by certain countries, a portion of which may be recoverable. Foreign taxes are accrued based upon the funds' understanding of the tax rules and rates that exist in the foreign markets in which it invests. Taxes are accrued based on gains realized by the funds as a result of certain foreign security sales. In certain circumstances, estimated taxes are accrued based on unrealized appreciation of such securities. Investment income is recorded net of foreign withholding taxes.
Overdraft. The funds may have the ability to borrow from banks for temporary or emergency purposes, including meeting redemption requests that otherwise might require the untimely sale of securities. Pursuant to the funds' custodian agreement, the custodian may loan money to the funds to make properly authorized payments. The funds are obligated to repay the custodian for any overdraft, including any related costs or expenses. The custodian may have a lien, security interest or security entitlement in any fund property that is not otherwise segregated or pledged, to the extent of any overdraft, and to the maximum extent permitted by law. Overdrafts at period end, if any, are presented under the caption Due to custodian in the Statements of assets and liabilities.
Significant accounting policies, continued
Line of credit. Effective June 25, 2020, the funds and other affiliated funds, excluding Core Bond Fund and U.S. High Yield Bond Fund, have entered into a syndicated line of credit agreement with Citibank, N.A. as the administrative agent that enables them to participate in a $1 billion unsecured committed line of credit. Excluding commitments designated for a certain fund and subject to the needs of all other affiliated funds, a fund can borrow up to an aggregate commitment amount of $850 million, subject to asset coverage and other limitations as specified in the agreement. Each participating fund paid an upfront fee in connection with this line of credit agreement, which is charged based on a combination of fixed and asset based allocations and amortized over 365 days. Prior to June 25, 2020, the funds and other affiliated funds had a similar agreement that enabled them to participate in a $750 million unsecured committed line of credit.
Core Bond Fund, U.S. High Yield Bond Fund, and other affiliated funds have entered into a separate unsecured $50 million line of credit agreement with BNP Paribas. Subject to the needs of other affiliated funds, Core Bond Fund and U.S. High Yield Bond Fund can borrow up to the $50 million, subject to asset coverage and other limitations as specified in the agreement.
A commitment fee payable at the end of each calendar quarter, based on the average daily unused portion of each line of credit, is charged to each participating fund based on a combination of fixed and asset based allocations and is reflected in Other expenses on the Statements of operations. For the year ended August 31, 2020, the funds had no borrowings under the line of credit.
Commitment fees for the year ended August 31, 2020 were as follows:
| Fund | Commitment fee |
| Asia Pacific Total Return Bond Fund | $3,298 |
| Core Bond Fund | 22,015 |
| High Yield Fund | 3,198 |
| Opportunistic Fixed Income Fund | 2,697 |
| U.S. High Yield Bond Fund | 6,885 |
Expenses. Within the John Hancock group of funds complex, expenses that are directly attributable to an individual fund are allocated to such fund. Expenses that are not readily attributable to a specific fund are allocated among all funds in an equitable manner, taking into consideration, among other things, the nature and type of expense and the fund’s relative net assets. Expense estimates are accrued in the period to which they relate and adjustments are made when actual amounts are known.
Class allocations. Income, common expenses and realized and unrealized gains (losses) are determined at the fund level and allocated daily to each class of shares based on the net assets of the class. Class-specific expenses, such as distribution and service fees, if any, and transfer agent fees, for all classes, are charged daily at the class level based on the net assets of each class and the specific expense rates applicable to each class.
Change in accounting principle. Accounting Standards Update (ASU) 2017-08, Premium Amortization on Purchased Callable Debt Securities, shortens the premium amortization period for purchased non contingently callable debt securities and is effective for public companies with fiscal years beginning after December 15, 2018. Adoption of the ASU did not have a material impact to the funds.
Federal income taxes. Each fund intends to continue to qualify as a regulated investment company by complying with the applicable provisions of the Internal Revenue Code and will not be subject to federal income tax on taxable income that is distributed to shareholders. Therefore, no federal income tax provision is required.
For federal income tax purposes, as of August 31, 2020, certain funds have capital loss carryforwards available to offset future net realized capital gains. The following table details the capital loss carryforwards available as of August 31, 2020:
| | No Expiration Date |
| Fund | Short Term | Long Term |
| Asia Pacific Total Return Bond Fund | $ — | $8,985,158 |
| High Yield Fund | 3,129,351 | 83,696,916 |
| Opportunistic Fixed Income Fund | 298,646 | 5,489,575 |
| U.S. High Yield Bond Fund | — | 21,369,339 |
As of August 31, 2020, the funds had no uncertain tax positions that would require financial statement recognition, derecognition or disclosure. The funds' federal tax returns are subject to examination by the Internal Revenue Service for a period of three years.
For federal income tax purposes, the costs of investments owned on August 31, 2020, including short-term investments, were as follows:
| Fund | Aggregate
cost | Unrealized
appreciation | Unrealized
(depreciation) | Net unrealized
appreciation/
(depreciation) |
| Asia Pacific Total Return Bond Fund | $172,830,730 | $5,683,536 | $(5,121,777) | $561,759 |
| Core Bond Fund | 3,010,112,104 | 90,515,191 | (6,743,339) | 83,771,852 |
| High Yield Fund | 225,436,788 | 11,860,458 | (36,758,951) | (24,898,493) |
| Opportunistic Fixed Income Fund | 42,436,192 | 1,408,285 | (934,628) | 473,657 |
| U.S. High Yield Bond Fund | 238,159,689 | 12,347,904 | (12,275,052) | 72,852 |
Distribution of income and gains. Distributions to shareholders from net investment income and net realized gains, if any, are recorded on the ex-date. Core Bond Fund, High Yield Fund and U.S. High Yield Bond Fund generally declare and pay dividends from net investment income quarterly. All other funds generally declare and pay dividends from net investment income annually. All funds generally declare and pay capital gain distributions, if any, annually.
The tax character of distributions for the year ended August 31, 2020 was as follows:
Significant accounting policies, continued
| Fund | Ordinary
Income | Long Term
Capital Gains | Total |
| Asia Pacific Total Return Bond Fund | $11,534,899 | — | $11,534,899 |
| Core Bond Fund | 86,689,645 | $3,617,696 | 90,307,341 |
| High Yield Fund | 13,263,417 | — | 13,263,417 |
| Opportunistic Fixed Income Fund | 1,410,083 | — | 1,410,083 |
| U.S. High Yield Bond Fund | 13,096,794 | — | 13,096,794 |
The tax character of distributions for the year ended August 31, 2019 was as follows:
| Fund | Ordinary
Income |
| Asia Pacific Total Return Bond Fund | $9,927,876 |
| Core Bond Fund | 57,078,130 |
| High Yield Fund | 20,745,709 |
| Opportunistic Fixed Income Fund | 3,494,066 |
| U.S. High Yield Bond Fund | 14,114,234 |
Distributions paid by the funds with respect to each class of shares are calculated in the same manner, at the same time and in the same amount, except for the effect of class level expenses that may be applied differently to each class. As of August 31, 2020, the components of distributable earnings on a tax basis were as follows:
| Fund | Undistributed
Ordinary Income | Undistributed
Long Term
Capital Gains |
| Asia Pacific Total Return Bond Fund | $13,739 | — |
| Core Bond Fund | 112,620,802 | $9,880,485 |
| High Yield Fund | 2,284,035 | — |
| Opportunistic Fixed Income Fund | 1,509,369 | — |
| U.S. High Yield Bond Fund | 2,295,325 | — |
Such distributions and distributable earnings, on a tax basis, are determined in conformity with income tax regulations, which may differ from US GAAP. Distributions in excess of tax basis earnings and profits, if any, are reported in the funds' financial statements as a return of capital.
Capital accounts within the financial statements are adjusted for permanent book-tax differences. These adjustments have no impact on net assets or the results of operations. Temporary book-tax differences, if any, will reverse in a subsequent period. Book-tax differences are primarily attributable to foreign currency transactions, wash sale loss deferrals, derivative transactions, amortization and accretion on debt securities and foreign capital gain tax.
3. Derivative instruments
The funds may invest in derivatives in order to meet their investment objective. Derivatives include a variety of different instruments that may be traded in the over-the-counter (OTC) market, on a regulated exchange or through a clearing facility. The risks in using derivatives vary depending upon the structure of the instruments, including the use of leverage, optionality, the liquidity or lack of liquidity of the contract, the creditworthiness of the counterparty or clearing organization and the volatility of the position. Some derivatives involve risks that are potentially greater than the risks associated with investing directly in the referenced securities or other referenced underlying instrument. Specifically, the funds are exposed to the risk that the counterparty to an OTC derivatives contract will be unable or unwilling to make timely settlement payments or otherwise honor its obligations. OTC derivatives transactions typically can only be closed out with the other party to the transaction.
Derivatives which are typically traded through the OTC market are regulated by the Commodity Futures Trading Commission (the CFTC). Derivative counterparty risk is managed through an ongoing evaluation of the creditworthiness of all potential counterparties and, if applicable, designated clearing organizations. The funds attempt to reduce their exposure to counterparty risk for derivatives traded in the OTC market, whenever possible, by entering into an International Swaps and Derivatives Association (ISDA) Master Agreement with each of their OTC counterparties. The ISDA gives each party to the agreement the right to terminate all transactions traded under the agreement if there is certain deterioration in the credit quality or contractual default of the other party, as defined in the ISDA. Upon an event of default or a termination of the ISDA, the non-defaulting party has the right to close out all transactions and to net amounts owed.
As defined by the ISDA, the funds may have collateral agreements with certain counterparties to mitigate counterparty risk on OTC derivatives. Subject to established minimum levels, collateral for OTC transactions is generally determined based on the net aggregate unrealized gain or loss on contracts with a particular counterparty. Collateral pledged to the funds, if any, are held in a segregated account by a third-party agent or held by the custodian bank for the benefit of the funds and can be in the form of cash or debt securities issued by the U.S. government or related agencies; collateral posted by the funds, if any, for OTC transactions is held in a segregated account at the funds' custodian and is noted in the accompanying portfolio of investments, or if cash is posted, on the Statements of assets and liabilities. The funds' risk of loss due to counterparty risk is equal to the asset value of outstanding contracts offset by collateral received.
Certain derivatives are traded or cleared on an exchange or central clearinghouse. Exchange-traded or centrally-cleared transactions generally present less counterparty risk to a fund than OTC transactions. The exchange or clearinghouse stands between the funds and the broker to the contract and therefore, credit risk is generally limited to the failure of the exchange or clearinghouse and the clearing member.
Centrally-cleared swap contracts are subject to clearinghouse rules, including initial and variation margin requirements, daily settlement of obligations and the clearinghouse guarantee of payments to the broker. There is, however, still counterparty risk due to the potential insolvency of the broker with respect to any margin held in the brokers’ customer accounts. While clearing members are required to segregate customer assets from their own assets, in the event of insolvency, there may be a shortfall in the amount of margin held by the broker for its clients. Collateral or margin requirements for centrally-cleared
Derivative instruments, continued
derivatives are set by the broker or applicable clearinghouse. Margin for centrally-cleared transactions is detailed in the Statements of assets and liabilities as Receivable/Payable for centrally-cleared swaps. Securities pledged by the funds for centrally-cleared transactions, if any, are identified in the Portfolio of investments.
Futures. A futures contract is a contractual agreement to buy or sell a particular currency or financial instrument at a pre-determined price in the future. Futures are traded on an exchange and cleared through a central clearinghouse. Risks related to the use of futures contracts include possible illiquidity of the futures markets and contract prices that can be highly volatile and imperfectly correlated to movements in the underlying financial instrument and potential losses in excess of the amounts recognized on the Statements of assets and liabilities. Use of long futures contracts subjects the funds to the risk of loss up to the notional value of the futures contracts. Use of short futures contracts subjects the funds to unlimited risk of loss.
Upon entering into a futures contract, the fund is required to deposit initial margin with the broker in the form of cash or securities. The amount of required margin is set by the broker and is generally based on a percentage of the contract value. The margin deposit must then be maintained at the established level over the life of the contract. Cash that has been pledged by a fund is detailed in the Statements of assets and liabilities as Collateral held at broker for futures contracts. Securities pledged by the funds, if any, are identified in the Portfolio of investments. Subsequent payments, referred to as variation margin, are made or received by a fund periodically and are based on changes in the market value of open futures contracts. Futures contracts are marked-to-market daily and unrealized gain or loss is recorded by the fund. Receivable/Payable for futures variation margin is included in the Statements of assets and liabilities. When the contract is closed, a fund records a realized gain or loss equal to the difference between the value of the contract at the time it was opened and the value at the time it was closed.
The following table details how the funds used futures contracts during the year ended August 31, 2020. In addition, the table summarizes the range of notional contract amounts held by the funds, as measured at each quarter end:
| Fund | Reason | USD Notional range |
| Asia Pacific Total Return Bond Fund | To manage against anticipated interest rate changes and manage duration. | $25.0 million to $45.9 million |
| High Yield Fund | To manage duration of the portfolio. | $23.6 million to $33.6 million |
| Opportunistic Fixed Income Fund | To manage against changes in interest rates, gain exposure to certain bond markets and manage duration of the fund. | Up to $28.5 million |
Forward foreign currency contracts. A forward foreign currency contract is an agreement between two parties to buy and sell specific currencies at a price that is set on the date of the contract. The forward contract calls for delivery of the currencies on a future date that is specified in the contract. Forwards are typically traded OTC. Risks related to the use of forwards include the possible failure of counterparties to meet the terms of the forward agreement, the failure of the counterparties to timely post collateral if applicable, and the risk that currency movements will not favor the funds thereby reducing the funds' total return, and the potential for losses in excess of the amounts recognized on the Statements of assets and liabilities.
The market value of a forward foreign currency contract fluctuates with changes in foreign currency exchange rates. Forward foreign currency contracts are marked-to-market daily and the change in value is recorded by the fund as an unrealized gain or loss. Realized gains or losses, equal to the difference between the value of the contract at the time it was opened and the value at the time it was closed, are recorded upon delivery or receipt of the currency or settlement with the counterparty.
The following table details how the funds used forward foreign currency contracts during the year ended August 31, 2020. In addition, the table summarizes the range of notional contract amounts held by the funds, as measured at each quarter end:
| Fund | Reason | USD Notional range |
| High Yield Fund | To manage against changes in foreign currency exchange rates and to gain exposure to foreign currencies. | $2.5 million to $7.3 million |
| Opportunistic Fixed Income Fund | To manage against changes in foreign currency exchange rates and to gain exposure to foreign currencies. | Up to $63.5 million |
Options. There are two types of options, put options and call options. Options are traded either OTC or on an exchange. A call option gives the purchaser of the option the right to buy (and the seller the obligation to sell) the underlying instrument at the exercise price. A put option gives the purchaser of the option the right to sell (and the writer the obligation to buy) the underlying instrument at the exercise price. Writing puts and buying calls may increase the funds' exposure to changes in the value of the underlying instrument. Buying puts and writing calls may decrease the funds' exposure to such changes. Risks related to the use of options include the loss of premiums, possible illiquidity of the options markets, trading restrictions imposed by an exchange and movements in underlying security values, and for written options, potential losses in excess of the amounts recognized on the Statements of assets and liabilities. In addition, OTC options are subject to the risks of all OTC derivatives contracts.
When a fund purchases an option, the premium paid is included in the Portfolio of investments and subsequently “marked-to-market” to reflect current market value. If the purchased option expires, a fund realizes a loss equal to the cost of the option. If a fund exercises a call option, the cost of the securities acquired by exercising the call is increased by the premium paid to buy the call. If a fund exercises a put option, it realizes a gain or loss from the sale of the underlying security and the proceeds from such sale are decreased by the premium paid. If a fund enters into a closing sale transaction, it realizes a gain or loss, depending on whether proceeds from the closing sale are greater or less than the original cost. When a fund writes an option, the premium received is included as a liability and subsequently “marked-to-market” to reflect the current market value of the option written. Premiums received from writing options that expire unexercised are recorded as realized gains. Premiums received from writing options which are exercised or are closed are added to or offset against the proceeds or amount paid on the transaction to determine the realized gain or loss. If a put option on a security is exercised, the premium received reduces the cost basis of the securities purchased by a fund.
The following table details how the funds used purchased options contracts during the year ended August 31, 2020. In addition, the table summarizes the range of notional contract amounts held by the funds, as measured at each quarter end:
| Fund | Reason | Market value range |
| High Yield Fund | To manage against anticipated changes in currency exchange rates and to gain exposure to foreign currencies. At August 31, 2020, there were no open written options contacts. | Up to $31,000 |
Derivative instruments, continued
| Fund | Reason | Market value range |
| Opportunistic Fixed Income Fund | To gain exposure to the bond market and foreign currency, manage against anticipated currency exchange rates and interest rate changes and manage duration of the fund. At August 31, 2020, there were no open purchased options contacts. | Up to $51,000 |
The following table details how the funds used written options contracts during the year ended August 31, 2020. In addition, the table summarizes the range of notional contract amounts held by the funds, as measured at each quarter end:
| Fund | Reason | Market value range |
| High Yield Fund | To gain exposure to certain securities markets, to manage against changes in certain securities markets and to generate potential income from options premiums. At August 31, 2020, there were no open written options contacts. | Up to $119,000 |
| Opportunistic Fixed Income Fund | To gain exposure to the bond market and foreign currency, manage against anticipated currency exchange rates and interest rate changes and manage duration of the fund. At August 31, 2020, there were no open written options contacts. | Up to $67,000 |
Swaps. Swap agreements are agreements between the fund and a counterparty to exchange cash flows, assets, foreign currencies or market-linked returns at specified intervals. Swap agreements are privately negotiated in the OTC market (OTC swaps) or may be executed on a registered commodities exchange (centrally cleared swaps). Swaps are marked-to-market daily and the change in value is recorded as a component of unrealized appreciation/depreciation of swap contracts. The value of the swap will typically impose collateral posting obligations on the party that is considered out-of-the-money on the swap.
Upfront payments made/received by the funds, if any, are amortized/accreted for financial reporting purposes, with the unamortized/unaccreted portion included in the Statement of assets and liabilities. A termination payment by the counterparty or the funds is recorded as realized gain or loss, as well as the net periodic payments received or paid by the funds.
Entering into swap agreements involves, to varying degrees, elements of credit, market and documentation risk that may provide outcomes that are in excess of the amounts recognized on the Statement of assets and liabilities. Such risks involve the possibility that there will be no liquid market for the swap, or that a counterparty may default on its obligation or delay payment under the swap terms. The counterparty may disagree or contest the terms of the swap. In addition to interest rate risk, market risks may also impact the swap. The funds may also suffer losses if it is unable to terminate or assign outstanding swaps or reduce its exposure through offsetting transactions.
Interest rate swaps. Interest rate swaps represent an agreement between the fund and a counterparty to exchange cash flows based on the difference between two interest rates applied to a notional amount. The payment flows are usually netted against each other, with the difference being paid by one party to the other. The funds settles accrued net interest receivable or payable under the swap contracts at specified, future intervals.
The following table details how the funds used interest rate swaps contracts during the year ended August 31, 2020. In addition, the table summarizes the range of notional contract amounts held by the funds, as measured at each quarter end:
| Fund | Reason | USD Notional range |
| Opportunistic Fixed Income Fund | To manage against changes in interest rates and to manage duration of the fund. | Up to $138.1 million |
Credit default swaps. Credit default swaps (CDS) involve the exchange of a fixed rate premium (paid by the Buyer), for protection against the loss in value of an underlying debt instrument, referenced entity or index, in the event of a defined credit event (such as payment default or bankruptcy). Under the terms of the swap, one party acts as a “guarantor” (the Seller), receiving the premium and agreeing to contingent payments that are specified within the credit default agreement. The funds may enter into CDS in which it may act as either Buyer or Seller. By acting as the Seller, the funds may incur economic leverage since it would be obligated to pay the Buyer the notional amount of the contract in the event of a default. The amount of loss in such case could be significant, but would typically be reduced by any recovery value on the underlying credit.
Credit default swaps — Buyer
The following table details how the funds used credit default swap contracts as a buyer during the year ended August 31, 2020. In addition, the table summarizes the range of notional contract amounts held by the funds, as measured at each quarter end:
| Fund | Reason | USD Notional range |
| High Yield Fund | To manage against potential credit events. At August 31, 2020, there were no open credit default swap buy contacts. | Up to $744,000 |
| Opportunistic Fixed Income Fund | To manage against potential credit events. | Up to $10.9 million |
Credit default swaps — Seller
Implied credit spreads are utilized in determining the market value of CDS agreements in which the fund is the Seller at period end. The implied credit spread generally represents the yield of the instrument above a credit-risk free rate, such as the U.S. Treasury Bond Yield, and may include upfront payments required to be made to enter into the agreement. It also serves as an indicator of the current status of the payment/performance risk and represents the likelihood or risk of default for the credit derivative. Wider credit spreads represent a deterioration of the referenced entity’s creditworthiness and an increased risk of default or other credit event occurring as defined under the terms of the agreement.
For CDS agreements where implied credit spreads are not reported or available, the average credit rating on the underlying index is shown. A deterioration of the referenced entity’s creditworthiness would indicate a greater likelihood of a credit event occurring and result in increasing market values, in absolute terms when compared to the notional amount of the swap. The maximum potential amount of future payments (undiscounted) that the fund as the Seller could be required to make under any CDS agreement equals the notional amount of the agreement.
The following table details how the funds used credit default swap contracts as a seller during the year ended August 31, 2020. In addition, the table summarizes the range of notional contract amounts held by the funds, as measured at each quarter end:
Derivative instruments, continued
| Fund | Reason | USD Notional range |
| High Yield Fund | To gain credit exposure to an issuer or index. | Up to $643,000 |
| Opportunistic Fixed Income Fund | To gain credit exposure to an issuer or index. | Up to $9.9 million |
Currency swaps. A currency swap is an agreement between the fund and a counterparty to exchange cash flows based on the notional difference among two or more currencies.
The following table details how the funds used currency swap contracts during the year ended August 31, 2020. In addition, the table summarizes the range of notional contract amounts held by the funds, as measured at each quarter end:
| Fund | Reason | USD Notional range |
| Opportunistic Fixed Income Fund | To manage against anticipated currency exchange rate changes. At August 31, 2020, there were no open currency swaps contacts. | Up to $1.0 million |
Total Return Swaps. The funds may enter into total return swap contracts to obtain synthetic exposure to a specific reference asset or index without owning, taking physical custody of, or short selling the underlying assets. Total return swaps are commitments where one party pays a fixed or variable rate premium (the Buyer) in exchange for a market-linked return (the Seller). The Seller pays the total return of a specific reference asset or index and in return receives interest payments from the Buyer. To the extent the total return of the underlying asset or index exceeds or falls short of the offsetting interest rate obligation, the Buyer will receive or make a payment to the Seller. A fund may enter into total return swaps in which it may act as either the Buyer or the Seller. Total return swap contracts are subject to the risk associated with the investment in the underlying reference asset or index. The risk in the case of short total return swap contracts is unlimited based on the potential for unlimited increases in the market value of the underlying reference asset or index.
The following table details how the funds used total return swaps during the year ended August 31, 2020. In addition, the table summarizes the range of notional contract amounts held by the funds, as measured at each quarter end:
| Fund | Reason | USD Notional range |
| Opportunistic Fixed Income Fund | To gain exposure to a security or market without investing directly in such security or market. | Up to $5.2 milion |
Fair value of derivative instruments by risk category
The table below summarizes the fair value of derivatives held by the funds at August 31, 2020 by risk category:
| Fund | Risk | Statements of
assets and
liabilities location | Financial
instruments
location | Assets
derivatives
fair value | Liabilities
derivatives
fair value |
| Asia Pacific Total Return Bond Fund | Interest rate | Receivable/payable for futures variation margin | Futures 1 | — | $(87,565) |
| | | | | — | $(87,565) |
| High Yield Fund | Interest rate | Receivable/payable for futures variation margin | Futures 1 | $29,120 | — |
| | Currency | Unrealized appreciation / depreciation on forward foreign currency contracts | Forward foreign currency contracts | 78,960 | $(201,349) |
| | Credit | Swap contracts, at value | Credit default swaps2 | 50,156 | — |
| | | | | $158,236 | $(201,349) |
| Opportunistic Fixed Income Fund | Interest rate | Receivable/payable for futures variation margin | Futures 1 | $1,949 | $(27,285) |
| | Currency | Unrealized appreciation / depreciation on forward foreign currency contracts | Forward foreign currency contracts | 96,528 | (203,775) |
| | Credit | Swap contracts, at value | Credit default swaps2 | 429,397 | (234,397) |
| | Interest rate | Swap contracts, at value | Total return swaps2 | 91,169 | (14,992) |
| | Interest rate | Swap contracts, at value | Interest rate swaps2 | 15,061 | (34,928) |
| | | | | $634,104 | $(515,377) |
| | |
| 1 | Reflects cumulative appreciation/depreciation on futures as disclosed in the Portfolio of investments. Only the year end variation margin is separately disclosed on the Statements of assets and liabilities. |
| 2 | Reflects cumulative value of swap contracts. Receivable/payable for centrally cleared swaps, which includes value and margin, are shown separately on the Statements of assets and liabilities. |
For financial reporting purposes, the funds do not offset OTC derivative assets or liabilities that are subject to master netting arrangements, as defined by the ISDAs, in the Statements of assets and liabilities. In the event of default by the counterparty or a termination of the agreement, the ISDA allows an offset of amounts across the various transactions between the fund and the applicable counterparty. The tables below reflect the funds' exposure to OTC derivative transactions and exposure to counterparties subject to an ISDA:
| OTC Financial Instruments | Asset | Liability |
| Opportunistic Fixed Income Fund | | |
| Forward foreign currency contracts | $96,528 | $(203,775) |
| Swap contracts | 376,882 | (268,770) |
| Totals | $473,410 | $(472,545) |
Derivative instruments, continued
| Counterparty | Total Market
Value of OTC
Derivatives | Collateral
Posted by
Counterparty | Collateral
Posted by
Fund | Net
Exposure |
| Opportunistic Fixed Income Fund | | | | |
| Bank of America, N.A. | $(22,515) | — | — | $(22,515) |
| Barclays Bank PLC | 13,846 | $10,000 | — | 3,846 |
| Citibank, N.A. | (45,520) | — | — | (45,520) |
| Goldman Sachs International | (25,682) | — | — | (25,682) |
| JPMorgan Chase Bank, N.A. | (79,469) | — | $79,469 | — |
| Morgan Stanley & Co. International PLC | 160,205 | 140,000 | — | 20,205 |
| Totals | $865 | $150,000 | $79,469 | $(69,666) |
Effect of derivative instruments on the Statements of operations
The table below summarizes the net realized gain (loss) included in the net increase (decrease) in net assets from operations, classified by derivative instrument and risk category, for the year ended August 31, 2020:
| | | Statements of operations location - Net realized gain (loss) on: |
| Fund | Risk | Unaffiliated
investments and
foreign currency
transactions1 | Futures contracts | Forward foreign
currency contracts | Written options | Swap contracts | Total |
| Asia Pacific Total Return Bond Fund | Interest rate | — | $(1,222,128) | — | — | — | $(1,222,128) |
| | Total | — | $(1,222,128) | — | — | — | $(1,222,128) |
| High Yield Fund | Interest rate | $(51,822) | $230,607 | — | $(1,146,848) | — | $(968,063) |
| | Currency | — | — | $32,622 | — | — | 32,622 |
| | Credit | — | — | — | — | $219,660 | 219,660 |
| | Equity | (33,683) | — | — | — | — | (33,683) |
| | Total | $(85,505) | $230,607 | $32,622 | $(1,146,848) | $219,660 | $(749,464) |
| Opportunistic Fixed Income Fund | Interest rate | $(3,253) | $117,959 | — | $89,830 | $139,857 | $344,393 |
| | Currency | (7,018) | — | $(267,344) | 20,729 | (41,058) | (294,691) |
| | Credit | — | — | — | 2,597 | (245,912) | (243,315) |
| | Total | $(10,271) | $117,959 | $(267,344) | $113,156 | $(147,113) | $(193,613) |
| | |
| 1 | Realized gain/loss associated with purchased options is included in this caption on the Statements of operations. |
The table below summarizes the net change in unrealized appreciation (depreciation) included in the net increase (decrease) in net assets from operations, classified by derivative instrument and risk category, for the year ended August 31, 2020:
| | | Statements of operations location - Change in net unrealized appreciation (depreciation) of: |
| Fund | Risk | Unaffiliated
investments and
translation of assets
and liabilities in
foreign currencies1 | Futures contracts | Forward foreign
currency contracts | Written options | Swap contracts | Total |
| Asia Pacific Total Return Bond Fund | Interest rate | — | $(83,637) | — | — | — | $(83,637) |
| | Total | — | $(83,637) | — | — | — | $(83,637) |
| High Yield Fund | Interest rate | — | $4,637 | — | — | — | $4,637 |
| | Currency | — | — | $(131,534) | — | — | (131,534) |
| | Credit | — | — | — | — | $88,278 | 88,278 |
| | Equity | $5,682 | — | — | — | — | 5,682 |
| | Total | $5,682 | $4,637 | $(131,534) | — | $88,278 | $(32,937) |
| Opportunistic Fixed Income Fund | Interest rate | $7,088 | $(89,876) | — | $(21,416) | $(91,157) | $(195,361) |
| | Currency | 7,398 | — | $87,486 | 2,510 | 16,344 | 113,738 |
| | Credit | — | — | — | (3,367) | 407,483 | 404,116 |
| | Total | $14,486 | $(89,876) | $87,486 | $(22,273) | $332,670 | $322,493 |
| | |
| 1 | Change in unrealized appreciation/depreciation associated with purchased options is included in this caption on the Statements of operations. |
4. Guarantees and indemnifications
Under the Trust's organizational documents, its Officers and Trustees are indemnified against certain liabilities arising out of the performance of their duties to the Trust, including the funds. Additionally, in the normal course of business, the Trust enters into contracts with service providers that contain general indemnification clauses. The Trust's maximum exposure under these arrangements is unknown, as this would involve future claims that may be made against the Trust that have not yet occurred. The risk of material loss from such claims is considered remote.
5. Fees and transactions with affiliates
John Hancock Investment Management LLC (the Advisor) serves as investment advisor for the funds. John Hancock Investment Management Distributors LLC (the Distributor), an affiliate of the Advisor, serves as principal underwriter of the funds. The Advisor and the Distributor are indirect, principally owned subsidiaries of Manulife Financial Corporation.
Management fee. The funds have an investment management agreement with the Advisor under which the funds pay a monthly management fee to the Advisor equivalent on an annual basis as detailed below. Aggregate net assets generally include the net assets of the funds and the net assets of a similar fund of John Hancock Variable Insurance Trust (JHVIT), unless otherwise noted below. JHVIT funds are advised by an affiliate of the Advisor, John Hancock Variable Trust Advisers LLC, and are distributed by an affiliate of the Advisor, John Hancock Distributors, LLC.
• Asia Pacific Total Return Bond Fund — a) 0.725% of the first $250 million of average net assets; b) 0.700% of the next $250 million of average net assets and c) 0.600% of the excess over $500 million of average net assets.
• Core Bond Fund — a) 0.690% of the first $200 million of aggregate net assets; b) 0.640% of the next $200 million of aggregate net assets; c) 0.570% of the next $600 million of aggregate net assets.; d) 0.560% of the next $1 billion of aggregate net assets; and e) 0.550% of the excess over $2 billion of aggregate net assets.
• High Yield Fund — a) 0.700% of the first $500 million of aggregate net assets and b) 0.650% of the excess over $500 million of aggregate net assets.
• Opportunistic Fixed Income Fund — a) 0.650% of the first $1 billion of aggregate net assets and b) 0.625% of the excess over $1 billion of aggregate net assets. Prior to July 1, 2020, management fee was 0.650% on aggregate net assets. Prior to February 28, 2020, management fee was a) 0.700% of the first $1 billion of aggregate net assets and b) 0.650% of the excess over $1 billion of aggregate net assets.
• U.S. High Yield Bond Fund — a) 0.750% of the first $200 million of average net assets and b) 0.720% of the excess over $200 million of average net assets.
The organizations described below act as the subadvisors to the Trust and its funds pursuant to Subadvisory Agreements with the Advisor. Fund management is allocated among the following managers:
| Fund | Subadvisor(s) |
| Asia Pacific Total Return Bond Fund | Manulife Investment Management (US) LLC 1 |
| Opportunistic Fixed Income Fund | Wellington Management Company LLP2 |
Core Bond Fund
U.S. High Yield Bond Fund | Wells Capital Management, Incorporated |
| High Yield Fund | Western Asset Management Company |
1 An affiliate of the Advisor.
2 Effective February 28, 2020, Wellington Management Company LLP replaced Pacific Investment Management Company LLC as subadvisor.
The funds are not responsible for payment of the subadvisory fees.
Expense reimbursements. The Advisor has voluntarily agreed to waive a portion of its management fee if certain expenses of the respective funds exceed the percentage of average net assets as detailed below. Expenses excluded from this waiver are taxes, brokerage commissions, interest expense, litigation and indemnification expenses and other extraordinary expenses not incurred in the ordinary course of the funds’ business, management fees, class specific expenses, acquired fund fees and short dividends. This expense reduction will continue in effect until terminated by the Advisor.
| Fund | Expense
limitation as a
percentage of
average net
assets |
| Asia Pacific Total Return Bond Fund | 0.15% |
| Core Bond Fund | 0.15% |
| High Yield Fund | 0.15% |
| Fund | Expense
limitation as a
percentage of
average net
assets |
| Opportunistic Fixed Income Fund | 0.15% |
| U.S. High Yield Bond Fund | 0.15% |
The Advisor has contractually agreed to waive a portion of its management fee and/or reimburse expenses for certain funds of the John Hancock group of funds complex, including the fund (the participating portfolios). This waiver is based upon aggregate net assets of all the participating portfolios. The amount of the reimbursement is calculated daily and allocated among all the participating portfolios in proportion to the daily net assets of each fund. During the year ended August 31, 2020, this waiver amounted to 0.01% of the fund’s average daily net assets. This arrangement expires on July 31, 2022, unless renewed by mutual agreement of the fund and the Advisor based upon a determination that this is appropriate under the circumstances at that time.
Effective March 19, 2020, the Advisor contractually agreed to waive its management fee on Opportunistic Fixed Income Fund so that the annual operating expenses do not exceed 0.80% of average net assets for the fund. Expenses excluded from this waiver are taxes, brokerage commissions, interest expense, litigation and indemnification expenses and other extraordinary expenses not incurred in the ordinary course of the fund’s business, Rule 12b-1 fees, transfer agent fees and service fees, shareholder servicing fees, borrowing costs, prime brokerage fees, acquired fund fees and expenses paid indirectly and short dividend expenses. This agreement expires on December 31, 2021, unless renewed by mutual agreement of the advisor and the portfolio based upon a determination that this is appropriate under the circumstances at that time.
Fees and transactions with affiliates, continued
For the year ended August 31, 2020, the expense reductions described above amounted to the following:
| Expense Reimbursement by Class |
| Fund | Class 1 | Class NAV | Total |
| Asia Pacific Total Return Bond Fund | — | $17,779 | $17,779 |
| Core Bond Fund | $13,130 | 183,797 | 196,927 |
| High Yield Fund | 15,646 | — | 15,646 |
| Opportunistic Fixed Income Fund | 285,935 | — | 285,935 |
| U.S. High Yield Bond Fund | 4,744 | 12,048 | 16,792 |
Expenses waived or reimbursed in the current fiscal period are not subject to recapture in future fiscal periods.
The investment management fees, including the impact of the waivers and reimbursements as described above, incurred for the year ended August 31, 2020, were equivalent to a net annual effective rate of the funds' average daily net assets as follows:
| Fund | Net Annual Effective Rate |
| Asia Pacific Total Return Bond Fund | 0.72% |
| Core Bond Fund | 0.56% |
| High Yield Fund | 0.69% |
| Fund | Net Annual Effective Rate |
| Opportunistic Fixed Income Fund | 0.00% |
| U.S. High Yield Bond Fund | 0.74% |
Accounting and legal services. Pursuant to a service agreement, the funds reimburse the Advisor for all expenses associated with providing the administrative, financial, legal, compliance, accounting and recordkeeping services to the funds, including the preparation of all tax returns, periodic reports to shareholders and regulatory reports, among other services. These expenses are allocated to each share class based on its relative net assets at the time the expense was incurred. These accounting and legal services fees incurred, for the year ended August 31, 2020, amounted to an annual rate of 0.02% of the funds' average daily net assets.
Distribution and service plans. The funds have a distribution agreement with the Distributor. The funds have adopted distribution and service plans for certain classes as detailed below pursuant to Rule 12b-1 under the 1940 Act, to pay the Distributor for services provided as the distributor of shares of the funds. The funds may pay up to the following contractual rates of distribution and service fees under these arrangements, expressed as an annual percentage of average daily net assets for each class of the funds' shares:
| Class | Rule 12b-1 Fee |
| Class 1 | 0.05% |
Trustee expenses. The funds compensate each Trustee who is not an employee of the Advisor or its affiliates. The costs of paying Trustee compensation and expenses are allocated to each fund based on their net assets relative to other funds within the John Hancock group of funds complex.
Interfund lending program. Pursuant to an Exemptive Order issued by the SEC, the funds, along with certain other funds advised by the Advisor or its affiliates, may participate in an interfund lending program. This program provides an alternative credit facility allowing the funds to borrow from, or lend money to, other participating affiliated funds. At period end, no interfund loans were outstanding. Interest expense is included in Other expenses on the Statements of operations. The funds' activity in this program during the period for which loans were outstanding was as follows:
| Fund | Borrower
or Lender | Weighted Average
Loan Balance | Days
Outstanding | Weighted Average
Interest Rate | Interest Income
(Expense) |
| Asia Pacific Total Return Bond Fund | Borrower | $5,208,333 | 12 | 0.575% | $(999) |
| Opportunistic Fixed Income Fund | Lender | 2,100,000 | 1 | 1.070% | 62 |
6. Fund share transactions
Transactions in funds' shares for the years ended August 31, 2020 and 2019 were as follows:
| Asia Pacific Total Return Bond Fund | Year Ended 8-31-20 | Year Ended 8-31-19 |
| | Shares | Amount | Shares | Amount |
| Class NAV shares | | | | |
| Sold | 622,470 | $6,052,445 | 2,357,811 | $22,559,494 |
| Distributions reinvested | 1,187,940 | 11,534,899 | 1,069,814 | 9,927,876 |
| Repurchased | (14,664,101) | (141,383,552) | (9,834,752) | (93,835,766) |
| Net decrease | (12,853,691) | $(123,796,208) | (6,407,127) | $(61,348,396) |
| Total net decrease | (12,853,691) | $(123,796,208) | (6,407,127) | $(61,348,396) |
| Core Bond Fund | Year Ended 8-31-20 | Year Ended 8-31-19 |
| | Shares | Amount | Shares | Amount |
| Class 1 shares | | | | |
| Sold | 4,100,406 | $55,671,502 | 2,476,833 | $31,829,228 |
| Distributions reinvested | 427,345 | 5,663,456 | 342,715 | 4,342,494 |
| Repurchased | (2,636,573) | (35,391,823) | (2,600,640) | (33,029,680) |
| Net increase | 1,891,178 | $25,943,135 | 218,908 | $3,142,042 |
Fund share transactions, continued
| Core Bond Fund , Cont'd | Year Ended 8-31-20 | Year Ended 8-31-19 |
| | Shares | Amount | Shares | Amount |
| Class NAV shares | | | | |
| Sold | 20,516,036 | $275,267,732 | 122,829,292 | $1,565,914,512 |
| Distributions reinvested | 6,402,984 | 84,643,885 | 4,144,403 | 52,735,636 |
| Repurchased | (47,015,195) | (627,363,940) | (49,605,775) | (639,991,485) |
| Net increase (decrease) | (20,096,175) | $(267,452,323) | 77,367,920 | $978,658,663 |
| Total net increase (decrease) | (18,204,997) | $(241,509,188) | 77,586,828 | $981,800,705 |
| High Yield Fund | Year Ended 8-31-20 | Year Ended 8-31-19 |
| | Shares | Amount | Shares | Amount |
| Class 1 shares | | | | |
| Sold | 1,929,866 | $15,076,870 | 1,520,532 | $12,191,321 |
| Distributions reinvested | 1,769,163 | 13,263,417 | 2,030,292 | 15,929,257 |
| Repurchased | (9,101,936) | (69,556,464) | (6,940,528) | (54,913,514) |
| Net decrease | (5,402,907) | $(41,216,177) | (3,389,704) | $(26,792,936) |
| Class NAV shares1 | | | | |
| Sold | — | — | 61,648 | $480,103 |
| Distributions reinvested | — | — | 626,974 | 4,816,452 |
| Repurchased | — | — | (17,556,929) | (138,149,496) |
| Net decrease | — | — | (16,868,307) | $(132,852,941) |
| Total net decrease | (5,402,907) | $(41,216,177) | (20,258,011) | $(159,645,877) |
| | |
| 1 | Class NAV shares were fully redeemed on 3-28-19. |
| Opportunistic Fixed Income Fund | Year Ended 8-31-20 | Year Ended 8-31-19 |
| | Shares | Amount | Shares | Amount |
| Class 1 shares | | | | |
| Sold | 848,596 | $11,202,825 | 520,704 | $6,606,636 |
| Distributions reinvested | 110,682 | 1,410,083 | 52,415 | 648,896 |
| Repurchased | (1,579,659) | (20,768,430) | (979,631) | (12,432,894) |
| Net decrease | (620,381) | $(8,155,522) | (406,512) | $(5,177,362) |
| Class NAV shares1 | | | | |
| Sold | — | — | 48,422 | $604,726 |
| Distributions reinvested | — | — | 230,192 | 2,845,170 |
| Repurchased | — | — | (18,087,028) | (228,474,139) |
| Net decrease | — | — | (17,808,414) | $(225,024,243) |
| Total net decrease | (620,381) | $(8,155,522) | (18,214,926) | $(230,201,605) |
| | |
| 1 | Class NAV shares were fully redeemed on 4-17-19. |
| U.S. High Yield Bond Fund | Year Ended 8-31-20 | Year Ended 8-31-19 |
| | Shares | Amount | Shares | Amount |
| Class 1 shares | | | | |
| Sold | 872,995 | $9,628,379 | 1,118,013 | $12,311,473 |
| Distributions reinvested | 350,006 | 3,705,811 | 375,923 | 4,094,406 |
| Repurchased | (2,202,611) | (23,388,569) | (1,673,286) | (18,424,154) |
| Net decrease | (979,610) | $(10,054,379) | (179,350) | $(2,018,275) |
| Class NAV shares | | | | |
| Sold | 1,252,532 | $13,333,966 | 1,009,198 | $11,090,690 |
| Distributions reinvested | 889,876 | 9,390,983 | 920,914 | 10,019,828 |
| Repurchased | (2,259,973) | (23,774,502) | (3,875,556) | (42,608,023) |
| Net decrease | (117,565) | $(1,049,553) | (1,945,444) | $(21,497,505) |
| Total net decrease | (1,097,175) | $(11,103,932) | (2,124,794) | $(23,515,780) |
Affiliates of the Trust owned 100% of shares of Class 1 and Class NAV, with the exception of Core Bond Fund where affiliates owned 76.8% of shares of Class NAV on August 31, 2020. Such concentration of shareholders’ capital could have a material effect on the fund if such shareholders redeem from the fund.
7. Purchase and sale of securities
Purchases and sales of securities, other than short-term investments, amounted to the following for the year ended August 31, 2020:
| | Purchases | Sales |
| Fund | U.S. Government | Other issuers | U.S. Government | Other issuers |
| Asia Pacific Total Return Bond Fund | $14,183,898 | $98,472,232 | $23,904,547 | $213,503,859 |
Purchase and sale of securities, continued
| | Purchases | Sales |
| Fund | U.S. Government | Other issuers | U.S. Government | Other issuers |
| Core Bond Fund | $6,584,817,955 | $3,490,081,054 | $7,024,853,076 | $3,612,825,711 |
| High Yield Fund | — | 173,669,186 | — | 209,630,848 |
| Opportunistic Fixed Income Fund | 43,710,736 | 65,835,088 | 49,264,573 | 74,755,224 |
| U.S. High Yield Bond Fund | — | 187,198,561 | — | 200,040,995 |
8. Industry or sector risk
Certain funds generally invest a large percentage of their assets in one or more particular industries or sectors of the economy. If a large percentage of a fund's assets are economically tied to a single or small number of industries or sectors of the economy, the fund will be less diversified than a more broadly diversified fund, and it may cause the fund to underperform if that industry or sector underperforms. In addition, focusing on a particular industry or sector may make the fund’s NAV more volatile. Further, a fund that invests in particular industries or sectors is particularly susceptible to the impact of market, economic, regulatory and other factors affecting those industries or sectors. Financial services companies can be hurt by economic declines, changes in interest rates, and regulatory and market impacts.
9. Investment in affiliated underlying funds
The fund may invest in affiliated underlying funds that are managed by the Advisor and its affiliates. Information regarding the funds' fiscal year to date purchases and sales of the affiliated underlying funds as well as income and capital gains earned by the funds, if any, is as follows:
| | | | | | | | Dividends and distributions |
| Affiliate | Ending
share
amount | Beginning
value | Cost of
purchases | Proceeds
from shares
sold | Realized
gain
(loss) | Change in
unrealized
appreciation
(depreciation) | Income
distributions
received | Capital gain
distributions
received | Ending
value |
| Core Bond Fund |
| John Hancock Collateral Trust* | — | $1,019,314 | $14,055,885 | $(15,074,312) | $(857) | $(30) | $4,540 | — | — |
| High Yield Fund |
| John Hancock Collateral Trust* | 27,237 | $877,204 | $22,727,505 | $(23,326,733) | $(5,363) | $53 | $18,986 | — | $272,666 |
| U.S. High Yield Bond Fund |
| John Hancock Collateral Trust* | 943,564 | $12,857,869 | $80,330,738 | $(83,741,663) | $(7,211) | $6,000 | $114,659 | — | $9,445,733 |
| * | Refer to the Securities lending note within Note 2 for details regarding this investment. |
10. Investment by affiliated funds
Certain investors in the funds are affiliated funds that are managed by the Advisor and its affiliates. The affiliated funds do not invest in the funds for the purpose of exercising management or control; however, this investment may represent a significant portion of the funds' net assets. The following fund(s) had an affiliate ownership of 5% or more of the funds' net assets:
| Fund | Affiliated Concentration |
| Asia Pacific Total Return Bond Fund | 100.0% |
| Core Bond Fund | 70.9% |
| U.S. High Yield Bond Fund | 73.5% |
11. Interfund trading
The funds are permitted to purchase or sell securities from or to certain other affiliated funds, as set forth in Rule 17a-7 of the 1940 Act, under specified conditions outlined in procedures adopted by the Board of Trustees of the Trust. The procedures have been designed to ensure that any purchase or sale of securities by the funds from or to another fund that is or could be considered an affiliate complies with Rule 17a-7 of the 1940 Act. Further, as defined under the procedures, each transaction is effected at the current market price. Pursuant to these procedures, for the year ended August 31, 2020, the funds engaged in securities purchases and sales with affiliated funds, some of which have different fiscal reporting periods, as follows:
| Fund | Purchases | Sales |
| Opportunistic Fixed Income Fund | $325,632 | $10,489,027 |
| U.S. High Yield Bond Fund | $1,250,547 | $735,537 |
12. Restricted securities
The funds may hold restricted securities which are restricted as to resale and the funds have limited rights to registration under the Securities Act of 1933. Disposal may involve time-consuming negotiations and expenses, and prompt sale at an acceptable price may be difficult to achieve. The following table summarizes the restricted securities held at August 31, 2020:
Restricted securities, continued
Issuer,
Description | Original
acquisition date | Acquisition
cost | Beginning
share
amount | Shares
purchased | Shares
sold | Ending
share
amount | Value as a
percentage of
net assets | Ending
value |
| High Yield Fund | | | | | | | | |
| KCAD Holdings I, Ltd. | 3-21-11 | $6,150,520 | 752,218,031 | — | — | 752,218,031 | 0.0%* | $752 |
| MWO Holdings LLC | 8-30-16 | 1,116,559 | 1,134 | — | — | 1,134 | 0.0%* | 65,851 |
| New Cotai, Inc., Class B | 4-12-13 | — | 11 | — | — | 11 | 0.0% | — |
| | | | | | | | | $66,603 |
13. Coronavirus (COVID-19) pandemic
The novel COVID-19 disease has resulted in significant disruptions to global business activity. A widespread health crisis such as a global pandemic could cause substantial market volatility, exchange trading suspensions and closures, impact the ability to complete redemptions, and affect fund performance.
14. LIBOR discontinuation risk
LIBOR (London Interbank Offered Rate) is a measure of the average interest rate at which major global banks can borrow from one another. Following allegations of rate manipulation and concerns regarding its thin liquidity, in July 2017, the U.K. Financial Conduct Authority, which regulates LIBOR, announced that it will stop encouraging banks to provide the quotations needed to sustain LIBOR after 2021. This event will likely cause LIBOR to cease to be published. Before then, it is expected that market participants will transition to the use of different reference or benchmark rates. However, although regulators have suggested alternative rates, there is currently no definitive information regarding the future utilization of LIBOR or of any replacement rate.
It is uncertain what impact the discontinuation of LIBOR will have on the use of LIBOR as a reference rate for securities in which the funds invest. It is expected that market participants will amend financial instruments referencing LIBOR to include fallback provisions and other measures that contemplate the discontinuation of LIBOR or other similar market disruption events, but neither the effect of the transition process nor the viability of such measures is known. In addition, there are obstacles to converting certain longer term securities and transactions to a new benchmark or benchmarks and the effectiveness of one alternative reference rate versus multiple alternative reference rates in new or existing financial instruments and products has not been determined. As market participants transition away from LIBOR, LIBOR's usefulness may deteriorate, which could occur prior to the end of 2021. The transition process may lead to increased volatility and illiquidity in markets that currently rely on LIBOR to determine interest rates. LIBOR's deterioration may adversely affect the liquidity and/or market value of securities that use LIBOR as a benchmark interest rate.
15. Other matters
In or around May 2015, certain John Hancock Funds, including U.S. High Yield Bond Fund, were served with a complaint brought by the Motors Liquidation Avoidance Action Trust (the “Motors Trust”). The complaint sought disgorgement of certain amounts paid to the Term Loan Lenders as holders of indebtedness issued by General Motors pursuant to a $1.5 billion term loan, dated as of November 29, 2006 (as amended, the “Term Loan”). The litigation has now been settled resulting in no payments by the fund. As part of the settlement, the fund received payment of $107,429 representing reimbursement of approximately 73% of the legal fees incurred.
Report of Independent Registered Public Accounting Firm
To the Board of Trustees of John Hancock Funds II and Shareholders of John Hancock Asia Pacific Total Return Bond Fund, John Hancock Core Bond Fund, John Hancock High Yield Fund, John Hancock Opportunistic Fixed Income Fund and John Hancock U.S. High Yield Bond Fund
Opinions on the Financial Statements
We have audited the accompanying statements of assets and liabilities, including the portfolio of investments, of John Hancock Asia Pacific Total Return Bond Fund, John Hancock Core Bond Fund, John Hancock High Yield Fund, John Hancock Opportunistic Fixed Income Fund and John Hancock U.S. High Yield Bond Fund (five of the funds constituting John Hancock Funds II, hereafter collectively referred to as the "Funds") as of August 31, 2020, the related statements of operations for the year ended August 31, 2020, the statements of changes in net assets for each of the two years in the period ended August 31, 2020, including the related notes, and the financial highlights for each of the five years in the period ended August 31, 2020 (collectively referred to as the “financial statements”). In our opinion, the financial statements present fairly, in all material respects, the financial position of each of the Funds as of August 31, 2020, the results of each of their operations for the year then ended, the changes in each of their net assets for each of the two years in the period ended August 31, 2020 and each of the financial highlights for each of the five years in the period ended August 31, 2020 in conformity with accounting principles generally accepted in the United States of America.
Basis for Opinions
These financial statements are the responsibility of the Funds’ management. Our responsibility is to express an opinion on the Funds’ financial statements based on our audits. We are a public accounting firm registered with the Public Company Accounting Oversight Board (United States) (PCAOB) and are required to be independent with respect to the Funds in accordance with the U.S. federal securities laws and the applicable rules and regulations of the Securities and Exchange Commission and the PCAOB.
We conducted our audits of these financial statements in accordance with the standards of the PCAOB. Those standards require that we plan and perform the audit to obtain reasonable assurance about whether the financial statements are free of material misstatement, whether due to error or fraud.
Our audits included performing procedures to assess the risks of material misstatement of the financial statements, whether due to error or fraud, and performing procedures that respond to those risks. Such procedures included examining, on a test basis, evidence regarding the amounts and disclosures in the financial statements. Our audits also included evaluating the accounting principles used and significant estimates made by management, as well as evaluating the overall presentation of the financial statements. Our procedures included confirmation of securities owned as of August 31, 2020 by correspondence with the custodians, transfer agents, agent banks and brokers; when replies were not received from agent banks and brokers, we performed other auditing procedures. We believe that our audits provide a reasonable basis for our opinions.
/s/ PricewaterhouseCoopers LLP
Boston, Massachusetts
October 22, 2020
We have served as the auditor of one or more investment companies in the John Hancock group of funds since 1988.
John Hancock Funds II
Federal tax information (Unaudited)
For federal income tax purposes, the following information is furnished with respect to the distributions of the funds, if any, paid during its taxable year ended August 31, 2020.
Dividend Received Deduction The funds report the maximum amount allowable of their net taxable income as eligible for the corporate dividends-received deduction.
Qualified Dividend Income The funds report the maximum amount allowable of their net taxable income as qualified dividend income as provided in the Jobs and Growth Tax Relief Reconciliation Act of 2003.
Each fund reports the maximum amount allowable of its Section 199A dividends as defined in Proposed Treasury Regulation §1.199A-3(d).
Foreign Tax Credit The income derived from foreign sources and the amount the fund intends to pass through as foreign tax credits for Asia Pacific Total Return Bond Fund amounted to $12,140,048 and $947,006, respectively, for the year ended August 31, 2020.
Long Term Capital Gains Core Bond Fund paid $3,617,696 in long term capital gain dividends.
Eligible shareholders will be mailed a 2020 Form 1099-DIV in early 2021. This will reflect the tax character of all distributions paid in calendar year 2020.
Please consult a tax advisor regarding the tax consequences of your investment in the fund.
Evaluation of advisory and subadvisory agreements by the board of trustees
This section describes the evaluation by the Board of Trustees (the “Board”) of John Hancock Funds II (the “Trust”) of the Advisory Agreement (the “Advisory Agreement”) with John Hancock Investment Management LLC (the “Advisor”, formerly known as “John Hancock Advisers, LLC”) and each of the Subadvisory Agreements (collectively, the “Subadvisory Agreements”) with respect to each of the portfolios of the Trust included in this report (the “Funds”). The Advisory Agreement and Subadvisory Agreements are collectively referred to as the Agreements. Prior to the June 23-25, 2020 telephonic1 meeting at which the Agreements were approved, the Board also discussed and considered information regarding the proposed continuation of the Agreements at the telephonic meeting held on May 26-27, 2020.
Approval of Advisory and Subadvisory Agreements
At telephonic meetings held on June 23-25, 2020, the Board, including the Trustees who are not parties to any Agreement or considered to be interested persons of the Trust under the Investment Company Act of 1940, as amended (the “1940 Act”) (the “Independent Trustees”), reapproved for an annual period, the continuation of the Advisory Agreement between the Trust and the Advisor and the applicable Subadvisory Agreements between the Advisor and the investment subadvisors (each, a “Subadvisor” and collectively, the “Subadvisors”) with respect to each of the Funds identified below in Appendix A.
In considering the Advisory Agreement and the Subadvisory Agreements with respect to each Fund, the Board received in advance of the meetings a variety of materials relating to each Fund, the Advisor and each Subadvisor, including comparative performance, fee and expense information for peer groups of similar funds prepared by an independent third-party provider of fund data; performance information for the Funds’ benchmark indices; and, with respect to each Subadvisor, comparative performance information for comparably managed accounts, as applicable; and other information provided by the Advisor and the Subadvisors regarding the nature, extent and quality of services provided by the Advisor and the Subadvisors under their respective Agreements, as well as information regarding the Advisor’s revenues and costs of providing services to the Funds and any compensation paid to affiliates of the Advisor. At the meetings at which the renewal of the Advisory Agreement and Subadvisory Agreements are considered, particular focus is given to information concerning Fund performance, comparability of fees and total expenses, and profitability. However, the Board notes that the evaluation process with respect to the Advisor and the Subadvisors is an ongoing one. In this regard, the Board also took into account discussions with management and information provided to the Board (including its various committees) at prior meetings with respect to the services provided by the Advisor and the Subadvisors to the Funds, including quarterly performance reports prepared by management containing reviews of investment results, and prior presentations from the Subadvisors with respect to the Funds they manage. The information received and considered by the Board in connection with the May and June meetings and throughout the year was both written and oral. The Board noted the affiliation of certain of the Subadvisors with the Advisor, noting any potential conflicts of interest. The Board also considered the nature, quality, and extent of the services, if any, to be provided to the Funds by the Advisor’s affiliates, including distribution services. The Board considered the Advisory Agreement and the Subadvisory Agreement separately in the course of its review. In doing so, the Board noted the respective roles of the Advisor and Subadvisor in providing services to the Funds. In addition, although the Board approved the renewal of the Agreements for all the Funds at the June meeting, the Board considered each Fund separately.
Throughout the process, the Board asked questions of and requested additional information from management. The Board is assisted by counsel for the Trust and the Independent Trustees are also separately assisted by independent legal counsel throughout the process. The Independent Trustees also received a memorandum from their independent legal counsel discussing the legal standards for their consideration of the proposed continuation of the Agreements and discussed the proposed continuation of the Agreements in private sessions with their independent legal counsel at which no representatives of management were present.
Approval of Advisory Agreement
In approving the Advisory Agreement with respect to each Fund, the Board, including the Independent Trustees, considered a variety of factors, including those discussed below. The Board also considered other factors (including conditions and trends prevailing generally in the economy, the securities markets and the industry) and did not treat any single factor as determinative, and each Trustee may have attributed different weights to different factors. The Board’s conclusions may be based in part on its consideration of the advisory and subadvisory arrangements in prior years and on the Board’s ongoing regular review of Fund performance and operations throughout the year.
Nature, Extent and Quality of Services. Among the information received by the Board from the Advisor relating to the nature, extent and quality of services provided to the Funds, the Board reviewed information provided by the Advisor relating to its operations and personnel, descriptions of its organizational and management structure, and information regarding the Advisor’s compliance and regulatory history, including its Form ADV. The Board also noted that on a regular basis it receives and reviews information from the Trust’s Chief Compliance Officer (“CCO”) regarding the Funds’ compliance policies and procedures established pursuant to Rule 38a-1 under the 1940 Act. The Board observed that the scope of services provided by the Advisor, and of the undertakings required of the Advisor in connection with those services, including maintaining and monitoring its own and the fund’s compliance programs, risk management programs, liquidity management programs and cybersecurity programs, had expanded over time as a result of regulatory, market and other developments. The Board considered that the Advisor is responsible for the management of the day-to-day operations of the Funds, including but not limited to, general supervision of and coordination of the services provided by the Subadvisors, and is also responsible for monitoring and reviewing the activities of the Subadvisors and other third-party service providers. The Board also considered the significant risk assumed by the Advisor in connection with the services provided to the Funds including entrepreneurial risk in sponsoring new Funds and ongoing risks including investment, operational, enterprise, litigation, regulatory and compliance risks with respect to all Funds.
In considering the nature, extent and quality of the services provided by the Advisor, the Trustees also took into account their knowledge of the Advisor’s management and the quality of the performance of the Advisor’s duties, through Board meetings, discussions and reports during the preceding year and through each Trustee’s experience as a Trustee of the Trust and of the other trusts in the complex (the John Hancock Fund Complex).
In the course of their deliberations regarding the Advisory Agreement, the Board considered, among other things:
(a) the skills and competency with which the Advisor has in the past managed the Trust’s affairs and its subadvisory relationships, the Advisor’s oversight and monitoring of the Subadvisors’ investment performance and compliance programs, such as the Subadvisors’ compliance with fund policies and objectives, review of brokerage matters including with respect to trade allocation and best execution, and the Advisor’s timeliness in responding to performance issues;
(b) the background, qualifications and skills of the Advisor’s personnel;
1 | |
On March 25, 2020, as a result of health and safety measures put in place to combat the global COVID-19 pandemic, the Securities and Exchange Commission issued an exemptive order (the “Order”) pursuant to Sections 6(c) and 38(a) of the Investment Company Act of 1940, as amended (the “1940 Act”), that temporarily exempts registered investment management companies from the in-person voting requirements under the 1940 Act, subject to certain requirements, including that votes taken pursuant to the Order are ratified at the next in-person meeting. The Board determined that reliance on the Order was necessary or appropriate due to the circumstances related to current or potential effects of COVID-19 and therefore, the Board’s May and June meetings were held telephonically in reliance on the Order. |
72
Evaluation of advisory and subadvisory agreements by the board of trustees
(c) the Advisor’s compliance policies and procedures and its responsiveness to regulatory changes and fund industry developments;
(d) the Advisor’s administrative capabilities, including its ability to supervise the other service providers for the Funds, as well as the Advisor’s oversight of any securities lending activity, its monitoring of class action litigation and collection of class action settlements on behalf of the Funds, and bringing loss recovery actions on behalf of the Funds;
(e) the financial condition of the Advisor and whether it has the financial wherewithal to provide a high level and quality of services to the Funds;
(f) the Advisor’s initiative intended to improve various aspects of the Trust’s operations and investor experience with the Funds; and
(g) the Advisor’s reputation and experience in serving as an investment adviser to the Trust and the benefit to shareholders of investing in funds that are part of a family of funds offering a variety of investments.
The Board concluded that the Advisor may reasonably be expected to continue to provide a high quality of services under the Advisory Agreement with respect to the Funds.
Investment Performance. In considering each Fund’s performance, the Board noted that it reviews at its regularly scheduled meetings information about the Funds’ performance results. In connection with the consideration of the Advisory Agreement, the Board:
(a) reviewed information prepared by management regarding the Funds’ performance;
(b) considered the comparative performance of each Fund’s respective benchmark index;
(c) considered the performance of comparable funds, if any, as included in the report prepared by an independent third-party provider of fund data; and
(d) took into account the Advisor’s analysis of each Fund’s performance and its plans and recommendations regarding the Trust’s subadvisory arrangements generally and with respect to particular Funds.
The Board noted that while it found the data provided by the independent third-party generally useful it recognized its limitations, including in particular that the data may vary depending on the end date selected and that the results of the performance comparisons may vary depending on the selection of the peer group. The Board reviewed Fund performance against each Funds’ respective benchmark and peer group median and also concluded that the performance of each of the Funds has generally been in line with or generally outperformed the historical performance of comparable funds and/or each Fund’s respective benchmark, with certain exceptions noted in Appendix A. In such cases, the Board concluded that such performance is being monitored and reasonably addressed, where appropriate.
Fees and Expenses. The Board reviewed comparative information prepared by an independent third-party provider of fund data including, among other data, each Fund’s contractual and net management fees (and subadvisory fees, to the extent available) and total expenses as compared to similarly situated investment companies deemed to be comparable to the Fund in light of the nature, extent and quality of the management and advisory and subadvisory services provided by the Advisor and the Subadvisor. The Board considered each Fund’s ranking within a smaller group of peer funds chosen by the independent third-party provider, as well as the Fund’s ranking within broader groups of funds. In comparing each Fund’s contractual and net management fees to that of comparable funds, the Board noted that such fees include both advisory and administrative costs.
The Board took into account management’s discussion of the fund’s expenses. The Board also took into account management’s discussion with respect to the overall management fee, the fees of the Subadvisor, including the amount of the advisory fee retained by the Advisor after payment of the subadvisory fee, in each case in light of the services rendered for those amounts and the risks undertaken by the Advisor. The Board also noted that the Advisor pays the subadvisory fees of the Funds, and that such fees are negotiated at arm’s length with respect to the unaffiliated Subadvisors. The Board also took into account that management had agreed to implement an overall fee waiver across the complex, which is discussed further below. The Board also noted management’s discussion of the Funds’ expenses, as well as any actions taken over the past several years to reduce the Funds’ operating expenses. The Board reviewed information provided by the Advisor concerning investment advisory fee charged by the Advisor or one of its advisory affiliates to other clients (including other funds in the complex) having similar investment mandates, if any. The Board considered any differences between the Advisor’s and each Subadvisor’s services to a Fund and the services they provide to other comparable clients or funds. The Board concluded that the advisory fee paid with respect to each of the Funds is reasonable in light of the nature, extent and quality of the services provided to the Funds under the Advisory Agreement.
Profitability/indirect benefits. In considering the costs of the services to be provided and the profits to be realized by the Advisor and its affiliates (including the Subadvisors that are affiliated with the Advisor) from the Advisor’s relationship with the Trust, the Board:
(a) reviewed financial information of the Advisor;
(b) reviewed and considered information presented by the Advisor regarding the net profitability to the Advisor and its affiliates, of each Fund;
(c) received and reviewed profitability information with respect to the John Hancock fund complex as a whole and with respect to each Fund;
(d) received information with respect to the Advisor’s allocation methodologies used in preparing the profitability data and considered that the Advisor hired an independent third-party consultant to provide an analysis of the Advisor’s allocation methodologies;
(e) considered that the John Hancock insurance companies that are affiliates of the Advisor, as shareholders of the Trust directly or through their separate accounts, receive certain tax credits or deductions relating to foreign taxes paid and dividends received by certain Funds of the Trust and noted that these tax benefits, which are not available to participants in qualified retirement plans under applicable income tax law, are reflected in the profitability analysis reviewed by the Board;
(f) considered that the Advisor also provides administrative services to the Funds on a cost basis pursuant to an administrative services agreement;
(g) noted that certain of the Funds’ Subadvisors are affiliates of the Advisor;
(h) noted that affiliates of the Advisor provide transfer agency services and distribution services to the fund, and that the fund’s distributor also receives Rule 12b-1 payments to support distribution of the fund;
(i) noted that the Advisor also derives reputational and other indirect benefits from providing advisory services to the Funds;
(j) noted that the subadvisory fees for the Funds are paid by the Advisor and are negotiated at arms’ length with respect to the unaffiliated Subadvisors;
(k) with respect to each Fund of the Funds, the Board noted that the advisory fee is in addition to the fees received by the Advisor and its affiliates with regard to the underlying portfolios in which each Fund of Funds may invest;
(l) considered the Advisor’s ongoing costs and expenditures necessary to improve services, meet new regulatory and compliance requirements, and adapt to other challenges impacting the fund industry; and
(m) considered that the Advisor should be entitled to earn a reasonable level of profits in exchange for the level of services it provides to the fund and the risks that it assumes as Advisor, including entrepreneurial, operational, reputational, litigation and regulatory risk.
73
Evaluation of advisory and subadvisory agreements by the board of trustees
Based upon its review, the Board concluded that the level of profitability, if any, of the Advisor and its affiliates (including any Subadvisors that are affiliated with the Advisor), from their relationship with each Fund was reasonable and not excessive.
Economies of Scale. In considering the extent to which a Fund may realize any economies of scale and whether fee levels reflect these economies of scale for the benefit of Fund shareholders, the Board:
(a) considered that the Advisor has contractually agreed to waive a portion of its management fee for certain funds of the John Hancock Fund Complex, including the fund (the participating portfolios) or otherwise reimburse the expenses of the participating portfolios (the reimbursement). This waiver is based upon aggregate net assets of all the participating portfolios. The amount of the reimbursement is calculated daily and allocated among all the participating portfolios in proportion to the daily net assets of each Fund;
(b) reviewed the Fund’s advisory fee structure and concluded that: (i) the fund’s fee structure contains breakpoints at the subadvisory fee level and that such breakpoints are reflected as breakpoints in the advisory fees for the fund; and (ii) although economies of scale cannot be measured with precision, these arrangements permit shareholders of the Fund to benefit from economies of scale if the Fund grows. The Board also took into account management’s discussion of the Fund’s advisory fee structure; and
(c) considered the effect of the Funds’ growth in size on their performance and fees. The Board also noted that if the Funds’ assets increase over time, the Funds may realize other economies of scale.
Approval of Subadvisory Agreements
In making its determination with respect to approval of the Subadvisory Agreements, the Board reviewed:
| (1) | | information relating to each Subadvisor’s business, including current subadvisory services to the Trust (and other funds in the John Hancock family of funds); |
| (2) | | the historical and current performance of each Fund and comparative performance information relating to the Fund’s benchmark and comparable funds; |
| (3) | | the subadvisory fee for each Fund, and comparative fee information, where available, prepared by an independent third party provider of fund data; and |
| (4) | | information relating to the nature and scope of any material relationships and their significance to the Trust’s Advisor and unaffiliated Subadvisors. |
Nature, Extent and Quality of Services. With respect to the services provided by each of the Subadvisors with respect to each Fund, the Board received information provided to the Board by each Subadvisor, including each Subadvisor’s Form ADV, as well as took into account information presented throughout the past year. The Board considered each Subadvisor’s current level of staffing and its overall resources, as well as received information relating to a Subadvisor’s compensation program. The Board reviewed each Subadvisor’s history and investment experience, as well as information regarding the qualifications, background and responsibilities of each Subadvisor’s investment and compliance personnel who provide services to the Funds. The Board also considered, among other things, each Subadvisor’s compliance program and any disciplinary history. The Board also considered each Subadvisor’s risk assessment and monitoring process. The Board reviewed each Subadvisor’s regulatory history, including whether it was involved in any regulatory actions or investigations as well as material litigation, and any settlements and amelioratory actions undertaken, as appropriate. The Board noted that the Advisor conducts regular, periodic reviews of each Subadvisor and its operations, including regarding investment processes and organizational and staffing matters. The Board also noted that the CCO and his staff conduct regular, periodic compliance reviews with each of the Subadvisors and present reports to the Independent Trustees regarding the same, which includes evaluating the regulatory compliance systems of the Subadvisors and procedures reasonably designed by them to assure compliance with the federal securities laws. The Board also took into account the financial condition of each Subadvisor.
The Board considered each Subadvisor’s investment process and philosophy. The Board took into account that each Subadvisor’s responsibilities include the development and maintenance of an investment program for the applicable Fund that is consistent with the Fund’s investment objective, the selection of investment securities and the placement of orders for the purchase and sale of such securities, as well as the implementation of compliance controls related to performance of these services. The Board also received information with respect to each Subadvisor’s brokerage policies and practices, including with respect to best execution and soft dollars.
Subadvisor Compensation. In considering the cost of services to be provided by each Subadvisor and the profitability to that Subadvisor of its relationship with the Fund, the Board noted that the fees under the Subadvisory Agreements are paid by the Advisor and not the Funds. The Board also received information and took into account any other potential conflicts of interest the Advisor might have in connection with the Subadvisory Agreements.
The Board also relied on the ability of the Advisor to negotiate each Subadvisory Agreement with Subadvisors that are not affiliated with the Advisor and the fees thereunder at arm’s length. As a result, the costs of the services to be provided and the profits to be realized by unaffiliated Subadvisors from their relationship with the Trust were not a material factor in the Board’s consideration of the Subadvisory Agreements.
The Board also received information regarding the nature and scope (including their significance to the Advisor and its affiliates and to unaffiliated Subadvisors) of any material relationships with respect to the unaffiliated Subadvisors, which include arrangements in which unaffiliated Subadvisors or their affiliates provide advisory, distribution or management services in connection with financial products sponsored by the Trust’s Advisor or its affiliates, and may include shares of the Trust, other registered investment companies, a 529 education savings plan, managed separate accounts and exempt group annuity contracts sold to qualified plans.
In addition, the Board considered other potential indirect benefits that the Subadvisors and their affiliates may receive from a Subadvisor’s relationship with the Fund, such as the opportunity to provide advisory services to additional funds in the John Hancock fund complex and reputational benefits.
Subadvisory Fees. The Board considered that the Fund pays an advisory fee to the Advisor and that, in turn, the Advisor pays subadvisory fees to each Subadvisor. As noted above, the Board also considered, if available, each Fund’s subadvisory fees as compared to similarly situated investment companies deemed to be comparable to the Fund as included in the report prepared by the independent third party provider of fund data, to the extent applicable. The Board also took into account the subadvisory fees paid by the Advisor to a Subadvisor with respect to the Funds to fees charged by each Fund’s Subadvisor to manage other subadvised portfolios and portfolios not subject to regulation under the 1940 Act, as applicable.
Subadvisor Performance. As noted above, the Board considered each Fund’s performance as compared to the Fund’s respective peer group median and the benchmark index and noted that the Board reviews information about the Fund’s performance results at its regularly scheduled meetings. The Board noted the Advisor’s expertise and resources in monitoring the performance, investment style, and risk-adjusted performance of each Subadvisor. The Board was mindful of the Advisor’s focus on each Subadvisor’s performance. The Board also noted each Subadvisor’s long-term performance record for similar accounts, as applicable.
74
Evaluation of advisory and subadvisory agreements by the board of trustees
The Board’s decision to approve the Subadvisory Agreements with respect to each Fund was based on a number of determinations, including the following:
| (1) | | each Subadvisor has extensive experience and demonstrated skills as a manager; |
| (2) | | although not without variation, the performance of each Fund managed by a Subadvisor generally has been in line with or outperformed the historical performance of comparable funds and/or each Fund’s respective benchmark, with the exceptions noted in Appendix A (with respect to such exceptions, the Board concluded that performance is being monitored and reasonably addressed); |
| (3) | | the subadvisory fees are reasonable in relation to the level and quality of services being provided under the Subadvisory Agreements; and |
| (4) | | the subadvisory fees are paid by the Advisor and not the Funds, and that the fee structure for certain of the Funds contains breakpoints, certain breakpoints are reflected as breakpoints in the advisory fees for the Funds in order to permit shareholders to benefit from economies of scale if those Funds grow. |
Based on the Board’s evaluation of all factors that the Board deemed to be material, including those factors described above, the Board, including the Independent Trustees, concluded that renewal of the Advisory Agreement and each of the Subadvisory Agreements with respect to each Fund would be in the best interest of each of the respective Funds and its shareholders. Accordingly, the Board, and the Independent Trustees voting separately, approved the Advisory Agreement and Subadvisory Agreements with respect to each Fund for an additional one-year period.
75
Appendix A
Portfolio
(subadvisors)
|
|
|
| Performance of fund,
as of 12.31.2019
|
| Fees and expenses
|
| Comments
|
|---|
| |
Asia Pacific Total Return Bond Fund
(Manulife Investment Management (US)) | | | | Benchmark Index — The fund outperformed for the one-, three- and five-year periods.
Lipper Category — The fund outperformed the median for the one-, three- and five-year periods. | | Subadvisory fee comparative data not provided due to limited size of Lipper peer group for this purpose.
Net management fees for this fund are higher than the peer group median.
Total expenses for this fund are higher than the peer group median. | | The Board took into account management’s discussion of the fund’s performance, including the favorable performance relative to the benchmark index and the peer group median for the one-, three- and five-year periods.
The Board took into account management’s discussion of the fund’s expenses. |
| |
Core Bond Fund
(Wells Capital Management, Inc.) | | | | Benchmark Index — The fund underperformed for the one-, three- and five-year periods and outperformed for the ten-year period.
Lipper Category — The fund outperformed the median for the ten-year period and underperformed the median for the one-, three- and five-year periods. | | Subadvisory fee comparative data not provided due to limited size of Lipper peer group for this purpose.
Net management fees for this fund are higher than the peer group median.
Total expenses for this fund are lower than the peer group median. | | The Board took into account management’s discussion of the fund’s performance, including the favorable performance relative to the benchmark index and peer group median for the ten-year period. The Board took into account management’s discussion of the factors that contributed to the fund’s performance for the benchmark index and peer group median for the one-, three- and five-year periods including the impact of past and current market conditions on the fund’s strategy and management’s outlook for the fund.
The Board concluded that the fund’s performance is being monitored and reasonably addressed, where appropriate.
The Board took into account management’s discussion of the fund’s expenses. |
| |
Opportunistic Fixed Income Fund (formerly known as “Global Bond Fund”)
(Wellington Management Company LLP) | | | | Benchmark Index — The fund underperformed for the one-year period and outperformed for the three-, five- and ten-year periods.
Lipper category — The fund underperformed the median for the one-year period and outperformed the median for the, three-, five- and ten-year periods. | | Subadvisory fee comparative data not provided due to limited size of Lipper peer group for this purpose.
Net management fees for this fund are higher than the peer group median.
Total expenses for this fund are equal to the peer group median. | | The Board took into account management’s discussion of the fund’s performance, including the favorable performance relative to the benchmark index and peer group median for the three-, five- and ten-year periods. The Board noted that the fund’s longer term performance in part reflects that of the previous subadvisor.
The Board took into account management’s discussion of the fund’s expenses.
The Board also took into account management’s discussion of the fund’s peer group. |
76
Appendix A
Portfolio
(subadvisors)
|
|
|
| Performance of fund,
as of 12.31.2019
|
| Fees and expenses
|
| Comments
|
|---|
| |
High Yield Fund
(Western Asset Management) | | | | Benchmark Index — The fund outperformed for the one-year period and underperformed for the three-, five-, and ten-year periods.
Lipper Category — The fund outperformed the median for the one-, three-, five-, and ten-year periods. | | Subadvisory fee comparative data not provided due to limited size of Lipper peer group for this purpose.
Net management fees for this fund are higher than the peer group median.
Total expenses for this fund are lower than the peer group median. | | The Board took into account management’s discussion of the fund’s performance, including the favorable performance relative to the benchmark index for the one-year period and to the peer group median for the one-, three-, five-, and ten-year periods.
The Board took into account management’s discussion of the fund’s expenses. |
| |
U.S. High Yield Bond Fund
(Wells Capital Management, Inc.) | | | | Benchmark Index — The fund underperformed for the one-, three-, five- and ten-year periods.
Lipper Category — The fund outperformed the median for the three-, five- and ten-year periods and underperformed for the one-year period. | | Subadvisory fee comparative data not provided due to limited size of Lipper peer group for this purpose.
Net management fees for this fund are higher than the peer group median.
Total expenses for this fund are lower than the peer group median | | The Board took into account management’s discussion of the fund’s performance, including the favorable performance relative to the peer group median for the three, five-, and ten-year periods.
The Board took into account management’s discussion of the fund’s expenses. |
77
Statement regarding liquidity risk management
Operation of the Liquidity Risk Management Program
This section describes operation and effectiveness of the Liquidity Risk Management Program (LRMP) established in accordance with Rule 22e-4 under the Investment Company Act of 1940, as amended (the Liquidity Rule). The Board of Trustees (the Board) of each Fund in the John Hancock Group of Funds (each a Fund and collectively, the Funds) that is subject to the requirements of the Liquidity Rule has appointed John Hancock Investment Management LLC and John Hancock Variable Trust Advisers LLC (together, the Advisor) to serve as Administrator of the LRMP with respect to each of the Funds, including Asia Pacific Total Return Bond Fund, Core Bond Fund, High Yield Fund, Opportunistic Fixed Income Fund (formerly Global Bond Fund), and U.S. High Yield Bond Fund, subject to the oversight of the Board. In order to provide a mechanism and process to perform the functions necessary to administer the LRMP, the Advisor established the Liquidity Risk Management Committee (the Committee). The Funds’ subadvisor(s), Manulife Investment Management (US) LLC, Wells Capital Management, Incorporated, Western Asset Management Company, LLC, and Wellington Management Company LLP (the Subadvisor), execute the day-to-day investment management and security-level activities of the Fund in accordance with the requirements of the LRMP, subject to the supervision of the Advisor and the Board.
The Committee holds monthly meetings to: (1) review the day-to-day operations of the LRMP; (2) review and approve month end liquidity classifications; (3) review quarterly testing and determinations, as applicable; and (4) review other LRMP related material. The Committee also conducts daily, monthly, quarterly, and annual quantitative and qualitative assessments of each subadvisor to a Fund that is subject to the requirements of the Liquidity Rule and is a part of the LRMP to monitor investment performance issues, risks and trends. In addition, the Committee may conduct ad-hoc reviews and meetings with subadvisors as issues and trends are identified, including potential liquidity and valuation issues.
The Committee provided the Board at a meeting held on March 15-17, 2020 with a written report which addressed the Committee’s assessment of the adequacy and effectiveness of the implementation and operation of the LRMP and any material changes to the LRMP. The report, which covered the period December 1, 2018 through December 31, 2019, included an assessment of important aspects of the LRMP including, but not limited to:
| • | | Operation of the Fund’s Redemption-In-Kind Procedures; |
| • | | Highly Liquid Investment Minimum (HLIM) determination; |
| • | | Compliance with the 15% limit on illiquid investments; |
| • | | Reasonably Anticipated Trade Size (RATS) determination; |
| • | | Security-level liquidity classifications; and |
| • | | Liquidity risk assessment. |
The report also covered material liquidity matters which occurred or were reported during this period applicable to the Fund, if any, and the Committee’s actions to address such matters.
Redemption-In-Kind Procedures
Rule 22e-4 requires any fund that engages in or reserves the right to engage in in-kind redemptions to adopt and implement written policies and procedures regarding in-kind redemptions as part of the management of its liquidity risk. These procedures address the process for redeeming in kind, as well as the circumstances under which the Fund would consider redeeming in kind. Anticipated large redemption activity will be evaluated to identify situations where redeeming in securities instead of cash may be appropriate.
As part of its annual assessment of the LRMP, the Committee reviewed the implementation and operation of the Redemption-In-Kind Procedures and determined they are operating in a manner that such procedures are adequate and effective to manage in-kind redemptions on behalf of the Fund as part of the LRMP.
Highly Liquid Investment Minimum determination
The Committee uses an HLIM model to determine a Fund’s HLIM. This process incorporates the Fund’s investment strategy, historical redemptions, liquidity classification rollup percentages and cash balances, redemption policy, access to funding sources, distribution channels and client concentrations. If the Fund falls below its established HLIM for a period greater than 7 consecutive calendar days, the Committee prepares a report to the Board within one business day following the seventh consecutive calendar day with an explanation of how the Fund plans to restore its HLIM within a reasonable period of time.
Based on the HLIM model, the Committee has determined that the Fund qualifies as a Primarily Highly Liquid Fund (PHLF). It is therefore not required to establish a HLIM. The Fund is tested quarterly to confirm its PHLF status.
As part of its annual assessment of the LRMP, the Committee reviewed the policies and procedures in place with respect to HLIM and PHLF determinations, and determined that such policies and procedures are operating in a manner that is adequate and effective as part of the LRMP.
Compliance with the 15% limit on illiquid investments
Rule 22e-4 sets an aggregate illiquid investment limit of 15% for a fund. Funds are prohibited from acquiring an illiquid investment if this results in greater than 15% of its net assets being classified as illiquid. When applying this limit, the Committee defines “illiquid investment” to mean any investment that the Fund reasonably expects cannot be sold or disposed of in current market conditions in seven calendar days or less without the sale or disposition significantly changing the market value of the investment. If a 15% illiquid investment limit breach occurs for longer than 1 business day, the Fund is required to notify the Board and provide a plan on how to bring illiquid investments within the 15% threshold, and after 7 days confidentially notify the Securities and Exchange Commission (the SEC).
In February 2019, as a result of extended security markets closures in connection with the Chinese New Year in certain countries, the SEC released guidance, and the Committee approved and adopted an Extended Market Holiday Policy to plan for and monitor known Extended Market Holidays (defined as all expected market holiday closures spanning four or more calendar days).
As part of its annual assessment of the LRMP, the Committee reviewed the policies and procedures in place with respect to the 15% illiquid investment limit and determined such policies and procedures are operating in a manner that is adequate and effective as part of the LMRP.
Reasonably Anticipated Trade Size determination
In order to assess the liquidity risk of a Fund, the Committee considers the impact on the Fund that redemptions of a RATS would have under both normal and reasonably foreseeable stressed conditions. Modelling the Fund’s RATS requires quantifying cash flow volatility and analyzing distribution channel concentration and redemption risk. The model is designed to estimate the amount of assets that the Fund could reasonably anticipate trading on a given day, during both normal and reasonably foreseeable stressed conditions, to satisfy redemption requests.
As part of its annual assessment of the LRMP, the Committee reviewed the policies and procedures in place with respect to RATS determinations and determined that such policies and procedures are operating in a manner that is adequate and effective at making RATS determinations as part of the LRMP.
Security-level liquidity classifications
When classifying the liquidity of portfolio securities, the Fund adheres to the liquidity classification procedures established by the Advisor. In assigning a liquidity classification to Fund portfolio holdings, the following key inputs, among others, are considered: the Fund’s RATS, feedback from the applicable Subadvisor on market-, trading- and investment-specific considerations, an assessment of current market conditions and fund portfolio holdings, and a value
78
Statement regarding liquidity risk management
impact standard. The Subadvisor also provides position-level data to the Committee for use in monthly classification reconciliation in order to identify any classifications that may need to be changed as a result of the above considerations.
As part of its annual assessment of the LRMP, the Committee reviewed the policies and procedures in place with respect to security-level liquidity classifications and determined that such policies and procedures are operating in a manner that is adequate and effective as part of the LRMP.
Liquidity risk assessment
The Committee periodically reviews and assesses, the Fund’s liquidity risk, including its investment strategy and liquidity of portfolio investments during both normal and reasonably foreseeable stressed conditions (including whether the investment strategy is appropriate for an open-end fund, the extent to which the strategy involves a relatively concentrated portfolio or large positions in particular issuers, and the use of borrowings for investment purposes and derivatives), cash flow analysis during both normal and reasonably foreseeable stressed conditions, and holdings of cash and cash equivalents, as well as borrowing arrangements and other funding sources.
The Committee also monitors global events, such as the COVID-19 Coronavirus, that could impact the markets and liquidity of portfolio investments and their classifications.
As part of its annual assessment of the LRMP, the Committee reviewed Fund-Level Liquidity Risk Assessment Reports for each of the Funds and determined that the investment strategy for each Fund continues to be appropriate for an open-ended structure.
Adequacy and Effectiveness
Based on the review and assessment conducted by the Committee, the Committee has determined that the LRMP has been implemented, and is operating in a manner that is adequate and effective at assessing and managing the liquidity risk of each Fund.
79
Trustees and officers information
This chart provides information about the Trustees and Officers of John Hancock Funds II who oversee your John Hancock funds. Officers elected by the Trustees manage the day-to-day operations of the Funds and execute policies formulated by the Trustees.
INDEPENDENT TRUSTEES
| Name, Year of Birth | | | | Position with the Trust1 | | Principal Occupation(s) and
Other Directorships During Past Five Years |
|---|
Hassell H. McClellan
Born: 1945 | | | | Trustee (since 2005)
and Chairperson of the
Board (since 2017) | | Director/Trustee, Virtus Funds (since 2008); Director, The Barnes Group (since 2010); Associate Professor, The Wallace E. Carroll School of Management, Boston College (retired 2013).
Trustee (since 2005) and Chairperson of the Board (since 2017) of various trusts within the John Hancock Fund Complex. |
Charles L. Bardelis2
Born: 1941 | | | | | | Director, Island Commuter Corp. (marine transport).
Trustee of various trusts within the John Hancock Fund Complex (since 1988). |
| | | | | | Chief Executive Officer, Foresters Financial (since 2018); Chairman and Chief Executive Officer, Zillion Group, Inc. (formerly HealthFleet, Inc.) (healthcare) (2014–2018); Executive Vice President and Chief Executive Officer, U.S. Life Insurance Division of Genworth Financial, Inc. (insurance) (January 2014–July 2014); Senior Executive Vice President, Manulife Financial, President and Chief Executive Officer, John Hancock (1999–2012); Chairman and Director, John Hancock Investment Management LLC, John Hancock Investment Management Distributors LLC, and John Hancock Variable Trust Advisers LLC (2005–2010).
Trustee of various trusts within the John Hancock Fund Complex (2005–2014 and since 2015). |
Peter S. Burgess2
Born: 1942 | | | | | | Consultant (financial, accounting, and auditing matters) (since 1999); Certified Public Accountant; Partner, Arthur Andersen (independent public accounting firm) (prior to 1999); Director, Lincoln Educational Services Corporation (since 2004); Director, Symetra Financial Corporation (2010–2016); Director, PMA Capital Corporation (2004–2010).
Trustee of various trusts within the John Hancock Fund Complex (since 2005). |
William H. Cunningham
Born: 1944 | | | | Trustee
(since 2012 and 2005-2006) | | Professor, University of Texas, Austin, Texas (since 1971); former Chancellor, University of Texas System and former President of the University of Texas, Austin, Texas; Chairman (since 2009) and Director (since 2006), Lincoln National Corporation (insurance); Director, Southwest Airlines (since 2000); former Director, LIN Television (2009–2014).
Trustee of various trusts within the John Hancock Fund Complex (since 1986). |
| | | | | | Chief Executive Officer, Grace Fey Advisors (since 2007); Director and Executive Vice President, Frontier Capital Management Company (1988–2007); Director, Fiduciary Trust (since 2009).
Trustee of various trusts within the John Hancock Fund Complex (since 2008). |
80
Trustees and officers information
| Name, Year of Birth | | | | Position with the Trust1 | | Principal Occupation(s) and
Other Directorships During Past Five Years |
|---|
Deborah C. Jackson
Born: 1952 | | | | | | President, Cambridge College, Cambridge, Massachusetts (since 2011); Board of Directors, Massachusetts Women’s Forum (since 2018); Board of Directors, National Association of Corporate Directors/New England (since 2015); Board of Directors, Association of Independent Colleges and Universities of Massachusetts (2014–2017); Chief Executive Officer, American Red Cross of Massachusetts Bay (2002–2011); Board of Directors of Eastern Bank Corporation (since 2001); Board of Directors of Eastern Bank Charitable Foundation (since 2001); Board of Directors of American Student Assistance Corporation (1996–2009); Board of Directors of Boston Stock Exchange (2002–2008); Board of Directors of Harvard Pilgrim Healthcare (health benefits company) (2007–2011).
Trustee of various trusts within the John Hancock Fund Complex (since 2008). |
James M. Oates2
Born: 1946 | | | | | | Managing Director, Wydown Group (financial consulting firm) (since 1994); Chairman and Director, Emerson Investment Management, Inc. (2000–2015); Independent Chairman, Hudson Castle Group, Inc. (formerly IBEX Capital Markets, Inc.) (financial services company) (1997–2011); Director, Stifel Financial (since 1996); Director, Investor Financial Services Corporation (1995–2007); Director, Connecticut River Bancorp (1998–2014); Director/Trustee, Virtus Funds (since 1988).
Trustee (since 2004) and Chairperson of the Board (2005–2016) of various trusts within the John Hancock Fund Complex. |
Steven R. Pruchansky
Born: 1944 | | | | Trustee and Vice Chairperson
of the Board
(since 2012) | | Managing Director, Pru Realty (since 2017); Chairman and Chief Executive Officer, Greenscapes of Southwest Florida, Inc. (2000–2014); Director and President, Greenscapes of Southwest Florida, Inc. (until 2000); Member, Board of Advisors, First American Bank (until 2010); Managing Director, Jon James, LLC (real estate) (since 2000); Partner, Right Funding, LLC (2014–2017); Director, First Signature Bank & Trust Company (until 1991); Director, Mast Realty Trust (until 1994); President, Maxwell Building Corp. (until 1991).
Trustee (since 1992), Chairperson of the Board (2011–2012), and Vice Chairperson of the Board (since 2012) of various trusts within the John Hancock Fund Complex. |
Frances G. Rathke2,*
Born: 1960 | | | | | | Director, Northern New England Energy Corporation (since 2017); Director, Audit Committee Chair and Compensation Committee Member, Green Mountain Power Corporation (since 2016); Director, Treasurer and Finance & Audit Committee Chair, Flynn Center for Performing Arts (since 2016); Director, Audit Committee Chair and Compensation Committee Member, Planet Fitness (since 2016); Director, Citizen Cider, Inc. (high-end hard cider and hard seltzer company) (since 2016); Chief Financial Officer and Treasurer, Keurig Green Mountain, Inc. (2003-retired 2015); Independent Financial Consultant, Frances Rathke Consulting (strategic and financial consulting services) (2001-2003); Chief Financial Officer and Secretary, Ben & Jerry’s Homemade, Inc. (1989-2000, including prior positions); Senior Manager, Coopers & Lybrand, LLC (independent public accounting firm) (1982-1989).
Trustee of various trusts within the John Hancock Fund Complex (since 2020). |
81
Trustees and officers information
| Name, Year of Birth | | | | Position with the Trust1 | | Principal Occupation(s) and
Other Directorships During Past Five Years |
|---|
Gregory A Russo
Born: 1949 | | | | | | Director and Audit Committee Chairman (since 2012), and Member, Audit Committee and Finance Committee (2011–2020), NCH Healthcare System, Inc. (holding company for multi-entity healthcare system); Director and Member (2012–2018), and Finance Committee Chairman (2014–2018), The Moorings, Inc. (nonprofit continuing care community); Vice Chairman, Risk & Regulatory Matters, KPMG LLP (KPMG) (2002–2006); Vice Chairman, Industrial Markets, KPMG (1998–2002); Chairman and Treasurer, Westchester County, New York, Chamber of Commerce (1986–1992); Director, Treasurer and Chairman of Audit and Finance Committees, Putnam Hospital Center (1989–1995); Director and Chairman of Fundraising Campaign, United Way of Westchester and Putnam Counties, New York (1990–1995).
Trustee of various trusts within the John Hancock Fund Complex (since 2008). |
NON-INDEPENDENT TRUSTEES3
| Name, Year of Birth | | | | Position with the Trust1 | | Principal Occupation(s) and
Other Directorships During Past Five Years |
|---|
Andrew G. Arnott
Born: 1971 | | | | President and Non-Independent Trustee
(Since 2017) | | Head of Wealth and Asset Management, United States and Europe, for John Hancock and Manulife (since 2018); Executive Vice President, John Hancock Financial Services (since 2009, including prior positions); Director and Executive Vice President, John Hancock Investment Management LLC (since 2005, including prior positions); Director and Executive Vice President, John Hancock Variable Trust Advisers LLC (since 2006, including prior positions); President, John Hancock Investment Management Distributors LLC (since 2004, including prior positions); President of various trusts within the John Hancock Fund Complex (since 2007, including prior positions).
Trustee of various trusts within the John Hancock Fund Complex (since 2017). |
Marianne Harrison
Born: 1963 | | | | Non-Independent Trustee
(since 2018) | | President and CEO, John Hancock (since 2017); President and CEO, Manulife Canadian Division (2013–2017); Member, Board of Directors, CAE Inc. (since 2019); Member, Board of Directors, MA Competitive Partnership Board (since 2018); Member, Board of Directors, American Council of Life Insurers (ACLI) (since 2018); Member, Board of Directors, Communitech, an industry-led innovation center that fosters technology companies in Canada (2017–2019); Member, Board of Directors, Manulife Assurance Canada (2015–2017); Board Member, St. Mary’s General Hospital Foundation (2014–2017); Member, Board of Directors, Manulife Bank of Canada (2013–2017); Member, Standing Committee of the Canadian Life & Health Assurance Association (2013–2017); Member, Board of Directors, John Hancock USA, John Hancock Life & Health, John Hancock New York (2012–2013).
Trustee of various trusts within the John Hancock Fund Complex (since 2018). |
82
Trustees and officers information
PRINCIPAL OFFICERS WHO ARE NOT TRUSTEES
| Name, Year of Birth | | | | Position with the Trust | | Principal Occupation(s) and
Other Directorships During Past Five Years |
|---|
Charles A. Rizzo
Born: 1957 | | | | Chief Financial Officer
(since 2007) | | Vice President, John Hancock Financial Services (since 2008); Senior Vice President, John Hancock Investment Management LLC and John Hancock Variable Trust Advisers LLC (since 2008); Chief Financial Officer of various trusts within the John Hancock Fund Complex (since 2007). |
Salvatore Schiavone
Born: 1965 | | | | Treasurer
(2007-2009 and since 2010, including prior positions) | | Assistant Vice President, John Hancock Financial Services (since 2007); Vice President, John Hancock Investment Management LLC and John Hancock Variable Trust Advisers LLC (since 2007); Treasurer of various trusts within the John Hancock Fund Complex (since 2007, including prior positions). |
Christopher (Kit) Sechler
Born: 1973 | | | | Chief Legal Officer and
Secretary
(since 2018) | | Vice President and Deputy Chief Counsel, John Hancock Investments (since 2015); Assistant Vice President and Senior Counsel (2009 -2015), John Hancock Investment Management; Chief Legal Officer and Secretary of various trusts within the John Hancock Fund Complex (since 2018); Assistant Secretary of John Hancock Investment Management LLC and John Hancock Variable Trust Advisers LLC (since 2009). |
Trevor Swanberg
Born: 1979 | | | | Chief Compliance Officer
(since 2020) | | Chief Compliance Officer, various trusts within the John Hancock Fund Complex, John Hancock Investment Management LLC, and John Hancock Variable Trust Advisers LLC (since 2020); Deputy Chief Compliance Officer, various trusts within the John Hancock Fund Complex (2018–2020); Deputy Chief Compliance Officer, John Hancock Investment Management LLC and John Hancock Variable Trust Advisers LLC (2019–2020); Assistant Chief Compliance Officer, various trusts within the John Hancock Fund Complex (2016–2018); Assistant Chief Compliance Officer, John Hancock Investment Management LLC and John Hancock Variable Trust Advisers LLC (2016–2019); Vice President, State Street Global Advisors (2015–2016). |
| 1 | | Each Trustee holds office until his or her successor is elected and qualified, or until the Trustee’s death, retirement, resignation, or removal.Mr. Boyle has served as Trustee at various times prior to the date listed in the table. |
| 2 | | Member of the Audit Committee. |
| 3 | | The Trustee is a Non-Independent Trustee due to current or former positions with the Advisor and certain affiliates. |
| * | | Appointed as Independent Trustee effective as of September 15, 2020. |
The business address for all Trustees and Officers is 200 Berkeley Street, Boston, Massachusetts 02116-5010.
The Statement of Additional Information of the fund includes additional information about members of the Board of Trustees of the Trust and is available without charge, upon request, by calling 1-800-225-5291.
83
John Hancock Funds II
For more information
The Statement of Additional Information, a separate document with supplemental information not contained in the prospectus, includes additional information on the Board of Trustees and can be obtained without charge by calling 800-344-1029 or on the Securities and Exchange Commission (SEC) website at sec.gov.
PROXY VOTING POLICY A description of the trust’s proxy voting policies and procedures and information regarding how the trust voted proxies relating to portfolio securities during the most recent twelve-month period ended June 30 is available without charge, upon request, by calling 800-344-1029 or on the SEC website at sec.gov.
QUARTERLY PORTFOLIO DISCLOSURE The Trust’s complete schedule of portfolio holdings as of the end of the third month of every fiscal quarter are filed with the SEC on Form N-PORT within 60 days of the end of the fiscal quarter. N-PORT filings are available on our website and the SEC’s website, sec.gov.
The report is certified under the Sarbanes-Oxley Act, which requires mutual funds and other public companies to affirm that, to the best of their knowledge, the information in their financial reports is fairly and accurately stated in all material respects.
84

ITEM 2. CODE OF ETHICS.
| (a) | As of the end of the fiscal year August 31, 2020 the Registrant has adopted a code of ethics, as defined in Item 2 of Form N-CSR that applies to its principal executive officer and principal financial officer. A copy of the code of ethics is filed as an exhibit to this Form N-CSR. |
| | |
| (b) | Not applicable |
| | |
| (c) | Not applicable |
| | |
| (d) | Not applicable |
| (e) Not applicable |
| |
| (f)(1) A copy of the code of ethics is filed as an exhibit to this Form N-CSR. |
| | |
| (f)(2) Not applicable. |
| | |
| (f)(3) The Registrant will provide a copy of the Code of Ethics to any person without charge, upon request by calling the following toll free number (800) 344-1029. |
ITEM 3. AUDIT COMMITTEE FINANCIAL EXPERT.
The Board of Trustees has determined that at least one member of its audit committee is an “audit committee financial expert”. Peter S. Burgess is an audit committee financial expert and is “independent”, pursuant to general instructions on Form N-CSR Item 3.
ITEM 4. PRINCIPAL ACCOUNTANT FEES AND SERVICES.
| (a) | AUDIT FEES: |
| 2020: | | $1,062,343 |
| 2019: | | $1,305,869 |
These fees represent aggregate fees billed for the last two fiscal years (the “Reporting Periods”) for professional services rendered by the principal accountant for the audits of the Registrant’s annual financial statements or services that are normally provided by the accountant in connection with statutory and regulatory filing or engagements for such Reporting Periods.
| (b) | AUDIT RELATED FEES: |
| 2020: | | $69,964 |
| 2019: | | $47,563 |
These fees represent the aggregate fees billed for the Reporting Periods for assurance and related services by the principal accountant that are reasonably related to the performance of the audit of the Registrant’s financial statements and are not reported under paragraph (a) of this Item. Such fees relate to professional services rendered by the principal accountant for separate audit reports in connection with security counts pursuant to Rule 17f-2 under the Investment Company Act of 1940 and service provider internal controls reviews. Additionally, amounts billed to control affiliates for service provider internal controls reviews were $216,467 and $113,000 for the fiscal years ended August 31, 2020 and 2019, respectively.
| (c) | TAX FEES: |
| 2020: | | $4,000 |
| 2019: | | $0 |
These fees represent aggregate fees billed for the Reporting Periods for professional services rendered by the principal accountant for tax compliance, tax advice and tax planning. The tax fees for the year ended August 31, 2019 were $0 as tax services for the reporting period were provided by a service provider other than the principal accountant.
| (d) | ALL OTHER FEES: |
| 2020: | | $2,312 |
| 2019: | | $2,688 |
These fees represent all other fees billed to the Registrant for products and services provided by the principal accountant. Such fees relate primarily to procedures performed in connection with year end reporting for retail shareholders. These fees were billed to the Registrant and were approved by the Registrant’s audit committee.
| (e) | (1) Audit Committee Pre-Approval Policies and Procedures: |
| |
| The Trust’s Audit Committee must pre-approve all audit and non-audit services provided by the independent registered public accounting firm (the “Auditor”) relating to the operations or financial reporting of the funds. Prior to the commencement of any audit or non-audit services to a fund, the Audit Committee reviews the services to determine whether they are appropriate and permissible under applicable law. The Trust’s Audit Committee has adopted policies and procedures to, among other purposes, provide a framework for the Committee’s consideration of audit-related and non-audit services by the Auditor. The policies and procedures require that any audit-related and non-audit service provided by the Auditor and any non-audit service provided by the Auditor to a fund service provider that relates directly to the operations and financial reporting of a fund are subject to approval by the Audit Committee before such service is provided. Audit-related services provided by the Auditor that are expected to exceed $25,000 per instance/per fund are subject to specific pre-approval by the Audit Committee. Tax services provided by the Auditor that are expected to exceed $30,000 per instance/per fund are subject to specific pre-approval by the Audit Committee. All audit services, as well as the audit-related and non-audit services that are expected to exceed the amounts stated above, must be approved in advance of provision of the service by formal resolution of the Audit Committee. At the regularly scheduled Audit Committee meetings, the Committee reviews a report summarizing the services, including fees, provided by the Auditor. (2) Amount approved by the Audit Committee pursuant paragraph (c) (7) (i) (C) of Rule 2-01 of Regulation S-X: None. |
| | |
| (f) | Not applicable. |
| |
| (g) | The aggregate non-audit fees billed by the registrant’s principal accountant for services rendered to the registrant and rendered to the registrant’s control affiliates for each of the last two fiscal years of the registrant were $1,297,806 and $912,042 for the fiscal years ended August 31, 2020 and August 31, 2019, respectively. |
| |
| (h) | The audit committee of the registrant has considered the non-audit services provided by the registrant’s principal accountant to the control affiliates and has determined that the services that were non pre-approved are compatible with maintaining the principal accountant’s independence. |
ITEM 5. AUDIT COMMITTEE OF LISTED REGISTRANTS.
Peter S. Burgess – Chairman
Charles L. Bardelis
James M. Oates
ITEM 6. SCHEDULE OF INVESTMENTS.
(a) Not applicable.
(b) Not applicable.
ITEM 7. DISCLOSURE OF PROXY VOTING POLICIES AND PROCEDURES FOR CLOSED-END MANAGEMENT INVESTMENT COMPANIES.
Not applicable.
ITEM 8. PORTFOLIO MANAGERS OF CLOSED-END MANAGEMENT INVESTMENT COMPANIES.
Not applicable.
ITEM 9. PURCHASE OF EQUITY SECURITIES BY CLOSED-END MANAGEMENT INVESTMENT COMPANIES AND AFFILIATED PURCHASERS.
Not applicable.
ITEM 10. SUBMISSION OF MATTERS TO VOTE OF SECURITY HOLDERS.
| (a) | The registrant has adopted procedures by which shareholders may recommend nominees to the registrant's Board of Trustees. A copy of the procedures is filed as an exhibit to this Form N-CSR. See attached "John Hancock Funds - Nominating and Governance Committee Charter". |
ITEM 11. CONTROLS AND PROCEDURES.
(a) Based upon their evaluation of the registrant's disclosure controls and procedures as conducted within 90 days of the filing date of this Form N-CSR, the registrant's principal executive officer and principal financial officer have concluded that those disclosure controls and procedures provide reasonable assurance that the material information required to be disclosed by the registrant on this report is recorded, processed, summarized and reported within the time periods specified in the Securities and Exchange Commission's rules and forms.
(b) There were no changes in the registrant's internal control over financial reporting that occurred during the period covered by this report that have materially affected, or are reasonably likely to materially affect, the registrant's internal control over financial reporting.
ITEM 12. DISCLOSURE OF SECURITIES LENDING ACTIVITIES FOR CLOSED-END MANGEMENT INVESTMENT COMPANIES.
Not applicable.
ITEM 13. EXHIBITS.
(a)(1) Code of Ethics for Covered Officers is attached.
(a)(2) Separate certifications for the registrant's principal executive officer and principal financial officer, as required by Section 302 of the Sarbanes-Oxley Act of 2002 and Rule 30a-2(a) under the Investment Company Act of 1940, are attached.
(b)(1) Separate certifications for the registrant's principal executive officer and principal financial officer, as required by 18 U.S.C. Section 1350, as adopted pursuant to Section 906 of the Sarbanes-Oxley Act of 2002, and Rule 30a-2(b) under the Investment Company Act of 1940, are attached. The certifications furnished pursuant to this paragraph are not deemed to be "filed" for purposes of Section 18 of the Securities Exchange Act of 1934, or otherwise subject to the liability of that section. Such certifications are not deemed to be incorporated by reference into any filing under the Securities Act of 1933 or the Securities Exchange Act of 1934, except to the extent that the Registrant specifically incorporates them by reference.
(c)(1) Submission of Matters to a Vote of Security Holders is attached. See attached "John Hancock Funds -Nominating and Governance Committee Charter"
SIGNATURES
Pursuant to the requirements of the Securities Exchange Act of 1934 and the Investment Company Act of 1940, the registrant has duly caused this report to be signed on its behalf by the undersigned, thereunto duly authorized.
| JOHN HANCOCK FUNDS II |
| |
| |
| /s/ Andrew Arnott |
| Andrew Arnott |
| President |
| Date: October 22, 2020 |
Pursuant to the requirements of the Securities Exchange Act of 1934 and the Investment Company Act of 1940, this report has been signed below by the following persons on behalf of the registrant and in the capacities and on the dates indicated.
| /s/ Andrew Arnott |
| Andrew Arnott |
| President |
| Date: October 22, 2020 |
| |
| |
| /s/ Charles A. Rizzo |
| Charles A. Rizzo |
| Chief Financial Officer |
| Date: October 22, 2020 |