 Company Update June 2014 Filed by Brookdale Senior Living Inc. Pursuant to Rule 425 under the Securities Act of 1933 and deemed filed pursuant to Rule 14a-12 of the Securities Exchange Act of 1934 Subject Company: Emeritus Corporation (Commission File No. 001-14012) The following investor presentation was posted by Brookdale on its web site: |
 2 Forward-Looking Statements Certain statements in this Annual Report and other information we provide from time to time (including statements with respect to our pending merger with Emeritus Corporation (the "Merger") and the pending transactions with HCP, Inc.(the “HCP Transactions”)) may constitute forward-looking statements within the meaning of the Private Securities Litigation Reform Act of 1995. Those forward-looking statements include all statements that are not historical statements of fact and those regarding our intent, belief or expectations, including, but not limited to, statements relating to our operational initiatives and growth strategies and our expectations regarding their effect on our results; our expectations regarding the economy, the senior living industry, occupancy, revenue, cash flow, operating income, expenses, capital expenditures, Program Max opportunities, cost savings, the demand for senior housing, the home resale market, expansion, development and construction activity, acquisition opportunities, asset dispositions, our share repurchase program, capital deployment, returns on invested capital and taxes; our expectations regarding returns to shareholders and our growth prospects; our expectations concerning the future performance of recently acquired communities and the effects of acquisitions on our financial results; our ability to secure financing or repay, replace or extend existing debt at or prior to maturity; our ability to remain in compliance with all of our debt and lease agreements (including the financial covenants contained therein); our expectations regarding liquidity and leverage; our expectations regarding financings and refinancings of assets (including the timing thereof) and their effect on our results; our expectations regarding changes in government reimbursement programs and their effect on our results; our plans to generate growth organically through occupancy improvements, increases in annual rental rates and the achievement of operating efficiencies and cost savings; our plans to expand our offering of ancillary services (therapy, home health and hospice); our plans to expand, renovate, redevelop and reposition existing communities; our plans to acquire additional communities, asset portfolios, operating companies and home health agencies; the expected project costs for our expansion, redevelopment and repositioning program; our expected levels of expenditures and reimbursements (and the timing thereof); our expectations regarding our sales, marketing and branding initiatives and their impact on our results; our expectations for the performance of our entrance fee communities; our ability to anticipate, manage and address industry trends and their effect on our business; our expectations regarding the payment of dividends; our ability to increase revenues, earnings, Adjusted EBITDA, Cash From Facility Operations, and/or Facility Operating Income (as such terms are defined herein); and our expectations regarding the Merger and the HCP Transactions. Words such as "anticipate(s)", "expect(s)", "intend(s)", "plan(s)", "target(s)", "project(s)", "predict(s)", "believe(s)", "may", "will", "would", "could", "should", "seek(s)", "estimate(s)" and similar expressions are intended to identify such forward-looking statements. These statements are based on management’s current expectations and beliefs and are subject to a number of risks and uncertainties that could lead to actual results differing materially from those projected, forecasted or expected. Although we believe that the assumptions underlying the forward-looking statements are reasonable, we can give no assurance that our expectations will be attained. Factors which could have a material adverse effect on our operations and future prospects or which could cause actual results to differ materially from our expectations include, but are not limited to, the risk associated with the current global economic situation and its impact upon capital markets and liquidity; changes in governmental reimbursement programs; our inability to extend (or refinance) debt (including our credit and letter of credit facilities) as it matures; the risk that we may not be able to satisfy the conditions precedent to exercising the extension options associated with certain of our debt agreements; events which adversely affect the ability of seniors to afford our monthly resident fees or entrance fees; the conditions of housing markets in certain geographic areas; our ability to generate sufficient cash flow to cover required interest and long-term operating lease payments; the effect of our indebtedness and long-term operating leases on our liquidity; the risk of loss of property pursuant to our mortgage debt and long-term lease obligations; the possibilities that changes in the capital markets, including changes in interest rates and/or credit spreads, or other factors could make financing more expensive or unavailable to us; our determination from time to time to purchase any shares under the repurchase program; our ability to fund any repurchases; our ability to effectively manage our growth; our ability to maintain consistent quality control; delays in obtaining regulatory approvals; the risk that we may not be able to expand, redevelop and reposition our communities in accordance with our plans; our ability to complete acquisitions and integrate them into our operations; competition for the acquisition of assets; our ability to obtain additional capital on terms acceptable to us; a decrease in the overall demand for senior housing; our vulnerability to economic downturns; acts of nature in certain geographic areas; terminations of our resident agreements and vacancies in the living spaces we lease; early terminations or non- renewal of management agreements; increased competition for skilled personnel; increased union activity; departure of our key officers; increases in market interest rates; environmental contamination at any of our communities; failure to comply with existing environmental laws; an adverse determination or resolution of complaints filed against us; the cost and difficulty of complying with increasing and evolving regulation; risks relating to the Merger and the HCP Transactions, including in respect of the satisfaction of closing conditions to such transactions; unanticipated difficulties and/or expenditures relating to such transactions; the risk that regulatory approvals required for such transactions are not obtained or are obtained subject to conditions that are not anticipated; uncertainties as to the timing of such transactions; litigation relating to such transactions; the impact of such transactions on relationships with residents, employees and third parties; and the inability to obtain, or delays in obtaining cost savings and synergies from such transactions; as well as other risks detailed from time to time in our filings with the Securities and Exchange Commission, press releases and other communications, including those set forth under "Risk Factors" included in the accompanying Annual Report on Form 10-K. Such forward-looking statements speak only as of the date of this Annual Report. We expressly disclaim any obligation to release publicly any updates or revisions to any forward-looking statements to reflect any change in our expectations with regard thereto or change in events, conditions or circumstances on which any statement is based. |
 Additional Information In connection with the Merger, the Company has filed with the SEC a Registration Statement on Form S-4 that includes a joint proxy statement of the Company and Emeritus that also constitutes a prospectus of the Company, as well as other relevant documents concerning the proposed transaction. STOCKHOLDERS ARE URGED TO READ THE JOINT PROXY STATEMENT/PROSPECTUS REGARDING THE MERGER AND ANY OTHER RELEVANT DOCUMENTS FILED WITH THE SEC, AS WELL AS ANY AMENDMENTS OR SUPPLEMENTS TO THOSE DOCUMENTS, BECAUSE THEY CONTAIN IMPORTANT INFORMATION. A free copy of the joint proxy statement/prospectus and other filings containing information about the Company and Emeritus may be obtained at the SEC's Internet site (http://www.sec.gov). You are also able to obtain these documents, free of charge, from the Company at www.brookdale.com under the heading "About Brookdale / Investor Relations" or from Emeritus at www.emeritus.com under the heading "Investor Relations." The Company and Emeritus and their respective directors and executive officers may be deemed to be participants in the solicitation of proxies from the Company's and Emeritus' stockholders in connection with the Merger. Information about the directors and executive officers of the Company and their ownership of Company Common Stock is set forth in the Annual Report on Form 10-K/A, as filed with the SEC on April 30, 2014. Information about the directors and executive officers of Emeritus and their ownership of Emeritus Common Stock is set forth in Emeritus' Annual Report on Form 10-K/A, as filed with the SEC on April 30, 2014. Additional information regarding the interests of those participants and other persons who may be deemed participants in the Merger may be obtained by reading the joint proxy statement regarding the Merger. Free copies of this document may be obtained as described in the preceding paragraph. This communication shall not constitute an offer to sell or the solicitation of an offer to sell or the solicitation of an offer to buy any securities, nor shall there be any sale of securities in any jurisdiction in which such offer, solicitation or sale would be unlawful prior to registration or qualification under the securities laws of any such jurisdiction. No offer of securities shall be made except by means of a prospectus meeting the requirements of Section 10 of the Securities Act of 1933, as amended. 3 |
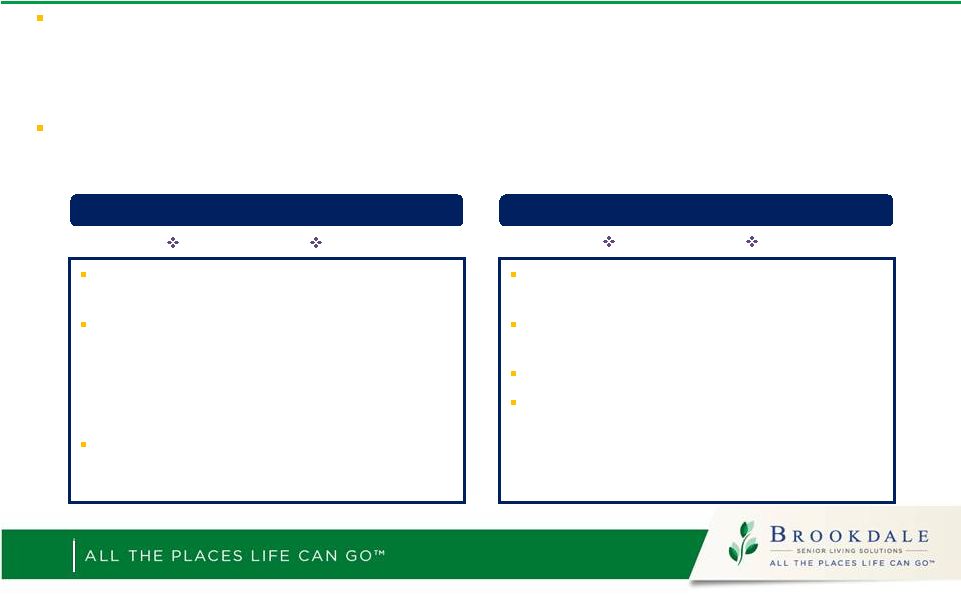
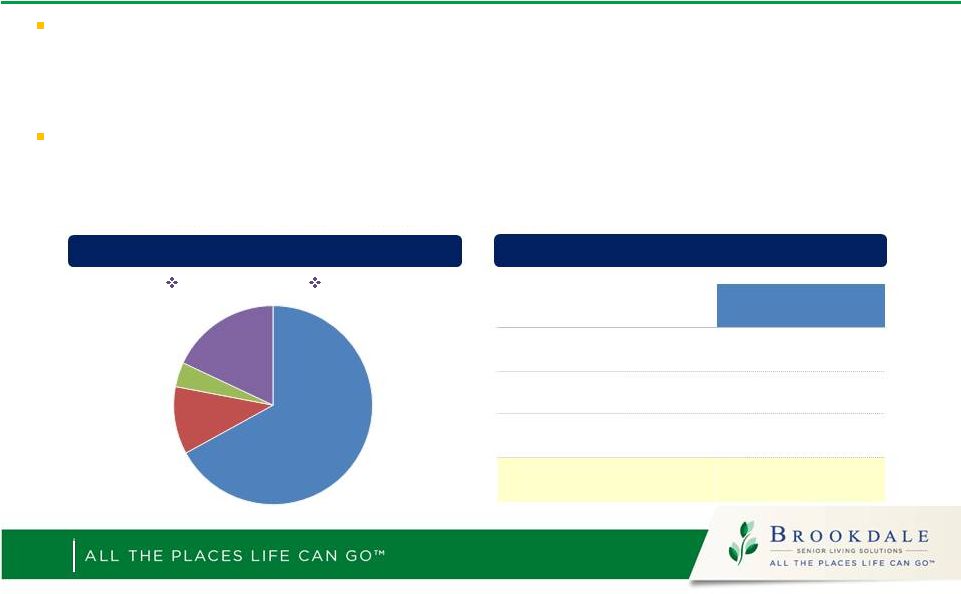
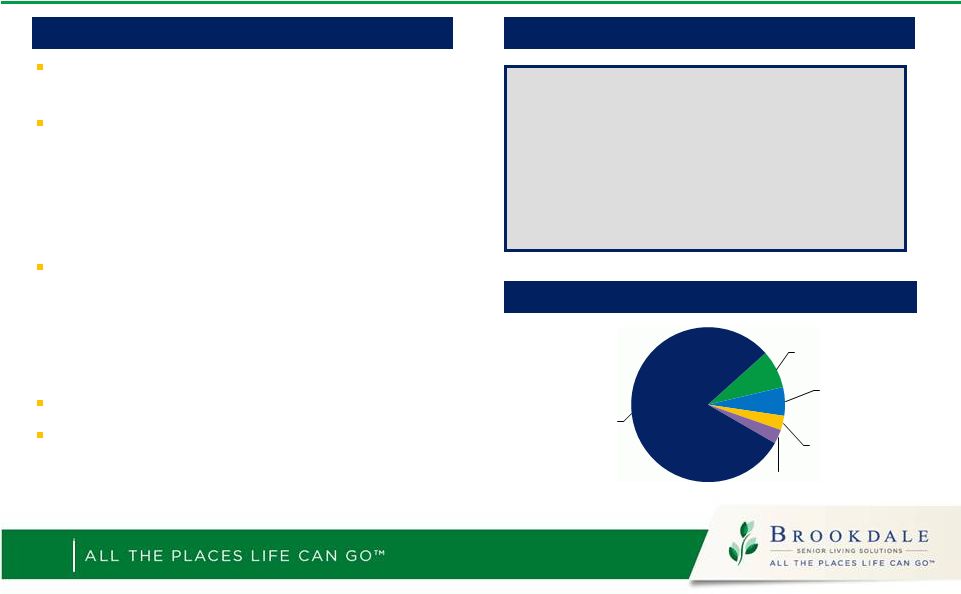 Brookdale Overview Unit Mix by Product Type 4 Company Highlights Favorable Payor Mix Independent Living – Rental 22,333 34% Independent Living – Entry Fee 5,679 9% Assisted Living 27,350 41% Alzheimer’s Care 6,971 11% Skilled Nursing 3,992 6% Note: All data as of March 31, 2014. Largest operator of senior housing in the United States Operates 647 communities in 36 states – Most diversified service continuum and broadest geographic footprint in the industry – Capacity to serve approximately 66,000 residents Ancillary services platform unique to Brookdale – Offers a fully-integrated set of ancillary services (home health, therapy, and/or hospice) to its residents Real estate ownership of 44% of its units 80% of revenue generated from private pay sources Medicare – Ancillary 8% Medicare – SNF 6% Medicaid 3% Insurance 3% Private Pay 80% |
 Key Investment Considerations Positive industry dynamics Broadest range of solutions to meet the needs of a growing and increasingly frail senior population Largest provider with broad geographic presence and national brand Significant near and long-term growth opportunities – Sustainable organic growth – Opportunities to redevelop and enhance current portfolio – Accretive acquisition opportunities in highly fragmented market Definitive agreement to merge with Emeritus Definitive agreement with HCP to restructure Emeritus’ leases and create Entry Fee CCRC joint venture 5 |
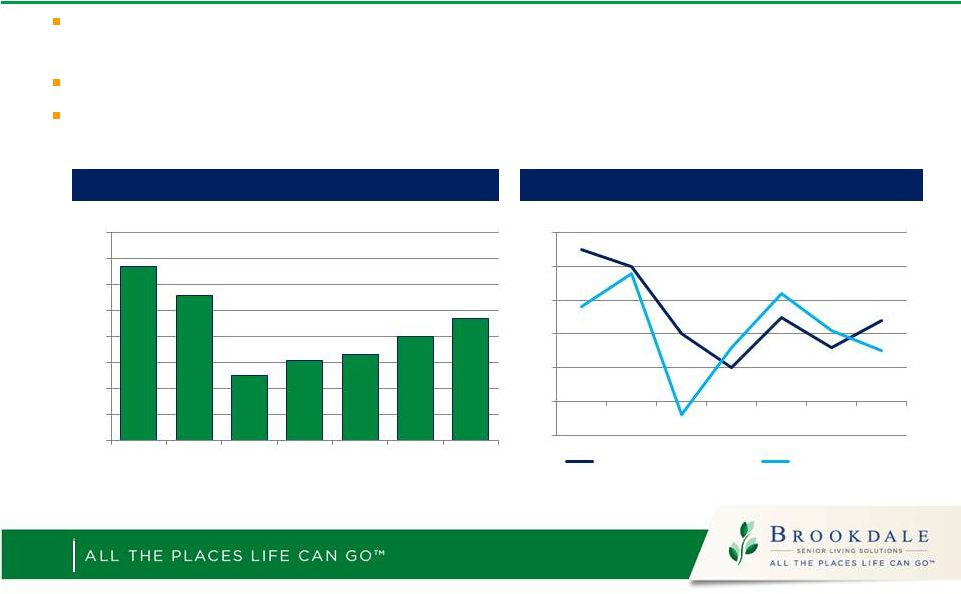
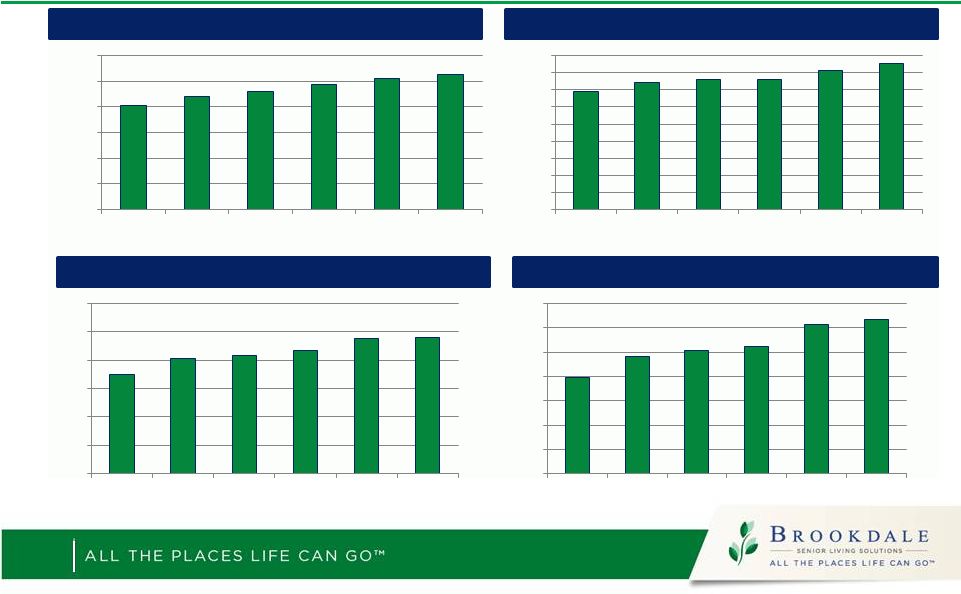 Improving Industry Operating Environment ($ in millions) 6 Facility Operating Income Adjusted EBITDA (2) Total Fee Revenues Cash From Facility Operations (2) (1) Note: See reconciliations of Non-GAAP measures at the end of the presentation (2) Excludes integration, transaction and EMR roll-out costs of $14.4 million, $23.5 million and $14.5 million for the full years of 2011, 2012 and 2013, respectively, and $11.8 million for the first quarter of 2014 2,023 2,213 2,305 2,445 2,546 2,631 - 500 1,000 1,500 2,000 2,500 3,000 2009 2010 2011 2012 2013 2014 Q1 Ann. 690 744 758 759 812 853 0 100 200 300 400 500 600 700 800 900 2009 2010 2011 2012 2013 2014 Q1 Ann. 349 408 417 433 478 479 0 100 200 300 400 500 600 2009 2010 2011 2012 2013 2014 Q1 Ann. 197 241 254 262 308 317 0 50 100 150 200 250 300 350 2009 2010 2011 2012 2013 2014 Q1 Ann. |
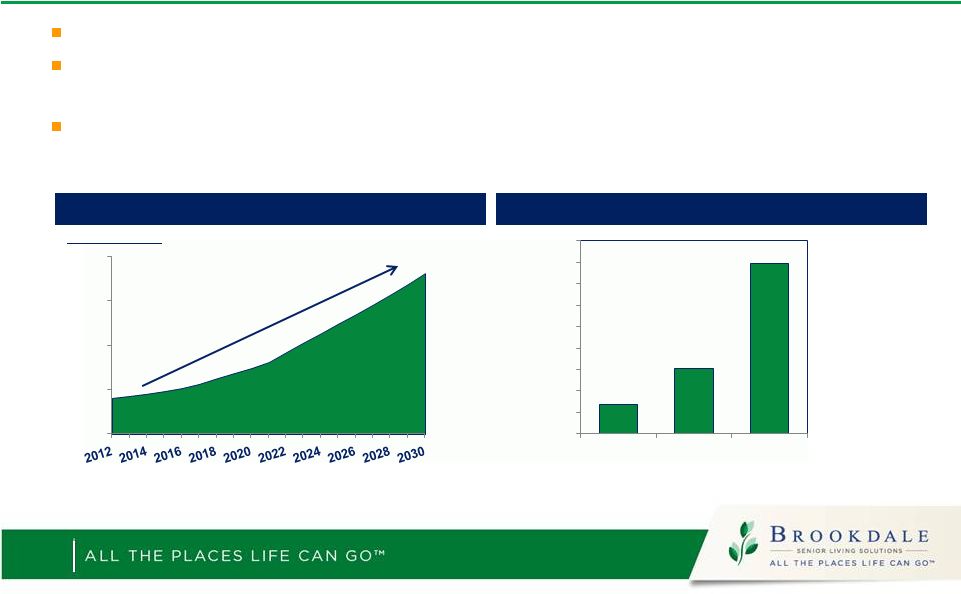 Favorable Demographics Sources: U.S Census Bureau National Health Interview 2003-2007 and Population projections; Alzheimer’s Association 2013 Report Senior population is estimated to grow 3x faster than base population According to the U.S. Census Bureau, people 75 and over are expected to represent 12% of the population by 2030 (compared to just 6% in 2012) Need for assistance increases progressively with aging; one in three over the age of 85 have Alzheimer’s Strong Population Growth Millions of People Need for Assistance Grows Dramatically % of Population with limitation in three or more Activities of Daily Living Population projection for 75 and older 7 15.0 20.0 25.0 30.0 35.0 7% 15% 40% 0% 5% 10% 15% 20% 25% 30% 35% 40% 45% 65-74 75-84 85+ |
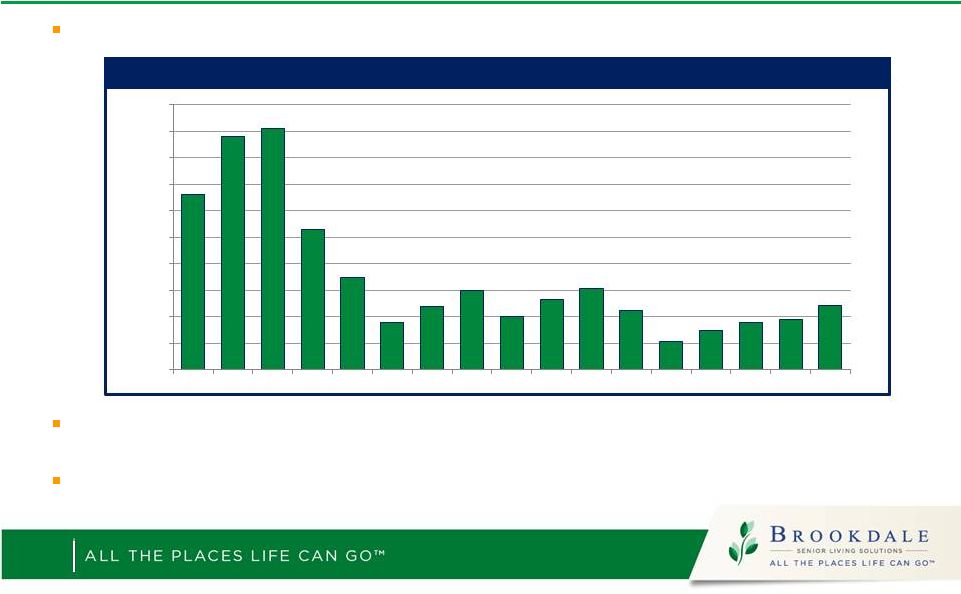 Supply-Demand Fundamentals New construction starts increasing, but remain at historic low levels Currently, only 1.9 million units serving a population of 12.0 million seniors (approx. 15% penetration rate) 1% increase in penetration is more than 100,000 new residents (1) Source: American Seniors Housing Association, NIC Map, PREI Research Construction Starts in Top 31 Metros (Units) (1) 8 - 5,000 10,000 15,000 20,000 25,000 30,000 35,000 40,000 45,000 50,000 1997 1998 1999 2000 2001 2002 2003 2004 2005 2006 2007 2008 2009 2010 2011 2012 2013 |
 Organic Growth Improving revenue growth with controlled costs produces significant cash flow growth High incremental margins from fixed cost structure Upside potential in occupancy and rate 9 Improving Occupancy Trends (1) Improving Same Store Pricing Growth 4.5% 4.0% 2.0% 1.0% 2.5% 1.6% 2.4% -1.0% 0.0% 1.0% 2.0% 3.0% 4.0% 5.0% 2007 2008 2009 2010 2011 2012 2013 Same Store Pricing Growth Inflation - CPI 90.7% 89.6% 86.5% 87.1% 87.3% 88.0% 88.7% 84.0% 85.0% 86.0% 87.0% 88.0% 89.0% 90.0% 91.0% 92.0% 2007 2008 2009 2010 2011 2012 2013 |
 10 Ancillary Services Growth Opportunities Brookdale has a unique, fully-integrated ancillary services platform – Strategic component of our service offerings providing solutions to address rising acuity, increases length of stay – Strategic differentiator in evolving post-acute care continuum Growth Opportunities – Rolling out services to new unit capacity through acquisitions, expansions or additional third-party management agreements – Adding services such as hospice, private pay home care, private pay case management and taking services “outside the walls” to the community in general |
 Development Growth (Program Max) Current development program focused on repositioning and expanding communities in current portfolio – Respond to changing customer needs by adding higher demand levels of care and services – Expect to generate 12% - 15% unlevered returns with lowest risk profile Large pipeline of potential future Program Max projects Highest capital deployment priority, with best returns 11 |
 Building Market Leading Brand Began in May 2013 to build the industry’s first truly national brand Striving to become the recognized provider of solutions as seniors and their adult children grapple with the confusing landscape of choices Diversified service continuum positions Brookdale with many of the potential choices National ad campaign is focused on facilitating conversations regarding those choices before it becomes critical Involves a multi-layered approach that combines national and local market activities Brand equity creates preference and drives loyalty with residents and their families and with lessors and managed / JV partners 12 |
 13 Name of Presentation | Date of Presentation Brookdale Merger with Emeritus |
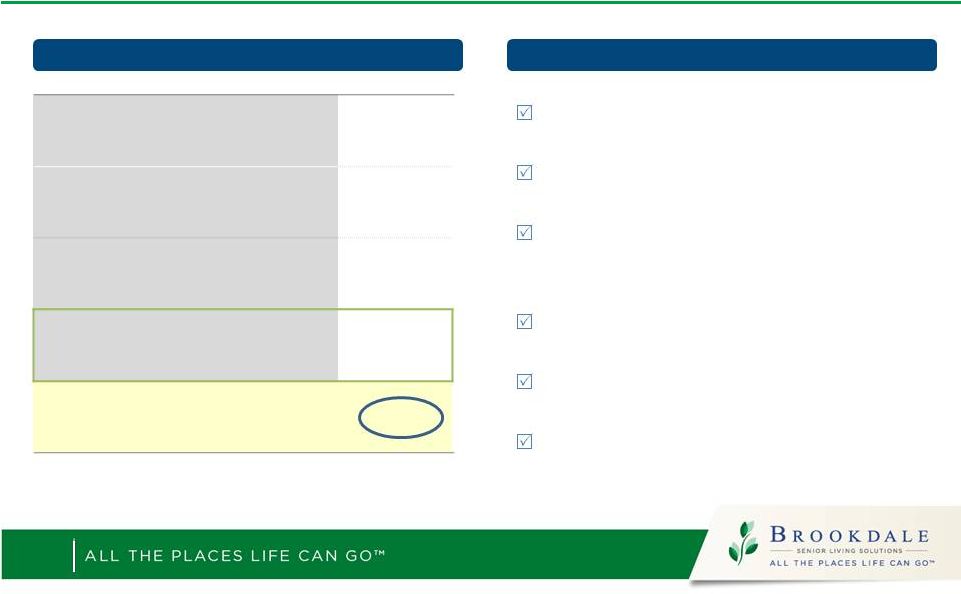
 Transaction Overview Exchange Ratio Each share of ESC will be converted into 0.95 of a share of BKD Ownership 73.1% BKD / 26.9% ESC Shares Outstanding Expect to have 172mm (approx.) shares outstanding following the merger Expected Close Expected to close in the third quarter of 2014 Brookdale Senior Living (“BKD”) is merging with Emeritus Corporation (“ESC”) in a 100% stock-for-stock transaction 14 |
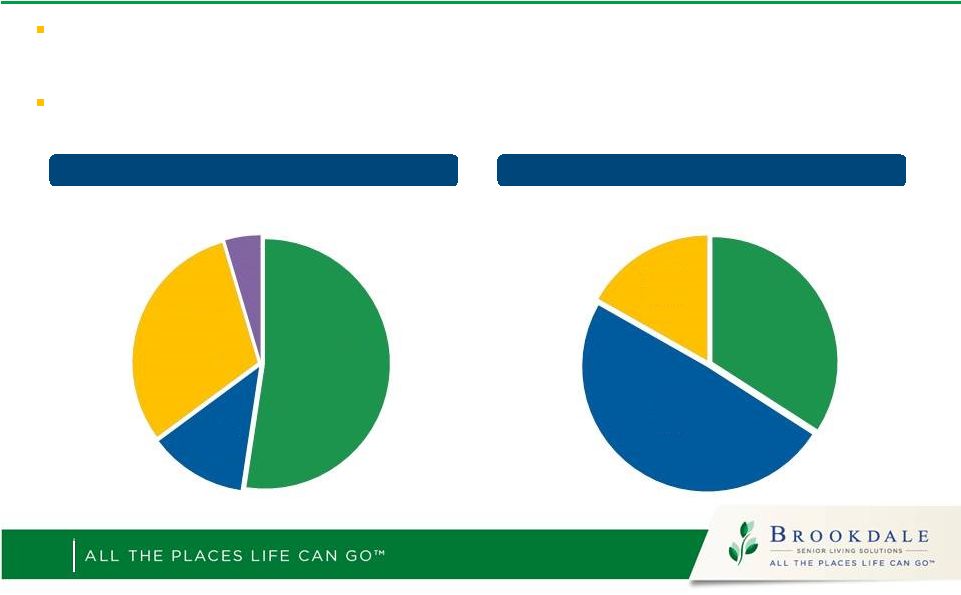 Combined Company Overview Merger creates the largest owner-operator of senior housing in the U.S with approximately 1,200 properties and 113,000 units $4.9bn of combined revenues in 2013 – over 80% from private pay sources Diversified Product Mix Diversified Operating Model Independent Living Managed Skilled Nursing Assisted Living Owned Leased Memory Care 15 (Properties) (% of Total) (Properties) (% of Total) 38,442 34% 55,352 49% 18,900 17% 59,026 52% 14,055 12% 34,449 31% 5,164 5% |
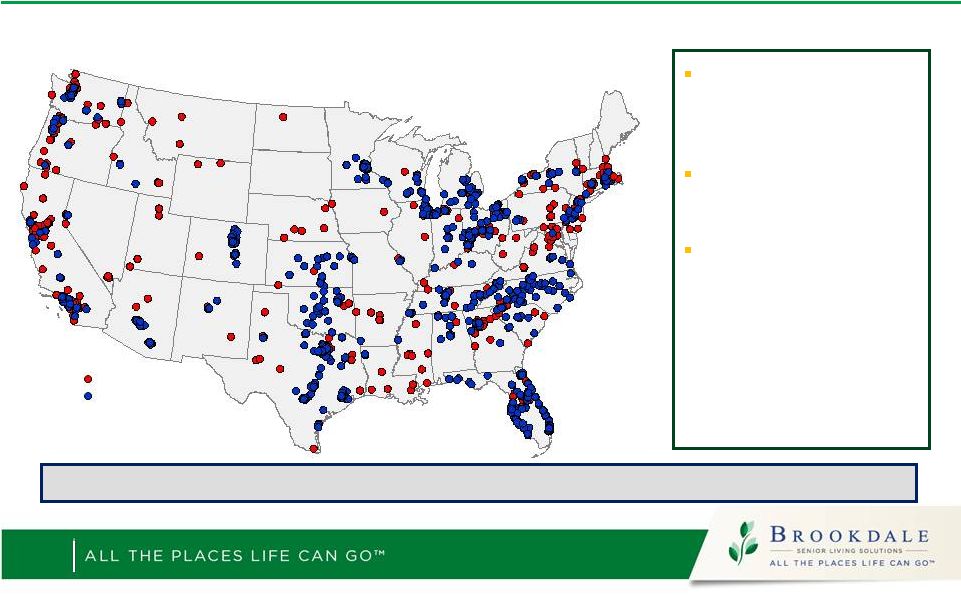 Builds Out Geographic Coverage 16 Emeritus Significantly Expands Brookdale’s Coverage and Density in Key Geographies Will have a presence in all top 31 markets, with a #1 position in 18 markets Will have a presence in 88 of the top 100 markets There will be 6.5 million of those 80+ and 37.7 million of those age 50 to 69 (adult influencers) living within 10 miles of a post-merger community Brookdale Emeritus Combined portfolio reaches 330 markets, covering 81% of the U.S. population |
 Agreement with HCP to Restructure ESC Leases 17 HCP has agreed to restructure all 202 ESC leases – Adds $0.10 of Year 3 accretion through rent reductions and improved economics of RIDEA assets – Deleverage and de-risk ESC NNN lease portfolios through rent reductions – Immediate monetization and value creation from ESC purchase options with HCP In consideration, BKD will cancel 49 purchase options and pay $34 million ($24 million net of deposits) for lease restructuring over 2 years (1) Annual rent reductions drive cash flow; $8.0 million in 2016 and $9.0 million thereafter HCP to provide $100 million of capital expenditures through 2017 Eliminates all FMV rent resets Amended initial term to 15 years on average with new purchase options totaling $60 million on under-performing properties BKD acquires 20% JV interest for $68 million, financed by HCP at 7% Eliminates negative EBITDA – terminates leases with negative coverage and above market escalators – Current rent coverage 0.84x before capex BKD receives management fees, all ancillary revenues and future participation in 20% of net cash flows 2017 and beyond (1) 49 purchase options reflect present value of $130-$160 mm based on 7.25% to 7.75% FMV cap rate range on seniors housing assets. Valuation assumes 10.0% discount rate 5,400 Units 79.7% occupancy 17 year Avg. Age 12,800 Units 90.6% occupancy 16 year Avg. Age 49 Properties – Converted to RIDEA JV 153 Properties – Amended NNN Leases |
 Also Creates Unique $1.2 billion CCRC Joint Venture BKD will own 51% and HCP 49% of a JV that owns and operates $1.2 billion of entry fee CCRCs – 5% management fee, 2% of entry fee resale cash receipts, 2% incentive fee – Pro rata sharing of cash flows; all ancillary revenue stays with BKD Significant consolidation potential in entry fee CCRC industry – 1,860 entry fee CCRC communities – 81% are typically highly levered “non-profits” – Little new supply being developed – Benefit as housing market continues to recover 18 Portfolio Snapshot JV Capitalization at Inception 7,000 Units 81.0% occupancy 22 year Avg. Age (1) Contribution of eight owned and two leasehold campuses (with related purchase options) IL 67% AL 11% ALZ 4% SNF 18% Sources (millions) BKD Equity (1) $516 HCP Equity $495 In-Place Mortgage Debt $220 Total $1,231 |
 Partnership & Merger Drive Potential Upside 19 Management Base Case – Year 3 Accretion Levers for Potential Upside Value of remaining purchase options Program Max 2.0 at ESC properties Implement innovative products/services to capture residents’ healthcare spend Additional synergies and cost savings New RIDEA joint venture New EF CCRC joint venture G&A $0.14 Property Level OpEx $0.12 New Ancillary Services $0.14 Additional Accretion from Enhanced HCP Partnership $0.10 Total CFFO/Share Accretion $0.50 |
 Roadmap to Closing 1. Customary regulatory and lender approvals 2. BKD and ESC shareholder approvals 3. Closing expected in the third quarter of 2014 20 |
 Brookdale Non-GAAP Financial Measure Definitions 21 Adjusted EBITDA Cash From Facility Operations Facility Operating Income Facility Operating Income is not a measurement of operating performance calculated in accordance with GAAP and should not be considered in isolation as a substitute for net income, income from operations, or cash flows provided by or used in operations, as determined in accordance with GAAP. We define Facility Operating Income as net income (loss) before provision (benefit) for income taxes, non-operating (income) expense items, (gain) loss on sale or acquisition of communities (including gain (loss) on facility lease termination), depreciation and amortization (including non-cash impairment charges), facility lease expense, general and administrative expense, including non-cash stock-based compensation expense, change in future service obligation, amortization of deferred entrance fee revenue and management fees. Cash From Facility Operations (CFFO) is a measurement of liquidity that is not calculated in accordance with GAAP and should not be considered in isolation as a substitute for cash flows provided by or used in operations, as determined in accordance with GAAP. We define CFFO as net cash provided by (used in) operating activities adjusted for changes in operating assets and liabilities, deferred interest and fees added to principal, refundable entrance fees received, first generation entrance fee receipts at a recently opened entrance fee CCRC prior to stabilization, entrance fee refunds disbursed adjusted for first generation entrance fee refunds not replaced by second generation entrance fee receipts at the recently opened community prior to stabilization, lease financing debt amortization with fair market value or no purchase options, gain (loss) on facility lease termination, recurring capital expenditures (net), distributions from unconsolidated ventures from cumulative share of net earnings, CFFO from unconsolidated ventures, and other. Recurring capital expenditures include routine expenditures capitalized in accordance with GAAP that are funded from current operations. Amounts excluded from recurring capital expenditures consist primarily of major projects, renovations, community repositionings, expansions, systems projects or other non-recurring or unusual capital items (including integration capital expenditures) or community purchases that are funded using lease or financing proceeds, available cash and/or proceeds from the sale of communities that are held for sale. Adjusted EBITDA is a measure of operating performance that is not calculated in accordance with U.S. generally accepted accounting principles (“GAAP”). Adjusted EBITDA should not be considered in isolation or as a substitute for net income, income from operations or cash flows provided by or used in operations, as determined in accordance with GAAP. Adjusted EBITDA is a key measure of the Company's operating performance used by management to focus on operating performance and management without mixing in items of income and expense that relate to long-term contracts and the financing and capitalization of the business. We define Adjusted EBITDA as net income (loss) before provision (benefit) for income taxes, non-operating (income) expense items, (gain) loss on sale or acquisition of communities (including gain (loss) on facility lease termination), depreciation and amortization (including non-cash impairment charges), straight-line lease expense (income), amortization of deferred gain, amortization of deferred entrance fees, non-cash stock-based compensation expense, and change in future service obligation and including entrance fee receipts and refunds (excluding (i) first generation entrance fee receipts from the sale of units at a recently opened entrance fee CCRC prior to stabilization and (ii) first generation entrance fee refunds not replaced by second generation entrance fee receipts at the recently opened community prior to stabilization). |
 Brookdale Adjusted EBITDA Reconciliation The table below reconciles Adjusted EBITDA from net (loss) income for the full years 2009 through 2013 and three months ended March 31, 2014 (in thousands): 22 Three Months Ended March 31, 2009 2010 2011 2012 2013 2014 Net loss (66,255) $ (48,901) $ (68,175) $ (66,467) $ (3,584) $ (2,299) $ Provision (benefit) for income taxes (32,926) (31,432) 2,340 1,519 1,756 1,006 Equity in (earnings) loss of unconsolidated ventures (440) (168) (1,432) 3,488 (1,484) (636) Loss on extinguishment of debt, net 1,292 1,557 18,863 221 1,265 - Other non-operating expense (income) (4,146) 1,454 (56) (593) (2,725) (465) Interest expense: Debt 99,653 102,245 93,229 98,183 96,131 23,844 Capitalized lease obligation 29,216 30,396 31,644 30,155 25,194 6,154 Amortization of deferred financing costs and debt discount 9,505 8,963 13,427 18,081 17,054 4,018 Change in fair value of derivatives and amortization (3,765) 4,118 3,878 364 (980) 847 Interest income (2,354) (2,238) (3,538) (4,012) (1,339) (321) Income from operations 29,780 65,994 90,180 80,939 131,288 32,148 Facility lease termination (gain) expense - 4,608 - (11,584) - - Depreciation and amortization 271,935 292,341 268,506 252,281 268,757 70,316 Asset impairment 10,073 13,075 16,892 27,677 12,891 - Loss (gain) on sale of communities 2,043 (3,298) - - - - Loss (gain) on acquisition - - (1,982) 636 - - Straight-line lease expense 15,851 10,521 8,608 6,668 2,597 (223) Amortization of deferred gain (4,345) (4,343) (4,373) (4,372) (4,372) (1,093) Amortization of entrance fees (21,661) (24,397) (25,401) (25,362) (29,009) (7,202) Non-cash stock-based compensation expense 26,935 20,759 19,856 25,520 25,978 7,572 Change in future service obligation (2,342) (1,064) - 2,188 (1,917) - Entrance fee receipts 68,875 73,906 67,989 82,705 92,331 14,959 First generation entrance fees received (25,673) (18,548) (12,617) - - - Entrance fee disbursements (22,916) (21,060) (24,993) (27,356) (35,325) (8,446) Adjusted EBITDA 348,555 $ 408,494 $ 402,665 $ 409,940 $ 463,219 $ 108,031 $ Years Ended December 31, (2) (3) (4) |
 Brookdale Cash From Facility Operations Reconciliation 23 The table below reconciles Cash from Facility Operations (CFFO) from net (loss) income for the full years 2009 through 2013 and three months ended March 31, 2014 (in thousands): Three Months Ended March 31, 2009 2010 2,011 2012 2013 2014 Net cash provided by operating activities 237,220 $ 228,244 $ 268,427 $ 290,969 $ 366,121 $ 52,696 $ Changes in operating assets and liabilities 4,532 46,674 20,914 (20,698) (33,198) 28,558 Refundable entrance fees received 30,386 36,420 29,611 42,600 48,140 5,924 First generation entrance fees received (25,673) (18,548) (12,617) - - - Entrance fee refunds disbursed (22,916) (21,060) (24,993) (27,356) (35,325) (8,446) Recurring capital expenditures, net (19,522) (27,969) (33,661) (38,306) (42,901) (9,369) Lease financing debt amortization with fair market value or no purchase options (7,195) (8,972) (10,465) (12,120) (13,927) (3,897) Facility lease termination (gain) expense - 4,608 - - - - Distributions from unconsolidated ventures from cumulative share of net earnings - (775) (582) (1,507) (2,691) (245) CFFO from unconsolidated ventures - 2,050 3,289 5,376 7,804 2,241 Cash From Facility Operations 196,832 $ 240,672 $ 239,923 $ 238,958 $ 294,023 $ 67,462 $ Years Ended December 31, |
 Brookdale Facility Operating Income Reconciliation 24 Three Months Ended March 31, 2009 2010 2011 2012 2013 2014 Net loss (66,255) $ (48,901) $ (68,175) $ (66,467) $ (3,584) $ (2,299) $ Provision (benefit) for income taxes (32,926) (31,432) 2,340 1,519 1,756 1,006 Equity in (earnings) loss of unconsolidated ventures (440) (168) (1,432) 3,488 (1,484) (636) Loss on extinguishment of debt 1,292 1,557 18,863 221 1,265 - Other non-operating expense (income) (4,146) 1,454 (56) (593) (2,725) (465) Interest expense: Debt 99,653 102,245 93,229 98,183 96,131 23,844 Capitalized lease obligation 29,216 30,396 31,644 30,155 25,194 6,154 Amortization of deferred financing costs and debt discount 9,505 8,963 13,427 18,081 17,054 4,018 Change in fair value of derivatives and amortization (3,765) 4,118 3,878 364 (980) 847 Interest income (2,354) (2,238) (3,538) (4,012) (1,339) (321) Income from operations 29,780 65,994 90,180 80,939 131,288 32,148 Facility lease termination (gain) expense - 4,608 - (11,584) - - Loss (gain) on sale of communities 2,043 (3,298) - - - - Depreciation and amortization 271,935 292,341 268,506 252,281 268,757 70,316 Asset impairment 10,073 13,075 16,892 27,677 12,891 - Loss (gain) on acquisition - - (1,982) 636 - - Change in future service obligation (2,342) (1,064) - 2,188 (1,917) - Facility lease expense 272,096 270,905 274,858 284,025 276,729 69,869 General and administrative (including non-cash stock-based compensation expense) 134,864 131,709 148,327 178,829 184,548 55,509 Amortization of entrance fees (21,661) (24,397) (25,401) (25,362) (29,009) (7,202) Management fees (6,719) (5,591) (13,595) (30,786) (31,125) (7,402) Facility Operating Income 690,069 $ 744,282 $ 757,785 $ 758,843 $ 812,162 $ 213,238 $ Years Ended December 31, The table below reconciles Facility Operating Income from net (loss) income for the full years 2009 through 2013 and three months ended March 31, 2014 (in thousands): |