
Supplemental Information 3rd Quarter 2017 Exhibit 99.2
2 Financial Overview 3 Segment Overview 7 Senior Housing 8 Ancillary Services 13 G&A Expense & Transaction Costs 14 Capital Expenditures 15 Cash Lease Payments 16 Unconsolidated Ventures 17 Debt & Liquidity 18 Net Asset Value Elements 20 Definitions 21 Appendix: Consolidated Statements of Cash Flows 24 Non-GAAP Financial Measures 25 Table of Contents

3 (1) Brookdale’s weighted average unit ownership percentage is 21.8%. Important Note Regarding Non-GAAP Financial Measures. Adjusted EBITDA, Adjusted Free Cash Flow, Brookdale's Proportionate Share of Adjusted EBITDA of Unconsolidated Ventures and Brookdale’s Proportionate Share of Adjusted Free Cash Flow of Unconsolidated Ventures are financial measures that are not calculated in accordance with U.S. generally accepted accounting principles (GAAP). See the definitions of such measures under “Definitions” below and important information regarding such measures, including reconciliations to the most comparable GAAP financial measures, under “Non-GAAP Financial Measures” below. ($ in 000s, except Total RevPAR) FY 2016 FY 2017 YoY Q3 Q4 Q1 Q2 Q3 Q3 Resident fee and management fee revenue $ 1,058,363 $ 1,030,338 $ 1,032,821 $ 956,512 $ 941,030 (11.1)% Net income (loss) $ (51,728) $ (268,600) $ (126,361) $ (46,337) $ (413,929) NM Net cash provided by operating activities $ 99,442 $ 88,451 $ 66,766 $ 133,108 $ 83,235 (16.3)% Adjusted EBITDA $ 202,343 $ 184,198 $ 198,296 $ 160,325 $ 141,829 (29.9)% Adjusted Free Cash Flow $ 47,829 $ 33,156 $ 63,445 $ 39,959 $ 5,804 (87.9)% Brookdale's Proportionate Share of Adjusted EBITDA of Unconsolidated Ventures $ 15,353 $ 17,989 $ 17,126 $ 18,219 $ 16,788 9.3 % Brookdale's Proportionate Share of Adjusted Free Cash Flow of Unconsolidated Ventures $ 7,502 $ 6,763 $ 8,750 $ 7,920 $ 6,709 (10.6)% Total RevPAR $ 4,337 $ 4,310 $ 4,405 $ 4,392 $ 4,386 1.1 % Q3 2017 weighted average unit occupancy Community % of Period End Occupancy Band Count Communities Greater than 95% 225 22% 90% < 95% 202 20% 85% < 90% 162 16% 80% < 85% 150 14% Less than 80% 292 28% Total 1,031 Consolidated Portfolio Average Asset Age ~21 years Managed - 3rd Party: 1,513 Managed- Venture : 30,014 Owned: 32,721 Leased: 36,954 101,202 period end number of units Managed - 3rd Party: 9 Managed- Venture: 202 Owned: 360 Leased: 460 1,031 periodend number of communities Overview (1) As of September 30, 2017

4 Segment Overview (1) Senior Housing Segments Re venue (2 ) Segme nt O pe ra ting In come (3 ) (1) Brookdale’s five segments are Retirement Centers, Assisted Living, CCRCs–Rental (which combined are referred to as Senior Housing), Brookdale Ancillary Services and Management Services. (2) Percentage of revenue is based on Q3 2017 resident fee and management fee revenue. (3) Percentage of segment operating income is based on Q3 2017 results. Brookdale Ancillary Services 12% Management Services 2% Senior Housing 86% Brookdale Ancillary Services 3% Management Services 7% Senior Housing 90% CCRCs - Rental 13% Retirement Centers 20% Assisted Living 67% CCRCs Rental 9% Retirement Centers 25% Assisted Living 66% Consolidated Portfolio Overview
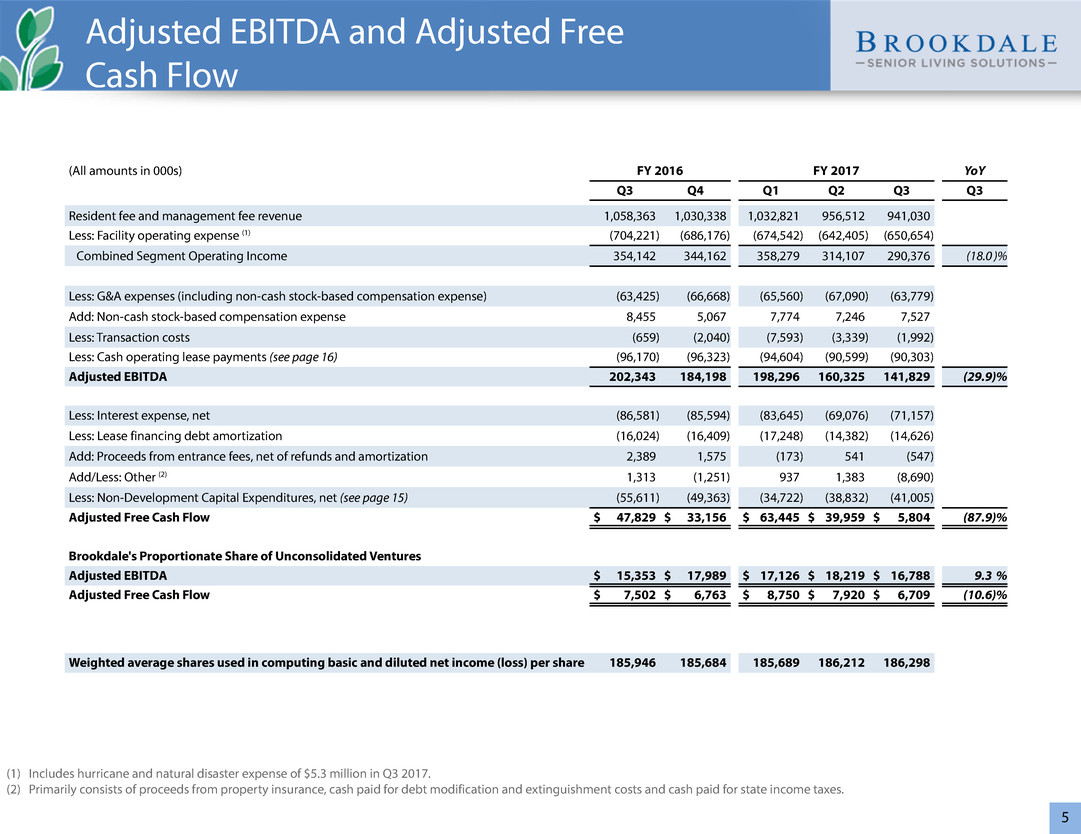
5 (1) Includes hurricane and natural disaster expense of $5.3 million in Q3 2017. (2) Primarily consists of proceeds from property insurance, cash paid for debt modification and extinguishment costs and cash paid for state income taxes. (All amounts in 000s) FY 2016 FY 2017 YoY Q3 Q4 Q1 Q2 Q3 Q3 Resident fee and management fee revenue 1,058,363 1,030,338 1,032,821 956,512 941,030 Less: Facility operating expense (1) (704,221) (686,176) (674,542) (642,405) (650,654) Combined Segment Operating Income 354,142 344,162 358,279 314,107 290,376 (18.0 )% Less: G&A expenses (including non-cash stock-based compensation expense) (63,425) (66,668) (65,560) (67,090) (63,779) Add: Non-cash stock-based compensation expense 8,455 5,067 7,774 7,246 7,527 Less: Transaction costs (659) (2,040) (7,593) (3,339) (1,992) Less: Cash operating lease payments (see page 16) (96,170) (96,323) (94,604) (90,599) (90,303) Adjusted EBITDA 202,343 184,198 198,296 160,325 141,829 (29.9)% Less: Interest expense, net (86,581) (85,594) (83,645) (69,076) (71,157) Less: Lease financing debt amortization (16,024) (16,409) (17,248) (14,382) (14,626) Add: Proceeds from entrance fees, net of refunds and amortization 2,389 1,575 (173) 541 (547) Add/Less: Other (2) 1,313 (1,251) 937 1,383 (8,690) Less: Non-Development Capital Expenditures, net (see page 15) (55,611) (49,363) (34,722) (38,832) (41,005) Adjusted Free Cash Flow $ 47,829 $ 33,156 $ 63,445 $ 39,959 $ 5,804 (87.9)% Brookdale's Proportionate Share of Unconsolidated Ventures Adjusted EBITDA $ 15,353 $ 17,989 $ 17,126 $ 18,219 $ 16,788 9.3 % Adjusted Free Cash Flow $ 7,502 $ 6,763 $ 8,750 $ 7,920 $ 6,709 (10.6)% Weighted average shares used in computing basic and diluted net income (loss) per share 185,946 185,684 185,689 186,212 186,298 Adjusted EBITDA and Adjusted Free Cash Flow
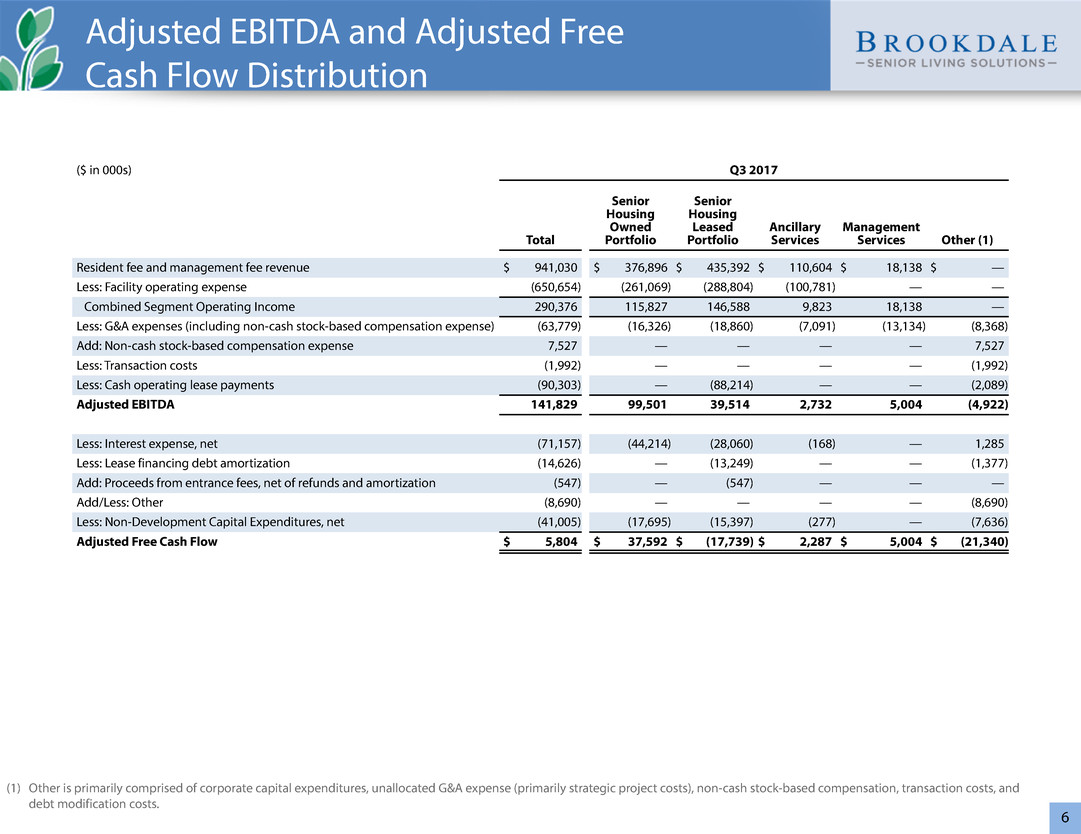
6 (1) Other is primarily comprised of corporate capital expenditures, unallocated G&A expense (primarily strategic project costs), non-cash stock-based compensation, transaction costs, and debt modification costs. ($ in 000s) Q3 2017 Total Senior Housing Owned Portfolio Senior Housing Leased Portfolio Ancillary Services Management Services Other (1) Resident fee and management fee revenue $ 941,030 $ 376,896 $ 435,392 $ 110,604 $ 18,138 $ — Less: Facility operating expense (650,654) (261,069) (288,804) (100,781) — — Combined Segment Operating Income 290,376 115,827 146,588 9,823 18,138 — Less: G&A expenses (including non-cash stock-based compensation expense) (63,779) (16,326) (18,860) (7,091) (13,134) (8,368) Add: Non-cash stock-based compensation expense 7,527 — — — — 7,527 Less: Transaction costs (1,992) — — — — (1,992) Less: Cash operating lease payments (90,303) — (88,214) — — (2,089) Adjusted EBITDA 141,829 99,501 39,514 2,732 5,004 (4,922) Less: Interest expense, net (71,157) (44,214) (28,060) (168) — 1,285 Less: Lease financing debt amortization (14,626) — (13,249) — — (1,377) Add: Proceeds from entrance fees, net of refunds and amortization (547) — (547) — — — Add/Less: Other (8,690) — — — — (8,690) Less: Non-Development Capital Expenditures, net (41,005) (17,695) (15,397) (277) — (7,636) Adjusted Free Cash Flow $ 5,804 $ 37,592 $ (17,739) $ 2,287 $ 5,004 $ (21,340) Adjusted EBITDA and Adjusted Free Cash Flow Distribution
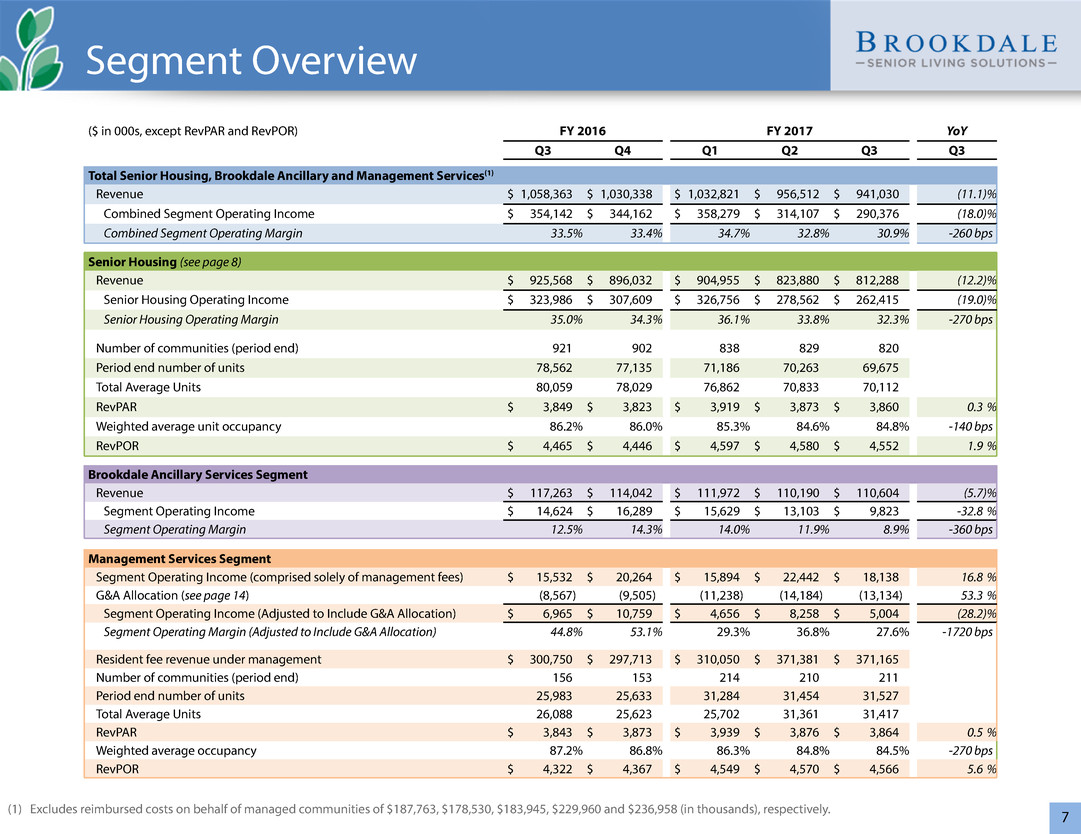
7(1) Excludes reimbursed costs on behalf of managed communities of $187,763, $178,530, $183,945, $229,960 and $236,958 (in thousands), respectively. ($ in 000s, except RevPAR and RevPOR) FY 2016 FY 2017 YoY Q3 Q4 Q1 Q2 Q3 Q3 Total Senior Housing, Brookdale Ancillary and Management Services(1) Revenue $ 1,058,363 $ 1,030,338 $ 1,032,821 $ 956,512 $ 941,030 (11.1)% Combined Segment Operating Income $ 354,142 $ 344,162 $ 358,279 $ 314,107 $ 290,376 (18.0)% Combined Segment Operating Margin 33.5% 33.4% 34.7% 32.8% 30.9% -260 bps Senior Housing (see page 8) Revenue $ 925,568 $ 896,032 $ 904,955 $ 823,880 $ 812,288 (12.2)% Senior Housing Operating Income $ 323,986 $ 307,609 $ 326,756 $ 278,562 $ 262,415 (19.0)% Senior Housing Operating Margin 35.0% 34.3% 36.1% 33.8% 32.3% -270 bps Number of communities (period end) 921 902 838 829 820 Period end number of units 78,562 77,135 71,186 70,263 69,675 Total Average Units 80,059 78,029 76,862 70,833 70,112 RevPAR $ 3,849 $ 3,823 $ 3,919 $ 3,873 $ 3,860 0.3 % Weighted average unit occupancy 86.2% 86.0% 85.3% 84.6% 84.8% -140 bps RevPOR $ 4,465 $ 4,446 $ 4,597 $ 4,580 $ 4,552 1.9 % Brookdale Ancillary Services Segment Revenue $ 117,263 $ 114,042 $ 111,972 $ 110,190 $ 110,604 (5.7)% Segment Operating Income $ 14,624 $ 16,289 $ 15,629 $ 13,103 $ 9,823 -32.8 % Segment Operating Margin 12.5% 14.3% 14.0% 11.9% 8.9% -360 bps Management Services Segment Segment Operating Income (comprised solely of management fees) $ 15,532 $ 20,264 $ 15,894 $ 22,442 $ 18,138 16.8 % G&A Allocation (see page 14) (8,567) (9,505) (11,238) (14,184) (13,134) 53.3 % Segment Operating Income (Adjusted to Include G&A Allocation) $ 6,965 $ 10,759 $ 4,656 $ 8,258 $ 5,004 (28.2)% Segment Operating Margin (Adjusted to Include G&A Allocation) 44.8% 53.1% 29.3% 36.8% 27.6% -1720 bps Resident fee revenue under management $ 300,750 $ 297,713 $ 310,050 $ 371,381 $ 371,165 Number of communities (period end) 156 153 214 210 211 Period end number of units 25,983 25,633 31,284 31,454 31,527 Total Average Units 26,088 25,623 25,702 31,361 31,417 RevPAR $ 3,843 $ 3,873 $ 3,939 $ 3,876 $ 3,864 0.5 % Weighted average occupancy 87.2% 86.8% 86.3% 84.8% 84.5% -270 bps RevPOR $ 4,322 $ 4,367 $ 4,549 $ 4,570 $ 4,566 5.6 % Segment Overview

8 Retirement Centers Revenue $ 170,706 $ 169,381 $ 172,620 $ 162,248 $ 161,986 (5.1)% Segment Operating Income $ 73,112 $ 72,215 $ 74,002 $ 67,297 $ 65,907 (9.9)% Segment Operating Margin 42.8% 42.6% 42.9% 41.5% 40.7% -210 bps Number of communities (period end) 95 93 86 86 85 Period end number of units 17,105 17,017 16,071 16,071 15,961 Total Average Units 17,105 17,115 17,108 16,071 16,061 RevPAR $ 3,327 $ 3,299 $ 3,363 $ 3,365 $ 3,362 1.1 % Weighted average unit occupancy 89.3% 88.9% 88.0% 87.3% 87.6% -170 bps RevPOR $ 3,727 $ 3,711 $ 3,823 $ 3,857 $ 3,836 2.9 % Assisted Living Revenue $ 607,345 $ 581,827 $ 590,537 $ 547,430 $ 542,227 (10.7)% Segment Operating Income $ 217,878 $ 204,044 $ 217,439 $ 186,921 $ 173,576 (20.3)% Segment Operating Margin 35.9% 35.1% 36.8% 34.1% 32.0% -390 bps Number of communities (period end) 783 768 720 713 705 Period end number of units 51,494 50,682 47,296 46,999 46,520 Total Average Units 52,991 51,087 50,540 47,246 46,858 RevPAR $ 3,820 $ 3,796 $ 3,895 $ 3,862 $ 3,857 1.0 % Weighted average unit occupancy 85.6% 85.6% 84.7% 83.9% 84.2% -140 bps RevPOR $ 4,461 $ 4,437 $ 4,600 $ 4,602 $ 4,582 2.7 % CCRCs - Rental Revenue $ 147,517 $ 144,824 $ 141,798 $ 114,202 $ 108,075 (26.7)% Segment Operating Income $ 32,996 $ 31,350 $ 35,315 $ 24,344 $ 22,932 (30.5)% Segment Operating Margin 22.4% 21.6% 24.9% 21.3% 21.2% -120 bps Number of communities (period end) 43 41 32 30 30 Period end number of units 9,963 9,436 7,819 7,193 7,194 Total Average Units 9,963 9,827 9,214 7,516 7,193 RevPAR $ 4,896 $ 4,876 $ 5,086 $ 5,028 $ 4,989 1.9 % Weighted average unit occupancy 84.0% 83.2% 83.5% 83.0% 82.6% -140 bps RevPOR $ 5,833 $ 5,861 $ 6,091 $ 6,063 $ 6,046 3.7 % ($ in 000s, except RevPAR and RevPOR) FY 2016 FY 2017 YoY Q3 Q4 Q1 Q2 Q3 Q3 Senior Housing Segments

9 Revenue $ 795,568 $ 787,756 $ 808,173 $ 796,482 $ 792,449 (0.4)% Community Labor Expense (322,967) (327,879) (330,890) (337,920) (342,677) Other facility operating expense (182,193) (179,487) (176,638) (182,788) (185,774) Facility operating expense (1) (505,160) (507,366) (507,528) (520,708) (528,451) Same Community Operating Income $ 290,408 $ 280,390 $ 300,645 $ 275,774 $ 263,998 (9.1)% Same Community Operating Margin 36.5% 35.6% 37.2% 34.6% 33.3% -320 bps Number of communities (period end) 809 809 809 809 809 Total Average Units 68,031 68,032 68,023 68,014 68,001 RevPAR $ 3,896 $ 3,858 $ 3,958 $ 3,901 $ 3,882 (0.4)% Weighted average unit occupancy 86.8% 86.5% 85.9% 85.0% 85.2% -160 bps RevPOR $ 4,491 $ 4,459 $ 4,609 $ 4,587 $ 4,556 1.4 % ($ in 000s, except RevPAR and RevPOR) FY 2016 FY 2017 YoY Q3 Q4 Q1 Q2 Q3 Q3 Same Community Operating Income/Weighted average unit occupancy Q3 2016 Q4 2016 Q1 2017 Q2 2017 Q3 2017 86.8% 86.5% 85.9% 85.0% 85.2% $290,408 $280,390 $300,645 $275,774 $263,998 Same Community RevPAR Q3 2016 Q4 2016 Q1 2017 Q2 2017 Q3 2017 $3,896 $3,858 $3,958 $3,901 $3,882 Senior Housing: Same Community (1) Excludes hurricane and natural disaster expense.

10 Resident fee revenue $ 403,655 $ 383,588 $ 388,310 $ 381,418 $ 376,896 Less: Facility operating expense (271,664) (259,430) (252,673) (257,991) (261,069) Owned Portfolio Operating Income 131,991 124,158 135,637 123,427 115,827 (12.2)% Less: G&A Portfolio Allocation (see page 14) (14,685) (16,163) (16,808) (17,580) (16,326) Owned Portfolio Operating Income (Adjusted to Include G&A Allocation) $ 117,306 $ 107,995 $ 118,829 $ 105,847 $ 99,501 (15.2)% Additional Information Interest expense: property level and corporate debt $ (43,380) $ (42,302) $ (40,285) $ (41,352) $ (44,214) Community level capital expenditures, net (see page 15) $ (19,983) $ (18,668) $ (13,909) $ (16,733) $ (17,695) Number of communities (period end) 375 363 362 360 360 Period end number of units 33,800 33,054 33,016 32,765 32,721 Total Average Units 35,206 33,489 33,041 32,921 32,734 RevPAR $ 3,822 $ 3,818 $ 3,916 $ 3,862 $ 3,838 0.4 % Weighted average unit occupancy 85.4% 85.2% 84.4% 83.9% 84.0% -140 bps RevPOR $ 4,473 $ 4,481 $ 4,641 $ 4,603 $ 4,569 2.1 % Interest Coverage (as of September 30, 2017) 2.4x Net Debt (as of September 30, 2017; see page 19) $ 3,398,029 ($ in 000s, except RevPAR and RevPOR) FY 2016 FY 2017 YoY Q3 Q4 Q1 Q2 Q3 Q3 Senior Housing: Owned Portfolio
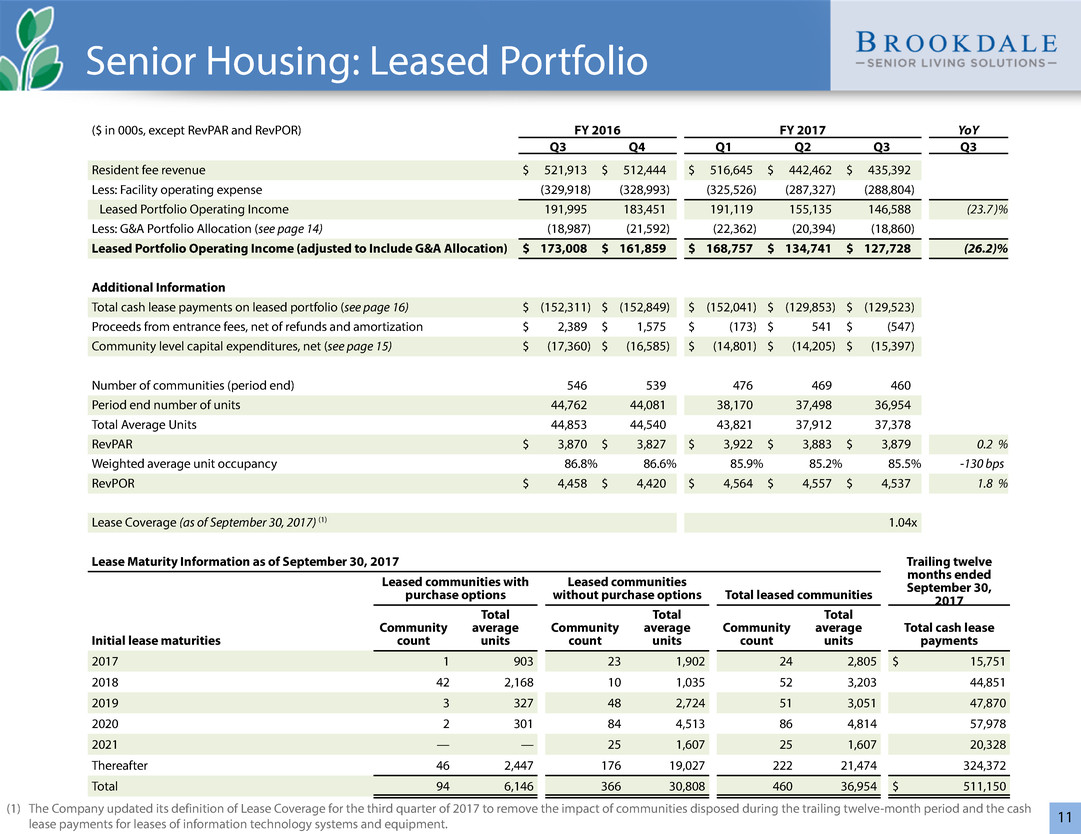
11 Resident fee revenue $ 521,913 $ 512,444 $ 516,645 $ 442,462 $ 435,392 Less: Facility operating expense (329,918) (328,993) (325,526) (287,327) (288,804) Leased Portfolio Operating Income 191,995 183,451 191,119 155,135 146,588 (23.7 )% Less: G&A Portfolio Allocation (see page 14) (18,987) (21,592) (22,362) (20,394) (18,860) Leased Portfolio Operating Income (adjusted to Include G&A Allocation) $ 173,008 $ 161,859 $ 168,757 $ 134,741 $ 127,728 (26.2)% Additional Information Total cash lease payments on leased portfolio (see page 16) $ (152,311) $ (152,849) $ (152,041) $ (129,853) $ (129,523) Proceeds from entrance fees, net of refunds and amortization $ 2,389 $ 1,575 $ (173) $ 541 $ (547) Community level capital expenditures, net (see page 15) $ (17,360) $ (16,585) $ (14,801) $ (14,205) $ (15,397) Number of communities (period end) 546 539 476 469 460 Period end number of units 44,762 44,081 38,170 37,498 36,954 Total Average Units 44,853 44,540 43,821 37,912 37,378 RevPAR $ 3,870 $ 3,827 $ 3,922 $ 3,883 $ 3,879 0.2 % Weighted average unit occupancy 86.8% 86.6% 85.9% 85.2% 85.5% -130 bps RevPOR $ 4,458 $ 4,420 $ 4,564 $ 4,557 $ 4,537 1.8 % Lease Coverage (as of September 30, 2017) (1) 1.04x ($ in 000s, except RevPAR and RevPOR) FY 2016 FY 2017 YoY Q3 Q4 Q1 Q2 Q3 Q3 Lease Maturity Information as of September 30, 2017 Trailing twelve months ended September 30, 2017 Leased communities with purchase options Leased communities without purchase options Total leased communities Initial lease maturities Community count Total average units Community count Total average units Community count Total average units Total cash lease payments 2017 1 903 23 1,902 24 2,805 $ 15,751 2018 42 2,168 10 1,035 52 3,203 44,851 2019 3 327 48 2,724 51 3,051 47,870 2020 2 301 84 4,513 86 4,814 57,978 2021 — — 25 1,607 25 1,607 20,328 Thereafter 46 2,447 176 19,027 222 21,474 324,372 Total 94 6,146 366 30,808 460 36,954 $ 511,150 Senior Housing: Leased Portfolio (1) The Company updated its definition of Lease Coverage for the third quarter of 2017 to remove the impact of communities disposed during the trailing twelve-month period and the cash lease payments for leases of information technology systems and equipment.

12 (1) Data reflected is for the consolidated senior housing portfolio only. (2) NIC MAP Supply Set, Q3 2017 "New Construction" properties with projected open dates through Q3 2018. (3) Saturation is equal to units per population Age 75+ with income 50k+. (4) Percentage changes are based on data from ESRI for 2016-2021. Brookdale's Largest 20 Markets - Competitive Summary Brookdale in NIC Markets Competition Within 20 Minute Drive Market Community Count Total Average Units (IL/AL/MC) Q3 2017 Weighted Average Unit Occupancy Q3 2017 RevPAR New Const. Properties(2) IL/AL/MC New Const. Units(2) 1 Yr Projected Unit Opens % of Supply(2) Current Saturation(3) 5 Yr Projected Total Pop Growth(4) 5 Yr Projected Age 75 + Pop w/ Inc. $50k + Growth(4) Chicago, IL 16 2,602 90.0% $ 3,961 10 1,239 4.9% 22.9% 1.5% 19.9% Seattle, WA 25 2,449 87.7% 3,719 3 224 1.0% 31.4% 7.1% 32.9% Los Angeles, CA 20 2,145 83.7% 3,888 4 518 2.0% 11.6% 3.7% 22.7% Phoenix, AZ 22 1,791 86.9% 3,698 11 1,401 6.7% 30.1% 7.3% 43.4% Dallas, TX 25 1,709 85.3% 3,432 18 1,468 5.5% 31.5% 8.6% 35.2% Portland, OR 19 1,649 94.1% 3,710 3 463 2.4% 51.7% 6.0% 45.5% Charlotte, NC 18 1,403 90.6% 4,446 2 316 3.1% 39.7% 8.6% 46.2% Denver, CO 11 1,207 83.1% 4,327 11 1,478 11.6% 29.2% 8.7% 34.5% Riverside, CA 10 1,043 86.0% 5,319 5 620 8.4% 29.4% 13.5% 41.7% Austin, TX 7 1,040 82.3% 2,892 5 876 6.0% 18.9% 6.5% 40.4% Miami, FL 10 993 83.1% 3,256 3 487 4.6% 17.0% 4.7% 19.9% Jacksonville, FL 9 991 87.0% 3,542 4 407 8.0% 28.7% 6.2% 50.7% Houston, TX 12 989 85.1% 4,431 9 920 8.8% 18.6% 9.6% 36.8% Richmond, VA 2 981 86.1% 1,957 2 96 1.3% 43.8% 5.6% 8.8% San Antonio, TX 12 971 73.0% 2,944 — — —% 26.2% 8.7% 29.6% Detroit, MI 10 955 82.1% 3,198 12 1,309 8.0% 30.8% 1.4% 42.9% Santa Rosa, CA 6 866 79.1% 4,035 — — —% 21.1% 3.8% 26.1% Atlanta, GA 9 858 88.6% 3,396 7 855 8.4% 34.4% 8.1% 56.2% Philadelphia, PA 11 853 85.9% 4,584 3 256 1.8% 24.1% 1.7% 18.6% Tampa, FL 8 850 79.7% 3,005 6 677 6.1% 24.4% 5.5% 7.9% Top 20 Markets 262 26,345 85.7% $ 3,737 118 13,610 4.9% 28.3% 6.4% 33.0% All Other NIC Markets 324 26,413 84.6% $ 3,876 87 9,715 2.8% 26.5% 4.3% 29.4% New Supply (1)

13 Resident fee revenue Home Health $ 91,858 $ 91,199 $ 92,241 $ 88,561 $ 87,315 Outpatient Therapy 12,667 9,320 6,375 6,179 5,941 Hospice 11,766 12,531 13,346 15,441 17,328 Other ancillary services 972 992 10 9 20 Segment resident fee revenue 117,263 114,042 111,972 110,190 110,604 (5.7)% Segment Operating Income 14,624 16,289 15,629 13,103 9,823 (32.8)% Segment Operating Margin 12.5% 14.3% 14.0% 11.9% 8.9% -360 bps Less: G&A Allocation (see page 14) (6,323) (6,331) (7,225) (7,128) (7,091) Segment Operating Income (Adjusted to Include G&A Allocation) $ 8,301 $ 9,958 $ 8,404 $ 5,975 $ 2,732 (67.1)% Segment Operating Margin (Adjusted to Include G&A Allocation) 7.1% 8.7% 7.5% 5.4% 2.5% -460 bps Additional Information Interest expense $ (321) $ (303) $ (288) $ (165) $ (168) Community level capital expenditures, net (see page 15) $ (155) $ (51) $ (22) $ (35) $ (277) Outpatient Therapy treatment codes 419,619 307,933 193,853 190,618 178,851 (57.4)% Home Health average daily census 14,456 14,587 15,370 14,821 14,844 2.7 % Hospice average daily census 813 863 920 1,033 1,169 43.8 % ($ in 000s) FY 2016 FY 2017 YoY Q3 Q4 Q1 Q2 Q3 Q3 Ancillary Services
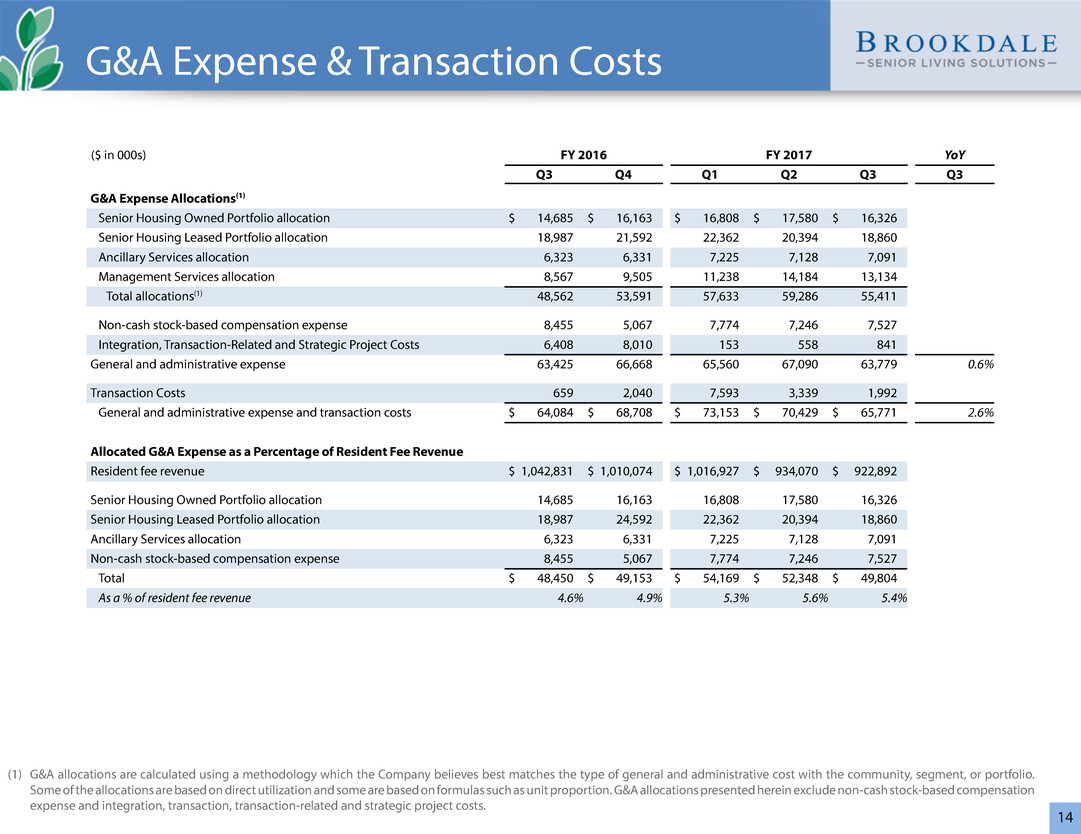
14 (1) G&A allocations are calculated using a methodology which the Company believes best matches the type of general and administrative cost with the community, segment, or portfolio. Some of the allocations are based on direct utilization and some are based on formulas such as unit proportion. G&A allocations presented herein exclude non-cash stock-based compensation expense and integration, transaction, transaction-related and strategic project costs. G&A Expense Allocations(1) Senior Housing Owned Portfolio allocation $ 14,685 $ 16,163 $ 16,808 $ 17,580 $ 16,326 Senior Housing Leased Portfolio allocation 18,987 21,592 22,362 20,394 18,860 Ancillary Services allocation 6,323 6,331 7,225 7,128 7,091 Management Services allocation 8,567 9,505 11,238 14,184 13,134 Total allocations(1) 48,562 53,591 57,633 59,286 55,411 Non-cash stock-based compensation expense 8,455 5,067 7,774 7,246 7,527 Integration, Transaction-Related and Strategic Project Costs 6,408 8,010 153 558 841 General and administrative expense 63,425 66,668 65,560 67,090 63,779 0.6% Transaction Costs 659 2,040 7,593 3,339 1,992 General and administrative expense and transaction costs $ 64,084 $ 68,708 $ 73,153 $ 70,429 $ 65,771 2.6% Allocated G&A Expense as a Percentage of Resident Fee Revenue Resident fee revenue $ 1,042,831 $ 1,010,074 $ 1,016,927 $ 934,070 $ 922,892 Senior Housing Owned Portfolio allocation 14,685 16,163 16,808 17,580 16,326 Senior Housing Leased Portfolio allocation 18,987 24,592 22,362 20,394 18,860 Ancillary Services allocation 6,323 6,331 7,225 7,128 7,091 Non-cash stock-based compensation expense 8,455 5,067 7,774 7,246 7,527 Total $ 48,450 $ 49,153 $ 54,169 $ 52,348 $ 49,804 As a % of resident fee revenue 4.6% 4.9% 5.3% 5.6% 5.4% ($ in 000s) FY 2016 FY 2017 YoY Q3 Q4 Q1 Q2 Q3 Q3 G&A Expense & Transaction Costs
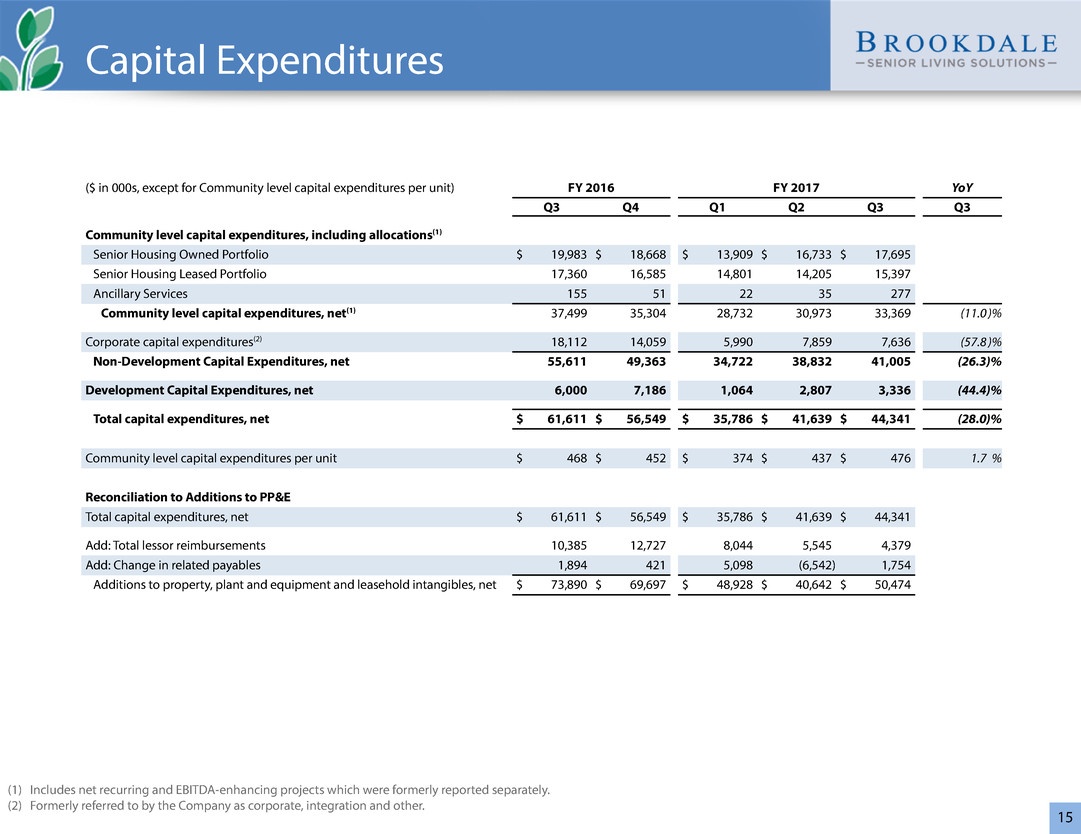
15 (1) Includes net recurring and EBITDA-enhancing projects which were formerly reported separately. (2) Formerly referred to by the Company as corporate, integration and other. Community level capital expenditures, including allocations(1) Senior Housing Owned Portfolio $ 19,983 $ 18,668 $ 13,909 $ 16,733 $ 17,695 Senior Housing Leased Portfolio 17,360 16,585 14,801 14,205 15,397 Ancillary Services 155 51 22 35 277 Community level capital expenditures, net(1) 37,499 35,304 28,732 30,973 33,369 (11.0 )% Corporate capital expenditures(2) 18,112 14,059 5,990 7,859 7,636 (57.8 )% Non-Development Capital Expenditures, net 55,611 49,363 34,722 38,832 41,005 (26.3)% Development Capital Expenditures, net 6,000 7,186 1,064 2,807 3,336 (44.4)% Total capital expenditures, net $ 61,611 $ 56,549 $ 35,786 $ 41,639 $ 44,341 (28.0)% Community level capital expenditures per unit $ 468 $ 452 $ 374 $ 437 $ 476 1.7 % Reconciliation to Additions to PP&E Total capital expenditures, net $ 61,611 $ 56,549 $ 35,786 $ 41,639 $ 44,341 Add: Total lessor reimbursements 10,385 12,727 8,044 5,545 4,379 Add: Change in related payables 1,894 421 5,098 (6,542) 1,754 Additions to property, plant and equipment and leasehold intangibles, net $ 73,890 $ 69,697 $ 48,928 $ 40,642 $ 50,474 ($ in 000s, except for Community level capital expenditures per unit) FY 2016 FY 2017 YoY Q3 Q4 Q1 Q2 Q3 Q3 Capital Expenditures
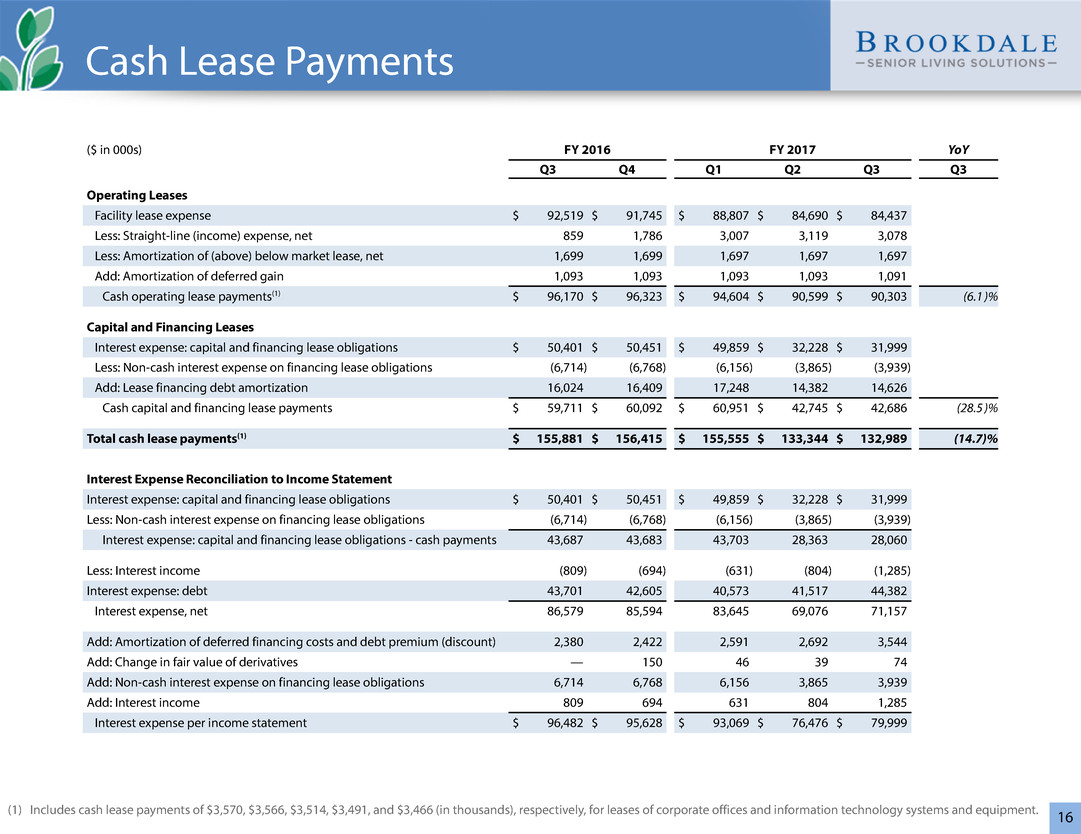
16(1) Includes cash lease payments of $3,570, $3,566, $3,514, $3,491, and $3,466 (in thousands), respectively, for leases of corporate offices and information technology systems and equipment. Operating Leases Facility lease expense $ 92,519 $ 91,745 $ 88,807 $ 84,690 $ 84,437 Less: Straight-line (income) expense, net 859 1,786 3,007 3,119 3,078 Less: Amortization of (above) below market lease, net 1,699 1,699 1,697 1,697 1,697 Add: Amortization of deferred gain 1,093 1,093 1,093 1,093 1,091 Cash operating lease payments(1) $ 96,170 $ 96,323 $ 94,604 $ 90,599 $ 90,303 (6.1 )% Capital and Financing Leases Interest expense: capital and financing lease obligations $ 50,401 $ 50,451 $ 49,859 $ 32,228 $ 31,999 Less: Non-cash interest expense on financing lease obligations (6,714) (6,768) (6,156) (3,865) (3,939) Add: Lease financing debt amortization 16,024 16,409 17,248 14,382 14,626 Cash capital and financing lease payments $ 59,711 $ 60,092 $ 60,951 $ 42,745 $ 42,686 (28.5 )% Total cash lease payments(1) $ 155,881 $ 156,415 $ 155,555 $ 133,344 $ 132,989 (14.7)% Interest Expense Reconciliation to Income Statement Interest expense: capital and financing lease obligations $ 50,401 $ 50,451 $ 49,859 $ 32,228 $ 31,999 Less: Non-cash interest expense on financing lease obligations (6,714) (6,768) (6,156) (3,865) (3,939) Interest expense: capital and financing lease obligations - cash payments 43,687 43,683 43,703 28,363 28,060 Less: Interest income (809) (694) (631) (804) (1,285) Interest expense: debt 43,701 42,605 40,573 41,517 44,382 Interest expense, net 86,579 85,594 83,645 69,076 71,157 Add: Amortization of deferred financing costs and debt premium (discount) 2,380 2,422 2,591 2,692 3,544 Add: Change in fair value of derivatives — 150 46 39 74 Add: Non-cash interest expense on financing lease obligations 6,714 6,768 6,156 3,865 3,939 Add: Interest income 809 694 631 804 1,285 Interest expense per income statement $ 96,482 $ 95,628 $ 93,069 $ 76,476 $ 79,999 ($ in 000s) FY 2016 FY 2017 YoY Q3 Q4 Q1 Q2 Q3 Q3 Cash Lease Payments
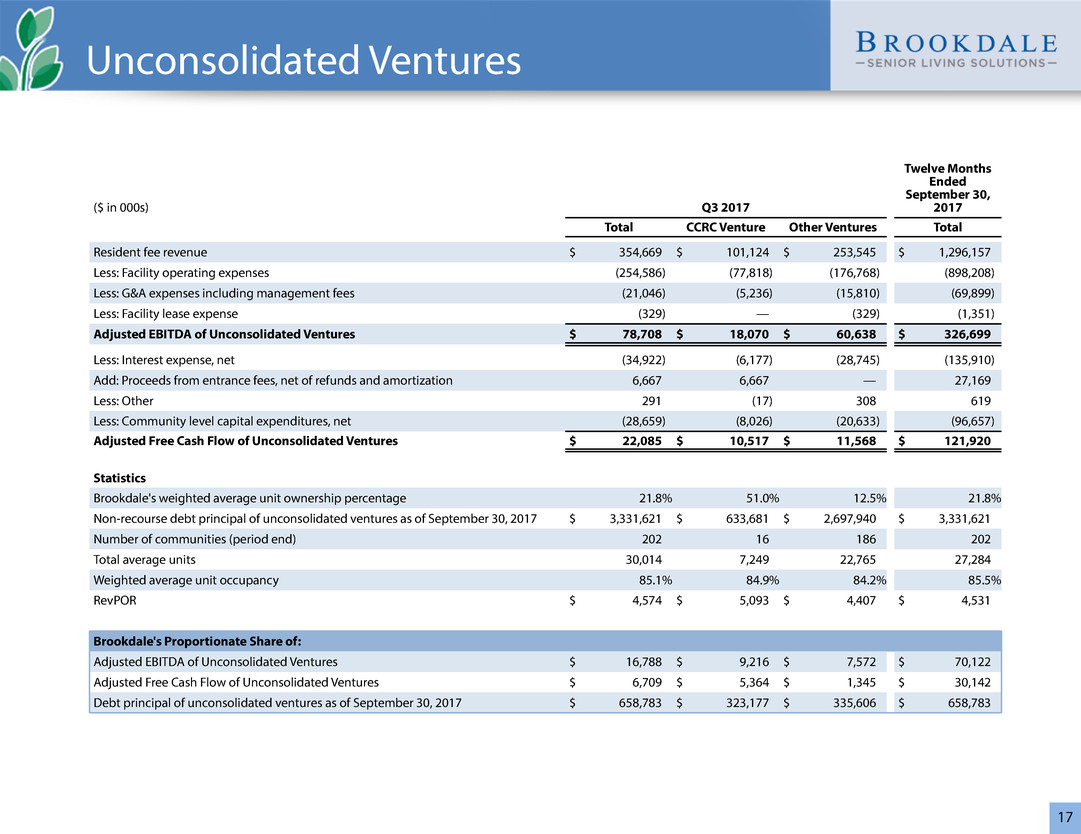
17 ($ in 000s) Q3 2017 Twelve Months Ended September 30, 2017 Total CCRC Venture Other Ventures Total Resident fee revenue $ 354,669 $ 101,124 $ 253,545 $ 1,296,157 Less: Facility operating expenses (254,586) (77,818) (176,768) (898,208) Less: G&A expenses including management fees (21,046) (5,236) (15,810) (69,899) Less: Facility lease expense (329) — (329) (1,351) Adjusted EBITDA of Unconsolidated Ventures $ 78,708 $ 18,070 $ 60,638 $ 326,699 Less: Interest expense, net (34,922) (6,177) (28,745) (135,910) Add: Proceeds from entrance fees, net of refunds and amortization 6,667 6,667 — 27,169 Less: Other 291 (17) 308 619 Less: Community level capital expenditures, net (28,659) (8,026) (20,633) (96,657) Adjusted Free Cash Flow of Unconsolidated Ventures $ 22,085 $ 10,517 $ 11,568 $ 121,920 Statistics Brookdale's weighted average unit ownership percentage 21.8% 51.0% 12.5% 21.8% Non-recourse debt principal of unconsolidated ventures as of September 30, 2017 $ 3,331,621 $ 633,681 $ 2,697,940 $ 3,331,621 Number of communities (period end) 202 16 186 202 Total average units 30,014 7,249 22,765 27,284 Weighted average unit occupancy 85.1% 84.9% 84.2% 85.5% RevPOR $ 4,574 $ 5,093 $ 4,407 $ 4,531 Brookdale's Proportionate Share of: Adjusted EBITDA of Unconsolidated Ventures $ 16,788 $ 9,216 $ 7,572 $ 70,122 Adjusted Free Cash Flow of Unconsolidated Ventures $ 6,709 $ 5,364 $ 1,345 $ 30,142 Debt principal of unconsolidated ventures as of September 30, 2017 $ 658,783 $ 323,177 $ 335,606 $ 658,783 Unconsolidated Ventures
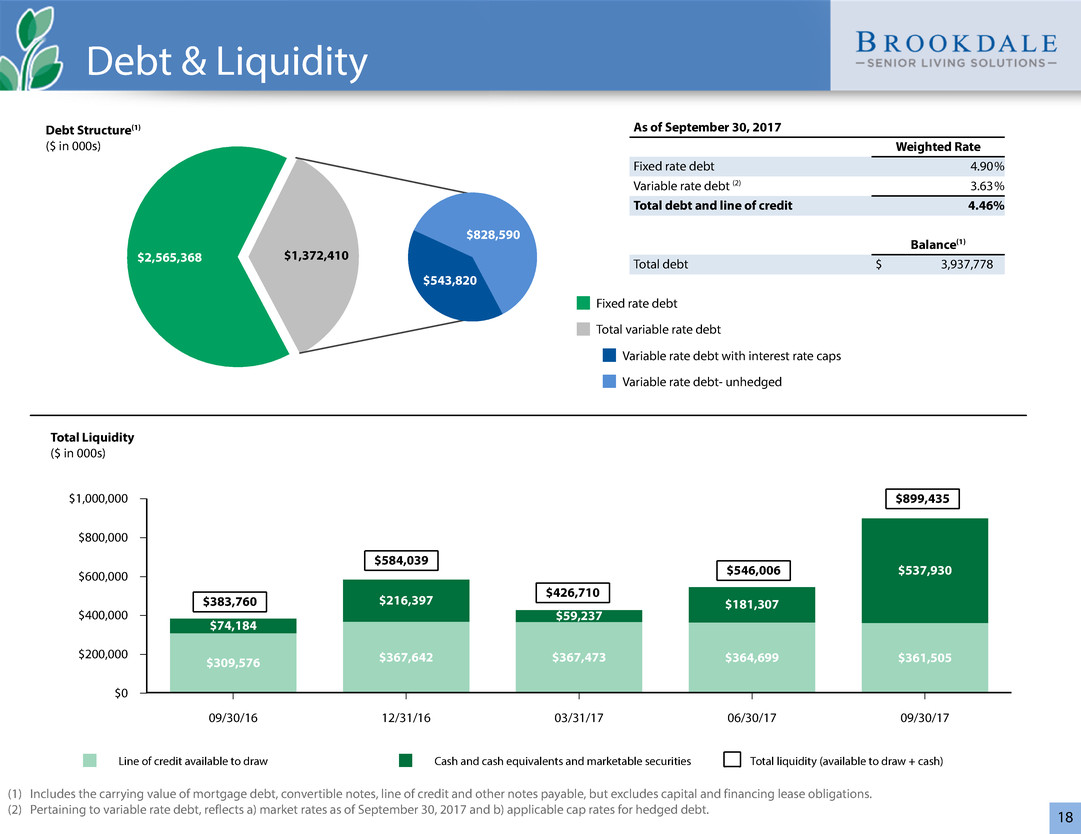
18 $2,565,368 $1,372,410 (1) Includes the carrying value of mortgage debt, convertible notes, line of credit and other notes payable, but excludes capital and financing lease obligations. (2) Pertaining to variable rate debt, reflects a) market rates as of September 30, 2017 and b) applicable cap rates for hedged debt. Line of credit available to draw Cash and cash equivalents and marketable securities Total liquidity (available to draw + cash) $1,000,000 $800,000 $600,000 $400,000 $200,000 $0 09/30/16 12/31/16 03/31/17 06/30/17 09/30/17 $309,576 $367,642 $367,473 $364,699 $361,505 $74,184 $216,397 $59,237 $181,307 $537,930$546,006 $426,710 $584,039 $383,760 As of September 30, 2017 Weighted Rate Fixed rate debt 4.90% Variable rate debt (2) 3.63% Total debt and line of credit 4.46% Balance(1) Total debt $ 3,937,778 Total Liquidity ($ in 000s) Debt & Liquidity $899,435 Debt Structure(1) ($ in 000s) Fixed rate debt Variable rate debt with interest rate caps Variable rate debt- unhedged Total variable rate debt $543,820 $828,590
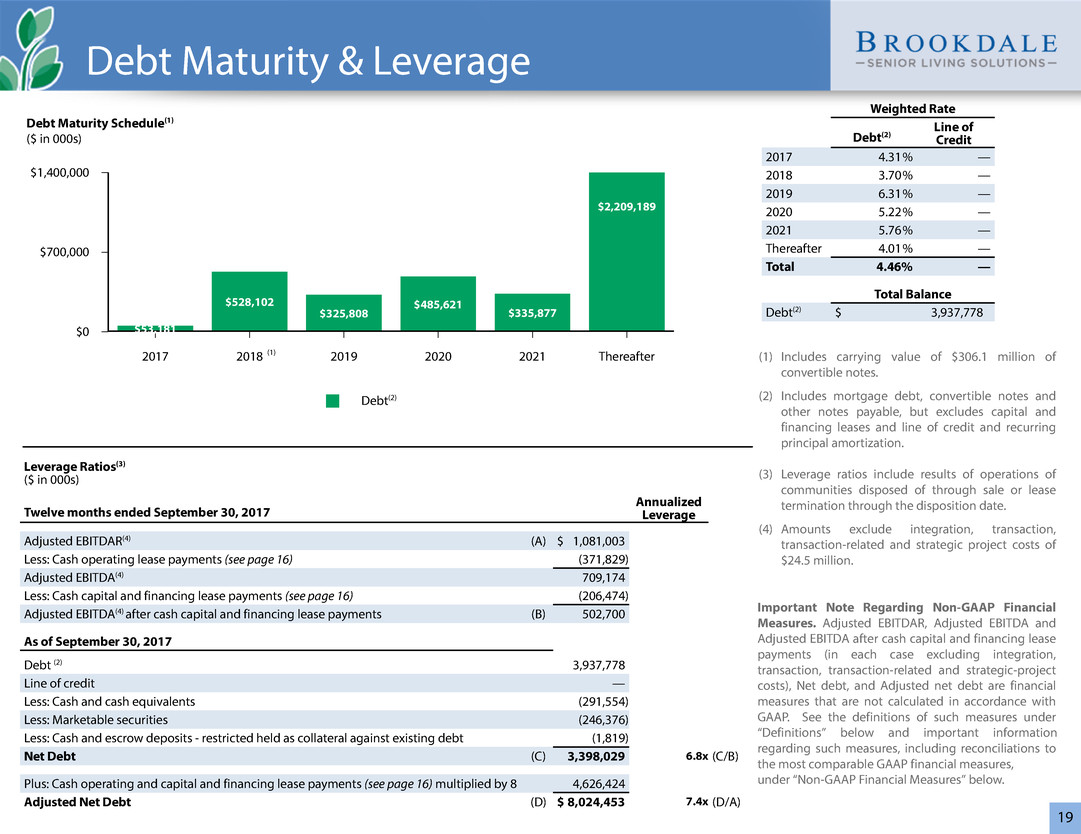
19 Debt Maturity Schedule(1) ($ in 000s) Debt $1,400,000 $700,000 $0 2017 2018 2019 2020 2021 Thereafter $53,181 $528,102 $325,808 $485,621 $335,877 $2,209,189 (1) Includes carrying value of $306.1 million of convertible notes. (2) Includes mortgage debt, convertible notes and other notes payable, but excludes capital and financing leases and line of credit and recurring principal amortization. (3) Leverage ratios include results of operations of communities disposed of through sale or lease termination through the disposition date. (4) Amounts exclude integration, transaction, transaction-related and strategic project costs of $24.5 million. Important Note Regarding Non-GAAP Financial Measures. Adjusted EBITDAR, Adjusted EBITDA and Adjusted EBITDA after cash capital and financing lease payments (in each case excluding integration, transaction, transaction-related and strategic-project costs), Net debt, and Adjusted net debt are financial measures that are not calculated in accordance with GAAP. See the definitions of such measures under “Definitions” below and important information regarding such measures, including reconciliations to the most comparable GAAP financial measures, under “Non-GAAP Financial Measures” below. (2) (1) Leverage Ratios(3) ($ in 000s) Twelve months ended September 30, 2017 Annualized Leverage Adjusted EBITDAR(4) (A) $ 1,081,003 Less: Cash operating lease payments (see page 16) (371,829) Adjusted EBITDA(4) 709,174 Less: Cash capital and financing lease payments (see page 16) (206,474) Adjusted EBITDA(4) after cash capital and financing lease payments (B) 502,700 As of September 30, 2017 Debt (2) 3,937,778 Line of credit — Less: Cash and cash equivalents (291,554) Less: Marketable securities (246,376) Less: Cash and escrow deposits - restricted held as collateral against existing debt (1,819) Net Debt (C) 3,398,029 6.8x (C/B) Plus: Cash operating and capital and financing lease payments (see page 16) multiplied by 8 4,626,424 Adjusted Net Debt (D) $ 8,024,453 7.4x (D/A) Weighted Rate Debt(2) Line of Credit 2017 4.31% — 2018 3.70% — 2019 6.31% — 2020 5.22% — 2021 5.76% — Thereafter 4.01% — Total 4.46% — Total Balance Debt(2) $ 3,937,778 Debt Maturity & Leverage
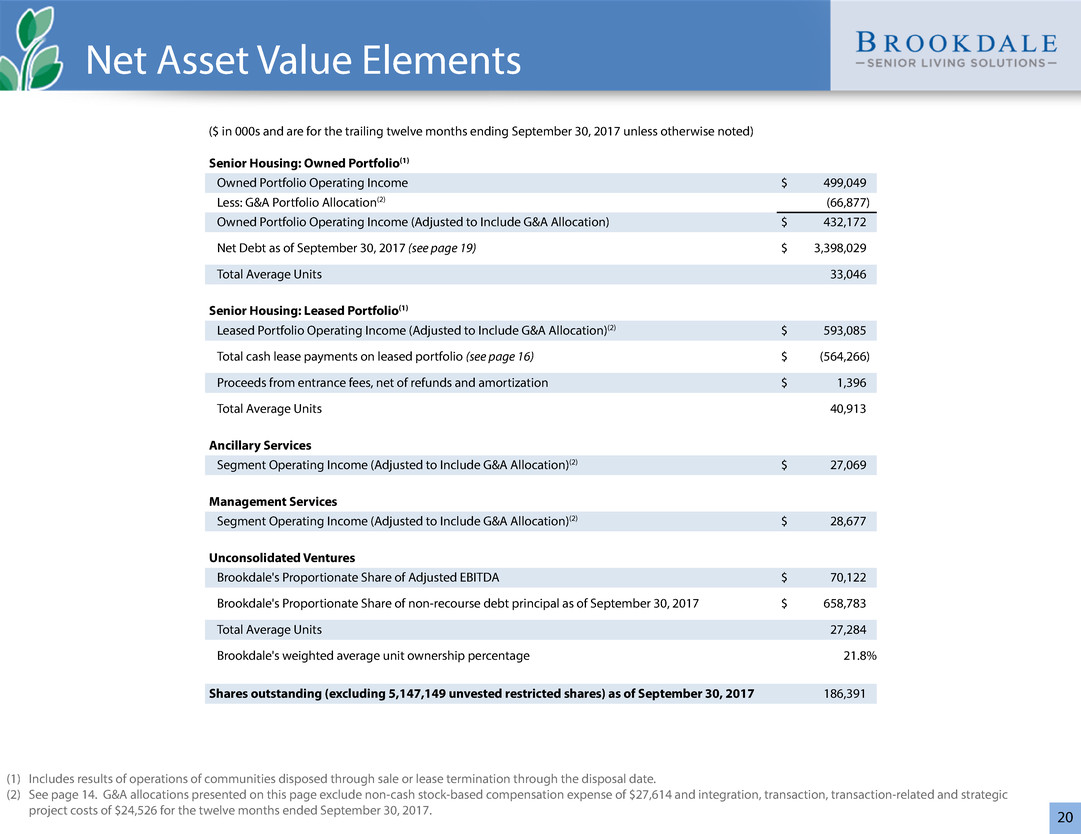
20 (1) Includes results of operations of communities disposed through sale or lease termination through the disposal date. (2) See page 14. G&A allocations presented on this page exclude non-cash stock-based compensation expense of $27,614 and integration, transaction, transaction-related and strategic project costs of $24,526 for the twelve months ended September 30, 2017. Senior Housing: Owned Portfolio(1) Owned Portfolio Operating Income $ 499,049 Less: G&A Portfolio Allocation(2) (66,877) Owned Portfolio Operating Income (Adjusted to Include G&A Allocation) $ 432,172 Net Debt as of September 30, 2017 (see page 19) $ 3,398,029 Total Average Units 33,046 Senior Housing: Leased Portfolio(1) Leased Portfolio Operating Income (Adjusted to Include G&A Allocation)(2) $ 593,085 Total cash lease payments on leased portfolio (see page 16) $ (564,266) Proceeds from entrance fees, net of refunds and amortization $ 1,396 Total Average Units 40,913 Ancillary Services Segment Operating Income (Adjusted to Include G&A Allocation)(2) $ 27,069 Management Services Segment Operating Income (Adjusted to Include G&A Allocation)(2) $ 28,677 Unconsolidated Ventures Brookdale's Proportionate Share of Adjusted EBITDA $ 70,122 Brookdale's Proportionate Share of non-recourse debt principal as of September 30, 2017 $ 658,783 Total Average Units 27,284 Brookdale's weighted average unit ownership percentage 21.8% Shares outstanding (excluding 5,147,149 unvested restricted shares) as of September 30, 2017 186,391 ($ in 000s and are for the trailing twelve months ending September 30, 2017 unless otherwise noted) Net Asset Value Elements
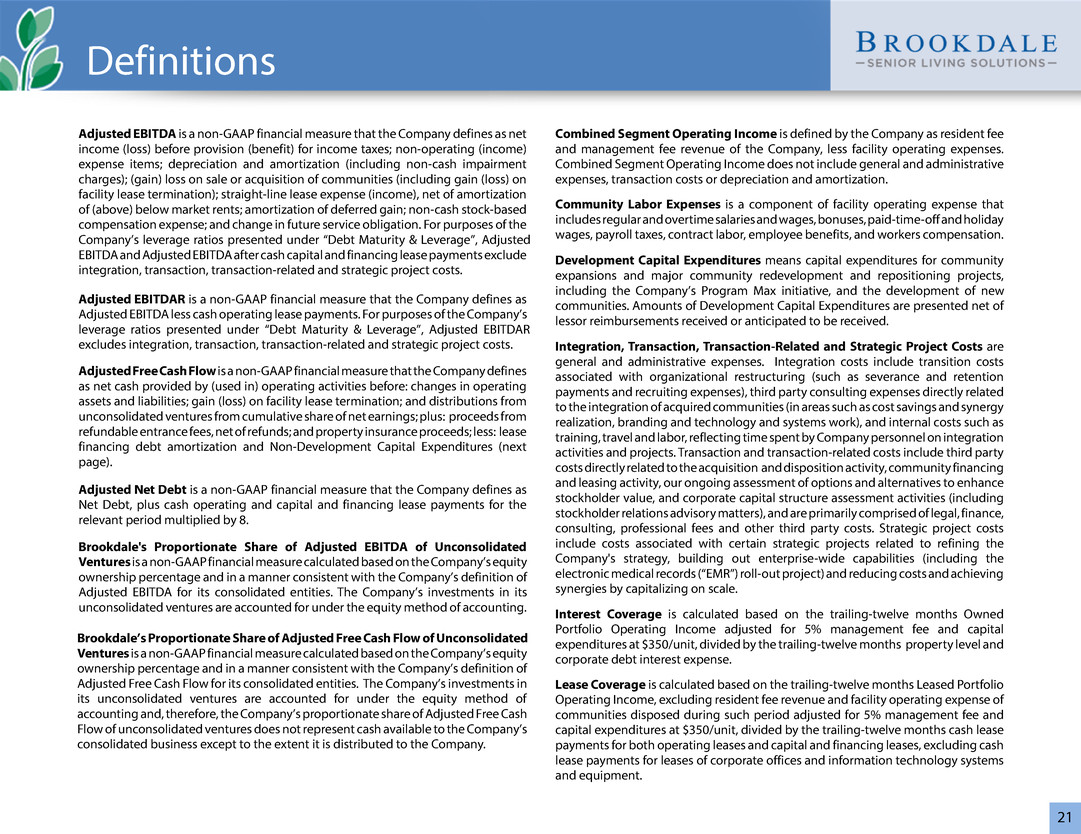
21 Adjusted EBITDA is a non-GAAP financial measure that the Company defines as net income (loss) before provision (benefit) for income taxes; non-operating (income) expense items; depreciation and amortization (including non-cash impairment charges); (gain) loss on sale or acquisition of communities (including gain (loss) on facility lease termination); straight-line lease expense (income), net of amortization of (above) below market rents; amortization of deferred gain; non-cash stock-based compensation expense; and change in future service obligation. For purposes of the Company’s leverage ratios presented under “Debt Maturity & Leverage”, Adjusted EBITDA and Adjusted EBITDA after cash capital and financing lease payments exclude integration, transaction, transaction-related and strategic project costs. Adjusted EBITDAR is a non-GAAP financial measure that the Company defines as Adjusted EBITDA less cash operating lease payments. For purposes of the Company’s leverage ratios presented under “Debt Maturity & Leverage”, Adjusted EBITDAR excludes integration, transaction, transaction-related and strategic project costs. Adjusted Free Cash Flow is a non-GAAP financial measure that the Company defines as net cash provided by (used in) operating activities before: changes in operating assets and liabilities; gain (loss) on facility lease termination; and distributions from unconsolidated ventures from cumulative share of net earnings; plus: proceeds from refundable entrance fees, net of refunds; and property insurance proceeds; less: lease financing debt amortization and Non-Development Capital Expenditures (next page). Adjusted Net Debt is a non-GAAP financial measure that the Company defines as Net Debt, plus cash operating and capital and financing lease payments for the relevant period multiplied by 8. Brookdale's Proportionate Share of Adjusted EBITDA of Unconsolidated Ventures is a non-GAAP financial measure calculated based on the Company’s equity ownership percentage and in a manner consistent with the Company’s definition of Adjusted EBITDA for its consolidated entities. The Company’s investments in its unconsolidated ventures are accounted for under the equity method of accounting. Brookdale’s Proportionate Share of Adjusted Free Cash Flow of Unconsolidated Ventures is a non-GAAP financial measure calculated based on the Company’s equity ownership percentage and in a manner consistent with the Company’s definition of Adjusted Free Cash Flow for its consolidated entities. The Company’s investments in its unconsolidated ventures are accounted for under the equity method of accounting and, therefore, the Company’s proportionate share of Adjusted Free Cash Flow of unconsolidated ventures does not represent cash available to the Company’s consolidated business except to the extent it is distributed to the Company. Combined Segment Operating Income is defined by the Company as resident fee and management fee revenue of the Company, less facility operating expenses. Combined Segment Operating Income does not include general and administrative expenses, transaction costs or depreciation and amortization. Community Labor Expenses is a component of facility operating expense that includes regular and overtime salaries and wages, bonuses, paid-time-off and holiday wages, payroll taxes, contract labor, employee benefits, and workers compensation. Development Capital Expenditures means capital expenditures for community expansions and major community redevelopment and repositioning projects, including the Company’s Program Max initiative, and the development of new communities. Amounts of Development Capital Expenditures are presented net of lessor reimbursements received or anticipated to be received. Integration, Transaction, Transaction-Related and Strategic Project Costs are general and administrative expenses. Integration costs include transition costs associated with organizational restructuring (such as severance and retention payments and recruiting expenses), third party consulting expenses directly related to the integration of acquired communities (in areas such as cost savings and synergy realization, branding and technology and systems work), and internal costs such as training, travel and labor, reflecting time spent by Company personnel on integration activities and projects. Transaction and transaction-related costs include third party costs directly related to the acquisition and disposition activity, community financing and leasing activity, our ongoing assessment of options and alternatives to enhance stockholder value, and corporate capital structure assessment activities (including stockholder relations advisory matters), and are primarily comprised of legal, finance, consulting, professional fees and other third party costs. Strategic project costs include costs associated with certain strategic projects related to refining the Company's strategy, building out enterprise-wide capabilities (including the electronic medical records (“EMR”) roll-out project) and reducing costs and achieving synergies by capitalizing on scale. Interest Coverage is calculated based on the trailing-twelve months Owned Portfolio Operating Income adjusted for 5% management fee and capital expenditures at $350/unit, divided by the trailing-twelve months property level and corporate debt interest expense. Lease Coverage is calculated based on the trailing-twelve months Leased Portfolio Operating Income, excluding resident fee revenue and facility operating expense of communities disposed during such period adjusted for 5% management fee and capital expenditures at $350/unit, divided by the trailing-twelve months cash lease payments for both operating leases and capital and financing leases, excluding cash lease payments for leases of corporate offices and information technology systems and equipment. Definitions
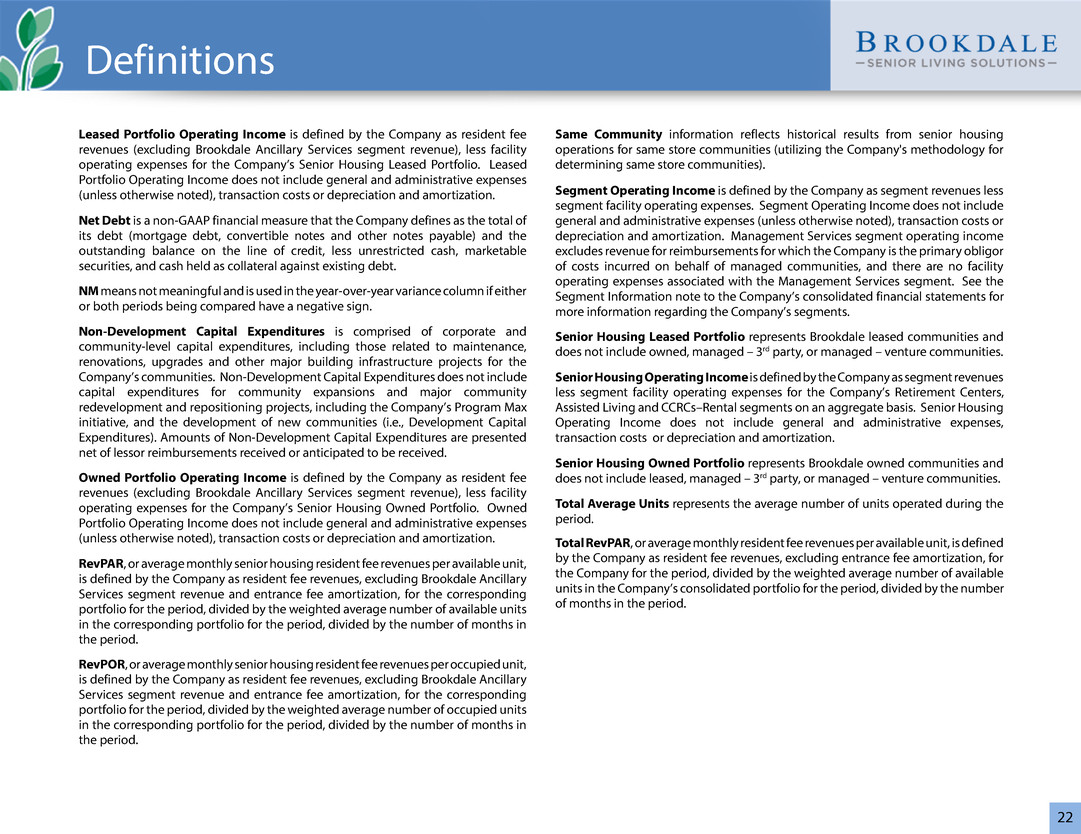
22 Leased Portfolio Operating Income is defined by the Company as resident fee revenues (excluding Brookdale Ancillary Services segment revenue), less facility operating expenses for the Company’s Senior Housing Leased Portfolio. Leased Portfolio Operating Income does not include general and administrative expenses (unless otherwise noted), transaction costs or depreciation and amortization. Net Debt is a non-GAAP financial measure that the Company defines as the total of its debt (mortgage debt, convertible notes and other notes payable) and the outstanding balance on the line of credit, less unrestricted cash, marketable securities, and cash held as collateral against existing debt. NM means not meaningful and is used in the year-over-year variance column if either or both periods being compared have a negative sign. Non-Development Capital Expenditures is comprised of corporate and community-level capital expenditures, including those related to maintenance, renovations, upgrades and other major building infrastructure projects for the Company’s communities. Non-Development Capital Expenditures does not include capital expenditures for community expansions and major community redevelopment and repositioning projects, including the Company’s Program Max initiative, and the development of new communities (i.e., Development Capital Expenditures). Amounts of Non-Development Capital Expenditures are presented net of lessor reimbursements received or anticipated to be received. Owned Portfolio Operating Income is defined by the Company as resident fee revenues (excluding Brookdale Ancillary Services segment revenue), less facility operating expenses for the Company’s Senior Housing Owned Portfolio. Owned Portfolio Operating Income does not include general and administrative expenses (unless otherwise noted), transaction costs or depreciation and amortization. RevPAR, or average monthly senior housing resident fee revenues per available unit, is defined by the Company as resident fee revenues, excluding Brookdale Ancillary Services segment revenue and entrance fee amortization, for the corresponding portfolio for the period, divided by the weighted average number of available units in the corresponding portfolio for the period, divided by the number of months in the period. RevPOR, or average monthly senior housing resident fee revenues per occupied unit, is defined by the Company as resident fee revenues, excluding Brookdale Ancillary Services segment revenue and entrance fee amortization, for the corresponding portfolio for the period, divided by the weighted average number of occupied units in the corresponding portfolio for the period, divided by the number of months in the period. Same Community information reflects historical results from senior housing operations for same store communities (utilizing the Company's methodology for determining same store communities). Segment Operating Income is defined by the Company as segment revenues less segment facility operating expenses. Segment Operating Income does not include general and administrative expenses (unless otherwise noted), transaction costs or depreciation and amortization. Management Services segment operating income excludes revenue for reimbursements for which the Company is the primary obligor of costs incurred on behalf of managed communities, and there are no facility operating expenses associated with the Management Services segment. See the Segment Information note to the Company’s consolidated financial statements for more information regarding the Company’s segments. Senior Housing Leased Portfolio represents Brookdale leased communities and does not include owned, managed – 3rd party, or managed – venture communities. Senior Housing Operating Income is defined by the Company as segment revenues less segment facility operating expenses for the Company’s Retirement Centers, Assisted Living and CCRCs–Rental segments on an aggregate basis. Senior Housing Operating Income does not include general and administrative expenses, transaction costs or depreciation and amortization. Senior Housing Owned Portfolio represents Brookdale owned communities and does not include leased, managed – 3rd party, or managed – venture communities. Total Average Units represents the average number of units operated during the period. Total RevPAR, or average monthly resident fee revenues per available unit, is defined by the Company as resident fee revenues, excluding entrance fee amortization, for the Company for the period, divided by the weighted average number of available units in the Company’s consolidated portfolio for the period, divided by the number of months in the period. Definitions
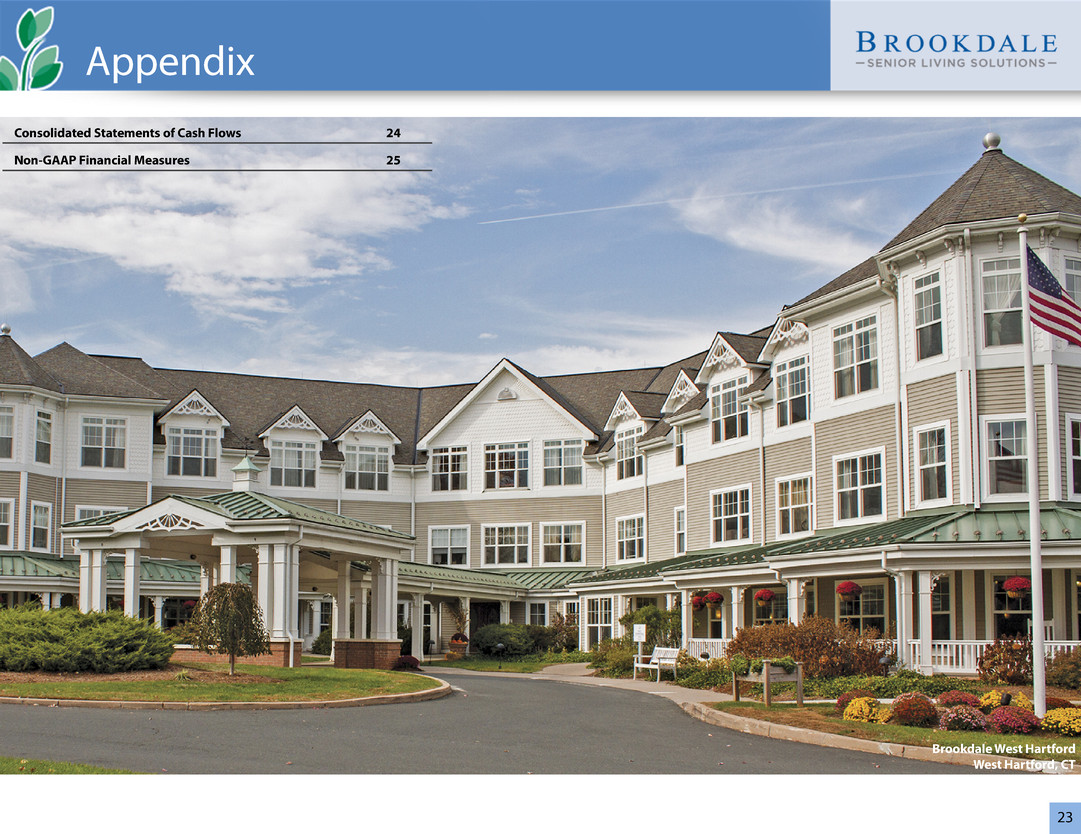
23 Brookdale West Hartford West Hartford, CT Consolidated Statements of Cash Flows 24 Non-GAAP Financial Measures 25 Appendix
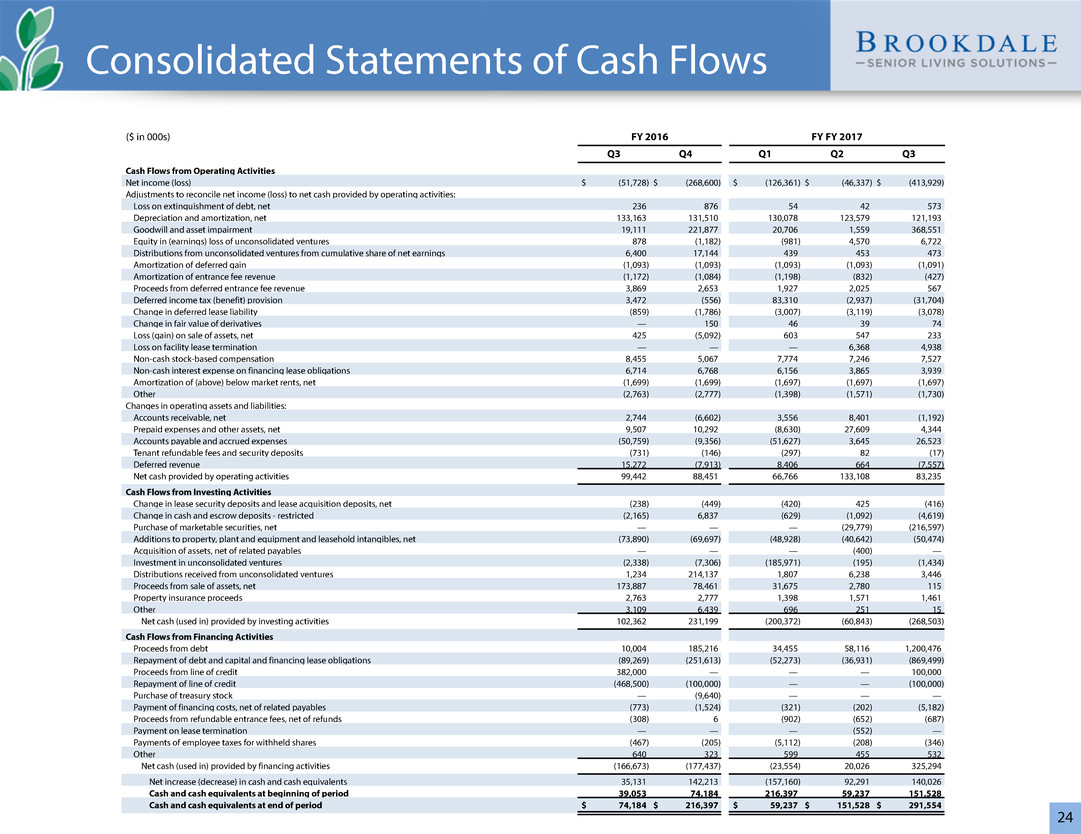
24 Cash Flows from Operating Activities Net income (loss) $ (51,728) $ (268,600) $ (126,361) $ (46,337) $ (413,929) Adjustments to reconcile net income (loss) to net cash provided by operating activities: Loss on extinguishment of debt, net 236 876 54 42 573 Depreciation and amortization, net 133,163 131,510 130,078 123,579 121,193 Goodwill and asset impairment 19,111 221,877 20,706 1,559 368,551 Equity in (earnings) loss of unconsolidated ventures 878 (1,182) (981) 4,570 6,722 Distributions from unconsolidated ventures from cumulative share of net earnings 6,400 17,144 439 453 473 Amortization of deferred gain (1,093) (1,093) (1,093) (1,093) (1,091) Amortization of entrance fee revenue (1,172) (1,084) (1,198) (832) (427) Proceeds from deferred entrance fee revenue 3,869 2,653 1,927 2,025 567 Deferred income tax (benefit) provision 3,472 (556) 83,310 (2,937) (31,704) Change in deferred lease liability (859) (1,786) (3,007) (3,119) (3,078) Change in fair value of derivatives — 150 46 39 74 Loss (gain) on sale of assets, net 425 (5,092) 603 547 233 Loss on facility lease termination — — — 6,368 4,938 Non-cash stock-based compensation 8,455 5,067 7,774 7,246 7,527 Non-cash interest expense on financing lease obligations 6,714 6,768 6,156 3,865 3,939 Amortization of (above) below market rents, net (1,699) (1,699) (1,697) (1,697) (1,697) Other (2,763) (2,777) (1,398) (1,571) (1,730) Changes in operating assets and liabilities: Accounts receivable, net 2,744 (6,602) 3,556 8,401 (1,192) Prepaid expenses and other assets, net 9,507 10,292 (8,630) 27,609 4,344 Accounts payable and accrued expenses (50,759) (9,356) (51,627) 3,645 26,523 Tenant refundable fees and security deposits (731) (146) (297) 82 (17) Deferred revenue 15,272 (7,913) 8,406 664 (7,557) Net cash provided by operating activities 99,442 88,451 66,766 133,108 83,235 Cash Flows from Investing Activities Change in lease security deposits and lease acquisition deposits, net (238) (449) (420) 425 (416) Change in cash and escrow deposits - restricted (2,165) 6,837 (629) (1,092) (4,619) Purchase of marketable securities, net — — — (29,779) (216,597) Additions to property, plant and equipment and leasehold intangibles, net (73,890) (69,697) (48,928) (40,642) (50,474) Acquisition of assets, net of related payables — — — (400) — Investment in unconsolidated ventures (2,338) (7,306) (185,971) (195) (1,434) Distributions received from unconsolidated ventures 1,234 214,137 1,807 6,238 3,446 Proceeds from sale of assets, net 173,887 78,461 31,675 2,780 115 Property insurance proceeds 2,763 2,777 1,398 1,571 1,461 Other 3,109 6,439 696 251 15 Net cash (used in) provided by investing activities 102,362 231,199 (200,372) (60,843) (268,503) Cash Flows from Financing Activities Proceeds from debt 10,004 185,216 34,455 58,116 1,200,476 Repayment of debt and capital and financing lease obligations (89,269) (251,613) (52,273) (36,931) (869,499) Proceeds from line of credit 382,000 — — — 100,000 Repayment of line of credit (468,500) (100,000) — — (100,000) Purchase of treasury stock — (9,640) — — — Payment of financing costs, net of related payables (773) (1,524) (321) (202) (5,182) Proceeds from refundable entrance fees, net of refunds (308) 6 (902) (652) (687) Payment on lease termination — — — (552) — Payments of employee taxes for withheld shares (467) (205) (5,112) (208) (346) Other 640 323 599 455 532 Net cash (used in) provided by financing activities (166,673) (177,437) (23,554) 20,026 325,294 Net increase (decrease) in cash and cash equivalents 35,131 142,213 (157,160) 92,291 140,026 Cash and cash equivalents at beginning of period 39,053 74,184 216,397 59,237 151,528 Cash and cash equivalents at end of period $ 74,184 $ 216,397 $ 59,237 $ 151,528 $ 291,554 ($ in 000s) FY 2016 FY FY 2017 Q3 Q4 Q1 Q2 Q3 Consolidated Statements of Cash Flows
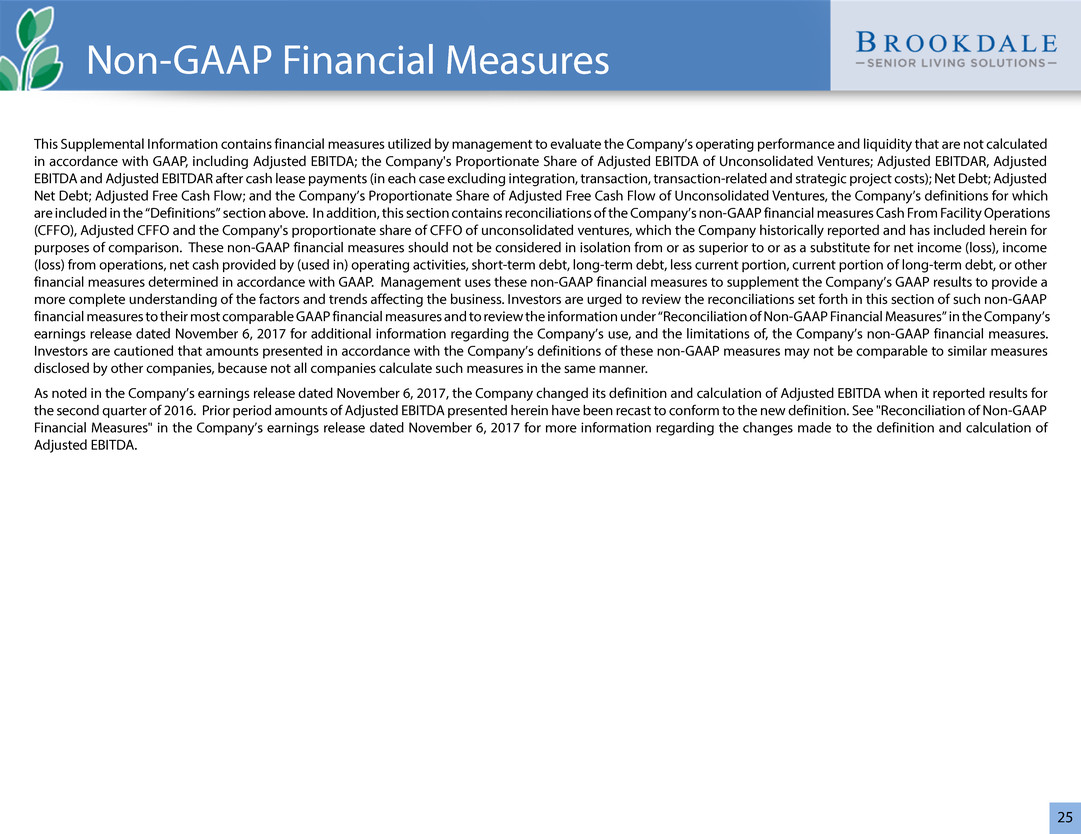
25 This Supplemental Information contains financial measures utilized by management to evaluate the Company’s operating performance and liquidity that are not calculated in accordance with GAAP, including Adjusted EBITDA; the Company's Proportionate Share of Adjusted EBITDA of Unconsolidated Ventures; Adjusted EBITDAR, Adjusted EBITDA and Adjusted EBITDAR after cash lease payments (in each case excluding integration, transaction, transaction-related and strategic project costs); Net Debt; Adjusted Net Debt; Adjusted Free Cash Flow; and the Company’s Proportionate Share of Adjusted Free Cash Flow of Unconsolidated Ventures, the Company’s definitions for which are included in the “Definitions” section above. In addition, this section contains reconciliations of the Company’s non-GAAP financial measures Cash From Facility Operations (CFFO), Adjusted CFFO and the Company's proportionate share of CFFO of unconsolidated ventures, which the Company historically reported and has included herein for purposes of comparison. These non-GAAP financial measures should not be considered in isolation from or as superior to or as a substitute for net income (loss), income (loss) from operations, net cash provided by (used in) operating activities, short-term debt, long-term debt, less current portion, current portion of long-term debt, or other financial measures determined in accordance with GAAP. Management uses these non-GAAP financial measures to supplement the Company’s GAAP results to provide a more complete understanding of the factors and trends affecting the business. Investors are urged to review the reconciliations set forth in this section of such non-GAAP financial measures to their most comparable GAAP financial measures and to review the information under “Reconciliation of Non-GAAP Financial Measures” in the Company’s earnings release dated November 6, 2017 for additional information regarding the Company’s use, and the limitations of, the Company’s non-GAAP financial measures. Investors are cautioned that amounts presented in accordance with the Company’s definitions of these non-GAAP measures may not be comparable to similar measures disclosed by other companies, because not all companies calculate such measures in the same manner. As noted in the Company’s earnings release dated November 6, 2017, the Company changed its definition and calculation of Adjusted EBITDA when it reported results for the second quarter of 2016. Prior period amounts of Adjusted EBITDA presented herein have been recast to conform to the new definition. See "Reconciliation of Non-GAAP Financial Measures" in the Company’s earnings release dated November 6, 2017 for more information regarding the changes made to the definition and calculation of Adjusted EBITDA. Non-GAAP Financial Measures
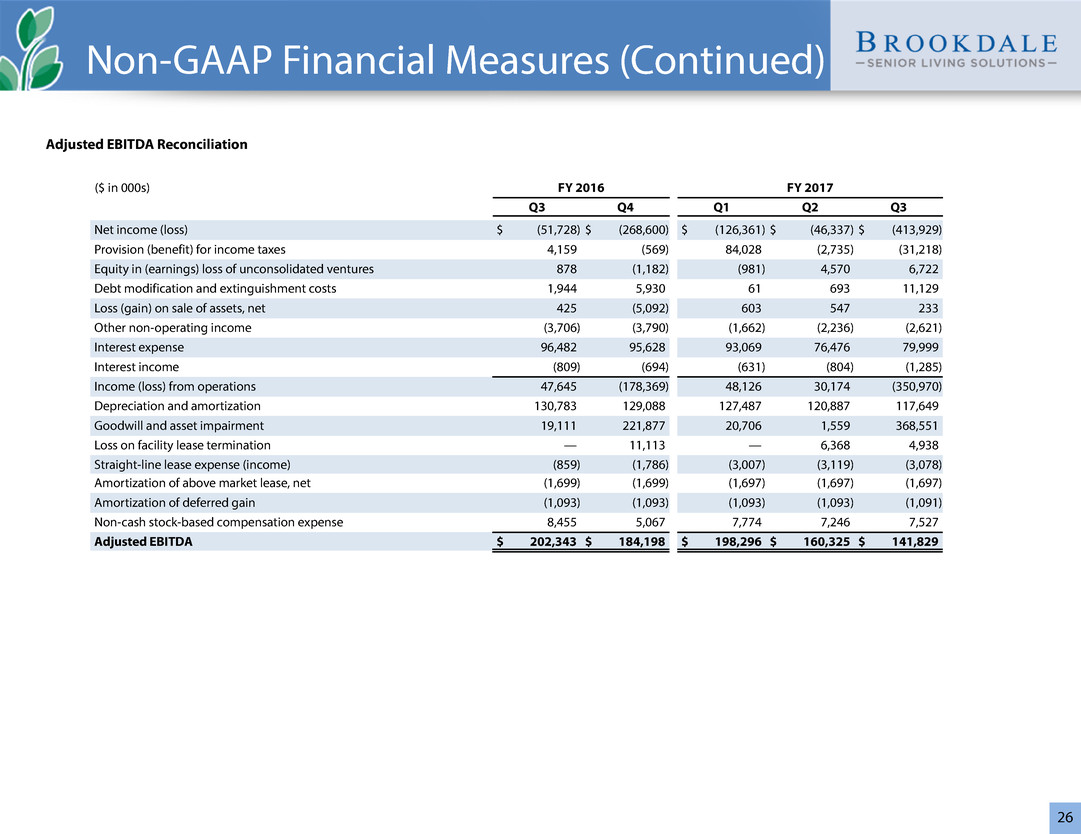
26 Net income (loss) $ (51,728) $ (268,600) $ (126,361) $ (46,337) $ (413,929) Provision (benefit) for income taxes 4,159 (569) 84,028 (2,735) (31,218) Equity in (earnings) loss of unconsolidated ventures 878 (1,182) (981) 4,570 6,722 Debt modification and extinguishment costs 1,944 5,930 61 693 11,129 Loss (gain) on sale of assets, net 425 (5,092) 603 547 233 Other non-operating income (3,706) (3,790) (1,662) (2,236) (2,621) Interest expense 96,482 95,628 93,069 76,476 79,999 Interest income (809) (694) (631) (804) (1,285) Income (loss) from operations 47,645 (178,369) 48,126 30,174 (350,970) Depreciation and amortization 130,783 129,088 127,487 120,887 117,649 Goodwill and asset impairment 19,111 221,877 20,706 1,559 368,551 Loss on facility lease termination — 11,113 — 6,368 4,938 Straight-line lease expense (income) (859) (1,786) (3,007) (3,119) (3,078) Amortization of above market lease, net (1,699) (1,699) (1,697) (1,697) (1,697) Amortization of deferred gain (1,093) (1,093) (1,093) (1,093) (1,091) Non-cash stock-based compensation expense 8,455 5,067 7,774 7,246 7,527 Adjusted EBITDA $ 202,343 $ 184,198 $ 198,296 $ 160,325 $ 141,829 ($ in 000s) FY 2016 FY 2017 Q3 Q4 Q1 Q2 Q3 Adjusted EBITDA Reconciliation Non-GAAP Financial Measures (Continued)
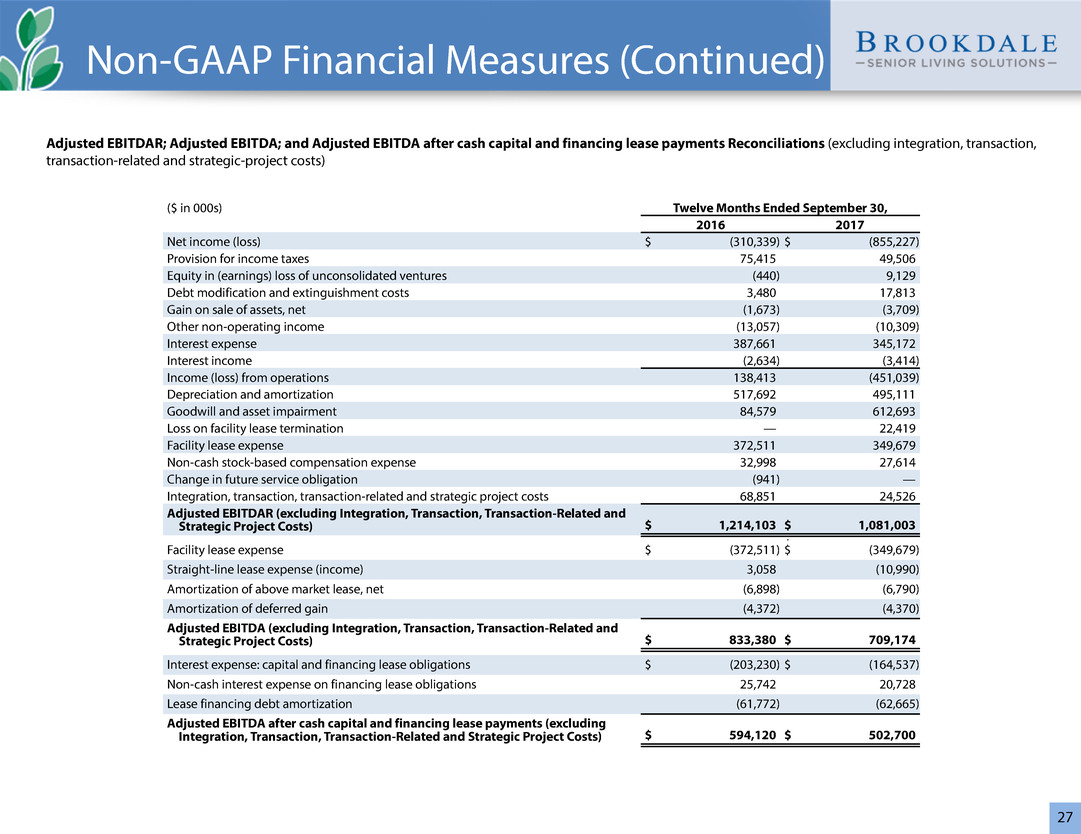
27 Adjusted EBITDAR; Adjusted EBITDA; and Adjusted EBITDA after cash capital and financing lease payments Reconciliations (excluding integration, transaction, transaction-related and strategic-project costs) ($ in 000s) Twelve Months Ended September 30, 2016 2017 Net income (loss) $ (310,339) $ (855,227) Provision for income taxes 75,415 49,506 Equity in (earnings) loss of unconsolidated ventures (440) 9,129 Debt modification and extinguishment costs 3,480 17,813 Gain on sale of assets, net (1,673) (3,709) Other non-operating income (13,057) (10,309) Interest expense 387,661 345,172 Interest income (2,634) (3,414) Income (loss) from operations 138,413 (451,039) Depreciation and amortization 517,692 495,111 Goodwill and asset impairment 84,579 612,693 Loss on facility lease termination — 22,419 Facility lease expense 372,511 349,679 Non-cash stock-based compensation expense 32,998 27,614 Change in future service obligation (941) — Integration, transaction, transaction-related and strategic project costs 68,851 24,526 Adjusted EBITDAR (excluding Integration, Transaction, Transaction-Related and Strategic Project Costs) $ 1,214,103 $ 1,081,003 $ —Facility lease expense $ (372,511) $ (349,679) Straight-line lease expense (income) 3,058 (10,990) Amortization of above market lease, net (6,898) (6,790) Amortization of deferred gain (4,372) (4,370) Adjusted EBITDA (excluding Integration, Transaction, Transaction-Related and Strategic Project Costs) $ 833,380 $ 709,174 Interest expense: capital and financing lease obligations $ (203,230) $ (164,537) Non-cash interest expense on financing lease obligations 25,742 20,728 Lease financing debt amortization (61,772) (62,665) Adjusted EBITDA after cash capital and financing lease payments (excluding Integration, Transaction, Transaction-Related and Strategic Project Costs) $ 594,120 $ 502,700 Non-GAAP Financial Measures (Continued)
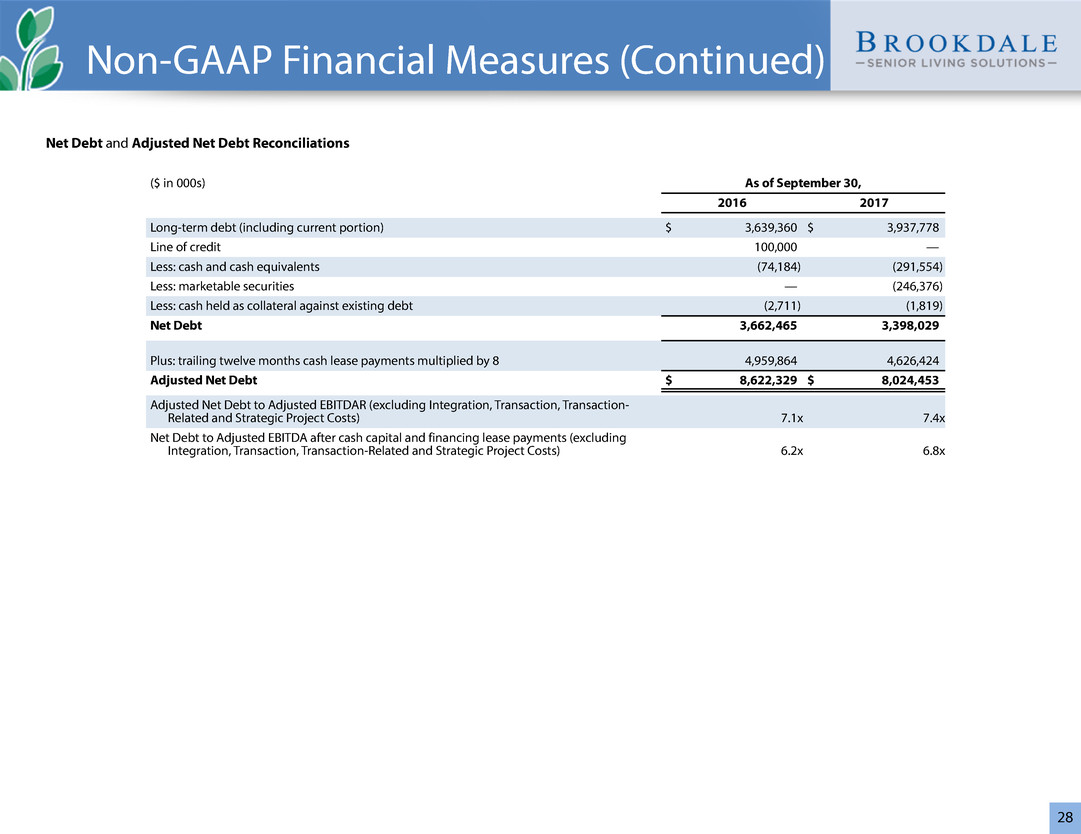
28 Net Debt and Adjusted Net Debt Reconciliations ($ in 000s) As of September 30, 2016 2017 Long-term debt (including current portion) $ 3,639,360 $ 3,937,778 Line of credit 100,000 — Less: cash and cash equivalents (74,184) (291,554) Less: marketable securities — (246,376) Less: cash held as collateral against existing debt (2,711) (1,819) Net Debt 3,662,465 3,398,029 Plus: trailing twelve months cash lease payments multiplied by 8 4,959,864 4,626,424 Adjusted Net Debt $ 8,622,329 $ 8,024,453 Adjusted Net Debt to Adjusted EBITDAR (excluding Integration, Transaction, Transaction- Related and Strategic Project Costs) 7.1x 7.4x Net Debt to Adjusted EBITDA after cash capital and financing lease payments (excluding Integration, Transaction, Transaction-Related and Strategic Project Costs) 6.2x 6.8x Non-GAAP Financial Measures (Continued)
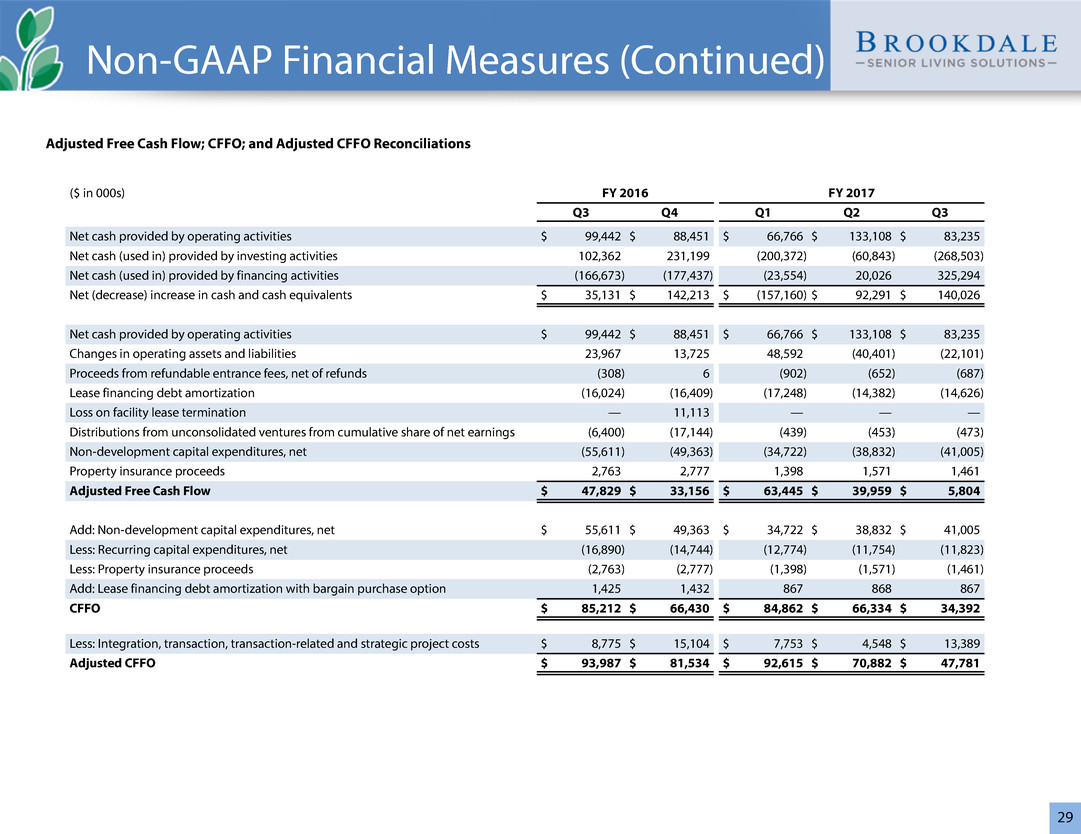
29 Net cash provided by operating activities $ 99,442 $ 88,451 $ 66,766 $ 133,108 $ 83,235 Net cash (used in) provided by investing activities 102,362 231,199 (200,372) (60,843) (268,503) Net cash (used in) provided by financing activities (166,673) (177,437) (23,554) 20,026 325,294 Net (decrease) increase in cash and cash equivalents $ 35,131 $ 142,213 $ (157,160) $ 92,291 $ 140,026 Net cash provided by operating activities $ 99,442 $ 88,451 $ 66,766 $ 133,108 $ 83,235 Changes in operating assets and liabilities 23,967 13,725 48,592 (40,401) (22,101) Proceeds from refundable entrance fees, net of refunds (308) 6 (902) (652) (687) Lease financing debt amortization (16,024) (16,409) (17,248) (14,382) (14,626) Loss on facility lease termination — 11,113 — — — Distributions from unconsolidated ventures from cumulative share of net earnings (6,400) (17,144) (439) (453) (473) Non-development capital expenditures, net (55,611) (49,363) (34,722) (38,832) (41,005) Property insurance proceeds 2,763 2,777 1,398 1,571 1,461 Adjusted Free Cash Flow $ 47,829 $ 33,156 $ 63,445 $ 39,959 $ 5,804 Add: Non-development capital expenditures, net $ 55,611 $ 49,363 $ 34,722 $ 38,832 $ 41,005 Less: Recurring capital expenditures, net (16,890) (14,744) (12,774) (11,754) (11,823) Less: Property insurance proceeds (2,763) (2,777) (1,398) (1,571) (1,461) Add: Lease financing debt amortization with bargain purchase option 1,425 1,432 867 868 867 CFFO $ 85,212 $ 66,430 $ 84,862 $ 66,334 $ 34,392 Less: Integration, transaction, transaction-related and strategic project costs $ 8,775 $ 15,104 $ 7,753 $ 4,548 $ 13,389 Adjusted CFFO $ 93,987 $ 81,534 $ 92,615 $ 70,882 $ 47,781 ($ in 000s) FY 2016 FY 2017 Q3 Q4 Q1 Q2 Q3 Adjusted Free Cash Flow; CFFO; and Adjusted CFFO Reconciliations Non-GAAP Financial Measures (Continued)

30 Brookdale's Proportionate Share of Adjusted EBITDA of Unconsolidated Ventures For purposes of this presentation, amounts for each line item represent the aggregate amounts of such line items for all the Company's unconsolidated ventures. ($ in 000s) FY 2016 FY 2017 TTM Q3 Q4 Q1 Q2 Q3 Q3 2017 Net income (loss) $ (6,195) $ 1,917 $ 8,118 $ (26,412) $ (42,672) $ (59,049) Provision for income taxes 224 227 263 327 323 1,140 Debt modification and extinguishment costs — 131 13 16 80 240 (Gain) loss on sale of assets, net — (724) (372) 189 20 (887) Other non-operating income (loss) — (781) (434) (837) (617) (2,669) Interest expense 28,021 27,183 26,391 35,304 36,119 124,997 Interest income (700) (723) (703) (750) (783) (2,959) Income (loss) from operations 21,350 27,230 33,276 7,837 (7,530) 60,813 Depreciation and amortization 47,085 48,042 47,528 83,172 85,038 263,780 Asset impairment — 413 2 483 3,911 4,809 Straight-line lease expense (income) — — — 8 (2,711) (2,703) Adjusted EBITDA of unconsolidated ventures $ 68,435 $ 75,685 $ 80,806 $ 91,500 $ 78,708 $ 326,699 Brookdale's weighted average ownership percentage 22.4% 23.8% 21.2% 19.9% 21.3% 21.5% Brookdale's proportionate share of Adjusted EBITDA of unconsolidated ventures $ 15,353 $ 17,989 $ 17,126 $ 18,219 $ 16,788 $ 70,122 Non-GAAP Financial Measures (Continued)

31 Net cash provided by operating activities $ 47,095 $ 40,994 $ 59,924 $ 85,867 $ 62,054 $ 248,839 Net cash (used in) provided by investing activities (40,885) 5,556 (1,150,080) (68,585) (20,267) (1,233,376) Net cash (used in) provided by financing activities (12,073) (55,554) 1,145,059 (29,166) (32,514) 1,027,825 Net (decrease) increase in cash and cash equivalents $ (5,863) $ (9,004) $ 54,903 $ (11,884) $ 9,273 $ 43,288 Net cash provided by operating activities $ 47,095 $ 40,994 $ 59,924 $ 85,867 $ 62,054 $ 248,839 Changes in operating assets and liabilities (3,600) 8,617 2,086 (16,559) (5,615) (11,471) Proceeds from refundable entrance fees, net of refunds 32 (4,931) (4,365) (5,028) (6,309) (20,633) Non-development capital expenditures, net (25,761) (26,232) (17,027) (23,739) (28,659) (95,657) Property insurance proceeds — — 393 834 614 1,841 Adjusted Free Cash Flow of unconsolidated ventures $ 17,766 $ 18,448 $ 41,011 $ 41,375 $ 22,085 $ 122,919 Brookdale's Weighted Average Ownership percentage 42.2% 36.7% 21.3% 19.1% 30.4% 24.5% Brookdale’s Proportionate Share of Adjusted Free Cash Flow of Unconsolidated Ventures $ 7,502 $ 6,763 $ 8,750 $ 7,920 $ 6,709 $ 30,142 Adjusted Free Cash Flow $ 17,766 $ 18,448 $ 41,011 $ 41,375 $ 22,085 $ 122,919 Add: Non-development capital expenditures, net 25,761 26,232 17,027 23,739 28,659 95,657 Less: Recurring capital expenditures, net (5,256) (5,075) (4,475) (6,461) (6,240) (22,251) Less: Property insurance proceeds — — (393) (834) (614) (1,841) CFFO of unconsolidated ventures $ 38,271 $ 39,605 $ 53,170 $ 57,819 $ 43,890 $ 194,484 Brookdale's Weighted Average Ownership percentage 36.2% 32.5% 24.6% 23.8% 27.4% 26.6% Brookdale’s proportionate share of CFFO of unconsolidated ventures $ 13,837 $ 12,870 $ 13,057 $ 13,762 $ 12,040 $ 51,729 ($ in 000s) FY 2016 FY 2017 TTM Q3 Q4 Q1 Q2 Q3 Q3 2017 Brookdale's Proportionate Share of Adjusted Free Cash Flow and CFFO of Unconsolidated Ventures For purposes of this presentation, amounts for each line item represent the aggregate amounts of such line items for all the Company's unconsolidated ventures. Non-GAAP Financial Measures (Continued)

Brookdale Senior Living Inc. 111 Westwood Place, Suite 400 Brentwood, TN 37027 (615) 221-2250 www.brookdale.com


