
Exhibit 99.2 Supplemental Information 3rd Quarter 2018
Table of Contents Financial Overview 3 Segment Overview 7 Senior Housing 8 Ancillary Services 13 G&A Expense & Transaction Costs 14 Capital Expenditures 15 Cash Lease Payments 16 Unconsolidated Ventures 17 Debt & Liquidity 18 Net Asset Value Elements 20 Definitions 21 Appendix: Consolidated Statements of Cash Flows 24 Non-GAAP Financial Measures 25 2
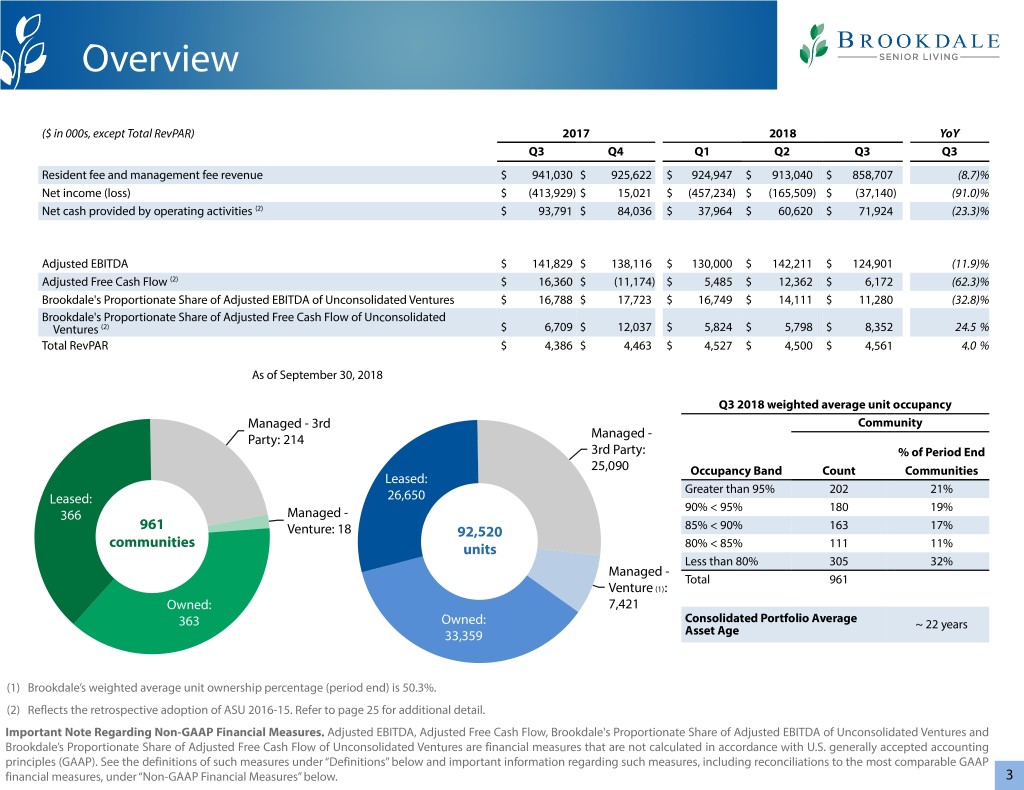
Overview ($ in 000s, except Total RevPAR) 2017 2018 YoY Q3 Q4 Q1 Q2 Q3 Q3 Resident fee and management fee revenue $ 941,030 $ 925,622 $ 924,947 $ 913,040 $ 858,707 (8.7)% Net income (loss) $ (413,929) $ 15,021 $ (457,234) $ (165,509) $ (37,140) (91.0)% Net cash provided by operating activities (2) $ 93,791 $ 84,036 $ 37,964 $ 60,620 $ 71,924 (23.3)% Adjusted EBITDA $ 141,829 $ 138,116 $ 130,000 $ 142,211 $ 124,901 (11.9)% Adjusted Free Cash Flow (2) $ 16,360 $ (11,174) $ 5,485 $ 12,362 $ 6,172 (62.3)% Brookdale's Proportionate Share of Adjusted EBITDA of Unconsolidated Ventures $ 16,788 $ 17,723 $ 16,749 $ 14,111 $ 11,280 (32.8)% Brookdale's Proportionate Share of Adjusted Free Cash Flow of Unconsolidated Ventures (2) $ 6,709 $ 12,037 $ 5,824 $ 5,798 $ 8,352 24.5 % Total RevPAR $ 4,386 $ 4,463 $ 4,527 $ 4,500 $ 4,561 4.0 % As of September 30, 2018 Q3 2018 weighted average unit occupancy Managed - 3rd Community Party: 214 Managed - 3rd Party: % of Period End 25,090 Occupancy Band Count Communities Leased: Greater than 95% 202 21% Leased: 26,650 90% < 95% 180 19% 366 Managed - 961 Venture: 18 92,520 85% < 90% 163 17% communities units 80% < 85% 111 11% Less than 80% 305 32% Managed - Total 961 Venture (1): Owned: 7,421 363 Owned: Consolidated Portfolio Average ~ 22 years 33,359 Asset Age (1) Brookdale’s weighted average unit ownership percentage (period end) is 50.3%. (2) Reflects the retrospective adoption of ASU 2016-15. Refer to page 25 for additional detail. Important Note Regarding Non-GAAP Financial Measures. Adjusted EBITDA, Adjusted Free Cash Flow, Brookdale's Proportionate Share of Adjusted EBITDA of Unconsolidated Ventures and Brookdale’s Proportionate Share of Adjusted Free Cash Flow of Unconsolidated Ventures are financial measures that are not calculated in accordance with U.S. generally accepted accounting principles (GAAP). See the definitions of such measures under “Definitions” below and important information regarding such measures, including reconciliations to the most comparable GAAP financial measures, under “Non-GAAP Financial Measures” below. 3

Consolidated Portfolio Overview Segment Overview (1) Senior Housing Segments Brookdale CCRCs - Rental Ancillary 14% Services 13% (2) Assisted Living Management 66% Senior Housing Services 2% 85% Revenue Revenue Retirement Centers 20% Brookdale (3) Ancillary Services 4% Management CCRCs - Rental Services 7% Assisted Living 10% 64% Senior Housing 89% Segment Operating Income Income Segment Operating Retirement Centers 26% (1) Brookdale’s five segments are Retirement Centers, Assisted Living, CCRCs-Rental (which combined are referred to as Senior Housing), Brookdale Ancillary Services and Management Services. (2) Percentage of revenue is based on Q3 2018 resident fee and management fee revenue. (3) Percentage of segment operating income is based on Q3 2018 results. 4

Adjusted EBITDA and Adjusted Free Cash Flow (All amounts in 000s) 2017 2018 YoY Q3 Q4 Q1 Q2 Q3 Q3 Resident fee and management fee revenue $ 941,030 $ 925,622 $ 924,947 $ 913,040 $ 858,707 Less: Facility operating expense (1) (650,654) (634,554) (632,325) (627,076) (607,076) Combined Segment Operating Income 290,376 291,068 292,622 285,964 251,631 (13.3)% Less: General and administrative expense (including non-cash stock-based compensation expense) (63,779) (59,017) (76,710) (60,314) (57,309) Add: Non-cash stock-based compensation expense 7,527 5,285 8,406 6,269 6,035 Less: Transaction costs (1,992) (9,649) (4,725) (2,593) (1,487) Less: Cash operating lease payments (see page 16) (90,303) (89,571) (89,593) (87,115) (73,969) Adjusted EBITDA 141,829 138,116 130,000 142,211 124,901 (11.9)% Less: Interest expense, net (71,157) (67,054) (62,292) (65,352) (63,428) Less: Lease financing debt amortization (14,626) (18,650) (21,114) (18,787) (13,370) Add: Proceeds from entrance fees, net of refunds and amortization (547) 811 831 (218) 358 Add/Less: Other (2) 1,866 7,511 (204) 2,189 (1,014) Less: Non-Development Capital Expenditures, net (see page 15) (41,005) (71,908) (41,736) (47,681) (41,275) Adjusted Free Cash Flow $ 16,360 $ (11,174) $ 5,485 $ 12,362 $ 6,172 (62.3)% Brookdale's Proportionate Share of Unconsolidated Ventures Adjusted EBITDA $ 16,788 $ 17,723 $ 16,749 $ 14,111 $ 11,280 (32.8)% Adjusted Free Cash Flow $ 6,709 $ 12,037 $ 5,824 $ 5,798 $ 8,352 24.5 % Weighted average shares used in computing basic net income (loss) per share 186,298 186,412 186,880 187,585 187,675 (1) Includes hurricane and natural disaster expense of $5.3 million, $1.9 million, and $1.5 million in Q3 2017, Q4 2017, and Q3 2018 respectively. (2) Primarily consists of proceeds from property insurance and cash paid for state income taxes. 5
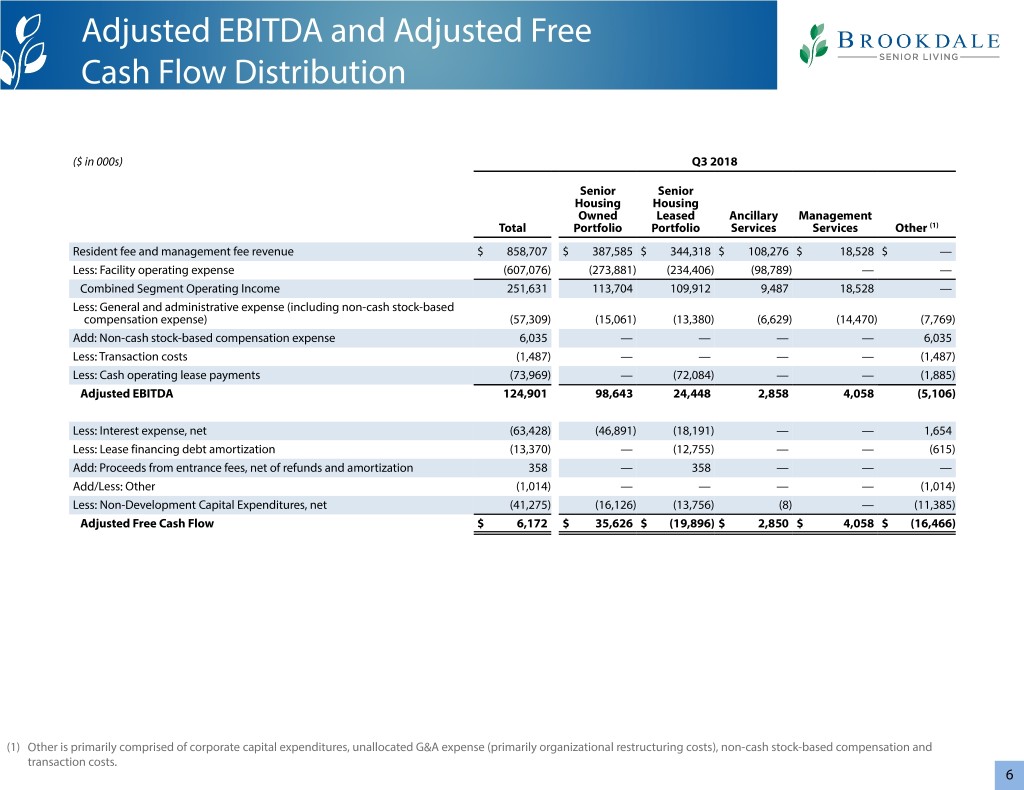
Adjusted EBITDA and Adjusted Free Cash Flow Distribution ($ in 000s) Q3 2018 Senior Senior Housing Housing Owned Leased Ancillary Management Total Portfolio Portfolio Services Services Other (1) Resident fee and management fee revenue $ 858,707 $ 387,585 $ 344,318 $ 108,276 $ 18,528 $ — Less: Facility operating expense (607,076) (273,881) (234,406) (98,789) — — Combined Segment Operating Income 251,631 113,704 109,912 9,487 18,528 — Less: General and administrative expense (including non-cash stock-based compensation expense) (57,309) (15,061) (13,380) (6,629) (14,470) (7,769) Add: Non-cash stock-based compensation expense 6,035 — — — — 6,035 Less: Transaction costs (1,487) — — — — (1,487) Less: Cash operating lease payments (73,969) — (72,084) — — (1,885) Adjusted EBITDA 124,901 98,643 24,448 2,858 4,058 (5,106) Less: Interest expense, net (63,428) (46,891) (18,191) — — 1,654 Less: Lease financing debt amortization (13,370) — (12,755) — — (615) Add: Proceeds from entrance fees, net of refunds and amortization 358 — 358 — — — Add/Less: Other (1,014) — — — — (1,014) Less: Non-Development Capital Expenditures, net (41,275) (16,126) (13,756) (8) — (11,385) Adjusted Free Cash Flow $ 6,172 $ 35,626 $ (19,896) $ 2,850 $ 4,058 $ (16,466) (1) Other is primarily comprised of corporate capital expenditures, unallocated G&A expense (primarily organizational restructuring costs), non-cash stock-based compensation and transaction costs. 6
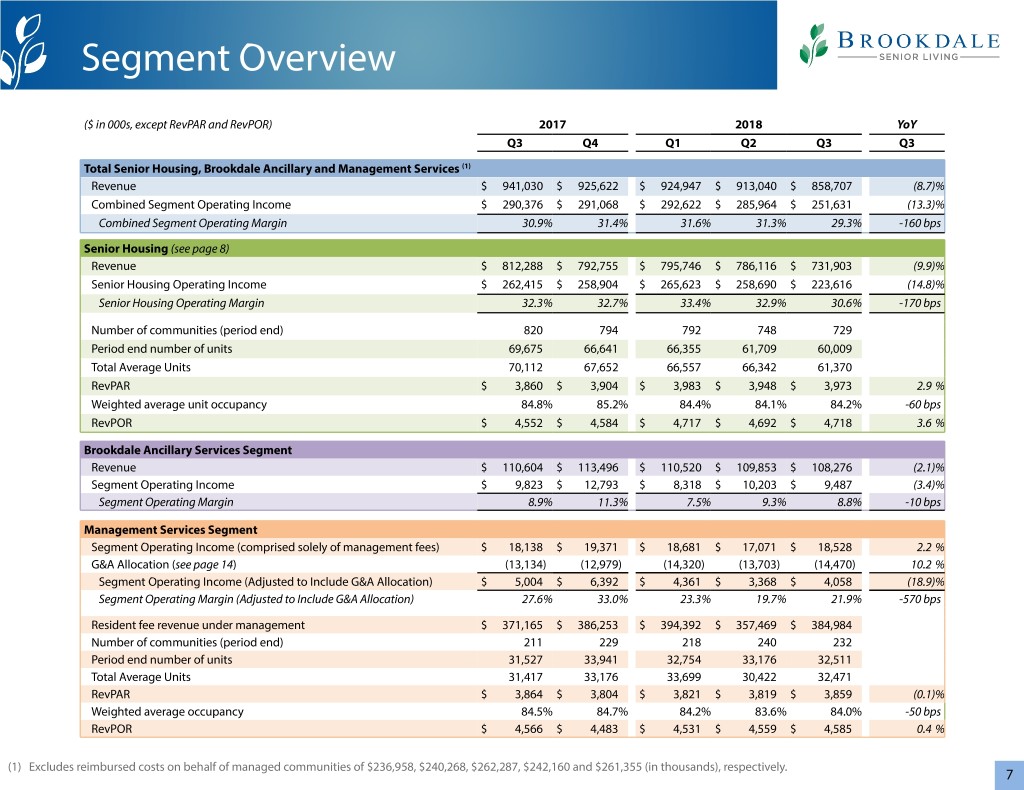
Segment Overview ($ in 000s, except RevPAR and RevPOR) 2017 2018 YoY Q3 Q4 Q1 Q2 Q3 Q3 Total Senior Housing, Brookdale Ancillary and Management Services (1) Revenue $ 941,030 $ 925,622 $ 924,947 $ 913,040 $ 858,707 (8.7)% Combined Segment Operating Income $ 290,376 $ 291,068 $ 292,622 $ 285,964 $ 251,631 (13.3)% Combined Segment Operating Margin 30.9% 31.4% 31.6% 31.3% 29.3% -160 bps Senior Housing (see page 8) Revenue $ 812,288 $ 792,755 $ 795,746 $ 786,116 $ 731,903 (9.9)% Senior Housing Operating Income $ 262,415 $ 258,904 $ 265,623 $ 258,690 $ 223,616 (14.8)% Senior Housing Operating Margin 32.3% 32.7% 33.4% 32.9% 30.6% -170 bps Number of communities (period end) 820 794 792 748 729 Period end number of units 69,675 66,641 66,355 61,709 60,009 Total Average Units 70,112 67,652 66,557 66,342 61,370 RevPAR $ 3,860 $ 3,904 $ 3,983 $ 3,948 $ 3,973 2.9 % Weighted average unit occupancy 84.8% 85.2% 84.4% 84.1% 84.2% -60 bps RevPOR $ 4,552 $ 4,584 $ 4,717 $ 4,692 $ 4,718 3.6 % Brookdale Ancillary Services Segment Revenue $ 110,604 $ 113,496 $ 110,520 $ 109,853 $ 108,276 (2.1)% Segment Operating Income $ 9,823 $ 12,793 $ 8,318 $ 10,203 $ 9,487 (3.4)% Segment Operating Margin 8.9% 11.3% 7.5% 9.3% 8.8% -10 bps Management Services Segment Segment Operating Income (comprised solely of management fees) $ 18,138 $ 19,371 $ 18,681 $ 17,071 $ 18,528 2.2 % G&A Allocation (see page 14) (13,134) (12,979) (14,320) (13,703) (14,470) 10.2 % Segment Operating Income (Adjusted to Include G&A Allocation) $ 5,004 $ 6,392 $ 4,361 $ 3,368 $ 4,058 (18.9)% Segment Operating Margin (Adjusted to Include G&A Allocation) 27.6% 33.0% 23.3% 19.7% 21.9% -570 bps Resident fee revenue under management $ 371,165 $ 386,253 $ 394,392 $ 357,469 $ 384,984 Number of communities (period end) 211 229 218 240 232 Period end number of units 31,527 33,941 32,754 33,176 32,511 Total Average Units 31,417 33,176 33,699 30,422 32,471 RevPAR $ 3,864 $ 3,804 $ 3,821 $ 3,819 $ 3,859 (0.1)% Weighted average occupancy 84.5% 84.7% 84.2% 83.6% 84.0% -50 bps RevPOR $ 4,566 $ 4,483 $ 4,531 $ 4,559 $ 4,585 0.4 % (1) Excludes reimbursed costs on behalf of managed communities of $236,958, $240,268, $262,287, $242,160 and $261,355 (in thousands), respectively. 7
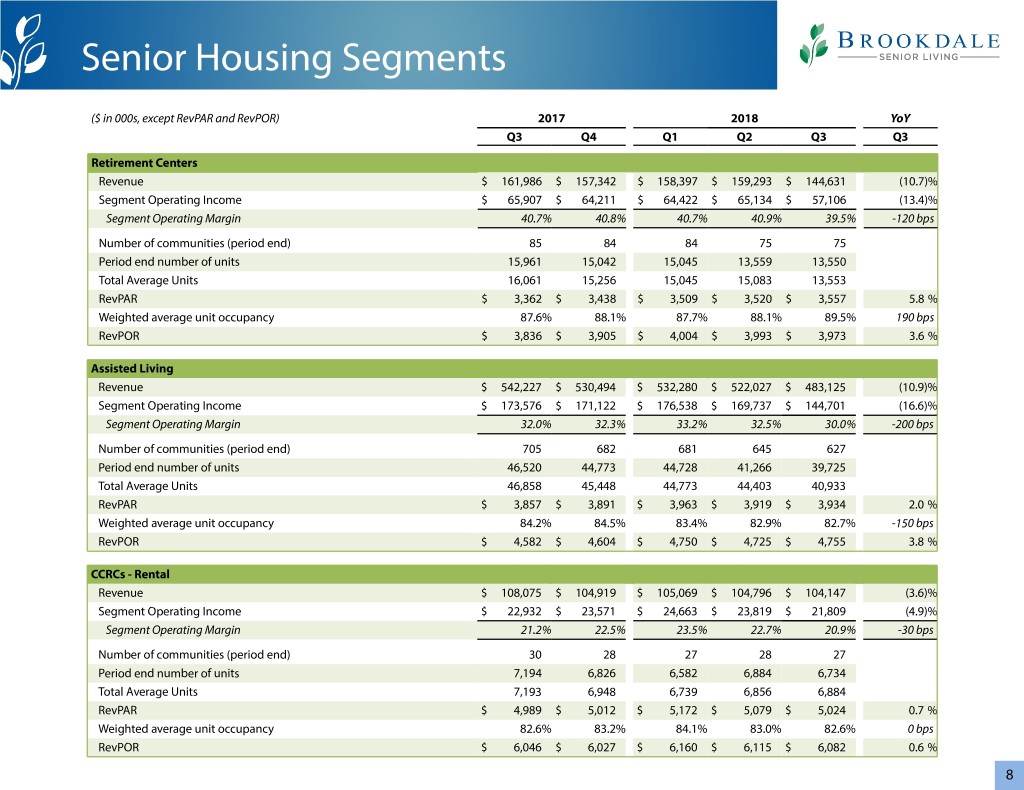
Senior Housing Segments ($ in 000s, except RevPAR and RevPOR) 2017 2018 YoY Q3 Q4 Q1 Q2 Q3 Q3 Retirement Centers Revenue $ 161,986 $ 157,342 $ 158,397 $ 159,293 $ 144,631 (10.7)% Segment Operating Income $ 65,907 $ 64,211 $ 64,422 $ 65,134 $ 57,106 (13.4)% Segment Operating Margin 40.7% 40.8% 40.7% 40.9% 39.5% -120 bps Number of communities (period end) 85 84 84 75 75 Period end number of units 15,961 15,042 15,045 13,559 13,550 Total Average Units 16,061 15,256 15,045 15,083 13,553 RevPAR $ 3,362 $ 3,438 $ 3,509 $ 3,520 $ 3,557 5.8 % Weighted average unit occupancy 87.6% 88.1% 87.7% 88.1% 89.5% 190 bps RevPOR $ 3,836 $ 3,905 $ 4,004 $ 3,993 $ 3,973 3.6 % Assisted Living Revenue $ 542,227 $ 530,494 $ 532,280 $ 522,027 $ 483,125 (10.9)% Segment Operating Income $ 173,576 $ 171,122 $ 176,538 $ 169,737 $ 144,701 (16.6)% Segment Operating Margin 32.0% 32.3% 33.2% 32.5% 30.0% -200 bps Number of communities (period end) 705 682 681 645 627 Period end number of units 46,520 44,773 44,728 41,266 39,725 Total Average Units 46,858 45,448 44,773 44,403 40,933 RevPAR $ 3,857 $ 3,891 $ 3,963 $ 3,919 $ 3,934 2.0 % Weighted average unit occupancy 84.2% 84.5% 83.4% 82.9% 82.7% -150 bps RevPOR $ 4,582 $ 4,604 $ 4,750 $ 4,725 $ 4,755 3.8 % CCRCs - Rental Revenue $ 108,075 $ 104,919 $ 105,069 $ 104,796 $ 104,147 (3.6)% Segment Operating Income $ 22,932 $ 23,571 $ 24,663 $ 23,819 $ 21,809 (4.9)% Segment Operating Margin 21.2% 22.5% 23.5% 22.7% 20.9% -30 bps Number of communities (period end) 30 28 27 28 27 Period end number of units 7,194 6,826 6,582 6,884 6,734 Total Average Units 7,193 6,948 6,739 6,856 6,884 RevPAR $ 4,989 $ 5,012 $ 5,172 $ 5,079 $ 5,024 0.7 % Weighted average unit occupancy 82.6% 83.2% 84.1% 83.0% 82.6% 0 bps RevPOR $ 6,046 $ 6,027 $ 6,160 $ 6,115 $ 6,082 0.6 % 8
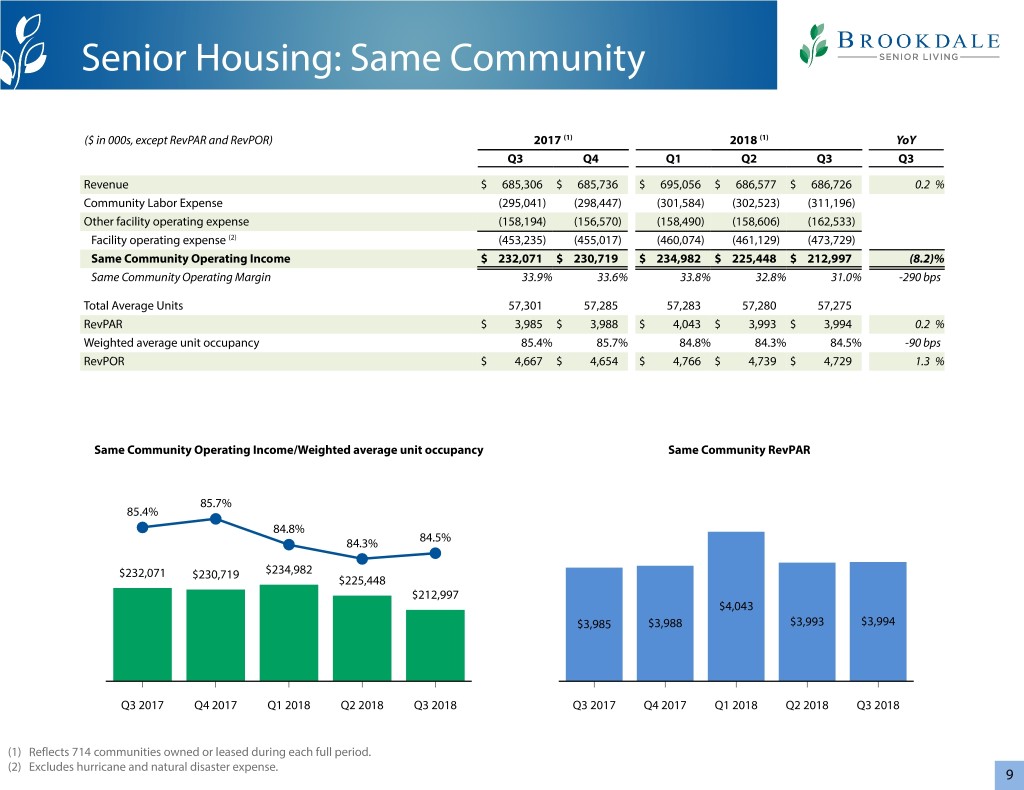
Senior Housing: Same Community ($ in 000s, except RevPAR and RevPOR) 2017 (1) 2018 (1) YoY Q3 Q4 Q1 Q2 Q3 Q3 Revenue $ 685,306 $ 685,736 $ 695,056 $ 686,577 $ 686,726 0.2 % Community Labor Expense (295,041) (298,447) (301,584) (302,523) (311,196) Other facility operating expense (158,194) (156,570) (158,490) (158,606) (162,533) Facility operating expense (2) (453,235) (455,017) (460,074) (461,129) (473,729) Same Community Operating Income $ 232,071 $ 230,719 $ 234,982 $ 225,448 $ 212,997 (8.2)% Same Community Operating Margin 33.9% 33.6% 33.8% 32.8% 31.0% -290 bps Total Average Units 57,301 57,285 57,283 57,280 57,275 RevPAR $ 3,985 $ 3,988 $ 4,043 $ 3,993 $ 3,994 0.2 % Weighted average unit occupancy 85.4% 85.7% 84.8% 84.3% 84.5% -90 bps RevPOR $ 4,667 $ 4,654 $ 4,766 $ 4,739 $ 4,729 1.3 % Same Community Operating Income/Weighted average unit occupancy Same Community RevPAR 85.7% 85.4% 84.8% 84.3% 84.5% $232,071 $234,982 $230,719 $225,448 $212,997 $4,043 $3,985 $3,988 $3,993 $3,994 Q3 2017 Q4 2017 Q1 2018 Q2 2018 Q3 2018 Q3 2017 Q4 2017 Q1 2018 Q2 2018 Q3 2018 (1) Reflects 714 communities owned or leased during each full period. (2) Excludes hurricane and natural disaster expense. 9
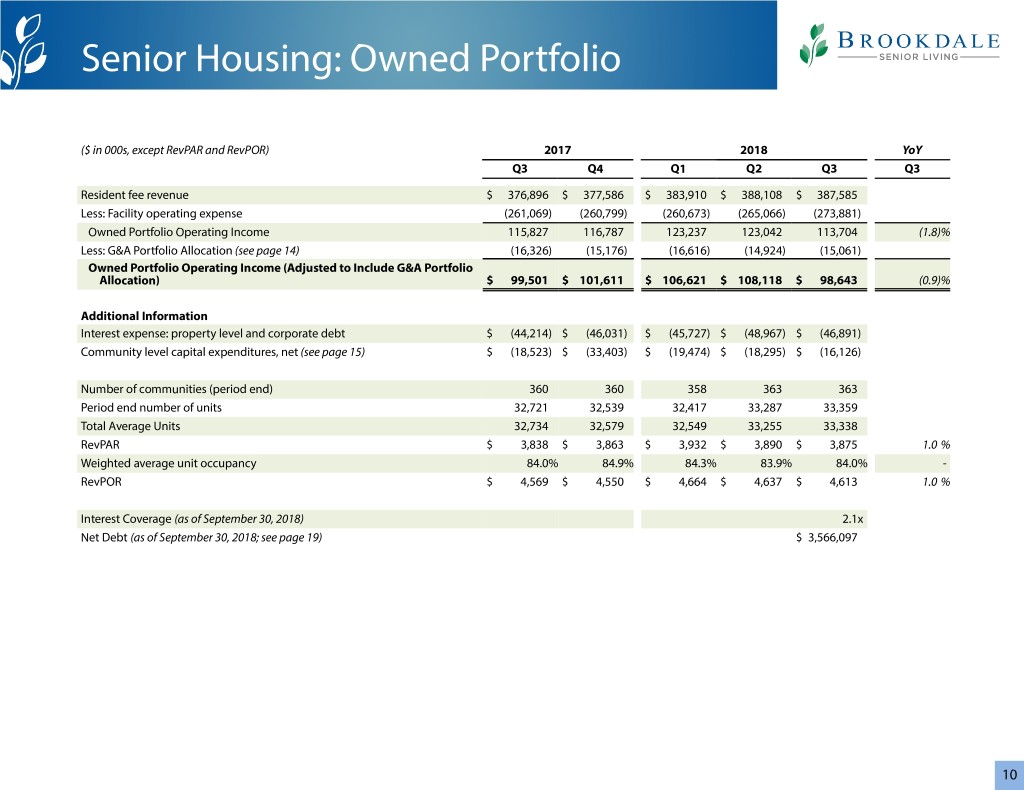
Senior Housing: Owned Portfolio ($ in 000s, except RevPAR and RevPOR) 2017 2018 YoY Q3 Q4 Q1 Q2 Q3 Q3 Resident fee revenue $ 376,896 $ 377,586 $ 383,910 $ 388,108 $ 387,585 Less: Facility operating expense (261,069) (260,799) (260,673) (265,066) (273,881) Owned Portfolio Operating Income 115,827 116,787 123,237 123,042 113,704 (1.8)% Less: G&A Portfolio Allocation (see page 14) (16,326) (15,176) (16,616) (14,924) (15,061) Owned Portfolio Operating Income (Adjusted to Include G&A Portfolio Allocation) $ 99,501 $ 101,611 $ 106,621 $ 108,118 $ 98,643 (0.9)% Additional Information Interest expense: property level and corporate debt $ (44,214) $ (46,031) $ (45,727) $ (48,967) $ (46,891) Community level capital expenditures, net (see page 15) $ (18,523) $ (33,403) $ (19,474) $ (18,295) $ (16,126) Number of communities (period end) 360 360 358 363 363 Period end number of units 32,721 32,539 32,417 33,287 33,359 Total Average Units 32,734 32,579 32,549 33,255 33,338 RevPAR $ 3,838 $ 3,863 $ 3,932 $ 3,890 $ 3,875 1.0 % Weighted average unit occupancy 84.0% 84.9% 84.3% 83.9% 84.0% - RevPOR $ 4,569 $ 4,550 $ 4,664 $ 4,637 $ 4,613 1.0 % Interest Coverage (as of September 30, 2018) 2.1x Net Debt (as of September 30, 2018; see page 19) $ 3,566,097 10
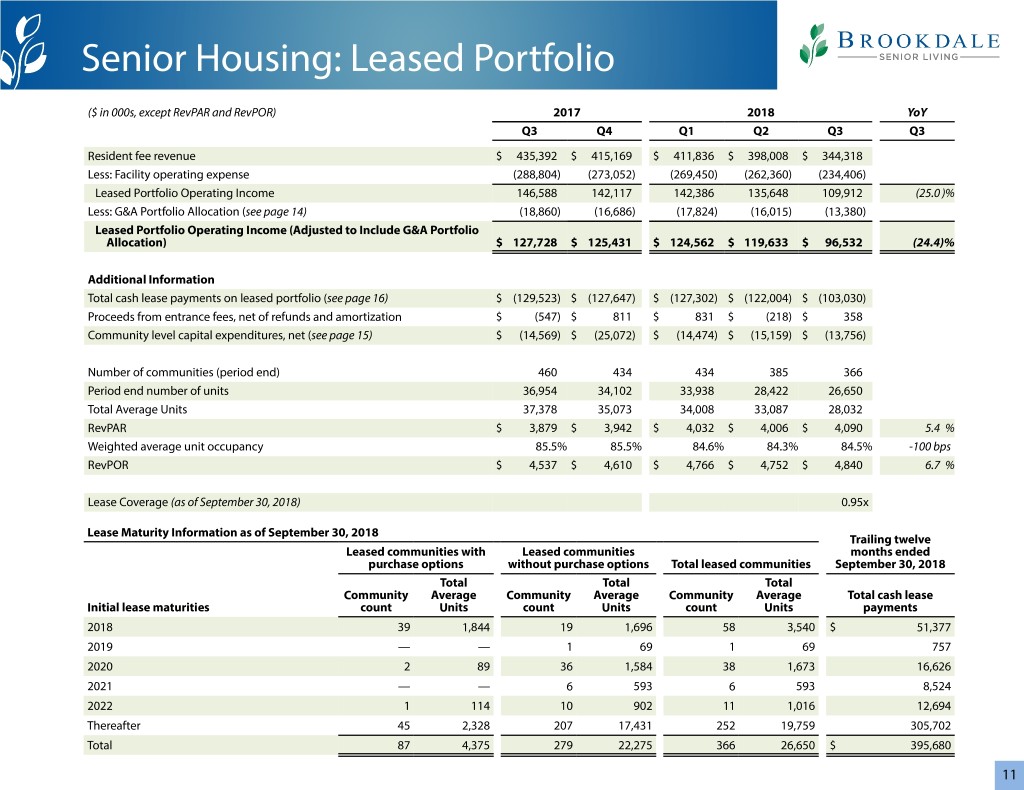
Senior Housing: Leased Portfolio ($ in 000s, except RevPAR and RevPOR) 2017 2018 YoY Q3 Q4 Q1 Q2 Q3 Q3 Resident fee revenue $ 435,392 $ 415,169 $ 411,836 $ 398,008 $ 344,318 Less: Facility operating expense (288,804) (273,052) (269,450) (262,360) (234,406) Leased Portfolio Operating Income 146,588 142,117 142,386 135,648 109,912 (25.0)% Less: G&A Portfolio Allocation (see page 14) (18,860) (16,686) (17,824) (16,015) (13,380) Leased Portfolio Operating Income (Adjusted to Include G&A Portfolio Allocation) $ 127,728 $ 125,431 $ 124,562 $ 119,633 $ 96,532 (24.4)% Additional Information Total cash lease payments on leased portfolio (see page 16) $ (129,523) $ (127,647) $ (127,302) $ (122,004) $ (103,030) Proceeds from entrance fees, net of refunds and amortization $ (547) $ 811 $ 831 $ (218) $ 358 Community level capital expenditures, net (see page 15) $ (14,569) $ (25,072) $ (14,474) $ (15,159) $ (13,756) Number of communities (period end) 460 434 434 385 366 Period end number of units 36,954 34,102 33,938 28,422 26,650 Total Average Units 37,378 35,073 34,008 33,087 28,032 RevPAR $ 3,879 $ 3,942 $ 4,032 $ 4,006 $ 4,090 5.4 % Weighted average unit occupancy 85.5% 85.5% 84.6% 84.3% 84.5% -100 bps RevPOR $ 4,537 $ 4,610 $ 4,766 $ 4,752 $ 4,840 6.7 % Lease Coverage (as of September 30, 2018) 0.95x Lease Maturity Information as of September 30, 2018 Trailing twelve Leased communities with Leased communities months ended purchase options without purchase options Total leased communities September 30, 2018 Total Total Total Community Average Community Average Community Average Total cash lease Initial lease maturities count Units count Units count Units payments 2018 39 1,844 19 1,696 58 3,540 $ 51,377 2019 — — 1 69 1 69 757 2020 2 89 36 1,584 38 1,673 16,626 2021 — — 6 593 6 593 8,524 2022 1 114 10 902 11 1,016 12,694 Thereafter 45 2,328 207 17,431 252 19,759 305,702 Total 87 4,375 279 22,275 366 26,650 $ 395,680 11

New Supply (1) Brookdale's Largest 20 Markets - Competitive Summary Brookdale in NIC Markets Competition Within 20 Minute Drive Q3 2018 Total Weighted IL/AL/MC 5 Yr 5 Yr Projected Average Average New 1 Yr Projected Projected Age 75 + Pop Community Units Unit Q3 2018 New Const. Const. Unit Opens % Current Total Pop w/ Inc. $50k + Market Count (IL/AL/MC) Occupancy RevPAR Properties (2) Units (2) of Supply (2) Saturation (3) Growth (4) Growth (4) Chicago, IL 16 2,604 91.1% $ 4,098 13 1,643 5.6% 21.7% 1.2% 27.1% Seattle, WA 23 2,228 87.9% 3,837 — — —% 25.8% 7.7% 46.5% Los Angeles, CA 20 2,145 83.2% 3,968 4 507 1.9% 9.8% 3.1% 33.8% Phoenix, AZ 22 1,808 87.7% 3,813 15 2,391 10.9% 23.2% 8.0% 47.2% Dallas, TX 22 1,419 86.1% 3,393 6 901 3.2% 26.1% 9.7% 43.6% Denver, CO 12 1,400 80.3% 4,232 5 641 4.8% 23.8% 8.2% 52.2% Portland, OR 16 1,378 94.2% 3,936 5 528 3.2% 37.2% 7.3% 44.9% Charlotte, NC 17 1,268 88.8% 4,447 2 341 3.3% 31.8% 9.4% 49.6% Miami, FL 8 1,118 82.4% 3,346 7 911 5.5% 16.6% 5.7% 41.1% Orlando, FL 13 1,080 87.4% 3,382 2 283 3.7% 20.7% 9.2% 52.1% Austin, TX 10 1,043 85.1% 5,416 5 912 11.7% 23.1% 14.2% 50.4% Jacksonville, FL 9 1,012 79.9% 3,295 2 500 9.3% 23.7% 7.6% 53.5% San Antonio, TX 12 971 74.6% 2,996 — — —% 22.0% 8.6% 39.7% Detroit, MI 10 950 84.6% 3,159 7 613 3.4% 26.8% 1.6% 41.6% Riverside, CA 9 903 84.0% 3,412 4 473 4.4% 13.9% 5.4% 41.3% Tampa, FL 8 877 71.1% 2,781 2 323 2.7% 21.3% 6.6% 47.6% Atlanta, GA 9 858 88.8% 3,422 8 1,088 9.7% 29.0% 8.6% 45.3% Santa Rosa, CA 6 842 80.8% 4,358 — — —% 18.1% 1.8% 45.9% San Francisco, CA 7 828 82.3% 4,034 — — —% 13.2% 4.9% 35.8% Houston, TX 10 765 82.6% 4,278 4 234 2.1% 16.4% 9.0% 44.6% Top 20 Markets 259 25,497 85.0% $ 3,829 91 12,289 4.3% 22.2% 6.9% 44.2% All Other NIC Markets 294 23,359 82.7% $ 4,072 98 10,759 2.3% 23.0% 4.5% 40.0% (1) Data reflected is for the consolidated senior housing portfolio only. (2) NIC MAP Supply Set, Q3 2018 "New Construction" properties with projected open dates through Q3 2019. (3) Saturation is equal to units per population Age 75+ with income 50k+. (4) Percentage changes are based on data from ESRI for 2017-2022. 12

Ancillary Services ($ in 000s) 2017 2018 YoY Q3 Q4 Q1 Q2 Q3 Q3 Resident fee revenue (1) Home Health $ 87,315 $ 89,272 $ 85,490 $ 83,818 $ 81,722 Hospice 17,328 18,248 19,327 19,676 20,574 Outpatient Therapy 5,941 5,937 5,685 6,359 5,980 Other ancillary services 20 39 18 — — Segment resident fee revenue 110,604 113,496 110,520 109,853 108,276 (2.1)% Segment Operating Income $ 9,823 $ 12,793 $ 8,318 $ 10,203 $ 9,487 (3.4)% Segment Operating Margin 8.9% 11.3% 7.5% 9.3% 8.8% -12 bps Less: G&A allocation (see page 14) (7,091) (7,630) (7,113) (6,990) (6,629) Segment Operating Income (Adjusted to Include G&A Allocation) $ 2,732 $ 5,163 $ 1,205 $ 3,213 $ 2,858 4.6 % Segment Operating Margin (Adjusted to Include G&A Allocation) 2.5% 4.5% 1.1% 2.9% 2.6% 17 bps Additional Information Interest expense $ (168) $ (132) $ — $ — $ — Community level capital expenditures, net (see page 15) $ (277) $ (3) $ (6) $ (5) $ (8) Home Health average daily census 14,844 15,335 15,497 15,238 14,890 0.3 % Hospice average daily census 1,169 1,257 1,302 1,337 1,411 20.7 % Outpatient Therapy treatment codes 178,851 179,132 167,170 176,065 168,569 (5.7)% (1) The Company adopted ASC 606 on January 1, 2018, which resulted in a decrease in resident fee revenue of $0.8 million, $1.7 million, and $1.5 million for the three months ended March 31, 2018, June 30, 2018, and September 30, 2018, respectively, with a corresponding increase in facility operating expense and no net impact on Segment Operating Income. 13
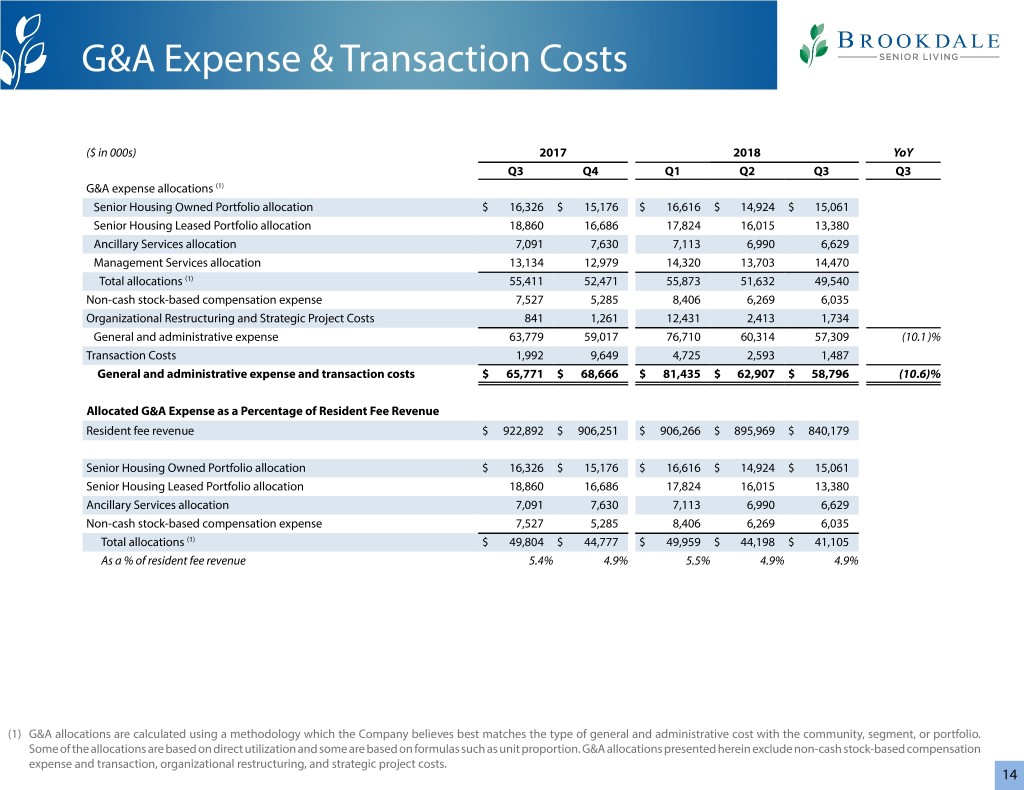
G&A Expense & Transaction Costs ($ in 000s) 2017 2018 YoY Q3 Q4 Q1 Q2 Q3 Q3 G&A expense allocations (1) Senior Housing Owned Portfolio allocation $ 16,326 $ 15,176 $ 16,616 $ 14,924 $ 15,061 Senior Housing Leased Portfolio allocation 18,860 16,686 17,824 16,015 13,380 Ancillary Services allocation 7,091 7,630 7,113 6,990 6,629 Management Services allocation 13,134 12,979 14,320 13,703 14,470 Total allocations (1) 55,411 52,471 55,873 51,632 49,540 Non-cash stock-based compensation expense 7,527 5,285 8,406 6,269 6,035 Organizational Restructuring and Strategic Project Costs 841 1,261 12,431 2,413 1,734 General and administrative expense 63,779 59,017 76,710 60,314 57,309 (10.1)% Transaction Costs 1,992 9,649 4,725 2,593 1,487 General and administrative expense and transaction costs $ 65,771 $ 68,666 $ 81,435 $ 62,907 $ 58,796 (10.6)% Allocated G&A Expense as a Percentage of Resident Fee Revenue Resident fee revenue $ 922,892 $ 906,251 $ 906,266 $ 895,969 $ 840,179 Senior Housing Owned Portfolio allocation $ 16,326 $ 15,176 $ 16,616 $ 14,924 $ 15,061 Senior Housing Leased Portfolio allocation 18,860 16,686 17,824 16,015 13,380 Ancillary Services allocation 7,091 7,630 7,113 6,990 6,629 Non-cash stock-based compensation expense 7,527 5,285 8,406 6,269 6,035 Total allocations (1) $ 49,804 $ 44,777 $ 49,959 $ 44,198 $ 41,105 As a % of resident fee revenue 5.4% 4.9% 5.5% 4.9% 4.9% (1) G&A allocations are calculated using a methodology which the Company believes best matches the type of general and administrative cost with the community, segment, or portfolio. Some of the allocations are based on direct utilization and some are based on formulas such as unit proportion. G&A allocations presented herein exclude non-cash stock-based compensation expense and transaction, organizational restructuring, and strategic project costs. 14

Capital Expenditures ($ in 000s, except for Community level capital expenditures, net, per unit) 2017 2018 YoY Q3 Q4 Q1 Q2 Q3 Q3 Community level capital expenditures, including allocations (1) Senior Housing Owned Portfolio $ 18,523 $ 33,403 $ 19,474 $ 18,295 $ 16,126 Senior Housing Leased Portfolio 14,569 25,072 14,474 15,159 13,756 Ancillary Services 277 3 6 5 8 Community level capital expenditures, net 33,369 58,478 33,954 33,459 29,890 (10.4)% Corporate capital expenditures 7,636 13,430 7,782 14,222 11,385 49.1 % Non-Development Capital Expenditures, net 41,005 71,908 41,736 47,681 41,275 0.7 % Development Capital Expenditures, net 3,336 1,616 5,381 8,009 6,694 100.7 % Total capital expenditures, net $ 44,341 $ 73,524 $ 47,117 $ 55,690 $ 47,969 8.2 % Community level capital expenditures, net, per unit $ 476 $ 864 $ 510 $ 504 $ 487 2.3 % Reconciliation to Additions to PP&E Total capital expenditures, net $ 44,341 $ 73,524 $ 47,117 $ 55,690 $ 47,969 Add: Total lessor reimbursements 4,379 8,218 2,379 80 1,014 Add: Change in related payables 1,754 (7,899) 17,096 (1,904) (92) Additions to property, plant and equipment and leasehold intangibles, net $ 50,474 $ 73,843 $ 66,592 $ 53,866 $ 48,891 (1) The Company updated its methodology for the allocations of community level capital expenditures for the third quarter of 2018. Prior period amounts of community level capital expenditures, net presented herein have been recast to conform to the new methodology. 15
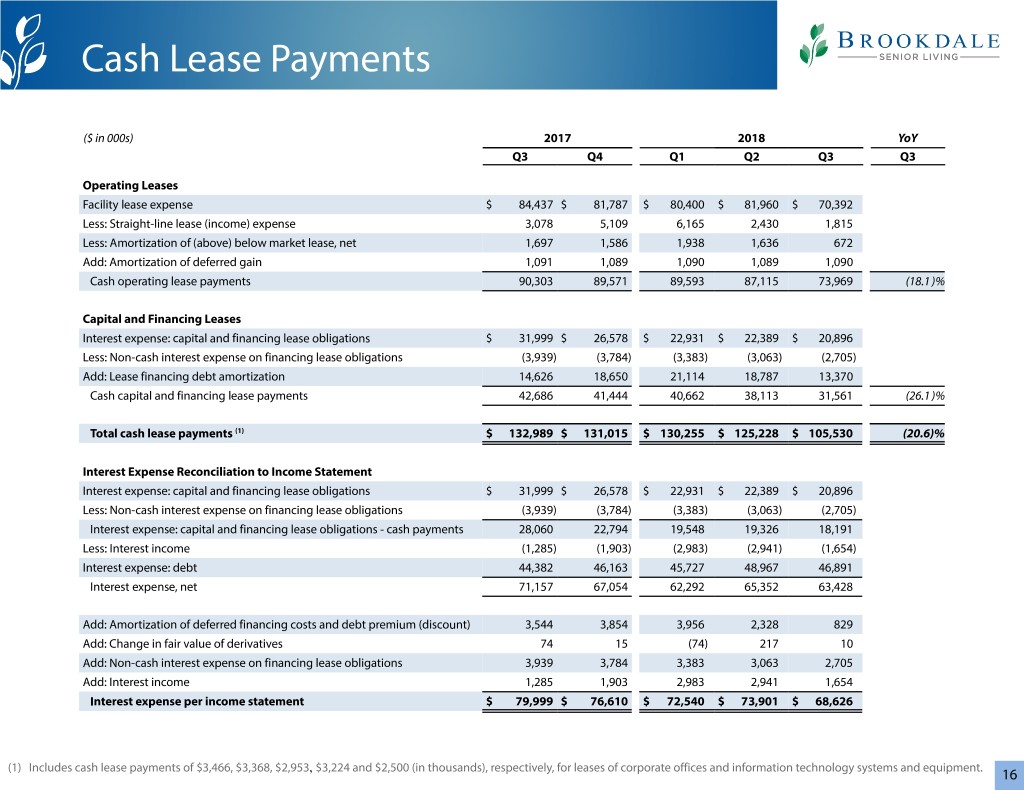
Cash Lease Payments ($ in 000s) 2017 2018 YoY Q3 Q4 Q1 Q2 Q3 Q3 Operating Leases Facility lease expense $ 84,437 $ 81,787 $ 80,400 $ 81,960 $ 70,392 Less: Straight-line lease (income) expense 3,078 5,109 6,165 2,430 1,815 Less: Amortization of (above) below market lease, net 1,697 1,586 1,938 1,636 672 Add: Amortization of deferred gain 1,091 1,089 1,090 1,089 1,090 Cash operating lease payments 90,303 89,571 89,593 87,115 73,969 (18.1)% Capital and Financing Leases Interest expense: capital and financing lease obligations $ 31,999 $ 26,578 $ 22,931 $ 22,389 $ 20,896 Less: Non-cash interest expense on financing lease obligations (3,939) (3,784) (3,383) (3,063) (2,705) Add: Lease financing debt amortization 14,626 18,650 21,114 18,787 13,370 Cash capital and financing lease payments 42,686 41,444 40,662 38,113 31,561 (26.1)% Total cash lease payments (1) $ 132,989 $ 131,015 $ 130,255 $ 125,228 $ 105,530 (20.6)% Interest Expense Reconciliation to Income Statement Interest expense: capital and financing lease obligations $ 31,999 $ 26,578 $ 22,931 $ 22,389 $ 20,896 Less: Non-cash interest expense on financing lease obligations (3,939) (3,784) (3,383) (3,063) (2,705) Interest expense: capital and financing lease obligations - cash payments 28,060 22,794 19,548 19,326 18,191 Less: Interest income (1,285) (1,903) (2,983) (2,941) (1,654) Interest expense: debt 44,382 46,163 45,727 48,967 46,891 Interest expense, net 71,157 67,054 62,292 65,352 63,428 Add: Amortization of deferred financing costs and debt premium (discount) 3,544 3,854 3,956 2,328 829 Add: Change in fair value of derivatives 74 15 (74) 217 10 Add: Non-cash interest expense on financing lease obligations 3,939 3,784 3,383 3,063 2,705 Add: Interest income 1,285 1,903 2,983 2,941 1,654 Interest expense per income statement $ 79,999 $ 76,610 $ 72,540 $ 73,901 $ 68,626 , (1) Includes cash lease payments of $3,466, $3,368, $2,953 $3,224 and $2,500 (in thousands), respectively, for leases of corporate offices and information technology systems and equipment. 16
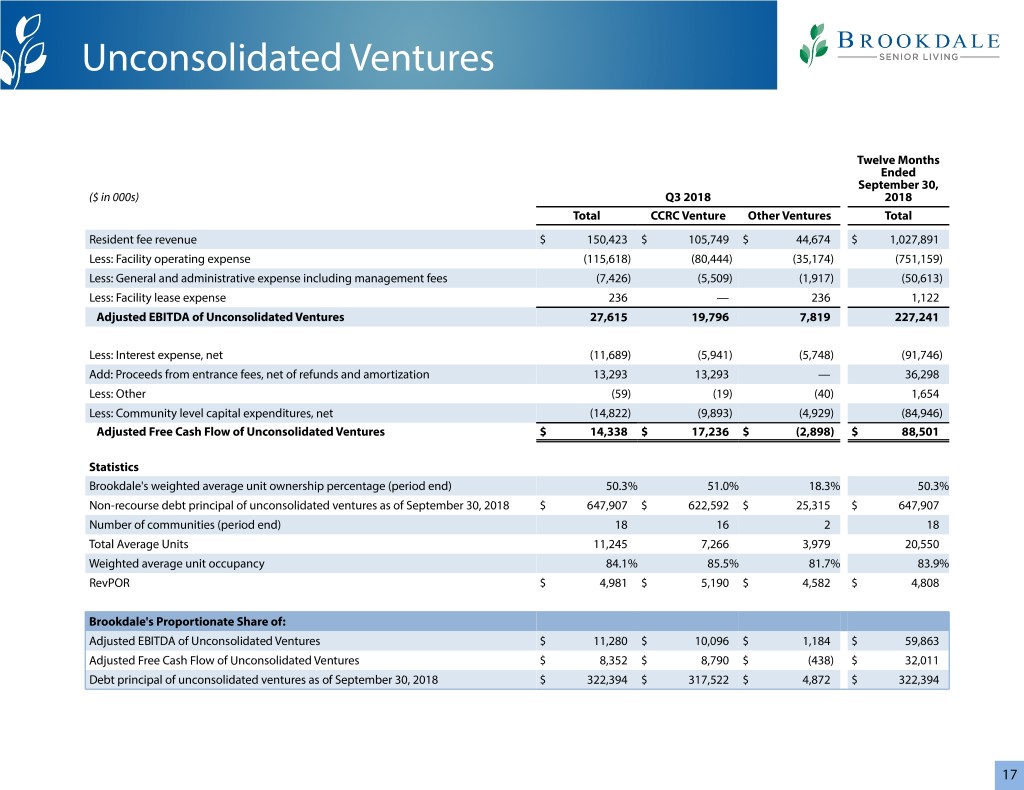
Unconsolidated Ventures Twelve Months Ended September 30, ($ in 000s) Q3 2018 2018 Total CCRC Venture Other Ventures Total Resident fee revenue $ 150,423 $ 105,749 $ 44,674 $ 1,027,891 Less: Facility operating expense (115,618) (80,444) (35,174) (751,159) Less: General and administrative expense including management fees (7,426) (5,509) (1,917) (50,613) Less: Facility lease expense 236 — 236 1,122 Adjusted EBITDA of Unconsolidated Ventures 27,615 19,796 7,819 227,241 Less: Interest expense, net (11,689) (5,941) (5,748) (91,746) Add: Proceeds from entrance fees, net of refunds and amortization 13,293 13,293 — 36,298 Less: Other (59) (19) (40) 1,654 Less: Community level capital expenditures, net (14,822) (9,893) (4,929) (84,946) Adjusted Free Cash Flow of Unconsolidated Ventures $ 14,338 $ 17,236 $ (2,898) $ 88,501 Statistics Brookdale's weighted average unit ownership percentage (period end) 50.3% 51.0% 18.3% 50.3% Non-recourse debt principal of unconsolidated ventures as of September 30, 2018 $ 647,907 $ 622,592 $ 25,315 $ 647,907 Number of communities (period end) 18 16 2 18 Total Average Units 11,245 7,266 3,979 20,550 Weighted average unit occupancy 84.1% 85.5% 81.7% 83.9% RevPOR $ 4,981 $ 5,190 $ 4,582 $ 4,808 Brookdale's Proportionate Share of: Adjusted EBITDA of Unconsolidated Ventures $ 11,280 $ 10,096 $ 1,184 $ 59,863 Adjusted Free Cash Flow of Unconsolidated Ventures $ 8,352 $ 8,790 $ (438) $ 32,011 Debt principal of unconsolidated ventures as of September 30, 2018 $ 322,394 $ 317,522 $ 4,872 $ 322,394 17
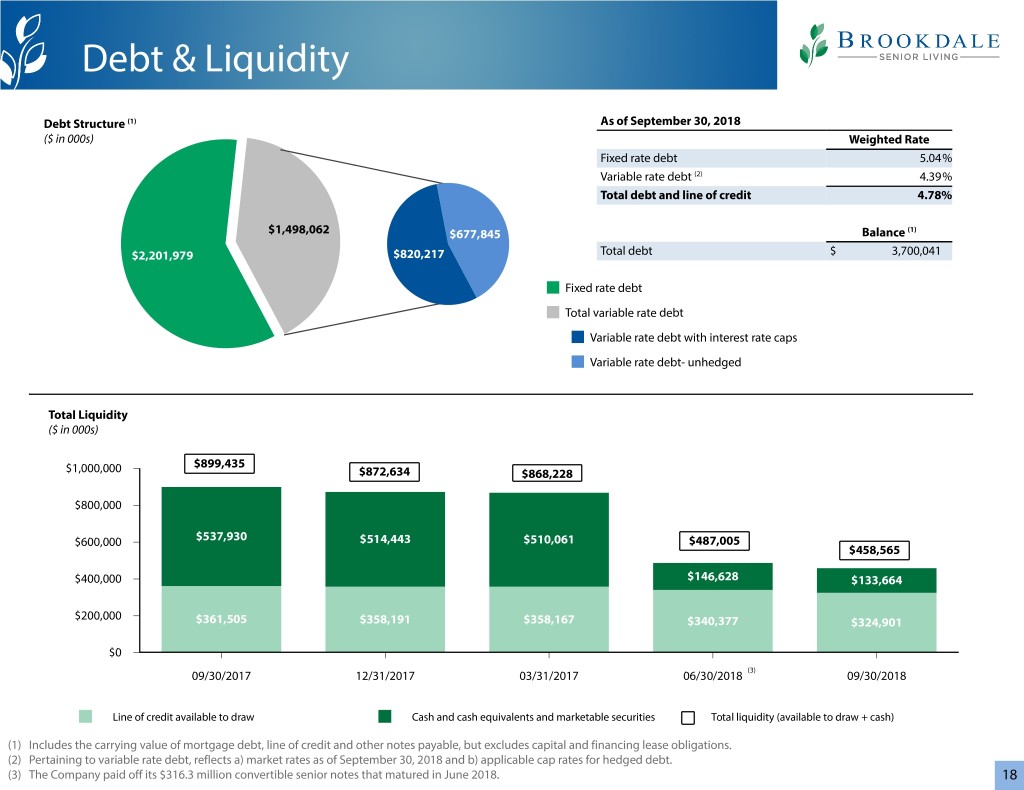
Debt & Liquidity Debt Structure (1) As of September 30, 2018 ($ in 000s) Weighted Rate Fixed rate debt 5.04% Variable rate debt (2) 4.39% Total debt and line of credit 4.78% $1,498,062 $677,845 Balance (1) $2,201,979 $820,217 Total debt $ 3,700,041 Fixed rate debt Total variable rate debt Variable rate debt with interest rate caps Variable rate debt- unhedged Total Liquidity ($ in 000s) $899,435 $1,000,000 $872,634 $868,228 $800,000 $600,000 $537,930 $514,443 $510,061 $487,005 $458,565 $400,000 $146,628 $133,664 $200,000 $361,505 $358,191 $358,167 $340,377 $324,901 $0 09/30/2017 12/31/2017 03/31/2017 06/30/2018 (3) 09/30/2018 Line of credit available to draw Cash and cash equivalents and marketable securities Total liquidity (available to draw + cash) (1) Includes the carrying value of mortgage debt, line of credit and other notes payable, but excludes capital and financing lease obligations. (2) Pertaining to variable rate debt, reflects a) market rates as of September 30, 2018 and b) applicable cap rates for hedged debt. (3) The Company paid off its $316.3 million convertible senior notes that matured in June 2018. 18
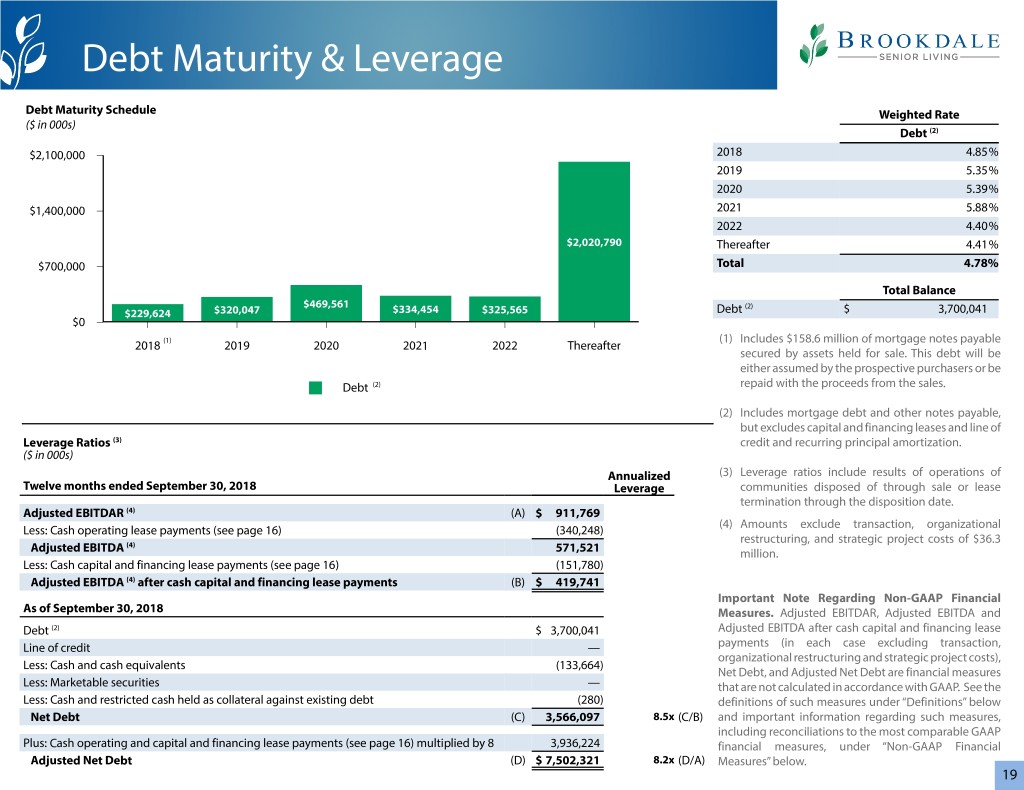
Debt Maturity & Leverage Debt Maturity Schedule Weighted Rate ($ in 000s) Debt (2) $2,100,000 2018 4.85% 2019 5.35% 2020 5.39% $1,400,000 2021 5.88% 2022 4.40% $2,020,790 Thereafter 4.41% $700,000 Total 4.78% Total Balance $469,561 (2) $229,624 $320,047 $334,454 $325,565 Debt $ 3,700,041 $0 (1) (1) Includes $158.6 million of mortgage notes payable 2018 2019 2020 2021 2022 Thereafter secured by assets held for sale. This debt will be either assumed by the prospective purchasers or be Debt (2) repaid with the proceeds from the sales. (2) Includes mortgage debt and other notes payable, but excludes capital and financing leases and line of Leverage Ratios (3) credit and recurring principal amortization. ($ in 000s) Annualized (3) Leverage ratios include results of operations of Twelve months ended September 30, 2018 Leverage communities disposed of through sale or lease termination through the disposition date. Adjusted EBITDAR (4) (A) $ 911,769 (4) Amounts exclude transaction, organizational Less: Cash operating lease payments (see page 16) (340,248) (4) restructuring, and strategic project costs of $36.3 Adjusted EBITDA 571,521 million. Less: Cash capital and financing lease payments (see page 16) (151,780) Adjusted EBITDA (4) after cash capital and financing lease payments (B) $ 419,741 Important Note Regarding Non-GAAP Financial As of September 30, 2018 Measures. Adjusted EBITDAR, Adjusted EBITDA and Debt (2) $ 3,700,041 Adjusted EBITDA after cash capital and financing lease Line of credit — payments (in each case excluding transaction, organizational restructuring and strategic project costs), Less: Cash and cash equivalents (133,664) Net Debt, and Adjusted Net Debt are financial measures Less: Marketable securities — that are not calculated in accordance with GAAP. See the Less: Cash and restricted cash held as collateral against existing debt (280) definitions of such measures under “Definitions” below Net Debt (C) 3,566,097 8.5x (C/B) and important information regarding such measures, including reconciliations to the most comparable GAAP Plus: Cash operating and capital and financing lease payments (see page 16) multiplied by 8 3,936,224 financial measures, under “Non-GAAP Financial Adjusted Net Debt (D) $ 7,502,321 8.2x (D/A) Measures” below. 19
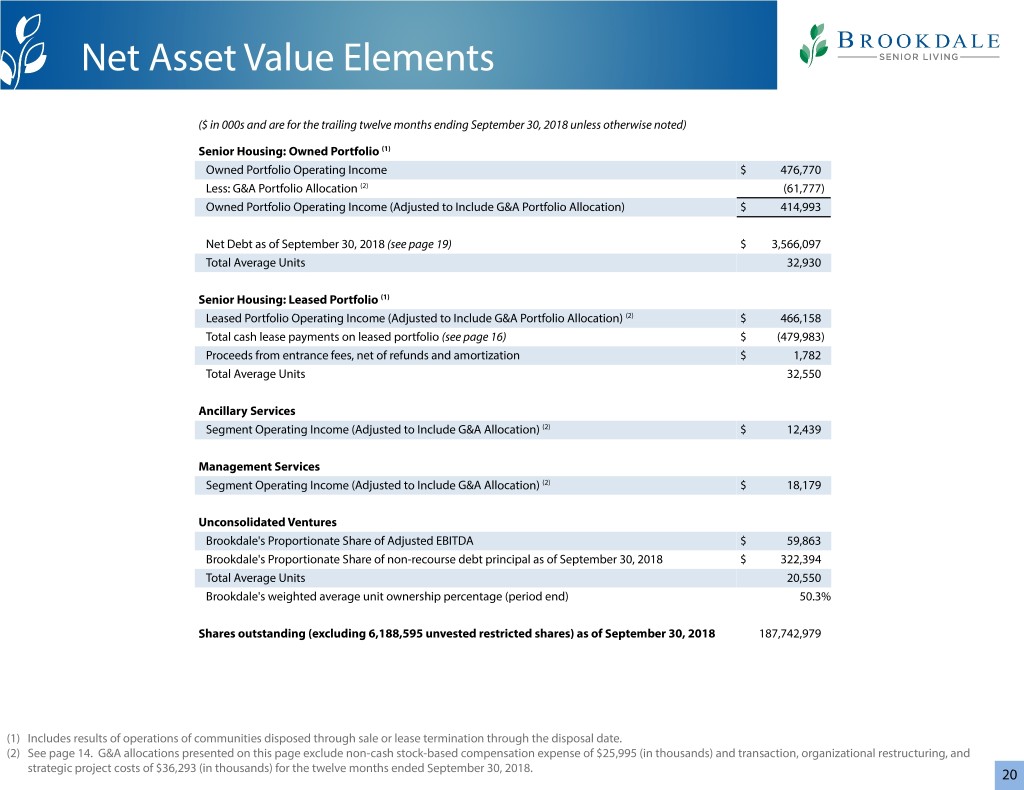
Net Asset Value Elements ($ in 000s and are for the trailing twelve months ending September 30, 2018 unless otherwise noted) Senior Housing: Owned Portfolio (1) Owned Portfolio Operating Income $ 476,770 Less: G&A Portfolio Allocation (2) (61,777) Owned Portfolio Operating Income (Adjusted to Include G&A Portfolio Allocation) $ 414,993 Net Debt as of September 30, 2018 (see page 19) $ 3,566,097 Total Average Units 32,930 Senior Housing: Leased Portfolio (1) Leased Portfolio Operating Income (Adjusted to Include G&A Portfolio Allocation) (2) $ 466,158 Total cash lease payments on leased portfolio (see page 16) $ (479,983) Proceeds from entrance fees, net of refunds and amortization $ 1,782 Total Average Units 32,550 Ancillary Services Segment Operating Income (Adjusted to Include G&A Allocation) (2) $ 12,439 Management Services Segment Operating Income (Adjusted to Include G&A Allocation) (2) $ 18,179 Unconsolidated Ventures Brookdale's Proportionate Share of Adjusted EBITDA $ 59,863 Brookdale's Proportionate Share of non-recourse debt principal as of September 30, 2018 $ 322,394 Total Average Units 20,550 Brookdale's weighted average unit ownership percentage (period end) 50.3% Shares outstanding (excluding 6,188,595 unvested restricted shares) as of September 30, 2018 187,742,979 (1) Includes results of operations of communities disposed through sale or lease termination through the disposal date. (2) See page 14. G&A allocations presented on this page exclude non-cash stock-based compensation expense of $25,995 (in thousands) and transaction, organizational restructuring, and strategic project costs of $36,293 (in thousands) for the twelve months ended September 30, 2018. 20

Definitions Adjusted EBITDA is a non-GAAP financial measure that the Company defines as net Combined Segment Operating Income is defined by the Company as resident fee income (loss) before provision (benefit) for income taxes; non-operating (income) and management fee revenue of the Company, less facility operating expenses. expense items; depreciation and amortization (including non-cash impairment Combined Segment Operating Income does not include general and administrative charges); (gain) loss on sale or acquisition of communities (including gain (loss) on expenses, transaction costs or depreciation and amortization. facility lease termination and modification); straight-line lease expense (income), net of amortization of (above) below market rents; amortization of deferred gain; non- Community Labor Expenses is a component of facility operating expense that cash stock-based compensation expense; and change in future service obligation. includes regular and overtime salaries and wages, bonuses, paid-time-off and holiday For purposes of the Company’s leverage ratios presented under “Debt Maturity & wages, payroll taxes, contract labor, employee benefits, and workers compensation. Leverage”, Adjusted EBITDA and Adjusted EBITDA after cash capital and financing Development Capital Expenditures means capital expenditures for community lease payments exclude transaction, organizational restructuring, and strategic expansions and major community redevelopment and repositioning projects, project costs. including the Company’s Program Max initiative, and the development of new communities. Amounts of Development Capital Expenditures are presented net of Adjusted EBITDAR is a non-GAAP financial measure that the Company defines as lessor reimbursements received or anticipated to be received. Adjusted EBITDA before cash operating lease payments. For purposes of the Company’s leverage ratios presented under “Debt Maturity & Leverage”, Adjusted Interest Coverage is calculated based on the trailing-twelve months Owned EBITDAR excludes transaction, organizational restructuring, and strategic project Portfolio Operating Income adjusted for 5% management fee and capital costs. expenditures at $350/unit, divided by the trailing-twelve months property level and corporate debt interest expense. Adjusted Free Cash Flow is a non-GAAP financial measure that the Company defines as net cash provided by (used in) operating activities before: changes in operating Lease Coverage is calculated based on the trailing-twelve months Leased Portfolio assets and liabilities; gain (loss) on facility lease termination and modification; and Operating Income, excluding resident fee revenue and facility operating expense of distributions from unconsolidated ventures from cumulative share of net earnings; communities disposed during such period adjusted for 5% management fee and plus: proceeds from refundable entrance fees, net of refunds; and property insurance capital expenditures at $350/unit, divided by the trailing-twelve months cash lease proceeds; less: lease financing debt amortization and Non-Development Capital payments for both operating leases and capital and financing leases, excluding cash Expenditures (next page). lease payments for leases of communities disposed during such period, corporate offices, and information technology systems and equipment. Adjusted Net Debt is a non-GAAP financial measure that the Company defines as Net Debt, plus cash operating and capital and financing lease payments for the Leased Portfolio Operating Income is defined by the Company as resident fee relevant period multiplied by 8. revenues (excluding Brookdale Ancillary Services segment revenue), less facility operating expenses for the Company’s Senior Housing Leased Portfolio. Leased Brookdale's Proportionate Share of Adjusted EBITDA of Unconsolidated Portfolio Operating Income does not include general and administrative expenses Ventures is a non-GAAP financial measure calculated based on the Company’s equity (unless otherwise noted), transaction costs or depreciation and amortization. ownership percentage and in a manner consistent with the Company’s definition of Adjusted EBITDA for its consolidated entities. The Company’s investments in its Net Debt is a non-GAAP financial measure that the Company defines as the total of unconsolidated ventures are accounted for under the equity method of accounting. its debt (mortgage debt and other notes payable) and the outstanding balance on the line of credit, less unrestricted cash, marketable securities, and cash held as Brookdale’s Proportionate Share of Adjusted Free Cash Flow of Unconsolidated collateral against existing debt. Ventures is a non-GAAP financial measure calculated based on the Company’s equity ownership percentage and in a manner consistent with the Company’s definition of NM means not meaningful and is used in the year-over-year variance column if either Adjusted Free Cash Flow for its consolidated entities. The Company’s investments in or both periods being compared are negative values. its unconsolidated ventures are accounted for under the equity method of accounting and, therefore, the Company’s proportionate share of Adjusted Free Cash Flow of unconsolidated ventures does not represent cash available to the Company’s consolidated business except to the extent it is distributed to the Company. 21
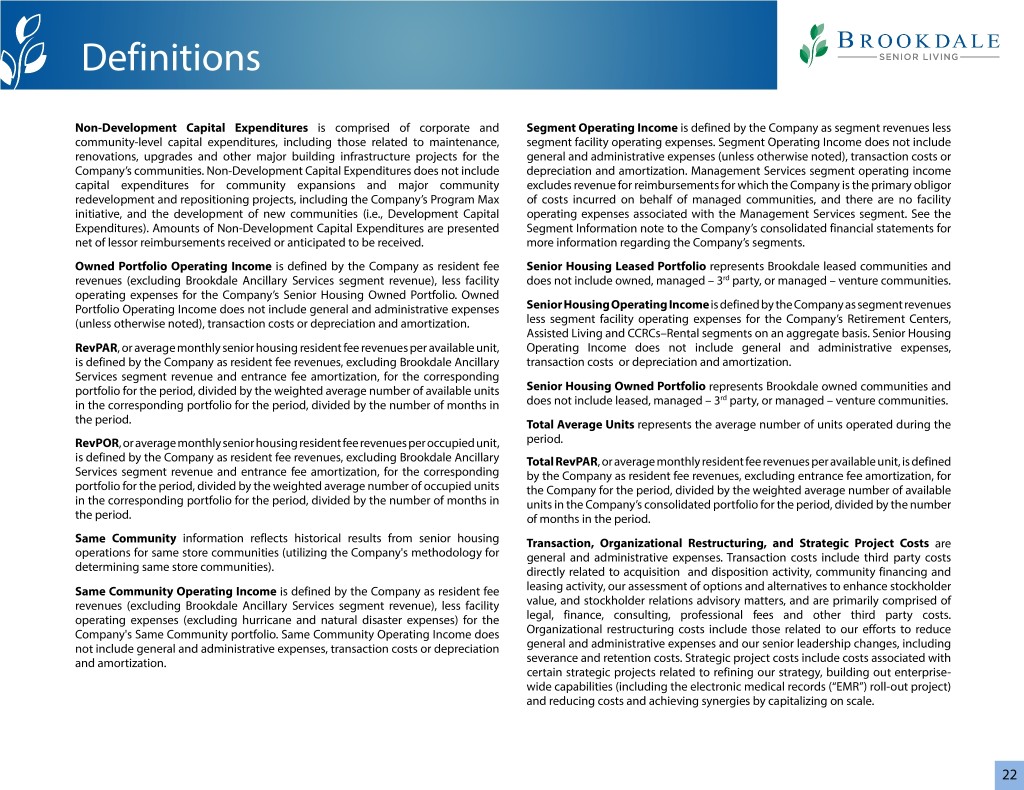
Definitions Non-Development Capital Expenditures is comprised of corporate and Segment Operating Income is defined by the Company as segment revenues less community-level capital expenditures, including those related to maintenance, segment facility operating expenses. Segment Operating Income does not include renovations, upgrades and other major building infrastructure projects for the general and administrative expenses (unless otherwise noted), transaction costs or Company’s communities. Non-Development Capital Expenditures does not include depreciation and amortization. Management Services segment operating income capital expenditures for community expansions and major community excludes revenue for reimbursements for which the Company is the primary obligor redevelopment and repositioning projects, including the Company’s Program Max of costs incurred on behalf of managed communities, and there are no facility initiative, and the development of new communities (i.e., Development Capital operating expenses associated with the Management Services segment. See the Expenditures). Amounts of Non-Development Capital Expenditures are presented Segment Information note to the Company’s consolidated financial statements for net of lessor reimbursements received or anticipated to be received. more information regarding the Company’s segments. Owned Portfolio Operating Income is defined by the Company as resident fee Senior Housing Leased Portfolio represents Brookdale leased communities and revenues (excluding Brookdale Ancillary Services segment revenue), less facility does not include owned, managed – 3rd party, or managed – venture communities. operating expenses for the Company’s Senior Housing Owned Portfolio. Owned Portfolio Operating Income does not include general and administrative expenses Senior Housing Operating Income is defined by the Company as segment revenues (unless otherwise noted), transaction costs or depreciation and amortization. less segment facility operating expenses for the Company’s Retirement Centers, Assisted Living and CCRCs–Rental segments on an aggregate basis. Senior Housing RevPAR, or average monthly senior housing resident fee revenues per available unit, Operating Income does not include general and administrative expenses, is defined by the Company as resident fee revenues, excluding Brookdale Ancillary transaction costs or depreciation and amortization. Services segment revenue and entrance fee amortization, for the corresponding portfolio for the period, divided by the weighted average number of available units Senior Housing Owned Portfolio represents Brookdale owned communities and rd in the corresponding portfolio for the period, divided by the number of months in does not include leased, managed – 3 party, or managed – venture communities. the period. Total Average Units represents the average number of units operated during the RevPOR, or average monthly senior housing resident fee revenues per occupied unit, period. is defined by the Company as resident fee revenues, excluding Brookdale Ancillary Total RevPAR, or average monthly resident fee revenues per available unit, is defined Services segment revenue and entrance fee amortization, for the corresponding by the Company as resident fee revenues, excluding entrance fee amortization, for portfolio for the period, divided by the weighted average number of occupied units the Company for the period, divided by the weighted average number of available in the corresponding portfolio for the period, divided by the number of months in units in the Company’s consolidated portfolio for the period, divided by the number the period. of months in the period. Same Community information reflects historical results from senior housing Transaction, Organizational Restructuring, and Strategic Project Costs are operations for same store communities (utilizing the Company's methodology for general and administrative expenses. Transaction costs include third party costs determining same store communities). directly related to acquisition and disposition activity, community financing and Same Community Operating Income is defined by the Company as resident fee leasing activity, our assessment of options and alternatives to enhance stockholder revenues (excluding Brookdale Ancillary Services segment revenue), less facility value, and stockholder relations advisory matters, and are primarily comprised of operating expenses (excluding hurricane and natural disaster expenses) for the legal, finance, consulting, professional fees and other third party costs. Company's Same Community portfolio. Same Community Operating Income does Organizational restructuring costs include those related to our efforts to reduce not include general and administrative expenses, transaction costs or depreciation general and administrative expenses and our senior leadership changes, including and amortization. severance and retention costs. Strategic project costs include costs associated with certain strategic projects related to refining our strategy, building out enterprise- wide capabilities (including the electronic medical records (“EMR”) roll-out project) and reducing costs and achieving synergies by capitalizing on scale. 22

Appendix Consolidated Statements of Cash Flows 24 Non-GAAP Financial Measures 25 Brookdale West Hartford West Hartford, CT 23

Consolidated Statements of Cash Flows ($ in 000s) 2017 2018 Q3 Q4 Q1 Q2 Q3 Cash Flows from Operating Activities Net income (loss) $ (413,929) $ 15,021 $ (457,234) $ (165,509) $ (37,140) Adjustments to reconcile net income (loss) to net cash provided by operating activities: Debt modification and extinguishment costs 11,129 526 35 9 33 Depreciation and amortization, net 121,193 119,908 118,211 118,444 111,809 Goodwill and asset impairment 368,551 18,966 430,363 16,103 5,500 Equity in (earnings) loss of unconsolidated ventures 6,722 4,516 4,243 1,324 1,340 Distributions from unconsolidated ventures from cumulative share of net earnings 473 6,893 408 739 1,012 Amortization of deferred gain (1,091) (1,089) (1,090) (1,089) (1,090) Amortization of entrance fees (427) (444) (501) (336) (383) Proceeds from deferred entrance fee revenue 567 1,193 1,109 289 1,109 Deferred income tax provision (benefit) (31,704) (63,978) 15,037 (16,028) (18,189) Straight-line lease (income) expense (3,078) (5,109) (6,165) (2,430) (1,815) Change in fair value of derivatives 74 15 (74) 217 10 Loss (gain) on sale of assets, net 233 (20,656) (43,431) (23,322) (9,833) Loss on facility lease termination and modification, net 4,938 2,970 — 133,423 2,337 Non-cash stock-based compensation expense 7,527 5,285 8,406 6,269 6,035 Non-cash interest expense on financing lease obligations 3,939 3,784 3,383 3,063 2,705 Amortization of (above) below market lease, net (1,697) (1,586) (1,938) (1,636) (672) Non-cash management contract termination fee — — (2,242) (2,834) (573) Other (1,730) (4,120) (156) — 2 Changes in operating assets and liabilities: Accounts receivable, net (1,192) 1,982 3,488 7,468 (12,083) Prepaid expenses and other assets, net 4,344 (1,353) (24,807) 26,685 19,996 Trade accounts payable and accrued expenses 26,523 16,932 (21,370) (36,245) 14,358 Tenant refundable fees and security deposits (17) (190) (137) (166) (38) Deferred revenue (7,557) (15,430) 12,426 (3,818) (12,506) Net cash provided by operating activities 93,791 84,036 37,964 60,620 71,924 Cash Flows from Investing Activities Change in lease security deposits and lease acquisition deposits, net (416) (1,702) (2,015) (947) 2,298 (Purchase) sale of marketable securities, net (216,597) (44,811) 118,273 155,000 20,000 Additions to property, plant and equipment and leasehold intangibles, net (50,474) (73,843) (66,592) (53,866) (48,891) Acquisition of assets, net of related payables and cash received — (4,796) (27,330) (243,990) (451) Investment in unconsolidated ventures (1,434) (11,417) (8,434) (430) (82) Distributions received from unconsolidated ventures 3,446 17,544 2,037 7,360 1,385 Proceeds from sale of assets, net 115 35,937 75,060 55,837 1,015 Property insurance proceeds 1,461 4,120 156 — — Other 15 13 — 1,393 187 Net cash (used in) provided by investing activities (263,884) (78,955) 91,155 (79,643) (24,539) Cash Flows from Financing Activities Proceeds from debt 1,200,476 14,158 30,168 249,751 — Repayment of debt and capital and financing lease obligations (869,499) (95,458) (44,001) (422,266) (35,679) Proceeds from line of credit 100,000 — — 200,000 — Repayment of line of credit (100,000) — — (200,000) — Payment of financing costs, net of related payables (15,738) (350) (248) (2,943) (150) Proceeds from refundable entrance fees, net of refunds (687) 62 223 (171) (368) Payments for lease termination — — — (10,548) (2,000) Payments of employee taxes for withheld shares (346) (223) (2,618) (97) (129) Other 532 457 372 398 377 Net cash (used in) provided by financing activities 314,738 (81,354) (16,104) (185,876) (37,949) Net (decrease) increase in cash, cash equivalents and restricted cash 144,645 (76,273) 113,015 (204,899) 9,436 Cash, cash equivalents and restricted cash at beginning of period 214,174 358,819 282,546 395,561 190,662 Cash, cash equivalents and restricted cash at end of period $ 358,819 $ 282,546 $ 395,561 $ 190,662 $ 200,098 Reflects the retrospective adoption of ASU 2016-15 and 2016-18. Refer to page 25 for additional detail regarding the impact of ASU 2016-15. For ASU 2016-18, the Company identified that the inclusion of the change in restricted cash within the retrospective presentation of the statements of cash flows resulted in a (decrease) increase to the amount of net cash used in investing activities of ($4.6 million) and $7.4 million for each of the three months ended September 30, 2017 and December 31, 2017, respectively. 24

Non-GAAP Financial Measures This Supplemental Information contains financial measures utilized by management to evaluate the Company’s operating performance and liquidity that are not calculated in accordance with GAAP, including Adjusted EBITDA; the Company's Proportionate Share of Adjusted EBITDA of Unconsolidated Ventures; Adjusted EBITDAR, Adjusted EBITDA and Adjusted EBITDAR after cash lease payments (in each case excluding transaction, organizational restructuring and strategic project costs); Net Debt; Adjusted Net Debt; Adjusted Free Cash Flow; and the Company’s Proportionate Share of Adjusted Free Cash Flow of Unconsolidated Ventures, the Company’s definitions for which are included in the “Definitions” section above. These non-GAAP financial measures should not be considered in isolation from or as superior to or as a substitute for net income (loss), income (loss) from operations, net cash provided by (used in) operating activities, short-term debt, long-term debt, less current portion, current portion of long-term debt, or other financial measures determined in accordance with GAAP. Management uses these non-GAAP financial measures to supplement the Company’s GAAP results to provide a more complete understanding of the factors and trends affecting the business. Investors are urged to review the reconciliations set forth in this section of such non-GAAP financial measures to their most comparable GAAP financial measures and to review the information under “Reconciliation of Non-GAAP Financial Measures” in the Company’s earnings release dated November 5, 2018 for additional information regarding the Company’s use, and the limitations of, the Company’s non- GAAP financial measures. Investors are cautioned that amounts presented in accordance with the Company’s definitions of these non-GAAP measures may not be comparable to similar measures disclosed by other companies, because not all companies calculate such measures in the same manner. The Company adopted ASU 2016-15, Statement of Cash Flows - Classification of Certain Cash Receipts and Cash Payments ("ASU 2016-15") on January 1, 2018 and applied ASU 2016-15 retrospectively for all prior periods presented. Among other things, ASU 2016-15 provides that debt prepayment and extinguishment costs will be classified within financing activities in the statement of cash flows. The Company identified $10,556 and $481 (in thousands) of cash paid for debt modification and extinguishment costs which have been retrospectively classified as cash flows from financing activities, resulting in a corresponding increase to the amount of net cash provided by operating activities for each of the three months ended September 30, 2017 and December 31, 2017, respectively. The Company did not change its definition of Adjusted Free Cash Flow upon the adoption of ASU 2016-15. Following the adoption of ASU 2016-15, the amount of Adjusted Free Cash Flow reflects a $10,556 and $481 (in thousands) increase for each the three months ended September 30, 2017 and December 31, 2017, respectively. 25
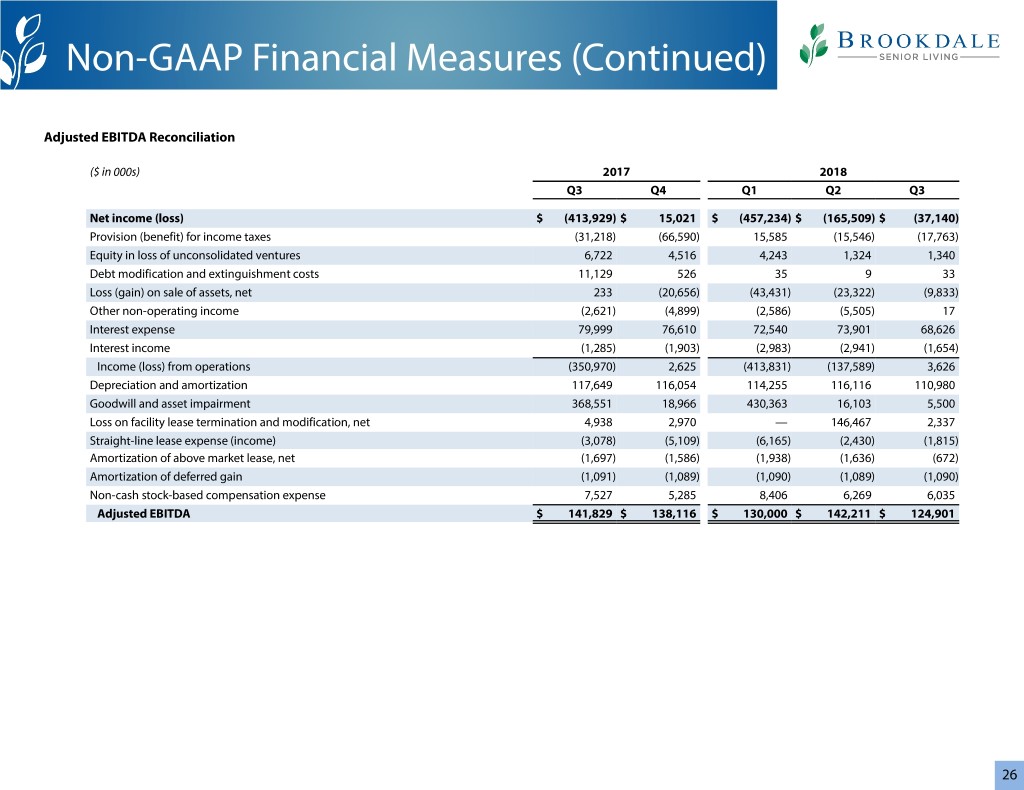
Non-GAAP Financial Measures (Continued) Adjusted EBITDA Reconciliation ($ in 000s) 2017 2018 Q3 Q4 Q1 Q2 Q3 Net income (loss) $ (413,929) $ 15,021 $ (457,234) $ (165,509) $ (37,140) Provision (benefit) for income taxes (31,218) (66,590) 15,585 (15,546) (17,763) Equity in loss of unconsolidated ventures 6,722 4,516 4,243 1,324 1,340 Debt modification and extinguishment costs 11,129 526 35 9 33 Loss (gain) on sale of assets, net 233 (20,656) (43,431) (23,322) (9,833) Other non-operating income (2,621) (4,899) (2,586) (5,505) 17 Interest expense 79,999 76,610 72,540 73,901 68,626 Interest income (1,285) (1,903) (2,983) (2,941) (1,654) Income (loss) from operations (350,970) 2,625 (413,831) (137,589) 3,626 Depreciation and amortization 117,649 116,054 114,255 116,116 110,980 Goodwill and asset impairment 368,551 18,966 430,363 16,103 5,500 Loss on facility lease termination and modification, net 4,938 2,970 — 146,467 2,337 Straight-line lease expense (income) (3,078) (5,109) (6,165) (2,430) (1,815) Amortization of above market lease, net (1,697) (1,586) (1,938) (1,636) (672) Amortization of deferred gain (1,091) (1,089) (1,090) (1,089) (1,090) Non-cash stock-based compensation expense 7,527 5,285 8,406 6,269 6,035 Adjusted EBITDA $ 141,829 $ 138,116 $ 130,000 $ 142,211 $ 124,901 26

Non-GAAP Financial Measures (Continued) Adjusted EBITDAR; Adjusted EBITDA; and Adjusted EBITDA after cash capital and financing lease payments Reconciliations (excluding transaction, organizational restructuring, and strategic project costs) ($ in 000s) Twelve Months Ended September 30, 2018 Net income (loss) $ (644,862) Benefit for income taxes (84,314) Equity in loss of unconsolidated ventures 11,423 Debt modification and extinguishment costs 603 Gain on sale of assets, net (97,242) Other non-operating income (12,973) Interest expense 291,677 Interest income (9,481) Income (loss) from operations (545,169) Depreciation and amortization 457,405 Goodwill and asset impairment 470,932 Loss on facility lease termination and modification, net 151,774 Facility lease expense 314,539 Non-cash stock-based compensation expense 25,995 Transaction, organizational restructuring, and strategic project costs 36,293 Adjusted EBITDAR (excluding Transaction, Organizational Restructuring, and Strategic Project Costs) $ 911,769 Facility lease expense $ (314,539) Straight-line lease expense (income) (15,519) Amortization of above market lease, net (5,832) Amortization of deferred gain (4,358) Adjusted EBITDA (excluding Transaction, Organizational Restructuring, and Strategic Project Costs) $ 571,521 Interest expense: capital and financing lease obligations $ (92,794) Non-cash interest expense on financing lease obligations 12,935 Lease financing debt amortization (71,921) Adjusted EBITDA after cash capital and financing lease payments (excluding Transaction, Organizational Restructuring, and Strategic Project Costs) $ 419,741 27

Non-GAAP Financial Measures (Continued) Net Debt and Adjusted Net Debt Reconciliations ($ in 000s) As of September 30, 2018 Long-term debt (including current portion) $ 3,700,041 Line of credit — Less: cash and cash equivalents (133,664) Less: marketable securities — Less: cash held as collateral against existing debt (280) Net Debt 3,566,097 Plus: trailing twelve months cash lease payments multiplied by 8 3,936,224 Adjusted Net Debt $ 7,502,321 Adjusted Net Debt to Adjusted EBITDAR (excluding Transaction, Organizational Restructuring, and Strategic Project Costs) 8.2x Net Debt to Adjusted EBITDA after cash capital and financing lease payments (excluding Transaction, Organizational Restructuring, and Strategic Project Costs) 8.5x 28

Non-GAAP Financial Measures (Continued) Adjusted Free Cash Flow Reconciliation ($ in 000s) 2017 2018 Q3 Q4 Q1 Q2 Q3 Net cash provided by operating activities $ 93,791 $ 84,036 $ 37,964 $ 60,620 $ 71,924 Net cash (used in) provided by investing activities (263,884) (78,955) 91,155 (79,643) (24,539) Net cash provided by (used in) financing activities 314,738 (81,354) (16,104) (185,876) (37,949) Net increase (decrease) in cash, cash equivalents and restricted cash $ 144,645 $ (76,273) $ 113,015 $ (204,899) $ 9,436 Net cash provided by operating activities $ 93,791 $ 84,036 $ 37,964 $ 60,620 $ 71,924 Changes in operating assets and liabilities (22,101) (1,941) 30,400 6,076 (9,727) Proceeds from refundable entrance fees, net of refunds (687) 62 223 (171) (368) Lease financing debt amortization (14,626) (18,650) (21,114) (18,787) (13,370) Loss on facility lease termination and modification, net — — — 13,044 — Distributions from unconsolidated ventures from cumulative share of net earnings (473) (6,893) (408) (739) (1,012) Non-development capital expenditures, net (41,005) (71,908) (41,736) (47,681) (41,275) Property insurance proceeds 1,461 4,120 156 — — Adjusted Free Cash Flow $ 16,360 $ (11,174) $ 5,485 $ 12,362 $ 6,172 29
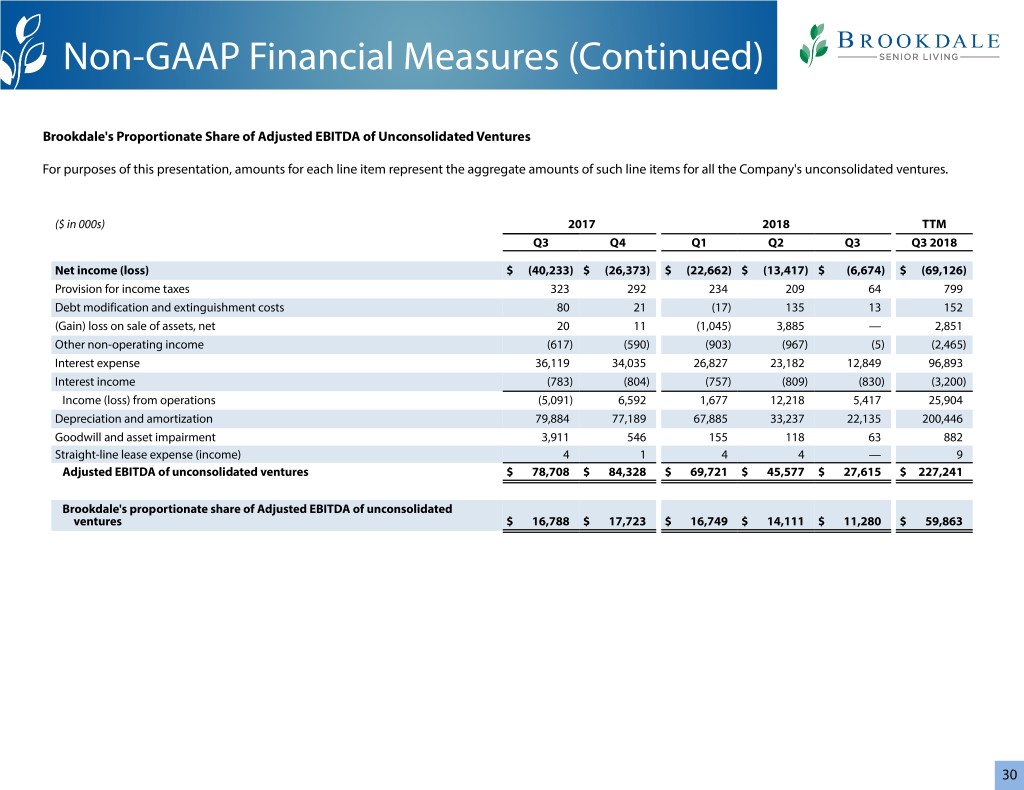
Non-GAAP Financial Measures (Continued) Brookdale's Proportionate Share of Adjusted EBITDA of Unconsolidated Ventures For purposes of this presentation, amounts for each line item represent the aggregate amounts of such line items for all the Company's unconsolidated ventures. ($ in 000s) 2017 2018 TTM Q3 Q4 Q1 Q2 Q3 Q3 2018 Net income (loss) $ (40,233) $ (26,373) $ (22,662) $ (13,417) $ (6,674) $ (69,126) Provision for income taxes 323 292 234 209 64 799 Debt modification and extinguishment costs 80 21 (17) 135 13 152 (Gain) loss on sale of assets, net 20 11 (1,045) 3,885 — 2,851 Other non-operating income (617) (590) (903) (967) (5) (2,465) Interest expense 36,119 34,035 26,827 23,182 12,849 96,893 Interest income (783) (804) (757) (809) (830) (3,200) Income (loss) from operations (5,091) 6,592 1,677 12,218 5,417 25,904 Depreciation and amortization 79,884 77,189 67,885 33,237 22,135 200,446 Goodwill and asset impairment 3,911 546 155 118 63 882 Straight-line lease expense (income) 4 1 4 4 — 9 Adjusted EBITDA of unconsolidated ventures $ 78,708 $ 84,328 $ 69,721 $ 45,577 $ 27,615 $ 227,241 Brookdale's proportionate share of Adjusted EBITDA of unconsolidated ventures $ 16,788 $ 17,723 $ 16,749 $ 14,111 $ 11,280 $ 59,863 30

Non-GAAP Financial Measures (Continued) Brookdale's Proportionate Share of Adjusted Free Cash Flow of Unconsolidated Ventures For purposes of this presentation, amounts for each line item represent the aggregate amounts of such line items for all the Company's unconsolidated ventures. ($ in 000s) 2017 2018 TTM Q3 Q4 Q1 Q2 Q3 Q3 2018 Net cash provided by operating activities $ 62,054 $ 61,910 $ 50,262 $ 47,510 $ 24,497 $ 184,179 Net cash used in investing activities (16,476) (26,550) (14,642) (15,746) (14,623) (71,561) Net cash used in financing activities (32,514) (52,315) (23,279) (29,380) (9,702) (114,676) Net increase (decrease) in cash, cash equivalents and restricted cash $ 13,064 $ (16,955) $ 12,341 $ 2,384 $ 172 $ (2,058) Net cash provided by operating activities $ 62,054 $ 61,910 $ 50,262 $ 47,510 $ 24,497 $ 184,179 Changes in operating assets and liabilities (5,615) 6,904 1,119 (13,838) 7,163 1,348 Proceeds from refundable entrance fees, net of refunds (6,309) (1,664) (6,712) (3,323) (2,500) (14,199) Non-development capital expenditures, net (28,659) (31,196) (20,061) (18,867) (14,822) (84,946) Property insurance proceeds 614 584 901 634 — 2,119 Adjusted Free Cash Flow of Unconsolidated Ventures $ 22,085 $ 36,538 $ 25,509 $ 12,116 $ 14,338 $ 88,501 Brookdale’s Proportionate Share of Adjusted Free Cash Flow of Unconsolidated Ventures $ 6,709 $ 12,037 $ 5,824 $ 5,798 $ 8,352 $ 32,011 31

Brookdale Senior Living Inc. 111 Westwood Place, Suite 400 Brentwood, TN 37027 (615) 221-2250 www.brookdale.com


