Resource Capital Corp. FBR Capital Markets Fall Investor Conference December 3, 2008 Exhibit 99.1 |
2 Forward-Looking Statements Some of the statements in this presentation constitute forward-looking statements. Forward-looking statements relate to expectations, beliefs, projections, future plans and strategies, anticipated events or trends and similar expressions concerning matters that are not historical facts. In some cases, you can identify forward looking statements by terms such as “anticipate,” “believe,” “could,” “estimate,” “expect,” “intend,” “may,” “plan,” “potential,” “project,” “should,” “will” and “would” or the negative of these terms or other comparable terminology. The forward-looking statements are based on our beliefs, assumptions and expectations of our future performance, taking into account all information currently available to us. These beliefs, assumptions and expectations can change as a result of many possible events or factors, not all of which are known to us or are within our control. If a change occurs, our business, financial condition, liquidity and results of operations may vary materially from those expressed in our forward-looking statements. Forward-looking statements we make in this presentation are subject to various risks and uncertainties that could cause actual results to vary from our forward-looking statements, including: The factors described in our prospectus, including those set forth under the sections captioned “Risk Factors” and “Business;” Our future operating results; Our business prospects; General volatility of the securities markets in which we invest and the market price of our common stock; Changes in our business strategy; Availability, terms and deployment of capital; Availability of qualified personnel; Changes in our industry, interest rates, the debt securities markets or the general economy; Increased rates of default and/or decreased recovery rates on our investments; Increased prepayments of the mortgage and other loans underlying our mortgage-backed or other asset-backed securities; Changes in governmental regulations, tax rates and similar matters; Availability of investment opportunities in real estate-related and commercial finance assets; The degree and nature of our competition; The adequacy of our cash reserves and working capital; and The timing of cash flows, if any, from our investments. |

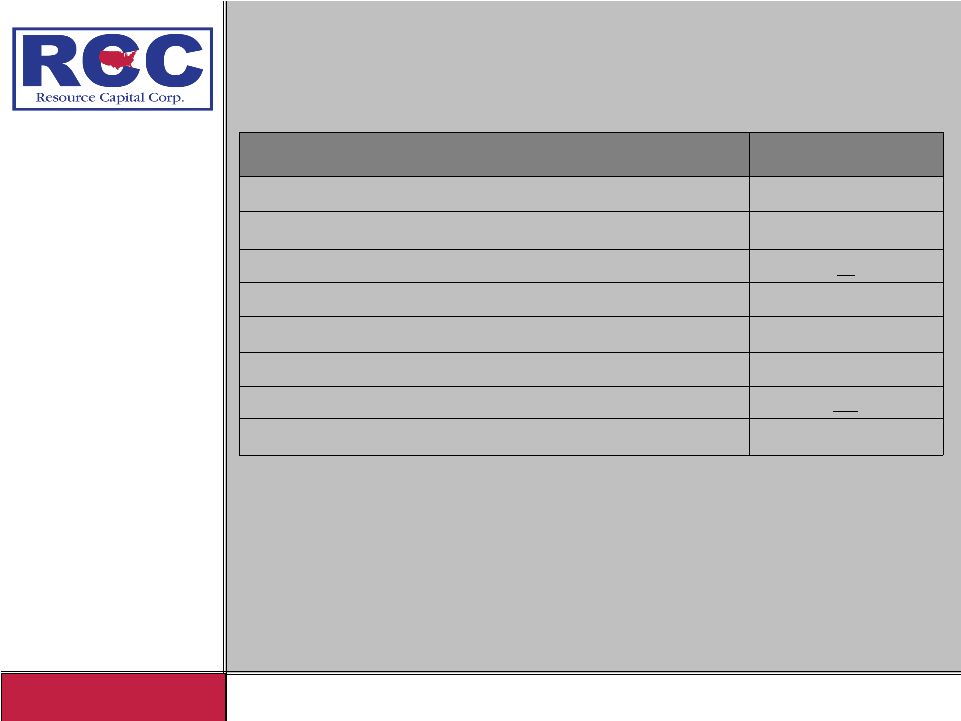
3 Business Overview Exchange / Ticker NYSE : “RSO” 144A Offering March 2005 $214.8 million Initial Public Offering – February 2006 27.6 million Follow-on Offering – December 2006 103.0 million Market Capitalization (1) 59.5 million Trust preferred – May / September 2006 50.0 million Investment Portfolio 2.0 billion Externally managed by a subsidiary of Resource America, Inc. (NASDAQ: “REXI”) (1) As of December 1, 2008 |
4 Resource Capital Corporation A commercial finance business structured as a REIT with substantial focus on commercial mortgage investments as well as commercial loans Provides high value, customized financing solutions Whole loans B notes Mezzanine loans Bank loans Small business loans and leases Stated objective is to deliver a healthy dividend based on exceptional risk- adjusted returns on equity to shareholders by providing first-class financing solutions for our customers Committed and experienced sponsor and management team 8% ownership post offering ($12.0 million equity investment) Long track record in creating public shareholder value As of September 30, 2008, RCC had an investment portfolio of $2.0 billion |
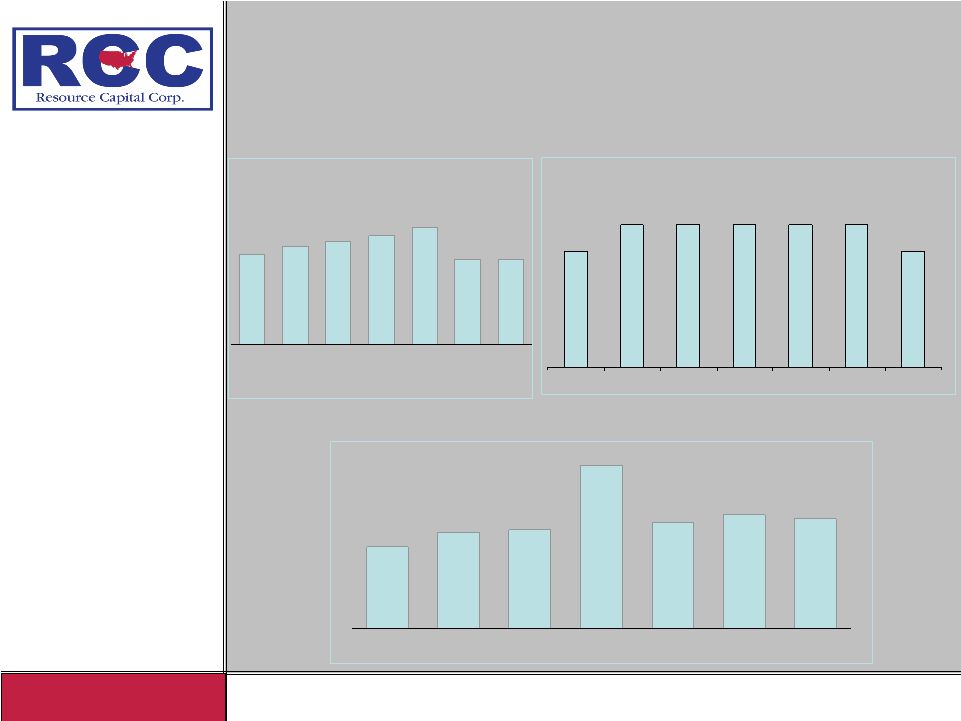
5 REIT Taxable Earnings ($ in millions) Dividends Declared Per Share Dividends Declared / Beginning Book Value (annualized) $0.39 $0.41 $0.41 $0.41 $0.41 $0.41 $0.39 1Q07 2Q07 3Q07 4Q07 1Q08 2Q08 3Q08 15.8% 15.2% 13.9% 23.5% 14.2% 11.7% 16.4% 1Q07 2Q07 3Q07 4Q07 1Q08 2Q08 3Q08 $9.4 $10.5 $10.9 $11.4 $9.4 $9.7 $12.1 1Q07 2Q07 3Q07 4Q07 1Q08 2Q08 3Q08 Stable Financial Performance |
6 RCC – Investment Highlights Attractive Returns • Declared Q3 2008 dividend of $0.39, 2008 YTD total payout of $1.21 High Yielding Portfolio • $2.0 billion portfolio with an average yield of 6.5% (for the nine months ended September 30, 2008) • Predominantly secured commercial mortgages and rated secured corporate loans (over 95%) Match Funding Principle • Assets predominantly funded by 5 structured vehicles • The financings had a weighted average cost of funds of 3.6% at September 30, 2008 Origination Platform • Dedicated origination team with offices in New York and Los Angeles • Strong loan origination of approximately $2.0 billion since 6/1/05 Disciplined Credit Culture with Proven Results • Deep market knowledge • Comprehensive asset and credit analysis • Access to Resource America’s 179 investment professionals |
7 Commercial RE Mortgage Platform Commercial real estate and net lease market $3+ trillion Portfolio of approximately $865 million (including CMBS) at 09/30/08 Approximately 73% of common equity and proceeds from TRUPS invested into Commercial Real Estate (“CRE”) Originated approximately $2.0 billion in loans since 6/1/05 Closed Two CRE Financing Structures $845 Million of long-term dedicated capital Weighted average cost of the two CRE Funds is LIBOR + 69 bps |
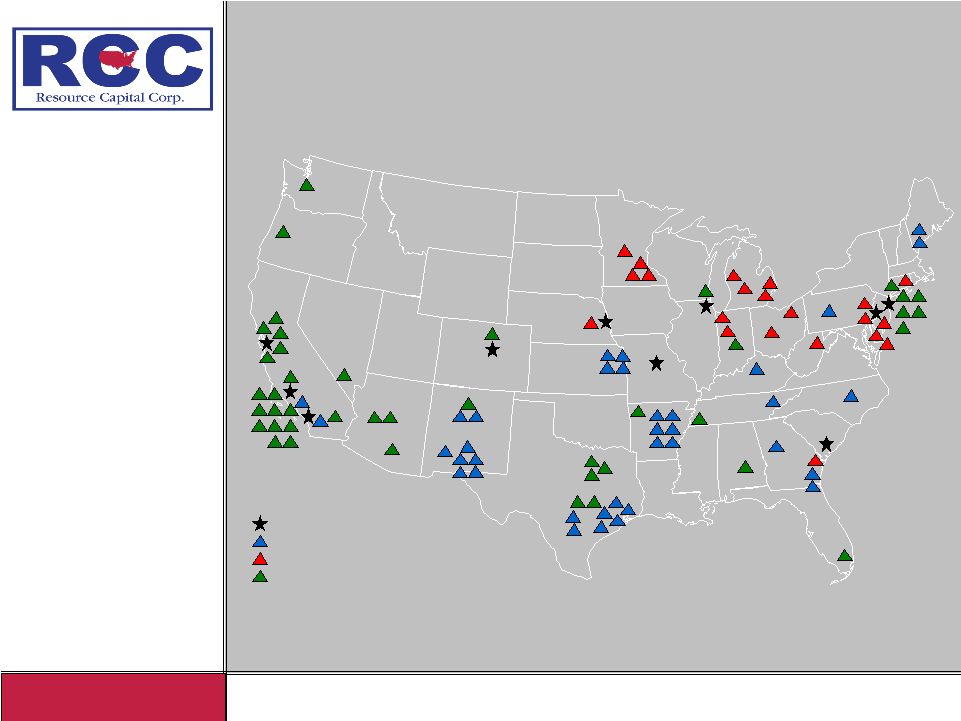
8 Power of the RRE Platform: Sourcing & Asset Mgmt. Capability *Multiple property portfolio investments excluded. RAI Offices Real Estate Equity Investments Distressed Real Estate Debt Investment Performing Real Estate Debt Investments* |
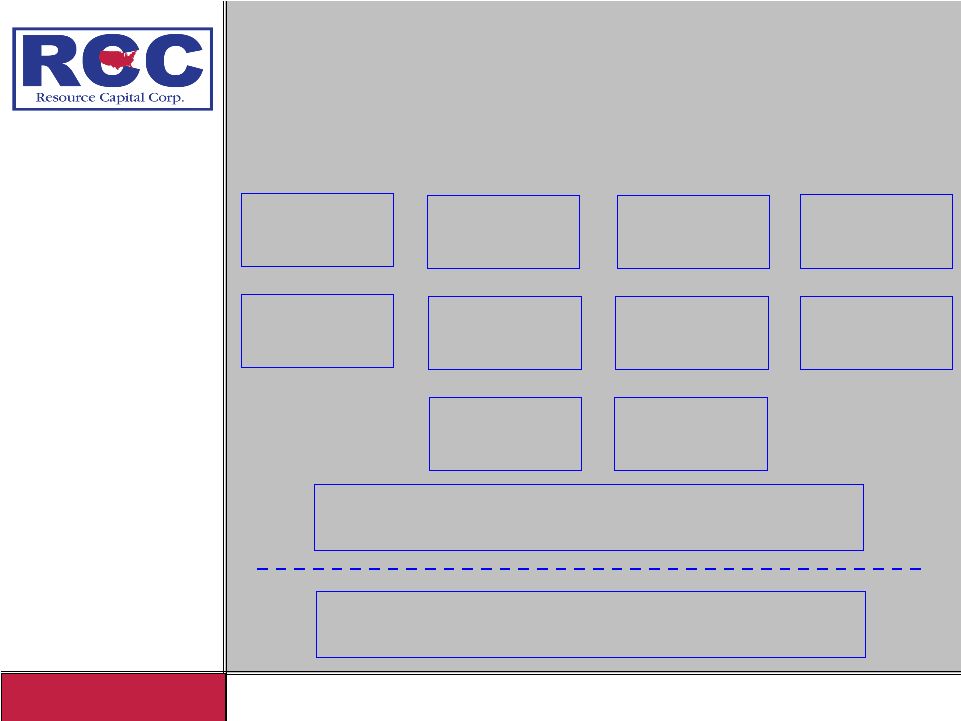
9 RCC Real Estate Team As in its other businesses, Resource America has developed a strong team with extensive experience in the commercial real estate sector: Edward E. Cohen Chairman Jonathan Z. Cohen President & CEO Steven J. Kessler CFO of RAI Joan Sapinsley Managing Director Debt Origination 10 Additional Professionals Dedicated to Commercial Real Estate Lending 35 Additional Professionals Dedicated to Commercial Real Estate Property Acquisitions and Asset Management David Bloom President, Resource Real Estate David Bryant CFO of RCC Kyle Geoghegan Managing Director Debt Origination Darryl Myrose Managing Director Debt Origination Alan F. Feldman CEO, Resource Real Estate Yuriko Iwai Vice President Debt Origination |
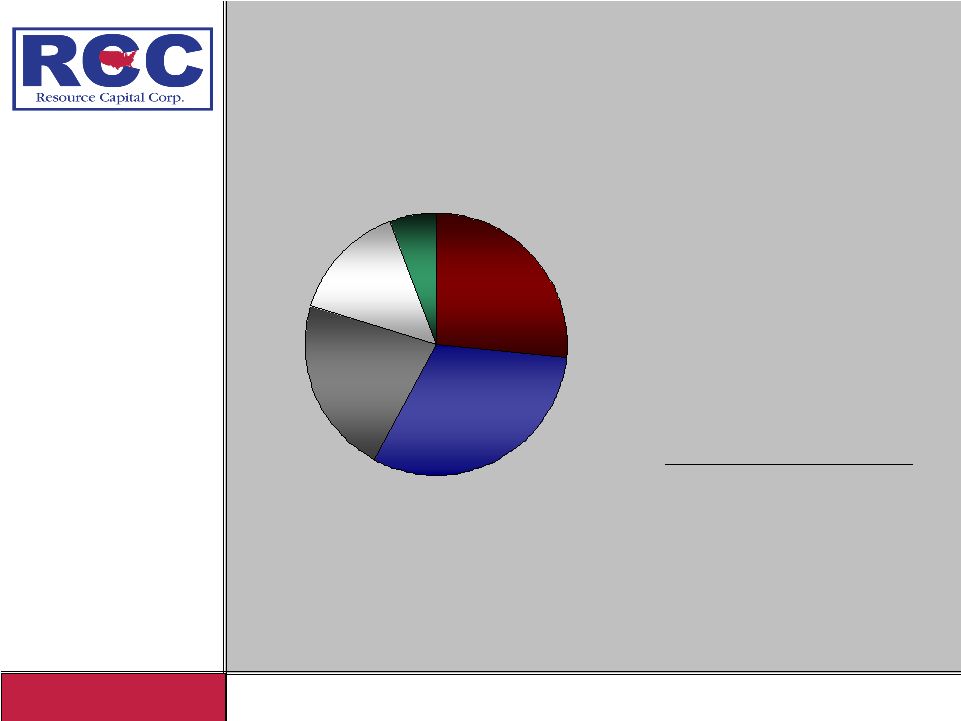
10 CRE Portfolio Diversity Office 22% Multifamily 31% Other 6% Hotel 27% Retail 14% 222.2 MM Hotel $834.1 MM TOTAL 49.4 MM Other 119.1 MM Retail 182.7 MM Office $260.7 MM Multifamily Total Portfolio Holding Value Based on total loan commitments as of November 6, 2008 |
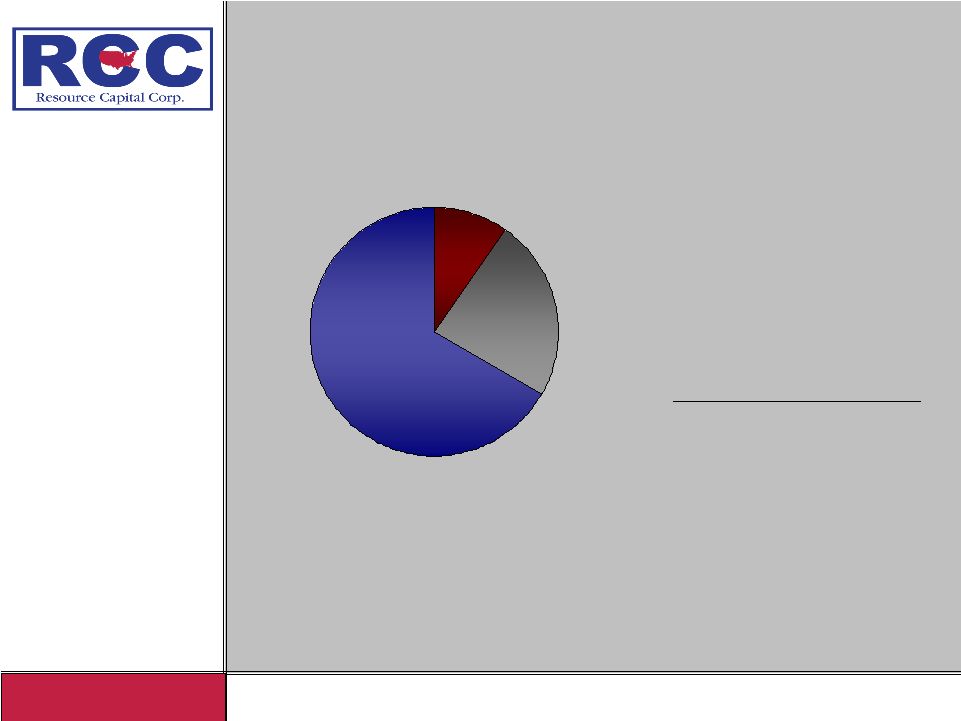
11 CRE Portfolio Diversity Mezz 24% Whole Loan 65% B Note 11% $834.1 MM TOTAL 89.1 MM B note 198.0 MM Mezzanine Loan $547.0 MM Whole loan Total Portfolio Holding Value Based on total loan commitments as of November 6, 2008 |
12 CURRENT MARKET DYNAMICS The 10 year fixed rate CMBS quote is still largely absent from the market Loan amounts, pricing and terms have all changed with a much more conservative approach across the board Loan spreads continue to be dramatically wide Very low transaction volumes in the new acquisition loan and refinance markets RCC is well positioned for the temporary pull-back Match-funded portfolio with no bullet maturities in 2008 Approximately half of the portfolio benefiting from LIBOR floors with a weighted average level of 4.76% - a pick-up of 285 bps The entire debt-team is now actively involved in asset and portfolio management and the portfolio is performing – in general, the portfolio is performing well The majority of RCC’s loans are for value-add asset plays that will be sold upon stabilization – low leverage buyers of core assets remain RCC is well positioned to take advantage of existing low cost liabilities and to make new loans in line with the current market as the existing portfolio repays RCC amended its CRE term facility on 11-26-08 with Natixis to substantially reduce leverage and improve unrestricted liquidity. Outstanding balance paid down by $43.8 million and reduced from $60.9 million to $17.1 million at 11-30-08 Term financing reduced to a very conservative advance rate of 38% of pledged collateral |
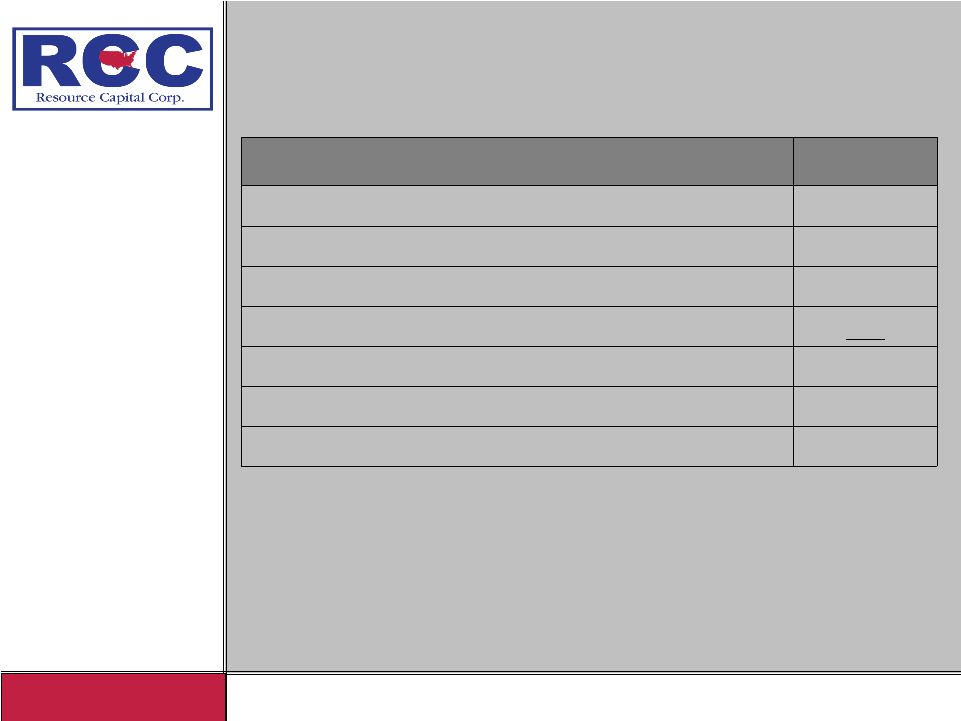
13 Liquidity at 11/30/08 $76.0 Proforma total cash 11.1 Restricted cash in margin call and other accounts 26.8 Restricted cash available for investment 8.7 Capacity for future funding obligations under the 2007 CRE CDO $29.4 Proforma unrestricted cash 4.8 Undrawn capacity under a secured term facility 10.0 Undrawn capacity under an unsecured revolving credit facility $14.6 Unrestricted cash balances Amount (in Millions) Description |
14 Economic Book Value at 9/30/08 ($ in thousands) $ 10.92 Economic Book Value Per Share 25,296,164 Shares outstanding as of September 30, 2008 276,183 Economic Book Value 12,885 Unrealized losses recognized in excess of value at risk – Interest Rate Swaps 24,197 Unrealized losses - CMBS Portfolio Add: 239,101 Shareholders' equity - GAAP As of 9.30.08 Description * In thousands except share data |
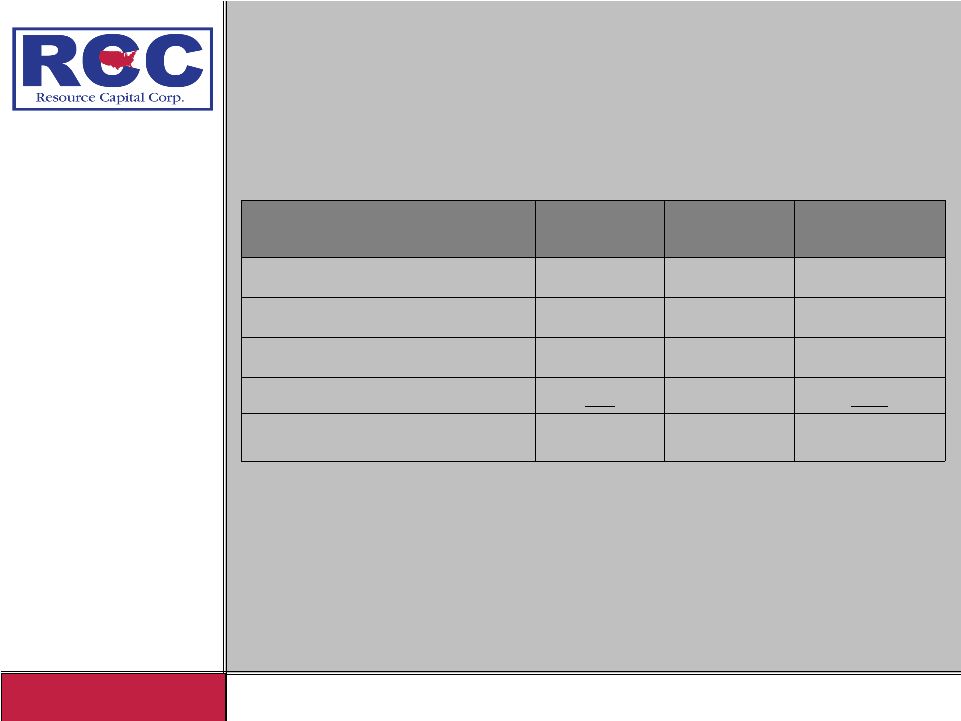
15 Return on Equity (before provisions for loan losses) 17.9% 100% Aggregate (gross return) 29.1% 15.6x 1.9% Leasing Assets Net of Tax 23.5% 11.4x 23.9% Bank Loans 5.7% 0.0x 3.6% Cash and Margin Calls 16.34% 3.0x 70.6% CRE Loans and CMBS ROE Leverage Equity / Trups Invested Portfolio Based on actual results annualized for Q3 2008 |
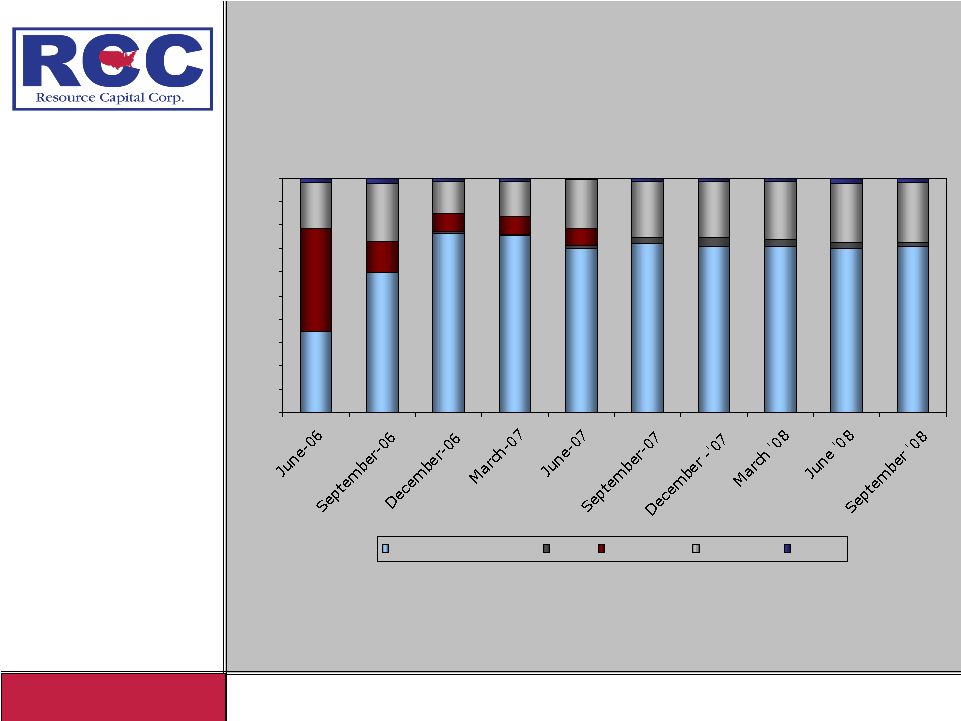
16 Equity Composition Trends 0% 10% 20% 30% 40% 50% 60% 70% 80% 90% 100% Commercial RE Loans CMBS ABS - RMBS Bank Loans Leasing |
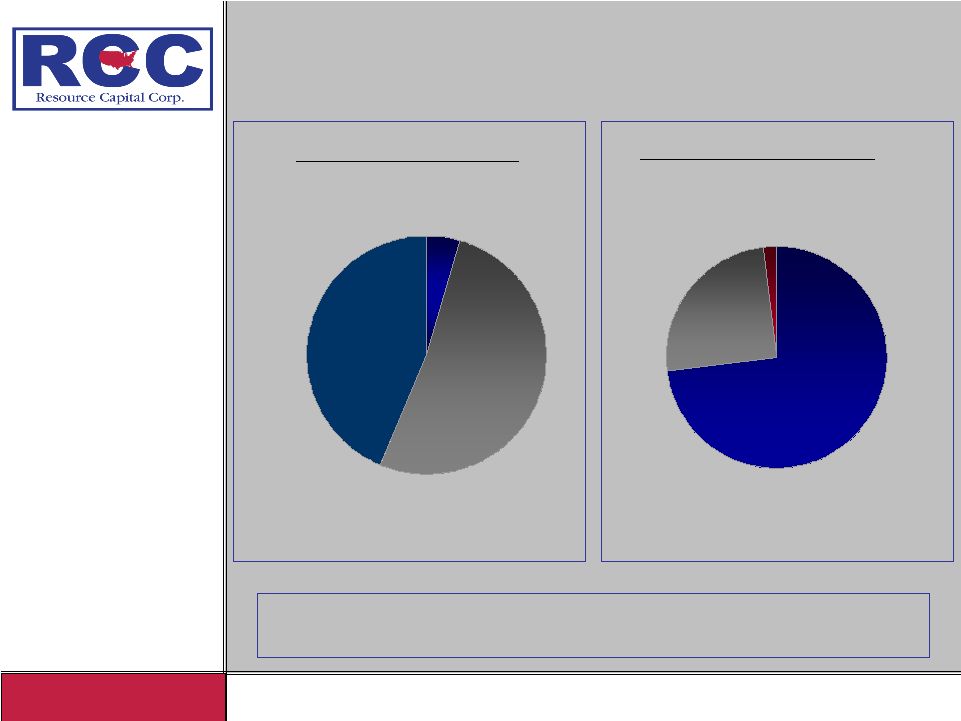
17 Illustrative Portfolio Mix as of 9/30/08 Asset Allocation Equity Allocation Commercial RE-Related, 44% Commercial Finance, 52% Cash, 4% Commercial Real Estate, 73% Commercial Finance 25% Leasing, 2% The flexibility of the Resource America platform provides access to attractive investments across a variety of economic environments |
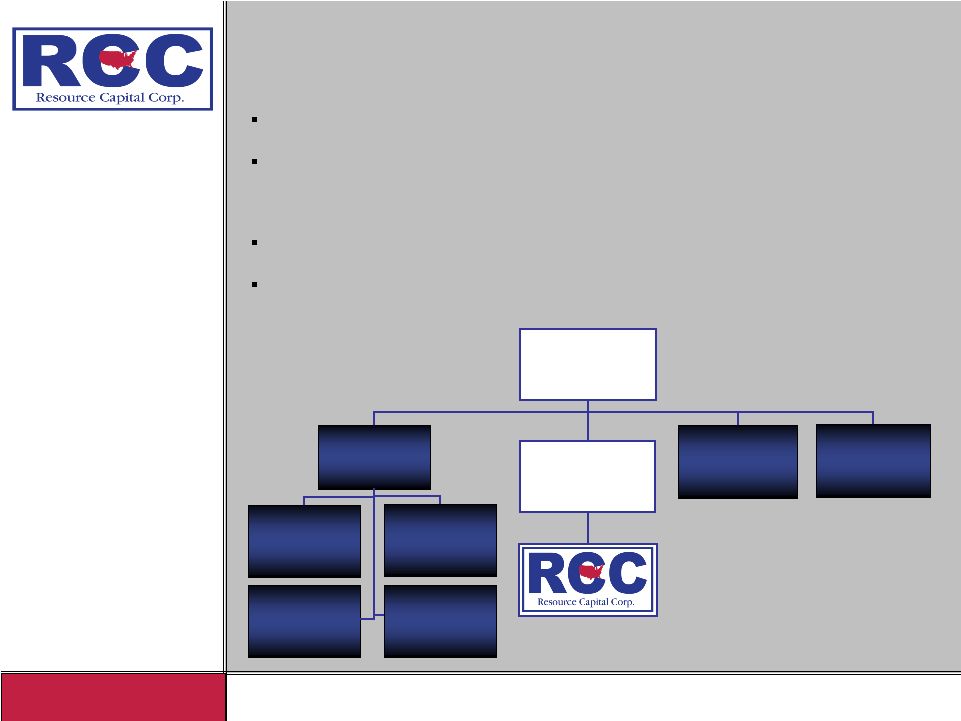
18 Resource America Relationship Resource Capital is externally managed by a subsidiary of Resource America (Nasdaq:REXI) Resource America is a specialized asset management company that uses industry specific expertise to generate and administer investment opportunities for its own account and for outside investors in the financial fund management, real estate and commercial finance sectors Resource America had approximately $18.8 billion assets under management at 06/30/08. Resource America owned 2.0 million shares of RCC or approximately 8.0% at 6/30/08. Primarily all of these shares were purchased Resource America, Inc. NASDAQ: “REXI” Resource Financial Fund Management Ischus Capital (MBS/ABS) 9 Funds, $5.9 billion under management Trapeza Capital (Bank Trust Preferred) 13 Funds, $5.0 billion under management Apidos Capital (Bank Loans) 12 Funds, $3.9 billion under management Resource Europe Management (Bank Loans) 1 Fund, $459 million under management Resource Real Estate (Commercial Real Estate and Loans) 2 Funds, $1.8 billion under management LEAF Financial Corp. (Equipment Leasing) $1.6 billion under management Resource Capital Manager |