0 Resource Capital Corp. June 2015
1 Safe Harbor This presentation contains forward-looking statements that involve risks and uncertainties. These forward-looking statements are not historical facts but rather are based on our current beliefs, assumptions and expectations. These beliefs, assumptions and expectations can change as a result of many possible events or factors, not all of which are known to us or are within our control. If a change occurs, our business, financial condition, liquidity and results of operations may vary materially from those expressed in our forward-looking statements. You should not place undue reliance on these forward-looking statements, which reflect our view only as of the date of this presentation. We use words such as “anticipate,” “expect,” “intend,” “plan,” “believe,” “seek,” “estimate,” and variations of these words and similar expressions to identify forward-looking statements. Forward-looking statements are subject to various risks and uncertainties that could cause actual results to vary from our forward-looking statements, including: changes in our industry, interest rates, the debt securities markets, real estate markets or the general economy; increased rates of default and/or decreased recovery rates on our investments; the performance and financial condition of our borrowers; the cost and availability of our financings, which depends in part on our asset quality, the nature of our relationships with our lenders and other capital providers, our business prospects and outlook and general market conditions; the availability and attractiveness of terms of additional debt repurchases; availability, terms and deployment of short-term and long-term capital; availability of, and ability to retain, qualified personnel; changes in our business strategy; availability of investment opportunities in commercial real estate-related and commercial finance assets; the resolution of our non-performing and sub-performing assets; our ability to comply with financial covenants in our debt instruments; the degree and nature of our competition; the adequacy of our cash reserves and working capital; the timing of cash flows, if any, from our investments; unanticipated increases in financial and other costs, including a rise in interest rates; our ability to maintain compliance with over-collateralization and interest coverage tests in our CDOs and/or CLOs; our dependence on our Manager and ability to find a suitable replacement in a timely manner, or at all, if we or our Manager were to terminate the management agreement; environmental and/or safety requirements; our ability to satisfy complex rules in order for us to qualify as a REIT, for federal income tax purposes and qualify for our exemption under the Investment Company Act of 1940, as amended, and our ability and the ability of our subsidiaries to operate effectively within the limitations imposed by these rules; legislative and regulatory changes (including changes to laws governing the taxation of REITs or the exemptions from registration as an investment company); and other factors discussed under Item IA. Risk Factors of our Annual Report on Form 10-K for the year ended December 31, 2014 and those factors that may be contained in any subsequent filing we make with the Securities Exchange Commission. We undertake no obligation to publicly update or revise any forward-looking statements, whether as a result of new information, future events or otherwise, except as required by law. In light of these risks and uncertainties, the forward-looking events and circumstances discussed in this presentation might not occur and actual results, performance or achievement could differ materially from that anticipated or implied in the forward-looking statements.

2 Business Overview (1) As of March 31, 2015 (2) Declared for the quarter ended and shareholders of record as of March 31, 2015 Exchange / Ticker NYSE: "RSO" Business Structure REIT Total Market Capitalization (1) $609 million Investment Portfolio (1) $2.9 billion Dividend paid (2) $0.16/share

RSO is a REIT primarily focused on originating, underwriting and investing in transitional commercial real estate mortgage loans Approximately $2.9 billion in assets as of March 31, 2015 Provides customized financing solutions throughout the US to commercial real estate borrowers in multi-family, office, retail, hotel and other property classes Well established and seasoned direct origination platform RSO has originated over $3 billion of real estate loans since inception, which includes the 2008-2010 period when only $39 million was originated across three loans Floating-rate assets (LIBOR based) provide protection against rising interest rates Committed and experienced sponsor and management team Approximately 5.3% ownership by management team and affiliates Assets are predominantly term-funded RSO had $138.2 million of unrestricted cash as of April 30, 2015 Resource Capital Corp. Overview 3
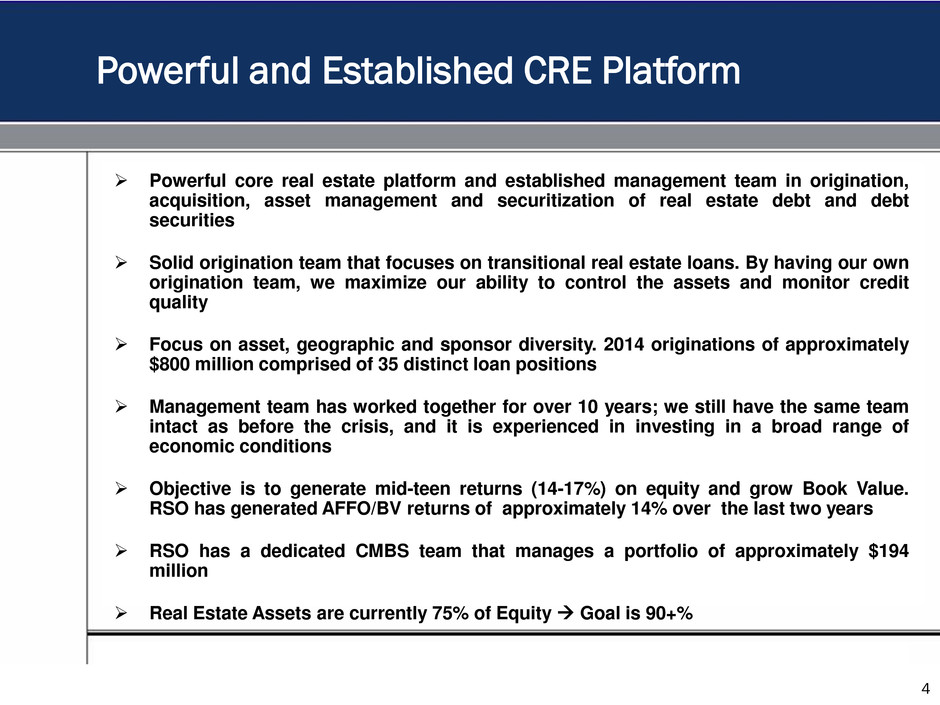
4 Powerful and Established CRE Platform Powerful core real estate platform and established management team in origination, acquisition, asset management and securitization of real estate debt and debt securities Solid origination team that focuses on transitional real estate loans. By having our own origination team, we maximize our ability to control the assets and monitor credit quality Focus on asset, geographic and sponsor diversity. 2014 originations of approximately $800 million comprised of 35 distinct loan positions Management team has worked together for over 10 years; we still have the same team intact as before the crisis, and it is experienced in investing in a broad range of economic conditions Objective is to generate mid-teen returns (14-17%) on equity and grow Book Value. RSO has generated AFFO/BV returns of approximately 14% over the last two years RSO has a dedicated CMBS team that manages a portfolio of approximately $194 million Real Estate Assets are currently 75% of Equity Goal is 90+%

Return on Equity in CRE Loans Illustrative Example of a $22.1 Million Loan Notes: * Loan terms are based on the weighted average loan terms of the two most recent securitizations * Cost of financing is based on the weighted average costs of the two most recent securitizations and are fully loaded to include all deal expenses * LIBOR is assumed to be 0.185% * Fees are collected on the entire loan amount, in this case $22.1 million. Typical loan size ranges from $7-$50 million. 5 Terms of Loan Loan Amount $22,100,000 Coupon 5.33% Financing 75.00% Cost of Financing 1.77% Origination Fee 1.00% Exit Fee 0.50% Typical Loan Term 3 years ROE Calculation Balance Rate Total Loan $22,100,000 5.33% $1,177,930 Financing at 75% 16,575,000 1.77% 294,149 RSO Return $883,781 RSO Equity 5,525,000 RSO Return On Equity (Exclusive of Fees) 16.00% Amortized Origination Fee $22,100,000 0.33% $73,667 RSO Return 957,448 RSO Equity 5,525,000 RSO Return On Equity (Inclusive of Origination Fee) 17.33% Exit Fee $22,100,000 0.50% $110,500

Real Estate Loan Originations By Year 6 * Projected M il lio n s $0 $100 $200 $300 $400 $500 $600 $700 $800 $900 2010 2011 2012 2013 2014 2015* CAGR= 164%

Multifamily 46.6% Office 17.3% Hotel 16.7% Retail 13.9% Other 5.5% CRE Loan Portfolio Details 7 * As of 3/31/2015 Substantial portfolio diversification supports our strong credit performance Total CRE Loan Portfolio by Property Type Total = $1,454 million Total CRE Loan Portfolio by Loan Type Whole loans 94.3% B notes 1.1% 0% Mezzanine loans 4.6%

8 The term financing facilities are being utilized as we aggregate collateral and make plans to access the securitized financing markets to optimally match fund our assets Loans are currently financed on a $400 million term financing facility with Wells Fargo Bank and a $200 million term financing facility with Deutsche Bank Returned back to the securitization market to match fund its assets with no recourse in December 2013 with RSO 2013-CRE1 Issued RSO 2014-CRE2 in July 2014 Issued RSO 2015-CRE3 in February 2015 RSO has financed approximately $1.1 billion of commercial real estate loans and issued $778 million of highly-rated senior notes to a wide array of outside investors Securitization also increases the Company’s ability to efficiently lever the portfolio Securitization frees up capacity on the term financing facilities allowing us to continue to expand our loan originations CRE Loan Financing
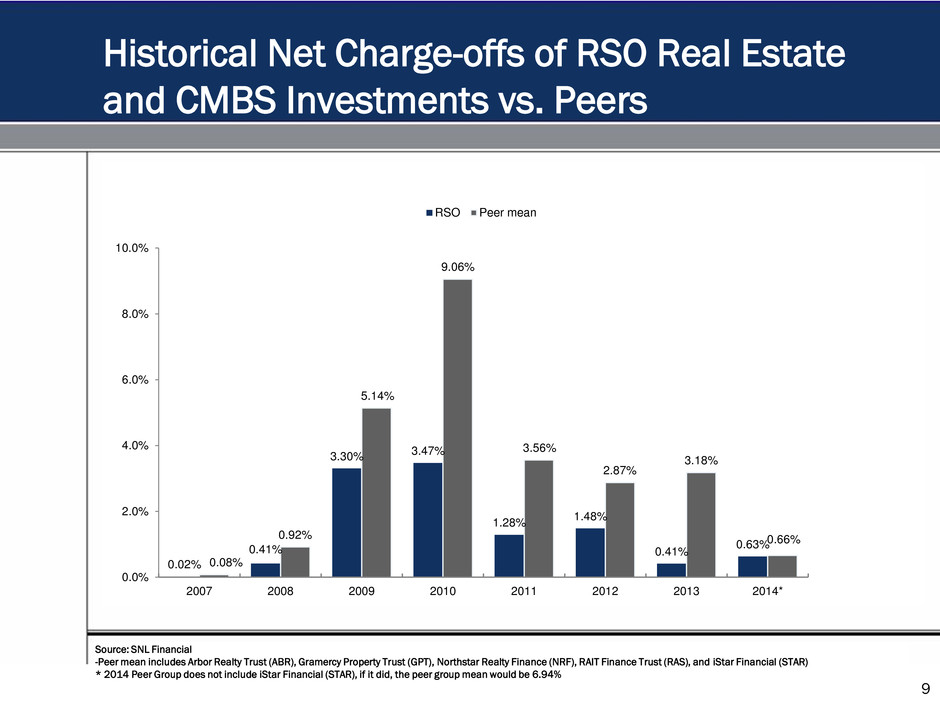
Historical Net Charge-offs of RSO Real Estate and CMBS Investments vs. Peers 0.02% 0.41% 3.30% 3.47% 1.28% 1.48% 0.41% 0.63% 0.08% 0.92% 5.14% 9.06% 3.56% 2.87% 3.18% 0.66% 0.0% 2.0% 4.0% 6.0% 8.0% 10.0% 2007 2008 2009 2010 2011 2012 2013 2014* RSO Peer mean Source: SNL Financial -Peer mean includes Arbor Realty Trust (ABR), Gramercy Property Trust (GPT), Northstar Realty Finance (NRF), RAIT Finance Trust (RAS), and iStar Financial (STAR) * 2014 Peer Group does not include iStar Financial (STAR), if it did, the peer group mean would be 6.94% 9
Leveraged/Middle Market Loans & Commercial Finance 10
Middle Market Loans - Northport Capital 11 Northport Capital (“Northport”) is a commercial lending platform specializing in middle market and lower middle market US companies Managed by an experienced middle market investment team − The team includes 7 investment professionals primarily engaged in Northport, with additional shared resources available to complement this team as needed. The 4 senior team members have over 50 years of combined direct middle market lending experience − The Investment Committee members have over 70 years of combined corporate credit experience It has a direct origination platform, leveraging strong relationships with financial sponsors, corporate management teams, advisory firms, lenders and other financial intermediaries Disciplined origination and underwriting process with 10% of potential transactions resulting in deals − The initial underwriting criteria review and stress test cash flows, capitalization, collateral position, financing, operations, legal, and execution risk, amongst other criteria Northport’s conservative standards are also reflected in the portfolio management procedures which are employed pre- and post-deal closing Target portfolio mix − 25% broadly syndicated, 75% direct origination − 50% 1st lien loans, 50% 2nd lien loans Key metrics of current portfolio − 22% broadly syndicated, 17% club syndicated, 61% direct origination − 60% 1st lien loans, 40% 2nd lien loans − 82% sponsor-backed companies
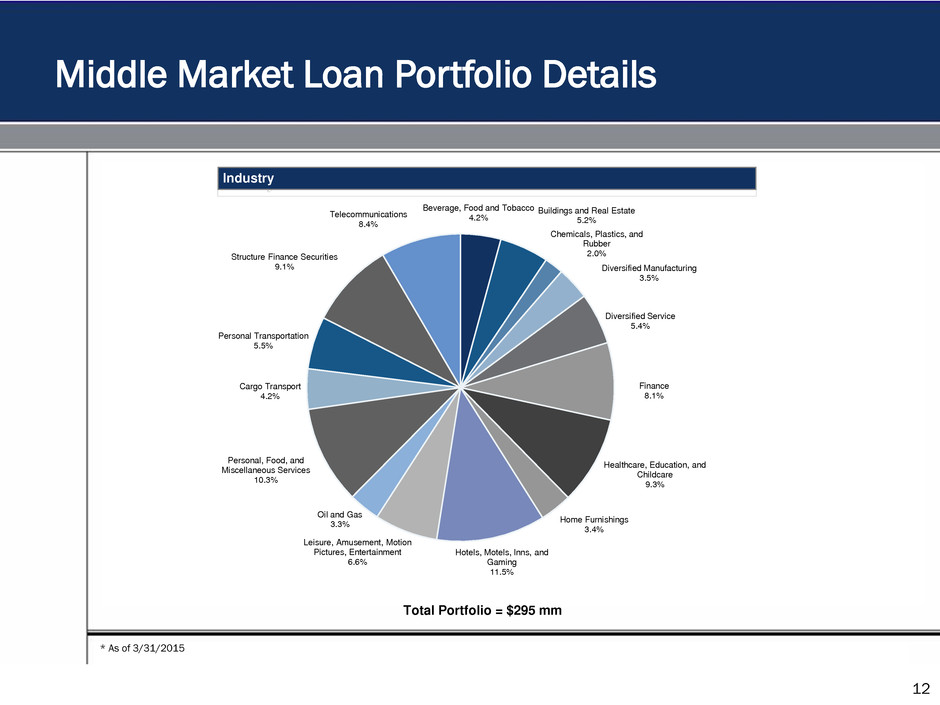
Middle Market Loan Portfolio Details 12 Industry Total Portfolio = $295 mm Beverage, Food and Tobacco 4.2% Buildings and Real Estate 5.2% Chemicals, Plastics, and Rubber 2.0% Diversified Manufacturing 3.5% Diversified Service 5.4% Finance 8.1% Healthcare, Education, and Childcare 9.3% Home Furnishings 3.4% Hotels, Motels, Inns, and Gaming 11.5% Leisure, Amusement, Motion Pictures, Entertainment 6.6% Oil and Gas 3.3% Personal, Food, and Miscellaneous Services 10.3% Cargo Transport 4.2% Personal Transportation 5.5% Structure Finance Securities 9.1% Telecommunications 8.4% * As of 3/31/2015

Company Summary 13
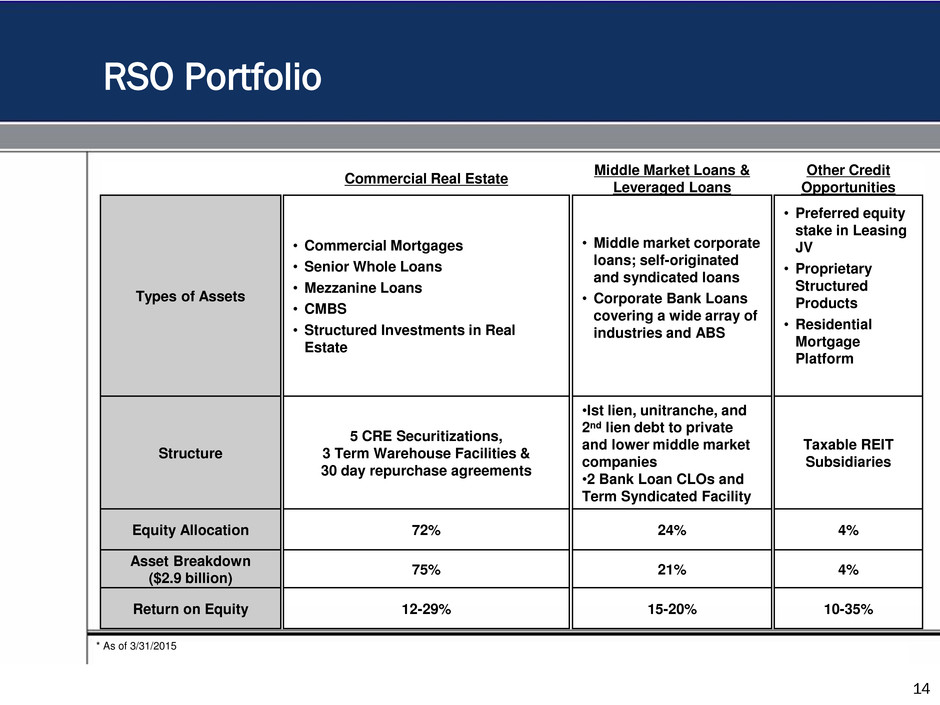
RSO Portfolio Commercial Real Estate Middle Market Loans & Leveraged Loans Other Credit Opportunities Types of Assets • Commercial Mortgages • Senior Whole Loans • Mezzanine Loans • CMBS • Structured Investments in Real Estate • Middle market corporate loans; self-originated and syndicated loans • Corporate Bank Loans covering a wide array of industries and ABS • Preferred equity stake in Leasing JV • Proprietary Structured Products • Residential Mortgage Platform Structure 5 CRE Securitizations, 3 Term Warehouse Facilities & 30 day repurchase agreements •Ist lien, unitranche, and 2nd lien debt to private and lower middle market companies •2 Bank Loan CLOs and Term Syndicated Facility Taxable REIT Subsidiaries Equity Allocation 72% 24% 4% Asset Breakdown ($2.9 billion) 75% 21% 4% Return on Equity 12-29% 15-20% 10-35% 14 * As of 3/31/2015

15 Clean Balance Sheet Leverage Since 2008 Securitization Compliance All RSO structured finance vehicles continue to pay all classes according to their terms Compliant with OC and IC tests as of 3/31/15 and have never failed either test since inception RSO voluntarily reports over and above CREFC standards and publishes full asset updates on all of the properties financed through its CLOs 9.1x 6.7x 4.5x 4.2x 2.9x 1.7x 1.8x 2.1x 0.0x 1.0x 2.0x 3.0x 4.0x 5.0x 6.0x 7.0x 8.0x 9.0x 10.0x Q4'08 Q4'09 Q4'10 Q4'11 Q4'12 Q4'13 Q4'14 Q1'15 D e b t / E q u it y

RSO Objectives 16 Goal of at least 90% equity invested in Real Estate – currently 74% Optimize business units for maximum regulatory and tax efficiency Address market perceptions of diversity of business units Narrow the gap between AFFO and Net Income Increase Net Interest Income

Maintain a strong cash dividend and ROE, and have paid $11.28 in dividends since inception in March 2005 Powerful core platforms and established management teams in real estate lending and broadly syndicated corporate loans Pristine Balance Sheet with leverage at 2.1x Floating-rate assets (LIBOR based) provide protection against rising interest rates Superior Executions on Real Estate Securitizations in December 2013, July 2014 and February 2015 that financed approximately $1.1 billion of CRE loans with ROE in the mid-teens RSO Highlights 17


