May 2019 Investor Presentation Exhibit 99.1
This presentation contains forward-looking statements within the meaning of federal securities laws. These forward-looking statements are not historical facts but rather are based on our current beliefs, assumptions and expectations. These beliefs, assumptions and expectations can change as a result of many possible events or factors, not all of which are known to us or are within our control. If a change occurs, our business, financial condition, liquidity and results of operations may vary materially from those expressed in our forward-looking statements. You should not place undue reliance on these forward-looking statements, which reflect our view only as of the date of this presentation. We use words such as “anticipate,” “expect,” “intend,” “plan,” “believe,” “seek,” “estimate,” “target,” and variations of these words and similar expressions to identify forward-looking statements. Forward-looking statements are subject to various risks and uncertainties that could cause actual results to vary from our forward-looking statements, including, but not limited to: Forward Looking Statements and Other Disclosures i changes in our industry, interest rates, the debt securities markets, real estate markets or the general economy; increased rates of default and/or decreased recovery rates on our investments; the performance and financial condition of our borrowers; the cost and availability of our financings, which depend in part on our asset quality, the nature of our relationships with our lenders and other capital providers, our business prospects and outlook and general market conditions; the availability and attractiveness of terms of additional debt repurchases; availability, terms and deployment of short-term and long-term capital; availability of, and ability to retain, qualified personnel; changes in our business strategy; availability of investment opportunities in commercial real estate-related and commercial finance assets; the degree and nature of our competition; the resolution of our non-performing and sub-performing assets; our ability to comply with financial covenants in our debt instruments; the adequacy of our cash reserves and working capital; We undertake no obligation, and specifically disclaim any obligation, to publicly update or revise any forward-looking statements, whether as a result of new information, future events or otherwise, except as required by law. In light of these risks and uncertainties, the forward-looking events and circumstances discussed in this presentation might not occur and actual results, performance or achievement could differ materially from those anticipated or implied in the forward-looking statements. the timing of cash flows, if any, from our investments; unanticipated increases in financial and other costs, including a rise in interest rates; our ability to maintain compliance with over-collateralization and interest coverage tests in our CDOs and/or CLOs; our dependence on Exantas Capital Manager Inc., our “Manager”, and ability to find a suitable replacement in a timely manner, or at all, if we or our Manager were to terminate the management agreement; environmental and/or safety requirements; our ability to satisfy complex rules in order for us to qualify as a REIT, for federal income tax purposes and qualify for our exemption under the Investment Company Act of 1940, as amended, and our ability and the ability of our subsidiaries to operate effectively within the limitations imposed by these rules; legislative and regulatory changes (including changes to laws governing the taxation of REITs or the exemptions from registration as an investment company); and other factors discussed under Item IA. Risk Factors in our Annual Report on Form 10-K for the year ended December 31, 2018 and those factors that may be contained in any subsequent filing we make with the Securities and Exchange Commission.
Past performance is not indicative of future results. There is no guarantee that any investment strategy referenced herein will work under all market conditions. Prior to making any investment decision, you should evaluate your ability to invest for the long-term, especially during periods of downturns in the market. You alone assume the responsibility of evaluating the merits and risks associated with any potential investment or investment strategy referenced herein. This presentation contains information regarding financial results that is calculated and presented on the basis of methodologies other than in accordance with accounting principles generally accepted in the United States (“GAAP”), which management believes is relevant to assessing Exantas Capital Corp.’s (“Exantas’s,” “XAN’s” or the “Company’s”) financial performance. Please refer to page 30 for the reconciliation of Net Income (Loss) to Core Earnings. Unless otherwise indicated, information included in this presentation is as of or for the period ended March 31, 2019. Core Earnings Core Earnings is a non-GAAP financial measure that we use to evaluate our operating performance. Core Earnings exclude the effects of certain transactions and GAAP adjustments that we believe are not necessarily indicative of our current commercial real estate (“CRE”) loan portfolio and other CRE-related investments and operations. Core Earnings exclude income (loss) from all non-core assets such as commercial finance, middle market lending, residential mortgage lending, certain legacy CRE loans and other non-CRE assets designated as assets held for sale at the initial measurement date of December 31, 2016. Core Earnings, for reporting purposes, is defined as GAAP net income (loss) allocable to common shares, excluding (i) non-cash equity compensation expense, (ii) unrealized gains and losses, (iii) non-cash provisions for loan losses, (iv) non-cash impairments on securities, (v) non-cash amortization of discounts or premiums associated with borrowings, (vi) net income or loss from a limited partnership interest owned at the initial measurement date, (vii) net income or loss from non-core assets, (viii) real estate depreciation and amortization, (ix) foreign currency gains or losses and (x) income or loss from discontinued operations. Core Earnings may also be adjusted periodically to exclude certain one-time events pursuant to changes in GAAP and certain non-cash items. Although pursuant to the Third Amended and Restated Management Agreement we calculate incentive compensation using Core Earnings excluding incentive fees payable to the Manager, we include incentive fees payable to the Manager in Core Earnings for reporting purposes. Core Earnings allocable to common shares, adjusted (“Core Earnings Adjusted”) is a non-GAAP financial measure used to evaluate our operating performance. Core Earnings Adjusted exclude certain non-recurring items and the results of certain transactions that are not indicative of our ongoing operating performance. Core Earnings and Core Earnings Adjusted do not represent net income or cash generated from operating activities and should not be considered as alternatives to GAAP net income or as measures of liquidity under GAAP. The methodology for calculating Core Earnings and Core Earnings Adjusted may differ from methodologies used by other companies to calculate similar supplemental performance measures, and, accordingly, our reported Core Earnings and Core Earnings Adjusted may not be comparable to similar performance measures used by other companies. No Offer or Sale of Securities This presentation is for informational purposes only and does not constitute an offer to sell or the solicitation of any offer to buy any securities of XAN or any other entity. Any offering of securities would be made pursuant to separate documentation and any such securities would not be offered or sold in the United States absent registration or an applicable exemption from registration requirements. Hypothetical Performance Hypothetical performance results presented herein are for illustrative purposes only and should not be interpreted as an indication of future performance. Hypothetical performance results have many inherent limitations, some of which, but not all, are described herein. No representation is being made that any fund or account will or is likely to achieve profits or losses similar to those shown herein. In fact, there are frequently sharp differences between hypothetical performance results and the actual results subsequently realized by any particular investment program. One of the limitations of hypothetical performance results is that they are generally prepared with the benefit of hindsight. In addition, hypothetical investing does not involve financial risk, and no hypothetical track record can completely account for the impact of financial risk in investing. For example, the ability to withstand losses or adhere to a particular investment program in spite of losses are material points that can adversely affect actual investment results. The hypothetical performance results contained herein represent the application of the models as currently in effect, and there can be no assurance that the models or portfolio constituents will remain the same in the future or that an application of the current models in the future will produce similar results because the relevant market and economic conditions that prevailed during the hypothetical performance period will not necessarily recur. There are numerous other factors related to the markets in general or to the implementation of any specific investment program that cannot be fully accounted for in the preparation of hypothetical performance results, all of which can adversely affect actual investment results. Historical data and analysis should not be taken as an indication or guarantee of any future performance. Forward Looking Statements and Other Disclosures ii
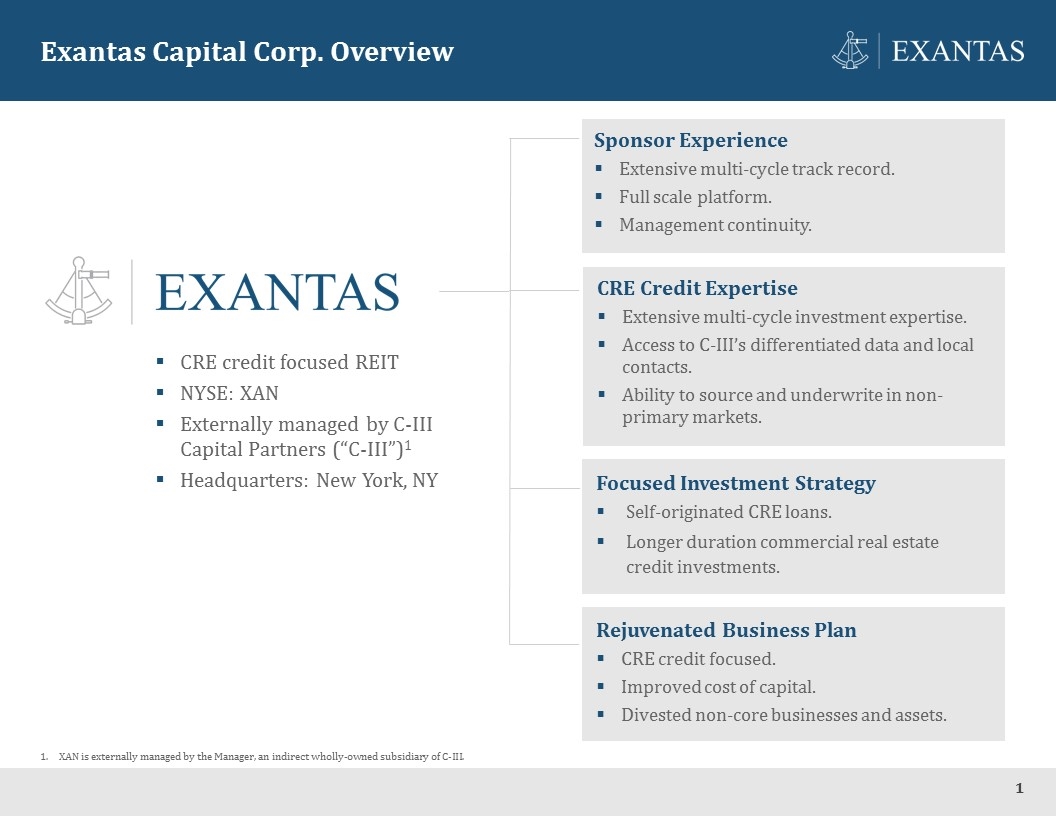
Exantas Capital Corp. Overview 1 CRE Credit Expertise Extensive multi-cycle investment expertise. Access to C-III’s differentiated data and local contacts. Ability to source and underwrite in non-primary markets. Sponsor Experience Extensive multi-cycle track record. Full scale platform. Management continuity. Focused Investment Strategy Self-originated CRE loans. Longer duration commercial real estate credit investments. CRE credit focused REIT NYSE: XAN Externally managed by C-III Capital Partners (“C-III”)1 Headquarters: New York, NY Rejuvenated Business Plan CRE credit focused. Improved cost of capital. Divested non-core businesses and assets. XAN is externally managed by the Manager, an indirect wholly-owned subsidiary of C-III.
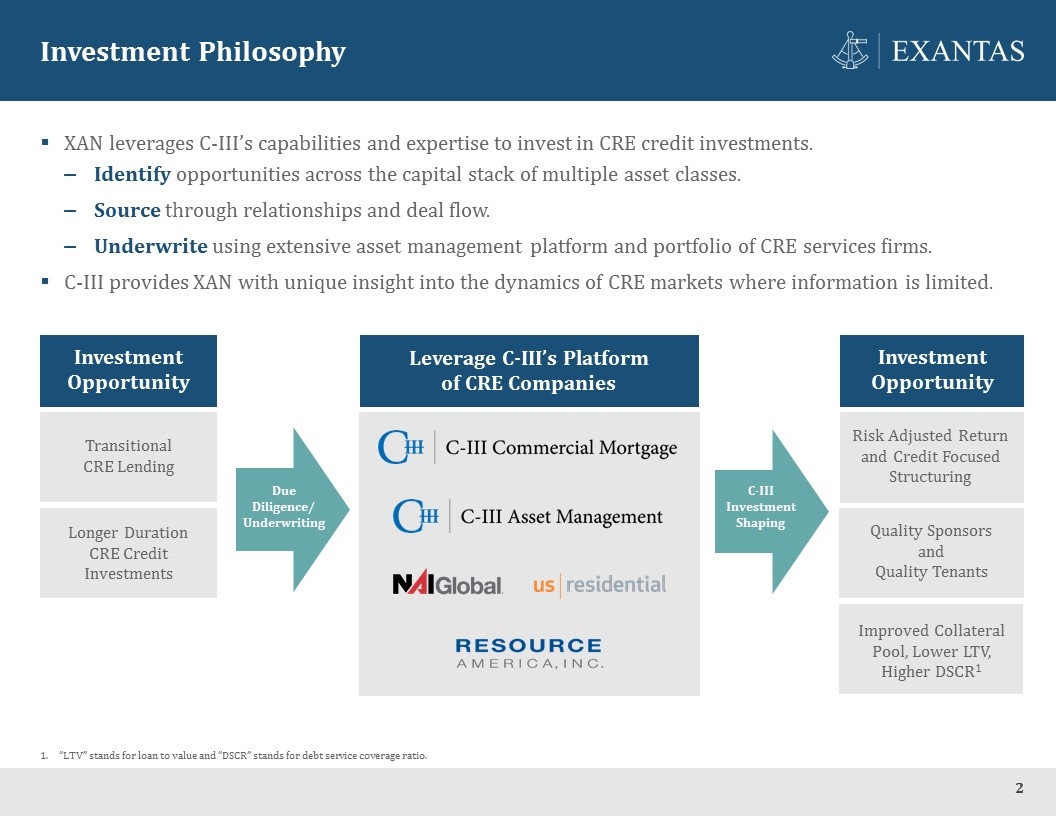
Investment Philosophy 2 XAN leverages C-III’s capabilities and expertise to invest in CRE credit investments. Identify opportunities across the capital stack of multiple asset classes. Source through relationships and deal flow. Underwrite using extensive asset management platform and portfolio of CRE services firms. C-III provides XAN with unique insight into the dynamics of CRE markets where information is limited. Investment Opportunity Resulting Investment Transitional CRE Lending Longer Duration CRE Credit Investments Risk Adjusted Return and Credit Focused Structuring Quality Sponsors and Quality Tenants Due Diligence/ Underwriting C-III Investment Shaping Improved Collateral Pool, Lower LTV, Higher DSCR1 “LTV” stands for loan to value and “DSCR” stands for debt service coverage ratio. Investment Opportunity Leverage C-III’s Platform of CRE Companies
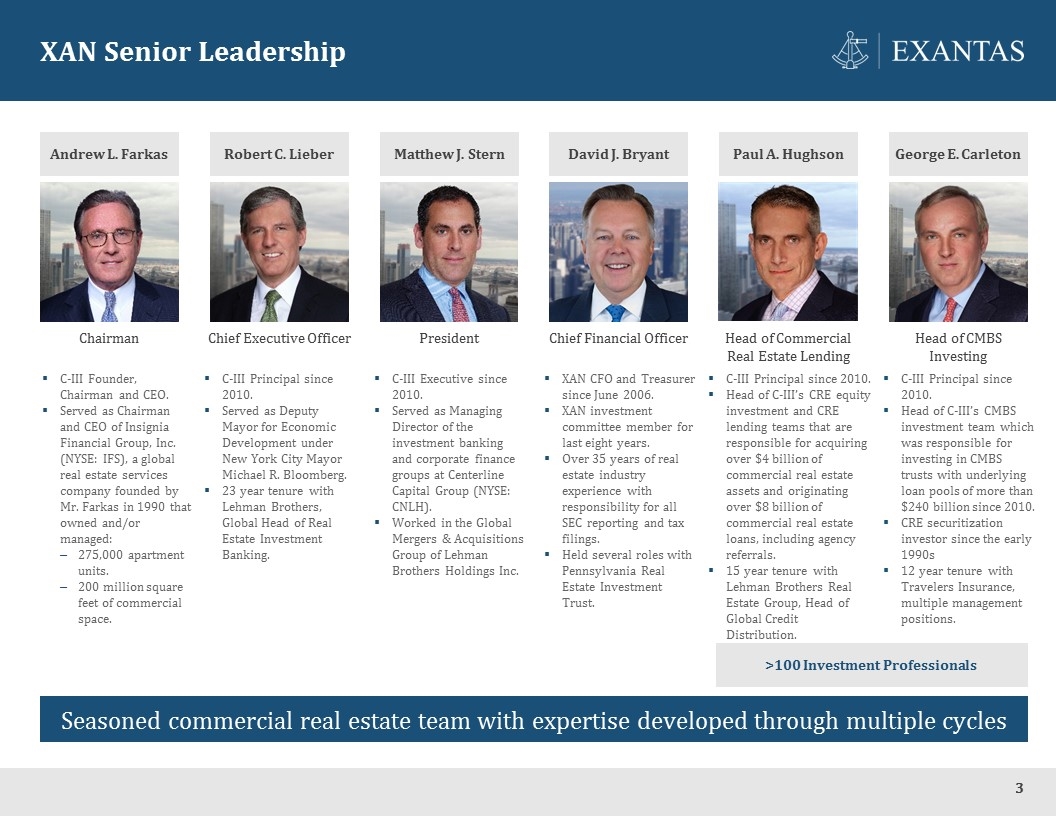
XAN Senior Leadership 3 Andrew L. Farkas Robert C. Lieber Matthew J. Stern David J. Bryant Paul A. Hughson George E. Carleton Chairman Chief Executive Officer President Chief Financial Officer Head of Commercial Real Estate Lending Head of CMBS Investing C-III Founder, Chairman and CEO. Served as Chairman and CEO of Insignia Financial Group, Inc. (NYSE: IFS), a global real estate services company founded by Mr. Farkas in 1990 that owned and/or managed: 275,000 apartment units. 200 million square feet of commercial space. C-III Principal since 2010. Served as Deputy Mayor for Economic Development under New York City Mayor Michael R. Bloomberg. 23 year tenure with Lehman Brothers, Global Head of Real Estate Investment Banking. C-III Executive since 2010. Served as Managing Director of the investment banking and corporate finance groups at Centerline Capital Group (NYSE: CNLH). Worked in the Global Mergers & Acquisitions Group of Lehman Brothers Holdings Inc. XAN CFO and Treasurer since June 2006. XAN investment committee member for last eight years. Over 35 years of real estate industry experience with responsibility for all SEC reporting and tax filings. Held several roles with Pennsylvania Real Estate Investment Trust. C-III Principal since 2010. Head of C-III’s CRE equity investment and CRE lending teams that are responsible for acquiring over $4 billion of commercial real estate assets and originating over $8 billion of commercial real estate loans, including agency referrals. 15 year tenure with Lehman Brothers Real Estate Group, Head of Global Credit Distribution. C-III Principal since 2010. Head of C-III’s CMBS investment team which was responsible for investing in CMBS trusts with underlying loan pools of more than $240 billion since 2010. CRE securitization investor since the early 1990s 12 year tenure with Travelers Insurance, multiple management positions. Seasoned commercial real estate team with expertise developed through multiple cycles >100 Investment Professionals
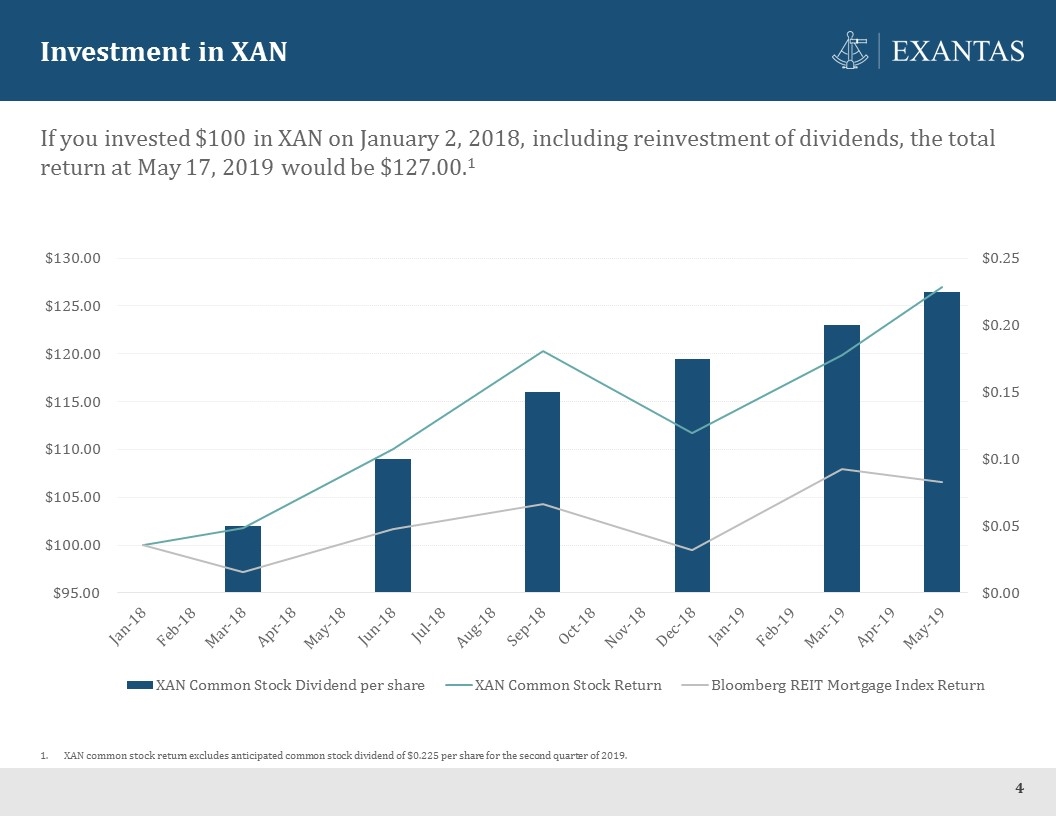
Investment in XAN 4 XAN common stock return excludes anticipated common stock dividend of $0.225 per share for the second quarter of 2019. If you invested $100 in XAN on January 2, 2018, including reinvestment of dividends, the total return at May 17, 2019 would be $127.00.1
Manager Overview 5
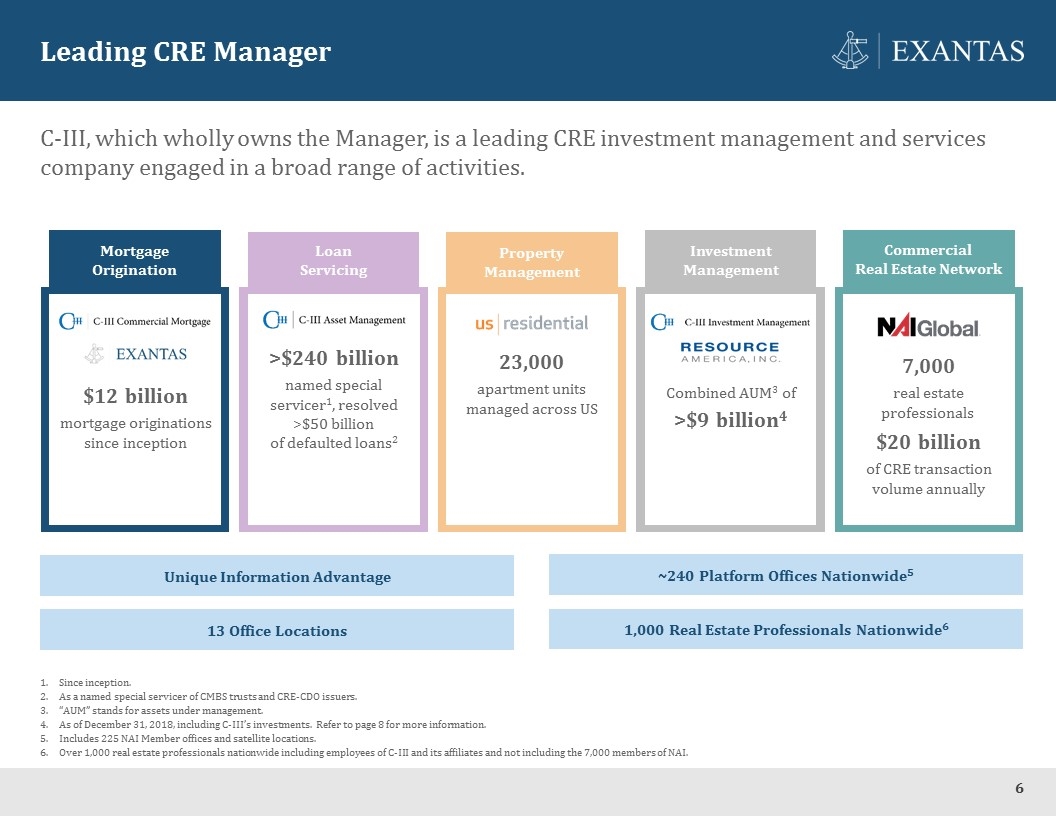
Property Management 23,000 apartment units managed across US Leading CRE Manager 6 Since inception. As a named special servicer of CMBS trusts and CRE-CDO issuers. “AUM” stands for assets under management. As of December 31, 2018, including C-III’s investments. Refer to page 8 for more information. Includes 225 NAI Member offices and satellite locations. Over 1,000 real estate professionals nationwide including employees of C-III and its affiliates and not including the 7,000 members of NAI. ~240 Platform Offices Nationwide5 13 Office Locations Unique Information Advantage 1,000 Real Estate Professionals Nationwide6 Commercial Real Estate Network 7,000 real estate professionals $20 billion of CRE transaction volume annually Investment Management Combined AUM3 of >$9 billion4 Loan Servicing >$240 billion named special servicer1, resolved >$50 billion of defaulted loans2 Mortgage Origination $12 billion mortgage originations since inception C-III, which wholly owns the Manager, is a leading CRE investment management and services company engaged in a broad range of activities.
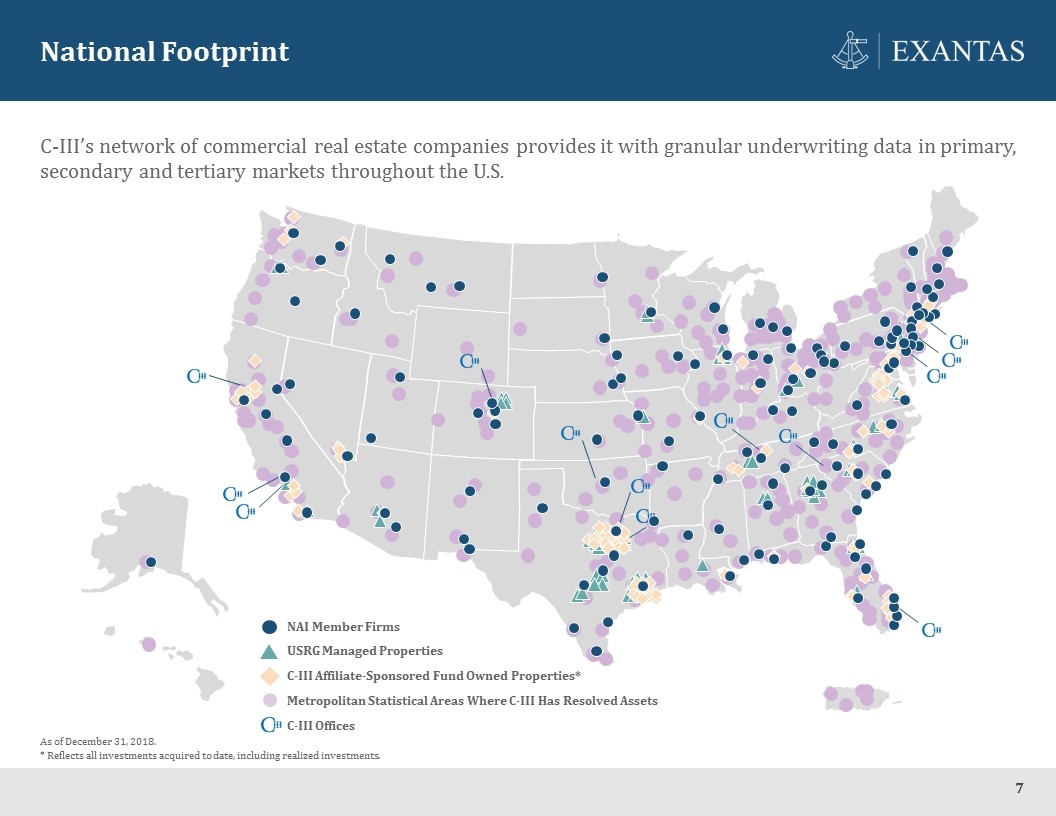
National Footprint 7 C-III’s network of commercial real estate companies provides it with granular underwriting data in primary, secondary and tertiary markets throughout the U.S. As of December 31, 2018. * Reflects all investments acquired to date, including realized investments. NAI Member Firms USRG Managed Properties Metropolitan Statistical Areas Where C-III Has Resolved Assets C-III Offices C-III Affiliate-Sponsored Fund Owned Properties*
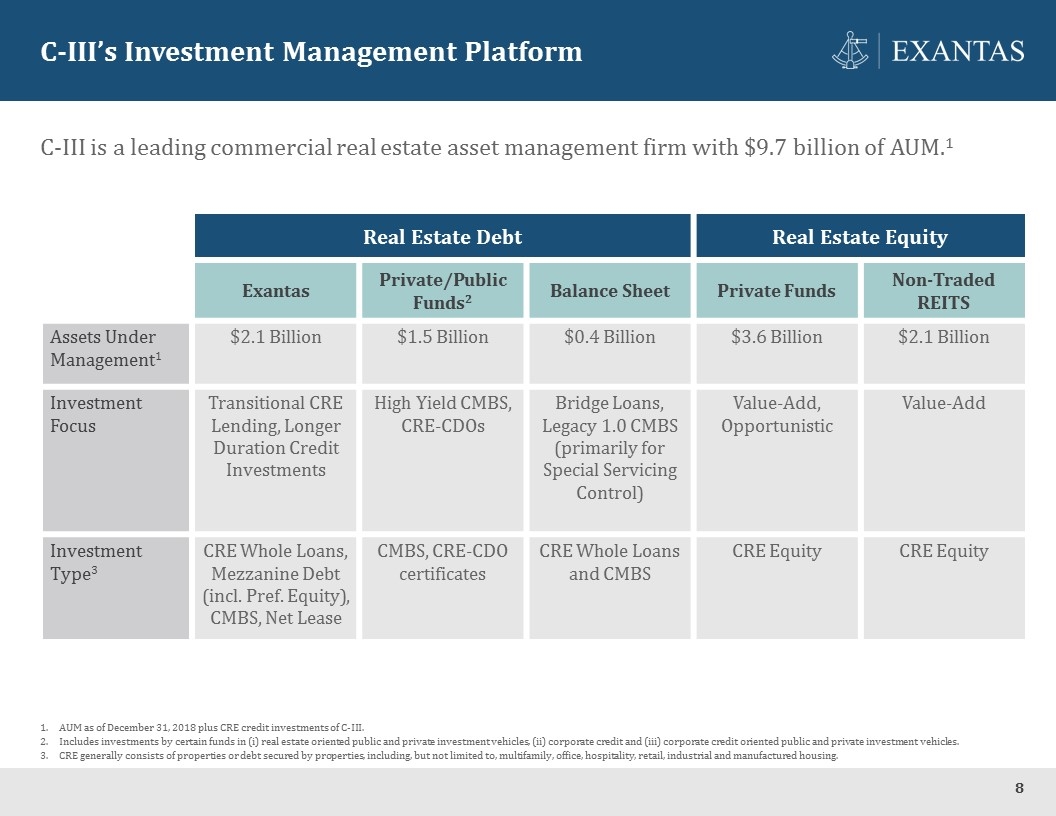
C-III’s Investment Management Platform 8 C-III is a leading commercial real estate asset management firm with $9.7 billion of AUM.1 Real Estate Debt Real Estate Equity Exantas Private/Public Funds2 Balance Sheet Private Funds Non-Traded REITS Assets Under Management1 $2.1 Billion $1.5 Billion $0.4 Billion $3.6 Billion $2.1 Billion Investment Focus Transitional CRE Lending, Longer Duration Credit Investments High Yield CMBS, CRE-CDOs Bridge Loans, Legacy 1.0 CMBS (primarily for Special Servicing Control) Value-Add, Opportunistic Value-Add Investment Type3 CRE Whole Loans, Mezzanine Debt (incl. Pref. Equity), CMBS, Net Lease CMBS, CRE-CDO certificates CRE Whole Loans and CMBS CRE Equity CRE Equity AUM as of December 31, 2018 plus CRE credit investments of C-III. Includes investments by certain funds in (i) real estate oriented public and private investment vehicles, (ii) corporate credit and (iii) corporate credit oriented public and private investment vehicles. CRE generally consists of properties or debt secured by properties, including, but not limited to, multifamily, office, hospitality, retail, industrial and manufactured housing.
Path Forward 9
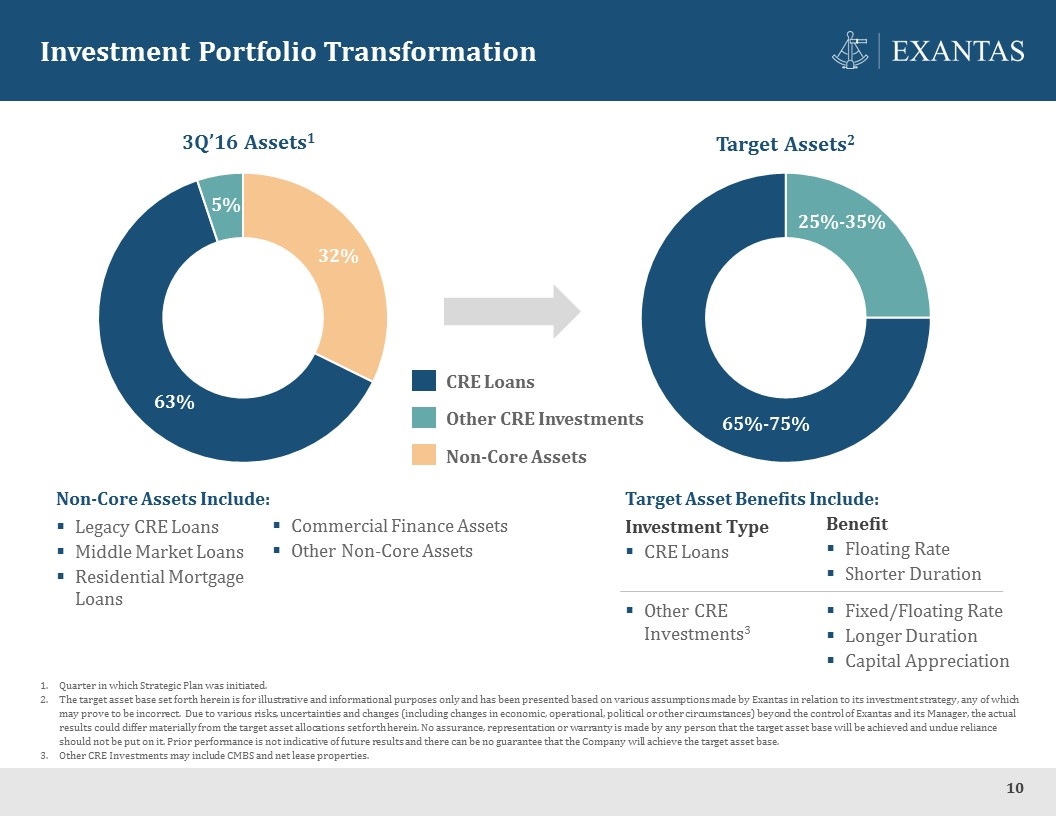
Investment Portfolio Transformation 10 Quarter in which Strategic Plan was initiated. The target asset base set forth herein is for illustrative and informational purposes only and has been presented based on various assumptions made by Exantas in relation to its investment strategy, any of which may prove to be incorrect. Due to various risks, uncertainties and changes (including changes in economic, operational, political or other circumstances) beyond the control of Exantas and its Manager, the actual results could differ materially from the target asset allocations set forth herein. No assurance, representation or warranty is made by any person that the target asset base will be achieved and undue reliance should not be put on it. Prior performance is not indicative of future results and there can be no guarantee that the Company will achieve the target asset base. Other CRE Investments may include CMBS and net lease properties. 3Q’16 Assets1 Target Assets2 65%-75% 25%-35% CRE Loans Other CRE Investments Non-Core Assets 32% 63% 5% Non-Core Assets Include: Legacy CRE Loans Middle Market Loans Residential Mortgage Loans Benefit Floating Rate Shorter Duration Target Asset Benefits Include: Investment Type CRE Loans Fixed/Floating Rate Longer Duration Capital Appreciation Other CRE Investments3 Commercial Finance Assets Other Non-Core Assets
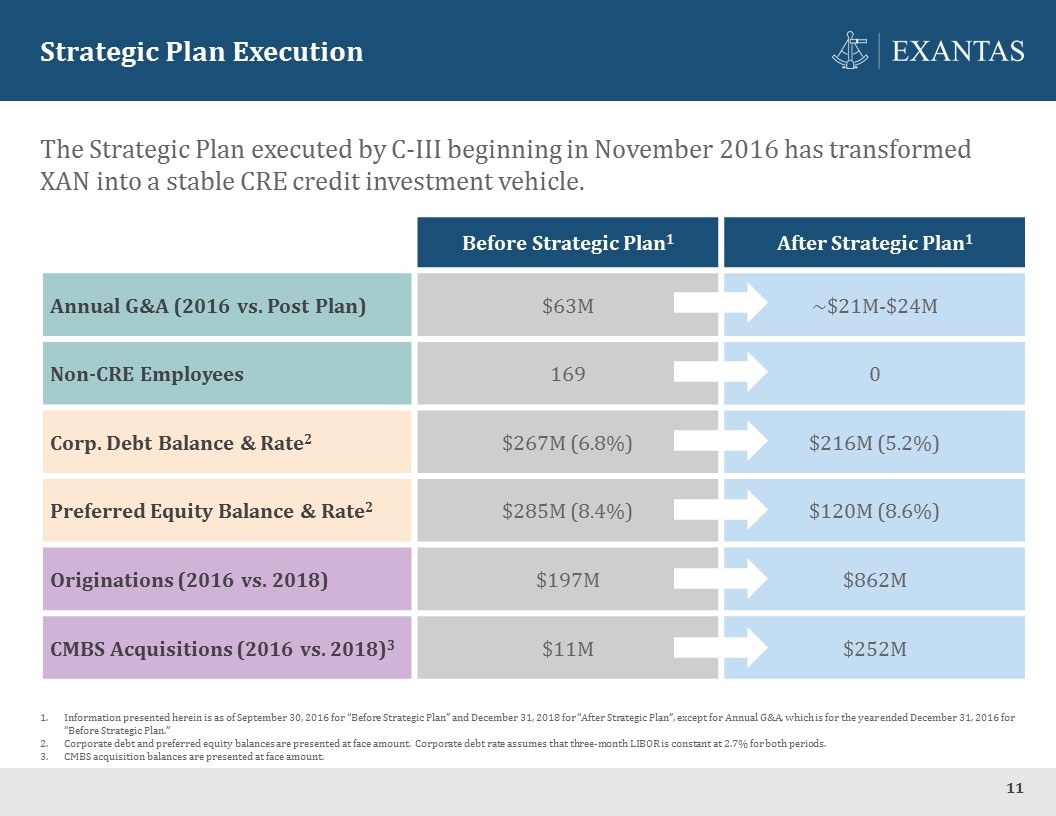
Strategic Plan Execution 11 The Strategic Plan executed by C-III beginning in November 2016 has transformed XAN into a stable CRE credit investment vehicle. Before Strategic Plan1 After Strategic Plan1 Annual G&A (2016 vs. Post Plan) $63M ~$21M-$24M Non-CRE Employees 169 0 Corp. Debt Balance & Rate2 $267M (6.8%) $216M (5.2%) Preferred Equity Balance & Rate2 $285M (8.4%) $120M (8.6%) Originations (2016 vs. 2018) $197M $862M CMBS Acquisitions (2016 vs. 2018)3 $11M $252M Information presented herein is as of September 30, 2016 for “Before Strategic Plan” and December 31, 2018 for “After Strategic Plan”, except for Annual G&A, which is for the year ended December 31, 2016 for “Before Strategic Plan.” Corporate debt and preferred equity balances are presented at face amount. Corporate debt rate assumes that three-month LIBOR is constant at 2.7% for both periods. CMBS acquisition balances are presented at face amount.
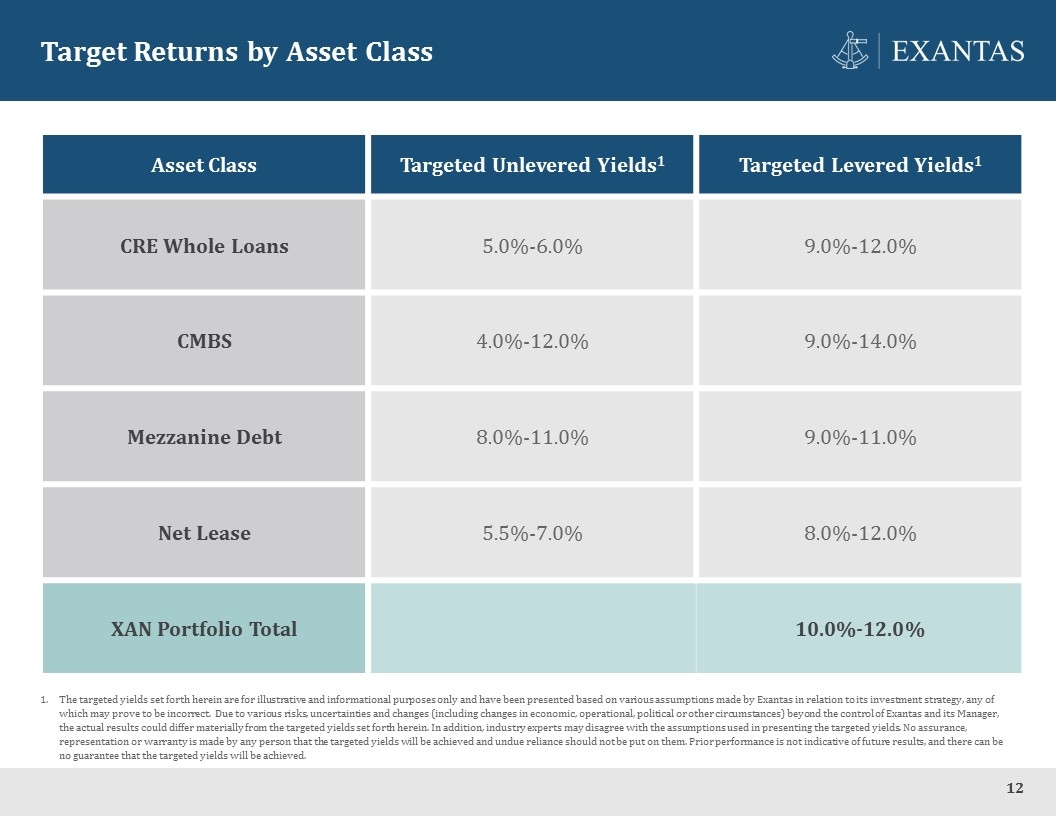
Target Returns by Asset Class 12 Asset Class Targeted Unlevered Yields1 Targeted Levered Yields1 CRE Whole Loans 5.0%-6.0% 9.0%-12.0% CMBS 4.0%-12.0% 9.0%-14.0% Mezzanine Debt 8.0%-11.0% 9.0%-11.0% Net Lease 5.5%-7.0% 8.0%-12.0% XAN Portfolio Total 10.0%-12.0% The targeted yields set forth herein are for illustrative and informational purposes only and have been presented based on various assumptions made by Exantas in relation to its investment strategy, any of which may prove to be incorrect. Due to various risks, uncertainties and changes (including changes in economic, operational, political or other circumstances) beyond the control of Exantas and its Manager, the actual results could differ materially from the targeted yields set forth herein. In addition, industry experts may disagree with the assumptions used in presenting the targeted yields. No assurance, representation or warranty is made by any person that the targeted yields will be achieved and undue reliance should not be put on them. Prior performance is not indicative of future results, and there can be no guarantee that the targeted yields will be achieved.
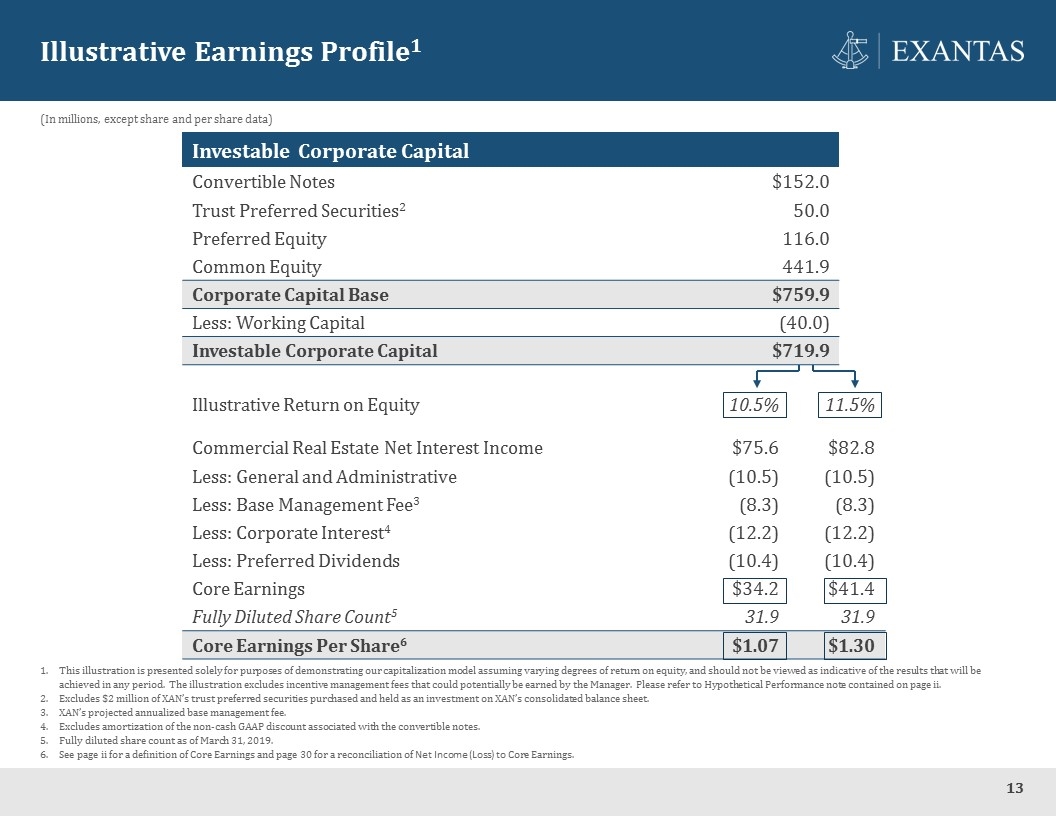
Illustrative Return on Equity 10.5% 11.5% Commercial Real Estate Net Interest Income $75.6 $82.8 Less: General and Administrative (10.5) (10.5) Less: Base Management Fee3 (8.3) (8.3) Less: Corporate Interest4 (12.2) (12.2) Less: Preferred Dividends (10.4) (10.4) Core Earnings $34.2 $41.4 Fully Diluted Share Count5 31.9 31.9 Core Earnings Per Share6 $1.07 $1.30 Illustrative Earnings Profile1 13 Investable Corporate Capital Convertible Notes $152.0 Trust Preferred Securities2 50.0 Preferred Equity 116.0 Common Equity 441.9 Corporate Capital Base $759.9 Less: Working Capital (40.0) Investable Corporate Capital $719.9 This illustration is presented solely for purposes of demonstrating our capitalization model assuming varying degrees of return on equity, and should not be viewed as indicative of the results that will be achieved in any period. The illustration excludes incentive management fees that could potentially be earned by the Manager. Please refer to Hypothetical Performance note contained on page ii. Excludes $2 million of XAN’s trust preferred securities purchased and held as an investment on XAN’s consolidated balance sheet. XAN’s projected annualized base management fee. Excludes amortization of the non-cash GAAP discount associated with the convertible notes. Fully diluted share count as of March 31, 2019. See page ii for a definition of Core Earnings and page 30 for a reconciliation of Net Income (Loss) to Core Earnings. (In millions, except share and per share data)
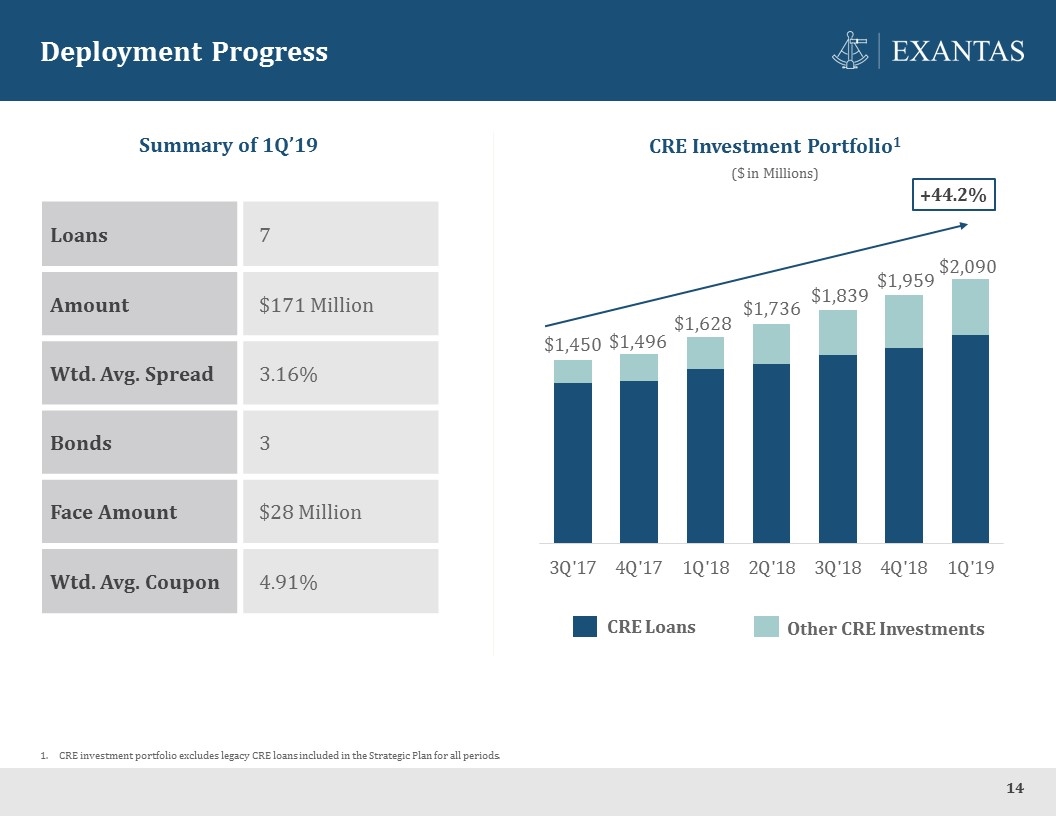
Deployment Progress 14 Summary of 1Q’19 CRE Investment Portfolio1 Loans 7 Amount $171 Million Wtd. Avg. Spread 3.16% Bonds 3 Face Amount $28 Million Wtd. Avg. Coupon 4.91% $1,450 $1,496 $1,736 $1,839 +44.2% ($ in Millions) CRE Loans Other CRE Investments CRE investment portfolio excludes legacy CRE loans included in the Strategic Plan for all periods.
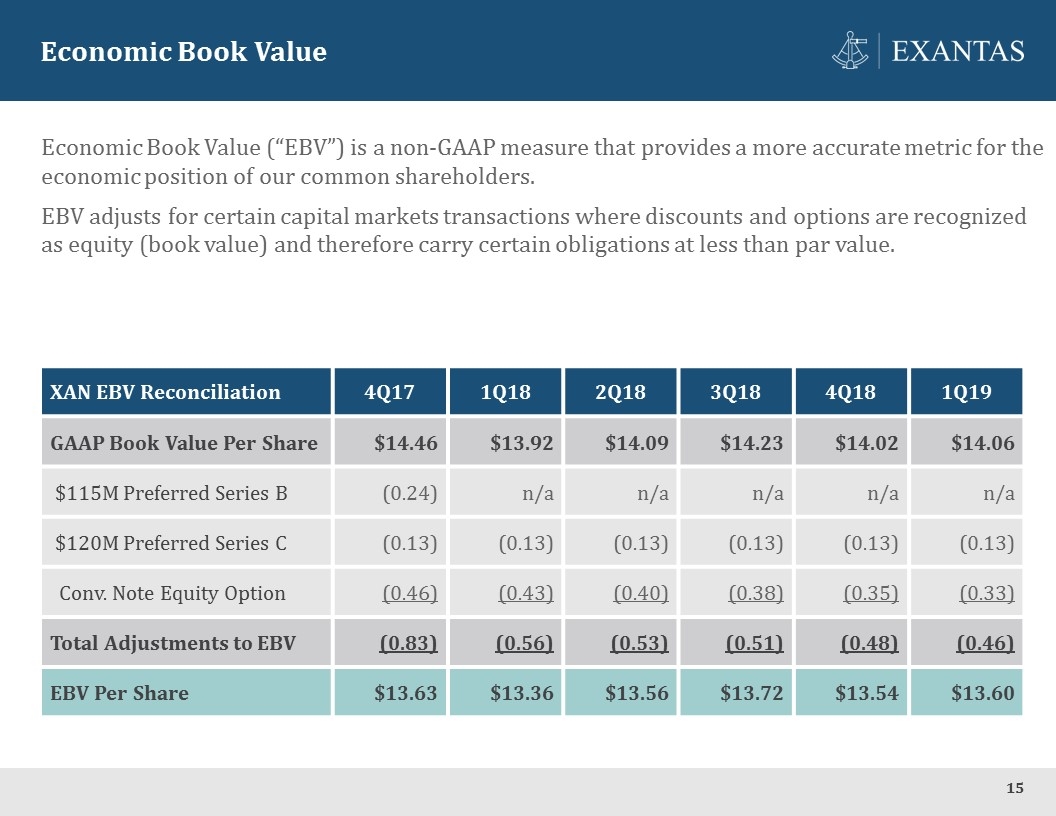
Economic Book Value 15 Economic Book Value (“EBV”) is a non-GAAP measure that provides a more accurate metric for the economic position of our common shareholders. EBV adjusts for certain capital markets transactions where discounts and options are recognized as equity (book value) and therefore carry certain obligations at less than par value. XAN EBV Reconciliation 4Q17 1Q18 2Q18 3Q18 4Q18 1Q19 GAAP Book Value Per Share $14.46 $13.92 $14.09 $14.23 $14.02 $14.06 $115M Preferred Series B (0.24) n/a n/a n/a n/a n/a $120M Preferred Series C (0.13) (0.13) (0.13) (0.13) (0.13) (0.13) Conv. Note Equity Option (0.46) (0.43) (0.40) (0.38) (0.35) (0.33) Total Adjustments to EBV (0.83) (0.56) (0.53) (0.51) (0.48) (0.46) EBV Per Share $13.63 $13.36 $13.56 $13.72 $13.54 $13.60
CRE Loan Origination 16
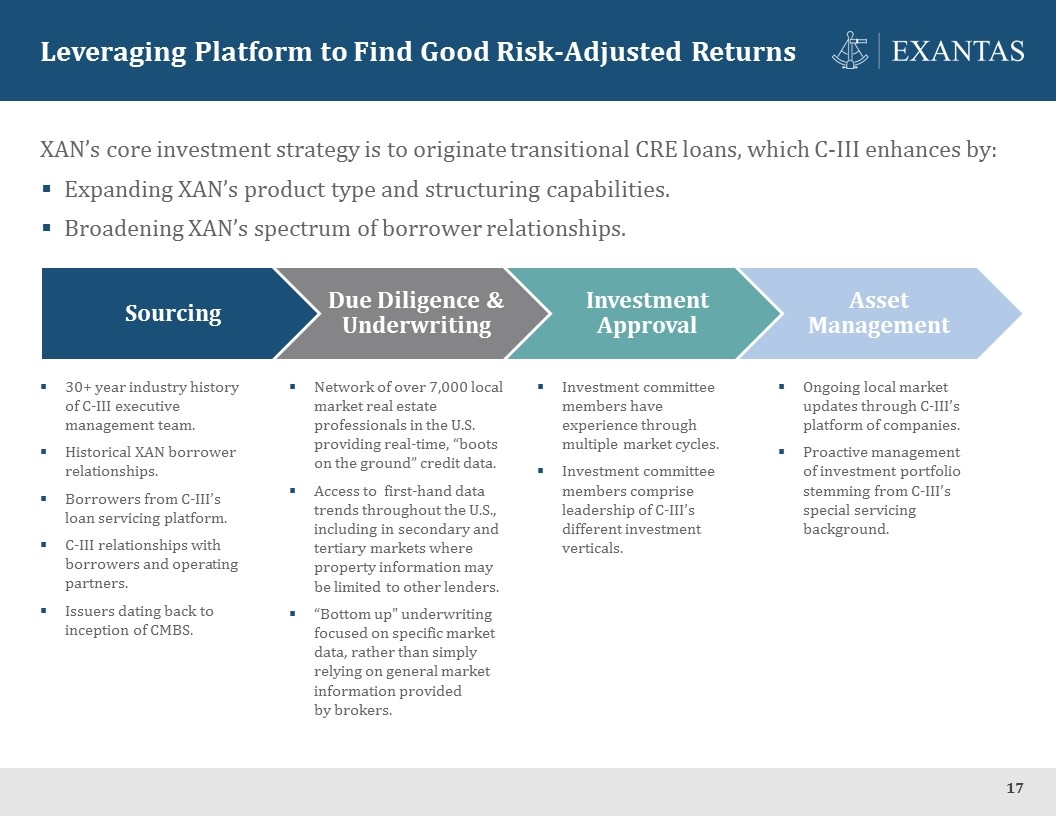
Leveraging Platform to Find Good Risk-Adjusted Returns 17 XAN’s core investment strategy is to originate transitional CRE loans, which C-III enhances by: Expanding XAN’s product type and structuring capabilities. Broadening XAN’s spectrum of borrower relationships. 30+ year industry history of C-III executive management team. Historical XAN borrower relationships. Borrowers from C-III’s loan servicing platform. C-III relationships with borrowers and operating partners. Issuers dating back to inception of CMBS. Network of over 7,000 local market real estate professionals in the U.S. providing real-time, “boots on the ground” credit data. Access to first-hand data trends throughout the U.S., including in secondary and tertiary markets where property information may be limited to other lenders. “Bottom up" underwriting focused on specific market data, rather than simply relying on general market information provided by brokers. Investment committee members have experience through multiple market cycles. Investment committee members comprise leadership of C-III’s different investment verticals. Ongoing local market updates through C-III’s platform of companies. Proactive management of investment portfolio stemming from C-III’s special servicing background. Sourcing Due Diligence & Underwriting Investment Approval Asset Management
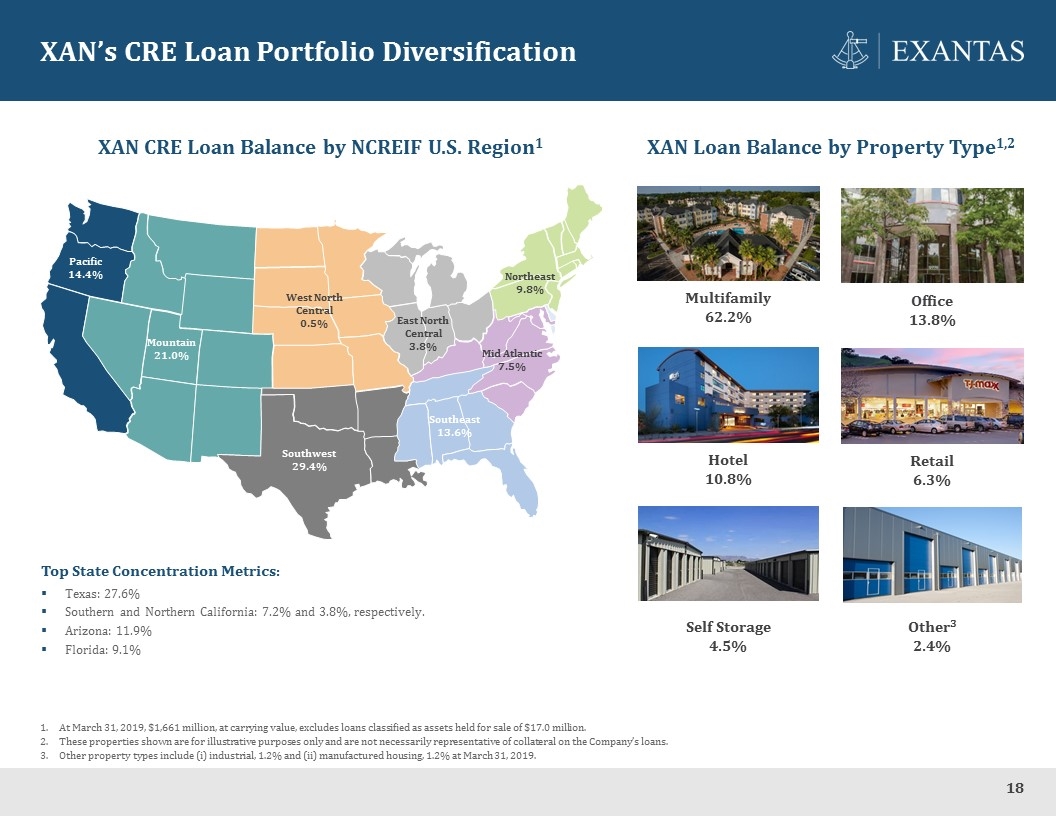
XAN’s CRE Loan Portfolio Diversification 18 XAN Loan Balance by Property Type1,2 XAN CRE Loan Balance by NCREIF U.S. Region1 Pacific 14.4% Mountain 21.0% West North Central 0.5% Southwest 29.4% Southeast 13.6% East North Central 3.8% Mid Atlantic 7.5% Northeast 9.8% Multifamily 62.2% Office 13.8% Top State Concentration Metrics: Texas: 27.6% Southern and Northern California: 7.2% and 3.8%, respectively. Arizona: 11.9% Florida: 9.1% Retail 6.3% Hotel 10.8% Self Storage 4.5% Other3 2.4% At March 31, 2019, $1,661 million, at carrying value, excludes loans classified as assets held for sale of $17.0 million. These properties shown are for illustrative purposes only and are not necessarily representative of collateral on the Company’s loans. Other property types include (i) industrial, 1.2% and (ii) manufactured housing, 1.2% at March 31, 2019.
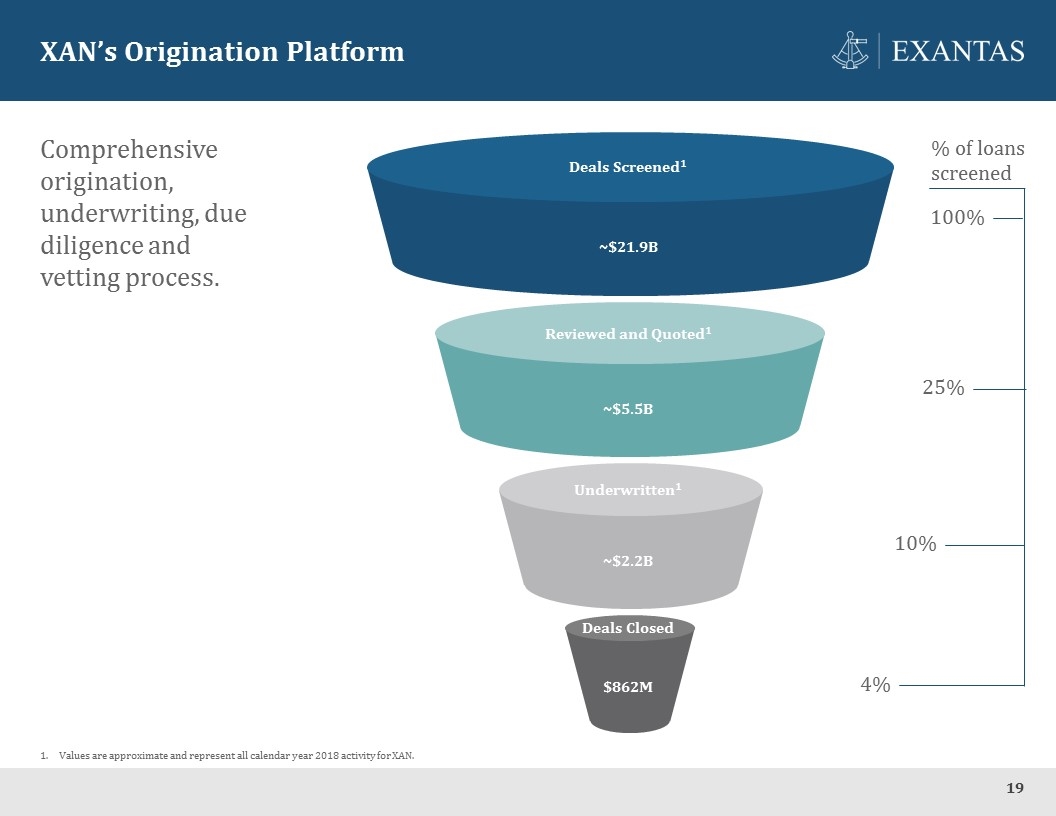
XAN’s Origination Platform 19 Comprehensive origination, underwriting, due diligence and vetting process. Deals Screened1 Reviewed and Quoted1 Underwritten1 Deals Closed ~$21.9B ~$5.5B ~$2.2B $862M % of loans screened 100% 25% 10% 4% Values are approximate and represent all calendar year 2018 activity for XAN.
Real Estate Credit Investment Opportunities 20
Benefits of Longer Duration Investments 21 Transitional CRE lending remains XAN’s primary investment strategy. As an open-ended, stable income-oriented investment vehicle, supplementing XAN’s loan portfolio with longer duration investments can enhance return on equity and could provide increased: Earnings visibility; Cash flow stability; and Capital deployment consistency. Select longer duration assets also have attractive portfolio diversification and tax attributes.
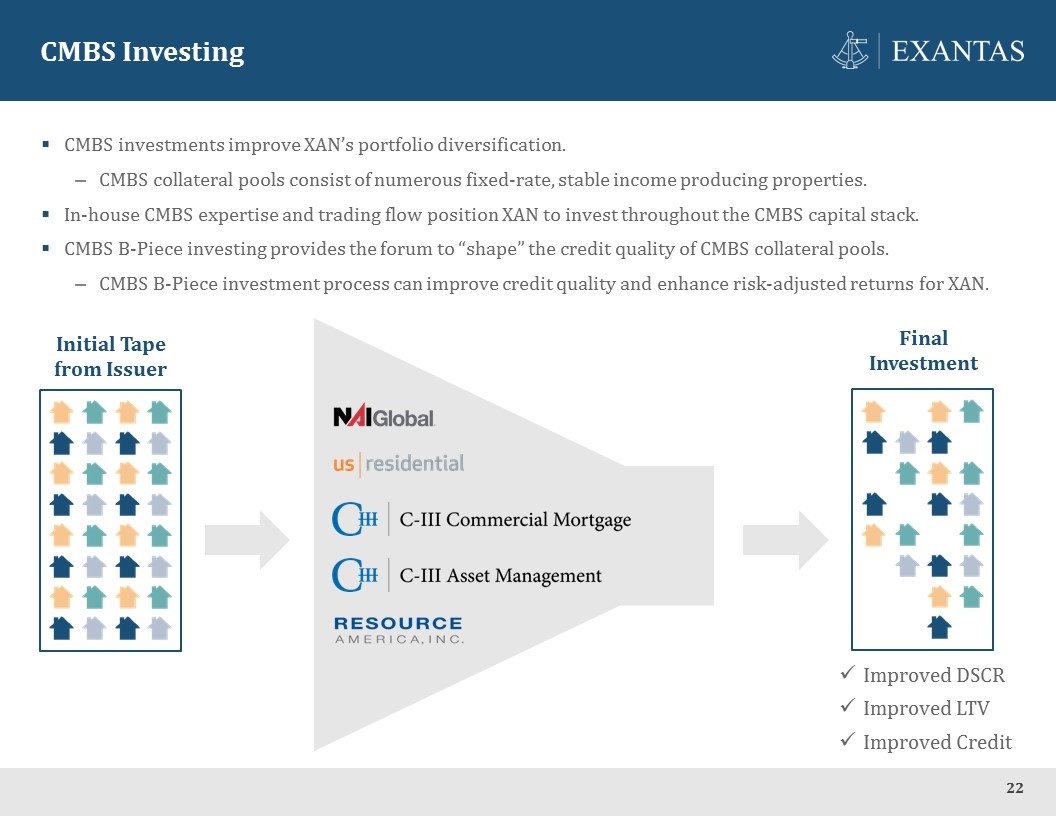
CMBS Investing 22 Improved DSCR Improved LTV Improved Credit CMBS investments improve XAN’s portfolio diversification. CMBS collateral pools consist of numerous fixed-rate, stable income producing properties. In-house CMBS expertise and trading flow position XAN to invest throughout the CMBS capital stack. CMBS B-Piece investing provides the forum to “shape” the credit quality of CMBS collateral pools. CMBS B-Piece investment process can improve credit quality and enhance risk-adjusted returns for XAN. Initial Tape from Issuer Final Investment
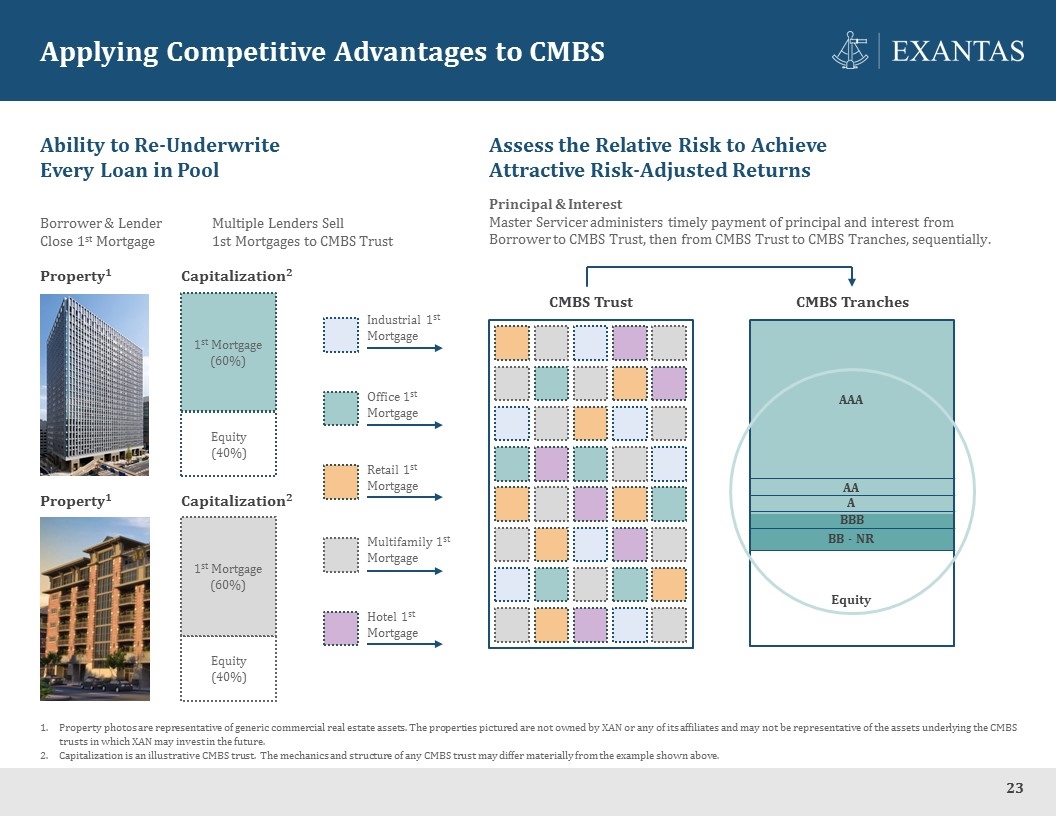
Applying Competitive Advantages to CMBS 23 Property photos are representative of generic commercial real estate assets. The properties pictured are not owned by XAN or any of its affiliates and may not be representative of the assets underlying the CMBS trusts in which XAN may invest in the future. Capitalization is an illustrative CMBS trust. The mechanics and structure of any CMBS trust may differ materially from the example shown above. Ability to Re-Underwrite Every Loan in Pool CMBS Trust Equity AAA AA A CMBS Tranches BB - NR Borrower & Lender Close 1st Mortgage Multiple Lenders Sell 1st Mortgages to CMBS Trust Assess the Relative Risk to Achieve Attractive Risk-Adjusted Returns Principal & Interest Master Servicer administers timely payment of principal and interest from Borrower to CMBS Trust, then from CMBS Trust to CMBS Tranches, sequentially. Multifamily 1st Mortgage Office 1st Mortgage Retail 1st Mortgage Hotel 1st Mortgage Industrial 1st Mortgage Property1 Property1 Capitalization2 Equity (40%) 1st Mortgage (60%) Capitalization2 Equity (40%) 1st Mortgage (60%) BBB
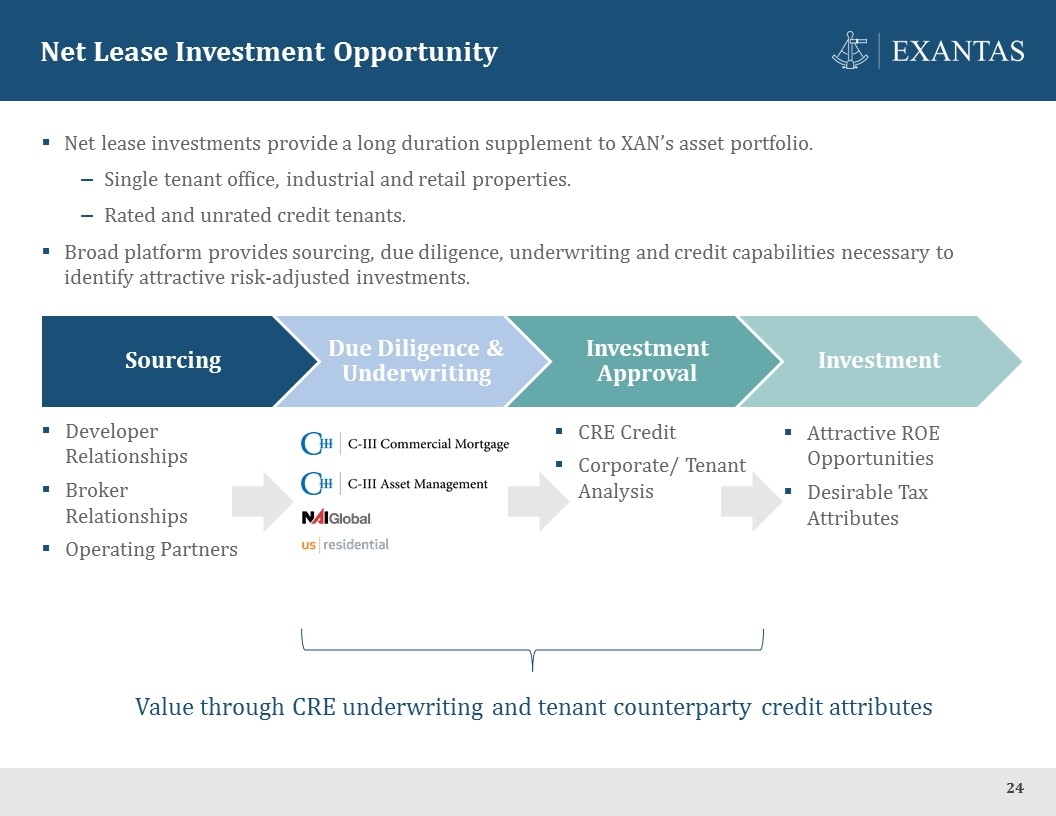
Net lease investments provide a long duration supplement to XAN’s asset portfolio. Single tenant office, industrial and retail properties. Rated and unrated credit tenants. Broad platform provides sourcing, due diligence, underwriting and credit capabilities necessary to identify attractive risk-adjusted investments. Net Lease Investment Opportunity 24 Developer Relationships Broker Relationships Operating Partners CRE Credit Corporate/ Tenant Analysis Attractive ROE Opportunities Desirable Tax Attributes Value through CRE underwriting and tenant counterparty credit attributes Sourcing Due Diligence & Underwriting Investment Approval Investment
Conclusion 25
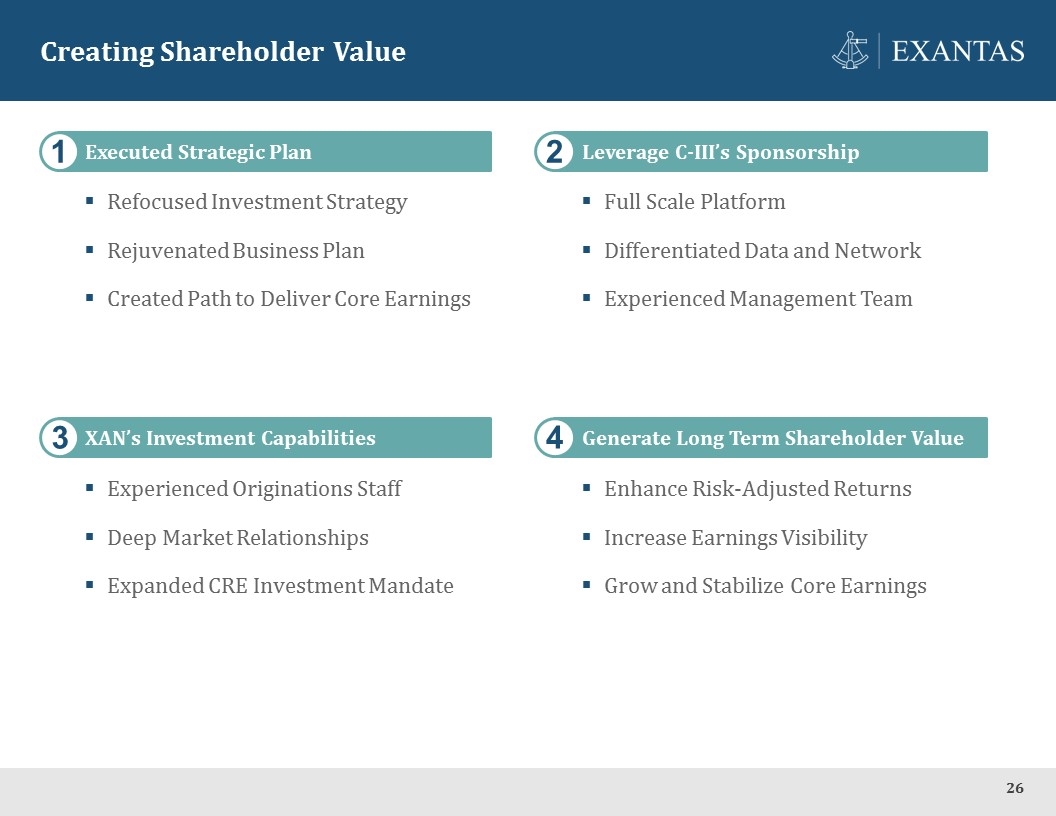
Creating Shareholder Value 26 1 2 Executed Strategic Plan Leverage C-III’s Sponsorship 3 4 XAN’s Investment Capabilities Generate Long Term Shareholder Value Refocused Investment Strategy Rejuvenated Business Plan Created Path to Deliver Core Earnings Full Scale Platform Differentiated Data and Network Experienced Management Team Experienced Originations Staff Deep Market Relationships Expanded CRE Investment Mandate Enhance Risk-Adjusted Returns Increase Earnings Visibility Grow and Stabilize Core Earnings
Appendix 27
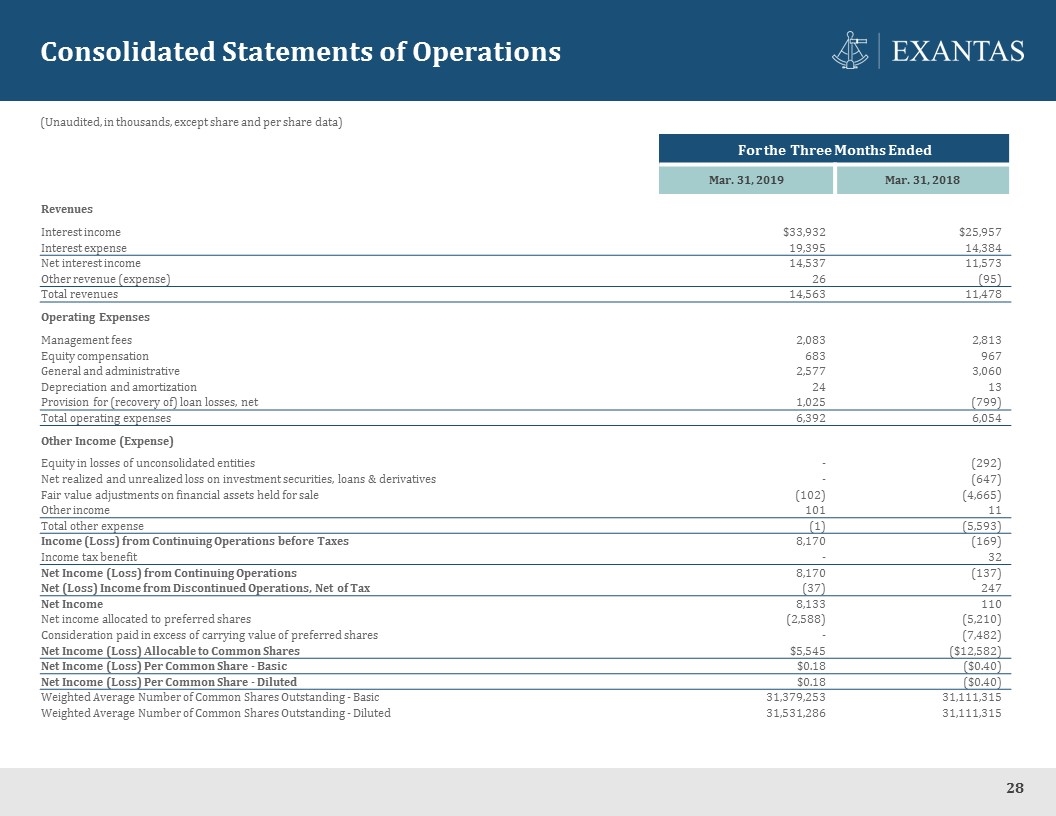
Consolidated Statements of Operations 28 For the Three Months Ended Mar. 31, 2019 Mar. 31, 2018 Revenues Interest income $33,932 $25,957 Interest expense 19,395 14,384 Net interest income 14,537 11,573 Other revenue (expense) 26 (95) Total revenues 14,563 11,478 Operating Expenses Management fees 2,083 2,813 Equity compensation 683 967 General and administrative 2,577 3,060 Depreciation and amortization 24 13 Provision for (recovery of) loan losses, net 1,025 (799) Total operating expenses 6,392 6,054 Other Income (Expense) Equity in losses of unconsolidated entities - (292) Net realized and unrealized loss on investment securities, loans & derivatives - (647) Fair value adjustments on financial assets held for sale (102) (4,665) Other income 101 11 Total other expense (1) (5,593) Income (Loss) from Continuing Operations before Taxes 8,170 (169) Income tax benefit - 32 Net Income (Loss) from Continuing Operations 8,170 (137) Net (Loss) Income from Discontinued Operations, Net of Tax (37) 247 Net Income 8,133 110 Net income allocated to preferred shares (2,588) (5,210) Consideration paid in excess of carrying value of preferred shares - (7,482) Net Income (Loss) Allocable to Common Shares $5,545 ($12,582) Net Income (Loss) Per Common Share - Basic $0.18 ($0.40) Net Income (Loss) Per Common Share - Diluted $0.18 ($0.40) Weighted Average Number of Common Shares Outstanding - Basic 31,379,253 31,111,315 Weighted Average Number of Common Shares Outstanding - Diluted 31,531,286 31,111,315 (Unaudited, in thousands, except share and per share data)
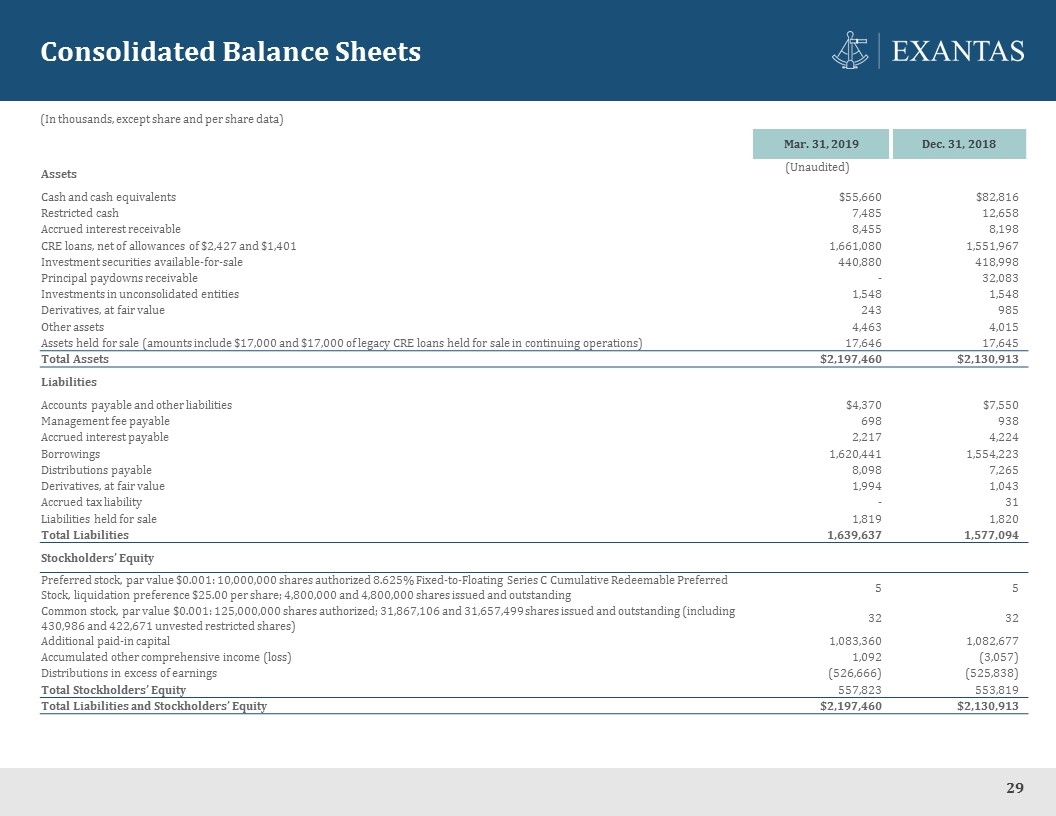
Consolidated Balance Sheets 29 Mar. 31, 2019 Dec. 31, 2018 Assets (Unaudited) Cash and cash equivalents $55,660 $82,816 Restricted cash 7,485 12,658 Accrued interest receivable 8,455 8,198 CRE loans, net of allowances of $2,427 and $1,401 1,661,080 1,551,967 Investment securities available-for-sale 440,880 418,998 Principal paydowns receivable - 32,083 Investments in unconsolidated entities 1,548 1,548 Derivatives, at fair value 243 985 Other assets 4,463 4,015 Assets held for sale (amounts include $17,000 and $17,000 of legacy CRE loans held for sale in continuing operations) 17,646 17,645 Total Assets $2,197,460 $2,130,913 Liabilities Accounts payable and other liabilities $4,370 $7,550 Management fee payable 698 938 Accrued interest payable 2,217 4,224 Borrowings 1,620,441 1,554,223 Distributions payable 8,098 7,265 Derivatives, at fair value 1,994 1,043 Accrued tax liability - 31 Liabilities held for sale 1,819 1,820 Total Liabilities 1,639,637 1,577,094 Stockholders’ Equity Preferred stock, par value $0.001: 10,000,000 shares authorized 8.625% Fixed-to-Floating Series C Cumulative Redeemable Preferred Stock, liquidation preference $25.00 per share; 4,800,000 and 4,800,000 shares issued and outstanding 5 5 Common stock, par value $0.001: 125,000,000 shares authorized; 31,867,106 and 31,657,499 shares issued and outstanding (including 430,986 and 422,671 unvested restricted shares) 32 32 Additional paid-in capital 1,083,360 1,082,677 Accumulated other comprehensive income (loss) 1,092 (3,057) Distributions in excess of earnings (526,666) (525,838) Total Stockholders’ Equity 557,823 553,819 Total Liabilities and Stockholders’ Equity $2,197,460 $2,130,913 (In thousands, except share and per share data)
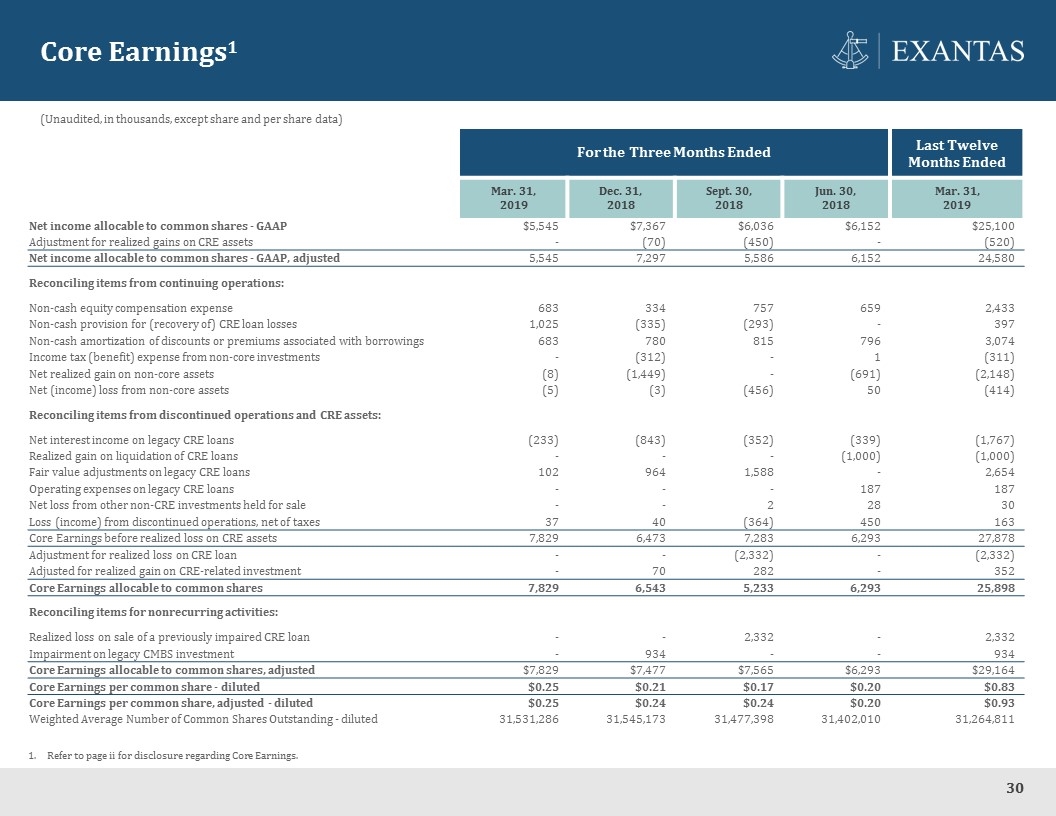
Core Earnings1 30 For the Three Months Ended Last Twelve Months Ended Mar. 31, 2019 Dec. 31, 2018 Sept. 30, 2018 Jun. 30, 2018 Mar. 31, 2019 Net income allocable to common shares - GAAP $5,545 $7,367 $6,036 $6,152 $25,100 Adjustment for realized gains on CRE assets - (70) (450) - (520) Net income allocable to common shares - GAAP, adjusted 5,545 7,297 5,586 6,152 24,580 Reconciling items from continuing operations: Non-cash equity compensation expense 683 334 757 659 2,433 Non-cash provision for (recovery of) CRE loan losses 1,025 (335) (293) - 397 Non-cash amortization of discounts or premiums associated with borrowings 683 780 815 796 3,074 Income tax (benefit) expense from non-core investments - (312) - 1 (311) Net realized gain on non-core assets (8) (1,449) - (691) (2,148) Net (income) loss from non-core assets (5) (3) (456) 50 (414) Reconciling items from discontinued operations and CRE assets: Net interest income on legacy CRE loans (233) (843) (352) (339) (1,767) Realized gain on liquidation of CRE loans - - - (1,000) (1,000) Fair value adjustments on legacy CRE loans 102 964 1,588 - 2,654 Operating expenses on legacy CRE loans - - - 187 187 Net loss from other non-CRE investments held for sale - - 2 28 30 Loss (income) from discontinued operations, net of taxes 37 40 (364) 450 163 Core Earnings before realized loss on CRE assets 7,829 6,473 7,283 6,293 27,878 Adjustment for realized loss on CRE loan - - (2,332) - (2,332) Adjusted for realized gain on CRE-related investment - 70 282 - 352 Core Earnings allocable to common shares 7,829 6,543 5,233 6,293 25,898 Reconciling items for nonrecurring activities: Realized loss on sale of a previously impaired CRE loan - - 2,332 - 2,332 Impairment on legacy CMBS investment - 934 - - 934 Core Earnings allocable to common shares, adjusted $7,829 $7,477 $7,565 $6,293 $29,164 Core Earnings per common share - diluted $0.25 $0.21 $0.17 $0.20 $0.83 Core Earnings per common share, adjusted - diluted $0.25 $0.24 $0.24 $0.20 $0.93 Weighted Average Number of Common Shares Outstanding - diluted 31,531,286 31,545,173 31,477,398 31,402,010 31,264,811 Refer to page ii for disclosure regarding Core Earnings. (Unaudited, in thousands, except share and per share data)
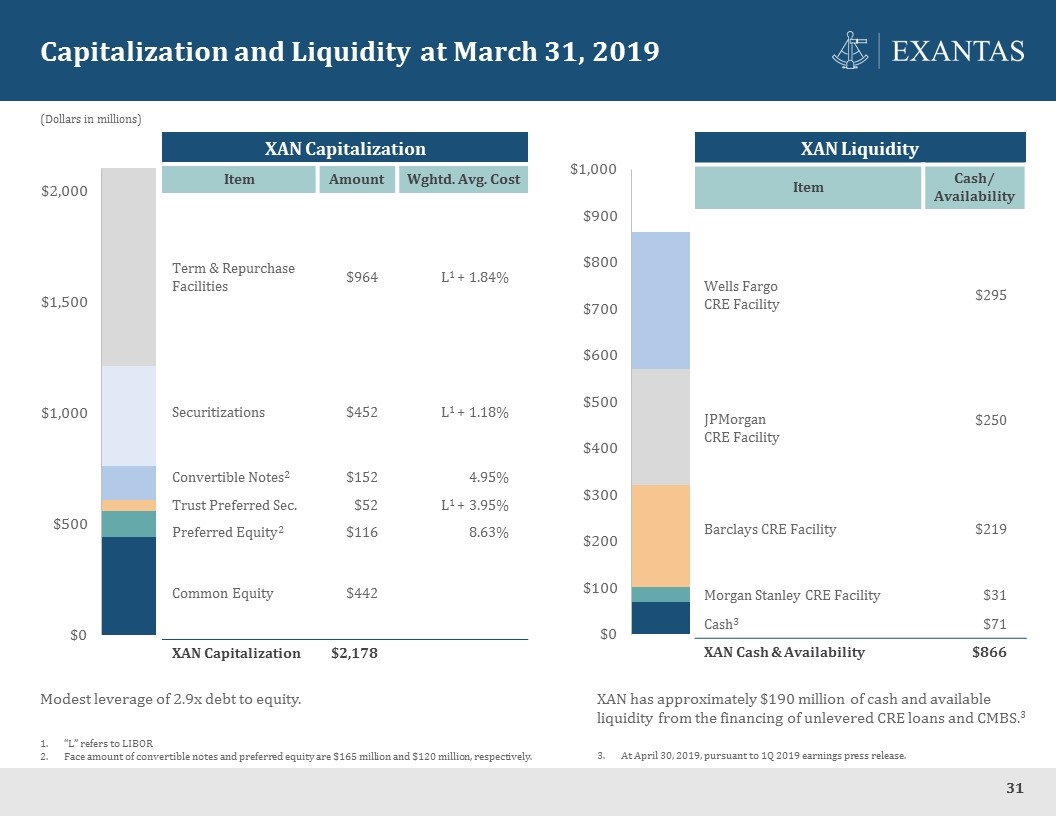
Capitalization and Liquidity at March 31, 2019 31 Modest leverage of 2.9x debt to equity. “L” refers to LIBOR Face amount of convertible notes and preferred equity are $165 million and $120 million, respectively. XAN has approximately $190 million of cash and available liquidity from the financing of unlevered CRE loans and CMBS.3 XAN Capitalization Item Amount Wghtd. Avg. Cost Term & Repurchase Facilities $964 L1 + 1.84% Securitizations $452 L1 + 1.18% Convertible Notes2 $152 4.95% Trust Preferred Sec. $52 L1 + 3.95% Preferred Equity2 $116 8.63% Common Equity $442 XAN Capitalization $2,178 XAN Liquidity Item Cash/ Availability Wells Fargo CRE Facility $295 JPMorgan CRE Facility $250 Barclays CRE Facility $219 Morgan Stanley CRE Facility $31 Cash3 $71 XAN Cash & Availability $866 At April 30, 2019, pursuant to 1Q 2019 earnings press release. (Dollars in millions)


