Fresenius Medical Care AG & Co. KGaA COMPLETE OVERVIEW OF THE RESULTS FOR THE FIRST QUARTER 2019 May 2, 2019 Investor Relations phone: +49 6172 609 2525 email: ir@fmc-ag.com Content: Statement of earnings Segment information Balance sheet Cash flow Revenue development Key metrics Quality data Reconciliation Reconciliation non-IFRS page 2 page 3 page 4 page 5 page 6 page 7 page 8 page 9 page 10 Disclaimer This release contains forward-looking statements that are subject to various risks and uncertainties. Actual results could differ materially from those described in these forward-looking statements due to certain factors, including changes in business, economic and competitive conditions, regulatory reforms, foreign exchange rate fluctuations, uncertainties in litigation or investigative proceedings, and the availability of financing. These and other risks and uncertainties are detailed in Fresenius Medical Care AG & Co. KGaA's reports filed with the U.S. Securities and Exchange Commission. Fresenius Medical Care AG & Co. KGaA does not undertake any responsibility to update the forward-looking statements in this release. Copyright by Fresenius Medical Care AG & Co. KGaA
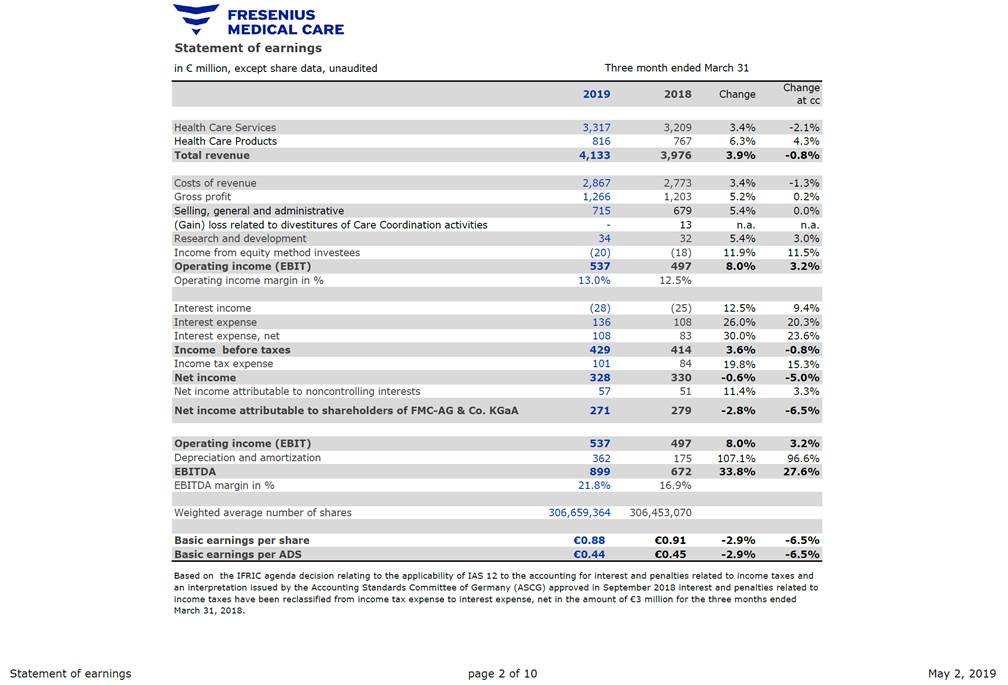
Statement of earnings in € million, except share data, unaudited Three month ended March 31 at cc Health Care Products 816 767 6.3% 4.3% Gross profit 1,266 1,203 5.2% 0.2% (Gain) loss related to divestitures of Care Coordination activities - 13 n.a. n.a. Income from equity method investees (20) (18) 11.9% 11.5% Operating income margin in % 13.0% 12.5% Interest income (28) (25) 12.5% 9.4% Interest expense, net 108 83 30.0% 23.6% Income tax expense 101 84 19.8% 15.3% Net income attributable to noncontrolling interests 57 51 11.4% 3.3% Depreciation and amortization 362 175 107.1% 96.6% EBITDA margin in % 21.8% 16.9% Weighted average number of shares 306,659,364 306,453,070 Basic earnings per share €0.88 €0.91 -2.9% -6.5% Based on the IFRIC agenda decision relating to the applicability of IAS 12 to the accounting for interest and penalties related to income taxes and an interpretation issued by the Accounting Standards Committee of Germany (ASCG) approved in September 2018 interest and penalties related to income taxes have been reclassified from income tax expense to interest expense, net in the amount of €3 million for the three months ended March 31, 2018. Statement of earnings page 2 of 10 May 2, 2019 Basic earnings per ADS€0.44€0.45-2.9%-6.5% EBITDA89967233.8%27.6% Operating income (EBIT)5374978.0%3.2% Net income attributable to shareholders of FMC-AG & Co. KGaA271279-2.8%-6.5% Net income328330-0.6%-5.0% Income before taxes4294143.6%-0.8% Interest expense13610826.0%20.3% Operating income (EBIT)5374978.0%3.2% Research and development34325.4%3.0% Selling, general and administrative7156795.4%0.0% Costs of revenue2,8672,7733.4%-1.3% Total revenue4,1333,9763.9%-0.8% Health Care Services3,3173,2093.4%-2.1% 20192018ChangeChange
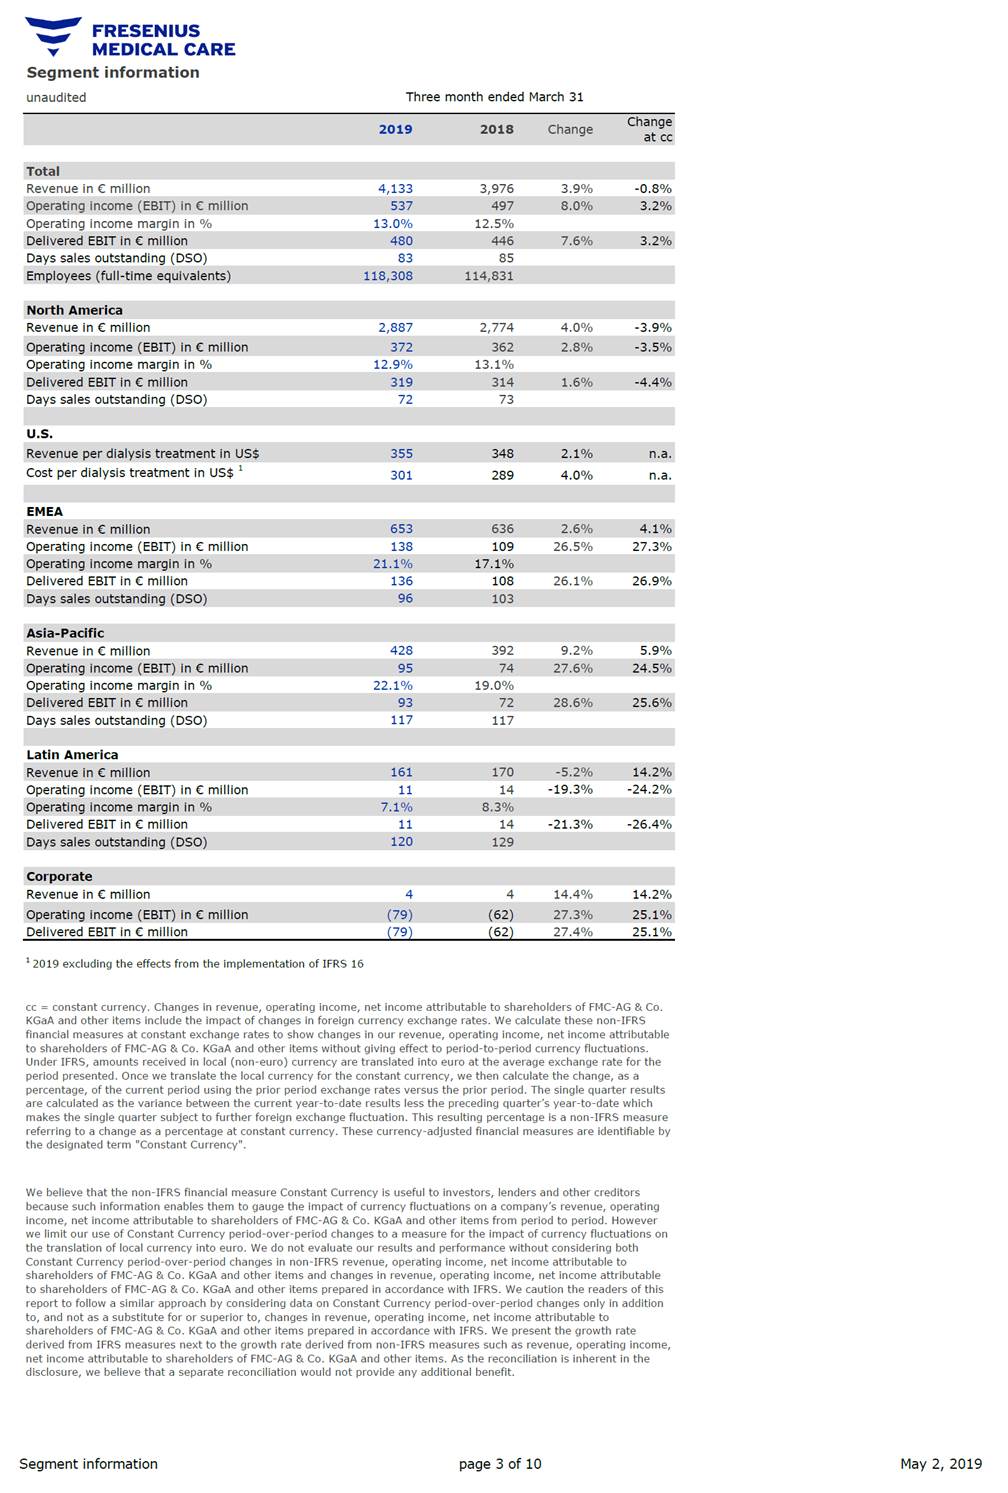
Segment information unaudited Three month ended March 31 at cc Revenue in € million 4,133 3,976 3.9% -0.8% Operating income margin in % 13.0% 12.5% Days sales outstanding (DSO) 83 85 Revenue in € million 2,887 2,774 4.0% -3.9% Operating income margin in % 12.9% 13.1% Days sales outstanding (DSO) 72 73 U.S. Cost per dialysis treatment in US$ 1 301 289 4.0% n.a. EMEA Operating income (EBIT) in € million 138 109 26.5% 27.3% Delivered EBIT in € million 136 108 26.1% 26.9% Revenue in € million 428 392 9.2% 5.9% Operating income margin in % 22.1% 19.0% Days sales outstanding (DSO) 117 117 Latin America Operating income (EBIT) in € million 11 14 -19.3% -24.2% Delivered EBIT in € million 11 14 -21.3% -26.4% Revenue in € million 4 4 14.4% 14.2% Delivered EBIT in € million (79) (62) 27.4% 25.1% 1 2019 excluding the effects from the implementation of IFRS 16 cc = constant currency. Changes in revenue, operating income, net income attributable to shareholders of FMC-AG & Co. KGaA and other items include the impact of changes in foreign currency exchange rates. We calculate these non-IFRS financial measures at constant exchange rates to show changes in our revenue, operating income, net income attributable to shareholders of FMC-AG & Co. KGaA and other items without giving effect to period-to-period currency fluctuations. Under IFRS, amounts received in local (non-euro) currency are translated into euro at the average exchange rate for the period presented. Once we translate the local currency for the constant currency, we then calculate the change, as a percentage, of the current period using the prior period exchange rates versus the prior period. The single quarter results are calculated as the variance between the current year-to-date results less the preceding quarter’s year-to-date which makes the single quarter subject to further foreign exchange fluctuation. This resulting percentage is a non-IFRS measure referring to a change as a percentage at constant currency. These currency-adjusted financial measures are identifiable by the designated term "Constant Currency". We believe that the non-IFRS financial measure Constant Currency is useful to investors, lenders and other creditors because such information enables them to gauge the impact of currency fluctuations on a company’s revenue, operating income, net income attributable to shareholders of FMC-AG & Co. KGaA and other items from period to period. However we limit our use of Constant Currency period-over-period changes to a measure for the impact of currency fluctuations on the translation of local currency into euro. We do not evaluate our results and performance without considering both Constant Currency period-over-period changes in non-IFRS revenue, operating income, net income attributable to shareholders of FMC-AG & Co. KGaA and other items and changes in revenue, operating income, net income attributable to shareholders of FMC-AG & Co. KGaA and other items prepared in accordance with IFRS. We caution the readers of this report to follow a similar approach by considering data on Constant Currency period-over-period changes only in addition to, and not as a substitute for or superior to, changes in revenue, operating income, net income attributable to shareholders of FMC-AG & Co. KGaA and other items prepared in accordance with IFRS. We present the growth rate derived from IFRS measures next to the growth rate derived from non-IFRS measures such as revenue, operating income, net income attributable to shareholders of FMC-AG & Co. KGaA and other items. As the reconciliation is inherent in the disclosure, we believe that a separate reconciliation would not provide any additional benefit. Segment information page 3 of 10 May 2, 2019 Operating income (EBIT) in € million (79) (62) 27.3% 25.1% Corporate Days sales outstanding (DSO) 120129 Operating income margin in % 7.1% 8.3% Revenue in € million 161170-5.2% 14.2% Delivered EBIT in € million 937228.6% 25.6% Operating income (EBIT) in € million 957427.6% 24.5% Asia-Pacific Days sales outstanding (DSO) 96103 Operating income margin in % 21.1% 17.1% Revenue in € million 6536362.6% 4.1% Revenue per dialysis treatment in US$ 3553482.1% n.a. Delivered EBIT in € million 3193141.6% -4.4% Operating income (EBIT) in € million 3723622.8% -3.5% North America Employees (full-time equivalents) 118,308114,831 Delivered EBIT in € million 4804467.6% 3.2% Operating income (EBIT) in € million 5374978.0% 3.2% Total 2019 2018 Change Change
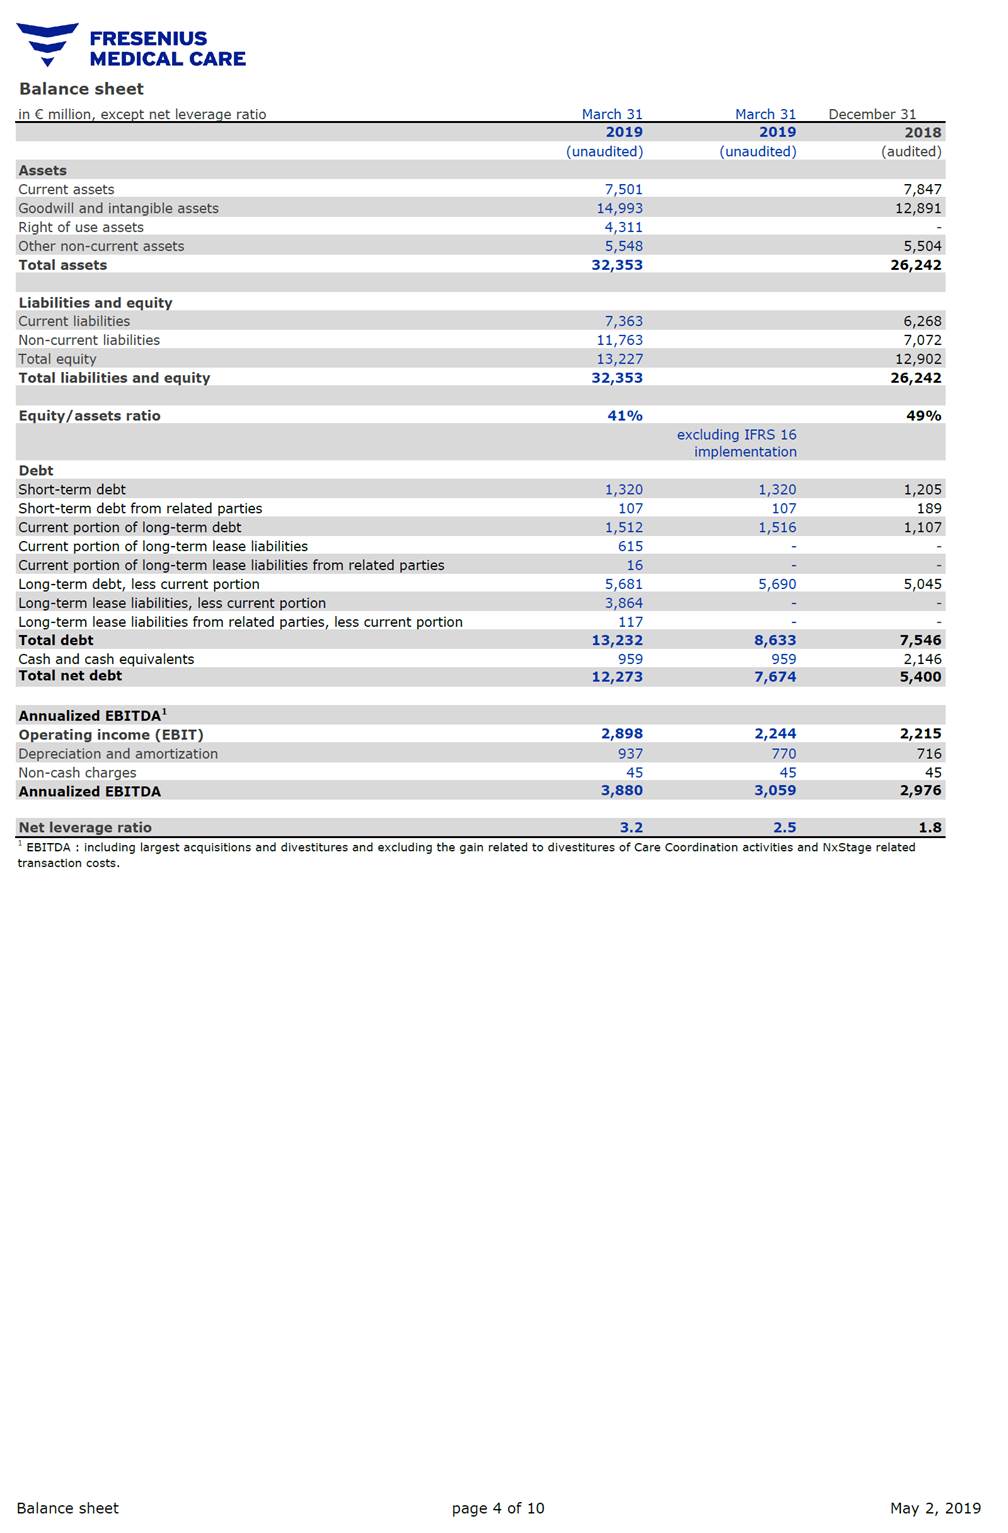
Balance sheet in € million, except net leverage ratio March 31 March 31 December 31 (unaudited) (unaudited) (audited) Current assets 7,501 7,847 Right of use assets 4,311 - Total assets 32,353 26,242 Liabilities and equity Non-current liabilities 11,763 7,072 Total liabilities and equity 32,353 26,242 Equity/assets ratio 41% 49% Debt Short-term debt from related parties 107 107 189 Current portion of long-term lease liabilities 615 - - Long-term debt, less current portion 5,681 5,690 5,045 Long-term lease liabilities from related parties, less current portion 117 - - Cash and cash equivalents 959 959 2,146 Total net debt 12,273 7,674 5,400 Annualized EBITDA1 2,898 2,244 2,215 Operating income (EBIT) Non-cash charges 45 45 45 Annualized EBITDA 3,880 3,059 2,976 1 EBITDA : including largest acquisitions and divestitures and excluding the gain related to divestitures of Care Coordination activities and NxStage related transaction costs. Balance sheet page 4 of 10 May 2, 2019 Net leverage ratio3.22.51.8 Depreciation and amortization 937770716 Total debt13,2328,6337,546 Long-term lease liabilities, less current portion 3,864--Current portion of long-term lease liabilities from related parties 16--Current portion of long-term debt1,5121,5161,107 Short-term debt1,3201,3201,205 excluding IFRS 16 implementation Total equity 13,22712,902 Current liabilities 7,3636,268 Other non-current assets5,5485,504 Goodwill and intangible assets14,99312,891 Assets 201920192018
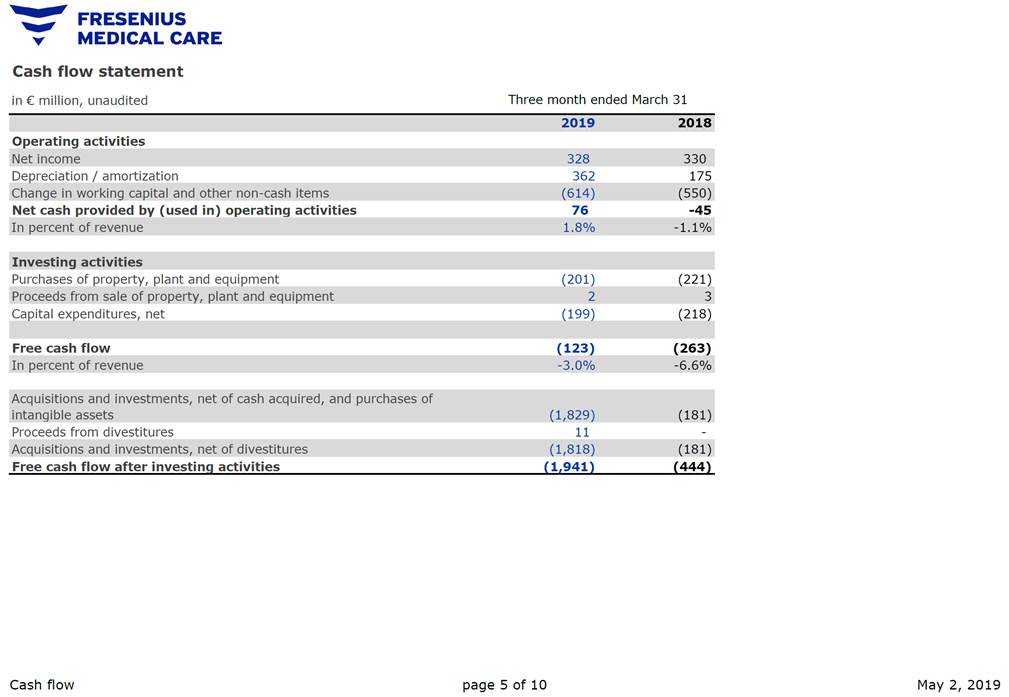
Cash flow statement in € million, unaudited Three month ended March 31 Operating activities Depreciation / amortization 362 175 Net cash provided by (used in) operating activities 76 -45 Purchases of property, plant and equipment (201) (221) Capital expenditures, net (199) (218) Free cash flow (123) (263) Proceeds from divestitures 11 - Free cash flow after investing activities (1,941) (444) Cash flow page 5 of 10 May 2, 2019 Acquisitions and investments, net of divestitures(1,818)(181) Acquisitions and investments, net of cash acquired, and purchases of intangible assets(1,829)(181) In percent of revenue-3.0%-6.6% Proceeds from sale of property, plant and equipment23 Investing activities In percent of revenue1.8%-1.1% Change in working capital and other non-cash items(614)(550) Net income328330 20192018
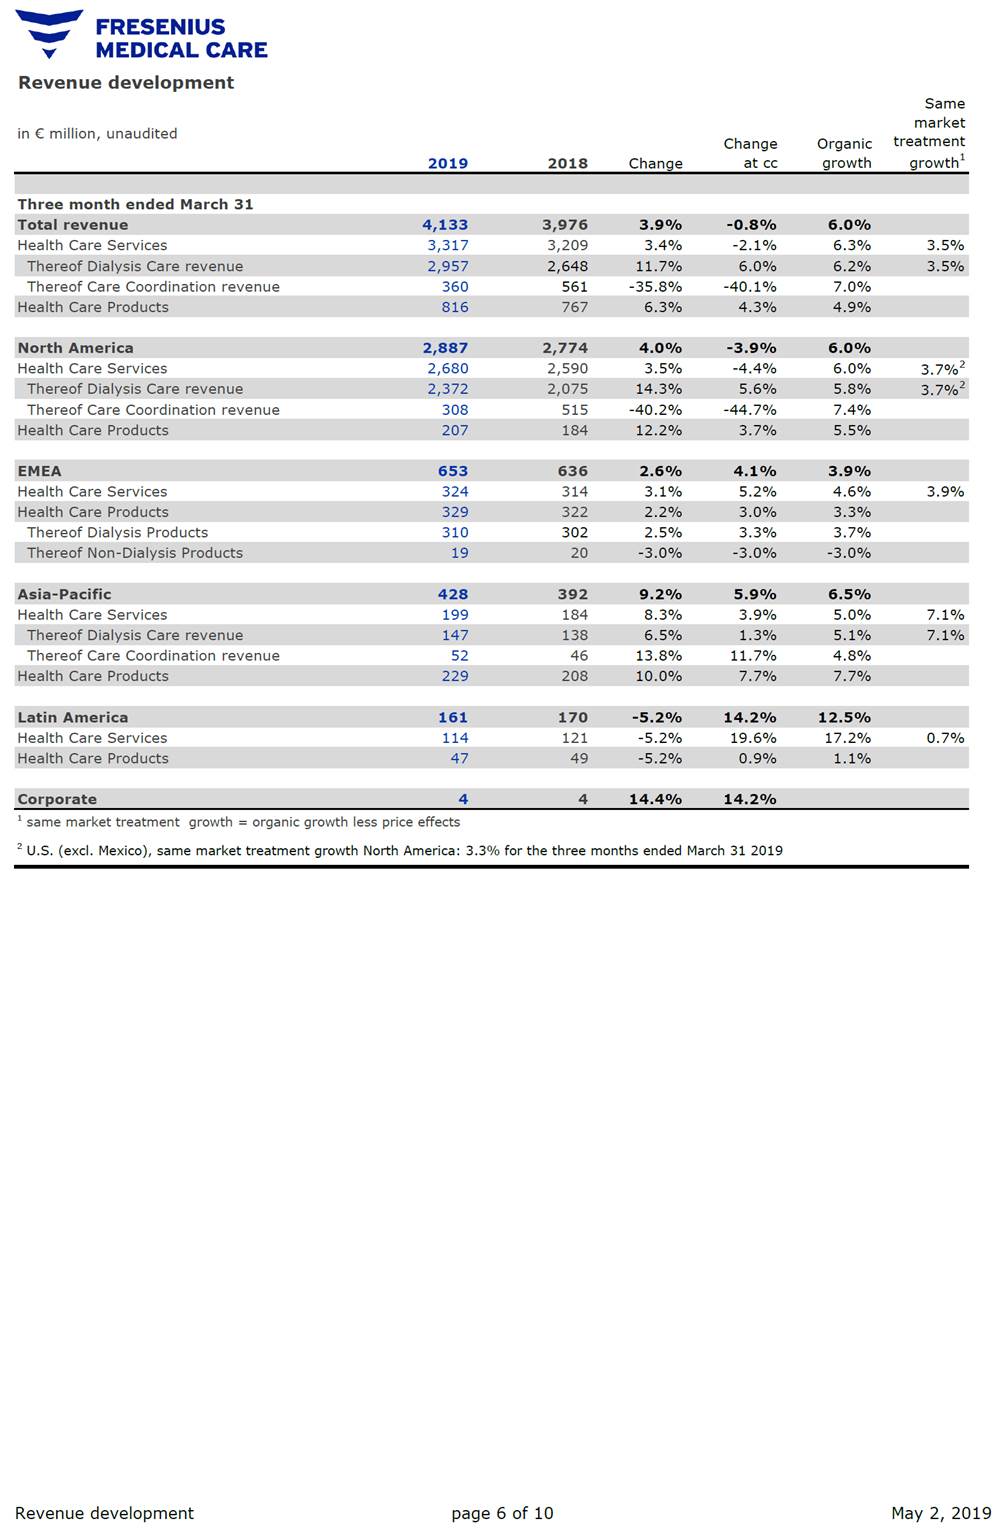
Revenue development Same market treatment growth1 in € million, unaudited Change at cc Organic growth 2019 2018 Change Three month ended March 31 Health Care Services 3,317 3,209 3.4% -2.1% 6.3% 3.5% Thereof Care Coordination revenue 360 561 -35.8% -40.1% 7.0% 3.7%2 Health Care Services 2,680 2,590 3.5% -4.4% 6.0% Thereof Dialysis Care revenue 2,372 2,075 14.3% 5.6% 5.8% 3.7%2 Thereof Care Coordination revenue 308 515 -40.2% -44.7% 7.4% Health Care Services 324 314 3.1% 5.2% 4.6% 3.9% Thereof Dialysis Products 310 302 2.5% 3.3% 3.7% Health Care Services 199 184 8.3% 3.9% 5.0% 7.1% Thereof Care Coordination revenue 52 46 13.8% 11.7% 4.8% Health Care Services 114 121 -5.2% 19.6% 17.2% 0.7% 1 same market treatment growth = organic growth less price effects 2 U.S. (excl. Mexico), same market treatment growth North America: 3.3% for the three months ended March 31 2019 Revenue development page 6 of 10 May 2, 2019 Corporate4414.4%14.2% Health Care Products4749-5.2%0.9%1.1% Latin America161170-5.2%14.2%12.5% Health Care Products22920810.0%7.7%7.7% Thereof Dialysis Care revenue1471386.5%1.3%5.1%7.1% Asia-Pacific4283929.2%5.9%6.5% Thereof Non-Dialysis Products1920-3.0%-3.0%-3.0% Health Care Products3293222.2%3.0%3.3% EMEA6536362.6%4.1%3.9% Health Care Products20718412.2%3.7%5.5% North America2,8872,7744.0%-3.9%6.0% Health Care Products8167676.3%4.3%4.9% Thereof Dialysis Care revenue2,9572,64811.7%6.0%6.2%3.5% Total revenue4,1333,9763.9%-0.8%6.0%
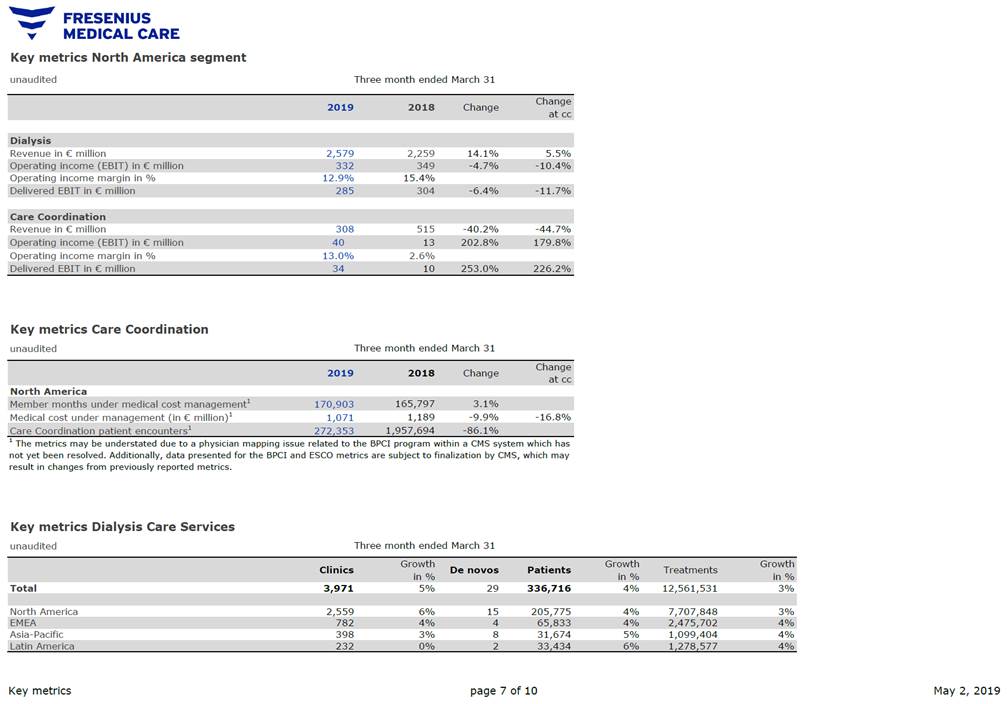
Key metrics North America segment unaudited Three month ended March 31 at cc Revenue in € million 2,579 2,259 14.1% 5.5% Operating income (EBIT) in € million 332 349 -4.7% -10.4% Operating income margin in % 12.9% 15.4% Delivered EBIT in € million 285 304 -6.4% -11.7% Revenue in € million 308 515 -40.2% -44.7% Operating income margin in % 13.0% 2.6% Key metrics Care Coordination unaudited Three month ended March 31 at cc North America Member months under medical cost management1 170,903 165,797 3.1% Medical cost under management (in € million)1 1,071 1,189 -9.9% -16.8% 1 The metrics may be understated due to a physician mapping issue related to the BPCI program within a CMS system which has not yet been resolved. Additionally, data presented for the BPCI and ESCO metrics are subject to finalization by CMS, which may result in changes from previously reported metrics. Key metrics Dialysis Care Services unaudited Three month ended March 31 in % in % in % Total 3,971 5% 29 336,716 4% 12,561,531 3% North America 2,559 6% 15 205,775 4% 7,707,848 3% EMEA 782 4% 4 65,833 4% 2,475,702 4% Asia-Pacific 398 3% 8 31,674 5% 1,099,404 4% Key metrics page 7 of 10 May 2, 2019 Latin America2320%233,4346%1,278,5774% ClinicsGrowthDe novosPatientsGrowthTreatmentsGrowth Care Coordination patient encounters1272,3531,957,694-86.1% 20192018ChangeChange Delivered EBIT in € million3410253.0%226.2% Operating income (EBIT) in € million4013202.8%179.8% Care Coordination Dialysis 20192018ChangeChange
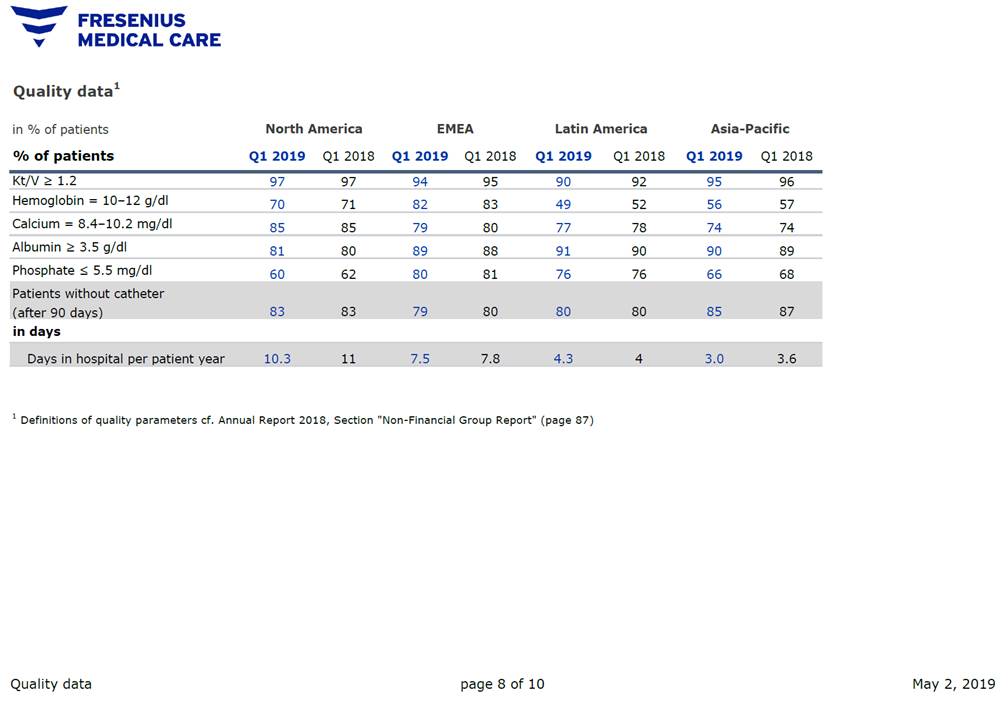
Quality data1 in % of patients North America EMEA Latin America Asia-Pacific % of patients Q1 2019 Q1 2018 Q1 2019 Q1 2018 Q1 2019 Q1 2018 Q1 2019 Q1 2018 Kt/V > 1.2 97 97 94 95 90 92 95 96 Hemoglobin = 10–12 g/dl 70 71 82 83 49 52 56 57 Calcium = 8.4–10.2 mg/dl 85 85 79 80 77 78 74 74 Albumin > 3.5 g/dl 81 80 89 88 91 90 90 89 Phosphate < 5.5 mg/dl 60 62 80 81 76 76 66 68 in days 1 Definitions of quality parameters cf. Annual Report 2018, Section "Non-Financial Group Report" (page 87) Quality data page 8 of 10 May 2, 2019 Days in hospital per patient year10.3117.57.84.343.03.6 Patients without catheter (after 90 days)8383798080808587
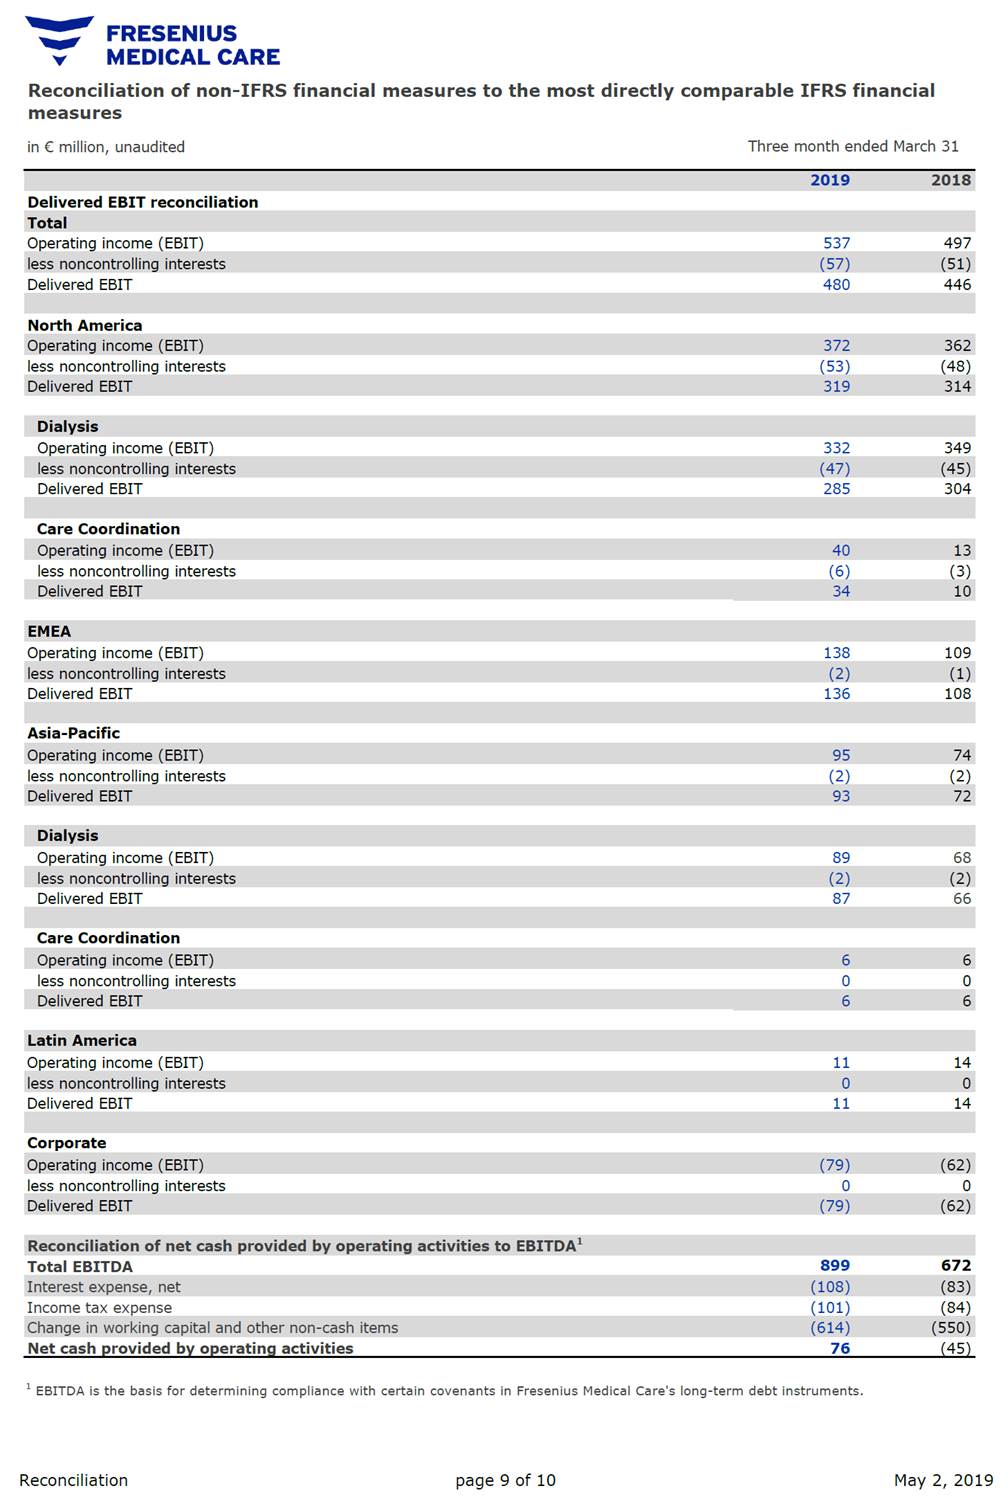
Reconciliation of non-IFRS financial measures to the most directly comparable IFRS financial measures Three month ended March 31 in € million, unaudited Delivered EBIT reconciliation Operating income (EBIT) 537 497 Delivered EBIT 480 446 North America less noncontrolling interests (53) (48) Operating income (EBIT) 332 349 Delivered EBIT 285 304 Care Coordination less noncontrolling interests (6) (3) Operating income (EBIT) 138 109 Delivered EBIT 136 108 Asia-Pacific less noncontrolling interests (2) (2) Operating income (EBIT) 89 68 Delivered EBIT 87 66 Care Coordination less noncontrolling interests 0 0 Operating income (EBIT) 11 14 Delivered EBIT 11 14 Corporate less noncontrolling interests 0 0 Reconciliation of net cash provided by operating activities to EBITDA1 899 672 Total EBITDA Income tax expense (101) (84) Net cash provided by operating activities 76 (45) 1 EBITDA is the basis for determining compliance with certain covenants in Fresenius Medical Care's long-term debt instruments. Reconciliation page 9 of 10 May 2, 2019 Change in working capital and other non-cash items(614)(550) Interest expense, net(108)(83) Delivered EBIT(79)(62) Operating income (EBIT)(79)(62) less noncontrolling interests00 Latin America Delivered EBIT66 Operating income (EBIT)66 less noncontrolling interests(2)(2) Dialysis Delivered EBIT9372 Operating income (EBIT)9574 less noncontrolling interests(2)(1) EMEA Delivered EBIT3410 Operating income (EBIT)4013 less noncontrolling interests(47)(45) Dialysis Delivered EBIT319314 Operating income (EBIT)372362 less noncontrolling interests(57)(51) Total 20192018
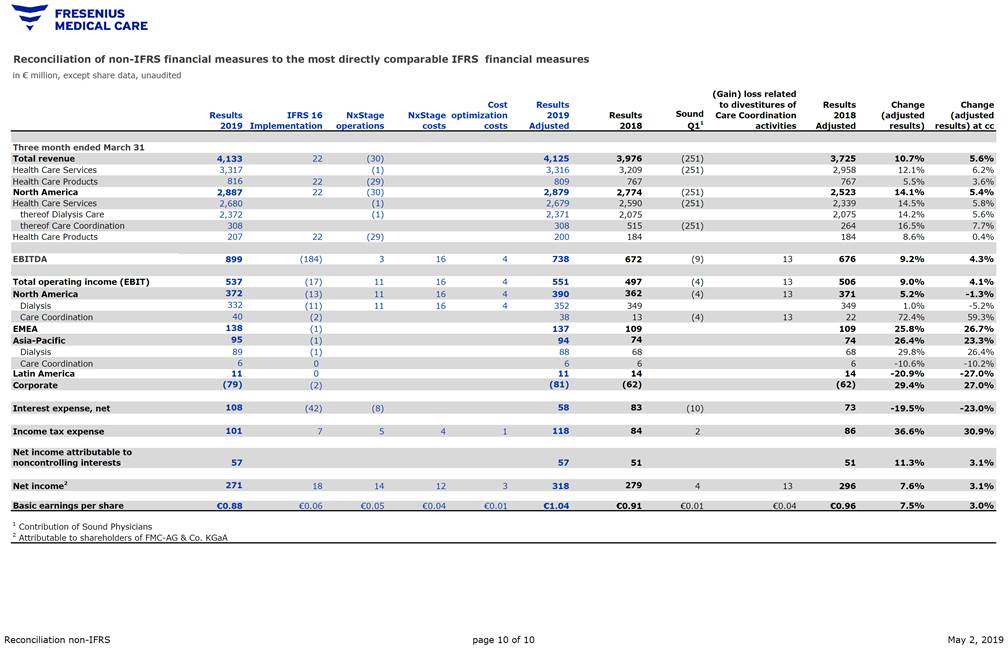
Reconciliation of non-IFRS financial measures to the most directly comparable IFRS financial measures in € million, except share data, unaudited (Gain) loss related to divestitures of Care Coordination activities Cost NxStage optimization Results 2019 Adjusted Results 2018 Adjusted Change (adjusted results) Change (adjusted results) at cc Sound Q11 Results IFRS 16 NxStage operations Results 2018 2019 Implementation costs costs Three month ended March 31 Total revenue 4,133 22 (30) 4,125 3,976 (251) 3,725 10.7% 5.6% Health Care Services 3,317 (1) 3,316 3,209 (251) 2,958 12.1% 6.2% Health Care Products 816 22 (29) 809 767 767 5.5% 3.6% North America 2,887 22 (30) 2,879 2,774 (251) 2,523 14.1% 5.4% Health Care Services 2,680 (1) 2,679 2,590 (251) 2,339 14.5% 5.8% thereof Dialysis Care 2,372 (1) 2,371 2,075 2,075 14.2% 5.6% thereof Care Coordination 308 308 515 (251) 264 16.5% 7.7% Health Care Products 207 22 (29) 200 184 184 8.6% 0.4% EBITDA 899 (184) 3 16 4 738 672 (9) 13 676 9.2% 4.3% Total operating income (EBIT) 537 (17) 11 16 4 551 497 (4) 13 506 9.0% 4.1% North America 372 (13) 11 16 4 390 362 (4) 13 371 5.2% -1.3% 332 Dialysis (11) 11 16 4 352 349 349 1.0% -5.2% Care Coordination 40 (2) 38 13 (4) 13 22 72.4% 59.3% 138 EMEA (1) 137 109 109 25.8% 26.7% Asia-Pacific 95 (1) 94 74 74 26.4% 23.3% Dialysis 89 (1) 88 68 68 29.8% 26.4% Care Coordination 6 0 6 6 6 -10.6% -10.2% Latin America 11 0 11 14 14 -20.9% -27.0% Corporate (79) (2) (81) (62) (62) 29.4% 27.0% Income tax expense 101 7 5 4 1 118 84 2 86 36.6% 30.9% Net income2 271 18 14 12 3 318 279 4 13 296 7.6% 3.1% 1 Contribution of Sound Physicians 2 Attributable to shareholders of FMC-AG & Co. KGaA Reconciliation non-IFRS page 10 of 10 May 2, 2019 Basic earnings per share€0.88€0.06€0.05€0.04€0.01€1.04€0.91€0.01€0.04€0.967.5%3.0% Net income attributable to noncontrolling interests5757515111.3%3.1% Interest expense, net108(42)(8)5883(10)73-19.5%-23.0%