| Content: Statement of earnings page 2 Segment information page 3 Balance sheet page 4 Cash flow page 5 page 6 Key metrics page 7 page 8 - 9 page 10 Outlook 2023 page 11 Disclaimer Copyright by Fresenius Medical Care AG & Co. KGaA email: ir@fmc-ag.com phone: +49 6172 609 2525 Revenue development by segment Reconciliation results excl. special items This release contains forward-looking statements that are subject to various risks and uncertainties. Actual results could differ materially from those described in these forward-looking statements due to certain factors, including changes in business, economic and competitive conditions, regulatory reforms, foreign exchange rate fluctuations, uncertainties in litigation or investigative proceedings, and the availability of financing. These and other risks and uncertainties are detailed in Fresenius Medical Care AG & Co. KGaA's reports filed with the U.S. Securities and Exchange Commission. Fresenius Medical Care AG & Co. KGaA does not undertake any responsibility to update the forward-looking statements in this release. Rounding adjustments applied to individual numbers and percentages may result in these figures differing immaterially from their absolute values. Furthermore, totals and subtotals in tables may differ slightly from unrounded figures due to rounding in accordance with commercial rounding conventions. Reconciliation revenue to new segments Fresenius Medical Care AG & Co. KGaA June 2, 2023 QUARTERLY OVERVIEW 2022 Investor Relations |
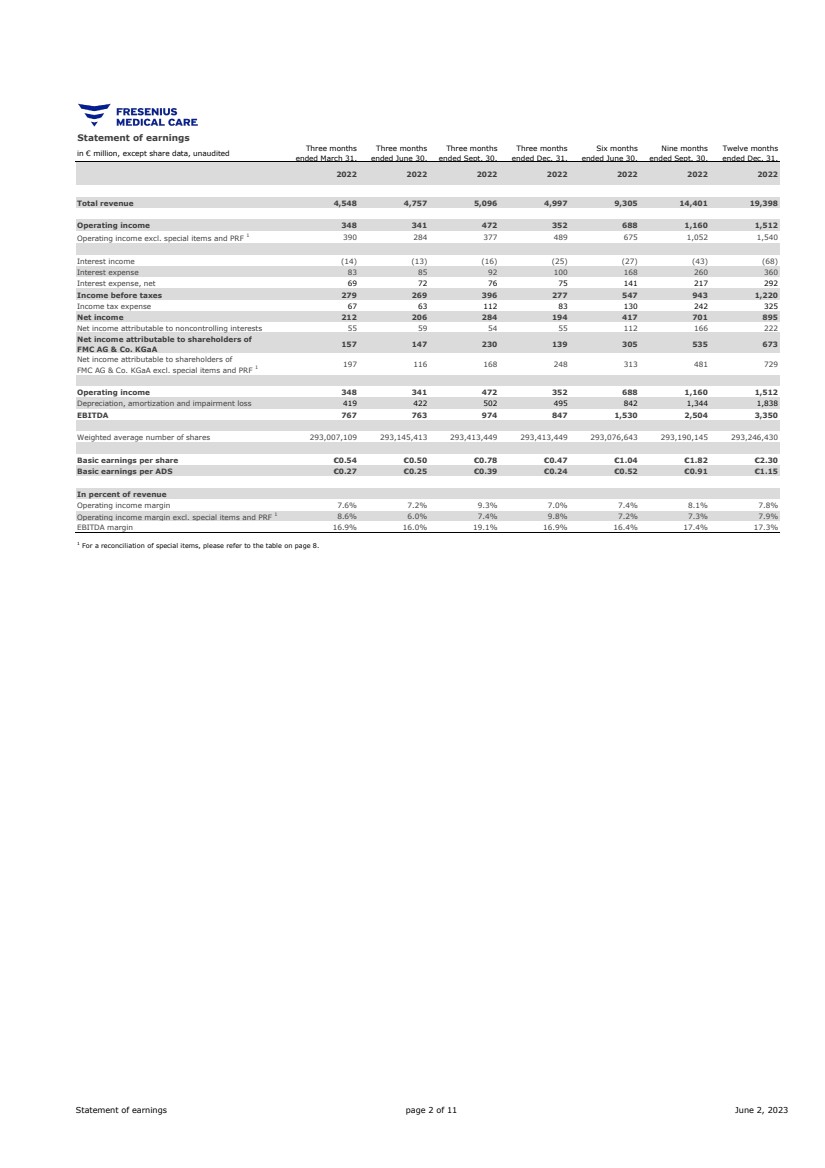
| Statement of earnings in € million, except share data, unaudited Three months ended March 31, Three months ended June 30, Three months ended Sept. 30, Three months ended Dec. 31, Six months ended June 30, Nine months ended Sept. 30, Twelve months ended Dec. 31, 2022 2022 2022 2022 2022 2022 2022 Total revenue 4,548 4,757 5,096 4,997 9,305 14,401 19,398 Operating income 348 341 472 352 688 1,160 1,512 Operating income excl. special items and PRF 1 390 284 377 489 675 1,052 1,540 Interest income (14) (13) (16) (25) (27) (43) (68) Interest expense 83 85 92 100 168 260 360 Interest expense, net 69 72 76 75 141 217 292 Income before taxes 279 269 396 277 547 943 1,220 Income tax expense 67 63 112 83 130 242 325 Net income 212 206 284 194 417 701 895 Net income attributable to noncontrolling interests 55 59 54 55 112 166 222 Net income attributable to shareholders of FMC AG & Co. KGaA 157 147 230 139 305 535 673 Net income attributable to shareholders of FMC AG & Co. KGaA excl. special items and PRF 1 197 116 168 248 313 481 729 Operating income 348 341 472 352 688 1,160 1,512 Depreciation, amortization and impairment loss 419 422 502 495 842 1,344 1,838 EBITDA 767 763 974 847 1,530 2,504 3,350 Weighted average number of shares 293,007,109 293,145,413 293,413,449 293,413,449 293,076,643 293,190,145 293,246,430 Basic earnings per share €0.54 €0.50 €0.78 €0.47 €1.04 €1.82 €2.30 Basic earnings per ADS €0.27 €0.25 €0.39 €0.24 €0.52 €0.91 €1.15 In percent of revenue Operating income margin 7.6% 7.2% 9.3% 7.0% 7.4% 8.1% 7.8% Operating income margin excl. special items and PRF 1 8.6% 6.0% 7.4% 9.8% 7.2% 7.3% 7.9% EBITDA margin 16.9% 16.0% 19.1% 16.9% 16.4% 17.4% 17.3% 1 For a reconciliation of special items, please refer to the table on page 8. Statement of earnings page 2 of 11 June 2, 2023 |
| Segment information unaudited Three months ended March 31, Three months ended June 30, Three months ended Sept. 30, Three months ended Dec. 31, Six months ended June 30, Nine months ended Sept. 30, Twelve months ended Dec. 31, 2022 2022 2022 2022 2022 2022 2022 Total Revenue in € million 4,548 4,757 5,096 4,997 9,305 14,401 19,398 Operating income in € million 348 341 472 352 688 1,160 1,512 Operating income margin 7.6% 7.2% 9.3% 7.0% 7.4% 8.1% 7.8% Operating income in € million (excluding special items and PRF) 2 390 284 377 489 675 1,052 1,540 Operating income margin (excluding special items and PRF) 2 8.6% 6.0% 7.4% 9.8% 7.2% 7.3% 7.9% Days sales outstanding (DSO) 69 69 69 68 Employees (headcount) 130,177 130,448 130,295 128,044 Care Delivery segment Revenue in € million 3,647 3,822 4,131 3,993 7,469 11,600 15,593 Operating income in € million 298 433 500 455 731 1,230 1,686 Operating income margin 8.2% 11.3% 12.1% 11.4% 9.8% 10.6% 10.8% Operating income in € million (excluding special items and PRF) 2 310 287 371 509 599 969 1,478 Operating income margin (excluding special items and PRF) 2 8.5% 7.5% 9.0% 12.7% 8.0% 8.3% 9.5% Care Enablement segment Revenue in € million 1,267 1,318 1,376 1,392 2,586 3,961 5,353 Operating income in € million 69 (11) (26) (61) 59 33 (30) Operating income margin 5.5% -0.8% -1.9% -4.4% 2.3% 0.8% -0.6% Operating income in € million (excluding special items and PRF) 2 96 3 7 (2) 100 107 103 Operating income margin (excluding special items and PRF) 2 7.6% 0.2% 0.5% -0.2% 3.8% 2.7% 1.9% Inter-segment eliminations 1 Revenue in € million (366) (383) (411) (388) (750) (1,160) (1,548) Operating income in € million (9) 3 5 2 (8) (2) 0 Corporate Operating income in € million (10) (84) (7) (44) (94) (101) (144) Operating income in € million (excluding special items and PRF) 2 (7) (9) (6) (20) (16) (22) (41) 1 The Company transfers products between segments at fair market value. The associated internal revenues and expenses and any remaining internally generated profit or loss for the product transfers are recorded within the operating segments initially, are eliminated upon consolidation and are included within “Inter-segment eliminations”. 2 For a reconciliation of operating income in € million (excluding special items and PRF) and operating income margin (excluding special items and PRF), please refer to the table on page 8. Segment information page 3 of 11 June 2, 2023 |

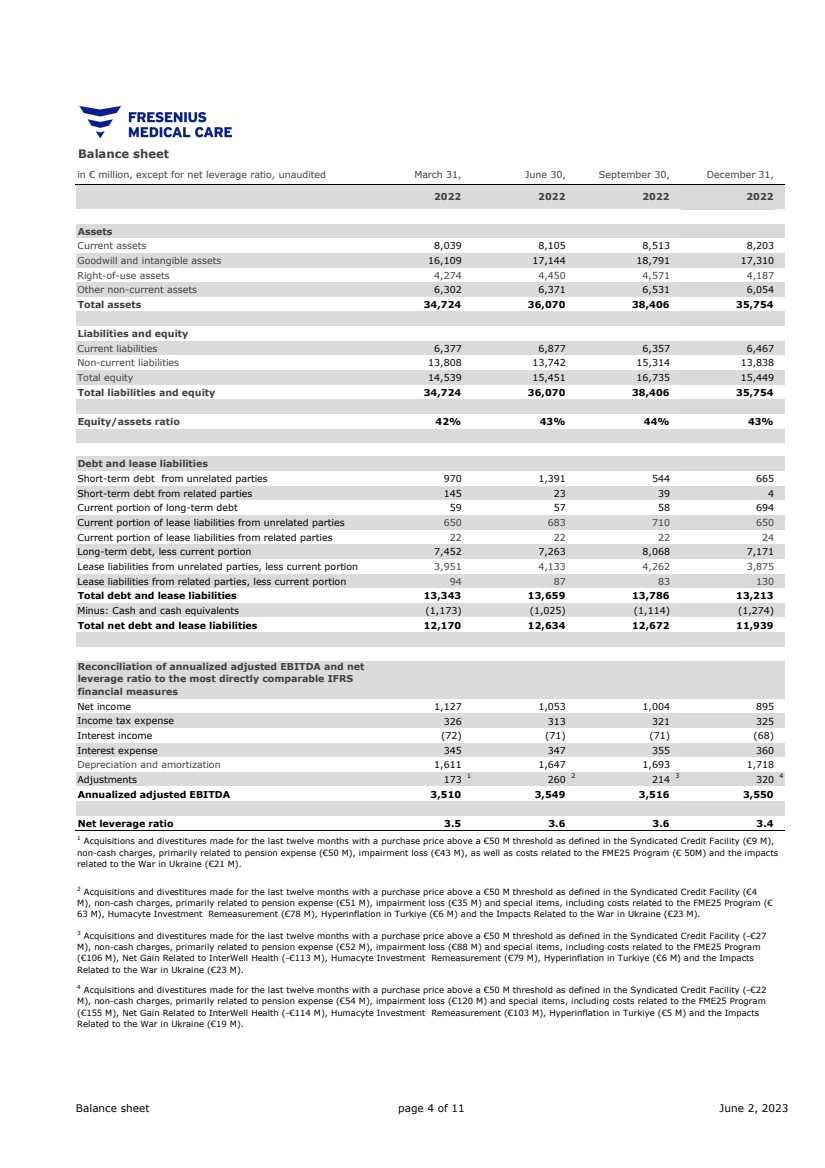
| Balance sheet in € million, except for net leverage ratio, unaudited March 31, June 30, September 30, December 31, 2022 2022 2022 2022 Assets Current assets 8,039 8,105 8,513 8,203 Goodwill and intangible assets 16,109 17,144 18,791 17,310 Right-of-use assets 4,274 4,450 4,571 4,187 Other non-current assets 6,302 6,371 6,531 6,054 Total assets 34,724 36,070 38,406 35,754 Liabilities and equity Current liabilities 6,377 6,877 6,357 6,467 Non-current liabilities 13,808 13,742 15,314 13,838 Total equity 14,539 15,451 16,735 15,449 Total liabilities and equity 34,724 36,070 38,406 35,754 Equity/assets ratio 42% 43% 44% 43% Debt and lease liabilities Short-term debt from unrelated parties 970 1,391 544 665 Short-term debt from related parties 145 23 39 4 Current portion of long-term debt 59 57 58 694 Current portion of lease liabilities from unrelated parties 650 683 710 650 Current portion of lease liabilities from related parties 22 22 22 24 Long-term debt, less current portion 7,452 7,263 8,068 7,171 Lease liabilities from unrelated parties, less current portion 3,951 4,133 4,262 3,875 Lease liabilities from related parties, less current portion 94 87 83 130 Total debt and lease liabilities 13,343 13,659 13,786 13,213 Minus: Cash and cash equivalents (1,173) (1,025) (1,114) (1,274) Total net debt and lease liabilities 12,170 12,634 12,672 11,939 Reconciliation of annualized adjusted EBITDA and net leverage ratio to the most directly comparable IFRS financial measures Net income 1,127 1,053 1,004 895 Income tax expense 326 313 321 325 Interest income (72) (71) (71) (68) Interest expense 345 347 355 360 Depreciation and amortization 1,611 1,647 1,693 1,718 Adjustments 173 1 260 2 214 3 320 4 Annualized adjusted EBITDA 3,510 3,549 3,516 3,550 Net leverage ratio 3.5 3.6 3.6 3.4 1 Acquisitions and divestitures made for the last twelve months with a purchase price above a €50 M threshold as defined in the Syndicated Credit Facility (€9 M), non-cash charges, primarily related to pension expense (€50 M), impairment loss (€43 M), as well as costs related to the FME25 Program (€ 50M) and the impacts related to the War in Ukraine (€21 M). 4 Acquisitions and divestitures made for the last twelve months with a purchase price above a €50 M threshold as defined in the Syndicated Credit Facility (-€22 M), non-cash charges, primarily related to pension expense (€54 M), impairment loss (€120 M) and special items, including costs related to the FME25 Program (€155 M), Net Gain Related to InterWell Health (-€114 M), Humacyte Investment Remeasurement (€103 M), Hyperinflation in Turkiye (€5 M) and the Impacts Related to the War in Ukraine (€19 M). 2 Acquisitions and divestitures made for the last twelve months with a purchase price above a €50 M threshold as defined in the Syndicated Credit Facility (€4 M), non-cash charges, primarily related to pension expense (€51 M), impairment loss (€35 M) and special items, including costs related to the FME25 Program (€ 63 M), Humacyte Investment Remeasurement (€78 M), Hyperinflation in Turkiye (€6 M) and the Impacts Related to the War in Ukraine (€23 M). 3 Acquisitions and divestitures made for the last twelve months with a purchase price above a €50 M threshold as defined in the Syndicated Credit Facility (-€27 M), non-cash charges, primarily related to pension expense (€52 M), impairment loss (€88 M) and special items, including costs related to the FME25 Program (€106 M), Net Gain Related to InterWell Health (-€113 M), Humacyte Investment Remeasurement (€79 M), Hyperinflation in Turkiye (€6 M) and the Impacts Related to the War in Ukraine (€23 M). Balance sheet page 4 of 11 June 2, 2023 |
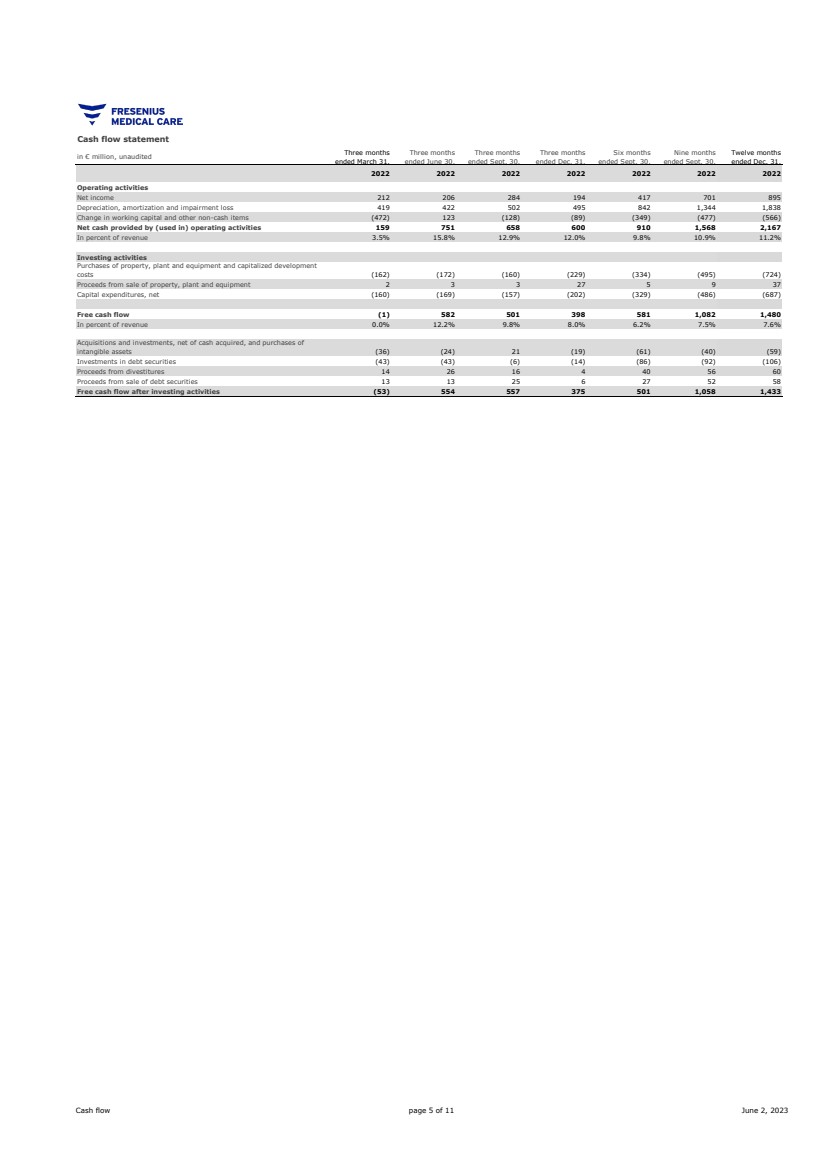
| Cash flow statement in € million, unaudited Three months ended March 31, Three months ended June 30, Three months ended Sept. 30, Three months ended Dec. 31, Six months ended Sept. 30, Nine months ended Sept. 30, Twelve months ended Dec. 31, 2022 2022 2022 2022 2022 2022 2022 Operating activities Net income 212 206 284 194 417 701 895 Depreciation, amortization and impairment loss 419 422 502 495 842 1,344 1,838 Change in working capital and other non-cash items (472) 123 (128) (89) (349) (477) (566) Net cash provided by (used in) operating activities 159 751 658 600 910 1,568 2,167 In percent of revenue 3.5% 15.8% 12.9% 12.0% 9.8% 10.9% 11.2% Investing activities Purchases of property, plant and equipment and capitalized development costs (162) (172) (160) (229) (334) (495) (724) Proceeds from sale of property, plant and equipment 2 3 3 27 5 9 37 Capital expenditures, net (160) (169) (157) (202) (329) (486) (687) Free cash flow (1) 582 501 398 581 1,082 1,480 In percent of revenue 0.0% 12.2% 9.8% 8.0% 6.2% 7.5% 7.6% Acquisitions and investments, net of cash acquired, and purchases of intangible assets (36) (24) 21 (19) (61) (40) (59) Investments in debt securities (43) (43) (6) (14) (86) (92) (106) Proceeds from divestitures 14 26 16 4 40 56 60 Proceeds from sale of debt securities 13 13 25 6 27 52 58 Free cash flow after investing activities (53) 554 557 375 501 1,058 1,433 Cash flow page 5 of 11 June 2, 2023 |
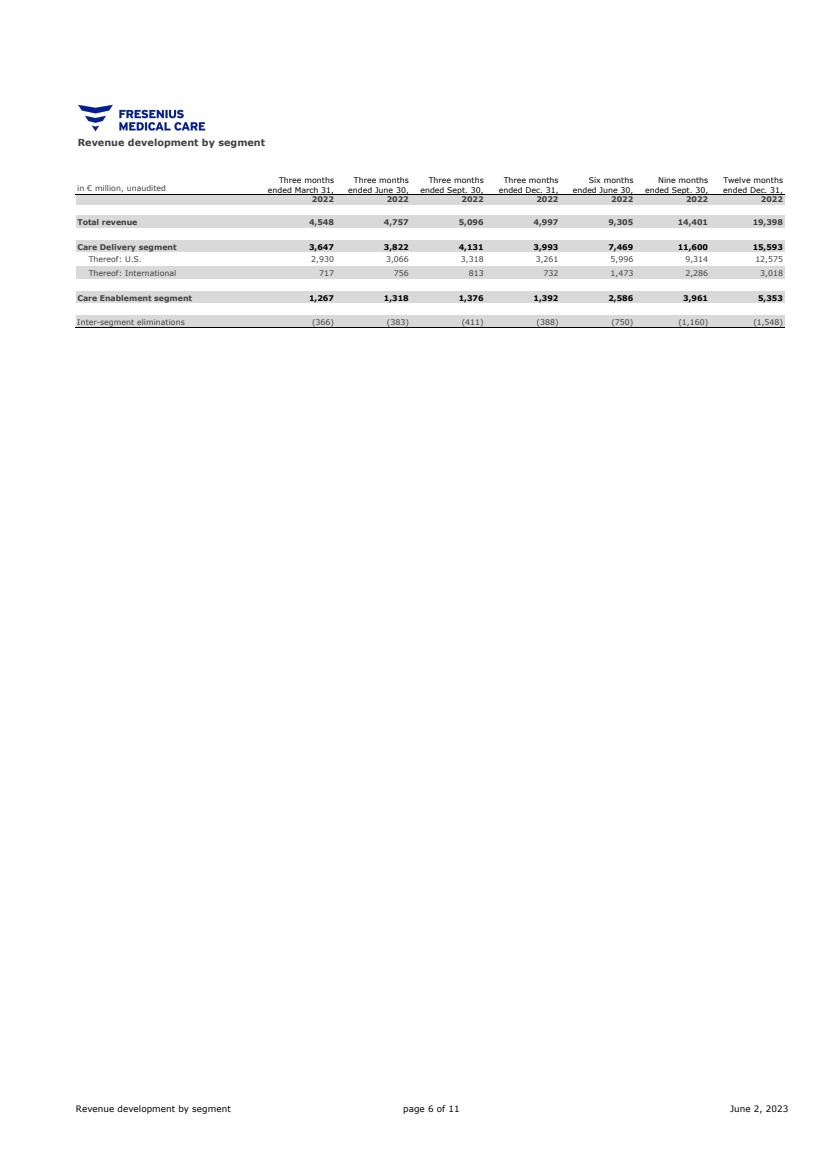
| in € million, unaudited Three months ended March 31, Three months ended June 30, Three months ended Sept. 30, Three months ended Dec. 31, Six months ended June 30, Nine months ended Sept. 30, Twelve months ended Dec. 31, 2022 2022 2022 2022 2022 2022 2022 Total revenue 4,548 4,757 5,096 4,997 9,305 14,401 19,398 Care Delivery segment 3,647 3,822 4,131 3,993 7,469 11,600 15,593 Thereof: U.S. 2,930 3,066 3,318 3,261 5,996 9,314 12,575 Thereof: International 717 756 813 732 1,473 2,286 3,018 Care Enablement segment 1,267 1,318 1,376 1,392 2,586 3,961 5,353 Inter-segment eliminations (366) (383) (411) (388) (750) (1,160) (1,548) Revenue development by segment Revenue development by segment page 6 of 11 June 2, 2023 |
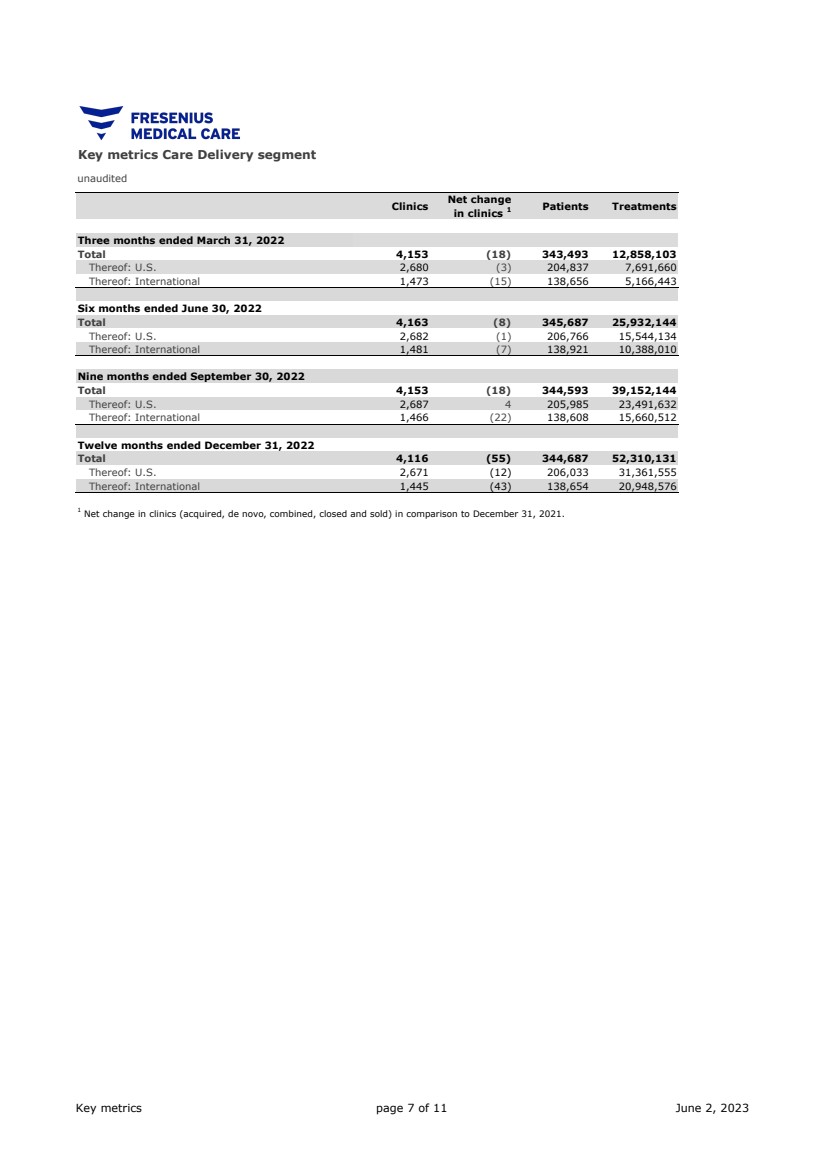
| unaudited Clinics Net change in clinics 1 Patients Treatments Three months ended March 31, 2022 Total 4,153 (18) 343,493 12,858,103 Thereof: U.S. 2,680 (3) 204,837 7,691,660 Thereof: International 1,473 (15) 138,656 5,166,443 Six months ended June 30, 2022 Total 4,163 (8) 345,687 25,932,144 Thereof: U.S. 2,682 (1) 206,766 15,544,134 Thereof: International 1,481 (7) 138,921 10,388,010 Nine months ended September 30, 2022 Total 4,153 (18) 344,593 39,152,144 Thereof: U.S. 2,687 4 205,985 23,491,632 Thereof: International 1,466 (22) 138,608 15,660,512 Twelve months ended December 31, 2022 Total 4,116 (55) 344,687 52,310,131 Thereof: U.S. 2,671 (12) 206,033 31,361,555 Thereof: International 1,445 (43) 138,654 20,948,576 Key metrics Care Delivery segment 1 Net change in clinics (acquired, de novo, combined, closed and sold) in comparison to December 31, 2021. Key metrics page 7 of 11 June 2, 2023 |
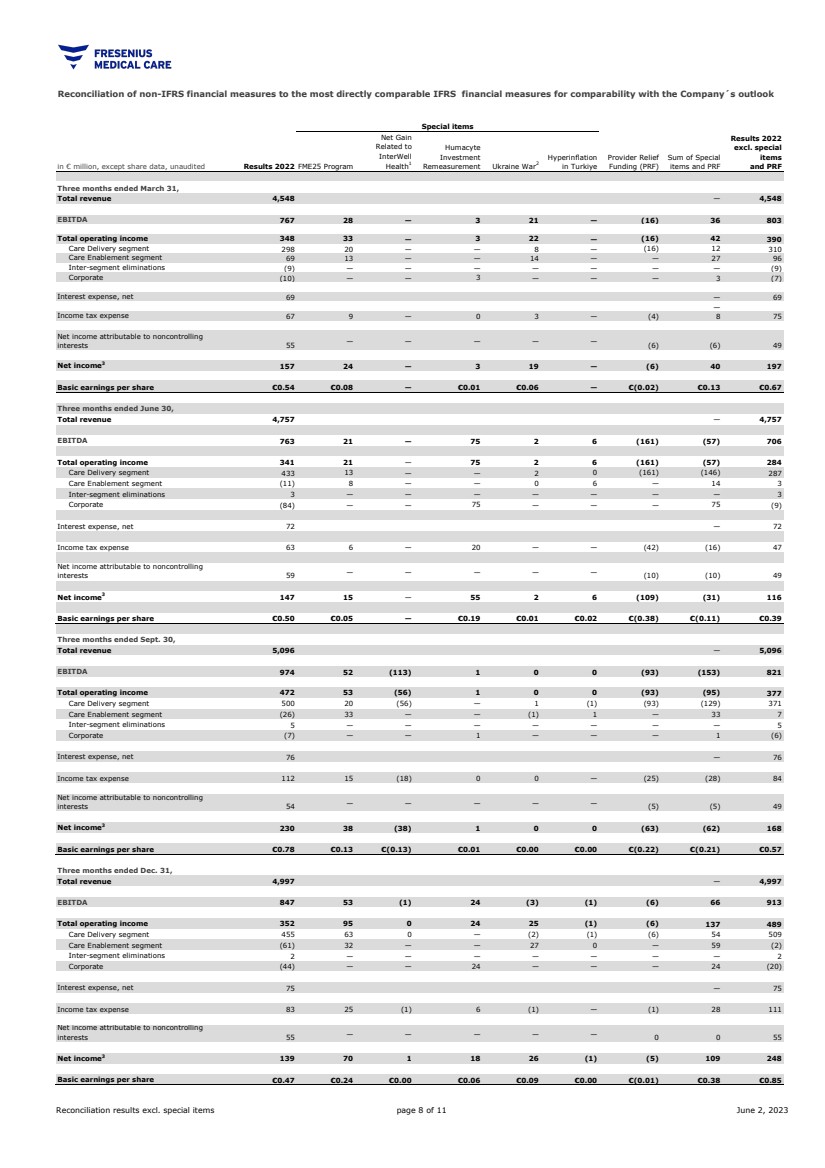
| in € million, except share data, unaudited Results 2022 FME25 Program Net Gain Related to InterWell Health1 Humacyte Investment Remeasurement Ukraine War2 Hyperinflation in Turkiye Provider Relief Funding (PRF) Sum of Special items and PRF Results 2022 excl. special items and PRF Three months ended March 31, Total revenue 4,548 — 4,548 EBITDA 767 28 — 3 21 — (16) 36 803 Total operating income 348 33 — 3 22 — (16) 42 390 Care Delivery segment 298 20 — — 8 — (16) 12 310 Care Enablement segment 69 13 — — 14 — — 27 96 Inter-segment eliminations (9) — — — — — — — (9) Corporate (10) �� — 3 — — — 3 (7) Interest expense, net 69 — 69 — Income tax expense 67 9 — 0 3 — (4) 8 75 Net income attributable to noncontrolling interests 55 — — — — — (6) (6) 49 Net income3 157 24 — 3 19 — (6) 40 197 Basic earnings per share €0.54 €0.08 — €0.01 €0.06 — €(0.02) €0.13 €0.67 Three months ended June 30, Total revenue 4,757 — 4,757 EBITDA 763 21 — 75 2 6 (161) (57) 706 Total operating income 341 21 — 75 2 6 (161) (57) 284 Care Delivery segment 433 13 — — 2 0 (161) (146) 287 Care Enablement segment (11) 8 — — 0 6 — 14 3 Inter-segment eliminations 3 — — — — — — — 3 Corporate (84) — — 75 — — — 75 (9) Interest expense, net 72 — 72 Income tax expense 63 6 — 20 — — (42) (16) 47 Net income attributable to noncontrolling interests 59 — — — — — (10) (10) 49 Net income3 147 15 — 55 2 6 (109) (31) 116 Basic earnings per share €0.50 €0.05 — €0.19 €0.01 €0.02 €(0.38) €(0.11) €0.39 Three months ended Sept. 30, Total revenue 5,096 — 5,096 EBITDA 974 52 (113) 1 0 0 (93) (153) 821 Total operating income 472 53 (56) 1 0 0 (93) (95) 377 Care Delivery segment 500 20 (56) — 1 (1) (93) (129) 371 Care Enablement segment (26) 33 — — (1) 1 — 33 7 Inter-segment eliminations 5 — — — — — — — 5 Corporate (7) — — 1 — — — 1 (6) Interest expense, net 76 — 76 Income tax expense 112 15 (18) 0 0 — (25) (28) 84 Net income attributable to noncontrolling interests 54 — — — — — (5) (5) 49 Net income3 230 38 (38) 1 0 0 (63) (62) 168 Basic earnings per share €0.78 €0.13 €(0.13) €0.01 €0.00 €0.00 €(0.22) €(0.21) €0.57 Three months ended Dec. 31, Total revenue 4,997 — 4,997 EBITDA 847 53 (1) 24 (3) (1) (6) 66 913 Total operating income 352 95 0 24 25 (1) (6) 137 489 Care Delivery segment 455 63 0 — (2) (1) (6) 54 509 Care Enablement segment (61) 32 — — 27 0 — 59 (2) Inter-segment eliminations 2 — — — — — — — 2 Corporate (44) — — 24 — — — 24 (20) Interest expense, net 75 — 75 Income tax expense 83 25 (1) 6 (1) — (1) 28 111 Net income attributable to noncontrolling interests 55 — — — — — 0 0 55 Net income3 139 70 1 18 26 (1) (5) 109 248 Basic earnings per share €0.47 €0.24 €0.00 €0.06 €0.09 €0.00 €(0.01) €0.38 €0.85 Reconciliation of non-IFRS financial measures to the most directly comparable IFRS financial measures for comparability with the Company´s outlook Special items Reconciliation results excl. special items page 8 of 11 June 2, 2023 |
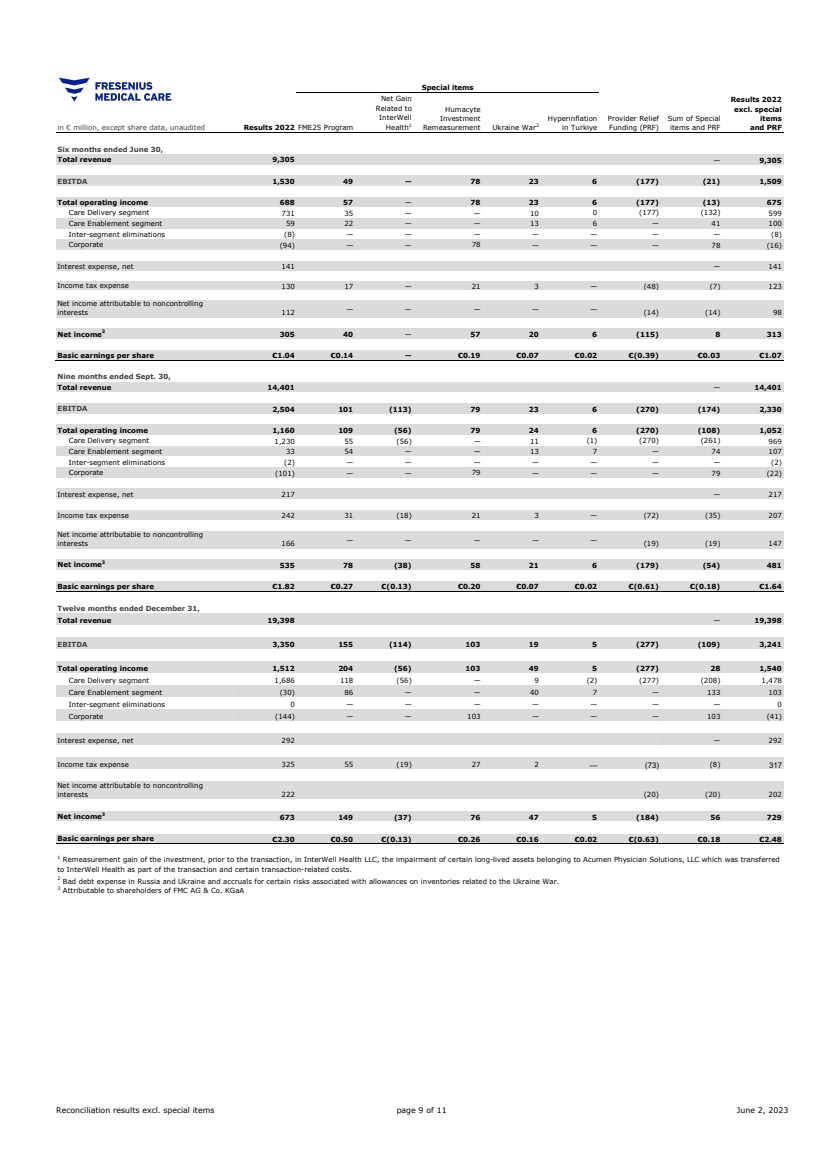
| in € million, except share data, unaudited Results 2022 FME25 Program Net Gain Related to InterWell Health1 Humacyte Investment Remeasurement Ukraine War2 Hyperinflation in Turkiye Provider Relief Funding (PRF) Sum of Special items and PRF Results 2022 excl. special items and PRF Six months ended June 30, Total revenue 9,305 — 9,305 EBITDA 1,530 49 — 78 23 6 (177) (21) 1,509 Total operating income 688 57 — 78 23 6 (177) (13) 675 Care Delivery segment 731 35 — — 10 0 (177) (132) 599 Care Enablement segment 59 22 — — 13 6 — 41 100 Inter-segment eliminations (8) — — — — — — — (8) Corporate (94) — — 78 — — — 78 (16) Interest expense, net 141 — 141 Income tax expense 130 17 — 21 3 — (48) (7) 123 Net income attributable to noncontrolling interests 112 — — — — — (14) (14) 98 Net income3 305 40 — 57 20 6 (115) 8 313 Basic earnings per share €1.04 €0.14 — €0.19 €0.07 €0.02 €(0.39) €0.03 €1.07 Nine months ended Sept. 30, Total revenue 14,401 — 14,401 EBITDA 2,504 101 (113) 79 23 6 (270) (174) 2,330 Total operating income 1,160 109 (56) 79 24 6 (270) (108) 1,052 Care Delivery segment 1,230 55 (56) — 11 (1) (270) (261) 969 Care Enablement segment 33 54 — — 13 7 — 74 107 Inter-segment eliminations (2) — — — — — — — (2) Corporate (101) — — 79 — — — 79 (22) Interest expense, net 217 — 217 Income tax expense 242 31 (18) 21 3 — (72) (35) 207 Net income attributable to noncontrolling interests 166 — — — — — (19) (19) 147 Net income3 535 78 (38) 58 21 6 (179) (54) 481 Basic earnings per share €1.82 €0.27 €(0.13) €0.20 €0.07 €0.02 €(0.61) €(0.18) €1.64 Twelve months ended December 31, Total revenue 19,398 — 19,398 EBITDA 3,350 155 (114) 103 19 5 (277) (109) 3,241 Total operating income 1,512 204 (56) 103 49 5 (277) 28 1,540 Care Delivery segment 1,686 118 (56) — 9 (2) (277) (208) 1,478 Care Enablement segment (30) 86 — — 40 7 — 133 103 Inter-segment eliminations 0 — — — — — — — 0 Corporate (144) — — 103 — — — 103 (41) Interest expense, net 292 — 292 Income tax expense 325 55 (19) 27 2 — (73) (8) 317 Net income attributable to noncontrolling interests 222 (20) (20) 202 Net income3 673 149 (37) 76 47 5 (184) 56 729 Basic earnings per share €2.30 €0.50 €(0.13) €0.26 €0.16 €0.02 €(0.63) €0.18 €2.48 2 Bad debt expense in Russia and Ukraine and accruals for certain risks associated with allowances on inventories related to the Ukraine War. 1 Remeasurement gain of the investment, prior to the transaction, in InterWell Health LLC, the impairment of certain long-lived assets belonging to Acumen Physician Solutions, LLC which was transferred to InterWell Health as part of the transaction and certain transaction-related costs. 3 Attributable to shareholders of FMC AG & Co. KGaA Special items Reconciliation results excl. special items page 9 of 11 June 2, 2023 |
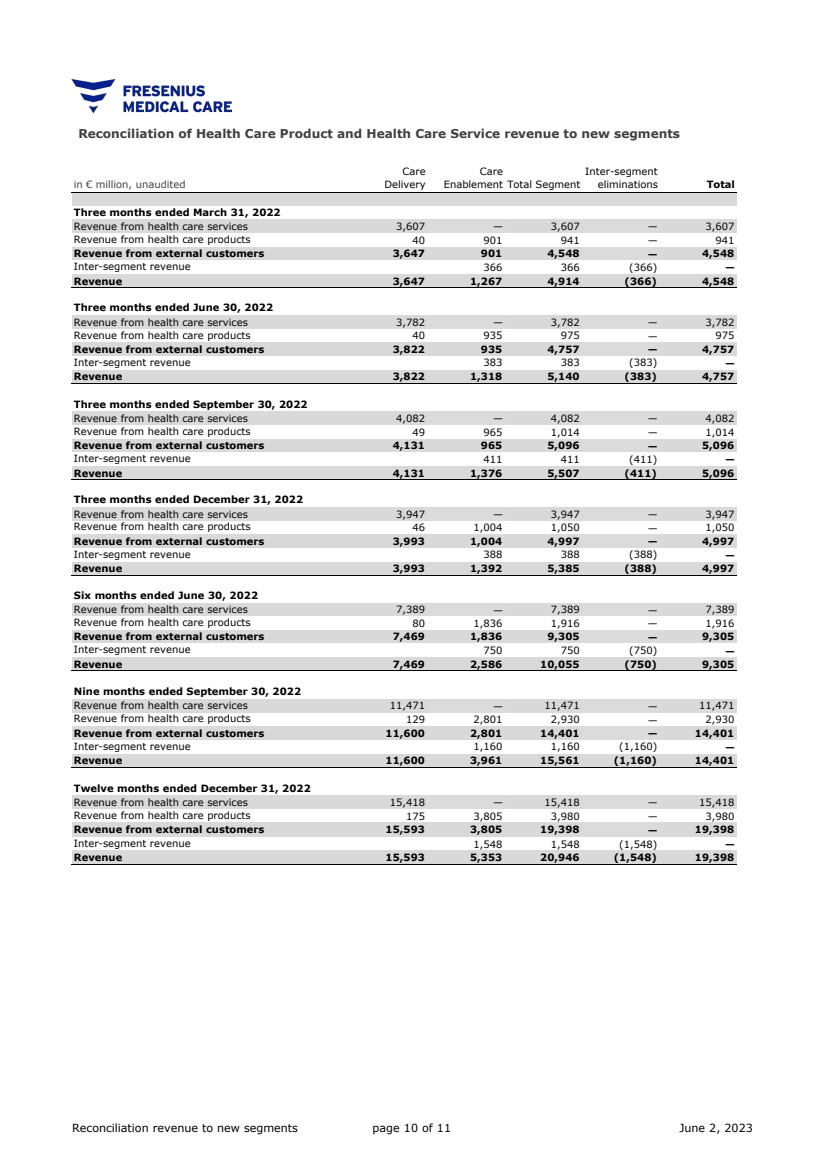
| in € million, unaudited Care Delivery Care Enablement Total Segment Inter-segment eliminations Total Three months ended March 31, 2022 Revenue from health care services 3,607 — 3,607 — 3,607 Revenue from health care products 40 901 941 — 941 Revenue from external customers 3,647 901 4,548 — 4,548 Inter-segment revenue 366 366 (366) — Revenue 3,647 1,267 4,914 (366) 4,548 Three months ended June 30, 2022 Revenue from health care services 3,782 — 3,782 — 3,782 Revenue from health care products 40 935 975 — 975 Revenue from external customers 3,822 935 4,757 — 4,757 Inter-segment revenue 383 383 (383) — Revenue 3,822 1,318 5,140 (383) 4,757 Three months ended September 30, 2022 Revenue from health care services 4,082 — 4,082 — 4,082 Revenue from health care products 49 965 1,014 — 1,014 Revenue from external customers 4,131 965 5,096 — 5,096 Inter-segment revenue 411 411 (411) — Revenue 4,131 1,376 5,507 (411) 5,096 Three months ended December 31, 2022 Revenue from health care services 3,947 — 3,947 — 3,947 Revenue from health care products 46 1,004 1,050 — 1,050 Revenue from external customers 3,993 1,004 4,997 — 4,997 Inter-segment revenue 388 388 (388) — Revenue 3,993 1,392 5,385 (388) 4,997 Six months ended June 30, 2022 Revenue from health care services 7,389 — 7,389 — 7,389 Revenue from health care products 80 1,836 1,916 — 1,916 Revenue from external customers 7,469 1,836 9,305 — 9,305 Inter-segment revenue 750 750 (750) — Revenue 7,469 2,586 10,055 (750) 9,305 Nine months ended September 30, 2022 Revenue from health care services 11,471 — 11,471 — 11,471 Revenue from health care products 129 2,801 2,930 — 2,930 Revenue from external customers 11,600 2,801 14,401 — 14,401 Inter-segment revenue 1,160 1,160 (1,160) — Revenue 11,600 3,961 15,561 (1,160) 14,401 Twelve months ended December 31, 2022 Revenue from health care services 15,418 — 15,418 — 15,418 Revenue from health care products 175 3,805 3,980 — 3,980 Revenue from external customers 15,593 3,805 19,398 — 19,398 Inter-segment revenue 1,548 1,548 (1,548) — Revenue 15,593 5,353 20,946 (1,548) 19,398 Reconciliation of Health Care Product and Health Care Service revenue to new segments Reconciliation revenue to new segments page 10 of 11 June 2, 2023 |
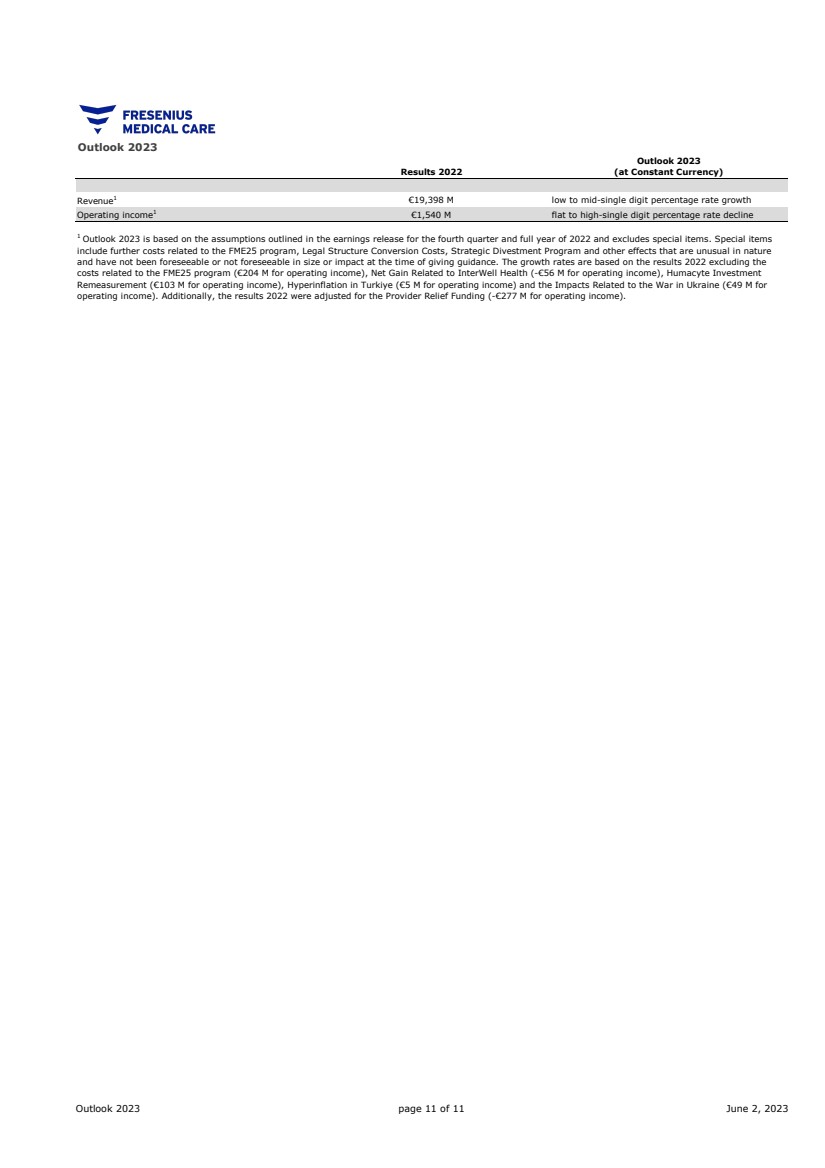
| Outlook 2023 Spalte1 Results 2022 Outlook 2023 (at Constant Currency) Revenue1 €19,398 M low to mid-single digit percentage rate growth Operating income1 €1,540 M flat to high-single digit percentage rate decline 1 Outlook 2023 is based on the assumptions outlined in the earnings release for the fourth quarter and full year of 2022 and excludes special items. Special items include further costs related to the FME25 program, Legal Structure Conversion Costs, Strategic Divestment Program and other effects that are unusual in nature and have not been foreseeable or not foreseeable in size or impact at the time of giving guidance. The growth rates are based on the results 2022 excluding the costs related to the FME25 program (€204 M for operating income), Net Gain Related to InterWell Health (-€56 M for operating income), Humacyte Investment Remeasurement (€103 M for operating income), Hyperinflation in Turkiye (€5 M for operating income) and the Impacts Related to the War in Ukraine (€49 M for operating income). Additionally, the results 2022 were adjusted for the Provider Relief Funding (-€277 M for operating income). Outlook 2023 page 11 of 11 June 2, 2023 |