|
Exhibit 99.1 
|
Exhibit 99.1
CIBC 18th Annual Whistler Institutional Investor Conference
Investor Discussion Materials
January 2015
Forward Looking Statements
The Private Securities Litigation Reform Act of 1995 provides a “safe harbor” for forward-looking statements. Certain information included in this presentation contains statements that are forward-looking, such as statements relating to results of operations and financial conditions and business development activities, as well as capital spending and financing sources. Such forward-looking information involves important risks and uncertainties that could significantly affect anticipated results in the future and, accordingly, such results may differ materially from those expressed in any forward-looking statements made by or on behalf of Mercer. For more information regarding these risks and uncertainties, review Mercer’s filings with the United States Securities and Exchange Commission. Unless required by law, we do not assume any obligation to update forward-looking statements based on unanticipated events or changed expectations.
NASDAQ:MERC | TSX:MRI.U | www.mercerint.com 2
Mercer International Inc.
NASDAQ:MERC | TSX:MRI.U | www.mercerint.com 3
Corporate Structure
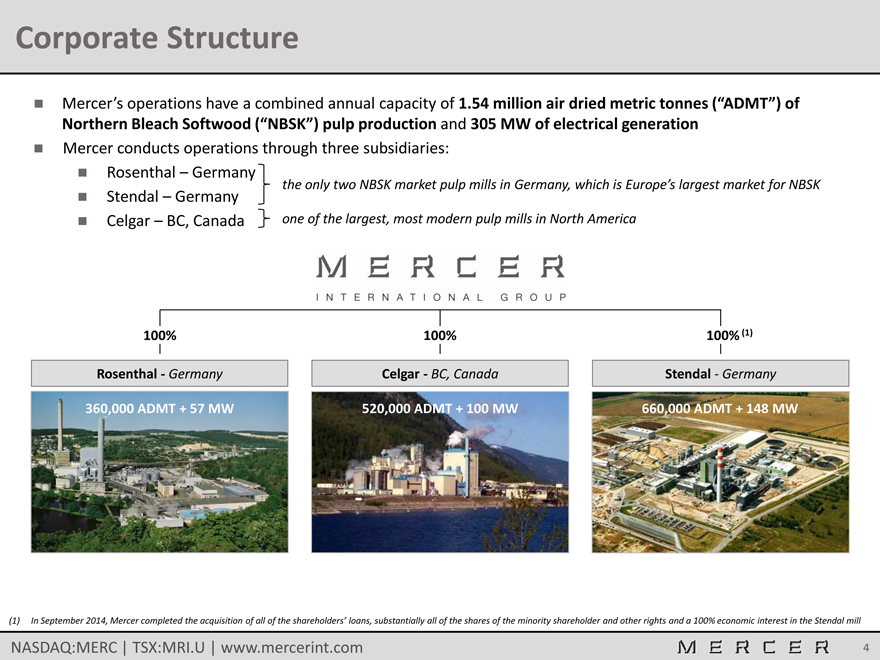
Mercer’s operations have a combined annual capacity of 1.54 million air dried metric tonnes (“ADMT”) of Northern Bleach Softwood (“NBSK”) pulp production and 305 MW of electrical generation
Mercer conducts operations through three subsidiaries:
Rosenthal – Germany
the only two NBSK market pulp mills in Germany, which is Europe’s largest market for NBSK
Stendal – Germany
Celgar – BC, Canada one of the largest, most modern pulp mills in North America
100%
Rosenthal—Germany
360,000 ADMT + 57 MW
100%
Celgar—BC, Canada
520,000 ADMT + 100 MW
100% (1)
Stendal—Germany
660,000 ADMT + 148 MW
(1) In September 2014, Mercer completed the acquisition of all of the shareholders’ loans, substantially all of the shares of the minority shareholder and other rights and a 100% economic interest in the Stendal mill
NASDAQ:MERC | TSX:MRI.U | www.mercerint.com
4
Strategically Located Mills with Access to Global Markets
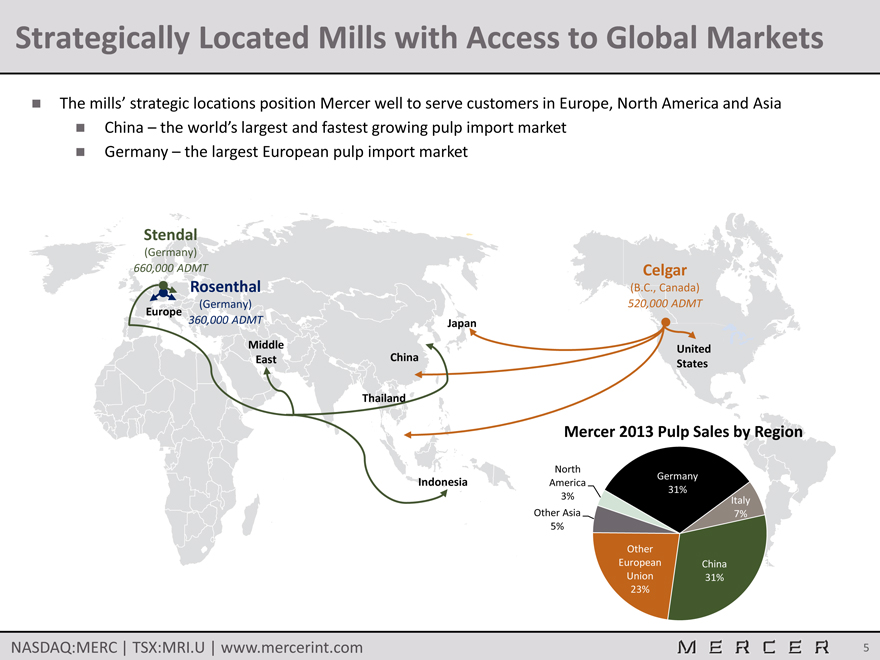
The mills’ strategic locations position Mercer well to serve customers in Europe, North America and Asia
China – the world’s largest and fastest growing pulp import market
Germany – the largest European pulp import market
Stendal
(Germany)
660,000 ADMT Celgar
Rosenthal (B.C., Canada)
(Germany) 520,000 ADMT
Europe
360,000 ADMT Japan
Middle United East China States
Thailand
Indonesia
Mercer 2013 Pulp Sales by Region
North America 3% Other Asia 5%
Germany 31%
Italy 7%
Other
European China Union 31% 23%
NASDAQ:MERC | TSX:MRI.U | www.mercerint.com 5
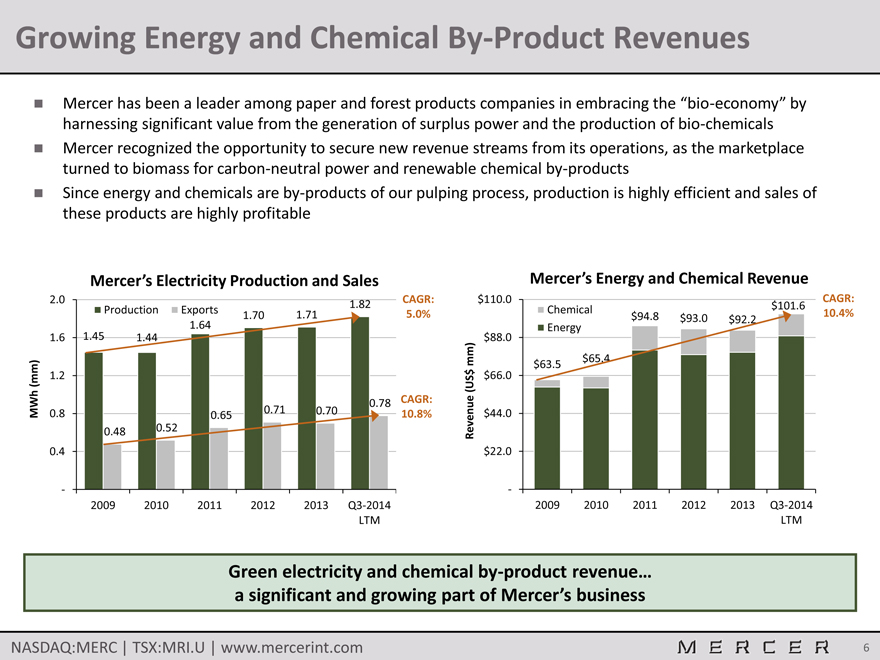
Growing Energy and Chemical By-Product Revenues
Mercer has been a leader among paper and forest products companies in embracing the “bio-economy” by harnessing significant value from the generation of surplus power and the production of bio-chemicals
Mercer recognized the opportunity to secure new revenue streams from its operations, as the marketplace turned to biomass for carbon-neutral power and renewable chemical by-products Since energy and chemicals are by-products of our pulping process, production is highly efficient and sales of these products are highly profitable
Mercer’s Electricity Production and Sales
2.0 1.82
Production Exports 1.70 1.71
1.64
1.6 1.45 1.44
(mm) 1.2
MWh 0.71 0.70 0.78
0.8 0.65
0.48 0.52
0.4
—
2009 2010 2011 2012 2013 Q3-2014
LTM
CAGR: 5.0%
CAGR: 10.8%
Mercer’s Energy and Chemical Revenue
$110.0
Chemical $101.6
$94.8 $93.0 $92.2
Energy
$88.0
mm) $65.4
$63.5
$ $66.0
(US
Revenue $44.0
$22.0
—
2009 2010 2011 2012 2013 Q3-2014
LTM
CAGR: 10.4%
Green electricity and chemical by-product revenue… a significant and growing part of Mercer’s business
NASDAQ:MERC | TSX:MRI.U | www.mercerint.com 6
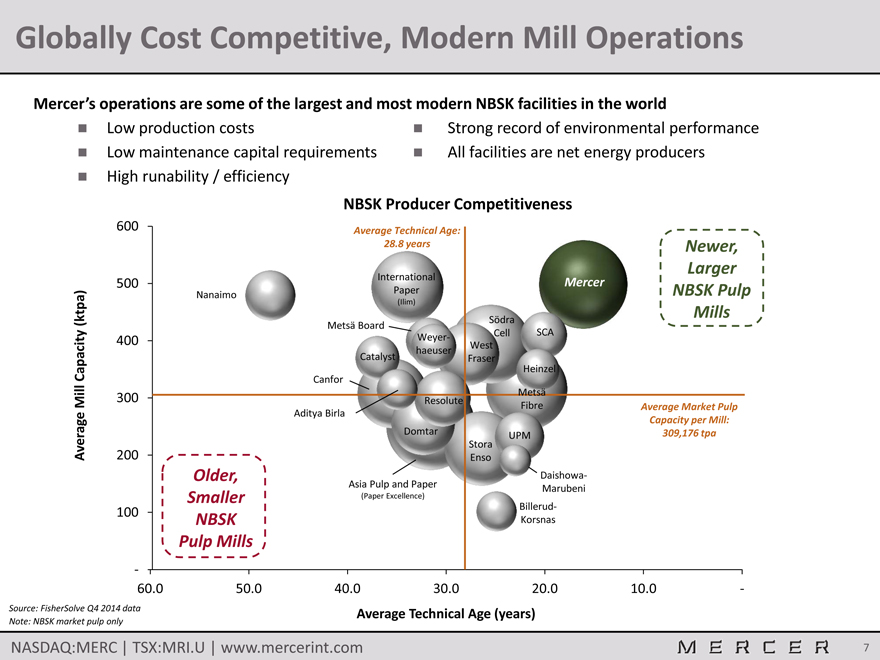
Globally Cost Competitive, Modern Mill Operations
Mercer’s operations are some of the largest and most modern NBSK facilities in the world
Low production costs
Low maintenance capital requirements High runability / efficiency
Strong record of environmental performance All facilities are net energy producers
Average Mill Capacity (ktpa)
NBSK Producer Competitiveness
600 Average Technical Age: 600
28.8 years Newer,
Larger
500 International Mercer 500
Nanaimo Paper NBSK Pulp
(Ilim)
Södra Mills
Metsä Board
400 Weyer- Cell SCA 400
haeuser West
Catalyst Fraser
Heinzel
Canfor
Metsä
300 Resolute 300
Fibre Average Market Pulp
Aditya Birla
Capacity per Mill:
Domtar UPM 309,176 tpa
Stora
200 Enso 200
Older, Daishowa-
Asia Pulp and Paper Marubeni
Smaller (Paper Excellence)
100 Billerud- 100
NBSK Korsnas
Pulp Mills
- -
60.0 50.0 40.0 30.0 20.0 10.0 —
Source: FisherSolve Q4 2014 data Note: NBSK market pulp only
Average Technical Age (years)
NASDAQ:MERC | TSX:MRI.U | www.mercerint.com 7
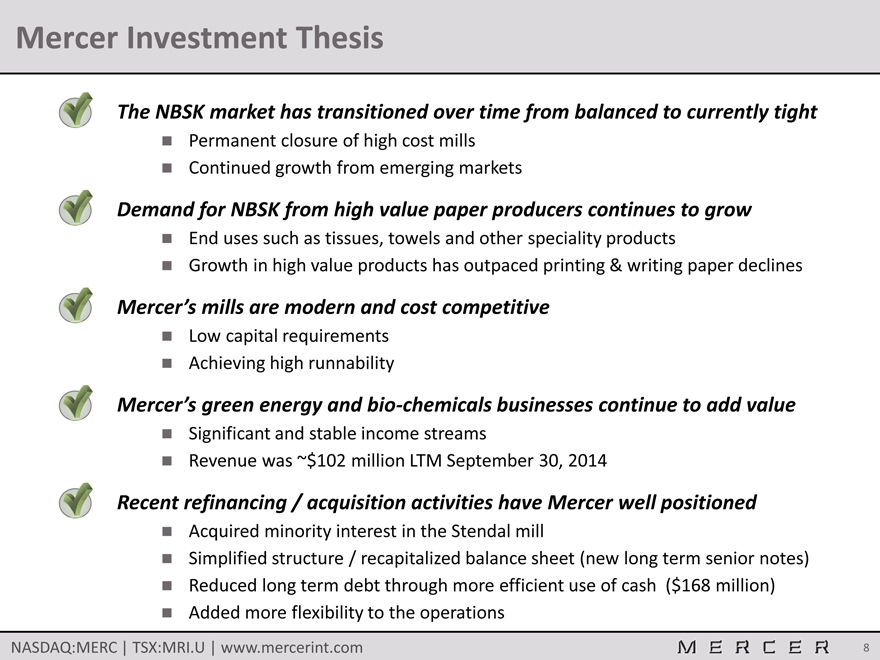
Mercer Investment Thesis
The NBSK market has transitioned over time from balanced to currently tight
Permanent closure of high cost mills Continued growth from emerging markets
Demand for NBSK from high value paper producers continues to grow
End uses such as tissues, towels and other speciality products
Growth in high value products has outpaced printing & writing paper declines
Mercer’s mills are modern and cost competitive
Low capital requirements Achieving high runnability
Mercer’s green energy and bio-chemicals businesses continue to add value
Significant and stable income streams
Revenue was ~$102 million LTM September 30, 2014
Recent refinancing / acquisition activities have Mercer well positioned
Acquired minority interest in the Stendal mill
Simplified structure / recapitalized balance sheet (new long term senior notes)
Reduced long term debt through more efficient use of cash ($168 million)
Added more flexibility to the operations
NASDAQ:MERC | TSX:MRI.U | www.mercerint.com 8
The NBSK Market
NASDAQ:MERC | TSX:MRI.U | www.mercerint.com 9
Introduction to the Major Themes in NBSK
Current themes surrounding the NBSK market include:
The impact of digital media on paper demand and end uses
The effect of China and other emerging economies’ continuing growth
The net supply impact of mill closures, facility conversions, restarts and new mill announcements
The potential supply impact of integrated players selling their pulp on the market
The impact of additional hardwood capacity coming online
NASDAQ:MERC | TSX:MRI.U | www.mercerint.com 10
Global Pulp Market
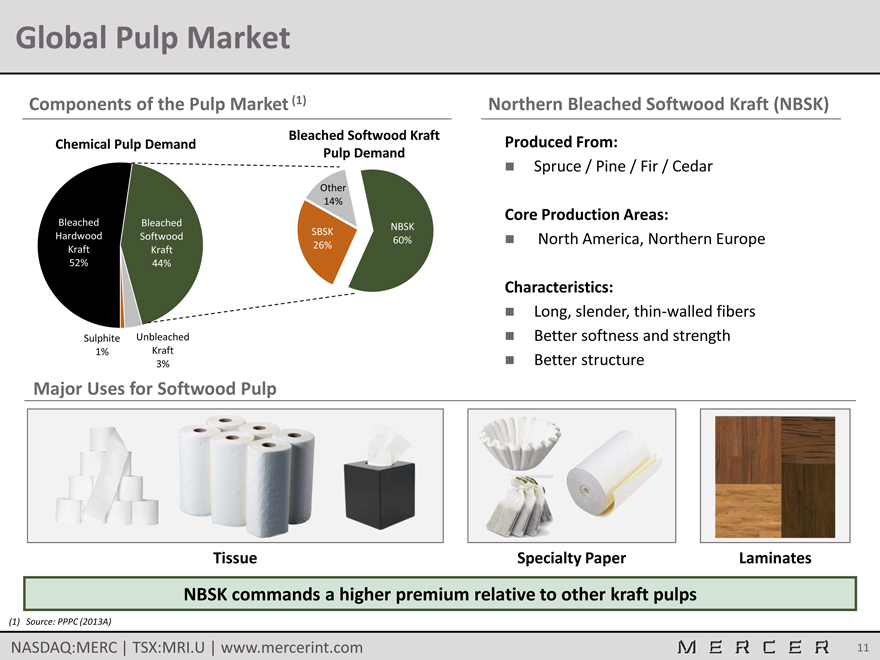
Components of the Pulp Market (1)
Chemical Pulp Demand
Bleached Softwood Kraft Pulp Demand
Bleached Hardwood Kraft 52%
Bleached Softwood Kraft 44%
Sulphite 1%
Unbleached Kraft 3%
Northern Bleached Softwood Kraft (NBSK)
Produced From:
Spruce / Pine / Fir / Cedar
Core Production Areas:
North America, Northern Europe
Characteristics:
Long, slender, thin-walled fibers
Better softness and strength
Better structure
Major Uses for Softwood Pulp
Tissue Specialty Paper Laminates
NBSK commands a higher premium relative to other kraft pulps
(1) Source: PPPC (2013A)
NASDAQ:MERC | TSX:MRI.U | www.mercerint.com 11
Demand Fundamentals – Changes to NBSK End Use Markets
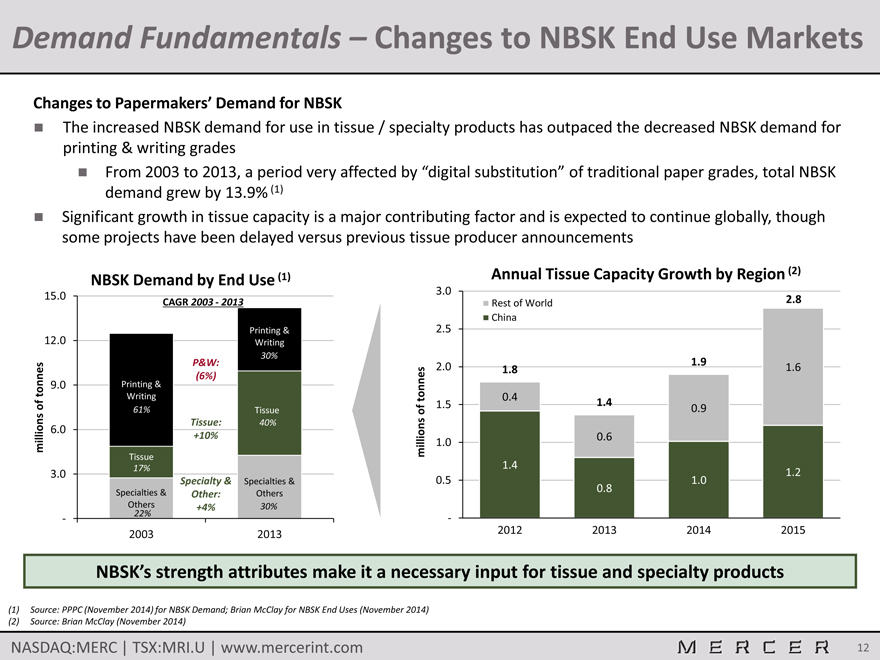
Changes to Papermakers’ Demand for NBSK
The increased NBSK demand for use in tissue / specialty products has outpaced the decreased NBSK demand for printing & writing grades
From 2003 to 2013, a period very affected by “digital substitution” of traditional paper grades, total NBSK demand grew by 13.9% (1)
Significant growth in tissue capacity is a major contributing factor and is expected to continue globally, though some projects have been delayed versus previous tissue producer announcements
Annual Tissue Capacity Growth by Region (2)
NBSK Demand by End Use (1)
15.0 CAGR 2003—2013
Printing &
12.0 Writing
30%
P&W:
(6%)
tonnes 9.0 Printing &
Writing
of 61% Tissue
Tissue: 40%
millions 6.0 +10%
Tissue
3.0 17%
Specialty & Specialties &
Specialties & Other: Others
Others +4% 30%
— 22%
2003 2013
3.0
Rest of World 2.8
China
2.5
1.9
2.0 1.8 1.6
tonnes 0.4
1.5 1.4
of 0.9
millions 1.0 0.6
1.4
1.2
0.5 1.0
0.8
—
2012 2013 2014 2015
NBSK’s strength attributes make it a necessary input for tissue and specialty products
(1) Source: PPPC (November 2014) for NBSK Demand; Brian McClay for NBSK End Uses (November 2014) (2) Source: Brian McClay (November 2014)
NASDAQ:MERC | TSX:MRI.U | www.mercerint.com 12
Demand Fundamentals – China’s Growing Demand
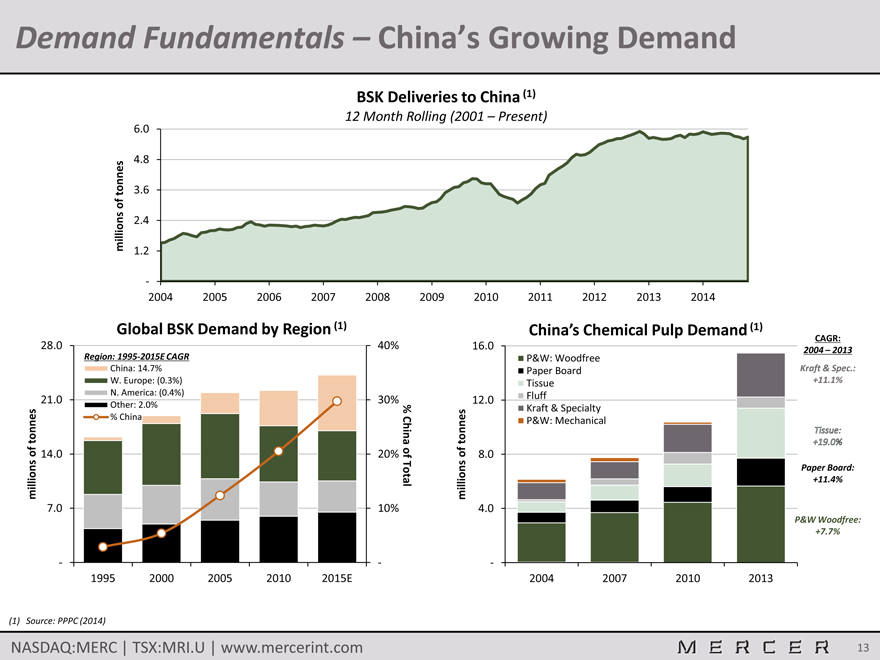
BSK Deliveries to China (1)
12 Month Rolling (2001 – Present)
6.0
4.8
tonnes 3.6
of
millions 2.4
1.2
—
2004 2005 2006 2007 2008 2009 2010 2011 2012 2013 2014
Global BSK Demand by Region (1)
28.0 40%
Region: 1995-2015E CAGR
China: 14.7%
W. Europe: (0.3%)
N. America: (0.4%)
21.0 30%
Other: 2.0% %
tonnes % China China
of 14.0 20% of
millions Total
7.0 10%
— -
1995 2000 2005 2010 2015E
China’s Chemical Pulp Demand (1)
16.0
P&W: Woodfree
Paper Board
Tissue
12.0 Fluff
Kraft & Specialty
tonnes P&W: Mechanical
of 8.0
millions
4.0
—
2004 2007 2010 2013
CAGR:
2004 – 2013
Kraft & Spec.: +11.1%
Paper Board: +11.4%
P&W Woodfree: +7.7%
Tissue: +19.0%
(1) Source: PPPC (2014)
NASDAQ:MERC | TSX:MRI.U | www.mercerint.com 13
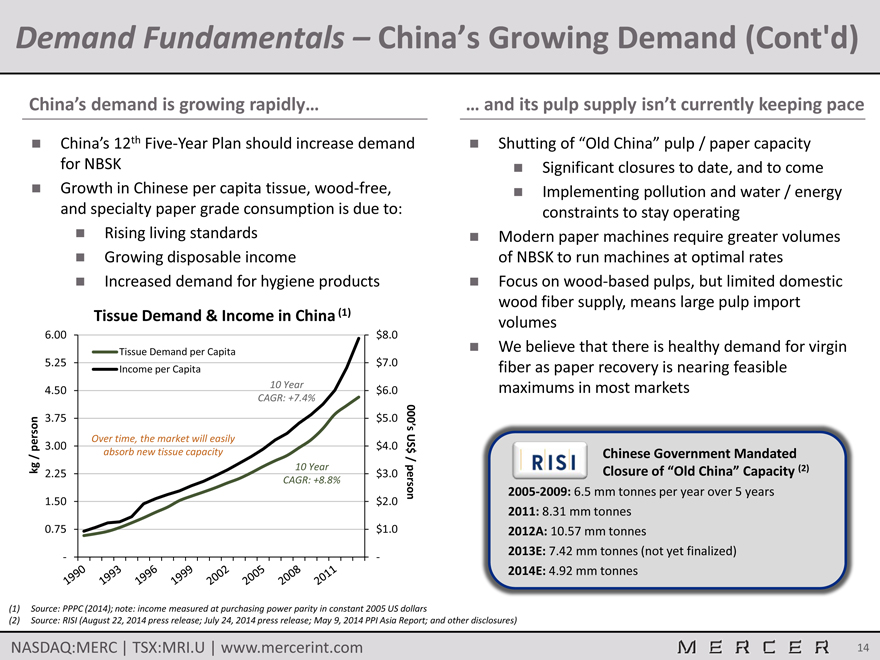
Demand Fundamentals – China’s Growing Demand (Cont’d)
China’s demand is growing rapidly…
China’s 12th Five-Year Plan should increase demand for NBSK
Growth in Chinese per capita tissue, wood-free, and specialty paper grade consumption is due to:
Rising living standards Growing disposable income
Increased demand for hygiene products
Tissue Demand & Income in China (1)
6.00 $ 8.0
Tissue Demand per Capita
5.25 $ 7.0
Income per Capita
10 Year
4.50 $ 6.0
CAGR: +7.4%
3.75 $ 5.0 000’s
person 3.00 Over time, the market will easily $ 4.0 US
absorb new tissue capacity $
/ /
kg 2.25 10 Year $ 3.0
CAGR: +8.8% person
1.50 $ 2.0
0.75 $ 1.0
— —
… and its pulp supply isn’t currently keeping pace
Shutting of “Old China” pulp / paper capacity
Significant closures to date, and to come
Implementing pollution and water / energy constraints to stay operating
Modern paper machines require greater volumes of NBSK to run machines at optimal rates
Focus on wood-based pulps, but limited domestic wood fiber supply, means large pulp import volumes
We believe that there is healthy demand for virgin fiber as paper recovery is nearing feasible maximums in most markets
Chinese Government Mandated
Closure of “Old China” Capacity (2) mm tonnes per year over 5 years tonnes 2012A: 10.57 mm tonnes 2013E: 7.42 mm tonnes (not yet finalized) 2014E: 4.92 mm tonnes
(1) Source: PPPC (2014); note: income measured at purchasing power parity in constant 2005 US dollars
(2) Source: RISI (August 22, 2014 press release; July 24, 2014 press release; May 9, 2014 PPI Asia Report; and other disclosures)
NASDAQ:MERC | TSX:MRI.U | www.mercerint.com 14
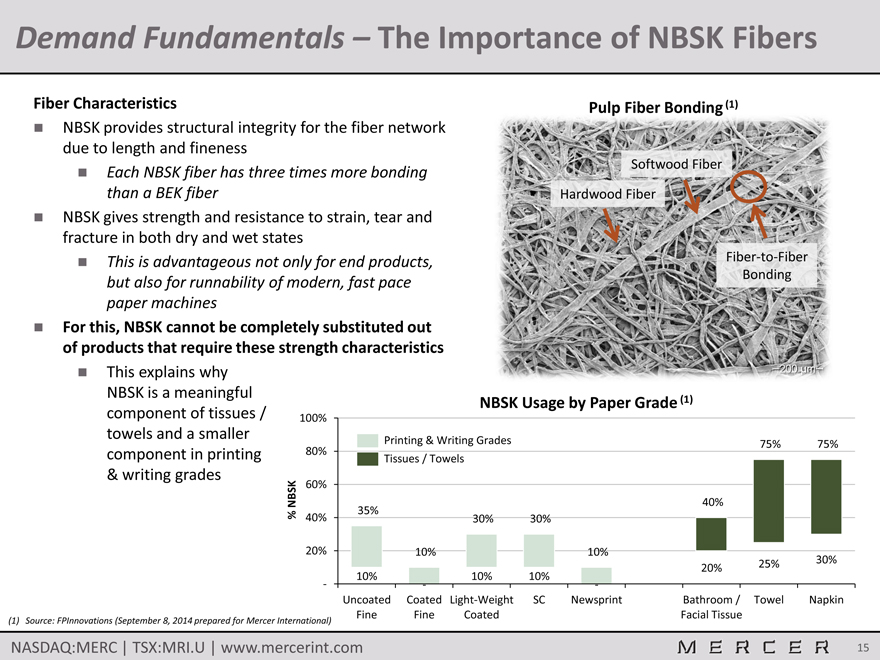
Demand Fundamentals – The Importance of NBSK Fibers
Fiber Characteristics
NBSK provides structural integrity for the fiber network due to length and fineness
Each NBSK fiber has three times more bonding than a BEK fiber
NBSK gives strength and resistance to strain, tear and fracture in both dry and wet states
This is advantageous not only for end products, but also for runnability of modern, fast pace paper machines
For this, NBSK cannot be completely substituted out of products that require these strength characteristics
This explains why NBSK is a meaningful component of tissues / towels and a smaller component in printing & writing grades
Pulp Fiber Bonding (1)
Softwood Fiber
Hardwood Fiber
Fiber-to-Fiber Bonding
NBSK Usage by Paper Grade (1)
100%
Printing & Writing Grades 75% 75%
80%
Tissues / Towels
60%
NBSK 40%
35%
% 40% 30% 30%
20% 10% 10%
25% 30%
20%
10% 10% 10%
- — —
Uncoated Coated Light-Weight SC Newsprint Bathroom / Towel Napkin
Fine Fine Coated Facial Tissue (1) Source: FPInnovations (September 8, 2014 prepared for Mercer International)
NASDAQ:MERC | TSX:MRI.U | www.mercerint.com 15
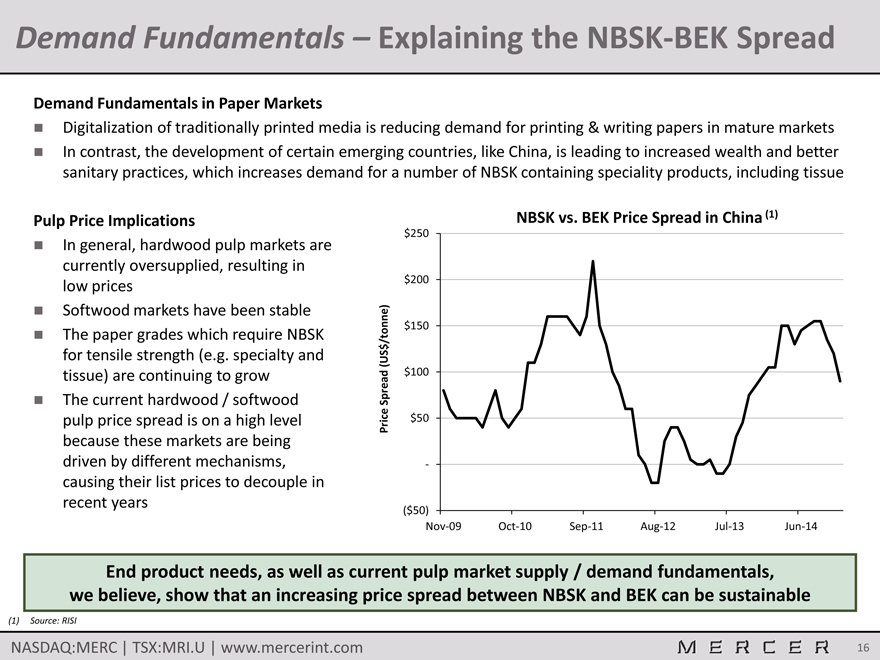
Demand Fundamentals – Explaining the NBSK-BEK Spread
Demand Fundamentals in Paper Markets
Digitalization of traditionally printed media is reducing demand for printing & writing papers in mature markets
In contrast, the development of certain emerging countries, like China, is leading to increased wealth and better sanitary practices, which increases demand for a number of NBSK containing speciality products, including tissue
Pulp Price Implications
In general, hardwood pulp markets are currently oversupplied, resulting in low prices
Softwood markets have been stable
The paper grades which require NBSK for tensile strength (e.g. specialty and tissue) are continuing to grow
The current hardwood / softwood pulp price spread is on a high level because these markets are being driven by different mechanisms, causing their list prices to decouple in recent years
$250 $200 $150 $100 $50 -
($50)
Price Spread (US$/tonne)
NBSK vs. BEK Price Spread in China (1)
Nov-09 Oct-10 Sep-11 Aug-12 Jul-13 Jun-14
End product needs, as well as current pulp market supply / demand fundamentals, we believe, show that an increasing price spread between NBSK and BEK can be sustainable
(1) Source: RISI
NASDAQ:MERC | TSX:MRI.U | www.mercerint.com 16
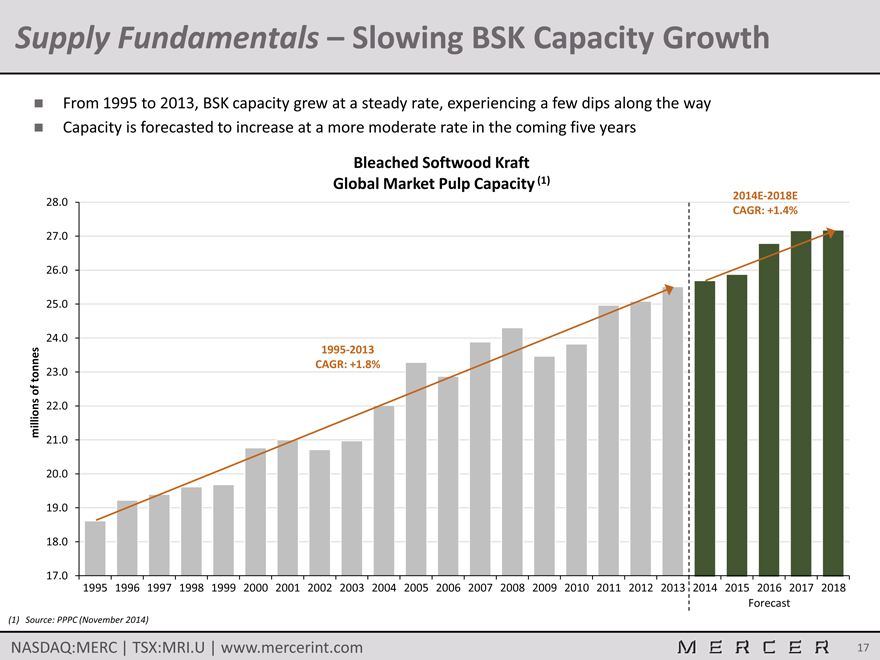
Supply Fundamentals – Slowing BSK Capacity Growth
From 1995 to 2013, BSK capacity grew at a steady rate, experiencing a few dips along the way Capacity is forecasted to increase at a more moderate rate in the coming five years
Bleached Softwood Kraft Global Market Pulp Capacity (1)
2014E-2018E
28.0
CAGR: +1.4% 27.0 26.0 25.0
24.0 tonnes 23.0 of millions 22.0 21.0
20.0 19.0 18.0 17.0
1995-2013 CAGR: +1.8%
2014E-2018E CAGR: +1.4%
1995 1996 1997 1998 1999 2000 2001 2002 2003 2004 2005 2006 2007 2008 2009 2010 2011 2012 2013 2014 2015 2016 2017 2018 Forecast
(1) Source: PPPC
NASDAQ:MERC | TSX:MRI.U | www.mercerint.com 17
(November 2014)
Supply Fundamentals – Net Capacity Change Analysis
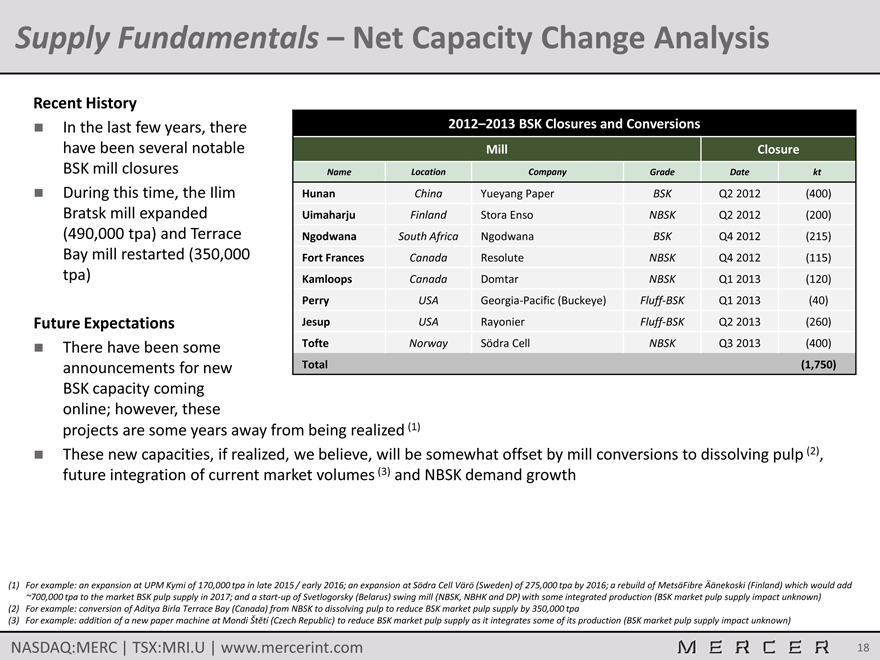
Recent History
In the last few years, there have been several notable BSK mill closures
During this time, the Ilim Bratsk mill expanded (490,000 tpa) and Terrace Bay mill restarted (350,000 tpa)
Future Expectations
There have been some Tofte Norway Södra Cell NBSK Q3 2013 (400)
announcements for new Total (1,750) BSK capacity coming online; however, these projects are some years away from being realized (1) These new capacities, if realized, we believe, will be somewhat offset by mill conversions to dissolving pulp (2), future integration of current market volumes (3) and NBSK demand growth
2012–2013 BSK Closures and Conversions
Mill Closure
Name Location Company Grade Date kt
Hunan China Yueyang Paper BSK Q2 2012 (400)
Uimaharju Finland Stora Enso NBSK Q2 2012 (200)
Ngodwana South Africa Ngodwana BSK Q4 2012 (215)
Fort Frances Canada Resolute NBSK Q4 2012 (115)
Kamloops Canada Domtar NBSK Q1 2013 (120)
Perry USA Georgia-Pacific (Buckeye) Fluff-BSK Q1 2013 (40)
Jesup USA Rayonier Fluff-BSK Q2 2013 (260)
(1) For example: an expansion at UPM Kymi of 170,000 tpa in late 2015 / early 2016; an expansion at Södra Cell Värö (Sweden) of 275,000 tpa by 2016; a rebuild of MetsäFibre Äänekoski (Finland) which would add ~700,000 tpa to the market BSK pulp supply in 2017; and a start-up of Svetlogorsky (Belarus) swing mill (NBSK, NBHK and DP) with some integrated production (BSK market pulp supply impact unknown)
(2) For example: conversion of Aditya Birla Terrace Bay (Canada) from NBSK to dissolving pulp to reduce BSK market pulp supply by 350,000 tpa
(3) For example: addition of a new paper machine at Mondi Štĕtí (Czech Republic) to reduce BSK market pulp supply as it integrates some of its production (BSK market pulp supply impact unknown)
NASDAQ:MERC | TSX:MRI.U | www.mercerint.com 18
Resulting Supply Demand Balance
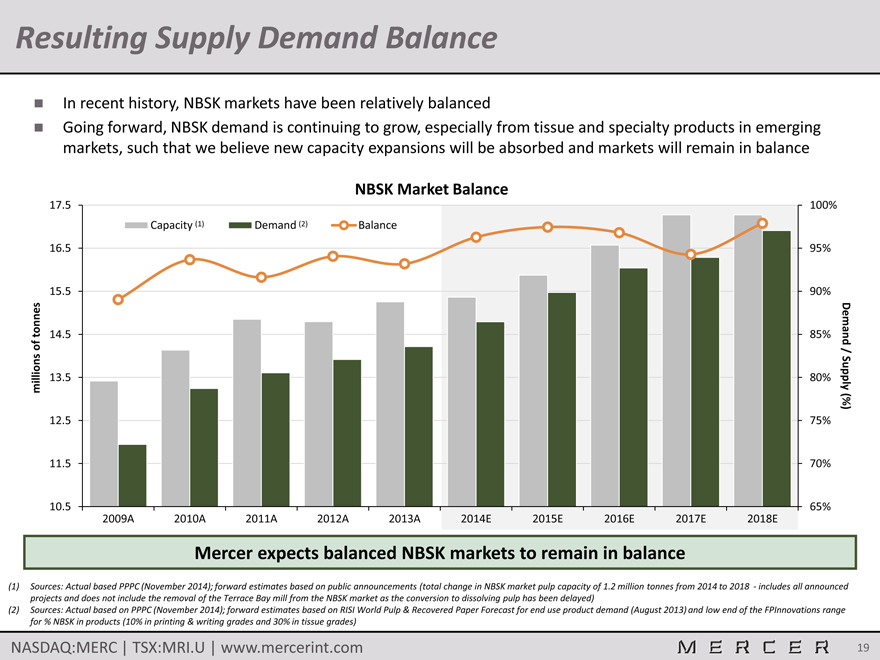
In recent history, NBSK markets have been relatively balanced
Going forward, NBSK demand is continuing to grow, especially from tissue and specialty products in emerging markets, such that we believe new capacity expansions will be absorbed and markets will remain in balance
NBSK Market Balance
17.5 100%
Capacity (1) Demand (2) Balance
16.5 95%
15.5 90%
tonnes 14.5 85% Demand
of /
millions 13.5 80% Supply
(%)
12.5 75%
11.5 70%
10.5 65%
2009A 2010A 2011A 2012A 2013A 2014E 2015E 2016E 2017E 2018E
Mercer expects balanced NBSK markets to remain in balance
(1) Sources: Actual based PPPC (November 2014); forward estimates based on public announcements (total change in NBSK market pulp capacity of 1.2 million tonnes from 2014 to 2018 —includes all announced projects and does not include the removal of the Terrace Bay mill from the NBSK market as the conversion to dissolving pulp has been delayed)
(2) Sources: Actual based on PPPC (November 2014); forward estimates based on RISI World Pulp & Recovered Paper Forecast for end use product demand (August 2013) and low end of the FPInnovations range for % NBSK in products (10% in printing & writing grades and 30% in tissue grades)
NASDAQ:MERC | TSX:MRI.U | www.mercerint.com 19
Strong Long-Term NBSK Fundamentals
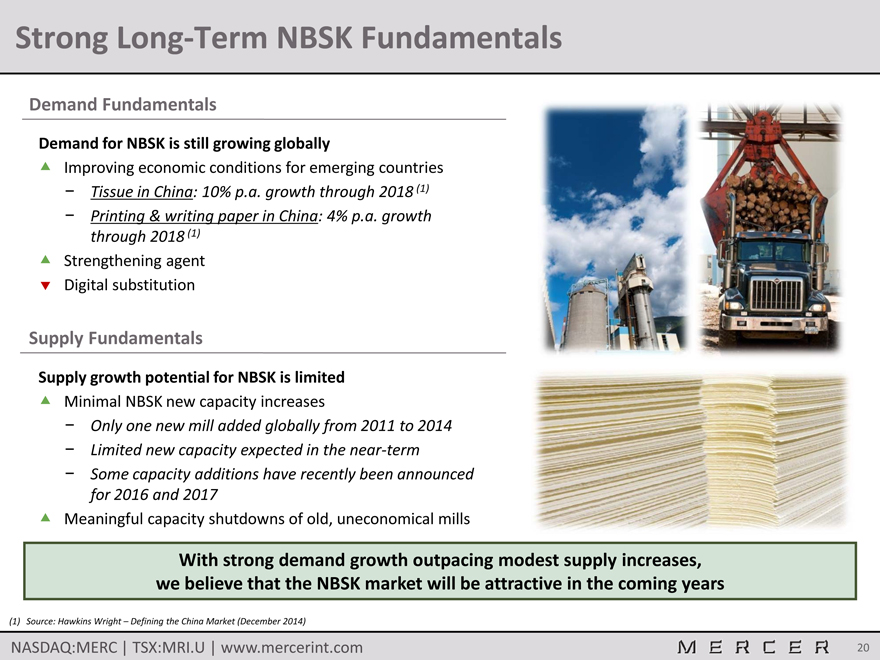
Demand Fundamentals
Demand for NBSK is still growing globally
Improving economic conditions for emerging countries
Tissue in China: 10% p.a. growth through 2018 (1)
Printing & writing paper in China: 4% p.a. growth through 2018 (1)
Strengthening agent Digital substitution
Supply Fundamentals
Supply growth potential for NBSK is limited
Minimal NBSK new capacity increases
Only one new mill added globally from 2011 to 2014
Limited new capacity expected in the near-term
Some capacity additions have recently been announced for 2016 and 2017
Meaningful capacity shutdowns of old, uneconomical mills
With strong demand growth outpacing modest supply increases, we believe that the NBSK market will be attractive in the coming years
(1) Source: Hawkins Wright – Defining the China Market (December 2014)
NASDAQ:MERC | TSX:MRI.U | www.mercerint.com 20
Financial Performance and Recent Developments
NASDAQ:MERC | TSX:MRI.U | www.mercerint.com 21
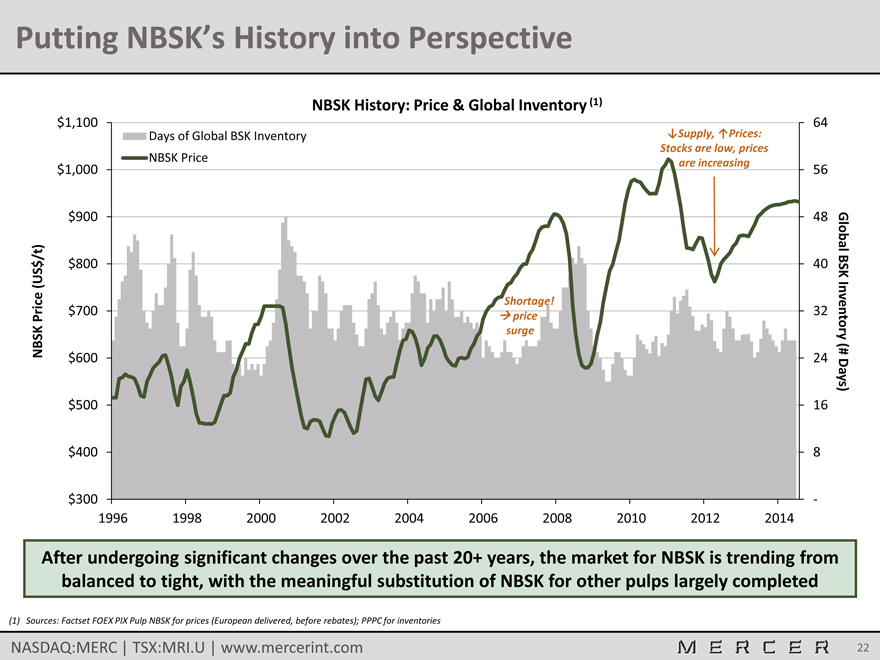
Putting NBSK’s History into Perspective
NBSK History: Price & Global Inventory (1)
$1,100 64
Days of Global BSK Inventory Supply, Prices:
Stocks are low, prices
NBSK Price are increasing
$1,000 56
$900 48
/t) Global
$ $800 40 BSK
(US
Shortage!
$700 price 32
Price surge Inventory
NBSK (#
$600 24
Days)
$500 16
$400 8
$300 —
1996 1998 2000 2002 2004 2006 2008 2010 2012 2014
After undergoing significant changes over the past 20+ years, the market for NBSK is trending from balanced to tight, with the meaningful substitution of NBSK for other pulps largely completed
(1) Sources: Factset FOEX PIX Pulp NBSK for prices (European delivered, before rebates); PPPC for inventories
NASDAQ:MERC | TSX:MRI.U | www.mercerint.com 22
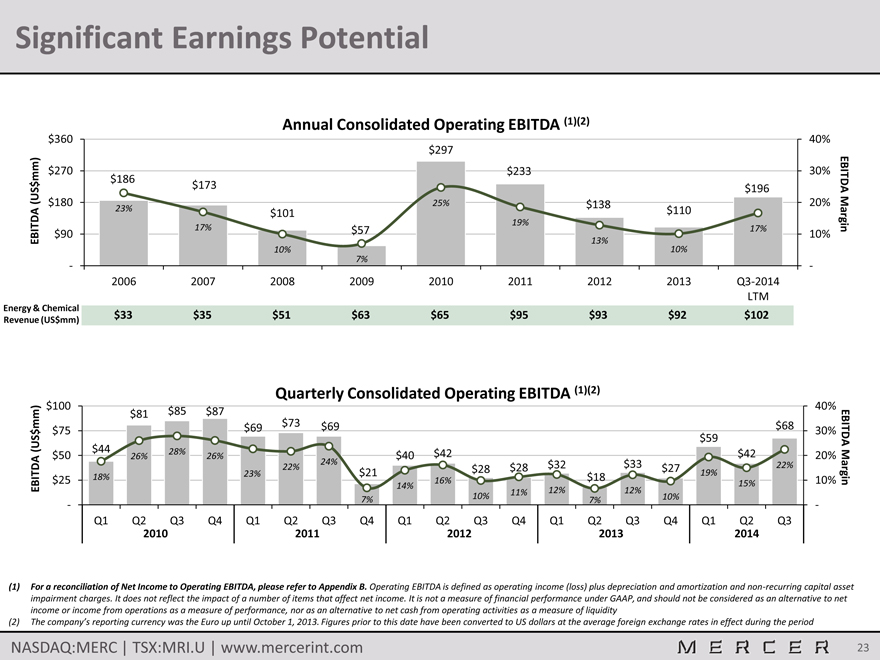
Significant Earnings Potential
Annual Consolidated Operating EBITDA (1)(2)
$360 40%
$297
mm) $270 $186 $233 30%
$ $173 $196 EBITDA
(US $180 25% $138 20%
23% $101 $110
19%
$90 17% $57 17% 10%
EBITDA 13% Margin
10% 10%
7%
- —
2006 2007 2008 2009 2010 2011 2012 2013 Q3-2014
LTM
Energy & Chemical
Revenue (US$mm) $33 $35 $51 $63 $65 $95 $93 $92 $102
Quarterly Consolidated Operating EBITDA (1)(2)
$100 40%
$81 $85 $87
$73
$
(US mm) $75 $69 $69 $59 $68 30% EBITDA
$50 $44 26% 28% 26% $40 $42 $42 20%
22%
23% $21 19%
EBITDA $25 18% 22% 24% 14% 16% $28 $28 $32 $18 $33 $27 15% 10% Margin
11% 12% 12%
7% 10% 7% 10%
— -
Q1 Q2 Q3 Q4 Q1 Q2 Q3 Q4 Q1 Q2 Q3 Q4 Q1 Q2 Q3 Q4 Q1 Q2 Q3
2010 2011 2012 2013 2014
(1) For a reconciliation of Net Income to Operating EBITDA, please refer to Appendix B. Operating EBITDA is defined as operating income (loss) plus depreciation and amortization and non-recurring capital asset impairment charges. It does not reflect the impact of a number of items that affect net income. It is not a measure of financial performance under GAAP, and should not be considered as an alternative to net income or income from operations as a measure of performance, nor as an alternative to net cash from operating activities as a measure of liquidity
(2) The company’s reporting currency was the Euro up until October 1, 2013. Figures prior to this date have been converted to US dollars at the average foreign exchange rates in effect during the period
NASDAQ:MERC | TSX:MRI.U | www.mercerint.com 23
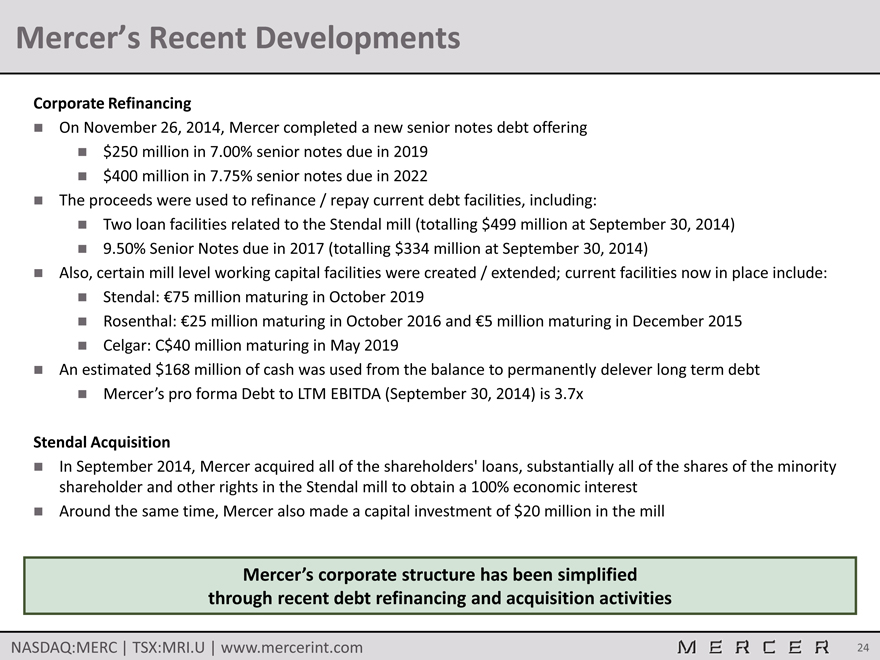
Mercer’s Recent Developments
Corporate Refinancing
On November 26, 2014, Mercer completed a new senior notes debt offering
$250 million in 7.00% senior notes due in 2019
$400 million in 7.75% senior notes due in 2022
The proceeds were used to refinance / repay current debt facilities, including:
Two loan facilities related to the Stendal mill (totalling $499 million at September 30, 2014)
9.50% Senior Notes due in 2017 (totalling $334 million at September 30, 2014)
Also, certain mill level working capital facilities were created / extended; current facilities now in place include:
Stendal: €75 million maturing in October 2019
Rosenthal: €25 million maturing in October 2016 and €5 million maturing in December 2015
Celgar: C$40 million maturing in May 2019
An estimated $168 million of cash was used from the balance to permanently delever long term debt
Mercer’s pro forma Debt to LTM EBITDA (September 30, 2014) is 3.7x
Stendal Acquisition
In September 2014, Mercer acquired all of the shareholders’ loans, substantially all of the shares of the minority shareholder and other rights in the Stendal mill to obtain a 100% economic interest
Around the same time, Mercer also made a capital investment of $20 million in the mill
Mercer’s corporate structure has been simplified through recent debt refinancing and acquisition activities
NASDAQ:MERC | TSX:MRI.U | www.mercerint.com 24
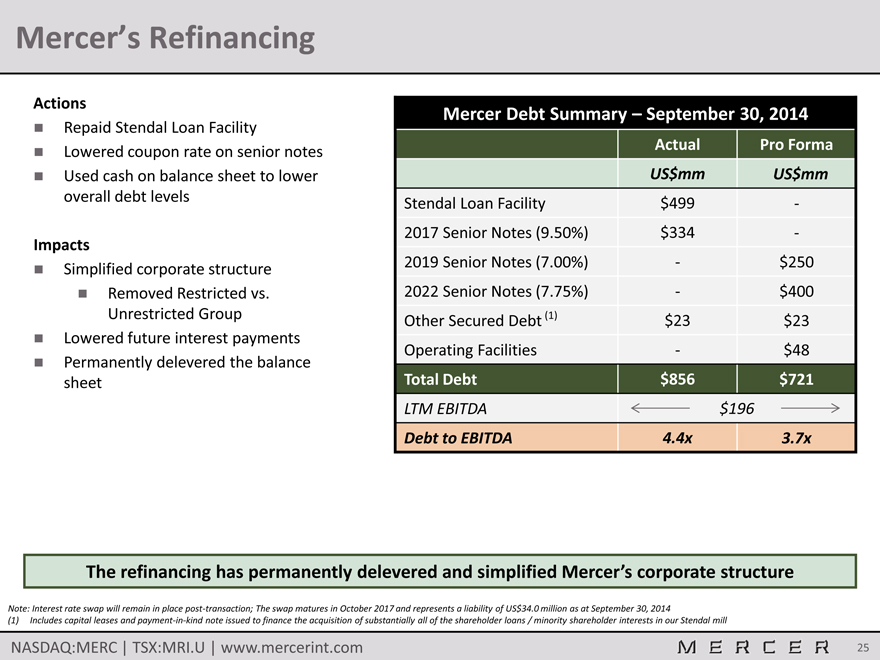
Mercer’s Refinancing
Actions
Repaid Stendal Loan Facility
Lowered coupon rate on senior notes
Used cash on balance sheet to lower overall debt levels
Impacts
Simplified corporate structure
Removed Restricted vs.
Unrestricted Group
Lowered future interest payments
Permanently delevered the balance sheet
Mercer Debt Summary – September 30, 2014
Actual Pro Forma
US$mm US$mm
Stendal Loan Facility $499 -
2017 Senior Notes (9.50%) $334 -
2019 Senior Notes (7.00%) — $250
2022 Senior Notes (7.75%) — $400
Other Secured Debt (1) $23 $23
Operating Facilities — $48
Total Debt $856 $721
LTM EBITDA $196
Debt to EBITDA 4.4x 3.7x
The refinancing has permanently delevered and simplified Mercer’s corporate structure
Note: Interest rate swap will remain in place post-transaction; The swap matures in October 2017 and represents a liability of US$34.0 million as at September 30, 2014
(1) Includes capital leases and payment-in-kind note issued to finance the acquisition of substantially all of the shareholder loans / minority shareholder interests in our Stendal mill
NASDAQ:MERC | TSX:MRI.U | www.mercerint.com 25
Mercer’s Recent Developments (Cont’d)
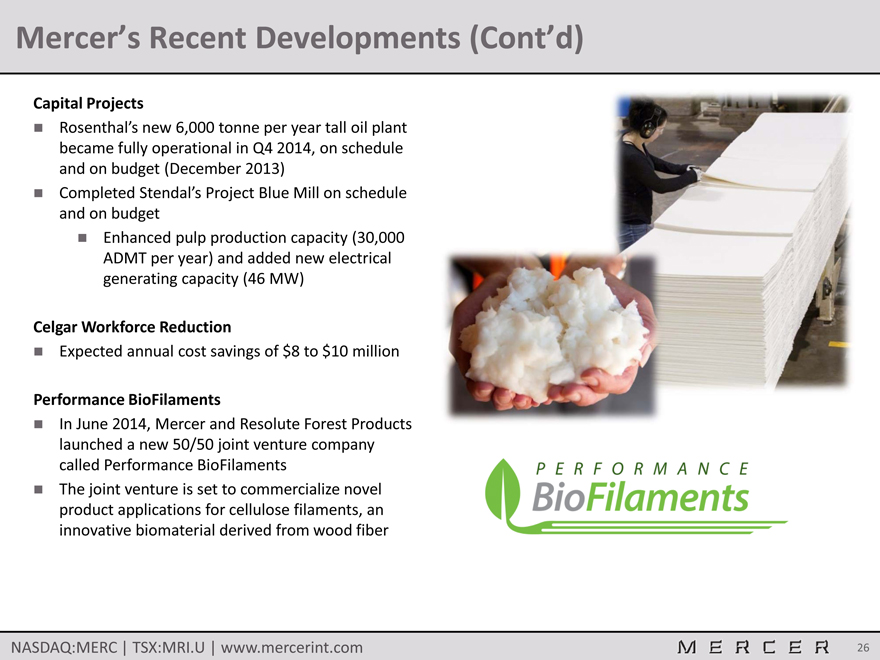
Capital Projects
Rosenthal’s new 6,000 tonne per year tall oil plant became fully operational in Q4 2014, on schedule and on budget (December 2013)
Completed Stendal’s Project Blue Mill on schedule and on budget
Enhanced pulp production capacity (30,000 ADMT per year) and added new electrical generating capacity (46 MW)
Celgar Workforce Reduction
Expected annual cost savings of $8 to $10 million
Performance BioFilaments
In June 2014, Mercer and Resolute Forest Products launched a new 50/50 joint venture company called Performance BioFilaments
The joint venture is set to commercialize novel product applications for cellulose filaments, an innovative biomaterial derived from wood fiber
NASDAQ:MERC | TSX:MRI.U | www.mercerint.com 26
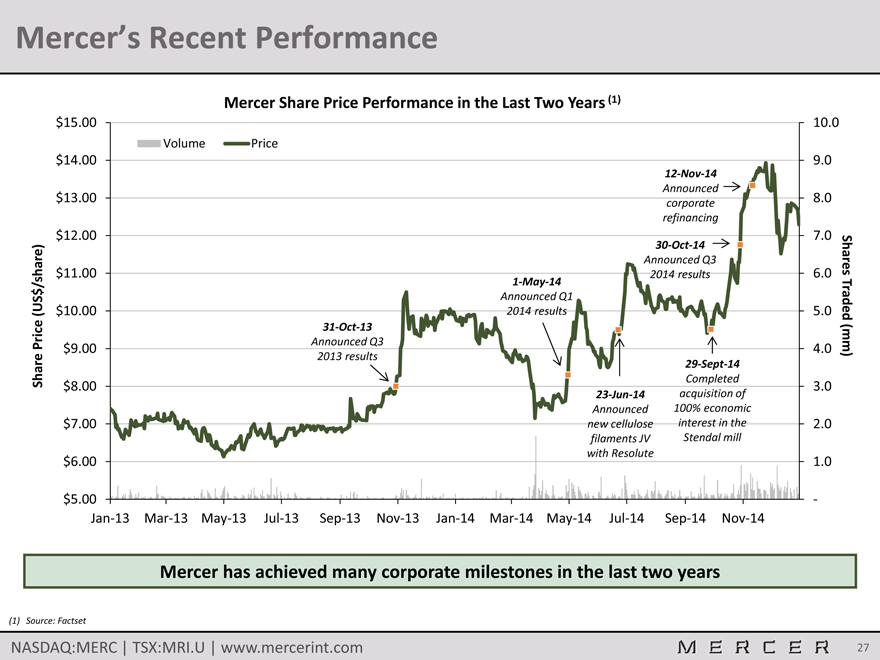
Mercer’s Recent Performance
Mercer Share Price Performance in the Last Two Years (1)
$15.00 $14.00 $13.00
$12.00 share) $11.00 / (US$ $10.00
Price Share $9.00 $8.00
$7.00 $6.00 $5.00
10.0
9.0
8.0
7.0
6.0Shares
5.0 Traded
4.0 (mm)
3.0
2.0
1.0
-
Jan-13 Mar-13 May-13 Jul-13 Sep-13 Nov-13 Jan-14 Mar-14 May-14 Jul-14 Sep-14 Nov-14
Volume Price
12-Nov-14
Announced
corporate
refinancing
30-Oct-14
Announced Q3
2014 results
1-May-14
Announced Q1
2014 results
31-Oct-13
Announced Q3
2013 results
29-Sept-14
Completed
23-Jun-14 acquisition of
Announced 100% economic
new cellulose interest in the
filaments JV Stendal mill
with Resolute
Mercer has achieved many corporate milestones in the last two years
(1) Source: Factset
NASDAQ:MERC | TSX:MRI.U | www.mercerint.com 27
Mercer – Summary
The largest “pure-play” NBSK market pulp producer
Globally cost competitive, modern mill operations
Strategically located mills with excellent access to key markets
Stable and growing revenue from high-margin energy & bio-chemical by-product sales Strong long-term NBSK fundamentals Significant leverage to the NBSK pulp cycle Recently recapitalized and delevered the balance sheet Experienced management team
NASDAQ:MERC | TSX:MRI.U | www.mercerint.com 28
Appendix A
Detailed Overview of Operations
NASDAQ:MERC | TSX:MRI.U | www.mercerint.com 29
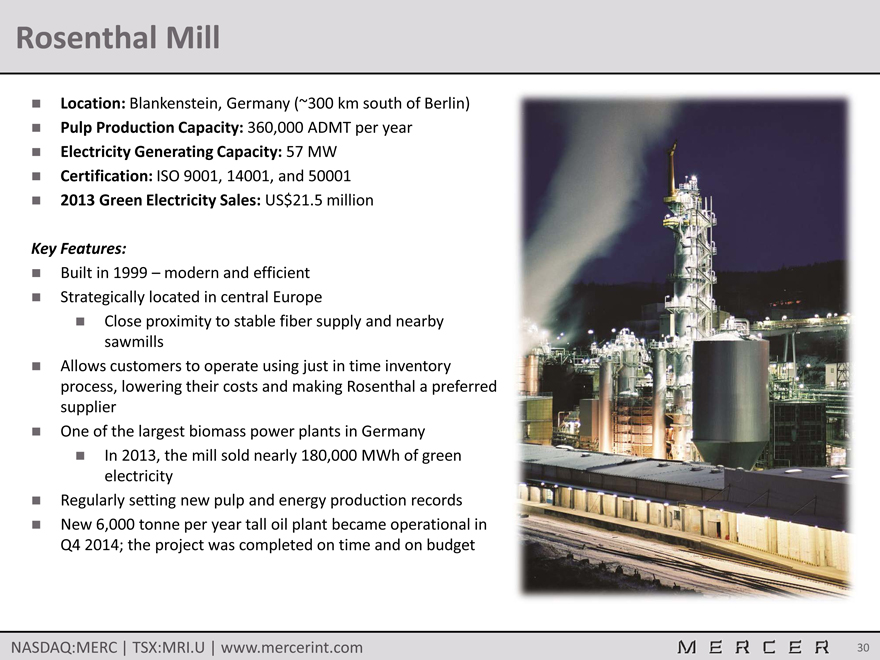
Rosenthal Mill
Location: Blankenstein, Germany (~300 km south of Berlin)
Pulp Production Capacity: 360,000 ADMT per year
Electricity Generating Capacity: 57 MW
Certification: ISO 9001, 14001, and 50001
2013 Green Electricity Sales: US$21.5 million
Key Features:
Built in 1999 – modern and efficient
Strategically located in central Europe
Close proximity to stable fiber supply and nearby sawmills
Allows customers to operate using just in time inventory process, lowering their costs and making Rosenthal a preferred supplier
One of the largest biomass power plants in Germany
In 2013, the mill sold nearly 180,000 MWh of green electricity
Regularly setting new pulp and energy production records
New 6,000 tonne per year tall oil plant became operational in Q4 2014; the project was completed on time and on budget
NASDAQ:MERC | TSX:MRI.U | www.mercerint.com 30
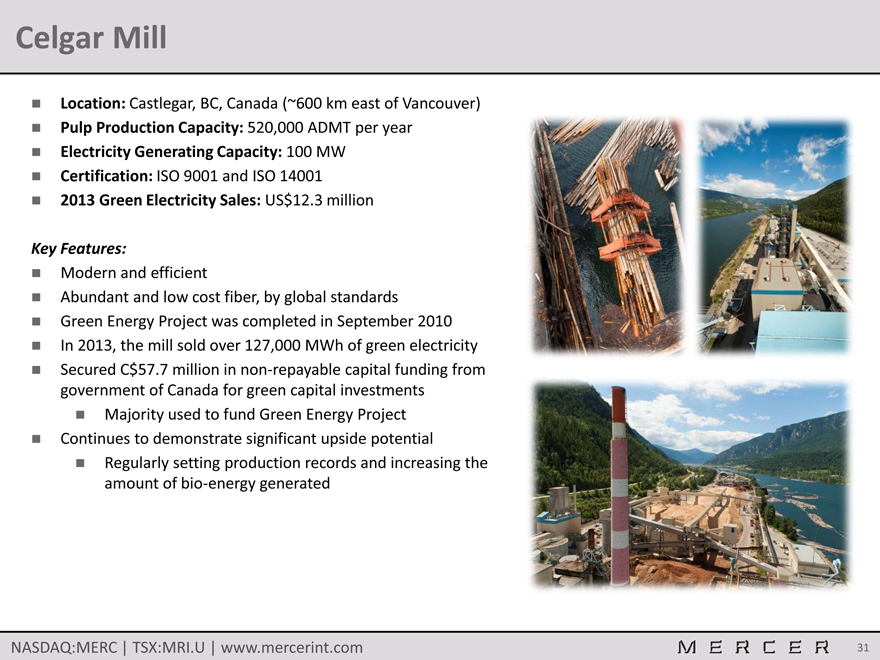
Celgar Mill
Location: Castlegar, BC, Canada (~600 km east of Vancouver)
Pulp Production Capacity: 520,000 ADMT per year
Electricity Generating Capacity: 100 MW
Certification: ISO 9001 and ISO 14001
2013 Green Electricity Sales: US$12.3 million
Key Features:
Modern and efficient
Abundant and low cost fiber, by global standards
Green Energy Project was completed in September 2010
In 2013, the mill sold over 127,000 MWh of green electricity
Secured C$57.7 million in non-repayable capital funding from government of Canada for green capital investments
Majority used to fund Green Energy Project
Continues to demonstrate significant upside potential
Regularly setting production records and increasing the amount of bio-energy generated
NASDAQ:MERC | TSX:MRI.U | www.mercerint.com 31
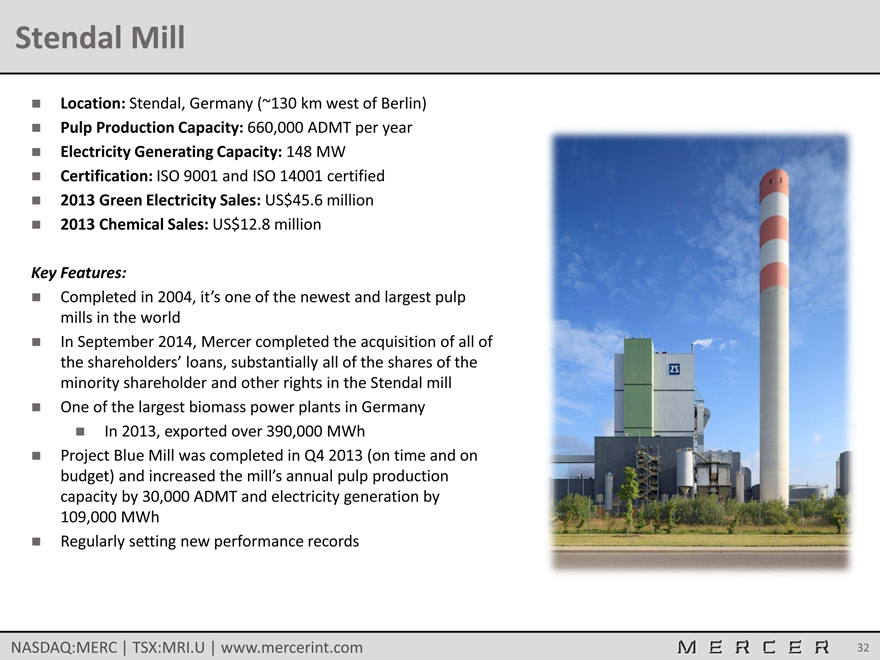
Stendal Mill
Location: Stendal, Germany (~130 km west of Berlin)
Pulp Production Capacity: 660,000 ADMT per year
Electricity Generating Capacity: 148 MW
Certification: ISO 9001 and ISO 14001 certified
2013 Green Electricity Sales: US$45.6 million
2013 Chemical Sales: US$12.8 million
Key Features:
Completed in 2004, it’s one of the newest and largest pulp mills in the world
In September 2014, Mercer completed the acquisition of all of the shareholders’ loans, substantially all of the shares of the minority shareholder and other rights in the Stendal mill
One of the largest biomass power plants in Germany
In 2013, exported over 390,000 MWh
Project Blue Mill was completed in Q4 2013 (on time and on budget) and increased the mill’s annual pulp production capacity by 30,000 ADMT and electricity generation by 109,000 MWh
Regularly setting new performance records
NASDAQ:MERC | TSX:MRI.U | www.mercerint.com 32
Appendix B
Reconciliation of Net Income to Operating EBITDA
NASDAQ:MERC | TSX:MRI.U | www.mercerint.com 33
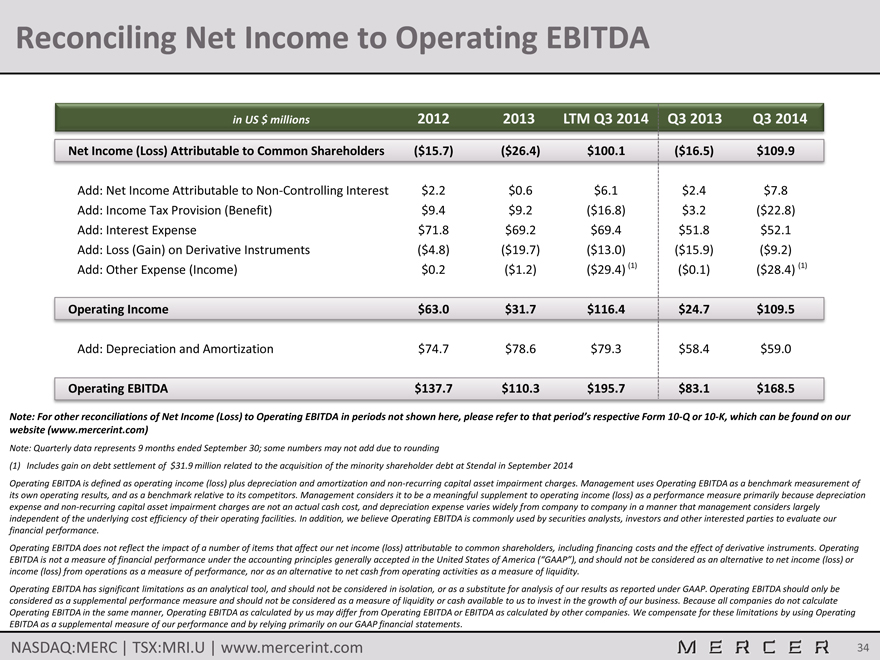
Reconciling Net Income to Operating EBITDA
in US $ millions 2012 2013 LTM Q3 2014 Q3 2013 Q3 2014
Net Income (Loss) Attributable to Common Shareholders ($15.7) ($26.4) $100.1 ($16.5) $109.9
Add: Net Income Attributable to Non-Controlling Interest $2.2 $0.6 $6.1 $2.4 $7.8
Add: Income Tax Provision (Benefit) $9.4 $9.2 ($16.8) $3.2 ($22.8)
Add: Interest Expense $71.8 $69.2 $69.4 $51.8 $52.1
Add: Loss (Gain) on Derivative Instruments ($4.8) ($19.7) ($13.0) ($15.9) ($9.2)
Add: Other Expense (Income) $0.2 ($1.2) ($29.4) (1) ($0.1) ($28.4) (1)
Operating Income $63.0 $31.7 $116.4 $24.7 $109.5
Add: Depreciation and Amortization $74.7 $78.6 $79.3 $58.4 $59.0
Operating EBITDA $137.7 $110.3 $195.7 $83.1 $168.5
Note: For other reconciliations of Net Income (Loss) to Operating EBITDA in periods not shown here, please refer to that period’s respective Form 10-Q or 10-K, which can be found on our website (www.mercerint.com)
Note: Quarterly data represents 9 months ended September 30; some numbers may not add due to rounding
(1) Includes gain on debt settlement of $31.9 million related to the acquisition of the minority shareholder debt at Stendal in September 2014
Operating EBITDA is defined as operating income (loss) plus depreciation and amortization and non-recurring capital asset impairment charges. Management uses Operating EBITDA as a benchmark measurement of its own operating results, and as a benchmark relative to its competitors. Management considers it to be a meaningful supplement to operating income (loss) as a performance measure primarily because depreciation expense and non-recurring capital asset impairment charges are not an actual cash cost, and depreciation expense varies widely from company to company in a manner that management considers largely independent of the underlying cost efficiency of their operating facilities. In addition, we believe Operating EBITDA is commonly used by securities analysts, investors and other interested parties to evaluate our financial performance.
Operating EBITDA does not reflect the impact of a number of items that affect our net income (loss) attributable to common shareholders, including financing costs and the effect of derivative instruments. Operating EBITDA is not a measure of financial performance under the accounting principles generally accepted in the United States of America (“GAAP”), and should not be considered as an alternative to net income (loss) or income (loss) from operations as a measure of performance, nor as an alternative to net cash from operating activities as a measure of liquidity.
Operating EBITDA has significant limitations as an analytical tool, and should not be considered in isolation, or as a substitute for analysis of our results as reported under GAAP. Operating EBITDA should only be considered as a supplemental performance measure and should not be considered as a measure of liquidity or cash available to us to invest in the growth of our business. Because all companies do not calculate Operating EBITDA in the same manner, Operating EBITDA as calculated by us may differ from Operating EBITDA or EBITDA as calculated by other companies. We compensate for these limitations by using Operating EBITDA as a supplemental measure of our performance and by relying primarily on our GAAP financial statements.
NASDAQ:MERC | TSX:MRI.U | www.mercerint.com 34