Table of Contents
Index to Financial Statements
UNITED STATES
SECURITIES AND EXCHANGE COMMISSION
Washington, D.C. 20549
FORM 10-K
| x | Annual Report Pursuant to Section 13 or 15(d) of the Securities Exchange Act of 1934 |
For the year ended June 30, 2008.
or
| ¨ | Transition Report Pursuant to Section 13 or 15(d) of the Securities Exchange Act of 1934 |
For the transition period from to
Commission File Number 000-51636
TRIPLE CROWN MEDIA, INC.
(Exact name of registrant as specified in its charter)
| Delaware | 20-3012824 | |
(State or other jurisdiction of incorporation or organization) | (I.R.S. Employer Identification No.) | |
| 725A Old Norcross Rd, Lawrenceville, Georgia | 30045 | |
| (Address of principal executive offices) | (Zip Code) | |
Registrant’s telephone number, including area code (770) 338-7351
Securities registered pursuant to Section 12(b) of the Act:
None
Securities registered pursuant to Section 12(g) of the Act:
Common Stock, $.001 par value.
Indicate by check mark if the registrant is a well-known seasoned issuer, as defined in Rule 405 of the Securities Act. ¨ Yes x No
Indicate by check mark if the registrant is not required to file reports pursuant to Section 13 or Section 15(d) of the Act. ¨ Yes x No
Indicate by check mark whether the registrant (1) has filed all reports required to be filed by Section 13 or 15(d) of the Securities Exchange Act of 1934 during the preceding 12 months (or for such shorter period that the registrant was required to file such reports), and (2) has been subject to such filing requirements for the past 90 days.x Yes ¨ No
Indicate by check mark if disclosure of delinquent filers pursuant to Item 405 of Regulation S-K (§229.405 of this chapter) is not contained herein, and will not be contained, to the best of registrant’s knowledge, in definitive proxy or information statements incorporated by reference in Part III of this Form 10-K or any amendment to this Form 10-K. ¨
Indicate by check mark whether the registrant is a large accelerated filer, an accelerated filer, a non-accelerated filer, or a smaller reporting company. See the definitions of “large accelerated filer,” “accelerated filer” and “smaller reporting company” in Rule 12b-2 of the Exchange Act. (Check one):
| Large accelerated filer ¨ | Accelerated filer ¨ | |
| Non-accelerated filer ¨ | Smaller reporting company x | |
| (Do not check if a smaller reporting company) |
Indicate by check mark whether the registrant is a shell company (as defined in Rule 12b-2 of the Act). ¨ Yes x No
The aggregate market value of the voting and non-voting common equity held by non-affiliates was $26,314,556 based on the price of Triple Crown Media Inc.’s common stock as of December 31, 2007, as reported on the Nasdaq Global Market.
The number of shares outstanding of Triple Crown Media, Inc.’s common stock as of September 29, 2008 was 5,591,626.
DOCUMENTS INCORPORATED BY REFERENCE
Documents | Form 10-K Reference | |
| None | Not Applicable |
Table of Contents
Index to Financial Statements
TRIPLE CROWN MEDIA, INC.
FORM 10-K
For the fiscal year ended June 30, 2008
| Page | ||||
PART I | ||||
Item 1 | 3 | |||
Item 1A | 11 | |||
Item 1B | 17 | |||
Item 2 | 18 | |||
Item 3 | 18 | |||
Item 4 | 18 | |||
PART II | ||||
Item 5 | 19 | |||
Item 6 | 21 | |||
Item 7 | Management’s Discussion and Analysis of Financial Condition and Results of Operations | 23 | ||
Item 7A | 40 | |||
Item 8 | 41 | |||
Item 9 | Changes in and Disagreements with Accountants on Accounting and Financial Disclosure | 71 | ||
Item 9A | 71 | |||
Item 9B | 72 | |||
PART III | ||||
Item 10 | 73 | |||
Item 11 | 76 | |||
Item 12 | Security Ownership of Certain Beneficial Owners and Management and Related Stockholder Matters | 93 | ||
Item 13 | Certain Relationships and Related Transactions, and Director Independence | 95 | ||
Item 14 | 95 | |||
PART IV | ||||
Item 15 | 97 | |||
| 100 | ||||
2
Table of Contents
Index to Financial Statements
PART I
| Item 1. | Business |
General
Until December 30, 2005, Triple Crown Media, Inc., or the Company, was comprised of integrated businesses owned and operated by Gray Television, Inc., or Gray, consisting of two reportable segments: Newspaper Publishing and GrayLink Wireless. On December 30, 2005, all shares of the Company’s common stock were distributed to shareholders of Gray and, as a result, the Company became a separate, stand-alone entity, independent of Gray, in a series of transactions referred to as the Spin-off. Immediately following the Spin-off on December 30, 2005, Bull Run Corporation, or Bull Run, was merged into a wholly owned subsidiary of the Company through the issuance of shares of the Company’s common stock in exchange for shares of Bull Run common stock, and the issuance of shares of the Company series A and series B convertible preferred stock for certain shares of Bull Run preferred stock, in a transaction referred to as the Merger. As a result of the Spin-off and the Merger, the Company was comprised of its Newspaper Publishing and GrayLink Wireless segments, plus Bull Run’s Collegiate Marketing segment and Association Management Services segment, both of which were operated by the Company’s wholly owned subsidiary, Host Communications, Inc., or Host. Additional information concerning the Company’s reportable segments is included in Note 15 to the Company’s combined and consolidated financial statements included in this Form 10-K. Hereinafter, all references to Triple Crown Media, Inc., the “Company,” “TCM,” “we,” “us,” or “our” in this Part I of this Form 10-K refer to the combined businesses.
We sold our GrayLink Wireless segment on June 22, 2007. The results of operations for the GrayLink Wireless segment for all periods presented have been reclassified to discontinued operations for financial statement presentation. Additional information regarding the GrayLink Wireless segment and its results of operations are contained elsewhere in this Form 10-K.
We sold our Host Collegiate Marketing segment on November 15, 2007. The results of operations for the Host Collegiate Marketing segment for all periods have been reclassified to discontinued operations for financial statement presentation. Additional information regarding the Host Collegiate Marketing segment and its results of operations are contained elsewhere in this Form 10-K.
We sold our Host Association Management Services segment on November 15, 2007. The results of operations for the Host Association Management Services segment for all periods have been reclassified to discontinued operations for financial statement presentation. Additional information regarding the Host Association Management Services segment and its results of operations are contained elsewhere in this Form 10-K.
Our sole remaining operating segment is comprised of our Newspaper Publishing business. This consists of the ownership and operation of six daily newspapers and one weekly newspaper with a total daily circulation as of June 30, 2008 of approximately 95,200 and a total Sunday circulation as of June 30, 2008 of approximately 131,850. Our newspapers are characterized by their focus on the coverage of local news and local sports. Newspaper Publishing revenue of $46.0 million comprised 100% of our total revenues for the twelve months ended June 30, 2008.
Spin-off and Merger
Immediately prior to the distribution of our common stock in the Spin-off, pursuant to the terms of a separation and distribution agreement between Gray and us, Gray contributed (i) all of the membership interests of Gray Publishing, LLC, which owned and operated the Newspaper Publishing and GrayLink Wireless businesses and (ii) certain other assets to us. In the distribution of our common stock
3
Table of Contents
Index to Financial Statements
pursuant to the Spin-off, each Gray shareholder received (i) one share of our common stock for every 10 shares of Gray common stock that was owned on the date of the Spin-off and (ii) one share of our common stock for every 10 shares of Gray’s Class A common stock that was owned on the date of the Spin-off. On the date of the Spin-off, in partial consideration of the transfer of the membership interests to TCM, we distributed $44.6 million to Gray, including $4.6 million for transaction costs.
Pursuant to the terms of an Agreement and Plan of Merger dated August 2, 2005, by and among us, BR Acquisition Corp. (our wholly owned subsidiary) and Bull Run, Bull Run was merged with and into BR Acquisition Corp. with BR Acquisition Corp. surviving. At the effective time of the Merger: (i) each share of Bull Run common stock was converted into 0.0289 shares of our common stock; (ii) each share of Bull Run Series D preferred stock was converted into one share of our Series A redeemable, convertible preferred stock; (iii) each share of Bull Run Series E preferred stock held by J. Mack Robinson, Gray’s current Chairman and Chief Executive Officer and any transferee of Mr. Robinson was converted into one share of our Series A redeemable, convertible preferred stock; (iv) each share of Bull Run Series E preferred stock held by a Series E preferred shareholder (other than Mr. Robinson and any transferee of Mr. Robinson) was converted into $1,000 in cash; (v) each share of Bull Run Series F preferred stock was converted into 22.56 shares of our common stock; (vi) we paid to each Bull Run Series E preferred shareholder (other than Mr. Robinson and any transferee or affiliate of Mr. Robinson) cash in an amount equal to the accrued and unpaid dividends due to each such shareholder; (vii) all accrued and unpaid dividends (through July 1, 2005) on each outstanding share of Bull Run Series D preferred stock and Bull Run Series E preferred stock held by Mr. Robinson and any transferee or affiliate of Mr. Robinson, was converted into the number of shares of our Series A redeemable, convertible preferred stock determined by dividing the accrued and unpaid dividends due on such shares by $1,000; (viii) all accrued and unpaid dividends (through July 1, 2005) on each outstanding share of Bull Run Series F preferred stock was converted into an aggregate of 12,737 shares of our common stock; and (ix) the cash advances in the aggregate amount of $6.05 million made by Mr. Robinson to Bull Run were converted into 6,050 shares of our Series B redeemable, convertible preferred stock.
On December 30, 2005, we executed a new $140 million long-term credit facility that accommodated the payment of the $40 million cash distribution to Gray arising from the Spin-off, the refinancing of all of Bull Run’s long-term debt in connection with the Merger, the payment of the cash portion of the Merger consideration paid to certain Bull Run preferred stockholders and the payment of transaction costs.
Newspaper Publishing
We own and operate six daily newspapers and one weekly newspaper, located in the Southeast with daily circulation ranging from approximately 2,100 to approximately 58,600 and Sunday circulation ranging from approximately 7,800 to approximately 102,600. We believe that our newspapers are an effective medium for advertisers to maximize their reach of the households in the markets served by our newspapers. Our newspapers focus on local content, including coverage of local youth, high school and college sports, as well as local business, politics, entertainment and cultural news. Each of our newspapers is tailored to its market in order to provide local content that radio, television and large metropolitan daily newspapers are unable to provide on a cost-effective basis because of their broader geographic coverage. Our newspapers also differentiate themselves from other forms of media by providing a cost-effective medium for local advertisers to target their customers. We maintain high product quality standards and use extensive process color and compelling graphic design to fully engage existing readers and to attract new readers.
Our Newspaper Publishing revenues for the twelve months ended June 30, 2008 were derived 87% from advertising, 10% from paid circulation and 3% from commercial printing and other revenue.
4
Table of Contents
Index to Financial Statements
Our advertiser base is predominantly local, including the local stores and outlets of major regional and national retailers. Our newspapers seek to produce desirable results for local advertisers by targeting readers based on certain geographic and demographic characteristics. We seek to increase readership, and thereby generate traffic for our advertisers, by focusing on high product quality, compelling and often proprietary local content and creative and interactive promotions. Circulation sales are primarily generated through subscription sales and single copy sales. We promote single copy sales of our newspapers because we believe that such sales tend to generate higher profit margins than subscription sales, as single copy sales generally have higher per unit prices and lower distribution costs. Subscription sales, which provide readers with the convenience of home delivery, are an important component of our circulation base because these readers are very important to advertisers. From time to time, we publish special sections for our newspapers and niche publications. Such special sections and niche publications tend to increase readership within targeted demographic groups and geographic areas and provide opportunities for our newspapers to capture new or additional advertising revenue.
Industrywide, newspaper subscriber circulation levels have been slowly declining. From December 31, 2005 through June 30, 2008, our aggregate daily circulation has declined approximately 11%. We attempt to offset declines in circulation and corresponding circulation revenue with strategies that include readership growth initiatives in Gwinnett and Newton County, Georgia and efforts to increase circulation among cable subscribers in Gwinnett County, Georgia under our unique relationship whereby newspaper subscriptions are sponsored by local cable companies.
Goshen/Jonesboro Swap
On April 7, 2006, we entered into an asset exchange agreement with Community First Holdings, Inc. (CNHI), dated as of April 1, 2006, to exchange The Goshen News for the Jonesboro Group consisting of the Clayton News Daily, Clayton News Weekly, Henry Daily Herald and Jackson Progress-Argus. Subject to the terms and conditions of the agreement, effective as of April 1, 2006, CNHI assumed substantially all of the operating assets and assumed and became liable and otherwise responsible for substantially all of the operating liabilities and obligations of The Goshen News, and we assumed the operating assets and liabilities of the Jonesboro Group. Accordingly, the results of operations for the six months ended June 30, 2006 include only the results of the Jonesboro Group operations for the three months ended June 30, 2006. The results of operations for The Goshen News, for the year ended December 31, 2005 and the six months ended June 30, 2006, have been reclassified to discontinued operations for financial statement presentation. Additional information regarding the Jonesboro Group, its results of operations and its circulation are contained elsewhere in this Form 10-K.
5
Table of Contents
Index to Financial Statements
Operations
We own and operate The Albany Herald, Gwinnett Daily Post, Rockdale Citizen/Newton Citizen and Jonesboro Group. The following sets forth information regarding our newspapers as of June 30, 2008:
Originated | Year Originated | Year Acquired | Principal Location | Daily Circulation (1) | Sunday Circulation (1) | Non-Daily Circulation (2) | ||||||
The Albany | ||||||||||||
Herald | 1891 | 1948 | Albany, GA | 19,300 | 21,400 | 38,500 | ||||||
Rockdale | ||||||||||||
Citizen | 1953 | 1994 | Conyers, GA | 5,000 | 7,800 | |||||||
Newton | ||||||||||||
Citizen | 2004(3) | Covington, GA | 3,900 | n/a | ||||||||
Gwinnett | ||||||||||||
Daily Post | 1970(4) | 1995 | Lawrenceville, GA | 58,600 | 102,600 | |||||||
The Jackson | ||||||||||||
Progress- | 1873 | 2006(5) | Jackson, GA | 3,900 | n/a | |||||||
The Henry | ||||||||||||
Daily Herald | 1867 | 2006(5) | McDonough, GA | 2,400 | n/a | |||||||
The Clayton | ||||||||||||
News Daily | 1964 | 2006(5) | Jonesboro, GA | 2,100 | n/a |
| (1) | Circulation averages are derived from our internal records as of June 30, 2008. These internal records are subject to periodic independent audit by Certified Audit of Circulations, a circulation audit and research organization, but have not been audited as of June 30, 2008. |
| (2) | Non-Daily Distribution includes both paid and free distribution of the Albany Area Advertiser. Non-Daily Distribution reflects the averages according to the most recent internal reports. |
| (3) | In 2004, we began publication of the Newton Citizen. |
| (4) | The Gwinnett Daily Post was originally a weekly newspaper. In 1995, we began publishing the Gwinnett Daily Post on a daily basis. |
| (5) | The Jonesboro Group consists of three newspapers operated as a group sharing the printing facility at the Clayton News Daily. These newspapers were acquired in a swap transaction for The Goshen News as of April 1, 2006. |
The Albany Herald. The Albany Herald newspaper is located in Albany, Georgia and is published seven days a week to serve southwest Georgia. As of June 30, 2008, the Albany Herald has a daily circulation of approximately 19,300 and a Sunday circulation of approximately 21,400. The Albany Herald is the only daily newspaper in Albany, Georgia. The Albany Herald also produces a weekly advertising shopper and other niche publications. The Albany Area Advertiser is a shopper distributed weekly to all households in Dougherty and Lee counties. The Express is an advertising section distributed in selected zip codes, and The Emblem is a newspaper serving Marine Corps Logistics Base—Albany. Albany, situated in the Plantation Trace region, is the primary trade center for southwest Georgia. The city lies at the head of the Flint River, 145 miles south of Atlanta. Although the economy of the Albany region was formerly principally agricultural, it has developed a diversified industrial economy which includes companies such as The Procter & Gamble Company, Miller Brewing and M & M Mars. Albany is approximately 57 square miles and has a population of approximately 96,000.
6
Table of Contents
Index to Financial Statements
Gwinnett Daily Post, Rockdale Citizen and Newton Citizen. The Gwinnett Daily Post, Rockdale Citizen and Newton Citizen are newspapers that serve communities in the metro Atlanta, Georgia area with complete local news, sports and lifestyles coverage together with national stories that directly impact their local communities. The Gwinnett Daily Post, Rockdale Citizen and Newton Citizen are in adjacent metro Atlanta counties and benefit from cross selling advertising to classified and selected display advertisers, utilizing both a combined classified sales staff and major account sales staff located in Gwinnett. Additionally, synergies are derived from a combined production facility and news department copy desk, and centralized business and accounting functions where feasible.
As of June 30, 2008, the Gwinnett Daily Post is published Tuesday through Sunday and has a daily circulation of approximately 58,600 and a Sunday circulation of approximately 102,300. Since 1995, the frequency of publication has increased from three to six days per week and the circulation has grown from approximately 13,000 (daily) to its present levels. Gwinnett County is located 30 miles northeast of Atlanta, Georgia. The county is approximately 437 square miles in size and has a population of approximately 776,000. The offices of the Gwinnett Daily Post are located in Lawrenceville, Georgia, which is the county seat of Gwinnett County.
The Rockdale Citizen. The Rockdale Citizen was established in 1953 and is published seven days a week with weekday circulation of approximately 5,000 and Saturday and Sunday circulation of approximately 7,800 as of June 30, 2008. In 1999, the Rockdale Citizen began a zoned version of the newspaper in neighboring Newton County. As this product developed it was spun off as a separate publication in April 2004, known as the Newton Citizen, and it is published weekdays with circulation of approximately 3,900. Advertising is sold into the weekday products of both Citizens on a combined basis reaching approximately 8,900 households. The Rockdale Citizen maintains offices located in Conyers, the county seat of Rockdale County, and the Newton Citizen maintains offices located in Covington, the county seat of Newton County. Rockdale County is located 20 miles east of downtown Atlanta on Interstate 20, is approximately 130 square miles in size and has a population of approximately 82,000. Newton County is located 35 miles east of Atlanta on Interstate 20, is approximately 276 square miles in size and has a population of approximately 96,000.
Jonesboro Group.The Jonesboro Group consists of three newspapers in adjacent counties in the suburban Atlanta, Georgia area. The Clayton News Daily has been serving Clayton County since 1964 with a daily circulation as of June 30, 2008 of approximately 2,100 published Monday through Saturday. The Clayton County area has an estimated population of approximately 272,200. The Henry Daily Herald has been serving Henry County since 1867 with a daily circulation as of June 30, 2008 of approximately 2,400 published Monday through Saturday. The Henry County area has an estimated population of 186,000 and is expected to grow by 6% through 2009. The Jackson Progress-Argus has been serving Butts County since 1873, published every Wednesday with a circulation of approximately 3,900 as of June 30, 2008. Butts County has an estimated population of 23,700.
Advertising
Advertising revenue is the largest component of the total revenue from Newspaper Publishing, accounting for approximately 87%, 88%, 87% and 87% of the total revenue from Newspaper Publishing for the year ended December 31, 2005, the six months ended June 30, 2006 and the twelve months ended June 30, 2007 and 2008, respectively. We derive our advertising revenue from retail (local department stores, local accounts at national department stores, specialty shops and other retailers), national (national advertising accounts), classified (employment, automotive, real estate and personals) and other advertising. Our advertising rate structures vary among our publications and are a function of various factors, including advertising effectiveness, local market conditions, competition, circulation, readership, demographics and type of advertising (whether display or classified).
7
Table of Contents
Index to Financial Statements
The majority of Newspaper Publishing advertising revenue is derived from a diverse group of local retailers and classified advertisers. We believe, based upon our operating experience that our advertising revenue tends to be more stable than the advertising revenue of large metropolitan daily newspapers because our publications rely primarily on local advertising. Local advertising has historically been more stable than national advertising because local businesses generally have fewer effective advertising channels through which to reach their customers. Moreover, we are less reliant than large metropolitan daily newspapers upon classified advertising, which is generally more sensitive to economic conditions.
We do not rely upon any one company or industry for our advertising revenue, but rather are supported by a variety of companies and industries, including financial institutions, realtors, automobile dealerships, grocery stores, universities, hospitals and many other local businesses. No single advertiser represented more than 2% of the total revenue for the twelve months ended June 30, 2008 from Newspaper Publishing.
Our corporate management works with our local newspaper management to approve advertising rates and to establish goals for each year during a detailed annual budget process. We share advertising concepts among our publications, enabling our advertising managers and publishers to leverage advertising products and sales strategies that have already been successful in other markets that we serve.
Circulation
Circulation revenue accounted for approximately 12%, 10%, 10% and 10% of the total revenue from Newspaper Publishing for the year ended December 31, 2005, the six months ended June 30, 2006 and the twelve months ended June 30, 2007 and 2008, respectively. While our circulation revenue is not as significant as our advertising revenue, circulation trends impact the decisions of advertisers and advertising rates. Substantially all of our circulation revenue is derived from home delivery sales of publications to subscribers and single copy sales made through retailers and vending racks. Our corporate management works with our local newspaper management to establish subscription and single copy rates. In addition, we track rates of newspaper returns and customer service calls in an effort to optimize the number of newspapers available for sale and to improve delivery and customer service.
Our six paid daily and one paid weekly publications range in circulation from approximately 2,100 to approximately 58,600 (daily) and from approximately 7,800 to approximately 102,600 (Sunday). Set forth below is the percent change in our daily circulation from December 31, 2005 to June 30, 2008:
Percent Change in Daily Circulation
| December 31, 2005 | June 30, 2008 | Decrease | |||||
Daily circulation: | |||||||
Gwinnett Daily Post | 60,700 | 58,600 | -3.5 | % | |||
The Albany Herald | 26,100 | 19,300 | -26.1 | % | |||
Jonesboro Group (1) | 10,000 | 8,400 | -16.0 | % | |||
Rockdale Citizen/Newton Citizen | 10,700 | 8,900 | -16.8 | % | |||
Total | 107,500 | 95,200 | -11.4 | % | |||
| 1. | The Jonesboro Group consists of the Jackson Progress-Argus, Henry Daily Herald and Clayton News Daily. |
8
Table of Contents
Index to Financial Statements
Job Printing
We operate three printing facilities. To the extent we have excess press capacity at these facilities, we have from time to time provided commercial printing services to third parties, primarily for commercial materials, including other newsprint publications, to produce incremental revenue from existing equipment and personnel. Job printing and other revenue accounted for only approximately 1%, 2%,3%, and 3% of the total revenue from Newspaper Publishing for the year ended December 31, 2005, the six months ended June 30, 2006 and the twelve months ended June 30, 2007 and 2008, respectively.
Online Operations
All of our daily newspapers have their own free-access websites. Our objective is to have our websites complement our print newspapers by providing certain content from our newspapers, as well as unique content and interactive features. Our websites also provide an online marketplace for our advertisers.
The following is a list of our websites:
Newspaper | Website | |||
The Albany Herald | www.albanyherald.com | |||
Gwinnett Daily Post | www.gwinnettdailypost.com | |||
Rockdale Citizen | www.rockdalecitizen.com | |||
Newton Citizen | www.newtoncitizen.com | |||
Clayton News Daily | www.new-daily.com | |||
Henry Daily Herald | www.henryherald.com | |||
Jackson Progress-Argus | www.jacksonprogress-argus.com | |||
Online revenue is currently a mix of retail advertising, sold as a single product comprised of both printed and online advertising with proceeds allocated between the two, and classified advertising. For the twelve months ended June 30, 2008, our websites generated approximately $0.5 million of revenue. This revenue was insignificant in prior years.
Editorial
Our newspapers generally contain 16 to 100 pages with editorial content that emphasizes local news and topics of interest to the communities that they serve, such as local business, politics, entertainment and culture, as well as local youth, high school, college and professional sports. National and world news stories are sourced from the Associated Press. The editorial staff at each of our newspapers typically consists of a managing editor and several assistant editors and field reporters, who identify and report the local news in their communities. As of June 30, 2008, we employed 76 full-time and 2 part-time editorial personnel that we believe provide the most comprehensive local news coverage in the communities we serve. Approximately 58% of our total pages for the twelve months ended June 30, 2008 were devoted to news content.
Printing and Distribution
We operate three newspaper production and distribution facilities. The production facility for The Albany Herald is located in Albany, Georgia. The production facility in Jonesboro, Georgia is shared by the Jackson Progress-Argus, Henry Daily Herald and Clayton News Daily. The production facility located in Lawrenceville, Georgia is shared by the Gwinnett Daily Post and the Rockdale Citizen/Newton Citizen. By using this production facility for three daily newspapers, we are able to reduce the operating costs of our newspapers while increasing the quality of our newspapers. Our newspapers are generally fully paginated utilizing image-setter technology, which allows for design flexibility and high-quality reproduction of color graphics. Our newspapers are printed on efficient, high-speed web offset presses. The distribution of our daily newspapers is outsourced to independent, third-party distributors.
9
Table of Contents
Index to Financial Statements
Newsprint
The basic raw material of newspapers is newsprint. Newsprint represents one of our largest costs of producing our publications. In the twelve months ended June 30, 2008, we consumed approximately 8,500 metric tons of newsprint. We are currently operating under a contract with Abitibi Consolidated to purchase newsprint at prices that we believe are competitive for similar volume purchasers. Our current contract with Abitibi expires in 2012. We incurred newsprint expense related to our publications of approximately $4.8 million for the twelve months ended June 30, 2008.
Historically, the price of newsprint has been cyclical and volatile. The industry average price of newsprint for the twelve months ended June 30, 2008 was approximately $610 per metric ton. Prices fluctuate based upon factors that include both foreign and domestic production capacity and consumption. Price fluctuations can have a significant effect on our results of operations. We seek to manage the effects of increases in prices of newsprint through a combination of technology improvements, page width and page count reductions, inventory management and advertising and circulation price increases.
Competition
Our newspaper in Albany, Georgia is the dominant print editorial and advertising voice for the communities it serves. In Albany, The Herald is the only daily newspaper serving the primary market area with the exception of very limited circulation efforts by statewide and national newspapers, The Atlanta Journal-Constitution and USA Today. Our six Atlanta suburban newspapers enjoy a circulation advantage over The Atlanta Journal-Constitution in each paper’s designated market area, Gwinnett, Rockdale, Newton, Jackson (Butts County), Henry and Clayton, but The Atlanta Journal-Constitution has greater overall circulation in the Atlanta metro area.
Each of our newspapers competes for advertising and circulation revenue with local, regional and national newspapers, shoppers, magazines, radio, broadcast and cable television, direct mail, the Internet and other media sources. Competition for newspaper advertising revenue is based largely on advertising results, advertising rates, readership demographics and circulation levels. Competition for circulation revenue is generally based on the content of the newspaper, its price and editorial quality.
We differentiate our publications from other newspapers and media by focusing on local news and local sports coverage. We clearly identify the markets we wish to target and seek to become the primary source for local news and advertising information within those markets. We believe that our newspapers co-exist well with our larger competitors through our targeted distribution strategies that are designed to maximize unduplicated reach for advertisers and avoid head-to-head competition. We provide our readers with community-specific content, which is generally not available on a consistent basis from our larger competitors. Local advertisers, especially businesses located within a small community, typically target advertising towards customers living or working within their own communities. We believe that each of our newspapers generally capture the largest share of local advertising as a result of our direct and focused coverage of the market and our cost-effective advertising rates relative to the more broadly circulated newspapers of our larger competitors.
Although alternative media may be available, we believe that local advertisers generally regard newspapers as the most cost-effective method of advertising time-sensitive promotions and price-specific advertisements, as compared with broadcast and cable television, which are generally used to advertise image, or radio, which is usually used to recall images or brands in the minds of listeners. We have, however, over the past several years faced increased competition for classified advertising from online advertising.
10
Table of Contents
Index to Financial Statements
Environmental Matters
We are subject to a wide range of federal, state and local environmental laws and regulations pertaining to air and water quality, storage tanks and the management and disposal of waste at our facilities. To the best of our knowledge, our operations are in material compliance with applicable environmental laws and regulations as currently interpreted. We believe that continued compliance with these laws and regulations will not have a material adverse effect on our financial condition or results of operations.
Employees
At June 30, 2008, we employed approximately 340 persons, of which approximately 300 were full-time and 44 were part-time employees of the Newspaper Publishing business. None of our employees are covered by collective bargaining agreements. We consider our relationship with our employees to be satisfactory.
Available Information
Our Internet address iswww.triplecrownmedia.com, where we make available, free of charge, our Annual Reports on Form 10-K, Quarterly Reports on Form 10-Q, Current Reports on Form 8-K and any amendments to those reports, as soon as practicable after such reports are electronically filed with, or furnished to, the SEC. The SEC reports can be accessed through the “SEC Reports” link in the index on our website. Other information found on our website is not part of this or any other report we file with, or furnish to, the Securities and Exchange Commission, or the SEC.
Code of Ethics
We have adopted a Code of Ethics that applies to all of our directors, officers and employees. The Code is available on our website. If any waivers of the Code are granted, the waivers will be disclosed in an SEC filing on Form 8-K. Our website also includes the Charters of the Audit Committee and the Nominating, Corporate Governance, Compensation and Stock Option Committee. Stockholders may request free copies of these documents by writing to Mark G. Meikle, 725 Old Norcross Road, Lawrenceville, GA, 30045, by calling 770-338-7351 or sending an email request to mark.meikle@triplecrownmedia.com.
The public may also read and copy any materials we file with the SEC at the SEC’s Public Reference Room at 100 F Street, N.E., Washington, D.C. 20549. Information on the operation of the Public Reference Room may be obtained by calling 1-800-SEC-0330. The SEC maintains an Internet site that contains reports, proxy and information statements, and other information regarding issuers that file electronically with the SEC, atwww.sec.gov.
| Item 1A. | Risk Factors |
Going Concern
We do not anticipate meeting future debt compliance covenants in the fiscal year ending June 30 2009. Without waiver of these violations, which could occur at any time between now and June 30, 2009, and/or restructuring of our debt, our bank could accelerate our payment provisions. Further, the sale of Host and Pinnacle resulted in $2.6 million of tax liabilities to various taxing authorities which began to come due on September 15, 2008. Assuming no acceleration of payments, material portions of our debt facilities become due in December 2009, June 2010 and December 2010. In order to meet these obligations, we will be required to restructure our current credit facilities, refinance with another lender or, in the case of our income tax obligations successfully negotiate with the taxing authorities to
11
Table of Contents
Index to Financial Statements
arrange a payment plan which will allow us to spread our payments over an extended period of time. Should we be unsuccessful in these restructuring efforts, we will attempt to derive capital from alternate sources which may include any of the following; public equity offering, private placement, the issuance of additional shares of preferred stock or other means not yet identified. In the event that we are not able to arrange a payment plan for our tax obligations, or refinance our debt obligations, we may not have sufficient liquidity to operate.
These factors raise substantial doubt as to our ability to continue as a going concern. The accompanying financial statements have been prepared as on a going concern basis which assumes continuity of operations and realization of assets and liabilities in the ordinary course of business. The financial statements do not include any adjustments that might result from the outcome of this uncertainty.
Our flexibility is limited by the terms of our senior secured credit facility.
Our senior secured credit facility prevents us from taking certain actions and requires us to meet certain tests. These limitations and tests include, without limitation, the following:
| • | limitations on liens; |
| • | limitations on incurrence of debt; |
| • | limitations on making dividends and distributions; |
| • | provisions for mandatory prepayments; |
| • | limitations on transactions with affiliates; |
| • | limitations on guarantees; |
| • | limitations on asset sales; |
| • | limitations on sale-leaseback transactions; |
| • | limitations on acquisitions; |
| • | limitations on changes in our business; |
| • | limitations on mergers and other corporate reorganizations; |
| • | limitations on loans, investments and advances, including investments in joint ventures and foreign subsidiaries; |
| • | financial ratio and condition tests; and |
| • | increases in our cost of borrowings or inability or unavailability of additional debt or equity capital. |
These restrictions and tests may prevent us from taking action that could increase the value of our securities, or may require actions that decrease the value of our securities. In addition, we may fail to meet the tests and thereby default under our senior secured credit facility. If we default on our obligations, our lenders could require immediate payment of the obligations or foreclose on collateral. If this happened, we could be forced to sell assets or take other action that would reduce the value of our securities.
Servicing our debt will require a significant amount of cash, and our ability to generate sufficient cash depends on many factors, some of which are beyond our control.
Our total debt as of June 30, 2008 was $70.8 million and as of the date of this filing we do not anticipate meeting our bank covenants in fiscal year 2009. Without waivers of these expected violations and restructuring of our debt, our bank could accelerate our payment provisions. Assuming
12
Table of Contents
Index to Financial Statements
no acceleration of payments, material portions of our debt facilities become due in December 2009, June 2010, and December 2010. Further, the sale of Host and Pinnacle Sports Production LLC, or Pinnacle, resulted in a $2.6 million tax liability which became due in September 2008 for which we are currently negotiating a payment plan with the taxing autorities. In order to meet these obligations, we will be required to restructure our current credit facilities, refinance with another lender or, in the case of our income tax obligations, attempt to arrange a payment plan which will allow us to spread our payments over an extended period of time. Should we be unsuccessful in these restructuring efforts, we will attempt to derive capital from alternate sources which may include any of the following; public equity offering, private placement, the issuance of additional shares of preferred stock or other means not yet identified. In the event that we are not able to arrange a payment plan for our tax obligations, or refinance our debt obligations, we may not have sufficient liquidity to operate.
We depend on the economies and the demographics of the local communities that our newspaper publications serve and we are also susceptible to general economic downturns, which could adversely affect our advertising and circulation revenue and our profitability.
Our advertising revenue and, to a lesser extent, circulation revenue depend upon a variety of factors specific to the communities that our publications serve. These factors include, among others:
| • | local economic conditions in general; |
| • | the economic condition of the retail segments of the communities that our publications serve; |
| • | the popularity of our publications; |
| • | the size and demographic characteristics of the local population; |
| • | pricing fluctuations in local and national advertising; |
| • | the activities of our competitors, including increased competition from other forms of advertising-based mediums; and |
| • | changing consumer lifestyles. |
Our newspapers operate in six suburban Atlanta counties—Gwinnett, Rockdale, Newton, Butts, Henry and Clayton counties, and Dougherty County in southwest Georgia. If the local economy, population or prevailing retail environment of a community served by our publications experiences a downturn, our publications, revenue and profitability in that market would be adversely affected. Our advertising and circulation revenue are also susceptible to negative trends in the general economy that affect consumer spending. The advertisers in our newspapers and related publications are primarily retail businesses, which can be significantly affected by regional or national economic downturns and other developments.
In the newspaper industry, we rely on advertising and paid circulation revenue, for which we face competition from other newspapers, some significantly larger than us, as well as other communications, media and web-based sources.
Our newspapers and other publications are located primarily in small metropolitan and suburban areas in the United States. Our newspapers operate in six suburban Atlanta counties—Gwinnett, Rockdale, Newton, Butts (Jackson Progress-Argus), Henry and Clayton counties, and Dougherty County in southwest Georgia. Revenue from Newspaper Publishing primarily consists of advertising and paid circulation. Competition for advertising expenditures and paid circulation comes from local, regional and national newspapers, shoppers, television, radio, direct mail, Internet and other forms of communication and advertising media. Competition for newspaper advertising expenditures is based largely upon advertiser results, readership, advertising rates, demographics and circulation levels,
13
Table of Contents
Index to Financial Statements
while competition for circulation and readership is based largely upon the content of the newspaper, its price and the effectiveness of its distribution. In recent years, web sites dedicated to recruitment, real estate and automotive sales have become significant competitors of our newspapers for classified advertising. Our six Atlanta suburban newspapers face competition from the larger metropolitan newspaper, The Atlanta Journal-Constitution, which serves the entire Atlanta metropolitan area and much of the state of Georgia. The Atlanta Journal-Constitution is significantly larger than our newspapers. Both advertising and circulation revenues are being affected by consumer trends, including declining newspaper buying by young people and the migration to other available forms of media for news.
Any significant increases in newsprint costs could have a material adverse effect on our operating results.
The basic raw material for newspapers is newsprint. Historically, the industry price of newsprint has been cyclical and volatile. The average price of newsprint was $610 and $643 per metric ton during the twelve months ended June 30, 2008 and June 30, 2007, respectively. During the twelve months ended June 30, 2008, we consumed approximately 8,500 metric tons of newsprint, the cost of which represented approximately 10.5% of the total revenue from Newspaper Publishing during such period. We have a contract with Abitibi Consolidated to purchase newsprint at prices pegged to industry averages and we expect price increases in fiscal 2009 up to $100 per metric ton. Our contract with Abitibi expires on December 31, 2012. Significant increases in newsprint costs could have a material adverse effect on our operating results.
We may be unable to identify or integrate acquisitions of daily and non-daily newspapers and similar publications successfully or on commercially acceptable terms and such failure could adversely affect our business, financial condition and results of operations.
We have made several acquisitions and in the future may make additional acquisitions of daily and non-daily newspapers and similar publications. We cannot assure you that we will be able to identify suitable acquisition candidates in the future. Even if we do identify suitable candidates, we cannot assure you that we will be able to make acquisitions on commercially acceptable terms. In making acquisitions, we compete for acquisition targets with other companies, many of which are larger and have greater financial resources than us. Our failure to acquire suitable candidates, or the consummation of a future acquisition at a price or on other terms that prove to be unfavorable, could adversely affect our business, financial condition and results of operations. In addition, acquisitions may expose us to particular business and financial risks that include:
| • | diverting management’s attention; |
| • | incurring significant additional liabilities, capital expenditures, transaction and operating expenses and non-recurring acquisition-related charges; |
| • | experiencing an adverse impact on our earnings from the amortization or impairment of acquired goodwill and other intangible assets; |
| • | failing to integrate the operations, facilities and personnel of the acquired newspapers and publications; |
| • | entering new markets with which we are not familiar; and |
| • | failing to retain key personnel of the acquired newspapers and publications. |
We may not be able to manage acquired newspapers and publications successfully. If we are unable successfully to implement our acquisition strategy or address the risks associated with acquisitions, or if we encounter unforeseen expenses, difficulties, complications or delays frequently encountered in connection with the integration of acquired entities and the expansion of operations, our
14
Table of Contents
Index to Financial Statements
growth and ability to compete may be impaired. We may fail to achieve acquisition synergies and we may be required to focus resources on the integration of operations rather than more profitable areas.
We will need to incur debt or issue equity securities to pay for any future acquisitions and to pay for increased capital expenditures following any acquisitions. However, debt or equity financing may not be available in sufficient amounts or on terms acceptable to us, or at all, and equity financing could be dilutive to our stockholders.
Changes in the regulations that govern our business might increase competition or make it more difficult or costly to operate our business or comply with such changes.
The FCC has broad authority to promulgate and enforce regulations that could adversely affect us. The FCC’s rules prohibit or place limitations on common ownership, including common officers or directors, of companies publishing newspapers or operating television stations in the same market. Because of ongoing administrative and judicial proceedings, these rules will remain in effect for the foreseeable future. As a result, our ability to acquire newspapers in areas served by Gray’s television stations could be foreclosed or limited to the term remaining on the television station’s license, a period not to exceed eight years. In certain instances, the ownership rules could result in our being required to divest our ownership interest in a newspaper whose city of publication is encompassed by the Grade A service contour of a station owned or acquired by Gray.
We may be required to take additional impairment charges on our goodwill, which may have a material effect on the value of our total assets.
As of June 30, 2008, the book value of our goodwill was $12.6 million in comparison to total assets of approximately $40.6 million. Not less than annually, we are required to evaluate our goodwill to determine if the estimated fair value of goodwill is less than its book value. If the estimated fair value of goodwill is less than book value, we will be required to record a non-cash expense to write down the book value of the goodwill to the estimated fair value. We cannot make any assurances that any required impairment charges will not have a material effect on our total assets.
We may incur significant capital and operating expenditures to achieve and maintain compliance with applicable environmental laws and regulations, or associated with environmental liabilities, and if such expenses significantly exceed our expectations, our operating income may be adversely affected.
Our business is subject to a wide range of federal, state and local environmental laws and regulations. We may incur significant capital and operating expenditures to achieve and maintain compliance with applicable environmental laws and regulations. Our failure to comply with applicable environmental laws and regulations or permit requirements could result in substantial civil or criminal fines or penalties or enforcement actions. As an owner and operator of real estate, we may be responsible under environmental laws and regulations for the investigation, remediation and monitoring, as well as associated costs, expenses and third-party damages, including tort liability relating to past or present releases of hazardous substances on or from our properties. Liability under these laws may be imposed without regard to whether we knew of, or were responsible for, the presence of those substances on our property and may not be limited to the value of the property. We also may be responsible under environmental laws and regulations for the investigation, remediation and monitoring, as well as associated costs, expenses and third-party damages, including tort liability, related to facilities or sites to which we have sent hazardous waste materials. In addition, situations may give rise to material environmental liabilities that have not yet been discovered. New environmental laws (or regulations or changes in existing laws) may be enacted that require significant expenditures by us. If the resulting expenses significantly exceed our expectations, our operating income may be adversely affected.
15
Table of Contents
Index to Financial Statements
Our success depends on our senior management.
Our success depends to a significant extent on the efforts of our senior management. As a result, if any of these individuals were to leave, we could face substantial difficulty in hiring and retaining qualified successors and could experience a loss in productivity while any successors gain the necessary experience.
Our historical financial information may not be representative of our results, as our Newspaper Publishing business previously operated as a subsidiary or division of Gray.
Our historical financial information for the year ended December 31, 2005, included in this Form 10-K may not be representative of our results of operations, financial position and cash flows had our Newspaper Publishing business operated as an independent company rather than as a subsidiary or division of Gray during the periods presented or of our results of operations, financial position and cash flows in the future. This results from the following:
| • | in preparing this historical financial information, adjustments and allocations were made because Gray did not account for this business as, and this business never operated as, a stand-alone business for any periods presented until the Spin-off on December 30, 2005; and |
| • | the information does not reflect many changes that have occurred in our funding and operations as a result of the Spin-off and the Merger. |
The agreements governing our relationship with Gray following the Spin-off were negotiated while we were a subsidiary of Gray and, as a result, we cannot assure you that the agreements are on terms favorable to us.
The agreements governing our relationship with Gray following the Spin-off were negotiated in a parent-subsidiary context and were negotiated in the overall context of our separation from Gray. At the time of these negotiations, our officers were employees of Gray, and each of the members of our board of directors was also a member of Gray’s board of directors. Accordingly, we cannot assure you that the terms of these agreements were the same as the terms that would have resulted from arm’s-length negotiations between third parties. These agreements include a separation and distribution agreement, as amended, a tax sharing agreement and a lease agreement.
After the separation, certain members of management and directors of Gray and TCM, who are also shareholders of both companies, may face issues with respect to their relationships with Gray and TCM when the interests of Gray and TCM are not aligned or with respect to the allocation of their time between Gray and TCM.
The management and directors of Gray and TCM own our common stock and both Gray Class A common stock and Gray common stock. For instance, J. Mack Robinson is the Chairman and Chief Executive Officer of Gray and the beneficial owner of approximately 9% of the outstanding shares of our common stock and all of the outstanding shares of our preferred stock. Robert S. Prather, Jr. is the President, Chief Operating Officer and a director of Gray and the Chief Executive Officer and a director of TCM. Hilton H. Howell, Jr. is the Vice Chairman and a director of Gray and the Chairman of the Board of TCM. This ownership overlap and these common directors could create, or appear to create, potential issues when Gray’s and TCM’s management and directors face decisions where our interests and Gray’s interests are not aligned. For example, potential issues could arise in connection with the resolution of any dispute between Gray and us regarding the terms of the agreements governing the separation and the relationship between Gray and us. These agreements include a separation and distribution agreement, as amended, a tax sharing agreement and a lease agreement. Each of Mr. Prather and Mr. Howell may also face issues with regard to the allocation of his time between Gray and us.
16
Table of Contents
Index to Financial Statements
The market price for our common stock may be volatile and stockholders may not be able to sell our common stock at a favorable price or at all.
Many factors could cause the market price of our common stock to rise and fall, including:
| • | variations in our quarterly results; |
| • | announcements of technological innovations by us or by our competitors; |
| • | introductions of new products or new pricing policies by us or by our competitors; |
| • | acquisitions or strategic alliances by us or by our competitors; |
| • | recruitment or departure of key personnel; |
| • | the gain or loss of significant customers; |
| • | changes in the estimates of our operating performance or changes in recommendations by any securities analysts that elect to follow our common stock; and |
| • | market conditions in our industry, the industries of our customers, and the economy as a whole. |
On April 15, 2007 we received an initial notification from The Nasdaq Stock Market that we had not maintained a minimum market value of its shares of common stock in accordance with Marketplace Rule 4450(e)(1) and would be required to regain compliance by July 14, 2008. On July 16, 2008 we received a follow-up notification from The Nasdaq Stock Market that we had not regained compliance in accordance with Marketplace Rule 4450(e)(1). Accordingly, our securities were delisted from The Nasdaq Global Market. Trading of our common stock was suspended at the opening of business on July 25, 2008, and a Form 25-NSE was filed with the SEC, which removed our securities from listing and registration on The Nasdaq Stock Market. Our securities will continue to be quoted in the pink sheets under the symbol TCMI.
Change in control provisions could make it more difficult for a third party to acquire us and discourage a takeover, even when such attempts may be in the best interests of our stockholders or on terms where our stockholders may be able to receive a premium for their shares over then current market prices.
Our amended and restated certificate of incorporation and the Delaware General Corporation Law, or the DGCL, contain provisions that may have the effect of making more difficult or delaying attempts by others to obtain control of us, even when these attempts may be in the best interests of stockholders. These include provisions authorizing our board of directors, without stockholder approval, to issue one or more series of preferred stock, which could have voting and conversion rights that adversely affect or dilute the voting power of the holders of our common stock. The DGCL also imposes conditions on certain business combination transactions with “interested stockholders.” These provisions and others that could be adopted in the future could deter unsolicited takeovers or delay or prevent changes in our control or management, including transactions in which stockholders might otherwise receive a premium for their shares over then current market prices. These provisions may limit the ability of stockholders to approve transactions that they may deem to be in their best interests.
We may be unable to restructure our senior secured facility.
Recent news accounts report that Wachovia Corporation, the administrative agent within the Company’s lending group, is to be acquired in a transaction structured with the assistance of federal regulators. Wachovia’s situation could further complicate our debt restructuring progress.
| Item 1B. | Unresolved Staff Comments |
None.
17
Table of Contents
Index to Financial Statements
| Item 2. | Properties |
Our executive offices are located in Lawrenceville, Georgia in office space leased under an agreement that expires October 2013.
Property Location | Use | Owned or Leased | Approximate Size (Sq. Ft.) | Lease Expiration Date | ||||
Albany, GA | Offices and production facility for The Albany Herald | Owned | 83,000 | n/a | ||||
Conyers, GA | Offices forRockdale Citizen | Owned | 20,000 | n/a | ||||
Conyers, GA | Warehouse | Leased | 9,600 | 3/08 | ||||
Covington, GA | Offices forNewton Citizen | Leased | 3,750 | 4/10 | ||||
Duluth, GA | Circulation distribution center | Leased | 7,866 | 8/08 | ||||
Lawrenceville, GA | Offices and production facility forGwinnett Daily Postand Rockdale Citizen/Newton Citizen | Leased | 72,000 | 10/13 | ||||
Bethlehem, GA | Circulation distribution center | Leased | 5,600 | 6/09 | ||||
Jonesboro, GA | Offices and production facility forClayton News Daily, Henry Daily Herald and Jackson Progress-Argus | Owned | 19,275 | n/a | ||||
Jackson, GA | Offices forJackson Progress-Argus | Owned | 3,096 | n/a | ||||
McDonough, GA | Offices forHenry Daily Herald | Leased | 2,400 | 12/08 | ||||
In addition, we have approximately 4,300 square feet of office space under lease in New York City through August 2010, all of which has been subleased, and also have small regional and local field offices primarily located close to the universities and conferences that we used to do business with when we owned Host.
We believe our facilities are adequate for the continuing operations of our existing businesses. Our Credit Facilities, as described in Note 8 to the financial statements are secured by all property that we own.
| Item 3. | Legal Proceedings |
We are subject to various legal proceedings in the ordinary course of business, none of which is required to be disclosed under this item 3.
| Item 4. | Submission of Matters to a Vote of Security Holders |
No matters were submitted to a vote of security holders during the fourth quarter of the fiscal year ended June 30, 2008.
18
Table of Contents
Index to Financial Statements
PART II
| Item 5. | Market for the Registrant’s Common Equity, Related Stockholder Matters and Issuer Purchases of Equity Securities |
Market Information
Our common stock, par value $.001 per share, has been listed and traded on the Nasdaq Global Market (“NASDAQ”) since December 20, 2005 under the symbol “TCMI.”
On April 15, 2008, we received an initial notification from The Nasdaq Stock Market that we had not maintained a minimum market value of our shares of common stock in accordance with Marketplace Rule 4450(e)(1) and would be required to regain compliance by July 14, 2008. On July 16, 2008, we received a follow-up notification from The Nasdaq Stock Market that we had not regained compliance in accordance with Marketplace Rule 4450(e)(1). Accordingly, our securities were delisted from The Nasdaq Global Market. Trading of our common stock was suspended at the opening of business on July 25, 2008, and a Form 25-NSE was filed with the SEC, which removed our securities from listing and registration on The Nasdaq Stock Market. Our securities will continue to be quoted in the pink sheets under the symbol TCMI.
The following table sets forth the high and low sale prices of our common stock for the periods indicated. The high and low sales prices are as reported by the NASDAQ.
Quarter Ended | High | Low | ||||
Fiscal 2008 | ||||||
September 30, 2007 | $ | 10.44 | $ | 5.72 | ||
December 31, 2007 | $ | 6.50 | $ | 4.40 | ||
March 31, 2008 | $ | 5.55 | $ | 2.71 | ||
June 30, 2008 | $ | 2.80 | $ | 0.47 | ||
Fiscal 2007 | ||||||
September 30, 2006 | $ | 8.66 | $ | 7.15 | ||
December 31, 2006 | $ | 7.98 | $ | 6.80 | ||
March 31, 2007 | $ | 11.31 | $ | 7.88 | ||
June 30, 2007 | $ | 10.49 | $ | 8.30 | ||
Fiscal 2006 | ||||||
March 31, 2006 | $ | 12.00 | $ | 5.66 | ||
June 30, 2006 | $ | 8.67 | $ | 5.00 | ||
Fiscal 2005 | ||||||
December 31, 2005 | $ | 15.50 | $ | 11.01 | ||
As of September 15, 2008, we had approximately 380 stockholders of record.
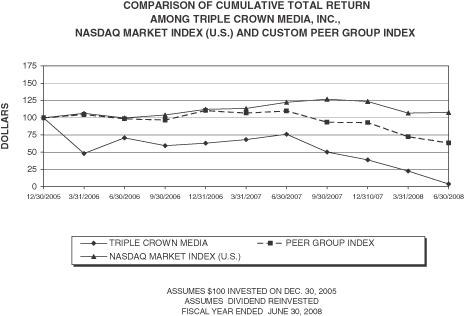
The following graphs compare the cumulative total return of our common stock from December 30, 2005 to June 30, 2008 as compared to the stock market total return indexes for (1) the NASDAQ Market Index and (2) a Custom Peer Group Index based upon the Hemscott Marketing Services Industry Group Index (50.7%) and Hemscott Publishing—Newspaper Industry Group Index (49.3%). These percentages are based on relative revenue and profitability of each of our primary business segments.
19
Table of Contents
Index to Financial Statements
The graphs assume the investment of $100 in the common stock, the NASDAQ Market Index and the Custom Peer Group Index on December 30, 2005. Dividends are assumed to have been reinvested as paid.
Dividends
We have not declared or paid a cash dividend on our common stock. It is the present policy of our Board of Directors to retain all earnings to finance the development and growth of our business. Our future dividend policy will depend upon our earnings, capital requirements, financial condition and other relevant circumstances existing at that time. Our bank credit agreements also contain restrictions on our ability to declare and pay dividends on our common stock.
Equity Compensation Plan Information
See “Item 12—Security Ownership of Certain Beneficial Owners and Management and Related Stockholder Matters—Equity Compensation Plan Information” for disclosure regarding our equity compensation plans.
20
Table of Contents
Index to Financial Statements
| Item 6. | Selected Financial Data |
The following table sets forth our summary historical financial information after giving effect to the Spin-off and Merger. The summary selected historical statement of operations data for the years ended December 31, 2003 and 2004 and the summary selected balance sheet data as of December 31, 2003 and 2004 was derived from our audited financial statements as of and for the years then ended. The summary selected historical statement of operations data for the year ended December 31, 2005 was derived from our audited financial statements for the year then ended, and includes the combined operating results for 364 days as part of Gray through the date of the Spin-off and the consolidated operating results for the one day after the Spin-off (which are included in discontinued operations). The summary selected statement of operations data for the six months ended June 30, 2006 and the twelve months ended June 30, 2007 and 2008 was derived from our audited financial statements. The summary selected balance sheet data as of December 31, 2005 and June 30, 2006, 2007 and 2008 was derived from our audited financial statements. The audited financial statements include all adjustments, consisting of normal recurring items, which we consider necessary for a fair statement of our financial position and results of operations for those periods. For the periods and dates prior to the Spin-off, the financial statements were derived from the financial statements and accounting records of Gray using the historical results of operations and historical basis of the assets and liabilities of the Newspaper Publishing segment and the GrayLink Wireless segment and include those assets, liabilities, revenues, and expenses directly attributable to the operations of the Newspaper Publishing and the GrayLink Wireless segments and allocations of certain Gray corporate expenses to the Newspaper Publishing and the GrayLink Wireless segments. These amounts were allocated to us on the basis that was considered by us and Gray to reflect most fairly or reasonably the utilization of the services provided, or the benefit received by, us. All significant intercompany amounts and transactions were eliminated. The GrayLink Wireless segment is included in discontinued operations as further discussed in footnote 10 to the consolidated financial statements. The summary historical financial information presented for periods prior to the Spin-off is not necessarily indicative of our past or future performance as an independent company. The summary historical financial information as of December 31, 2005 include the effect of the Merger, including the operating results of the Collegiate Marketing and Association Management Services segments for the one day subsequent to the Merger (which is accounted for in discontinued operations as further discussed in footnote 10 to the consolidated financial statements). This information should be read in conjunction with our combined financial statements and notes thereto and the discussion under “Management’s Discussion and Analysis of Financial Condition and Results of Operations” contained elsewhere in this Form 10-K.
21
Table of Contents
Index to Financial Statements
Statement of Operations Data: (Dollars in thousands, except per share data) | ||||||||||||||||||||||
| Year Ended December 31, (1) | Six Months Ended June 30, 2006 | Twelve Months Ended June 30, 2007 | Twelve Months Ended June 30, 2008 (2) | |||||||||||||||||||
| 2003 | 2004 | 2005 | ||||||||||||||||||||
Operating revenues | $ | 36,670 | $ | 38,790 | $ | 40,237 | $ | 22,047 | $ | 48,464 | $ | 46,021 | ||||||||||
Operating income | 8,927 | 9,002 | 7,782 | 2,893 | 6,894 | 1,444 | ||||||||||||||||
Earnings (loss) from continuing operations | 5,238 | 5,681 | 4,679 | (2,276 | ) | (5,062 | ) | (17,994 | ) | |||||||||||||
Income (loss) from discontinued operations, net of tax | 1,691 | 1,574 | (262 | ) | 987 | 1,967 | (37,189 | ) | ||||||||||||||
Gain (loss) on disposal of discontinued operations, net of tax | — | — | — | 5,685 | (381 | ) | (3,767 | ) | ||||||||||||||
Net income | 6,929 | 7,255 | 4,417 | 4,396 | (3,476 | ) | (58,950 | ) | ||||||||||||||
Net income available to common stockholders | 6,929 | 7,255 | 4,414 | 3,854 | (4,562 | ) | (60,040 | ) | ||||||||||||||
Basic and diluted net income (loss) per common share (3) | ||||||||||||||||||||||
Earnings (loss) from continuing operations | $ | 1.08 | $ | 1.17 | $ | 0.96 | $ | (0.44 | ) | $ | (0.96 | ) | $ | (3.24 | ) | |||||||
Income (loss) from discontinued operations | $ | 0.35 | $ | 0.32 | $ | (0.05 | ) | $ | 0.19 | $ | 0.37 | $ | (6.70 | ) | ||||||||
Gain (loss) on disposal of discontinued operations, net of tax | $ | — | $ | — | $ | — | $ | 1.11 | $ | (0.07 | ) | $ | (0.68 | ) | ||||||||
Net income (loss) | $ | 1.42 | $ | 1.49 | $ | 0.91 | $ | 0.86 | $ | (0.66 | ) | $ | (10.62 | ) | ||||||||
Net income (loss) available to common stockholders | $ | 1.42 | $ | 1.49 | $ | 0.91 | $ | 0.75 | $ | (0.87 | ) | $ | (10.81 | ) | ||||||||
Weighted average shares outstanding | 4,870 | 4,870 | 4,871 | 5,139 | 5,246 | 5,553 | ||||||||||||||||
| (1) | Operating revenues and income have been adjusted for discontinued operations of The Goshen News and GrayLink, LLC, or Graylink, discussed elsewhere in this Form 10-K. See footnote 11 to the consolidated financial statements contained elsewhere in this Form 10-K for further information. |
| (2) | Income (loss) from discontinued operations, net of tax, includes a $27.3 million goodwill impairment charge. |
| (3) | For the years ended December 31, 2003, 2004 and 2005, the (basic and diluted) income from continuing operations per share gives effect to the issuance of 4,870,000 shares of our common stock in the Spin-off as if it had occurred at the beginning of the periods presented. For the day of December 31, 2005, 5,128,000 shares of our common stock were assumed to be outstanding, including 258,000 shares to be issued in exchange for shares of Bull Run common stock. Average shares outstanding for the six months ended June 30, 2006 and the twelve months ended June 30, 2007 were 5,138,775 and 5,246,249, respectively. |
We did not pay or declare any cash dividends during the periods presented.
| (Dollars in thousands) | As of December 31, | As of June 30, | ||||||||||||||||||||
| 2003 | 2004 | 2005 | 2006 | 2007 | 2008 | |||||||||||||||||
Total assets | $ | 37,818 | $ | 39,240 | $ | 171,029 | $ | 163,575 | $ | 174,462 | $ | 40,625 | ||||||||||
Long-term debt (including current portion) | 56 | — | 121,939 | 119,276 | 124,770 | 70,802 | ||||||||||||||||
Owner’s net investment / Stockholder’s equity (deficit) | 29,254 | 29,800 | (7,210 | ) | (2,714 | ) | (5,872 | ) | (64,962 | ) | ||||||||||||
22
Table of Contents
Index to Financial Statements
| Item 7. | Management’s Discussion and Analysis of Financial Condition and Results of Operations |
Executive Overview
Introduction
The following analysis of our financial condition and results of operations should be read in conjunction with our audited combined financial statements and notes thereto included elsewhere in this Form 10-K. All references to Triple Crown Media, Inc., “TCM”, “we,” “us,” or “our” in this discussion refer to the consolidated Newspaper Publishing business. The Newspaper Publishing business has historically operated as a wholly-owned subsidiary or division of Gray and since June 30, 2005, has operated as Gray Publishing LLC, a wholly-owned limited liability company and subsidiary of Gray prior to the Spin-off and of TCM, subsequent to the Spin-off.
We do not anticipate meeting certain future debt compliance covenants (First Lien leverage and total leverage ratio) in the fiscal year ending June 30 2009. Without waiver of these violations, which could occur at any time between now and June 30, 2009, and/or restructuring of our debt, our bank could accelerate our payment provisions. Further, the sale of Host and Pinnacle resulted in $2.6 million of tax liabilities which began to come due on September 15, 2008. Assuming no acceleration of payments, material portions of our debt facilities become due in December 2009, June 2010 and December 2010. In order to meet these obligations, we will be required to restructure our current credit facilities and refinance with another lender. In the case of our income tax obligations, we are negotiating with the taxing authorities to arrange a payment plan which will allow us to spread our payments over an extended period of time. Should we be unsuccessful in these restructuring efforts, we will attempt to derive capital from alternate sources which may include any of the following; private placement, the issuance of additional shares of preferred stock or other means not yet identified. In the event that we are not able to arrange a payment plan for our tax obligations, or refinance our debt obligations, we may not have sufficient liquidity to operate.
These factors raise substantial doubt as to our ability to continue as a going concern. The accompanying financial statements have been prepared on a going concern basis which assumes continuity of operations and realization of assets and liabilities in the ordinary course of business. The financial statements do not include any adjustments that might result from the outcome of this uncertainty.
Change in Year End
In April 2006, we elected to change our fiscal year end from December 31 to a new fiscal year end of June 30. In view of this change, this Item 7, “Management’s Discussion and Analysis of Financial Condition and Results of Operations,” (“MD&A”) compares the consolidated financial statements as of and for the twelve months ended June 30, 2008 with the combined financial statements as of and for the twelve months ended June 30, 2007. Note that although the combined financial statements are not presented as of and for the twelve months ended June 30, 2006, we have included summary information in the MD&A for this period for comparability purposes.
Throughout the MD&A, data for all periods, except as of and for the twelve months ended June 30, 2006, are derived from our audited combined and consolidated financial statements, which appear in this report. All data as of and for the twelve months ended June 30, 2006, are derived from our unaudited combined financial statements, which are not presented herein. Summary financial information for this period can be found in Note 16 to the consolidated financial statements contained elsewhere in this Form 10-K.
23
Table of Contents
Index to Financial Statements
Overview
We derive revenue from our Newspaper Publishing operations. Our Newspaper Publishing operations derive revenue primarily from three sources: retail advertising, circulation and classified advertising
Our Newspaper Publishing operations’ advertising contracts are generally entered into annually and provide for a commitment as to the volume of advertising to be purchased by an advertiser during the year. Our Newspaper Publishing operations’ advertising revenues are primarily generated from local advertising and are generally highest in the second and fourth quarters of each calendar year.
Industrywide, newspaper subscriber circulation levels have been slowly declining. From December 31, 2005 through June 30, 2008, our aggregate daily circulation has declined approximately 11%. We attempt to offset declines in circulation and corresponding circulation revenue with strategies that include readership growth in Gwinnett and Newton County, Georgia and efforts to increase circulation among cable subscribers in Gwinnett County, Georgia under our unique relationship whereby newspaper subscriptions are sponsored by local cable companies.
Our Newspaper Publishing operations’ primary operating expenses are employee compensation, related benefits and newsprint costs. In addition, the operations incur overhead expenses, such as maintenance, supplies, insurance and utilities. A large portion of the operating expenses of the Newspaper Publishing operations are fixed, although our Newspaper Publishing operations have experienced significant variability in its newsprint costs in recent years. Historically, for the newspaper publishing industry, the price of newsprint has been cyclical and volatile. The average price for the twelve months ended June 30, 2008 was $610 per metric ton compared to the average price for the twelve months ended June 30, 2007 of $643. Prices fluctuate based on factors that include both foreign and domestic production capacity and consumption. Price fluctuations can have a significant effect on our results of operations. We seek to manage the effects of increases in prices of newsprint through a combination of technology improvements, page width and page count reductions, inventory management and advertising and circulation price increases. In addition, newspaper production costs are variable based on circulation and advertising volumes.
Discontinued Operations
On April 7, 2006, we entered into an asset exchange agreement with CNHI, dated as of April 1, 2006, to exchange The Goshen News for the Jonesboro Group consisting of the Clayton News Daily, Clayton News Weekly, Henry Daily Herald and Jackson Progress-Argus. Subject to the terms and conditions of the agreement, effective as of April 1, 2006, CNHI assumed substantially all of the operating assets and liabilities and obligations of The Goshen News, and we assumed substantially all of the operating assets and liabilities of the Jonesboro Group. Accordingly, we have accounted for The Goshen News as a discontinued operation in the accompanying financial statements. The results of the Jonesboro Group operations are included in our results of operations for the six months ended June 30,2006 and twelve months ended June 30, 2007. Additional information regarding the Jonesboro Group, its results of operations and its circulation are contained elsewhere in this Form 10-K.
We applied the provisions of Statements of Financial Accounting Standards (“SFAS”) No. 144, “Accounting for the Impairment or Disposal of Long-lived Assets,” (“SFAS 144”) to the exchange of The Goshen News, which requires that in a period in which a component of an entity has been disposed of or is classified as held for sale, the income statement of a business enterprise for current and prior periods shall report the results of operations of the component, including any gain or loss recognized, in discontinued operations. The table below summarizes the effect of the reclassification on the year ended December 31, 2005 and the six months ended June 30, 2006:
24
Table of Contents
Index to Financial Statements
| For the Year Ended December 31, 2005 | For the Six Months Ended June 30, 2006 | |||||
Operating revenue | $ | 5,966 | $ | 1,417 | ||
Income before taxes | 1,613 | 445 | ||||
Income tax expense | 625 | 174 | ||||
Income, net of tax | 988 | 271 | ||||
Gain on exchange, net of tax | — | 5,685 | ||||
On June 15, 2007, we entered into an agreement to sell substantially all of the assets and liabilities of our GrayLink Wireless business segment to a third party, effective June 22, 2007. Accordingly, the results of operations of the Wireless business segment for the year ended December 31, 2005 and for the six and twelve months ended June 30, 2006 and 2007, have been reclassified to discontinued operations. Accordingly, we have accounted for GrayLink as a discontinued operation in the accompanying financial statements.
We applied the provisions of SFAS 144, to the sale of GrayLink, which requires that in a period in which a component of an entity has been disposed of or is classified as held for sale, the income statement of a business enterprise for current and prior periods shall report the results of operations of the component, including any gain or loss recognized, in discontinued operations. The table below summarizes the effect of the reclassification on the year ended December 31, 2005 and the six and twelve months ended June 30, 2006 and 2007:
| Year Ended December 31, 2005 | Six Months Ended June 30, 2006 | Twelve Months Ended June 30, 2007 | |||||||||
Operating revenue | $ | 7,507 | $ | 3,457 | $ | 5,415 | |||||
Income before taxes | (2,005 | ) | 280 | (735 | ) | ||||||
Income tax expense (benefit) | (765 | ) | 76 | (275 | ) | ||||||
Income, net of tax | (1,240 | ) | 204 | (460 | ) | ||||||
Loss on sale, net of tax | — | — | (381 | ) | |||||||
On November 15, 2007, subsequent to the twelve months ended June 30, 2007 we completed our sale of Host and Pinnacle comprising our Collegiate Marketing and Association Management businesses. The Board of Directors hired an outside investment banker to evaluate the proposed offer from IMG, Worldwide. The investment banker’s analysis revealed that the offer provided a very compelling reason to sell Host Communications, Inc. Based on that analysis, consultation with legal counsel, the Company’s debt position and other factors the Board of Directors approved the sale. The gross sales price was $74.3 million with $67.9 received at closing and $1.4 million held in escrow subject to working capital settlement provisions and $5.0 million held in escrow subject to indemnity settlement provisions. We have recorded a $5.1 receivable in other long-term assets, of which $0.1 relates to the working capital settlement provisions and $5.0 relates to the indemnity provisions, as management believes no conditions exist which would constitute valid claims for indemnification. During the first quarter ended September 30, 2007, we recorded a goodwill impairment charge of $23.7 million to reduce the carrying value of these businesses to fair value less cost to sell. Accordingly, the results of operations of the Collegiate Marketing and Association Management business segment for the year ended December 31,2005, the six months ended June 30, 2006, and the twelve months ended June 30, 2007, and 2008 have been reclassified to discontinued operations.
25
Table of Contents
Index to Financial Statements
Summary operating results for Host and Pinnacle were as follows:
| Year Ended December 31, 2005 | Six Months Ended June 30, 2006 | Twelve Months Ended June 30, 2007 | Twelve Months Ended June 30, 2008 | |||||||||||
Operating revenue | $ | 113 | $ | 28,875 | $ | 81,837 | $ | 39,147 | ||||||
Income before taxes | (10 | ) | 1,440 | 3,875 | (25,697 | ) | ||||||||
Income tax expense (benefit) | — | 590 | 1,447 | 15,259 | ||||||||||
Income, net of tax | (10 | ) | 850 | 2,428 | (40,956 | ) | ||||||||
Loss on sale, net of tax | — | — | — | (3,767 | ) | |||||||||
Newspaper Publishing and Other Revenues
Set forth below are the principal types of revenues earned by our Newspaper Publishing operations for the periods indicated and the percentage contribution of each to our total revenues:
| Twelve Months Ended December 31, 2005 | Six Months Ended June 30, 2006 | Twelve Months Ended June 30, 2007 | Twelve Months Ended June 30, 2008 | |||||||||||||||||||||
| Amount | % | Amount | % | Amount | % | Amount | % | |||||||||||||||||
Publishing: | ||||||||||||||||||||||||
Retail Advertising | $ | 23,057 | 57.3 | % | $ | 11,882 | 53.9 | % | $ | 26,299 | 54.3 | % | $ | 24,682 | 53.6 | % | ||||||||
Classified Advertising | 12,672 | 31.5 | % | 7,500 | 34.0 | % | 16,071 | 33.2 | % | 15,112 | 32.8 | % | ||||||||||||
Circulation | 4,264 | 10.6 | % | 2,195 | 10.0 | % | 4,560 | 9.4 | % | 4,742 | 10.3 | % | ||||||||||||
Other | 244 | 0.6 | % | 470 | 2.1 | % | 1,534 | 3.2 | % | 1,485 | 3.2 | % | ||||||||||||
Total Revenues | $ | 40,237 | 100.0 | % | $ | 22,047 | 100.0 | % | $ | 48,464 | 100.0 | % | $ | 46,021 | 100.0 | % | ||||||||
Results of Operations
Twelve Months Ended June 30, 2008 compared to Twelve Months Ended June 30, 2007
The following analysis of our financial condition and results of operations should be read in conjunction with our accompanying financial statements for the twelve months ended June 30, 2008 and 2007.
Revenues.Total revenues for the twelve months ended June 30, 2008 decreased 5% to approximately $46.0 million from approximately $48.5 million for the twelve months ended June 30, 2007. Advertising revenue decreased a total of 6%. Three of our advertising categories; real estate, automotive, and help wanted, comprise the majority of our advertising decreases at $(1.0) million, $(0.6) million and $(1.3) million, respectively. An offset to these decreases was an unprecedented increase in legal advertising of $1.8 million. The increase was due in large part to record foreclosures in Gwinnett, Rockdale, Clayton and Henry counties. Advertising decreases in general can be attributed to economic trends over the past year. Management anticipates that these sluggish trends will continue through the majority of fiscal year 2009 and should begin to show signs of recovery in late fiscal year 2009 and/or early fiscal year 2010. Circulation revenue increased $0.2 million due to a full cycle of The Albany Herald transitioning from a carrier collect to retail market. Under the carrier collect market, newspapers are sold at a wholesale rate to carriers, therefore realizing less revenue and relatively no expense. Under the retail market newspapers are sold directly to the subscriber at a higher rate and the payments to the carriers for delivery are expensed.
26
Table of Contents
Index to Financial Statements
Operating Expenses.Operating expenses, before depreciation and amortization, for the twelve months ended June 30, 2008 decreased 2.85% to approximately $33.1 million compared to approximately $34.1 million for the twelve months ended June 30, 2007.
| • | Newsprint expense decreased 19% to approximately $4.8 million for the twelve months ended June 30, 2008 compared to $6.0 million for the twelve months ended June 30, 2007. The average cost per metric ton of newsprint decreased by $48 compared to the prior year. Industry pricing of newsprint decreased steadily in the first five months of the fiscal year hitting a low of $560/mt in November 2007. The industry initiated a series of monthly price increases beginning in December 2007. The industry price at June 30, 2008 was $700/mt .Total usage was approximately 8,500 metric tons during the twelve months ended June 30, 2008 compared to 9,700 metric tons during the twelve months ended June 30, 2007. The decrease in usage is primarily due to cost-cutting measures implemented to help offset the decrease in advertising revenue and increases in newsprint expense per ton. One of these cost- cutting measures is a reduction in page count including: elimination of the Sunday metro section in Rockdale, elimination of the travel section in Gwinnett, less amount of newshole at all papers. Another cost-cutting measure is planned reduction of circulation volume in Gwinnett. |
| • | Payroll and related expense decreased 3.45% to approximately $14.8 million for the twelve months ended June 30, 2008 compared to approximately $15.3 million for the twelve months ended June 30, 2007. A contributing factor to the decrease is a result of a reduction of headcount from 378 at the end of fiscal 2007 to 339 at the end of fiscal 2008. This included a reduction in force of 20 people in the fourth quarter of fiscal 2008. Another contributing factor is lower amounts being paid in commissions and bonuses over the course of the year which is directly tied to lower revenue and EBITDA amounts. |
| • | Newspaper Publishing transportation service costs, which are primarily outsourced, increased 8.9% to approximately $5.4 million for the twelve months ended June 30, 2008 compared to approximately $5.0 million for the twelve months ended June 30, 2007. Higher gas stipends for carriers, increases in hauler charges (transporting papers from the printing facilities to circulation drops), and contracting certain routes at higher amounts than in previous years to help combat carrier turnover were all primarily the result of increases in fuel costs. |
Corporate and Administrative expenses, before depreciation and amortization, decreased by 34% to approximately $3.8 million for the twelve months ended June 30, 2008 compared to $5.7 million for the twelve months ended June 30, 2007. The decrease was due to the elimination of headcount and restructuring of corporate duties after the sale of Host. Share-based compensation expense decreased $0.4 million for the twelve months ended June 30, 2008 compared to the prior twelve months.
Depreciation of property and equipment totaled approximately $1.2 million and $1.1 million for the twelve months ended June 30, 2008 and 2007, respectively.
Amortization expense in connection with definite-lived intangible assets was $0.7 million for the twelve months ended June 30, 2008 and June 30, 2007.
Goodwill Impairment. We recorded a $5.8 million impairment charge related to our Jonesboro reporting unit in the twelve months ended June 30, 2008. No such charge was taken in the period ended June 30, 2007.
Interest Expense.Interest expense incurred in connection with our credit facilities was approximately $10.9 million for the twelve months ended June 30, 2008 compared to $13.2 million for the twelve months ended June 30, 2007. The reduction in interest expense was mainly due to a principal payment on the first lien of $65.5 million after the sale of Host, which occurred halfway through fiscal 2008.
27
Table of Contents
Index to Financial Statements
Debt issue cost amortization.Amortization of costs incurred in connection with our credit Facilities were approximately $1.4 million for the twelve months ended June 30, 2008 compared to $1.3 million for the twelve months ended June 30, 2007.
Income tax expense. Income tax expense was approximately $22.0 million for the twelve months ended June 30, 2008 compared to a $2.1 million benefit for the twelve months ended June 30, 2007. The effective tax rate was approximately (59%) for the twelve months ended June 30, 2008 compared to 37% for the twelve months ended June 30, 2007. The change in the effective tax rate compared to the prior year is primarily the result of the utilization of a portion of our deferred tax assets related to net operating losses against the tax gain on the sale of Host, as well as recording a valuation allowance against our net deferred tax assets. We have recorded deferred tax assets of approximately $13.7 million for net operating loss carryforwards which expire through fiscal 2027. We do not anticipate that all of our available net operating loss carryforward amounts for tax purposes obtained in the Merger or generated thereafter will ultimately be realized, due to their expiration or other limitations on utilization. We do not believe it is more likely than not that we will be able to recognize the deferred tax assets resulting from these net operating loss carryovers or our other net deferred tax assets. As a result, as of June 30, 2008, we have recognized a valuation allowance of approximately $18.8 million against our net deferred tax assets which is an increase of $8.5 million over that of $10.3 million at June 30, 2007. If we revise our estimate of the benefit expected to be derived from the net operating loss carryforward or other deferred tax assets, the valuation allowance may be modified. Increases in the valuation allowance could increase the tax provision or decrease the tax benefit recognized in the period of the change in estimate. For periods in 2005 prior to the Spin-off, the tax provision was based on an allocation of income tax expense from Gray.
Discontinued operations.The loss from discontinued operations was $37.2 million net of tax, separate from continuing operations for the twelve months ended June 30, 2008. Income from discontinued operations was $2.0 million net of tax, separate from continuing operations for the twelve months ended June 30, 2007. The increase in the loss was due to the sale of Host and Pinnacle in November 15, 2007. Historically these businesses’ most profitable quarters were the quarters ended on December 31 and March 31 which coincided with college football and basketball, respectively. During fiscal 2008 we owned those businesses for only a short time compared to a full year in fiscal 2007. Also, during the first quarter ended September 30, 2007, we recorded a goodwill impairment charge of $23.7 million to reduce the carrying value of these businesses to fair value less cost to sell. In addition, we recorded a loss of $3.8 million, net of tax on disposal of Host and Pinnacle.
Twelve Months Ended June 30, 2007 compared to Twelve Months Ended June 30, 2006
The following analysis of our financial condition and results of operations should be read in conjunction with our audited financial statements for the twelve months ended June 30, 2007 and the summary unaudited financial information as of and for the twelve months ended June 30, 2006, contained in Note 17 to the financial statements.
Revenues.Total revenues for the twelve months ended June 30, 2007 increased 14% to approximately $48.5 million from approximately $42.5 million for the twelve months ended June 30, 2006. The twelve months ended June 30, 2007 contains twelve months of revenue at the Jonesboro Group versus only three months in the comparable prior year. An increase in classified advertising revenue of 18% was the primary contributor to the increase in Newspaper Publishing revenues. The increase in classified advertising was primarily driven by legal advertising. Retail advertising increased 9% with gains attributable to the Jonesboro Group and The Gwinnett Daily Post, partially offset by the decline in the Albany market. Circulation revenue increased 7%, reflecting strength at The Gwinnett Daily Post in addition to the Jonesboro Group.
28
Table of Contents
Index to Financial Statements
Operating Expenses.Operating expenses, before depreciation and amortization, for the twelve months ended June 30, 2007 increased 9.5% to approximately $34.1 million compared to approximately $31.2 million for the twelve months ended June 30, 2006.
| • | Newsprint expense increased 7% to approximately $6.0 million for the twelve months ended June 30, 2007 compared to $5.6 million for the twelve months ended June 30, 2006. The twelve months ended June 30, 2007 contains twelve months of expense for the Jonesboro Group compared to three months in the comparable prior year which is the primary cause of the increase in newsprint expense. The average cost per metric ton of newsprint increased by $4 compared to the comparable prior year. Total usage was approximately 9,700 metric tons during the twelve months ended June 30, 2007 compared to 9,200 metric tons during the twelve months ended June 30, 2006 with the increase due primarily to twelve months of usage at the Jonesboro Group in the current year versus only three months in the comparable prior year. |
| • | Payroll expense increased 7% to approximately $15.3 million for the twelve months ended June 30, 2007 compared to approximately $14.2 million for the twelve months ended June 30, 2006. |
| • | Newspaper Publishing transportation service costs, which are primarily outsourced, increased 17% to approximately $4.9 million for the twelve months ended June 30, 2007 compared to approximately $4.2 million for the twelve months ended June 30, 2006. The increase in expense was primarily the result of increases in fuel costs. |
Corporate and Administrative expenses, before depreciation and amortization, increased by 58% to approximately $5.7 million for the twelve months ended June 30, 2007 compared to $3.6 million for the twelve months ended June 30, 2006. Share-based compensation expense increased $1.0 million for the twelve months ended June 30, 2007 compared to the comparable prior twelve months. Other compensation related expenses increased by $1.4 million for the twelve months ended June 30, 2007, that contained a full year of salaries for corporate personnel, compared to the twelve months ended June 30, 2006 that contained only six months of such salaries.
Depreciation of property and equipment totaled approximately $1.1 million for the twelve months ended June 30, 2007 and 2006.
Amortization expense in connection with definite-lived intangible assets was $0.7 million for the twelve months ended June 30, 2007 compared to $0.2 million for the twelve months ended June 30, 2006, that contained only six months of such amortization.
Interest Expense.Interest expense incurred in connection with our credit facilities was approximately $13.2 million for the twelve months ended June 30, 2007 compared to $5.9 million for the twelve months ended June 30, 2006, that contained only six months of such expense. Interest expense related to our Series B preferred stock, a non-cash expense, was approximately $0.5 million for the twelve months ended June 30, 2007 compared to $0.2 million for the twelve months ended June 30, 2006, that contained only six months of such expense.
Debt issue cost amortization.Amortization of costs incurred in connection with our credit facilities were approximately $1.3 million for the twelve months ended June 30, 2007 compared to $0.6 million for the twelve months ended June 30, 2006, that contained only six months of such costs. Debt issue costs are being amortized over four years, the estimated life of the loans.
Income tax expense. Income tax benefit was approximately $3.0 million benefit for the twelve months ended June 30, 2007 compared to a $1.4 million expense for the twelve months ended June 30, 2006. The effective tax rate was approximately 37% for the twelve months ended June 30, 2007 compared to 42% for the twelve months ended June 30, 2006. The decrease in the effective tax rate compared to the prior year is primarily the result of a change in the future expected state tax rate
29
Table of Contents
Index to Financial Statements
that will more likely than not be in effect as applied to our deferred tax assets. We have recorded net operating loss carryforwards of approximately $31.2 million as deferred tax assets which will begin to expire in fiscal 2018. We do not anticipate that all of our available net operating loss carryforward amounts for tax purposes obtained in the Merger or generated thereafter will ultimately be realized, due to their expiration or other limitations on utilization or the determination that it is more likely than not that they will not be fully utilized. As a result, as of June 30, 2007, we have recognized a valuation allowance of approximately $10.3 million against our net deferred tax assets which is an increase of $0.8 million compared to $9.5 million at June 30, 2006. For periods in 2005 prior to the Spin-off, the tax provision was based on an allocation of income tax expense from Gray.
Discontinued operations. Income from discontinued operations of approximately $2.0 million is reported net of tax, separate from continuing operations. In addition, we recorded a loss of $0.4 million, net of tax on disposal of GrayLink.
Six Months Ended June 30, 2006 compared to Six Months Ended June 30, 2005
The following analysis of our financial condition and results of operations should be read in conjunction with our audited financial statements for the six months ended June 30, 2006 and the summary unaudited financial information as of and for the six months ended June 30, 2005, contained in Note 17 to the consolidated financial statements contained in this Form 10-K .
| • | Revenues.Total revenues increased 11% to approximately $22.0 million for the six months ended June 30, 2006 compared to approximately $19.8 million for the six months ended June 30, 2005. An increase in classified advertising revenue of 16% was the primary contributor to the increase in Newspaper Publishing revenues. The increase in classified advertising was primarily driven by legal advertising. Retail advertising increased 7% with gains at The Gwinnett Daily Post partially offset by the decline in the Albany market. Circulation revenue increased 5% reflecting strength at The Gwinnett Daily Post. |
| • | Operating Expenses.Operating expenses, before depreciation and amortization, increased 8% to approximately $15.8 million for the six months ended June 30, 2006 compared to approximately $14.7 million for the six months ended June 30, 2005. |
| • | Newsprint expense increased 16% to approximately $2.9 million for the six months ended June 30, 2006 compared to $2.5 million for the six months ended June 30, 2005. The increase in newsprint expense was primarily due to the increase in the average cost per metric ton of standard newsprint by $72 for the six months ended June 30, 2006 compared to the six months ended June 30, 2005. Total usage was approximately 3,960 metric tons during the six months ended June 30, 2006 compared to 4,530 metric tons during the six months ended June 30, 2005. |
| • | Payroll expense increased 7% to approximately $7.7 million for the six months ended June 30, 2006 compared to approximately $7.2 million for the six months ended June 30, 2005. |
| • | Newspaper Publishing transportation service costs, which are primarily outsourced, increased 16% to approximately $2.2 million for the six months ended June 30, 2006 compared to approximately $1.9 million for the six months ended June 30, 2005. The increase in expense was primarily the result of increases in fuel costs. |
Corporate and Administrative expenses for the six months ended June 30, 2006 of approximately $2.6 million included approximately $0.6 million of expense incurred in connection with the combination of the merged business and services related thereto. For the six months ended June 30, 2005, corporate and administrative expenses include only costs allocated to us by Gray, and therefore do not include certain costs incurred by a separate, stand-alone public company.
30
Table of Contents
Index to Financial Statements
Depreciation of property and equipment totaled approximately $0.6 million and $0.8 million for the six months ended June 30, 2006 and 2005, respectively.
Amortization expense in connection with definite-lived intangible assets was $0.2 million for the six months ended June 30, 2006.
Interest Expense.Interest expense incurred in connection with our credit facilities was approximately $5.9 million for the six months ended June 30, 2006. Interest expense related to our Series B preferred stock, a non-cash expense, was approximately $0.2 million for such period. Interest expense of $0.8 million was recorded by Bull Run during the six months ended June 30, 2005, but no interest expense was recorded related to Newspaper Publishing during this period since prior to the Spin-off, Gray provided all of the capitalization for TCM.
Debt issue cost amortization.Amortization of costs incurred in connection with our credit facilities were approximately $0.6 million for the six months ended June 30, 2006. Such costs are being amortized over four years, the estimated life of the loans. There was no such expense for the six months ended June 30, 2005 prior to the Spin-off since Gray provided all of the capitalization for TCM.
Income tax expense. Income tax expense was approximately a $1.6 million benefit for the six months ended June 30, 2006 compared to a $1.3 million expense for the six months ended June 30, 2005. The effective tax rate was approximately 41% for the six months ended June 30, 2006 compared to 30% for the six months ended June 30, 2005. We recognized net operating loss carryforwards of approximately $26.8 million as deferred tax assets which begin to expire in 2018. We do not anticipate that all of our available net operating loss carryforward amounts for tax purposes obtained in the Merger will ultimately be realized, due to their expiration or other limitations on utilization. As a result, as of June 30, 2006, we have recognized a valuation allowance of approximately $9.5 million for net deferred tax assets. For periods in 2005 prior to the Spin-off, the tax provision was based on an allocation of income tax expense from Gray.
Discontinued operations.Income from discontinued operations of $1.0 million is reported net of tax, separate from continuing operations. In addition, we recorded a gain of $5.7 million, net of tax on disposal of The Goshen News.
Liquidity and Capital Resources
Going Concern
We do not anticipate meeting future debt compliance covenants in the fiscal year ending June 30 2009. Without waiver of these violations, which could occur at any time between now and June 30, 2009, and/or restructuring of our debt, our bank could accelerate our payment provisions. Further, the sale of Host and Pinnacle resulted in $2.6 million of tax liabilities which became due on September 15, 2008. Assuming no acceleration of payments, material portions of our debt facilities become due in December 2009, June 2010 and December 2010. In order to meet these obligations, we will be required to restructure our current credit facilities, refinance with another lender or, in the case of our income tax obligations successfully negotiate with the taxing authorities to arrange a payment plan which will allow us to spread our payments over an extended period of time. Should we be unsuccessful in these restructuring efforts, we will attempt to derive capital from alternate sources which may include any of the following; public equity offering, private placement, the issuance of additional shares of preferred stock or other means not yet identified. In the event that we are not able to arrange a payment plan for our tax obligations, or refinance our debt obligations, we may not have sufficient liquidity to operate.
These factors raise substantial doubt as to our ability to continue as a going concern. The accompanying financial statements have been prepared as on a going concern basis which assumes
31
Table of Contents
Index to Financial Statements
continuity of operations and realization of assets and liabilities in the ordinary course of business. The financial statements do not include any adjustments that might result from the outcome of this uncertainty
General
The following tables present cash flow data that we believe is helpful in evaluating our liquidity and capital resources:
| (Dollars in thousands) | ||||||||||||||||
| Year Ended December 31, 2005 | Six Months Ended June 30, 2006 | Twelve Months Ended June 30, 2007 | Twelve Months Ended June 30, 2008 | |||||||||||||
Net cash provided by (used in) continuing operations | $ | 9,090 | $ | (2,765 | ) | $ | (63 | ) | $ | (969 | ) | |||||
Net cash used in investing activities | (2,087 | ) | (801 | ) | (432 | ) | (274 | ) | ||||||||
Net cash provided by (used in) financing activities | 65,995 | (3,710 | ) | 4,799 | (54,475 | ) | ||||||||||
Net cash provided by (used in) discontinued operations | (73,272 | ) | 7,079 | (4,311 | ) | 56,647 | ||||||||||
Net (decrease) increase in cash and cash equivalents | $ | (274 | ) | $ | (197 | ) | $ | (7 | ) | $ | 929 | |||||
| (Dollars in thousands) | ||||||||||||
| December 31, 2005 | June 30, 2006 | June 30, 2007 | June 30, 2008 | |||||||||
Cash and cash equivalents | $ | 370 | $ | 173 | $ | 166 | $ | 1,095 | ||||
Long-term debt, including current portion | 121,939 | 119,276 | 124,770 | 70,802 | ||||||||
Twelve Months Ended June 30, 2008 compared to the Twelve Months Ended June 30, 2007
Cash provided from continuing operating activities decreased approximately $0.9 million in fiscal 2008 compared to fiscal 2007. Net income from continuing operations, net of non cash items, caused a decrease in cash of $2.8 million compared to a decrease in cash of $3.7 million in the prior year, however, the company’s income tax liability of $2.6 million for fiscal 2008 was not paid prior to year end. No such tax amounts were paid in the prior year. Also, a $1.2 million decrease in accounts payable, which resulted from increased availability on our line of credit as a result of the sale of Host, created less cash from continuing operations in fiscal 2008 compared to fiscal 2007.
Cash used in investing activities decreased by $0.2 million due to a decline in capital expenditures in the twelve months ended June 30, 2008 compared to the twelve months ended June 30, 2007.
Cash used in financing activities decreased $59.3 million due primarily to the debt repayment made with the proceeds from the sale of Host.
Twelve Months Ended June 30, 2007 compared to the Twelve Months Ended June 30, 2006
Cash provided from continuing activities decreased approximately $5.9 million primarily due to the increase in interest for the twelve months ended June 30, 2007 of $7.0 million compared to that of the comparable prior twelve-month period. In addition, cash increased approximately $1.1 million for the twelve months ended June 30, 2007 compared to the comparable prior year period related to decreases in other current assets of approximately $0.2 million compared to increases of approximately $0.8 million in the comparable prior period.
32
Table of Contents
Index to Financial Statements
Cash used in investing activities from continuing operations increased approximately $4.3 million due primarily to an increase in cash of $6.3 million used in the acquisition of Pinnacle during the twelve months ended June 30, 2007 compared to the twelve months ended June 30, 2006. This was partially offset by $1.1 million provided by the sale of our printing assets and GrayLink business during twelve months ended June 30, 2007.
Cash provided by financing activities increased $5.4 million due primarily approximately $6.2 million drawn on our line of credit related to the purchase of Pinnacle partially offset by approximately $0.7 million of debt issue costs related to refinancing our Credit Facilities.
Six Months Ended June 30, 2006 compared to the Six Months Ended June 30, 2005
On a pro forma basis, cash provided from continuing operations decreased approximately $3.7 million primarily due to (a) approximately $6.1 million of interest in 2006 compared to approximately $0.8 million for the six months ended June 30, 2005; and (b) an approximate $2.0 million increase in corporate overhead in 2006 for expenses related to being a stand alone public company; partially offset by (i) an increase in operating income of approximately $1.5 million due primarily to increases in revenue at our Newspaper Publishing over the comparable prior period.
Net cash used in investing activities increased approximately $0.2 due primarily to the $0.6 million expenditure related to the acquisition of the Jonesboro Group for the six months ended June 30, 2006 over the comparable prior period.
Net cash used in financing activities increased approximately $4.8 million due to changes in our capital structure. In 2006, we had repayments, net of borrowings, of our Credit Facilities totaling approximately $2.7 million, paid the remaining approximately $0.6 million of our accrued distribution to Gray for reimbursement of certain expenses paid by Gray in 2006 in connection with the Spin-off and incurred approximately $0.4 million in debt issue costs in connection with our Credit Facilities.
Off-Balance Sheet Arrangements
We have various operating lease commitments for equipment and real estate used for office space and production facilities. The minimum annual rental commitments under these and other operating leases, net of subleases, with an original lease term exceeding one year are approximately $0.4 million, $0.4 million, $0.4 million, $0.3 million and $0.3 million for the years ending June 30, 2009 through 2013, respectively, and $0.1 million thereafter.
We use interest rate swap agreements to hedge exposure to interest rate fluctuations on our variable rate debt, designating these swaps as cash flow hedges of anticipated interest payments. These hedging activities may be transacted with one or more highly-rated institutions, reducing the exposure to credit risk in the event of nonperformance by the counter-party to the swap agreement.
The fair value of the swap agreement will be recognized on the balance sheet as an asset or liability, with the offset recorded in accumulated other comprehensive income net of income taxes. Any changes in the market value of the swaps are adjusted to the asset or liability account and recorded net of the related income taxes in other comprehensive income, except to the extent that the swap is considered ineffective. To the extent that the swap is considered ineffective, changes in market value of the swap are recognized as a component of interest expense in the period of the change.
In February 2006, we entered into an interest rate swap agreement effective in June 2006 and terminating in March 2009. Under the agreement, we converted a notional amount of $60 million of floating rate debt (currently bearing interest at LIBOR plus the currently applicable margin of 3.25%) to fixed rate debt, bearing interest at 5.05% plus the applicable margin.
33
Table of Contents
Index to Financial Statements
Contractual Obligations as of June 30, 2008
| (Dollars in thousands) | Payment Due by Period | ||||||||||||||
Contractual Obligations | Total | Year 1 | Years 2-3 | Years 4-5 | More Than 5 Years | ||||||||||
Long-term debt obligations | $ | 70,802 | $ | 216 | $ | 70,586 | $ | — | $ | — | |||||
Interest obligations (1) | 19,297 | 7,642 | 9,426 | 2,229 | — | ||||||||||
Operating lease obligations (2) | 2,074 | 542 | 844 | 593 | 95 | ||||||||||
| $ | 92,173 | $ | 8,400 | $ | 80,856 | $ | 2,822 | $ | 95 | ||||||
| (1) | Interest obligations assume the current contract LIBOR rate in effect at the date of this Form 10-K, as adjusted for the fixed interest rate under the interest rate swap agreement for the period during which the interest rate swap agreement will be effective. Interest obligations are presented through the maturity dates of each component of the credit facilities. |
| (2) | Operating lease obligations represent payment obligations under non-cancelable lease agreements classified as operating leases and disclosed pursuant to SFAS No. 13, “Accounting for Leases”, as may be modified or supplemented. These amounts are not recorded as liabilities as of the current balance sheet date. Operating lease obligations are presented net of future receipts on contracted sublease arrangements totaling approximately $2 million as of June 30, 2008. |
Dividends on Series A preferred stock and Series B preferred stock are payable annually at an annual rate of $40 and $60 per share, respectively, in cash or with the issuance of the respective preferred stock, at the Company’s option. If we were to fund dividends accruing during the year ending June 30, 2008 in cash, the total obligation would be approximately $3.0 million based on the number of shares of Series A and Series B preferred stock outstanding as of June 30, 2008.
Historically, we have funded our cash requirements for capital expenditures, operating lease commitments and working capital from Gray and the net cash provided by our operating activities. Excess cash of approximately $6.7 million for the year ended December 31, 2004 and approximately $8.1 million for the period January 1, 2005 to December 30, 2005, was transferred to Gray prior to the Spin-off. For all periods prior to the Spin-off, our capitalization consisted of non-interest bearing funding from Gray.
We currently anticipate that the cash requirements for capital expenditures, operating lease commitments and working capital with respect to the Newspaper Publishing business over the next few years will be generally consistent, in the aggregate, with historical levels and would likely be funded from cash provided by operating activities. In the aggregate, total capital expenditures are not expected to exceed $1.7 million for the year ending June 30, 2009.
On December 30, 2005, we entered into a senior secured credit facility, with Wachovia Bank, National Association (“Wachovia”), among others, for debt financing in an aggregate principal amount of up to $140 million, consisting of a 4-year $20 million revolving credit facility (the “First Lien Revolving Credit Facility”), a 4.5-year $90 million first lien term loan (the “First Lien Term Loan Facility” and, together with the First Lien Revolving Credit Facility, the “First Lien Credit Facility”) and a 5-year $30 million second lien term loan (the “Second Lien Credit Facility” and, together with the First Lien Credit Facility, the “Credit Facilities”). The interest rate is based on the bank lender’s base rate (generally reflecting the lender’s prime rate) or LIBOR plus in each case a specified margin, and for revolving and first lien term loan advances, the margin is based upon our debt leverage ratio as defined in the agreement. On September 18, 2006, we amended the Credit Facilities in conjunction with our acquisition of Pinnacle Sports Promotions, LLC. Pursuant to the amendment, amounts under the First Lien Revolving Credit Facility may be borrowed, repaid and reborrowed by the Company from time to time
34
Table of Contents
Index to Financial Statements
until maturity. Interest for borrowings under the First Lien Revolving Credit Facility is currently based, at our option, on either (a) 2.25% per annum plus the higher of (1) the prime rate of interest announced or established by Wachovia from time to time, and (2) the Federal funds rate plus 0.50% per annum (the “Base Rate”) or (b) 3.25% per annum plus the applicable London Interbank Offered Rate (“LIBOR”) rate for Eurocurrency borrowings. If and when we meet certain leverage ratio criteria under the First Lien Credit Facility, our interest rate may decline at .25% increments to (a) 1.50% per annum above the Base Rate or (b) 2.50% per annum above the applicable LIBOR rate for Eurocurrency borrowings. We currently anticipate that we will not qualify for a reduction in our Base Rate of LIBOR applicable margins of 2.25% and 3.25%, respectively, for at least the next year. Interest for borrowings under the First Lien Term Credit Facility is based, at our option, on either (a) 2.50% per annum plus the higher of (1) the prime rate of interest announced or established by Wachovia from time to time, and (2) the Federal funds rate plus 0.50% per annum (the “Base Rate”) or (b) 3.50% per annum plus the applicable LIBOR rate for Eurocurrency borrowings, subject to adjustment based on our credit ratings assigned by Standards & Poors and Moody’s. Interest under the Second Lien Credit Facility is based upon (a) 8.50% per annum above the Base Rate or (b) 9.50% per annum above the applicable LIBOR rate for Eurocurrency borrowings, subject to adjustment based on our credit ratings assigned by Standards & Poors and Moody’s. As of June 30, 2008, the interest rates on the first lien and second lien term loans were approximately 9.5% and 14.65%, respectively. At June 30, 2008, the First Lien Term Loan Facility and the Second Lien Credit Facility were fully drawn. At June 30, 2008 and 2007, $19.3 million and $7.6 million were drawn on the First Lien Revolving Credit Facility, respectively.
Our Credit Facilities contain affirmative and negative covenants and financial ratios customary for financings of this type, including, among other things, limits on the incurrence of debt or liens, a limit on the making of dividends or distributions, provision for mandatory prepayments under certain conditions, limitations on transactions with affiliates and investments, a limit on the ratio of debt to earnings before interest, income taxes, depreciation, and amortization, as adjusted for certain non-cash and nonrecurring items (which we refer to as “EBITDA”), a limit on the ratio of EBITDA to fixed charges, and a limit to the ratio of EBITDA to all cash interest expense on all debt. The Credit Facilities contain events of default customary for facilities of this type (with customary grace periods, as applicable) and provide that, upon the occurrence of an event of default, the interest rate on all outstanding obligations will be increased and payment of all outstanding loans may be accelerated and/or the lenders’ commitments may be terminated. In addition, upon the occurrence of certain insolvency or bankruptcy related events of default, all amounts payable under the Credit Agreements shall automatically become immediately due and payable, and the lenders’ commitments will automatically terminate.
On November 9, 2007, we entered into the third amendment to our Credit Facilities due, in part, to our failure to meet our financial covenants. Pursuant to the amendment, our lenders agreed to temporarily suspend, on a retroactive basis, the requirement for us to comply with all financial covenants contained therein for the period September 30, 2007 through November 15, 2007. Subsequent to the consummation of the Host and Pinnacle transactions, we were required to remain in compliance with our leverage covenants. We were in compliance with our covenants as of December 31, 2007; however, our forecasts indicated that we would not be in compliance with future covenants and, accordingly, we sought to further amend our covenants.
On February 15, 2008 we executed our Fourth Amendment to the First Lien Term Loan Facility. Pursuant to the amendments, borrowings associated with Base Rate and Eurodollar advances will be charged interest at rates of 4.50% and 5.50% per annum, respectively, provided that the Base Rate and Eurodollar Rate (as defined) cannot fall below 4.00% and 3.00%, respectively. The amendments also provided for a reduction in the First Lien Leverage Coverage, Fixed Charge Coverage, and Interest Coverage Ratios for each quarter ending through September 30, 2009. Capital expenditures cannot exceed $500,000 for any four consecutive quarters. We were in compliance with our covenants as of June 30, 2008, however, we do not currently anticipate meeting our fiscal year 2009 covenants.
35
Table of Contents
Index to Financial Statements
On February 15, 2008 we executed our Fourth Amendment to the Second Lien Credit Facility. Pursuant to these amendments, borrowings associated with Base Rate and Eurodollar advances will be charged interest at rates of 11.00% and 12.00% per annum, respectively, provided that the Base Rate and Eurodollar Rate cannot fall below 4.00% and 3.00%, respectively. The amendments also provided for a reduction in the Leverage Ratio for each quarter ending through September 30, 2009. Capital expenditures cannot exceed $500,000 for any four consecutive quarters. We were in compliance with our covenants as of June 30, 2008, however, we do not currently anticipate meeting our fiscal year 2009 covenants.
We incurred $0.6 million of bank fees to execute the fourth amendment to the First Lien Term Facility and the Second Lien Term Facility which were executed in 2008. These costs were capitalized and will be amortized over the remaining life of the credit facilities with the previously capitalized debt costs.
The first lien term loan facility will require payments of $0.9 million per annum in equal quarterly installments beginning March 31, 2006. Aggregate interest expense on the first and second lien term loans is currently anticipated to initially approximate at least $11 to $12 million per year. The cash required to service the debt is currently expected to be funded from cash generated by operating activities. In addition, we will have access to the $20 million revolving credit facility to support cash liquidity needs, subject to debt leverage ratio requirements tested as of the end of each quarterly period. At June 30, 2008, our term loans were fully funded and there was $19.34 million outstanding under the First Lien Revolving Credit Facility, thereby allowing approximately $0.6 million in available borrowing capacity, subject to the adherence to leverage ratio financial covenants measured quarterly.
Working Capital
We do not anticipate meeting our future debt compliance covenants in fiscal year 2009. Without waivers of these violations and restructuring of our debt, our bank could accelerate our payment provisions. Assuming no acceleration of payments, material portions of our debt facilities become due in December 2009, June 2010, and December 2010. Further, the sale of Host and Pinnacle resulted in a $2.6 million tax liability which became due in September 2008 for which we are currently negotiating extended payment terms with the Internal Revenue Service. In order to meet these obligations, we will be required to restructure our current credit facilities, refinance with another lender or, in the case of our income tax obligations, attempt to arrange a payment plan which will allow us to spread our payments over an extended period of time. Should we be unsuccessful in these restructuring efforts, we will attempt to derive capital from alternate sources which may include any of the following; private placement, the issuance of additional shares of preferred stock or other means not yet identified. In the event that we are not able to arrange a payment plan for our tax obligations, or refinance our debt obligations, we may not have sufficient liquidity to operate. Given the volatility and uncertainty in the current banking environment, restructuring our senior secured facility could prove difficult or not possible at this time. Recent news accounts report that Wachovia Corporation, the administrative agent within the Company’s lending group, is to be acquired in a transaction structured with the assistance of federal regulators. Wachovia’s situation could further complicate our debt restructuring progress.
Certain Relationships
Effective December 30, 2005 following the time of the Spin-off, we obtained certain workers compensation insurance coverage under an insurance contract with Georgia Casualty & Surety Co., which is a wholly-owned subsidiary of Atlantic American Corporation, a publicly traded company in which J. Mack Robinson (a significant shareholder of ours) and certain of his affiliates have a substantial ownership interest, and a company of which Hilton H. Howell, a member of our board of directors and Mr. Robinson’s son-in-law, is an executive officer (as of March 31, 2008, Georgia Casualty was no longer a subsidiary of Atlantic American and thus no longer an affiliated company).
36
Table of Contents
Index to Financial Statements
Prior to the Spin-off Gray had a similar insurance contract with the same company. For each of the years ended December 31, 2004 and 2005, and the six and twelve months ended June 30, 2006 and 2007, our workers’ compensation insurance expense attributable to Gray’s insurance contract with Georgia Casualty was approximately $0.2 million.
Critical Accounting Policies
The preparation of financial statements in conformity with accounting principles generally accepted in the United States of America requires management to make judgments and estimations that affect the amounts reported in the financial statements and accompanying notes. Actual results could differ from those estimates. We consider the following accounting policies to be critical policies that require judgments or estimations in their application where variances in those judgments or estimations could make a significant difference to future reported results.
Revenue Recognition
Revenue is generated primarily from circulation and advertising revenue. Advertising revenue is billed to the customer and recognized when the advertisement is published. We bill our customers in advance for newspaper subscriptions and the related revenues are recognized over the period the service is provided on a straight-line basis.
The allowance for doubtful accounts represents our best estimate of the accounts receivable that will be ultimately collected, based on, among other things, historical collection experience, a review of the current aging status of customer receivables and a review of specific information for those customers that are deemed to be higher risk. We evaluate the adequacy of the allowance for doubtful accounts on at least a quarterly basis. Unfavorable changes in economic conditions might impact the amounts ultimately collected from advertisers and corporate sponsors and therefore may result in an inadequate allowance.
Valuation and Impairment Testing of Intangible Assets
In accordance with SFAS No. 142, “Goodwill and Other Intangible Assets,” (“SFAS 142”), we do not amortize goodwill and certain intangible assets with indefinite useful lives. Instead, SFAS 142 requires that we review goodwill and intangible assets deemed to have indefinite useful lives for impairment on at least an annual basis. We perform our annual impairment review during the fourth quarter of each year or whenever events or changes in circumstances indicate that such assets might be impaired.
Customer relationships are amortized on a straight-line basis over a period of 11 years, based on the estimated future economic benefit. Trademarks and tradenames are being amortized over 20 years, using a straight-line method, which approximates the estimated future economic benefit.
For purposes of testing goodwill impairment, each of the Gwinnett Daily Post, Rockdale/Newton Citizen and the Jonesboro Group are each considered separate reporting units. There is no recorded goodwill associated with the Albany Herald.
The impairment analysis is based on our estimates of the net present value of future cash flows derived from each reporting unit in order to determine the estimated market value. The determination of estimated market value requires significant management judgment including estimating operating cash flow to be derived in each reporting unit beyond the next three years, changes in working capital, capital expenditures and the selection of an appropriate discount rate. Factors potentially leading to a reduction of the estimated net present value of future cash flows could include (i) the loss of significant customers or contracts, (ii) significantly less favorable terms of new contracts and contract renewals and (iii) prolonged economic downturns affecting advertising spending.
37
Table of Contents
Index to Financial Statements
We review each reporting unit for possible goodwill impairment by comparing the estimated market value of each respective reporting unit to the carrying value of that reporting unit’s net assets. If the estimated market values exceed the net assets, no goodwill impairment is deemed to exist. If the fair value of the reporting unit does not exceed the carrying value of that reporting unit’s net assets, goodwill impairment is deemed to exist. We then perform, on a notional basis, a purchase price allocation applying the guidance of SFAS No. 141, “Business Combinations,” (“SFAS 141”), by allocating the reporting unit’s fair value to the fair value of all tangible and identifiable intangible assets residual fair value representing the implied fair value of goodwill of that reporting unit. The carrying value of goodwill for the reporting unit is written down to this implied value.
Deferred Income Taxes
As of June 30, 2007, we had approximately $80.7 million in net operating loss carryforwards with expiration dates through 2018. We did not anticipate that all of our available net operating loss carryforward amounts for tax purposes obtained in the Merger would ultimately be realized, due to their expiration or other limitations on utilization. As a result, as of June 30, 2007, we had a valuation allowance of approximately $10.3 million for net deferred tax assets.
Subsequent to the twelve months ended June 30, 2007, it became evident that our forecasts without Host and Pinnacle, which were sold in November, would not meet previously calculated projections. This lessened the weight that we could assign to future prospects for returning to consistent profitability. That, combined with recent cumulative net losses, represented sufficient negative evidence that was difficult for positive evidence to overcome under the evaluation guidance of SFAS No. 109, “Accounting for Income Taxes,” (“SFAS No. 109”). As a result, we concluded that it was appropriate in the second quarter of the twelve months ended June 30, 2008 to establish a full valuation allowance for our net deferred tax assets. The effect was to reverse the benefit of net deferred tax assets that were generated in prior years’ financial statements. These tax benefits will be available, prior to the expiration of carryforwards, to reduce future income tax expense resulting from earnings or increases in deferred tax liabilities. During the second quarter of the twelve months ended June 30, 2008, we recorded a non-cash charge to provide a full valuation allowance on our net deferred tax assets.
Transactions with Related Parties
Since the Spin-off and Merger, the terms of all material transactions involving related persons or entities have been on terms similar to those of our transactions with independent parties, or in cases where we have not entered into similar transactions with unrelated parties, on terms that were believed to be representative of those that would likely be negotiated with independent parties. All material transactions with related parties will be, reviewed and approved by our independent directors.
Recent Accounting Pronouncements
We adopted the provisions of FASB Interpretation 48, “Accounting for Uncertainty in Income Taxes” (“FIN 48”), on July 1, 2007. Previously, we had accounted for tax contingencies in accordance with SFAS 5, “Accounting for Contingencies”.As required by FIN 48, which clarifies SFAS No. 109, we recognize the financial statement benefit of a tax position only after determining that the relevant tax authority would more likely than not sustain the position following an audit. For tax positions meeting the more-likely-than-not threshold, the amount recognized in the financial statements is the largest benefit that has a greater than 50 percent likelihood of being realized upon ultimate settlement with the relevant tax authority. We would recognize interest accrued related to unrecognized tax benefits in interest expense and penalties in operating expenses for all periods presented.
At the adoption date, we applied FIN 48 to all tax positions for which the statute of limitations remained open and determined there were no unrecognized tax benefits for which a liability would be required as of July 1, 2007. There have been no material changes in unrecognized tax benefits since July 1, 2007.
38
Table of Contents
Index to Financial Statements
In September 2006, the Financial Accounting Standards Board (“FASB”) issued SFAS No. 157, “Fair Value Measurements,” (“SFAS No. 157”), to clarify the definition of fair value, establish a framework for measuring fair value and expand the disclosures on fair value measurements. SFAS No. 157 defines fair value as the price that would be received to sell an asset or paid to transfer a liability in an orderly transaction between market participants at the measurement date. SFAS No. 157 also stipulates that, as a market-based measurement, fair value measurement should be determined based on the assumptions that market participants would use in pricing the asset or liability, and establishes a fair value hierarchy that distinguishes between (a) market participant assumptions developed based on market data obtained from sources independent of the reporting entity (observable inputs) and (b) the reporting entity’s own assumptions about market participant developed based on the best information available in the circumstances (unobservable inputs). We adopted SFAS No. 157 as of July 1, 2008 for our financial assets and liabilities. Further, in February 2008, the FASB issued FASB Staff Position (“FSP”) 157-2, “Effective Date of FASB Statement No. 157,” (“FSP FAS 157-2”) which delays the effective date of SFAS No. 157 for nonfinancial assets and nonfinancial liabilities until fiscal years beginning after November 15, 2008, which for us is the fiscal year ending June 30, 2010. We are currently evaluating the impact FSP FAS 157-2 will have on our consolidated financial statements.
In February 2007, the FASB issued SFAS No. 159, “The Fair Value Option for Financial Assets and Financial Liabilities, including an amendment of FASB Statement No. 115” (“SFAS No. 159”). SFAS No. 159 permits companies to choose to measure certain financial instruments and other items at fair value, with unrealized gains and losses on items for which the fair value option has been elected reported in earnings at each subsequent reporting date. We are continuing to review the provisions of SFAS No. 159, which is effective in the first quarter of fiscal 2009, and currently do not expect this new accounting standard to have a significant impact on the consolidated financial statements.
In December 2007, the FASB issued SFAS No. 141 (Revised 2007), “Business Combinations”, (“SFAS No. 141R”). Under SFAS No. 141R, an acquiring entity will be required to recognize all assets acquired and liabilities assumed in a transaction at the acquisition-date fair value, with limited exceptions. Under SFAS No. 141R, certain items, including acquisition costs, will be generally expensed as incurred; non-controlling interests will be valued at fair value at the acquisition date and subsequently measured at the higher of such amount or the amount determined under existing guidance for non-acquired contingencies; in-process research and development will be recorded at fair value as an indefinite-lived intangible asset at the acquisition date; restructuring costs associated with a business combination will be generally expensed subsequent to the acquisition date; and changes in deferred tax asset valuation allowances and income tax uncertainties after the acquisition date generally will affect income tax expense. SFAS No. 141R also includes new disclosure requirements. SFAS No. 141R applies prospectively to business combinations for which the acquisition date is on or after the beginning of the first annual reporting period beginning on or after December 15, 2008. We have not determined the effect that adoption of SFAS No. 141R will have on our financial statements, since such effect is not reasonably estimable at this time.
In March 2008, the FASB issued SFAS No. 161, “Disclosures about Derivative Instruments and Hedging Activities—An Amendment of FASB Statement No. 133.” (“SFAS 161”). This statement revises the requirements for the disclosure of derivative instruments and hedging activities that include the reasons a company uses derivative instruments, how derivative instruments and related hedged items are accounted under SFAS 133 and how derivative instruments and related hedged items affect a company’s financial position, financial performance and cash flows. SFAS 161 will be effective July 1, 2009. The company is currently evaluating the impact of adopting SFAS 161 and does not anticipate a material effect.
39
Table of Contents
Index to Financial Statements
In May 2008, the FASB issued FASB Staff Position APB 14-1 (FSP APB 14-1), “Accounting for Convertible Debt Instruments That May Be Settled in Cash upon Conversion (Including Partial Cash Settlement),” which applies to all convertible debt instruments that have a “net settlement feature,” which means that such convertible debt instruments, by their terms, may be settled either wholly or partially in cash upon conversion. FSP APB 14-1 requires issuers of convertible debt instruments that may be settled wholly or partially in cash upon conversion to separately account for the liability and equity components in a manner reflective of the issuers’ nonconvertible debt borrowing rate. FSP APB 14-1 is effective for financial statements issued for fiscal years beginning after December 15, 2008 and interim periods within those fiscal years. Early adoption is not permitted and retroactive application to all periods presented is required. We are currently evaluating the impact of the application of FSP APB 14-1 on our financial statements, and do not anticipate a material effect.
Interest Rate and Market Rate Risk
We are exposed to changes in interest rates due to our financing of our acquisitions, investments and operations. Interest rate risk is present with both fixed and floating rate debt. Based on our debt profile as of June 30, 2007, a 100 basis point increase in market interest rates would increase interest expense and decrease pretax income (or increase pretax loss) by approximately $1.2 million annually. This amount was determined based on our floating rate debt. This amount does not include the effects of certain potential results of increased interest rates, such as reduced level of overall economic activity or other actions management may take to mitigate the risk. Furthermore, this sensitivity analysis does not assume changes in our financial structure that could occur if interest rates were higher.
In February 2006, we entered into an interest rate swap agreement effective in June 2006 and terminating in March 2009. Under the agreement, we converted a notional amount of $60 million of floating rate debt (currently bearing interest at LIBOR plus the currently applicable margin of 3.26%) to fixed rate debt, bearing interest at 5.05% plus the applicable margin. The interest rate swap has been designated as a cash-flow hedge against the anticipated interest payments on $60 million of the first lien term loan. As a result of this interest rate swap and the resulting payment of interest at fixed rates on $60 million of our debt, the effect of a 100 basis point change in market interest rates on interest expense and pretax income or loss, assuming the interest rate swap agreement was effective as of the beginning of the year, would be $0.6 million less than indicated in the preceding paragraph.
Forward-Looking Statements
This Annual Report on Form 10-K contains “forward-looking statements” within the meaning of the Private Securities Litigation Reform Act of 1995. When used in this report, the words “believes,” “expects,” “anticipates,” “estimates” and similar words and expressions are generally intended to identify forward-looking statements. Statements that describe our future strategic plans, goals or objectives are also forward-looking statements. Readers of this report are cautioned that any forward-looking statements, including those regarding the intent, belief or current expectations of our management, are not guarantees of future performance, results or events, and involve risks and uncertainties. The forward-looking statements included in this report are made only as of the date hereof. We undertake no obligation to update such forward-looking statements to reflect subsequent events or circumstances. Actual results and events may differ materially from those in the forward- looking statements as a result of various factors, including the factors disclosed in Item 1A of this Form 10-K.
| Item 7A. | Quantitative and Qualitative Disclosures About Market Risk |
See “Interest Rate and Market Rate Risk” in Item 7 of this Form 10-K.
40
Table of Contents
Index to Financial Statements
| Item 8. | Financial Statements and Supplementary Data |
Combined and Consolidated Financial Statements of Triple Crown Media, Inc.
41
Table of Contents
Index to Financial Statements
REPORT OF INDEPENDENT REGISTERED PUBLIC ACCOUNTING FIRM
Board of Directors and Stockholders
Triple Crown Media, Inc.
Lawrenceville, Georgia
We have audited the accompanying consolidated balance sheets of Triple Crown Media, Inc. and subsidiaries as of June 30, 2008 and 2007 and the related consolidated statements of operations, stockholders’ equity (deficit) and comprehensive income (loss), and cash flows for each of the twelve months periods then ended and for the six month period ended June 30, 2006. These financial statements are the responsibility of the Company’s management. Our responsibility is to express an opinion on these financial statements based on our audits.
We conducted our audits in accordance with the standards of the Public Company Accounting Oversight Board (United States). Those standards require that we plan and perform our audits to obtain reasonable assurance about whether the financial statements are free of material misstatement. The Company is not required to have, nor were we engaged to perform, an audit of its internal control over financial reporting. An audit includes consideration of internal control over financial reporting as a basis for designing audit procedures that are appropriate in the circumstances, but not for the purpose of expressing an opinion on the effectiveness of the Company’s internal control over financial reporting. Accordingly, we express no such opinion. An audit also includes examining, on a test basis, evidence supporting the amounts and disclosures in the financial statements, assessing the accounting principles used and significant estimates made by management, as well as evaluating the overall financial statement presentation. We believe that our audits provide a reasonable basis for our opinion.
In our opinion, the consolidated financial statements referred to above present fairly, in all material respects, the financial position of Triple Crown Media, Inc. and subsidiaries as of June 30, 2008 and 2007, and the results of their operations and cash flows for each of the twelve month periods then ended and six month period ended June 30,2006, in conformity with accounting principles generally accepted in the United States of America.
The accompanying consolidated financial statements have been prepared assuming the Company will continue as a going concern. As discussed in Note 18 to the consolidated financial statements, the Company currently does not anticipate meeting its loan covenants in fiscal year 2009, did not have sufficient funds to meet its income tax obligations as they became due in September 2008 and has developed significant deficiencies in working capital in 2008. Together, these matters raise substantial doubt as to its ability to continue as a going concern. Management’s plan in regard to these matters is also described in Note 18. The consolidated financial statements do not include any adjustments that might result from the outcome of this uncertainty.
/s/ BDO Seidman, LLP
Atlanta, Georgia
October 10, 2008
42
Table of Contents
Index to Financial Statements
Report of Independent Registered Public Accounting Firm
To the Board of Directors and
Shareholders of Triple Crown Media, Inc:
In our opinion, the combined and consolidated statements of operations, of stockholders’ equity (deficit) and comprehensive income, and of cash flows of Triple Crown Media, Inc. present fairly, in all material respects, the consolidated results of operations and cash flows for the year ended December 31, 2005, in conformity with accounting principles generally accepted in the United States of America. These financial statements are the responsibility of the Company’s management. Our responsibility is to express an opinion on these financial statements based on our audits. We conducted our audits of these financial statements in accordance with the requirements of the Public Company Accounting Oversight Board (United States). Those standards require that we plan and perform the audit to obtain reasonable assurance about whether the financial statements are free of material misstatement. An audit includes examining, on a test basis, evidence supporting the amounts and disclosures in the financial statements, assessing the accounting principles used and significant estimates made by management, and evaluating the overall financial statement presentation. We believe that our audits provide a reasonable basis for our opinion.
/s/ PricewaterhouseCoopers LLP
Louisville, Kentucky
March 30, 2006, except for Note 10, as to which the date is October 10, 2008
43
Table of Contents
Index to Financial Statements
CONSOLIDATED BALANCE SHEETS
(Amounts in thousands, except per share data)
| June 30, 2007 | June 30, 2008 | |||||||
| ASSETS | ||||||||
Current assets: | ||||||||
Cash and cash equivalents | $ | 166 | $ | 1,095 | ||||
Accounts receivable, less allowance for doubtful accounts of $108 and $212, respectively | 5,123 | 4,307 | ||||||
Inventories | 310 | 435 | ||||||
Other receivables | — | 5,100 | ||||||
Other current assets | 360 | 820 | ||||||
Current assets of discontinued operations | 9,805 | — | ||||||
Total current assets | 15,764 | 11,757 | ||||||
Property and equipment: | ||||||||
Land | 1,993 | 1,077 | ||||||
Buildings and improvements | 7,754 | 6,192 | ||||||
Equipment | 13,035 | 15,288 | ||||||
| 22,782 | 22,557 | |||||||
Accumulated depreciation | (14,848 | ) | (15,545 | ) | ||||
| 7,934 | 7,012 | |||||||
Goodwill | 18,428 | 12,625 | ||||||
Other intangible assets, net | 7,003 | 6,343 | ||||||
Deferred income taxes | 22,781 | — | ||||||
Other assets | 3,437 | 2,888 | ||||||
Long-term assets of discontinued operations | 99,115 | — | ||||||
Total assets | $ | 174,462 | $ | 40,625 | ||||
| LIABILITIES, PREFERRED STOCK AND STOCKHOLDERS’ DEFICIT | ||||||||
Current liabilities: | ||||||||
Current portion of long-term debt and line of credit | $ | 8,492 | $ | 20,193 | ||||
Accounts payable | 2,319 | 1,163 | ||||||
Accrued expenses | 3,102 | 3,732 | ||||||
Federal and state income taxes payable | — | 2,624 | ||||||
Deferred revenue | 987 | 949 | ||||||
Current liabilities of discontinued operations | 24,157 | — | ||||||
Total current liabilities | 39,057 | 28,661 | ||||||
Long-term debt | 116,278 | 50,609 | ||||||
Other liabilities | 3,220 | 4,321 | ||||||
Series B redeemable preferred stock, $.001 par value (authorized 20,000 shares; issued and outstanding 6,050 shares; $6,050 liquidation value) | 4,515 | 4,607 | ||||||
Long-term liabilities of discontinued operations | 129 | — | ||||||
Total liabilities | 163,199 | 88,198 | ||||||
Series A redeemable, convertible preferred stock, $.001 par value (authorized 50,000 shares; issued and outstanding 20,890 shares; $20,890 liquidation value) | 17,135 | 17,389 | ||||||
Commitments and contingencies | ||||||||
Stockholders’ Deficit: | ||||||||
Common stock, par value $0.001 authorized 25,000 shares, issued and outstanding | 5 | 6 | ||||||
Additional paid-in capital | 5,128 | 7,170 | ||||||
Accumulated deficit | (11,134 | ) | (71,174 | ) | ||||
Accumulated other comprehensive income (loss), net of tax | 129 | (964 | ) | |||||
Total stockholders’ deficit | (5,872 | ) | (64,962 | ) | ||||
Total liabilities, preferred stock and stockholders’ deficit | $ | 174,462 | $ | 40,625 | ||||
The accompanying notes are an integral part of these combined and consolidated financial statements.
44
Table of Contents
Index to Financial Statements
COMBINED AND CONSOLIDATED STATEMENTS OF OPERATIONS
(Amounts in thousands, except per share data)
| Year Ended December 31, 2005 | Six Months Ended June 30, 2006 | Twelve Months Ended June 30, 2007 | Twelve Months Ended June 30, 2008 | |||||||||||||
Operating revenues: | ||||||||||||||||
Publishing | $ | 40,237 | $ | 22,047 | $ | 48,464 | $ | 46,021 | ||||||||
Expenses: | ||||||||||||||||
Operating expenses before depreciation, amortization and loss on disposal of assets | ||||||||||||||||
Publishing | 30,304 | 15,829 | 34,104 | 33,133 | ||||||||||||
Corporate and administrative | 1,117 | 2,594 | 5,712 | 3,785 | ||||||||||||
Depreciation | 980 | 566 | 1,094 | 1,196 | ||||||||||||
Amortization of intangible assets | 7 | 165 | 662 | 660 | ||||||||||||
Goodwill Impairment | 5,803 | |||||||||||||||
Loss on disposal of assets, net | 47 | — | (2 | ) | — | |||||||||||
| 32,455 | 19,154 | 41,570 | 44,577 | |||||||||||||
Operating income | 7,782 | 2,893 | 6,894 | 1,444 | ||||||||||||
Other income (expense): | ||||||||||||||||
Interest expense related to Series B preferred stock | (1 | ) | (226 | ) | (453 | ) | (455 | ) | ||||||||
Interest expense, other | (236 | ) | (5,917 | ) | (13,247 | ) | (10,856 | ) | ||||||||
Debt issue cost amortization | (3 | ) | (608 | ) | (1,276 | ) | (1,432 | ) | ||||||||
Miscellaneous income, net | — | — | — | 8 | ||||||||||||
Income (loss) from continuing operations before income taxes | 7,542 | (3,858 | ) | (8,082 | ) | (11,291 | ) | |||||||||
Income tax expense (benefit) | 2,863 | (1,582 | ) | (3,020 | ) | 6,703 | ||||||||||
Earnings (loss) from continuing operations | 4,679 | (2,276 | ) | (5,062 | ) | (17,994 | ) | |||||||||
Income (loss) from discontinued operations, net of tax | (262 | ) | 987 | 1,967 | (37,189 | ) | ||||||||||
Gain (loss) on disposal of discontinued operations, net of tax | — | 5,685 | (381 | ) | (3,767 | ) | ||||||||||
Net income (loss) | 4,417 | 4,396 | (3,476 | ) | (58,950 | ) | ||||||||||
Series A preferred stock dividends accrued | (3 | ) | (542 | ) | (1,086 | ) | (1,090 | ) | ||||||||
Net income (loss) available to common stockholders | $ | 4,414 | $ | 3,854 | $ | (4,562 | ) | $ | (60,040 | ) | ||||||
Basic and diluted per share information: | ||||||||||||||||
Earnings (loss) from continuing operations | $ | 0.96 | $ | (0.44 | ) | $ | (0.96 | ) | $ | (3.24 | ) | |||||
Earnings (loss) from discontinued operations, net of tax | $ | (0.05 | ) | $ | 1.30 | $ | 0.30 | $ | (7.38 | ) | ||||||
Net income (loss) | $ | 0.91 | $ | 0.86 | $ | (0.66 | ) | $ | (10.62 | ) | ||||||
Net income (loss) available to common stockholders | $ | 0.91 | $ | 0.75 | $ | (0.87 | ) | $ | (10.81 | ) | ||||||
Weighted average shares outstanding | 4,871 | 5,139 | 5,246 | 5,553 | ||||||||||||
The accompanying notes are an integral part of these combined and consolidated financial statements.
45
Table of Contents
Index to Financial Statements
COMBINED AND CONSOLIDATED STATEMENTS OF STOCKHOLDERS’ EQUITY (DEFICIT) AND COMPREHENSIVE INCOME (LOSS)
(Amounts in thousands)
| Owner’s Net Investment | Common Stock | Additional Paid-In Capital | Accumulated Deficit | Acumulated Other Comprehensive Income, Net | Total Stockholders’ Equity (Deficit) | Current Year Comprehensive Income (loss) | ||||||||||||||||||||
Balance as of December 31, 2004 | 29,800 | 29,800 | ||||||||||||||||||||||||
Net income | 4,482 | (65 | ) | 4,417 | ||||||||||||||||||||||
Net transfers to Gray Television, Inc. | (4,895 | ) | (4,895 | ) | ||||||||||||||||||||||
Common stock issued in Spin-off (4,870 shares) | 5 | 5 | ||||||||||||||||||||||||
Increase in deferred income taxes for Gray’s tax gain on Spin-off | 4,855 | 4,855 | ||||||||||||||||||||||||
Distribution to Gray under terms of Spin-off | (44,600 | ) | (44,600 | ) | ||||||||||||||||||||||
Reclassify owner’s net investment to accumulated deficit | 10,358 | (10,358 | ) | — | ||||||||||||||||||||||
Common stock issued in Merger transaction (258 shares) | 3,211 | 3,211 | ||||||||||||||||||||||||
Series A preferred dividends accrued | (3 | ) | (3 | ) | ||||||||||||||||||||||
Balance as of December 31, 2005 | $ | 0 | $ | 5 | $ | 3,211 | $ | (10,426 | ) | $ | (7,210 | ) | ||||||||||||||
Issuance of restricted stock (35 shares) | 20 | 20 | ||||||||||||||||||||||||
Issuance of common stock to 401K plan (24 Shares) | 157 | 157 | ||||||||||||||||||||||||
Issuance of stock options (374 shares) | 65 | 65 | ||||||||||||||||||||||||
Net Income | 4,396 | 4,396 | 4,396 | |||||||||||||||||||||||
Series A preferred dividends accrued | (542 | ) | (542 | ) | ||||||||||||||||||||||
Net change in accumulated other comprehensive income, net of tax | 400 | 400 | 400 | |||||||||||||||||||||||
Total comprehensive income | $ | 4,796 | ||||||||||||||||||||||||
Balance as of June 30, 2006 | $ | 0 | $ | 5 | $ | 3,453 | $ | (6,572 | ) | $ | 400 | (2,714 | ) | |||||||||||||
Issuance of restricted stock (120 shares) | 149 | 149 | ||||||||||||||||||||||||
Issuance of common stock to 401K plan (52 shares) | 423 | 423 | ||||||||||||||||||||||||
Issuance of common stock for acquisition (56 shares) | 406 | 406 | ||||||||||||||||||||||||
Issuance of unrestricted common stock (40 shares) | 351 | 351 | ||||||||||||||||||||||||
Stock options exercised (4 shares) | 22 | 22 | ||||||||||||||||||||||||
Issuance of stock options (45 shares) | 324 | 324 | ||||||||||||||||||||||||
Net Loss | (3,476 | ) | (3,476 | ) | (3,476 | ) | ||||||||||||||||||||
Series A preferred dividends accrued | (1,086 | ) | (1,086 | ) | ||||||||||||||||||||||
Net change in accumulated other comprehensive loss, net of tax | (271 | ) | (271 | ) | (271 | ) | ||||||||||||||||||||
Total comprehensive Loss | $ | (3,747 | ) | |||||||||||||||||||||||
Balance as of June 30, 2007 | $ | 0 | $ | 5 | $ | 5,128 | $ | (11,134 | ) | $ | 129 | $ | (5,872 | ) | ||||||||||||
Restricted stock award expense | 1,504 | 1,504 | ||||||||||||||||||||||||
Issuance of common stock to 401K plan (64 shares) | 244 | 244 | ||||||||||||||||||||||||
Stock options exercised (12 shares) | 1 | 52 | 53 | |||||||||||||||||||||||
Stock option expense | 242 | 242 | ||||||||||||||||||||||||
Net Loss | (58,950 | ) | (58,950 | ) | (58,950 | ) | ||||||||||||||||||||
Series A preferred dividends accrued | (1,090 | ) | (1,090 | ) | ||||||||||||||||||||||
Net change in accumulated other comprehensive loss, net of tax | (1,093 | ) | (1,093 | ) | (1,093 | ) | ||||||||||||||||||||
Total comprehensive Loss | $ | (60,043 | ) | |||||||||||||||||||||||
Balance as of June 30, 2008 | $ | 0 | $ | 6 | $ | 7,170 | $ | (71,174 | ) | $ | (964 | ) | $ | (64,962 | ) | |||||||||||
The accompanying notes are an integral part of these combined and consolidated financial statements.
46
Table of Contents
Index to Financial Statements
COMBINED AND CONSOLIDATED STATEMENTS OF CASH FLOWS
(Amounts in thousands)
| Year Ended December 31, 2005 | Six Months Ended June 30, 2006 | Twelve Months Ended June 30, 2007 | Twelve Months Ended June 30, 2008 | |||||||||||||
Operating activities: | ||||||||||||||||
Net income (loss) | $ | 4,417 | $ | 4,396 | $ | (3,476 | ) | $ | (58,950 | ) | ||||||
(Income) loss from discontinued operations | 262 | (987 | ) | (1,967 | ) | 3,767 | ||||||||||
(Gain) loss from sale of discontinued operations | — | (5,685 | ) | 381 | 37,189 | |||||||||||
Income (loss) from continuing operations | $ | 4,679 | $ | (2,276 | ) | $ | (5,062 | ) | $ | (17,994 | ) | |||||
Adjustments to reconcile net income (loss) to net cash provided by operating activities: | ||||||||||||||||
Depreciation | 980 | 566 | 1,094 | 1,196 | ||||||||||||
Amortization | 7 | 165 | 662 | 660 | ||||||||||||
Goodwill Impairment | — | — | — | 5,803 | ||||||||||||
Provision for bad debt | 165 | 81 | 131 | 388 | ||||||||||||
Interest accrued on redeemable preferred stock | — | 226 | 453 | 453 | ||||||||||||
Loss on disposal of assets, net | 47 | — | 70 | — | ||||||||||||
Stock compensation expense | — | 85 | 846 | 446 | ||||||||||||
Issuance of common stock to 401K plan | — | 157 | 423 | 244 | ||||||||||||
Deferred income taxes | 1,481 | (2,997 | ) | (2,285 | ) | 6,012 | ||||||||||
Changes in operating assets and liabilities: | ||||||||||||||||
Accounts receivable, net | 25 | 486 | (325 | ) | 428 | |||||||||||
Inventories | 219 | (127 | ) | 336 | (125 | ) | ||||||||||
Other current assets | (19 | ) | (190 | ) | 1 | (460 | ) | |||||||||
Accounts payable and accrued expenses | 615 | 1,905 | (501 | ) | (971 | ) | ||||||||||
Accrued income taxes | 866 | 76 | — | 2,624 | ||||||||||||
Deferred revenue | (140 | ) | 3 | 38 | (38 | ) | ||||||||||
Other assets and liabilities | 165 | (925 | ) | 4,056 | 365 | |||||||||||
Net cash provided by (used in) continuing operations | 9,090 | (2,765 | ) | (63 | ) | (969 | ) | |||||||||
Net cash provided by (used in) discontinued operations | 298 | 7,347 | 1,316 | (5,405 | ) | |||||||||||
Net cash provided by (used in) operating activities | 9,388 | 4,582 | 1,253 | (6,374 | ) | |||||||||||
Investing activities: | ||||||||||||||||
Purchases of property and equipment | (2,096 | ) | (216 | ) | (432 | ) | (285 | ) | ||||||||
Proceeds from asset sales | 9 | — | — | 11 | ||||||||||||
Acquisition of business, net of cash acquired | — | (585 | ) | — | — | |||||||||||
Net cash used in continuing operations | (2,087 | ) | (801 | ) | (432 | ) | (274 | ) | ||||||||
Net cash provided by (used in) discontinued operations | (73,570 | ) | (268 | ) | (5,490 | ) | 62,052 | |||||||||
Net cash (used in) provided by investing activities | (75,657 | ) | (1,069 | ) | (5,922 | ) | 61,778 | |||||||||
Financing activities: | ||||||||||||||||
Proceeds from borrowings on revolving line of credit | 1,939 | 8,500 | 31,300 | 11,701 | ||||||||||||
Proceeds from borrowings on long-term debt | 120,000 | — | — | — | ||||||||||||
Distributions paid to Gray Television, Inc. | (43,953 | ) | (647 | ) | — | — | ||||||||||
Other transfers to Gray Television, Inc., net | (8,103 | ) | — | — | — | |||||||||||
Repayments of borrowings on debt | — | (11,163 | ) | (25,806 | ) | (65,616 | ) | |||||||||
Debt issue costs | (3,888 | ) | (400 | ) | (695 | ) | (560 | ) | ||||||||
Net cash provided by (used in) continuing operations | 65,995 | (3,710 | ) | 4,799 | (54,475 | ) | ||||||||||
Net cash used in discontinued operations | — | — | (137 | ) | — | |||||||||||
Net cash provided by (used in) financing activities | 65,995 | (3,710 | ) | 4,662 | (54,475 | ) | ||||||||||
(Decrease) increase in cash and cash equivalents | (274 | ) | (197 | ) | (7 | ) | 929 | |||||||||
Cash and cash equivalents, beginning of period | 644 | 370 | 173 | 166 | ||||||||||||
Cash and cash equivalents, end of period | $ | 370 | $ | 173 | $ | 166 | $ | 1,095 | ||||||||
Supplemental schedule of non cash financing activities | ||||||||||||||||
The accompanying notes are an integral part of these combined and consolidated financial statements.
47
Table of Contents
Index to Financial Statements
NOTES TO CONSOLIDATED FINANCIAL STATEMENTS
(amounts in thousands, except share and per share data)
| 1. | ORGANIZATION AND DESCRIPTION OF BUSINESS |
Until December 30, 2005, the Company was comprised of the newspaper publishing and wireless businesses owned and operated by Gray Television, Inc., or Gray, operating as wholly owned subsidiaries or divisions of Gray.
On December 30, 2005, Gray distributed to each common stockholder of Gray’s common stock one share of our common stock for every ten shares of Gray common stock held by each Gray common stockholder and one share of our common stock for every ten shares of Gray Class A common stock held by each Gray Class A common stockholder. As a result, the Company became a separate, stand-alone entity, independent of Gray. We refer to this transaction as the Spin-off.
Immediately following the Spin-off, and also on December 30, 2005, Bull Run Corporation was merged into a wholly owned subsidiary of the Company, in a transaction referred to as the Merger. Under the terms of the Merger, each Bull Run common stockholder received .0289 shares of our common stock in exchange for each share of Bull Run common stock owned by each Bull Run common stockholder; holders of Bull Run’s series D preferred stock and a certain holder of Bull Run’s series E preferred stock received shares of our series A redeemable, convertible preferred stock for their shares of Bull Run preferred stock and accrued dividends thereon; certain other holders of Bull Run’s series E preferred stock had their shares redeemed in cash at the liquidation value of those shares; the holder of Bull Run series F preferred stock received shares of our common stock for such holder’s shares of Bull Run preferred stock and accrued dividends thereon; and a significant stockholder of Bull Run who had advanced cash to Bull Run prior to the Merger received shares of our series B redeemable preferred stock in exchange for settlement of Bull Run’s liabilities payable to such holder.
Following the consummation of the Merger on December 30, 2005, the Company was comprised of the Newspaper Publishing and Wireless segments formerly owned and operated by Gray, as well as the Collegiate Marketing and Production Services segment and Association Management Services segment acquired in the Merger, both of which were operated by a wholly owned subsidiary, Host Communications, Inc., or Host.
The Company sold its Wireless business, operated as GrayLink, LLC, or GrayLink, on June 22, 2007. In addition, the Company sold Host and Pinnacle Sports Productions, LLC, or Pinnacle, comprising its Collegiate Marketing and Production Services and Association Management Services businesses on November 15, 2007. Accordingly, the Company has reclassified the results of operations and financial position of these segments to discontinued operations. Subsequent to November 15, 2007, the Company’s sole remaining operating segment is comprised of its newspaper publishing businesses.
Hereinafter, all references to Triple Crown Media, Inc., the “Company,” “TCM,” “we,” “us” or “our” in these footnotes refer to the combined and consolidated businesses.
| 2. | SUMMARY OF SIGNIFICANT ACCOUNTING POLICIES |
Basis of Presentation—The accompanying consolidated financial statements as of and for the year ended December 31, 2005, reflecting the effects of the Spin-off and Merger, include the accounts of the Company and its wholly owned subsidiaries, including those acquired in the Merger, after
48
Table of Contents
Index to Financial Statements
elimination of intercompany accounts and transactions. The results of operations for the year ended December 31, 2005 include the combined operating results of the Company’s Newspaper Publishing business for 364 days as part of Gray through the date of the Spin-off and the consolidated operating results of the Company, after giving effect to the Merger, as a stand-alone company for the one day after the Spin-off. Discontinued operations reflects the results of operations for the Collegiate Marketing and Production Services and Association Management Services businesses on November 15, 2007 that was part of the Spin-off, but sold on November 15, 2007. Discontinued operations also reflect the results of operations for Graylink Wireless which was sold on June 30, 2007. For more information regarding discontinued operations refer to Note 10 to these financial statements.
The financial information included herein is not necessarily indicative of our future financial position, results of operations, or cash flows, nor is it necessarily indicative of what the financial position, results of operations, or cash flows would have been had we operated as a stand-alone entity during the periods prior to the Spin-off. The combined financial statements also do not reflect the many significant changes that have occurred in our operations as a result of becoming a stand-alone public entity following the close of business on December 30, 2005.
The accompanying consolidated financial statements as of and for the six months ended June 30, 2006 and the twelve months ended June 30, 2007 and 2008 reflect the results of our operations post Spin-Off and post Merger. The results of operations for the six months ended June 30, 2006 include the consolidated results for 181 days as a stand-alone company. The financial information included herein was not necessarily indicative of our future financial position, results of operations, or cash flows, nor was it necessarily indicative of what the financial position, results of operations, or cash flows would have been had we operated as a stand-alone entity for a full year although the consolidated balance sheet presented as of June 30, 2006 does reflect our financial position as a stand-alone entity. The twelve months ended June 30, 2007 reflect our first full year operated as a stand-alone entity.
Use of Estimates—The preparation of financial statements in conformity with generally accepted accounting principles requires management to make estimates and assumptions that affect the amounts reported in the financial statements and accompanying notes. Actual results could differ from those estimates.
Change in Fiscal Year—In April 2006, we elected to change our fiscal year end from December 31 to a new fiscal year end of June 30. As a result of the change, our quarterly reporting periods are now comprised of the three calendar months ending September 30, December 31, March 31 and June 30. A June 30 fiscal year end was consistent with the seasonal business cycle of our Collegiate Marketing segment which has now been sold.
Revenue Recognition—Newspaper Publishing revenue is generated primarily from circulation and advertising revenue. Advertising revenue is billed to the customer and recognized when the advertisement is published. We bill our customers in advance for newspaper subscriptions and the related revenues are recognized over the period the service is provided on a straight-line basis.
The allowance for doubtful accounts represents our best estimate of the accounts receivable that will be ultimately collected, based on, among other things, historical collection experience, a review of the current aging status of customer receivables and a review of specific information for those customers that are deemed to be higher risk. We evaluate the adequacy of the allowance for doubtful accounts on at least a quarterly basis. Unfavorable changes in economic conditions might impact the amounts ultimately collected from advertisers and corporate sponsors and therefore may result in an inadequate allowance.
49
Table of Contents
Index to Financial Statements
Advertising Expense—Advertising expense is expensed immediately when incurred. Our advertising expense is summarized as follows:
| Year Ended December 31, 2005 | Six Months Ended June 30, 2006 | Twelve Months Ended June 30, 2007 | Twelve Months Ended June 30, 2008 | |||||||||
Advertising Expense | $ | 91 | $ | 57 | $ | 279 | $ | 194 | ||||
Cash and Cash Equivalents—Cash equivalents consist of highly liquid investments that are readily convertible to known amounts of cash and have a maturity of three months or less when purchased. Our cash and cash equivalents were held by a single major financial institution until the Spin-off, and by primarily two major financial institutions thereafter; however, risk of loss is mitigated by the size and the financial health of the institutions.
Accounts Receivable and Credit Risk—Accounts receivable include customer billings on invoices issued by us, and to a lesser extent, unbilled receivables for contracted services billed after the service is rendered or the revenue is earned. Our newspaper subscribers may also be billed in advance.
Our Newspaper Publishing business provides print advertising. Credit is extended based on an evaluation of our customer’s financial condition, and generally advance payment is not required. Credit losses are provided for in the financial statements and consistently have been within management’s expectations.
We perform ongoing credit evaluations of our customers’ financial condition and we require no collateral from our customers. The allowance for doubtful accounts represents our best estimate of the accounts receivable that will be ultimately not collected, based on, among other things, historical collection experience, a review of the current aging status of customer receivables, and a review of specific information for those customers deemed to be higher risk. We evaluate the adequacy of the allowance for doubtful accounts on at least a quarterly basis. Unfavorable changes in economic conditions might impact the amounts ultimately collected from advertisers and corporate sponsors and therefore may result in changes to the estimated allowance. Once an account is considered uncollectible or otherwise settled with a customer, the uncollectible amount is charged against the allowance for doubtful accounts. Changes in our allowance for doubtful accounts are as follows:
| Year Ended December 31, 2005 | Six Months Ended June 30, 2006 | Twelve Months Ended June 30, 2007 | Twelve Months Ended June 30, 2008 | |||||||||||||
Balance at beginning of period | $ | 195 | $ | 156 | $ | 133 | $ | 108 | ||||||||
Provision for bad debts | 165 | 81 | 131 | 388 | ||||||||||||
Write-offs | (204 | ) | (104 | ) | (156 | ) | (284 | ) | ||||||||
Balance at end of period | $ | 156 | $ | 133 | $ | 108 | $ | 212 | ||||||||
Inventories—Inventories are stated at the lower of cost or market. Newspaper Publishing inventories consist principally of newsprint and printing supplies. Inventories are accounted for using the average cost method. We do not record an allowance for inventory obsolescence because our existing newsprint inventories are generally utilized in revenue producing activities within approximately 30 and 60 days, respectively, of their initial purchase. Publishing inventories were $310 and $435 as of June 30, 2007 and June 30, 2008, respectively.
Property and Equipment—Property and equipment are carried at cost. Depreciation is computed principally by the straight-line method. Buildings, improvements and equipment are generally depreciated over estimated useful lives of 30 to 35 years, 10 to 15 years and 3 to 10 years,
50
Table of Contents
Index to Financial Statements
respectively. Leasehold improvements are depreciated over the lesser of the economic useful life of the asset or the remaining life of the underlying lease. Maintenance, repairs and minor replacements are charged to operations as incurred; major replacements and betterments are capitalized. The cost of any assets sold or retired and related accumulated depreciation are removed from the accounts at the time of disposition, and any resulting profit or loss is reflected in income or expense for the period.
Income Taxes—We account for income taxes under “SFAS 109,” “Accounting for Income Taxes,” (“SFAS 109”). Under SFAS 109, deferred tax assets and liabilities are recognized for future tax consequences attributable to differences between the financial statement carrying amounts of existing assets and liabilities and their respective tax bases. Deferred tax assets and liabilities are measured using enacted tax rates expected to apply to taxable income in the years in which those temporary differences are expected to reverse. The effect on deferred tax assets and liabilities of a change in tax rates is recognized in income in the period that includes the enactment date. Valuation allowances are established when necessary to reduce deferred assets to the amount more likely than not to be recognized.
We adopted the provisions of FASB Interpretation 48, “Accounting for Uncertainty in Income Taxes” (“FIN 48”), on July 1, 2007. Previously, we had accounted for tax contingencies in accordance with SFAS 5, “Accounting for Contingencies”.As required by FIN 48, which clarifies SFAS No. 109, we recognize the financial statement benefit of a tax position only after determining that the relevant tax authority would more likely than not sustain the position following an audit. For tax positions meeting the more-likely-than-not threshold, the amount recognized in the financial statements is the largest benefit that has a greater than 50 percent likelihood of being realized upon ultimate settlement with the relevant tax authority. We would recognize interest accrued related to unrecognized tax benefits in interest expense and penalties in operating expenses for all periods presented.
At the adoption date, we applied FIN 48 to all tax positions for which the statute of limitations remained open and determined there were no unrecognized tax benefits for which a liability would be required as of July 1, 2007. There have been no material changes in unrecognized tax benefits since July 1, 2007.
Stock-Based Compensation—We accounted for stock-based compensation prior to the Spin-off using APB Opinion No. 25, “Accounting for Stock Issued to Employees” (“APB 25”) and related interpretations. Under APB 25, compensation expense is based on the difference, if any, on the date of grant, between the fair value of TCM’s stock and the exercise price. In accordance with APB 25, Gray elected not to record compensation expense associated with qualified stock options for Gray common stock granted to our employees prior to the Spin-off. Effective January 1, 2006, we account for stock-based compensation using SFAS Statement No. 123R, Accounting for Stock-Based Compensation (“SFAS 123R”), as amended, which results in the recognition of compensation expense for stock-based compensation.
51
Table of Contents
Index to Financial Statements
Had compensation expense related to outstanding options for Gray common stock prior to the Spin-off been determined based on the fair value at the grant dates consistent with SFAS 123R, net income (loss) available to common stockholders and earnings per share would be as reflected below:
| Year Ended December 31, 2005 | ||||
Net income available to common stockholders, as reported | $ | 4,414 | ||
Add: Stock-based employee compensation expense included in reported net income, net of related tax effects | — | |||
Deduct: Total stock-based employee compensation expense determined under fair value based method for all awards, net of related tax effects | (31 | ) | ||
Net income available to common stockholders, pro forma | $ | 4,383 | ||
Net income available to common stockholders per share: | ||||
Basic and diluted, as reported | $ | 0.91 | ||
Basic and diluted, pro forma | $ | 0.90 | ||
The fair value for the options was estimated at the date of grant using a Black-Scholes option pricing model with the following weighted-average assumptions for 2005: risk-free interest rates of 3.81%; dividend yields of 0.86%; volatility factors of the expected market price of Gray’s common stock of 0.30; and a weighted-average expected life of the options of 3.0 years.
See Note 12 for further information regarding stock-based compensation.
Valuation and Impairment Testing of Intangible Assets—In accordance with SFAS No. 142, “Goodwill and Other Intangible Assets,” (“SFAS 142”), we do not amortize goodwill and certain intangible assets with indefinite useful lives. Instead, SFAS 142 requires that we review goodwill and intangible assets deemed to have indefinite useful lives for impairment on at least an annual basis. We perform our annual impairment review during the fourth quarter of each year or whenever events or changes in circumstances indicate that such assets might be impaired.
Customer relationships are amortized on a straight-line basis over a period of 11 years, based on the estimated future economic benefit as a significant portion of our customer base is made up of large recurring customers with limited expectations of churn. Trademarks and trade names are being amortized over 20 years, using a straight-line method, which approximates the estimated future economic benefit.
For purposes of testing goodwill impairment, each of the Gwinnett Daily Post, Rockdale/Newton Citizen and the Jonesboro Group are each considered separate reporting units. There is no recorded goodwill associated with the Albany Herald.
The impairment analysis is based on our estimates of the net present value of future cash flows derived from each reporting unit in order to determine the estimated market value. The determination of estimated market value requires significant management judgment including estimating operating cash flow to be derived in each reporting unit beyond the next three years, changes in working capital, capital expenditures and the selection of an appropriate discount rate. Factors potentially leading to a reduction of the estimated net present value of future cash flows could include (i) the loss of significant customers or contracts, (ii) significantly less favorable terms of new contracts and contract renewals, and (iii) prolonged economic downturns affecting advertising spending.
We review each reporting unit for possible goodwill impairment by comparing the estimated market value of each respective reporting unit to the carrying value of that reporting unit’s net assets. If
52
Table of Contents
Index to Financial Statements
the estimated market values exceed the net assets, no goodwill impairment is deemed to exist. If the fair value of the reporting unit does not exceed the carrying value of that reporting unit’s net assets, goodwill impairment is deemed to exist. We then perform a purchase price allocation applying the guidance of SFAS No. 141, “Business Combinations,” (“SFAS 141”), by allocating the reporting unit’s fair value to the fair value of all tangible and identifiable intangible assets residual fair value representing the implied fair value of goodwill of that reporting unit. The carrying value of goodwill for the reporting unit is written down to this implied value.
Accounting for Derivatives—We adopted SFAS No. 133, “Accounting for Derivative Instruments and Hedging Activities,” (“SFAS 133”), as amended, effective December 31, 2005. SFAS 133 requires a company to recognize all derivatives on the balance sheet at fair value. Derivatives that are not hedges must be adjusted to fair value through income. If the derivative is a fair value hedge, changes in the fair value of the hedged assets, liabilities or firm commitments are recognized through earnings. If the derivative is a cash flow hedge, the effective portion of changes in the fair value of the derivative are recognized in other comprehensive income until the hedged item is recognized in earnings. The ineffective portion of a derivative’s change in fair value is immediately recognized in earnings.
We use interest rate swap agreements to hedge exposure to interest rate fluctuations on our variable rate debt, designating these swaps as cash flow hedges of anticipated interest payments. These hedging activities may be transacted with one or more highly-rated institutions, reducing the exposure to credit risk in the event of nonperformance by the counter-party to the swap agreement.
In February 2006, we entered into an interest rate swap agreement effective in June 2006 and terminating in March 2009. Under the agreement, we converted a notional amount of $60 million of floating rate debt (currently bearing interest at LIBOR plus the currently applicable margin of 3.25%) to fixed rate debt, bearing interest at 5.05% plus the applicable margin.
Comprehensive Income (Loss)—Comprehensive income includes the change in value of an interest rate swap that was entered into in February 2006 and was effective June 2006, terminating in March 2009, net of taxes. The fair value of the swap agreement is recognized on the balance sheet as an asset, with the offset recorded in accumulated other comprehensive income net of income taxes. Any changes in the market value of the swap is adjusted to the asset or liability account and recorded net of the related income taxes in other comprehensive income, except to the extent that the swap is considered ineffective. To the extent that the swap is considered ineffective, changes in market value of the swap are recognized as a component of interest expense in the period of the change.
Earnings (Loss) Per Share—Basic earnings (loss) per share excludes any dilutive effects of stock options, convertible preferred stock and accrued preferred stock dividends potentially paid in common stock. In periods where they are anti-dilutive, such amounts are excluded from the calculation of dilutive earnings (loss) per share.
The number of shares used to calculate basic earnings per share in the Combined Statements of Operations for fiscal periods prior to the Spin-off was based on the 4,870,000 shares of our common stock issued in connection with the Spin-off. The number of shares used to calculate basic earnings per share in the Combined and Consolidated Statement of Operations for the twelve months ended December 31, 2005 were 4,871,080, the six months ended June 30, 2006 were 5,138,775, and for the twelve months ended June 30, 2007 and 2008 were 5,246,249 and 5,553,117 shares, respectively, the weighted average shares outstanding for the periods then ended. Due to the net loss for the six months ended June 30, 2006 and the twelve months ended June 30, 2007 and 2008, potentially dilutive stock options, unvested restricted stock and convertible preferred stock would have been anti-dilutive, therefore; diluted earnings per share is equal to basic earnings per share. For the year ended December 31, 2005, there were no dilutive potential common shares outstanding.
53
Table of Contents
Index to Financial Statements
Reclassifications—Certain amounts included in the consolidated financial statements for prior years have been reclassified from their original presentation to conform with the current year presentation.
Recent Accounting Pronouncements
In September 2006, the Financial Accounting Standards Board (“FASB”) issued SFAS No. 157, “Fair Value Measurements,” (“SFAS No. 157”), to clarify the definition of fair value, establish a framework for measuring fair value and expand the disclosures on fair value measurements. SFAS No. 157 defines fair value as the price that would be received to sell an asset or paid to transfer a liability in an orderly transaction between market participants at the measurement date. SFAS No. 157 also stipulates that, as a market-based measurement, fair value measurement should be determined based on the assumptions that market participants would use in pricing the asset or liability, and establishes a fair value hierarchy that distinguishes between (a) market participant assumptions developed based on market data obtained from sources independent of the reporting entity (observable inputs) and (b) the reporting entity’s own assumptions about market participant developed based on the best information available in the circumstances (unobservable inputs). We adopted SFAS No. 157 as of July 1, 2008 for our financial assets and liabilities. Further, in February 2008, the FASB issued FASB Staff Position (“FSP”) 157-2, “Effective Date of FASB Statement No. 157,” (“FSP FAS 157-2”) which delays the effective date of SFAS No. 157 for nonfinancial assets and nonfinancial liabilities until fiscal years beginning after November 15, 2008, which for us is our fiscal year ending June 30, 2010. We are currently evaluating the impact FSP FAS 157-2 will have on our consolidated financial statements.
In February 2007, the FASB issued SFAS No. 159, “The Fair Value Option for Financial Assets and Financial Liabilities, including an amendment of FASB Statement No. 115” (“SFAS No. 159”). SFAS No. 159 permits companies to choose to measure certain financial instruments and other items at fair value, with unrealized gains and losses on items for which the fair value option has been elected reported in earnings at each subsequent reporting date. We are continuing to review the provisions of SFAS No. 159, which is effective in the first quarter of fiscal 2009, and currently do not expect this new accounting standard to have a significant impact on the consolidated financial statements.
In December 2007, the FASB issued SFAS No. 141 (Revised 2007), “Business Combinations”, (“SFAS 141R”). Under SFAS No. 141R, an acquiring entity will be required to recognize all assets acquired and liabilities assumed in a transaction at the acquisition-date fair value, with limited exceptions. Under SFAS No.141R, certain items, including acquisition costs, will be generally expensed as incurred; non-controlling interests will be valued at fair value at the acquisition date and subsequently measured at the higher of such amount or the amount determined under existing guidance for non-acquired contingencies; in-process research and development will be recorded at fair value as an indefinite-lived intangible asset at the acquisition date; restructuring costs associated with a business combination will be generally expensed subsequent to the acquisition date; and changes in deferred tax asset valuation allowances and income tax uncertainties after the acquisition date generally will affect income tax expense. SFAS No. 141R also includes new disclosure requirements. SFAS No. 141R applies prospectively to business combinations for which the acquisition date is on or after the beginning of the first annual reporting period beginning on or after December 15, 2008. We have not determined the effect that adoption of SFAS No. 141R will have on our financial statements, since such effect is not reasonably estimable at this time.
In March 2008, the FASB issued SFAS No. 161, “Disclosures about Derivative Instruments and Hedging Activities—An Amendment of FASB Statement No. 133” (“SFAS 161”). This statement revises the requirements for the disclosure of derivative instruments and hedging activities that include the reasons a company uses derivative instruments, how derivative instruments and related hedged items
54
Table of Contents
Index to Financial Statements
are accounted under SFAS 133 and how derivative instruments and related hedged items affect a company’s financial position, financial performance and cash flows. SFAS 161 will be effective July 1, 2009. We are currently evaluating the impact of adopting SFAS 161 and do not anticipate a material effect.
In May 2008, the FASB issued FASB Staff Position APB 14-1 (FSP APB 14-1), “Accounting for Convertible Debt Instruments That May Be Settled in Cash upon Conversion (Including Partial Cash Settlement),” which applies to all convertible debt instruments that have a “net settlement feature,” which means that such convertible debt instruments, by their terms, may be settled either wholly or partially in cash upon conversion. FSP APB 14-1 requires issuers of convertible debt instruments that may be settled wholly or partially in cash upon conversion to separately account for the liability and equity components in a manner reflective of the issuers’ nonconvertible debt borrowing rate. FSP APB 14-1 is effective for financial statements issued for fiscal years beginning after December 15, 2008 and interim periods within those fiscal years. Early adoption is not permitted and retroactive application to all periods presented is required. We are currently evaluating the impact of the application of FSP APB 14-1 on our financial statements, and do not anticipate a material effect.
| 3. | ACQUISITION OF THE JONESBORO GROUP |
On March 31, 2006, we acquired the Jonesboro Group of newspapers in a like kind exchange of The Goshen News, hereinafter referred to as “the Swap” pursuant to the terms of the agreement that we entered into with Gray in connection with the Spin-Off. Prior to the Spin-off, in connection with the acquisition of a television station, Gray and TCM entered into an amendment to the separation and distribution agreement the terms of which obligated us to sell or swap The Goshen News pursuant to FCC cross-ownership rules. On March 3, 2006, Gray completed the acquisition of a television station in South Bend, Indiana obligating us to dispose of The Goshen News.
Beginning April 1, 2006, the day immediately following the effective date of the Swap, the financial results of the Jonesboro Group have been consolidated with those of our business. The Swap has been accounted for under the purchase method of accounting, whereby a preliminary valuation of the assets and liabilities of the merged business have been included as of the closing of business on March 31, 2006, based on an allocation of the purchase price. A gain of $5.7 million, net of $3.4 million tax impact, was recognized in connection with the swap in 2006. The excess of the purchase price over assets acquired of approximately $13.6 million was recorded as goodwill. For the twelve months ended June 30, 2008, as further discussed in note 6, we recorded a $5.8 million impairment charge to goodwill.
The estimated fair values of assets and liabilities acquired under the Swap are summarized as follows:
Receivables | $ | 716 | ||
Other current assets | 115 | |||
Property and equipment | 1,410 | |||
Goodwill | 13,618 | |||
Customer base and trademarks | 7,830 | |||
Deferred income taxes | (1,873 | ) | ||
Accounts payable and accrued expenses | (165 | ) | ||
Deferred Revenue | (151 | ) | ||
| $ | 21,500 | |||
55
Table of Contents
Index to Financial Statements
The treatment of the Swap as a like kind exchange results in the tax basis of The Goshen News continuing as the tax basis of the Jonesboro Group. All tax attributes of The Goshen News will continue to carryforward including the previous value of goodwill related to The Goshen News. See footnote 10 to these financial statements for details regarding the disposition of The Goshen News as discontinued operations.
Pro forma operating results for the year ended December 31, 2005 and the six months ended June 30, 2006, assuming the Swap had been consummated as of January 1, 2005, would have been as follows:
| (Unaudited) | |||||||
| Year Ended December 31, 2005 | Six Months Ended June 30, 2006 | ||||||
Operating revenues | $ | 46,203 | $ | 20,012 | |||
Operating income | 9,824 | 5,718 | |||||
Income (loss) from continuing operations | 9,214 | (1,202 | ) | ||||
Gain on disposal of discontinued operation | — | 5,685 | |||||
Net income | 5,487 | 4,893 | |||||
Net income available to common stockholders | 5,484 | 4,351 | |||||
Per share, basic and diluted: | |||||||
Net income available to common stockholders | $ | 1.13 | $ | 0.85 | |||
Pro forma weighted average shares outstanding | 4,871 | 5,139 | |||||
The pro forma net income includes a non-cash gain of $5.7 million for the six months ended June 30, 2006, related to the Swap. The pro forma weighted average shares outstanding is determined based on the number of shares of our common stock issued in connection with the Spin-off and the Merger and the weighted average shares outstanding as of December 31, 2005 and June 30, 2006, respectively. These pro forma results are not necessarily indicative of actual results that might have occurred had the Swap actually occurred in prior years.
| 4. | CORPORATE AND ADMINISTRATIVE EXPENSE |
For the period January 1, 2005 to December 30, 2005, our costs and expenses include allocations from Gray for centralized legal, accounting, treasury, real estate, information technology, engineering, and other Gray corporate services and infrastructure costs. These allocations have been determined on the basis that we and Gray considered to be reasonable reflections of the utilization of services provided to, or the benefits received by, us as wholly owned subsidiaries of Gray during these periods. The basis for allocation included specifically identifying those elements that were not applicable to our operations and the remaining costs were allocated on the basis of revenue. Allocated costs totaled $1.1 million for the year ended December 31, 2005. Corporate and administrative expenses totaled $2.6 million for the six months ended June 30, 2006, and $5.7 million and $3.8 million for the twelve months ended June 30, 2007 and 2008, respectively, including the costs of being a public entity. Prior to the Spin-off, Gray provided all capitalization for us.
| 5. | TRANSACTIONS WITH AFFILIATED COMPANIES |
Insurance Contract with Georgia Casualty & Surety Co.—Effective December 30, 2005 following the Spin-off, we obtained certain workers’ compensation insurance coverage under an insurance contract with Georgia Casualty & Surety Co., which was a wholly owned subsidiary of Atlantic American Corporation, a publicly traded company in which J. Mack Robinson (a significant shareholder of ours) and certain of his affiliates have a substantial ownership interest, and a company
56
Table of Contents
Index to Financial Statements
of which Hilton H. Howell, a member of our board of directors and Mr. Robinson’s son-in-law, is an executive officer. As of March 31, 2008, Georgia Casualty is no longer a subsidiary of Atlantic American and thus is no longer an affiliated company. Prior to the Spin-off, Gray had a similar insurance contract with the same company. For the year ended December 31, 2005 our workers’ compensation insurance expense attributable to Gray’s insurance contract with Georgia Casualty was approximately $0.2 million. For the six months ended June 30, 2006, insurance expense attributable to our insurance contract with Georgia Casualty was approximately $0.2 million and for the twelve months ended June 30, 2007 and 2008, $0.2 million and $0.2 million, respectively. Effective of March 31, 2008, Georgia Casualty was no longer a subsidiary of Atlantic American and thus no longer an affiliated company.
| 6. | GOODWILL AND INTANGIBLE ASSETS |
Approximately $25.4 million and $19.0 million, or 15% and 46%, of our total assets as of June 30, 2007 and 2008, respectively, consists of unamortized intangible assets and goodwill.
A summary of changes in our goodwill and other intangible assets for the years ended December 31, 2004 and December 31,2005 is as follows:
| Net Amount at December 31, 2004 | Acquisitions | Amortization | Net Amount at December 31, 2005 | |||||||||
Goodwill | $ | 4,782 | $ | — | $ | — | $ | 4,782 | ||||
Definite lived intangible assets | — | — | — | — | ||||||||
Total intangible assets net of accumulated amortization | $ | 4,782 | $ | — | $ | — | $ | 4,782 | ||||
A summary of changes in our goodwill and other intangible assets for the year ended December 31, 2005 and the six months ended June 30, 2006 is as follows:
| Net Amount at December 31, 2005 | Acquisitions | Amortization | Net Amount at June 30, 2006 | ||||||||||
Goodwill | $ | 4,782 | $ | 13,618 | $ | — | $ | 18,400 | |||||
Definite lived intangible assets | — | 7,830 | (165 | ) | 7,665 | ||||||||
Total intangible assets net of accumulated amortization | $ | 4,782 | $ | 21,448 | $ | (165 | ) | $ | 26,065 | ||||
Goodwill of $13.6 million and intangible assets of $7.8 million was recognized related to the Swap. Amortization expense was recognized for the three months ended June 30, 2006, the period subsequent to the Swap. The Swap is further explained in Note 3—Acquisition of the Jonesboro Group.
A summary of changes in our goodwill and other intangible assets for the twelve months ended June 30, 2006 and June 30, 2007 is as follows:
| Net Amount at June 30, 2006 | Acquisitions and Dispositions | Amortization | Net Amount at June 30, 2007 | ||||||||||
Goodwill: | $ | 18,400 | $ | 28 | $ | — | $ | 18,428 | |||||
Definite lived intangible assets: | 7,665 | — | (662 | ) | 7,003 | ||||||||
Total intangible assets net of accumulated amortization | $ | 26,065 | $ | 28 | $ | (662 | ) | $ | 25,431 | ||||
57
Table of Contents
Index to Financial Statements
We recorded an insignificant adjustment of approximately $0.3 million to goodwill for deferred tax assets related to fixed assets acquired in the Merger and an adjustment to the Swap. The Swap is further explained in Note 3—Acquisition of the Jonesboro Group.
A summary of changes in our goodwill and other intangible assets for the twelve months ended June 30, 2007 and June 30, 2008 is as follows:
| Net Amount at June 30, 2007 | Impairment Charge | Amortization | Net Amount at June 30, 2008 | |||||||||||
Goodwill: | $ | 18,428 | $ | (5,803 | ) | $ | — | $ | 12,625 | |||||
Definite lived intangible assets: | 7,003 | — | (660 | ) | 6,343 | |||||||||
Total intangible assets net of accumulated amortization | $ | 25,431 | $ | (5,803 | ) | $ | (660 | ) | $ | 18,968 | ||||
In accordance with SFAS No. 142, “Goodwill and Other Intangible Assets” (“SFAS 142”), we review goodwill and intangible assets deemed to have indefinite useful lives for impairment during the fourth quarter. In connection with that review, we took an impairment charge of $5.8 million in connection with the Jonesboro assets.
As of June 30, 2007 and 2008, our intangible assets and related accumulated amortization consisted of the following:
| As of June 30, 2007 | As of June 30, 2008 | |||||||||||||||||||
| Gross | Accumulated Amortization | Net | Gross | Accumulated Amortization | Net | |||||||||||||||
Intangible asset not subject to amortization: | ||||||||||||||||||||
Goodwill | $ | 18,428 | $ | — | $ | 18,428 | $ | 12,625 | $ | — | $ | 12,625 | ||||||||
| $ | 18,428 | $ | — | $ | 18,428 | $ | 12,625 | $ | — | $ | 12,625 | |||||||||
Other definite lived intangible assets subject to amortization | $ | 7,830 | $ | (827 | ) | $ | 7,003 | $ | 7,830 | $ | (1,487 | ) | $ | 6,343 | ||||||
Total intangibles | $ | 26,258 | $ | (827 | ) | $ | 25,431 | $ | 20,455 | $ | (1,487 | ) | $ | 18,968 | ||||||
Amortization expense is expected to approximate $0.66 million over each of the five years from fiscal 2009 through fiscal 2013, and $3 million thereafter.
| 7. | ACCRUED EXPENSES |
Accrued expenses consist of the following:
| June 30, 2007 | June 30, 2008 | |||||
Compensation and related costs | $ | 423 | $ | 845 | ||
Accrued Interest | 1,703 | 1,148 | ||||
Other accrued liabilities | 976 | 1,739 | ||||
| $ | 3,102 | $ | 3,732 | |||
58
Table of Contents
Index to Financial Statements
| 8. | LONG-TERM DEBT |
Long-term debt outstanding as of June 30, 2007 and 2008 consists of the following:
| June 30, 2007 | June 30, 2008 | |||||
First lien senior term loan | $ | 87,170 | $ | 21,280 | ||
Second lien senior term loan | 30,000 | 30,229 | ||||
First lien revolving credit facility | 7,600 | 19,293 | ||||
| $ | 124,770 | $ | 70,802 | |||
Future principal payment obligations of long-term debt are as follows:
Fiscal Year | Total | ||
2009 | $ | 216 | |
2010 | 40,357 | ||
2011 | 30,229 | ||
| $ | 70,802 | ||
On December 30, 2005, we entered into (i) a First Lien Secured Credit Agreement and (ii) a Second Lien Senior Secured Credit Agreement with Wachovia Bank, National Association, among others. The First Lien Secured Credit Agreement provides for a senior secured revolving credit facility in the aggregate principal amount of $20,000, which matures on December 30, 2009 (which we refer to as the “First Lien Revolving Credit Facility”) and a senior secured term loan facility in an aggregate principal amount of $90,000, which matures on June 30, 2010 (which we refer to as the “First Lien Term Loan Facility” and, together with the First Lien Revolving Credit Facility, the “First Lien Credit Facility”). The Second Lien Credit Agreement provides for a senior secured term loan facility in the aggregate principal amount of up to $30,000, which matures on December 30, 2010 (which we refer to as the “Second Lien Credit Facility” and, together with the First Lien Credit Facility, the “Credit Facilities”). Substantially all of our assets are pledged as collateral in conjunction with the Credit Facilities. Proceeds of the Credit Facilities were used to fund a $40,000 cash distribution to Gray in connection with the Spin-off, refinance all of Bull Run’s long-term debt in connection with the Merger, pay the cash portion of the Merger consideration, and pay transaction costs.
On September 18, 2006, we amended the Credit Facilities in conjunction with our acquisition of Pinnacle (now presented as part of discontinued operations). Pursuant to the amendments, amounts under the First Lien Revolving Credit Facility may be borrowed, repaid and reborrowed by us from time to time until maturity. Interest for borrowings under the First Lien Revolving Credit Facility is currently based, at our option, on either (a) 2.25% per annum plus the higher of (1) the prime rate of interest announced or established by Wachovia from time to time, and (2) the Federal funds rate plus 0.50% per annum (the “Base Rate”) or (b) 3.25% per annum plus the applicable London Interbank Offered Rate (“LIBOR”) rate for Eurocurrency borrowings. If and when we meet certain leverage ratio criteria as set forth in the First Lien Senior Secured Credit Agreement, our interest rate may decline at .25% increments to (a) 1.50% per annum above the Base Rate or (b) 2.50% per annum above the applicable LIBOR rate for Eurocurrency borrowings. We currently anticipate that we will not qualify for a reduction in our Base Rate of LIBOR applicable margins of 2.25% and 3.25%, respectively, for at least the next year. Interest for borrowings under the First Lien Term Credit Facility is based, at our option, on either (a) 2.50% per annum plus the higher of (1) the prime rate of interest announced or established by Wachovia from time to time, and (2) the Base Rate or (b) 3.50% per annum plus the applicable LIBOR rate for Eurocurrency borrowings, subject to adjustment based on our credit ratings assigned to the Second Lien Credit Facility by Standard & Poors and Moody’s. Interest under the
59
Table of Contents
Index to Financial Statements
Second Lien Credit Facility is based upon (a) 8.50% per annum above the Base Rate or (b) 9.50% per annum above the applicable LIBOR rate for Eurocurrency borrowings, subject to adjustment based on our credit ratings assigned by Standard & Poors and Moody’s.
At June 30, 2008, the First Lien Term Loan Facility and the Second Lien Credit Facility were fully drawn. At June 30, 2008 and 2007, $19.3 million and $7.6 million were drawn on the First Lien Revolving Credit Facility, respectively.
Our Credit Facilities contain affirmative and negative covenants and financial ratios customary for financings of this type, including, among other things, limits on the incurrence of debt or liens, a limit on the making of dividends or distributions, provision for mandatory prepayments under certain conditions, limitations on transactions with affiliates and investments, a limit on the ratio of debt to earnings before interest, income taxes, depreciation, and amortization, as adjusted for certain non-cash and nonrecurring items (which we refer to as “EBITDA”), a limit on the ratio of EBITDA to fixed charges, and a limit to the ratio of EBITDA to all cash interest expense on all debt. The Credit Facilities contain events of default customary for facilities of this type (with customary grace periods, as applicable) and provide that, upon the occurrence of an event of default, the interest rate on all outstanding obligations will be increased and payment of all outstanding loans may be accelerated and/or the lenders’ commitments may be terminated. In addition, upon the occurrence of certain insolvency or bankruptcy related events of default, all amounts payable under the Credit Agreements shall automatically become immediately due and payable, and the lenders’ commitments will automatically terminate.
Debt issue costs incurred in relation to the Credit Facilities were $5 million and $5.6 million as of June 30, 2007 and 2008, respectively. Accumulated amortization of debt issue costs were $1.8 million and $3.2 million as of June 30, 2007 and 2008, respectively. Debt issue cost expensed during the twelve months ended June 30, 2007 were $1.3 million and included $0.1 million of fees incurred and expensed for the period. Debt issue costs expensed during the twelve months ended June 30, 2008 were $1.4 million and included $0.1 million of fees incurred and expensed for the period. Debt issue costs are being amortized over four years on a straight-line basis, which approximates the estimated life of the loan and is appropriate given the revolving line of credit. We expect amortization of debt issue costs to be approximately $1.6 million and $0.8 million for the twelve months ending June 30, 2009 and 2010, respectively.
We use derivative financial instruments for the purpose of reducing our exposure to adverse fluctuations in interest rates. While these hedging instruments are subject to fluctuations in value, such fluctuations are offset by the fluctuations in values of the underlying exposures being hedged. We have not held or issued derivative financial instruments for trading purposes. Historically, we have monitored the use of derivative financial instruments through the use of objective measurable systems, well-defined market and credit risk limits, and timely reports to senior management according to prescribed guidelines. We have established strict counterparty credit guidelines and have entered into transactions only with financial institutions of investment grade or better. As a result, we have historically considered the risk of counter-party default to be minimal.
In February 2006, we entered into an interest rate swap agreement effective in June 2006 and terminating in March 2009. Under the agreement, we converted a notional amount of $60 million of floating rate debt (currently bearing interest at LIBOR plus the currently applicable margin of 3.25%) to fixed rate debt, bearing interest at 5.05% plus the applicable margin. For the six months ended June 30, 2006, based on specific testing, we considered the hedge to be effective. The fair value of the hedge as of June 30, 2007 and 2008 was $0.2 million and $(1.0) million, respectively, recorded as an asset in other assets. Accordingly, we recognized $0.4 million, $(0.3) million and $(1.1) million of other comprehensive income (loss), net of tax related to this interest rate swap for the six months ended June 30, 2006 and the twelve months ended June 30, 2007 and 2008, respectively.
60
Table of Contents
Index to Financial Statements
On November 9, 2007, we entered into the third amendment to our Credit Facilities due, in part, to our failure to meet our financial covenants. Pursuant to the amendment, our lenders agreed to temporarily suspend, on a retroactive basis, the requirement for us to comply with all financial covenants contained therein for the period September 30, 2007 through November 15, 2007. Subsequent to the consummation of the Host and Pinnacle transactions, we were required to remain in compliance with our leverage covenants. We were in compliance with our covenants as of December 31, 2007; however, our forecasts indicated that we would not be in compliance with future covenants and, accordingly, we sought to further amend our covenants.
On February 15, 2008 we executed our fourth amendment to the First Lien Term Loan Facility. Pursuant to the amendments, borrowings associated with Base Rate and Eurodollar advances will be charged interest at rates of 4.50% and 5.50% per annum, respectively, provided that the Base Rate and Eurodollar Rate (as defined) cannot fall below 4.00% and 3.00%, respectively. The amendments also provided for a reduction in the First Lien Leverage Coverage, Fixed Charge Coverage, and Interest Coverage Ratios for each quarter ending through September 30, 2009. Capital expenditures cannot exceed $500,000 for any four consecutive quarters. We were in compliance with our covenants as of June 30, 2008; however we do not currently anticipate meeting our covenants for the fiscal year ending June 30, 2009 or fiscal 2009.
On February 15, 2008 we executed our fourth amendment to the Second Lien Credit Facility. Pursuant to these amendments, borrowings associated with Base Rate and Eurodollar advances will be charged interest at rates of 11.00% and 12.00% per annum, respectively, provided that the Base Rate and Eurodollar Rate cannot fall below 4.00% and 3.00%, respectively. The amendments also provided for a reduction in the Leverage Ratio for each quarter ending through September 30, 2009. Capital expenditures cannot exceed $500,000 for any four consecutive quarters. We were in compliance with our covenants as of June 30, 2008; however we do not currently anticipate meeting our fiscal 2009 covenants.
We incurred $0.6 million of bank fees to execute the fourth amendment to the First Lien Term Facility and the Second Lien Term Facility which were executed in 2008. These costs were capitalized and will be amortized over the remaining life of the credit facilities with the previously capitalized debt costs.
| 9. | INCOME TAXES |
For the twelve months ended June 30, 2007 and 2008, income tax expense in our consolidated financial statements has been determined on a consolidated basis for jurisdictions that permit consolidated filings. In prior years, income tax expense in our combined and consolidated financial statements has been determined on a separate tax return basis. Federal and state income tax expense is summarized as follows:
| Year Ended December 31, 2005 | Six Months Ended June 30, 2006 | Twelve Months Ended June 30, 2007 | Twelve Months Ended June 30, 2008 | ||||||||||||
Current: | |||||||||||||||
Federal | $ | 2,432 | $ | 5,621 | $ | — | $ | 980 | |||||||
State and local | 313 | 449 | 212 | 1,586 | |||||||||||
Deferred | (22 | ) | (2,997 | ) | (2,285 | ) | 19,396 | ||||||||
| $ | 2,723 | $ | 3,073 | $ | (2,073 | ) | $ | 21,962 | |||||||
61
Table of Contents
Index to Financial Statements
Income tax expense is included in the accompanying combined and consolidated financial statements as follows:
| Year Ended December 31, 2005 | Six Months Ended June 30, 2006 | Twelve Months Ended June 30, 2007 | Twelve Months Ended June 30, 2008 | ||||||||||||
Continuing operations | $ | 2,863 | $ | (1,582 | ) | $ | (3,020 | ) | $ | 6,703 | |||||
(Loss) income from discontinued operations | (140 | ) | 705 | 1,450 | 1,404 | ||||||||||
Gain (loss) on disposal of discontinued operations | — | 3,950 | (503 | ) | 13,855 | ||||||||||
| $ | 2,723 | $ | 3,073 | $ | (2,073 | ) | $ | 21,962 | |||||||
During the six months ended June 30, 2006, pursuant to the Swap referred to in Note 3, we recognized a gain on disposal of The Goshen News of $5.7 million, net of tax. As a result of the gain recognized by Gray on the Spin-off, we increased the book basis in our assets by approximately $12.8 million, thereby increasing our deferred tax assets by approximately $4.8 million. Significant components of our deferred tax assets and liabilities are as follows:
| June 30, 2007 | June 30, 2008 | |||||||
Deferred tax assets: | ||||||||
Allowance for doubtful accounts | $ | 41 | $ | 81 | ||||
Reserves against nonoperating receivables | 272 | 387 | ||||||
Accrued expenses | 136 | 305 | ||||||
Net operating loss carryforward | 31,187 | 13,742 | ||||||
Contribution carryforward | 113 | 20 | ||||||
Business credit carryforward | 116 | 42 | ||||||
Stock options | 213 | 889 | ||||||
FCC licenses, goodwill and other intangibles | 834 | 2,715 | ||||||
Alternative Minimum Tax credit carryforward | 566 | 1,481 | ||||||
Total deferred tax assets | 33,478 | 19,662 | ||||||
Deferred tax liabilities: | ||||||||
Net book value of property and equipment | (360 | ) | (862 | ) | ||||
Other | (79 | ) | — | |||||
Total deferred tax liabilities | (439 | ) | (862 | ) | ||||
Net deferred tax assets (liabilities) before valuation allowance | 33,039 | 18,800 | ||||||
Valuation allowance | (10,257 | ) | (18,800 | ) | ||||
Deferred tax assets (liabilities), net | $ | 22,782 | $ | — | ||||
During the twelve months ended June 30, 2007, we reclassified $0.3 million of goodwill related to the net book value of property and equipment acquired in the Merger.
SFAS 109 requires that a valuation allowance be established when it is “more likely than not” that all or a portion of a deferred tax asset will not be realized. A review of all available positive and negative evidence was considered in judging the likelihood of realizing tax benefits. Forming a conclusion that a valuation allowance is not needed is difficult when there is negative evidence such as cumulative losses in recent years. Cumulative losses are one of the most difficult pieces of negative evidence to overcome in the absence of sufficient existing orders and backlog (versus forecasted future orders) supporting a return to profitability.
62
Table of Contents
Index to Financial Statements
Subsequent to the twelve months ended June 30, 2007, it became evident that our forecasts without Host and Pinnacle, which were sold in November 2007, would not meet previously calculated projections. This lessened the weight that we could assign to future prospects for returning to consistent profitability. That, combined with recent cumulative net losses, represented sufficient negative evidence that was difficult for positive evidence to overcome under the evaluation guidance of SFAS 109. As a result, we concluded that it was appropriate in the second quarter of fiscal 2008 to establish a full valuation allowance for our net deferred tax assets. The effect was to reverse the benefit of net deferred tax assets that were generated in prior years’ financial statements. These tax benefits will be available, prior to the expiration of carryforwards, to reduce future income tax expense resulting from earnings or increases in deferred tax liabilities. During the second quarter of fiscal 2008, we recorded a non-cash charge to provide a full valuation allowance on our net deferred tax assets.
As of June 30, 2008, we had approximately $31 million in gross federal operating loss carryforwards and $80 million in gross state operating loss carryforwards with expiration dates through fiscal 2027. We do not anticipate that all of our available net operating loss carryforward amounts for tax purposes obtained in the Merger or generated thereafter will ultimately be realized, due to their expiration or other limitations on utilization. As a result, as of June 30, 2008, we had a valuation allowance of approximately $18.8 million for net deferred tax assets.
As a result of the sale of Host we recorded a $2.6 million current income tax liability. This liability arose in part from $1.0 million of alternative minimum tax which cannot be offset with net operating losses. The remaining $1.6 million was due to insufficient state net operating losses in the states where this transaction was taxable.
Our effective tax rate in future periods may differ from that experienced prior to the Spin-off, which was based on a separate return allocation of income taxes to us by Gray. A reconciliation of income tax expense at the statutory federal income tax rate and income taxes as reflected in the combined and consolidated financial statements is as follows:
| Year Ended December 31, 2005 | Six Months Ended June 30, 2006 | Twelve Months Ended June 30, 2007 | Twelve Months Ended June 30, 2008 | |||||||||||
Statutory federal rate applied to income before Income taxes | $ | 2,428 | $ | 2,542 | $ | (1,887 | ) | $ | (12,576 | ) | ||||
Book tax differences associated with asset sale | — | — | — | 24,394 | ||||||||||
State and local taxes, net of federal tax benefit | 257 | 296 | (36 | ) | 1,050 | |||||||||
Change in valuation allowance | — | — | — | 8,543 | ||||||||||
Change in state rate applied to deferred taxes | — | — | (175 | ) | — | |||||||||
Interest on series B preferred stock | — | 77 | 154 | 154 | ||||||||||
Other items, net | 38 | 158 | (129 | ) | 397 | |||||||||
Income tax expense (benefit) | $ | 2,723 | $ | 3,073 | $ | (2,073 | ) | $ | 21,962 | |||||
We adopted the provisions of FIN 48 on July 1, 2007. After application of the provisions of FIN 48, it was not necessary for us to recognize any liability for unrecognized tax benefits or adjustment to the balance of retained earnings as of July 1, 2007. Our policy is to classify interest and penalties related to unrecognized tax benefits in income tax expense. As of July 1, 2007, we had no accrued interest and penalties related to tax benefits. As of July 1, 2007, after the implementation of FIN 48, our unrecognized tax benefits were $0. The amount, if recognized, that would affect the effective tax rate is $0. We believe the previous seven years remain subject to examination by taxing authorities in each of its jurisdictions.
63
Table of Contents
Index to Financial Statements
| 10. | DISCONTINUED OPERATIONS |
The Goshen News
On April 7, 2006, we entered into an asset exchange agreement with Community First Holdings, Inc. (CNHI), dated as of April 1, 2006, to exchange The Goshen News for the Jonesboro Group, consisting of the Clayton News Daily, Clayton News Weekly, Henry Daily Herald and Jackson Progress-Argus. Subject to the terms and conditions of the agreement, effective as of April 1, 2006, CNHI assumed substantially all of the operating assets and liabilities and obligations of The Goshen News, and we assumed substantially all of the operating assets and liabilities of the Jonesboro Group. Accordingly, the results of operations for the six months ended June 30, 2006 include only the results of the Jonesboro Group operations for the three months ended June 30, 2006. The results of operations for The Goshen News, for the year ended December 31, 2005 and the six months ended June 30, 2006, have been reclassified to discontinued operations. For the six months ended June 30, 2006, we recognized a gain on exchange of business related to this transaction of $5.7 million, net of $3.5 million income tax impact.
Summary operating results for The Goshen News are as follows:
| For the Year Ended December 31, 2005 | For the Six Months Ended June 30, 2006 | |||||
Operating revenue | $ | 5,966 | $ | 1,417 | ||
Income before taxes | 1,613 | 445 | ||||
Income tax expense | 625 | 174 | ||||
Income, net of tax | 988 | 271 | ||||
Gain on exchange, net of tax | — | 5,685 | ||||
The exchange occurred on April 1, 2006; therefore we did not have any assets or liabilities related to The Goshen News as of June 30, 2006.
GrayLink, LLC
On June 15, 2007, we entered into an agreement to sell substantially all of the assets and liabilities of our GrayLink Wireless business segment to a third party, effective June 22, 2007. Accordingly, the results of operations of the Wireless business segment for the year ended December 31, 2005, the six months ended June 30, 2006 and the twelve months ended June 30, 2007 have been reclassified to discontinued operations. For the twelve months ended June 30, 2007, we recognized a loss on sale of assets related to this transaction of $0.6 million, net of $0.2 million income tax impact.
Summary operating results for GrayLink are as follows:
| Year Ended December 31 2005 | Six Months Ended June 30, 2006 | Twelve Months Ended June 30, 2007 | |||||||||
Operating revenue | $ | 7,507 | $ | 3,457 | $ | 5,415 | |||||
(Loss) income before taxes | (2,005 | ) | 280 | (735 | ) | ||||||
Income tax expense (benefit) | (765 | ) | 76 | (275 | ) | ||||||
(Loss) income, net of tax | (1,240 | ) | 204 | (460 | ) | ||||||
Loss on sale, net of tax | — | — | (381 | ) | |||||||
64
Table of Contents
Index to Financial Statements
Assets and liabilities related to GrayLink held for sale as of June 30, 2006.
| June 30, 2006 | |||
Current assets | $ | 1,586 | |
Property and equipment | 477 | ||
Definite lived intangibles | 800 | ||
Other non-current assets | 1,818 | ||
Current liabilities | 1,158 | ||
Non-current liabilities | 28 | ||
Host Communications, Inc.; Pinnacle Sports Production, LLC
On November 15, 2007 we completed our sale of Host and Pinnacle comprised of our Collegiate Marketing and Association Management businesses. The gross sales price was $74.3 million with $67.9 received at closing and $1.4 million held in escrow subject to working capital settlement provisions and $5.0 million held in escrow subject to indemnity settlement provisions. We have recorded a $5.1 receivable in current assets, of which $0.1 relates to the working capital settlement provisions and $5.0 relates to the indemnity provisions, as management believes the probability of collecting these amounts from escrow is highly probable. During the first quarter ended September 30, 2007, we recorded a goodwill impairment charge of $23.7 million to reduce the carrying value of these businesses to fair value less cost to sell. Accordingly, the results of operations of the Collegiate Marketing and Association Management business segment for the year ended December 31, 2005, the six months ended June 30, 2006 and the twelve months ended June 30, 2007 and 2008 have been reclassified to discontinued operations.
Summary operating results for Host and Pinnacle were as follows:
| Year Ended December 31, 2005 | Six Months Ended June 30, 2006 | Twelve Months Ended June 30, 2007 | Twelve Months Ended June 30, 2008 | |||||||||||
Operating revenue | $ | 113 | $ | 28,875 | $ | 81,837 | $ | 39,147 | ||||||
(Loss) income before taxes | (10 | ) | 1,440 | 3,875 | (25,697 | ) | ||||||||
Income tax expense (benefit) | — | 590 | 1,447 | 15,259 | ||||||||||
(Loss) income , net of tax | (10 | ) | 850 | 2,428 | (40,956 | ) | ||||||||
Loss on sale, net of tax | — | — | — | (3,767 | ) | |||||||||
Assets and liabilities related to Host and Pinnacle held for sale as of June 30, 2007.
| June 30, 2007 | |||
Current assets | $ | 9,805 | |
Property and equipment | 5,665 | ||
Definite lived intangibles | 18,264 | ||
Other non-current assets | 75,186 | ||
Current liabilities | 24,157 | ||
Non-current liabilities | 129 | ||
| 11. | PREFERRED STOCK |
As of June 30, 2008, 20,890 shares of our series A redeemable, convertible preferred stock (which we refer to as Series A Preferred Stock) were outstanding, having an aggregate face value of $20,890 and a carrying value of $16,760 at issuance, all of which are convertible into shares of our common stock (a) at the holder’s option, at any time after December 30, 2006, or (b) at our option, upon a
65
Table of Contents
Index to Financial Statements
change of control or liquidation event at a conversion price equal to $16.54 per share. Each holder of the Series A Preferred Stock is entitled to receive dividends at an annual rate of $40 per share in cash or in additional shares of Series A Preferred Stock, at our option. We currently do not anticipate that cash dividends will be paid for the foreseeable future. The liquidation and redemption price of the Series A Preferred Stock is $1,000 per share and dividends are cumulative. We have the option to redeem the Series A Preferred Stock at any time after December 30, 2010 at the liquidation value, which includes accrued dividends, but in any case we are required to redeem all outstanding Series A Preferred Stock on or prior to August 2, 2020. As of June 30, 2008, all outstanding shares of Series A Preferred Stock were held by Mr. J Mack Robinson, who also beneficially owns approximately 10% of our common stock.
As of June 30, 2008, 6,050 shares of our series B convertible preferred stock (which we refer to as Series B Preferred Stock) were outstanding, having an aggregate face value of $6,050 and a carrying value of $4,380 at issuance, all of which are convertible into shares of our common stock at our option, upon a change of control or liquidation event at a conversion price equal to $16.54 per share. Each holder of the Series B Preferred Stock is entitled to receive dividends at an annual rate of $60 per share in cash or in additional shares of Series B Preferred Stock, at our option. We currently do not anticipate that cash dividends will be paid for the foreseeable future. The liquidation and redemption price of the Series B Preferred Stock is $1,000 per share and dividends are cumulative. We have the option to redeem the Series B Preferred Stock at any time after December 31, 2010 at the liquidation value, which includes accrued dividends, but in any case we are required to redeem all outstanding Series B Preferred Stock on or prior to August 2, 2021. As of June 30, 2008, all shares of Series B Preferred Stock were held by Mr. Robinson.
All shares of preferred stock rank, as to payment of dividends and as to distribution of assets upon our liquidation or dissolution, on a parity with all other currently issued preferred stock and any preferred stock issued by us in the future, and senior to our currently issued common stock and common stock issued in the future. The difference between the carrying value and face value of each series of preferred stock will be accreted using the interest method through the applicable mandatory redemption date of the series of preferred stock. Accordingly, for the six months ended June 30, 2006 and the twelve months ended June 30, 2007 and 2008, accretion in the amount of approximately $0.1 million, $0.3 million and $0.3 million, respectively, was recognized as a component of Series A Preferred Stock dividends accrued and $45, $90 and $92, respectively, was recognized as a component of interest expense related to Series B Preferred Stock. Accrued dividends at June 30, 2007 were approximately $1.3 million and $0.5 million related to the Series A Preferred Stock and Series B Preferred Stock, respectively. Accrued dividends at June 30, 2008 were approximately $2.1 million and $0.9 million related to the Series A Preferred Stock and Series B Preferred Stock, respectively.
| 12. | STOCK OPTIONS AND OTHER EQUITY COMPENSATION PLANS |
In November 2005, we adopted our 2005 Long-Term Incentive Plan, referred to as the 2005 Incentive Plan. We have reserved 1 million shares of our common stock under the 2005 Incentive Plan for the issuance of stock options, restricted stock awards, stock appreciation rights and performance awards, pursuant to which certain options were granted as discussed in footnote 2 to these consolidated financial statements. The terms and conditions of such awards are determined at the sole discretion of our board of directors or a committee designated by the Board to administer the plan. We provide previously unissued shares of our common stock to a participant upon a participant’s exercise of vested options. Of the 1 million shares authorized, approximately 0.4 million shares are available for future grants as of each of June 30, 2007 and 2008.
66
Table of Contents
Index to Financial Statements
Effective January 1, 2006, we account for stock-based compensation under SFAS No. 123(R), which requires us to expense the fair value of grants made under the stock option program over the vesting period of each individual option agreement. Awards that are granted after the effective date of SFAS No. 123(R) are valued and non-cash share-based compensation expense is recognized in the consolidated statements of operations in accordance with SFAS No. 123(R). No non-vested awards were granted before the effective date of SFAS No. 123(R). We recognize non-cash share-based compensation expense ratably over the requisite service period which generally equals the vesting period of options, adjusted for expected forfeitures.
In accordance with SFAS No. 123(R), we recognized non-cash share-based compensation expenses as follows:
| Twelve Months Ended June 30, 2007 | Twelve Months Ended June 30, 2008 | |||||||
Non-Cash Share-Based Compensation Expense | ||||||||
Stock Options | $ | 324 | $ | 242 | ||||
Restricted Stock | 149 | 1,504 | ||||||
Unrestricted Stock | 638 | — | ||||||
Non-Cash Stock Compensation Expense | 1,111 | 1,746 | ||||||
Less: Related Income Tax Benefit | (416 | ) | (653 | ) | ||||
Non-Cash Share-Based Compensation Expense, net of taxes | $ | 695 | $ | 1,093 | ||||
Earnings Per Share | $ | (0.13 | ) | $ | (0.20 | ) | ||
Income Tax Benefit Per Share | $ | 0.08 | $ | 0.12 | ||||
Non-cash share-based compensation expense was included in the consolidated statements of operations as corporate and administrative expenses. No share-based compensation expense has been capitalized related to employees whose labor is capitalized.
We value stock options using the Black-Scholes option-pricing model, which was developed for use in estimating the fair value of traded options that are fully transferable and have no vesting restrictions. The option-pricing model requires the input of highly subjective assumptions, such as those listed below. The volatility rates are based on historical stock prices. The expected life of options granted are based on historical data, which, as of June 30, 2006, 2007 and 2008, is a partial option life cycle, adjusted for the remaining option life cycle by assuming ratable exercise of any unexercised vested options over the remaining term. The risk-free interest rate is based on the U.S. Treasury yield curve in effect at the time of grant. The total expense to be recorded in future periods will depend on several variables, including the number of share-based awards.
The fair values of options granted were estimated on the date of grant using the following assumptions for the six months ended June 30, 2006, and the twelve months ended June 30, 2007 and 2008:
Grant Date | Weighted Average Expected Volatility | Expected Life (Years) | Expected Dividend Yield | Risk-Free Interest Rate | ||||
| 4/27/2006 | 33.6% | 5.75 | 0% | 4.79% | ||||
| 11/29/2006 | 33.6% | 5.75 | 0% | 4.51% |
67
Table of Contents
Index to Financial Statements
The following is a summary of option activity:
| Number of Shares | Weighted- Average Exercise Price | Weighted- Average Remaining Contractual Term (in years) | Aggregate Intrinsic Value | ||||||||
Oustanding at | 7 | $ | 501.92 | ||||||||
Granted | 374 | $ | 5.43 | 9.8 | $ | 1,455 | |||||
Forfeited or expired | (1 | ) | $ | 546.56 | |||||||
Oustanding at | 380 | $ | 12.70 | 9.7 | $ | 1,455 | |||||
Exercisable at | 6 | $ | 489.14 | 3.5 | |||||||
Granted | 45 | $ | 6.90 | 9.4 | $ | 109 | |||||
Exercised | (4 | ) | $ | 5.43 | |||||||
Forfeited | (4 | ) | $ | 5.43 | |||||||
Expired | (2 | ) | $ | 604.80 | |||||||
Oustanding at | 415 | $ | 10.10 | 8.9 | $ | 1,564 | |||||
Exercisable at | 126 | $ | 20.26 | 8.7 | $ | 475 | |||||
Exercised | (12 | ) | $ | 5.43 | |||||||
Forfeited | (70 | ) | $ | 5.43 | |||||||
Oustanding at | 333 | $ | 11.07 | 11.4 | — | ||||||
Exercisable at | 208 | $ | 14.07 | 7.7 | — | ||||||
The weighted-average grant date fair value of options granted during the six and twelve months ended June 30, 2006 and 2007 was $5.43 and $6.90, respectively. No options were granted in fiscal 2008. Shares granted during the six months ended June 30, 2006 vest 33% annually as of each April 27 from April 27, 2007 through 2009. Shares granted during the twelve months ended June 30, 2007 vest 33% annually as of each November 29 from November 29, 2008 through 2010. As of June 30, 2008, there was approximately $0.1 million in non-cash share-based compensation cost related to non-vested awards not yet recognized in our consolidated statements of operations. This cost is expected to be recognized over a weighted-average period of .7 years. Approximately 89,500 shares vested, 12,000 shares were exercised and 69,680 shares were forfeited during the twelve months ended June 30, 2008.
As a result of the Merger and the resulting exchange of options to purchase Bull Run common stock for options to purchase shares of our common stock, certain of our employees hold options to acquire shares of our common stock at exercise prices ranging from $40.14 to $1,513.85 per share. All of these options were fully vested as of the date of the Merger. As of June 30, 2008, options for 3,925 shares were outstanding, having a weighted-average exercise price of $461.88 per share and a weighted-average remaining live of 2.8 years. During the twelve months ended June 30, 2008, options for 301 shares having a weighted-average exercise price of $274.40 per share were forfeited.
68
Table of Contents
Index to Financial Statements
In connection with the grant of restricted stock, the fair market value of our common stock on the date the awards were granted, net of expected forfeitures, represents unrecognized deferred share-based compensation, which is being amortized on a straight-line basis over the probable vesting periods of the underlying awards. In February 2006, each of the seven members of our board of directors received an award of 5,000 shares of our common stock, subject to a vesting schedule, whereby 1,000 shares vest annually as of each December 31 from December 31, 2006 through December 31, 2010. On February 21, 2007, pursuant to an employment agreement with our then Chief Executive Officer, 120,000 shares of restricted stock were granted to Thomas J. Stultz subject to a vesting schedule whereby 30,000 shares vest annually as of each February 21 from February 21, 2008 through February 21, 2011 and 55,000 shares of restricted stock were granted on July 1, 2007 which will vest on February 21, 2012. On November 15, 2007, we and Tom Stultz entered into a severance and consulting agreement as a result of our sale of Host. Accordingly, we recorded a $1.3 million charge to discontinued operations to account for the accelerated vesting of the restricted stock previously granted. This agreement also contained other provisions in which we recognized an expense in the statement of operations, namely cash compensation in the amount of $0.6 million. The amount was paid on a biweekly basis through September 2008. As of June 30, 2008, $0.1 million of share-based compensation expense related to restricted stock remains to be amortized. This remaining cost is expected to be recognized over a weighted-average period of 1.9 years.
| 13. | EMPLOYEE BENEFIT PLANS |
Effective January 1, 2006, we began providing retirement benefits to substantially all of our employees with one or more years of service, in the form of a plan referred to as the TCM 401k Plan, intended to meet the requirements of section 401(k) of the Internal Revenue Code of 1986 as amended. Under the TCM 401k Plan, our employees may contribute up to the maximum allowable under federal law and, prior to April 22, 2008, we would match up to 50% of the first 6% contributed by the employee, in the form of contributions of our common stock. On April 22, 2008, the Board of Directors voted to discontinue the employer matching contribution.
Prior to the Spin-off, Gray offered a similar 401k retirement plan that included both matching and voluntary employer contributions, made in the form of Gray common stock, for employees that participated in the plan. Bull Run also provided a 401k retirement plan to its employees prior to the Merger. In January 2006, the assets of the Gray plan, including outstanding employee loans, were transferred into the TCM 401k Plan, and the Bull Run 401k plan was merged into the TCM 401k Plan.
Total contributions under the Gray 401k plan prior to the Spin-off, recorded by us as an expense totaled $0.4 million for the year ended December 31, 2005. These contributions included a voluntary contribution authorized by Gray in addition to the matching contribution equal to 2% of each participant’s earnings in 2005, prior to the Spin-off.
Certain of our eligible employees participated in a defined benefit pension plan sponsored by Gray. The pension plan covered substantially all of our full-time employees prior to the Spin-off with one or more years of service. We recorded pension expense as allocated to us by Gray of $0.6 million for the year ended December 31, 2005. In connection with the Spin-off, the participants in the pension plan were terminated from the Gray pension plan and their respective earned benefit through the date of the Spin-off became fully vested and has remained a liability of Gray, not TCM, under Gray’s pension plan terms and conditions.
| 14. | COMMITMENTS AND CONTINGENCIES |
Operating Leases—We have various operating lease commitments for equipment, land and office space. Rent expense resulting from operating leases for the year ended December 31, 2005 was
69
Table of Contents
Index to Financial Statements
approximately $1.1 million. Rent expense resulting from operating leases for the six months ended June 30, 2006 and the twelve months ended June 30, 2007 and 2008 were approximately $0.5 million, $0.5 million and $0.4 million, respectively. The minimum annual rental commitments under these and other operating leases, net of subleases, with an original lease term exceeding one year are $0.5 million, $0.5 million, $0.4 million, $0.3 million and $0.3 million for the fiscal years ending June 30, 2009 through 2013, respectively, and $0.1 million thereafter.
| 15. | INFORMATION ON BUSINESS SEGMENTS |
Based on the quantitative thresholds specified in SFAS No. 131, we have determined that we operate in one reportable segment, which is Newspaper Publishing. All other segments we previously owned have been reclassified to discontinued operations and further discussions can be found in Note 10—Discontinued Operations.
The Newspaper Publishing segment operates six daily newspapers and one weekly newspaper in seven different markets located in Georgia. Our Newspaper Publishing operations derive their revenue from three sources: retail advertising, circulation and classified advertising. Corporate and administrative expenses are allocated to the segment based on net segment revenues.
| 16. | SUPPLEMENTAL CASH FLOW INFORMATION |
In 2005, we paid $43,953 of the anticipated $44,600 distribution to Gray. The remaining $647 was paid in 2006 for transaction expenses related to the Spin-Off. We issued common and preferred stock totaling $24,313 as part of the Merger.
For the six months ended June 30,2006 and the twelve months ended June 30, 2007 and 2008, we paid approximately $5.3 million, $13.2 and $9.8 million in interest, respectively.
| 17. | SELECTED QUARTERLY FINANCIAL DATA (unaudited) |
(Dollars and shares in thousands, except per share amounts)
| Quarter Ended | ||||||||||||||||
| September 30, 2007 | December 31, 2007 | March 31, 2008 | June 30, 2008 | |||||||||||||
Operating revenues | $ | 11,958 | $ | 12,483 | $ | 10,892 | $ | 10,688 | ||||||||
Operating income (loss) | 1,710 | 2,426 | 1,393 | (4,085 | ) | |||||||||||
(Loss) from continuing operations | (2,210 | ) | (3,648 | ) | (2,197 | ) | (9,939 | ) | ||||||||
(Loss) Income from discontinued operations, net of tax | (24,012 | ) | (16,840 | ) | 787 | 2,876 | ||||||||||
(Loss) Income on sale of discontinued operations, net of tax | — | (4,246 | ) | 185 | 294 | |||||||||||
Net loss | (26,222 | ) | (24,734 | ) | (1,225 | ) | (6,769 | ) | ||||||||
Net loss available to common stockholders | (26,494 | ) | (25,006 | ) | (1,497 | ) | (7,043 | ) | ||||||||
Per share data, basic and diluted | ||||||||||||||||
(Loss) from continuing operations | $ | (0.42 | ) | $ | (0.75 | ) | $ | (0.41 | ) | $ | (1.78 | ) | ||||
(Loss) Income from discontinued operations, net of tax | $ | (4.51 | ) | $ | (4.33 | ) | $ | 0.18 | $ | 0.57 | ||||||
Net loss | $ | (4.93 | ) | $ | (5.08 | ) | $ | (0.23 | ) | $ | (1.21 | ) | ||||
Net loss available to common stockholders | $ | (4.98 | ) | $ | (5.13 | ) | $ | (0.28 | ) | $ | (1.26 | ) | ||||
Weighted average number of shares, basic and diluted | 5,319 | 4,873 | 5,352 | 5,582 | ||||||||||||
70
Table of Contents
Index to Financial Statements
| Quarter Ended | ||||||||||||||||
| September 30, 2006 | December 31, 2006 | March 31, 2007 | June 30, 2007 | |||||||||||||
Operating revenues | $ | 11,985 | $ | 13,015 | $ | 11,236 | $ | 12,228 | ||||||||
Operating income | 1,900 | 2,465 | 688 | 1,841 | ||||||||||||
Income (Loss) from continuing operations | (986 | ) | 1,129 | (5,171 | ) | (34 | ) | |||||||||
Income (Loss) from discontinued operations, net of tax | 241 | (440 | ) | 4,596 | (2,430 | ) | ||||||||||
Gain on sale of discontinued operations, net of tax | — | — | — | (381 | ) | |||||||||||
Net income (loss) | (745 | ) | 689 | (575 | ) | (2,845 | ) | |||||||||
Net income (loss) available to common stockholders | (1,016 | ) | 418 | (846 | ) | (3,118 | ) | |||||||||
Per share data, basic and diluted | ||||||||||||||||
(Loss) from continuing operations | $ | (0.19 | ) | $ | (0.22 | ) | $ | (0.98 | ) | $ | (0.01 | ) | ||||
Income from discontinued operations, net of tax | $ | 0.05 | $ | (0.08 | ) | $ | 0.87 | $ | (0.53 | ) | ||||||
Net income (loss) | $ | (0.14 | ) | $ | 0.13 | $ | (0.11 | ) | $ | (0.54 | ) | |||||
Net income (loss) available to common stockholders | $ | (0.20 | ) | $ | 0.08 | $ | (0.16 | ) | $ | (0.59 | ) | |||||
Weighted average number of shares, basic and diluted | 5,169 | 5,230 | 5,268 | 5,307 | ||||||||||||
| 18. | GOING CONCERN |
We do not anticipate meeting certain future debt compliance covenants in the fiscal year ending June 30 2009. Without waiver of these violations, which could occur at any time between now and June 30, 2009, and/or restructuring of our debt, our bank could accelerate our payment provisions. Further, the sale of Host and Pinnacle resulted in $2.6 million of tax liabilities which became due on September 15, 2008. Assuming no acceleration of payments, material portions of our debt facilities become due in December 2009, June 2010 and December 2010. In order to meet these obligations, we will be required to restructure our current credit facilities or refinance with another lender. In the case of our income tax obligations, we are currently negotiating with the taxing authorities to arrange a payment plan that will allow us to spread our payments over an extended period of time. Should we be unsuccessful in these restructuring efforts, we will attempt to derive capital from alternate sources which may include any of the following; public equity offering, private placement, the issuance of additional shares of preferred stock or other means not yet identified. In the event that we are not able to arrange a payment plan for our tax obligations, or refinance our debt obligations, we may not have sufficient liquidity to operate.
These factors raise substantial doubt as to our ability to continue as a going concern. The accompanying financial statements have been prepared on a going concern basis which assumes continuity of operations and realization of assets and liabilities in the ordinary course of business. The financial statements do not include any adjustments that might result from the outcome of this uncertainty.
| Item 9. | Changes in and Disagreements with Accountants on Accounting and Financial Disclosure |
None.
| Item 9A. | Controls and Procedures |
Disclosure Controls and Procedures
We maintain disclosure controls and procedures, as defined in Rules 13a-15(e) and 15d-15(e) under the Securities Exchange Act of 1934, as amended, refered to herein as the Exchange Act. These disclosure controls and procedures are designed to ensure that information required to be disclosed by us in the reports that we file or submit under the Exchange Act is recorded, processed, summarized, and reported within the time periods specified in the SEC’s rules and forms, and that such information is accumulated and communicated to our management, including our chief executive officer and chief financial officer, as appropriate, to allow timely decisions regarding required disclosure.
71
Table of Contents
Index to Financial Statements
We carried out, under the supervision and with the participation of our management, including our Chief Executive Officer and our Chief Financial Officer, an evaluation of the effectiveness of the design and operation of our disclosure controls and procedures performed pursuant to Rule 13a-15 under the Exchange Act. Based on their evaluation, our Chief Executive Officer and our Chief Financial Officer concluded that, as of June 30, 2008, our disclosure controls and procedures were effective.
There were no material changes in our internal control over financial reporting during the quarter ended June 30, 2008 identified in connection with the evaluation thereof by the Company’s management that have materially affected, or are reasonably likely to materially affect, the Company’s internal control over financial reporting.
Management’s Report on Internal Control over Financial Reporting
Our management is responsible for establishing and maintaining adequate internal control over financial reporting and for the assessment of the effectiveness of internal control over financial reporting. As defined by the Securities and Exchange Commission, internal control over financial reporting is a process designed by, or under the supervision of our principal executive and principal financial officers and effected by our Board of Directors, management and other personnel, to provide reasonable assurance regarding the reliability of financial reporting and the preparation of the consolidated financial statements in accordance with U.S. generally accepted accounting principles.
Our internal control over financial reporting includes those policies and procedures that (1) pertain to the maintenance of records that, in reasonable detail, accurately and fairly reflect our transactions and dispositions of our assets; (2) provide reasonable assurance that transactions are recorded as necessary to permit preparation of the consolidated financial statements in accordance with generally accepted accounting principles, and that our receipts and expenditures are being made only in accordance with authorizations of our management and directors; and (3) provide reasonable assurance regarding prevention or timely detection of unauthorized acquisition, use or disposition of our assets that could have a material effect on the consolidated financial statements.
Because of its inherent limitations, internal control over financial reporting may not prevent or detect misstatements. Also, projections of any evaluation of effectiveness to future periods are subject to the risk that controls may become inadequate because of changes in conditions, or that the degree of compliance with the policies or procedures may deteriorate.
In connection with the preparation of our annual consolidated financial statements, management has undertaken an assessment of the effectiveness of our internal control over financial reporting as of June 30, 2008 based on criteria established in Internal Control—Integrated Framework issued by the Committee of Sponsoring Organizations of the Treadway Commission, or the COSO Framework. Management’s assessment included an evaluation of the design of our internal control over financial reporting and testing of the operational effectiveness of those controls.
Based on this evaluation, management has concluded that our internal control over financial reporting was effective as of June 30, 2008.
This annual report on Form 10-K does not include an attestation report of our registered public accounting firm regarding internal control over financial reporting. Management’s report was not subject to attestation by our registered public accounting firm pursuant to temporary rules of the Securities and Exchange Commission that permits us to provide only management’s report in this annual report.
| Item 9B. | Other Information |
None.
72
Table of Contents
Index to Financial Statements
PART III
| Item 10. | Directors, Executive Officers and Corporate Governance |
Information concerning each of our directors and executive officers as of June 30, 2008, is as follows:
Name | Age | Position | ||
Hilton H. Howell, Jr. | 46 | Director, Chairman | ||
Robert S. Prather, Jr. | 63 | Director, President and Chief Executive Officer | ||
Gerald N. Agranoff | 61 | Director | ||
James W. Busby | 54 | Director | ||
Monte C. Johnson | 71 | Director | ||
George E. “Nick” Nicholson | 60 | Director | ||
Mark G. Meikle | 43 | Executive Vice President and Chief Financial Officer | ||
Michael J. Gebhart | 52 | Executive Vice President of Operations |
HILTON H. HOWELL, JR. has been one of our directors since December 2005 and Chairman since November 2007. Mr. Howell was Bull Run Corporation’s Vice President and Secretary from 1994 until December 2005. He has served as Gray’s Vice Chairman and a director since 2002 and as Gray’s Executive Vice President and a director since 2000. Mr. Howell has served as President and Chief Executive Officer of Atlantic American Corporation, an insurance holding company, since 1995 and Executive Vice President from 1992 to 1995. He has been Executive Vice President and General Counsel of Delta Life Insurance Company and Delta Fire and Casualty Insurance Company since 1991, and Vice Chairman of Bankers Fidelity Life Insurance Company and Georgia Casualty & Surety Company since 1992. Mr. Howell also serves as a director of the following companies: Atlantic American Corporation, Bankers Fidelity Life Insurance Company, Delta Life Insurance Company, Delta Fire and Casualty Insurance Company, Georgia Casualty & Surety Company, American Southern Insurance Company, American Safety Insurance Company, Association Casualty Insurance Company and Association Risk Management General Agency.
ROBERT S. PRATHER, JR., has been our President and Chief Executive Officer since November 2007 and, prior to that date, from May 2005 until December 2005. He was Chairman from December 2005, until November 2007. He had been Bull Run Corporation’s President and Chief Executive Officer from 1992 until December 2005. He served as President, Chief Operating Officer and a director of Gray Television, Inc., or Gray, since 2002, and as Gray’s Executive Vice President-Acquisitions and a member of Gray’s Board of Directors from 1996. Mr. Prather serves as a director of Gabelli Asset Management Inc. (a provider of investment advisory and brokerage services). He is also an advisory director of Swiss Army Brands, Inc. and serves on the Board of Trustees of the Georgia World Congress Center Authority.
GERALD N. AGRANOFF has been one of our directors since December 2005. Mr. Agranoff has served as Managing Member of Inveraray Capital Management LLC, an investment management company, since 2002; general partner of SES Family Investment & Trading Partnership, L.P., an investment partnership, since 1996. Mr. Agranoff also serves as a director of Petrosearch Energy Corporation.
JAMES W. BUSBY has been one of our directors since December 2005. Mr. Busby has been President of Del Mar of Wilmington Corporation, a real estate development company, since 1997. Mr. Busby was President of Datasouth Computer Corporation, a subsidiary of Bull Run Corporation from 1984 through 1997, and was one of Datasouth’s founders in 1977.
73
Table of Contents
Index to Financial Statements
MONTE C. JOHNSON has been one of our directors since December 2005. Mr. Johnson has been a self-employed business consultant since 1987 and has served as President of KAJO, Inc., an oil and gas operating company, since 1995. From 1982 to 1987 Mr. Johnson was the Director of Athletics at the University of Kansas.
GEORGE E. “NICK” NICHOLSON has been one of our directors since February 2006. Mr. Nicholson has been President and Chief Executive Officer of Keeneland Association, a thoroughbred race course and sales company located in Lexington, KY, since 2000.
MARK G. MEIKLE has been our Executive Vice President and Chief Financial Officer since April 2006. Prior to that Mr. Meikle was Vice President, Treasurer and Chief Financial Officer of Roanoke Electric Steel Corporation.
MICHAEL J. GEBHART has been our Executive Vice President since November 2007 and has served as the Publisher of The Albany Herald since October 2005. From May 2004 until October 2005, Mr. Gebhart served as the General Manager and Advertising Director of the Albany Herald. Prior to that Mr. Gebhart was a Senior Vice President for Morning Start Publishing Company in Michigan.
Audit Committee
Our board of directors has an Audit Committee, the purpose of which is to review and evaluate the results and scope of the audit and other services provided by our independent registered public accounting firm, as well as our accounting principles and system of internal accounting controls, and to review and approve any transactions between us and our directors, officers or significant shareholders. In fulfilling its responsibility, the Audit Committee pre-approves, subject to stockholder ratification, the selection of our independent registered public accounting firm. The Audit Committee also reviews our consolidated financial statements and the adequacy of our internal controls. The Audit Committee meets at least quarterly with our management and our independent registered public accounting firm to review and discuss the results of audits or reviews of our consolidated financial statements, the evaluation of our internal audit controls, and the overall quality of our financial reporting and our critical accounting policies. The Audit Committee meets separately, at least quarterly, with the independent registered public accounting firm. In addition, the Audit Committee oversees our existing procedures for the receipt, retention and handling of complaints related to auditing, accounting and internal control issues, including the confidential, anonymous submission by employees of concerns on questionable accounting and auditing matters. The board of directors has determined that all members of the Audit Committee, comprised of Gerald N. Agranoff, James W. Busby, Monte C. Johnson and George E. “Nick” Nicholson, are independent in accordance with Nasdaq Marketplace Rules and regulations established by the Securities and Exchange Commission, or SEC Regulations, governing audit committee member independence, and has affirmatively determined that Gerald N. Agranoff is an “audit committee financial expert” as that term is defined under SEC Regulations.
Section 16(a) Beneficial Ownership Reporting Compliance
Section 16(a) of the Securities Exchange Act of 1934. as amended, requires the directors, executive officers, and persons who own more than 10 percent of a registered class of a company’s equity securities to file with the SEC initial reports of ownership (Form 3) and reports of changes in ownership (Forms 4 and 5) of such class of equity securities. Such officers, directors and greater than 10 percent shareholders of a company are required by SEC Regulations to furnish the company with copies of all such Section 16(a) reports that they file.
To our knowledge, based solely on our review of the copies of such reports furnished to us during the twelve months ended June 30, 2008, all Section 16(a) filing requirements applicable to our executive officers, directors and greater than 10 percent beneficial owners were met.
74
Table of Contents
Index to Financial Statements
Code of Ethics
Pursuant to Section 406 of the Sarbanes-Oxley Act of 2002, we have adopted a Code of Ethics for all employees, including the Chief Executive Officer and Chief Financial Officer. The Code of Ethics is posted on our website,www.triplecrownmedia.com, (under the captions entitled “Investing—Investor Links—Management & Directors”) and is included as Exhibit 14 to this Form 10-K. We intend to satisfy the disclosure requirement regarding any amendment to, or waiver of, a provision of the Code of Ethics for the Chief Executive Officer and Chief Financial Officer by posting such information on our website. We undertake to provide to any person a copy of this Code of Ethics upon request to our Corporate Secretary at our principal executive’s offices.
75
Table of Contents
Index to Financial Statements
| Item 11. | Executive Compensation |
COMPENSATION DISCUSSION AND ANALYSIS
In this section, we will give an overview and analysis of our compensation program and policies, the material compensation decisions we have made under those programs and policies, and the material factors that we considered in making those decisions. Later in this Part III under the heading “Additional Information Regarding Executive Compensation,” you will find tables containing specific information about the compensation earned by, and equity awards granted to, the following individuals, all of whom received compensation in excess of $100,000 for the twelve months ended June 30, 2008, or fiscal year 2008, whom we refer to as our “named executive officers”:
| • | Robert S. Prather, Jr., President, Chief Executive Officer and Director |
| • | Thomas J. Stultz, former President, Chief Executive Officer and Director (1) |
| • | Mark G. Meikle, Chief Financial Officer and Executive Vice President |
| • | Michael J. Gebhart, Executive Vice President of Operations |
| • | Michael Steven Cornwell, Executive Vice President of Operations (1) |
| • | Lawton M. Logan, Executive Vice President of Sales (1) |
| (1) | Messrs. Stultz, Cornwell, and Logan resigned from the Company on November 15, 2007 in connection with the sale of Host. |
The discussion below is intended to help you understand the detailed information provided in those tables and put that information into context within our overall compensation program.
Overview of Compensation Philosophy
The goal of our compensation program for our named executive officers is the same as our goal for operating TCM—to create long-term value for our shareowners. Toward this goal, we have designed and implemented our compensation programs for our named executive officers to reward them for sustained financial and operating performance and leadership excellence, to align their interests with those of our shareowners and to encourage them to remain with us for long and productive careers. Most of our compensation elements simultaneously fulfill one or more of our performance, alignment and retention objectives, as described below. These elements consist of salary, annual bonus and share-based incentive compensation. In deciding on the type and amount of compensation for each named executive, we focus on both current pay and the opportunity for future compensation. We combine the compensation elements for each named executive in a manner we believe optimizes the executive’s contribution to us.
Overview of Compensation Objectives
Performance.
The amount of compensation for each named executive officer reflects his superior management experience, continued high performance and exceptional career of service to us. Key elements of compensation that depend upon the named executive officer’s performance include:
| • | base salary, which provides fixed compensation based on competitive market practice and, in the case of Mark G. Meikle, in accordance with the terms of his employment agreement; |
| • | a discretionary bonus, payable in cash or equity incentives, that is based on an assessment of each executive’s performance against pre-determined quantitative and qualitative measures within the context of our overall performance; |
76
Table of Contents
Index to Financial Statements
| • | equity incentive compensation in the form of stock options and/or restricted stock subject to vesting schedules that require continued service with us; |
| • | our matching stock contributions to our named executive officers who participate in our 401(k) Plan; and |
| • | other benefits. |
Base salary and bonus are designed to reward annual achievements and be commensurate with the executive’s scope of responsibilities, demonstrated leadership abilities, and management experience and effectiveness. Share-based compensation is focused on motivating and challenging the executive to achieve superior, longer-term, sustained results.
Alignment.
We seek to align the interests of our named executive officers with those of our stockholders, and provide them with an opportunity to acquire a proprietary interest in us, by evaluating executive performance on the basis of key financial measurements, which we believe closely correlate to long-term shareowner value, including revenue, operating profit and cash flow from operating activities. Key elements of compensation that align the interests of the named executives with shareowners include equity incentive compensation, which links a significant portion of compensation to shareowner value because the total value of those awards corresponds to stock price appreciation that correlates strongly with meeting company performance goals.
Retention.
Due to extensive management experience, our senior executives are often presented with other professional opportunities, including ones at potentially higher compensation levels. We attempt to retain our executives by using continued service as a determinant of total pay opportunity. Key elements of compensation that require continued service to receive any, or maximum, payout include the vesting terms in our equity-based compensation programs, including stock option and restricted stock awards.
Implementing Our Objectives
Determining Appropriate Pay Levels.
We compete with many other companies for experienced and talented executives. As such, market information regarding pay practices at peer companies (as provided in the public reports filed by such companies with the SEC) is reviewed and considered in assessing the reasonableness of compensation and ensuring that compensation levels remain competitive in the marketplace.
We rely upon our judgment in making compensation decisions, after reviewing our performance and carefully evaluating an executive’s performance during the year against established goals, leadership qualities, operational performance, business responsibilities, such individual’s career with us, current compensation arrangements and long-term potential to enhance shareowner value. Specific factors affecting compensation decisions for our named executive officers include:
| • | key financial measurements such as revenue, operating profit and cash flow from operating activities; |
| • | strategic objectives such as acquisitions, dispositions or joint ventures; |
| • | promoting commercial excellence by launching new or continuously improving services, and attracting and retaining customers and collegiate properties; |
77
Table of Contents
Index to Financial Statements
| • | achieving specific operational goals for us including improved productivity, simplification and risk management; and |
| • | achieving excellence in their organizational structure and among their employees. |
We generally do not adhere to rigid formulas or necessarily react to short-term changes in business performance in determining the amount and mix of compensation elements. Although we consider competitive market compensation paid by other companies, we do not attempt to maintain a certain target percentile within a peer group or otherwise rely on those data to determine executive compensation. We incorporate flexibility into our compensation programs and in the assessment process to respond to and adjust for the evolving business environment.
Allocation of Compensation
There is no pre-established policy or target for the allocation of compensation, other than the employment agreements as previously referenced. We strive to achieve an appropriate mix between equity incentive awards and cash payments in order to meet our objectives. Any apportionment goal is not applied rigidly and does not control our compensation decisions; we use it as another tool to assess an executive’s total pay opportunities and whether we have provided the appropriate incentives to accomplish our compensation objectives. Our mix of compensation elements is designed to reward recent results and motivate long-term performance through a combination of cash and equity incentive awards. We believe the most important indicator of whether our compensation objectives are being met is our ability to motivate our named executive officers to deliver superior performance and retain them on a cost-effective basis.
Timing of Compensation
As discussed elsewhere, compensation (including salary base adjustments, stock options and restrictive stock awards, incentive plan eligibility, incentive plan goal specifications and incentive plan payments, for our named executive officers) are reviewed annually.
Minimum Stock Ownership Requirements
We do not have any minimum stock ownership guidelines. All of our named executive officers, however, currently beneficially own either one, or a combination, of shares of common stock, shares of our restricted stock, or stock options to purchase our common stock.
Role of Nominating, Corporate Governance, Compensation and Stock Option Committee.
The Nominating, Corporate Governance, Compensation and Stock Option Committee of our Board, referred to herein as the NCGCC, has primary responsibility for assisting the Board in developing and evaluating potential candidates for executive positions, including the CEO, and for overseeing the development of executive succession plans. As part of this responsibility, the NCGCC oversees the design, development and implementation of the compensation program for the CEO and the other named executive officers. The NCGCC evaluates the performance of the CEO and determines CEO compensation in light of the goals and objectives of the compensation program.
Role of Executive Officers in Determining Compensation
The CEO and the NCGCC together assess the performance of the other named executives and determine their compensation, based on initial recommendations from the CEO. Our CEO assists the NCGCC in reaching compensation decisions with respect to the named executives other than the
78
Table of Contents
Index to Financial Statements
CEO. The other named executives do not play a role in their own compensation determination, other than discussing individual performance objectives with the CEO. Our CEO is not involved with any aspect of determining his own compensation. The NCGCC makes all compensation decisions for our CEO. Although our CEO assists the NCGCC in reaching compensation decisions with respect to the other named executive officers, the NCGCC has final discretionary authority to approve compensation of all named executive officers, including our CEO.
Role of Compensation Consultant.
The NCGCC did not use the services of a compensation consultant to establish the compensation program for named executive officers for fiscal year 2008. In the future, the NCGCC may engage or seek the advice of compensation consultants to provide insight on compensation trends along with general views on specific compensation programs.
Equity Grant Practices.
The exercise price of each stock option awarded to our named executive officers under our long-term incentive plan is equal to the closing price of our stock on the date of grant. The NCGCC has no pre-set schedule as to when, or if, such grants shall occur.
Annual Compensation Objectives
Base Salary.
Base salaries for our named executive officers depend on the scope of their responsibilities, their performance, and the period over which they have performed those responsibilities. Decisions regarding salary increases take into account the executive’s current salary and the amounts paid to the executive’s peers within and outside TCM. Base salaries are reviewed periodically, but are not automatically increased if the NCGCC believes that other elements of compensation are more appropriate in light of our stated objectives. This strategy is consistent with our primary intent of offering compensation that is contingent on the achievement of performance objectives.
On February 21, 2007, we entered into employment agreements with each of Thomas J. Stultz and Mark G. Meikle. On November 15, 2007, the employment agreement with Mr. Stultz was terminated at which time we entered into a transaction bonus and consulting agreement with Mr. Stultz as a condition of our sale of Host. We discuss the terms and conditions of these agreements elsewhere in this Part III under “Additional Information Regarding Executive Compensation—Employment Agreement” and “—Transaction Bonus and Consulting Agreement.”
Bonus.
Each June, the CEO reviews with the NCGCC our estimated full-year financial results against the financial, strategic and operational goals established for the year, and our financial performance in prior periods. Based on that review, the NCGCC determines on a preliminary basis whether each named executive officer has achieved the objectives upon which the bonus is evaluated. After reviewing the final full-year results, the NCGCC approves total bonuses to be awarded. Bonuses will be approved subject to the results of our year end financial audit and paid shortly thereafter.
The NCGCC, with input from the CEO with respect to the other named executive officers, uses discretion in determining the current year’s bonus for each named executive officer. It evaluates our overall performance, the performance of the business unit or function that the named executive officer leads and an assessment of each executive officer’s performance against expectations, which is
79
Table of Contents
Index to Financial Statements
reviewed at the end of the year. The bonuses also reflect (and are proportionate to) the consistently increasing and sustained annual financial results of TCM. We believe that the annual bonus rewards the executives who drive these results and incentivizes them to sustain this performance.
Whether or not a bonus is in fact earned by an executive is based on both an objective analysis (predetermined operating profit targets based on budgeted operating revenues) and a subjective analysis (based on the individual’s contribution to us or the business unit), The financial objective for each named executive officer for fiscal year 2008 is discussed below. In making the subjective determinations, the NCGCC does not base its determination on any single performance factor nor does it assign relative weights to factors, but considers a mix of factors, including evaluations of superiors, and evaluates an individual’s performance against such mix in absolute terms in relation to our other executives.
The salaries paid and the annual bonuses awarded to the named executive officers for fiscal year 2008 are discussed below and disclosed in the Summary Compensation Table.
Equity Awards
Our equity incentive compensation program is designed to recognize scope of responsibilities, reward demonstrated performance and leadership, motivate future superior performance, align the interests of the executive with our stockholders and retain the executives through the vesting period established for the awards. All of our officers and key employees (including our named executive officers) and our directors are eligible for grants of stock options and other stock-based awards (including restricted stock), under our 2005 Long-Term Incentive Plan, referred to herein as the Incentive Plan, which is administered by the NCGCC. We consider the grant size and the appropriate combination of stock options, common stock and restricted stock when making award decisions. There was no equity incentive compensation granted for fiscal 2008. Existing ownership levels are not a factor in award determination, as we do not want to discourage executives from holding our stock.
We have expensed stock option grants under SFAS 123, Share-Based Payment (SFAS 123) since December 31, 2005, and adopted SFAS 123, as revised, in 2004 (SFAS 123R) beginning in 2005. When determining the appropriate combination of stock options and restricted stock, our goal is to weigh the cost of these grants with their potential benefits as a compensation tool. We believe that providing combined grants of stock options and restricted stock effectively balances our objective of focusing the named executive officers on delivering long-term value to our shareowners, with our objective of providing value to the executives with the equity awards. Stock options only have value to the extent the price of our stock on the date of exercise exceeds the exercise price on the grant date, and thus are an effective compensation element only if the stock price grows over the term of the award. In this sense, stock options are a motivational tool. Unlike stock options, restricted stock offers executives the opportunity to receive shares of our stock on the date the restricted stock vests. In this regard, restricted stock serves both to reward and retain executives, as the value of the restricted stock is linked to the price of our stock on the date the restricted stock vests. In fiscal 2008, we awarded 55,000 shares of restricted stock to Thomas J. Stultz.
There were no stock option awards for fiscal year 2008.
401(k) Plan
We have a 401(k) Savings Plan qualified under Section 401(k) of the Internal Revenue Code, as amended, which is available to all our employees who are at least 21 years of age the first month following one year of service. Employees may contribute up to 100% of their annual compensation (subject to certain statutory limitations) to the plan through voluntary salary deferred payments. We
80
Table of Contents
Index to Financial Statements
matched 50% of each employee’s contribution up to 6% of the employee’s salary until April 22, 2008 at which time the Board of Directors voted to discontinue the matching contribution.
Eligible named executive officers participated in the 401(k) Plan in fiscal year 2008 and received matching contribution from us under the 401(k) Plan for the twelve months ended June 30, 2008 as follows:
Named Executive Officer | Matching Contributions for the Twelve Months Ended June 30, 2008 | ||
Thomas Stultz | $ | 0 | |
Mark G. Meikle | $ | 6,585 | |
Michael J. Gebhart | $ | 5,488 | |
Michael Steven Cornwell | $ | 2,913 | |
Lawton M. Logan | $ | 0 | |
Other Compensation.
We provide our named executive officers with medical, dental and vision insurance coverage that are consistent with those provided to our other employees. In addition, we provide certain perquisites, which are described in the Summary Compensation Table, to our named executive officers, as a component of their total compensation.
Compensation for Named Executive Officers in Fiscal 2008
Strength of company performance. The specific compensation decisions made for each of the named executive officers for the twelve months ended June 30, 2008 reflect our strong performance against key financial and operational measurements. A more detailed analysis of our financial and operational performance is contained in the Management’s Discussion & Analysis contained elsewhere in this Annual Report on Form 10-K. Earnings before interest, taxes, depreciation and amortization (EBITDA) for the twelve months ended June 30, 2008 decreased by less than 2% compared to the twelve months ended June 30, 2007.
CEO Compensation.In determining Mr. Prather’s compensation for the twelve months ended June 30, 2008, the NCGCC considered his performance against financial, strategic and operational goals for this year as follows:
Financial Objectives
EBITDA for TCM decreased by less than 2% for the twelve months ended June 30, 2008 compared to the twelve months ended June 30, 2007.
Strategic and Operational Goals
Retain an excellent team | Mr. Prather continues to add strong management expertise at all levels of the organization. | |
Reduction of Debt | Mr. Prather led the sale of Host which allowed us to reduce debt by approximately $67.9 million. |
Mr. Prather’s salary for fiscal 2008 was $95,370 which was reduced by $4,630 from his stated salary of $100,000 due to an overpayment in fiscal 2007.
81
Table of Contents
Index to Financial Statements
Other Named Executive Officers’ Compensation.In determining the compensation of Messrs. Meikle and Gebhart for the twelve months ended June 30, 2008, the NCGCC compared their achievements against the performance objectives established for each of them at the beginning of the year and discussed with each individual at the beginning of the year by the CEO. The NCGCC evaluated our overall performance and the contributions of each of the other named executive officers to that performance, as well as the performance of the departments that each individual leads when relevant.
Mr. Meikle’s base salary did not change in fiscal 2008. Mr. Gebhart’s salary was increased from $184,000 annually to $210,000 annually in connection with his promotion to Executive Vice President of Operations for the Newspaper group. Messrs. Meikle and Gebhart did not earn any bonus for fiscal 2008 nor were they granted any share-based compensation. Bonus amounts paid to Mr. Meikle and Mr. Gebhart in fiscal 2008 were earned in fiscal 2007.
82
Table of Contents
Index to Financial Statements
COMPENSATION COMMITTEE REPORT
The Nominating, Corporate Governance, Compensation and Stock Option Committee of the Board of Directors has reviewed and discussed with management the Compensation Discussion and Analysis required by Item 402(b) of Regulation S-K. Based on the review and discussion referred to above, the NCGCC recommended to the Board that the Compensation Discussion and Analysis be included in this Annual Report on Form 10-K.
The Nominating, Corporate Governance, Compensation and Stock Option Committee
Monte C. Johnson
Hilton H. Howell, Jr.
James W. Busby
Gerald N. Agranoff
83
Table of Contents
Index to Financial Statements
ADDITIONAL INFORMATION REGARDING EXECUTIVE COMPENSATION
The following table sets forth a summary of the compensation of our Chairman, Chief Executive Officer, Chief Financial Officer and the other named executive officers for the twelve months ended June 30, 2008.
Name and Principal Position (A) | Year (B) | Salary (C) | Bonus $ (D) | Stock Awards $ (E) (1) | Option Awards $ (F) (2) | Non-Equity Incentive Plan Compen- sation $ (G) (H) (3) | All Other Compen- sation $ (I) | Total $ (J) | ||||||||||||||||||
Robert S. Prather, Jr. | 2008 | $ | 95,370 | (4) | $ | 7,606 | $ | 49,942 | $ | 48,505 | (5) | $ | 201,423 | |||||||||||||
President and Chief Executive Officer | 2007 | $ | 123,860 | $ | 81,011 | $ | 47,464 | $ | 252,335 | |||||||||||||||||
Thomas J. Stultz | 2008 | $ | 659,971 | (6) | $ | 100,000 | (7) | $ | 1,489,131 | $ | 74,163 | $ | 6,572 | (8) | $ | 2,329,837 | ||||||||||
Prior President and Chief Executive Officer | 2007 | $ | 571,875 | $ | 732,511 | $ | 81,011 | $ | 388,750 | $ | 44,387 | $ | 1,818,534 | |||||||||||||
Mark G. Meikle | 2008 | $ | 236,000 | (9) | $ | 50,000 | (10) | $ | 14,908 | $ | 11,226 | (11) | $ | 312,134 | ||||||||||||
Executive Vice President and Chief Financial Officer | 2007 | $ | 230,288 | $ | 27,602 | $ | 50,000 | $ | 17,004 | $ | 324,894 | |||||||||||||||
Michael J. Gebhart | 2008 | $ | 207,773 | (12) | $ | 30,000 | (10) | $ | 14,763 | $ | 10,737 | (13) | $ | 263,273 | ||||||||||||
Executive Vice President and Chief Operating Officer | ||||||||||||||||||||||||||
Michael Steven Cornwell | 2008 | $ | 78,000 | (14) | $ | 35,000 | (10) | $ | 7,320 | $ | 4,255 | $ | 124,575 | |||||||||||||
Prior Executive Vice President and Chief Operating Officer | 2007 | $ | 191,106 | $ | 23,551 | $ | 30,500 | $ | 8,586 | $ | 253,743 | |||||||||||||||
Lawton M. Logan | 2008 | $ | 117,599 | (15) | $ | 914 | $ | 10,737 | $ | 129,250 | ||||||||||||||||
Prior Executive Vice President of Sales | 2007 | $ | 207,666 | $ | 11,400 | $ | 69,402 | $ | 14,314 | $ | 302,782 | |||||||||||||||
| (1) | The amounts in column (E) represent the proportionate amount of the total fair value of restricted stock and unrestricted stock recognized by us as an expense in fiscal year 2008 for financial accounting purposes, disregarding for this purpose the estimate of forfeitures related to service-based vesting conditions. The fair values of these awards and the amounts expensed in fiscal year 2008 were determined in accordance with FAS No. 123R. The award for Mr. Stultz for which expense is shown in column (E) includes the award described under “—Grants of Plan-Based Awards” contained elsewhere in this section. The assumptions used in determining the grant date fair values of these awards are set forth in Note 12 to our consolidated financial statements included elsewhere in this Annual Report. Mr. Stultz and Mr. Prather each received 5,000 shares of restricted stock awards from us in fiscal 2006, for which we continue to recognize expense in fiscal year 2008, for their service as Directors. The expense is also reported in the Director Compensation Table. |
| (2) | The amounts in column (F) represent the proportionate amount of the total fair value of stock options recognized by us as an expense in fiscal year 2008 for financial accounting purposes, disregarding for this purpose the estimate of forfeitures related to service-based vesting conditions. The fair value of these awards and the amounts expensed in fiscal year 2008 were determined in accordance with |
84
Table of Contents
Index to Financial Statements
FAS No. 123R. The award for Mr. Stultz for which expense is shown in column (F) includes the award described under “—Grants of Plan-Based Awards” contained elsewhere in this section. The assumptions used in determining the grant date fair values of these awards are set forth in Note 12 to our consolidated financial statements included elsewhere in this Annual Report. The following officers received a grant of options to purchase our common stock in fiscal 2006: Mr. Prather 100,000 shares, Mr. Stultz 100,000 shares, Mr. Meikle 40,000 shares, Mr. Cornwell 35,000 shares, Mr. Logan 20,000 shares, and Mr. Gebhart 5,000 shares. |
| (3) | There was no Non-Equity Incentive Plan Compensation in fiscal 2008. There was no Change in Pension Value and Nonqualified Deferred Compensation Earnings in fiscal 2008. The amounts in column (G) reflect the cash incentive awards to the named executive officers which were awarded in fiscal 2007 and that, for purposes of this Summary Compensation Table, have been characterized as “Non-Equity Incentive Plan Compensation” under this column (G) rather than “Bonus” under column (D). |
| (4) | The amount reported in fiscal 2008 includes a reduction in pay of $4,630 due to an overpayment in fiscal 2007. As of June 30, 2008, we paid Mr. Prather’s salary at the annual rate of $100,000. |
| (5) | For the twelve months ended June 30, 2008, the amount reported includes an auto allowance of $22,956, medical expenses of $12,906, club dues of $9,040, reimbursement of auto insurance and registration of $3,603. Fees of $32,000 paid to Mr. Prather for his services as a Director are reported in the Director Compensation Table. |
| (6) | Mr. Stultz resigned effective November 15, 2007, in connection with the sale of Host. |
| (7) | Mr. Stultz was paid a bonus of $100,000 in connection with the Host Transaction Bonus and Consulting Agreement dated November 15, 2007. |
| (8) | For the twelve months ended June 30, 2008, the amount reported includes $3,919 of club dues and $2,653 of employee benefits. The amount reported does not include an auto allowance of $4,125, paid to Mr. Stultz but which is reported as part of salary paid to Mr. Stultz in Column (C). Mr. Stultz did not receive any matching contributions by us under our 401(K) Plan. Fees of $17,500 paid to Mr. Stultz for his services as a Director are reported in the Director Compensation Table. |
| (9) | As of June 30, 2008, we paid Mr. Meikle a salary at an annual rate of $236,000. Mr. Meikle’s salary was increased in fiscal year 2007 from $225,000 to $236,000, which increase applied only to a portion of fiscal 2007. |
| (10) | Represents bonuses earned by the individual in fiscal 2007 but paid in fiscal 2008. |
| (11) | For the twelve months ended June 30, 2008, the amount reported for Mr. Meikle includes $4,641 of employee benefits and $6,585 of matching contributions by us to our 401(k) Plan. |
| (12) | As of June 30, 2008, we paid Mr. Gebhart a salary at an annual rate of $210,000. |
| (13) | For the twelve months ended June 30, 2008, the amount reported for Mr. Gebhart includes $5,249 of employee benefits, and $5,488 of matching contributions by us to our 401(k) Plan. |
| (14) | Mr. Cornwell resigned effective November 15, 2007, in connection with the sale of Host. |
| (15) | Mr. Logan resigned effective November 15, 2007, in connection with the sale of Host. |
Employment Agreements
On February 21, 2007, we entered into a three-year employment agreement, which we refer to herein as the Employment Agreement, with Mark G. Meikle, Executive Vice President and Chief Financial Officer, who is referred to herein as an Executive. The Employment Agreement provides that it shall be extended automatically for an additional one-year period, unless sooner terminated by either party. The intent is that on each anniversary of the commencement date, the employment term automatically extends to a full three-year period.
Mr. Meikle has been our Executive Vice President and Chief Financial Officer since April 2006. Mr. Meikle’s base salary will be $236,000, and he will continue to participate in the compensation plans available to executive officers as described in our proxy statement for our 2007 Annual Meeting of Stockholders dated October 31, 2007, and as set forth as exhibits to our various periodic filings. In
85
Table of Contents
Index to Financial Statements
addition, Mr. Meikle is eligible to receive a bonus of up to $50,000 contingent upon achieving certain performance targets, payable in cash, stock or a combination of cash and stock at the discretion of the NCGCC.
The Employment Agreement provides that the following payments shall be made upon the Executive’s termination of employment for any reason: (a) any earned but unpaid salary through the date of termination; (b) any earned bonus, for which the performance measurement period has ended, but which is unpaid as of the date of termination; (c) any accrued but unpaid vacation; and (d) any unreimbursed business expenses incurred by the Executive.
The Employment Agreement provides that we shall have the right to terminate the Executive’s employment during the employment term on account of the Executive’s Disability (as defined in the Employment Agreements) and the Executive’s employment shall terminate automatically upon the Executive’s death. If the Executive’s employment with us terminates on account of Disability or death, the Executive or the Executive’s estate, as applicable shall receive, in addition to the payments set forth above, a pro rata bonus payment for the fiscal year in which the Executive’s Disability or death occurs equal to the amount of the Executive’s bonus earned for the prior fiscal year multiplied by a fraction, the numerator of which is the number of days during the current fiscal year that transpired before the date of termination and the denominator of which is 365.
The Employment Agreement provides that we shall have the right to terminate the Executive’s employment at any time for Cause (as defined in the Employment Agreements) upon written notice to the Executive. In the event of a termination of the Executive’s employment by us for Cause, the Executive shall be entitled to receive only the payments set forth above.
The Employment Agreement provides that the Executive shall have the right to terminate his employment, without Good Reason (as defined in the Employment Agreement) at any time, upon 60 days’ written notice to us. If the Executive voluntarily terminates his employment with us without Good Reason, the Executive shall be entitled to receive only those payments set forth above.
The Employment Agreement provides that we shall have the right to terminate the Executive’s employment at any time, for any reason or no reason, with or without Cause, effective upon the date designated by us upon written notice to the Executive. The Executive shall have the right to terminate his employment, with Good Reason, at any time, by giving us written notice of the termination. A termination of employment by the Executive for Good Reason shall be effective ten business days following the date when such notice is given, unless, if applicable, the event constituting Good Reason is remedied by us prior to that date.
If we terminate the Executive’s employment for any reason other than Cause or the Executive terminates his employment for Good Reason, then, in addition to the payments set forth above, we shall pay the following amounts: (a) the Executive’s salary, in effect as of the date of termination, for the remaining period of the then current employment term (disregarding any renewal term that would commence following the date of termination); (b) a pro rata bonus payment for the fiscal year during which the termination of employment occurs equal to the amount of the Executive’s bonus earned for the prior fiscal year multiplied by a fraction, the numerator of which is the number of days during the current fiscal year that transpired before the date of termination and the denominator of which is 365; (c) coverage for the Executive and his eligible dependents under our medical and dental plans for the remaining period of the then current employment term (disregarding any renewal term that would commence following the date of termination), at the same cost to the Executive as in effect on the date of termination; and (d) any outstanding equity award made under an equity incentive plan maintained by us shall become 100% vested as of the date of termination, and shall be exercisable following the Executive’s termination of employment for such period of time, as specified in the applicable award agreement.
86
Table of Contents
Index to Financial Statements
All amounts payable upon the termination of an Executive’s employment are conditioned upon the Executive honoring the restrictive covenants set forth in his respective Employment Agreement and the execution of a general release of all claims arising from the Executive’s employment with us.
The Employment Agreement provides that, subject to certain limited exceptions, both during the employment term and thereafter, the Executive shall not, without our prior written consent, for any reason either directly or indirectly divulge to any third party or use for his own benefit, or for any purpose other than our exclusive benefit, any of our confidential, proprietary, business and technical information or trade secrets or of our parent or any subsidiary (which we refer to herein as Proprietary Information) revealed, obtained or developed in the course of his employment with us. All right, title and interest in and to Proprietary Information shall be and remain our sole and exclusive property.
Both during the employment term and thereafter, the Executive and we have each agreed not to make any comment or take any action which disparages, defames, or places in a negative light the other party.
The Employment Agreement provides that the Executive shall not, during the employment term and for a period of two years thereafter, and in any geographic area or market in which we or our parent or any subsidiary is conducting its business, do any of the following, directly or indirectly, without our prior written consent: (i) engage or participate, directly or indirectly, in any business activity competitive with our business as conducted during the employment term; (ii) become interested in any person, firm, corporation, association or other entity (or portion thereof) engaged in any business that is competitive with our business or the business of our parent or any subsidiary as conducted during the employment term; provided, however, the Executive may hold not more than one percent of the outstanding securities of any class of any publicly-traded securities of a company that is engaged in activities that are competitive with our business; (iii) influence or attempt to influence any then current or prospective supplier, customer, corporate partner, collaborator, or independent contractor of ours to terminate or modify any written or oral agreement or course of dealing with us; or (iv) influence or attempt to influence any person either (A) to terminate or modify an employment, consulting, agency, distributorship or other arrangement with us, or (B) to employ or retain, or arrange to have any other person or entity employ or retain, any person who has been employed or retained by us as an employee, consultant, agent or distributor of ours at any time during the one year period immediately preceding the termination of the Executive’s employment.
The foregoing description of the Employment Agreement does not purport to be complete and is qualified in its entirety by reference to the Employment Agreement, a copy of which was filed as an exhibit to our Quarterly Report on Form 10-Q for the quarter ended March 31, 2007.
On February 21, 2007, we also entered into an employment agreement with Thomas J. Stultz, in his capacity at that time as our President and Chief Executive Officer. Pursuant to employment agreement, Mr. Stultz’s base salary was $577,500. In addition, pursuant to the employment agreement, Mr. Stultz received a grant of 55,000 restricted shares of our common stock on July 1, 2007, which will vest on February 21, 2012 subject to certain conditions. On November 15, 2007, the employment agreement with Mr. Stultz was terminated as a result of our sale of Host. See “—Transaction Bonus and Consulting Agreement” immediately below.
Transaction Bonus and Consulting Agreement
We and Mr. Stultz entered into a transaction bonus and consulting agreement on November 15, 2007. As a condition of IMG Worldwide, Inc.’s, or IMG, purchase of Host, Mr. Stultz entered into an employment agreement with IMG, which became effective as of the closing of the Host transaction. We recognized that Mr. Stulz’s acceptance of an offer of employment with IMG was a critical component of
87
Table of Contents
Index to Financial Statements
the transaction and that by accepting the offer Mr. Stultz was forfeiting certain benefits under his former employment agreement with us. We also recognized that Mr. Stultz had valuable expertise with respect to our remaining business operations and wished to enter into a consulting agreement with Mr. Stultz.
Pursuant to the agreement:
| 1. | We paid Mr. Stultz a transaction bonus of $577,500. The bonus was paid as follows: (i) $22,211.54 on a bi-weekly basis commencing on November 15, 2007 and ending August 22, 2008, and (ii) $111,057.69 in a single lump sum payment on September 5, 2008. The bonus payments were inclusive of all applicable income, social security and other taxes and charges that are required by law to be withheld by us. Payments made during fiscal 2008 are included in column “C” of the compensation table. |
| 2. | Mr. Stultz agreed to provide consulting services to us, on an as-needed basis and as permitted by Mr. Stultz’s supervisor at IMG, from the effective date of the closing of the Host transaction and ending on the earlier of February 29, 2012 or the date we terminate the consulting agreement. In consideration of the consulting services we made a single lump sum payment of $100,000 to Mr. Stultz as of the effective date of the closing of the Host transaction. |
| 3. | In accordance with Section 2(dd) of the 2005 LTIP, as long as Mr. Stultz continues to perform services as a consultant to us, Mr. Stultz will not be deemed to have a termination of employment for purposes of the following restricted awards granted under the 2005 LTIP: restricted stock award of 5,000 shares dated February 15, 2006, restricted stock award of 120,000 shares dated February 21, 2007 and restricted stock award of 55,000 shares dated July 1, 2007. |
| 4. | On April 27, 2006, we awarded Mr. Stultz an option to purchase 100,000 shares of our common stock at an exercise price of $5.43 per share (referred to as the “Option Agreement”). As of the effective date of the closing of the Host transaction, the option awarded pursuant to the Option Agreement became 100% vested and exercisable. |
Grants of Plan-Based Awards
Under the 2005 long-term incentive plan, Mr. Stultz received a restricted stock award of 55,000 shares dated July 1, 2007, of which shares will vest in equal amounts annually on each of February 21, 2009, 2010, 2011 and 2012. The full grant date fair value of this restricted stock award under SFAS 123R is $512,600. There were no other equity or share-based awards granted during the twelve months ended June 30, 2008 to the named executive officers.
88
Table of Contents
Index to Financial Statements
Outstanding Equity Awards at Fiscal Year-End
The following table details the equity incentive awards outstanding as of June 30, 2008. For additional information about the option awards, see “Equity Awards” and “Compensation for Named Executive Officers in Fiscal Year 2008” under “Compensation Discussion and Analysis.”
Outstanding Equity Awards at Fiscal Year-End
| Option Awards | Stock Awards | |||||||||||||||||||
| Number of Securities Underlying Unexercised Options (#) Exercisable | Number of Securities Underlying Unexercised Options (#) Unexercisable | Equity Awards: | Option Exercise Price | Option Expiration Date | Number of Shares or Vested (#) | Market Value Have Not | Equity Incentive Plan Awards: Number of Unearned Shares, Units or Other Rights That Have Not Vested (#) | Equity Have Not | ||||||||||||
Name (A) | (B) | (C) | (D) | (E) | (F) | (G) | (H) | (I) | (J) | |||||||||||
Robert S. Prather, Jr. | 66,667 | 33,333 | $ | 5.43 | 4/27/2016 | |||||||||||||||
| 3,000 | $ | 1,410 | ||||||||||||||||||
Thomas J. Stultz | 100,000 | — | $ | 5.43 | 4/27/2016 | |||||||||||||||
| 3,000 | $ | 1,410 | ||||||||||||||||||
| 90,000 | $ | 42,300 | ||||||||||||||||||
| 55,000 | $ | 25,850 | ||||||||||||||||||
Mark G. Meikle | 16,667 | 8,333 | $ | 5.43 | 4/27/2016 | |||||||||||||||
| 5,000 | 10,000 | $ | 6.90 | 11/29/2016 | ||||||||||||||||
Michael Steven Cornwell | 6,666 | — | $ | 5.43 | 4/27/2016 | |||||||||||||||
| — | $ | 6.90 | 11/29/2016 | |||||||||||||||||
Lawton M. Logan | 1,666 | — | $ | 5.43 | 4/27/2016 | |||||||||||||||
| — | $ | 6.90 | 11/29/2016 | |||||||||||||||||
Mike Gebhart | 3,333 | 1,667 | $ | 5.43 | 4/27/2016 | |||||||||||||||
89
Table of Contents
Index to Financial Statements
Options Exercises and Stock Vested
The following table provides information on stock awards vested for the twelve months ended June 30, 2008. Pursuant to a grant of 5,000 shares of restricted stock to each of Mr. Prather and Mr. Stultz as directors awarded in fiscal 2006, 1,000 shares vested on December 31, 2007 when the stock closed at $4.75 per share. Pursuant to a grant of 120,000 shares of restricted stock to Mr. Stultz that was awarded in fiscal 2007, 30,000 shares vested on February 21,2008 when the stock closed at $4.37 per share.
Option Exercises and Stock Vested
| Option Awards | Stock Awards | ||||||||
| Name | Number (#) | Value Realized on Exercise ($) | Number (#) | Value Realized on Vesting ($) | |||||
(A) | (B) | (C) | (D) | (E) | |||||
Robert S. Prather, Jr. | 1,000 | $ | 4,750 | ||||||
Thomas J. Stultz | 1,000 | $ | 4,750 | ||||||
Thomas J. Stultz | 30,000 | $ | 131,100 | ||||||
Potential Payments Upon Termination or Change in Control
The following table summarizes the value of the termination payments and benefits Mr. Meikle would receive if he had terminated employment on June 30, 2008 under the circumstances shown pursuant to the terms of the employment agreements we have entered into with him. For further description of the employment agreement governing these payments, see “Employment Agreements.” We have not entered into any employment agreements, severance agreements or any other type of termination or change in control agreements with any of our other named executive officers. Other than the employment agreement with Mr. Meikle, there is no formal policy with respect to payments to named executive officers upon a termination of such officer or change in control of the Company. In addition, the employment agreement with Mr. Meikle does not provide for any payments upon a change in control of TCM. The tables exclude (i) amounts accrued through June 30, 2008 that would be paid in the normal course of continued employment, such as accrued but unpaid salary and earned annual bonus for fiscal year 2008 and reimbursed business expenses and (ii) vested account balances under our 401(k) Plan that is generally available to all of our employees.
Mark G. Meikle
Benefit | Retirement ($) | Death ($) | Disability ($) | Termination by Company without Cause or Executive with Good Reason ($) | Termination following or prior to a Change in Control ($) | ||||||||||||||
Cash Severance | — | $ | 50,000 | (1) | $ | 50,000 | (1) | $ | 640,000 | (2) | $ | — | (3) | ||||||
Acceleration of Restricted Stock | — | — | — | — | $ | — | (3) | ||||||||||||
Acceleration of Stock Options | �� | — | — | — | — | $ | — | (3) | |||||||||||
Health & Welfare Benefits | — | (4) | — | (4) | — | (4) | 33,479 | (5) | $ | — | (3) | ||||||||
Total | — | 50,000 | 50,000 | 673,479 | — | ||||||||||||||
| (1) | Excluding accrued, but unpaid, base salary, annual bonus, accrued vacation, 401(k) payments and unreimbursed business expenses, executive is entitled to receive a lump sum pro rata bonus payment equal to the amount of the Executive’s bonus earned for the prior fiscal year multiplied by |
90
Table of Contents
Index to Financial Statements
a fraction, the numerator of which is the number of days during the current fiscal year that transpired before the date of termination and the denominator of which is 365. |
| (2) | Excluding accrued, but unpaid, base salary, annual bonus, accrued vacation, 401(k) payments and unreimbursed business expenses, executive is entitled to receive an amount equal to (i) the Executive’s salary, in effect as of the date of termination, for the remaining period of the then current employment term (disregarding any renewal term that would commence following the date of termination); and (ii) a pro rata bonus payment for the fiscal year during which the termination of employment occurred equal to the amount of the Executive’s bonus earned for the prior fiscal year multiplied by a fraction, the numerator of which is the number of days during the current fiscal year that transpired before the date of termination and the denominator of which is 365. |
| (3) | Executive is not entitled to any specific payments upon a change in control, other than such payments that Executive would otherwise be entitled to if termination upon a change in control is by reason of death or disability or by the Company without Cause or the Executive for Good Reason, as provided in the related columns. |
| (4) | Executive is entitled to continued participation in our group health plan, assuming he makes a timely election of continuation coverage under COBRA, at the Executive’s expense. |
| (5) | The Company will continue to provide coverage for the Executive and his eligible dependents under its medical and dental plans for the remaining period of the then current employment term (disregarding any renewal term that would commence following the date of termination) at the same cost to the Executive as in effect on the date of termination. |
Thomas J. Stultz resigned on November 15, 2007 and received compensation at the termination of his employment, as further described in “—Transaction Bonus and Consulting Agreement.”
91
Table of Contents
Index to Financial Statements
DIRECTOR COMPENSATION
Compensation for Non-Management Directors.All of our directors are currently being paid an annual retainer fee in the amount of $20,000. The Chairman of each of our Audit Committee and our Nominating, Corporate Governance, Compensation and Stock Option Committee receive an additional annual fee of $5,000, and each board member is entitled to a fee of $1,500 per board or committee meeting attended. Non-employee directors are eligible to receive a grant of options to purchase shares of our common stock at the time of the meeting of our Board of Directors held immediately following each annual meeting of stockholders at the fair market value of such stock on the date of grant. We also reimburse each director for travel and related expenses incurred in connection with attendance at board and committee meetings.
On February 15, 2006, under the Incentive Plan, 5,000 shares of restricted Common Stock were granted to each of our following directors: Robert S. Prather, Jr.; Thomas J. Stultz; Gerald N. Agranoff; James W. Busby; Hilton H. Howell, Jr.; Monte C. Johnson; and George E. “Nick” Nicholson.
The following table provides summary information of compensation of directors for the twelve months ended June 30, 2008. The amount reported under stock awards relates to the shares of restricted stock awarded to each director on February 15, 2006, for which we continue to recognize expense in fiscal year 2008. In a Board Meeting on May 16, 2008, by unanimous vote, it was decided that, in light of our current liquidity situation, Board fees in the future would be accrued but not paid until our financial condition improves.
Director Compensation
Name and Principal Position (A) | Fees Earned or Paid in Cash ($) (B) | Stock Awards ($) (1) (C) | Options Awards ($) (D) | Non-Equity Incentive Plan Compen- sation ($) (E) | Change in Pension Value and Non-qualified Deferred Compen- sation Earnings ($) (F) | All Other Compen- sation ($) (G) | Total ($) (H) | |||||||
Robert S. Prather, Jr. (2) | 32,000 | 7,713 | 39,713 | |||||||||||
Gerald N. Agranoff | 55,000 | 7,713 | 62,713 | |||||||||||
James W. Busby | 51,500 | 7,713 | 59,213 | |||||||||||
Hilton H. Howell, Jr. | 38,000 | 7,713 | 45,713 | |||||||||||
Monte C. Johnson | 56,500 | 7,713 | 64,213 | |||||||||||
George E. “Nick” Nicholson | 45,500 | 7,713 | 53,213 | |||||||||||
Thomas J. Stultz (2) | 17,500 | 32,571 | 50,071 |
| (1) | The amounts in column (C) represent the proportionate amount of the total fair value of restricted stock recognized by us as an expense in fiscal 2008 for financial accounting purposes, disregarding for this purpose the estimate of forfeitures related to service-based vesting conditions. The fair values of these awards and the amounts expensed in fiscal 2008 were determined in accordance with FAS No. 123R. The assumptions used in determining the grant date fair values of these awards are set forth in Note 12 to our consolidated financial statements included elsewhere in this Annual Report on Form 10-K. |
| (2) | The fees earned and stock awards granted to each of Mr. Prather and Mr. Stultz for his services as a Director as disclosed in the above table have not been reported and included in the Summary Compensation Table for Named Executive Officers to avoid duplication of compensation. |
92
Table of Contents
Index to Financial Statements
| Item 12. | Security Ownership of Certain Beneficial Owners and Management and Related Stockholder Matters |
The following table sets forth certain information regarding the ownership of our common stock as of August 12, 2008 by (i) any person who is known to us to be the beneficial owner of more than five percent of our common stock, (ii) all directors, (iii) all executive officers named in the Summary Compensation Table herein and (iv) all directors and executive officers as a group. Warrants and options to acquire our common stock included in the amounts listed below are currently exercisable or will be exercisable within 60 days after August 12, 2008, and are deemed outstanding for computing the ownership percentage of the stockholder holding such warrants and/or options, but are not deemed outstanding for computing the ownership percentage of any other stockholder.
Name | Beneficial Ownership | of Class | ||||
Hilton H. Howell, Jr. | 121,665 | (1) | 2.2 | % | ||
Robert S. Prather, Jr. | 108,565 | (2) | 1.9 | % | ||
Gerald N. Agranoff | 5,142 | (3) | * | |||
Monte C. Johnson | 5,699 | (4) | * | |||
James W. Busby | 11,032 | (5) | * | |||
George E. “Nick Nicholson | 5,000 | * | ||||
Mark G. Meikle | 16,666 | (6) | * | |||
Michael J. Gebhart | 3,332 | (7) | * | |||
All directors and executive officers as a group | 277,101 | (8) | 5.0 | % | ||
J. Mack Robinson | 500,176 | (9) | 8.9 | % | ||
Harriett J. Robinson | 530,777 | (10) | 9.5 | % | ||
GAMCO Investors, Inc. | 1,057,676 | (11) | 18.9 | % | ||
Harvey Sandler | 660,513 | (12) | 11.8 | % | ||
Bislett Parners, L.P. | 266,412 | (13) | 4.8 | % | ||
Dimensional Fund Advisors, LP | 378,903 | (14) | 6.8 | % | ||
Somerset Capital Advisors, LLC | 356,975 | (15) | 6.4 | % | ||
S. Muoio & Co., LLC | 544,011 | (16) | 9.7 | % |
| (1) | Includes (a) 50 shares held by Mr. Howell’s spouse as custodian for his minor child; (b) 5,857 shares held by Mr. Howell’s spouse; (c) 8,976 shares owned by Delta Fire & Casualty Insurance Co.; (d) 20,537 shares owned by Delta Life Insurance Co.; (e) 24,376 shares owned by Bankers Fidelity Life Insurance Co.; (f) 17,156 shares owned by Georgia Casualty & Surety Co.; (g) 8,200 shares owned by Associated Casualty Insurance Co.; and (h) 5,000 shares owned by American Southern Insurance Co. Mr. Howell is an executive officer and director of each of Delta Fire, Delta Life, Bankers Fidelity, Georgia Casualty, Associated Casualty and American Southern. Mr. Howell is married to Robin R. Howell, Mr. Robinson’s daughter and a beneficiary of the Robin M. Robinson Trust. |
| (2) | Includes options issued to Mr. Prather to purchase 66,667 shares of our common stock. |
| (3) | Includes options issued to Mr. Agranoff to purchase 70 shares of common stock. |
| (4) | Includes options issued to Mr. Johnson to purchase 94 shares of our common stock. |
| (5) | Includes options issued to Mr. Busby to purchase 70 shares of our common stock; and an aggregate of 20 shares owned by Mr. Busby’s two children. |
| (6) | Includes options issued to Mr. Meikle to purchase 16,667 shares of our common stock. |
| (7) | Includes options issued to Mr. Gebhart to purchase 3,333 shares of our common stock. |
| (8) | Includes options issued to all directors and executive officers as a group to purchase an aggregate 55,640 shares of our common stock. The address for all of our directors and executive officers is c/o Triple Crown Media, Inc., 725 Old Norcross Road, Lawrenceville, GA 30045. |
| (9) | Includes (a) 71,173 shares held by Mr. Robinson’s spouse; (b) 8,976 shares owned by Delta Fire & Casualty Insurance Co.; (c) 20,537 shares owned by Delta Life Insurance Co.; (d) 24,376 shares |
93
Table of Contents
Index to Financial Statements
owned by Bankers Fidelity Life Insurance Co.; (e) 17,156 shares owned by Georgia Casualty & Surety Co.; (f) 8,500 shares owned by Associated Casualty Insurance Co.; (g) 5,000 shares owned by American Southern Insurance Co.; (h) 29,877 shares owned by Gulf Capital Services, Ltd.; (i) 551 shares owned by JMR Foundation; and (j) 114,472 shares held by Mr. Robinson’s spouse as trustee under trusts for their children. Mr. Robinson is an executive officer, director, principal or sole shareholder of each of Delta Fire, Delta Life, Bankers Fidelity, Georgia Casualty, Associated Casualty, American Southern and Gulf Capital. Mr. Robinson’s address is 4370 Peachtree Road, N.E., Atlanta, Georgia 30319. |
| (10) | Includes (a) 230,459 shares held by Mrs. Robinson’s spouse; (b) 8,976 shares owned by Delta Fire & Casualty Insurance Co.; (c) 20,537 shares owned by Delta Life Insurance Co.; (d) 24,376 shares owned by Bankers Fidelity Life Insurance Co.; (e) 17,156 shares owned by Georgia Casualty & Surety Co.; (f) 8,500 shares owned by Associated Casualty Insurance Co.; (g) 5,000 shares owned by American Southern Insurance Co.; (h) 29,877 shares owned by Gulf Capital Services, Ltd.; and (i) 114,472 shares held by Mr. Robinson’s spouse as trustee under trusts for their children. Mrs. Robinson’s address is 4370 Peachtree Road, N.E., Atlanta, Georgia 30319. |
| (11) | Based upon a Schedule 13D filed with the SEC on September 8, 2008 by GAMCO Investors, Inc. Includes (a) 646,676 shares of our common stock held by GAMCO Asset Management; (b) 381,000 shares held by Gabelli Funds, LLC; (c) 20,000 shares held by Teton Advisors; and (d) 10,000 shares held by MJG Associates, Inc. The address for GAMCO Investors, Inc. is One Corporate Center, Rye, New York 10580. |
(12) | Based upon a Form 4 filed with the SEC on November 14, 2007 and Schedule SC13G/A filed on May 2, 2007 by Harvey Sandler Revocable Trust Includes (a) 605,693 shares of our common stock held by Harvey Sandler Revocable Trust and (b) 51,010 shares of our common stock held by The Harvey and Phyllis Sandler Foundation Inc. The address for Harvey Sandler Revocable Trust is c/o Sandler Enterprises, Inc., 21170 N.E. 22nd Court North, Miami Beach, Florida 33180. |
| (13) | Based upon a Schedule SC13G/A filed on August 11, 2008 by Bislett Partners L.P. includes (a) 265,000 shares of our common stock held by the partnership and (b) 1,412 shares held by James D. Harris. The address for Bislett Partners L.P. is 200 Sheridan Avenue, Suite 408, Palo Alto, California 94306. |
| (14) | Based upon a Schedule S13G/A filed February 6, 2008 by Dimensional Fund Advisors LP 387,903 shares of our common stock are held by the funds under management. Dimensional Fund Advisors LP disclaims beneficial ownership of the shares. The address of Dimensional Fund Advisors LP is 1299 Ocean Avenue, Santa Monica, California 90401. |
(15) | Based upon a Schedule S13G/A filed January 30,2008 by Somerset Capital Advisers, LLC, Somerset Capital Advisers, LLC, Stuart Goldberg and F. Tracy Lavery hold shared power to dispose of 356,975 shares of our common stock. The address of Somerset Capital Advisers, LLC is 10 East 40th Street, Suite 4210, New York, New York 10016. |
| (16) | Based upon a Schedule S13G/A filed June 6, 2008 by S. Muoio & Co. LLC, S. Muoio & Co., LLC and Salvatore Muoio hold shared power to dispose of 544,011 shares of our common stock. The address of S. Muoio & Co. LLC is 509 Madison Avenue, Suite 406, New York, New York 10022. |
94
Table of Contents
Index to Financial Statements
| Item 13. | Certain Relationships and Related Transactions, and Directors Independence |
Robert S. Prather, Jr., President and Chief Executive Officer of TCM, is also President, Chief Operating Officer and a director of Gray. Hilton H. Howell, Jr., Chairman of TCM, is also Vice Chairman and a director of Gray.
Insurance Contract with Georgia Casualty & Surety Co.—Effective December 30, 2005, following the Spin-off, we obtained certain workers’ compensation insurance coverage under an insurance contract with Georgia Casualty & Surety Co., which is a wholly owned subsidiary of Atlantic American Corporation, a publicly traded company in which J. Mack Robinson (a significant shareholder of ours) and certain of his affiliates have a substantial ownership interest, and a company of which Hilton H. Howell, a member of our board of directors and Mr. Robinson’s son-in-law, is an executive officer (as of March 31, 2008, Georgia Casualty was no longer a subsidiary of Atlantic American and thus no longer an affiliated company). Prior to the Spin-off, Gray had a similar insurance contract with the same company. For the period January 1, 2005 to December 30, 2005, our workers’ compensation insurance expense attributable to Gray’s insurance contract with Georgia Casualty was approximately $0.2 million. For the six months ended June 30, 2006, insurance expense related to Georgia Casualty was approximately $0.2 million. For the twelve months ended June 30, 2007 and 2008 insurance expense related to Georgia Casualty was approximately $0.2 million and $0.2 million, respectively.
After considering all applicable regulatory requirements and assessing the materiality of each director’s relationship with us, our Board of Directors has affirmatively determined that all of our directors are independent in accordance with NASDAQ rules and regulations established by the SEC, except for Mr. Prather due to his status as an executive officer. Consequently, our Board of Directors has determined that five of our six directors are independent in accordance with NASDAQ rules and regulations.
| Item 14. | Principal Accounting Fees and Services |
BDO Seidman, LLP has been our principal independent accountants since July 25, 2006. PricewaterhouseCoopers LLP (“PwC”) was our principal independent accountants from June 2005 until May 15, 2006.
Previous Independent Registered Public Accounting Firm
On May 10, 2006, PwC informed us they declined to stand for reelection as our independent registered public accounting firm, effective upon completion of services related to our unaudited interim financial statements as of and for the quarter ended March 31, 2006 and the Quarterly Report on Form 10-Q in which such unaudited interim financial statements were included. Such services were completed on May 15, 2006.
The reports of PwC on our combined and consolidated financial statements as of and for the year ended December 31, 2005 did not contain any adverse opinion or disclaimer of opinion, nor was it qualified or modified as to uncertainty, audit scope or accounting principle.
During fiscal years ended December 31, 2004 and 2005 and through May 15, 2006, there were no disagreements with PwC on any matter of accounting principles or practices, financial statement disclosure, or auditing scope or procedure, which disagreements if not resolved to the satisfaction of PwC, would have caused them to make reference to such disagreements in connection with their reports on the financial statements for such years.
During fiscal years ended December 31, 2004 and 2005 and through May 15, 2006, there were no reportable events (as defined in Item 304(a)(1)(v) of Regulation S-K).
95
Table of Contents
Index to Financial Statements
PwC furnished a letter dated May 16, 2006 addressed to the SEC stating that it agreed with the above statements. A copy of the letter is filed as Exhibit 16.1 to our Current Report on Form 8-K dated May 16, 2006.
New Independent Registered Public Accounting Firm
On July 25, 2006, our Audit Committee authorized the engagement of BDO Seidman, LLP as its new independent registered public accounting firm. For the years ended December 31, 2004 and 2005 and through July 25, 2006, neither we nor anyone on our behalf have consulted with BDO Seidman regarding any of the following:
| • | the application of accounting principles to a specified transaction, either completed or proposed; |
| • | the type of audit opinion that might be rendered on our financial statements, and in no case was a written report provided to us nor was oral advice provided that we concluded was an important factor in reaching a decision as to accounting, auditing or financial reporting issues; or |
| • | any matter that was either the subject of a disagreement, as that term is defined in Item 304(a)(1)(iv) of Regulation S-K and the related instructions to Item 304 of Regulation S-K, or a reportable event, as that term is defined in Item 304(a)(1)(v) of Regulation S-K. |
BDO Seidman, LLP audited our annual financial statements for the six months ended June 30, 2006 and the twelve months ended June 30, 2007 and 2008. We have selected BDO Seidman, LLP as our independent registered public accounting firm to audit our financial statements for the fiscal year ending June 30, 2009.
Fees
The following table presents fees for professional services rendered by BDO Seidman, LLP for the audit of our annual financial statements for the twelve months ended June 30, 2007 and 2008:
| Twelve Months Ended June 30, 2008 | Twelve Months Ended June 30, 2007 | |||||
Audit fees (1) | $ | 245,429 | $ | 338,500 | ||
Audit related fees (2) | 64,917 | — | ||||
Tax fees | — | — | ||||
Other fees | — | — | ||||
Total | $ | 310,346 | $ | 338,500 | ||
| (1) | For professional services in connection with the audit of our financial statements for the periods indicated. For the twelve months ended June 30, 2007 and 2008, the fees also include professional services in connection with reviews of our quarterly financial statements. All fees are inclusive of out–of- pocket costs. |
| (2) | For professional services rendered in connection with review of filings related to proposed and executed transactions. |
In accordance with its written charter, the Audit Committee reviews and discusses with BDO Seidman, LLP, on a periodic basis, any disclosed relationships or services that may impact the objectivity and independence of the independent registered public accounting firm and pre-approves all audit and permitted non-audit services (including the fees and terms thereof) to be performed for us by our independent registered public accounting firm.
96
Table of Contents
Index to Financial Statements
| Item 15. | Exhibits and Financial Statement Schedules |
| (a) | List of documents filed as part of this report: |
| (1) | Financial Statements: |
The following combined and consolidated financial statements of TCM and Report of Independent Registered Public Accounting Firm are included in Item 8:
Report of Independent Registered Public Accounting Firm—BDO Seidman, LLP
Report of Independent Registered Public Accounting Firm—PricewaterhouseCoopers LLP
Consolidated Balance Sheets as of June 30, 2008 and June 30, 2007
Consolidated Statements of Operations for the year ended December 31, 2005, the six months ended June 30, 2006 and the twelve months ended June 30, 2007 and June 30, 2008
Consolidated Statements of Stockholders’ Equity (Deficit) And Comprehensive Income for the year ended December 31, 2005, the six months ended June 30, 2006 and the twelve months ended June 30, 2007 and June 30, 2008
Consolidated Statements of Cash Flows for the year ended December 31, 2005, the six months ended June 30, 2006 and the twelve months ended June 30, 2007 and June 30, 2008
Notes to Combined and Consolidated Financial Statements
| (2) | Financial statement schedule of Triple Crown Media, Inc. required to be filed by Item 8 of this Form and by Item 15(c): |
All schedules for which provision is made in the applicable accounting regulations of the Securities and Exchange Commission are not required under the related instructions or are inapplicable and therefore have been omitted.
| (3) | Exhibits |
Exhibit | Number Description | |
| (2.1) | Separation and Distribution Agreement dated August 2, 2005, by and between Gray Television, Inc. and Triple Crown Media, Inc. (a) | |
| (2.2) | Tax Sharing Agreement dated August 2, 2005, by and between Gray Television, Inc. and Triple Crown Media, Inc. (a) | |
| (2.3) | Agreement and Plan of Merger dated August 2, 2005, by and among Triple Crown Media, Inc., BR Acquisition Corp. and Bull Run Corporation (a) | |
| (3.1) | Amended and Restated Certificate of Incorporation of Triple Crown Media, Inc. (a) | |
| (3.2) | By-Laws of Triple Crown Media, Inc. (a) | |
| (3.3) | By-Laws of Triple Crown Media, Inc. as amended. (b) | |
| (10.1) | Triple Crown Media, Inc. 2005 Long Term Incentive Plan (c) | |
| (10.2) | Bull Run Corporation Amended and Restated 1994 Long Term Incentive Plan (d) | |
| (10.3) | Bull Run Corporation Non-Employee Directors 1994 Stock Option Plan (d) | |
97
Table of Contents
Index to Financial Statements
Exhibit | Number Description | |
| (10.4) | Form of Directors Restricted Stock Agreement under the Triple Crown Media, Inc. 2005 Long Term Incentive Plan (e) | |
| (10.5) | Form of Employee Restricted Stock Agreement under the Triple Crown Media, Inc. 2005 Long Term Incentive Plan (e) | |
| (10.6) | Indemnity Agreement dated February 15, 2006 between Triple Crown Media, Inc. and Robert S. Prather, Jr. (e) | |
| (10.7) | Indemnity Agreement dated February 15, 2006 between Triple Crown Media, Inc. and Thomas J. Stultz (e) | |
| (10.8) | Indemnity Agreement dated February 15, 2006 between Triple Crown Media, Inc. and Frederick J. Erickson (e) | |
| (10.9) | Indemnity Agreement dated February 15, 2006 between Triple Crown Media, Inc. and Gerald N. Agranoff (e) | |
| (10.10) | Indemnity Agreement dated February 15, 2006 between Triple Crown Media, Inc. and James W. Busby (e) | |
| (10.11) | Indemnity Agreement dated February 15, 2006 between Triple Crown Media, Inc. and Hilton H. Howell, Jr. (e) | |
| (10.12) | Indemnity Agreement dated February 15, 2006 between Triple Crown Media, Inc. and Monte C. Johnson (e) | |
| (10.13) | Indemnity Agreement dated February 15, 2006 between Triple Crown Media, Inc. and George E. Nicholson (e) | |
| (10.14) | First Lien Senior Secured Credit Agreement dated December 30, 2005 (f) | |
| (10.15) | Second Lien Senior Secured Credit Agreement dated December 30, 2005 (f) | |
| (10.16) | Second, third, and fourth amendment to First Lien Senior Secured Credit Agreement (g) | |
| (10.17) | Second, third and fourth amendment to Second Lien Senior Secured Credit Agreement (g) | |
| (10.18) | Employment Agreement between Thomas J Stultz and Triple Ccrown Media Inc. (h) | |
| (10.19) | Employment Agreement between Mark G Meikle and Triple Ccrown Media Inc. (h) | |
| (10.20) | Stock Purchase Agreement among IMG Worldwide, Inc.B.R. Holding, Inc. and Triple Crown Media , Inc. (i) | |
| (14) | Code of Ethics (j) | |
| (21) | List of Subsidiaries of Registrant (k) | |
| (23) | Consent of BDO Seidman, LLP (k) | |
| (31.1) | Certifications of Chief Executive Officer Pursuant to Section 302 of the Sarbanes-Oxley Act of 2002 (k) | |
| (31.2) | Certifications of Chief Financial Officer Pursuant to Section 302 of the Sarbanes-Oxley Act of 2002 (k) | |
| (32.1) | Certifications of Chief Executive Officer Pursuant to Section 906 of the Sarbanes-Oxley Act of 2002 (k) | |
| (32.2) | Certifications of Chief Financial Officer Pursuant to Section 906 of the Sarbanes-Oxley Act of 2002 (k) | |
| (a) | Filed as an exhibit to Amendment No. 4 to Form S-4 and Form S-1 (Registration No. 333-128270) dated November 29, 2005 and incorporated by reference herein |
98
Table of Contents
Index to Financial Statements
| (b) | Filed as an exhibit to Form 8-K Current Report dated as of August 23, 2007 and incorporated by reference herein |
| (c) | Filed as an exhibit to Form 8-K Current Report dated as of December 2, 2005 and incorporated by reference herein |
| (d) | Filed as an exhibit to Form S-8 (Registration No. 333-131075), effective January 17, 2006 and incorporated by (c) reference herein |
| (e) | Filed as an exhibit to Form 8-K Current Report dated as of December 2, 2005 and incorporated by reference herein |
| (f) | Filed as an exhibit to Form 8-K Current Report dated as of December 2, 2005 and incorporated by reference herein |
| (g) | Second, third, and fourth amendments filed as an exhibit to Form 8-K Current Report dated as of September 18, 2006, November 13, 2007 and February 21, 2008, respectively, and incorporated by reference herein. |
| (h) | Filed as an exhibit to Form 8-K Current Report dated as of February 23, 2007 and incorporated by reference herein |
| (i) | Filed as an exhibit to Form 8-K Current Report dated as of November 19, 2007 and incorporated by reference herein |
| (j) | Filed as an exhibit to Form 10-K Annual Report dated as of December 31, 2005 and incorporated by reference herein |
| (k) | Filed herewith |
| (c) | Financial Statement Schedules |
The response to this section is submitted as part of Item 15(a)(1) and Item 15(a)(2).
99
Table of Contents
Index to Financial Statements
Pursuant to the requirements of Section 13 or 15(d) of the Securities Exchange Act of 1934, the registrant has duly caused this report to be signed on its behalf by the undersigned, thereunto duly authorized, on October 10, 2008.
| TRIPLE CROWN MEDIA, INC. | ||
| by: | /s/ ROBERT S. PRATHER, JR. | |
| Robert S. Prather, Jr. | ||
| President and Chief Executive Officer | ||
Pursuant to the requirements of the Securities Exchange Act of 1934, this report has been signed below by the following persons on behalf of the registrant and in the capacities and on the date indicated.
Signature | Title | Date | ||
/S/ ROBERT S. PRATHER, JR. Robert S. Prather, Jr. | President, Chief Executive Officer and Director (Principal Executive Officer) | October 10, 2008 | ||
/S/ GERALD N. AGRANOFF Gerald N. Agranoff | Director | October 10, 2008 | ||
/S/ JAMES W. BUSBY James W. Busby | Director | October 10, 2008 | ||
/s/ HILTON H. HOWELL, JR. Hilton H. Howell, Jr. | Chairman of the Board | October 10, 2008 | ||
/s/ MONTE C. JOHNSON Monte C. Johnson | Director | October 10, 2008 | ||
/s/ GEORGE E. NICHOLSON George E. Nicholson | Director | October 10, 2008 | ||
/s/ MARK G. MEIKLE | Executive Vice President and Chief Financial Officer (Principal Accounting and Financial Officer) | October 10, 2008 | ||
100