
Q3 2019 Financial Results Conference Call Slides October 24, 2019
Non-GAAP Financial Measures Non-GAAP Information This presentation includes both GAAP and non-GAAP financial measures. The presentation of non-GAAP financial information is not intended to be considered in isolation or as a substitute for results prepared in accordance with GAAP. A reconciliation of the non-GAAP financial measures included in this presentation to the most directly comparable GAAP financial measures is available in the Appendix to this presentation. Management uses both GAAP and non-GAAP information in evaluating and operating its business internally and as such has determined that it is important to provide this information to investors. . 1

eHealth Q3 2019 Highlights Q3 2019 revenue grew 72% compared to Q3 2018, exceeding company’s expectations. Q3 2019, with Adjusted EBITDA of -$18.8MM, represented an investment quarter in preparation for Medicare Annual Enrollment Period (AEP) in Q4 Medicare segment revenue grew 75% year-over-year, with approved members increasing by 70% year-over-year 21% of Medicare major medical applications submitted online, compared to 9% in Q3 2018 Individual, Family and Small Business segment revenue grew 59% year-over-year, with IFP approved members increasing by 76% year-over-year $358MM commissions receivable balance at the end of Q3 2019 2
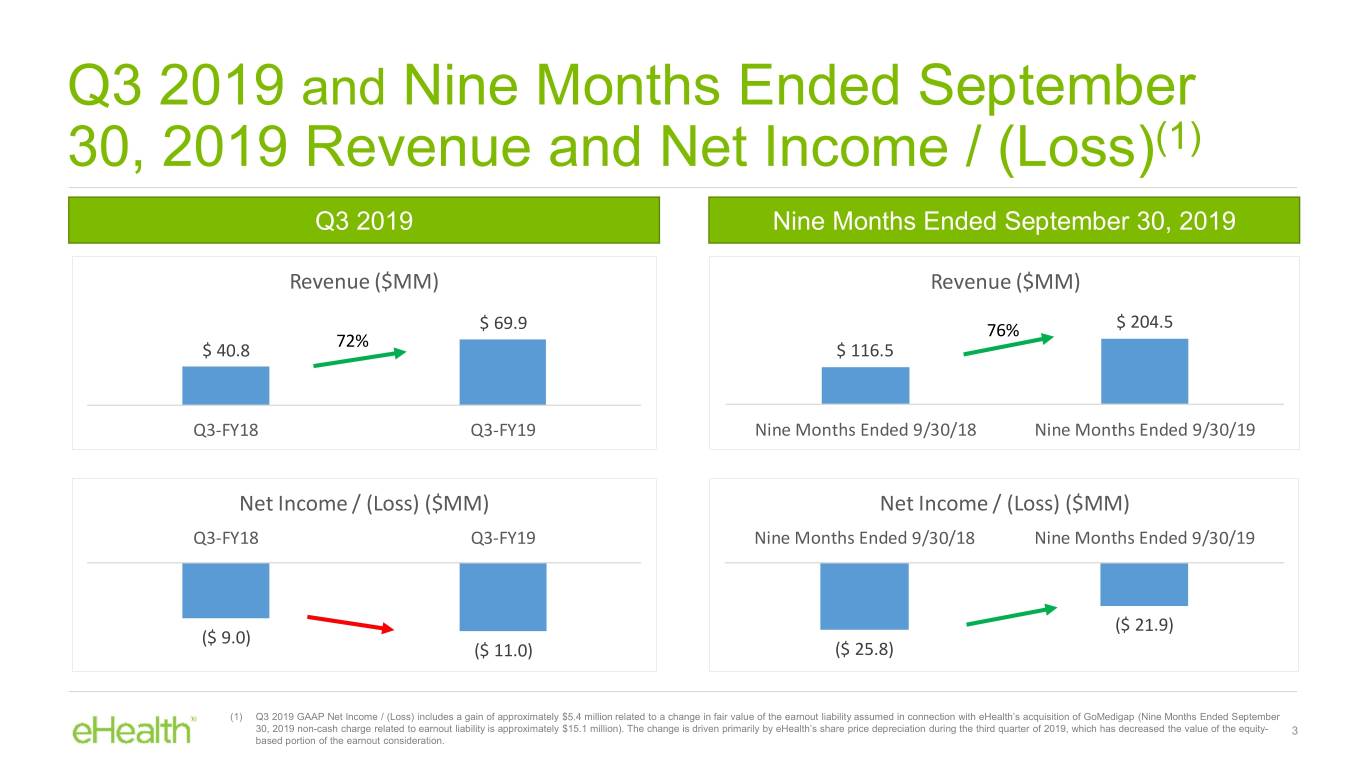
Q3 2019 and Nine Months Ended September 30, 2019 Revenue and Net Income / (Loss)(1) Q3 2019 Nine Months Ended September 30, 2019 Revenue ($MM) Revenue ($MM) $ 69.9 76% $ 204.5 72% $ 40.8 $ 116.5 Q3-FY18 Q3-FY19 Nine Months Ended 9/30/18 Nine Months Ended 9/30/19 Net Income / (Loss) ($MM) Net Income / (Loss) ($MM) Q3-FY18 Q3-FY19 Nine Months Ended 9/30/18 Nine Months Ended 9/30/19 ($ 21.9) ($ 9.0) ($ 11.0) ($ 25.8) (1) Q3 2019 GAAP Net Income / (Loss) includes a gain of approximately $5.4 million related to a change in fair value of the earnout liability assumed in connection with eHealth’s acquisition of GoMedigap (Nine Months Ended September 30, 2019 non-cash charge related to earnout liability is approximately $15.1 million). The change is driven primarily by eHealth’s share price depreciation during the third quarter of 2019, which has decreased the value of the equity- 3 based portion of the earnout consideration.

Q3 2019 and Nine Months Ended September 30, 2019 AEBITDA(1) and Non-GAAP Net Income / (Loss)(2) Q3 2019 Nine Months Ended September 30, 2019 Adjusted EBITDA ($MM) Adjusted EBITDA ($MM) ($6.9) ($ 9.4) ($18.8) ($ 18.2) Q3-FY18 Q3-FY19 Nine Months Ended 9/30/18 Nine Months Ended 9/30/19 Non-GAAP Net Income / (Loss) ($MM) Non-GAAP Net Income / (Loss) ($MM) ($ 0.6) ($ 4.2) ($ 10.1) ($ 13.0) Nine Months Ended 9/30/18 Nine Months Ended 9/30/19 Q3-FY18 Q3-FY19 (1) Adjusted EBITDA is calculated by adding stock-based compensation, depreciation and amortization expense, restructuring charges, acquisition costs, amortization of intangible assets, change in fair value of earnout liability, other income (expense), net and provision for income taxes to GAAP Net Income / (Loss). 4 (2) Non-GAAP Net Income / (Loss) is calculated by adding stock-based compensation, restructuring charges, acquisition costs, amortization of intangible assets, change in fair value of earnout liability and the income tax effect of non- GAAP adjustments to GAAP Net Income / (Loss).
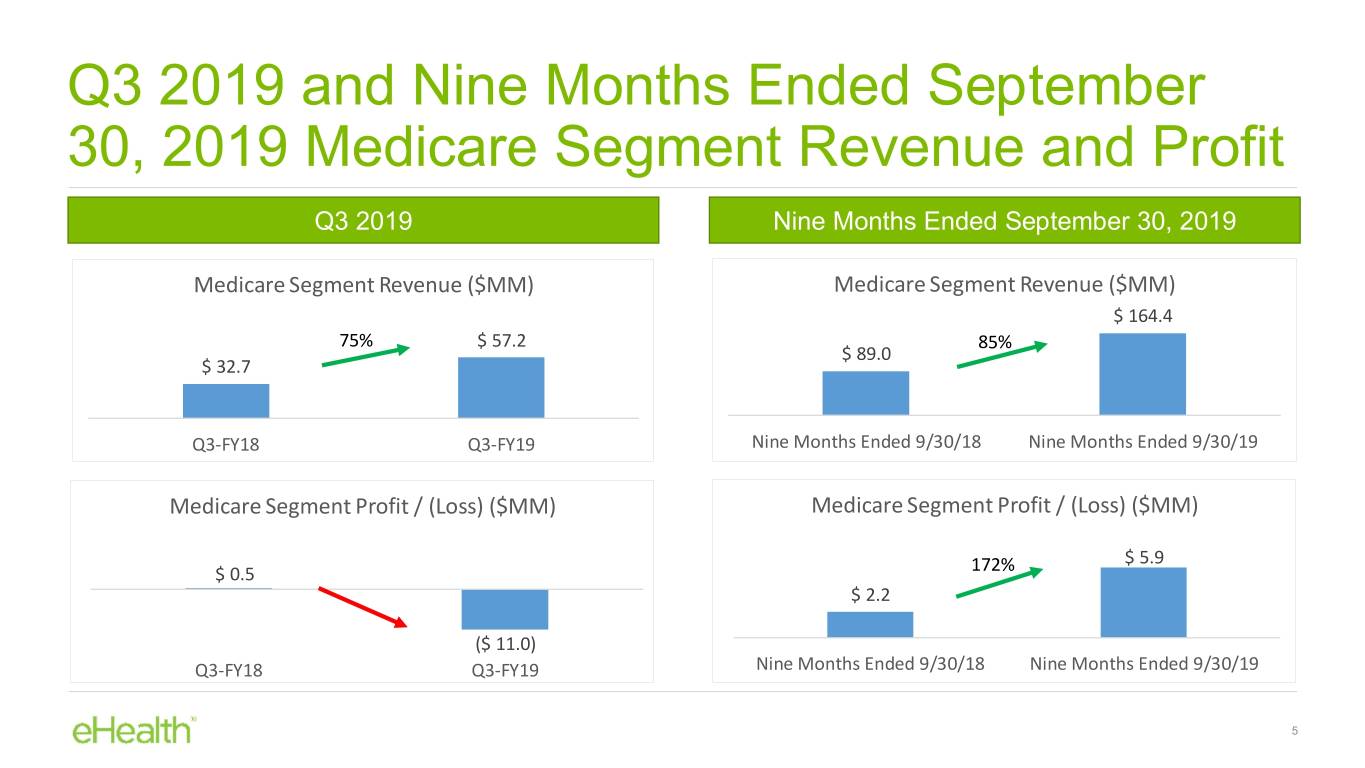
Q3 2019 and Nine Months Ended September 30, 2019 Medicare Segment Revenue and Profit Q3 2019 Nine Months Ended September 30, 2019 Medicare Segment Revenue ($MM) Medicare Segment Revenue ($MM) $ 164.4 75% $ 57.2 85% $ 89.0 $ 32.7 Q3-FY18 Q3-FY19 Nine Months Ended 9/30/18 Nine Months Ended 9/30/19 Medicare Segment Profit / (Loss) ($MM) Medicare Segment Profit / (Loss) ($MM) $ 5.9 $ 0.5 172% $ 2.2 ($ 11.0) Q3-FY18 Q3-FY19 Nine Months Ended 9/30/18 Nine Months Ended 9/30/19 5

Q3 2019 and Nine Months Ended September 30, 2019 Medicare Application Volumes and Medicare Major Medical Online %(1) Q3 2019 Nine Months Ended September 30, 2019 Medicare Submitted Applications (000s) Medicare Submitted Applications (000s) 56 66% 72% 177 34 103 Q3-FY18 Q3-FY19 Nine Months Ended 9/30/18 Nine Months Ended 9/30/19 Medicare Major Medical Online Application % Medicare Major Medical Online Application % 21% 15% 145% 80% 9% 8% Q3-FY18 Q3-FY19 Nine Months Ended 9/30/18 Nine Months Ended 9/30/19 (1) Major Medicare plans include Medicare Advantage and Medicare Supplement plans 6
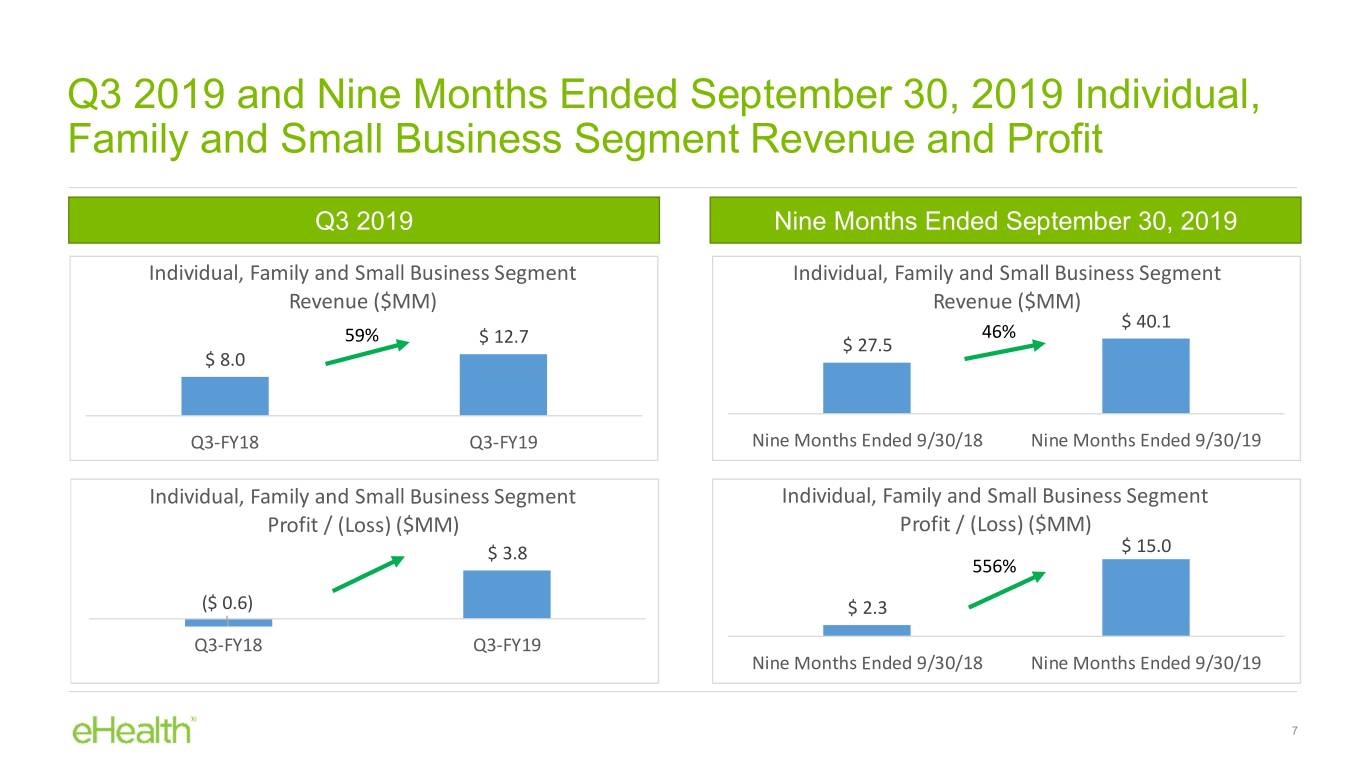
Q3 2019 and Nine Months Ended September 30, 2019 Individual, Family and Small Business Segment Revenue and Profit Q3 2019 Nine Months Ended September 30, 2019 Individual, Family and Small Business Segment Individual, Family and Small Business Segment Revenue ($MM) Revenue ($MM) $ 40.1 46% 59% $ 12.7 $ 27.5 $ 8.0 Q3-FY18 Q3-FY19 Nine Months Ended 9/30/18 Nine Months Ended 9/30/19 Individual, Family and Small Business Segment Individual, Family and Small Business Segment Profit / (Loss) ($MM) Profit / (Loss) ($MM) $ 3.8 $ 15.0 556% ($ 0.6) $ 2.3 Q3-FY18 Q3-FY19 Nine Months Ended 9/30/18 Nine Months Ended 9/30/19 7
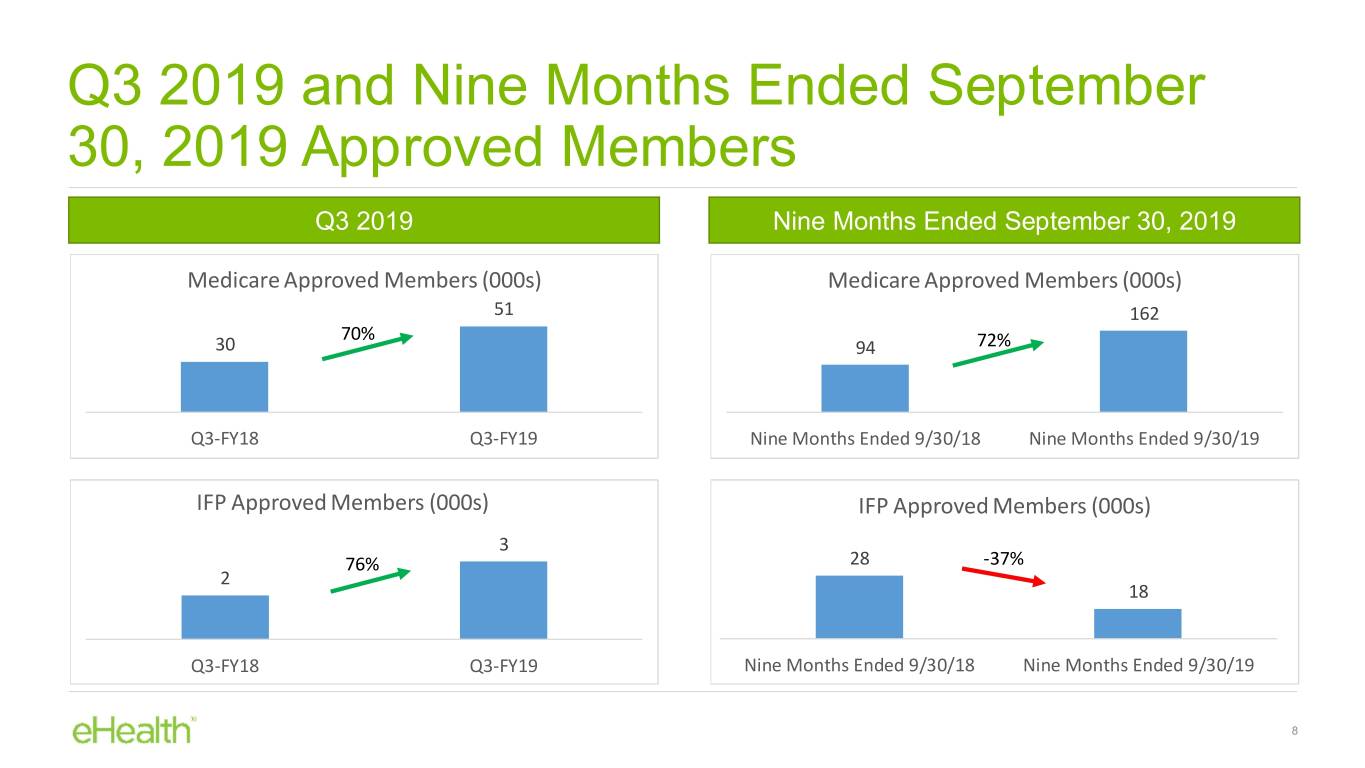
Q3 2019 and Nine Months Ended September 30, 2019 Approved Members Q3 2019 Nine Months Ended September 30, 2019 Medicare Approved Members (000s) Medicare Approved Members (000s) 51 162 70% 30 94 72% Q3-FY18 Q3-FY19 Nine Months Ended 9/30/18 Nine Months Ended 9/30/19 IFP Approved Members (000s) IFP Approved Members (000s) 3 76% 28 -37% 2 18 Q3-FY18 Q3-FY19 Nine Months Ended 9/30/18 Nine Months Ended 9/30/19 8
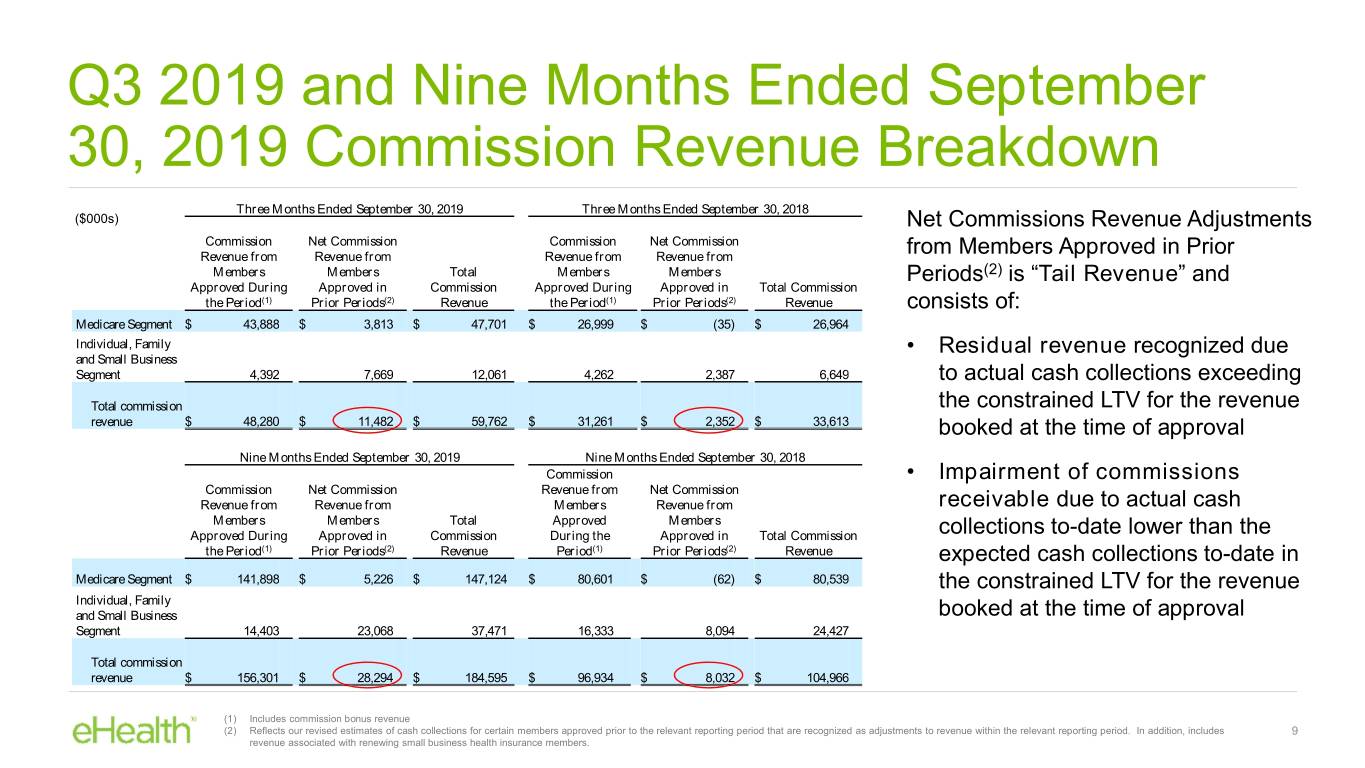
Q3 2019 and Nine Months Ended September 30, 2019 Commission Revenue Breakdown Three Months Ended September 30, 2019 Three Months Ended September 30, 2018 ($000s) Net Commissions Revenue Adjustments Commission Net Commission Commission Net Commission Revenue from Revenue from Revenue from Revenue from from Members Approved in Prior Members Members Total Members Members Periods(2) is “Tail Revenue” and Approved During Approved in Commission Approved During Approved in Total Commission the Period(1) Prior Periods(2) Revenue the Period(1) Prior Periods(2) Revenue consists of: Medicare Segment $ 43,888 $ 3,813 $ 47,701 $ 26,999 $ (35) $ 26,964 Individual, Family • Residual revenue recognized due and Small Business Segment 4,392 7,669 12,061 4,262 2,387 6,649 to actual cash collections exceeding Total commission the constrained LTV for the revenue revenue $ 48,280 $ 11,482 $ 59,762 $ 31,261 $ 2,352 $ 33,613 booked at the time of approval Nine Months Ended September 30, 2019 Nine Months Ended September 30, 2018 Commission • Impairment of commissions Commission Net Commission Revenue from Net Commission Revenue from Revenue from Members Revenue from receivable due to actual cash Members Members Total Approved Members Approved During Approved in Commission During the Approved in Total Commission collections to-date lower than the the Period(1) Prior Periods(2) Revenue Period(1) Prior Periods(2) Revenue expected cash collections to-date in Medicare Segment $ 141,898 $ 5,226 $ 147,124 $ 80,601 $ (62) $ 80,539 the constrained LTV for the revenue Individual, Family and Small Business booked at the time of approval Segment 14,403 23,068 37,471 16,333 8,094 24,427 Total commission revenue $ 156,301 $ 28,294 $ 184,595 $ 96,934 $ 8,032 $ 104,966 (1) Includes commission bonus revenue (2) Reflects our revised estimates of cash collections for certain members approved prior to the relevant reporting period that are recognized as adjustments to revenue within the relevant reporting period. In addition, includes 9 revenue associated with renewing small business health insurance members.

Medicare Advantage Plan Member Turnover Trend Since Q4 2018 Q4 18 Q1 19 Q2 19 Q3 19 Estimated Beginning Membership(1) 235,269 276,357 280,763 291,171 Approved Members(2) 83,376 40,741 36,576 35,171 Estimated Total New Paying Members from Approved Members (3) 76,180 39,087 34,614 33,284 Less Estimated Future Quarters Paying Members from Approved Members (4) (15,920) (5,476) (3,968) (3,278) New Paying Members from Approved Members(5) 60,260 33,611 30,646 30,006 Plus New Paying Members from Prior Quarters Approved Members(6) 2,557 15,920 5,476 3,968 New Paying Members(7) 62,817 49,531 36,122 33,974 Estimated Ending Membership(8) 276,357 280,763 291,171 309,180 Medicare Advantage Plan Member Turnover(9) 21,729 45,125 25,714 15,965 Trailing Twelve Month Member Turnover(10) 95,065 89,357 102,403 108,533 Average Trailing Twelve Month Estimated Membership Plus New Paying Members (11) 262,856 276,949 296,491 316,501 Trailing Twelve Month Member Turnover Rate(12) 36% 32% 35% 34% Trailing Twelve Month Approved to Paid Ratio (13) 91% 92% 93% 93% Avg = 92% 10
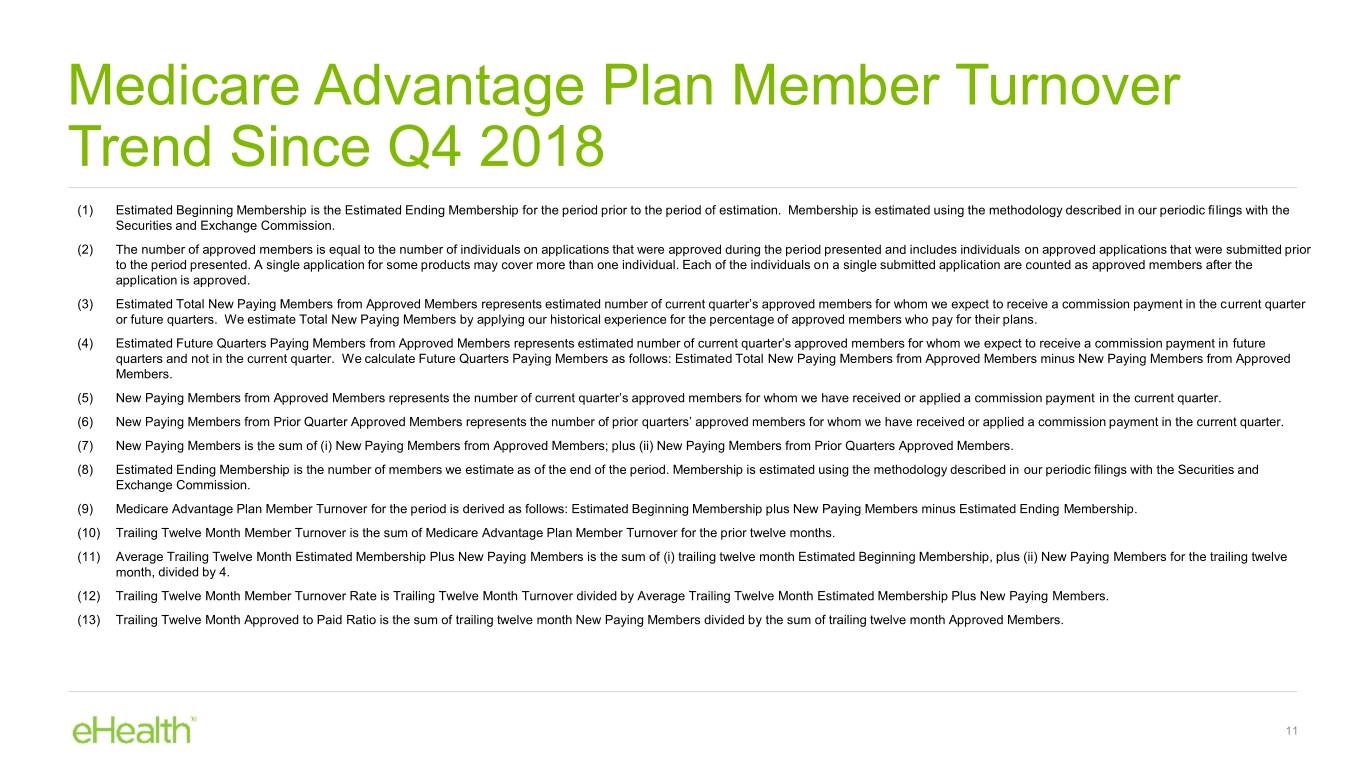
Medicare Advantage Plan Member Turnover Trend Since Q4 2018 (1) Estimated Beginning Membership is the Estimated Ending Membership for the period prior to the period of estimation. Membership is estimated using the methodology described in our periodic filings with the Securities and Exchange Commission. (2) The number of approved members is equal to the number of individuals on applications that were approved during the period presented and includes individuals on approved applications that were submitted prior to the period presented. A single application for some products may cover more than one individual. Each of the individuals on a single submitted application are counted as approved members after the application is approved. (3) Estimated Total New Paying Members from Approved Members represents estimated number of current quarter’s approved members for whom we expect to receive a commission payment in the current quarter or future quarters. We estimate Total New Paying Members by applying our historical experience for the percentage of approved members who pay for their plans. (4) Estimated Future Quarters Paying Members from Approved Members represents estimated number of current quarter’s approved members for whom we expect to receive a commission payment in future quarters and not in the current quarter. We calculate Future Quarters Paying Members as follows: Estimated Total New Paying Members from Approved Members minus New Paying Members from Approved Members. (5) New Paying Members from Approved Members represents the number of current quarter’s approved members for whom we have received or applied a commission payment in the current quarter. (6) New Paying Members from Prior Quarter Approved Members represents the number of prior quarters’ approved members for whom we have received or applied a commission payment in the current quarter. (7) New Paying Members is the sum of (i) New Paying Members from Approved Members; plus (ii) New Paying Members from Prior Quarters Approved Members. (8) Estimated Ending Membership is the number of members we estimate as of the end of the period. Membership is estimated using the methodology described in our periodic filings with the Securities and Exchange Commission. (9) Medicare Advantage Plan Member Turnover for the period is derived as follows: Estimated Beginning Membership plus New Paying Members minus Estimated Ending Membership. (10) Trailing Twelve Month Member Turnover is the sum of Medicare Advantage Plan Member Turnover for the prior twelve months. (11) Average Trailing Twelve Month Estimated Membership Plus New Paying Members is the sum of (i) trailing twelve month Estimated Beginning Membership, plus (ii) New Paying Members for the trailing twelve month, divided by 4. (12) Trailing Twelve Month Member Turnover Rate is Trailing Twelve Month Turnover divided by Average Trailing Twelve Month Estimated Membership Plus New Paying Members. (13) Trailing Twelve Month Approved to Paid Ratio is the sum of trailing twelve month New Paying Members divided by the sum of trailing twelve month Approved Members. 11
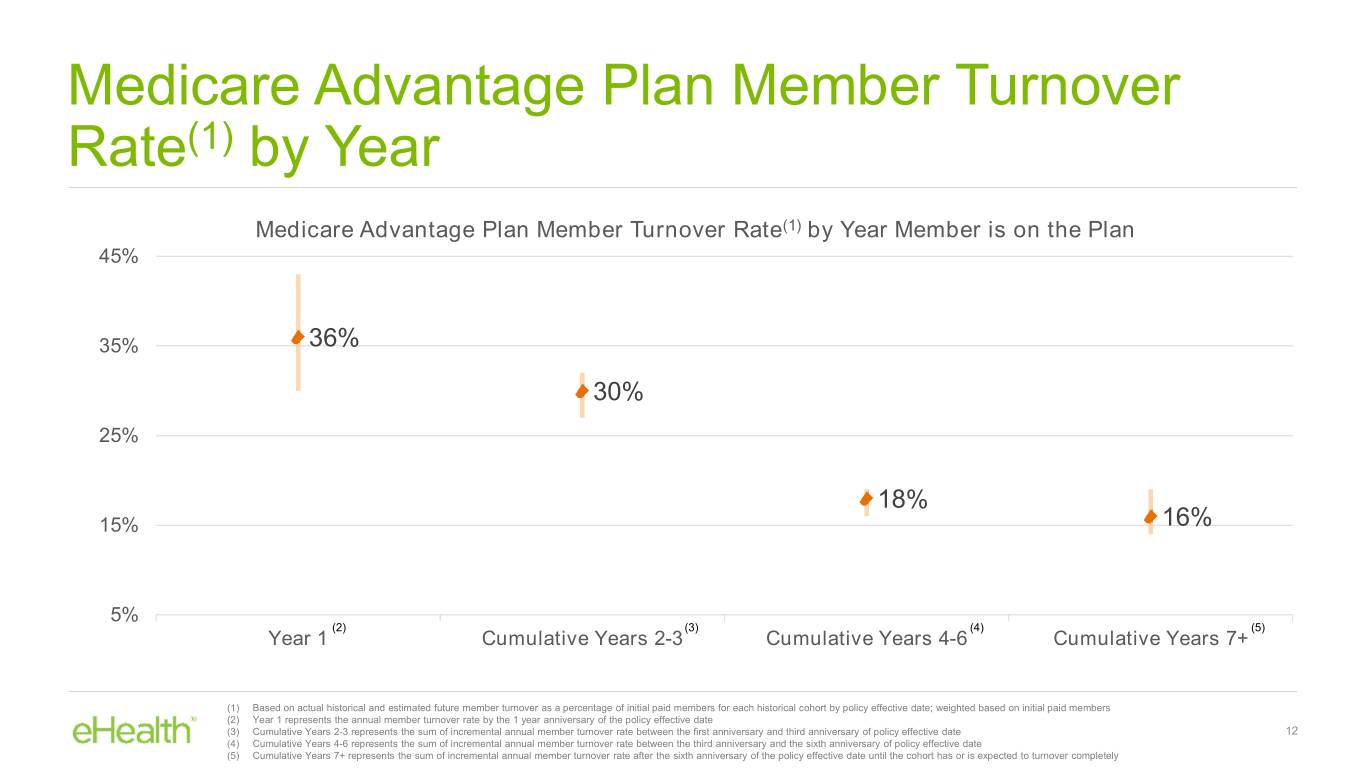
Medicare Advantage Plan Member Turnover Rate(1) by Year Medicare Advantage Plan Member Turnover Rate(1) by Year Member is on the Plan 45% 35% 36% 30% 25% 18% 15% 16% 5% (2) (3) (4) (5) Year 1 Cumulative Years 2-3 Cumulative Years 4-6 Cumulative Years 7+ (1) Based on actual historical and estimated future member turnover as a percentage of initial paid members for each historical cohort by policy effective date; weighted based on initial paid members (2) Year 1 represents the annual member turnover rate by the 1 year anniversary of the policy effective date (3) Cumulative Years 2-3 represents the sum of incremental annual member turnover rate between the first anniversary and third anniversary of policy effective date 12 (4) Cumulative Years 4-6 represents the sum of incremental annual member turnover rate between the third anniversary and the sixth anniversary of policy effective date (5) Cumulative Years 7+ represents the sum of incremental annual member turnover rate after the sixth anniversary of the policy effective date until the cohort has or is expected to turnover completely

Appendix 13

Reconciliation of GAAP to Non-GAAP Financial Measures Three Months Ended Nine Months Ended September 30, September 30, (In $000’s) 2019 2018 2019 2018 GAAP net loss $ (11,024) $ (8,972) $ (21,937) $ (25,831) Stock-based compensation expense 5,510 3,543 13,417 9,224 Change in fair value of earnout liability (5,400) 3,800 15,106 6,300 Acquisition costs — — — 76 Restructuring — — — 1,865 Amortization of intangible assets 547 547 1,641 1,545 Tax effect of non-GAAP adjustments 312 (3,083) (8,782) (6,197) Non-GAAP net loss $ (10,055) $ (4,165) $ (555) $ (13,018) GAAP net loss $ (11,024) $ (8,972) $ (21,937) $ (25,831) Stock-based compensation expense 5,510 3,543 13,417 9,224 Change in fair value of earnout liability (5,400) 3,800 15,106 6,300 Depreciation and amortization 765 620 2,153 1,870 Acquisition costs — — — 76 Restructuring — — — 1,865 Amortization of intangible assets 547 547 1,641 1,545 Other income, net (568) (296) (1,824) (776) Benefit from income taxes (8,649) (6,186) (17,974) (12,487) Adjusted EBITDA $ (18,819) $ (6,944) $ (9,418) $ (18,214) 14


