
August 8, 2022 Q2 2022 Financial Results Conference Call Slides
The image part with relationship ID rId17 was not found in the file. Safe Harbor Statement 1 Forward-Looking Statements This presentation includes forward-looking statements within the meaning of the federal securities laws. Forward-looking statements generally relate to future events or our future financial or operating performance. Forward-looking statements in this presentation include, but are not limited to, the following: our annual enrollment opportunity; our operational focus in 2022, including our expectations related to changes in our operating plan; our expectations relating to our cost savings initiatives; our expected cash collections for Medicare Advantage plans; our estimated memberships; trends in our enrollment growth; our long-term opportunities for profitable growth; and our 2022 annual guidance for total revenue, GAAP net loss, adjusted EBITDA, and total cash outflow. Our expectations and beliefs regarding these matters may not materialize, and actual results in future periods are subject to risks and uncertainties that could cause actual results to differ materially from those projected. These risks include those set forth in our filings with the Securities and Exchange Commission, including our latest Form 10-Q and 10-K. The forward-looking statements in this presentation are based on information available to us as of today, and we disclaim any obligation to update any forward-looking statements, except as required by law. Non-GAAP Information This presentation includes both GAAP and non-GAAP financial measures. The presentation of non-GAAP financial information is not intended to be considered in isolation or as a substitute for results prepared in accordance with GAAP. A reconciliation of the non-GAAP financial measures included in this presentation to the most directly comparable GAAP financial measures is available in the Appendix to this presentation. Management uses both GAAP and non-GAAP information in evaluating and operating its business internally and as such has determined that it is important to provide this information to investors.
The image part with relationship ID rId17 was not found in the file. Q2 2022 Summary 2 • Our Medicare and IFP businesses continue to provide significant value to beneficiaries and carriers. • Core operational results exceeded internal expectations driven primarily by better-than-expected Medicare call conversion rates. • At the same time, telephonic conversion rate declined year-over-year reflecting changes to the enrollment process implemented in July of ‘21 to emphasize enrollment quality and retention. • Progress in implementing the cost savings program: • Significant year-over-year reduction in variable costs reflects a more targeted allocation of marketing budget and a corresponding reduction in agent headcount. • Fixed cost reductions underway. • Q2 results reflect negative revenue adjustment of $8.7MM driven primarily by higher-than-expected lapses within Medicare cohorts enrolled during the first half of 2021. • Favorable retention dynamics on the newer Medicare Advantage cohorts enrolled after the enrollment quality initiatives were introduced in July of ‘21. Significant improvement in quality metrics – CTMs.

The image part with relationship ID rId17 was not found in the file. Cost Savings Initiatives Update 3 • Q2 ‘22 Technology & Content and G&A costs combined declined $3.6MM year-over-year. • Savings achieved through vendor contract rationalization, targeted workforce reduction and other measures of cost discipline. • Positive impact will be magnified on a full-year basis. • Further measures are in the works including reduction in real estate footprint and becoming a virtual-first workplace. Fixed Costs • Q2 ‘22 marketing spend was down 33% and call center costs down 24% year-over-year for a combined reduction of $23.8MM vs. Q2 ’21. • Reduced marketing investment for 2H ’22 relative to original operating plan, reflecting increased emphasis on member profitability vs. enrollment growth. Made corresponding adjustment to agent hiring plans. • Expect to generate similar levels of profitability, net of the negative revenue adjustment, on lower enrollment volumes vs. prior plan, as reflected in revised outlook for the full year 2022. Variable Costs • We are on track to deliver more than $60 million in cost savings year-over-year.
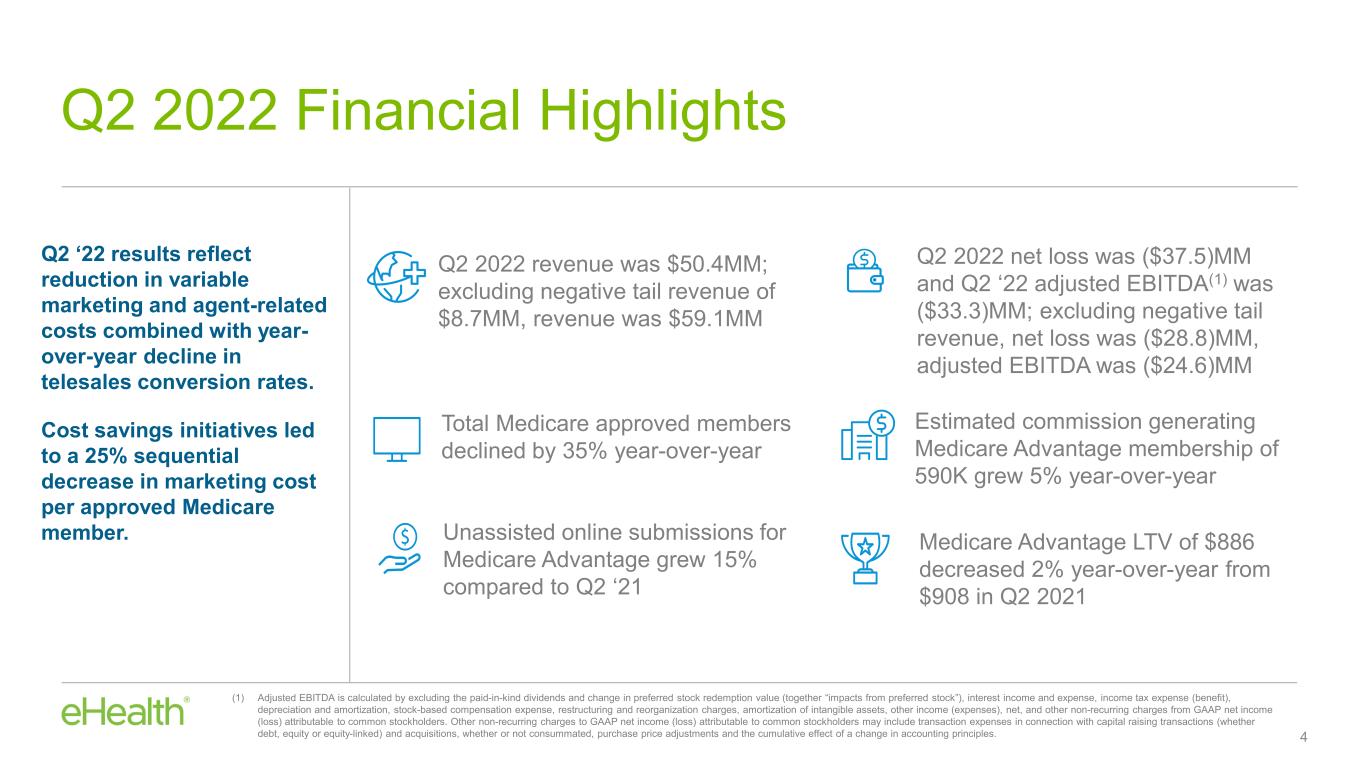
The image part with relationship ID rId17 was not found in the file. Q2 2022 Financial Highlights 4 Estimated commission generating Medicare Advantage membership of 590K grew 5% year-over-year Q2 2022 revenue was $50.4MM; excluding negative tail revenue of $8.7MM, revenue was $59.1MM (1) Adjusted EBITDA is calculated by excluding the paid-in-kind dividends and change in preferred stock redemption value (together “impacts from preferred stock”), interest income and expense, income tax expense (benefit), depreciation and amortization, stock-based compensation expense, restructuring and reorganization charges, amortization of intangible assets, other income (expenses), net, and other non-recurring charges from GAAP net income (loss) attributable to common stockholders. Other non-recurring charges to GAAP net income (loss) attributable to common stockholders may include transaction expenses in connection with capital raising transactions (whether debt, equity or equity-linked) and acquisitions, whether or not consummated, purchase price adjustments and the cumulative effect of a change in accounting principles. Total Medicare approved members declined by 35% year-over-year Medicare Advantage LTV of $886 decreased 2% year-over-year from $908 in Q2 2021 Unassisted online submissions for Medicare Advantage grew 15% compared to Q2 ‘21 Q2 ‘22 results reflect reduction in variable marketing and agent-related costs combined with year- over-year decline in telesales conversion rates. Cost savings initiatives led to a 25% sequential decrease in marketing cost per approved Medicare member. Q2 2022 net loss was ($37.5)MM and Q2 ‘22 adjusted EBITDA(1) was ($33.3)MM; excluding negative tail revenue, net loss was ($28.8)MM, adjusted EBITDA was ($24.6)MM
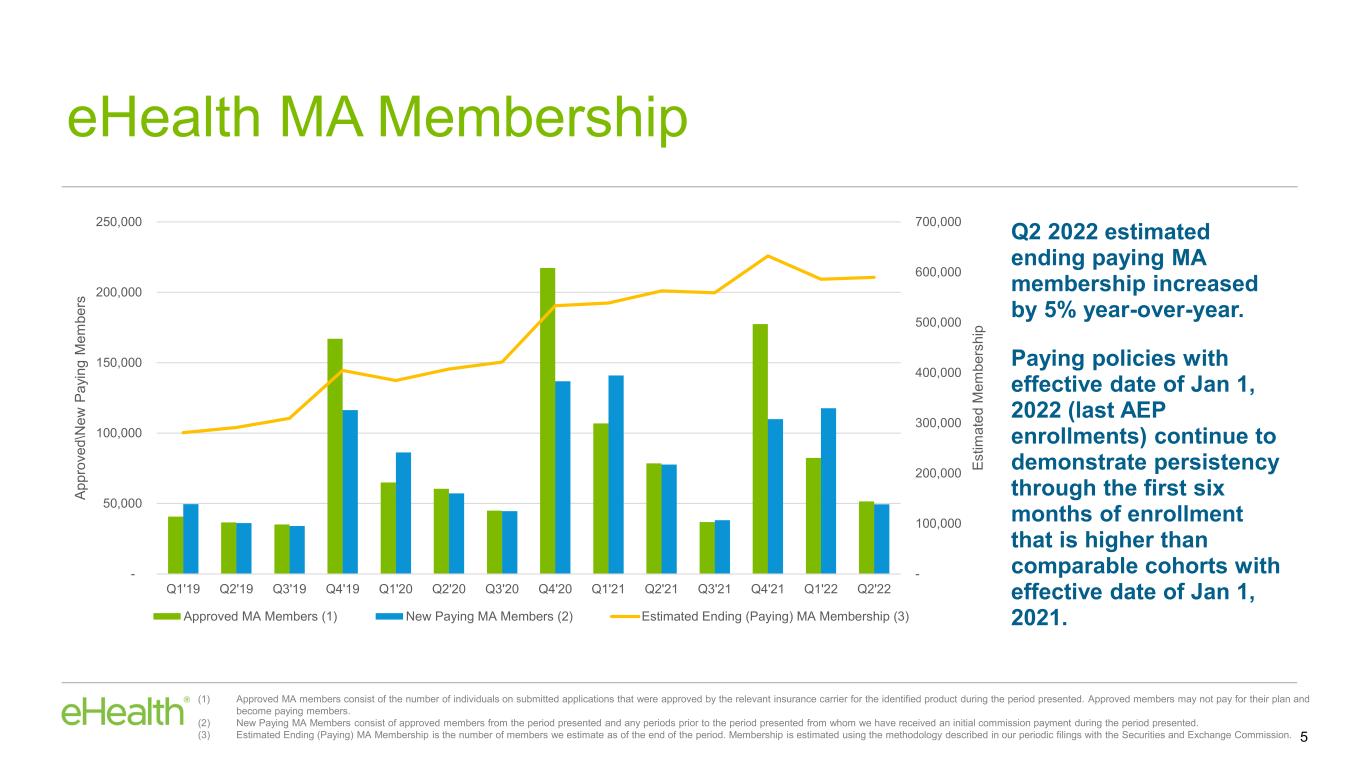
The image part with relationship ID rId17 was not found in the file. - 100,000 200,000 300,000 400,000 500,000 600,000 700,000 - 50,000 100,000 150,000 200,000 250,000 Q1'19 Q2'19 Q3'19 Q4'19 Q1'20 Q2'20 Q3'20 Q4'20 Q1'21 Q2'21 Q3'21 Q4'21 Q1'22 Q2'22 Es tim at ed M em be rs hi p Ap pr ov ed \N ew P ay in g M em be rs Approved MA Members (1) New Paying MA Members (2) Estimated Ending (Paying) MA Membership (3) eHealth MA Membership 5 Q2 2022 estimated ending paying MA membership increased by 5% year-over-year. Paying policies with effective date of Jan 1, 2022 (last AEP enrollments) continue to demonstrate persistency through the first six months of enrollment that is higher than comparable cohorts with effective date of Jan 1, 2021. (1) Approved MA members consist of the number of individuals on submitted applications that were approved by the relevant insurance carrier for the identified product during the period presented. Approved members may not pay for their plan and become paying members. (2) New Paying MA Members consist of approved members from the period presented and any periods prior to the period presented from whom we have received an initial commission payment during the period presented. (3) Estimated Ending (Paying) MA Membership is the number of members we estimate as of the end of the period. Membership is estimated using the methodology described in our periodic filings with the Securities and Exchange Commission.

The image part with relationship ID rId17 was not found in the file. Q2 2022 Total Revenue 6 Total revenue declined 48% on a year-over-year basis due primarily to a $28.0 million decrease in in-period Medicare commission revenue. Q2 ‘22 results were also impacted by the negative tail revenue from prior enrollments. Excluding the impact of the $(8.7) million tail revenue, total Q2 ‘22 revenue was $59.1 million, a decline of 39% year-over year. Total Revenue $96.6 $50.4 $8.7 Q2-FY21 Q2-FY22 Total Revenue ($MM) (48%) $59.1
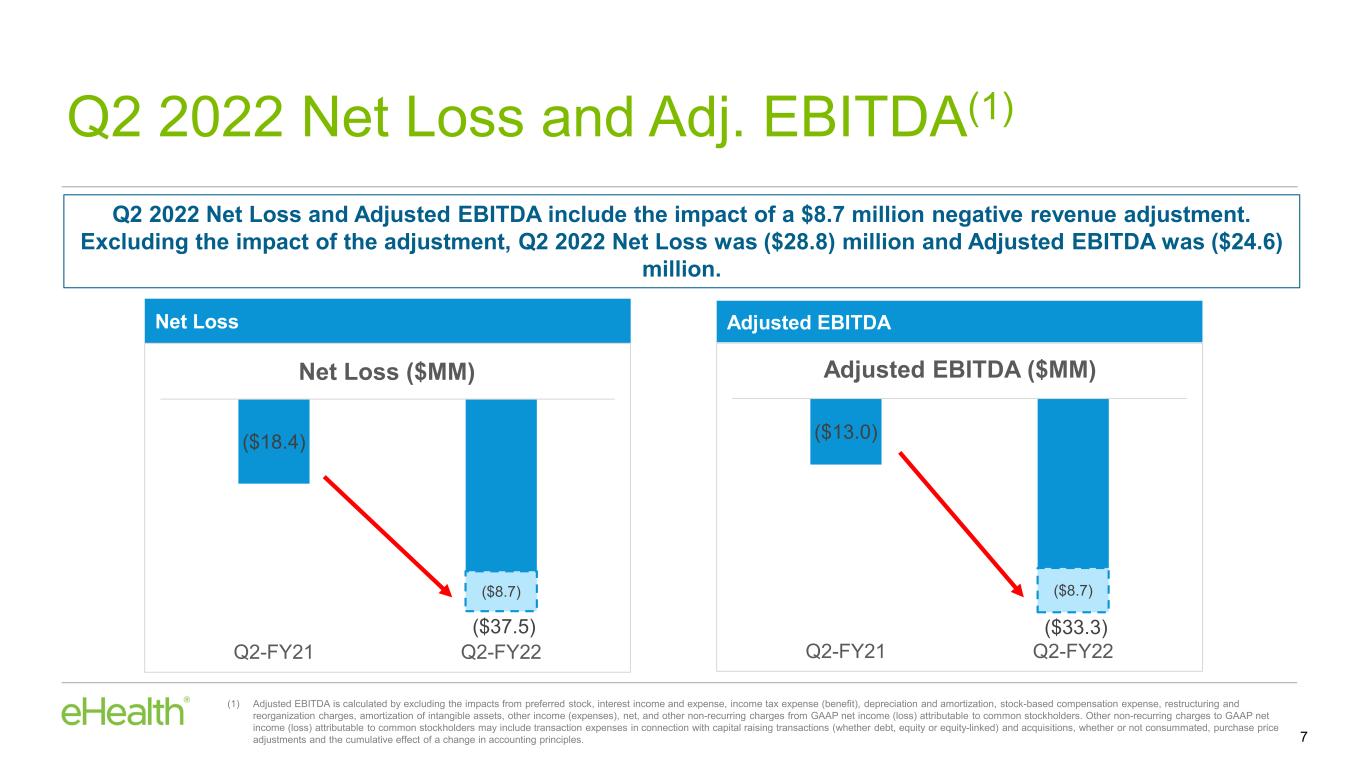
The image part with relationship ID rId17 was not found in the file. Q2 2022 Net Loss and Adj. EBITDA(1) 7 (1) Adjusted EBITDA is calculated by excluding the impacts from preferred stock, interest income and expense, income tax expense (benefit), depreciation and amortization, stock-based compensation expense, restructuring and reorganization charges, amortization of intangible assets, other income (expenses), net, and other non-recurring charges from GAAP net income (loss) attributable to common stockholders. Other non-recurring charges to GAAP net income (loss) attributable to common stockholders may include transaction expenses in connection with capital raising transactions (whether debt, equity or equity-linked) and acquisitions, whether or not consummated, purchase price adjustments and the cumulative effect of a change in accounting principles. Exceeded expectations due to significant growth in Medicare enrollments Net Loss Adjusted EBITDA Q2 2022 Net Loss and Adjusted EBITDA include the impact of a $8.7 million negative revenue adjustment. Excluding the impact of the adjustment, Q2 2022 Net Loss was ($28.8) million and Adjusted EBITDA was ($24.6) million. ($18.4) ($37.5) ($8.7) Q2-FY21 Q2-FY22 Net Loss ($MM) ($13.0) ($33.3) ($8.7) Q2-FY21 Q2-FY22 Adjusted EBITDA ($MM)

The image part with relationship ID rId17 was not found in the file. 6,556 7,356 Q2-FY21 Q2-FY22 Major Medicare Online Unassisted Submissions 12% Q2 2022 Major Medicare Online Unassisted Applications 8 (1) Major Medicare plans include Medicare Advantage and Medicare Supplement plans Major Medicare Online Unassisted SubmissionsOnline business continues to generate enrollment growth despite the reduction in variable marketing expense across our lead generation channels. 13.4% of major Medicare submissions were online unassisted in Q2 2022 compared to 7.1% in Q2 2021.
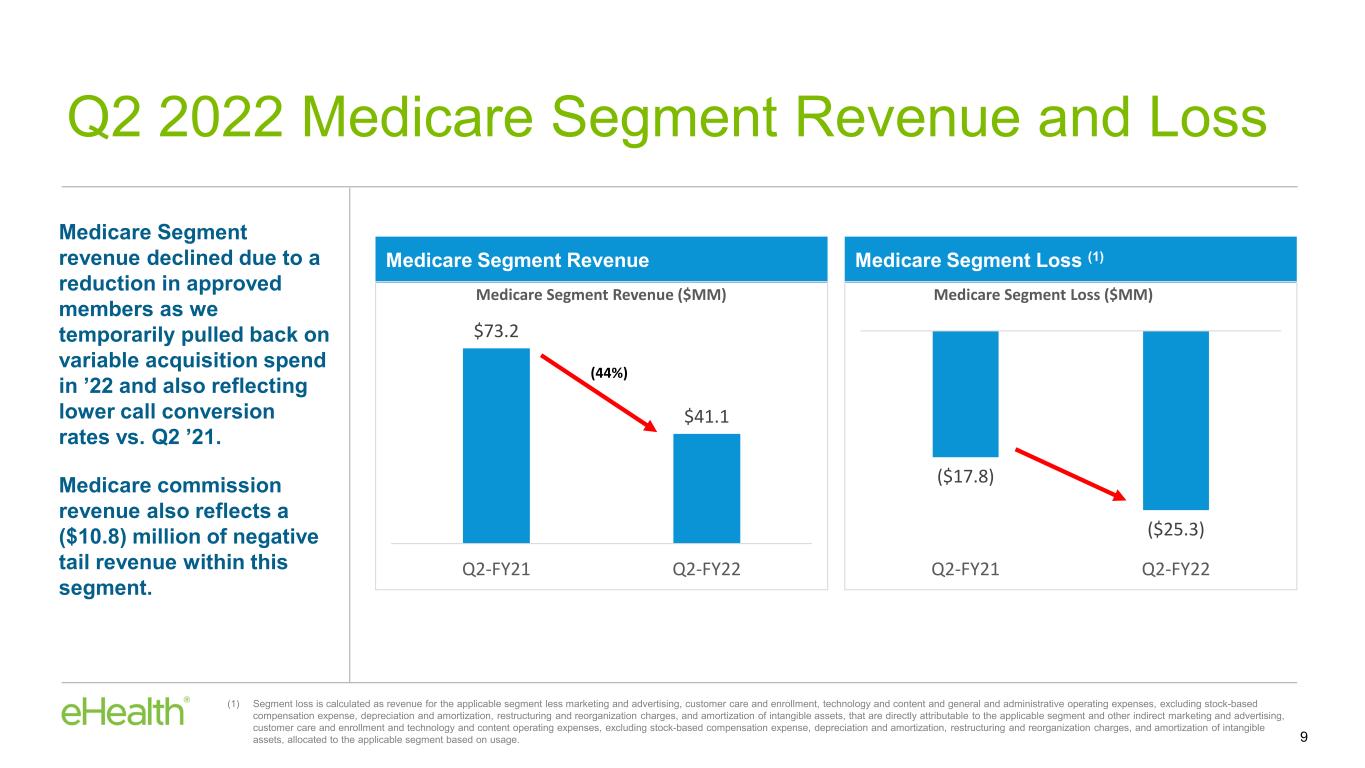
The image part with relationship ID rId17 was not found in the file. Q2 2022 Medicare Segment Revenue and Loss 9 Medicare Segment Revenue Medicare Segment Loss (1) (1) Segment loss is calculated as revenue for the applicable segment less marketing and advertising, customer care and enrollment, technology and content and general and administrative operating expenses, excluding stock-based compensation expense, depreciation and amortization, restructuring and reorganization charges, and amortization of intangible assets, that are directly attributable to the applicable segment and other indirect marketing and advertising, customer care and enrollment and technology and content operating expenses, excluding stock-based compensation expense, depreciation and amortization, restructuring and reorganization charges, and amortization of intangible assets, allocated to the applicable segment based on usage. $73.2 $41.1 Q2-FY21 Q2-FY22 Medicare Segment Revenue ($MM) (44%) ($17.8) ($25.3) Q2-FY21 Q2-FY22 Medicare Segment Loss ($MM) Medicare Segment revenue declined due to a reduction in approved members as we temporarily pulled back on variable acquisition spend in ’22 and also reflecting lower call conversion rates vs. Q2 ’21. Medicare commission revenue also reflects a ($10.8) million of negative tail revenue within this segment.
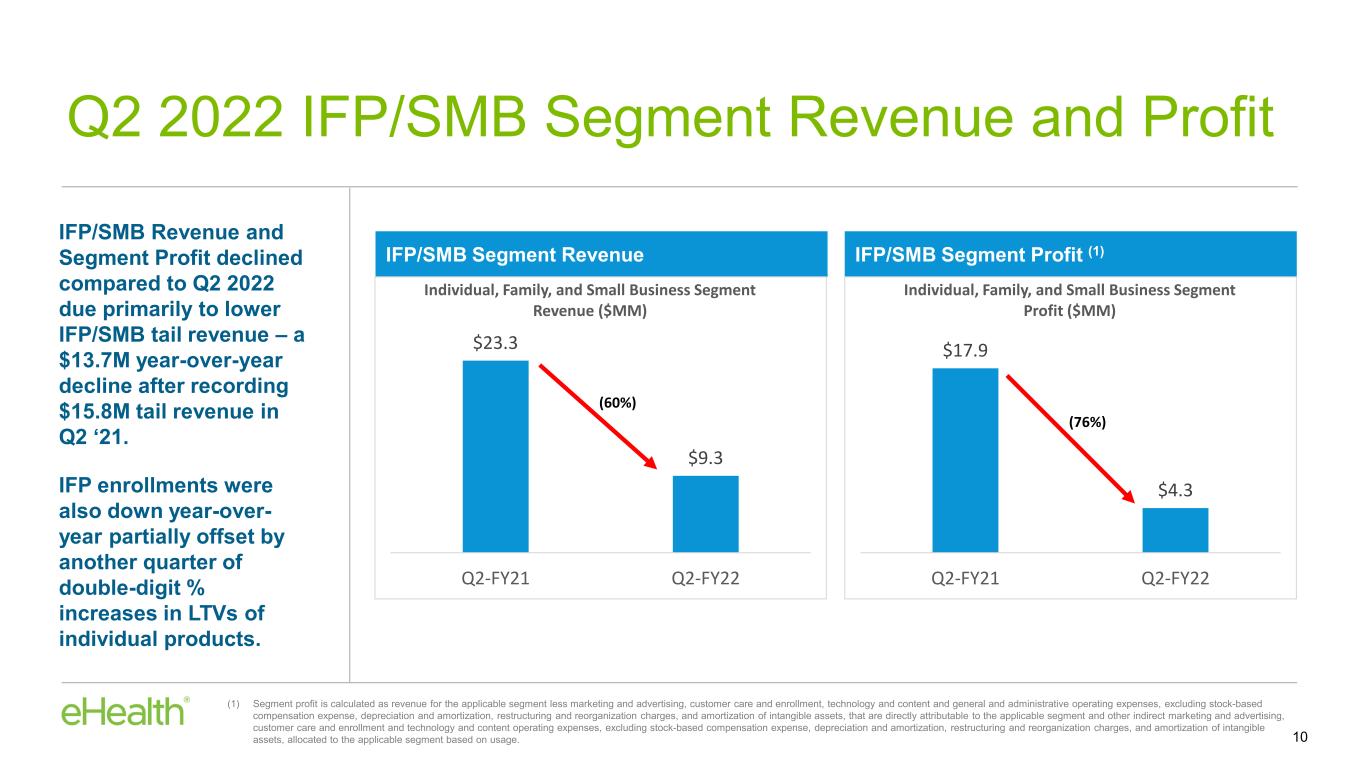
The image part with relationship ID rId17 was not found in the file. IFP/SMB Revenue and Segment Profit declined compared to Q2 2022 due primarily to lower IFP/SMB tail revenue – a $13.7M year-over-year decline after recording $15.8M tail revenue in Q2 ‘21. IFP enrollments were also down year-over- year partially offset by another quarter of double-digit % increases in LTVs of individual products. Q2 2022 IFP/SMB Segment Revenue and Profit 10 IFP/SMB Segment Revenue IFP/SMB Segment Profit (1) (1) Segment profit is calculated as revenue for the applicable segment less marketing and advertising, customer care and enrollment, technology and content and general and administrative operating expenses, excluding stock-based compensation expense, depreciation and amortization, restructuring and reorganization charges, and amortization of intangible assets, that are directly attributable to the applicable segment and other indirect marketing and advertising, customer care and enrollment and technology and content operating expenses, excluding stock-based compensation expense, depreciation and amortization, restructuring and reorganization charges, and amortization of intangible assets, allocated to the applicable segment based on usage. $23.3 $9.3 Q2-FY21 Q2-FY22 Individual, Family, and Small Business Segment Revenue ($MM) (60%) $17.9 $4.3 Q2-FY21 Q2-FY22 Individual, Family, and Small Business Segment Profit ($MM) (76%)

The image part with relationship ID rId17 was not found in the file. 2015 2016 2017 2018 2019 2020 2021 Jan -Jul'22 Cohorts Medicare Advantage Variable Cost and Cash Collection (1) per Medicare Advantage Member Variable Cost First Year Cash Collected Renewal Cash Collected Until Q2 22 Receivables Outstanding as of Q2 22 Medicare Advantage Variable Cost and Cash Collection 11 2020 MA cohorts have achieved break even, i.e., the upfront acquisition cost compared to cash collections generated by the cohort to date These cohorts are now generating positive cash flow as we continue to collect monthly renewal payments. (1) Medicare Advantage (MA) variable cost and cash collections are grouped by member cohorts based on policy effective date. (2) Variable cost includes variable marketing and customer care & enrollment costs allocated to the MA members. (3) Cash collected are commissions for MA members. For the first year, it also includes non-commission revenue allocated to the MA product. Va ria bl e C os t To be Collected Breakeven (2) (3)
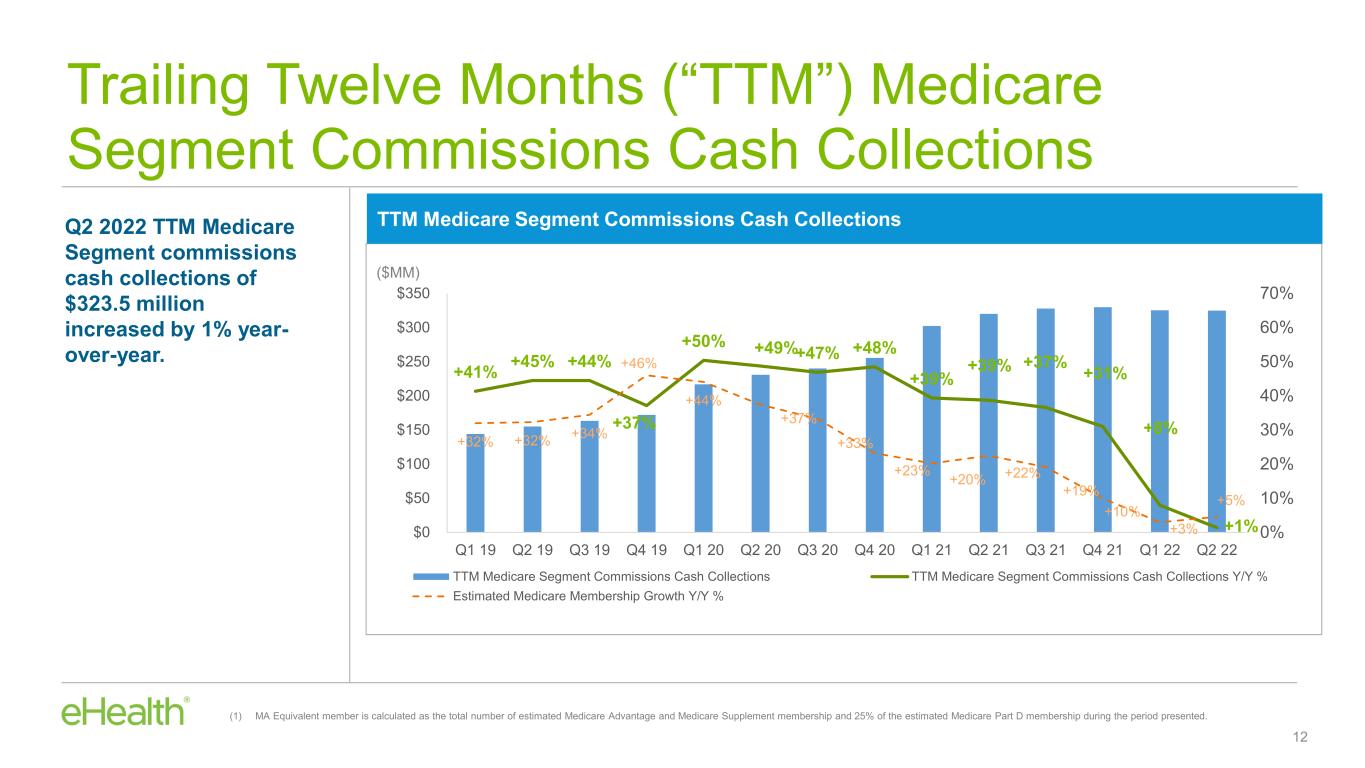
The image part with relationship ID rId17 was not found in the file. Trailing Twelve Months (“TTM”) Medicare Segment Commissions Cash Collections 12 Q2 2022 TTM Medicare Segment commissions cash collections of $323.5 million increased by 1% year- over-year. +41% +45% +44% +37% +50% +49%+47% +48% +39% +39% +37% +31% +8% +1% +32% +32% +34% +46% +44% +37% +33% +23% +20% +22% +19% +10% +3% +5% 0% 10% 20% 30% 40% 50% 60% 70% $0 $50 $100 $150 $200 $250 $300 $350 Q1 19 Q2 19 Q3 19 Q4 19 Q1 20 Q2 20 Q3 20 Q4 20 Q1 21 Q2 21 Q3 21 Q4 21 Q1 22 Q2 22 TTM Medicare Segment Commissions Cash Collections TTM Medicare Segment Commissions Cash Collections Y/Y % Estimated Medicare Membership Growth Y/Y % ($MM) TTM Medicare Segment Commissions Cash Collections (1) MA Equivalent member is calculated as the total number of estimated Medicare Advantage and Medicare Supplement membership and 25% of the estimated Medicare Part D membership during the period presented.
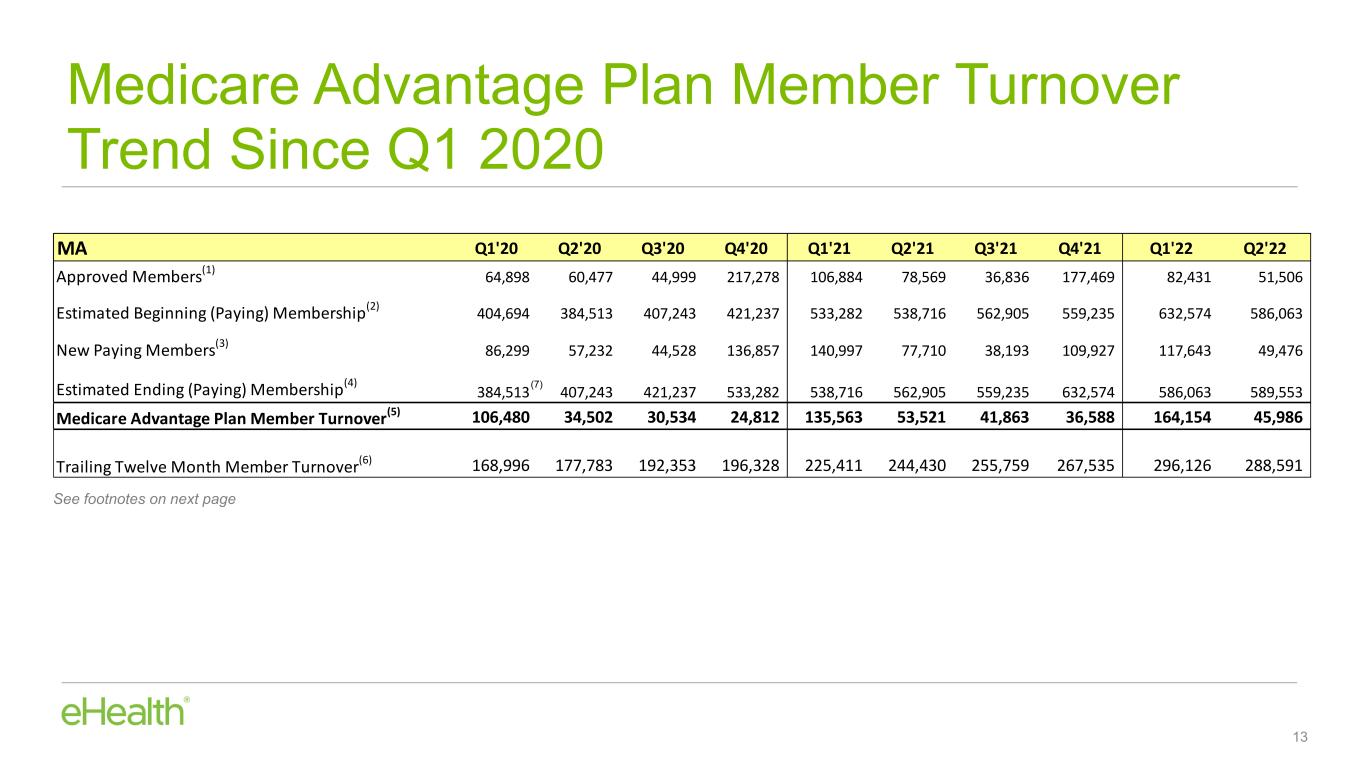
The image part with relationship ID rId17 was not found in the file. MA Q1'20 Q2'20 Q3'20 Q4'20 Q1'21 Q2'21 Q3'21 Q4'21 Q1'22 Q2'22 Approved Members(1) 64,898 60,477 44,999 217,278 106,884 78,569 36,836 177,469 82,431 51,506 Estimated Beginning (Paying) Membership(2) 404,694 384,513 407,243 421,237 533,282 538,716 562,905 559,235 632,574 586,063 New Paying Members(3) 86,299 57,232 44,528 136,857 140,997 77,710 38,193 109,927 117,643 49,476 Estimated Ending (Paying) Membership(4) 384,513 407,243 421,237 533,282 538,716 562,905 559,235 632,574 586,063 589,553 Medicare Advantage Plan Member Turnover(5) 106,480 34,502 30,534 24,812 135,563 53,521 41,863 36,588 164,154 45,986 Trailing Twelve Month Member Turnover(6) 168,996 177,783 192,353 196,328 225,411 244,430 255,759 267,535 296,126 288,591 Medicare Advantage Plan Member Turnover Trend Since Q1 2020 13 (7) See footnotes on next page
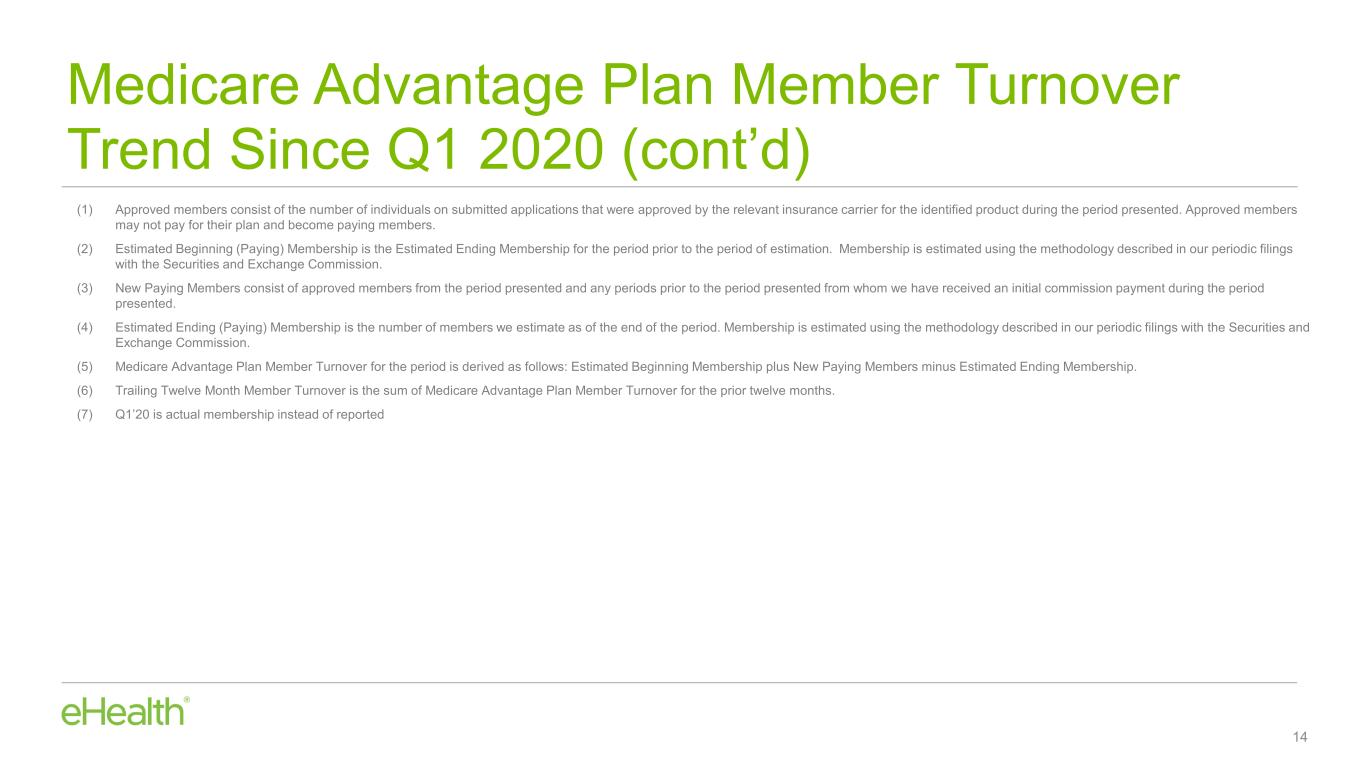
The image part with relationship ID rId17 was not found in the file. Medicare Advantage Plan Member Turnover Trend Since Q1 2020 (cont’d) 14 (1) Approved members consist of the number of individuals on submitted applications that were approved by the relevant insurance carrier for the identified product during the period presented. Approved members may not pay for their plan and become paying members. (2) Estimated Beginning (Paying) Membership is the Estimated Ending Membership for the period prior to the period of estimation. Membership is estimated using the methodology described in our periodic filings with the Securities and Exchange Commission. (3) New Paying Members consist of approved members from the period presented and any periods prior to the period presented from whom we have received an initial commission payment during the period presented. (4) Estimated Ending (Paying) Membership is the number of members we estimate as of the end of the period. Membership is estimated using the methodology described in our periodic filings with the Securities and Exchange Commission. (5) Medicare Advantage Plan Member Turnover for the period is derived as follows: Estimated Beginning Membership plus New Paying Members minus Estimated Ending Membership. (6) Trailing Twelve Month Member Turnover is the sum of Medicare Advantage Plan Member Turnover for the prior twelve months. (7) Q1’20 is actual membership instead of reported
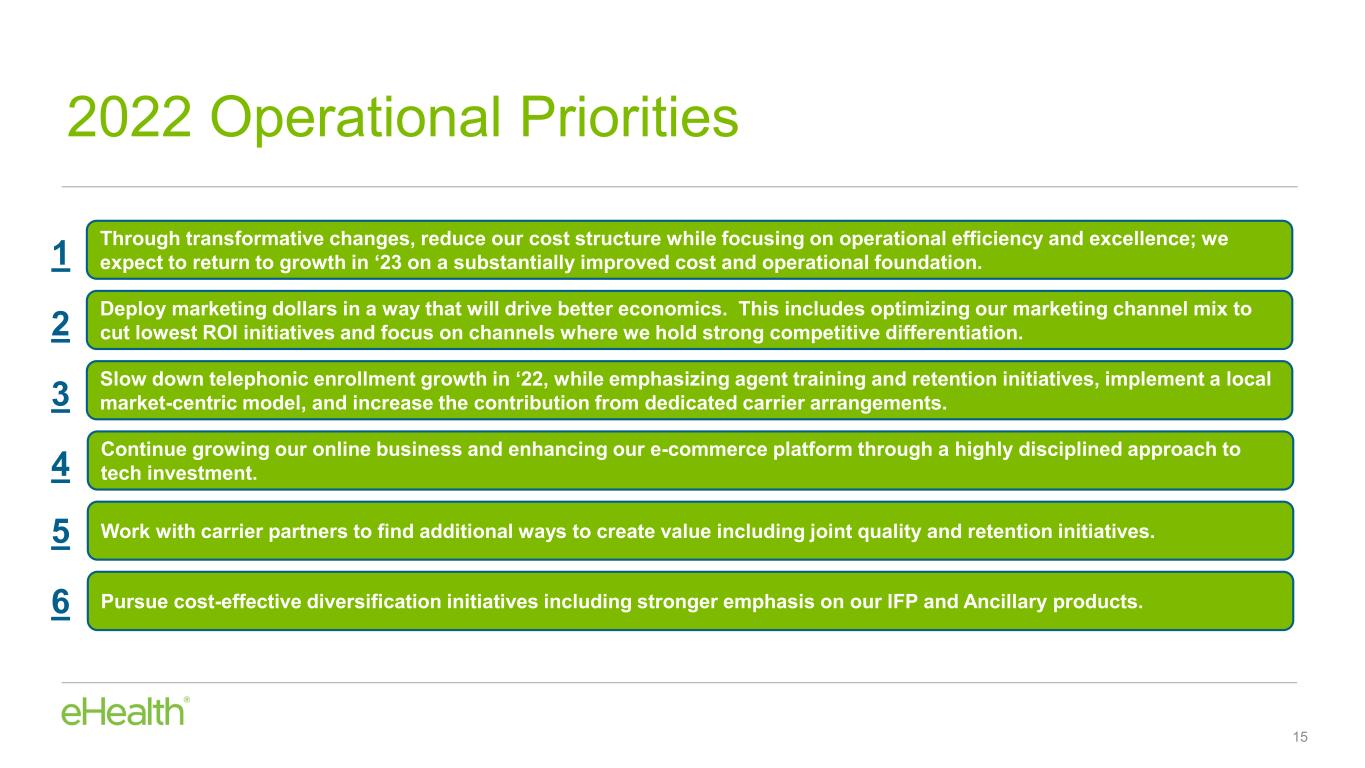
The image part with relationship ID rId17 was not found in the file. 2022 Operational Priorities 15 Through transformative changes, reduce our cost structure while focusing on operational efficiency and excellence; we expect to return to growth in ‘23 on a substantially improved cost and operational foundation. Deploy marketing dollars in a way that will drive better economics. This includes optimizing our marketing channel mix to cut lowest ROI initiatives and focus on channels where we hold strong competitive differentiation. Slow down telephonic enrollment growth in ‘22, while emphasizing agent training and retention initiatives, implement a local market-centric model, and increase the contribution from dedicated carrier arrangements. Continue growing our online business and enhancing our e-commerce platform through a highly disciplined approach to tech investment. Work with carrier partners to find additional ways to create value including joint quality and retention initiatives. Pursue cost-effective diversification initiatives including stronger emphasis on our IFP and Ancillary products. 1 2 3 4 5 6

The image part with relationship ID rId17 was not found in the file. 2022 Guidance 16 2022 Full Year Guidance New Range (in millions) Old Range (in millions) Total Revenue $375 - $395 $448 - $470 GAAP Net Loss ($115) – ($92) ($106) – ($83) Adjusted EBITDA(1) ($73) – ($45) ($64) – ($37) Total Cash Outflow, excluding the impact of our $70 million term loan and associated costs $110 - $90 $140 - $120 For the full year ending December 31, 2022, we are revising our financial guidance: (1) Adjusted EBITDA is calculated by excluding the impacts from preferred stock, interest income and expense, income tax expense (benefit), depreciation and amortization, stock-based compensation expense, restructuring and reorganization charges, amortization of intangible assets, other income (expenses), net, and other non-recurring charges from GAAP net income (loss) attributable to common stockholders. Other non-recurring charges to GAAP net income (loss) attributable to common stockholders may include transaction expenses in connection with capital raising transactions (whether debt, equity or equity-linked) and acquisitions, whether or not consummated, purchase price adjustments and the cumulative effect of a change in accounting principles. • 2022 Guidance update reflects our decision to further rationalize our Medicare marketing spend to de- emphasize the less profitable member acquisition channels during the AEP. We expect to generate similar levels of adjusted EBITDA and GAAP net loss on lower Medicare enrollment volumes, excluding the impact of the $8.7M in negative revenue adjustment recorded in Q2 ’22. • New plan for the year is also expected to have a significant positive effect on total cash outflow.

Confidential and proprietary Appendix

The image part with relationship ID rId17 was not found in the file. Net Loss to Adjusted EBITDA Reconciliation 18

The image part with relationship ID rId17 was not found in the file. FY 2022 Guidance Net Loss to Adjusted EBITDA Reconciliation 19


