Exhibit 99.1 -Financing Disclosure
Pro forma historical revenue ($mm)
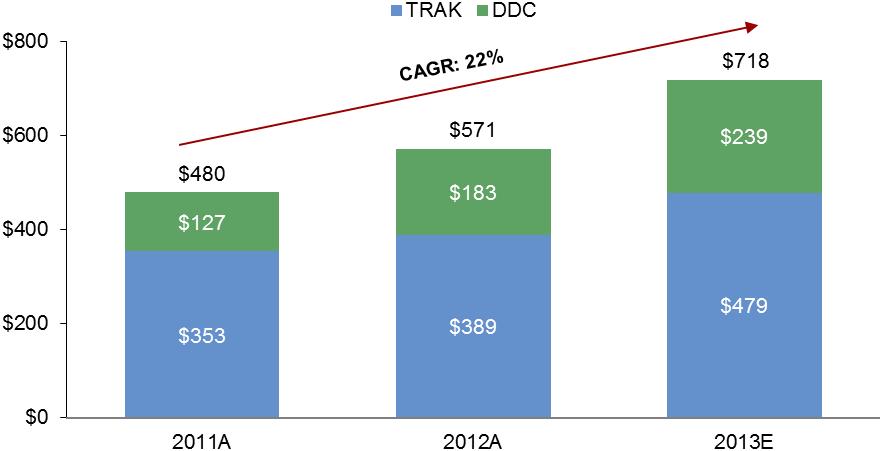
Note: 2013E revenue based on midpoint of Dealertrack public guidance and management estimate for DDC
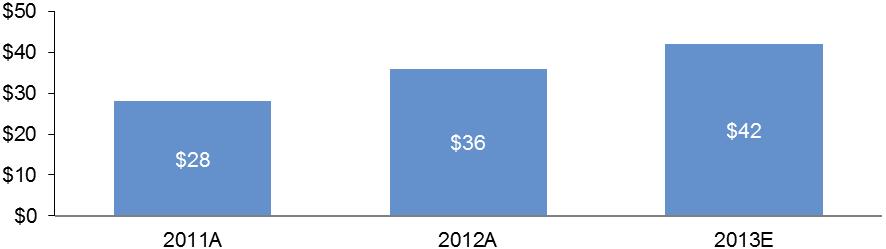
Pro forma historical EBITDA ($mm)
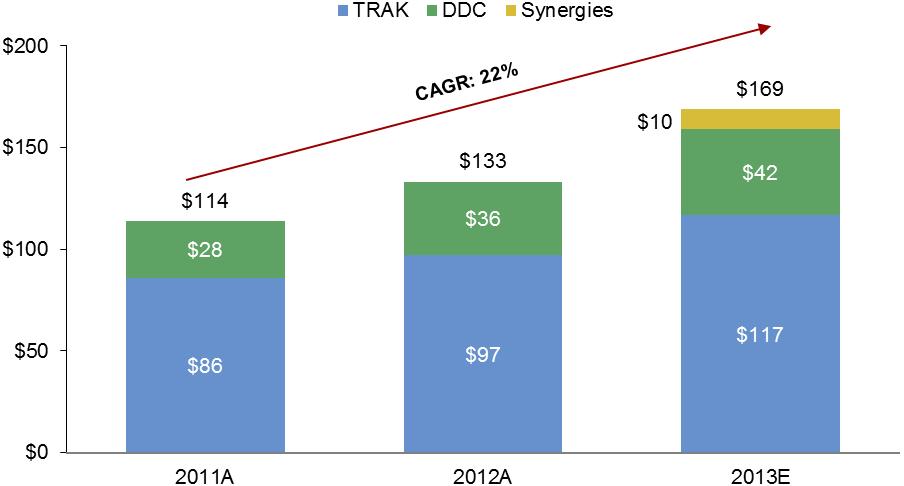
Note: 2013E EBITDA based on midpoint of Dealertrack’s Adj. EBITDA public guidance and management estimate for DDC’s EBITDA (refer to Section 13 for DDC’s EBITDA bridge).
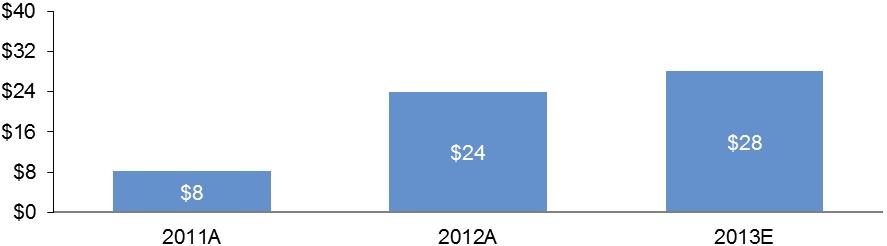
Pro forma historical cash flows (EBITDA– capex), excluding synergies
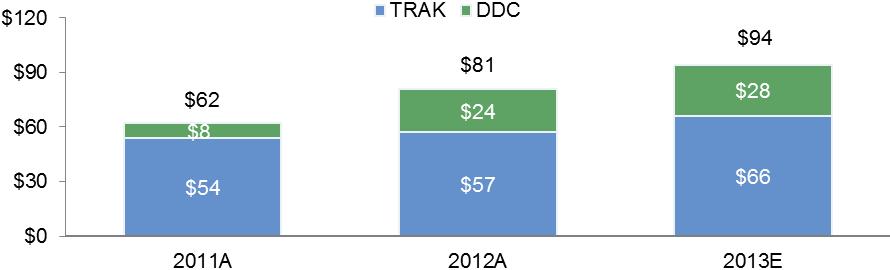
Note: Dealertrack 2013E figures based on midpoint of Dealertrack’s Adj. EBITDA public guidance and management estimate for DDC’s EBITDA (refer to Section 13 for DDC’s EBITDA bridge).
1Does not include synergies.
Dealer.com stand-alone summary financial information
Revenue ($mm)
EBITDA ($mm)
EBITDA - Capex ($mm)
| 1. | Dealer.com historical financial overview |
Balance sheet
| | | December 31, | |
| ($000s) | | | 2013Est. | | | | 2012Act. | | | | 2011Act. | |
| Assets | | | | | | | | | | | | |
| Current assets | | | | | | | | | | | | |
| Cash and cash equivalents | | $ | 50,803 | | | $ | 46,734 | | | $ | 23,455 | |
| Accounts receivable–net | | | 29,658 | | | | 20,500 | | | | 12,349 | |
| Prepaid expenses and other current assets | | | 8,294 | | | | 2,855 | | | | 2,055 | |
| Income tax receivable | | | 2,087 | | | | 2,072 | | | | 6,427 | |
| Deferred income taxes | | | 1,500 | | | | 1,656 | | | | 2,241 | |
| Total current assets | | $ | 92,342 | | | $ | 73,817 | | | $ | 46,527 | |
| Property and equipment–net | | | 42,490 | | | | 37,684 | | | | 35,584 | |
| Internal use software–net | | | 7,953 | | | | 5,938 | | | | 5,950 | |
| Goodwill | | | 6,948 | | | | 949 | | | | 850 | |
| Intangibles, net | | | 5,499 | | | | - | | | | - | |
| Other assets | | | 339 | | | | 762 | | | | 520 | |
| Total assets | | $ | 155,571 | | | $ | 119,150 | | | $ | 89,431 | |
| | | | | | | | | | | | | |
| Liabilities and stockholder’s equity | | | | | | | | | | | | |
| Current liabilities | | | | | | | | | | | | |
| Current portion of notes payable | | $ | 626 | | | $ | 605 | | | $ | 581 | |
| Accounts payable | | | 21,937 | | | | 9,501 | | | | 5,484 | |
| Accrued expenses | | | 14,296 | | | | 16,622 | | | | 12,330 | |
| Deferred revenue | | | 4,045 | | | | 7,138 | | | | 3,074 | |
| Other liabilities | | | 3,793 | | | | 1,024 | | | | 914 | |
| Total current liabilities | | $ | 44,697 | | | $ | 34,890 | | | $ | 22,383 | |
| Income tax payable | | | 2,009 | | | | 5,448 | | | | 4,686 | |
| Deferred revenue–net of current portion | | | 252 | | | | 551 | | | | 2,636 | |
| Notes payable–net of current portion | | | 9,949 | | | | 10,575 | | | | 11,179 | |
| Deferred income taxes | | | 2,962 | | | | 1,291 | | | | 3,190 | |
| Other long-term liabilities | | | 1,599 | | | | 702 | | | | - | |
| Total liabilities | | $ | 61,468 | | | $ | 53,457 | | | $ | 44,074 | |
| Stockholder’s equity | | | | | | | | | | | | |
| Common stock | | $ | 15 | | | $ | 14 | | | $ | 14 | |
| Additional paid-in capital | | | 42,328 | | | | 31,379 | | | | 18,144 | |
| Retained earnings | | | 63,574 | | | | 46,114 | | | | 29,619 | |
| Treasury stock, at cost | | | (11,814 | ) | | | (11,814 | ) | | | (2,420 | ) |
| Total stockholder’s equity | | $ | 94,103 | | | $ | 65,693 | | | $ | 45,357 | |
| Total | | $ | 155,571 | | | $ | 119,150 | | | $ | 89,431 | |
Statement of operations
| | | Year ended December 31, | |
| ($000s) | | | 2013Est. | | | | 2012Act. | | | | 2011Act. | |
| Revenue | | | | | | | | | | | | |
| Website services | | $ | 131,316 | | | $ | 109,164 | | | $ | 86,961 | |
| Advertising and media services | | | 107,775 | | | | 73,473 | | | | 40,110 | |
| Total revenue | | $ | 239,091 | | | $ | 182,637 | | | $ | 127,071 | |
| Cost of revenue | | | | | | | | | | | | |
| Website services | | $ | 36,976 | | | $ | 28,609 | | | $ | 20,166 | |
| Advertising and media services | | | 91,458 | | | | 60,816 | | | | 32,499 | |
| Total cost of revenue | | $ | 128,434 | | | $ | 89,425 | | | $ | 52,665 | |
| | | | | | | | | | | | | |
| Gross profit | | $ | 110,657 | | | $ | 93,212 | | | $ | 74,406 | |
| | | | | | | | | | | | | |
| Operating expenses | | | | | | | | | | | | |
| Sales and marketing | | $ | 38,317 | | | $ | 29,304 | | | $ | 24,771 | |
| Research and development | | | 20,048 | | | | 17,529 | | | | 10,450 | |
| General and administrative | | | 20,608 | | | | 19,442 | | | | 17,770 | |
| Total operating expenses | | $ | 78,973 | | | $ | 66,275 | | | $ | 52,991 | |
| | | | | | | | | | | | | |
| | | | | | | | | | | | | |
| | | | | | | | | | | | | |
| Income from operations | | $ | 31,684 | | | $ | 26,937 | | | $ | 21,415 | |
| | | | | | | | | | | | | |
| Other (expense) income | | | | | | | | | | | | |
| Interest expense–net | | $ | (505 | ) | | $ | (426 | ) | | $ | (391 | ) |
| Other income (expense) | | | (8 | ) | | | 10 | | | | (2 | ) |
| Total other expense | | $ | (513 | ) | | $ | (416 | ) | | $ | (393 | ) |
| Income before provision for income taxes | | $ | 31,171 | | | $ | 26,521 | | | $ | 21,022 | |
| Provision for income taxes | | | (13,711 | ) | | | (10,027 | ) | | | (9,380 | ) |
| Net income | | $ | 17,460 | | | $ | 16,494 | | | $ | 11,642 | |
EBITDA reconciliation
| | | Year ended December 31, | |
| ($000s) | | | 2013Est. | | | | 2012Act. | | | | 2011Act. | |
| Net income | | $ | 17,460 | | | $ | 16,494 | | | $ | 11,642 | |
| Provision for income taxes | | | 13,711 | | | | 10,027 | | | | 9,380 | |
| Interest expense–net | | | 505 | | | | 426 | | | | 391 | |
| Other income (expense) | | | 8 | | | | (10 | ) | | | 2 | |
| Depreciation and amortization | | | 10,743 | | | | 8,928 | | | | 6,263 | |
| EBITDA | | $ | 42,427 | | | $ | 35,865 | | | $ | 27,678 | |
Statement of cash flows
| | | Year ended December 31, | |
| ($000) | | | 2013Est. | | | | 2012Act. | | | | 2011Act. | |
| Cash flows from operating activities: | | | | | | | | | | | | |
| Net income | | $ | 17,460 | | | $ | 16,494 | | | $ | 11,642 | |
| Adjustments to reconcile net income to net cash provided by operating activities: |
| Depreciation and amortization | | $ | 10,743 | | | $ | 8,928 | | | $ | 6,263 | |
| Loss on impairment of internal use software | | | 130 | | | | 317 | | | | - | |
| Bad debt expense | | | 194 | | | | (38 | ) | | | 364 | |
| Amortization of debt issuance costs | | | 41 | | | | - | | | | - | |
| Stock based compensation | | | 3,929 | | | | 3,241 | | | | 1,683 | |
| Deferred income taxes | | | 1,828 | | | | (1,316 | ) | | | 1,454 | |
| Excess tax benefit of options exercised | | | (1,331 | ) | | | (2,620 | ) | | | (2,061 | ) |
| Changes in operating assets and liabilities: |
| Accounts receivable | | $ | (9,352 | ) | | $ | (8,113 | ) | | $ | (4,722 | ) |
| Prepaid expenses and other current assets | | | (3,867 | ) | | | (799 | ) | | | (689 | ) |
| Income taxes | | | (2,122 | ) | | | 7,737 | | | | (3,032 | ) |
| Other assets | | | 424 | | | | (242 | ) | | | (352 | ) |
| Accounts payable | | | 8,487 | | | | 4,806 | | | | (2,018 | ) |
| Accrued expenses | | | (3,684 | ) | | | 4,293 | | | | 4,708 | |
| Deferred revenue | | | (3,392 | ) | | | 1,980 | | | | 1,134 | |
| Other liabilities | | | 2,916 | | | | 812 | | | | 186 | |
| Net cash provided by operating activities | | $ | 22,404 | | | $ | 35,480 | | | $ | 14,560 | |
| | | | | | | | | | | | | |
| Cash flows from investing activities: | | | | | | | | | | | | |
| Decrease in restricted cash | | $ | - | | | $ | - | | | $ | 4,334 | |
| Purchase of property and equipment | | | (7,388 | ) | | | (7,568 | ) | | | (14,520 | ) |
| Capitalization of internal use software | | | (6,314 | ) | | | (4,552 | ) | | | (5,233 | ) |
| Payments for acquisitions, net of cash acquired | | | (7,614 | ) | | | (100 | ) | | | (850 | ) |
| Net cash used in investing activities | | $ | (21,316 | ) | | $ | (12,220 | ) | | $ | (16,269 | ) |
| | | | | | | | | | | | | |
| Cash flows from financing activities: | | | | | | | | | | | | |
| Repurchase of common stock | | $ | - | | | $ | (2,750 | ) | | $ | - | |
| Proceeds from exercise of stock options | | | 2,809 | | | | 730 | | | | 664 | |
| Tax benefit of exercised stock options | | | 1,331 | | | | 2,620 | | | | 2,061 | |
| Repayment on notes payable and capital leases | | | (962 | ) | | | - | | | | - | |
| Debt issuance costs | | | (198 | ) | | | (580 | ) | | | (565 | ) |
| Net cash provided by financing activities | | $ | 2,980 | | | $ | 20 | | | $ | 2,160 | |
| | | | | | | | | | | | | |
| Increase in cash and cash equivalents | | $ | 4,068 | | | $ | 23,280 | | | $ | 451 | |
| Cash and cash equivalents, beginning of period | | $ | 46,735 | | | $ | 23,455 | | | $ | 23,004 | |
| Cash and cash equivalents, end of period | | $ | 50,803 | | | $ | 46,735 | | | $ | 23,455 | |