Exhibit 99.2
1 February 23, 2015 Investor Presentation
2 Safe Harbor for Forward - Looking Statements ■ Statements in this press release regarding Dealertrack’s expected 2015 performance based on both GAAP and non - GAAP measures, the long - term outlook for its business, and all other statements in this release other than the recitation of historical facts are forward - looking statements (as defined in the Private Securities Litigation Reform Act of 1995 ) . These statements involve a number of risks, uncertainties and other factors that could cause actual results, performance or achievements of Dealertrack to be materially different from any future results, performance or achievements expressed or implied by these forward - looking statements . ■ Factors that might cause such a difference include : economic trends that affect the automotive retail industry or the indirect automotive financing industry including the number of new and used cars sold ; credit availability ; reductions in automotive dealerships ; increased competitive pressure from other industry participants, including CDK Global (formerly ADP), Cox Automotive, Dominion Dealer Solutions, Open Dealer Exchange, Reynolds and Reynolds, and RouteOne ; the impact of some vendors of software products for automotive dealers making it more difficult for our customers to use our solutions and services ; security breaches, interruptions, failures and/or other errors involving our systems or networks ; the failure or inability to execute any element of our business strategy, including selling additional products and services to existing and new customers ; our success in implementing an ERP system ; the volatility of our stock price ; new regulations or changes to existing regulations ; the integration of recent acquisitions and the expected benefits, as well as the integration and expected benefits of any future acquisitions that we may pursue ; our success in expanding its customer base and product and service offerings, the impact of recent economic trends, and difficulties and increased costs associated with raising additional capital ; the impairment of intangible assets, such as trademarks and goodwill ; the possibility that the expected benefits of our acquisition of incadea may not materialize as expected ; failure to successfully integrate the business, infrastructure and employees of incadea ; and other risks listed in our reports filed with the Securities and Exchange Commission (SEC), including its most recent Annual Report on Form 10 - K . These filings can be found on our website at www . dealertrack . com and the SEC’s website at www . sec . gov . Forward - looking statements included herein speak only as of the date hereof and Dealertrack disclaims any obligation to revise or update such statements to reflect events or circumstances after the date hereof or to reflect the occurrence of unanticipated events or circumstances, except as required by law .
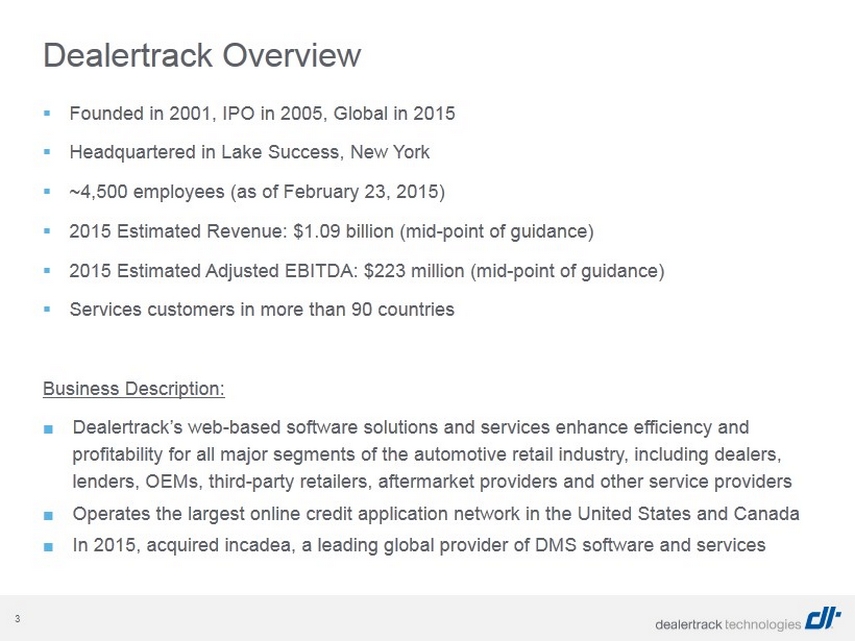
3 ▪ Founded in 2001, IPO in 2005, Global in 2015 ▪ Headquartered in Lake Success, New York ▪ ~ 4, 5 00 employees (as of February 23, 2015) ▪ 2015 Estimated Revenue: $ 1.09 billion (mid - point of guidance) ▪ 2015 Estimated Adjusted EBITDA: $ 223 million (mid - point of guidance) ▪ S ervices customers in more than 90 countries Business Description: ■ Dealertrack’s web - based software solutions and services enhance efficiency and profitability for all major segments of the automotive retail industry, including dealers, lenders, OEMs, third - party retailers, aftermarket providers and other service providers ■ Operates the largest online credit application network in the United States and Canada ■ In 2015, acquired incadea , a leading global provider of DMS software and services Dealertrack Overview
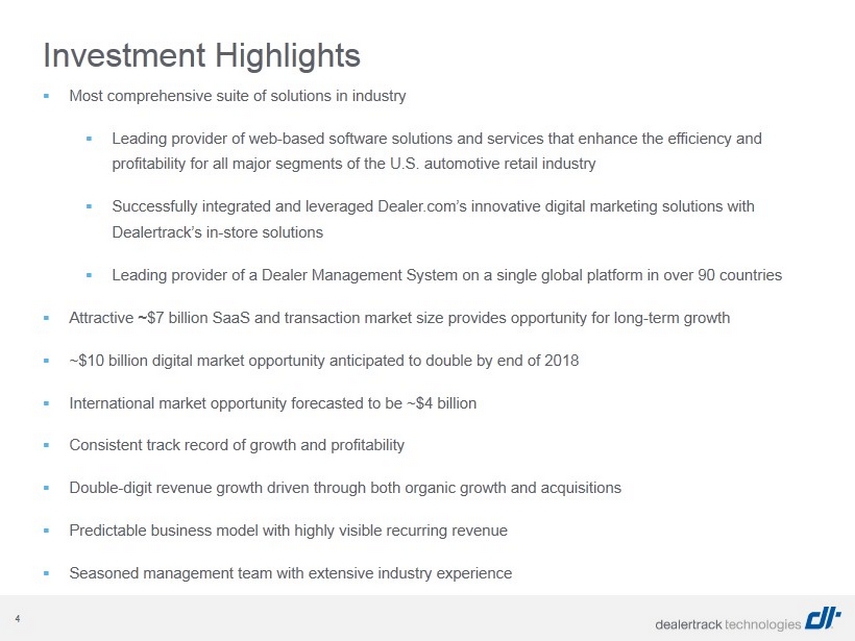
4 ▪ Most comprehensive suite of solutions in industry ▪ Leading provider of web - based software solutions and services that enhance the efficiency and profitability for all major segments of the U.S. automotive retail industry ▪ Successfully integrated and leveraged Dealer.com’s innovative digital marketing solutions with Dealertrack’s in - store solutions ▪ Leading provider of a Dealer Management System on a single global platform in over 90 countries ▪ Attractive ~ $7 billion SaaS and transaction market size provides opportunity for long - term growth ▪ ~$10 billion digital market opportunity anticipated to double by end of 2018 ▪ International market opportunity forecasted to be ~$4 billion ▪ Consistent track record of growth and profitability ▪ Double - digit revenue growth driven through both organic growth and acquisitions ▪ Predictable business model with highly visible recurring revenue ▪ Seasoned management team with extensive industry experience Investment Highlights
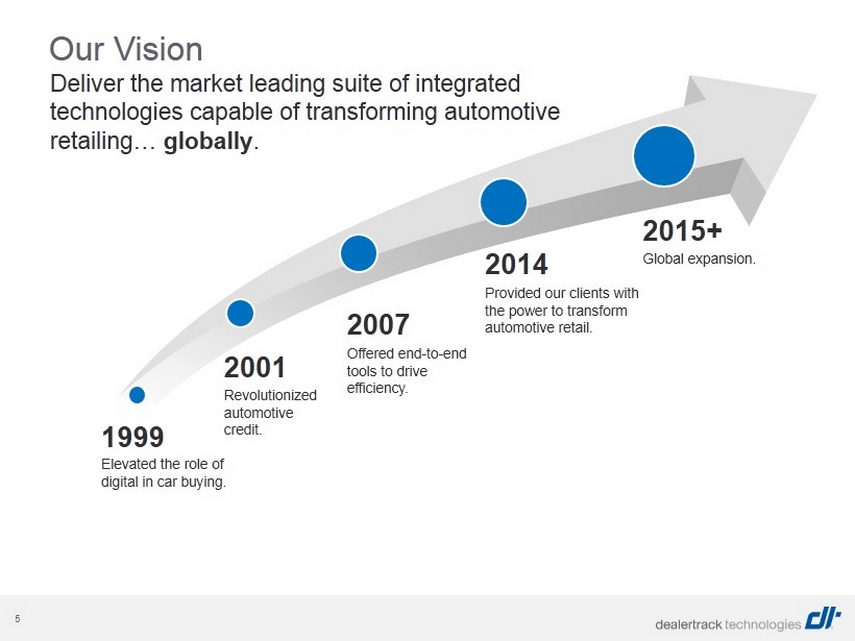
5 Our Vision Deliver the market leading suite of integrated technologies capable of transforming automotive retailing… globally . 2001 2007 2014 Revolutionized automotive credit. Offered end - to - end tools to drive efficiency. Provided our clients with the power to transform automotive retail. 1999 Elevated the role of digital in car buying. 2015+ Global expansion.
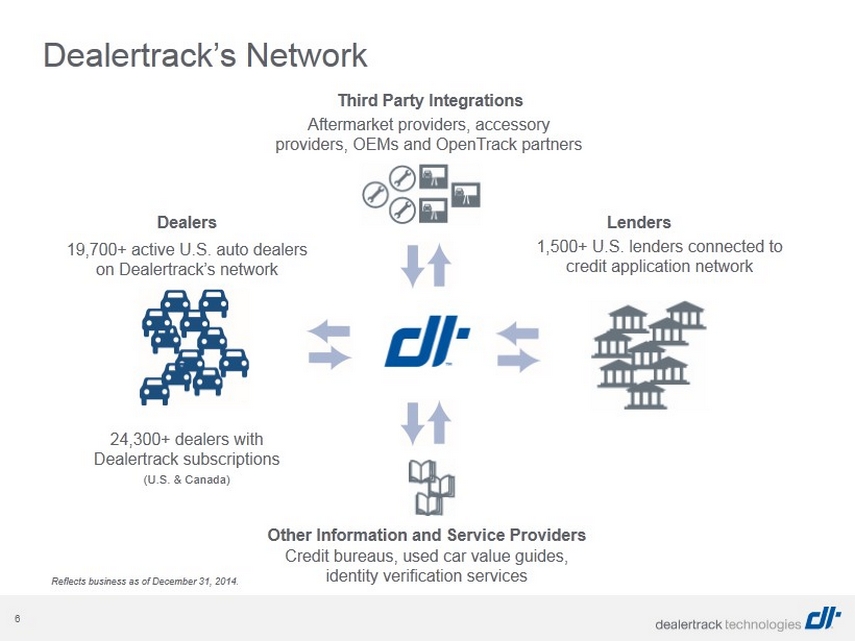
6 Dealertrack’s Network Aftermarket providers, accessory providers, OEMs and OpenTrack partners Third Party Integrations Other Information and Service Providers Lenders 1,500+ U.S. lenders connected to credit application network Credit bureaus, used car value guides, identity verification services Dealers 19,700+ active U.S. auto dealers on Dealertrack’s network 24,300+ dealers with Dealertrack subscriptions (U.S. & Canada) Reflects business as of December 31, 2014.
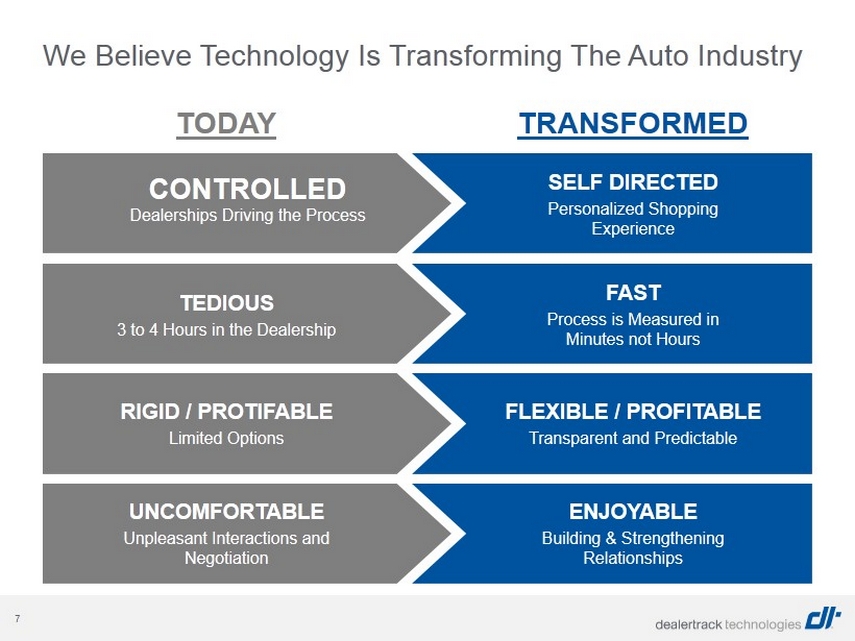
7 We Believe Technology Is Transforming The Auto Industry SELF DIRECTED Personalized Shopping Experience TEDIOUS 3 to 4 Hours in the Dealership FAST Process is Measured in Minutes not Hours RIGID / PROTIFABLE Limited Options FLEXIBLE / PROFITABLE Transparent and Predictable UNCOMFORTABLE Unpleasant Interactions and Negotiation ENJOYABLE Building & Strengthening Relationships TODAY TRANSFORMED CONTROLLED Dealerships Driving the Process

8 4,500+ Team members worldwide 19,700+ Dealerships 94%+ of U.S. franchise dealers 20+ OEMs 1,500+ Lenders 45% of all U.S. cars financed via dealertrack.com 100M+ Transactions Annually Generating $1 B + In Expected 2015 Revenue Connecting with supporting and Over 4 5M + Unique visitors / month on 13,000+ Dealer Websites “Touching” 3 of 4 Cars sold in the U.S. and Canada and hosting “Insight into” 1 out of 4 Buy/Sell Lists & 5M+ Inventory Listings and and Managing 41M+ Financed Titles We Have Unique Capabilities To Achieve Change
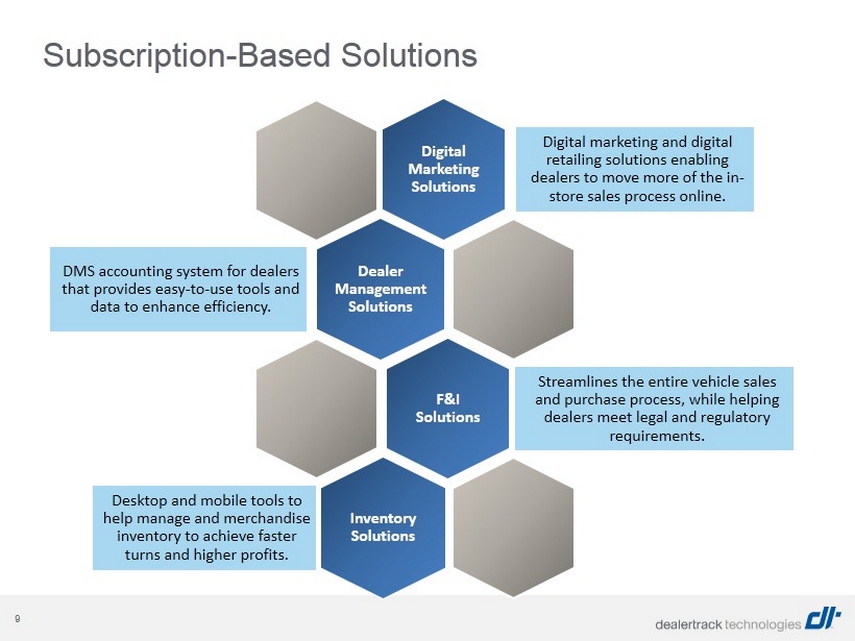
9 Subscription - Based Solutions Dealer Management Solutions DMS accounting system for dealers that provides easy - to - use tools and data to enhance efficiency. Digital Marketing Solutions Digital marketing and digital retailing solutions enabling dealers to move more of the in - store sales process online. F&I Solutions Streamlines the entire vehicle sales and purchase process, while helping dealers meet legal and regulatory requirements. Inventory Solutions Desktop and mobile tools to help manage and merchandise inventory to achieve faster turns and higher profits.
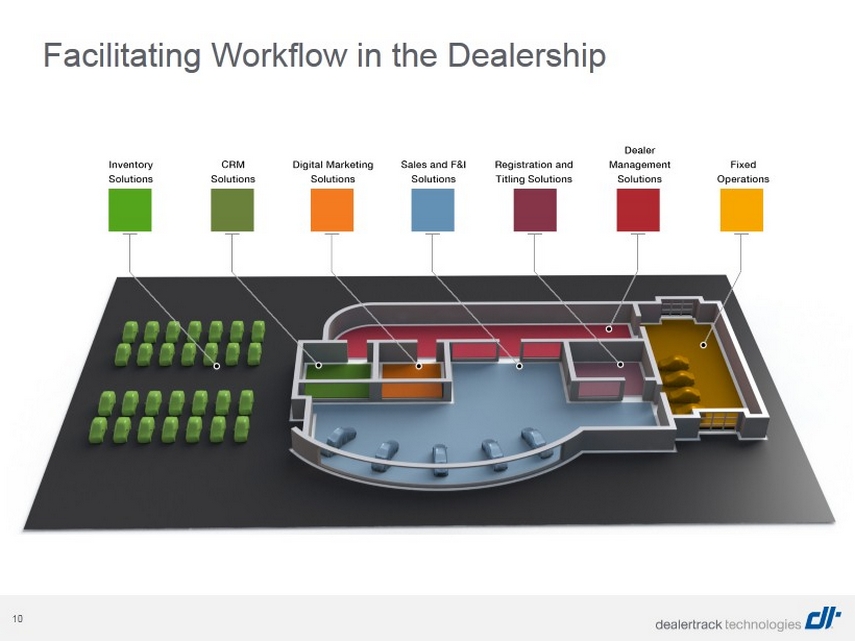
10 Facilitating Workflow in the Dealership
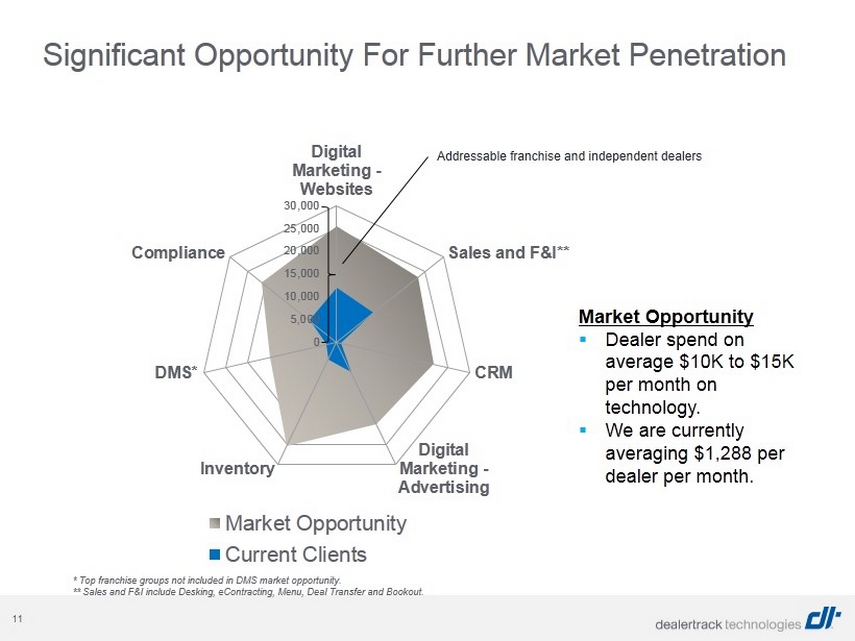
11 0 5,000 10,000 15,000 20,000 25,000 30,000 Digital Marketing - Websites Sales and F&I** CRM Digital Marketing - Advertising Inventory DMS* Compliance Market Opportunity Current Clients Significant Opportunity For Further Market Penetration * Top franchise groups not included in DMS market opportunity. ** Sales and F&I include Desking, eContracting, Menu, Deal Transfer and Bookout. Addressable franchise and independent dealers Market Opportunity ▪ Dealer spend on average $10K to $15K per month on technology. ▪ We are currently averaging $ 1,288 per dealer per month.
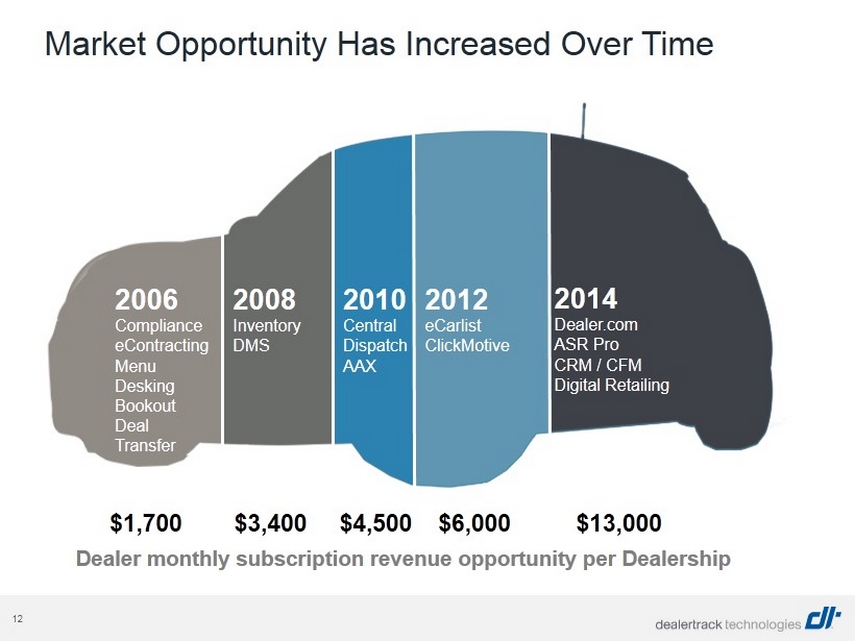
12 Market Opportunity Has Increased Over Time 2006 Compliance eContracting Menu Desking Bookout Deal Transfer 2008 Inventory DMS 2014 Dealer.com ASR Pro CRM / CFM Digital Retailing 2010 Central Dispatch AAX 2012 eCarlist ClickMotive $1,700 $3,400 $ 4,500 $6,000 $13,000 Dealer monthly subscription revenue opportunity per Dealership
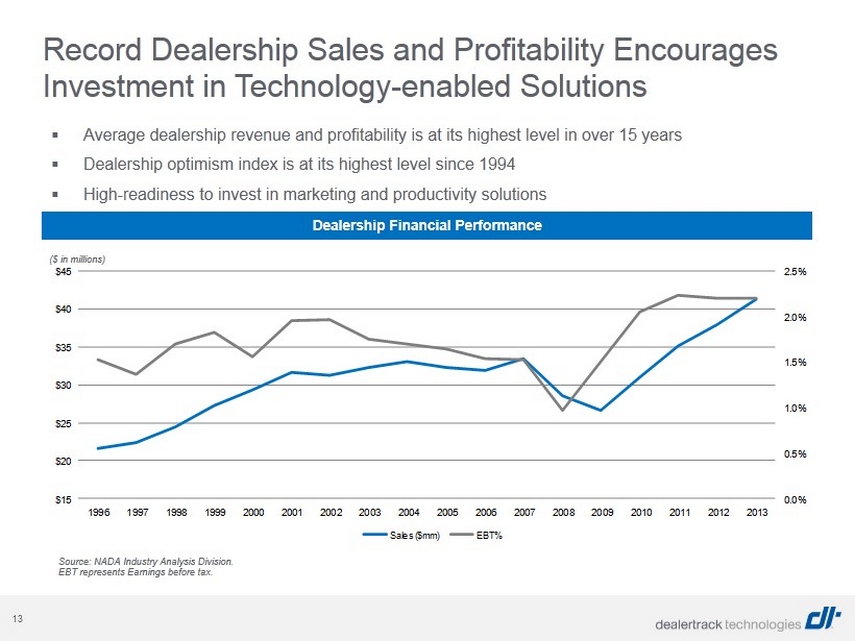
13 ▪ Average dealership revenue and profitability is at its highest level in over 15 years ▪ Dealership optimism index is at its highest level since 1994 ▪ High - readiness to invest in marketing and productivity solutions Source: NADA Industry Analysis Division. EBT represents Earnings before tax. Record Dealership Sales and Profitability Encourages Investment in Technology - enabled Solutions Dealership Financial Performance 0.0% 0.5% 1.0% 1.5% 2.0% 2.5% $15 $20 $25 $30 $35 $40 $45 1996 1997 1998 1999 2000 2001 2002 2003 2004 2005 2006 2007 2008 2009 2010 2011 2012 2013 Sales ($mm) EBT% ( $ in millions)
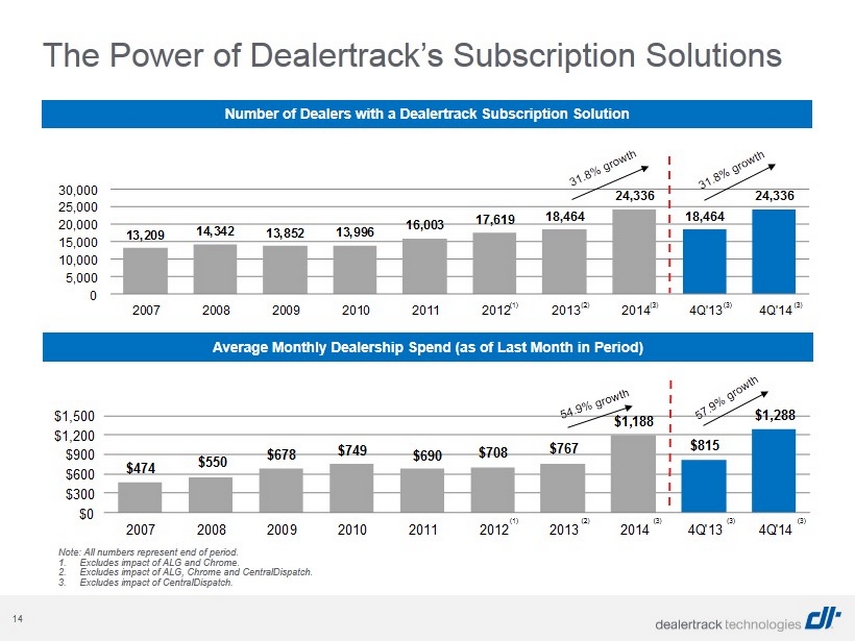
14 $474 $550 $678 $749 $690 $708 $767 $1,188 $815 $1,288 $0 $300 $600 $900 $1,200 $1,500 2007 2008 2009 2010 2011 2012 2013 2014 4Q'13 4Q'14 13,209 14,342 13,852 13,996 16,003 17,619 18,464 24,336 18,464 24,336 0 5,000 10,000 15,000 20,000 25,000 30,000 2007 2008 2009 2010 2011 2012 2013 2014 4Q'13 4Q'14 The Power of Dealertrack’s Subscription Solutions Note: All numbers represent end of period. 1. Excludes impact of ALG and Chrome. 2. Excludes impact of ALG, Chrome and CentralDispatch. 3. Excludes impact of CentralDispatch. Number of Dealers with a Dealertrack Subscription Solution Average Monthly Dealership Spend (as of Last Month in Period) (1) (2) (3) (3) (3) (1) (2) (3) (3) (3)
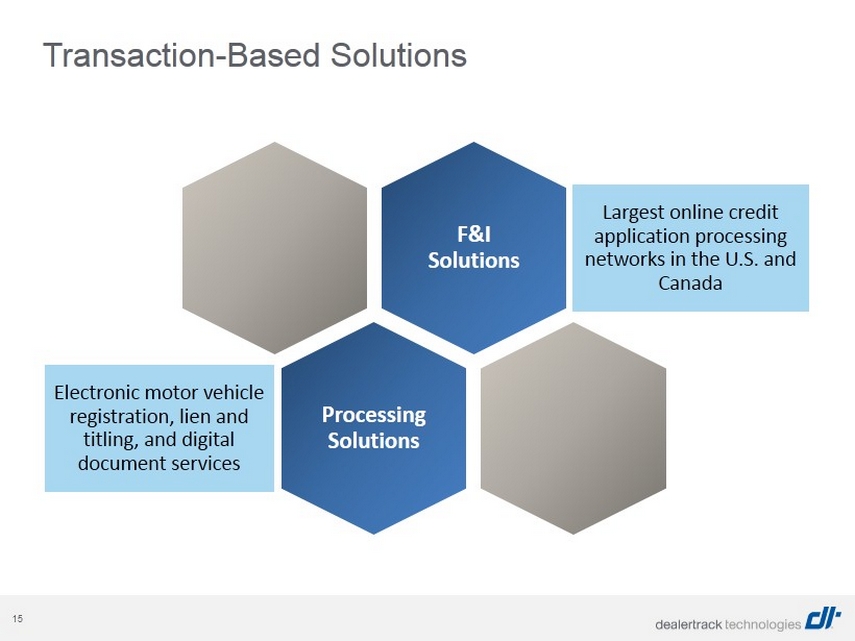
15 Transaction - Based Solutions F&I Solutions Largest online credit application processing networks in the U.S. and Canada Processing Solutions Electronic motor vehicle registration, lien and titling, and digital document services

16 Growing Number of Transactions in Car Buying Process Processing an increasing number of transactions on a single car sale through Dealertrack’s network * Verification services can either be transaction or subscription revenue. ** Additional contract related transactions can occur based on lenders’ participation in digital document services. Note: Not all cars sold are processed through the Dealertrack’s network. Dollar amounts are illustrative of US pricing and may not reflect actual pricing. Dealer Dealer Lender Lender Lender Verify ID* and pull credit bureau Submit credit application Process contract** Vehicle registration Title and lien administration ~1 to 2 transactions ~2 to 4 transactions ~1 to 2 transactions ~1 transaction ~1 to 2 transactions $0.05 to $1.00 $1.50 to $5.00 $2.50 to $5.00 $2.00 to $25.00 $1.50 to $5.00 $29.00 Revenue Potential per Car Sold
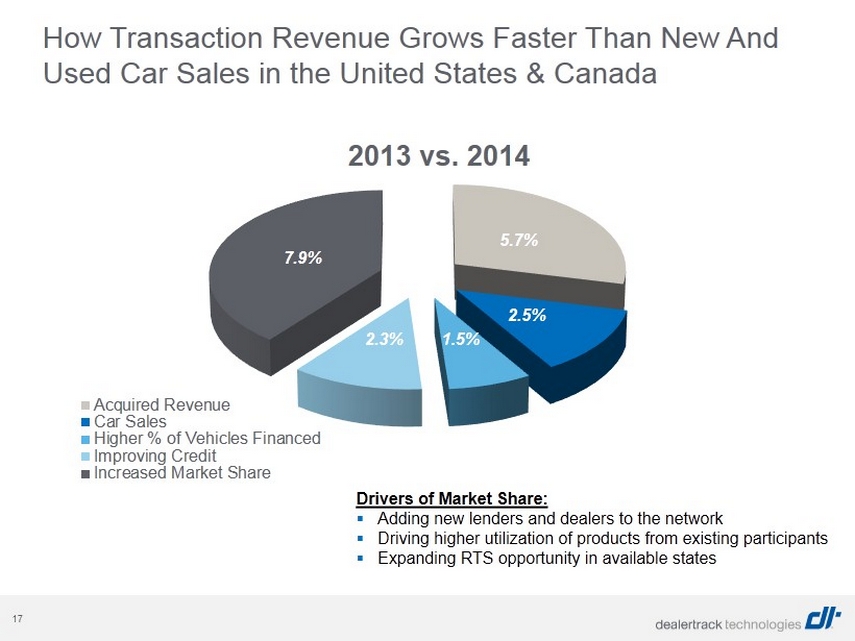
17 5.7% 2.5% 1.5% 2.3% 7.9% 2013 vs. 2014 Acquired Revenue Car Sales Higher % of Vehicles Financed Improving Credit Increased Market Share How Transaction Revenue Grows Faster Than New And Used Car Sales in the United States & Canada Drivers of Market Share: ▪ Adding new lenders and dealers to the network ▪ Driving higher utilization of products from existing participants ▪ Expanding RTS opportunity in available states
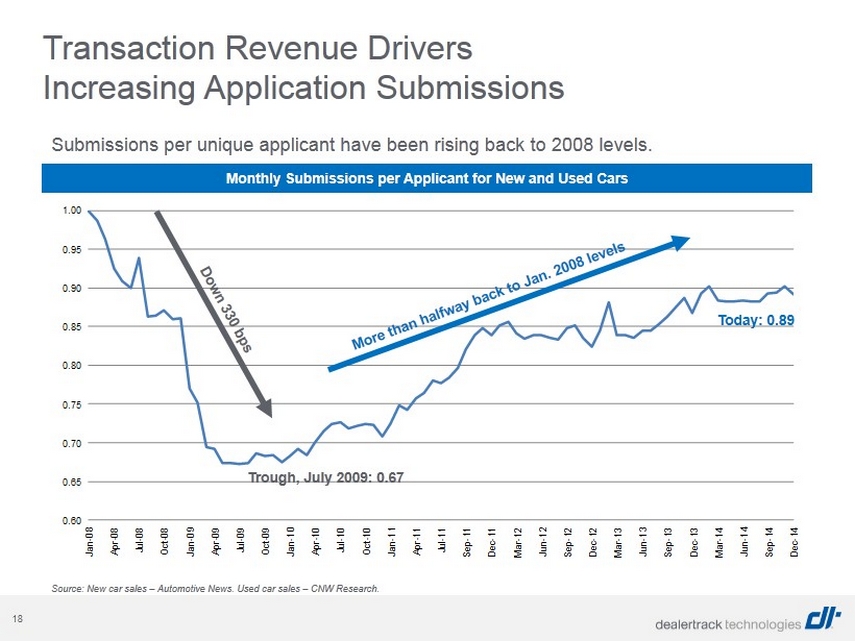
18 0.60 0.65 0.70 0.75 0.80 0.85 0.90 0.95 1.00 Jan-08 Apr-08 Jul-08 Oct-08 Jan-09 Apr-09 Jul-09 Oct-09 Jan-10 Apr-10 Jul-10 Oct-10 Jan-11 Apr-11 Jul-11 Sep-11 Dec-11 Mar-12 Jun-12 Sep-12 Dec-12 Mar-13 Jun-13 Sep-13 Dec-13 Mar-14 Jun-14 Sep-14 Dec-14 Submissions per unique applicant have been rising back to 2008 levels. Source: New car sales – Automotive News. Used car sales – CNW Research. Today: 0.89 Trough, July 2009: 0.67 Transaction Revenue Drivers Increasing Application Submissions Monthly Submissions per Applicant for New and Used Cars
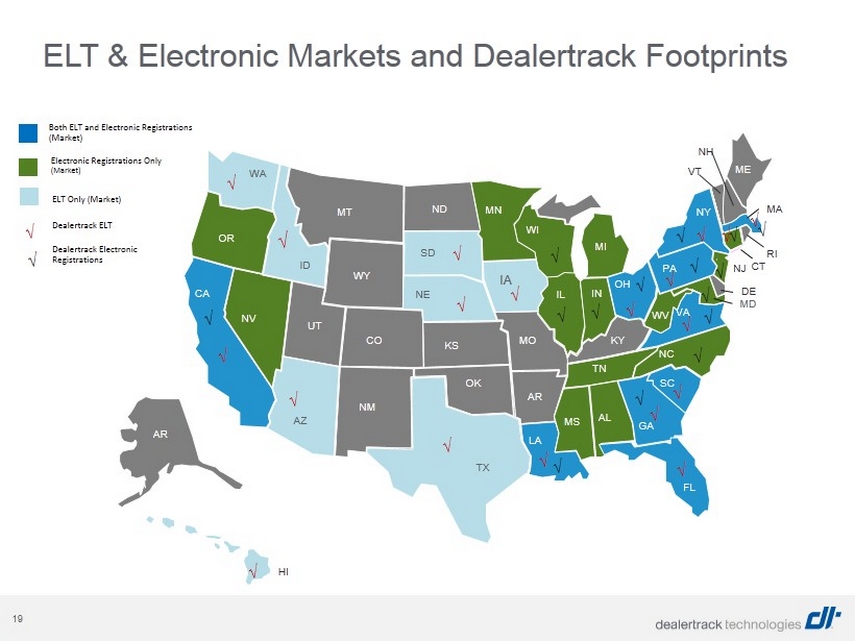
19 ELT & Electronic Markets and Dealertrack Footprints Dealertrack ELT Dealertrack Electronic Registrations Both ELT and Electronic Registrations (Market) Electronic Registrations Only (Market) ELT Only (Market) NM CO UT NV OR MT ND WY KS OK AR MO LA MS AL TN KY MN WI MI IL IN OH CA AR AZ TX WA ID SD NE IA FL GA SC NC VA WV PA NY ME NH VT HI MD DE NJ CT RI MA √ √ √ √ √ √ √ √ √ √ √ √ √ √ √ √ √ √ √ √ √ √ √ √ √ √ √ √ √ √ √ √ √ √ √ √
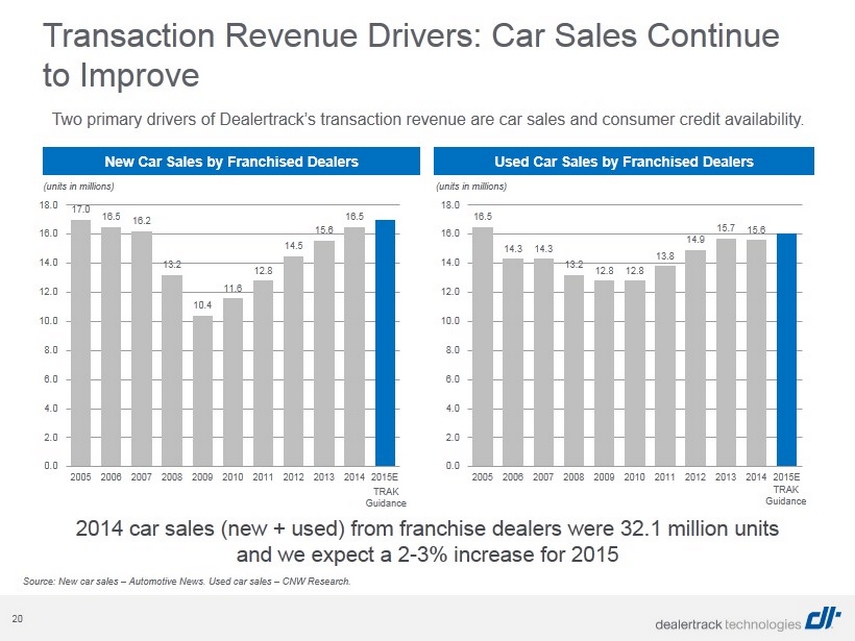
20 16.5 14.3 14.3 13.2 12.8 12.8 13.8 14.9 15.7 15.6 0.0 2.0 4.0 6.0 8.0 10.0 12.0 14.0 16.0 18.0 2005 2006 2007 2008 2009 2010 2011 2012 2013 2014 2015E 17.0 16.5 16.2 13.2 10.4 11.6 12.8 14.5 15.6 16.5 0.0 2.0 4.0 6.0 8.0 10.0 12.0 14.0 16.0 18.0 2005 2006 2007 2008 2009 2010 2011 2012 2013 2014 2015E Transaction Revenue Drivers: Car Sales Continue to Improve New Car Sales by Franchised Dealers Used Car Sales by Franchised Dealers (units in millions) TRAK Guidance (units in millions) Two primary drivers of Dealertrack’s transaction revenue are car sales and consumer credit availability. TRAK Guidance Source: New car sales – Automotive News. Used car sales – CNW Research. 2014 car sales (new + used) from franchise dealers were 32.1 million units and we expect a 2 - 3% increase for 2015
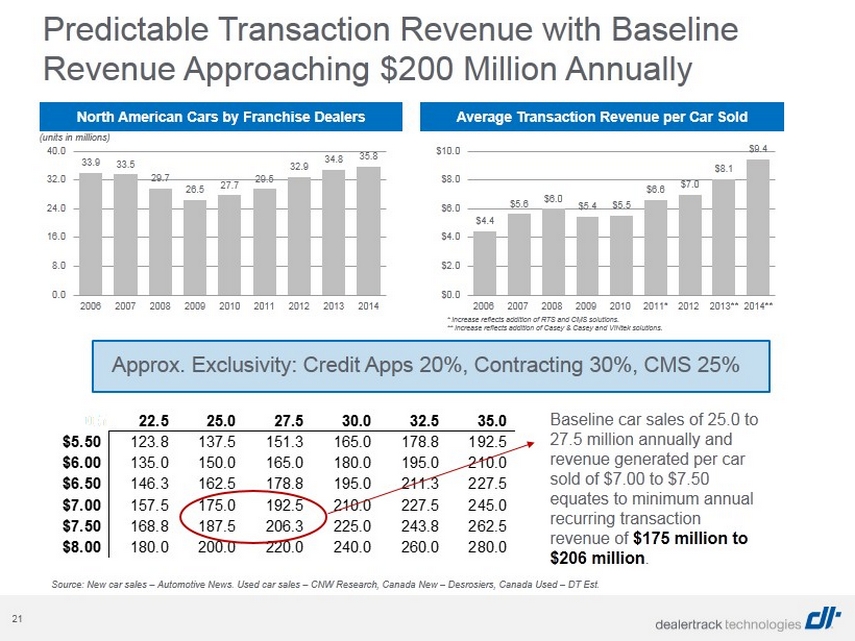
21 0.5 22.5 25.0 27.5 30.0 32.5 35.0 $5.50 123.8 137.5 151.3 165.0 178.8 192.5 $6.00 135.0 150.0 165.0 180.0 195.0 210.0 $6.50 146.3 162.5 178.8 195.0 211.3 227.5 $7.00 157.5 175.0 192.5 210.0 227.5 245.0 $7.50 168.8 187.5 206.3 225.0 243.8 262.5 $8.00 180.0 200.0 220.0 240.0 260.0 280.0 Predictable Transaction Revenue with Baseline Revenue Approaching $200 Million Annually North American Cars by Franchise Dealers (units in millions) Source: New car sales – Automotive News. Used car sales – CNW Research, Canada New – Desrosiers, Canada Used – DT Est. Average Transaction Revenue per Car Sold Approx. Exclusivity: Credit Apps 20%, Contracting 30%, CMS 25% Baseline car sales of 25.0 to 27.5 million annually and revenue generated per car sold of $7.00 to $7.50 equates to minimum annual recurring transaction revenue of $175 million to $206 million . * Increase reflects addition of RTS and CMS solutions. ** Increase reflects addition of Casey & Casey and VINtek solutions. 33.9 33.5 29.7 26.5 27.7 29.5 32.9 34.8 35.8 0.0 8.0 16.0 24.0 32.0 40.0 2006 2007 2008 2009 2010 2011 2012 2013 2014 $4.4 $5.6 $6.0 $5.4 $5.5 $6.6 $7.0 $8.1 $9.4 $0.0 $2.0 $4.0 $6.0 $8.0 $10.0 2006 2007 2008 2009 2010 2011* 2012 2013** 2014**
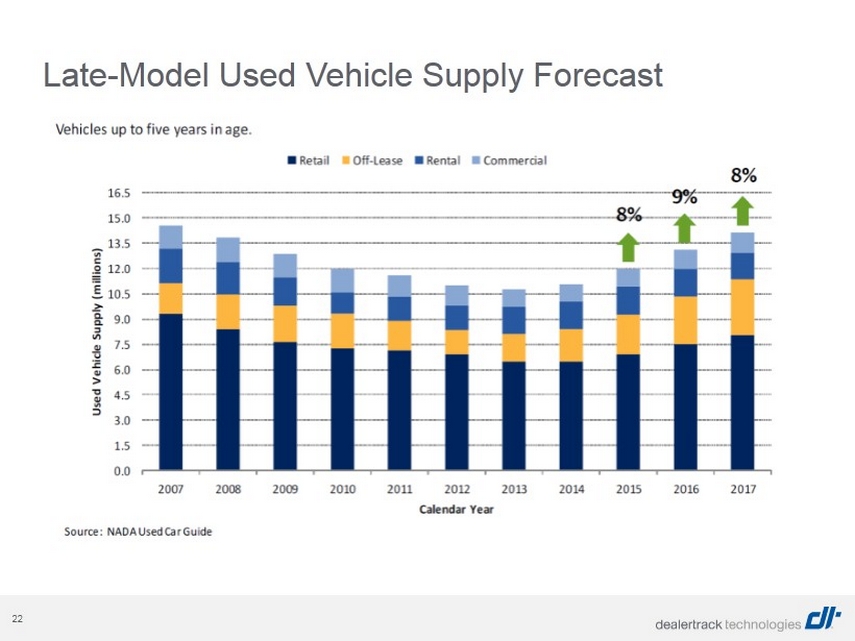
22 Late - Model Used Vehicle Supply Forecast
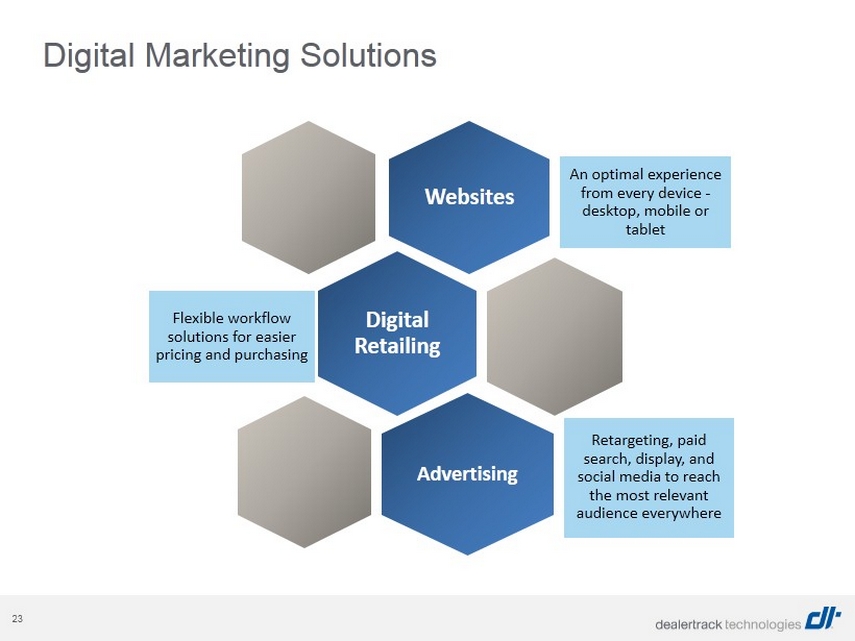
23 Digital Marketing Solutions Websites An optimal experience from every device - desktop, mobile or tablet Digital Retailing Flexible workflow solutions for easier pricing and purchasing Advertising Retargeting, paid search, display, and social media to reach the most relevant audience everywhere
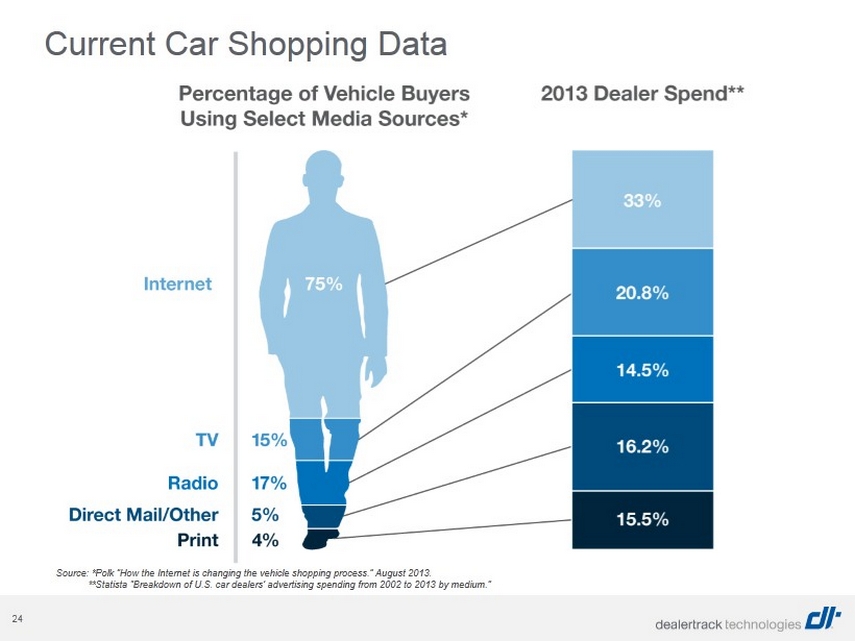
24 Source: *Polk ”How the Internet is changing the vehicle shopping process.” August 2013. **Statista “Breakdown of U.S. car dealers’ advertising spending from 2002 to 2013 by medium.” Current Car Shopping Data
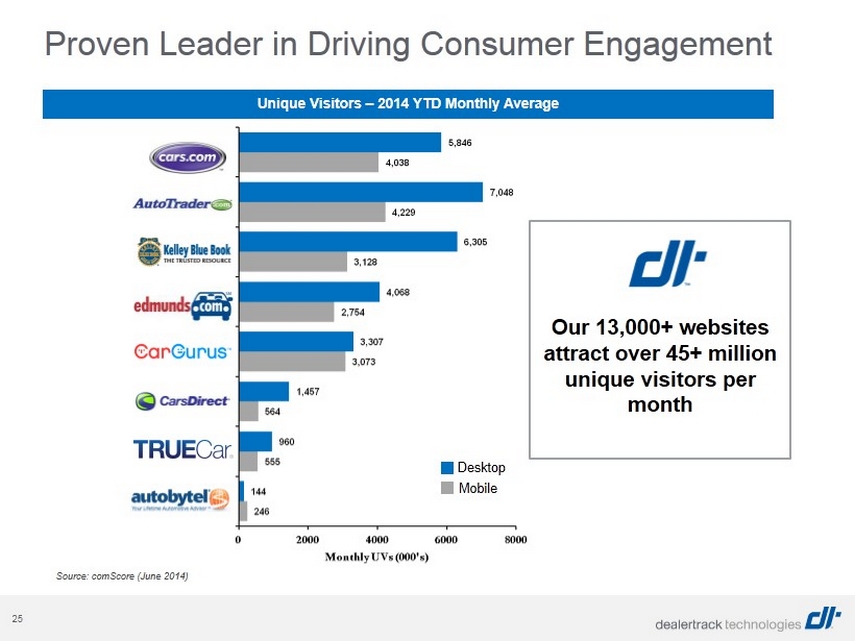
25 Source: comScore (June 2014) Proven Leader in Driving Consumer Engagement Unique Visitors – 2014 YTD Monthly Average Desktop Mobile Our 13,000+ websites attract over 45+ million unique visitors per month
26

27 Advertising Channels Our combination of paid search, network and premium display, and social provides complete coverage across all digital ad opportunities. Unified Advertising Dashboard Connects cross - channel campaign results with market intelligence, providing performance transparency and forecasting, and precise customization of ad spending. Media Consultants Align campaigns with your strategy and leverage Real Time Bidding technology to maximize every campaign’s effectiveness. 99 The Dealer.com UAX covers of the Web % Dealer.com Advertising Overview
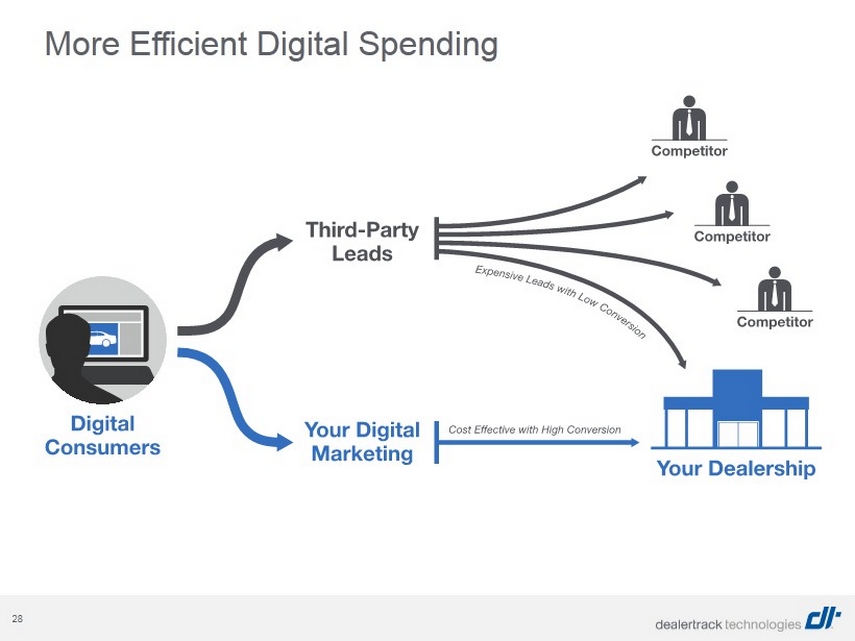
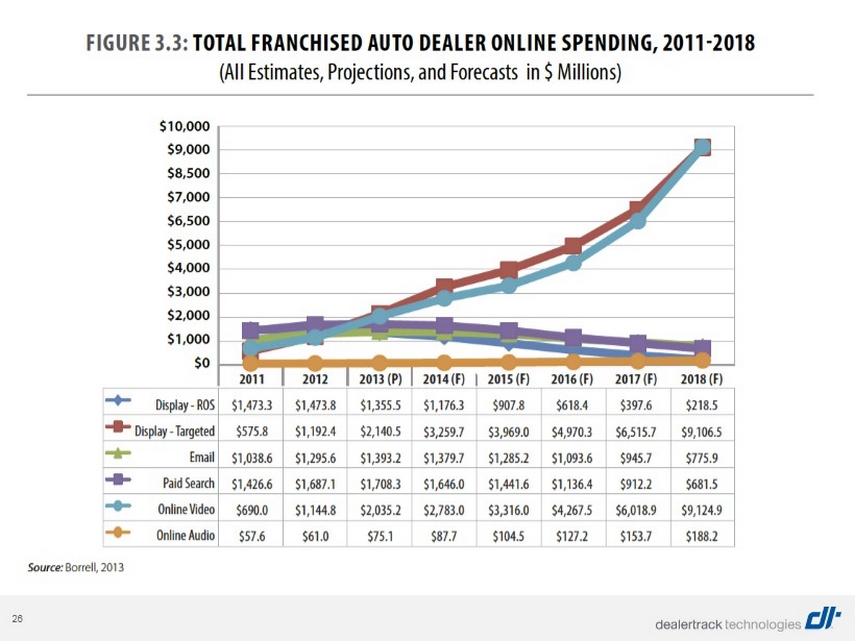
28 More Efficient Digital Spending
29 i ncadea Overview
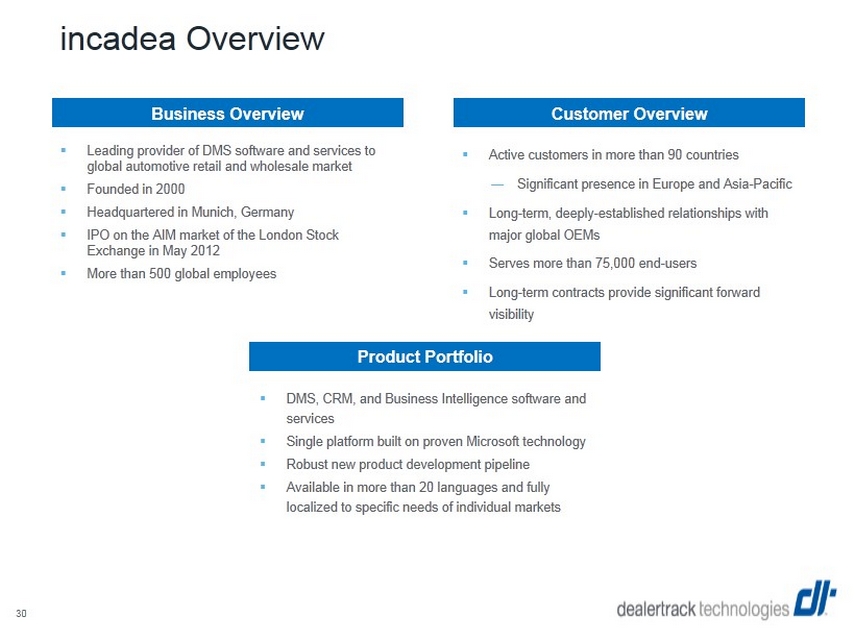
i ncadea Overview Business Overview Customer Overview Product Portfolio ▪ DMS, CRM, and Business Intelligence software and services ▪ Single platform built on proven Microsoft technology ▪ Robust new product development pipeline ▪ Available in more than 20 languages and fully localized to specific needs of individual markets ▪ Active customers in more than 90 countries ― Significant presence in Europe and Asia - Pacific ▪ Long - term, deeply - established relationships with major global OEMs ▪ Serves more than 75,000 end - users ▪ Long - term contracts provide significant forward visibility ▪ Leading provider of DMS software and services to global automotive retail and wholesale market ▪ Founded in 2000 ▪ Headquartered in Munich, Germany ▪ IPO on the AIM market of the London Stock Exchange in May 2012 ▪ More than 500 global employees 30
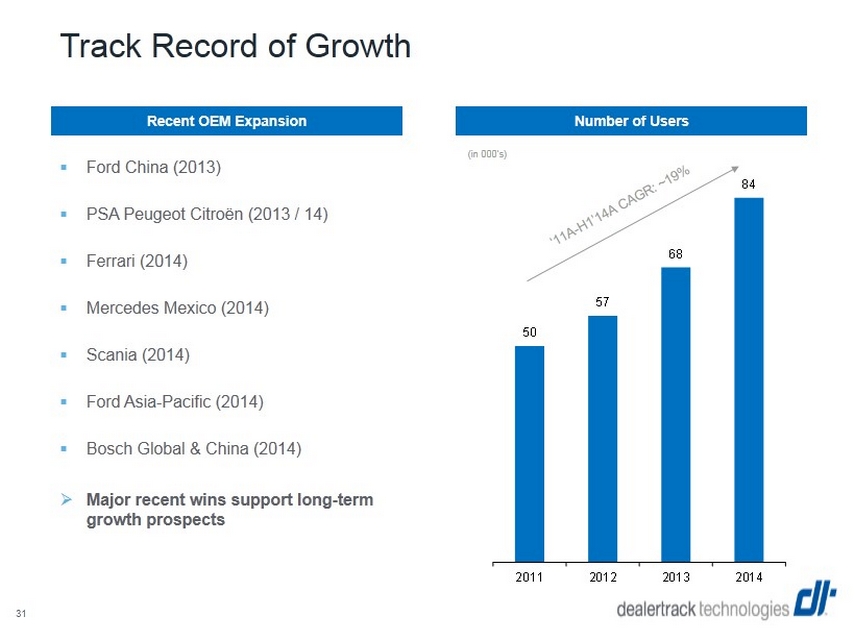
Track Record of Growth ▪ Ford China (2013) ▪ PSA Peugeot Citroën ( 2013 / 14 ) ▪ Ferrari (2014) ▪ Mercedes Mexico (2014 ) ▪ Scania (2014) ▪ Ford Asia - Pacific (2014) ▪ Bosch Global & China (2014 ) Recent OEM Expansion Number of Users » Major recent wins support long - term growth prospects 31 (in 000’s) 50 57 68 84 2011 2012 2013 2014
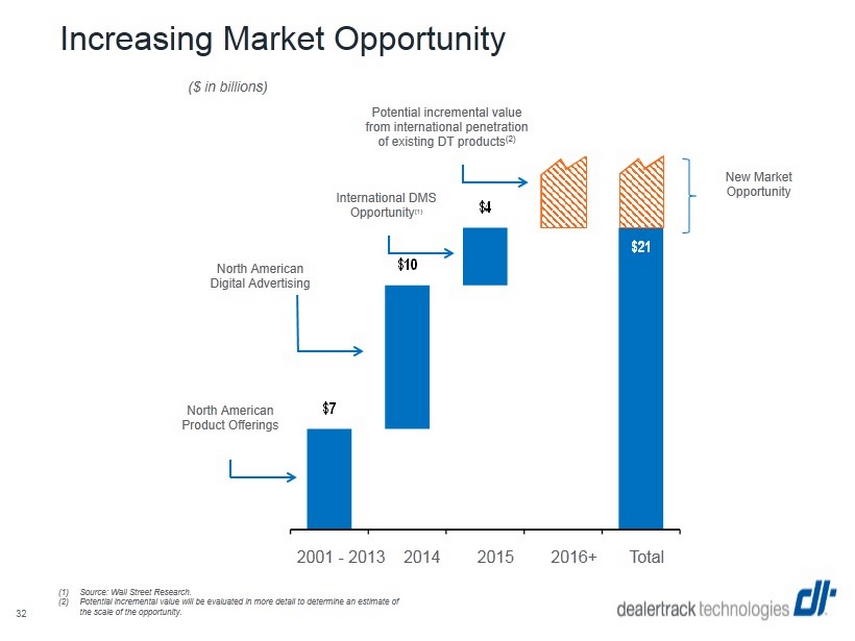
$7 $10 $4 $21 DRIVER (pre- DDC) DDC IRENE Other Pro Forma DRIVER Increasing Market Opportunity International DMS Opportunity (1) ($ in billions) 2001 - 2013 2014 2015 2016+ Total North American Digital Advertising North American Product Offerings 32 ~ New Market Opportunity Potential incremental value from international penetration of existing DT products (2) (1) Source: Wall Street Research. (2) Potential incremental value will be evaluated in more detail to determine an estimate of the scale of the opportunity.

33 Growth Strategy & Financial Results
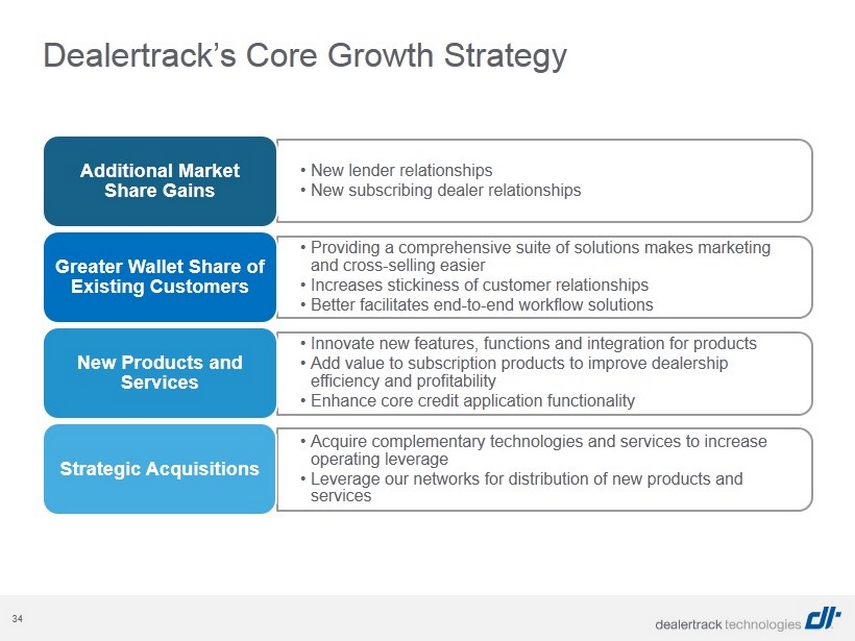
34 Dealertrack’s Core Growth Strategy • New lender relationships • New subscribing dealer relationships Additional Market Share Gains • Providing a comprehensive suite of solutions makes marketing and cross - selling easier • Increases stickiness of customer relationships • Better facilitates end - to - end workflow solutions Greater Wallet Share of Existing Customers • Innovate new features, functions and integration for products • Add value to subscription products to improve dealership efficiency and profitability • Enhance core credit application functionality New Products and Services • Acquire complementary technologies and services to increase operating leverage • Leverage our networks for distribution of new products and services Strategic Acquisitions
35 ▪ Twenty consecutive quarters of year - over - year revenue growth ▪ Over 66% of revenue from recurring subscription services and highly predictable advertising revenue ▪ Diversified transaction revenue outpacing car sales growth ▪ Advertising revenue now a significant contributor to our overall business ▪ Strong subscription renewal rates ▪ Operating leverage drives long - term margin potential ▪ Proven acquisition strategy complements healthy organic growth Financial Highlights
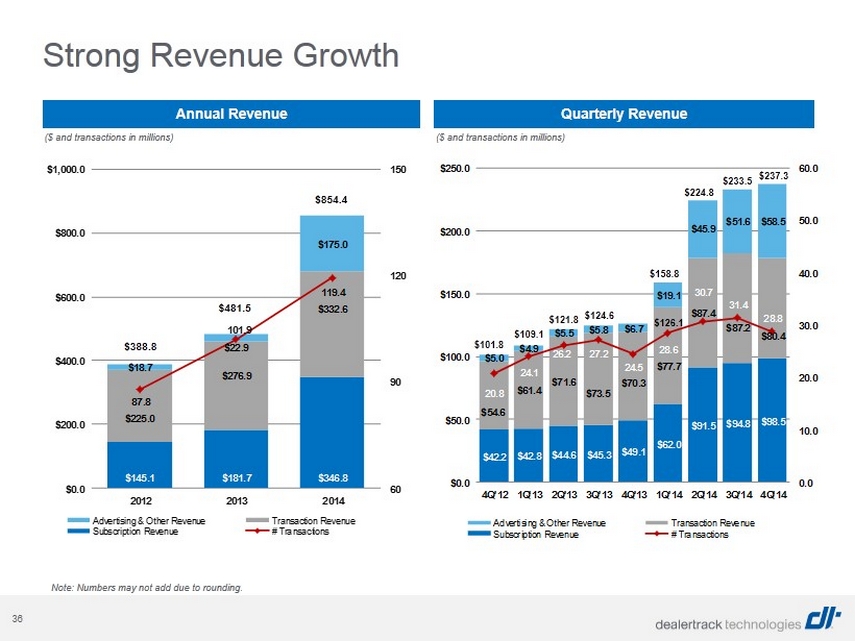
36 Strong Revenue Growth Annual Revenue Quarterly Revenue $145.1 $181.7 $346.8 $225.0 $276.9 $332.6 $18.7 $22.9 $175.0 87.8 101.9 119.4 60 90 120 150 $0.0 $200.0 $400.0 $600.0 $800.0 $1,000.0 2012 2013 2014 Advertising & Other Revenue Transaction Revenue Subscription Revenue # Transactions $388.8 $481.5 $854.4 $42.2 $42.8 $44.6 $45.3 $49.1 $62.0 $91.5 $94.8 $98.5 $54.6 $61.4 $71.6 $73.5 $70.3 $77.7 $87.4 $87.2 $80.4 $5.0 $4.9 $5.5 $5.8 $6.7 $19.1 $45.9 $51.6 $58.5 20.8 24.1 26.2 27.2 24.5 28.6 30.7 31.4 28.8 0.0 10.0 20.0 30.0 40.0 50.0 60.0 $0.0 $50.0 $100.0 $150.0 $200.0 $250.0 4Q'12 1Q'13 2Q'13 3Q'13 4Q'13 1Q'14 2Q'14 3Q'14 4Q'14 Advertising & Other Revenue Transaction Revenue Subscription Revenue # Transactions $101.8 $109.1 $121.8 ($ and transactions in millions) ($ and transactions in millions) Note: Numbers may not add due to rounding. $124.6 $126.1 $158.8 $224.8 $ 237.3 $233.5
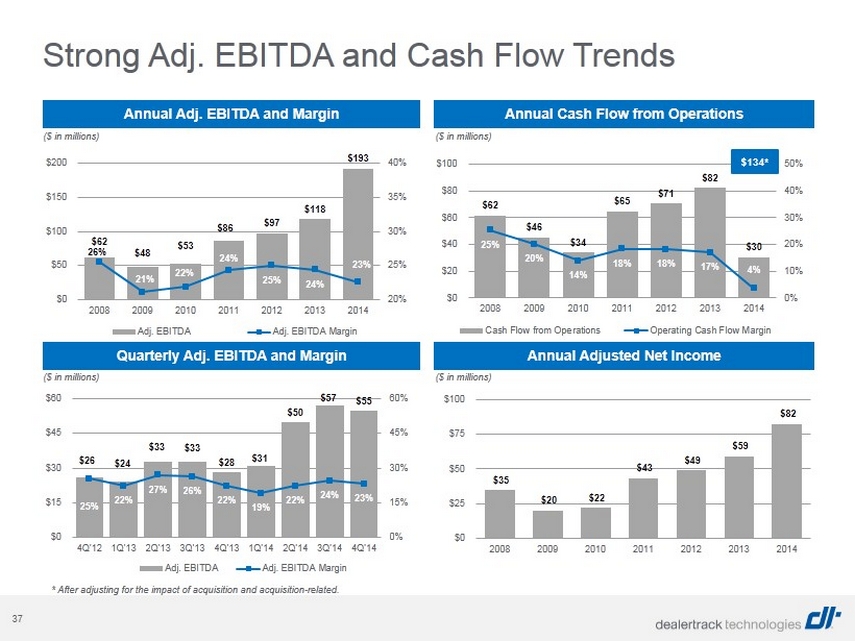
37 $62 $48 $53 $86 $97 $118 $193 26% 21% 22% 24% 25% 24% 23% 20% 25% 30% 35% 40% $0 $50 $100 $150 $200 2008 2009 2010 2011 2012 2013 2014 Adj. EBITDA Adj. EBITDA Margin $26 $24 $33 $33 $28 $31 $50 $57 $55 25% 22% 27% 26% 22% 19% 22% 24% 23% 0% 15% 30% 45% 60% $0 $15 $30 $45 $60 4Q'12 1Q'13 2Q'13 3Q'13 4Q'13 1Q'14 2Q'14 3Q'14 4Q'14 Adj. EBITDA Adj. EBITDA Margin $62 $46 $34 $65 $71 $82 $30 25% 20% 14% 18% 18% 17% 4% 0% 10% 20% 30% 40% 50% $0 $20 $40 $60 $80 $100 2008 2009 2010 2011 2012 2013 2014 Cash Flow from Operations Operating Cash Flow Margin $35 $20 $22 $43 $49 $59 $82 $0 $25 $50 $75 $100 2008 2009 2010 2011 2012 2013 2014 ($ in millions) ($ in millions) Annual Adj. EBITDA and Margin Annual Cash Flow from Operations Quarterly Adj. EBITDA and Margin Annual Adjusted Net Income ($ in millions) ($ in millions) Strong Adj. EBITDA and Cash Flow Trends $134* * After adjusting for the impact of acquisition and acquisition - related.

38 Appendix
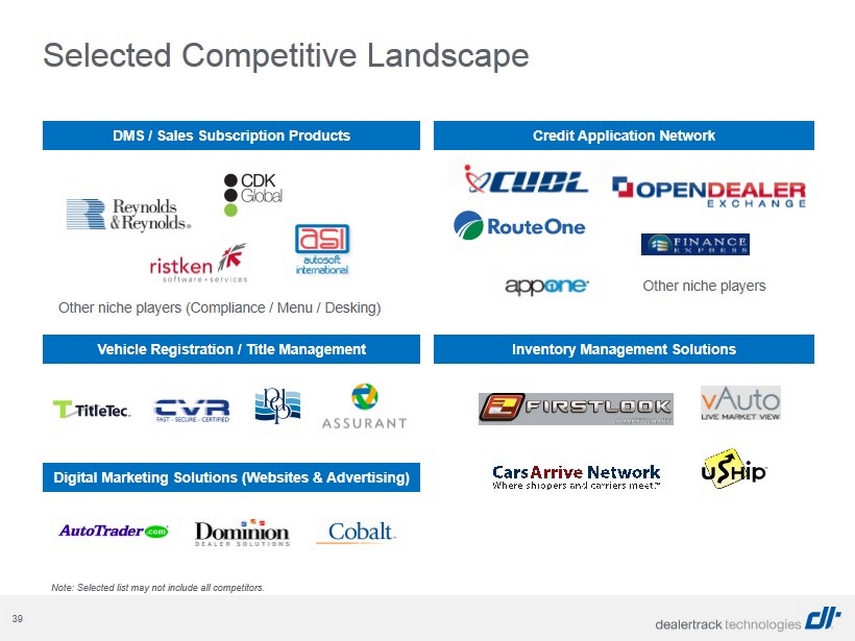
39 Other niche players (Compliance / Menu / Desking) Other niche players Note: Selected list may not include all competitors. DMS / Sales Subscription Products Credit Application Network Vehicle Registration / Title Management Inventory Management Solutions Digital Marketing Solutions (Websites & Advertising) Selected Competitive Landscape
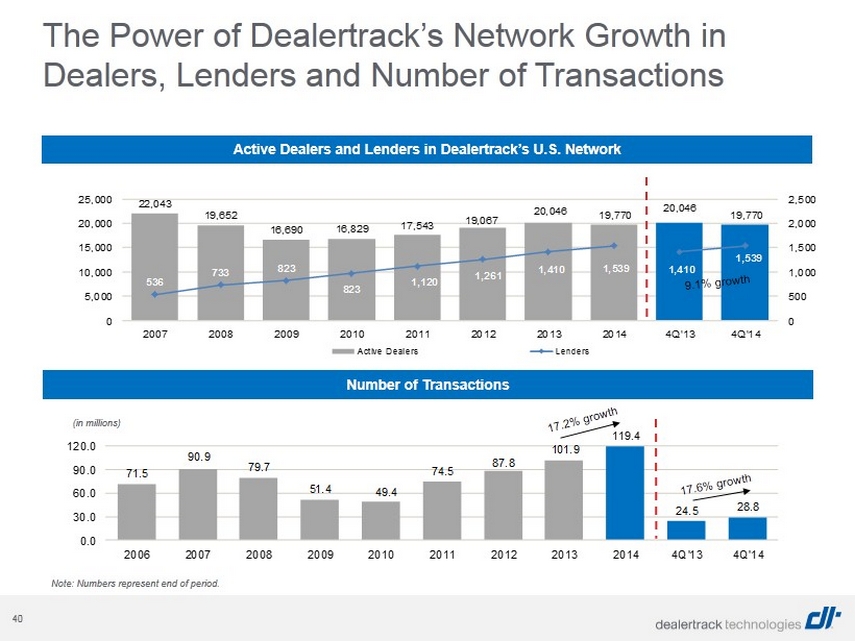
40 22,043 19,652 16,690 16,829 17,543 19,067 20,046 19,770 20,046 19,770 536 733 823 823 1,120 1,261 1,410 1,539 1,410 1,539 0 500 1,000 1,500 2,000 2,500 0 5,000 10,000 15,000 20,000 25,000 2007 2008 2009 2010 2011 2012 2013 2014 4Q'13 4Q'14 Active Dealers Lenders Active Dealers and Lenders in Dealertrack’s U.S. Network Note: Numbers represent end of period. Number of Transactions (in millions) 71.5 90.9 79.7 51.4 49.4 74.5 87.8 101.9 119.4 24.5 28.8 0.0 30.0 60.0 90.0 120.0 2006 2007 2008 2009 2010 2011 2012 2013 2014 4Q'13 4Q'14 The Power of Dealertrack’s Network Growth in Dealers, Lenders and Number of Transactions
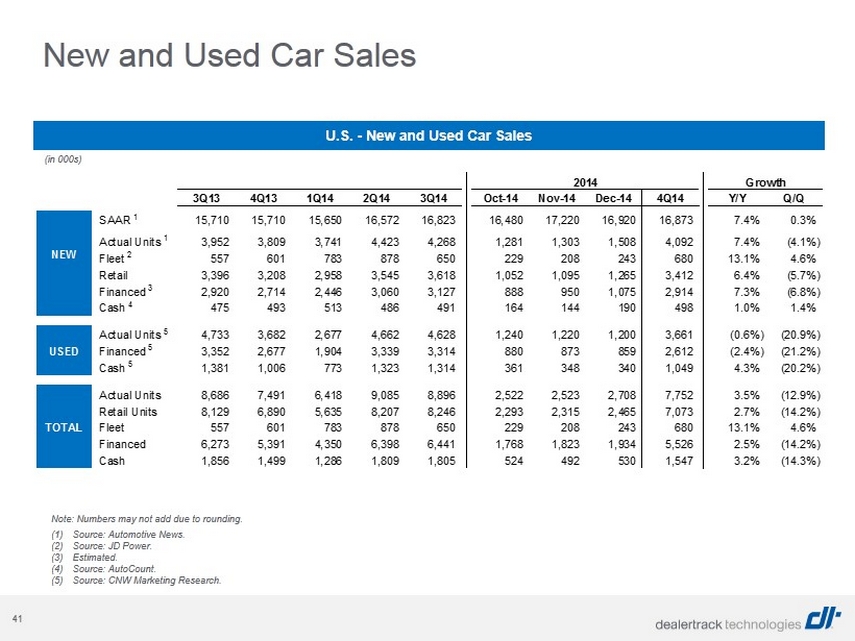
41 New and Used Car Sales 2014 Growth 3Q13 4Q13 1Q14 2Q14 3Q14 Oct-14 Nov-14 Dec-14 4Q14 Y/Y Q/Q SAAR 1 15,710 15,710 15,650 16,572 16,823 16,480 17,220 16,920 16,873 7.4% 0.3% Actual Units 1 3,952 3,809 3,741 4,423 4,268 1,281 1,303 1,508 4,092 7.4% (4.1%) Fleet 2 557 601 783 878 650 229 208 243 680 13.1% 4.6% Retail 3,396 3,208 2,958 3,545 3,618 1,052 1,095 1,265 3,412 6.4% (5.7%) Financed 3 2,920 2,714 2,446 3,060 3,127 888 950 1,075 2,914 7.3% (6.8%) Cash 4 475 493 513 486 491 164 144 190 498 1.0% 1.4% Actual Units 5 4,733 3,682 2,677 4,662 4,628 1,240 1,220 1,200 3,661 (0.6%) (20.9%) USED Financed 5 3,352 2,677 1,904 3,339 3,314 880 873 859 2,612 (2.4%) (21.2%) Cash 5 1,381 1,006 773 1,323 1,314 361 348 340 1,049 4.3% (20.2%) Actual Units 8,686 7,491 6,418 9,085 8,896 2,522 2,523 2,708 7,752 3.5% (12.9%) Retail Units 8,129 6,890 5,635 8,207 8,246 2,293 2,315 2,465 7,073 2.7% (14.2%) TOTAL Fleet 557 601 783 878 650 229 208 243 680 13.1% 4.6% Financed 6,273 5,391 4,350 6,398 6,441 1,768 1,823 1,934 5,526 2.5% (14.2%) Cash 1,856 1,499 1,286 1,809 1,805 524 492 530 1,547 3.2% (14.3%) NEW (1) Source: Automotive News. (2) Source: JD Power. (3) Estimated. (4) Source: AutoCount. (5) Source: CNW Marketing Research. U.S. - New and Used Car Sales (in 000s) Note: Numbers may not add due to rounding.
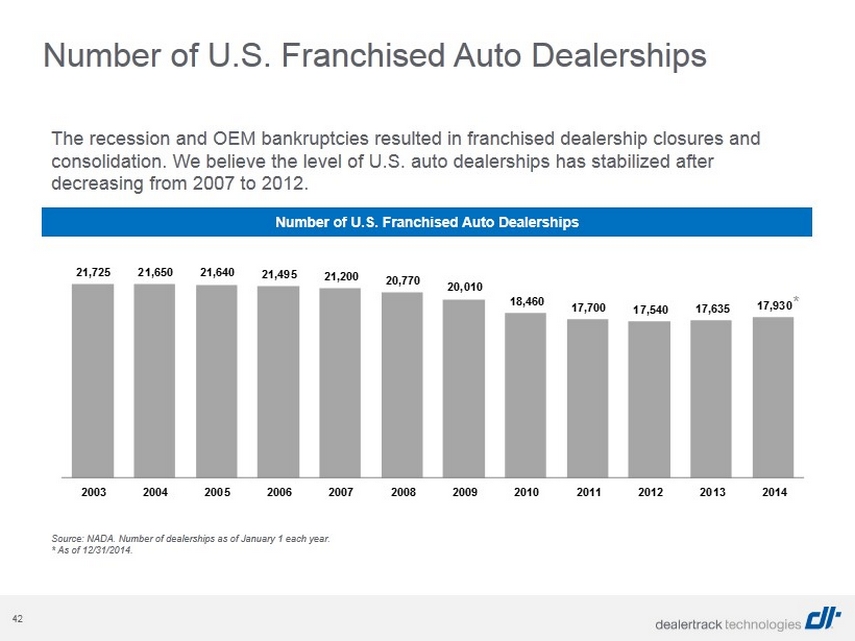
42 The recession and OEM bankruptcies resulted in franchised dealership closures and consolidation. We believe the level of U.S. auto dealerships has stabilized after decreasing from 2007 to 2012. 21,725 21,650 21,640 21,495 21,200 20,770 20,010 18,460 17,700 17,540 17,635 17,930 2003 2004 2005 2006 2007 2008 2009 2010 2011 2012 2013 2014 Source: NADA. Number of dealerships as of January 1 each year . * As of 12/31/2014. Number of U.S. Franchised Auto Dealerships Number of U.S. Franchised Auto Dealerships *
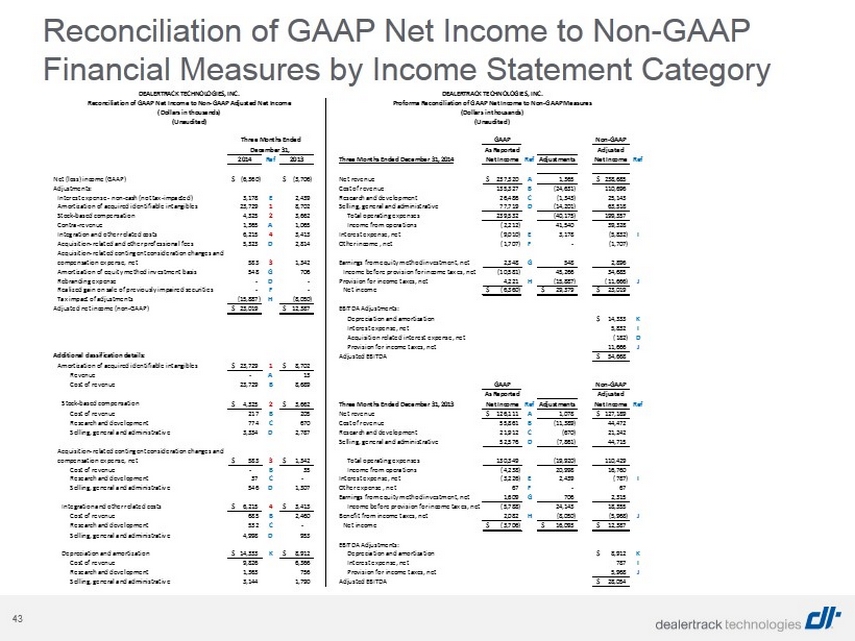
43 Reconciliation of GAAP Net Income to Non - GAAP Financial Measures by Income Statement Category GAAP Non-GAAP As Reported Adjusted 2014 Ref 2013 Three Months Ended December 31, 2014 Net Income Ref Adjustments Net Income Ref Net (loss) income (GAAP) (6,360)$ (3,706)$ Net revenue 237,320$ A 1,365 238,685$ Adjustments: Cost of revenue 135,327 B (24,631) 110,696 Interest expense - non-cash (not tax-impacted) 3,178 E 2,439 Research and development 26,486 C (1,343) 25,143 Amortization of acquired identifiable intangibles 23,729 1 8,702 Selling, general and administrative 77,719 D (14,201) 63,518 Stock-based compensation 4,325 2 3,662 Total operating expenses 239,532 (40,175) 199,357 Contra-revenue 1,365 A 1,065 Income from operations (2,212) 41,540 39,328 Integration and other related costs 6,215 4 3,413 Interest expense, net (9,010) E 3,178 (5,832) I Acquisition-related and other professional fees 5,323 D 2,814 Other income , net (1,707) F - (1,707) Acquisition-related contingent consideration changes and compensation expense, net 583 3 1,342 Earnings from equity method investment, net 2,348 G 548 2,896 Amortization of equity method investment basis 548 G 706 Income before provision for income taxes, net (10,581) 45,266 34,685 Rebranding expense - D - Provision for income taxes, net 4,221 H (15,887) (11,666) J Realized gain on sale of previously impaired securities - F - Net income (6,360)$ 29,379$ 23,019$ Tax impact of adjustments (15,887) H (8,050) Adjusted net income (non-GAAP) 23,019$ 12,387$ EBITDA Adjustments: Depreciation and amortization 14,333$ K Interest expense, net 5,832 I Acquisition related interest expense, net (182) D Provision for income taxes, net 11,666 J Additional classification details: Adjusted EBITDA 54,668$ Amortization of acquired identifiable intangibles 23,729$ 1 8,702$ Revenue - A 13 Cost of revenue 23,729 B 8,689 GAAP Non-GAAP As Reported Adjusted Stock-based compensation 4,325$ 2 3,662$ Three Months Ended December 31, 2013 Net Income Ref Adjustments Net Income Ref Cost of revenue 217 B 205 Net revenue 126,111$ A 1,078 127,189$ Research and development 774 C 670 Cost of revenue 55,861 B (11,389) 44,472 Selling, general and administrative 3,334 D 2,787 Research and development 21,912 C (670) 21,242 Selling, general and administrative 52,576 D (7,861) 44,715 Acquisition-related contingent consideration changes and compensation expense, net 583$ 3 1,342$ Total operating expenses 130,349 (19,920) 110,429 Cost of revenue - B 35 Income from operations (4,238) 20,998 16,760 Research and development 37 C - Interest expense, net (3,226) E 2,439 (787) I Selling, general and administrative 546 D 1,307 Other expense , net 67 F - 67 Earnings from equity method investment, net 1,609 G 706 2,315 Integration and other related costs 6,215$ 4 3,413$ Income before provision for income taxes, net (5,788) 24,143 18,355 Cost of revenue 685 B 2,460 Benefit from income taxes, net 2,082 H (8,050) (5,968) J Research and development 532 C - Net income (3,706)$ 16,093$ 12,387$ Selling, general and administrative 4,998 D 953 EBITDA Adjustments: Depreciation and amortization 14,333$ K 8,912$ Depreciation and amortization 8,912$ K Cost of revenue 9,826 6,366 Interest expense, net 787 I Research and development 1,363 756 Provision for income taxes, net 5,968 J Selling, general and administrative 3,144 1,790 Adjusted EBITDA 28,054$ (Unaudited) (Unaudited) Three Months Ended December 31, DEALERTRACK TECHNOLOGIES, INC. DEALERTRACK TECHNOLOGIES, INC. Reconciliation of GAAP Net Income to Non-GAAP Adjusted Net Income Proforma Reconciliation of GAAP Net Income to Non-GAAP Measures (Dollars in thousands) (Dollars in thousands)
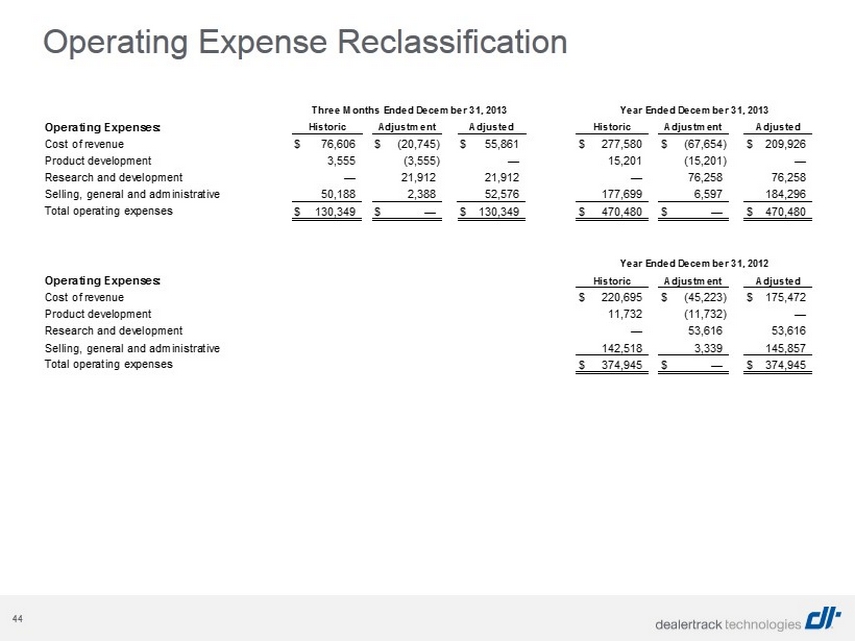
44 Operating Expense Reclassification Operating Expenses: Cost of revenue $ 76,606 $ (20,745) $ 55,861 $ 277,580 $ (67,654) $ 209,926 Product development 3,555 (3,555) — 15,201 (15,201) — Research and development — 21,912 21,912 — 76,258 76,258 Selling, general and administrative 50,188 2,388 52,576 177,699 6,597 184,296 Total operating expenses $ 130,349 $ — $ 130,349 $ 470,480 $ — $ 470,480 Operating Expenses: Cost of revenue $ 220,695 $ (45,223) $ 175,472 Product development 11,732 (11,732) — Research and development — 53,616 53,616 Selling, general and administrative 142,518 3,339 145,857 Total operating expenses $ 374,945 $ — $ 374,945 Year Ended December 31, 2012 Historic Adjustment Adjusted Three Months Ended December 31, 2013 Year Ended December 31, 2013 Historic Adjustment Adjusted Historic Adjustment Adjusted
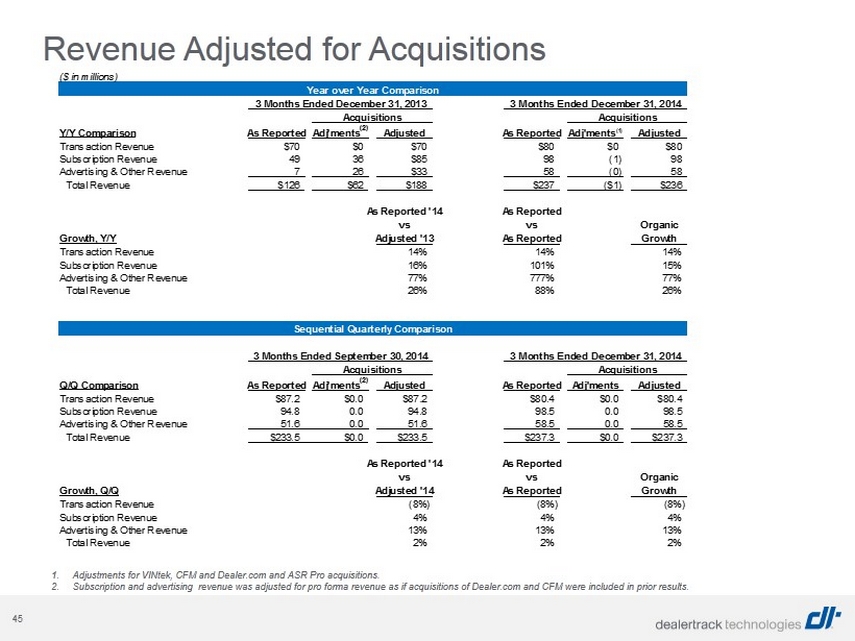
45 Revenue Adjusted for Acquisitions 1. Adjustments for VINtek, CFM and Dealer.com and ASR Pro acquisitions. 2. Subscription and advertising revenue was adjusted for pro forma revenue as if acquisitions of Dealer.com and CFM were includ ed in prior results. ($ in millions) Year over Year Comparison Acquisitions Acquisitions Acquisitions Y/Y Comparison As Reported Adj'ments (2) Adjusted As Reported Adj'ments (1) Adjusted Transaction Revenue $70 $0 $70 $80 $0 $80 Subscription Revenue 49 36 $85 98 (1) 98 Advertising & Other Revenue 7 26 $33 58 (0) 58 Total Revenue $126 $62 $188 $237 ($1) $236 As Reported '14 As Reported vs vs Organic Growth, Y/Y Adjusted '13 As Reported Growth Transaction Revenue 14% 14% 14% Subscription Revenue 16% 101% 15% Advertising & Other Revenue 77% 777% 77% Total Revenue 26% 88% 26% Sequential Quarterly Comparison Acquisitions Acquisitions AcquiSitionS Q/Q Comparison As Reported Adj'ments (2) Adjusted As Reported Adj'ments Adjusted Transaction Revenue $87.2 $0.0 $87.2 $80.4 $0.0 $80.4 Subscription Revenue 94.8 0.0 94.8 98.5 0.0 98.5 Advertising & Other Revenue 51.6 0.0 51.6 58.5 0.0 58.5 Total Revenue $233.5 $0.0 $233.5 $237.3 $0.0 $237.3 As Reported '14 As Reported vs vs Organic Growth, Q/Q Adjusted '14 As Reported Growth Transaction Revenue (8%) (8%) (8%) Subscription Revenue 4% 4% 4% Advertising & Other Revenue 13% 13% 13% Total Revenue 2% 2% 2% 3 Months Ended December 31, 2013 3 Months Ended September 30, 2014 3 Months Ended December 31, 2014 3 Months Ended December 31, 2014
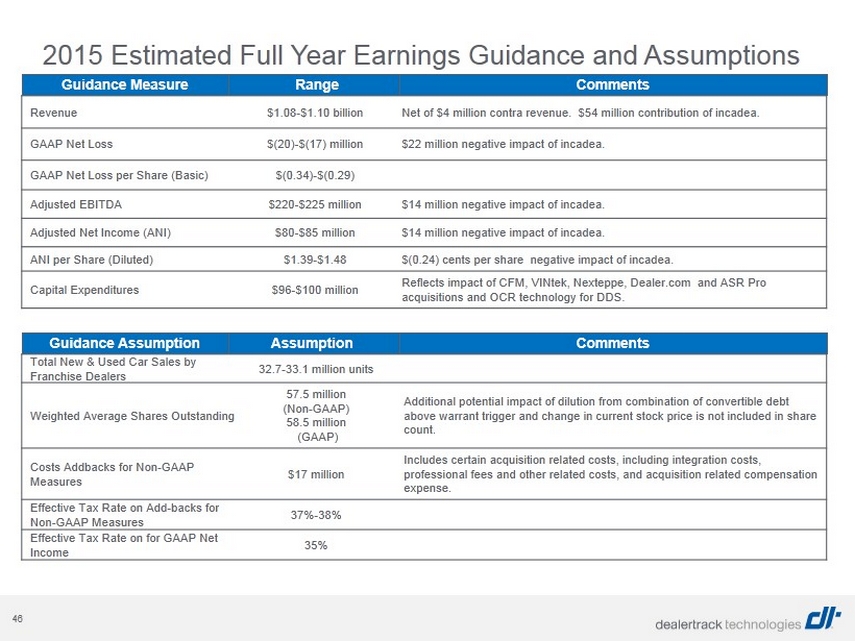
46 2015 Estimated Full Year Earnings Guidance and Assumptions Total New & Used Car Sales by Franchise Dealers 32.7 - 33.1 million units Weighted Average Shares Outstanding 57.5 million (Non - GAAP) 58.5 million (GAAP) Additional potential impact of dilution from combination of convertible debt above warrant trigger and change in current stock price is not included in share count. Costs Addbacks for Non - GAAP Measures $17 million Includes certain acquisition related costs, including integration costs, professional fees and other related costs, and acquisition related compensation expense. Effective Tax Rate on Add - backs for Non - GAAP Measures 37% - 38% Effective Tax Rate on for GAAP Net Income 35% Revenue $1.08 - $1.10 billion Net of $4 million contra revenue. $54 million contribution of incadea . GAAP Net Loss $(20) - $(17) million $22 million negative impact of incadea . GAAP Net Loss per Share (Basic) $(0.34) - $(0.29) Adjusted EBITDA $220 - $225 million $14 million negative impact of incadea . Adjusted Net Income (ANI) $80 - $85 million $14 million negative impact of incadea . ANI per Share (Diluted) $1.39 - $1.48 $(0.24) cents per share negative impact of incadea . Capital Expenditures $96 - $100 million Reflects impact of CFM, VINtek, Nexteppe, Dealer.com and ASR Pro acquisitions and OCR technology for DDS. Guidance Measure Range Comments Guidance Assumption Assumption Comments