Exhibit 99.1
| DealerTrack Holdings, Inc. 2009 First Quarter Results & Opportunities for Growth in 2009 May 20, 2009 JMP Conference, San Francisco |
| Safe Harbor for Forward-looking Statements Statements in this presentation regarding DealerTrack's expected performance, the development and expansion of DealerTrack's products and services, the addition of participants to the network, the likelihood or benefits of acquisitions, the demand for DealerTrack's products and services, and all other statements in this release other than the recitation of historical facts are forward-looking statements (as defined in the Private Securities Litigation Reform Act of 1995). These statements involve a number of risks, uncertainties and other factors that could cause actual results, performance or achievements of DealerTrack to be materially different from any future results, performance or achievements expressed or implied by these forward-looking statements. Factors that might cause such a difference include: economic trends that affect the automotive retail industry or the indirect automotive financing industry; reductions in auto dealerships by General Motors and Chrysler in the United States; increased competitive pressure from other industry participants, including Open Dealer Exchange, RouteOne, CUDL, Finance Express and AppOne; the impact of some vendors of software products for automotive dealers making it more difficult for DealerTrack's customers to use DealerTrack's solutions and services; security breaches, interruptions, failures and/or other errors involving DealerTrack's systems or networks; the failure or inability to execute any element of DealerTrack's business strategy, including selling additional products and services to existing and new customers; the volatility of DealerTrack's stock price; new regulations or changes to existing regulations; the integration of recent acquisitions and the expected benefits, as well as the integration and expected benefits of any future acquisitions that DealerTrack may pursue; DealerTrack's success in expanding its customer base and product and service offerings; the timing, cost and extent of litigation, the impact of recent economic trends, including the inaccessibility of funds associated with DealerTrack's auction rate securities, the potential for impairment charges on certain assets, and difficulties and increased costs associated with raising additional capital and other risks listed in DealerTrack's reports filed with the SEC, including DealerTrack's Form 10-K. These filings can be found on DealerTrack's website at www.dealertrack.com and the SEC's website at www.sec.gov. Forward-looking statements and all other statements included herein speak only as of May 20, 2009 unless publicly released subsequent to that date. DealerTrack disclaims any obligation to revise or update such statements to reflect events or circumstances after the date hereof or to reflect the occurrence of unanticipated events or circumstances. |
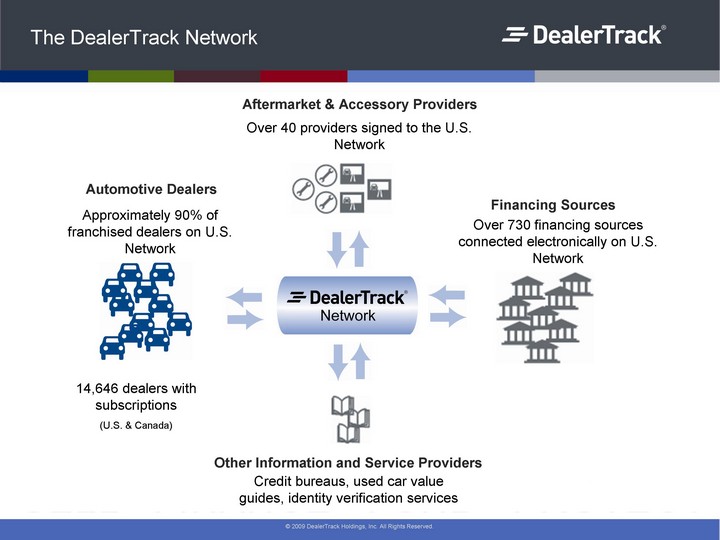
| The DealerTrack Network Over 40 providers signed to the U.S. Network Aftermarket & Accessory Providers Automotive Dealers Financing Sources Other Information and Service Providers Over 730 financing sources connected electronically on U.S. Network Credit bureaus, used car value guides, identity verification services Approximately 90% of franchised dealers on U.S. Network 14,646 dealers with subscriptions (U.S. & Canada) |
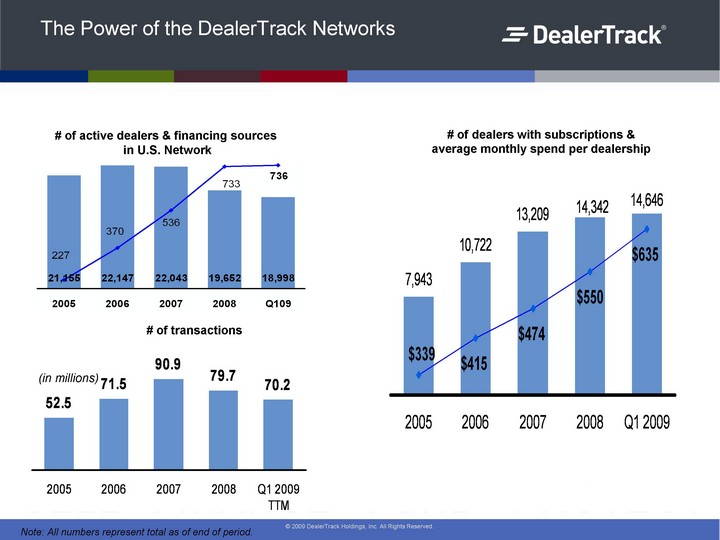
| The Power of the DealerTrack Networks Dealers Financing Sources Column 3 Column 4 Column 5 Column 6 Column 7 Column 8 Column 9 Column 10 Column 11 Column 12 Column 13 Column 14 Column 15 Column 16 2003 15999 2004 19150 109 2005 21155 227 2006 22147 370 2007 22043 536 2008 19652 733 Q109 18998 736 # of active dealers & financing sources in U.S. Network Note: All numbers represent total as of end of period. % margin Line 1 Column 4 Column 5 Column 6 Column 7 Column 8 Column 9 Column 10 Column 11 Column 12 Column 13 Column 14 Column 15 Column 16 2003 2552 0.09 2004 4862 0.16 2005 7943 0.15 340 2006 10722 415 2007 13209 474 2008 14342 550 Q1 2009 14646 635 # of dealers with subscriptions & average monthly spend per dealership % margin Column 3 Column 4 Column 5 Column 6 Column 7 Column 8 Column 9 Column 10 Column 11 Column 12 Column 13 Column 14 Column 15 Column 16 2003 23 0.09 2004 34 0.16 2005 52.5 0.15 2006 71.5 2007 90.9 2008 79.7 Q1 2009 TTM 70.2 # of transactions (in millions) |
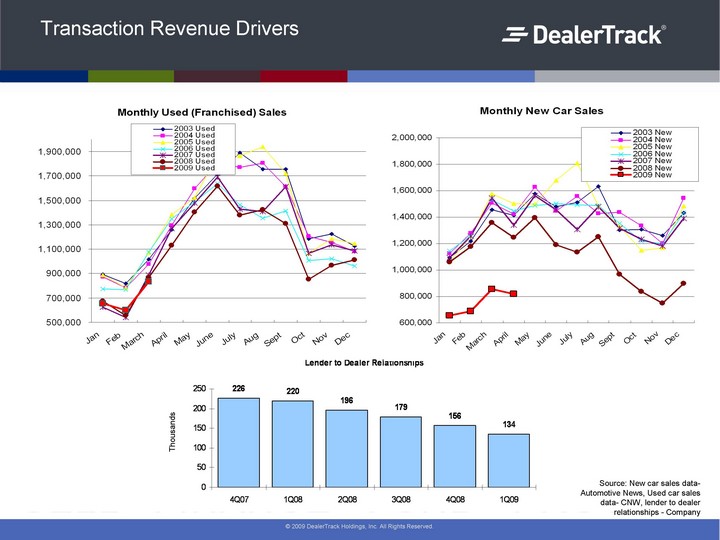
| Transaction Revenue Drivers Source: New car sales data- Automotive News, Used car sales data- CNW, lender to dealer relationships - Company Thousands |
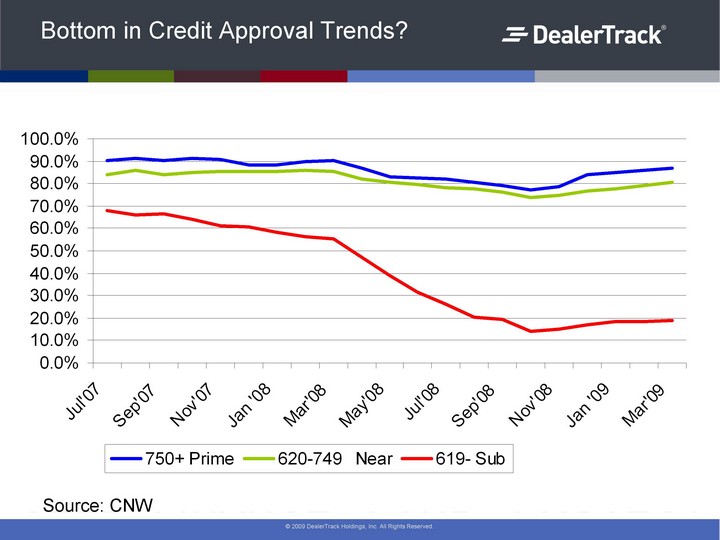
| Bottom in Credit Approval Trends? Source: CNW |
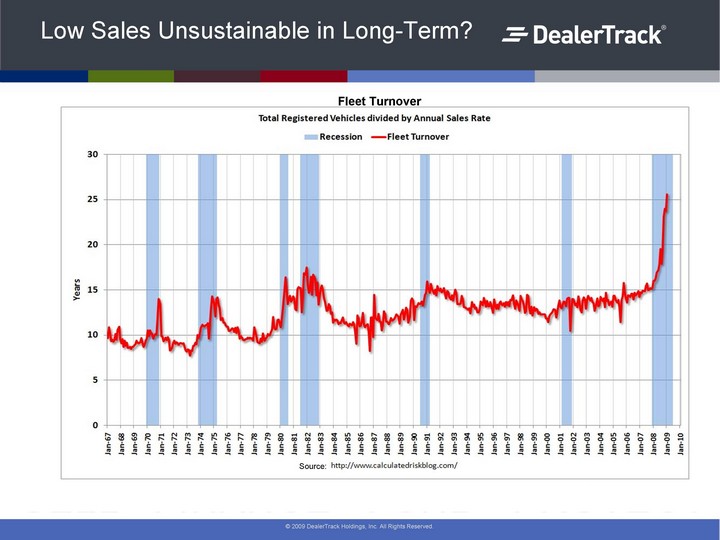
| Low Sales Unsustainable in Long-Term? Fleet Turnover Source: |
| Subscription Drivers Dealership Closures Approximately 54% of GM and Chrysler Dealerships have one or more DealerTrack subscriptions DealerTrack Exposure Example given on May 8, 2009 during the first quarter earnings call: If 30% of GM and Chrysler dealers (approximately 2,900 dealers) closed on July 1, 2009 Given: 54% subscription penetration rate and average spend per subscribing dealer of $635 a month Then DealerTrack subscription revenue exposure would be approximately $6 million |
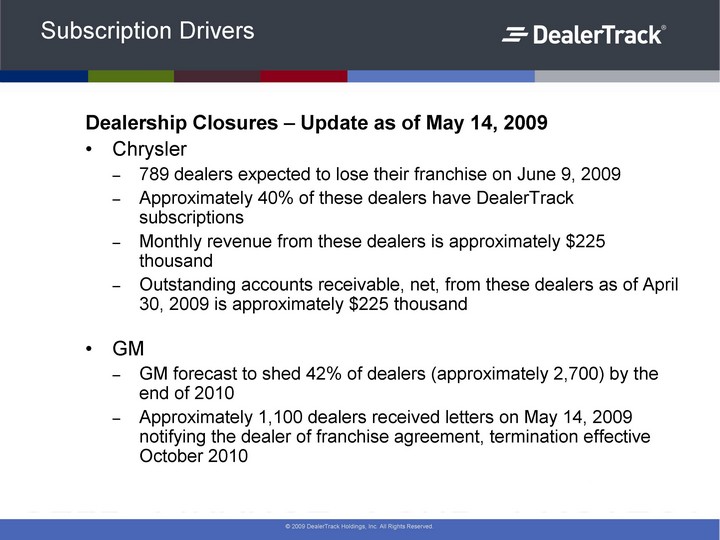
| Subscription Drivers Dealership Closures - Update as of May 14, 2009 Chrysler 789 dealers expected to lose their franchise on June 9, 2009 Approximately 40% of these dealers have DealerTrack subscriptions Monthly revenue from these dealers is approximately $225 thousand Outstanding accounts receivable, net, from these dealers as of April 30, 2009 is approximately $225 thousand GM GM forecast to shed 42% of dealers (approximately 2,700) by the end of 2010 Approximately 1,100 dealers received letters on May 14, 2009 notifying the dealer of franchise agreement, termination effective October 2010 |
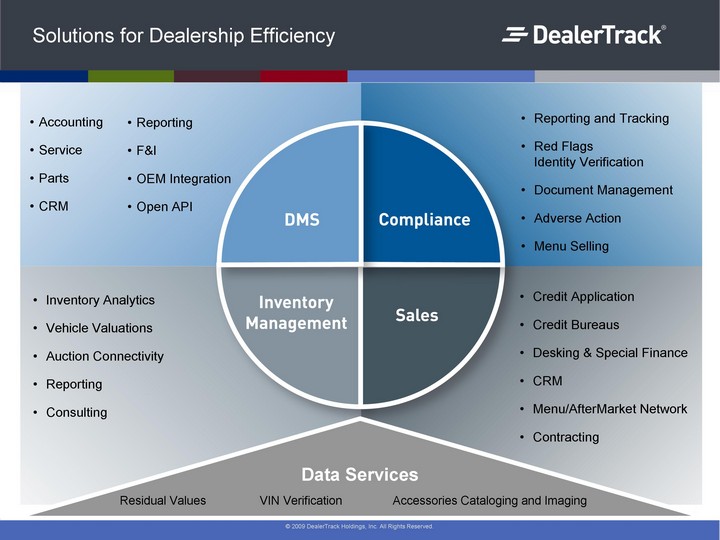
| Reporting and Tracking Red Flags Identity Verification Document Management Adverse Action Menu Selling Credit Application Credit Bureaus Desking & Special Finance CRM Menu/AfterMarket Network Contracting Inventory Analytics Vehicle Valuations Auction Connectivity Reporting Consulting Accounting Service Parts CRM Reporting F&I OEM Integration Open API Solutions for Dealership Efficiency Data Services Residual Values VIN Verification Accessories Cataloging and Imaging |
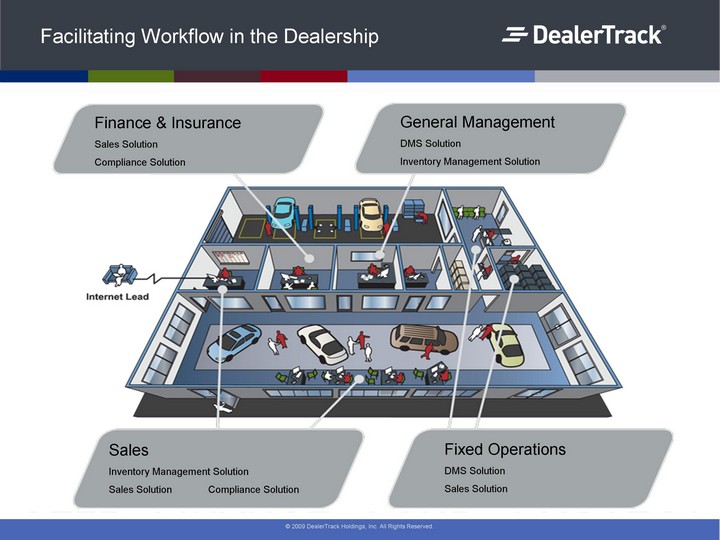
| Facilitating Workflow in the Dealership Finance & Insurance Sales Solution Compliance Solution General Management DMS Solution Inventory Management Solution Sales Inventory Management Solution Sales Solution Compliance Solution Fixed Operations DMS Solution Sales Solution |
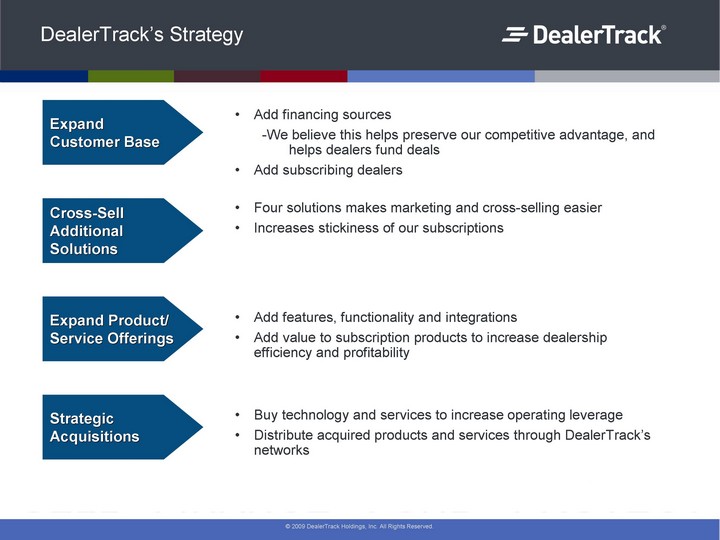
| DealerTrack's Strategy Four solutions makes marketing and cross-selling easier Increases stickiness of our subscriptions Add financing sources - -We believe this helps preserve our competitive advantage, and helps dealers fund deals Add subscribing dealers Add features, functionality and integrations Add value to subscription products to increase dealership efficiency and profitability Buy technology and services to increase operating leverage Distribute acquired products and services through DealerTrack's networks Expand Customer Base Cross-Sell Additional Solutions Expand Product/ Service Offerings Strategic Acquisitions |
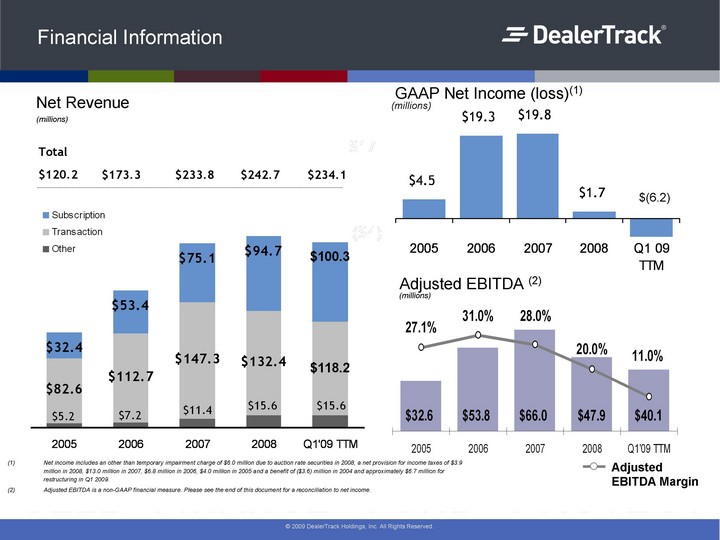
| Financial Information Net income includes an other than temporary impairment charge of $6.0 million due to auction rate securities in 2008, a net provision for income taxes of $3.9 million in 2008, $13.0 million in 2007, $6.8 million in 2006, $4.0 million in 2005 and a benefit of ($3.6) million in 2004 and approximately $6.7 million for restructuring in Q1 2009. Adjusted EBITDA is a non-GAAP financial measure. Please see the end of this document for a reconciliation to net income. Adjusted EBITDA (2) Adjusted EBITDA Margin Net Income Column 5 Column 6 Column 7 Column 8 Column 9 Column 10 Column 11 Column 12 Column 13 Column 14 Column 15 Column 16 2003 -3.3 2004 11.3 2005 4.5 2006 19.3 2007 19.8 2008 6 1.7 Q1 09 TTM -6.2 (millions) Total Other Transaction Subscription Column 4 Column 5 Column 6 Column 7 Column 8 Column 9 Column 10 Column 11 Column 12 Column 13 Column 14 Column 15 Column 16 2003 1.9 32.7 4.1 2004 1.2 56.4 12.4 2005 5.2 82.6 32.4 2006 7.2 112.7 53.4 2007 11.4 147.3 75.1 2008 15.6 132.4 94.7 Q1'09 TTM 15.6 118.2 100.3 Net Revenue $120.2 $173.3 (millions) $233.8 $242.7 (millions) GAAP Net Income (loss)(1) $234.1 $(6.2) |
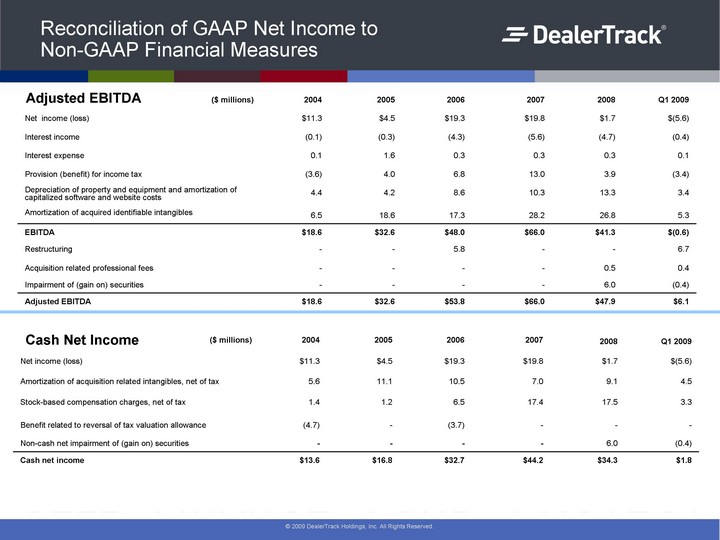
| Reconciliation of GAAP Net Income to Non-GAAP Financial Measures ($ millions) 2004 2005 2006 2007 2008 Q1 2009 Net income (loss) $11.3 $4.5 $19.3 $19.8 $1.7 $(5.6) Interest income (0.1) (0.3) (4.3) (5.6) (4.7) (0.4) Interest expense 0.1 1.6 0.3 0.3 0.3 0.1 Provision (benefit) for income tax (3.6) 4.0 6.8 13.0 3.9 (3.4) Depreciation of property and equipment and amortization of capitalized software and website costs 4.4 4.2 8.6 10.3 13.3 3.4 Amortization of acquired identifiable intangibles 6.5 18.6 17.3 28.2 26.8 5.3 EBITDA $18.6 $32.6 $48.0 $66.0 $41.3 $(0.6) Restructuring - - 5.8 - - 6.7 Acquisition related professional fees - - - - 0.5 0.4 Impairment of (gain on) securities - - - - 6.0 (0.4) Adjusted EBITDA $18.6 $32.6 $53.8 $66.0 $47.9 $6.1 ($ millions) 2004 2005 2006 2007 2008 Q1 2009 Net income (loss) $11.3 $4.5 $19.3 $19.8 $1.7 $(5.6) Amortization of acquisition related intangibles, net of tax 5.6 11.1 10.5 7.0 9.1 4.5 Stock-based compensation charges, net of tax 1.4 1.2 6.5 17.4 17.5 3.3 Benefit related to reversal of tax valuation allowance (4.7) - (3.7) - - - Non-cash net impairment of (gain on) securities - - - - 6.0 (0.4) Cash net income $13.6 $16.8 $32.7 $44.2 $34.3 $1.8 Cash Net Income Adjusted EBITDA |
| DealerTrack Holdings, Inc. NASDAQ: TRAK For more information, contact: Katherine Piscopo Stein Investor Relations katherine.stein@dealertrack.com 1.516.734.3758 |