Exhibit 99.2

MANAGEMENT’S DISCUSSION AND ANALYSIS
SECOND QUARTER ENDED JUNE 30, 2014
TABLE OF CONTENTS
| SECOND QUARTER 2014 HIGHLIGHTS | 2 |
| TRADING OF COMMON SHARES | 3 |
| CORE BUSINESS | 3 |
| FINANCIAL RESTRUCTURING PLAN – CCAA PROCEEDINGS | 4 |
| OPERATIONAL RESTRUCTURING AND TURNAROUND PLAN | 8 |
| REVIEW OF OPERATING PERFORMANCE | 10 |
| REVIEW OF FINANCIAL RESULTS | 14 |
| FINANCIAL CONDITION, CASH FLOW, LIQUIDITY AND CAPITAL RESOURCES | 16 |
| INCOME TAXES | 20 |
| OUTLOOK | 20 |
| LITIGATION AND CONTINGENCIES | 21 |
| RISKS AND UNCERTAINTIES | 22 |
| DEVELOPMENT AND EXPLORATION | 23 |
| NON-IFRS PERFORMANCE MEASURES | 25 |
| CRITICAL ACCOUNTING ESTIMATES | 29 |
| CHANGES IN ACCOUNTING POLICIES INCLUDING INITIAL ADOPTION | 29 |
| DISCLOSURE CONTROLS AND PROCEDURES AND INTERNAL CONTROLS OVER FINANCIAL REPORTING | 30 |
| OUTSTANDING SHARE DATA | 30 |
| CAUTIONARY NOTE REGARDING FORWARD-LOOKING STATEMENTS | 31 |
| CAUTIONARY NOTE TO U.S. INVESTORS CONCERNING ESTIMATES OF INFERRED AND MEASURED AND INDICATED MINERAL RESOURCES | 31 |
| CORPORATE DIRECTORY | 33 |
| MD&A – Second quarter ended June 30, 2014 | Jaguar Mining Inc. | 1 |
MANAGEMENT’S DISCUSSION AND ANALYSIS
FOR THE SECOND QUARTER ENDED JUNE 30, 2014
This Management’s Discussion and Analysis (“MD&A”) should be read in conjunction with the condensed interim consolidated financial statements for the three and six months ended June 30, 2014, and the annual audited consolidated financial statements and MD&A for the year ended December 31, 2013 and related notes thereto which have been prepared in accordance with International Financial Reporting Standards (“IFRS”). For further information on Jaguar Mining Inc., reference should be made to its public filings (including its most recently filed annual information form (“AIF”) which is available on SEDAR atwww.sedar.com). Information is also available on the Company’s website atwww.jaguarmining.com. Information on risks associated with investing in the Company’s securities and technical and scientific information under National Instrument 43-101 concerning the Company’s material property, including information about mineral resources and reserves, are contained in the Company’s most recently filed AIF and technical reports.
All amounts included in this MD&A are in United States dollars (“$”), unless otherwise specified. References to Cdn$ are to Canadian dollars and R$ are to Brazilian reais. This report is dated as of August 25, 2014.
Where we say “we”, “us”, “our”, the “Company” or “Jaguar”, we mean Jaguar Mining Inc. or Jaguar Mining Inc. and/or one or more or all of its subsidiaries, as it may apply.
The following abbreviations are used to describe the periods under review throughout this MD&A:
| Abbreviation | | Period | | Abbreviation | | Period |
| YTD 2014 | | January 1, 2014 – June 30, 2014 | | YTD 2013 | | January 1, 2013 – June 30, 2013 |
| Q1 2014 | | January 1, 2014 – March 31, 2014 | | Q1 2013 | | January 1, 2013 – March 31, 2013 |
| Q2 2014 | | April 1, 2014 – June 30, 2014 | | Q2 2013 | | April 1, 2013 – June 30, 2013 |
SECOND QUARTER 2014 HIGHLIGHTS
| | | Q2 2014 | |
| | | | | |
| Gold produced (ounces) | | | 23,867 | |
| Gold sold (ounces) | | | 24,002 | |
| | | | | |
| Average sales price per oz of gold sold | | $ | 1,280 | |
| Cash operating cost per oz of gold produced(*) | | $ | 958 | |
| Cash operating margin per oz of gold produced(*) | | $ | 322 | |
| | | | | |
| All-in sustaining cost per ounce sold(*) (**) | | $ | 1,337 | |
| All-in cost per ounce sold(*) (**) | | $ | 1,377 | |
| | | | | |
| Revenue (000s) | | $ | 31,044 | |
| Gross profit (000s) | | $ | 431 | |
| Net income (000s) | | $ | 246,646 | |
(*) Refer to “Non-IFRS Performance Measures" on page 24.
(**) Relates to the all-in cost excluding the restructuring expenses that were incurred during Q2 2014, in the amount of $7.1 million. If the restructuring expenses are considered then the all-in cost is $1,672 per ounce of gold sold in Q2 2014.
| MD&A – Second quarter ended June 30, 2014 | Jaguar Mining Inc. | 2 |
Company Developments:
| · | On April 22, 2014, the Company successfully implemented the previously announced Financial Restructuring Plan (“CCAA Plan”); |
| · | On April 22, 2014, Mr. George Bee and Mr. Derrick Weyrauch were appointed Chief Executive Officer and Chief Financial Officer, respectively. |
TRADING OF COMMON SHARES
Jaguar is a public company with its common shares listed on the TSX Venture Exchange (the “TSX-V”). Trading in the common shares of Jaguar on the Toronto Stock Exchange (“TSX”) was suspended on December 23, 2013 as a result of the commencement of the CCAA Proceedings (see “Financial Restructuring Plan – CCAA Proceedings”). On April 29, 2014, the Company announced the common shares of the Company have been accepted for listing by the TSX-V, with trading commencing at the opening of market on May 1, 2014. The trading symbol of Jaguar’s common shares will remain “JAG”.
The common shares of the Company were delisted from the TSX effective at the close of market on April 30, 2014.
In connection with the implementation of its amended and restated plan of compromise and arrangement pursuant to the Companies’ Creditors Arrangement Act (Canada) (the “Plan”) on April 22, 2014, the common shares of Jaguar that existed immediately prior to the implementation of the Plan were consolidated at a ratio of one (1) post-consolidation common share for each 86.39636 pre-consolidation common shares. The common shares of Jaguar commenced trading on the TSX-V on a post-consolidated basis and there are currently 111,111,038 common shares of the Company issued and outstanding. The new CUSIP and ISIN numbers of the Company’s common shares are 47009M400 and CA47009M4002, respectively.
CORE BUSINESS
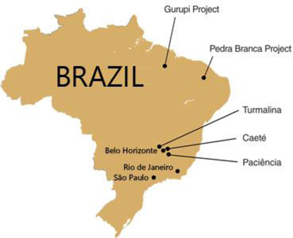
The Company is engaged in the acquisition, exploration, development and operation of gold producing properties in Brazil. The Company controls 23,777 hectares in the Iron Quadrangle mining district of Brazil, a prolific greenstone belt located near the city of Belo Horizonte in the State of Minas Gerais, where the Company owns operating assets. In addition, Jaguar holds mineral concessions totaling 138,548 hectares in the State of Maranhão, where the Company owns the Gurupi Project and 34,251 hectares in the State of Ceará, where the Company’s Pedra Branca Project is located. The Company may consider the acquisition, exploration, development and operation of other gold properties.
The Company produces gold at its Turmalina and Caeté operations, while the Company’s Paciência operation is on temporary care and maintenance. While the Company continues to demonstrate a turnaround at the Turmalina and Caeté operations and is on track to produce sustained positive margins and allow the exploitation of opportunities at core operations, the potential for a significant increase in gold production exists through the development of the Company’s Gurupi Project, which contemplates an open-pit gold mining operation in the state of Maranhão in the northeast of Brazil. On achieving sustained positive performance, management intends to turn its attention to growing the business.
| MD&A – Second quarter ended June 30, 2014 | Jaguar Mining Inc. | 3 |
FINANCIAL RESTRUCTURING PLAN – CCAA PROCEEDINGS
On November 13, 2013, the Company and its subsidiaries entered into a support agreement (as amended, the “Support Agreement”) with holders (the “Noteholders”) of approximately 81% of its $165.0 million 4.5% Senior Unsecured Convertible Notes due November 1, 2014 (“4.5% Convertible Notes”) and 82% of its $103.5 million 5.5% Senior Unsecured Convertible Notes due March 31, 2016 (together with the 4.5% Convertible Notes, the “Notes”) to effect a recapitalization and financing transaction that would eliminate approximately $268.5 million of the Company’s outstanding indebtedness by exchanging the Notes for common shares of Jaguar and inject approximately $50.0 million into the Company by way of a backstopped share offering (the “Share Offering”) by Noteholders pursuant to a backstop agreement dated November 13, 2013 (as amended, the “Backstop Agreement”) between the Company, its subsidiaries and certain Noteholders. Additional Noteholders signed consent agreements to the Support Agreement such that as of November 26, 2013, holders of approximately 93% of the Notes had signed the Support Agreement or a consent agreement thereto.
On December 23, 2013, the Company filed for creditor protection (the “CCAA Proceedings”) under the Companies’ Creditors Arrangement Act (Canada) (the “CCAA”) in the Ontario Superior Court of Justice (Commercial List) (the “Court”). The CCAA Proceedings were commenced in order to implement a recapitalization transaction as contemplated in the Support Agreement through a plan of compromise and arrangement (as amended, supplemented or restated from time to time, the “CCAA Plan”). The Court granted an Initial Order, Claims Procedure Order and Meeting Order, each dated December 23, 2013.
The Claims Procedure Order provided for, among other things, the establishment of a claims procedure for the identification, quantification and determination of certain claims against the Company. Pursuant to the Meeting Order, Jaguar was authorized to call a meeting (the “Meeting”) of Affected Unsecured Creditors (as defined in the CCAA Plan) to consider and, if deemed advisable, to pass a resolution approving the CCAA Plan. The Meeting was held on January 31, 2014 and the CCAA Plan was approved by 100% of the Affected Unsecured Creditors that voted, in person or by proxy, at the Meeting. Following the Meeting, Jaguar obtained an order from the Court on February 6, 2014 sanctioning the CCAA Plan.
On April 22, 2014, the Company successfully implemented the CCAA Plan dated February 5, 2014.
The CCAA Plan was designed to reduce the amount of the Company’s indebtedness and cash interest expense. The Company believes that the consummation of its financial restructuring enhanced the Company’s liquidity and provides it with improved financial and operating flexibility.
The CCAA Plan implemented a series of steps leading to an overall capital reorganization of Jaguar. These steps included, among other things:
| MD&A – Second quarter ended June 30, 2014 | Jaguar Mining Inc. | 4 |
| · | The common shares of the Company issued and outstanding immediately prior to the implementation of the CCAA Plan were consolidated at a ratio of one (1) post-consolidation common share for each 86.39636 pre-consolidation common shares (the “Consolidation”). Any fractional Common Shares resulting from the Consolidation were rounded down to the next whole share without any additional compensation therefor. A total of 999,927 common shares were outstanding as a result of the consolidation. |
| · | The Noteholders and certain other Affected Unsecured Creditors of the Company with proven claims received their pro-rata share of 14,000,000 common shares of the Company in exchange for their Notes and in satisfaction of their claims, respectively, and Noteholders who signed the Support Agreement, or a consent agreement thereto, as of November 26, 2013 received their pro rata share of an additional 5,000,000 common shares of the Company in exchange for their Notes. Pursuant to the CCAA Plan, the Notes (and the indentures under which such Notes were issued) have been irrevocably and finally cancelled and all unsecured claims of certain affected unsecured creditors of the Company are fully and finally released. |
| · | Noteholders who participated in the Share Offering purchased up to their pro-rata share of 70,955,797 common shares of the Company (collectively, the “Offering Shares”) and such Noteholders received their pro-rata share of 9,044,203 common shares of the Company (the “Accrued Interest Offering Shares”) (based on the percentage that the unpaid interest on their Notes bore to the aggregate of all unpaid interest owing to all Noteholders who participated in the Share Offering as at December 31, 2013) in exchange for their Notes. |
| · | Noteholders who backstopped the Share Offering pursuant to the Backstop Agreement purchased their pro-rata share (based on their backstop commitments) of the Offering Shares not subscribed for under the Share Offering and received their pro-rata share of an additional 11,111,111 common shares of the Company in exchange for their Notes. |
The equity-based compensation arrangements of the Company existing immediately prior to implementation of the CCAA Plan were cancelled pursuant to the terms of the CCAA Plan. The Board of Directors (the “Board”) has approved a new 10% rolling stock option plan (the “New Stock Option Plan”). The New Stock Option Plan has received conditional approval from the TSX-V and is subject to the approval of disinterested shareholders of the Company. It was approved at the Company's annual general meeting of shareholders (“AGM”), held on June 25, 2014. The Board has also approved a new deferred share unit plan (the “DSU Plan”), which reserves a maximum of 11,111,111 common shares for issuance under the plan. The DSU Plan has received conditional approval from the TSX-V and was approved by shareholders at the Company’s AGM.
In connection with the CCAA Plan, the Company negotiated amendments to certain terms of the Renvest Credit Facility (the “Facility”). The Facility amendments provide among other things, that:
| · | the maturity date of the Facility is extended to December 31, 2015 from July 25, 2014; |
| · | mandatory repayments of $1.0 million of principal amount plus accrued and unpaid interest shall be made each month from and including July 2014 to and including November 2015, with the balance of all outstanding obligations to be repaid on December 31, 2015; |
| · | the Lender shall have a right to convert up to $5.0 million of the outstanding obligations under the Facility into equity at a specified conversion price (subject to certain anti-dilution protections); |
| · | the Lender shall have a right to participate in certain offerings of equity securities by the Company if the offering occurs at a prescribed price; |
| · | the Company shall maintain certain minimum levels of cash on hand; |
| · | the Lender shall be entitled to appoint an observer to the meetings of the Board of Directors; |
| · | the Company and the Lender enter into a Right of First Refusal Agreement with respect to assignments of the Facility by the Lender; and |
| · | existing breaches, defaults and events of default under the Facility are waived by the Lender. Certain events of default under the Facility were also amended to reflect the Company’s current financial circumstances. |
The Company paid a fee of $1.0 million in connection with the amendments to the Facility ($0.6 million paid in cash and $0.4 million payable as an increase in the principal amount of the Facility).
| MD&A – Second quarter ended June 30, 2014 | Jaguar Mining Inc. | 5 |
In connection with the above amendments, the Company agreed to repay immediately to the Lender $10.0 million on account of the outstanding obligations under the Facility. Also, the Lender waived its rights under the Facility to receive any portion of the net proceeds of the Share Offering, with the exception of the agreed upon $10.0 million repayment described above.
The Company believes that the implementation of the CCAA Plan resulted in a number of benefits to the Company, including, among other things, a significant reduction of the Company’s debt, increased liquidity for operations and facilitation of the Company’s ability to make certain necessary capital investments and accelerate operational improvements allowing it to continue operations for the foreseeable future.
Capital Structure
(All figures in US$ millions except number of Common Shares)
| | | As at June 30, 2014 | |
| Bank Indebtedness | | $ | 15.9 | |
| Renvest Facility | | | 19.6 | |
| Vale Note | | | 8.0 | |
| Total Debt | | $ | 43.5 | |
| Less: Cash and Cash Equivalents | | | (31.3 | ) |
| Total Net Debt | | $ | 12.2 | |
| Number of Common Shares Outstanding | | | 111.1 million | |
(*) Non-ifrs measure. These non-IFRS performance measures do not have any standardized meaning prescribed by IFRS and, therefore, may not be comparable to similar measures presented by other companies.
Directors and Senior Management of Jaguar
The board of directors of Jaguar was reconstituted in connection with the implementation of the CCAA Plan so as to be comprised of seven individuals, four of whom are incumbent directors of the Company. In addition, in connection with the Plan, Mr. George Bee and Mr. Derrick Weyrauch have been appointed as Chief Executive Officer and Chief Financial Officer, respectively.
Set out below are biographies of the directors and executive officers of the Company, as of August 25, 2014:
| · | Richard D. Falconer (Director): Mr. Falconer was elected to the Board on May 22, 2012 and was appointed Chairman of the Board on June 29, 2012. Mr. Falconer retired from CIBC after 40 years with the bank. At the time of retirement, Mr. Falconer was Vice Chairman and Managing Director, CIBC World Markets Inc. Current directorships include Chorus Aviation Inc.; Resolute Forest Products Inc.; Dorothy Ley Hospice; LOFT Community Services; and Member, Shaw Festival Theatre Endowment Foundation Board of Governors. He is a Chartered Financial Analyst and holds a Master of Business Administration degree, York University, and Honours B.A., University of Toronto. |
| · | George Bee (Director and Chief Executive Officer): Mr. Bee was elected to the Board on June 10, 2013 and was appointed Chief Executive Officer of the Company on April 22, 2014. Mr. Bee is a mining engineer and has over 30 years’ experience in the mining industry, developing world-class gold mining projects. Recently, he was the President and Chief Executive Officer and a director of Andina Minerals Inc. Prior to that, Mr. Bee was Chief Operating Officer of Aurelian Resources and spent over 16 years at Barrick Gold Corporation where he was responsible for a number of operating and development projects. Mr. Bee is a graduate of the Camborne School of Mines in Cornwall, United Kingdom. Mr. Bee currently serves on the boards of Stillwater Mining Company and Sandspring Resources Inc. and holds an ICD.D designation from the Institute of Corporate Directors. |
| · | Edward V. Reeser (Director): Mr. Reeser was appointed to the Board on June 10, 2013. Mr. Reeser is the owner and President of Celco Inc. (Food Service Equipment), one of Canada's major commercial food service equipment importers and distributors. Mr. Reeser has been a director and member of the Finance and Audit Committee of Bridgepoint Health since September 2011. Mr. Reeser has over 15 years’ experience as a senior financial officer of TSX-listed companies in the metallurgical, aviation and energy utility industries. Mr. Reeser has also served as a director and officer of a number of private companies and non-profit organizations. Mr. Reeser holds a Master of Business Administration degree (finance concentration) from York University, a Bachelor of Arts from York University and an ICD.D designation from the Institute of Corporate Directors. |
| MD&A – Second quarter ended June 30, 2014 | Jaguar Mining Inc. | 6 |
| · | Luis Miraglia (Director): Mr. Miraglia was appointed as a director of the Company on September 27, 2012. Mr. Miraglia is a native of Minas Gerais, Brazil and is a Partner at the law firm of Azevedo Sette Advogados with 19 years of experience in legal practice specializing in corporate law, mergers and acquisitions, project finance, infrastructure projects and mining. He holds a degree (Juris Doctorate equivalent) from the Universidade Federal de Minas Gerais in Belo Horizonte, Brazil and a Masters of Law degree from the University of Chicago Law School. |
| · | Stephen Hope (Director): Mr. Hope has worked in fixed-income investment management for over fifteen years. Prior to forming Outrider Management (“Outrider”) in January 2004, he was a portfolio manager with Dalton Investments LLC where he managed a fund with a substantially similar investment strategy to that of Outrider. Prior to joining Dalton, he managed an emerging markets debt fund focused on distressed debt for two years at San Francisco Sentry Investment Group. Prior to San Francisco Sentry, he worked at Bracebridge Capital as an analyst and trader for their Asian operations. From 1995 to 1997, Stephen was a currency and bond trader for the Asian and Dollar Bloc markets for Eaton Vance Management. Stephen began his career at the First National Bank of Maryland as a corporate credit analyst and trader. Stephen Hope holds a Bachelor of Arts in Economics from Princeton University. |
| · | Jared Hardner (Director): Mr. Hardner has worked in the field of environmental management for 21 years. Over the past decade his work has focused increasingly on the mining industry and he includes among his clients Rio Tinto, Barrick Gold, Teck, First Quantum, and Newmont Mining. His geographic experience includes the U.S., Canada, Africa, Asia, Australia, and numerous countries in Latin America including Brazil. He holds a Bachelor of Arts in Economics and a Certificate in Latin American Studies from Princeton University, and a Masters of Forest Science from Yale University. |
| · | Robert J. Chadwick (Director): Mr. Chadwick is a partner and a member of the Executive Committee at Goodmans. He practices corporate and commercial law in the areas of corporate restructuring and insolvency, financial services and private equity law. Mr. Chadwick focuses his practice on corporate, banking, private equity, insolvency and reorganization law and mergers and acquisitions. He also has expertise in national, cross-border and international transactions. Mr. Chadwick has participated in significant financings and acquisitions and other transactional matters in various industries on behalf of a diverse group of clients. He has been an advisor in many of the major Canadian and cross-border commercial matters and restructurings. He is a director of TSX-listed Ainsworth Lumber Co. Ltd. |
| · | Derrick Weyrauch (Chief Financial Officer): Mr. Weyrauch served as an independent director of the Company from June 10, 2013 until April 22, 2014, and was appointed Chief Financial Officer of the Company on April 22, 2014. Mr. Weyrauch is a Chartered Professional Accountant (“CPA”) and a Chartered Accountant (“CA”) and has over 15 years’ experience as a senior financial officer of TSX/TSX-V-listed companies in the mining, contract manufacturing and medical device industries. Mr. Weyrauch is also an independent director of Banro Corporation. Prior to its sale in 2013, Mr. Weyrauch served as the Chief Financial Officer of Andina Minerals Inc. Mr. Weyrauch earned his CA designation in 1990 while employed at KPMG LLP. He is a member of the Institute of Chartered Accountants of Ontario, the Institute of Corporate Directors and holds a Bachelor of Arts degree in Economics from York University. |
Implementation of the Plan resulted in two unrelated investment managers each owning or exercising control or direction over in excess of 10% of the outstanding common shares as at April 22, 2014: (i) Outrider Management, LLC had beneficial ownership, or exercised control or direction, directly or indirectly, over approximately 32.4% of the common shares; and (ii) Dupont Capital Management Corp. exercised control over approximately 10.8% of the common shares. Mr. Stephen Hope, one of the directors of the Company, is the principal of Outrider Management, LLC.
| MD&A – Second quarter ended June 30, 2014 | Jaguar Mining Inc. | 7 |
The finalization of the restructuring process has provided Jaguar with a strong balance sheet, thereby, allowing the new management team to continue with operational improvements and has provided the opportunity to embrace future opportunities associated with existing assets.
OPERATIONAL RESTRUCTURING AND TURNAROUND PLAN
On May 8, 2012, Jaguar announced the implementation of a comprehensive operational restructuring and turnaround plan to improve costs and efficiency at its operations in the state of Minas Gerais, Brazil. The plan incorporates objectives and initiatives identified by Jaguar’s management and a number of expert industry consultants who were retained to assist with operational and cost improvements.
Key activities aimed towards further cost reductions and production efficiencies include continued focus on safety, further optimization of the workforce and manpower levels, and continued emphasis on advanced development and definition drilling. A general Human Resources/Community Social Responsibility review has been initiated by the Company. The Company believes the successful implementation of these programs will enable it to further reduce cash operating cost per ounce.
Work programs carried out during the quarter ended June 30, 2014 include the following:
Health and Safety
| · | Progress was made in promoting working in a safe manner and changing corporate culture in Brazil to a “safety first” mentality. No lost time incidents (“LTI”) occurred during Q2 2014. |
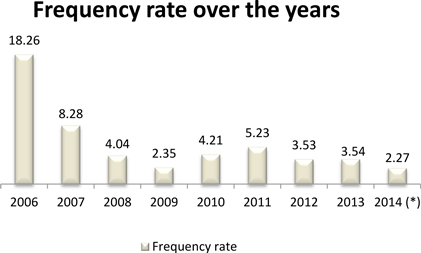
(*) Cumulative over the last twelve months
| MD&A – Second quarter ended June 30, 2014 | Jaguar Mining Inc. | 8 |
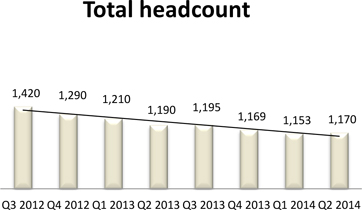
Human Resources
| · | Headcount remains consistent, maintaining the necessary operations personnel, with the trend noted in the graph presented below: |
| · | Considerable progress was made in remediating the 47 labour law deviations (see“Legacy Issues – Labour practices”). |
Turmalina and Caeté Plants
| · | There are continuing efforts in the implementation of a revised purchasing system led by the purchasing manager, aiming at acquisition cost, inventory level reductions and consumption controls. |
| · | Change in mining methods: |
Historically, access to the Company’s ore bodies has been through 5 meter by 5 meter decline ramps, haulages, crosscuts and stope development headings to accommodate 30-tonne conventional and articulated dump trucks and matching loading equipment in the stoping horizon using a modified bench cut and fill mining technique. In some places, these excavations have been prone to ground control issues, which tend to compromise excavation integrity and lead to increased safety risks and the production of excessive quantities of development waste.
As a result of the evaluation of ground stability and control, a comprehensive plan has been implemented based on determination of operational adjustments required to optimize excavation stability and support. This program is a work in progress with the Company incorporating a new application of friction bolt to eliminate the use of split sets in the stopes being mined.
Past investigation which delineated factors that determine excavation stability, including the sensitivity of potentially weak planes to bending deflection, failure mechanisms in drifts and stopes, integration of rock reinforcement and surface support in drifts and stopes, effective installation of support, excavation size, shape and orientation, drilling accuracy and blasting control.
Practical ground stability and control objectives were defined which included stopping undue ground displacement, accurately delineating objective ore zones, using properly scaled equipment, drilling accurately and controlling blasting to avoid over-break and breaching of walls, identifying and deploying the appropriate equipment to ensure effective installation of support and installing all elements of support in a timely and efficient manner.
| MD&A – Second quarter ended June 30, 2014 | Jaguar Mining Inc. | 9 |
At the end of Q2 2014, the Company continued to investigate optimum excavation size to keep dilution to a minimum in order to minimize costs and maximize ounces generated. Work programs continue to change operations parameters, the size and dimension of the excavations on ore, designed in a manner that does not compromise the hanging wall and footwall contacts. Additional benefits are also expected including, but not limited to, ground control accessories reduction (due to smaller profile of drifting), improved geological control, reduced ventilation costs, reduced development costs, reduced equipment costs, improved efficiencies in mining cycles, improved safety of operations (due to new equipment and operational techniques) and reduced milling costs on a per ounce milled basis.
With the change in operating philosophy, the size of excavations will be reduced to approximately 3.0 meters by 3.5 meters and the new trapezoidal shape of the excavations should not compromise the existing hanging wall and footwall units. These efforts are well advanced in the Turmalina and Caeté operations.
Efforts continue at both sites on the reduction to smaller ore and waste development headings. Reductions continue in stope dimension, improvements in ground control and ground control methodologies. Implementation of the external consultant’s 2012 recommendations on ground control methodology has resulted in successful applications and completion of the first sublevel stope incorporating this technology. Noted observations in ground control improvement have been observed in all areas due to this ground support work.
The program has resulted in improvements to mine dilution. These changes are being implemented concurrently with continuing operations and are expected to reduce the cash operating cost per ounce and allow for more predictable production.
Paciência Plant
The Paciência complex continued on care and maintenance. Work was initiated on the evaluation of the Santa Isabel geology and the remaining accessible ore zones, the geological model was updated, and a review of the mill plant facility was undertaken along with the tailings disposal facility, all with the intent of a restart program. The Company continues to evaluate the potential of mining the accessible ore zones as well as the development and drilling programs to sustain the operation in the future. The efforts in 2014 will remain focused on Turmalina and Caeté operations.
REVIEW OF OPERATING PERFORMANCE
The table below sets forth certain operating data for the combined operating performance:
| | | Three Months Ended | |
| | | Q2 2014 | | | Q1 2014 | | | Q4 2013 | | | Q3 2013 | | | Q2 2013 | | | Q1 2013 | | | Q4 2012 | | | Q3 2012 | |
| | | | | | | | | | | | | | | | | | | | | | | | | |
| Tonnes of ore processed (t) | | | 263,000 | | | | 268,000 | | | | 258,000 | | | | 298,000 | | | | 271,000 | | | | 265,000 | | | | 285,000 | | | | 285,000 | |
| Average recovery grade (g/t)(**) | | | 3.11 | | | | 2.89 | | | | 2.96 | | | | 3.06 | | | | 2.96 | | | | 3.30 | | | | 2.76 | | | | 2.85 | |
| Average recovery rate (%) | | | 89 | % | | | 88 | % | | | 88 | % | | | 88 | % | | | 88 | % | | | 88 | % | | | 88 | % | | | 88 | % |
| Gold (ounces) | | | | | | | | | | | | | | | | | | | | | | | | | | | | | | | | |
| Produced | | | 23,867 | | | | 23,359 | | | | 21,956 | | | | 26,300 | | | | 22,503 | | | | 24,836 | | | | 21,676 | | | | 23,026 | |
| Sold | | | 24,002 | | | | 24,181 | | | | 22,503 | | | | 24,111 | | | | 22,920 | | | | 25,316 | | | | 21,298 | | | | 23,307 | |
| Average sales price per oz sold | | $ | 1,280 | | | $ | 1,288 | | | $ | 1,263 | | | $ | 1,331 | | | $ | 1,415 | | | $ | 1,626 | | | $ | 1,714 | | | $ | 1,648 | |
| Cash operating cost (per tonne processed)(*) | | $ | 86 | | | $ | 77 | | | $ | 78 | | | $ | 72 | | | $ | 81 | | | $ | 77 | | | $ | 69 | | | $ | 78 | |
| Cash operating cost (per ounce produced)(*) | | $ | 958 | | | $ | 923 | | | $ | 889 | | | $ | 847 | | | $ | 931 | | | $ | 826 | | | $ | 915 | | | $ | 963 | |
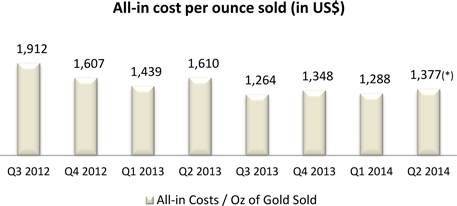
| All-in cost (per ounce sold)(*) (***) | | $ | 1,377 | | | $ | 1,288 | | | $ | 1,348 | | | $ | 1,253 | | | $ | 1,572 | | | $ | 1,439 | | | $ | 1,607 | | | $ | 1,912 | |
(*) Refer to “Non-IFRS Performance Measures” on page 25.
(**) The Company is now disclosing the average recovery grade instead of the average feed grade, as management believes this information has higher relevance in this table.
| MD&A – Second quarter ended June 30, 2014 | Jaguar Mining Inc. | 10 |
(***) This relates to the all-in cost excluding the restructuring expenses that were incurred during Q2 2014, in the amount of $7.1 million. If the restructuring expenses are considered then the all-in cost is $1,672 per ounce of gold sold in Q2 2014.
(*) This relates to the all-in cost excluding the restructuring expenses that were incurred during Q2 2014, in the amount of $7.1 million. If the restructuring expenses are considered then the all-in cost is $1,672 per ounce of gold sold in Q2 2014.
The Company’s operating and financial performances are largely determined by the price of gold. The average price of gold sold has declined 10% or $135 per ounce from $1,415 per ounce in Q2 2013 to $1,280 per ounce in Q2 2014. Management has implemented company-wide initiatives to reduce operating and capital costs to counteract current market conditions while focusing on maintaining current productivity levels.
The result of the continuing effort in cost reduction is evidenced in the table and chart above. The all-in costs per ounce of gold sold have decreased significantly over the periods being reported. Most of the cost reduction is attributable to the decrease in labour, external services, maintenance and material costs.
As Jaguar’s mining operations and exploration activities are located in Brazil, a large portion of operating costs and capital expenditures are denominated in Brazilian reais. The recent weakening of the R$ against the US$ has made a positive contribution to reducing the cash operating and all-in costs. The average exchange rate for the R$ per US$1.00 for Q2 2013 and Q2 2014 were 2.07 and 2.23, respectively, an increase of 8% as the US$ strengthened against the R$.
The Company’s Paciência operation was put on care and maintenance in May 2012, and as a result, the consolidated production level has dropped since Q2 2012. Apart from Paciência, the Company’s gold production level has been consistent, except for Q2 2013 and Q4 2013, where gold production decreased as the Caeté site experienced mill liner failures, lower head grade mill feed, and costly challenges with transportation due to poor road conditions.
As a result of the Company-wide cost reduction initiative, some of the primary development and secondary development in the operations have been deferred. Accordingly, delineation drilling which usually follows the completion of development has also been reduced.
| MD&A – Second quarter ended June 30, 2014 | Jaguar Mining Inc. | 11 |
Turmalina
| | | Three Months Ended | |
| | | Q2 2014 | | | Q1 2014 | | | Q4 2013 | | | Q3 2013 | | | Q2 2013 | | | Q1 2013 | | | Q4 2012 | | | Q3 2012 | |
| | | | | | | | | | | | | | | | | | | | | | | | | |
| Tonnes of ore processed (t) | | | 107,000 | | | | 111,000 | | | | 114,000 | | | | 122,000 | | | | 123,000 | | | | 108,000 | | | | 113,000 | | | | 115,000 | |
| Average recovery grade (g/t)(**) | | | 4.14 | | | | 3.24 | | | | 3.13 | | | | 3.46 | | | | 3.01 | | | | 3.37 | | | | 2.57 | | | | 2.78 | |
| Average recovery rate (%) | | | 91 | % | | | 88 | % | | | 89 | % | | | 89 | % | | | 88 | % | | | 89 | % | | | 87 | % | | | 89 | % |
| Gold (ounces) | | | | | | | | | | | | | | | | | | | | | | | | | | | | | | | | |
| Produced | | | 13,190 | | | | 11,374 | | | | 10,451 | | | | 12,308 | | | | 10,345 | | | | 10,321 | | | | 8,206 | | | | 9,186 | |
| Sold | | | 13,481 | | | | 11,513 | | | | 10,850 | | | | 10,850 | | | | 10,061 | | | | 10,850 | | | | 8,037 | | | | 9,242 | |
| Cash operating cost (per tonne processed)(*) | | $ | 84 | | | $ | 77 | | | $ | 75 | | | $ | 73 | | | $ | 78 | | | $ | 83 | | | $ | 74 | | | $ | 80 | |
| Cash operating cost (per ounce produced)(*) | | $ | 696 | | | $ | 857 | | | $ | 822 | | | $ | 758 | | | $ | 923 | | | $ | 862 | | | $ | 1,057 | | | $ | 991 | |
(*) Refer to “Non-IFRS Performance Measures” on page 24.
(**) The Company is now disclosing the average recovery grade instead of the average feed grade, as management believes this information has higher relevance in this table.
The primary mining method utilized at the Turmalina underground mine is sublevel stoping with a fill program resulting in a modified “cut and fill” mining technique. Ore produced at the Turmalina mine is transported to the adjacent 2,000 tonnes per day (“tpd”) carbon-in-pulp (“CIP”) processing plant.
During Q2 2014, Turmalina produced 13,190 ounces of gold at a cash operating cost of $696 per ounce. This compares to 10,345 ounces at a cash operating cost of $923 per ounce during Q2 2013. The $227 (25%) decrease in the Company’s cash operating cost per ounce during Q2 2014, as compared to Q2 2013, was mainly attributable to the increase in the recovery grade and rate and change in the exchange rate.
Underground development at the Turmalina mine totaled 1,400 and 2,700 meters during Q2 2014 and YTD 2014, respectively, compared to 1,800 and 3,700 meters during Q2 2013 and YTD 2013, respectively. Underground delineation drilling at Turmalina totaled 4,700 and 8,500 meters during Q2 2014 and YTD 2014, respectively, compared to 8,600 and 14,500 meters during Q2 2013 and YTD 2013, respectively.
Caeté
| | | Three Months Ended | |
| | | Q2 2014 | | | Q1 2014 | | | Q4 2013 | | | Q3 2013 | | | Q2 2013 | | | Q1 2013 | | | Q4 2012 | | | Q3 2012 | |
| | | | | | | | | | | | | | | | | | | | | | | | | |
| Tonnes of ore processed (t) | | | 156,000 | | | | 157,000 | | | | 144,000 | | | | 176,000 | | | | 148,000 | | | | 157,000 | | | | 172,000 | | | | 170,000 | |
| Average recovery grade (g/t)(**) | | | 2.40 | | | | 2.65 | | | | 2.82 | | | | 2.78 | | | | 2.92 | | | | 3.25 | | | | 2.88 | | | | 2.90 | |
| Average recovery rate (%) | | | 88 | % | | | 88 | % | | | 88 | % | | | 88 | % | | | 88 | % | | | 88 | % | | | 88 | % | | | 88 | % |
| Gold (ounces) | | | | | | | | | | | | | | | | | | | | | | | | | | | | | | | | |
| Produced | | | 10,677 | | | | 11,985 | | | | 11,505 | | | | 13,992 | | | | 12,158 | | | | 14,515 | | | | 13,470 | | | | 13,840 | |
| Sold | | | 10,521 | | | | 12,668 | | | | 11,653 | | | | 13,261 | | | | 12,859 | | | | 14,466 | | | | 13,261 | | | | 13,692 | |
| Cash operating cost (per tonne processed)(*) | | $ | 88 | | | $ | 77 | | | $ | 79 | | | $ | 71 | | | $ | 84 | | | $ | 73 | | | $ | 66 | | | $ | 77 | |
| Cash operating cost (per ounce produced)(*) | | $ | 1,281 | | | $ | 986 | | | $ | 950 | | | $ | 925 | | | $ | 938 | | | $ | 801 | | | $ | 828 | | | $ | 945 | |
(*) Refer to “Non-IFRS Performance Measures” on page 24.
(**) The Company is now disclosing the average recovery grade instead of the average feed grade, as management believes this information has higher relevance in this table.
The Caeté mining complex has two underground mines (Roça Grande and Pilar) that primarily utilize the “cut and fill” mining method as well as some “sublevel stoping” at Pilar. Ore produced from these mines is transported to the 2,200 tpd CIP processing plant adjacent to the Roça Grande mine.
| MD&A – Second quarter ended June 30, 2014 | Jaguar Mining Inc. | 12 |
During Q2 2014, Caeté produced 10,677 ounces of gold at a cash operating cost of $1,281 per ounce. This compares to 12,158 ounces at a cash operating cost of $938 per ounce during Q2 2013. The $343 (37%) increase in cash operating cost is mainly attributable to the lower average recovery grades.
Underground development at the Pilar and Roça Grande mines totaled 1,200 and 2,400 meters during Q2 2014 and YTD 2014, respectively, compared to 1,700 and 3,500 meters during Q2 2013 and YTD 2013, respectively. Underground delineation drilling at the mines totaled 5,400 and 9,400 meters during Q2 2014 and YTD 2014, respectively, compared to 6,200 and 11,800 meters during Q2 2013 and YTD 2013, respectively. These figures reflect some of the drilling and mine development which is being deferred at the Pilar and Roça Grande mines, to reduce capital expenditure.
Paciência
The Paciência operation continued on care and maintenance during Q2 2014. No gold has been produced since Q2 2012 when it was put on care and maintenance. No underground development or drilling work was carried out by the Company at the Paciência mine during Q2 2014.
The Company has not established a timeframe to complete the Paciência remediation plans and restart production.
Sabará
The remediation and re-vegetation program started in 2012 continues at the Sabará operation.
| MD&A – Second quarter ended June 30, 2014 | Jaguar Mining Inc. | 13 |
REVIEW OF FINANCIAL RESULTS
| | | Three Months Ended | |
| ($ in 000s, except per share amounts) | | Q2 2014 | | | Q1 2014 | | | Q4 2013 | | | Q3 2013 | | | Q2 2013 | | | Q1 2013 | | | Q4 2012 | | | Q3 2012 | |
| | | | | | | | | | | | | | | | | | | | | | | | | |
| Gold sales | | $ | 31,044 | | | $ | 31,100 | | | $ | 28,461 | | | $ | 32,082 | | | $ | 32,427 | | | $ | 41,170 | | | $ | 36,511 | | | $ | 38,412 | |
| Gross profit (loss) | | | 431 | | | | 1,087 | | | | (1,427 | ) | | | 3,496 | | | | 336 | | | | 10,382 | | | | 9,344 | | | | 5,522 | |
| Net income (loss) | | | 246,646 | | | | (15,755 | ) | | | (166,642 | ) | | | (13,192 | ) | | * | (62,717 | ) | | | (6,926 | ) | | | (49,371 | ) | | | (21,625 | ) |
| Basic gain (loss) per share(**) | | | 2.92 | | | | (15.76 | ) | | | (166.64 | ) | | | (13.19 | ) | | | (62.93 | ) | | | (7.05 | ) | | | (50.53 | ) | | | (22.13 | ) |
| Diluted gain (loss) per share(**) | | | 2.91 | | | | (15.76 | ) | | | (166.64 | ) | | | (13.19 | ) | | | (62.93 | ) | | | (7.05 | ) | | | (50.53 | ) | | | (22.13 | ) |
| Cashflows from operating activities | | | (8,045 | ) | | | 2,609 | | | | (3,199 | ) | | | 5,072 | | | | (131 | ) | | | 11,071 | | | | 5,380 | | | | (2,600 | ) |
| Total assets | | | 308,220 | | | | 285,372 | | | | 294,788 | | | | 441,659 | | | | 458,129 | | | | 504,564 | | | | 503,875 | | | | 568,162 | |
| Total liabilities | | | 107,522 | | | | 394,954 | | | | 388,347 | | | | 369,297 | | | | 373,999 | | | | 357,017 | | | | 350,072 | | | | 365,200 | |
(*)Recast from Q3 2012 to Q1 2014 figures to reflect the share consolidation disclosed in section Financial Restructuring Plan - CCAA Proceedings
During Q2 2014, the market price of gold (London PM Fix) traded in a range from $1,243 to $1,326 and averaged $1,288 per troy ounce. This was approximately 9% lower than the average price for Q2 2013 which was $1,415 and traded in a range from $1,192 to $1,584.
The Company reports its financial statements in US$; however, a significant portion of the Company’s expenses are incurred in either Cdn$ or R$. The average exchange rates for the Cdn$ per US$ for Q2 2014 and Q2 2013 were 1.09 and 1.02, respectively. The average exchange rates for the R$ per US$ for Q2 2014 and Q2 2013 were 2.23 and 2.07, respectively.
Q2 2014 Compared to Q2 2013
| | | Three Months Ended
June 30, | | | Six Months Ended
June 30, | |
| ($ in 000s) | | 2014 | | | 2013 | | | 2014 | | | 2013 | |
| | | | | | | | | | | | | |
| Gold sales | | $ | 31,044 | | | $ | 32,427 | | | $ | 62,143 | | | $ | 73,597 | |
| Production costs | | | (23,274 | ) | | | (23,960 | ) | | | (44,611 | ) | | | (46,780 | ) |
| Depletion and amortization | | | (7,339 | ) | | | (8,131 | ) | | | (16,015 | ) | | | (16,100 | ) |
| Gross profit | | $ | 431 | | | $ | 336 | | | $ | 1,517 | | | $ | 10,717 | |
Gold sales for Q2 2014 decreased $1.4 million or 4% from Q2 2013. The reduction is mainly due to the decrease in gold price. The average realized gold price decreased 10% to $1,280 per ounce for Q2 2014 from $1,415 per ounce in Q2 2013, which is partially offset by 5% increase in ounces sold. Below is the breakdown of gold sales, by unit:
| | | Three Months ended June 30, | |
| | | 2014 | | | 2013 | |
| Gold Sales by Mine | | in $ 000 | | | in oz | | | in $ 000 | | | in oz | |
| | | | | | | | | | | | | | | | | |
| Turmalina | | $ | 17,426 | | | | 13,481 | | | $ | 14,139 | | | | 10,061 | |
| Caeté | | | 13,618 | | | | 10,521 | | | | 18,288 | | | | 12,859 | |
| Total | | $ | 31,044 | | | | 24,002 | | | $ | 32,427 | | | | 22,920 | |
| MD&A – Second quarter ended June 30, 2014 | Jaguar Mining Inc. | 14 |
The Company reported a gross profit of $431,000 for Q2 2014 compared to a gross profit of $336,000 for Q2 2013. The increase in gross profit for Q2 2014 versus Q2 2013 was primarily related to the decrease in production costs. The gross profit represents 1% of the total gold sales in Q2 2014 and Q2 2013.
Net profit for Q2 2014 was $246.6 million compared to a net loss of $64.0 million for Q2 2013. For YTD 2014 the net profit was $230.9 million, compared to a net loss of $71.0 million for YTD 2013. The table and paragraphs below provide relevant summary information for the key operating and non-operating expenses:
Operating Expenses
| | | Three Months Ended
June 30, | | | Six Months Ended
June 30, | |
| ($ in 000s) | | 2014 | | | 2013 | | | 2014 | | | 2013 | |
| | | | | | | | | | | | | |
| Exploration | | $ | 81 | | | $ | 274 | | | $ | 120 | | | $ | 601 | |
| Paciência care and maintenance | | | 520 | | | | 746 | | | | 1,126 | | | | 1,454 | |
| Stock-based compensation | | | 697 | | | | 68 | | | | 742 | | | | 291 | |
| Restructuring fees | | | 7,059 | | | | 865 | | | | 9,966 | | | | 865 | |
| Administration | | | 3,037 | | | | 3,894 | | | | 7,074 | | | | 8,108 | |
| Amortization | | | 268 | | | | 288 | | | | 538 | | | | 580 | |
| Impairment of properties | | | - | | | | 46,834 | | | | - | | | | 46,834 | |
| Adjustment to provision for VAT and other taxes | | | 2,026 | | | | - | | | | 4,764 | | | | - | |
| Legal and other provision | | | 1,678 | | | | 1,110 | | | | 2,960 | | | | 4,019 | |
| Other operating expenses | | | 1,504 | | | | 519 | | | | 2,753 | | | | 593 | |
| Total Operating Expenses | | $ | 16,870 | | | $ | 54,598 | | | $ | 30,043 | | | $ | 63,345 | |
As previously discussed, the Company’s Paciência project was put on care and maintenance in May 2012. The care and maintenance charges include labour and services on site and ongoing care and maintenance costs relating to the plant and mine.
Restructuring fees include the fees related to the recapitalization and financing transaction under the CCAA Plan, mainly legal fees and consulting expenses.
Administration expenses include legal and accounting costs, costs to maintain offices and personnel and costs associated with being a publicly-traded company. Administration expenses decreased in Q2 2014 compared to the same period in 2013 mainly due to the implementation of company-wide cost reduction initiatives.
During the quarter ended June 30, 2013, the Company recorded an impairment charge of $46.8 million, mainly due to the decrease in the gold price being $3.9 million related to the Paciência project, $17.8 million related to the Turmalina project and $25.1 million for the Caeté project.
The Company recorded a provision during Q4 2013 against its recoverable taxes given limited methods available to recover such taxes and the length of time it will take to recover such taxes over life of mine. The provision reduced the net carrying value of value added taxes and other taxes to their estimated present value based on the manner and timing of expected recovery, discounted at a rate of 10.9%. The impact in the statements of operations and comprehensive loss in Q2 2014 is related to the net increase of the provision, due to the change in the discount rate (Selic – Brazilian free risk rate) that was 9.9% in Q4 2013 and 10.9% in Q2 2014 and new additions to recoverable taxes.
Legal and other provision include the financial impact of provisions for outstanding lawsuits in Brazil. The Company had approximately 427 labour claims outstanding as at June 30, 2014 which are being disputed through various court actions. In the normal course of operations, the Company may be subject to lawsuits and other claims, including environmental, labour and other matters. The ultimate outcome or actual cost of settlement may vary significantly from management estimates. As at June 30, 2014, the Company has recognized a provision of $9.8 million (December 31, 2013 - $8.0 million) representing management’s best estimate of expenditures required to settle present obligations.
| MD&A – Second quarter ended June 30, 2014 | Jaguar Mining Inc. | 15 |
Related-Party Transactions
The Company incurred legal fees from Azevedo Sette Advogados (“ASA”), a company whose partner is Luis Miraglia, a director of Jaguar. Fees paid to ASA are recorded at the exchange amount – being the amount agreed to by the parties and included in administration expenses in the statements of operations and comprehensive loss – and amount to $6,000 and $22,000 for the three and six months ended June 30, 2014, respectively ($27,000 and $113,500 for the three and six months ended June 30, 2013, respectively).
The Company incurred consulting expenses from Hermann Consulting Inc. (“Hermann”), a company owned by Fred Hermann, a former director of Jaguar. Fees paid to Hermann were recorded at the exchange amount – being the amount agreed to by the parties and included in administration expenses in the statements of operations and comprehensive loss – and amount to $32,600 and $93,000 for the three and six months ended June 30, 2014, respectively ($72,800 and $159,300 for the three and months ended June 30, 2013, respectively).
Other Expenses (Income)
| | | Three Months Ended
June 30, | | | Six Months Ended
June 30, | |
| ($ in 000s) | | 2014 | | | 2013 | | | 2014 | | | 2013 | |
| | | | | | | | | | | | | |
| Loss (gain) on derivatives | | $ | 281 | | | $ | 3 | | | $ | 281 | | | $ | (479 | ) |
| Gain on conversion option embedded in convertible debt | | | (8 | ) | | | (3,041 | ) | | | (8 | ) | | | (4,164 | ) |
| Gain on debt forgiveness | | | (265,566 | ) | | | - | | | | (265,566 | ) | | | - | |
| Foreign exchange loss (gain) | | | (837 | ) | | | 4,683 | | | | (1,819 | ) | | | 4,037 | |
| Reclamation expense | | | 443 | | | | 435 | | | | 899 | | | | 892 | |
| Interest expense | | | 1,939 | | | | 8,072 | | | | 6,302 | | | | 16,246 | |
| Interest income | | | (150 | ) | | | (253 | ) | | | (324 | ) | | | (514 | ) |
| Loss on disposition of property | | | 45 | | | | 556 | | | | 53 | | | | 2,291 | |
| Other non-operating expenses (recoveries) | | | 1 | | | | (826 | ) | | | 9 | | | | (325 | ) |
| Total Other Expenses (Income) | | $ | (263,852 | ) | | $ | 9,629 | | | $ | (260,173 | ) | | $ | 17,984 | |
During Q2 2014, upon implementation of the CCAA, the Company recorded a gain in the amount of $265.6 million related to the forgiveness of the convertible notes and accrued interests. See“Financial Restructuring Plan – CCAA Proceedings”.
During Q2 2014, the US$ weakened against the R$. The exchange rate moved from 2.26 R$/US$ at March 31, 2014 to 2.20 R$/US$ at June 30, 2014, resulting in a foreign exchange gain of recoverable taxes which is offset by the foreign exchange loss on accounts payable, reclamation provisions and deferred tax liabilities.
The interest expense is composed of interest on debt and any discount and transaction costs on debt. The decrease in interest expense for Q2 2014 compared to the same period in 2013 is related to the implementation of the CCAA plan on April 22, 2014.See“Financial Restructuring Plan – CCAA Proceedings”.
FINANCIAL CONDITION, CASH FLOW, LIQUIDITY AND CAPITAL RESOURCES
The Company’s financial statements were prepared on a going concern basis which assumes that the Company will continue in operation for the foreseeable future and will be able to realize its assets and discharge its liabilities and commitments in the normal course of business. On April 22, 2014, the CCAA Plan was implemented. See“Financial Restructuring Plan – CCAA Proceedings”.
| MD&A – Second quarter ended June 30, 2014 | Jaguar Mining Inc. | 16 |
While liquidity concerns continue to be a risk factor, following the debt restructuring and recapitalization concluded on April 22, 2014, management believes it is necessary to deploy capital in order to maximize the enterprise value of the Company. Capital expenditures are primarily targeted to sustaining activities including capital investments in mining equipment, exploration/delineation drilling and underground development. Initiating these activities and the associated expenditures creates additional liquidity risks that the Company believes can be managed in the normal course.
Cash Flow Highlights
| | | Three Months Ended
June 30, | | | Six Months Ended
June 30, | |
| ($ in 000s) | | 2014 | | | 2013 | | | 2014 | | | 2013 | |
| | | | | | | | | | | | | |
| Operating activities | | $ | (8,045 | ) | | $ | (131 | ) | | $ | (5,440 | ) | | $ | 10,940 | |
| Financing activities | | | 37,705 | | | | 17,612 | | | | 37,010 | | | | 18,824 | |
| Investing activities | | | (5,010 | ) | | | (6,651 | ) | | | (9,303 | ) | | | (14,107 | ) |
| Effect of foreign exchange on non-US$ denominated cash and cash equivalents | | | (345 | ) | | | (154 | ) | | | 32 | | | | (452 | ) |
| Decrease in cash for the period | | | 24,305 | | | | 10,676 | | | | 22,299 | | | | 15,205 | |
| Beginning cash balance | | | 7,009 | | | | 18,385 | | | | 9,015 | | | | 13,856 | |
| Ending cash balance(1) | | $ | 31,314 | | | $ | 29,061 | | | $ | 31,314 | | | $ | 29,061 | |
Cash flow from operating activities consumed $8.0 million of cash during Q2 2014, compared to $131,000 consumed during Q2 2013. The decrease of $7.9 million is mainly related to the reduction of the gold price, despite the efforts to reduce costs and expenses.
Cash flow from financing activities generated $37.7 million of cash during Q2 2014, compared to $17.6 million generated during Q2 2013. The increase is due to implementation of the CCAA Plan. See“Financial Restructuring Plan – CCAA Proceedings”.
Investing activities consumed $5.0 million of cash during Q2 2014 compared to $6.7 million for Q2 2013. The reduction is part of the Company´s plan to defer some capital expenditures in order to preserve cash.
Capital expenditures were primarily used for underground development, equipment improvement and replacement throughout the Company’s operations in Minas Gerais. The table below summarizes the actual capital spending by site and by category:
| | | Three Months Ended
June 30, | | | Six Months Ended
June 30, | |
| ($ in 000s) | | 2014 | | | 2013 | | | 2014 | | | 2013 | |
| Turmalina | | $ | 2,040 | | | $ | 1,130 | | �� | $ | 3,315 | | | $ | 5,090 | |
| Caeté | | | 2,790 | | | | 5,390 | | | | 5,500 | | | | 9,147 | |
| Gurupi Project | | | 180 | | | | 31 | | | | 313 | | | | 93 | |
| Other spending | | | - | | | | 100 | | | | 175 | | | | 290 | |
| Total capital spending | | $ | 5,010 | | | $ | 6,651 | | | $ | 9,303 | | | $ | 14,620 | |
| | | Three Months Ended
June 30, | | | Six Months Ended
June 30, | |
| ($ in 000s) | | 2014 | | | 2013 | | | 2014 | | | 2013 | |
| Mine development | | $ | 3,921 | | | $ | 1,196 | | | $ | 6,573 | | | | 5,606 | |
| Sustaining (equipment and services) | | | 266 | | | | 769 | | | | 1,051 | | | | 2,281 | |
| Sustaining (engineering) | | | 215 | | | | 4,289 | | | | 312 | | | | 5,793 | |
| Exploration | | | 429 | | | | 365 | | | | 727 | | | | 858 | |
| Other | | | 179 | | | | 32 | | | | 640 | | | | 82 | |
| Total capital spending | | $ | 5,010 | | | $ | 6,651 | | | $ | 9,303 | | | $ | 14,620 | |
| Amount paid in cash | | $ | 5,010 | | | $ | 6,651 | | | $ | 9,303 | | | $ | 14,620 | |
| MD&A – Second quarter ended June 30, 2014 | Jaguar Mining Inc. | 17 |
Contractual Obligations
The Company’s contractual obligations as at June 30, 2014 are summarized as follows:
($ in 000s)
As at June 30, 2014 | | Less than 1
year | | | 1 - 3 years | | | 3 - 5 years | | | More than 5
years | | | Total | |
| | | | | | | | | | | | | | | | |
| Financial Liabilities | | | | | | | | | | | | | | | | | | | | |
| Notes payable | | | | | | | | | | | | | | | | | | | | |
| Principal | | $ | 29,925 | | | $ | 15,340 | | | $ | - | | | $ | - | | | $ | 45,265 | |
| Interest | | | 1,993 | | | | 331 | | | | - | | | | - | | | | 2,324 | |
| | | $ | 31,918 | | | $ | 15,671 | | | $ | - | | | $ | - | | | $ | 47,589 | |
| Other Commitments | | | | | | | | | | | | | | | | | | | | |
| Operating lease agreements | | $ | 235 | | | $ | 144 | | | $ | - | | | $ | - | | | $ | 379 | |
| Suppliers' agreements Mine operations(1) | | | 1,116 | | | | - | | | | - | | | | - | | | | 1,116 | |
| Reclamation provisions(2) | | | 1,329 | | | | 6,165 | | | | 1,272 | | | | 13,874 | | | | 22,640 | |
| | | $ | 2,680 | | | $ | 6,309 | | | $ | 1,272 | | | $ | 13,874 | | | $ | 24,135 | |
| Total | | $ | 34,598 | | | $ | 21,980 | | | $ | 1,272 | | | $ | 13,874 | | | $ | 71,724 | |
| (1) | The Company has the right to cancel the mine operations contracts with 30 days advance notice. The amount included in the contractual obligations table represents the amount due within 30 days. |
| (2) | Reclamation provisions are not adjusted for inflation and are not discounted. |
Balance Sheet Highlights
| ($ in 000s) | | June 30,
2014 | | | December 31,
2013 | |
| | | | | | | |
| Current assets | | $ | 63,180 | | | $ | 44,635 | |
| Non-current assets | | | 245,040 | | | | 250,153 | |
| Total assets | | $ | 308,220 | | | $ | 294,788 | |
| | | | | | | | | |
| Current liabilities | | $ | 63,665 | | | $ | 361,180 | |
| Non-current liabilities | | | 43,857 | | | | 27,167 | |
| Total liabilities | | $ | 107,522 | | | $ | 388,347 | |
Working capital increased $316.0 million from negative $316.5 million at December 31, 2013 to negative $485,000 at June 30, 2014. The decrease in the working capital is largely related to the implementation of the CCAA Plan. See“Financial Restructuring Plan – CCAA Proceedings”.
Risk Management Policies – Hedging
As at June 30, 2014, the Company had the following outstanding gold forward contracts:
| MD&A – Second quarter ended June 30, 2014 | Jaguar Mining Inc. | 18 |
| Settlement date | | Ounces hedged | | | Average US$
per ounce | | | Fair value
unrealized loss $ | |
| July 31, 2014 | | | 4,979 | | | | 1,303 | | | | (62 | ) |
| August 29, 2014 | | | 3,000 | | | | 1,276 | | | | (118 | ) |
| September 30, 2014 | | | 3,000 | | | | 1,276 | | | | (118 | ) |
| October 31, 2014 | | | 1,000 | | | | 1,313 | | | | (2 | ) |
| Total | | | 11,979 | | | | 1,290 | | | | (300 | ) |
The Company entered into gold forward contracts to hedge against the risk of declining gold prices for a portion of its forecasted gold sales. The Company closely monitors the changes in gold price and, as deemed appropriate by management, may enter into gold forward contracts with the aim of minimizing the impact of adverse changes to the price of gold.
The forward exchange contracts are derivative financial instruments and are used for risk management purposes and not for generating trading profits. The Company closely monitors exchange rates and, as deemed appropriate by management, may enter into forward currency contracts (to the extent that credit facilities are available) with the aim of minimizing the impact of adverse changes of the R$ and US$ relationship. As at June 30, 2014, the Company did not have any outstanding forward foreign exchange contracts.
To the extent that derivative instruments are in assets or unrealized gain position, the Company is exposed to credit-related losses in the event of non-performance by its financial counterparties to the derivative financial instruments, but does not expect these counterparties to fail to meet their obligations.
Hedge accounting is applied to cash flow hedges that qualify under the hedging requirements of IAS 39 Financial Instruments: Recognition and Measurement (“IAS39”). Under hedge accounting, derivative instruments are recorded on the statement of financial position at fair value. The effective portion of any gain or loss on the hedging instrument, net of any tax effects, is recognized in other comprehensive income (“OCI”) and the ineffective portion is reported as an unrealized gain (loss) on derivatives contracts in the statements of operations and comprehensive loss.
Unrealized gains and losses on forward sales contracts are a result of the difference between the forward spot price of the gold and the forward sales contract price. Unrealized gains and losses on forward foreign exchange contracts are primarily a result of the difference between the forward currency contract price and the spot price of the Brazilian reais.
Recoverable Taxes
The Company is required to pay certain taxes in Brazil that are based on purchases of consumables and property, plant and equipment. These taxes are recoverable from the Brazilian tax authorities through various structures. The Company is currently working on several initiatives to obtain an exemption for taxes in certain transactions and to accelerate the process of recovering existing credits. During Q2 2014, the Company updated the provision for VAT and other taxes. This provision was recorded against its recoverable taxes given limited methods available to recover such taxes and the length of time it will take to recover such taxes. The provision reduces the net carrying value of value added taxes and other to their estimated present value based on the manner and timing of expected recovery, discounted at a rate of 10.90%. As at June 30, 2014, total recoverable taxes denominated in Brazilian reais, net of related provisions, amounted to R$65.8 million, equivalent to approximately $29.9 million (December 31, 2013 - R$68.4 million, equivalent to approximately $29.2 million).
During the six month period ended June 30, 2014, the Company sold ICMS credits to other taxpayers totaling $767,000 using a discount rate of approximately 13%, and used $2.6 million of recoverable federal tax credits to offset taxes payable, mainly related to payroll taxes.
| MD&A – Second quarter ended June 30, 2014 | Jaguar Mining Inc. | 19 |
Off-Balance Sheet Arrangements
The Company does not have any off-balance sheet investment or debt arrangements.
INCOME TAXES
The Company recorded an income tax expense of $767,000 for Q2 2014, compared to an income tax expense of $150,000 for Q2 2013. The income tax provision reflects a current income tax expense of $983,000 and a deferred income tax recovery $216,000. This compares to a current income tax expense of $661,000 and a deferred income tax recovery of $511,000 for Q2 2013. The income tax expense of $767,000 for Q2 2014 primarily relates to the deferred tax impact of the weakening US$ during the quarter offset by current income taxes. The consolidated balance sheet reflects a current tax liability of $4.1 million and a non-current tax liability of $8.1 million as at June 30, 2014 (December 31, 2013 - $11.6 million and $nil, respectively); and a deferred income tax liability of $6.2 million as at June 30, 2014 (December 31, 2013 - $6.4 million).
The income tax provision is subject to a number of factors, including the allocation of income between different countries, different tax rates in various jurisdictions, the non-recognition of tax assets, foreign currency exchange rate movements, changes in tax laws and the impact of specific transactions and assessments. Due to the number of factors that can potentially impact the effective tax rate and the sensitivity of the tax provision to these factors, as discussed above, it is expected that the Company’s effective tax rate will fluctuate in future periods.
During Q2 2014, Jaguar had a significant forgiveness of debt. The forgiveness of debt did not result in an income taxes liability however the income tax attributes in Canada were reduced.
After the tax effect of the restructuring transactions, the Company has approximately $5.0 million of tax loss carry forwards available in Canada and $127.0 million in Brazil. The Brazilian tax loss can be carried forward indefinitely. In Brazil only 30% of taxable income can be offset by such loss carry forwards in any given tax year.
OUTLOOK
The following section of this MD&A represents forward-looking information and users are cautioned that actual results may vary. We refer to the risks and assumptions contained in the Cautionary Note Regarding Forward-Looking Statements on page 29 of this MD&A.
The price of gold is the largest single factor in determining profitability and cash flow from operations, therefore, the financial performance of the Company has been, and is expected to continue to be, closely linked to the price of gold. Historically, the price of gold has been subject to volatile price movements over short periods of time and is affected by numerous macroeconomic and industry factors that are beyond the Company’s control. Major influences on gold price include currency exchange rate fluctuations and the relative strength of the U.S. dollar, the supply of and demand for gold and macroeconomic factors such as the level of interest rates and inflation expectations. A Company-wide effort has been made to reduce operating costs and capital costs to counteract current market conditions while focusing on maintaining current productivity levels to meet budget guidance for 2014.
| MD&A – Second quarter ended June 30, 2014 | Jaguar Mining Inc. | 20 |
LITIGATION AND CONTINGENCIES
Labour Practices
Brazilian labour law is a complex system of regulations, one in which the Company has historically not been in full compliance. Management has identified at least 47 labour law violations in the Company’s legacy human resource practices. As of June 30, 2014, there were 427 employee-initiated lawsuits against the Company, largely related to wages or accidents. During the quarter ended June 30, 2014, 36 new lawsuits were filed and 152 old lawsuits were finalized, via settlements. Although the aggregate face amount of the legacy lawsuits approximates to $27.6 million, based on management's assessment of the likelihood of loss related to these lawsuits, the Company has recognized $9.8 million as the estimated liability in its financial statements as at June 30, 2014. In the second quarter of 2014, court and settlement costs were $1.0 million. There can be no assurance that additional lawsuits will not be filed against the Company with respect to past practices.
Union contracts, negotiated in 2014, are in substantial compliance with applicable laws. Of the 47 labour law violations identified, management made significant progress during 2014 and during the period ended June 30, 2014, in rectifying the deficiencies. As of June 30, 2014, 67% of the identified violations have been remedied, while 30% are in progress and the remaining 3% are pending action.
Litigation with Former Directors and Officers
On July 30, 2013, Daniel R. Titcomb (“Titcomb”), the Company’s former President and Chief Executive Officer, and a group of former officers, a former Director and a former related party (Brazilian Resources Inc. -“BZI”), filed a complaint (the “Complaint”) in New Hampshire against the Company and selected current and former directors (the “Named Directors”) of the Company. Among other items, the Complaint alleges wrongful termination of Mr. Daniel R. Titcomb on December 6, 2011 and mismanagement of the strategic review process regarding the possible change of control of Jaguar which ended May 8, 2012.
On November 21, 2013, the Company and the Named Directors filed motions to dismiss various aspects of the Complaint on a number of grounds (the “Motions to Dismiss”).
On December 27, 2013, the plaintiffs in the Complaint filed a motion to (i) stay the Complaint until the Ontario Superior Court of Justice (Commercial List) lifts the stay in the CCAA proceeding or the CCAA proceeding is concluded; and (ii) stay and suspend the deadline for the plaintiffs in the Complaint to respond to the Motions to Dismiss. The Company and the Named Directors did not object to this motion. An order granting the requested stay was issued by the U.S. District Court for the District of New Hampshire on December 30, 2013.
On February 5, 2014, the Company entered into an agreement with the plaintiffs in the Complaint providing, among other things, that upon implementation of the CCAA Plan, the plaintiffs in the Complaint shall have no right to, and shall not, make any claim or seek any recoveries under the Complaint, other than enforcing such plaintiffs’ rights, if any, to be paid from the proceeds of an enumerated company or director and officer insurance policy by the applicable insurers. The Company agreed that, upon implementation of the CCAA Plan and if requested by the plaintiffs in the Complaint, it would withdraw its counterclaims against the plaintiffs in the Complaint.
On April 22, 2014, the CCAA Plan was implemented, thereby giving effect to the February 5, 2014 agreement between the Company and the plaintiffs in the Complaint. The plaintiffs in the Complaint have not at this time requested that the Company withdraw its counterclaims against the plaintiffs in the Complaint.
The Company has been informed that the plaintiffs in the Complaint filed a Notice of Action with the Ontario Superior Court of Justice (Commercial List) on May 7, 2014. The Notice of Action is subject to the terms of the February 5, 2014 agreement and the CCAA Plan.
Based on completion of the CCAA Plan no accrual has been recorded with respect to the Complaint or the Notice of Action.
| MD&A – Second quarter ended June 30, 2014 | Jaguar Mining Inc. | 21 |
MSOL vs. Brazilian Resources, Inc.
BZI failed to pay to the Company on December 31, 2012 and December 31, 2013, an amount of $197,872 for each year, totaling the amount of $395,744 by way of a note payable. The Company is pursuing redress through court action in Brazil and currently has a lien on real estate in Concord, New Hampshire to ensure the protection of its interests against BZI.
BZI also has yet to pay R$387,839 (approximately $166,000) in respect of a Brazilian labour court settlement. By way of background, in 2008, a Brazilian labour claim settlement for R$378,158 was awarded against a BZI subsidiary in Brazil known as BW Mineração Ltda. (“BZI BW”). As BZI BW failed to pay the court ordered claim and the Brazilian labour court considered MSOL, MTL and BZI BW, to be an economic group, and MSOL and MTL had funds taken directly from their Brazilian bank accounts by the court to settle the R$378,158 claim on BZI BW’s behalf. BZI subsequently agreed to repay the amount awarded by the court to MSOL and MTL. The BZI liability is denominated in Brazilian reais in the amount of R$387,839, and bears interest at U.S. LIBOR payable quarterly. No payment of interest, accrued interest or principal has been made to date, nor has BZI confirmed a date when it intends to pay its debt outstanding. The Company is pursuing court action in the Merrimack Superior Court of New Hampshire, USA, to obtain repayment in full.
Environmental Issues
All phases of the Company’s operations are subject to environmental regulation in Brazil. The Company has not been in full compliance with all environmental laws and regulations or held, or been in full compliance with, all required environmental and health and safety permits at all times. The Company is currently subject to a number of reclamation and remediation liabilities and may have civil or criminal fines or penalties imposed for alleged violations of applicable laws or regulations in Brazil. The Company has implemented and prioritized control structures and monitoring programs to address each environmental non-compliance, and a reclamation plan for each of its mining/project sites is being prepared.
RISKS AND UNCERTAINTIES
The business of Jaguar involves significant risk due to the nature of mining, exploration, and development activities. Certain risk factors are related to the mining industry in general while others are specific to Jaguar. The Company’s exposure to risks and other uncertainties are particularly described in the Company’s Annual Information Form and in the form 20-F for the period ended December 31, 2013. Such risk factors could materially affect the future operating results of the Company and could cause actual events to differ materially from those described in forward-looking statements relating to the Company.
| MD&A – Second quarter ended June 30, 2014 | Jaguar Mining Inc. | 22 |
DEVELOPMENT AND EXPLORATION
Gurupi Project
Work on the Gurupi Project is planned to be reinitiated in 2014 and the Company recruited a Project Manager to lead the Gurupi advancement efforts. Recently, the Company has only made those expenditures necessary to maintain the claims in good standing.
While the Company has focused drilling and exploration on the Chega Tudo and Cipoeiro deposits, the 100% Jaguar-owned Gurupi concession includes 12 additional identified targets in 32 contiguous mineral rights totaling 138,548 hectares. These additional targets have not been included in any of the Company's mineral resource estimates or feasibility studies related to the Gurupi Project to date. These targets have been identified by favorable geology, structural framework, old artisanal mine workings, soil and channel sampling anomalies and exploration drilling. They have the potential to further increase mineral resources at Gurupi.
On October 14, 2013, the Company became aware that the Federal Public Prosecutor in São Luis, Maranhão, Brazil, filed a lawsuit against MCT Mineração Ltda. (“MCT”), a wholly-owned subsidiary of the Company that holds the Gurupi project, claiming that:
| · | MCT should be classified as a “foreign company”, and therefore be completely restricted from carrying on operations in Brazil and, in particular, at the Gurupi project; |
| · | there are purported irregularities in the environmental licensing, mainly as the installation license previously granted to MCT covers only a fraction of the area in which MCT will operate; and |
| · | there is no INCRA agreement for MCT’s surface rights, which include an area in which there is a settlement of inhabitants that will be affected by the proposed project. |
The Public Prosecutor requested an urgent (preliminary) decision from the Court claiming that if MCT’s activities continued, it would be prejudicial to the State of Maranhão.
In a hearing held in the Federal Court in São Luis on November 13, 2013, at which MCT was neither invited to attend or was present at, the judge decided to:
| · | suspend the environmental licenses granted to MCT; |
| · | prohibit any construction of the gold beneficiation plant; and |
| · | cease any negotiations with local residents without the participation of INCRA. |
MCT has not been served with the formal notice relating to the Federal Court’s decision. The Company has retained the services of a legal firm to review the claims and prepare a response. The Company intends to vigorously defend its Gurupi interests and believes that the claims are without merit.
Pedra Branca Project
Work on the Pedra Branca Project has been delayed as the Company focuses its efforts on completing the operational turnaround plan and implementation of production improvement programs at the Turmalina and Caeté operations. Consequently, the Company made only those expenditures required to maintain the claims and land tenure in good standing.
| MD&A – Second quarter ended June 30, 2014 | Jaguar Mining Inc. | 23 |
In March 2007, Jaguar entered into an earn-in agreement with Glencore Xstrata plc. (formerly known as Xstrata plc.) to explore the Pedra Branca Project in the State of Ceará in northeastern Brazil. The Pedra Branca Project currently has mineral rights to 6 exploration licenses and 15 pending applications for exploration licenses totaling 34,251 hectares covering a 38-kilometer section of a regional shear zone. The concessions are located in and around municipal areas with good infrastructure. The mineralized structures are open along strike with potential for significant gold mineralization. During 2007 and 2008, Jaguar completed an exploration drilling program to test the continuity of the mineralization laterally and at depth. During 2009, Jaguar carried out geological reconnaissance in the concession area, trenching and soil geochemistry. In 2010, Jaguar continued with the exploration program, including extensive geological mapping, drainage and soil geochemistry, mapping of anomalous zones and trenching. During 2011, the trenching program data was thoroughly analyzed in order to prioritize previously identified target zones. Of the original 50-kilometer strike length, a stretch of 15 kilometers of the gold-bearing shear zone containing 18 relevant high potential targets were identified. Among the 18 mineralized zones, Mirador, Coelho, Queimadas and Igrejinha are considered high priority targets where exploratory drilling has been performed. Drilling results and geological data suggest potential for gold deposits.
On April 24, 2012, Jaguar executed an amendment to the 2007 earn-in agreement with Glencore Xstrata plc. to acquire the remaining 40% interest in the Pedra Branca Project. The Project, which was previously owned jointly by Jaguar and Glencore Xstrata plc. on a 60/40 basis, is now 100% owned by Jaguar. In accordance with the terms of the amendment, Jaguar committed to: (i) cash consideration in the amount of $400,000 paid in installments in the following year (fully paid as at June 30, 2014);(ii) a Net Smelter Royalty (“NSR”) of one percent (1%) payable to Glencore Xstrata plc., on future gold production; and (iii) rights of first refusal on any Base Metal Dominant Deposit (as defined in the amendment) discovered. Upon such discovery, Glencore Xstrata plc. may elect to form a new company owned 30% by the Company’s wholly owned subsidiary, Mineração Serras do Oeste Ltda. (“MSOL”) and 70% by Glencore Xstrata plc, by paying three hundred percent (300%) of MSOL’s exploration expenditures incurred exclusively on the relevant Base Metal Dominant Area of the property.
Turmalina Zona Basal Project
The Company has completed an Exploration Report on the Zona Basal target, located 3 kilometers west of the Turmalina plant facility and filed it with the Brazilian Federal authority for mineral rightsDepartamento Nacional de Produção Mineral(“DNPM”), applying for a Mining Concession. The Company intends to continue exploration on this target.
Palmital and Bocaina
The Company has applied for exploration permits for Iron minerals in its Palmital and Bocaina gold exploration permits, located 26 km from Itabirito, state of Minas Gerais, Brazil.
Jaguar has filed a communication to DNPM declaring the existence of a mineral deposit containing Iron, on its gold exploration permits in the Bocaina and Palmital areas, located at approximately 130 meters from the gate to Palmital gold mine, now under care and maintenance. The access to the area is the same as for the Palmital gold mine.
Additionally, Jaguar has applied for a Guia de Utilização (an exploration authorization) with DNPM (“Departamento Nacional de Produção Mineral”), the federal mineral rights agency, and a LOP (Licença de Operação para Pesquisa or Exploration License) with SUPRAM, Superintendência de Regularização Ambiental de Minas Gerais, the state environmental agency.
Based on the initial exploration activities conducted to date, a talus type of iron minerals deposit, containing hematite, itabirite, and quartz fragments, cemented by limonite, goethite and other iron and clay minerals, has been mapped and surveyed by Jaguar. Seven channel samples were collected from outcrops by Jaguar geologists, and sent to SGS Geosol Laboratorios LTDA., an independent laboratory in Belo Horizonte, Brazil, for screening, sample preparation, and analysis, providing the following results.
| MD&A – Second quarter ended June 30, 2014 | Jaguar Mining Inc. | 24 |
| Natural Pellet | | mE | | | mS | | | Altitude (masl) | | | >6.3mm (%) | | | Fe (%) | | | SiO2 (%) | | | Al2O3 (%) | | | P (%) | | | Mn (%) | | | LOI (%) | |
| CFEPL0001 | | | 639,160 | | | | 7,774,004 | | | | 1,345 | | | | 48.81 | | | | 60.10 | | | | 1.91 | | | | 5.27 | | | | 0.055 | | | | 0.03 | | | | 5.97 | |
| CFEPL0002 | | | 639,251 | | | | 7,774,141 | | | | 1,358 | | | | 48.62 | | | | 63.10 | | | | 2.28 | | | | 3.61 | | | | 0.064 | | | | 0.02 | | | | 3.33 | |
| CFEPL0003 | | | 639,386 | | | | 7,774,466 | | | | 1,401 | | | | 36.01 | | | | 55.70 | | | | 5.16 | | | | 8.77 | | | | 0.052 | | | | 0.08 | | | | 5.81 | |
| CFEPL0004 | | | 639,376 | | | | 7,774,429 | | | | 1,395 | | | | 52.44 | | | | 57.00 | | | | 2.25 | | | | 8.60 | | | | 0.060 | | | | 0.04 | | | | 6.75 | |
| CFEPL0005 | | | 639,333 | | | | 7,774,354 | | | | 1,390 | | | | 58.41 | | | | 61.10 | | | | 1.35 | | | | 5.84 | | | | 0.070 | | | | 0.06 | | | | 5.24 | |
| CFEPL0006 | | | 639,314 | | | | 7,774,361 | | | | 1,384 | | | | 39.33 | | | | 61.70 | | | | 1.31 | | | | 5.50 | | | | 0.062 | | | | 0.03 | | | | 5.24 | |
| CFEPL0007 | | | 639,186 | | | | 7,773,915 | | | | 1,341 | | | | 64.33 | | | | 58.00 | | | | 3.13 | | | | 7.02 | | | | 0.078 | | | | 0.04 | | | | 6.55 | |
| Average | | | | | | | | | | | | | | | 49.71 | | | | 59.56 | | | | 2.41 | | | | 6.35 | | | | 0.064 | | | | 0.04 | | | | 6.26 | |
| Fines | | mE | | | mS | | | Altitude (masl) | | | <6.3mm (%) | | | Fe (%) | | | SiO2 (%) | | | Al2O3 (%) | | | P (%) | | | Mn (%) | | | LOI (%) | |
| CFEPL0001 | | | 639,160 | | | | 7,774,004 | | | | 1,345 | | | | 51.19 | | | | 59.20 | | | | 3.86 | | | | 5.29 | | | | 0.055 | | | | 0.04 | | | | 5.11 | |
| CFEPL0002 | | | 639,251 | | | | 7,774,141 | | | | 1,358 | | | | 51.38 | | | | 53.80 | | | | 10.5 | | | | 6.04 | | | | 0.073 | | | | 0.02 | | | | 5.53 | |
| CFEPL0003 | | | 639,386 | | | | 7,774,466 | | | | 1,401 | | | | 63.99 | | | | 44.80 | | | | 15.6 | | | | 11.60 | | | | 0.042 | | | | 0.03 | | | | 7.05 | |
| CFEPL0004 | | | 639,376 | | | | 7,774,429 | | | | 1,395 | | | | 47.56 | | | | 55.80 | | | | 4.45 | | | | 8.11 | | | | 0.057 | | | | 0.05 | | | | 6.53 | |
| CFEPL0005 | | | 639,333 | | | | 7,774,354 | | | | 1,390 | | | | 41.60 | | | | 57.20 | | | | 3.41 | | | | 7.59 | | | | 0.074 | | | | 0.04 | | | | 6.85 | |
| CFEPL0006 | | | 639,314 | | | | 7,774,361 | | | | 1,384 | | | | 60.67 | | | | 59.00 | | | | 2.95 | | | | 6.34 | | | | 0.066 | | | | 0.04 | | | | 6.16 | |
| CFEPL0007 | | | 639,186 | | | | 7,773,915 | | | | 1,341 | | | | 35.67 | | | | 57.30 | | | | 4.44 | | | | 6.69 | | | | 0.083 | | | | 0.05 | | | | 6.55 | |
| Average | | | | | | | | | | | | | | | 50.29 | | | | 54.87 | | | | 6.02 | | | | 7.24 | | | | 0.066 | | | | 0.04 | | | | 6.26 | |
The elemental and oxide grades were analyzed by X-ray fluorescence, and loss on ignition (“LOI”) was determined by high temperature ashing. The location of the samples is indicated on the table by their UTM coordinates - Datum Córrego Alegre.
The grades shown are conceptual in nature, and there has been insufficient exploration to define a mineral resource, and it is uncertain if further exploration will result in the target being delineated as a mineral resource. The Company may conduct further exploration to delineate and evaluate the talus deposit upon receipt of applicable licensing and approvals.
NON-IFRS PERFORMANCE MEASURES
The Company has included the non-IFRS performance measures cash operating margin per ounce of gold produced, cash operating cost per tonne of ore processed, and cash operating cost per ounce of gold produced, and all-in costs per ounce of gold sold in this document. These non-IFRS performance measures do not have any standardized meaning prescribed by IFRS and, therefore, may not be comparable to similar measures presented by other companies. The Company believes that, in addition to conventional measures prepared in accordance with IFRS, certain investors use this information to evaluate the Company’s performance. Accordingly, they are intended to provide additional information and should not be considered in isolation or as a substitute for measures of performance prepared in accordance with IFRS. More specifically, management believes that these figures are a useful indicator to investors and management of a mine’s performance as they provide: (i) a measure of the mine’s cash margin per tonne/ounce, by comparison of the cash operating costs per tonne/ounce to the price of gold; (ii) the trend in costs as the mine matures; and (iii) an internal benchmark of performance to allow for comparison against other mines. The definitions of these performance measures and reconciliation of the non-IFRS measures to reported IFRS measures are as follows:
| | | Three Months Ended
June 30, | | | Six Months Ended
June 30, | |
| | | 2014 | | | 2013 | | | 2014 | | | 2013 | |
| | | | | | | | | | | | | |
| Average sales price per ounce of gold | | $ | 1,280 | | | $ | 1,415 | | | $ | 1,283 | | | $ | 1,526 | |
| Less:Cash operating cost per ounce of gold produced | | $ | 958 | | | | 967 | | | $ | 941 | | | | 919 | |
| Cash operating margin per ounce of gold | | $ | 322 | | | $ | 448 | | | $ | 342 | | | $ | 607 | |
| MD&A – Second quarter ended June 30, 2014 | Jaguar Mining Inc. | 25 |
Summary of Cash Operating Cost per Tonne Processed:
| | | Three Months Ended
June 30, | | | Six Months Ended
June 30, | |
| Consolidated | | 2014 | | | 2013 | | | 2014 | | | 2013 | |
| | | | | | | | | | | | | |
| Production costs per statement of operations(1) | | $ | 22,577 | | | $ | 20,751 | | | $ | 44,847 | | | $ | 41,692 | |
| Change in inventory(2) | | | 41 | | | | 1,281 | | | | (1,305 | ) | | | 681 | |
| Operational cost of gold produced(3) | | $ | 22,618 | | | $ | 22,032 | | | $ | 43,542 | | | $ | 42,373 | |
| Tonnes processed (t) | | | 263,000 | | | $ | 271,000 | | | | 531,000 | | | $ | 535,000 | |
| Cost per tonne processed | | $ | 86 | | | $ | 81 | | | $ | 82 | | | $ | 79 | |
| | | | | | | | | | | | | | | | | |
| Turmalina Plant | | | | | | | | | | | | | | | | |
| | | | | | | | | | | | | | | | | |
| Production costs | | $ | 9,561 | | | $ | 9,273 | | | $ | 19,583 | | | $ | 18,880 | |
| Change in inventory(2) | | | (625 | ) | | | 357 | | | | (1,847 | ) | | | (331 | ) |
| Operational cost of gold produced(3) | | $ | 8,936 | | | $ | 9,630 | | | $ | 17,736 | | | $ | 18,549 | |
| Tonnes processed (t) | | | 107,000 | | | | 123,000 | | | | 218,000 | | | | 231,000 | |
| Cost per tonne processed | | $ | 84 | | | $ | 78 | | | $ | 81 | | | $ | 80 | |
| | | | | | | | | | | | | | | | | |
| Caeté Plant | | | | | | | | | | | | | | | | |
| | | | | | | | | | | | | | | | | |
| Production costs | | $ | 13,016 | | | $ | 11,478 | | | $ | 25,264 | | | $ | 22,812 | |
| Change in inventory(2) | | | 666 | | | | 924 | | | | 542 | | | | 1,012 | |
| Operational cost of gold produced(3) | | $ | 13,682 | | | $ | 12,402 | | | $ | 25,806 | | | $ | 23,824 | |
| Tonnes processed (t) | | | 156,000 | | | | 148,000 | | | | 313,000 | | | | 304,000 | |
| Cost per tonne processed | | $ | 88 | | | $ | 84 | | | $ | 82 | | | $ | 78 | |
| (1) | Production costs do not include cost of goods sold recovery adjustment of approximately $175,000, royalty expenses of $564,000 and CFEM tax expenses of $308,000 for the three months ended June 30, 2014. |
| (2) | Under the Company’s revenue recognition policy, revenue is recognized when legal title passes. Since total cash operating costs are calculated on a production basis, this change reflects the portion of gold production for which revenue has not been recognized in the period. |
| (3) | The basis for calculating cost per ounce produced includes the change to gold-in-process inventory, whereas the cost per tonne processed does not include the change to gold-in-process inventory. |
| MD&A – Second quarter ended June 30, 2014 | Jaguar Mining Inc. | 26 |
Summary of Cash Operating Cost per Ounce of Gold Produced:
| | | Three Months Ended
June 30, | | | Six Months Ended
June 30, | |
| Consolidated | | 2014 | | | 2013 | | | 2014 | | | 2013 | |
| | | | | | | | | | | | | |
| Production costs per statement of operations(1) | | $ | 22,577 | | | $ | 20,751 | | | $ | 44,847 | | | $ | 41,692 | |
| Change in inventory(2) | | | 288 | | | | 202 | | | | (407 | ) | | | (218 | ) |
| Operational cost of gold produced(3) | | $ | 22,865 | | | $ | 20,953 | | | $ | 44,440 | | | $ | 41,474 | |
| Gold produced (ounce) | | | 23,867 | | | | 22,503 | | | | 47,226 | | | | 47,339 | |
| Cost per ounce of gold produced | | $ | 958 | | | $ | 931 | | | $ | 941 | | | $ | 876 | |
| | | | | | | | | | | | | | | | | |
| Turmalina Plant | | | | | | | | | | | | | | | | |
| | | | | | | | | | | | | | | | | |
| Production costs | | $ | 9,561 | | | $ | 9,273 | | | $ | 19,583 | | | $ | 18,880 | |
| Change in inventory(2) | | | (377 | ) | | | 275 | | | | (644 | ) | | | (425 | ) |
| Operational cost of gold produced(3) | | $ | 9,184 | | | $ | 9,548 | | | $ | 18,939 | | | $ | 18,455 | |
| Gold produced (ounce) | | | 13,190 | | | | 10,345 | | | | 24,564 | | | | 20,666 | |
| Cost per ounce of gold produced | | $ | 696 | | | $ | 923 | | | $ | 771 | | | $ | 893 | |
| | | | | | | | | | | | | | | | | |
| Caeté Plant | | | | | | | | | | | | | | | | |
| | | | | | | | | | | | | | | | | |
| Production costs | | $ | 13,016 | | | $ | 11,478 | | | $ | 25,264 | | | $ | 22,812 | |
| Change in inventory(2) | | | 665 | | | | (74 | ) | | | 237 | | | | 207 | |
| Operational cost of gold produced(3) | | $ | 13,681 | | | $ | 11,404 | | | $ | 25,501 | | | $ | 23,019 | |
| Gold produced (ounce) | | | 10,677 | | | | 12,158 | | | | 22,662 | | | | 26,673 | |
| Cost per ounce of gold produced | | $ | 1,281 | | | $ | 938 | | | $ | 1,125 | | | $ | 863 | |
| (1) | Production costs do not include cost of goods sold recovery adjustment of approximately $175,000, royalty expenses of $564,000 and CFEM tax expenses of $308,000 for the three months ended June 30, 2014. |
| (2) | Under the Company’s revenue recognition policy, revenue is recognized when legal title passes. Since total cash operating costs are calculated on a production basis, this change reflects the portion of gold production for which revenue has not been recognized in the period. |
| (3) | The basis for calculating cost per ounce produced includes the change to gold-in-process inventory, whereas the cost per tonne processed does not include the change to gold-in-process inventory. |
| MD&A – Second quarter ended June 30, 2014 | Jaguar Mining Inc. | 27 |
Summary of All-in Cost per Ounce of Gold Sold:
The all-in cost per ounce of gold sold was calculated in accordance with the guidance of The World Gold Council.
| | | Three Months Ended
June 30, | | | Six Months Ended
June 30, | |
| | | 2014 | | | 2013 | | | 2014 | | | 2013 | |
| | | | | | | | | | | | | |
| Production cost per unaudited interim consolidated financial statements | | $ | 23,274 | | | $ | 23,960 | | | $ | 44,611 | | | $ | 46,780 | |
| Stock-based compensation (recoveries) - site-based | | | - | | | | - | | | | - | | | | - | |
| Adjusted Operating Costs | | | 23,274 | | | | 23,960 | | | | 44,611 | | | | 46,780 | |
| | | | | | | | | | | | | | | | | |
| Corporate administration (*) | | | 3,037 | | | | 3,894 | | | | 7,074 | | | | 8,108 | |
| Stock-based compensation - corporate | | | 697 | | | | 68 | | | | 742 | | | | 291 | |
| Accretion expenses (operating sites) | | | 254 | | | | 265 | | | | 406 | | | | 521 | |
| Exploration (sustaining) | | | 429 | | | | 365 | | | | 727 | | | | 869 | |
| Capital expenditure (sustaining) | | | 4,401 | | | | 6,255 | | | | 8,592 | | | | 13,348 | |
| All-in Sustaining Costs | | | 32,092 | | | | 34,807 | | | | 62,152 | | | | 69,917 | |
| | | | | | | | | | | | | | | | | |
| Accretion expenses (non-operating sites) | | | 189 | | | | 170 | | | | 493 | | | | 371 | |
| Exploration (green field) | | | 81 | | | | 274 | | | | 120 | | | | 601 | |
| Capital expenditure (non-sustaining) | | | 180 | | | | 31 | | | | 313 | | | | 117 | |
| Care and maintenance (non-operating sites) | | | 520 | | | | 746 | | | | 1,126 | | | | 1,454 | |
| All-in Costs | | $ | 33,062 | | | $ | 36,028 | | | $ | 64,204 | | | $ | 72,460 | |
| | | | | | | | | | | | | | | | | |
| Ounces of gold sold | | | 24,002 | | | | 22,920 | | | | 48,183 | | | | 48,236 | |
| | | | | | | | | | | | | | | | | |
| Adjusted Operating Costs / Oz of Gold Sold | | $ | 970 | | | $ | 1,045 | | | $ | 926 | | | $ | 970 | |
| All-in Sustaining Costs / Oz of Gold Sold | | $ | 1,337 | | | $ | 1,519 | | | $ | 1,290 | | | $ | 1,449 | |
| All-in Costs / Oz of Gold Sold | | $ | 1,377 | | | $ | 1,572 | | | $ | 1,333 | | | $ | 1,502 | |
(*)Excludes the restructuring expenses occurred during Q2 2014 (See “Operating Expenses”, under Review of Financial Results, on page 15).
(**)Non-ifrs measures.
| MD&A – Second quarter ended June 30, 2014 | Jaguar Mining Inc. | 28 |
CRITICAL ACCOUNTING ESTIMATES
The preparation of consolidated financial statements in conformity with IFRS requires management to make estimates, judgments and assumptions that affect the application of accounting policies and the reported amounts of assets and liabilities at the date of the financial statements and the reported amounts of revenue and expenses during the period. Actual results could differ from those estimates.
Estimates and underlying assumptions are reviewed on an ongoing basis. Revisions to accounting estimates are recognized in the period in which the estimates are revised and in any future periods affected.
Certain estimates, such as those related to the assessment of recoverability of the carrying amount of property, plant, and equipment, valuation of mineral exploration projects, recoverable taxes, deferred tax assets and liabilities, reclamation provisions, derivatives, liabilities associated with certain long-term incentive plans, measurement of inventory and disclosure of contingent assets and liabilities depend on subjective or complex judgments about matters that may be uncertain. Changes in those estimates could materially impact the Company’s condensed interim consolidated financial statements.
The judgments that management has applied in the application of accounting policies and related estimates that have the most significant effect on the amounts recognized are discussed in Note 3 of the Company’s December 31, 2013 annual consolidated financial statements which are available on SEDAR and EDGAR.
CHANGES IN ACCOUNTING POLICIES INCLUDING INITIAL ADOPTION
The accounting policies applied in the condensed interim consolidated financial statements as at June 30, 2014 are consistent with those used in the Company’s annual audited consolidated financial statements for the year ended December 31, 2013, with the exception of the following standards and interpretations adopted in 2014:
| - | IFRIC 21 – Levies (“IFRIC 21”) - In May 2013, the IFRS Interpretations Committee (IRFIC), with the approval of the IASB, issued IFRIC 21 – Levies. IFRIC 21 provides guidance on when to recognize a liability to pay a levy imposed by government that is accounted for in accordance with IAS 37 – Provisions, Contingent Liabilities and Contingent Assets. IFRIC 21 is effective for annual periods beginning on or after January 1, 2014, and is to be applied retrospectively. The adoption of IFRIC 21 had no material impact on the Company’s unaudited condensed interim consolidated financial statements.. |
| - | IAS 32 – Offsetting of financial instruments (“IAS 32”) - The amendments to IAS 32, Financial Instruments: Presentation, clarify the criteria that should be considered in determining whether an entity has a legally enforceable right of set off in respect of its financial instruments. Amendments to IAS 32 are applicable to annual periods beginning on or after January 1, 2014, with retrospective application required. There was no material impact on the Company’s unaudited condensed interim consolidated financial statements upon adoption of these amendments. |
| - | IAS 36 - Impairments of Assets (“IAS 36”) was amended by the IASB in May 2013 to clarify the requirements to disclose the recoverable amounts of impaired assets and require additional disclosures about the measurement of impaired assets when the recoverable amount is based on fair value less costs of disposal, including the discount rate when a present value technique is used to measure the recoverable amount. There was no impact on the Company’s unaudited condensed interim consolidated financial statements upon adoption of these amendments. |
| MD&A – Second quarter ended June 30, 2014 | Jaguar Mining Inc. | 29 |
Future Accounting Policy Changes Issued but Not Yet in Effect
The following are new pronouncements approved by the IASB. The following new standards and interpretations are not yet effective and have not been applied in preparing the financial statements for the three and six months ended June 30, 2014, however, they may impact future periods:
IFRS 9 Financial Instruments - In July 2014, the IASB issued the final version of IFRS 9 Financial Instruments, bringing together the classification and measurement, impairment and hedge accounting phases of the IASB’s project to replace IAS 39 Financial Instruments: Recognition and Measurement. The mandatory effective date of IFRS 9 would be annual periods beginning on or after January 1, 2018, with early adoption permitted.The impact of IFRS 9 on the Company’s financial instruments has not yet been determined.
IFRS 15 Revenue from Contracts with Customers was issued by IASB in May 2014. It specifies how and when an IFRS reporter will recognize revenue as well as requiring such entities to provide users of financial statements with more informative, relevant disclosures. The standard provides a single, principles based five-step model to be applied to all contracts with customers. IFRS 15 is effective for annual reporting periods beginning on or after 1 January 2017. The impact of IFRS 15 on the Company’s consolidated financial statements has not yet been determined.
DISCLOSURE CONTROLS AND PROCEDURES AND INTERNAL CONTROLS OVER FINANCIAL REPORTING
Management of the Company is responsible for establishing and maintaining a system of disclosure controls and procedures to provide reasonable assurance that all material information relating to the Company is gathered and reported to senior management on a timely basis so that appropriate decisions can be made regarding public disclosure.
Management is also responsible for establishing and maintaining adequate internal controls over financial reporting (as such term is defined under rules adopted by the U.S. Securities Exchange Commission and National Instrument 52-109 as issued by the Canadian Securities Administrator). Internal control over financial reporting is designed to provide reasonable assurance regarding the reliability of financial reporting and the preparation of financial statements for external purposes in accordance with IFRS.
There have been no changes during the quarter ended June 30, 2014 that, in management’s view, would have materially affected, or that are reasonably likely to materially affect, the Company’s internal controls over financial reporting.
OUTSTANDING SHARE DATA
| | | August 22, | |
| | | 2014 | |
| | | | | |
| Issued and outstanding common shares | | | 111,111,038 | |
| Stock options | | | 1,994,735 | |
| Deferred Shares Units | | | 1,500,566 | |
| Total | | | 114,606,339 | |
| MD&A – Second quarter ended June 30, 2014 | Jaguar Mining Inc. | 30 |
CAUTIONARY NOTE REGARDING FORWARD-LOOKING STATEMENTS
Certain statements in this MD&A constitute “Forward-Looking Statements” within the meaning of the U.S. Private Securities Litigation Reform Act of 1995 and Canadian securities legislation. These Forward-Looking Statements include, but are not limited to, statements concerning the Company’s future objectives, Measured and Indicated Mineral Resources, Proven and Probable Mineral reserves, their average grade, the commencement period of production, cash operating costs per ounce and completion dates of feasibility studies, gold production and sales targets, capital expenditure costs, future profitability and growth in mineral reserves. Forward-Looking Statements can be identified by the use of words such as, “are expected”, “is forecast”, “is targeted”, “approximately” or variations of such words and phrases or statements that certain actions, events or results “may”, “could”, “would”, “might”, or “will” be taken, occur or be achieved. Forward-Looking Statements involve known and unknown risks, uncertainties and other factors which may cause the actual results or performance to be materially different from any future results or performance expressed or implied by the Forward-Looking Statements.
These factors include the inherent risks involved in the exploration and development of mineral properties, the uncertainties involved in interpreting drilling results and other geological data, fluctuating gold prices and monetary exchange rates, the possibility of project delays and cost overruns or unanticipated costs and expenses, uncertainties relating to the availability and costs of financing needed in the future, uncertainties related to production rates, timing of production and the cash and total costs of production, changes in applicable laws including laws related to mining development, environmental protection, and the protection of the health and safety of mine workers, the availability of labour and equipment, the possibility of civil insurrection, labour strikes and work stoppages and changes in general economic conditions. Although the Company has attempted to identify important factors that could cause actual actions, events or results to differ materially from those described in the Forward-Looking Statements, there may be other factors that could cause actions, events or results to differ from those anticipated, estimated or intended.
These Forward-Looking Statements represent the Company’s views as of the date of this MD&A. The Company anticipates that subsequent events and developments may cause the Company’s views to change. The Company does not undertake to update any Forward-Looking Statements, either written or oral, that may be made from time to time by, or on behalf of the Company, subsequent to the date of this discussion, other than as required by law. For a discussion of important factors affecting the Company, including fluctuations in the price of gold and exchange rates, uncertainty in the calculation of mineral resources, competition, uncertainty concerning geological conditions and governmental regulations and assumptions underlying the Company’s Forward-Looking Statements, see “CAUTIONARY NOTE REGARDING FORWARD LOOKING STATEMENTS” and “RISK FACTORS” in the Company’s Annual Information Form for the year ended December 31, 2013, filed on SEDAR and available atwww.sedar.com. Further information about the Company is available on its corporate website atwww.jaguarmining.com.
CAUTIONARY NOTE TO U.S. INVESTORS CONCERNING ESTIMATES OF INFERRED AND MEASURED AND INDICATED MINERAL RESOURCES
The disclosure in this MD&A and documents incorporated by reference has been prepared in accordance with the requirements of Canadian securities laws, which differ from the requirements of United States securities laws.
Unless otherwise indicated, all mineral reserves and mineral resources estimates included in this MD&A have been prepared in accordance with National Instrument 43-101 - Standards of Disclosure for Mineral Projects (“NI 43-101”) and the CIM classification system. NI 43-101 is a rule developed by the Canadian Securities Administrators (“CSA”) that establishes standards for all public disclosure a Canadian issuer makes of scientific and technical information concerning mineral projects.
| MD&A – Second quarter ended June 30, 2014 | Jaguar Mining Inc. | 31 |
Canadian standards, including NI 43-101, differ significantly from the requirements of the Securities and Exchange Commission (the “SEC”), and mineral reserve and mineral resource information contained in this Annual Information Form may not be comparable to similar information disclosed by U.S. companies. In particular, and without limiting the generality of the foregoing, this Annual Information Form uses the terms “Measured Mineral Resources,” “Indicated Mineral Resources” and “Inferred Mineral Resources.” U.S. investors are advised that, while such terms are recognized and required by Canadian securities laws, the SEC does not recognize them. Under U.S. standards, mineralization may not be classified as a “Mineral Reserve” unless the determination has been made that the mineralization could be economically and legally produced or extracted at the time the mineral reserve determination is made. U.S. investors are cautioned not to assume that any part of the “Measured Mineral Resource” or “Indicated Mineral Resource” will ever be converted into a “Mineral Reserve.” U.S. investors should also understand that “Inferred Mineral Resources” have a great amount of uncertainty as to their existence and great uncertainty as to their economic and legal feasibility. It cannot be assumed that all or any part of “Inferred Mineral Resources” exist, are economically or legally mineable or will ever be upgraded to a higher category. Under Canadian securities laws, estimated “Inferred Mineral Resources” may not form the basis of feasibility or pre-feasibility studies except in rare cases. Disclosure of “contained ounces” in a Mineral Resource is also permitted disclosure under Canadian securities laws. However, the SEC normally only permits issuers to report mineralization that does not constitute “Mineral Reserves” by SEC standards as in-place tonnage and grade, without reference to unit measures. The requirements of NI 43-101 for identification of “Mineral Reserves” are also not the same as those of the SEC, and Mineral Reserves reported in compliance with NI 43-101 may not qualify as “Mineral Reserves” under SEC standards. Accordingly, information concerning mineral deposits set forth may not be comparable with information made public by companies that report in accordance with U.S. standards.
| MD&A – Second quarter ended June 30, 2014 | Jaguar Mining Inc. | 32 |
CORPORATE DIRECTORY
| BOARD OF DIRECTORS | | REGISTERED OFFICE |
| | | |
| Richard D. Falconer(1)(3)Chairman | | 67 Yonge Street, Suite 1203 |
| George M. Bee | | Toronto, ON M5E 1J8 |
| Edward V. Reeser(1)(2)(3) | | Canada |
| Luis R. Miraglia(2) | | |
| Stephen Hope(1)(2) | | AUDITORS |
| Jared Hardner(3) | | |
| Robert J. Chadwick | | KPMG LLP |
| | | Toronto, ON, Canada |
| (1) Audit & Risk Committee | | Belo Horizonte, MG, Brazil |
| (2) Governance, Compensation and Nominating Committee | | |
| (3) Safety, Environmental, Technical & Reserves Committee | | LEGAL COUNSEL |
| | Norton Rose Fulbright Canada LLP |
| OFFICERS | | Toronto, ON, Canada |
| | | |
| George M. Bee | | Azevedo Sette Advogados |
| Chief Executive Officer | | Belo Horizonte, MG, Brazil |
| | | |
| Derrick H. Weyrauch | | BANKS |
| Chief Financial Officer | | |
| | | HSBC |
| PRINCIPAL EXECUTIVE OFFICE | | Toronto, ON, Canada |
| | | |
| 67 Yonge Street, Suite 1203 | | Royal Bank of Canada |
| Toronto, ON M5E 1J8 | | Toronto, ON, Canada |
| Canada | | |
| | | STOCK TRANSFER AGENT |
| Phone: (647) 494-5JAG (5524) | | |
| Fax: (647) 494-8885 | | Computershare Investor Services Inc. |
| Website:www.jaguarmining.com | | 100 University Avenue, 9th Floor |
| | | Toronto, ON M5J 2Y1 |
| ADMINISTRATIVE OFFICES | | Canada |
| | | Phone: 1 (800) 564-6253 |
| Rua Levindo Lopes, 323 - Funcionários | | Fax: 1 (866) 249-7775 |
| CEP 30140-170 - Belo Horizonte | | Email: service@computershare.com |
| Brazil | | |
| | | EXCHANGE LISTING |
| | | |
| | | TSX-V: “JAG” |
| MD&A – Second quarter ended June 30, 2014 | Jaguar Mining Inc. | 33 |