Exhibit 99.2 Equitable Holdings Individual Life Strategic Transaction Review February 24, 2025 Equitable

Disclaimers This presentation contains forward-looking statements. Words such as “expects,” “believes,” “anticipates,” “forecasts,” “intends,” “seeks,” “aims,” “plans,” “assumes,” “estimates,” “projects,” “should,” “would,” “could,” “may,” “will,” “shall” or variations of such words are generally part of forward-looking statements. Forward-looking statements are made based on management’s current expectations and beliefs concerning future developments and their potential effects upon Equitable Holdings, Inc. (“Holdings”) and its consolidated subsidiaries. These forward-looking statements include, but are not limited to, statements regarding projections, estimates, forecasts and other financials and performance metrics and projections of market expectations. “We,” “us” and “our” refer to Holdings and its consolidated subsidiaries, unless the context refers only to Holdings as a corporate entity. There can be no assurance that future developments affecting Holdings will be those anticipated by management. Forward-looking statements include, without limitation, all matters that are not historical facts. These forward-looking statements are not a guarantee of future performance and involve risks and uncertainties, and there are certain important factors that could cause actual results to differ, possibly materially, from expectations or estimates reflected in such forward-looking statements, including, among others: (i) conditions in the financial markets and economy, including the impact of geopolitical conflicts, changes in tariffs and trade barriers, and related economic conditions, equity market declines and volatility, interest rate fluctuations, impacts on our goodwill and changes in liquidity and access to and cost of capital; our ability to satisfy the customary closing conditions in connection with the reinsurance transaction described herein; (ii) operational factors, including reliance on the payment of dividends to Holdings by its subsidiaries, protection of confidential customer information or proprietary business information, operational failures by us or our service providers, potential strategic transactions, changes in accounting standards, and catastrophic events, such as the outbreak of pandemic diseases; (iii) credit, counterparties and investments, including counterparty default on derivative contracts, failure of financial institutions, defaults by third parties and affiliates and economic downturns, defaults and other events adversely affecting our investments; (iv) our reinsurance and hedging programs; (v) our products, structure and product distribution, including variable annuity guaranteed benefits features within certain of our products, variations in statutory capital requirements, financial strength and claims-paying ratings, state insurance laws limiting the ability of our insurance subsidiaries to pay dividends and key product distribution relationships; (vi) estimates, assumptions and valuations, including risk management policies and procedures, potential inadequacy of reserves and experience differing from pricing expectations, amortization of deferred acquisition costs and financial models; (vii) our Asset Management segment, including fluctuations in assets under management and the industry-wide shift from actively-managed investment services to passive services; (viii) recruitment and retention of key employees and experienced and productive financial professionals; (ix) subjectivity of the determination of the amount of allowances and impairments taken on our investments; (x) legal and regulatory risks, including federal and state legislation affecting financial institutions, insurance regulation and tax reform; (xi) risks related to our common stock and (xii) general risks, including strong industry competition, information systems failing or being compromised and protecting our intellectual property. Forward-looking statements, including any financial guidance, should be read in conjunction with the other cautionary statements, risks, uncertainties and other factors identified in Holdings’ filings with the Securities and Exchange Commission. Further, any forward-looking statement speaks only as of the date on which it is made, and we undertake no obligation to update or revise any forward-looking statement to reflect events or circumstances after the date on which the statement is made or to reflect the occurrence of unanticipated events, except as otherwise may be required by law. This presentation and certain of the remarks made orally contain Non-GAAP financial measures. Non-GAAP financial measures include Non-GAAP operating earnings, and Non-GAAP operating EPS. Information regarding these and other Non-GAAP financial measures, including reconciliations to the most directly comparable GAAP financial measures, is provided in our quarterly earnings press releases and in our quarterly financial supplements, which are available on our Investor Relations website at ir.equitableholdings.com. See also Appendix A. The Company has presented forward-looking statements regarding Non-GAAP operating earnings, Non-GAAP operating earnings per share and Adjusted operating margin at AB. These Non-GAAP financial measures are derived by excluding certain amounts, expenses or income, from the corresponding financial measures determined in accordance with GAAP. The determination of the amounts that are excluded from these Non- GAAP financial measures is a matter of management judgment and depends upon, among other factors, the nature of the underlying expense or income amounts recognized in a given period. We are unable to present a quantitative reconciliation of forward-looking adjusted operating earnings per share and payout ratio targeted to Non-GAAP operating earnings to their most directly comparable forward-looking GAAP financial measures because such information is not available, and management cannot reliably predict all of the necessary components of such GAAP measures without unreasonable effort or expense. In addition, we believe such reconciliations would imply a degree of precision that would be confusing or misleading to investors. The unavailable information could have a significant impact on the Company’s future financial results. These Non-GAAP financial measures are preliminary estimates and are subject to risks and uncertainties, including, among others changes in connection with quarter-end and year-end adjustments. Any variations between the Company’s actual results and preliminary financial data set forth above may be material. This presentation is provided for informational purposes only and does not constitute an offer to purchase or a solicitation of an offer to sell any securities, nor is it a substitute for the tender offer materials that will be filed with the SEC, including among other materials, a tender offer statement on Schedule TO containing an Offer to Purchase, the related Letter of Transmittal and other materials relating to the tender offer. AB Unitholders are urged to read carefully and in their entirety the information in the Offer to Purchase and in the Letter of Transmittal (as they may be amended or supplemented), including the purposes and effects of the tender offer, because they will contain important information that unitholders should consider before making any decision regarding the tender offer. The Offer to Purchase and related Letter of Transmittal will be made available free of charge on the SEC's website at www.sec.gov. Life Strategic Transaction 2
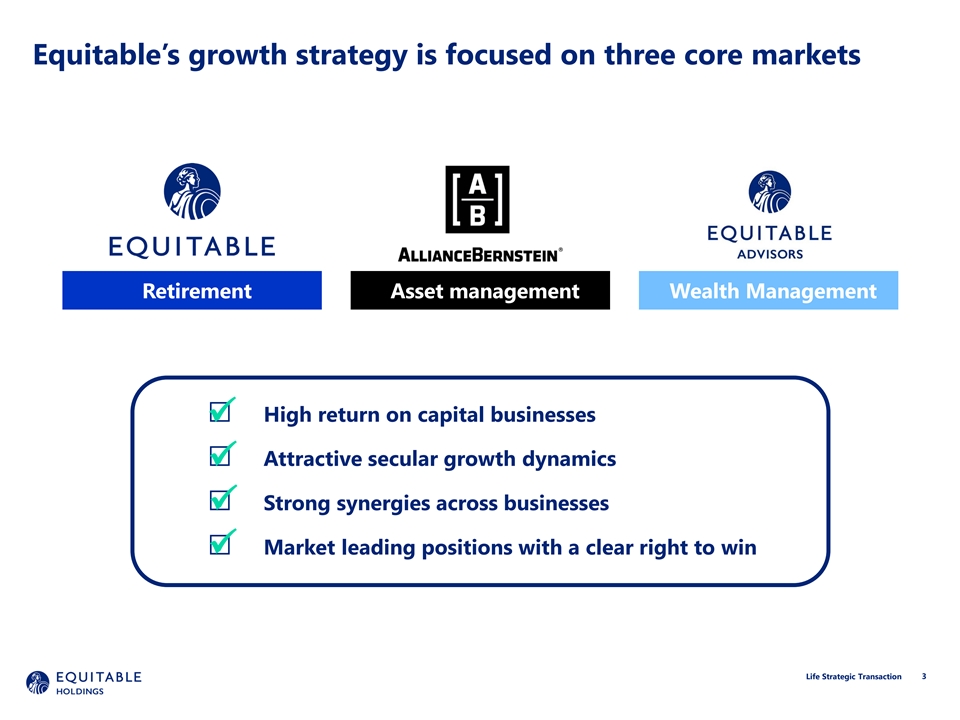
Equitable’s growth strategy is focused on three core markets Retirement Asset management Wealth Management □ High return on capital businesses ü □ Attractive secular growth dynamics ü □ Strong synergies across businesses ü □ Market leading positions with a clear right to win ü Life Strategic Transaction 3
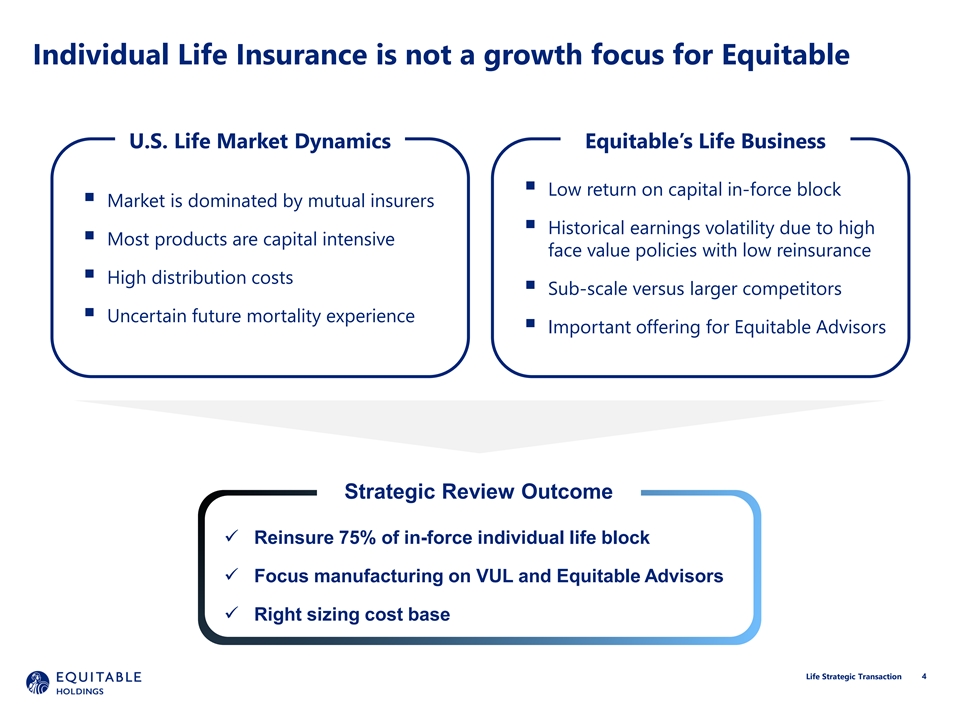
Individual Life Insurance is not a growth focus for Equitable U.S. Life Market Dynamics Equitable’s Life Business § Low return on capital in-force block § Market is dominated by mutual insurers § Historical earnings volatility due to high § Most products are capital intensive face value policies with low reinsurance § High distribution costs § Sub-scale versus larger competitors § Uncertain future mortality experience § Important offering for Equitable Advisors Strategic Review Outcome ü Reinsure 75% of in-force individual life block ü Focus manufacturing on VUL and Equitable Advisors ü Right sizing cost base Life Strategic Transaction 4
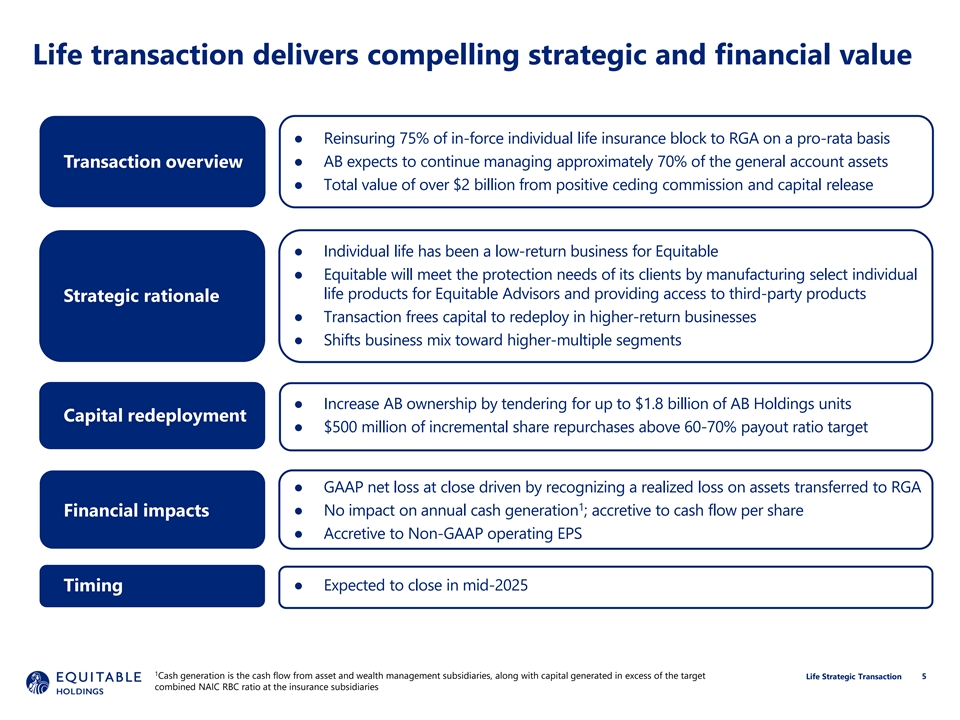
Life transaction delivers compelling strategic and financial value ● Reinsuring 75% of in-force individual life insurance block to RGA on a pro-rata basis ● AB expects to continue managing approximately 70% of the general account assets Transaction overview ● Total value of over $2 billion from positive ceding commission and capital release ● Individual life has been a low-return business for Equitable ● Equitable will meet the protection needs of its clients by manufacturing select individual life products for Equitable Advisors and providing access to third-party products Strategic rationale ● Transaction frees capital to redeploy in higher-return businesses ● Shifts business mix toward higher-multiple segments ● Increase AB ownership by tendering for up to $1.8 billion of AB Holdings units Capital redeployment ● $500 million of incremental share repurchases above 60-70% payout ratio target ● GAAP net loss at close driven by recognizing a realized loss on assets transferred to RGA 1 ● No impact on annual cash generation ; accretive to cash flow per share Financial impacts ● Accretive to Non-GAAP operating EPS ● Expected to close in mid-2025 Timing 1 Cash generation is the cash flow from asset and wealth management subsidiaries, along with capital generated in excess of the target Life Strategic Transaction 5 combined NAIC RBC ratio at the insurance subsidiaries
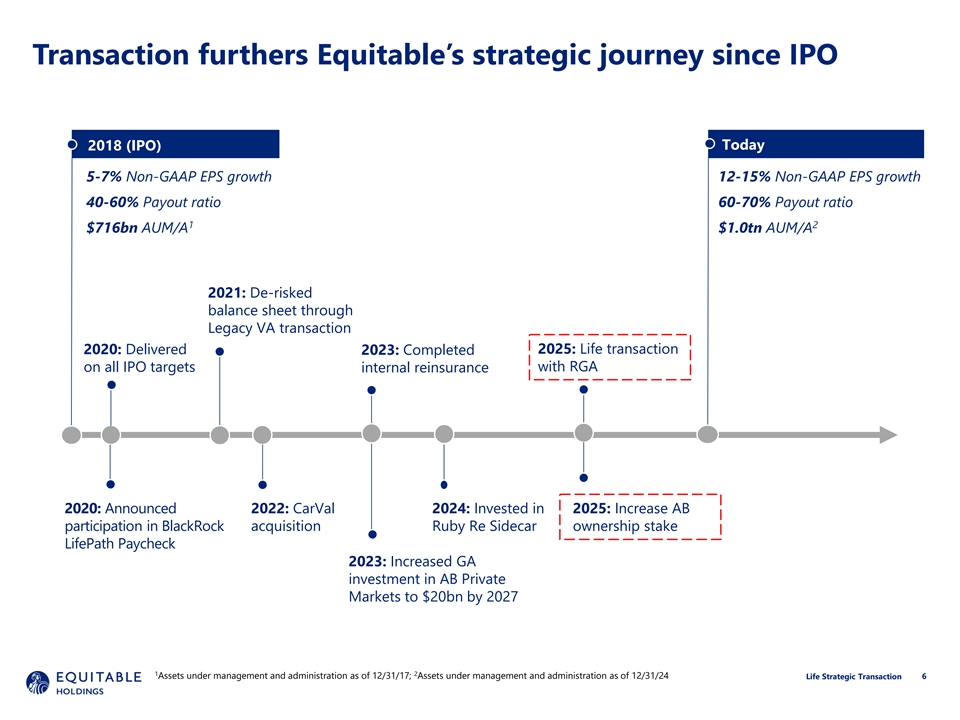
Transaction furthers Equitable’s strategic journey since IPO Today 2018 (IPO) 5-7% Non-GAAP EPS growth 12-15% Non-GAAP EPS growth 40-60% Payout ratio 60-70% Payout ratio 1 2 $716bn AUM/A $1.0tn AUM/A 2021: De-risked balance sheet through Legacy VA transaction 2020: Delivered 2023: Completed 2025: Life transaction on all IPO targets with RGA internal reinsurance 2020: Announced 2022: CarVal 2024: Invested in 2025: Increase AB participation in BlackRock acquisition Ruby Re Sidecar ownership stake LifePath Paycheck 2023: Increased GA investment in AB Private Markets to $20bn by 2027 1 2 Assets under management and administration as of 12/31/17; Assets under management and administration as of 12/31/24 6 Life Strategic Transaction
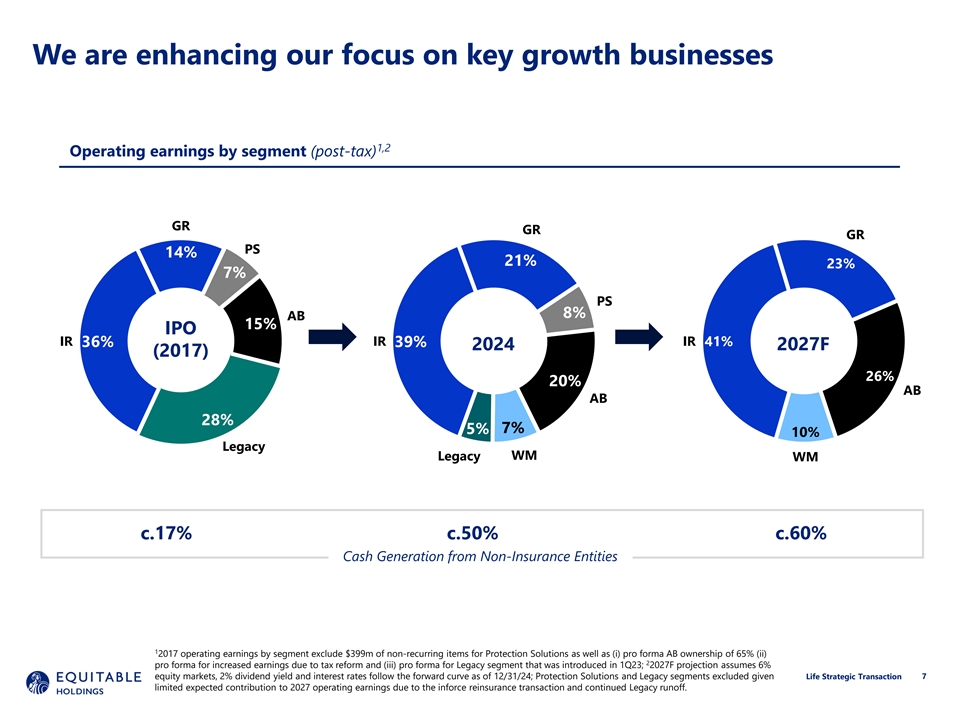
We are enhancing our focus on key growth businesses 1,2 Operating earnings by segment (post-tax) GR GR GR PS 14% 21% 23% 7% PS 8% AB 15% IPO IR 36% IR IR 41% 39% 2024 2027F (2017) 26% 20% AB AB 28% 7% 5% 10% Legacy WM Legacy WM c.17% c.50% c.60% Cash Generation from Non-Insurance Entities 1 2017 operating earnings by segment exclude $399m of non-recurring items for Protection Solutions as well as (i) pro forma AB ownership of 65% (ii) 2 pro forma for increased earnings due to tax reform and (iii) pro forma for Legacy segment that was introduced in 1Q23; 2027F projection assumes 6% 7 equity markets, 2% dividend yield and interest rates follow the forward curve as of 12/31/24; Protection Solutions and Legacy segments excluded given Life Strategic Transaction limited expected contribution to 2027 operating earnings due to the inforce reinsurance transaction and continued Legacy runoff.
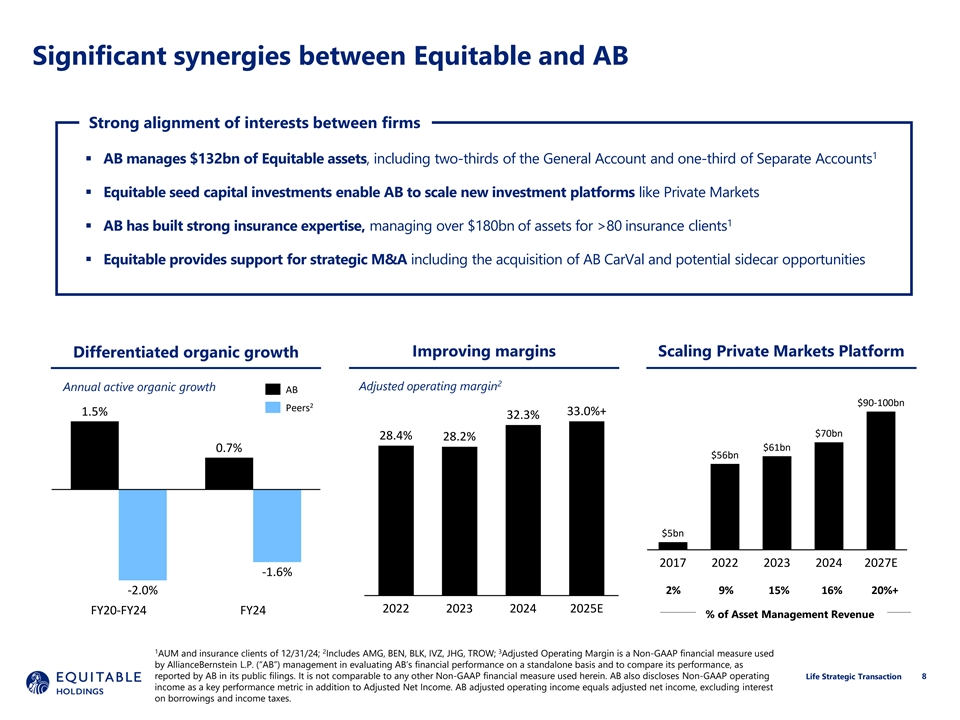
Significant synergies between Equitable and AB Strong alignment of interests between firms 1 § AB manages $132bn of Equitable assets, including two-thirds of the General Account and one-third of Separate Accounts § Equitable seed capital investments enable AB to scale new investment platforms like Private Markets 1 § AB has built strong insurance expertise, managing over $180bn of assets for >80 insurance clients § Equitable provides support for strategic M&A including the acquisition of AB CarVal and potential sidecar opportunities Differentiated organic growth Improving margins Scaling Private Markets Platform 2 Adjusted operating margin Annual active organic growth AB $90-100bn 2 Peers 1.5% 33.0%+ 32.3% $70bn 28.4% 28.2% $61bn 0.7% $56bn $5bn 2017 2022 2023 2024 2027E -1.6% -2.0% 2% 9% 15% 16% 20%+ 2022 2023 2024 2025E FY20-FY24 FY24 % of Asset Management Revenue 1 2 3 AUM and insurance clients of 12/31/24; Includes AMG, BEN, BLK, IVZ, JHG, TROW; Adjusted Operating Margin is a Non-GAAP financial measure used by AllianceBernstein L.P. (“AB”) management in evaluating AB’s financial performance on a standalone basis and to compare its performance, as reported by AB in its public filings. It is not comparable to any other Non-GAAP financial measure used herein. AB also discloses Non-GAAP operating Life Strategic Transaction 8 income as a key performance metric in addition to Adjusted Net Income. AB adjusted operating income equals adjusted net income, excluding interest on borrowings and income taxes.
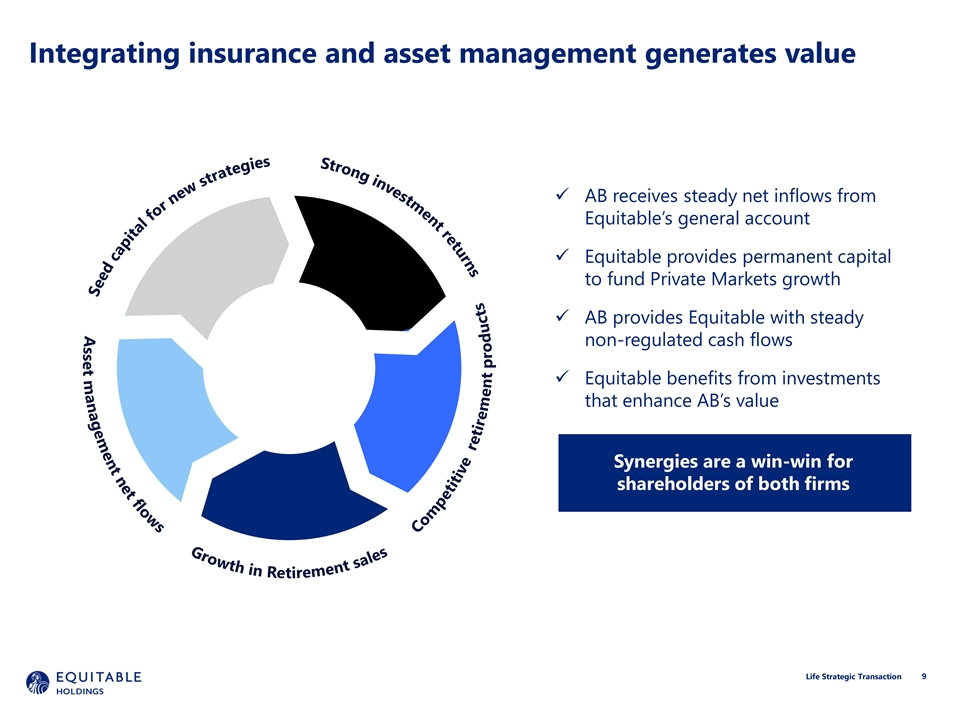
Integrating insurance and asset management generates value ü AB receives steady net inflows from Equitable’s general account ü Equitable provides permanent capital to fund Private Markets growth ü AB provides Equitable with steady non-regulated cash flows ü Equitable benefits from investments that enhance AB’s value Synergies are a win-win for shareholders of both firms 9 Life Strategic Transaction
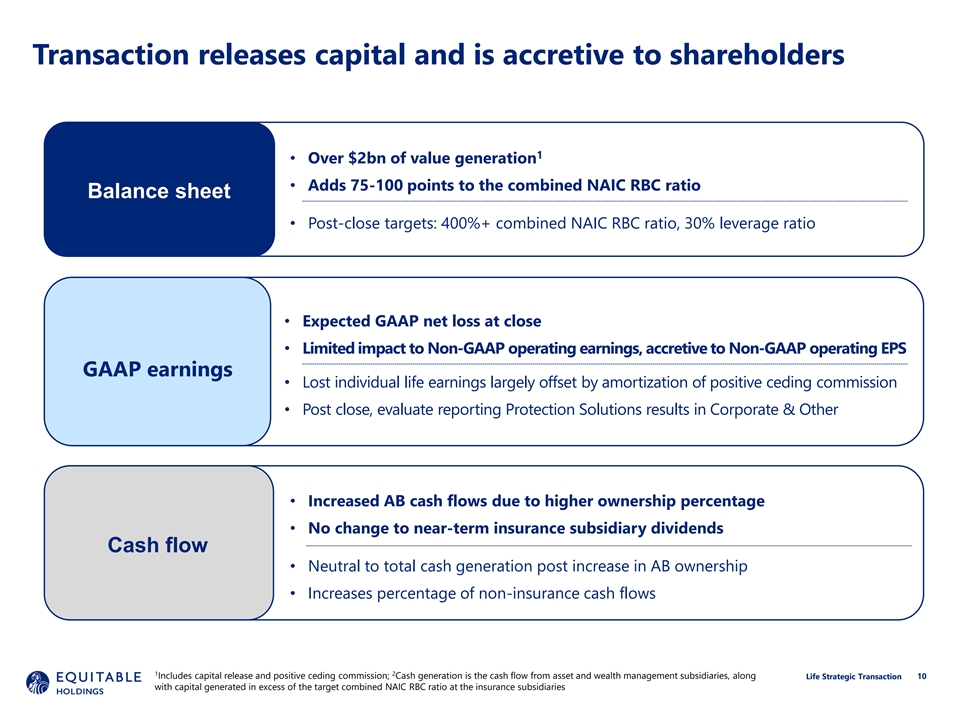
Transaction releases capital and is accretive to shareholders 1 • Over $2bn of value generation • Adds 75-100 points to the combined NAIC RBC ratio Balance sheet • Post-close targets: 400%+ combined NAIC RBC ratio, 30% leverage ratio • Expected GAAP net loss at close • Limited impact to Non-GAAP operating earnings, accretive to Non-GAAP operating EPS GAAP earnings • Lost individual life earnings largely offset by amortization of positive ceding commission • Post close, evaluate reporting Protection Solutions results in Corporate & Other • Increased AB cash flows due to higher ownership percentage • No change to near-term insurance subsidiary dividends Cash flow • Neutral to total cash generation post increase in AB ownership • Increases percentage of non-insurance cash flows 1 2 Includes capital release and positive ceding commission; Cash generation is the cash flow from asset and wealth management subsidiaries, along Life Strategic Transaction 10 with capital generated in excess of the target combined NAIC RBC ratio at the insurance subsidiaries
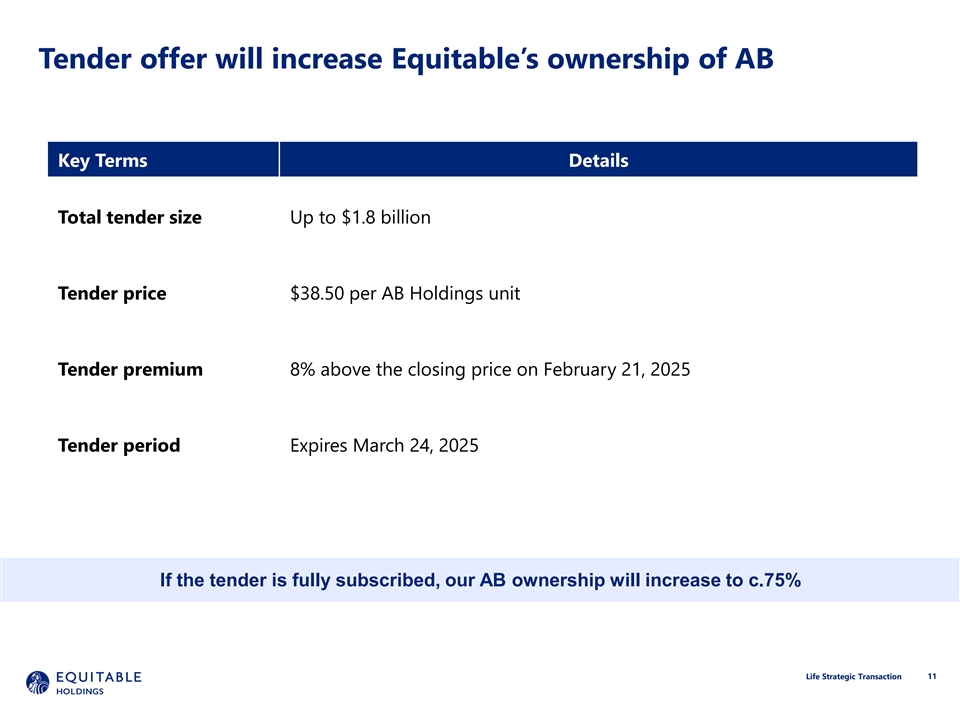
Tender offer will increase Equitable’s ownership of AB Key Terms Details Total tender size Up to $1.8 billion Tender price $38.50 per AB Holdings unit Tender premium 8% above the closing price on February 21, 2025 Tender period Expires March 24, 2025 If the tender is fully subscribed, our AB ownership will increase to c.75% Life Strategic Transaction 11
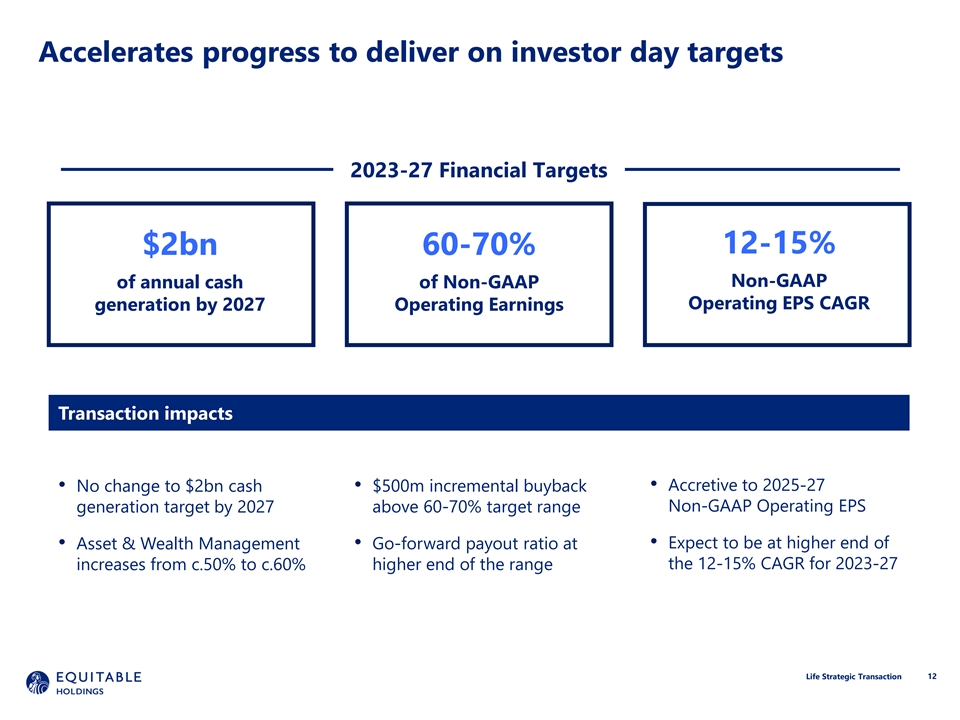
Accelerates progress to deliver on investor day targets 2023-27 Financial Targets 12-15% $2bn 60-70% Non-GAAP of annual cash of Non-GAAP Operating EPS CAGR generation by 2027 Operating Earnings Transaction impacts • Accretive to 2025-27 • No change to $2bn cash • $500m incremental buyback Non-GAAP Operating EPS generation target by 2027 above 60-70% target range • Asset & Wealth Management • Go-forward payout ratio at • Expect to be at higher end of the 12-15% CAGR for 2023-27 increases from c.50% to c.60% higher end of the range Life Strategic Transaction 12
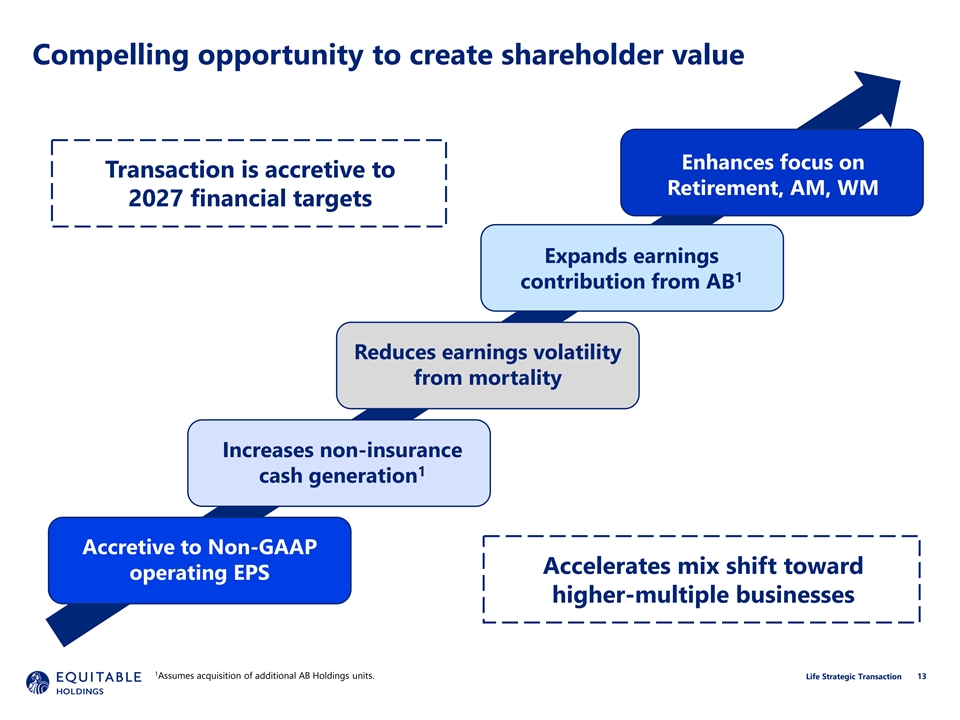
Compelling opportunity to create shareholder value Enhances focus on Transaction is accretive to Retirement, AM, WM 2027 financial targets Expands earnings 1 contribution from AB Reduces earnings volatility from mortality Increases non-insurance 1 cash generation Accretive to Non-GAAP Accelerates mix shift toward operating EPS higher-multiple businesses 1 Assumes acquisition of additional AB Holdings units. Life Strategic Transaction 13

Appendix Equitable Holdings Individual Life Strategic Transaction Review
Appendix A: Use of Non-GAAP Financial Measures In addition to our results presented in accordance with U.S. GAAP, we report Non-GAAP Operating Earnings and Non-GAAP operating EPS, each of which is a measure that is not determined in accordance with U.S. GAAP. Management principally uses these non-GAAP financial measures in evaluating performance because they present a clearer picture of our operating performance and they allow management to allocate resources. Similarly, management believes that the use of these Non-GAAP financial measures, together with relevant U.S. GAAP measures, provide investors with a better understanding of our results of operations and the underlying profitability drivers and trends of our business. These non-GAAP financial measures are intended to remove from our results of operations the impact of market changes (where there is a mismatch in the valuation of assets and liabilities) as well as certain other expenses which are not part of our underlying profitability drivers or likely to re-occur in the foreseeable future, as such items fluctuate from period-to-period in a manner inconsistent with these drivers. These measures should be considered supplementary to our results that are presented in accordance with U.S. GAAP and should not be viewed as a substitute for the U.S. GAAP measures. Other companies may use similarly titled non-GAAP financial measures that are calculated differently from the way we calculate such measures. Consequently, our non-GAAP financial measures may not be comparable to similar measures used by other companies. Non-GAAP Operating Earnings Non-GAAP Operating Earnings is an after-tax Non-GAAP financial measure used to evaluate our financial performance on a consolidated basis that is determined by making certain adjustments to our consolidated after-tax net income attributable to Holdings. The most significant of such adjustments relates to our derivative positions, which protect economic value and statutory capital, and the variable annuity product MRBs. This is a large source of volatility in net income. Non-GAAP Operating Earnings equals our consolidated after-tax net income attributable to Holdings adjusted to eliminate the impact of the following items: • Items related to variable annuity product features, which include: (i) changes in the fair value of MRB and purchased MRB, including the related attributed fees and claims, offset by derivatives and other securities used to hedge the MRB which result in residual net income volatility as the change in fair value of certain securities is reflected in OCI and due to our statutory capital hedge program; and (ii) market adjustments to deposit asset or liability accounts arising from reinsurance agreements which do not expose the reinsurer to a reasonable possibility of a significant loss from insurance risk; • Investment (gains) losses, which includes credit loss impairments of securities/investments, sales or disposals of securities/investments, realized capital gains/losses and valuation allowances; • Net actuarial (gains) losses, which includes actuarial gains and losses as a result of differences between actual and expected experience on pension plan assets or projected benefit obligation during a given period related to pension, other postretirement benefit obligations, and the one-time impact of the settlement of the defined benefit obligation; • Other adjustments, which primarily include restructuring costs related to severance and separation, lease write-offs related to non-recurring restructuring activities, COVID-19 related impacts, net derivative gains (losses) on certain Non-GMxB derivatives, net investment income from certain items including consolidated VIE investments, seed capital mark-to-market adjustments, unrealized gain/losses and realized capital gains/losses from sales or disposals of select securities, certain legal accruals; a bespoke deal to repurchase UL policies from one entity that had invested in numerous policies purchased in the life settlement market, which disposed of the risk of additional COI litigation by that entity related to those UL policies, impact of the annual actuarial assumption updates attributable to LFPB when the majority of the impact relates to the non-core business; and • Income tax expense (benefit) related to the above items and non-recurring tax items, which includes the effect of uncertain tax positions for a given audit period and changes to the deferred tax valuation allowance. Because Non-GAAP Operating Earnings excludes items that can be distortive or unpredictable, management believes that this measure enhances the understanding of the Company’s underlying drivers of profitability and trends in our business, thereby allowing management to make decisions that will positively impact our business. We use the prevailing corporate federal income tax rate of 21% while taking into account any non-recurring differences for events recognized differently in our financial statements and federal income tax returns as well as partnership income taxed at lower rates when reconciling Net income (loss) attributable to Holdings to Non-GAAP Operating Earnings. Non-GAAP Operating EPS Non-GAAP Operating Earnings per common share is calculated by dividing Non-GAAP Operating Earnings less preferred stock dividends by diluted common shares outstanding. Life Strategic Transaction 15