
Filed by Obsidian Energy Ltd. (Commission File No. 001-32895) Pursuant to Rule 425 under the Securities Act of 1933 Subject Company: Bonterra Energy Corp. Obsidian Energy Corporate Presentation October 2020Filed by Obsidian Energy Ltd. (Commission File No. 001-32895) Pursuant to Rule 425 under the Securities Act of 1933 Subject Company: Bonterra Energy Corp. Obsidian Energy Corporate Presentation October 2020

Important Notice to the Readers This presentation should be read in conjunction with the Company’s unaudited interim consolidated financial statements, Management's Discussion and Analysis ( MD&A ) for the three and six months ended June 30, 2020. All dollar amounts contained in this presentation are expressed in millions of Canadian dollars unless otherwise indicated. Certain financial measures included in this presentation do not have a standardized meaning prescribed by International Financial Reporting Standards (“IFRS”) and therefore are considered non-generally accepted accounting practice (“Non-GAAP ) measures; accordingly, they may not be comparable to similar measures provided by other issuers. This presentation also contains oil and gas disclosures, various industry terms, and forward-looking statements, including various assumptions on which such forward-looking statements are based and related risk factors. Please see the Company's disclosures located in the Appendix & Endnotes at the end of this presentation for further details regarding these matters. All slides in this presentation should be read in conjunction with “Definitions and Industry Terms”, “Non-GAAP Measure Advisory”, “Oil and Gas Information Advisory”, “Reserves Disclosure and Definitions Advisory” and “Forward-Looking Information Advisory”. All locations are considered to be Unbooked locations unless otherwise noted. This presentation does not constitute an offer to buy or sell, or an invitation or a solicitation of an offer to buy or sell, any securities of the Company or Bonterra Energy Corp. (“Bonterra”). The Company’s offer to purchase all of the issued and outstanding common shares of Bonterra for consideration consisting of two common shares of the Company for each Bonterra share (the “Offer”) the offer to purchase and take-over bid circular dated September 21, 2020 and related offer documents (collectively, “Offer Documents”) that were mailed to Bonterra shareholders and have also been filed with the Canadian and United States securities regulators and are available under the Company’s SEDAR profile at www.sedar.com, in the United States on EDGAR at www.sec.gov and on the Company’s website at www.obsidianenergy.com. The Offer is made exclusively by means of, and subject to the terms and conditions set out in, the Offer Documents. While the Offer will be made to all holders of Bonterra shares, the Offer will not be made or directed to, nor will deposits of Bonterra shares be accepted from or on behalf of, holders of Bonterra shares in any jurisdiction in which the making or acceptance of the Offer would not be in compliance with the laws of such jurisdiction. The Offer is open for acceptance until 5:00 p.m. (Mountain Standard Time) on January 4, 2021, unless extended, accelerated or withdrawn. As set out in further detail in the Offer Documents, the Offer is subject to certain conditions, including: that the Bonterra shares validly deposited to the Offer, and not withdrawn, represent at least 66 2/3% of the then outstanding Bonterra shares (on a fully-diluted basis) and certain regulatory and third party approvals (as outlined in the Offer Documents) shall have been obtained, including the Company’s shareholders approving, as required by the rules of the Toronto Stock Exchange, the issuance of the shares to be distributed by the Company in connection with the Offer, and other customary conditions. Subject to applicable law, the Company reserves the right to withdraw, accelerate or extend the Offer and to not take up and pay for any Bonterra shares deposited under the Offer unless each of the conditions of the Offer is satisfied or waived by the Company at or prior to the expiry of the Offer. Bonterra shareholders are strongly encouraged to read the Offer Documents carefully and in their entirety since they contain additional important information regarding the Company and the terms and conditions of the Offer as well as detailed instructions on how Bonterra shareholders can tender their Bonterra shares to the Offer. The offer and sale of shares of the Company pursuant to the Offer is subject to a registration statement (the “Registration Statement”) filed with the United States Securities and Exchange Commission (the “SEC”) under the U.S. Securities Act of 1933, as amended. The Registration Statement includes various documents related to such offer and sale. THE COMPANY URGES INVESTORS AND SHAREHOLDERS OF BONTERRA TO READ THE REGISTRATION STATEMENT AND ANY AND ALL OTHER RELEVANT DOCUMENTS FILED OR TO BE FILED WITH THE SEC IN CONNECTION WITH THE OFFER AND SALE OF OBSIDIAN SHARES AS THOSE DOCUMENTS BECOME AVAILABLE, AS WELL AS ANY AMENDMENTS OR SUPPLEMENTS TO THOSE DOCUMENTS, BECAUSE THEY CONTAIN OR WILL CONTAIN IMPORTANT INFORMATION. You will be able to obtain a free copy of such registration statement, as well as other relevant filings regarding the Company or the Offer, at the SEC’s website (www.sec.gov) under the issuer profile for the Company, or on request without charge from the Corporate Secretary of the Company at Suite 200, 207 – 9th Avenue, SW, Calgary, Alberta T2P 1K3. 2Important Notice to the Readers This presentation should be read in conjunction with the Company’s unaudited interim consolidated financial statements, Management's Discussion and Analysis ( MD&A ) for the three and six months ended June 30, 2020. All dollar amounts contained in this presentation are expressed in millions of Canadian dollars unless otherwise indicated. Certain financial measures included in this presentation do not have a standardized meaning prescribed by International Financial Reporting Standards (“IFRS”) and therefore are considered non-generally accepted accounting practice (“Non-GAAP ) measures; accordingly, they may not be comparable to similar measures provided by other issuers. This presentation also contains oil and gas disclosures, various industry terms, and forward-looking statements, including various assumptions on which such forward-looking statements are based and related risk factors. Please see the Company's disclosures located in the Appendix & Endnotes at the end of this presentation for further details regarding these matters. All slides in this presentation should be read in conjunction with “Definitions and Industry Terms”, “Non-GAAP Measure Advisory”, “Oil and Gas Information Advisory”, “Reserves Disclosure and Definitions Advisory” and “Forward-Looking Information Advisory”. All locations are considered to be Unbooked locations unless otherwise noted. This presentation does not constitute an offer to buy or sell, or an invitation or a solicitation of an offer to buy or sell, any securities of the Company or Bonterra Energy Corp. (“Bonterra”). The Company’s offer to purchase all of the issued and outstanding common shares of Bonterra for consideration consisting of two common shares of the Company for each Bonterra share (the “Offer”) the offer to purchase and take-over bid circular dated September 21, 2020 and related offer documents (collectively, “Offer Documents”) that were mailed to Bonterra shareholders and have also been filed with the Canadian and United States securities regulators and are available under the Company’s SEDAR profile at www.sedar.com, in the United States on EDGAR at www.sec.gov and on the Company’s website at www.obsidianenergy.com. The Offer is made exclusively by means of, and subject to the terms and conditions set out in, the Offer Documents. While the Offer will be made to all holders of Bonterra shares, the Offer will not be made or directed to, nor will deposits of Bonterra shares be accepted from or on behalf of, holders of Bonterra shares in any jurisdiction in which the making or acceptance of the Offer would not be in compliance with the laws of such jurisdiction. The Offer is open for acceptance until 5:00 p.m. (Mountain Standard Time) on January 4, 2021, unless extended, accelerated or withdrawn. As set out in further detail in the Offer Documents, the Offer is subject to certain conditions, including: that the Bonterra shares validly deposited to the Offer, and not withdrawn, represent at least 66 2/3% of the then outstanding Bonterra shares (on a fully-diluted basis) and certain regulatory and third party approvals (as outlined in the Offer Documents) shall have been obtained, including the Company’s shareholders approving, as required by the rules of the Toronto Stock Exchange, the issuance of the shares to be distributed by the Company in connection with the Offer, and other customary conditions. Subject to applicable law, the Company reserves the right to withdraw, accelerate or extend the Offer and to not take up and pay for any Bonterra shares deposited under the Offer unless each of the conditions of the Offer is satisfied or waived by the Company at or prior to the expiry of the Offer. Bonterra shareholders are strongly encouraged to read the Offer Documents carefully and in their entirety since they contain additional important information regarding the Company and the terms and conditions of the Offer as well as detailed instructions on how Bonterra shareholders can tender their Bonterra shares to the Offer. The offer and sale of shares of the Company pursuant to the Offer is subject to a registration statement (the “Registration Statement”) filed with the United States Securities and Exchange Commission (the “SEC”) under the U.S. Securities Act of 1933, as amended. The Registration Statement includes various documents related to such offer and sale. THE COMPANY URGES INVESTORS AND SHAREHOLDERS OF BONTERRA TO READ THE REGISTRATION STATEMENT AND ANY AND ALL OTHER RELEVANT DOCUMENTS FILED OR TO BE FILED WITH THE SEC IN CONNECTION WITH THE OFFER AND SALE OF OBSIDIAN SHARES AS THOSE DOCUMENTS BECOME AVAILABLE, AS WELL AS ANY AMENDMENTS OR SUPPLEMENTS TO THOSE DOCUMENTS, BECAUSE THEY CONTAIN OR WILL CONTAIN IMPORTANT INFORMATION. You will be able to obtain a free copy of such registration statement, as well as other relevant filings regarding the Company or the Offer, at the SEC’s website (www.sec.gov) under the issuer profile for the Company, or on request without charge from the Corporate Secretary of the Company at Suite 200, 207 – 9th Avenue, SW, Calgary, Alberta T2P 1K3. 2

Corporate Overview Market Summary Ticker Symbol OBE Peace River MM Shares Outstanding 73 2,132 boe/d Q2 2020 Cold flow heavy oil MM Market Capitalization $35 Manage base production MM Net Debt $496 MM Enterprise Value $531 Corporate Summary mmboe Reserves (2P YE 2019) 126 Cardium years RLI (2P YE 2019) 14 22,456 boe/d Q2 2020 Light oil conventional % PDP Decline (YE 2019) 17 development Manufacturing model for MM Tax Pools (YE 2019) $2,547 extensive, repeatable inventory. Leverage shallow decline base Guidance Period H2 2020 boe/d Production 24,000 – 24,500 25,000 – 25,500 MM Capital Expenditures $10 $51 MM Decommissioning $3 $11 Alberta Viking $/boe Operating Costs $12.00 – $12.50 $11.10 – 11.50 880 boe/d Q2 2020 General & Higher GOR oil play $/boe $1.50 – $1.65 $1.50 – 1.60 Administrative Manage base production *Legacy Asset Production of 405 boe/d Q2 2020 3 3 See end notes for additional information Corporate Overview Market Summary Ticker Symbol OBE Peace River MM Shares Outstanding 73 2,132 boe/d Q2 2020 Cold flow heavy oil MM Market Capitalization $35 Manage base production MM Net Debt $496 MM Enterprise Value $531 Corporate Summary mmboe Reserves (2P YE 2019) 126 Cardium years RLI (2P YE 2019) 14 22,456 boe/d Q2 2020 Light oil conventional % PDP Decline (YE 2019) 17 development Manufacturing model for MM Tax Pools (YE 2019) $2,547 extensive, repeatable inventory. Leverage shallow decline base Guidance Period H2 2020 boe/d Production 24,000 – 24,500 25,000 – 25,500 MM Capital Expenditures $10 $51 MM Decommissioning $3 $11 Alberta Viking $/boe Operating Costs $12.00 – $12.50 $11.10 – 11.50 880 boe/d Q2 2020 General & Higher GOR oil play $/boe $1.50 – $1.65 $1.50 – 1.60 Administrative Manage base production *Legacy Asset Production of 405 boe/d Q2 2020 3 3 See end notes for additional information

Short-term Strategic Priorities & H1 2020 Results Short-term Priorities • Pursue successful acquisition of Bonterra to create “The Cardium Champion” • Transformational opportunity for both companies shareholders • Continue operational momentum and cost reduction initiatives to improve the base business • Protect long-term asset value • Substantial future development program optionality exists within Obsidian Energy’s portfolio in both available drilling inventory and product mix (gas/oil) – the asset base allows us significant flexibility to navigate volatility in commodity price environments • Development plans are ready to be executed when the economic environment justifies investment • Expand decommissioning activity utilizing $17 million in grants and $4 million in allocation eligibility within the Alberta Site Rehabilitation Program (ASRP) H1 2020 Results Guidance Results boe/d • Obsidian Energy exceeded all guidance targets in a Production 25,500 – 26,000 26,482 very challenging macro environment Capital MM $43 $41 • Production ahead due to strong Expenditures development program results MM Decommissioning $8 $8 • Capital expenditures lower due to effective execution $/boe Operating Costs $11.50 – 11.90 $10.32 • Operating costs and G&A lower due to cost cutting efforts and proactive decision making General & $/boe $1.65 – 1.85 $1.50 Administrative 4Short-term Strategic Priorities & H1 2020 Results Short-term Priorities • Pursue successful acquisition of Bonterra to create “The Cardium Champion” • Transformational opportunity for both companies shareholders • Continue operational momentum and cost reduction initiatives to improve the base business • Protect long-term asset value • Substantial future development program optionality exists within Obsidian Energy’s portfolio in both available drilling inventory and product mix (gas/oil) – the asset base allows us significant flexibility to navigate volatility in commodity price environments • Development plans are ready to be executed when the economic environment justifies investment • Expand decommissioning activity utilizing $17 million in grants and $4 million in allocation eligibility within the Alberta Site Rehabilitation Program (ASRP) H1 2020 Results Guidance Results boe/d • Obsidian Energy exceeded all guidance targets in a Production 25,500 – 26,000 26,482 very challenging macro environment Capital MM $43 $41 • Production ahead due to strong Expenditures development program results MM Decommissioning $8 $8 • Capital expenditures lower due to effective execution $/boe Operating Costs $11.50 – 11.90 $10.32 • Operating costs and G&A lower due to cost cutting efforts and proactive decision making General & $/boe $1.65 – 1.85 $1.50 Administrative 4
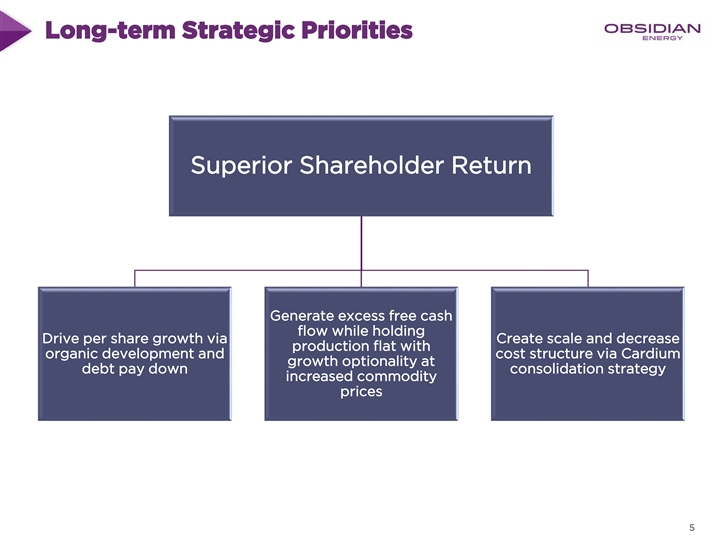
Long-term Strategic Priorities Superior Shareholder Return Generate excess free cash flow while holding Drive per share growth via Create scale and decrease production flat with organic development and cost structure via Cardium growth optionality at debt pay down consolidation strategy increased commodity prices 5Long-term Strategic Priorities Superior Shareholder Return Generate excess free cash flow while holding Drive per share growth via Create scale and decrease production flat with organic development and cost structure via Cardium growth optionality at debt pay down consolidation strategy increased commodity prices 5

Creating The Cardium Champion st On September 21 2020 Obsidian Energy commenced a formal offer to purchase all of the issued and outstanding common shares of Bonterra Energy Corp. • Obsidian Energy has offered 2 Obsidian Energy shares for each Bonterra share Central Pembina • Creates the Cardium Champion with enhanced scale and capital markets relevance • Accretive across all equity metrics resulting in the potential for significant per share value appreciation East to the benefit of both Bonterra and Obsidian Pembina Energy shareholders West Pembina • Up to C$100 million expected in identified financial, operational and other synergies over the first three years resulting in significantly improved free cash flow • The re-introduction of a monthly dividend payment after an appropriate level of debt repayment East • Retain significant upside to higher commodity Crimson prices through continued participation with a 48% pro forma ownership in a stronger combined Crimson Lake company • An outcome far superior to what Bonterra can achieve on a stand-alone basis Obsidian Energy is the #1 Cardium Producer and the Logical Consolidator 6Creating The Cardium Champion st On September 21 2020 Obsidian Energy commenced a formal offer to purchase all of the issued and outstanding common shares of Bonterra Energy Corp. • Obsidian Energy has offered 2 Obsidian Energy shares for each Bonterra share Central Pembina • Creates the Cardium Champion with enhanced scale and capital markets relevance • Accretive across all equity metrics resulting in the potential for significant per share value appreciation East to the benefit of both Bonterra and Obsidian Pembina Energy shareholders West Pembina • Up to C$100 million expected in identified financial, operational and other synergies over the first three years resulting in significantly improved free cash flow • The re-introduction of a monthly dividend payment after an appropriate level of debt repayment East • Retain significant upside to higher commodity Crimson prices through continued participation with a 48% pro forma ownership in a stronger combined Crimson Lake company • An outcome far superior to what Bonterra can achieve on a stand-alone basis Obsidian Energy is the #1 Cardium Producer and the Logical Consolidator 6
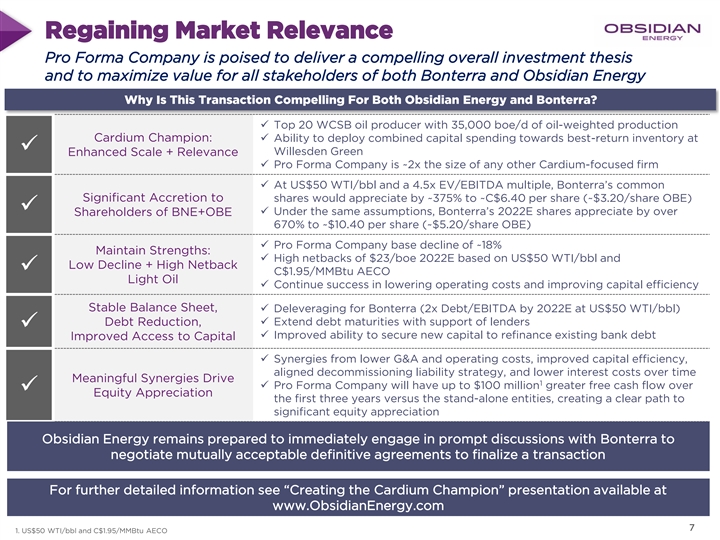
Regaining Market Relevance Pro Forma Company is poised to deliver a compelling overall investment thesis and to maximize value for all stakeholders of both Bonterra and Obsidian Energy Why Is This Transaction Compelling For Both Obsidian Energy and Bonterra? ✓ Top 20 WCSB oil producer with 35,000 boe/d of oil-weighted production Cardium Champion: ✓ Ability to deploy combined capital spending towards best-return inventory at ✓ Willesden Green Enhanced Scale + Relevance ✓ Pro Forma Company is ~2x the size of any other Cardium-focused firm ✓ At US$50 WTI/bbl and a 4.5x EV/EBITDA multiple, Bonterra’s common Significant Accretion to shares would appreciate by ~375% to ~C$6.40 per share (~$3.20/share OBE) ✓ ✓ Under the same assumptions, Bonterra’s 2022E shares appreciate by over Shareholders of BNE+OBE 670% to ~$10.40 per share (~$5.20/share OBE) ✓ Pro Forma Company base decline of ~18% Maintain Strengths: ✓ High netbacks of $23/boe 2022E based on US$50 WTI/bbl and Low Decline + High Netback ✓ C$1.95/MMBtu AECO Light Oil ✓ Continue success in lowering operating costs and improving capital efficiency Stable Balance Sheet, ✓ Deleveraging for Bonterra (2x Debt/EBITDA by 2022E at US$50 WTI/bbl) Debt Reduction,✓ Extend debt maturities with support of lenders ✓ ✓ Improved ability to secure new capital to refinance existing bank debt Improved Access to Capital ✓ Synergies from lower G&A and operating costs, improved capital efficiency, aligned decommissioning liability strategy, and lower interest costs over time Meaningful Synergies Drive 1 ✓ Pro Forma Company will have up to $100 million greater free cash flow over ✓ Equity Appreciation the first three years versus the stand-alone entities, creating a clear path to significant equity appreciation Obsidian Energy remains prepared to immediately engage in prompt discussions with Bonterra to negotiate mutually acceptable definitive agreements to finalize a transaction For further detailed information see “Creating the Cardium Champion” presentation available at www.ObsidianEnergy.com 7 7 1. US$50 WTI/bbl and C$1.95/MMBtu AECORegaining Market Relevance Pro Forma Company is poised to deliver a compelling overall investment thesis and to maximize value for all stakeholders of both Bonterra and Obsidian Energy Why Is This Transaction Compelling For Both Obsidian Energy and Bonterra? ✓ Top 20 WCSB oil producer with 35,000 boe/d of oil-weighted production Cardium Champion: ✓ Ability to deploy combined capital spending towards best-return inventory at ✓ Willesden Green Enhanced Scale + Relevance ✓ Pro Forma Company is ~2x the size of any other Cardium-focused firm ✓ At US$50 WTI/bbl and a 4.5x EV/EBITDA multiple, Bonterra’s common Significant Accretion to shares would appreciate by ~375% to ~C$6.40 per share (~$3.20/share OBE) ✓ ✓ Under the same assumptions, Bonterra’s 2022E shares appreciate by over Shareholders of BNE+OBE 670% to ~$10.40 per share (~$5.20/share OBE) ✓ Pro Forma Company base decline of ~18% Maintain Strengths: ✓ High netbacks of $23/boe 2022E based on US$50 WTI/bbl and Low Decline + High Netback ✓ C$1.95/MMBtu AECO Light Oil ✓ Continue success in lowering operating costs and improving capital efficiency Stable Balance Sheet, ✓ Deleveraging for Bonterra (2x Debt/EBITDA by 2022E at US$50 WTI/bbl) Debt Reduction,✓ Extend debt maturities with support of lenders ✓ ✓ Improved ability to secure new capital to refinance existing bank debt Improved Access to Capital ✓ Synergies from lower G&A and operating costs, improved capital efficiency, aligned decommissioning liability strategy, and lower interest costs over time Meaningful Synergies Drive 1 ✓ Pro Forma Company will have up to $100 million greater free cash flow over ✓ Equity Appreciation the first three years versus the stand-alone entities, creating a clear path to significant equity appreciation Obsidian Energy remains prepared to immediately engage in prompt discussions with Bonterra to negotiate mutually acceptable definitive agreements to finalize a transaction For further detailed information see “Creating the Cardium Champion” presentation available at www.ObsidianEnergy.com 7 7 1. US$50 WTI/bbl and C$1.95/MMBtu AECO

Corporate Cost Improvements Commentary Opex Operating Costs (Opex) • Total reduction in Opex/boe of 26% from 2017 to mid-point of 2020 Guidance ($11.30/boe) • Currently achieving better than 2020 Opex guidance despite lower production volumes • Increase in FY 2020 Opex/boe vs. H1 2020 driven by timing of key activities and return to production of profitable but higher cost of supply assets • Includes temporary field staff salary reductions which began in Q2 Further Opex Improvements G&A • Take advantage of Crimson Lake’s low operating costs with continued development focus • Continue to optimize and drive efficiencies across our entire Cardium footprint G&A • Total reduction in G&A/boe of 42% from 2017 to mid-point of 2020 Guidance • Currently surpassing 2020 G&A guidance despite lower production volumes • Includes temporary office staff salary reductions which began in Q2 8 See end notes for additional information Corporate Cost Improvements Commentary Opex Operating Costs (Opex) • Total reduction in Opex/boe of 26% from 2017 to mid-point of 2020 Guidance ($11.30/boe) • Currently achieving better than 2020 Opex guidance despite lower production volumes • Increase in FY 2020 Opex/boe vs. H1 2020 driven by timing of key activities and return to production of profitable but higher cost of supply assets • Includes temporary field staff salary reductions which began in Q2 Further Opex Improvements G&A • Take advantage of Crimson Lake’s low operating costs with continued development focus • Continue to optimize and drive efficiencies across our entire Cardium footprint G&A • Total reduction in G&A/boe of 42% from 2017 to mid-point of 2020 Guidance • Currently surpassing 2020 G&A guidance despite lower production volumes • Includes temporary office staff salary reductions which began in Q2 8 See end notes for additional information

Obsidian Energy Corporate Breakeven Historical and Projected Obsidian Breakeven WTI Select Intermediate and Junior Peer Breakeven WTI Unhedged Cash Flow (US$/bbl) 2021 Unhedged Cash Flow (US$/bbl) 2020 Breakeven Price ~$US39 WTI including $60 $60 Obsidian Hedge Positions $50 $50 $40 $40 $30 $30 $20 $20 $10 $10 $0 $0 2018 2019 OBE 2020 OBE 2021 Projected Projected Commentary • Our focus on improving the efficiency of the business is yielding material reductions in our WTI break-even assessment • Continued focus on cost optimization throughout the business (G&A/ Opex/ Capex) • Execution of our development and optimization programs yielding top tier results 9 See end notes for additional information Peer 1 Peer 2 Peer 3 Peer 4 Peer 5 Peer 6 Peer 7 Peer 8 Peer 9 Peer 10 Peer 11 Peer 12 Peer 13 Peer 14 Peer 15 Peer 16 Peer 17 Peer 18 Peer 19Obsidian Energy Corporate Breakeven Historical and Projected Obsidian Breakeven WTI Select Intermediate and Junior Peer Breakeven WTI Unhedged Cash Flow (US$/bbl) 2021 Unhedged Cash Flow (US$/bbl) 2020 Breakeven Price ~$US39 WTI including $60 $60 Obsidian Hedge Positions $50 $50 $40 $40 $30 $30 $20 $20 $10 $10 $0 $0 2018 2019 OBE 2020 OBE 2021 Projected Projected Commentary • Our focus on improving the efficiency of the business is yielding material reductions in our WTI break-even assessment • Continued focus on cost optimization throughout the business (G&A/ Opex/ Capex) • Execution of our development and optimization programs yielding top tier results 9 See end notes for additional information Peer 1 Peer 2 Peer 3 Peer 4 Peer 5 Peer 6 Peer 7 Peer 8 Peer 9 Peer 10 Peer 11 Peer 12 Peer 13 Peer 14 Peer 15 Peer 16 Peer 17 Peer 18 Peer 19
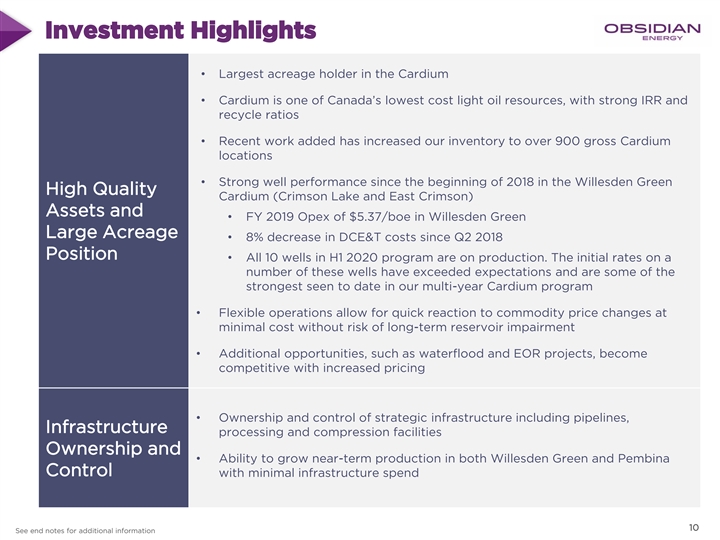
Investment Highlights • Largest acreage holder in the Cardium • Cardium is one of Canada’s lowest cost light oil resources, with strong IRR and recycle ratios • Recent work added has increased our inventory to over 900 gross Cardium locations • Strong well performance since the beginning of 2018 in the Willesden Green High Quality Cardium (Crimson Lake and East Crimson) Assets and • FY 2019 Opex of $5.37/boe in Willesden Green Large Acreage • 8% decrease in DCE&T costs since Q2 2018 Position • All 10 wells in H1 2020 program are on production. The initial rates on a number of these wells have exceeded expectations and are some of the strongest seen to date in our multi-year Cardium program • Flexible operations allow for quick reaction to commodity price changes at minimal cost without risk of long-term reservoir impairment • Additional opportunities, such as waterflood and EOR projects, become competitive with increased pricing • Ownership and control of strategic infrastructure including pipelines, Infrastructure processing and compression facilities Ownership and • Ability to grow near-term production in both Willesden Green and Pembina Control with minimal infrastructure spend 10 See end notes for additional information Investment Highlights • Largest acreage holder in the Cardium • Cardium is one of Canada’s lowest cost light oil resources, with strong IRR and recycle ratios • Recent work added has increased our inventory to over 900 gross Cardium locations • Strong well performance since the beginning of 2018 in the Willesden Green High Quality Cardium (Crimson Lake and East Crimson) Assets and • FY 2019 Opex of $5.37/boe in Willesden Green Large Acreage • 8% decrease in DCE&T costs since Q2 2018 Position • All 10 wells in H1 2020 program are on production. The initial rates on a number of these wells have exceeded expectations and are some of the strongest seen to date in our multi-year Cardium program • Flexible operations allow for quick reaction to commodity price changes at minimal cost without risk of long-term reservoir impairment • Additional opportunities, such as waterflood and EOR projects, become competitive with increased pricing • Ownership and control of strategic infrastructure including pipelines, Infrastructure processing and compression facilities Ownership and • Ability to grow near-term production in both Willesden Green and Pembina Control with minimal infrastructure spend 10 See end notes for additional information

Cardium Development Program Focused on Delivering Strong Capital Returns Willesden Green • Drilling prioritized to target highest return opportunities Focused • Light oil rich wells ranked by IRR, payout, and recycle ratios Strong Economics • Program is license ready and scalable with an inventory of drill ready Flexible locations to add significant program optionality • Additional capital can be allocated to highly efficient, liquids weighted Optimization optimization projects yielding rapid project returns • Well spacing and frac designed for cost efficiency and Well Design tailored to our target reservoirs • Minimal infrastructure spend required Infrastructure • Drill order optimized to manage infrastructure capacity 11Cardium Development Program Focused on Delivering Strong Capital Returns Willesden Green • Drilling prioritized to target highest return opportunities Focused • Light oil rich wells ranked by IRR, payout, and recycle ratios Strong Economics • Program is license ready and scalable with an inventory of drill ready Flexible locations to add significant program optionality • Additional capital can be allocated to highly efficient, liquids weighted Optimization optimization projects yielding rapid project returns • Well spacing and frac designed for cost efficiency and Well Design tailored to our target reservoirs • Minimal infrastructure spend required Infrastructure • Drill order optimized to manage infrastructure capacity 11

Execute Operationally H1 2020 Development Program Crimson Lake Commentary • Early deliverability results from the first half program to 3 kms INDEX MAP R8W5 date have been above our type curve 2 miles 12-26 Pad: 3 Wells (avg/well) IP10: 1,215 boe/d (82% oil) • Pad 12-26 on-stream delivering IP30: 1075 boe/d (74% oil) IP60: 832 boe/d (66% oil) • IP10: 1,215 boe/d (82% light oil) IP90: 684 boe/d (63% oil) • IP30: 1,075 boe/d (74% light oil) H1 2020 Development • IP60 832 boe/d (66% light oil) Program directly • IP90: 684 boe/d (63% light oil) are our strongest offsetting successful 2018-2019 programs oil-equivalent rates in our primary Cardium program T43 • Five of Obsidian Energy’s ten wells drilled in 2020 were among the top performing wells in the Cardium (June 03-29 Pad: 1 Well (avg/well) 01-27 Pad: 2 Wells (avg/well) IP10: 587 boe/d (95% oil) 2020) IP10:1,222 boe/d (82% oil) IP30: 443 boe/d (93% oil) IP30: 999 boe/d (71% oil) IP60: 397 boe/d (90% oil) IP60: 734 boe/d (66% oil) IP90: 340 boe/d (88% oil) IP90: 619 boe/d (64% oil) June 2020 Top Cardium Wells On Stream Latest Month Volume # of Company Well Name Field Date Oil/C5 bbls Gas mmcf Days Whitecap Rsrcs Inc. WHITECAP HZ WAPITI 15-7- 67- 8 WAPITI 10-Mar-20 15,728 23 30 03-06 Pad: 2 Wells (avg/well) IP10: 493 boe/d (97% oil) Obsidian Enrg Ltd. OBE HZ 102 WILLGR 15-16- 43- 8 WILLESDEN GR 4-Feb-20 14,179 58 29 IP30: 527 boe/d (89% oil) Obsidian Enrg Ltd. OBE HZ 102 WILLGR 5-15- 43- 8 WILLESDEN GR 1-Feb-20 12,809 48 30 IP60: 451 boe/d (84% oil) Orlen Upstream Cda Ltd OUC HZ FERRIER 14-23- 39- 9 FERRIER 4-Mar-20 10,554 63 30 IP90: 399 boe/d (81% oil) NAL Rsrcs Ltd NAL HZ LOCHEND 2-16- 26- 3 LOCHEND 24-Sep-19 7,650 21 30 Ridgeback Rs cs Inc RIDGEBACK ET AL HZ LOCHEND 4-23- LOCHEND 14-Jan-20 7,447 7 30 Orlen Upstream Cda Ltd OUC 102 HZ LOCHEND 1- 11-26- LOCHEND 27-Dec-19 7,442 35 30 14-17 Pad: 2 Wells (avg/well) IP10: 204 boe/d (96% oil) Obsidian Enrg Ltd OBE WILLGR 2- 30- 42-7 WILLESDEN GR 1-Mar-20 7,417 17 30 IP30: 215 boe/d (93% oil) Obsidian Enrg Ltd OBE HZ 102 WILLGR 14-28-43- 8 WILLESDEN GR 1-Feb-20 7,336 35 30 IP60: 219 boe/d (90% oil) Obsidian Enrg Ltd OBE 100 HZ WILLGR 4-30-42-7 WILLESDEN GR 14-Mar-20 7,210 8 30 IP90: 203 boe/d (89% oil) Petrus Rsrcs Corp PETRUS 102 HZ FERRIER 4-16-38-8 FERRIER 12-Mar-20 6,616 25 30 OBE H1 2020 program Whitecap Rsrcs Inc WHITECAP HZ WAPITI 12-30-67-8 WAPITI 11-Mar-20 6,601 4 30 OBE 2018-2019 well NAL Rsrcs Ltd NAL HZ LOCHEND 1-16-26-3 LOCHEND 24-Sep-19 6,530 13 30 Peer well Ridgeback Rsrcs Inc RIDGEBACK HZ 102 BRAZR 15-33-48- PEMBINA 14-Mar-20 6,002 8 29 Unit land OBE Cardium WI land Whitecap Rsrcs Inc WHITECAP 102 HZ WAPITI 13-30-67-8 WAPITI 12-Mar-20 5,980 5 30 Source: GeoLOGIC Systems Ltd., Google, and Raymond James Ltd. 12 See end notes for additional information Execute Operationally H1 2020 Development Program Crimson Lake Commentary • Early deliverability results from the first half program to 3 kms INDEX MAP R8W5 date have been above our type curve 2 miles 12-26 Pad: 3 Wells (avg/well) IP10: 1,215 boe/d (82% oil) • Pad 12-26 on-stream delivering IP30: 1075 boe/d (74% oil) IP60: 832 boe/d (66% oil) • IP10: 1,215 boe/d (82% light oil) IP90: 684 boe/d (63% oil) • IP30: 1,075 boe/d (74% light oil) H1 2020 Development • IP60 832 boe/d (66% light oil) Program directly • IP90: 684 boe/d (63% light oil) are our strongest offsetting successful 2018-2019 programs oil-equivalent rates in our primary Cardium program T43 • Five of Obsidian Energy’s ten wells drilled in 2020 were among the top performing wells in the Cardium (June 03-29 Pad: 1 Well (avg/well) 01-27 Pad: 2 Wells (avg/well) IP10: 587 boe/d (95% oil) 2020) IP10:1,222 boe/d (82% oil) IP30: 443 boe/d (93% oil) IP30: 999 boe/d (71% oil) IP60: 397 boe/d (90% oil) IP60: 734 boe/d (66% oil) IP90: 340 boe/d (88% oil) IP90: 619 boe/d (64% oil) June 2020 Top Cardium Wells On Stream Latest Month Volume # of Company Well Name Field Date Oil/C5 bbls Gas mmcf Days Whitecap Rsrcs Inc. WHITECAP HZ WAPITI 15-7- 67- 8 WAPITI 10-Mar-20 15,728 23 30 03-06 Pad: 2 Wells (avg/well) IP10: 493 boe/d (97% oil) Obsidian Enrg Ltd. OBE HZ 102 WILLGR 15-16- 43- 8 WILLESDEN GR 4-Feb-20 14,179 58 29 IP30: 527 boe/d (89% oil) Obsidian Enrg Ltd. OBE HZ 102 WILLGR 5-15- 43- 8 WILLESDEN GR 1-Feb-20 12,809 48 30 IP60: 451 boe/d (84% oil) Orlen Upstream Cda Ltd OUC HZ FERRIER 14-23- 39- 9 FERRIER 4-Mar-20 10,554 63 30 IP90: 399 boe/d (81% oil) NAL Rsrcs Ltd NAL HZ LOCHEND 2-16- 26- 3 LOCHEND 24-Sep-19 7,650 21 30 Ridgeback Rs cs Inc RIDGEBACK ET AL HZ LOCHEND 4-23- LOCHEND 14-Jan-20 7,447 7 30 Orlen Upstream Cda Ltd OUC 102 HZ LOCHEND 1- 11-26- LOCHEND 27-Dec-19 7,442 35 30 14-17 Pad: 2 Wells (avg/well) IP10: 204 boe/d (96% oil) Obsidian Enrg Ltd OBE WILLGR 2- 30- 42-7 WILLESDEN GR 1-Mar-20 7,417 17 30 IP30: 215 boe/d (93% oil) Obsidian Enrg Ltd OBE HZ 102 WILLGR 14-28-43- 8 WILLESDEN GR 1-Feb-20 7,336 35 30 IP60: 219 boe/d (90% oil) Obsidian Enrg Ltd OBE 100 HZ WILLGR 4-30-42-7 WILLESDEN GR 14-Mar-20 7,210 8 30 IP90: 203 boe/d (89% oil) Petrus Rsrcs Corp PETRUS 102 HZ FERRIER 4-16-38-8 FERRIER 12-Mar-20 6,616 25 30 OBE H1 2020 program Whitecap Rsrcs Inc WHITECAP HZ WAPITI 12-30-67-8 WAPITI 11-Mar-20 6,601 4 30 OBE 2018-2019 well NAL Rsrcs Ltd NAL HZ LOCHEND 1-16-26-3 LOCHEND 24-Sep-19 6,530 13 30 Peer well Ridgeback Rsrcs Inc RIDGEBACK HZ 102 BRAZR 15-33-48- PEMBINA 14-Mar-20 6,002 8 29 Unit land OBE Cardium WI land Whitecap Rsrcs Inc WHITECAP 102 HZ WAPITI 13-30-67-8 WAPITI 12-Mar-20 5,980 5 30 Source: GeoLOGIC Systems Ltd., Google, and Raymond James Ltd. 12 See end notes for additional information

Cardium Growth & Operational Improvements Commentary Total Cardium Production • Our 2017-2020 drilling programs in Crimson Lake 25,000 have delivered robust production growth with high- Netbacks and low operating costs 20,000 34% • Cardium 35% 37% 15,000 • 25% Liquids Growth since 2017 36% 10% 10% • 22% Total Production growth since 2017 11% 11% 10,000 • Willesden Green 56% 55% • 119% Liquids growth since 2017 5,000 52% 54% • 93% Total Production growth since 2017 0 • 49% Opex/boe improvement since 2017 FY 2017 FY 2018 FY 2019 H1 2020 Oil (bbl/d) NGL (bbl/d) Gas (boe/d) Willesden Green Production Willesden Green Production & Operating Costs 14,000 12,000 38% 10,000 39% 8,000 10% 46% 11% 6,000 45% 13% 4,000 13% 52% 50% 2,000 41% 42% 0 FY 2017 FY 2018 FY 2019 H1 2020 Oil (bbl/d) NGL (bbl/d) Gas (boe/d) 13 See end notes for additional information Average Daily Production (boe/d) Average Daily Production (boe/d)Cardium Growth & Operational Improvements Commentary Total Cardium Production • Our 2017-2020 drilling programs in Crimson Lake 25,000 have delivered robust production growth with high- Netbacks and low operating costs 20,000 34% • Cardium 35% 37% 15,000 • 25% Liquids Growth since 2017 36% 10% 10% • 22% Total Production growth since 2017 11% 11% 10,000 • Willesden Green 56% 55% • 119% Liquids growth since 2017 5,000 52% 54% • 93% Total Production growth since 2017 0 • 49% Opex/boe improvement since 2017 FY 2017 FY 2018 FY 2019 H1 2020 Oil (bbl/d) NGL (bbl/d) Gas (boe/d) Willesden Green Production Willesden Green Production & Operating Costs 14,000 12,000 38% 10,000 39% 8,000 10% 46% 11% 6,000 45% 13% 4,000 13% 52% 50% 2,000 41% 42% 0 FY 2017 FY 2018 FY 2019 H1 2020 Oil (bbl/d) NGL (bbl/d) Gas (boe/d) 13 See end notes for additional information Average Daily Production (boe/d) Average Daily Production (boe/d)

Optimization Finding low cost, high value opportunities in our base Total Optimization Program Production Commentary Optimization at Obsidian 1,800 2019 Annual Average • Multi-year inventory of targeted, low 787 boe/d (71% Oil) 1,600 cost projects to increase base production, improve injection, reduce 1,400 OPEX, maximize reserves recovery 2020 Optimization 1,200 764 boe/d (79% Oil) 1,000 • Maintains very low decline rates and 800 adds to recognized PDP reserves 600 2019 Summary 400 • $8.4MM Capital spend across 200 200 projects - Jan Feb Mar Apr May Jun Jul Aug Sep Oct Nov Dec • 12 Month Capital Efficiency 2020 2019 <$8,000/boe with high oil weighting (>70%) Pembina Optimization Program Production 12,000 • PDP additions of 1.1 mmboe 10,000 2020 Summary 8,000 • Q1 spend of $5 MM focused on wellbore stimulations, reactivations, 6,000 and recompletions Shut-in of uneconomic Resumption of 4,000 production and optimization spending deferred maintenance • $3.1 MM planned in H2 2020 2,000 0 Jan Feb Mar Apr May Jun Jul Aug Sep Oct Nov Dec Jan Feb Mar Apr May Jun Jul Aug 2019 2020 14 boe/d boe/dOptimization Finding low cost, high value opportunities in our base Total Optimization Program Production Commentary Optimization at Obsidian 1,800 2019 Annual Average • Multi-year inventory of targeted, low 787 boe/d (71% Oil) 1,600 cost projects to increase base production, improve injection, reduce 1,400 OPEX, maximize reserves recovery 2020 Optimization 1,200 764 boe/d (79% Oil) 1,000 • Maintains very low decline rates and 800 adds to recognized PDP reserves 600 2019 Summary 400 • $8.4MM Capital spend across 200 200 projects - Jan Feb Mar Apr May Jun Jul Aug Sep Oct Nov Dec • 12 Month Capital Efficiency 2020 2019 <$8,000/boe with high oil weighting (>70%) Pembina Optimization Program Production 12,000 • PDP additions of 1.1 mmboe 10,000 2020 Summary 8,000 • Q1 spend of $5 MM focused on wellbore stimulations, reactivations, 6,000 and recompletions Shut-in of uneconomic Resumption of 4,000 production and optimization spending deferred maintenance • $3.1 MM planned in H2 2020 2,000 0 Jan Feb Mar Apr May Jun Jul Aug Sep Oct Nov Dec Jan Feb Mar Apr May Jun Jul Aug 2019 2020 14 boe/d boe/d

Willesden Green Cost Reduction Trajectory Drill, Complete, Equip & Tie-In Costs – (DCET) Commentary Construction Drill cost increase driven by optimization of well design • Utilization and expansion of existing pads leading to increased well lengths $3,700 to reduce construction and infrastructure costs • Construction timing optimization to -$235 -$59 $3,612 reduce weather related impact and $3,600 +$70 equipment mobilization costs Drilling • Monobore where reservoir pressure $3,500 permits • Single bit runs over extended reach HZ wells -$61 • Multi-well pads and geographically $3,400 focused programs mitigate rig move costs • Wells have increased in length by an $3,327 average of 5% to optimize project returns 8% improvement in drilling $3,300 costs since Q2 2018 Completions • Frac optimization and nitrogen reduction • Elimination of c-rings to reduce $3,200 water costs • Utilizing industry proven Coil-Shift Frac technology • Lateral placement targeted to improve $3,100 drilling and completion efficiency Site Facilities • Leverage existing infrastructure and $3,000 inventory H2 2018 Construction Drill Completion Tie-In 2020 H1 • Develop within current infrastructure capacity 15 See end notes for additional information DCET ($M)Willesden Green Cost Reduction Trajectory Drill, Complete, Equip & Tie-In Costs – (DCET) Commentary Construction Drill cost increase driven by optimization of well design • Utilization and expansion of existing pads leading to increased well lengths $3,700 to reduce construction and infrastructure costs • Construction timing optimization to -$235 -$59 $3,612 reduce weather related impact and $3,600 +$70 equipment mobilization costs Drilling • Monobore where reservoir pressure $3,500 permits • Single bit runs over extended reach HZ wells -$61 • Multi-well pads and geographically $3,400 focused programs mitigate rig move costs • Wells have increased in length by an $3,327 average of 5% to optimize project returns 8% improvement in drilling $3,300 costs since Q2 2018 Completions • Frac optimization and nitrogen reduction • Elimination of c-rings to reduce $3,200 water costs • Utilizing industry proven Coil-Shift Frac technology • Lateral placement targeted to improve $3,100 drilling and completion efficiency Site Facilities • Leverage existing infrastructure and $3,000 inventory H2 2018 Construction Drill Completion Tie-In 2020 H1 • Develop within current infrastructure capacity 15 See end notes for additional information DCET ($M)

Cardium Play Fairways A Large High-Graded Inventory West Pembina Central Pembina R10W5 INDEX MAP 132 680 Type Curve Locations Type Curve Locations • Well established • Individual fairways and productive trend unit boundaries in significantly de-risked by historically pressure West major Cardium players supported properties Pembina • Underdeveloped acreage • Ability to waterflood for • Easy access to existing minimal capital through Central OBE facilities and direct existing infrastructure Pembina access to regional • Recent technical work has transportation added ~500 identified inventory locations Crimson Lake East Crimson T45 36 71 Type Curve Locations Type Curve Locations 15 kms 10 miles East • Banked oil from historical • Continued eastward Crimson pressure maintenance extension of Crimson Lake Crimson • Top quality reservoir development program Lake previously • De-risked by new underdeveloped by competitor drilling in OBE Cardium WI land vertical drilling 2018/2019 Peer lands • Recent top quartile results • Existing flexible • Existing flexible infrastructure infrastructure 900+ total identified inventory 135 YE 2019 Net Booked Cardium Locations 16 See end notes for additional information Cardium Play Fairways A Large High-Graded Inventory West Pembina Central Pembina R10W5 INDEX MAP 132 680 Type Curve Locations Type Curve Locations • Well established • Individual fairways and productive trend unit boundaries in significantly de-risked by historically pressure West major Cardium players supported properties Pembina • Underdeveloped acreage • Ability to waterflood for • Easy access to existing minimal capital through Central OBE facilities and direct existing infrastructure Pembina access to regional • Recent technical work has transportation added ~500 identified inventory locations Crimson Lake East Crimson T45 36 71 Type Curve Locations Type Curve Locations 15 kms 10 miles East • Banked oil from historical • Continued eastward Crimson pressure maintenance extension of Crimson Lake Crimson • Top quality reservoir development program Lake previously • De-risked by new underdeveloped by competitor drilling in OBE Cardium WI land vertical drilling 2018/2019 Peer lands • Recent top quartile results • Existing flexible • Existing flexible infrastructure infrastructure 900+ total identified inventory 135 YE 2019 Net Booked Cardium Locations 16 See end notes for additional information

Crimson Lake – Near Term Focus Summary Economics • Q2 2020 average production of 10,134 boe/d DCET Capex($MM) $3.2 • Obsidian Energy cornerstone for revitalized primary EUR (Mboe) 229 development on our Cardium acreage Oil IP365 (bbl/d) 157 • Banked oil from historical pressure maintenance in WGCU#9 Total IP365 (boe/d) 235 • Top quality reservoir previously undeveloped due to NPV BTAX 10% ($MM) $2.7 topographic and infrastructure challenges for vertical drilling IRR (%) 118% • Existing flexible infrastructure at the Crimson 13-27 Payout (years) 1.0 facility with optionality to East Crimson Technical F&D ($/boe) $14.00 R7W5 OBE H1 2020 program OBE 2018-2019 well 12 Month Efficiency ($/boed) $13,700 Peer well Inventory Unit land Breakeven (IRR 10%) WTI ($US/bbl) $26.29 OBE Cardium WI land OBE East Crimson land Type Curve – Crimson Lake 500 160 450 T43 140 400 120 350 100 300 250 80 Crimson Lake - Daily Production 200 60 WGCU#9 Crimson Lake - Cumulative Production 5 kms 150 3 miles 40 100 20 50 0 0 0 12 24 36 Months *Economics Flat Pricing Assumptions: WTI USD$50.00, Ed Par Diff USD$6.00, AECO CAD$2.25, FX CAD/USD $1.36 17 See end notes for additional information Average Daily Production (boe/d) Cumulative Production (mboe)Crimson Lake – Near Term Focus Summary Economics • Q2 2020 average production of 10,134 boe/d DCET Capex($MM) $3.2 • Obsidian Energy cornerstone for revitalized primary EUR (Mboe) 229 development on our Cardium acreage Oil IP365 (bbl/d) 157 • Banked oil from historical pressure maintenance in WGCU#9 Total IP365 (boe/d) 235 • Top quality reservoir previously undeveloped due to NPV BTAX 10% ($MM) $2.7 topographic and infrastructure challenges for vertical drilling IRR (%) 118% • Existing flexible infrastructure at the Crimson 13-27 Payout (years) 1.0 facility with optionality to East Crimson Technical F&D ($/boe) $14.00 R7W5 OBE H1 2020 program OBE 2018-2019 well 12 Month Efficiency ($/boed) $13,700 Peer well Inventory Unit land Breakeven (IRR 10%) WTI ($US/bbl) $26.29 OBE Cardium WI land OBE East Crimson land Type Curve – Crimson Lake 500 160 450 T43 140 400 120 350 100 300 250 80 Crimson Lake - Daily Production 200 60 WGCU#9 Crimson Lake - Cumulative Production 5 kms 150 3 miles 40 100 20 50 0 0 0 12 24 36 Months *Economics Flat Pricing Assumptions: WTI USD$50.00, Ed Par Diff USD$6.00, AECO CAD$2.25, FX CAD/USD $1.36 17 See end notes for additional information Average Daily Production (boe/d) Cumulative Production (mboe)

East Crimson – Mid Term Focus Summary Economics • Q2 2020 average production of 3,609 boe/d DCET Capex ($MM) $2.9 • Continued Eastward extension of the successful EUR (Mboe) 203 Crimson Lake development program Oil IP365 (bbl/d) 136 • Area has been de-risked by recent peer drilling results supporting the revitalized development Total IP365 (boe/d) 194 • Shared and scalable infrastructure with the Crimson NPV BTAX 10% ($MM) $2.1 Lake program IRR (%) 90% • Combination of pressure supported edge drilling and underdeveloped unit fairways Payout (years) 1.2 Technical F&D ($/boe) $14.00 R7W5 OBE H1 2020 program 12 Month Efficiency ($/boed) $14,700 OBE 2018-2019 well Peer well Inventory Breakeven (IRR 10%) WTI ($US/bbl) $30.83 Unit land OBE Cardium WI land OBE Crimson land Type Curve – East Crimson 400 140 350 120 T43 300 100 WGCU#1 250 80 WGCU#2 200 East Crimson - Daily Production 60 150 East Crimson - Cumulative Production 5 kms WGCU#6 40 100 3 miles 20 50 WGCU#3 0 0 0 12 24 36 Months *Economics Flat Pricing Assumptions: WTI USD$50.00, Ed Par Diff USD$6.00, AECO CAD$2.25, FX CAD/USD $1.36 18 See end notes for additional information Average Daily Production (boe/d) Cumulative Production (mboe)East Crimson – Mid Term Focus Summary Economics • Q2 2020 average production of 3,609 boe/d DCET Capex ($MM) $2.9 • Continued Eastward extension of the successful EUR (Mboe) 203 Crimson Lake development program Oil IP365 (bbl/d) 136 • Area has been de-risked by recent peer drilling results supporting the revitalized development Total IP365 (boe/d) 194 • Shared and scalable infrastructure with the Crimson NPV BTAX 10% ($MM) $2.1 Lake program IRR (%) 90% • Combination of pressure supported edge drilling and underdeveloped unit fairways Payout (years) 1.2 Technical F&D ($/boe) $14.00 R7W5 OBE H1 2020 program 12 Month Efficiency ($/boed) $14,700 OBE 2018-2019 well Peer well Inventory Breakeven (IRR 10%) WTI ($US/bbl) $30.83 Unit land OBE Cardium WI land OBE Crimson land Type Curve – East Crimson 400 140 350 120 T43 300 100 WGCU#1 250 80 WGCU#2 200 East Crimson - Daily Production 60 150 East Crimson - Cumulative Production 5 kms WGCU#6 40 100 3 miles 20 50 WGCU#3 0 0 0 12 24 36 Months *Economics Flat Pricing Assumptions: WTI USD$50.00, Ed Par Diff USD$6.00, AECO CAD$2.25, FX CAD/USD $1.36 18 See end notes for additional information Average Daily Production (boe/d) Cumulative Production (mboe)

West Pembina – Mid Term Focus Summary Economics • Q2 2020 average production of 4,290 boe/d DCET Capex ($MM) $3.0 • Proven oil rich Cardium trend with undeveloped EUR (Mboe) 196 primary development acreage Oil IP365 (bbl/d) 148 • Significant offsetting production from established Total IP365 (boe/d) 163 Cardium players throughout the West side of Pembina • Underdeveloped core acreage NPV BTAX 10% ($MM) $2.1 • Existing flexible infrastructure with significant available IRR (%) 57% capacity in multiple facilities Payout (years) 1.5 • Additional uncaptured inventory in non-operated lands Technical F&D ($/boe) $15.25 R10W5 Inventory 12 Month Efficiency ($/boed) $18,500 Unit land OBE Cardium WI land OBE Pembina land Breakeven (IRR 10%) WTI ($US/bbl) $28.57 Type Curve – West Pembina 300 120 250 100 T48 200 80 150 60 West Pembina-Daily Production West Pembina Cumulative Production 100 40 50 20 5 kms 0 0 3 miles 0 12 24 36 Months *Economics Flat Pricing Assumptions: WTI USD$50.00, Ed Par Diff USD$6.00, AECO CAD$2.25, FX CAD/USD $1.36 19 See end notes for additional information Average Daily Production (boe/d) Cumulative Prod (mboe)West Pembina – Mid Term Focus Summary Economics • Q2 2020 average production of 4,290 boe/d DCET Capex ($MM) $3.0 • Proven oil rich Cardium trend with undeveloped EUR (Mboe) 196 primary development acreage Oil IP365 (bbl/d) 148 • Significant offsetting production from established Total IP365 (boe/d) 163 Cardium players throughout the West side of Pembina • Underdeveloped core acreage NPV BTAX 10% ($MM) $2.1 • Existing flexible infrastructure with significant available IRR (%) 57% capacity in multiple facilities Payout (years) 1.5 • Additional uncaptured inventory in non-operated lands Technical F&D ($/boe) $15.25 R10W5 Inventory 12 Month Efficiency ($/boed) $18,500 Unit land OBE Cardium WI land OBE Pembina land Breakeven (IRR 10%) WTI ($US/bbl) $28.57 Type Curve – West Pembina 300 120 250 100 T48 200 80 150 60 West Pembina-Daily Production West Pembina Cumulative Production 100 40 50 20 5 kms 0 0 3 miles 0 12 24 36 Months *Economics Flat Pricing Assumptions: WTI USD$50.00, Ed Par Diff USD$6.00, AECO CAD$2.25, FX CAD/USD $1.36 19 See end notes for additional information Average Daily Production (boe/d) Cumulative Prod (mboe)

Central Pembina – Long Term Focus Summary Economics • Q2 2020 average production of 4,679 boe/d DCET Capex ($MM) $2.3 • The epicenter of low decline and pressure maintained EUR (Mboe) 184 development Oil IP365 (bbl/d) 101 • Recent technical work led to over 500 additional identified locations in Central Pembina, using Total IP365 (boe/d) 120 techniques consistent with peer modeling NPV BTAX 10% ($MM) $1.7 • Ability to de-risk through geological and reservoir IRR (%) 59% modelling • Proven and booked waterflood response as the Payout (years) 1.6 foundation for growth – Strong F&D Technical F&D ($/boe) $12.25 • Ability to grow waterflood scale through existing wells and infrastructure for minimal capital cost allows for 12 Month Efficiency ($/boed) $18,900 corporate decline maintenance Inventory Breakeven (IRR 10%) WTI ($US/bbl) $27.69 Unit land OBE Cardium WI land OBE Pembina land Type Curve – Central Pembina 200 100 180 90 160 80 140 70 10 kms 120 60 5 miles Pembina-Daily Production 100 50 80 Pembina Cumulative Production 40 60 30 40 20 20 10 0 0 0 12 24 36 Months *Economics Flat Pricing Assumptions: WTI USD$50.00, Ed Par Diff USD$6.00, AECO CAD$2.25, FX CAD/USD $1.36 20 See end notes for additional information Average Daily Production (boe/d) Cumulative Prod (mboe)Central Pembina – Long Term Focus Summary Economics • Q2 2020 average production of 4,679 boe/d DCET Capex ($MM) $2.3 • The epicenter of low decline and pressure maintained EUR (Mboe) 184 development Oil IP365 (bbl/d) 101 • Recent technical work led to over 500 additional identified locations in Central Pembina, using Total IP365 (boe/d) 120 techniques consistent with peer modeling NPV BTAX 10% ($MM) $1.7 • Ability to de-risk through geological and reservoir IRR (%) 59% modelling • Proven and booked waterflood response as the Payout (years) 1.6 foundation for growth – Strong F&D Technical F&D ($/boe) $12.25 • Ability to grow waterflood scale through existing wells and infrastructure for minimal capital cost allows for 12 Month Efficiency ($/boed) $18,900 corporate decline maintenance Inventory Breakeven (IRR 10%) WTI ($US/bbl) $27.69 Unit land OBE Cardium WI land OBE Pembina land Type Curve – Central Pembina 200 100 180 90 160 80 140 70 10 kms 120 60 5 miles Pembina-Daily Production 100 50 80 Pembina Cumulative Production 40 60 30 40 20 20 10 0 0 0 12 24 36 Months *Economics Flat Pricing Assumptions: WTI USD$50.00, Ed Par Diff USD$6.00, AECO CAD$2.25, FX CAD/USD $1.36 20 See end notes for additional information Average Daily Production (boe/d) Cumulative Prod (mboe)

AB Viking – Mid Term Focus Summary Economics • Q2 2020 average production of 880 boe/d DCET Capex($MM) $1.2 • Sweet, light oil development play with significant EUR (Mboe) 74 drilling inventory, including both low risk infill and step- out development Oil IP365 (bbl/d) 57 • Low DCET well costs, combined with owned and Total IP365 (boe/d) 96 controlled infrastructure and direct market access yields superior netbacks NPV BTAX 10% ($MM) $0.6 • Shallow, low geological risk resource play IRR (%) 47% • Asset is proximal to multiple, successful offset Payout (years) 1.7 producers Technical F&D ($/boe) $16.25 OBE Inventory 12 Month Efficiency ($/boed) $12,600 Viking Producer OBE Viking WI Land Industry Land Breakeven (IRR 10%) WTI ($US/bbl) $29.04 Type Curve – AB Viking 200 60 180 50 160 140 40 120 AB Viking-Daily Production 100 30 80 AB Viking-Cumulative Production 20 60 5 kms 40 10 20 3 miles 0 0 0 12 24 36 Months *Economics Flat Pricing Assumptions: WTI USD$50.00, Ed Par Diff USD$6.00, AECO CAD$2.25, FX CAD/USD $1.36 21 See end notes for additional information Average Daily Production (boe/d) Cumulative Prod (mboe)AB Viking – Mid Term Focus Summary Economics • Q2 2020 average production of 880 boe/d DCET Capex($MM) $1.2 • Sweet, light oil development play with significant EUR (Mboe) 74 drilling inventory, including both low risk infill and step- out development Oil IP365 (bbl/d) 57 • Low DCET well costs, combined with owned and Total IP365 (boe/d) 96 controlled infrastructure and direct market access yields superior netbacks NPV BTAX 10% ($MM) $0.6 • Shallow, low geological risk resource play IRR (%) 47% • Asset is proximal to multiple, successful offset Payout (years) 1.7 producers Technical F&D ($/boe) $16.25 OBE Inventory 12 Month Efficiency ($/boed) $12,600 Viking Producer OBE Viking WI Land Industry Land Breakeven (IRR 10%) WTI ($US/bbl) $29.04 Type Curve – AB Viking 200 60 180 50 160 140 40 120 AB Viking-Daily Production 100 30 80 AB Viking-Cumulative Production 20 60 5 kms 40 10 20 3 miles 0 0 0 12 24 36 Months *Economics Flat Pricing Assumptions: WTI USD$50.00, Ed Par Diff USD$6.00, AECO CAD$2.25, FX CAD/USD $1.36 21 See end notes for additional information Average Daily Production (boe/d) Cumulative Prod (mboe)

Peace River Oil Partnership (PROP) Summary PROP • Q2 2020 average production of 2,132 boe/d, with an R25 R20 R15W5 average of 1,701 boe/d shut-in during quarter in T90 response to low commodity prices • 85% of previously shut-in production has been returned to production as of July 1, 2020 • Large contiguous heavy oil resource developed with cold-flow, multi-leg horizontal wells • Reliable and steady base production with Nampa multiple sales points to allow for pricing optimization T85 • Emerging Clearwater formation oil play and Cadotte EOR potential provides additional upside Historical Production (boe/d) 6,000 Seal Harmon Valley Shut-in of temporarily South uneconomic production – 85% of shut-in volumes returned to production July 1 T80 4,000 2,000 T75 OBE land 0 22 See end notes for additional information Average Daily Production (boe/d) Jan-18 Feb-18 Mar-18 Apr-18 May-18 Jun-18 Jul-18 Aug-18 Sep-18 Oct-18 Nov-18 Dec-18 Jan-19 Feb-19 Mar-19 Apr-19 May-19 Jun-19 Jul-19 Aug-19 Sep-19 Oct-19 Nov-19 Dec-19 Jan-20 Feb-20 Mar-20 Apr-20 May-20 Jun-20Peace River Oil Partnership (PROP) Summary PROP • Q2 2020 average production of 2,132 boe/d, with an R25 R20 R15W5 average of 1,701 boe/d shut-in during quarter in T90 response to low commodity prices • 85% of previously shut-in production has been returned to production as of July 1, 2020 • Large contiguous heavy oil resource developed with cold-flow, multi-leg horizontal wells • Reliable and steady base production with Nampa multiple sales points to allow for pricing optimization T85 • Emerging Clearwater formation oil play and Cadotte EOR potential provides additional upside Historical Production (boe/d) 6,000 Seal Harmon Valley Shut-in of temporarily South uneconomic production – 85% of shut-in volumes returned to production July 1 T80 4,000 2,000 T75 OBE land 0 22 See end notes for additional information Average Daily Production (boe/d) Jan-18 Feb-18 Mar-18 Apr-18 May-18 Jun-18 Jul-18 Aug-18 Sep-18 Oct-18 Nov-18 Dec-18 Jan-19 Feb-19 Mar-19 Apr-19 May-19 Jun-19 Jul-19 Aug-19 Sep-19 Oct-19 Nov-19 Dec-19 Jan-20 Feb-20 Mar-20 Apr-20 May-20 Jun-20

Reducing Decommissioning Liability Commentary Demonstrated Reduction in Well Abandonment Costs Compelling Decommissioning Liability reductions Wainwright 2019 Cardium 2019 12 Wells 115 Wells • Multi-year trend of decommissioning liability reduction 50% Decrease in $5.0 $0.8 Q2 2020: $604MM undiscounted 35% Per-Well Decrease Abandonment • Active participant in AER’s Area-Base Closure (ABC) Costs Below D11 $4.0 $0.6 Near-term spending minimized $3.0 • 2020 ABC spend requirements suspended; YTD 2020 spend fully creditable to 2021 requirements $0.4 $2.0 Government support & engagement $0.2 • Obsidian sites awarded $17MM million in grants and $1.0 additional $4MM allocation eligibility to date on our 3,492 applications within the ASRP $0.0 $0.0 D11 XI Actuals D11 XI Actuals • Actively engaged with EPAC and the AER to improve closure programs and regulations Historical Reductions in Abandonment Costs – Obsidian Energy Undiscounted & Uninflated Targeted, Efficient spending Decommissioning Liability • Focus on inactive Legacy assets to eliminate fixed OPEX from non-productive assets at costs well below D11 estimates • Shallow decline, long life, high netback, oil-weighted Pembina assets extend ARO requirements 76% decrease in Obsidian Energy ARO liability since 2015 over a long time period, stretching well into the future • Many wells in the Cardium can be reactivated, recompleted, or repurposed for use in reservoir monitoring See end notes for additional information 23 Well Abaondonment Costs ($MM) Well Abandonment Costs ($MM)Reducing Decommissioning Liability Commentary Demonstrated Reduction in Well Abandonment Costs Compelling Decommissioning Liability reductions Wainwright 2019 Cardium 2019 12 Wells 115 Wells • Multi-year trend of decommissioning liability reduction 50% Decrease in $5.0 $0.8 Q2 2020: $604MM undiscounted 35% Per-Well Decrease Abandonment • Active participant in AER’s Area-Base Closure (ABC) Costs Below D11 $4.0 $0.6 Near-term spending minimized $3.0 • 2020 ABC spend requirements suspended; YTD 2020 spend fully creditable to 2021 requirements $0.4 $2.0 Government support & engagement $0.2 • Obsidian sites awarded $17MM million in grants and $1.0 additional $4MM allocation eligibility to date on our 3,492 applications within the ASRP $0.0 $0.0 D11 XI Actuals D11 XI Actuals • Actively engaged with EPAC and the AER to improve closure programs and regulations Historical Reductions in Abandonment Costs – Obsidian Energy Undiscounted & Uninflated Targeted, Efficient spending Decommissioning Liability • Focus on inactive Legacy assets to eliminate fixed OPEX from non-productive assets at costs well below D11 estimates • Shallow decline, long life, high netback, oil-weighted Pembina assets extend ARO requirements 76% decrease in Obsidian Energy ARO liability since 2015 over a long time period, stretching well into the future • Many wells in the Cardium can be reactivated, recompleted, or repurposed for use in reservoir monitoring See end notes for additional information 23 Well Abaondonment Costs ($MM) Well Abandonment Costs ($MM)
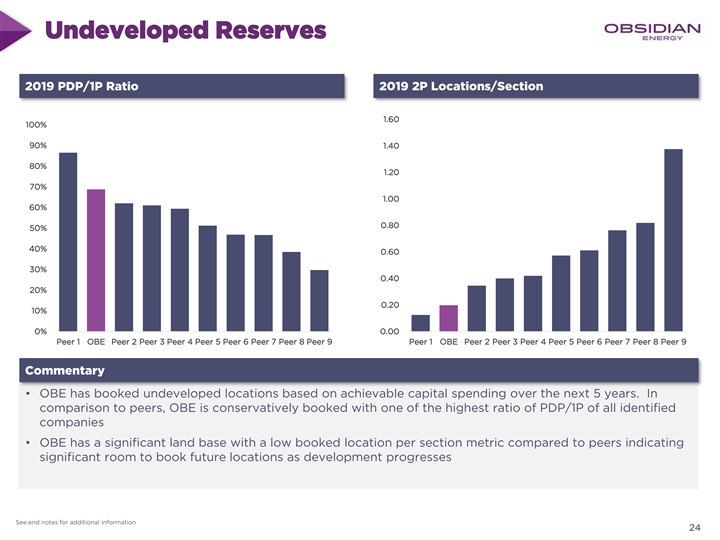
Undeveloped Reserves 2019 PDP/1P Ratio 2019 2P Locations/Section 1.60 100% 90% 1.40 80% 1.20 70% 1.00 60% 0.80 50% 40% 0.60 30% 0.40 20% 0.20 10% 0% 0.00 Peer 1 OBE Peer 2 Peer 3 Peer 4 Peer 5 Peer 6 Peer 7 Peer 8 Peer 9 Peer 1 OBE Peer 2 Peer 3 Peer 4 Peer 5 Peer 6 Peer 7 Peer 8 Peer 9 Commentary • OBE has booked undeveloped locations based on achievable capital spending over the next 5 years. In comparison to peers, OBE is conservatively booked with one of the highest ratio of PDP/1P of all identified companies • OBE has a significant land base with a low booked location per section metric compared to peers indicating significant room to book future locations as development progresses See end notes for additional information 24Undeveloped Reserves 2019 PDP/1P Ratio 2019 2P Locations/Section 1.60 100% 90% 1.40 80% 1.20 70% 1.00 60% 0.80 50% 40% 0.60 30% 0.40 20% 0.20 10% 0% 0.00 Peer 1 OBE Peer 2 Peer 3 Peer 4 Peer 5 Peer 6 Peer 7 Peer 8 Peer 9 Peer 1 OBE Peer 2 Peer 3 Peer 4 Peer 5 Peer 6 Peer 7 Peer 8 Peer 9 Commentary • OBE has booked undeveloped locations based on achievable capital spending over the next 5 years. In comparison to peers, OBE is conservatively booked with one of the highest ratio of PDP/1P of all identified companies • OBE has a significant land base with a low booked location per section metric compared to peers indicating significant room to book future locations as development progresses See end notes for additional information 24

Current Hedge Strategy and Position Hedging Strategy • Hedge up to 50% of production volumes after royalty • Hedge at price levels to: • Protect FFO • Support economic capital program • Potential debt repayment • Hedges are done on a $CAD basis to avoid FX management Hedged Oil Position & Exercise Price (CAD$/bbl) Hedged AECO Gas Position & Exercise Price (CAD$/GJ) Volumes hedged physically to ensure positive NOI on specific heavy oil assets *Hedged Positions are current as of Sept. 30, 2020 25 See end notes for additional information Current Hedge Strategy and Position Hedging Strategy • Hedge up to 50% of production volumes after royalty • Hedge at price levels to: • Protect FFO • Support economic capital program • Potential debt repayment • Hedges are done on a $CAD basis to avoid FX management Hedged Oil Position & Exercise Price (CAD$/bbl) Hedged AECO Gas Position & Exercise Price (CAD$/GJ) Volumes hedged physically to ensure positive NOI on specific heavy oil assets *Hedged Positions are current as of Sept. 30, 2020 25 See end notes for additional information

Environmental, Social & Governance Environmental Governance Social Obsidian Energy is committed to Obsidian Energy is committed to Obsidian Energy makes it a minimizing the impact of our making a positive impact in the priority to ensure all operations on the environment. communities in which we stakeholders have a clear operate and live. understanding of our approach The ABC program allows for to business operations and our significant progress on Obsidian Energy supported and expectations for regulatory abandonment and reclamation donated to children’s compliance. of areas as a whole while development organizations, the increasing efficiencies and Prostate Cancer Center, and The Board is comprised of 88% decreasing costs of managing mental health organizations in independents, with an average our ARO profile. 2019. tenure for Board members of 3 years. Our environmental programs Obsidian Energy is a member of aim to meet or exceed all Explorers and Producers Our governance policies include environmental regulation, Association of Canada (EPAC), written documents such as a encompass stakeholder supporting Canada’s Diversity Policy, Business communication, resource conventional energy producers Conduct, Ethics Code of conservation, and proper site and its employees across Conduct and Whistleblower abandonment and reclamation western Canada. Policy. practices. 26Environmental, Social & Governance Environmental Governance Social Obsidian Energy is committed to Obsidian Energy is committed to Obsidian Energy makes it a minimizing the impact of our making a positive impact in the priority to ensure all operations on the environment. communities in which we stakeholders have a clear operate and live. understanding of our approach The ABC program allows for to business operations and our significant progress on Obsidian Energy supported and expectations for regulatory abandonment and reclamation donated to children’s compliance. of areas as a whole while development organizations, the increasing efficiencies and Prostate Cancer Center, and The Board is comprised of 88% decreasing costs of managing mental health organizations in independents, with an average our ARO profile. 2019. tenure for Board members of 3 years. Our environmental programs Obsidian Energy is a member of aim to meet or exceed all Explorers and Producers Our governance policies include environmental regulation, Association of Canada (EPAC), written documents such as a encompass stakeholder supporting Canada’s Diversity Policy, Business communication, resource conventional energy producers Conduct, Ethics Code of conservation, and proper site and its employees across Conduct and Whistleblower abandonment and reclamation western Canada. Policy. practices. 26

Experienced management and strong technical team Stephen E. Loukas, Interim President and Chief Executive Officer Financial and commercial • Vast experience in corporate transactions, capital markets, corporate finance Strong financial, and leadership commercial and capital $ • Mr. Loukas is a partner, managing member, and portfolio manager at $ markets experience FrontFour Capital Group LLC, one of the Company’s top shareholders, and leading the Company has been a member of the Board of Directors since 2018 Peter D. Scott, Senior Vice President, Chief Financial Officer Drilling, completions and Subsurface technical • 30 years of extensive financial experience, 20 years in CFO roles primarily in Canadian Oil and Gas companies Strong understanding of • Previously, Senior Vice President and Chief Financial Officer at Ridgeback geological subsurface, Resources Inc., previously Lightstream Resources Ltd. reservoir modelling, advanced design, construction and Aaron Smith, Senior Vice President, Development & Operations production of multi-stage • 20 years of engineering expertise across a broad range of technical and fractured horizonal wells leadership roles • Prior to Obsidian, VP-level leadership roles at Sinopec Canada and early career experience in Corporate Planning, Completions, and Reservoir Engineering Encana Corp. Operations Well-established routines Gary Sykes, Vice President, Commercial with methodical planning ▪ Over 25 years of experience in a variety of technical, operational and and preparations, which managerial positions in domestic and international oil and gas, primarily with has resulted in exemplary ConocoPhillips safety performance • Extensive Board experience, including the Qatargas 3 joint venture, The Mackenzie Valley Pipeline Board and Calgary Zoo Employees Mark Hawkins, Vice President, Legal, General Counsel and Deeply experienced with Corporate Secretary long track-record, • Served as the corporate secretary at Obsidian Energy since 2015 and was formerly the General Counsel and Corporate Secretary representing the top tier • 15 years of legal experience of Cardium expertise 27Experienced management and strong technical team Stephen E. Loukas, Interim President and Chief Executive Officer Financial and commercial • Vast experience in corporate transactions, capital markets, corporate finance Strong financial, and leadership commercial and capital $ • Mr. Loukas is a partner, managing member, and portfolio manager at $ markets experience FrontFour Capital Group LLC, one of the Company’s top shareholders, and leading the Company has been a member of the Board of Directors since 2018 Peter D. Scott, Senior Vice President, Chief Financial Officer Drilling, completions and Subsurface technical • 30 years of extensive financial experience, 20 years in CFO roles primarily in Canadian Oil and Gas companies Strong understanding of • Previously, Senior Vice President and Chief Financial Officer at Ridgeback geological subsurface, Resources Inc., previously Lightstream Resources Ltd. reservoir modelling, advanced design, construction and Aaron Smith, Senior Vice President, Development & Operations production of multi-stage • 20 years of engineering expertise across a broad range of technical and fractured horizonal wells leadership roles • Prior to Obsidian, VP-level leadership roles at Sinopec Canada and early career experience in Corporate Planning, Completions, and Reservoir Engineering Encana Corp. Operations Well-established routines Gary Sykes, Vice President, Commercial with methodical planning ▪ Over 25 years of experience in a variety of technical, operational and and preparations, which managerial positions in domestic and international oil and gas, primarily with has resulted in exemplary ConocoPhillips safety performance • Extensive Board experience, including the Qatargas 3 joint venture, The Mackenzie Valley Pipeline Board and Calgary Zoo Employees Mark Hawkins, Vice President, Legal, General Counsel and Deeply experienced with Corporate Secretary long track-record, • Served as the corporate secretary at Obsidian Energy since 2015 and was formerly the General Counsel and Corporate Secretary representing the top tier • 15 years of legal experience of Cardium expertise 27
Appendix & Endnotes 28Appendix & Endnotes 28

End Notes Slide 3: Corporate Overview Slide 16: Cardium Play Fairways Market Capitalization and Enterprise Value was determined at the close of business on September 30, Individual play fairways are Obsidian Energy defined trends displaying similar reservoir and geological 2020. Net Debt, Tax Pools and Common Shares Outstanding is based on Q2 2020 financials. characteristics. Type curves are defined by existing productive wells within the defined trend displaying similar reservoir and geological characteristics and normalized for horizontal length and completion. Reserves (2P), RLI, is based on 2P, PDP Decline are as disclosed in our press release dated February 6, 2020, titled “Obsidian Energy Releases 2019 Reserves Results” (the “Release”). Slide 17 - 22: Asset Slides Inventory locations are internal estimates and are subject to change. No inventory locations have been assigned See end note for Slide 17 – 22 for further details regarding production breakdown. to land where Obsidian Energy is not the operator. Mid-points of guidance: Crimson Lake and East Crimson Second half of 2020: 10,840 bbl/d light oil, 2,995 bbl/d heavy oil, 2,000 bbl/d NGLs and 50.5 mmcf/d Capital estimates do not include field infrastructure or rig mobilization and demobilization costs. Well lengths are natural gas normalized in length to 2600m. Full year 2020: 11,680 bbl/d light oil, 2,885 bbl/d heavy oil, 2,135 bbl/d NGLs and 51.3 mmcf/d natural gas West Pembina, Central Pembina, and Viking Capital estimates do not include field infrastructure or rig mobilization and demobilization costs. Slide 9: Obsidian Energy Corporate Breakeven Source: Company filings, Obsidian, Wall Street Research. Economic metrics are defined from provided type curves, on the Plan Pricing Scenario and break-even IRR10%. Price deck based on US$4.00/bbl Edmonton Par differentials, C$2.04/MMBtu AECO, 1.36 USD/CAD Type curve production is defined by existing productive wells within the defined trend displaying similar reservoir FX in 2021. and geological characteristics and normalized for horizontal length and completion. Development plan well counts are indicative and based on internal estimates under our Plan Pricing Scenario. Breakeven WTI price defined as US$ WTI price required to fund sustaining capital to maintain flat production within cash flow on an exit to exit basis. Historical PROP production includes production data as of June 30, 2020. Obsidian and Peer breakeven analysis based on unhedged cash flow, per Wall Street Research Q2 2020 Asset Production is broken down as follows: estimates. Crimson Lake: Light Oil – 5,103 bbl/d, NGL – 968 bbl/d, Gas – 24,376 mcf/d East Crimson: Light Oil – 2,030 bbl/d, NGL – 395 bbl/d, Gas – 7,104 mcf/d Obsidian breakeven burdened by $18.3MM of cash lease expenses in 2018 and 2019, $10MM 2020 West Pembina: Light Oil – 2,812 bbl/d, NGL – 335 bbl/d, Gas – 5,639 mcf/d go-forward. Central Pembina: Light Oil – 2,558 bbl/d, Heavy Oil – 31 bbl/d, NGL – 510 bbl/d, Gas – 9,163 mcf/d AB Viking: Light Oil – 223 bbl/d, Heavy Oil – 36 bbl/d, NGL – 36 bbl/d, Gas – 3,507 mcf/d Peers include: BNE, BTE, CJ, CPG, GXE, KEL, NVA, POU, SGY, TOG, TVE, VET, VII, WCP, YGR PROP: Light Oil – 0 bbl/d, Heavy Oil – 1,805 bbl/d, NGL – 4 bbl/d, Gas – 1,942 mcf/d Legacy: Light Oil – 75 bbl/d, Heavy Oil – 94 bbl/d, NGL – 30 bbl/d, Gas – 1,241 mcf/d Slide 10: Investment Highlights See slide 15 for further details regarding 2018 internal estimates DCE&T costs. Slide 20: Central Pembina The economics shown reflect the tier 1 locations (279 of the 680 type curve locations). Slide 12: Execute Operationally Production amounts and Drilling Costs are averaged per well. Source for June: Top Cardium Wells is GeoLOGIC Systems Ltd., Google, and Raymond James Ltd. Slide 23: Reducing Decommissioning Liability XI refers to estimates by XI Technologies. Slide 13: Cardium Growth & Operational Improvements Actuals per Obsidian Energy 2019 ARO activities and spending results Liquids include oil, condensates, and propane. Production is A&D adjusted. Slide 14: Optimization Slide 24: Underdeveloped Reserves Production and capital costs are both based on internal estimates. Reserves data was collected from publicly available information. Peers include BNE, CJ, IPO, PRQ, SGY, TVE, TOG, WCP and YGR. Slide 15: Willesden Green Cost Reduction Trajectory Costs have been normalized to a 2,600m lateral well and are internal estimates Slide 25: Current Hedge Position and Strategy Current Hedge Position and the weighted average price, or the “Exercise Price” is current as of September 30, 2020. All hedges have been executed in Canadian dollars. (1) Production profiles are based on reserve profiles 29 (2) Reserves data based on YE 2019 reserves evaluation (Sproule Associates Limited)End Notes Slide 3: Corporate Overview Slide 16: Cardium Play Fairways Market Capitalization and Enterprise Value was determined at the close of business on September 30, Individual play fairways are Obsidian Energy defined trends displaying similar reservoir and geological 2020. Net Debt, Tax Pools and Common Shares Outstanding is based on Q2 2020 financials. characteristics. Type curves are defined by existing productive wells within the defined trend displaying similar reservoir and geological characteristics and normalized for horizontal length and completion. Reserves (2P), RLI, is based on 2P, PDP Decline are as disclosed in our press release dated February 6, 2020, titled “Obsidian Energy Releases 2019 Reserves Results” (the “Release”). Slide 17 - 22: Asset Slides Inventory locations are internal estimates and are subject to change. No inventory locations have been assigned See end note for Slide 17 – 22 for further details regarding production breakdown. to land where Obsidian Energy is not the operator. Mid-points of guidance: Crimson Lake and East Crimson Second half of 2020: 10,840 bbl/d light oil, 2,995 bbl/d heavy oil, 2,000 bbl/d NGLs and 50.5 mmcf/d Capital estimates do not include field infrastructure or rig mobilization and demobilization costs. Well lengths are natural gas normalized in length to 2600m. Full year 2020: 11,680 bbl/d light oil, 2,885 bbl/d heavy oil, 2,135 bbl/d NGLs and 51.3 mmcf/d natural gas West Pembina, Central Pembina, and Viking Capital estimates do not include field infrastructure or rig mobilization and demobilization costs. Slide 9: Obsidian Energy Corporate Breakeven Source: Company filings, Obsidian, Wall Street Research. Economic metrics are defined from provided type curves, on the Plan Pricing Scenario and break-even IRR10%. Price deck based on US$4.00/bbl Edmonton Par differentials, C$2.04/MMBtu AECO, 1.36 USD/CAD Type curve production is defined by existing productive wells within the defined trend displaying similar reservoir FX in 2021. and geological characteristics and normalized for horizontal length and completion. Development plan well counts are indicative and based on internal estimates under our Plan Pricing Scenario. Breakeven WTI price defined as US$ WTI price required to fund sustaining capital to maintain flat production within cash flow on an exit to exit basis. Historical PROP production includes production data as of June 30, 2020. Obsidian and Peer breakeven analysis based on unhedged cash flow, per Wall Street Research Q2 2020 Asset Production is broken down as follows: estimates. Crimson Lake: Light Oil – 5,103 bbl/d, NGL – 968 bbl/d, Gas – 24,376 mcf/d East Crimson: Light Oil – 2,030 bbl/d, NGL – 395 bbl/d, Gas – 7,104 mcf/d Obsidian breakeven burdened by $18.3MM of cash lease expenses in 2018 and 2019, $10MM 2020 West Pembina: Light Oil – 2,812 bbl/d, NGL – 335 bbl/d, Gas – 5,639 mcf/d go-forward. Central Pembina: Light Oil – 2,558 bbl/d, Heavy Oil – 31 bbl/d, NGL – 510 bbl/d, Gas – 9,163 mcf/d AB Viking: Light Oil – 223 bbl/d, Heavy Oil – 36 bbl/d, NGL – 36 bbl/d, Gas – 3,507 mcf/d Peers include: BNE, BTE, CJ, CPG, GXE, KEL, NVA, POU, SGY, TOG, TVE, VET, VII, WCP, YGR PROP: Light Oil – 0 bbl/d, Heavy Oil – 1,805 bbl/d, NGL – 4 bbl/d, Gas – 1,942 mcf/d Legacy: Light Oil – 75 bbl/d, Heavy Oil – 94 bbl/d, NGL – 30 bbl/d, Gas – 1,241 mcf/d Slide 10: Investment Highlights See slide 15 for further details regarding 2018 internal estimates DCE&T costs. Slide 20: Central Pembina The economics shown reflect the tier 1 locations (279 of the 680 type curve locations). Slide 12: Execute Operationally Production amounts and Drilling Costs are averaged per well. Source for June: Top Cardium Wells is GeoLOGIC Systems Ltd., Google, and Raymond James Ltd. Slide 23: Reducing Decommissioning Liability XI refers to estimates by XI Technologies. Slide 13: Cardium Growth & Operational Improvements Actuals per Obsidian Energy 2019 ARO activities and spending results Liquids include oil, condensates, and propane. Production is A&D adjusted. Slide 14: Optimization Slide 24: Underdeveloped Reserves Production and capital costs are both based on internal estimates. Reserves data was collected from publicly available information. Peers include BNE, CJ, IPO, PRQ, SGY, TVE, TOG, WCP and YGR. Slide 15: Willesden Green Cost Reduction Trajectory Costs have been normalized to a 2,600m lateral well and are internal estimates Slide 25: Current Hedge Position and Strategy Current Hedge Position and the weighted average price, or the “Exercise Price” is current as of September 30, 2020. All hedges have been executed in Canadian dollars. (1) Production profiles are based on reserve profiles 29 (2) Reserves data based on YE 2019 reserves evaluation (Sproule Associates Limited)

Definitions and Industry Terms G&A means general and administrative expenses Spud means the process of beginning to drill a well PDP means proved developed producing reserves as per Oil and Gas Disclosures Advisory GOR means gas oil ratio Unbooked means locations that are internal estimates based on 1P means proved reserves as per Oil and Gas Disclosures Obsidian Energy’s prospective acreage and an assumption as to the Advisory number of wells that can be drilled per section based on industry H1 means first half of the year practice and internal review. Unbooked locations do not have 2P means proved plus probable reserves as per Oil and Gas attributed reserves or resources (including contingent and Disclosures Advisory H2 means second half of the year prospective). Unbooked locations have been identified by management as an estimation of Obsidian Energy’s multi-year drilling ABC means area based closure program initiative from the AER Hz means horizontal well activities based on evaluation of applicable geologic, seismic, A&D means oil and natural gas property acquisitions and engineering, production and reserves information. divestitures IP means initial production, which is the average production over a specified number of days USD means United States Dollar AER means Alberta Energy Regulor ARO means Asset Retirement Obligation IRR means Internal Rate of Return which is the interest rate at WCS means Western Canadian Select which the NPV equals zero ASRP means Alberta Ste Rehabilitation Program WI means working interest Liquids means crude oil and NGLs Avg means Average WTI means West Texas Intermediate bbl and bbl/d means barrels of oil and barrels of oil per day, M or k means thousands respectively YE means year end MM means millions boe, boe/d means barrels of oil equivalent and barrels of oil equivalent per day, respectively YDT means year to date Mboe means thousand barrels oil equivalent Bonterra means Bonterra Energy Corp. MMboe means million barrels oil equivalent CAD means Canadian Dollar Capital Expenditures & Capex includes all direct costs related to N, S, E, W means the North, South, East, West or in any our operated and non-operated development programs including combination drilling, completions, tie-in, development of and expansions to existing facilities and major infrastructure, optimization and EOR Netback means the summary of all costs associated with bringing activities one unit of oil to the marketplace and the revenues from the sale of all products generated from that same unit and is expressed as a Company or OBE means Obsidian Energy Ltd; as applicable gross profit per barrel DCE&T means drilling, completion, equip and tie-in NGL means natural gas liquids which includes hydrocarbon not Decommissioning means decommissioning expenditures marketed as natural gas (methane) or various classes of oil EOR means enhance oil recovery NPV means net present value, before tax discounted at 10 percent EUR means estimated ultimate recovery Opex means operating costs F&D means finding and development costs Payout means the time it takes to cover the return of your initial Frac means fraccing or fracturing, short name for Hydraulic cash outlay fracturing, a method for extracting oil and natural gas Plan Pricing Scenario means the flat price deck at WTI Free Cash Flow, which is Funds Flow from Operations less Total USD$50.00, Ed Par Diff USD$6.00, AECO CAD$2.25, FX Capital Expenditures CAD/USD $1.36 FX means foreign exchange rate, in our case typically refers to C$ PROP and Peace River means Peace River Oil Partnership to US$ exchange rates Release means our a press release dated February 6, 2020 FFO means funds flow from operations, detailed in the Non-GAAP measure advisory Recycle Ratio means Netback divided by F&D FY means fiscal year RLI means Reserve Life Index GJ means gigajoules 30 SEC means U.S. Securities and Exchange Commission Definitions and Industry Terms G&A means general and administrative expenses Spud means the process of beginning to drill a well PDP means proved developed producing reserves as per Oil and Gas Disclosures Advisory GOR means gas oil ratio Unbooked means locations that are internal estimates based on 1P means proved reserves as per Oil and Gas Disclosures Obsidian Energy’s prospective acreage and an assumption as to the Advisory number of wells that can be drilled per section based on industry H1 means first half of the year practice and internal review. Unbooked locations do not have 2P means proved plus probable reserves as per Oil and Gas attributed reserves or resources (including contingent and Disclosures Advisory H2 means second half of the year prospective). Unbooked locations have been identified by management as an estimation of Obsidian Energy’s multi-year drilling ABC means area based closure program initiative from the AER Hz means horizontal well activities based on evaluation of applicable geologic, seismic, A&D means oil and natural gas property acquisitions and engineering, production and reserves information. divestitures IP means initial production, which is the average production over a specified number of days USD means United States Dollar AER means Alberta Energy Regulor ARO means Asset Retirement Obligation IRR means Internal Rate of Return which is the interest rate at WCS means Western Canadian Select which the NPV equals zero ASRP means Alberta Ste Rehabilitation Program WI means working interest Liquids means crude oil and NGLs Avg means Average WTI means West Texas Intermediate bbl and bbl/d means barrels of oil and barrels of oil per day, M or k means thousands respectively YE means year end MM means millions boe, boe/d means barrels of oil equivalent and barrels of oil equivalent per day, respectively YDT means year to date Mboe means thousand barrels oil equivalent Bonterra means Bonterra Energy Corp. MMboe means million barrels oil equivalent CAD means Canadian Dollar Capital Expenditures & Capex includes all direct costs related to N, S, E, W means the North, South, East, West or in any our operated and non-operated development programs including combination drilling, completions, tie-in, development of and expansions to existing facilities and major infrastructure, optimization and EOR Netback means the summary of all costs associated with bringing activities one unit of oil to the marketplace and the revenues from the sale of all products generated from that same unit and is expressed as a Company or OBE means Obsidian Energy Ltd; as applicable gross profit per barrel DCE&T means drilling, completion, equip and tie-in NGL means natural gas liquids which includes hydrocarbon not Decommissioning means decommissioning expenditures marketed as natural gas (methane) or various classes of oil EOR means enhance oil recovery NPV means net present value, before tax discounted at 10 percent EUR means estimated ultimate recovery Opex means operating costs F&D means finding and development costs Payout means the time it takes to cover the return of your initial Frac means fraccing or fracturing, short name for Hydraulic cash outlay fracturing, a method for extracting oil and natural gas Plan Pricing Scenario means the flat price deck at WTI Free Cash Flow, which is Funds Flow from Operations less Total USD$50.00, Ed Par Diff USD$6.00, AECO CAD$2.25, FX Capital Expenditures CAD/USD $1.36 FX means foreign exchange rate, in our case typically refers to C$ PROP and Peace River means Peace River Oil Partnership to US$ exchange rates Release means our a press release dated February 6, 2020 FFO means funds flow from operations, detailed in the Non-GAAP measure advisory Recycle Ratio means Netback divided by F&D FY means fiscal year RLI means Reserve Life Index GJ means gigajoules 30 SEC means U.S. Securities and Exchange Commission

Non-GAAP Measures Advisory In this presentation, we refer to certain financial measures that are not determined in accordance with IFRS. These measures as presented do not have any standardized meaning prescribed by IFRS and therefore they may not be comparable with calculations of similar measures for other companies. We believe that, in conjunction with results presented in accordance with IFRS, these measures assist in providing a more complete understanding of certain aspects of our results of operations and financial performance. You are cautioned, however, that these measures should not be construed as an alternative to measures determined in accordance with IFRS as an indication of our performance. These measures include the following: EBITDA is net earnings (loss) plus finance expenses (income), provisions for (recovery of) income taxes, and depletion, depreciation and amortization. Net Debt in regard to Obsidian Energy, it is the amount of long-term debt, comprised of long-term notes and bank debt, plus net working capital (surplus)/deficit. Net Debt is a measure of leverage and liquidity Debt is bank debt, notes and, solely in respect of Bonterra, subordinated debt. Cash cost is sum of operating costs, transport costs and G&A on a $/boe basis. Production per Debt Adjusted Share is based on the year over year change in net debt adjusted at the Pro Forma Company equity value per share at 4.5x EV/EBITDA Enterprise Value is a measure of total value of the applicable company calculated by aggregating the market value of its common shares at a specific date, adding its total Debt and subtracting its cash and cash and cash equivalents. Funds Flow from Operations is cash flow from operating activities before changes in non-cash working capital, decommissioning expenditures, onerous office lease settlements, the effects of financing related transactions from foreign exchange contracts and debt repayments, restructuring charges and certain other expenses and is representative of cash related to continuing operations. Funds flow from operations is used to assess the combined entity’s ability to fund planned capital programs. Cash Flow is funds flow from operations before changes in any non-cash working capital changes and decommissioning liabilities. Free cash flow is funds flow from operations less capital and decommissioning expenditures. Netback is the per unit of production amount of revenue less royalties, operating expenses, transportation expenses and realized risk management gains and losses, and is used in capital allocation decisions and to economically rank projects. Notice to Shareholders in the United States The financial information presented herein has been prepared in accordance with Canadian GAAP and is subject to Canadian auditing and auditor independence standards, and thus may not be comparable to financial statements of U.S. companies presented in accordance with U.S. GAAP. 31Non-GAAP Measures Advisory In this presentation, we refer to certain financial measures that are not determined in accordance with IFRS. These measures as presented do not have any standardized meaning prescribed by IFRS and therefore they may not be comparable with calculations of similar measures for other companies. We believe that, in conjunction with results presented in accordance with IFRS, these measures assist in providing a more complete understanding of certain aspects of our results of operations and financial performance. You are cautioned, however, that these measures should not be construed as an alternative to measures determined in accordance with IFRS as an indication of our performance. These measures include the following: EBITDA is net earnings (loss) plus finance expenses (income), provisions for (recovery of) income taxes, and depletion, depreciation and amortization. Net Debt in regard to Obsidian Energy, it is the amount of long-term debt, comprised of long-term notes and bank debt, plus net working capital (surplus)/deficit. Net Debt is a measure of leverage and liquidity Debt is bank debt, notes and, solely in respect of Bonterra, subordinated debt. Cash cost is sum of operating costs, transport costs and G&A on a $/boe basis. Production per Debt Adjusted Share is based on the year over year change in net debt adjusted at the Pro Forma Company equity value per share at 4.5x EV/EBITDA Enterprise Value is a measure of total value of the applicable company calculated by aggregating the market value of its common shares at a specific date, adding its total Debt and subtracting its cash and cash and cash equivalents. Funds Flow from Operations is cash flow from operating activities before changes in non-cash working capital, decommissioning expenditures, onerous office lease settlements, the effects of financing related transactions from foreign exchange contracts and debt repayments, restructuring charges and certain other expenses and is representative of cash related to continuing operations. Funds flow from operations is used to assess the combined entity’s ability to fund planned capital programs. Cash Flow is funds flow from operations before changes in any non-cash working capital changes and decommissioning liabilities. Free cash flow is funds flow from operations less capital and decommissioning expenditures. Netback is the per unit of production amount of revenue less royalties, operating expenses, transportation expenses and realized risk management gains and losses, and is used in capital allocation decisions and to economically rank projects. Notice to Shareholders in the United States The financial information presented herein has been prepared in accordance with Canadian GAAP and is subject to Canadian auditing and auditor independence standards, and thus may not be comparable to financial statements of U.S. companies presented in accordance with U.S. GAAP. 31

Oil and Gas Information Advisory Barrels of oil equivalent ( boe ) may be misleading, particularly if used in isolation. A boe conversion ratio of six thousand cubic feet of natural gas to one barrel of crude oil is based on an energy equivalency conversion method primarily applicable at the burner tip and does not represent a value equivalency at the wellhead. Given that the value ratio based on the current price of crude oil as compared to natural gas is significantly different from the energy equivalency conversion ratio of 6:1, utilizing a conversion on a 6:1 basis is misleading as an indication of value. Inventory This presentation discloses drilling locations in three categories: (i) proved locations; (ii) probable locations; and (iii) unbooked locations. Proved locations and probable locations are derived from the Sproule Report and account for drilling locations that have associated proved and/or probable reserves, as applicable. Unbooked locations are internal estimates based on our prospective acreage and an assumption as to the number of wells that can be drilled per section based on industry practice and internal review. Unbooked locations do not have attributed reserves or resources. Corporately, the Company has 212 gross booked proved locations and 228 gross booked probable locations as set forth in the Sproule Report. Unbooked locations have been identified by management as an estimation of our multi-year drilling activities based on evaluation of applicable geologic, seismic, engineering, production and reserves information. There is no certainty that we will drill all unbooked drilling locations and if drilled there is no certainty that such locations will result in additional oil and gas reserves, resources or production. The drilling locations on which we actually drill wells will ultimately depend upon the availability of capital, regulatory approvals, seasonal restrictions, oil and natural gas prices, costs, actual drilling results, additional reservoir information that is obtained and other factors. While certain of the unbooked drilling locations have been derisked by drilling existing wells in relative close proximity to such unbooked drilling locations, other unbooked drilling locations are farther away from existing wells where management has less information about the characteristics of the reservoir and therefore there is more uncertainty whether wells will be drilled in such locations and if drilled there is more uncertainty that such wells will result in additional oil and gas reserves or production. 32Oil and Gas Information Advisory Barrels of oil equivalent ( boe ) may be misleading, particularly if used in isolation. A boe conversion ratio of six thousand cubic feet of natural gas to one barrel of crude oil is based on an energy equivalency conversion method primarily applicable at the burner tip and does not represent a value equivalency at the wellhead. Given that the value ratio based on the current price of crude oil as compared to natural gas is significantly different from the energy equivalency conversion ratio of 6:1, utilizing a conversion on a 6:1 basis is misleading as an indication of value. Inventory This presentation discloses drilling locations in three categories: (i) proved locations; (ii) probable locations; and (iii) unbooked locations. Proved locations and probable locations are derived from the Sproule Report and account for drilling locations that have associated proved and/or probable reserves, as applicable. Unbooked locations are internal estimates based on our prospective acreage and an assumption as to the number of wells that can be drilled per section based on industry practice and internal review. Unbooked locations do not have attributed reserves or resources. Corporately, the Company has 212 gross booked proved locations and 228 gross booked probable locations as set forth in the Sproule Report. Unbooked locations have been identified by management as an estimation of our multi-year drilling activities based on evaluation of applicable geologic, seismic, engineering, production and reserves information. There is no certainty that we will drill all unbooked drilling locations and if drilled there is no certainty that such locations will result in additional oil and gas reserves, resources or production. The drilling locations on which we actually drill wells will ultimately depend upon the availability of capital, regulatory approvals, seasonal restrictions, oil and natural gas prices, costs, actual drilling results, additional reservoir information that is obtained and other factors. While certain of the unbooked drilling locations have been derisked by drilling existing wells in relative close proximity to such unbooked drilling locations, other unbooked drilling locations are farther away from existing wells where management has less information about the characteristics of the reservoir and therefore there is more uncertainty whether wells will be drilled in such locations and if drilled there is more uncertainty that such wells will result in additional oil and gas reserves or production. 32

Reserves Disclosure and Definitions Unless otherwise noted, any reference to reserves in this presentation are based on the report ( Sproule Report ) prepared by Sproule Associates Limited dated February 3, 2020 where they evaluated one hundred percent of the crude oil, natural gas and natural gas liquids reserves of Obsidian Energy and the net present value of future net revenue attributable to those reserves effective as at December 31, 2019. For further information regarding the Sproule Report, see our Release. It should not be assumed that the estimates of future net revenues presented herein represent the fair market value of the reserves. There is no assurance that the forecast price and cost assumptions will be attained and variances could be material. The recovery and reserves estimates of crude oil, natural gas liquids and natural gas reserves provided herein are estimates only and there is no guarantee that the estimated reserves will be recovered. Actual crude oil, natural gas and natural gas liquid reserves may be greater than or less than the estimates provided herein. The estimates of reserves for individual properties may not reflect the same confidence level as estimates of reserves for all properties, due to the effects of aggregation. Production and Reserves The use of the word gross in this presentation (i) in relation to our interest in production and reserves, means our working interest (operating or non-operating) share before deduction of royalties and without including our royalty interests, (ii) in relation to wells, means the total number of wells in which we have an interest, and (iii) in relation to properties, means the total area of properties in which we have an interest. The use of the word net in this presentation (i) in relation to our interest in production and reserves, means our working interest (operating or non-operating) share after deduction of royalty obligations, plus our royalty interests, (ii) in relation to our interest in wells, means the number of wells obtained by aggregating our working interest in each of our gross wells, and (iii) in relation to our interest in a property, means the total area in which we have an interest multiplied by the working interest owned by us. Unless otherwise stated, production volumes and reserves estimates in this presentation are stated on a gross basis. All references to well counts are net to the Company, unless otherwise indicated. Reserve Definitions Reserves are estimated remaining quantities of oil and natural gas and related substances anticipated to be recoverable from known accumulations, as of a given date, based on the analysis of drilling, geological, geophysical, and engineering data; the use of established technology; and specified economic conditions, which are generally accepted as being reasonable. Reserves are classified according to the degree of certainty associated with the estimates. proved reserves are those reserves that can be estimated with a high degree of certainty to be recoverable. It is likely that the actual remaining quantities recovered will exceed the estimated proved reserves. probable reserves are those additional reserves that are less certain to be recovered than proved reserves. It is equally likely that the actual remaining quantities recovered will be greater or less than the sum of the estimated proved plus probable reserves. Each of the reserves categories (proved and probable) may be divided into developed and undeveloped categories: Developed reserves are those reserves that are expected to be recovered from existing wells and installed facilities or, if facilities have not been installed, that would involve a low expenditure (for example, when compared to the cost of drilling a well) to put the reserves on production. The developed category may be subdivided into producing and non-producing. Developed producing reserves are those reserves that are expected to be recovered from completion intervals open at the time of the estimate. These reserves may be currently producing or, if shut-in, they must have previously been on production, and the date of resumption of production must be known with reasonable certainty. Developed non-producing reserves are those reserves that either have not been on production, or have previously been on production, but are shut-in, and the date of resumption of production is unknown. Undeveloped reserves are those reserves expected to be recovered from known accumulations where a significant expenditure (for example, when compared to the cost of drilling a well) is required to render them capable of production. They must fully meet the requirements of the reserves category (proved, probable) to which they are assigned. For additional reserve definitions, see the Release. 33Reserves Disclosure and Definitions Unless otherwise noted, any reference to reserves in this presentation are based on the report ( Sproule Report ) prepared by Sproule Associates Limited dated February 3, 2020 where they evaluated one hundred percent of the crude oil, natural gas and natural gas liquids reserves of Obsidian Energy and the net present value of future net revenue attributable to those reserves effective as at December 31, 2019. For further information regarding the Sproule Report, see our Release. It should not be assumed that the estimates of future net revenues presented herein represent the fair market value of the reserves. There is no assurance that the forecast price and cost assumptions will be attained and variances could be material. The recovery and reserves estimates of crude oil, natural gas liquids and natural gas reserves provided herein are estimates only and there is no guarantee that the estimated reserves will be recovered. Actual crude oil, natural gas and natural gas liquid reserves may be greater than or less than the estimates provided herein. The estimates of reserves for individual properties may not reflect the same confidence level as estimates of reserves for all properties, due to the effects of aggregation. Production and Reserves The use of the word gross in this presentation (i) in relation to our interest in production and reserves, means our working interest (operating or non-operating) share before deduction of royalties and without including our royalty interests, (ii) in relation to wells, means the total number of wells in which we have an interest, and (iii) in relation to properties, means the total area of properties in which we have an interest. The use of the word net in this presentation (i) in relation to our interest in production and reserves, means our working interest (operating or non-operating) share after deduction of royalty obligations, plus our royalty interests, (ii) in relation to our interest in wells, means the number of wells obtained by aggregating our working interest in each of our gross wells, and (iii) in relation to our interest in a property, means the total area in which we have an interest multiplied by the working interest owned by us. Unless otherwise stated, production volumes and reserves estimates in this presentation are stated on a gross basis. All references to well counts are net to the Company, unless otherwise indicated. Reserve Definitions Reserves are estimated remaining quantities of oil and natural gas and related substances anticipated to be recoverable from known accumulations, as of a given date, based on the analysis of drilling, geological, geophysical, and engineering data; the use of established technology; and specified economic conditions, which are generally accepted as being reasonable. Reserves are classified according to the degree of certainty associated with the estimates. proved reserves are those reserves that can be estimated with a high degree of certainty to be recoverable. It is likely that the actual remaining quantities recovered will exceed the estimated proved reserves. probable reserves are those additional reserves that are less certain to be recovered than proved reserves. It is equally likely that the actual remaining quantities recovered will be greater or less than the sum of the estimated proved plus probable reserves. Each of the reserves categories (proved and probable) may be divided into developed and undeveloped categories: Developed reserves are those reserves that are expected to be recovered from existing wells and installed facilities or, if facilities have not been installed, that would involve a low expenditure (for example, when compared to the cost of drilling a well) to put the reserves on production. The developed category may be subdivided into producing and non-producing. Developed producing reserves are those reserves that are expected to be recovered from completion intervals open at the time of the estimate. These reserves may be currently producing or, if shut-in, they must have previously been on production, and the date of resumption of production must be known with reasonable certainty. Developed non-producing reserves are those reserves that either have not been on production, or have previously been on production, but are shut-in, and the date of resumption of production is unknown. Undeveloped reserves are those reserves expected to be recovered from known accumulations where a significant expenditure (for example, when compared to the cost of drilling a well) is required to render them capable of production. They must fully meet the requirements of the reserves category (proved, probable) to which they are assigned. For additional reserve definitions, see the Release. 33

Forward-Looking Information Advisory Certain statements contained in this presentation constitute forward-looking statements or information (collectively forward-looking statements). Forward-looking statements are typically identified by words such as anticipate , continue , estimate , expect , forecast , budget , may , will , project , could , plan , intend , should , believe , outlook , objective , aim , potential , target and similar words suggesting future events or future performance. In addition, statements relating to reserves or resources are deemed to be forward-looking statements as they involve the implied assessment, based on certain estimates and assumptions, that the reserves and resources described exist in the quantities predicted or estimated and can be profitably produced in the future. Please note that initial production and/or peak rates are not necessarily indicative of long-term performance or ultimate recovery. In particular, this presentation contains, without limitation, forward-looking statements pertaining to the following: our second half and full year 2020 guidance including production, capital expenditures including decommissioning, operating and G&A cost range; the expected decline rates and reserve life index on reserves; our go-forward strategic priorities in both the short and long term; that we will utilize the grants and allocation eligibility within the ASRP; that we will continue to optimize and drive efficiencies across our entire Cardium footprint; our projected 2020 and 2021 breakeven prices; that recent technical work done has increased our Pembina inventory to over 900 gross Cardium locations; that flexible operations allow for quick reaction to commodity price changes at minimal cost without risk of long-term reservoir impairment; that there are additional opportunities in the portfolio, such as waterflood and EOR projects, which become competitive with increased pricing; our ability to grow near-term production in both Willesden Green and Pembina with minimal infrastructure spend; our Cardium development program including timing, locations, costs, optionality, spacing and frac design; how our optimization program is structured and the anticipated spend amount for H2 2020; our potential inventory locations; our focuses in the near, mid and long term; that certain locations have been de-risked due to various reasons; how we plan to target certain oil banks and the keys to its success; how we plan to reduce certain costs; that the emerging Clearwater formation oil play provides potential upside with stacked development potential and that there is future EOR potential which can provide additional upside; that there is additional uncaptured inventory in non- operated lands; our ability to waterflood certain locations and for minimal capital through existing infrastructure and impact that has on corporate decline maintenance; that the AER has suspended 2020 ABC spend requirements and will credit 2021 targets by our year to date 2020 spend; the timing for acceptance of the offer to Bonterra (the “Offer”); the satisfaction of the conditions to the Offer; the anticipated strategic, operational and financial benefits and synergies that may result from the proposed combination between the Company and Bonterra, including as to expected cost synergies, accretion, and expectations for each of the entities on a stand-alone basis; the resulting benefits of the Offer to the Company and Bonterra shareholders; and that the Offer is the better option compared to adding more debt to an already over-levered balance sheet for Bonterra shareholders. In addition, all other statements and other information that address the Offer (including satisfaction of the Offer conditions) are forward-looking statements. The key metrics for the Company set forth in this presentation may be considered to be future-oriented financial information or a financial outlook for the purposes of applicable Canadian securities laws. Financial outlook and future-oriented financial information contained in this presentation are based on assumptions about future events based on management's assessment of the relevant information currently available. In particular, this presentation contains projected operational and financial information for 2020 and beyond for the Company. The future-oriented financial information and financial outlooks contained in this presentation have been approved by management as of the date of this presentation. Readers are cautioned that any such financial outlook and future-oriented financial information contained herein should not be used for purposes other than those for which it is disclosed herein. With respect to forward-looking statements contained in this document, we have made assumptions regarding, among other things: we will have the ability to continue as a going concern going forward and realize our assets and discharge our liabilities in the normal course of business; our ability to complete asset sales and the terms and timing of any such sales; our plans to participate in government programs and future approvals; the impact of regional and/or global health related events on energy demand; global energy policies going forward; the economic returns that we anticipate realizing from expenditures made on our assets; future crude oil, natural gas liquids and natural gas prices and differentials between light, medium and heavy oil prices and Canadian, WTI and world oil and natural gas prices; future capital expenditure levels; future crude oil, natural gas liquids and natural gas production levels; drilling results; future exchange rates and interest rates; future taxes and royalties; the continued suspension of our dividend; our ability to execute our capital programs as planned without significant adverse impacts from various factors beyond our control, including weather, infrastructure access and delays in obtaining regulatory approvals and third party consents; our ability to obtain equipment in a timely manner to carry out development activities and the costs thereof; our ability to market our oil and natural gas successfully; our ability to add production and reserves through our development and exploitation activities; that both the Company and Bonterra, each of which are subject to short term extensions on their respective senior revolving credit facilities continue to obtain extensions in respect of their thereof and otherwise continue to satisfy the applicable covenants under such facilities, including following the completion of the Offer and any subsequent second step transaction, the ability to complete the Offer and the proposed combination, integrate the Company’s and Bonterra’s respective businesses and operations and realize financial, operational and other synergies from the proposed combination; that each of the Company, Bonterra and, following the completion of the Offer, the combined entity will have the ability to continue as a going concern going forward and realize its assets and discharge its liabilities in the normal course of business. In addition, many of the forward-looking statements contained in this document are located proximate to assumptions that are specific to those forward-looking statements, and such assumptions should be taken into account when reading such forward-looking statements. Please note that illustrative examples are not to be construed as guidance for the Company and further details on assumptions can be found in the End Notes section of the presentation. Although Obsidian Energy believes that the expectations and assumptions on which such forward-looking information is based are reasonable, undue reliance should not be placed on the forward-looking information because Obsidian Energy can give no assurances that they will prove to be correct. Since forward-looking information addresses future events and conditions, by its very nature it involves inherent risks and uncertainties. Actual results could differ materially from those currently anticipated due to a number of factors and risks. These include, but are not limited to: the risks associated with the oil and gas industry in general such as operational risks in development, exploration and production; the possibility that the semi-annual borrowing base re-determination under our reserve-based loan is not acceptable to the Company or that we breach one or more of the financial covenants pursuant to our amending agreements with holders of our senior, secured notes; the impact that any government assistance programs could have on the Company in connection with, among other things, the COVID- 19 pandemic and other regional and/or global health related events; the possibility that we are not able to continue as a going concern and realize our assets and discharge our liabilities in the normal course of business; the impact on energy demands due to regional and/or global health related events; delays or changes in plans with respect to exploration or development projects or capital expenditures; the uncertainty of estimates and projections relating to reserves, production, costs and expenses; health, safety and environmental risks; commodity price and exchange rate fluctuations; interest rate fluctuations; marketing and transportation; loss of markets; environmental risks; competition; incorrect assessment of the value of acquisitions; failure to complete or realize the anticipated benefits of acquisitions or dispositions; ability to access sufficient capital from internal and external sources; failure to obtain required regulatory and other approvals; reliance on third parties; and changes in legislation, including but not limited to tax laws, royalties and environmental regulations. Readers are cautioned that the foregoing list of factors is not exhaustive. Additional information on these and other factors that could affect Obsidian Energy, or its operations or financial results, are included in the Company's Annual Information Form (See Risk Factors and Forward-Looking Statements therein) which may be accessed through the SEDAR website (www.sedar.com), EDGAR website (www.sec.gov) or Obsidian Energy's website. Unless otherwise specified, the forward-looking statements contained in this document speak only as of Sept 30, 2020. Except as expressly required by applicable securities laws, we do not undertake any obligation to publicly update or revise any forward. 34Forward-Looking Information Advisory Certain statements contained in this presentation constitute forward-looking statements or information (collectively forward-looking statements). Forward-looking statements are typically identified by words such as anticipate , continue , estimate , expect , forecast , budget , may , will , project , could , plan , intend , should , believe , outlook , objective , aim , potential , target and similar words suggesting future events or future performance. In addition, statements relating to reserves or resources are deemed to be forward-looking statements as they involve the implied assessment, based on certain estimates and assumptions, that the reserves and resources described exist in the quantities predicted or estimated and can be profitably produced in the future. Please note that initial production and/or peak rates are not necessarily indicative of long-term performance or ultimate recovery. In particular, this presentation contains, without limitation, forward-looking statements pertaining to the following: our second half and full year 2020 guidance including production, capital expenditures including decommissioning, operating and G&A cost range; the expected decline rates and reserve life index on reserves; our go-forward strategic priorities in both the short and long term; that we will utilize the grants and allocation eligibility within the ASRP; that we will continue to optimize and drive efficiencies across our entire Cardium footprint; our projected 2020 and 2021 breakeven prices; that recent technical work done has increased our Pembina inventory to over 900 gross Cardium locations; that flexible operations allow for quick reaction to commodity price changes at minimal cost without risk of long-term reservoir impairment; that there are additional opportunities in the portfolio, such as waterflood and EOR projects, which become competitive with increased pricing; our ability to grow near-term production in both Willesden Green and Pembina with minimal infrastructure spend; our Cardium development program including timing, locations, costs, optionality, spacing and frac design; how our optimization program is structured and the anticipated spend amount for H2 2020; our potential inventory locations; our focuses in the near, mid and long term; that certain locations have been de-risked due to various reasons; how we plan to target certain oil banks and the keys to its success; how we plan to reduce certain costs; that the emerging Clearwater formation oil play provides potential upside with stacked development potential and that there is future EOR potential which can provide additional upside; that there is additional uncaptured inventory in non- operated lands; our ability to waterflood certain locations and for minimal capital through existing infrastructure and impact that has on corporate decline maintenance; that the AER has suspended 2020 ABC spend requirements and will credit 2021 targets by our year to date 2020 spend; the timing for acceptance of the offer to Bonterra (the “Offer”); the satisfaction of the conditions to the Offer; the anticipated strategic, operational and financial benefits and synergies that may result from the proposed combination between the Company and Bonterra, including as to expected cost synergies, accretion, and expectations for each of the entities on a stand-alone basis; the resulting benefits of the Offer to the Company and Bonterra shareholders; and that the Offer is the better option compared to adding more debt to an already over-levered balance sheet for Bonterra shareholders. In addition, all other statements and other information that address the Offer (including satisfaction of the Offer conditions) are forward-looking statements. The key metrics for the Company set forth in this presentation may be considered to be future-oriented financial information or a financial outlook for the purposes of applicable Canadian securities laws. Financial outlook and future-oriented financial information contained in this presentation are based on assumptions about future events based on management's assessment of the relevant information currently available. In particular, this presentation contains projected operational and financial information for 2020 and beyond for the Company. The future-oriented financial information and financial outlooks contained in this presentation have been approved by management as of the date of this presentation. Readers are cautioned that any such financial outlook and future-oriented financial information contained herein should not be used for purposes other than those for which it is disclosed herein. With respect to forward-looking statements contained in this document, we have made assumptions regarding, among other things: we will have the ability to continue as a going concern going forward and realize our assets and discharge our liabilities in the normal course of business; our ability to complete asset sales and the terms and timing of any such sales; our plans to participate in government programs and future approvals; the impact of regional and/or global health related events on energy demand; global energy policies going forward; the economic returns that we anticipate realizing from expenditures made on our assets; future crude oil, natural gas liquids and natural gas prices and differentials between light, medium and heavy oil prices and Canadian, WTI and world oil and natural gas prices; future capital expenditure levels; future crude oil, natural gas liquids and natural gas production levels; drilling results; future exchange rates and interest rates; future taxes and royalties; the continued suspension of our dividend; our ability to execute our capital programs as planned without significant adverse impacts from various factors beyond our control, including weather, infrastructure access and delays in obtaining regulatory approvals and third party consents; our ability to obtain equipment in a timely manner to carry out development activities and the costs thereof; our ability to market our oil and natural gas successfully; our ability to add production and reserves through our development and exploitation activities; that both the Company and Bonterra, each of which are subject to short term extensions on their respective senior revolving credit facilities continue to obtain extensions in respect of their thereof and otherwise continue to satisfy the applicable covenants under such facilities, including following the completion of the Offer and any subsequent second step transaction, the ability to complete the Offer and the proposed combination, integrate the Company’s and Bonterra’s respective businesses and operations and realize financial, operational and other synergies from the proposed combination; that each of the Company, Bonterra and, following the completion of the Offer, the combined entity will have the ability to continue as a going concern going forward and realize its assets and discharge its liabilities in the normal course of business. In addition, many of the forward-looking statements contained in this document are located proximate to assumptions that are specific to those forward-looking statements, and such assumptions should be taken into account when reading such forward-looking statements. Please note that illustrative examples are not to be construed as guidance for the Company and further details on assumptions can be found in the End Notes section of the presentation. Although Obsidian Energy believes that the expectations and assumptions on which such forward-looking information is based are reasonable, undue reliance should not be placed on the forward-looking information because Obsidian Energy can give no assurances that they will prove to be correct. Since forward-looking information addresses future events and conditions, by its very nature it involves inherent risks and uncertainties. Actual results could differ materially from those currently anticipated due to a number of factors and risks. These include, but are not limited to: the risks associated with the oil and gas industry in general such as operational risks in development, exploration and production; the possibility that the semi-annual borrowing base re-determination under our reserve-based loan is not acceptable to the Company or that we breach one or more of the financial covenants pursuant to our amending agreements with holders of our senior, secured notes; the impact that any government assistance programs could have on the Company in connection with, among other things, the COVID- 19 pandemic and other regional and/or global health related events; the possibility that we are not able to continue as a going concern and realize our assets and discharge our liabilities in the normal course of business; the impact on energy demands due to regional and/or global health related events; delays or changes in plans with respect to exploration or development projects or capital expenditures; the uncertainty of estimates and projections relating to reserves, production, costs and expenses; health, safety and environmental risks; commodity price and exchange rate fluctuations; interest rate fluctuations; marketing and transportation; loss of markets; environmental risks; competition; incorrect assessment of the value of acquisitions; failure to complete or realize the anticipated benefits of acquisitions or dispositions; ability to access sufficient capital from internal and external sources; failure to obtain required regulatory and other approvals; reliance on third parties; and changes in legislation, including but not limited to tax laws, royalties and environmental regulations. Readers are cautioned that the foregoing list of factors is not exhaustive. Additional information on these and other factors that could affect Obsidian Energy, or its operations or financial results, are included in the Company's Annual Information Form (See Risk Factors and Forward-Looking Statements therein) which may be accessed through the SEDAR website (www.sedar.com), EDGAR website (www.sec.gov) or Obsidian Energy's website. Unless otherwise specified, the forward-looking statements contained in this document speak only as of Sept 30, 2020. Except as expressly required by applicable securities laws, we do not undertake any obligation to publicly update or revise any forward. 34