 Creating the World’s Premier Live Entertainment Company Exhibit 99.1 |
 2 Transaction Overview Stock-for-Stock transaction valued at approximately $0.8B equity value; $2.5B enterprise value Each share of Ticketmaster Entertainment stock to be exchanged for 1.384x Live Nation shares (subject to adjustment at closing) Consideration Live Nation shareholders: 49.99% Ticketmaster Entertainment shareholders: 50.01% Pro Forma Ownership 7 Directors designated by Live Nation 7 Directors designated by Ticketmaster Entertainment Board of Directors Chairman: Barry Diller Executive Chairman of the Combined Company & CEO of Front Line: Irving Azoff CEO: Michael Rapino Leadership Live Nation and Ticketmaster Entertainment shareholder approval Ticketmaster Entertainment lenders’ approval Regulatory approvals Other customary conditions Conditions Expected close: Second half of 2009 Timetable |
 3 Strategic Highlights Creates world’s premier live entertainment experience and drives major innovations in ticketing technology, marketing and service Combines leading global concert business, global ticketing operations and artist management company Brings together artist-centric leadership team with the vision to adapt to the evolving music industry landscape Bringing together promotions and ticketing expertise accelerates benefits to concert- goers, artists and venues Significant opportunities to sell more tickets (many tickets go unsold today) Improves ability to service fans at the initial ticket sale with more options and better access Reduces current inefficiencies in system that result in higher costs |
 4 Financial Highlights Significantly stronger financial position • Combined market cap of $0.8B; Enterprise value of $2.5B • Combined LTM (Sept 08) Revenue ~$6.0B ¹ • Diversified Revenue base across all live entertainment genres • Combined LTM (Sept 08) Adjusted Operating Income ~$0.5B ¹ Combines attractive growth engine with stable, recurring revenue model generating significant free cash flow Significant realizable synergy opportunity • $40MM in estimated cost synergies Creates combined company with strong pro forma balance sheet • 3.4x Pro Forma Debt / LTM Adjusted Operating Income (Sept 08) • 3.2x Pro Forma Debt / LTM Adjusted Operating Income (Sept 08) (incl. synergies) Source: Company filings and management estimates 1 Ticketmaster Entertainment is pro forma for the Front Line acquisition ($194MM of LTM Revenue and $44MM of LTM EBITDA as of 30-Sep-08). Live Nation is not pro forma for discontinued operations. Ticketmaster Entertainment uses EBITDA, but are using Adjusted Operating Income above for consistency. See page 16 for definition of non-GAAP measures. |
 5 Creating the World’s Premier Live Entertainment Company Concert Promotion Ticketing Store Front Fan SPONSORSHIP Concerts/ Venues/ Festivals Marketing Combined Global Fan Database 60MM+ Artist Nation Front Line |
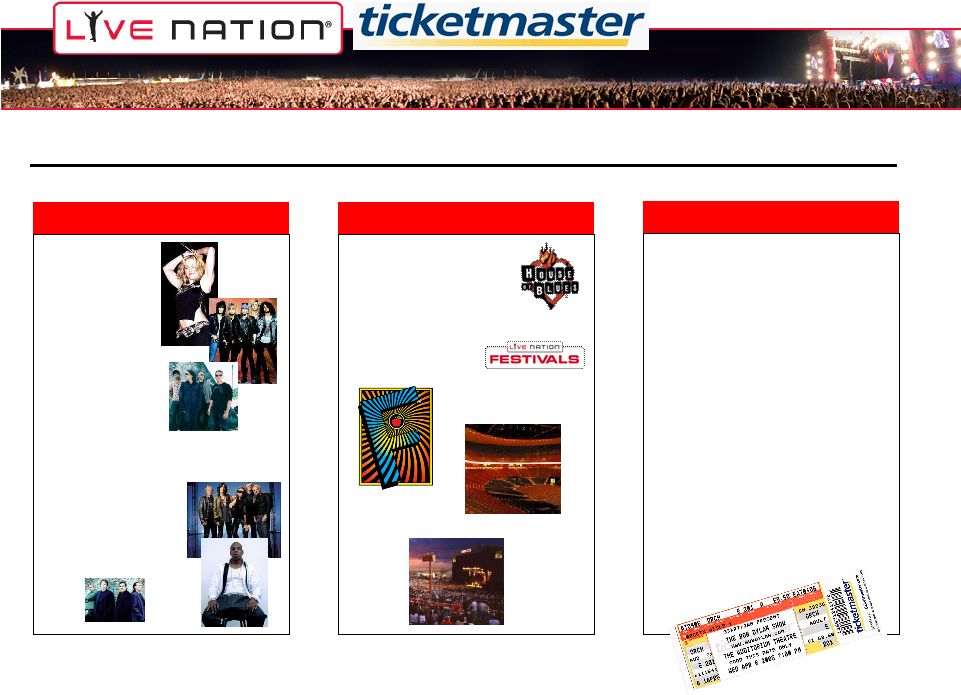
 6 Combines Leading Global Concert Business with Leading Global Ticketing Operator and Management Company Management Company Promotions Ticketing • Madonna • U2 • Jay-Z • Shakira • Nickelback • The Eagles • Christina Aguilera • Aerosmith • Guns N Roses • 200+ others • 47 Amphitheaters • 11 House of Blues • 46 Clubs and Theaters • 30+ Festivals • 32 years of ticketing expertise • More than 280 million tickets processed annually; approximately 140 million sold annually • $8.3 billion gross transaction values; $6.0 billion online • 11,000 venue clients across 20 countries • 6,700 outlets + 16 contact centers |
 7 Integrated Promotion and Ticketing Platform Fans Enhanced ticket / purchasing experience Greater seating and pricing choices • All-in ticket opportunities • Dynamic ticketing solutions Artists Direct-to-fan connection Ability to offer fan base more services and products beyond content / performance Coordinated global image and positioning Venues Improved attendance driven by – • Alignment of promoter and ticketer incentives • Dynamic promotions and flexible ticketing solutions Complementary services offer potential for one- stop shopping Over 30 years of ticketing experience |
 8 Source: Jack Meyers Media Business Report 2007; Live Nation 2007 Actuals Significant Opportunities for Growth Sponsorship Opportunity Online Monetization Opportunity Sponsorship Spending By Segment (US, $B) Sports $9.9B Causes $1.4B Music $1.0B Fairs / Festivals $0.7B Arts $0.8B Other $1.1B $161MM / $1B = 16.1% 23MM+ registered 58MM+ registered $6.0B Gross Transaction Value Resale Opportunity |
 9 Source: 2007 10-K and 2008 Q3 10-Q Note: Ticketmaster Entertainment EBITDA is pro forma for the Front Line acquisition for only the LTM period as of 30-Sep-08. Attractive Combined Financial Profile $2.7 $2.8 $2.9 $3.7 $4.2 $4.4 2003 2004 2005 2006 2007 LTM Q3 CY 08 Live Nation’s Strong Growth Engine $171 $190 $248 $295 $294 $324 2003 2004 2005 2006 2007 LTM Q3 CY 08 Ticketmaster Entertainment’s Stable EBITDA Profile |
 10 Source: Company filings and management estimates Note: Ticketmaster Entertainment is pro forma for the balance sheet impact and $44M of LTM EBITDA as of 30-Sep-08 for the Front Line acquisition. The Ticketmaster Entertainment preferred stock is paid in kind (PIK) and $35MM value of preferred stock is subject to accounting adjustments. Live Nation LTM Adjusted Operating Income is not pro forma for discontinued operations. Operating Cash for Ticketmaster Entertainment excludes client cash. Free Cash for Live Nation excludes deferred income, accrued artist fees, collections on behalf of others and prepaids related to artist settlements / events. Strong Pro Forma Balance Sheet ($ in millions) Live Nation Ticketmaster Pro Forma Combined Cash & Cash Equivalents $ 206 $ 545 $ 751 Free Cash / Operating Cash 50 188 239 Senior Debt $ 461 $ 565 $ 1,026 Senior Notes 300 300 Convertible Bonds 220 220 Other (Including Capital Leases) 118 3 121 Total Debt $ 799 $ 868 $ 1,667 Preferred Stock 40 35 75 Total Debt & Preferred Stock $ 839 $ 903 $ 1,742 Market Capitalization 420 396 816 Total Capitalization $ 1,259 $ 1,299 $ 2,558 LTM Adj Op Income / EBITDA (Sep-08) $ 181 $ 324 $ 505 Estimated Synergies $ 20 $ 20 $ 40 Total Debt & Pref. Stock / Adj Op Inc/EBITDA 4.6 x 2.8 x 3.4 x 4.2 x 2.6 x 3.2 x September 30, 2008 Total Debt & Pref. Stock / Adj Op Income/EBITDA (Incl. Estimated $40mm Synergies) |
 11 Timetable to Close Event Expected Timeline Ticketmaster Entertainment lenders consent process Live Nation and Ticketmaster Entertainment shareholder votes Close transaction Targeting 6-8 weeks 2-4 months Anticipate second half of 2009 following regulatory approval |
 12 Q&A |
 13 Appendix |
 14 Live Nation Current Capitalization Source: Balance sheet data as of 30-Sep-08 per 10-Q. 1 Total size of $285MM with maturity on 6/21/12. 2 $325 million at issue in 2005 due 6/21/13; incurred $225MM Incremental Loan in 2006 with 12/21/13 maturity. 3 Based on 6-Feb-09 closing share price of $5.30 and 79.3MM diluted shares outstanding. ($ in millions) Spread / As of 9/30/08 Maturity Coupon Cash & Cash Equivalents $ 206 Free Cash 50 Revolver¹ $ 40 2012 L + 225 Term Loan² 421 2013 L + 325 Total Bank Debt $ 461 Other (Incl. Capital Leases) 118 Total Senior Debt $ 579 Convertible Sr. Notes 220 2027 2.875% Total Debt $ 799 Preferred Stock 40 2011 13.00% Market Capitalization³ 420 Total Capitalization $ 1,259 Guarantees of Indebtedness $ 3 Letters of Credit 41 |
 15 Ticketmaster Entertainment Current Capitalization Source: Balance sheet data as of 30-Sep-08 per 10-Q. Note: Ticketmaster Entertainment is pro forma for the balance sheet impact of the Front Line acquisition. 1 Total size of $200MM with maturity on 7/25/13. 2 Term Loan A due 7/25/13; Term Loan B due 7/25/14. 3 Based on 6-Feb-09 closing share price of $6.90 and 57.3MM diluted shares outstanding. ($ in millions) Spread / As of 9/30/08 Maturity Coupon Cash & Cash Equivalents $ 545 Operating Cash 188 Revolver¹ 115 2013 L + 225 Term Loan A² 100 2013 L + 275 Term Loan B² 350 2014 L + 325 Total Senior Secured Debt $ 565 Other (Incl. Capital Leases) 3 Sr. Notes 300 2016 10.75% Total Debt $ 868 Preferred Stock $ 35 2013 3.00% Market Capitalization³ 396 Total Capitalization $ 1,299 |
 16 The company uses operating cash as a proxy for how much cash it has available to, among other things, optionally repay debt Non-GAAP Measures This presentation contains certain non-GAAP financial measures as defined by SEC Regulation G. A reconciliation of each such measure to its most directly comparable GAAP financial measure, together with an explanation of why management believes that these non-GAAP financial measures provide useful information to investors, is provided below. Adjusted Operating Income (Loss) is a non-GAAP financial measure that Live Nation defines as operating income (loss) before depreciation and amortization, loss (gain) on sale of operating assets, non-cash compensation expense and certain litigation and reorganization costs. The company uses Adjusted Operating Income (Loss) to evaluate the performance of its operating segments. The company believes that information about Adjusted Operating Income (Loss) assists investors by allowing them to evaluate changes in the operating results of the company’s portfolio of businesses separate from non-operational factors that affect net income, thus providing insights into both operations and the other factors that affect reported results. Adjusted Operating Income (Loss) is not calculated or presented in accordance with U.S. generally accepted accounting principles. A limitation of the use of Adjusted Operating Income (Loss) as a performance measure is that it does not reflect the periodic costs of certain capitalized tangible and intangible assets used in generating revenue in the company’s business. Accordingly, Adjusted Operating Income (Loss) should be considered in addition to, and not as a substitute for, operating income (loss), net income (loss), and other measures of financial performance reported in accordance with U.S. GAAP. Furthermore, this measure may vary among other companies; thus, Adjusted Operating Income (Loss) as presented herein may not be comparable to similarly titled measures of other companies. EBITDA is defined by Ticketmaster Entertainment as operating income excluding, if applicable: (1) depreciation expense (2) non-cash compensation expense, (3) amortization and impairment of intangibles, (4) goodwill impairment, (5) pro forma adjustments for significant acquisitions, and (6) one-time items. Ticketmaster Entertainment believes this measure is useful to investors because it represents the operating results of Ticketmaster Entertainment’s businesses excluding the effects of any other non-cash expenses. EBITDA has certain limitations in that it does not take into account the impact to Ticketmaster Entertainment’s statement of operations of certain expenses, including non-cash compensation, and acquisition-related accounting. Ticketmaster Entertainment endeavors to compensate for the limitations of the non-GAAP measure presented by also providing the comparable GAAP measure with equal or greater prominence and descriptions of the reconciling items, including quantifying such items, to derive the non-GAAP measure. Free Cash is a non-GAAP financial measure that Live Nation defines as cash and cash equivalents less event-related deferred income, less accrued artist fees, less collections on behalf of others plus prepaids related to artist settlements/events. The company uses free cash as a proxy for how much cash it has available to, among other things, optionally repay debt balances, make acquisitions and finance new venue expenditures. Free cash is not calculated or presented in accordance with U.S. generally accepted accounting principles. A limitation of the use of free cash as a performance measure is that it does not necessarily represent funds available for operations and it is not necessarily a measure of our ability to fund our cash needs. Accordingly, free cash should be considered in addition to, and not as a substitute for, cash and cash equivalents and other measures of financial performance reported in accordance with U.S. GAAP. Furthermore, this measure may vary among other companies; thus, free cash as presented herein may not be comparable to similarly titled measures of other companies. Operating Cash is a non-GAAP financial measure that Ticketmaster Entertainment defines as cash and cash equivalents and marketable securities less cash held on behalf of venue clients’. balances, make acquisitions and finance new expenditures. Operating cash is not calculated or presented in accordance with U.S. generally accepted accounting principles. A limitation of the use of operating cash as a performance measure is that it does not necessarily represent funds available for operations and it is not necessarily a measure of our ability to fund our cash needs. Accordingly, operating cash should be considered in addition to, and not as a substitute for, cash and cash equivalents and other measures of financial performance reported in accordance with U.S. GAAP. Furthermore, this measure may vary among other companies; thus, operating cash as presented herein may not be comparable to similarly titled measures of other companies. |
 17 Live Nation Non-GAAP Reconciliation Source: Company filings and related earnings releases Note: Not adjusted for discontinued operations for North American theatrical business, motor sports business and events division that were sold during or subsequent to the period. ($ in millions) 2003 2004 2005 2006 2007 LTM Sep-08 Revenue $ 2,708 $ 2,806 $ 2,937 $ 3,712 $ 4,185 $ 4,425 Operating income $ 108 $ 59 $(13) $ 33 $ 82 $ 198 Depreciation and amortization 64 64 65 128 121 154 Loss (gain) on sale of operating assets (1) 6 5 (11) (51) (198) Non-cash compensation expense 1 1 1 3 29 27 Certain litigation and reorganization costs 0 0 80 0 0 0 Adjusted operating income $ 172 $ 130 $ 138 $ 153 $ 181 $ 181 |
 18 Ticketmaster Entertainment Non-GAAP Reconciliation Source: Company filings and related earnings releases Note: Not adjusted for the pro forma impact of the Front Line acquisition. ($ in millions) LTM 2003 2004 2005 2006 2007 Sep-08 Revenue $ 724 $ 748 $ 929 $ 1,063 $ 1,240 $ 1,422 Net Income $ 82 $ 69 $ 118 $ 177 $ 169 $ 116 Net Interest (income) / expense (1) (7) (17) (34) (32) (1) Equity in income of unconsolidated affiliates (1) (2) (3) (3) (6) (5) Other income (5) (1) (1) (1) (1) (1) Income tax provision 22 51 68 86 89 69 Mintority interest in losses (income) of consolidated subsidiaries 1 2 1 0 (3) (2) Operating Income $ 99 $ 112 $ 166 $ 225 $ 216 $ 175 Non-cash compensation 0 22 20 8 13 23 Depreciation & Amortization 72 56 62 62 65 82 EBITDA $ 171 $ 190 $ 248 $ 295 $ 294 $ 280 |
 19 Reconciliation of Non-GAAP Measures to Their Most Directly Comparable GAAP Measures (Unaudited) Source: Company filings and related earnings releases as of 30-Sep-08 and press releases Note: Ticketmaster Entertainment is pro forma for the balance sheet impact of the Front Line acquisition. ($ in millions) Ticketmaster Entertainment Cash and Cash Equivalents $ 545 Client Cash (357) Operating Cash $ 188 Live Nation Cash and Cash Equivalents $ 206 Deferred Income (222) Accrued Artist Fees (27) Collections on Behalf of Others (83) Prepaids Related to Artist Settlements/Events 176 Free Cash $ 50 |
 20 Forward-Looking Statements Certain statements in this presentation may constitute “forward-looking statements” within the meaning of the Private Securities Litigation Reform Act of 1995. Such forward-looking statements include, but are not limited to, statements regarding: the growth of the North American concert industry; our market and growth opportunities; ticket sales trends information; our ticketing opportunity and strategies; and the amount of anticipated synergies and other benefits associated with the proposed transaction. We wish to caution you that there are some known and unknown factors that could cause actual results to differ materially from any future results, performance or achievements expressed or implied by such forward-looking statements, including but not limited to operational challenges in achieving strategic objectives and executing our plans, the risk that markets do not evolve as anticipated, the possibility that artists may unexpectedly cancel or reschedule all or part of scheduled tours, the potential impact of the general economic slowdown, competition in the industry and challenges associated with building out our ticketing and digital media operations. We refer you to the documents that Live Nation and Ticketmaster Entertainment file from time to time with the SEC, specifically the section titled “Risk Factors” of Live Nation’s most recent Annual Report filed on Form 10-K and Quarterly Reports on Form 10-Q and Ticketmaster Entertainment’s Form 10 and most recent Quarterly Report on Form 10-Q, which contain and identify other important factors that could cause actual results to differ materially from those contained in our projections or forward-looking statements. You are cautioned not to place undue reliance on these forward- looking statements, which speak only as of the date of this presentation. All subsequent written and oral forward-looking statements by or concerning Live Nation or Ticketmaster Entertainment are expressly qualified in their entirety by the cautionary statements above. Live Nation and Ticketmaster Entertainment do not undertake any obligation to publicly update or revise any forward-looking statements because of new information, future events or otherwise. |
 21 In connection with the proposed transaction, Ticketmaster Entertainment and Live Nation intend to file relevant materials with the SEC, including a joint proxy statement/prospectus. INVESTORS ARE URGED TO READ THESE MATERIALS WHEN THEY BECOME AVAILABLE BECAUSE THEY WILL CONTAIN IMPORTANT INFORMATION ABOUT Ticketmaster Entertainment, LIVE NATION AND THE TRANSACTION. The joint proxy statement/prospectus and other relevant materials (when they become available) and any other documents filed by Ticketmaster Entertainment or Live Nation with the SEC may be obtained free of charge at the SEC’s website at http://www.sec.gov. In addition, investors may obtain free copies of the documents filed with the SEC (i) by contacting Live Nation’s Investor Relations at (310) 867-7000 or by accessing Live Nation’s investor relations website at www.livenation.com/investors; or (ii) by contacting Ticketmaster Entertainment’s Investor Relations at (310) 360-2354 or by accessing Ticketmaster Entertainment’s investor relations website at http://investors.Ticketmaster Entertainment.com. Investors are urged to read the joint proxy statement/prospectus and the other relevant materials when they become available before making any voting or investment decision with respect to the transaction. Ticketmaster Entertainment, Live Nation and their respective executive officers and directors may be deemed to be participating in the solicitation of proxies in connection with the transaction. Information about the executive officers and directors of Ticketmaster Entertainment and the number of shares of Ticketmaster Entertainment’s common stock beneficially owned by such persons is set forth in the registration statement on Form S-1 which was filed with the SEC on August 20, 2008. Information about the executive officers and directors of Live Nation and the number of shares of Live Nation’s common stock beneficially owned by such persons is set forth in the proxy statement for Live Nation’s 2008 Annual Meeting of Stockholders which was filed with the SEC on April 29, 2008. Investors may obtain additional information regarding the direct and indirect interests of Ticketmaster Entertainment, Live Nation and their respective executive officers and directors in the transaction by reading the joint proxy statement/prospectus regarding the transaction when it becomes available. This communication shall not constitute an offer to sell or the solicitation of an offer to sell or the solicitation of an offer to buy any securities, nor shall there be any sale of securities in any jurisdiction in which such offer, solicitation or sale would be unlawful prior to registration or qualification under the securities laws of any such jurisdiction. |