Table of Contents
UNITED STATES
SECURITIES AND EXCHANGE COMMISSION
Washington, D.C. 20549
FORM6-K
REPORT OF FOREIGN PRIVATE ISSUER
PURSUANT TO RULE13a-16 OR15d-16
UNDER THE SECURITIES EXCHANGE ACT OF 1934
For the month of July 2019
Commission File Number001-33098
Mizuho Financial Group, Inc.
(Translation of registrant’s name into English)
5-5, Otemachi1-chome
Chiyoda-ku, Tokyo100-8176
Japan
(Address of principal executive office)
Indicate by check mark whether the registrant files or will file annual reports under cover ofForm 20-F orForm 40-F.Form 20-F ☒ Form 40-F ☐
Indicate by check mark if the registrant is submitting theForm 6-K in paper as permitted byRegulation S-T Rule 101(b)(1): ☐
Indicate by check mark if the registrant is submitting the Form6-K in paper as permitted byRegulation S-T Rule 101(b)(7): ☐
Indicate by check mark whether the registrant by furnishing the information contained in this Form is also thereby furnishing the information to the Commission pursuant toRule 12g3-2(b) under the Securities Exchange Act of 1934.
Yes ☐ No ☒
If “Yes” is marked, indicate below the file number assigned to the registrant in connection with Rule12g3-2(b):82- .
Table of Contents
SIGNATURES
Pursuant to the requirements of the Securities Exchange Act of 1934, the registrant has duly caused this report to be signed on its behalf by the undersigned, thereunto duly authorized.
| Date: | July 30, 2019 | |
| Mizuho Financial Group, Inc. | ||
| By: | /s/ Makoto Umemiya | |
| Name: | Makoto Umemiya | |
| Title: | Managing Executive Officer / Group CFO | |
Table of Contents
The following is the English translation of excerpt regarding the Basel Pillar 3 disclosures and the relevant information from our Japanese language disclosure material published in July 2019. The Japanese regulatory disclosure requirements are fulfilled with the Basel Pillar 3 disclosures and Japanese GAAP is applied to the relevant financial information. In this report, “we,” “us,” and “our” refer to Mizuho Financial Group, Inc. and, unless the context indicates otherwise, its consolidated subsidiaries. “Mizuho Financial Group” refers to Mizuho Financial Group, Inc.
| 2 | ||||
| 2 | ||||
Status of Mizuho Financial Group’s Consolidated Capital Adequacy | 3 | |||
| 3 | ||||
| 4 | ||||
| 13 | ||||
∎ Linkages between Financial Statements and Regulatory Exposures | 15 | |||
| 18 | ||||
| 37 | ||||
| 45 | ||||
| 52 | ||||
| 55 | ||||
| 55 | ||||
| 56 | ||||
| 57 | ||||
∎ Geographical distribution of credit exposures used in the countercyclical capital buffer | 59 | |||
∎ Indicators for Assessing Global Systemically Important Banks(G-SIBs) | 60 | |||
| 61 | ||||
| 61 | ||||
| 62 | ||||
| 62 | ||||
| 63 | ||||
| 63 | ||||
| 68 | ||||
| 68 | ||||
| 69 | ||||
| 72 | ||||
| 76 | ||||
| 77 | ||||
1
Table of Contents
Under the capital adequacy ratio regulations agreed upon by the Basel Committee on Banking Supervision, banks are required to meet certain minimum capital requirements. We calculate our capital adequacy ratio on a consolidated basis based on “the criteria used by a bank holding company for deciding whether or not the adequacy of equity capital of the bank holding company and its subsidiaries is appropriate in light of the assets owned by the bank holding company and its subsidiaries pursuant to Article52-25 of the Banking Law” (Financial Services Agency, or FSA, Notice No.20 issued in 2006).
We also calculate our leverage ratio on a consolidated basis according to “the criteria for evaluating the soundness of the leverage, prescribed as supplemental requirements of the criteria used by a bank holding company in deciding whether or not the adequacy of equity capital of the bank holding company and its subsidiaries is appropriate in light of the assets owned by the bank holding company and its subsidiaries, pursuant to Article52-25 of the Banking Law” (FSA Notice No.12 issued in 2019.)
Liquidity standards agreed upon by the Basel Committee on Banking Supervision require our liquidity coverage ratio to surpass certain minimum standards. We calculate our consolidated liquidity coverage ratio (the “Consolidated LCR”) in accordance with the regulation “The Evaluation Criterion on the Sound Management of Liquidity Risk Defined, Based on Banking Law Article52-25, as One of Criteria for Bank Holding Companies to Evaluate the Soundness of Their Management and the Ones of Their Subsidiaries and Others, which is also One of Evaluation Criteria on the Soundness of the Banks’ Management”(the FSA Notice No. 62 of 2014 (the “Notice No. 62”)).
KM1: Key Metrics
| (Millions of yen, except percentages) | ||||||||||||||||||||||
| Basel III Template No. | a | b | c | d | e | |||||||||||||||||
| As of March 31, 2019 | As of December 31, 2018 | As of September 30, 2018 | As of June 30, 2018 | As of March 31, 2018 | ||||||||||||||||||
Capital | ||||||||||||||||||||||
| 1 | Common Equity Tier 1 capital | 7,390,058 | 7,326,381 | 7,607,267 | 7,631,486 | 7,437,048 | ||||||||||||||||
| 2 | Tier 1 capital | 9,232,160 | 9,175,195 | 9,434,893 | 9,112,127 | 9,192,244 | ||||||||||||||||
| 3 | Total capital | 10,917,507 | 10,920,208 | 11,214,088 | 10,859,912 | 10,860,440 | ||||||||||||||||
Risk weighted assets | ||||||||||||||||||||||
| 4 | Risk weighted assets | 57,899,567 | 61,655,523 | 60,240,051 | 60,157,998 | 59,528,983 | ||||||||||||||||
Capital ratio | ||||||||||||||||||||||
| 5 | Common Equity Tier 1 capital ratio | 12.76 | % | 11.88 | % | 12.62 | % | 12.68 | % | 12.49 | % | |||||||||||
| 6 | Tier 1 capital ratio | 15.94 | % | 14.88 | % | 15.66 | % | 15.14 | % | 15.44 | % | |||||||||||
| 7 | Total capital ratio | 18.85 | % | 17.71 | % | 18.61 | % | 18.05 | % | 18.24 | % | |||||||||||
Capital buffer | ||||||||||||||||||||||
| 8 | Capital conservation buffer requirement | 2.50 | % | 1.87 | % | 1.87 | % | 1.87 | % | 1.87 | % | |||||||||||
| 9 | Countercyclical buffer requirement | 0.05 | % | 0.03 | % | 0.02 | % | 0.02 | % | 0.01 | % | |||||||||||
| 10 | BankG-SIB/D-SIB additional requirements | 1.00 | % | 0.75 | % | 0.75 | % | 0.75 | % | 0.75 | % | |||||||||||
| 11 | Total of bank CET1 specific buffer requirements | 3.55 | % | 2.65 | % | 2.64 | % | 2.64 | % | 2.63 | % | |||||||||||
| 12 | CET1 available after meeting the bank’s minimum capital requirements | 8.26 | % | 7.38 | % | 8.12 | % | 8.18 | % | 7.99 | % | |||||||||||
Leverage ratio | ||||||||||||||||||||||
| 13 | Total exposures | 208,557,401 | 209,483,123 | 216,920,174 | 217,040,028 | 214,277,824 | ||||||||||||||||
| 14 | Leverage ratio | 4.42 | % | 4.37 | % | 4.34 | % | 4.19 | % | 4.28 | % | |||||||||||
Liquidity coverage ratio (LCR) | ||||||||||||||||||||||
| 15 | Total HQLA allowed to be included in the calculation | 59,797,149 | 59,793,333 | 62,485,008 | 62,777,196 | 60,159,630 | ||||||||||||||||
| 16 | Net cash outflows | 41,447,805 | 41,184,048 | 48,045,874 | 51,729,447 | 50,079,075 | ||||||||||||||||
| 17 | LCR | 144.3 | % | 145.2 | % | 130.1 | % | 121.3 | % | 120.1 | % | |||||||||||
Note:
Base III Template No. from 15 to 17 are quarterly averages.
2
Table of Contents
Status of Mizuho Financial Group’s Consolidated Capital Adequacy
The information disclosed herein is in accordance with “Matters Separately Prescribed by the Commissioner of the Financial Services Agency Regarding Status of the Adequacy of Equity Capital Pursuant to Article19-2, Paragraph 1, Item 5, Subitem (d), etc. of the Ordinance for Enforcement of the Banking Law” (the FSA Notice No. 7 issued in 2014).
(1) Scope of Consolidation for Calculating Consolidated Capital Adequacy Ratio
(A) Difference from the companies included in the scope of consolidation based on consolidation rules for preparation of consolidated financial statements (the “scope of accounting consolidation”)
None as of March 31, 2018 and 2019
(B) Number of consolidated subsidiaries
| As of March 31, 2018 | As of March 31, 2019 | |||||||
Consolidated subsidiaries | 124 | 117 | ||||||
Our major consolidated subsidiaries are Mizuho Bank, Ltd., Mizuho Trust & Banking Co., Ltd. and Mizuho Securities Co., Ltd.
The following table sets forth information with respect to our principal consolidated subsidiaries as of March 31, 2019:
Name | Country of organization | Main business | Proportion of ownership interest (%) | Proportion of voting interest (%) | ||||||||
Domestic | ||||||||||||
Mizuho Bank, Ltd. | Japan | Banking | 100.0 | 100.0 | ||||||||
Mizuho Trust & Banking Co., Ltd. | Japan | Trust and banking | 100.0 | 100.0 | ||||||||
Mizuho Securities Co., Ltd. | Japan | Securities | 95.8 | 95.8 | ||||||||
Mizuho Research Institute Ltd. | Japan | Research and consulting | 98.6 | 98.6 | ||||||||
Mizuho Information & Research Institute, Inc. | Japan | Information technology | 91.5 | 91.5 | ||||||||
Asset Management One Co., Ltd. | Japan | Investment management | 70.0 | 51.0 | ||||||||
Mizuho Private Wealth Management Co., Ltd. | Japan | Consulting | 100.0 | 100.0 | ||||||||
Mizuho Credit Guarantee Co., Ltd. | Japan | Credit guarantee | 100.0 | 100.0 | ||||||||
Mizuho Realty Co., Ltd. | Japan | Real estate agency | 100.0 | 100.0 | ||||||||
Mizuho Factors, Limited | Japan | Factoring | 100.0 | 100.0 | ||||||||
Mizuho Realty One Co., Ltd. | Japan | Holding company | 100.0 | 100.0 | ||||||||
Defined Contribution Plan Services Co., Ltd. | Japan | Pension plan-related business | 60.0 | 60.0 | ||||||||
Mizuho-DL Financial Technology Co., Ltd. | Japan | Application and Sophistication of Financial Technology | 60.0 | 60.0 | ||||||||
UC Card Co., Ltd. | Japan | Credit card | 51.0 | 51.0 | ||||||||
J.Score CO., LTD. | Japan | Lending | 50.0 | 50.0 | ||||||||
Mizuho Trust Systems Company, Limited. | Japan | Subcontracted calculation services, software development | 50.0 | 50.0 | ||||||||
Mizuho Capital Co., Ltd. | Japan | Venture capital | 50.0 | 50.0 | ||||||||
Overseas | ||||||||||||
Mizuho Americas LLC | U.S.A. | Holding company | 100.0 | 100.0 | ||||||||
Mizuho Bank (China), Ltd. | China | Banking | 100.0 | 100.0 | ||||||||
Mizuho International plc | U.K. | Securities and banking | 100.0 | 100.0 | ||||||||
Mizuho Securities Asia Limited | China | Securities | 100.0 | 100.0 | ||||||||
Mizuho Securities USA LLC | U.S.A. | Securities | 100.0 | 100.0 | ||||||||
Mizuho Bank Europe N.V. | Netherlands | Banking and securities | 100.0 | 100.0 | ||||||||
Banco Mizuho do Brasil S.A. | Brazil | Banking | 100.0 | 100.0 | ||||||||
Mizuho Trust & Banking (Luxembourg) S.A. | Luxembourg | Trust and banking | 100.0 | 100.0 | ||||||||
Mizuho Bank (USA) | U.S.A. | Banking and trust | 100.0 | 100.0 | ||||||||
Mizuho Securities Europe GmbH | Germany | Securities | 100.0 | 100.0 | ||||||||
Mizuho Capital Markets LLC | U.S.A. | Derivatives | 100.0 | 100.0 | ||||||||
PT. Bank Mizuho Indonesia | Indonesia | Banking | 99.0 | 99.0 | ||||||||
(C) Corporations providing financial services for which Article 9 of the FSA Notice No. 20 is applicable
None as of March 31, 2018 and 2019.
3
Table of Contents
(D) Companies that are in the bank holding company’s corporate group but not included in the scope of accounting consolidation and companies that are not in the bank holding company’s corporate group but included in the scope of accounting consolidation
None as of March 31, 2018 and 2019.
(E) Restrictions on transfer of funds or capital within the bank holding company’s corporate group
None as of March 31, 2018 and 2019.
(F) Names of any other financial institutions, etc., classified as subsidiaries or other members of the bank holding company that are deficient in regulatory capital
None as of March 31, 2018 and 2019.
(1) Summary of Approach to Assessing Capital Adequacy
In order to ensure that risk-based capital is sufficiently maintained in light of the risk held by us, we regularly conduct the following assessment of capital adequacy in addition to adopting a suitable and effective capital adequacy monitoring structure.
Maintaining a sufficient BIS capital ratio
We confirm our maintenance of a high level of financial soundness by conducting regular evaluations to examine whether our risk-based capital is adequate in qualitative as well as quantitative terms, in light of our business plans and strategic targets to match the increase in risk-weighted assets acquired for growth, in addition to maintaining our capital above the minimum requirements of common equity Tier 1 capital ratio, Tier 1 capital ratio, total capital ratio, capital buffer ratio, adequate leverage ratio and TLAC ratio.
Balancing risk and capital
On the basis of the framework for allocating risk capital, after obtaining the clearest possible grasp of the group’s overall risk exposure, we endeavor to control risk so as to keep it within the range of our business capacity by means of allocating capital that corresponds to the amount of risk to the principal banking subsidiaries, etc., within the bounds of our capital, and we conduct regular assessments to ensure that a sufficient level of capital is maintained for our risk profile. When making these assessments, we calculate the potential losses arising from assumed stress events and risk volumes, which we assess whether they balance with the group’s capital. Stress events are based on risk scenarios that are formulated based on the current economic condition and the economic outlook, etc. In addition, we examine whether an appropriate return on risk is maintained in the assessments.
4
Table of Contents
(2) Composition of Capital, etc.
(A) CC1: Composition of Capital Disclosure
| (Millions of yen, except percentage) | ||||||||||||||||||
| a | b | c | ||||||||||||||||
Basel III Template | As of March 31, 2018 | As of March 31, 2019 | Reference to Template CC2 | |||||||||||||||
Common Equity Tier 1 capital: instruments and reserves | (1) | |||||||||||||||||
| 1a+2-1c-26 | Directly issued qualifying common share capital plus related stock surplus and retained earnings | 7,292,638 | 7,207,427 | |||||||||||||||
| 1a | of which: capital and stock surplus | 3,391,471 | 3,395,217 | |||||||||||||||
| 2 | of which: retained earnings | 4,002,350 | 3,915,111 | |||||||||||||||
| 1c | of which: treasury stock (-) | 5,997 | 7,703 | |||||||||||||||
| 26 | of which: national specific regulatory adjustments (earnings to be distributed) (-) | 95,186 | 95,197 | |||||||||||||||
of which: other than above | — | — | ||||||||||||||||
| 1b | Subscription rights to common shares | 1,163 | 707 | |||||||||||||||
| 3 | Accumulated other comprehensive income and other disclosed reserves | 1,677,534 | 1,445,770 | (a | ) | |||||||||||||
| 5 | Common share capital issued by subsidiaries and held by third parties (amount allowed in group CET1) | 14,344 | 6,460 | |||||||||||||||
| 6 | Common Equity Tier 1 capital: instruments and reserves | (A) | 8,985,680 | 8,660,365 | ||||||||||||||
Common Equity Tier 1 capital: regulatory adjustments | (2) | |||||||||||||||||
| 8+9 | Total intangible assets (net of related tax liability, excluding those relating to mortgage servicing rights) | 794,953 | 459,991 | |||||||||||||||
| 8 | of which: goodwill (net of related tax liability, including those equivalent) | 85,103 | 73,003 | |||||||||||||||
| 9 | of which: other intangibles other than goodwill and mortgage servicing rights (net of related tax liability) | 709,850 | 386,987 | |||||||||||||||
| 10 | Deferred tax assets that rely on future profitability excluding those arising from temporary differences (net of related tax liability) | 42,352 | 36,566 | |||||||||||||||
| 11 | Deferred gains or losses on derivatives under hedge accounting | (67,578 | ) | (22,282 | ) | |||||||||||||
| 12 | Shortfall of eligible provisions to expected losses | 61,964 | 96,090 | |||||||||||||||
| 13 | Securitization gain on sale | — | — | |||||||||||||||
| 14 | Gains and losses due to changes in own credit risk on fair valued liabilities | 3,960 | 13,006 | |||||||||||||||
| 15 | Net defined benefit asset | 691,380 | 682,142 | |||||||||||||||
| 16 | Investments in own shares (excluding those reported in the net assets section) | 1,457 | 4,792 | |||||||||||||||
| 17 | Reciprocal cross-holdings in common equity | — | — | |||||||||||||||
| 18 | Investments in the capital of banking, financial and insurance entities that are outside the scope of regulatory consolidation, net of eligible short positions, where the bank does not own more than 10% of the issued share capital (amount above the 10% threshold) | 20,140 | — | |||||||||||||||
| 19+20+21 | Amount exceeding the 10% threshold on specified items | — | — | |||||||||||||||
| 19 | of which: significant investments in the common stock of financials | — | — | |||||||||||||||
| 20 | of which: mortgage servicing rights | — | — | |||||||||||||||
| 21 | of which: deferred tax assets arising from temporary differences (net of related tax liability) | — | — | |||||||||||||||
| 22 | Amount exceeding the 15% threshold on specified items | — | — | |||||||||||||||
| 23 | of which: significant investments in the common stock of financials | — | — | |||||||||||||||
| 24 | of which: mortgage servicing rights | — | — | |||||||||||||||
| 25 | of which: deferred tax assets arising from temporary differences (net of related tax liability) | — | — | |||||||||||||||
| 27 | Regulatory adjustments applied to Common Equity Tier 1 due to insufficient Additional Tier 1 and Tier 2 to cover deductions | — | — | |||||||||||||||
| 28 | Common Equity Tier 1 capital: regulatory adjustments | (B) | 1,548,631 | 1,270,307 | ||||||||||||||
Common Equity Tier 1 capital (CET1) | ||||||||||||||||||
| 29 | Common Equity Tier 1 capital (CET1) ((A)-(B)) | (C) | 7,437,048 | 7,390,058 | ||||||||||||||
Additional Tier 1 capital: instruments | (3) | |||||||||||||||||
5
Table of Contents
| 30 31a | Directly issued qualifying Additional Tier 1 instruments plus related stock surplus of which: classified as equity under applicable accounting standards and the breakdown | — | — | |||||||||||||||
| 30 31b | Subscription rights to Additional Tier 1 instruments | — | — | |||||||||||||||
| 30 32 | Directly issued qualifying Additional Tier 1 instruments plus related stock surplus of which: classified as liabilities under applicable accounting standards | 1,220,000 | 1,570,000 | |||||||||||||||
| 30 | Qualifying Additional Tier 1 instruments plus related stock surplus issued by special purpose vehicles and other equivalent entities | — | — | |||||||||||||||
| 34-35 | Additional Tier 1 instruments issued by subsidiaries and held by third parties (amount allowed in group AT1) | 31,317 | 28,502 | |||||||||||||||
| 33+35 | Eligible Tier 1 capital instruments subject tophase-out arrangements included in Additional Tier 1 capital: instruments | 577,500 | 303,000 | |||||||||||||||
| 33 | of which: directly issued capital instruments subject to phase out from Additional Tier 1 | 577,500 | 303,000 | |||||||||||||||
| 35 | of which: instruments issued by subsidiaries subject to phase out | — | — | |||||||||||||||
| 36 | Additional Tier 1 capital: instruments | (D) | 1,828,817 | 1,901,502 | ||||||||||||||
Additional Tier 1 capital: regulatory adjustments | ||||||||||||||||||
| 37 | Investments in own Additional Tier 1 instruments | — | 2,900 | |||||||||||||||
| 38 | Reciprocal cross-holdings in Additional Tier 1 instruments | — | — | |||||||||||||||
| 39
| Investments in the capital of banking, financial and insurance entities that are outside the scope of regulatory consolidation, net of eligible short positions, where the bank does not own more than 10% of the issued common share capital of the entity (amount above 10% threshold) | 121 | — | |||||||||||||||
| 40 | Significant investments in the capital of banking, financial and insurance entities that are outside the scope of regulatory consolidation (net of eligible short positions) | 73,500 | 56,500 | |||||||||||||||
| 42 | Regulatory adjustments applied to Additional Tier 1 due to insufficient Tier 2 to cover deductions | — | — | |||||||||||||||
| 43 | Additional Tier 1 capital: regulatory adjustments | (E) | 73,621 | 59,400 | ||||||||||||||
Additional Tier 1 capital (AT1) | ||||||||||||||||||
| 44 | Additional Tier 1 capital ((D)-(E)) | (F) | 1,755,195 | 1,842,102 | ||||||||||||||
Tier 1 capital (T1 = CET1 + AT1) | ||||||||||||||||||
| 45 | Tier 1 capital (T1 = CET1 + AT1) ((C) + (F)) | (G) | 9,192,244 | 9,232,160 | ||||||||||||||
Tier 2 capital: instruments and provisions | (4) | |||||||||||||||||
| 46 | Directly issued qualifying Tier 2 instruments plus related stock surplus of which: classified as equity under applicable accounting standards and the breakdown | — | — | |||||||||||||||
| 46 | Subscription rights to Tier 2 instruments | — | — | |||||||||||||||
| 46 | Directly issued qualifying Tier 2 instruments plus related stock surplus of which: classified as liabilities under applicable accounting standards | 828,702 | 1,002,257 | |||||||||||||||
| 46 | Tier 2 instruments plus related stock surplus issued by special purpose vehicles and other equivalent entities | 159,405 | 166,150 | |||||||||||||||
| 48-49 | Tier 2 instruments issued by subsidiaries and held by third parties (amount allowed in group Tier 2) | 10,378 | 7,777 | |||||||||||||||
| 47+49 | Eligible Tier 2 capital instruments subject tophase-out arrangements included in Tier 2:instruments and provisions | 674,824 | 506,118 | |||||||||||||||
| 47 | of which: directly issued capital instruments subject to phase out from Tier 2 | 135,135 | 102,237 | |||||||||||||||
| 49 | of which: instruments issued by subsidiaries subject to phase out | 539,688 | 403,880 | |||||||||||||||
| 50 | Total of general allowance for loan losses and eligible provisions included in Tier 2 | 4,794 | 4,377 | |||||||||||||||
| 50a | of which: general allowance for loan losses | 4,794 | 4,377 | |||||||||||||||
| 50b | of which: eligible provisions | — | — | |||||||||||||||
| 51 | Tier 2 capital: instruments and provisions | (H) | 1,678,105 | 1,686,680 | ||||||||||||||
Tier 2 capital: regulatory adjustments | (5) | |||||||||||||||||
| 52 | Investments in own Tier 2 instruments | 1,892 | 1,333 | |||||||||||||||
| 53 | Reciprocal cross-holdings in Tier 2 instruments and other TLAC liabilities | — | — | |||||||||||||||
| 54 | Investments in the capital and other TLAC liabilities of banking, financial and insurance entities that are outside the scope of regulatory consolidation, net of eligible short positions, where the bank does not own more than 10% of the issued common share capital of the entity (amount above the 10% threshold) | 8,016 | — | |||||||||||||||
6
Table of Contents
| 54a | Investments in the other TLAC liabilities of banking, financial and insurance entities that are outside the scope of regulatory consolidation, where the bank does not own more than 10% of the issued common share capital of the entity: amount previously designated for the 5% threshold but that no longer meets the conditions | / | — | |||||||||||||||
| 55 | Significant investments in the capital and other TLAC liabilities of banking, financial and insurance entities that are outside the scope of regulatory consolidation (net of eligible short positions) | — | — | |||||||||||||||
| 57 | Tier 2 capital: regulatory adjustments | (I) | 9,908 | 1,333 | ||||||||||||||
Tier 2 capital (T2) | ||||||||||||||||||
| 58 | Tier 2 capital (T2) ((H)-(I)) | (J) | 1,668,196 | 1,685,347 | ||||||||||||||
Total capital (TC = T1 + T2) | ||||||||||||||||||
| 59 | Total capital (TC = T1 + T2) ((G) + (J)) | (K) | 10,860,440 | 10,917,507 | ||||||||||||||
Risk weighted assets | (6) | |||||||||||||||||
| 60 | Risk weighted assets | (L) | 59,528,983 | 57,899,567 | ||||||||||||||
Capital ratio and buffers (consolidated) | (7) | |||||||||||||||||
| 61 | Common Equity Tier 1 capital ratio (consolidated) ((C)/(L)) | 12.49 | % | 12.76 | % | |||||||||||||
| 62 | Tier 1 capital ratio (consolidated) ((G)/(L)) | 15.44 | % | 15.94 | % | |||||||||||||
| 63 | Total capital ratio (consolidated) ((K)/(L)) | 18.24 | % | 18.85 | % | |||||||||||||
| 64 | Total of bank CET1 specific buffer requirements | 2.63 | % | 3.55 | % | |||||||||||||
| 65 | of which: capital conservation buffer requirement | 1.87 | % | 2.50 | % | |||||||||||||
| 66 | of which: countercyclical buffer requirement | 0.01 | % | 0.05 | % | |||||||||||||
| 67 | of which: bankG-SIB/D-SIB additional requirements | 0.75 | % | 1.00 | % | |||||||||||||
| 68 | CET1 available after meeting the bank’s minimum capital requirements | 7.99 | % | 8.26 | % | |||||||||||||
Regulatory adjustments | (8) | |||||||||||||||||
| 72 | Non-significant investments in the capital and other TLAC liabilities of other financials that are below the thresholds for deduction (before risk weighting) | 745,717 | 540,695 | |||||||||||||||
| 73 | Significant investments in the common stock of financials that are below the thresholds for deduction (before risk weighting) | 142,407 | 250,095 | |||||||||||||||
| 74 | Mortgage servicing rights that are below the thresholds for deduction (before risk weighting) | — | — | |||||||||||||||
| 75 | Deferred tax assets arising from temporary differences that are below the thresholds for deduction (before risk weighting) | 185,172 | 233,628 | |||||||||||||||
Provisions included in Tier 2 capital: instruments and provisions | (9) | |||||||||||||||||
| 76 | Provisions (general allowance for loan losses) | 4,794 | 4,377 | |||||||||||||||
| 77 | Cap on inclusion of provisions (general allowance for loan losses) | 43,678 | 43,521 | |||||||||||||||
| 78 | Provisions eligible for inclusion in Tier 2 in respect of exposures subject to internal ratings-based approach (prior to application of cap) (if the amount is negative, report as “nil”) | — | — | |||||||||||||||
| 79 | Cap for inclusion of provisions in Tier 2 under internal ratings-based approach | 284,521 | 278,991 | |||||||||||||||
Capital instruments subject tophase-out arrangements | (10) | |||||||||||||||||
| 82 | Current cap on AT1 instruments subject tophase-out arrangements | 833,255 | 624,941 | |||||||||||||||
| 83 | Amount excluded from AT1 due to cap (excess over cap after redemptions and maturities) (if the amount is negative, report as “nil”) | — | — | |||||||||||||||
| 84 | Current cap on T2 instruments subject tophase-out arrangements | 674,824 | 506,118 | |||||||||||||||
| 85 | Amount excluded from T2 due to cap (excess over cap after redemptions and maturities) (if the amount is negative, report as “nil”) | 7,304 | 37,812 | |||||||||||||||
Notes: | ||
1. | The above figures are calculated based on the international standard applied on a consolidated basis under the FSA Notice No. 20. | |
2. | As an external audit of calculating the consolidated capital adequacy ratio, we underwent an examination under the procedures agreed with by Ernst & Young ShinNihon LLC, on the basis of “Practical guidance on agreed-upon procedures for the calculation of capital adequacy ratio” (Practical Guideline for specialized fields No. 4465 of the Japanese Institute of Certified Public Accountants). Note that this examination is not a part of the audit performed on our consolidated financial statements or internal controls over financial reporting. Ernst & Young ShinNihon LLC does not give its opinion or conclusion concerning the capital adequacy ratio or our internal control structure regarding the calculation of the capital adequacy ratio. Instead, it performs an examination to the extent both of us agreed to and reports the results to us. | |
7
Table of Contents
(B) CC2:Reconciliation of regulatory capital to consolidated balance sheet
| (Millions of yen) | ||||||||||||||
Items | a | b | c | d | ||||||||||
| Consolidated balance sheet as in published financial statements | Consolidated balance sheet as in published financial statements | Reference to Template CC1 | Cross-reference to Appended template | |||||||||||
| As of March 31, 2018 | As of March 31, 2019 | |||||||||||||
(Assets) | ||||||||||||||
Cash and Due from Banks | 47,725,360 | 45,108,602 | ||||||||||||
Call Loans and Bills Purchased | 715,149 | 648,254 | ||||||||||||
Receivables under Resale Agreements | 8,080,873 | 12,997,628 | ||||||||||||
Guarantee Deposits Paid under Securities Borrowing Transactions | 4,350,527 | 2,578,133 | ||||||||||||
Other Debt Purchased | 2,713,742 | 2,828,959 | ||||||||||||
Trading Assets | 10,507,133 | 12,043,608 | 6-a | |||||||||||
Money Held in Trust | 337,429 | 351,889 | ||||||||||||
Securities | 34,183,033 | 29,774,489 | 2-b,6-b | |||||||||||
Loans and Bills Discounted | 79,421,473 | 78,456,935 | 6-c | |||||||||||
Foreign Exchange Assets | 1,941,677 | 1,993,668 | ||||||||||||
Derivatives other than for Trading Assets | 1,807,999 | 1,328,227 | 6-d | |||||||||||
Other Assets | 4,588,484 | 4,229,589 | 6-e | |||||||||||
Tangible Fixed Assets | 1,111,128 | 1,037,006 | ||||||||||||
Intangible Fixed Assets | 1,092,708 | 620,231 | 2-a | |||||||||||
Net Defined Benefit Asset | 996,173 | 982,804 | 3 | |||||||||||
Deferred Tax Assets | 47,839 | 37,960 | 4-a | |||||||||||
Customers’ Liabilities for Acceptances and Guarantees | 5,723,186 | 6,062,053 | ||||||||||||
Reserves for Possible Losses on Loans | (315,621 | ) | (287,815 | ) | ||||||||||
|
|
|
| |||||||||||
Total Assets | 205,028,300 | 200,792,226 | ||||||||||||
|
|
|
| |||||||||||
(Liabilities) | ||||||||||||||
Deposits | 125,081,233 | 124,311,025 | ||||||||||||
Negotiable Certificates of Deposit | 11,382,590 | 13,338,571 | ||||||||||||
Call Money and Bills Sold | 2,105,293 | 2,841,931 | ||||||||||||
Payables under Repurchase Agreements | 16,656,828 | 14,640,439 | ||||||||||||
Guarantee Deposits Received under Securities Lending Transactions | 1,566,833 | 1,484,584 | ||||||||||||
Commercial Paper | 710,391 | 941,181 | ||||||||||||
Trading Liabilities | 8,121,543 | 8,325,520 | 6-f | |||||||||||
Borrowed Money | 4,896,218 | 3,061,504 | 8-a | |||||||||||
Foreign Exchange Liabilities | 445,804 | 669,578 | ||||||||||||
Short-term Bonds | 362,185 | 355,539 | ||||||||||||
Bonds and Notes | 7,544,256 | 8,351,071 | 8-b | |||||||||||
Due to Trust Accounts | 4,733,131 | 1,102,073 | ||||||||||||
Derivatives other than for Trading Liabilities | 1,514,483 | 1,165,602 | 6-g | |||||||||||
Other Liabilities | 3,685,585 | 4,512,325 | ||||||||||||
Reserve for Bonus Payments | 66,872 | 68,117 | ||||||||||||
Reserve for Variable Compensation | 3,242 | 2,867 | ||||||||||||
Net Defined Benefit Liability | 58,890 | 60,873 | ||||||||||||
Reserve for Director and Corporate Auditor Retirement Benefits | 1,460 | 1,389 | ||||||||||||
Reserve for Possible Losses on Sales of Loans | 1,075 | 630 | ||||||||||||
Reserve for Contingencies | 5,622 | 4,910 | ||||||||||||
Reserve for Reimbursement of Deposits | 20,011 | 19,068 | ||||||||||||
Reserve for Reimbursement of Debentures | 30,760 | 25,566 | ||||||||||||
Reserves under Special Laws | 2,361 | 2,473 | ||||||||||||
Deferred Tax Liabilities | 421,002 | 185,974 | 4-b | |||||||||||
Deferred Tax Liabilities for Revaluation Reserve for Land | 66,186 | 63,315 | 4-c | |||||||||||
Acceptances and Guarantees | 5,723,186 | 6,062,053 | ||||||||||||
|
|
|
| |||||||||||
Total Liabilities | 195,207,054 | 191,598,188 | ||||||||||||
|
|
|
| |||||||||||
8
Table of Contents
(Net Assets) | ||||||||||||||
Common Stock | 2,256,548 | 2,256,767 | 1-a | |||||||||||
Capital Surplus | 1,134,922 | 1,138,449 | 1-b | |||||||||||
Retained Earnings | 4,002,835 | 3,915,521 | 1-c | |||||||||||
Treasury Stock | (5,997 | ) | (7,703 | ) | 1-d | |||||||||
|
|
|
| |||||||||||
Total Shareholders’ Equity | 7,388,309 | 7,303,034 | ||||||||||||
|
|
|
| |||||||||||
Net Unrealized Gains (Losses) on Other Securities | 1,392,392 | 1,186,401 | ||||||||||||
Deferred Gains or Losses on Hedges | (67,578 | ) | (22,282 | ) | 5 | |||||||||
Revaluation Reserve for Land | 144,277 | 137,772 | ||||||||||||
Foreign Currency Translation Adjustments | (85,094 | ) | (111,057 | ) | ||||||||||
Remeasurements of Defined Benefit Plans | 293,536 | 254,936 | ||||||||||||
|
|
|
| |||||||||||
Total Accumulated Other Comprehensive Income | 1,677,534 | 1,445,770 | (a) | |||||||||||
|
|
|
| |||||||||||
Stock Acquisition Rights | 1,163 | 707 | ||||||||||||
Non-Controlling Interests | 754,239 | 444,525 | 7 | |||||||||||
|
|
|
| |||||||||||
Total Net Assets | 9,821,246 | 9,194,038 | ||||||||||||
|
|
|
| |||||||||||
Total Liabilities and Net Assets | 205,028,300 | 200,792,226 | ||||||||||||
|
|
|
| |||||||||||
Note:
The regulatory scope of consolidation is the same as the accounting scope of consolidation.
Appended template
1. Shareholders’ equity
(1) Consolidated balance sheet
(Millions of yen) | ||||||||||||
Ref. | Consolidated balance sheet items | As of March 31, 2018 | As of March 31, 2019 | Remarks | ||||||||
1-a | Common stock | 2,256,548 | 2,256,767 | |||||||||
1-b | Capital surplus | 1,134,922 | 1,138,449 | |||||||||
1-c | Retained earnings | 4,002,835 | 3,915,521 | |||||||||
1-d | Treasury stock | (5,997 | ) | (7,703 | ) | |||||||
| Total shareholders’ equity | 7,388,309 | 7,303,034 | ||||||||||
(2) Composition of capital | ||||||||||||
Basel III | (Millions of yen) | |||||||||||
Composition of capital disclosure | As of March 31, 2018 | As of March 31, 2019 | Remarks | |||||||||
| Directly issued qualifying common share capital plus related stock surplus and retained earnings | 7,387,824 | 7,302,625 | Shareholders’ equity attributable to common shares (before adjusting national specific regulatory adjustments (earnings to be distributed)) | ||||||||
1a | of which: capital and stock surplus | 3,391,471 | 3,395,217 | |||||||||
2 | of which: retained earnings | 4,002,350 | 3,915,111 | |||||||||
1c | of which: treasury stock (-) | 5,997 | 7,703 | |||||||||
of which: other than above | — | — | ||||||||||
31a | Directly issued qualifying additional Tier 1 instruments plus related stock surplus of which: classified as equity under applicable accounting standards and the breakdown | — | — | |||||||||
2. Intangible fixed assets | ||||||||||||
(1) Consolidated balance sheet | ||||||||||||
| (Millions of yen) | ||||||||||||
Ref. | Consolidated balance sheet items | As of March 31, 2018 | As of March 31, 2019 | Remarks | ||||||||
2-a | Intangible fixed assets | 1,092,708 | 620,231 | |||||||||
2-b | Securities | 34,183,033 | 29,774,489 | |||||||||
of which: share of goodwill of companies accounted for using the equity method | 14,588 | 7,508 | Share of goodwill of companies accounted for using the equity method | |||||||||
| Income taxes related to above | (312,342 | ) | (167,749 | ) | |||||||
9
Table of Contents
(2) Composition of capital | ||||||||||||
| Basel III | (Millions of yen) | |||||||||||
template | Composition of capital disclosure | As of March 31, 2018 | As of March 31, 2019 | Remarks | ||||||||
| 8 | Goodwill (net of related tax liability, including those equivalent) | 85,103 | 73,003 | |||||||||
| 9 | Other intangibles other than goodwill and mortgage servicing rights (net of related tax liability) | 709,850 | 386,987 | Software and other | ||||||||
Mortgage servicing rights (net of related tax liability) | — | — | ||||||||||
| 20 | Amount exceeding the 10% threshold on specified items | — | — | |||||||||
| 24 | Amount exceeding the 15% threshold on specified items | — | — | |||||||||
| 74 | Mortgage servicing rights that are below the thresholds for deduction (before risk weighting) | — | — | |||||||||
3. Net defined benefit asset | ||||||||||||
(1) Consolidated balance sheet
| ||||||||||||
(Millions of yen) | ||||||||||||
Ref. | Consolidated balance sheet items | As of March 31, 2018 | As of March 31, 2019 | Remarks | ||||||||
3 | Net defined benefit asset | 996,173 | 982,804 | |||||||||
Income taxes related to above | (304,793 | ) | (300,661 | ) | ||||||||
(2) Composition of capital
| ||||||||||||
Basel III | Composition of capital disclosure | (Millions of yen) | ||||||||||
As of March 31, 2018 | As of March 31, 2019 | Remarks | ||||||||||
| 15 | Net defined benefit asset | 691,380 | 682,142 | |||||||||
4. Deferred tax assets
| ||||||||||||
(1) Consolidated balance sheet
| ||||||||||||
(Millions of yen) | ||||||||||||
Ref. | Consolidated balance sheet items | As of March 31, 2018 | As of March 31, 2019 | Remarks | ||||||||
| 4-a | Deferred tax assets | 47,839 | 37,960 | |||||||||
| 4-b | Deferred tax liabilities | 421,002 | 185,974 | |||||||||
| 4-c | Deferred tax liabilities for revaluation reserve for land | 66,186 | 63,315 | |||||||||
Tax effects on intangible fixed assets | 312,342 | 167,749 | ||||||||||
Tax effects on net defined benefit asset | 304,793 | 300,661 | ||||||||||
(2) Composition of capital
| ||||||||||||
| Basel III | (Millions of yen) | |||||||||||
template | Composition of capital disclosure | As of March 31, 2018 | As of March 31, 2019 | Remarks | ||||||||
| 10 | Deferred tax assets that rely on future profitability excluding those arising from temporary differences (net of related tax liability) | 42,352 | 36,566 | This item does not agree with the amount reported on the consolidated balance sheet due to offsetting of assets and liabilities. | ||||||||
Deferred tax assets that rely on future profitability arising from temporary differences (net of related tax liability) | 185,172 | 233,628 | This item does not agree with the amount reported on the consolidated balance sheet due to offsetting of assets and liabilities. | |||||||||
| 21 | Amount exceeding the 10% threshold on specified items | — | — | |||||||||
| 25 | Amount exceeding the 15% threshold on specified items | — | — | |||||||||
| 75 | Deferred tax assets arising from temporary differences that are below the thresholds for deduction (before risk weighting) | 185,172 | 233,628 | |||||||||
10
Table of Contents
5. Deferred gains or losses on derivatives under hedge accounting
(1) Consolidated balance sheet |
| (Millions of yen) | ||||||||||||
Ref. | Consolidated balance sheet items | As of March 31, 2018 | As of March 31, 2019 | Remarks | ||||||||
| 5 | Deferred gains or losses on hedges | (67,578 | ) | (22,282 | ) | |||||||
(2) Composition of capital |
| |||||||||||
Basel III template | (Millions of yen) | |||||||||||
Composition of capital disclosure | As of March 31, 2018 | As of March 31, 2019 | Remarks | |||||||||
11
| Deferred gains or losses on derivatives under hedge accounting | (67,578 | ) | (22,282 | ) | |||||||
6. Items associated with investments in the capital of financial institutions
(1) Consolidated balance sheet |
| (Millions of yen) | ||||||||||||
Ref. | Consolidated balance sheet items | As of March 31, 2018 | As of March 31, 2019 | Remarks | ||||||||
6-a | Trading assets | 10,507,133 | 12,043,608 | Including trading account securities and derivatives for trading assets | ||||||||
6-b | Securities | 34,183,033 | 29,774,489 | |||||||||
6-c | Loans and bills discounted | 79,421,473 | 78,456,935 | Including subordinated loans | ||||||||
6-d | Derivatives other than for trading assets | 1,807,999 | 1,328,227 | |||||||||
6-e | Other assets | 4,588,484 | 4,229,589 | Including money invested | ||||||||
6-f | Trading liabilities | 8,121,543 | 8,325,520 | Including trading account securities sold | ||||||||
6-g | Derivatives other than for trading liabilities | 1,514,483 | 1,165,602 | |||||||||
(2) Composition of capital |
| |||||||||||
Basel III template | (Millions of yen) | |||||||||||
Composition of capital disclosure | As of March 31, 2018 | As of March 31, 2019 | Remarks | |||||||||
Investments in own capital instruments | 3,349 | 9,026 | ||||||||||
16 | Common equity Tier 1 capital | 1,457 | 4,792 | |||||||||
37 | Additional Tier 1 capital | — | 2,900 | |||||||||
52 | Tier 2 capital | 1,892 | 1,333 | |||||||||
Reciprocal cross-holdings in the capital of banking, financial and insurance entities | — | — | ||||||||||
17 | Common equity Tier 1 capital | — | — | |||||||||
38 | Additional Tier 1 capital | — | — | |||||||||
53 | Tier 2 capital and other TLAC liabilities | — | — | |||||||||
Investments in the capital of banking, financial and insurance entities that are outside the scope of regulatory consolidation, net of eligible short positions, where the bank does not own more than 10% of the issued share capital (amount above 10% threshold) | 773,996 | 540,695 | ||||||||||
18 | Common equity Tier 1 capital | 20,140 | — | |||||||||
39 | Additional Tier 1 capital | 121 | — | |||||||||
54 | Tier 2 capital and other TLAC liabilities | 8,016 | — | |||||||||
72 | Non-significant investments in the capital and other TLAC liabilities of other financials that are below the thresholds for deduction (before risk weighting) | 745,717 | 540,695 | |||||||||
Significant investments in the capital of banking, financial and insurance entities that are outside the scope of regulatory consolidation, net of eligible short positions | 215,907 | 306,595 | ||||||||||
19 | Amount exceeding the 10% threshold on specified items | — | — | |||||||||
23 | Amount exceeding the 15% threshold on specified items | — | — | |||||||||
40 | Additional Tier 1 capital | 73,500 | 56,500 | |||||||||
55 | Tier 2 capital and other TLAC liabilities | — | — | |||||||||
73 | Significant investments in the common stock of financials that are below the thresholds for deduction (before risk weighting) | 142,407 | 250,095 | |||||||||
11
Table of Contents
7.Non-Controlling interests
| ||||||||||||
(1) Consolidated balance sheet
| ||||||||||||
| (Millions of yen) | ||||||||||||
Ref. | Consolidated balance sheet items | As of March 31, 2018 | As of March 31, 2019 | Remarks | ||||||||
7 | Non-Controlling interests | 754,239 | 444,525 | |||||||||
(2) Composition of capital
| ||||||||||||
| Basel III | (Millions of yen) | |||||||||||
template | Composition of capital disclosure | As of March 31, 2018 | As of March 31, 2019 | Remarks | ||||||||
5 | Common share capital issued by subsidiaries and held by third parties (amount allowed in group CET1) | 14,344 | 6,460 | After reflecting amounts eligible for inclusion(non-controlling interest after adjustments) | ||||||||
30- 31ab-32 | Qualifying additional Tier 1 instruments plus related stock surplus issued by special purpose vehicles and other equivalent entities | — | — | After reflecting amounts eligible for inclusion(non-controlling interest after adjustments) | ||||||||
34-35 | Additional Tier 1 instruments issued by subsidiaries and held by third parties (amount allowed in group AT1) | 31,317 | 28,502 | After reflecting amounts eligible for inclusion(non-controlling interest after adjustments) | ||||||||
46 | Tier 2 instruments plus related stock surplus issued by special purpose vehicles and other equivalent entities | 159,405 | 166,150 | After reflecting amounts eligible for inclusion(non-controlling interest after adjustments) | ||||||||
48-49 | Tier 2 instruments issued by subsidiaries and held by third parties (amount allowed in group Tier 2) | 10,378 | 7,777 | After reflecting amounts eligible for inclusion(non-controlling interest after adjustments) | ||||||||
8. Other capital instruments
| ||||||||||||
(1) Consolidated balance sheet
| ||||||||||||
| (Millions of yen) | ||||||||||||
Ref. | Consolidated balance sheet items | As of March 31, 2018 | As of March 31, 2019 | Remarks | ||||||||
8-a | Borrowed money | 4,896,218 | 3,061,504 | |||||||||
8-b | Bonds and notes | 7,544,256 | 8,351,071 | |||||||||
Total | 12,440,475 | 11,412,575 | ||||||||||
(2) Composition of capital
| ||||||||||||
| Basel III | (Millions of yen) | |||||||||||
template | Composition of capital disclosure | As of March 31, 2018 | As of March 31, 2019 | Remarks | ||||||||
32 | Directly issued qualifying additional Tier 1 instruments plus related stock surplus of which: classified as liabilities under applicable accounting standards | 1,220,000 | 1,570,000 | |||||||||
46 | Directly issued qualifying Tier 2 instruments plus related stock surplus of which: classified as liabilities under applicable accounting standards | 828,702 | 1,002,257 | |||||||||
12
Table of Contents
∎ Summary of Risk Management and Risk-weighted Assets (RWA)
(1) Summary of Our Group’s Risk Profile, Risk Management Policies/ Procedures and Structure
See page 68 for a summary of our group’s risk profile and risk management policies, etc.
(2) Summary of RWA
(A) OV1: Overview of Risk-weighted Assets (RWA)
| (Millions of yen) | ||||||||||||||||||
| a | b | c | d | |||||||||||||||
| RWA | Capital requirements | |||||||||||||||||
| Basel III Template No. | As of March 31, 2019 | As of March 31, 2018 | As of March 31, 2019 | As of March 31, 2018 | ||||||||||||||
| 1 | Credit risk (excluding counterparty credit risk) | 37,656,623 | 38,823,030 | 3,177,419 | 3,275,858 | |||||||||||||
|
|
|
|
|
|
|
| |||||||||||
| 2 | of which: standardized approach (SA) | 1,738,523 | 1,820,063 | 139,081 | 145,605 | |||||||||||||
| 3 | of which: internal rating-based (IRB) approach | 34,352,032 | 35,420,038 | 2,913,052 | 3,003,619 | |||||||||||||
of which: significant investments | — | — | — | — | ||||||||||||||
of which: estimated residual value of lease transactions | — | — | — | — | ||||||||||||||
others | 1,566,067 | 1,582,929 | 125,285 | 126,634 | ||||||||||||||
|
|
|
|
|
|
|
| |||||||||||
| 4 | Counterparty credit risk (CCR) | 4,491,743 | 4,531,171 | 364,208 | 366,994 | |||||||||||||
|
|
|
|
|
|
|
| |||||||||||
| 5 | of which:SA-CCR | — | — | — | — | |||||||||||||
of which: current exposure method | 139,720 | 216,424 | 11,518 | 17,723 | ||||||||||||||
| 6 | of which: expected positive exposure (EPE) method | 878,845 | 887,843 | 73,961 | 74,632 | |||||||||||||
of which: credit valuation adjustment (CVA) risk | 2,457,535 | 2,539,780 | 196,602 | 203,182 | ||||||||||||||
of which: central counterparty-related | 190,997 | 193,088 | 15,279 | 15,447 | ||||||||||||||
Others | 824,644 | 694,035 | 66,846 | 56,009 | ||||||||||||||
|
|
|
|
|
|
|
| |||||||||||
| 7 | Equity positions in banking book under market-based approach | 2,492,949 | 2,972,073 | 211,402 | 252,031 | |||||||||||||
|
|
|
|
|
|
|
| |||||||||||
| 8 | Equity investments in funds–Look-through approach | 2,620,615 | / | 220,993 | / | |||||||||||||
| 9 | Equity investments in funds–Mandate-based approach | — | / | — | / | |||||||||||||
Equity investments in funds–Simple approach (subject to 250% RW) | — | / | — | / | ||||||||||||||
Equity investments in funds–Simple approach (subject to 400% RW) | 598,267 | / | 50,733 | / | ||||||||||||||
| 10 | Equity investments in funds–Fall-back approach | 19,489 | / | 1,563 | / | |||||||||||||
Fund exposures–standardized approach | / | — | / | — | ||||||||||||||
Fund exposures–regarded method | / | 3,515,582 | / | 297,289 | ||||||||||||||
|
|
|
|
|
|
|
| |||||||||||
| 11 | Settlement risk | 2,705 | 4,574 | 229 | 386 | |||||||||||||
|
|
|
|
|
|
|
| |||||||||||
| 12 | Securitization exposures in banking book | 1,050,204 | 379,016 | 84,016 | 32,003 | |||||||||||||
|
|
|
|
|
|
|
| |||||||||||
| 13 | of which: Securitisation IRB approach(SEC-IRBA) or internal assessment approach(IAA) | 735,081 | / | 58,806 | / | |||||||||||||
| 14 | of which: Securitisation external ratings-based approach(SEC-ERBA) | 304,189 | / | 24,335 | / | |||||||||||||
| 15 | of which: Securitisation standardised approach(SEC-SA) | — | / | — | / | |||||||||||||
of which: IRB ratings-based approach (RBA) or IRB internal assessment approach (IAA) | / | 110,551 | / | 9,374 | ||||||||||||||
of which: IRB supervisory formula approach (SFA) | / | 231,492 | / | 19,630 | ||||||||||||||
of which: SA/simplified supervisory formula approach (SSFA) | / | 25,711 | / | 2,056 | ||||||||||||||
of which: 1250% risk weight is applied | 10,933 | 11,261 | 874 | 941 | ||||||||||||||
|
|
|
|
|
|
|
| |||||||||||
| 16 | Market risk | 2,034,213 | 2,470,321 | 162,737 | 197,625 | |||||||||||||
|
|
|
|
|
|
|
| |||||||||||
| 17 | of which: standardized approach (SA) | 1,172,343 | 1,406,398 | 93,787 | 112,511 | |||||||||||||
| 18 | of which: internal model approaches (IMA) | 861,870 | 1,063,922 | 68,949 | 85,113 | |||||||||||||
|
|
|
|
|
|
|
| |||||||||||
| 19 | Operational risk | 3,236,495 | 3,411,289 | 258,919 | 272,903 | |||||||||||||
|
|
|
|
|
|
|
| |||||||||||
| 20 | of which: basic indicator approach | 628,110 | 591,083 | 50,248 | 47,286 | |||||||||||||
| 21 | of which: standardized approach | — | — | — | — | |||||||||||||
| 22 | of which: advanced measurement approach | 2,608,385 | 2,820,206 | 208,670 | 225,616 | |||||||||||||
|
|
|
|
|
|
|
| |||||||||||
| 23 | Exposures of specified items not subject to regulatory adjustments | 1,209,277 | 818,950 | 99,743 | 67,224 | |||||||||||||
|
|
|
|
|
|
|
| |||||||||||
Amounts included in RWA subject tophase-out arrangements | — | — | — | — | ||||||||||||||
|
|
|
|
|
|
|
| |||||||||||
| 24 | Floor adjustment | — | — | — | — | |||||||||||||
|
|
|
|
|
|
|
| |||||||||||
| 25 | Total (after applying the scaling factor) | 57,899,567 | 59,528,983 | 4,631,965 | 4,762,318 | |||||||||||||
|
|
|
|
|
|
|
| |||||||||||
13
Table of Contents
(B) Credit Risk-weighted Assets by Asset Class and Ratings Segment
| (Billions of yen) | ||||||||||||||||||||||||
| As of March 31, 2018 | As of March 31, 2019 | |||||||||||||||||||||||
| EAD | RWA | Risk Weight (%) | EAD | RWA | Risk Weight (%) | |||||||||||||||||||
Internal ratings-based approach | 188,162.7 | 47,619.7 | 25.30 | 188,866.1 | 42,309.2 | 22.40 | ||||||||||||||||||
|
|
|
|
|
|
|
|
|
|
|
| |||||||||||||
Corporate, etc. | 162,853.7 | 29,536.1 | 18.13 | 171,471.5 | 29,822.5 | 17.39 | ||||||||||||||||||
Corporate (except specialized lending) | 79,917.9 | 27,232.1 | 34.07 | 87,608.9 | 27,339.1 | 31.20 | ||||||||||||||||||
RatingsA1-B2 | 58,776.0 | 13,840.5 | 23.54 | 65,892.5 | 13,942.5 | 21.15 | ||||||||||||||||||
RatingsC1-D3 | 19,376.2 | 11,569.6 | 59.71 | 20,261.6 | 12,045.7 | 59.45 | ||||||||||||||||||
RatingsE1-E2 | 1,182.2 | 1,625.0 | 137.45 | 867.6 | 1,105.3 | 127.39 | ||||||||||||||||||
RatingsE2R-H1 | 583.3 | 196.7 | 33.73 | 587.1 | 245.4 | 41.81 | ||||||||||||||||||
Sovereign | 76,803.1 | 833.9 | 1.08 | 77,227.7 | 963.2 | 1.24 | ||||||||||||||||||
RatingsA1-B2 | 76,674.5 | 758.3 | 0.98 | 77,117.9 | 886.3 | 1.14 | ||||||||||||||||||
RatingsC1-D3 | 128.2 | 75.2 | 58.70 | 108.0 | 73.8 | 68.33 | ||||||||||||||||||
RatingsE1-E2 | 0.3 | 0.2 | 82.31 | 1.8 | 3.0 | 169.08 | ||||||||||||||||||
RatingsE2R-H1 | 0.0 | 0.0 | 39.56 | 0.0 | 0.0 | 40.96 | ||||||||||||||||||
Bank | 5,986.3 | 1,313.1 | 21.93 | 6,461.1 | 1,338.4 | 20.71 | ||||||||||||||||||
RatingsA1-B2 | 5,447.4 | 1,002.1 | 18.39 | 5,951.3 | 1,027.1 | 17.25 | ||||||||||||||||||
RatingsC1-D3 | 537.5 | 310.5 | 57.77 | 508.5 | 310.7 | 61.10 | ||||||||||||||||||
RatingsE1-E2 | 0.0 | 0.0 | 129.81 | 0.0 | 0.0 | 153.40 | ||||||||||||||||||
RatingsE2R-H1 | 1.2 | 0.3 | 29.94 | 1.2 | 0.3 | 32.33 | ||||||||||||||||||
Specialized lending | 146.3 | 156.9 | 107.22 | 173.5 | 181.6 | 104.67 | ||||||||||||||||||
Retail | 11,629.8 | 3,818.0 | 32.83 | 11,046.3 | 3,526.3 | 31.92 | ||||||||||||||||||
Residential mortgage | 9,046.0 | 2,508.1 | 27.72 | 8,716.2 | 2,338.3 | 26.82 | ||||||||||||||||||
Qualifying revolving loan | 673.7 | 513.0 | 76.14 | 642.9 | 504.2 | 78.42 | ||||||||||||||||||
Other retail | 1,910.0 | 796.8 | 41.72 | 1,687.1 | 683.7 | 40.52 | ||||||||||||||||||
Equities | 5,136.2 | 8,436.2 | 164.25 | 4,407.4 | 7,183.3 | 162.98 | ||||||||||||||||||
PD/LGD approach | 4,162.6 | 5,279.2 | 126.82 | 3,559.8 | 4,445.9 | 124.89 | ||||||||||||||||||
Market-based approach | 973.5 | 3,157.0 | 324.26 | 847.6 | 2,737.4 | 322.95 | ||||||||||||||||||
Regarded-method exposure | 2,102.9 | 3,716.1 | 176.70 | / | / | / | ||||||||||||||||||
Securitizations | 4,169.4 | 371.5 | 8.91 | / | / | / | ||||||||||||||||||
Others | 2,270.5 | 1,741.5 | 76.70 | 1,940.7 | 1,776.9 | 91.56 | ||||||||||||||||||
|
|
|
|
|
|
|
|
|
|
|
| |||||||||||||
Standardized approach | 18,603.6 | 3,294.7 | 17.71 | 4,620.6 | 3,282.2 | 71.03 | ||||||||||||||||||
|
|
|
|
|
|
|
|
|
|
|
| |||||||||||||
Equity investments in funds | / | / | / | 2,262.8 | 3,416.1 | 150.96 | ||||||||||||||||||
|
|
|
|
|
|
|
|
|
|
|
| |||||||||||||
Securitization exposures | / | / | / | 4,185.2 | 972.7 | 23.24 | ||||||||||||||||||
|
|
|
|
|
|
|
|
|
|
|
| |||||||||||||
CVA risk | / | 2,539.7 | / | / | 2,457.5 | / | ||||||||||||||||||
|
|
|
|
|
|
|
|
|
|
|
| |||||||||||||
Central counterparty-related | / | 193.0 | / | / | 190.9 | / | ||||||||||||||||||
|
|
|
|
|
|
|
|
|
|
|
| |||||||||||||
Total | 206,766.4 | 53,647.3 | 25.94 | 199,934.8 | 52,628.8 | 24.99 | ||||||||||||||||||
|
|
|
|
|
|
|
|
|
|
|
| |||||||||||||
| Note 1: | “Specialized lending” is specialized lending exposure under supervisory slotting criteria. | |
| Note 2: | “Equity investments in funds” is total of look-though approach, mandate-based approach, simple approach and fall-back approach. | |
| Note 3: | “Equity investments in funds” and “Securitization exposures” as of March 31, 2019 are disclosed out of Internal ratings-based approach due to revision of FSA Notice No.20. |
14
Table of Contents
∎ Linkages between Financial Statements and Regulatory Exposures
(A) LI1: Differences between Accounting and Regulatory Scopes of Consolidation and Mapping of Financial Statement Categories with Regulatory Risk Categories
| (Millions of yen) | ||||||||||||||||||||||||||||
| ||||||||||||||||||||||||||||
| As of March 31, 2018 | ||||||||||||||||||||||||||||
| ||||||||||||||||||||||||||||
| a | b | c | d | e | f | g | ||||||||||||||||||||||
|
|
|
|
|
|
|
|
|
|
|
| |||||||||||||||||
| Carrying values of items: | ||||||||||||||||||||||||||||
| Carrying values as reported in published financial statements/ | Carrying values under scope of regulatory consolidation | Subject to credit risk framework | Subject to counterparty credit risk framework | Subject to the securitization framework | Subject to the market risk framework | Not subject to capital requirements or subject to deduction from capital | ||||||||||||||||||||||
Assets | ||||||||||||||||||||||||||||
Cash and Due from Banks | 47,725,360 | 47,725,360 | — | — | — | — | ||||||||||||||||||||||
Call Loans and Bills Purchased | 715,149 | 715,149 | — | — | — | — | ||||||||||||||||||||||
Receivables under Resale Agreements | 8,080,873 | — | 8,080,873 | — | — | — | ||||||||||||||||||||||
Guarantee Deposits Paid under Securities Borrowing Transactions | 4,350,527 | — | 4,350,527 | — | — | — | ||||||||||||||||||||||
Other Debt Purchased | 2,713,742 | 2,127,247 | — | 551,092 | — | 35,402 | ||||||||||||||||||||||
Trading Assets | 10,507,133 | — | 5,318,732 | — | 10,507,133 | 2,249 | ||||||||||||||||||||||
Money Held in Trust | 337,429 | 337,429 | — | — | — | — | ||||||||||||||||||||||
Securities | 34,183,033 | 32,788,339 | — | 1,287,391 | — | 107,303 | ||||||||||||||||||||||
Loans and Bills Discounted | 79,421,473 | 77,937,924 | 1,305 | 1,475,430 | — | 6,812 | ||||||||||||||||||||||
Foreign Exchange Assets | 1,941,677 | 1,941,677 | — | — | — | — | ||||||||||||||||||||||
Derivatives Other than for Trading Assets | 1,807,999 | — | 1,807,999 | — | — | — | ||||||||||||||||||||||
Other Assets | 4,588,484 | 1,549,959 | 1,936,112 | 4,161 | — | 1,098,251 | ||||||||||||||||||||||
Tangible Fixed Assets | 1,111,128 | 1,111,128 | — | — | — | — | ||||||||||||||||||||||
Intangible Fixed Assets | 1,092,708 | 312,342 | — | — | — | 780,365 | ||||||||||||||||||||||
Net Defined Benefit Asset | 996,173 | 304,793 | — | — | — | 691,380 | ||||||||||||||||||||||
Deferred Tax Assets | 47,839 | 5,487 | — | — | — | 42,352 | ||||||||||||||||||||||
Customers’ Liabilities for Acceptances and Guarantees | 5,723,186 | 5,722,952 | 234 | — | — | — | ||||||||||||||||||||||
Reserves for Possible Losses on Loans | (315,621) | (314,330 | ) | — | — | — | (1,291 | ) | ||||||||||||||||||||
|
|
|
|
|
|
|
|
|
|
| ||||||||||||||||||
Total assets | 205,028,300 | 172,265,461 | 21,495,785 | 3,318,075 | 10,507,133 | 2,762,827 | ||||||||||||||||||||||
|
|
|
|
|
|
|
|
|
|
| ||||||||||||||||||
Liabilities | ||||||||||||||||||||||||||||
Deposits | 125,081,233 | — | — | — | — | 125,081,233 | ||||||||||||||||||||||
Negotiable Certificates of Deposit | 11,382,590 | — | — | — | — | 11,382,590 | ||||||||||||||||||||||
Call Money and Bills Sold | 2,105,293 | — | — | — | — | 2,105,293 | ||||||||||||||||||||||
Payables under Repurchase Agreements | 16,656,828 | — | 16,656,828 | — | — | — | ||||||||||||||||||||||
Guarantee Deposits Received under Securities Lending Transactions | 1,566,833 | — | 1,566,833 | — | — | — | ||||||||||||||||||||||
Commercial Paper | 710,391 | — | — | — | — | 710,391 | ||||||||||||||||||||||
Trading Liabilities | 8,121,543 | — | 4,936,441 | — | 8,121,543 | — | ||||||||||||||||||||||
Borrowed Money | 4,896,218 | — | — | — | — | 4,896,218 | ||||||||||||||||||||||
Foreign Exchange Liabilities | 445,804 | — | — | — | — | 445,804 | ||||||||||||||||||||||
Short-term Bonds | 362,185 | — | — | — | — | 362,185 | ||||||||||||||||||||||
Bonds and Notes | 7,544,256 | — | — | — | — | 7,544,256 | ||||||||||||||||||||||
Due to Trust Accounts | 4,733,131 | — | — | — | — | 4,733,131 | ||||||||||||||||||||||
Derivatives other than for trading liabilities | 1,514,483 | — | 1,514,483 | — | — | — | ||||||||||||||||||||||
Other Liabilities | 3,685,585 | — | 76,599 | — | — | 3,608,986 | ||||||||||||||||||||||
Reserve for Bonus Payments | 66,872 | — | — | — | — | 66,872 | ||||||||||||||||||||||
Reserve for variable compensation | 3,242 | — | — | — | — | 3,242 | ||||||||||||||||||||||
Net Defined Benefit Liability | 58,890 | — | — | — | — | 58,890 | ||||||||||||||||||||||
Reserve for Director and Corporate Auditor Retirement Benefits | 1,460 | — | — | — | — | 1,460 | ||||||||||||||||||||||
Reserve for possible losses on sales of loans | 1,075 | — | — | — | — | 1,075 | ||||||||||||||||||||||
Reserve for contingencies | 5,622 | 56 | — | — | — | 5,566 | ||||||||||||||||||||||
Reserve for reimbursement of deposits | 20,011 | — | — | — | — | 20,011 | ||||||||||||||||||||||
Reserve for reimbursement of debentures | 30,760 | — | — | — | — | 30,760 | ||||||||||||||||||||||
Reserves under Special Laws | 2,361 | — | — | — | — | 2,361 | ||||||||||||||||||||||
Deferred Tax Liabilities | 421,002 | — | — | — | — | 421,002 | ||||||||||||||||||||||
Deferred Tax Liabilities for Revaluation Reserve for Land | 66,186 | — | — | — | — | 66,186 | ||||||||||||||||||||||
Acceptances and Guarantees | 5,723,186 | — | — | — | — | 5,723,186 | ||||||||||||||||||||||
|
|
|
|
|
|
|
|
|
|
| ||||||||||||||||||
Total liabilities | 195,207,054 | 56 | 24,751,187 | — | 8,121,543 | 167,270,708 | ||||||||||||||||||||||
|
|
|
|
|
|
|
|
|
|
| ||||||||||||||||||
| Notes: | ||
| 1. | Since the scope of accounting consolidation and that of regulatory consolidation are the same, the column (a) and (b) have been combined. | |
| 2. | Market risk includes foreign exchange risk and commodities risk in the banking book, but only those items in the trading book are recorded. | |
15
Table of Contents
| (Millions of yen) | ||||||||||||||||||||||||||||
| ||||||||||||||||||||||||||||
| As of March 31, 2019 | ||||||||||||||||||||||||||||
| ||||||||||||||||||||||||||||
| a | b | c | d | e | f | g | ||||||||||||||||||||||
|
|
|
|
|
|
|
|
|
|
|
| |||||||||||||||||
| Carrying values of items: | ||||||||||||||||||||||||||||
| Carrying values as reported in published financial statements/ | Carrying values under scope of regulatory consolidation | Subject to credit risk framework | Subject to counterparty credit risk framework | Subject to the securitization framework | Subject to the market risk framework | Not subject to capital requirements or subject to deduction from capital | ||||||||||||||||||||||
Assets | ||||||||||||||||||||||||||||
Cash and Due from Banks | 45,108,602 | 45,108,602 | — | — | — | — | ||||||||||||||||||||||
Call Loans and Bills Purchased | 648,254 | 648,254 | — | — | — | — | ||||||||||||||||||||||
Receivables under Resale Agreements | 12,997,628 | — | 12,997,628 | — | — | — | ||||||||||||||||||||||
Guarantee Deposits Paid under Securities Borrowing Transactions | 2,578,133 | — | 2,578,133 | — | — | — | ||||||||||||||||||||||
Other Debt Purchased | 2,828,959 | 2,205,129 | — | 589,211 | — | 34,619 | ||||||||||||||||||||||
Trading Assets | 12,043,608 | — | 6,074,759 | — | 12,043,608 | — | ||||||||||||||||||||||
Money Held in Trust | 351,889 | 351,889 | — | — | — | — | ||||||||||||||||||||||
Securities | 29,774,489 | 28,542,167 | — | 1,168,312 | — | 64,008 | ||||||||||||||||||||||
Loans and Bills Discounted | 78,456,935 | 77,017,297 | 456 | 1,439,181 | — | — | ||||||||||||||||||||||
Foreign Exchange Assets | 1,993,668 | 1,993,668 | — | — | — | — | ||||||||||||||||||||||
Derivatives Other than for Trading Assets | 1,328,227 | — | 1,328,227 | — | — | — | ||||||||||||||||||||||
Other Assets | 4,229,589 | 1,465,349 | 1,557,007 | 6,724 | — | 1,200,507 | ||||||||||||||||||||||
Tangible Fixed Assets | 1,037,006 | 1,037,006 | — | — | — | — | ||||||||||||||||||||||
Intangible Fixed Assets | 620,231 | 167,749 | — | — | — | 452,482 | ||||||||||||||||||||||
Net Defined Benefit Asset | 982,804 | 300,661 | — | — | — | 682,142 | ||||||||||||||||||||||
Deferred Tax Assets | 37,960 | 1,393 | — | — | — | 36,566 | ||||||||||||||||||||||
Customers’ Liabilities for Acceptances and Guarantees | 6,062,053 | 6,060,193 | 7 | 1,852 | — | — | ||||||||||||||||||||||
Reserves for Possible Losses on Loans | (287,815) | (287,794 | ) | — | — | — | (20 | ) | ||||||||||||||||||||
|
|
|
|
|
|
|
|
|
|
| ||||||||||||||||||
Total assets | 200,792,226 | 164,611,568 | 24,536,221 | 3,205,281 | 12,043,608 | 2,470,306 | ||||||||||||||||||||||
|
|
|
|
|
|
|
|
|
|
| ||||||||||||||||||
Liabilities | ||||||||||||||||||||||||||||
Deposits | 124,311,025 | — | — | — | — | 124,311,025 | ||||||||||||||||||||||
Negotiable Certificates of Deposit | 13,338,571 | — | — | — | — | 13,338,571 | ||||||||||||||||||||||
Call Money and Bills Sold | 2,841,931 | — | — | — | — | 2,841,931 | ||||||||||||||||||||||
Payables under Repurchase Agreements | 14,640,439 | — | 14,640,439 | — | — | — | ||||||||||||||||||||||
Guarantee Deposits Received under Securities Lending Transactions | 1,484,584 | — | 1,484,584 | — | — | — | ||||||||||||||||||||||
Commercial Paper | 941,181 | — | — | — | — | 941,181 | ||||||||||||||||||||||
Trading Liabilities | 8,325,520 | — | 5,745,580 | — | 8,325,520 | — | ||||||||||||||||||||||
Borrowed Money | 3,061,504 | — | — | — | — | 3,061,504 | ||||||||||||||||||||||
Foreign Exchange Liabilities | 669,578 | — | — | — | — | 669,578 | ||||||||||||||||||||||
Short-term Bonds | 355,539 | — | — | — | — | 355,539 | ||||||||||||||||||||||
Bonds and Notes | 8,351,071 | — | — | — | — | 8,351,071 | ||||||||||||||||||||||
Due to Trust Accounts | 1,102,073 | — | — | — | — | 1,102,073 | ||||||||||||||||||||||
Derivatives other than for trading liabilities | 1,165,602 | — | 1,165,602 | — | — | — | ||||||||||||||||||||||
Other Liabilities | 4,512,325 | — | 55,033 | — | — | 4,457,291 | ||||||||||||||||||||||
Reserve for Bonus Payments | 68,117 | — | — | — | — | 68,117 | ||||||||||||||||||||||
Reserve for variable compensation | 2,867 | — | — | — | — | 2,867 | ||||||||||||||||||||||
Net Defined Benefit Liability | 60,873 | — | — | — | — | 60,873 | ||||||||||||||||||||||
Reserve for Director and Corporate Auditor Retirement Benefits | 1,389 | — | — | — | — | 1,389 | ||||||||||||||||||||||
Reserve for possible losses on sales of loans | 630 | — | — | — | — | 630 | ||||||||||||||||||||||
Reserve for contingencies | 4,910 | 100 | — | — | — | 4,809 | ||||||||||||||||||||||
Reserve for reimbursement of deposits | 19,068 | — | — | — | — | 19,068 | ||||||||||||||||||||||
Reserve for reimbursement of debentures | 25,566 | — | — | — | — | 25,566 | ||||||||||||||||||||||
Reserves under Special Laws | 2,473 | — | — | — | — | 2,473 | ||||||||||||||||||||||
Deferred Tax Liabilities | 185,974 | — | — | — | — | 185,974 | ||||||||||||||||||||||
Deferred Tax Liabilities for Revaluation Reserve for Land | 63,315 | — | — | — | — | 63,315 | ||||||||||||||||||||||
Acceptances and Guarantees | 6,062,053 | — | — | — | — | 6,062,053 | ||||||||||||||||||||||
|
|
|
|
|
|
|
|
|
|
| ||||||||||||||||||
Total liabilities | 191,598,188 | 100 | 23,091,239 | — | 8,325,520 | 165,926,908 | ||||||||||||||||||||||
|
|
|
|
|
|
|
|
|
|
| ||||||||||||||||||
| Notes: | ||
| 1. | Since the scope of accounting consolidation and that of regulatory consolidation are the same, the column (a) and (b) have been combined. | |
| 2. | Market risk includes foreign exchange risk and commodities risk in the banking book, but only those items in the trading book are recorded. | |
16
Table of Contents
(B) LI2: Main Sources of Differences between Regulatory Exposure Amounts and Carrying Values in Financial Statements
| (Millions of yen) | ||||||||||||||||||||||||||
| As of March 31, 2018 | ||||||||||||||||||||||||||
| a | b | c | d | e | ||||||||||||||||||||||
| Total | Items subject to: | |||||||||||||||||||||||||
| Credit risk framework | Counterparty credit risk framework | Securitization framework | Market risk framework | |||||||||||||||||||||||
| 1 | Asset carrying value amount under scope of regulatory consolidation (as per template LI1) | 202,265,473 | 172,265,461 | 21,495,785 | 3,318,075 | 10,507,133 | ||||||||||||||||||||
| 2 | Liabilities carrying value amount under regulatory scope of consolidation (as per template LI1) | 27,936,345 | 56 | 24,751,187 | — | 8,121,543 | ||||||||||||||||||||
| 3 | Total net amount under regulatory scope of consolidation | 174,329,127 | 172,265,405 | (3,255,401 | ) | 3,318,075 | 2,385,589 | |||||||||||||||||||
| 4 | Off-balance sheet amounts | 17,311,153 | 16,446,822 | — | 864,331 | — | ||||||||||||||||||||
| 5 | Differences due to consideration of provision for loan losses and write-offs | 401,252 | 401,252 | — | — | — | ||||||||||||||||||||
| 6 | Differences due to derivative transactions, etc. | 1,887,980 | — | 1,887,980 | — | — | ||||||||||||||||||||
| 7 | Differences due to repurchase transactions | 17,310,011 | — | 17,310,011 | — | — | ||||||||||||||||||||
| 8 | Other differences | (523,103 | ) | (907,644 | ) | — | — | — | ||||||||||||||||||
| 9 | Exposure amounts considered for regulatory purposes | 210,716,420 | 188,205,836 | 15,942,589 | 4,182,406 | 2,385,589 | ||||||||||||||||||||
| Notes: | ||
| 1. | Column (a) is not necessarily equal to the sum of columns (b) to (e) due to assets being riskweighted more than once. | |
| 2. | Differences between regulatory exposure amounts and carrying values in consolidated financial statements and the main sources of the differences are as follows. | |
• Off-balance sheet amounts correspond to the differences produced mainly by adding exposures to undrawn commitments and by multiplying customer liabilities for acceptances and guarantees by the credit conversion factor (CCF) assigned tooff-balance sheet items under the regulatory capital requirements.
• Differences due to consideration of provision for loan losses, and write-offs are produced mainly by adding general provisions for loan losses, specific provisions for loan losses and partial direct bad debt write-offs to those assets subject to the advanced internal ratings-based approach.
• Differences due to derivative transactions, etc. are produced mainly by incorporating future market value fluctuations and the effect of netting into regulatory exposure amounts. Derivative transactions, etc. include long-settlement transactions.
• Differences due to repurchase transactions are mainly produced by adding the exposure amounts related to assets pledged as collateral and considering the effect of netting and collateral.
• Other differences are produced mainly by considering the offsetting of deferred tax assets against deferred tax liabilities and the regulatory recognized effectiveness of hedging and making regulatory prudential adjustments. | ||
| (Millions of yen) | ||||||||||||||||||||||||||
| As of March 31, 2019 | ||||||||||||||||||||||||||
| a | b | c | d | e | ||||||||||||||||||||||
| Total | Items subject to: | |||||||||||||||||||||||||
| Credit risk framework | Counterparty credit risk framework | Securitization framework | Market risk framework | |||||||||||||||||||||||
| 1 | Asset carrying value amount under scope of regulatory consolidation (as per template LI1) | 198,321,920 | 164,611,568 | 24,536,221 | 3,205,281 | 12,043,608 | ||||||||||||||||||||
| 2 | Liabilities carrying value amount under regulatory scope of consolidation (as per template LI1) | 25,671,280 | 100 | 23,091,239 | — | 8,325,520 | ||||||||||||||||||||
| 3 | Total net amount under regulatory scope of consolidation | 172,650,640 | 164,611,467 | 1,444,982 | 3,205,281 | 3,718,088 | ||||||||||||||||||||
| 4 | Off-balance sheet amounts | 18,704,303 | 17,707,842 | — | 996,461 | — | ||||||||||||||||||||
| 5 | Differences due to consideration of provision for loan losses and write-offs | 372,837 | 372,837 | — | — | — | ||||||||||||||||||||
| 6 | Differences due to derivative transactions, etc. | 1,818,614 | — | 1,818,614 | — | — | ||||||||||||||||||||
| 7 | Differences due to repurchase transactions | 11,473,212 | — | 11,473,212 | — | — | ||||||||||||||||||||
| 8 | Other differences | (21,575 | ) | (350,755 | ) | — | — | — | ||||||||||||||||||
| 9 | Exposure amounts considered for regulatory purposes | 204,998,031 | 182,341,391 | 14,736,809 | 4,201,743 | 3,718,088 | ||||||||||||||||||||
| Notes: | ||
| 1. | Column (a) is not necessarily equal to the sum of columns (b) to (e) due to assets being riskweighted more than once. | |
| 2. | Differences between regulatory exposure amounts and carrying values in consolidated financial statements and the main sources of the differences are as follows. | |
• Off-balance sheet amounts correspond to the differences produced mainly by adding exposures to undrawn commitments and by multiplying customer liabilities for acceptances and guarantees by the credit conversion factor (CCF) assigned tooff-balance sheet items under the regulatory capital requirements.
• Differences due to consideration of provision for loan losses, and write-offs are produced mainly by adding general provisions for loan losses, specific provisions for loan losses and partial direct bad debt write-offs to those assets subject to the advanced internal ratings-based approach.
• Differences due to derivative transactions, etc. are produced mainly by incorporating future market value fluctuations and the effect of netting into regulatory exposure amounts. Derivative transactions, etc. include long-settlement transactions.
• Differences due to repurchase transactions are mainly produced by adding the exposure amounts related to assets pledged as collateral and considering the effect of netting and collateral.
• Other differences are produced mainly by considering the offsetting of deferred tax assets against deferred tax liabilities and the regulatory recognized effectiveness of hedging and making regulatory prudential adjustments. | ||
17
Table of Contents
(1) Summary of Risk Profile, Risk Management Policies/ Procedures and Structure
See pages 69 to 71 for a summary of our credit risk profile and credit risk management policies, etc.
(2) Summary of Provision for Loan Losses and Charge-offs
See page 70 for a summary of provision for loan losses and charge-offs.
(3) Quantitative Disclosure on Credit Risk
Counterparty credit risk exposures, securitization exposures, and regarded-method exposures are excluded from the amount of credit risk exposures below.
(A) CR1: Credit Quality of Assets
| (Millions of yen) | ||||||||||||||||||
| As of March 31, 2018 | ||||||||||||||||||
| a | b | c | d | |||||||||||||||
| Gross carrying values of | ||||||||||||||||||
| Defaulted exposures | Non-defaulted exposures | Reserve | Net values (a+b-c) | |||||||||||||||
| On-balance sheet exposures | ||||||||||||||||||
| 1 | Loans | 645,060 | 77,305,616 | 271,369 | 77,679,307 | |||||||||||||
| 2 | Debt securities | 5,946 | 26,116,905 | — | 26,122,851 | |||||||||||||
| 3 | Otheron-balance sheet debt exposures | 2,652 | 51,697,897 | 2,526 | 51,698,023 | |||||||||||||
|
|
|
|
|
|
|
| |||||||||||
| 4 | Totalon-balance sheet exposures (1+2+3) | 653,659 | 155,120,419 | 273,896 | 155,500,182 | |||||||||||||
|
|
|
|
|
|
|
| |||||||||||
| Off-balance sheet exposures | ||||||||||||||||||
| 5 | Guarantees | 13,776 | 5,709,421 | 30,819 | 5,692,378 | |||||||||||||
| 6 | Commitments | 15,249 | 25,189,759 | — | 25,205,009 | |||||||||||||
|
|
|
|
|
|
|
| |||||||||||
| 7 | Totaloff-balance sheet exposures (5+6) | 29,026 | 30,899,180 | 30,819 | 30,897,388 | |||||||||||||
|
|
|
|
|
|
|
| |||||||||||
| Total | ||||||||||||||||||
|
|
|
|
|
|
|
| |||||||||||
| 8 | Total assets (4+7) | 682,685 | 186,019,600 | 304,715 | 186,397,570 | |||||||||||||
|
|
|
|
|
|
|
| |||||||||||
Notes: | ||
1. | Otheron-balance sheet debt exposures include deposits, call loans, bills purchased, other debt purchased, money held in trust and foreign exchange assets, etc. | |
2. | Defaulted exposures include restructured loans, loans past due for three months or more, loans to bankrupt borrowers and so on. | |
3. | Reserve corresponds to the amount of reserves for possible loan losses | |
| (Millions of yen) | ||||||||||||||||||
| As of March 31, 2019 | ||||||||||||||||||
| a | b | c | d | |||||||||||||||
| Gross carrying values of | ||||||||||||||||||
| Defaulted exposures | Non-defaulted exposures | Reserve | Net values (a+b-c) | |||||||||||||||
| On-balance sheet exposures | ||||||||||||||||||
| 1 | Loans | 626,537 | 76,391,257 | 250,708 | 76,767,086 | |||||||||||||
| 2 | Debt securities | 5,616 | 22,665,487 | — | 22,671,103 | |||||||||||||
| 3 | Otheron-balance sheet debt exposures | 8,724 | 49,282,616 | 2,506 | 49,288,834 | |||||||||||||
|
|
|
|
|
|
|
| |||||||||||
| 4 | Totalon-balance sheet exposures (1+2+3) | 640,879 | 148,339,361 | 253,215 | 148,727,025 | |||||||||||||
|
|
|
|
|
|
|
| |||||||||||
| Off-balance sheet exposures | ||||||||||||||||||
| 5 | Guarantees | 18,741 | 6,043,311 | 30,717 | 6,031,335 | |||||||||||||
| 6 | Commitments | 15,216 | 26,990,138 | — | 27,005,354 | |||||||||||||
|
|
|
|
|
|
|
| |||||||||||
| 7 | Totaloff-balance sheet exposures (5+6) | 30,168 | 31,247,288 | 30,717 | 33,036,689 | |||||||||||||
|
|
|
|
|
|
|
| |||||||||||
| Total | ||||||||||||||||||
|
|
|
|
|
|
|
| |||||||||||
| 8 | Total assets (4+7) | 674,836 | 181,372,812 | 283,933 | 181,763,715 | |||||||||||||
|
|
|
|
|
|
|
| |||||||||||
Notes: | ||
1. | Otheron-balance sheet debt exposures include deposits, call loans, bills purchased, other debt purchased, money held in trust and foreign exchange assets, etc. | |
2. | Defaulted exposures include restructured loans, loans past due for three months or more, loans to bankrupt borrowers and so on. | |
3. | Reserve corresponds to the amount of reserves for possible loan losses | |
18
Table of Contents
(B) Breakdown of Credit Risk Exposures
(a) Breakdown by Geographical Area
| (Billions of yen) | ||||||||||||||||||||||||||||||||
| As of March 31, 2018 | As of March 31, 2019 | |||||||||||||||||||||||||||||||
| Loans, commitments and other non-derivative off-balance-sheet exposures | Securities | Others | Total | Loans, commitments and other non-derivative off-balance-sheet exposures | Securities | Others | Total | |||||||||||||||||||||||||
Domestic | 62,042.2 | 21,449.0 | 37,376.2 | 120,867.5 | 65,407.9 | 18,914.7 | 40,872 | 125,194.7 | ||||||||||||||||||||||||
|
|
|
|
|
|
|
|
|
|
|
|
|
|
|
| |||||||||||||||||
Overseas | 39,785.8 | 9,122.3 | 10,527.5 | 59,435.7 | 43,521.4 | 7,804.6 | 10,834.2 | 62,160.3 | ||||||||||||||||||||||||
Asia | 10,263.4 | 1,961.2 | 1,947.9 | 14,172.7 | 11,448.8 | 2,068.7 | 1,812.5 | 15,330.0 | ||||||||||||||||||||||||
Central and South America | 2,947.5 | 52.0 | 1,136.3 | 4,135.9 | 3,421.1 | 69.0 | 1,058.2 | 4,548.4 | ||||||||||||||||||||||||
North America | 14,172.5 | 5,074.6 | 5,917.4 | 25,164.6 | 15,596.8 | 2,811.5 | 5,624.2 | 24,032.6 | ||||||||||||||||||||||||
Eastern Europe | 346.0 | — | 10.0 | 356.1 | 338.1 | — | 6.8 | 345.0 | ||||||||||||||||||||||||
Western Europe | 7,876.3 | 1,313.7 | 844.5 | 10,034.6 | 8,700.7 | 2,199.6 | 1,983.9 | 12,884.3 | ||||||||||||||||||||||||
Other areas | 4,179.8 | 720.5 | 671.1 | 5,571.5 | 4,015.7 | 655.4 | 348.5 | 5,019.7 | ||||||||||||||||||||||||
|
|
|
|
|
|
|
|
|
|
|
|
|
|
|
| |||||||||||||||||
Total | 101,828.0 | 30,571.3 | 47,903.8 | 180,303.2 | 108,929.4 | 26,719.3 | 51,706.3 | 187,355.1 | ||||||||||||||||||||||||
|
|
|
|
|
|
|
|
|
|
|
|
|
|
|
| |||||||||||||||||
Standardized approach portion | / | / | / | 16,604.4 | / | / | / | 3,446.8 | ||||||||||||||||||||||||
|
|
|
|
|
|
|
|
|
|
|
|
|
|
|
| |||||||||||||||||
Notes:
| 1. | Standardized approach portion represents the amount calculated using the standardized approach for business units and asset classes that are immaterial for the purpose of calculating credit RWA |
| 2. | Exposure tonon-Japanese residents is included in Overseas. |
| 3. | Others include cash, deposits, call loans, other debt purchased, money held in trust, foreign exchange assets and other assets, etc. |
(b) Breakdown by Industry
| (Billions of yen) | ||||||||||||||||||||||||||||||||
| As of March 31, 2018 | As of March 31, 2019 | |||||||||||||||||||||||||||||||
| Loans, commitments and other non-derivative off-balance-sheet exposures | Securities | Others | Total | Loans, commitments and other non-derivative off-balance-sheet exposures | Securities | Others | Total | |||||||||||||||||||||||||
Manufacturing | 22,348.0 | 2,335.3 | 551.1 | 25,234.5 | 24,669.8 | 1,961.9 | 383.6 | 27,015.4 | ||||||||||||||||||||||||
Construction | 1,834.4 | 235.7 | 65.5 | 2,135.6 | 1,745.6 | 230.3 | 11.3 | 1,987.3 | ||||||||||||||||||||||||
Real estate | 9,576.2 | 814.1 | 18.0 | 10,408.5 | 10,741.9 | 872.3 | 5.9 | 11,620.1 | ||||||||||||||||||||||||
Service industries | 5,455.8 | 440.1 | 714.2 | 6,610.2 | 5,800.9 | 418.9 | 34.3 | 6,254.2 | ||||||||||||||||||||||||
Wholesale and retail | 9,536.2 | 755.6 | 744.0 | 11,036.0 | 10,268.6 | 702.8 | 662.7 | 11,634.2 | ||||||||||||||||||||||||
Finance and insurance | 13,028.8 | 2,395.8 | 3,706.3 | 19,131.0 | 16,080.8 | 2,960.3 | 11,484.8 | 30,525.9 | ||||||||||||||||||||||||
Individuals | 12,145.6 | 9.9 | 114.1 | 12,269.6 | 11,667.7 | — | 10.3 | 11,678.1 | ||||||||||||||||||||||||
Other industries | 25,827.4 | 8,314.1 | 9,790.1 | 43,931.7 | 26,389.4 | 6,574.3 | 2,729.5 | 35,693.3 | ||||||||||||||||||||||||
Japanese Government; Bank of Japan | 2,075.1 | 15,270.3 | 32,200.0 | 49,545.6 | 1,564.4 | 12,998.3 | 36,383.5 | 50,946.2 | ||||||||||||||||||||||||
|
|
|
|
|
|
|
|
|
|
|
|
|
|
|
| |||||||||||||||||
Total | 101,828.0 | 30,571.3 | 47,903.8 | 180,303.2 | 108,929.4 | 26,719.3 | 51,706.3 | 187,355.1 | ||||||||||||||||||||||||
|
|
|
|
|
|
|
|
|
|
|
|
|
|
|
| |||||||||||||||||
Standardized approach portion | / | / | / | 16,604.4 | / | / | / | 3,446.8 | ||||||||||||||||||||||||
|
|
|
|
|
|
|
|
|
|
|
|
|
|
|
| |||||||||||||||||
Notes:
| 1. | Standardized approach portion represents the amount calculated using the standardized approach for business units and asset classes that are immaterial for the purpose of calculating credit RWA. |
| 2. | Others include cash, deposits, call loans, other debt purchased, money held in trust, foreign exchange assets and other assets, etc. |
(c) Breakdown by Residual Contractual Maturity
| (Billions of yen) | ||||||||||||||||||||||||||||||||
| As of March 31, 2018 | As of March 31, 2019 | |||||||||||||||||||||||||||||||
| Loans, commitments and other non-derivative off-balance-sheet exposures | Securities | Others | Total | Loans, commitments and other non-derivative off-balance-sheet exposures | Securities | Others | Total | |||||||||||||||||||||||||
Less than one year | 30,139.5 | 10,117.3 | 6,135.9 | 46,392.7 | 28,047.5 | 12,158.2 | 7,605.5 | 47,811.3 | ||||||||||||||||||||||||
From one year to less than three years | 22,692.1 | 4,828.9 | 789.9 | 28,311.0 | 28,129.7 | 4,153.6 | 17.4 | 32,300.8 | ||||||||||||||||||||||||
From three years to less than five years | 20,637.6 | 3,738.5 | 14.5 | 24,390.7 | 23,229.0 | 1,252.1 | 13.8 | 24,495.0 | ||||||||||||||||||||||||
Five years or more | 27,872.8 | 7,042.5 | 165.4 | 35,080.9 | 29,160.9 | 4,980.4 | 38.1 | 34,179.5 | ||||||||||||||||||||||||
Other than above | 485.8 | 4,843.9 | 40,798.0 | 46,127.8 | 362.1 | 4,174.8 | 44,031.3 | 48,568.3 | ||||||||||||||||||||||||
|
|
|
|
|
|
|
|
|
|
|
|
|
|
|
| |||||||||||||||||
Total | 101,828.0 | 30,571.3 | 47,903.8 | 180,303.2 | 108,929.4 | 26,719.3 | 51,706.3 | 187,355.1 | ||||||||||||||||||||||||
|
|
|
|
|
|
|
|
|
|
|
|
|
|
|
| |||||||||||||||||
Standardized approach portion | / | / | / | 16,604.4 | / | / | / | 3,446.8 | ||||||||||||||||||||||||
|
|
|
|
|
|
|
|
|
|
|
|
|
|
|
| |||||||||||||||||
Notes:
| 1. | Standardized approach portion represents the amount calculated using the standardized approach for business units and asset classes that are immaterial for the purpose of calculating credit RWA |
| 2. | Others include cash, deposits, call loans, other debt purchased, money held in trust, foreign exchange assets and other assets, etc. |
19
Table of Contents
(C) Exposure to Obligors Claims of Whom Meet the Stipulations in the Article 4 Paragraph 2, 3 or 4 of the Ordinance for Enforcement of the Act on Emergency Measures for the Revitalization of the Financial Functions Enacted in Japan
| (a) Breakdown by Geographical Area |
| (Billions of yen) | ||||||||||||||||||||||||
| As of March 31, 2018 | As of March 31, 2019 | |||||||||||||||||||||||
| Exposure | Reserve | Write-Offs | Exposure | Reserve | Write-Offs | |||||||||||||||||||
Domestic | 598.8 | 121.9 | 13.7 | 580.0 | 110.0 | 15.9 | ||||||||||||||||||
|
|
|
|
|
|
|
|
|
|
|
| |||||||||||||
Overseas | 193.0 | 35.9 | 1.4 | 185.1 | 61.0 | 9.4 | ||||||||||||||||||
Asia | 28.6 | 2.4 | 0.0 | 51.9 | 28.3 | 8.9 | ||||||||||||||||||
Central and South America | 63.1 | 4.3 | — | 20.2 | 2.9 | 0.5 | ||||||||||||||||||
North America | 19.9 | 0.3 | — | 78.1 | 19.5 | — | ||||||||||||||||||
Eastern Europe | 0.4 | 0.4 | — | 0.2 | 0.2 | — | ||||||||||||||||||
Western Europe | 71.4 | 24.8 | 1.3 | 22.2 | 4.0 | 0.0 | ||||||||||||||||||
Other areas | 9.2 | 3.4 | — | 12.3 | 5.7 | — | ||||||||||||||||||
|
|
|
|
|
|
|
|
|
|
|
| |||||||||||||
Total | 791.8 | 157.8 | 15.2 | 765.2 | 171.0 | 25.4 | ||||||||||||||||||
|
|
|
|
|
|
|
|
|
|
|
| |||||||||||||
Standardized approach portion | 14.1 | 6.9 | 0.3 | 8.8 | 3.0 | 0.9 | ||||||||||||||||||
|
|
|
|
|
|
|
|
|
|
|
| |||||||||||||
Note:
Standardized approach portion represents the amount calculated using the standardized approach for business units and asset classes that are immaterial for the purpose of calculating credit RWA
| (b) Breakdown by Industry |
| (Billions of yen) | ||||||||||||||||||||||||
| As of March 31, 2018 | As of March 31, 2019 | |||||||||||||||||||||||
| Exposure | Reserve | Write-Offs | Exposure | Reserve | Write-Offs | |||||||||||||||||||
Manufacturing | 190.9 | 50.4 | 2.8 | 151.1 | 48.2 | 3.2 | ||||||||||||||||||
Construction | 7.8 | 0.8 | 0.1 | 21.2 | 6.3 | 9.4 | ||||||||||||||||||
Real estate | 43.5 | 1.8 | 0.2 | 52.8 | 2.2 | 0.0 | ||||||||||||||||||
Service industries | 73.6 | 12.9 | 1.9 | 89.2 | 15.3 | 0.9 | ||||||||||||||||||
Wholesale and retail | 198.2 | 55.0 | 5.7 | 148.1 | 29.3 | 8.3 | ||||||||||||||||||
Finance and insurance | 21.5 | 1.9 | — | 26.3 | 3.9 | 0.0 | ||||||||||||||||||
Individuals | 103.3 | 12.3 | 3.3 | 82.3 | 10.2 | 3.0 | ||||||||||||||||||
Other industries | 152.6 | 22.4 | 0.8 | 193.7 | 55.3 | 0.4 | ||||||||||||||||||
|
|
|
|
|
|
|
|
|
|
|
| |||||||||||||
Total | 791.8 | 157.8 | 15.2 | 765.2 | 171.0 | 25.4 | ||||||||||||||||||
|
|
|
|
|
|
|
|
|
|
|
| |||||||||||||
Standardized approach portion | 14.1 | 6.9 | 0.3 | 8.8 | 3.0 | 0.9 | ||||||||||||||||||
|
|
|
|
|
|
|
|
|
|
|
| |||||||||||||
Note:
Standardized approach portion represents the amount calculated using the standardized approach for business units and asset classes that are immaterial for the purpose of calculating credit RWA.
(D) Exposure by Past Due Period
(Billions of yen) | ||||||||||||||||
As of March 31, 2018 | ||||||||||||||||
Less than one month | From one month to less than two months | From two months to less than three months | Three months or more | Total | ||||||||||||
| 100.7 | 46.1 | 15.1 | 29.4 | 191.5 | ||||||||||||
Note:
Excluding claims under bankruptcy or substantial bankruptcy stipulated in the Article 4 paragraph 2 of the Ordinance for Enforcement of the Act on Emergency Measures for the Revitalization of the Financial Functions as well as high risk claims stipulated in the Article 4 paragraph 3.
(Billions of yen) | ||||||||||||||||
As of March 31, 2019 | ||||||||||||||||
Less than one month | From one month to less than two months | From two months to less than three months | Three months or more | Total | ||||||||||||
| 385.6 | 117.3 | 24.7 | 119.5 | 647.3 | ||||||||||||
Note:
Excluding claims under bankruptcy or substantial bankruptcy stipulated in the Article 4 paragraph 2 of the Ordinance for Enforcement of the Act on Emergency Measures for the Revitalization of the Financial Functions as well as high risk claims stipulated in the Article 4 paragraph 3.
20
Table of Contents
(E) Exposure to Obligors Claims of Whom Have been Restructured for the Purpose of Corporate Restructuring or Supporting the Customer
(Billions of yen) | ||||
| As of March 31, 2018 | ||||
Exposure |
Amount of exposure for which loss | Others | ||
322.7 | 280.6 | 42.0 | ||
Note:
Excluding claims under bankruptcy or substantial bankruptcy stipulated in the Article 4 paragraph 2 of the Ordinance for Enforcement of the Act on Emergency Measures for the Revitalization of the Financial Functions, high risk claims stipulated in the Article 4 paragraph 3 or claims overdue for more than three months stipulated in the Article 4 paragraph 4.
(Billions of yen) | ||||
| As of March 31, 2019 | ||||
Exposure |
Amount of exposure for which loss | Others | ||
263.2 | 225.4 | 37.7 | ||
Note:
Excluding claims under bankruptcy or substantial bankruptcy stipulated in the Article 4 paragraph 2 of the Ordinance for Enforcement of the Act on Emergency Measures for the Revitalization of the Financial Functions, high risk claims stipulated in the Article 4 paragraph 3 or claims overdue for more than three months stipulated in the Article 4 paragraph 4.
(F) CR2: Changes in Defaulted Loans and Debt Securities
| (Millions of yen) | ||||||||
No. | Exposure | |||||||
1 | Defaulted loans and debt securities as of March 31, 2018 | 653,659 | ||||||
2 | Breakdown of changes in loans and debt securities during this reporting period | Defaulted | 224,717 | |||||
3 | Returned tonon-defaulted status | 85,190 | ||||||
4 | Amounts written off | 33,999 | ||||||
5 | Other changes | (118,308 | ) | |||||
6 | Defaulted loans and debt securities as of March 31, 2019(1+2-3-4+5) | 640,879 | ||||||
Note:
Other changes corresponds to the amount of variation in defaulted exposures arising from debt recovery and additional credit to defaulted obligors, etc.
(4) Credit Risk under Internal Ratings-Based (IRB) Approach
(i) Summary of Internal Ratings-Based (IRB) Approach
We have adopted Advanced Internal Ratings-Based (AIRB) Approach as a method to calculate credit risk weighted assets (RWA) since March 31, 2009. The following business units have adopted AIRB approach:
Mizuho Financial Group, Inc., Mizuho Bank, Ltd., Mizuho Trust & Banking Co., Ltd., Mizuho Credit Guarantee Co., Ltd., Mizuho Trust Realty Company Limited, Mizuho Bank (China), Mizuho Bank (USA), Ltd., Mizuho Bank Europe N.V., and Mizuho Capital Markets LLC.
Note: Special purpose companies (SPCs) controlled by the above companies have also adopted the AIRB approach due to their business operations integrated with their parent companies.
The application scope of AIRB is determined through taking into account the importance for each business unit, such as the ratio of its credit RWA to that of the entire group. AIRB is generally applied to those assets held by the business units that have adopted AIRB except for some asset classes considered immaterial for the purpose of calculating credit RWA. In addition, AIRB is used for all equity exposures regardless of what approach the business unit has adopted. With respect to credit RWA exposures under Regarded-Method, AIRB is used for those of which the look-through approach is applied except for cases where it is difficult to accurately calculate credit RWA regarding their underlying assets based on the IRB Approach and therefore reliability of credit RWA cannot be secured. The standardized approach will be applied to any of those business units and asset classes that do not meet the above conditions.
21
Table of Contents
(ii) Summary of Our Internal Rating System
See page 69 for a summary of our internal rating system and rating assignment procedures.
The following table sets forth information with respect to the definition of obligor ratings:
Obligor ratings (major category) | Definition of ratings | Classification | ||||||||||||||
A1–A3 |
Obligors whose certainty of debt fulfillment is very high, hence their level of credit risk is excellent. | Investment grade zone | ||||||||||||||
| B1–B2 | Obligors whose certainty of debt fulfillment poses no problems for the foreseeable future, hence their level of credit risk is sufficient. | |||||||||||||||
| C1–C3 | Obligors whose certainty of debt fulfillment and their level of credit risk pose no problems for the foreseeable future. | Non-investment grade zone | ||||||||||||||
| D1–D3 | Obligors whose current certainty of debt fulfillment poses no problems, however, their resistance to future changes in business environment is low. | |||||||||||||||
| E1 | Obligors who require close watching going forward because there are problems with their borrowing conditions, such as reduced or suspended interest payments, problems with fulfillment such as de facto postponements of principal or interest payments, or problems with their financial positions as a result of their poor or unstable business conditions. | |||||||||||||||
| E2 | ||||||||||||||||
| R | * | |||||||||||||||
| F1 | Obligors who are not yet bankrupt but are in financial difficulties and are deemed to be very likely to go bankrupt in the future because they are finding it difficult to make progress in implementing their management improvement plans (including obligors who are receiving ongoing support from financial institutions). | Default
| ||||||||||||||
| G1 | Obligors who have not yet gone legally or formally bankrupt but who are substantially bankrupt because they are in serious financial difficulties and are not deemed to be capable of restructuring. | |||||||||||||||
| H1 | Obligors who have already gone bankrupt, from both a legal and/or formal perspective. | |||||||||||||||
| * | Obligors who have loans in need of monitoring (restructured loans and loans past due for three months or more) out of the obligors who require close watching going forward |
Estimation of parameters and validation
We use our own estimates for the parameters indicated below in the calculation of credit RWA under the Basel Framework. We generally validate the parameters by backtesting or other methods on an annual basis. Methods of estimation and validation as well as results are approved by the Chief Risk Officer.
PD | Probability of default (likelihood of default of an obligor over a period of one year) | |
LGD | Loss given default | |
EAD | Exposure at default |
The definition of default conforms to the Notice issued by Japan’s Financial Services Agency.
Details of Estimates:
We estimate PD of corporate, sovereign and bank exposures per obligor rating, and that of retail exposures per pool allocations. In making estimations, we make conservative adjustments such as accounting for estimation error on the long-term average of internal default records. We supplement estimations for low default portfolios with external data. We apply the regulatory floor PD (0.03%) toA1-rated obligors in the measurement of credit RWA, except for sovereign exposures. The estimated parameters in almost all the PD categories such as obligor rating or pool allocations exceeded actual defaults in the last three years. The differences stemmed from such reasons as: actual defaults in the last few years were lower than the long-term average of the defaults over the entire period, which was the basis for our estimation; conservative adjustments have been made to estimated parameters.
We estimate LGD based on obligor classifications in our self-assessments or pool allocations, and protection coverage. For LGD per obligor classifications, we estimate LGD under normal economic circumstances based on prior defaulted obligor data, making adjustments in consideration of periods of economic downturn using stochastic methods. Our estimation is based on validation of the time between the default event and the closure of the exposure as well as LGD for low default portfolios etc. With regard to protection, we estimate LGD per type of collateral using some external data.
We estimate EAD based on prior defaulted obligor data.
(iii) Asset Class-based EAD Ratios to the Total EAD by Credit RWA Calculation Approach
| As of March 31, 2018 | As of March 31, 2019 | |||||||
Internal Ratings-based Approach | 91.18 | % | 98.08 | % | ||||
Corporate | 79.20 | % | 86.81 | % | ||||
Retail | 6.24 | % | 6.12 | % | ||||
Equities | 2.75 | % | 2.44 | % | ||||
Purchase Receivables | 1.75 | % | 1.62 | % | ||||
Others | 1.21 | % | 1.07 | % | ||||
|
|
|
| |||||
Standardized Approach | 8.81 | % | 1.91 | % | ||||
|
|
|
| |||||
Total | 100.00 | % | 100.00 | % | ||||
|
|
|
| |||||
Notes: | ||
1. | Counterparty credit risk exposures, securitization exposures, and regarded-method exposures are excluded from the amount of credit risk exposures above. | |
2. | As for any portfolio to which the standardized approach is applied, exposure instead of EAD is used for calculation. | |
22
Table of Contents
(iv) Quantitative Disclosure on Credit Risk under Internal Ratings-based Approach
(A) CR6: IRB–Credit Risk Exposures by Portfolio and PD Range
| (Millions of yen, %, number in the thousands, year) | ||||||||||||||||||||||||||||||||||||||||||||||||||
| As of March 31, 2018 | ||||||||||||||||||||||||||||||||||||||||||||||||||
| a | b | c | d | e | f | g | h | i | j | k | l | |||||||||||||||||||||||||||||||||||||||
PD scale | Original on-balance sheet gross exposure | Off- balance sheet exposures pre CCF | Average CCF | EAD post CRM and post-CCF | Average PD | Number of obligors | Average LGD | Average maturity | RWA | RWA density | EL | Provisions | ||||||||||||||||||||||||||||||||||||||
Sovereign |
| |||||||||||||||||||||||||||||||||||||||||||||||||
| 1 | 0.00 to <0.15 | 65,282,123 | 493,305 | 78.14 | 67,094,685 | 0.00 | 0.3 | 37.99 | 1.6 | 633,434 | 0.94 | 828 | / | |||||||||||||||||||||||||||||||||||||
| 2 | 0.15 to <0.25 | — | — | — | — | — | — | — | — | — | — | — | / | |||||||||||||||||||||||||||||||||||||
| 3 | 0.25 to <0.50 | 30,742 | 3,142 | 75.00 | 9,343 | 0.27 | 0.0 | 37.97 | 3.5 | 4,931 | 52.77 | 9 | / | |||||||||||||||||||||||||||||||||||||
| 4 | 0.50 to <0.75 | 76,127 | 14,762 | 75.00 | 76,646 | 0.50 | 0.0 | 37.97 | 1.1 | 35,076 | 45.76 | 146 | / | |||||||||||||||||||||||||||||||||||||
| 5 | 0.75 to <2.50 | 80,202 | 163 | 75.00 | 28,798 | 1.46 | 0.0 | 37.44 | 1.6 | 22,058 | 76.59 | 158 | / | |||||||||||||||||||||||||||||||||||||
| 6 | 2.50 to <10.00 | 62,602 | 9,186 | 75.00 | 947 | 3.30 | 0.0 | 37.97 | 2.6 | 1,068 | 112.71 | 11 | / | |||||||||||||||||||||||||||||||||||||
| 7 | 10.00 to <100.00 | 16,952 | 26 | 75.00 | 217 | 15.16 | 0.0 | 8.17 | 1.1 | 83 | 38.66 | 2 | / | |||||||||||||||||||||||||||||||||||||
| 8 | 100.00 (Default) | 1,819 | — | — | 19 | 100.00 | 0.0 | 28.17 | 1.2 | 7 | 37.33 | 4 | / | |||||||||||||||||||||||||||||||||||||
|
|
|
|
|
|
|
|
|
|
|
|
|
|
|
|
|
|
|
|
|
|
|
| |||||||||||||||||||||||||||
| 9 | Sub-total | 65,550,571 | 520,586 | 77.97 | 67,210,657 | 0.00 | 0.3 | 37.99 | 1.6 | 696,660 | 1.03 | 1,163 | 792 | |||||||||||||||||||||||||||||||||||||
|
|
|
|
|
|
|
|
|
|
|
|
|
|
|
|
|
|
|
|
|
|
|
| |||||||||||||||||||||||||||
Banks |
| |||||||||||||||||||||||||||||||||||||||||||||||||
| 1 | 0.00 to <0.15 | 3,444,364 | 704,050 | 72.47 | 4,274,768 | 0.06 | 0.3 | 37.38 | 1.4 | 693,677 | 16.22 | 1,011 | / | |||||||||||||||||||||||||||||||||||||
| 2 | 0.15 to <0.25 | — | — | — | — | — | — | — | — | — | — | — | / | |||||||||||||||||||||||||||||||||||||
| 3 | 0.25 to <0.50 | 106,079 | 34,292 | 83.00 | 157,228 | 0.27 | 0.0 | 34.08 | 1.5 | 45,560 | 28.97 | 123 | / | |||||||||||||||||||||||||||||||||||||
| 4 | 0.50 to <0.75 | 197,750 | 55,035 | 72.89 | 211,024 | 0.50 | 0.0 | 36.75 | 1.4 | 103,707 | 49.14 | 378 | / | |||||||||||||||||||||||||||||||||||||
| 5 | 0.75 to <2.50 | 130,564 | 9,911 | 75.32 | 138,643 | 1.00 | 0.0 | 36.73 | 1.4 | 102,512 | 73.93 | 504 | / | |||||||||||||||||||||||||||||||||||||
| 6 | 2.50 to <10.00 | 20,652 | 18,128 | 67.96 | 24,045 | 3.13 | 0.0 | 40.38 | 2.2 | 28,335 | 117.84 | 304 | / | |||||||||||||||||||||||||||||||||||||
| 7 | 10.00 to <100.00 | — | — | — | — | — | — | — | — | — | — | — | / | |||||||||||||||||||||||||||||||||||||
| 8 | 100.00 (Default) | 1,287 | — | — | 1,287 | 100.00 | 0.0 | 96.57 | 4.9 | 363 | 28.25 | 1,214 | / | |||||||||||||||||||||||||||||||||||||
|
|
|
|
|
|
|
|
|
|
|
|
|
|
|
|
|
|
|
|
|
|
|
| |||||||||||||||||||||||||||
| 9 | Sub-total | 3,900,699 | 821,418 | 72.87 | 4,806,998 | 0.16 | 0.5 | 37.26 | 1.4 | 974,158 | 20.26 | 3,536 | 2,408 | |||||||||||||||||||||||||||||||||||||
|
|
|
|
|
|
|
|
|
|
|
|
|
|
|
|
|
|
|
|
|
|
|
| |||||||||||||||||||||||||||
Corporate (except SME and specialized lending) |
| |||||||||||||||||||||||||||||||||||||||||||||||||
| 1 | 0.00 to <0.15 | 35,728,142 | 21,717,226 | 73.81 | 52,701,719 | 0.07 | 6.5 | 37.97 | 2.4 | 11,485,859 | 21.79 | 15,786 | / | |||||||||||||||||||||||||||||||||||||
| 2 | 0.15 to <0.25 | — | — | — | — | — | — | — | — | — | — | — | / | |||||||||||||||||||||||||||||||||||||
| 3 | 0.25 to <0.50 | 4,154,221 | 1,464,926 | 75.16 | 4,954,125 | 0.27 | 5.3 | 33.22 | 2.6 | 1,978,399 | 39.93 | 4,556 | / | |||||||||||||||||||||||||||||||||||||
| 4 | 0.50 to <0.75 | 3,335,203 | 874,325 | 74.03 | 3,808,160 | 0.50 | 3.8 | 33.57 | 2.7 | 2,073,698 | 54.45 | 6,434 | / | |||||||||||||||||||||||||||||||||||||
| 5 | 0.75 to <2.50 | 4,212,757 | 926,478 | 75.97 | 4,518,372 | 1.18 | 5.2 | 31.97 | 2.6 | 3,145,660 | 69.61 | 17,169 | / | |||||||||||||||||||||||||||||||||||||
| 6 | 2.50 to <10.00 | 1,967,931 | 684,281 | 70.34 | 1,912,682 | 3.86 | 1.9 | 32.58 | 3.0 | 2,026,392 | 105.94 | 24,920 | / | |||||||||||||||||||||||||||||||||||||
| 7 | 10.00 to <100.00 | 478,359 | 172,021 | 77.99 | 418,948 | 15.16 | 0.7 | 28.23 | 2.2 | 574,489 | 137.12 | 17,943 | / | |||||||||||||||||||||||||||||||||||||
| 8 | 100.00 (Default) | 420,603 | 22,230 | 80.22 | 414,611 | 100.00 | 0.7 | 38.96 | 2.1 | 127,172 | 30.67 | 151,385 | / | |||||||||||||||||||||||||||||||||||||
|
|
|
|
|
|
|
|
|
|
|
|
|
|
|
|
|
|
|
|
|
|
|
| |||||||||||||||||||||||||||
| 9 | Sub-total | 50,297,219 | 25,861,490 | 73.92 | 68,728,619 | 0.99 | 24.3 | 36.78 | 2.5 | 21,411,672 | 31.15 | 238,196 | 162,210 | |||||||||||||||||||||||||||||||||||||
|
|
|
|
|
|
|
|
|
|
|
|
|
|
|
|
|
|
|
|
|
|
|
| |||||||||||||||||||||||||||
SME |
| |||||||||||||||||||||||||||||||||||||||||||||||||
| 1 | 0.00 to <0.15 | 82,869 | 20,926 | 74.99 | 98,562 | 0.07 | 0.0 | 31.64 | 2.3 | 14,696 | 14.91 | 24 | / | |||||||||||||||||||||||||||||||||||||
| 2 | 0.15 to <0.25 | — | — | — | — | — | — | — | — | — | — | — | / | |||||||||||||||||||||||||||||||||||||
| 3 | 0.25 to <0.50 | 552,499 | 29,152 | 73.71 | 562,058 | 0.27 | 3.0 | 24.31 | 2.8 | 142,029 | 25.26 | 378 | / | |||||||||||||||||||||||||||||||||||||
| 4 | 0.50 to <0.75 | 688,348 | 26,430 | 74.25 | 690,992 | 0.50 | 3.3 | 23.91 | 3.0 | 229,938 | 33.27 | 831 | / | |||||||||||||||||||||||||||||||||||||
| 5 | 0.75 to <2.50 | 1,243,471 | 29,192 | 75.43 | 1,226,916 | 1.19 | 5.9 | 20.75 | 3.4 | 491,630 | 40.07 | 3,124 | / | |||||||||||||||||||||||||||||||||||||
| 6 | 2.50 to <10.00 | 454,790 | 12,354 | 76.30 | 446,427 | 3.25 | 1.7 | 19.05 | 3.7 | 214,824 | 48.12 | 2,802 | / | |||||||||||||||||||||||||||||||||||||
| 7 | 10.00 to <100.00 | 147,430 | 5,173 | 92.75 | 140,309 | 15.16 | 0.7 | 17.98 | 3.1 | 106,804 | 76.12 | 3,828 | / | |||||||||||||||||||||||||||||||||||||
| 8 | 100.00 (Default) | 146,588 | 623 | 66.96 | 137,093 | 100.00 | 0.6 | 42.41 | 2.2 | 43,356 | 31.62 | 54,678 | / | |||||||||||||||||||||||||||||||||||||
|
|
|
|
|
|
|
|
|
|
|
|
|
|
|
|
|
|
|
|
|
|
|
| |||||||||||||||||||||||||||
| 9 | Sub-total | 3,315,998 | 123,853 | 75.47 | 3,302,360 | 5.83 | 15.4 | 22.89 | 3.2 | 1,243,280 | 37.64 | 65,667 | 44,718 | |||||||||||||||||||||||||||||||||||||
|
|
|
|
|
|
|
|
|
|
|
|
|
|
|
|
|
|
|
|
|
|
|
| |||||||||||||||||||||||||||
Specialized Lending |
| |||||||||||||||||||||||||||||||||||||||||||||||||
| 1 | 0.00 to <0.15 | 2,375,330 | 262,272 | 77.84 | 2,206,165 | 0.09 | 0.4 | 36.49 | 4.3 | 707,374 | 32.06 | 759 | / | |||||||||||||||||||||||||||||||||||||
| 2 | 0.15 to <0.25 | — | — | — | — | — | — | — | — | — | — | — | / | |||||||||||||||||||||||||||||||||||||
| 3 | 0.25 to <0.50 | 386,629 | 139,797 | 77.89 | 373,281 | 0.27 | 0.0 | 38.49 | 4.1 | 219,941 | 58.92 | 397 | / | |||||||||||||||||||||||||||||||||||||
| 4 | 0.50 to <0.75 | 230,853 | 74,918 | 77.70 | 215,900 | 0.50 | 0.0 | 43.42 | 4.1 | 185,680 | 86.00 | 471 | / | |||||||||||||||||||||||||||||||||||||
| 5 | 0.75 to <2.50 | 413,034 | 107,078 | 75.36 | 331,811 | 1.02 | 0.0 | 38.49 | 4.5 | 335,100 | 100.99 | 1,312 | / | |||||||||||||||||||||||||||||||||||||
| 6 | 2.50 to <10.00 | 76,132 | 14,241 | 76.45 | 51,744 | 4.38 | 0.0 | 38.19 | 3.5 | 68,274 | 131.94 | 867 | / | |||||||||||||||||||||||||||||||||||||
| 7 | 10.00 to <100.00 | 40,737 | 1,342 | 94.02 | 9,364 | 15.16 | 0.0 | 37.97 | 3.9 | 18,836 | 201.13 | 539 | / | |||||||||||||||||||||||||||||||||||||
| 8 | 100.00 (Default) | 29,001 | 389 | 100.00 | 25,293 | 100.00 | 0.0 | 64.04 | 4.2 | 12,473 | 49.31 | 15,201 | / | |||||||||||||||||||||||||||||||||||||
|
|
|
|
|
|
|
|
|
|
|
|
|
|
|
|
|
|
|
|
|
|
|
| |||||||||||||||||||||||||||
| 9 | Sub-total | 3,551,720 | 600,039 | 77.41 | 3,213,563 | 1.13 | 0.6 | 37.64 | 4.2 | 1,547,680 | 48.16 | 19,549 | 13,313 | |||||||||||||||||||||||||||||||||||||
|
|
|
|
|
|
|
|
|
|
|
|
|
|
|
|
|
|
|
|
|
|
|
| |||||||||||||||||||||||||||
Equities (PD/LGD approach) |
| |||||||||||||||||||||||||||||||||||||||||||||||||
| 1 | 0.00 to <0.15 | 3,704,926 | 21,305 | 100.00 | 3,726,232 | 0.05 | 1.0 | 90.00 | 5.0 | 3,795,623 | 101.86 | / | / | |||||||||||||||||||||||||||||||||||||
| 2 | 0.15 to <0.25 | — | — | — | — | — | — | — | — | — | — | / | / | |||||||||||||||||||||||||||||||||||||
| 3 | 0.25 to <0.50 | 90,067 | — | — | 90,067 | 0.27 | 0.5 | 90.00 | 5.0 | 142,515 | 158.23 | / | / | |||||||||||||||||||||||||||||||||||||
| 4 | 0.50 to <0.75 | 43,662 | — | — | 43,662 | 0.50 | 0.3 | 90.00 | 5.0 | 89,021 | 203.88 | / | / | |||||||||||||||||||||||||||||||||||||
| 5 | 0.75 to <2.50 | 40,387 | — | — | 40,387 | 1.15 | 0.2 | 90.00 | 5.0 | 107,668 | 266.58 | / | / | |||||||||||||||||||||||||||||||||||||
| 6 | 2.50 to <10.00 | 113,095 | — | — | 113,095 | 3.76 | 0.0 | 90.00 | 5.0 | 425,736 | 376.44 | / | / | |||||||||||||||||||||||||||||||||||||
| 7 | 10.00 to <100.00 | 915 | — | — | 915 | 15.16 | 0.0 | 90.00 | 5.0 | 5,851 | 638.79 | / | / | |||||||||||||||||||||||||||||||||||||
| 8 | 100.00 (Default) | 5,710 | — | — | 5,710 | 100.00 | 0.1 | 90.00 | 5.0 | 64,245 | 1,125.00 | / | / | |||||||||||||||||||||||||||||||||||||
|
|
|
|
|
|
|
|
|
|
|
|
|
|
|
|
|
|
|
|
|
|
|
| |||||||||||||||||||||||||||
| 9 | Sub-total | 3,998,766 | 21,305 | 100.00 | 4,020,072 | 0.33 | 2.3 | 90.00 | 5.0 | 4,630,663 | 115.18 | / | / | |||||||||||||||||||||||||||||||||||||
|
|
|
|
|
|
|
|
|
|
|
|
|
|
|
|
|
|
|
|
|
|
|
| |||||||||||||||||||||||||||
23
Table of Contents
(-Continued)
| (Millions of yen, %, number in the thousands, year) | ||||||||||||||||||||||||||||||||||||||||||||||||||
| As of March 31, 2018 | ||||||||||||||||||||||||||||||||||||||||||||||||||
| a | b | c | d | e | f | g | h | i | j | k | l | |||||||||||||||||||||||||||||||||||||||
PD scale | Original on-balance sheet gross exposure | Off- balance sheet exposures pre CCF | Average CCF | EAD post CRM and post-CCF | Average PD | Number of obligors | Average LGD | Average maturity | RWA | RWA density | EL | Provisions | ||||||||||||||||||||||||||||||||||||||
Purchased receivables (Corporate, etc.)–Default Risk Equivalent |
| |||||||||||||||||||||||||||||||||||||||||||||||||
| 1 | 0.00 to <0.15 | 2,148,219 | 701,913 | 75.14 | 2,671,876 | 0.08 | 0.9 | 38.23 | 1.9 | 472,908 | 17.69 | 818 | / | |||||||||||||||||||||||||||||||||||||
| 2 | 0.15 to <0.25 | — | — | — | — | — | — | — | — | — | — | — | / | |||||||||||||||||||||||||||||||||||||
| 3 | 0.25 to <0.50 | 129,026 | 94,175 | 77.74 | 202,240 | 0.27 | 0.2 | 37.89 | 2.0 | 80,622 | 39.86 | 212 | / | |||||||||||||||||||||||||||||||||||||
| 4 | 0.50 to <0.75 | 102,644 | 31,136 | 79.27 | 127,326 | 0.50 | 0.1 | 37.89 | 1.8 | 66,997 | 52.61 | 242 | / | |||||||||||||||||||||||||||||||||||||
| 5 | 0.75 to <2.50 | 83,546 | 28,528 | 77.42 | 105,635 | 1.04 | 0.1 | 37.88 | 2.3 | 80,956 | 76.63 | 419 | / | |||||||||||||||||||||||||||||||||||||
| 6 | 2.50 to <10.00 | 122,256 | 30,434 | 75.58 | 144,774 | 5.78 | 0.0 | 37.97 | 1.4 | 177,211 | 122.40 | 3,180 | / | |||||||||||||||||||||||||||||||||||||
| 7 | 10.00 to <100.00 | 1,163 | 18,484 | 75.71 | 15,159 | 15.16 | 0.0 | 37.97 | 1.6 | 27,179 | 179.28 | 873 | / | |||||||||||||||||||||||||||||||||||||
| 8 | 100.00 (Default) | 1,720 | — | — | 1,720 | 100.00 | 0.0 | 93.53 | 1.0 | 521 | 30.29 | 1,567 | / | |||||||||||||||||||||||||||||||||||||
|
|
|
|
|
|
|
|
|
|
|
|
|
|
|
|
|
|
|
|
|
|
|
| |||||||||||||||||||||||||||
| 9 | Sub-total | 2,588,578 | 904,673 | 75.65 | 3,268,735 | 0.51 | 1.6 | 38.20 | 1.9 | 906,398 | 27.72 | 7,314 | 4,980 | |||||||||||||||||||||||||||||||||||||
|
|
|
|
|
|
|
|
|
|
|
|
|
|
|
|
|
|
|
|
|
|
|
| |||||||||||||||||||||||||||
Purchased receivables (Retail)–Default Risk Equivalent |
| |||||||||||||||||||||||||||||||||||||||||||||||||
| 1 | 0.00 to <0.15 | — | — | — | — | — | — | — | — | — | — | — | / | |||||||||||||||||||||||||||||||||||||
| 2 | 0.15 to <0.25 | — | — | — | — | — | — | — | — | — | — | — | / | |||||||||||||||||||||||||||||||||||||
| 3 | 0.25 to <0.50 | — | — | — | — | — | — | — | — | — | — | — | / | |||||||||||||||||||||||||||||||||||||
| 4 | 0.50 to <0.75 | — | — | — | — | — | — | — | — | — | — | — | / | |||||||||||||||||||||||||||||||||||||
| 5 | 0.75 to <2.50 | — | — | — | — | — | — | — | — | — | — | — | / | |||||||||||||||||||||||||||||||||||||
| 6 | 2.50 to <10.00 | — | — | — | — | — | — | — | — | — | — | — | / | |||||||||||||||||||||||||||||||||||||
| 7 | 10.00 to <100.00 | — | — | — | — | — | — | — | — | — | — | — | / | |||||||||||||||||||||||||||||||||||||
| 8 | 100.00 (Default) | — | — | — | — | — | — | — | — | — | — | — | / | |||||||||||||||||||||||||||||||||||||
|
|
|
|
|
|
|
|
|
|
|
|
|
|
|
|
|
|
|
|
|
|
|
| |||||||||||||||||||||||||||
| 9 | Sub-total | — | — | — | — | — | — | — | — | — | — | — | — | |||||||||||||||||||||||||||||||||||||
|
|
|
|
|
|
|
|
|
|
|
|
|
|
|
|
|
|
|
|
|
|
|
| |||||||||||||||||||||||||||
Purchased receivables (Dilution Risk Equivalent) |
| |||||||||||||||||||||||||||||||||||||||||||||||||
| 1 | 0.00 to <0.15 | 895,557 | 16,505 | 100.00 | 912,062 | 0.02 | 0.1 | 7.96 | — | 166,817 | 18.29 | 411 | / | |||||||||||||||||||||||||||||||||||||
| 2 | 0.15 to <0.25 | — | — | — | — | — | — | — | — | — | — | — | / | |||||||||||||||||||||||||||||||||||||
| 3 | 0.25 to <0.50 | 11,735 | — | — | 11,735 | 0.27 | 0.0 | 37.97 | — | 3,654 | 31.13 | 12 | / | |||||||||||||||||||||||||||||||||||||
| 4 | 0.50 to <0.75 | 17,229 | — | — | 17,229 | 0.50 | 0.0 | 37.31 | — | 7,609 | 44.16 | 32 | / | |||||||||||||||||||||||||||||||||||||
| 5 | 0.75 to <2.50 | 97,240 | 5,881 | 100.00 | 103,122 | 1.39 | 0.0 | 19.96 | — | 69,059 | 66.96 | 463 | / | |||||||||||||||||||||||||||||||||||||
| 6 | 2.50 to <10.00 | 11,811 | — | — | 11,811 | 3.03 | 0.0 | 8.82 | — | 11,116 | 94.11 | 140 | / | |||||||||||||||||||||||||||||||||||||
| 7 | 10.00 to <100.00 | 923 | — | — | 923 | 15.16 | 0.0 | 37.97 | — | 1,553 | 168.25 | 53 | / | |||||||||||||||||||||||||||||||||||||
| 8 | 100.00 (Default) | 2,139 | — | — | 2,139 | 100.00 | 0.0 | 47.79 | — | 1,087 | 50.85 | 935 | / | |||||||||||||||||||||||||||||||||||||
|
|
|
|
|
|
|
|
|
|
|
|
|
|
|
|
|
|
|
|
|
|
|
| |||||||||||||||||||||||||||
| 9 | Sub-total | 1,036,637 | 22,387 | 100.00 | 1,059,024 | 0.41 | 0.1 | 10.06 | — | 260,898 | 24.63 | 2,050 | / | |||||||||||||||||||||||||||||||||||||
|
|
|
|
|
|
|
|
|
|
|
|
|
|
|
|
|
|
|
|
|
|
|
| |||||||||||||||||||||||||||
Retail–qualifying revolving retail exposures (QRRE) |
| |||||||||||||||||||||||||||||||||||||||||||||||||
| 1 | 0.00 to <0.15 | — | — | — | 0 | 0.13 | 0.0 | 78.04 | / | 0 | 6.01 | 0 | / | |||||||||||||||||||||||||||||||||||||
| 2 | 0.15 to <0.25 | — | — | — | 33 | 0.18 | 0.4 | 77.05 | / | 2 | 7.79 | 0 | / | |||||||||||||||||||||||||||||||||||||
| 3 | 0.25 to <0.50 | — | — | — | 60 | 0.34 | 2.0 | 78.04 | / | 7 | 12.85 | 0 | / | |||||||||||||||||||||||||||||||||||||
| 4 | 0.50 to <0.75 | — | — | — | — | — | — | — | / | — | — | — | / | |||||||||||||||||||||||||||||||||||||
| 5 | 0.75 to <2.50 | 246,700 | 882,617 | 15.67 | 385,057 | 2.31 | 484.0 | 78.03 | / | 214,816 | 55.78 | 6,961 | / | |||||||||||||||||||||||||||||||||||||
| 6 | 2.50 to <10.00 | 171,502 | 904,560 | 8.86 | 251,550 | 4.06 | 1,838.9 | 78.04 | / | 204,438 | 81.27 | 7,973 | / | |||||||||||||||||||||||||||||||||||||
| 7 | 10.00 to <100.00 | 30,330 | 15,707 | 38.33 | 36,349 | 18.49 | 111.4 | 78.04 | / | 64,164 | 176.51 | 5,245 | / | |||||||||||||||||||||||||||||||||||||
| 8 | 100.00 (Default) | 547 | 1,389 | 12.13 | 710 | 100.00 | 2.1 | 71.86 | / | 564 | 79.48 | 465 | / | |||||||||||||||||||||||||||||||||||||
|
|
|
|
|
|
|
|
|
|
|
|
|
|
|
|
|
|
|
|
|
|
|
| |||||||||||||||||||||||||||
| 9 | Sub-total | 449,080 | 1,804,276 | 12.45 | 673,761 | 3.94 | 2,439.0 | 78.03 | / | 483,995 | 71.83 | 20,647 | 14,060 | |||||||||||||||||||||||||||||||||||||
|
|
|
|
|
|
|
|
|
|
|
|
|
|
|
|
|
|
|
|
|
|
|
| |||||||||||||||||||||||||||
Retail–Residential mortgage |
| |||||||||||||||||||||||||||||||||||||||||||||||||
| 1 | 0.00 to <0.15 | 1,753,094 | — | — | 1,788,294 | 0.07 | 134.0 | 29.40 | / | 98,880 | 5.52 | 396 | / | |||||||||||||||||||||||||||||||||||||
| 2 | 0.15 to <0.25 | 1,555,463 | — | — | 1,557,206 | 0.19 | 98.7 | 31.48 | / | 196,694 | 12.63 | 984 | / | |||||||||||||||||||||||||||||||||||||
| 3 | 0.25 to <0.50 | 1,995,206 | — | — | 1,996,178 | 0.35 | 137.5 | 33.88 | / | 411,553 | 20.61 | 2,400 | / | |||||||||||||||||||||||||||||||||||||
| 4 | 0.50 to <0.75 | 1,913,740 | 106,001 | 97.52 | 1,976,720 | 0.66 | 176.4 | 36.68 | / | 684,897 | 34.64 | 4,785 | / | |||||||||||||||||||||||||||||||||||||
| 5 | 0.75 to <2.50 | 1,540,512 | 869 | 100.00 | 1,543,115 | 1.08 | 118.2 | 36.58 | / | 736,804 | 47.74 | 6,054 | / | |||||||||||||||||||||||||||||||||||||
| 6 | 2.50 to <10.00 | 78,221 | 2,795 | 100.00 | 81,793 | 9.58 | 6.9 | 37.92 | / | 138,206 | 168.97 | 2,969 | / | |||||||||||||||||||||||||||||||||||||
| 7 | 10.00 to <100.00 | 31,308 | 2,477 | 100.00 | 33,807 | 47.05 | 3.2 | 40.24 | / | 66,608 | 197.02 | 6,406 | / | |||||||||||||||||||||||||||||||||||||
| 8 | 100.00 (Default) | 67,581 | 1,372 | 100.00 | 68,903 | 100.00 | 4.3 | 45.19 | / | 32,533 | 47.21 | 28,537 | / | |||||||||||||||||||||||||||||||||||||
|
|
|
|
|
|
|
|
|
|
|
|
|
|
|
|
|
|
|
|
|
|
|
| |||||||||||||||||||||||||||
| 9 | Sub-total | 8,935,128 | 113,516 | 97.68 | 9,046,019 | 1.48 | 679.7 | 33.80 | / | 2,366,178 | 26.15 | 52,535 | 35,776 | |||||||||||||||||||||||||||||||||||||
|
|
|
|
|
|
|
|
|
|
|
|
|
|
|
|
|
|
|
|
|
|
|
| |||||||||||||||||||||||||||
Other retail |
| |||||||||||||||||||||||||||||||||||||||||||||||||
| 1 | 0.00 to <0.15 | 20 | — | — | 307,294 | 0.05 | 41.4 | 43.50 | / | 19,034 | 6.19 | 75 | / | |||||||||||||||||||||||||||||||||||||
| 2 | 0.15 to <0.25 | 2 | — | — | 55,690 | 0.18 | 4.5 | 43.16 | / | 9,068 | 16.28 | 43 | / | |||||||||||||||||||||||||||||||||||||
| 3 | 0.25 to <0.50 | 121,031 | 155 | 100.00 | 137,772 | 0.34 | 4.1 | 46.55 | / | 37,291 | 27.06 | 224 | / | |||||||||||||||||||||||||||||||||||||
| 4 | 0.50 to <0.75 | 188,160 | 550 | 75.18 | 184,968 | 0.69 | 65.9 | 26.93 | / | 41,514 | 22.44 | 327 | / | |||||||||||||||||||||||||||||||||||||
| 5 | 0.75 to <2.50 | 1,017,097 | 3,472 | 78.21 | 940,438 | 1.36 | 26.4 | 53.29 | / | 528,419 | 56.18 | 5,988 | / | |||||||||||||||||||||||||||||||||||||
| 6 | 2.50 to <10.00 | 398,879 | 1,897 | 63.40 | 174,889 | 6.29 | 16.0 | 22.22 | / | 57,981 | 33.15 | 2,149 | / | |||||||||||||||||||||||||||||||||||||
| 7 | 10.00 to <100.00 | 98,427 | 9,870 | 51.83 | 49,497 | 18.27 | 11.8 | 31.29 | / | 32,253 | 65.16 | 3,156 | / | |||||||||||||||||||||||||||||||||||||
| 8 | 100.00 (Default) | 73,064 | 3,023 | 94.67 | 58,600 | 100.00 | 2.9 | 44.01 | / | 25,897 | 44.19 | 23,722 | / | |||||||||||||||||||||||||||||||||||||
|
|
|
|
|
|
|
|
|
|
|
|
|
|
|
|
|
|
|
|
|
|
|
| |||||||||||||||||||||||||||
| 9 | Sub-total | 1,896,684 | 18,970 | 65.72 | 1,909,152 | 4.89 | 173.4 | 44.68 | / | 751,460 | 39.36 | 35,688 | 24,303 | |||||||||||||||||||||||||||||||||||||
|
|
|
|
|
|
|
|
|
|
|
|
|
|
|
|
|
|
|
|
|
|
|
| |||||||||||||||||||||||||||
Total (all portfolios) | 145,521,084 | 30,812,518 | 70.60 | 167,238,965 | 0.72 | 3,337.8 | 38.21 | 2.20 | 35,273,045 | 21.01 | 446,348 | 302,564 | ||||||||||||||||||||||||||||||||||||||
|
|
|
|
|
|
|
|
|
|
|
|
|
|
|
|
|
|
|
|
|
|
|
| |||||||||||||||||||||||||||
Notes: | ||
1. | Counterparty credit risk exposures, securitization exposures, and regarded-method exposures are excluded from the amount of credit risk exposures above. | |
2. | On-balance sheet exposures,pre-CCF andpre- CRMoff-balance sheet exposures, and the average CCF are allocated to the PD ranges based onpre- CRM PD estimates. | |
3. | The number of credits is disclosed as the number of data of obligors for QRRE, residential mortgage and other retail excluding credit for business purpose. | |
24
Table of Contents
| (Millions of yen, %, number in the thousands, year) | ||||||||||||||||||||||||||||||||||||||||||||||||||
| As of March 31, 2019 | ||||||||||||||||||||||||||||||||||||||||||||||||||
| a | b | c | d | e | f | g | h | i | j | k | l | |||||||||||||||||||||||||||||||||||||||
PD scale | Original on-balance sheet gross exposure | Off- balance sheet exposures pre CCF | Average CCF | EAD post CRM and post-CCF | Average PD | Number of obligors | Average LGD | Average maturity | RWA | RWA density | EL | Provisions | ||||||||||||||||||||||||||||||||||||||
Sovereign |
| |||||||||||||||||||||||||||||||||||||||||||||||||
| 1 | 0.00 to <0.15 | 66,209,608 | 413,709 | 79.43 | 67,797,332 | 0.00 | 0.3 | 38.03 | 1.3 | 671,312 | 0.99 | 930 | / | |||||||||||||||||||||||||||||||||||||
| 2 | 0.15 to <0.25 | — | — | — | — | — | — | — | — | — | — | — | / | |||||||||||||||||||||||||||||||||||||
| 3 | 0.25 to <0.50 | 22,190 | 1,474 | 75.00 | 11,124 | 0.34 | 0.0 | 36.76 | 3.9 | 6,566 | 59.03 | 13 | / | |||||||||||||||||||||||||||||||||||||
| 4 | 0.50 to <0.75 | — | — | — | — | — | — | — | — | — | — | — | / | |||||||||||||||||||||||||||||||||||||
| 5 | 0.75 to <2.50 | 138,214 | 4,995 | 75.00 | 85,505 | 1.11 | 0.0 | 37.97 | 1.1 | 55,620 | 65.04 | 361 | / | |||||||||||||||||||||||||||||||||||||
| 6 | 2.50 to <10.00 | 61,800 | 5,173 | 75.00 | 1,489 | 3.91 | 0.0 | 38.01 | 1.4 | 1,573 | 105.67 | 22 | / | |||||||||||||||||||||||||||||||||||||
| 7 | 10.00 to <100.00 | 16,436 | — | — | 1,428 | 14.89 | 0.0 | 33.77 | 3.0 | 2,429 | 170.03 | 71 | / | |||||||||||||||||||||||||||||||||||||
| 8 | 100.00 (Default) | 2 | — | — | 2 | 100.00 | 0.0 | 30.41 | 1.0 | 0 | 38.64 | 0 | / | |||||||||||||||||||||||||||||||||||||
|
|
|
|
|
|
|
|
|
|
|
|
|
|
|
|
|
|
|
|
|
|
|
| |||||||||||||||||||||||||||
| 9 | Sub-total | 66,448,251 | 425,353 | 79.31 | 67,896,882 | 0.00 | 0.3 | 38.03 | 1.3 | 737,504 | 1.08 | 1,400 | 870 | |||||||||||||||||||||||||||||||||||||
|
|
|
|
|
|
|
|
|
|
|
|
|
|
|
|
|
|
|
|
|
|
|
| |||||||||||||||||||||||||||
Banks |
| |||||||||||||||||||||||||||||||||||||||||||||||||
| 1 | 0.00 to <0.15 | 3,592,231 | 725,966 | 74.88 | 4,596,204 | 0.05 | 0.3 | 37.91 | 1.5 | 688,280 | 14.97 | 919 | / | |||||||||||||||||||||||||||||||||||||
| 2 | 0.15 to <0.25 | — | — | — | — | — | — | — | — | — | — | — | / | |||||||||||||||||||||||||||||||||||||
| 3 | 0.25 to <0.50 | 237,686 | 40,584 | 60.92 | 278,522 | 0.36 | 0.1 | 36.95 | 1.6 | 107,045 | 38.43 | 326 | / | |||||||||||||||||||||||||||||||||||||
| 4 | 0.50 to <0.75 | — | — | — | — | — | — | — | — | — | — | — | / | |||||||||||||||||||||||||||||||||||||
| 5 | 0.75 to <2.50 | 219,123 | 29,303 | 84.78 | 216,764 | 1.09 | 0.0 | 37.02 | 0.9 | 154,486 | 71.26 | 882 | / | |||||||||||||||||||||||||||||||||||||
| 6 | 2.50 to <10.00 | 21,103 | 22,332 | 74.21 | 21,994 | 3.07 | 0.0 | 41.05 | 2.6 | 26,736 | 121.56 | 277 | / | |||||||||||||||||||||||||||||||||||||
| 7 | 10.00 to <100.00 | — | — | — | — | — | — | — | — | — | — | — | / | |||||||||||||||||||||||||||||||||||||
| 8 | 100.00 (Default) | 1,027 | — | — | 1,027 | 100.00 | 0.0 | 96.59 | 5.0 | 313 | 30.50 | 967 | / | |||||||||||||||||||||||||||||||||||||
|
|
|
|
|
|
|
|
|
|
|
|
|
|
|
|
|
|
|
|
|
|
|
| |||||||||||||||||||||||||||
| 9 | Sub-total | 4,071,173 | 818,186 | 74.53 | 5,114,513 | 0.15 | 0.5 | 37.84 | 1.5 | 976,862 | 19.09 | 3,372 | 2,097 | |||||||||||||||||||||||||||||||||||||
|
|
|
|
|
|
|
|
|
|
|
|
|
|
|
|
|
|
|
|
|
|
|
| |||||||||||||||||||||||||||
Corporate (except SME and specialized lending) |
| |||||||||||||||||||||||||||||||||||||||||||||||||
| 1 | 0.00 to <0.15 | 40,813,958 | 24,147,753 | 73.81 | 59,581,637 | 0.06 | 7.4 | 37.97 | 2.4 | 11,710,662 | 19.65 | 14,916 | / | |||||||||||||||||||||||||||||||||||||
| 2 | 0.15 to <0.25 | — | — | — | — | — | — | — | — | — | — | — | / | |||||||||||||||||||||||||||||||||||||
| 3 | 0.25 to <0.50 | 7,720,193 | 2,298,649 | 74.72 | 8,953,178 | 0.36 | 8.8 | 33.72 | 2.7 | 4,145,489 | 46.30 | 11,029 | / | |||||||||||||||||||||||||||||||||||||
| 4 | 0.50 to <0.75 | — | — | — | — | — | — | — | — | — | — | — | / | |||||||||||||||||||||||||||||||||||||
| 5 | 0.75 to <2.50 | 4,813,838 | 1,175,144 | 75.42 | 5,206,907 | 1.15 | 4.9 | 32.17 | 2.8 | 3,721,758 | 71.47 | 19,267 | / | |||||||||||||||||||||||||||||||||||||
| 6 | 2.50 to <10.00 | 1,460,606 | 388,260 | 66.82 | 1,284,345 | 3.55 | 325.4 | 30.88 | 2.8 | 1,217,196 | 94.77 | 14,174 | / | |||||||||||||||||||||||||||||||||||||
| 7 | 10.00 to <100.00 | 528,967 | 156,905 | 78.38 | 439,761 | 14.89 | 3.1 | 28.10 | 2.5 | 605,761 | 137.74 | 18,409 | / | |||||||||||||||||||||||||||||||||||||
| 8 | 100.00 (Default) | 427,003 | 27,531 | 75.69 | 428,303 | 100.00 | 2.7 | 45.25 | 1.7 | 172,313 | 40.23 | 180,058 | / | |||||||||||||||||||||||||||||||||||||
|
|
|
|
|
|
|
|
|
|
|
|
|
|
|
|
|
|
|
|
|
|
|
| |||||||||||||||||||||||||||
| 9 | Sub-total | 55,764,567 | 28,194,244 | 73.88 | 75,894,134 | 0.88 | 352.5 | 36.94 | 2.5 | 21,573,181 | 28.42 | 257,855 | 160,329 | |||||||||||||||||||||||||||||||||||||
|
|
|
|
|
|
|
|
|
|
|
|
|
|
|
|
|
|
|
|
|
|
|
| |||||||||||||||||||||||||||
SME |
| |||||||||||||||||||||||||||||||||||||||||||||||||
| 1 | 0.00 to <0.15 | 203,291 | 31,166 | 73.21 | 229,178 | 0.06 | 0.0 | 34.50 | 3.2 | 47,184 | 20.58 | 49 | / | |||||||||||||||||||||||||||||||||||||
| 2 | 0.15 to <0.25 | — | — | — | — | — | — | — | — | — | — | — | / | |||||||||||||||||||||||||||||||||||||
| 3 | 0.25 to <0.50 | 1,375,014 | 60,686 | 74.30 | 1,398,157 | 0.37 | 7.0 | 25.12 | 3.0 | 427,172 | 30.55 | 1,298 | / | |||||||||||||||||||||||||||||||||||||
| 4 | 0.50 to <0.75 | — | — | — | — | — | — | — | — | — | — | — | / | |||||||||||||||||||||||||||||||||||||
| 5 | 0.75 to <2.50 | 1,354,712 | 45,022 | 77.81 | 1,353,538 | 1.16 | 6.0 | 22.44 | 3.3 | 580,133 | 42.86 | 3,600 | / | |||||||||||||||||||||||||||||||||||||
| 6 | 2.50 to <10.00 | 489,549 | 13,808 | 80.96 | 483,191 | 3.19 | 110.3 | 21.16 | 3.8 | 261,443 | 54.10 | 3,316 | / | |||||||||||||||||||||||||||||||||||||
| 7 | 10.00 to <100.00 | 173,990 | 3,889 | 70.49 | 169,776 | 14.89 | 1.8 | 17.62 | 3.2 | 126,925 | 74.76 | 4,456 | / | |||||||||||||||||||||||||||||||||||||
| 8 | 100.00 (Default) | 134,811 | 926 | 76.62 | 126,842 | 100.00 | 1.0 | 39.69 | 2.2 | 42,527 | 33.52 | 46,945 | / | |||||||||||||||||||||||||||||||||||||
|
|
|
|
|
|
|
|
|
|
|
|
|
|
|
|
|
|
|
|
|
|
|
| |||||||||||||||||||||||||||
| 9 | Sub-total | 3,731,369 | 155,499 | 75.61 | 3,760,684 | 5.01 | 126.4 | 24.37 | 3.2 | 1,485,386 | 39.49 | 59,667 | 37,099 | |||||||||||||||||||||||||||||||||||||
|
|
|
|
|
|
|
|
|
|
|
|
|
|
|
|
|
|
|
|
|
|
|
| |||||||||||||||||||||||||||
Specialized Lending |
| |||||||||||||||||||||||||||||||||||||||||||||||||
| 1 | 0.00 to <0.15 | 2,709,198 | 333,675 | 76.43 | 2,561,400 | 0.08 | 0.4 | 34.94 | 4.3 | 736,152 | 28.74 | 725 | / | |||||||||||||||||||||||||||||||||||||
| 2 | 0.15 to <0.25 | — | — | — | — | — | — | — | — | — | — | — | / | |||||||||||||||||||||||||||||||||||||
| 3 | 0.25 to <0.50 | 683,188 | 291,892 | 77.22 | 695,724 | 0.33 | 0.1 | 38.38 | 4.1 | 444,157 | 63.84 | 915 | / | |||||||||||||||||||||||||||||||||||||
| 4 | 0.50 to <0.75 | — | — | — | — | — | — | — | — | — | — | — | / | |||||||||||||||||||||||||||||||||||||
| 5 | 0.75 to <2.50 | 383,404 | 81,839 | 74.89 | 326,439 | 0.93 | 0.0 | 38.87 | 4.4 | 320,941 | 98.31 | 1,186 | / | |||||||||||||||||||||||||||||||||||||
| 6 | 2.50 to <10.00 | 77,269 | 6,208 | 92.47 | 44,533 | 3.46 | 0.0 | 37.55 | 3.7 | 55,284 | 124.13 | 582 | / | |||||||||||||||||||||||||||||||||||||
| 7 | 10.00 to <100.00 | 24,918 | 6,265 | 77.55 | 16,303 | 14.89 | 0.0 | 38.01 | 3.9 | 32,615 | 200.04 | 923 | / | |||||||||||||||||||||||||||||||||||||
| 8 | 100.00 (Default) | 29,225 | 363 | 100.00 | 27,175 | 100.00 | 0.0 | 62.73 | 4.4 | 14,536 | 53.48 | 15,884 | / | |||||||||||||||||||||||||||||||||||||
|
|
|
|
|
|
|
|
|
|
|
|
|
| �� |
|
|
|
|
|
|
|
|
| |||||||||||||||||||||||||||
| 9 | Sub-total | 3,907,204 | 720,244 | 76.74 | 3,671,578 | 1.05 | 0.7 | 36.19 | 4.2 | 1,603,687 | 43.67 | 20,218 | 12,571 | |||||||||||||||||||||||||||||||||||||
|
|
|
|
|
|
|
|
|
|
|
|
|
|
|
|
|
|
|
|
|
|
|
| |||||||||||||||||||||||||||
Equities (PD/LGD approach) |
| |||||||||||||||||||||||||||||||||||||||||||||||||
| 1 | 0.00 to <0.15 | 3,123,409 | 11,603 | 100.00 | 3,135,013 | 0.04 | 1.0 | 90.00 | 5.0 | 3,165,376 | 100.96 | / | / | |||||||||||||||||||||||||||||||||||||
| 2 | 0.15 to <0.25 | — | — | — | — | — | — | — | — | — | — | / | / | |||||||||||||||||||||||||||||||||||||
| 3 | 0.25 to <0.50 | 119,829 | — | — | 119,829 | 0.33 | 0.7 | 90.00 | 5.0 | 202,127 | 168.67 | / | / | |||||||||||||||||||||||||||||||||||||
| 4 | 0.50 to <0.75 | — | — | — | — | — | — | — | — | — | — | / | / | |||||||||||||||||||||||||||||||||||||
| 5 | 0.75 to <2.50 | 70,861 | — | — | 70,861 | 1.19 | 0.2 | 90.00 | 5.0 | 192,321 | 271.40 | / | / | |||||||||||||||||||||||||||||||||||||
| 6 | 2.50 to <10.00 | 11,930 | — | — | 11,930 | 4.01 | 0.0 | 90.00 | 5.0 | 45,342 | 380.06 | / | / | |||||||||||||||||||||||||||||||||||||
| 7 | 10.00 to <100.00 | 1,164 | — | — | 1,164 | 14.89 | 0.0 | 90.00 | 5.0 | 7,520 | 646.00 | / | / | |||||||||||||||||||||||||||||||||||||
| 8 | 100.00 (Default) | 4,084 | — | — | 4,084 | 100.00 | 0.1 | 90.00 | 5.0 | 45,948 | 1,125.00 | / | / | |||||||||||||||||||||||||||||||||||||
|
|
|
|
|
|
|
|
|
|
|
|
|
|
|
|
|
|
|
|
|
|
|
| |||||||||||||||||||||||||||
| 9 | Sub-total | 3,331,279 | 11,603 | 100.00 | 3,342,883 | 0.22 | 2.2 | 90.00 | 5.0 | 3,658,637 | 109.44 | / | / | |||||||||||||||||||||||||||||||||||||
|
|
|
|
|
|
|
|
|
|
|
|
|
|
|
|
|
|
|
|
|
|
|
| |||||||||||||||||||||||||||
25
Table of Contents
(-Continued)
| (Millions of yen, %, number in the thousands, year) | ||||||||||||||||||||||||||||||||||||||||||||||||||
| As of March 31, 2019 | ||||||||||||||||||||||||||||||||||||||||||||||||||
| a | b | c | d | e | f | g | h | i | j | k | l | |||||||||||||||||||||||||||||||||||||||
PD scale | Original on-balance sheet gross exposure | Off- balance sheet exposures pre CCF | Average CCF | EAD post CRM and post-CCF | Average PD | Number of obligors | Average LGD | Average maturity | RWA | RWA density | EL | Provisions | ||||||||||||||||||||||||||||||||||||||
Purchased receivables (Corporate, etc.)–Default Risk Equivalent |
| |||||||||||||||||||||||||||||||||||||||||||||||||
| 1 | 0.00 to <0.15 | 2,072,913 | 550,531 | 78.15 | 2,503,107 | 0.06 | 0.6 | 38.33 | 1.5 | 338,704 | 13.53 | 657 | / | |||||||||||||||||||||||||||||||||||||
| 2 | 0.15 to <0.25 | — | — | — | — | — | — | — | — | — | — | — | / | |||||||||||||||||||||||||||||||||||||
| 3 | 0.25 to <0.50 | 232,216 | 74,542 | 76.53 | 289,269 | 0.37 | 0.2 | 38.01 | 1.7 | 127,787 | 44.17 | 413 | / | |||||||||||||||||||||||||||||||||||||
| 4 | 0.50 to <0.75 | — | — | — | — | — | — | — | — | — | — | — | / | |||||||||||||||||||||||||||||||||||||
| 5 | 0.75 to <2.50 | 83,738 | 22,631 | 86.29 | 103,268 | 0.93 | 0.0 | 38.01 | 1.1 | 62,883 | 60.89 | 366 | / | |||||||||||||||||||||||||||||||||||||
| 6 | 2.50 to <10.00 | 18,318 | 2,873 | 94.31 | 21,029 | 3.08 | 0.0 | 38.01 | 1.3 | 20,303 | 96.55 | 246 | / | |||||||||||||||||||||||||||||||||||||
| 7 | 10.00 to <100.00 | 0 | 17,891 | 75.08 | 13,434 | 14.89 | 0.0 | 38.01 | 1.0 | 23,247 | 173.03 | 760 | / | |||||||||||||||||||||||||||||||||||||
| 8 | 100.00 (Default) | 217 | — | — | 217 | 100.00 | 0.0 | 31.88 | 4.3 | 91 | 42.30 | 61 | / | |||||||||||||||||||||||||||||||||||||
|
|
|
|
|
|
|
|
|
|
|
|
|
|
|
|
|
|
|
|
|
|
|
| |||||||||||||||||||||||||||
| 9 | Sub-total | 2,407,405 | 668,470 | 78.23 | 2,930,326 | 0.22 | 1.0 | 38.28 | 1.5 | 573,018 | 19.55 | 2,506 | 1,558 | |||||||||||||||||||||||||||||||||||||
|
|
|
|
|
|
|
|
|
|
|
|
|
|
|
|
|
|
|
|
|
|
|
| |||||||||||||||||||||||||||
Purchased receivables (Retail)–Default Risk Equivalent |
| |||||||||||||||||||||||||||||||||||||||||||||||||
| 1 | 0.00 to <0.15 | — | — | — | — | — | — | — | — | — | — | — | / | |||||||||||||||||||||||||||||||||||||
| 2 | 0.15 to <0.25 | — | — | — | — | — | — | — | — | — | — | — | / | |||||||||||||||||||||||||||||||||||||
| 3 | 0.25 to <0.50 | — | — | — | — | — | — | — | — | — | — | / | ||||||||||||||||||||||||||||||||||||||
| 4 | 0.50 to <0.75 | — | — | — | — | — | — | — | — | — | — | — | / | |||||||||||||||||||||||||||||||||||||
| 5 | 0.75 to <2.50 | — | — | — | — | — | — | — | — | — | — | — | / | |||||||||||||||||||||||||||||||||||||
| 6 | 2.50 to <10.00 | — | — | — | — | — | — | — | — | — | — | — | / | |||||||||||||||||||||||||||||||||||||
| 7 | 10.00 to <100.00 | — | — | — | — | — | — | — | — | — | — | — | / | |||||||||||||||||||||||||||||||||||||
| 8 | 100.00 (Default) | — | — | — | — | — | — | — | — | — | — | — | / | |||||||||||||||||||||||||||||||||||||
|
|
|
|
|
|
|
|
|
|
|
|
|
|
|
|
|
|
|
|
|
|
|
| |||||||||||||||||||||||||||
| 9 | Sub-total | — | — | — | — | — | — | — | — | — | — | — | — | |||||||||||||||||||||||||||||||||||||
|
|
|
|
|
|
|
|
|
|
|
|
|
|
|
|
|
|
|
|
|
|
|
| |||||||||||||||||||||||||||
Purchased receivables (Dilution Risk Equivalent) |
| |||||||||||||||||||||||||||||||||||||||||||||||||
| 1 | 0.00 to <0.15 | 1,039,561 | 80,631 | 100.00 | 1,120,192 | 0.07 | 0.1 | 38.01 | — | 145,295 | 12.97 | 313 | / | |||||||||||||||||||||||||||||||||||||
| 2 | 0.15 to <0.25 | — | — | — | — | — | — | — | — | — | — | — | / | |||||||||||||||||||||||||||||||||||||
| 3 | 0.25 to <0.50 | 72,202 | — | — | 72,202 | 0.33 | 0.0 | 37.89 | — | 24,992 | 34.61 | 91 | / | |||||||||||||||||||||||||||||||||||||
| 4 | 0.50 to <0.75 | — | — | — | — | — | — | — | — | — | — | — | / | |||||||||||||||||||||||||||||||||||||
| 5 | 0.75 to <2.50 | 94,637 | — | — | 94,637 | 1.37 | 0.0 | 38.01 | — | 65,989 | 69.72 | 493 | / | |||||||||||||||||||||||||||||||||||||
| 6 | 2.50 to <10.00 | 6,623 | — | — | 6,623 | 3.54 | 0.0 | 38.01 | — | 6,473 | 97.73 | 89 | / | |||||||||||||||||||||||||||||||||||||
| 7 | 10.00 to <100.00 | — | — | — | — | — | — | — | — | — | — | — | / | |||||||||||||||||||||||||||||||||||||
| 8 | 100.00 (Default) | 7,126 | — | — | 7,126 | 100.00 | 0.0 | 46.87 | — | 3,825 | 53.67 | 3,034 | / | |||||||||||||||||||||||||||||||||||||
|
|
|
|
|
|
|
|
|
|
|
|
|
|
|
|
|
|
|
|
|
|
|
| |||||||||||||||||||||||||||
| 9 | Sub-total | 1,220,150 | 80,631 | 100.00 | 1,300,781 | 0.74 | 0.1 | 38.05 | — | 246,577 | 18.95 | 4,022 | / | |||||||||||||||||||||||||||||||||||||
|
|
|
|
|
|
|
|
|
|
|
|
|
|
|
|
|
|
|
|
|
|
|
| |||||||||||||||||||||||||||
Retail–qualifying revolving retail exposures (QRRE) |
| |||||||||||||||||||||||||||||||||||||||||||||||||
| 1 | 0.00 to <0.15 | — | — | — | — | — | — | — | / | — | — | — | / | |||||||||||||||||||||||||||||||||||||
| 2 | 0.15 to <0.25 | — | — | — | 25 | 0.19 | 0.8 | 77.69 | / | 2 | 8.14 | 0 | / | |||||||||||||||||||||||||||||||||||||
| 3 | 0.25 to <0.50 | — | — | — | 30 | 0.33 | 0.7 | 78.44 | / | 3 | 12.65 | 0 | / | |||||||||||||||||||||||||||||||||||||
| 4 | 0.50 to <0.75 | — | — | — | — | — | — | — | / | — | — | — | / | |||||||||||||||||||||||||||||||||||||
| 5 | 0.75 to <2.50 | 237,551 | 865,682 | 14.27 | 361,157 | 2.34 | 593.9 | 78.44 | / | 204,539 | 56.63 | 6,653 | / | |||||||||||||||||||||||||||||||||||||
| 6 | 2.50 to <10.00 | 170,152 | 892,916 | 7.95 | 241,079 | 4.14 | 2,067.1 | 78.45 | / | 199,358 | 82.69 | 7,829 | / | |||||||||||||||||||||||||||||||||||||
| 7 | 10.00 to <100.00 | 34,125 | 17,631 | 33.62 | 40,054 | 19.89 | 205.0 | 78.45 | / | 71,273 | 177.93 | 6,251 | / | |||||||||||||||||||||||||||||||||||||
| 8 | 100.00 (Default) | 482 | 1,229 | 11.44 | 619 | 100.00 | 1.9 | 71.90 | / | 522 | 84.32 | 403 | / | |||||||||||||||||||||||||||||||||||||
|
|
|
|
|
|
|
|
|
|
|
|
|
|
|
|
|
|
|
|
|
|
|
| |||||||||||||||||||||||||||
| 9 | Sub-total | 442,312 | 1,777,459 | 11.28 | 642,966 | 4.20 | 2,869.6 | 78.44 | / | 475,700 | 73.98 | 21,139 | 13,144 | |||||||||||||||||||||||||||||||||||||
|
|
|
|
|
|
|
|
|
|
|
|
|
|
|
|
|
|
|
|
|
|
|
| |||||||||||||||||||||||||||
Retail–Residential mortgage |
| |||||||||||||||||||||||||||||||||||||||||||||||||
| 1 | 0.00 to <0.15 | 1,944,487 | — | — | 1,979,064 | 0.08 | 248.9 | 28.72 | / | 115,422 | 5.83 | 475 | / | |||||||||||||||||||||||||||||||||||||
| 2 | 0.15 to <0.25 | 1,147,939 | — | — | 1,150,775 | 0.20 | 114.5 | 31.96 | / | 150,495 | 13.07 | 756 | / | |||||||||||||||||||||||||||||||||||||
| 3 | 0.25 to <0.50 | 1,988,711 | — | — | 1,988,027 | 0.34 | 231.1 | 32.65 | / | 388,607 | 19.54 | 2,253 | / | |||||||||||||||||||||||||||||||||||||
| 4 | 0.50 to <0.75 | 1,880,714 | 88,387 | 97.55 | 1,928,162 | 0.64 | 284.0 | 35.67 | / | 639,405 | 33.16 | 4,434 | / | |||||||||||||||||||||||||||||||||||||
| 5 | 0.75 to <2.50 | 1,501,250 | 629 | 100.00 | 1,503,498 | 1.09 | 198.7 | 35.64 | / | 703,107 | 46.76 | 5,783 | / | |||||||||||||||||||||||||||||||||||||
| 6 | 2.50 to <10.00 | 70,680 | 2,380 | 100.00 | 73,417 | 9.45 | 10.4 | 37.38 | / | 121,737 | 165.81 | 2,592 | / | |||||||||||||||||||||||||||||||||||||
| 7 | 10.00 to <100.00 | 26,306 | 2,136 | 100.00 | 28,456 | 46.92 | 4.3 | 39.43 | / | 54,817 | 192.63 | 5,272 | / | |||||||||||||||||||||||||||||||||||||
| 8 | 100.00 (Default) | 63,491 | 1,315 | 100.00 | 64,871 | 100.00 | 5.4 | 44.36 | / | 32,383 | 49.91 | 26,192 | / | |||||||||||||||||||||||||||||||||||||
|
|
|
|
|
|
|
|
|
|
|
|
|
|
|
|
|
|
|
|
|
|
|
| |||||||||||||||||||||||||||
| 9 | Sub-total | 8,623,582 | 94,848 | 97.72 | 8,716,274 | 1.43 | 1,097.6 | 33.00 | / | 2,205,975 | 25.30 | 47,762 | 29,697 | |||||||||||||||||||||||||||||||||||||
|
|
|
|
|
|
|
|
|
|
|
|
|
|
|
|
|
|
|
|
|
|
|
| |||||||||||||||||||||||||||
Other retail |
| |||||||||||||||||||||||||||||||||||||||||||||||||
| 1 | 0.00 to <0.15 | 22 | — | — | 259,936 | 0.05 | 37.7 | 47.73 | / | 18,716 | 7.20 | 73 | / | |||||||||||||||||||||||||||||||||||||
| 2 | 0.15 to <0.25 | 6 | — | — | 68,228 | 0.18 | 4.8 | 46.76 | / | 12,328 | 18.06 | 60 | / | |||||||||||||||||||||||||||||||||||||
| 3 | 0.25 to <0.50 | 117,622 | 32 | 100.00 | 118,210 | 0.35 | 5.2 | 47.57 | / | 32,836 | 27.77 | 197 | / | |||||||||||||||||||||||||||||||||||||
| 4 | 0.50 to <0.75 | 94,978 | 266 | 75.25 | 93,320 | 0.66 | 88.6 | 46.78 | / | 36,409 | 39.01 | 287 | / | |||||||||||||||||||||||||||||||||||||
| 5 | 0.75 to <2.50 | 953,276 | 3,252 | 80.96 | 890,437 | 1.36 | 27.1 | 46.54 | / | 443,075 | 49.75 | 5,181 | / | |||||||||||||||||||||||||||||||||||||
| 6 | 2.50 to <10.00 | 352,855 | 1,980 | 61.13 | 156,726 | 6.46 | 11.1 | 19.31 | / | 44,909 | 28.65 | 1,593 | / | |||||||||||||||||||||||||||||||||||||
| 7 | 10.00 to <100.00 | 88,419 | 9,336 | 52.40 | 45,890 | 17.80 | 15.0 | 32.98 | / | 31,233 | 68.06 | 2,940 | / | |||||||||||||||||||||||||||||||||||||
| 8 | 100.00 (Default) | 67,629 | 2,590 | 90.22 | 53,369 | 100.00 | 2.8 | 47.47 | / | 25,175 | 47.17 | 23,323 | / | |||||||||||||||||||||||||||||||||||||
|
|
|
|
|
|
|
|
|
|
|
|
|
|
|
|
|
|
|
|
|
|
|
| |||||||||||||||||||||||||||
| 9 | Sub-total | 1,674,812 | 17,457 | 64.76 | 1,686,119 | 5.04 | 192.7 | 43.95 | / | 644,684 | 38.23 | 33,658 | 20,927 | |||||||||||||||||||||||||||||||||||||
|
|
|
|
|
|
|
|
|
|
|
|
|
|
|
|
|
|
|
|
|
|
|
| |||||||||||||||||||||||||||
Total (all portfolios) | 151,622,109 | 32,964,000 | 70.89 | 174,957,145 | 0.66 | 4,644.3 | 38.17 | 2.00 | 34,181,215 | 19.53 | 451,605 | 278,296 | ||||||||||||||||||||||||||||||||||||||
|
|
|
|
|
|
|
|
|
|
|
|
|
|
|
|
|
|
|
|
|
|
|
| |||||||||||||||||||||||||||
Notes: | ||
1. | Counterparty credit risk exposures, securitization exposures, and regarded-method exposures are excluded from the amount of credit risk exposures above. | |
2. | On-balance sheet exposures,pre-CCF andpre- CRMoff-balance sheet exposures, and the average CCF are allocated to the PD ranges based onpre- CRM PD estimates. | |
3. | The number of credits is disclosed as the number of data of obligors for QRRE, residential mortgage and other retail excluding credit for business purpose. | |
26
Table of Contents
(B) CR8:RWA flow statements of credit risk exposures under IRB approach
| (Billions of yen) | ||||||||
No. | RWA | |||||||
| 1 | RWA as of March 31, 2018 | 40,008.8 | ||||||
| 2 | Breakdown of changes during this reporting period | Asset size | 988.2 | |||||
| 3 | Portfolio quality | (2,253.8 | ) | |||||
| 4 | Model updates | — | ||||||
| 5 | Methodology and policy | (224.1 | ) | |||||
| 6 | Acquisitions and disposals | — | ||||||
| 7 | Foreign currency fluctuations | 294.4 | ||||||
| 8 | Other | (29.9 | ) | |||||
| 9 | RWA as of March 31, 2019 | 38,783.5 | ||||||
Notes:
| 1. | Counterparty credit risk exposures, securitization exposures, and regarded-method exposures are excluded from the amount of credit risk exposures above. |
| 2. | Asset size corresponds to the amount of variation in RWA arising from changes in book size and composition, increased assets resulting from origination of new businesses, decreased assets due to matured receivables, etc. |
| 3. | Portfolio quality corresponds to the amount of variation in RWA arising from changes in obligor’s and facilities’ ratings, changes in collateral values and guarantees, etc. |
| 4. | Methodology and policy corresponds to the amount of variation in RWA arising from methodological changes in calculations driven by regulatory policy changes including revisions to existing regulations. |
| 5. | Foreign currency fluctuations correspond to the amount of variation in RWA arising from the effect of fluctuations in foreign exchange rates involving exposures to transactions denominated in foreign currencies. |
(C) CR9: IRB–Backtesting of Probability of Default (PD) per Portfolio
(%, the number of data) | ||||||||||||||||||||||||||||||||||||||||||||||||||
As of March 31, 2018 | ||||||||||||||||||||||||||||||||||||||||||||||||||
a | b | c | d | e | f | g | h | i | ||||||||||||||||||||||||||||||||||||||||||
Portfolio | PD Range | External rating equivalent | Weighted average PD | Arithmetic average PD by obligors | Number of obligors | Defaulted obligors in the year | of which: new defaulted obligors in the year | Average historical annual default rate | ||||||||||||||||||||||||||||||||||||||||||
| S&P | Moody’s | Fitch | R&I | JCR | As of March 31, 2017 | As of March 31, 2018 | ||||||||||||||||||||||||||||||||||||||||||||
Corporate, etc. | 0.00 to <0.10 | AAA~A- | Aaa~A3 | AAA~A- | AAA~A- | AAA~A- | 0.05 | 0.06 | 2,330 | 2,395 | — | — | — | |||||||||||||||||||||||||||||||||||||
| 0.10 to <0.20 | BBB+~BBB- | Baa1~Baa3 | BBB+~BBB- | BBB+~BBB- | BBB+~BBB- | 0.15 | 0.15 | 5,072 | 5,272 | 2 | — | 0.03 | ||||||||||||||||||||||||||||||||||||||
| 0.20 to <1.00 | BB+~BB- | Ba1~Ba3 | BB+~BB- | BB+~BB- | BB+~BB- | 0.48 | 0.52 | 20,736 | 21,267 | 52 | — | 0.21 | ||||||||||||||||||||||||||||||||||||||
| 1.00 to <5.00 | B+~B- | B1~B3 | B+~B- | B+~B- | B+~B- | 2.06 | 2.15 | 9,832 | 9,041 | 112 | 2 | 1.29 | ||||||||||||||||||||||||||||||||||||||
| 5.00 to <100.00 | CCC+~CCC- | Caa1~Caa3 | CCC+~CCC- | CCC+~CCC- | CCC~C | 12.59 | 12.86 | 2,500 | 2,144 | 197 | 4 | 8.02 | ||||||||||||||||||||||||||||||||||||||
Retail–qualifying revolving retail exposures (QRRE) | 0.00 to <0.10 | / | / | / | / | / | — | — | — | — | — | — | — | |||||||||||||||||||||||||||||||||||||
| 0.10 to <0.20 | / | / | / | / | / | — | — | — | — | — | — | — | ||||||||||||||||||||||||||||||||||||||
| 0.20 to <1.00 | / | / | / | / | / | — | — | — | — | — | — | — | ||||||||||||||||||||||||||||||||||||||
| 1.00 to <5.00 | / | / | / | / | / | 2.35 | 2.80 | 316,263 | 338,973 | 5,789 | 1,004 | 1.68 | ||||||||||||||||||||||||||||||||||||||
| 5.00 to <100.00 | / | / | / | / | / | 10.17 | 6.24 | 137,011 | 146,695 | 12,315 | 1,232 | 7.85 | ||||||||||||||||||||||||||||||||||||||
Retail–Residential mortgage | 0.00 to <0.10 | / | / | / | / | / | 0.05 | 0.05 | 77,649 | 71,310 | 20 | — | 0.02 | |||||||||||||||||||||||||||||||||||||
| 0.10 to <0.20 | / | / | / | / | / | 0.14 | 0.14 | 101,477 | 103,939 | 44 | — | 0.07 | ||||||||||||||||||||||||||||||||||||||
| 0.20 to <1.00 | / | / | / | / | / | 0.53 | 0.53 | 413,756 | 395,746 | 966 | 3 | 0.28 | ||||||||||||||||||||||||||||||||||||||
| 1.00 to <5.00 | / | / | / | / | / | 1.26 | 1.22 | 62,374 | 75,664 | 303 | — | 0.57 | ||||||||||||||||||||||||||||||||||||||
| 5.00 to <100.00 | / | / | / | / | / | 19.03 | 20.36 | 11,209 | 8,551 | 1,014 | — | 11.81 | ||||||||||||||||||||||||||||||||||||||
Other retail | 0.00 to <0.10 | / | / | / | / | / | — | — | — | — | — | — | — | |||||||||||||||||||||||||||||||||||||
| 0.10 to <0.20 | / | / | / | / | / | — | — | — | — | — | — | — | ||||||||||||||||||||||||||||||||||||||
| 0.20 to <1.00 | / | / | / | / | / | 0.80 | 0.66 | 429,469 | 340,586 | 1,333 | 27 | 0.31 | ||||||||||||||||||||||||||||||||||||||
| 1.00 to <5.00 | / | / | / | / | / | 2.20 | 3.08 | 440,253 | 322,169 | 2,020 | 180 | 0.73 | ||||||||||||||||||||||||||||||||||||||
| 5.00 to <100.00 | / | / | / | / | / | 17.74 | 22.92 | 73,044 | 47,241 | 3,113 | 13 | 4.23 | ||||||||||||||||||||||||||||||||||||||
Notes:
| 1. | Counterparty credit risk exposures, securitization exposures, and regarded-method exposures are excluded from the amount of credit risk exposures above. |
| 2. | Exposures to sovereign and bank is included in the category of corporate, etc. because their obligors can be presumably specified. Likewise, exposures to corporate (except specialized lending), specialized lending, equity and purchased receivables (corporate) is included in the category of corporate, etc. because the data of the respective portfolios is not separately used for PD estimation. Since purchased receivables (retail) account for a small portion of the entire exposure, they are incorporated with any one of QRRE, residential mortgage or other retail depending on the portfolio classification of the purchased receivables. |
| 3. | PD Range indicates the ranges of PD estimates for multiple consolidated internal ratings groups. |
| 4. | The following shows the percentages accounted for by the respective portfolios among the credit RWA calculated by the AIRB: Corporate, etc. : 76%, QRRE: 1%, Residential mortgage : 7%, Other retail : 3% |
| 5. | The number of credits is disclosed as the number of data of obligors for QRRE, residential mortgage and other retail excluding credit for business purpose. |
| 6. | The back testing covers the period from September 30, 2016 to September 30, 2017. |
27
Table of Contents
(%, the number of data) | ||||||||||||||||||||||||||||||||||||||||||||||||||
As of March 31, 2019 | ||||||||||||||||||||||||||||||||||||||||||||||||||
a | b | c | d | e | f | g | h | i | ||||||||||||||||||||||||||||||||||||||||||
Portfolio | PD Range | External rating equivalent | Weighted average PD | Arithmetic average PD by obligors | Number of obligors | Defaulted obligors in the year | of which: new defaulted obligors in the year | Average historical annual default rate | ||||||||||||||||||||||||||||||||||||||||||
| S&P | Moody’s | Fitch | R&I | JCR | As of March 31, 2018 | As of March 31, 2019 | ||||||||||||||||||||||||||||||||||||||||||||
Corporate, etc. | 0.00 to <0.10 | AAA~A- | Aaa~A3 | AAA~A- | AAA~A- | AAA~A- | 0.05 | 0.05 | 2,404 | 2,381 | — | — | — | |||||||||||||||||||||||||||||||||||||
| 0.10 to <0.20 | BBB+~BBB- | Baa1~Baa3 | BBB+~BBB- | BBB+~BBB- | BBB+~BBB- | 0.13 | 0.14 | 5,295 | 5,295 | 2 | — | 0.03 | ||||||||||||||||||||||||||||||||||||||
| 0.20 to <1.00 | BB+~BB- | Ba1~Ba3 | BB+~BB- | BB+~BB- | BB+~BB- | 0.48 | 0.51 | 21,259 | 21,605 | 44 | 1 | 0.22 | ||||||||||||||||||||||||||||||||||||||
| 1.00 to <5.00 | B+~B- | B1~B3 | B+~B- | B+~B- | B+~B- | 2.24 | 2.15 | 9,037 | 8,453 | 115 | 2 | 1.29 | ||||||||||||||||||||||||||||||||||||||
| 5.00 to <100.00 | CCC+~CCC- | Caa1~Caa3 | CCC+~CCC- | CCC+~CCC- | CCC~C | 10.79 | 13.08 | 2,144 | 1,882 | 140 | 2 | 7.77 | ||||||||||||||||||||||||||||||||||||||
Retail–qualifying revolving retail exposures (QRRE) | 0.00 to <0.10 | / | / | / | / | / | — | — | — | — | — | — | — | |||||||||||||||||||||||||||||||||||||
| 0.10 to <0.20 | / | / | / | / | / | — | — | — | — | — | — | — | ||||||||||||||||||||||||||||||||||||||
| 0.20 to <1.00 | / | / | / | / | / | — | — | — | — | — | — | — | ||||||||||||||||||||||||||||||||||||||
| 1.00 to <5.00 | / | / | / | / | / | 2.40 | 2.81 | 376,296 | 363,146 | 7,834 | 913 | 1.88 | ||||||||||||||||||||||||||||||||||||||
| 5.00 to <100.00 | / | / | / | / | / | 10.75 | 6.73 | 109,372 | 115,560 | 11,704 | 709 | 8.95 | ||||||||||||||||||||||||||||||||||||||
Retail–Residential mortgage | 0.00 to <0.10 | / | / | / | / | / | 0.06 | 0.06 | 96,887 | 87,230 | 38 | — | 0.02 | |||||||||||||||||||||||||||||||||||||
| 0.10 to <0.20 | / | / | / | / | / | 0.15 | 0.15 | 78,362 | 78,900 | 39 | 1 | 0.06 | ||||||||||||||||||||||||||||||||||||||
| 0.20 to <1.00 | / | / | / | / | / | 0.53 | 0.53 | 396,443 | 385,619 | 871 | 5 | 0.24 | ||||||||||||||||||||||||||||||||||||||
| 1.00 to <5.00 | / | / | / | / | / | 1.30 | 1.26 | 75,664 | 82,718 | 363 | — | 0.51 | ||||||||||||||||||||||||||||||||||||||
| 5.00 to <100.00 | / | / | / | / | / | 21.24 | 22.41 | 8,551 | 9,024 | 961 | — | 10.77 | ||||||||||||||||||||||||||||||||||||||
Other retail | 0.00 to <0.10 | / | / | / | / | / | — | — | — | — | — | — | — | |||||||||||||||||||||||||||||||||||||
| 0.10 to <0.20 | / | / | / | / | / | — | — | — | — | — | — | — | ||||||||||||||||||||||||||||||||||||||
| 0.20 to <1.00 | / | / | / | / | / | 0.77 | 0.67 | 389,084 | 273,543 | 1,343 | 25 | 0.32 | ||||||||||||||||||||||||||||||||||||||
| 1.00 to <5.00 | / | / | / | / | / | 2.38 | 3.20 | 273,668 | 207,228 | 1,508 | 12 | 0.48 | ||||||||||||||||||||||||||||||||||||||
| 5.00 to <100.00 | / | / | / | / | / | 18.47 | 22.85 | 47,239 | 34,136 | 2,579 | 5 | 4.46 | ||||||||||||||||||||||||||||||||||||||
Notes:
| 1. | Counterparty credit risk exposures, securitization exposures, and regarded-method exposures are excluded from the amount of credit risk exposures above. |
| 2. | Exposures to sovereign and bank is included in the category of corporate, etc. because their obligors can be presumably specified. Likewise, exposures to corporate (except specialized lending), specialized lending, equity and purchased receivables (corporate) is included in the category of corporate, etc. because the data of the respective portfolios is not separately used for PD estimation. Since purchased receivables (retail) account for a small portion of the entire exposure, they are incorporated with any one of QRRE, residential mortgage or other retail depending on the portfolio classification of the purchased receivables. |
| 3. | PD Range indicates the ranges of PD estimates for multiple consolidated internal ratings groups. |
| 4. | The following shows the percentages accounted for by the respective portfolios among the credit RWA calculated by the AIRB: Corporate, etc. : 75%, QRRE: 1%, Residential mortgage : 7%, Other retail : 2% |
| 5. | The number of credits is disclosed as the number of data of obligors for QRRE, residential mortgage and other retail excluding credit for business purpose. |
| 6. | The back testing covers the period from September 30, 2017 to September 30, 2018. |
28
Table of Contents
(D) CR10: IRB -Specialized Lending under the Slotting Criteria Approach and Equity Exposures under the Market-based Approach etc.
(Millions of yen, %) |
As of March 31, 2018 | ||||||||||||||||||||||||||||||||||||||||||
a | b | c | d | e | f | g | h | i | j | k | l | |||||||||||||||||||||||||||||||
Specialized lending under slotting criteria approach | ||||||||||||||||||||||||||||||||||||||||||
Other than HVCRE | ||||||||||||||||||||||||||||||||||||||||||
Regulatory categories | Remaining maturity | On- balance sheet amount | Off- balance sheet amount | RW |
Exposure amount | RWA | Expected losses | |||||||||||||||||||||||||||||||||||
| P F | O F | C F | I P R E | Total | ||||||||||||||||||||||||||||||||||||||
Strong |
Less than 2.5 years | — | — | 50 | % | — | — | — | — | — | — | — | ||||||||||||||||||||||||||||||
Equal to or more | 24,919 | — | 70 | % | — | 24,919 | — | — | 24,919 | 17,443 | 99 | |||||||||||||||||||||||||||||||
Good | Less than 2.5 years | — | — | 70 | % | — | — | — | — | — | — | — | ||||||||||||||||||||||||||||||
Equal to or more | — | — | 90 | % | — | — | — | — | — | — | — | |||||||||||||||||||||||||||||||
Satisfactory | 3,464 | — | 115 | % | — | 3,464 | — | — | 3,464 | 3,984 | 97 | |||||||||||||||||||||||||||||||
Weak | 11,108 | — | 250 | % | — | 11,147 | — | — | 11,147 | 27,868 | 891 | |||||||||||||||||||||||||||||||
Default | 3,081 | — | — | — | 9,312 | — | — | 9,312 | — | 4,656 | ||||||||||||||||||||||||||||||||
|
|
|
|
|
|
|
|
|
|
|
|
|
|
|
|
|
|
|
| |||||||||||||||||||||||
Total | 42,574 | — | — | — | 48,844 | — | — | 48,844 | 49,296 | 5,744 | ||||||||||||||||||||||||||||||||
|
|
|
|
|
|
|
|
|
|
|
|
|
|
|
|
|
|
|
| |||||||||||||||||||||||
HVCRE | ||||||||||||||||||||||||||||||||||||||||||
Regulatory categories | Remaining | On- balance sheet amount | Off- balance sheet amount | RW | Exposure amount | RWA | Expected losses | |||||||||||||||||||||||||||||||||||
Strong |
Less than 2.5 years | 2,698 | 700 | 70 | % | 3,225 | 2,257 | 12 | ||||||||||||||||||||||||||||||||||
Equal to or more | 55,022 | 16,356 | 95 | % | 67,290 | 63,925 | 269 | |||||||||||||||||||||||||||||||||||
Good | Less than 2.5 years | 13 | — | 95 | % | 13 | 13 | 0 | ||||||||||||||||||||||||||||||||||
Equal to or more | 23,260 | 3,970 | 120 | % | 26,250 | 31,500 | 105 | |||||||||||||||||||||||||||||||||||
Satisfactory | — | — | 140 | % | — | — | — | |||||||||||||||||||||||||||||||||||
Weak | — | — | 250 | % | — | — | — | |||||||||||||||||||||||||||||||||||
Default | — | — | — | — | — | — | ||||||||||||||||||||||||||||||||||||
|
|
|
|
|
|
|
|
|
|
|
| |||||||||||||||||||||||||||||||
Total | 80,996 | 21,026 | — | 96,779 | 97,696 | 387 | ||||||||||||||||||||||||||||||||||||
|
|
|
|
|
|
|
|
|
|
|
| |||||||||||||||||||||||||||||||
Equity exposures under the market-based approach etc. | ||||||||||||||||||||||||||||||||||||||||||
Equity exposures under the market-based approach | ||||||||||||||||||||||||||||||||||||||||||
Categories | On- balance sheet amount | Off- balance sheet amount | RW | Exposure amount | RWA | |||||||||||||||||||||||||||||||||||||
Exchange-traded equity exposures | 841,626 | 68,014 | 300 | % | 909,640 | 2,728,922 | ||||||||||||||||||||||||||||||||||||
Private equity exposures | 58,551 | 1,510 | 400 | % | 59,683 | 238,735 | ||||||||||||||||||||||||||||||||||||
Other equity exposures | — | — | — | — | — | |||||||||||||||||||||||||||||||||||||
|
|
|
|
|
|
|
|
|
| |||||||||||||||||||||||||||||||||
Total | 900,177 | 69,524 | — | 969,324 | 2,967,658 | |||||||||||||||||||||||||||||||||||||
|
|
|
|
|
|
|
|
|
| |||||||||||||||||||||||||||||||||
Equity exposures to which a risk weight of 100% is applied | ||||||||||||||||||||||||||||||||||||||||||
Equity exposures to which a risk weight of 100% is applied | 4,415 | — | 100 | % | 4,415 | 4,415 | ||||||||||||||||||||||||||||||||||||
Notes: | ||
1. | Counterparty credit risk exposures, securitization exposures, and regarded-method exposures are excluded from the amount of credit risk exposures above. | |
2. | PF, OF, CF and IPRE respectively stand for project finance, object finance, commodity finance and income-producing real estate. | |
29
Table of Contents
(Millions of yen, %) | ||||||||||||||||||||||||||||||||||||||||||
As of March 31, 2019 | ||||||||||||||||||||||||||||||||||||||||||
a | b | c | d | e | f | g | h | i | j | k | l | |||||||||||||||||||||||||||||||
Specialized lending under slotting criteria approach | ||||||||||||||||||||||||||||||||||||||||||
Other than HVCRE | ||||||||||||||||||||||||||||||||||||||||||
Regulatory categories | Remaining maturity | On- balance sheet amount | Off- balance sheet amount | RW |
Exposure amount | RWA | Expected losses | |||||||||||||||||||||||||||||||||||
| P F | O F | C F | I P R E | Total | ||||||||||||||||||||||||||||||||||||||
Strong |
Less than 2.5 years | — | — | 50 | % | — | — | — | — | — | — | — | ||||||||||||||||||||||||||||||
Equal to or more | 24,983 | — | 70 | % | — | 24,983 | — | — | 24,983 | 17,488 | 99 | |||||||||||||||||||||||||||||||
Good | Less than 2.5 years | — | — | 70 | % | — | — | — | — | — | — | — | ||||||||||||||||||||||||||||||
Equal to or more | 504 | — | 90 | % | — | 504 | — | — | 504 | 454 | 4 | |||||||||||||||||||||||||||||||
Satisfactory | 3,735 | 10,422 | 115 | % | — | 11,553 | — | — | 11,553 | 13,286 | 323 | |||||||||||||||||||||||||||||||
Weak | 9,962 | — | 250 | % | — | 10,109 | — | — | 10,109 | 25,273 | 808 | |||||||||||||||||||||||||||||||
Default | 3,081 | — | — | — | 9,312 | — | — | 9,312 | — | 4,656 | ||||||||||||||||||||||||||||||||
|
|
|
|
|
|
|
|
|
|
|
|
|
|
|
|
|
|
|
| |||||||||||||||||||||||
Total | 42,267 | 10,422 | — | — | 56,463 | — | — | 56,463 | 56,502 | 5,892 | ||||||||||||||||||||||||||||||||
|
|
|
|
|
|
|
|
|
|
|
|
|
|
|
|
|
|
|
| |||||||||||||||||||||||
HVCRE | ||||||||||||||||||||||||||||||||||||||||||
Regulatory categories | Remaining maturity | On- balance sheet amount | Off- balance sheet amount | RW | Exposure amount | RWA | Expected losses | |||||||||||||||||||||||||||||||||||
Strong | Less than 2.5 years | 8,449 | — | 70 | % | 8,449 | 5,914 | 33 | ||||||||||||||||||||||||||||||||||
Equal to or more | 72,936 | 14,206 | 95 | % | 83,601 | 79,421 | 334 | |||||||||||||||||||||||||||||||||||
Good | Less than 2.5 years | 2,010 | — | 95 | % | 2,010 | 1,910 | 8 | ||||||||||||||||||||||||||||||||||
Equal to or more | 8,654 | 18,530 | 120 | % | 22,555 | 27,066 | 90 | |||||||||||||||||||||||||||||||||||
Satisfactory | — | — | 140 | % | — | — | — | |||||||||||||||||||||||||||||||||||
Weak | — | — | 250 | % | — | — | — | |||||||||||||||||||||||||||||||||||
Default | — | — | — | — | — | — | ||||||||||||||||||||||||||||||||||||
|
|
|
|
|
|
|
|
|
|
|
| |||||||||||||||||||||||||||||||
Total | 92,050 | 32,736 | — | 116,618 | 114,313 | 466 | ||||||||||||||||||||||||||||||||||||
|
|
|
|
|
|
|
|
|
|
|
| |||||||||||||||||||||||||||||||
Equity exposures under the market-based approach etc. | ||||||||||||||||||||||||||||||||||||||||||
Equity exposures under the market-based approach | ||||||||||||||||||||||||||||||||||||||||||
Categories | On- balance sheet amount | Off- balance sheet amount | RW | Exposure amount | RWA | |||||||||||||||||||||||||||||||||||||
Exchange-traded equity exposures | 721,228 | 30,289 | 300 | % | 751,517 | 2,254,553 | ||||||||||||||||||||||||||||||||||||
Private equity exposures | 57,192 | 1,694 | 400 | % | 58463 | 233,852 | ||||||||||||||||||||||||||||||||||||
Other equity exposures | — | — | — | — | — | |||||||||||||||||||||||||||||||||||||
|
|
|
|
|
|
|
|
|
| |||||||||||||||||||||||||||||||||
Total | 778,420 | 31,984 | — | 809,980 | 2,488,405 | |||||||||||||||||||||||||||||||||||||
|
|
|
|
|
|
|
|
|
| |||||||||||||||||||||||||||||||||
Equity exposures to which a risk weight of 100% is applied | ||||||||||||||||||||||||||||||||||||||||||
Equity exposures to which a risk weight of 100% is applied | 4,543 | — | 100 | % | 4,543 | 4,543 | ||||||||||||||||||||||||||||||||||||
Notes: | ||
1. | Counterparty credit risk exposures, securitization exposures, and regarded-method exposures are excluded from the amount of credit risk exposures above. | |
2. | PF, OF, CF and IPRE respectively stand for project finance, object finance, commodity finance and income-producing real estate. | |
30
Table of Contents
(5) Credit Risk under Standardized Approach
(i) Status of portfolios to which the standardized approach is applied
Eligible external credit assessment institutions used for determining the risk weight for portfolios to which the standardized approach is applied are Rating and Investment Information, Inc. (R&I) in Japan and S&P Global Ratings overseas.
We apply a risk weight of 100% for all of our corporate exposure.
(ii) Quantitative disclosure on credit risk under standardized approach
(A) CR5: Standardized Approach–Exposures by Asset Classes and Risk Weights
| (Millions of yen) | ||||||||||||||||||||||||||||||||||||||||||||||||||||
| As of March 31, 2018 | ||||||||||||||||||||||||||||||||||||||||||||||||||||
| a | b | c | d | e | f | g | h | i | j | k | ||||||||||||||||||||||||||||||||||||||||||
| Credit exposures amount (post CCF andpost-CRM) | ||||||||||||||||||||||||||||||||||||||||||||||||||||
Asset classes | Risk weight | 0% | 10% | 20% | 35% | 50% | 75% | 100% | 150% | 250% | 1,250% | Total | ||||||||||||||||||||||||||||||||||||||||
| 1 | Cash | 10,169 | — | — | — | — | — | — | — | — | — | 10,169 | ||||||||||||||||||||||||||||||||||||||||
| 2 | Japanese sovereigns and Bank of Japan | 12,698,108 | — | — | — | — | — | — | — | — | — | 12,698,108 | ||||||||||||||||||||||||||||||||||||||||
| 3 | Foreign central sovereigns and central banks | 75,651 | — | 34,791 | — | 64,684 | — | 75,963 | — | — | — | 251,091 | ||||||||||||||||||||||||||||||||||||||||
| 4 | Bank for International Settlements,etc. | — | — | — | — | — | — | — | — | — | — | — | ||||||||||||||||||||||||||||||||||||||||
| 5 | Japanesenon-central governmental PSEs | 1,089 | — | — | — | — | — | — | — | — | — | 1,089 | ||||||||||||||||||||||||||||||||||||||||
| 6 | Non-central governmental PSEs other than foreign central sovereigns, etc. | — | — | 7,731 | — | 38 | — | 16 | — | — | — | 7,786 | ||||||||||||||||||||||||||||||||||||||||
| 7 | International development banks | 2,983 | — | — | — | — | — | — | — | — | — | 2,983 | ||||||||||||||||||||||||||||||||||||||||
| 8 | Japan Finance Organization for Municipalities | — | 36,192 | — | — | — | — | — | — | — | — | 36,192 | ||||||||||||||||||||||||||||||||||||||||
| 9 | Japanese government institutions | — | 523,138 | — | — | — | — | — | — | — | — | 523,138 | ||||||||||||||||||||||||||||||||||||||||
| 10 | Three regional public sectors of Japan | — | — | — | — | — | — | — | — | — | — | — | ||||||||||||||||||||||||||||||||||||||||
| 11 | Financial institutions and business operators conducting the type I financial instruments business | — | — | 703,187 | — | 19,773 | — | 48,083 | — | — | — | 771,044 | ||||||||||||||||||||||||||||||||||||||||
| 12 | Corporates, etc. | — | — | — | — | — | — | 1,484,951 | — | — | — | 1,484,951 | ||||||||||||||||||||||||||||||||||||||||
| 13 | Regulatory retail portfolios and individuals | — | — | — | — | — | — | — | — | — | — | — | ||||||||||||||||||||||||||||||||||||||||
| 14 | Mortgage housing loan | — | — | — | — | — | — | — | — | — | — | — | ||||||||||||||||||||||||||||||||||||||||
| 15 | Real estate acquisition business, etc. | — | — | — | — | — | — | — | — | — | — | — | ||||||||||||||||||||||||||||||||||||||||
| 16 | Claims past due for 3 months or more (excluding mortgage housing loan) | — | — | — | — | 60 | — | 12 | 27 | — | — | 100 | ||||||||||||||||||||||||||||||||||||||||
| 17 | Claims past due for 3 months or more regarding mortgage housing loan | — | — | — | — | — | — | — | — | — | — | — | ||||||||||||||||||||||||||||||||||||||||
| 18 | Bills in process of collection | — | — | — | — | — | — | — | — | — | — | — | ||||||||||||||||||||||||||||||||||||||||
| 19 | With guarantee of Credit Guarantee Corporations, etc. | — | — | — | — | — | — | — | — | — | — | — | ||||||||||||||||||||||||||||||||||||||||
| 20 | With guarantee of Regional Economy Vitalization Corporation of Japan | — | — | — | — | — | — | — | — | — | — | — | ||||||||||||||||||||||||||||||||||||||||
| 21 | Investments, etc.(excluding significant investments) | — | — | — | — | — | — | — | — | — | — | — | ||||||||||||||||||||||||||||||||||||||||
|
|
|
|
|
|
|
|
|
|
|
|
|
|
|
|
|
|
|
|
|
| |||||||||||||||||||||||||||||||
| 22 | Total |
| 12,788,002 | 559,331 | 745,710 | — | 84,557 | — | 1,609,027 | 27 | — | — | 15,786,656 | |||||||||||||||||||||||||||||||||||||||
|
|
|
|
|
|
|
|
|
|
|
|
|
|
|
|
|
|
|
|
|
| |||||||||||||||||||||||||||||||
Note: | ||
Counterparty credit risk exposures, credit risk related to securitization transactions, and exposures which are underlaid with the plural number of assets and transactions are excluded from the amount of credit risk exposures above. | ||
31
Table of Contents
| (Millions of yen) | ||||||||||||||||||||||||||||||||||||||||||||||||||||
| As of March 31, 2019 | ||||||||||||||||||||||||||||||||||||||||||||||||||||
| a | b | c | d | e | f | g | h | i | j | k | ||||||||||||||||||||||||||||||||||||||||||
| Credit exposures amount (post CCF andpost-CRM) | ||||||||||||||||||||||||||||||||||||||||||||||||||||
Asset classes | Risk weight | 0% | 10% | 20% | 35% | 50% | 75% | 100% | 150% | 250% | 1,250% | Total | ||||||||||||||||||||||||||||||||||||||||
| 1 | Cash | 116 | — | — | — | — | — | — | — | — | — | 116 | ||||||||||||||||||||||||||||||||||||||||
| 2 | Japanese sovereigns and Bank of Japan | �� | 465,728 | — | — | — | — | — | — | — | — | — | 465,728 | |||||||||||||||||||||||||||||||||||||||
| 3 | Foreign central sovereigns and central banks | 46,903 | — | 39,562 | — | 123,316 | — | 55,915 | — | — | — | 265,699 | ||||||||||||||||||||||||||||||||||||||||
| 4 | Bank for International Settlements, etc. | — | — | — | — | — | — | — | — | — | — | — | ||||||||||||||||||||||||||||||||||||||||
| 5 | Japanesenon-central governmental PSEs | 1,043 | — | — | — | — | — | — | — | — | — | 1,043 | ||||||||||||||||||||||||||||||||||||||||
| 6 | Non-central governmental PSEs other than foreign central sovereigns, etc. | — | — | 1,103 | — | 61 | — | 28 | — | — | — | 1,194 | ||||||||||||||||||||||||||||||||||||||||
| 7 | International development banks | 6 | — | — | — | — | — | — | — | — | — | 6 | ||||||||||||||||||||||||||||||||||||||||
| 8 | Japan Finance Organization for Municipalities | — | 1 | — | — | — | — | — | — | — | — | 1 | ||||||||||||||||||||||||||||||||||||||||
| 9 | Japanese government institutions | — | 2,328 | — | — | — | — | — | — | — | — | 2,328 | ||||||||||||||||||||||||||||||||||||||||
| 10 | Three regional public sectors of Japan | — | — | — | — | — | — | — | — | — | — | — | ||||||||||||||||||||||||||||||||||||||||
| 11 | Financial institutions and business operators conducting the type I financial instruments business | — | — | 238,960 | — | 45,431 | — | 62,702 | — | — | — | 347,093 | ||||||||||||||||||||||||||||||||||||||||
| 12 | Corporates, etc. | — | — | — | — | — | — | 1,479,276 | — | — | — | 1,479,276 | ||||||||||||||||||||||||||||||||||||||||
| 13 | Regulatory retail portfolios and individuals | — | — | — | — | — | — | — | — | — | — | — | ||||||||||||||||||||||||||||||||||||||||
| 14 | Mortgage housing loan | — | — | — | — | — | — | — | — | — | — | — | ||||||||||||||||||||||||||||||||||||||||
| 15 | Real estate acquisition business, etc. | — | — | — | — | — | — | — | — | — | — | — | ||||||||||||||||||||||||||||||||||||||||
| 16 | Claims past due for 3 months or more (excluding mortgage housing loan) | — | — | — | — | 87 | — | 17 | 21 | — | — | 126 | ||||||||||||||||||||||||||||||||||||||||
| 17 | Claims past due for 3 months or more regarding mortgage housing loan | — | — | — | — | — | — | — | — | — | — | — | ||||||||||||||||||||||||||||||||||||||||
| 18 | Bills in process of collection | — | — | — | — | — | — | — | — | — | — | — | ||||||||||||||||||||||||||||||||||||||||
| 19 | With guarantee of Credit Guarantee Corporations, etc. | — | — | — | — | — | — | — | — | — | — | — | ||||||||||||||||||||||||||||||||||||||||
| 20 | With guarantee of Regional Economy Vitalization Corporation of Japan | — | — | — | — | — | — | — | — | — | — | — | ||||||||||||||||||||||||||||||||||||||||
| 21 | Investments, etc. (excluding significant investments) | — | — | — | — | — | — | — | — | — | — | — | ||||||||||||||||||||||||||||||||||||||||
|
|
|
|
|
|
|
|
|
|
|
|
|
|
|
|
|
|
|
|
|
| |||||||||||||||||||||||||||||||
| 22 | Total |
| 513,798 | 2,330 | 279,627 | — | 168,897 | — | 1,597,940 | 21 | — | — | 2,562,615 | |||||||||||||||||||||||||||||||||||||||
|
|
|
|
|
|
|
|
|
|
|
|
|
|
|
|
|
|
|
|
|
| |||||||||||||||||||||||||||||||
Note: | ||
Counterparty credit risk exposures, credit risk related to securitization transactions, and fund exposures are excluded from the amount of credit risk exposures above. | ||
32
Table of Contents
(6) Credit Risk Mitigation Techniques
(i) Summary of Risk Profile, Risk Management Policies/ Procedures and Structure
We obtain collateral and guarantees as a means of securing credit. In obtaining the collateral and guarantees, we evaluate the value of the collateral, guarantee performance capability of guarantor and legal enforceability, and we also conduct periodical subsequentre-evaluations. Furthermore, we monitor any concentration of risks in a particular classification, keeping an eye on the concentration of collateral type and/or of credit risks in particular companies including indirect credit exposure such as guarantees. When calculating the credit risk weighted assets for capital adequacy ratio regulations, the effect of credit risk mitigation through financial collateral (mainly deposits and securities), other collateral (mainly real estate) and guarantees by “sovereign, banks or corporations above a certain credit rating” is reflected.
(ii) Quantitative Disclosure on Credit Risk Mitigation Techniques
Counterparty risk exposures, securitization exposures, and regarded-method exposures are excluded from the amount of credit risk exposures below.
(A) CR3: Credit Risk Mitigation Techniques–Overview
| (Millions of yen) | ||||||||||||||||||||||||
| As of March 31, 2018 | ||||||||||||||||||||||||
| a | b | c | d | e | ||||||||||||||||||||
| Exposures unsecured | Exposures secured | Exposures secured by collateral | Exposures secured by financial guarantees | Exposures secured by credit derivatives | ||||||||||||||||||||
| 1 | Loans | 64,898,669 | 12,780,637 | 5,990,412 | 6,784,828 | 5,397 | ||||||||||||||||||
| 2 | Debt securities | 25,670,926 | 451,924 | 179,920 | 272,003 | — | ||||||||||||||||||
| 3 | Other on balance debt assets | 51,653,415 | 44,607 | 5,016 | 39,591 | — | ||||||||||||||||||
|
|
|
|
|
|
|
|
|
| |||||||||||||||
| 4 | Total (1+2+3) | 142,223,012 | 13,277,170 | 6,175,349 | 7,096,423 | 5,397 | ||||||||||||||||||
|
|
|
|
|
|
|
|
|
| |||||||||||||||
| 5 | Of which defaulted | 461,445 | 192,214 | 135,384 | 56,830 | — | ||||||||||||||||||
| Notes: | ||
| 1. | Otheron-balance debt assets include deposits, call loans, bills purchased, monetary claims bought, money held in trust, and foreign exchange assets, etc. | |
| 2. | Defaulted exposures include restructured loans, loans past due for three months or more, loans to bankrupt borrowers and so on. | |
| (Millions of yen) | ||||||||||||||||||||||||
| As of March 31, 2019 | ||||||||||||||||||||||||
| a | b | c | d | e | ||||||||||||||||||||
| Exposures unsecured | Exposures secured | Exposures secured by collateral | Exposures secured by financial guarantees | Exposures secured by credit derivatives | ||||||||||||||||||||
| 1 | Loans | 60,910,902 | 15,856,184 | 6,365,790 | 7,169,389 | 3,137 | ||||||||||||||||||
| 2 | Debt securities | 22,289,542 | 381,561 | 212,479 | 95,790 | — | ||||||||||||||||||
| 3 | Other on balance debt assets | 49,191,702 | 97,131 | 3,037 | 78,503 | — | ||||||||||||||||||
|
|
|
|
|
|
|
|
|
| |||||||||||||||
| 4 | Total (1+2+3) | 132,392,148 | 16,334,877 | 6,581,306 | 7,343,683 | 3,137 | ||||||||||||||||||
|
|
|
|
|
|
|
|
|
| |||||||||||||||
| 5 | Of which defaulted | 261,864 | 220,226 | 101,305 | 47,220 | — | ||||||||||||||||||
| Notes: | ||
| 1. | Otheron-balance debt assets include deposits, call loans, bills purchased, monetary claims bought, money held in trust, and foreign exchange assets, etc. | |
| 2. | Defaulted exposures include restructured loans, loans past due for three months or more, loans to bankrupt borrowers and so on. | |
33
Table of Contents
(B) CR4: Standardized Approach–Credit Risk Exposure and Credit Risk Mitigation (CRM) Effects
| (Millions of yen, except percentages) | ||||||||||||||||||||||||||||
| As of March 31, 2018 | ||||||||||||||||||||||||||||
| a | b | c | d | e | f | |||||||||||||||||||||||
| Exposures before CCF and CRM |
Exposurespost-CCF and | |||||||||||||||||||||||||||
Asset classes | On-balance sheet amount | Off-balance sheet amount | On-balance sheet amount | Off-balance sheet amount | RWA | RWA density | ||||||||||||||||||||||
| 1 | Cash | 10,169 | — | 10,169 | — | — | 0.00 | |||||||||||||||||||||
| 2 | Japanese sovereigns and Bank of Japan | 12,698,108 | — | 12,698,108 | — | — | 0.00 | |||||||||||||||||||||
| 3 | Foreign central sovereigns and central banks | 251,091 | — | 251,091 | — | 115,264 | 45.90 | |||||||||||||||||||||
| 4 | Bank for International Settlements,etc. | — | — | — | — | — | — | |||||||||||||||||||||
| 5 | Japanesenon-central governmental PSEs | 1,089 | — | 1,089 | — | — | 0.00 | |||||||||||||||||||||
| 6 | Non-central governmental PSEs other than foreign central sovereigns, etc. | 7,786 | — | 7,786 | — | 1,581 | 20.31 | |||||||||||||||||||||
| 7 | International development banks | 2,983 | — | 2,983 | — | — | 0.00 | |||||||||||||||||||||
| 8 | Japan finance organization for municipalities | 36,192 | — | 36,192 | — | 100 | 0.27 | |||||||||||||||||||||
| 9 | Japanese government institutions | 523,138 | — | 523,138 | — | 19,531 | 3.73 | |||||||||||||||||||||
| 10 | Three regional public sectors of Japan | — | — | — | — | — | — | |||||||||||||||||||||
| 11 | Financial institutions and business operators conducting the type I financial instruments business | 770,920 | 774 | 770,657 | 387 | 198,607 | 25.75 | |||||||||||||||||||||
| 12 | Corporates, etc. | 1,282,944 | 261,731 | 1,282,944 | 202,006 | 1,484,893 | 99.99 | |||||||||||||||||||||
| 13 | Regulatory retail portfolios and individuals | — | — | — | — | — | — | |||||||||||||||||||||
| 14 | Mortgage housing loan | — | — | — | — | — | — | |||||||||||||||||||||
| 15 | Real estate acquisition business, etc. | — | — | — | — | — | — | |||||||||||||||||||||
| 16 | Loans past due for 3 months or more (excluding mortgage housing loan) | 100 | — | 100 | — | 83 | 83.26 | |||||||||||||||||||||
| 17 | Loans past due for 3 months or more regarding mortgage housing loan | — | — | — | — | — | — | |||||||||||||||||||||
| 18 | Bills in process of collection | — | — | — | — | — | — | |||||||||||||||||||||
| 19 | With guarantee of Credit Guarantee Corporation, etc. | — | — | — | — | — | — | |||||||||||||||||||||
| 20 | With guarantee of Regional Economy Vitalization Corporation of Japan | — | — | — | — | — | — | |||||||||||||||||||||
| 21 | Investments, etc.(excluding significant investments) | — | — | — | — | — | — | |||||||||||||||||||||
|
|
|
|
|
|
|
|
|
|
|
| |||||||||||||||||
| 22 | Total | 15,584,525 | 262,506 | 15,584,262 | 202,393 | 1,820,063 | 11.52 | |||||||||||||||||||||
|
|
|
|
|
|
|
|
|
|
|
| |||||||||||||||||
| (Millions of yen, except percentages) | ||||||||||||||||||||||||||||
| As of March 31, 2019 | ||||||||||||||||||||||||||||
| a | b | c | d | e | f | |||||||||||||||||||||||
| Exposures before CCF and CRM |
Exposurespost-CCF and | |||||||||||||||||||||||||||
Asset classes | On-balance sheet amount | Off-balance sheet amount | On-balance sheet amount | Off-balance sheet amount | RWA | RWA density | ||||||||||||||||||||||
| 1 | Cash | 116 | — | 116 | — | — | 0.00 | |||||||||||||||||||||
| 2 | Japanese sovereigns and Bank of Japan | 465,728 | — | 465,728 | — | — | 0.00 | |||||||||||||||||||||
| 3 | Foreign central sovereigns and central banks | 265,699 | — | 265,699 | — | 125,486 | 47.22 | |||||||||||||||||||||
| 4 | Bank for International Settlements,etc. | — | — | — | — | — | — | |||||||||||||||||||||
| 5 | Japanesenon-central governmental PSEs | 1,043 | — | 1,043 | — | — | 0.00 | |||||||||||||||||||||
| 6 | Non-central governmental PSEs other than foreign central sovereigns, etc. | 1,194 | — | 1,194 | — | 280 | 23.48 | |||||||||||||||||||||
| 7 | International development banks | 6 | — | 6 | — | — | 0.00 | |||||||||||||||||||||
| 8 | Japan finance organization for municipalities | 1 | — | 1 | — | 0 | 10.00 | |||||||||||||||||||||
| 9 | Japanese government institutions | 2,328 | — | 2,328 | — | 232 | 10.00 | |||||||||||||||||||||
| 10 | Three regional public sectors of Japan | — | — | — | — | — | — | |||||||||||||||||||||
| 11 | Financial institutions and business operators conducting the type I financial instruments business | 315,793 | 63,536 | 315,325 | 31,768 | 133,210 | 38.37 | |||||||||||||||||||||
| 12 | Corporates, etc. | 1,274,106 | 258,259 | 1,274,106 | 205,170 | 1,479,220 | 99.99 | |||||||||||||||||||||
| 13 | Regulatory retail portfolios and individuals | — | — | — | — | — | — | |||||||||||||||||||||
| 14 | Mortgage housing loan | — | — | — | — | — | — | |||||||||||||||||||||
| 15 | Real estate acquisition business, etc. | — | — | — | — | — | — | |||||||||||||||||||||
| 16 | Loans past due for 3 months or more (excluding mortgage housing loan) | 126 | — | 126 | — | 93 | 73.70 | |||||||||||||||||||||
| 17 | Loans past due for 3 months or more regarding mortgage housing loan | — | — | — | — | — | — | |||||||||||||||||||||
| 18 | Bills in process of collection | — | — | — | — | — | — | |||||||||||||||||||||
| 19 | With guarantee of Credit Guarantee Corporation, etc. | — | — | — | — | — | — | |||||||||||||||||||||
| 20 | With guarantee of Regional Economy Vitalization Corporation of Japan | — | — | — | — | — | — | |||||||||||||||||||||
| 21 | Investments, etc.(excluding significant investments) | — | — | — | — | — | — | |||||||||||||||||||||
|
|
|
|
|
|
|
|
|
|
|
| |||||||||||||||||
| 22 | Total | 2,326,144 | 321,795 | 2,325,677 | 236,938 | 1,738,523 | 67.84 | |||||||||||||||||||||
|
|
|
|
|
|
|
|
|
|
|
| |||||||||||||||||
34
Table of Contents
(C) CR7: IRB–Effect on RWA of Credit Derivatives Used as CRM Techniques
| (Millions of yen) | ||||||||||||
| As of March 31, 2018 | ||||||||||||
| a | b | |||||||||||
Portfolios | Pre-credit derivatives RWA | Actual RWA | ||||||||||
| 1 | Sovereign–FIRB | — | — | |||||||||
| 2 | Sovereign–AIRB | 577,518 | 577,518 | |||||||||
| 3 | Banks–FIRB | — | — | |||||||||
| 4 | Banks–AIRB | 930,901 | 930,901 | |||||||||
| 5 | Corporate (except Specialized lending)–FIRB | — | — | |||||||||
| 6 | Corporate (except Specialized lending)–AIRB | 22,718,567 | 22,715,534 | |||||||||
| 7 | Specialized lending–FIRB | — | — | |||||||||
| 8 | Specialized lending–AIRB | 1,796,490 | 1,796,490 | |||||||||
| 9 | Retail–qualifying revolving retail exposures (QRRE) | 483,995 | 483,995 | |||||||||
| 10 | Retail–residential mortgage exposures | 2,366,178 | 2,366,178 | |||||||||
| 11 | Other retail exposures | 751,460 | 751,460 | |||||||||
| 12 | Equity–FIRB | — | — | |||||||||
| 13 | Equity–AIRB | 4,640,872 | 4,640,872 | |||||||||
| 14 | Purchased receivables–FIRB | — | — | |||||||||
| 15 | Purchased receivables–AIRB | 1,167,296 | 1,167,296 | |||||||||
|
|
|
| |||||||||
| 16 | Total | 35,433,279 | 35,430,246 | |||||||||
|
|
|
| |||||||||
| (Millions of yen) | ||||||||||||
| As of March 31, 2019 | ||||||||||||
| a | b | |||||||||||
Portfolios | Pre-credit derivatives RWA | Actual RWA | ||||||||||
| 1 | Sovereign–FIRB | — | — | |||||||||
| 2 | Sovereign–AIRB | 640,973 | 640,973 | |||||||||
| 3 | Banks–FIRB | — | — | |||||||||
| 4 | Banks–AIRB | 906,425 | 906,425 | |||||||||
| 5 | Corporate (except Specialized lending)–FIRB | — | — | |||||||||
| 6 | Corporate (except Specialized lending)–AIRB | 23,135,521 | 23,133,739 | |||||||||
| 7 | Specialized lending–FIRB | — | — | |||||||||
| 8 | Specialized lending–AIRB | 1,866,300 | 1,866,300 | |||||||||
| 9 | Retail–qualifying revolving retail exposures (QRRE) | 475,700 | 475,700 | |||||||||
| 10 | Retail–residential mortgage exposures | 2,205,975 | 2,205,975 | |||||||||
| 11 | Other retail exposures | 644,684 | 644,684 | |||||||||
| 12 | Equity–FIRB | — | — | |||||||||
| 13 | Equity–AIRB | 3,658,637 | 3,658,637 | |||||||||
| 14 | Purchased receivables–FIRB | — | — | |||||||||
| 15 | Purchased receivables–AIRB | 819,595 | 819,595 | |||||||||
|
|
|
| |||||||||
| 16 | Total | 34,353,814 | 34,352,032 | |||||||||
|
|
|
| |||||||||
35
Table of Contents
(7) Equity investments in funds
| (Millions of yen) | ||||||||
| As of March 31, 2018 | As of March 31, 2019 | |||||||
| Exposure | Exposure | |||||||
Equity investments in funds–Look-through approach | / | 2,111,716 | ||||||
Equity investments in funds–Mandate-based approach | / | — | ||||||
Equity investments in funds–Simple approach (subject to 250% RW) | / | — | ||||||
Equity investments in funds–Simple approach (subject to 400% RW) | / | 149,567 | ||||||
Equity investments in funds–Fall-back approach | / | 1,559 | ||||||
|
|
|
| |||||
Total | 2,102,954 | 2,262,842 | ||||||
|
|
|
| |||||
| Notes: | ||
| 1. | “Total” as of March 31, 2018 is the amount of fund exposures that the regarded method is applied. | |
| 2. | There are no fund exposures that the standardized approach is applied as of March 31, 2018. | |
36
Table of Contents
(1) Summary of Risk Profile, Risk Management Policies/ Procedures and Structure
In managing the risk pertaining to counterparty credit risk (including central counterparty) in derivatives transactions and repurchase transactions etc., we generally allocate risk capital together with loans, etc., (we take into account wrong way risk for derivatives transactions). For derivatives transactions and repurchase transactions, in cases in which a bilateral netting agreement is valid in light of the legal system of the relevant jurisdiction, we take its effect into consideration. As to derivatives transactions with financial institutions, etc., we periodically, where necessary, deliver and receive collateral to and from the counterparty based on the replacement cost to mitigate credit risk (collateralized derivatives transactions). In conducting such transactions, there is a risk in which we may be required to provide additional collateral in cases where our credit profile deteriorates.
(2) Quantitative Disclosure on Counterparty Credit Risk
(A) CCR1: Analysis of Counterparty Credit risk (CCR) Exposure by Approach
| (Millions of yen) | ||||||||||||||||||||||||||||
| As of March 31, 2018 | ||||||||||||||||||||||||||||
| a | b | c | d | e | f | |||||||||||||||||||||||
| Replacement cost | Potential future exposure | EEPE | Alpha used for computing regulatory EAD | EAD post-CRM | RWA | |||||||||||||||||||||||
| 1 | SA-CCR | — | — | / | 1.4 | — | — | |||||||||||||||||||||
Current Exposure Method | 323,382 | 230,084 | / | / | 535,507 | 216,424 | ||||||||||||||||||||||
| 2 | Expected Positive Exposure Method | / | / | 1,944,443 | 1.4 | 2,722,221 | 887,843 | |||||||||||||||||||||
| 3 | Simple Approach for credit risk mitigation | / | / | / | / | 763,521 | 39,710 | |||||||||||||||||||||
| 4 | Comprehensive Approach for credit risk mitigation | / | / | / | / | 10,332,329 | 654,325 | |||||||||||||||||||||
| 5 | VAR for SFTs | / | / | / | / | — | — | |||||||||||||||||||||
|
|
|
|
|
|
|
|
|
|
|
| |||||||||||||||||
| 6 | Total | / | / | / | / | / | 1,798,303 | |||||||||||||||||||||
|
|
|
|
|
|
|
|
|
|
|
| |||||||||||||||||
| (Millions of yen) | ||||||||||||||||||||||||||||
| As of March 31, 2019 | ||||||||||||||||||||||||||||
| a | b | c | d | e | f | |||||||||||||||||||||||
| Replacement cost | Potential future exposure | EEPE | Alpha used for computing regulatory EAD | EAD post-CRM | RWA | |||||||||||||||||||||||
| 1 | SA-CCR | — | — | / | 1.4 | — | — | |||||||||||||||||||||
Current Exposure Method | 170,412 | 200,077 | / | / | 370,490 | 139,720 | ||||||||||||||||||||||
| 2 | Expected Positive Exposure Method | / | / | 1,994,045 | 1.4 | 2,791,664 | 878,845 | |||||||||||||||||||||
| 3 | Simple Approach for credit risk mitigation | / | / | / | / | 41,823 | 31,043 | |||||||||||||||||||||
| 4 | Comprehensive Approach for credit risk mitigation | / | / | / | / | 10,176,903 | 793,601 | |||||||||||||||||||||
| 5 | VAR for SFTs | / | / | / | / | — | — | |||||||||||||||||||||
|
|
|
|
|
|
|
|
|
|
|
| |||||||||||||||||
| 6 | Total | / | / | / | / | / | 1,843,210 | |||||||||||||||||||||
|
|
|
|
|
|
|
|
|
|
|
| |||||||||||||||||
(B) CCR2: Credit Valuation Adjustment (CVA) Capital Charge
| (Millions of yen) | ||||||||||||
| As of March 31, 2018 | ||||||||||||
| a | b | |||||||||||
| EAD post-CRM | RWA | |||||||||||
| 1 | Total portfolios subject to the Advanced CVA capital charge | — | — | |||||||||
| 2 | (i) VAR component (including the 3×multiplier) | / | — | |||||||||
| 3 | (ii) Stressed VAR component (including the 3×multiplier) | / | — | |||||||||
|
|
|
| |||||||||
| 4 | All portfolios subject to the Standardized CVA capital charge | 3,552,645 | 2,539,780 | |||||||||
|
|
|
| |||||||||
| 5 | Total subject to the CVA capital charge | 3,552,645 | 2,539,780 | |||||||||
|
|
|
| |||||||||
| (Millions of yen) | ||||||||||||
| As of March 31, 2019 | ||||||||||||
| a | b | |||||||||||
| EAD post-CRM | RWA | |||||||||||
| 1 | Total portfolios subject to the Advanced CVA capital charge | — | — | |||||||||
| 2 | (i) VAR component (including the 3×multiplier) | / | — | |||||||||
| 3 | (ii) Stressed VAR component (including the 3×multiplier) | / | — | |||||||||
|
|
|
| |||||||||
| 4 | All portfolios subject to the Standardized CVA capital charge | 3,162,959 | 2,457,535 | |||||||||
|
|
|
| |||||||||
| 5 | Total subject to the CVA capital charge | 3,162,959 | 2,457,535 | |||||||||
|
|
|
| |||||||||
37
Table of Contents
(C) CCR3: Standardized Approach–CCR Exposures by Regulatory Portfolio and Risk Weights
| (Millions of yen) | ||||||||||||||||||||||||||||||||||||||||||||
| As of March 31, 2018 | ||||||||||||||||||||||||||||||||||||||||||||
| a | b | c | d | e | f | g | h | i | ||||||||||||||||||||||||||||||||||||
| Credit exposures amount (post CCF andpost-CRM) | ||||||||||||||||||||||||||||||||||||||||||||
Regulatory portfolio | Risk weight | 0% | 10% | 20% | 50% | 75% | 100% | 150% | Other | Total | ||||||||||||||||||||||||||||||||||
| 1 | Japanese sovereigns and Bank of Japan | 742,381 | — | — | — | — | — | — | — | 742,381 | ||||||||||||||||||||||||||||||||||
| 2 | Foreign central sovereigns and central banks | 4,065 | — | 3,934 | 361 | — | 289 | — | — | 8,650 | ||||||||||||||||||||||||||||||||||
| 3 | Bank for International Settlements,etc. | — | — | — | — | — | — | — | — | — | ||||||||||||||||||||||||||||||||||
| 4 | Japanesenon-central governmental PSEs | — | — | — | — | — | — | — | — | — | ||||||||||||||||||||||||||||||||||
| 5 | Non-central governmental PSEs other than foreign central sovereigns, etc. | — | — | 6,843 | 1,504 | — | 12 | — | — | 8,361 | ||||||||||||||||||||||||||||||||||
| 6 | International development banks | 15,357 | — | — | — | — | — | — | — | 15,357 | ||||||||||||||||||||||||||||||||||
| 7 | Japan Finance Organization for Municipalities | — | — | — | — | — | — | — | — | — | ||||||||||||||||||||||||||||||||||
| 8 | Japanese government institutions | — | 1,076 | — | — | — | — | — | — | 1,076 | ||||||||||||||||||||||||||||||||||
| 9 | Three regional public sectors of Japan | — | — | — | — | — | — | — | — | — | ||||||||||||||||||||||||||||||||||
| 10 | Financial institutions and business operators conducting the type I financial instruments business | — | — | 665,336 | 13,269 | — | 41,948 | — | — | 720,554 | ||||||||||||||||||||||||||||||||||
| 11 | Corporates, etc. | — | — | — | — | — | 679,087 | — | — | 679,087 | ||||||||||||||||||||||||||||||||||
| 12 | Regulatory retail portfolios and individuals | — | — | — | — | — | — | — | — | — | ||||||||||||||||||||||||||||||||||
| 13 | Other assets | — | — | — | — | — | — | — | — | — | ||||||||||||||||||||||||||||||||||
|
|
|
|
|
|
|
|
|
|
|
|
|
|
|
|
|
| |||||||||||||||||||||||||||
| 14 | Total | 761,805 | 1,076 | 676,114 | 15,135 | — | 721,337 | — | — | 2,175,469 | ||||||||||||||||||||||||||||||||||
|
|
|
|
|
|
|
|
|
|
|
|
|
|
|
|
|
| |||||||||||||||||||||||||||
| (Millions of yen) | ||||||||||||||||||||||||||||||||||||||||||||
| As of March 31, 2019 | ||||||||||||||||||||||||||||||||||||||||||||
| a | b | c | d | e | f | g | h | i | ||||||||||||||||||||||||||||||||||||
| Credit exposures amount (post CCF andpost-CRM) | ||||||||||||||||||||||||||||||||||||||||||||
Regulatory portfolio | Risk weight | 0% | 10% | 20% | 50% | 75% | 100% | 150% | Other | Total | ||||||||||||||||||||||||||||||||||
| 1 | Japanese sovereigns and Bank of Japan | 68,027 | — | — | — | — | — | — | — | 68,027 | ||||||||||||||||||||||||||||||||||
| 2 | Foreign central sovereigns and central banks | 822 | — | 8,120 | 532 | — | 697 | — | — | 10,173 | ||||||||||||||||||||||||||||||||||
| 3 | Bank for International Settlements,etc. | — | — | — | — | — | — | — | — | — | ||||||||||||||||||||||||||||||||||
| 4 | Japanesenon-central governmental PSEs | — | — | — | — | — | — | — | — | — | ||||||||||||||||||||||||||||||||||
| 5 | Non-central governmental PSEs other than foreign central sovereigns, etc. | — | — | 25,043 | 3,945 | — | 19 | — | — | 29,008 | ||||||||||||||||||||||||||||||||||
| 6 | International development banks | 7,933 | — | — | — | — | — | — | — | 7,933 | ||||||||||||||||||||||||||||||||||
| 7 | Japan Finance Organization for Municipalities | — | — | — | — | — | — | — | — | — | ||||||||||||||||||||||||||||||||||
| 8 | Japanese government institutions | — | 819 | — | — | — | — | — | — | 819 | ||||||||||||||||||||||||||||||||||
| 9 | Three regional public sectors of Japan | — | — | — | — | — | — | — | — | — | ||||||||||||||||||||||||||||||||||
| 10 | Financial institutions and business operators conducting the type I financial instruments business | — | — | 499,625 | 16,438 | — | 31,460 | — | — | 547,524 | ||||||||||||||||||||||||||||||||||
| 11 | Corporates, etc. | — | — | — | — | — | 686,087 | — | — | 686,087 | ||||||||||||||||||||||||||||||||||
| 12 | Regulatory retail portfolios and individuals | — | — | — | — | — | — | — | — | — | ||||||||||||||||||||||||||||||||||
| 13 | Other assets | — | — | — | — | — | — | — | — | — | ||||||||||||||||||||||||||||||||||
|
|
|
|
|
|
|
|
|
|
|
|
|
|
|
|
|
| |||||||||||||||||||||||||||
| 14 | Total | 76,784 | 819 | 532,788 | 20,916 | — | 718,265 | — | — | 1,349,574 | ||||||||||||||||||||||||||||||||||
|
|
|
|
|
|
|
|
|
|
|
|
|
|
|
|
|
| |||||||||||||||||||||||||||
38
Table of Contents
(D) CCR4: IRB–CCR Exposures by Portfolio and PD Scale
| (Millions of yen, %, number in the thousands, year) | ||||||||||||||||||||||||||||||||
| As of March 31, 2018 | ||||||||||||||||||||||||||||||||
| a | b | c | d | e | f | g | ||||||||||||||||||||||||||
PD scale | EAD post-CRM | Average PD | Number of counterparty | Average LGD | Average maturity | RWA | RWA density | |||||||||||||||||||||||||
Sovereign | ||||||||||||||||||||||||||||||||
| 1 | 0.00 to <0.15 | 9,213,266 | 0.00 | 0.0 | 37.97 | 4.5 | 40,100 | 0.43 | ||||||||||||||||||||||||
| 2 | 0.15 to <0.25 | — | — | — | — | — | — | — | ||||||||||||||||||||||||
| 3 | 0.25 to <0.50 | 419 | 0.27 | 0.0 | 37.97 | 2.3 | 180 | 42.94 | ||||||||||||||||||||||||
| 4 | 0.50 to <0.75 | 682 | 0.50 | 0.0 | 37.97 | 3.0 | 440 | 64.52 | ||||||||||||||||||||||||
| 5 | 0.75 to <2.50 | 2,944 | 1.28 | 0.0 | 37.97 | 4.9 | 3,291 | 111.77 | ||||||||||||||||||||||||
| 6 | 2.50 to <10.00 | 84 | 6.34 | 0.0 | 37.97 | 1.6 | 108 | 129.20 | ||||||||||||||||||||||||
| 7 | 10.00 to <100.00 | — | — | — | — | — | — | — | ||||||||||||||||||||||||
| 8 | 100.00 (Default) | — | — | — | — | — | — | — | ||||||||||||||||||||||||
|
|
|
|
|
|
|
|
|
|
|
|
|
| |||||||||||||||||||
| 9 | Sub-total | 9,217,397 | 0.00 | 0.0 | 37.97 | 4.5 | 44,120 | 0.47 | ||||||||||||||||||||||||
|
|
|
|
|
|
|
|
|
|
|
|
|
| |||||||||||||||||||
Banks | ||||||||||||||||||||||||||||||||
| 1 | 0.00 to <0.15 | 1,121,064 | 0.06 | 0.3 | 37.97 | 2.0 | 239,768 | 21.38 | ||||||||||||||||||||||||
| 2 | 0.15 to <0.25 | — | — | — | — | — | — | — | ||||||||||||||||||||||||
| 3 | 0.25 to <0.50 | 26,824 | 0.27 | 0.0 | 37.97 | 1.0 | 11,354 | 42.32 | ||||||||||||||||||||||||
| 4 | 0.50 to <0.75 | 3,623 | 0.50 | 0.0 | 37.97 | 4.0 | 3,472 | 95.81 | ||||||||||||||||||||||||
| 5 | 0.75 to <2.50 | 130 | 1.11 | 0.0 | 35.50 | 1.1 | 78 | 59.96 | ||||||||||||||||||||||||
| 6 | 2.50 to <10.00 | 1,506 | 3.13 | 0.0 | 37.97 | 0.9 | 1,431 | 95.04 | ||||||||||||||||||||||||
| 7 | 10.00 to <100.00 | — | — | — | — | — | — | — | ||||||||||||||||||||||||
| 8 | 100.00 (Default) | — | — | — | — | — | — | — | ||||||||||||||||||||||||
|
|
|
|
|
|
|
|
|
|
|
|
|
| |||||||||||||||||||
| 9 | Sub-total | 1,153,150 | 0.07 | 0.4 | 37.96 | 2.0 | 256,105 | 22.20 | ||||||||||||||||||||||||
|
|
|
|
|
|
|
|
|
|
|
|
|
| |||||||||||||||||||
Corporate | ||||||||||||||||||||||||||||||||
| 1 | 0.00 to <0.15 | 1,276,093 | 0.07 | 2.3 | 37.87 | 3.3 | 338,813 | 26.55 | ||||||||||||||||||||||||
| 2 | 0.15 to <0.25 | — | — | — | — | — | — | — | ||||||||||||||||||||||||
| 3 | 0.25 to <0.50 | 71,739 | 0.27 | 1.3 | 34.64 | 2.8 | 31,462 | 43.85 | ||||||||||||||||||||||||
| 4 | 0.50 to <0.75 | 45,443 | 0.50 | 0.9 | 34.76 | 2.4 | 24,117 | 53.07 | ||||||||||||||||||||||||
| 5 | 0.75 to <2.50 | 41,705 | 1.23 | 1.3 | 34.66 | 2.8 | 32,929 | 78.95 | ||||||||||||||||||||||||
| 6 | 2.50 to <10.00 | 22,779 | 3.58 | 0.4 | 33.64 | 2.2 | 22,050 | 96.80 | ||||||||||||||||||||||||
| 7 | 10.00 to <100.00 | 2,328 | 15.16 | 0.1 | 30.64 | 2.2 | 3,445 | 147.92 | ||||||||||||||||||||||||
| 8 | 100.00 (Default) | 1,301 | 100.00 | 0.1 | 51.99 | 2.5 | 446 | 34.31 | ||||||||||||||||||||||||
|
|
|
|
|
|
|
|
|
|
|
|
|
| |||||||||||||||||||
| 9 | Sub-total | 1,461,390 | 0.30 | 6.6 | 37.45 | 3.2 | 453,264 | 31.01 | ||||||||||||||||||||||||
|
|
|
|
|
|
|
|
|
|
|
|
|
| |||||||||||||||||||
39
Table of Contents
(-Continued)
| As of March 31, 2018 | ||||||||||||||||||||||||||||||||
| a | b | c | d | e | f | g | ||||||||||||||||||||||||||
PD scale | EAD post-CRM | Average PD | Number of counterparty | Average LGD | Average maturity | RWA | RWA density | |||||||||||||||||||||||||
SME | ||||||||||||||||||||||||||||||||
| 1 | 0.00 to <0.15 | 147 | 0.07 | 0.0 | 14.18 | 2.7 | 12 | 8.33 | ||||||||||||||||||||||||
| 2 | 0.15 to <0.25 | — | — | — | — | — | — | — | ||||||||||||||||||||||||
| 3 | 0.25 to <0.50 | 7,928 | 0.27 | 0.5 | 21.80 | 3.2 | 1,954 | 24.64 | ||||||||||||||||||||||||
| 4 | 0.50 to <0.75 | 5,688 | 0.50 | 0.5 | 22.58 | 3.3 | 1,892 | 33.27 | ||||||||||||||||||||||||
| 5 | 0.75 to <2.50 | 6,843 | 1.16 | 0.9 | 23.24 | 3.2 | 3,136 | 45.82 | ||||||||||||||||||||||||
| �� | 6 | 2.50 to <10.00 | 4,172 | 3.16 | 0.2 | 23.43 | 3.8 | 2,612 | 62.61 | |||||||||||||||||||||||
| 7 | 10.00 to <100.00 | 999 | 15.16 | 0.0 | 22.64 | 3.0 | 984 | 98.44 | ||||||||||||||||||||||||
| 8 | 100.00 (Default) | 559 | 100.00 | 0.0 | 40.35 | 3.5 | 126 | 22.51 | ||||||||||||||||||||||||
|
|
|
|
|
|
|
|
|
|
|
|
|
| |||||||||||||||||||
| 9 | Sub-total | 26,340 | 3.69 | 2.5 | 22.98 | 3.3 | 10,718 | 40.69 | ||||||||||||||||||||||||
|
|
|
|
|
|
|
|
|
|
|
|
|
| |||||||||||||||||||
Specialized Lending | ||||||||||||||||||||||||||||||||
| 1 | 0.00 to <0.15 | 209,425 | 0.10 | 0.1 | 40.14 | 4.5 | 84,829 | 40.50 | ||||||||||||||||||||||||
| 2 | 0.15 to <0.25 | — | — | — | — | — | — | — | ||||||||||||||||||||||||
| 3 | 0.25 to <0.50 | 36,813 | 0.27 | 0.0 | 38.75 | 4.6 | 23,601 | 64.11 | ||||||||||||||||||||||||
| 4 | 0.50 to <0.75 | 30,159 | 0.50 | 0.0 | 37.97 | 4.3 | 23,135 | 76.70 | ||||||||||||||||||||||||
| 5 | 0.75 to <2.50 | 34,864 | 0.96 | 0.0 | 37.97 | 4.1 | 32,817 | 94.12 | ||||||||||||||||||||||||
| 6 | 2.50 to <10.00 | 2,966 | 3.60 | 0.0 | 37.97 | 4.0 | 3,861 | 130.20 | ||||||||||||||||||||||||
| 7 | 10.00 to <100.00 | 1,194 | 15.16 | 0.0 | 37.97 | 3.4 | 2,348 | 196.71 | ||||||||||||||||||||||||
| 8 | 100.00 (Default) | 2,768 | 100.00 | 0.0 | 55.90 | 4.9 | 1,540 | 55.66 | ||||||||||||||||||||||||
|
|
|
|
|
|
|
|
|
|
|
|
|
| |||||||||||||||||||
| 9 | Sub-total | 318,190 | 1.21 | 0.3 | 39.64 | 4.5 | 172,134 | 54.09 | ||||||||||||||||||||||||
|
|
|
|
|
|
|
|
|
|
|
|
|
| |||||||||||||||||||
Purchased receivables | ||||||||||||||||||||||||||||||||
| 1 | 0.00 to <0.15 | — | — | — | — | — | — | — | ||||||||||||||||||||||||
| 2 | 0.15 to <0.25 | — | — | — | — | — | — | — | ||||||||||||||||||||||||
| 3 | 0.25 to <0.50 | — | — | — | — | — | — | — | ||||||||||||||||||||||||
| 4 | 0.50 to <0.75 | — | — | — | — | — | — | — | ||||||||||||||||||||||||
| 5 | 0.75 to <2.50 | — | — | — | — | — | — | — | ||||||||||||||||||||||||
| 6 | 2.50 to <10.00 | — | — | — | — | — | — | — | ||||||||||||||||||||||||
| 7 | 10.00 to <100.00 | — | — | — | — | — | — | — | ||||||||||||||||||||||||
| 8 | 100.00 (Default) | — | — | — | — | — | — | — | ||||||||||||||||||||||||
|
|
|
|
|
|
|
|
|
|
|
|
|
| |||||||||||||||||||
| 9 | Sub-total | — | — | — | — | — | — | — | ||||||||||||||||||||||||
|
|
|
|
|
|
|
|
|
|
|
|
|
| |||||||||||||||||||
Retails | ||||||||||||||||||||||||||||||||
| 1 | 0.00 to <0.15 | — | — | — | — | / | — | — | ||||||||||||||||||||||||
| 2 | 0.15 to <0.25 | — | — | — | — | / | — | — | ||||||||||||||||||||||||
| 3 | 0.25 to <0.50 | — | — | — | — | / | — | — | ||||||||||||||||||||||||
| 4 | 0.50 to <0.75 | — | — | — | — | / | — | — | ||||||||||||||||||||||||
| 5 | 0.75 to <2.50 | 834 | 1.95 | 0.8 | 28.77 | / | 307 | 36.86 | ||||||||||||||||||||||||
| 6 | 2.50 to <10.00 | 13 | 4.03 | 0.0 | 4.41 | / | 0 | 6.37 | ||||||||||||||||||||||||
| 7 | 10.00 to <100.00 | 35 | 13.39 | 0.0 | 21.68 | / | 14 | 40.29 | ||||||||||||||||||||||||
| 8 | 100.00 (Default) | 3 | 100.00 | 0.0 | 36.77 | / | 1 | 40.68 | ||||||||||||||||||||||||
|
|
|
|
|
|
|
|
|
|
|
|
|
| |||||||||||||||||||
| 9 | Sub-total | 886 | 2.83 | 0.9 | 28.16 | / | 323 | 36.55 | ||||||||||||||||||||||||
|
|
|
|
|
|
|
|
|
|
|
|
|
| |||||||||||||||||||
Total (all portfolios) | 12,177,355 | 0.08 | 10.9 | 37.91 | 4.1 | 936,667 | 7.69 | |||||||||||||||||||||||||
|
|
|
|
|
|
|
|
|
|
|
|
|
| |||||||||||||||||||
40
Table of Contents
| (Millions of yen, %, number in the thousands, year) | ||||||||||||||||||||||||||||||||
| As of March 31, 2019 | ||||||||||||||||||||||||||||||||
| a | b | c | d | e | f | g | ||||||||||||||||||||||||||
PD scale | EAD post-CRM | Average PD | Number of counterparty | Average LGD | Average maturity | RWA | RWA density | |||||||||||||||||||||||||
Sovereign | ||||||||||||||||||||||||||||||||
| 1 | 0.00 to <0.15 | 8,930,341 | 0.00 | 0.0 | 38.01 | 4.6 | 118,295 | 1.32 | ||||||||||||||||||||||||
| 2 | 0.15 to <0.25 | — | — | — | — | — | — | — | ||||||||||||||||||||||||
| 3 | 0.25 to <0.50 | 500 | 0.27 | 0.0 | 38.01 | 2.9 | 240 | 48.11 | ||||||||||||||||||||||||
| 4 | 0.50 to <0.75 | — | — | — | — | — | — | — | ||||||||||||||||||||||||
| 5 | 0.75 to <2.50 | 3,527 | 0.91 | 0.0 | 38.01 | 4.5 | 3,388 | 96.04 | ||||||||||||||||||||||||
| 6 | 2.50 to <10.00 | 43 | 3.06 | 0.0 | 38.01 | 1.3 | 42 | 97.12 | ||||||||||||||||||||||||
| 7 | 10.00 to <100.00 | — | — | — | — | — | — | — | ||||||||||||||||||||||||
| 8 | 100.00 (Default) | — | — | — | — | — | — | — | ||||||||||||||||||||||||
|
|
|
|
|
|
|
|
|
|
|
|
|
| |||||||||||||||||||
| 9 | Sub-total | 8,934,414 | 0.00 | 0.0 | 38.01 | 4.6 | 121,967 | 1.36 | ||||||||||||||||||||||||
|
|
|
|
|
|
|
|
|
|
|
|
|
| |||||||||||||||||||
Banks | ||||||||||||||||||||||||||||||||
| 1 | 0.00 to <0.15 | 1,290,871 | 0.05 | 0.3 | 38.01 | 2.3 | 266,984 | 20.68 | ||||||||||||||||||||||||
| 2 | 0.15 to <0.25 | — | — | — | — | — | — | — | ||||||||||||||||||||||||
| 3 | 0.25 to <0.50 | 22,216 | 0.29 | 0.0 | 37.98 | 1.5 | 10,872 | 48.94 | ||||||||||||||||||||||||
| 4 | 0.50 to <0.75 | — | — | — | — | — | — | — | ||||||||||||||||||||||||
| 5 | 0.75 to <2.50 | 110 | 1.07 | 0.0 | 37.74 | 1.2 | 73 | 66.63 | ||||||||||||||||||||||||
| 6 | 2.50 to <10.00 | 794 | 3.06 | 0.0 | 38.01 | 0.5 | 709 | 89.25 | ||||||||||||||||||||||||
| 7 | 10.00 to <100.00 | — | — | — | — | — | — | — | ||||||||||||||||||||||||
| 8 | 100.00 (Default) | 196 | 100.00 | 0.0 | 96.59 | 5.0 | 60 | 30.50 | ||||||||||||||||||||||||
|
|
|
|
|
|
|
|
|
|
|
|
|
| |||||||||||||||||||
| 9 | Sub-total | 1,314,189 | 0.07 | 0.4 | 38.01 | 2.3 | 278,700 | 21.20 | ||||||||||||||||||||||||
|
|
|
|
|
|
|
|
|
|
|
|
|
| |||||||||||||||||||
Corporate | ||||||||||||||||||||||||||||||||
| 1 | 0.00 to <0.15 | 1,207,074 | 0.06 | 2.4 | 37.89 | 3.2 | 287,136 | 23.78 | ||||||||||||||||||||||||
| 2 | 0.15 to <0.25 | — | — | — | — | — | — | — | ||||||||||||||||||||||||
| 3 | 0.25 to <0.50 | 72,626 | 0.36 | 2.1 | 34.74 | 2.7 | 34,397 | 47.36 | ||||||||||||||||||||||||
| 4 | 0.50 to <0.75 | — | — | — | — | — | — | — | ||||||||||||||||||||||||
| 5 | 0.75 to <2.50 | 68,940 | 1.08 | 1.3 | 36.25 | 2.6 | 52,736 | 76.49 | ||||||||||||||||||||||||
| 6 | 2.50 to <10.00 | 22,183 | 3.23 | 0.3 | 33.42 | 2.9 | 22,351 | 100.75 | ||||||||||||||||||||||||
| 7 | 10.00 to <100.00 | 3,476 | 14.89 | 0.1 | 33.95 | 2.5 | 5,813 | 167.20 | ||||||||||||||||||||||||
| 8 | 100.00 (Default) | 1,436 | 100.00 | 0.1 | 41.93 | 2.9 | 408 | 28.45 | ||||||||||||||||||||||||
|
|
|
|
|
|
|
|
|
|
|
|
|
| |||||||||||||||||||
| 9 | Sub-total | 1,375,738 | 0.32 | 6.6 | 37.56 | 3.2 | 402,844 | 29.28 | ||||||||||||||||||||||||
|
|
|
|
|
|
|
|
|
|
|
|
|
| |||||||||||||||||||
41
Table of Contents
(-Continued)
| As of March 31, 2019 | ||||||||||||||||||||||||||||||||
| a | b | c | d | e | f | g | ||||||||||||||||||||||||||
PD scale | EAD post-CRM | Average PD | Number of counterparty | Average LGD | Average maturity | RWA | RWA density | |||||||||||||||||||||||||
SME | ||||||||||||||||||||||||||||||||
| 1 | 0.00 to <0.15 | 828 | 0.10 | 0.0 | 19.39 | 3.3 | 105 | 12.71 | ||||||||||||||||||||||||
| 2 | 0.15 to <0.25 | — | — | — | — | — | — | — | ||||||||||||||||||||||||
| 3 | 0.25 to <0.50 | 13,396 | 0.35 | 1.3 | 23.89 | 3.3 | 4,208 | 31.41 | ||||||||||||||||||||||||
| 4 | 0.50 to <0.75 | — | — | — | — | — | — | — | ||||||||||||||||||||||||
| 5 | 0.75 to <2.50 | 10,122 | 1.13 | 1.1 | 22.40 | 3.6 | 4,667 | 46.11 | ||||||||||||||||||||||||
| 6 | 2.50 to <10.00 | 5,463 | 3.08 | 0.3 | 21.83 | 4.0 | 3,056 | 55.94 | ||||||||||||||||||||||||
| 7 | 10.00 to <100.00 | 1,123 | 14.89 | 0.0 | 28.90 | 3.1 | 1,404 | 125.04 | ||||||||||||||||||||||||
| 8 | 100.00 (Default) | 605 | 100.00 | 0.0 | 32.29 | 3.1 | 215 | 35.54 | ||||||||||||||||||||||||
|
|
|
|
|
|
|
|
|
|
|
|
|
| |||||||||||||||||||
| 9 | Sub-total | 31,538 | 3.50 | 2.9 | 23.28 | 3.5 | 13,656 | 43.30 | ||||||||||||||||||||||||
|
|
|
|
|
|
|
|
|
|
|
|
|
| |||||||||||||||||||
Specialized Lending | ||||||||||||||||||||||||||||||||
| 1 | 0.00 to <0.15 | 230,919 | 0.09 | 0.1 | 40.54 | 4.5 | 86,486 | 37.45 | ||||||||||||||||||||||||
| 2 | 0.15 to <0.25 | — | — | — | — | — | — | — | ||||||||||||||||||||||||
| 3 | 0.25 to <0.50 | 104,070 | 0.35 | 0.0 | 38.01 | 4.6 | 71,498 | 68.70 | ||||||||||||||||||||||||
| 4 | 0.50 to <0.75 | — | — | — | — | — | — | — | ||||||||||||||||||||||||
| 5 | 0.75 to <2.50 | 34,753 | 1.04 | 0.0 | 38.01 | 4.4 | 34,152 | 98.26 | ||||||||||||||||||||||||
| 6 | 2.50 to <10.00 | 1,057 | 3.77 | 0.0 | 38.01 | 3.9 | 1,383 | 130.80 | ||||||||||||||||||||||||
| 7 | 10.00 to <100.00 | 606 | 14.89 | 0.0 | 38.01 | 3.8 | 1,208 | 199.35 | ||||||||||||||||||||||||
| 8 | 100.00 (Default) | 2,530 | 100.00 | 0.0 | 54.96 | 4.9 | 1,504 | 59.45 | ||||||||||||||||||||||||
|
|
|
|
|
|
|
|
|
|
|
|
|
| |||||||||||||||||||
| 9 | Sub-total | 373,938 | 0.96 | 0.3 | 39.68 | 4.5 | 196,232 | 52.47 | ||||||||||||||||||||||||
|
|
|
|
|
|
|
|
|
|
|
|
|
| |||||||||||||||||||
Purchased receivables | ||||||||||||||||||||||||||||||||
| 1 | 0.00 to <0.15 | — | — | — | — | — | — | — | ||||||||||||||||||||||||
| 2 | 0.15 to <0.25 | — | — | — | — | — | — | — | ||||||||||||||||||||||||
| 3 | 0.25 to <0.50 | — | — | — | — | — | — | — | ||||||||||||||||||||||||
| 4 | 0.50 to <0.75 | — | — | — | — | — | — | — | ||||||||||||||||||||||||
| 5 | 0.75 to <2.50 | — | — | — | — | — | — | — | ||||||||||||||||||||||||
| 6 | 2.50 to <10.00 | — | — | — | — | — | — | — | ||||||||||||||||||||||||
| 7 | 10.00 to <100.00 | — | — | — | — | — | — | — | ||||||||||||||||||||||||
| 8 | 100.00 (Default) | — | — | — | — | — | — | — | ||||||||||||||||||||||||
|
|
|
|
|
|
|
|
|
|
|
|
|
| |||||||||||||||||||
| 9 | Sub-total | — | — | — | — | — | — | — | ||||||||||||||||||||||||
|
|
|
|
|
|
|
|
|
|
|
|
|
| |||||||||||||||||||
Retails | ||||||||||||||||||||||||||||||||
| 1 | 0.00 to <0.15 | — | — | — | — | / | — | — | ||||||||||||||||||||||||
| 2 | 0.15 to <0.25 | — | — | — | — | / | — | — | ||||||||||||||||||||||||
| 3 | 0.25 to <0.50 | — | — | — | — | �� | / | — | — | |||||||||||||||||||||||
| 4 | 0.50 to <0.75 | — | — | — | — | / | — | — | ||||||||||||||||||||||||
| 5 | 0.75 to <2.50 | 951 | 1.85 | 0.9 | 28.36 | / | 343 | 36.04 | ||||||||||||||||||||||||
| 6 | 2.50 to <10.00 | 8 | 3.95 | 0.0 | 4.41 | / | 0 | 6.36 | ||||||||||||||||||||||||
| 7 | 10.00 to <100.00 | 38 | 14.57 | 0.0 | 23.05 | / | 16 | 43.25 | ||||||||||||||||||||||||
| 8 | 100.00 (Default) | 3 | 100.00 | 0.0 | 53.05 | / | 1 | 48.18 | ||||||||||||||||||||||||
|
|
|
|
|
|
|
|
|
|
|
|
|
| |||||||||||||||||||
| 9 | Sub-total | 1,001 | 2.69 | 1.0 | 28.04 | / | 361 | 36.12 | ||||||||||||||||||||||||
|
|
|
|
|
|
|
|
|
|
|
|
|
| |||||||||||||||||||
Total (all portfolios) | 12,030,820 | 0.08 | 11.4 | 37.97 | 4.2 | 1,013,762 | 8.42 | |||||||||||||||||||||||||
|
|
|
|
|
|
|
|
|
|
|
|
|
| |||||||||||||||||||
(E) CCR5: Composition of Collateral for CCR Exposure
| (Millions of yen) | ||||||||||||||||||||||||||||
| As of March 31, 2018 | ||||||||||||||||||||||||||||
| a | b | c | d | e | f | |||||||||||||||||||||||
| Collateral used in derivative transactions | Collateral used in SFTs | |||||||||||||||||||||||||||
| Fair value of collateral received | Fair value of posted collateral | Fair value of collateral received | Fair value of posted collateral | |||||||||||||||||||||||||
| Segregated | Unsegregated | Segregated | Unsegregated | |||||||||||||||||||||||||
| 1 | Cash–domestic currency | 3,458 | 481,886 | 5,310 | 803,536 | 1,695,567 | 2,996,441 | |||||||||||||||||||||
| 2 | Cash–other currencies | 343,180 | 385,532 | 257,532 | 536,166 | 16,529,816 | 9,267,379 | |||||||||||||||||||||
| 3 | Domestic sovereign debt | 27,877 | 303,956 | 122,227 | 265,290 | 1,951,674 | 2,364,378 | |||||||||||||||||||||
| 4 | Other sovereign debt | 48,205 | 69,742 | 253,988 | 184,402 | 7,744,419 | 13,853,163 | |||||||||||||||||||||
| 5 | Government agency debt | 1,234 | — | 481 | — | 620,455 | 1,070,112 | |||||||||||||||||||||
| 6 | Corporate bonds | 55 | 49,094 | 21 | 3,141 | 493,226 | 603,156 | |||||||||||||||||||||
| 7 | Equity securities | — | 254,472 | — | 128,584 | 1,904,428 | 1,413,438 | |||||||||||||||||||||
| 8 | Other collateral | — | 7,806 | — | 4,944 | 4,464 | 394,305 | |||||||||||||||||||||
|
|
|
|
|
|
|
|
|
|
|
| |||||||||||||||||
| 9 | Total | 424,012 | 1,552,490 | 639,562 | 1,926,066 | 30,944,054 | 31,962,377 | |||||||||||||||||||||
|
|
|
|
|
|
|
|
|
|
|
| |||||||||||||||||
42
Table of Contents
| (Millions of yen) | ||||||||||||||||||||||||||||
| As of March 31, 2019 | ||||||||||||||||||||||||||||
| a | b | c | d | e | f | |||||||||||||||||||||||
| Collateral used in derivative transactions | Collateral used in SFTs | |||||||||||||||||||||||||||
| Fair value of collateral received | Fair value of posted collateral | Fair value of collateral received | Fair value of posted collateral | |||||||||||||||||||||||||
| Segregated | Unsegregated | Segregated | Unsegregated | |||||||||||||||||||||||||
| 1 | Cash–domestic currency | 11,079 | 570,998 | 4,056 | 883,792 | 1,704,049 | 3,730,404 | |||||||||||||||||||||
| 2 | Cash–other currencies | 336,654 | 336,381 | 260,207 | 374,001 | 14,465,337 | 11,540,222 | |||||||||||||||||||||
| 3 | Domestic sovereign debt | 19,336 | 324,357 | 106,721 | 377,249 | 3,183,024 | 2,674,023 | |||||||||||||||||||||
| 4 | Other sovereign debt | 105,414 | 91,743 | 306,088 | 118,358 | 9,482,818 | 11,223,557 | |||||||||||||||||||||
| 5 | Government agency debt | 226 | — | — | — | 206,703 | 61,130 | |||||||||||||||||||||
| 6 | Corporate bonds | 20 | 24,331 | 20 | 5,077 | 1,102,381 | 1,777,925 | |||||||||||||||||||||
| 7 | Equity securities | — | 93,877 | — | 86,874 | 1,645,752 | 1,311,029 | |||||||||||||||||||||
| 8 | Other collateral | — | — | — | — | 13,411 | 433,352 | |||||||||||||||||||||
|
|
|
|
|
|
|
|
|
|
|
| |||||||||||||||||
| 9 | Total | 472,731 | 1,441,690 | 677,094 | 1,845,353 | 31,803,478 | 32,751,646 | |||||||||||||||||||||
|
|
|
|
|
|
|
|
|
|
|
| |||||||||||||||||
(F) CCR6: Credit Derivatives Exposures
| (Millions of yen) | ||||||||||||
| As of March 31, 2018 | ||||||||||||
| a | b | |||||||||||
| Protection bought | Protection sold | |||||||||||
| Notionals | ||||||||||||
| 1 | Single-name credit default swaps | 1,120,511 | 1,142,042 | |||||||||
| 2 | Index credit default swaps | 178,477 | 159,997 | |||||||||
| 3 | Total return swaps | — | — | |||||||||
| 4 | Credit options | — | — | |||||||||
| 5 | Other credit derivatives | — | — | |||||||||
| 6 | Total notionals | 1,298,988 | 1,302,040 | |||||||||
|
|
|
| |||||||||
Fair values | ||||||||||||
| 7 | Positive fair value (asset) | 2,480 | 20,313 | |||||||||
| 8 | Negative fair value (liability) | (18,489 | ) | (868 | ) | |||||||
| (Millions of yen) | ||||||||||||
| As of March 31, 2019 | ||||||||||||
| a | b | |||||||||||
| Protection bought | Protection sold | |||||||||||
| Notionals | ||||||||||||
| 1 | Single-name credit default swaps | 1,108,432 | 1,109,082 | |||||||||
| 2 | Index credit default swaps | 350,692 | 330,913 | |||||||||
| 3 | Total return swaps | 14,431 | 23,471 | |||||||||
| 4 | Credit options | — | — | |||||||||
| 5 | Other credit derivatives | 1,100 | — | |||||||||
| 6 | Total notionals | 1,474,656 | 1,463,467 | |||||||||
|
|
|
| |||||||||
Fair values | ||||||||||||
| 7 | Positive fair value (asset) | 2,653 | 16,814 | |||||||||
| 8 | Negative fair value (liability) | (14,162 | ) | (1,969 | ) | |||||||
(G) CCR7: RWA flow statements of CCR exposures under EPE method
| (Billions of yen) | ||||||||
No. | RWA | |||||||
1 | RWA as of March 31, 2018 | 887.8 | ||||||
2 | Breakdown of changes during this reporting period | Asset size | 34.7 | |||||
3 | Credit quality of counterparties | (56.1 | ) | |||||
4 | Model updates (EPE only) | — | ||||||
5 | Methodology and policy (EPE only) | — | ||||||
6 | Acquisitions and disposals | — | ||||||
7 | Foreign currency fluctuations | 12.1 | ||||||
8 | Other | 0.2 | ||||||
9 | RWA as of March 31, 2019 | 878.8 | ||||||
43
Table of Contents
(H) CCR8: Exposures to Central Counterparties
| (Millions of yen) | ||||||||||||
| As of March 31, 2018 | ||||||||||||
| a | b | |||||||||||
| EAD (post-CRM) | RWA | |||||||||||
| 1 | Exposures to QCCPs (total) | / | 193,088 | |||||||||
| 2 | Exposures for trades at QCCPs (excluding initial margin and default fund contributions); of which | 676,795 | 3,053 | |||||||||
| 3 | (i) OTC derivatives | 438,891 | 425 | |||||||||
| 4 | (ii) Exchange-traded derivatives | 115,828 | 2,035 | |||||||||
| 5 | (iii) Securities financing transactions | 122,076 | 593 | |||||||||
| 6 | (iv) Netting sets where cross-product netting has been approved | — | — | |||||||||
| 7 | Segregated initial margin | 95,392 | / | |||||||||
| 8 | Non-segregated initial margin | 531,371 | 10,967 | |||||||||
| 9 | Pre-funded default fund contributions | 332,443 | 162,394 | |||||||||
| 10 | Unfunded default fund contributions | 34,112 | 16,672 | |||||||||
| 11 | Exposures tonon-QCCPs (total) | / | — | |||||||||
| 12 | Exposures for trades atnon-QCCPs (excluding initial margin and default fund contributions); of which | — | — | |||||||||
| 13 | (i) OTC derivatives | — | — | |||||||||
| 14 | (ii) Exchange-traded derivatives | — | — | |||||||||
| 15 | (iii) Securities financing transactions | — | — | |||||||||
| 16 | (iv) Netting sets where cross-product netting has been approved | — | — | |||||||||
| 17 | Segregated initial margin | — | / | |||||||||
| 18 | Non-segregated initial margin | — | — | |||||||||
| 19 | Pre-funded default fund contributions | — | — | |||||||||
| 20 | Unfunded default fund contributions | — | — | |||||||||
| (Millions of yen) | ||||||||||||
| As of March 31, 2019 | ||||||||||||
| a | b | |||||||||||
| EAD (post-CRM) | RWA | |||||||||||
| 1 | Exposures to QCCPs (total) | / | 190,997 | |||||||||
| 2 | Exposures for trades at QCCPs (excluding initial margin and default fund contributions); of which | 654,350 | 4,670 | |||||||||
| 3 | (i) OTC derivatives | 145,239 | 501 | |||||||||
| 4 | (ii) Exchange-traded derivatives | 83,138 | 1,931 | |||||||||
| 5 | (iii) Securities financing transactions | 425,973 | 2,237 | |||||||||
| 6 | (iv) Netting sets where cross-product netting has been approved | — | — | |||||||||
| 7 | Segregated initial margin | 167,185 | / | |||||||||
| 8 | Non-segregated initial margin | 478,110 | 9,317 | |||||||||
| 9 | Pre-funded default fund contributions | 219,871 | 177,009 | |||||||||
| 10 | Unfunded default fund contributions | — | — | |||||||||
| 11 | Exposures tonon-QCCPs (total) | / | — | |||||||||
| 12 | Exposures for trades atnon-QCCPs (excluding initial margin and default fund contributions); of which | — | — | |||||||||
| 13 | (i) OTC derivatives | — | — | |||||||||
| 14 | (ii) Exchange-traded derivatives | — | — | |||||||||
| 15 | (iii) Securities financing transactions | — | — | |||||||||
| 16 | (iv) Netting sets where cross-product netting has been approved | — | — | |||||||||
| 17 | Segregated initial margin | — | / | |||||||||
| 18 | Non-segregated initial margin | — | — | |||||||||
| 19 | Pre-funded default fund contributions | — | — | |||||||||
| 20 | Unfunded default fund contributions | — | — | |||||||||
44
Table of Contents
We classify transactions as securitization exposures based on two characteristics,“non-recourse” and “senior/subordinated structure,” pursuant to the definitions set forth in the FSA Notice No.20, etc.; provided that the transactions do not include those which fall within specialized lending exposure.
(1) Summary of Risk Management Regarding Securitization Exposures
Our role in securitization transactions
We are associated with securitization transactions from various purposes and positions through our banking book and trading book.
(a) Securitization of our assets (“Securitization as originator”)
For the purposes of mitigating credit risk and credit concentration risk, controlling economic capital and responding to the needs of our investors, etc., we engage in securitization transactions, the underlying assets of which include mortgage loans and loans to our corporate customers. When conducting a securitization as an originator, we consider such transactions from various aspects, including the effects of reduction of economic capital and improvement of return on risk as well as the practical effects of risk transfers, and make a comprehensive judgment on the structure and appropriateness of such transactions.
(b) Securitization program (ABCP/ABL) sponsor
As a means of supporting our customers in the securitization of their account receivables and notes receivables, etc., we retain securitization exposure by providing asset-backed loans (ABLs, which areon-balance-sheet transactions), and providing asset-backed commercial paper (ABCP) backup lines(off-balance-sheet transactions), as sponsor to special purpose companies (in the form of Cayman Islands Corporations, etc.). In such cases, in addition to gaining firm understanding of the actual risk profile through due diligence from the viewpoint of investors, we assign internal ratings and make evaluations by assessing such transactions and carefully managing the exposure together with other direct loan assets.
(c) Investment in alternative credit risk assets (“Securitization Transactions as an Investor”)
We hold securitization products, such as ABS, CMBS, RMBS, and CDO, and resecuritization products, the underlying assets of which are mainly RMBS and CDO, etc., for the purpose of investing in alternative credit risk assets that are different from conventional credit risk assets in order to diversify our investment portfolio. The Risk Management Committee, etc. set limits on the amount of investment for Securitization Transactions as an Investor, and we maintain a stringent structure for management of such transactions. In addition, we implement stress tests based on scenarios under the market liquidity depletion and sharp price declines.
In addition, we undertake various securitization program arrangements such as ABL, ABCP and trust schemes, etc., as a means of financing for our customers. We endeavor to understand the actual risk profile, including the underlying assets, and to appropriately disclose the risks and terms of the program to the customers who invest in the product.
Furthermore, we actively act as servicer for securitization transactions, offer settlement account facilities (servicer cash advance) and provide interest rate swaps to securitization conduits.
One of our affiliated entities, IBJ Leasing Company, Ltd, holds securitization products in which we are involved as originators or sponsors.
The securitization conduits included within the scope of consolidation are as follows:
ROCK FIELD CORPORATION, FANTASTIC FUNDING CORPORATION, ARTEMIS FUNDING CORPORATION, N&M FUNDING CORPORATION, Denshi Saiken Kaitori Godo Kaisha, JAPAN SECURITIZATION CORPORATION, Allstar Funding Co., Ltd, SPARCS FUNDING CORPORATION, PERPETUAL FUNDING CORPORATION, Working Capital Management Co. L.P., ALWAYS CAPITAL CORPORATION, HORIZON CAPITAL CORPORATION There are no securitization conduits that provide credit enhancement beyond what is provided in agreements.
Overview of risk profile of securitization transactions and monitoring system
In addition to price fluctuation and market liquidity risks, securitization and resecuritization products are exposed to risks related to default, recovery and granularity of underlying asset portfolio. The structure of these products also contains risks related to the originators, the administrators, trustees and managers of the underlying assets.
To address these risks, we also analyze the structure in terms of the underlying assets and credit events. We monitor the ability, quality and operating performance of originators and managers in charge of controlling the underlying assets as well as covenant information and credit status of the parties related to the program. In addition, for resecuritization products, we pay attention to the underlying assets of the underlying securitization products. We also assign internal ratings to all products and review the rating at least once a year. If there is a change in the credit situations, we will review the internal rating as appropriate. As mentioned above, we have established a system to comprehensively understand the risk characteristics of securitization exposures and manage these exposures.
We conduct credit risk measurements on all credit transactions, including securitization transactions. Furthermore, we carry out periodic monitoring on investment amount and performance on securitization transactions and report the situations to our Risk Management Committee, etc.
45
Table of Contents
Response to Basel Framework
In calculating credit risk-weighted assets of securitization exposure, we apply the internal-ratings-based approach (“IRBA”) if we have sufficient information regarding all the underlying assets for IRBA. If IRBA cannot be applied to a certain asset and it has a rating obtained from an eligible external credit assessment institution, we apply the External rating-based approach (“ERBA”) We apply the standardized approach (“SA”) in other cases pursuant to the FSA Notice No. 20. We apply a risk weight of 1,250% under Basel III when neither IRBA, ERBA nor SA can be applied.
In terms of securitization exposure in our trading book that is subject to market risk regulations, we adopt the standardized measurement method and calculate market risk equivalent amounts in connection with the specific risks of securitization products based on risk weights according to ratings assigned by eligible external credit assessment institutions pursuant to the FSA Notice No. 20.
As for the eligible external credit assessment institutions, we refer to Rating and Investment Information, Inc. (R&I), Japan Credit Rating Agency, Ltd. (JCR), Moody’s Investors Service Inc. (Moody’s), Standard & Poor’s (S&P) and Fitch Ratings, Ltd. in determining securitization exposure risk weight.
(2) Accounting Policies for Securitization Transactions
The point at which financial assets and liabilities relating to securitization transactions begin or cease to be recognized, their evaluation and accounting treatment are pursuant to “Accounting Standards Relating to Financial Products”(Business Accounting Standards No. 10).
(3) Quantitative Disclosure on Securitization Exposures
(A) SEC1: Securitization Exposures in the Banking Book by Type of Underlying Assets
| (Millions of yen) | ||||||||||||||||||||||||||||||||||||||
| As of March 31, 2018 | ||||||||||||||||||||||||||||||||||||||
| a | b | c | d | e | f | g | h | i | ||||||||||||||||||||||||||||||
| Bank acts as originator | Bank acts as sponsor | Banks acts as investor | ||||||||||||||||||||||||||||||||||||
type of underlying assets | Traditional | Synthetic | Sub-total | Traditional | Synthetic | Sub-total | Traditional | Synthetic | Sub-total | |||||||||||||||||||||||||||||
1 | Retail (total)–of which | 0 | — | 0 | 882,415 | — | 882,415 | 1,745,598 | — | 1,745,598 | ||||||||||||||||||||||||||||
2 | residential mortgage | 0 | — | 0 | — | — | — | 842,644 | — | 842,644 | ||||||||||||||||||||||||||||
3 | credit card | — | — | — | 219,986 | — | 219,986 | 93,976 | — | 93,976 | ||||||||||||||||||||||||||||
4 | other retail exposures | — | — | — | 662,429 | — | 662,429 | 808,977 | — | 808,977 | ||||||||||||||||||||||||||||
5 | re-securitization | — | — | — | — | — | — | — | — | — | ||||||||||||||||||||||||||||
6 | Wholesale (total)–of which | — | 422,098 | 422,098 | 219,123 | — | 219,123 | 913,169 | — | 913,169 | ||||||||||||||||||||||||||||
7 | loans to corporates | — | 422,098 | 422,098 | — | — | — | 398,149 | — | 398,149 | ||||||||||||||||||||||||||||
8 | commercial mortgage | — | — | — | — | — | — | 210 | — | 210 | ||||||||||||||||||||||||||||
9 | lease and receivables | — | — | — | 219,123 | — | 219,123 | 414,345 | — | 414,345 | ||||||||||||||||||||||||||||
10 | other wholesale | — | — | — | — | — | — | 100,463 | — | 100,463 | ||||||||||||||||||||||||||||
11 | re-securitization | — | — | — | — | — | — | — | — | — | ||||||||||||||||||||||||||||
| (Millions of yen) | ||||||||||||||||||||||||||||||||||||||
| As of March 31, 2019 | ||||||||||||||||||||||||||||||||||||||
| a | b | c | d | e | f | g | h | i | ||||||||||||||||||||||||||||||
| Bank acts as originator | Bank acts as sponsor | Banks acts as investor | ||||||||||||||||||||||||||||||||||||
type of underlying assets | Traditional | Synthetic | Sub-total | Traditional | Synthetic | Sub-total | Traditional | Synthetic | Sub-total | |||||||||||||||||||||||||||||
1 | Retail (total)–of which | — | — | — | 978,411 | — | 978,411 | 1,481,218 | — | 1,481,218 | ||||||||||||||||||||||||||||
2 | residential mortgage | — | — | — | — | — | — | 606,346 | — | 606,346 | ||||||||||||||||||||||||||||
3 | credit card | — | — | — | 290,688 | — | 290,688 | 70,910 | — | 70,910 | ||||||||||||||||||||||||||||
4 | other retail exposures | — | — | — | 687,722 | — | 687,722 | 803,962 | — | 803,962 | ||||||||||||||||||||||||||||
5 | re-securitization | — | — | — | — | — | — | — | — | — | ||||||||||||||||||||||||||||
6 | Wholesale (total)–of which | 59,109 | 341,145 | 400,254 | 201,905 | — | 201,905 | 1,139,953 | — | 1,139,953 | ||||||||||||||||||||||||||||
7 | loans to corporates | 59,109 | 341,145 | 400,254 | — | — | — | 538,872 | — | 538,872 | ||||||||||||||||||||||||||||
8 | commercial mortgage | — | — | — | — | — | — | 184 | — | 184 | ||||||||||||||||||||||||||||
9 | lease and receivables | — | — | — | 189,125 | — | 189,125 | 477,959 | — | 477,959 | ||||||||||||||||||||||||||||
10 | other wholesale | — | — | — | 12,779 | — | 12,779 | 122,936 | — | 122,936 | ||||||||||||||||||||||||||||
11 | re-securitization | — | — | — | — | — | — | — | — | — | ||||||||||||||||||||||||||||
46
Table of Contents
(B) SEC2: Securitization Exposures in the Trading Book by Type of Underlying Assets
| (Millions of yen) | ||||||||||||||||||||||||||||||||||||||
| As of March 31, 2018 | ||||||||||||||||||||||||||||||||||||||
| a | b | c | d | e | f | g | h | i | ||||||||||||||||||||||||||||||
| Bank acts as originator | Bank acts as sponsor | Banks acts as investor | ||||||||||||||||||||||||||||||||||||
type of underlying assets | Traditional | Synthetic | Sub-total | Traditional | Synthetic | Sub-total | Traditional | Synthetic | Sub-total | |||||||||||||||||||||||||||||
| 1 | Retail (total)–of which | — | — | — | — | — | — | 11,560 | — | 11,560 | ||||||||||||||||||||||||||||
| 2 | residential mortgage | — | — | — | — | — | — | 4,287 | — | 4,287 | ||||||||||||||||||||||||||||
| 3 | credit card | — | — | — | — | — | — | 2,956 | — | 2,956 | ||||||||||||||||||||||||||||
| 4 | other retail exposures | — | — | — | — | — | — | 4,316 | — | 4,316 | ||||||||||||||||||||||||||||
| 5 | re-securitization | — | — | — | — | — | — | 0 | — | 0 | ||||||||||||||||||||||||||||
| 6 | Wholesale (total)–of which | — | — | — | — | — | — | 11,541 | — | 11,541 | ||||||||||||||||||||||||||||
| 7 | loans to corporates | — | — | — | — | — | — | 11,240 | — | 11,240 | ||||||||||||||||||||||||||||
| 8 | commercial mortgage | — | — | — | — | — | — | — | — | — | ||||||||||||||||||||||||||||
| 9 | lease and receivables | — | — | — | — | — | — | 301 | — | 301 | ||||||||||||||||||||||||||||
| 10 | other wholesale | — | — | — | — | — | — | — | — | — | ||||||||||||||||||||||||||||
| 11 | re-securitization | — | — | — | — | — | — | — | — | — | ||||||||||||||||||||||||||||
| (Millions of yen) | ||||||||||||||||||||||||||||||||||||||
| As of March 31, 2019 | ||||||||||||||||||||||||||||||||||||||
| a | b | c | d | e | f | g | h | i | ||||||||||||||||||||||||||||||
| Bank acts as originator | Bank acts as sponsor | Banks acts as investor | ||||||||||||||||||||||||||||||||||||
type of underlying assets | Traditional | Synthetic | Sub-total | Traditional | Synthetic | Sub-total | Traditional | Synthetic | Sub-total | |||||||||||||||||||||||||||||
| 1 | Retail (total)–of which | — | — | — | — | — | — | 20,847 | — | 20,847 | ||||||||||||||||||||||||||||
| 2 | residential mortgage | — | — | — | — | — | — | 13,727 | — | 13,727 | ||||||||||||||||||||||||||||
| 3 | credit card | — | — | — | — | — | — | 6,243 | — | 6,243 | ||||||||||||||||||||||||||||
| 4 | other retail exposures | — | — | — | — | — | — | 875 | — | 875 | ||||||||||||||||||||||||||||
| 5 | re-securitization | — | — | — | — | — | — | 0 | — | 0 | ||||||||||||||||||||||||||||
| 6 | Wholesale (total)–of which | — | — | — | — | — | — | 7,091 | — | 7,091 | ||||||||||||||||||||||||||||
| 7 | loans to corporates | — | — | — | — | — | — | 7,091 | — | 7,091 | ||||||||||||||||||||||||||||
| 8 | commercial mortgage | — | — | — | — | — | — | — | — | — | ||||||||||||||||||||||||||||
| 9 | lease and receivables | — | — | — | — | — | — | — | — | — | ||||||||||||||||||||||||||||
| 10 | other wholesale | — | — | — | — | — | — | — | — | — | ||||||||||||||||||||||||||||
| 11 | re-securitization | — | — | — | — | — | — | — | — | — | ||||||||||||||||||||||||||||
47
Table of Contents
(C) SEC3: Securitization Exposures in the Banking Book and Associated Regulatory Capital Requirements–Bank Acting as Originator or as Sponsor
| (Millions of yen) | ||||||||||||||||||||||||||||||||||||
| As of March 31, 2018 | ||||||||||||||||||||||||||||||||||||
| a | b | c | d | e | f | g | h | |||||||||||||||||||||||||||||
| Total exposures | Traditional securitization | Of which securitization | Of which retail underlying | Of which wholesale | Of which re-securitization | Of which senior | Of which non-senior | |||||||||||||||||||||||||||||
| Exposure values (by RW bands) |
| |||||||||||||||||||||||||||||||||||
| 1 | £20% RW | 1,478,354 | 1,075,137 | 1,075,137 | 859,674 | 215,463 | — | — | — | |||||||||||||||||||||||||||
| 2 | >20% to 50% RW | 25,515 | 25,515 | 25,515 | 22,741 | 2,773 | — | — | — | |||||||||||||||||||||||||||
| 3 | >50% to 100% RW | 886 | 886 | 886 | — | 886 | — | — | — | |||||||||||||||||||||||||||
| 4 | >100% to <1250% RW | 18,201 | — | — | — | — | — | — | — | |||||||||||||||||||||||||||
| 5 | 1250% RW | 680 | — | — | — | — | — | — | — | |||||||||||||||||||||||||||
| Exposure values (by regulatory approach) |
| |||||||||||||||||||||||||||||||||||
| 6 | IRB RBA (including IAA) | 136,048 | 136,048 | 136,048 | 117,049 | 18,999 | — | — | — | |||||||||||||||||||||||||||
| 7 | IRB SFA | 1,386,908 | 965,490 | 965,490 | 765,366 | 200,124 | — | — | — | |||||||||||||||||||||||||||
| 8 | SA/SSFA | — | — | — | — | — | — | — | — | |||||||||||||||||||||||||||
| 9 | 1250% | 680 | — | — | — | — | — | — | — | |||||||||||||||||||||||||||
| RWA (by regulatory approach) |
| |||||||||||||||||||||||||||||||||||
| 10 | IRB RBA (including IAA) | 11,093 | 11,093 | 11,093 | 9,722 | 1,370 | — | — | — | |||||||||||||||||||||||||||
| 11 | IRB SFA | 110,473 | 77,763 | 77,763 | 58,417 | 19,345 | — | — | — | |||||||||||||||||||||||||||
| 12 | SA/SSFA | — | — | — | — | — | — | — | — | |||||||||||||||||||||||||||
| 13 | 1250% | 8,500 | — | — | — | — | — | — | — | |||||||||||||||||||||||||||
| Capital charge after cap |
| |||||||||||||||||||||||||||||||||||
| 14 | IRB RBA (including IAA) | 940 | 940 | 940 | 824 | 116 | — | — | — | |||||||||||||||||||||||||||
| 15 | IRB SFA | 9,368 | 6,594 | 6,594 | 4,953 | 1,640 | — | — | — | |||||||||||||||||||||||||||
| 16 | SA/SSFA | — | — | — | — | — | — | — | — | |||||||||||||||||||||||||||
| 17 | 1250% | 720 | — | — | — | — | — | — | — | |||||||||||||||||||||||||||
| As of March 31, 2018 | ||||||||||||||||||||||||||||||||||||
| i | j | k | l | m | n | o | ||||||||||||||||||||||||||||||
| Synthetic securitization | Of which securitization | Of which retail underlying | Of which wholesale | Of which re-securitization | Of which senior | Of which non-senior | ||||||||||||||||||||||||||||||
| Exposure values (by RW bands) |
| |||||||||||||||||||||||||||||||||||
| 1 | £20% RW | 403,216 | 403,216 | — | 403,216 | — | — | — | ||||||||||||||||||||||||||||
| 2 | >20% to 50% RW | — | — | — | — | — | — | — | ||||||||||||||||||||||||||||
| 3 | >50% to 100% RW | — | — | — | — | — | — | — | ||||||||||||||||||||||||||||
| 4 | >100% to <1250% RW | 18,201 | 18,201 | — | 18,201 | — | — | — | ||||||||||||||||||||||||||||
| 5 | 1250% RW | 680 | 680 | — | 680 | — | — | — | ||||||||||||||||||||||||||||
| Exposure values (by regulatory approach) |
| |||||||||||||||||||||||||||||||||||
| 6 | IRB RBA (including IAA) | — | — | — | — | — | — | — | ||||||||||||||||||||||||||||
| 7 | IRB SFA | 421,418 | 421,418 | — | 421,418 | — | — | — | ||||||||||||||||||||||||||||
| 8 | SA/SSFA | — | — | — | — | — | — | — | ||||||||||||||||||||||||||||
| �� | 9 | 1250% | 680 | 680 | — | 680 | — | — | — | |||||||||||||||||||||||||||
| RWA (by regulatory approach) |
| |||||||||||||||||||||||||||||||||||
| 10 | IRB RBA (including IAA) | — | — | — | — | — | — | — | ||||||||||||||||||||||||||||
| 11 | IRB SFA | 32,710 | 32,710 | — | 32,710 | — | — | — | ||||||||||||||||||||||||||||
| 12 | SA/SSFA | — | — | — | — | — | — | — | ||||||||||||||||||||||||||||
| 13 | 1250% | 8,500 | 8,500 | — | 8,500 | — | — | — | ||||||||||||||||||||||||||||
| Capital charge after cap |
| |||||||||||||||||||||||||||||||||||
| 14 | IRB RBA (including IAA) | — | — | — | — | — | — | — | ||||||||||||||||||||||||||||
| 15 | IRB SFA | 2,773 | 2,773 | — | 2,773 | — | — | — | ||||||||||||||||||||||||||||
| 16 | SA/SSFA | — | — | — | — | — | — | — | ||||||||||||||||||||||||||||
| 17 | 1250% | 720 | 720 | — | 720 | — | — | — | ||||||||||||||||||||||||||||
48
Table of Contents
| (Millions of yen) | ||||||||||||||||||||||||||||||||||||
| As of March 31, 2019 | ||||||||||||||||||||||||||||||||||||
| a | b | c | d | e | f | g | h | |||||||||||||||||||||||||||||
| Total exposures | Traditional securitization | Of which securitization | Of which retail underlying | Of which wholesale | Of which re-securitization | Of which senior | Of which non-senior | |||||||||||||||||||||||||||||
| Exposure values (by RW bands) |
| |||||||||||||||||||||||||||||||||||
| 1 | £20% RW | 1,183,396 | 922,808 | 922,808 | 735,148 | 187,660 | — | — | — | |||||||||||||||||||||||||||
| 2 | >20% to 50% RW | 324,215 | 262,437 | 262,437 | 193,235 | 69,202 | — | — | — | |||||||||||||||||||||||||||
| 3 | >50% to 100% RW | 36,795 | 36,795 | 36,795 | 34,918 | 1,876 | — | — | — | |||||||||||||||||||||||||||
| 4 | >100% to <1250% RW | 35,483 | 17,383 | 17,383 | 15,108 | 2,275 | — | — | — | |||||||||||||||||||||||||||
| 5 | 1250% RW | 680 | — | — | — | — | — | — | — | |||||||||||||||||||||||||||
| Exposure values (by regulatory approach) |
| |||||||||||||||||||||||||||||||||||
| 6 | Internal Ratings-Based Approach(SEC-IRBA) | 1,579,891 | 1,239,426 | 1,239,426 | 978,411 | 261,014 | — | — | — | |||||||||||||||||||||||||||
| 7 | External Ratings-Based Approach(SEC-ERBA) | — | — | — | — | — | — | — | — | |||||||||||||||||||||||||||
| 8 | Standardised Approach(SEC-SA) | — | — | — | — | — | — | — | — | |||||||||||||||||||||||||||
| 9 | 1250% | 680 | — | — | — | — | — | — | — | |||||||||||||||||||||||||||
| RWA (by regulatory approach) |
| |||||||||||||||||||||||||||||||||||
| 10 | Internal Ratings-Based Approach(SEC-IRBA) | 402,373 | 345,603 | 345,603 | 282,384 | 63,219 | — | — | — | |||||||||||||||||||||||||||
| 11 | External Ratings-Based Approach(SEC-ERBA) | — | — | — | — | — | — | — | — | |||||||||||||||||||||||||||
| 12 | Standardised Approach(SEC-SA) | — | — | — | — | — | — | — | — | |||||||||||||||||||||||||||
| 13 | 1250% | 8,500 | — | — | — | — | — | — | — | |||||||||||||||||||||||||||
| Capital charge after cap |
| |||||||||||||||||||||||||||||||||||
| 14 | Internal Ratings-Based Approach(SEC-IRBA) | 32,189 | 27,648 | 27,648 | 22,590 | 5,057 | — | — | — | |||||||||||||||||||||||||||
| 15 | External Ratings-Based Approach(SEC-ERBA) | — | — | — | — | — | — | — | — | |||||||||||||||||||||||||||
| 16 | Standardised Approach(SEC-SA) | — | — | — | — | — | — | — | — | |||||||||||||||||||||||||||
| 17 | 1250% | 680 | — | — | — | — | — | — | — | |||||||||||||||||||||||||||
| As of March 31, 2019 | ||||||||||||||||||||||||||||||||||||
| i | j | k | l | m | n | o | ||||||||||||||||||||||||||||||
| Synthetic securitization | Of which securitization | Of which retail underlying | Of which wholesale | Of which re-securitization | Of which senior | Of which non-senior | ||||||||||||||||||||||||||||||
| Exposure values (by RW bands) |
| |||||||||||||||||||||||||||||||||||
| 1 | £20% RW | 260,587 | 260,587 | — | 260,587 | — | — | — | ||||||||||||||||||||||||||||
| 2 | >20% to 50% RW | 61,777 | 61,777 | — | 61,777 | — | — | — | ||||||||||||||||||||||||||||
| 3 | >50% to 100% RW | — | — | — | — | — | — | — | ||||||||||||||||||||||||||||
| 4 | >100% to <1250% RW | 18,100 | 18,100 | — | 18,100 | — | — | — | ||||||||||||||||||||||||||||
| 5 | 1250% RW | 680 | 680 | — | 680 | — | — | — | ||||||||||||||||||||||||||||
| Exposure values (by regulatory approach) |
| |||||||||||||||||||||||||||||||||||
| 6 | Internal Ratings-Based Approach(SEC-IRBA) | 340,465 | 340,465 | — | 340,465 | — | — | — | ||||||||||||||||||||||||||||
| 7 | External Ratings-Based Approach(SEC-ERBA) | — | — | — | — | — | — | — | ||||||||||||||||||||||||||||
| 8 | Standardised Approach(SEC-SA) | — | — | — | — | — | — | — | ||||||||||||||||||||||||||||
| 9 | 1250% | 680 | 680 | — | 680 | — | — | — | ||||||||||||||||||||||||||||
| RWA (by regulatory approach) |
| |||||||||||||||||||||||||||||||||||
| 10 | Internal Ratings-Based Approach(SEC-IRBA) | 56,769 | 56,769 | — | 56,769 | — | — | — | ||||||||||||||||||||||||||||
| 11 | External Ratings-Based Approach(SEC-ERBA) | — | — | — | — | — | — | — | ||||||||||||||||||||||||||||
| 12 | Standardised Approach(SEC-SA) | — | — | — | — | — | — | — | ||||||||||||||||||||||||||||
| 13 | 1250% | 8,500 | 8,500 | — | 8,500 | — | — | — | ||||||||||||||||||||||||||||
| Capital charge after cap |
| |||||||||||||||||||||||||||||||||||
| 14 | Internal Ratings-Based Approach(SEC-IRBA)– | 4,541 | 4,541 | — | 4,541 | — | — | — | ||||||||||||||||||||||||||||
| 15 | External Ratings-Based Approach(SEC-ERBA) | — | — | — | — | — | — | — | ||||||||||||||||||||||||||||
| 16 | Standardised Approach(SEC-SA) | — | — | — | — | — | — | — | ||||||||||||||||||||||||||||
| 17 | 1250% | 680 | 680 | — | 680 | — | — | — | ||||||||||||||||||||||||||||
49
Table of Contents
(D) SEC4: Securitization Exposures in the Banking Book and Associated Regulatory Capital Requirements–Bank Acting as Investor
| (Millions of yen) | ||||||||||||||||||||||||||||||||||||
| As of March 31, 2018 | ||||||||||||||||||||||||||||||||||||
| a | b | c | d | e | f | g | h | |||||||||||||||||||||||||||||
| Total exposures | Traditional securitization | Of which securitization | Of which retail underlying | Of which wholesale | Of which re-securitization | Of which senior | Of which non-senior | |||||||||||||||||||||||||||||
| Exposure values (by RW bands) |
| |||||||||||||||||||||||||||||||||||
| 1 | £20% RW | 2,535,058 | 2,535,058 | 2,535,058 | 1,677,283 | 857,775 | — | — | — | |||||||||||||||||||||||||||
| 2 | >20% to 50% RW | 107,393 | 107,393 | 107,393 | 68,315 | 39,078 | — | — | — | |||||||||||||||||||||||||||
| 3 | >50% to 100% RW | 7,415 | 7,415 | 7,415 | — | 7,415 | — | — | — | |||||||||||||||||||||||||||
| 4 | >100% to <1250% RW | 8,678 | 8,678 | 8,678 | — | 8,678 | — | — | — | |||||||||||||||||||||||||||
| 5 | 1250% RW | 220 | 220 | 220 | 0 | 220 | — | — | — | |||||||||||||||||||||||||||
| Exposure values (by regulatory approach) |
| |||||||||||||||||||||||||||||||||||
| 6 | IRB RBA (including IAA) | 1,381,546 | 1,381,546 | 1,381,546 | 929,913 | 451,633 | — | — | — | |||||||||||||||||||||||||||
| 7 | IRB SFA | 1,264,262 | 1,264,262 | 1,264,262 | 815,585 | 448,677 | — | — | — | |||||||||||||||||||||||||||
| 8 | SA/SSFA | 12,737 | 12,737 | 12,737 | 100 | 12,637 | — | — | — | |||||||||||||||||||||||||||
| 9 | 1250% | 220 | 220 | 220 | 0 | 220 | — | — | — | |||||||||||||||||||||||||||
| RWA (by regulatory approach) |
| |||||||||||||||||||||||||||||||||||
| 10 | IRB RBA (including IAA) | 99,457 | 99,457 | 99,457 | 67,768 | 31,689 | — | — | — | |||||||||||||||||||||||||||
| 11 | IRB SFA | 121,018 | 121,018 | 121,018 | 69,257 | 51,761 | — | — | — | |||||||||||||||||||||||||||
| 12 | SA/SSFA | 25,711 | 25,711 | 25,711 | 20 | 25,691 | — | — | — | |||||||||||||||||||||||||||
| 13 | 1250% | 2,761 | 2,761 | 2,761 | 0 | 2,761 | — | — | — | |||||||||||||||||||||||||||
| Capital charge after cap |
| |||||||||||||||||||||||||||||||||||
| 14 | IRB RBA (including IAA) | 8,433 | 8,433 | 8,433 | 5,746 | 2,687 | — | — | — | |||||||||||||||||||||||||||
| 15 | IRB SFA | 10,262 | 10,262 | 10,262 | 5,873 | 4,389 | — | — | — | |||||||||||||||||||||||||||
| 16 | SA/SSFA | 2,056 | 2,056 | 2,056 | 1 | 2,055 | — | — | — | |||||||||||||||||||||||||||
| 17 | 1250% | 220 | 220 | 220 | 0 | 220 | — | — | — | |||||||||||||||||||||||||||
| As of March 31, 2018 | ||||||||||||||||||||||||||||||||||||
| i | j | k | l | m | n | o | ||||||||||||||||||||||||||||||
| Synthetic securitization | Of which securitization | Of which retail underlying | Of which wholesale | Of which re-securitization | Of which senior | Of which non-senior | ||||||||||||||||||||||||||||||
| Exposure values (by RW bands) |
| |||||||||||||||||||||||||||||||||||
| 1 | £20% RW | — | — | — | — | — | — | — | ||||||||||||||||||||||||||||
| 2 | >20% to 50% RW | — | — | — | — | — | — | — | ||||||||||||||||||||||||||||
| 3 | >50% to 100% RW | — | — | — | — | — | — | — | ||||||||||||||||||||||||||||
| 4 | >100% to <1250% RW | — | — | — | — | — | — | — | ||||||||||||||||||||||||||||
| 5 | 1250% RW | — | — | — | — | — | — | — | ||||||||||||||||||||||||||||
| Exposure values (by regulatory approach) |
| |||||||||||||||||||||||||||||||||||
| 6 | IRB RBA (including IAA) | — | — | — | — | — | — | — | ||||||||||||||||||||||||||||
| 7 | IRB SFA | — | — | — | — | — | — | — | ||||||||||||||||||||||||||||
| 8 | SA/SSFA | — | — | — | — | — | — | — | ||||||||||||||||||||||||||||
| 9 | 1250% | — | — | — | — | — | — | — | ||||||||||||||||||||||||||||
| RWA (by regulatory approach) |
| |||||||||||||||||||||||||||||||||||
| 10 | IRB RBA (including IAA) | — | — | — | — | — | — | — | ||||||||||||||||||||||||||||
| 11 | IRB SFA | — | — | — | — | — | — | — | ||||||||||||||||||||||||||||
| 12 | SA/SSFA | — | — | — | — | — | — | — | ||||||||||||||||||||||||||||
| 13 | 1250% | — | — | — | — | — | — | — | ||||||||||||||||||||||||||||
| Capital charge after cap |
| |||||||||||||||||||||||||||||||||||
| 14 | IRB RBA (including IAA) | — | — | — | — | — | — | — | ||||||||||||||||||||||||||||
| 15 | IRB SFA | — | — | — | — | — | — | — | ||||||||||||||||||||||||||||
| 16 | SA/SSFA | — | — | — | — | — | — | — | ||||||||||||||||||||||||||||
| 17 | 1250% | — | — | — | — | — | — | — | ||||||||||||||||||||||||||||
50
Table of Contents
| (Millions of yen) | ||||||||||||||||||||||||||||||||||||
| As of March 31, 2019 | ||||||||||||||||||||||||||||||||||||
| a | b | c | d | e | f | g | h | |||||||||||||||||||||||||||||
| Total exposures | Traditional securitization | Of which securitization | Of which retail underlying | Of which wholesale | Of which re-securitization | Of which senior | Of which non-senior | |||||||||||||||||||||||||||||
| Exposure values (by RW bands) |
| |||||||||||||||||||||||||||||||||||
| 1 | £20% RW | 2,407,832 | 2,407,832 | 2,407,832 | 1,318,476 | 1,089,355 | — | — | — | |||||||||||||||||||||||||||
| 2 | >20% to 50% RW | 20,044 | 20,044 | 20,044 | 20,044 | — | — | — | — | |||||||||||||||||||||||||||
| 3 | >50% to 100% RW | 162,557 | 162,557 | 162,557 | 137,995 | 24,561 | — | — | — | |||||||||||||||||||||||||||
| 4 | >100% to <1250% RW | 30,542 | 30,542 | 30,542 | 4,701 | 25,840 | — | — | — | |||||||||||||||||||||||||||
| 5 | 1250% RW | 194 | 194 | 194 | 0 | 194 | — | — | — | |||||||||||||||||||||||||||
| Exposure values (by regulatory approach) |
| |||||||||||||||||||||||||||||||||||
| 6 | Internal Ratings-Based Approach(SEC-IRBA) | 1,462,952 | 1,462,952 | 1,462,952 | 867,244 | 595,708 | — | — | — | |||||||||||||||||||||||||||
| 7 | External Ratings-Based Approach(SEC-ERBA) | 1,158,024 | 1,158,024 | 1,158,024 | 613,974 | 544,050 | — | — | — | |||||||||||||||||||||||||||
| 8 | Standardised Approach(SEC-SA) | — | — | — | — | — | — | — | — | |||||||||||||||||||||||||||
| 9 | 1250% | 194 | 194 | 194 | 0 | 194 | — | — | — | |||||||||||||||||||||||||||
| RWA (by regulatory approach) |
| |||||||||||||||||||||||||||||||||||
| 10 | Internal Ratings-Based Approach(SEC-IRBA) | 332,708 | 332,708 | 332,708 | 216,665 | 116,042 | — | — | — | |||||||||||||||||||||||||||
| 11 | External Ratings-Based Approach(SEC-ERBA) | 304,189 | 304,189 | 304,189 | 123,610 | 180,579 | — | — | — | |||||||||||||||||||||||||||
| 12 | Standardised Approach(SEC-SA) | — | — | — | — | — | — | — | — | |||||||||||||||||||||||||||
| 13 | 1250% | 2,433 | 2,433 | 2,433 | 0 | 2,433 | — | — | — | |||||||||||||||||||||||||||
| Capital charge after cap |
| |||||||||||||||||||||||||||||||||||
| 14 | Internal Ratings-Based Approach(SEC-IRBA) | 26,616 | 26,616 | 26,616 | 17,333 | 9,283 | — | — | — | |||||||||||||||||||||||||||
| 15 | External Ratings-Based Approach(SEC-ERBA) | 24,335 | 24,335 | 24,335 | 9,888 | 14,446 | — | — | — | |||||||||||||||||||||||||||
| 16 | Standardised Approach(SEC-SA) | — | — | — | — | — | — | — | — | |||||||||||||||||||||||||||
| 17 | 1250% | 194 | 194 | 194 | 0 | 194 | — | — | — | |||||||||||||||||||||||||||
| As of March 31, 2019 | ||||||||||||||||||||||||||||||||||||
| i | j | k | l | m | n | o | ||||||||||||||||||||||||||||||
| Synthetic securitization | Of which securitization | Of which retail underlying | Of which wholesale | Of which re-securitization | Of which senior | Of which non-senior | ||||||||||||||||||||||||||||||
| Exposure values (by RW bands) |
| |||||||||||||||||||||||||||||||||||
| 1 | £20% RW | — | — | — | — | — | — | — | ||||||||||||||||||||||||||||
| 2 | >20% to 50% RW | — | — | — | — | — | — | — | ||||||||||||||||||||||||||||
| 3 | >50% to 100% RW | — | — | — | — | — | — | — | ||||||||||||||||||||||||||||
| 4 | >100% to <1250% RW | — | — | — | — | — | — | — | ||||||||||||||||||||||||||||
| 5 | 1250% RW | — | — | — | — | — | — | — | ||||||||||||||||||||||||||||
| Exposure values (by regulatory approach) |
| |||||||||||||||||||||||||||||||||||
| 6 | Internal Ratings-Based Approach(SEC-IRBA) | — | — | — | — | — | — | — | ||||||||||||||||||||||||||||
| 7 | External Ratings-Based Approach(SEC-ERBA) | — | — | — | — | — | — | — | ||||||||||||||||||||||||||||
| 8 | Standardised Approach(SEC-SA) | — | — | — | — | — | — | — | ||||||||||||||||||||||||||||
| 9 | 1250% | — | — | — | — | — | — | — | ||||||||||||||||||||||||||||
| RWA (by regulatory approach) |
| |||||||||||||||||||||||||||||||||||
| 10 | Internal Ratings-Based Approach(SEC-IRBA) | — | — | — | — | — | — | — | ||||||||||||||||||||||||||||
| 11 | External Ratings-Based Approach(SEC-ERBA) | — | — | — | — | — | — | — | ||||||||||||||||||||||||||||
| 12 | Standardised Approach(SEC-SA) | — | — | — | — | — | — | — | ||||||||||||||||||||||||||||
| 13 | 1250% | — | — | — | — | — | — | — | ||||||||||||||||||||||||||||
| Capital charge after cap |
| |||||||||||||||||||||||||||||||||||
| 14 | Internal Ratings-Based Approach(SEC-IRBA) | — | — | — | — | — | — | — | ||||||||||||||||||||||||||||
| 15 | External Ratings-Based Approach(SEC-ERBA) | — | — | — | — | — | — | — | ||||||||||||||||||||||||||||
| 16 | Standardised Approach(SEC-SA) | — | — | — | — | — | — | — | ||||||||||||||||||||||||||||
| 17 | 1250% | — | — | — | — | — | — | — | ||||||||||||||||||||||||||||
51
Table of Contents
See pages 72 to 75 for information regarding our market risk management structure, etc.
(1) Trading Activities
In the calculation of the market risk equivalent amounts under the regulatory capital requirements, the risk arising from fluctuations in common factors across the market as a whole (e.g. foreign exchange and interest rates, etc.) is referred to as general market risk, and the risk arising from a deterioration in creditworthiness or market liquidity inherent in bonds and stocks is referred to as specific risk. In principle, we calculate market risk equivalent amounts by determining both general market risk and specific risk by applying the Internal Models Approach (IMA) to the former and the standardized approach to the latter, and by simply adding up both amounts. The Internal Models Approach is applied to trading transactions and calculated by adding up VAR and stressed VAR.
(A) MR1 : Market risk under standardized approach
| (Millions of yen) | ||||||||||
| As of March 31, 2018 | As of March 31, 2019 | |||||||||
No. | RWA (Risk equivalent / 8%) | RWA (Risk equivalent / 8%) | ||||||||
| 1 | Interest rate risk (general and specific) | 405,247 | 536,232 | |||||||
| 2 | Equity risk (general and specific) | 652,526 | 288,604 | |||||||
| 3 | Foreign exchange risk | 81,926 | 53,471 | |||||||
| 4 | Commodity risk | 167,631 | 187,430 | |||||||
| Options | ||||||||||
| 5 | Simplified approach | — | — | |||||||
| 6 | Delta-plus method | 24,628 | 37,307 | |||||||
| 7 | Scenario approach | — | — | |||||||
| 8 | Securitization | 74,438 | 69,297 | |||||||
| �� |
|
| |||||||
| 9 | Total | 1,406,398 | 1,172,343 | |||||||
|
|
|
| |||||||
(B) MR2:RWA flow statements of market risk exposures under IMA
| (Billions of yen) | ||||||||||||||||||||||||||||
No. | A | B | C | D | E | F | ||||||||||||||||||||||
| VAR | Stressed VAR | IRC | CRM | Other | Total | |||||||||||||||||||||||
| 1a | RWA as of March 31, 2018 | 269.0 | 794.8 | — | — | / | 1,063.9 | |||||||||||||||||||||
| 1b | Adjustment to RWA as of March 31, 2018 | 3.02 | 3.72 | — | — | / | 3.51 | |||||||||||||||||||||
| 1c | IMA values as of March 31, 2018 | 89.0 | 213.6 | — | — | / | 302.6 | |||||||||||||||||||||
| 2 | Breakdown of changes during this reporting period | Change in risk levels | 27.6 | 29.3 | — | — | / | 57.0 | ||||||||||||||||||||
| 3 | Model updates/changes | 2.8 | 5.7 | — | — | / | 8.5 | |||||||||||||||||||||
| 4 | Methodology and policy | — | — | — | — | / | — | |||||||||||||||||||||
| 5 | Acquisitions and disposals | — | — | — | — | / | — | |||||||||||||||||||||
| 6 | Foreign currency fluctuations | 30.3 | 23.2 | — | — | / | 53.6 | |||||||||||||||||||||
| 7 | Other | (83.9 | ) | (54.1 | ) | — | — | / | (138.0 | ) | ||||||||||||||||||
| 8a | IMA values as of March 31, 2019 | 66.0 | 217.9 | — | — | / | 283.9 | |||||||||||||||||||||
| 8b | Adjustment to RWA as of March 31, 2019 | 3.92 | 2.76 | — | — | / | 3.03 | |||||||||||||||||||||
| 8c | RWA as of March 31, 2019 | 259.0 | 602.8 | — | — | / | 861.8 | |||||||||||||||||||||
52
Table of Contents
| (C) MR3 : IMA values for trading portfolios |
| (Millions of yen) | ||||||||||
No. | As of March 31, 2018 | As of March 31, 2019 | ||||||||
| VAR (10 day 99%) | ||||||||||
| 1 | Maximum value | 13,059 | 27,114 | |||||||
| 2 | Average value | 7,496 | 7,939 | |||||||
| 3 | Minimum value | 4,978 | 4,800 | |||||||
| 4 | Period end | 7,120 | 5,280 | |||||||
| Stressed VAR (10 day 99%) | ||||||||||
| 5 | Maximum value | 27,270 | 61,302 | |||||||
| 6 | Average value | 18,882 | 21,544 | |||||||
| 7 | Minimum value | 13,131 | 12,623 | |||||||
| 8 | Period end | 17,093 | 17,434 | |||||||
| Incremental Risk Charge (99.9%) | ||||||||||
| 9 | Maximum value | — | — | |||||||
| 10 | Average value | — | — | |||||||
| 11 | Minimum value | — | — | |||||||
| 12 | Period end | — | — | |||||||
| Comprehensive Risk Capital Charge (99.9%) | ||||||||||
| 13 | Maximum value | — | — | |||||||
| 14 | Average value | — | — | |||||||
| 15 | Minimum value | — | — | |||||||
| 16 | Period end | — | — | |||||||
| 17 | Floor (standardized measurement method) | — | — | |||||||
| Notes: | ||
1. | The historical simulation method is used for the calculation of VAR and stressed VAR under the Internal Models Approach. | |
2. | VAR is measured based on the observation period of 3 years (801 business days), a 99% confidence interval and a1-day holding period. This1-day VAR is scaled up to10-business day VAR using thesquare-root-of-time (ÖT) rule. We update historical data on a daily basis, in principle, and do not weight such data. Whenre-pricing instruments, we use the full revaluation method, a sensitivity-based approach and the like. We consider change width or rate as market volatility of risk factors according to product attributes. | |
3. | When measuring stressed VAR, the same measurement approach as VAR is used except for the observation period of 1 year (265 business days). As a stressed period, we select a period which has an adequate length of time and is considered the most stressful under a certain set of criteria established based on the most recent portfolio. | |
4. | When applying the internal model, we regularly verify the preconditions used for VAR measurement. | |
53
Table of Contents
(D) MR4 : Back testing results of IMA
| As of March 31, 2018 | As of March 31, 2019 | |
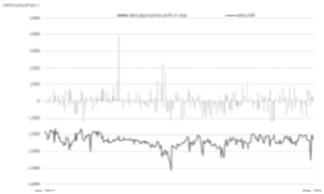 | 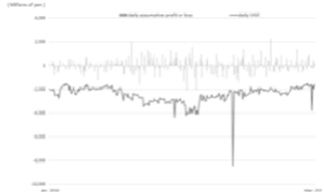 | |
Note:
In the past 250 business days, the number of times loss exceeded VAR was 0 as of March 31, 2019 (0 as of March 31, 2018), and the VAR model(one-tailed confidence level of 99%) is considered to have sufficient accuracy.
(2) Banking Activities
To comply with Interest Rate Risk in the Banking Book (IRRBB) requirements, we are required to calculate expected changes in the economic value of equity (DEVE) arising from banking activities and expected changes in net interest income (DNII) from the reference date until the date no later than 12 months from the reference date under interest rate shock scenarios (i.e. parallel up and downwards shifts in the yield curve and the like).DEVE andDNII change according to changes in the banking portfolio.
(A) IRRBB1 : Interest rate risk
| (Millions of yen) | ||||||||||||||||||
| a | b | c | d | |||||||||||||||
| DEVE | DNII | |||||||||||||||||
No. | As of March 31, 2019 | As of March 31, 2018 | As of March 31, 2019 | As of March 31, 2018 | ||||||||||||||
| 1 | Parallel up | 673,609 | 895,416 | (376,420 | ) | (274,475 | ) | |||||||||||
| 2 | Parallel down | 0 | 0 | 459,808 | 370,566 | |||||||||||||
| 3 | Steepener | 357,183 | 436,819 | / | / | |||||||||||||
| 4 | Flattener | 83,150 | 90,789 | / | / | |||||||||||||
| 5 | Short rate up | 229,431 | 321,141 | / | / | |||||||||||||
| 6 | Short rate down | 64,517 | 69,824 | / | / | |||||||||||||
| 7 | Maximum | 673,609 | 895,416 | 459,808 | 370,566 | |||||||||||||
| e | f | |||||||||||||||||
| As of March 31, 2019 | As of March 31, 2018 | |||||||||||||||||
| 8 | Tier1 capital | 9,232,160 | 9,192,244 | |||||||||||||||
| Notes: | ||
1. | Decreased economic values and interest income are shown as positive values. | |
2. | As for some of those current deposits and ordinary deposits whose interest rates are not changed at predetermined intervals and from which depositors can withdraw money as desired on demand, we measure the interest rate risk associated with such deposits by applying an appropriate method after recognizing them as core deposits. The average repricing maturities are 0.8 years for yen deposits and 0.2 years for dollar deposits respectively. The longest repricing maturities are 10.0 years for yen deposits and 5.0 years for dollar deposits respectively. We measure interest rate risk associated with term deposits and loans in an appropriate manner by estimating their early redemption rates based on their historical prepayment and cancellation data. | |
3. | When aggregating the respectiveDEVE of multiple currencies, we use the internal model that estimates the correlations between the key currencies based on historical data. When aggregating the respectiveDNII of multiple currencies, we simply add their respectiveDNII. | |
4. | For the calculation ofDEVE andDNII, we set an appropriate interest rate and spread according to a certain discount rate and reference rate. | |
5. | When making the calculations above, we use regulatory defined preconditions including an interest rate shock scenario. | |
54
Table of Contents
⬛ Investment or Equity Exposure
(1) Summary of Risk Profile, Risk Management Policies/ Procedures and Structure
With regard to equities, we manage default risk through our credit risk management structure and price fluctuation risk through our market risk management structure. With regard to subsidiaries and related companies in which we invest, we manage their risks on a consolidated basis, and manage them appropriately in accordance with their management classification. In addition, securities, a part of equity exposure, are valued as follows: Japanese stocks with quoted market prices are valued based on the average quoted market price over the month preceding the consolidated balance sheet date; other securities which have readily determinable fair values are valued at the quoted market price if available, or otherwise based on their reasonable value at the consolidated balance sheet date (cost of securities sold is calculated primarily by the moving average method); and other securities the fair values of which are extremely difficult to determine are stated at acquisition cost or amortized cost and determined by the moving average method.
(1) Summary of Operational Risk Management and Procedures
See pages 77 to 79 for a summary of our operational risk management policies, etc.
(2) Approach Used for the Measurement of Operational Risk Equivalent
We use the Advanced Measurement Approach for the calculation of operational risk equivalent. See pages 78 to 79 a for the outline of the Advanced Measurement Approach. In the measurement of operational risk equivalent, we do not recognize the risk mitigating impact of insurance. The following entities have adopted the Advanced Measurement Approach:
Mizuho Financial Group, Inc.; Mizuho Bank., Ltd., Mizuho Trust & Banking Co., Ltd.; Mizuho Securities Co., Ltd.; Mizuho Information & Research Institute, Inc.; Mizuho Operation Service, Ltd.; Mizuho Credit Guarantee Co., Ltd.; Mizuho Business Service Co., Ltd.; Mizuho Trust Operations Co., Ltd.; Mizuho Trust Systems Co., Ltd.; Mizuho Trust Business Operations Co., Ltd.; Mizuho Trust Retail Support Co., Ltd.; Mizuho Bank Europe N.V.; and Mizuho International plc.
55
Table of Contents
⬛ Composition of Leverage Ratio
(Millions of yen, except percentage) | ||||||||||||||||||
Corresponding disclosure template (Table 2) | Corresponding disclosure template (Table 1) | Item | As of March 31, 2018 | As of March 31, 2019 | ||||||||||||||
| On-balance sheet exposures | (1 | ) | ||||||||||||||||
| 1 | On-balance sheet exposures before deducting adjustment items | 178,888,103 | 170,866,057 | |||||||||||||||
| 1a | 1 | Total assets reported in the consolidated balance sheet | 205,028,300 | 200,792,226 | ||||||||||||||
| 1b | 2 | The amount of assets of subsidiaries that are not included in the scope of the leverage ratio on a consolidated basis (-) | — | — | ||||||||||||||
| 1c | 7 | The amount of assets of subsidiaries that are included in the scope of the leverage ratio on a consolidated basis (except those included in the total assets reported in the consolidated balance sheet) | — | — | ||||||||||||||
| 1d | 3 | The amount of assets that are deducted from the total assets reported in the consolidated balance sheet (except adjustment items) (-) | 26,140,197 | 29,926,169 | ||||||||||||||
| 2 | 7 | The amount of adjustment items pertaining to Tier1 capital (-) | 1,685,871 | 1,338,983 | ||||||||||||||
| 3 | Totalon-balance sheet exposures | (a | ) | 177,202,231 | 169,527,074 | |||||||||||||
Exposures related to derivative transactions | (2 | ) | ||||||||||||||||
| 4 | RC multiplied by 1.4 associated with derivatives transactions, etc. | / | — | |||||||||||||||
Replacement cost associated with derivatives transactions, etc. | 2,655,175 | 1,965,230 | ||||||||||||||||
| 5 | PFE multiplied by 1.4 associated with derivatives transactions, etc. | / | — | |||||||||||||||
Add-on amount associated with derivatives transactions, etc. | 6,524,621 | 6,846,996 | ||||||||||||||||
The amount of receivables arising from providing cash margin in relation to derivatives transactions, etc. | 858,877 | 885,366 | ||||||||||||||||
| 6 | The amount of receivables arising from providing collateral, provided where deducted from the consolidated balance sheet pursuant to the operative accounting framework | / | — | |||||||||||||||
The amount of receivables arising from providing cash margin, provided where deducted from the consolidated balance sheet pursuant to the operative accounting framework | 263,112 | 130,942 | ||||||||||||||||
| 7 | The amount of deductions of receivables (out of those arising from providing cash variation margin) (-) | — | — | |||||||||||||||
| 8 | The amount of client-cleared trade exposures for which a bank holding company acting as a clearing member is not obliged to make any indemnification (-) | / | / | |||||||||||||||
| 9 | Adjusted effective notional amount of written credit derivatives | 1,319,146 | 1,469,165 | |||||||||||||||
| 10 | The amount of deductions from effective notional amount of written credit derivatives (-) | 1,207,805 | 1,350,813 | |||||||||||||||
| 11 | 4 | Total exposures related to derivative transactions | (b | ) | 10,413,128 | 9,946,886 | ||||||||||||
Exposures related to repo transactions | (3 | ) | ||||||||||||||||
| 12 | The amount of assets related to repo transactions, etc. | 12,431,400 | 15,575,762 | |||||||||||||||
| 13 | The amount of deductions from the assets above (line 12) (-) | 4,196,150 | 4,961,226 | |||||||||||||||
| 14 | The exposures for counterparty credit risk for repo transactions, etc. | 521,728 | 457,242 | |||||||||||||||
| 15 | The exposures for agent repo transactions | / | / | |||||||||||||||
| 16 | 5 | Total exposures related to repo transactions, etc. | (c | ) | 8,756,979 | 11,071,778 | ||||||||||||
Exposures related tooff-balance sheet transactions | (4 | ) | ||||||||||||||||
| 17 | Notional amount ofoff-balance sheet transactions | 50,668,428 | 41,344,892 | |||||||||||||||
| 18 | The amount of adjustments for conversion in relation tooff-balance sheet transactions (-) | 32,762,942 | 23,333,230 | |||||||||||||||
| 19 | 6 | Total exposures related tooff-balance sheet transactions | (d | ) | 17,905,485 | 18,011,661 | ||||||||||||
Leverage ratio on a consolidated basis | (5 | ) | ||||||||||||||||
| 20 | The amount of capital (Tier1 capital) | (e | ) | 9,192,244 | 9,232,160 | |||||||||||||
| 21 | 8 | Total exposures ((a)+(b)+(c)+(d)) | (f | ) | 214,277,824 | 208,557,401 | ||||||||||||
| 22 | Leverage ratio on a consolidated basis ((e)/(f)) | 4.28 | % | 4.42 | % | |||||||||||||
56
Table of Contents
(1) TLAC1: TLAC composition forG-SIBs (at resolution group level)
(Millions of yen, except percentage) | ||||||||
Basel III Template No. | a | |||||||
Items | As of March 31, 2019 | |||||||
Preferred resolution strategy | (1) | |||||||
The SPE (Single Point of Entry) resolution strategy is considered to be the preferred resolution strategy for Mizuho Financial Group, Inc. (MHFG) and its subsidiaries.
More concretely, at the time of a stress, following the relevant authority’s determination that one or more of the materialsub-groups, i.e. Mizuho Bank, Ltd., Mizuho Trust & Banking Co., Ltd. and Mizuho Securities Co., Ltd. have reached the point ofnon-viability, losses incurred to them would be passed to MHFG, the ultimate holding company. While this could lead to a resolution of MHFG, the materialsub-groups are expected to continue their business as usual under the Specified Bridge Financial Institution, etc. incorporated by the Deposit Insurance Corporation of Japan (DICJ) to which MHFG transfers its business.
| ||||||||
| Regulatory capital elements of TLAC and adjustments | (2) | |||||||
1 | Common Equity Tier 1 capital (CET1) | (A) | 7,390,058 | |||||
2 | Additional Tier 1 capital (AT1) before TLAC adjustments | (B) | 1,842,102 | |||||
3 | AT1 ineligible as TLAC as issued out of subsidiaries to third parties | (C) | — | |||||
4 | Other adjustments | (D) | — | |||||
5 | AT1 instruments eligible under the TLAC framework ((B)-(C)-(D)) | (E) | 1,842,102 | |||||
6 | Tier 2 capital (T2) before TLAC adjustments | (F) | 1,685,347 | |||||
7 | Amortised portion of T2 instruments where remaining maturity > 1 year | (G) | (189,764 | ) | ||||
8 | T2 capital ineligible as TLAC as issued out of subsidiaries to third parties | (H) | — | |||||
9 | Other adjustments | (I) | 189,401 | |||||
10 | T2 instruments eligible under the TLAC framework ((F)-(G)-(H)-(I)) | (J) | 1,685,711 | |||||
11 | TLAC arising from regulatory capital ((A) + (E) + (J)) | (K) | 10,917,871 | |||||
| Non-regulatory capital elements of TLAC | (3) | |||||||
12 | External TLAC instruments issued directly by the bank and subordinated to excluded liabilities | (L) | 2,537,990 | |||||
13 | External TLAC instruments issued directly by the bank which are not subordinated to excluded liabilities but meet all other TLAC term sheet requirements | / | ||||||
14 | of which: amount eligible as TLAC after application of the caps | / | ||||||
15 | External TLAC instruments issued by funding vehicles prior to 1 January 2022 | / | ||||||
16 | Eligible ex ante commitments to recapitalise aG-SIB in resolution | (M) | 1,447,489 | |||||
17 | TLAC arising fromnon-regulatory capital instruments before adjustments ((L) + (M)) | (N) | 3,985,479 | |||||
| Non-regulatory capital elements of TLAC: adjustments | (4) | |||||||
18 | TLAC before deductions ((K) + (N)) | (O) | 14,903,350 | |||||
19 | Deductions of exposures between MPE resolution groups that correspond to items eligible for TLAC (not applicable to SPEG-SIBs) | (P) | — | |||||
20 | Deduction of investments in own other TLAC liabilities | (Q) | 2,587 | |||||
21 | Other adjustments to TLAC | (R) | — | |||||
22 | TLAC after deductions ((O)-(P)-(Q)-(R)) | (S) | 14,900,763 | |||||
| Risk-weighted assets and leverage exposure measure for TLAC purposes | (5) | |||||||
23 | Total RWA | (T) | 57,899,567 | |||||
24 | Leverage ratio exposure measure | (U) | 208,557,401 | |||||
| TLAC ratios and buffers | (6) | |||||||
25 | TLAC before deduction of CET1 specific buffer requirement (as a percentage of RWA) ((S)/(T)) | 25.73 | % | |||||
25a | TLAC as a percentage of RWA | 22.18 | % | |||||
26 | TLAC as a percentage of leverage ratio exposure measure ((S)/(U)) | 7.14 | % | |||||
27 | CET1 available after meeting the bank’s minimum capital requirements | 8.26 | % | |||||
28 | Total of bank CET1 specific buffer requirements | 3.55 | % | |||||
29 | of which: capital conservation buffer requirement | 2.50 | % | |||||
30 | of which: countercyclical buffer requirement | 0.05 | % | |||||
31 | of which: bankG-SIB/D-SIB additional requirements | 1.00 | % | |||||
57
Table of Contents
(2) TLAC2:Material subgroup entity–creditor ranking at legal entity level
| (Millions of yen) | ||||||||||||||||||||||||||||||||||||||||||||||
Mizuho Bank(Non-consolidated) | ||||||||||||||||||||||||||||||||||||||||||||||
| Creditor ranking | Sum of 1 to 5 | |||||||||||||||||||||||||||||||||||||||||||||
Basel III Template | Items | 1 | 2 | 3 | 4 | 5 | ||||||||||||||||||||||||||||||||||||||||
| most junior | most senior | |||||||||||||||||||||||||||||||||||||||||||||
| 1 | Is the resolution entity the creditor/investor? | ✓ | — | ✓ | — | ✓ | — | ✓ | — | ✓ | — | |||||||||||||||||||||||||||||||||||
| 2 | Description of creditor ranking | Common equity | | Additional Tier 1 capital instruments |
| | Tier 2 capital instruments | | | Eligible Tier 2 capital instruments subject to phase-out arrangements |
| | Other internal TLAC eligible instruments | | ||||||||||||||||||||||||||||||||
| 3 | Total capital and liabilities net of credit risk mitigation (A) | 3,690,389 | — | 1,873,004 | — | 1,168,772 | — | 166,515 | 601,000 | 2,537,990 | — | 10,037,671 | ||||||||||||||||||||||||||||||||||
| 4 | Subset of row 3 that are excluded liabilities (B) | — | — | — | — | — | — | — | — | — | — | — | ||||||||||||||||||||||||||||||||||
| 5 | Total capital and liabilities less excluded liabilities ((A) -(B)) | 3,690,389 | — | 1,873,004 | — | 1,168,772 | — | 166,515 | 601,000 | 2,537,990 | — | 10,037,671 | ||||||||||||||||||||||||||||||||||
| 6 | Subset of row 5 that are eligible as TLAC | 3,690,389 | — | 1,570,004 | — | 1,002,257 | — | — | — | 2,537,990 | — | 8,800,641 | ||||||||||||||||||||||||||||||||||
| 7 | Subset of row 6 with 1 year£ residual maturity < 2 years | — | — | — | — | — | — | — | — | — | — | — | ||||||||||||||||||||||||||||||||||
| 8 | Subset of row 6 with 2 years£ residual maturity < 5 years | — | — | — | — | — | — | — | — | 1,480,946 | — | 1,480,946 | ||||||||||||||||||||||||||||||||||
| 9 | Subset of row 6 with 5 years£ residual maturity < 10 years | — | — | — | — | 907,257 | — | — | — | 946,034 | — | 1,853,291 | ||||||||||||||||||||||||||||||||||
| 10 | Subset of row 6 with 10 years£ residual maturity, but excluding perpetual securities | — | — | — | — | 95,000 | — | — | — | 111,010 | — | 206.010 | ||||||||||||||||||||||||||||||||||
| 11 | Subset of row 6 that is perpetual securities | 3,690,389 | — | 1,570,004 | — | — | — | — | — | — | — | 5,260,393 | ||||||||||||||||||||||||||||||||||
| *1 : | Additional Tier1 capital instruments include eligible Tier 1 capital instruments subject tophase-out arrangements issued by SPC (303,000 million yen) |
| (Millions of yen) | ||||||||||||||||||||||||||||||
Mizuho Trust & Banking(Non-consolidated) | ||||||||||||||||||||||||||||||
| Creditor ranking | Sum of 1 to 3 | |||||||||||||||||||||||||||||
Basel III Template | Items | 1 | 3 | |||||||||||||||||||||||||||
| most junior | 2 | most senior | ||||||||||||||||||||||||||||
| 1 | Is the resolution entity the creditor/investor? | ✓ | — | ✓ | — | ✓ | — | |||||||||||||||||||||||
| 2 | Description of creditor ranking | Common equity | | Eligible Tier 2 capital instruments subject to phase-out arrangements | | | Other internal TLAC eligible instruments | | ||||||||||||||||||||||
| 3 | Total capital and liabilities net of credit risk mitigation (A) | 262,874 | — | — | 10,000 | — | — | 272,874 | ||||||||||||||||||||||
| 4 | Subset of row 3 that are excluded liabilities (B) | — | — | — | — | — | — | — | ||||||||||||||||||||||
| 5 | Total capital and liabilities less excluded liabilities ((A) -(B) ) | 262,874 | — | — | 10,000 | — | — | 272,874 | ||||||||||||||||||||||
| 6 | Subset of row 5 that are eligible as TLAC | 262,874 | — | — | — | — | — | 262,874 | ||||||||||||||||||||||
| 7 | Subset of row 6 with 1 year£ residual maturity < 2 years | — | —�� | — | — | — | — | — | ||||||||||||||||||||||
| 8 | Subset of row 6 with 2 years£ residual maturity < 5 years | — | — | — | — | — | — | — | ||||||||||||||||||||||
| 9 | Subset of row 6 with 5 years£ residual maturity < 10 years | — | — | — | — | — | — | — | ||||||||||||||||||||||
| 10 | Subset of row 6 with 10 years£ residual maturity, but excluding perpetual securities | — | — | — | — | — | — | — | ||||||||||||||||||||||
| 11 | Subset of row 6 that is perpetual securities | 262,874 | — | — | — | — | — | 262,874 | ||||||||||||||||||||||
| (Millions of yen) | ||||||||||||||||||||||||||||||
Mizuho Securities(Non-consolidated) | ||||||||||||||||||||||||||||||
| Creditor ranking | Sum of 1 to 3 | |||||||||||||||||||||||||||||
Basel III | Items | 1 | 3 | |||||||||||||||||||||||||||
| most junior | 2 | most senior | ||||||||||||||||||||||||||||
| 1 | Is the resolution entity the creditor/investor? | ✓ | — | ✓ | — | ✓ | — | |||||||||||||||||||||||
| 2 | Description of creditor ranking | Common equity | | Long-term subordinated debt/Short-term subordinated |
| | Other internal TLAC instruments | | ||||||||||||||||||||||
| 3 | Total capital and liabilities net of credit risk mitigation (A) | 485,530 | 21,286 | — | 90,000 | — | — | 596,816 | ||||||||||||||||||||||
| 4 | Subset of row 3 that are excluded liabilities (B) | — | — | — | — | — | — | — | ||||||||||||||||||||||
| 5 | Total capital and liabilities less excluded liabilities ((A) -(B) ) | 485,530 | 21,286 | — | 90,000 | — | — | 596,816 | ||||||||||||||||||||||
| 6 | Subset of row 5 that are eligible as TLAC | 485,530 | 21,286 | — | — | — | — | 506,816 | ||||||||||||||||||||||
| 7 | Subset of row 6 with 1 year£ residual maturity < 2 years | — | — | — | — | — | — | — | ||||||||||||||||||||||
| 8 | Subset of row 6 with 2 years£ residual maturity < 5 years | — | — | — | — | — | — | — | ||||||||||||||||||||||
| 9 | Subset of row 6 with 5 years£ residual maturity < 10 years | — | — | — | — | — | — | — | ||||||||||||||||||||||
| 10 | Subset of row 6 with 10 years£ residual maturity, but excluding perpetual securities | — | — | — | — | — | — | — | ||||||||||||||||||||||
| 11 | Subset of row 6 that is perpetual securities | 485,530 | 21,286 | — | — | — | — | 506,816 | ||||||||||||||||||||||
58
Table of Contents
(3) TLAC3:Resolution entity–creditor ranking at legal entity level
| (Millions of yen) | ||||||||||||||||||||||
Mizuho Financial Group(Non-Consolidated) | ||||||||||||||||||||||
| Creditor ranking | Sum of 1 to 4 | |||||||||||||||||||||
| Basel III Template | Items | 1 | 2 | 3 | 4 | |||||||||||||||||
| most junior | most senior | |||||||||||||||||||||
| 1 | Description of creditor ranking | | Common equity | | | Additional Tier 1 capital instruments | | | Tier 2 capital instruments | | | Unsecured senior debts |
| |||||||||
| 2 | Total capital and liabilities net of credit risk mitigation (A) | 3,453,440 | 1,873,000 | 1,335,287 | 2,542,714 | 9,204,443 | ||||||||||||||||
| 3 | Subset of row 2 that are excluded liabilities (B) | — | — | — | 4,724 | 4,724 | ||||||||||||||||
| 4 | Total capital and liabilities less excluded liabilities ((A) - (B)) | 3,453,440 | 1,873,000 | 1,335,287 | 2,537,990 | 9,199,718 | ||||||||||||||||
| 5 | Subset of row 4 that are eligible as TLAC | 3,453,440 | 1,873,000 | 1,335,287 | 2,537,990 | 9,199,178 | ||||||||||||||||
| 6 | Subset of row 5 with 1 year£ residual maturity < 2 years | — | — | — | — | — | ||||||||||||||||
| 7 | Subset of row 5 with 2 years£ residual maturity < 5 years | — | — | 333,030 | 1,480,946 | 1,813,976 | ||||||||||||||||
| 8 | Subset of row 5 with 5 years£ residual maturity < 10 years | — | — | 907,257 | 946,034 | 1,853,291 | ||||||||||||||||
| 9 | Subset of row 5 with 10 years£ residual maturity,but excluding perpetual securities | — | — | 95,000 | 111,010 | 206,010 | ||||||||||||||||
| 10 | Subset of row 5 that is perpetual securities | 3,453,440 | 1,873,000 | — | — | 5,326,440 | ||||||||||||||||
| *1: | Additional Tier1 capital instruments include eligible Tier 1 capital instruments subject tophase-out arrangements issued by SPC (303,000 million yen) |
| *2: | Tier2 capital instruments include eligible Tier 2 capital instruments subject tophase-out arrangements issued by SPC (166,515 million yen) |
| *3: | Internal transactions are excluded from unsecured senior debts |
| *4: | Excluded liabilities are recognized on a conservative basis in consideration of the materiality of the amounts |
∎ Geographical Distribution of Credit Exposures Used in the Countercyclical Buffer
(1) CCyB1: Geographical distribution of credit exposures used in the countercyclical buffer
| (Millions of yen, except percentage) | ||||||||||||||||
| As of March 31, 2019 | ||||||||||||||||
| a | b | c | d | |||||||||||||
Geographical breakdown | Countercyclical buffer rate | Risk-weighted assets used in the computation of the countercyclical buffer | Countercyclical buffer requirements | Countercyclical buffer amount | ||||||||||||
Hong Kong SAR | 2.50 | % | 506,903 | / | / | |||||||||||
Sweden | 2.00 | % | 38,767 | / | / | |||||||||||
United Kingdom | 1.00 | % | 1,294,630 | / | / | |||||||||||
Subtotal | / | 1,840,301 | / | / | ||||||||||||
|
|
|
|
|
|
|
| |||||||||
Total | / | 46,499,620 | 0.05 | % | 28,949 | |||||||||||
|
|
|
|
|
|
|
| |||||||||
| Notes: | ||
| Credit risk-weighted assets used in the computation of the countercyclical buffer of each country or region are calculated based on where counterparties are located. | ||
| Some equity exposures, regarded-method exposures, securitization exposures and standardized approach portion which are difficult to calculate based on the locations of counterparties, are calculated based on the country or region in which the reporting office is located. | ||
59
Table of Contents
∎ Indicators for Assessing Global Systemically Important Banks(G-SIBs)
(1) GSIB1:Disclosure ofG-SIB indicators
| (Millions of yen) | ||||||||||||
Category | Individual indicator | As of March 31, 2018 | As of March 31, 2019 | |||||||||
1 | Cross-jurisdictional activity | Cross-jurisdictional claims | 45,183,039 | 50,199,293 | ||||||||
2 | Cross-jurisdictional liabilities | 31,932,945 | 32,082,253 | |||||||||
3 | Size | Total exposures | 215,963,696 | 209,896,384 | ||||||||
4 | Interconnectedness | Intra-financial system assets | 12,910,458 | 12,963,646 | ||||||||
5 | Intra-financial system liabilities | 22,558,264 | 17,843,309 | |||||||||
6 | Securities outstanding | 24,854,249 | 27,330,280 | |||||||||
7 | Substitutability / Financial institution infrastructure | Assets under custody | 140,047,358 | 74,795,019 | ||||||||
8 | Payment activity | 5,991,927,800 | 4,597,783,411 | |||||||||
9 | Underwritten transactions in debt and equity markets | 16,938,132 | 15,764,776 | |||||||||
10 | Complexity | Notional amount ofover-the-counter (OTC) derivatives | 1,168,293,975 | 1,325,053,254 | ||||||||
11 | Level 3 assets | 1,901,418 | 1,941,045 | |||||||||
12 | Trading and available for sale (AFS) securities | 10,838,346 | 10,073,336 | |||||||||
60
Table of Contents
Status of Sound Management of Liquidity Risk
The information disclosed herein is in accordance with “Matters Separately Prescribed by the Commissioner of the Financial Services Agency Regarding Status of Sound Management of Liquidity Risk, etc. pursuant to Article19-2, Paragraph 1, Item 5,Sub-item (e), etc. of the Ordinance for Enforcement of the Banking Law (the FSA Notice No. 7 of 2015).
(1) Disclosure of quantitative information regarding Liquidity Coverage Ratio
| (In million yen, the number of data) | ||||||||||||||||||||
| Item | For the three months ended December 31, 2018 | For the three months ended March 31, 2019 | ||||||||||||||||||
High-Quality Liquid Assets | (1) | / | / | |||||||||||||||||
| 1 | Total high-quality liquid assets (HQLA) | 59,793,333 | 59,797,149 | |||||||||||||||||
Cash Outflows | (2) | | TOTAL UNWEIGHTED VALUE |
| | TOTAL WEIGHTED VALUE |
| | TOTAL UNWEIGHTED VALUE |
| | TOTAL WEIGHTED VALUE |
| |||||||
| 2 | Cash outflows related to unsecured retail funding | 47,036,243 | 3,745,286 | 47,424,967 | 3,791,658 | |||||||||||||||
| 3 | of which, Stable deposits | 13,756,053 | 412,681 | 13,620,177 | 408,605 | |||||||||||||||
| 4 | of which, Less stable deposits | 33,280,189 | 3,332,604 | 33,804,789 | 3,383,053 | |||||||||||||||
| 5 | Cash outflows related to unsecured wholesale funding | 66,465,073 | 36,647,857 | 69,158,857 | 38,700,654 | |||||||||||||||
| 6 | of which, Qualifying operational deposits | 0 | 0 | 0 | 0 | |||||||||||||||
| 7 | of which, Cash outflows related to unsecured wholesale funding other than qualifying operational deposits and debt securities | 61,463,843 | 31,646,626 | 62,841,393 | 32,383,190 | |||||||||||||||
| 8 | of which, Debt securities | 5,001,230 | 5,001,230 | 6,317,464 | 6,317,464 | |||||||||||||||
| 9 | Cash outflows related to secured funding, etc | / | 1,216,944 | / | 1,038,595 | |||||||||||||||
| 10 | Cash outflows related to derivative transactions, etc. funding programs, credit and liquidity facilities | 25,318,942 | 7,217,613 | 24,666,425 | 6,969,601 | |||||||||||||||
| 11 | of which, Cash outflows related to derivative transactions, etc | 2,206,890 | 2,206,890 | 1,836,239 | 1,836,239 | |||||||||||||||
| 12 | of which, Cash outflows related to funding programs | 18,666 | 18,666 | 18,141 | 18,141 | |||||||||||||||
| 13 | of which, Cash outflows related to credit and liquidity facilities | 23,093,384 | 4,992,056 | 22,812,044 | 5,115,220 | |||||||||||||||
| 14 | Cash outflows related to contractual funding obligations, etc. | 5,870,401 | 1,874,332 | 6,284,751 | 1,663,084 | |||||||||||||||
| 15 | Cash outflows related to contingencies | 75,954,584 | 728,361 | 75,277,900 | 723,445 | |||||||||||||||
| 16 | Total cash outflows | / | 51,430,395 | / | 52,887,041 | |||||||||||||||
Cash Inflows | (3) | | TOTAL UNWEIGHTED VALUE |
|
|
TOTAL VALUE |
| | TOTAL UNWEIGHTED VALUE |
| | TOTAL WEIGHTED VALUE |
| |||||||
| 17 | Cash inflows related to secured lending, etc. | 11,831,118 | 1,029,761 | 14,339,359 | 1,456,464 | |||||||||||||||
| 18 | Cash inflows related to collections of loans, etc | 10,571,333 | 7,395,647 | 11,456,961 | 7,945,763 | |||||||||||||||
| 19 | Other cash inflows | 7,516,139 | 1,820,938 | 7,208,397 | 2,037,008 | |||||||||||||||
| 20 | Total cash inflows | 29,918,592 | 10,246,347 | 33,004,717 | 11,439,235 | |||||||||||||||
Consolidated liquidity coverage ratio | (4) | / | / | |||||||||||||||||
| 21 | Total HQLA allowed to be included in the calculation | / | 59,793,333 | / | 59,797,149 | |||||||||||||||
| 22 | Net cash outflows | / | 41,184,048 | / | 41,447,805 | |||||||||||||||
| 23 | Consolidated liquidity coverage ratio (LCR) | / | 145.2 | % | / | 144.3 | % | |||||||||||||
| 24 | The number of data used to calculate the average value | 62 | 58 | |||||||||||||||||
(2) Disclosure of qualitative information regarding Liquidity Coverage Ratio
(A) Chronological changes in Liquidity Coverage Ratio
Our Consolidated LCR has remained stable over the past two years.
(B) Evaluation of the consolidated Liquidity Coverage Ratio Level
Our Consolidated LCR surpasses the final regulatory standard (100%), with no issues. Our Consolidated LCR disclosed herein does not differ significantly from our original expectations, and we do not expect our Consolidated LCR to deviate significantly from the current level in the future.
(C) Composition of the total HQLA allowed to be included in the calculation
There are no significant changes in the composition, such as by currency or type, and geographic distribution of the HQLA allowed to be included in the calculation. In addition, there is no significant currency mismatch between total amount of the HQLA allowed to be included in the calculation and net cash outflow regarding main currencies (those currencies of which the aggregate liabilities denominated amount to 5% or more of our total liabilities).
61
Table of Contents
(D) Other matters regarding the Liquidity Coverage Ratio
We do not apply the “exception regarding qualifying operational deposits” in Article 28 of the Notice No. 62 and “the amount of additional collateral required due to market valuation changes to derivatives transactions estimated by the scenario approach” in Article 37 of the Notice No. 62. “Cash outflows from other contracts” in Article 59 of the Notice No. 62 incluedes “cash outflows related to small consolidated subsidiaries.” There are no material items that require detailed explanation of “cash outflows from other contingent events” in Article 52 of the Notice No. 62 and “cash inflows from other contracts” in Article 72 of the Notice No. 62. Monthly or quarterly data is used for our consolidated subsidiaries.
∎ Status of Major Liquid Assets
(Billions of yen) | ||||||||
Item | As of March 31, 2018 | As of March 31, 2019 | ||||||
Cash and Due from Banks (including Due from Central Banks) | 47,725.3 | 45,108.6 | ||||||
Trading Securities | 5,188.4 | 5,968.8 | ||||||
Securities | 33,618.9 | 29,135.0 | ||||||
Bonds Held to Maturity | 2,515.8 | 1,602.2 | ||||||
Other Securities | 31,103.1 | 27,532.8 | ||||||
Japanese Stocks | 3,582.2 | 3,143.5 | ||||||
Japanese Bonds | 16,535.6 | 14,786.9 | ||||||
Japanese Government Bonds | 13,332.0 | 11,896.1 | ||||||
Japanese Local Government Bonds | 239.3 | 209.8 | ||||||
Japanese Corporate Bonds | 2,964.1 | 2,680.9 | ||||||
Other | 10,985.2 | 9,602.3 | ||||||
Foreign Bonds | 8,329.1 | 7,418.3 | ||||||
Other | 2,656.1 | 2,183.9 | ||||||
|
|
|
| |||||
Total | 86,532.7 | 80,212.4 | ||||||
|
|
|
| |||||
Portion pledged as collateral | (11,660.9 | ) | (9,691.9 | ) | ||||
|
|
|
| |||||
Total after the deduction above | 74,871.7 | 70,520.5 | ||||||
|
|
|
| |||||
| Notes: | ||
1. | All securities included in the above table have fair value. | |
2. | Portion pledged as collateral mainly consists of securities and others collateralized for borrowed money, foreign and domestic exchange transactions or derivatives transactions, or substituted for margins for futures transactions. | |
3. | Figures in the above table do not represent high quality liquid assets. | |
(Billions of yen) | ||||||||||||||||||||||||
| As of March 31, 2018 | ||||||||||||||||||||||||
Types of Financial Instruments | Within 1 year | 1-3 years | 3-5 years | 5-7 years | 7-10 years | Over 10 years | ||||||||||||||||||
Deposits | 121,278.4 | 2,974.1 | 691.7 | 86.9 | 41.3 | 8.5 | ||||||||||||||||||
Negotiable Certificates of Deposit | 11,021.7 | 357.7 | 4.0 | — | — | — | ||||||||||||||||||
Call Money and Bills Sold | 2,105.2 | — | — | — | — | — | ||||||||||||||||||
Borrowed Money | 2,221.5 | 1,541.5 | 309.4 | 260.2 | 303.8 | 259.5 | ||||||||||||||||||
Commercial Paper | 362.1 | — | — | — | — | — | ||||||||||||||||||
Issued Bonds | 740.9 | 1,145.7 | 1,883.4 | 626.6 | 1,375.9 | 532.9 | ||||||||||||||||||
Due to Trust Account | 4,733.1 | — | — | — | — | — | ||||||||||||||||||
|
|
|
|
|
|
|
|
|
|
|
| |||||||||||||
Total | 142,463.2 | 6,019.2 | 2,888.7 | 973.9 | 1,721.0 | 801.0 | ||||||||||||||||||
|
|
|
|
|
|
|
|
|
|
|
| |||||||||||||
(Billions of yen) | ||||||||||||||||||||||||
| As of March 31, 2019 | ||||||||||||||||||||||||
Types of Financial Instruments | Within 1 year | 1-3 years | 3-5 years | 5-7 years | 7-10 years | Over 10 years | ||||||||||||||||||
Deposits | 120,184.3 | 3,166.2 | 703.8 | 61.6 | 53.9 | 140.9 | ||||||||||||||||||
Negotiable Certificates of Deposit | 12,964.4 | 377.4 | — | — | — | — | ||||||||||||||||||
Call Money and Bills Sold | 2,841.9 | — | — | — | — | — | ||||||||||||||||||
Borrowed Money | 970.3 | 1,058.9 | 304.2 | 258.0 | 225.2 | 244.7 | ||||||||||||||||||
Commercial Paper | 355.5 | — | — | — | — | — | ||||||||||||||||||
Issued Bonds | 1,010.3 | 1,494.3 | 1,158.4 | 1,014.6 | 1,464.8 | 623.7 | ||||||||||||||||||
Due to Trust Account | 1,102.0 | — | — | — | — | — | ||||||||||||||||||
|
|
|
|
|
|
|
|
|
|
|
| |||||||||||||
Total | 139,429.0 | 6,096.9 | 2,166.5 | 1,334.3 | 1,744.0 | 1,009.5 | ||||||||||||||||||
|
|
|
|
|
|
|
|
|
|
|
| |||||||||||||
| Notes: | ||
1. | Regarding Deposits, Demand deposits are included in “Within 1 year” | |
2. | Borrowed money or issued bonds with open ended, 0.0 billion, 1,239.0 billion, respectively, at March 31, 2018, and 0.0 billion, 1,585.0 billion, respectively, at March 31, 2019, are excluded. | |
62
Table of Contents
Compensation of Directors and Employees
∎ Compensation of Directors and Employees
(1) Qualitative Disclosure
(A) State of the Organizational System Relating to Compensation of “Subject Directors and Employees” of Mizuho Group
| 1. | Scope of “Subject directors and employees” |
“Subject directors, etc.” and “Subject employees, etc.” subject to disclosure as provided for in the FSA Notice (collectively, “Subject directors and employees”) are as follows:
| (1) | Scope of “Subject directors, etc.” |
“Subject directors, etc.” are directors and executive officers as defined in the Companies Act of Mizuho Financial Group, Inc. (“MHFG”). Outside directors are excluded.
| (2) | Scope of “Subject employees, etc.” |
“Subject employees, etc.” who are subject to disclosure are executive officers (as defined in our internal regulations), specialist officers and employees of MHFG and directors and employees of its “Major consolidated subsidiaries”, who are “persons who receive large amounts of compensation” and “materially affect the operation of business or the state of assets of Mizuho group or its major consolidated subsidiaries.”
| (a) | Scope of “Major consolidated subsidiaries” |
A “Major consolidated subsidiary” is a consolidated subsidiary, etc., (i) whose total assets as a percentage of consolidated total assets exceeds 2% of a bank holding company or bank and (ii) who materially affects the management of our group. Specifically, those are Mizuho Bank, Ltd. (“MHBK”), Mizuho Bank (USA) and other subsidiaries who conduct banking business similar to a branch of MHBK, Mizuho Trust & Banking Co., Ltd. (“MHTB”), Mizuho Securities Co., Ltd. (“MHSC”), Mizuho Securities USA Inc. and Mizuho International Plc.
| (b) | Scope of “Persons who receive large amounts of compensation” |
A “Person who receives large amounts of compensation” refers to a person who receives compensation that exceeds the base amount from MHFG or its “Major consolidated subsidiaries.” The base amount at MHFG has been set at ¥60 million. Such base amount has been set based on the average amounts of the compensation of directors and executive officers (as defined in the Companies Act) of MHFG, MHBK and MHTB for the last three fiscal years (excluding persons who resigned or retired during each of such fiscal years), taking into account fluctuations in amounts of compensation over past fiscal years. The preceding base amount has been adopted as the common base in order to unify the selection criteria of persons who receive large amounts of compensation at each of the companies in this paragraph.
| (c) | Scope of “Persons who materially affect the operation of business or the state of assets of Mizuho group” |
A “Person who materially affects the operation of business or the state of assets of Mizuho group” means a person who exerts significant influence on the operation of the business of MHFG or a “Major consolidated subsidiary” through his or her work in conducting transactions or management, or who materially affects the state of assets by incurring losses on transactions. Specifically, it includes executive officers (as defined in our internal regulations) and specialist officers of MHFG and directors, executive officers (as defined in our internal regulations), specialist officers and market department employees of “Major consolidated subsidiaries.”
| 2. | Decisions on compensation of “Subject directors and employees” and the name, composition and duties of the committee to supervise business execution and other major organizations relating to payment of compensation and other compensation, etc. |
| (1) | State of maintaining and ensuring the Compensation Committee, etc. |
MHFG is a Company with Three Committees, and has established the Compensation Committee as a statutory committee.
The chairman of the statutory Compensation Committee shall be an outside director, and in principle its members shall be appointed from among the outside directors (or at leastnon-executive directors) in order to ensure objectivity and transparency in director and executive officer compensation. As of March 2019, all four members of the Compensation Committee, including the chairman, were outside directors. The Compensation Committee shall determine the basic policy and compensation system for directors and executive officers of MHFG, MHBK, MHTB and MHSC, determine the compensation for each individual director and executive officer (as defined in the Companies Act) of MHFG, and exercise approval rights in MHFG for compensation for each individual director of MHBK, MHTB and MHSC.
In addition, the president of each of MHBK, MHTB and MHSC determines the amount of compensation for each of its executive officers and specialist officers.
| (2) | Decisions on compensation of “Subject employees, etc.” |
Matters relating to executive officers (as defined in our internal regulations) and specialist officers of MHFG and directors, executive officers (as defined in our internal regulations) and specialist officers of MHBK, MHTB and MHSC are as set out in (1) State of maintaining and ensuring the Compensation Committee, etc.. With regard to the compensation of directors of MHBK, MHTB and MHSC, it is determined through approval by the Compensation Committee, pursuant to each statutory procedure for directors who are Audit & Supervisory Committee Members and for directors who are not Audit & Supervisory Committee Members, and set within the scope of the total amount of compensation of directors resolved at the ordinary general meeting of shareholders.
The compensation of subject employees, etc., is decided and paid in accordance with the salary and bonus system established by MHFG and the “Major consolidated subsidiaries.” Such system is designed and put into writing by the human resources departments of MHFG and the “Major consolidated subsidiaries” which are independent of departments furthering business. In terms of the compensation of overseas employees, each overseas office or operation determines its own compensation policy based on local laws and regulations as well as employment relationships.
| 3. | Total amount of compensation paid to members of the compensation committee and number of meetings held by the Compensation Committee |
Number of meetings held |
| |||||
| Compensation Committee (MHFG) | 11 |
Note: The total amount of compensation is not set out above as it is not possible to separately calculate the amounts that are paid as consideration for the execution of duties by the compensation committee.
(B) Evaluating the Appropriateness of the Design and Operation of the System Relating to Compensation of “Subject Directors and Employees” of Mizuho Group
| 1. | Policies relating to compensation |
| (1) | Policies relating to compensation of “Subject directors, etc.” |
MHFG set out the “Mizuho Financial Group Compensation Policy” concerning the determination of compensation for each individual director, executive officer and specialist officer (“Officers, etc.”) of MHFG as well as MHBK, MHTB and MHSC (the “Three Core Companies”).
| a. | Philosophy and objectives |
Executive compensation for MHFG and the Three Core Companies pursuant to such policy is determined based on appropriate governance and control, and aims to function as incentive and compensation for each Officer, etc., to exercise their designated function to the fullest in our efforts to realize management that contributes to value creation for various stakeholders and improve corporate value through continuous and stable corporate growth based on our basic management policies under our Corporate Identity.
63
Table of Contents
| b. | Basic Policy |
The basic policy with respect to the determination concerning the individual compensation of Officers, etc., of MHFG and the Three Core Companies is set forth below:
| (i) | The executive compensation shall be determined based on appropriate governance and control, and function as an appropriate incentive in order to realize management that contributes to value creation for various stakeholders and improve corporate value through continuous and stable corporate growth based on our basic management policies under our Corporate Philosophy. |
| (ii) | The executive compensation shall be based on the function and responsibility assigned to and the performance of each Officer, etc. |
| (iii) | The executive compensation shall contribute to suppressing excessive risk-taking, improving corporate value and creating value for various stakeholders not only in the short-term, but also over the medium- to long-term. |
| (iv) | The executive compensation shall reflect the management environment and business performance of our group. |
| (v) | The executive compensation shall enable compensation for securing expert personnel such as professionals with a competitive edge in the market. |
| (vi) | The compensation system and standards shall be timely and appropriately reevaluated and set at a competitive and appropriate standard based on such factors as the economic and social conditions and survey data with respect to management compensation provided by external specialized organizations. |
| (vii) | Regulations and guidelines, etc., concerning executive compensation, both in Japan and overseas, shall be complied with. |
| c. | Compensation System |
| I. | Compensation for Officers, etc., shall, in principle, consist of a “Basic Salary,” “Performance Payment” and “Stock Compensation.” |
| (i) | “Basic Salaries” shall factor in the function and responsibility of each Officer, etc., in addition to the standard amount for each position and payment will be made monthly in cash. |
| (ii) | “Performance Payments” shall be made as a monetary incentive for Officers, etc., to achieve the annual budget and as compensation for their achievement. The payment thereof shall reflect our company-wide results of operations, the results of organizations (ourin-house companies and units, etc.) that each Officer, etc., is in charge of and the performance or each Officer, etc., in addition to the standard amount for each position. A system shall be adopted which, based on resolution by the Compensation Committee, etc., enables certain amount of deferred payments of the performance payments over three years, as well as a decrease or forfeiture of the deferred amount depending on performance, etc., of the company or the individual. |
| (iii) | “Stock Compensation” shall be paid in the form of shares of common stock of MHFG consisting of “Stock Compensation I” and “Stock Compensation II,” (together “Stock Compensation I and II”) acquired from the stock market through a trust with an aim to align the interests of Officers, etc., with those of the shareholders and increase the incentive to enhance corporate value. |
| (a) | “Stock Compensation I” shall be paid at the time of retirement of each Officer, etc., in the form of shares of common stock of MHFG calculated based on each position. A system shall be adopted which enables a decrease or forfeiture of the amount by resolution of the Compensation Committee, etc., depending on performance of the company or the individual. |
| (b) | “Stock Compensation II” shall be paid in accordance with our company-wide results of operations, the results of organizations (ourin-house companies and units, etc.) that each Officer, etc., is in charge of and the performance of each Officer, etc., in addition to the standard amount for each position. A system shall be adopted which enables the entire amount of deferred payments over three years, as well as a decrease or forfeiture of the deferred amount by resolution of the Compensation Committee, etc., depending on performance of the company or the individual. |
| II. | Within the Officers, etc., the compensation system for the executive officers as defined in the Companies Act, the directors, the executive officers as defined in our internal regulations and the specialist officers responsible for business execution (the “Officers Responsible for Business Execution”) shall be separate from the compensation system for the directors responsible for management supervision(“Non-Executive Officers Responsible for Management Supervision”). |
| (i) | The basic compensation system for “Officers Responsible for Business Execution” shall be a “Basic Salary,” “Performance Payment” and “Stock Compensation I and II.” |
| (a) | The composition of the compensation shall, in principle, be 50%, 17.5% and 32.5% for “Basic Salary,” “Performance Payment” and “Stock Compensation I and II” respectively. |
| (b) | “The upper limit of “Performance Payment” and “Stock Compensation II” shall be decided* in accordance with the our annual results of operations taking into account the traits of business activities of MHFG as a Financial Services Group. The payment to each officer shall reflect the performance of each officer and the results of organizations (ourin-house companies and units, etc.) that each Officer, etc., is in charge of, and be, in principle, within the range of 0% to 150% of the standard amount for each position. |
| * | The amount of funds for “Performance Payment” and “Stock Compensation II” is decided for each fiscal year by multiplying the standard amount for each position in a respective year with the total number of officers in that year and a coefficient based on the result from the fiscal year’s results of operations. The evaluation metric for this coefficient is decided by setting metrics based on our Consolidated Net Business Profits, and using such evaluation metrics for the reference year and the current fiscal year (provided that, for Mizuho Securities Co., Ltd., the system is linked to Ordinary Income, which is a metric that is equivalent to Consolidated Net Business Profits based on the traits of business activities and financial structure of securities companies). |
| (ii) | The compensation forNon-Executive Officers Responsible for Management Supervision, in principle, shall be in the form of fixed compensation from the perspective of ensuring the effectiveness of the supervisory function. The compensation system shall consist of “Basic Salaries” and “Stock Compensation” and the composition shall, in principle, be 85% and 15% for “Basic Salaries” and “Stock Compensation,” respectively. |
| III. | There are cases where compensation for some personnel, including those officers recruited locally in countries other than Japan, may be designed individually in compliance with local compensation regulations while taking into consideration local compensation practices and the responsibilities, business characteristics and market value, etc., of each respective officer. For cases where compensation is designed individually, payment of compensation is also made in accordance with the performance of the company or the individual. Payment of compensation is designed to avoid excessive risk-taking through a system which enables certain amount or a portion of deferred payments andnon-monetary payments such as stock, as well as a decrease or forfeiture of the deferred amount depending on the performance, etc., of the company or the individual. |
| d. | Compensation Determination Process |
| I. | The Compensation Committee shall determine the determination policy of executive compensation for MHFG and the Three Core Companies and the executive compensation system including the compensation system set out in “Compensation System” in order to effectively secure the transparency and objectivity of compensation, etc., for individual Officers, etc. In addition, the Compensation Committee shall determine the compensation for each individual director and executive officer, as defined in the Companies Act, of MHFG and approve at MHFG the compensation of each individual director of the Three Core Companies. |
| II. | The President & CEO, pursuant to this policy and regulations and detailed rules, etc., shall determine the compensation for each executive officer, as defined in our internal regulations, and specialist officer of MHFG and approve at the MHFG the compensation of each individual executive officer and specialist officer of the Three Core Companies. |
| III. | The Compensation Committee will verify the validity of the compensation system and standards based on economic and social conditions and survey data with respect to management compensation provided by external specialized organizations. |
| IV. | All members of the Compensation Committee shall be appointed from among outside directors (or at leastnon-executive directors) and the Chairman thereof shall be an outside director. |
| V. | The Compensation Committee may have officers who are not members of the committee (including officers of the Three Core Companies) such as the President & CEO and external experts, etc., attend its meetings and provide their opinion in order to facilitate adequate and appropriate discussions and determinations. |
64
Table of Contents
| (2) | Policies relating to compensation of “Subject employees, etc.” |
The policies relating to compensation for executive officers (as defined in our internal regulations) and specialist officers of MHFG and directors, executive officers (as defined in our internal regulations) and specialist officers of MHBK, MHTB and MHSC are also the same as the policies described in (1) Policies relating to compensation of “Subject directors, etc.” above. Compensation for other employees, etc., is determined in accordance with their duties and responsibilities. Some bonuses that are linked to performance are determined after comprehensively evaluating the employee’s contribution to business, including any qualitative contributions to the organization, in a manner that does not place an excessive emphasis on results.
| 2. | The effect of the overall level of compensation, etc., on equity capital |
The Compensation Committee of MHFG receives reports on the amount of compensation paid to directors, executive officers (as defined in the Companies Act), executive officers (as defined in our internal regulations) and specialist officers of MHFG, MHBK, MHTB and MHSC in the previous fiscal year and confirms that there is no material effect on the Mizuho group’s performance or the adequacy of equity capital.
(C) Compatibility between System for Compensation of “Subject Directors and Employees” of Mizuho Group and Risk Management and Mmatters Relating to Linking Compensation with Performance
| 1. | Compatibility between system for compensation of “Subject directors and employees” and risk management |
The compensation of employees in risk management department, compliance department and internal audit department is decided in accordance with the salary and bonus system, and specific payment amounts are conclusively determined in accordance with employee performance evaluations made by the relevant department and the human resources department, independent from departments furthering business.
Each employee of the risk management department, the compliance department and the internal audit department sets their own objectives in the employee performance evaluations, subject to the approval of their superiors. The degree to which the objectives are achieved is evaluated by taking into account the degree of the employee’s contribution to the establishment of a system for risk management, compliance and internal audit.
| 2. | Linking compensation of “Subject directors and employees” with performance |
The performance payments and performance-based stock compensation for “Officers Responsible for Business Execution” are made or paid based on the standard amount set for each position, with which each officer’s performance shall be reflected, and determined in accord with a performance evaluation, etc., against the annual business plan. A certain amount of the performance payments and the entire amount of the performance-based stock compensation shall be made or paid in deferred payments over three years, and a decrease or forfeiture of the deferred amount may be made depending on the performance, etc., of the company and such officer. It should be noted that certain “Subject directors and employees” have entered into compensation-related contracts. Stock compensation for“Non-Executive Officers Responsible for Management Supervision” shall be made in accordance with the standard amount set for each position, and the payment level shall not change based on the performance of each officer. With regard to compensation for other employees, salary is determined according to their job duties and responsibilities. In addition, the proportion linked to the performance bonus is determined through appropriately and comprehensively evaluating the contribution to performance, including the degree of contribution to the organization, etc., so as not to become excessively performance based.
65
Table of Contents
(2) Quantitative Disclosure Items
(A) REM1 : Compensation Assigned to the Relevant Fiscal Year
| (Millions of yen, except people) | ||||||||||||
| a | b | |||||||||||
No. | “Subject directors, etc.” | “Subject employees, etc.” | ||||||||||
| 1 | Fixed compensation | Number of “Subject directors, etc.” and “Subject employees, etc.” | 18 | 219 | ||||||||
| 2 | Fixed compensation amount (3+5+7) | 840 | 8,481 | |||||||||
| 3 | Cash compensation amount | 713 | 7,854 | |||||||||
| 4 | Of which, deffered amount | — | — | |||||||||
| 5 | Stock compensation amount or stock-based type compensation amount | 125 | 91 | |||||||||
| 6 | Of which, deffered amount | — | — | |||||||||
| 7 | Other compensation amount | 1 | 535 | |||||||||
| 8 | Of which, deffered amount | — | — | |||||||||
| 9 | Variable compensation | Number of “Subject directors, etc.” and “Subject employees, etc.” | 18 | 218 | ||||||||
| 10 | Variable compensation amount (11+13+15) | 284 | 11,072 | |||||||||
| 11 | Cash compensation amount | 134 | 9,934 | |||||||||
| 12 | Of which, deffered amount | — | 3,375 | |||||||||
| 13 | Stock compensation amount or stock-based type compensation amount | 150 | 1,137 | |||||||||
| 14 | Of which, deffered amount | 150 | 612 | |||||||||
| 15 | Other compensation amount | — | — | |||||||||
| 16 | Of which, deffered amount | — | — | |||||||||
| 17 | Retirement benefits | Number of “Subject directors, etc.” and “Subject employees, etc.” | — | — | ||||||||
| 18 | Retirement benefits amount | — | — | |||||||||
| 19 | Of which, deffered amount | — | — | |||||||||
| 20 | Other compensation | Number of “Subject directors, etc.” and “Subject employees, etc.” | — | 140 | ||||||||
| 21 | Other compensation amount | — | 661 | |||||||||
| 22 | Of which, deffered amount | — | 260 | |||||||||
| 23 | Comensation amount (2+10+18+21) | 1,125 | 20,215 | |||||||||
Notes:
| 1. | Amounts of compensation of “Subject directors, etc.” include amounts of compensation received for duties performed as a director or executive officer of a “Major consolidated subsidiary.” |
| 2. | The number of employees is the actual number of persons (a) for the compensation for the fiscal year ended March 31, 2019 and (b) for the compensation for the fiscal year ended March 31, 2018 for the payments made or anticipated payments for which the amount became clear during the fiscal year ended March 31, 2019 are stated. |
| 3. | The stated amount is the total amount for the fiscal year ended March 31, 2019 and the fiscal year ended March 31, 2018. |
| 4. | No. 7, “Fixed compensation,” “Other compensation amount,” includes condolence money insurance premiums, based on the decision of our Compensation Committee. |
| 5. | No. 11, “Variable compensation” “Cash compensation amount,” includes the recorded performance payment for the fiscal year ended March 31, 2018 for directors, executive officers (as defined in the Companies Act), executive officers (as defined in our internal regulations) and specialist officers of MHFG, MHBK, MHTB and MHSC. For portions that exceed a certain amount, we plan to defer payment over the three-year period from the fiscal year ending March 31, 2020. |
| 6. | No. 13, “Variable compensation” “Stock compensation amount or stock-based type compensation amount” includes the amount obtained by multiplying the stock compensation and performance-based stock compensation ownership points (with one point to be converted into one share of MHFG stock) granted to the directors, executive officers (as defined in the Companies Act), executive officers (as defined in our internal regulations) and specialist officers of MHFG, MHBK, MHTB and MHSC for the fiscal year ended March 31, 2018 by the book value of MHFG’s shares (196.3922 yen per share). For stock compensation and performance-based stock compensation for the fiscal year ended March 31, 2018, we plan to defer payment over the three-year period from the fiscal year ending March 31, 2020. |
| 7. | Because the amounts of the stock compensation, performance payment and performance-based-type stock compensation for the directors, executive officers (as defined in the Companies Act), executive officers (as defined in our internal regulations) and specialist officers of MHFG, MHBK, MHTB and MHSC for the fiscal year ended March 31, 2019 have not been determined at this time, they are not included in the above compensation. However, we have recorded the required reserves for accounting purposes. |
| 8. | The exercise periods for the stock compensation-type stock options (stock acquisition rights) are as set out below. Under the stock option agreements, exercise of the options is postponed, even during the exercise period, until the time of retirement of the director or employee. |
[The exercise periods for stock options have been omitted from the table]
66
Table of Contents
(B) REM2 : Special Compensation
| (Millions of yen, except people) | ||||||||||||||||||||||||
| a | b | c | d | e | f | |||||||||||||||||||
| Bonus guarantees | Lump sum payments at the time of recruitment | Additional retirement benefits | ||||||||||||||||||||||
| People | JPY | Peopl | JPY | Peopl | JPY | |||||||||||||||||||
“Subject directors, etc.” | — | — | — | — | — | — | ||||||||||||||||||
“Subject employees, etc.” | — | — | 3 | 260 | 11 | 445 | ||||||||||||||||||
(C) REM3 : Deferred Compensation
| (Millions of yen) | ||||||||||||||||||||||
| a | b | c | d | e | ||||||||||||||||||
| Deferred compensation amount | Of which, the deferred compensation amount subject to adjustment or variation | Regarding compensation after allocation, variable amounts adjusted but not linked to variations for the relevant fiscal year | Regarding compensation after allocation, variable amounts adjusted and linked to variations for the relevant fiscal year | Amount of deferred compensation paid in the relavent fiscal year | ||||||||||||||||||
“Subject directors, etc.” | Cash compensation amount | 5 | 5 | — | — | 3 | ||||||||||||||||
Stock compensation amount or stock-based type compensation amount | 513 | 328 | — | (22 | ) | 229 | ||||||||||||||||
Other compensation amount | — | — | — | — | — | |||||||||||||||||
“Subject employees, etc.” | Cash compensation amount | 4,978 | 641 | 21 | — | 2,135 | ||||||||||||||||
Stock compensation amount or stock-based type compensation amount | 1,200 | 484 | — | (19 | ) | 348 | ||||||||||||||||
Other compensation amount | — | — | — | — | — | |||||||||||||||||
Total amount | 6,697 | 1,459 | 21 | (42 | ) | 2,717 | ||||||||||||||||
(D) Other Relevant Matters Relating to Our System of Compensation for “Subject Directors and Employees” of Mizuho Group
Not applicable, other than those covered in the above.
67
Table of Contents
Amid the growing diversity and complexity of banking operations, financial institutions are exposed to various risks, including credit, market, operations, information technology, legal, settlement and other risks. We recognize the conducting of operations tailored to the risks and managing such risks as a key issue relating to overall management. In order to implement our business strategy while maintaining our financial stability, we maintain comprehensive risk management and control measures. Mizuho Financial Group maintains basic policies for risk management established by our Board of Directors that are applicable to the entire Mizuho group. These policies clearly define the kinds of risks to be managed, set forth the organizational structure and provide for the human resources training necessary for appropriate levels of risk management. The policies also provide for audits to measure the effectiveness and suitability of the risk management structure. In line with these basic policies, we maintain various measures to strengthen and enhance the sophistication of our risk management system.
All yen figures and percentages in this item are truncated. Accordingly, the total of each column of figures may not be equal to the total of the individual items.
Risk Management Structure
Each of our subsidiaries adopts appropriate risk management measures for its business based on the size and nature of its risk exposures, while Mizuho Financial Group controls risk management for the Mizuho group as a whole. At Mizuho Financial Group, the Risk Management Committee, which is one of the Business Policy Committees of Mizuho Financial Group, chaired by the Group Chief Risk Officer, provides integrated monitoring and management of the overall risk for the Mizuho group. The Group Chief Risk Officer reports the risk management situation to the Board of Directors, the Risk Committee and the Executive Management Committee, etc., on a regular basis and as needed. Mizuho Financial Group regularly receives reports and applications concerning the risk management situation from our principal banking subsidiaries and other core group companies and gives them appropriate instructions concerning risk management. Our principal banking subsidiaries and other core group companies each maintain their own systems for managing various types of risk, receiving reports on the status of risk at their respective subsidiaries, and gives them appropriate instructions concerning risk management as necessary.
Basic Approach
We classify the risks arising from the group’s businesses into different types of risk such as credit risk, market risk, liquidity risk and operational risk according to their risk factors, and manage each type of risk depending on its characteristics. Furthermore, each group entity manages such risks according to the characteristics of its business operations (i.e., management of risks associated with settlement and trust businesses, etc.). In addition to managing each type of risk individually, we have established a comprehensive risk management structure to identify and evaluate overall risk and to keep risk within limits that are managerially acceptable. In line with the basic policies relating to overall risk management laid down by Mizuho Financial Group, companies within the Mizuho group identify risk broadly and take a proactive and sophisticated approach to risk management.
Risk Capital Allocation
We endeavor to obtain a clear grasp of the group’s risk exposure and have implemented measures to control such risks within the group’s financial base in accordance with the risk capital allocation framework. More specifically, we allocate risk capital to our principal banking subsidiaries, including their respective subsidiaries, and other core group companies to control risk within the limits set for each company. We also control risk within managerially acceptable limits by working to ensure that the overall risk we hold on a consolidated basis does not exceed our financial strength. To ensure the ongoing financial soundness of Mizuho Financial Group, our principal banking subsidiaries and other core group companies, we regularly monitor the manner in which risk capital is being used in order to obtain a proper grasp of the risk profile within this framework. Reports are also submitted to the Board of Directors and other committees of each company. Risk capital is allocated to Mizuho Bank, Mizuho Trust & Banking, Mizuho Securities and Mizuho Americas by risk category, and is further allocated within their respective business units based on established frameworks.
Stress Testing
For the purpose of verifying the appropriateness of the Mizuho group’s risk appetite and the adequacy of its business plans, we carry out stress testing on our entire portfolio by measuring and assessing the impacts on our capital ratio and financial performance of the stress events assumed in the scenarios set by the group. Stress testing is carried out to confirm that the required capital ratio and financial performance can be secured on the occurrence of any of the assumed stress events. When our capital ratio or financial performance falls below the required level, we will consider and carry out a revision of our risk appetite and business plans. We also calculate the impacts of assumed stress events on risk volumes, including interest rate risk related to our banking book that is not covered by regulatory capital, to confirm whether the risk volumes balance with the group’s capital when a risk event occurs. The calculated risk volumes are used for assessing the group’s internal capital adequacy. Risk scenarios are set considering the current and projected economic conditions, as well as vulnerabilities in the group’s business and financial structure. Moreover, we have established a robust risk management framework under which stress testing is respectively carried out for each risk category, including market risk. Through such stress testing, we deepen our understanding of the distinctive features of our businesses and portfolios, and proactively determine action to be taken if a stress event happens. In this way, we are committed to enhancing our risk management capabilities on a continued basis.
68
Table of Contents
We define credit risk as the Mizuho group’s exposure to the risk of losses that may be incurred due to a decline in, or total loss of, the value of assets (includingoff-balance-sheet instruments), as a result of deterioration in obligors’ financial position. Mizuho Financial Group has established the methods and structures necessary for grasping and managing credit risk. Mizuho Financial Group manages credit risk for the Mizuho group as a whole. Specifically, Mizuho Financial Group establishes the group’s fundamental credit risk policy to manage major group companies, and monitors and manages the credit risks of the group as a whole.
Credit Risk Management Structure
Credit Risk Management of the Mizuho Group
Our Board of Directors determines the Mizuho group’s basic matters pertaining to credit risk management. In addition, the Risk Management Committee broadly discusses and coordinates matters relating to basic policies and operations in connection with credit risk management and matters relating to credit risk monitoring for the Mizuho group. Under the control of the Group Chief Risk Officer of Mizuho Financial Group, the Credit Risk Management Department and the Risk Management Department jointly monitor, analyze and submit suggestions concerning credit risk and formulate and execute plans in connection with basic matters pertaining to credit risk management.
Credit Risk Management at Our Principal Banking Subsidiaries and Other Core Group Companies
Our principal banking subsidiaries and other core group companies manage their credit risk according to the scale and nature of their exposures in line with basic policies set forth by Mizuho Financial Group. The Board of Directors of each company determines key matters pertaining to credit risk management.
The Balance Sheet & Risk Management Committee and the Credit Committee, each of which is a Business Policy Committee of our principal banking subsidiaries, are responsible for discussing and coordinating overall management of their individual credit portfolios and transaction policies towards obligors. The respective Chief Risk Officers of our principal banking subsidiaries are responsible for matters relating to planning and implementing credit risk management. The credit risk management departments of our principal banking subsidiaries are in charge of planning and administering credit risk management and conducting credit risk measuring and monitoring. The departments regularly present reports regarding their risk management situation to Mizuho Financial Group. The credit departments of our principal banking subsidiaries determine policies and approve/disapprove individual transactions in terms of credit review, credit management and collection from customers in accordance with the lines of authority set forth respectively by our principal banking subsidiaries. In addition, our principal banking subsidiaries have established internal audit groups that are independent of the business departments in order to ensure appropriate credit risk management.
Method of Credit Risk Management
We have adopted two different but mutually complementary approaches to credit risk management. The first approach is “individual credit management,” in which we manage the process for each individual transaction and individual obligor from execution until collection, based on our assessment of the credit quality of the customer. Through this process, we curb losses in the case of a credit event. The second is “credit portfolio management,” in which we utilize statistical methods to assess the potential for losses related to credit risk. Through this process, we identify credit risks and respond appropriately.
Individual Credit Management
Credit Codes
The basic code of conduct for all of our officers and employees engaged in the credit business is set forth in our credit code. Seeking to fulfill the bank’s mission and social responsibilities, our basic policy for credit business is determined in light of fundamental principles focusing on public welfare, safety, growth and profitability.
Internal Rating System
One of the most important elements of the risk management infrastructure of our principal banking subsidiaries is the use of an internal rating system that consists of credit ratings and pool allocations. Credit ratings consist of obligor ratings which represent the level of credit risk of the obligor, and transaction ratings which represent the possibility of ultimately incurring losses related to each individual claim by taking into consideration the nature of any collateral or guarantee and the seniority of the claim. In principle, obligor ratings apply to all obligors and are subject to regular reviews at least once a year to reflect promptly the fiscal period end financial results of the obligors, as well as special reviews as required whenever a obligor’s credit standing changes. This enables our principal banking subsidiaries to monitor both individual obligors and the status of the overall portfolio in a timely fashion. Because we consider obligor ratings to be an initial phase of the self-assessment process regarding the quality of our loans andoff-balance-sheet instruments, such obligor ratings are closely linked to the obligor classifications and are an integral part of the process for determining the provision for loan losses and charge-offs in our self-assessment of loans andoff-balance-sheet instruments.
To assign obligor ratings, we have a quantitative evaluation system (rating model) in place to enable proper assessment of an obligor’s credit standing. The system gives a quantitative rating to an obligor based on obligor-specific characteristics such as type of business (corporation or individual) and geography (in Japan or outside Japan). We categorize our rating models for companies in Japan into those for large companies and those for small andmedium-sized companies. The former consist of 13 models according to industry-specific factors, while the latter consist of three models. For companies outside Japan, we utilize nine models.
These were developed by the Credit Risk Management Department based on a statistical methodology and approved by the Chief Risk Officer.
Pool allocations are applied to small claims that are less than a specified amount by pooling customers and claims with similar risk characteristics and assessing and managing the risk for each such pool. Our principal banking subsidiaries efficiently manage credit risk and credit screening by dispersing a sufficient number of small claims within each pool. Our principal banking subsidiaries generally review the appropriateness and effectiveness of our approach to obligor ratings and pool allocations once a year in accordance with predetermined procedures, which is audited by the Internal Audit Group.
Mizuho Financial Group defines a Restructured Loan as a loan extended to a Customer with Special Attention when the following conditions are met: we are aiming for business reconstruction or financial support; and lending conditions were amended favorably to the customer such as allowing interest rate reduction, postponement of principal repayment/interest payment, debt forgiveness, etc.
An overdue loan is defined as a loan for a Customer with Special Attention of which the loan principal or interest is overdue for three months or more following the contractual payment date.
69
Table of Contents
Self-assessment, Provision for Loan Losses andOff-Balance-Sheet Instruments and Charge-Offs
We conduct self-assessment of assets to ascertain the status of assets both as an integral part of credit risk management and in preparation for appropriate accounting treatment, including provision for loan losses andoff-balance-sheet instruments and charge-offs. During the process of self-assessment, obligors are categorized into certain groups taking into consideration their financial condition and their ability to make payments, and credit ratings are assigned to all obligors, in principle, to reflect the extent of their credit risks. The related assets are then categorized into certain classes based on the risk of impairment. This process allows us to identify and control the actual quality of assets and determine the appropriate accounting treatment, including provision for loan losses andoff-balance-sheet instruments and charge-offs. Specifically, the credit risk management department of each of our principal subsidiaries is responsible for the overall control of the self-assessment of assets of the respective banking subsidiaries, cooperating with the administrative departments specified for each type of asset, including loan portfolios and securities, in executing and managing self-assessments. In our assessment of the probability of obligor bankruptcy, we deem an obligor that is rated as being insolvent or lower as being bankrupt.
Credit Review
Prevention of new impaired loans through routine credit management is important in maintaining the quality of our overall loan assets. Credit review involves analysis and screening of each potential transaction within the relevant business department. In case the screening exceeds the authority of the department, the credit department in charge at headquarters carries out the review. The credit group has specialist departments for different industries, business sizes and regions, carries out timely and specialized examinations based on the characteristics of the customer and its market, and provides appropriate advice to the business department. In addition, in the case of obligors with low credit ratings and high downside risks, the business department and credit department jointly clarify their credit policy and in appropriate cases assist the obligors at an early stage in working towards credit soundness.
Credit Portfolio Management
Risk Measurement
We use statistical methodologies that involve a risk measurement system (enterprise value corporate valuation model, holding period of one year) to manage the possibility of losses by measuring the expected average loss for aone-year risk horizon (“Expected Loss”) and the maximum loss within a certain confidence interval (“credit VAR”). The difference between expected loss and credit VAR is measured as the credit risk amount (“Unexpected Loss”). The risk measurement system covers the following account items reported by each Mizuho Financial Group company: credit transactions including loans and discounts; securities; customer’s liabilities for acceptances and guarantees; deposits and foreign exchange; derivatives including swaps and options;off-balance sheet items including commitments; and other assets involving credit risk.
In establishing transaction spread guidelines for credit transactions, we aim to ensure an appropriate return from the transaction in light of the level of risk by utilizing credit cost data as a reference. Also, we monitor our credit portfolio from various perspectives and set guidelines noted below so that losses incurred through a hypothetical realization of the full credit VAR would be within the amount of risk capital and loan loss reserves.
70
Table of Contents
Risk Control Methods
Our principal banking subsidiaries recognize the risk arising from allowing unexpected loss to become too large. Our principal banking subsidiaries manage “credit concentration risk,” which stems from granting excessive credit to individual corporate groups in line with our specific guidelines. [please let us know why we are deleting the reference to chain reaction default risk so we can confirm that it’s deletion isn’t something that should be explained here] Our principal banking subsidiaries also set the credit limit based on verification of status of capital adequacy. In cases where the limit is exceeded, our principal banking subsidiaries will formulate a handling policy and/or action plan. In addition to the above, our principal banking subsidiaries monitor total credit exposure, credit exposure per rating, credit concentration per individual corporate group, geography and business sector to make a periodical report to the Balance Sheet & Risk Management Committee and the Credit Committee.
The following diagram shows our risk management structure:
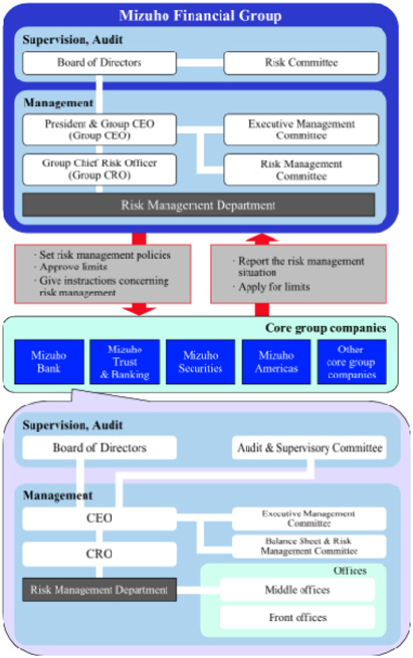
71
Table of Contents
We define market risk as the risk of losses incurred by the group due to fluctuations in interest rates, stock prices and foreign exchange rates. Market risk includes market liquidity risk; i.e., the risk that we will suffer a loss due to market disruptions or other disorders that prevent us from conducting transactions in the market or require us to pay significantly higher prices than normal to conduct transactions. Mizuho Financial Group manages market risk for the Mizuho group as a whole. Specifically, Mizuho Financial Group establishes the fundamental risk management policy for the entire group, manages the market risk of our principal banking subsidiaries and other core group companies and monitors how the group’s market risk is being managed as a whole.
Market Risk Management Structure
Our Board of Directors determines basic matters pertaining to market risk management policies. The Risk Management Committee of Mizuho Financial Group broadly discusses and coordinates matters relating to basic policies in connection with market risk management, market risk operations and market risk monitoring. The Chief Risk Officer of Mizuho Financial Group is responsible for matters relating to market risk management planning and operations.
The Risk Management Department of Mizuho Financial Group is responsible for monitoring market risk, reporting and analysing, making proposals, setting limits and guidelines, and formulating and implementing plans relating to market risk management.
As for the situation of market risk, the Risk Management Department submits reports to the President and Group CEO on a daily basis and to the Board of Directors on a regular basis. For the purpose of managing the market risk of our principal banking subsidiaries and other core group companies, the Department regularly receives reports from each of them to properly identify and manage their market risk. These subsidiaries and core group companies, which account for most of the Mizuho group’s exposure to market risk, establish their basic policies based on ours, and their Boards of Directors determine important matters relating to market risk management.
Market Risk Management Method
To manage market risk, we set limits that correspond to risk capital allocations according to the risk profile of each of our principal banking subsidiaries and other core group companies and thereby prevent the overall market risk we hold from exceeding our financial strength represented by capital, etc. The amount of risk capital allocated to market risk corresponds tovalue-at-risk (the “VAR”) and additional costs that may arise in order to close relevant positions.
Setting Limits
When the said limits are set, various factors are taken into account, including business strategies, historical limit usage ratios, risk-bearing capacity (profits, equity capital and risk management framework), profit targets and the market liquidity of the products involved. The limits are discussed and coordinated by the Risk Management Committee, discussed further by the Executive Management Committee and then determined by the President & Group CEO. For trading and banking activities, we set limits for VAR and for losses. For banking activities, we set position limits based on interest rate sensitivity (10 BPV) as needed. An excess over any of these limits is immediately reported and addressed according to apre-determined procedure.
Monitoring
To provide a system of mutual checks and balances in market operations, we have established middle offices specializing in risk management that are independent of front offices which engage in market transactions and of back offices which are responsible for book entries and settlements. When VAR is not adequate to control risk, the middle offices manage risk using additional risk indices, carry out stress testing and set stop loss limits as needed. We monitor market liquidity risk for individual financial products in the market while taking turnover and other factors into consideration.
Value-at-Risk
We use the VAR method, supplemented with stress testing, as our principal tool to measure market risk. The VAR method measures the maximum possible loss that could be incurred due to market movements within a certain time period (or holding period) and degree of probability (or confidence interval).
Trading Activities
VAR related to our trading activities is based on the following:
| • | historical simulation method; |
| • | confidence interval:one-tailed 99.0%; |
| • | holding period of one day; and |
| • | historical observation period of three years. |
72
Table of Contents
The following tables show the VAR related to our trading activities by risk category for the fiscal years ended March 31, 2017, 2018 and 2019 and as of March 31, 2017, 2018 and 2019:
| Fiscal year ended March 31, 2017 | As of March 31, 2017 | |||||||||||||||
Risk category | Daily average | Maximum | Minimum | |||||||||||||
| (in billions of yen) | ||||||||||||||||
Interest rate | ¥ | 2.0 | ¥ | 3.6 | ¥ | 1.0 | ¥ | 1.0 | ||||||||
Foreign exchange | 0.5 | 1.6 | 0.1 | 0.1 | ||||||||||||
Equities | 0.4 | 3.2 | 0.1 | 0.9 | ||||||||||||
Commodities | 0.0 | 0.0 | 0.0 | 0.0 | ||||||||||||
|
|
|
|
|
|
|
| |||||||||
Total | ¥ | 3.3 | ¥ | 5.8 | ¥ | 2.3 | ¥ | 2.6 | ||||||||
|
|
|
|
|
|
|
| |||||||||
| Fiscal year ended March 31, 2018 | As of March 31, 2018 | |||||||||||||||
Risk category | Daily average | Maximum | Minimum | |||||||||||||
| (in billions of yen) | ||||||||||||||||
Interest rate | ¥ | 1.7 | ¥ | 2.5 | ¥ | 1.0 | ¥ | 2.2 | ||||||||
Foreign exchange | 0.4 | 1.2 | 0.1 | 0.1 | ||||||||||||
Equities | 0.6 | 2.4 | 0.3 | 0.5 | ||||||||||||
Commodities | 0.0 | 0.0 | 0.0 | 0.0 | ||||||||||||
|
|
|
|
|
|
|
| |||||||||
Total | ¥ | 3.0 | ¥ | 6.2 | ¥ | 2.2 | ¥ | 3.0 | ||||||||
|
|
|
|
|
|
|
| |||||||||
| Fiscal year ended March 31, 2019 | As of March 31, 2019 | |||||||||||||||
Risk category | Daily average | Maximum | Minimum | |||||||||||||
| (in billions of yen) | ||||||||||||||||
Interest rate | ¥ | 2.0 | ¥ | 2.9 | ¥ | 1.3 | ¥ | 2.0 | ||||||||
Foreign exchange | 0.8 | 2.8 | 0.1 | 0.3 | ||||||||||||
Equities | 0.6 | 7.7 | 0.2 | 0.5 | ||||||||||||
Commodities | 0.0 | 0.0 | 0.0 | 0.0 | ||||||||||||
|
|
|
|
|
|
|
| |||||||||
Total | ¥ | 3.4 | ¥ | 9.2 | ¥ | 2.4 | ¥ | 2.6 | ||||||||
|
|
|
|
|
|
|
| |||||||||
The following graph shows VAR figures of our trading activities for the fiscal year ended March 31, 2019:
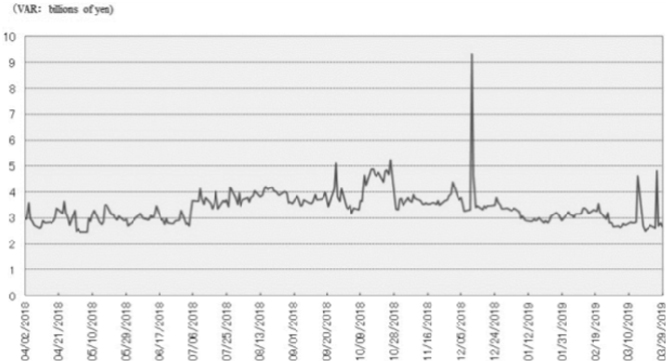
73
Table of Contents
The following table shows VAR figures of our trading activities for the fiscal years indicated:
| Fiscal years ended March 31, | ||||||||||||||||
| 2017 | 2018 | 2019 | Change | |||||||||||||
| (in billions of yen) | ||||||||||||||||
As of fiscal year end | ¥ | 2.6 | ¥ | 3.0 | ¥ | 2.6 | ¥ | (0.3 | ) | |||||||
Maximum | 5.8 | 6.2 | 9.2 | 3.0 | ||||||||||||
Minimum | 2.3 | 2.2 | 2.4 | 0.2 | ||||||||||||
Average | 3.3 | 3.0 | 3.4 | 0.3 | ||||||||||||
Non-trading Activities
The VAR related to our banking activities is based on the same conditions as those of trading activities, but the holding period is one month. In addition, as for risk management of banking activities, it is important to properly measure interest rate risk so that we calculate interest risk using appropriate methods such as recognizing demand deposits as “core deposits.”
The following graph shows the VAR related to our banking activities excluding our cross-shareholdings portfolio for the year ended March 31, 2019:
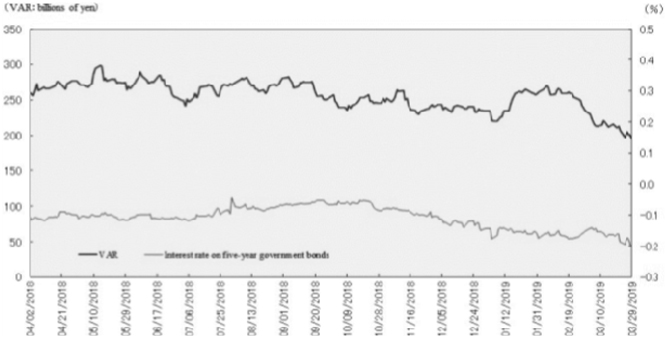
The following table shows the VAR figures relating to our banking activities for the fiscal years indicated:
| Fiscal years ended March 31, | ||||||||||||||||
| 2017 | 2018 | 2019 | Change | |||||||||||||
| (in billions of yen) | ||||||||||||||||
As of fiscal year end | ¥ | 292.7 | ¥ | 268.4 | ¥ | 194.4 | ¥ | (74.0 | ) | |||||||
Maximum | 397.5 | 307.2 | 298.5 | (8.7 | ) | |||||||||||
Minimum | 247.4 | 210.8 | 194.4 | (16.3 | ) | |||||||||||
Average | 331.0 | 267.8 | 255.5 | (12.2 | ) | |||||||||||
VAR is a commonly used market risk management technique. However, VAR models have the following shortcomings:
| • | By its nature as a statistical approach, VAR estimates possible losses over a certain period at a particular confidence level using past market movement data. Past market movement, however, is not necessarily a good indicator of future events, particularly potential future events that are extreme in nature. |
| • | VAR may underestimate the probability of extreme market movements. |
| • | The use of a 99.0% confidence level does not take account of, nor makes any statement about, any losses that might occur beyond this confidence level. |
74
Table of Contents
| • | VAR does not capture all complex effects of various risk factors on the value of positions and portfolios and could underestimate potential losses. |
Cross-shareholdings Portfolio Management Activities
We take the market risk management approach with use of VAR and risk indices for cross-shareholdings portfolio management activities to properly manage stock price risk. Specifically, we monitor VAR measurements and the state of risk capital on a daily basis. Moreover, in order to control stock price risk, we are working on the reduction in cross-shareholdings through careful negotiations with counterparties.
Back Testing
In order to evaluate the effectiveness of market risk measurements calculated using the VAR method, we carry out regular back tests to compare VAR with assumptive profits and losses. Assumptive profits and losses accounts for general market risk. The graph below shows daily VAR of trading activities for the fiscal year ended March 31, 2019 and the corresponding paired distribution of profits and losses. We had zero case where losses exceeded VAR during the period. In addition, we conduct evaluations of the assumptions related to the VAR models. Based on the number of times losses exceeded VAR through back testing and the results of the evaluation of the model assumptions, we will make adjustments to the models as appropriate. Changes to fundamental portions of the VAR models are subject to the approval of our Group Chief Risk Officer.
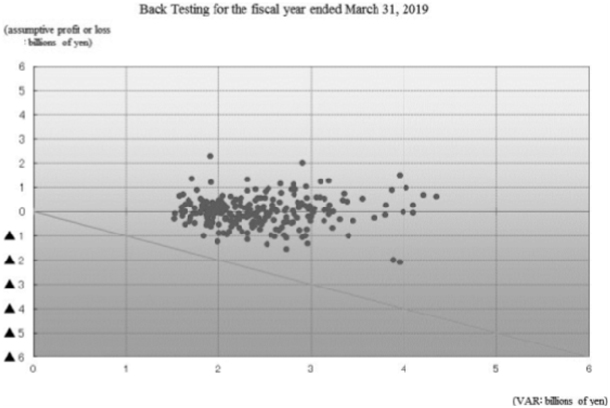
| Note: | We conduct our back testing and assess the number of cases where losses exceed VAR based on a 250 business day year. The expected average number of instances whereone-day trading losses exceeded VAR at the 99% confidence level is 2.5. |
Stress Testing
Because the VAR method is based on statistical assumptions, we conduct stress testing to simulate the levels of losses that could be incurred in cases where the market moves suddenly to levels that exceed these assumptions. The stress testing methods we use include the calculation of losses under scenarios in which stresses are applied to interest rate risk and stock price risk based on current and projected economic conditions, historical market events, etc.
75
Table of Contents
We define liquidity risk as the risk of losses arising from funding difficulties due to a deterioration in our financial position that makes it difficult for us to raise necessary funds or that forces us to raise funds at significantly higher interest rates than usual. Mizuho Financial Group manages liquidity risk for the Mizuho group as a whole. Specifically, Mizuho Financial Group establishes the fundamental liquidity risk management policy for the entire group, manages the liquidity risk of our principal banking subsidiaries and other core group companies and monitors how the group’s liquidity risk is being managed as a whole.
Liquidity Risk Management Structure
Our Board of Directors determines basic matters pertaining to liquidity risk management policies. The Risk Management Committee of Mizuho Financial Group broadly discusses and coordinates matters relating to basic policies in connection with liquidity risk management, operations, monitoring and proposes responses to emergencies such as sudden market changes. The Group Chief Risk Officer of Mizuho Financial Group is responsible for matters relating to liquidity risk management planning and operations. The Risk Management Department of Mizuho Financial Group is responsible for monitoring liquidity risk, reporting and analysing, making proposals, and formulating and implementing plans relating to liquidity risk management. In addition, the Group Chief Financial Officer of Mizuho Financial Group is additionally responsible for matters relating to planning and running cash flow management operations, and the Financial Planning Department is responsible for monitoring and adjusting cash flow management situation and for planning and implementing cash flow management to maintain appropriate funding liquidity. Reports on the liquidity risk management are submitted to the Risk Management Committee and the Balance Sheet Management Committee (each of which is a Business Policy Committee), the Executive Management Committee and the President & Group CEO on a regular basis.
Our principal banking subsidiaries and other core group companies also establish their basic policies on liquidity risk management to properly identify and manage liquidity risk.
Liquidity Risk Management Method
We manage liquidity risk with the use of “Liquidity Risk Management Indicators” and “Liquidity Categorization.” The former is determined for the purpose of managing limits on funds raised in the market considering our fund raising capabilities, and the latter is determined based on our funding conditions. We also carry out liquidity stress testing to verify the sufficiency of liquidity reserve assets and the effectiveness of countermeasures against a possible outflow of funds during a stress event. The results of stress testing are used for cash flow management operations.
Liquidity Risk Management Indicators
Limits on funds raised in the market are set based on a number of time horizons taking into account characteristics and strategies of each of our principal banking subsidiaries and other core group companies. Such limits are discussed and coordinated by the Risk Management Committee, discussed further by the Executive Management Committee and determined by the President & Group CEO. An excess over any of these limits is immediately reported and addressed according to apre-determined procedure.
Liquidity Categorization
We have established a group-wide framework of liquidity risk stages such as “Normal,” “Anxious” and “Crisis,” which reflects funding conditions. In addition, we set Early Warning Indicators (“EWIs”) and monitor on a daily basis to manage funding conditions. As EWIs, we select stock prices, credit ratings, amount of liquidity reserve assets such as Japanese government bonds, our funding situations and others.
Liquidity Stress Testing
We carry out stress testing regularly based on market-wide factors, idiosyncratic factors of the group and a combination of both types of factors to verify the sufficiency of liquidity reserve assets and the effectiveness of our liquidity contingency funding plans. Furthermore, we utilize stress testing for evaluating the appropriateness of our annual funding plan.
76
Table of Contents
We define operational risk as the risk of loss that we may incur resulting from inadequate or failed internal processes, people and systems or from external events. We control operational risk management for the Mizuho group as a whole. Considering that operational risk includes information technology risk, operations risk, legal risk, human resources risk, tangible asset risk, regulatory change risk and reputational risk, we have separately determined the fundamental risk management policies for these different types of risk. We manage the operational risk associated with our principal banking subsidiaries and other core group companies while monitoring the state of group-wide operational risk.
Operational Risk Management Structure
Our Board of Directors determines basic matters pertaining to operational risk management policies. The Risk Management Committee of Mizuho Financial Group broadly discusses and coordinates matters relating to basic policies in connection with operational risk management, operational risk operations and operational risk monitoring. The Group Chief Risk Officer of Mizuho Financial Group is responsible for matters relating to operational risk management planning and operations. The Risk Management Department of Mizuho Financial Group is responsible for monitoring market risk, reporting and analysing, making proposals, setting limits and guidelines, and formulating and implementing plans relating to operational risk management.
Our principal banking subsidiaries and core group companies establish their basic policies on operational risk management, and their Boards of Directors determine important matters relating to operational risk management.
Operational Risk Management Method
To manage operational risk, we set common rules for data gathering to develop various databases shared by the group and measure operational risk as operational VAR on a regular basis, taking into account possible future loss events and changes in the business environment and internal management.
We have established and are strengthening management methods and systems to appropriately identify, assess, measure, monitor and control the operational risks that arise from the growing sophistication and diversification of financial operations and developments relating to information technology by utilizing control self-assessments and improving measurement methods.
Definition of Risks and Risk Management Methods
As shown in the table below, we have defined each component of operational risk, and we apply appropriate risk management methods in accordance with the scale and nature of each risk.
Definition | Principal Risk Management Methods | |||
Information Technology Risk | Information technology risk (“IT risk”) shall refer to the risk that problems (e.g. malfunctions, disruptions, etc.) with the computer systems or improper use of the computers in these systems, which cause disruptions of the services provided to customers, or have significant impact on settlement systems, etc., will result in losses for customers, and the incurrence of losses (tangible or intangible) by our group companies. | • Identify and evaluate the risk by setting specific standards that need to be complied with and implementing measures tailored based on evaluation results to reduce the risk. • Ensure ongoing project management in systems development and quality control. • Strengthen security to prevent information leaks. • Strengthen capabilities for rapidly and effectively dealing with cyberattacks. • Improve effectiveness of emergency responses by improving backup systems and holding drills. | ||
Operations Risk | Risk that customers may suffer service disruptions, as well as the risk that customers or the group may incur losses because senior executives or employees fail to fulfill their tasks properly, cause accidents or otherwise act improperly. | • Establish clearly defined procedures for handling operations. • Periodically check the status of operational processes. • Conduct training and development programs by headquarters. • Introduce information technology, office automation and centralization for operations. • Improve the effectiveness of emergency responses by holding drills. | ||
Legal Risk | Risk that the group may incur losses due to violation of laws and regulations, breach of contract, entering into improper contracts or other legal factors. | • Review and confirm legal issues, including the legality of material decisions, agreements and external documents, etc. • Collect and distribute legal information and conduct internal training programs. • Analyze and manage issues related to lawsuits. | ||
Human Resources Risk | Risk that the group may incur losses due to drain or loss of personnel, deterioration of morale, inadequate development of human resources, inappropriate working schedule, inappropriate working and safety environment, inequality or inequity in human resource management or discriminatory conduct. | • Conduct employee satisfaction surveys. • Understand the status of working hours. • Understand the status of vacation days taken by personnel. • Understand the status of voluntary resignations. • Understand the status of the stress check system. | ||
Tangible Asset Risk | Risk that the group may incur losses from damage to tangible assets or a decline in the quality of working environment as a result of disasters, criminal actions or defects in asset maintenance. | • Manage the planning and implementation of construction projects related to the repair and replacement of facilities. • Identify and evaluate the status of damage to tangible assets caused by natural disasters, etc., and respond appropriately to such damage. | ||
Regulatory Change Risk | Risk that the group may incur losses due to changes in various regulations or systems, such as those related to law, taxation and accounting. | • Understand important changes in regulations or systems that have significant influence on our business operations or financial condition in a timely and accurate manner. | ||
77
Table of Contents
• Analyze degree of influence of regulatory changes and establish countermeasures. • Continuously monitor our regulatory change risk management mentioned above. | ||||
Reputational Risk | Risk that the group may incur losses due to damage to our credibility or the value of the “Mizuho” brand when market participants or others learn about, or the media reports on, various adverse events, including actual materialization of risks or false rumors. | • Establish framework to identify and manage, on an integrated basis, information that may have a serious impact on group management and respond to such risk in a manner appropriate to its scale and nature. • Swiftly identify rumors and devise appropriate responses depending on the urgency and possible impact of the situation to minimize possible losses. | ||
We also recognize and manage “Information Security Risk” and “Compliance Risk,” which constitute a combination of more than one of the above components of operational risk, as operational risk.
Measurement of operational risk equivalent
Implementation of the AMA/Advanced Measurement Approach (“AMA”)
We have adopted the AMA for the calculation of operational risk equivalent in association with capital adequacy ratios based on Basel Regulation. However, we use the Basic Indicator Approach for entities that are deemed to be less important in the measurement of operational risk equivalent.
The measurement results under the AMA are used not only as the operational risk equivalent in the calculation of capital adequacy ratios based on Basel Regulation, but also as operational VAR for internal risk management purposes for implementing action plans to reduce operational risk, etc.
Outline of the AMA
| • | Outline of measurement system |
We have established the model by taking account of four elements: internal loss data; external loss data; scenario analysis and business environment; and internal control factors (BEICFs). We calculate the operational risk amount by estimating the maximum loss, using a 99.9th percentileone-tailed confidence interval and aone-year holding period, etc., as operational risk equivalent, employing both internal loss data (i.e., actually experienced operational loss events) and scenario data to reflect unexperienced potential future loss events in the measurement.
In the measurement of operational risk equivalent as of March 31, 2019, we did not exclude expected losses and also did not recognize the risk mitigating impact of insurance. In addition, we did not take into account the events related to credit risk in measuring operational risk equivalent.
| • | Outline of measurement model |
Operational risk equivalent is calculated as a simple sum of those risk amounts related to the seven loss event types defined in the FSA’s Capital Adequacy Notice, large-scale natural disasters and litigation. In the measurement of operational risk equivalent as of March 31, 2019, we did not reflect the correlation effects among operational risk related to each of the seven loss event types.
| • | Operational risk by loss event type |
Loss Distribution (Compound Poisson Distribution) Approach (LDA) is adopted for the calculation of operational risk. LDA is based on the assumption that Poisson Distribution applies to the occurrence frequency of operational risk events, and loss severity is expressed through a separate distribution. Operational risk is calculated for each of the seven loss event types employing both internal loss data, based on our actual experience as operational loss events and scenario data. Scenario data, expressed as numerical values of occurrence frequency and loss severity, reflects external loss data and BEICFs, in order to estimate unexperienced potential future loss events (of low frequency and high severity).
“Frequency Distribution” and “Severity Distribution” are estimated employing the above mentioned internal loss data and scenario data, and Monte-Carlo simulations are then applied to these distributions to measure operational risk. The detailed steps of creation of scenario data are explained later in “Scenario Analysis.”
| • | Estimation of “Frequency Distribution” and “Loss Severity Distribution” |
“Frequency Distribution” is estimated by applying information on occurrence frequency of both internal loss data and scenario data to Poisson Distribution. “Loss Severity Distribution” is generated as the result of combining, through a statistical approach (Extreme Value Theory), of the actual distribution for the low severity distribution portion created by internal loss data and another loss distribution(Log-normal Distribution or Generalized Pareto Distribution) for the high severity distribution portion created by scenario data.
| • | Operational risk of large-scale natural disasters |
Monte-Carlo simulation is applied to the datasets expressed as a combination of the probability of occurrence of large-scale natural disasters and the probable loss amount in case of such occurrence, as opposed to estimating “Frequency Distribution” and “Loss Severity Distribution.”
| • | Operational risk of litigation |
Each litigation is converted into data according to the profile of the individual litigation to which Monte-Carlo simulation is applied, as opposed to estimating “Frequency Distribution” and “Loss Severity Distribution.”
| • | Verification |
We confirm the appropriateness of the measurement model by verifying it, in principle, semi-annually.
Scenario Analysis
| • | Outline of scenario analysis |
In the process of scenario analysis, scenario data is created as numerical values of occurrence frequency and loss severity reflecting external loss data and BEICFs, in order to estimate unexperienced potential future operational risk events (of low frequency and high severity).
As for external loss data, we refer to data publicly reported by domestic and overseas media, and such data are reflected in the estimation of occurrence frequency and loss severity distribution in the process of scenario analysis. In addition, BEICFs are utilized as indices to adjust occurrence frequency and loss severity distribution in the process of scenario analysis.
We categorize scenario analysis into four approaches in accordance with the characteristics of each loss event type and risk management structures.
78
Table of Contents
Approach | Loss event type(s) to be applied | |
| A | Internal fraud / External fraud / Clients, products and business practices / Execution, delivery and process management | |
| B | Employment practices and workplace safety | |
| C | Damage to [physical/tangible] assets | |
| D | Business disruption and system failure |
At Mizuho Financial Group, loss event types to which Approach A is applied account for a considerable amount of operational risk. The detailed process of Approach A is explained below as a typical example of scenario analysis.
| • | Setting units for scenario analysis |
In order to ensure completeness and sufficiency, we set units that are commonly applied across group entities that adopt AMA (the “Group Entities”) by referencing and categorizing risk scenarios recognized through control self-assessment, internal loss data of the Group Entities and external loss data, etc. Then each of the Group Entities selects the unit on which scenario analysis is conducted from the units established on a group-wide basis in accordance with its business activities and operational risk profile.
| • | Estimation of occurrence frequency |
Basic occurrence frequency (once a year) is calculated for each scenario analysis unit. If a certain scenario analysis unit has relevant internal loss data of apre-determined threshold amount or above, its basic occurrence frequency is calculated based on such data, and if not, the basic occurrence frequency (the occurrence frequency per year of losses at or above apre-determined threshold) is calculated with reference to the situation of occurrence of internal loss data of less than the threshold amount and/or external loss data. The basic occurrence frequency is then adjusted within apre-determined range for the purpose of reflecting the most recent BEICFs to determine the final occurrence frequency.
| • | Estimation of loss severity distribution |
In order to estimate loss severity distribution, we use apre-determined series of severity ranges. Basic loss severity distribution is calculated for each scenario analysis unit as an occurrence ratio (in percentile figures) of loss at each severity range when losses at or above apre-determined threshold occurred, with reference to transaction amount data, external loss data, etc. Then the basic severity distribution is adjusted, if necessary, from the viewpoint of statistical data processing to determine the final loss severity distribution.
| • | Creation of scenario data |
For each scenario analysis unit, scenario data is generated as a series of combinations of occurrence frequency per year at each severity range, based on the final occurrence frequency and the final loss severity distribution.
79