UNITED STATES
SECURITIES AND EXCHANGE COMMISSION
Washington, D.C. 20549
FORM6-K
REPORT OF FOREIGN PRIVATE ISSUER
PURSUANT TO RULE13a-16 OR15d-16
UNDER THE SECURITIES EXCHANGE ACT OF 1934
For the month of May 2020
Commission File Number001-33098
Mizuho Financial Group, Inc.
(Translation of registrant’s name into English)
5-5, Otemachi 1-chome
Chiyoda-ku, Tokyo 100-8176
Japan
(Address of principal executive office)
Indicate by check mark whether the registrant files or will file annual reports under cover of Form20-F or Form40-F.Form 20-F ☒ Form40-F ☐
Indicate by check mark if the registrant is submitting the Form6-K in paper as permitted by RegulationS-T Rule 101(b)(1): ☐
Indicate by check mark if the registrant is submitting the Form6-K in paper as permitted by RegulationS-T Rule 101(b)(7): ☐
Indicate by check mark whether the registrant by furnishing the information contained in this Form is also thereby furnishing the information to the Commission pursuant to Rule12g3-2(b) under the Securities Exchange Act of 1934. Yes ☐ No ☒
If “Yes” is marked, indicate below the file number assigned to the registrant in connection with Rule12g3-2(b):82- .
THIS REPORT ON FORM6-K SHALL BE DEEMED TO BE INCORPORATED BY REFERENCE INTO THE PROSPECTUS FORMING A PART OF MIZUHO FINANCIAL GROUP, INC.’S REGISTRATION STATEMENT ON FORMF-3 (FILE NO. 333-233354) AND TO BE A PART OF SUCH PROSPECTUS FROM THE DATE ON WHICH THIS REPORT IS FURNISHED, TO THE EXTENT NOT SUPERSEDED BY DOCUMENTS OR REPORTS SUBSEQUENTLY FILED OR FURNISHED.
SIGNATURES
Pursuant to the requirements of the Securities Exchange Act of 1934, the registrant has duly caused this report to be signed on its behalf by the undersigned, thereunto duly authorized.
| Date: May 15, 2020 | ||
| Mizuho Financial Group, Inc. | ||
| By: | �� | /s/ Makoto Umemiya |
| Name: | Makoto Umemiya | |
| Title: | Senior Managing Executive Officer / Group CFO |
For Immediate Release:
Consolidated Financial Statements for Fiscal 2019 (Under Japanese GAAP) |  |
| Company Name: | Mizuho Financial Group, Inc. (“MHFG”) | May 15, 2020 |
| Stock Code Number (Japan): | 8411 | |||||||
| Stock Exchange Listings: | Tokyo Stock Exchange (First Section), New York Stock Exchange | |||||||
| URL: | https://www.mizuho-fg.com/index.html | |||||||
| Representative: | Tatsufumi Sakai | President & CEO | ||||||
| For Inquiry: | Tomomichi Fujita | General Manager of Accounting | ||||||
| Phone: | +81-3-6838-6101 | |||||||
| Ordinary General Meeting of Shareholders (scheduled): | June 25, 2020 | Commencement of Dividend Payment (scheduled): | June 8, 2020 | |||||
| Filing of Yuka Shoken Hokokusho to the Kanto Local Finance Bureau (scheduled): | June 26, 2020 | Trading Accounts: Established | ||||||
| Supplementary Materials on Annual Results: | Attached | |||||||
| IR Conference on Annual Results: | Scheduled | |||||||
| Amounts less than one million yen are rounded down. | ||||||||
1. Financial Highlights for Fiscal 2019 (for the fiscal year ended March 31, 2020)
(1) Consolidated Results of Operations
| (%: Changes from the previous fiscal year) |
| |||||||||||||||||||||||
| Ordinary Income | Ordinary Profits | Profit Attributable to Owners of Parent | ||||||||||||||||||||||
| ¥ million | % | ¥ million | % | ¥ million | % | |||||||||||||||||||
Fiscal 2019 | 3,986,701 | 1.5 | 637,877 | 3.8 | 448,568 | 364.5 | ||||||||||||||||||
Fiscal 2018 | 3,925,649 | 10.2 | 614,118 | (21.5 | ) | 96,566 | (83.2 | ) | ||||||||||||||||
Note: | Comprehensive Income: Fiscal 2019: ¥7,673 million, —%; Fiscal 2018: ¥(110,542) million, —% | |
| Net Income per Share of Common Stock | Diluted Net Income per Share of Common Stock | Net Income on Own Capital | Ordinary Profits to Total Assets | Ordinary Profits to Ordinary Income | ||||||||||||||||
| ¥ | ¥ | % | % | % | ||||||||||||||||
Fiscal 2019 | 17.68 | 17.68 | 5.1 | 0.3 | 16.0 | |||||||||||||||
Fiscal 2018 | 3.80 | 3.80 | 1.0 | 0.3 | 15.6 | |||||||||||||||
Reference: | Equity in Income from Investments in Affiliates: Fiscal 2019: ¥30,382 million; Fiscal 2018: ¥51,215 million | |
(2) Consolidated Financial Conditions
| Total Assets | Total Net Assets | Own Capital Ratio | Total Net Assets per Share of Common Stock | |||||||||||||
| ¥ million | ¥ million | % | ¥ | |||||||||||||
Fiscal 2019 | 214,659,077 | 8,663,847 | 3.9 | 337.29 | ||||||||||||
Fiscal 2018 | 200,792,226 | 9,194,038 | 4.3 | 345.00 | ||||||||||||
Reference: | Own Capital: As of March 31, 2020: ¥8,553,971 million; As of March 31, 2019: ¥8,748,805 million | |
Note: | Own Capital Ratio is calculated as follows: (Total Net Assets - Stock Acquisition Rights -Non-controlling Interests) / Total Assets × 100 | |
| Own Capital Ratio stated above is not calculated based on the public notice of Own Capital Ratio. |
(3) Conditions of Consolidated Cash Flows
| Cash Flows from Operating Activities | Cash Flows from Investing Activities | Cash Flows from Financing Activities | Cash and Cash Equivalents at the end of the fiscal year | |||||||||||||
| ¥ million | ¥ million | ¥ million | ¥ million | |||||||||||||
Fiscal 2019 | 1,901,893 | (5,808,537 | ) | (281,849 | ) | 39,863,604 | ||||||||||
Fiscal 2018 | (2,636,096 | ) | 5,487,153 | (18,640 | ) | 44,254,874 | ||||||||||
2. Cash Dividends for Shareholders of Common Stock
| Annual Cash Dividends per Share | Total Cash Dividends (Total) | Dividends Pay-out Ratio (Consolidated basis) | Dividends on Net Assets (Consolidated basis) | |||||||||||||||||||||||||||||
| First quarter-end | Second quarter-end | Third quarter-end | Fiscal year-end | Annual | ||||||||||||||||||||||||||||
| ¥ | ¥ | ¥ | ¥ | ¥ | ¥ million | % | % | |||||||||||||||||||||||||
Fiscal 2018 | — | 3.75 | — | 3.75 | 7.50 | 190,395 | 197.3 | 2.1 | ||||||||||||||||||||||||
Fiscal 2019 | — | 3.75 | — | 3.75 | 7.50 | 190,416 | 42.4 | 2.1 | ||||||||||||||||||||||||
Fiscal 2020 (estimate) | — | 3.75 | — | 3.75 | 7.50 | 59.4 | ||||||||||||||||||||||||||
| Note: | The impact from the share consolidation scheduled on October 1, 2020 is not reflected to the estimate for Cash Dividend per Share of Common Stock at the end of fiscal 2020. If the share consolidation is taken into account, it would be ¥37.50. Please refer to “Notes” below for detail. |
3. Consolidated Earnings Estimates for Fiscal 2020 (for the fiscal year ending March 31, 2021)
| (%: Changes from the corresponding period of the previous fiscal year) | ||||||||||||
| Profit Attributable to Owners of Parent | Net Income per Share of Common Stock | |||||||||||
| ¥ million | % | ¥ | ||||||||||
1H F2020 | — | — | — | |||||||||
Fiscal 2020 | 320,000 | (28.6) | 12.61 | |||||||||
Note: | The number of shares of common stock used in the above calculation is based on the number of outstanding shares of common stock as of March 31, 2020. The impact from the share consolidation scheduled on October 1, 2020 is not reflected to the Consolidated Earnings Estimates for Net Income per Share of Common Stock for Fiscal 2020 (for the fiscal year ending March 31, 2021). If the share consolidation is taken into account, it would be ¥126.12. Please refer to “Notes” below for detail. | |
Notes
(1) Changes in Significant Subsidiaries during the Fiscal Year (changes in specified subsidiaries accompanying changes in the scope of consolidation): No
(2) Changes in Accounting Policies and Accounting Estimates / Restatements
i. Changes in accounting policies due to revisions of accounting standards, etc.: Yes
ii. Changes in accounting policies other than i above: Yes
iii. Changes in accounting estimates: No
iv. Restatements: No
Note: For more information, please refer to “Changes in Accounting Policies” on page 1 – 14 of the attachment.
(3) Issued Shares of Common Stock
i. Year-end issued shares (including treasury stock): | As of March 31, 2020 | 25,392,498,945 shares | As of March 31, 2019 | 25,392,498,945 shares | ||||||||||||
ii.Year-end treasury stock: | As of March 31, 2020 | 32,106,811 shares | As of March 31, 2019 | 33,962,404 shares | ||||||||||||
iii. Average number of outstanding shares: | Fiscal 2019 | 25,360,661,215 shares | Fiscal 2018 | 25,362,375,520 shares |
This immediate release is outside the scope of the audit.
The Board of Directors of the MHFG today (May 15, 2020) resolved to include the following share consolidation in the agenda for the 18th Ordinary General Meeting of Shareholders to be held in June 2020.
Estimate for cash dividends and consolidated earnings estimates for the fiscal year ending March 31, 2021 with effect from the share consolidation, are as follows.
| (1) Estimate for cash dividends and consolidated earnings estimates for the fiscal year ending March 31, 2021 |
| |||||||
Cash dividends per share of common stock | Second quarter-end | ¥ | 3.75 | |||||
| Fiscalyear-end | ¥ | 37.50 | ||||||
(2) Estimate for consolidated earnings estimates for the fiscal year ending March 31, 2021 | ||||||||
Net income per share of common stock (Consolidated) | ¥ | 126.12 | ||||||
This immediate release contains statements that constitute forward-looking statements within the meaning of the United States Private Securities Litigation Reform Act of 1995, including estimates, forecasts, targets and plans. Such forward-looking statements do not represent any guarantee by management of future performance.
In many cases, but not all, we use such words as “aim,” “anticipate,” “believe,” “endeavor,” “estimate,” “expect,” “intend,” “may,” “plan,” “probability,” “project,” “risk,” “seek,” “should,” “strive,” “target” and similar expressions in relation to us or our management to identify forward-looking statements. You can also identify forward-looking statements by discussions of strategy, plans or intentions. These statements reflect our current views with respect to future events and are subject to risks, uncertainties and assumptions.
We may not be successful in implementing our business strategies, and management may fail to achieve its targets, for a wide range of possible reasons, including, without limitation: incurrence of significant credit-related costs; declines in the value of our securities portfolio; changes in interest rates; foreign currency fluctuations; decrease in the market liquidity of our assets; revised assumptions or other changes related to our pension plans; a decline in our deferred tax assets; impairment of the carrying value of our long-lived assets; problems related to our information technology systems, including as a result of cyber attacks; the effect of financial transactions entered into for hedging and other similar purposes; failure to maintain required capital adequacy ratio levels and meet other financial regulatory requirements; downgrades in our credit ratings; our ability to avoid reputational harm; our ability to implement our Medium-term Business Plan, realize the synergy effects of “One MIZUHO, ” and implement other strategic initiatives and measures effectively; the effectiveness of our operational, legal and other risk management policies; the effect of changes in general economic conditions in Japan and elsewhere; and changes to applicable laws and regulations.
Further information regarding factors that could affect our financial condition and results of operations is included in “Item 3.D. Key Information—Risk Factors” and “Item 5. Operating and Financial Review and Prospects” in our most recent Form20-F filed with the U.S. Securities and Exchange Commission (“SEC”) and our report on Form6-K furnished to the SEC on December 26, 2019, both of which are available in the Financial Information section of our web page atwww.mizuho-fg.com/index.html and also at the SEC’s web site at www.sec.gov.
We do not intend to update our forward-looking statements. We are under no obligation, and disclaim any obligation, to update or alter our forward-looking statements, whether as a result of new information, future events or otherwise, except as may be required by the rules of the Tokyo Stock Exchange.
Mizuho Financial Group, Inc.
m Contents of Attachment
| 1. | Overview of Consolidated Results of Operations and Financial Conditions | p.1-2 | ||||
| (1) Overview of Results of Operations | p.1-2 | |||||
| (2) Overview of Financial Conditions | p.1-3 | |||||
| (3) Basic Policy on Profit Distribution, Dividend Payment for Fiscal 2019 and Dividend Estimates for Fiscal 2020 | p.1-3 | |||||
| 2. | Basic Stance on Selection of Accounting Standards | p.1-4 | ||||
| 3. | Consolidated Financial Statements and Others | p.1-5 | ||||
| (1) Consolidated Balance Sheets | p.1-5 | |||||
| (2) Consolidated Statements of Income and Consolidated Statements of Comprehensive Income | p.1-7 | |||||
| (3) Consolidated Statements of Changes in Net Assets | p.1-10 | |||||
| (4) Consolidated Statements of Cash Flows | p.1-12 | |||||
| (5) Notes regarding Consolidated Financial Statements | p.1-14 | |||||
(Matters Related to the Assumption of Going Concern) | ||||||
(Changes in Accounting Policies) | ||||||
(Business Segment Information) | ||||||
(Per Share Information) | ||||||
(Subsequent Events) | ||||||
Note to XBRL
Please note that the names of the English accounts contained in XBRL data, which are available through EDINET and TDNet, may be different from those of the English accounts in our financial statements.
An MHFG IR conference for institutional investors and analysts is scheduled for Wednesday, May 20, 2020. The IR conference presentation materials and audio archive will be available for use by individual investors in the IR Information section of the Mizuho Financial Group website immediately after the conference.
1-1
Mizuho Financial Group, Inc.
1. Overview of Consolidated Results of Operations and Financial Conditions
(1) Overview of Results of Operations
Reviewing the economic environment over the fiscal year ended March 31, 2020, the global economy showed a slowdown, primarily in the manufacturing industry, due to factors such as uncertainty related to the trade disputes between the United States and China. Furthermore, toward the end of the fiscal year, the global economy began to show signs indicative of a state of crisis due to the worldwide spread ofCOVID-19.
In the United States, the economy of which had been expanding, the economic base began to deteriorate rapidly, including a substantial decline in the rate of employment due to the impact of the spread ofCOVID-19. In light of such circumstances, the Federal Reserve Board (FRB) cut interest rates as an emergency measure twice in March, and the Trump administration implemented US$2 trillion worth of economic measures. However, concerns about a further decline in the economy have not been dispelled.
In Europe, where the economy remained weak, the European Central Bank (ECB) decided to purchase assets and expand long-term refinancing operations in response to the spread ofCOVID-19 throughout Europe. However, the economic situation is becoming increasingly serious.
In Asia, the Chinese economy continued to slow down. The growth of production, investment and consumption has slowed as economic activities have contracted since the beginning of 2020 due toCOVID-19, in addition to the impact of trade disputes between the United States and China. Moreover, in emerging countries, currency depreciation and capital outflows have been observed, partly due to the fall in the prices of crude oil and other resources.
In Japan, the real GDP growth rate fell sharply negative in the October to December quarter of 2019, partly due to the impact of the consumption tax increase amid the sluggishness in export and production activities. In response to the spread ofCOVID-19, the Bank of Japan decided to expand financial support measures for businesses and increase purchases of exchange-traded funds (ETFs) and corporate bonds, and the government has also taken a series of emergency measures. However, economic activities are contracting at an accelerating pace.
As to the prospects for the global economy, negative growth is expected due to the impact of the spread ofCOVID-19. While monetary easing and economic stimulus measures implemented in each country are expected to have a positive effect on the economy, there is a concern that, if the impact becomes prolonged, demand will decrease further due to worsening employment and income situations. The Japanese economy is expected to remain in a difficult situation for the time being, due to factors such as decreased consumption, primarily in the service-related sector, and capital investments.
Under the foregoing business environment, we recorded Consolidated Gross Profits of ¥2,062.2 billion for fiscal 2019, increasing by ¥249.4 billion from the previous fiscal year due to the steady business performance in both Customer Groups and Markets.
General and Administrative Expenses decreased by ¥52.4 billion on ayear-on-year basis to ¥1,378.3 billion due to the efforts of structural reform.
As a result, Consolidated Net Business Profits increased by ¥268.5 billion on ayear-on-year basis to ¥661.9 billion.
Consolidated Net Business Profits + Net gains or losses related to ETFs and others that consist of Consolidated Net Business Profits, Net gains or losses related to ETFs and others on anon-consolidated aggregated basis of the banks, and Net gains or losses related to operating investment securities on a consolidated basis of Mizuho Securities Co., Ltd. increased by ¥264.2 billion on ayear-on-year basis to ¥672.5 billion.
Credit-related Costs increased by ¥152.1 billion on ayear-on-year basis to ¥171.7 billion due to recording Reserves for Possible Losses on Loans for some credit exposures reflecting the impact ofCOVID-19 in light of the principles set forth in the report entitled “JFSA’s supervisory approaches to lending business and loan loss provisioning” published by the Japanese Financial Services Agency in December 2019.
Net Gains (Losses) related to Stocks decreased by ¥137.6 billion on ayear-on-year basis to net gains of ¥137.1 billion.
As a result, Ordinary Income increased by ¥23.7 billion on ayear-on-year basis to ¥637.8 billion.
Extraordinary Gains (Losses) increased by ¥478.6 billion on ayear-on-year basis to net losses of ¥19.1 billion due to the lack of losses in light of structural reform recorded last year.
Tax-related Expenses increased by ¥163.9 billion on ayear-on-year basis to ¥161.4 billion.
As a result, Profit Attributable to Owners of Parent for fiscal 2019 increased by ¥352.0 billion on ayear-on-year basis to ¥448.5 billion.
1-2
Mizuho Financial Group, Inc.
As for earnings estimates for fiscal 2020, we estimate Ordinary Profits of ¥400.0 billion and Profit Attributable to Owners of Parent of ¥320.0 billion on a consolidated basis.
We will disclose promptly if we need to revise the above consolidated earnings estimates due to the further spread ofCOVID-19.
(2) Overview of Financial Conditions
Consolidated total assets as of March 31, 2020 amounted to ¥214,659.0 billion, increasing by ¥13,866.8 billion from the end of the previous fiscal year mainly due to an increase in Receivables under Resale Agreements.
Securities were ¥34,907.2 billion, increasing by ¥5,132.7 billion from the end of the previous fiscal year.
Loans and Bills Discounted amounted to ¥83,468.1 billion, increasing by ¥5,011.2 billion from the end of the previous fiscal year.
Deposits and Negotiable Certificates of Deposit amounted to ¥144,472.2 billion, increasing by ¥6,822.6 billion from the end of the previous fiscal year.
Net Assets amounted to ¥8,663.8 billion, decreasing by ¥530.1 billion from the end of the previous fiscal year. Shareholders’ Equity was ¥7,561.0 billion, Accumulated Other Comprehensive Income was ¥992.9 billion, andNon-controlling Interests was ¥109.6 billion.
Net Cash Provided by Operating Activities was ¥1,901.8 billion mainly due to increased deposits. Net Cash Used in Investing Activities was ¥5,808.5 billion mainly due to purchase, sale, and redemption of securities and Net Cash Used in Financing Activities was ¥281.8 billion mainly due to repayments tonon-controlling shareholders and cash dividends paid.
As a result, Cash and Cash Equivalents as of March 31, 2020 was ¥39,863.6 billion.
(3) Basic Policy on Profit Distribution, Dividend Payment for Fiscal 2019 and Dividend Estimates for Fiscal 2020
We have been implementing disciplined capital management by pursuing the optimum balance between strengthening of stable capital base and steady returns to shareholders, and set forth our shareholder return policy that we are maintaining the current level of dividends for the time being while aiming to strengthen our capital base further to enhance returns to shareholders at an early stage.
Based on this policy, we have decided to issue ¥3.75 ofyear-end cash dividends on common stock for Fiscal 2019 (annual cash dividends of ¥7.50 including interim dividends of ¥3.75) in accordance with Dividend Estimate at the beginning of the fiscal year.
The Board of Directors has decided on the ¥7.50 of annual cash dividends on common stock for Fiscal 2019, even though Profit Attributable to Owners of Parent for Fiscal 2019 was slightly lower than our Earnings Estimate at the beginning of the fiscal year as a result of additional Reserves for Possible Losses on Loans for some credit exposures from a forward-looking perspective based on future projections, reflecting the potential impact ofCOVID-19 on our financials. To make such decision, the Board of Directors has taken into account and considered thoroughly our business environment comprehensively including capital adequacy, and domestic and international regulation trends including the Basel regulatory framework.
Common Stock | ¥3.75 per share | (unchanged from the estimate at the beginning of Fiscal 2019) | ||
Annual cash dividends incl. interim dividends | ¥7.50 per share | (unchanged from the estimate at the beginning of Fiscal 2019) |
Furthermore, in accordance with the Articles of Incorporation, we decide to issue dividends not by a resolution at the General Meeting of Shareholders but by a resolution at the Board of Directors unless otherwise stipulated by laws and regulations. We decided on theyear-end cash dividend payments on common stock for Fiscal 2020 at the Board of Directors held today.
For Fiscal 2020, based on the shareholder return policy, we will comprehensively consider the business environment such as the Group’s business results, profit base, status of capital adequacy, and domestic and international regulation trends, including the Basel framework, in determining the amounts of dividends payment.
As for the dividend estimates of common stock for Fiscal 2020, we predict ¥7.50 per share of common stock, which is the same as Fiscal 2019. We intend to continue payments of cash dividends at the interim period to return profits to shareholders in a timely manner.
1-3
Mizuho Financial Group, Inc.
| (Dividend Estimates for Fiscal 2020) | ||||||||
Common Stock | Cash Dividends per Share | ¥ | 7.50 | |||||
of which Interim Dividends | ¥ | 3.75 | ||||||
In addition, with the approval of the 18th Ordinary General Meeting of Shareholders to be held in June 2020, the shares of common stock will be consolidated on the basis of one post-consolidation share per tenpre-consolidation shares to be effective on October 1, 2020. Taking such share consolidation into account, fiscalyear-end dividend estimates for Fiscal 2020 will be ¥37.50.
Also, with the approval of the same General Meeting of Shareholders, the Articles of Incorporation will be amended such that the Board of Directors remains as the organization to make decisions on issuing dividends, but the General Meeting of Shareholders may also make decisions on such matters in the event a shareholder’s proposal is presented.
2. Basic Stance on Selection of Accounting Standards
MHFG prepares its consolidated financial statements in accordance with Japanese Generally Accepted Accounting Principles. With respect to International Financial Reporting Standards (IFRS), in light of possible adoption in the future, MHFG is continuing research and study on the situation in Japan and Overseas and/or the development of IFRS.
1-4
Mizuho Financial Group, Inc.
3. Consolidated Financial Statements and Others
(1) Consolidated Balance Sheets
| Millions of yen | ||||||||
| As of March 31, 2019 | As of March 31, 2020 | |||||||
Assets | ||||||||
Cash and Due from Banks | ¥ | 45,108,602 | ¥ | 41,069,745 | ||||
Call Loans and Bills Purchased | 648,254 | 584,686 | ||||||
Receivables under Resale Agreements | 12,997,628 | 18,581,488 | ||||||
Guarantee Deposits Paid under Securities Borrowing Transactions | 2,578,133 | 2,243,161 | ||||||
Other Debt Purchased | 2,828,959 | 2,688,273 | ||||||
Trading Assets | 12,043,608 | 13,248,734 | ||||||
Money Held in Trust | 351,889 | 411,847 | ||||||
Securities | 29,774,489 | 34,907,234 | ||||||
Loans and Bills Discounted | 78,456,935 | 83,468,185 | ||||||
Foreign Exchange Assets | 1,993,668 | 2,044,415 | ||||||
Derivatives other than for Trading Assets | 1,328,227 | 1,944,060 | ||||||
Other Assets | 4,229,589 | 5,206,121 | ||||||
Tangible Fixed Assets | 1,037,006 | 1,103,622 | ||||||
Buildings | 287,634 | 287,038 | ||||||
Land | 614,851 | 610,305 | ||||||
Lease Assets | 22,557 | 13,293 | ||||||
Construction in Progress | 36,300 | 72,290 | ||||||
Other Tangible Fixed Assets | 75,661 | 120,694 | ||||||
Intangible Fixed Assets | 620,231 | 636,139 | ||||||
Software | 161,364 | 429,136 | ||||||
Goodwill | 65,495 | 61,276 | ||||||
Lease Assets | 5,839 | 4,118 | ||||||
Other Intangible Fixed Assets | 387,532 | 141,608 | ||||||
Net Defined Benefit Asset | 982,804 | 846,782 | ||||||
Deferred Tax Assets | 37,960 | 32,493 | ||||||
Customers’ Liabilities for Acceptances and Guarantees | 6,062,053 | 6,066,527 | ||||||
Reserves for Possible Losses on Loans | (287,815 | ) | (424,446 | ) | ||||
|
|
|
| |||||
Total Assets | ¥ | 200,792,226 | ¥ | 214,659,077 | ||||
|
|
|
| |||||
1-5
Mizuho Financial Group, Inc.
| Millions of yen | ||||||||
| As of March 31, 2019 | As of March 31, 2020 | |||||||
Liabilities | ||||||||
Deposits | ¥ | 124,311,025 | ¥ | 131,189,673 | ||||
Negotiable Certificates of Deposit | 13,338,571 | 13,282,561 | ||||||
Call Money and Bills Sold | 2,841,931 | 2,263,076 | ||||||
Payables under Repurchase Agreements | 14,640,439 | 17,971,098 | ||||||
Guarantee Deposits Received under Securities Lending Transactions | 1,484,584 | 1,108,255 | ||||||
Commercial Paper | 941,181 | 411,089 | ||||||
Trading Liabilities | 8,325,520 | 9,604,890 | ||||||
Borrowed Money | 3,061,504 | 5,209,947 | ||||||
Foreign Exchange Liabilities | 669,578 | 509,405 | ||||||
Short-term Bonds | 355,539 | 373,658 | ||||||
Bonds and Notes | 8,351,071 | 8,906,432 | ||||||
Due to Trust Accounts | 1,102,073 | 1,055,510 | ||||||
Derivatives other than for Trading Liabilities | 1,165,602 | 1,619,151 | ||||||
Other Liabilities | 4,512,325 | 6,111,195 | ||||||
Reserve for Bonus Payments | 68,117 | 75,175 | ||||||
Reserve for Variable Compensation | 2,867 | 2,559 | ||||||
Net Defined Benefit Liability | 60,873 | 62,113 | ||||||
Reserve for Director and Corporate Auditor Retirement Benefits | 1,389 | 944 | ||||||
Reserve for Possible Losses on Sales of Loans | 630 | 637 | ||||||
Reserve for Contingencies | 4,910 | 6,443 | ||||||
Reserve for Reimbursement of Deposits | 19,068 | 27,851 | ||||||
Reserve for Reimbursement of Debentures | 25,566 | 18,672 | ||||||
Reserves under Special Laws | 2,473 | 2,509 | ||||||
Deferred Tax Liabilities | 185,974 | 53,150 | ||||||
Deferred Tax Liabilities for Revaluation Reserve for Land | 63,315 | 62,695 | ||||||
Acceptances and Guarantees | 6,062,053 | 6,066,527 | ||||||
|
|
|
| |||||
Total Liabilities | ¥ | 191,598,188 | ¥ | 205,995,229 | ||||
|
|
|
| |||||
Net Assets | ||||||||
Common Stock | ¥ | 2,256,767 | ¥ | 2,256,767 | ||||
Capital Surplus | 1,138,449 | 1,136,467 | ||||||
Retained Earnings | 3,915,521 | 4,174,190 | ||||||
Treasury Stock | (7,703 | ) | (6,414 | ) | ||||
|
|
|
| |||||
Total Shareholders’ Equity | 7,303,034 | 7,561,010 | ||||||
|
|
|
| |||||
Net Unrealized Gains (Losses) on Other Securities | 1,186,401 | 823,085 | ||||||
Deferred Gains or Losses on Hedges | (22,282 | ) | 72,081 | |||||
Revaluation Reserve for Land | 137,772 | 136,655 | ||||||
Foreign Currency Translation Adjustments | (111,057 | ) | (133,178 | ) | ||||
Remeasurements of Defined Benefit Plans | 254,936 | 94,317 | ||||||
|
|
|
| |||||
Total Accumulated Other Comprehensive Income | 1,445,770 | 992,960 | ||||||
|
|
|
| |||||
Stock Acquisition Rights | 707 | 213 | ||||||
Non-controlling Interests | 444,525 | 109,662 | ||||||
|
|
|
| |||||
Total Net Assets | 9,194,038 | 8,663,847 | ||||||
|
|
|
| |||||
Total Liabilities and Net Assets | ¥ | 200,792,226 | ¥ | 214,659,077 | ||||
|
|
|
| |||||
1-6
Mizuho Financial Group, Inc.
(2) Consolidated Statements of Income and Consolidated Statements of Comprehensive Income
Consolidated Statements of Income
| Millions of yen | ||||||||
| For the fiscal year ended March 31, 2019 | For the fiscal year ended March 31, 2020 | |||||||
Ordinary Income | ¥ | 3,925,649 | ¥ | 3,986,701 | ||||
Interest Income | 2,056,327 | 2,014,440 | ||||||
Interest on Loans and Bills Discounted | 1,253,970 | 1,242,279 | ||||||
Interest and Dividends on Securities | 302,768 | 266,861 | ||||||
Interest on Call Loans and Bills Purchased | 5,510 | 5,356 | ||||||
Interest on Receivables under Resale Agreements | 229,637 | 251,830 | ||||||
Interest on Securities Borrowing Transactions | 25,081 | 18,779 | ||||||
Interest on Due from Banks | 123,545 | 105,257 | ||||||
Other Interest Income | 115,813 | 124,074 | ||||||
Fiduciary Income | 55,153 | 58,565 | ||||||
Fee and Commission Income | 765,977 | 778,842 | ||||||
Trading Income | 299,355 | 406,539 | ||||||
Other Operating Income | 312,815 | 412,114 | ||||||
Other Ordinary Income | 436,019 | 316,198 | ||||||
Gains on Reversal of Reserves for Possible Losses on Loans | 4,357 | — | ||||||
Recovery ofWritten-off Claims | 10,395 | 11,901 | ||||||
Other | 421,266 | 304,296 | ||||||
Ordinary Expenses | 3,311,531 | 3,348,823 | ||||||
Interest Expenses | 1,293,846 | 1,280,897 | ||||||
Interest on Deposits | 480,593 | 482,887 | ||||||
Interest on Negotiable Certificates of Deposit | 129,752 | 124,332 | ||||||
Interest on Call Money and Bills Sold | 11,030 | 8,686 | ||||||
Interest on Payables under Repurchase Agreements | 374,524 | 351,012 | ||||||
Interest on Securities Lending Transactions | 7,292 | 7,041 | ||||||
Interest on Commercial Paper | 19,304 | 15,484 | ||||||
Interest on Borrowed Money | 35,522 | 33,949 | ||||||
Interest on Short-term Bonds | 28 | 31 | ||||||
Interest on Bonds and Notes | 172,811 | 173,398 | ||||||
Other Interest Expenses | 62,986 | 84,073 | ||||||
Fee and Commission Expenses | 155,550 | 159,598 | ||||||
Trading Expenses | 1,987 | 15,239 | ||||||
Other Operating Expenses | 225,509 | 152,547 | ||||||
General and Administrative Expenses | 1,430,850 | 1,378,398 | ||||||
Other Ordinary Expenses | 203,788 | 362,142 | ||||||
Provision for Reserves for Possible Losses on Loans | — | 161,005 | ||||||
Other | 203,788 | 201,137 | ||||||
|
|
|
| |||||
Ordinary Profits | ¥ | 614,118 | ¥ | 637,877 | ||||
|
|
|
| |||||
1-7
Mizuho Financial Group, Inc.
| Millions of yen | ||||||||
| For the fiscal year ended March 31, 2019 | For the fiscal year ended March 31, 2020 | |||||||
Extraordinary Gains | ¥ | 11,280 | ¥ | 2,239 | ||||
Gains on Disposition of Fixed Assets | 3,438 | 2,239 | ||||||
Other Extraordinary Gains | 7,841 | — | ||||||
Extraordinary Losses | 509,138 | 21,399 | ||||||
Losses on Disposition of Fixed Assets | 5,414 | 6,138 | ||||||
Losses on Impairment of Fixed Assets | 503,612 | 15,224 | ||||||
Other Extraordinary Losses | 112 | 36 | ||||||
|
|
|
| |||||
Income before Income Taxes | 116,259 | 618,717 | ||||||
|
|
|
| |||||
Income Taxes: | ||||||||
Current | 161,376 | 150,088 | ||||||
Deferred | (163,879 | ) | 11,408 | |||||
|
|
|
| |||||
Total Income Taxes | (2,502 | ) | 161,496 | |||||
|
|
|
| |||||
Profit | 118,762 | 457,221 | ||||||
|
|
|
| |||||
Profit Attributable toNon-controlling Interests | 22,196 | 8,652 | ||||||
|
|
|
| |||||
Profit Attributable to Owners of Parent | ¥ | 96,566 | ¥ | 448,568 | ||||
|
|
|
| |||||
1-8
Mizuho Financial Group, Inc.
Consolidated Statements of Comprehensive Income
| Millions of yen | ||||||||
| For the fiscal year ended March 31, 2019 | For the fiscal year ended March 31, 2020 | |||||||
Profit | ¥ | 118,762 | ¥ | 457,221 | ||||
Other Comprehensive Income | (229,304 | ) | (449,547 | ) | ||||
Net Unrealized Gains (Losses) on Other Securities | (207,505 | ) | (359,779 | ) | ||||
Deferred Gains or Losses on Hedges | 45,391 | 94,536 | ||||||
Foreign Currency Translation Adjustments | (23,882 | ) | (20,650 | ) | ||||
Remeasurements of Defined Benefit Plans | (35,577 | ) | (157,693 | ) | ||||
Share of Other Comprehensive Income of Associates Accounted for Using Equity Method | (7,730 | ) | (5,961 | ) | ||||
|
|
|
| |||||
Comprehensive Income | (110,542) | 7,673 | ||||||
|
|
|
| |||||
(Breakdown) | ||||||||
Comprehensive Income Attributable to Owners of Parent | (128,692 | ) | (3,123 | ) | ||||
Comprehensive Income Attributable toNon-controlling Interests | 18,150 | 10,797 | ||||||
1-9
Mizuho Financial Group, Inc.
(3) Consolidated Statements of Changes in Net Assets
For the fiscal year ended March 31, 2019
| Millions of yen | ||||||||||||||||||||
| Shareholders’ Equity | ||||||||||||||||||||
| Common Stock | Capital Surplus | Retained Earnings | Treasury Stock | Total Shareholders’ Equity | ||||||||||||||||
Balance as of the beginning of the period | 2,256,548 | 1,134,922 | 4,002,835 | (5,997 | ) | 7,388,309 | ||||||||||||||
Changes during the period | ||||||||||||||||||||
Issuance of New Shares | 218 | 218 | 437 | |||||||||||||||||
Cash Dividends | (190,384 | ) | (190,384 | ) | ||||||||||||||||
Profit Attributable to Owners of Parent | 96,566 | 96,566 | ||||||||||||||||||
Repurchase of Treasury Stock | (3,001 | ) | (3,001 | ) | ||||||||||||||||
Disposition of Treasury Stock | (23 | ) | 1,295 | 1,271 | ||||||||||||||||
Transfer from Revaluation Reserve for Land | 6,504 | 6,504 | ||||||||||||||||||
Change in Treasury Shares of Parent Arising from Transactions withNon-controlling Shareholders | 3,331 | 3,331 | ||||||||||||||||||
Net Changes in Items other than Shareholders’ Equity | ||||||||||||||||||||
|
|
|
|
|
|
|
|
|
| |||||||||||
Total Changes during the period | 218 | 3,526 | (87,313 | ) | (1,706 | ) | (85,274 | ) | ||||||||||||
|
|
|
|
|
|
|
|
|
| |||||||||||
Balance as of the end of the period | 2,256,767 | 1,138,449 | 3,915,521 | (7,703 | ) | 7,303,034 | ||||||||||||||
|
|
|
|
|
|
|
|
|
| |||||||||||
| Accumulated Other Comprehensive Income | Stock Acquisition Rights | Non- Controlling Interests | Total Net Assets | |||||||||||||||||||||||||||||||||
| Net Unrealized Gains (Losses) on Other Securities | Deferred Gains or Losses on Hedges | Revaluation Reserve for Land | Foreign Currency Translation Adjustments | Remeasurements of Defined Benefit Plans | Total Accumulated Other Comprehensive Income | |||||||||||||||||||||||||||||||
Balance as of the beginning of the period | 1,392,392 | (67,578 | ) | 144,277 | (85,094 | ) | 293,536 | 1,677,534 | 1,163 | 754,239 | 9,821,246 | |||||||||||||||||||||||||
Changes during the period | ||||||||||||||||||||||||||||||||||||
Issuance of New Shares | 437 | |||||||||||||||||||||||||||||||||||
Cash Dividends | (190,384 | ) | ||||||||||||||||||||||||||||||||||
Profit Attributable to Owners of Parent | 96,566 | |||||||||||||||||||||||||||||||||||
Repurchase of Treasury Stock | (3,001 | ) | ||||||||||||||||||||||||||||||||||
Disposition of Treasury Stock | 1,271 | |||||||||||||||||||||||||||||||||||
Transfer from Revaluation Reserve for Land | 6,504 | |||||||||||||||||||||||||||||||||||
Change in Treasury Shares of Parent Arising from Transactions withNon-controlling Shareholders | 3,331 | |||||||||||||||||||||||||||||||||||
Net Changes in Items other than Shareholders’ Equity | (205,990 | ) | 45,295 | (6,504 | ) | (25,963 | ) | (38,600 | ) | (231,763 | ) | (456 | ) | (309,713 | ) | (541,934 | ) | |||||||||||||||||||
|
|
|
|
|
|
|
|
|
|
|
|
|
|
|
|
|
| |||||||||||||||||||
Total Changes during the period | (205,990 | ) | 45,295 | (6,504 | ) | (25,963 | ) | (38,600 | ) | (231,763 | ) | (456 | ) | (309,713 | ) | (627,208 | ) | |||||||||||||||||||
|
|
|
|
|
|
|
|
|
|
|
|
|
|
|
|
|
| |||||||||||||||||||
Balance as of the end of the period | 1,186,401 | (22,282 | ) | 137,772 | (111,057 | ) | 254,936 | 1,445,770 | 707 | 444,525 | 9,194,038 | |||||||||||||||||||||||||
|
|
|
|
|
|
|
|
|
|
|
|
|
|
|
|
|
| |||||||||||||||||||
1-10
Mizuho Financial Group, Inc.
For the fiscal year ended March 31, 2020
| Millions of yen | ||||||||||||||||||||
| Shareholders’ Equity | ||||||||||||||||||||
| Common Stock | Capital Surplus | Retained Earnings | Treasury Stock | Total Shareholders’ Equity | ||||||||||||||||
Balance as of the beginning of the period | 2,256,767 | 1,138,449 | 3,915,521 | (7,703 | ) | 7,303,034 | ||||||||||||||
Changes during the period | ||||||||||||||||||||
Cash Dividends | (190,405 | ) | (190,405 | ) | ||||||||||||||||
Profit Attributable to Owners of Parent | 448,568 | 448,568 | ||||||||||||||||||
Repurchase of Treasury Stock | (1,908 | ) | (1,908 | ) | ||||||||||||||||
Disposition of Treasury Stock | (625 | ) | 3,197 | 2,571 | ||||||||||||||||
Transfer from Revaluation Reserve for Land | 1,117 | 1,117 | ||||||||||||||||||
Change in Treasury Shares of Parent Arising from Transactions withNon-controlling Shareholders | (1,968 | ) | (1,968 | ) | ||||||||||||||||
Transfer from Retained Earnings to Capital Surplus | 611 | (611 | ) | — | ||||||||||||||||
Net Changes in Items other than Shareholders’ Equity | ||||||||||||||||||||
|
|
|
|
|
|
|
|
|
| |||||||||||
Total Changes during the period | — | (1,981 | ) | 258,668 | 1,288 | 257,975 | ||||||||||||||
|
|
|
|
|
|
|
|
|
| |||||||||||
Balance as of the end of the period | 2,256,767 | 1,136,467 | 4,174,190 | (6,414 | ) | 7,561,010 | ||||||||||||||
|
|
|
|
|
|
|
|
|
| |||||||||||
| Accumulated Other Comprehensive Income | ||||||||||||||||||||||||||||||||||||
| Net Unrealized Gains (Losses) on Other Securities | Deferred Gains or Losses on Hedges | Revaluation Reserve for Land | Foreign Currency Translation Adjustments | Remeasurements of Defined Benefit Plans | Total Accumulated Other Comprehensive Income | Stock Acquisition Rights | Non- Controlling Interests | Total Net Assets | ||||||||||||||||||||||||||||
Balance as of the beginning of the period | 1,186,401 | (22,282 | ) | 137,772 | (111,057 | ) | 254,936 | 1,445,770 | 707 | 444,525 | 9,194,038 | |||||||||||||||||||||||||
Changes during the period | ||||||||||||||||||||||||||||||||||||
Cash Dividends | (190,405 | ) | ||||||||||||||||||||||||||||||||||
Profit Attributable to Owners of Parent | 448,568 | |||||||||||||||||||||||||||||||||||
Repurchase of Treasury Stock | (1,908 | ) | ||||||||||||||||||||||||||||||||||
Disposition of Treasury Stock | 2,571 | |||||||||||||||||||||||||||||||||||
Transfer from Revaluation Reserve for Land | 1,117 | |||||||||||||||||||||||||||||||||||
Change in Treasury Shares of Parent Arising from Transactions withNon-controlling Shareholders | (1,968 | ) | ||||||||||||||||||||||||||||||||||
Transfer from Retained Earnings to Capital Surplus | — | |||||||||||||||||||||||||||||||||||
Net Changes in Items other than Shareholders’ Equity | (363,316 | ) | 94,364 | (1,117 | ) | (22,120 | ) | (160,619 | ) | (452,809 | ) | (493 | ) | (334,862 | ) | (788,165 | ) | |||||||||||||||||||
|
|
|
|
|
|
|
|
|
|
|
|
|
|
|
|
|
| |||||||||||||||||||
Total Changes during the period | (363,316 | ) | 94,364 | (1,117 | ) | (22,120 | ) | (160,619 | ) | (452,809 | ) | (493 | ) | (334,862 | ) | (530,190 | ) | |||||||||||||||||||
|
|
|
|
|
|
|
|
|
|
|
|
|
|
|
|
|
| |||||||||||||||||||
Balance as of the end of the period | 823,085 | 72,081 | 136,655 | (133,178 | ) | 94,317 | 992,960 | 213 | 109,662 | 8,663,847 | ||||||||||||||||||||||||||
|
|
|
|
|
|
|
|
|
|
|
|
|
|
|
|
|
| |||||||||||||||||||
1-11
Mizuho Financial Group, Inc.
(4) Consolidated Statements of Cash Flows
| Millions of yen | ||||||||||||
| For the fiscal year ended March 31, 2019 | For the fiscal year ended March 31, 2020 | |||||||||||
Cash Flow from Operating Activities | ||||||||||||
Income before Income Taxes | ¥ | 116,259 | ¥ | 618,717 | ||||||||
Depreciation | 168,200 | 152,666 | ||||||||||
Losses on Impairment of Fixed Assets | 503,612 | 15,224 | ||||||||||
Amortization of Goodwill | 4,080 | 4,062 | ||||||||||
Equity in Loss (Gain) from Investments in Affiliates | (51,215 | ) | (30,382 | ) | ||||||||
Increase (Decrease) in Reserves for Possible Losses on Loans | (26,910 | ) | 139,940 | |||||||||
Increase (Decrease) in Reserve for Possible Losses on Sales of Loans | (444 | ) | 6 | |||||||||
Increase (Decrease) in Reserve for Contingencies | 183 | 1,793 | ||||||||||
Increase (Decrease) in Reserve for Bonus Payments | 591 | 8,611 | ||||||||||
Increase (Decrease) in Reserve for Variable Compensation | (375 | ) | (307 | ) | ||||||||
Decrease (Increase) in Net Defined Benefit Asset | (57,863 | ) | (91,950 | ) | ||||||||
Increase (Decrease) in Net Defined Benefit Liability | 2,497 | 2,590 | ||||||||||
Increase (Decrease) in Reserve for Director and Corporate Auditor Retirement Benefits | (41 | ) | (439 | ) | ||||||||
Increase (Decrease) in Reserve for Reimbursement of Deposits | (942 | ) | 8,782 | |||||||||
Increase (Decrease) in Reserve for Reimbursement of Debentures | (5,194 | ) | (6,893 | ) | ||||||||
Interest Income—accrual basis | (2,056,327 | ) | (2,014,440 | ) | ||||||||
Interest Expenses—accrual basis | 1,293,846 | 1,280,897 | ||||||||||
Losses (Gains) on Securities | (195,755 | ) | (231,382 | ) | ||||||||
Losses (Gains) on Money Held in Trust | (40 | ) | (121 | ) | ||||||||
Foreign Exchange Losses (Gains)—net | (170,422 | ) | 103,125 | |||||||||
Losses (Gains) on Disposition of Fixed Assets | 1,976 | 3,898 | ||||||||||
Losses (Gains) on Cancellation of Employee Retirement Benefit Trust | (7,841 | ) | — | |||||||||
Decrease (Increase) in Trading Assets | (1,536,520 | ) | (1,435,994 | ) | ||||||||
Increase (Decrease) in Trading Liabilities | 227,455 | 1,488,005 | ||||||||||
Decrease (Increase) in Derivatives other than for Trading Assets | 485,333 | (638,977 | ) | |||||||||
Increase (Decrease) in Derivatives other than for Trading Liabilities | (355,068 | ) | 475,833 | |||||||||
Decrease (Increase) in Loans and Bills Discounted | (2,407,594 | ) | (5,967,287 | ) | ||||||||
Increase (Decrease) in Deposits | 927,918 | 7,732,005 | ||||||||||
Increase (Decrease) in Negotiable Certificates of Deposit | 1,878,841 | 367,378 | ||||||||||
Increase (Decrease) in Borrowed Money (excluding Subordinated Borrowed Money) | (1,800,307 | ) | 2,165,756 | |||||||||
Decrease (Increase) in Due from Banks (excluding Due from Central Banks) | 611,070 | (365,564 | ) | |||||||||
Decrease (Increase) in Call Loans, etc. | (4,807,554 | ) | (5,758,002 | ) | ||||||||
Decrease (Increase) in Guarantee Deposits Paid under Securities Borrowing Transactions | 1,772,393 | 334,971 | ||||||||||
Increase (Decrease) in Call Money, etc. | 1,748,141 | 3,128,355 | ||||||||||
Increase (Decrease) in Commercial Paper | 199,104 | (511,609 | ) | |||||||||
Increase (Decrease) in Guarantee Deposits Received under Securities Lending Transactions | (82,249 | ) | (376,328 | ) | ||||||||
Decrease (Increase) in Foreign Exchange Assets | (34,376 | ) | (106,795 | ) | ||||||||
Increase (Decrease) in Foreign Exchange Liabilities | 223,848 | (159,598 | ) | |||||||||
Increase (Decrease) in Short-term Bonds (Liabilities) | (6,646 | ) | 18,119 | |||||||||
Increase (Decrease) in Bonds and Notes | 286,158 | 308,937 | ||||||||||
Increase (Decrease) in Due to Trust Accounts | (10,232 | ) | (46,563 | ) | ||||||||
Interest and Dividend Income—cash basis | 2,027,241 | 2,047,339 | ||||||||||
Interest Expenses—cash basis | (1,250,247 | ) | (1,315,446 | ) | ||||||||
Other—net | (75,059 | ) | 650,590 | |||||||||
|
|
|
| |||||||||
Subtotal | (2,460,479 | ) | 1,999,524 | |||||||||
|
|
|
| |||||||||
Cash Refunded (Paid) in Income Taxes | (175,617 | ) | (97,631 | ) | ||||||||
|
|
|
| |||||||||
Net Cash Provided by (Used in) Operating Activities | (2,636,096 | ) | 1,901,893 | |||||||||
|
|
|
| |||||||||
1-12
Mizuho Financial Group, Inc.
| Millions of yen | ||||||||||||
| For the fiscal year ended March 31, 2019 | For the fiscal year ended March 31, 2020 | |||||||||||
Cash Flow from Investing Activities | ||||||||||||
Payments for Purchase of Securities | (52,363,143 | ) | (72,474,752 | ) | ||||||||
Proceeds from Sale of Securities | 38,799,373 | 48,136,966 | ||||||||||
Proceeds from Redemption of Securities | 19,211,836 | 18,815,661 | ||||||||||
Payments for Increase in Money Held in Trust | (109,630 | ) | (78,650 | ) | ||||||||
Proceeds from Decrease in Money Held in Trust | 94,984 | 18,523 | ||||||||||
Payments for Purchase of Tangible Fixed Assets | (42,703 | ) | (85,840 | ) | ||||||||
Payments for Purchase of Intangible Fixed Assets | (111,595 | ) | (151,011 | ) | ||||||||
Proceeds from Sale of Tangible Fixed Assets | 7,811 | 6,353 | ||||||||||
Proceeds from Sale of Intangible Fixed Assets | — | 3,144 | ||||||||||
Proceeds from Sales of Stocks of Subsidiaries (affecting the scope of consolidation) | 219 | 1,067 | ||||||||||
|
|
|
| |||||||||
Net Cash Provided by (Used in) Investing Activities | 5,487,153 | (5,808,537 | ) | |||||||||
|
|
|
| |||||||||
Cash Flow from Financing Activities | ||||||||||||
Proceeds from Subordinated Borrowed Money | 10,000 | 15,000 | ||||||||||
Repayments of Subordinated Borrowed Money | (45,000 | ) | (30,000 | ) | ||||||||
Proceeds from Issuance of Subordinated Bonds | 510,000 | 483,000 | ||||||||||
Payments for Redemption of Subordinated Bonds | (5,000 | ) | (213,000 | ) | ||||||||
Proceeds from Issuance of Common Stock | 2 | — | ||||||||||
Proceeds from Investments byNon-controlling Shareholders | 3,514 | 2,883 | ||||||||||
Repayments toNon-controlling Shareholders | (275,079 | ) | (303,000 | ) | ||||||||
Cash Dividends Paid | (190,413 | ) | (190,386 | ) | ||||||||
Cash Dividends Paid toNon-controlling Shareholders | (25,494 | ) | (9,568 | ) | ||||||||
Payments for Purchase of Stocks of Subsidiaries (not affecting the scope of consolidation) | — | (4,653 | ) | |||||||||
Payments for Repurchase of Treasury Stock | (2,124 | ) | (1,441 | ) | ||||||||
Proceeds from Sale of Treasury Stock | 952 | 1,516 | ||||||||||
Payments for Repurchase of Treasury Stock of Subsidiaries | — | (32,199 | ) | |||||||||
|
|
|
| |||||||||
Net Cash Provided by (Used in) Financing Activities | (18,640 | ) | (281,849 | ) | ||||||||
|
|
|
| |||||||||
Effect of Foreign Exchange Rate Changes on Cash and Cash Equivalents | (32,656 | ) | (202,776 | ) | ||||||||
|
|
|
| |||||||||
Net Increase (Decrease) in Cash and Cash Equivalents | 2,799,759 | (4,391,269 | ) | |||||||||
|
|
|
| |||||||||
Cash and Cash Equivalents at the beginning of the fiscal year | 46,334,334 | 44,254,874 | ||||||||||
Decrease in Cash and Cash Equivalents resulting from Exclusion of Subsidiaries from Consolidation | (4,879,218 | ) | (0 | ) | ||||||||
|
|
|
| |||||||||
Cash and Cash Equivalents at the end of the fiscal year | ¥ | 44,254,874 | ¥ | 39,863,604 | ||||||||
|
|
|
| |||||||||
1-13
Mizuho Financial Group, Inc.
(5) Notes regarding Consolidated Financial Statements
(Matters Related to the Assumption of Going Concern)
There is no applicable information.
(Changes in Accounting Policies)
(Application of “Leases” (IFRS 16 and ASU2016-02))
MHFG has applied “Leases” (IFRS 16 and ASU2016-02) at some consolidated subsidiaries from the consolidated fiscal year ended March 31, 2020. Accordingly, lessees recognize assets and liabilities for all leases as a general rule.
In accordance with transitional treatment, MHFG has recognized the impact of adoption of this accounting standard cumulatively as of the date of adoption for balances at the beginning of the consolidated fiscal year ended March 31, 2020.
The impact on the consolidated financial statements for the consolidated fiscal year ended March 31, 2020 is immaterial.
(Changes in Hedge Accounting)
Previously, deferred method or the fair-value hedge method have been applied as hedge accounting methods.
From the third quarter ended December 31, 2019, hedge accounting methods of some items were changed from fair-value method to deferred method.
Based on current market trends, MHFG reconsidered its risk management activities from the third quarter ended December 31, 2019, in order to provide more transparent disclosure in the financial statements.
If the same accounting policy as that of the current fiscal year had been adopted in the interim period ended September 30, 2019, the effect of this change on this interim period would have been immaterial.
The effect of this change in accounting policy on past periods is immaterial. Therefore, we do not retrospectively apply this policy change in prior periods. This change has no impact on the gains and losses.
1-14
Mizuho Financial Group, Inc.
(Business Segment Information)
1. Summary of reportable segment
MHFG has introduced anin-house company system based on the group’s diverse customer segments.
The aim of this system is to leverage MHFG’s strengths and competitive advantage, which is the seamless integration of MHFG’s banking, trust and securities functions under a holding company structure, to speedily provide high-quality financial services that closely match customer needs.
Specifically, the company system is classified into the following fivein-house companies, each based on a customer segment: the Retail & Business Banking Company, the Corporate & Institutional Company, the Global Corporate Company, the Global Markets Company, and the Asset Management Company.
The services that eachin-house company is in charge of are as follows:
Retail & Business Banking Company:
Services for individual customers, small andmedium-sized enterprises and middle market firms in Japan
Corporate & Institutional Company:
Services for large corporations, financial institutions and public corporations in Japan
Global Corporate Company:
Services for Japanese overseas affiliated corporate customers andnon-Japanese corporate customers, etc.
Global Markets Company:
Investment services with respect to interest rates, equities and credits, etc. , and other services
Asset Management Company:
Development of products and provision of services that match the asset management needs of its wide range of customers from individuals to institutional investors
The reportable segment information, set forth below, is derived from the internal management reporting systems used by management to measure the performance of the Group’s operating segments.
Management measures the performance of each of the operating segments in accordance with internal managerial accounting rules and practices.
2. Calculating method of Gross profits (excluding the amounts of credit costs of trust accounts) + Net gains or losses related to ETFs and others, Net business profits or losses (excluding the amounts of credit costs of trust accounts, before reversal of (provision for) general reserve for losses on loans) + Net gains or losses related to ETFs and others, and Fixed assets by reportable segment
The following information of reportable segment is based on internal management reporting.
Gross profits (excluding the amounts of credit costs of trust accounts) + Net gains or losses related to ETFs and others is the total amount of Interest Income, Fiduciary Income, Fee and Commission Income, Trading Income, Other Operating Income, and Net gains or losses related to ETFs and others.
Net business profits or losses (excluding the amounts of credit costs of trust accounts, before reversal of (provision for) general reserve for losses on loans) + Net gains or losses related to ETFs and others is the amount of which General and administrative expenses (excludingnon-recurring expenses and others), Equity in income from investments in affiliates, Amortization of goodwill and others (including amortization of intangible assets), and Others (consolidation adjustments) are deducted from, or added to, Gross profits (excluding the amounts of credit costs of trust accounts) + Net gains or losses related to ETFs and others.
Gross profits (excluding the amounts of credit costs of trust accounts) + Net gains or losses related to ETFs and others relating to transactions between segments is based on the current market price.
Fixed assets disclosed as asset information by segment are the total amount of tangible fixed assets and intangible fixed assets. Fixed assets pertaining to Mizuho Bank, Ltd., Mizuho Trust & Banking Co., Ltd., and Mizuho Securities Co., Ltd. have been allocated to each segment.
1-15
Mizuho Financial Group, Inc.
3. Gross profits (excluding the amounts of credit costs of trust accounts) + Net gains or losses related to ETFs and others, Net business profits or losses (excluding the amounts of credit costs of trust accounts, before reversal of (provision for) general reserve for losses on loans) + Net gains or losses related to ETFs and others, and Fixed assets by reportable segment
| Millions of yen | ||||||||||||||||||||||||||||
| MHFG (Consolidated) | ||||||||||||||||||||||||||||
| Retail & Business Banking Company | Corporate & Institutional Company | Global Corporate Company | Global Markets Company | Asset Management Company | Others (Note 2) | |||||||||||||||||||||||
Gross profits (excluding the amounts of credit costs of trust accounts) + Net gains or losses related to ETFs and others | 673,572 | 462,418 | 417,770 | 410,138 | 48,361 | 60,563 | 2,072,822 | |||||||||||||||||||||
General and administrative expenses (excludingNon-Recurring Losses and others) | 668,435 | 215,035 | 249,044 | 208,861 | 28,966 | 41,097 | 1,411,438 | |||||||||||||||||||||
Equity in income from investments in affiliates | 11,762 | 1,957 | 10,355 | — | 1,295 | 5,013 | 30,382 | |||||||||||||||||||||
Amortization of goodwill and others | 363 | 425 | 369 | 2,346 | 7,774 | 1,961 | 13,238 | |||||||||||||||||||||
Others | — | — | — | — | — | (5,942 | ) | (5,942 | ) | |||||||||||||||||||
Net business profits or losses (excluding the amounts of credit costs of trust accounts, before reversal of (provision for) general reserve for losses on loans) + Net gains or losses related to ETFs and others | 16,536 | 248,915 | 178,712 | 198,931 | 12,916 | 16,575 | 672,585 | |||||||||||||||||||||
Fixed assets | 503,692 | 204,134 | 173,023 | 91,459 | 93 | 767,361 | 1,739,762 | |||||||||||||||||||||
(Notes) 1. | Gross profits (excluding the amounts of credit costs of trust accounts) +Net gains or losses related to ETFs and others is reported instead of sales reported by general corporations. Net gains or losses related to ETFs and others amounted to ¥ 10,602 million, of which ¥ 7,334 million is included in the Global Markets Company. | |
2. | “Others” includes items which should be eliminated as internal transactions between each segment on a consolidated basis. | |
3. | “Others” in Fixed assets includes assets of headquarters that have not been allocated to each segment, Fixed assets pertaining to consolidated subsidiaries that are not subject to allocation, consolidated adjustments, and others. | |
| Among Fixed assets that have not been allocated to each segment, some related expenses are allocated to each segment using the reasonable criteria of allocation. | ||
1-16
Mizuho Financial Group, Inc.
4. The difference between the total amounts of reportable segments and the recorded amounts in the Consolidated Statement of Income, and the contents of the difference (Matters relating to adjustment to difference)
The above amount of Gross profits (excluding the amounts of credit costs of trust accounts) + Net gains or losses related to ETFs and others and that of Net business profits (excluding the amounts of credit costs of trust accounts, before reversal of (provision for) general reserve for losses on loans) + Net gains or losses related to ETFs and others derived from internal management reporting by reportable segment are different from the amounts recorded in the Consolidated Statement of Income.
The contents of the difference for the period are as follows:
| (1) | The total of Gross profits (excluding the amounts of credit costs of trust accounts) + Net gains or losses related to ETFs and others of Segment Information and Ordinary Profits recorded in the Consolidated Statement of Income |
| Millions of yen | ||||
| Amount | ||||
| Gross profits (excluding the amounts of credit costs of trust accounts) + Net gains or losses related to ETFs and others | 2,072,822 | |||
Net gains or losses related to ETFs and others | (10,602 | ) | ||
Other Ordinary Income | 316,198 | |||
General and Administrative Expenses | (1,378,398 | ) | ||
Other Ordinary Expenses | (362,142 | ) | ||
|
| |||
Ordinary Profits recorded in Consolidated Statement of Income | 637,877 | |||
|
| |||
| (2) | The total of Net business profits (excluding the amounts of credit costs of trust accounts, before reversal of (provision for) general reserve for losses on loans) + Net gains or losses related to ETFs and others of Segment Information and Income before Income Taxes recorded in the Consolidated Statement of Income |
| Millions of yen | ||||
| Amount | ||||
Net Business Profits (excluding the amounts of credit costs of trust accounts, before reversal of (provision for) general reserve for losses on loans) + Net Gains (Losses) related to ETFs and others | 672,585 | |||
Credit Costs for Trust Accounts | — | |||
General and Administrative Expenses(non-recurring losses) | 46,278 | |||
Expenses related to Portfolio Problems (including reversal of (provision for) general reserve for losses on loans) | (183,308 | ) | ||
Gains on Reversal of Reserves for Possible Losses on Loans, and others | 11,605 | |||
Net Gains (Losses) related to Stocks—Net Gains (Losses) related to ETFs and others | 126,571 | |||
Net Extraordinary Gains (Losses) | (19,159 | ) | ||
Others | (35,854 | ) | ||
|
| |||
Income before Income Taxes recorded in Consolidated Statement of Income | 618,717 | |||
|
| |||
1-17
Mizuho Financial Group, Inc.
(Per Share Information)
(Consolidated basis)
| Fiscal 2018 | Fiscal 2019 | |||||||||||
Net Assets per Share of Common Stock | ¥ | 345.00 | ¥ | 337.29 | ||||||||
Net Income per Share of Common Stock | ¥ | 3.80 | ¥ | 17.68 | ||||||||
Diluted Net Income per Share of Common Stock | ¥ | 3.80 | ¥ | 17.68 | ||||||||
1. Total Net Assets per Share of Common Stock is based on the following information: |
| |||||||||||
| Fiscal 2018 | Fiscal 2019 | |||||||||||
Net Assets per Share of Common Stock |
| |||||||||||
Total Net Assets | ¥ | million | 9,194,038 | 8,663,847 | ||||||||
Deductions from Total Net Assets | ¥ | million | 445,232 | 109,876 | ||||||||
Stock Acquisition Rights | ¥ | million | 707 | 213 | ||||||||
Non-Controlling Interests | ¥ | million | 444,525 | 109,662 | ||||||||
Net Assets(year-end) related to Common Stock | ¥ | million | 8,748,805 | 8,553,971 | ||||||||
Year-end Outstanding Shares of Common Stock, based on which Total Net Assets per Share of Common Stock was calculated | | Thousands of shares |
| 25,358,536 | 25,360,392 | |||||||
2. Net Income per Share of Common Stock and Diluted Net Income per Share of Common Stock are based on the following information: |
| |||||||||||
| Fiscal 2018 | Fiscal 2019 | |||||||||||
Net Income per Share of Common Stock |
| |||||||||||
Profit Attributable to Owners of Parent | ¥ | million | 96,566 | 448,568 | ||||||||
Amount not attributable to Common Stock | ¥ | million | — | — | ||||||||
Profit Attributable to Owners of Parent related to Common Stock | ¥ | million | 96,566 | 448,568 | ||||||||
Average Outstanding Shares of Common Stock (during the period) | | Thousands of shares |
| 25,362,375 | 25,360,661 | |||||||
Diluted Net Income per Share of Common Stock |
| |||||||||||
Adjustment to Profit Attributable to Owners of Parent | ¥ | million | — | — | ||||||||
Increased Number of Shares of Common Stock | | Thousands of shares |
| 4,522 | 1,582 | |||||||
Stock Acquisition Rights | | Thousands of shares |
| 4,522 | 1,582 | |||||||
Description of dilutive securities which were not included in the calculation of Diluted Net Income per Share of Common Stock as they have no dilutive effects | — | — | ||||||||||
1-18
Mizuho Financial Group, Inc.
| 3. | In the calculation of Net Assets per Share of Common Stock, MHFG shares outstanding in BBT trust account that were recognized as Treasury Stock in Shareholders’ Equity are included in Treasury Stock shares deducted from the number of issued shares as of March 31, 2019 and 2020. The numbers of such Treasury Stock shares deducted during the period ended March 31, 2019 and 2020 are 18,917 thousand and 19,636 thousand, respectively. |
In the calculation of Net Income per Share of Common Stock and Diluted Net Income per Share of Common Stock, such Treasury Stock shares are included in Treasury Stock shares deducted in the calculation of the Average Outstanding Shares of Common Stock during the period. The average numbers of such Treasury Stock shares deducted during the period ended March 31, 2019 and 2020 are 17,195 thousand and 19,255 thousand, respectively. |
(Subsequent Events)
The Board of Directors of the MHFG today (May 15, 2020) resolved to include the share consolidation in the agenda for the 18th Ordinary General Meeting of Shareholders to be held in June 2020.
For details, please refer to “Notice on Partial Amendment to the Articles of Incorporation and Share Consolidation” announced today.
1-19
SELECTED FINANCIAL INFORMATION
For Fiscal 2019
(Under Japanese GAAP)

C O N T E N T S
Notes:
“CON”:Consolidated figures for Mizuho Financial Group, Inc. (“MHFG”)
“NON”:Non-consolidated figures for Mizuho Financial Group, Inc., Mizuho Bank, Ltd. (“MHBK”) and Mizuho Trust & Banking Co., Ltd. (“MHTB”)
I. FINANCIAL DATA FOR FISCAL 2019 | See above Notes | Page | ||||||||||
1. Income Analysis | CON | NON | 2- 1 | |||||||||
2. Interest Margins (Domestic Operations) | NON | 2- 5 | ||||||||||
3. Use and Source of Funds | NON | 2- 6 | ||||||||||
4. Net Gains/Losses on Securities | CON | NON | 2- 8 | |||||||||
5. Unrealized Gains/Losses on Securities | CON | NON | 2- 10 | |||||||||
6. Projected Redemption Amounts for Securities | NON | 2- 12 | ||||||||||
7. Overview of Derivative Transactions Qualifying for Hedge Accounting | NON | 2- 13 | ||||||||||
8. Employee Retirement Benefits | NON | CON | 2- 14 | |||||||||
9. Capital Ratio | CON | NON | 2- 17 | |||||||||
II. REVIEW OF CREDITS | See above Notes | Page | ||||||||||
1. Status ofNon-Accrual, Past Due & Restructured Loans | CON | NON | 2- 18 | |||||||||
2. Status of Reserves for Possible Losses on Loans | CON | NON | 2- 20 | |||||||||
3. Reserve Ratios forNon-Accrual, Past Due & Restructured Loans | CON | NON | 2- 21 | |||||||||
4. Status of Non Performing Loans based on the Financial Reconstruction Act(“FRA”) | CON | NON | 2- 22 | |||||||||
5. Coverage on Non Performing Loans based on the FRA | NON | 2- 24 | ||||||||||
6. Overview ofNon-Performing Loans(“NPLs”) | NON | 2- 27 | ||||||||||
7. Results of Removal of NPLs from the Balance Sheet | NON | 2- 28 | ||||||||||
8. Status of Loans by Industry | ||||||||||||
(1) Outstanding Balances andNon-Accrual, Past Due & Restructured Loans by Industry | NON | 2- 29 | ||||||||||
(2) Non Performing Loans based on the FRA and Coverage Ratio by Industry | NON | 2- 31 | ||||||||||
9. Housing and Consumer Loans & Loans to Small andMedium-Sized Enterprises | ||||||||||||
(“SMEs”) and Individual Customers | ||||||||||||
(1) Balance of Housing and Consumer Loans | NON | 2- 32 | ||||||||||
(2) Loans to SMEs and Individual Customers | NON | 2- 32 | ||||||||||
10. Status of Loans by Region | NON | 2- 33 | ||||||||||
III. DEFERRED TAXES | See above Notes | Page | ||||||||||
1. Estimation for Calculating Deferred Tax Assets | NON | 2- 34 | ||||||||||
IV. OTHERS | See above Notes | Page | ||||||||||
1. Breakdown of Deposits (Domestic Offices) | NON | 2- 36 | ||||||||||
2. Number of Directors and Employees | 2- 37 | |||||||||||
3. Number of Offices | 2- 37 | |||||||||||
4. Earnings Plan for Fiscal 2020 | CON | NON | 2- 38 | |||||||||
Attachments | Page | |||||||
Mizuho Bank, Ltd. | ||||||||
Comparison ofNon-Consolidated Balance Sheets (selected items) | 2- 39 | |||||||
Comparison ofNon-Consolidated Statements of Income (selected items) | 2- 40 | |||||||
Mizuho Trust & Banking Co., Ltd. | ||||||||
Comparison ofNon-Consolidated Balance Sheets (selected items) | 2- 41 | |||||||
Comparison ofNon-Consolidated Statements of Income (selected items) | 2- 42 | |||||||
Statement of Trust Assets and Liabilities | 2- 43 | |||||||
Comparison of Balances of Principal Items | 2- 44 | |||||||
Mizuho Securities Co., Ltd. | ||||||||
Comparison ofNon-Consolidated Balance Sheets (selected items) | 2- 45 | |||||||
Comparison ofNon-Consolidated Statements of Income (selected items) | 2- 46 | |||||||
This immediate release contains statements that constitute forward-looking statements within the meaning of the United States Private Securities Litigation Reform Act of 1995, including estimates, forecasts, targets and plans. Such forward-looking statements do not represent any guarantee by management of future performance.
In many cases, but not all, we use such words as “aim,” “anticipate,” “believe,” “endeavor,” “estimate,” “expect,” “intend,” “may,” “plan,” “probability,” “project,” “risk,” “seek,” “should,” “strive,” “target” and similar expressions in relation to us or our management to identify forward-looking statements. You can also identify forward-looking statements by discussions of strategy, plans or intentions. These statements reflect our current views with respect to future events and are subject to risks, uncertainties and assumptions.
We may not be successful in implementing our business strategies, and management may fail to achieve its targets, for a wide range of possible reasons, including, without limitation: incurrence of significant credit-related costs; declines in the value of our securities portfolio; changes in interest rates; foreign currency fluctuations; decrease in the market liquidity of our assets; revised assumptions or other changes related to our pension plans; a decline in our deferred tax assets; impairment of the carrying value of our long-lived assets; problems related to our information technology systems, including as a result of cyber attacks; the effect of financial transactions entered into for hedging and other similar purposes; failure to maintain required capital adequacy ratio levels and meet other financial regulatory requirements; downgrades in our credit ratings; our ability to avoid reputational harm; our ability to implement our Medium-term Business Plan, realize the synergy effects of ”One MIZUHO”, and implement other strategic initiatives and measures effectively; the effectiveness of our operational, legal and other risk management policies; the effect of changes in general economic conditions in Japan and elsewhere; and changes to applicable laws and regulations.
Further information regarding factors that could affect our financial condition and results of operations is included in “Item 3.D. Key Information-Risk Factors” and “Item 5. Operating and Financial Review and Prospects” in our most recent Form20-F filed with the U.S. Securities and Exchange Commission (“SEC”), and our report on Form6-K furnished to the SEC on December 26, 2019, both of which are available in the Financial Information section of our web page atwww.mizuho-fg.com/index.html and also at the SEC’s web site at www.sec.gov.
We do not intend to update our forward-looking statements. We are under no obligation, and disclaim any obligation, to update or alter our forward-looking statements, whether as a result of new information, future events or otherwise, except as may be required by the rules of the Tokyo Stock Exchange.
Mizuho Financial Group, Inc.
I. FINANCIAL DATA FOR FISCAL 2019
1. Income Analysis
Consolidated
| (Millions of yen) | ||||||||||||||||
| Fiscal 2019 | Fiscal 2018 | |||||||||||||||
| Change | ||||||||||||||||
Consolidated Gross Profits | 1 | 2,062,219 | 249,482 | 1,812,737 | ||||||||||||
Net Interest Income | 2 | 733,542 | (28,937 | ) | 762,480 | |||||||||||
Fiduciary Income | 3 | 58,565 | 3,411 | 55,153 | ||||||||||||
Credit Costs for Trust Accounts | 4 | — | — | — | ||||||||||||
Net Fee and Commission Income | 5 | 619,243 | 8,815 | 610,427 | ||||||||||||
Net Trading Income | 6 | 391,299 | 93,931 | 297,367 | ||||||||||||
Net Other Operating Income | 7 | 259,567 | 172,261 | 87,306 | ||||||||||||
General and Administrative Expenses | 8 | (1,378,398 | ) | 52,451 | (1,430,850 | ) | ||||||||||
Expenses related to Portfolio Problems (including Reversal of (Provision for) General Reserve for Losses on Loans) | 9 | (183,308 | ) | (152,598 | ) | (30,710 | ) | |||||||||
Losses on Write-offs of Loans | 10 | (21,940 | ) | 4,425 | (26,366 | ) | ||||||||||
Gains on Reversal of Reserves for Possible Losses on Loans, and others | 11 | 11,605 | 449 | 11,156 | ||||||||||||
Net Gains (Losses) related to Stocks | 12 | 137,174 | (137,689 | ) | 274,863 | |||||||||||
Equity in Income from Investments in Affiliates | 13 | 30,382 | (20,832 | ) | 51,215 | |||||||||||
Other | 14 | (41,797 | ) | 32,496 | (74,293 | ) | ||||||||||
|
|
|
|
|
| |||||||||||
Ordinary Profits | 15 | 637,877 | 23,758 | 614,118 | ||||||||||||
|
|
|
|
|
| |||||||||||
Net Extraordinary Gains (Losses) | 16 | (19,159 | ) | 478,698 | (497,858 | ) | ||||||||||
Income before Income Taxes | 17 | 618,717 | 502,457 | 116,259 | ||||||||||||
Income Taxes - Current | 18 | (150,088 | ) | 11,288 | (161,376 | ) | ||||||||||
- Deferred | 19 | (11,408 | ) | (175,287 | ) | 163,879 | ||||||||||
Profit | 20 | 457,221 | 338,458 | 118,762 | ||||||||||||
Profit Attributable toNon-controlling Interests | 21 | (8,652 | ) | 13,543 | (22,196 | ) | ||||||||||
|
|
|
|
|
| |||||||||||
Profit Attributable to Owners of Parent | 22 | 448,568 | 352,002 | 96,566 | ||||||||||||
|
|
|
|
|
| |||||||||||
Credit-related Costs (including Credit Costs for Trust Accounts) | 23 | (171,703 | ) | (152,149 | ) | (19,553 | ) | |||||||||
* Credit-related Costs [23] = Expenses related to Portfolio Problems (including Reversal of (Provision for) General Reserve for Losses on Loans) [9] + Gains on Reversal of Reserves for Possible Losses on Loans, and others [11] + Credit Costs for Trust Accounts [4] |
| |||||||||||||||
| (Reference) | ||||||||||||||||
Consolidated Net Business Profits | 24 | 661,982 | 268,593 | 393,389 | ||||||||||||
* Consolidated Net Business Profits [24] = Consolidated Gross Profits [1] - General and Administrative Expenses (excludingNon-Recurring Losses) + Equity in Income from Investments in Affiliates and certain other consolidation adjustments |
| |||||||||||||||
Number of consolidated subsidiaries | 25 | 126 | 9 | 117 | ||||||||||||
Number of affiliates under the equity method | 26 | 26 | 4 | 22 | ||||||||||||
2-1
Mizuho Financial Group, Inc.
Aggregate Figures for the 2 Banks
Non-Consolidated
| (Millions of yen) | ||||||||||||||||||||||||
| Fiscal 2019 | Fiscal 2018 | |||||||||||||||||||||||
| MHBK | MHTB | Aggregate Figures | Change | |||||||||||||||||||||
Gross Profits | 1 | 1,304,598 | 132,949 | 1,437,547 | 240,389 | 1,197,158 | ||||||||||||||||||
Domestic Gross Profits | 2 | 750,934 | 126,769 | 877,703 | 88,440 | 789,263 | ||||||||||||||||||
Net Interest Income | 3 | 413,957 | 21,810 | 435,768 | (44,668 | ) | 480,436 | |||||||||||||||||
Fiduciary Income | 4 | 59,132 | 59,132 | 4,134 | 54,997 | |||||||||||||||||||
Trust Fees for Jointly Operated Designated Money Trust | 5 | 4,229 | 4,229 | 370 | 3,859 | |||||||||||||||||||
Credit Costs for Trust Accounts(1) | 6 | — | — | — | — | |||||||||||||||||||
Net Fee and Commission Income | 7 | 248,316 | 36,202 | 284,519 | 1,045 | 283,473 | ||||||||||||||||||
Net Trading Income(2) | 8 | 48,841 | 8,267 | 57,109 | 108,797 | (51,687 | ) | |||||||||||||||||
Net Other Operating Income | 9 | 39,818 | 1,355 | 41,173 | 19,131 | 22,042 | ||||||||||||||||||
International Gross Profits | 10 | 553,663 | 6,179 | 559,843 | 151,948 | 407,895 | ||||||||||||||||||
Net Interest Income | 11 | 215,056 | 2,055 | 217,111 | 21,409 | 195,702 | ||||||||||||||||||
Net Fee and Commission Income | 12 | 136,819 | (619 | ) | 136,200 | 2,496 | 133,703 | |||||||||||||||||
Net Trading Income(2) | 13 | 100,945 | (6,761 | ) | 94,183 | (20,534 | ) | 114,717 | ||||||||||||||||
Net Other Operating Income | 14 | 100,841 | 11,505 | 112,347 | 148,576 | (36,229 | ) | |||||||||||||||||
General and Administrative Expenses (excludingNon-Recurring Losses) | 15 | (838,102 | ) | (84,183 | ) | (922,286 | ) | 27,105 | (949,392 | ) | ||||||||||||||
Expense Ratio | 16 | 64.2 | % | 63.3 | % | 64.1 | % | (15.1 | %) | 79.3 | % | |||||||||||||
Personnel Expenses | 17 | (323,917 | ) | (39,766 | ) | (363,683 | ) | 13,253 | (376,936 | ) | ||||||||||||||
Non-Personnel Expenses | 18 | (464,785 | ) | (40,969 | ) | (505,754 | ) | 14,699 | (520,454 | ) | ||||||||||||||
Premium for Deposit Insurance | 19 | (31,138 | ) | (1,295 | ) | (32,433 | ) | (514 | ) | (31,919 | ) | |||||||||||||
Miscellaneous Taxes | 20 | (49,400 | ) | (3,448 | ) | (52,848 | ) | (847 | ) | (52,001 | ) | |||||||||||||
|
|
|
|
|
|
|
|
|
| |||||||||||||||
Net Business Profits (before Reversal of (Provision for) General Reserve for Losses on Loans) | 21 | 466,495 | 48,765 | 515,261 | 267,495 | 247,766 | ||||||||||||||||||
Net Business Profits (before Reversal of (Provision for) General Reserve for Losses on Loans) from core business areas(3) | 22 | 364,306 | 36,187 | 400,494 | 47,171 | 353,322 | ||||||||||||||||||
Excluding Net Gains (Losses) from redemption of Investment Trusts | 23 | 359,557 | 36,083 | 395,641 | 48,547 | 347,093 | ||||||||||||||||||
|
|
|
|
|
|
|
|
|
| |||||||||||||||
Reversal of (Provision for) General Reserve for Losses on Loans | 24 | (105,579 | ) | (649 | ) | (106,229 | ) | (151,120 | ) | 44,890 | ||||||||||||||
|
|
|
|
|
|
|
|
|
| |||||||||||||||
Net Business Profits | 25 | 360,916 | 48,115 | 409,031 | 116,374 | 292,656 | ||||||||||||||||||
Net Gains (Losses) related to Bonds | 26 | 102,189 | 12,577 | 114,767 | 220,323 | (105,556 | ) | |||||||||||||||||
|
|
|
|
|
|
|
|
|
| |||||||||||||||
NetNon-Recurring Gains (Losses) | 27 | 69,845 | 1,560 | 71,406 | 24,135 | 47,271 | ||||||||||||||||||
Net Gains (Losses) related to Stocks | 28 | 121,341 | 4,157 | 125,499 | (50,665 | ) | 176,164 | |||||||||||||||||
Expenses related to Portfolio Problems | 29 | (77,270 | ) | (979 | ) | (78,250 | ) | (3,823 | ) | (74,427 | ) | |||||||||||||
Gains on Reversal of Reserves for Possible Losses on Loans, and others | 30 | 10,439 | 299 | 10,738 | 3,945 | 6,792 | ||||||||||||||||||
Other | 31 | 15,335 | (1,916 | ) | 13,419 | 74,678 | (61,259 | ) | ||||||||||||||||
|
|
|
|
|
|
|
|
|
| |||||||||||||||
Ordinary Profits | 32 | 430,762 | 49,676 | 480,438 | 140,510 | 339,928 | ||||||||||||||||||
|
|
|
|
|
|
|
|
|
| |||||||||||||||
Net Extraordinary Gains (Losses) | 33 | (17,187 | ) | 212 | (16,975 | ) | 477,225 | (494,200 | ) | |||||||||||||||
Net Gains (Losses) on Disposition of Fixed Assets | 34 | (3,631 | ) | 617 | (3,013 | ) | (2,796 | ) | (217 | ) | ||||||||||||||
Losses on Impairment of Fixed Assets | 35 | (13,556 | ) | (405 | ) | (13,961 | ) | 487,864 | (501,825 | ) | ||||||||||||||
Gains on Cancellation of Employee Retirement Benefit Trust | 36 | — | — | — | (7,841 | ) | 7,841 | |||||||||||||||||
Income before Income Taxes (Losses) | 37 | 413,574 | 49,888 | 463,463 | 617,736 | (154,272 | ) | |||||||||||||||||
Income Taxes - Current | 38 | (109,151 | ) | (10,342 | ) | (119,493 | ) | (12,025 | ) | (107,468 | ) | |||||||||||||
- Deferred | 39 | 3,364 | (4,147 | ) | (782 | ) | (157,143 | ) | 156,360 | |||||||||||||||
|
|
|
|
|
|
|
|
|
| |||||||||||||||
Net Income (Losses) | 40 | 307,788 | 35,398 | 343,186 | 448,567 | (105,380 | ) | |||||||||||||||||
|
|
|
|
|
|
|
|
|
| |||||||||||||||
(1) Net Business Profits (before Reversal of (Provision for) General Reserve for Losses on Loans) for MHTB excludes the amounts of “Credit Costs for Trust Accounts” [6]. |
| |||||||||||||||||||||||
(2) As for Gross Profits for MHTB, parts of Net Trading Income which have been included in International Gross Profits are included in Domestic Gross Profits. |
| |||||||||||||||||||||||
(3) Net Business Profits (before Reversal of (Provision for) General Reserve for Losses on Loans) from core business areas[22] |
| |||||||||||||||||||||||
=Net Business Profits (before Reversal of (Provision for) General Reserve for Losses onLoans)[21]-Net Gains (Losses) related to Bonds[26] |
| |||||||||||||||||||||||
Credit-related Costs | 41 | (172,410) | (1,330 | ) | (173,741 | ) | (150,997 | ) | (22,743) | |||||||||||||||
* Credit-related Costs [41] = Expenses related to Portfolio Problems [29] + Reversal of (Provision for) General Reserve for Losses on Loans [24] + Gains on Reversal of Reserves for Possible Losses on Loans, and others [30] + Credit Costs for Trust Accounts [6] |
| |||||||||||||||||||||||
(Reference) Breakdown of Credit-related Costs | ||||||||||||||||||||||||
Credit Costs for Trust Accounts | 42 | — | — | — | — | |||||||||||||||||||
Reversal of (Provision for) General Reserve for Losses on Loans | 43 | (105,579 | ) | (649 | ) | (106,229 | ) | (151,120 | ) | 44,890 | ||||||||||||||
Losses on Write-offs of Loans | 44 | (8,634 | ) | 296 | (8,337 | ) | 7,507 | (15,845 | ) | |||||||||||||||
Reversal of (Provision for) Specific Reserve for Possible Losses on Loans | 45 | (55,516 | ) | (976 | ) | (56,492 | ) | (9,865 | ) | (46,627 | ) | |||||||||||||
Reversal of (Provision for) Reserve for Possible Losses on Loans to Restructuring Countries | 46 | 5 | — | 5 | 8 | (3 | ) | |||||||||||||||||
Reversal of (Provision for) Reserve for Contingencies | 47 | (1,669 | ) | — | (1,669 | ) | (1,627 | ) | (41 | ) | ||||||||||||||
Other (including Losses on Sales of Loans) | 48 | (1,016 | ) | — | (1,016 | ) | 4,098 | (5,115 | ) | |||||||||||||||
Total | 49 | (172,410 | ) | (1,330 | ) | (173,741 | ) | (150,997 | ) | (22,743 | ) | |||||||||||||
2-2
Mizuho Financial Group, Inc.
Mizuho Bank
Non-Consolidated
| (Millions of yen) | ||||||||||||||
| Fiscal 2019 | Fiscal 2018 | |||||||||||||
| Change | ||||||||||||||
Gross Profits | 1 | 1,304,598 | 229,569 | 1,075,028 | ||||||||||
Domestic Gross Profits | 2 | 750,934 | 81,472 | 669,461 | ||||||||||
Net Interest Income | 3 | 413,957 | (42,446 | ) | 456,403 | |||||||||
Net Fee and Commission Income | 4 | 248,316 | 2,458 | 245,857 | ||||||||||
Net Trading Income | 5 | 48,841 | 99,397 | (50,555 | ) | |||||||||
Net Other Operating Income | 6 | 39,818 | 22,062 | 17,755 | ||||||||||
International Gross Profits | 7 | 553,663 | 148,097 | 405,566 | ||||||||||
Net Interest Income | 8 | 215,056 | 21,704 | 193,352 | ||||||||||
Net Fee and Commission Income | 9 | 136,819 | 2,415 | 134,404 | ||||||||||
Net Trading Income | 10 | 100,945 | (11,088 | ) | 112,033 | |||||||||
Net Other Operating Income | 11 | 100,841 | 135,065 | (34,224 | ) | |||||||||
General and Administrative Expenses (excludingNon-Recurring Losses) | 12 | (838,102 | ) | 29,081 | (867,184 | ) | ||||||||
Expense Ratio | 13 | 64.2 | % | (16.4 | %) | 80.6 | % | |||||||
Personnel Expenses | 14 | (323,917 | ) | 13,313 | (337,230 | ) | ||||||||
Non-Personnel Expenses | 15 | (464,785 | ) | 16,627 | (481,413 | ) | ||||||||
Premium for Deposit Insurance | 16 | (31,138 | ) | (523 | ) | (30,615 | ) | |||||||
Miscellaneous Taxes | 17 | (49,400 | ) | (859 | ) | (48,540 | ) | |||||||
|
|
|
|
|
| |||||||||
Net Business Profits (before Reversal of (Provision for) General Reserve for Losses on Loans) | 18 | 466,495 | 258,651 | 207,844 | ||||||||||
Net Business Profits (before Reversal of (Provision for) General Reserve for Losses on Loans) from core business areas * | 19 | 364,306 | 48,820 | 315,486 | ||||||||||
Excluding Net Gains (Losses) from redemption of Investment Trusts | 20 | 359,557 | 50,248 | 309,308 | ||||||||||
|
|
|
|
|
| |||||||||
Reversal of (Provision for) General Reserve for Losses on Loans | 21 | (105,579 | ) | (150,664 | ) | 45,084 | ||||||||
Net Business Profits | 22 | 360,916 | 107,987 | 252,929 | ||||||||||
Net Gains (Losses) related to Bonds | 23 | 102,189 | 209,831 | (107,641 | ) | |||||||||
|
|
|
|
|
| |||||||||
NetNon-Recurring Gains (Losses) | 24 | 69,845 | 38,201 | 31,644 | ||||||||||
Net Gains (Losses) related to Stocks | 25 | 121,341 | (34,435 | ) | 155,777 | |||||||||
Expenses related to Portfolio Problems | 26 | (77,270 | ) | (3,124 | ) | (74,146 | ) | |||||||
Gains on Reversal of Reserves for Possible Losses on Loans, and others | 27 | 10,439 | 3,646 | 6,792 | ||||||||||
Other | 28 | 15,335 | 72,114 | (56,779 | ) | |||||||||
|
|
|
|
|
| |||||||||
Ordinary Profits | 29 | 430,762 | 146,188 | 284,573 | ||||||||||
|
|
|
|
|
| |||||||||
Net Extraordinary Gains (Losses) | 30 | (17,187 | ) | 474,849 | (492,037 | ) | ||||||||
Net Gains (Losses) on Disposition of Fixed Assets | 31 | (3,631 | ) | (3,452 | ) | (179 | ) | |||||||
Losses on Impairment of Fixed Assets | 32 | (13,556 | ) | 486,143 | (499,700 | ) | ||||||||
Gains on Cancellation of Employee Retirement Benefit Trust | 33 | — | (7,841 | ) | 7,841 | |||||||||
Income before Income Taxes (Losses) | 34 | 413,574 | 621,038 | (207,463 | ) | |||||||||
Income Taxes - Current | 35 | (109,151 | ) | (14,227 | ) | (94,923 | ) | |||||||
- Deferred | 36 | 3,364 | (154,578 | ) | 157,943 | |||||||||
|
|
|
|
|
| |||||||||
Net Income (Losses) | 37 | 307,788 | 452,232 | (144,444 | ) | |||||||||
|
|
|
|
|
| |||||||||
* Net Business Profits (before Reversal of (Provision for) General Reserve for Losses on Loans) from core business areas [19] = Net Business Profits (before Reversal of (Provision for) General Reserve for Losses on Loans) [18]- Net Gains (Losses) related to Bonds [23] |
| |||||||||||||
Credit-related Costs | 38 | (172,410 | ) | (150,142 | ) | (22,268 | ) | |||||||
* Credit-related Costs [38] = Expenses related to Portfolio Problems [26] + Reversal of (Provision for) General Reserve for Losses on Loans [21] + Gains on Reversal of Reserves for Possible Losses on Loans, and others [27] |
| |||||||||||||
(Reference) Breakdown of Credit-related Costs | ||||||||||||||
Reversal of (Provision for) General Reserve for Losses on Loans | 39 | (105,579 | ) | (150,664 | ) | 45,084 | ||||||||
Losses on Write-offs of Loans | 40 | (8,634 | ) | 7,211 | (15,845 | ) | ||||||||
Reversal of (Provision for) Specific Reserve for Possible Losses on Loans | 41 | (55,516 | ) | (9,169 | ) | (46,346 | ) | |||||||
Reversal of (Provision for) Reserve for Possible Losses on Loans to Restructuring Countries | 42 | 5 | 8 | (3 | ) | |||||||||
Reversal of (Provision for) Reserve for Contingencies | 43 | (1,669 | ) | (1,627 | ) | (41 | ) | |||||||
Other (including Losses on Sales of Loans) | 44 | (1,016 | ) | 4,098 | (5,115 | ) | ||||||||
Total | 45 | (172,410 | ) | (150,142 | ) | (22,268 | ) | |||||||
2-3
Mizuho Financial Group, Inc.
Mizuho Trust & Banking
Non-Consolidated
| (Millions of yen) | ||||||||||||||||
| Fiscal 2019 | Fiscal 2018 | |||||||||||||||
| Change | ||||||||||||||||
Gross Profits | 1 | 132,949 | 10,819 | 122,129 | ||||||||||||
Domestic Gross Profits | 2 | 126,769 | 6,967 | 119,801 | ||||||||||||
Net Interest Income | 3 | 21,810 | (2,222 | ) | 24,033 | |||||||||||
Fiduciary Income | 4 | 59,132 | 4,134 | 54,997 | ||||||||||||
Trust Fees for Jointly Operated Designated Money Trust | 5 | 4,229 | 370 | 3,859 | ||||||||||||
Credit Costs for Trust Accounts(1) | 6 | — | — | — | ||||||||||||
Net Fee and Commission Income | 7 | 36,202 | (1,413 | ) | 37,615 | |||||||||||
Net Trading Income(2) | 8 | 8,267 | 9,399 | (1,132 | ) | |||||||||||
Net Other Operating Income | 9 | 1,355 | (2,931 | ) | 4,286 | |||||||||||
International Gross Profits | 10 | 6,179 | 3,851 | 2,328 | ||||||||||||
Net Interest Income | 11 | 2,055 | (295 | ) | 2,350 | |||||||||||
Net Fee and Commission Income | 12 | (619 | ) | 81 | (700 | ) | ||||||||||
Net Trading Income(2) | 13 | (6,761 | ) | (9,445 | ) | 2,684 | ||||||||||
Net Other Operating Income | 14 | 11,505 | 13,511 | (2,005 | ) | |||||||||||
General and Administrative Expenses (excludingNon-Recurring Losses) | 15 | (84,183 | ) | (1,976 | ) | (82,207 | ) | |||||||||
Expense Ratio | 16 | 63.3 | % | (3.9 | %) | 67.3 | % | |||||||||
Personnel Expenses | 17 | (39,766 | ) | (60 | ) | (39,706 | ) | |||||||||
Non-Personnel Expenses | 18 | (40,969 | ) | (1,928 | ) | (39,041 | ) | |||||||||
Premium for Deposit Insurance | 19 | (1,295 | ) | 8 | (1,304 | ) | ||||||||||
Miscellaneous Taxes | 20 | (3,448 | ) | 12 | (3,460 | ) | ||||||||||
|
|
|
|
|
| |||||||||||
Net Business Profits (before Reversal of (Provision for) General Reserve for Losses on Loans) | 21 | 48,765 | 8,843 | 39,921 | ||||||||||||
Net Business Profits (before Reversal of (Provision for) General Reserve for Losses on Loans) from core business areas(3) | 22 | 36,187 | (1,648 | ) | 37,836 | |||||||||||
Excluding Net Gains (Losses) from redemption of Investment Trusts | 23 | 36,083 | (1,701 | ) | 37,784 | |||||||||||
|
|
|
|
|
| |||||||||||
Reversal of (Provision for) General Reserve for Losses on Loans | 24 | (649 | ) | (455 | ) | (194 | ) | |||||||||
|
|
|
|
|
| |||||||||||
Net Business Profits | 25 | 48,115 | 8,387 | 39,727 | ||||||||||||
Net Gains (Losses) related to Bonds | 26 | 12,577 | 10,492 | 2,085 | ||||||||||||
|
|
|
|
|
| |||||||||||
NetNon-Recurring Gains (Losses) | 27 | 1,560 | (14,065 | ) | 15,626 | |||||||||||
Net Gains (Losses) related to Stocks | 28 | 4,157 | (16,229 | ) | 20,387 | |||||||||||
Expenses related to Portfolio Problems | 29 | (979 | ) | (698 | ) | (280 | ) | |||||||||
Gains on Reversal of Reserves for Possible Losses on Loans, and others | 30 | 299 | 299 | — | ||||||||||||
Other | 31 | (1,916 | ) | 2,563 | (4,479 | ) | ||||||||||
|
|
|
|
|
| |||||||||||
Ordinary Profits | 32 | 49,676 | (5,678 | ) | 55,354 | |||||||||||
|
|
|
|
|
| |||||||||||
Net Extraordinary Gains (Losses) | 33 | 212 | 2,376 | (2,163 | ) | |||||||||||
Net Gains (Losses) on Disposition of Fixed Assets | 34 | 617 | 655 | (38 | ) | |||||||||||
Losses on Impairment of Fixed Assets | 35 | (405 | ) | 1,720 | (2,125 | ) | ||||||||||
Income before Income Taxes | 36 | 49,888 | (3,302 | ) | 53,190 | |||||||||||
Income Taxes - Current | 37 | (10,342 | ) | 2,201 | (12,544 | ) | ||||||||||
- Deferred | 38 | (4,147 | ) | (2,564 | ) | (1,582 | ) | |||||||||
|
|
|
|
|
| |||||||||||
Net Income | 39 | 35,398 | (3,665 | ) | 39,063 | |||||||||||
|
|
|
|
|
| |||||||||||
(1) Net Business Profits (before Reversal of (Provision for) General Reserve for Losses on Loans) excludes the amounts of “Credit Costs for Trust Accounts” [6]. |
| |||||||||||||||
(2) As for Gross Profits, parts of Net Trading Income which have been included in International Gross Profits are included in Domestic Gross Profits. |
| |||||||||||||||
(3) Net Business Profits (before Reversal of (Provision for) General Reserve for Losses on Loans) from core business areas [22] = Net Business Profits (before Reversal of (Provision for) General Reserve for Losses on Loans)[21]- Net Gains (Losses) related to Bonds [26] |
| |||||||||||||||
Credit-related Costs | 40 | (1,330 | ) | (855) | (474 | ) | ||||||||||
* Credit-related Costs [40] = Expenses related to Portfolio Problems [29] + Reversal of (Provision for) General Reserve for Losses on Loans [24] + Gains on Reversal of Reserves for Possible Losses on Loans, and others [30] + Credit Costs for Trust Accounts [6] |
| |||||||||||||||
| (Reference) Breakdown of Credit-related Costs | ||||||||||||||||
Credit Costs for Trust Accounts | 41 | — | — | — | ||||||||||||
Reversal of (Provision for) General Reserve for Losses on Loans | 42 | (649 | ) | (455 | ) | (194 | ) | |||||||||
Losses on Write-offs of Loans | 43 | 296 | 296 | — | ||||||||||||
Reversal of (Provision for) Specific Reserve for Possible Losses on Loans | 44 | (976 | ) | (696 | ) | (280 | ) | |||||||||
Reversal of (Provision for) Reserve for Possible Losses on Loans to Restructuring Countries | 45 | — | — | — | ||||||||||||
Reversal of (Provision for) Reserve for Contingencies | 46 | — | — | — | ||||||||||||
Other (including Losses on Sales of Loans) | 47 | — | — | — | ||||||||||||
Total | 48 | (1,330 | ) | (855 | ) | (474 | ) | |||||||||
2-4
Mizuho Financial Group, Inc.
2. Interest Margins (Domestic Operations)
Non-Consolidated
| (%) | ||||||||||||||||||
| Fiscal 2019 | Fiscal 2018 | |||||||||||||||||
| Mizuho Bank | Change | |||||||||||||||||
Return on Interest-Earning Assets | 1 | 0.43 | (0.04 | ) | 0.47 | |||||||||||||
Return on Loans and Bills Discounted *1 | 2 | 0.76 | (0.03 | ) | 0.79 | |||||||||||||
Return on Securities | 3 | 0.42 | (0.09 | ) | 0.51 | |||||||||||||
Cost of Funding (including Expenses) | 4 | 0.65 | (0.03 | ) | 0.68 | |||||||||||||
Cost of Deposits (including Expenses) | 5 | 0.64 | (0.06 | ) | 0.70 | |||||||||||||
Cost of Deposits *2 | 6 | 0.00 | (0.00 | ) | 0.00 | |||||||||||||
Cost of Other External Liabilities | 7 | 0.63 | 0.26 | 0.37 | ||||||||||||||
|
|
|
|
|
| |||||||||||||
Net Interest Margin | (1)-(4) | 8 | (0.21 | ) | (0.00 | ) | (0.21 | ) | ||||||||||
Loan and Deposit Rate Margin (including Expenses) | (2)-(5) | 9 | 0.12 | 0.02 | 0.09 | |||||||||||||
Loan and Deposit Rate Margin | (2)-(6) | 10 | 0.76 | (0.03 | ) | 0.79 | ||||||||||||
|
|
|
|
|
| |||||||||||||
*1 Return on Loans and Bills Discounted excludes loans to financial institutions (including MHFG). |
| |||||||||||||||||
*2 Deposits include Negotiable Certificates of Deposit (“NCDs”). |
| |||||||||||||||||
| (Reference) After excluding loans to the Japanese government and others |
| |||||||||||||||||
Return on Loans and Bills Discounted | 11 | 0.78 | (0.04 | ) | 0.83 | |||||||||||||
Loan and Deposit Rate Margin (including Expenses) | (11)-(5) | 12 | 0.14 | 0.01 | 0.12 | |||||||||||||
Loan and Deposit Rate Margin | (11)-(6) | 13 | 0.78 | (0.04 | ) | 0.82 | ||||||||||||
| (%) | ||||||||||||||||||
| Fiscal 2019 | Fiscal 2018 | |||||||||||||||||
| Mizuho Trust & Banking | Change | |||||||||||||||||
Return on Interest-Earning Assets | 14 | 0.47 | (0.03 | ) | 0.51 | |||||||||||||
Return on Loans and Bills Discounted *1 | 15 | 0.59 | (0.01 | ) | 0.61 | |||||||||||||
Return on Securities | 16 | 1.38 | (0.13 | ) | 1.52 | |||||||||||||
Cost of Funding | 17 | 0.09 | 0.00 | 0.08 | ||||||||||||||
Cost of Deposits *2 | 18 | 0.01 | (0.00 | ) | 0.02 | |||||||||||||
|
|
|
|
|
| |||||||||||||
Net Interest Margin | (14)-(17) | 19 | 0.38 | (0.03 | ) | 0.42 | ||||||||||||
Loan and Deposit Rate Margin | (15)-(18) | 20 | 0.58 | (0.01 | ) | 0.59 | ||||||||||||
|
|
|
|
|
| |||||||||||||
*1 Return on Loans and Bills Discounted excludes loans to financial institutions (including MHFG). |
| |||||||||||||||||
*2 Deposits include NCDs. |
| |||||||||||||||||
(Reference) After excluding loans to the Japanese government and others |
| |||||||||||||||||
Return on Loans and Bills Discounted | 21 | 0.61 | (0.02 | ) | 0.64 | |||||||||||||
Loan and Deposit Rate Margin | (21)-(18) | 22 | 0.60 | (0.02 | ) | 0.62 | ||||||||||||
| (Reference) | (%) | |||||||||||||||||
| Fiscal 2019 | Fiscal 2018 | |||||||||||||||||
| Aggregate Figures for the 2 Banks | Change | |||||||||||||||||
Return on Loans and Bills Discounted *1 | 23 | 0.75 | (0.03 | ) | 0.78 | |||||||||||||
Cost of Deposits *2 | 24 | 0.00 | (0.00 | ) | 0.00 | |||||||||||||
|
|
|
|
|
| |||||||||||||
Loan and Deposit Rate Margin | (23)-(24) | 25 | 0.75 | (0.03 | ) | 0.78 | ||||||||||||
|
|
|
|
|
| |||||||||||||
*1 Return on Loans and Bills Discounted excludes loans to financial institutions (including MHFG). |
| |||||||||||||||||
*2 Deposits include NCDs. |
| |||||||||||||||||
(Reference) After excluding loans to the Japanese government and others |
| |||||||||||||||||
Return on Loans and Bills Discounted | 26 | 0.77 | (0.04 | ) | 0.81 | |||||||||||||
Loan and Deposit Rate Margin | (26)-(24) | 27 | 0.77 | (0.03 | ) | 0.81 | ||||||||||||
2-5
Mizuho Financial Group, Inc.
3. Use and Source of Funds
Non-Consolidated
Mizuho Bank
| (Millions of yen, %) | ||||||||||||||||||||||||
| Fiscal 2019 | Fiscal 2018 | |||||||||||||||||||||||
| Change | ||||||||||||||||||||||||
| Average Balance | Rate | Average Balance | Rate | Average Balance | Rate | |||||||||||||||||||
(Total) | ||||||||||||||||||||||||
Use of Funds | 155,653,684 | 1.05 | 3,675,568 | (0.04 | ) | 151,978,115 | 1.10 | |||||||||||||||||
Loans and Bills Discounted | 77,097,703 | 1.44 | 2,667,952 | (0.06 | ) | 74,429,750 | 1.51 | |||||||||||||||||
Securities | 28,255,948 | 0.91 | (2,508,702 | ) | (0.00 | ) | 30,764,651 | 0.91 | ||||||||||||||||
|
|
|
|
|
|
|
|
|
|
|
| |||||||||||||
Source of Funds | 155,316,129 | 0.65 | 3,118,268 | (0.02 | ) | 152,197,861 | 0.67 | |||||||||||||||||
Deposits | 119,877,778 | 0.37 | 5,421,449 | (0.01 | ) | 114,456,329 | 0.39 | |||||||||||||||||
NCDs | 14,238,551 | 0.84 | 1,053,191 | (0.13 | ) | 13,185,359 | 0.97 | |||||||||||||||||
(Domestic Operations) | ||||||||||||||||||||||||
Use of Funds | 107,729,598 | 0.43 | 1,835,526 | (0.04 | ) | 105,894,071 | 0.47 | |||||||||||||||||
Loans and Bills Discounted | 48,949,371 | 0.75 | 1,864,314 | (0.02 | ) | 47,085,056 | 0.78 | |||||||||||||||||
Securities | 17,599,601 | 0.42 | (1,715,912 | ) | (0.09 | ) | 19,315,514 | 0.51 | ||||||||||||||||
|
|
|
|
|
|
|
|
|
|
|
| |||||||||||||
Source of Funds | 107,281,154 | 0.04 | 1,818,187 | 0.00 | 105,462,967 | 0.04 | ||||||||||||||||||
Deposits | 93,082,592 | 0.00 | 3,589,693 | (0.00 | ) | 89,492,898 | 0.00 | |||||||||||||||||
NCDs | 7,909,075 | 0.00 | 1,151,522 | 0.00 | 6,757,553 | 0.00 | ||||||||||||||||||
(International Operations) | ||||||||||||||||||||||||
Use of Funds | 51,088,019 | 2.30 | 1,128,057 | (0.06 | ) | 49,959,962 | 2.37 | |||||||||||||||||
Loans and Bills Discounted | 28,148,331 | 2.64 | 803,637 | (0.12 | ) | 27,344,694 | 2.77 | |||||||||||||||||
Securities | 10,656,347 | 1.71 | (792,790 | ) | 0.13 | 11,449,137 | 1.58 | |||||||||||||||||
|
|
|
|
|
|
|
|
|
|
|
| |||||||||||||
Source of Funds | 51,198,908 | 1.88 | 588,096 | (0.07 | ) | 50,610,811 | 1.96 | |||||||||||||||||
Deposits | 26,795,186 | 1.67 | 1,831,755 | (0.11 | ) | 24,963,431 | 1.78 | |||||||||||||||||
NCDs | 6,329,475 | 1.88 | (98,331 | ) | (0.11 | ) | 6,427,806 | 1.99 | ||||||||||||||||
2-6
Mizuho Financial Group, Inc.
| Mizuho Trust & Banking (Banking Account) |
| |||||||||||||||||||||||
| (Millions of yen, %) | ||||||||||||||||||||||||
| Fiscal 2019 | Fiscal 2018 | |||||||||||||||||||||||
| Change | ||||||||||||||||||||||||
| Average Balance | Rate | Average Balance | Rate | Average Balance | Rate | |||||||||||||||||||
(Total) | ||||||||||||||||||||||||
Use of Funds | 6,203,818 | 0.60 | (93,915 | ) | (0.07 | ) | 6,297,733 | 0.67 | ||||||||||||||||
Loans and Bills Discounted | 3,380,972 | 0.72 | 14,245 | (0.06 | ) | 3,366,727 | 0.79 | |||||||||||||||||
Securities | 787,969 | 1.35 | (110,103 | ) | (0.18 | ) | 898,072 | 1.53 | ||||||||||||||||
|
|
|
|
|
|
|
|
|
|
|
| |||||||||||||
Source of Funds | 6,622,855 | 0.20 | (160,377 | ) | (0.03 | ) | 6,783,233 | 0.24 | ||||||||||||||||
Deposits | 3,353,168 | 0.01 | (114,014 | ) | (0.01 | ) | 3,467,183 | 0.03 | ||||||||||||||||
NCDs | 541,402 | 0.00 | 127,256 | (0.00 | ) | 414,145 | 0.01 | |||||||||||||||||
(Domestic Operations) | ||||||||||||||||||||||||
Use of Funds | 5,767,526 | 0.47 | (16,523 | ) | (0.03 | ) | 5,784,050 | 0.51 | ||||||||||||||||
Loans and Bills Discounted | 3,191,918 | 0.59 | 70,944 | (0.01 | ) | 3,120,974 | 0.61 | |||||||||||||||||
Securities | 499,480 | 1.38 | (70,874 | ) | (0.13 | ) | 570,355 | 1.52 | ||||||||||||||||
|
|
|
|
|
|
|
|
|
|
|
| |||||||||||||
Source of Funds | 6,176,693 | 0.09 | (75,557 | ) | 0.00 | 6,252,251 | 0.08 | |||||||||||||||||
Deposits | 3,346,557 | 0.01 | (106,868 | ) | (0.00 | ) | 3,453,426 | 0.02 | ||||||||||||||||
NCDs | 541,402 | 0.00 | 127,256 | (0.00 | ) | 414,145 | 0.01 | |||||||||||||||||
(International Operations) | ||||||||||||||||||||||||
Use of Funds | 494,142 | 1.94 | (103,825 | ) | (0.25 | ) | 597,968 | 2.20 | ||||||||||||||||
Loans and Bills Discounted | 189,053 | 2.93 | (56,698 | ) | (0.08 | ) | 245,752 | 3.01 | ||||||||||||||||
Securities | 288,488 | 1.28 | (39,228 | ) | (0.27 | ) | 327,716 | 1.55 | ||||||||||||||||
|
|
|
|
|
|
|
|
|
|
|
| |||||||||||||
Source of Funds | 504,013 | 1.50 | (111,254 | ) | (0.25 | ) | 615,267 | 1.75 | ||||||||||||||||
Deposits | 6,610 | 1.25 | (7,145 | ) | (0.59 | ) | 13,756 | 1.84 | ||||||||||||||||
NCDs | — | — | — | — | — | — | ||||||||||||||||||
2-7
Mizuho Financial Group, Inc.
4. Net Gains/Losses on Securities
Consolidated
| (Millions of yen) | ||||||||||||
| Fiscal 2019 | Fiscal 2018 | |||||||||||
| Change | ||||||||||||
Net Gains (Losses) related to Bonds | 114,242 | 223,601 | (109,359 | ) | ||||||||
Gains on Sales and Others | 224,833 | 152,151 | 72,682 | |||||||||
Losses on Sales and Others | (103,320 | ) | 71,753 | (175,074 | ) | |||||||
Impairment (Devaluation) | (2,185 | ) | (926 | ) | (1,259 | ) | ||||||
Reversal of (Provision for) Reserve for Possible Losses on Investments | — | — | — | |||||||||
Gains (Losses) on Derivatives other than for Trading | (5,084 | ) | 624 | (5,708 | ) | |||||||
| Fiscal 2019 | Fiscal 2018 | |||||||||||
| Change | ||||||||||||
Net Gains (Losses) related to Stocks | 137,174 | (137,689 | ) | 274,863 | ||||||||
Gains on Sales | 226,005 | (125,044 | ) | 351,049 | ||||||||
Losses on Sales | (72,258 | ) | (26,410 | ) | (45,847 | ) | ||||||
Impairment (Devaluation) | (41,691 | ) | (35,896 | ) | (5,795 | ) | ||||||
Reversal of (Provision for) Reserve for Possible Losses on Investments | — | — | — | |||||||||
Gains (Losses) on Derivatives other than for Trading | 25,118 | 49,661 | (24,542 | ) | ||||||||
Non-Consolidated
Aggregate Figures for the 2 Banks |
| |||||||||||
| (Millions of yen) | ||||||||||||
| Fiscal 2019 | Fiscal 2018 | |||||||||||
| Change | ||||||||||||
Net Gains (Losses) related to Bonds | 114,767 | 220,323 | (105,556 | ) | ||||||||
Gains on Sales and Others | 226,174 | 149,619 | 76,554 | |||||||||
Losses on Sales and Others | (104,136 | ) | 71,006 | (175,143 | ) | |||||||
Impairment (Devaluation) | (2,185 | ) | (926 | ) | (1,259 | ) | ||||||
Reversal of (Provision for) Reserve for Possible Losses on Investments | — | — | — | |||||||||
Gains (Losses) on Derivatives other than for Trading | (5,084 | ) | 624 | (5,708 | ) | |||||||
| Fiscal 2019 | Fiscal 2018 | |||||||||||
| Change | ||||||||||||
Net Gains (Losses) related to Stocks | 125,499 | (50,665 | ) | 176,164 | ||||||||
Gains on Sales | 214,169 | (40,631 | ) | 254,801 | ||||||||
Losses on Sales | (70,725 | ) | (24,769 | ) | (45,956 | ) | ||||||
Impairment (Devaluation) | (40,980 | ) | (33,212 | ) | (7,767 | ) | ||||||
Reversal of (Provision for) Reserve for Possible Losses on Investments | (2,082 | ) | (1,712 | ) | (370 | ) | ||||||
Gains (Losses) on Derivatives other than for Trading | 25,118 | 49,661 | (24,542 | ) | ||||||||
2-8
Mizuho Financial Group, Inc.
| Mizuho Bank |
| |||||||||||
| (Millions of yen) | ||||||||||||
| Fiscal 2019 | Fiscal 2018 | |||||||||||
| Change | ||||||||||||
Net Gains (Losses) related to Bonds | 102,189 | 209,831 | (107,641 | ) | ||||||||
Gains on Sales and Others | 202,254 | 133,752 | 68,501 | |||||||||
Losses on Sales and Others | (92,978 | ) | 77,454 | (170,433 | ) | |||||||
Impairment (Devaluation) | (2,185 | ) | (926 | ) | (1,259 | ) | ||||||
Reversal of (Provision for) Reserve for Possible Losses on Investments | — | — | — | |||||||||
Gains (Losses) on Derivatives other than for Trading | (4,900 | ) | (448 | ) | (4,451 | ) | ||||||
| Fiscal 2019 | Fiscal 2018 | |||||||||||
| Change | ||||||||||||
Net Gains (Losses) related to Stocks | 121,341 | (34,435 | ) | 155,777 | ||||||||
Gains on Sales | 202,601 | (22,958 | ) | 225,559 | ||||||||
Losses on Sales | (62,550 | ) | (22,792 | ) | (39,757 | ) | ||||||
Impairment (Devaluation) | (38,528 | ) | (31,206 | ) | (7,321 | ) | ||||||
Reversal of (Provision for) Reserve for Possible Losses on Investments | (2,082 | ) | (1,712 | ) | (370 | ) | ||||||
Gains (Losses) on Derivatives other than for Trading | 21,901 | 44,234 | (22,332 | ) | ||||||||
| Mizuho Trust & Banking |
| |||||||||||
| (Millions of yen) | ||||||||||||
| Fiscal 2019 | Fiscal 2018 | |||||||||||
| Change | ||||||||||||
Net Gains (Losses) related to Bonds | 12,577 | 10,492 | 2,085 | |||||||||
Gains on Sales and Others | 23,919 | 15,867 | 8,052 | |||||||||
Losses on Sales and Others | (11,157 | ) | (6,447 | ) | (4,710 | ) | ||||||
Impairment (Devaluation) | — | — | — | |||||||||
Reversal of (Provision for) Reserve for Possible Losses on Investments | — | — | — | |||||||||
Gains (Losses) on Derivatives other than for Trading | (184 | ) | 1,072 | (1,257 | ) | |||||||
| Fiscal 2019 | Fiscal 2018 | |||||||||||
| Change | ||||||||||||
Net Gains (Losses) related to Stocks | 4,157 | (16,229 | ) | 20,387 | ||||||||
Gains on Sales | 11,568 | (17,672 | ) | 29,241 | ||||||||
Losses on Sales | (8,175 | ) | (1,977 | ) | (6,198 | ) | ||||||
Impairment (Devaluation) | (2,451 | ) | (2,005 | ) | (446 | ) | ||||||
Reversal of (Provision for) Reserve for Possible Losses on Investments | — | — | — | |||||||||
Gains (Losses) on Derivatives other than for Trading | 3,216 | 5,426 | (2,210 | ) | ||||||||
2-9
Mizuho Financial Group, Inc.
5. Unrealized Gains/Losses on Securities
| • | Securities for which it is deemed to be extremely difficult to determine the fair value are excluded. |
Consolidated
(1) Other Securities
| (Millions of yen) | ||||||||||||||||||||||||||||||||
| As of March 31, 2020 | As of March 31, 2019 | |||||||||||||||||||||||||||||||
| Book Value (= Fair Value) | Unrealized Gains/Losses | Book Value (= Fair Value) | Unrealized Gains/Losses | |||||||||||||||||||||||||||||
| Gains | Losses | Gains | Losses | |||||||||||||||||||||||||||||
Other Securities | 33,429,383 | 1,172,759 | 1,547,278 | 374,519 | 27,847,545 | 1,689,866 | 1,883,436 | 193,570 | ||||||||||||||||||||||||
Japanese Stocks | 2,338,429 | 1,066,360 | 1,167,903 | 101,543 | 3,143,560 | 1,723,661 | 1,774,459 | 50,797 | ||||||||||||||||||||||||
Japanese Bonds | 15,702,512 | (54,100 | ) | 30,037 | 84,137 | 14,786,949 | 5,270 | 37,284 | 32,014 | |||||||||||||||||||||||
Japanese Government Bonds | 12,601,934 | (44,021 | ) | 6,540 | 50,562 | 11,896,134 | 5,921 | 8,755 | 2,834 | |||||||||||||||||||||||
Other | 15,388,441 | 160,499 | 349,337 | 188,837 | 9,917,034 | (39,065 | ) | 71,692 | 110,757 | |||||||||||||||||||||||
Foreign Bonds | 12,702,213 | 200,954 | 246,097 | 45,142 | 7,418,321 | 23,694 | 35,306 | 11,611 | ||||||||||||||||||||||||
* In addition to “Securities” on the consolidated balance sheets, NCDs in “Cash and Due from Banks, ” certain items in “Other Debt Purchased” and certain items in “Other Assets” are also included. * Fair value of Japanese stocks with a quoted market price is determined based on the average quoted market price over the month preceding the consolidated balance sheet date. Fair value of securities other than Japanese stocks is determined at the quoted market price if available, or other reasonable value at the consolidated balance sheet date. * The book values of Other Securities which have readily determinable fair value are stated at fair value, so Unrealized Gains/Losses indicate the difference between book values on the consolidated balance sheets and the acquisition costs. * Unrealized Gains/Losses include ¥(5,191) million and ¥38,000 million, which were recognized in the statement of income for March 31, 2020 and March 31, 2019, respectively, by applying the fair-value hedge method. As a result, the base amounts to be recorded directly to Net Assets after tax and consolidation adjustments as of March 31, 2020 and March 31, 2019 are ¥1,177,950 million and ¥1,651,865 million, respectively. * Unrealized Gains (Losses) on Other Securities, net of Taxes (recorded directly to Net Assets after tax and consolidation adjustments, excluding the amount recognized in the statement of income by applying the fair value hedge method, including translation differences regarding securities, the fair values of which are extremely difficult to determine) as of March 31, 2020 and March 31, 2019 are ¥823,085 million and ¥1,186,401 million, respectively.
(2) Bonds Held to Maturity
|
| |||||||||||||||||||||||||||||||
| (Millions of yen) | ||||||||||||||||||||||||||||||||
| As of March 31, 2020 | As of March 31, 2019 | |||||||||||||||||||||||||||||||
| Book Value | Unrealized Gains/Losses | Book Value | Unrealized Gains/Losses | |||||||||||||||||||||||||||||
| Gains | Losses | Gains | Losses | |||||||||||||||||||||||||||||
Bonds Held to Maturity | 860,233 | 15,096 | 15,467 | 370 | 1,602,209 | 7,378 | 19,907 | 12,528 | ||||||||||||||||||||||||
Non-Consolidated
(1) Other Securities
Aggregate Figures for the 2 Banks
| (Millions of yen) | ||||||||||||||||||||||||||||||||
| As of March 31, 2020 | As of March 31, 2019 | |||||||||||||||||||||||||||||||
| Book Value | Unrealized Gains/Losses | Book Value | Unrealized Gains/Losses | |||||||||||||||||||||||||||||
| (= Fair Value) | Gains | Losses | (= Fair Value) | Gains | Losses | |||||||||||||||||||||||||||
Other Securities | 32,816,718 | 1,098,369 | 1,474,980 | 376,610 | 27,416,537 | 1,617,290 | 1,813,859 | 196,568 | ||||||||||||||||||||||||
Japanese Stocks | 2,253,467 | 994,275 | 1,098,051 | 103,776 | 3,064,419 | 1,654,186 | 1,708,161 | 53,974 | ||||||||||||||||||||||||
Japanese Bonds | 15,675,573 | (54,111 | ) | 30,026 | 84,137 | 14,764,299 | 5,258 | 37,271 | 32,012 | |||||||||||||||||||||||
Japanese Government Bonds | 12,585,075 | (44,028 | ) | 6,533 | 50,562 | 11,877,711 | 5,913 | 8,745 | 2,832 | |||||||||||||||||||||||
Other | 14,887,678 | 158,205 | 346,902 | 188,696 | 9,587,819 | (42,155 | ) | 68,426 | 110,581 | |||||||||||||||||||||||
Foreign Bonds | 12,360,799 | 199,672 | 244,795 | 45,122 | 7,196,583 | 23,108 | 34,617 | 11,508 | ||||||||||||||||||||||||
Mizuho Bank | ||||||||||||||||||||||||||||||||
Other Securities | 31,904,667 | 1,034,870 | 1,396,801 | 361,930 | 26,622,049 | 1,521,244 | 1,707,856 | 186,612 | ||||||||||||||||||||||||
Japanese Stocks | 2,118,532 | 937,153 | 1,033,813 | 96,660 | 2,880,149 | 1,557,759 | 1,608,371 | 50,611 | ||||||||||||||||||||||||
Japanese Bonds | 15,413,226 | (55,616 | ) | 28,480 | 84,097 | 14,500,458 | 4,637 | 36,525 | 31,887 | |||||||||||||||||||||||
Japanese Government Bonds | 12,406,892 | (44,931 | ) | 5,631 | 50,562 | 11,687,096 | 5,853 | 8,594 | 2,740 | |||||||||||||||||||||||
Other | 14,372,909 | 153,334 | 334,506 | 181,172 | 9,241,441 | (41,152 | ) | 62,959 | 104,112 | |||||||||||||||||||||||
Foreign Bonds | 11,916,915 | 188,388 | 233,272 | 44,883 | 6,973,236 | 20,431 | 31,940 | 11,508 | ||||||||||||||||||||||||
Mizuho Trust & Banking | ||||||||||||||||||||||||||||||||
Other Securities | 912,050 | 63,499 | 78,179 | 14,680 | 794,488 | 96,046 | 106,002 | 9,956 | ||||||||||||||||||||||||
Japanese Stocks | 134,934 | 57,122 | 64,237 | 7,115 | 184,269 | 96,427 | 99,790 | 3,362 | ||||||||||||||||||||||||
Japanese Bonds | 262,347 | 1,505 | 1,545 | 40 | 263,840 | 621 | 745 | 124 | ||||||||||||||||||||||||
Japanese Government Bonds | 178,183 | 902 | 902 | — | 190,614 | 59 | 151 | 91 | ||||||||||||||||||||||||
Other | 514,768 | 4,871 | 12,395 | 7,524 | 346,377 | (1,002 | ) | 5,466 | 6,469 | |||||||||||||||||||||||
Foreign Bonds | 443,884 | 11,283 | 11,522 | 238 | 223,347 | 2,676 | 2,676 | — | ||||||||||||||||||||||||
| * | In addition to “Securities” on the balance sheets, NCDs in “Cash and Due from Banks” and certain items in “Other Debt Purchased” are also included. |
| * | Fair value of Japanese stocks with a quoted market price is determined based on the average quoted market price over the month preceding the balance sheet date. |
Fair value of securities other than Japanese stocks is determined at the quoted market price if available, or other reasonable value at the balance sheet date. |
| * | The book values of Other Securities which have readily determinable fair value are stated at fair value, so Unrealized Gains/Losses indicate the difference between book values on the balance sheets and the acquisition costs. |
| * | Unrealized Gains/Losses include ¥(5,191) million and ¥38,000 million, which were recognized in the statement of income (aggregate figures for the 2 banks) for March 31, 2020 and March 31, 2019, respectively, by applying the fair-value hedge method. As a result, the base amounts to be recorded directly to Net Assets after tax adjustment (aggregate figures for the 2 banks) as of March 31, 2020 and March 31, 2019 are ¥1,103,561million and ¥1,579,289 million, respectively. |
| * | Unrealized Gains (Losses) on Other Securities, net of Taxes (recorded directly to Net Assets after tax adjustment, excluding the amount recognized in the statement of income by applying the fair-value hedge method including translation differences regarding securities, the fair values of which are extremely difficult to determine) as of March 31, 2020 and March 31, 2019 are as follows: |
| (Millions of yen) | ||||||||
| As of March 31, 2020 | As of March 31, 2019 | |||||||
Aggregate Figures | 786,221 | 1,147,453 | ||||||
Mizuho Bank | 736,239 | 1,071,157 | ||||||
Mizuho Trust & Banking | 49,981 | 76,295 | ||||||
2-10
Mizuho Financial Group, Inc.
(2) Bonds Held to Maturity
Aggregate Figures for the 2 Banks
| (Millions of yen) | ||||||||||||||||||||||||||||||||
| As of March 31, 2020 | As of March 31, 2019 | |||||||||||||||||||||||||||||||
| Unrealized Gains/Losses | Unrealized Gains/Losses | |||||||||||||||||||||||||||||||
| Book Value | Gains | Losses | Book Value | Gains | Losses | |||||||||||||||||||||||||||
Aggregate Figures | 860,233 | 15,096 | 15,467 | 370 | 1,602,209 | 7,378 | 19,907 | 12,528 | ||||||||||||||||||||||||
Mizuho Bank | 860,233 | 15,096 | 15,467 | 370 | 1,602,209 | 7,378 | 19,907 | 12,528 | ||||||||||||||||||||||||
Mizuho Trust & Banking | — | — | — | — | — | — | — | — | ||||||||||||||||||||||||
(3) Investment in Subsidiaries and Affiliates
Aggregate Figures for the 2 Banks |
| |||||||||||||||||||||||||||||||
| (Millions of yen) | ||||||||||||||||||||||||||||||||
| As of March 31, 2020 | As of March 31, 2019 | |||||||||||||||||||||||||||||||
| Unrealized Gains/Losses | Unrealized Gains/Losses | |||||||||||||||||||||||||||||||
| Book Value | Gains | Losses | Book Value | Gains | Losses | |||||||||||||||||||||||||||
Aggregate Figures | 135,771 | 151,877 | 153,740 | 1,862 | 135,763 | 176,806 | 176,806 | — | ||||||||||||||||||||||||
Mizuho Bank | 135,771 | 151,877 | 153,740 | 1,862 | 135,763 | 176,806 | 176,806 | — | ||||||||||||||||||||||||
Mizuho Trust & Banking | — | — | — | — | — | — | — | — | ||||||||||||||||||||||||
(Reference)
Unrealized Gains/Losses on Other Securities
(the base amount to be recorded directly to Net Assets after tax and other necessary adjustments)
For certain Other Securities, Unrealized Gains/Losses were recognized in the statement of income by applying the fair-value hedge method. Unrealized Gains/Losses on Other Securities after excluding such Income/Loss (the “base amount”) are recorded directly to Net Assets after tax and other necessary adjustments. The base amount is as follows:
Consolidated
| (Millions of yen) | ||||||||||||
| As of March 31, 2020 | As of March 31, 2019 | |||||||||||
| Unrealized Gains/Losses | Unrealized Gains/Losses | |||||||||||
| Change | ||||||||||||
Other Securities | 1,177,950 | (473,915 | ) | 1,651,865 | ||||||||
Japanese Stocks | 1,071,551 | (616,099 | ) | 1,687,650 | ||||||||
Japanese Bonds | (54,100 | ) | (59,370 | ) | 5,270 | |||||||
Japanese Government Bonds | (44,021 | ) | (49,942 | ) | 5,921 | |||||||
Other | 160,499 | 201,554 | (41,055 | ) | ||||||||
Foreign Bonds | 200,954 | 179,249 | 21,704 | |||||||||
Non-Consolidated
Aggregate Figures for the 2 Banks
| (Millions of yen) | ||||||||||||
| As of March 31, 2020 | As of March 31, 2019 | |||||||||||
| Unrealized Gains/Losses | Unrealized Gains/Losses | |||||||||||
| Change | ||||||||||||
Other Securities | 1,103,561 | (475,728 | ) | 1,579,289 | ||||||||
Japanese Stocks | 999,466 | (618,709 | ) | 1,618,175 | ||||||||
Japanese Bonds | (54,111 | ) | (59,370 | ) | 5,258 | |||||||
Japanese Government Bonds | (44,028 | ) | (49,941 | ) | 5,913 | |||||||
Other | 158,205 | 202,350 | (44,145 | ) | ||||||||
Foreign Bonds | 199,672 | 178,553 | 21,118 | |||||||||
2-11
Mizuho Financial Group, Inc.
6. Projected Redemption Amounts for Securities
| • | The redemption schedule by term for Bonds Held to Maturity and Other Securities with maturities is as follows: |
Non-Consolidated
Aggregate Figures for the 2 Banks
| (Billions of yen) | ||||||||||||||||||||||||||||||||||||||||||||||||
| Maturity as of March 31, 2020 | Change | Maturity as of March 31, 2019 | ||||||||||||||||||||||||||||||||||||||||||||||
| Within 1 year | 1 - 5 years | 5 - 10 years | Over 10 years | Within 1 year | 1 - 5 years | 5 - 10 years | Over 10 years | Within 1 year | 1 - 5 years | 5 - 10 years | Over 10 years | |||||||||||||||||||||||||||||||||||||
Japanese Bonds | 6,248.6 | 6,888.8 | 2,277.4 | 626.2 | (2,569.0 | ) | 2,871.8 | 139.9 | (202.1 | ) | 8,817.6 | 4,016.9 | 2,137.5 | 828.3 | ||||||||||||||||||||||||||||||||||
Japanese Government Bonds | 5,851.4 | 5,389.5 | 1,662.1 | 45.0 | (2,603.3 | ) | 2,691.4 | 137.7 | (200.0 | ) | 8,454.7 | 2,698.1 | 1,524.4 | 245.0 | ||||||||||||||||||||||||||||||||||
Japanese Local Government Bonds | 11.5 | 171.4 | 84.6 | 4.4 | 4.2 | 53.2 | 7.2 | (0.3 | ) | 7.2 | 118.1 | 77.3 | 4.7 | |||||||||||||||||||||||||||||||||||
Japanese Corporate Bonds | 385.7 | 1,327.8 | 530.7 | 576.8 | 30.0 | 127.1 | (5.0 | ) | (1.7 | ) | 355.7 | 1,200.7 | 535.7 | 578.5 | ||||||||||||||||||||||||||||||||||
Other | 3,229.3 | 3,022.1 | 2,576.5 | 4,732.7 | (480.6 | ) | 1,424.7 | 1,617.0 | 3,022.9 | 3,709.9 | 1,597.3 | 959.5 | 1,709.8 | |||||||||||||||||||||||||||||||||||
| Mizuho Bank | ||||||||||||||||||||||||||||||||||||||||||||||||
Japanese Bonds | 6,186.3 | 6,718.1 | 2,253.7 | 626.2 | (2,486.0 | ) | 2,781.4 | 153.3 | (202.1 | ) | 8,672.3 | 3,936.6 | 2,100.4 | 828.3 | ||||||||||||||||||||||||||||||||||
Japanese Government Bonds | 5,798.3 | 5,269.5 | 1,662.1 | 45.0 | (2,521.4 | ) | 2,606.4 | 157.7 | (200.0 | ) | 8,319.7 | 2,663.1 | 1,504.4 | 245.0 | ||||||||||||||||||||||||||||||||||
Japanese Local Government Bonds | 10.7 | 171.1 | 84.6 | 4.4 | 4.0 | 54.0 | 7.2 | (0.3 | ) | 6.7 | 117.1 | 77.3 | 4.7 | |||||||||||||||||||||||||||||||||||
Japanese Corporate Bonds | 377.2 | 1,277.4 | 507.0 | 576.8 | 31.3 | 121.0 | (11.5 | ) | (1.7 | ) | 345.8 | 1,156.4 | 518.6 | 578.5 | ||||||||||||||||||||||||||||||||||
Other | 3,210.6 | 2,885.5 | 2,401.3 | 4,636.1 | (498.2 | ) | 1,338.7 | 1,592.4 | 2,951.2 | 3,708.8 | 1,546.7 | 808.8 | 1,684.9 | |||||||||||||||||||||||||||||||||||
| Mizuho Trust & Banking | ||||||||||||||||||||||||||||||||||||||||||||||||
Japanese Bonds | 62.3 | 170.7 | 23.6 | — | (82.9 | ) | 90.4 | (13.4 | ) | — | 145.2 | 80.3 | 37.0 | — | ||||||||||||||||||||||||||||||||||
Japanese Government Bonds | 53.1 | 120.0 | — | — | (81.9 | ) | 85.0 | (20.0 | ) | — | 135.0 | 35.0 | 20.0 | — | ||||||||||||||||||||||||||||||||||
Japanese Local Government Bonds | 0.7 | 0.2 | — | — | 0.2 | (0.7 | ) | — | — | 0.4 | 1.0 | — | — | |||||||||||||||||||||||||||||||||||
Japanese Corporate Bonds | 8.4 | 50.4 | 23.6 | — | (1.3 | ) | 6.1 | 6.5 | — | 9.8 | 44.2 | 17.0 | — | |||||||||||||||||||||||||||||||||||
Other | 18.7 | 136.6 | 175.2 | 96.6 | 17.5 | 86.0 | 24.5 | 71.7 | 1.1 | 50.6 | 150.6 | 24.9 | ||||||||||||||||||||||||||||||||||||
2-12
Mizuho Financial Group, Inc.
7. Overview of Derivative Transactions Qualifying for Hedge Accounting
Non-Consolidated
| • | Notional Amounts of Interest Rate Swaps (qualifying for hedge accounting (deferred method)) by Remaining Contractual Term |
Aggregate Figures for the 2 Banks
| (Billions of yen) | ||||||||||||||||||||||||||||||||||||||||||||||||
| As of March 31, 2020 | Change | As of March 31, 2019 | ||||||||||||||||||||||||||||||||||||||||||||||
| Within 1 year | 1 - 5 years | Over 5 years | Total | Within 1 year | 1 - 5 years | Over 5 years | Total | Within 1 year | 1 - 5 years | Over 5 years | Total | |||||||||||||||||||||||||||||||||||||
Receive Fixed / Pay Float | 1,809.7 | 10,483.7 | 5,858.2 | 18,151.7 | (1,483.1 | ) | 795.6 | (3,555.4 | ) | (4,242.9 | ) | 3,292.9 | 9,688.1 | 9,413.6 | 22,394.7 | |||||||||||||||||||||||||||||||||
Receive Float / Pay Fixed | 420.1 | 2,584.7 | 3,135.7 | 6,140.6 | 189.5 | 336.7 | (1,955.4 | ) | (1,429.1 | ) | 230.5 | 2,247.9 | 5,091.2 | 7,569.7 | ||||||||||||||||||||||||||||||||||
Receive Float / Pay Float | — | — | — | — | — | — | — | — | — | — | — | — | ||||||||||||||||||||||||||||||||||||
Receive Fixed / Pay Fixed | — | — | — | — | — | — | — | — | — | — | — | — | ||||||||||||||||||||||||||||||||||||
Total | 2,229.8 | 13,068.5 | 8,994.0 | 24,292.3 | (1,293.6 | ) | 1,132.3 | (5,510.8 | ) | (5,672.1 | ) | 3,523.4 | 11,936.1 | 14,504.9 | 29,964.5 | |||||||||||||||||||||||||||||||||
| Mizuho Bank | ||||||||||||||||||||||||||||||||||||||||||||||||
Receive Fixed / Pay Float | 1,809.7 | 10,483.7 | 5,858.2 | 18,151.7 | (1,483.1 | ) | 795.6 | (3,555.4 | ) | (4,242.9 | ) | 3,292.9 | 9,688.1 | 9,413.6 | 22,394.7 | |||||||||||||||||||||||||||||||||
Receive Float / Pay Fixed | 400.1 | 2,454.7 | 2,712.9 | 5,567.7 | 169.5 | 296.7 | (2,233.3 | ) | (1,766.9 | ) | 230.5 | 2,157.9 | 4,946.2 | 7,334.7 | ||||||||||||||||||||||||||||||||||
Receive Float / Pay Float | — | — | — | — | — | — | — | — | — | — | — | — | ||||||||||||||||||||||||||||||||||||
Receive Fixed / Pay Fixed | — | — | — | — | — | — | — | — | — | — | — | — | ||||||||||||||||||||||||||||||||||||
Total | 2,209.8 | 12,938.5 | 8,571.1 | 23,719.5 | (1,313.6 | ) | 1,092.3 | (5,788.7 | ) | (6,009.9 | ) | 3,523.4 | 11,846.1 | 14,359.9 | 29,729.5 | |||||||||||||||||||||||||||||||||
| Mizuho Trust & Banking | ||||||||||||||||||||||||||||||||||||||||||||||||
Receive Fixed / Pay Float | — | — | — | — | — | — | — | — | — | — | — | — | ||||||||||||||||||||||||||||||||||||
Receive Float / Pay Fixed | 20.0 | 130.0 | 422.8 | 572.8 | 20.0 | 40.0 | 277.8 | 337.8 | — | 90.0 | 145.0 | 235.0 | ||||||||||||||||||||||||||||||||||||
Receive Float / Pay Float | — | — | — | — | — | — | — | — | — | — | — | — | ||||||||||||||||||||||||||||||||||||
Receive Fixed / Pay Fixed | — | — | — | — | — | — | — | — | — | — | — | — | ||||||||||||||||||||||||||||||||||||
Total | 20.0 | 130.0 | 422.8 | 572.8 | 20.0 | 40.0 | 277.8 | 337.8 | — | 90.0 | 145.0 | 235.0 | ||||||||||||||||||||||||||||||||||||
(Reference)
Deferred Hedge Gains/Losses on Derivative Transactions Qualifying for Hedge Accounting
| (Billions of yen) | ||||||||||||||||||||||||||||||||||||
| As of March 31, 2020 | Change | As of March 31, 2019 | ||||||||||||||||||||||||||||||||||
| Deferred Hedge Gains/Losses | Deferred Hedge Gains/Losses | Deferred Hedge Gains/Losses | ||||||||||||||||||||||||||||||||||
| Gains | Losses | Gains | Losses | Gains | Losses | |||||||||||||||||||||||||||||||
Aggregate Figures | 1,396.6 | 1,299.1 | 97.4 | 464.5 | 325.6 | 138.8 | 932.1 | 973.5 | (41.3 | ) | ||||||||||||||||||||||||||
Mizuho Bank | 1,321.4 | 1,217.3 | 104.1 | 473.4 | 330.2 | 143.1 | 848.0 | 887.1 | (39.0 | ) | ||||||||||||||||||||||||||
Mizuho Trust & Banking | 75.1 | 81.8 | (6.6 | ) | (8.8 | ) | (4.5 | ) | (4.3 | ) | 84.0 | 86.3 | (2.3 | ) | ||||||||||||||||||||||
Note: Above figures reflect all derivative transactions qualifying for hedge accounting, and are before net of applicable income taxes and others.
2-13
Mizuho Financial Group, Inc.
8. Employee Retirement Benefits
Non-Consolidated
Retirement Benefit Obligations
Aggregate Figures for the 2 Banks
| (Millions of yen) | ||||||||||||||||
| Fiscal 2019 | Change | Fiscal 2018 | ||||||||||||||
Retirement Benefit Obligations | (A) | 1,220,755 | (25,113 | ) | 1,245,869 | |||||||||||
Discount Rate (%) | (0.00)~0.62 | 0.00~0.70 | ||||||||||||||
|
|
|
|
|
| |||||||||||
Total Fair Value of Plan Assets | (B) | 1,997,428 | (160,525 | ) | 2,157,954 | |||||||||||
Unrecognized Actuarial Differences | (C) | (154,639 | ) | 219,803 | (374,443 | ) | ||||||||||
Prepaid Pension Cost | (B)+(C)-(A) | 622,033 | 84,391 | 537,641 | ||||||||||||
Mizuho Bank | ||||||||||||||||
Retirement Benefit Obligations | (A) | 1,072,553 | (23,859 | ) | 1,096,412 | |||||||||||
Discount Rate (%) | (0.00)~0.62 | 0.00~0.70 | ||||||||||||||
|
|
|
|
|
| |||||||||||
Total Fair Value of Plan Assets | (B) | 1,756,585 | (166,223 | ) | 1,922,809 | |||||||||||
Unrecognized Actuarial Differences | (C) | (127,758 | ) | 216,762 | (344,521 | ) | ||||||||||
Prepaid Pension Cost | (B)+(C)-(A) | 556,273 | 74,397 | 481,875 | ||||||||||||
Mizuho Trust & Banking | ||||||||||||||||
Retirement Benefit Obligations | (A) | 148,201 | (1,254 | ) | 149,456 | |||||||||||
Discount Rate (%) | (0.00)~0.62 | 0.00~0.70 | ||||||||||||||
|
|
|
|
|
| |||||||||||
Total Fair Value of Plan Assets | (B) | 240,842 | 5,697 | 235,145 | ||||||||||||
Unrecognized Actuarial Differences | (C) | (26,881 | ) | 3,040 | (29,922) | |||||||||||
Prepaid Pension Cost | (B)+(C)-(A) | 65,759 | 9,993 | 55,766 | ||||||||||||
2-14
Mizuho Financial Group, Inc.
Income (Expenses) related to Employee Retirement Benefits
Aggregate Figures for the 2 Banks
| (Millions of yen) | ||||||||||||||||
| Fiscal 2019 | Change | Fiscal 2018 | ||||||||||||||
Service Cost | (29,505 | ) | (1,174 | ) | (28,331 | ) | ||||||||||
Interest Cost | (3,128 | ) | 1,076 | (4,205 | ) | |||||||||||
Expected Return on Plan Assets | 34,726 | 1,824 | 32,901 | |||||||||||||
Accumulation (Amortization) of Unrecognized Actuarial Differences | 61,590 | 30,428 | 31,162 | |||||||||||||
Accumulation (Amortization) of Unrecognized Prior Service Cost | (2,301 | ) | (2,301 | ) | — | |||||||||||
Gains on Cancellation of Employee Retirement Benefit Trust | — | (7,841 | ) | 7,841 | ||||||||||||
Other | (5,682 | ) | (3,443 | ) | (2,238 | ) | ||||||||||
|
|
|
|
|
| |||||||||||
Total | 55,698 | 18,567 | 37,131 | |||||||||||||
|
|
|
|
|
| |||||||||||
Note: Gains on Cancellation of Employee Retirement Benefit Trust is recorded to Extraordinary Gains.
Mizuho Bank
| (Millions of yen) | ||||||||||||||||
| Fiscal 2019 | Change | Fiscal 2018 | ||||||||||||||
Service Cost | (25,010 | ) | (903 | ) | (24,107 | ) | ||||||||||
Interest Cost | (2,749 | ) | 951 | (3,701 | ) | |||||||||||
Expected Return on Plan Assets | 31,105 | 1,686 | 29,419 | |||||||||||||
Accumulation (Amortization) of Unrecognized Actuarial Differences | 57,322 | 26,781 | 30,541 | |||||||||||||
Accumulation (Amortization) of Unrecognized Prior Service Cost | (2,013 | ) | (2,013 | ) | — | |||||||||||
Gains on Cancellation of Employee Retirement Benefit Trust | — | (7,841 | ) | 7,841 | ||||||||||||
Other | (4,973 | ) | (2,979 | ) | (1,993 | ) | ||||||||||
|
|
|
|
|
| |||||||||||
Total | 53,680 | 15,680 | 37,999 | |||||||||||||
|
|
|
|
|
| |||||||||||
Note: Gains on Cancellation of Employee Retirement Benefit Trust is recorded to Extraordinary Gains.
Mizuho Trust & Banking
| (Millions of yen) | ||||||||||||||||
| Fiscal 2019 | Change | Fiscal 2018 | ||||||||||||||
Service Cost | (4,495 | ) | (271 | ) | (4,224 | ) | ||||||||||
Interest Cost | (379 | ) | 124 | (503 | ) | |||||||||||
Expected Return on Plan Assets | 3,620 | 137 | 3,482 | |||||||||||||
Accumulation (Amortization) of Unrecognized Actuarial Differences | 4,268 | 3,646 | 621 | |||||||||||||
Accumulation (Amortization) of Unrecognized Prior Service Cost | (287 | ) | (287 | ) | — | |||||||||||
Other | (709 | ) | (464 | ) | (244 | ) | ||||||||||
|
|
|
|
|
| |||||||||||
Total | 2,018 | 2,886 | (868 | ) | ||||||||||||
|
|
|
|
|
| |||||||||||
2-15
Mizuho Financial Group, Inc.
Consolidated
Retirement Benefit Obligations
| (Millions of yen) | ||||||||||||||||
| As of March 31, 2020 | Change | As of March 31, 2019 | ||||||||||||||
Retirement Benefit Obligations | (A) | 1,440,341 | (21,896 | ) | 1,462,237 | |||||||||||
Fair Value of Plan Assets | (B) | 2,225,010 | (159,158 | ) | 2,384,168 | |||||||||||
Unrecognized Actuarial Differences | (C) | (138,808 | ) | 227,368 | (366,177 | ) | ||||||||||
Net Defined Benefit Asset | (D) | 846,782 | (136,021 | ) | 982,804 | |||||||||||
Net Defined Benefit Liability | (A)-(B)+(D) | 62,113 | 1,240 | 60,873 | ||||||||||||
Income (Expenses) related to Employee Retirement Benefits
|
| |||||||||||||||
| (Millions of yen) | ||||||||||||||||
| Fiscal 2019 | Change | Fiscal 2018 | ||||||||||||||
Service Cost | (43,697 | ) | (1,645 | ) | (42,051 | ) | ||||||||||
Interest Cost | (4,013 | ) | 1,217 | (5,231 | ) | |||||||||||
Expected Return on Plan Assets | 39,117 | 2,036 | 37,080 | |||||||||||||
Accumulation (Amortization) of Unrecognized Actuarial Differences | 60,477 | 30,440 | 30,036 | |||||||||||||
Accumulation (Amortization) of Unrecognized Prior Service Cost | (2,803 | ) | (2,734 | ) | (69 | ) | ||||||||||
Gains on Cancellation of Employee Retirement Benefit Trust | — | (7,841 | ) | 7,841 | ||||||||||||
Other | (11,953 | ) | (5,673 | ) | (6,279 | ) | ||||||||||
|
|
|
|
|
| |||||||||||
Total | 37,126 | 15,799 | 21,327 | |||||||||||||
|
|
|
|
|
| |||||||||||
Notes: | (1 | ) | Gains on Cancellation of Employee Retirement Benefit Trust is recorded to Extraordinary Gains. | |||
| (2 | ) | Parts of Income (Expenses) related to Employee Retirement Benefits which have been included in Other are included in Accumulation (Amortization) of Unrecognized Prior Service Cost. | ||||
2-16
Mizuho Financial Group, Inc.
9. Capital Ratio
Mizuho Financial Group
International Standard
| Consolidated | (%, Billions of yen) | |||||||||||||||
| As of March 31, 2020 (Preliminary) | Change | As of March 31, 2019
| ||||||||||||||
(1) Total Capital Ratio | 17.25 | (1.60 | ) | 18.85 | ||||||||||||
(2) Tier 1 Capital Ratio | 14.52 | (1.42 | ) | 15.94 | ||||||||||||
(3) Common Equity Tier 1 Capital Ratio | 11.65 | (1.11 | ) | 12.76 | ||||||||||||
(4) Total Capital | 10,722.2 | (195.2 | ) | 10,917.5 | ||||||||||||
(5) Tier 1 Capital | 9,024.4 | (207.7 | ) | 9,232.1 | ||||||||||||
(6) Common Equity Tier 1 Capital | 7,244.7 | (145.2 | ) | 7,390.0 | ||||||||||||
(7) ���Risk weighted Assets | 62,141.2 | 4,241.6 | 57,899.5 | |||||||||||||
(8) Total Required Capital (7) X8% | 4,971.2 | 339.3 | 4,631.9 | |||||||||||||
Mizuho Bank
International Standard | ||||||||||||||||
| Consolidated | Non-Consolidated | |||||||||||||||
| As of March 31, 2020 (Preliminary) | Change | As of March 31, 2019
| As of March 31, 2020 (Preliminary) | |||||||||||||
(1) Total Capital Ratio | 17.29 | (1.73 | ) | 19.02 | 17.75 | |||||||||||
(2) Tier 1 Capital Ratio | 14.50 | (1.56 | ) | 16.06 | 14.80 | |||||||||||
(3) Common Equity Tier 1 Capital Ratio | 11.39 | (1.21 | ) | 12.60 | 11.47 | |||||||||||
(4) Total Capital | 9,864.6 | (233.3 | ) | 10,098.0 | 9,481.9 | |||||||||||
(5) Tier 1 Capital | 8,274.7 | (252.6 | ) | 8,527.3 | 7,905.0 | |||||||||||
(6) Common Equity Tier 1 Capital | 6,501.3 | (188.3 | ) | 6,689.7 | 6,130.3 | |||||||||||
(7) Risk weighted Assets | 57,040.2 | 3,966.6 | 53,073.6 | 53,404.4 | ||||||||||||
(8) Total Required Capital (7) X8% | 4,563.2 | 317.3 | 4,245.8 | 4,272.3 | ||||||||||||
Mizuho Trust & Banking
International Standard | ||||||||||||||||
| Consolidated | Non-Consolidated | |||||||||||||||
| As of March 31, 2020 (Preliminary) | Change | As of March 31, 2019
| As of March 31, 2020 (Preliminary) | |||||||||||||
(1) Total Capital Ratio | 23.74 | (0.13 | ) | 23.87 | 23.18 | |||||||||||
(2) Tier 1 Capital Ratio | 23.66 | (0.04 | ) | 23.70 | 23.10 | |||||||||||
(3) Common Equity Tier 1 Capital Ratio | 23.64 | (0.03 | ) | 23.67 | 23.10 | |||||||||||
(4) Total Capital | 490.8 | (13.7 | ) | 504.6 | 476.8 | |||||||||||
(5) Tier 1 Capital | 489.2 | (11.7 | ) | 500.9 | 475.2 | |||||||||||
(6) Common Equity Tier 1 Capital | 488.7 | (11.6 | ) | 500.4 | 475.2 | |||||||||||
(7) Risk weighted Assets | 2,067.3 | (46.1 | ) | 2,113.4 | 2,056.8 | |||||||||||
(8) Total Required Capital (7) X8% | 165.3 | (3.6 | ) | 169.0 | 164.5 | |||||||||||
2-17
Mizuho Financial Group, Inc.
II. REVIEW OF CREDITS
1. Status ofNon-Accrual, Past Due & Restructured Loans
| • | The figures below are presented net of partial direct write-offs. |
| • | Treatment of accrued interest is based on the results of the self-assessment of assets. |
(All loans to obligors classified in the self-assessment of assets as Bankrupt Obligors, Substantially Bankrupt Obligors, and Intensive Control Obligors are categorized asnon-accrual loans.)
Consolidated
| (Millions of yen, %) | ||||||||||||||||||||||||
| As of March 31, 2020 | As of March 31, 2019 | |||||||||||||||||||||||
| % | Change | % | % | |||||||||||||||||||||
Loans to Bankrupt Obligors | 15,938 | 0.01 | 4,545 | 0.00 | 11,393 | 0.01 | ||||||||||||||||||
Non-Accrual Delinquent Loans | 401,016 | 0.48 | 21,791 | (0.00 | ) | 379,225 | 0.48 | |||||||||||||||||
Loans Past Due for 3 Months or More | 1,468 | 0.00 | 1,032 | 0.00 | 436 | 0.00 | ||||||||||||||||||
Restructured Loans | 256,429 | 0.30 | 61,062 | 0.05 | 195,366 | 0.24 | ||||||||||||||||||
|
|
|
|
|
|
|
|
|
|
|
| |||||||||||||
Total | 674,853 | 0.80 | 88,431 | 0.06 | 586,422 | 0.74 | ||||||||||||||||||
|
|
|
|
|
|
|
|
|
|
|
| |||||||||||||
Total Loans | 83,468,185 | 100.00 | 5,011,250 | 78,456,935 | 100.00 | |||||||||||||||||||
Above figures are presented net of partial direct write-offs, the amounts of which are indicated in the table below. |
| |||||||||||||||||||||||
Amount of Partial Direct Write-offs | 79,826 | (7,587 | ) | 87,413 | ||||||||||||||||||||
| Trust Account |
| |||||||||||||||||||||||
| As of March 31, 2020 | As of March 31, 2019 | |||||||||||||||||||||||
| % | Change | % | % | |||||||||||||||||||||
Loans to Bankrupt Obligors | — | — | — | — | — | — | ||||||||||||||||||
Non-Accrual Delinquent Loans | — | — | (2,770 | ) | (28.15 | ) | 2,770 | 28.15 | ||||||||||||||||
Loans Past Due for 3 Months or More | — | — | — | — | — | — | ||||||||||||||||||
Restructured Loans | — | — | — | — | — | — | ||||||||||||||||||
|
|
|
|
|
|
|
|
|
|
|
| |||||||||||||
Total | — | — | (2,770 | ) | (28.15 | ) | 2,770 | 28.15 | ||||||||||||||||
|
|
|
|
|
|
|
|
|
|
|
| |||||||||||||
Total Loans | 8,773 | 100.00 | (1,066 | ) | 9,840 | 100.00 | ||||||||||||||||||
Consolidated + Trust Account | ||||||||||||||||||||||||
| As of March 31, 2020 | As of March 31, 2019 | |||||||||||||||||||||||
| % | Change | % | % | |||||||||||||||||||||
Loans to Bankrupt Obligors | 15,938 | 0.01 | 4,545 | 0.00 | 11,393 | 0.01 | ||||||||||||||||||
Non-Accrual Delinquent Loans | 401,016 | 0.48 | 19,020 | (0.00 | ) | 381,995 | 0.48 | |||||||||||||||||
Loans Past Due for 3 Months or More | 1,468 | 0.00 | 1,032 | 0.00 | 436 | 0.00 | ||||||||||||||||||
Restructured Loans | 256,429 | 0.30 | 61,062 | 0.05 | 195,366 | 0.24 | ||||||||||||||||||
|
|
|
|
|
|
|
|
|
|
|
| |||||||||||||
Total | 674,853 | 0.80 | 85,661 | 0.05 | 589,192 | 0.75 | ||||||||||||||||||
|
|
|
|
|
|
|
|
|
|
|
| |||||||||||||
Total Loans | 83,476,958 | 100.00 | 5,010,183 | 78,466,775 | 100.00 | |||||||||||||||||||
Trust account represents trust accounts that guarantee principals in the agreement. |
2-18
Mizuho Financial Group, Inc.
Non-Consolidated
Aggregate Figures for the 2 Banks
(Banking Account + Trust Account)
| (Millions of yen, %) | ||||||||||||||||||||||||
| As of March 31, 2020 | As of March 31, 2019 | |||||||||||||||||||||||
| % | Change | % | % | |||||||||||||||||||||
Loans to Bankrupt Obligors | 14,786 | 0.01 | 4,479 | 0.00 | 10,306 | 0.01 | ||||||||||||||||||
Non-Accrual Delinquent Loans | 383,705 | 0.45 | 34,236 | 0.01 | 349,469 | 0.44 | ||||||||||||||||||
Loans Past Due for 3 Months or More | 1,468 | 0.00 | 1,032 | 0.00 | 436 | 0.00 | ||||||||||||||||||
Restructured Loans | 222,011 | 0.26 | 62,648 | 0.06 | 159,363 | 0.20 | ||||||||||||||||||
|
|
|
|
|
|
|
|
|
|
|
| |||||||||||||
Total | 621,972 | 0.73 | 102,396 | 0.08 | 519,575 | 0.65 | ||||||||||||||||||
|
|
|
|
|
|
|
|
|
|
|
| |||||||||||||
Total Loans | 84,247,518 | 100.00 | 4,835,141 | 79,412,377 | 100.00 | |||||||||||||||||||
Above figures are presented net of partial direct write-offs, the amounts of which are indicated in the table below. |
| |||||||||||||||||||||||
Amount of Partial Direct Write-offs | 74,578 | (7,217 | ) | 81,795 | ||||||||||||||||||||
Mizuho Bank | ||||||||||||||||||||||||
Loans to Bankrupt Obligors | 14,786 | 0.01 | 4,492 | 0.00 | 10,293 | 0.01 | ||||||||||||||||||
Non-Accrual Delinquent Loans | 379,472 | 0.46 | 36,311 | 0.01 | 343,161 | 0.45 | ||||||||||||||||||
Loans Past Due for 3 Months or More | 1,468 | 0.00 | 1,032 | 0.00 | 436 | 0.00 | ||||||||||||||||||
Restructured Loans | 220,871 | 0.27 | 62,743 | 0.06 | 158,127 | 0.20 | ||||||||||||||||||
|
|
|
|
|
|
|
|
|
|
|
| |||||||||||||
Total | 616,599 | 0.76 | 104,580 | 0.08 | 512,019 | 0.67 | ||||||||||||||||||
|
|
|
|
|
|
|
|
|
|
|
| |||||||||||||
Total Loans | 80,871,269 | 100.00 | 4,823,905 | 76,047,363 | 100.00 | |||||||||||||||||||
Above figures are presented net of partial direct write-offs, the amounts of which are indicated in the table below. |
| |||||||||||||||||||||||
Amount of Partial Direct Write-offs | 74,362 | (6,921 | ) | 81,284 | ||||||||||||||||||||
Mizuho Trust & Banking (Banking Account) | ||||||||||||||||||||||||
Loans to Bankrupt Obligors | — | — | (13 | ) | (0.00 | ) | 13 | 0.00 | ||||||||||||||||
Non-Accrual Delinquent Loans | 4,232 | 0.12 | 695 | 0.02 | 3,537 | 0.10 | ||||||||||||||||||
Loans Past Due for 3 Months or More | — | — | — | — | — | — | ||||||||||||||||||
Restructured Loans | 1,140 | 0.03 | (94 | ) | (0.00 | ) | 1,235 | 0.03 | ||||||||||||||||
|
|
|
|
|
|
|
|
|
|
|
| |||||||||||||
Total | 5,373 | 0.15 | 587 | 0.01 | 4,785 | 0.14 | ||||||||||||||||||
|
|
|
|
|
|
|
|
|
|
|
| |||||||||||||
Total Loans | 3,367,475 | 100.00 | 12,302 | 3,355,173 | 100.00 | |||||||||||||||||||
Above figures are presented net of partial direct write-offs, the amounts of which are indicated in the table below. |
| |||||||||||||||||||||||
Amount of Partial Direct Write-offs | 215 | (296 | ) | 511 | ||||||||||||||||||||
(Trust Account) | ||||||||||||||||||||||||
Loans to Bankrupt Obligors | — | — | — | — | — | — | ||||||||||||||||||
Non-Accrual Delinquent Loans | — | — | (2,770 | ) | (28.15 | ) | 2,770 | 28.15 | ||||||||||||||||
Loans Past Due for 3 Months or More | — | — | — | — | — | — | ||||||||||||||||||
Restructured Loans | — | — | — | — | — | — | ||||||||||||||||||
|
|
|
|
|
|
|
|
|
|
|
| |||||||||||||
Total | — | — | (2,770 | ) | (28.15 | ) | 2,770 | 28.15 | ||||||||||||||||
|
|
|
|
|
|
|
|
|
|
|
| |||||||||||||
Total Loans | 8,773 | 100.00 | (1,066 | ) | 9,840 | 100.00 | ||||||||||||||||||
Trust account represents trust accounts that guarantee principals in the agreement. |
2-19
Mizuho Financial Group, Inc.
2. Status of Reserves for Possible Losses on Loans
Consolidated
| (Millions of yen) | ||||||||||||
| As of March 31, 2020 | Change | As of March 31, 2019 | ||||||||||
Reserves for Possible Losses on Loans | 424,446 | 136,630 | 287,815 | |||||||||
General Reserve for Possible Losses on Loans | 239,035 | 103,013 | 136,022 | |||||||||
Specific Reserve for Possible Losses on Loans | 185,410 | 33,622 | 151,787 | |||||||||
Reserve for Possible Losses on Loans to Restructuring Countries | — | (5 | ) | 5 | ||||||||
Above figures are presented net of partial direct write-offs, the amounts of which are indicated in the table below. | ||||||||||||
Amount of Partial Direct Write-offs | 89,216 | (3,052 | ) | 92,269 | ||||||||
Non-Consolidated
Aggregate Figures for the 2 Banks
| (Millions of yen) | ||||||||||||
| As of March 31, 2020 | Change | As of March 31, 2019 | ||||||||||
Reserves for Possible Losses on Loans | 388,818 | 144,417 | 244,401 | |||||||||
General Reserve for Possible Losses on Loans | 216,597 | 106,229 | 110,367 | |||||||||
Specific Reserve for Possible Losses on Loans | 172,221 | 38,192 | 134,028 | |||||||||
Reserve for Possible Losses on Loans to Restructuring Countries | — | (5 | ) | 5 | ||||||||
Above figures are presented net of partial direct write-offs, the amounts of which are indicated in the table below. | ||||||||||||
Amount of Partial Direct Write-offs | 83,523 | (2,727 | ) | 86,250 | ||||||||
Mizuho Bank | ||||||||||||
Reserves for Possible Losses on Loans | 385,129 | 143,053 | 242,076 | |||||||||
General Reserve for Possible Losses on Loans | 214,064 | 105,579 | 108,485 | |||||||||
Specific Reserve for Possible Losses on Loans | 171,064 | 37,478 | 133,585 | |||||||||
Reserve for Possible Losses on Loans to Restructuring Countries | — | (5 | ) | 5 | ||||||||
Above figures are presented net of partial direct write-offs, the amounts of which are indicated in the table below. | ||||||||||||
Amount of Partial Direct Write-offs | 83,308 | (2,430 | ) | 85,739 | ||||||||
Mizuho Trust & Banking | ||||||||||||
Reserves for Possible Losses on Loans | 3,689 | 1,364 | 2,324 | |||||||||
General Reserve for Possible Losses on Loans | 2,532 | 649 | 1,882 | |||||||||
Specific Reserve for Possible Losses on Loans | 1,156 | 714 | 442 | |||||||||
Reserve for Possible Losses on Loans to Restructuring Countries | — | — | — | |||||||||
Above figures are presented net of partial direct write-offs, the amounts of which are indicated in the table below. | ||||||||||||
Amount of Partial Direct Write-offs | 215 | (296 | ) | 511 | ||||||||
Reserve for Possible Losses on Entrusted Loans (¥27 million and ¥30 million for March 31, 2020 and March 31, 2019, respectively) is not included in the above figures for Trust Account.
2-20
Mizuho Financial Group, Inc.
3. Reserve Ratios forNon-Accrual, Past Due & Restructured Loans
Consolidated
| (%) | ||||||||||||
| As of March 31, 2020 | Change | As of March 31, 2019 | ||||||||||
Mizuho Financial Group | 62.89 | 13.81 | 49.07 | |||||||||
Above figures are presented net of partial direct write-offs. | ||||||||||||
Non-Consolidated | ||||||||||||
| (%) | ||||||||||||
| As of March 31, 2020 | Change | As of March 31, 2019 | ||||||||||
Total | 62.51 | 15.22 | 47.29 | |||||||||
Mizuho Bank | 62.46 | 15.18 | 47.27 | |||||||||
Mizuho Trust & Banking (Banking Account) | 68.65 | 20.07 | 48.58 | |||||||||
Above figures are presented net of partial direct write-offs.
2-21
Mizuho Financial Group, Inc.
4. Status of Non Performing Loans based on the Financial Reconstruction Act (“FRA”)
Consolidated
| (Millions of yen) | ||||||||||||
| As of March 31, 2020 | Change | As of March 31, 2019 | ||||||||||
Claims against Bankrupt and Substantially Bankrupt Obligors | 59,212 | (578 | ) | 59,790 | ||||||||
Claims with Collection Risk | 383,734 | 24,893 | 358,841 | |||||||||
Claims for Special Attention | 257,898 | 62,094 | 195,803 | |||||||||
Sub-total[1] | 700,845 | 86,409 | 614,435 | |||||||||
Normal Claims | 92,661,291 | 5,489,767 | 87,171,524 | |||||||||
|
|
|
|
|
| |||||||
Total[2] | 93,362,137 | 5,576,176 | 87,785,960 | |||||||||
|
|
|
|
|
| |||||||
| (%) | ||||||||||||
NPL ratio[1]/[2] | 0.75 | 0.05 | 0.69 | |||||||||
| Above figures are presented net of partial direct write-offs. |
| |||||||||||
| Trust Account | ||||||||||||
| (Millions of yen) | ||||||||||||
| As of March 31, 2020 | Change | As of March 31, 2019 | ||||||||||
Claims against Bankrupt and Substantially Bankrupt Obligors | — | — | — | |||||||||
Claims with Collection Risk | — | (2,770 | ) | 2,770 | ||||||||
Claims for Special Attention | — | — | — | |||||||||
Sub-total[3] | — | (2,770 | ) | 2,770 | ||||||||
Normal Claims | 8,773 | 1,703 | 7,069 | |||||||||
|
|
|
|
|
| |||||||
Total[4] | 8,773 | (1,066 | ) | 9,840 | ||||||||
|
|
|
|
|
| |||||||
| (%) | ||||||||||||
NPL ratio[3]/[4] | — | (28.15 | ) | 28.15 | ||||||||
Consolidated + Trust Account | ||||||||||||
| (Millions of yen) | ||||||||||||
| As of March 31, 2020 | Change | As of March 31, 2019 | ||||||||||
Claims against Bankrupt and Substantially Bankrupt Obligors | 59,212 | (578 | ) | 59,790 | ||||||||
Claims with Collection Risk | 383,734 | 22,122 | 361,612 | |||||||||
Claims for Special Attention | 257,898 | 62,094 | 195,803 | |||||||||
Sub-total[5] | 700,845 | 83,639 | 617,206 | |||||||||
Normal Claims | 92,670,065 | 5,491,470 | 87,178,594 | |||||||||
|
|
|
|
|
| |||||||
Total[6] | 93,370,910 | 5,575,110 | 87,795,800 | |||||||||
|
|
|
|
|
| |||||||
| (%) | ||||||||||||
NPL ratio[5]/[6] | 0.75 | 0.04 | 0.70 | |||||||||
Trust account represents trust accounts that guarantee principals in the agreement.
2-22
Mizuho Financial Group, Inc.
Non-Consolidated
Aggregate Figures for the 2 Banks (Banking Account + Trust Account)
| (Millions of yen) | ||||||||||||
| As of March 31, 2020 | Change | As of March 31, 2019 | ||||||||||
Claims against Bankrupt and Substantially Bankrupt Obligors | 51,042 | (1,924 | ) | 52,966 | ||||||||
Claims with Collection Risk | 386,532 | 38,840 | 347,692 | |||||||||
Claims for Special Attention | 223,480 | 63,681 | 159,799 | |||||||||
Sub-total[1] | 661,055 | 100,597 | 560,458 | |||||||||
Normal Claims | 93,890,914 | 4,654,107 | 89,236,806 | |||||||||
|
|
|
|
|
| |||||||
Total[2] | 94,551,969 | 4,754,705 | 89,797,264 | |||||||||
|
|
|
|
|
| |||||||
| (%) | ||||||||||||
NPL ratio[1]/[2] | 0.69 | 0.07 | 0.62 | |||||||||
Above figures are presented net of partial direct write-offs. |
| |||||||||||
| Mizuho Bank | ||||||||||||
| (Millions of yen) | ||||||||||||
Claims against Bankrupt and Substantially Bankrupt Obligors | 50,602 | (1,882 | ) | 52,485 | ||||||||
Claims with Collection Risk | 382,739 | 40,886 | 341,852 | |||||||||
Claims for Special Attention | 222,340 | 63,776 | 158,563 | |||||||||
Sub-total[3] | 655,682 | 102,780 | 552,902 | |||||||||
Normal Claims | 90,503,034 | 4,643,603 | 85,859,431 | |||||||||
|
|
|
|
|
| |||||||
Total[4] | 91,158,717 | 4,746,383 | 86,412,333 | |||||||||
|
|
|
|
|
| |||||||
| (%) | ||||||||||||
NPL ratio[3]/[4] | 0.71 | 0.07 | 0.63 | |||||||||
Above figures are presented net of partial direct write-offs. | ||||||||||||
Mizuho Trust & Banking
| ||||||||||||
| (Banking Account) | ||||||||||||
| (Millions of yen) | ||||||||||||
Claims against Bankrupt and Substantially Bankrupt Obligors | 439 | (41 | ) | 481 | ||||||||
Claims with Collection Risk | 3,793 | 723 | 3,069 | |||||||||
Claims for Special Attention | 1,140 | (94 | ) | 1,235 | ||||||||
Sub-total[5] | 5,373 | 587 | 4,785 | |||||||||
Normal Claims | 3,379,106 | 8,800 | 3,370,305 | |||||||||
|
|
|
|
|
| |||||||
Total[6] | 3,384,479 | 9,388 | 3,375,091 | |||||||||
|
|
|
|
|
| |||||||
| (%) | ||||||||||||
NPL ratio[5]/[6] | 0.15 | 0.01 | 0.14 | |||||||||
Above figures are presented net of partial direct write-offs. |
| |||||||||||
| (Trust Account) | ||||||||||||
| (Millions of yen) | ||||||||||||
Claims against Bankrupt and Substantially Bankrupt Obligors | — | — | — | |||||||||
Claims with Collection Risk | — | (2,770 | ) | 2,770 | ||||||||
Claims for Special Attention | — | — | — | |||||||||
Sub-total[7] | — | (2,770 | ) | 2,770 | ||||||||
Normal Claims | 8,773 | 1,703 | 7,069 | |||||||||
|
|
|
|
|
| |||||||
Total[8] | 8,773 | (1,066 | ) | 9,840 | ||||||||
|
|
|
|
|
| |||||||
| (%) | ||||||||||||
NPL ratio[7]/[8] | — | (28.15 | ) | 28.15 | ||||||||
Trust account represents trust accounts that guarantee principals in the agreement.
2-23
Mizuho Financial Group, Inc.
5. Coverage on Non Performing Loans based on the FRA
Non-Consolidated
(1) Non Performing Loans based on the FRA and Coverage Amount
| (Billions of yen) | ||||||||||||
| As of March 31, 2020 | Change | As of March 31, 2019 | ||||||||||
| Aggregate Figures for the 2 Banks (Banking Account) | ||||||||||||
Claims against Bankrupt and Substantially Bankrupt Obligors | 51.0 | (1.9 | ) | 52.9 | ||||||||
Collateral, Guarantees, and equivalent | 45.2 | (0.8 | ) | 46.0 | ||||||||
Reserve for Possible Losses | 5.7 | (1.1 | ) | 6.8 | ||||||||
Claims with Collection Risk | 386.5 | 41.6 | 344.9 | |||||||||
Collateral, Guarantees, and equivalent | 149.5 | 20.4 | 129.1 | |||||||||
Reserve for Possible Losses | 167.8 | 39.2 | 128.6 | |||||||||
Claims for Special Attention | 223.4 | 63.6 | 159.7 | |||||||||
Collateral, Guarantees, and equivalent | 68.2 | 13.8 | 54.3 | |||||||||
Reserve for Possible Losses | 36.5 | 15.9 | 20.6 | |||||||||
Total | 661.0 | 103.3 | 557.6 | |||||||||
Collateral, Guarantees, and equivalent | 263.1 | 33.4 | 229.6 | |||||||||
Reserve for Possible Losses | 210.2 | 54.0 | 156.1 | |||||||||
| Mizuho Bank | ||||||||||||
Claims against Bankrupt and Substantially Bankrupt Obligors | 50.6 | (1.8 | ) | 52.4 | ||||||||
Collateral, Guarantees, and equivalent | 44.8 | (0.7 | ) | 45.6 | ||||||||
Reserve for Possible Losses | 5.7 | (1.1 | ) | 6.8 | ||||||||
Claims with Collection Risk | 382.7 | 40.8 | 341.8 | |||||||||
Collateral, Guarantees, and equivalent | 147.6 | 20.8 | 126.8 | |||||||||
Reserve for Possible Losses | 166.7 | 38.5 | 128.1 | |||||||||
Claims for Special Attention | 222.3 | 63.7 | 158.5 | |||||||||
Collateral, Guarantees, and equivalent | 68.2 | 13.9 | 54.2 | |||||||||
Reserve for Possible Losses | 36.3 | 15.9 | 20.4 | |||||||||
Total | 655.6 | 102.7 | 552.9 | |||||||||
Collateral, Guarantees, and equivalent | 260.7 | 34.0 | 226.6 | |||||||||
Reserve for Possible Losses | 208.8 | 53.3 | 155.5 | |||||||||
| Mizuho Trust & Banking (Banking Account) | ||||||||||||
Claims against Bankrupt and Substantially Bankrupt Obligors | 0.4 | (0.0 | ) | 0.4 | ||||||||
Collateral, Guarantees, and equivalent | 0.4 | (0.0 | ) | 0.4 | ||||||||
Reserve for Possible Losses | — | — | — | |||||||||
Claims with Collection Risk | 3.7 | 0.7 | 3.0 | |||||||||
Collateral, Guarantees, and equivalent | 1.9 | (0.3 | ) | 2.3 | ||||||||
Reserve for Possible Losses | 1.1 | 0.7 | 0.4 | |||||||||
Claims for Special Attention | 1.1 | (0.0 | ) | 1.2 | ||||||||
Collateral, Guarantees, and equivalent | 0.0 | (0.1 | ) | 0.1 | ||||||||
Reserve for Possible Losses | 0.2 | 0.0 | 0.2 | |||||||||
Total | 5.3 | 0.5 | 4.7 | |||||||||
Collateral, Guarantees, and equivalent | 2.3 | (0.5 | ) | 2.9 | ||||||||
Reserve for Possible Losses | 1.3 | 0.7 | 0.6 | |||||||||
| Reference: Trust Account | ||||||||||||
Claims against Bankrupt and Substantially Bankrupt Obligors | — | — | — | |||||||||
Collateral, Guarantees, and equivalent | — | — | — | |||||||||
Claims with Collection Risk | — | (2.7 | ) | 2.7 | ||||||||
Collateral, Guarantees, and equivalent | — | (2.7 | ) | 2.7 | ||||||||
Claims for Special Attention | — | — | — | |||||||||
Collateral, Guarantees, and equivalent | — | — | — | |||||||||
Total | — | (2.7 | ) | 2.7 | ||||||||
Collateral, Guarantees, and equivalent | — | (2.7 | ) | 2.7 | ||||||||
Trust account represents trust accounts that guarantee principals in the agreement.
2-24
Mizuho Financial Group, Inc.
(2) Coverage Ratio
| (Billions of yen) | ||||||||||||
| As of March 31, 2020 | Change | As of March 31, 2019 | ||||||||||
Aggregate Figures for the 2 Banks (Banking Account) | ||||||||||||
Coverage Amount | 473.3 | 87.4 | 385.8 | |||||||||
Reserves for Possible Losses on Loans | 210.2 | 54.0 | 156.1 | |||||||||
Collateral, Guarantees, and equivalent | 263.1 | 33.4 | 229.6 | |||||||||
| (%) | ||||||||||||
Coverage Ratio | 71.6 | 2.3 | 69.3 | |||||||||
Claims against Bankrupt and Substantially Bankrupt Obligors | 100.0 | — | 100.0 | |||||||||
Claims with Collection Risk | 82.1 | 7.3 | 74.7 | |||||||||
Claims for Special Attention | 46.9 | (0.0 | ) | 46.9 | ||||||||
Claims against Special Attention Obligors | 50.7 | 0.2 | 50.5 | |||||||||
Reserve Ratio againstNon-collateralized Claims | ||||||||||||
| (%) | ||||||||||||
Claims against Bankrupt and Substantially Bankrupt Obligors | 100.0 | — | 100.0 | |||||||||
Claims with Collection Risk | 70.8 | 11.2 | 59.6 | |||||||||
Claims for Special Attention | 23.5 | 3.9 | 19.6 | |||||||||
Claims against Special Attention Obligors | 23.3 | 2.8 | 20.5 | |||||||||
Reference: Reserve Ratio | ||||||||||||
| (%) | ||||||||||||
Claims against Special Attention Obligors | 15.01 | 2.25 | 12.75 | |||||||||
Claims against Watch Obligors excluding Special Attention Obligors | 4.91 | 2.45 | 2.46 | |||||||||
Claims against Normal Obligors | 0.09 | 0.04 | 0.05 | |||||||||
Mizuho Bank | ||||||||||||
| (Billions of yen) | ||||||||||||
Coverage Amount | 469.5 | 87.3 | 382.2 | |||||||||
Reserves for Possible Losses on Loans | 208.8 | 53.3 | 155.5 | |||||||||
Collateral, Guarantees, and equivalent | 260.7 | 34.0 | 226.6 | |||||||||
| (%) | ||||||||||||
Coverage Ratio | 71.6 | 2.4 | 69.1 | |||||||||
Claims against Bankrupt and Substantially Bankrupt Obligors | 100.0 | — | 100.0 | |||||||||
Claims with Collection Risk | 82.1 | 7.5 | 74.6 | |||||||||
Claims for Special Attention | 47.0 | (0.0 | ) | 47.1 | ||||||||
Claims against Special Attention Obligors | 50.8 | 0.2 | 50.6 | |||||||||
Reserve Ratio againstNon-collateralized Claims |
| |||||||||||
| (%) | ||||||||||||
Claims against Bankrupt and Substantially Bankrupt Obligors | 100.0 | — | 100.0 | |||||||||
Claims with Collection Risk | 70.9 | 11.2 | 59.6 | |||||||||
Claims for Special Attention | 23.5 | 3.9 | 19.6 | |||||||||
Claims against Special Attention Obligors | 23.3 | 2.8 | 20.5 | |||||||||
Reference: Reserve Ratio | ||||||||||||
| (%) | ||||||||||||
Claims against Special Attention Obligors | 14.99 | 2.24 | 12.74 | |||||||||
Claims against Watch Obligors excluding Special Attention Obligors | 4.95 | 2.48 | 2.47 | |||||||||
Claims against Normal Obligors | 0.09 | 0.04 | 0.05 | |||||||||
2-25
Mizuho Financial Group, Inc.
Mizuho Trust & Banking (Banking Account)
| (Billions of yen) | ||||||||||||
| As of March 31, 2020 | Change | As of March 31, 2019 | ||||||||||
Coverage Amount | 3.7 | 0.1 | 3.5 | |||||||||
Reserves for Possible Losses on Loans | 1.3 | 0.7 | 0.6 | |||||||||
Collateral, Guarantees, and equivalent | 2.3 | (0.5 | ) | 2.9 | ||||||||
| (%) | ||||||||||||
Coverage Ratio | 69.7 | (5.2 | ) | 75.0 | ||||||||
Claims against Bankrupt and Substantially Bankrupt Obligors | 100.0 | — | 100.0 | |||||||||
Claims with Collection Risk | 80.6 | (8.9 | ) | 89.5 | ||||||||
Claims for Special Attention | 22.1 | (7.0 | ) | 29.2 | ||||||||
Claims against Special Attention Obligors | 22.1 | (19.2 | ) | 41.3 | ||||||||
Reserve Ratio againstNon-collateralized Claims | ||||||||||||
| (%) | ||||||||||||
Claims against Bankrupt and Substantially Bankrupt Obligors | — | — | — | |||||||||
Claims with Collection Risk | 60.8 | 2.9 | 57.9 | |||||||||
Claims for Special Attention | 20.2 | 0.8 | 19.4 | |||||||||
Claims against Special Attention Obligors | 20.2 | 0.8 | 19.4 | |||||||||
Reference: Reserve Ratio | ||||||||||||
| (%) | ||||||||||||
Claims against Special Attention Obligors | 19.79 | 5.64 | 14.15 | |||||||||
Claims against Watch Obligors excluding Special Attention Obligors | 1.47 | 0.36 | 1.11 | |||||||||
Claims against Normal Obligors | 0.05 | 0.01 | 0.04 | |||||||||
2-26
Mizuho Financial Group, Inc.
6. Overview ofNon-Performing Loans (“NPLs”)
Non-Consolidated
Aggregate Figures for the 2 Banks (Banking Account)
(Billions of yen)
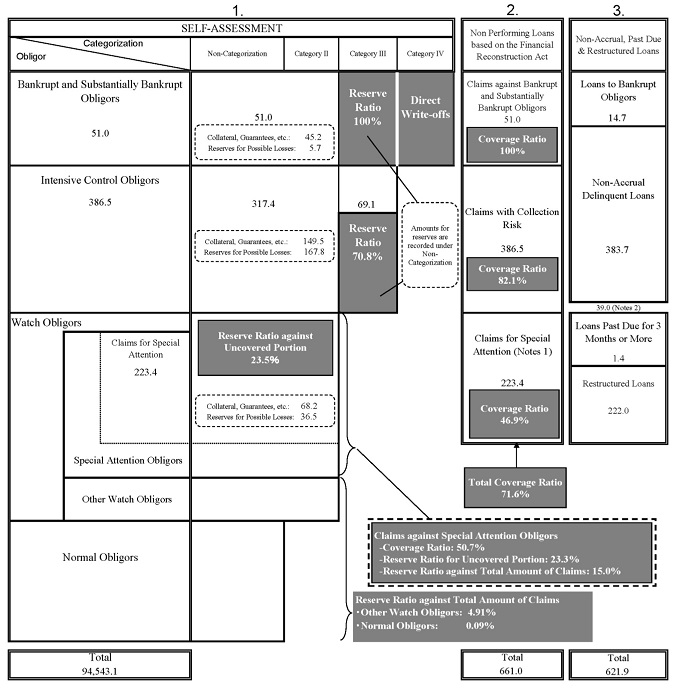
| Notes: 1. | Claims for Special Attention is denoted on an individual loans basis. Claims against Special Attention Obligors includes all claims, not limited to Claims for Special Attention. | |
2. | The difference between totalNon-Accrual, Past Due & Restructured Loans and total Non Performing Loans based on the FRA represents the amount of claims other than loans included in Non Performing Loans based on the FRA. | |
2-27
Mizuho Financial Group, Inc.
7. Results of Removal of NPLs from the Balance Sheet
Non-Consolidated
(1) Outstanding Balance of Claims against Bankrupt and Substantially Bankrupt Obligors and Claims with Collection Risk (under the FRA)
Aggregate Figures for the 2 Banks (Banking Account + Trust Account)
| (Billions of yen) | ||||||||||||||||||||||||||||
| Fiscal 2016 | Fiscal 2017 | Fiscal 2018 | Fiscal 2019 | |||||||||||||||||||||||||
| As of March 31, 2017 | As of March 31, 2018 | As of March 31, 2019 | As of March 31, 2020 | |||||||||||||||||||||||||
| MHBK | MHTB* | Aggregate Figures for the 2 Banks | Change from March 31, 2019 | |||||||||||||||||||||||||
Claims against Bankrupt and Substantially Bankrupt Obligors | 82.7 | 64.1 | 27.7 | 23.9 | 0.2 | 24.2 | (3.5 | ) | ||||||||||||||||||||
Claims with Collection Risk | 390.0 | 218.1 | 153.8 | 121.2 | 1.4 | 122.7 | (31.1 | ) | ||||||||||||||||||||
Amount Categorized as above up to Fiscal 2016 | 472.8 | 282.3 | 181.6 | 145.2 | 1.7 | 146.9 | (34.6 | ) | ||||||||||||||||||||
of which the amount which was in the process of being removed from the balance sheet | 72.7 | 34.9 | 16.8 | 18.1 | 0.2 | 18.4 | 1.5 | |||||||||||||||||||||
Claims against Bankrupt and Substantially Bankrupt Obligors | 12.4 | 5.9 | 2.3 | 0.0 | 2.3 | (3.5 | ) | |||||||||||||||||||||
Claims with Collection Risk | 66.1 | 33.9 | 16.8 | 0.1 | 16.9 | (16.9 | ) | |||||||||||||||||||||
Amount Newly Categorized as above during Fiscal 2017 | 78.5 | 39.8 | 19.1 | 0.1 | 19.3 | (20.5 | ) | |||||||||||||||||||||
of which the amount which was in the process of being removed from the balance sheet | 12.2 | 5.7 | 2.1 | 0.0 | 2.1 | (3.5 | ) | |||||||||||||||||||||
Claims against Bankrupt and Substantially Bankrupt Obligors | 19.3 | 11.4 | 0.1 | 11.5 | (7.7 | ) | ||||||||||||||||||||||
Claims with Collection Risk | 159.8 | 74.6 | 0.2 | 74.8 | (84.9 | ) | ||||||||||||||||||||||
Amount Newly Categorized as above during Fiscal 2018 | 179.1 | 86.1 | 0.3 | 86.4 | (92.7 | ) | ||||||||||||||||||||||
of which the amount which was in the process of being removed from the balance sheet | 18.2 | 11.7 | 0.1 | 11.8 | (6.3 | ) | ||||||||||||||||||||||
Claims against Bankrupt and Substantially Bankrupt Obligors | 12.8 | 0.0 | 12.8 | 12.8 | ||||||||||||||||||||||||
Claims with Collection Risk | 169.9 | 1.9 | 171.8 | 171.8 | ||||||||||||||||||||||||
Amount Newly Categorized as above during Fiscal 2019 | 182.8 | 1.9 | 184.7 | 184.7 | ||||||||||||||||||||||||
of which the amount which was in the process of being removed from the balance sheet | 11.9 | 0.0 | 12.0 | 12.0 | ||||||||||||||||||||||||
Claims against Bankrupt and Substantially Bankrupt Obligors | 82.7 | 76.6 | 52.9 | 50.6 | 0.4 | 51.0 | (1.9 | ) | ||||||||||||||||||||
Claims with Collection Risk | 390.0 | 284.2 | 347.6 | 382.7 | 3.7 | 386.5 | 38.8 | |||||||||||||||||||||
Total | 472.8 | 360.9 | 400.6 | 433.3 | 4.2 | 437.5 | 36.9 | |||||||||||||||||||||
of which the amount which was in the process of being removed from the balance sheet | 72.7 | 47.2 | 40.8 | 44.0 | 0.4 | 44.5 | 3.7 | |||||||||||||||||||||
* Trust account represents trust accounts that guarantee principals in the agreement. | ||||
| * | denotes newly categorized amounts. | |||
(2) Breakdown of Reasons for Removal of NPLs from the Balance Sheet in Fiscal 2019
| (Billions of yen) | ||||||||||||
| Aggregate Figures for the 2 Banks (Banking Account + Trust Account) | MHBK | MHTB (Banking Account + Trust Account) | ||||||||||
Liquidation | (7.5 | ) | (7.5 | ) | — | |||||||
Restructuring | (11.4 | ) | (11.4 | ) | — | |||||||
Improvement in Business Performance due to Restructuring | (0.0 | ) | — | (0.0 | ) | |||||||
Loan Sales | (35.2 | ) | (35.2 | ) | — | |||||||
DirectWrite-off | 12.5 | 12.8 | (0.2 | ) | ||||||||
Other | (106.1 | ) | (102.3 | ) | (3.7 | ) | ||||||
Debt recovery | (91.0 | ) | (90.7 | ) | (0.2 | ) | ||||||
Improvement in Business Performance | (15.0 | ) | (11.5 | ) | (3.5 | ) | ||||||
|
|
|
|
|
| |||||||
Total | (147.8 | ) | (143.7 | ) | (4.0 | ) | ||||||
|
|
|
|
|
| |||||||
2-28
Mizuho Financial Group, Inc.
8. Status of Loans by Industry
(1) Outstanding Balances andNon-Accrual, Past Due & Restructured Loans by Industry
Non-Consolidated
Aggregate Figures for the 2 Banks (Banking Account + Trust Account)
| (Billions of yen) | ||||||||||||||||||||||||
| As of March 31, 2020 | As of March 31, 2019 | |||||||||||||||||||||||
| Outstanding Balance | Non-Accrual, Past Due & Restructured Loans | Change | Outstanding Balance | Non-Accrual, Past Due & Restructured Loans | ||||||||||||||||||||
| Outstanding Balance | Non-Accrual, Past Due & Restructured Loans | |||||||||||||||||||||||
Domestic Total (excluding Loans Booked Offshore) | 58,947.6 | 511.4 | 1,513.0 | 78.4 | 57,434.6 | 433.0 | ||||||||||||||||||
Manufacturing | 9,638.9 | 140.5 | 201.2 | 45.3 | 9,437.6 | 95.1 | ||||||||||||||||||
Agriculture & Forestry | 54.7 | 0.8 | 7.2 | 0.6 | 47.4 | 0.2 | ||||||||||||||||||
Fishery | 3.3 | 0.3 | 1.1 | 0.3 | 2.1 | — | ||||||||||||||||||
Mining, Quarrying Industry & Gravel Extraction Industry | 226.9 | 0.2 | (20.1 | ) | 0.1 | 247.1 | 0.1 | |||||||||||||||||
Construction | 725.4 | 8.0 | 58.2 | 3.1 | 667.1 | 4.9 | ||||||||||||||||||
Utilities | 2,835.9 | 11.5 | 34.3 | 9.9 | 2,801.5 | 1.5 | ||||||||||||||||||
Communication | 1,436.9 | 11.5 | 153.8 | (4.0 | ) | 1,283.0 | 15.5 | |||||||||||||||||
Transportation & Postal Industry | 2,360.1 | 9.3 | (10.6 | ) | (0.9 | ) | 2,370.7 | 10.3 | ||||||||||||||||
Wholesale & Retail | 4,930.0 | 132.9 | 58.1 | 25.5 | 4,871.8 | 107.4 | ||||||||||||||||||
Finance & Insurance | 8,220.3 | 10.3 | 236.9 | (0.3 | ) | 7,983.4 | 10.7 | |||||||||||||||||
Real Estate | 8,740.2 | 36.4 | 579.7 | 7.2 | 8,160.4 | 29.2 | ||||||||||||||||||
Commodity Lease | 2,884.9 | 1.6 | 712.4 | (0.1 | ) | 2,172.5 | 1.8 | |||||||||||||||||
Service Industries | 3,107.8 | 70.0 | 235.6 | 4.4 | 2,872.1 | 65.6 | ||||||||||||||||||
Local Governments | 760.3 | — | (40.1 | ) | (2.7 | ) | 800.4 | 2.7 | ||||||||||||||||
Governments | 1,443.5 | — | (120.8 | ) | — | 1,564.4 | — | |||||||||||||||||
Other | 11,578.0 | 77.5 | (574.3 | ) | (10.0 | ) | 12,152.4 | 87.5 | ||||||||||||||||
Overseas Total (including Loans Booked Offshore) | 25,925.5 | 110.4 | 3,299.3 | 23.9 | 22,626.2 | 86.5 | ||||||||||||||||||
Governments | 342.2 | — | (3.8 | ) | — | 346.0 | — | |||||||||||||||||
Financial Institutions | 9,170.5 | — | 1,242.8 | — | 7,927.7 | — | ||||||||||||||||||
Other | 16,412.7 | 110.4 | 2,060.3 | 23.9 | 14,352.4 | 86.5 | ||||||||||||||||||
|
|
|
|
|
|
|
|
|
|
|
| |||||||||||||
Total | 84,873.2 | 621.9 | 4,812.3 | 102.3 | 80,060.9 | 519.5 | ||||||||||||||||||
|
|
|
|
|
|
|
|
|
|
|
| |||||||||||||
| * | Loans to Finance & Insurance sector includes loans to MHFG as follows: |
As of March 31, 2020: | ¥860.0billion (from MHBK) | |
As of March 31, 2019: | ¥945.5 billion (from MHBK) |
| * | Amounts of Outstanding Balances are the aggregate figures for banking and trust accounts, and amounts ofNon-Accrual, Past Due & Restructured Loans are the aggregate figures for banking and trust accounts with contracts indemnifying the principal amounts. |
| * | A reclassification of Industry type has been made on the above table as of March 31, 2019 for consistency with current figures. |
2-29
Mizuho Financial Group, Inc.
| (Billions of yen) | ||||||||||||||||||||||||
| As of March 31, 2020 | As of March 31, 2019 | |||||||||||||||||||||||
| Outstanding Balance | Non-Accrual, Past Due & Restructured Loans | Change | Outstanding Balance | Non-Accrual, Past Due & Restructured Loans | ||||||||||||||||||||
| Outstanding Balance | Non-Accrual, Past Due & Restructured Loans | |||||||||||||||||||||||
| Mizuho Bank | ||||||||||||||||||||||||
Domestic Total (excluding Loans Booked Offshore) | 54,946.8 | 506.1 | 1,524.0 | 80.6 | 53,422.7 | 425.4 | ||||||||||||||||||
Manufacturing | 9,173.7 | 138.2 | 221.7 | 44.0 | 8,952.0 | 94.1 | ||||||||||||||||||
Agriculture & Forestry | 54.6 | 0.8 | 7.1 | 0.6 | 47.4 | 0.2 | ||||||||||||||||||
Fishery | 3.3 | 0.3 | 1.1 | 0.3 | 2.1 | — | ||||||||||||||||||
Mining, Quarrying Industry & Gravel Extraction Industry | 224.7 | 0.2 | (20.1 | ) | 0.1 | 244.9 | 0.1 | |||||||||||||||||
Construction | 689.3 | 7.9 | 59.8 | 3.1 | 629.5 | 4.7 | ||||||||||||||||||
Utilities | 2,564.8 | 11.5 | 41.6 | 9.9 | 2,523.2 | 1.5 | ||||||||||||||||||
Communication | 1,306.8 | 11.2 | 142.5 | (4.3 | ) | 1,164.2 | 15.5 | |||||||||||||||||
Transportation & Postal Industry | 2,161.6 | 9.3 | 4.4 | (0.9 | ) | 2,157.2 | 10.3 | |||||||||||||||||
Wholesale & Retail | 4,782.3 | 132.9 | 83.8 | 25.9 | 4,698.4 | 106.9 | ||||||||||||||||||
Finance & Insurance | 7,700.9 | 10.3 | 178.8 | (0.3 | ) | 7,522.1 | 10.7 | |||||||||||||||||
Real Estate | 7,450.1 | 36.0 | 462.7 | 7.2 | 6,987.3 | 28.7 | ||||||||||||||||||
Commodity Lease | 2,667.8 | 1.6 | 728.9 | (0.1 | ) | 1,938.9 | 1.8 | |||||||||||||||||
Service Industries | 3,051.9 | 70.0 | 236.8 | 4.5 | 2,815.0 | 65.5 | ||||||||||||||||||
Local Governments | 753.2 | — | (38.3 | ) | — | 791.6 | — | |||||||||||||||||
Governments | 1,338.0 | — | (126.3 | ) | — | 1,464.3 | — | |||||||||||||||||
Other | 11,023.0 | 75.2 | (460.8 | ) | (9.5 | ) | 11,483.9 | 84.8 | ||||||||||||||||
Overseas Total (including Loans Booked Offshore) | 25,924.4 | 110.4 | 3,299.8 | 23.9 | 22,624.6 | 86.5 | ||||||||||||||||||
Governments | 342.2 | — | (3.8 | ) | — | 346.0 | — | |||||||||||||||||
Financial Institutions | 9,170.5 | — | 1,242.8 | — | 7,927.7 | — | ||||||||||||||||||
Other | 16,411.6 | 110.4 | 2,060.8 | 23.9 | 14,350.8 | 86.5 | ||||||||||||||||||
|
|
|
|
|
|
|
|
|
|
|
| |||||||||||||
Total | 80,871.2 | 616.5 | 4,823.9 | 104.5 | 76,047.3 | 512.0 | ||||||||||||||||||
|
|
|
|
|
|
|
|
|
|
|
| |||||||||||||
* A reclassification of Industry type has been made on the above table as of March 31, 2019 for consistency with current figures. |
| |||||||||||||||||||||||
| Mizuho Trust & Banking (Banking Account + Trust Account) | ||||||||||||||||||||||||
Domestic Total (excluding Loans Booked Offshore) | 4,000.8 | 5.3 | (11.0 | ) | (2.1 | ) | 4,011.9 | 7.5 | ||||||||||||||||
Manufacturing | 465.1 | 2.2 | (20.4 | ) | 1.3 | 485.5 | 0.9 | |||||||||||||||||
Agriculture & Forestry | 0.0 | — | 0.0 | — | — | — | ||||||||||||||||||
Fishery | — | — | — | — | — | — | ||||||||||||||||||
Mining, Quarrying Industry & Gravel Extraction Industry | 2.2 | — | 0.0 | — | 2.1 | — | ||||||||||||||||||
Construction | 36.0 | 0.1 | (1.5 | ) | (0.0 | ) | 37.6 | 0.1 | ||||||||||||||||
Utilities | 271.0 | — | (7.2 | ) | — | 278.3 | — | |||||||||||||||||
Communication | 130.1 | 0.3 | 11.2 | 0.3 | 118.8 | — | ||||||||||||||||||
Transportation & Postal Industry | 198.4 | — | (15.0 | ) | — | 213.5 | — | |||||||||||||||||
Wholesale & Retail | 147.6 | — | (25.6 | ) | (0.4 | ) | 173.3 | 0.4 | ||||||||||||||||
Finance & Insurance | 519.3 | — | 58.1 | — | 461.2 | — | ||||||||||||||||||
Real Estate | 1,290.0 | 0.4 | 116.9 | (0.0 | ) | 1,173.1 | 0.4 | |||||||||||||||||
Commodity Lease | 217.1 | — | (16.4 | ) | — | 233.6 | — | |||||||||||||||||
Service Industries | 55.9 | — | (1.2 | ) | (0.0 | ) | 57.1 | 0.0 | ||||||||||||||||
Local Governments | 7.0 | — | (1.7 | ) | (2.7 | ) | 8.7 | 2.7 | ||||||||||||||||
Governments | 105.4 | — | 5.4 | — | 100.0 | — | ||||||||||||||||||
Other | 554.9 | 2.2 | (113.5 | ) | (0.4 | ) | 668.5 | 2.6 | ||||||||||||||||
Overseas Total (including Loans Booked Offshore) | 1.1 | — | (0.5 | ) | — | 1.6 | — | |||||||||||||||||
Governments | — | — | — | — | — | — | ||||||||||||||||||
Financial Institutions | — | — | — | — | — | — | ||||||||||||||||||
Other | 1.1 | — | (0.5 | ) | — | 1.6 | — | |||||||||||||||||
|
|
|
|
|
|
|
|
|
|
|
| |||||||||||||
Total | 4,001.9 | 5.3 | (11.5 | ) | (2.1 | ) | 4,013.5 | 7.5 | ||||||||||||||||
|
|
|
|
|
|
|
|
|
|
|
| |||||||||||||
| * | Amounts of Outstanding Balances are the aggregate figures for banking and trust accounts, and amounts ofNon-Accrual, Past Due & Restructured Loans are the aggregate figures for banking and trust accounts with contracts indemnifying the principal amounts. |
2-30
Mizuho Financial Group, Inc.
(2) Non Performing Loans based on the FRA and Coverage Ratio by Industry
Non-Consolidated
Aggregate Figures for the 2 Banks (Banking Account + Trust Account)
| (Billions of yen, %) | ||||||||||||||||||||||||
| As of March 31, 2020 | As of March 31, 2019 | |||||||||||||||||||||||
| Change | ||||||||||||||||||||||||
| Non Performing Loans based on the FRA | Coverage Ratio | Non Performing Loans based on the FRA | Coverage Ratio | Non Performing Loans based on the FRA | Coverage Ratio | |||||||||||||||||||
Domestic Total (excluding Loans Booked Offshore) | 529.5 | 67.6 | 77.1 | (3.9 | ) | 452.4 | 71.6 | |||||||||||||||||
Manufacturing | 150.3 | 64.2 | 42.6 | (2.6 | ) | 107.6 | 66.8 | |||||||||||||||||
Agriculture & Forestry | 0.8 | 41.5 | 0.6 | (23.3 | ) | 0.2 | 64.8 | |||||||||||||||||
Fishery | 0.3 | 62.6 | 0.3 | — | — | — | ||||||||||||||||||
Mining, Quarrying Industry & Gravel Extraction Industry | 0.5 | 94.4 | (0.1 | ) | 4.6 | 0.6 | 89.7 | |||||||||||||||||
Construction | 8.3 | 72.0 | 3.3 | (1.1 | ) | 5.0 | 73.1 | |||||||||||||||||
Utilities | 11.5 | 38.5 | 9.9 | (25.6 | ) | 1.5 | 64.1 | |||||||||||||||||
Communication | 11.5 | 66.1 | (4.5 | ) | 1.0 | 16.0 | 65.1 | |||||||||||||||||
Transportation & Postal Industry | 9.4 | 65.5 | (0.9 | ) | (3.5 | ) | 10.3 | 69.1 | ||||||||||||||||
Wholesale & Retail | 135.3 | 57.7 | 25.8 | (4.0 | ) | 109.4 | 61.7 | |||||||||||||||||
Finance & Insurance | 10.7 | 81.6 | (0.0 | ) | 12.6 | 10.7 | 68.9 | |||||||||||||||||
Real Estate | 35.6 | 81.7 | 4.6 | (2.8 | ) | 31.0 | 84.6 | |||||||||||||||||
Commodity Lease | 1.7 | 72.3 | (0.1 | ) | 0.7 | 1.9 | 71.6 | |||||||||||||||||
Service Industries | 73.2 | 65.9 | 7.1 | 1.0 | 66.1 | 64.9 | ||||||||||||||||||
Local Governments | — | — | (2.7 | ) | — | 2.7 | 100.0 | |||||||||||||||||
Other | 79.9 | 88.4 | (8.8 | ) | (2.4 | ) | 88.7 | 90.8 | ||||||||||||||||
Overseas Total (including Loans Booked Offshore) | 131.4 | 87.6 | 23.4 | 27.7 | 108.0 | 59.8 | ||||||||||||||||||
Governments | — | — | — | — | — | — | ||||||||||||||||||
Financial Institutions | — | — | — | — | — | — | ||||||||||||||||||
Other | 131.4 | 87.6 | 23.4 | 27.7 | 108.0 | 59.8 | ||||||||||||||||||
|
|
|
|
|
|
|
|
|
|
|
| |||||||||||||
Total | 661.0 | 71.6 | 100.5 | 2.2 | 560.4 | 69.3 | ||||||||||||||||||
|
|
|
|
|
|
|
|
|
|
|
| |||||||||||||
| * | Trust account represents trust accounts that guarantee principals in the agreement. |
2-31
Mizuho Financial Group, Inc.
9. Housing and Consumer Loans & Loans to Small andMedium-Sized Enterprises (“SMEs”) and Individual Customers
(1) Balance of Housing and Consumer Loans
Non-Consolidated
Aggregate Figures for the 2 Banks (Banking Account + Trust Account)
| (Billions of yen) | ||||||||||||
| As of March 31, 2020 | As of March 31, 2019 | |||||||||||
| Change | ||||||||||||
Housing and Consumer Loans | 9,215.7 | (446.1 | ) | 9,661.9 | ||||||||
Housing Loans for owner’s residential housing | 8,463.4 | (327.9 | ) | 8,791.4 | ||||||||
Mizuho Bank | ||||||||||||
Housing and Consumer Loans | 9,143.1 | (434.1 | ) | 9,577.2 | ||||||||
Housing Loans | 8,595.0 | (360.7 | ) | 8,955.7 | ||||||||
for owner’s residential housing | 8,396.1 | (317.1 | ) | 8,713.2 | ||||||||
Consumer loans | 548.0 | (73.4 | ) | 621.4 | ||||||||
Mizuho Trust & Banking (Banking Account + Trust Account) | ||||||||||||
Housing and Consumer Loans | 72.6 | (12.0 | ) | 84.7 | ||||||||
Housing Loans for owner’s residential housing | 67.3 | (10.8 | ) | 78.1 | ||||||||
* Above figures are aggregate banking and trust account amounts. |
| |||||||||||
(2) Loans to SMEs and Individual Customers |
| |||||||||||
Non-Consolidated |
| |||||||||||
Aggregate Figures for the 2 Banks (Banking Account + Trust Account) |
| |||||||||||
| (%, Billions of yen) | ||||||||||||
| As of March 31, 2020 | As of March 31, 2019 | |||||||||||
| Change | ||||||||||||
Percentage of Loans to SMEs and Individual Customers, of Total Domestic Loans | 57.4 | (0.2 | ) | 57.7 | ||||||||
Loans to SMEs and Individual Customers | 33,892.4 | 705.9 | 33,186.5 | |||||||||
Mizuho Bank | ||||||||||||
Percentage of Loans to SMEs and Individual Customers, of Total Domestic Loans | 58.1 | (0.2 | ) | 58.4 | ||||||||
Loans to SMEs and Individual Customers | 31,956.5 | 740.4 | 31,216.1 | |||||||||
Mizuho Trust & Banking (Banking Account + Trust Account) | ||||||||||||
Percentage of Loans to SMEs and Individual Customers, of Total Domestic Loans | 48.3 | (0.7 | ) | 49.1 | ||||||||
Loans to SMEs and Individual Customers | 1,935.9 | (34.4 | ) | 1,970.3 | ||||||||
| * | Above figures are aggregate banking and trust account amounts. |
| * | Above figures do not include loans booked at overseas offices and offshore loans. |
| * | The definition of “Small andMedium-sized Enterprises” is as follows: |
Enterprises of which the capital is ¥300 million or below (¥100 million or below for the wholesale industry, and ¥50 million or below for the retail, restaurant and commodity lease industries, etc.), or enterprises with full-time employees of 300 or below (100 or below for the wholesale and commodity lease industries etc., 50 or below for the retail and restaurant industries.) |
2-32
Mizuho Financial Group, Inc.
10. Status of Loans by Region
Non-Consolidated
Aggregate Figures for the 2 Banks (Banking Account + Trust Account)
| (Billions of yen) | ||||||||||||||||||||||||
| As of March 31, 2020 | As of March 31, 2019 | |||||||||||||||||||||||
| Non-Accrual, Past Due & Restructured Loans | Change | Non-Accrual, Past Due & Restructured Loans | ||||||||||||||||||||||
| Outstanding Balance | Outstanding Balance | Non-Accrual, Past Due & Restructured Loans | Outstanding Balance | |||||||||||||||||||||
Asia | 7,543.3 | 35.8 | (306.6 | ) | 3.9 | 7,849.9 | 31.8 | |||||||||||||||||
Hong Kong | 1,808.8 | 4.4 | (40.9 | ) | 2.0 | 1,849.7 | 2.4 | |||||||||||||||||
Singapore | 1,286.0 | 26.1 | 50.3 | 0.2 | 1,235.7 | 25.9 | ||||||||||||||||||
Thailand | 1,037.2 | 1.4 | 1.5 | 0.9 | 1,035.7 | 0.4 | ||||||||||||||||||
Taiwan | 746.9 | 0.0 | 16.3 | (0.0 | ) | 730.5 | 0.0 | |||||||||||||||||
India | 619.2 | 2.7 | (98.9 | ) | 1.8 | 718.1 | 0.8 | |||||||||||||||||
South Korea | 671.2 | — | (48.4 | ) | — | 719.6 | — | |||||||||||||||||
Indonesia | 451.9 | 0.9 | (12.0 | ) | (0.9 | ) | 463.9 | 1.9 | ||||||||||||||||
Philippines | 282.8 | 0.0 | 2.9 | (0.0 | ) | 279.9 | 0.0 | |||||||||||||||||
China | 220.1 | — | (82.4 | ) | — | 302.5 | — | |||||||||||||||||
Thailand | 164.1 | — | (104.8 | ) | — | 269.0 | — | |||||||||||||||||
Central and South America | 4,660.4 | 22.5 | 342.4 | (6.9 | ) | 4,317.9 | 29.5 | |||||||||||||||||
Mexico | 426.4 | 0.8 | 78.0 | 0.5 | 348.3 | 0.3 | ||||||||||||||||||
Brazile | 250.5 | 7.5 | (21.3 | ) | (3.1 | ) | 271.9 | 10.6 | ||||||||||||||||
North America | 8,765.2 | 44.1 | 2,030.6 | (14.4 | ) | 6,734.6 | 58.5 | |||||||||||||||||
United States | 7,929.9 | 44.1 | 1,904.6 | (14.4 | ) | 6,025.3 | 58.5 | |||||||||||||||||
Eastern Europe | 277.2 | — | 44.7 | — | 232.4 | — | ||||||||||||||||||
Russia | 171.7 | — | 24.3 | — | 147.4 | — | ||||||||||||||||||
Western Europe | 4,553.6 | 13.8 | 808.7 | 12.4 | 3,744.8 | 1.4 | ||||||||||||||||||
United Kingdom | 1,315.3 | — | 277.9 | (0.9 | ) | 1,037.3 | 0.9 | |||||||||||||||||
Netherlands | 1,152.2 | 1.2 | 135.2 | 0.6 | 1,017.0 | 0.5 | ||||||||||||||||||
Germany | 516.7 | 7.2 | 16.8 | 7.2 | 499.8 | — | ||||||||||||||||||
Ireland | 252.0 | — | 79.8 | — | 172.1 | — | ||||||||||||||||||
Switzerland | 171.9 | — | 29.0 | — | 142.9 | — | ||||||||||||||||||
France | 250.6 | — | 98.2 | — | 152.4 | — | ||||||||||||||||||
Turkey | 102.1 | — | (56.1 | ) | — | 158.3 | — | |||||||||||||||||
Italy | 155.1 | — | 59.3 | — | 95.7 | — | ||||||||||||||||||
Other | 3,268.8 | 29.4 | 132.3 | 20.4 | 3,136.4 | 8.9 | ||||||||||||||||||
Australia | 1,524.8 | — | 100.4 | — | 1,424.3 | — | ||||||||||||||||||
Total | 29,068.7 | 145.8 | 3,052.3 | 15.3 | 26,016.3 | 130.4 | ||||||||||||||||||
* Parts of Loans and Non-Accrual, Past Due & Restructured Loans which have been included in “Japan” are included in “Central and South America” and parts of Loans which have been included in “Eastern Europe” are included in “North America”. As a result, the total of Loans by Region as of March 31, 2019 increased by ¥619.3 billion and the total of Non-Accrual, Past Due & Restructured Loans by Region as of March 31, 2019 increased by ¥2.5 billion.
|
| |||||||||||||||||||||||
The above figures are based on obligor country of location.
|
| |||||||||||||||||||||||
| The outstanding balance of loans andNon-Accrual, Past Due & Restructured Loans in major banking subsidiaries outside Japan is as follows. |
| |||||||||||||||||||||||
| As of March 31, 2020 | As of March 31, 2019 | |||||||||||||||||||||||
| Change | ||||||||||||||||||||||||
| Outstanding Balance | Non-Accrual, Past Due & Restructured Loans | Outstanding Balance | Non-Accrual, Past Due & Restructured Loans | Outstanding Balance | Non-Accrual, Past Due & Restructured Loans | |||||||||||||||||||
Mizuho Bank (China) ,Ltd | 1,058.5 | 4.7 | 10.2 | 3.1 | 1,048.3 | 1.6 | ||||||||||||||||||
Mizuho Bank (USA) | 470.6 | — | 20.5 | — | 450.1 | — | ||||||||||||||||||
PT. Bank Mizuho Indonesia | 352.8 | 0.1 | 15.9 | (0.3 | ) | 336.8 | 0.5 | |||||||||||||||||
2-33
Mizuho Financial Group, Inc.
III. DEFERRED TAXES
1. Estimation for Calculating Deferred Tax Assets
Non-Consolidated
Mizuho Bank
1. Estimate of future taxable income
| (Billions of yen) | ||||||||
| Total amount for five years (from April 1, 2020 to March 31, 2025) | ||||||||
Net Business Profits (before Reversal of (Provision for) General Reserve for Losses on Loans) | 1 | 2,524.6 | ||||||
Income before Income Taxes | 2 | 2,456.0 | ||||||
Tax Adjustments *1 | 3 | 92.9 | ||||||
Taxable Income before Current Deductible Temporary Differences *2 | 4 | 2,548.9 | ||||||
Effective Statutory Tax Rate | 5 | 30.62% | ||||||
Deferred Tax Assets corresponding to Taxable Income before Current Deductible Temporary Differences [ 4 x 5 ] | 6 | 780.4 | ||||||
| *1. | Tax Adjustments are estimated futurebook-tax differences under the provisions of the corporation tax law and others. |
| *2. | Taxable Income before Current Deductible Temporary Differences is an estimate of taxable income before adjusting deductible temporary differences as of March 31, 2020. |
(Reference) Past results of taxable income (tax loss)
| ||||
| (Billions of yen) | ||||
Fiscal 2015 | 496.0 | |||
Fiscal 2016 | 442.3 | |||
Fiscal 2017 | 379.9 | |||
Fiscal 2018 | 267.2 | |||
Fiscal 2019(estimate) | 361.0 | |||
| *1. | Figures are taxable income (tax loss) amounts per the final corporation tax returns before deducting tax losses carried forward from prior years. Subsequent amendments have not been reflected. |
| *2. | Figure for fiscal 2019 is an estimate of taxable income. |
2. Breakdown of Deferred Tax Assets
| (Billions of yen) | ||||||||||||||||
| As of March 31, 2020 | Change | As of March 31, 2019 | ||||||||||||||
Reserves for Possible Losses on Loans | 7 | 131.9 | 44.8 | 87.1 | ||||||||||||
Impairment of Securities | 8 | 145.9 | 16.1 | 129.8 | ||||||||||||
Net Unrealized Losses on Other Securities | 9 | 22.0 | 9.7 | 12.3 | ||||||||||||
Reserve for Employee Retirement Benefits | 10 | — | — | — | ||||||||||||
Depreciation and Impairment | 11 | 176.3 | (24.0 | ) | 200.3 | |||||||||||
Net Deferred Hedge Losses | 12 | — | (17.8 | ) | 17.8 | |||||||||||
Tax Losses Carried Forward | 13 | — | — | — | ||||||||||||
Other | 14 | 261.0 | (3.7 | ) | 264.7 | |||||||||||
Total Deferred Tax Assets | 15 | 737.3 | 25.1 | 712.2 | ||||||||||||
|
|
|
|
|
| |||||||||||
Valuation Allowance | 16 | (160.6 | ) | (15.8 | ) | (144.8 | ) | |||||||||
Sub-Total [ 15 + 16 ] | 17 | 576.7 | 9.3 | 567.3 | ||||||||||||
|
|
|
|
|
| |||||||||||
Amount related to Retirement Benefits Accounting | 18 | (170.3 | ) | (22.7 | ) | (147.5 | ) | |||||||||
Net Unrealized Gains on Other Securities | 19 | (304.3 | ) | 106.2 | (410.6 | ) | ||||||||||
Net Deferred Hedge Gains | 20 | (27.9 | ) | (27.9 | ) | — | ||||||||||
Other | 21 | (37.1 | ) | 0.3 | (37.5 | ) | ||||||||||
Total Deferred Tax Liabilities | 22 | (539.7 | ) | 55.9 | (595.7 | ) | ||||||||||
|
|
|
|
|
| |||||||||||
Net Deferred Tax Assets (Liabilities) [17 + 22] | 23 | 36.9 | 65.2 | (28.3 | ) | |||||||||||
Tax effects related to Net Unrealized Losses (Gains) on Other Securities * | 24 | (303.8 | ) | 108.2 | (412.0 | ) | ||||||||||
Tax effects related to Net Deferred Hedge Losses (Gains) | 25 | (27.9 | ) | (45.7 | ) | 17.8 | ||||||||||
Tax effects related to others | 26 | 368.6 | 2.7 | 365.9 | ||||||||||||
| * | Tax effects related to Net Unrealized Losses (Gains) on Other Securities is the amount after deducting Valuation Allowance. |
Assessment of Recoverability of Deferred Tax Assets is based on 19. Company Classification (Category 2) of “Revised Implementation Guidance on Recoverability of Deferred Tax Assets” (ASBJ Guidance No.26).
Future taxable income was estimated using assumptions used in the Business Plan, etc.
The above includes forward-looking information. See the disclaimer at the end of the table of contents located at the beginning of this document.
2-34
Mizuho Financial Group, Inc.
Mizuho Trust & Banking
1. Estimate of future taxable income
| (Billions of yen) | ||||||||
| Total amount for five years (from April 1, 2020 to March 31, 2025) | ||||||||
Net Business Profits (before Reversal of (Provision for) General Reserve for Losses on Loans) | 1 | 226.7 | ||||||
Income before Income Taxes | 2 | 239.4 | ||||||
Tax Adjustments *1 | 3 | (47.8 | ) | |||||
Taxable Income before Current Deductible Temporary Differences *2 | 4 | 191.5 | ||||||
Effective Statutory Tax Rate | 5 | 30.60% | ||||||
Deferred Tax Assets corresponding to Taxable Income before Current Deductible Temporary Differences [ 4 x 5 ] | 6 | 58.5 | ||||||
| *1. | Tax Adjustments are estimated futurebook-tax differences under the provisions of the corporation tax law and others. |
| *2. | Taxable Income before Current Deductible Temporary Differences is an estimate of taxable income before adjusting deductible temporary differences as of March 31, 2020. |
(Reference) Past results of taxable income (tax loss)
| ||||
| (Billions of yen) | ||||
Fiscal 2015 | 45.1 | |||
Fiscal 2016 | 52.1 | |||
Fiscal 2017 | 40.5 | |||
Fiscal 2018 | 39.0 | |||
Fiscal 2019(estimate) | 32.0 | |||
| *1. | Figures are taxable income (tax loss) amounts per the final corporation tax returns before deducting tax losses carried forward from prior years. Subsequent amendments have not been reflected. |
| *2. | Figure for fiscal 2019 is an estimate of taxable income. |
2. Breakdown of Deferred Tax Assets
| (Billions of yen) | ||||||||||||||||
| As of March 31, 2020 | Change | As of March 31, 2019 | ||||||||||||||
Reserves for Possible Losses on Loans | 7 | 1.1 | 0.3 | 0.8 | ||||||||||||
Impairment of Securities | 8 | 11.1 | 2.2 | 8.9 | ||||||||||||
Net Unrealized Losses on Other Securities | 9 | 1.1 | 0.9 | 0.2 | ||||||||||||
Reserve for Employee Retirement Benefits | 10 | 7.2 | (2.5 | ) | 9.8 | |||||||||||
Net Deferred Hedge Losses | 11 | 2.0 | 1.3 | 0.7 | ||||||||||||
Tax Losses Carried Forward | 12 | — | — | — | ||||||||||||
Other | 13 | 5.1 | (1.9 | ) | 7.0 | |||||||||||
Total Deferred Tax Assets | 14 | 27.9 | 0.3 | 27.6 | ||||||||||||
|
|
|
|
|
| |||||||||||
Valuation Allowance | 15 | (12.6 | ) | (3.1 | ) | (9.4 | ) | |||||||||
Sub-Total [ 14 + 15 ] | 16 | 15.3 | (2.7 | ) | 18.1 | |||||||||||
|
|
|
|
|
| |||||||||||
Amount related to Retirement Benefits Accounting | 17 | (4.5 | ) | — | (4.5 | ) | ||||||||||
Net Unrealized Gains on Other Securities | 18 | (13.4 | ) | 6.1 | (19.6 | ) | ||||||||||
Net Deferred Hedge Gains | 19 | — | — | — | ||||||||||||
Other | 20 | (0.5 | ) | 0.0 | (0.5 | ) | ||||||||||
Total Deferred Tax Liabilities | 21 | (18.5 | ) | 6.1 | (24.7 | ) | ||||||||||
|
|
|
|
|
| |||||||||||
Net Deferred Tax Assets (Liabilities) [16 + 21] | 22 | (3.2 | ) | 3.4 | (6.6 | ) | ||||||||||
Tax effects related to Net Unrealized Losses (Gains) on Other Securities * | 23 | (13.5 | ) | 6.2 | (19.7 | ) | ||||||||||
Tax effects related to Net Deferred Hedge Losses (Gains) | 24 | 2.0 | 1.3 | 0.7 | ||||||||||||
Tax effects related to others | 25 | 8.2 | (4.1 | ) | 12.4 | |||||||||||
| * | Tax effects related to Net Unrealized Losses (Gains) on Other Securities is the amount after deducting Valuation Allowance. |
Assessment of Recoverability of Deferred Tax Assets is based on 19. Company Classification (Category 2) of “Revised Implementation Guidance on Recoverability of Deferred Tax Assets” (ASBJ Guidance No.26).
Future taxable income was estimated using assumptions used in the Business Plan, etc.
The above includes forward-looking information. See the disclaimer at the end of the table of contents located at the beginning of this document.
2-35
Mizuho Financial Group, Inc.
IV. OTHERS
1. Breakdown of Deposits (Domestic Offices)
Non-Consolidated
Aggregate Figures for the 2 Banks
| (Billions of yen) | ||||||||||||
| As of March 31, 2020 | Change | As of March 31, 2019 | ||||||||||
Deposits | 106,876.1 | 5,220.9 | 101,655.1 | |||||||||
Individual Deposits | 45,018.6 | 1,059.1 | 43,959.4 | |||||||||
Corporate Deposits | 54,086.4 | 3,879.2 | 50,207.1 | |||||||||
Financial/Government Institutions | 7,771.0 | 282.5 | 7,488.5 | |||||||||
| Mizuho Bank | ||||||||||||
Deposits | 103,779.8 | 5,368.5 | 98,411.2 | |||||||||
Individual Deposits | 44,160.3 | 1,114.4 | 43,045.9 | |||||||||
Corporate Deposits | 52,676.4 | 3,842.5 | 48,833.8 | |||||||||
Financial/Government Institutions | 6,943.0 | 411.5 | 6,531.4 | |||||||||
| Mizuho Trust & Banking | ||||||||||||
Deposits | 3,096.2 | (147.6 | ) | 3,243.8 | ||||||||
Individual Deposits | 858.2 | (55.2 | ) | 913.5 | ||||||||
Corporate Deposits | 1,409.9 | 36.6 | 1,373.2 | |||||||||
Financial/Government Institutions | 828.0 | (129.0 | ) | 957.0 | ||||||||
| * | Above figures do not include deposits booked at overseas offices and offshore deposits. |
| * | As for Mizuho Trust & Banking, parts of Deposits which have been included in Financial/Government Institutions are included in Corporate Deposits. |
2-36
Mizuho Financial Group, Inc.
2. Number of Directors and Employees
(1) Number of Directors
Aggregate Figures for Mizuho Financial Group, the 2 Banks, and Mizuho Securities
| As of March 31, 2020 | Change | As of March 31, 2019 | ||||||||||
Directors, Executive Officers as defined in the Companies Act, and Auditors | 49 | (15 | ) | 64 | ||||||||
Executive Officers as defined in our internal regulations and Specialist Officers (excluding those doubling as Directors and Executive Officers as defined in the Companies Act) | 128 | — | 128 | |||||||||
* The above numbers have been adjusted for those who are doubling other positions. |
| |||||||||||
(2) Number of Employees
Consolidated
|
| |||||||||||
| As of March 31, 2020 | Change | As of March 31, 2019 | ||||||||||
Employees (excluding Executive Officers as defined in our internal regulations and Specialist Officers) | 57,264 | (1,868 | ) | 59,132 | ||||||||
Average number of temporary employees | 17,010 | (697 | ) | 17,707 | ||||||||
* The number of Employees excludes employees seconded to outside the company and includes employees seconded from outside the company in each consolidated subsidiary. That number also includes overseas local staff but excludes advisers and temporary employees. |
| |||||||||||
3. Number of Offices
(Domestic) The 2 Banks and Mizuho Securities
|
| |||||||||||
| As of March 31, 2020 | Change | As of March 31, 2019 | ||||||||||
Mizuho Bank | 464 | — | 464 | |||||||||
Mizuho Trust & Banking | 60 | — | 60 | |||||||||
Mizuho Securities | 256 | (3 | ) | 259 | ||||||||
* The above numbers are the numbers of head office, domestic branches (excluding branches and offices for remittance purposes only (46), branches offering account transfer services only (2), branches and offices to maintain shared ATMs only (1), internet branches (1), and pension plan advisory offices (1)), domesticsub-branches, and others. |
| |||||||||||
(Overseas) The 2 Banks and Mizuho Securities
|
| |||||||||||
| As of March 31, 2020 | Change | As of March 31, 2019 | ||||||||||
Mizuho Bank | 49 | 1 | 48 | |||||||||
Mizuho Trust & Banking | — | — | — | |||||||||
Mizuho Securities | 2 | — | 2 | |||||||||
* The above numbers are the numbers of overseas branches or relevant offices, and overseas representative offices. |
| |||||||||||
2-37
Mizuho Financial Group, Inc.
4. Earnings Plan for Fiscal 2020
Consolidated
| (Billions of yen) | ||||
| Fiscal 2020 | ||||
Ordinary Profits | 400.0 | |||
Profit Attributable to Owners of Parent | 320.0 | |||
Non-Consolidated
Mizuho Bank, Mizuho Trust & Banking
| (Billions of yen) | ||||||||||||
| Fiscal 2020 | ||||||||||||
| Aggregate Figures for the 2 Banks | MHBK | MHTB* | ||||||||||
Net Business Profits (before Reversal of (Provision for) General Reserve for Losses on Loans) | 415.0 | 380.0 | 35.0 | |||||||||
Ordinary Profits | 275.0 | 240.0 | 35.0 | |||||||||
Net Income | 215.0 | 190.0 | 25.0 | |||||||||
Credit-related Costs | (190.0 | ) | (185.0 | ) | (5.0 | ) | ||||||
| * | Net Business Profits (before Reversal of (Provision for) General Reserve for Losses on Loans) for MHTB excludes the amounts of Credit Costs for Trust Accounts. |
The above information constitute forward-looking statements. Please see the legend regarding forward-looking statements in CONTENTS.
2-38
Mizuho Bank, Ltd.
(Attachments)
COMPARISON OFNON-CONSOLIDATED BALANCE SHEETS (selected items)
OF MIZUHO BANK
| Millions of yen | ||||||||||||
| As of March 31, 2020 (A) | As of March 31, 2019 (B) | Change (A) - (B) | ||||||||||
Assets | ||||||||||||
Cash and Due from Banks | ¥ | 38,833,234 | ¥ | 42,044,263 | ¥ | (3,211,029 | ) | |||||
Call Loans | 958,359 | 516,085 | 442,273 | |||||||||
Receivables under Resale Agreements | 8,599,865 | 4,226,040 | 4,373,824 | |||||||||
Guarantee Deposits Paid under Securities Borrowing Transactions | 122,001 | 100,501 | 21,500 | |||||||||
Other Debt Purchased | 430,330 | 491,276 | (60,946 | ) | ||||||||
Trading Assets | 5,013,413 | 3,708,952 | 1,304,460 | |||||||||
Money Held in Trust | 503 | 503 | 0 | |||||||||
Securities | 34,372,765 | 29,475,876 | 4,896,888 | |||||||||
Loans and Bills Discounted | 80,871,269 | 76,047,363 | 4,823,905 | |||||||||
Foreign Exchange Assets | 1,966,593 | 2,043,874 | (77,280 | ) | ||||||||
Derivatives other than for Trading | 5,164,666 | 3,192,132 | 1,972,533 | |||||||||
Other Assets | 2,939,258 | 2,705,113 | 234,145 | |||||||||
Tangible Fixed Assets | 843,058 | 729,129 | 113,928 | |||||||||
Intangible Fixed Assets | 357,432 | 354,116 | 3,315 | |||||||||
Prepaid Pension Cost | 556,273 | 481,875 | 74,397 | |||||||||
Deferred Tax Assets | 36,950 | — | 36,950 | |||||||||
Customers’ Liabilities for Acceptances and Guarantees | 6,535,786 | 6,492,905 | 42,881 | |||||||||
Reserves for Possible Losses on Loans | (385,129 | ) | (242,076 | ) | (143,053 | ) | ||||||
Reserve for Possible Losses on Investments | (2,458 | ) | (370 | ) | (2,088 | ) | ||||||
|
|
|
|
|
| |||||||
Total Assets | ¥ | 187,214,174 | ¥ | 172,367,564 | ¥ | 14,846,609 | ||||||
|
|
|
|
|
| |||||||
Liabilities | ||||||||||||
Deposits | ¥ | 126,337,030 | ¥ | 119,411,223 | ¥ | 6,925,806 | ||||||
Negotiable Certificates of Deposit | 12,706,349 | 12,912,548 | (206,199 | ) | ||||||||
Call Money | 1,213,576 | 1,308,045 | (94,468 | ) | ||||||||
Payables under Repurchase Agreements | 7,469,615 | 5,162,334 | 2,307,280 | |||||||||
Guarantee Deposits Received under Securities Lending Transactions | 276,869 | 305,032 | (28,163 | ) | ||||||||
Commercial Paper | 411,089 | 941,181 | (530,092 | ) | ||||||||
Trading Liabilities | 3,795,423 | 2,577,856 | 1,217,567 | |||||||||
Borrowed Money | 11,394,924 | 7,998,715 | 3,396,208 | |||||||||
Foreign Exchange Liabilities | 716,394 | 925,879 | (209,484 | ) | ||||||||
Bonds and Notes | 1,100,670 | 1,968,205 | (867,534 | ) | ||||||||
Derivatives other than for Trading | 4,843,165 | 3,031,284 | 1,811,881 | |||||||||
Other Liabilities | 3,175,327 | 2,138,527 | 1,036,800 | |||||||||
Reserve for Bonus Payments | 19,841 | 22,362 | (2,521 | ) | ||||||||
Reserve for Variable Compensation | 765 | 1,100 | (334 | ) | ||||||||
Reserve for Possible Losses on Sales of Loans | 637 | 630 | 6 | |||||||||
Reserve for Contingencies | 1,770 | 100 | 1,669 | |||||||||
Reserve for Reimbursement of Deposits | 25,943 | 16,987 | 8,956 | |||||||||
Reserve for Reimbursement of Debentures | 18,672 | 25,566 | (6,893 | ) | ||||||||
Deferred Tax Liabilities | — | 28,338 | (28,338 | ) | ||||||||
Deferred Tax Liabilities for Revaluation Reserve for Land | 62,695 | 63,315 | (619 | ) | ||||||||
Acceptances and Guarantees | 6,535,786 | 6,492,905 | 42,881 | |||||||||
|
|
|
|
|
| |||||||
Total Liabilities | 180,106,550 | 165,332,144 | 14,774,406 | |||||||||
|
|
|
|
|
| |||||||
Net Assets | ||||||||||||
Common Stock and Preferred Stock | 1,404,065 | 1,404,065 | — | |||||||||
Capital Surplus | 2,286,328 | 2,286,328 | — | |||||||||
Capital Reserve | 655,418 | 655,418 | — | |||||||||
Other Capital Surplus | 1,630,910 | 1,630,910 | — | |||||||||
Retained Earnings | 2,472,640 | 2,163,735 | 308,905 | |||||||||
Appropriated Reserve | 315,177 | 315,177 | 0 | |||||||||
Other Retained Earnings | 2,157,463 | 1,848,557 | 308,905 | |||||||||
Retained Earnings Brought Forward | 2,157,463 | 1,848,557 | 308,905 | |||||||||
|
|
|
|
|
| |||||||
Total Shareholders’ Equity | 6,163,034 | 5,854,129 | 308,905 | |||||||||
|
|
|
|
|
| |||||||
Net Unrealized Gains (Losses) on Other Securities, net of Taxes | 736,239 | 1,071,157 | (334,918 | ) | ||||||||
Net Deferred Hedge Gains (Losses), net of Taxes | 71,693 | (27,639 | ) | 99,333 | ||||||||
Revaluation Reserve for Land, net of Taxes | 136,655 | 137,772 | (1,117 | ) | ||||||||
|
|
|
|
|
| |||||||
Total Valuation and Translation Adjustments | 944,588 | 1,181,291 | (236,702 | ) | ||||||||
|
|
|
|
|
| |||||||
Total Net Assets | 7,107,623 | 7,035,420 | 72,202 | |||||||||
|
|
|
|
|
| |||||||
Total Liabilities and Net Assets | ¥ | 187,214,174 | ¥ | 172,367,564 | ¥ | 14,846,609 | ||||||
|
|
|
|
|
| |||||||
2-39
Mizuho Bank, Ltd.
COMPARISON OFNON-CONSOLIDATED STATEMENTS OF INCOME
(selected items) OF MIZUHO BANK
| Millions of yen | ||||||||||||
| For the fiscal year ended March 31, 2020 (A) | For the fiscal year ended March 31, 2019 (B) | Change (A) - (B) | ||||||||||
Ordinary Income | ¥ | 2,762,200 | ¥ | 2,616,940 | ¥ | 145,260 | ||||||
Interest Income | 1,642,866 | 1,678,702 | (35,835 | ) | ||||||||
Interest on Loans and Bills Discounted | 1,113,558 | 1,126,596 | (13,037 | ) | ||||||||
Interest and Dividends on Securities | 258,265 | 281,807 | (23,541 | ) | ||||||||
Fee and Commission Income | 476,787 | 471,196 | 5,590 | |||||||||
Trading Income | 150,596 | 61,855 | 88,741 | |||||||||
Other Operating Income | 238,043 | 158,466 | 79,576 | |||||||||
Other Ordinary Income | 253,906 | 246,719 | 7,187 | |||||||||
|
|
|
|
|
| |||||||
Ordinary Expenses | 2,331,438 | 2,332,366 | (928 | ) | ||||||||
Interest Expenses | 1,013,852 | 1,028,946 | (15,094 | ) | ||||||||
Interest on Deposits | 451,000 | 449,145 | 1,855 | |||||||||
Fee and Commission Expenses | 91,650 | 90,934 | 716 | |||||||||
Trading Expenses | 809 | 377 | 431 | |||||||||
Other Operating Expenses | 97,383 | 174,935 | (77,552 | ) | ||||||||
General and Administrative Expenses | 789,552 | 840,607 | (51,054 | ) | ||||||||
Other Ordinary Expenses | 338,189 | 196,565 | 141,624 | |||||||||
|
|
|
|
|
| |||||||
Ordinary Profits | 430,762 | 284,573 | 146,188 | |||||||||
|
|
|
|
|
| |||||||
Extraordinary Gains | 1,296 | 11,181 | (9,885 | ) | ||||||||
|
|
|
|
|
| |||||||
Extraordinary Losses | 18,484 | 503,219 | (484,734 | ) | ||||||||
|
|
|
|
|
| |||||||
Income (Loss) before Income Taxes | 413,574 | (207,463 | ) | 621,038 | ||||||||
Income Taxes: | ||||||||||||
Current | 109,151 | 94,923 | 14,227 | |||||||||
Deferred | (3,364 | ) | (157,943 | ) | 154,578 | |||||||
|
|
|
|
|
| |||||||
Net Income (Loss) | ¥ | 307,788 | ¥ | (144,444 | ) | ¥ | 452,232 | |||||
|
|
|
|
|
| |||||||
2-40
Mizuho Trust & Banking Co., Ltd.
COMPARISON OFNON-CONSOLIDATED BALANCE SHEETS (selected items)
OF MIZUHO TRUST & BANKING
| Millions of yen | ||||||||||||
| As of March 31, 2020 (A) | As of March 31, 2019 (B) | Change (A) - (B) | ||||||||||
Assets | ||||||||||||
Cash and Due from Banks | ¥ | 1,766,799 | ¥ | 2,434,150 | ¥ | (667,350 | ) | |||||
Call Loans | 14,678 | 24,417 | (9,739 | ) | ||||||||
Guarantee Deposits Paid under Securities Borrowing Transactions | 198,053 | 332,116 | (134,062 | ) | ||||||||
Other Debt Purchased | 32,493 | 6,692 | 25,800 | |||||||||
Trading Assets | 169,750 | 111,667 | 58,083 | |||||||||
Money Held in Trust | 7,125 | 4,641 | 2,483 | |||||||||
Securities | 958,624 | 841,621 | 117,003 | |||||||||
Loans and Bills Discounted | 3,367,475 | 3,355,173 | 12,302 | |||||||||
Foreign Exchange Assets | 7,865 | 4,073 | 3,792 | |||||||||
Other Assets | 359,752 | 188,381 | 171,371 | |||||||||
Tangible Fixed Assets | 86,705 | 20,559 | 66,145 | |||||||||
Intangible Fixed Assets | 30,529 | 32,664 | (2,134 | ) | ||||||||
Prepaid Pension Cost | 65,759 | 55,766 | 9,993 | |||||||||
Customers’ Liabilities for Acceptances and Guarantees | 14,755 | 16,885 | (2,129 | ) | ||||||||
Reserves for Possible Losses on Loans | (3,689 | ) | (2,324 | ) | (1,364 | ) | ||||||
|
|
|
|
|
| |||||||
Total Assets | ¥ | 7,076,682 | ¥ | 7,426,486 | ¥ | (349,803 | ) | |||||
|
|
|
|
|
| |||||||
Liabilities | ||||||||||||
Deposits | ¥ | 3,096,295 | ¥ | 3,253,498 | ¥ | (157,203 | ) | |||||
Negotiable Certificates of Deposit | 664,780 | 566,110 | 98,670 | |||||||||
Call Money | 807,706 | 947,104 | (139,398 | ) | ||||||||
Payables under Repurchase Agreements | — | 22,198 | (22,198 | ) | ||||||||
Guarantee Deposits Received under Securities Lending Transactions | 289,789 | 362,246 | (72,456 | ) | ||||||||
Trading Liabilities | 170,146 | 107,096 | 63,049 | |||||||||
Borrowed Money | 255,860 | 379,706 | (123,846 | ) | ||||||||
Foreign Exchange Liabilities | 23 | — | 23 | |||||||||
Bonds and Notes | 10,000 | 10,000 | — | |||||||||
Due to Trust Accounts | 1,055,510 | 1,102,073 | (46,563 | ) | ||||||||
Other Liabilities | 142,457 | 68,806 | 73,651 | |||||||||
Reserve for Bonus Payments | 2,153 | 2,125 | 28 | |||||||||
Reserve for Variable Compensation | 368 | 467 | (99 | ) | ||||||||
Reserve for Reimbursement of Deposits | 1,907 | 2,081 | (173 | ) | ||||||||
Deferred Tax Liabilities | 3,220 | 6,631 | (3,411 | ) | ||||||||
Acceptances and Guarantees | 14,755 | 16,885 | (2,129 | ) | ||||||||
|
|
|
|
|
| |||||||
Total Liabilities | 6,514,977 | 6,847,033 | (332,056 | ) | ||||||||
|
|
|
|
|
| |||||||
Net Assets | ||||||||||||
Common Stock and Preferred Stock | 247,369 | 247,369 | — | |||||||||
Capital Surplus | 15,505 | 15,505 | — | |||||||||
Capital Reserve | 15,505 | 15,505 | — | |||||||||
Retained Earnings | 253,465 | 241,889 | 11,575 | |||||||||
Appropriated Reserve | 41,484 | 36,719 | 4,764 | |||||||||
Other Retained Earnings | 211,980 | 205,170 | 6,810 | |||||||||
Retained Earnings Brought Forward | 211,980 | 205,170 | 6,810 | |||||||||
|
|
|
|
|
| |||||||
Total Shareholders’ Equity | 516,339 | 504,764 | 11,575 | |||||||||
|
|
|
|
|
| |||||||
Net Unrealized Gains (Losses) on Other Securities, net of Taxes | 49,981 | 76,295 | (26,314 | ) | ||||||||
Net Deferred Hedge Gains (Losses), net of Taxes | (4,615 | ) | (1,608 | ) | (3,007 | ) | ||||||
|
|
|
|
|
| |||||||
Total Valuation and Translation Adjustments | 45,365 | 74,687 | (29,322 | ) | ||||||||
|
|
|
|
|
| |||||||
Total Net Assets | 561,705 | 579,452 | (17,747 | ) | ||||||||
|
|
|
|
|
| |||||||
Total Liabilities and Net Assets | ¥ | 7,076,682 | ¥ | 7,426,486 | ¥ | (349,803 | ) | |||||
|
|
|
|
|
| |||||||
2-41
Mizuho Trust & Banking Co., Ltd.
COMPARISON OFNON-CONSOLIDATED STATEMENTS OF INCOME
(selected items) OF MIZUHO TRUST & BANKING
| Millions of yen | ||||||||||||
| For the fiscal year ended March 31, 2020 (A) | For the fiscal year ended March 31, 2019 (B) | Change (A) - (B) | ||||||||||
Ordinary Income | ¥ | 209,112 | ¥ | 209,539 | ¥ | (427 | ) | |||||
Fiduciary Income | 59,132 | 54,997 | 4,134 | |||||||||
Interest Income | 37,305 | 42,795 | (5,489 | ) | ||||||||
Interest on Loans and Bills Discounted | 24,619 | 26,691 | (2,072 | ) | ||||||||
Interest and Dividends on Securities | 10,654 | 13,786 | (3,132 | ) | ||||||||
Fee and Commission Income | 70,610 | 70,307 | 303 | |||||||||
Trading Income | 1,526 | 1,552 | (25 | ) | ||||||||
Other Operating Income | 24,319 | 8,319 | 16,000 | |||||||||
Other Ordinary Income | 16,217 | 31,567 | (15,350 | ) | ||||||||
|
|
|
|
|
| |||||||
Ordinary Expenses | 159,435 | 154,184 | 5,250 | |||||||||
Interest Expenses | 13,445 | 16,415 | (2,969 | ) | ||||||||
Interest on Deposits | 614 | 1,059 | (444 | ) | ||||||||
Fee and Commission Expenses | 35,027 | 33,391 | 1,635 | |||||||||
Trading Expenses | 20 | 0 | 20 | |||||||||
Other Operating Expenses | 11,458 | 6,037 | 5,420 | |||||||||
General and Administrative Expenses | 81,211 | 82,395 | (1,183 | ) | ||||||||
Other Ordinary Expenses | 18,272 | 15,944 | 2,328 | |||||||||
|
|
|
|
|
| |||||||
Ordinary Profits | 49,676 | 55,354 | (5,678 | ) | ||||||||
|
|
|
|
|
| |||||||
Extraordinary Gains | 907 | 82 | 824 | |||||||||
|
|
|
|
|
| |||||||
Extraordinary Losses | 694 | 2,245 | (1,551 | ) | ||||||||
|
|
|
|
|
| |||||||
Income before Income Taxes | 49,888 | 53,190 | (3,302 | ) | ||||||||
Income Taxes: | ||||||||||||
Current | 10,342 | 12,544 | (2,201 | ) | ||||||||
Deferred | 4,147 | 1,582 | 2,564 | |||||||||
|
|
|
|
|
| |||||||
Net Income | ¥ | 35,398 | ¥ | 39,063 | ¥ | (3,665 | ) | |||||
|
|
|
|
|
| |||||||
2-42
Mizuho Trust & Banking Co., Ltd.
(Reference)
Statement of Trust Assets and Liabilities
As of March 31, 2020
Millions of yen | ||||||||||
Assets | Amount | Liabilities | Amount | |||||||
Loans and Bills Discounted | 634,513 | Money Trusts | 24,065,825 | |||||||
Securities | 130,890 | Pension Trusts | 3,183,854 | |||||||
Beneficiary Rights to the Trusts | 63,240,425 | Property Formation Benefit Trusts | 4,692 | |||||||
Securities held in Custody Accounts | 410,192 | Investment Trusts | 18,396,464 | |||||||
Money Claims | 5,500,206 | Money Entrusted Other than Money Trusts | 1,829,192 | |||||||
Tangible Fixed Assets | 8,319,291 | Securities Trusts | 14,009,829 | |||||||
Intangible Fixed Assets | 361,170 | Money Claims Trusts | 4,304,969 | |||||||
Other Claims | 580,858 | Land and Fixtures Trusts | 435,204 | |||||||
Due from Banking Account | 1,055,510 | Composite Trusts | 14,473,878 | |||||||
Cash and Due from Banks | 476,227 | Other Trusts | 5,375 | |||||||
|
|
|
| |||||||
Total | 80,709,287 | Total | 80,709,287 | |||||||
|
|
|
| |||||||
Notes:
| 1. | The statement is exclusive of the Trusts that are difficult to value monetarily. |
| 2. | Beneficiary Rights to the Trusts include entrusted Trusts for asset maintenance of ¥61,077,996 million. |
| 3. | Joint trust assets under the management of other companies: ¥279,436 million |
| 4. | There is no balance of Loans to Bankrupt Obligors,Non-Accrual Delinquent Loans, |
(Reference) Breakdown of Accounts of Money Trusts and Loan Trusts with the contracts of principal indemnification (including Trusts entrusted for asset management) are as follows:
Money Trusts
Millions of yen | ||||||||||
Assets | Amount | Liabilities | Amount | |||||||
Loans and Bills Discounted | 8,773 | Principal | 883,781 | |||||||
Securities | 1 | Reserve | 27 | |||||||
Others | 875,127 | Others | 94 | |||||||
|
|
|
| |||||||
Total | 883,902 | Total | 883,902 | |||||||
|
|
|
| |||||||
2-43
Mizuho Trust & Banking Co., Ltd.
(Reference)
Comparison of Balances of Principal Items
| Millions of yen | ||||||||||||
Items | As of March 31, 2020 (A) | As of March 31, 2019 (B) | Change (A) - (B) | |||||||||
Total Amount of Funds | 31,015,448 | 29,169,953 | 1,845,494 | |||||||||
Deposits | 3,096,295 | 3,253,498 | (157,203 | ) | ||||||||
Negotiable Certificates of Deposit | 664,780 | 566,110 | 98,670 | |||||||||
Money Trusts | 24,065,825 | 22,197,075 | 1,868,749 | |||||||||
Pension Trusts | 3,183,854 | 3,148,711 | 35,143 | |||||||||
Property Formation Benefit Trusts | 4,692 | 4,558 | 134 | |||||||||
Loans and Bills Discounted | 4,001,989 | 4,013,541 | (11,552 | ) | ||||||||
of Banking accounts | 3,367,475 | 3,355,173 | 12,302 | |||||||||
of Trust accounts | 634,513 | 658,368 | (23,854 | ) | ||||||||
Securities for Investments | 1,089,515 | 1,023,278 | 66,236 | |||||||||
of Banking accounts | 958,624 | 841,621 | 117,003 | |||||||||
of Trust accounts | 130,890 | 181,657 | (50,767 | ) | ||||||||
2-44
Mizuho Securities Co., Ltd.
COMPARISON OFNON-CONSOLIDATED BALANCE SHEETS (selected items)
OF MIZUHO SECURITIES
| Millions of yen | ||||||||||||
| As of March 31, 2020 (A) | As of March 31, 2019 (B) | Change (A) - (B) | ||||||||||
Assets | ||||||||||||
Current Assets | ||||||||||||
Cash and Bank Deposits | ¥ | 533,288 | ¥ | 388,516 | ¥ | 144,772 | ||||||
Cash Segregated as Deposits for Customers and Others | 387,043 | 335,712 | 51,330 | |||||||||
Trading Assets | 6,461,814 | 6,061,110 | 400,703 | |||||||||
Operating Investment Securities | 33,430 | 28,640 | 4,789 | |||||||||
Receivables Related to Margin Transactions | 22,055 | 34,162 | (12,107 | ) | ||||||||
Collateralized Short-Term Financing Agreements-Receivable | 4,296,231 | 3,871,953 | 424,278 | |||||||||
Advances Paid | 579 | 488 | 90 | |||||||||
Securities: Fail to Deliver | 12,971 | 9,613 | 3,357 | |||||||||
Short-Term Loans Receivable | 37,298 | 52,652 | (15,354 | ) | ||||||||
Other Current Assets | 595,830 | 434,483 | 161,346 | |||||||||
Less: Allowance for Doubtful Accounts | (7 | ) | (3 | ) | (3 | ) | ||||||
Noncurrent Assets | ||||||||||||
Property and Equipment | 11,196 | 12,527 | (1,330 | ) | ||||||||
Intangible Assets | 61,637 | 50,829 | 10,808 | |||||||||
Investments and Other Assets | 302,584 | 315,137 | (12,552 | ) | ||||||||
|
|
|
|
|
| |||||||
Total Assets | ¥ | 12,755,956 | ¥ | 11,595,825 | ¥ | 1,160,130 | ||||||
|
|
|
|
|
| |||||||
Liabilities | ||||||||||||
Current Liabilities | ||||||||||||
Trading Liabilities | ¥ | 5,032,193 | ¥ | 4,340,952 | ¥ | 691,240 | ||||||
Payables - Unsettled Trades | 61,668 | 36,888 | 24,779 | |||||||||
Payables Related to Margin Transactions | 47,395 | 53,591 | (6,196 | ) | ||||||||
Collateralized Short-Term Financing Agreements-Payable | 3,660,235 | 3,575,497 | 84,738 | |||||||||
Deposits Received | 350,409 | 308,251 | 42,158 | |||||||||
Guarantee Deposits Received | 370,607 | 297,472 | 73,134 | |||||||||
Securities: Fail to Receive | 2,029 | 2,064 | (35 | ) | ||||||||
Short-Term Borrowings | 1,035,215 | 773,484 | 261,730 | |||||||||
Commercial Paper | 319,000 | 333,200 | (14,200 | ) | ||||||||
Bonds and Notes Due within One Year | 137,358 | 76,393 | 60,964 | |||||||||
Lease Obligations | — | 174 | (174 | ) | ||||||||
Income Taxes Payable | 3,022 | 2,220 | 802 | |||||||||
Accrued Employees’ Bonuses | 13,531 | 9,359 | 4,172 | |||||||||
Provision for Variable Compensation | 816 | 927 | (110 | ) | ||||||||
Provision for Bonus Point Redemption | 487 | 686 | (198 | ) | ||||||||
Other Current Liabilities | 53,465 | 40,800 | 12,665 | |||||||||
Noncurrent Liabilities | ||||||||||||
Bonds and Notes | 620,079 | 679,688 | (59,609 | ) | ||||||||
Long-Term Borrowings | 135,600 | 173,000 | (37,400 | ) | ||||||||
Provision for Retirement Benefits | 19,828 | 19,799 | 29 | |||||||||
Other Noncurrent Liabilities | 2,111 | 2,263 | (152 | ) | ||||||||
Statutory Reserves | ||||||||||||
Reserve for Financial Instruments Transaction Liabilities | 2,509 | 2,473 | 36 | |||||||||
|
|
|
|
|
| |||||||
Total Liabilities | 11,867,565 | 10,729,189 | 1,138,375 | |||||||||
|
|
|
|
|
| |||||||
Net Assets | ||||||||||||
Common Stock | 125,167 | 125,167 | — | |||||||||
Capital Surplus | 381,649 | 381,649 | — | |||||||||
Additional Paid - in Capital | 285,831 | 285,831 | — | |||||||||
Other Capital Surplus | 95,817 | 95,817 | — | |||||||||
Retained Earnings | 371,261 | 346,585 | 24,676 | |||||||||
Other Retained Earnings | 371,261 | 346,585 | 24,676 | |||||||||
Retained Earnings Brought Forward | 371,261 | 346,585 | 24,676 | |||||||||
|
|
|
|
|
| |||||||
Total Shareholders’ Equity | 878,078 | 853,401 | 24,676 | |||||||||
|
|
|
|
|
| |||||||
Net Unrealized Gains on (Operating) Investment Securities, net of Tax | 20,066 | 23,023 | (2,956 | ) | ||||||||
Net Deferred Gains or Losses on Hedges, net of Tax | (9,754 | ) | (9,789 | ) | 35 | |||||||
|
|
|
|
|
| |||||||
Total Valuation and Translation Adjustments | 10,312 | 13,233 | (2,921 | ) | ||||||||
|
|
|
|
|
| |||||||
Total Net Assets | 888,390 | 866,635 | 21,754 | |||||||||
|
|
|
|
|
| |||||||
Total Liabilities and Net Assets | ¥ | 12,755,956 | ¥ | 11,595,825 | ¥ | 1,160,130 | ||||||
|
|
|
|
|
| |||||||
2-45
Mizuho Securities Co., Ltd.
COMPARISON OFNON-CONSOLIDATED STATEMENTS OF INCOME
(selected items) OF MIZUHO SECURITIES
| Millions of yen | ||||||||||||
| For the fiscal year ended March 31, 2020 (A) | For the fiscal year ended March 31, 2019 (B) | Change (A) - (B) | ||||||||||
Operating Revenues | ¥ | 354,192 | ¥ | 341,131 | ¥ | 13,060 | ||||||
Commissions | 149,514 | 151,810 | (2,296 | ) | ||||||||
Net Gain on Trading | 111,981 | 93,568 | 18,413 | |||||||||
Net Gain on Operating Investment Securities | 2,621 | 5,287 | (2,666 | ) | ||||||||
Interest and Dividend Income | 90,075 | 90,465 | (390 | ) | ||||||||
|
|
|
|
|
| |||||||
Interest Expenses | 82,590 | 77,794 | 4,796 | |||||||||
|
|
|
|
|
| |||||||
Net Operating Revenues | 271,602 | 263,337 | 8,264 | |||||||||
|
|
|
|
|
| |||||||
Selling, General and Administrative Expenses | 237,737 | 236,229 | 1,507 | |||||||||
Transaction-Related Expenses | 57,929 | 53,157 | 4,772 | |||||||||
Personnel Expenses | 86,215 | 86,662 | (446 | ) | ||||||||
Real Estate Expenses | 24,151 | 25,585 | (1,434 | ) | ||||||||
Administrative Expenses | 42,322 | 43,374 | (1,052 | ) | ||||||||
Depreciation and Amortization | 19,702 | 18,931 | 770 | |||||||||
Taxes and Dues | 4,436 | 5,452 | (1,015 | ) | ||||||||
Provision of Allowance for Doubtful Accounts | (20 | ) | 2 | (22 | ) | |||||||
Other | 3,000 | 3,064 | (63 | ) | ||||||||
|
|
|
|
|
| |||||||
Operating Income | 33,864 | 27,107 | 6,756 | |||||||||
|
|
|
|
|
| |||||||
Non-Operating Income | 4,744 | 9,044 | (4,300 | ) | ||||||||
Non-Operating Expenses | 179 | 196 | (16 | ) | ||||||||
|
|
|
|
|
| |||||||
Ordinary Income | 38,429 | 35,955 | 2,473 | |||||||||
|
|
|
|
|
| |||||||
Extraordinary Gain | 1,110 | 2,512 | (1,402 | ) | ||||||||
|
|
|
|
|
| |||||||
Extraordinary Loss | 2,860 | 16,467 | (13,607 | ) | ||||||||
|
|
|
|
|
| |||||||
Income before Income Taxes | 36,679 | 22,000 | 14,678 | |||||||||
Income Taxes: | ||||||||||||
Current | 5,158 | 3,006 | 2,151 | |||||||||
Deferred | 2,310 | 6,600 | (4,289 | ) | ||||||||
|
|
|
|
|
| |||||||
Net Income | ¥ | 29,210 | ¥ | 12,393 | ¥ | 16,816 | ||||||
|
|
|
|
|
| |||||||
2-46