UNITED STATES
SECURITIES AND EXCHANGE COMMISSION
Washington, D.C. 20549
FORM 6-K
REPORT OF FOREIGN PRIVATE ISSUER
PURSUANT TO RULE 13a-16 OR 15d-16
UNDER THE SECURITIES EXCHANGE ACT OF 1934
For the month of November 2021
Commission File Number 001-33098
Mizuho Financial Group, Inc.
(Translation of registrant’s name into English)
5-5, Otemachi 1-chome
Chiyoda-ku, Tokyo 100-8176
Japan
(Address of principal executive office)
Indicate by check mark whether the registrant files or will file annual reports under cover of Form 20-F or Form 40-F. Form 20-F ☒ Form 40-F ☐
Indicate by check mark if the registrant is submitting the Form 6-K in paper as permitted by Regulation S-T Rule 101(b)(1): ☐
Indicate by check mark if the registrant is submitting the Form 6-K in paper as permitted by Regulation S-T Rule 101(b)(7): ☐
Indicate by check mark whether the registrant by furnishing the information contained in this Form is also thereby furnishing the information to the Commission pursuant to Rule 12g3-2(b) under the Securities Exchange Act of 1934. Yes ☐ No ☒
If “Yes” is marked, indicate below the file number assigned to the registrant in connection with Rule 12g3-2(b):82- .
THIS REPORT ON FORM 6-K SHALL BE DEEMED TO BE INCORPORATED BY REFERENCE INTO THE PROSPECTUS FORMING A PART OF MIZUHO FINANCIAL GROUP, INC.’S REGISTRATION STATEMENT ON FORM F-3 (FILE NO. 333-233354) AND TO BE A PART OF SUCH PROSPECTUS FROM THE DATE ON WHICH THIS REPORT IS FURNISHED, TO THE EXTENT NOT SUPERSEDED BY DOCUMENTS OR REPORTS SUBSEQUENTLY FILED OR FURNISHED.
SIGNATURES
Pursuant to the requirements of the Securities Exchange Act of 1934, the registrant has duly caused this report to be signed on its behalf by the undersigned, thereunto duly authorized.
| Date: | November 12, 2021 | |
| Mizuho Financial Group, Inc. | ||
| By: | /s/ Makoto Umemiya | |
| Name: | Makoto Umemiya | |
| Title: | Senior Executive Officer / Group CFO | |
For Immediate Release:
Consolidated Financial Statements for the Second Quarter of Fiscal 2021 (Six months ended September 30, 2021) (Under Japanese GAAP) |  |
| Company Name: | Mizuho Financial Group, Inc. (“MHFG”) | November 12, 2021 |
| Stock Code Number (Japan): | 8411 | |||||||
| Stock Exchange Listings: | Tokyo Stock Exchange (First Section), New York Stock Exchange | |||||||
| URL: | https://www.mizuhogroup.com | |||||||
| Representative: | Tatsufumi Sakai | President & CEO | ||||||
| For Inquiry: | Tomomichi Fujita | General Manager of Accounting | Phone: | +81-3-6838-6101 | ||||
| Filing of Shihanki Hokokusho (scheduled): | November 29, 2021 | Trading Accounts: | Established | |||||
| Commencement of Dividend Payment (scheduled): | December 7, 2021 | |||||||
| Supplementary Materials on Quarterly Results: | Attached | |||||||
| IR Conference on Quarterly Results: | Scheduled | |||||||
Amounts less than one million yen are rounded down.
1. Financial Highlights for the Second Quarter (First Half) of Fiscal 2021 (for the six months ended September 30, 2021)
(1) Consolidated Results of Operations
| (%: Changes from the previous first half) |
| |||||||||||||||||||||||
| Ordinary Income | Ordinary Profits | Profit Attributable to Owners of Parent | ||||||||||||||||||||||
| ¥ million | % | ¥ million | % | ¥ million | % | |||||||||||||||||||
1H F2021 | 1,579,249 | 0.1 | 399,340 | 49.2 | 385,657 | 78.9 | ||||||||||||||||||
1H F2020 | 1,576,761 | (20.6 | ) | 267,610 | (32.5 | ) | 215,523 | (25.0 | ) | |||||||||||||||
| Note: | Comprehensive Income: 1H F2021: ¥382,910 million, 1.7%; 1H F2020: ¥376,172 million, 97.5% | |||||||||||||||
| Net Income per Share of Common Stock | Diluted Net Income per Share of Common Stock | |||||||
| ¥ | ¥ | |||||||
1H F2021 | 152.12 | 152.12 | ||||||
1H F2020 | 84.99 | 84.98 | ||||||
| Note: | MHFG conducted a share consolidation of common stock on the basis of one post-consolidation share per ten pre-consolidation shares effective as of October 1, 2020. | |
| The impact of the share consolidation is reflected in Net Income per Share of Common Stock and Diluted Net Income per Share of Common Stock. |
(2) Consolidated Financial Conditions
| Total Assets | Total Net Assets | Own Capital Ratio | ||||||||||
| ¥ million | ¥ million | % | ||||||||||
1H F2021 | 227,195,390 | 9,640,884 | 4.1 | |||||||||
Fiscal 2020 | 225,586,211 | 9,362,207 | 4.1 | |||||||||
| Reference: | Own Capital: As of September 30, 2021: ¥9,523,829 million; As of March 31, 2021: ¥9,256,275 million | |||||||||||
| Note: | Own Capital Ratio is calculated as follows: (Total Net Assets - Stock Acquisition Rights - Non-controlling Interests) / Total Assets × 100 Own Capital Ratio stated above is not calculated based on the public notice of Own Capital Ratio. |
2. Cash Dividends for Shareholders of Common Stock
| Annual Cash Dividends per Share | ||||||||||||||||||||
| First Quarter-end | Second Quarter-end | Third Quarter-end | Fiscal Year-end | Total | ||||||||||||||||
| ¥ | ¥ | ¥ | ¥ | ¥ | ||||||||||||||||
Fiscal 2020 | — | 3.75 | — | 37.50 | — | |||||||||||||||
Fiscal 2021 | — | 40.00 | ||||||||||||||||||
Fiscal 2021 (estimate) | — | 40.00 | 80.00 | |||||||||||||||||
| Notes: | 1. | Revision of the latest announced estimates for cash dividends for shareholders of common stock : Yes | ||||||||
| 2. | MHFG conducted a share consolidation of common stock on the basis of one post-consolidation share per ten pre-consolidation shares effective as of October 1, 2020. The impact of the share consolidation is not reflected in Cash Dividends per Share of Common Stock for the end of the second quarter of Fiscal 2020. If the share consolidation were taken into consideration, it would be ¥37.50 per share. In addition, MHFG left the value of total annual dividend blank (—) as it is inappropriate simply to total the value of the dividend at the end of the first half of Fiscal 2020 and the value of the dividend at the end of Fiscal 2020. | |||||||||
3. Consolidated Earnings Estimates for Fiscal 2021 (for the fiscal year ending March 31, 2022)
| (%: Changes from the previous fiscal year) | ||||||||||||||||||||
| Profit Attributable to Owners of Parent | Net Income per Share of Common Stock | |||||||||||||||||||
| ¥ million | % | ¥ | ||||||||||||||||||
Fiscal 2021 | 530,000 | 12.5 | 209.03 | |||||||||||||||||
| Notes: | 1. | Revision of the latest announced earnings estimates for Fiscal 2021: Yes | ||||||||
Following the result from 1H, MHFG revised Consolidated Earnings Estimates for Fiscal 2021 (for the fiscal year ending March 31, 2022). Profit Attributable to Owners of Parent: The latest announced estimates: ¥510,000 million, Revised estimates: ¥530,000 million, Changes from the original estimates: ¥20,000 million, 3.9% | ||||||||||
| 2. | The number of shares of common stock used in the above per share information is based on the weighted average of the average number of outstanding shares during 1H and the number of outstanding shares as of September 30, 2021 (which is used as a proxy for the average number of outstanding shares during the remainder of the relevant period). | |||||||||
Notes
(1) Changes in Significant Subsidiaries during the Period (changes in specified subsidiaries accompanying changes in the scope of consolidation): No
(2) Changes in Accounting Policies and Accounting Estimates / Restatements
i. Changes in accounting policies due to revisions of accounting standards: Yes
ii. Changes in accounting policies other than i above: No
iii. Changes in accounting estimates: No
iv. Restatements: No
Note: For more information, please refer to “1.(1) Changes in Accounting Policies and Accounting Estimates / Restatements” on page 1-2 of the attachment.
(3) Issued Shares of Common Stock
i. Period-end issued shares (including treasury stock): | As of September 30, 2021 | 2,539,249,894 shares | As of March 31, 2021 | 2,539,249,894 shares | ||||
ii. Period-end treasury stock: | As of September 30, 2021 | 4,599,386 shares | As of March 31, 2021 | 3,889,782 shares | ||||
iii. Average outstanding shares: | 1st Half Fiscal 2021 | 2,535,113,784 shares | 1st Half Fiscal 2020 | 2,535,837,918 shares |
| Note: | MHFG conducted a share consolidation of common stock on the basis of one post-consolidation share per ten pre-consolidation shares effective as of October 1, 2020. The impact of the share consolidation is reflected in the number of Average outstanding shares. |
This immediate release is outside the scope of semi-annual audit by certified public accountants or audit firms.
This immediate release contains statements that constitute forward-looking statements within the meaning of the United States Private Securities Litigation Reform Act of 1995, including estimates, forecasts, targets and plans. Such forward-looking statements do not represent any guarantee by management of future performance. In many cases, but not all, we use such words as “aim,” “anticipate,” “believe,” “endeavor,” “estimate,” “expect,” “intend,” “may,” “plan,” “probability,” “project,” “risk,” “seek,” “should,” “strive,” “target” and similar expressions in relation to us or our management to identify forward-looking statements. You can also identify forward-looking statements by discussions of strategy, plans or intentions. These statements reflect our current views with respect to future events and are subject to risks, uncertainties and assumptions. We may not be successful in implementing our business strategies, and management may fail to achieve its targets, for a wide range of possible reasons, including, without limitation: impact of the corona virus pandemic; incurrence of significant credit-related costs; declines in the value of our securities portfolio; changes in interest rates; foreign currency fluctuations; decrease in the market liquidity of our assets; revised assumptions or other changes related to our pension plans; a decline in our deferred tax assets; impairment of the carrying value of our long-lived assets; problems related to our information technology systems, including as a result of cyber attacks; the effect of financial transactions entered into for hedging and other similar purposes; failure to maintain required capital adequacy ratio levels and meet other financial regulatory requirements; downgrades in our credit ratings; our ability to avoid reputational harm; our ability to implement our 5-Year Business Plan and implement other strategic initiatives and measures effectively; the effectiveness of our operational, legal and other risk management policies; the effect of changes in general economic conditions in Japan and elsewhere; and changes to applicable laws and regulations. Further information regarding factors that could affect our financial condition and results of operations is included in “Item 3. D. Key Information-Risk Factors” and “Item 5. Operating and Financial Review and Prospects” in our most recent Form 20-F filed with the U.S. Securities and Exchange Commission (“SEC”), which is available in the Financial Information section of our web page at www.mizuhogroup.com and also at the SEC’s web site at www.sec.gov. We do not intend to update our forward-looking statements. We are under no obligation, and disclaim any obligation, to update or alter our forward-looking statements, whether as a result of new information, future events or otherwise, except as may be required by the rules of the Tokyo Stock Exchange. MHFG is a specified business company under “Cabinet Office Ordinance on Disclosure of Corporate Information, etc.” Article 17-15 clause 2 and prepares the interim consolidated financial statements in the second quarter.
|
Mizuho Financial Group, Inc.
m Contents of Attachment
| 1. Matters Related to Summary Information (Notes) | p.1-2 | |
(1) Changes in Accounting Policies and Accounting Estimates / Restatements | p.1-2 | |
| 2. Interim Consolidated Financial Statements and Others | p.1-3 | |
(1) Consolidated Balance Sheets | p.1-3 | |
(2) Consolidated Statements of Income and Consolidated Statements of Comprehensive Income | p.1-5 | |
(3) Consolidated Statements of Changes in Net Assets | p.1-7 | |
(4) Note for Assumption of Going Concern | p.1-8 | |
øSELECTED FINANCIAL INFORMATION For the Second Quarter (First Half) of Fiscal 2021 | ||
Note to XBRL
Please note that the names of the English accounts contained in XBRL data, which are available through EDINET and TDNet, may be different from those of the English accounts in our financial statements.
An MHFG IR conference for institutional investors and analysts is scheduled for Wednesday, November 17, 2021. The IR conference presentation materials and audio archive will be available for use by individual investors in the IR Information section of the Mizuho Financial Group website immediately after the conference.
1-1
Mizuho Financial Group, Inc.
1. Matters Related to Summary Information (Notes)
(1) Changes in Accounting Policies and Accounting Estimates / Restatements
(Changes in Accounting Policies)
(Accounting Standard for Revenue Recognition and Others)
MHFG has applied “Accounting Standard for Revenue Recognition” (ASBJ Statement No.29, March 31, 2020) and others from the beginning of the interim period ended September 30, 2021.
In accordance with “Accounting Standard for Revenue Recognition”, MHFG recognizes revenue at the time of the transfer of promised goods or services to the customer in an amount that reflects the consideration to which MHFG expects to be entitled in exchange for those goods or services.
In accordance with transitional treatment set out in the proviso of Article 84 of “Accounting Standard for Revenue Recognition”, the cumulative effects arising from the retroactive application of these new accounting policies to all the previous fiscal years were reflected in Retained Earnings as of April 1, 2021, and the new accounting policies are applied from the beginning of the fiscal year.
As a result of the cumulative effects arising from the retroactive application of these new accounting policies, Retained Earnings of the interim consolidated statement of changes in net assets decreased by ¥724 million as of April 1, 2021. The impact on the interim consolidated balance sheet, the interim consolidated statement of income and per share information for the interim period ended September 30, 2021 is immaterial.
1-2
Mizuho Financial Group, Inc.
2. Interim Consolidated Financial Statements and Others
(1) Consolidated Balance Sheets
| Millions of yen | ||||||||
| As of March 31, 2021 | As of September 30, 2021 | |||||||
Assets | ||||||||
Cash and Due from Banks | ¥ | 47,981,981 | ¥ | 47,075,429 | ||||
Call Loans and Bills Purchased | 589,776 | 330,455 | ||||||
Receivables under Resale Agreements | 11,623,654 | 16,932,692 | ||||||
Guarantee Deposits Paid under Securities Borrowing Transactions | 2,707,711 | 2,412,626 | ||||||
Other Debt Purchased | 3,208,004 | 3,137,520 | ||||||
Trading Assets | 12,589,294 | 12,610,648 | ||||||
Money Held in Trust | 582,368 | 637,862 | ||||||
Securities | 43,697,262 | 43,725,034 | ||||||
Loans and Bills Discounted | 83,704,675 | 82,198,528 | ||||||
Foreign Exchange Assets | 2,084,756 | 2,228,808 | ||||||
Derivatives other than for Trading Assets | 1,719,349 | 1,407,561 | ||||||
Other Assets | 6,174,020 | 5,296,681 | ||||||
Tangible Fixed Assets | 1,135,449 | 1,118,837 | ||||||
Intangible Fixed Assets | 620,224 | 603,477 | ||||||
Net Defined Benefit Asset | 1,109,107 | 959,987 | ||||||
Deferred Tax Assets | 31,402 | 27,842 | ||||||
Customers’ Liabilities for Acceptances and Guarantees | 6,602,744 | 7,085,422 | ||||||
Reserves for Possible Losses on Loans | (575,572 | ) | (594,023 | ) | ||||
Reserve for Possible Losses on Investments | (0 | ) | (1 | ) | ||||
|
|
|
| |||||
Total Assets | ¥ | 225,586,211 | ¥ | 227,195,390 | ||||
|
|
|
| |||||
1-3
Mizuho Financial Group, Inc.
| Millions of yen | ||||||||
| As of March 31, 2021 | As of September 30, 2021 | |||||||
Liabilities | ||||||||
Deposits | ¥ | 133,312,406 | ¥ | 129,291,662 | ||||
Negotiable Certificates of Deposit | 17,192,572 | 19,215,068 | ||||||
Call Money and Bills Sold | 1,312,790 | 1,431,315 | ||||||
Payables under Repurchase Agreements | 18,607,255 | 22,277,769 | ||||||
Guarantee Deposits Received under Securities Lending Transactions | 958,148 | 1,229,187 | ||||||
Commercial Paper | 2,105,067 | 1,969,424 | ||||||
Trading Liabilities | 8,115,377 | 6,464,003 | ||||||
Borrowed Money | 7,441,822 | 7,495,869 | ||||||
Foreign Exchange Liabilities | 532,042 | 500,486 | ||||||
Short-term Bonds | 456,045 | 543,561 | ||||||
Bonds and Notes | 10,321,672 | 10,513,503 | ||||||
Due to Trust Accounts | 1,160,608 | 1,182,263 | ||||||
Derivatives other than for Trading Liabilities | 1,739,671 | 1,480,764 | ||||||
Other Liabilities | 5,862,013 | 6,469,900 | ||||||
Reserve for Bonus Payments | 104,131 | 58,833 | ||||||
Reserve for Variable Compensation | 2,935 | 1,014 | ||||||
Net Defined Benefit Liability | 71,049 | 71,775 | ||||||
Reserve for Director and Corporate Auditor Retirement Benefits | 683 | 488 | ||||||
Reserve for Possible Losses on Sales of Loans | 1,074 | 181 | ||||||
Reserve for Contingencies | 6,762 | 8,562 | ||||||
Reserve for Reimbursement of Deposits | 22,099 | 19,901 | ||||||
Reserve for Reimbursement of Debentures | 14,419 | 12,157 | ||||||
Reserves under Special Laws | 3,135 | 3,127 | ||||||
Deferred Tax Liabilities | 215,557 | 166,823 | ||||||
Deferred Tax Liabilities for Revaluation Reserve for Land | 61,915 | 61,436 | ||||||
Acceptances and Guarantees | 6,602,744 | 7,085,422 | ||||||
|
|
|
| |||||
Total Liabilities | ¥ | 216,224,003 | ¥ | 217,554,505 | ||||
|
|
|
| |||||
Net Assets | ||||||||
Common Stock | ¥ | 2,256,767 | ¥ | 2,256,767 | ||||
Capital Surplus | 1,135,940 | 1,125,324 | ||||||
Retained Earnings | 4,421,655 | 4,712,422 | ||||||
Treasury Stock | (7,124 | ) | (8,164 | ) | ||||
|
|
|
| |||||
Total Shareholders’ Equity | 7,807,239 | 8,086,349 | ||||||
|
|
|
| |||||
Net Unrealized Gains (Losses) on Other Securities | 1,132,460 | 1,154,756 | ||||||
Deferred Gains or Losses on Hedges | 31,618 | (743 | ) | |||||
Revaluation Reserve for Land | 136,384 | 135,297 | ||||||
Foreign Currency Translation Adjustments | (139,514 | ) | (80,968 | ) | ||||
Remeasurements of Defined Benefit Plans | 288,088 | 229,137 | ||||||
|
|
|
| |||||
Total Accumulated Other Comprehensive Income | 1,449,035 | 1,437,480 | ||||||
|
|
|
| |||||
Stock Acquisition Rights | 134 | 95 | ||||||
Non-Controlling Interests | 105,797 | 116,959 | ||||||
|
|
|
| |||||
Total Net Assets | 9,362,207 | 9,640,884 | ||||||
|
|
|
| |||||
Total Liabilities and Net Assets | ¥ | 225,586,211 | ¥ | 227,195,390 | ||||
|
|
|
| |||||
1-4
Mizuho Financial Group, Inc.
(2) Consolidated Statements of Income and Consolidated Statements of Comprehensive Income
Consolidated Statements of Income
| Millions of yen | ||||||||
| For the six months ended September 30, 2020 | For the six months ended September 30, 2021 | |||||||
Ordinary Income | ¥ | 1,576,761 | ¥ | 1,579,249 | ||||
Interest Income | 693,651 | 615,622 | ||||||
Interest on Loans and Bills Discounted | 490,811 | 422,172 | ||||||
Interest and Dividends on Securities | 122,600 | 119,583 | ||||||
Fiduciary Income | 27,143 | 29,728 | ||||||
Fee and Commission Income | 397,087 | 416,769 | ||||||
Trading Income | 238,219 | 226,614 | ||||||
Other Operating Income | 156,922 | 142,799 | ||||||
Other Ordinary Income | 63,736 | 147,714 | ||||||
Ordinary Expenses | 1,309,150 | 1,179,909 | ||||||
Interest Expenses | 253,522 | 141,461 | ||||||
Interest on Deposits | 91,376 | 28,002 | ||||||
Fee and Commission Expenses | 77,475 | 86,326 | ||||||
Trading Expenses | 1,455 | 35,301 | ||||||
Other Operating Expenses | 68,248 | 59,622 | ||||||
General and Administrative Expenses | 681,287 | 667,594 | ||||||
Other Ordinary Expenses | 227,161 | 189,602 | ||||||
|
|
|
| |||||
Ordinary Profits | 267,610 | 399,340 | ||||||
|
|
|
| |||||
Extraordinary Gains | 72,735 | 51,553 | ||||||
Extraordinary Losses | 6,955 | 4,271 | ||||||
|
|
|
| |||||
Income before Income Taxes | 333,391 | 446,622 | ||||||
|
|
|
| |||||
Income Taxes: | ||||||||
Current | 74,186 | 65,604 | ||||||
Deferred | 41,813 | (10,941 | ) | |||||
|
|
|
| |||||
Total Income Taxes | 116,000 | 54,663 | ||||||
|
|
|
| |||||
Profit | 217,390 | 391,958 | ||||||
|
|
|
| |||||
Profit Attributable to Non-controlling Interests | 1,867 | 6,301 | ||||||
|
|
|
| |||||
Profit Attributable to Owners of Parent | ¥ | 215,523 | ¥ | 385,657 | ||||
|
|
|
| |||||
1-5
Mizuho Financial Group, Inc.
Consolidated Statements of Comprehensive Income
| Millions of yen | ||||||||
| For the six months ended September 30, 2020 | For the six months ended September 30, 2021 | |||||||
Profit | ¥ | 217,390 | ¥ | 391,958 | ||||
Other Comprehensive Income | 158,782 | (9,048 | ) | |||||
Net Unrealized Gains (Losses) on Other Securities | 212,348 | 23,805 | ||||||
Deferred Gains or Losses on Hedges | (5,843 | ) | (32,261 | ) | ||||
Foreign Currency Translation Adjustments | (36,529 | ) | 50,061 | |||||
Remeasurements of Defined Benefit Plans | (9,851 | ) | (58,390 | ) | ||||
Share of Other Comprehensive Income of Associates Accounted for Using Equity Method | (1,341 | ) | 7,736 | |||||
|
|
|
| |||||
Comprehensive Income | 376,172 | 382,910 | ||||||
|
|
|
| |||||
(Breakdown) | ||||||||
Comprehensive Income Attributable to Owners of Parent | 377,963 | 375,995 | ||||||
Comprehensive Income Attributable to Non-controlling Interests | (1,791 | ) | 6,914 | |||||
1-6
Mizuho Financial Group, Inc.
(3) Consolidated Statements of Changes in Net Assets
For the six months ended September 30, 2020
| Millions of yen | ||||||||||||||||||||
| Shareholders’ Equity | ||||||||||||||||||||
| Common Stock | Capital Surplus | Retained Earnings | Treasury Stock | Total Shareholders’ Equity | ||||||||||||||||
Balance as of the beginning of the period | 2,256,767 | 1,136,467 | 4,174,190 | (6,414 | ) | 7,561,010 | ||||||||||||||
Cumulative Effects of Changes in Accounting Policies | (32,639 | ) | (32,639 | ) | ||||||||||||||||
Balance as of the beginning of the period reflecting Changes in Accounting Policies | 2,256,767 | 1,136,467 | 4,141,550 | (6,414 | ) | 7,528,370 | ||||||||||||||
Changes during the period | ||||||||||||||||||||
Cash Dividends | (95,208 | ) | (95,208 | ) | ||||||||||||||||
Profit Attributable to Owners of Parent | 215,523 | 215,523 | ||||||||||||||||||
Repurchase of Treasury Stock | (1,995 | ) | (1,995 | ) | ||||||||||||||||
Disposition of Treasury Stock | (80 | ) | 1,385 | 1,305 | ||||||||||||||||
Transfer from Revaluation Reserve for Land | (1,178 | ) | (1,178 | ) | ||||||||||||||||
Change in Treasury Shares of Parent Arising from Transactions with Non-controlling Shareholders | (519 | ) | (519 | ) | ||||||||||||||||
Transfer from Retained Earnings to Capital Surplus | 80 | (80 | ) | — | ||||||||||||||||
Net Changes in Items other than Shareholders’ Equity | ||||||||||||||||||||
|
|
|
|
|
|
|
|
|
| |||||||||||
Total Changes during the period | — | (519 | ) | 119,056 | (610 | ) | 117,926 | |||||||||||||
|
|
|
|
|
|
|
|
|
| |||||||||||
Balance as of the end of the period | 2,256,767 | 1,135,948 | 4,260,606 | (7,025 | ) | 7,646,297 | ||||||||||||||
|
|
|
|
|
|
|
|
|
| |||||||||||
| Accumulated Other Comprehensive Income | Stock Acquisition Rights | Non- Controlling Interests | Total Net Assets | |||||||||||||||||||||||||||||||||
| Net Unrealized Gains (Losses) on Other Securities | Deferred Gains or Losses on Hedges | Revaluation Reserve for Land | Foreign Currency Translation Adjustments | Remeasurements of Defined Benefit Plans | Total Accumulated Other Comprehensive Income | |||||||||||||||||||||||||||||||
Balance as of the beginning of the period | 823,085 | 72,081 | 136,655 | (133,178 | ) | 94,317 | 992,960 | 213 | 109,662 | 8,663,847 | ||||||||||||||||||||||||||
Cumulative Effects of Changes in Accounting Policies | — | (32,639 | ) | |||||||||||||||||||||||||||||||||
Balance as of the beginning of the period reflecting Changes in Accounting Policies | 823,085 | 72,081 | 136,655 | (133,178 | ) | 94,317 | 992,960 | 213 | 109,662 | 8,631,208 | ||||||||||||||||||||||||||
Changes during the period | ||||||||||||||||||||||||||||||||||||
Cash Dividends | (95,208 | ) | ||||||||||||||||||||||||||||||||||
Profit Attributable to Owners of Parent | 215,523 | |||||||||||||||||||||||||||||||||||
Repurchase of Treasury Stock | (1,995 | ) | ||||||||||||||||||||||||||||||||||
Disposition of Treasury Stock | 1,305 | |||||||||||||||||||||||||||||||||||
Transfer from Revaluation Reserve for Land | (1,178 | ) | ||||||||||||||||||||||||||||||||||
Change in Treasury Shares of Parent Arising from Transactions with Non-controlling Shareholders | (519 | ) | ||||||||||||||||||||||||||||||||||
Transfer from Retained Earnings to Capital Surplus | — | |||||||||||||||||||||||||||||||||||
Net Changes in Items other than Shareholders’ Equity | 215,696 | (5,819 | ) | 1,178 | (37,594 | ) | (9,842 | ) | 163,619 | (79 | ) | (7,469 | ) | 156,070 | ||||||||||||||||||||||
|
|
|
|
|
|
|
|
|
|
|
|
|
|
|
|
|
| |||||||||||||||||||
Total Changes during the period | 215,696 | (5,819 | ) | 1,178 | (37,594 | ) | (9,842 | ) | 163,619 | (79 | ) | (7,469 | ) | 273,997 | ||||||||||||||||||||||
|
|
|
|
|
|
|
|
|
|
|
|
|
|
|
|
|
| |||||||||||||||||||
Balance as of the end of the period | 1,038,781 | 66,262 | 137,834 | (170,773 | ) | 84,475 | 1,156,580 | 134 | 102,192 | 8,905,205 | ||||||||||||||||||||||||||
|
|
|
|
|
|
|
|
|
|
|
|
|
|
|
|
|
| |||||||||||||||||||
1-7
Mizuho Financial Group, Inc.
For the six months ended September 30, 2021
| Millions of yen | ||||||||||||||||||||
| Shareholders’ Equity | ||||||||||||||||||||
| Common Stock | Capital Surplus | Retained Earnings | Treasury Stock | Total Shareholders’ Equity | ||||||||||||||||
Balance as of the beginning of the period | 2,256,767 | 1,135,940 | 4,421,655 | (7,124 | ) | 7,807,239 | ||||||||||||||
Cumulative Effects of Changes in Accounting Policies | (724 | ) | (724 | ) | ||||||||||||||||
Balance as of the beginning of the period reflecting Changes in Accounting Policies | 2,256,767 | 1,135,940 | 4,420,931 | (7,124 | ) | 7,806,515 | ||||||||||||||
Changes during the period | ||||||||||||||||||||
Cash Dividends | (95,201 | ) | (95,201 | ) | ||||||||||||||||
Profit Attributable to Owners of Parent | 385,657 | 385,657 | ||||||||||||||||||
Repurchase of Treasury Stock | (2,646 | ) | (2,646 | ) | ||||||||||||||||
Disposition of Treasury Stock | (51 | ) | 1,606 | 1,554 | ||||||||||||||||
Transfer from Revaluation Reserve for Land | 1,086 | 1,086 | ||||||||||||||||||
Change in Treasury Shares of Parent Arising from Transactions with Non-controlling Shareholders | (10,616 | ) | (10,616 | ) | ||||||||||||||||
Transfer from Retained Earnings to Capital Surplus | 51 | (51 | ) | — | ||||||||||||||||
Net Changes in Items other than Shareholders’ Equity | ||||||||||||||||||||
|
|
|
|
|
|
|
|
|
| |||||||||||
Total Changes during the period | — | (10,616 | ) | 291,490 | (1,040 | ) | 279,833 | |||||||||||||
|
|
|
|
|
|
|
|
|
| |||||||||||
Balance as of the end of the period | 2,256,767 | 1,125,324 | 4,712,422 | (8,164 | ) | 8,086,349 | ||||||||||||||
|
|
|
|
|
|
|
|
|
| |||||||||||
| Accumulated Other Comprehensive Income | Stock Acquisition Rights | Non- Controlling Interests | Total Net Assets | |||||||||||||||||||||||||||||||||
| Net Unrealized Gains (Losses) on Other Securities | Deferred Gains or Losses on Hedges | Revaluation Reserve for Land | Foreign Currency Translation Adjustments | Remeasurements of Defined Benefit Plans | Total Accumulated Other Comprehensive Income | |||||||||||||||||||||||||||||||
Balance as of the beginning of the period | 1,132,460 | 31,618 | 136,384 | (139,514 | ) | 288,088 | 1,449,035 | 134 | 105,797 | 9,362,207 | ||||||||||||||||||||||||||
Cumulative Effects of Changes in Accounting Policies | — | (724 | ) | |||||||||||||||||||||||||||||||||
Balance as of the beginning of the period reflecting Changes in Accounting Policies | 1,132,460 | 31,618 | 136,384 | (139,514 | ) | 288,088 | 1,449,035 | 134 | 105,797 | 9,361,483 | ||||||||||||||||||||||||||
Changes during the period | ||||||||||||||||||||||||||||||||||||
Cash Dividends | (95,201 | ) | ||||||||||||||||||||||||||||||||||
Profit Attributable to Owners of Parent | 385,657 | |||||||||||||||||||||||||||||||||||
Repurchase of Treasury Stock | (2,646 | ) | ||||||||||||||||||||||||||||||||||
Disposition of Treasury Stock | 1,554 | |||||||||||||||||||||||||||||||||||
Transfer from Revaluation Reserve for Land | 1,086 | |||||||||||||||||||||||||||||||||||
Change in Treasury Shares of Parent Arising from Transactions with Non-controlling Shareholders | (10,616 | ) | ||||||||||||||||||||||||||||||||||
Transfer from Retained Earnings to Capital Surplus | — | |||||||||||||||||||||||||||||||||||
Net Changes in Items other than Shareholders’ Equity | 22,295 | (32,361 | ) | (1,086 | ) | 58,546 | (58,950 | ) | (11,555 | ) | (39 | ) | 11,161 | (433 | ) | |||||||||||||||||||||
|
|
|
|
|
|
|
|
|
|
|
|
|
|
|
|
|
| |||||||||||||||||||
Total Changes during the period | 22,295 | (32,361 | ) | (1,086 | ) | 58,546 | (58,950 | ) | (11,555 | ) | (39 | ) | 11,161 | 279,400 | ||||||||||||||||||||||
|
|
|
|
|
|
|
|
|
|
|
|
|
|
|
|
|
| |||||||||||||||||||
Balance as of the end of the period | 1,154,756 | (743 | ) | 135,297 | (80,968 | ) | 229,137 | 1,437,480 | 95 | 116,959 | 9,640,884 | |||||||||||||||||||||||||
|
|
|
|
|
|
|
|
|
|
|
|
|
|
|
|
|
| |||||||||||||||||||
(4) Note for Assumption of Going Concern
There is no applicable information.
1-8
SELECTED FINANCIAL INFORMATION
For the Second Quarter (First Half) of Fiscal 2021
(Six months ended September 30, 2021)
(Under Japanese GAAP)

Mizuho Financial Group, Inc.
C O N T E N T S
Notes:
“CON”: Consolidated figures for Mizuho Financial Group, Inc. (“MHFG”)
“NON”: Non-consolidated figures for Mizuho Financial Group, Inc., Mizuho Bank, Ltd. (“MHBK”) and Mizuho Trust & Banking Co., Ltd. (“MHTB”)
I. FINANCIAL DATA FOR THE FIRST HALF OF FISCAL 2021 | See above Notes | Page | ||||||||||
1. Income Analysis | CON | NON | 2-1 | |||||||||
2. Interest Margins (Domestic Operations) | NON | 2-5 | ||||||||||
3. Use and Source of Funds | NON | 2-6 | ||||||||||
4. Net Gains/Losses on Securities | CON | NON | 2-8 | |||||||||
5. Unrealized Gains/Losses on Securities | CON | NON | 2-10 | |||||||||
6. Projected Redemption Amounts for Securities | NON | 2-12 | ||||||||||
7. Overview of Derivative Transactions Qualifying for Hedge Accounting | NON | 2-13 | ||||||||||
8. Employee Retirement Benefits | NON | CON | 2-14 | |||||||||
9. Capital Ratio | CON | NON | 2-17 | |||||||||
II. REVIEW OF CREDITS | See above Notes | Page | ||||||||||
1. Status of Non-Accrual, Past Due & Restructured Loans | CON | NON | 2-18 | |||||||||
2. Status of Reserves for Possible Losses on Loans | CON | NON | 2-20 | |||||||||
3. Reserve Ratios for Non-Accrual, Past Due & Restructured Loans | CON | NON | 2-21 | |||||||||
4. Status of Non Performing Loans based on the Financial Reconstruction Act(“FRA”) | CON | NON | 2-22 | |||||||||
5. Coverage on Non Performing Loans based on the FRA | NON | 2-24 | ||||||||||
6. Overview of Non-Performing Loans(“NPLs”) | NON | 2-27 | ||||||||||
7. Results of Removal of NPLs from the Balance Sheet | NON | 2-28 | ||||||||||
8. Status of Loans by Industry | ||||||||||||
(1) Outstanding Balances and Non-Accrual, Past Due & Restructured Loans by Industry | NON | 2-29 | ||||||||||
(2) Non Performing Loans basaed on the FRA and Coverage Ratio by Industry | NON | 2-31 | ||||||||||
9. Housing and Consumer Loans & Loans to Small and Medium-Sized Enterprises | ||||||||||||
(“SMEs”) and Individual Customers | ||||||||||||
(1) Balance of Housing and Consumer Loans | NON | 2-32 | ||||||||||
(2) Loans to SMEs and Individual Customers | NON | 2-32 | ||||||||||
10. Status of Loans by Region | NON | 2-33 | ||||||||||
III. DEFERRED TAXES | See above Notes | Page | ||||||||||
1. Estimation for Calculating Deferred Tax Assets | NON | 2-34 | ||||||||||
IV. OTHERS | See above Notes | Page | ||||||||||
1. Breakdown of Deposits (Domestic Offices) | NON | 2-36 | ||||||||||
2. Number of Directors and Employees | 2-37 | |||||||||||
3. Number of Offices | 2-37 | |||||||||||
4. Earnings Plan for Fiscal 2021 | CON | NON | 2-38 | |||||||||
Attachments | Page | |||||||
Mizuho Bank, Ltd. | ||||||||
Comparison of Non-Consolidated Balance Sheets (selected items) | 2-39 | |||||||
Comparison of Non-Consolidated Statements of Income (selected items) | 2-40 | |||||||
Mizuho Trust & Banking Co., Ltd. | ||||||||
Comparison of Non-Consolidated Balance Sheets (selected items) | 2-41 | |||||||
Comparison of Non-Consolidated Statements of Income (selected items) | 2-42 | |||||||
Statement of Trust Assets and Liabilities | 2-43 | |||||||
Comparison of Balances of Principal Items | 2-44 | |||||||
Mizuho Securities Co., Ltd. | ||||||||
Comparison of Non-Consolidated Balance Sheets (selected items) | 2-45 | |||||||
Comparison of Non-Consolidated Statements of Income (selected items) | 2-46 | |||||||
This immediate release contains statements that constitute forward-looking statements within the meaning of the United States Private Securities Litigation Reform Act of 1995, including estimates, forecasts, targets and plans. Such forward-looking statements do not represent any guarantee by management of future performance.
In many cases, but not all, we use such words as “aim,” “anticipate,” “believe,” “endeavor,” “estimate,” “expect,” “intend,” “may,” “plan,” “probability,” “project,” “risk,” “seek,” “should,” “strive,” “target” and similar expressions in relation to us or our management to identify forward-looking statements. You can also identify forward-looking statements by discussions of strategy, plans or intentions. These statements reflect our current views with respect to future events and are subject to risks, uncertainties and assumptions.
We may not be successful in implementing our business strategies, and management may fail to achieve its targets, for a wide range of possible reasons, including, without limitation: impact of the corona virus pandemic; incurrence of significant credit-related costs; declines in the value of our securities portfolio; changes in interest rates; foreign currency fluctuations; decrease in the market liquidity of our assets; revised assumptions or other changes related to our pension plans; a decline in our deferred tax assets; impairment of the carrying value of our long-lived assets; problems related to our information technology systems, including as a result of cyber attacks; the effect of financial transactions entered into for hedging and other similar purposes; failure to maintain required capital adequacy ratio levels and meet other financial regulatory requirements; downgrades in our credit ratings; our ability to avoid reputational harm; our ability to implement our 5-Year Business Plan and implement other strategic initiatives and measures effectively; the effectiveness of our operational, legal and other risk management policies; the effect of changes in general economic conditions in Japan and elsewhere; and changes to applicable laws and regulations.
Further information regarding factors that could affect our financial condition and results of operations is included in “Item 3.D. Key Information-Risk Factors” and “Item 5. Operating and Financial Review and Prospects” in our most recent Form 20-F filed with the U.S. Securities and Exchange Commission (“SEC”), which is available in the Financial Information section of our web page at www.mizuho-fg.com/index.html and also at the SEC’s web site at www.sec.gov.
We do not intend to update our forward-looking statements. We are under no obligation, and disclaim any obligation, to update or alter our forward-looking statements, whether as a result of new information, future events or otherwise, except as may be required by the rules of the Tokyo Stock Exchange.
MHFG is a specified business company under “Cabinet Office Ordinance on Disclosure of Corporate Information, etc.” Article 17-15 clause 2 and prepares the interim consolidated financial statements in the second quarter.
Mizuho Financial Group, Inc.
I. FINANCIAL DATA FOR THE FIRST HALF OF FISCAL 2021
1. Income Analysis
Consolidated
| (Millions of yen) | ||||||||||||||||
| First Half of Fiscal 2021 | First Half of Fiscal 2020 | |||||||||||||||
| Change | ||||||||||||||||
Consolidated Gross Profits | 1 | 1,108,822 | (3,500 | ) | 1,112,323 | |||||||||||
Net Interest Income | 2 | 474,160 | 34,031 | 440,129 | ||||||||||||
Fiduciary Income | 3 | 29,728 | 2,584 | 27,143 | ||||||||||||
Credit Costs for Trust Accounts | 4 | — | — | — | ||||||||||||
Net Fee and Commission Income | 5 | 330,443 | 10,831 | 319,611 | ||||||||||||
Net Trading Income | 6 | 191,312 | (45,451 | ) | 236,764 | |||||||||||
Net Other Operating Income | 7 | 83,177 | (5,496 | ) | 88,673 | |||||||||||
General and Administrative Expenses | 8 | (667,594 | ) | 13,693 | (681,287 | ) | ||||||||||
Expenses related to Portfolio Problems (including Reversal of (Provision for) General Reserve for Losses on Loans) | 9 | (59,856 | ) | 24,921 | (84,777 | ) | ||||||||||
Losses on Write-offs of Loans | 10 | (7,023 | ) | 420 | (7,444 | ) | ||||||||||
Gains on Reversal of Reserves for Possible Losses on Loans, and others | 11 | 10,225 | 6,669 | 3,555 | ||||||||||||
Net Gains (Losses) related to Stocks | 12 | 14,931 | 84,422 | (69,490 | ) | |||||||||||
Equity in Income from Investments in Affiliates | 13 | 16,519 | 4,959 | 11,559 | ||||||||||||
Other | 14 | (23,707 | ) | 564 | (24,271 | ) | ||||||||||
|
|
|
|
|
| |||||||||||
Ordinary Profits | 15 | 399,340 | 131,729 | 267,610 | ||||||||||||
|
|
|
|
|
| |||||||||||
Net Extraordinary Gains (Losses) | 16 | 47,281 | (18,498 | ) | 65,780 | |||||||||||
Income before Income Taxes | 17 | 446,622 | 113,231 | 333,391 | ||||||||||||
Income Taxes - Current | 18 | (65,604 | ) | 8,581 | (74,186 | ) | ||||||||||
- Deferred | 19 | 10,941 | 52,755 | (41,813 | ) | |||||||||||
Profit | 20 | 391,958 | 174,568 | 217,390 | ||||||||||||
Profit Attributable to Non-controlling Interests | 21 | (6,301 | ) | (4,434 | ) | (1,867 | ) | |||||||||
|
|
|
|
|
| |||||||||||
Profit Attributable to Owners of Parent | 22 | 385,657 | 170,133 | 215,523 | ||||||||||||
|
|
|
|
|
| |||||||||||
Credit-related Costs (including Credit Costs for Trust Accounts) | 23 | (49,631 | ) | 31,590 | (81,222 | ) | ||||||||||
Credit-related Costs [23] = Expenses related to Portfolio Problems (including Reversal of (Provision for) General Reserve for Losses on Loans) [9] + Gains on Reversal of Reserves for Possible Losses on Loans, and others [11] + Credit Costs for Trust Accounts [4] |
| |||||||||||||||
Reference: | ||||||||||||||||
Consolidated Net Business Profits | 24 | 438,574 | 126 | 438,448 | ||||||||||||
Consolidated Net Business Profits [24] = Consolidated Gross Profits [1] - General and Administrative Expenses (excluding Non-Recurring Losses) + Equity in Income from Investments in Affiliates and certain other consolidation adjustments |
| |||||||||||||||
Number of consolidated subsidiaries | 25 | 160 | 7 | 153 | ||||||||||||
Number of affiliates under the equity method | 26 | 29 | 3 | 26 | ||||||||||||
2-1
Mizuho Financial Group, Inc.
Aggregate Figures for the 2 Banks
Non-Consolidated
| (Millions of yen) | ||||||||||||||||||||||||
| First Half of Fiscal 2021 | First Half of Fiscal 2020 | |||||||||||||||||||||||
| MHBK | MHTB | Aggregate Figures | Change | |||||||||||||||||||||
Gross Profits | 1 | 666,600 | 57,772 | 724,373 | (30,547 | ) | 754,920 | |||||||||||||||||
Domestic Gross Profits | 2 | 337,771 | 57,677 | 395,449 | 9,459 | 385,989 | ||||||||||||||||||
Net Interest Income | 3 | 225,666 | 9,105 | 234,772 | 26,305 | 208,466 | ||||||||||||||||||
Fiduciary Income | 4 | 30,058 | 30,058 | 2,781 | 27,277 | |||||||||||||||||||
Trust Fees for Jointly Operated Designated Money Trust | 5 | 1,975 | 1,975 | (48 | ) | 2,024 | ||||||||||||||||||
Credit Costs for Trust Accounts (1) | 6 | — | — | — | — | |||||||||||||||||||
Net Fee and Commission Income | 7 | 112,122 | 18,954 | 131,076 | (11,647 | ) | 142,724 | |||||||||||||||||
Net Trading Income | 8 | (7,790 | ) | (629 | ) | (8,419 | ) | (19,559 | ) | 11,139 | ||||||||||||||
Net Other Operating Income | 9 | 7,773 | 188 | 7,961 | 11,579 | (3,618 | ) | |||||||||||||||||
International Gross Profits | 10 | 328,829 | 94 | 328,924 | (40,006 | ) | 368,930 | |||||||||||||||||
Net Interest Income | 11 | 190,025 | 274 | 190,299 | 7,513 | 182,785 | ||||||||||||||||||
Net Fee and Commission Income | 12 | 63,630 | (172 | ) | 63,457 | (8,020 | ) | 71,477 | ||||||||||||||||
Net Trading Income | 13 | 47,785 | (11 | ) | 47,774 | (14,841 | ) | 62,615 | ||||||||||||||||
Net Other Operating Income | 14 | 27,388 | 4 | 27,392 | (24,659 | ) | 52,051 | |||||||||||||||||
General and Administrative Expenses (excluding Non-Recurring Losses) | 15 | (382,729 | ) | (40,130 | ) | (422,859 | ) | 17,401 | (440,260 | ) | ||||||||||||||
Expense Ratio | 16 | 57.4 | % | 69.4 | % | 58.3 | % | 0.0 | % | 58.3 | % | |||||||||||||
Personnel Expenses | 17 | (149,030 | ) | (18,813 | ) | (167,844 | ) | 5,926 | (173,771 | ) | ||||||||||||||
Non-Personnel Expenses | 18 | (211,158 | ) | (19,447 | ) | (230,605 | ) | 10,220 | (240,825 | ) | ||||||||||||||
Premium for Deposit Insurance | 19 | (16,227 | ) | (559 | ) | (16,787 | ) | (67 | ) | (16,720 | ) | |||||||||||||
Miscellaneous Taxes | 20 | (22,540 | ) | (1,869 | ) | (24,409 | ) | 1,254 | (25,664 | ) | ||||||||||||||
|
|
|
|
|
|
|
|
|
| |||||||||||||||
Net Business Profits (before Reversal of (Provision for) General Reserve for Losses on Loans) | 21 | 283,871 | 17,642 | 301,513 | (13,145 | ) | 314,659 | |||||||||||||||||
Net Business Profits (before Reversal of (Provision for) General Reserve for Losses on Loans) from core business areas (2) | 22 | 260,591 | 17,631 | 278,223 | 8,047 | 270,176 | ||||||||||||||||||
Excluding Net Gains (Losses) from redemption of Investment Trusts | 23 | 253,835 | 17,631 | 271,467 | 3,479 | 267,988 | ||||||||||||||||||
|
|
|
|
|
|
|
|
|
| |||||||||||||||
Reversal of (Provision for) General Reserve for Losses on Loans | 24 | (68,140 | ) | (809 | ) | (68,950 | ) | (8,083 | ) | (60,866 | ) | |||||||||||||
|
|
|
|
|
|
|
|
|
| |||||||||||||||
Net Business Profits | 25 | 215,731 | 16,832 | 232,563 | (21,228 | ) | 253,792 | |||||||||||||||||
Net Gains (Losses) related to Bonds | 26 | 23,279 | 10 | 23,290 | (21,193 | ) | 44,483 | |||||||||||||||||
|
|
|
|
|
|
|
|
|
| |||||||||||||||
Net Non-Recurring Gains (Losses) | 27 | 29,129 | 2,116 | 31,246 | 136,692 | (105,446 | ) | |||||||||||||||||
Net Gains (Losses) related to Stocks | 28 | 10,360 | 400 | 10,761 | 86,078 | (75,317 | ) | |||||||||||||||||
Expenses related to Portfolio Problems | 29 | 10,517 | (88 | ) | 10,429 | 32,411 | (21,981 | ) | ||||||||||||||||
Gains on Reversal of Reserves for Possible Losses on Loans, and others | 30 | 9,202 | 0 | 9,202 | 5,833 | 3,368 | ||||||||||||||||||
Other | 31 | (951 | ) | 1,804 | 853 | 12,368 | (11,515 | ) | ||||||||||||||||
|
|
|
|
|
|
|
|
|
| |||||||||||||||
Ordinary Profits | 32 | 244,860 | 18,949 | 263,810 | 115,463 | 148,346 | ||||||||||||||||||
|
|
|
|
|
|
|
|
|
| |||||||||||||||
Net Extraordinary Gains (Losses) | 33 | 40,249 | 7,331 | 47,581 | (10,279 | ) | 57,860 | |||||||||||||||||
Net Gains (Losses) on Disposition of Fixed Assets | 34 | (821 | ) | (113 | ) | (934 | ) | (1,788 | ) | 853 | ||||||||||||||
Losses on Impairment of Fixed Assets | 35 | (2,539 | ) | (38 | ) | (2,577 | ) | (1,816 | ) | (761 | ) | |||||||||||||
Gains on Cancellation of Employee Retirement Benefit Trust | 36 | 43,610 | 7,483 | 51,093 | 43,198 | 7,895 | ||||||||||||||||||
Accumulation (Amortization) of Unrecognized Prior Service Cost | 37 | — | — | — | (52,391 | ) | 52,391 | |||||||||||||||||
Losses on Transfer to Defined Contribution Pension Plan | 38 | — | — | — | 2,519 | (2,519 | ) | |||||||||||||||||
Income before Income Taxes | 39 | 285,110 | 26,281 | 311,391 | 105,184 | 206,206 | ||||||||||||||||||
Income Taxes - Current | 40 | (90,355 | ) | (4,559 | ) | (94,914 | ) | (46,228 | ) | (48,685 | ) | |||||||||||||
- Deferred | 41 | (25,332 | ) | (3,255 | ) | (28,587 | ) | 3,506 | (32,094 | ) | ||||||||||||||
|
|
|
|
|
|
|
|
|
| |||||||||||||||
Net Income | 42 | 169,422 | 18,466 | 187,888 | 62,462 | 125,426 | ||||||||||||||||||
|
|
|
|
|
|
|
|
|
| |||||||||||||||
(1) Net Business Profits (before Reversal of (Provision for) General Reserve for Losses on Loans) for MHTB excludes the amounts of “Credit Costs for Trust Accounts” [6]. |
| |||||||||||||||||||||||
(2) Net Business Profits (before Reversal of (Provision for) General Reserve for Losses on Loans) from core business areas[22] |
| |||||||||||||||||||||||
=Net Business Profits(before Reversal of (Provision for) General Reserve for Losses on Loans)[21]-Net Gains (Losses) related to Bonds[26] |
| |||||||||||||||||||||||
Credit-related Costs | 43 | (48,420 | ) | (897 | ) | (49,317 | ) | 30,161 | (79,479 | ) | ||||||||||||||
Credit-related Costs [43] = Expenses related to Portfolio Problems [29] + Reversal of (Provision for) General Reserve for Losses on Loans [24] + Gains on Reversal of Reserves for Possible Losses on Loans, and others [30] + Credit Costs for Trust Accounts [6] |
| |||||||||||||||||||||||
Reference: Breakdown of Credit-related Costs | ||||||||||||||||||||||||
Credit Costs for Trust Accounts | 44 | — | — | — | — | |||||||||||||||||||
Reversal of (Provision for) General Reserve for Losses on Loans | 45 | (68,140 | ) | (809 | ) | (68,950 | ) | (8,302 | ) | (60,647 | ) | |||||||||||||
Losses on Write-offs of Loans | 46 | 2,990 | (73 | ) | 2,916 | 6,874 | (3,958 | ) | ||||||||||||||||
Reversal of (Provision for) Specific Reserve for Possible Losses on Loans | 47 | 16,549 | (14 | ) | 16,534 | 31,946 | (15,411 | ) | ||||||||||||||||
Reversal of (Provision for) Reserve for Possible Losses on Loans to Restructuring Countries | 48 | 106 | — | 106 | 106 | — | ||||||||||||||||||
Reversal of (Provision for) Reserve for Contingencies | 49 | 306 | — | 306 | (814 | ) | 1,120 | |||||||||||||||||
Other (including Losses on Sales of Loans) | 50 | (232 | ) | — | (232 | ) | 350 | (583 | ) | |||||||||||||||
Total | 51 | (48,420 | ) | (897 | ) | (49,317 | ) | 30,161 | (79,479 | ) | ||||||||||||||
2-2
Mizuho Financial Group, Inc.
Mizuho Bank
Non-Consolidated
| (Millions of yen) | ||||||||||||||||
| First Half of Fiscal 2021 | First Half of Fiscal 2020 | |||||||||||||||
| Change | ||||||||||||||||
Gross Profits | 1 | 666,600 | (28,393 | ) | 694,993 | |||||||||||
Domestic Gross Profits | 2 | 337,771 | 3,760 | 334,010 | ||||||||||||
Net Interest Income | 3 | 225,666 | 27,353 | 198,312 | ||||||||||||
Net Fee and Commission Income | 4 | 112,122 | (17,978 | ) | 130,100 | |||||||||||
Net Trading Income | 5 | (7,790 | ) | (17,757 | ) | 9,966 | ||||||||||
Net Other Operating Income | 6 | 7,773 | 12,142 | (4,369 | ) | |||||||||||
International Gross Profits | 7 | 328,829 | (32,153 | ) | 360,983 | |||||||||||
Net Interest Income | 8 | 190,025 | 10,553 | 179,471 | ||||||||||||
Net Fee and Commission Income | 9 | 63,630 | (8,199 | ) | 71,830 | |||||||||||
Net Trading Income | 10 | 47,785 | (15,514 | ) | 63,299 | |||||||||||
Net Other Operating Income | 11 | 27,388 | (18,993 | ) | 46,381 | |||||||||||
General and Administrative Expenses (excluding Non-Recurring Losses) | 12 | (382,729 | ) | 16,433 | (399,162 | ) | ||||||||||
Expense Ratio | 13 | 57.4 | % | (0.0 | %) | 57.4 | % | |||||||||
Personnel Expenses | 14 | (149,030 | ) | 5,150 | (154,180 | ) | ||||||||||
Non-Personnel Expenses | 15 | (211,158 | ) | 9,818 | (220,976 | ) | ||||||||||
Premium for Deposit Insurance | 16 | (16,227 | ) | (144 | ) | (16,083 | ) | |||||||||
Miscellaneous Taxes | 17 | (22,540 | ) | 1,465 | (24,005 | ) | ||||||||||
|
|
|
|
|
| |||||||||||
Net Business Profits (before Reversal of (Provision for) General Reserve for Losses on Loans) | 18 | 283,871 | (11,959 | ) | 295,831 | |||||||||||
Net Business Profits (before Reversal of (Provision for) General Reserve for Losses on Loans) from core business areas * | 19 | 260,591 | 2,841 | 257,750 | ||||||||||||
Excluding Net Gains (Losses) from redemption of Investment Trusts | 20 | 253,835 | (2,229 | ) | 256,064 | |||||||||||
|
|
|
|
|
| |||||||||||
Reversal of (Provision for) General Reserve for Losses on Loans | 21 | (68,140 | ) | (7,273 | ) | (60,866 | ) | |||||||||
|
|
|
|
|
| |||||||||||
Net Business Profits | 22 | 215,731 | (19,233 | ) | 234,964 | |||||||||||
Net Gains (Losses) related to Bonds | 23 | 23,279 | (14,800 | ) | 38,080 | |||||||||||
|
|
|
|
|
| |||||||||||
Net Non-Recurring Gains (Losses) | 24 | 29,129 | 131,567 | (102,437 | ) | |||||||||||
Net Gains (Losses) related to Stocks | 25 | 10,360 | 82,745 | (72,385 | ) | |||||||||||
Expenses related to Portfolio Problems | 26 | 10,517 | 32,499 | (21,981 | ) | |||||||||||
Gains on Reversal of Reserves for Possible Losses on Loans, and others | 27 | 9,202 | 6,081 | 3,121 | ||||||||||||
Other | 28 | (951 | ) | 10,240 | (11,191 | ) | ||||||||||
|
|
|
|
|
| |||||||||||
Ordinary Profits | 29 | 244,860 | 112,333 | 132,527 | ||||||||||||
|
|
|
|
|
| |||||||||||
Net Extraordinary Gains (Losses) | 30 | 40,249 | (11,749 | ) | 51,998 | |||||||||||
Net Gains (Losses) on Disposition of Fixed Assets | 31 | (821 | ) | (2,050 | ) | 1,229 | ||||||||||
Losses on Impairment of Fixed Assets | 32 | (2,539 | ) | (1,778 | ) | (761 | ) | |||||||||
Gains on Cancellation of Employee Retirement Benefit Trust | 33 | 43,610 | 35,715 | 7,895 | ||||||||||||
Accumulation (Amortization) of Unrecognized Prior Service Cost | 34 | — | (45,822 | ) | 45,822 | |||||||||||
Losses on Transfer to Defined Contribution Pension Plan | 35 | — | 2,187 | (2,187 | ) | |||||||||||
Income before Income Taxes | 36 | 285,110 | 100,584 | 184,525 | ||||||||||||
Income Taxes - Current | 37 | (90,355 | ) | (43,850 | ) | (46,504 | ) | |||||||||
- Deferred | 38 | (25,332 | ) | 2,965 | (28,298 | ) | ||||||||||
|
|
|
|
|
| |||||||||||
Net Income | 39 | 169,422 | 59,699 | 109,722 | ||||||||||||
|
|
|
|
|
| |||||||||||
* Net Business Profits (before Reversal of (Provision for) General Reserve for Losses on Loans) from core business areas[19] =Net Business Profits(before Reversal of (Provision for) General Reserve for Losses on Loans)[18]-Net Gains (Losses) related to Bonds[23] |
| |||||||||||||||
Credit-related Costs | 40 | (48,420 | ) | 31,306 | (79,726 | ) | ||||||||||
Credit-related Costs [40] = Expenses related to Portfolio Problems [26] + Reversal of (Provision for) General Reserve for Losses on Loans [21] + Gains on Reversal of Reserves for Possible Losses on Loans, and others [27] |
| |||||||||||||||
Reference: Breakdown of Credit-related Costs | ||||||||||||||||
Reversal of (Provision for) General Reserve for Losses on Loans | 41 | (68,140 | ) | (7,273 | ) | (60,866 | ) | |||||||||
Losses on Write-offs of Loans | 42 | 2,990 | 6,948 | (3,958 | ) | |||||||||||
Reversal of (Provision for) Specific Reserve for Possible Losses on Loans | 43 | 16,549 | 31,988 | (15,438 | ) | |||||||||||
Reversal of (Provision for) Reserve for Possible Losses on Loans to Restructuring Countries | 44 | 106 | 106 | — | ||||||||||||
Reversal of (Provision for) Reserve for Contingencies | 45 | 306 | (814 | ) | 1,120 | |||||||||||
Other (including Losses on Sales of Loans) | 46 | (232 | ) | 350 | (583 | ) | ||||||||||
Total | 47 | (48,420 | ) | 31,306 | (79,726 | ) | ||||||||||
2-3
Mizuho Financial Group, Inc.
Mizuho Trust & Banking
Non-Consolidated
| (Millions of yen) | ||||||||||||||||
| First Half of Fiscal 2021 | First Half of Fiscal 2020 | |||||||||||||||
| Change | ||||||||||||||||
Gross Profits | 1 | 57,772 | (2,154 | ) | 59,926 | |||||||||||
Domestic Gross Profits | 2 | 57,677 | 5,699 | 51,978 | ||||||||||||
Net Interest Income | 3 | 9,105 | (1,048 | ) | 10,153 | |||||||||||
Fiduciary Income | 4 | 30,058 | 2,781 | 27,277 | ||||||||||||
Trust Fees for Jointly Operated Designated Money Trust | 5 | 1,975 | (48 | ) | 2,024 | |||||||||||
Credit Costs for Trust Accounts (1) | 6 | — | — | — | ||||||||||||
Net Fee and Commission Income | 7 | 18,954 | 6,330 | 12,623 | ||||||||||||
Net Trading Income | 8 | (629 | ) | (1,801 | ) | 1,172 | ||||||||||
Net Other Operating Income | 9 | 188 | (563 | ) | 751 | |||||||||||
International Gross Profits | 10 | 94 | (7,853 | ) | 7,947 | |||||||||||
Net Interest Income | 11 | 274 | (3,039 | ) | 3,313 | |||||||||||
Net Fee and Commission Income | 12 | (172 | ) | 179 | (352 | ) | ||||||||||
Net Trading Income | 13 | (11 | ) | 672 | (683 | ) | ||||||||||
Net Other Operating Income | 14 | 4 | (5,665 | ) | 5,670 | |||||||||||
General and Administrative Expenses (excluding Non-Recurring Losses) | 15 | (40,130 | ) | 967 | (41,098 | ) | ||||||||||
Expense Ratio | 16 | 69.4 | % | 0.8 | % | 68.5 | % | |||||||||
Personnel Expenses | 17 | (18,813 | ) | 776 | (19,590 | ) | ||||||||||
Non-Personnel Expenses | 18 | (19,447 | ) | 401 | (19,848 | ) | ||||||||||
Premium for Deposit Insurance | 19 | (559 | ) | 76 | (636 | ) | ||||||||||
Miscellaneous Taxes | 20 | (1,869 | ) | (210 | ) | (1,659 | ) | |||||||||
|
|
|
|
|
| |||||||||||
Net Business Profits (before Reversal of (Provision for) General Reserve for Losses on Loans) | 21 | 17,642 | (1,186 | ) | 18,828 | |||||||||||
Net Business Profits (before Reversal of (Provision for) General Reserve for Losses on Loans) from core business areas (2) | 22 | 17,631 | 5,206 | 12,425 | ||||||||||||
Excluding Net Gains (Losses) from redemption of Investment Trusts | 23 | 17,631 | 5,708 | 11,923 | ||||||||||||
|
|
|
|
|
| |||||||||||
Reversal of (Provision for) General Reserve for Losses on Loans | 24 | (809 | ) | (809 | ) | — | ||||||||||
|
|
|
|
|
| |||||||||||
Net Business Profits | 25 | 16,832 | (1,995 | ) | 18,828 | |||||||||||
Net Gains (Losses) related to Bonds | 26 | 10 | (6,392 | ) | 6,402 | |||||||||||
|
|
|
|
|
| |||||||||||
Net Non-Recurring Gains (Losses) | 27 | 2,116 | 5,125 | (3,009 | ) | |||||||||||
Net Gains (Losses) related to Stocks | 28 | 400 | 3,332 | (2,932 | ) | |||||||||||
Expenses related to Portfolio Problems | 29 | (88 | ) | (88 | ) | (0 | ) | |||||||||
Gains on Reversal of Reserves for Possible Losses on Loans, and others | 30 | 0 | (247 | ) | 247 | |||||||||||
Other | 31 | 1,804 | 2,128 | (323 | ) | |||||||||||
|
|
|
|
|
| |||||||||||
Ordinary Profits | 32 | 18,949 | 3,129 | 15,819 | ||||||||||||
|
|
|
|
|
| |||||||||||
Net Extraordinary Gains (Losses) | 33 | 7,331 | 1,469 | 5,862 | ||||||||||||
Net Gains (Losses) on Disposition of Fixed Assets | 34 | (113 | ) | 262 | (375 | ) | ||||||||||
Losses on Impairment of Fixed Assets | 35 | (38 | ) | (38 | ) | — | ||||||||||
Gains on Cancellation of Employee Retirement Benefit Trust | 36 | 7,483 | 7,483 | — | ||||||||||||
Accumulation (Amortization) of Unrecognized Prior Service Cost | 37 | — | (6,569 | ) | 6,569 | |||||||||||
Losses on Transfer to Defined Contribution Pension Plan | 38 | — | 331 | (331 | ) | |||||||||||
Income before Income Taxes | 39 | 26,281 | 4,599 | 21,681 | ||||||||||||
Income Taxes - Current | 40 | (4,559 | ) | (2,378 | ) | (2,181 | ) | |||||||||
- Deferred | 41 | (3,255 | ) | 540 | (3,796 | ) | ||||||||||
|
|
|
|
|
| |||||||||||
Net Income | 42 | 18,466 | 2,762 | 15,704 | ||||||||||||
|
|
|
|
|
| |||||||||||
(1) Net Business Profits (before Reversal of (Provision for) General Reserve for Losses on Loans) excludes the amounts of “Credit Costs for Trust Accounts” [6]. |
| |||||||||||||||
(2) Net Business Profits (before Reversal of (Provision for) General Reserve for Losses on Loans) from core business areas[22] |
| |||||||||||||||
=Net Business Profits(before Reversal of (Provision for) General Reserve for Losses on Loans)[21]-Net Gains (Losses) related to Bonds[26] |
| |||||||||||||||
Credit-related Costs | 43 | (897 | ) | (1,144 | ) | 247 | ||||||||||
Credit-related Costs [43] = Expenses related to Portfolio Problems [29] + Reversal of (Provision for) General Reserve for Losses on Loans [24] + Gains on Reversal of Reserves for Possible Losses on Loans, and others [30] + Credit Costs for Trust Accounts [6] |
| |||||||||||||||
Reference: Breakdown of Credit-related Costs | ||||||||||||||||
Credit Costs for Trust Accounts | 44 | — | — | — | ||||||||||||
Reversal of (Provision for) General Reserve for Losses on Loans | 45 | (809 | ) | (1,028 | ) | 219 | ||||||||||
Losses on Write-offs of Loans | 46 | (73 | ) | (73 | ) | 0 | ||||||||||
Reversal of (Provision for) Specific Reserve for Possible Losses on Loans | 47 | (14 | ) | (42 | ) | 27 | ||||||||||
Reversal of (Provision for) Reserve for Possible Losses on Loans to Restructuring Countries | 48 | — | — | — | ||||||||||||
Reversal of (Provision for) Reserve for Contingencies | 49 | — | — | — | ||||||||||||
Other (including Losses on Sales of Loans) | 50 | — | — | — | ||||||||||||
Total | 51 | (897 | ) | (1,144 | ) | 247 | ||||||||||
2-4
Mizuho Financial Group, Inc.
2. Interest Margins (Domestic Operations)
Non-Consolidated
| (%) | ||||||||||||||||
| First Half of Fiscal 2021 | First Half of Fiscal 2020 | |||||||||||||||
| Mizuho Bank | Change | |||||||||||||||
Return on Interest-Earning Assets | 1 | 0.39 | 0.01 | 0.37 | ||||||||||||
Return on Loans and Bills Discounted (1) | 2 | 0.74 | 0.03 | 0.71 | ||||||||||||
Return on Securities | 3 | 0.30 | 0.08 | 0.21 | ||||||||||||
Cost of Funding (including Expenses) | 4 | 0.51 | (0.05 | ) | 0.56 | |||||||||||
Cost of Deposits (including Expenses) | 5 | 0.52 | (0.03 | ) | 0.56 | |||||||||||
Cost of Deposits (2) | 6 | 0.00 | (0.00 | ) | 0.00 | |||||||||||
Cost of Other External Liabilities | 7 | 0.30 | (0.22 | ) | 0.52 | |||||||||||
|
|
|
|
|
| |||||||||||
Net Interest Margin | (1)-(4) | 8 | (0.12 | ) | 0.06 | (0.18 | ) | |||||||||
Loan and Deposit Rate Margin (including Expenses) | (2)-(5) | 9 | 0.22 | 0.07 | 0.15 | |||||||||||
Loan and Deposit Rate Margin | (2)-(6) | 10 | 0.74 | 0.03 | 0.71 | |||||||||||
|
|
|
|
|
| |||||||||||
(1) Return on Loans and Bills Discounted excludes loans to financial institutions (including MHFG). |
| |||||||||||||||
(2) Deposits include Negotiable Certificates of Deposit (“NCDs”). |
| |||||||||||||||
| Reference: After excluding loans to the Japanese government and others |
| |||||||||||||||
Return on Loans and Bills Discounted | 11 | 0.76 | 0.02 | 0.73 | ||||||||||||
Loan and Deposit Rate Margin (including Expenses) | (11)-(5) | 12 | 0.23 | 0.06 | 0.17 | |||||||||||
Loan and Deposit Rate Margin | (11)-(6) | 13 | 0.76 | 0.02 | 0.73 | |||||||||||
| (%) | ||||||||||||||||
| First Half of Fiscal 2021 | First Half of Fiscal 2020 | |||||||||||||||
| Mizuho Trust & Banking | Change | |||||||||||||||
Return on Interest-Earning Assets | 14 | 0.47 | 0.01 | 0.45 | ||||||||||||
Return on Loans and Bills Discounted (1) | 15 | 0.59 | 0.01 | 0.57 | ||||||||||||
Return on Securities | 16 | 1.74 | 0.62 | 1.12 | ||||||||||||
Cost of Funding | 17 | 0.13 | 0.02 | 0.10 | ||||||||||||
Cost of Deposits (2) | 18 | 0.01 | (0.00 | ) | 0.01 | |||||||||||
|
|
|
|
|
| |||||||||||
Net Interest Margin | (14)-(17) | 19 | 0.34 | (0.00 | ) | 0.35 | ||||||||||
Loan and Deposit Rate Margin | (15)-(18) | 20 | 0.58 | 0.01 | 0.56 | |||||||||||
|
|
|
|
|
| |||||||||||
(1) Return on Loans and Bills Discounted excludes loans to financial institutions (including MHFG). |
| |||||||||||||||
(2) Deposits include NCDs. |
| |||||||||||||||
Reference: After excluding loans to the Japanese government and others |
| |||||||||||||||
Return on Loans and Bills Discounted | 21 | 0.60 | (0.00 | ) | 0.60 | |||||||||||
Loan and Deposit Rate Margin | (21)-(18) | 22 | 0.59 | (0.00 | ) | 0.59 | ||||||||||
| Reference | (%) | |||||||||||||||
| First Half of Fiscal 2021 | First Half of Fiscal 2020 | |||||||||||||||
| Aggregate Figures for the 2 Banks | Change | |||||||||||||||
Return on Loans and Bills Discounted (1) | 23 | 0.73 | 0.03 | 0.70 | ||||||||||||
Cost of Deposits (2) | 24 | 0.00 | (0.00 | ) | 0.00 | |||||||||||
|
|
|
|
|
| |||||||||||
Loan and Deposit Rate Margin | (23)-(24) | 25 | 0.73 | 0.03 | 0.70 | |||||||||||
|
|
|
|
|
| |||||||||||
(1) Return on Loans and Bills Discounted excludes loans to financial institutions (including MHFG). |
| |||||||||||||||
(2) Deposits include NCDs. |
| |||||||||||||||
Reference: After excluding loans to the Japanese government and others |
| |||||||||||||||
Return on Loans and Bills Discounted | 26 | 0.75 | 0.02 | 0.73 | ||||||||||||
Loan and Deposit Rate Margin | (26)-(24) | 27 | 0.75 | 0.02 | 0.72 | |||||||||||
2-5
Mizuho Financial Group, Inc.
3. Use and Source of Funds
Non-Consolidated
Mizuho Bank
| (Millions of yen, %) | ||||||||||||||||||||||||
| First Half of Fiscal 2021 | First Half of Fiscal 2020 | |||||||||||||||||||||||
| Change | ||||||||||||||||||||||||
| Average Balance | Rate | Average Balance | Rate | Average Balance | Rate | |||||||||||||||||||
Total | ||||||||||||||||||||||||
Use of Funds | 184,666,842 | 0.57 | 7,415,632 | (0.09 | ) | 177,251,209 | 0.66 | |||||||||||||||||
Loans and Bills Discounted | 80,865,008 | 0.91 | (3,891,405 | ) | (0.09 | ) | 84,756,413 | 1.01 | ||||||||||||||||
Securities | 45,009,933 | 0.49 | 8,018,814 | (0.11 | ) | 36,991,118 | 0.60 | |||||||||||||||||
|
|
|
|
|
|
|
|
|
|
|
| |||||||||||||
Source of Funds | 183,824,544 | 0.12 | 7,941,608 | (0.12 | ) | 175,882,935 | 0.24 | |||||||||||||||||
Deposits | 128,046,394 | 0.02 | (3,738,599 | ) | (0.09 | ) | 131,784,993 | 0.11 | ||||||||||||||||
NCDs | 19,877,406 | 0.05 | 6,329,745 | (0.19 | ) | 13,547,661 | 0.24 | |||||||||||||||||
| Domestic Operations | ||||||||||||||||||||||||
Use of Funds | 127,843,280 | 0.39 | 9,541,078 | 0.01 | 118,302,201 | 0.37 | ||||||||||||||||||
Loans and Bills Discounted | 52,802,381 | 0.73 | (1,003,909 | ) | 0.03 | 53,806,290 | 0.70 | |||||||||||||||||
Securities | 29,583,431 | 0.30 | 7,368,742 | 0.08 | 22,214,688 | 0.21 | ||||||||||||||||||
|
|
|
|
|
|
|
|
|
|
|
| |||||||||||||
Source of Funds | 126,395,809 | 0.03 | 9,308,343 | (0.00 | ) | 117,087,466 | 0.04 | |||||||||||||||||
Deposits | 100,679,698 | 0.00 | (751,478 | ) | (0.00 | ) | 101,431,176 | 0.00 | ||||||||||||||||
NCDs | 13,728,174 | 0.00 | 5,827,518 | (0.00 | ) | 7,900,656 | 0.00 | |||||||||||||||||
| International Operations | ||||||||||||||||||||||||
Use of Funds | 59,514,244 | 0.94 | (615,573 | ) | (0.28 | ) | 60,129,817 | 1.23 | ||||||||||||||||
Loans and Bills Discounted | 28,062,627 | 1.26 | (2,887,495 | ) | (0.29 | ) | 30,950,123 | 1.55 | ||||||||||||||||
Securities | 15,426,502 | 0.86 | 650,072 | (0.32 | ) | 14,776,429 | 1.18 | |||||||||||||||||
|
|
|
|
|
|
|
|
|
|
|
| |||||||||||||
Source of Funds | 60,119,416 | 0.30 | 143,137 | (0.33 | ) | 59,976,279 | 0.63 | |||||||||||||||||
Deposits | 27,366,695 | 0.10 | (2,987,121 | ) | (0.40 | ) | 30,353,817 | 0.50 | ||||||||||||||||
NCDs | 6,149,232 | 0.15 | 502,226 | (0.43 | ) | 5,647,005 | 0.59 | |||||||||||||||||
2-6
Mizuho Financial Group, Inc.
Mizuho Trust & Banking (Banking Account)
| (Millions of yen, %) | ||||||||||||||||||||||||
| First Half of Fiscal 2021 | First Half of Fiscal 2020 | |||||||||||||||||||||||
| Change | ||||||||||||||||||||||||
| Average Balance | Rate | Average Balance | Rate | Average Balance | Rate | |||||||||||||||||||
Total | ||||||||||||||||||||||||
Use of Funds | 5,304,757 | 0.48 | (994,057 | ) | (0.09 | ) | 6,298,815 | 0.57 | ||||||||||||||||
Loans and Bills Discounted | 3,268,511 | 0.60 | (235,864 | ) | (0.02 | ) | 3,504,375 | 0.62 | ||||||||||||||||
Securities | 253,726 | 1.69 | (622,218 | ) | 0.29 | 875,944 | 1.40 | |||||||||||||||||
|
|
|
|
|
|
|
|
|
|
|
| |||||||||||||
Source of Funds | 5,377,237 | 0.13 | (1,016,785 | ) | (0.01 | ) | 6,394,023 | 0.14 | ||||||||||||||||
Deposits | 2,880,365 | 0.01 | (235,353 | ) | (0.00 | ) | 3,115,718 | 0.01 | ||||||||||||||||
NCDs | 645,954 | 0.00 | 82,902 | (0.00 | ) | 563,051 | 0.00 | |||||||||||||||||
| Domestic Operations | ||||||||||||||||||||||||
Use of Funds | 5,264,259 | 0.47 | (470,432 | ) | 0.01 | 5,734,692 | 0.45 | |||||||||||||||||
Loans and Bills Discounted | 3,223,676 | 0.59 | (140,696 | ) | 0.01 | 3,364,372 | 0.57 | |||||||||||||||||
Securities | 245,476 | 1.74 | (185,911 | ) | 0.62 | 431,388 | 1.12 | |||||||||||||||||
|
|
|
|
|
|
|
|
|
|
|
| |||||||||||||
Source of Funds | 5,336,361 | 0.13 | (460,549 | ) | 0.02 | 5,796,911 | 0.10 | |||||||||||||||||
Deposits | 2,876,384 | 0.01 | (235,724 | ) | (0.00 | ) | 3,112,108 | 0.01 | ||||||||||||||||
NCDs | 645,954 | 0.00 | 82,902 | (0.00 | ) | 563,051 | 0.00 | |||||||||||||||||
| International Operations | ||||||||||||||||||||||||
Use of Funds | 67,984 | 1.02 | (543,088 | ) | (0.62 | ) | 611,073 | 1.65 | ||||||||||||||||
Loans and Bills Discounted | 44,835 | 1.47 | (95,167 | ) | (0.41 | ) | 140,003 | 1.88 | ||||||||||||||||
Securities | 8,249 | 0.29 | (436,306 | ) | (1.37 | ) | 444,556 | 1.67 | ||||||||||||||||
|
|
|
|
|
|
|
|
|
|
|
| |||||||||||||
Source of Funds | 68,362 | 0.21 | (575,699 | ) | (0.32 | ) | 644,062 | 0.54 | ||||||||||||||||
Deposits | 3,981 | 0.01 | 371 | (0.11 | ) | 3,609 | 0.13 | |||||||||||||||||
NCDs | — | — | — | — | — | — | ||||||||||||||||||
2-7
Mizuho Financial Group, Inc.
4. Net Gains/Losses on Securities
Consolidated
| (Millions of yen) | ||||||||||||
| First Half of Fiscal 2021 | First Half of Fiscal 2020 | |||||||||||
| Change | ||||||||||||
Net Gains (Losses) related to Bonds | 21,178 | (24,100 | ) | 45,279 | ||||||||
Gains on Sales and Others | 49,923 | (27,378 | ) | 77,301 | ||||||||
Losses on Sales and Others | (27,219 | ) | 2,692 | (29,912 | ) | |||||||
Impairment (Devaluation) | (1,296 | ) | 1,751 | (3,048 | ) | |||||||
Reversal of (Provision for) Reserve for Possible Losses on Investments | (0 | ) | (0 | ) | (0 | ) | ||||||
Gains (Losses) on Derivatives other than for Trading | (228 | ) | (1,166 | ) | 938 | |||||||
| First Half of Fiscal 2021 | First Half of Fiscal 2020 | |||||||||||
| Change | ||||||||||||
Net Gains (Losses) related to Stocks | 14,931 | 84,422 | (69,490 | ) | ||||||||
Gains on Sales | 116,459 | 72,330 | 44,129 | |||||||||
Losses on Sales | (80,931 | ) | (56,923 | ) | (24,008 | ) | ||||||
Impairment (Devaluation) | (1,906 | ) | 60,776 | (62,682 | ) | |||||||
Reversal of (Provision for) Reserve for Possible Losses on Investments | — | — | — | |||||||||
Gains (Losses) on Derivatives other than for Trading | (18,690 | ) | 8,238 | (26,929 | ) | |||||||
Non-Consolidated
Aggregate Figures for the 2 Banks |
| |||||||||||
| (Millions of yen) | ||||||||||||
| First Half of Fiscal 2021 | First Half of Fiscal 2020 | |||||||||||
| Change | ||||||||||||
Net Gains (Losses) related to Bonds | 23,290 | (21,193 | ) | 44,483 | ||||||||
Gains on Sales and Others | 52,146 | (25,137 | ) | 77,284 | ||||||||
Losses on Sales and Others | (27,332 | ) | 3,399 | (30,731 | ) | |||||||
Impairment (Devaluation) | (1,296 | ) | 1,721 | (3,017 | ) | |||||||
Reversal of (Provision for) Reserve for Possible Losses on Investments | — | — | — | |||||||||
Gains (Losses) on Derivatives other than for Trading | (228 | ) | (1,176 | ) | 947 | |||||||
| First Half of Fiscal 2021 | First Half of Fiscal 2020 | |||||||||||
| Change | ||||||||||||
Net Gains (Losses) related to Stocks | 10,761 | 86,078 | (75,317 | ) | ||||||||
Gains on Sales | 109,122 | 70,788 | 38,333 | |||||||||
Losses on Sales | (78,276 | ) | (57,462 | ) | (20,814 | ) | ||||||
Impairment (Devaluation) | (1,394 | ) | 64,424 | (65,818 | ) | |||||||
Reversal of (Provision for) Reserve for Possible Losses on Investments | — | 89 | (89 | ) | ||||||||
Gains (Losses) on Derivatives other than for Trading | (18,690 | ) | 8,238 | (26,929 | ) | |||||||
2-8
Mizuho Financial Group, Inc.
| Mizuho Bank |
| |||||||||||
| (Millions of yen) | ||||||||||||
| First Half of Fiscal 2021 | First Half of Fiscal 2020 | |||||||||||
| Change | ||||||||||||
Net Gains (Losses) related to Bonds | 23,279 | (14,800 | ) | 38,080 | ||||||||
Gains on Sales and Others | 52,135 | (17,530 | ) | 69,665 | ||||||||
Losses on Sales and Others | (27,330 | ) | 2,358 | (29,689 | ) | |||||||
Impairment (Devaluation) | (1,296 | ) | 1,720 | (3,017 | ) | |||||||
Reversal of (Provision for) Reserve for Possible Losses on Investments | — | — | — | |||||||||
Gains (Losses) on Derivatives other than for Trading | (228 | ) | (1,349 | ) | 1,121 | |||||||
| First Half of Fiscal 2021 | First Half of Fiscal 2020 | |||||||||||
| Change | ||||||||||||
Net Gains (Losses) related to Stocks | 10,360 | 82,745 | (72,385 | ) | ||||||||
Gains on Sales | 108,640 | 76,278 | 32,361 | |||||||||
Losses on Sales | (78,233 | ) | (59,951 | ) | (18,281 | ) | ||||||
Impairment (Devaluation) | (1,356 | ) | 62,529 | (63,885 | ) | |||||||
Reversal of (Provision for) Reserve for Possible Losses on Investments | — | 89 | (89 | ) | ||||||||
Gains (Losses) on Derivatives other than for Trading | (18,690 | ) | 3,800 | (22,490 | ) | |||||||
| Mizuho Trust & Banking |
| |||||||||||
| (Millions of yen) | ||||||||||||
| First Half of Fiscal 2021 | First Half of Fiscal 2020 | |||||||||||
| Change | ||||||||||||
Net Gains (Losses) related to Bonds | 10 | (6,392 | ) | 6,402 | ||||||||
Gains on Sales and Others | 11 | (7,606 | ) | 7,618 | ||||||||
Losses on Sales and Others | (1 | ) | 1,040 | (1,041 | ) | |||||||
Impairment (Devaluation) | — | 0 | (0 | ) | ||||||||
Reversal of (Provision for) Reserve for Possible Losses on Investments | — | — | — | |||||||||
Gains (Losses) on Derivatives other than for Trading | — | 173 | (173 | ) | ||||||||
| First Half of Fiscal 2021 | First Half of Fiscal 2020 | |||||||||||
| Change | ||||||||||||
Net Gains (Losses) related to Stocks | 400 | 3,332 | (2,932 | ) | ||||||||
Gains on Sales | 482 | (5,490 | ) | 5,972 | ||||||||
Losses on Sales | (43 | ) | 2,489 | (2,532 | ) | |||||||
Impairment (Devaluation) | (38 | ) | 1,895 | (1,933 | ) | |||||||
Reversal of (Provision for) Reserve for Possible Losses on Investments | — | — | — | |||||||||
Gains (Losses) on Derivatives other than for Trading | — | 4,438 | (4,438 | ) | ||||||||
2-9
Mizuho Financial Group, Inc.
5. Unrealized Gains/Losses on Securities
| • | Stocks and others without a quoted market price and Investments in Partnerships are excluded. |
Consolidated
(1) Other Securities
| (Millions of yen) | ||||||||||||||||||||||||||||||||
| As of September 30, 2021 | As of March 31, 2021 | |||||||||||||||||||||||||||||||
| Book Value | Unrealized Gains/Losses | Book Value | Unrealized Gains/Losses | |||||||||||||||||||||||||||||
| (= Fair Value) | Gains | Losses | (= Fair Value) | Gains | Losses | |||||||||||||||||||||||||||
Other Securities | 41,930,391 | 1,627,137 | 1,986,505 | 359,367 | 42,534,848 | 1,603,253 | 1,989,800 | 386,547 | ||||||||||||||||||||||||
Japanese Stocks | 2,933,126 | 1,734,527 | 1,780,968 | 46,441 | 2,865,985 | 1,698,265 | 1,744,614 | 46,348 | ||||||||||||||||||||||||
Japanese Bonds | 22,433,956 | (35,116 | ) | 22,009 | 57,125 | 24,145,048 | (44,978 | ) | 24,765 | 69,743 | ||||||||||||||||||||||
Japanese Government Bonds | 19,003,042 | (24,301 | ) | 1,113 | 25,415 | 20,920,582 | (31,717 | ) | 3,583 | 35,301 | ||||||||||||||||||||||
Other | 16,563,307 | (72,273 | ) | 183,526 | 255,800 | 15,523,814 | (50,033 | ) | 220,421 | 270,454 | ||||||||||||||||||||||
Foreign Bonds | 13,489,382 | (47,725 | ) | 58,129 | 105,855 | 12,433,912 | (33,009 | ) | 66,678 | 99,687 | ||||||||||||||||||||||
| ||||||||||||||||||||||||||||||||
* In addition to “Securities” on the consolidated balance sheets, NCDs in “Cash and Due from Banks,” certain items in “Other Debt Purchased” and certain items in “Other Assets” are also included. * The book values of Other Securities which have readily determinable fair value are stated at fair value, so Unrealized Gains/Losses indicate the difference between book values on the consolidated balance sheets and the acquisition costs. * Unrealized Gains/Losses include ¥38,068 million and ¥32,481 million, which were recognized in the statement of income for September 30, 2021 and March 31, 2021, respectively, by applying the fair-value hedge method. As a result, the base amounts to be recorded directly to Net Assets after necessary consolidation adjustments as of September 30, 2021 and March 31, 2021 are ¥1,589,069 million and ¥1,570,772 million, respectively. * Unrealized Gains (Losses) on Other Securities, net of Taxes (recorded directly to Net Assets after tax and consolidation adjustments, excluding the amount recognized in the statement of income by applying the fair-value hedge method, including translation differences and others regarding stocks and others without a quoted market price and Investments in Partnerships) as of September 30, 2021 and March 31, 2021 are ¥1,154,756 million and ¥1,132,460 million, respectively.
(2) Bonds Held to Maturity
|
| |||||||||||||||||||||||||||||||
| (Millions of yen) | ||||||||||||||||||||||||||||||||
| As of September 30, 2021 | As of March 31, 2021 | |||||||||||||||||||||||||||||||
| Book Value | Unrealized Gains/Losses | Book Value | Unrealized Gains/Losses | |||||||||||||||||||||||||||||
| Gains | Losses | Gains | Losses | |||||||||||||||||||||||||||||
Bonds Held to Maturity | 1,394,142 | 9,439 | 15,871 | 6,431 | 885,529 | 18,069 | 21,225 | 3,155 | ||||||||||||||||||||||||
Non-Consolidated
(1) Other Securities
Aggregate Figures for the 2 Banks
| (Millions of yen) | ||||||||||||||||||||||||||||||||
| As of September 30, 2021 | As of March 31, 2021 | |||||||||||||||||||||||||||||||
| Book Value | Unrealized Gains/Losses | Book Value | Unrealized Gains/Losses | |||||||||||||||||||||||||||||
| (= Fair Value) | Gains | Losses | (= Fair Value) | Gains | Losses | |||||||||||||||||||||||||||
Other Securities | 40,729,325 | 1,547,414 | 1,908,231 | 360,816 | 41,388,529 | 1,527,548 | 1,915,021 | 387,472 | ||||||||||||||||||||||||
Japanese Stocks | 2,842,612 | 1,656,686 | 1,705,296 | 48,610 | 2,779,891 | 1,624,579 | 1,673,165 | 48,585 | ||||||||||||||||||||||||
Japanese Bonds | 22,413,879 | (35,121 | ) | 22,004 | 57,125 | 24,125,549 | (44,985 | ) | 24,758 | 69,743 | ||||||||||||||||||||||
Japanese Government Bonds | 18,991,867 | (24,304 | ) | 1,110 | 25,415 | 20,909,339 | (31,722 | ) | 3,578 | 35,301 | ||||||||||||||||||||||
Other | 15,472,833 | (74,150 | ) | 180,930 | 255,080 | 14,483,088 | (52,045 | ) | 217,097 | 269,142 | ||||||||||||||||||||||
Foreign Bonds | 13,019,159 | (47,982 | ) | 57,157 | 105,140 | 12,031,174 | (32,575 | ) | 65,800 | 98,375 | ||||||||||||||||||||||
Mizuho Bank | ||||||||||||||||||||||||||||||||
Other Securities | 40,438,630 | 1,457,776 | 1,815,072 | 357,295 | 41,113,338 | 1,441,229 | 1,826,408 | 385,178 | ||||||||||||||||||||||||
Japanese Stocks | 2,673,371 | 1,568,326 | 1,613,450 | 45,123 | 2,625,643 | 1,539,526 | 1,585,832 | 46,306 | ||||||||||||||||||||||||
Japanese Bonds | 22,298,234 | (36,009 | ) | 21,081 | 57,091 | 24,010,684 | (45,887 | ) | 23,842 | 69,729 | ||||||||||||||||||||||
Japanese Government Bonds | 18,961,865 | (24,302 | ) | 1,110 | 25,413 | 20,879,330 | (31,720 | ) | 3,578 | 35,299 | ||||||||||||||||||||||
Other | 15,467,024 | (74,539 | ) | 180,540 | 255,080 | 14,477,009 | (52,409 | ) | 216,733 | 269,142 | ||||||||||||||||||||||
Foreign Bonds | 13,019,159 | (47,982 | ) | 57,157 | 105,140 | 12,031,174 | (32,575 | ) | 65,800 | 98,375 | ||||||||||||||||||||||
Mizuho Trust & Banking | ||||||||||||||||||||||||||||||||
Other Securities | 290,695 | 89,637 | 93,158 | 3,520 | 275,190 | 86,318 | 88,612 | 2,293 | ||||||||||||||||||||||||
Japanese Stocks | 169,240 | 88,360 | 91,846 | 3,486 | 154,247 | 85,052 | 87,332 | 2,279 | ||||||||||||||||||||||||
Japanese Bonds | 115,645 | 888 | 922 | 34 | 114,865 | 901 | 915 | 13 | ||||||||||||||||||||||||
Japanese Government Bonds | 30,002 | (1 | ) | — | 1 | 30,009 | (1 | ) | — | 1 | ||||||||||||||||||||||
Other | 5,809 | 389 | 389 | 0 | 6,078 | 364 | 364 | 0 | ||||||||||||||||||||||||
Foreign Bonds | — | — | — | — | — | — | — | — | ||||||||||||||||||||||||
| * | In addition to “Securities” on the balance sheets, NCDs in “Cash and Due from Banks” and certain items in “Other Debt Purchased” are also included. |
| * | The book values of Other Securities which have readily determinable fair value are stated at fair value, so Unrealized Gains/Losses indicate the difference between book values on the balance sheets and the acquisition costs. |
| * | Unrealized Gains/Losses include ¥38,068 million and ¥32,481 million, which were recognized in the statement of income (aggregate figures for the 2 banks) for September 30, 2021 and March 31, 2021, respectively, by applying the fair-value hedge method. As a result, the base amounts to be recorded directly to Net Assets after necessary adjustments (aggregate figures for the 2 banks) as of September 30, 2021 and March 31, 2021 are ¥1,509,346 million and ¥1,495,067 million, respectively. |
| * | Unrealized Gains (Losses) on Other Securities, net of Taxes (recorded directly to Net Assets after tax adjustment, excluding the amount recognized in the statement of income by applying the fair-value hedge method including translation differences and others regarding stocks and others without a quoted market price and Investments in Partnerships) as of September 30, 2021 and March 31, 2021 are as follows: |
| (Millions of yen) | ||||||||
| As of September 30, 2021 | As of March 31, 2021 | |||||||
Aggregate Figures | 1,082,874 | 1,076,333 | ||||||
Mizuho Bank | 1,012,693 | 1,009,001 | ||||||
Mizuho Trust & Banking | 70,180 | 67,331 | ||||||
2-10
Mizuho Financial Group, Inc.
(2) Bonds Held to Maturity
Aggregate Figures for the 2 Banks
| (Millions of yen) | ||||||||||||||||||||||||||||||||
| As of September 30, 2021 | As of March 31, 2021 | |||||||||||||||||||||||||||||||
| Unrealized Gains/Losses | Unrealized Gains/Losses | |||||||||||||||||||||||||||||||
| Book Value | Gains | Losses | Book Value | Gains | Losses | |||||||||||||||||||||||||||
Aggregate Figures | 1,394,142 | 9,439 | 15,871 | 6,431 | 885,529 | 18,069 | 21,225 | 3,155 | ||||||||||||||||||||||||
Mizuho Bank | 1,394,142 | 9,439 | 15,871 | 6,431 | 885,529 | 18,069 | 21,225 | 3,155 | ||||||||||||||||||||||||
Mizuho Trust & Banking | — | — | — | — | — | — | — | — | ||||||||||||||||||||||||
(3) Investment in Subsidiaries and Affiliates
Aggregate Figures for the 2 Banks |
| |||||||||||||||||||||||||||||||
| (Millions of yen) | ||||||||||||||||||||||||||||||||
| As of September 30, 2021 | As of March 31, 2021 | |||||||||||||||||||||||||||||||
| Unrealized Gains/Losses | Unrealized Gains/Losses | |||||||||||||||||||||||||||||||
| Book Value | Gains | Losses | Book Value | Gains | Losses | |||||||||||||||||||||||||||
Aggregate Figures | 135,771 | 311,808 | 311,980 | 172 | 135,771 | 286,554 | 286,573 | 19 | ||||||||||||||||||||||||
Mizuho Bank | 135,771 | 311,808 | 311,980 | 172 | 135,771 | 286,554 | 286,573 | 19 | ||||||||||||||||||||||||
Mizuho Trust & Banking | — | — | — | — | — | — | — | — | ||||||||||||||||||||||||
Reference
Unrealized Gains/Losses on Other Securities
(the base amount to be recorded directly to Net Assets after necessary adjustments)
For certain Other Securities, Unrealized Gains/Losses were recognized in the statement of income by applying the fair-value hedge method.Unrealized Gains/Losses on Other Securities after excluding such Income/Loss (the “base amount”) are recorded directly to Net Assets after necessary adjustments. The base amounts are as follows:
Consolidated
| (Millions of yen) | ||||||||||||
| As of September 30, 2021 | As of March 31, 2021 | |||||||||||
| Unrealized Gains/Losses | Unrealized Gains/Losses | |||||||||||
| Change | ||||||||||||
Other Securities | 1,589,069 | 18,297 | 1,570,772 | |||||||||
Japanese Stocks | 1,696,459 | 30,674 | 1,665,784 | |||||||||
Japanese Bonds | (35,116 | ) | 9,862 | (44,978 | ) | |||||||
Japanese Government Bonds | (24,301 | ) | 7,416 | (31,717 | ) | |||||||
Other | (72,273 | ) | (22,240 | ) | (50,033 | ) | ||||||
Foreign Bonds | (47,725 | ) | (14,716 | ) | (33,009 | ) | ||||||
Non-Consolidated
Aggregate Figures for the 2 Banks
| (Millions of yen) | ||||||||||||
| As of September 30, 2021 | As of March 31, 2021 | |||||||||||
| Unrealized Gains/Losses | Unrealized Gains/Losses | |||||||||||
| Change | ||||||||||||
Other Securities | 1,509,346 | 14,278 | 1,495,067 | |||||||||
Japanese Stocks | 1,618,618 | 26,520 | 1,592,098 | |||||||||
Japanese Bonds | (35,121 | ) | 9,863 | (44,985 | ) | |||||||
Japanese Government Bonds | (24,304 | ) | 7,417 | (31,722 | ) | |||||||
Other | (74,150 | ) | (22,105 | ) | (52,045 | ) | ||||||
Foreign Bonds | (47,982 | ) | (15,407 | ) | (32,575 | ) | ||||||
2-11
Mizuho Financial Group, Inc.
6. Projected Redemption Amounts for Securities
| • | The redemption schedule by term for Bonds Held to Maturity and Other Securities with maturities is as follows: |
Non-Consolidated
Aggregate Figures for the 2 Banks
| (Billions of yen) | ||||||||||||||||||||||||||||||||||||||||||||||||
| Maturity as of September 30, 2021 | Change | Maturity as of March 31, 2021 | ||||||||||||||||||||||||||||||||||||||||||||||
| Within 1 year | 1 - 5 years | 5 - 10 years | Over 10 years | Within 1 year | 1 - 5 years | 5 - 10 years | Over 10 years | Within 1 year | 1 - 5 years | 5 - 10 years | Over 10 years | |||||||||||||||||||||||||||||||||||||
Japanese Bonds | 11,547.1 | 8,630.5 | 1,741.6 | 938.3 | (4,314.3 | ) | 2,222.4 | 102.5 | 272.4 | 15,861.4 | 6,408.1 | 1,639.1 | 665.9 | |||||||||||||||||||||||||||||||||||
Japanese Government Bonds | 11,096.7 | 6,918.6 | 1,152.7 | 265.1 | (4,350.6 | ) | 2,074.7 | 147.7 | 210.1 | 15,447.4 | 4,843.9 | 1,005.0 | 55.0 | |||||||||||||||||||||||||||||||||||
Japanese Local Government Bonds | 40.9 | 241.5 | 204.6 | 7.4 | (13.9 | ) | 22.7 | 33.3 | (11.1 | ) | 54.9 | 218.7 | 171.3 | 18.5 | ||||||||||||||||||||||||||||||||||
Japanese Corporate Bonds | 409.3 | 1,470.3 | 384.3 | 665.8 | 50.2 | 124.9 | (78.4 | ) | 73.4 | 359.1 | 1,345.4 | 462.8 | 592.4 | |||||||||||||||||||||||||||||||||||
Other | 2,503.6 | 3,371.8 | 2,786.0 | 5,676.2 | (127.8 | ) | 555.0 | 744.0 | 99.8 | 2,631.5 | 2,816.7 | 2,041.9 | 5,576.4 | |||||||||||||||||||||||||||||||||||
| Mizuho Bank | ||||||||||||||||||||||||||||||||||||||||||||||||
Japanese Bonds | 11,513.9 | 8,560.5 | 1,730.0 | 938.3 | (4,314.3 | ) | 2,213.0 | 111.1 | 272.4 | 15,828.3 | 6,347.4 | 1,618.9 | 665.9 | |||||||||||||||||||||||||||||||||||
Japanese Government Bonds | 11,066.7 | 6,918.6 | 1,152.7 | 265.1 | (4,350.6 | ) | 2,074.7 | 147.7 | 210.1 | 15,417.4 | 4,843.9 | 1,005.0 | 55.0 | |||||||||||||||||||||||||||||||||||
Japanese Local Government Bonds | 40.9 | 241.5 | 204.6 | 7.4 | (13.9 | ) | 22.7 | 33.3 | (11.1 | ) | 54.9 | 218.7 | 171.3 | �� | 18.5 | |||||||||||||||||||||||||||||||||
Japanese Corporate Bonds | 406.2 | 1,400.4 | 372.6 | 665.8 | 50.2 | 115.5 | (69.9 | ) | 73.4 | 355.9 | 1,284.8 | 442.6 | 592.4 | |||||||||||||||||||||||||||||||||||
Other | 2,503.2 | 3,367.1 | 2,783.9 | 5,676.2 | (127.7 | ) | 554.6 | 743.8 | 99.8 | 2,630.9 | 2,812.5 | 2,040.0 | 5,576.4 | |||||||||||||||||||||||||||||||||||
| Mizuho Trust & Banking | ||||||||||||||||||||||||||||||||||||||||||||||||
Japanese Bonds | 33.1 | 69.9 | 11.6 | — | 0.0 | 9.3 | (8.5 | ) | — | 33.1 | 60.6 | 20.2 | — | |||||||||||||||||||||||||||||||||||
Japanese Government Bonds | 30.0 | — | — | — | — | — | — | — | 30.0 | — | — | — | ||||||||||||||||||||||||||||||||||||
Japanese Local Government Bonds | — | — | — | — | — | — | — | — | — | — | — | — | ||||||||||||||||||||||||||||||||||||
Japanese Corporate Bonds | 3.1 | 69.9 | 11.6 | — | 0.0 | 9.3 | (8.5 | ) | — | 3.1 | 60.6 | 20.2 | — | |||||||||||||||||||||||||||||||||||
Other | 0.4 | 4.6 | 2.1 | 0.0 | (0.0 | ) | 0.3 | 0.1 | 0.0 | 0.5 | 4.2 | 1.9 | — | |||||||||||||||||||||||||||||||||||
2-12
Mizuho Financial Group, Inc.
7. Overview of Derivative Transactions Qualifying for Hedge Accounting
Non-Consolidated
| • | Notional Amounts of Interest Rate Swaps (qualifying for hedge accounting (deferred method)) by Remaining Contractual Term |
Aggregate Figures for the 2 Banks
| (Billions of yen) | ||||||||||||||||||||||||||||||||||||||||||||||||
| As of September 30, 2021 | Change | As of March 31, 2021 | ||||||||||||||||||||||||||||||||||||||||||||||
| Within 1 year | 1 - 5 years | Over 5 years | Total | Within 1 year | 1 - 5 years | Over 5 years | Total | Within 1 year | 1 - 5 years | Over 5 years | Total | |||||||||||||||||||||||||||||||||||||
Receive Fixed / Pay Float | 3,024.5 | 9,118.0 | 4,941.9 | 17,084.5 | 78.7 | 42.5 | (637.1 | ) | (515.7 | ) | 2,945.7 | 9,075.4 | 5,579.0 | 17,600.3 | ||||||||||||||||||||||||||||||||||
Receive Float / Pay Fixed | 701.8 | 1,535.9 | 4,323.9 | 6,561.8 | 93.5 | (371.8 | ) | 1,056.0 | 777.8 | 608.2 | 1,907.8 | 3,267.8 | 5,784.0 | |||||||||||||||||||||||||||||||||||
Receive Float / Pay Float | — | — | — | — | — | — | — | — | — | — | — | — | ||||||||||||||||||||||||||||||||||||
Receive Fixed / Pay Fixed | — | — | — | — | — | — | — | — | — | — | — | — | ||||||||||||||||||||||||||||||||||||
Total | 3,726.3 | 10,654.0 | 9,265.9 | 23,646.3 | 172.3 | (329.3 | ) | 418.9 | 262.0 | 3,553.9 | 10,983.3 | 8,846.9 | 23,384.3 | |||||||||||||||||||||||||||||||||||
| Mizuho Bank | ||||||||||||||||||||||||||||||||||||||||||||||||
Receive Fixed / Pay Float | 3,024.5 | 9,118.0 | 4,926.9 | 17,069.5 | 78.7 | 42.5 | (642.1 | ) | (520.7 | ) | 2,945.7 | 9,075.4 | 5,569.0 | 17,590.3 | ||||||||||||||||||||||||||||||||||
Receive Float / Pay Fixed | 701.8 | 1,465.9 | 3,958.9 | 6,126.8 | 93.5 | (371.8 | ) | 1,056.0 | 777.8 | 608.2 | 1,837.8 | 2,902.8 | 5,349.0 | |||||||||||||||||||||||||||||||||||
Receive Float / Pay Float | — | — | — | — | — | — | — | — | — | — | — | — | ||||||||||||||||||||||||||||||||||||
Receive Fixed / Pay Fixed | — | — | — | — | — | — | — | — | — | — | — | — | ||||||||||||||||||||||||||||||||||||
Total | 3,726.3 | 10,584.0 | 8,885.9 | 23,196.3 | 172.3 | (329.3 | ) | 413.9 | 257.0 | 3,553.9 | 10,913.3 | 8,471.9 | 22,939.3 | |||||||||||||||||||||||||||||||||||
| Mizuho Trust & Banking | ||||||||||||||||||||||||||||||||||||||||||||||||
Receive Fixed / Pay Float | — | — | 15.0 | 15.0 | — | — | 5.0 | 5.0 | — | — | 10.0 | 10.0 | ||||||||||||||||||||||||||||||||||||
Receive Float / Pay Fixed | — | 70.0 | 365.0 | 435.0 | — | — | — | — | — | 70.0 | 365.0 | 435.0 | ||||||||||||||||||||||||||||||||||||
Receive Float / Pay Float | — | — | — | — | — | — | — | — | — | — | — | — | ||||||||||||||||||||||||||||||||||||
Receive Fixed / Pay Fixed | — | — | — | — | — | — | — | — | — | — | — | — | ||||||||||||||||||||||||||||||||||||
Total | — | 70.0 | 380.0 | 450.0 | — | — | 5.0 | 5.0 | — | 70.0 | 375.0 | 445.0 | ||||||||||||||||||||||||||||||||||||
Reference:
Deferred Hedge Gains/Losses on Derivative Transactions Qualifying for Hedge Accounting
| (Billions of yen) | ||||||||||||||||||||||||||||||||||||
| As of September 30, 2021 | Change | As of March 31, 2021 | ||||||||||||||||||||||||||||||||||
| Deferred Hedge Gains/Losses | Deferred Hedge Gains/Losses | Deferred Hedge Gains/Losses | ||||||||||||||||||||||||||||||||||
| Gains | Losses | Gains | Losses | Gains | Losses | |||||||||||||||||||||||||||||||
Aggregate Figures | 1,107.4 | 1,114.2 | (6.7 | ) | (70.9 | ) | (24.7 | ) | (46.2 | ) | 1,178.4 | 1,138.9 | 39.5 | |||||||||||||||||||||||
Mizuho Bank | 1,097.4 | 1,097.3 | 0.0 | (71.3 | ) | (28.1 | ) | (43.1 | ) | 1,168.8 | 1,125.5 | 43.2 | ||||||||||||||||||||||||
Mizuho Trust & Banking | 10.0 | 16.8 | (6.8 | ) | 0.3 | 3.4 | (3.0 | ) | 9.6 | 13.3 | (3.7 | ) | ||||||||||||||||||||||||
Note: Above figures reflect all derivative transactions qualifying for hedge accounting, and are before net of applicable income taxes and others.
2-13
Mizuho Financial Group, Inc.
8. Employee Retirement Benefits
Non-Consolidated
Retirement Benefit Obligations
Aggregate Figures for the 2 Banks
| (Millions of yen) | ||||||||||||||
| First Half of Fiscal 2021 | Change | First Half of Fiscal 2020 | ||||||||||||
Retirement Benefit Obligations (at the beginning of the fiscal year) | (A) | 1,125,762 | (94,993 | ) | 1,220,755 | |||||||||
Discount Rate (%) | (0.07)~0.82 | (0.00)~0.62 | ||||||||||||
|
|
|
|
|
| |||||||||
Fair Value of Plan Assets (at the beginning of the fiscal year) | (B) | 2,113,359 | 115,930 | 1,997,428 | ||||||||||
Unrecognized Actuarial Differences (at the beginning of the fiscal year) | (C) | (397,727 | ) | (243,087 | ) | (154,639 | ) | |||||||
Prepaid Pension Cost/Reserve for Employee Retirement Benefits (at the beginning of the fiscal year) | (B)+ (C) - (A) | 589,869 | (32,163 | ) | 622,033 | |||||||||
Mizuho Bank | ||||||||||||||
Retirement Benefit Obligations (at the beginning of the fiscal year) | (A) | 987,980 | (84,573 | ) | 1,072,553 | |||||||||
Discount Rate (%) | (0.07)~0.82 | (0.00)~0.62 | ||||||||||||
|
|
|
|
|
| |||||||||
Fair Value of Plan Assets (at the beginning of the fiscal year) | (B) | 1,851,065 | 94,480 | 1,756,585 | ||||||||||
Unrecognized Actuarial Differences (at the beginning of the fiscal year) | (C) | (338,917 | ) | (211,159 | ) | (127,758 | ) | |||||||
Prepaid Pension Cost (at the beginning of the fiscal year) | (B)+ (C) - (A) | 524,167 | (32,105 | ) | 556,273 | |||||||||
Mizuho Trust & Banking | ||||||||||||||
Retirement Benefit Obligations (at the beginning of the fiscal year) | (A) | 137,781 | (10,420 | ) | 148,201 | |||||||||
Discount Rate (%) | (0.07)~0.82 | (0.00)~0.62 | ||||||||||||
|
|
|
|
|
| |||||||||
Fair Value of Plan Assets (at the beginning of the fiscal year) | (B) | 262,293 | 21,450 | 240,842 | ||||||||||
Unrecognized Actuarial Differences (at the beginning of the fiscal year) | (C) | (58,809 | ) | (31,928 | ) | (26,881 | ) | |||||||
Prepaid Pension Cost/Reserve for Employee Retirement Benefits (at the beginning of the fiscal year) | (B)+ (C) - (A) | 65,701 | (57 | ) | 65,759 | |||||||||
2-14
Mizuho Financial Group, Inc.
Income (Expenses) related to Employee Retirement Benefits
Aggregate Figures for the 2 Banks
| (Millions of yen) | ||||||||||||||
| First Half of Fiscal 2021 | Change | First Half of Fiscal 2020 | ||||||||||||
Service Cost | (10,139 | ) | 3,614 | (13,753 | ) | |||||||||
Interest Cost | (1,629 | ) | 156 | (1,785 | ) | |||||||||
Expected Return on Plan Assets | 15,028 | (2,347 | ) | 17,376 | ||||||||||
Accumulation (Amortization) of Unrecognized Actuarial Differences | 25,725 | 11,961 | 13,763 | |||||||||||
Accumulation (Amortization) of Unrecognized Prior Service Cost | — | (52,391 | ) | 52,391 | ||||||||||
Gains on Cancellation of Employee Retirement Benefit Trust | 51,093 | 43,198 | 7,895 | |||||||||||
Losses on Transfer to Defined Contribution Pension Plan | — | 2,519 | (2,519 | ) | ||||||||||
Other | (3,813 | ) | 413 | (4,226 | ) | |||||||||
|
|
|
|
|
| |||||||||
Total | 76,266 | 7,124 | 69,141 | |||||||||||
|
|
|
|
|
| |||||||||
Note: Accumulation (Amortization) of Unrecognized Prior Service Cost, Gains on Cancellation of Employee Retirement Benefit Trust and Losses on Transfer to Defined Contribution Pension Plan are recorded to Extraordinary Gains (Losses). |
| |||||||||||||
Mizuho Bank | ||||||||||||||
| (Millions of yen) | ||||||||||||||
| First Half of Fiscal 2021 | Change | First Half of Fiscal 2020 | ||||||||||||
Service Cost | (8,524 | ) | 3,085 | (11,609 | ) | |||||||||
Interest Cost | (1,428 | ) | 138 | (1,566 | ) | |||||||||
Expected Return on Plan Assets | 13,398 | (2,172 | ) | 15,570 | ||||||||||
Accumulation (Amortization) of Unrecognized Actuarial Differences | 22,682 | 10,247 | 12,435 | |||||||||||
Accumulation (Amortization) of Unrecognized Prior Service Cost | — | (45,822 | ) | 45,822 | ||||||||||
Gains on Cancellation of Employee Retirement Benefit Trust | 43,610 | 35,715 | 7,895 | |||||||||||
Losses on Transfer to Defined Contribution Pension Plan | — | 2,187 | (2,187 | ) | ||||||||||
Other | (3,539 | ) | 287 | (3,826 | ) | |||||||||
|
|
|
|
|
| |||||||||
Total | 66,199 | 3,667 | 62,532 | |||||||||||
|
|
|
|
|
| |||||||||
Note: Accumulation (Amortization) of Unrecognized Prior Service Cost, Gains on Cancellation of Employee Retirement Benefit Trust and Losses on Transfer to Defined Contribution Pension Plan are recorded to Extraordinary Gains (Losses). |
| |||||||||||||
Mizuho Trust & Banking |
| |||||||||||||
| (Millions of yen) | ||||||||||||||
| First Half of Fiscal 2021 | Change | First Half of Fiscal 2020 | ||||||||||||
Service Cost | (1,614 | ) | 528 | (2,143 | ) | |||||||||
Interest Cost | (201 | ) | 17 | (218 | ) | |||||||||
Expected Return on Plan Assets | 1,630 | (175 | ) | 1,805 | ||||||||||
Accumulation (Amortization) of Unrecognized Actuarial Differences | 3,042 | 1,714 | 1,328 | |||||||||||
Accumulation (Amortization) of Unrecognized Prior Service Cost | — | (6,569 | ) | 6,569 | ||||||||||
Gains on Cancellation of Employee Retirement Benefit Trust | �� | 7,483 | 7,483 | — | ||||||||||
Losses on Transfer to Defined Contribution Pension Plan | — | 331 | (331 | ) | ||||||||||
Other | (274 | ) | 125 | (400 | ) | |||||||||
|
|
|
|
|
| |||||||||
Total | 10,066 | 3,456 | 6,609 | |||||||||||
|
|
|
|
|
| |||||||||
Note: Accumulation (Amortization) of Unrecognized Prior Service Cost, Gains on Cancellation of Employee Retirement Benefit Trust and Losses on Transfer to Defined Contribution Pension Plan are recorded to Extraordinary Gains (Losses).
2-15
Mizuho Financial Group, Inc.
Consolidated
Retirement Benefit Obligations
| (Millions of yen) | ||||||||||||||
| First Half of Fiscal 2021 | Change | First Half of Fiscal 2020 | ||||||||||||
Retirement Benefit Obligations (at the beginning of the fiscal year) | (A) | 1,335,890 | (104,450 | ) | 1,440,341 | |||||||||
Fair Value of Plan Assets (at the beginning of the fiscal year) | (B) | 2,373,949 | 148,939 | 2,225,010 | ||||||||||
Unrecognized Actuarial Differences (at the beginning of the fiscal year) | (C) | (409,679 | ) | (270,870 | ) | (138,808 | ) | |||||||
Net Defined Benefit Asset (at the beginning of the fiscal year) | (D) | 1,109,107 | 262,325 | 846,782 | ||||||||||
Net Defined Benefit Liability (at the beginning of the fiscal year) | (A)-(B)+(D) | 71,049 | 8,935 | 62,113 | ||||||||||
Income (Expenses) related to Employee Retirement Benefits |
| |||||||||||||
| (Millions of yen) | ||||||||||||||
| First Half of Fiscal 2021 | Change | First Half of Fiscal 2020 | ||||||||||||
Service Cost | (15,917 | ) | 4,808 | (20,725 | ) | |||||||||
Interest Cost | (1,970 | ) | 173 | (2,144 | ) | |||||||||
Expected Return on Plan Assets | 17,402 | (2,057 | ) | 19,460 | ||||||||||
Accumulation (Amortization) of Unrecognized Actuarial Differences | 25,922 | 13,483 | 12,439 | |||||||||||
Accumulation (Amortization) of Unrecognized Prior Service Cost | (23 | ) | (61,993 | ) | 61,969 | |||||||||
Gains on Cancellation of Employee Retirement Benefit Trust | 51,093 | 43,198 | 7,895 | |||||||||||
Losses on Transfer to Defined Contribution Pension Plan | — | 3,320 | (3,320 | ) | ||||||||||
Other | (6,832 | ) | 508 | (7,341 | ) | |||||||||
|
|
|
|
|
| |||||||||
Total | 69,675 | 1,442 | 68,232 | |||||||||||
|
|
|
|
|
| |||||||||
| Notes: (1) | Accumulation (Amortization) of Unrecognized Prior Service Cost,Gains on Cancellation of Employee Retirement Benefit Trust and Losses on Transfer to Defined Contribution Pension Plan that arose in Fiscal 2020, except for a portion thereof, are recorded to Extraordinary Gains (Losses) (¥66,579 million). |
(2) Gains on Cancellation of Employee Retirement Benefit Trust in Fiscal 2021 is recorded to Extraordinary Gains. |
2-16
Mizuho Financial Group, Inc.
9. Capital Ratio
Mizuho Financial Group
International Standard
| Consolidated | (%, Billions of yen) | |||||||||||||||
| As of September 30, 2021 (Preliminary) | Change | As of March 31, 2021
| ||||||||||||||
(1) Total Capital Ratio | 17.76 | 0.89 | 16.87 | |||||||||||||
(2) Tier 1 Capital Ratio | 15.03 | 0.66 | 14.37 | |||||||||||||
(3) Common Equity Tier 1 Capital Ratio | 12.27 | 0.64 | 11.63 | |||||||||||||
(4) Total Capital | 11,927.0 | 541.6 | 11,385.3 | |||||||||||||
(5) Tier 1 Capital | 10,098.4 | 396.4 | 9,701.9 | |||||||||||||
(6) Common Equity Tier 1 Capital | 8,243.5 | 393.6 | 7,849.9 | |||||||||||||
(7) Risk weighted Assets | 67,147.7 | (334.2 | ) | 67,481.9 | ||||||||||||
(8) Total Required Capital (7) X8% | 5,371.8 | (26.7 | ) | 5,398.5 | ||||||||||||
Mizuho Bank
International Standard | ||||||||||||||||
| Consolidated | Non-Consolidated | |||||||||||||||
| As of September 30, 2021 (Preliminary) | Change | As of March 31, 2021
| As of September 30, 2021 (Preliminary) | |||||||||||||
(1) Total Capital Ratio | 17.59 | 1.02 | 16.57 | 17.79 | ||||||||||||
(2) Tier 1 Capital Ratio | 14.79 | 0.74 | 14.05 | 14.83 | ||||||||||||
(3) Common Equity Tier 1 Capital Ratio | 11.82 | 0.71 | 11.11 | 11.66 | ||||||||||||
(4) Total Capital | 10,923.5 | 523.5 | 10,399.9 | 10,354.9 | ||||||||||||
(5) Tier 1 Capital | 9,186.6 | 367.8 | 8,818.7 | 8,634.6 | ||||||||||||
(6) Common Equity Tier 1 Capital | 7,339.5 | 367.7 | 6,971.8 | 6,789.8 | ||||||||||||
(7) Risk weighted Assets | 62,092.0 | (641.9 | ) | 62,734.0 | 58,204.1 | |||||||||||
(8) Total Required Capital (7) X8% | 4,967.3 | (51.3 | ) | 5,018.7 | 4,656.3 | |||||||||||
Mizuho Trust & Banking
International Standard | ||||||||||||||||
| Consolidated | Non-Consolidated | |||||||||||||||
| As of September 30, 2021 (Preliminary) | Change | As of March 31, 2021
| As of September 30, 2021 (Preliminary) | |||||||||||||
(1) Total Capital Ratio | 26.71 | (2.23 | ) | 28.94 | 26.04 | |||||||||||
(2) Tier 1 Capital Ratio | 26.70 | (2.24 | ) | 28.94 | 26.03 | |||||||||||
(3) Common Equity Tier 1 Capital Ratio | 26.70 | (2.24 | ) | 28.94 | 26.03 | |||||||||||
(4) Total Capital | 479.4 | (47.1 | ) | 526.6 | 464.8 | |||||||||||
(5) Tier 1 Capital | 479.3 | (47.1 | ) | 526.5 | 464.7 | |||||||||||
(6) Common Equity Tier 1 Capital | 479.3 | (47.1 | ) | 526.5 | 464.7 | |||||||||||
(7) Risk weighted Assets | 1,794.9 | (24.2 | ) | 1,819.1 | 1,784.8 | |||||||||||
(8) Total Required Capital (7) X8% | 143.5 | (1.9 | ) | 145.5 | 142.7 | |||||||||||
2-17
Mizuho Financial Group, Inc.
II. REVIEW OF CREDITS
1. Status of Non-Accrual, Past Due & Restructured Loans
| • | The figures below are presented net of partial direct write-offs. |
| • | Treatment of accrued interest is based on the results of the self-assessment of assets. |
(All loans to obligors classified in the self-assessment of assets as Bankrupt Obligors, Substantially Bankrupt Obligors, and Intensive Control Obligors are categorized as non-accrual loans.)
Consolidated
| (Millions of yen, %) | ||||||||||||||||||||||||
| As of September 30, 2021 | As of March 31, 2021 | |||||||||||||||||||||||
| % | Change | % | % | |||||||||||||||||||||
Loans to Bankrupt Obligors | 23,211 | 0.02 | 3,657 | 0.00 | 19,554 | 0.02 | ||||||||||||||||||
Non-Accrual Delinquent Loans | 329,493 | 0.40 | (85,825 | ) | (0.09 | ) | 415,318 | 0.49 | ||||||||||||||||
Loans Past Due for 3 Months or More | 1,126 | 0.00 | 591 | 0.00 | 534 | 0.00 | ||||||||||||||||||
Restructured Loans | 457,085 | 0.55 | 80,035 | 0.10 | 377,049 | 0.45 | ||||||||||||||||||
|
|
|
|
|
|
|
|
|
|
|
| |||||||||||||
Total | 810,916 | 0.98 | (1,541 | ) | 0.01 | 812,457 | 0.97 | |||||||||||||||||
|
|
|
|
|
|
|
|
|
|
|
| |||||||||||||
Total Loans | 82,198,528 | 100.00 | (1,506,147 | ) | 83,704,675 | 100.00 | ||||||||||||||||||
Above figures are presented net of partial direct write-offs, the amounts of which are indicated in the table below. |
| |||||||||||||||||||||||
Amount of Partial Direct Write-offs | 103,956 | (1,392 | ) | 105,348 | ||||||||||||||||||||
| Trust Account |
| |||||||||||||||||||||||
| As of September 30, 2021 | As of March 31, 2021 | |||||||||||||||||||||||
| % | Change | % | % | |||||||||||||||||||||
Loans to Bankrupt Obligors | — | — | — | — | — | — | ||||||||||||||||||
Non-Accrual Delinquent Loans | — | — | — | — | — | — | ||||||||||||||||||
Loans Past Due for 3 Months or More | — | — | — | — | — | — | ||||||||||||||||||
Restructured Loans | — | — | — | — | — | — | ||||||||||||||||||
|
|
|
|
|
|
|
|
|
|
|
| |||||||||||||
Total | — | — | — | — | — | — | ||||||||||||||||||
|
|
|
|
|
|
|
|
|
|
|
| |||||||||||||
Total Loans | 4,292 | 100.00 | (494 | ) | 4,787 | 100.00 | ||||||||||||||||||
Consolidated + Trust Account | ||||||||||||||||||||||||
| As of September 30, 2021 | As of March 31, 2021 | |||||||||||||||||||||||
| % | Change | % | % | |||||||||||||||||||||
Loans to Bankrupt Obligors | 23,211 | 0.02 | 3,657 | 0.00 | 19,554 | 0.02 | ||||||||||||||||||
Non-Accrual Delinquent Loans | 329,493 | 0.40 | (85,825 | ) | (0.09 | ) | 415,318 | 0.49 | ||||||||||||||||
Loans Past Due for 3 Months or More | 1,126 | 0.00 | 591 | 0.00 | 534 | 0.00 | ||||||||||||||||||
Restructured Loans | 457,085 | 0.55 | 80,035 | 0.10 | 377,049 | 0.45 | ||||||||||||||||||
|
|
|
|
|
|
|
|
|
|
|
| |||||||||||||
Total | 810,916 | 0.98 | (1,541 | ) | 0.01 | 812,457 | 0.97 | |||||||||||||||||
|
|
|
|
|
|
|
|
|
|
|
| |||||||||||||
Total Loans | 82,202,820 | 100.00 | (1,506,641 | ) | 83,709,462 | 100.00 | ||||||||||||||||||
Trust account represents trust accounts that guarantee principals in the agreement. |
2-18
Mizuho Financial Group, Inc.
Non-Consolidated
Aggregate Figures for the 2 Banks
(Banking Account + Trust Account)
| (Millions of yen, %) | ||||||||||||||||||||||||
| As of September 30, 2021 | As of March 31, 2021 | |||||||||||||||||||||||
| % | Change | % | % | |||||||||||||||||||||
Loans to Bankrupt Obligors | 21,689 | 0.02 | 2,679 | 0.00 | 19,009 | 0.02 | ||||||||||||||||||
Non-Accrual Delinquent Loans | 315,367 | 0.37 | (82,205 | ) | (0.08 | ) | 397,573 | 0.46 | ||||||||||||||||
Loans Past Due for 3 Months or More | 1,125 | 0.00 | 591 | 0.00 | 534 | 0.00 | ||||||||||||||||||
Restructured Loans | 417,318 | 0.50 | 84,849 | 0.11 | 332,469 | 0.38 | ||||||||||||||||||
|
|
|
|
|
|
|
|
|
|
|
| |||||||||||||
Total | 755,501 | 0.90 | 5,914 | 0.03 | 749,587 | 0.87 | ||||||||||||||||||
|
|
|
|
|
|
|
|
|
|
|
| |||||||||||||
Total Loans | 83,264,462 | 100.00 | (2,177,182 | ) | 85,441,645 | 100.00 | ||||||||||||||||||
Above figures are presented net of partial direct write-offs, the amounts of which are indicated in the table below. |
| |||||||||||||||||||||||
Amount of Partial Direct Write-offs | 99,559 | (1,275 | ) | 100,834 | ||||||||||||||||||||
Mizuho Bank | ||||||||||||||||||||||||
Loans to Bankrupt Obligors | 21,689 | 0.02 | 2,693 | 0.00 | 18,995 | 0.02 | ||||||||||||||||||
Non-Accrual Delinquent Loans | 310,339 | 0.38 | (80,555 | ) | (0.08 | ) | 390,895 | 0.47 | ||||||||||||||||
Loans Past Due for 3 Months or More | 1,124 | 0.00 | 589 | 0.00 | 534 | 0.00 | ||||||||||||||||||
Restructured Loans | 416,040 | 0.51 | 84,017 | 0.11 | 332,022 | 0.40 | ||||||||||||||||||
|
|
|
|
|
|
|
|
|
|
|
| |||||||||||||
Total | 749,193 | 0.93 | 6,744 | 0.03 | 742,448 | 0.90 | ||||||||||||||||||
|
|
|
|
|
|
|
|
|
|
|
| |||||||||||||
| Total Loans | 80,080,848 | 100.00 | (1,993,742 | ) | 82,074,591 | 100.00 | ||||||||||||||||||
| Above figures are presented net of partial direct write-offs, the amounts of which are indicated in the table below. |
| |||||||||||||||||||||||
Amount of Partial Direct Write-offs | 99,343 | (1,275 | ) | 100,618 | ||||||||||||||||||||
Mizuho Trust & Banking (Banking Account) | ||||||||||||||||||||||||
Loans to Bankrupt Obligors | — | — | (14 | ) | (0.00 | ) | 14 | 0.00 | ||||||||||||||||
Non-Accrual Delinquent Loans | 5,028 | 0.15 | (1,649 | ) | (0.04 | ) | 6,678 | 0.19 | ||||||||||||||||
Loans Past Due for 3 Months or More | 1 | 0.00 | 1 | 0.00 | — | — | ||||||||||||||||||
Restructured Loans | 1,278 | 0.04 | 831 | 0.02 | 446 | 0.01 | ||||||||||||||||||
|
|
|
|
|
|
|
|
|
|
|
| |||||||||||||
Total | 6,308 | 0.19 | (830 | ) | (0.01 | ) | 7,138 | 0.21 | ||||||||||||||||
|
|
|
|
|
|
|
|
|
|
|
| |||||||||||||
Total Loans | 3,179,321 | 100.00 | (182,945 | ) | 3,362,267 | 100.00 | ||||||||||||||||||
Above figures are presented net of partial direct write-offs, the amounts of which are indicated in the table below. |
| |||||||||||||||||||||||
Amount of Partial Direct Write-offs | 215 | (0 | ) | 216 | ||||||||||||||||||||
(Trust Account) | ||||||||||||||||||||||||
Loans to Bankrupt Obligors | — | — | — | — | — | — | ||||||||||||||||||
Non-Accrual Delinquent Loans | — | — | — | — | — | — | ||||||||||||||||||
Loans Past Due for 3 Months or More | — | — | — | — | — | — | ||||||||||||||||||
Restructured Loans | — | — | — | — | — | — | ||||||||||||||||||
|
|
|
|
|
|
|
|
|
|
|
| |||||||||||||
Total | — | — | — | — | — | — | ||||||||||||||||||
|
|
|
|
|
|
|
|
|
|
|
| |||||||||||||
Total Loans | 4,292 | 100.00 | (494 | ) | 4,787 | 100.00 | ||||||||||||||||||
Trust account represents trust accounts that guarantee principals in the agreement. |
2-19
Mizuho Financial Group, Inc.
2. Status of Reserves for Possible Losses on Loans
Consolidated
| (Millions of yen) | ||||||||||||
| As of September 30, 2021 | Change | As of March 31, 2021 | ||||||||||
Reserves for Possible Losses on Loans | 594,023 | 18,450 | 575,572 | |||||||||
General Reserve for Possible Losses on Loans | 448,993 | 65,931 | 383,062 | |||||||||
Specific Reserve for Possible Losses on Loans | 143,821 | (47,387 | ) | 191,208 | ||||||||
Reserve for Possible Losses on Loans to Restructuring Countries | 1,209 | (92 | ) | 1,301 | ||||||||
Above figures are presented net of partial direct write-offs, the amounts of which are indicated in the table below. | ||||||||||||
Amount of Partial Direct Write-offs | 113,626 | (3,208 | ) | 116,834 | ||||||||
Non-Consolidated
Aggregate Figures for the 2 Banks
| ||||||||||||
| (Millions of yen) | ||||||||||||
| As of September 30, 2021 | Change | As of March 31, 2021 | ||||||||||
Reserves for Possible Losses on Loans | 560,225 | 19,928 | 540,297 | |||||||||
General Reserve for Possible Losses on Loans | 430,386 | 65,469 | 364,916 | |||||||||
Specific Reserve for Possible Losses on Loans | 128,629 | (45,448 | ) | 174,078 | ||||||||
Reserve for Possible Losses on Loans to Restructuring Countries | 1,209 | (92 | ) | 1,301 | ||||||||
Above figures are presented net of partial direct write-offs, the amounts of which are indicated in the table below. | ||||||||||||
Amount of Partial Direct Write-offs | 108,735 | (2,930 | ) | 111,666 | ||||||||
Mizuho Bank | ||||||||||||
| Reserves for Possible Losses on Loans | 556,219 | 20,118 | 536,101 | |||||||||
General Reserve for Possible Losses on Loans | 426,729 | 64,660 | 362,068 | |||||||||
Specific Reserve for Possible Losses on Loans | 128,280 | (44,449 | ) | 172,730 | ||||||||
Reserve for Possible Losses on Loans to Restructuring Countries | 1,209 | (92 | ) | 1,301 | ||||||||
Above figures are presented net of partial direct write-offs, the amounts of which are indicated in the table below. | ||||||||||||
Amount of Partial Direct Write-offs | 108,519 | (2,930 | ) | 111,450 | ||||||||
Mizuho Trust & Banking | ||||||||||||
Reserves for Possible Losses on Loans | 4,006 | (189 | ) | 4,196 | ||||||||
General Reserve for Possible Losses on Loans | 3,657 | 809 | 2,847 | |||||||||
Specific Reserve for Possible Losses on Loans | 349 | (998 | ) | 1,348 | ||||||||
Reserve for Possible Losses on Loans to Restructuring Countries | — | — | — | |||||||||
Above figures are presented net of partial direct write-offs, the amounts of which are indicated in the table below. | ||||||||||||
Amount of Partial Direct Write-offs | 215 | (0 | ) | 216 | ||||||||
Reserve for Possible Losses on Entrusted Loans (¥13 million and ¥15 million for September 30, 2021 and March 31, 2021, respectively) is not included in the above figures for Trust Account.
2-20
Mizuho Financial Group, Inc.
3. Reserve Ratios for Non-Accrual, Past Due & Restructured Loans
Consolidated
| (%) | ||||||||||||
| As of September 30, 2021 | Change | As of March 31, 2021 | ||||||||||
Mizuho Financial Group | 73.25 | 2.40 | 70.84 | |||||||||
Above figures are presented net of partial direct write-offs. |
| |||||||||||
Non-Consolidated | ||||||||||||
| (%) | ||||||||||||
| As of September 30, 2021 | Change | As of March 31, 2021 | ||||||||||
Total | 74.15 | 2.07 | 72.07 | |||||||||
Mizuho Bank | 74.24 | 2.03 | 72.20 | |||||||||
Mizuho Trust & Banking (Banking Account) | 63.51 | 4.73 | 58.77 | |||||||||
Above figures are presented net of partial direct write-offs.
2-21
Mizuho Financial Group, Inc.
4. Status of Non Performing Loans based on the Financial Reconstruction Act(“FRA”)
Consolidated
| (Millions of yen) | ||||||||||||
| As of September 30, 2021 | Change | As of March 31, 2021 | ||||||||||
Claims against Bankrupt and Substantially Bankrupt Obligors | 54,362 | (1,143 | ) | 55,506 | ||||||||
Claims with Collection Risk | 327,028 | (82,713 | ) | 409,742 | ||||||||
Claims for Special Attention | 458,211 | 80,627 | 377,584 | |||||||||
Sub-total[1] | 839,603 | (3,229 | ) | 842,832 | ||||||||
Normal Claims | 92,186,254 | (1,000,543 | ) | 93,186,798 | ||||||||
|
|
|
|
|
| |||||||
Total[2] | 93,025,857 | (1,003,773 | ) | 94,029,630 | ||||||||
|
|
|
|
|
| |||||||
| (%) | ||||||||||||
NPL ratio[1]/[2] | 0.90 | 0.00 | 0.89 | |||||||||
| Above figures are presented net of partial direct write-offs. |
| |||||||||||
| Trust Account | ||||||||||||
| (Millions of yen) | ||||||||||||
| As of September 30, 2021 | Change | As of March 31, 2021 | ||||||||||
Claims against Bankrupt and Substantially Bankrupt Obligors | — | — | — | |||||||||
Claims with Collection Risk | — | — | — | |||||||||
Claims for Special Attention | — | — | — | |||||||||
Sub-total[3] | — | — | — | |||||||||
Normal Claims | 4,292 | (494 | ) | 4,787 | ||||||||
|
|
|
|
|
| |||||||
Total[4] | 4,292 | (494 | ) | 4,787 | ||||||||
|
|
|
|
|
| |||||||
| (%) | ||||||||||||
NPL ratio[3]/[4] | — | — | — | |||||||||
Consolidated + Trust Account | ||||||||||||
| (Millions of yen) | ||||||||||||
| As of September 30, 2021 | Change | As of March 31, 2021 | ||||||||||
Claims against Bankrupt and Substantially Bankrupt Obligors | 54,362 | (1,143 | ) | 55,506 | ||||||||
Claims with Collection Risk | 327,028 | (82,713 | ) | 409,742 | ||||||||
Claims for Special Attention | 458,211 | 80,627 | 377,584 | |||||||||
Sub-total[5] | 839,603 | (3,229 | ) | 842,832 | ||||||||
Normal Claims | 92,190,547 | (1,001,037 | ) | 93,191,585 | ||||||||
|
|
|
|
|
| |||||||
Total[6] | 93,030,150 | (1,004,267 | ) | 94,034,418 | ||||||||
|
|
|
|
|
| |||||||
| (%) | ||||||||||||
NPL ratio[5]/[6] | 0.90 | 0.00 | 0.89 | |||||||||
Trust account represents trust accounts that guarantee principals in the agreement.
2-22
Mizuho Financial Group, Inc.
Non-Consolidated
Aggregate Figures for the 2 Banks (Banking Account + Trust Account)
| (Millions of yen) | ||||||||||||
| As of September 30, 2021 | Change | As of March 31, 2021 | ||||||||||
Claims against Bankrupt and Substantially Bankrupt Obligors | 43,576 | (5,144 | ) | 48,720 | ||||||||
Claims with Collection Risk | 327,254 | (83,798 | ) | 411,052 | ||||||||
Claims for Special Attention | 418,444 | 85,440 | 333,004 | |||||||||
Sub-total[1] | 789,275 | (3,502 | ) | 792,777 | ||||||||
Normal Claims | 93,455,464 | (1,688,911 | ) | 95,144,375 | ||||||||
|
|
|
|
|
| |||||||
Total[2] | 94,244,739 | (1,692,413 | ) | 95,937,152 | ||||||||
|
|
|
|
|
| |||||||
| (%) | ||||||||||||
NPL ratio[1]/[2] | 0.83 | 0.01 | 0.82 | |||||||||
Above figures are presented net of partial direct write-offs. |
| |||||||||||
| Mizuho Bank | ||||||||||||
| (Millions of yen) | ||||||||||||
Claims against Bankrupt and Substantially Bankrupt Obligors | 43,304 | (5,136 | ) | 48,440 | ||||||||
Claims with Collection Risk | 322,497 | (82,142 | ) | 404,640 | ||||||||
Claims for Special Attention | 417,165 | 84,607 | 332,557 | |||||||||
Sub-total[3] | 782,966 | (2,671 | ) | 785,638 | ||||||||
Normal Claims | 90,261,980 | (1,506,909 | ) | 91,768,889 | ||||||||
|
|
|
|
|
| |||||||
Total[4] | 91,044,947 | (1,509,580 | ) | 92,554,528 | ||||||||
|
|
|
|
|
| |||||||
| (%) | ||||||||||||
NPL ratio[3]/[4] | 0.85 | 0.01 | 0.84 | |||||||||
Above figures are presented net of partial direct write-offs. | ||||||||||||
| Mizuho Trust & Banking | ||||||||||||
| (Banking Account) | ||||||||||||
| (Millions of yen) | ||||||||||||
Claims against Bankrupt and Substantially Bankrupt Obligors | 272 | (8 | ) | 280 | ||||||||
Claims with Collection Risk | 4,756 | (1,655 | ) | 6,412 | ||||||||
Claims for Special Attention | 1,279 | 833 | 446 | |||||||||
Sub-total[5] | 6,308 | (830 | ) | 7,138 | ||||||||
Normal Claims | 3,189,190 | (181,507 | ) | 3,370,698 | ||||||||
|
|
|
|
|
| |||||||
Total[6] | 3,195,499 | (182,338 | ) | 3,377,837 | ||||||||
|
|
|
|
|
| |||||||
| (%) | ||||||||||||
NPL ratio[5]/[6] | 0.19 | (0.01 | ) | 0.21 | ||||||||
Above figures are presented net of partial direct write-offs. |
| |||||||||||
| (Trust Account) | ||||||||||||
| (Millions of yen) | ||||||||||||
Claims against Bankrupt and Substantially Bankrupt Obligors | — | — | — | |||||||||
Claims with Collection Risk | — | — | — | |||||||||
Claims for Special Attention | — | — | — | |||||||||
Sub-total[7] | — | — | — | |||||||||
Normal Claims | 4,292 | (494 | ) | 4,787 | ||||||||
|
|
|
|
|
| |||||||
Total[8] | 4,292 | (494 | ) | 4,787 | ||||||||
|
|
|
|
|
| |||||||
| (%) | ||||||||||||
NPL ratio[7]/[8] | — | — | — | |||||||||
Trust account represents trust accounts that guarantee principals in the agreement.
2-23
Mizuho Financial Group, Inc.
5. Coverage on Non Performing Loans based on the FRA
Non-Consolidated
(1) Non Performing Loans based on the FRA and Coverage Amount
| (Billions of yen) | ||||||||||||
| As of September 30, 2021 | Change | As of March 31, 2021 | ||||||||||
| Aggregate Figures for the 2 Banks (Banking Account) | ||||||||||||
Claims against Bankrupt and Substantially Bankrupt Obligors | 43.5 | (5.1 | ) | 48.7 | ||||||||
Collateral, Guarantees, and equivalent | 37.6 | (4.6 | ) | 42.3 | ||||||||
Reserve for Possible Losses | 5.8 | (0.4 | ) | 6.3 | ||||||||
Claims with Collection Risk | 327.2 | (83.7 | ) | 411.0 | ||||||||
Collateral, Guarantees, and equivalent | 142.3 | (22.3 | ) | 164.7 | ||||||||
Reserve for Possible Losses | 122.7 | (44.9 | ) | 167.6 | ||||||||
Claims for Special Attention | 418.4 | 85.4 | 333.0 | |||||||||
Collateral, Guarantees, and equivalent | 111.7 | 10.8 | 100.9 | |||||||||
Reserve for Possible Losses | 92.4 | 34.9 | 57.5 | |||||||||
Total | 789.2 | (3.5 | ) | 792.7 | ||||||||
Collateral, Guarantees, and equivalent | 291.8 | (16.2 | ) | 308.0 | ||||||||
Reserve for Possible Losses | 221.1 | (10.4 | ) | 231.6 | ||||||||
| Mizuho Bank | ||||||||||||
Claims against Bankrupt and Substantially Bankrupt Obligors | 43.3 | (5.1 | ) | 48.4 | ||||||||
Collateral, Guarantees, and equivalent | 37.4 | (4.6 | ) | 42.0 | ||||||||
Reserve for Possible Losses | 5.8 | (0.4 | ) | 6.3 | ||||||||
Claims with Collection Risk | 322.4 | (82.1 | ) | 404.6 | ||||||||
Collateral, Guarantees, and equivalent | 138.2 | (22.3 | ) | 160.5 | ||||||||
Reserve for Possible Losses | 122.3 | (43.9 | ) | 166.3 | ||||||||
Claims for Special Attention | 417.1 | 84.6 | 332.5 | |||||||||
Collateral, Guarantees, and equivalent | 111.6 | 10.8 | 100.8 | |||||||||
Reserve for Possible Losses | 92.2 | 34.7 | 57.4 | |||||||||
Total | 782.9 | (2.6 | ) | 785.6 | ||||||||
Collateral, Guarantees, and equivalent | 287.3 | (16.1 | ) | 303.4 | ||||||||
Reserve for Possible Losses | 220.5 | (9.6 | ) | 230.1 | ||||||||
| Mizuho Trust & Banking (Banking Account) | ||||||||||||
Claims against Bankrupt and Substantially Bankrupt Obligors | 0.2 | (0.0 | ) | 0.2 | ||||||||
Collateral, Guarantees, and equivalent | 0.2 | (0.0 | ) | 0.2 | ||||||||
Reserve for Possible Losses | — | — | — | |||||||||
Claims with Collection Risk | 4.7 | (1.6 | ) | 6.4 | ||||||||
Collateral, Guarantees, and equivalent | 4.1 | (0.0 | ) | 4.2 | ||||||||
Reserve for Possible Losses | 0.3 | (0.9 | ) | 1.3 | ||||||||
Claims for Special Attention | 1.2 | 0.8 | 0.4 | |||||||||
Collateral, Guarantees, and equivalent | 0.0 | (0.0 | ) | 0.0 | ||||||||
Reserve for Possible Losses | 0.2 | 0.1 | 0.0 | |||||||||
Total | 6.3 | (0.8 | ) | 7.1 | ||||||||
Collateral, Guarantees, and equivalent | 4.4 | (0.0 | ) | 4.5 | ||||||||
Reserve for Possible Losses | 0.5 | (0.8 | ) | 1.4 | ||||||||
| Reference: Trust Account | ||||||||||||
Claims against Bankrupt and Substantially Bankrupt Obligors | — | — | — | |||||||||
Collateral, Guarantees, and equivalent | — | — | — | |||||||||
Claims with Collection Risk | — | — | — | |||||||||
Collateral, Guarantees, and equivalent | — | — | — | |||||||||
Claims for Special Attention | — | — | — | |||||||||
Collateral, Guarantees, and equivalent | — | — | — | |||||||||
Total | — | — | — | |||||||||
Collateral, Guarantees, and equivalent | — | — | — | |||||||||
| * | Trust account represents trust accounts that guarantee principals in the agreement. |
2-24
Mizuho Financial Group, Inc.
(2) Coverage Ratio
| (Billions of yen) | ||||||||||||
| As of September 30, 2021 | Change | As of March 31, 2021 | ||||||||||
| Aggregate Figures for the 2 Banks (Banking Account) | ||||||||||||
Coverage Amount | 512.9 | (26.6 | ) | 539.6 | ||||||||
Reserves for Possible Losses on Loans | 221.1 | (10.4 | ) | 231.6 | ||||||||
Collateral, Guarantees, and equivalent | 291.8 | (16.2 | ) | 308.0 | ||||||||
| (%) | ||||||||||||
Coverage Ratio | 64.9 | (3.0 | ) | 68.0 | ||||||||
Claims against Bankrupt and Substantially Bankrupt Obligors | 100.0 | — | 100.0 | |||||||||
Claims with Collection Risk | 81.0 | 0.1 | 80.8 | |||||||||
Claims for Special Attention | 48.8 | 1.2 | 47.5 | |||||||||
Claims against Special Attention Obligors | 48.5 | 5.1 | 43.3 | |||||||||
Reserve Ratio against Non-collateralized Claims | ||||||||||||
| (%) | ||||||||||||
Claims against Bankrupt and Substantially Bankrupt Obligors | 100.0 | — | 100.0 | |||||||||
Claims with Collection Risk | 66.3 | (1.6 | ) | 68.0 | ||||||||
Claims for Special Attention | 30.1 | 5.3 | 24.7 | |||||||||
Claims against Special Attention Obligors | 37.1 | 8.3 | 28.7 | |||||||||
Reference: Reserve Ratio | ||||||||||||
| (%) | ||||||||||||
Claims against Special Attention Obligors | 30.38 | 7.52 | 22.85 | |||||||||
Claims against Watch Obligors excluding Special Attention Obligors | 4.18 | (0.68 | ) | 4.87 | ||||||||
Claims against Normal Obligors | 0.10 | (0.00 | ) | 0.10 | ||||||||
Mizuho Bank | ||||||||||||
| (Billions of yen) | ||||||||||||
Coverage Amount | 507.8 | (25.7 | ) | 533.6 | ||||||||
Reserves for Possible Losses on Loans | 220.5 | (9.6 | ) | 230.1 | ||||||||
Collateral, Guarantees, and equivalent | 287.3 | (16.1 | ) | 303.4 | ||||||||
| (%) | ||||||||||||
Coverage Ratio | 64.8 | (3.0 | ) | 67.9 | ||||||||
Claims against Bankrupt and Substantially Bankrupt Obligors | 100.0 | — | 100.0 | |||||||||
Claims with Collection Risk | 80.8 | 0.0 | 80.7 | |||||||||
Claims for Special Attention | 48.8 | 1.2 | 47.6 | |||||||||
Claims against Special Attention Obligors | 48.6 | 5.2 | 43.3 | |||||||||
Reserve Ratio against Non-collateralized Claims |
| |||||||||||
| (%) | ||||||||||||
Claims against Bankrupt and Substantially Bankrupt Obligors | 100.0 | — | 100.0 | |||||||||
Claims with Collection Risk | 66.4 | (1.7 | ) | 68.1 | ||||||||
Claims for Special Attention | 30.2 | 5.4 | 24.8 | |||||||||
Claims against Special Attention Obligors | 37.1 | 8.4 | 28.7 | |||||||||
Reference: Reserve Ratio | ||||||||||||
| (%) | ||||||||||||
Claims against Special Attention Obligors | 30.41 | 7.55 | 22.86 | |||||||||
Claims against Watch Obligors excluding Special Attention Obligors | 4.25 | (0.66 | ) | 4.92 | ||||||||
Claims against Normal Obligors | 0.10 | (0.00 | ) | 0.10 | ||||||||
2-25
Mizuho Financial Group, Inc.
Mizuho Trust & Banking (Banking Account)
| (Billions of yen) | ||||||||||||
| As of September 30, 2021 | Change | As of March 31, 2021 | ||||||||||
Coverage Amount | 5.0 | (0.9 | ) | 5.9 | ||||||||
Reserves for Possible Losses on Loans | 0.5 | (0.8 | ) | 1.4 | ||||||||
Collateral, Guarantees, and equivalent | 4.4 | (0.0 | ) | 4.5 | ||||||||
| (%) | ||||||||||||
Coverage Ratio | 80.1 | (3.5 | ) | 83.7 | ||||||||
Claims against Bankrupt and Substantially Bankrupt Obligors | 100.0 | — | 100.0 | |||||||||
Claims with Collection Risk | 94.6 | 7.9 | 86.7 | |||||||||
Claims for Special Attention | 21.9 | (7.5 | ) | 29.4 | ||||||||
Claims against Special Attention Obligors | 20.9 | (5.4 | ) | 26.4 | ||||||||
Reserve Ratio against Non-collateralized Claims | ||||||||||||
| (%) | ||||||||||||
Claims against Bankrupt and Substantially Bankrupt Obligors | — | — | — | |||||||||
Claims with Collection Risk | 57.1 | (4.0 | ) | 61.1 | ||||||||
Claims for Special Attention | 19.2 | (0.9 | ) | 20.2 | ||||||||
Claims against Special Attention Obligors | 19.2 | (0.9 | ) | 20.1 | ||||||||
Reference: Reserve Ratio | ||||||||||||
| (%) | ||||||||||||
Claims against Special Attention Obligors | 18.81 | 0.23 | 18.57 | |||||||||
Claims against Watch Obligors excluding Special Attention Obligors | 1.00 | (0.65 | ) | 1.66 | ||||||||
Claims against Normal Obligors | 0.08 | 0.02 | 0.06 | |||||||||
2-26
Mizuho Financial Group, Inc.
6. Overview of Non-Performing Loans (“NPLs”)
Non-Consolidated
Aggregate Figures for the 2 Banks (Banking Account)
(Billions of yen)
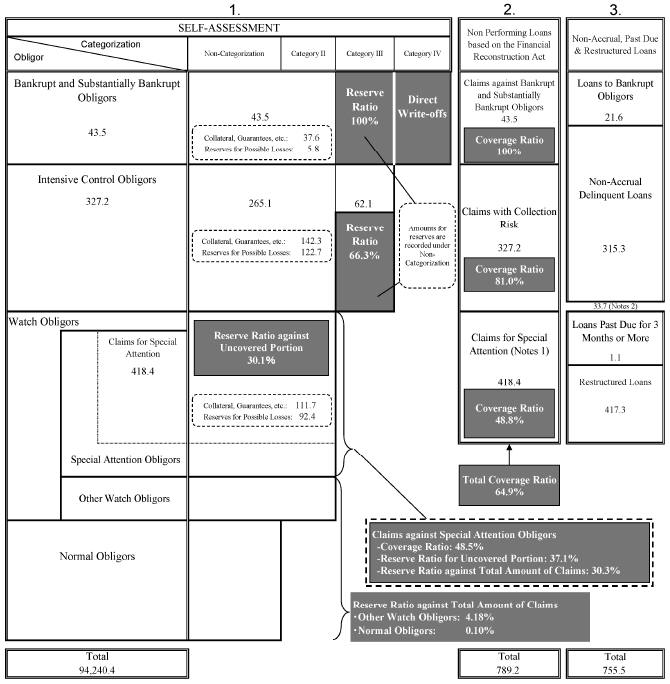
| Notes: 1. | Claims for Special Attention is denoted on an individual loans basis. Claims against Special Attention Obligors includes all claims, not limited to Claims for Special Attention. | |
2. | The difference between total Non-Accrual, Past Due & Restructured Loans and total Non Performing Loans based on the FRA represents the amount of claims other than loans included in Non Performing Loans based on the FRA. | |
2-27
Mizuho Financial Group, Inc.
7. Results of Removal of NPLs from the Balance Sheet
Non-Consolidated
(1) Outstanding Balance of Claims against Bankrupt and Substantially Bankrupt Obligors and Claims with Collection Risk (under the FRA)
Aggregate Figures for the 2 Banks (Banking Account + Trust Account)
| (Billions of yen) | ||||||||||||||||||||||||||||
| Fiscal 2018 | Fiscal 2019 | Fiscal 2020 | Fiscal 2021 | |||||||||||||||||||||||||
| As of March 31, 2019 | As of March 31, 2020 | As of March 31, 2021 | As of September 30, 2021 | |||||||||||||||||||||||||
| MHBK | MHTB* | Aggregate Figures for the 2 Banks | Change from March 31, 2021 | |||||||||||||||||||||||||
Claims against Bankrupt and Substantially Bankrupt Obligors | 52.9 | 38.1 | 29.2 | 26.1 | 0.2 | 26.4 | (2.8 | ) | ||||||||||||||||||||
Claims with Collection Risk | 347.6 | 214.6 | 164.1 | 144.2 | 1.1 | 145.4 | (18.7 | ) | ||||||||||||||||||||
Amount Categorized as above up to Fiscal 2018 | 400.6 | 252.7 | 193.4 | 170.4 | 1.3 | 171.8 | (21.5 | ) | ||||||||||||||||||||
of which the amount which was in the process of being removed from the balance sheet | 40.8 | 32.4 | 26.5 | 28.1 | 0.2 | 28.3 | 1.7 | |||||||||||||||||||||
Claims against Bankrupt and Substantially Bankrupt Obligors | 12.8 | 4.4 | 6.5 | 0.0 | 6.5 | 2.1 | ||||||||||||||||||||||
Claims with Collection Risk | 171.8 | 82.6 | 34.1 | 0.0 | 34.2 | (48.4 | ) | |||||||||||||||||||||
Amount Newly Categorized as above during Fiscal 2019 | 184.7 | 87.0 | 40.7 | 0.1 | 40.8 | (46.2 | ) | |||||||||||||||||||||
of which the amount which was in the process of being removed from the balance sheet | 12.0 | 5.0 | 7.2 | 0.0 | 7.2 | 2.1 | ||||||||||||||||||||||
Claims against Bankrupt and Substantially Bankrupt Obligors | 15.0 | 5.2 | 0.0 | 5.2 | (9.7 | ) | ||||||||||||||||||||||
Claims with Collection Risk | 164.2 | 110.7 | 3.3 | 114.0 | (50.1 | ) | ||||||||||||||||||||||
Amount Newly Categorized as above during Fiscal 2020 | 179.2 | 116.0 | 3.3 | 119.3 | (59.8 | ) | ||||||||||||||||||||||
of which the amount which was in the process of being removed from the balance sheet | 13.6 | 4.6 | 0.0 | 4.6 | (9.0 | ) | ||||||||||||||||||||||
Claims against Bankrupt and Substantially Bankrupt Obligors | 5.3 | 0.0 | 5.3 | 5.3 | ||||||||||||||||||||||||
Claims with Collection Risk | 33.2 | 0.1 | 33.4 | 33.4 | ||||||||||||||||||||||||
Amount Newly Categorized as above during the First Half of Fiscal 2021 | 38.6 | 0.1 | 38.8 | 38.8 | ||||||||||||||||||||||||
of which the amount which was in the process of being removed from the balance sheet | 5.3 | 0.0 | 5.3 | 5.3 | ||||||||||||||||||||||||
Claims against Bankrupt and Substantially Bankrupt Obligors | 52.9 | 51.0 | 48.7 | 43.3 | 0.2 | 43.5 | (5.1 | ) | ||||||||||||||||||||
Claims with Collection Risk | 347.6 | 386.5 | 411.0 | 322.4 | 4.7 | 327.2 | (83.7 | ) | ||||||||||||||||||||
Total | 400.6 | 437.5 | 459.7 | 365.8 | 5.0 | 370.8 | (88.9 | ) | ||||||||||||||||||||
of which the amount which was in the process of being removed from the balance sheet | 40.8 | 44.5 | 45.3 | 45.3 | 0.2 | 45.5 | 0.2 | |||||||||||||||||||||
* Trust account represents trust accounts that guarantee principals in the agreement. | ||||
| * | denotes newly categorized amounts. | |||
(2) Breakdown of Reasons for Removal of NPLs from the Balance Sheet in the First Half of Fiscal 2021
| (Billions of yen) | ||||||||||||
| Aggregate Figures for the 2 Banks (Banking Account + Trust Account) | MHBK | MHTB (Banking Account + Trust Account) | ||||||||||
Liquidation | (3.3 | ) | (3.3 | ) | — | |||||||
Restructuring | (21.9 | ) | (21.9 | ) | — | |||||||
Improvement in Business Performance due to Restructuring | (0.0 | ) | — | (0.0 | ) | |||||||
Loan Sales | (14.9 | ) | (14.9 | ) | — | |||||||
Direct Write-off | 19.9 | 21.0 | (1.0 | ) | ||||||||
Other | (107.5 | ) | (106.7 | ) | (0.7 | ) | ||||||
Debt recovery | (36.1 | ) | (35.5 | ) | (0.6 | ) | ||||||
Improvement in Business Performance | (71.3 | ) | (71.2 | ) | (0.1 | ) | ||||||
|
|
|
|
|
| |||||||
Total | (127.7 | ) | (125.9 | ) | (1.8 | ) | ||||||
|
|
|
|
|
| |||||||
2-28
Mizuho Financial Group, Inc.
8. Status of Loans by Industry
(1) Outstanding Balances and Non-Accrual, Past Due & Restructured Loans by Industry
Non-Consolidated
Aggregate Figures for the 2 Banks (Banking Account + Trust Account)
| (Billions of yen) | ||||||||||||||||||||||||
| As of September 30, 2021 | As of March 31, 2021 | |||||||||||||||||||||||
| Outstanding Balance | Non-Accrual, Past Due & Restructured Loans | Change | Outstanding Balance | Non-Accrual, Past Due & Restructured Loans | ||||||||||||||||||||
| Outstanding Balance | Non-Accrual, Past Due & Restructured Loans | |||||||||||||||||||||||
Domestic Total (excluding Loans Booked Offshore) | 59,938.6 | 706.2 | (2,105.5 | ) | 26.3 | 62,044.2 | 679.8 | |||||||||||||||||
Manufacturing | 10,462.1 | 229.1 | (452.4 | ) | 17.9 | 10,914.5 | 211.1 | |||||||||||||||||
Agriculture & Forestry | 47.8 | 0.7 | (2.8 | ) | (0.0 | ) | 50.7 | 0.7 | ||||||||||||||||
Fishery | 2.5 | 0.3 | 0.2 | (0.0 | ) | 2.2 | 0.3 | |||||||||||||||||
Mining, Quarrying Industry & Gravel Extraction Industry | 225.8 | 0.2 | (90.0 | ) | 0.1 | 315.8 | 0.1 | |||||||||||||||||
Construction | 708.8 | 5.0 | (19.3 | ) | (0.2 | ) | 728.1 | 5.2 | ||||||||||||||||
Utilities | 2,890.2 | 1.1 | 37.5 | (0.9 | ) | 2,852.6 | 2.1 | |||||||||||||||||
Communication | 1,270.5 | 9.4 | 45.4 | 0.0 | 1,225.0 | 9.3 | ||||||||||||||||||
Transportation & Postal Industry | 2,628.9 | 28.5 | (18.8 | ) | 19.9 | 2,647.7 | 8.5 | |||||||||||||||||
Wholesale & Retail | 5,154.8 | 142.1 | 60.8 | 4.0 | 5,093.9 | 138.0 | ||||||||||||||||||
Finance & Insurance | 8,477.4 | 15.3 | (743.9 | ) | (9.3 | ) | 9,221.3 | 24.7 | ||||||||||||||||
Real Estate | 9,704.8 | 36.5 | 77.1 | (3.5 | ) | 9,627.6 | 40.0 | |||||||||||||||||
Commodity Lease | 2,921.0 | 1.4 | (145.0 | ) | (0.0 | ) | 3,066.0 | 1.4 | ||||||||||||||||
Service Industries | 3,083.2 | 153.4 | (258.6 | ) | 15.0 | 3,341.8 | 138.4 | |||||||||||||||||
Local Governments | 642.8 | — | (33.3 | ) | — | 676.2 | — | |||||||||||||||||
Governments | 955.5 | — | (268.1 | ) | — | 1,223.6 | — | |||||||||||||||||
Other | 10,762.1 | 82.7 | (294.3 | ) | (16.6 | ) | 11,056.5 | 99.3 | ||||||||||||||||
Overseas Total (including Loans Booked Offshore) | 23,833.0 | 49.2 | (107.2 | ) | (20.4 | ) | 23,940.2 | 69.6 | ||||||||||||||||
Governments | 169.7 | — | (55.4 | ) | — | 225.1 | — | |||||||||||||||||
Financial Institutions | 8,770.6 | — | 90.3 | — | 8,680.3 | — | ||||||||||||||||||
Other | 14,892.5 | 49.2 | (142.2 | ) | (20.4 | ) | 15,034.7 | 69.6 | ||||||||||||||||
|
|
|
|
|
|
|
|
|
|
|
| |||||||||||||
Total | 83,771.7 | 755.5 | (2,212.8 | ) | 5.9 | 85,984.5 | 749.5 | |||||||||||||||||
|
|
|
|
|
|
|
|
|
|
|
| |||||||||||||
| * | Loans to Finance & Insurance sector includes loans to MHFG as follows: |
As of September 30, 2021: | ¥590.0 billion (from MHBK) | |
As of March 31, 2021: | ¥850.0 billion (from MHBK) |
| * | Amounts of Outstanding Balances are the aggregate figures for banking and trust accounts, and amounts of Non-Accrual, Past Due & Restructured Loans are the aggregate figures for banking and trust accounts with contracts indemnifying the principal amounts. |
2-29
Mizuho Financial Group, Inc.
| (Billions of yen) | ||||||||||||||||||||||||
| As of September 30, 2021 | As of March 31, 2021 | |||||||||||||||||||||||
| Outstanding Balance | Non-Accrual, Past Due & Restructured Loans | Change | Outstanding Balance | Non-Accrual, Past Due & Restructured Loans | ||||||||||||||||||||
| Outstanding Balance | Non-Accrual, Past Due & Restructured Loans | |||||||||||||||||||||||
| Mizuho Bank | ||||||||||||||||||||||||
Domestic Total (excluding Loans Booked Offshore) | 56,248.2 | 699.9 | (1,886.7 | ) | 27.2 | 58,134.9 | 672.7 | |||||||||||||||||
Manufacturing | 10,033.6 | 228.8 | (421.1 | ) | 19.6 | 10,454.8 | 209.1 | |||||||||||||||||
Agriculture & Forestry | 47.7 | 0.7 | (2.8 | ) | (0.0 | ) | 50.6 | 0.7 | ||||||||||||||||
Fishery | 2.5 | 0.3 | 0.2 | (0.0 | ) | 2.2 | 0.3 | |||||||||||||||||
Mining, Quarrying Industry & Gravel Extraction Industry | 224.2 | 0.2 | (89.8 | ) | 0.1 | 314.1 | 0.1 | |||||||||||||||||
Construction | 667.5 | 5.0 | (24.9 | ) | (0.2 | ) | 692.4 | 5.2 | ||||||||||||||||
Utilities | 2,606.8 | 1.1 | 37.4 | (0.9 | ) | 2,569.4 | 2.1 | |||||||||||||||||
Communication | 1,177.8 | 9.4 | 40.3 | 0.0 | 1,137.4 | 9.3 | ||||||||||||||||||
Transportation & Postal Industry | 2,451.9 | 28.5 | 6.8 | 19.9 | 2,445.1 | 8.5 | ||||||||||||||||||
Wholesale & Retail | 5,027.1 | 141.1 | 79.6 | 3.0 | 4,947.4 | 138.0 | ||||||||||||||||||
Finance & Insurance | 7,973.9 | 15.3 | (761.9 | ) | (9.3 | ) | 8,735.8 | 24.7 | ||||||||||||||||
Real Estate | 8,317.5 | 33.6 | 73.3 | (3.4 | ) | 8,244.1 | 37.1 | |||||||||||||||||
Commodity Lease | 2,709.9 | 1.4 | (146.8 | ) | (0.0 | ) | 2,856.8 | 1.4 | ||||||||||||||||
Service Industries | 3,034.3 | 152.9 | (253.2 | ) | 15.0 | 3,287.6 | 137.9 | |||||||||||||||||
Local Governments | 640.6 | — | (32.8 | ) | — | 673.5 | — | |||||||||||||||||
Governments | 955.5 | — | (132.3 | ) | — | 1,087.9 | — | |||||||||||||||||
Other | 10,376.7 | 81.0 | (258.5 | ) | (16.5 | ) | 10,635.3 | 97.5 | ||||||||||||||||
Overseas Total (including Loans Booked Offshore) | 23,832.5 | 49.2 | (107.0 | ) | (20.4 | ) | 23,939.6 | 69.6 | ||||||||||||||||
Governments | 169.7 | — | (55.4 | ) | — | 225.1 | — | |||||||||||||||||
Financial Institutions | 8,770.6 | — | 90.3 | — | 8,680.3 | — | ||||||||||||||||||
Other | 14,892.1 | 49.2 | (142.0 | ) | (20.4 | ) | 15,034.1 | 69.6 | ||||||||||||||||
|
|
|
|
|
|
|
|
|
|
|
| |||||||||||||
Total | 80,080.8 | 749.1 | (1,993.7 | ) | 6.7 | 82,074.5 | 742.4 | |||||||||||||||||
|
|
|
|
|
|
|
|
|
|
|
| |||||||||||||
| Mizuho Trust & Banking (Banking Account + Trust Account) | ||||||||||||||||||||||||
Domestic Total (excluding Loans Booked Offshore) | 3,690.4 | 6.3 | (218.8 | ) | (0.8 | ) | 3,909.3 | 7.1 | ||||||||||||||||
Manufacturing | 428.4 | 0.2 | (31.3 | ) | (1.7 | ) | 459.7 | 1.9 | ||||||||||||||||
Agriculture & Forestry | 0.0 | — | (0.0 | ) | — | 0.0 | — | |||||||||||||||||
Fishery | — | — | — | — | — | — | ||||||||||||||||||
Mining, Quarrying Industry & Gravel Extraction Industry | 1.5 | — | (0.1 | ) | — | 1.7 | — | |||||||||||||||||
Construction | 41.2 | — | 5.5 | — | 35.7 | — | ||||||||||||||||||
Utilities | 283.3 | — | 0.1 | — | 283.2 | — | ||||||||||||||||||
Communication | 92.6 | — | 5.1 | — | 87.5 | — | ||||||||||||||||||
Transportation & Postal Industry | 176.9 | — | (25.7 | ) | — | 202.6 | — | |||||||||||||||||
Wholesale & Retail | 127.7 | 0.9 | (18.7 | ) | 0.9 | 146.4 | — | |||||||||||||||||
Finance & Insurance | 503.4 | — | 17.9 | — | 485.5 | — | ||||||||||||||||||
Real Estate | 1,387.2 | 2.9 | 3.8 | (0.0 | ) | 1,383.4 | 2.9 | |||||||||||||||||
Commodity Lease | 211.0 | — | 1.8 | — | 209.2 | — | ||||||||||||||||||
Service Industries | 48.8 | 0.5 | (5.3 | ) | 0.0 | 54.2 | 0.5 | |||||||||||||||||
Local Governments | 2.2 | — | (0.4 | ) | — | 2.7 | — | |||||||||||||||||
Governments | — | — | (135.7 | ) | — | 135.7 | — | |||||||||||||||||
Other | 385.3 | 1.6 | (35.7 | ) | (0.0 | ) | 421.1 | 1.7 | ||||||||||||||||
Overseas Total (including Loans Booked Offshore) | 0.4 | — | (0.2 | ) | — | 0.6 | — | |||||||||||||||||
Governments | — | — | — | — | — | — | ||||||||||||||||||
Financial Institutions | — | — | — | — | — | — | ||||||||||||||||||
Other | 0.4 | — | (0.2 | ) | — | 0.6 | — | |||||||||||||||||
|
|
|
|
|
|
|
|
|
|
|
| |||||||||||||
Total | 3,690.8 | 6.3 | (219.1 | ) | (0.8 | ) | 3,909.9 | 7.1 | ||||||||||||||||
|
|
|
|
|
|
|
|
|
|
|
| |||||||||||||
| * | Amounts of Outstanding Balances are the aggregate figures for banking and trust accounts, and amounts of Non-Accrual, Past Due & Restructured Loans are the aggregate figures for banking and trust accounts with contracts indemnifying the principal amounts. |
2-30
Mizuho Financial Group, Inc.
(2) Non Performing Loans based on the FRA and Coverage Ratio by Industry
Non-Consolidated
Aggregate Figures for the 2 Banks (Banking Account + Trust Account)
| (Billions of yen, %) | ||||||||||||||||||||||||
| As of September 30, 2021 | As of March 31, 2021 | |||||||||||||||||||||||
| Change | ||||||||||||||||||||||||
| Non Performing Loans basaed on the FRA | Coverage Ratio | Non Performing Loans basaed on the FRA | Coverage Ratio | Non Performing Loans basaed on the FRA | Coverage Ratio | |||||||||||||||||||
Domestic Total (excluding Loans Booked Offshore) | 722.3 | 63.6 | 21.3 | (2.6 | ) | 700.9 | 66.3 | |||||||||||||||||
Manufacturing | 238.9 | 53.7 | 13.7 | (1.9 | ) | 225.1 | 55.6 | |||||||||||||||||
Agriculture & Forestry | 0.7 | 52.3 | (0.0 | ) | (1.1 | ) | 0.7 | 53.4 | ||||||||||||||||
Fishery | 0.3 | 62.6 | (0.0 | ) | 0.0 | 0.3 | 62.6 | |||||||||||||||||
Mining, Quarrying Industry & Gravel Extraction Industry | 0.2 | 90.4 | 0.1 | 11.4 | 0.1 | 78.9 | ||||||||||||||||||
Construction | 5.2 | 81.8 | (0.2 | ) | 5.5 | 5.5 | 76.3 | |||||||||||||||||
Utilities | 1.1 | 52.0 | (0.9 | ) | (19.8 | ) | 2.1 | 71.8 | ||||||||||||||||
Communication | 9.7 | 73.3 | 0.0 | (0.4 | ) | 9.7 | 73.7 | |||||||||||||||||
Transportation & Postal Industry | 28.6 | 48.3 | 19.9 | (20.8 | ) | 8.7 | 69.1 | |||||||||||||||||
Wholesale & Retail | 144.2 | 56.2 | 4.6 | (0.5 | ) | 139.6 | 56.8 | |||||||||||||||||
Finance & Insurance | 15.3 | 74.0 | (9.7 | ) | (8.4 | ) | 25.1 | 82.5 | ||||||||||||||||
Real Estate | 37.0 | 86.2 | (3.5 | ) | (2.6 | ) | 40.5 | 88.8 | ||||||||||||||||
Commodity Lease | 1.4 | 79.7 | (0.0 | ) | (10.8 | ) | 1.4 | 90.6 | ||||||||||||||||
Service Industries | 156.3 | 66.2 | 14.2 | (0.5 | ) | 142.0 | 66.7 | |||||||||||||||||
Local Governments | — | — | — | — | — | — | ||||||||||||||||||
Other | 82.7 | 91.6 | (16.6 | ) | 3.7 | 99.4 | 87.9 | |||||||||||||||||
Overseas Total (including Loans Booked Offshore) | 66.9 | 78.9 | (24.8 | ) | (2.4 | ) | 91.8 | 81.3 | ||||||||||||||||
Governments | — | — | — | — | — | — | ||||||||||||||||||
Financial Institutions | — | — | — | — | — | — | ||||||||||||||||||
Other | 66.9 | 78.9 | (24.8 | ) | (2.4 | ) | 91.8 | 81.3 | ||||||||||||||||
|
|
|
|
|
|
|
|
|
|
|
| |||||||||||||
Total | 789.2 | 64.9 | (3.5 | ) | (3.0 | ) | 792.7 | 68.0 | ||||||||||||||||
|
|
|
|
|
|
|
|
|
|
|
| |||||||||||||
| * | Trust account represents trust accounts that guarantee principals in the agreement. |
2-31
Mizuho Financial Group, Inc.
9. Housing and Consumer Loans & Loans to Small and Medium-Sized Enterprises (“SMEs”) and Individual Customers
(1) Balance of Housing and Consumer Loans
Non-Consolidated
Aggregate Figures for the 2 Banks (Banking Account + Trust Account)
| (Billions of yen) | ||||||||||||
| As of September 30, 2021 | As of March 31, 2021 | |||||||||||
| Change | ||||||||||||
Housing and Consumer Loans | 8,599.0 | (163.7 | ) | 8,762.8 | ||||||||
Housing Loans for owner’s residential housing | 8,003.0 | (122.5 | ) | 8,125.6 | ||||||||
Mizuho Bank | ||||||||||||
Housing and Consumer Loans | 8,541.4 | (159.1 | ) | 8,700.5 | ||||||||
Housing Loans | 8,099.1 | (132.9 | ) | 8,232.0 | ||||||||
for owner’s residential housing | 7,949.2 | (118.4 | ) | 8,067.6 | ||||||||
Consumer loans | 442.2 | (26.2 | ) | 468.4 | ||||||||
Mizuho Trust & Banking (Banking Account + Trust Account) | ||||||||||||
Housing and Consumer Loans | 57.6 | (4.6 | ) | 62.2 | ||||||||
Housing Loans for owner’s residential housing | 53.8 | (4.1 | ) | 57.9 | ||||||||
* Above figures are aggregate banking and trust account amounts. | ||||||||||||
(2) Loans to SMEs and Individual Customers |
| |||||||||||
Non-Consolidated |
| |||||||||||
Aggregate Figures for the 2 Banks (Banking Account + Trust Account) |
| |||||||||||
| (%, Billions of yen) | ||||||||||||
| As of September 30, 2021 | As of March 31, 2021 | |||||||||||
| Change | ||||||||||||
Percentage of Loans to SMEs and Individual Customers, of Total Domestic Loans | 57.3 | (0.0 | ) | 57.3 | ||||||||
Loans to SMEs and Individual Customers | 34,362.8 | (1,238.2 | ) | 35,601.0 | ||||||||
Mizuho Bank | ||||||||||||
Percentage of Loans to SMEs and Individual Customers, of Total Domestic Loans | 57.7 | (0.2 | ) | 57.9 | ||||||||
Loans to SMEs and Individual Customers | 32,470.1 | (1,208.6 | ) | 33,678.8 | ||||||||
Mizuho Trust & Banking (Banking Account + Trust Account) | ||||||||||||
Percentage of Loans to SMEs and Individual Customers, of Total Domestic Loans | 51.2 | 2.1 | 49.1 | |||||||||
Loans to SMEs and Individual Customers | 1,892.6 | (29.6 | ) | 1,922.2 | ||||||||
| * | Above figures are aggregate banking and trust account amounts. |
| * | Above figures do not include loans booked at overseas offices and offshore loans. |
| * | The definition of “Small and Medium-sized Enterprises” is as follows: |
Enterprises of which the capital is ¥300 million or below (¥100 million or below for the wholesale industry, and ¥50 million or below for the retail, restaurant and commodity lease industries, etc.), or enterprises with full-time employees of 300 or below (100 or below for the wholesale and commodity lease industries etc., 50 or below for the retail and restaurant industries.) |
2-32
Mizuho Financial Group, Inc.
10. Status of Loans by Region
Non-Consolidated
Aggregate Figures for the 2 Banks (Banking Account + Trust Account)
| (Billions of yen) | ||||||||||||||||||||||||
| As of September 30, 2021 | As of March 31, 2021 | |||||||||||||||||||||||
| Non-Accrual, Past Due & Restructured Loans | Change | Non-Accrual, Past Due & Restructured Loans | ||||||||||||||||||||||
| Outstanding Balance | Outstanding Balance | Non-Accrual, Past Due & Restructured Loans | Outstanding Balance | |||||||||||||||||||||
Asia | 7,338.8 | 29.7 | 21.8 | (2.5 | ) | 7,317.0 | 32.3 | |||||||||||||||||
Hong Kong | 1,903.9 | 0.4 | (11.3 | ) | 0.1 | 1,915.3 | 0.3 | |||||||||||||||||
Singapore | 1,012.4 | 27.6 | (113.4 | ) | 0.0 | 1,125.9 | 27.6 | |||||||||||||||||
Thailand | 1,039.6 | 0.2 | (42.5 | ) | (0.2 | ) | 1,082.2 | 0.5 | ||||||||||||||||
Taiwan | 1,121.6 | 0.1 | 274.7 | 0.0 | 846.8 | 0.0 | ||||||||||||||||||
India | 489.3 | 0.2 | 10.2 | (2.4 | ) | 479.0 | 2.7 | |||||||||||||||||
South Korea | 545.9 | 0.0 | 2.1 | 0.0 | 543.8 | 0.0 | ||||||||||||||||||
Indonesia | 355.6 | 0.9 | (66.7 | ) | 0.0 | 422.3 | 0.9 | |||||||||||||||||
Philippines | 279.7 | 0.0 | (13.6 | ) | (0.0 | ) | 293.3 | 0.0 | ||||||||||||||||
China | 157.4 | — | (39.7 | ) | — | 197.2 | — | |||||||||||||||||
Malaysia | 103.6 | — | (9.3 | ) | — | 113.0 | — | |||||||||||||||||
Central and South America | 4,945.7 | 16.4 | (171.7 | ) | (6.8 | ) | 5,117.4 | 23.2 | ||||||||||||||||
Mexico | 317.0 | 0.8 | (27.7 | ) | (0.0 | ) | 344.7 | 0.8 | ||||||||||||||||
Brazile | 174.2 | 4.0 | (2.9 | ) | (0.7 | ) | 177.1 | 4.8 | ||||||||||||||||
North America | 7,714.0 | 10.1 | 238.4 | (23.5 | ) | 7,475.6 | 33.6 | |||||||||||||||||
United States | 6,920.8 | 10.1 | 367.3 | (11.5 | ) | 6,553.4 | 21.6 | |||||||||||||||||
Eastern Europe | 288.3 | — | (2.1 | ) | — | 290.4 | — | |||||||||||||||||
Russia | 217.7 | — | 5.8 | — | 211.8 | — | ||||||||||||||||||
Western Europe | 3,927.4 | 27.9 | (235.5 | ) | 9.9 | 4,162.9 | 18.0 | |||||||||||||||||
United Kingdom | 1,151.3 | 6.4 | (24.6 | ) | (1.1 | ) | 1,176.0 | 7.5 | ||||||||||||||||
Netherlands | 918.2 | — | (55.4 | ) | — | 973.7 | — | |||||||||||||||||
Germany | 416.0 | — | (93.1 | ) | (4.9 | ) | 509.1 | 4.9 | ||||||||||||||||
Ireland | 342.4 | 21.4 | 34.1 | 21.4 | 308.3 | — | ||||||||||||||||||
Switzerland | 149.7 | 0.0 | (15.2 | ) | 0.0 | 165.0 | — | |||||||||||||||||
France | 173.0 | — | (42.5 | ) | — | 215.6 | — | |||||||||||||||||
Turkey | 84.8 | — | (10.4 | ) | — | 95.2 | — | |||||||||||||||||
Italy | 112.9 | — | (30.0 | ) | — | 142.9 | — | |||||||||||||||||
Other | 2,918.7 | 8.3 | (226.8 | ) | 3.8 | 3,145.6 | 4.5 | |||||||||||||||||
Australia | 1,577.7 | — | (55.1 | ) | — | 1,632.8 | — | |||||||||||||||||
Total | 27,133.1 | 92.7 | (376.0 | ) | (19.1 | ) | 27,509.1 | 111.8 | ||||||||||||||||
The above figures are based on obligor country of location. |
| |||||||||||||||||||||||
The outstanding balance of loans and Non-Accrual, Past Due & Restructured Loans in major banking subsidiaries outside Japan is as follows. |
| |||||||||||||||||||||||
| As of September 30, 2021 | As of March 31, 2021 | |||||||||||||||||||||||
| Change | ||||||||||||||||||||||||
| Outstanding Balance | Non-Accrual, Past Due & Restructured Loans | Outstanding Balance | Non-Accrual, Past Due & Restructured Loans | Outstanding Balance | Non-Accrual, Past Due & Restructured Loans | |||||||||||||||||||
Mizuho Bank (China) ,Ltd | 1,147.9 | 1.4 | 34.8 | 0.4 | 1,113.0 | 1.0 | ||||||||||||||||||
Mizuho Bank (USA) | 464.9 | 2.9 | 70.6 | 0.1 | 394.2 | 2.7 | ||||||||||||||||||
PT. Bank Mizuho Indonesia | 289.7 | 1.2 | (24.9 | ) | (1.7 | ) | 314.7 | 3.0 | ||||||||||||||||
2-33
Mizuho Financial Group, Inc.
III. DEFERRED TAXES
1. Estimation for Calculating Deferred Tax Assets
Non-Consolidated
Mizuho Bank
1. Estimate of future taxable income
| (Billions of yen) | ||||||||
| Total amount for five years (from October 1, 2021 to September 30, 2026) | ||||||||
Net Business Profits (before Reversal of (Provision for) General Reserve for Losses on Loans) | 1 | 3,233.8 | ||||||
Income before Income Taxes | 2 | 3,466.3 | ||||||
Tax Adjustments (1) | 3 | 180.1 | ||||||
Taxable Income before Current Deductible Temporary Differences (2) | 4 | 3,646.4 | ||||||
Effective Statutory Tax Rate | 5 | 30.62% | ||||||
Deferred Tax Assets corresponding to Taxable Income before Current Deductible Temporary Differences [ 4 x 5 ] | 6 | 1,116.5 | ||||||
| (1) | Tax Adjustments are estimated future book-tax differences under the provisions of the corporation tax law and others. |
| (2) | Taxable Income before Current Deductible Temporary Differences is an estimate of taxable income before adjusting deductible temporary differences as of September 30, 2021. |
Reference: Past results of taxable income (tax loss)
| ||||
| (Billions of yen) | ||||
Fiscal 2017 | 379.9 | |||
Fiscal 2018 | 267.2 | |||
Fiscal 2019 | 378.5 | |||
Fiscal 2020 | 316.3 | |||
First Half of Fiscal 2021 (estimate) | 186.0 | |||
| * | Figures are taxable income (tax loss) amounts per the final corporation tax returns before deducting tax losses carried forward from prior years. Subsequent amendments have not been reflected. |
| * | Figure for the first half of fiscal 2021 is an estimate of taxable income. |
2. Breakdown of Deferred Tax Assets
| (Billions of yen) | ||||||||||||||||
| As of September 30, 2021 | Change | As of March 31, 2021 | ||||||||||||||
Reserves for Possible Losses on Loans | 7 | 190.6 | 4.3 | 186.2 | ||||||||||||
Impairment of Securities | 8 | 122.5 | (3.6 | ) | 126.2 | |||||||||||
Net Unrealized Losses on Other Securities | 9 | 9.7 | (1.0 | ) | 10.7 | |||||||||||
Reserve for Employee Retirement Benefits | 10 | — | — | — | ||||||||||||
Depreciation and Impairment | 11 | 132.5 | (13.9 | ) | 146.5 | |||||||||||
Net Deferred Hedge Losses | 12 | 4.7 | 4.7 | — | ||||||||||||
Tax Losses Carried Forward | 13 | — | — | — | ||||||||||||
Other | 14 | 214.4 | (17.3 | ) | 231.7 | |||||||||||
|
|
|
|
|
| |||||||||||
Total Deferred Tax Assets | 15 | 674.7 | (26.9 | ) | 701.6 | |||||||||||
|
|
|
|
|
| |||||||||||
Valuation Allowance | 16 | (133.6 | ) | 2.1 | (135.7 | ) | ||||||||||
|
|
|
|
|
| |||||||||||
Sub-Total [ 15 + 16 ] | 17 | 541.0 | (24.7 | ) | 565.8 | |||||||||||
|
|
|
|
|
| |||||||||||
Amount related to Retirement Benefits Accounting | 18 | (142.2 | ) | 18.2 | (160.5 | ) | ||||||||||
Net Unrealized Gains on Other Securities | 19 | (405.6 | ) | (8.8 | ) | (396.8 | ) | |||||||||
Net Deferred Hedge Gains | 20 | — | 10.8 | (10.8 | ) | |||||||||||
Other | 21 | (49.3 | ) | (12.9 | ) | (36.3 | ) | |||||||||
|
|
|
|
|
| |||||||||||
Total Deferred Tax Liabilities | 22 | (597.2 | ) | 7.3 | (604.5 | ) | ||||||||||
|
|
|
|
|
| |||||||||||
Net Deferred Tax Assets (Liabilities) [17 + 22] | 23 | (56.1 | ) | (17.4 | ) | (38.7 | ) | |||||||||
Tax effects related to Net Unrealized Losses (Gains) on Other Securities* | 24 | (407.0 | ) | (7.2 | ) | (399.7 | ) | |||||||||
Tax effects related to Net Deferred Hedge Losses (Gains) | 25 | 4.7 | 15.6 | (10.8 | ) | |||||||||||
Tax effects related to others | 26 | 346.0 | (25.8 | ) | 371.8 | |||||||||||
| * | Tax effects related to Net Unrealized Losses (Gains) on Other Securities is the amount after deducting Valuation Allowance. |
Assessment of Recoverability of Deferred Tax Assets is based on 19. Company Classification (Category 2) of “Revised Implementation Guidance on Recoverability of Deferred Tax Assets” (ASBJ Guidance No.26).
Future taxable income was estimated using assumptions used in the Business Plan, etc.
The above includes forward-looking information. See the disclaimer at the end of the table of contents located at the beginning of this document.
2-34
Mizuho Financial Group, Inc.
Mizuho Trust & Banking
1. Estimate of future taxable income
| (Billions of yen) | ||||||||
| Total amount for five years (from October 1, 2021 to September 30, 2026) | ||||||||
Net Business Profits (before Reversal of (Provision for) General Reserve for Losses on Loans) | 1 | 215.4 | ||||||
Income before Income Taxes | 2 | 227.7 | ||||||
Tax Adjustments (1) | 3 | (41.7 | ) | |||||
Taxable Income before Current Deductible Temporary Differences (2) | 4 | 186.0 | ||||||
Effective Statutory Tax Rate | 5 | 30.62% | ||||||
Deferred Tax Assets corresponding to Taxable Income before Current Deductible Temporary Differences [ 4 x 5 ] | 6 | 56.9 | ||||||
| (1) | Tax Adjustments are estimated future book-tax differences under the provisions of the corporation tax law and others. |
| (2) | Taxable Income before Current Deductible Temporary Differences is an estimate of taxable income before adjusting deductible temporary differences as of September 30, 2021. |
Reference: Past results of taxable income (tax loss)
| ||||
| (Billions of yen) | ||||
Fiscal 2017 | 40.5 | |||
Fiscal 2018 | 39.0 | |||
Fiscal 2019 | 31.7 | |||
Fiscal 2020 | 26.6 | |||
First Half of Fiscal 2021 (estimate) | 14.0 | |||
| * | Figures are taxable income (tax loss) amounts per the final corporation tax returns before deducting tax losses carried forward from prior years. Subsequent amendments have not been reflected. |
| * | Figure for the first half of fiscal 2021 is an estimate of taxable income. |
2. Breakdown of Deferred Tax Assets
| (Billions of yen) | ||||||||||||||||
| As of September 30, 2021 | Change | As of March 31, 2021 | ||||||||||||||
Reserves for Possible Losses on Loans | 7 | 1.2 | (0.0 | ) | 1.3 | |||||||||||
Impairment of Securities | 8 | 8.1 | (0.8 | ) | 9.0 | |||||||||||
Net Unrealized Losses on Other Securities | 9 | 0.4 | 0.1 | 0.2 | ||||||||||||
Reserve for Employee Retirement Benefits (1) | 10 | 2.0 | 2.0 | 0.0 | ||||||||||||
Reserve for Loss of Transfer | 11 | 1.3 | (0.1 | ) | 1.4 | |||||||||||
Net Deferred Hedge Losses | 12 | 2.0 | 0.9 | 1.1 | ||||||||||||
Tax Losses Carried Forward | 13 | — | — | — | ||||||||||||
Other (2) | 14 | 17.4 | (2.9 | ) | 20.4 | |||||||||||
|
|
|
|
|
| |||||||||||
Total Deferred Tax Assets | 15 | 32.8 | (0.9 | ) | 33.7 | |||||||||||
|
|
|
|
|
| |||||||||||
Valuation Allowance | 16 | (8.9 | ) | 0.6 | (9.6 | ) | ||||||||||
|
|
|
|
|
| |||||||||||
Sub-Total [ 15 + 16 ] | 17 | 23.8 | (0.2 | ) | 24.0 | |||||||||||
|
|
|
|
|
| |||||||||||
Amount related to Retirement Benefits Accounting (3) | 18 | (19.3 | ) | 0.8 | (20.1 | ) | ||||||||||
Net Unrealized Gains on Other Securities | 19 | (19.7 | ) | (0.7 | ) | (18.9 | ) | |||||||||
Net Deferred Hedge Gains | 20 | — | — | — | ||||||||||||
Other | 21 | (2.9 | ) | (2.6 | ) | (0.3 | ) | |||||||||
|
|
|
|
|
| |||||||||||
Total Deferred Tax Liabilities | 22 | (42.0 | ) | (2.5 | ) | (39.5 | ) | |||||||||
|
|
|
|
|
| |||||||||||
Net Deferred Tax Assets (Liabilities) [17 + 22] | 23 | (18.2 | ) | (2.7 | ) | (15.5 | ) | |||||||||
Tax effects related to Net Unrealized Losses (Gains) on Other Securities (4) | 24 | (19.4 | ) | (0.4 | ) | (18.9 | ) | |||||||||
Tax effects related to Net Deferred Hedge Losses (Gains) | 25 | 2.0 | 0.9 | 1.1 | ||||||||||||
Tax effects related to others | 26 | (0.9 | ) | (3.2 | ) | 2.3 | ||||||||||
| (1,2,3) | The presentation of “Reserve for Employee Retirement Benefits”, “Other” and “Amount related to Retirement Benefits Accounting” has been changed from this fiscal year. In order to reflect the change in presentation of the financial statements, “ Reserve for Employee Retirement Benefits “ of ¥3.1 billion, “Other” of ¥5.1 billion and “Amount related to Retirement Benefits Accounting” of ¥(7.9) billion presented in the statements for the previous fiscal year have been reclassified as “ Reserve for Employee Retirement Benefits “ of ¥0 billion, “Other” of ¥20.4 billion and “Amount related to Retirement Benefits Accounting” of ¥(20.1) billion. |
| (4) | Tax effects related to Net Unrealized Losses (Gains) on Other Securities is the amount after deducting Valuation Allowance. |
Assessment of Recoverability of Deferred Tax Assets is based on 19. Company Classification (Category 2) of “Revised Implementation Guidance on Recoverability of Deferred Tax Assets” (ASBJ Guidance No.26).
Future taxable income was estimated using assumptions used in the Business Plan, etc.
The above includes forward-looking information. See the disclaimer at the end of the table of contents located at the beginning of this document.
2-35
Mizuho Financial Group, Inc.
IV. OTHERS
1. Breakdown of Deposits (Domestic Offices)
Non-Consolidated
Aggregate Figures for the 2 Banks
| (Billions of yen) | ||||||||||||
| As of September 30, 2021 | Change | As of March 31, 2021 | ||||||||||
Deposits | 107,624.9 | (3,418.3 | ) | 111,043.3 | ||||||||
|
|
|
|
|
| |||||||
Individual Deposits | 47,702.7 | 381.1 | 47,321.6 | |||||||||
Corporate Deposits | 51,794.3 | (2,798.4 | ) | 54,592.7 | ||||||||
Financial/Government Institutions | 8,127.7 | (1,001.1 | ) | 9,128.8 | ||||||||
| Mizuho Bank | ||||||||||||
Deposits | 104,960.2 | (3,203.1 | ) | 108,163.3 | ||||||||
|
|
|
|
|
| |||||||
Individual Deposits | 46,870.1 | 378.6 | 46,491.5 | |||||||||
Corporate Deposits | 50,620.0 | (2,653.9 | ) | 53,273.9 | ||||||||
Financial/Government Institutions | 7,469.9 | (927.8 | ) | 8,397.8 | ||||||||
| Mizuho Trust & Banking | ||||||||||||
Deposits | 2,664.7 | (215.2 | ) | 2,879.9 | ||||||||
|
|
|
|
|
| |||||||
Individual Deposits | 832.6 | 2.4 | 830.1 | |||||||||
Corporate Deposits | 1,174.3 | (144.4 | ) | 1,318.8 | ||||||||
Financial/Government Institutions | 657.7 | (73.2 | ) | 731.0 | ||||||||
Above figures do not include deposits booked at overseas offices and offshore deposits.
2-36
Mizuho Financial Group, Inc.
2. Number of Directors and Employees
(1) Number of Directors
Aggregate Figures for Mizuho Financial Group, the 2 Banks, and Mizuho Securities
| As of September 30, 2021 | Change | As of March 31, 2021 | ||||||||||
Directors, Executive Officers as defined in the Companies Act, and Auditors | 47 | 2 | 45 | |||||||||
Executive Officers as defined in our internal regulations (excluding those doubling as Directors as defined in the Companies Act) | 42 | (75 | ) | 117 | ||||||||
The above numbers have been adjusted for those who are doubling other positions. |
| |||||||||||
(2) Number of Employees
Consolidated
|
| |||||||||||
| As of September 30, 2021 | Change | As of March 31, 2021 | ||||||||||
Employees (excluding Executive Officers as defined in our internal regulations) | 53,952 | (540 | ) | 54,492 | ||||||||
Average number of temporary employees | 14,277 | (1,032 | ) | 15,309 | ||||||||
The number of Employees excludes employees seconded outside the company and includes employees seconded from outside the company in each consolidated subsidiary. That number also includes overseas local staff but excludes advisers and temporary employees.
3. Number of Offices
Domestic: The 2 Banks and Mizuho Securities
|
| |||||||||||
| As of September 30, 2021 | Change | As of March 31, 2021 | ||||||||||
Mizuho Bank | 461 | (2 | ) | 463 | ||||||||
Mizuho Trust & Banking | 60 | — | 60 | |||||||||
Mizuho Securities | 237 | (1 | ) | 238 | ||||||||
The above numbers are the numbers of head office, domestic branches (excluding branches and offices for remittance purposes only (46), branches offering account transfer services only (2), branches and offices to maintain shared ATMs only (1), internet branches (1), and pension plan advisory offices (1)), domestic sub-branches, and others.
Overseas: The 2 Banks and Mizuho Securities
|
| |||||||||||
| As of September 30, 2021 | Change | As of March 31, 2021 | ||||||||||
Mizuho Bank | 49 | — | 49 | |||||||||
Mizuho Trust & Banking | — | — | — | |||||||||
Mizuho Securities | 2 | — | 2 | |||||||||
The above numbers are the numbers of overseas branches or relevant offices, and overseas representative offices. |
| |||||||||||
2-37
Mizuho Financial Group, Inc.
4. Earnings Plan for Fiscal 2021
Consolidated
| (Billions of yen) | ||||
| Fiscal 2021 | ||||
Ordinary Profits | 690.0 | |||
Profit Attributable to Owners of Parent | 530.0 | |||
Non-Consolidated
Mizuho Bank, Mizuho Trust & Banking
| (Billions of yen) | ||||||||||||
| Fiscal 2021 | ||||||||||||
| Aggregate Figures for the 2 Banks | MHBK | MHTB* | ||||||||||
Net Business Profits (before Reversal of (Provision for) General Reserve for Losses on Loans) + Net Gains (Losses) related to ETF | 580.0 | 545.0 | 35.0 | |||||||||
Ordinary Profits | 475.0 | 435.0 | 40.0 | |||||||||
Net Income | 280.0 | 245.0 | 35.0 | |||||||||
Credit-related Costs | (90.0 | ) | (85.0 | ) | (5.0 | ) | ||||||
| * | Net Business Profits (before Reversal of (Provision for) General Reserve for Losses on Loans) for MHTB excludes the amounts of Credit Costs for Trust Accounts. |
Note: Following the results from 1H, MHFG revised Earnings Plan for Fiscal 2021.
Consolidated
Ordinary Profits:
The latest previously announced estimates: ¥720.0 billion, Revised estimates: ¥690.0 billion, Changes from the original estimates: ¥(30.0) billion, (4.1)%
Profit Attributable to Owners of Parent:
The latest previously announced estimates: ¥510.0 billion, Revised estimates: ¥530.0 billion, Changes from the original estimates: ¥20.0 billion, 3.9%
Non-Consolidated
Net Business Profits (before Reversal of (Provision for) General Reserve for Losses on Loans) + Net Gains (Losses) related to ETF:
The latest previously announced estimates: ¥590.0 billion, Revised estimates: ¥580.0 billion, Changes from the original estimates: ¥(10.0) billion, (1.6)%
Ordinary Profits:
The latest previously announced estimates: ¥540.0 billion, Revised estimates: ¥475.0 billion, Changes from the original estimates: ¥(65.0) billion, (12.0)%
Net Income:
The latest previously announced estimates: ¥375.0 billion, Revised estimates: ¥280.0 billion, Changes from the original estimates: ¥(95.0) billion, (25.3)%
The above information constitute forward-looking statements. Please see the legend regarding forward-looking statements in CONTENTS.
2-38
Mizuho Bank, Ltd.
Attachments
COMPARISON OF NON-CONSOLIDATED BALANCE SHEETS (selected items)
OF MIZUHO BANK
| Millions of yen | ||||||||||||
| As of September 30, 2021 (A) | As of March 31, 2021 (B) | Change (A) - (B) | ||||||||||
Assets | ||||||||||||
Cash and Due from Banks | ¥ | 43,993,613 | ¥ | 45,460,471 | ¥ | (1,466,858 | ) | |||||
Call Loans | 748,154 | 967,504 | (219,350 | ) | ||||||||
Receivables under Resale Agreements | 7,867,773 | 2,376,420 | 5,491,353 | |||||||||
Guarantee Deposits Paid under Securities Borrowing Transactions | 151,967 | 151,282 | 685 | |||||||||
Other Debt Purchased | 470,267 | 482,837 | (12,569 | ) | ||||||||
Trading Assets | 4,007,832 | 4,655,665 | (647,833 | ) | ||||||||
Money Held in Trust | 503 | 503 | 0 | |||||||||
Securities | 43,636,219 | 43,720,657 | (84,438 | ) | ||||||||
Loans and Bills Discounted | 80,080,848 | 82,074,591 | (1,993,742 | ) | ||||||||
Foreign Exchange Assets | 2,138,323 | 2,016,766 | 121,557 | |||||||||
Derivatives other than for Trading | 3,290,700 | 3,998,530 | (707,829 | ) | ||||||||
Other Assets | 4,191,028 | 4,920,054 | (729,025 | ) | ||||||||
Tangible Fixed Assets | 866,226 | 881,564 | (15,337 | ) | ||||||||
Intangible Fixed Assets | 352,293 | 360,296 | (8,003 | ) | ||||||||
Prepaid Pension Cost | 464,578 | 524,167 | (59,589 | ) | ||||||||
Customers’ Liabilities for Acceptances and Guarantees | 7,333,353 | 6,828,085 | 505,267 | |||||||||
Reserves for Possible Losses on Loans | (556,219 | ) | (536,101 | ) | (20,118 | ) | ||||||
|
|
|
|
|
| |||||||
Total Assets | ¥ | 199,037,466 | ¥ | 198,883,298 | ¥ | 154,167 | ||||||
|
|
|
|
|
| |||||||
Liabilities | ||||||||||||
Deposits | ¥ | 124,153,095 | ¥ | 128,279,005 | ¥ | (4,125,910 | ) | |||||
Negotiable Certificates of Deposit | 18,476,561 | 16,684,774 | 1,791,787 | |||||||||
Call Money | 1,065,799 | 1,061,104 | 4,694 | |||||||||
Payables under Repurchase Agreements | 11,668,064 | 8,760,834 | 2,907,230 | |||||||||
Guarantee Deposits Received under Securities Lending Transactions | 268,420 | 170,648 | 97,771 | |||||||||
Commercial Paper | 1,969,424 | 2,105,067 | (135,643 | ) | ||||||||
Trading Liabilities | 2,580,677 | 3,255,476 | (674,798 | ) | ||||||||
Borrowed Money | 15,372,230 | �� | 15,084,290 | 287,939 | ||||||||
Foreign Exchange Liabilities | 684,472 | 717,422 | (32,950 | ) | ||||||||
Bonds and Notes | 841,616 | 911,779 | (70,162 | ) | ||||||||
Derivatives other than for Trading | 3,365,770 | 4,016,868 | (651,098 | ) | ||||||||
Other Liabilities | 3,719,473 | 3,448,928 | 270,545 | |||||||||
Reserve for Bonus Payments | 12,282 | 25,042 | (12,760 | ) | ||||||||
Reserve for Variable Compensation | 308 | 983 | (674 | ) | ||||||||
Reserve for Possible Losses on Sales of Loans | 181 | 1,074 | (893 | ) | ||||||||
Reserve for Contingencies | 2,815 | 3,092 | (277 | ) | ||||||||
Reserve for Reimbursement of Deposits | 18,537 | 20,540 | (2,003 | ) | ||||||||
Reserve for Reimbursement of Debentures | 12,157 | 14,419 | (2,261 | ) | ||||||||
Deferred Tax Liabilities | 56,170 | 38,723 | 17,447 | |||||||||
Deferred Tax Liabilities for Revaluation Reserve for Land | 61,436 | 61,915 | (479 | ) | ||||||||
Acceptances and Guarantees | 7,333,353 | 6,828,085 | 505,267 | |||||||||
|
|
|
|
|
| |||||||
Total Liabilities | 191,662,849 | 191,490,080 | 172,769 | |||||||||
|
|
|
|
|
| |||||||
Net Assets | ||||||||||||
Common Stock and Preferred Stock | 1,404,065 | 1,404,065 | — | |||||||||
Capital Surplus | 2,286,167 | 2,286,167 | — | |||||||||
Capital Reserve | 655,450 | 655,450 | — | |||||||||
Other Capital Surplus | 1,630,716 | 1,630,716 | — | |||||||||
Retained Earnings | 2,508,993 | 2,514,003 | (5,010 | ) | ||||||||
Appropriated Reserve | 389,012 | 353,908 | 35,103 | |||||||||
Other Retained Earnings | 2,119,980 | 2,160,095 | (40,114 | ) | ||||||||
Retained Earnings Brought Forward | 2,119,980 | 2,160,095 | (40,114 | ) | ||||||||
|
|
|
|
|
| |||||||
Total Shareholders’ Equity | 6,199,225 | 6,204,236 | (5,010 | ) | ||||||||
|
|
|
|
|
| |||||||
Net Unrealized Gains (Losses) on Other Securities, net of Taxes | 1,040,601 | 1,023,139 | 17,462 | |||||||||
Net Deferred Hedge Gains (Losses), net of Taxes | (508 | ) | 29,458 | (29,967 | ) | |||||||
Revaluation Reserve for Land, net of Taxes | 135,297 | 136,384 | (1,086 | ) | ||||||||
|
|
|
|
|
| |||||||
Total Valuation and Translation Adjustments | 1,175,391 | 1,188,982 | (13,590 | ) | ||||||||
|
|
|
|
|
| |||||||
Total Net Assets | 7,374,616 | 7,393,218 | (18,601 | ) | ||||||||
|
|
|
|
|
| |||||||
Total Liabilities and Net Assets | ¥ | 199,037,466 | ¥ | 198,883,298 | ¥ | 154,167 | ||||||
|
|
|
|
|
| |||||||
2-39
Mizuho Bank, Ltd.
COMPARISON OF NON-CONSOLIDATED STATEMENTS OF INCOME
(selected items) OF MIZUHO BANK
| Millions of yen | ||||||||||||
| For the six months ended September 30, 2021 (A) | For the six months ended September 30, 2020 (B) | Change (A) - (B) | ||||||||||
Ordinary Income | ¥ | 1,011,425 | ¥ | 1,046,419 | ¥ | (34,994 | ) | |||||
Interest Income | 530,212 | 593,571 | (63,358 | ) | ||||||||
Interest on Loans and Bills Discounted | 372,420 | 431,238 | (58,818 | ) | ||||||||
Interest and Dividends on Securities | 111,191 | 112,486 | (1,295 | ) | ||||||||
Fee and Commission Income | 247,688 | 249,820 | (2,131 | ) | ||||||||
Trading Income | 39,994 | 73,501 | (33,506 | ) | ||||||||
Other Operating Income | 70,736 | 92,307 | (21,570 | ) | ||||||||
Other Ordinary Income | 122,792 | 37,219 | 85,572 | |||||||||
|
|
|
|
|
| |||||||
Ordinary Expenses | 766,564 | 913,892 | (147,328 | ) | ||||||||
Interest Expenses | 114,521 | 215,786 | (101,265 | ) | ||||||||
Interest on Deposits | 15,417 | 78,339 | (62,922 | ) | ||||||||
Fee and Commission Expenses | 71,935 | 47,890 | 24,045 | |||||||||
Trading Expenses | — | 234 | (234 | ) | ||||||||
Other Operating Expenses | 35,575 | 50,294 | (14,719 | ) | ||||||||
General and Administrative Expenses | 364,459 | 392,026 | (27,567 | ) | ||||||||
Other Ordinary Expenses | 180,072 | 207,659 | (27,586 | ) | ||||||||
|
|
|
|
|
| |||||||
Ordinary Profits | 244,860 | 132,527 | 112,333 | |||||||||
|
|
|
|
|
| |||||||
Extraordinary Gains | 44,053 | 56,548 | (12,494 | ) | ||||||||
|
|
|
|
|
| |||||||
Extraordinary Losses | 3,804 | 4,550 | (745 | ) | ||||||||
|
|
|
|
|
| |||||||
Income before Income Taxes | 285,110 | 184,525 | 100,584 | |||||||||
Income Taxes: | ||||||||||||
Current | 90,355 | 46,504 | 43,850 | |||||||||
Deferred | 25,332 | 28,298 | (2,965 | ) | ||||||||
|
|
|
|
|
| |||||||
Net Income | ¥ | 169,422 | ¥ | 109,722 | ¥ | 59,699 | ||||||
|
|
|
|
|
| |||||||
2-40
Mizuho Trust & Banking Co., Ltd.
COMPARISON OF NON-CONSOLIDATED BALANCE SHEETS (selected items)
OF MIZUHO TRUST & BANKING
| Millions of yen | ||||||||||||
| As of September 30, 2021 (A) | As of March 31, 2021 (B) | Change (A) - (B) | ||||||||||
Assets | ||||||||||||
Cash and Due from Banks | ¥ | 2,127,000 | ¥ | 2,010,405 | ¥ | 116,594 | ||||||
Call Loans | — | 22,134 | (22,134 | ) | ||||||||
Guarantee Deposits Paid under Securities Borrowing Transactions | 40,152 | — | 40,152 | |||||||||
Other Debt Purchased | 43,763 | 26,092 | 17,671 | |||||||||
Trading Assets | — | 130,476 | (130,476 | ) | ||||||||
Money Held in Trust | 25,702 | 9,804 | 15,897 | |||||||||
Securities | 337,566 | 321,504 | 16,062 | |||||||||
Loans and Bills Discounted | 3,179,321 | 3,362,267 | (182,945 | ) | ||||||||
Foreign Exchange Assets | 2,802 | 6,313 | (3,510 | ) | ||||||||
Other Assets | 125,210 | 321,181 | (195,970 | ) | ||||||||
Tangible Fixed Assets | 100,696 | 102,139 | (1,442 | ) | ||||||||
Intangible Fixed Assets | 22,928 | 25,486 | (2,557 | ) | ||||||||
Prepaid Pension Cost | 63,341 | 65,962 | (2,620 | ) | ||||||||
Customers’ Liabilities for Acceptances and Guarantees | 14,649 | 14,008 | 640 | |||||||||
Reserves for Possible Losses on Loans | (4,006 | ) | (4,196 | ) | 189 | |||||||
|
|
|
|
|
| |||||||
Total Assets | ¥ | 6,079,130 | ¥ | 6,413,579 | ¥ | (334,449 | ) | |||||
|
|
|
|
|
| |||||||
Liabilities | ||||||||||||
Deposits | ¥ | 2,664,715 | ¥ | 2,879,951 | ¥ | (215,235 | ) | |||||
Negotiable Certificates of Deposit | 720,080 | 618,380 | 101,700 | |||||||||
Call Money | 604,200 | 581,838 | 22,362 | |||||||||
Trading Liabilities | — | 131,235 | (131,235 | ) | ||||||||
Borrowed Money | 300,000 | 375,082 | (75,082 | ) | ||||||||
Due to Trust Accounts | 1,182,263 | 1,160,608 | 21,655 | |||||||||
Other Liabilities | 39,918 | 23,141 | 16,777 | |||||||||
Reserve for Bonus Payments | 1,676 | 3,199 | (1,522 | ) | ||||||||
Reserve for Variable Compensation | 122 | 380 | (257 | ) | ||||||||
Provision for Retirement Benefits | 6,794 | 260 | 6,534 | |||||||||
Reserve for Reimbursement of Deposits | 1,363 | 1,558 | (194 | ) | ||||||||
Reserve for Loss of Transfer | 4,449 | 4,814 | (364 | ) | ||||||||
Deferred Tax Liabilities | 18,293 | 15,515 | 2,777 | |||||||||
Acceptances and Guarantees | 14,649 | 14,008 | 640 | |||||||||
|
|
|
|
|
| |||||||
Total Liabilities | 5,558,528 | 5,809,974 | (251,445 | ) | ||||||||
|
|
|
|
|
| |||||||
Net Assets | ||||||||||||
Common Stock and Preferred Stock | 247,369 | 247,369 | — | |||||||||
Capital Surplus | 15,505 | 15,505 | — | |||||||||
Capital Reserve | 15,505 | 15,505 | — | |||||||||
Retained Earnings | 272,254 | 275,949 | (3,694 | ) | ||||||||
Appropriated Reserve | 150,297 | 45,865 | 104,432 | |||||||||
Other Retained Earnings | 121,956 | 230,083 | (108,126 | ) | ||||||||
Retained Earnings Brought Forward | 121,956 | 230,083 | (108,126 | ) | ||||||||
Treasury shares | (79,999 | ) | — | (79,999 | ) | |||||||
|
|
|
|
|
| |||||||
Total Shareholders’ Equity | 455,129 | 538,824 | (83,694 | ) | ||||||||
|
|
|
|
|
| |||||||
Net Unrealized Gains (Losses) on Other Securities, net of Taxes | 70,199 | 67,360 | 2,838 | |||||||||
Net Deferred Hedge Gains (Losses), net of Taxes | (4,727 | ) | (2,579 | ) | (2,147 | ) | ||||||
|
|
|
|
|
| |||||||
Total Valuation and Translation Adjustments | 65,472 | 64,781 | 690 | |||||||||
|
|
|
|
|
| |||||||
Total Net Assets | 520,601 | 603,605 | (83,003 | ) | ||||||||
|
|
|
|
|
| |||||||
Total Liabilities and Net Assets | ¥ | 6,079,130 | ¥ | 6,413,579 | ¥ | (334,449 | ) | |||||
|
|
|
|
|
| |||||||
2-41
Mizuho Trust & Banking Co., Ltd.
COMPARISON OF NON-CONSOLIDATED STATEMENTS OF INCOME
(selected items) OF MIZUHO TRUST & BANKING
| Millions of yen | ||||||||||||
| For the six months ended September 30, 2021 (A) | For the six months ended September 30, 2020 (B) | Change (A) - (B) | ||||||||||
Ordinary Income | ¥ | 80,950 | ¥ | 89,548 | ¥ | (8,598 | ) | |||||
Fiduciary Income | 30,058 | 27,277 | 2,781 | |||||||||
Interest Income | 12,973 | 18,261 | (5,287 | ) | ||||||||
Interest on Loans and Bills Discounted | 9,915 | 11,066 | (1,150 | ) | ||||||||
Interest and Dividends on Securities | 2,161 | 6,154 | (3,993 | ) | ||||||||
Fee and Commission Income | 36,499 | 29,087 | 7,412 | |||||||||
Trading Income | — | 488 | (488 | ) | ||||||||
Other Operating Income | 194 | 7,749 | (7,555 | ) | ||||||||
Other Ordinary Income | 1,224 | 6,684 | (5,460 | ) | ||||||||
|
|
|
|
|
| |||||||
Ordinary Expenses | 62,001 | 73,729 | (11,727 | ) | ||||||||
Interest Expenses | 3,600 | 4,797 | (1,197 | ) | ||||||||
Interest on Deposits | 157 | 205 | (48 | ) | ||||||||
Fee and Commission Expenses | 17,717 | 16,815 | 902 | |||||||||
Trading Expenses | 640 | — | 640 | |||||||||
Other Operating Expenses | 1 | 1,328 | (1,326 | ) | ||||||||
General and Administrative Expenses | 37,503 | 40,447 | (2,943 | ) | ||||||||
Other Ordinary Expenses | 2,536 | 10,340 | (7,803 | ) | ||||||||
|
|
|
|
|
| |||||||
Ordinary Profits | 18,949 | 15,819 | 3,129 | |||||||||
|
|
|
|
|
| |||||||
Extraordinary Gains | 7,483 | 6,569 | 914 | |||||||||
|
|
|
|
|
| |||||||
Extraordinary Losses | 151 | 707 | (555 | ) | ||||||||
|
|
|
|
|
| |||||||
Income before Income Taxes | 26,281 | 21,681 | 4,599 | |||||||||
Income Taxes: | ||||||||||||
Current | 4,559 | 2,181 | 2,378 | |||||||||
Deferred | 3,255 | 3,796 | (540 | ) | ||||||||
|
|
|
|
|
| |||||||
Net Income | ¥ | 18,466 | ¥ | 15,704 | ¥ | 2,762 | ||||||
|
|
|
|
|
| |||||||
2-42
Mizuho Trust & Banking Co., Ltd.
Reference
Statement of Trust Assets and Liabilities
As of September 30, 2021 | Millions of yen | |||||||||
Assets | Amount | Liabilities | Amount | |||||||
Loans and Bills Discounted | 511,553 | Money Trusts | 27,421,391 | |||||||
Securities | 108,628 | Pension Trusts | 3,820,541 | |||||||
Beneficiary Rights to the Trusts | 71,206,945 | Property Formation Benefit Trusts | 4,695 | |||||||
Securities held in Custody Accounts | 279,864 | Investment Trusts | 21,598,683 | |||||||
Money Claims | 22,382,121 | Money Entrusted Other than Money Trusts | 2,148,355 | |||||||
Tangible Fixed Assets | 9,528,476 | Securities Trusts | 14,390,853 | |||||||
Intangible Fixed Assets | 338,026 | Money Claims Trusts | 21,351,294 | |||||||
Other Claims | 347,897 | Land and Fixtures Trusts | 512,918 | |||||||
Due from Banking Account | 1,182,263 | Composite Trusts | 15,124,077 | |||||||
Cash and Due from Banks | 492,446 | Other Trusts | 5,413 | |||||||
|
|
|
| |||||||
Total | 106,378,224 | Total | 106,378,224 | |||||||
|
|
|
| |||||||
Notes:
| 1. | The statement is exclusive of Trusts that are difficult to value monetarily. |
| 2. | Beneficiary Rights to the Trusts include entrusted Trusts for asset maintenance of ¥68,969,832 million. |
| 3. | Joint trust assets under the management of other companies: ¥163,644 million. |
| 4. | There is no balance of Loans to Bankrupt Obligors, Non-Accrual Delinquent Loans, or Loans Past Due for 3 Months or More in the loans of trust accounts that guarantee principals in the agreement of ¥4,292 million. |
Reference: Breakdown of Accounts of Money Trusts and Loan Trusts with the contracts of principal indemnification (including Trusts entrusted for asset management) are as follows:
Money Trusts | Millions of yen | |||||||||
Assets | Amount | Liabilities | Amount | |||||||
Loans and Bills Discounted | 4,292 | Principal | 832,615 | |||||||
Securities | 1 | Reserve | 13 | |||||||
Others | 828,404 | Others | 69 | |||||||
|
|
|
| |||||||
Total | 832,698 | Total | 832,698 | |||||||
|
|
|
| |||||||
2-43
Mizuho Trust & Banking Co., Ltd.
Reference
Comparison of Balances of Principal Items
| Millions of yen | ||||||||||||
Items | As of September 30, 2021 (A) | As of March 31, 2021 (B) | Change (A) - (B) | |||||||||
Total Amount of Funds | 34,631,424 | 34,615,632 | 15,791 | |||||||||
Deposits | 2,664,715 | 2,879,951 | (215,235 | ) | ||||||||
Negotiable Certificates of Deposit | 720,080 | 618,380 | 101,700 | |||||||||
Money Trusts | 27,421,391 | 27,961,821 | (540,430 | ) | ||||||||
Pension Trusts | 3,820,541 | 3,150,691 | 669,850 | |||||||||
Property Formation Benefit Trusts | 4,695 | 4,788 | (92 | ) | ||||||||
Loans and Bills Discounted | 3,690,874 | 3,909,986 | (219,112 | ) | ||||||||
of Banking accounts | 3,179,321 | 3,362,267 | (182,945 | ) | ||||||||
of Trust accounts | 511,553 | 547,719 | (36,166 | ) | ||||||||
Securities for Investments | 446,195 | 430,543 | 15,651 | |||||||||
of Banking accounts | 337,566 | 321,504 | 16,062 | |||||||||
of Trust accounts | 108,628 | 109,039 | (410 | ) | ||||||||
2-44
Mizuho Securities Co., Ltd.
COMPARISON OF NON-CONSOLIDATED BALANCE SHEETS (selected items)
OF MIZUHO SECURITIES
| Millions of yen | ||||||||||||
| As of September 30, 2021 (A) | As of March 31, 2021 (B) | Change (A) - (B) | ||||||||||
Assets | ||||||||||||
Current Assets | ||||||||||||
Cash and Bank Deposits | ¥ | 430,716 | ¥ | 369,894 | ¥ | 60,821 | ||||||
Cash Segregated as Deposits for Customers and Others | 592,654 | 554,281 | 38,372 | |||||||||
Trading Assets | 6,728,207 | 6,222,426 | 505,781 | |||||||||
Operating Investment Securities | 35,027 | 34,338 | 689 | |||||||||
Receivables Related to Margin Transactions | 36,203 | 32,553 | 3,649 | |||||||||
Collateralized Short-Term Financing Agreements-Receivable | 4,565,714 | 4,520,477 | 45,236 | |||||||||
Advances Paid | 745 | 441 | 303 | |||||||||
Securities: Fail to Deliver | 38,814 | 15,265 | 23,549 | |||||||||
Short-Term Loans Receivable | 45,324 | 36,085 | 9,239 | |||||||||
Other Current Assets | 441,150 | 461,711 | (20,560 | ) | ||||||||
Less: Allowance for Doubtful Accounts | (278 | ) | (276 | ) | (1 | ) | ||||||
Noncurrent Assets | ||||||||||||
Property and Equipment | 18,449 | 19,775 | (1,326 | ) | ||||||||
Intangible Assets | 63,831 | 66,544 | (2,712 | ) | ||||||||
Investments and Other Assets | 304,744 | 314,486 | (9,742 | ) | ||||||||
|
|
|
|
|
| |||||||
Total Assets | ¥ | 13,301,305 | ¥ | 12,648,003 | ¥ | 653,301 | ||||||
|
|
|
|
|
| |||||||
Liabilities | ||||||||||||
Current Liabilities | ||||||||||||
Trading Liabilities | ¥ | 3,997,225 | ¥ | 4,765,362 | ¥ | (768,136 | ) | |||||
Payables - Unsettled Trades | 133,699 | 253,734 | (120,034 | ) | ||||||||
Payables Related to Margin Transactions | 47,063 | 39,793 | 7,269 | |||||||||
Collateralized Short-Term Financing Agreements-Payable | 4,981,955 | 3,510,972 | 1,470,983 | |||||||||
Deposits Received | 538,169 | 444,112 | 94,056 | |||||||||
Guarantee Deposits Received | 365,589 | 417,142 | (51,552 | ) | ||||||||
Securities: Fail to Receive | 8,587 | 2,854 | 5,733 | |||||||||
Short-Term Borrowings | 764,033 | 806,728 | (42,694 | ) | ||||||||
Commercial Paper | 490,500 | 423,500 | 67,000 | |||||||||
Bonds and Notes Due within One Year | 112,941 | 127,648 | (14,706 | ) | ||||||||
Income Taxes Payable | 3,431 | 11,565 | (8,134 | ) | ||||||||
Accrued Employees’ Bonuses | 14,661 | 25,365 | (10,703 | ) | ||||||||
Provision for Variable Compensation | 185 | 788 | (602 | ) | ||||||||
Other Current Liabilities | 34,532 | 50,122 | (15,590 | ) | ||||||||
Noncurrent Liabilities | ||||||||||||
Bonds and Notes | 701,383 | 623,175 | 78,207 | |||||||||
Long-Term Borrowings | 522,400 | 150,400 | 372,000 | |||||||||
Provision for Retirement Benefits | 21,766 | 21,216 | 549 | |||||||||
Reserve for Loss of Transfer | 3,481 | 4,194 | (713 | ) | ||||||||
Other Noncurrent Liabilities | 3,040 | 3,132 | (92 | ) | ||||||||
Statutory Reserves | ||||||||||||
Reserve for Financial Instruments Transaction Liabilities | 3,127 | 3,135 | (7 | ) | ||||||||
|
|
|
|
|
| |||||||
Total Liabilities | 12,747,773 | 11,684,945 | 1,062,828 | |||||||||
|
|
|
|
|
| |||||||
Net Assets | ||||||||||||
Common Stock | 125,167 | 125,167 | — | |||||||||
Capital Surplus | 381,649 | 381,649 | — | |||||||||
Additional Paid - in Capital | 285,831 | 285,831 | — | |||||||||
Other Capital Surplus | 95,817 | 95,817 | — | |||||||||
Retained Earnings | 400,756 | 440,661 | (39,905 | ) | ||||||||
Other Retained Earnings | 400,756 | 440,661 | (39,905 | ) | ||||||||
Retained Earnings Brought Forward | 400,756 | 440,661 | (39,905 | ) | ||||||||
Treasury shares | (369,999 | ) | — | (369,999 | ) | |||||||
|
|
|
|
|
| |||||||
Total Shareholders’ Equity | 537,573 | 947,478 | (409,905 | ) | ||||||||
|
|
|
|
|
| |||||||
Net Unrealized Gains on (Operating) Investment Securities, net of Tax | 25,720 | 25,339 | 380 | |||||||||
Net Deferred Gains or Losses on Hedges, net of Tax | (9,762 | ) | (9,759 | ) | (2 | ) | ||||||
|
|
|
|
|
| |||||||
Total Valuation and Translation Adjustments | 15,958 | 15,580 | 377 | |||||||||
|
|
|
|
|
| |||||||
Total Net Assets | 553,531 | 963,058 | (409,527 | ) | ||||||||
|
|
|
|
|
| |||||||
Total Liabilities and Net Assets | ¥ | 13,301,305 | ¥ | 12,648,003 | ¥ | 653,301 | ||||||
|
|
|
|
|
| |||||||
2-45
Mizuho Securities Co., Ltd.
COMPARISON OF NON-CONSOLIDATED STATEMENTS OF INCOME
(selected items) OF MIZUHO SECURITIES
| Millions of yen | ||||||||||||
| For the six months ended September 30, 2021 (A) | For the six months ended September 30, 2020 (B) | Change (A) - (B) | ||||||||||
Operating Revenues | ¥ | 201,981 | ¥ | 183,483 | ¥ | 18,498 | ||||||
Commissions | 92,240 | 81,518 | 10,722 | |||||||||
Net Gain on Trading | 73,686 | 61,738 | 11,948 | |||||||||
Net Gain on Operating Investment Securities | (1,759 | ) | 222 | (1,982 | ) | |||||||
Interest and Dividend Income | 37,814 | 40,004 | (2,190 | ) | ||||||||
|
|
|
|
|
| |||||||
Interest Expenses | 28,080 | 31,396 | (3,315 | ) | ||||||||
|
|
|
|
|
| |||||||
Net Operating Revenues | 173,900 | 152,086 | 21,814 | |||||||||
|
|
|
|
|
| |||||||
Selling, General and Administrative Expenses | 129,544 | 122,541 | 7,002 | |||||||||
Transaction-Related Expenses | 38,439 | 32,744 | 5,695 | |||||||||
Personnel Expenses | 48,778 | 45,919 | 2,859 | |||||||||
Real Estate Expenses | 9,819 | 10,456 | (637 | ) | ||||||||
Administrative Expenses | 19,087 | 19,566 | (478 | ) | ||||||||
Depreciation and Amortization | 9,501 | 10,229 | (728 | ) | ||||||||
Taxes and Dues | 2,687 | 2,460 | 226 | |||||||||
Provision of Allowance for Doubtful Accounts | (3 | ) | (16 | ) | 13 | |||||||
Other | 1,233 | 1,181 | 51 | |||||||||
|
|
|
|
|
| |||||||
Operating Income | 44,356 | 29,545 | 14,811 | |||||||||
|
|
|
|
|
| |||||||
Non-Operating Income | 1,632 | 3,324 | (1,691 | ) | ||||||||
Non-Operating Expenses | 420 | 75 | 345 | |||||||||
|
|
|
|
|
| |||||||
Ordinary Income | 45,569 | 32,794 | 12,774 | |||||||||
|
|
|
|
|
| |||||||
Extraordinary Gain | 727 | 6,740 | (6,012 | ) | ||||||||
|
|
|
|
|
| |||||||
Extraordinary Loss | 2,290 | 1,586 | 703 | |||||||||
|
|
|
|
|
| |||||||
Income before Income Taxes | 44,006 | 37,948 | 6,057 | |||||||||
Income Taxes: | ||||||||||||
Current | 4,537 | 2,449 | 2,087 | |||||||||
Deferred | 3,807 | 3,495 | 311 | |||||||||
|
|
|
|
|
| |||||||
Net Income | ¥ | 35,661 | ¥ | 32,002 | ¥ | 3,658 | ||||||
|
|
|
|
|
| |||||||
2-46