
1Boardwalk Louisiana Midstream: Sulphur HubPineville Compressor Station Investor Presentation May 2017 Dillsboro Compressor Station (Dillsboro, Indiana)
2 Important Information Forward-looking statements disclosure Statements made at this meeting or in the materials distributed in conjunction with this meeting that contain "forward-looking statements" include, but are not limited to, statements using the words “believe”, “expect”, “plan”, “intend”, “anticipate”, “estimate”, “project”, “should” and similar expressions, as well as other statements concerning our future plans, objectives, and expected performance, including statements with respect to the completion, cost, timing and financial performance of growth projects. Such statements are inherently subject to a variety of risks and uncertainties that could cause actual results to differ materially from those projected. Forward-looking statements speak only as of the date they are made, and the company expressly disclaims any obligation or undertaking to release publicly any updates or revisions to any forward-looking statement contained herein or made at this meeting to reflect any change in our expectations with regard thereto or any change in events, conditions or circumstances on which any such statement is based. For information about important Risk Factors that could cause our actual results to differ from those expressed in the forward-looking statements contained in this presentation or discussed at this meeting please see “Available Information and Risk Factors”, below. Given the Risk Factors referred to below, investors and analysts should not place undue reliance on forward-looking statements. Available Information and Risk Factors We file annual, quarterly and current reports and other information with the Securities and Exchange Commission, or “SEC”. Our SEC filings are available to the public over the internet at our website, www.bwpmlp.com, and at the SEC’s website www.sec.gov. Our filings with the SEC contain important information which anyone considering the purchase of our debt securities or limited partnership units should read. Our business faces many risks and uncertainties. We have described in our SEC filings the most significant risks facing us. There may be additional risks that we do not yet know or that we do not currently perceive to be material that may also impact our business. These risks and uncertainties described in our SEC filings could lead to events or circumstances that may have a material adverse effect on our business, financial condition, results of operations or cash flows, including our ability to make distributions to our unitholders. Our limited partnership units are listed on the New York Stock Exchange under the trading symbol “BWP”.
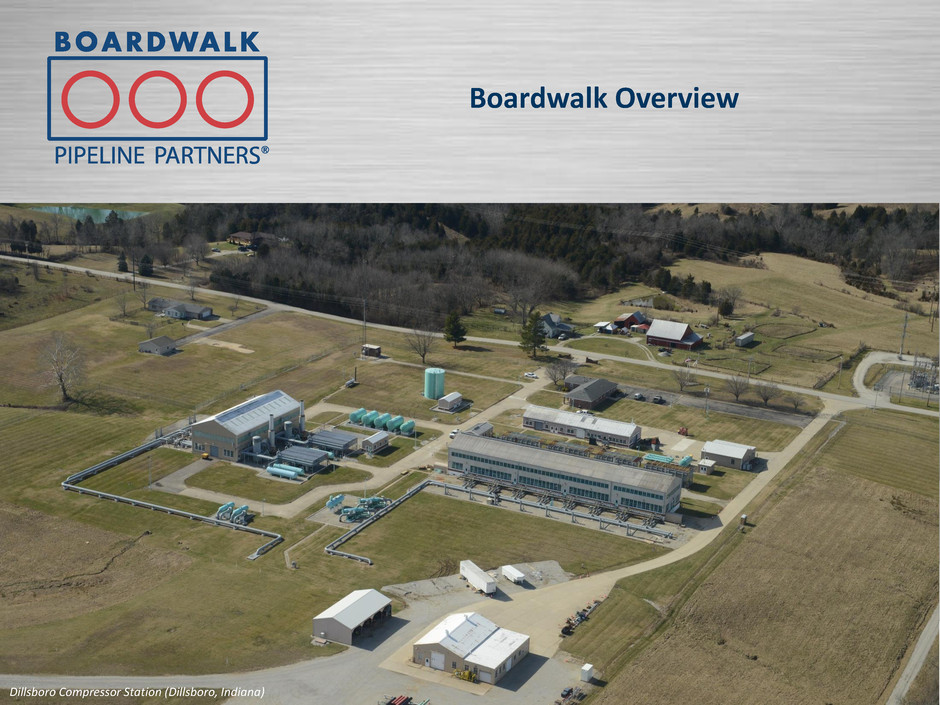
3Boardwalk Louisiana Midstream: Sulphur HubPineville Compressor Station Boardwalk Overview Dillsboro Compressor Station (Dillsboro, Indiana)

Key Investment Highlights 4 •Primary services: Transportation and storage of natural gas and liquids •Geographic footprint situated to serve growing supply and demand Diversified midstream MLP • Approximately 90% of annual revenue is from fixed-fee, ship-or-pay contracts • Customers primarily rated investment grade •Weighted-average contract life of approximately 5 years for firm transportation agreements that are currently in service • Recently placed into service five projects that represent more than $500 million of capital expenditures and nearly 1.4 Bcf/d of capacity and are secured by ship-or- pay agreements with a weighted-average contract life of approximately 17 years Stable revenue profile • Growth projects to be placed into service between now and 2019 represent approximately $1.1 billion of planned capital expenditures and approximately 1.7 Bcf/d of natural gas transportation capacity, plus brine supply and liquids transportation and storage services • These projects are secured by ship-or-pay agreements with a weighted-average contract life of approximately 17 years Significant project backlog • Focused on disciplined capital allocation and long-term value creation •Average energy experience more than 25 years Conservative, experienced leadership •Subsidiary of Loews Corporation • History of supporting Boardwalk growth Well-capitalized general partner
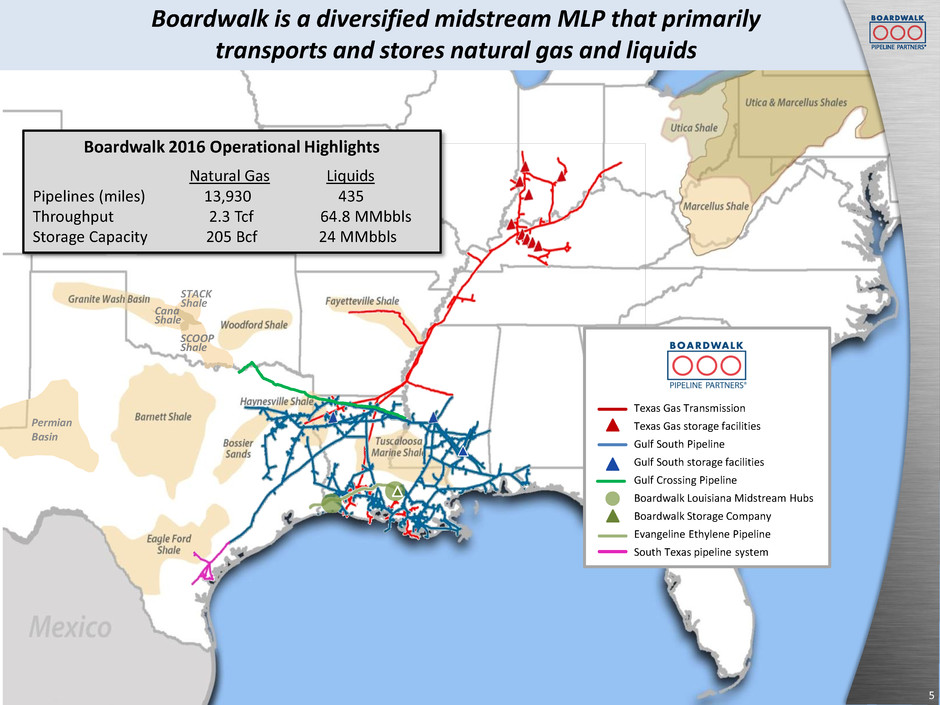
Texas Gas Transmission Texas Gas storage facilities Gulf South Pipeline Gulf South storage facilities Gulf Crossing Pipeline Boardwalk Louisiana Midstream Hubs Boardwalk Storage Company Evangeline Ethylene Pipeline South Texas pipeline system Boardwalk 2016 Operational Highlights Natural Gas Liquids Pipelines (miles) 13,930 435 Throughput 2.3 Tcf 64.8 MMbbls Storage Capacity 205 Bcf 24 MMbbls Cana Shale SCOOP Shale STACK Shale Permian Basin 5 Boardwalk is a diversified midstream MLP that primarily transports and stores natural gas and liquids
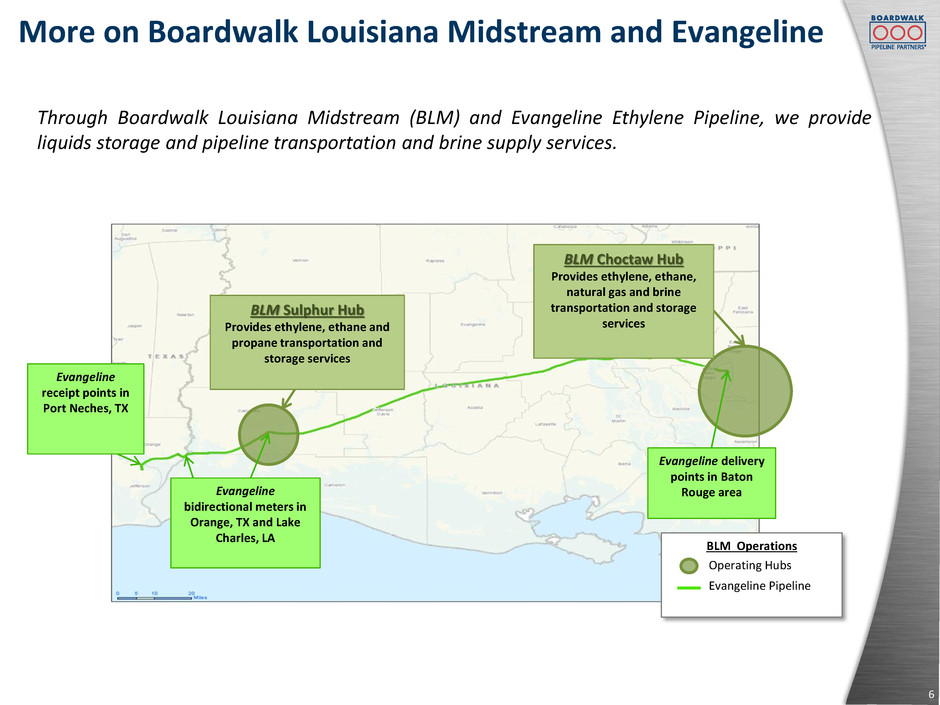
More on Boardwalk Louisiana Midstream and Evangeline 6 Evangeline receipt points in Port Neches, TX Evangeline delivery points in Baton Rouge area BLM Operations Operating Hubs Evangeline Pipeline Evangeline bidirectional meters in Orange, TX and Lake Charles, LA BLM Sulphur Hub Provides ethylene, ethane and propane transportation and storage services BLM Choctaw Hub Provides ethylene, ethane, natural gas and brine transportation and storage services Through Boardwalk Louisiana Midstream (BLM) and Evangeline Ethylene Pipeline, we provide liquids storage and pipeline transportation and brine supply services.
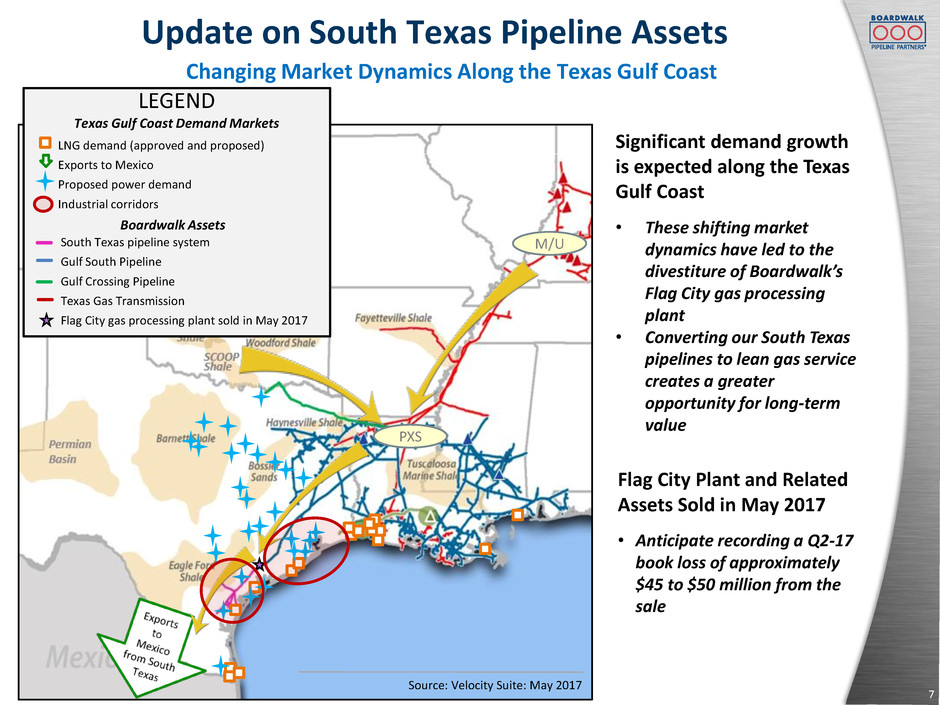
7 Update on South Texas Pipeline Assets Changing Market Dynamics Along the Texas Gulf Coast Significant demand growth is expected along the Texas Gulf Coast • These shifting market dynamics have led to the divestiture of Boardwalk’s Flag City gas processing plant • Converting our South Texas pipelines to lean gas service creates a greater opportunity for long-term value Flag City Plant and Related Assets Sold in May 2017 • Anticipate recording a Q2-17 book loss of approximately $45 to $50 million from the sale M/U PXS Source: Velocity Suite: May 2017 LEGEND Texas Gulf Coast Demand Markets LNG demand (approved and proposed) Exports to Mexico Proposed power demand Industrial corridors South Texas pipeline system Gulf South Pipeline Gulf Crossing Pipeline Texas Gas Transmission Flag City gas processing plant sold in May 2017 Boardwalk Assets

8 Growth Projects Placed Into Service Since June 2016 Project Driver Project Description In-Service Date (estimate) • Supply push from Marcellus/Utica production growth (approx. 2/3 of contracted capacity) • End-use market: LNG export facility (approx. 1/3 of contracted capacity) Two projects to provide firm natural gas transportation service primarily from Marcellus and Utica production areas to Louisiana; the addition of north-to-south capacity has made Texas Gas a bi- directional pipeline: • Ohio-to-Louisiana Access: 626,000 MMBtu/d of capacity • Northern Supply Access: 284,000 MMBtu/d of capacity June 2016 and March 2017, respectively End-use market: power generation Two projects to provide firm natural gas transportation service to new power plants: • Western Kentucky Lateral: 230,000 MMBtu/d (Texas Gas) • Power plant in South Texas: 185,000 MMBtu/d (Gulf South) September 2016 End-use market: industrial Project on Texas Gas to provide firm natural gas transportation service to an industrial customer: • Southern Indiana Lateral: 53,500 MMBtu/d June 2016 These projects added nearly 1.4 Bcf/d of natural gas transportation services
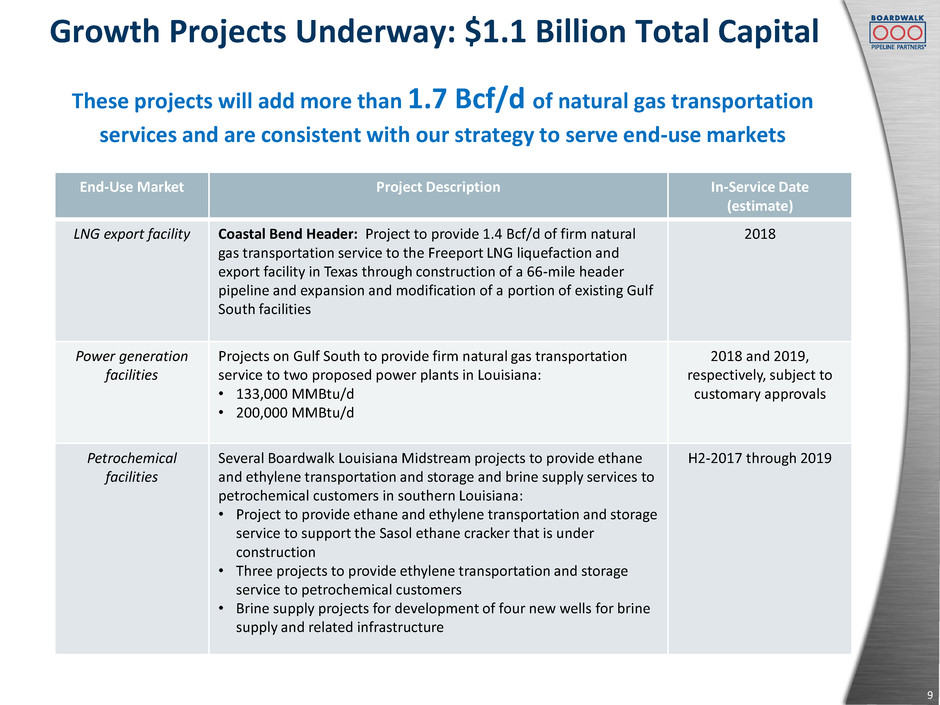
9 Growth Projects Underway: $1.1 Billion Total Capital These projects will add more than 1.7 Bcf/d of natural gas transportation services and are consistent with our strategy to serve end-use markets End-Use Market Project Description In-Service Date (estimate) LNG export facility Coastal Bend Header: Project to provide 1.4 Bcf/d of firm natural gas transportation service to the Freeport LNG liquefaction and export facility in Texas through construction of a 66-mile header pipeline and expansion and modification of a portion of existing Gulf South facilities 2018 Power generation facilities Projects on Gulf South to provide firm natural gas transportation service to two proposed power plants in Louisiana: • 133,000 MMBtu/d • 200,000 MMBtu/d 2018 and 2019, respectively, subject to customary approvals Petrochemical facilities Several Boardwalk Louisiana Midstream projects to provide ethane and ethylene transportation and storage and brine supply services to petrochemical customers in southern Louisiana: • Project to provide ethane and ethylene transportation and storage service to support the Sasol ethane cracker that is under construction • Three projects to provide ethylene transportation and storage service to petrochemical customers • Brine supply projects for development of four new wells for brine supply and related infrastructure H2-2017 through 2019
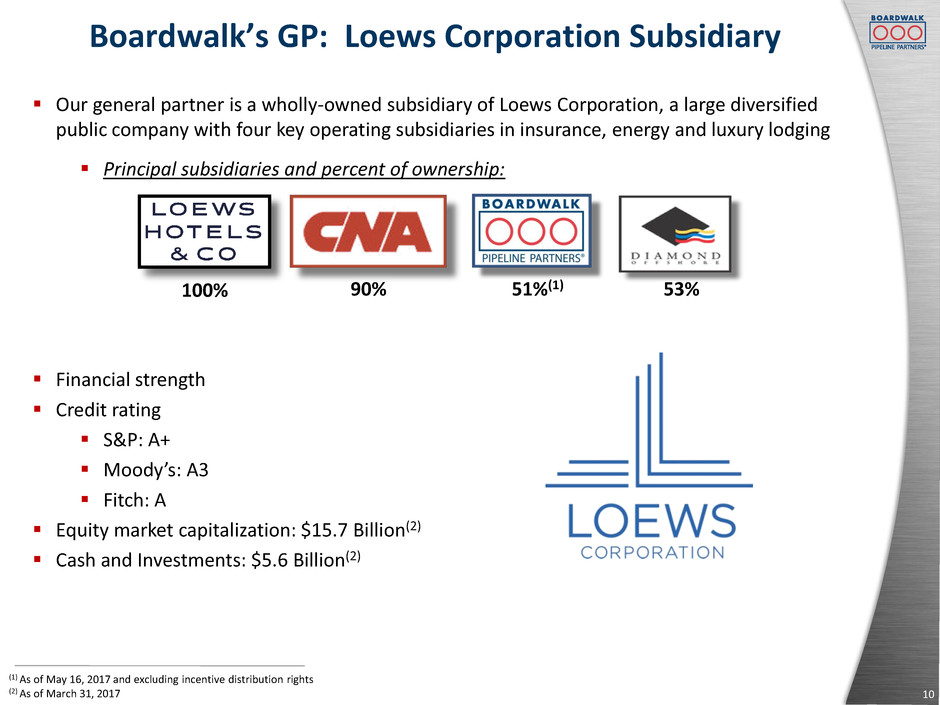
Boardwalk’s GP: Loews Corporation Subsidiary 10 Our general partner is a wholly-owned subsidiary of Loews Corporation, a large diversified public company with four key operating subsidiaries in insurance, energy and luxury lodging Principal subsidiaries and percent of ownership: Financial strength Credit rating S&P: A+ Moody’s: A3 Fitch: A Equity market capitalization: $15.7 Billion(2) Cash and Investments: $5.6 Billion(2) (1) As of May 16, 2017 and excluding incentive distribution rights (2) As of March 31, 2017 100% 51%(1)90% 53%
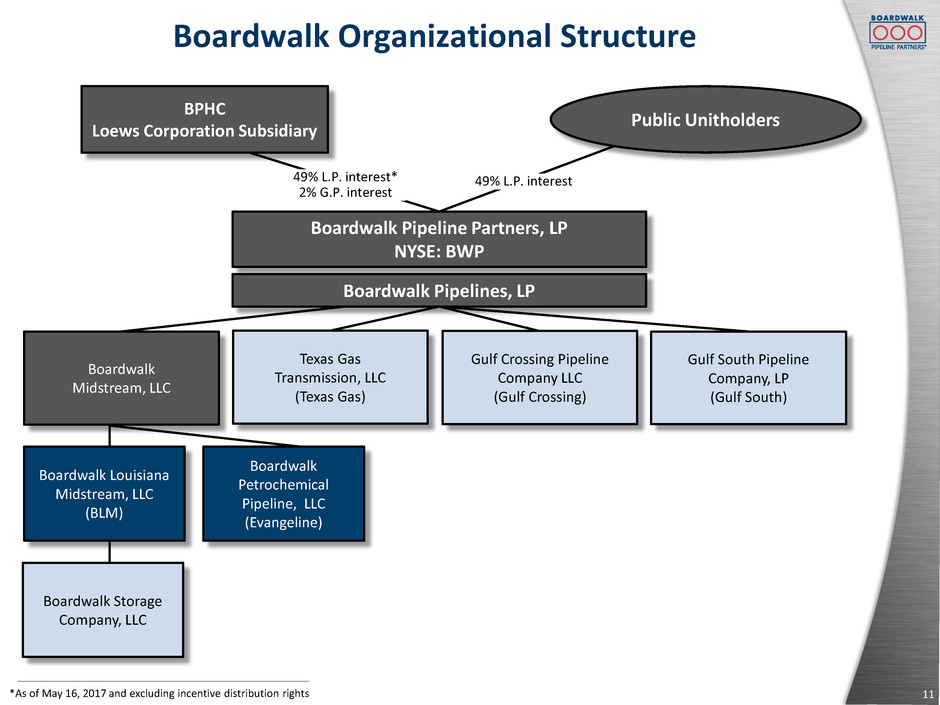
Boardwalk Organizational Structure 11 49% L.P. interest* 2% G.P. interest 49% L.P. interest BPHC Loews Corporation Subsidiary Boardwalk Pipeline Partners, LP NYSE: BWP Public Unitholders Boardwalk Pipelines, LP *As of May 16, 2017 and excluding incentive distribution rights Boardwalk Midstream, LLC Texas Gas Transmission, LLC (Texas Gas) Gulf Crossing Pipeline Company LLC (Gulf Crossing) Gulf South Pipeline Company, LP (Gulf South) Boardwalk Louisiana Midstream, LLC (BLM) Boardwalk Storage Company, LLC Boardwalk Petrochemical Pipeline, LLC (Evangeline)

12Boardwalk Louisiana Midstream: Sulphur HubPineville Compressor Station Financial Highlights Dillsboro Compressor Station (Dillsboro, Indiana)

Financial Highlights 13 Substantially a long-term, fixed-fee revenue base Significant portion of revenues backed by firm, ship-or-pay contracts with primarily investment-grade customers Internally generated cash flow, in excess of distributions, used to improve balance sheet and fund growth capital expenditures 2016 distribution coverage ratio of approximately 5x and financing decisions demonstrate commitment to strengthening the balance sheet Available liquidity: 2016 cash provided by operating activities, net of cash distributions to unitholders, was approximately $500 million $1.5 billion revolving credit facility (1) $300 million subordinated loan agreement with general partner (2) (1) As of March 31, 2017, there were no borrowings outstanding under the revolving credit facility. (2) As of March 31, 2017, there were no borrowings outstanding under the subordinated loan agreement. The borrowing period ends December 31, 2018. Boardwalk Pipelines BBB- Baa3 BBB- Gulf South BBB- Baa2 BBB- Texas Gas BBB- Baa2 BBB- Senior Unsecured Credit Ratings: S&P Moody's Fitch
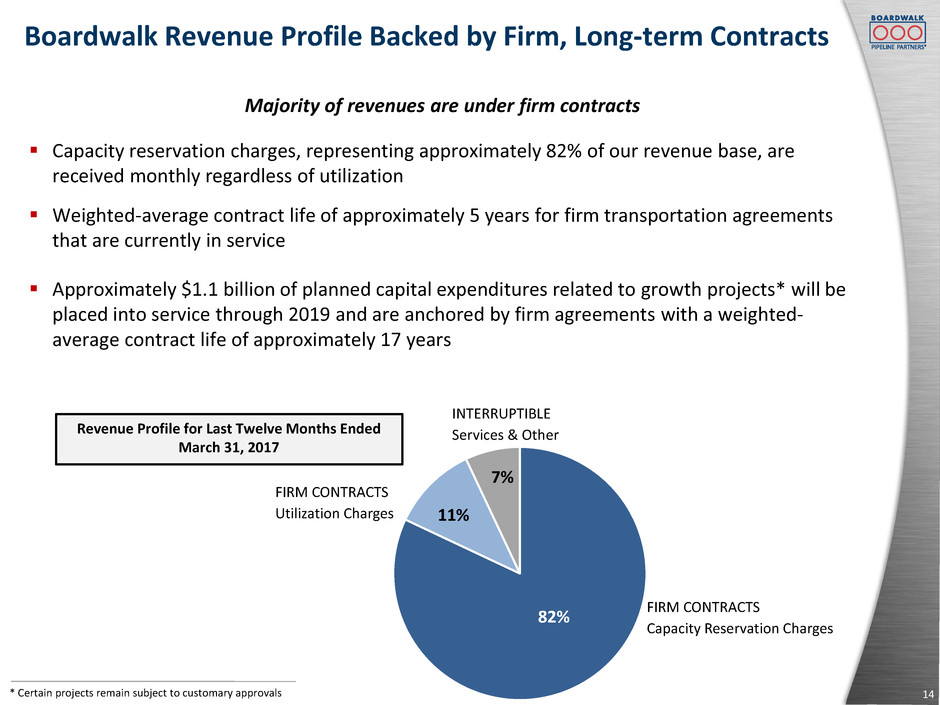
Boardwalk Revenue Profile Backed by Firm, Long-term Contracts 14 Majority of revenues are under firm contracts Capacity reservation charges, representing approximately 82% of our revenue base, are received monthly regardless of utilization Weighted-average contract life of approximately 5 years for firm transportation agreements that are currently in service Approximately $1.1 billion of planned capital expenditures related to growth projects* will be placed into service through 2019 and are anchored by firm agreements with a weighted- average contract life of approximately 17 years * Certain projects remain subject to customary approvals 12% 9% 79% FIRM CONTRACTS Capacity Reservation Charges FIRM CONTRACTS Utilization Charges INTERRUPTIBLE Services & Other 82% 11% 7% Revenue Profile for Last Twelve Months Ended March 31, 2017

Contracted Firm Transportation Revenues 15 Contracted Annual Revenues from Capacity Reservation and Minimum Bill Charges under Committed Firm Transportation Agreements Based on contracts in place as of December 31, 2016 Contracted revenues do not include revenues from actual utilization or any expected revenues for periods after the expiration dates of the existing agreements Note: Please refer to Boardwalk’s 2016 Form 10-K, filed with the SEC on February 15, 2017, for additional disclosures related to contracted firm transportation revenues and contract renewals. $1,023 $1,055 $975 $500 $600 $700 $800 $900 $1,000 $1,100 $1,200 2016 2017 2018 (i n m il lio n s)

EBITDA and Leverage Improving 16 ($ m ill io n s) We invested approximately $810 million in growth capital between January 1, 2015 and March 31, 2017 Debt‐to‐EBITDA ratio is expected to increase in 2017, as we fund capital expenditures associated with our growth projects, until those projects are placed into service and begin generating revenues Distribution Coverage Ratio for twelve months ended March 31, 2017 = 5.1x ($ m ill io n s) $3,698 $3,556 $3,490 $3,469 $3,481 $3,490 $3,497 $3,548 $3,584 $3,580 $3,350 $3,400 $3,450 $3,500 $3,550 $3,600 $3,650 $3,700 $3,750 4Q14 1Q15 2Q15 3Q15 4Q15 1Q16 2Q16 3Q16 4Q16 1Q17 Long-Term Debt, net of Cash (at quarter end) 5.4 5.3 5.2 5.0 4.8 4.7 4.6 4.6 4.5 4.3 3.5 3.7 3.9 4.1 4.3 4.5 4.7 4.9 5.1 5.3 5.5 4Q14 1Q15 2Q15 3Q15 4Q15 1Q16 2Q16 3Q16 4Q16 1Q17 Debt (net of cash) to EBITDA (at quarter end) $688 $672 $672 $692 $722 $740 $763 $778 $803 $827 $600 $650 $700 $750 $800 $850 $900 4Q14 1Q15 2Q15 3Q15 4Q15 1Q16 2Q16 3Q16 4Q16 1Q17 EBITDA (Rolling Last Twelve Months)
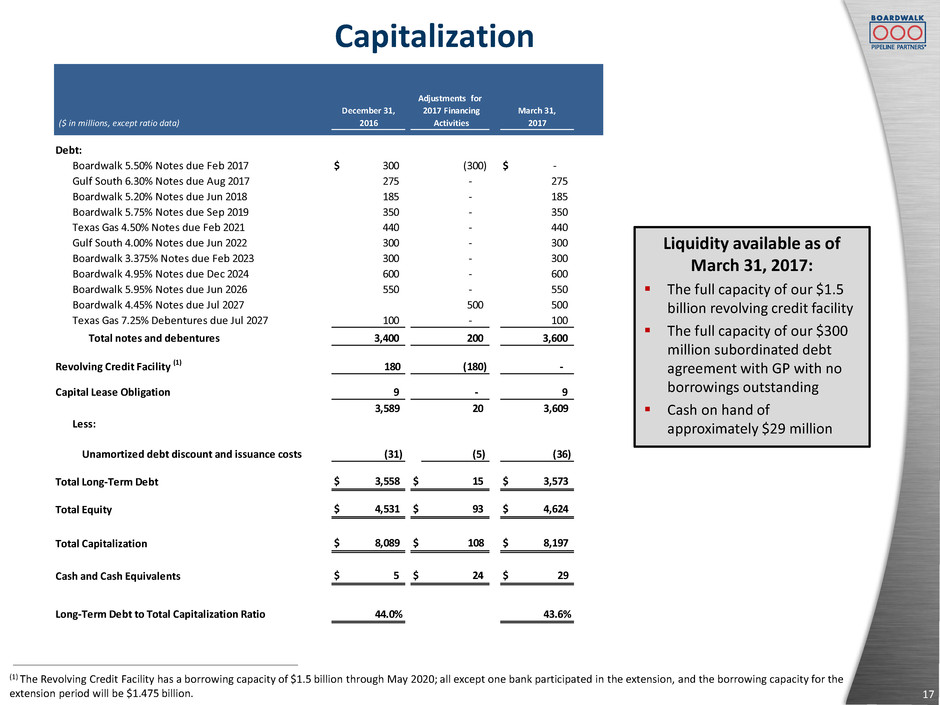
Capitalization 17 Liquidity available as of March 31, 2017: The full capacity of our $1.5 billion revolving credit facility The full capacity of our $300 million subordinated debt agreement with GP with no borrowings outstanding Cash on hand of approximately $29 million (1) The Revolving Credit Facility has a borrowing capacity of $1.5 billion through May 2020; all except one bank participated in the extension, and the borrowing capacity for the extension period will be $1.475 billion. ($ in millions, except ratio data) Boardwalk 5.50% Notes due Feb 2017 $ 300 (300) $ - Gulf South 6.30% Notes due Aug 2017 275 - 275 Boardwalk 5.20% Notes due Jun 2018 185 - 185 Boardwalk 5.75% Notes due Sep 2019 350 - 350 Texas Gas 4.50% Notes due Feb 2021 440 - 440 Gulf South 4.00% Notes due Jun 2022 300 - 300 Boardwalk 3.375% Notes due Feb 2023 300 - 300 Boardwalk 4.95% Notes due Dec 2024 600 - 600 Boardwalk 5.95% Notes due Jun 2026 550 - 550 Boardwalk 4.45% Notes due Jul 2027 500 500 Texas Gas 7.25% Debentures due Jul 2027 100 - 100 Total notes and debentures 3,400 200 3,600 Revolving Credit Facility (1) 180 (180) - 9 - 9 3,589 20 3,609 Less: Unamortized debt discount and issuance costs (31) (5) (36) $ 3,558 $ 15 $ 3,573 433 $ 4,531 $ 93 $ 4,624 $ 8,089 $ 108 $ 8,197 $ 5 $ 24 $ 29 44.0% 43.6% Capital Lease Obligation Debt: December 31, 2016 Adjustments for 2017 Financing Activities March 31, 2017 Total Long-Term Debt Total Equity Total Capitalization Cash and Cash Equivalents Long-Term Debt to Total Capitalization Ratio

18Boardwalk Louisiana Midstream: Sulphur HubPineville Compressor Station Market Fundamentals Dillsboro Compressor Station (Dillsboro, Indiana)
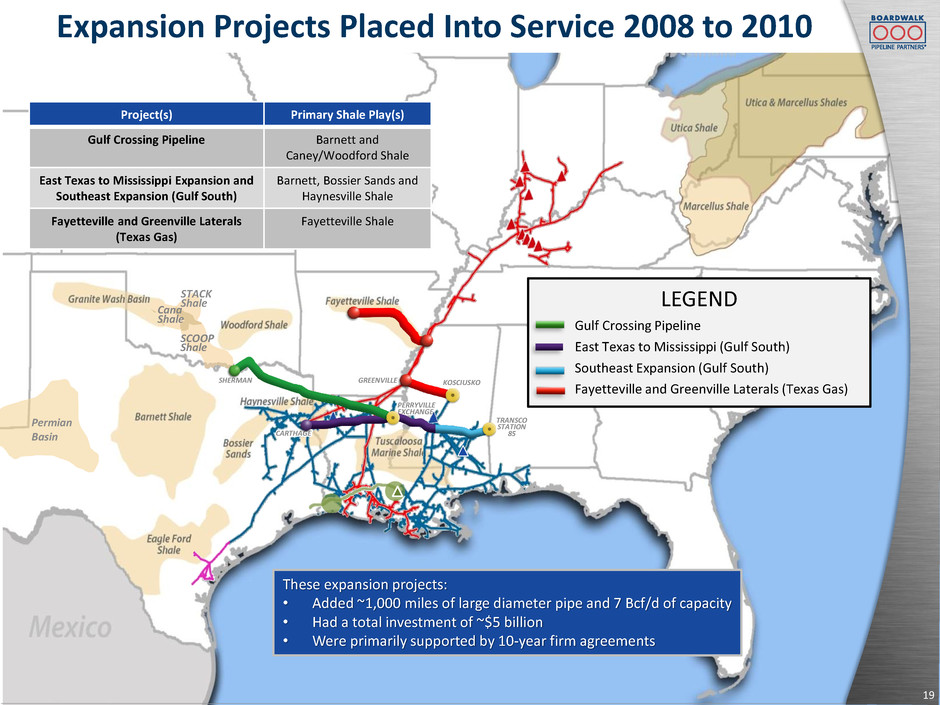
Permian Basin Cana Shale SCOOP Shale STACK Shale 19 SHERMAN KOSCIUSKO TRANSCO STATION 85 PERRYVILLE EXCHANGE CARTHAGE GREENVILLE Expansion Projects Placed Into Service 2008 to 2010 These expansion projects: • Added ~1,000 miles of large diameter pipe and 7 Bcf/d of capacity • Had a total investment of ~$5 billion • Were primarily supported by 10-year firm agreements Project(s) Primary Shale Play(s) Gulf Crossing Pipeline Barnett and Caney/Woodford Shale East Texas to Mississippi Expansion and Southeast Expansion (Gulf South) Barnett, Bossier Sands and Haynesville Shale Fayetteville and Greenville Laterals (Texas Gas) Fayetteville Shale LEGEND Gulf Crossing Pipeline East Texas to Mississippi (Gulf South) Southeast Expansion (Gulf South) Fayetteville and Greenville Laterals (Texas Gas)
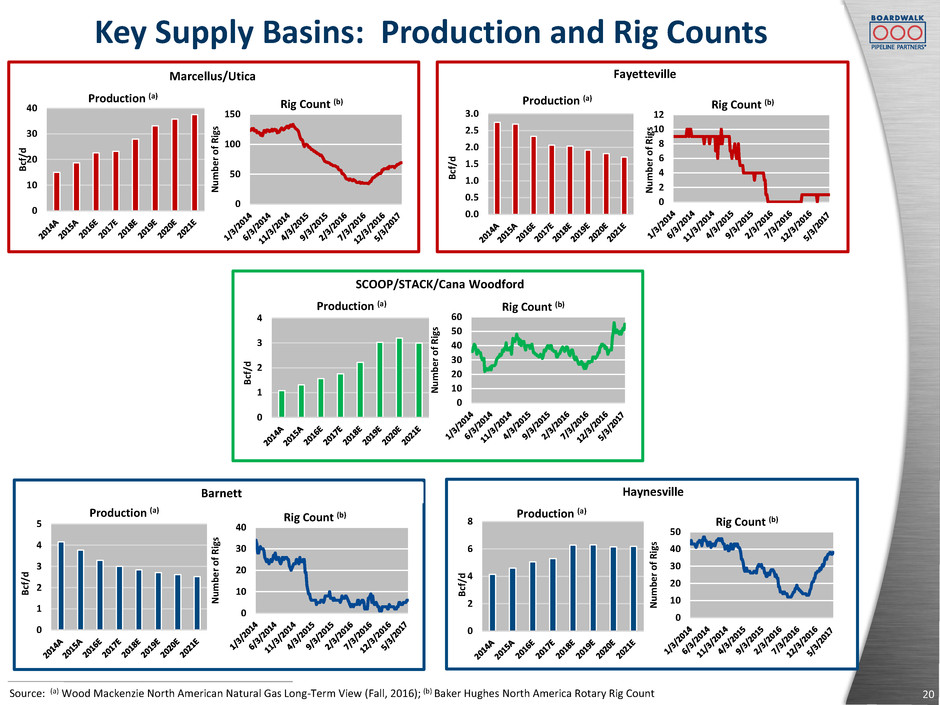
20 Key Supply Basins: Production and Rig Counts Source: (a) Wood Mackenzie North American Natural Gas Long-Term View (Fall, 2016); (b) Baker Hughes North America Rotary Rig Count Marcellus/Utica Fayetteville Barnett Haynesville SCOOP/STACK/Cana Woodford 0 1 2 3 4 B cf/ d Production (a) 0 2 4 6 8 B cf/ d Production (a) 0 1 2 3 4 5 B cf/ d Production (a) 0.0 0.5 1.0 1.5 2.0 2.5 3.0 B cf/ d Production (a) 0 10 20 30 40 B cf/ d Production (a) 0 2 4 6 8 10 12 Nu m b e r o f R ig s Rig Count (b) 0 50 100 150 Nu m b e r o f R ig s Rig Count (b) 0 10 20 30 40 50 60 Nu m b e r o f R ig s Rig Count (b) 0 10 20 30 40 Nu m b e r o f R ig s Rig Count (b) 0 10 20 30 40 50 Nu m b e r o f R ig s Rig Count (b)
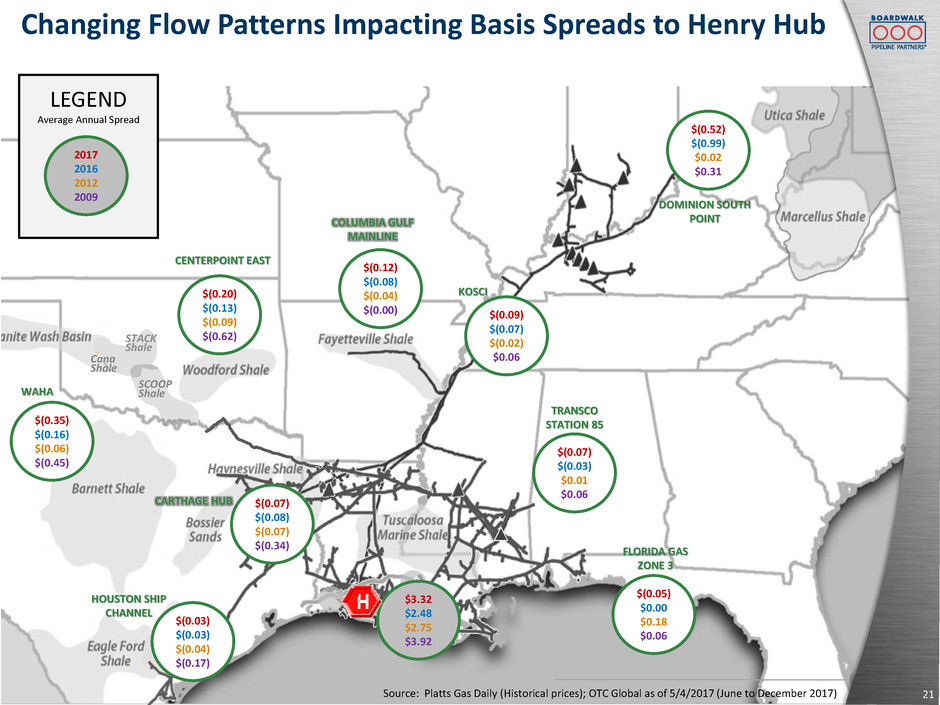
Cana Shale SCOOP Shale STACK Shale Changing Flow Patterns Impacting Basis Spreads to Henry Hub Source: Platts Gas Daily (Historical prices); OTC Global as of 5/4/2017 (June to December 2017) LEGEND Average Annual Spread 2017 2016 2012 2009 $(0.35) $(0.16) $(0.06) $(0.45) $(0.20) $(0.13) $(0.09) $(0.62) $(0.12) $(0.08) $(0.04) $(0.00) $(0.09) $(0.07) $(0.02) $0.06 $(0.52) $(0.99) $0.02 $0.31 $(0.07) $(0.03) $0.01 $0.06 $(0.05) $0.00 $0.18 $0.06 $3.32 $2.48 $2.75 $3.92 $(0.07) $(0.08) $(0.07) $(0.34) $(0.03) $(0.03) $(0.04) $(0.17) CENTERPOINT EAST HOUSTON SHIP CHANNEL CARTHAGE HUB KOSCI TRANSCO STATION 85 FLORIDA GAS ZONE 3 WAHA COLUMBIA GULF MAINLINE DOMINION SOUTH POINT 21

Permian Basin Cana Shale SCOOP Shale STACK Shale Demand Forecast: LNG Exports Freeport Sabine Pass Cameron LNG Corpus Christi Total US LNG Export Capacity (a) Bcf/d LNG Facilities by Location Existing Approved (Under Construction & Not Under Construction) Proposed (Pending Application) Proposed (Pre-filing) Texas - 6.4 6.9 2.1 Louisiana 1.4 9.6 1.4 8.6 Mississippi - - 1.5 - Grand Total 1.4 16.0 9.8 10.8 6.9 12.3 12.3 0.0 2.0 4.0 6.0 8.0 10.0 12.0 14.0 5-Year Growth 10-Year Growth 15-Year Growth B cf/ d Forecasted LNG Export Demand Growth (b) Source: (a) FERC (January 5, 2017); (b) Wood Mackenzie North American Natural Gas Long-Term View (Fall, 2016) 22 LEGEND FERC Existing, Approved and Proposed U.S. LNG Export Facilities
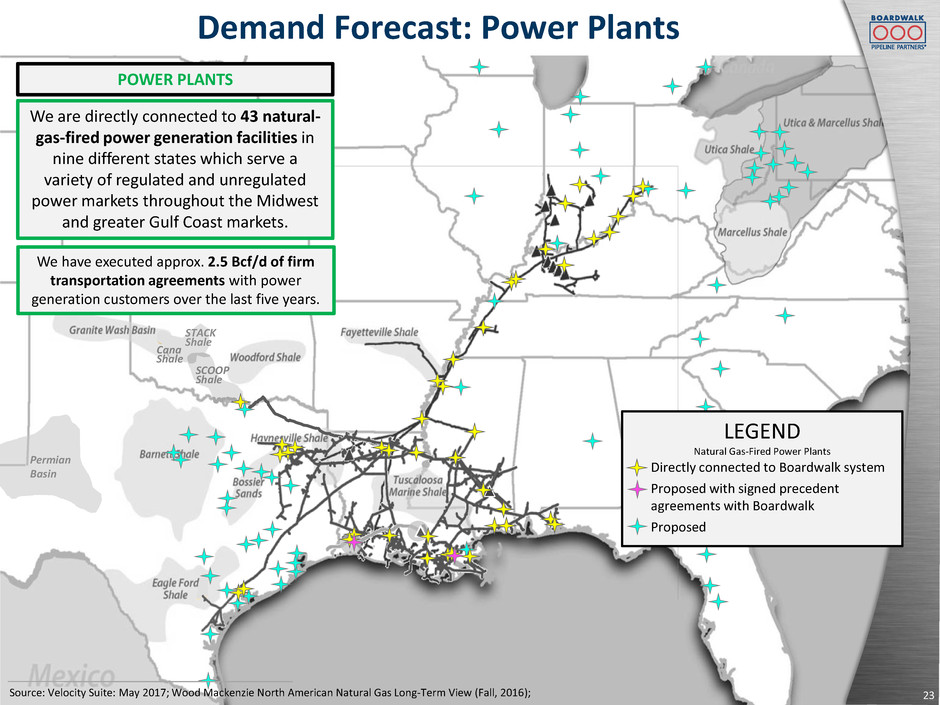
Permian Basin Cana Shale SCOOP Shale STACK Shale Demand Forecast: Power Plants We are directly connected to 43 natural- gas-fired power generation facilities in nine different states which serve a variety of regulated and unregulated power markets throughout the Midwest and greater Gulf Coast markets. POWER PLANTS We have executed approx. 2.5 Bcf/d of firm transportation agreements with power generation customers over the last five years. Source: Velocity Suite: May 2017; Wood Mackenzie North American Natural Gas Long-Term View (Fall, 2016); LEGEND Natural Gas-Fired Power Plants Directly connected to Boardwalk system Proposed with signed precedent agreements with Boardwalk Proposed 23

Permian Basin Cana Shale SCOOP Shale STACK Shale Demand Forecast: Industrials Source: Wood Mackenzie North American Natural Gas Long-Term View (Fall, 2016) We provide approximately 190 industrial facilities with a combination of firm and interruptible natural gas and liquids transportation and storage services INDUSTRIALS 2.6 3.6 4.2 0.0 0.5 1.0 1.5 2.0 2.5 3.0 3.5 4.0 4.5 5.0 5-Year Growth 10-Year Growth 15-Year Growth B cf/ d Forecasted Industrial Demand Growth Houston Ship Channel Lake Charles Baton Rouge New Orleans East Side Corpus Christi 24 LEGEND Industrial Corridors

Our Boardwalk Louisiana Midstream and Evangeline Assets are Well Situated to Provide Ethylene Transportation and Storage Services to Accommodate Forecasted Supply and Demand Mont Belvieu Baton Rouge Lake Charles Source: IHS, Boardwalk Legend Ethane Crackers Under Construction Ethane Crackers Announced Evangeline Ethylene Pipeline BLM Operating Hubs 2 5 25

Key Investment Highlights 26 •Primary services: Transportation and storage of natural gas and liquids •Geographic footprint situated to serve growing supply and demand Diversified midstream MLP • Approximately 90% of annual revenue is from fixed-fee, ship-or-pay contracts • Customers primarily rated investment grade •Weighted-average contract life of approximately 5 years for firm transportation agreements that are currently in service • Recently placed into service five projects that represent more than $500 million of capital expenditures and nearly 1.4 Bcf/d of capacity and are secured by ship-or- pay agreements with a weighted-average contract life of approximately 17 years Stable revenue profile • Growth projects to be placed into service between now and 2019 represent approximately $1.1 billion of planned capital expenditures and approximately 1.7 Bcf/d of natural gas transportation capacity, plus brine supply and liquids transportation and storage services • These projects are secured by ship-or-pay agreements with a weighted-average contract life of approximately 17 years Significant project backlog • Focused on disciplined capital allocation and long-term value creation •Average energy experience more than 25 years Conservative, experienced leadership •Subsidiary of Loews Corporation • History of supporting Boardwalk growth Well-capitalized general partner
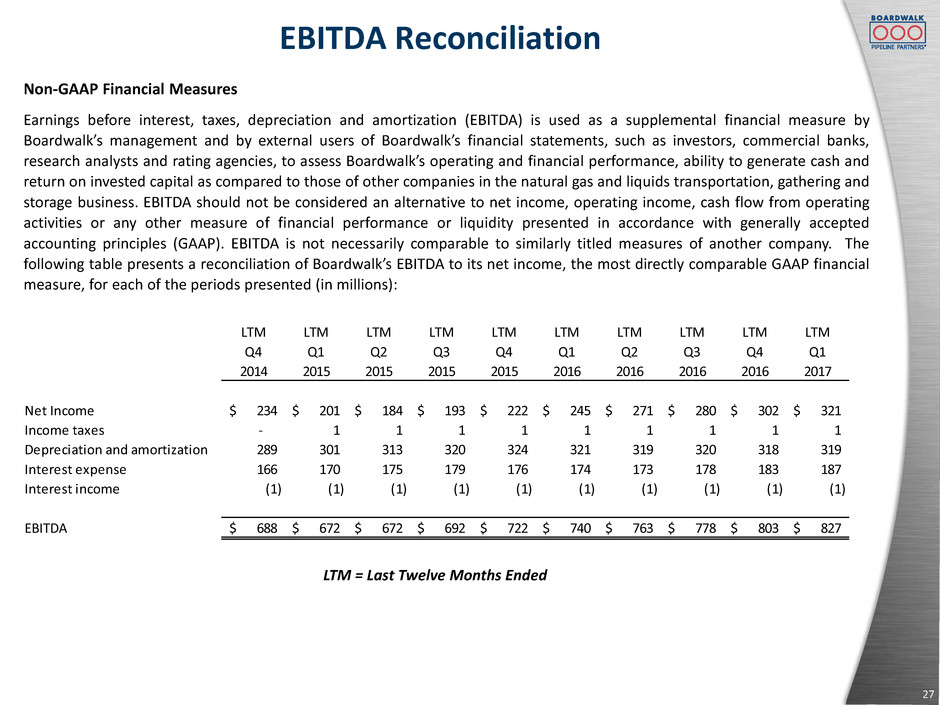
EBITDA Reconciliation 27 Non-GAAP Financial Measures Earnings before interest, taxes, depreciation and amortization (EBITDA) is used as a supplemental financial measure by Boardwalk’s management and by external users of Boardwalk’s financial statements, such as investors, commercial banks, research analysts and rating agencies, to assess Boardwalk’s operating and financial performance, ability to generate cash and return on invested capital as compared to those of other companies in the natural gas and liquids transportation, gathering and storage business. EBITDA should not be considered an alternative to net income, operating income, cash flow from operating activities or any other measure of financial performance or liquidity presented in accordance with generally accepted accounting principles (GAAP). EBITDA is not necessarily comparable to similarly titled measures of another company. The following table presents a reconciliation of Boardwalk’s EBITDA to its net income, the most directly comparable GAAP financial measure, for each of the periods presented (in millions): LTM = Last Twelve Months Ended LTM LTM LTM LTM LTM LTM LTM LTM LTM LTM Q4 Q1 Q2 Q3 Q4 Q1 Q2 Q3 Q4 Q1 2014 2015 2015 2015 2015 2016 2016 2016 2016 2017 N t I com 234$ 201$ 184$ 193$ 222$ 245$ 271$ 280$ 302$ 321$ I com taxes - 1 1 1 1 1 1 1 1 1 D ciation and amortization 289 301 313 320 324 321 319 320 318 319 Interest expense 166 170 175 179 176 174 173 178 183 187 Interest income (1) (1) (1) (1) (1) (1) (1) (1) (1) (1) EBITDA 688$ 672$ 672$ 692$ 722$ 740$ 763$ 778$ 803$ 827$
28Boardwalk Louisiana Midstream: Sulphur HubPineville Compressor Station Investor Presentation May 2017 Dillsboro Compressor Station (Dillsboro, Indiana)


