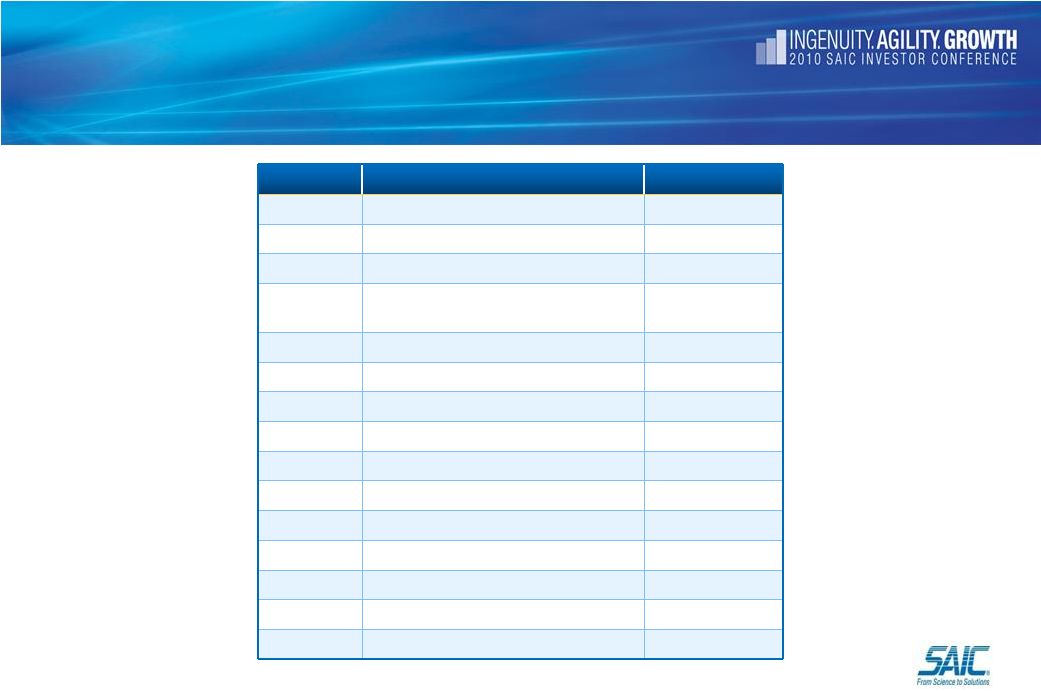
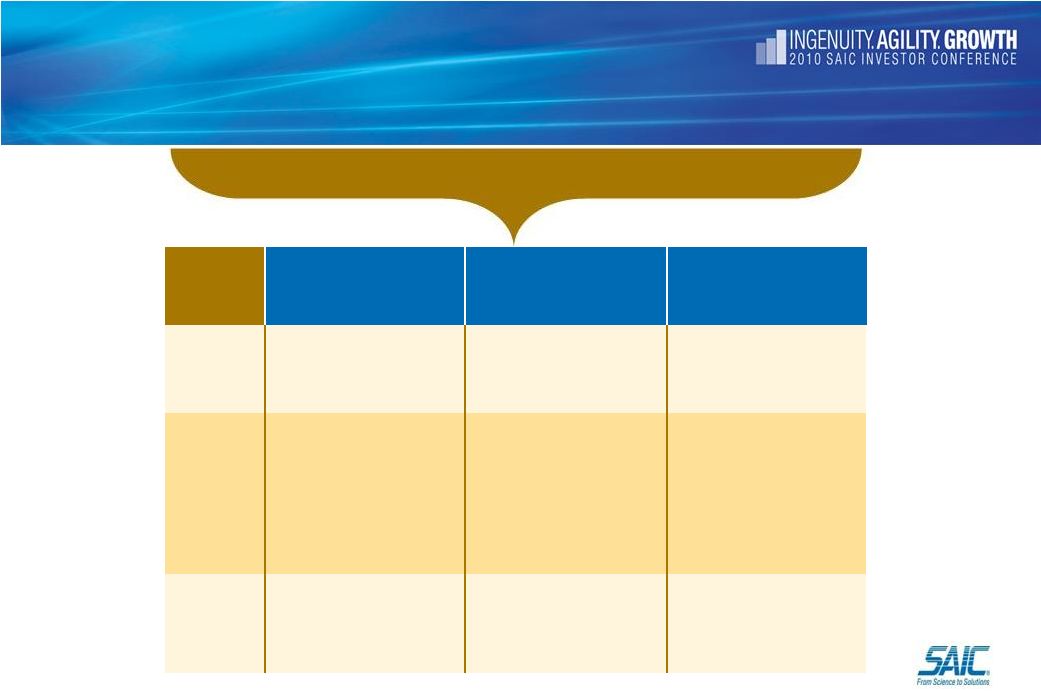
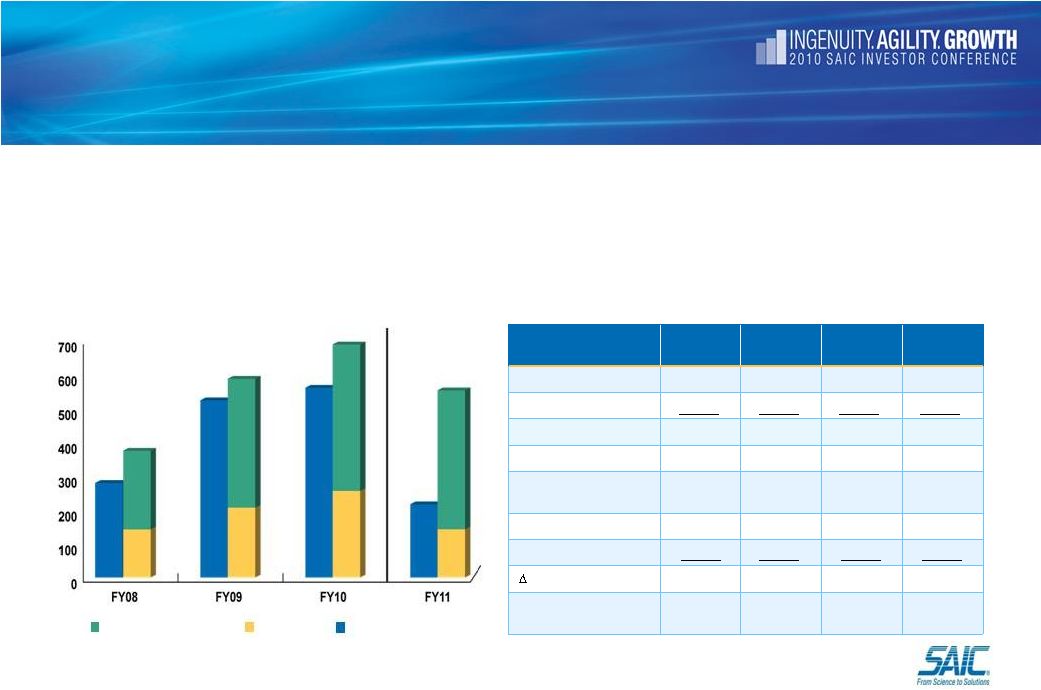
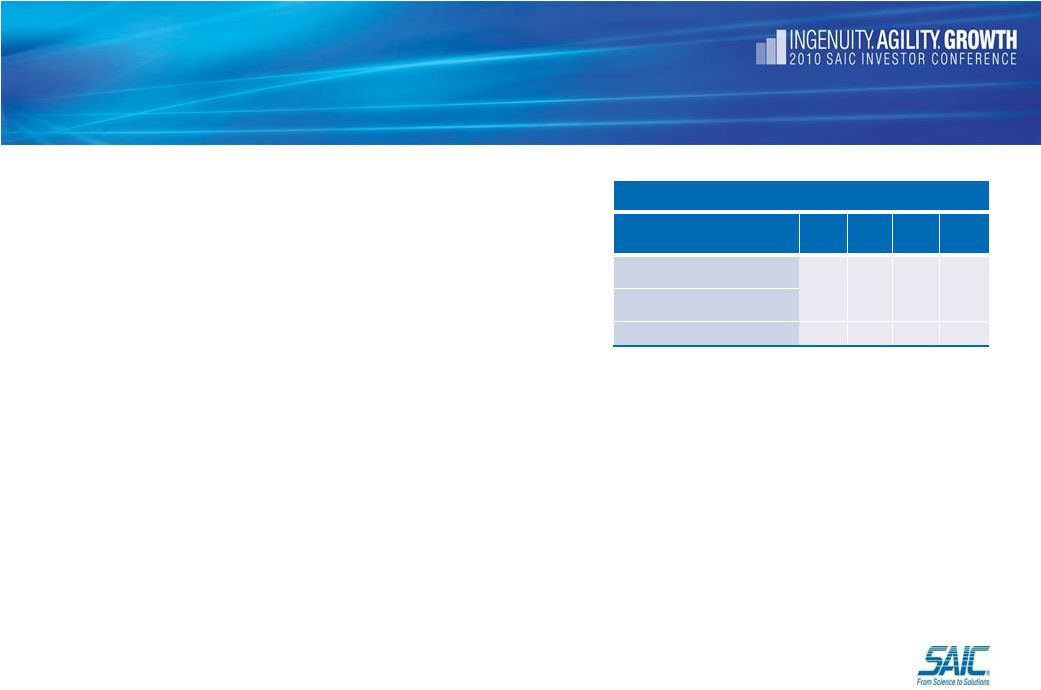
Energy | Environment | National Security | Health | Critical Infrastructure Reconciliation of Non-GAAP ROIC to GAAP Operating Income In this presentation, SAIC, Inc. refers to return on invested capital (ROIC) which is a non-GAAP financial measure that is reconciled to the most directly comparable financial measure, which is operating income. The company believes that reporting ROIC provides investors with greater visibility into how effectively it uses the capital invested in its operations. The company calculates ROIC by dividing operating income after normalized income taxes by average invested capital. Operating income after normalized income taxes is calculated by multiplying the sum of operating income by (1 - the normalized income tax rate). The normalized income tax rate of 38.5% approximates our combined federal and state statutory tax rate. Average invested capital is calculated by adding total stockholders' equity to notes payable and long-term debt and subtracting cash and cash equivalents. The limitation of this non-GAAP financial measure as compared to the most directly comparable GAAP financial measure is that financing or cash deployment decisions may cause ROIC to trend differently from operating income which is the most directly comparable GAAP financial measure. The company addresses this limitation by presenting ROIC near disclosures of operating income and net income. This financial measure is not meant to be considered in isolation or as a substitute for comparable GAAP measures and should be read only in conjunction with SAIC, Inc.’s consolidated financial statements prepared in accordance with GAAP. The method that the company uses to calculate ROIC is not necessarily comparable to similarly titled financial measures presented by other companies. Reconciliation of Return on Invested Capital FY08 FY09 FY10 H1 FY11 Operating income, as reported $673 $776 $867 $480 Normalized income tax rate 38.5% 38.5% 38.5% 38.5% Operating income after normalized income taxes $414 $477 $533 $295 Components of Invested Capital: 31-Jan-07 31-Jan-08 31-Jan-09 31-Jan-10 31-Jul-10 Total stockholders equity $1,502 $1,868 $2,084 $2,291 $2,280 Notes payable and long-term debt 1,228 1,228 1,116 1,106 1,105 Cash and cash equivalents (1,109) (1,096) (936) (861) (604) Invested Capital $1,621 $2,000 $2,264 $2,536 $2,781 Average Invested Capital $1,811 $2,132 $2,400 $2,659 Return on Invested Capital 22.9% 22.4% 22.2% 22.2%* * FY 2011 H1 Return on Invested Capital is an annualized number 67 © 2010 Science Applications International Corporation. All rights reserved. SAIC, the SAIC logo, and "From Science to Solutions" are trademarks or registered trademarks of Science Applications International Corporation in the United States and/or other countries. |