UNITED STATES
SECURITIES AND EXCHANGE COMMISSION
WASHINGTON, D.C. 20549
FORM 20-F
(Mark One)
| ¨ | REGISTRATION STATEMENT PURSUANT TO SECTION 12(b) OR (g) OF THE SECURITIES EXCHANGE ACT OF 1934 |
OR
| x | ANNUAL REPORT PURSUANT TO SECTION 13 OR 15(d) OF THE SECURITIES EXCHANGE ACT OF 1934 |
For the fiscal year ended December 31, 2005
OR
| ¨ | TRANSITION REPORT PURSUANT TO SECTION 13 OR 15(d) OF THE SECURITIES EXCHANGE ACT OF 1934 |
For the transition period from to
| ¨ | SHELL COMPANY REPORT PURSUANT TO SECTION 13 OR 15(d) OF THE SECURITIES EXCHANGE ACT OF 1934 |
Commission file number: 001-51544
A-Max Technology Limited
(Exact name of Registrant as specified in its charter)
N/A
(Translation of Registrant’s name into English)
Bermuda
(Jurisdiction of incorporation or organization)
10/F, A-MAX Technology Tower
12-16 Fui Yiu Kok Street, Tsuen Wan
New Territories, Hong Kong
(852) 2798-6699
(Address of principal executive offices)
Securities registered or to be registered pursuant to Section 12(b) of the Act
American Depositary Shares, each representing 25 ordinary shares, par value $0.00002 per share
Securities registered or to be registered pursuant to Section 12(g) of the Act
None
(Title of Class)
Securities for which there is a reporting obligation pursuant to Section 15(d) of the Act
None
(Title of Class)
Indicate the number of outstanding shares of each of the issuer’s classes of capital or common stock as of the close of the period covered by the annual report. 749,900,000 ordinary shares
Indicate by check mark if the registrant is a well-known seasoned issuer, as defined in Rule 405 of the Securities Act. ¨ Yes x No
If this report is an annual or transition report, indicate by check mark if the registrant is not required to file reports pursuant to Section 13 or 15(d) of the Securities Exchange Act of 1934. ¨ Yes x No
Indicate by check mark whether the registrant (1) has filed all reports required to be filed by Section 13 or 15(d) of the Securities Exchange Act of 1934 during the preceding 12 months (or for such shorter period that the registrant was required to file such reports), and (2) has been subject to such filing requirements for the past 90 days. x Yes ¨ No
Indicate by check mark whether the registrant is a large accelerated filer, an accelerated filer, or a non-accelerated filer. See definition of “accelerated filer and large accelerated filer” in Rule 12b-2 of the Exchange Act. (Check one):
¨ Large accelerated filer ¨ Accelerated filer x Non-accelerated filer
Indicate by check mark which financial statement item the registrant has elected to follow: ¨ Item 17 x Item 18
If this is an annual report, indicate by check mark whether the registrant is a shell company (as defined in Rule 12b-2 of the Exchange Act) ¨ Yes x No
TABLE OF CONTENTS
INTRODUCTION
- 3 -
INTRODUCTION
Unless otherwise indicated, references in this annual report on Form 20-F to:
| | • | | ““we,” “us,” “our company,” “our” and “A-Max” refer to A-Max Technology Limited and its subsidiaries; |
| | • | | “A-Max China” refers to Shenzhen Zhongyuyuanyi Digital Science and Technology Company Limited; |
| | • | | “China” and the “PRC” are to the People’s Republic of China, excluding, for the purposes of this annual report on Form 20-F only, Taiwan and the special administrative regions of Hong Kong and Macao; |
| | • | | “Hong Kong” refers to the Hong Kong Special Administrative Region of the People’s Republic of China; |
| | • | | “Macao” refers to the Macao Special Administrative Region of the People’s Republic of China; |
| | • | | “HK$” and “HK dollars” are to the legal currency of Hong Kong; |
| | • | | “RMB” and “Renminbi” are to the legal currency of China; |
| | • | | “$” and, “US$” and “U.S. dollars” are to the legal currency of the United States; and |
| | • | | “shares” or “ordinary shares” refers to our ordinary shares, “Series A Preferred Shares” refers to our Series A convertible preferred shares, “ADSs” refers to our American depositary shares, each of which represents 25 ordinary shares, and “ADRs” refers to the American depositary receipts that evidence our ADSs. |
This annual report on Form 20-F includes our audited consolidated financial statements for the years ended December 31, 2003, 2004 and 2005 and as of December 31, 2004 and 2005.
Currently, no public market exists for our shares or ADSs.
PART I
ITEM 1 IDENTITY OF DIRECTORS, SENIOR MANAGEMENT AND ADVISERS
Not applicable.
ITEM 2 OFFER STATISTICS AND EXPECTED TIMETABLE
Not applicable.
ITEM 3 KEY INFORMATION
| A. | Selected Financial Data |
- 4 -
SELECTED CONSOLIDATED FINANCIAL DATA
The following selected consolidated financial data as of and for the years ended December 31, 2003, 2004 and 2005 are derived from our audited consolidated financial statements included elsewhere in this annual report and should be read in conjunction with, and are qualified in their entirety by reference to those consolidated financial statements and related notes. Our consolidated financial statements have been audited by Deloitte Touche Tohmatsu and were prepared in accordance with U.S. GAAP. The following selected consolidated financial data as of and for the year ended December 31, 2002 are derived from our audited consolidated financial statements not included in this annual report and were prepared in accordance with U.S. GAAP. The following selected consolidated financial data as of and for the year ended December 31, 2001 are derived from our unaudited consolidated financial statements not included in this annual report and were prepared in accordance with U.S. GAAP. We have prepared the unaudited information on the same basis as the audited consolidated financial statements, and have included, in our opinion, all adjustments, consisting only of normal and recurring adjustments that we consider necessary for a fair presentation of the financial information set forth in those statements. The following selected consolidated financial data should be read in conjunction with our “Item 5. Operating and Financial Review and Prospects” included elsewhere in this annual report.
| | | | | | | | | | | | | | | | | | | | |
| | | Year Ended December 31, | |
| | | 2001 | | | 2002 | | | 2003 | | | 2004 | | | 2005 | |
| | | (in thousands, except per share data) | |
Consolidated Statement of Operations Data | | | | | | | | | | | | | | | | | | | | |
Net sales | | $ | 40,129 | | | $ | 41,921 | | | $ | 39,388 | | | $ | 141,384 | | | $ | 328,321 | |
Cost of sales | | | (36,775 | ) | | | (37,454 | ) | | | (33,232 | ) | | | (118,206 | ) | | | (288,057 | ) |
| | | | | | | | | | | | | | | | | | | | |
Gross profit | | $ | 3,354 | | | $ | 4,467 | | | $ | 6,156 | | | $ | 23,178 | | | $ | 40,264 | |
Selling expenses | | | (1,808 | ) | | | (1,507 | ) | | | (1,722 | ) | | | (2,926 | ) | | | (5,748 | ) |
General and administrative expenses | | | (3,063 | ) | | | (2,990 | ) | | | (3,878 | ) | | | (3,882 | ) | | | (8,893 | ) |
Research and development expenses | | | (254 | ) | | | (369 | ) | | | (153 | ) | | | (359 | ) | | | (1,652 | ) |
Impairment on long-lived assets | | | — | | | | (424 | ) | | | — | | | | — | | | | — | |
Gain on disposal of variable interest entity | | | — | | | | — | | | | — | | | | — | | | | 433 | |
Gain on disposal of subsidiaries and tradename | | | — | | | | — | | | | 827 | | | | — | | | | — | |
| | | | | | | | | | | | | | | | | | | | |
Operating income (loss) | | $ | (1,771 | ) | | $ | (823 | ) | | $ | 1,230 | | | $ | 16,011 | | | $ | 24,404 | |
Other income | | | 343 | | | | 249 | | | | 466 | | | | 120 | | | | 649 | |
Net unrealized (loss) gain on investment securities | | | — | | | | — | | | | — | | | | (19 | ) | | | 1 | |
Impairment on investments | | | — | | | | — | | | | — | | | | (179 | ) | | | — | |
Initial Public Offering expenses | | | — | | | | — | | | | — | | | | — | | | | (3,080 | ) |
Interest income | | | 55 | | | | 3 | | | | 4 | | | | 15 | | | | 873 | |
Interest expense | | | (513 | ) | | | (545 | ) | | | (401 | ) | | | (649 | ) | | | (1,026 | ) |
| | | | | | | | | | | | | | | | | | | | |
Income (loss) before income taxes | | $ | (1,886 | ) | | $ | (1,116 | ) | | $ | 1,299 | | | $ | 15,299 | | | $ | 21,821 | |
Provision for income taxes | | | (1 | ) | | | (93 | ) | | | (165 | ) | | | (2,568 | ) | | | (4,400 | ) |
| | | | | | | | | | | | | | | | | | | | |
Net income (loss) | | $ | (1,887 | ) | | $ | (1,209 | ) | | $ | 1,134 | | | $ | 12,731 | | | $ | 17,421 | |
| | | | | |
Dividends on Series A Preferred Shares | | | — | | | | — | | | | — | | | | (36 | ) | | | (3,238 | ) |
Beneficial Conversion Amount | | | — | | | | — | | | | — | | | | — | | | | (27,619 | ) |
Income attributable to Series A preferred shareholders | | | — | | | | — | | | | — | | | | — | | | | (1,500 | ) |
| | | | | | | | | | | | | | | | | | | | |
Income (loss) available to ordinary shareholders | | | (1,887 | ) | | | (1,209 | ) | | | 1,134 | | | | 12,695 | | | | (14,936 | ) |
| | | | | | | | | | | | | | | | | | | | |
Basic earnings (loss) per share | | $ | (0.003 | ) | | $ | (0.002 | ) | | $ | 0.002 | | | $ | 0.021 | | | $ | (0.020 | ) |
| | | | | | | | | | | | | | | | | | | | |
Diluted earnings (loss) per share | | | N/A | | | | N/A | | | | N/A | | | | 0.018 | | | | (0.020 | ) |
| | | | | | | | | | | | | | | | | | | | |
Shares used in computing basic earnings (loss) per share | | | 600,000 | | | | 600,000 | | | | 600,000 | | | | 613,150 | | | | 749,900 | |
Shares used in computing diluted earnings (loss) per share | | | N/A | | | | N/A | | | | N/A | | | | 712,550 | | | | 749,900 | |
- 5 -
| | | | | | | | | | | | | | | | |
| | | As of December 31, |
| | | 2001 | | 2002 | | | 2003 | | 2004 | | 2005 |
| | | (in thousands, except per share data) |
Consolidated Balance Sheet Data | | | | | | | | | | | | | | | | |
Cash and cash equivalents | | $ | 1,112 | | $ | 409 | | | $ | 1,710 | | $ | 7,081 | | $ | 49,106 |
Accounts receivable, net | | | 3,940 | | | 6,412 | | | | 8,394 | | | 43,262 | | | 73,256 |
Inventories | | | 6,706 | | | 6,056 | | | | 7,131 | | | 25,604 | | | 43,426 |
Total assets | | | 18,713 | | | 19,855 | | | | 23,430 | | | 85,162 | | | 189,215 |
Borrowings | | | 8,515 | | | 8,491 | | | | 13,429 | | | 32,819 | | | 30,955 |
Accounts payable | | | 4,068 | | | 5,891 | | | | 4,985 | | | 30,025 | | | 49,168 |
Total current liabilities | | | 17,261 | | | 19,998 | | | | 22,469 | | | 70,387 | | | 94,495 |
Total shareholders’ equity (deficit) | | | 1,223 | | | (170 | ) | | | 502 | | | 14,636 | | | 29,339 |
Total liabilities and shareholders’ equity | | | 18,713 | | | 19,855 | | | | 23,430 | | | 85,162 | | | 189,215 |
| B. | Capitalization and Indebtedness |
Not applicable.
| C. | Reasons for the Offer and Use of Proceeds |
Not applicable.
Risks Related to Our Business
We depend heavily on sales of flash-based players and if those players do not remain popular with consumers, our business and prospects could be materially and adversely affected.
We depend heavily on sales of flash-based players, which accounted for 91.4% and 92.1% of our net sales in 2004 and 2005, respectively. As a result, our business depends on the continued viability and growth of the market for these products. The continued popularity of stand-alone flash-based players will be affected significantly by factors that include:
| | • | | the prices of flash-based players and competing products such as HDD-based players or other portable devices; |
| | • | | consumer demands and preferences as to desired performance and features; |
| | • | | the availability of compressed digital audio content; |
| | • | | the increased market adoption of other portable digital audio and multimedia devices, such as HDD-based players, portable multimedia players, or PMPs, digital audio broadcast players, or DAB players, and converged devices such as mobile phones and personal digital assistants, or PDAs, with digital audio player capabilities; and |
| | • | | general economic and other conditions that affect consumers’ discretionary spending. |
In addition, changes in technology, consumer preferences or other factors may cause flash-based players to become uncompetitive with HDD-based players, PMPs, DAB players or other devices. Consumers may want HDD-based players and PMPs that offer a greater capacity to store a very large number of songs, photos or memory-intensive content, such as digital video. If even more compact and energy-efficient hard disk drives are introduced to the market or the price of HDD-based players decreases at a significantly faster rate than that of flash-based players, consumers may decide to purchase, or switch to, HDD-based players. In addition, consumers may demand converged devices, or “do-everything devices,” such as certain high-end multimedia mobile phones that incorporate a digital audio playback function. If we are unsuccessful in broadening our product mix and leveraging our experience and reputation in the flash-based player market to gain new customers in other markets, our business and prospects could be materially and adversely affected.
- 6 -
Our limited operating history in the portable player industry makes it difficult to evaluate our business and prospects.
We began producing portable players in 2000 and did not launch our first flash-based player product until 2002. In addition, with the emergence and rapid growth of the portable player market, and in particular, the flash-based player market, we have experienced a high rate of growth since 2003. As such, our historical operating results may not provide a meaningful basis for evaluating our business and prospects. We do not expect to achieve a similar growth rate in future periods. Accordingly, you should not rely on our results of operations for any prior period as an indication of our future performance.
We have incurred losses in prior periods and may incur losses in the future.
We incurred net losses in 2002 and in prior years, and we may incur losses in the future. We expect our operating expenses to increase as we expand our operations. Our ability to maintain profitability depends on the rate of growth of our target markets, the continued market acceptance and competitiveness of our products and our ability to provide new products and product enhancements to meet our customers’ demands. Even though we have achieved profitability in recent periods, we may not be able to sustain or increase profitability on a quarterly or an annual basis.
Because our business depends on an adequate and timely supply of components and we rely on a limited number of suppliers for the flash memory and chipsets used in our products, any shortages, interruptions in supply or substantial price increases by our key suppliers would cause a material adverse effect on our business, financial results and relationships with our customers.
Our business depends on our ability to obtain adequate supplies of components on a timely and cost-competitive basis. We purchase our components from various third-party vendors that meet our quality standards and volume requirements. In 2004 and 2005, we purchased a majority of our flash memory and chipsets from Samsung Electronics Co., Ltd., or Samsung, and SigmaTel, Inc., or SigmaTel, respectively. We do not have long-term agreements with our suppliers of key components. Some of our suppliers are one of only several sources for these components and hold dominant market shares in their respective markets. Reliance on a small number of key suppliers involves risks that could adversely affect our operations or financial condition, including shortages of components, an increase in component costs and our lack of control over component delivery schedules.
Certain components critical to our products have been subject to periodic shortages of supply in the past. For example, there have been industry-wide shortages of flash memory and hard disk drives due to increased demand across the entire consumer electronics industry. We cannot assure you that shortages of these kinds will not recur in the future. Any shortages, interruptions in supply or substantial price increases by our key suppliers would cause a material adverse effect on our business, financial results and relationships with our customers.
- 7 -
If our brand owner customers discontinue or reduce the use of independent end-to-end solutions providers such as ourselves, our business would be materially and adversely affected.
The growth of our business depends substantially on the extent to which brand owners rely on independent end-to-end solutions providers such as ourselves to provide comprehensive solutions for the design and manufacture of portable players, as opposed to producing portable players in-house or through a combination of other third parties such as design houses and electronic manufacturing service, or EMS, providers. If the leading brand owners in the flash-based player market manufacture their products in-house or discontinue or reduce the use of independent end-to-end solutions providers such as ourselves, our business would be materially and adversely affected.
If we fail to acquire new large retail chain customers or increase sales from our existing large retail chain customers, our business may be materially and adversely affected.
The growth of our business will depend in part on the extent to which we obtain the business of new large retail chain customers and increase the business of our existing large retail chain customers. An increasing number of large retail chains have begun to sell portable players under their own house brands, and these and other large retail chains are expected to increase their market share in the future. These large retail chains do not typically have in-house technical expertise, manufacturing capabilities or experience in the market and rely on independent providers to design and produce portable players for them. As the large retail chains’ products do not have the advantage of well-known consumer electronics brand names, there is even greater pressure on them to keep the retail price of their products low by using cost-efficient providers. If we are not successful in acquiring additional large retail customers and increased sales from our existing large retail customers, the growth of our business may be materially and adversely affected.
The average retail selling prices of consumer electronics products typically decrease significantly over a product’s life and will likely continue to do so in the future, which could adversely affect our revenue and profitability.
The average retail selling prices, or ASPs, of consumer electronics products, including portable players, typically decline significantly over a product’s life as new models are introduced, due to improvements in technology that permit enhanced performance and features at the same or lower prices. If ASPs for portable players continue to decline, we will be required to either reduce our costs and unit selling prices for comparable products over time or enhance the performance and features of our products in a cost-efficient manner in order to maintain our average unit selling prices. Our financial results will suffer if we are unable to increase our sales volumes, reduce our costs or introduce new or enhanced features for existing products or new products that can attain higher unit selling prices.
- 8 -
If we cannot provide new product models and enhancements in a timely and cost-efficient manner to meet our customers’ demands, the growth and success of our business will be materially and adversely affected.
The portable player industry is characterized by changing consumer preferences, demand for new and advanced features and greater storage capacities, rapid product obsolescence, declines in unit selling prices, intense competition, evolving industry standards, seasonality and fluctuations in product and component supply and demand. These factors result in the frequent introduction of new products, short product life cycles and significant price competition. Our ability and our customers’ ability to accurately forecast quarterly and annual sales is limited.
In order to be competitive, we must, among other things:
| | • | | be responsive to consumers’ demands for new features and functions in portable player products; |
| | • | | quickly incorporate those features and functions into new products and product enhancements; |
| | • | | timely deliver new products and enhanced products to our customers with high quality and in large volumes; |
| | • | | closely manage our key supplier relationships and the availability and pricing of adequate quantities of the main components of our products; |
| | • | | price our products and product enhancements competitively; and |
| | • | | manage product transitions smoothly and cost-effectively. |
If we are unable to cost-efficiently identify, develop, manufacture and sell new products or product enhancements, or if we are unable to manage product transitions smoothly and efficiently, the growth and success of our business will be materially and adversely affected.
Our business will suffer if we cannot meet increases in demand due to seasonality.
Sales of our portable players, as with many consumer electronic products, are subject to significant seasonality, with higher revenues typically in the fourth quarter of each year, when customers place orders to meet year-end holiday demand, and lower revenues in the first and second quarters of each year. However, our limited operating history in the portable player industry and recent market growth make it difficult for us to accurately assess the impact of seasonal factors on our business. We failed to ramp up production to meet increased customer orders in the third quarter and early part of the fourth quarter of 2004 prior to relocating to our current manufacturing facilities in November 2004, and we had to turn down some increased customer orders in advance of the winter holiday season due to our insufficient production capacity. If we are unable to ramp up production of new or existing products to meet any increases in demand due to seasonality or other factors, our sales and operating results could suffer materially.
Because of the length of the sales cycles for new products designed by us, we may make substantial expenditures before we earn revenues and may not ultimately achieve our forecasted sales.
For new products that we design based on our customers’ specifications, our sales cycle from design to manufacture and delivery is typically three to six months. The length of this sales cycle is due to a number of reasons, including the following:
| | • | | our customers usually complete in-depth technical evaluations of our designs and manufacturing plans and processes before they place purchase orders; |
- 9 -
| | • | | the volume production of our portable players may be limited during our customers’ initial release of these portable players to evaluate performance and consumer demand; |
| | • | | new product introductions often center around key trade shows and selling seasons and the failure to launch a new product at such times may result in a delay in the introduction of the new product; and |
| | • | | the development and commercial introduction of products incorporating complex technology are often delayed or canceled. |
We may make substantial expenditures before we earn revenues because we must order components and build inventory in advance of customer orders for products. In addition, we may make substantial expenditures to develop new products that may ultimately be unsuccessful in the market. For example, we have recently incurred expenditures to develop PMPs and electronic photo frames and have commenced the design of DAB players. We cannot be certain, however, that any of such products will be successful in the market. Because demand for our products is affected by a number of factors, including market acceptance of our products, competition and general economic conditions, there is a risk that we may forecast demand incorrectly and produce or order from component suppliers excess or insufficient inventories of particular products or components. Further, particularly during times of potential component shortages, we have purchased, and may continue to purchase, component parts in the expectation of receiving purchase orders. In the event we forecast demand incorrectly, we may experience product shortages or increased inventory levels and possible write-downs of inventory that could materially and adversely affect our business and operating results.
Our recent expansion has strained our management, personnel, systems and resources, and the continued success of our business depends on our ability to successfully manage our growth.
Our business operations have expanded significantly since 2003 due to the rapid growth of our sales of flash-based players, and we expect to further expand our operations to take advantage of the potential growth in our customer base and the portable player market. This expansion has placed, and our intended expansion will continue to place, a strain on our management, personnel, systems and resources. If we are unable to manage our growth effectively, we may not be able to take advantage of market opportunities, develop new products, enhance our design and manufacturing capabilities, satisfy customer requirements, execute our business plan or respond to competitive pressures. Further, as we become a public company, we will need to augment our support infrastructure because our information and control systems must enable us to prepare accurate and timely financial information and other required disclosures. To successfully manage our growth, we believe we must:
| | • | | recruit and retain skilled employees necessary to support our expanded operations; |
| | • | | continue to maintain adequate control of our costs and expenses; |
| | • | | continue to maintain strong relationships with our key suppliers, customers and other third parties; and |
| | • | | enhance our design, manufacturing, packaging and logistics services and after-sales support. |
- 10 -
All of these measures will require substantial management efforts and resources. We cannot assure you that we will be able to implement the measures successfully or to effectively manage our growth; any failure to do so may adversely and materially affect our business.
If we are unable to manage the expansion and relocation of our production facilities effectively, our financial results may be adversely affected.
We must expand our production facilities to meet growing customer orders and maintain growth. In the third quarter and early part of the fourth quarter of 2004 prior to relocating to our current production facilities in November 2004, we had to turn down some increased customer orders due to our insufficient production capacity. We must constantly evaluate our facilities to make sure that we have sufficient production capacity to meet growing customer orders and fulfill orders by new portable player brand owners and retail chain customers. If we are unable to expand our production facilities to meet growing customer orders, our existing and prospective customers may seek other companies to meet their demand.
In order to expand our production capacity, we relocated our production facilities to Shenzhen in November 2004. The new facilities have monthly production capacity of approximately 1.0 to 1.2 million units per month, depending on the models being produced. We have doubled our monthly production capacity to approximately 2.0 to 2.4 million units through the completion of Phase II of the expansion of our Shenzhen manufacturing facilities. In addition, we intend to acquire land in Shenzhen for the future relocation of our manufacturing facilities and purchase additional machinery and equipment to enhance our manufacturing efficiency. There are a number of events that could delay these expansion projects or increase the costs associated with our expansion. Such potential events include:
| | • | | shortages and late delivery of building materials and equipment; |
| | • | | delays in the delivery, installation, commissioning and qualification of our manufacturing equipment; |
| | • | | design or construction changes with respect to building spaces or equipment layout; |
| | • | | delays in securing the necessary governmental approvals; |
| | • | | technological, capacity and other changes to our plans necessitated by changes in market conditions; |
| | • | | failure to timely train new and existing employees to use the new production facilities. |
Expansion and modification of our production facilities will increase our costs. We will need to purchase additional equipment, train employees to operate the new equipment and hire additional employees. In addition, we have already committed substantial expenditures and resources towards certain of these expansion projects. We will need to increase our net sales accordingly to offset these higher costs. However, demand for our products may not be as high as we expect, and we cannot guarantee that we will be able to fully utilize additional capacity. If that happens, we may fail to realize the expected benefit from our investment in our new and expanded facilities and our financial results will be adversely affected.
- 11 -
Because the markets in which we operate are competitive and many of our competitors have greater resources than we do, we may not be able to compete successfully and we may lose or be unable to gain market share.
We face current and potential future competition from brand owners, original design manufacturers, or ODMs, and EMS providers. Many of our current and potential competitors have significantly greater financial, technical, marketing, sales and other resources than we do. In addition, some of these competitors may be closer in geographic proximity, and have greater cultural and language connections, to the leading brand owners and large retail chains which sell portable players. We cannot assure you that we will be able to compete successfully against our current or future competitors in our market.
If our customers are not successful in selling our products under their brands, our sales growth and financial results will be adversely affected.
As our products are sold to end users by our customers under their own brands, our success depends on our customers’ success in their portable player sales. Our customers face intense competition from other major consumer electronics brand owners and large retail chains that may have greater brand recognition and financial, marketing, distribution and other resources. We are not able to control our customers’ product and design choices, marketing and pricing strategies and other critical factors in the success and competitiveness of their sales of portable players. Accordingly, we cannot assure you that our customers will be successful in their sales of our products under their brands or that their purchases of our portable players will continue or grow with future orders. If our customers are not successful in selling our products under their brand names, our sales growth and financial results will be adversely affected. For example, some leading consumer electronics brand owners that have recently entered the flash-based player market design and manufacture their products entirely in-house or outsource the design and manufacturing of their products to other companies. Apple Computer, Inc., which already has a commanding market share of the HDD-based player market, entered the flash-based player market in January 2005, and has captured a substantial portion of that market. If leading brand names take market share from our existing customers and do not outsource the design and manufacturing of their products to us, our business will be adversely affected.
We rely on a limited number of customers for a significant portion of our net sales, and if a large customer fails to place additional orders with us, or if we fail to develop additional major customers, our operating results and financial condition could be materially and adversely affected.
We have been dependent on a small number of customers to generate a significant portion of our net sales. In 2004 and 2005, our top five customers collectively accounted for approximately 65.2% and 50.5%, respectively, of our net sales. Each of Medion, NEC Computers International BV, or NEC and a leading China-based consumer electronics company contributed over 10% of our net sales for 2004, and each of DSG Retail, Maxfield GmbH, or Maxfield and NEC contributed over 10% of our net sales for 2005. Sales to our largest customers have varied from period to period due primarily to our changing product mix and our relatively short history of sales of portable players, particularly flash-based players, as well as the continued expansion of our customer base and the impact of seasonality on customers’ purchasing decisions. Our largest customers may continue to vary in the future as we aim to attract more brand owners and large retail chains and our sales to different customers may vary from period to period.
- 12 -
We expect that we will continue to rely on a small number of customers for a significant portion of our revenues in the foreseeable future. Our ability to maintain close relationships with these customers is essential to the growth and profitability of our business. If a large customer fails to place additional orders with us, or if we fail to develop additional major customers, our revenues could decline, and our results of operations and financial condition could be materially and adversely affected.
The technologies and industry standards on which our products are based are continually evolving, and our success depends on our ability to adapt our products to incorporate and support these changing technologies and industry standards.
The continuing emergence of new technologies and industry standards, such as the introduction of new compression algorithms for digital audio and multimedia content, could render our products uncompetitive or obsolete. As a result, we may be required to invest significant time, effort and expense to enhance or redesign our products to incorporate new features, functions and technologies and ensure compliance with relevant standards. If our products do not comply with prevailing industry standards and technologies or we or our suppliers are unable to obtain the rights for us to incorporate new standards and technologies into our products, we may fail to attract new customers or lose existing customers and our business and financial results could be materially and adversely affected.
Our business depends largely on the continuing services of our senior executives, and our business may be severely disrupted if we lose their services.
Our future success depends largely upon the continued services of our senior executives, especially our Chairman and Chief Executive Officer, Victor Chan, our Chief Operating Officer, Yu Xiao Dong, and our Chief Financial Officer, Diana Chan. We rely on their experience in the consumer electronics industry, in finance and in business operations and on their relationships with our shareholders, suppliers, technology partners and customers. We do not maintain key-man life insurance for any of our key executives. If one or more of our key executives are unable or unwilling to continue in their present positions, we may not be able to replace them easily or at all. Therefore, our business may be severely disrupted, and we may incur additional expenses to recruit and retain new officers.
The demand for portable players depends on the availability of compressed digital audio content and may be adversely impacted by intellectual property protection measures, including litigation, against music providers and consumers of compressed digital audio content.
Demand for portable players may be adversely affected by the enforcement of limits on file sharing and downloadable music or other copy protection techniques and intellectual property protection measures. Among other intellectual property protection and enforcement measures undertaken by music industry participants and groups, the Recording Industry Association of America, a recording industry trade group, has sued numerous individuals who are alleged to have illegally distributed copyrighted music over the Internet. In the United States, the legal standards for determining indirect liability for copyright infringement have recently been tightened by the United States Supreme Court in the decisionMetro Goldwyn-Mayer Studios Inc. v. Grokster, Ltd., et al., 125 S.Ct. 2764, orGrokster. The implications of theGrokster decision for providers of compressed digital audio content inside and outside the United States are uncertain and may increase the risk of legal liability for those providers, which may in turn result in decreased availability of compressed digital audio content on the Internet. Although we work closely with industry participants to incorporate digital rights management technology and other copyright protection measures in our portable players, if music industry participants or other parties are successful in limiting the ability of consumers to obtain free or inexpensive music on the Internet, the demand for compressed digital audio players may decline.
- 13 -
The emergence of alternative models for downloading digital music content may impact our business in ways we cannot anticipate.
Currently, most compressed digital audio content is available through a pay-per-download model in which consumers purchase and own the audio file that they can transfer to and play on their portable players. Several companies, including Microsoft Corporation, or Microsoft, have recently launched digital rights management software that is expected to provide consumers access to music content on a subscription basis, through which they pay a subscription fee to rent, rather than own, the audio file for a limited period of time. If this technology is successful, it could compete with existing pay-per-download music services. These services may require us to incur additional expenses, including additional license fees, to incorporate these technologies into our products. We cannot predict the impact on our business if this or other similar technology or other content distribution models become widely adopted.
Our products incorporate third-party technologies and if we are unable to continue to use these technologies, our business could suffer.
Our products use third-party chipsets with built-in support for third-party technologies, such as the MP3 and WMA codecs, which either we obtain the right to include through sub-license rights provided by the chipset providers who embed these codecs into their chipsets or pursuant to license agreements with codec owners. If these sub-license rights or license agreements are terminated by the third parties or we otherwise lose the rights to use these technologies, we may not be able to find suitable alternate sources and our business may be materially and adversely affected.
We and our suppliers and technology providers may face intellectual property infringement claims that could be time consuming and costly to defend, may result in our loss of the right to use certain third-party technologies, or may result in shortages or interruptions in supply or substantial price increases by our key suppliers.
We and our suppliers and technology providers may be subject to intellectual property infringement and other claims. Litigation is expensive and time consuming and could divert management’s attention from our business. If there is a successful claim of infringement, we and our suppliers and technology providers may be required to pay substantial damages to the party claiming infringement, develop non-infringing technology or enter into royalty or license agreements that may not be available to us on acceptable terms, if at all. In addition, many of our key suppliers and technology providers are in industries that have had significant intellectual property infringement litigation in recent years. Any significant litigation against any of them could result in our loss of the right to use certain third party technologies, shortages or interruptions in supply or substantial price increases by our key suppliers.
Defects in our products could damage our reputation as well as result in product liability claims against us.
Because we cannot test our products for all possible scenarios, our products may contain defects that are not discovered until after they are shipped to consumers. If our products are frequently found to contain defects, our reputation may be damaged, which could harm our ability to retain existing customers and/or attract new customers. Product defects may also result in product liability claims against us, which may negatively affect our results of operations.
- 14 -
The product warranties we provide to our customers expose us to risks from warranty claims.
We provide our customers with limited product warranties. Under this limited product warranty, if a customer claims that our products are defective, we will, upon receiving the pre-approved return of the defective products, either repair or replace the products, or, at our discretion, refund to the customer all or a portion of the purchase price of the defective products. We cannot assure you that costs associated with product warranties will not be material in the future. If we are exposed to warranty claims, or if limitations on our warranty provisions are unenforceable in a particular jurisdiction, a successful claim could require us to incur substantial expense.
If we are unable to attract, train and retain skilled personnel, our business may be materially and adversely affected.
Our future success depends on our ability to attract, train and retain additional skilled personnel. Our industry is characterized by high demand and intense competition for talent. We cannot assure you that we will be able to attract and retain new and existing skilled personnel whom we will need to achieve our strategic objectives. In addition, as our business has grown rapidly, our ability to train and integrate new employees into our operations may not meet the growing demands of our business.
Our operating results could be harmed if we have to comply with new environmental regulations.
Our operations create some environmentally sensitive materials that may increase in the future depending on the nature of our manufacturing operations. The disposal of hazardous waste has received increasing attention from Chinese national and local governments and has been subject to stricter regulation. Currently, relevant Chinese environmental protection laws and regulations impose fines on the discharge of waste materials and empower certain environmental authorities to close any facility which causes serious environmental problems. Although Chinese government officials have not alleged that we have violated any current environmental regulations, we cannot assure you that we will not be liable for violations of these regulations or that the Chinese government will not further tighten its current environmental protection laws and regulations. Our business and operating results could be adversely affected if we were to increase expenditures to comply with new environmental regulations.
Our insurance coverage may not be sufficient to cover the risks related to our operations and losses.
We have not experienced any major accidents in the course of our operations that have caused significant property damage or personal injuries. However, there is no assurance that we will not experience major accidents in the future. Although we have purchased certain insurance, including policies covering loss or damage in respect of buildings, machinery, equipment and inventories, the occurrence of certain incidents such as earthquakes, fires, floods and wars, and the consequences resulting therefrom, may not be covered adequately, or at all, by such insurance. We also face exposure to product liability claims in the event that any of our products are alleged to have resulted in property damage, bodily injury or other adverse effects. Losses incurred or payments we may be required to make may have a material adverse effect on our results of operations if such losses or payments are not fully insured.
- 15 -
We depend on shipping companies to deliver our products and any interruptions to shipping could materially and adversely affect our business and operating results.
We rely on shipping companies, primarily air carriers, to transport our products through world ports to our customers. A work stoppage, disease outbreak, strike or shutdown of one or more major ports or airports could result in shipping delays, which could have a material adverse effect on our business and operating results. For example, in the first half of 2003, the outbreak of SARS in Hong Kong and other parts of Asia caused interruptions in the delivery of our products as shipping companies were required to undergo greater and more time-consuming inspections prior to the shipment of products. An outbreak of avian flu or other illnesses may result in similar delays. Additionally, an increase in surcharges due to rising fuel costs or general price increases could materially and adversely affect our business and operating results.
We have substantial international activities, which expose us to additional business risks including increased logistical complexity and political instability.
We currently conduct sales activities in Europe, the United States and Asia. We also acquire some key components from international suppliers. We plan to further expand our international sales activities and expect to continue to rely on certain international suppliers. Our international operations are subject to a number of risks, including:
| | • | | fluctuations in the U.S. dollar, the principal currency we use to transact business; |
| | • | | increased complexity and costs of managing international operations; |
| | • | | protectionist laws and business practices that favor local competition in some countries; |
| | • | | multiple, conflicting and changing laws, regulations and tax schemes in different jurisdictions; |
| | • | | greater difficulty in accounts receivable collection and longer collection periods; |
| | • | | shipping delays resulting from disruptions to our supply chain caused by labor disputes, war or other events beyond our control; |
| | • | | political and economic instability; and |
| | • | | other factors beyond our control, including major health concerns such as an outbreak of SARS or avian flu, terrorist attacks and rising fuel costs. |
Any acquisition activity could disrupt our ongoing business and may present risks not contemplated at the time of the transaction.
We may acquire companies that have products, services, personnel and technologies that complement our strategic objectives and product roadmap. These acquisitions may involve significant risks and uncertainties, including difficulties in incorporating the operations and technologies of the acquired businesses, distraction of management’s attention away from normal business operations, insufficient revenue generation to offset liabilities assumed and expenses associated with the acquisition, and unidentified issues not discovered in our due diligence process, including product liability issues and legal contingencies. Acquisitions are inherently risky, and no assurance can be given that any acquisitions will be successful and will not materially adversely affect our business, operating results or financial condition. In addition, if we issue our ordinary shares or other equity-related purchase rights as consideration for an acquisition, our current shareholders’ percentage ownership and earnings per share may become diluted.
- 16 -
Failure to achieve and maintain effective internal controls may have a material adverse effect on our business and results of operations.
We are subject to the reporting obligations under the U.S. securities laws. The Securities and Exchange Commission, or the SEC, as required by Section 404 of the Sarbanes-Oxley Act of 2002, has adopted rules requiring public companies to include a report of management on such companies’ internal control over financial reporting in its annual report, that contains an assessment by management of the effectiveness of such company’s internal control over financial reporting. This requirement will first apply to our annual report on Form 20-F for our fiscal year ending on December 31, 2006. We have only recently begun to evaluate our internal control over financial reporting. Given the status of our efforts, coupled with the fact that guidance from regulatory authorities in the area of internal control continues to evolve, substantial uncertainty exists regarding our ability to comply by the deadline. If we are unable to conclude that we have effective internal control over financial reporting, or if our independent auditors are unable to provide us with an unqualified report as to the effectiveness of our internal control over financial reporting as of December 31, 2007 and future year ends, as required by Section 404 of the Sarbanes-Oxley Act, we could experience delays or inaccuracies in our reporting of financial information, or non-compliance with SEC reporting and other regulatory requirements. This could subject us to regulatory scrutiny and may result in us incurring additional costs or require the allocation of more management resources in an effort comply with the regulatory requirements, which may adversely affect our business or results of operations.
Risks Related to Doing Business in China and Hong Kong
Adverse changes in economic and political policies of the PRC government could have a material adverse effect on the overall economic growth of China, which could adversely affect our business.
We conduct substantial business operations in China, including all of our manufacturing operations. Accordingly, our results of operations, financial condition and prospects are subject to a significant degree to economic, political and legal developments in China. The PRC economy differs from the economies of many developed countries in various respects, including with respect to the amount of government involvement, level of development, growth rate, control of foreign exchange and allocation of resources. Although the PRC economy has experienced significant growth in the past 20 years, growth has been uneven across different regions and among various economic sectors in China. The PRC government may implement various measures to encourage economic development and guide the allocation of resources that may also have a negative effect on us. For example, our financial condition and results of operations may be adversely affected by government control over capital investments, access to foreign currency or changes in tax regulations that are applicable to us.
- 17 -
Uncertainties with respect to the Chinese legal system could adversely affect us.
We conduct our business in China primarily through A-Max China and we may in the future expand our business through other subsidiaries or other ventures established in the PRC. Our operations in China are governed by PRC laws and regulations. A-Max China is subject to laws and regulations applicable to foreign investments in China and, in particular, laws applicable to wholly foreign owned enterprises. The PRC legal system is based on written statutes. Prior court decisions may be cited for reference but have little precedential value.
Since 1979, PRC legislation and regulations have significantly enhanced the protections afforded to various forms of foreign investments in China. However, China has not developed a fully integrated legal system and recently enacted laws and regulations may not sufficiently cover all aspects of economic activities in China. In particular, because these laws and regulations are relatively new, and because of the limited volume of published decisions and their nonbinding nature, the interpretation and enforcement of these laws and regulations involve uncertainties. In addition, any litigation in China may be protracted and result in substantial costs and diversion of resources and management attention.
Certain preferential tax treatment benefiting A-Max China will expire in future years, which will result in a higher enterprise income tax rate for A-Max China and may adversely affect our results of operations.
Under current PRC laws and regulations, a foreign investment enterprise, or FIE, in China, such as A-Max China, is typically subject to enterprise income tax, or EIT, at the rate of 30% on taxable income and local income tax at the rate of 3% on taxable income. Because A-Max China is located in Shenzhen, it qualifies for a special reduced EIT rate of 15%. Furthermore, since A-Max China is an enterprise engaged in manufacturing with foreign investment and its term of operation is more than ten years, it is entitled to a two-year EIT exemption beginning from its first profitable year, followed by a 50% reduction of the EIT rate for three years. A-Max China became profitable in 2004. As a result, A-Max China is exempt from EIT in 2004 and 2005 and will be subject to a 7.5% EIT rate from 2006 to 2008.
However, if the PRC government phases out preferential tax treatment for enterprises like A-Max China, the application or interpretation of such preferential tax treatment changes to our disadvantage or A-Max China becomes subject to different taxation law, rules, policies, rates or methods of taxation in the PRC, A-Max China’s effective EIT rate may increase to the standard statutory rate.
Certain tax exemptions which may be available to A-Max Macao may change in future years, which could result in a higher tax rate for A-Max Macao and may adversely affect our results of operations.
Under relevant Macao laws and regulations, an offshore institution in Macao conducting certain activities may, subject to review and approval of the Macao government, be exempted from income tax, industrial tax and stamp duties. Because of the structure of our operations in 2005, we did not account for the profits generated by A-Max Macao using this exemption. The laws governing these tax exemptions have been revised in the past, including, most recently in 2005, and if the relevant laws and regulations are changed, or if interpretation of such tax exemption are changed to our disadvantage, the tax exemptions available to A-Max Macao may decrease for future periods, which may adversely affect our results of operations to the extent we would have been able to take advantage of such tax exemptions prior to any such change.
- 18 -
Any fluctuation in the value of the RMB or the H.K. dollar may adversely affect our expenses and profitability.
We use U.S. dollars as our reporting currency for our consolidated financial statements, although a portion of our expenses are denominated in currencies other than U.S. dollars, such as RMB and H.K. dollars, and to a lesser extent, Euro. The value of the RMB and the H.K. dollar against the U.S. dollar may fluctuate and may be affected by, among other things, changes in political and economic conditions. Although the exchange rate between the H.K. dollar to the U.S. dollar has been pegged since 1983, we cannot assure you that the H.K. dollar will remain pegged to the U.S. dollar. The conversion of the RMB into foreign currencies, including the U.S. dollar and the Euro, is based on rates set by the People’s Bank of China. On July 21, 2005, the PRC government changed its policy of pegging the value of the RMB to the U.S. dollar. Under the new policy, the RMB will be permitted to fluctuate within a band against a basket of certain foreign currencies. This change in policy resulted initially in an approximately 2.5% appreciation in the value of the RMB against the U.S. dollar as of December 31, 2005. There remains significant international pressure on the PRC government to adopt a substantial liberalization of its currency policy, which could result in a further and more significant appreciation in the value of the RMB against the U.S. dollar.
Although substantially all of our net sales and most of our costs and expenses are denominated in U.S. dollars, the remainder of our net sales and costs and expenses are denominated primarily in RMB or H.K. dollars. In addition, as we may in the future rely in part on dividends paid to us by our subsidiaries in China and Hong Kong, any significant revaluation of the RMB or the H.K. dollar may have a material adverse effect on our revenues and financial condition, and the value of, and any dividends payable on, our ADSs in foreign currencies. For example, if we decide to convert our RMB into U.S. dollars for the purpose of making payments for dividends on our ordinary shares or ADSs or for other business purposes, depreciation in the value of the RMB against the U.S. dollar would have a negative effect on the U.S. dollar amount available to us. We have not used any forward contracts, futures, swaps or currency borrowings to hedge our exposure to foreign currency risk. As a result, any material increase in the value of the RMB or the H.K. dollar may affect our expenses and profitability.
Governmental control of currency conversion may affect the value of your investment.
The PRC government imposes controls on the convertibility of RMB into foreign currencies and, in certain cases, the remittance of currency out of China. Shortages in the availability of foreign currencies may restrict the ability of A-Max China or any of our subsidiaries or invested ventures that may be established in the PRC in the future to remit sufficient foreign currency to make profit distributions or other payments to us, or otherwise satisfy their foreign currency denominated obligations. Under existing PRC foreign exchange regulations, payments of current account items, including dividends, interest payments and expenditures from trade-related transactions, can be made in foreign currencies without prior approval from the PRC State Administration of Foreign Exchange by complying with certain procedural requirements. However, conversion of RMB for most capital account items, including direct investments, is subject to government approval in China. The PRC government may also at its discretion restrict access in the future to foreign currencies for current account transactions. If the PRC foreign exchange control system prevents A-Max China or any of our subsidiaries or other ventures that may be established in the PRC from paying dividends in foreign currencies to us, we may in turn be unable to pay dividends to our shareholders, including holders of our ADSs.
- 19 -
Recent PRC regulations relating to the establishment of offshore special purpose companies by PRC residents may limit our ability to inject capital into A-Max China, limit A-Max China’s ability to distribute profits to us, or otherwise adversely affect us.
The PRC State Administration of Foreign Exchange, or SAFE, issued a public notice in October 2005 requiring PRC residents to register with the local SAFE branch before establishing or controlling any company outside of China for the purpose of capital financing, referred to in the notice as a “special purpose offshore company.” PRC residents that are shareholders of special purpose offshore companies established before November 1, 2005 were required to register with the local SAFE branch before March 31, 2006. We have notified a beneficial owner of our company who is a PRC resident to register with the local SAFE branch as required under the SAFE notice. The failure or inability of such beneficial owner to comply with the registration procedures set forth therein may subject him to fines and legal sanctions and may also limit our ability to contribute additional capital into A-Max China, limit A-Max China’s ability to distribute profits to us or otherwise adversely affect our business.
Hong Kong’s relationship with the rest of the PRC is unpredictable and could disrupt our business.
Hong Kong is a special administrative region of the PRC with its own government. Hong Kong enjoys a high degree of autonomy from the PRC under the principle of “one country, two systems.” However, there can be no assurance that our financial condition and results of operations will not be adversely affected as a consequence of the exercise of PRC sovereignty over Hong Kong.
A significant portion of our net sales is derived from operations conducted through our Hong Kong subsidiary. As a result, our financial condition and results of operations may be influenced by the political situation in Hong Kong and by the general state of the Hong Kong economy and the PRC economy.
ITEM 4 INFORMATION ON THE COMPANY
| A. | History and Development of the Company |
We commenced operations in 1996 through A-Max Technology Co., Ltd., or A-Max (HK), a company incorporated in Hong Kong, which currently conducts our logistics, finance and administrative activities. We conduct our manufacturing activities primarily in Shenzhen, China through A-Max China, which we established in March 2003 as a wholly-owned subsidiary of A-Max (HK). In March 2004, we established our holding company, A-Max Technology Limited, or A-Max, in Bermuda. In June 2005, we established A-Max Technology Macao Commercial Offshore Company Limited, or A-Max (Macao), in Macao, and subsequently transferred our sales and support activities to that company. In addition to A-Max (HK), A-Max China and A-Max (Macao), we also have the following subsidiaries:
| | • | | Techniques International Limited, or Techniques International, which was incorporated in the British Virgin Islands; |
- 20 -
| | • | | A-Max Technology GmbH, or A-Max (Europe), which was incorporated in Germany; and |
| | • | | A-Max F7 Technology Limited, or A-Max F7, which was incorporated in Scotland. |
On June 17, 2005, we effected a 1:50,000 share split and, unless otherwise indicated, all share numbers in this annual report reflect the share split.
Our principal executive offices are located at 10/F, A-Max Technology Tower, 12-16 Fui Yiu Kok Street, Tsuen Wan, New Territories, Hong Kong. Our telephone number at this address is (852) 2798-6699. Our registered office in Bermuda is located at Clarendon House, 2 Church Street, Hamilton HM11, Bermuda. Our telephone number at this address is (441) 295-1422.
Overview
We are a leading independent total solutions provider in the global portable player market. As an independent provider, we serve a wide group of customers, in each case on a non-exclusive basis. We provide flash-based players to leading international brand owners and large international retail chains that sell flash-based players under their own house brands.
We manufacture all of our products in China using components sourced from third-party suppliers and provide our customers with complete, “one-stop” services, including new product definition and introduction, product design and related electrical and mechanical engineering, embedded and application software development, manufacturing, packaging, logistics arrangements and after-sales support. In 2005, our net sales increased to $328.3 million from $141.4 million in 2004 and our net income increased to $17.4 million from $12.7 million in 2004.
Our portable players use third-party chipsets with built-in support for codecs, which are computer programs that encode and compress and decode and decompress digital audio data according to a given audio file format. The data compression offered by audio codecs allows a portable player to store significantly more audio content and facilitates faster downloads and transfers of digital audio data. To meet our customers’ demands, our portable players use third-party chipsets that support the widely-used MP3 and WMA codecs.
Since we began selling portable players in 2000, we have produced over 280 models for customers in Europe, the United States and Asia. In 2005, we generated net sales of $328.3 million, of which 92.1% was derived from flash-based players.
Products and Services
Flash-based Players. We depend heavily on sales of flash-based players, which accounted for 91.4% and 92.1% of our net sales in 2004 and 2005, respectively. We currently provide over 140 models of flash-based players with memory capacities of 128MB, 256MB, 512MB, 1GB, and 2GB. Our flash-based players consist of a wide variety of styles and form factors and all are highly portable and consume low amounts of power. Our flash-based players run on standard AAA alkaline batteries, providing between eight to eighteen hours of playback time. Our flash-based players are compatible with mainstream operating systems, including Windows and Macintosh, and use chipsets with built-in support for the MP3 and WMA codecs and Microsoft’s DRM platform.
- 21 -
We believe we were one of the first companies to launch 1GB flash-based players, which we introduced in September 2004, and 2GB flash-based players, which we introduced in June 2005. We were also one of the first companies to develop and ship a flash-based player using SigmaTel’s USB 2.0 chipset, which enables consumers to transfer digital audio content from personal computers to flash-based players at significantly faster transfer speeds and with greater convenience than USB 1.1 chipsets. All of our flash-based players can also be used as standard plug-and-play USB storage devices for documents and other types of data.
Our flash-based players include some or all of the following features, depending on the demands of the customer:
| | • | | USB 2.0 for data storage and high-speed transfer capabilities; |
| | • | | LCD, OLED, TFT, STN and CSTN screens and customizable displays and user menus; |
| | • | | Built-in voice recording and playback; |
| | • | | FM radio functionality and FM recording; |
| | • | | Equalizer with six defined presets; |
| | • | | SRS signal processing to improve audio sound; |
| | • | | Bluetooth version 1.2 module support; |
| | • | | Lyrics display synchronized with music; and |
| | • | | DRM 9 and DRM 10 support. |
Other Products. Our other products currently include MP3 CD players and computer peripherals. From time to time we also sell components for supply chain management purposes. We began to sell a small number of 1-inch HDD-based players in October 2004 but do not currently offer any HDD-based players due to lack of strong consumer demand. We have also recently developed PMPs and have commenced the design of DAB players, as well as electronic photo frames. PMPs enable users to capture, store and play digital media including compressed audio, photos and video. DAB players are devices that can be used to listen to DAB radio broadcasts using digital signals instead of traditional analog radio. An electronic photo frame allows users to insert a memory card into the photo frame and view pictures saved in the card sequentially.
Design, Manufacturing and Logistics
We offer complete end-to-end solutions to customers, including design, manufacturing and logistics services, with a goal of delivering complete, packaged products to customers.
Design. Our value-added design services consist of the following:
Industrial Design. With respect to a particular product that a customer requests us to design, our industrial design team is responsible for preliminary product exploration, market research, 2-D and 3-D sketch level drawings, 3-D mock-ups and proofs and hard models. In addition, in anticipation of future market demand and consumer preferences, our industrial design team also designs innovative products that we expect to become popular and attractive to consumers based on the latest market developments, customers’ suggestions and our design team’s creative ideas.
- 22 -
Mechanical Engineering Design. Our mechanical engineering design team designs the mechanical systems used in our portable players. It also prepares 2D and 3D designs to ensure that the mechanical parts and tools used in the portable player conform to the exterior design. In addition, our mechanical engineering team creates the bill of materials, or BOM, required for volume production of the portable player.
Tooling Design. Our tooling design team designs and develops prototypes and production tooling equipment for manufacturing our products. The goals of tooling design are to improve manufacturing efficiency, make use of new materials and techniques and improve the quality of portable players.
Electrical Engineering Design. Our electrical engineering design team develops electrical systems for our products, taking into consideration the need for cost-effective mass production. The electrical engineering design team is also responsible for schematic design, electrical layout, embedded system and digital signal processing design, high-speed digital interfaces, analog circuit design, power management solutions, wired and wireless communication protocols, display and storage solutions, imaging and audio/video applications and RF system and antenna design.
Software Design. Our software design team designs and develops software and applications for product and systems design, testing, maintenance and end-user interface, as well as product applications such as device drivers, embedded applications, communications protocols, digital signal processing algorithms and web applications.
Design Testing. Our design testing team is responsible for product testing, engineering testing and material testing. Our product testing involves product reliability tests, including accelerated life tests, climatic stress tests and mechanical endurance tests. Our engineering testing involves tests of product functions. Our material testing involves design-in tests to examine the quality and suitability of materials and components to be used in our products.
Manufacturing. Our customers seek a variety of high-quality and competitively priced products with extensive functionality and small form factors that are produced with fast time-to-market. This in turn requires more sophisticated yet highly efficient manufacturing technologies and processes. Our investment in advanced manufacturing equipment and our experience and expertise in manufacturing technologies enable us to offer a variety of manufacturing solutions to meet our customers’ demands. We currently have twenty surface mount technology lines, sixteen printed circuit board assembly lines, twenty assembly lines and twenty packaging lines. In addition, our easily-reset production lines allow us to quickly ramp up production for new designs as necessary. We are in compliance with applicable environmental regulations in China in all material respects.
We have implemented an enterprise resource planning, or ERP, system for our entire manufacturing process. We benefit from the ERP system in many aspects of our operations, including BOM system management, volume procurement, supplier qualification, inventory management and finance. The ERP system allows us to use sophisticated planning systems and enhanced electronic data interchange capabilities to ensure manufacturing efficiency, inventory control and optimization. We also fully leverage China’s competitive labor costs by utilizing labor in our manufacturing process where it proves to be more efficient and cost effective than equipment.
- 23 -
Logistics. We provide logistics services to our customers in Europe, the United States and Asia. We have established long-term, trusting relationships with major logistics companies serving us and these relationships are instrumental to the timely and cost-effective delivery of our products to customers. We offer our customers flexible delivery arrangements that allow us to coordinate product shipments with our customers’ inventory requirements. Increasingly, we ship products directly into our customers’ distribution channels or to their large retail chain customers. Combining our logistics services with our design and manufacturing operations and supply chain management, we are able to reduce costs and create integrated processes.
Quality Control
We maintain strict quality control programs for our products using quality management systems and advanced testing and calibration equipment. Our quality control personnel are divided into four major teams: incoming quality control, in-process quality control, output quality control and testing. The incoming quality control team inspects incoming materials and components to ensure they meet our quality standards. The in-process quality control team frequently examines our manufacturing process with a view to maintaining and improving the quality of our manufacturing process. The output quality control team inspects finished products to ensure they meet our customers’ specifications. The testing team conducts reliability tests for all product models, including accelerated life tests, climatic stress tests and mechanical endurance tests.
We work closely with our customers and provide support for them to monitor our production and test finished products on site at our manufacturing facilities. In addition, our research and development team is closely involved in the manufacturing process for new products designed by us for quality assurance purposes. Our manufacturing system for digital multimedia players and flash memory devices are certified under the ISO 9001:2000 quality system.
Suppliers
We purchase our components from third-party suppliers. The most costly components are flash memory for our flash-based players, and chipsets and display components such as LCDs. Due to the dominant market shares of several of our key suppliers, we rely on only a limited number of suppliers for certain key components.
In 2005, we purchased a majority of our flash memory from Samsung, a worldwide leader in providing flash-based memory. In February 2005, we received a “Most Valued Partner” award from Samsung. We also purchased a majority of our chipsets from SigmaTel in 2005. In March 2005, we announced a strategic relationship with SigmaTel for the development, design and manufacture of portable players.
Certain critical components for our players have been subject to periodic shortages of supply. For example, there have been industry-wide shortages of flash memory due to increased demand across the entire consumer electronics industry. Since the dramatic growth of portable players beginning in 2003, the demand for flash memory has often outpaced supply. We believe our strong relationships with key component suppliers and leading portable player brand owners have allowed us to secure the adequate and timely supply of components and timely deliver our players to customers even during periods of supply shortages in the market. In addition, some of our leading brand owner customers have access to memory and other key components for portable players and have helped us secure the supply of certain key components when there has been a shortage of supply. We intend to maintain and enhance our strong relationships with existing key suppliers and brand owner customers and develop relationships with new suppliers to ensure sufficient and timely supply of key components on favorable terms.
- 24 -
Customers
We provide portable players to leading brand owners and large international retail chains that sell portable players under their own house brands. We sell our products primarily through direct sales and, to a lesser extent, through distributors.
Leading brand owners. Portable player brand owners historically designed, manufactured, marketed and distributed their own products entirely in-house. In response to factors affecting the portable player market — including shortened development cycles, increasing demand for personalized features, increasing competition, higher cost structure and greater margin pressure — portable player brand owners have increasingly outsourced the design and manufacturing of their branded portable players in order to reduce development and production costs and risks, and to introduce new products with a faster time-to-market. We have benefited from this outsourcing trend and have acquired many leading brand owners as our customers, including the following current customers: Medion Aktiengesellschaft, which owns the Medion brand, Maxfield, which owns the Maxfield brand, and NEC Computers International, which owns the Packard Bell brand.
Large retail chains. Attempting to capitalize on the growth of the market, large retail chains have begun to sell portable players under house brands. Because they do not have well-known consumer electronics brand names for their products, it is particularly important for these large retail chains to provide quality products and keep the retail prices of their products relatively low. These large retail chains also typically do not have technical expertise or experience in designing and manufacturing portable players using in-house resources. As a result, these large retail chains use third parties to design and manufacture portable players. As portable players have grown into high volume consumer products, we believe large retail chains, which have substantial distribution power to reach a large number of consumers, are well positioned to capture a large share of this market. We have designed and manufactured portable players for a number of leading international retail chains in Europe and the U.S., including DSG Retail Ltd., which owns the Dixons retail chain.
A small number of customers have historically accounted for a majority of our net sales. In 2004 and 2005, our top five customers collectively accounted for approximately 65.2% and 50.5%, respectively, of our net sales for the respective period. Each of Medion, NEC and a China-based consumer electronics company contributed over 10% of our net sales for 2004, and each of DSG Retail, Maxfield and NEC contributed over 10% of our net sales for 2005.
Our sales cycle for products newly designed by us is typically three to six months, while our sales cycle for products designed for our customers based on our existing industrial, mechanical, electrical engineering and tooling designs is typically three to six weeks. Many of our customers conduct an in-depth technical evaluation of our designs and manufacturing plans, processes and facilities to qualify us before placing a purchase order.
- 25 -
Our design and manufacturing services are based on purchase orders received from customers. Our customers typically provide two- to three-month rolling forecasts and then commit to purchase orders with an average duration of one month. Purchase orders are often supported by letters of credit and generally may not be cancelled once confirmed without the consent of both parties. Even in those cases where customers are contractually obligated to purchase products from us or repurchase unused inventory from us, we may elect not to immediately enforce our contractual rights because of the long-term nature of our customer relationships and for other business reasons, and instead may negotiate accommodations with our customers.
We also provide customers with after-sales support, including product return and warranty services and in some cases, call center services. We typically provide a one-year limited warranty to our customers. Upon receiving the pre-approved return of defective products, we will repair the defective products and return them to the customer. For selected customers, we provide, without charge, extra units of our products equivalent to 1% of the units ordered by the customer to cover anticipated returns and replacements under warranty. If the customer claims defects based on the description or condition of the products beyond the initial 1% of the extra units shipped, we will repair the defective products at our own cost.
Sales and Marketing
We sell and market our portable players through a direct sales force located predominantly in Macao. We also have a sales office in Berlin for the Europe market and a sales representative dedicated to the U.S. market to assist with our sales and marketing. We intend to continue focusing on sales and marketing in Europe and the United States. In addition, we intend to expand our sales and marketing to focus on increasing our sales in Asia and other parts of the world.
We frequently attend conferences, exhibitions and trade fairs to promote our products and solutions. In addition, our relationships with key component suppliers, leading brand owners and technology companies have been instrumental in helping us promote our company and products.
Technology
Our modularized platform approach has allowed us to gain significant expertise in the design of portable players using third-party chipsets with built-in support for the MP3 and WMA codecs and to take advantage of leading-edge and innovative products from our technology partners. We have established strategic relationships with the following global technology leaders for the continuous development of our portable players:
| | • | | SigmaTel — we believe that we were one of the first companies to launch a USB 2.0 flash-based player using SigmaTel 35xx Series chipset, which we did in June 2004, and in March 2005, we and SigmaTel announced a strategic relationship for the development, design and manufacture of portable players. We are currently working closely with SigmaTel to adopt Microsoft’s newly developed “Janus” DRM technology platform in our portable players. |
| | • | | Samsung — we believe that we are one of the few companies that has developed a strategic relationship with Samsung for flash memory components, and we have been named a “Most Valued Partner” of Samsung for 2004. |
- 26 -
| | • | | Texas Instruments — we work closely with Texas Instruments, which launched chipsets specifically for the MPEG-4 video coding standard, to jointly develop PMPs and other portable multimedia devices. |
We have a high degree of technological expertise in all of the major areas of portable player design and development. Our software engineering capabilities have enabled us to develop modularized design platforms, upon which we can modify and/or add product features to meet our customers’ specifications at a relatively faster speed, with minimal engineering effort and high reliability. Our modularized platform-based design approach and our multi-disciplinary engineering expertise in the seamless integration of many different technologies and features have allowed us to deliver various products to a broad customer base, enabling our customers to quickly respond to rapidly-shifting end-user demands with quality products at a low cost and fast time-to-market.
Our flexible production set-up allows us to manufacture differentiated products efficiently even at a low volume per product. We use industry-standard, state-of-the-art manufacturing tools, which provide us significant flexibility to implement changes in manufacturing processes based on the requirements of our product management team and research and development engineers. We have earned numerous recognitions for our quality control systems and currently hold the ISO 9001:2000 certification for our quality management system from the International Standards Organization.
Research and Development
The portable digital audio and multimedia device industry is characterized by rapidly evolving technological advances as evidenced by frequent introductions of new products and enhancements. We consider our ability to efficiently design and manufacture high-quality models of portable players that meet our customers’ demands to be critical to the continued success of our business. We have offices in Taiwan, China and Scotland where we conduct research and development activities. As of December 31, 2005, we had completed over 280 models of flash-based, HDD-based and MP3 CD players with different functions and features and based on variations of our open platform. We seek to continue to enhance and expand our design and manufacturing capability through in-house research and development efforts and through strategic relationships with Samsung, SigmaTel and Texas Instruments. The goals of our research and development efforts include the following:
| | • | | to design and develop high-quality portable players based on widely adopted codecs; |
| | • | | to provide advanced and flexible design platforms to enable efficient development of new products and enhancements while maintaining timeliness to market; |
| | • | | to devise flexible manufacturing processes to improve production efficiency and reduce overall manufacturing costs; and |
| | • | | to keep abreast of technological advancements in the portable digital audio industry and the portable digital multimedia industry, which includes PMPs and DAB players. |
Our engineers are devoted mainly to our product marketing, research and development and production departments. Our product marketing department works closely with our sales and marketing department to develop new product ideas and identify suitable industrial designs and features based on the price points set by our customers. Once the specification of a product has been confirmed, we then form a project management team that is led by members of our product marketing team with support from engineers in our research and development and production departments. The product management team will select the appropriate platform and modules based on our customers’ preferences and our research and development engineers will then focus on developing selected modules to be integrated into the platform. We believe our product-driven and open-platform research and development approach has enabled us to improve the efficiencies of our engineering efforts while achieving faster time-to-market.
- 27 -
Our research and development department provides technical support at each stage of the product design and manufacturing processes and is divided into four separate areas of expertise: (i) software development, (ii) mechanical engineering, (iii) electrical engineering and (iv) quality engineering. The software development team focuses on the development or modification of our platform modules to integrate different features, product configurations and user interfaces. The electrical engineering team is responsible for the schematic design and electrical layout of the printed circuit boards of our products. The mechanical engineering team is responsible for component layout. The quality engineering team oversees every critical step of our design, technical and production processes to ensure the effectiveness of our quality control. We use advanced and standardized testing methods to monitor product quality and implement stringent design inspection and manufacturing controls throughout the production process.
Our research and development engineers seek to continue to enhance the functionality of our products. We are working closely with our strategic partners to upgrade our in-house platforms in order to fully utilize high-performance chipsets and enable us to quickly introduce new features and other new products such as PMPs and DAB players.
As of December 31, 2005, we employed 124 experienced engineers, most of whom hold a bachelor’s degree or higher educational qualification. In addition, most of our senior engineers have extensive work experience in the consumer electronics industry. We plan to continue to recruit qualified engineers with relevant experience from both within the industry and leading universities worldwide. We have also established existing long-term research and development relationships with leading universities and technology and research institutes in China.
Intellectual Property
We have registered our trade name, “A-Max,” and our trademarks in the United States, Hong Kong, Canada and China. We do not own any patents, nor have we registered any material copyrights for any of our inventions, original works of authorship or developments and improvements relating to our product designs. As we provide software, electrical and mechanical design solutions for our customers tailored to their specifications and needs, we rely on trade secret protections and nondisclosure agreements with our customers and third parties for our proprietary designs. We typically enter into nondisclosure agreements with third parties whose technology we use.
Our portable players use third-party chipsets with built-in support for the widely-used MP3 and WMA codecs. Portable player brand owners bear the ultimate responsibility to ensure that the portable players sold under their brands to end consumers do not infringe upon any third-party’s intellectual property rights. In the case of the MP3 codec, our chipset suppliers obtain licenses to use the MP3 codec from Thomson Hong Kong Holdings Limited, and we receive sub-license rights from the chipset suppliers to include the chipsets that embed the MP3 codec into our products. In the case of the WMA codec, the chipset suppliers obtain license rights from Microsoft, and we have entered into a Windows Media Format Components Distribution License with Microsoft Licensing, GP, which gives us the right to incorporate chipsets that support Microsoft Windows Media and WMA codec technologies into our portable players. This agreement expires on December 31, 2017. These rights are non-exclusive. Although we believe we have adequate third-party licenses to support our current operations, if we are unable to continue to have access to our current licensed technologies or any new technologies that we may employ, our business would be adversely affected. We have also registered our domain namewww.amaxhk.com.
- 28 -
Competition
The consumer electronics industry, including the portable player market, is intensely competitive and highly fragmented. Competition is characterized by shortened development cycles, rapid technological change and constantly changing consumer preferences. This intense competition has resulted in margin pressures.
We face current and potential competition from EMS providers and ODMs, many of which are also located in China or Taiwan, that we believe are trying to capture a share of the outsourced portable player market and improve their design and manufacturing capabilities to enhance their competitiveness and credibility in serving leading brand owners and retail chains. We believe our EMS competitors typically focus on manufacturing and seek to achieve scale by providing high-volume manufacturing services for a smaller number of products and a narrower base of customers, sometimes even on an exclusive basis. We believe our ODM competitors typically design and manufacture for a smaller number of products and a smaller customer base. In contrast to these competitors, we offer a full range of high value-added services to meet our customers’ needs for total solutions. Due to our cost-effective production of a large number of designs for a broader customer base, we are able to achieve significant economies of scale while retaining the ability to accommodate the short product cycles, lower volume of production per model and fast time-to-market required in the portable player market. We believe that these differences in our business model allow us to compete successfully against our EMS and ODM competitors.
Although we believe that we are currently well positioned against our EMS and ODM competitors, we compete with them to various degrees on the basis of the following factors:
| | • | | product quality and reliability; |
| | • | | price and performance of products; |
| | • | | scalability and economies of scale; |
| | • | | platform design and integration capabilities; |
| | • | | supplier relationships and technology partnerships; |
| | • | | customer service and support capabilities; and |
| | • | | size of customer base and customer loyalty. |
Our success in sales of portable players also depends on our customers’ success in selling their products and our ability to capture new outsourcing opportunities from leading consumer electronics brand owners and large retail chains. Some leading consumer electronics brand names that have recently entered the flash-based player market design and manufacture their products entirely in-house or outsource the design and manufacturing of their products to our competitors. Apple, which already has a commanding market share for the HDD-based players, entered the flash-based player market in January 2005 and recently introduced a new flash-based player product. If leading brand names take market share from our existing customers and do not outsource the design and manufacturing of their products to us, our business will be adversely affected.
- 29 -
Many of our competitors and competitors of our customers may have significantly greater financial, technical, manufacturing, marketing, sales and other resources than we or our customers do. We cannot assure you that we or our customers will be able to compete successfully against current or future competitors in the portable player market.
Government Regulation
Foreign Currency Exchange
The legal currency of China is the RMB, which is subject to foreign exchange controls. SAFE is empowered to administer all matters relating to foreign exchange under the authority of the People’s Bank of China, including the enforcement of foreign exchange controls.
Controls on the purchase of foreign exchange for transactions relating to current account items have recently been relaxed. Subject to the production of supporting documents, a company may purchase foreign exchange from designated banks for its trading activities or payment of remuneration to its employees without the prior approval of SAFE. A wholly foreign-owned enterprise like A-Max China may also retain foreign exchange, subject to a cap approved by SAFE, to satisfy foreign exchange liabilities or to pay dividends. However, most capital account transactions, such as direct investments or investments in securities outside China, are still subject to the prior approval of SAFE.
PRC Preferential Tax Treatment
Under current PRC laws and regulations, an FIE in China, such as A-Max China, is typically subject to EIT at the rate of 30% on taxable income and local income tax at the rate of 3% on taxable income. Because A-Max China is located in Shenzhen, it qualifies for a special reduced EIT rate of 15%. Furthermore, since A-Max China is an enterprise engaged in manufacturing with foreign investment and its term of operation is more than ten years, it is entitled to a two-year EIT exemption beginning from its first profitable year, followed by a 50% reduction of the EIT rate for three years. A-Max China became profitable in 2004. As a result, A-Max China is exempt from EIT in 2004 and 2005 and will be subject to a 7.5% EIT rate from 2006 to 2008. If the PRC government phases out preferential tax treatment for FIEs, A-Max China’s effective EIT rate may increase to the standard statutory rate.
Macao Tax Treatment
Under relevant Macao laws and regulations, an offshore institution in Macao conducting certain activities may, subject to review and approval of the Macao government, be exempted from income tax, industrial tax and stamp duties. Because of the structure of our operations in 2005, we did not account for the profits generated by A-Max Macao using this exemption. The laws governing these tax exemptions have been revised in the past, including, most recently in 2005, and if the relevant laws and regulations are changed, or if interpretation of such tax exemption are changed to our disadvantage, the tax exemptions available to A-Max Macao may decrease for future periods, which may adversely affect our results of operations to the extent we would have been able to take advantage of such tax exemptions prior to any such change.
- 30 -
Dividend Distribution
Under Chinese law, a wholly foreign-owned enterprise like A-Max China may only pay dividends out of its net income, if any, determined in accordance with accounting principles and regulations in China. In addition, a wholly foreign-owned enterprise is also required to set aside at least 10% of its net income each year, if any, to fund certain reserve funds, unless such reserves have reached 50% or more of its registered capital. These reserves are not distributable as cash dividends.
Under Hong Kong Law, a company incorporated under the Companies Ordinance (Chapter 32, Laws of Hong Kong) (the “Companies Ordinance”), including A-Max (HK), shall only make distributions of a company’s assets to its members (including dividends), whether in cash or otherwise, out of the profits available for such purposes, such available profits being calculated as (i) the distributing company’s accumulated, realized profits, so far as not previously utilised by distribution or capitalisation, less (ii) the distributing company’s accumulated, realized losses, so far as not previously written off in a reduction or reorganisation of capital duly made. For this purpose, the term “distribution” does not include:
| | • | | an issuance of shares as fully or partly paid bonus shares; |
| | • | | a redemption or purchase of any of the company’s own shares out of capital (including the proceeds of any new issuance of shares) or out of unrealized profits in accordance with the relevant sections of the Companies Ordinance; |
| | • | | a reduction of the company’s share capital due to (i) the reduction or extinguishment of liability owed by any shareholder on any of the company’s shares in respect of share capital not paid up or (ii) the paying off of paid up share capital; or |
| | • | | a distribution of assets to shareholders of the company upon a winding up of the company. |
| C. | Organizational Structure |
- 31 -
Corporate Structure
The following diagram illustrates our corporate structure and the place of organization and affiliation of each of our subsidiaries as of the date of December 31, 2005.
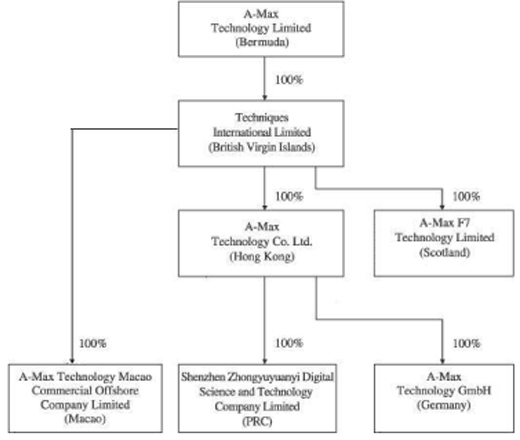
| D. | Property, Plant and Equipment |
Our principal executive offices are located on premises comprising approximately 420 square meters in Hong Kong. Our premises in Hong Kong are leased from a related party. See “Item 7. Major Shareholder and Relation Party Transactions – B. Related Party Transactions — Transactions with E2-Capital (Holdings) Limited.” In November 2004, we relocated our manufacturing facilities to Shenzhen, which comprise approximately 40,000 square meters. Prior to this relocation in November 2004, we conducted our manufacturing operations at a different location in Shenzhen. We had a manufacturing capacity of 1.0 to 1.2 million units per month, and doubled our capacity to approximately 2.0 to 2.4 million units per month units following the completion of Phase II of the expansion of our manufacturing facilities in the end of 2005.
ITEM 5 OPERATING AND FINANCIAL REVIEW AND PROSPECTS
The following discussion and analysis of our financial condition and results of operations is based upon and should be read in conjunction with our consolidated financial statements and the related notes included elsewhere in this annual report on Form 20-F. This discussion contains forward-looking statements based upon current expectations that involve risks and uncertainties. Our actual results may differ materially from those anticipated in these forward-looking statements as a result of various factors, including those set forth under “Item 3. Key Information—D. Risk Factors” or in other parts of this annual report on Form 20-F. We caution you that our business and financial performance are subject to substantial risks and uncertainties.
- 32 -
Overview
We are a leading independent total solutions provider in the global portable player market. Our current product offering consists primarily of flash-based players. Our recent results have been driven by the growth of the portable player market, in particular the dramatic increase in demand for flash-based players beginning in 2003 and carrying into 2004 and 2005. Since we began producing portable players in 2000, we have produced over 280 models of portable players for customers in Europe, the United States and Asia.
We commenced operations through A-Max (HK) in 1996. From then until 2000, our business consisted primarily of sales of computer peripherals and components. In 2000, we began to sell MP3 CD players, which are portable CD players that also provide MP3 and WMA playback. Sales of MP3 CD players constituted 45.4% of our total net sales in 2002 before experiencing a steep decline in 2003, 2004 and 2005 to 18.9%, 0.7% and 0.1% of our total net sales, respectively. The significant declines were due primarily to our strategic decision, guided by industry trends and consumer demand, to transition our focus on MP3 CD players to flash-based players. Although we did not sell our first flash-based player model until 2002, flash-based players quickly became our principal products and accounted for 51.1%, 91.4% and 92.1% of our net sales in 2003, 2004 and 2005, respectively. In October 2004, we added HDD-based players to our product mix in response to the demands of certain customers, and sales of HDD-based players accounted for 4.4% and 0.2% of our net sales in 2004 and 2005, respectively. We do not currently offer any HDD-based players due to lack of strong customer demand.
The portable player industry, like the larger consumer electronics products industry, is characterized by intense competition and increasing technological complexity with short development cycles. We expect our business to be driven primarily by the growing portable player market and a growing trend toward outsourcing of the design and manufacturing of consumer electronics products such as portable players. To stay abreast of technological advancements and changing consumer preferences, including demand for memory-intensive digital content such as video, we have developed PMPs and are in the process of developing DAB players. In the near term, we expect our net sales to consist primarily of sales of flash-based players, and to a lesser extent, sales of computer peripherals and components and possible sales of PMPs and DAB players.
We design and manufacture portable players for consumer electronics brand owners and large retail chains that offer their own house brands of consumer electronics products. We sell our products to customers primarily through direct sales, and to a lesser extent, through distributors. A small number of customers have accounted for a majority of our net sales. In 2004 and 2005, our top five customers collectively accounted for approximately 65.2% and 50.5%, respectively, of our net sales. Sales to our largest customers have varied from period to period due primarily to our changing product mix and our relatively short history of sales of portable players, as well as the continued expansion of our customer base. As our product portfolio has changed significantly in the past three years and we now focus primarily on sales of flash-based players, the contribution of sales of our computer peripherals and components to our net sales has generally decreased. Sales of our computer peripherals and components constituted 28.2%, 3.3% and 6.9% of our total net sales for each of 2003, 2004 and 2005, respectively. As there is typically market demand for components and we anticipate that we can procure new components on price terms no less favorable than the components we have on hand, we sell excess components from time to time to efficiently manage our inventory levels.
- 33 -
Our gross margins have varied since our inception and we expect that they will continue to vary as a result of a variety of factors. These factors include changes in our product mix, the unit price of our products and the prices of key components, in particular flash-based memory and chipsets. Our gross margins have increased during the period from 2002 to 2005 due primarily to the change in our product mix to consist primarily of flash-based players. Gross margins are generally higher on sales of portable players, particularly flash-based players, than on sales of computer peripherals and components. However, the portable player industry is characterized by falling unit prices, which forces us to constantly seek ways to maintain or improve our gross margins by achieving greater economies of scale, strengthening the cost efficiencies of our design and manufacturing processes, strengthening our relationships with key suppliers and constantly offering new products with more advanced features and functions.
Our business requires significant amounts of working capital to purchase key components, such as flash memory and chipsets, which we must order in advance of customer orders for our products. In the past, we have funded our working capital needs and capital expenditures primarily from bank borrowings, the issuance of shares in private offerings and cash generated from our operating activities. We expect our working capital and capital expenditure needs to continue to grow alongside the expected growth of our production and sales of portable players. We also have the option to draw from our existing lines of credit in the future to fund our working capital needs.
Net Sales. We typically ship our products freight on board Hong Kong, in which case title to our products passes to the customer immediately upon shipment from Hong Kong. Our net sales from portable players are primarily determined by the unit sales price and the number of units sold, which are in turn affected by many factors, including the type of player sold, the features, functions and memory capacity included in the players. Our sales of portable players are also affected by seasonality. Our sales tend to be higher during the fourth quarter due to the winter holiday season.
Cost of Sales. Our cost of sales consists primarily of:
| | • | | direct materials cost, in particular the cost of acquiring flash-based memory, chipsets, LCDs and hard disk drives; |
| | • | | direct labor costs associated with the manufacturing, assembly and testing of our portable players; and |
| | • | | manufacturing overhead. |
Direct materials cost accounted for 96.3%, 97.8% and 96.9% of our cost of sales in 2003, 2004 and 2005, respectively. For selected customers, we provide, without charge, extra units of our products equivalent to 1% of the units ordered by the customer to cover anticipated returns and replacements under warranty. We include the cost of producing these additional units in our cost of sales.
Selling Expenses. Our selling expenses consist primarily of salaries and wages for our sales and marketing personnel, freight charges in connection with the delivery of our products, advertising and promotion and traveling expenses. Our selling expenses have increased as we hired additional sales personnel and incurred additional expenses to promote new product and new model offerings. Our selling expenses have also increased as we have expanded the geographic scope of our market to cater to the large European and U.S. portable player markets. We expect that our selling expenses will increase as we hire additional sales and marketing personnel, continue to expand our sales and marketing network in Europe and the United States and seek to increase sales in Asia, in particular China.
- 34 -
General and Administrative Expenses. Our general and administrative expenses consist primarily of salaries and wages for our general and administrative personnel, charges in connection with our bank facilities, legal and other professional service fees, rental fees and allowance for bad debt in connection with accounts receivable that we are unlikely to collect. Our general and administrative expenses have increased slightly over the past three years primarily as a result of increased headcounts.
Research and Development Expenses. Research and development expenses consist primarily of salaries and wages for research and development personnel and tooling costs related to the development of prototype products. We expense research and development expenses as they are incurred. In the past three years, our research and development expenses have related primarily to the costs associated with the development of new product features and categories. In the future, we expect our research and development expenses to relate primarily to our efforts to enhance our design capabilities and technological expertise to create more advanced and efficient design and manufacturing processes.
Disposals of Subsidiaries and Tradename. In 2003, we completed the sales of two subsidiaries for total consideration of $1.3 million and recognized gains of $0.8 million from these sales. In January 2003, we sold Zhaoqing A-Max Technology Co. Ltd, or A-Max (Zhaoqing), to Botany Investment Limited, a third party. We had previously manufactured our computer peripherals, such as VGA graphics cards and sound cards, at our old factory in Zhaoqing, which was also used for our initial production of MP3 CD players. However, the Zhaoqing factory did not have the advanced manufacturing facilities required for our efficient production of high-quality flash-based players. In preparation for the transition of our product mix to primarily flash-based players and other new digital products, we moved our research and development and manufacturing activities to new facilities in Shenzhen, China, which have more advanced manufacturing equipment and production lines. We then sold the legal entity that owned our old factory and related fixed assets to a third party. Although the current owner of the Zhaoqing factory may be utilizing the fixed assets to produce certain competing products, we do not consider it to be a competitor with us in the flash-based player business or that our disposal of such factory has had or is likely to have any material impact on our results of operations or financial condition. In December 2003, we sold our subsidiary A-Max Technology (International) Company Ltd., or A-Max (International), through which we held our brand name “NAPA,” to a different third party. We disposed of the “NAPA” brand name in order to avoid competition with our customers and attract more leading brand owners and retail chain customers for our flash-based players. The current owner of the NAPA brand has continued to use our services.
Other Income (Expense). Our other income (expense) consists of foreign exchange gains and losses and gains or losses on our investments in marketable securities, among other things. Our gains and losses attributable to foreign exchange have been primarily attributable to remeasurements of transactions denominated in RMB, H.K. dollars or Euro into U.S. dollars. Historically, the impact attributable to the exchange rates between the H.K. dollar and the U.S. dollar and the RMB and the U.S. dollar has not been significant as a result of the Hong Kong government’s policy of pegging the H.K. dollar to the U.S. dollar and the PRC government’s previous policy of pegging the RMB to the U.S. dollar. On July 21, 2005, the PRC government changed its policy, permitting the RMB to fluctuate within a band against a basket of certain foreign currencies. The change resulted initially in an approximately 2.5% appreciation in the value of the RMB against the U.S. dollar by the end of 2005. The recent policy change may result in greater or lesser foreign exchange gains or losses than we have experienced in the past. We have invested in marketable securities, which we have classified as trading for accounting purposes. Based on our limited securities investment activities, we have not experienced, and do not expect to experience in the future, significant gains or losses on our securities trading activities.
- 35 -
Taxation. Under the current laws of Bermuda and the British Virgin Islands, where our holding company and intermediate holding company have been incorporated, respectively, we are not subject to tax on our income or capital gains. In addition, our payment of dividends is not subject to withholding tax in these jurisdictions.
Under the current laws of Macao, A-Max (Macao), which is treated as an offshore institution in Macao, is exempted from income tax, industrial tax and stamp duties. In addition, managers and specialized technicians of A-Max (Macao) who are authorized to reside in Macao but are not Macao permanent residents are exempted from salary tax for the first three years of their employment at A-Max (Macao). However, the availability of these tax benefits to A-Max Macao as an offshore company is subject to the review and approval of the Macao government. For 2005, based on the structure of our operations in that year, we provided for the profit generated by A-Max Macao based on the Hong Kong tax rate of 17.5%.
The provision for current income taxes of our operating subsidiary in Hong Kong, A-Max (HK), has been calculated by applying the current statutory income tax rate of 17.5% in each of 2003, 2004 and 2005 to the estimated taxable income earned in or derived from Hong Kong during the relevant period.
The statutory EIT rate in the PRC for FIEs, such as A-Max China, is 30% on taxable income and the local income tax rate is 3% on taxable income. However, because A-Max China is located in Shenzhen, China, it qualifies for a special reduced EIT rate of 15%. Furthermore, since A-Max China is an enterprise engaged in manufacturing with foreign investment and its term of operation is more than ten years, it is entitled to a two-year EIT exemption beginning from its first profitable year, followed by a 50% reduction of the EIT rate for three years. A-Max China became profitable in 2004. As a result, A-Max China is exempt from EIT in 2004 and 2005 and will be subject to a 7.5% EIT rate from 2006 to 2008.
Critical Accounting Policies
We prepare our consolidated financial statements in conformity with U.S. GAAP, which requires us to make estimates and assumptions that affect the reported amounts of assets and liabilities, disclosure of contingent assets and liabilities on the date of the consolidated financial statements and the reported amounts of net sales and expenses during the financial reporting period. We continually evaluate these estimates and assumptions based on the most recently available information, our own historical experience and various other assumptions that we believe are reasonable under the circumstances, the results of which form the basis for making judgments about the carrying values of assets and liabilities that are not readily apparent from other sources. Since the use of estimates is an integral component of the financial reporting process, actual results could differ from those estimates. Some of our accounting policies require higher degrees of judgment than others in their application. We consider the policies discussed below to be critical to an understanding of our consolidated financial statements as their application assists management in making their business decisions.
- 36 -
Revenue Recognition. We recognize revenue based on firm customer orders with fixed terms and conditions, including price. We recognize revenue when delivery has occurred and collectibility is determined to be reasonably assured. We meet these criteria at the point of shipment for shipments which are made with freight on board, or FOB, shipping point terms, and upon delivery for shipments which are made with FOB destination terms. We do not provide our customers with price protection and only provide the right of return or subsequent rebates for defective goods in connection with our warranty policy. For selected customers, we ship, without charge, extra units of our products equivalent to 1% of the units ordered by the customer.
Allowance for Doubtful Receivables. We periodically record an allowance for doubtful receivables based on our evaluation of the collectibility of our accounts receivable. The total amount of this provision is determined by us as follows. We first identify the receivables of customers that are considered to be a higher credit risk based on their current overdue accounts with us, difficulties in collecting from these customers in the past or their overall financial condition. For each of these customers, we estimate the extent to which the customer will be able to meet its financial obligations to us, and we record an allowance that reduces our accounts receivable for that customer to the amount that we reasonably believe will be collected. Additional allowances may be required in the future if the financial condition of our customers or general economic conditions deteriorate, and this additional allowance would reduce our net income.
Income Taxes. We provide for all taxes based on profits whether due at year end or estimated to become due in future periods but based on profits earned to date. Tax benefits arising from deductible temporary differences, unused tax credits and net operating loss carryforwards are recognized as deferred tax assets. We record a valuation allowance to reduce our deferred income tax assets to an amount that we believe will more likely than not be realized. We have considered future taxable income and ongoing prudent and feasible tax planning strategies in assessing the need and amount for the valuation allowance. In the event we were to determine that we would be able to realize our deferred income tax assets in the future in excess of our net recorded amount, an adjustment to our deferred income tax assets would increase income in the period such determination was made. Alternatively, should we determine that we would not be able to realize all or part of our net deferred income tax assets in the future, an adjustment to our deferred income tax assets would decrease income in the period such determination was made.
Accruals and Provisions for Loss Contingencies. We make provisions for all loss contingencies when information available to us prior to the issuance of the financial statements indicates that it is probable that an asset had been impaired or a liability had been incurred at the date of the financial statements and the amount of loss can be reasonably estimated. For provisions or accruals related to litigation, we make provisions based on information from legal counsels and the best estimation of management. As of December 31, 2005, we were involved in certain legal proceedings and contingencies. We record liabilities in relation to such matters based on our estimate of the probable cost of the resolution of the contingency. The actual resolution of these contingencies may differ from our estimates. A contingency that is settled for an amount greater than our estimate will result in a future charge to income. Likewise, a contingency that is settled for an amount less than our estimate will result in a future credit to income.
Impairment or Disposal of Long-Lived Assets. We review our long-lived assets for potential impairment based on a review of projected undiscounted cash flows associated with these assets. Long-lived assets are evaluated for impairment whenever events and circumstances exist that indicate the carrying amount of these assets may not be recoverable. Measurement of impairment losses for long-lived assets that we expect to hold and use is based on the difference between estimated fair value of the assets and the carrying value. Long-lived assets to be disposed of are stated at the lower of fair value or carrying amount. Expected future operating losses from discontinued operations are recorded in the periods in which the losses are incurred.
- 37 -
Results of Operations
The following table sets forth a summary of our consolidated statement of operations, both in absolute amounts and as a percentage of net sales, for the periods indicated. Our business has evolved rapidly and significantly since we launched our first flash-based player in 2002. Our limited history of sales of our key products makes the prediction of future operating results very difficult. We believe that period-to-period comparisons of past operating results should not be relied upon as indicative of future performance.
| | | | | | | | | | | | | | | | | | | | | |
| | | Year Ended December 31, | |
| | | 2003 | | | % | | | 2004 | | | % | | | 2005 | | | % | |
| | | (in thousands, except for percentages) | |
Consolidated Statement of Operations Data | | | | | | | | | | | | | | | | | | | | | |
Net Sales | | $ | 39,388 | | | 100.0 | % | | $ | 141,384 | | | 100.0 | % | | $ | 328,321 | | | 100.0 | % |
Cost of sales | | | (33,232 | ) | | (84.4 | ) | | | (118,206 | ) | | (83.6 | ) | | | (288,057 | ) | | (87.7 | ) |
| | | | | | | | | | | | | | | | | | | | | |
Gross profit | | $ | 6,156 | | | 15.6 | % | | | 23,178 | | | 16.4 | % | | | 40,264 | | | 12.3 | % |
Selling expenses | | | (1,722 | ) | | (4.4 | ) | | | (2,926 | ) | | (2.1 | ) | | | (5,748 | ) | | (1.8 | ) |
General and administrative expenses | | | (3,878 | ) | | (9.8 | ) | | | (3,882 | ) | | (2.7 | ) | | | (8,893 | ) | | (2.7 | ) |
Research and development expenses | | | (153 | ) | | (0.4 | ) | | | (359 | ) | | (0.3 | ) | | | (1,652 | ) | | (0.5 | ) |
Gain on disposal of variable interest entity | | | — | | | — | | | | — | | | — | | | | 433 | | | 0.1 | |
Gain on disposal of subsidiaries and tradename | | | 827 | | | 2.1 | | | | — | | | — | | | | — | | | — | |
| | | | | | | | | | | | | | | | | | | | | |
Operating income | | $ | 1,230 | | | 3.1 | % | | $ | 16,011 | | | 11.3 | % | | $ | 24,404 | | | 7.4 | % |
Other income | | | 466 | | | 1.2 | | | | 120 | | | 0.1 | | | | 649 | | | 0.2 | |
Net unrealized holding (loss) gain on trading securities | | | — | | | — | | | | (19 | ) | | (0.0 | ) | | | 1 | | | 0.0 | |
Impairment on investments | | | — | | | — | | | | (179 | ) | | (0.1 | ) | | | — | | | — | |
Initial Public Offering Expenses | | | — | | | — | | | | — | | | — | | | | (3,080 | ) | | (0.9 | ) |
Interest income | | | 4 | | | 0.0 | | | | 15 | | | 0.0 | | | | 873 | | | 0.2 | |
Interest expense | | | (401 | ) | | (1.0 | ) | | | (649 | ) | | (0.5 | ) | | | (1,026 | ) | | (0.3 | ) |
| | | | | | | | | | | | | | | | | | | | | |
Income before income taxes | | $ | 1,299 | | | 3.3 | % | | $ | 15,299 | | | 10.8 | % | | $ | 21,821 | | | 6.6 | % |
Provision for income taxes | | | (165 | ) | | (0.4 | ) | | | (2,568 | ) | | (1.8 | ) | | | (4,400 | ) | | (1.3 | ) |
| | | | | | | | | | | | | | | | | | | | | |
Net income | | $ | 1,134 | | | 2.9 | % | | $ | 12,731 | | | 9.0 | % | | $ | 17,421 | | | 5.3 | % |
| | | | | | | | | | | | | | | | | | | | | |
Comparison of Year Ended December 31, 2004 and Year Ended December 31, 2005
Net Sales. Our net sales increased by 132.2% from $141.4 million in 2004 to $328.3 million in 2005. The increase was due primarily to the significant increase in sales of our flash-based players from net sales of $129.2 million in 2004 to $302.5 million in 2005, mainly as a result of a substantial increase in sales volume driven by the addition of new customers and the growth of customer orders. The increase was also due in part to the increase in net sales generated by the sale of components from $4.7 million in 2004 to $22.8 million in 2005 as a result of our sales of our excess inventory of components.
Cost of Sales. Our cost of sales increased by 143.7% from $118.2 million in 2004 to $288.1 million in 2005. As a percent of net sales, cost of sales increased from 83.6% in 2004 to 87.7% in 2005. The increase was due primarily to an increase in the total direct materials costs resulting from the increase in sale volume, including costs for memory and chipsets for flash-based players, which increased from $105.0 million in 2004 to $256.9 million in 2005, and in connection with the sale of components, which increased from $4.5 million in 2004 to $20.5 million in 2005.
- 38 -
Selling Expenses. Our selling expenses increased by 96.4% from $2.9 million in 2004 to $5.7 million in 2005. The increase was due primarily to an increase in freight charges from $1.6 million in 2004 to $3.4 million in 2005 due to increased sales volume, primarily attributable to sales of flash-based players and the greater frequency, and longer distances, of our shipments.
General and Administrative Expenses. Our general and administrative expenses increased by 129.1% from $3.9 million in 2004 to $8.9 million in 2005. This increase was due primarily to an increase in provision of inventory and recognition of bad debts totaling approximately $1.0 million, an increase in salaries and wages as we hired more personnel in connection with the growth of our business of approximately $0.9 million, as well as due to net increases in other general and administrative expenses of approximately $3.1 million.
Research and Development Expenses. Our research and development expenses increased by 360.2% from $0.4 million in 2004 to $1.7 million in 2005. The increase was due primarily to an increase in salaries and wages as a result of an increase in the size of our research and development staff.
Gain on Disposal of Variable Interest Entity.On July 30, 2005, a variable interest entity for which we previously provided start-up capital in the amount of $0.5 million refunded the full amount to us. We no longer have any financial investment or obligations to provide funding to this entity. Accordingly, we ceased consolidating the entity as of July 30, 2005, and a gain on disposal of approximately $0.4 million was recognized.
Other Income. Other income increased from $0.1 million in 2004 to $0.6 million in 2005. The increase was due primarily to an increase in foreign exchange gains.
Interest Expense. Interest expense increased by 58.1% from $0.6 million in 2004 to $1.0 million in 2005. The increase was due primarily to increased bank borrowings in 2005 to meet our working capital needs.
Initial Public Offering Expenses. We incurred costs of approximately $3.1 million in connection with a proposed offering of securities in 2005. All costs were charged to the statement of operations as the proposed offering was postponed.
Provision for Income Taxes. Our income tax expenses increased by 71.3% from $2.6 million in 2004 to $4.4 million in 2005 as a result of the significant increase in income before income taxes in 2005.
Net Income. Our net income increased substantially from $12.7 million in 2004 to $17.4 million in 2005 as a result of the cumulative effect of the foregoing factors.
Comparison of Year Ended December 31, 2003 and Year Ended December 31, 2004
Net Sales. Our net sales increased by 259.0% from $39.4 million in 2003 to $141.4 million in 2004. The increase was due primarily to the significant increase in sales of our flash-based players from net sales of $20.9 million in 2003 to $129.2 million in 2004, mainly as a result of a substantial increase in sales volume. The increase was also due to a lesser extent to sales of our HDD-based players, which we commercially launched in 2004. The increase was partially offset by a decrease in net sales generated by MP3 CD players from $6.6 million in 2003 to $1.0 million in 2004, and the decrease in net sales generated by computer peripherals and components from $11.1 million in 2003 to $4.7 million in 2004.
- 39 -
Cost of Sales. Our cost of sales increased by 255.7% from $33.2 million in 2003 to $118.2 million in 2004. The increase was due primarily to an increase in the total direct materials cost for flash-based players, in particular memory, chipsets and LCDs, from $15.8 million in 2003 to $105.0 million in 2004. As a percentage of net sales, cost of sales decreased slightly from 84.4% in 2003 to 83.6% in 2004, due in part to greater economies of scale and the higher gross margins on portable players compared to computer peripherals and components.
Selling Expenses. Our selling expenses increased by 69.9% from $1.7 million in 2003 to $2.9 million in 2004. The increase was due primarily to an increase in freight charges from $0.8 million in 2003 to $1.6 million in 2004 due to increased sales of flash-based players and the greater frequency, and longer distance, of our shipments. The increase was also due to an increase in salaries and wages from $0.4 million in 2003 to $0.6 million in 2004 as we hired more sales and marketing personnel to expand sales efforts to cater to the larger European and U.S. portable player markets. As a percentage of net sales, selling expenses decreased from 4.4% in 2003 to 2.1% in 2004, primarily as a result of the greater economies of scale we have achieved.
General and Administrative Expenses. Our general and administrative expenses remained relatively stable at $3.9 million in 2003 and 2004. We experienced an increase in charges related to our bank facilities from $0.2 million in 2003 to $0.5 million in 2004. Salaries and wages increased from $1.1 million in 2003 to $1.3 million in 2004 as we hired more administrative personnel. Legal and professional fees increased from $0.2 million in 2003 to $0.4 million in 2004 as a result of our issuance of additional shares to private investors after incorporating in Bermuda and audit-related services. Allowance for doubtful receivables decreased to $0.3 million in 2004 from $1.1 million in 2003, when we were unable to collect payments due to us from our former customer Sonicblue, Inc., or Sonicblue, which petitioned for Chapter 11 bankruptcy relief in 2003. See “Item 8. Financial Information – A. Consolidated Financial Statements and Other Financial Information — Legal and Administrative Proceedings.” As a percentage of net sales, general and administrative expenses decreased from 9.8% in 2003 to 2.7% in 2004 due primarily to the economies of scale we have achieved and a smaller allowance for doubtful receivables in 2004.
Research and Development Expenses. Our research and development expenses increased by 134.6% from $0.2 million in 2003 to $0.4 million in 2004 as a result of $0.2 million that we paid to third parties in 2004 to assist with the design and development of new and advanced features for our flash-based players and for the development of HDD-based players, which we began to sell in October 2004. We did not incur any such fees in 2003. As a percentage of net sales, research and development expenses decreased slightly from 0.4% in 2003 to 0.3% in 2004.
Other Income. Other income decreased by 74.2% from $0.5 million in 2003 to $0.1 million in 2004. The decrease was due primarily to decreases in exchange gains and gain on disposal of investment securities.
Interest Expense. Interest expense increased by 61.8% from $0.4 million in 2003 to $0.6 million in 2004. The increase was due primarily to increased bank borrowings to meet working capital needs for the increase in our production and sales of flash-based players, offset in part by a decline in interest rates.
- 40 -
Provision for Income Taxes. Our income tax expenses increased from $0.2 million in 2003 to $2.6 million in 2004 as a result of the significant increase in our income before income taxes in 2004.
Net Income. Our net income increased significantly from $1.1 million in 2003 to $12.7 million in 2004 as a result of the cumulative effect of the foregoing factors.
| B. | Liquidity and Capital Resources |
The following table sets forth a summary of our cash flows for the periods indicated:
| | | | | | | | | |
| | | Year Ended December 31, |
| | | 2003 | | 2004 | | 2005 |
| | | (in thousands) |
Net cash used in operating activities | | $ | 4,025 | | $ | 11,761 | | $ | 3,940 |
Net cash used in investing activities | | | 676 | | | 2,241 | | | 13,340 |
Net cash from financing activities | | | 6,141 | | | 19,338 | | | 59,104 |
Net increase in cash and cash equivalents | | | 1,301 | | | 5,371 | | | 42,025 |
Cash and cash equivalents at beginning of period | | | 409 | | | 1,710 | | | 7,081 |
Cash and cash equivalents at end of period | | | 1,710 | | | 7,081 | | | 49,106 |
We have financed our operations through cash borrowed under our bank credit facilities and generated from private securities issuances and from our operating activities. As of December 31, 2003, 2004 and 2005, we had credit facilities in the aggregate amount of $8.1 million, $31.5 million and $64.4 million, of which $0.3 million, $6.1 million and $37.5 million were unused, respectively. Our credit facilities provide for extension of credit for trade acceptances, import and factoring facilities, equipment purchases and overdrafts. The funds borrowed under these facilities are generally repayable within 60 to 100 days. Interest rates are generally based on the Hong Kong Interbank Offered Rate, or HIBOR, or Singapore Interbank Offered Rate, or SIBOR, plus 0.75% to 1.5% per annum, and the credit lines are normally subject to annual review and renewal. The weighted average interest rates on import and factoring loans as of December 31, 2003, 2004 and 2005 were 4.0%, 4.0% and 5.9%, respectively. The bank facilities are secured by certain bank deposits totaling $0.3 million as of December 31, 2005. Certain bank facilities were previously guaranteed by E2-Capital (Holdings) Limited, or E2-Capital, and two of our directors had previously pledged the shares that they own in our company to E2-Capital as security for the guarantees. See “Item 7. Major Shareholders and Related Party Transactions – B. Related Party Transactions — Transactions with E2-Capital (Holdings) Limited.” These guarantees and pledges were released and terminated shortly prior to the consummation of our sale of Series A Preferred Shares in June 2005, with the written consent of E2-Capital and the lenders. In addition, our factoring facility agreements allow us to obtain financing for some customers in an amount equal to a portion of the balance of our accounts receivable owed by the customer, generally up to 80%. The financing institutions that extend the factoring loans have full recourse against us for any bad debts. The amounts of our accounts receivable we pledged to secure these factoring loans amounted to $5.3 million, $7.3 million and $4.1 million in 2003, 2004 and 2005, respectively. Payment terms under these factoring loan facilities are generally 60 to 90 days. The financing charges for these factoring loan agreements are typically at SIBOR plus 1.5% per annum.
- 41 -
In April 2004, we raised capital through the issuance of 149.9 million preference shares in a private placement for total consideration of $1.4 million. The preference shares were entitled to a cumulative dividend of 5% and were convertible into our ordinary shares on a 1-to-1 basis. All of these preference shares were converted into our ordinary shares in November 2004. In June 2005, we issued an aggregate of 141,490,566 Series A Preferred Shares to investment entities affiliated with General Atlantic LLC, or collectively General Atlantic, in a private placement for total consideration of $60.0 million.
As of December 31, 2005, we had $49.1 million in cash and cash equivalents, which consisted primarily of cash on hand, highly liquid investments purchased with a maturity date of three months or less and short-term deposits with various banks. Our accounts receivable were $8.4 million, $43.3 million and $73.3 million as of December 31, 2003, 2004 and 2005, respectively. Our inventories were $7.1 million, $25.6 million and $43.4 million as of December 31, 2003, 2004 and 2005, respectively.
Accounts receivable and inventories, two principal components of our current assets, are expected to continue to increase as our net sales continue to increase. The average number of days required for collection of our accounts receivable improved from 69 days in 2003 to 67 days in 2004 and 65 days for 2005. Average inventory turnover days declined from 72 days in 2003 to 51 days in 2004 and 44 days for 2005. The improvement in our average inventory days was due primarily to the increased sales of our flash-based players, more efficient inventory management, including increased sales of components to customers, and greater fungibility of the components of our flash-based players.
Accounts payable is a significant component of our current liabilities. Our key suppliers typically allow us credit terms of up to 30 days, depending on the type of component. We attempt to take advantage of the credit terms offered to us while ensuring that we make timely payments. The average number of days within which we paid our accounts payable was 60 days in 2003, 48 days in 2004 and 48 days for 2005. The decrease in the average number of days within which we paid our accounts payable was due primarily to the increase in sales of flash-based players as a percentage of overall net sales in 2004 and in 2005. Flash-based memory suppliers do not typically provide extended payment terms due to the commoditization of flash-based memory in the consumer electronics industry.
Operating Activities. Net cash used in operating activities decreased substantially from $11.8 million in 2004 to $3.9 million in 2005. The decrease was mainly attributable to several factors, including: (i) collections of accounts receivable resulting in a $5.0 million decrease in the accounts receivable balance as of December 31, 2005 from December 31, 2004 as compared to a $29.8 million increase as of December 31, 2004 from December 31, 2003 and (ii) a $0.7 million decrease in inventories that we carried as of December 31, 2005 from December 31, 2004 as compared to a $17.0 million increase as of December 31, 2004 from December 31, 2003. Net cash used in operating activities increased by 195.0% from $4.0 million in 2003 to $11.8 million in 2004. The increase was due primarily to a large increase in accounts receivable from 2003 to 2004 as a result of our increased sales, offset in part by an increase in accounts payable from 2003 to 2004. The increase in net cash used in operating activities was also due to an increase in inventories that we carried as of December 31, 2004 compared to December 31, 2003.
Investing Activities. Net cash used in investing activities increased significantly from $2.2 million in 2004 to $13.3 million in 2005. The change was due primarily to our purchase of additional equipment to expand our expanded operations in 2005. Net cash used in investing activities increased by 231.5% from $0.7 million in 2003 to $2.2 million in 2004. The increase was due primarily to the purchase of equipment in connection with the relocation to our current production facilities in Shenzhen in November 2004 and investments in equipment to increase our monthly production capacity, offset in part by a decrease in net cash from our disposals of subsidiaries and a trade name, which occurred only in 2003.
- 42 -
Financing Activities. Net cash from financing activities in 2005 was $59.1 million compared to net cash from financing activities of $19.3 million in 2004. The substantial change was due primarily to the $60.0 million in proceeds that we received from the sale of our Series A Preferred Shares in a private placement in June 2005. The increase was offset in part by a significant increase in repayment of bank loans, net of proceeds from bank loans, in the amount of $1.4 million in 2005, as compared to proceeds from bank loans, net of repayment of bank loans, in the amount of $17.6 million in 2004. Net cash from financing activities increased by 214.9% from $6.1 million in 2003 to $19.3 million in 2004. The increase was due primarily to an increase in bank borrowings to meet our working capital needs and capital expenditures and the $1.4 million that we generated from the sale of preference shares in 2004, offset in part by repayments of loans to banks and a director.
Capital Expenditures
Our development over the past three years has required significant investment. We will need to continue to make adequate investments in facilities and equipment to increase our production capacity and upgrade our manufacturing capability to use new technologies. Our capital expenditures were $2.6 million, $2.9 million and $13.8 million in 2003, 2004 and 2005, respectively. Our capital expenditures during this three-year period were principally for the relocation of our manufacturing facilities, expansion of our production capacity and purchases of machinery, equipment and other items related to the sale of our products. Our capital expenditures in 2005 primarily relate to the completion of Phase II of the expansion of our Shenzhen manufacturing facilities.
Taking into consideration the financial resources available to us, including cash generated from our operating activities, the present available banking facilities and the net proceeds from our sale of Series A Preferred Shares, we believe that we have sufficient liquidity to meet our working capital and operating requirements for at least the next 12 months.
| C. | Research and Development |
See “Item 4. Information on the Company - B. Business Overview – Research and Development.”
Other than as disclosed elsewhere in this annual report, we are not aware of any trends, uncertainties, demands, commitments or events for the period from January 1, 2003 to December 31, 2005 that are reasonably likely to have a material and adverse effect on our net revenues, income, profitability, liquidity or capital resources, or that caused the disclosed financial information to be not necessarily indicative of future operating results or financial conditions.
- 43 -
| E. | Off-balance Sheet Arrangements |
Off-Balance Sheet Commitments and Arrangements
As of December 31, 2005, we had not entered into any financial guarantees or other commitments to guarantee the payment obligations of any third parties. We have not entered into any derivative contracts that are indexed to our shares and classified as shareholder’s equity, or that are not reflected in our consolidated financial statements. Furthermore, we do not have any retained or contingent interest in assets transferred to an unconsolidated entity that serves as credit, liquidity or market risk support to such entity. We do not have any variable interest in any unconsolidated entity that provides financing, liquidity, market risk or credit support to us or engages in leasing, hedging or research and development services with us.
| F. | Contractual Obligations |
The following table sets forth our contractual obligations as of December 31, 2005:
| | | | | | | | | | | | | | | |
| | | Payment due by period |
Contractual Obligations | | Total | | Less than
1 year | | 1-3 years | | 3-5 years | | More than
5 years |
| | | (in thousands) |
Capital (Finance) Lease Obligations | | $ | 3,151 | | $ | 1,157 | | $ | 1,994 | | $ | — | | $ | — |
Operating Lease Obligations | | | 2,891 | | | 1,207 | | | 1,476 | | | 208 | | | — |
| | | | | | | | | | | | | | | |
Total | | $ | 6,042 | | $ | 2,364 | | $ | 3,470 | | $ | 208 | | $ | — |
| | | | | | | | | | | | | | | |
If a bona fide firm commitment underwritten public offering led by an internationally recognized investment banking firm and listing of our ordinary shares on the Nasdaq or other internationally recognized stock exchange does not first occur, beginning on June 17, 2009, upon the request of holders of a majority of the then-outstanding Series A Preferred Shares, if any, we will redeem for cash all outstanding Series A Preferred Shares. The redemption price will equal the sum of the original subscription price and all accrued dividends as of the redemption date, plus any additional amount that may be required such that the per annum return on the subscription price yields a compounded annual rate of return, net of withholding taxes, of 10% to the holders of Series A Preferred Shares as of the redemption date.
Other than the contractual obligations set forth above, we do not have any long-term commitments.
This annual report on Form 20-F contains forward-looking statements that relate to future events, including our future operating results and conditions, our prospects and our future financial performance and condition, all of which are largely based on our current expectations and projections. The forward-looking statements are contained principally in the sections entitled “Item 3. Key Information—D. Risk Factors,” “Item 4. Information on the Company” and “Item 5. Operating and Financial Review and Prospects.” These statements are made under the “safe harbor” provisions of the U.S. Private Securities Litigation Reform Act of 1995. You can identify these forward-looking statements by terminology such as “may,” “will,” “expect,” “anticipate,” “future,” “intend,” “plan,” “believe,” “estimate,” “is/are likely to” or other and similar expressions. Forward-looking statements involve inherent risks and uncertainties.
Known and unknown risks, uncertainties and other factors may cause our actual results, performance or achievements to be materially different from any future results, performance or achievements expressed or implied by the forward-looking statements. See “Item 3. Key Information – D. Risk Factors” for a discussion of some risk factors that may affect our business and results of operations. These risks are not exhaustive. Other sections of this annual report may include additional factors that could adversely impact our business and financial performance. Moreover, we operate in an emerging and evolving industry. New risk factors emerge from time to time, and it is not possible for our management to predict all risk factors, nor can we assess the impact of all factors on our business or the extent to which any factor, or combination of factors, may cause actual results to differ materially from those contained in any forward-looking statements.
- 44 -
These forward-looking statements can be identified by words or phrases such as “may,” “will,” “expect,” “anticipate,” “aim,” “estimate,” “intend,” “plan,” “believe,” “is/are likely to”, “would” or other similar expressions. We have based these forward-looking statements largely on our current expectations and projections about future events and financial trends that we believe may affect our financial condition, results of operations, business strategy and financial needs. These forward-looking statements relate to, among other things:
| | • | | our anticipated growth strategies; |
| | • | | our future business development, results of operations and financial condition; |
| | • | | the expected growth of the portable player market; and |
| | • | | our ability to provide new models of portable players to meet our customers’ demands. |
You should not rely upon forward-looking statements as predictions of future events. We undertake no obligation to update or revise any forward-looking statements, whether as a result of new information, future events or otherwise.
| H. | Recent Accounting Pronouncements |
In November 2004, the Financial Accounting Standards Board (“FASB”) issued SFAS No. 151,“Inventory Costs-an amendment of ARB No. 43, Chapter 4”. SFAS No. 151 clarifies the accounting that requires abnormal amounts of idle facility expenses, freight, handling costs, and spoilage costs to be recognized as current-period charges. It also requires that allocation of fixed production overheads to the costs of conversion be based on the normal capacity of the production facilities. SFAS No. 151 will be effective for inventory costs incurred on or after July 1, 2005. The adoption of the standard did not have a material impact on the Company’s consolidated financial statements.
In December 2004, the FASB issued SFAS No. 123R, “Share-Based Payment”. This statement is a revision to SFAS No. 123 and supercedes APB Opinion No. 25. This statement establishes standards for the accounting for transactions in which an entity exchanges its equity instruments for goods or services, primarily focusing on the accounting for transactions in which an entity obtains employee services in share-based payment transactions. Entities will be required to measure the cost of employee services received in exchange for an award of equity instruments based on the grant-date fair value of the award (with limited exceptions). That cost will be recognized over the period during which an employee is required to provide service, the requisite service period (usually the vesting period), in exchange for the award. The grant-date fair value of employee share options and similar instruments will be estimated using option-pricing models. If an equity award is modified after the grant date, incremental compensation cost will be recognized in an amount equal to the excess of the fair value of the modified award over the fair value of the original award immediately before the modification. This statement is effective as of the beginning of the first fiscal year that begins after June 15, 2005. In accordance with the standard, the Company will adopt SFAS No. 123R effective January 1, 2006.
- 45 -
In June 2005, the FASB issued SFAS No. 154, “Accounting Changes and Error Corrections,” a replacement of APB Opinion No. 20, “Accounting Changes,” and SFAS No.3, “Reporting Accounting Changes in Interim Financial Statements.” SFAS No. 154 changes the requirements for the accounting for, and reporting of, a change in accounting principle. Previously, most voluntary changes in accounting principles were required to be recognized by way of a cumulative effect adjustment within net income during the period of the change. SFAS No. 154 requires retrospective application to prior periods’ financial statements, unless it is impracticable to determine either the period-specific effects or the cumulative effect of the change. SFAS No. 154 is effective for accounting changes made in fiscal years beginning after December 15, 2005; however, the Statement does not change the transition provisions of any existing accounting pronouncements. The adoption of SFAS No. 154 is not expected to have a material impact on the Company’s consolidated financial statements.
ITEM 6 DIRECTORS, SENIOR MANAGEMENT AND EMPLOYEES
| A. | Directors and Senior Management |
Directors and Executive Officers
The following table sets forth information regarding our directors and executive officers as of December 31, 2005.
| | | | |
Directors and Executive Officers | | Age | | Position/Title |
Victor Chan | | 41 | | Chairman and Chief Executive Officer |
Yu Xiao Dong | | 49 | | Director, Chief Operating Officer |
Nam Kang Cheung | | 44 | | Director, Vice President |
Sin Just Wong | | 39 | | Director |
Diana Chan | | 39 | | Director, Chief Financial Officer |
H. Raymond Bingham | | 60 | | Lead Director, Independent Director |
Vince Feng | | 33 | | Independent Director |
Philip Trahanas | | 34 | | Independent Director |
Norman Lee | | 37 | | Vice President, Procurement |
B.J. Kang | | 40 | | Vice President, Product Marketing |
Li Yang | | 43 | | Vice President, Research and Development |
Billy Yeung | | 42 | | Vice President, Sales and Marketing |
Richard Burns | | 51 | | Managing Director, Sales |
Maria Janiszewska | | 48 | | Managing Director, Sales |
Directors
Victor Chan has served as our company’s chairman and chief executive officer since 2004. Mr. Chan has served in a chief executive role since founding A-Max (HK) in 1996. Mr. Chan received a B.S. degree in computer & electrical engineering and industrial management from Purdue University. Mr. Chan is the brother of Ms. Diana Chan, our Chief Financial Officer.
Yu Xiao Dong has served as the chief operating officer of our company since 2004 and as a director since 2005. Mr. Dong joined A-Max (HK) as a vice president in charge of operations in 1999 and has been primarily responsible for the overall management of our business and operations. Mr. Dong graduated from a military school in China.
- 46 -
Nam Kang Cheung has served as a director of our company since 2005. Mr. Cheung has been our vice president in charge of our production division since joining A-Max (HK) in 1997. Mr. Cheung received a bachelor’s degree in computer science from Xiamen University in China.
Sin Just Wong has served as a director of our company since February 2005. Dato Wong is co-chairman of E2-Capital (Holdings) Limited, vice-chairman and chief executive officer of Softbank Investment International (Strategic) Limited, Chairman of SBI E2-Capital Asia Holdings Limited and independent non-Executive Director of Capital Strategic Investment Limited and China.com Inc. Dato Wong has over 13 years of investment banking and venture capital experience. Dato Wong holds a bachelor’s degree in engineering from the Imperial College of Science, Technology and Medicine in London and is qualified with the Institute of Chartered Accountants, England and Wales.
Diana Chan has served as the chief financial officer of our company since 2004 and as a director since 2005. Ms. Chan has been in charge of our finance and accounting related affairs since joining A-Max (HK) in 1996. Prior to joining us, Ms. Chan worked in the United States in various finance and accounting positions at American Isuzu Motors, Inc. from 1992 to 1995, ICT Corporation from 1989 to 1991 and International Business Machines in 1988. Ms. Chan received a B.S. degree in accounting from Purdue University and received an M.B.A. degree from California State University at Hayward. Ms. Chan is the sister of Mr. Victor Chan, our Chairman and Chief Executive Officer.
Independent Directors
H. Raymond Binghamhas served as a lead director of our company since October 2005. Mr. Bingham meets the “independence” requirements of Rule 10A-3 under the Securities Exchange Act of 1934, as amended. Mr. Bingham was executive chairman of the board of directors of Cadence Design Systems, Inc., a supplier of electronic design automation software and services, from May 2004 to July 2005 and served as a director of Cadence from November 1997 to July 2005. Prior to being executive chairman, he served as president and chief executive officer of Cadence from April 1999 to May 2004 and as executive vice president and chief financial officer from April 1993 to April 1999. Before joining Cadence in 1993, Mr. Bingham served, for eight years, as executive vice president and chief financial officer for Red Lion Hotels, Inc., where he was also responsible for corporate business development. Mr. Bingham also serves as a director of KLA-Tencor Corporation, Oracle Corporation, Freescale Semiconductor, Inc. and Flextronics International Ltd.
Vince Fenghas served as a director of our company since June 2005. Mr. Feng is a managing director of General Atlantic LLC, a private equity firm focused exclusively on investing in information technology and IT-enabled businesses on a global basis. He has been with General Atlantic (or its predecessor) since 1998. Mr. Feng currently serves as a director of Vimicro International Corporation, Oak Pacific Interactive, an observer on the board of Digital China Holdings Limited and an alternate director of Lenovo Group Limited. Mr. Feng holds a B.A. degree with high honors in Social Studies from Harvard University, and an M.B.A. degree from the Stanford Graduate School of Business.
Philip Trahanas has served as a director of our company since August 2005. Mr. Trahanas is a managing director of General Atlantic LLC, a private equity firm focused exclusively on investing in information technology and IT-enabled businesses on a global basis. He has been with General Atlantic (or its predecessor) since 2000. Mr. Trahanas serves on the board of directors of PowerDsine and Ai Metrix, and is an observer on the board of directors of SRA International, Inc. Mr. Trahanas holds a B.E. in Electrical Engineering from the Cooper Union for the Advancement of Science and Art. He attended the University of Pennsylvania for his advanced studies and received an M.B.A. degree from the Wharton School, where he graduated as a Palmer Scholar, and an M.S. degree in Engineering from the Moore School of Engineering.
- 47 -
Executive Officers
Norman Lee has served as our vice president in charge of our procurement division since August 2004. Prior to joining us in August 2004, Mr. Lee served as the sales manager of Supreme Electronics Limited, a leading computer component distributor in Taiwan and the largest distributor of Samsung’s flash memory in the China, Hong Kong and Taiwan region, for more than five years. Mr. Lee was in charge of the distribution of flash memory products for the China, Hong Kong and Taiwan region while working at Supreme Electronics Limited. Mr. Lee received a bachelor’s degree in printing from China Culture University in Taiwan and an M.B.A. degree from the New York Institute of Technology.
B.J. Kang has served as our vice president in charge of our product marketing since October 2004. Before joining us in October 2004, Mr. Kang served as a senior manager of the research and development department of Starlight Co., Ltd., an original equipment manufacturer of audio products based in Hong Kong for three years. Prior to that, he had served as the development manager of the audio and video R&D division of Samsung Electronics for 12 years. Mr. Kang received a bachelor’s degree in electronics from Kyungpook National University of Korea.
Li Yang has served as our vice president in charge of our research and development division since August 2003. Before joining us in August 2003, Mr. Yang served as the chief engineer of Star Telecommunication (Shenzhen) Co., Ltd., a PRC technology company, for five years. Mr. Yang received a bachelor’s degree in communication engineering from Nanjing Communication Engineering Institute in China and a master’s degree in signal electrics system computer aid design from Tianjin University.
Billy Yeung joined us in 1996 and has served as our vice president in charge of our sales and marketing division since 2000. Mr. Yeung has over 23 years of experience working with IT products’ and components’ manufacturing or trading companies. Before joining us, Mr. Yeung worked as a global sales manager for Yee Shing Electronic Company Ltd. in Hong Kong from 1992 to 1996. Mr. Yeung also worked as a global sales manager for Man Tat Computer Company in Hong Kong from 1986 to 1992.
Richard Burns has served as our managing director of sales since May 2004 and focuses on U.S. sales of our portable players. Prior to joining us, Mr. Burns served as a vice president of sales with Digital Networks North America from January 2003 to May 2004, Vialta, Inc. from April 2002 to January 2003, Sonicblue, Inc. in 2001 and 3DFX Interactive, Inc. from 1998 to 2001. Mr. Burns received a degree in business management at Middlesex College.
Maria Janiszewska has served as our managing director of sales since 1998 and focuses on European sales of our portable players. Prior to joining us, Ms. Janiszewska worked as a sales manager at Chicony Electronics GmbH in Hamburg, Germany from 1990 to 1998. Ms. Janiszewska received a bachelor’s degree from Zeromski College of Business in 1978.
- 48 -
| B. | Compensation of Directors and Executive Officers |
Compensation of Directors and Executive Officers
In 2005, the aggregate cash compensation that we paid to our executive officers was approximately $1.1 million. We operate a Mandatory Provident Fund, or MPF, scheme for all qualifying employees in Hong Kong. The MPF is a defined contribution scheme and the assets of the MPF scheme are managed by independent trustees. We contribute the statutory minimum of HK$1,000 (approximately $130) per month for each of our executive officers. In addition, according to the relevant laws and regulations in the PRC, we are required to contribute 8% to 9% of the stipulated salaries set by the local government of Shenzhen, China, to the retirement benefit schemes to fund the retirement benefits of our employees in China. We contributed $7,000, $7,000 and $8,000 on behalf of our executive officers to the staff retirement plans in Hong Kong and China in 2003, 2004 and 2005, respectively. We did not pay any compensation to our directors in 2005 in connection with their director services, other than reimbursement of expenses.
2005 Share Incentive Plan
Our board of directors and our shareholders have recently adopted a 2005 Share Incentive Plan, or the 2005 plan. We have reserved for issuance up to 99,043,396 ordinary shares upon exercise of awards granted under our 2005 plan. As of December 31, 2005, no awards had been granted under the 2005 plan.
Types of Awards. We may grant the following types of awards under our 2005 plan:
| | • | | options to purchase our ordinary shares; |
| | • | | restricted shares, which are non-transferable ordinary shares, subject to forfeiture upon termination of a grantee’s employment or service; and |
| | • | | restricted share units, which represent the right to receive our ordinary shares at a specified date in the future, subject to forfeiture upon termination of a grantee’s employment or service. |
Awards may be designated in the form of ADSs instead of ordinary shares. If we designate an award in the form of ADSs, the number of shares issuable under the 2005 plan will be adjusted to reflect that one ADS represents 25 ordinary shares.
Plan Administration. Our board of directors, or a committee designated by our board or directors, will administer the 2005 plan. However, with respect to awards made to our non-employee directors and executive officers, the entire board of directors will administer the 2005 plan. The committee or the full board of directors, as appropriate, will determine the provisions and terms and conditions of each award grant.
Award Agreement. Awards granted under our 2005 plan are evidenced by an award agreement that sets forth the terms, conditions and limitations for each award. In addition, the award agreement also specifies whether the option constitutes an incentive share option, or ISO, or a non-qualifying stock option.
Eligibility. We may grant awards to employees, directors and consultants of our company or any of our related entities, which include our subsidiaries or any entities in which we hold a substantial ownership interest. However, we may grant options that are intended to qualify as ISOs only to our employees. Pursuant to their employment agreements with us, Victor Chan, Yu Xiao Dong and Diana Chan are entitled to receive awards in an amount equal to 30%, 10% and 10%, respectively, of the total shares granted by our board of directors under the 2005 plan.
- 49 -
Acceleration of Awards upon Corporate Transactions. The outstanding awards will accelerate upon occurrence of a change-of-control corporate transaction where the successor entity does not assume our outstanding awards under the 2005 plan. In such event, each outstanding award will become fully vested and immediately exercisable, and the transfer restrictions on the awards will be released and the repurchase or forfeiture rights will terminate immediately before the date of the change-of-control transaction.
Exercise Price and Term of Awards. In general, the plan administrator determines the exercise price of an option and sets forth the price in the award agreement. The exercise price may be a fixed or variable price related to the fair market value of our ordinary shares. If we grant an ISO to an employee, who, at the time of that grant, owns shares representing more than 10% of the voting power of all classes of our share capital, the exercise price cannot be less than 110% of the fair market value of our ordinary shares on the date of that grant.
The term of each award shall be stated in the award agreement. The term of an award shall not exceed 10 years from the date of the grant.
Vesting Schedule. In general, the plan administrator determines, or the award agreement specifies, the vesting schedule.
Amendment and Termination. Our board of directors may at any time amend, suspend or terminate the 2005 plan. Amendments to the 2005 plan are subject to shareholder approval to the extent required by law, or stock exchange rules or regulations. Additionally, shareholder approval will be specifically required to increase the number of shares available for issuance under the 2005 plan, to grant options with an exercise price that is below the fair market value on the date of grant, to extend the term of an option beyond ten years or that results in a material increase in benefits or a change in eligibility requirements. Unless terminated earlier, the 2005 plan will expire and no further awards may be granted after the tenth anniversary of the shareholder approval of the 2005 plan.
Board of Directors
Our board of directors consists of eight directors. A director is not required to hold any shares in the company. Currently, a director may not vote with respect to any contract, proposed contract or arrangement in which he has a material interest. We have established an audit committee of the board of directors and adopted a charter for the audit committee to comply with the U.S. Sarbanes-Oxley Act of 2002.
Audit Committee. Our audit committee currently has one member, Mr. H. Raymond Bingham. Mr. Bingham meets the “independence” requirements of Rule 10A-3 under the Securities Exchange Act of 1934, as amended. The audit committee oversees our accounting and financial reporting processes and the audits of the financial statements of our company. The audit committee reports regularly to the full board of directors and will be responsible for, among other things:
| | • | | selecting the independent auditors and pre-approving all auditing and non-auditing services to be performed by the independent auditors; |
- 50 -
| | • | | reviewing and approving all proposed related-party transactions; |
| | • | | discussing the annual audited financial statements with management and the independent auditors; |
| | • | | annually reviewing and reassessing the adequacy of our audit committee charter; |
| | • | | meeting separately and periodically with management and the independent auditors; and |
| | • | | such other matters that are specifically delegated to our audit committee by our board of directors from time to time. |
Duties of Directors
Under the common law of Bermuda, our directors owe two types of duties to our company — a fiduciary duty and a duty of skill and care.
A director’s fiduciary duty requires that he must act in good faith in his dealings with or on behalf of our company and exercise the powers and fulfill the duties of the office honestly. This duty has four aspects:
| | • | | A duty to act in good faith in what he considers is the best interest of our company and not for any collateral purpose; |
| | • | | A duty to exercise his director’s powers for a proper purpose and for the purposes for which they were intended and not in such a way as to prevent a majority of the members from exercising their rights; |
| | • | | A duty to avoid conflicts of interest; and |
| | • | | A duty not to personally profit from opportunities that arise from his directorship, even if the director is acting honestly and for the good of our company. |
A director’s duty of skill and care requires that he exercise whatever skill he possesses with reasonable care. This duty has three aspects:
| | • | | A degree of skill that may reasonably be expected from a person of like knowledge and experience — this includes a duty to acquire and maintain a sufficient knowledge and understanding of our company’s business to enable them to properly discharge their duties as directors; |
| | • | | Diligent attention to the business and the affairs of our company using the reasonable care an ordinary person may be expected to take in the same circumstances on his own behalf; and |
| | • | | Reliance on others and a duty of supervision of those on whom he relies. |
In general, the Companies Act 1981 imposes various duties and responsibilities on directors with regard to the operation of a company. These include the keeping of minutes of meetings, keeping of books of accounts, making certain information available to certain persons and such other general duties as are required under the Companies Act. In addition to the above, the Companies Act also imposes various duties on officers of a company with respect to certain matters of management and administration of the company. The Companies Act contains provisions that impose default fines on persons who fail to satisfy those requirements. However, in many circumstances, an individual shall only be liable if he is knowingly guilty of the default or knowingly and willfully authorizes or permits the default. Our bye-laws, however, provide that our shareholders waive all claims or rights of action that they may have, individually or in our right, against any of our directors or officers for any act or failure to act in the performance of such director’s or officer’s duties, except in respect of any fraud or dishonesty on the part of such director or officer.
- 51 -
Terms of Directors and Executive Officers
All directors hold office until their successors have been duly elected and qualified. A director may only be removed by the shareholders in a general meeting pursuant to our bye-laws. Officers are elected by, and serve at the discretion of, the board of directors.
Employment Agreements
We have entered into an employment agreement with each of our senior executive officers, Victor Chan, Yu Xiao Dong and Diana Chan. Under these agreements, each of our senior executive officers is employed for a specified time period. We may terminate the employment for cause, at any time, without notice or remuneration, for certain acts of the employee, including without limitation a conviction of, or plea of guilty to, a felony, negligence or dishonesty to our detriment and failure to perform any agreed-upon duties after giving a reasonable opportunity to cure the failure. Furthermore, either party may terminate the employment at any time without cause upon advance written notice to the other party. If we terminate the senior executive officer’s employment without cause, the senior executive officer will be entitled to continue to receive payments of his or her base salary for six months following the termination.
Each senior executive officer has agreed to hold in strict confidence and not to use, except as required in the performance of his duties in connection with his employment with us, any of our confidential information, technical data, trade secrets and know-how or the confidential information of any third party, including our affiliated entities and our subsidiaries, received by us, both during and after the employment agreement expires or is earlier terminated. The senior executive officers have also agreed to disclose in confidence to us all inventions, designs and trade secrets that they conceive, develop or reduce to practice and to assign all right, title and interest in them to us. In addition, each senior executive officer has agreed to be bound by non-competition restrictions set forth in his or her employment agreement. In particular, each senior executive officer has agreed not to, while employed by us and for a period of two years after termination of his or her employment:
| | • | | solicit business from or perform services for any person who is a client, customer, supplier or a prospective client or customer of ours during the executive officer’s employment; |
| | • | | solicit or induce any person to terminate his or her employment or consulting relationship with us; or |
| | • | | engage, invest or assist in any business that competes with our business or future business. |
- 52 -
Employees
As of December 31, 2005, we had approximately 1,642 employees, including 1,329 in manufacturing at our Shenzhen manufacturing facilities, 124 in research and development, 39 in sales and marketing and 150 in management, administration and other functions. We consider our relations with our employees to be good.
The following table sets forth information with respect to the beneficial ownership of our ordinary shares, on a fully diluted basis assuming conversion of all of our Series A Preferred Shares as of December 31, 2005, by:
| | (1) | each of our directors and executive officers; and |
| | (2) | our principal shareholders. |
| | | | |
| | | Ordinary Shares Beneficially Owned(1) |
| | | Number | | %(2) |
Directors and Executive Officers: | | | | |
Victor Chan(3) | | 552,486,387 | | 61.9 |
Yu Xiao Dong(4) | | 526,525,387 | | 59.0 |
Vince Feng(5) | | 142,536,093 | | 16.0 |
Philip Trahanas(6) | | 142,536,093 | | 16.0 |
Sin Just Wong(7) | | 44,284,433 | | 5.0 |
H. Raymond Bingham(8) | | 1,000,000 | | 0.1 |
All Directors and Executive Officers as a Group(9) | | 757,614,247 | | 84.9 |
| | |
Principal Shareholders: | | | | |
Shou Cheng Chiao(10) | | 525,443,678 | | 58.8 |
Jaw Lung Lee(11) | | 518,953,428 | | 58.1 |
Billion Creation Limited(12) | | 509,218,053 | | 57.0 |
Investment entities affiliated with General Atlantic LLC(13) | | 142,536,093 | | 16.0 |
Allied Knight Finance Limited(14) | | 44,284,433 | | 5.0 |
Brilliant Elite Limited(15) | | 44,284,433 | | 5.0 |
Lucktime Management Limited(16) | | 44,284,433 | | 5.0 |
Seamless China Profits Limited(17) | | 15,986,084 | | 1.8 |
| (1) | Beneficial ownership is determined in accordance with the rules of the Securities and Exchange Commission, or the SEC, and includes voting or investment power with respect to the securities. |
| (2) | The number of ordinary shares outstanding in calculating the percentages for each listed person includes the ordinary shares underlying options held by such person, if any. Percentage of beneficial ownership is based on 892,436,093 shares outstanding as of December 31, 2005, including 142,536,093 ordinary shares issuable upon conversion of our Series A Preferred Shares. |
| (3) | Includes 43,268,334 ordinary shares held by Mr. Chan and 509,218,053 ordinary shares held by Billion Creation Limited, in which Mr. Chan holds 50% of the beneficial interest. Mr. Chan beneficially owns his 50% interest in Billion Creation Limited through a revocable trust in which he retains voting and dispositive power over such shares and for which Merrill Lynch Bank and Trust Company (Cayman) Limited is acting as trustee. Mr. Chan disclaims beneficial ownership of the ordinary shares owned by Billion Creation Limited to the extent attributable to beneficial interests held therein by persons other than Mr. Chan. The business address for Mr. Victor Chan is 10/F, A-MAX Technology Tower, 12-16 Fui Yiu Kok Street, Tsuen Wan, New Territories, Hong Kong. |
| (4) | Includes 17,307,334 ordinary shares held by Mr. Dong and 509,218,053 ordinary shares held by Billion Creation Limited, in which Mr. Dong holds 20% of the beneficial interest. Mr. Dong beneficially owns his 20% interest in Billion Creation Limited through a revocable trust in which he retains voting and dispositive power over such shares and for which Merrill Lynch Bank and Trust Company (Cayman) Limited is acting as trustee. Mr. Dong disclaims beneficial ownership of the ordinary shares owned by Billion Creation Limited to the extent attributable to beneficial interests held therein by persons other than Mr. Dong. The business address for Mr. Yu Xiao Dong is 10/F, A-MAX Technology Tower, 12-16 Fui Yiu Kok Street, Tsuen Wan, New Territories, Hong Kong. |
- 53 -
| (5) | Includes 142,536,093 ordinary shares issuable upon conversion of 141,490,566 Series A Preferred Shares held by investment entities affiliated with General Atlantic LLC, as described at note (13). Mr. Feng is a Managing Director of General Atlantic LLC. Mr. Feng disclaims beneficial ownership of all the shares of our company held by the investment entities affiliated with General Atlantic LLC except to the extent of his pecuniary interest therein. The business address for Mr. Feng is c/o General Atlantic Service Corporation, 18/F, One International Finance Centre, 1 Harbour View Street, Central, Hong Kong. |
| (6) | Includes 142,536,093 ordinary shares issuable upon conversion of 141,490,566 Series A Preferred Shares held by investment entities affiliated with General Atlantic LLC, as described at note (13). Mr. Trahanas is a Managing Director of General Atlantic LLC. Mr. Trahanas disclaims beneficial ownership of all the shares of our company held by the investment entities affiliated with General Atlantic LLC except to the extent of his pecuniary interest therein. The business address for Mr. Trahanas is c/o General Atlantic Service Corporation, 3 Pickwick Plaza, Greenwich, Connecticut 06380. |
| (7) | Consists of 44,284,433 shares held by Allied Knight Finance Limited, a company incorporated in the British Virgin Islands that is 100% owned by Dato Sin Just Wong. The business address for Dato Wong is 10/F, A-Max Technology Tower, 12-16 Fui Yiu Kok Street, Tsuen Wan, New Territories, Hong Kong. |
| (8) | The business address for Mr. H. Raymond Bingham is 3000 Sand Hill Road, Bldg 3 Suite 210, Menlo Park, CA 94025, USA. |
| (9) | Shares owned by all of our directors and executive officers as a group include shares beneficially owned by Mr. Victor Chan, Mr. Yu Xiao Dong, Mr. Sin Just Wong, Mr. H. Raymond Bingham, Mr. Vince Feng and Mr. Philip Trahanas. See notes 4—8. |
| (10) | Includes 16,225,625 ordinary shares held by Mr. Chiao and 509,218,053 ordinary shares held by Billion Creation Limited, in which Mr. Chiao holds 18.75% of the beneficial interest. Mr. Chiao beneficially owns his 18.75% interest in Billion Creation Limited through a revocable trust in which he retains voting and dispositive power over such shares and for which Merrill Lynch Bank and Trust Company (Cayman) Limited is acting as trustee. Mr. Chiao disclaims beneficial ownership of the ordinary shares owned by Billion Creation Limited to the extent attributable to beneficial interests held therein by persons other than Mr. Chiao. The address for Mr. Chiao is No. 288, Beixing Street, North District, Tai Chung City 404, Taiwan, R.O.C. |
| (11) | Includes 9,735,375 ordinary shares held by Mr. Lee and 509,218,053 ordinary shares held by Billion Creation Limited, in which Mr. Lee holds 11.25% of the beneficial interest. Mr. Lee beneficially owns his 11.25% interest in Billion Creation Limited through a revocable trust in which he retains voting and dispositive power over such shares and for which Merrill Lynch Bank and Trust Company (Cayman) Limited is acting as trustee. Mr. Lee disclaims beneficial ownership of the ordinary shares owned by Billion Creation Limited to the extent attributable to beneficial interests held therein by persons other than Mr. Lee. The address for Mr. Lee is 6F, No. 72, Alley 49, Lane 113, Dong Hu Road, Neihu District, Taipei, Taiwan, R.O.C. |
| (12) | Billion Creation Limited, a company incorporated in the British Virgin Islands, is owned 50% by Mr. Victor Chan, 20% by Mr. Yu Xiao Dong, 18.75% by Mr. Shou Cheng Chiao and 11.25% by Mr. Jaw Lung Lee. The business address for Billion Creation Limited is Sea Meadow House, Blackburne Highway, Road Town, Tortola, British Virgin Islands. Each of Messrs. Chan, Dong, Chiao and Lee beneficially owns his shares in Billion Creation Limited through a revocable trust in which he retains voting and dispositive power over such shares and for which Merrill Lynch Bank and Trust Company (Cayman) Limited is acting as trustee. |
| (13) | Includes 142,536,093 ordinary shares issuable upon conversion of 99,292,140 Series A Preferred Shares held by General Atlantic Partners (Bermuda), L.P. (“GAP Bermuda”), 30,526,751 Series A Preferred Shares held by GAP-W International, LLC (“GAP-W International”), 7,668,376 Series A Preferred Shares held by GAP Coinvestments III, LLC (“GAPCO III”), 2,013,588 Series A Preferred Shares held by GAP Coinvestments IV, LLC (“GAPCO IV”), 1,768,632 Series A Preferred Shares held by GapStar, LLC (“GapStar”) and 221,079 Series A Preferred Shares held by GAPCO GmbH & Co. KG (“GAPCO KG”). GAP-W International proposes to transfer all of our Series A Preferred Shares held by it to GAP-W International, L.P. The general partner of GAP-W International, L.P. is GAP (Bermuda) Limited (“GAP Bermuda GenPar”), which is also the general partner of GAP Bermuda, one of our shareholders. GAP Bermuda GenPar is the general partner of GAP Bermuda. General Atlantic LLC (“GA LLC”) is the sole member of GapStar. GAPCO Management GmbH (“GAPCO Management”) is the general partner of GAPCO KG. The Managing Directors of GA LLC are Steven A. Denning (Chairman), William E. Ford (President), Peter L. Bloom, Mark F. Dzialga, Klaus Esser, Vince Feng, William O. Grabe, Abhay Havaldar, David C. Hodgson, Braden R. Kelly, Rene M. Kern, Marc F. McMorris, Matthew Nimetz, Franchon M. Smithson, Tom C. Tinsley, Philip P. Trahanas and Florian P. Wendelstadt (collectively, the “Managing Directors”). The Managing Directors of GA LLC are also the senior executive officers and directors of GAP Bermuda GenPar. The Managing Members of GAPCO III and GAPCO IV are Managing Directors of GA LLC. The Managing Directors of GA LLC are also the senior executive officers of GAP-W International. The Managing Directors of GA LLC have management and control over all of the General Atlantic entities and make all voting and investment decisions with respect to shares held by GAP Bermuda, GAP-W International , GAPCO III, GAPCO IV, GapStar and GAPCO KG. The address for the General Atlantic entities (other than GAP Bermuda, GAP Bermuda GenPar, GAPCO KG and GAPCO Management) is c/o General Atlantic Service Corporation, 3 Pickwick Plaza, Greenwich, Connecticut 06830. The address of GAP Bermuda and GAP Bermuda GenPar is Clarendon House, Church Street, Hamilton, Bermuda. The address of GAPCO KG and GAPCO Management is c/o General Atlantic GmbH, is Koenigsallee 62, 40212 Duesseldorf, Germany. |
| (14) | Allied Knight Finance Limited, a company incorporated in the British Virgin Islands, is wholly-owned by Mr. Sin Just Wong. The address for Allied Knight Finance Limited is Rooms 4301-4309, 43/F, Jardine House, One Connaught Place, Central, Hong Kong. |
| (15) | Brilliant Elite Limited, a company incorporated in the British Virgin Islands, is wholly-owned by Lawrence Yu. The address for Brilliant Elite Limited is PO Box 957, Offshore Incorporations Centre, Road Town, Tortola, British Virgin Islands. |
- 54 -
| (16) | Lucktime Management Limited, a company incorporated in the British Virgin Islands, is wholly-owned by K.P. Fung. The address for Lucktime Management Limited is Rooms 4301-4309, 43/F, Jardine House, One Connaught Place, Central, Hong Kong. |
| (17) | Seamless China Profits Limited, a company incorporated in the British Virgin Islands, is wholly-owned by Mr. Stephen Chen. The address for Seamless China Profits Limited is P.O. Box 957, Offshore Incorporations Centre, Road Town, Tortola, British Virgin Islands. |
As of December 31, 2005, 0.6% of our outstanding ordinary shares are held by three record holders in the United States, and 29.7% of our outstanding Series A Preferred Shares are held by four record holders in the United States. General Atlantic, which holds our Series A Preferred Shares, has represented to us that it is affiliated with a registered broker-dealer. Based on its representation, we believe that at the time of the purchase of our Series A Preferred Shares, General Atlantic purchased our Series A Preferred Shares in the ordinary course of business, and had no agreements or understandings, directly or indirectly, with any person to distribute the shares. None of our shareholders, including General Atlantic, is in the business of underwriting securities.
All of our existing shareholders will have the same voting rights. We are not aware of any arrangement that may, at a subsequent date, result in a change of control of our company.
ITEM 7 MAJOR SHAREHOLDERS AND RELATED PARTY TRANSACTIONS
Major Shareholders
Please refer to “Item 6. Directors, Senior Management and Employees — E. Share Ownership.”
Related Party Transactions
Private Placements
On March 25, 2004, we issued a total of 600 million ordinary shares to the former record owners of Techniques International, Victor Chan, Nam Kang Cheung, Hsien-Ping Liu and Jaw-Lung Lee, in exchange for all the shares that these shareholders previously held in Techniques International pro rata, based on their ownership interests in Techniques International.
On April 2, 2004, we issued 149.9 million preference shares to SIIS Multimedia (No. 1) Limited for an aggregate purchase price of $1.4 million. The preference shares were entitled to a cumulative dividend of 5% and were convertible into our ordinary shares on a 1-to-1 basis. These preference shares were later transferred to four shareholders, who then converted them into ordinary shares on November 30, 2004.
In June 2005, we issued an aggregate of 141,490,566 Series A Preferred Shares to investment entities affiliated with General Atlantic in a private placement at a price per share equal to approximately $0.42 for an aggregate purchase price of $60.0 million. The price per Series A Preferred Share was determined through our arms-length negotiation with General Atlantic, and we did not engage a financial advisor to assist us in valuing those shares. As part of the private placement, we entered into a registration rights agreement with General Atlantic and we and all of our shareholders entered into a shareholders agreement, as described below. Each of the holders of Series A Preferred Shares is entitled to vote on an “as converted” basis together with the holders of our ordinary shares. The holders of Series A Preferred Shares are entitled to receive dividends at an annual rate of 3%, which will accrue on a daily basis from the date of issuance, whether or not declared. Accrued and unpaid dividends will not be paid in cash, but instead will compound on a quarterly basis and be included in the calculation of the conversion ratio when Series A Preferred Shares convert into ordinary shares. The Series A Preferred Shares will automatically convert into ordinary shares based upon the then-applicable conversion ratio.
- 55 -
Registration Rights Agreement
In connection with our private placement of Series A Preferred Shares to General Atlantic in June 2005, we entered into a registration rights agreement with General Atlantic, pursuant to which we granted General Atlantic customary registration rights, including two demand registration rights and piggyback registration rights, and Form F-3 registration rights.
Shareholders Agreement
In connection with our private placement of Series A Preferred Shares to General Atlantic in June 2005, we and all of our shareholders entered into a shareholders agreement that provides that our board of directors will consist of seven directors, including our Chief Executive Officer and two individuals designated by the holders of the Series A Preferred Shares, provided at least one such designee shall be designated by General Atlantic so long as General Atlantic maintains a certain level of aggregate ownership of the Series A Preferred Shares and/or ordinary shares. We and certain of our shareholders each have certain rights of first refusal and tag-along rights with respect to any proposed share transfers by any of our shareholders. In addition, certain of our shareholders have preemptive rights with respect to any issuance of equity securities by us. Under this agreement, we are required to obtain the consent of General Atlantic by virtue of its ownership of a majority of the Series A Preferred Shares to take certain actions, including, for example, the creation or issuance of any securities senior to or pari passu with our Series A Preferred Shares, any action that may harm or adversely affect the interests of holders of our Series A Preferred Shares, any declaration, distribution or payment of dividends, capital expenditures in excess of $0.5 million and any change in the size of our board of directors.
Transactions with Certain Directors and Officers
We have entered into the following transactions with certain directors and officers.
On January 21, 2003, A-Max (HK) and Botany Investment Limited entered into a share transfer agreement in connection with the sale of A-Max (Zhaoqing) to Botany Investment. On the same day, at the request of Botany Investment, A-Max (HK), Botany Investment, Mr. Victor Chan, our chairman and chief executive officer, and Mr. Yu Xiao Dong, our director and chief operating officer, entered into a supplementary and guaranty agreement whereby Mr. Chan and Mr. Dong agreed, jointly and severally, to guarantee the accuracy of the representations and warranties and the performance of the obligations of A-Max (HK) to Botany Investment under the share transfer agreement. Mr. Chan and Mr. Dong did not receive any consideration from us in connection with the provision of these guarantees. The supplementary and guaranty agreement expired in 2005.
Mr. Chan and Mr. Dong have also guaranteed monthly payments pursuant to several leases that we have entered into for an automobile and certain manufacturing equipment. The aggregate remaining lease payments, under the equipment leases, total approximately $0.4 million.
- 56 -
Mr. Victor Chan made loans in an aggregate amount of $6.2 million to A-Max (HK) in the past to fund our working capital, the last of which was in 2001. The loans were non-interest bearing and payable on demand. The remaining outstanding balance was paid in full in June 2005.
Mr. Yu Xiao Dong made loans in an aggregate amount of $1.2 million to A-Max (HK) in the past to fund our working capital, the last of which was in 2003. The loans were non-interest bearing and payable on demand. The remaining outstanding balance was paid in full in January 2005.
Mr. Sin Just Wong, one of our directors, is also a director of SBI Crosby Limited. In November 2004, A-Max (HK) entered into an agreement with Crosby Capital Partners (Hong Kong) Limited and its affiliate, SBI Crosby Limited (collectively “Crosby”), pursuant to which Crosby provided certain financial advisory services to us in connection with the private placement of our Series A Preferred Shares. Such financial advisory services mainly related to assisting us in the preparation of certain marketing materials and identifying prospective investors, but did not include valuing the price of the Series A Preferred Shares. Under the terms of the agreement, A-Max (HK) agreed to pay Crosby an aggregate financial advisory fee of $40,000 and a success-based commission. The success-based commission for the private placement of our Series A Preferred Shares is approximately $0.5 million. The agreement terminated upon the completion of our sale of Series A Preferred Shares on June 17, 2005. As of December 31, 2005, A-Max (HK) had paid $525,000 to Crosby.
Transactions with E2-Capital (Holdings) Limited
Mr. Sin Just Wong, one of our directors and a beneficial owner of our company (before giving effect to our issuance of Series A Preferred Shares), is a director and shareholder of E2-Capital. Mr. K.B. Fung, a beneficial owner of our company (before giving effect to our issuance of Series A Preferred Shares), is also a director and shareholder of E2-Capital.
In 2004 and 2005, E2-Capital provided corporate guarantees in favor of certain commercial banks to secure banking facilities provided by those banks to A-Max (HK). The following table sets forth the amounts of the guarantees and the principal amounts of the underlying banking facilities.
| | | | | | |
Date of Guarantee | | Amount of Guarantee | | Bank | | Amount of Bank Facilities |
| | | |
August 2004 | | $4.2 million | | The Hongkong and Shanghai Banking Corporation Limited, or HSBC | | $6.0 million |
January 2005 | | $5.3 million | | Hang Seng Bank Limited | | $6.6 million |
January 2005 | | $2.5 million | | HSBC | | $5.0 million |
January 2005 | | $2.1 million | | DBS Bank (Hong Kong) Limited | | $1.7 million |
January 2005 | | $1.8 million | | HSBC | | $6.0 million |
As consideration for the August 31, 2004 guarantee, A-Max (HK) paid E2-Capital HK$660,000 ($84,917). As consideration for the remainder of the guarantees, A-Max (HK) agreed to pay a fee of 2% per annum to E2-Capital based on the monthly utilization of the banking facilities covered by those guarantees. As of December 31, 2005, we had incurred a total of $0.1 million in fees to E2-Capital based on the monthly utilization of the banking facilities covered by the guarantees. In addition, our directors Victor Chan and Yu Xiao Dong, pledged all of their shares that they beneficially own in our company to E2-Capital as security. All of these guarantees and the pledge of shares in connection therewith were released and terminated by the banks and E2-Capital in June 2005 prior to the consummation of the sale of our Series A Preferred Shares to General Atlantic in June 2005.
- 57 -
We entered into a lease agreement, dated October 15, 2004, with Lucky Happy Development Limited, an indirect wholly-owned subsidiary of E2-Capital, for the lease of our premises in Hong Kong. Our lease expires in October 2007. Our monthly rent under this lease agreement is approximately HK$36,000 ($4,615). Lucky Happy Development Limited transferred its ownership interest in our premises to a third party unaffiliated with E2-Capital by the end of June 2005.
NAPA Global Limited, a subsidiary of E2-Capital, is one of our customers. In 2004 and 2005, our net sales to NAPA Global Limited were $0.4 million and $0.1 million, respectively. We enter into these transactions with NAPA Global Limited at prevailing market rates.
Share Incentives
See “Item 6. Directors, Senior Management and Employees – B. Compensation of Directors and Executive Officers — 2005 Share Incentive Plan.”
Equity Incentive Plan
See “Item 6. Directors, Senior Management and Employees — B. Compensation of Directors and Executive Officers—2005 Share Incentive Plan.”
Interests of Experts and Counsel
Not applicable.
ITEM 8 FINANCIAL INFORMATION
| A. | Consolidated Statements and Other Financial Information |
We have appended consolidated financial statements filed as part of this annual report.
Legal and Administrative Proceedings
On March 15, 2005, Sonicblue, Inc., one of our former customers, and its affiliates, brought an action against us in the United States Bankruptcy Court for the Northern District of California, for (1) the avoidance of allegedly preferential payments totaling approximately $2.1 million based on payments we received from Sonicblue within 90 days of their filing of bankruptcy and (2) the disallowance of proofs of claim for approximately $2.8 million that we filed against Sonicblue in its underlying petition for Chapter 11 bankruptcy relief. On March 17, 2006, we entered into an amended and restated settlement and release with Sonicblue, Inc., and its debtors, pursuant to which the maximum settlement amount we would pay would be approximately $262,000. As of the date hereof, we have fully reserved that amount in our consolidated balance sheet.
- 58 -
From time to time, we are involved in litigation or other legal proceedings incidental to our business. However, we do not believe that our business or operations would be materially and adversely affected by any pending litigation or legal proceeding involving us.
Dividend Policy
We do not have any present plan to pay any cash dividends on our ordinary shares in the foreseeable future. We currently intend to retain most, if not all, of our available funds and any future earnings for use in the operation and expansion of our business.
Our board of directors has complete discretion as to whether we will distribute dividends in the future, subject to the approval of our shareholders and the laws of Bermuda. Even if our board of directors determines to distribute dividends, the form, frequency and amount of our dividends will depend upon our future operations and earnings, capital requirements and surplus, general financial condition, contractual restrictions and other factors as the board of directors may deem relevant. Any dividend we declare will be paid to the holders of ADSs, subject to the terms of the deposit agreement, to the same extent as holders of our ordinary shares, less the fees and expenses payable under the deposit agreement. Any dividend we declare will be distributed by the depositary to the holders of our ADSs. Cash dividends on our ordinary shares, if any, will be paid in U.S. dollars
We have not experienced any significant changes since the date of our audited consolidated financial statements included in this annual report.
ITEM 9 THE OFFER AND LISTING
| A. | Offering and Listing Details |
Not applicable.
Not applicable.
Currently, no public market exists for our shares or ADSs.
Not applicable.
Not applicable.
Not applicable.
- 59 -
ITEM 10 ADDITIONAL INFORMATION
Not applicable.
| B. | Memorandum and Articles of Association |
We incorporate by reference into this annual report the description of our memorandum of association contained in our F-1 registration statement (File No. 333-128297), as amended, initially filed with the Commission on September 13, 2005.
We have not entered into any material contracts other than in the ordinary course of business and other than those described in “Item 4. Information on the Company” and “Item 7. Major Shareholders and Related Party Transactions – Related Party Transactions” or elsewhere in this annual report on Form 20-F.
Foreign Currency Exchange
See “Item 4. Information on the Company – Regulations – Foreign Exchange Controls.”
Currently, no public market exists for our shares or ADSs. Accordingly, this section is not applicable to us.
| F. | Dividends and Paying Agents |
Not applicable.
Not applicable.
We have previously filed with the Commission our registration statement on Form F-1, as amended.
We are subject to the periodic reporting and other informational requirements of the Securities Exchange Act of 1934, as amended, or the Exchange Act. Under the Exchange Act, we are required to file reports and other information with the Securities and Exchange Commission. Specifically, we are required to file annually a Form 20-F no later than six months after the close of each fiscal year, which is December 31. Copies of reports and other information, when so filed, may be inspected without charge and may be obtained at prescribed rates at the public reference facilities maintained by the Securities and Exchange Commission at 100 F. Street, N.E., Washington, D.C. 20549, and at the regional office of the Securities and Exchange Commission located at Citicorp Center, 500 West Madison Street, Suite 1400, Chicago, Illinois 60661. The public may obtain information regarding the Washington, D.C. Public Reference Room by calling the Commission at 1-800-SEC-0330. The SEC also maintains a Web site atwww.sec.gov that contains reports, proxy and information statements, and other information regarding registrants that make electronic filings with the SEC using its EDGAR system. As a foreign private issuer, we are exempt from the rules under the Exchange Act prescribing the furnishing and content of quarterly reports and proxy statements, and officers, directors and principal shareholders are exempt from the reporting and short-swing profit recovery provisions contained in Section 16 of the Exchange Act.
- 60 -
Our financial statements have been prepared in accordance with U.S. GAAP.
For a listing of our subsidiaries, see Item 4. C. of this annual report, “Information on the Company – Organizational Structure.”
ITEM 11 QUANTITATIVE AND QUALITATIVE DISCLOSURES ABOUT MARKET RISK
Foreign Exchange Risk
Substantially all of our net sales and all of our direct materials costs, which comprise the majority of our cost of sales, are denominated in U.S. dollars. Our manufacturing facilities are located in the PRC and accordingly our manufacturing overhead is denominated in RMB. The majority of our operating expenses are denominated in H.K. dollars and to a lesser extent, in Euro and RMB. Although we believe that, in general, our exposure to foreign exchange risks is limited, fluctuations in exchange rates between the U.S. dollar and the RMB and H.K. dollar may affect our cost of sales and general and administrative expenses. On July 21, 2005, the PRC government changed its policy of pegging the value of the RMB to the U.S. dollar. Under the new policy, the RMB will be permitted to fluctuate within a band against a basket of certain foreign currencies. This change in policy resulted initially in an approximately 2.5% appreciation in the value of the RMB against the U.S. dollar by the end of 2005. There remains significant international pressure on the PRC government to adopt a substantial liberalization of its currency policy, which could result in a further and more significant appreciation in the value of the RMB against the U.S. dollar. We have not experienced significant foreign exchange gains or losses to date. Further, we have not engaged in any hedging activities to reduce our exposure to exchange rate fluctuations.
Interest Rate Risk
Our risk exposure from changes in interest rates relates primarily to fluctuations in interest expense on our short-term working capital borrowings. As of December 31, 2005, we had short-term bank facilities of $64.4 million, of which $37.5 million was unused. The interest rates are generally based on HIBOR or SIBOR plus 0.75% to 1.50% per annum. A 1% increase in the interest rates for our short-term bank facilities would have added approximately $0.3 million to our interest expense in 2005. We do not seek to hedge the risks of changes in short-term interest rates and may be exposed to material risks due to changes in interest rates.
ITEM 12 DESCRIPTION OF SECURITIES OTHER THAN EQUITY SECURITIES
Not applicable.
- 61 -
PART II
ITEM 13 DEFAULTS, DIVIDEND ARREARAGES AND DELINQUENCIES
Not applicable.
ITEM 14 MATERIAL MODIFICATIONS TO THE RIGHTS OF SECURITY HOLDERS AND USE OF PROCEEDS
Not applicable.
ITEM 15 CONTROLS AND PROCEDURES
Evaluation of Disclosure Controls and Procedures
Our Chief Executive Officer and our Chief Financial Officer have performed an evaluation of our disclosure controls and procedures, as that term is defined in Rules 13a-14(c) and 15d-14(c) of the Securities Exchange Act of 1934, as amended (the “Exchange Act”), as of the end of the period covered by this annual report, and each has concluded that such disclosure controls and procedures are effective.
Changes in Internal Controls
There were no adverse changes in our internal controls during 2005 that has materially affected or is reasonably likely to materially affect our internal control over financial reporting.
ITEM 16A. AUDIT COMMITTEE FINANCIAL EXPERT
Our Board of Directors has determined that H. Raymond Bingham qualifies as an “audit committee financial expert” as defined in Item 16A of Form 20-F.
ITEM 16B. CODE OF ETHICS
Our board of directors has adopted a code of ethics that applies to our directors, officers, employees and agents, including certain provisions that specifically apply to our chief executive officer, chief financial officer, chief operating officer, chief technology officer, vice presidents and any other persons who perform similar functions for us. We have filed our code of business conduct and ethics as an exhibit to this annual report on Form 20-F, and posted the code on our websitewww.amaxhk.com. We hereby undertake to provide to any person without charge, a copy of our code of business conduct and ethics within ten working days after we receive such person’s written request.
- 62 -
ITEM 16C. PRINCIPAL ACCOUNTANT FEES AND SERVICES
The following table sets forth the aggregate fees by categories specified below in connection with certain professional services rendered by Deloitte Touche Tohmatsu, our principal external auditors, for the periods indicated.
| | | | | | |
| | | For the Year Ended December 31, |
| | | 2003 | | 2004 | | 2005 |
| | | US$ | | US$ | | US$ |
Audit fees(1) | | 41,000 | | 41,000 | | 250,000 |
Audit-related fees | | 2,000 | | 1,000 | | — |
Tax Fees(2) | | 2,000 | | 2,000 | | 2,000 |
All other fees(3) | | — | | — | | 882,000 |
| (1) | “Audit fees” means the aggregate fees billed for professional services rendered by our principal auditors for the audit of our annual financial statements for each of the three years ended December 31, 2005. |
| (2) | “Tax fees” include fees billed for tax consultations. |
| (3) | “Other fees” means fees billed in respect of our postponed initial public offering in 2005 of $850,000 and other tax consultation services of $32,000. |
The policy of our audit committee is to pre-approve all audit and non-audit services provided by Deloitte Touche Tohmatsu, including audit services, audit-related services, tax services and other services as described above, other than those forde minimus services which are approved by the Audit Committee prior to the completion of the audit.
ITEM 16D. EXEMPTIONS FROM THE LISTING STANDARDS FOR AUDIT COMMITTEES
Not applicable.
ITEM 16E. PURCHASES OF EQUITY SECURITIES BY THE ISSUER AND AFFILIATED PURCHASERS.
None.
PART III
ITEM 17 FINANCIAL STATEMENTS
We have elected to provide financial statements pursuant to Item 18.
ITEM 18 FINANCIAL STATEMENTS
The following financial statements are filed as part of this Annual Report on Form 20-F, together with the report of the independent auditors:
| | • | | Independent Auditors’ Report |
| | • | | Consolidated Balance Sheets as of December 31, 2003, 2004 and 2005 |
| | • | | Consolidated Statements of Operations and Comprehensive Income for the years ended December 31, 2003, 2004 and 2005 |
| | • | | Consolidated Statements of Shareholders’ Equity for the years ended December 31, 2003, 2004 and 2005 |
| | • | | Consolidated Statements of Cash Flows for the years ended December 31, 2003, 2004 and 2005 |
| | • | | Notes to the Consolidated Financial Statements |
- 63 -
ITEM 19 EXHIBITS
| | |
Exhibit Number | | Description of Document |
| |
| 1.1 | | Amended and Restated Bye-laws and Memorandum of Association of A-Max (incorporated by reference to Exhibit 3.2 from our the Registration Statement on Form F-1 Amendment No.3 (File No. 333-128297), filed with the Commission on October 7, 2005). |
| |
| 2.1 | | A-Max’s Specimen American Depositary Receipt (incorporated by reference to Exhibit 4.2 from our the Registration Statement on Form F-1 Amendment No.1 (File No. 333-128297), filed with the Commission on September 23, 2005). |
| |
| 2.2 | | A-Max’s Specimen Certificate for Ordinary Shares (incorporated by reference to Exhibit 4.3 from our the Registration Statement on Form F-1 Amendment No.1 (File No. 333-128297), filed with the Commission on September 23, 2005). |
| |
| 4.1 | | 2005 Share Incentive Plan (incorporated by reference to Exhibit 10.1 from our the Registration Statement on Form F-1 Amendment No.1 (File No. 333-128297), filed with the Commission on September 23, 2005). |
| |
| 4.2 | | Form of Indemnification Agreement with A-Max’s directors (incorporated by reference to Exhibit 10.2 from our the Registration Statement on Form F-1 (File No. 333-128297), filed with the Commission on September 13, 2005). |
| |
| 4.3 | | Employment Agreement date June 17, 2005 between A-Max and Victor Chan (incorporated by reference to Exhibit 10.3 from our the Registration Statement on Form F-1 Amendment No.1 (File No. 333-128297), filed with the Commission on September 23, 2005). |
| |
| 4.4 | | Employment Agreement date June 17, 2005 between A-Max and Diana Chan (incorporated by reference to Exhibit 10.4 from our the Registration Statement on Form F-1 Amendment No.1 (File No. 333-128297), filed with the Commission on September 23, 2005). |
| |
| 4.5 | | Employment Agreement date June 17, 2005 between A-Max and Yu Xiao Dong (incorporated by reference to Exhibit 10.5 from our the Registration Statement on Form F-1 Amendment No.1 (File No. 333-128297), filed with the Commission on September 23, 2005). |
| 4.6 | | Windows Media Format Components Distribution License dated June 1, 2004, between A-Max and Microsoft Licensing, GP (incorporated by reference to Exhibit 10.2 from our the Registration Statement on Form F-1 (File No. 333-128297), filed with the Commission on September 13, 2005). |
| |
| 4.7 | | Lease Agreement dated October 15, 2004 (incorporated by reference to Exhibit 99.1 from our the Registration Statement on Form F-1 (File No. 333-128297), filed with the Commission on September 13, 2005). |
| |
| 4.8 | | Supplemental and Guarantee Agreement dated January 21, 2003 (incorporated by reference to Exhibit 99.3 from our the Registration Statement on Form F-1 (File No. 333-128297), filed with the Commission on September 13, 2005). |
| |
| 4.9 | | Letter Agreement dated November 17, 2004 (incorporated by reference to Exhibit 99.4 from our the Registration Statement on Form F-1 (File No. 333-128297), filed with the Commission on September 13, 2005). |
| |
| 4.10 | | Guarantee Agreement, dated August 321, 2004 (incorporated by reference to Exhibit 99.5 from our the Registration Statement on Form F-1 (File No. 333-128297), filed with the Commission on September 13, 2005). |
| |
| 4.11 | | Agreement between E2-Capital (Holdings) Limited and Hang Seng Bank Limited (incorporated by reference to Exhibit 99.6 from our the Registration Statement on Form F-1 (File No. 333-128297), filed with the Commission on September 13, 2005). |
| |
| 4.12 | | Agreement between E2-Capital (Holdings) Limited and the HSBC Limited (incorporated by reference to Exhibit 99.7 from our the Registration Statement on Form F-1 (File No. 333-128297), filed with the Commission on September 13, 2005). |
| |
| 4.13 | | Agreement between E2-Capital (Holdings) Limited and DBS Bank (Hong Kong) (incorporated by reference to Exhibit 99.8 from our the Registration Statement on Form F-1 (File No. 333-128297), filed with the Commission on September 13, 2005). |
| |
| 4.14 | | Agreement between E2-Capital (Holdings) Limited and The HSBC Limited (incorporated by reference to Exhibit 99.9 from our the Registration Statement on Form F-1 (File No. 333-128297), filed with the Commission on September 13, 2005). |
| |
| 8.1 | | Subsidiaries of A-Max (incorporated by reference to Exhibit 21.1 from our the Registration Statement on Form F-1 (File No. 333-128297), filed with the Commission on September 13, 2005). |
| 11.1 | | Code of Business Conduct and Ethics of A-Max (incorporated by reference to Exhibit 99.2 from our the Registration Statement on Form F-1 (File No. 333-128297), filed with the Commission on September 13, 2005). |
| |
| 12.1* | | CEO Certification Pursuant to Section 302 of the Sarbanes-Oxley Act of 2002 |
| |
| 12.2* | | CFO Certification Pursuant to Section 302 of the Sarbanes-Oxley Act of 2002 |
| |
| 13.1* | | CEO Certification Pursuant to Section 906 of the Sarbanes-Oxley Act of 2002 |
| |
| 13.2* | | CFO Certification Pursuant to Section 906 of the Sarbanes-Oxley Act of 2002 |
| * | Filed with this Annual Report on Form 20-F. |
- 64 -
SIGNATURES
The registrant hereby certifies that it meets all of the requirements for filing its annual report on Form 20-F and that it has duly caused and authorized the undersigned to sign this annual report on its behalf.
| | |
| A-MAX TECHNOLOGY LIMITED |
| |
| By | | /s/ Victor Chan |
Name: | | Victor Chan |
Title: | | Chairman and Chief Executive Officer |
Date: July 17, 2006
A-MAX TECHNOLOGY LIMITED
INDEX TO CONSOLIDATED FINANCIAL STATEMENTS FOR THE YEARS ENDED
DECEMBER 31, 2003, 2004 AND 2005
| | |
| | | Page |
Report of Independent Registered Public Accounting Firm | | F-1 |
| |
Consolidated Statements of Operations for the Years Ended December 31, 2003, 2004 and 2005 | | F-2 |
| |
Consolidated Balance Sheets as of December 31, 2003, 2004 and 2005 | | F-3 |
| |
Consolidated Statements of Shareholders’ Equity (Deficit) and Comprehensive Income (Loss) for the Years Ended December 31, 2003, 2004 and 2005 | | F-4 |
| |
Consolidated Statements of Cash Flows for the Years Ended December 31, 2003, 2004 and 2005 | | F-5 |
| |
Notes to Consolidated Financial Statements for the Years Ended December 31, 2003, 2004 and 2005 | | F-6 |
REPORT OF INDEPENDENT REGISTERED PUBLIC ACCOUNTING FIRM
To the Shareholders and the Board of Directors of A-Max Technology Limited:
We have audited the accompanying consolidated balance sheets of A-Max Technology Limited and subsidiaries as of December 31, 2003, 2004 and 2005, and the related consolidated statements of operations, shareholders’ equity (deficit) and comprehensive income (loss), and cash flows for each of the three years in the period ended December 31, 2005. These consolidated financial statements are the responsibility of the Company’s management. Our responsibility is to express an opinion on these consolidated financial statements based on our audits.
We conducted our audits in accordance with the standards of the Public Company Accounting Oversight Board (United States). Those standards require that we plan and perform the audit to obtain reasonable assurance about whether the consolidated financial statements are free of material misstatement. The Company is not required to have, nor were we engaged to perform, an audit of its internal control over financial reporting. Our audit included consideration of internal control over financial reporting as a basis for designing audit procedures that are appropriate in the circumstances, but not for the purpose of expressing an opinion on the effectiveness of the Company’s internal control over financial reporting. Accordingly, we express no such opinion. An audit also includes examining, on a test basis, evidence supporting the amounts and disclosures in the financial statements, assessing the accounting principles used and significant estimates made by management, as well as evaluating the overall financial statement presentation. We believe that our audits provide a reasonable basis for our opinion.
In our opinion, such consolidated financial statements referred to above present fairly, in all material respects, the financial position of A-Max Technology Limited and subsidiaries at December 31, 2003, 2004 and 2005, and the results of their operations and their cash flows for each of the three years in the period ended December 31, 2005 in conformity with accounting principles generally accepted in the United States of America.
Deloitte Touche Tohmatsu
Certified Public Accountants
Hong Kong
May 10, 2006
F-1
A-MAX TECHNOLOGY LIMITED
CONSOLIDATED STATEMENTS OF OPERATIONS
(In thousands of US dollars, except share and per share data)
| | | | | | | | | | | | |
| | | Years ended December 31, | |
| | | 2003 | | | 2004 | | | 2005 | |
Net sales | | $ | 39,388 | | | $ | 141,384 | | | $ | 328,321 | |
Cost of sales | | | (33,232 | ) | | | (118,206 | ) | | | (288,057 | ) |
| | | | | | | | | | | | |
Gross profit | | | 6,156 | | | | 23,178 | | | | 40,264 | |
Selling expenses | | | (1,722 | ) | | | (2,926 | ) | | | (5,748 | ) |
General and administrative expenses | | | (3,878 | ) | | | (3,882 | ) | | | (8,893 | ) |
Research and development expenses | | | (153 | ) | | | (359 | ) | | | (1,652 | ) |
Gain on disposal of variable interest entity (Note 3(b)) | | | — | | | | — | | | | 433 | |
Gain on disposal of subsidiaries and tradename (Note 3(c)) | | | 827 | | | | — | | | | — | |
| | | | | | | | | | | | |
Operating income | | | 1,230 | | | | 16,011 | | | | 24,404 | |
Other income (Note 12) | | | 466 | | | | 120 | | | | 649 | |
Net unrealized gains (losses) on investment securities | | | — | | | | (19 | ) | | | 1 | |
Impairment on investments | | | — | | | | (179 | ) | | | — | |
Initial Public Offering expenses (note 2(l)) | | | — | | | | — | | | | (3,080 | ) |
Interest income | | | 4 | | | | 15 | | | | 873 | |
Interest expense | | | (401 | ) | | | (649 | ) | | | (1,026 | ) |
| | | | | | | | | | | | |
Income before income taxes | | | 1,299 | | | | 15,299 | | | | 21,821 | |
Provision for income taxes (Note 14) | | | (165 | ) | | | (2,568 | ) | | | (4,400 | ) |
| | | | | | | | | | | | |
Net income for the year | | $ | 1,134 | | | $ | 12,731 | | | $ | 17,421 | |
Dividends on Series A preferred shares | | | — | | | | (36 | ) | | | (3,238 | ) |
Beneficial conversion amount | | | — | | | | — | | | | (27,619 | ) |
Income attributable to Series A preferred shareholders | | | — | | | | — | | | | (1,500 | ) |
| | | | | | | | | | | | |
Income (loss) available to ordinary shareholders | | $ | 1,134 | | | $ | 12,695 | | | $ | (14,936 | ) |
| | | | | | | | | | | | |
Basic earnings (loss) per share (Note 11) | | $ | 0.002 | | | $ | 0.021 | | | $ | (0.020 | ) |
| | | | | | | | | | | | |
Diluted earnings (loss) per share | | $ | N/A | | | $ | 0.018 | | | $ | (0.020 | ) |
| | | | | | | | | | | | |
Shares used in computation of: (Note 11) | | | | | | | | | | | | |
Basic earnings (loss) per share | | | 600,000,000 | | | | 613,150,000 | | | | 749,900,000 | |
| | | | | | | | | | | | |
Diluted earnings (loss) per share | | | N/A | | | | 712,550,000 | | | | 749,900,000 | |
| | | | | | | | | | | | |
See accompanying notes to consolidated financial statements.
F-2
A-MAX TECHNOLOGY LIMITED
CONSOLIDATED BALANCE SHEETS
(In thousands of US dollars, except share and per share data)
| | | | | | | | | | | | |
| | | At December 31, | |
| | | 2003 | | | 2004 | | | 2005 | |
ASSETS | | | | | | | | | | | | |
Current assets: | | | | | | | | | | | | |
Cash and cash equivalents | | $ | 1,710 | | | $ | 7,081 | | | $ | 49,106 | |
Investment securities (Note 7) | | | 1,068 | | | | 948 | | | | 630 | |
Accounts receivable, less allowance for doubtful receivables of $1,401, $1,588 and $433 at December 31, 2003, 2004 and 2005, respectively | | | 8,394 | | | | 43,262 | | | | 73,256 | |
Inventories (Note 4) | | | 7,131 | | | | 25,604 | | | | 43,426 | |
Pledged bank deposit | | | 906 | | | | 356 | | | | 263 | |
Prepaid expenses and other current assets | | | 990 | | | | 2,784 | | | | 5,388 | |
| | | | | | | | | | | | |
Total current assets | | | 20,199 | | | | 80,035 | | | | 172,069 | |
Other investments (Note 6) | | | 179 | | | | — | | | | — | |
Property, plant and equipment, net (Note 5) | | | 2,480 | | | | 4,685 | | | | 17,146 | |
Other assets | | | 572 | | | | 442 | | | | — | |
| | | | | | | | | | | | |
Total assets | | $ | 23,430 | | | $ | 85,162 | | | $ | 189,215 | |
| | | | | | | | | | | | |
LIABILITIES AND SHAREHOLDERS’ EQUITY | | | | | | | | | | | | |
Current liabilities: | | | | | | | | | | | | |
Bank overdraft | | $ | 25 | | | $ | 270 | | | $ | — | |
Borrowings (Note 8) | | | 13,429 | | | | 32,819 | | | | 30,955 | |
Accounts payable | | | 4,985 | | | | 30,025 | | | | 49,168 | |
Accrued expenses and other payables | | | 860 | | | | 2,898 | | | | 6,274 | |
Capital lease obligations - current portion (Note 9) | | | 438 | | | | 399 | | | | 1,157 | |
Amount due to a director | | | 2,654 | | | | 1,430 | | | | — | |
Income taxes payable | | | 78 | | | | 2,546 | | | | 6,941 | |
| | | | | | | | | | | | |
Total current liabilities | | | 22,469 | | | | 70,387 | | | | 94,495 | |
Capital lease obligation - non current portion (Note 9) | | | 418 | | | | 18 | | | | 1,994 | |
Deferred income taxes (Note 14) | | | 41 | | | | 121 | | | | 149 | |
| | | | | | | | | | | | |
Total liabilities | | | 22,928 | | | | 70,526 | | | | 96,638 | |
| | | | | | | | | | | | |
Mezzanine equity | | | | | | | | | | | | |
Series A Convertible Participating Redeemable Preferred Shares (authorized shares of $0.00002 par value - 2003 and 2004: nil and 2005: 141,490,566 shares) (Note 10) | | $ | — | | | $ | — | | | $ | 63,238 | |
| | | | | | | | | | | | |
Shareholders’ equity: | | | | | | | | | | | | |
Ordinary shares (authorized shares of $0.00002 par value - 2003, 2004 and 2005: 1,400,000,000 shares) | | | | | | | | | | | | |
Issued and outstanding shares - 2003: 600,000,000 shares, 2004 and 2005: 749,900,000 shares) | | | 12 | | | | 15 | | | | 15 | |
Additional paid-in capital | | | 5,866 | | | | 7,298 | | | | 35,049 | |
Retained earnings (accumulated deficit) | | | (4,946 | ) | | | 7,749 | | | | (5,687 | ) |
Accumulated other comprehensive loss | | | (430 | ) | | | (426 | ) | | | (38 | ) |
| | | | | | | | | | | | |
Total shareholders’ equity | | | 502 | | | | 14,636 | | | | 29,339 | |
| | | | | | | | | | | | |
Total liabilities and shareholders’ equity | | $ | 23,430 | | | $ | 85,162 | | | $ | 189,215 | |
| | | | | | | | | | | | |
See accompanying notes to consolidated financial statements.
F-3
A-MAX TECHNOLOGY LIMITED
CONSOLIDATED STATEMENTS OF SHAREHOLDERS’ EQUITY (DEFICIT)
AND COMPREHENSIVE INCOME (LOSS)
(In thousands of US dollars, except share and per share data)
| | | | | | | | | | | | | | | | | | | | | |
| | | Ordinary share
capital | | Convertible
preference share
capital | | | Additional
paid-in
capital | | Accumulated
other
comprehensive
income (loss) | | | Retained
earnings
(accumulated
deficit) | | | Total | |
| | | Share | | $ | | Share | | | $ | | | $ | | $ | | | $ | | | $ | |
At January 1, 2003 | | 600,000,000 | | 12 | | — | | | — | | | 5,866 | | 32 | | | (6,080 | ) | | (170 | ) |
Translation adjustment | | — | | — | | — | | | — | | | — | | (143 | ) | | — | | | (143 | ) |
Eliminated on disposal of subsidiaries | | — | | — | | — | | | — | | | — | | (319 | ) | | — | | | (319 | ) |
Net profit | | — | | — | | — | | | — | | | — | | — | | | 1,134 | | | 1,134 | |
| | | | | | | | | | | | | | | | | | | | | |
At December 31, 2003 | | 600,000,000 | | 12 | | — | | | — | | | 5,866 | | (430 | ) | | (4,946 | ) | | 502 | |
Issue of preference shares | | — | | — | | 149,900,000 | | | 3 | | | 1,432 | | — | | | — | | | 1,435 | |
Conversion of preference shares | | 149,900,000 | | 3 | | (149,900,000 | ) | | (3 | ) | | — | | — | | | — | | | — | |
Net profit | | — | | — | | — | | | — | | | — | | — | | | 12,731 | | | 12,731 | |
Translation adjustment | | — | | — | | — | | | — | | | — | | 4 | | | — | | | 4 | |
Dividends paid | | — | | — | | — | | | — | | | — | | — | | | (36 | ) | | (36 | ) |
| | | | | | | | | | | | | | | | | | | | | |
At 31 December, 2004 | | 749,900,000 | | 15 | | — | | | — | | | 7,298 | | (426 | ) | | 7,749 | | | 14,636 | |
Net profit | | — | | — | | — | | | — | | | — | | — | | | 17,421 | | | 17,421 | |
Share-based compensation expenses | | — | | — | | — | | | — | | | 132 | | — | | | — | | | 132 | |
Translation adjustment | | — | | — | | — | | | — | | | — | | 388 | | | — | | | 388 | |
Dividends on Series A preferred shares | | — | | — | | — | | | — | | | — | | — | | | (3,238 | ) | | (3,238 | ) |
Beneficial conversion amount | | — | | — | | — | | | — | | | 27,619 | | — | | | (27,619 | ) | | — | |
| | | | | | | | | | | | | | | | | | | | | |
At December 31, 2005 | | 749,900,000 | | 15 | | — | | | — | | | 35,049 | | (38 | ) | | (5,687 | ) | | 29,339 | |
| | | | | | | | | | | | | | | | | | | | | |
See accompanying notes to consolidated financial statements.
F-4
A-MAX TECHNOLOGY LIMITED
CONSOLIDATED STATEMENTS OF CASH FLOWS
(In thousands of US dollars)
| | | | | | | | | | | | |
| | | Years ended December 31, | |
| | | 2003 | | | 2004 | | | 2005 | |
Cash flows from operating activities: | | | | | | | | | | | | |
Net income | | $ | 1,134 | | | $ | 12,731 | | | $ | 17,421 | |
| | | | | | | | | | | | |
Adjustments to reconcile net income to net cash used in operating activities: | | | | | | | | | | | | |
Gain on disposal of investment securities | | | (20 | ) | | | (5 | ) | | | — | |
Impairment on other investments | | | — | | | | 179 | | | | — | |
Proceeds on disposal of investment securities | | | 534 | | | | 104 | | | | 322 | |
Purchase of investment securities | | | (848 | ) | | | — | | | | — | |
Depreciation of property, plant and equipment | | | 355 | | | | 649 | | | | 1,545 | |
Share-based compensation expenses | | | — | | | | — | | | | 132 | |
Net unrealized losses (gains) on investment securities | | | — | | | | 19 | | | | (1 | ) |
Gain on disposal of subsidiaries and tradename | | | (827 | ) | | | — | | | | — | |
Gain on disposal of variable interest entity | | | — | | | | — | | | | (433 | ) |
Unrealized gain on forward contract | | | — | | | | — | | | | (69 | ) |
Loss on disposal of property, plant and equipment | | | — | | | | 6 | | | | 4 | |
Allowance for doubtful receivables, net | | | 1,054 | | | | 247 | | | | 255 | |
Bad debts written off | | | — | | | | — | | | | 237 | |
Increase in inventories | | | (1,430 | ) | | | (18,473 | ) | | | (17,822 | ) |
Increase in accounts receivable | | | (5,250 | ) | | | (35,050 | ) | | | (30,043 | ) |
Decrease (increase) in prepaid expenses and other current assets | | | 365 | | | | (1,794 | ) | | | (2,542 | ) |
Increase in accounts payable | | | 2,392 | | | | 25,040 | | | | 19,143 | |
(Decrease) increase in accrued expenses and other payables | | | (1,473 | ) | | | 2,038 | | | | 3,488 | |
(Decrease) increase in income taxes payable | | | (25 | ) | | | 2,468 | | | | 4,395 | |
Increase in deferred income taxes | | | 14 | | | | 80 | | | | 28 | |
| | | | | | | | | | | | |
Total adjustments | | | (5,159 | ) | | | (24,492 | ) | | | (21,361 | ) |
| | | | | | | | | | | | |
Net cash used in operating activities | | $ | (4,025 | ) | | $ | (11,761 | ) | | $ | (3,940 | ) |
| | | | | | | | | | | | |
Cash flows from investing activities: | | | | | | | | | | | | |
Purchase of property, plant and equipment | | $ | (1,459 | ) | | $ | (2,855 | ) | | $ | (13,768 | ) |
Net cash received from disposal of subsidiaries and tradename | | | 987 | | | | 64 | | | | — | |
Net cash received from disposal of variable interest entity | | | — | | | | — | | | | 335 | |
(Decrease) increase in pledged bank deposit | | | (204 | ) | | | 550 | | | | 93 | |
| | | | | | | | | | | | |
Net cash used in investing activities | | $ | (676 | ) | | $ | (2,241 | ) | | $ | (13,340 | ) |
| | | | | | | | | | | | |
Cash flows from financing activities: | | | | | | | | | | | | |
Proceeds from bank loans | | $ | 37,922 | | | $ | 155,690 | | | $ | 327,129 | |
Repayment to a director | | | (82 | ) | | | (1,224 | ) | | | (1,430 | ) |
(Repayment) addition of capital lease obligation | | | (432 | ) | | | (439 | ) | | | 2,734 | |
Repayment of other loans | | | (275 | ) | | | (248 | ) | | | (104 | ) |
Repayment of bank loans | | | (34,508 | ) | | | (138,121 | ) | | | (325,755 | ) |
(Decrease) increase in bank overdraft | | | (231 | ) | | | 245 | | | | (270 | ) |
Issue of preferred shares | | | — | | | | 1,435 | | | | 60,000 | |
Net proceeds from (payments for) discounted bills with recourse | | | 3,747 | | | | 2,036 | | | | (3,200 | ) |
Cash dividend paid | | | — | | | | (36 | ) | | | — | |
| | | | | | | | | | | | |
Net cash from financing activities | | $ | 6,141 | | | $ | 19,338 | | | $ | 59,104 | |
| | | | | | | | | | | | |
Effect of foreign exchange rate changes | | $ | (139 | ) | | $ | 35 | | | $ | 201 | |
| | | | | | | | | | | | |
Net increase in cash and cash equivalents | | $ | 1,301 | | | $ | 5,371 | | | $ | 42,025 | |
Cash and cash equivalents at beginning of year | | | 409 | | | | 1,710 | | | | 7,081 | |
| | | | | | | | | | | | |
Cash and cash equivalents at end of year | | $ | 1,710 | | | $ | 7,081 | | | $ | 49,106 | |
| | | | | | | | | | | | |
Supplemental schedule of cash flow information: | | | | | | | | | | | | |
Interest paid | | $ | (401 | ) | | $ | (564 | ) | | $ | (939 | ) |
Income taxes refunded (paid), net | | | (176 | ) | | | (28 | ) | | | — | |
See accompanying notes to consolidated financial statements.
F-5
A-MAX TECHNOLOGY LIMITED
NOTES TO CONSOLIDATED FINANCIAL STATEMENTS
(In thousands of US dollars, except share and per share data)
1. Company Information
A-Max Technology Limited was incorporated on March 17, 2004 as an exempted company with limited liability in Bermuda under the Companies Act 1981 of Bermuda.
A-Max Technology Limited (the “Company” or “A-Max”) and its consolidated subsidiaries (collectively the “Group”), are principally engaged in the provision of total solutions to global brand name companies in the portable digital audio industry and the consumer products retail chains. As of December 31, 2005, substantially all of its business was conducted through subsidiaries in which the Company indirectly holds a 100% interest, collectively the “operating subsidiaries”. The Company holds its interests in the operating subsidiaries indirectly through Techniques International Limited (“Techniques”), which is wholly owned by the Company and incorporated in the British Virgin Islands (“BVI”).
2. Summary of Significant Accounting Policies
(a) Basis of presentation and principles of consolidation
The consolidated financial statements of the Company have been prepared in accordance with the accounting principles generally accepted in the United States of America (“US GAAP”).
The consolidated financial statements include the financial statements of the Company and all its majority-owned subsidiaries and the variable interest entity in which the Company is deemed to be the primary beneficiary (see note 2 (w)). All significant intercompany accounts, transactions and cash flows have been eliminated on consolidation.
(b) Cash and cash equivalents
Cash and cash equivalents include all cash balances and highly liquid investments purchased with a maturity date of three months or less at the date of purchase.
The Company’s cash equivalents consist of short term deposits with various banks.
(c) Investment securities
Investment securities are primarily comprised of equity funds, which the Company has classified as trading securities. Securities classified as trading securities are stated at fair value with unrealized gains and losses credited or charged to the consolidated statement of operations. Realized gains and losses on the sale of the trading securities are determined using the specific-identification method and are reflected in other income (expenses).
(d) Inventory
Inventory is stated at the lower of cost or market value. Cost is calculated using the weighted average cost method. Write downs of potentially obsolete or slow-moving inventory are recorded based on management’s specific analysis of inventory.
(e) Pledged deposits
As of December 31, 2003, 2004 and 2005 the Company had certain fixed rate deposits of $906, $356 and $263, respectively. These deposits were pledged to various banks to secure certain banking facilities of the Company.
F-6
A-MAX TECHNOLOGY LIMITED
NOTES TO CONSOLIDATED FINANCIAL STATEMENTS - continued
(In thousands of US dollars, except share and per share data)
2. Summary of Significant Accounting Policies - continued
(f) Property, plant and equipment
Property, plant and equipment are recorded at cost less accumulated depreciation. Gains and losses from the disposal of property, plant and equipment are included in income from operations.
Depreciation is computed using the straight-line method over the estimated lives of assets as follows:
| | |
Classification | | Years |
Property | | 20 years |
Furniture and fixtures | | 5 years |
Office equipment | | 5 years |
Leasehold improvements | | 5 years |
Production equipment | | 5 to 10 years |
Motor vehicles | | 5 years |
Moulds | | 3 years |
Assets recorded under capital leases and leasehold improvements are amortized using the straight-line method over the lesser of their useful lives or the related lease term.
(g) Impairment or disposal of long-lived assets
The Company reviews its long-lived assets for potential impairment based on a review of projected undiscounted cash flows associated with these assets. Long-lived assets are evaluated for impairment whenever events and circumstances exist that indicate the carrying amount of these assets may not be recoverable. Measurement of impairment losses for long-lived assets that the Company expects to hold and use is based on the difference between the estimated fair value of the assets and the carrying amount. Long-lived assets to be disposed of are stated at the lower of fair value or carrying amount.
(h) Revenue recognition
The Company recognizes revenue based on firm customer orders with fixed terms and conditions, including price. The Company recognizes revenue when delivery has occurred and collectibility is determined to be reasonably assured. The Company meets these criteria at the point of shipment, for shipments which are made with FOB shipping point terms, and upon delivery, for shipments which are made with FOB destination terms. The Company does not provide its customers with price protection and only provides the right of return or subsequent rebates for defective goods in connection with its warranty policy. For selected customers, the Company ships, without charge, extra units of its products equivalent to 1% of the units ordered by the customer. The intent of shipping the extra units is to cover any warranty issues that may arise, benefit both the Company and its customers by avoiding additional shipping and handling costs that would be associated with returns under warranty and enhance customer satisfaction. The cost of these extra units is included in cost of sales at the point of initial revenue recognition for the order. The costs of the Company’s warranty policy to date, including the cost of extra units, for the year ended December 31, 2003, 2004 and 2005 were $172, $561 and $1,017, respectively.
F-7
A-MAX TECHNOLOGY LIMITED
NOTES TO CONSOLIDATED FINANCIAL STATEMENTS - continued
(In thousands of US dollars, except share and per share data)
2. Summary of Significant Accounting Policies - continued
(i) Shipping and handling costs
Shipping and handling costs are classified as cost of sales for costs incurred for materials purchased and selling expenses for those costs incurred in the delivery of finished products. During the years ended December 31, 2003, 2004, and 2005, shipping and handling costs classified as costs of sales were $272, $248 and $327, respectively. During the years ended December 31, 2003, 2004 and 2005, shipping and handling costs classified as selling expenses were $831, $1,618 and $3,445, respectively.
(j) Research and development costs
Research and development expenses include payroll, employee benefits and other headcount-related costs associated with product development. Technological feasibility for the Company’s software products is reached shortly before the products are released to production. Costs incurred after technological feasibility is established are not material, and accordingly, the Company expenses all research and development costs when incurred.
(k) Advertising expenses
The Company expenses advertising costs as incurred. Advertising expenses were $164, $165 and $855 for the years ended December 31, 2003, 2004 and 2005, respectively, and are classified as selling expenses.
(l) Initial Public Offering expenses
This represented the incremental costs directly attributable to a proposed offering of securities in 2005. All costs were charged to the statement of operations as the proposed offering was postponed for more than 90 days.
(m) Staff retirement plan costs
The Company’s costs related to its defined contribution staff retirement plans (see Note 13) are expensed as incurred.
(n) Share-based compensation
The Company accounts for share-based compensation to directors of the Company based on the fair value of the ordinary shares at the date of purchase and will record compensation expense to the extent the fair value of the shares transferred is determined to be greater than the price paid by the director. The Company incurred compensation expense, which amounted to $132 during the year ended December 31, 2005, for shares issued to a director.
F-8
A-MAX TECHNOLOGY LIMITED
NOTES TO CONSOLIDATED FINANCIAL STATEMENTS - continued
(In thousands of US dollars, except share and per share data)
2. Summary of Significant Accounting Policies - continued
(o) Income taxes
The Company follows the asset and liability method of accounting for income taxes. Under the asset and liability method, the change in the net deferred tax asset or liability is included in the computation of net income. Deferred tax assets and liabilities are measured using enacted tax rates applicable to taxable income in the years in which temporary differences are expected to be recovered or settled. Deferred tax assets are evaluated and, if realization is not considered to be “more likely than not”, a valuation allowance is provided.
(p) Forward contract
The Company has entered into a forward foreign currency contract that has not been designated as a hedge for accounting purpose. The forward contract has been recorded in prepaid expenses and other current assets, at its fair value of $69 and the gain has been reported in other income.
(q) Foreign currency transactions and translations
All transactions in currencies other than functional currencies during the year are remeasured at the exchange rates prevailing on the respective transaction dates. Monetary assets and liabilities existing at the balance sheet date denominated in currencies other than functional currencies are remeasured at the exchange rates existing on that date. Exchange differences are recorded in the consolidated statement of operations.
The financial statements of all subsidiaries with functional currencies other than the U.S. dollar, the reporting currency, are translated in accordance with Statement of Financial Accounting Standard (“SFAS”) No. 52, “Foreign Currency Translation”. All assets and liabilities are translated at the rates of exchange prevailing at the balance sheet date and all income and expense items are translated at the average rates of exchange over the year. All exchange differences arising from the translation of subsidiaries’ financial statements are recorded as a component of comprehensive income.
(r) Earnings (loss) per share
Basic earnings per share is computed by dividing net income, adjusted for dividends paid and income attributable to preference shareholders, by the weighted average number of ordinary shares outstanding during the year.
Diluted earnings per share gives effect to all dilutive potential ordinary shares outstanding during the year. The weighted average number of ordinary shares outstanding is adjusted to include the number of additional ordinary shares that would have been outstanding if the dilutive potential ordinary shares had been issued.
F-9
A-MAX TECHNOLOGY LIMITED
NOTES TO CONSOLIDATED FINANCIAL STATEMENTS - continued
(In thousands of US dollars, except share and per share data)
2. Summary of Significant Accounting Policies - continued
(s) Use of estimates
The preparation of consolidated financial statements in conformity with US GAAP requires management to make estimates and assumptions that affect the reported amounts of assets and liabilities and disclosure of contingent assets and liabilities at the date of the consolidated financial statements and the reported amounts of revenues and expenses during the reporting period. Actual results could differ from those estimates.
(t) Comprehensive income (loss)
Accumulated other comprehensive income (loss) represents foreign currency translation adjustments and is included in the consolidated statement of shareholders’ equity.
(u) Fair value disclosures
The carrying amounts of cash and cash equivalents, investment securities, accounts receivable, accounts payable, accrued expenses and other payables approximate their fair values due to the short term nature of these instruments.
The Series A preferred shares are recorded at their accreted values, which approximate the cash outlay which is due upon net settlement, if not converted into common shares.
The fair value of the Company’s foreign currency contract has been estimated based on year-end quoted market prices.
(v) Concentration of risk
Financial instruments that potentially expose the Company to concentrations of credit risk consist primarily of cash and cash equivalents, and accounts receivable. The Company places its cash and cash equivalents with financial institutions with high-credit ratings and quality.
The Company conducts credit evaluations of customers and generally does not require collateral or other security from its customers. The Company establishes an allowance for doubtful receivables primarily based upon the age of the receivables and factors surrounding the credit risk of specific customers.
F-10
A-MAX TECHNOLOGY LIMITED
NOTES TO CONSOLIDATED FINANCIAL STATEMENTS - continued
(In thousands of US dollars, except share and per share data)
2. Summary of Significant Accounting Policies - continued
(w) Variable interest entity
On December 2, 2004, the Company provided capital for funding the start-up operations of an entity in exchange for a 6% convertible promissory note due December 2, 2006. The employees of the entity own 100% of its equity interests. The principal business activity of the entity is to promote portable digital consumer products. The Company consolidated the entity since its inception, based on the Company’s determination that it is the entity’s primary beneficiary.
On July 30, 2005, the entity refunded all amounts to the Company. The payment represents a reimbursement for all set-up capital previously provided by the Company to this entity. The Company no longer has any financial investment or any obligations to provide funding to this entity and accordingly, the Company ceased consolidating the entity as of July 31, 2005.
(x) Mezzanine equity
The Series A Preferred Shares issued on June 17, 2005 (see note 10), which were issued with a put option that permits the shareholders to sell back the shares to the Company after June 2009, are classified as mezzanine equity.
F-11
A-MAX TECHNOLOGY LIMITED
NOTES TO CONSOLIDATED FINANCIAL STATEMENTS - continued
(In thousands of US dollars, except share and per share data)
2. Summary of Significant Accounting Policies - continued
(y) Recent changes in accounting standards
In November 2004, the Financial Accounting Standards Board (“FASB”) issued SFAS No. 151,“Inventory Costs-an amendment of ARB No. 43, Chapter 4”. SFAS No. 151 clarifies the accounting that requires abnormal amounts of idle facility expenses, freight, handling costs, and spoilage costs to be recognized as current-period charges. It also requires that allocation of fixed production overheads to the costs of conversion be based on the normal capacity of the production facilities. SFAS No. 151 will be effective for inventory costs incurred on or after July 1, 2005. The adoption of the standard did not have a material impact on the Company’s consolidated financial statements.
In December 2004, the FASB issued SFAS No. 123R, “Share-Based Payment”. This statement is a revision to SFAS No. 123 and supercedes APB Opinion No. 25. This statement establishes standards for the accounting for transactions in which an entity exchanges its equity instruments for goods or services, primarily focusing on the accounting for transactions in which an entity obtains employee services in share-based payment transactions. Entities will be required to measure the cost of employee services received in exchange for an award of equity instruments based on the grant-date fair value of the award (with limited exceptions). That cost will be recognized over the period during which an employee is required to provide service, the requisite service period (usually the vesting period), in exchange for the award. The grant-date fair value of employee share options and similar instruments will be estimated using option-pricing models. If an equity award is modified after the grant date, incremental compensation cost will be recognized in an amount equal to the excess of the fair value of the modified award over the fair value of the original award immediately before the modification. This statement is effective as of the beginning of the first fiscal year that begins after June 15, 2005. In accordance with the standard, the Company will adopt SFAS No. 123R effective January 1, 2006.
In June 2005, the FASB issued SFAS No. 154, “Accounting Changes and Error Corrections,” a replacement of APB Opinion No. 20, “Accounting Changes,” and SFAS No.3, “Reporting Accounting Changes in Interim Financial Statements.” SFAS No. 154 changes the requirements for the accounting for, and reporting of, a change in accounting principle. Previously, most voluntary changes in accounting principles were required to be recognized by way of a cumulative effect adjustment within net income during the period of the change. SFAS No. 154 requires retrospective application to prior periods’ financial statements, unless it is impracticable to determine either the period-specific effects or the cumulative effect of the change. SFAS No. 154 is effective for accounting changes made in fiscal years beginning after December 15, 2005; however, the Statement does not change the transition provisions of any existing accounting pronouncements. The adoption of SFAS No. 154 is not expected to have a material impact on the Company’s consolidated financial statements.
F-12
A-MAX TECHNOLOGY LIMITED
NOTES TO CONSOLIDATED FINANCIAL STATEMENTS - continued
(In thousands of US dollars, except share and per share data)
3. Investment in Subsidiaries
(a) Subsidiaries
Particulars regarding the legal subsidiaries as of each balance sheet date are as follows:
| | | | | | | | | | | | | |
| | | Place of
establishment and
operation | | Percentage of ordinary share/
registered capital held by the
Company at December 31, | | | Principal activities |
Name of company | | | 2003 | | | 2004 | | | 2005 | | |
Techniques International Limited | | BVI | | 100 | % | | 100 | % | | 100 | % | | Investment holding |
| | | | | |
A-Max Technology Company Limited | �� | Hong Kong | | 100
(note) | %
| | 100
(note) | %
| | 100
(note) | %
| | Provision of total solutions and trading and development of portable multimedia computer-related consumer electronic products and provision of logistics and related services |
| | | | | |
A-Max Technology GmbH | | Germany | | 100
(note) | %
| | 100
(note) | %
| | 100
(note) | %
| | Trading and development of portable multimedia computer-related consumer electronic products |
| | | | | |

(“Shenzhen Zhongyuyuanyi Digital Science and Technology Company Limited”)
| | People’s Republic
of China (“PRC”) | | 100
(note) | %
| | 100
(note) | %
| | 100
(note) | %
| | Design and manufacture of portable multimedia computer-related consumer electronic products |
| | | | | |
A-Max Technology Macao Commercial Offshore Company Limited | | Macao | | — | | | — | | | 100
(note) | %
| | Provision of sales support in conjunction with total solutions and trading and development of portable multimedia computer-related consumer electronic products |
| | | | | |
A-Max F7 Technology Limited | | United Kingdom | | — | | | — | | | 100
(note) | %
| | Software development for digital audio and consumer electronic products |
Note:
The subsidiary was indirectly held by the Company as at balance sheet dates.
F-13
A-MAX TECHNOLOGY LIMITED
NOTES TO CONSOLIDATED FINANCIAL STATEMENTS - continued
(In thousands of US dollars, except share and per share data)
3. Investment in Subsidiaries - continued
(b) Disposals
In January and December 2003, the Company disposed of certain subsidiaries together with a tradename to third parties for total cash consideration of $1,260 at a total gain of $827. Sales and loss generated from the two subsidiaries for the year ended December 31, 2003 were $6,563 and $11 respectively. The net cash inflow for the year ended December 31, 2003 arising from the disposal of subsidiaries and tradename amounted to $987, which represents the cash consideration of $1,260, less cash on-hand at one of the subsidiaries of $273.
In July 2005, the variable interest entity refunded the amount of $500 to the Company as a reimbursement for all the set-up capital and gain on disposal of $433 was recognized. Sales and loss generated for this variable interest entity for the period from January 2005 to July 2005 were $20 and $368, respectively (December 2, 2004 to December 31, 2004: $nil and $65 respectively. The cash inflow for the year ended December 31, 2005 of $335, represented the cash consideration of $500 less cash on hand of $165. As at the disposal date, the variable interest entity has prepaid expenses and other assets of $7, fixed assets of $7, and accrued expenses and other payable of $112.
(c) Establishment of subsidiary
In March 2003, the Company established (Shenzhen Zhongyuyuanyi Digital Science and Technology Company Limited) in the PRC. The principal activity is design and manufacture of portable multimedia computer-related consumer electronic products.
During the year 2005, the Company established A-Max Technology Macao Commercial Offshore Company Limited and A-Max F7 Technology Limited in Macao and the United Kingdom respectively. The principal activity of A-Max Technology Macao Commercial Offshore Company Limited is provision of sales support in conjunction with total solutions and trading and development of portable multimedia computer-related consumer electronic products. The principal activity of A-Max F7 Technology Limited is software development for digital audio and consumer electronic products.
4. Inventories
Inventories consist of the following:
| | | | | | | | | |
At December 31, | | 2003 | | 2004 | | 2005 |
Raw materials | | $ | 4,464 | | $ | 12,105 | | $ | 24,593 |
Work-in-progress | | | 776 | | | 8,611 | | | 6,225 |
Finished goods | | | 1,891 | | | 4,888 | | | 12,608 |
| | | | | | | | | |
| | $ | 7,131 | | $ | 25,604 | | $ | 43,426 |
| | | | | | | | | |
F-14
A-MAX TECHNOLOGY LIMITED
NOTES TO CONSOLIDATED FINANCIAL STATEMENTS - continued
(In thousands of US dollars, except share and per share data)
5. Property, Plant and Equipment, net
Property, plant and equipment, net consist of the following:
| | | | | | | | | | | | |
At December 31, | | 2003 | | | 2004 | | | 2005 | |
Furniture and fixtures | | $ | 29 | | | $ | 14 | | | $ | 115 | |
Office equipment | | | 549 | | | | 944 | | | | 2,173 | |
Leasehold improvements | | | 170 | | | | 120 | | | | 1,921 | |
Production equipment | | | 2,040 | | | | 3,596 | | | | 12,880 | |
Motor vehicles | | | 14 | | | | 184 | | | | 382 | |
Moulds | | | 635 | | | | 1,255 | | | | 2,665 | |
| | | | | | | | | | | | |
Total | | | 3,437 | | | | 6,113 | | | | 20,136 | |
Less: Accumulated depreciation and amortization | | | (957 | ) | | | (1,428 | ) | | | (2,990 | ) |
| | | | | | | | | | | | |
Net book value | | $ | 2,480 | | | $ | 4,685 | | | $ | 17,146 | |
| | | | | | | | | | | | |
Depreciation of $1,110, $3 and $432 has been charged to cost of sales, selling expenses and general and administrative expenses, respectively.
6. Other Investments
| | | | | | | | | |
At December 31, | | 2003 | | 2004 | | 2005 |
Cost method investment | | $ | 179 | | $ | — | | $ | — |
| | | | | | | | | |
As of December 31, 2004, the Company conducted an analysis of its investment representing 11.11% of a private company incorporated in Korea. Based on evaluation of the financial performance of the investment, the Company recorded a full impairment of the investment at the balance sheet date.
7. Investment Securities
Investment securities represent investment in securities with readily determinable fair market values and original maturities in excess of three months. The investments are categorized as trading securities and are reported at fair value, with changes in fair value recorded in consolidated net income (loss). The cost of securities held at December 31, 2003, 2004 and 2005 were $1,068, $967 and $669, respectively. As of December 31, 2003, 2004 and 2005, the market value of such securities was $1,068, $948 and $630, respectively. Included in the determination of net income (loss) for the years ended December 31, 2003, 2004 and 2005 were net realized gains of $20 and unrealized losses of nil, net realized gains of $5 and net unrealized losses of $19; and net realized gain of $nil and net unrealized gains of $1 respectively.
As of December 31, 2003, 2004 and 2005, the investment securities balance of $1,068, $627 and $nil, respectively, was pledged as collateral for certain of the Company’s credit facilities.
F-15
A-MAX TECHNOLOGY LIMITED
NOTES TO CONSOLIDATED FINANCIAL STATEMENTS - continued
(In thousands of US dollars, except share and per share data)
8. Borrowings and Banking Facilities
The Company has credit facilities with various banks representing trade acceptances, import and factoring facilities, equipment purchases, foreign exchange, forward currency and overdrafts. As of December 31, 2003, 2004 and 2005, these facilities totaled $8,124, $31,534 and $64,379, of which $333, $6,139 and $37,544 respectively were unused. The funds borrowed under these facilities are generally repayable within 60 to 100 days. Interest rates are generally based on either the banks’ Hong Kong Interbank Offered Rate plus 0.75% to 1.5% per annum or Singapore Interbank Offered Rate plus 0.75% to 1.5% per annum, and the credit lines are normally subject to annual review and renewal. The weighted average interest rates on the import and factoring loans as of December 31, 2003, 2004 and 2005 were 4.0%, 4.0% and 5.9%, respectively. As of December 31, 2005, the banking facilities are secured by certain bank deposits.
| | | | | | | | | |
At December 31, | | 2003 | | 2004 | | 2005 |
Import and factoring loan | | $ | 7,791 | | $ | 25,395 | | $ | 26,835 |
Discounted bills with recourse | | | 5,286 | | | 7,320 | | | 4,120 |
Other loans | | | 352 | | | 104 | | | — |
| | | | | | | | | |
| | $ | 13,429 | | $ | 32,819 | | $ | 30,955 |
| | | | | | | | | |
At December 31, 2003, 2004 and 2005, included in the accounts receivable were receivables of $5,286, $7,320 and $4,120 respectively, pledged for securing the discounted bills with recourse. The Company has signed factoring agreements with certain financial institutions which allow the Company to obtain financing, for certain customers, from such financial institutions at an amount equal to a proportion of the receivable’s balance, generally up to 80%. One financial institution has full recourse against the Company for any bad debts. Payment terms under these agreements are generally 60 days to 90 days. The finance charge for such factoring agreements are typically at SIBOR plus 1.5% per annum.
9. Capital Lease Obligations
The Company leases certain equipment under capital leases. The capital lease obligations outstanding as of December 31, 2003, 2004 and 2005 related to certain equipment, which amounted to $856, $417 and $3,151, respectively. Future minimum lease payments under capital lease obligations as of December 31, 2005 are as follows:
| | | | |
| | | 2005 | |
Period ending December 31,: | | | | |
2006 | | $ | 1,205 | |
2007 | | | 1,187 | |
2008 | | | 792 | |
| | | | |
Total minimum lease payments | | $ | 3,184 | |
Less: amounts representing interest | | | (33 | ) |
| | | | |
Present value of minimum lease payments | | $ | 3,151 | |
Current portion | | | (1,157 | ) |
| | | | |
Non-current portion | | $ | 1,994 | |
| | | | |
F-16
A-MAX TECHNOLOGY LIMITED
NOTES TO CONSOLIDATED FINANCIAL STATEMENTS - continued
(In thousands of US dollars, except share and per share data)
10. Capital Structure
As of December 31, 2005, after the issuance of the Series A Convertible Participating Redeemable Preferred Shares, par value $0.00002 per share (the “Series A Preferred Shares”), discussed below, the Company had two classes of shares issued and outstanding: ordinary shares and Series A Preferred Shares.
On June 17, 2005, the Company approved a 50,000-for-1 stock split for all ordinary shares and changed the par value of its ordinary shares to $0.00002. Prior to the 50,000-for-1 stock split, which became effective as of June 17, 2005, there were 28,000 ordinary shares with a par value of $1.00 authorized and 14,998 ordinary shares issued and outstanding. All share and per share data have been retroactively restated in the accompanying consolidated financial statements and notes to the consolidated financial statements for all periods presented to reflect the stock split.
Series A Preferred Shares
On May 27, 2005, the Company entered into a share subscription agreement, pursuant to which the Company agreed to sell 141,490,566 Series A Preferred Shares to certain investors for an aggregate issue price of $60,000, representing a per share price of approximately $0.42. The Series A Preferred Shares were issued on June 17, 2005.
The key terms of the Series A Preferred Shares are as follows:
Convertible Dividends. The holders of Series A Preferred Shares are entitled to receive dividends at an annual rate of 3%, calculated on the basis of a 365-day year, which dividends shall accrue on a daily basis from the date of issuance, whether or not declared. Accrued and unpaid dividends shall not be paid in cash but instead shall compound and be added on a quarterly basis on March 31, June 30, September 30 and December 31 of each year. The dividends attributable to this provision amounted to $972 as of December 31, 2005 and are convertible into approximately 3,483,186 shares of the Company’s common stock.
Conversion. Each holder of Series A Preferred Shares is entitled to convert at any time and from time to time, subject to the automatic conversion terms, any or all of such holder’s Series A Preferred Shares. The number of ordinary shares to be received upon conversion is equal to the product of (i) the number of Series A Preferred Shares being so converted multiplied by (ii) the quotient of (x) the sum of the compounded and accrued dividends through the conversion date, divided by (y) the adjusted conversion price of $0.28 per share, subject to further adjustment for certain antidilution adjustments.
Automatic Conversion. Immediately upon the completion of a qualifying underwritten initial public offering (“IPO”), each Series A Preferred Share shall automatically be converted, with no further action required to be taken by the Company or the holder thereof, into the number of ordinary shares equal to the sum of (i) the quotient of the subscription price of $0.42405641, divided by the adjusted conversion price of $0.28 per share subject to further adjustment for certain antidilution provisions, plus (ii) the quotient of the sum of the compounded and accrued converted dividends through the conversion date, divided by the IPO price.
F-17
A-MAX TECHNOLOGY LIMITED
NOTES TO CONSOLIDATED FINANCIAL STATEMENTS - continued
(In thousands of US dollars, except share and per share data)
| 10. | Capital Structure - continued |
Voting rights. Each Series A Preferred Share shall entitle the holder to such number of votes as shall equal the number of ordinary shares into which such Series A Preferred Shares is then convertible. In addition, subject to certain threshold shareholding amounts, the Series A Preferred shareholders shall be entitled to elect one member to the Board of Directors of the Company. In addition, the Board of Directors of the Company and the shareholders of the Company shall not, without the prior affirmative vote or written consent of the holder(s) of more than 50.0% of the Series A Preferred Shares, approve, consent to or ratify certain specified corporate actions including the incurrence of any indebtedness, in the aggregate, above $5,000 and capital expenditures in excess of $500.
Redemption. Beginning on the fourth anniversary of the original issue date of the Series A Preferred Shares, upon the request of holders of a majority of the then-outstanding Series A Preferred Shares, the Company shall redeem for cash all Series A Preferred Shares. The redemption price shall equal the sum of the original subscription price and all accrued dividends as of the redemption date, plus any additional amount which may be required such that the per annum return on the preferred subscription price yields a compounded annual rate of return, net of withholding taxes, of 10% to the Series A Preferred shareholders as of the redemption date. The additional accrued and unpaid dividends attributable to this provision amounted to $3,238 as of December 31, 2005.
Antidilution provisions. In the event that the Company shall issue additional options, warrants, convertible securities and ordinary shares without consideration or for a consideration per share less than the applicable conversion price in effect, the conversion price shall be reduced, concurrently with such issue, to a new price.
Earnings adjustment. In the event the Company’s 2005 net income, as stipulated in the agreement, is less than certain predefined amounts, the conversion price, then in effect, shall be reduced. As the Company’s 2005 net income was less than predefined amounts the conversion price was adjusted from $0.42 to $0.28 and as a result, the Company recorded a beneficial conversion amount of $27,619.
Liquidation preference. In the event of any liquidation, dissolution or winding up of the affairs of the Company, the holders of the Series A Preferred Shares then outstanding shall be entitled to receive, prior and in preference to any distribution of any of the assets or surplus funds of the Company to the holders of ordinary shares, the amount of the subscription price plus all compounded and accrued dividends as of the liquidation date, and after the distribution and payment, if assets remain in the Company, the remaining assets of the Company available for distribution to shareholders shall be distributed among the holders of Series A Preferred Shares and the holders of ordinary shares pro rata based on the number of ordinary shares held by each (assuming the conversion of Series A Preferred Shares).
F-18
A-MAX TECHNOLOGY LIMITED
NOTES TO CONSOLIDATED FINANCIAL STATEMENTS - continued
(In thousands of US dollars, except share and per share data)
11. Earnings (loss) per share
The calculations of basic earnings (loss) per share and diluted earnings per share are computed as follows:
| | | | | | | | | | | |
| | | 2003 | | 2004 | | | 2005 | |
Income for the year | | $ | 1,134 | | $ | 12,731 | | | $ | 17,421 | |
Dividends on Series A Preferred shares | | | — | | | (36 | ) | | | (3,238 | ) |
Beneficial conversion amount | | | — | | | — | | | | (27,619 | ) |
Income attributable to Series A Preferred shareholders | | | — | | | — | | | | (1,500 | ) |
| | | | | | | | | | | |
Income (loss) available to ordinary shareholders | | $ | 1,134 | | $ | 12,695 | | | $ | (14,936 | ) |
| | | | | | | | | | | |
Weighted average number of ordinary shares for the calculation of basic earnings (loss) per share | | | 600,000,000 | | | 613,150,000 | | | | 749,900,000 | |
Effect of dilutive potential ordinary shares: Series A Preferred Shares | | | N/A | | | 99,400,000 | | | | — | |
| | | | | | | | | | | |
Weighted average number of ordinary shares for the purposes of diluted earnings (loss) per share | | | N/A | | | 712,550,000 | | | | 749,900,000 | |
| | | | | | | | | | | |
The Series A Preferred Shares are included in the calculation of the basic weighted average number of ordinary shares outstanding as each holder of Series A Preferred Shares is entitled to convert at any time and from time to time, subject to the automatic conversion terms, any or all of such holder’s Series A Preferred Shares. There is no dilutive effect as the conversion of Company’s outstanding Series A Preferred Shares would result in an increase in earnings per share.
F-19
A-MAX TECHNOLOGY LIMITED
NOTES TO CONSOLIDATED FINANCIAL STATEMENTS - continued
(In thousands of US dollars, except share and per share data)
12. Other Income
| | | | | | | | | |
Year ended December 31, | | 2003 | | 2004 | | 2005 |
Exchange gain | | $ | 393 | | $ | 9 | | $ | 258 |
Gain on disposal of investment securities | | | 20 | | | 5 | | | — |
Others | | | 53 | | | 106 | | | 391 |
| | | | | | | | | |
| | $ | 466 | | $ | 120 | | $ | 649 |
| | | | | | | | | |
13. Staff Retirement Plans
The Company operates a Mandatory Provident Fund (“MPF”) scheme for all qualifying employees in Hong Kong. The MPF is a defined contribution scheme and the assets of the scheme are managed by trustees independent to the Company.
The MPF is available to all employees aged 18 to 64 and with at least 60 days of service under the employment of the Company in Hong Kong. Contributions are made by the Company at 5% of the employee’s relevant income. The maximum relevant income for contribution purpose per employee is $3 per month. Employees are entitled to 100% of the Company’s contributions together with accrued returns irrespective of their length of service with the Company, but the benefits are required by law to be preserved until the retirement age of 65 for employees in Hong Kong.
According to the relevant laws and regulations in the PRC, the Company is required to contribute 8% to 9% of the stipulated salary set by the local government of Shenzhen, the PRC, to the retirement benefit schemes to fund the retirement benefits of their employees. The principal obligation of the Company with respect to these retirement benefit schemes is to make the required contributions under the scheme. No forfeited contributions may be used by the employer to reduce the existing level of contributions.
The aggregate cost of the Company’s contributions to the staff retirement plans in Hong Kong and the PRC amounted to $43, $93 and $265 for the years ended December 31, 2003, 2004 and 2005, respectively.
Save as aforesaid, there are no staff retirement costs incurred for other locations for the year ended December 31, 2003, 2004 and 2005 respectively.
F-20
A-MAX TECHNOLOGY LIMITED
NOTES TO CONSOLIDATED FINANCIAL STATEMENTS - continued
(In thousands of US dollars, except share and per share data)
14. Income Taxes
The components of income taxes are as follows:
| | | | | | | | | |
Year ended December 31, | | 2003 | | 2004 | | 2005 |
Hong Kong | | $ | 165 | | $ | 2,568 | | $ | 4,400 |
| | | | | | | | | |
Under the current Bermuda law, the Company’s income is not subject to taxation. Subsidiaries operating in Hong Kong and the PRC are subject to income taxes as described below, and the subsidiaries operating in the BVI are exempted from income taxes.
The provision for current income taxes of the subsidiaries operating in Hong Kong has been calculated by applying the statutory rate of taxation of 16% for 2003 and 17.5% for 2004 and 2005 to the estimated taxable income earned in or derived from Hong Kong during the relevant period, if applicable.
Deferred tax, where applicable, is provided under the liability method at the rate of 16% for 2003 and 17.5% for 2004 and 2005, being the enacted Hong Kong statutory income tax rate applicable to the respective financial years, on the difference between the financial statement carrying amounts and income tax base of assets and liabilities.
The basic corporate tax rate for Foreign Investment Enterprises (“FIEs”) in the PRC is currently 33% (30% state tax and 3% local tax). However, because Shenzhen A-Max Technology (China) Limited is located in Shenzhen and is involved in manufacturing operations, the subsidiary qualifies for a special reduced state tax rate of 15%. In addition, the local tax authorities in Shenzhen are not currently assessing any local tax. Since the PRC subsidiaries have agreed to operate for a minimum of 10 years in the PRC, a two-year tax holiday from the first profit making year is available, following which in the third through fifth years there is a 50% reduction to 7.5%. The first profit making year was 2004 and as a result, the last year for which the Company will benefit from this tax holiday will be the fiscal year ending December 31, 2008.
The current and deferred components of the income tax expense appearing in the consolidated statements of operations are as follows:
| | | | | | | | | | |
Year ended December 31, | | 2003 | | | 2004 | | 2005 |
Income tax | | | | | | | | | | |
Current year | | $ | 159 | | | $ | 2,490 | | $ | 4,370 |
Over provision in prior year | | | (9 | ) | | | — | | | — |
Deferred tax | | | | | | | | | | |
Charge for the year | | | 13 | | | | 78 | | | 30 |
Effects change in tax rate | | | 2 | | | | — | | | — |
| | | | | | | | | | |
| | $ | 165 | | | $ | 2,568 | | $ | 4,400 |
| | | | | | | | | | |
F-21
A-MAX TECHNOLOGY LIMITED
NOTES TO CONSOLIDATED FINANCIAL STATEMENTS - continued
(In thousands of US dollars, except share and per share data)
14. Income Taxes - continued
The Company’s deferred tax assets and liabilities as of December 31, 2003, 2004 and 2005 are attributable to the following:
| | | | | | | | | | | | |
At December 31, | | 2003 | | | 2004 | | | 2005 | |
Deferred tax liabilities: | | | | | | | | | | | | |
Accelerated tax depreciation | | $ | 41 | | | $ | 121 | | | $ | 149 | |
| | | | | | | | | | | | |
Deferred tax assets: | | | | | | | | | | | | |
Net operating loss | | $ | 346 | | | $ | 307 | | | $ | 247 | |
Valuation allowance | | | (346 | ) | | | (307 | ) | | | (247 | ) |
| | | | | | | | | | | | |
| | $ | — | | | $ | — | | | $ | — | |
| | | | | | | | | | | | |
The realization of the recorded deferred tax assets is dependent on generating sufficient taxable income in the jurisdiction in which the asset may be utilized prior to the expiration of net operating loss carryforwards. As the management does not believe that it is more likely than not that the deferred tax assets will be realized, a full valuation allowance has been established at balance sheet dates.
At December 31, 2003, 2004 and 2005, the Company had net operating loss carryforwards of $969, $903 and $985 respectively. As of December 31, 2004, the Company’s PRC subsidiary had tax losses of approximately $36 that will expire five years from the respective financial years incurring the losses. Other losses may be carried forward indefinitely.
At December 31, 2003, 2004 and 2005, net operating loss carryforwards attributable to A-Max Technology GmbH were $874, $808 and $635, respectively. Tax losses may be carried forward indefinitely.
At December 31, 2005, net operating loss carry forwards attributable to A-Max F7 Technology Limited were $314. Tax losses may be carried forward indefinitely.
No income tax arose in the United States of America in any of the periods presented.
F-22
A-MAX TECHNOLOGY LIMITED
NOTES TO CONSOLIDATED FINANCIAL STATEMENTS - continued
(In thousands of US dollars, except share and per share data)
14. Income Taxes - continued
A reconciliation of the income tax expense to the amount computed by applying the current tax rate to the income before income taxes in the consolidated statements of operations is as follows:
| | | | | | | | | | | | |
Year ended December 31, | | 2003 | | | 2004 | | | 2005 | |
Income before income taxes | | $ | 1,299 | | | $ | 15,299 | | | $ | 21,821 | |
Hong Kong Profits Tax rate | | | 17.5 | % | | | 17.5 | % | | | 17.5 | % |
Income tax expense at Hong Kong tax rate on income before income tax | | $ | 227 | | | $ | 2,677 | | | $ | 3,819 | |
Effect of income for which no income tax benefit/expense is receivable/payable | | | (7 | ) | | | 137 | | | | 454 | |
Effect of change in tax rate | | | 2 | | | | — | | | | — | |
Valuation allowance | | | 17 | | | | — | | | | 55 | |
Reversal of valuation allowance | | | (9 | ) | | | (21 | ) | | | — | |
Overprovision for income tax expense in prior years | | | (9 | ) | | | — | | | | — | |
Effect of different tax rates of operations in other jurisdictions | | | (17 | ) | | | (233 | ) | | | (11 | ) |
Tax effect of tax losses previously not recognised | | | — | | | | — | | | | (1 | ) |
Other | | | (39 | ) | | | 8 | | | | 84 | |
| | | | | | | | | | | | |
| | $ | 165 | | | $ | 2,568 | | | $ | 4,400 | |
| | | | | | | | | | | | |
The additional tax that would otherwise have been payable without tax holidays and tax concessions amounts to approximately $9 in the year ended December 31, 2005 which would have no impact on the basic and diluted loss per share for the year ended December 31, 2005.
During the year, the Company has established a subsidiary, A-Max Macao, in Macao where the local tax rate is 0%. The compliance of A-Max Macao as a Macao offshore company is subject to the review and approval of the Macao government. However, based on the structure of the Group’s operations in year 2005, the profit generated by A-Max Macao has been provided for based on the Hong Kong Profits tax of 17.5%.
F-23
A-MAX TECHNOLOGY LIMITED
NOTES TO CONSOLIDATED FINANCIAL STATEMENTS - continued
(In thousands of US dollars, except share and per share data)
15. Commitments and Contingencies
Lease commitments
Rental expense under operating leases was $205, $307 and $1,062 in the years ended December 31, 2003, 2004 and 2005, respectively.
At December 31, 2005, the Company was obligated under operating leases, which relate to land and buildings, requiring minimum rentals as follows:
| | | |
Year ending December 31, | | 2005 |
2006 | | $ | 1,207 |
2007 | | | 1,068 |
2008 | | | 408 |
2009 | | | 130 |
2010 | | | 78 |
| | | |
| | $ | 2,891 |
| | | |
16. Distribution of Profits
As stipulated by the relevant laws and regulations applicable to China’s FIEs, the Company’s subsidiaries in the PRC other than Hong Kong are required to make appropriations from net income as determined in accordance with accounting principles and the relevant financial regulations applicable to PRC enterprises (“PRC GAAP”) to non-distributable reserves which include a general reserve, an enterprise expansion reserve and a staff welfare and bonus reserve. Wholly owned PRC subsidiaries are not required to make appropriations to the enterprise expansion reserve but appropriations to the general reserve are required to be made at not less than 10% of the profit after tax as determined under PRC GAAP. The staff welfare and bonus reserve is determined by the board of directors.
The general reserve is used to offset future extraordinary losses. The subsidiaries may, upon a resolution passed by the stockholders, convert the general reserve into capital. The staff welfare and bonus reserve is used for the collective welfare of the employees of the subsidiaries. The enterprise expansion reserve is used for the expansion of the subsidiaries’ operations and can be converted to capital subject to approval by the relevant authorities. These reserves represent appropriations of retained earnings determined according to Chinese law and may not be distributed. There were no appropriations to reserves by the Company other than the Company’s subsidiaries in the PRC during any of the periods presented. However, as a result of these laws, approximately $192 is not available for distribution as of December 31, 2005.
F-24
A-MAX TECHNOLOGY LIMITED
NOTES TO CONSOLIDATED FINANCIAL STATEMENTS - continued
(In thousands of US dollars, except share and per share data)
17. Operations by Geographical Area
The Company currently operates in one reportable segment, the provision of IDS solutions, which includes the design and manufacture of portable multimedia computer related consumer electronic products for global brand name companies in the portable digital audio industry and the consumer products retail chains. The Company’s chief operating decision maker is the CEO.
Geographic information of the Group is as follows:
| | | | | | | | | |
Year ended December 31, | | 2003 | | 2004 | | 2005 |
Net sales to customers by geographical area based on the destination of shipments: | | | | | | | | | |
- Europe | | | | | | | | | |
- Germany | | $ | 7,900 | | $ | 23,082 | | $ | 57,495 |
- Netherlands | | | 6,853 | | | 3,880 | | | 3,604 |
- Luxembourg | | | — | | | 17,115 | | | 25,918 |
- United Kingdom | | | 377 | | | 17,190 | | | 56,729 |
- France | | | 1,990 | | | 16,608 | | | 37,889 |
- Others | | | 193 | | | 133 | | | 5,467 |
- United States | | | 3,965 | | | 25,092 | | | 33,028 |
- Asia (excluding Japan) | | | 17,812 | | | 25,023 | | | 95,323 |
- Japan | | | — | | | 11,619 | | | 8,444 |
- Others | | | 298 | | | 1,642 | | | 4,424 |
| | | | | | | | | |
Total net sales | | $ | 39,388 | | $ | 141,384 | | $ | 328,321 |
| | | | | | | | | |
| | | |
As at December 31, | | 2003 | | 2004 | | 2005 |
Long-lived assets by geographical area: | | | | | | | | | |
- PRC, excluding Hong Kong | | $ | 2,079 | | $ | 3,699 | | $ | 15,416 |
- Hong Kong | | | 339 | | | 928 | | | 1,570 |
- Others | | | 62 | | | 58 | | | 160 |
| | | | | | | | | |
Total long-lived assets | | $ | 2,480 | | $ | 4,685 | | $ | 17,146 |
| | | | | | | | | |
F-25
A-MAX TECHNOLOGY LIMITED
NOTES TO CONSOLIDATED FINANCIAL STATEMENTS - continued
(In thousands of US dollars, except share and per share data)
18. Major Customers
The Company’s sales to customers which accounted for 10% or more of its sales are as follows:
| | | | | | | | | |
Year ended December 31, | | 2003 | | | 2004 | | | 2005 | |
A | | 13 | % | | — | | | — | |
B | | — | | | — | | | 10 | % |
C | | — | | | — | | | 10 | % |
D | | — | | | 27 | % | | 21 | % |
E | | — | | | 15 | % | | — | |
F | | — | | | 10 | % | | — | |
G | | 10 | % | | — | | | — | |
Others | | 77 | % | | 48 | % | | 59 | % |
| | | | | | | | | |
| | 100 | % | | 100 | % | | 100 | % |
| | | | | | | | | |
19. Related Party Transactions
The Company received loans from a director of the Company in the past for working capital purposes, the last of which was in 2001. The loans are non-interest bearing and are payable on demand. Outstanding balances payable on demand were $2,654, $1,430 and $nil as of December 31, 2003, 2004 and 2005 respectively. The remaining outstanding balance was paid in full in June 2005.
The Company received loans from a shareholder of the Company in the past for working capital purposes. The loans are non-interest bearing and are payable on demand. Outstanding balances payable on demand were $92, $104 and $nil as of December 31, 2003, 2004 and 2005 respectively. The remaining outstanding balance was paid in full in January 2005.
During the year ended December 31, 2004, A-Max Technology Company Limited (“A-Max (HK)”) entered into an agreement with Crosby Capital Partners (Hong Kong) Limited and its affiliate SBI Crosby Limited (collectively “Crosby”), under which Crosby is to provide certain financial advisory services to the Company. Such financial advisory services mainly relate to assisting the Company in the preparation of certain marketing materials and to identify and assist in certain negotiations with prospective investors. The transaction is a related party transaction as a director of the Company is also a director of Crosby. Under the terms of the agreement, A-Max (HK) agrees to pay Crosby an aggregate financial advisory fee of $40 and a success-based commission. During the year ended December 31, 2005, A-Max (HK) paid $525 to Crosby as a success-based commission and financial advisory fee.
In January 2005, the Company had guarantees from E2-Capital Holdings Ltd. (“E2-Capital”), a listed company in Hong Kong in connection with obtaining certain banking facilities in an amount of approximately $11,590. The transaction is a related party transaction as certain substantial shareholders of E2-Capital are also shareholders of the Company. Under the terms of the guarantee agreement, the Company is required to pay a fee of 2% per annum to E-2 Capital based on the monthly utilization of the banking facilities. During the year ended December 31, 2005, the Company incurred $84 in such fees to E2-Capital. The last of which was paid in July 2005.
F-26
A-MAX TECHNOLOGY LIMITED
NOTES TO CONSOLIDATED FINANCIAL STATEMENTS - continued
(In thousands of US dollars, except share and per share data)
19. Related Party Transactions - continued
During the year ended December 31, 2005, the Company’s sales to NAPA Global Limited, a subsidiary of E2-Capital, amounted to $146 (2004: $417 and 2003: $nil). As of December 31, 2005, the amount due from NAPA Global Limited amounted to $nil.
During the year ended December 31, 2004, one of the Company’s operating subsidiaries entered into a tenancy agreement with Lucky Happy Development Limited, which is an indirectly wholly-owned subsidiary of E2-Capital, for the purpose of the Hong Kong office premise. Lucky Happy Development transferred its ownership interest in the Hong Kong office premise to a third party unaffiliated with E2-Capital by the end of June 2005. The rent paid during the year ended December 31, 2004 and 2005 amounted to $8 and $28 respectively.
On August 26, 2005, the existing holders of the Company’s ordinary shares entered into a share purchase agreement to sell 5,895,440 ordinary shares on a pro rata basis on their holdings of the Company’s ordinary shares for a total purchase price of approximately $2.5 million to four new investors, including a Company’s independent director, at approximately $0.42 per share. The share purchase and sale transaction was completed in September 2005. The director is being sold 1,000,000 ordinary shares in connection with his appointment as director of the Company. Accordingly, the Company engaged a third party appraiser to assist in the assessment of the fair value of the ordinary shares at the date of purchase, in order to determine the amount of share-based compensation expense required to be recorded in connection with this transaction. As a result, the Company incurred compensation expenses amounted to $132 during the year ended December 31, 2005.
20. Contingency
On March 30, 2005, the Company received a settlement offer from legal counsel representing a former customer which filed a complaint with the Bankruptcy Court in the United States District Court, North District of California on July 24, 2003 to recover certain amounts which may be deemed to be “preferential transfers”, pursuant to Chapter 11 of the Bankruptcy Code. The maximum potential claims under this complaint is approximately $2,000 based on payments received by A-Max from this customer within 90 days before the customer’s bankruptcy filing. The Company believes that these payments were made in the normal course of business and should not be deemed to be preferential and will defend its rights vigorously.
Pursuant to the Amended and Restated Settlement Agreement and Release which was entered into as of March 17, 2006 by and between the former customer and its debtors and the Company, the maximum settlement amount for this claim was $262 of which the Company has fully reserved in the consolidated balance sheet.
F-27