UNITED STATES
SECURITIES AND EXCHANGE COMMISSION
Washington, D.C. 20549
FORM N-CSR
CERTIFIED SHAREHOLDER REPORT OF REGISTERED
MANAGEMENT INVESTMENT COMPANIES
| | |
| Investment Company Act file number | | 811-21809 |
Nuveen S&P 500 Dynamic Overwrite Fund
(Exact name of registrant as specified in charter)
Nuveen Investments
333 West Wacker Drive, Chicago, IL 60606
(Address of principal executive offices) (Zip code)
Mark L. Winget
Nuveen Investments
333 West Wacker Drive, Chicago, IL 60606
(Name and address of agent for service)
Registrant’s telephone number, including area code: (312) 917-7700
Date of fiscal year end: December 31
Date of reporting period: June 30, 2022
Form N-CSR is to be used by management investment companies to file reports with the Commission not later than 10 days after the transmission to stockholders of any report that is required to be transmitted to stockholders under Rule 30e-1 under the Investment Company Act of 1940 (17 CFR 270.30e-1). The Commission may use the information provided on Form N-CSR in its regulatory, disclosure review, inspection, and policy making roles.
A registrant is required to disclose the information specified by Form N-CSR, and the Commission will make this information public. A registrant is not required to respond to the collection of information contained in Form N-CSR unless the Form displays a currently valid Office of Management and Budget (“OMB”) control number. Please direct comments concerning the accuracy of the information collection burden estimate and any suggestions for reducing the burden to Secretary, Securities and Exchange Commission, 450 Fifth Street, NW, Washington, DC 20549-0609. The OMB has reviewed this collection of information under the clearance requirements of 44 U.S.C. ss.3507.
ITEM 1. REPORTS TO STOCKHOLDERS.

Closed-End Funds
30 June
2022
Nuveen
Closed-End Funds
| | |
| BXMX | | Nuveen S&P 500 Buy-Write Income Fund |
| DIAX | | Nuveen Dow 30SM Dynamic Overwrite Fund |
| SPXX | | Nuveen S&P 500 Dynamic Overwrite Fund |
| QQQX | | Nuveen Nasdaq 100 Dynamic Overwrite Fund |
| JCE | | Nuveen Core Equity Alpha Fund |
Semiannual Report
IMPORTANT DISTRIBUTION NOTICE
for Shareholders of the Nuveen S&P 500 Buy-Write Income Fund (BXMX) Nuveen Dow 30SM Dynamic Overwrite Fund (DIAX)
Nuveen S&P 500 Dynamic Overwrite Fund (SPXX)
Nuveen Nasdaq 100 Dynamic Overwrite Fund (QQQX)
Nuveen Core Equity Alpha Fund (JCE)
Semiannual Shareholder Report for the period ending June 30, 2022
The Nuveen S&P 500 Buy-Write Income Fund (BXMX), Nuveen Dow 30SM Dynamic Overwrite Fund (DIAX), Nuveen S&P 500 Dynamic Overwrite Fund (SPXX), Nuveen Nasdaq 100 Dynamic Overwrite Fund (QQQX) and Nuveen Core Equity Alpha Fund (JCE) seek to offer attractive cash flow to their shareholders, by converting the expected long-term total return potential of the Funds’ portfolio of investments into regular quarterly distributions. Following is a discussion of the Managed Distribution Policy the Funds use to achieve this.
Each Fund pays quarterly common share distributions that seek to convert the Fund’s expected long-term total return potential into regular cash flow. As a result, the Funds’ regular common share distributions (presently $0.2365, $0.2867, $0.2940, $0.4934 and $0.3952 per share, respectively) may be derived from a variety of sources, including:
| | • | | net investment income consisting of regular interest and dividends, |
| | • | | realized capital gains or, |
| | • | | possibly, returns of capital representing in certain cases unrealized capital appreciation. |
Such distributions are sometimes referred to as “managed distributions.” Each Fund seeks to establish a distribution rate that roughly corresponds to the Adviser’s projections of the total return that could reasonably be expected to be generated by each Fund over an extended period of time. The Adviser may consider many factors when making such projections, including, but not limited to, long-term historical returns for the asset classes in which each Fund invests. As portfolio and market conditions change, the distribution amount and distribution rate on the Common Shares under the Funds’ Managed Distribution Policy could change.
When it pays a distribution, each Fund provides holders of its Common Shares a notice of the estimated sources of the Fund’s distributions (i.e., what percentage of the distributions is estimated to constitute ordinary income, short-term capital gains, long-term capital gains, and/or a non-taxable return of capital) on a year-to-date basis. It does this by posting the notice on its website (www.nuveen.com/cef), and by sending it in written form.
You should not draw any conclusions about the Funds’ investment performance from the amount of this distribution or from the terms of the Funds’ Managed Distribution Policy. The Funds’ actual financial performance will likely vary from month-to-month and from year-to-year, and there may be extended periods when the distribution rate will exceed the Funds’ actual total returns. The Managed Distribution Policy provides that the Board may amend or terminate the Policy at any time without prior notice to Fund shareholders. There are presently no reasonably foreseeable circumstances that might cause each Fund to terminate its Managed Distribution Policy.
Table of Contents
3
Chair’s Letter to Shareholders

Dear Shareholders,
The first half of 2022 was challenging for financial markets. While global economic activity began to slow from post-pandemic peaks as pent-up demand waned and crisis-era monetary and fiscal support programs were phased out, persistently high inflation and central banks’ response have contributed to heightened uncertainty about financial and economic conditions.
Inflation has surged partially due to supply chain bottlenecks and exacerbated by Russia’s war in Ukraine and recent lockdowns across China to contain a large-scale COVID-19 outbreak. This has necessitated more forceful responses from the U.S. Federal Reserve (Fed) and other central banks, who now face an even more difficult task of slowing inflation without pulling their respective economies into recession. As anticipated, the Fed began the rate hiking cycle in March 2022, raising its short-term rate by 0.25% from near zero for the first time since the pandemic was declared two years ago. Larger increases of 0.50% in May and 0.75% in both June and July 2022 followed, bringing the target fed funds rate to a range of 2.25% to 2.50%. Additional rate hikes are expected in the remainder of this year, although Fed officials will closely monitor inflation data along with other economic measures and modify their rate setting policy based upon these factors. U.S. gross domestic product growth has now contracted for two consecutive quarters, according to preliminary government estimates, as consumer and business activity has slowed in part due to higher prices and borrowing costs. However, the still strong labor market suggests not all areas of the economy are weakening.
In the meantime, while markets will likely continue fluctuating with the daily headlines, we encourage investors to keep a long-term perspective. To learn more about how well your portfolio is aligned to your time horizon, risk tolerance and investment goals, consider reviewing it with your financial professional.
On behalf of the other members of the Nuveen Fund Board, I look forward to continuing to earn your trust in the months and years ahead.

Terence J. Toth
Chair of the Board
August 22, 2022
4
Important Notices
Nuveen S&P 500 Buy-Write Income Fund (BXMX)
Nuveen Dow 30SM Dynamic Overwrite Fund (DIAX)
Nuveen S&P 500 Dynamic Overwrite Fund (SPXX)
Nuveen Nasdaq 100 Dynamic Overwrite Fund (QQQX)
Nuveen Core Equity Alpha Fund (JCE)
Portfolio Manager Commentaries in Semiannual Shareholder Reports
The Funds include portfolio manager commentary in their annual shareholder reports. For the Fund’s most recent annual portfolio manager discussion, please refer to the Portfolio Managers’ Comments section of the Fund’s December 31, 2021 annual shareholder report.
For current information on your Fund’s investment objectives, portfolio management team and average annual total returns please refer to the Fund’s website at www.nuveen.com.
For changes that occurred to your Fund both during and subsequent to this reporting period, please refer to the Notes to Financial Statements section of this report.
For average annual total returns as of the end of this reporting period, please refer to the Performance Overview and Holding Summaries section within this report.
5
Common Share Information
DISTRIBUTION INFORMATION
The following 19(a) Notice presents the Funds’ most current distribution information as of May 31, 2022 as required by certain exempted regulatory relief the Funds have received.
Because the ultimate tax character of your distributions depends on the Funds’ performance for its entire fiscal year (which is the calendar year for the Funds) as well as certain fiscal year-end (FYE) tax adjustments, estimated distribution source information you receive with each distribution may differ from the tax information reported to you on your Funds’ IRS Form 1099 statement.
DISTRIBUTION INFORMATION – AS OF MAY 31, 2022
This notice provides shareholders with information regarding fund distributions, as required by current securities laws. You should not draw any conclusions about the Funds’ investment performance from the amount of this distribution or from the terms of the Funds’ Managed Distribution Policy.
The amounts and sources of distributions set forth below are only estimates and are not being provided for tax reporting purposes. The actual amounts and sources of the amounts for tax reporting purposes will depend upon the Funds’ investment experience during the remainder of its fiscal year and may be subject to changes based on tax regulations. Each Fund will send you a Form 1099-DIV for the calendar year that will tell you how to report these distributions for federal income tax purposes. More details about the Funds’ distributions and the basis for these estimates are available on www.nuveen.com/cef.
The following table provides estimates of the Funds’ distribution sources, reflecting year-to-date cumulative experience through the month-end prior to the latest distribution. The Funds attribute these estimates equally to each regular distribution throughout the year. Consequently, the estimated information as of the specified month-end shown below is for the current distribution, and also represents an updated estimate for all prior months in the year.
6
Data as of May 31, 2022
| | | | | | | | | | | | | | | | | | | | | | | | | | | | | | | | | | | | | | | | |
| | | | | | | | | Estimated Per Share Sources of Distribution1 | | | Estimated Percentage of the Distribution1 | |
| Fund | | Inception
Date | | | Per Share
Distribution | | | Net
Investment
Income | | | Long-Term
Gains | | | Short-Term
Gains | | | Return of
Capital | | | Net
Investment
Income | | | Long-Term
Gains | | | Short-Term
Gains | | | Return of
Capital | |
BXMX (FYE 12/31) | | | Oct-2004 | | | | | | | | | | | | | | | | | | | | | | | | | | | | | | | | | | | | | |
Current Quarter | | | | | | $ | 0.2365 | | | $ | 0.0186 | | | $ | 0.0000 | | | $ | 0.2179 | | | $ | 0.0000 | | | | 7.90 | % | | | 0.00 | % | | | 92.10 | % | | | 0.00 | % |
Fiscal YTD | | | | | | $ | 0.4730 | | | $ | 0.0371 | | | $ | 0.0000 | | | $ | 0.4359 | | | $ | 0.0000 | | | | 7.90 | % | | | 0.00 | % | | | 92.10 | % | | | 0.00 | % |
DIAX (FYE 12/31) | | | Apr-2005 | | | | | | | | | | | | | | | | | | | | | | | | | | | | | | | | | | | | | |
Current Quarter | | | | | | $ | 0.2867 | | | $ | 0.0480 | | | $ | 0.0000 | | | $ | 0.2387 | | | $ | 0.0000 | | | | 16.80 | % | | | 0.00 | % | | | 83.20 | % | | | 0.00 | % |
Fiscal YTD | | | | | | $ | 0.5734 | | | $ | 0.0961 | | | $ | 0.0000 | | | $ | 0.4773 | | | $ | 0.0000 | | | | 16.80 | % | | | 0.00 | % | | | 83.20 | % | | | 0.00 | % |
SPXX (FYE 12/31) | | | Nov-2005 | | | | | | | | | | | | | | | | | | | | | | | | | | | | | | | | | | | | | |
Current Quarter | | | | | | $ | 0.2940 | | | $ | 0.0270 | | | $ | 0.0000 | | | $ | 0.2670 | | | $ | 0.0000 | | | | 9.20 | % | | | 0.00 | % | | | 90.80 | % | | | 0.00 | % |
Fiscal YTD | | | | | | $ | 0.5880 | | | $ | 0.0540 | | | $ | 0.0000 | | | $ | 0.5340 | | | $ | 0.0000 | | | | 9.20 | % | | | 0.00 | % | | | 90.80 | % | | | 0.00 | % |
QQQX (FYE 12/31) | | | Jan-2007 | | | | | | | | | | | | | | | | | | | | | | | | | | | | | | | | | | | | | |
Current Quarter | | | | | | $ | 0.4934 | | | $ | 0.0000 | | | $ | 0.0000 | | | $ | 0.4934 | | | $ | 0.0000 | | | | 0.00 | % | | | 0.00 | % | | | 100.00 | % | | | 0.00 | % |
Fiscal YTD | | | | | | $ | 0.9868 | | | $ | 0.0000 | | | $ | 0.0000 | | | $ | 0.9868 | | | $ | 0.0000 | | | | 0.00 | % | | | 0.00 | % | | | 100.00 | % | | | 0.00 | % |
JCE (FYE 12/31) | | | Mar-2007 | | | | | | | | | | | | | | | | | | | | | | | | | | | | | | | | | | | | | |
Current Quarter | | | | | | $ | 0.3952 | | | $ | 0.3952 | | | $ | 0.0000 | | | $ | 0.0000 | | | $ | 0.0000 | | | | 100.00 | % | | | 0.00 | % | | | 0.00 | % | | | 0.00 | % |
Fiscal YTD | | | | | | $ | 0.7904 | | | $ | 0.7904 | | | $ | 0.0000 | | | $ | 0.0000 | | | $ | 0.0000 | | | | 100.00 | % | | | 0.00 | % | | | 0.00 | % | | | 0.00 | % |
| 1 | Net investment income (NII) is a projection through the end of the current calendar quarter using actual data through the stated month-end date above. Capital gain amounts are as of the stated date above. The estimated per share sources above include an allocation of the NII based on prior year attributions which can be expected to differ from the actual final attributions for the current year. |
The following table provides information regarding the Funds’ distributions and total return performance over various time periods. This information is intended to help you better understand whether returns for the specified time periods were sufficient to meet distributions.
Data as of May 31, 2022
| | | | | | | | | | | | | | | | | | | | | | | | | | | | | | | | |
| | | | | | | | | | | | | | | Annualized | | | Cumulative | |
| Fund | | Inception
Date | | | Quarterly
Distribution | | | Fiscal YTD
Distribution | | | Net Asset
Value (NAV) | | | 5-Year
Return on NAV | | | Fiscal YTD
Dist Rate on NAV1 | | | Fiscal YTD
Return on NAV | | | Fiscal YTD
Dist Rate on NAV1 | |
BXMX | | | Oct-2004 | | | $ | 0.2365 | | | $ | 0.4730 | | | $ | 13.69 | | | | 6.31 | % | | | 6.91% | | | | (9.01 | )% | | | 3.46% | |
DIAX | | | Apr-2005 | | | $ | 0.2867 | | | $ | 0.5734 | | | $ | 16.79 | | | | 6.17 | % | | | 6.83% | | | | (5.68 | )% | | | 3.42% | |
SPXX | | | Nov-2005 | | | $ | 0.2940 | | | $ | 0.5880 | | | $ | 16.55 | | | | 7.68 | % | | | 7.11% | | | | (10.06 | )% | | | 3.55% | |
QQQX | | | Jan-2007 | | | $ | 0.4934 | | | $ | 0.9868 | | | $ | 23.96 | | | | 9.10 | % | | | 8.24% | | | | (17.69 | )% | | | 4.12% | |
JCE | | | Mar-2007 | | | $ | 0.3952 | | | $ | 0.7904 | | | $ | 15.07 | | | | 9.56 | % | | | 10.49% | | | | (10.94 | )% | | | 5.24% | |
| 1 | As a percentage of 5/31/22 NAV. |
NUVEEN CLOSED-END FUND DISTRIBUTION AMOUNTS
The Nuveen Closed-End Funds’ monthly and quarterly periodic distributions to shareholders are posted on www.nuveen.com and can be found on Nuveen’s enhanced closed-end fund resource page, which is at https://www.nuveen.com/resource-center-closed-end-funds, along with other Nuveen closed-end fund product updates. To ensure timely access to the latest information, shareholders may use a subscribe function, which can be activated at this web page (https://www.nuveen.com/subscriptions).
7
Common Share Information (continued)
COMMON SHARE EQUITY SHELF PROGRAMS
During the current reporting period, SPXX and QQQX were authorized by the Securities and Exchange Commission to issue additional common shares through an equity shelf program (Shelf Offering). Under these programs, the Funds, subject to market conditions, may raise additional capital from time to time in varying amounts and offering methods at a net price at or above each Fund’s NAV per common share. The maximum aggregate offering under these Shelf Offerings are as shown in the accompanying table.
| | | | | | | | |
| | | SPXX | | | QQQX | |
Maximum aggregate offering | | | 4,993,317 | | | | Unlimited | |
During the current reporting period, SPXX and QQQX sold common shares through their Shelf Offerings at a weighted average premium to their NAV per common share as shown in the accompanying table.
| | | | | | | | |
| | | SPXX | | | QQQX | |
Common shares sold through shelf offering | | | 218,784 | | | | 1,929,483 | |
Weighted average premium to NAV per common share sold | | | 1.31 | % | | | 2.13 | % |
Refer to Notes to Financial Statements, Note 5 – Fund Shares for further details of Shelf Offerings and each Fund’s respective transactions.
COMMON SHARE REPURCHASES
During August 2022 (subsequent to close of the reporting period), the Funds’ Board of Trustees reauthorized an open-market share repurchase program, allowing each Fund to repurchase an aggregate of up to approximately 10% of its outstanding common shares.
During the current reporting period, the Funds did not repurchase any of their outstanding common shares. As of June 30, 2022, and since the inception of the Funds’ repurchase programs, the Funds have cumulatively repurchased and retired their outstanding common shares as shown in the accompanying table.
| | | | | | | | | | | | | | | | | | | | |
| | | BXMX | | | DIAX | | | SPXX | | | QQQX | | | JCE | |
Common shares cumulatively repurchased and retired | | | 460,238 | | | | 0 | | | | 383,763 | | | | 0 | | | | 449,800 | |
Common shares authorized for repurchase | | | 10,405,000 | | | | 3,635,000 | | | | 1,720,000 | | | | 4,355,000 | | | | 1,600,000 | |
OTHER COMMON SHARE INFORMATION
As of June 30, 2022 the Funds’ common share prices were trading at a premium/(discount) to their common share NAVs and trading at an average premium/(discount) to NAV during the current reporting period, as follows:
| | | | | | | | | | | | | | | | | | | | |
| | | BXMX | | | DIAX | | | SPXX | | | QQQX | | | JCE | |
Common share NAV | | $ | 12.73 | | | $ | 15.83 | | | $ | 15.34 | | | $ | 22.02 | | | $ | 13.51 | |
Common share price | | $ | 12.37 | | | $ | 15.28 | | | $ | 15.66 | | | $ | 21.84 | | | $ | 13.35 | |
Premium/(Discount) to NAV | | | (2.83) | % | | | (3.47) | % | | | 2.09 | % | | | (0.82) | % | | | (1.18) | % |
Average premium/(discount) to NAV | | | (2.56) | % | | | (4.71) | % | | | (1.48) | % | | | 0.13 | % | | | (0.91) | % |
8
Shareholder
Meeting Report
The annual meeting of shareholders was held on April 8, 2022 for BXMX, DIAX, SPXX, QQQX and JCE. The meeting was held virtually due to public health concerns regarding the ongoing COVID-19 pandemic; at this meeting the shareholders were asked to elect Board members.
| | | | | | | | | | | | | | | | | | | | |
| | | BXMX | | | DIAX | | | SPXX | | | QQQX | | | JCE | |
| | | Common
Shares | | | Common
Shares | | | Common
Shares | | | Common
Shares | | | Common
Shares | |
Approval of the Board Members was reached as follows: | | | | | | | | | | | | | | | | | | | | |
William C. Hunter | | | | | | | | | | | | | | | | | | | | |
For | | | 86,857,786 | | | | 29,372,785 | | | | 13,532,642 | | | | 33,818,900 | | | | 13,276,806 | |
Withhold | | | 2,255,295 | | | | 573,310 | | | | 146,169 | | | | 548,513 | | | | 556,829 | |
Total | | | 89,113,081 | | | | 29,946,095 | | | | 13,678,811 | | | | 34,367,413 | | | | 13,833,635 | |
Judith M. Stockdale | | | | | | | | | | | | | | | | | | | | |
For | | | 87,404,832 | | | | 29,407,649 | | | | 13,514,800 | | | | 33,875,576 | | | | 13,271,604 | |
Withhold | | | 1,708,249 | | | | 538,446 | | | | 164,011 | | | | 491,837 | | | | 562,031 | |
Total | | | 89,113,081 | | | | 29,946,095 | | | | 13,678,811 | | | | 34,367,413 | | | | 13,833,635 | |
Carole E. Stone | | | | | | | | | | | | | | | | | | | | |
For | | | 87,379,934 | | | | 29,429,356 | | | | 13,522,661 | | | | 33,886,861 | | | | 13,294,191 | |
Withhold | | | 1,733,147 | | | | 516,739 | | | | 156,150 | | | | 480,552 | | | | 539,444 | |
Total | | | 89,113,081 | | | | 29,946,095 | | | | 13,678,811 | | | | 34,367,413 | | | | 13,833,635 | |
Margaret L. Wolff | | | | | | | | | | | | | | | | | | | | |
For | | | 87,490,144 | | | | 29,452,972 | | | | 13,537,129 | | | | 33,918,120 | | | | 13,306,961 | |
Withhold | | | 1,622,937 | | | | 493,123 | | | | 141,682 | | | | 449,293 | | | | 526,674 | |
Total | | | 89,113,081 | | | | 29,946,095 | | | | 13,678,811 | | | | 34,367,413 | | | | 13,833,635 | |
9
THIS PAGE INTENTIONALLY LEFT BLANK
10
| | |
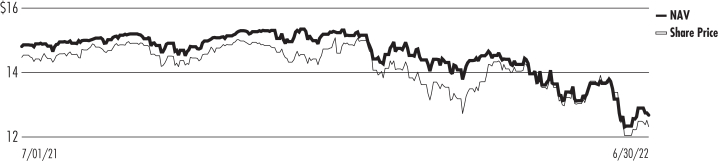
| BXMX | | Nuveen S&P 500 Buy-Write Income Fund Performance Overview and Holding Summaries as of June 30, 2022 |
Refer to the Glossary of Terms Used in this Report for further definition of the terms used within this section.
Average Annual Total Returns as of June 30, 2022*
| | | | | | | | | | | | | | | | |
| | | Cumulative | | | Average Annual | |
| | | 6-Month | | | 1-Year | | | 5-Year | | | 10-Year | |
| BXMX at Common Share NAV | | | (13.82)% | | | | (8.52)% | | | | 5.03% | | | | 6.88% | |
| BXMX at Common Share Price | | | (12.53)% | | | | (8.21)% | | | | 4.80% | | | | 7.87% | |
| Cboe S&P 500® BuyWrite Index (BXMSM) | | | (10.19)% | | | | (2.62)% | | | | 4.09% | | | | 5.89% | |
| * | For purposes of Fund performance, relative results are measured against the Cboe S&P 500® BuyWrite Index (BXMSM). |
Performance data shown represents past performance and does not predict or guarantee future results. Current performance may be higher or lower than the data shown. Returns do not reflect the deduction of taxes that shareholders may have to pay on Fund distributions or upon the sale of Fund shares. Returns at NAV are net of Fund expenses, and assume reinvestment of distributions. Comparative index return information is provided for the Fund’s shares at NAV only. Indexes are not available for direct investment.
Daily Common Share NAV and Share Price
11
This data relates to the securities held in the Fund’s portfolio of investments as of the end of the reporting period. It should not be construed as a measure of performance for the Fund itself. Holdings are subject to change.
Fund Allocation
(% of net assets)
| | | | |
| Common Stocks | | | 99.3% | |
| Repurchase Agreements | | | 3.8% | |
| Other Assets Less Liabilities | | | (3.1)% | |
Net Assets | | | 100% | |
Top Five Holdings
(% of total long-term investments)
| | | | |
| Apple Inc | | | 6.7% | |
| Microsoft Corp | | | 6.1% | |
| Amazon.com Inc | | | 3.0% | |
| Alphabet Inc, Class A | | | 2.4% | |
| Tesla Inc | | | 1.8% | |
Portfolio Composition1
(% of total investments)
| | | | |
| Software | | | 8.8% | |
| Technology Hardware, Storage & Peripherals | | | 6.6% | |
| Interactive Media & Services | | | 5.2% | |
| Semiconductors & Semiconductor Equipment | | | 5.0% | |
| Pharmaceuticals | | | 4.7% | |
| IT Services | | | 4.4% | |
| Oil, Gas & Consumable Fuels | | | 3.8% | |
| Banks | | | 3.7% | |
| Health Care Providers & Services | | | 3.4% | |
| Internet & Direct Marketing Retail | | | 2.9% | |
| Equity Real Estate Investment Trust | | | 2.7% | |
| Capital Markets | | | 2.4% | |
| Health Care Equipment & Supplies | | | 2.3% | |
| Insurance | | | 2.3% | |
| Biotechnology | | | 2.2% | |
| Automobiles | | | 2.0% | |
| Specialty Retail | | | 1.9% | |
| Hotels, Restaurants & Leisure | | | 1.9% | |
| Life Sciences Tools & Services | | | 1.8% | |
| Beverages | | | 1.8% | |
| Aerospace & Defense | | | 1.7% | |
| Diversified Financial Services | | | 1.7% | |
| Multi-Utilities | | | 1.7% | |
| Chemicals | | | 1.6% | |
| Household Products | | | 1.6% | |
| Machinery | | | 1.6% | |
| Food & Staples Retailing | | | 1.5% | |
| Other | | | 15.0% | |
| Repurchase Agreements | | | 3.8% | |
Total | | | 100% | |
| 1 | See the Portfolio of Investments for the remaining industries/sectors comprising “Other” and not listed in the Portfolio Composition above. |
12
| | |
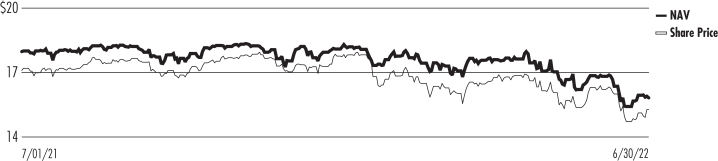
| DIAX | | Nuveen Dow 30SM Dynamic Overwrite Fund Performance Overview and Holding Summaries as of June 30, 2022 |
Refer to the Glossary of Terms Used in this Report for further definition of the terms used within this section.
Average Annual Total Returns as of June 30, 2022*
| | | | | | | | | | | | | | | | |
| | | Cumulative | | | Average Annual |
| | | 6-Month | | | 1-Year | | | 5-Year | | | 10-Year | |
| DIAX at Common Share NAV | | | (9.46)% | | | | (5.94)% | | | | 4.96% | | | | 7.78% | |
| DIAX at Common Share Price | | | (10.90)% | | | | (4.01)% | | | | 5.53% | | | | 8.59% | |
| Dow Jones Industrial Average Index (DJIA) | | | (14.44)% | | | | (9.05)% | | | | 9.98% | | | | 11.70% | |
| DIAX Blended Benchmark | | | (9.67)% | | | | (3.26)% | | | | 7.70% | | | | 8.33% | |
| * | For purposes of Fund performance, relative results are measured against the DIAX Blended Benchmark. The Fund’s Blended Benchmark consists of: 1) 55% Chicago Board Options Exchange (Cboe) DJIA BuyWrite Index (BXDSM) and 2) 45% Dow Jones Industrial Average Index (DJIA). |
Performance data shown represents past performance and does not predict or guarantee future results. Current performance may be higher or lower than the data shown. Returns do not reflect the deduction of taxes that shareholders may have to pay on Fund distributions or upon the sale of Fund shares. Returns at NAV are net of Fund expenses, and assume reinvestment of distributions. Comparative index return information is provided for the Fund’s shares at NAV only. Indexes are not available for direct investment.
Daily Common Share NAV and Share Price
13
This data relates to the securities held in the Fund’s portfolio of investments as of the end of the reporting period. It should not be construed as a measure of performance for the Fund itself. Holdings are subject to change.
Fund Allocation
(% of net assets)
| | | | |
| Common Stocks | | | 99.3% | |
| Exchange-Traded Funds | | | 3.1% | |
| Repurchase Agreements | | | 1.9% | |
| Other Assets Less Liabilities | | | (4.3)% | |
Net Assets | | | 100% | |
Top Five Holdings
(% of total long-term investments)
| | | | |
| UnitedHealth Group Inc | | | 10.7% | |
| Goldman Sachs Group Inc | | | 6.2% | |
| Home Depot Inc | | | 5.7% | |
| Microsoft Corp | | | 5.3% | |
| McDonald’s Corp | | | 5.1% | |
Portfolio Composition1
(% of total investments)
| | | | |
| Health Care Providers & Services | | | 10.5% | |
| Software | | | 8.5% | |
| IT Services | | | 6.9% | |
| Industrial Conglomerates | | | 6.2% | |
| Capital Markets | | | 6.1% | |
| Specialty Retail | | | 5.6% | |
| Pharmaceuticals | | | 5.5% | |
| Hotels, Restaurants & Leisure | | | 5.0% | |
| Biotechnology | | | 5.0% | |
| Machinery | | | 3.6% | |
| Insurance | | | 3.4% | |
| Food & Staples Retailing | | | 3.2% | |
| Oil, Gas & Consumable Fuels | | | 3.0% | |
| Household Products | | | 2.9% | |
| Consumer Finance | | | 2.8% | |
| Aerospace & Defense | | | 2.8% | |
| Technology Hardware, Storage & Peripherals | | | 2.8% | |
| Other | | | 11.3% | |
| Exchange-Traded Funds | | | 3.0% | |
| Repurchase Agreements | | | 1.9% | |
Total | | | 100% | |
| 1 | See the Portfolio of Investments for the remaining industries/sectors comprising “Other” and not listed in the Portfolio Composition above. |
14
| | |
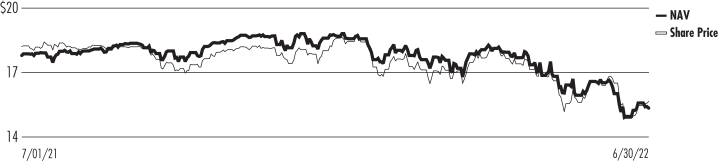
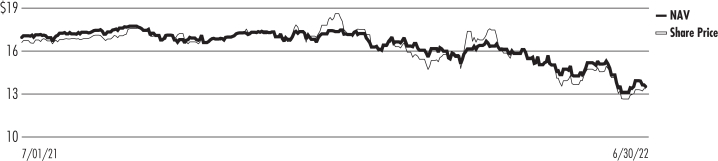
| SPXX | | Nuveen S&P 500 Dynamic Overwrite Fund Performance Overview and Holding Summaries as of June 30, 2022 |
Refer to the Glossary of Terms Used in this Report for further definition of the terms used within this section.
Average Annual Total Returns as of June 30, 2022*
| | | | | | | | | | | | | | | | |
| | | Cumulative | | | Average Annual | |
| | | 6-Month | | | 1-Year | | | 5-Year | | | 10-Year | |
| SPXX at Common Share NAV | | | (15.04)% | | | | (7.96)% | | | | 6.28% | | | | 7.67% | |
| SPXX at Common Share Price | | | (12.83)% | | | | (7.98)% | | | | 7.35% | | | | 9.53% | |
| S&P 500® Index | | | (19.96)% | | | | (10.62)% | | | | 11.31% | | | | 12.96% | |
| SPXX Blended Benchmark | | | (14.66)% | | | | (6.21)% | | | | 7.38% | | | | 9.09% | |
| * | For purposes of Fund performance, relative results are measured against the SPXX Blended Benchmark. The Fund’s Blended Benchmark consists of: 1) 55% Chicago Board Options Exchange (Cboe) S&P 500® BuyWrite Index (BXMSM) and 2) 45% S&P 500® Index |
Performance prior to December 22, 2014, reflects the Fund’s performance under the management of a sub-adviser using an investment strategy that differed from those currently in place.
Performance data shown represents past performance and does not predict or guarantee future results. Current performance may be higher or lower than the data shown. Returns do not reflect the deduction of taxes that shareholders may have to pay on Fund distributions or upon the sale of Fund shares. Returns at NAV are net of Fund expenses, and assume reinvestment of distributions. Comparative index return information is provided for the Fund’s shares at NAV only. Indexes are not available for direct investment.
Daily Common Share NAV and Share Price
15
This data relates to the securities held in the Fund’s portfolio of investments as of the end of the reporting period. It should not be construed as a measure of performance for the Fund itself. Holdings are subject to change.
Fund Allocation
(% of net assets)
| | | | |
| Common Stocks | | | 98.8% | |
| Exchange-Traded Funds | | | 3.0% | |
| Investments Purchased with Collateral from Securities Lending | | | 0.2% | |
| Repurchase Agreements | | | 2.1% | |
| Other Assets Less Liabilities | | | (4.1)% | |
Net Asset | | | 100% | |
Top Five Holdings
(% of total long-term investments)
| | | | |
| Apple Inc | | | 6.7% | |
| Microsoft Corp | | | 6.2% | |
| Amazon.com Inc | | | 3.0% | |
| Vanguard Total Stock Market ETF | | | 3.0% | |
| Alphabet Inc, Class C | | | 2.1% | |
Portfolio Composition
(% of total investments)1
| | | | |
| Software | | | 8.8% | |
| Technology Hardware, Storage & Peripherals | | | 6.6% | |
| Interactive Media & Services | | | 5.4% | |
| Pharmaceuticals | | | 4.5% | |
| Banks | | | 4.5% | |
| Semiconductors & Semiconductor Equipment | | | 4.2% | |
| Health Care Providers & Services | | | 4.0% | |
| IT Services | | | 3.8% | |
| Internet & Direct Marketing Retail | | | 3.1% | |
Equity Real Estate Investment Trust | | | 2.9% | |
| Oil, Gas & Consumable Fuels | | | 2.9% | |
| Beverages | | | 2.3% | |
| Machinery | | | 2.3% | |
| Capital Markets | | | 2.3% | |
| | | | |
| Health Care Equipment & Supplies | | | 2.2% | |
| Specialty Retail | | | 2.2% | |
| Biotechnology | | | 2.1% | |
| Household Products | | | 2.1% | |
| Hotels, Restaurants & Leisure | | | 1.9% | |
| Insurance | | | 1.9% | |
| Automobiles | | | 1.8% | |
| Diversified Financial Services | | | 1.8% | |
| Chemicals | | | 1.8% | |
| Aerospace & Defense | | | 1.7% | |
| Other | | | 17.8% | |
| Exchange-Traded Funds | | | 2.9% | |
| Investments Purchased with Collateral from Securities Lending | | | 0.2% | |
| Repurchase Agreements | | | 2.0% | |
Total | | | 100% | |
| 1 | See the Portfolio of Investments for the remaining industries/sectors comprising “Other” and not listed in the Portfolio Composition above. |
16
| | |
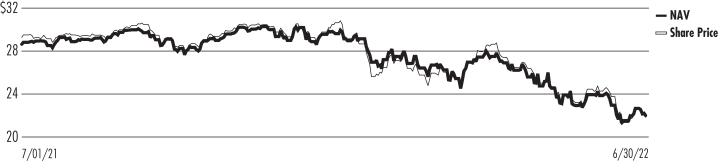
| QQQX | | Nuveen Nasdaq 100 Dynamic Overwrite Fund Performance Overview and Holding Summaries as of June 30, 2022 |
Refer to the Glossary of Terms Used in this Report for further definition of the terms used within this section.
Average Annual Total Returns as of June 30, 2022*
| | | | | | | | | | | | | | | | |
| | | Cumulative | | | Average Annual | |
| | | 6-Month | | | 1-Year | | | 5-Year | | | 10-Year | |
| QQQX at Common Share NAV | | | (22.72)% | | | | (17.26)% | | | | 8.02% | | | | 11.15% | |
| QQQX at Common Share Price | | | (25.83)% | | | | (20.20)% | | | | 7.26% | | | | 11.27% | |
| Nasdaq 100® Index | | | (29.22)% | | | | (20.38)% | | | | 16.37% | | | | 17.27% | |
| QQQX Blended Benchmark | | | (21.82)% | | | | (15.15)% | | | | 10.09% | | | | 11.23% | |
| * | For purposes of Fund performance, relative results are measured against the QQQX Blended Benchmark. The Fund’s Blended Benchmark consists of: 1) 55% Chicago Board Options Exchange (Cboe) Nasdaq 100 BuyWrite Index (BXNSM) and 2) 45% Nasdaq 100® Index. |
Performance data shown represents past performance and does not predict or guarantee future results. Current performance may be higher or lower than the data shown. Returns do not reflect the deduction of taxes that shareholders may have to pay on Fund distributions or upon the sale of Fund shares. Returns at NAV are net of Fund expenses, and assume reinvestment of distributions. Comparative index return information is provided for the Fund’s shares at NAV only. Indexes are not available for direct investment.
Daily Common Share NAV and Share Price
17
This data relates to the securities held in the Fund’s portfolio of investments as of the end of the reporting period. It should not be construed as a measure of performance for the Fund itself. Holdings are subject to change.
Fund Allocation
(% of net assets)
| | | | |
| Common Stocks | | | 99.3% | |
| Exchange-Traded Funds | | | 3.1% | |
| Investments Purchased with Collateral from Securities Lending | | | 0.4% | |
| Repurchase Agreements | | | 2.2% | |
| Other Assets Less Liabilities | | | (5.0)% | |
Net Assets | | | 100% | |
Top Five Holdings
(% of total long-term investments)
| | | | |
| Microsoft Corp | | | 12.8% | |
| Apple Inc | | | 12.6% | |
| Amazon.com Inc | | | 6.5% | |
| Alphabet Inc, Class A | | | 5.3% | |
| Tesla Inc | | | 3.9% | |
Portfolio Composition1
(% of total investments)
| | | | |
| Software | | | 17.5% | |
| Semiconductors & Semiconductor Equipment | | | 13.3% | |
| Technology Hardware, Storage & Peripherals | | | 12.3% | |
| Interactive Media & Services | | | 12.1% | |
| Internet & Direct Marketing Retail | | | 8.2% | |
| Biotechnology | | | 4.7% | |
| Automobiles | | | 4.1% | |
| Media | | | 3.2% | |
| Communications Equipment | | | 2.5% | |
| Beverages | | | 2.0% | |
| IT Services | | | 1.8% | |
| Health Care Equipment & Supplies | | | 1.5% | |
| Hotels, Restaurants & Leisure | | | 1.4% | |
| Food & Staples Retailing | | | 1.2% | |
| Food Products | | | 1.2% | |
| Other | | | 7.6% | |
| Exchange-Traded Funds | | | 2.9% | |
| Investments Purchased with Collateral from Securities Lending | | | 0.4% | |
| Repurchase Agreements | | | 2.1% | |
Total | | | 100% | |
| 1 | See the Portfolio of Investments for the remaining industries/sectors comprising “Other” and not listed in the Portfolio Composition above. |
18
| | |
| JCE | | Nuveen Core Equity Alpha Fund Performance Overview and Holding Summaries as of June 30, 2022 |
Refer to Glossary of Terms Used in this Report for further definition of the terms used within this section.
Average Annual Total Returns as of June 30, 2022*
| | | | | | | | | | | | | | | | |
| | | Cumulative | | | Average Annual | |
| | | 6-Month | | | 1-Year | | | 5-Year | | | 10-Year | |
| JCE at Common Share NAV | | | (17.82)% | | | | (9.34)% | | | | 7.80% | | | | 10.36% | |
| JCE at Common Share Price | | | (24.26)% | | | | (8.11)% | | | | 8.73% | | | | 11.55% | |
| S&P 500® Index | | | (19.96)% | | | | (10.62)% | | | | 11.31% | | | | 12.96% | |
| JCE Blended Benchmark | | | (15.15)% | | | | (6.61)% | | | | 7.74% | | | | 9.44% | |
| * | For purposes of Fund performance, relative results are measured against the JCE Blended Benchmark. The Fund’s Blended Benchmark consists of: 1) 50% S&P 500® Index and 2) 50% Chicago Board Options Exchange (Cboe) S&P 500® BuyWrite Index (BXMSM). |
Performance data shown represents past performance and does not predict or guarantee future results. Current performance may be higher or lower than the data shown. Returns do not reflect the deduction of taxes that shareholders may have to pay on Fund distributions or upon the sale of Fund shares. Returns at NAV are net of Fund expenses, and assume reinvestment of distributions. Comparative index return information is provided for the Fund’s shares at NAV only. Indexes are not available for direct investment.
Daily Common Share NAV and Share Price
19
This data relates to the securities held in the Fund’s portfolio of investments as of the end of the reporting period. It should not be construed as a measure of performance for the Fund itself. Holdings are subject to change.
Fund Allocation
(% of net assets)
| | | | |
| Common Stocks | | | 99.5% | |
| Exchange-Traded Funds | | | 0.5% | |
| Investments Purchased with Collateral from Securities Lending | | | 0.1% | |
| Repurchase Agreements | | | 3.0% | |
| Other Assets Less Liabilities | | | (3.1)% | |
Net Asset | | | 100% | |
Top Five Holdings
(% of total long-term investments)
| | | | |
| Apple Inc | | | 7.2% | |
| Microsoft Corp | | | 6.5% | |
| Amazon.com Inc | | | 2.5% | |
| UnitedHealth Group Inc | | | 2.2% | |
| Alphabet Inc, Class C | | | 2.2% | |
Portfolio Composition
(% of total investments)1
| | | | |
| Software | | | 10.6% | |
| Technology Hardware, Storage & Peripherals | | | 7.0% | |
| Interactive Media & Services | | | 5.5% | |
| Pharmaceuticals | | | 5.0% | |
| Oil, Gas & Consumable Fuels | | | 4.2% | |
| IT Services | | | 4.2% | |
| Semiconductors & Semiconductor Equipment | | | 3.9% | |
| Life Sciences Tools & Services | | | 3.8% | |
| Specialty Retail | | | 3.4% | |
| Health Care Providers & Services | | | 3.0% | |
| Health Care Equipment & Supplies | | | 2.8% | |
| Hotels, Restaurants & Leisure | | | 2.4% | |
| | | | |
| Internet & Direct Marketing Retail | | | 2.4% | |
| Banks | | | 2.3% | |
| Diversified Financial Services | | | 2.3% | |
| Household Products | | | 2.1% | |
| Multiline Retail | | | 2.0% | |
| Food & Staples Retailing | | | 1.9% | |
| Diversified Telecommunication Services | | | 1.8% | |
| Electrical Equipment | | | 1.7% | |
| Commercial Services & Supplies | | | 1.6% | |
| Building Products | | | 1.6% | |
| Industrial Conglomerates | | | 1.6% | |
| Road & Rail | | | 1.6% | |
| Other | | | 17.9% | |
| Exchange-Traded Funds | | | 0.4% | |
| Investments Purchased with Collateral from Securities Lending | | | 0.1% | |
| Repurchase Agreements | | | 2.9% | |
Total | | | 100% | |
| 1 | See the Portfolio of Investments for the remaining industries/sectors comprising “Other” and not listed in the Portfolio Composition above. |
20
| | |
| BXMX | | Nuveen S&P 500 Buy-Write
Income Fund Portfolio of Investments June 30, 2022 |
| | | (Unaudited) |
| | | | | | | | | | | | | | | | |
| Shares | | | Description (1) | | | | | | | | Value | |
| | | | |
| | | | LONG-TERM INVESTMENTS – 99.3% | | | | | | | | | | | | |
| | | | |
| | | | COMMON STOCKS – 99.3% (2) | | | | | | | | | | | | |
| | | | |
| | | | Aerospace & Defense – 1.8% | | | | | | | | | |
| | | | |
| | 28,960 | | | Boeing Co (3) | | | | | | | | | | $ | 3,959,411 | |
| | 9,566 | | | HEICO Corp | | | | | | | | | | | 1,254,294 | |
| | 62,456 | | | Howmet Aerospace Inc | | | | | | | | | | | 1,964,241 | |
| | 13,748 | | | Northrop Grumman Corp | | | | | | | | | | | 6,579,380 | |
| | 99,428 | | | Raytheon Technologies Corp | | | | | | | | | | | 9,556,025 | |
| | 4,597 | | | Woodward Inc | | | | | | | | | | | 425,177 | |
| | | | Total Aerospace & Defense | | | | | | | | | | | 23,738,528 | |
| | | | |
| | | | Air Freight & Logistics – 0.6% | | | | | | | | | |
| | | | |
| | 40,842 | | | United Parcel Service Inc, Class B | | | | | | | | | | | 7,455,299 | |
| | | | |
| | | | Airlines – 0.1% | | | | | | | | | |
| | | | |
| | 47,025 | | | United Airlines Holdings Inc (3) | | | | | | | | | | | 1,665,625 | |
| | | | |
| | | | Auto Components – 0.1% | | | | | | | | | |
| | | | |
| | 50,606 | | | Gentex Corp | | | | | | | | | | | 1,415,450 | |
| | 9,851 | | | Goodyear Tire & Rubber Co (3) | | | | | | | | | | | 105,504 | |
| | | | Total Auto Components | | | | | | | | | | | 1,520,954 | |
| | | | |
| | | | Automobiles – 2.0% | | | | | | | | | |
| | | | |
| | 252,900 | | | Ford Motor Co | | | | | | | | | | | 2,814,777 | |
| | 16,446 | | | Harley-Davidson Inc | | | | | | | | | | | 520,680 | |
| | 35,247 | | | Tesla Inc (3) | | | | | | | | | | | 23,736,035 | |
| | | | Total Automobiles | | | | | | | | | | | 27,071,492 | |
| | | | |
| | | | Banks – 3.8% | | | | | | | | | |
| | | | |
| | 81,507 | | | Citigroup Inc | | | | | | | | | | | 3,748,507 | |
| | 26,341 | | | Comerica Inc | | | | | | | | | | | 1,932,902 | |
| | 162,841 | | | Fifth Third Bancorp | | | | | | | | | | | 5,471,457 | |
| | 101,208 | | | First Horizon Corp | | | | | | | | | | | 2,212,407 | |
| | 132,821 | | | JPMorgan Chase & Co | | | | | | | | | | | 14,956,973 | |
| | 165,652 | | | KeyCorp | | | | | | | | | | | 2,854,184 | |
| | 14,051 | | | M&T Bank Corp | | | | | | | | | | | 2,239,589 | |
| | 41,891 | | | PNC Financial Services Group Inc | | | | | | | | | | | 6,609,143 | |
| | 195,504 | | | Wells Fargo & Co | | | | | | | | | | | 7,657,892 | |
| | 55,583 | | | Zions Bancorp NA | | | | | | | | | | | 2,829,175 | |
| | | | Total Banks | | | | | | | | | | | 50,512,229 | |
| | | | |
| | | | Beverages – 1.9% | | | | | | | | | |
| | | | |
| | 247,954 | | | Coca-Cola Co | | | | | | | | | | | 15,598,786 | |
| | 104,662 | | | Keurig Dr Pepper Inc | | | | | | | | | | | 3,703,988 | |
| | 56,712 | | | Monster Beverage Corp (3) | | | | | | | | | | | 5,257,203 | |
| | | | Total Beverages | | | | | | | | | | | 24,559,977 | |
| | | | |
| | | | Biotechnology – 2.3% | | | | | | | | | |
| | | | |
| | 83,076 | | | AbbVie Inc | | | | | | | | | | | 12,723,920 | |
| | 3,766 | | | Alnylam Pharmaceuticals Inc (3) | | | | | | | | | | | 549,271 | |
| | 28,089 | | | Amgen Inc | | | | | | | | | | | 6,834,054 | |
| | 9,647 | | | Biogen Inc (3) | | | | | | | | | | | 1,967,409 | |
| | 9,243 | | | BioMarin Pharmaceutical Inc (3) | | | | | | | | | | | 765,968 | |
| | 2,000 | | | Exact Sciences Corp (3) | | | | | | | | | | | 78,780 | |
| | 67,257 | | | Gilead Sciences Inc | | | | | | | | | | | 4,157,155 | |
| | 15,810 | | | Moderna Inc (3) | | | | | | | | | | | 2,258,459 | |
21
| | |
| |
| BXMX | | Nuveen S&P 500 Buy-Write Income Fund (continued) |
| | Portfolio of Investments June 30, 2022 |
| | (Unaudited) |
| | | | | | | | | | | | | | | | |
| Shares | | | Description (1) | | | | | | | | Value | |
| | | | |
| | | | Biotechnology (continued) | | | | | | | | | |
| | | | |
| | 4,961 | | | Seagen Inc (3) | | | | | | | | | | $ | 877,799 | |
| | | | Total Biotechnology | | | | | | | | | | | 30,212,815 | |
| | | | |
| | | | Building Products – 0.4% | | | | | | | | | |
| | | | |
| | 15,381 | | | Allegion plc | | | | | | | | | | | 1,505,800 | |
| | 23,666 | | | Fortune Brands Home & Security Inc | | | | | | | | | | | 1,417,120 | |
| | 43,726 | | | Masco Corp | | | | | | | | | | | 2,212,536 | |
| | | | Total Building Products | | | | | | | | | | | 5,135,456 | |
| | | | |
| | | | Capital Markets – 2.4% | | | | | | | | | |
| | | | |
| | 83,608 | | | Charles Schwab Corp | | | | | | | | | | | 5,282,353 | |
| | 23,102 | | | CME Group Inc | | | | | | | | | | | 4,728,979 | |
| | 44,488 | | | Intercontinental Exchange Inc | | | | | | | | | | | 4,183,651 | |
| | 53,398 | | | Jefferies Financial Group Inc | | | | | | | | | | | 1,474,853 | |
| | 86,746 | | | Morgan Stanley | | | | | | | | | | | 6,597,901 | |
| | 8,344 | | | MSCI Inc | | | | | | | | | | | 3,438,980 | |
| | 19,659 | | | S&P Global Inc | | | | | | | | | | | 6,626,263 | |
| | | | Total Capital Markets | | | | | | | | | | | 32,332,980 | |
| | | | |
| | | | Chemicals – 1.7% | | | | | | | | | |
| | | | |
| | 16,669 | | | Chemours Co | | | | | | | | | | | 533,741 | |
| | 52,881 | | | Corteva Inc | | | | | | | | | | | 2,862,977 | |
| | 53,214 | | | Dow Inc | | | | | | | | | | | 2,746,375 | |
| | 42,507 | | | DuPont de Nemours Inc | | | | | | | | | | | 2,362,539 | |
| | 34,775 | | | Eastman Chemical Co | | | | | | | | | | | 3,121,752 | |
| | 30,588 | | | Linde PLC | | | | | | | | | | | 8,794,968 | |
| | 20,651 | | | Olin Corp | | | | | | | | | | | 955,728 | |
| | 14,399 | | | RPM International Inc | | | | | | | | | | | 1,133,489 | |
| | | | Total Chemicals | | | | | | | | | | | 22,511,569 | |
| | | | |
| | | | Commercial Services & Supplies – 0.7% | | | | | | | | | |
| | | | |
| | 14,179 | | | Waste Connections Inc | | | | | | | | | | | 1,757,629 | |
| | 47,435 | | | Waste Management Inc | | | | | | | | | | | 7,256,606 | |
| | | | Total Commercial Services & Supplies | | | | | | | | | | | 9,014,235 | |
| | | | |
| | | | Communications Equipment – 0.9% | | | | | | | | | |
| | | | |
| | 13,699 | | | Ciena Corp (3) | | | | | | | | | | | 626,044 | |
| | 220,344 | | | Cisco Systems Inc | | | | | | | | | | | 9,395,468 | |
| | 5,140 | | | Lumentum Holdings Inc (3) | | | | | | | | | | | 408,219 | |
| | 74,070 | | | Viavi Solutions Inc (3) | | | | | | | | | | | 979,946 | |
| | | | Total Communications Equipment | | | | | | | | | | | 11,409,677 | |
| | | | |
| | | | Consumer Finance – 0.4% | | | | | | | | | |
| | | | |
| | 42,085 | | | Discover Financial Services | | | | | | | | | | | 3,980,399 | |
| | 89,957 | | | SLM Corp | | | | | | | | | | | 1,433,915 | |
| | | | Total Consumer Finance | | | | | | | | | | | 5,414,314 | |
| | | | |
| | | | Containers & Packaging – 0.5% | | | | | | | | | |
| | | | |
| | 13,574 | | | Avery Dennison Corp | | | | | | | | | | | 2,197,223 | |
| | 20,677 | | | Crown Holdings Inc | | | | | | | | | | | 1,905,799 | |
| | 15,364 | | | Packaging Corp of America | | | | | | | | | | | 2,112,550 | |
| | 18,945 | | | Sonoco Products Co | | | | | | | | | | | 1,080,623 | |
| | | | Total Containers & Packaging | | | | | | | | | | | 7,296,195 | |
| | | | |
| | | | Distributors – 0.2% | | | | | | | | | |
| | | | |
| | 51,888 | | | LKQ Corp | | | | | | | | | | | 2,547,182 | |
| | | | |
| | | | Diversified Financial Services – 1.8% | | | | | | | | | |
| | | | |
| | 86,707 | | | Berkshire Hathaway Inc, Class B (3) | | | | | | | | | | | 23,672,745 | |
22
| | | | | | | | | | | | | | | | |
| Shares | | | Description (1) | | | | | | | | Value | |
| | | | |
| | | | Diversified Telecommunication Services – 1.4% | | | | | | | | | |
| | | | |
| | 379,832 | | | AT&T Inc | | | | | | | | | | $ | 7,961,279 | |
| | 207,579 | | | Verizon Communications Inc | | | | | | | | | | | 10,534,634 | |
| | | | Total Diversified Telecommunication Services | | | | | | | | | | | 18,495,913 | |
| | | | |
| | | | Electric Utilities – 1.0% | | | | | | | | | |
| | | | |
| | 90,850 | | | Alliant Energy Corp | | | | | | | | | | | 5,324,718 | |
| | 58,152 | | | Evergy Inc | | | | | | | | | | | 3,794,418 | |
| | 52,512 | | | OGE Energy Corp | | | | | | | | | | | 2,024,863 | |
| | 29,198 | | | Pinnacle West Capital Corp | | | | | | | | | | | 2,134,958 | |
| | | | Total Electric Utilities | | | | | | | | | | | 13,278,957 | |
| | | | |
| | | | Electrical Equipment – 0.6% | | | | | | | | | |
| | | | |
| | 54,146 | | | Emerson Electric Co | | | | | | | | | | | 4,306,773 | |
| | 8,860 | | | Hubbell Inc | | | | | | | | | | | 1,582,219 | |
| | 13,511 | | | Rockwell Automation Inc | | | | | | | | | | | 2,692,877 | |
| | | | Total Electrical Equipment | | | | | | | | | | | 8,581,869 | |
| | | | |
| | | | Electronic Equipment, Instruments & Components – 0.4% | | | | | | | | | |
| | | | |
| | 20,728 | | | CDW Corp/DE | | | | | | | | | | | 3,265,904 | |
| | 86,143 | | | Corning Inc | | | | | | | | | | | 2,714,366 | |
| | | | Total Electronic Equipment, Instruments & Components | | | | | | | | | | | 5,980,270 | |
| | | | |
| | | | Energy Equipment & Services – 0.4% | | | | | | | | | |
| | | | |
| | 72,910 | | | Halliburton Co | | | | | | | | | | | 2,286,458 | |
| | 77,600 | | | Schlumberger NV | | | | | | | | | | | 2,774,976 | |
| | | | Total Energy Equipment & Services | | | | | | | | | | | 5,061,434 | |
| | | | |
| | | | Entertainment – 1.1% | | | | | | | | | |
| | | | |
| | 22,085 | | | Netflix Inc (3) | | | | | | | | | | | 3,862,004 | |
| | 1,091 | | | Roku Inc (3) | | | | | | | | | | | 89,615 | |
| | 85,224 | | | Walt Disney Co (3) | | | | | | | | | | | 8,045,146 | |
| | 146,699 | | | Warner Bros Discovery Inc (3) | | | | | | | | | | | 1,968,700 | |
| | | | Total Entertainment | | | | | | | | | | | 13,965,465 | |
| | | | |
| | | | Equity Real Estate Investment Trust – 2.8% | | | | | | | | | |
| | | | |
| | 97,035 | | | American Homes 4 Rent, Class A | | | | | | | | | | | 3,438,920 | |
| | 33,023 | | | American Tower Corp | | | | | | | | | | | 8,440,349 | |
| | 17,121 | | | Apartment Income REIT Corp | | | | | | | | | | | 712,234 | |
| | 73,114 | | | Apartment Investment and Management Co, Class A (3) | | | | | | | | | | | 467,930 | |
| | 123,846 | | | Brandywine Realty Trust | | | | | | | | | | | 1,193,875 | |
| | 75,722 | | | CubeSmart | | | | | | | | | | | 3,234,844 | |
| | 51,595 | | | Equity Commonwealth (3) | | | | | | | | | | | 1,420,410 | |
| | 84,268 | | | Healthcare Realty Trust Inc | | | | | | | | | | | 2,292,090 | |
| | 159,619 | | | Invitation Homes Inc | | | | | | | | | | | 5,679,244 | |
| | 19,823 | | | LXP Industrial Trust | | | | | | | | | | | 212,899 | |
| | 51,162 | | | Sabra Health Care REIT Inc | | | | | | | | | | | 714,733 | |
| | 15,931 | | | Sun Communities Inc | | | | | | | | | | | 2,538,764 | |
| | 42,955 | | | Welltower Inc | | | | | | | | | | | 3,537,344 | |
| | 94,015 | | | Weyerhaeuser Co | | | | | | | | | | | 3,113,777 | |
| | | | Total Equity Real Estate Investment Trust | | | | | | | | | | | 36,997,413 | |
| | | | |
| | | | Food & Staples Retailing – 1.5% | | | | | | | | | |
| | | | |
| | 3,640 | | | Casey’s General Stores Inc | | | | | | | | | | | 673,327 | |
| | 26,650 | | | Costco Wholesale Corp | | | | | | | | | | | 12,772,812 | |
| | 73,551 | | | Kroger Co | | | | | | | | | | | 3,481,169 | |
| | 34,540 | | | Sysco Corp | | | | | | | | | | | 2,925,883 | |
| | 15,913 | | | US Foods Holding Corp (3) | | | | | | | | | | | 488,211 | |
| | | | Total Food & Staples Retailing | | | | | | | | | | | 20,341,402 | |
| | | | |
| | | | Food Products – 1.0% | | | | | | | | | |
| | | | |
| | 71,353 | | | Hormel Foods Corp | | | | | | | | | | | 3,379,278 | |
23
| | |
| |
| BXMX | | Nuveen S&P 500 Buy-Write Income Fund (continued) |
| | Portfolio of Investments June 30, 2022 |
| | (Unaudited) |
| | | | | | | | | | | | | | | | |
| Shares | | | Description (1) | | | | | | | | Value | |
| | | | |
| | | | Food Products (continued) | | | | | | | | | |
| | | | |
| | 133,397 | | | Mondelez International Inc, Class A | | | | | | | | | | $ | 8,282,620 | |
| | 12,100 | | | Post Holdings Inc (3) | | | | | | | | | | | 996,435 | |
| | | | Total Food Products | | | | | | | | | | | 12,658,333 | |
| | | | |
| | | | Gas Utilities – 0.1% | | | | | | | | | |
| | | | |
| | 12,873 | | | Atmos Energy Corp | | | | | | | | | | | 1,443,063 | |
| | 2,933 | | | National Fuel Gas Co | | | | | | | | | | | 193,725 | |
| | | | Total Gas Utilities | | | | | | | | | | | 1,636,788 | |
| | | | |
| | | | Health Care Equipment & Supplies – 2.4% | | | | | | | | | |
| | | | |
| | 98,976 | | | Abbott Laboratories | | | | | | | | | | | 10,753,742 | |
| | 19,319 | | | Alcon Inc | | | | | | | | | | | 1,350,205 | |
| | 7,646 | | | Avanos Medical Inc (3) | | | | | | | | | | | 209,042 | |
| | 49,755 | | | Baxter International Inc | | | | | | | | | | | 3,195,764 | |
| | 130,178 | | | Boston Scientific Corp (3) | | | | | | | | | | | 4,851,734 | |
| | 8,009 | | | IDEXX Laboratories Inc (3) | | | | | | | | | | | 2,808,997 | |
| | 89,338 | | | Medtronic PLC | | | | | | | | | | | 8,018,085 | |
| | | | Total Health Care Equipment & Supplies | | | | | | | | | | | 31,187,569 | |
| | | | |
| | | | Health Care Providers & Services – 3.5% | | | | | | | | | |
| | | | |
| | 20,430 | | | Cigna Corp | | | | | | | | | | | 5,383,714 | |
| | 8,265 | | | Covetrus Inc (3) | | | | | | | | | | | 171,499 | |
| | 69,178 | | | CVS Health Corp | | | | | | | | | | | 6,410,033 | |
| | 15,832 | | | Elevance Health Inc | | | | | | | | | | | 7,640,206 | |
| | 20,595 | | | HCA Healthcare Inc | | | | | | | | | | | 3,461,196 | |
| | 45,020 | | | UnitedHealth Group Inc | | | | | | | | | | | 23,123,623 | |
| | | | Total Health Care Providers & Services | | | | | | | | | | | 46,190,271 | |
| | | | |
| | | | Health Care Technology – 0.1% | | | | | | | | | |
| | | | |
| | 6,414 | | | Veeva Systems Inc, Class A (3) | | | | | | | | | | | 1,270,229 | |
| | | | |
| | | | Hotels, Restaurants & Leisure – 1.9% | | | | | | | | | |
| | | | |
| | 2,484 | | | Booking Holdings Inc (3) | | | | | | | | | | | 4,344,491 | |
| | 31,485 | | | Marriott International Inc/MD, Class A | | | | | | | | | | | 4,282,275 | |
| | 41,884 | | | McDonald’s Corp | | | | | | | | | | | 10,340,322 | |
| | 16,077 | | | Restaurant Brands International Inc | | | | | | | | | | | 806,261 | |
| | 74,292 | | | Starbucks Corp | | | | | | | | | | | 5,675,166 | |
| | | | Total Hotels, Restaurants & Leisure | | | | | | | | | | | 25,448,515 | |
| | | | |
| | | | Household Durables – 0.3% | | | | | | | | | |
| | | | |
| | 16,552 | | | Garmin Ltd | | | | | | | | | | | 1,626,234 | |
| | 32,919 | | | KB Home | | | | | | | | | | | 936,875 | |
| | 6,575 | | | TopBuild Corp (3) | | | | | | | | | | | 1,099,077 | |
| | | | Total Household Durables | | | | | | | | | | | 3,662,186 | |
| | | | |
| | | | Household Products – 1.6% | | | | | | | | | |
| | | | |
| | 144,112 | | | Procter & Gamble Co | | | | | | | | | | | 20,721,864 | |
| | 13,445 | | | Spectrum Brands Holdings Inc | | | | | | | | | | | 1,102,759 | |
| | | | Total Household Products | | | | | | | | | | | 21,824,623 | |
| | | | |
| | | | Industrial Conglomerates – 1.2% | | | | | | | | | |
| | | | |
| | 38,682 | | | 3M Co | | | | | | | | | | | 5,005,837 | |
| | 50,397 | | | General Electric Co | | | | | | | | | | | 3,208,777 | |
| | 40,807 | | | Honeywell International Inc | | | | | | | | | | | 7,092,665 | |
| | | | Total Industrial Conglomerates | | | | | | | | | | | 15,307,279 | |
| | | | |
| | | | Insurance – 2.3% | | | | | | | | | |
| | | | |
| | 2,535 | | | Alleghany Corp (3) | | | | | | | | | | | 2,111,908 | |
| | 28,004 | | | Allstate Corp | | | | | | | | | | | 3,548,947 | |
| | 47,396 | | | Arthur J Gallagher & Co | | | | | | | | | | | 7,727,444 | |
| | 37,130 | | | CNO Financial Group Inc | | | | | | | | | | | 671,682 | |
| | 23,577 | | | Fidelity National Financial Inc | | | | | | | | | | | 871,406 | |
24
| | | | | | | | | | | | | | | | |
| Shares | | | Description (1) | | | | | | | | Value | |
| | | | |
| | | | Insurance (continued) | | | | | | | | | |
| | | | |
| | 16,078 | | | Genworth Financial Inc, Class A (3) | | | | | | | | | | $ | 56,755 | |
| | 38,545 | | | Hartford Financial Services Group Inc | | | | | | | | | | | 2,521,999 | |
| | 4,703 | | | Kemper Corp | | | | | | | | | | | 225,274 | |
| | 33,540 | | | Lincoln National Corp | | | | | | | | | | | 1,568,666 | |
| | 7,573 | | | RenaissanceRe Holdings Ltd | | | | | | | | | | | 1,184,190 | |
| | 32,951 | | | Travelers Cos Inc | | | | | | | | | | | 5,573,003 | |
| | 71,665 | | | W R Berkley Corp | | | | | | | | | | | 4,891,853 | |
| | | | Total Insurance | | | | | | | | | | | 30,953,127 | |
| | | | |
| | | | Interactive Media & Services – 5.3% | | | | | | | | | |
| | | | |
| | 14,278 | | | Alphabet Inc, Class A (3) | | | | | | | | | | | 31,115,474 | |
| | 9,974 | | | Alphabet Inc, Class C (3) | | | | | | | | | | | 21,817,626 | |
| | 99,036 | | | Meta Platforms Inc, Class (3) | | | | | | | | | | | 15,969,555 | |
| | 42,710 | | | Twitter Inc (3) | | | | | | | | | | | 1,596,927 | |
| | | | Total Interactive Media & Services | | | | | | | | | | | 70,499,582 | |
| | | | |
| | | | Internet & Direct Marketing Retail – 3.0% | | | | | | | | | |
| | | | |
| | 370,359 | | | Amazon.com Inc (3) | | | | | | | | | | | 39,335,829 | |
| | 5,685 | | | JD.com Inc, ADR | | | | | | | | | | | 365,091 | |
| | | | Total Internet & Direct Marketing Retail | | | | | | | | | | | 39,700,920 | |
| | | | |
| | | | IT Services – 4.6% | | | | | | | | | |
| | | | |
| | 30,096 | | | Accenture PLC, Class A | | | | | | | | | | | 8,356,155 | |
| | 20,604 | | | Akamai Technologies Inc (3) | | | | | | | | | | | 1,881,763 | |
| | 34,973 | | | Automatic Data Processing Inc | | | | | | | | | | | 7,345,729 | |
| | 15,971 | | | Broadridge Financial Solutions Inc | | | | | | | | | | | 2,276,666 | |
| | 39,198 | | | Fidelity National Information Services Inc | | | | | | | | | | | 3,593,281 | |
| | 41,235 | | | Mastercard Inc, Class A | | | | | | | | | | | 13,008,818 | |
| | 60,946 | | | PayPal Holdings Inc (3) | | | | | | | | | | | 4,256,468 | |
| | 9,442 | | | Twilio Inc, Class A (3) | | | | | | | | | | | 791,334 | |
| | 17,828 | | | VeriSign Inc (3) | | | | | | | | | | | 2,983,159 | |
| | 79,964 | | | Visa Inc, Class A | | | | | | | | | | | 15,744,112 | |
| | | | Total IT Services | | | | | | | | | | | 60,237,485 | |
| | | | |
| | | | Leisure Products – 0.1% | | | | | | | | | |
| | | | |
| | 25,861 | | | Mattel Inc (3) | | | | | | | | | | | 577,476 | |
| | 6,048 | | | Polaris Inc | | | | | | | | | | | 600,446 | |
| | | | Total Leisure Products | | | | | | | | | | | 1,177,922 | |
| | | | |
| | | | Life Sciences Tools & Services – 1.9% | | | | | | | | | |
| | | | |
| | 36,475 | | | Danaher Corp | | | | | | | | | | | 9,247,142 | |
| | 10,529 | | | Illumina Inc (3) | | | | | | | | | | | 1,941,126 | |
| | 21,185 | | | Thermo Fisher Scientific Inc | | | | | | | | | | | 11,509,387 | |
| | 7,519 | | | Waters Corp (3) | | | | | | | | | | | 2,488,639 | |
| | | | Total Life Sciences Tools & Services | | | | | | | | | | | 25,186,294 | |
| | | | |
| | | | Machinery – 1.6% | | | | | | | | | |
| | | | |
| | 32,898 | | | Caterpillar Inc | | | | | | | | | | | 5,880,847 | |
| | 15,389 | | | Deere & Co | | | | | | | | | | | 4,608,544 | |
| | 31,851 | | | Graco Inc | | | | | | | | | | | 1,892,268 | |
| | 39,784 | | | Otis Worldwide Corp | | | | | | | | | | | 2,811,535 | |
| | 15,767 | | | Parker-Hannifin Corp | | | | | | | | | | | 3,879,470 | |
| | 16,044 | | | Stanley Black & Decker Inc | | | | | | | | | | | 1,682,374 | |
| | 10,383 | | | Timken Co | | | | | | | | | | | 550,818 | |
| | | | Total Machinery | | | | | | | | | | | 21,305,856 | |
| | | | |
| | | | Media – 0.8% | | | | | | | | | |
| | | | |
| | 216,324 | | | Comcast Corp, Class A | | | | | | | | | | | 8,488,554 | |
| | 17,899 | | | New York Times Co, Class A | | | | | | | | | | | 499,382 | |
| | 78,489 | | | News Corp, Class A | | | | | | | | | | | 1,222,858 | |
| | | | Total Media | | | | | | | | | | | 10,210,794 | |
25
| | |
| |
| BXMX | | Nuveen S&P 500 Buy-Write Income Fund (continued) |
| | Portfolio of Investments June 30, 2022 |
| | (Unaudited) |
| | | | | | | | | | | | | | | | |
| Shares | | | Description (1) | | | | | | | | Value | |
| | | | |
| | | | Metals & Mining – 0.4% | | | | | | | | | |
| | | | |
| | 15,262 | | | Arconic Corp (3) | | | | | | | | | | $ | 428,099 | |
| | 42,845 | | | Newmont Corp | | | | | | | | | | | 2,556,561 | |
| | 20,588 | | | Nucor Corp | | | | | | | | | | | 2,149,593 | |
| | | | Total Metals & Mining | | | | | | | | | | | 5,134,253 | |
| | | | |
| | | | Mortgage Real Estate Investment Trust – 0.0% | | | | | | | | | |
| | | | |
| | 26,802 | | | Annaly Capital Management Inc | | | | | | | | | | | 158,400 | |
| | | | |
| | | | Multiline Retail – 0.4% | | | | | | | | | |
| | | | |
| | 25,320 | | | Macy’s Inc | | | | | | | | | | | 463,862 | |
| | 16,563 | | | Nordstrom Inc | | | | | | | | | | | 349,976 | |
| | 31,203 | | | Target Corp | | | | | | | | | | | 4,406,800 | |
| | | | Total Multiline Retail | | | | | | | | | | | 5,220,638 | |
| | | | |
| | | | Multi-Utilities – 1.7% | | | | | | | | | |
| | | | |
| | 80,101 | | | Ameren Corp | | | | | | | | | | | 7,237,926 | |
| | 17,519 | | | NorthWestern Corp | | | | | | | | | | | 1,032,395 | |
| | 105,501 | | | Public Service Enterprise Group Inc | | | | | | | | | | | 6,676,103 | |
| | 81,221 | | | WEC Energy Group Inc | | | | | | | | | | | 8,174,082 | |
| | | | Total Multi-Utilities | | | | | | | | | | | 23,120,506 | |
| | | | |
| | | | Oil, Gas & Consumable Fuels – 3.9% | | | | | | | | | |
| | | | |
| | 44,283 | | | Cenovus Energy Inc | | | | | | | | | | | 841,820 | |
| | 12,521 | | | Cheniere Energy Inc | | | | | | | | | | | 1,665,669 | |
| | 84,740 | | | Chevron Corp | | | | | | | | | | | 12,268,657 | |
| | 9,675 | | | CNX Resources Corp (3) | | | | | | | | | | | 159,251 | |
| | 81,811 | | | ConocoPhillips | | | | | | | | | | | 7,347,446 | |
| | 15,719 | | | Continental Resources Inc | | | | | | | | | | | 1,027,237 | |
| | 183,113 | | | Exxon Mobil Corp | | | | | | | | | | | 15,681,797 | |
| | 29,828 | | | Hess Corp | | | | | | | | | | | 3,159,978 | |
| | 42,055 | | | Marathon Petroleum Corp | | | | | | | | | | | 3,457,342 | |
| | 17,934 | | | Ovintiv Inc | | | | | | | | | | | 792,503 | |
| | 26,554 | | | Phillips 66 | | | | | | | | | | | 2,177,162 | |
| | 26,407 | | | Suncor Energy Inc | | | | | | | | | | | 926,093 | |
| | 25,961 | | | Valero Energy Corp | | | | | | | | | | | 2,759,135 | |
| | | | Total Oil, Gas & Consumable Fuels | | | | | | | | | | | 52,264,090 | |
| | | | |
| | | | Personal Products – 0.0% | | | | | | | | | |
| | | | |
| | 15,340 | | | BellRing Brands Inc (3) | | | | | | | | | | | 381,813 | |
| | | | |
| | | | Pharmaceuticals – 4.9% | | | | | | | | | |
| | | | |
| | 123,308 | | | Bristol-Myers Squibb Co | | | | | | | | | | | 9,494,716 | |
| | 36,480 | | | Eli Lilly & Co | | | | | | | | | | | 11,827,910 | |
| | 115,829 | | | Johnson & Johnson | | | | | | | | | | | 20,560,806 | |
| | 112,570 | | | Merck & Co Inc | | | | | | | | | | | 10,263,007 | |
| | 241,787 | | | Pfizer Inc | | | | | | | | | | | 12,676,892 | |
| | | | Total Pharmaceuticals | | | | | | | | | | | 64,823,331 | |
| | | | |
| | | | Professional Services – 0.3% | | | | | | | | | |
| | | | |
| | 21,760 | | | CoStar Group Inc (3) | | | | | | | | | | | 1,314,522 | |
| | 9,803 | | | ManpowerGroup Inc | | | | | | | | | | | 749,047 | |
| | 23,554 | | | TransUnion | | | | | | | | | | | 1,884,084 | |
| | | | Total Professional Services | | | | | | | | | | | 3,947,653 | |
| | | | |
| | | | Road & Rail – 0.9% | | | | | | | | | |
| | | | |
| | 30,324 | | | Canadian Pacific Railway Ltd | | | | | | | | | | | 2,117,828 | |
| | 4,425 | | | Lyft Inc, Class A (3) | | | | | | | | | | | 58,764 | |
| | 24,761 | | | Norfolk Southern Corp | | | | | | | | | | | 5,627,928 | |
| | 15,787 | | | Old Dominion Freight Line Inc | | | | | | | | | | | 4,045,892 | |
| | 31,571 | | | Uber Technologies Inc (3) | | | | | | | | | | | 645,943 | |
| | | | Total Road & Rail | | | | | | | | | | | 12,496,355 | |
26
| | | | | | | | | | | | | | | | |
| Shares | | | Description (1) | | | | | | | | Value | |
| | | | |
| | | | Semiconductors & Semiconductor Equipment – 5.2% | | | | | | | | | |
| | | | |
| | 76,680 | | | Advanced Micro Devices Inc (3) | | | | | | | | | | $ | 5,863,720 | |
| | 56,923 | | | Applied Materials Inc | | | | | | | | | | | 5,178,854 | |
| | 21,360 | | | Broadcom Inc | | | | | | | | | | | 10,376,902 | |
| | 7,284 | | | Enphase Energy Inc (3) | | | | | | | | | | | 1,422,128 | |
| | 203,100 | | | Intel Corp | | | | | | | | | | | 7,597,971 | |
| | 10,447 | | | Lam Research Corp | | | | | | | | | | | 4,451,989 | |
| | 32,109 | | | Marvell Technology Inc | | | | | | | | | | | 1,397,705 | |
| | 62,434 | | | Micron Technology Inc | | | | | | | | | | | 3,451,351 | |
| | 111,295 | | | NVIDIA Corp | | | | | | | | | | | 16,871,209 | |
| | 19,772 | | | NXP Semiconductors NV | | | | | | | | | | | 2,926,849 | |
| | 32,082 | | | ON Semiconductor Corp (3) | | | | | | | | | | | 1,614,045 | |
| | 56,144 | | | QUALCOMM Inc | | | | | | | | | | | 7,171,835 | |
| | | | Total Semiconductors & Semiconductor Equipment | | | | | | | | | | | 68,324,558 | |
| | | | |
| | | | Software – 9.1% | | | | | | | | | |
| | | | |
| | 25,704 | | | Adobe Inc (3) | | | | | | | | | | | 9,409,206 | |
| | 17,788 | | | Autodesk Inc (3) | | | | | | | | | | | 3,058,825 | |
| | 16,990 | | | Black Knight Inc (3) | | | | | | | | | | | 1,110,976 | |
| | 552 | | | CDK Global Inc | | | | | | | | | | | 30,233 | |
| | 10,744 | | | Check Point Software Technologies Ltd (3) | | | | | | | | | | | 1,308,404 | |
| | 48,865 | | | Fortinet Inc (3) | | | | | | | | | | | 2,764,782 | |
| | 314,362 | | | Microsoft Corp | | | | | | | | | | | 80,737,592 | |
| | 81,715 | | | Oracle Corp | | | | | | | | | | | 5,709,427 | |
| | 3,109 | | | Palo Alto Networks Inc (3) | | | | | | | | | | | 1,535,659 | |
| | 47,152 | | | Salesforce Inc (3) | | | | | | | | | | | 7,781,966 | |
| | 12,353 | | | ServiceNow Inc (3) | | | | | | | | | | | 5,874,099 | |
| | 6,422 | | | VMware Inc, Class A | | | | | | | | | | | 731,980 | |
| | | | Total Software | | | | | | | | | | | 120,053,149 | |
| | | | |
| | | | Specialty Retail – 2.0% | | | | | | | | | |
| | | | |
| | 8,358 | | | American Eagle Outfitters Inc | | | | | | | | | | | 93,442 | |
| | 24,636 | | | Best Buy Co Inc | | | | | | | | | | | 1,606,021 | |
| | 4,047 | | | Burlington Stores Inc (3) | | | | | | | | | | | 551,323 | |
| | 14,810 | | | CarMax Inc (3) | | | | | | | | | | | 1,340,009 | |
| | 4,361 | | | Five Below Inc (3) | | | | | | | | | | | 494,668 | |
| | 50,051 | | | Home Depot Inc | | | | | | | | | | | 13,727,488 | |
| | 38,481 | | | Lowe’s Cos Inc | | | | | | | | | | | 6,721,476 | |
| | 4,641 | | | Ulta Beauty Inc (3) | | | | | | | | | | | 1,789,013 | |
| | | | Total Specialty Retail | | | | | | | | | | | 26,323,440 | |
| | | | |
| | | | Technology Hardware, Storage & Peripherals – 6.8% | | | | | | | | | |
| | | | |
| | 645,863 | | | Apple Inc | | | | | | | | | | | 88,302,390 | |
| | 48,016 | | | Dell Technologies Inc, Class C | | | | | | | | | | | 2,218,819 | |
| | | | Total Technology Hardware, Storage & Peripherals | | | | | | | | | | | 90,521,209 | |
| | | | |
| | | | Textiles, Apparel & Luxury Goods – 0.6% | | | | | | | | | |
| | | | |
| | 6,689 | | | Kontoor Brands Inc | | | | | | | | | | | 223,212 | |
| | 3,315 | | | Lululemon Athletica Inc (3) | | | | | | | | | | | 903,702 | |
| | 63,640 | | | NIKE Inc, Class B | | | | | | | | | | | 6,504,008 | |
| | | | Total Textiles, Apparel & Luxury Goods | | | | | | | | | | | 7,630,922 | |
| | | | |
| | | | Thrifts & Mortgage Finance – 0.0% | | | | | | | | | |
| | | | |
| | 48,313 | | | MGIC Investment Corp | | | | | | | | | | | 608,744 | |
| | | | |
| | | | Tobacco – 0.6% | | | | | | | | | |
| | | | |
| | 175,892 | | | Altria Group Inc | | | | | | | | | | | 7,347,009 | |
| | | | Total Long-Term Investments (cost $584,362,523) | | | | | | | | | | | 1,315,587,838 | |
27
| | |
| |
| BXMX | | Nuveen S&P 500 Buy-Write Income Fund (continued) |
| | Portfolio of Investments June 30, 2022 |
| |
| | (Unaudited) |
| | | | | | | | | | | | | | | | |
Principal
Amount (000) | | | Description (1) | | Coupon | | | Maturity | | | Value | |
| | | | |
| | | | SHORT-TERM INVESTMENTS – 3.8% | | | | | | | | | | | | |
| | | | |
| | | | REPURCHASE AGREEMENTS – 3.8% | | | | | | | | | | | | |
| | | | |
| $ | 49,982 | | | Repurchase Agreement with Fixed Income Clearing Corporation,
dated 6/30/22, repurchase price $49,982,419,
collateralized by $43,831,600, U.S. Treasury Inflation Index Note,
0.500%, due 1/15/28, value $50,982,147 | | | 0.240% | | | | 7/01/22 | | | $ | 49,982,419 | |
| | | | Total Short-Term Investments (cost $49,982,419) | | | | | | | | | | | 49,982,419 | |
| | | | Total Investments (cost $634,344,942) – 103.1% | | | | | | | | | | | 1,365,570,257 | |
| | | | Other Assets Less Liabilities – (3.1)% (4) | | | | | | | | | | | (40,355,592 | ) |
| | | | Net Assets – 100% | | | | | | | | | | $ | 1,325,214,665 | |
Investments in Derivatives
Options Written
| | | | | | | | | | | | | | | | | | | | | | | | |
| Description (5) | | Type | | | Number of
Contracts | | | Notional
Amount (6) | | | Exercise
Price | | | Expiration
Date | | | Value | |
S&P 500® Index | | | Call | | | | (382 | ) | | $ | (146,115,000 | ) | | $ | 3,825 | | | | 7/15/22 | | | $ | (2,227,060 | ) |
S&P 500® Index | | | Call | | | | (382 | ) | | | (147,070,000 | ) | | | 3,850 | | | | 7/15/22 | | | | (1,808,770 | ) |
S&P 500® Index | | | Call | | | | (381 | ) | | | (148,590,000 | ) | | | 3,900 | | | | 7/15/22 | | | | (1,133,475 | ) |
S&P 500® Index | | | Call | | | | (382 | ) | | | (151,845,000 | ) | | | 3,975 | | | | 7/15/22 | | | | (490,870 | ) |
S&P 500® Index | | | Call | | | | (382 | ) | | | (156,620,000 | ) | | | 4,100 | | | | 7/15/22 | | | | (115,555 | ) |
S&P 500® Index | | | Call | | | | (383 | ) | | | (160,860,000 | ) | | | 4,200 | | | | 7/15/22 | | | | (35,428 | ) |
S&P 500® Index | | | Call | | | | (382 | ) | | | (142,295,000 | ) | | | 3,725 | | | | 7/29/22 | | | | (5,730,000 | ) |
S&P 500® Index | | | Call | | | | (383 | ) | | | (147,455,000 | ) | | | 3,850 | | | | 7/29/22 | | | | (3,102,300 | ) |
S&P 500® Index | | | Call | | | | (382 | ) | | | (152,800,000 | ) | | | 4,000 | | | | 8/19/22 | | | | (1,831,690 | ) |
Total Options Written (premiums received $35,322,334) | | | | (3,439 | ) | | $ | (1,353,650,000 | ) | | | | | | | | | | $ | (16,475,148 | ) |
For Fund portfolio compliance purposes, the Fund’s industry classifications refer to any one or more of the industry sub-classifications used by one or more widely recognized market indexes or ratings group indexes, and/or as defined by Fund management. This definition may not apply for purposes of this report, which may combine industry sub-classifications into sectors for reporting ease.
| (1) | All percentages shown in the Portfolio of Investments are based on net assets applicable to common shares unless otherwise noted. |
| (2) | The Fund may designate up to 100% of its common stock investments to cover outstanding options written. |
| (3) | Non-income producing; issuer has not declared an ex-dividend date within the past twelve months. |
| (4) | Other assets less liabilities includes the unrealized appreciation (depreciation) of certain over-the-counter (“OTC”) derivatives as presented on the Statement of Assets and Liabilities, when applicable. The unrealized appreciation (depreciation) of OTC cleared and exchange-traded derivatives is recognized as part of the cash collateral at brokers and/or the receivable or payable for variation margin as presented on the Statement of Assets and Liabilities, when applicable. Other assets less liabilities also includes the value of options as presented on the Statement of Assets and Liabilities. |
| (5) | Exchange-traded, unless otherwise noted. |
| (6) | For disclosure purposes, Notional Amount is calculated by multiplying the Number of Contracts by the Exercise Price by 100. |
| ADR | American Depositary Receipt |
| REIT | Real Estate Investment Trust |
See accompanying notes to financial statements.
28
| | |
| DIAX | | Nuveen Dow 30SM Dynamic
Overwrite Fund Portfolio of Investments June 30, 2022 |
| | | (Unaudited) |
| | | | | | | | | | | | | | | | |
| Shares | | | Description (1) | | | | | | | | Value | |
| | | | |
| | | | LONG-TERM INVESTMENTS – 102.4% | | | | | | | | | | | | |
| | | | |
| | | | COMMON STOCKS – 99.3% | | | | | | | | | | | | |
| | | | |
| | | | Aerospace & Defense – 2.9% | | | | | | | | | |
| | | | |
| | 122,356 | | | Boeing Co (2) | | | | | | | | | | $ | 16,728,512 | |
| | | | |
| | | | Banks – 2.4% | | | | | | | | | |
| | | | |
| | 122,356 | | | JPMorgan Chase & Co | | | | | | | | | | | 13,778,509 | |
| | | | |
| | | | Beverages – 1.3% | | | | | | | | | |
| | | | |
| | 122,356 | | | Coca-Cola Co | | | | | | | | | | | 7,697,416 | |
| | | | |
| | | | Biotechnology – 5.2% | | | | | | | | | |
| | | | |
| | 122,356 | | | Amgen Inc (3) | | | | | | | | | | | 29,769,215 | |
| | | | |
| | | | Capital Markets – 6.3% | | | | | | | | | |
| | | | |
| | 122,356 | | | Goldman Sachs Group Inc (3) | | | | | | | | | | | 36,342,179 | |
| | | | |
| | | | Chemicals – 1.1% | | | | | | | | | |
| | | | |
| | 122,356 | | | Dow Inc | | | | | | | | | | | 6,314,793 | |
| | | | |
| | | | Communications Equipment – 0.9% | | | | | | | | | |
| | | | |
| | 122,356 | | | Cisco Systems Inc | | | | | | | | | | | 5,217,260 | |
| | | | |
| | | | Consumer Finance – 2.9% | | | | | | | | | |
| | | | |
| | 122,356 | | | American Express Co | | | | | | | | | | | 16,960,989 | |
| | | | |
| | | | Diversified Telecommunication Services – 1.1% | | | | | | | | | |
| | | | |
| | 122,356 | | | Verizon Communications Inc | | | | | | | | | | | 6,209,567 | |
| | | | |
| | | | Entertainment – 2.0% | | | | | | | | | |
| | | | |
| | 122,356 | | | Walt Disney Co (2) | | | | | | | | | | | 11,550,407 | |
| | | | |
| | | | Food & Staples Retailing – 3.4% | | | | | | | | | |
| | | | |
| | 122,356 | | | Walgreens Boots Alliance Inc | | | | | | | | | | | 4,637,292 | |
| | 122,356 | | | Walmart Inc | | | | | | | | | | | 14,876,043 | |
| | | | Total Food & Staples Retailing | | | | | | | | | | | 19,513,335 | |
| | | | |
| | | | Health Care Providers & Services – 10.9% | | | | | | | | | |
| | | | |
| | 122,356 | | | UnitedHealth Group Inc | | | | | | | | | | | 62,845,712 | |
| | | | |
| | | | Hotels, Restaurants & Leisure – 5.3% | | | | | | | | | |
| | | | |
| | 122,356 | | | McDonald’s Corp | | | | | | | | | | | 30,207,249 | |
| | | | |
| | | | Household Products – 3.1% | | | | | | | | | |
| | | | |
| | 122,356 | | | Procter & Gamble Co | | | | | | | | | | | 17,593,569 | |
| | | | |
| | | | Industrial Conglomerates – 6.4% | | | | | | | | | |
| | | | |
| | 122,356 | | | 3M Co | | | | | | | | | | | 15,834,090 | |
| | 122,356 | | | Honeywell International Inc | | | | | | | | | | | 21,266,696 | |
| | | | Total Industrial Conglomerates | | | | | | | | | | | 37,100,786 | |
| | | | |
| | | | Insurance – 3.6% | | | | | | | | | |
| | | | |
| | 122,356 | | | Travelers Cos Inc | | | | | | | | | | | 20,694,070 | |
29
| | |
| |
| DIAX | | Nuveen Dow 30SM Dynamic Overwrite Fund (continued) |
| | Portfolio of Investments June 30, 2022 |
| | (Unaudited) |
| | | | | | | | | | | | | | | | |
| Shares | | | Description (1) | | | | | | | | Value | |
| | | | |
| | | | IT Services – 7.2% | | | | | | | | | |
| | | | |
| | 122,356 | | | International Business Machines Corp | | | | | | | | | | $ | 17,275,444 | |
| | 122,356 | | | Visa Inc, Class A | | | | | | | | | | | 24,090,673 | |
| | | | Total IT Services | | | | | | | | | | | 41,366,117 | |
| | | | |
| | | | Machinery – 3.8% | | | | | | | | | |
| | | | |
| | 122,356 | | | Caterpillar Inc | | | | | | | | | | | 21,872,359 | |
| | | | |
| | | | Oil, Gas & Consumable Fuels – 3.1% | | | | | | | | | |
| | | | |
| | 122,356 | | | Chevron Corp | | | | | | | | | | | 17,714,702 | |
| | | | |
| | | | Pharmaceuticals – 5.7% | | | | | | | | | |
| | | | |
| | 122,356 | | | Johnson & Johnson | | | | | | | | | | | 21,719,414 | |
| | 122,356 | | | Merck & Co Inc | | | | | | | | | | | 11,155,196 | |
| | | | Total Pharmaceuticals | | | | | | | | | | | 32,874,610 | |
| | | | |
| | | | Semiconductors & Semiconductor Equipment – 0.8% | | | | | | | | | |
| | | | |
| | 122,356 | | | Intel Corp | | | | | | | | | | | 4,577,338 | |
| | | | |
| | | | Software – 9.0% | | | | | | | | | |
| | | | |
| | 122,356 | | | Microsoft Corp (3) | | | | | | | | | | | 31,424,692 | |
| | 122,356 | | | Salesforce Inc (2) | | | | | | | | | | | 20,193,634 | |
| | | | Total Software | | | | | | | | | | | 51,618,326 | |
| | | | |
| | | | Specialty Retail – 5.8% | | | | | | | | | |
| | | | |
| | 122,356 | | | Home Depot Inc | | | | | | | | | | | 33,558,580 | |
| | | | |
| | | | Technology Hardware, Storage & Peripherals – 2.9% | | | | | | | | | |
| | | | |
| | 122,356 | | | Apple Inc (3) | | | | | | | | | | | 16,728,512 | |
| | | | |
| | | | Textiles, Apparel & Luxury Goods – 2.2% | | | | | | | | | |
| | | | |
| | 122,356 | | | NIKE Inc, Class B | | | | | | | | | | | 12,504,783 | |
| | | | Total Common Stocks (cost $262,115,223) | | | | | | | | | | | 571,338,895 | |
| | | | |
| Shares | | | Description (1) | | | | | | | | Value | |
| | | | |
| | | | EXCHANGE-TRADED FUNDS – 3.1% | | | | | | | | | |
| | | | |
| | 95,000 | | | Vanguard Total Stock Market ETF | | | | | | | | | | $ | 17,918,900 | |
| | | | Total Exchange-Traded Funds (cost $18,634,470) | | | | | | | | | | | 17,918,900 | |
| | | | Total Long-Term Investments (cost $280,749,693) | | | | | | | | | | | 589,257,795 | |
| | | | |
Principal
Amount (000) | | | Description (1) | | Coupon | | | Maturity | | | Value | |
| | | | |
| | | | SHORT-TERM INVESTMENTS – 1.9% | | | | | | | | | | | | |
| | | | |
| | | | REPURCHASE AGREEMENTS – 1.9% | | | | | | | | | | | | |
| | | | |
| $ | 11,251 | | | Repurchase Agreement with Fixed Income Clearing Corporation, dated 6/30/22, repurchase price $11,251,081, collateralized by $13,199,700, U.S. Treasury Note,
0.500%, due 10/31/27, value $11,476,120 | | | 0.240% | | | | 7/01/22 | | | $ | 11,251,081 | |
| | | | Total Short-Term Investments (cost $11,251,081) | | | | | | | | | | | 11,251,081 | |
| | | | Total Investments (cost $292,000,774) – 104.3% | | | | | | | | | | | 600,508,876 | |
| | | | Other Assets Less Liabilities – (4.3)% (4) | | | | | | | | | | | (24,911,230 | ) |
| | | | Net Assets – 100% | | | | | | | | | | $ | 575,597,646 | |
30
Investments in Derivatives
Options Purchased
| | | | | | | | | | | | | | | | | | | | | | | | |
Description (5) | | Type | | | Number of
Contracts | | | Notional
Amount (6) | | | Exercise
Price | | | Expiration
Date | | | Value | |
Cboe Volatility Index (premiums paid $21,465) | | | Put | | | | 300 | | | $ | 660,000 | | | $ | 22 | | | | 7/20/22 | | | $ | 750 | |
Options Written
| | | | | | | | | | | | | | | | | | | | | | | | |
Description (5) | | Type | | | Number of
Contracts | | | Notional
Amount (6) | | | Exercise
Price | | | Expiration
Date | | | Value | |
S&P 500® Index | | | Call | | | | (800 | ) | | $ | (292,400,000 | ) | | $ | 3,655 | | | | 7/15/22 | | | $ | (13,260,000 | ) |
S&P 500® Index | | | Call | | | | (50 | ) | | | (18,375,000 | ) | | | 3,675 | | | | 7/15/22 | | | | (753,250 | ) |
S&P 500® Index | | | Put | | | | (65 | ) | | | (24,050,000 | ) | | | 3,700 | | | | 7/15/22 | | | | (293,150 | ) |
Total Options Written (premiums received $10,997,433) | | | | | | | (915 | ) | | $ | (334,825,000 | ) | | | | | | | | | | $ | (14,306,400 | ) |
For Fund portfolio compliance purposes, the Fund’s industry classifications refer to any one or more of the industry sub-classifications used by one or more widely recognized market indexes or ratings group indexes, and/or as defined by Fund management. This definition may not apply for purposes of this report, which may combine industry sub-classifications into sectors for reporting ease.
| (1) | All percentages shown in the Portfolio of Investments are based on net assets applicable to common shares unless otherwise noted. |
| (2) | Non-income producing; issuer has not declared an ex-dividend date within the past twelve months. |
| (3) | Investment, or portion of investment, has been pledged to collateralize the net payment obligations for investments in derivatives. |
| (4) | Other assets less liabilities includes the unrealized appreciation (depreciation) of certain over-the-counter (“OTC”) derivatives as presented on the Statement of Assets and Liabilities, when applicable. The unrealized appreciation (depreciation) of OTC cleared and exchange-traded derivatives is recognized as part of the cash collateral at brokers and/or the receivable or payable for variation margin as presented on the Statement of Assets and Liabilities, when applicable. Other assets less liabilities also includes the value of options as presented on the Statement of Assets and Liabilities. |
| (5) | Exchange-traded, unless otherwise noted. |
| (6) | For disclosure purposes, Notional Amount is calculated by multiplying the Number of Contracts by the Exercise Price by 100. |
| Cboe | Chicago Board Options Exchange |
See accompanying notes to financial statements.
31
| | |
| SPXX | | Nuveen S&P 500 Dynamic
Overwrite Fund Portfolio of Investments June 30, 2022 |
| | | (Unaudited) |
| | | | | | | | | | | | | | | | |
| Shares | | | Description (1) | | | | | | | | Value | |
| | | | |
| | | | LONG-TERM INVESTMENTS – 101.8% | | | | | | | | | | | | |
| | | | |
| | | | COMMON STOCKS – 98.8% | | | | | | | | | | | | |
| | | | |
| | | | Aerospace & Defense – 1.8% | | | | | | | | | |
| | | | |
| | 5,621 | | | Boeing Co (2) | | | | | | | | | | $ | 768,503 | |
| | 1,033 | | | BWX Technologies Inc | | | | | | | | | | | 56,908 | |
| | 716 | | | Curtiss-Wright Corp | | | | | | | | | | | 94,555 | |
| | 793 | | | HEICO Corp | | | | | | | | | | | 103,978 | |
| | 3,921 | | | Lockheed Martin Corp | | | | | | | | | | | 1,685,873 | |
| | 20,963 | | | Raytheon Technologies Corp | | | | | | | | | | | 2,014,754 | |
| | 729 | | | Woodward Inc | | | | | | | | | | | 67,426 | |
| | | | Total Aerospace & Defense | | | | | | | | | | | 4,791,997 | |
| | | | |
| | | | Air Freight & Logistics – 0.6% | | | | | | | | | |
| | | | |
| | 8,775 | | | United Parcel Service Inc, Class B | | | | | | | | | | | 1,601,789 | |
| | | | |
| | | | Airlines – 0.1% | | | | | | | | | |
| | | | |
| | 7,767 | | | American Airlines Group Inc (2) | | | | | | | | | | | 98,486 | |
| | 5,123 | | | JetBlue Airways Corp (2) | | | | | | | | | | | 42,879 | |
| | 2,159 | | | Spirit Airlines Inc (2) | | | | | | | | | | | 51,471 | |
| | | | Total Airlines | | | | | | | | | | | 192,836 | |
| | | | |
| | | | Auto Components – 0.1% | | | | | | | | | |
| | | | |
| | 3,036 | | | Gentex Corp | | | | | | | | | | | 84,917 | |
| | 8,235 | | | Goodyear Tire & Rubber Co (2) | | | | | | | | | | | 88,197 | |
| | 519 | | | Lear Corp | | | | | | | | | | | 65,337 | |
| | | | Total Auto Components | | | | | | | | | | | 238,451 | |
| | | | |
| | | | Automobiles – 1.9% | | | | | | | | | |
| | | | |
| | 37,389 | | | Ford Motor Co | | | | | | | | | | | 416,140 | |
| | 1,133 | | | Rivian Automotive Inc, Class A (2) | | | | | | | | | | | 29,163 | |
| | 6,938 | | | Tesla Inc (2) | | | | | | | | | | | 4,672,188 | |
| | | | Total Automobiles | | | | | | | | | | | 5,117,491 | |
| | | | |
| | | | Banks – 4.7% | | | | | | | | | |
| | | | |
| | 13,874 | | | Associated Banc-Corp | | | | | | | | | | | 253,339 | |
| | 69,901 | | | Bank of America Corp | | | | | | | | | | | 2,176,018 | |
| | 906 | | | Bank of Hawaii Corp | | | | | | | | | | | 67,406 | |
| | 1,569 | | | Bank OZK | | | | | | | | | | | 58,885 | |
| | 1,508 | | | BankUnited Inc | | | | | | | | | | | 53,640 | |
| | 1,063 | | | BOK Financial Corp | | | | | | | | | | | 80,342 | |
| | 2,722 | | | Cadence Bank | | | | | | | | | | | 63,913 | |
| | 2,384 | | | Cathay General Bancorp | | | | | | | | | | | 93,334 | |
| | 24,364 | | | Citigroup Inc | | | | | | | | | | | 1,120,500 | |
| | 1,411 | | | Citizens Financial Group Inc | | | | | | | | | | | 50,359 | |
| | 5,340 | | | Comerica Inc | | | | | | | | | | | 391,849 | |
| | 1,830 | | | Commerce Bancshares Inc/MO | | | | | | | | | | | 120,139 | |
| | 1,323 | | | Community Bank System Inc | | | | | | | | | | | 83,719 | |
| | 872 | | | Cullen/Frost Bankers Inc | | | | | | | | | | | 101,544 | |
| | 2,667 | | | CVB Financial Corp | | | | | | | | | | | 66,168 | |
| | 1,261 | | | East West Bancorp Inc | | | | | | | | | | | 81,713 | |
| | 1,257 | | | Enterprise Financial Services Corp | | | | | | | | | | | 52,165 | |
| | 74 | | | First Citizens BancShares Inc/NC, Class A | | | | | | | | | | | 48,380 | |
| | 2,715 | | | First Financial Bancorp | | | | | | | | | | | 52,671 | |
| | 7,166 | | | First Hawaiian Inc | | | | | | | | | | | 162,740 | |
| | 9,948 | | | First Horizon Corp | | | | | | | | | | | 217,463 | |
| | 21,881 | | | FNB Corp/PA | | | | | | | | | | | 237,628 | |
| | 3,550 | | | Fulton Financial Corp | | | | | | | | | | | 51,297 | |
| | 1,542 | | | Glacier Bancorp Inc | | | | | | | | | | | 73,122 | |
32
| | | | | | | | | | | | | | | | |
| Shares | | | Description (1) | | | | | | | | Value | |
| | | | |
| | | | Banks (continued) | | | | | | | | | |
| | | | |
| | 9,405 | | | Hope Bancorp Inc | | | | | | | | | | $ | 130,165 | |
| | 730 | | | Independent Bank Corp | | | | | | | | | | | 57,984 | |
| | 32,606 | | | JPMorgan Chase & Co (3) | | | | | | | | | | | 3,671,762 | |
| | 18,999 | | | Old National Bancorp/IN | | | | | | | | | | | 280,995 | |
| | 2,579 | �� | | PacWest Bancorp | | | | | | | | | | | 68,756 | |
| | 1,012 | | | Pinnacle Financial Partners Inc | | | | | | | | | | | 73,178 | |
| | 2,043 | | | Popular Inc | | | | | | | | | | | 157,168 | |
| | 1,205 | | | Renasant Corp | | | | | | | | | | | 34,716 | |
| | 658 | | | SouthState Corp | | | | | | | | | | | 50,765 | |
| | 650 | | | Texas Capital Bancshares Inc (2) | | | | | | | | | | | 34,216 | |
| | 2,690 | | | Towne Bank/Portsmouth VA | | | | | | | | | | | 73,034 | |
| | 2,094 | | | United Community Banks Inc/GA | | | | | | | | | | | 63,218 | |
| | 10,088 | | | Valley National Bancorp | | | | | | | | | | | 105,016 | |
| | 1,329 | | | Webster Financial Corp | | | | | | | | | | | 56,017 | |
| | 36,733 | | | Wells Fargo & Co | | | | | | | | | | | 1,438,832 | |
| | 660 | | | Western Alliance Bancorp | | | | | | | | | | | 46,596 | |
| | 8,676 | | | Zions Bancorp NA | | | | | | | | | | | 441,608 | |
| | | | Total Banks | | | | | | | | | | | 12,542,360 | |
| | | | |
| | | | Beverages – 2.4% | | | | | | | | | |
| | | | |
| | 51,740 | | | Coca-Cola Co | | | | | | | | | | | 3,254,963 | |
| | 19,878 | | | PepsiCo Inc | | | | | | | | | | | 3,312,868 | |
| | | | Total Beverages | | | | | | | | | | | 6,567,831 | |
| | | | |
| | | | Biotechnology – 2.2% | | | | | | | | | |
| | | | |
| | 16,944 | | | AbbVie Inc | | | | | | | | | | | 2,595,143 | |
| | 7,117 | | | Amgen Inc | | | | | | | | | | | 1,731,566 | |
| | 1,457 | | | Biogen Inc (2) | | | | | | | | | | | 297,141 | |
| | 661 | | | BioMarin Pharmaceutical Inc (2) | | | | | | | | | | | 54,777 | |
| | 551 | | | Horizon Therapeutics Plc (2) | | | | | | | | | | | 43,948 | |
| | 3,054 | | | Moderna Inc (2) | | | | | | | | | | | 436,264 | |
| | 2,650 | | | Vertex Pharmaceuticals Inc (2) | | | | | | | | | | | 746,743 | |
| | | | Total Biotechnology | | | | | | | | | | | 5,905,582 | |
| | | | |
| | | | Building Products – 0.2% | | | | | | | | | |
| | | | |
| | 563 | | | Carlisle Cos Inc | | | | | | | | | | | 134,337 | |
| | 424 | | | Lennox International Inc | | | | | | | | | | | 87,594 | |
| | 1,102 | | | Owens Corning | | | | | | | | | | | 81,890 | |
| | 548 | | | Simpson Manufacturing Co Inc | | | | | | | | | | | 55,134 | |
| | 397 | | | Trex Co Inc (2) | | | | | | | | | | | 21,605 | |
| | 855 | | | UFP Industries Inc | | | | | | | | | | | 58,260 | |
| | | | Total Building Products | | | | | | | | | | | 438,820 | |
| | | | |
| | | | Capital Markets – 2.4% | | | | | | | | | |
| | | | |
| | 771 | | | Ares Management Corp, Class A | | | | | | | | | | | 43,839 | |
| | 975 | | | Blackstone Inc | | | | | | | | | | | 88,949 | |
| | 1,778 | | | Carlyle Group Inc | | | | | | | | | | | 56,291 | |
| | 16,181 | | | Charles Schwab Corp | | | | | | | | | | | 1,022,316 | |
| | 4,910 | | | CME Group Inc | | | | | | | | | | | 1,005,077 | |
| | 1,462 | | | Federated Hermes Inc | | | | | | | | | | | 46,477 | |
| | 4,325 | | | Goldman Sachs Group Inc | | | | | | | | | | | 1,284,612 | |
| | 492 | | | Hamilton Lane Inc, Class A | | | | | | | | | | | 33,053 | |
| | 496 | | | Houlihan Lokey Inc | | | | | | | | | | | 39,149 | |
| | 9,328 | | | Intercontinental Exchange Inc | | | | | | | | | | | 877,205 | |
| | 1,228 | | | Janus Henderson Group PLC | | | | | | | | | | | 28,870 | |
| | 1,763 | | | Jefferies Financial Group Inc | | | | | | | | | | | 48,694 | |
| | 1,435 | | | KKR & Co Inc | | | | | | | | | | | 66,426 | |
| | 1,234 | | | Lazard Ltd, Class A | | | | | | | | | | | 39,994 | |
| | 546 | | | LPL Financial Holdings Inc | | | | | | | | | | | 100,726 | |
| | 17,299 | | | Morgan Stanley | | | | | | | | | | | 1,315,762 | |
| | 2,060 | | | SEI Investments Co | | | | | | | | | | | 111,281 | |
| | 1,398 | | | Stifel Financial Corp | | | | | | | | | | | 78,316 | |
| | 954 | | | Tradeweb Markets Inc, Class A | | | | | | | | | | | 65,111 | |
| | | | Total Capital Markets | | | | | | | | | | | 6,352,148 | |
33
| | |
| |
| SPXX | | Nuveen S&P 500 Dynamic Overwrite Fund (continued) |
| | Portfolio of Investments June 30, 2022 |
| | (Unaudited) |
| | | | | | | | | | | | | | | | |
| Shares | | | Description (1) | | | | | | | | Value | |
| | | | |
| | | | Chemicals – 1.8% | | | | | | | | | |
| | | | |
| | 722 | | | Ashland Global Holdings Inc | | | | | | | | | | $ | 74,402 | |
| | 1,074 | | | Avient Corp | | | | | | | | | | | 43,046 | |
| | 2,854 | | | Axalta Coating Systems Ltd (2) | | | | | | | | | | | 63,102 | |
| | 337 | | | Balchem Corp | | | | | | | | | | | 43,722 | |
| | 1,117 | | | Cabot Corp | | | | | | | | | | | 71,253 | |
| | 10,837 | | | Dow Inc | | | | | | | | | | | 559,298 | |
| | 5,047 | | | Eastman Chemical Co | | | | | | | | | | | 453,069 | |
| | 3,516 | | | Ecolab Inc | | | | | | | | | | | 540,620 | |
| | 2,357 | | | Element Solutions Inc | | | | | | | | | | | 41,955 | |
| | 976 | | | HB Fuller Co | | | | | | | | | | | 58,765 | |
| | 5,409 | | | Linde PLC | | | | | | | | | | | 1,555,250 | |
| | 3,077 | | | Mosaic Co | | | | | | | | | | | 145,327 | |
| | 152 | | | NewMarket Corp | | | | | | | | | | | 45,746 | |
| | 1,562 | | | Olin Corp | | | | | | | | | | | 72,289 | |
| | 1,353 | | | RPM International Inc | | | | | | | | | | | 106,508 | |
| | 1,069 | | | Sensient Technologies Corp | | | | | | | | | | | 86,119 | |
| | 4,312 | | | Sherwin-Williams Co | | | | | | | | | | | 965,500 | |
| | 1,434 | | | Valvoline Inc | | | | | | | | | | | 41,342 | |
| | | | Total Chemicals | | | | | | | | | | | 4,967,313 | |
| | | | |
| | | | Commercial Services & Supplies – 0.2% | | | | | | | | | |
| | | | |
| | 903 | | | Casella Waste Systems Inc, Class A (2) | | | | | | | | | | | 65,630 | |
| | 638 | | | Clean Harbors Inc (2) | | | | | | | | | | | 55,933 | |
| | 8,663 | | | CoreCivic Inc (2) | | | | | | | | | | | 96,246 | |
| | 2,741 | | | GEO Group Inc (2) | | | | | | | | | | | 18,091 | |
| | 409 | | | MSA Safety Inc | | | | | | | | | | | 49,518 | |
| | 1,037 | | | Stericycle Inc (2) | | | | | | | | | | | 45,472 | |
| | 383 | | | Tetra Tech Inc | | | | | | | | | | | 52,299 | |
| | 258 | | | UniFirst Corp/MA | | | | | | | | | | | 44,422 | |
| | | | Total Commercial Services & Supplies | | | | | | | | | | | 427,611 | |
| | | | |
| | | | Communications Equipment – 1.1% | | | | | | | | | |
| | | | |
| | 1,059 | | | Ciena Corp (2) | | | | | | | | | | | 48,396 | |
| | 51,860 | | | Cisco Systems Inc | | | | | | | | | | | 2,211,310 | |
| | 2,967 | | | Motorola Solutions Inc | | | | | | | | | | | 621,883 | |
| | 4,298 | | | Viavi Solutions Inc (2) | | | | | | | | | | | 56,863 | |
| | | | Total Communications Equipment | | | | | | | | | | | 2,938,452 | |
| | | | |
| | | | Construction & Engineering – 0.1% | | | | | | | | | |
| | | | |
| | 740 | | | EMCOR Group Inc | | | | | | | | | | | 76,190 | |
| | 595 | | | MasTec Inc (2) | | | | | | | | | | | 42,638 | |
| | 3,092 | | | MDU Resources Group Inc | | | | | | | | | | | 83,453 | |
| | 275 | | | Valmont Industries Inc | | | | | | | | | | | 61,773 | |
| | | | Total Construction & Engineering | | | | | | | | | | | 264,054 | |
| | | | |
| | | | Construction Materials – 0.0% | | | | | | | | | |
| | | | |
| | 546 | | | Eagle Materials Inc | | | | | | | | | | | 60,027 | |
| | | | |
| | | | Consumer Finance – 0.4% | | | | | | | | | |
| | | | |
| | 1,842 | | | Ally Financial Inc | | | | | | | | | | | 61,725 | |
| | 7,538 | | | American Express Co | | | | | | | | | | | 1,044,918 | |
| | | | Total Consumer Finance | | | | | | | | | | | 1,106,643 | |
| | | | |
| | | | Containers & Packaging – 0.4% | | | | | | | | | |
| | | | |
| | 1,196 | | | AptarGroup Inc | | | | | | | | | | | 123,439 | |
| | 8,328 | | | Ardagh Metal Packaging SA | | | | | | | | | | | 50,801 | |
| | 3,220 | | | Avery Dennison Corp | | | | | | | | | | | 521,221 | |
| | 860 | | | Berry Global Group Inc (2) | | | | | | | | | | | 46,991 | |
| | 1,261 | | | Crown Holdings Inc | | | | | | | | | | | 116,226 | |
| | 4,826 | | | Graphic Packaging Holding Co | | | | | | | | | | | 98,933 | |
| | 2,023 | | | Silgan Holdings Inc | | | | | | | | | | | 83,651 | |
| | 2,568 | | | Sonoco Products Co | | | | | | | | | | | 146,479 | |
| | | | Total Containers & Packaging | | | | | | | | | | | 1,187,741 | |
34
| | | | | | | | | | | | | | | | |
| Shares | | | Description (1) | | | | | | | | Value | |
| | | | |
| | | | Diversified Financial Services – 1.9% | | | | | | | | | |
| | | | |
| | 1,611 | | | Apollo Global Management Inc | | | | | | | | | | $ | 78,101 | |
| | 17,656 | | | Berkshire Hathaway Inc, Class B (2) | | | | | | | | | | | 4,820,441 | |
| | 3,318 | | | Equitable Holdings Inc | | | | | | | | | | | 86,500 | |
| | 1,609 | | | Voya Financial Inc | | | | | | | | | | | 95,784 | |
| | | | Total Diversified Financial Services | | | | | | | | | | | 5,080,826 | |
| | | | |
| | | | Diversified Telecommunication Services – 1.5% | | | | | | | | | |
| | | | |
| | 80,112 | | | AT&T Inc | | | | | | | | | | | 1,679,148 | |
| | 45,978 | | | Verizon Communications Inc | | | | | | | | | | | 2,333,383 | |
| | | | Total Diversified Telecommunication Services | | | | | | | | | | | 4,012,531 | |
| | | | |
| | | | Electric Utilities – 1.2% | | | | | | | | | |
| | | | |
| | 3,632 | | | ALLETE Inc | | | | | | | | | | | 213,489 | |
| | 2,505 | | | Avangrid Inc | | | | | | | | | | | 115,531 | |
| | 13,297 | | | Duke Energy Corp | | | | | | | | | | | 1,425,571 | |
| | 4,531 | | | Hawaiian Electric Industries Inc | | | | | | | | | | | 185,318 | |
| | 3,171 | | | IDACORP Inc | | | | | | | | | | | 335,872 | |
| | 1,433 | | | MGE Energy Inc | | | | | | | | | | | 111,530 | |
| | 4,414 | | | OGE Energy Corp | | | | | | | | | | | 170,204 | |
| | 1,751 | | | Otter Tail Corp | | | | | | | | | | | 117,545 | |
| | 5,647 | | | PNM Resources Inc | | | | | | | | | | | 269,814 | |
| | 7,150 | | | Portland General Electric Co | | | | | | | | | | | 345,559 | |
| | | | Total Electric Utilities | | | | | | | | | | | 3,290,433 | |
| | | | |
| | | | Electrical Equipment – 0.9% | | | | | | | | | |
| | | | |
| | 5,829 | | | Eaton Corp PLC | | | | | | | | | | | 734,396 | |
| | 8,927 | | | Emerson Electric Co | | | | | | | | | | | 710,054 | |
| | 744 | | | Hubbell Inc | | | | | | | | | | | 132,863 | |
| | 4,452 | | | nVent Electric PLC | | | | | | | | | | | 139,481 | |
| | 537 | | | Regal Rexnord Corp | | | | | | | | | | | 60,960 | |
| | 2,492 | | | Rockwell Automation Inc | | | | | | | | | | | 496,681 | |
| | 1,678 | | | Sensata Technologies Holding PLC | | | | | | | | | | | 69,318 | |
| | | | Total Electrical Equipment | | | | | | | | | | | 2,343,753 | |
| | | | |
| | | | Electronic Equipment, Instruments & Components – 0.4% | | | | | | | | | |
| | | | |
| | 1,177 | | | Arrow Electronics Inc (2) | | | | | | | | | | | 131,930 | |
| | 1,858 | | | Avnet Inc | | | | | | | | | | | 79,671 | |
| | 914 | | | Cognex Corp | | | | | | | | | | | 38,863 | |
| | 18,044 | | | Corning Inc | | | | | | | | | | | 568,566 | |
| | 1,351 | | | Jabil Inc | | | | | | | | | | | 69,185 | |
| | 422 | | | Littelfuse Inc | | | | | | | | | | | 107,205 | |
| | 1,557 | | | National Instruments Corp | | | | | | | | | | | 48,625 | |
| | 486 | | | TD SYNNEX Corp | | | | | | | | | | | 44,275 | |
| | | | Total Electronic Equipment, Instruments & Components | | | | | | | | | | | 1,088,320 | |
| | | | |
| | | | Energy Equipment & Services – 0.4% | | | | | | | | | |
| | | | |
| | 1,887 | | | ChampionX Corp | | | | | | | | | | | 37,457 | |
| | 1,072 | | | Dril-Quip Inc (2) | | | | | | | | | | | 27,658 | |
| | 1,243 | | | Helmerich & Payne Inc | | | | | | | | | | | 53,524 | |
| | 12,922 | | | NOV Inc | | | | | | | | | | | 218,511 | |
| | 4,365 | | | Patterson-UTI Energy Inc | | | | | | | | | | | 68,792 | |
| | 11,657 | | | Schlumberger NV | | | | | | | | | | | 416,854 | |
| | 2,888 | | | Technip Energies NV, ADR, (2),(4) | | | | | | | | | | | 35,782 | |
| | 8,230 | | | TechnipFMC PLC (2) | | | | | | | | | | | 55,388 | |
| | 16,647 | | | Transocean Ltd (2) | | | | | | | | | | | 55,435 | |
| | | | Total Energy Equipment & Services | | | | | | | | | | | 969,401 | |
| | | | |
| | | | Entertainment – 1.2% | | | | | | | | | |
| | | | |
| | 1,257 | | | AMC Entertainment Holdings Inc, Class A (2),(4) | | | | | | | | | | | 17,032 | |
| | 4,361 | | | Electronic Arts Inc | | | | | | | | | | | 530,516 | |
| | 1,168 | | | Liberty Media Corp-Liberty Formula One, Class C (2) | | | | | | | | | | | 74,133 | |
| | 4,304 | | | Netflix Inc (2) | | | | | | | | | | | 752,640 | |
35
| | |
| |
| SPXX | | Nuveen S&P 500 Dynamic Overwrite Fund (continued) |
| | Portfolio of Investments June 30, 2022 |
| | (Unaudited) |
| | | | | | | | | | | | | | | | |
| Shares | | | Description (1) | | | | | | | | Value | |
| | | | |
| | | | Entertainment (continued) | | | | | | | | | |
| | | | |
| | 16,984 | | | Walt Disney Co (2) | | | | | | | | | | $ | 1,603,290 | |
| | 19,380 | | | Warner Bros Discovery Inc (2) | | | | | | | | | | | 260,080 | |
| | | | Total Entertainment | | | | | | | | | | | 3,237,691 | |
| | | | |
| | | | Equity Real Estate Investment Trust – 3.1% | | | | | | | | | |
| | | | |
| | 7,301 | | | Acadia Realty Trust | | | | | | | | | | | 114,042 | |
| | 1,995 | | | Agree Realty Corp | | | | | | | | | | | 143,899 | |
| | 4,624 | | | American Homes 4 Rent, Class A | | | | | | | | | | | 163,875 | |
| | 4,541 | | | American Tower Corp | | | | | | | | | | | 1,160,634 | |
| | 1,674 | | | Apartment Income REIT Corp | | | | | | | | | | | 69,638 | |
| | 5,269 | | | Apple Hospitality REIT Inc | | | | | | | | | | | 77,296 | |
| | 4,774 | | | Brandywine Realty Trust | | | | | | | | | | | 46,021 | |
| | 4,722 | | | Brixmor Property Group Inc | | | | | | | | | | | 95,432 | |
| | 3,021 | | | Broadstone Net Lease Inc | | | | | | | | | | | 61,961 | |
| | 1,563 | | | Camden Property Trust | | | | | | | | | | | 210,192 | |
| | 3,338 | | | Corporate Office Properties Trust | | | | | | | | | | | 87,422 | |
| | 2,572 | | | Cousins Properties Inc | | | | | | | | | | | 75,180 | |
| | 4,593 | | | Crown Castle International Corp | | | | | | | | | | | 773,369 | |
| | 601 | | | EastGroup Properties Inc | | | | | | | | | | | 92,752 | |
| | 14,750 | | | Empire State Realty Trust Inc, Class A | | | | | | | | | | | 103,692 | |
| | 947 | | | Equinix Inc | | | | | | | | | | | 622,198 | |
| | 2,548 | | | Equity Commonwealth | | | | | | | | | | | 70,146 | |
| | 2,806 | | | Equity LifeStyle Properties Inc | | | | | | | | | | | 197,739 | |
| | 2,766 | | | First Industrial Realty Trust Inc | | | | | | | | | | | 131,330 | |
| | 1,529 | | | Gaming and Leisure Properties Inc | | | | | | | | | | | 70,120 | |
| | 2,811 | | | Healthcare Realty Trust Inc | | | | | | | | | | | 76,459 | |
| | 3,146 | | | Healthcare Trust of America Inc, Class A | | | | | | | | | | | 87,805 | |
| | 2,487 | | | Highwoods Properties Inc | | | | | | | | | | | 85,031 | |
| | 1,750 | | | Hudson Pacific Properties Inc | | | | | | | | | | | 25,970 | |
| | 144 | | | Innovative Industrial Properties Inc | | | | | | | | | | | 15,821 | |
| | 5,001 | | | Invitation Homes Inc | | | | | | | | | | | 177,936 | |
| | 2,704 | | | JBG SMITH Properties | | | | | | | | | | | 63,923 | |
| | 1,482 | | | Kilroy Realty Corp | | | | | | | | | | | 77,553 | |
| | 561 | | | Lamar Advertising Co, Class A | | | | | | | | | | | 49,351 | |
| | 2,182 | | | Life Storage Inc | | | | | | | | | | | 243,642 | |
| | 4,548 | | | LXP Industrial Trust | | | | | | | | | | | 48,845 | |
| | 2,787 | | | Macerich Co | | | | | | | | | | | 24,275 | |
| | 3,371 | | | National Retail Properties Inc | | | | | | | | | | | 144,953 | |
| | 1,038 | | | National Storage Affiliates Trust | | | | | | | | | | | 51,973 | |
| | 1,904 | | | Omega Healthcare Investors Inc | | | | | | | | | | | 53,674 | |
| | 27,284 | | | Paramount Group Inc | | | | | | | | | | | 197,263 | |
| | 6,410 | | | Park Hotels & Resorts Inc | | | | | | | | | | | 86,984 | |
| | 7,431 | | | Pebblebrook Hotel Trust | | | | | | | | | | | 123,132 | |
| | 7,410 | | | Physicians Realty Trust | | | | | | | | | | | 129,304 | |
| | 5,697 | | | Piedmont Office Realty Trust Inc, Class A | | | | | | | | | | | 74,745 | |
| | 694 | | | PS Business Parks Inc | | | | | | | | | | | 129,882 | |
| | 7,659 | | | Retail Opportunity Investments Corp | | | | | | | | | | | 120,859 | |
| | 2,204 | | | Rexford Industrial Realty Inc | | | | | | | | | | | 126,928 | |
| | 3,073 | | | RLJ Lodging Trust | | | | | | | | | | | 33,895 | |
| | 8,449 | | | Sabra Health Care REIT Inc | | | | | | | | | | | 118,033 | |
| | 1,070 | | | Seritage Growth Properties (2) | | | | | | | | | | | 5,575 | |
| | 2,605 | | | Service Properties Trust | | | | | | | | | | | 13,624 | |
| | 4,261 | | | SITE Centers Corp | | | | | | | | | | | 57,396 | |
| | 3,186 | | | SL Green Realty Corp | | | | | | | | | | | 147,034 | |
| | 2,225 | | | Spirit Realty Capital Inc | | | | | | | | | | | 84,060 | |
| | 2,613 | | | STAG Industrial Inc | | | | | | | | | | | 80,689 | |
| | 2,447 | | | STORE Capital Corp | | | | | | | | | | | 63,818 | |
| | 4,169 | | | Summit Hotel Properties Inc (2) | | | | | | | | | | | 30,309 | |
| | 1,134 | | | Sun Communities Inc | | | | | | | | | | | 180,714 | |
| | 1,471 | | | Terreno Realty Corp | | | | | | | | | | | 81,979 | |
| | 4,316 | | | Ventas Inc | | | | | | | | | | | 221,972 | |
| | 5,572 | | | Veris Residential Inc (2) | | | | | | | | | | | 73,773 | |
| | 3,426 | | | VICI Properties Inc | | | | | | | | | | | 102,061 | |
| | 2,890 | | | WP Carey Inc | | | | | | | | | | | 239,465 | |
| | 2,214 | | | Xenia Hotels & Resorts Inc (2) | | | | | | | | | | | 32,169 | |
| | | | Total Equity Real Estate Investment Trust | | | | | | | | | | | 8,149,812 | |
36
| | | | | | | | | | | | |
| Shares | | | Description (1) | | | | | | Value | |
| | | | |
| | | | Food & Staples Retailing – 0.7% | | | | | | | |
| | | | |
| | 362 | | | Casey’s General Stores Inc | | | | | | $ | 66,963 | |
| | 15,426 | | | Walmart Inc | | | | | | | 1,875,493 | |
| | | | Total Food & Staples Retailing | | | | | | | 1,942,456 | |
| | | | |
| | | | Food Products – 0.5% | | | | | | | |
| | | | |
| | 12,387 | | | Archer-Daniels-Midland Co | | | | | | | 961,231 | |
| | 884 | | | Bunge Ltd (2) | | | | | | | 80,170 | |
| | 3,774 | | | Flowers Foods Inc | | | | | | | 99,332 | |
| | 2,671 | | | Hostess Brands Inc (2) | | | | | | | 56,652 | |
| | 907 | | | Ingredion Inc | | | | | | | 79,961 | |
| | 545 | | | J & J Snack Foods Corp | | | | | | | 76,115 | |
| | 427 | | | Lancaster Colony Corp | | | | | | | 54,989 | |
| | 880 | | | Post Holdings Inc (2) | | | | | | | 72,468 | |
| | | | Total Food Products | | | | | | | 1,480,918 | |
| | | | |
| | | | Gas Utilities – 0.3% | | | | | | | |
| | | | |
| | 876 | | | Chesapeake Utilities Corp | | | | | | | 113,486 | |
| | 1,299 | | | National Fuel Gas Co | | | | | | | 85,799 | |
| | 2,125 | | | New Jersey Resources Corp | | | | | | | 94,626 | |
| | 1,701 | | | ONE Gas Inc | | | | | | | 138,104 | |
| | 860 | | | Southwest Gas Holdings Inc | | | | | | | 74,889 | |
| | 2,325 | | | Spire Inc | | | | | | | 172,910 | |
| | 3,872 | | | UGI Corp | | | | | | | 149,498 | |
| | | | Total Gas Utilities | | | | | | | 829,312 | |
| | | | |
| | | | Health Care Equipment & Supplies – 2.3% | | | | | | | |
| | | | |
| | 19,910 | | | Abbott Laboratories | | | | | | | 2,163,221 | |
| | 25,472 | | | Boston Scientific Corp (2) | | | | | | | 949,341 | |
| | 3,220 | | | Dexcom Inc (2) | | | | | | | 239,987 | |
| | 450 | | | Enovis Corp (2) | | | | | | | 24,750 | |
| | 821 | | | Globus Medical Inc, Class A (2) | | | | | | | 46,091 | |
| | 216 | | | Insulet Corp (2) | | | | | | | 47,075 | |
| | 1,151 | | | Integra LifeSciences Holdings Corp (2) | | | | | | | 62,189 | |
| | 4,778 | | | Intuitive Surgical Inc (2) | | | | | | | 958,992 | |
| | 285 | | | Masimo Corp (2) | | | | | | | 37,241 | |
| | 17,840 | | | Medtronic PLC | | | | | | | 1,601,140 | |
| | 352 | | | Omnicell Inc (2) | | | | | | | 40,040 | |
| | | | Total Health Care Equipment & Supplies | | | | | | | 6,170,067 | |
| | | | |
| | | | Health Care Providers & Services – 4.2% | | | | | | | |
| | | | |
| | 699 | | | Acadia Healthcare Co Inc (2) | | | | | | | 47,273 | |
| | 149 | | | Chemed Corp | | | | | | | 69,939 | |
| | 13,155 | | | CVS Health Corp | | | | | | | 1,218,942 | |
| | 4,100 | | | Elevance Health Inc | | | | | | | 1,978,578 | |
| | 989 | | | Encompass Health Corp | | | | | | | 55,434 | |
| | 2,553 | | | Humana Inc | | | | | | | 1,194,983 | |
| | 1,646 | | | Laboratory Corp of America Holdings | | | | | | | 385,757 | |
| | 1,600 | | | McKesson Corp | | | | | | | 521,936 | |
| | 321 | | | Molina Healthcare Inc (2) | | | | | | | 89,755 | |
| | 1,213 | | | Tenet Healthcare Corp (2) | | | | | | | 63,755 | |
| | 10,938 | | | UnitedHealth Group Inc | | | | | | | 5,618,085 | |
| | | | Total Health Care Providers & Services | | | | | | | 11,244,437 | |
| | | | |
| | | | Health Care Technology – 0.0% | | | | | | | |
| | | | |
| | 2,831 | | | Change Healthcare Inc (2) | | | | | | | 65,283 | |
| | 465 | | | Veeva Systems Inc, Class A (2) | | | | | | | 92,088 | |
| | | | Total Health Care Technology | | | | | | | 157,371 | |
| | | | |
| | | | Hotels, Restaurants & Leisure – 2.0% | | | | | | | |
| | | | |
| | 344 | | | Airbnb Inc (2) | | | | | | | 30,643 | |
| | 1,826 | | | Aramark | | | | | | | 55,930 | |
| | 481 | | | Booking Holdings Inc (2) | | | | | | | 841,264 | |
37
| | |
| |
| SPXX | | Nuveen S&P 500 Dynamic Overwrite Fund (continued) |
| | Portfolio of Investments June 30, 2022 |
| | (Unaudited) |
| | | | | | | | | | | | | | | | |
| Shares | | | Description (1) | | | | | | | | Value | |
| | | | |
| | | | Hotels, Restaurants & Leisure (continued) | | | | | | | | | |
| | | | |
| | 2,044 | | | Caesars Entertainment Inc (2) | | | | | | | | | | $ | 78,285 | |
| | 714 | | | Choice Hotels International Inc | | | | | | | | | | | 79,704 | |
| | 278 | | | Churchill Downs Inc | | | | | | | | | | | 53,245 | |
| | 1,128 | | | Hilton Grand Vacations Inc (2) | | | | | | | | | | | 40,303 | |
| | 980 | | | Hyatt Hotels Corp, Class A (2) | | | | | | | | | | | 72,432 | |
| | 10,125 | | | McDonald’s Corp | | | | | | | | | | | 2,499,660 | |
| | 3,463 | | | Norwegian Cruise Line Holdings Ltd (2) | | | | | | | | | | | 38,509 | |
| | 1,730 | | | Penn National Gaming Inc (2) | | | | | | | | | | | 52,627 | |
| | 2,213 | | | Royal Caribbean Cruises Ltd (2) | | | | | | | | | | | 77,256 | |
| | 15,767 | | | Starbucks Corp | | | | | | | | | | | 1,204,441 | |
| | 173 | | | Vail Resorts Inc | | | | | | | | | | | 37,723 | |
| | 2,415 | | | Wendy’s Co | | | | | | | | | | | 45,595 | |
| | 955 | | | Wyndham Hotels & Resorts Inc | | | | | | | | | | | 62,763 | |
| | 1,140 | | | Yum China Holdings Inc | | | | | | | | | | | 55,290 | |
| | | | Total Hotels, Restaurants & Leisure | | | | | | | | | | | 5,325,670 | |
| | | | |
| | | | Household Durables – 0.2% | | | | | | | | | |
| | | | |
| | 5,382 | | | KB Home | | | | | | | | | | | 153,172 | |
| | 1,448 | | | Leggett & Platt Inc | | | | | | | | | | | 50,072 | |
| | 491 | | | Meritage Homes Corp (2) | | | | | | | | | | | 35,598 | |
| | 2,220 | | | Taylor Morrison Home Corp (2) | | | | | | | | | | | 51,859 | |
| | 4,004 | | | Tempur Sealy International Inc | | | | | | | | | | | 85,565 | |
| | 1,454 | | | Toll Brothers Inc | | | | | | | | | | | 64,848 | |
| | 219 | | | TopBuild Corp (2) | | | | | | | | | | | 36,608 | |
| | | | Total Household Durables | | | | | | | | | | | 477,722 | |
| | | | |
| | | | Household Products – 2.2% | | | | | | | | | |
| | | | |
| | 13,283 | | | Colgate-Palmolive Co | | | | | | | | | | | 1,064,500 | |
| | 8,653 | | | Kimberly-Clark Corp | | | | | | | | | | | 1,169,453 | |
| | 24,802 | | | Procter & Gamble Co | | | | | | | | | | | 3,566,279 | |
| | 1,619 | | | Reynolds Consumer Products Inc | | | | | | | | | | | 44,150 | |
| | | | Total Household Products | | | | | | | | | | | 5,844,382 | |
| | | | |
| | | | Independent Power & Renewable Electricity Producers – 0.1% | | | | | | | | | |
| | | | |
| | 617 | | | Sunnova Energy International Inc (2) | | | | | | | | | | | 11,371 | |
| | 8,660 | | | Vistra Corp | | | | | | | | | | | 197,881 | |
| | | | Total Independent Power & Renewable Electricity Producers | | | | | | | | | | | 209,252 | |
| | | | |
| | | | Industrial Conglomerates – 1.2% | | | | | | | | | |
| | | | |
| | 9,198 | | | 3M Co | | | | | | | | | | | 1,190,313 | |
| | 11,326 | | | Honeywell International Inc | | | | | | | | | | | 1,968,572 | |
| | | | Total Industrial Conglomerates | | | | | | | | | | | 3,158,885 | |
| | | | |
| | | | Insurance – 1.9% | | | | | | | | | |
| | | | |
| | 226 | | | Alleghany Corp (2) | | | | | | | | | | | 188,281 | |
| | 683 | | | American Financial Group Inc/OH | | | | | | | | | | | 94,807 | |
| | 3,629 | | | Arch Capital Group Ltd (2) | | | | | | | | | | | 165,083 | |
| | 5,688 | | | Arthur J Gallagher & Co | | | | | | | | | | | 927,372 | |
| | 1,126 | | | Axis Capital Holdings Ltd | | | | | | | | | | | 64,283 | |
| | 2,869 | | | CNA Financial Corp | | | | | | | | | | | 128,818 | |
| | 3,671 | | | CNO Financial Group Inc | | | | | | | | | | | 66,408 | |
| | 774 | | | First American Financial Corp | | | | | | | | | | | 40,960 | |
| | 863 | | | Hanover Insurance Group Inc | | | | | | | | | | | 126,214 | |
| | 134 | | | Markel Corp (2) | | | | | | | | | | | 173,295 | |
| | 8,946 | | | Marsh & McLennan Cos Inc | | | | | | | | | | | 1,388,867 | |
| | 6,140 | | | Old Republic International Corp | | | | | | | | | | | 137,290 | |
| | 548 | | | Primerica Inc | | | | | | | | | | | 65,590 | |
| | 1,511 | | | Reinsurance Group of America Inc | | | | | | | | | | | 177,225 | |
| | 503 | | | RenaissanceRe Holdings Ltd | | | | | | | | | | | 78,654 | |
| | 654 | | | RLI Corp | | | | | | | | | | | 76,250 | |
| | 1,002 | | | Selective Insurance Group Inc | | | | | | | | | | | 87,114 | |
| | 6,781 | | | Travelers Cos Inc | | | | | | | | | | | 1,146,871 | |
| | 3,092 | | | Unum Group | | | | | | | | | | | 105,190 | |
| | | | Total Insurance | | | | | | | | | | | 5,238,572 | |
38
| | | | | | | | | | | | | | | | |
| Shares | | | Description (1) | | | | | | | | Value | |
| | | | |
| | | | Interactive Media & Services – 5.6% | | | | | | | | | |
| | | | |
| | 2,629 | | | Alphabet Inc, Class C (2), (3) | | | | | | | | | | $ | 5,750,806 | |
| | 2,553 | | | Alphabet Inc, Class A (2), (3) | | | | | | | | | | | 5,563,651 | |
| | 21,101 | | | Meta Platforms Inc, Class (2) | | | | | | | | | | | 3,402,536 | |
| | 6,642 | | | Twitter Inc (2) | | | | | | | | | | | 248,344 | |
| | | | Total Interactive Media & Services | | | | | | | | | | | 14,965,337 | |
| | | | |
| | | | Internet & Direct Marketing Retail – 3.2% | | | | | | | | | |
| | | | |
| | 77,160 | | | Amazon.com Inc (2), (3) | | | | | | | | | | | 8,195,163 | |
| | 9,207 | | | eBay Inc | | | | | | | | | | | 383,656 | |
| | | | Total Internet & Direct Marketing Retail | | | | | | | | | | | 8,578,819 | |
| | | | |
| | | | IT Services – 3.9% | | | | | | | | | |
| | | | |
| | 6,194 | | | Accenture PLC, Class A | | | | | | | | | | | 1,719,764 | |
| | 1,592 | | | Amdocs Ltd | | | | | | | | | | | 132,630 | |
| | 411 | | | Block Inc (2) | | | | | | | | | | | 25,260 | |
| | 9,519 | | | Fidelity National Information Services Inc | | | | | | | | | | | 872,607 | |
| | 789 | | | GoDaddy Inc, Class A (2) | | | | | | | | | | | 54,883 | |
| | 8,929 | | | Mastercard Inc, Class A (3) | | | | | | | | | | | 2,816,921 | |
| | 1,008 | | | Maximus Inc | | | | | | | | | | | 63,010 | |
| | 258 | | | Okta Inc (2) | | | | | | | | | | | 23,323 | |
| | 11,603 | | | PayPal Holdings Inc (2) | | | | | | | | | | | 810,354 | |
| | 151 | | | Snowflake Inc, Class A (2) | | | | | | | | | | | 20,998 | |
| | 1,934 | | | SS&C Technologies Holdings Inc | | | | | | | | | | | 112,308 | |
| | 2,401 | | | VeriSign Inc (2) | | | | | | | | | | | 401,759 | |
| | 17,979 | | | Visa Inc, Class A | | | | | | | | | | | 3,539,885 | |
| | 3,260 | | | Western Union Co | | | | | | | | | | | 53,692 | |
| | | | Total IT Services | | | | | | | | | | | 10,647,394 | |
| | | | |
| | | | Leisure Products – 0.0% | | | | | | | | | |
| | | | |
| | 2,412 | | | Mattel Inc (2) | | | | | | | | | | | 53,860 | |
| | | | |
| | | | Life Sciences Tools & Services – 1.4% | | | | | | | | | |
| | | | |
| | 3,753 | | | Agilent Technologies Inc | | | | | | | | | | | 445,744 | |
| | 1,708 | | | Avantor Inc (2) | | | | | | | | | | | 53,119 | |
| | 869 | | | Bio-Techne Corp | | | | | | | | | | | 301,230 | |
| | 1,004 | | | Bruker Corp | | | | | | | | | | | 63,011 | |
| | 1,483 | | | Illumina Inc (2) | | | | | | | | | | | 273,406 | |
| | 1,171 | | | QIAGEN NV (2) | | | | | | | | | | | 55,271 | |
| | 4,185 | | | Thermo Fisher Scientific Inc | | | | | | | | | | | 2,273,627 | |
| | 760 | | | Waters Corp (2) | | | | | | | | | | | 251,545 | |
| | | | Total Life Sciences Tools & Services | | | | | | | | | | | 3,716,953 | |
| | | | |
| | | | Machinery – 2.4% | | | | | | | | | |
| | | | |
| | 697 | | | AGCO Corp | | | | | | | | | | | 68,794 | |
| | 7,025 | | | Caterpillar Inc | | | | | | | | | | | 1,255,789 | |
| | 864 | | | Crane Holdings Co | | | | | | | | | | | 75,652 | |
| | 3,551 | | | Cummins Inc | | | | | | | | | | | 687,225 | |
| | 4,362 | | | Deere & Co | | | | | | | | | | | 1,306,288 | |
| | 1,802 | | | Donaldson Co Inc | | | | | | | | | | | 86,748 | |
| | 450 | | | Esab Corp (2) | | | | | | | | | | | 19,687 | |
| | 2,609 | | | Federal Signal Corp | | | | | | | | | | | 92,880 | |
| | 1,391 | | | Franklin Electric Co Inc | | | | | | | | | | | 101,905 | |
| | 2,070 | | | Graco Inc | | | | | | | | | | | 122,979 | |
| | 7,660 | | | Illinois Tool Works Inc | | | | | | | | | | | 1,396,035 | |
| | 1,649 | | | ITT Inc | | | | | | | | | | | 110,879 | |
| | 1,020 | | | Lincoln Electric Holdings Inc | | | | | | | | | | | 125,827 | |
| | 884 | | | Nordson Corp | | | | | | | | | | | 178,957 | |
| | 833 | | | Oshkosh Corp | | | | | | | | | | | 68,423 | |
| | 2,194 | | | Snap-on Inc | | | | | | | | | | | 432,284 | |
| | 1,290 | | | Timken Co | | | | | | | | | | | 68,434 | |
| | 1,321 | | | Toro Co | | | | | | | | | | | 100,119 | |
| | 496 | | | Watts Water Technologies Inc, Class A | | | | | | | | | | | 60,929 | |
| | | | Total Machinery | | | | | | | | | | | 6,359,834 | |
39
| | |
| |
| SPXX | | Nuveen S&P 500 Dynamic Overwrite Fund (continued) |
| | Portfolio of Investments June 30, 2022 |
| | (Unaudited) |
| | | | | | | | | | | | | | | | |
| Shares | | | Description (1) | | | | | | | | Value | |
| | | | |
| | | | Media – 1.0% | | | | | | | | | |
| | | | |
| | 37 | | | Cable One Inc | | | | | | | | | | $ | 47,705 | |
| | 52,511 | | | Comcast Corp, Class A | | | | | | | | | | | 2,060,531 | |
| | 939 | | | Liberty Broadband Corp, Class C (2) | | | | | | | | | | | 108,586 | |
| | 1,733 | | | Liberty Media Corp-Liberty SiriusXM (2) | | | | | | | | | | | 62,475 | |
| | 369 | | | Nexstar Media Group Inc | | | | | | | | | | | 60,103 | |
| | 15,383 | | | Sirius XM Holdings Inc (4) | | | | | | | | | | | 94,298 | |
| | 7,195 | | | TEGNA Inc | | | | | | | | | | | 150,879 | |
| | | | Total Media | | | | | | | | | | | 2,584,577 | |
| | | | |
| | | | Metals & Mining – 0.4% | | | | | | | | | |
| | | | |
| | 18,887 | | | Freeport-McMoRan Inc | | | | | | | | | | | 552,634 | |
| | 555 | | | Reliance Steel & Aluminum Co | | | | | | | | | | | 94,272 | |
| | 714 | | | Royal Gold Inc | | | | | | | | | | | 76,241 | |
| | 2,973 | | | Southern Copper Corp | | | | | | | | | | | 148,085 | |
| | 2,415 | | | Steel Dynamics Inc | | | | | | | | | | | 159,752 | |
| | | | Total Metals & Mining | | | | | | | | | | | 1,030,984 | |
| | | | |
| | | | Mortgage Real Estate Investment Trust – 0.1% | | | | | | | | | |
| | | | |
| | 4,596 | | | AGNC Investment Corp | | | | | | | | | | | 50,878 | |
| | 10,864 | | | Annaly Capital Management Inc | | | | | | | | | | | 64,206 | |
| | 2,490 | | | Starwood Property Trust Inc REIT | | | | | | | | | | | 52,016 | |
| | | | Total Mortgage Real Estate Investment Trust | | | | | | | | | | | 167,100 | |
| | | | |
| | | | Multiline Retail – 0.3% | | | | | | | | | |
| | | | |
| | 6,058 | | | Target Corp | | | | | | | | | | | 855,571 | |
| | | | |
| | | | Multi-Utilities – 0.4% | | | | | | | | | |
| | | | |
| | 3,870 | | | Avista Corp | | | | | | | | | | | 168,384 | |
| | 1,438 | | | Black Hills Corp | | | | | | | | | | | 104,643 | |
| | 7,261 | | | Consolidated Edison Inc | | | | | | | | | | | 690,521 | |
| | 2,312 | | | NorthWestern Corp | | | | | | | | | | | 136,246 | |
| | | | Total Multi-Utilities | | | | | | | | | | | 1,099,794 | |
| | | | |
| | | | Oil, Gas & Consumable Fuels – 3.0% | | | | | | | | | |
| | | | |
| | 4,761 | | | Antero Midstream Corp | | | | | | | | | | | 43,087 | |
| | 2,207 | | | Antero Resources Corp (2) | | | | | | | | | | | 67,644 | |
| | 1,087 | | | Cheniere Energy Inc | | | | | | | | | | | 144,604 | |
| | 18,598 | | | Chevron Corp | | | | | | | | | | | 2,692,618 | |
| | 4,084 | | | CNX Resources Corp (2) | | | | | | | | | | | 67,223 | |
| | 5,980 | | | Comstock Resources Inc (2) | | | | | | | | | | | 72,238 | |
| | 1,025 | | | Continental Resources Inc | | | | | | | | | | | 66,984 | |
| | 7,795 | | | Coterra Energy Inc | | | | | | | | | | | 201,033 | |
| | 5,230 | | | Devon Energy Corp | | | | | | | | | | | 288,225 | |
| | 6,783 | | | DHT Holdings Inc | | | | | | | | | | | 41,580 | |
| | 4,216 | | | EOG Resources Inc | | | | | | | | | | | 465,615 | |
| | 1,982 | | | EQT Corp | | | | | | | | | | | 68,181 | |
| | 4,475 | | | Equitrans Midstream Corp | | | | | | | | | | | 28,461 | |
| | 4,410 | | | Frontline Ltd/Bermuda (2) | | | | | | | | | | | 39,073 | |
| | 5,508 | | | HF Sinclair Corp | | | | | | | | | | | 248,741 | |
| | 20,994 | | | Marathon Oil Corp | | | | | | | | | | | 471,945 | |
| | 10,200 | | | Marathon Petroleum Corp | | | | | | | | | | | 838,542 | |
| | 6,966 | | | Murphy Oil Corp | | | | | | | | | | | 210,303 | |
| | 7,370 | | | Occidental Petroleum Corp | | | | | | | | | | | 433,946 | |
| | 4,403 | | | Ovintiv Inc | | | | | | | | | | | 194,569 | |
| | 5,237 | | | PBF Energy Inc, Class A (2) | | | | | | | | | | | 151,978 | |
| | 2,566 | | | PDC Energy Inc | | | | | | | | | | | 158,091 | |
| | 8,289 | | | Phillips 66 | | | | | | | | | | | 679,615 | |
| | 4,093 | | | Range Resources Corp (2) | | | | | | | | | | | 101,302 | |
| | 2,100 | | | Scorpio Tankers Inc | | | | | | | | | | | 72,471 | |
| | 2,040 | | | SM Energy Co | | | | | | | | | | | 69,748 | |
| | 14,618 | | | Southwestern Energy Co (2) | | | | | | | | | | | 91,362 | |
| | 2,864 | | | Talos Energy Inc (2) | | | | | | | | | | | 44,306 | |
| | | | Total Oil, Gas & Consumable Fuels | | | | | | | | | | | 8,053,485 | |
40
| | | | | | | | | | | | | | | | |
| Shares | | | Description (1) | | | | | | | | Value | |
| | | | |
| | | | Paper & Forest Products – 0.0% | | | | | | | | | |
| | | | |
| | 658 | | | Louisiana-Pacific Corp | | | | | | | | | | $ | 34,486 | |
| | | | |
| | | | Personal Products – 0.0% | | | | | | | | | |
| | | | |
| | 1,115 | | | BellRing Brands Inc (2) | | | | | | | | | | | 27,752 | |
| | 5,617 | | | Olaplex Holdings Inc (2) | | | | | | | | | | | 79,144 | |
| | | | Total Personal Products | | | | | | | | | | | 106,896 | |
| | | | |
| | | | Pharmaceuticals – 4.7% | | | | | | | | | |
| | | | |
| | 7,744 | | | Eli Lilly & Co | | | | | | | | | | | 2,510,837 | |
| | 1,326 | | | Jazz Pharmaceuticals PLC (2) | | | | | | | | | | | 206,869 | |
| | 26,212 | | | Johnson & Johnson (3) | | | | | | | | | | | 4,652,892 | |
| | 26,004 | | | Merck & Co Inc | | | | | | | | | | | 2,370,785 | |
| | 55,221 | | | Pfizer Inc (3) | | | | | | | | | | | 2,895,237 | |
| | 1,490 | | | Royalty Pharma PLC, Class A | | | | | | | | | | | 62,640 | |
| | | | Total Pharmaceuticals | | | | | | | | | | | 12,699,260 | |
| | | | |
| | | | Professional Services – 0.2% | | | | | | | | | |
| | | | |
| | 558 | | | ASGN Inc (2) | | | | | | | | | | | 50,360 | |
| | 969 | | | Booz Allen Hamilton Holding Corp | | | | | | | | | | | 87,559 | |
| | 270 | | | CACI International Inc, Class A (2) | | | | | | | | | | | 76,081 | |
| | 1,040 | | | CoStar Group Inc (2) | | | | | | | | | | | 62,826 | |
| | 488 | | | Exponent Inc | | | | | | | | | | | 44,637 | |
| | 1,196 | | | KBR Inc | | | | | | | | | | | 57,874 | |
| | 596 | | | Science Applications International Corp | | | | | | | | | | | 55,488 | |
| | 1,386 | | | TransUnion | | | | | | | | | | | 110,866 | |
| | | | Total Professional Services | | | | | | | | | | | 545,691 | |
| | | | |
| | | | Real Estate Management & Development – 0.1% | | | | | | | | | |
| | | | |
| | 1,786 | | | Anywhere Real Estate Inc (2) | | | | | | | | | | | 17,556 | |
| | 588 | | | eXp World Holdings Inc (4) | | | | | | | | | | | 6,921 | |
| | 538 | | | Howard Hughes Corp (2) | | | | | | | | | | | 36,611 | |
| | 654 | | | Jones Lang LaSalle Inc (2) | | | | | | | | | | | 114,358 | |
| | 2,209 | | | Kennedy-Wilson Holdings Inc | | | | | | | | | | | 41,839 | |
| | | | Total Real Estate Management & Development | | | | | | | | | | | 217,285 | |
| | | | |
| | | | Road & Rail – 0.9% | | | | | | | | | |
| | | | |
| | 121 | | | AMERCO | | | | | | | | | | | 57,866 | |
| | 979 | | | Knight-Swift Transportation Holdings Inc | | | | | | | | | | | 45,318 | |
| | 505 | | | Landstar System Inc | | | | | | | | | | | 73,437 | |
| | 2,429 | | | Schneider National Inc, Class B | | | | | | | | | | | 54,361 | |
| | 1,498 | | | Uber Technologies Inc (2) | | | | | | | | | | | 30,649 | |
| | 9,444 | | | Union Pacific Corp | | | | | | | | | | | 2,014,216 | |
| | 1,807 | | | Werner Enterprises Inc | | | | | | | | | | | 69,642 | |
| | | | Total Road & Rail | | | | | | | | | | | 2,345,489 | |
| | | | |
| | | | Semiconductors & Semiconductor Equipment – 4.4% | | | | | | | | | |
| | | | |
| | 13,679 | | | Advanced Micro Devices Inc (2) | | | | | | | | | | | 1,046,033 | |
| | 8,397 | | | Analog Devices Inc | | | | | | | | | | | 1,226,718 | |
| | 196 | | | ASML Holding NV | | | | | | | | | | | 93,272 | |
| | 580 | | | Diodes Inc (2) | | | | | | | | | | | 37,451 | |
| | 1,112 | | | Enphase Energy Inc (2) | | | | | | | | | | | 217,107 | |
| | 743 | | | Entegris Inc | | | | | | | | | | | 68,453 | |
| | 1,162 | | | GlobalFoundries Inc (2) | | | | | | | | | | | 46,875 | |
| | 40,583 | | | Intel Corp | | | | | | | | | | | 1,518,210 | |
| | 741 | | | Lattice Semiconductor Corp (2) | | | | | | | | | | | 35,938 | |
| | 1,025 | | | Marvell Technology Inc | | | | | | | | | | | 44,618 | |
| | 9,964 | | | Microchip Technology Inc | | | | | | | | | | | 578,709 | |
| | 650 | | | MKS Instruments Inc | | | | | | | | | | | 66,709 | |
| | 360 | | | Monolithic Power Systems Inc | | | | | | | | | | | 138,254 | |
| | 22,301 | | | NVIDIA Corp (3) | | | | | | | | | | | 3,380,609 | |
| | 973 | | | ON Semiconductor Corp (2) | | | | | | | | | | | 48,952 | |
| | 11,276 | | | QUALCOMM Inc | | | | | | | | | | | 1,440,396 | |
41
| | |
| |
| SPXX | | Nuveen S&P 500 Dynamic Overwrite Fund (continued) |
| | Portfolio of Investments June 30, 2022 |
| | (Unaudited) |
| | | | | | | | | | | | | | | | |
| Shares | | | Description (1) | | | | | | | | Value | |
| | | | |
| | | | Semiconductors & Semiconductor Equipment (continued) | | | | | | | | | |
| | | | |
| | 644 | | | Semtech Corp (2) | | | | | | | | | | $ | 35,401 | |
| | 352 | | | Silicon Laboratories Inc (2) | | | | | | | | | | | 49,357 | |
| | 11,924 | | | Texas Instruments Inc | | | | | | | | | | | 1,832,123 | |
| | | | Total Semiconductors & Semiconductor Equipment | | | | | | | | | | | 11,905,185 | |
| | | | |
| | | | Software – 9.1% | | | | | | | | | |
| | | | |
| | 3,169 | | | Adobe Inc (2) | | | | | | | | | | | 1,160,044 | |
| | 249 | | | Atlassian Corp PLC, Class A (2) | | | | | | | | | | | 46,663 | |
| | 2,833 | | | Autodesk Inc (2) | | | | | | | | | | | 487,163 | |
| | 2,276 | | | Black Knight Inc (2) | | | | | | | | | | | 148,828 | |
| | 499 | | | Blackline Inc (2) | | | | | | | | | | | 33,233 | |
| | 5,008 | | | CDK Global Inc | | | | | | | | | | | 274,288 | |
| | 330 | | | Datadog Inc, Class A (2) | | | | | | | | | | | 31,429 | |
| | 365 | | | DocuSign Inc (2) | | | | | | | | | | | 20,944 | |
| | 2,055 | | | Dropbox Inc, Class A (2) | | | | | | | | | | | 43,134 | |
| | 866 | | | Dynatrace Inc (2) | | | | | | | | | | | 34,155 | |
| | 135 | | | Fair Isaac Corp (2) | | | | | | | | | | | 54,121 | |
| | 5,635 | | | Fortinet Inc (2) | | | | | | | | | | | 318,828 | |
| | 721 | | | Guidewire Software Inc (2) | | | | | | | | | | | 51,184 | |
| | 79 | | | HubSpot Inc (2) | | | | | | | | | | | 23,751 | |
| | 2,352 | | | Intuit Inc | | | | | | | | | | | 906,555 | |
| | 66,073 | | | Microsoft Corp (3) | | | | | | | | | | | 16,969,529 | |
| | 55 | | | MicroStrategy Inc, Class A (2), (4) | | | | | | | | | | | 9,037 | |
| | 16,855 | | | Oracle Corp | | | | | | | | | | | 1,177,659 | |
| | 180 | | | Palo Alto Networks Inc (2) | | | | | | | | | | | 88,909 | |
| | 592 | | | Pegasystems Inc | | | | | | | | | | | 28,321 | |
| | 454 | | | Rapid7 Inc (2) | | | | | | | | | | | 30,327 | |
| | 8,882 | | | Salesforce Inc (2) | | | | | | | | | | | 1,465,885 | |
| | 1,962 | | | ServiceNow Inc (2) | | | | | | | | | | | 932,970 | |
| | 558 | | | Splunk Inc (2) | | | | | | | | | | | 49,361 | |
| | 1,105 | | | Verint Systems Inc (2) | | | | | | | | | | | 46,797 | |
| | 474 | | | Workday Inc, Class A (2) | | | | | | | | | | | 66,161 | |
| | 219 | | | Zscaler Inc (2) | | | | | | | | | | | 32,743 | |
| | | | Total Software | | | | | | | | | | | 24,532,019 | |
| | | | |
| | | | Specialty Retail – 2.3% | | | | | | | | | |
| | | | |
| | 3,818 | | | Best Buy Co Inc | | | | | | | | | | | 248,896 | |
| | 291 | | | Burlington Stores Inc (2) | | | | | | | | | | | 39,643 | |
| | 113 | | | Dick’s Sporting Goods Inc | | | | | | | | | | | 8,517 | |
| | 280 | | | Five Below Inc (2) | | | | | | | | | | | 31,760 | |
| | 517 | | | Floor & Decor Holdings Inc, Class A (2) | | | | | | | | | | | 32,550 | |
| | 11,249 | | | Home Depot Inc | | | | | | | | | | | 3,085,263 | |
| | 8,430 | | | Lowe’s Cos Inc | | | | | | | | | | | 1,472,468 | |
| | 542 | | | Penske Automotive Group Inc | | | | | | | | | | | 56,742 | |
| | 19,493 | | | TJX Cos Inc | | | | | | | | | | | 1,088,684 | |
| | 2,594 | | | Urban Outfitters Inc (2) | | | | | | | | | | | 48,404 | |
| | | | Total Specialty Retail | | | | | | | | | | | 6,112,927 | |
| | | | |
| | | | Technology Hardware, Storage & Peripherals – 6.9% | | | | | | | | | |
| | | | |
| | 134,273 | | | Apple Inc (3) | | | | | | | | | | | 18,357,805 | |
| | 1,850 | | | Dell Technologies Inc, Class C | | | | | | | | | | | 85,488 | |
| | | | Total Technology Hardware, Storage & Peripherals | | | | | | | | | | | 18,443,293 | |
| | | | |
| | | | Textiles, Apparel & Luxury Goods – 0.5% | | | | | | | | | |
| | | | |
| | 896 | | | Columbia Sportswear Co | | | | | | | | | | | 64,136 | |
| | 154 | | | Deckers Outdoor Corp (2) | | | | | | | | | | | 39,324 | |
| | 1,936 | | | Kontoor Brands Inc | | | | | | | | | | | 64,604 | |
| | 12,444 | | | NIKE Inc, Class B | | | | | | | | | | | 1,271,777 | |
| | 1,536 | | | Skechers USA Inc, Class A (2) | | | | | | | | | | | 54,651 | |
| | | | Total Textiles, Apparel & Luxury Goods | | | | | | | | | | | 1,494,492 | |
42
| | | | | | | | | | | | | | | | |
| Shares | | | Description (1) | | | | | | | | Value | |
| | | | |
| | | | Thrifts & Mortgage Finance – 0.1% | | | | | | | | | |
| | | | |
| | 2,768 | | | MGIC Investment Corp | | | | | | | | | | $ | 34,877 | |
| | 10,698 | | | New York Community Bancorp Inc | | | | | | | | | | | 97,673 | |
| | 440 | | | PennyMac Financial Services Inc | | | | | | | | | | | 19,232 | |
| | 1,111 | | | Radian Group Inc | | | | | | | | | | | 21,831 | |
| | 3,026 | | | TFS Financial Corp | | | | | | | | | | | 41,547 | |
| | | | Total Thrifts & Mortgage Finance | | | | | | | | | | | 215,160 | |
| | | | |
| | | | Tobacco – 0.9% | | | | | | | | | |
| | | | |
| | 20,615 | | | Altria Group Inc | | | | | | | | | | | 861,089 | |
| | 16,845 | | | Philip Morris International Inc | | | | | | | | | | | 1,663,275 | |
| | | | Total Tobacco | | | | | | | | | | | 2,524,364 | |
| | | | |
| | | | Trading Companies & Distributors – 0.3% | | | | | | | | | |
| | | | |
| | 635 | | | Applied Industrial Technologies Inc | | | | | | | | | | | 61,068 | |
| | 911 | | | MSC Industrial Direct Co Inc, Class A | | | | | | | | | | | 68,425 | |
| | 271 | | | SiteOne Landscape Supply Inc (2) | | | | | | | | | | | 32,214 | |
| | 394 | | | Watsco Inc | | | | | | | | | | | 94,095 | |
| | 1,505 | | | WW Grainger Inc | | | | | | | | | | | 683,917 | |
| | | | Total Trading Companies & Distributors | | | | | | | | | | | 939,719 | |
| | | | |
| | | | Water Utilities – 0.1% | | | | | | | | | |
| | | | |
| | 1,309 | | | American States Water Co | | | | | | | | | | | 106,697 | |
| | 1,428 | | | California Water Service Group | | | | | | | | | | | 79,325 | |
| | 3,897 | | | Essential Utilities Inc | | | | | | | | | | | 178,677 | |
| | | | Total Water Utilities | | | | | | | | | | | 364,699 | |
| | | | |
| | | | Wireless Telecommunication Services – 0.0% | | | | | | | | | |
| | | | |
| | 1,094 | | | United States Cellular Corp (2) | | | | | | | | | | | 31,683 | |
| | | | Total Common Stocks (cost $124,460,910) | | | | | | | | | | | 265,579,313 | |
| | | | |
| Shares | | | Description (1) | | | | | | | | Value | |
| | | | |
| | | | EXCHANGE-TRADED FUNDS – 3.0% | | | | | | | | | | | | |
| | | | |
| | 43,000 | | | Vanguard Total Stock Market ETF (4) | | | | | | | | | | $ | 8,110,660 | |
| | | | Total Exchange-Traded Funds (cost $8,232,897) | | | | | | | | | | | 8,110,660 | |
| | | | Total Long-Term Investments (cost $132,693,807) | | | | | | | | | | | 273,689,973 | |
| | | | |
| Shares | | | Description (1) | | | | | | | | Value | |
| | | | |
| | | | INVESTMENTS PURCHASED WITH COLLATERAL FROM SECURITIES LENDING – 0.2% | | | | | | | | | | | | |
| | | | |
| | | | MONEY MARKET FUNDS – 0.2% | | | | | | | | | |
| | | | |
| | 447,227 | | | State Street Navigator Securities Lending Government Money Market Portfolio (5) | | | 1.540% (6) | | | | | | | $ | 447,227 | |
| | | | Total Investments Purchased with Collateral from Securities Lending (cost $447,227) | | | | | | | | 447,227 | |
| | | | |
Principal
Amount (000) | | | Description (1) | | Coupon | | | Maturity | | | Value | |
| | | | |
| | | | SHORT-TERM INVESTMENTS – 2.1% | | | | | | | | | |
| | | | |
| | | | REPURCHASE AGREEMENTS – 2.1% | | | | | | | | | |
| | | | |
| $ | 5,551 | | | Repurchase Agreement with Fixed Income Clearing Corporation, dated 6/30/22, repurchase price $5,550,958, collateralized by $4,867,900, U.S. Treasury Inflation Index Note, 0.500%, due 1/15/28, value $5,662,034 | | | 0.240% | | | | 7/01/22 | | | $ | 5,550,958 | |
| | | | Total Short-Term Investments (cost $5,550,958) | | | | | | | | | | | 5,550,958 | |
| | | | Total Investments (cost $138,691,992) – 104.1% | | | | | | | | | | | 279,688,158 | |
| | | | Other Assets Less Liabilities – (4.1)% (7) | | | | | | | | | | | (10,952,684 | ) |
| | | | Net Assets – 100% | | | | | | | | | | $ | 268,735,474 | |
43
| | |
| |
| SPXX | | Nuveen S&P 500 Dynamic Overwrite Fund (continued) |
| | Portfolio of Investments June 30, 2022 |
| |
| | (Unaudited) |
Investments in Derivatives
Options Purchased
| | | | | | | | | | | | | | | | | | | | | | | | |
| Description (8) | | Type | | | Number of
Contracts | | | Notional
Amount (9) | | | Exercise
Price | | | Expiration
Date | | | Value | |
Cboe Volatility Index SPX Volatility Index | | | Put | | | | 150 | | | $ | 330,000 | | | $ | 22 | | | | 7/20/22 | | | $ | 375 | |
Total Options Purchased (premiums paid $10,732) | | | | 150 | | | $ | 330,000 | | | | | | | | | | | $ | 375 | |
Options Written
| | | | | | | | | | | | | | | | | | | | | | | | |
| Description (8) | | Type | | | Number of
Contracts | | | Notional
Amount (9) | | | Exercise
Price | | | Expiration
Date | | | Value | |
S&P 500® Index | | | Call | | | | (370 | ) | | $ | (135,235,000 | ) | | $ | 3,655 | | | | 7/15/22 | | | $ | (6,132,750 | ) |
S&P 500® Index | | | Call | | | | (25 | ) | | | (9,187,500 | ) | | | 3,675 | | | | 7/15/22 | | | | (376,625 | ) |
S&P 500® Index | | | Put | | | | (30 | ) | | | (11,100,000 | ) | | | 3,700 | | | | 7/15/22 | | | | (135,300 | ) |
Total Options Written (premiums received $5,130,392) | | | | (425 | ) | | $ | (155,522,500 | ) | | | | | | | | | | $ | (6,644,675 | ) |
For Fund portfolio compliance purposes, the Fund’s industry classifications refer to any one or more of the industry sub-classifications used by one or more widely recognized market indexes or ratings group indexes, and/or as defined by Fund management. This definition may not apply for purposes of this report, which may combine industry sub-classifications into sectors for reporting ease.
| (1) | All percentages shown in the Portfolio of Investments are based on net assets applicable to common shares unless otherwise noted. |
| (2) | Non-income producing; issuer has not declared an ex-dividend date within the past twelve months. |
| (3) | Investment, or portion of investment, has been pledged to collateralize the net payment obligations for investments in derivatives. |
| (4) | Investment, or a portion of investment, is out on loan for securities lending. The total value of the securities out on loan as of the end of the reporting period was $433,435. |
| (5) | The Fund may loan securities representing up to one third of the market value of its total assets (which includes collateral for securities on loan) to broker dealers, banks, and other institutions. The collateral maintained by the Fund shall have a market value, at the inception of each loan, equal to not less than 100% of the market value of the loaned securities. The cash collateral received by the Fund is invested in this money market fund. |
| (6) | The rate shown is the one-day yield as of the end of the reporting period. |
| (7) | Other assets less liabilities includes the unrealized appreciation (depreciation) of certain over-the-counter (“OTC”) derivatives as presented on the Statement of Assets and Liabilities, when applicable. The unrealized appreciation (depreciation) of OTC cleared and exchange-traded derivatives is recognized as part of the cash collateral at brokers and/or the receivable or payable for variation margin as presented on the Statement of Assets and Liabilities, when applicable. Other assets less liabilities also includes the value of options as presented on the Statement of Assets and Liabilities. |
| (8) | Exchange-traded, unless otherwise noted. |
| (9) | For disclosure purposes, Notional Amount is calculated by multiplying the Number of Contracts by the Exercise Price by 100. |
| ADR | American Depositary Receipt |
| Cboe | Chicago Board Options Exchange |
| REIT | Real Estate Investment Trust |
See accompanying notes to financial statements.
44
| | |
| QQQX | | Nuveen Nasdaq 100 Dynamic
Overwrite Fund Portfolio of Investments June 30, 2022 |
| | | (Unaudited) |
| | | | | | | | | | | | | | | | |
| Shares | | | Description (1) | | | | | | | | Value | |
| | | | |
| | | | LONG-TERM INVESTMENTS – 102.4% | | | | | | | | | | | | |
| | | | |
| | | | COMMON STOCKS – 99.3% | | | | | | | | | | | | |
| | | | |
| | | | Air Freight & Logistics – 0.1% | | | | | | | | | |
| | | | |
| | 2,647 | | | FedEx Corp | | | | | | | | | | $ | 600,101 | |
| | | | |
| | | | Airlines – 0.2% | | | | | | | | | |
| | | | |
| | 26,595 | | | Delta Air Lines Inc (2) | | | | | | | | | | | 770,457 | |
| | 6,558 | | | Ryanair Holdings PLC, Sponsored ADR (2) | | | | | | | | | | | 441,025 | |
| | 25,632 | | | Southwest Airlines Co (2) | | | | | | | | | | | 925,828 | |
| | | | Total Airlines | | | | | | | | | | | 2,137,310 | |
| | | | |
| | | | Auto Components – 0.1% | | | | | | | | | |
| | | | |
| | 23,148 | | | Gentex Corp | | | | | | | | | | | 647,449 | |
| | 4,110 | | | Lear Corp | | | | | | | | | | | 517,408 | |
| | | | Total Auto Components | | | | | | | | | | | 1,164,857 | |
| | | | |
| | | | Automobiles – 4.3% | | | | | | | | | |
| | | | |
| | 101,941 | | | Ford Motor Co | | | | | | | | | | | 1,134,604 | |
| | 110,670 | | | Lucid Group Inc (2),(3) | | | | | | | | | | | 1,899,097 | |
| | 61,560 | | | Tesla Inc (2) | | | | | | | | | | | 41,455,735 | |
| | | | Total Automobiles | | | | | | | | | | | 44,489,436 | |
| | | | |
| | | | Beverages – 2.1% | | | | | | | | | |
| | | | |
| | 28,086 | | | Brown-Forman Corp, Class B | | | | | | | | | | | 1,970,514 | |
| | 5,525 | | | Celsius Holdings Inc (2) | | | | | | | | | | | 360,561 | |
| | 114,738 | | | Coca-Cola Co | | | | | | | | | | | 7,218,168 | |
| | 133,325 | | | Monster Beverage Corp (2) | | | | | | | | | | | 12,359,227 | |
| | | | Total Beverages | | | | | | | | | | | 21,908,470 | |
| | | | |
| | | | Biotechnology – 4.9% | | | | | | | | | |
| | | | |
| | 90,324 | | | Amgen Inc (4) | | | | | | | | | | | 21,975,829 | |
| | 176,343 | | | Gilead Sciences Inc | | | | | | | | | | | 10,899,761 | |
| | 11,093 | | | Ionis Pharmaceuticals Inc (2) | | | | | | | | | | | 410,663 | |
| | 42,980 | | | Moderna Inc (2) | | | | | | | | | | | 6,139,693 | |
| | 18,035 | | | Regeneron Pharmaceuticals Inc (2) | | | | | | | | | | | 10,661,030 | |
| | 3,808 | | | United Therapeutics Corp (2) | | | | | | | | | | | 897,317 | |
| | | | Total Biotechnology | | | | | | | | | | | 50,984,293 | |
| | | | |
| | | | Capital Markets – 0.9% | | | | | | | | | |
| | | | |
| | 10,021 | | | Moody’s Corp | | | | | | | | | | | 2,725,411 | |
| | 23,851 | | | Morgan Stanley | | | | | | | | | | | 1,814,107 | |
| | 9,235 | | | S&P Global Inc | | | | | | | | | | | 3,112,749 | |
| | 12,582 | | | SEI Investments Co | | | | | | | | | | | 679,680 | |
| | 5,699 | | | T Rowe Price Group Inc | | | | | | | | | | | 647,463 | |
| | | | Total Capital Markets | | | | | | | | | | | 8,979,410 | |
| | | | |
| | | | Chemicals – 0.3% | | | | | | | | | |
| | | | |
| | 6,204 | | | Ecolab Inc | | | | | | | | | | | 953,927 | |
| | 9,155 | | | Sherwin-Williams Co | | | | | | | | | | | 2,049,896 | |
| | | | Total Chemicals | | | | | | | | | | | 3,003,823 | |
| | | | |
| | | | Commercial Services & Supplies – 0.8% | | | | | | | | | |
| | | | |
| | 26,367 | | | Copart Inc (2) | | | | | | | | | | | 2,865,038 | |
| | 8,008 | | | IAA Inc (2) | | | | | | | | | | | 262,422 | |
45
| | |
| |
| QQQX | | Nuveen Nasdaq 100 Dynamic Overwrite Fund (continued) |
| | Portfolio of Investments June 30, 2022 |
| | (Unaudited) |
| | | | | | | | | | | | | | | | |
| Shares | | | Description (1) | | | | | | | | Value | |
| | | | |
| | | | Commercial Services & Supplies (continued) | | | | | | | | | |
| | | | |
| | 15,503 | | | Tetra Tech Inc | | | | | | | | | | $ | 2,116,935 | |
| | 8,329 | | | Waste Connections Inc | | | | | | | | | | | 1,032,463 | |
| | 10,605 | | | Waste Management Inc | | | | | | | | | | | 1,622,353 | |
| | | | Total Commercial Services & Supplies | | | | | | | | | | | 7,899,211 | |
| | | | |
| | | | Communications Equipment – 2.6% | | | | | | | | | |
| | | | |
| | 608,345 | | | Cisco Systems Inc | | | | | | | | | | | 25,939,831 | |
| | 5,262 | | | F5 Inc (2) | | | | | | | | | | | 805,296 | |
| | | | Total Communications Equipment | | | | | | | | | | | 26,745,127 | |
| | | | |
| | | | Containers & Packaging – 0.1% | | | | | | | | | |
| | | | |
| | 20,014 | | | Ball Corp | | | | | | | | | | | 1,376,363 | |
| | | | |
| | | | Distributors – 0.3% | | | | | | | | | |
| | | | |
| | 9,398 | | | Pool Corp | | | | | | | | | | | 3,300,859 | |
| | | | |
| | | | Diversified Consumer Services – 0.3% | | | | | | | | | |
| | | | |
| | 42,126 | | | Service Corp International/US | | | | | | | | | | | 2,911,749 | |
| | | | |
| | | | Diversified Financial Services – 0.4% | | | | | | | | | |
| | | | |
| | 15,690 | | | Berkshire Hathaway Inc, Class B (2) | | | | | | | | | | | 4,283,684 | |
| | | | |
| | | | Electric Utilities – 0.2% | | | | | | | | | |
| | | | |
| | 29,062 | | | NextEra Energy Inc | | | | | | | | | | | 2,251,142 | |
| | 26,822 | | | PG&E Corp (2) | | | | | | | | | | | 267,684 | |
| | | | Total Electric Utilities | | | | | | | | | | | 2,518,826 | |
| | | | |
| | | | Electrical Equipment – 0.2% | | | | | | | | | |
| | | | |
| | 9,512 | | | Rockwell Automation Inc | | | | | | | | | | | 1,895,837 | |
| | | | |
| | | | Electronic Equipment, Instruments & Components – 0.2% | | | | | | | | | |
| | | | |
| | 10,486 | | | Keysight Technologies Inc (2) | | | | | | | | | | | 1,445,495 | |
| | 12,059 | | | National Instruments Corp | | | | | | | | | | | 376,603 | |
| | | | Total Electronic Equipment, Instruments & Components | | | | | | | | | | | 1,822,098 | |
| | | | |
| | | | Energy Equipment & Services – 0.0% | | | | | | | | | |
| | | | |
| | 5,484 | | | Select Energy Services Inc, Class A (2) | | | | | | | | | | | 37,401 | |
| | | | |
| | | | Entertainment – 0.0% | | | | | | | | | |
| | | | |
| | 41,180 | | | AMC Entertainment Holdings Inc, Class A (2),(3) | | | | | | | | | | | 557,989 | |
| | | | |
| | | | Equity Real Estate Investment Trust – 0.3% | | | | | | | | | |
| | | | |
| | 62,781 | | | CubeSmart | | | | | | | | | | | 2,682,004 | |
| | | | |
| | | | Food & Staples Retailing – 1.3% | | | | | | | | | |
| | | | |
| | 4,001 | | | Casey’s General Stores Inc | | | | | | | | | | | 740,105 | |
| | 210,528 | | | HF Foods Group Inc (2) | | | | | | | | | | | 1,098,956 | |
| | 44,413 | | | Kroger Co | | | | | | | | | | | 2,102,067 | |
| | 22,661 | | | Sysco Corp | | | | | | | | | | | 1,919,613 | |
| | 19,549 | | | US Foods Holding Corp (2) | | | | | | | | | | | 599,764 | |
| | 56,581 | | | Walmart Inc | | | | | | | | | | | 6,879,118 | |
| | | | Total Food & Staples Retailing | | | | | | | | | | | 13,339,623 | |
| | | | |
| | | | Food Products – 1.2% | | | | | | | | | |
| | | | |
| | 10,258 | | | Archer-Daniels-Midland Co | | | | | | | | | | | 796,021 | |
| | 23,113 | | | Beyond Meat Inc (2),(3) | | | | | | | | | | | 553,325 | |
| | 70,834 | | | Bridgford Foods Corp (2) | | | | | | | | | | | 933,592 | |
| | 24,581 | | | Hershey Co | | | | | | | | | | | 5,288,848 | |
| | 16,902 | | | Hormel Foods Corp | | | | | | | | | | | 800,479 | |
| | 22,636 | | | Laird Superfood Inc (2) | | | | | | | | | | | 43,235 | |
| | 49,425 | | | McCormick & Co Inc/MD | | | | | | | | | | | 4,114,631 | |
| | 12,047 | | | Vital Farms Inc (2) | | | | | | | | | | | 105,411 | |
| | | | Total Food Products | | | | | | | | | | | 12,635,542 | |
46
| | | | | | | | | | | | | | | | |
| Shares | | | Description (1) | | | | | | | | Value | |
| | | | |
| | | | Health Care Equipment & Supplies – 1.6% | | | | | | | | | |
| | | | |
| | 69,911 | | | Abbott Laboratories | | | | | | | | | | $ | 7,595,830 | |
| | 3,843 | | | Becton Dickinson and Co | | | | | | | | | | | 947,415 | |
| | 768 | | | Embecta Corp (2) | | | | | | | | | | | 19,446 | |
| | 17,865 | | | LENSAR Inc (2) | | | | | | | | | | | 116,301 | |
| | 47,589 | | | NuVasive Inc (2) | | | | | | | | | | | 2,339,475 | |
| | 514 | | | Shockwave Medical Inc (2) | | | | | | | | | | | 98,262 | |
| | 19,914 | | | Stryker Corp | | | | | | | | | | | 3,961,492 | |
| | 62,738 | | | Venus Concept Inc (2) | | | | | | | | | | | 29,098 | |
| | 10,688 | | | Zimmer Biomet Holdings Inc | | | | | | | | | | | 1,122,881 | |
| | 3,702 | | | Zimvie Inc (2) | | | | | | | | | | | 59,269 | |
| | | | Total Health Care Equipment & Supplies | | | | | | | | | | | 16,289,469 | |
| | | | |
| | | | Health Care Providers & Services – 0.5% | | | | | | | | | |
| | | | |
| | 4,308 | | | McKesson Corp | | | | | | | | | | | 1,405,313 | |
| | 5,579 | | | UnitedHealth Group Inc | | | | | | | | | | | 2,865,542 | |
| | 7,651 | | | Universal Health Services Inc, Class B | | | | | | | | | | | 770,532 | |
| | | | Total Health Care Providers & Services | | | | | | | | | | | 5,041,387 | |
| | | | |
| | | | Hotels, Restaurants & Leisure – 1.5% | | | | | | | | | |
| | | | |
| | 6,648 | | | Booking Holdings Inc (2) | | | | | | | | | | | 11,627,286 | |
| | 21,002 | | | Darden Restaurants Inc | | | | | | | | | | | 2,375,746 | |
| | 28,119 | | | Restaurant Brands International Inc | | | | | | | | | | | 1,410,168 | |
| | | | Total Hotels, Restaurants & Leisure | | | | | | | | | | | 15,413,200 | |
| | | | |
| | | | Household Durables – 0.1% | | | | | | | | | |
| | | | |
| | 43,730 | | | KB Home | | | | | | | | | | | 1,244,556 | |
| | | | |
| | | | Insurance – 0.1% | | | | | | | | | |
| | | | |
| | 23,048 | | | Fidelity National Financial Inc | | | | | | | | | | | 851,854 | |
| | | | |
| | | | Interactive Media & Services – 12.7% | | | | | | | | | |
| | | | |
| | 25,775 | | | Alphabet Inc, Class A (2), (4) | | | | | | | | | | | 56,170,426 | |
| | 16,998 | | | Alphabet Inc, Class C (2) | | | | | | | | | | | 37,182,275 | |
| | 17,171 | | | IAC/InterActiveCorp (2) | | | | | | | | | | | 1,304,481 | |
| | 41,518 | | | Match Group Inc (2) | | | | | | | | | | | 2,893,389 | |
| | 196,403 | | | Meta Platforms Inc, Class (2) | | | | | | | | | | | 31,669,984 | |
| | 49,738 | | | Twitter Inc (2) | | | | | | | | | | | 1,859,704 | |
| | 27,877 | | | Vimeo Inc (2) | | | | | | | | | | | 167,820 | |
| | | | Total Interactive Media & Services | | | | | | | | | | | 131,248,079 | |
| | | | |
| | | | Internet & Direct Marketing Retail – 8.6% | | | | | | | | | |
| | | | |
| | 648,064 | | | Amazon.com Inc (2),(4) | | | | | | | | | | | 68,830,877 | |
| | 476,707 | | | eBay Inc | | | | | | | | | | | 19,864,381 | |
| | | | Total Internet & Direct Marketing Retail | | | | | | | | | | | 88,695,258 | |
| | | | |
| | | | IT Services – 1.9% | | | | | | | | | |
| | | | |
| | 18,183 | | | BigCommerce Holdings Inc (2) | | | | | | | | | | | 294,565 | |
| | 9,762 | | | Cloudflare Inc, Class A (2) | | | | | | | | | | | 427,087 | |
| | 42,378 | | | Jack Henry & Associates Inc | | | | | | | | | | | 7,628,888 | |
| | 165,979 | | | PayPal Holdings Inc (2) | | | | | | | | | | | 11,591,973 | |
| | | | Total IT Services | | | | | | | | | | | 19,942,513 | |
| | | | |
| | | | Leisure Products – 0.0% | | | | | | | | | |
| | | | |
| | 59,882 | | | Peloton Interactive Inc, Class A (2) | | | | | | | | | | | 549,717 | |
| | | | |
| | | | Life Sciences Tools & Services – 0.9% | | | | | | | | | |
| | | | |
| | 16,855 | | | Agilent Technologies Inc | | | | | | | | | | | 2,001,868 | |
| | 8,892 | | | Charles River Laboratories International Inc (2) | | | | | | | | | | | 1,902,621 | |
| | 21,697 | | | Danaher Corp | | | | | | | | | | | 5,500,624 | |
| | | | Total Life Sciences Tools & Services | | | | | | | | | | | 9,405,113 | |
47
| | |
| |
| QQQX | | Nuveen Nasdaq 100 Dynamic Overwrite Fund (continued) |
| | Portfolio of Investments June 30, 2022 |
| | (Unaudited) |
| | | | | | | | | | | | | | | | |
| Shares | | | Description (1) | | | | | | | | Value | |
| | | | |
| | | | Machinery – 0.2% | | | | | | | | | |
| | | | |
| | 10,028 | | | Caterpillar Inc | | | | | | | | | | $ | 1,792,605 | |
| | 10,172 | | | Fortive Corp | | | | | | | | | | | 553,154 | |
| | | | Total Machinery | | | | | | | | | | | 2,345,759 | |
| | | | |
| | | | Media – 3.3% | | | | | | | | | |
| | | | |
| | 2,283 | | | Cable One Inc | | | | | | | | | | | 2,943,518 | |
| | 692,529 | | | Comcast Corp, Class A | | | | | | | | | | | 27,174,838 | |
| | 168,489 | | | comScore Inc (2) | | | | | | | | | | | 347,087 | |
| | 62,041 | | | News Corp, Class B | | | | | | | | | | | 985,832 | |
| | 79,629 | | | News Corp, Class A | | | | | | | | | | | 1,240,620 | |
| | 18,730 | | | Paramount Global | | | | | | | | | | | 462,256 | |
| | 45,680 | | | Saga Communications Inc, Class A | | | | | | | | | | | 1,135,148 | |
| | | | Total Media | | | | | | | | | | | 34,289,299 | |
| | | | |
| | | | Multiline Retail – 0.3% | | | | | | | | | |
| | | | |
| | 19,983 | | | Target Corp | | | | | | | | | | | 2,822,199 | |
| | | | |
| | | | Oil, Gas & Consumable Fuels – 0.3% | | | | | | | | | |
| | | | |
| | 311,284 | | | Clean Energy Fuels Corp (2) | | | | | | | | | | | 1,394,553 | |
| | 37,282 | | | Peabody Energy Corp (2) | | | | | | | | | | | 795,225 | |
| | 13,845 | | | Ranger Oil Corp, Class A (2) | | | | | | | | | | | 455,085 | |
| | 123,234 | | | Tellurian Inc (2) | | | | | | | | | | | 367,237 | |
| | | | Total Oil, Gas & Consumable Fuels | | | | | | | | | | | 3,012,100 | |
| | | | |
| | | | Personal Products – 0.0% | | | | | | | | | |
| | | | |
| | 126,539 | | | NewAge Inc (2) | | | | | | | | | | | 28,345 | |
| | | | |
| | | | Pharmaceuticals – 0.1% | | | | | | | | | |
| | | | |
| | 11,759 | | | Bristol-Myers Squibb Co | | | | | | | | | | | 905,443 | |
| | 18,188 | | | Rockwell Medical Inc (2),(3) | | | | | | | | | | | 23,462 | |
| | | | Total Pharmaceuticals | | | | | | | | | | | 928,905 | |
| | | | |
| | | | Professional Services – 0.3% | | | | | | | | | |
| | | | |
| | 11,037 | | | ManpowerGroup Inc | | | | | | | | | | | 843,337 | |
| | 25,799 | | | Robert Half International Inc | | | | | | | | | | | 1,932,087 | |
| | | | Total Professional Services | | | | | | | | | | | 2,775,424 | |
| | | | |
| | | | Semiconductors & Semiconductor Equipment – 13.9% | | | | | | | | | |
| | | | |
| | 166,423 | | | Advanced Micro Devices Inc (2) | | | | | | | | | | | 12,726,367 | |
| | 123,009 | | | Analog Devices Inc | | | | | | | | | | | 17,970,385 | |
| | 200,364 | | | Applied Materials Inc | | | | | | | | | | | 18,229,117 | |
| | 2,109 | | | Enphase Energy Inc (2) | | | | | | | | | | | 411,761 | |
| | 422,722 | | | Intel Corp | | | | | | | | | | | 15,814,030 | |
| | 3,449 | | | Monolithic Power Systems Inc | | | | | | | | | | | 1,324,554 | |
| | 229,467 | | | NVIDIA Corp | | | | | | | | | | | 34,784,902 | |
| | 103,235 | | | ON Semiconductor Corp (2) | | | | | | | | | | | 5,193,753 | |
| | 41,083 | | | Power Integrations Inc | | | | | | | | | | | 3,081,636 | |
| | 190,701 | | | QUALCOMM Inc | | | | | | | | | | | 24,360,146 | |
| | 26,956 | | | Silicon Laboratories Inc (2) | | | | | | | | | | | 3,779,770 | |
| | 2,620 | | | SiTime Corp (2) | | | | | | | | | | | 427,138 | |
| | 34,851 | | | Skyworks Solutions Inc | | | | | | | | | | | 3,228,597 | |
| | 31,287 | | | Taiwan Semiconductor Manufacturing Co Ltd, Sponsored ADR (2) | | | | | | | | | | | 2,557,712 | |
| | 9,407 | | | Wolfspeed Inc (2) | | | | | | | | | | | 596,874 | |
| | | | Total Semiconductors & Semiconductor Equipment | | | | | | | | | | | 144,486,742 | |
| | | | |
| | | | Software – 18.5% | | | | | | | | | |
| | | | |
| | 29,879 | | | ANSYS Inc (2) | | | | | | | | | | | 7,149,746 | |
| | 55,282 | | | Autodesk Inc (2) | | | | | | | | | | | 9,506,293 | |
| | 39,633 | | | Black Knight Inc (2) | | | | | | | | | | | 2,591,602 | |
| | 11,614 | | | CDK Global Inc | | | | | | | | | | | 636,099 | |
| | 14,396 | | | Crowdstrike Holdings Inc, Class A (2) | | | | | | | | | | | 2,426,590 | |
| | 15,872 | | | Datadog Inc, Class A (2) | | | | | | | | | | | 1,511,649 | |
48
| | | | | | | | | | | | | | | | |
| Shares | | | Description (1) | | | | | | | | Value | |
| | | | |
| | | | Software (continued) | | | | | | | | | |
| | | | |
| | 67,810 | | | Fortinet Inc (2) | | | | | | | | | | $ | 3,836,690 | |
| | 527,790 | | | Microsoft Corp (4) | | | | | | | | | | | 135,552,306 | |
| | 115,511 | | | Nutanix Inc, Class A (2) | | | | | | | | | | | 1,689,926 | |
| | 22,586 | | | Open Text Corp | | | | | | | | | | | 854,654 | |
| | 67,979 | | | Oracle Corp | | | | | | | | | | | 4,749,693 | |
| | 7,344 | | | Palo Alto Networks Inc (2) | | | | | | | | | | | 3,627,495 | |
| | 41,179 | | | PTC Inc (2) | | | | | | | | | | | 4,378,975 | |
| | 34,197 | | | Salesforce Inc (2) | | | | | | | | | | | 5,643,873 | |
| | 3,480 | | | ServiceNow Inc (2) | | | | | | | | | | | 1,654,810 | |
| | 2,398 | | | Sprout Social Inc, Class A (2) | | | | | | | | | | | 139,252 | |
| | 88,342 | | | Sumo Logic Inc (2) | | | | | | | | | | | 661,681 | |
| | 1,581 | | | Tenable Holdings Inc (2) | | | | | | | | | | | 71,793 | |
| | 1,572 | | | Trade Desk Inc, Class A (2) | | | | | | | | | | | 65,851 | |
| | 1,363 | | | Zendesk Inc (2) | | | | | | | | | | | 100,957 | |
| | 44,126 | | | Zoom Video Communications Inc, Class A (2) | | | | | | | | | | | 4,764,284 | |
| | | | Total Software | | | | | | | | | | | 191,614,219 | |
| | | | |
| | | | Specialty Retail – 0.6% | | | | | | | | | |
| | | | |
| | 4,707 | | | Advance Auto Parts Inc | | | | | | | | | | | 814,734 | |
| | 940 | | | AutoZone Inc (2) | | | | | | | | | | | 2,020,173 | |
| | 1,904 | | | Bed Bath & Beyond Inc (2) | | | | | | | | | | | 9,463 | |
| | 20,239 | | | CarMax Inc (2) | | | | | | | | | | | 1,831,225 | |
| | 20,411 | | | Dick’s Sporting Goods Inc (3) | | | | | | | | | | | 1,538,377 | |
| | 17,348 | | | Urban Outfitters Inc (2) | | | | | | | | | | | 323,714 | |
| | | | Total Specialty Retail | | | | | | | | | | | 6,537,686 | |
| | | | |
| | | | Technology Hardware, Storage & Peripherals – 12.9% | | | | | | | | | |
| | | | |
| | 974,531 | | | Apple Inc (4) | | | | | | | | | | | 133,237,879 | |
| | 6,751 | | | NetApp Inc | | | | | | | | | | | 440,435 | |
| | | | Total Technology Hardware, Storage & Peripherals | | | | | | | | | | | 133,678,314 | |
| | | | |
| | | | Textiles, Apparel & Luxury Goods – 0.1% | | | | | | | | | |
| | | | |
| | 2,284 | | | PVH Corp | | | | | | | | | | | 129,959 | |
| | 18,741 | | | Skechers USA Inc, Class A (2) | | | | | | | | | | | 666,805 | |
| | | | Total Textiles, Apparel & Luxury Goods | | | | | | | | | | | 796,764 | |
| | | | |
| | | | Wireless Telecommunication Services – 0.1% | | | | | | | | | |
| | | | |
| | 49,835 | | | Gogo Inc (2) | | | | | | | | | | | 806,829 | |
| | 25,982 | | | Spok Holdings Inc | | | | | | | | | | | 163,686 | |
| | | | Total Wireless Telecommunication Services | | | | | | | | | | | 970,515 | |
| | | | Total Common Stocks (cost $445,819,129) | | | | | | | | | | | 1,028,241,430 | |
| | | | |
Shares | | | Description (1) | | | | | | | | Value | |
| | | | |
| | | | EXCHANGE-TRADED FUNDS – 3.1% | | | | | | | | | |
| | | | |
| | 5,000 | | | Invesco QQQ Trust Series 1 (3) | | | | | | | | | | $ | 1,401,400 | |
| | 160,000 | | | Vanguard Total Stock Market ETF | | | | | | | | | | | 30,179,200 | |
| | | | Total Exchange-Traded Funds (cost $32,185,915) | | | | | | | | | | | 31,580,600 | |
| | | | Total Long-Term Investments (cost $478,005,044) | | | | | | | | | | | 1,059,822,030 | |
| | | | |
| Shares | | | Description (1) | | Coupon | | | | | | Value | |
| | | | |
| | | | INVESTMENTS PURCHASED WITH COLLATERAL FROM SECURITIES LENDING – 0.4% | | | | | | | | | | | | |
| | | | |
| | | | MONEY MARKET FUNDS – 0.4% | | | | | | | | | | | | |
| | | | |
| | 4,521,847 | | | State Street Navigator Securities Lending Government Money Market Portfolio (5) | | | 1.540% | (6) | | | | | | $ | 4,521,847 | |
| | | | Total Investments Purchased with Collateral from Securities Lending (cost $4,521,847) | | | | | | | | | | | 4,521,847 | |
49
| | |
| |
| QQQX | | Nuveen Nasdaq 100 Dynamic Overwrite Fund (continued) |
| | Portfolio of Investments June 30, 2022 |
| | (Unaudited) |
| | | | | | | | | | | | | | | | |
Principal
Amount (000) | | | Description (1) | | Coupon | | | Maturity | | | Value | |
| | | | |
| | | | SHORT-TERM INVESTMENTS – 2.2% | | | | | | | | | | | | |
| | | | |
| | | | REPURCHASE AGREEMENTS – 2.2% | | | | | | | | | | | | |
| | | | |
| $ | 22,508 | | | Repurchase Agreement with Fixed Income Clearing Corporation, dated 6/30/22, repurchase price $22,508,483, collateralized by $8,782,200, U.S. Treasury Note, 0.500%, due 10/31/27, value $7,635,445; collateralized by $17,698,100, U.S. Treasury Note, 0.375%, due 9/30/27, value $15,323,287 | | | 0.240% | | | | 7/01/22 | | | $ | 22,508,483 | |
| | | | Total Short-Term Investments (cost $22,508,483) | | | | | | | | | | | 22,508,483 | |
| | | | Total Investments (cost $505,035,374) – 105.0% | | | | | | | | | | | 1,086,852,360 | |
| | | | Other Assets Less Liabilities – (5.0)% (7) | | | | | | | | | | | (51,482,040 | ) |
| | | | Net Assets – 100% | | | | | | | | | | $ | 1,035,370,320 | |
Investments in Derivatives
Options Purchased
| | | | | | | | | | | | | | | | | | | | | | | | |
| Description (8) | | Type | | | Number of
Contracts | | | Notional
Amount (9) | | | Exercise
Price | | | Expiration
Date | | | Value | |
Cboe Volatility Index (premiums paid $21,465) | | | Put | | | | 300 | | | $ | 660,000 | | | $ | 22 | | | | 7/20/22 | | | $ | 750 | |
Options Written
| | | | | | | | | | | | | | | | | | | | | | | | |
| Description (8) | | Type | | | Number of
Contracts | | | Notional
Amount (9) | | | Exercise
Price | | | Expiration
Date | | | Value | |
Invesco China Technology ETF (10) | | | Call | | | | (500 | ) | | $ | (14,250,000 | ) | | $ | 285 | | | | 7/15/22 | | | $ | (262,223 | ) |
Invesco China Technology ETF (10) | | | Call | | | | (500 | ) | | | (14,500,000 | ) | | | 290 | | | | 7/15/22 | | | | (168,959 | ) |
NASDAQ 100 Stock Index | | | Call | | | | (450 | ) | | | (501,750,000 | ) | | | 11,150 | | | | 7/15/22 | | | | (22,731,750 | ) |
NASDAQ 100 Stock Index | | | Call | | | | (25 | ) | | | (28,125,000 | ) | | | 11,250 | | | | 7/15/22 | | | | (1,092,875 | ) |
S&P 500® Index | | | Put | | | | (110 | ) | | | (40,700,000 | ) | | | 3,700 | | | | 7/15/22 | | | | (496,100 | ) |
Total Options Written (premiums received $24,442,914) | | | | (1,585 | ) | | $ | (599,325,000 | ) | | | | | | | | | | $ | (24,751,906 | ) |
For Fund portfolio compliance purposes, the Fund’s industry classifications refer to any one or more of the industry sub-classifications used by one or more widely recognized market indexes or ratings group indexes, and/or as defined by Fund management. This definition may not apply for purposes of this report, which may combine industry sub-classifications into sectors for reporting ease.
| (1) | All percentages shown in the Portfolio of Investments are based on net assets applicable to common shares unless otherwise noted. |
| (2) | Non-income producing; issuer has not declared an ex-dividend date within the past twelve months. |
| (3) | Investment, or a portion of investment, is out on loan for securities lending. The total value of the securities out on loan as of the end of the reporting period was $4,365,284. |
| (4) | Investment, or portion of investment, has been pledged to collateralize the net payment obligations for investments in derivatives. |
| (5) | The Fund may loan securities representing up to one third of the market value of its total assets (which includes collateral for securities on loan) to broker dealers, banks, and other institutions. The collateral maintained by the Fund shall have a market value, at the inception of each loan, equal to not less than 100% of the market value of the loaned securities. The cash collateral received by the Fund is invested in this money market fund. |
| (6) | The rate shown is the one-day yield as of the end of the reporting period. |
| (7) | Other assets less liabilities includes the unrealized appreciation (depreciation) of certain over-the-counter (“OTC”) derivatives as presented on the Statement of Assets and Liabilities, when applicable. The unrealized appreciation (depreciation) of OTC cleared and exchange-traded derivatives is recognized as part of the cash collateral at brokers and/or the receivable or payable for variation margin as presented on the Statement of Assets and Liabilities, when applicable. Other assets less liabilities also includes the value of options as presented on the Statement of Assets and Liabilities. |
| (8) | Exchange-traded, unless otherwise noted. |
| (9) | For disclosure purposes, Notional Amount is calculated by multiplying the Number of Contracts by the Exercise Price by 100. |
| (10) | For fair value measurement disclosure purposes, investment classified as Level 2. |
| ADR | American Depositary Receipt |
| Cboe | Chicago Board Options Exchange |
See accompanying notes to financial statements.
50
| | |
| JCE | | Nuveen Core Equity
Alpha Fund Portfolio of Investments June 30, 2022 |
| | | (Unaudited) |
| | | | | | | | | | | | | | | | |
| Shares | | | Description (1) | | | | | | | | Value | |
| | | | |
| | | | LONG-TERM INVESTMENTS – 100.0% | | | | | | | | | | | | |
| | | | |
| | | | COMMON STOCKS – 99.5% | | | | | | | | | | | | |
| | | | |
| | | | Aerospace & Defense – 1.0% | | | | | | | | | |
| | | | |
| | 5,060 | | | Lockheed Martin Corp | | | | | | | | | | $ | 2,175,598 | |
| | | | |
| | | | Air Freight & Logistics – 0.5% | | | | | | | | | |
| | | | |
| | 5,956 | | | United Parcel Service Inc, Class B | | | | | | | | | | | 1,087,208 | |
| | | | |
| | | | Automobiles – 1.3% | | | | | | | | | |
| | | | |
| | 4,060 | | | Tesla Inc (2) | | | | | | | | | | | 2,734,085 | |
| | | | |
| | | | Banks – 2.4% | | | | | | | | | |
| | | | |
| | 20,885 | | | Bank of America Corp | | | | | | | | | | | 650,150 | |
| | 36,910 | | | Citigroup Inc | | | | | | | | | | | 1,697,491 | |
| | 1,540 | | | First Republic Bank/CA | | | | | | | | | | | 222,068 | |
| | 10,680 | | | JPMorgan Chase & Co | | | | | | | | | | | 1,202,675 | |
| | 30,750 | | | Truist Financial Corp | | | | | | | | | | | 1,458,472 | |
| | | | Total Banks | | | | | | | | | | | 5,230,856 | |
| | | | |
| | | | Beverages – 1.6% | | | | | | | | | |
| | | | |
| | 9,760 | | | Coca-Cola Co | | | | | | | | | | | 614,002 | |
| | 16,760 | | | PepsiCo Inc | | | | | | | | | | | 2,793,221 | |
| | | | Total Beverages | | | | | | | | | | | 3,407,223 | |
| | | | |
| | | | Biotechnology – 0.8% | | | | | | | | | |
| | | | |
| | 2,460 | | | AbbVie Inc | | | | | | | | | | | 376,774 | |
| | 64,670 | | | Exelixis Inc (2) | | | | | | | | | | | 1,346,429 | |
| | | | Total Biotechnology | | | | | | | | | | | 1,723,203 | |
| | | | |
| | | | Building Products – 1.6% | | | | | | | | | |
| | | | |
| | 22,510 | | | Johnson Controls International plc | | | | | | | | | | | 1,077,779 | |
| | 15,460 | | | Owens Corning | | | | | | | | | | | 1,148,833 | |
| | 10,220 | | | Trane Technologies PLC | | | | | | | | | | | 1,327,271 | |
| | | | Total Building Products | | | | | | | | | | | 3,553,883 | |
| | | | |
| | | | Capital Markets – 1.5% | | | | | | | | | |
| | | | |
| | 23,884 | | | Carlyle Group Inc | | | | | | | | | | | 756,167 | |
| | 26,320 | | | Charles Schwab Corp | | | | | | | | | | | 1,662,898 | |
| | 1,360 | | | CME Group Inc | | | | | | | | | | | 278,392 | |
| | 1,460 | | | FactSet Research Systems Inc | | | | | | | | | | | 561,472 | |
| | 2,040 | | | KKR & Co Inc | | | | | | | | | | | 94,432 | |
| | | | Total Capital Markets | | | | | | | | | | | 3,353,361 | |
| | | | |
| | | | Chemicals – 1.3% | | | | | | | | | |
| | | | |
| | 15,470 | | | LyondellBasell Industries NV, Class A | | | | | | | | | | | 1,353,006 | |
| | 6,520 | | | Sherwin-Williams Co | | | | | | | | | | | 1,459,893 | |
| | | | Total Chemicals | | | | | | | | | | | 2,812,899 | |
| | | | |
| | | | Commercial Services & Supplies – 1.6% | | | | | | | | | |
| | | | |
| | 3,700 | | | Cintas Corp | | | | | | | | | | | 1,382,061 | |
| | 10,530 | | | Republic Services Inc | | | | | | | | | | | 1,378,061 | |
| | 5,190 | | | Waste Management Inc | | | | | | | | | | | 793,966 | |
| | | | Total Commercial Services & Supplies | | | | | | | | | | | 3,554,088 | |
| | | | |
| | | | Communications Equipment – 0.0% | | | | | | | | | |
| | | | |
| | 1,810 | | | Cisco Systems Inc | | | | | | | | | | | 77,178 | |
51
| | |
| |
| JCE | | Nuveen Core Equity Alpha Fund (continued) |
| | Portfolio of Investments June 30, 2022 |
| | (Unaudited) |
| | | | | | | | | | | | | | | | |
| Shares | | | Description (1) | | | | | | | | Value | |
| | | | |
| | | | Consumer Finance – 0.8% | | | | | | | | | |
| | | | |
| | 11,970 | | | American Express Co | | | | | | | | | | $ | 1,659,281 | |
| | | | |
| | | | Containers & Packaging – 0.6% | | | | | | | | | |
| | | | |
| | 32,960 | | | Westrock Co | | | | | | | | | | | 1,313,126 | |
| | | | |
| | | | Diversified Financial Services – 2.4% | | | | | | | | | |
| | | | |
| | 16,240 | | | Berkshire Hathaway Inc, Class B (2) | | | | | | | | | | | 4,433,845 | |
| | 27,100 | | | Equitable Holdings Inc | | | | | | | | | | | 706,497 | |
| | | | Total Diversified Financial Services | | | | | | | | | | | 5,140,342 | |
| | | | |
| | | | Diversified Telecommunication Services – 1.9% | | | | | | | | | |
| | | | |
| | 77,630 | | | AT&T Inc | | | | | | | | | | | 1,627,125 | |
| | 48,439 | | | Verizon Communications Inc | | | | | | | | | | | 2,458,279 | |
| | | | Total Diversified Telecommunication Services | | | | | | | | | | | 4,085,404 | |
| | | | |
| | | | Electric Utilities – 1.1% | | | | | | | | | |
| | | | |
| | 9,950 | | | Duke Energy Corp | | | | | | | | | | | 1,066,740 | |
| | 15,560 | | | Eversource Energy | | | | | | | | | | | 1,314,353 | |
| | | | Total Electric Utilities | | | | | | | | | | | 2,381,093 | |
| | | | |
| | | | Electrical Equipment – 1.7% | | | | | | | | | |
| | | | |
| | 11,370 | | | AMETEK Inc | | | | | | | | | | | 1,249,449 | |
| | 15,470 | | | Emerson Electric Co | | | | | | | | | | | 1,230,484 | |
| | 41,350 | | | nVent Electric PLC | | | | | | | | | | | 1,295,496 | |
| | | | Total Electrical Equipment | | | | | | | | | | | 3,775,429 | |
| | | | |
| | | | Electronic Equipment, Instruments & Components – 1.1% | | | | | | | | | |
| | | | |
| | 25,420 | | | Avnet Inc | | | | | | | | | | | 1,090,010 | |
| | 9,210 | | | Keysight Technologies Inc (2) | | | | | | | | | | | 1,269,598 | |
| | | | Total Electronic Equipment, Instruments & Components | | | | | | | | | | | 2,359,608 | |
| | | | |
| | | | Entertainment – 0.8% | | | | | | | | | |
| | | | |
| | 5,410 | | | Electronic Arts Inc | | | | | | | | | | | 658,126 | |
| | 3,910 | | | Walt Disney Co (2) | | | | | | | | | | | 369,104 | |
| | 56,437 | | | Warner Bros Discovery Inc (2) | | | | | | | | | | | 757,385 | |
| | | | Total Entertainment | | | | | | | | | | | 1,784,615 | |
| | | | |
| | | | Equity Real Estate Investment Trust – 0.6% | | | | | | | | | |
| | | | |
| | 39,100 | | | Weyerhaeuser Co | | | | | | | | | | | 1,294,992 | |
| | | | |
| | | | Food & Staples Retailing – 2.0% | | | | | | | | | |
| | | | |
| | 39,640 | | | Albertsons Cos Inc, Class A | | | | | | | | | | | 1,059,181 | |
| | 250 | | | Costco Wholesale Corp | | | | | | | | | | | 119,820 | |
| | 14,880 | | | Kroger Co | | | | | | | | | | | 704,270 | |
| | 20,039 | | | Walmart Inc | | | | | | | | | | | 2,436,342 | |
| | | | Total Food & Staples Retailing | | | | | | | | | | | 4,319,613 | |
| | | | |
| | | | Health Care Equipment & Supplies – 2.9% | | | | | | | | | |
| | | | |
| | 23,860 | | | Abbott Laboratories | | | | | | | | | | | 2,592,389 | |
| | 19,310 | | | Boston Scientific Corp (2) | | | | | | | | | | | 719,684 | |
| | 3,670 | | | IDEXX Laboratories Inc (2) | | | | | | | | | | | 1,287,179 | |
| | 3,120 | | | Masimo Corp (2) | | | | | | | | | | | 407,691 | |
| | 13,090 | | | QuidelOrtho Corp (2) | | | | | | | | | | | 1,272,086 | |
| | | | Total Health Care Equipment & Supplies | | | | | | | | | | | 6,279,029 | |
| | | | |
| | | | Health Care Providers & Services – 3.1% | | | | | | | | | |
| | | | |
| | 690 | | | Centene Corp (2) | | | | | | | | | | | 58,381 | |
| | 6,820 | | | Cigna Corp | | | | | | | | | | | 1,797,206 | |
| | 9,430 | | | UnitedHealth Group Inc | | | | | | | | | | | 4,843,531 | |
| | | | Total Health Care Providers & Services | | | | | | | | | | | 6,699,118 | |
52
| | | | | | | | | | | | | | | | |
| Shares | | | Description (1) | | | | | | | | Value | |
| | | | |
| | | | Hotels, Restaurants & Leisure – 2.5% | | | | | | | | | |
| | | | |
| | 11,390 | | | Hilton Worldwide Holdings Inc | | | | | | | | | | $ | 1,269,302 | |
| | 12,690 | | | Hyatt Hotels Corp, Class A (2) | | | | | | | | | | | 937,918 | |
| | 9,790 | | | Marriott International Inc/MD, Class A | | | | | | | | | | | 1,331,538 | |
| | 690 | | | McDonald’s Corp | | | | | | | | | | | 170,347 | |
| | 22,080 | | | Starbucks Corp | | | | | | | | | | | 1,686,691 | |
| | | | Total Hotels, Restaurants & Leisure | | | | | | | | | | | 5,395,796 | |
| | | | |
| | | | Household Products – 2.1% | | | | | | | | | |
| | | | |
| | 11,070 | | | Kimberly-Clark Corp | | | | | | | | | | | 1,496,111 | |
| | 21,850 | | | Procter & Gamble Co | | | | | | | | | | | 3,141,811 | |
| | | | Total Household Products | | | | | | | | | | | 4,637,922 | |
| | | | |
| | | | Industrial Conglomerates – 1.6% | | | | | | | | | |
| | | | |
| | 12,280 | | | 3M Co | | | | | | | | | | | 1,589,155 | |
| | 11,160 | | | Honeywell International Inc | | | | | | | | | | | 1,939,719 | |
| | | | Total Industrial Conglomerates | | | | | | | | | | | 3,528,874 | |
| | | | |
| | | | Insurance – 0.1% | | | | | | | | | |
| | | | |
| | 1,820 | | | Marsh & McLennan Cos Inc | | | | | | | | | | | 282,555 | |
| | 150 | | | Progressive Corp | | | | | | | | | | | 17,441 | |
| | | | Total Insurance | | | | | | | | | | | 299,996 | |
| | | | |
| | | | Interactive Media & Services – 5.7% | | | | | | | | | |
| | | | |
| | 2,150 | | | Alphabet Inc, Class C (2) | | | | | | | | | | | 4,703,017 | |
| | 1,980 | | | Alphabet Inc, Class A (2) | | | | | | | | | | | 4,314,935 | |
| | 21,050 | | | Meta Platforms Inc, Class (2) | | | | | | | | | | | 3,394,313 | |
| | | | Total Interactive Media & Services | | | | | | | | | | | 12,412,265 | |
| | | | |
| | | | Internet & Direct Marketing Retail – 2.5% | | | | | | | | | |
| | | | |
| | 50,120 | | | Amazon.com Inc (2) | | | | | | | | | | | 5,323,245 | |
| | | | |
| | | | IT Services – 4.3% | | | | | | | | | |
| | | | |
| | 8,420 | | | Accenture PLC, Class A | | | | | | | | | | | 2,337,813 | |
| | 16,190 | | | Amdocs Ltd | | | | | | | | | | | 1,348,789 | |
| | 19,630 | | | Cognizant Technology Solutions Corp, Class A | | | | | | | | | | | 1,324,829 | |
| | 7,770 | | | Concentrix Corp | | | | | | | | | | | 1,053,923 | |
| | 14,860 | | | Genpact Ltd | | | | | | | | | | | 629,469 | |
| | 81,318 | | | Kyndryl Holdings Inc (2) | | | | | | | | | | | 795,290 | |
| | 2,061 | | | Mastercard Inc, Class A | | | | | | | | | | | 650,204 | |
| | 2,290 | | | PayPal Holdings Inc (2) | | | | | | | | | | | 159,934 | |
| | 5,310 | | | Visa Inc, Class A | | | | | | | | | | | 1,045,486 | |
| | | | Total IT Services | | | | | | | | | | | 9,345,737 | |
| | | | |
| | | | Life Sciences Tools & Services – 4.0% | | | | | | | | | |
| | | | |
| | 3,170 | | | Agilent Technologies Inc | | | | | | | | | | | 376,501 | |
| | 9,400 | | | Danaher Corp | | | | | | | | | | | 2,383,088 | |
| | 420 | | | Mettler-Toledo International Inc (2) | | | | | | | | | | | 482,483 | |
| | 16,890 | | | Syneos Health Inc (2) | | | | | | | | | | | 1,210,675 | |
| | 5,173 | | | Thermo Fisher Scientific Inc | | | | | | | | | | | 2,810,388 | |
| | 4,060 | | | Waters Corp (2) | | | | | | | | | | | 1,343,779 | |
| | | | Total Life Sciences Tools & Services | | | | | | | | | | | 8,606,914 | |
| | | | |
| | | | Machinery – 1.2% | | | | | | | | | |
| | | | |
| | 21,000 | | | Otis Worldwide Corp | | | | | | | | | | | 1,484,070 | |
| | 24,750 | | | Pentair PLC | | | | | | | | | | | 1,132,808 | |
| | | | Total Machinery | | | | | | | | | | | 2,616,878 | |
| | | | |
| | | | Media – 0.1% | | | | | | | | | |
| | | | |
| | 6,460 | | | Comcast Corp, Class A | | | | | | | | | | | 253,490 | |
53
| | |
| |
| JCE | | Nuveen Core Equity Alpha Fund (continued) |
| | Portfolio of Investments June 30, 2022 |
| | (Unaudited) |
| | | | | | | | | | | | | | | | |
| Shares | | | Description (1) | | | | | | | | Value | |
| | | | |
| | | | Multiline Retail – 2.1% | | | | | | | | | |
| | | | |
| | 6,840 | | | Dollar General Corp | | | | | | | | | | $ | 1,678,810 | |
| | 9,160 | | | Dollar Tree Inc (2) | | | | | | | | | | | 1,427,586 | |
| | 9,669 | | | Target Corp | | | | | | | | | | | 1,365,553 | |
| | | | Total Multiline Retail | | | | | | | | | | | 4,471,949 | |
| | | | |
| | | | Oil, Gas & Consumable Fuels – 4.3% | | | | | | | | | |
| | | | |
| | 4,590 | | | Chevron Corp | | | | | | | | | | | 664,540 | |
| | 3,720 | | | ConocoPhillips | | | | | | | | | | | 334,093 | |
| | 8,070 | | | EOG Resources Inc | | | | | | | | | | | 891,251 | |
| | 44,720 | | | Exxon Mobil Corp | | | | | | | | | | | 3,829,821 | |
| | 28,460 | | | HF Sinclair Corp | | | | | | | | | | | 1,285,254 | |
| | 18,320 | | | Phillips 66 | | | | | | | | | | | 1,502,057 | |
| | 15,650 | | | Targa Resources Corp | | | | | | | | | | | 933,835 | |
| | | | Total Oil, Gas & Consumable Fuels | | | | | | | | | | | 9,440,851 | |
| | | | |
| | | | Pharmaceuticals – 5.2% | | | | | | | | | |
| | | | |
| | 560 | | | Eli Lilly & Co | | | | | | | | | | | 181,569 | |
| | 26,360 | | | Johnson & Johnson | | | | | | | | | | | 4,679,164 | |
| | 33,601 | | | Merck & Co Inc | | | | | | | | | | | 3,063,403 | |
| | 63,310 | | | Pfizer Inc | | | | | | | | | | | 3,319,343 | |
| | | | Total Pharmaceuticals | | | | | | | | | | | 11,243,479 | |
| | | | |
| | | | Professional Services – 0.6% | | | | | | | | | |
| | | | |
| | 13,850 | | | Booz Allen Hamilton Holding Corp | | | | | | | | | | | 1,251,486 | |
| | | | |
| | | | Real Estate Management & Development – 1.1% | | | | | | | | | |
| | 17,840 | | | CBRE Group Inc, Class A | | | | | | | | | | | 1,313,202 | |
| | 6,002 | | | Jones Lang LaSalle Inc (2) | | | | | | | | | | | 1,049,510 | |
| | 27,280 | | | Opendoor Technologies Inc (2), (3) | | | | | | | | | | | 128,489 | |
| | | | Total Real Estate Management & Development | | | | | | | | | | | 2,491,201 | |
| | | | |
| | | | Road & Rail – 1.6% | | | | | | | | | |
| | | | |
| | 6,390 | | | Norfolk Southern Corp | | | | | | | | | | | 1,452,383 | |
| | 9,450 | | | Union Pacific Corp | | | | | | | | | | | 2,015,496 | |
| | | | Total Road & Rail | | | | | | | | | | | 3,467,879 | |
| | | | |
| | | | Semiconductors & Semiconductor Equipment – 4.1% | | | | | | | | | |
| | | | |
| | 18,867 | | | Advanced Micro Devices Inc (2) | | | | | | | | | | | 1,442,759 | |
| | 17,370 | | | Applied Materials Inc | | | | | | | | | | | 1,580,323 | |
| | 330 | | | Broadcom Inc | | | | | | | | | | | 160,317 | |
| | 17,930 | | | Intel Corp | | | | | | | | | | | 670,761 | |
| | 2,570 | | | Marvell Technology Inc | | | | | | | | | | | 111,872 | |
| | 10,340 | | | NVIDIA Corp | | | | | | | | | | | 1,567,441 | |
| | 16,540 | | | QUALCOMM Inc | | | | | | | | | | | 2,112,820 | |
| | 12,480 | | | Skyworks Solutions Inc | | | | | | | | | | | 1,156,147 | |
| | | | Total Semiconductors & Semiconductor Equipment | | | | | | | | | | | 8,802,440 | |
| | | | |
| | | | Software – 10.9% | | | | | | | | | |
| | | | |
| | 6,090 | | | Adobe Inc (2) | | | | | | | | | | | 2,229,305 | |
| | 9,410 | | | Cadence Design Systems Inc (2) | | | | | | | | | | | 1,411,782 | |
| | 1,270 | | | Dynatrace Inc (2) | | | | | | | | | | | 50,089 | |
| | 9,760 | | | Manhattan Associates Inc (2) | | | | | | | | | | | 1,118,496 | |
| | 54,695 | | | Microsoft Corp | | | | | | | | | | | 14,047,317 | |
| | 7,331 | | | Salesforce Inc (2) | | | | | | | | | | | 1,209,908 | |
| | 8,170 | | | Splunk Inc (2) | | | | | | | | | | | 722,718 | |
| | 1,270 | | | Synopsys Inc (2) | | | | | | | | | | | 385,699 | |
| | 33,380 | | | Teradata Corp (2) | | | | | | | | | | | 1,235,394 | |
| | 4,180 | | | Workday Inc, Class A (2) | | | | | | | | | | | 583,445 | |
| | 8,290 | | | Zendesk Inc (2) | | | | | | | | | | | 614,040 | |
| | 240 | | | Zoom Video Communications Inc, Class A (2) | | | | | | | | | | | 25,913 | |
| | | | Total Software | | | | | | | | | | | 23,634,106 | |
| | | | |
| | | | Specialty Retail – 3.5% | | | | | | | | | |
| | | | |
| | 11,310 | | | Home Depot Inc | | | | | | | | | | | 3,101,994 | |
| | 10,700 | | | Lowe’s Cos Inc | | | | | | | | | | | 1,868,969 | |
54
| | | | | | | | | | | | | | | | |
| Shares | | | Description (1) | | | | | | | | Value | |
| | | | |
| | | | Specialty Retail (continued) | | | | | | | | | |
| | | | |
| | 6,560 | | | Tractor Supply Co | | | | | | | | | | $ | 1,271,656 | |
| | 3,580 | | | Ulta Beauty Inc (2) | | | | | | | | | | | 1,380,018 | |
| | | | Total Specialty Retail | | | | | | | | | | | 7,622,637 | |
| | | | |
| | | | Technology Hardware, Storage & Peripherals – 7.2% | | | | | | | | | |
| | | | |
| | 114,118 | | | Apple Inc (4) | | | | | | | | | | | 15,602,213 | |
| | | | |
| | | | Textiles, Apparel & Luxury Goods – 1.4% | | | | | | | | | |
| | | | |
| | 17,404 | | | NIKE Inc, Class B | | | | | | | | | | | 1,778,689 | |
| | 38,870 | | | Tapestry Inc | | | | | | | | | | | 1,186,312 | |
| | | | Total Textiles, Apparel & Luxury Goods | | | | | | | | | | | 2,965,001 | |
| | | | |
| | | | Wireless Telecommunication Services – 0.8% | | | | | | | | | |
| | 13,441 | | | T-Mobile US Inc (2) | | | | | | | | | | | 1,808,352 | |
| | | | Total Common Stocks (cost $211,017,002) | | | | | | | | | | | 216,023,943 | |
| | | | |
| Shares | | | Description (1) | | | | | | | | Value | |
| | | | |
| | | | EXCHANGE-TRADED FUNDS – 0.5% | | | | | | | | | |
| | | | |
| | 2,600 | | | iShares Core S&P 500 ETF | | | | | | | | | | $ | 985,790 | |
| | | | Total Exchange-Traded Funds (cost $928,587) | | | | | | | | | | | 985,790 | |
| | | | Total Long-Term Investments (cost $211,945,589) | | | | | | | | | | | 217,009,733 | |
| | | | |
| Shares | | | Description (1) | | | | | Coupon | | | Value | |
| | | | |
| | | | INVESTMENTS PURCHASED WITH COLLATERAL FROM SECURITIES LENDING – 0.1% | | | | | | | | | | | | |
| | | | |
| | | | MONEY MARKET FUNDS – 0.1% | | | | | | | | | |
| | | | |
| | 135,181 | | | State Street Navigator Securities Lending Government Money Market Portfolio (5) | | | | | | | 1.540% | (6) | | $ | 135,181 | |
| | | | Total Investments Purchased with Collateral from Securities Lending (cost $135,181) | | | | | | | | | | | 135,181 | |
| | | | |
Principal
Amount (000) | | | Description (1) | | Coupon | | | Maturity | | | Value | |
| | | | |
| | | | SHORT-TERM INVESTMENTS – 3.0% | | | | | | | | | | | | |
| | | | |
| | | | REPURCHASE AGREEMENTS – 3.0% | | | | | | | | | | | | |
| | | | |
| $ | 6,576 | | | Repurchase Agreement with Fixed Income Clearing Corporation, dated 6/30/22, repurchase price $6,575,581, collateralized by $7,013,400, U.S. Treasury Note, 2.250%, due 11/15/27, value $6,707,114 | | | 0.240% | | | | 7/01/22 | | | $ | 6,575,581 | |
| | | | Total Short-Term Investments (cost $6,575,581) | | | | | | | | | | | 6,575,581 | |
| | | | Total Investments (cost $218,656,351) – 103.1% | | | | | | | | | | | 223,720,495 | |
| | | | Other Assets Less Liabilities – (3.1)% (7) | | | | | | | | | | | (6,708,111 | ) |
| | | | Net Assets – 100% | | | | | | | | | | $ | 217,012,384 | |
55
| | |
| |
| JCE | | Nuveen Core Equity Alpha Fund (continued) |
| | Portfolio of Investments June 30, 2022 |
| | (Unaudited) |
Investments in Derivatives
Options Written
| | | | | | | | | | | | | | | | | | | | | | | | |
Description (8) | | Type | | | Number of
Contracts | | | Notional
Amount (9) | | | Exercise
Price | | | Expiration
Date | | | Value | |
S&P 500® Index | | | Call | | | | (75 | ) | | $ | (30,000,000 | ) | | $ | 4,000 | | | | 7/15/22 | | | $ | (74,625 | ) |
S&P 500® Index | | | Call | | | | (25 | ) | | | (10,250,000 | ) | | | 4,100 | | | | 7/15/22 | | | | (7,563 | ) |
Total Options Written (premiums received $257,008) | | | | (100 | ) | | $ | (40,250,000 | ) | | | | | | | | | | $ | (82,188 | ) |
For Fund portfolio compliance purposes, the Fund’s industry classifications refer to any one or more of the industry sub-classifications used by one or more widely recognized market indexes or ratings group indexes, and/or as defined by Fund management. This definition may not apply for purposes of this report, which may combine industry sub-classifications into sectors for reporting ease.
| (1) | All percentages shown in the Portfolio of Investments are based on net assets applicable to common shares unless otherwise noted. |
| (2) | Non-income producing; issuer has not declared an ex-dividend date within the past twelve months. |
| (3) | Investment, or a portion of investment, is out on loan for securities lending. The total value of the securities out on loan as of the end of the reporting period was $127,203. |
| (4) | Investment, or portion of investment, has been pledged to collateralize the net payment obligations for investments in derivatives. |
| (5) | The Fund may loan securities representing up to one third of the market value of its total assets (which includes collateral for securities on loan) to broker dealers, banks, and other institutions. The collateral maintained by the Fund shall have a market value, at the inception of each loan, equal to not less than 100% of the market value of the loaned securities. The cash collateral received by the Fund is invested in this money market fund. |
| (6) | The rate shown is the one-day yield as of the end of the reporting period. |
| (7) | Other assets less liabilities includes the unrealized appreciation (depreciation) of certain over-the-counter (“OTC”) derivatives as presented on the Statement of Assets and Liabilities, when applicable. The unrealized appreciation (depreciation) of OTC cleared and exchange-traded derivatives is recognized as part of the cash collateral at brokers and/or the receivable or payable for variation margin as presented on the Statement of Assets and Liabilities, when applicable. Other assets less liabilities also includes the value of options as presented on the Statement of Assets and Liabilities. |
| (8) | Exchange-traded, unless otherwise noted. |
| (9) | For disclosure purposes, Notional Amount is calculated by multiplying the Number of Contracts by the Exercise Price by 100. |
See accompanying notes to financial statements.
56
Statement of Assets and Liabilities
June 30, 2022
(Unaudited)
| | | | | | | | | | | | | | | | | | | | |
| | | BXMX | | | DIAX | | | SPXX | | | QQQX | | | JCE | |
Assets | | | | | | | | | | | | | | | | | | | | |
Long-term investments, at value (cost $584,362,523, $280,749,693, $132,693,807, $478,005,044 and $211,945,589, respectively)(1) | | $ | 1,315,587,838 | | | $ | 589,257,795 | | | $ | 273,689,973 | | | $ | 1,059,822,030 | | | $ | 217,009,733 | |
Short-term investments, at value (cost approximates value) | | | 49,982,419 | | | | 11,251,081 | | | | 5,550,958 | | | | 22,508,483 | | | | 6,575,581 | |
Investments purchased with collateral from securities lending, at value (cost approximates value) | | | — | | | | — | | | | 447,227 | | | | 4,521,847 | | | | 135,181 | |
Cash | | | 63,277 | | | | — | | | | — | | | | — | | | | 6,847 | |
Cash collateral at brokers for investments in options contracts(2) | | | — | | | | — | | | | — | | | | 200,000 | | | | — | |
Options purchased, at value (cost $—, $21,465, $10,732, $21,465, and $—, respectively) | | | — | | | | 750 | | | | 375 | | | | 750 | | | | — | |
Receivable for: | | | | | | | | | | | | | | | | | | | | |
Dividends | | | 1,141,080 | | | | 237,632 | | | | 207,123 | | | | 154,985 | | | | 91,967 | |
Interest | | | 333 | | | | 75 | | | | 37 | | | | — | | | | 44 | |
Reclaims | | | 1,210 | | | | — | | | | — | | | | 329 | | | | — | |
Shares sold | | | — | | | | — | | | | 1,101,280 | | | | 1,023,943 | | | | — | |
Deferred offering costs | | | — | | | | — | | | | 189,793 | | | | 67,568 | | | | — | |
Other assets | | | 347,533 | | | | 62,474 | | | | 52,814 | | | | 142,215 | | | | 48,385 | |
Total assets | | | 1,367,123,690 | | | | 600,809,807 | | | | 281,239,580 | | | | 1,088,442,150 | | | | 223,867,738 | |
Liabilities | | | | | | | | | | | | | | | | | | | | |
Options written, at value (premiums received $35,322,334, $10,997,433, $5,130,392, $24,442,914 and $257,008, respectively) | | | 16,475,148 | | | | 14,306,400 | | | | 6,644,675 | | | | 24,751,906 | | | | 82,188 | |
Payable for: | | | | | | | | | | | | | | | | | | | | |
Collateral from securities lending | | | — | | | | — | | | | 447,227 | | | | 4,521,847 | | | | 135,181 | |
Dividends | | | 23,706,042 | | | | 10,165,876 | | | | 5,010,561 | | | | 22,435,414 | | | | 6,208,401 | |
Options purchased | | | — | | | | 55,693 | | | | 27,846 | | | | 97,463 | | | | 97,463 | |
Accrued expenses: | | | | | | | | | | | | | | | | | | | | |
Management fees | | | 933,373 | | | | 411,920 | | | | 184,386 | | | | 729,148 | | | | 168,889 | |
Trustees fees | | | 311,610 | | | | 51,202 | | | | 50,095 | | | | 120,020 | | | | 40,615 | |
Shelf offering costs | | | — | | | | — | | | | 12,990 | | | | 53,973 | | | | — | |
Other | | | 482,852 | | | | 221,070 | | | | 126,326 | | | | 362,059 | | | | 122,617 | |
Total liabilities | | | 41,909,025 | | | | 25,212,161 | | | | 12,504,106 | | | | 53,071,830 | | | | 6,855,354 | |
Net assets applicable to common shares | | $ | 1,325,214,665 | | | $ | 575,597,646 | | | $ | 268,735,474 | | | $ | 1,035,370,320 | | | $ | 217,012,384 | |
Common shares outstanding | | | 104,086,837 | | | | 36,366,913 | | | | 17,515,356 | | | | 47,019,341 | | | | 16,061,944 | |
Net asset value (“NAV”) per common share outstanding | | $ | 12.73 | | | $ | 15.83 | | | $ | 15.34 | | | $ | 22.02 | | | $ | 13.51 | |
Net assets applicable to common shares consist of: | | | | | | | | | | | | | | | | | | | | |
Common shares, $0.01 par value per share | | $ | 1,040,868 | | | $ | 363,669 | | | $ | 175,154 | | | $ | 470,193 | | | $ | 160,619 | |
Paid-in-surplus | | | 524,623,098 | | | | 246,592,305 | | | | 118,478,571 | | | | 395,340,987 | | | | 192,233,942 | |
Total distributable earnings (loss) | | | 799,550,699 | | | | 328,641,672 | | | | 150,081,749 | | | | 639,559,140 | | | | 24,617,823 | |
Net assets applicable to common shares | | $ | 1,325,214,665 | | | $ | 575,597,646 | | | $ | 268,735,474 | | | $ | 1,035,370,320 | | | $ | 217,012,384 | |
Authorized common shares | | | Unlimited | | | | Unlimited | | | | Unlimited | | | | Unlimited | | | | Unlimited | |
| (1) | Includes securities loaned of $433,435, $4,365,284 and $127,203 for SPXX, ,QQQX and JCE, respectively. |
| (2) | Cash pledged to collateralize the net payment obligation for investments in derivatives is in addition to the Fund’s securities pledged as collateral as noted in the Portfolio of Investments. |
See accompanying notes to financial statements.
57
Statement of Operations
Six Months Ended June 30, 2022
(Unaudited)
| | | | | | | | | | | | | | | | | | | | |
| | | BXMX | | | DIAX | | | SPXX | | | QQQX | | | JCE | |
Investment Income | | | | | | | | | | | | | | | | | | | | |
Dividends | | $ | 10,772,479 | | | $ | 6,406,411 | | | $ | 2,354,512 | | | $ | 4,973,946 | | | $ | 1,940,948 | |
Interest | | | 8,199 | | | | 337 | | | | 197 | | | | — | | | | 134 | |
Securities Lending Income, net | | | 802 | | | | 4,031 | | | | 2,058 | | | | 62,628 | | | | 85 | |
Foreign tax withheld on dividend income | | | (13,642 | ) | | | — | | | | (776 | ) | | | (12,796 | ) | | | — | |
Total Investment Income | | | 10,767,838 | | | | 6,410,779 | | | | 2,355,991 | | | | 5,023,778 | | | | 1,941,167 | |
Expenses | | | | | | | | | | | | | | | | | | | | |
Management fees | | | 6,056,721 | | | | 2,639,408 | | | | 1,209,687 | | | | 4,844,505 | | | | 1,127,632 | |
Interest expense | | | 2,699 | | | | 716 | | | | 369 | | | | 2,359 | | | | — | |
Custodian fees | | | 64,850 | | | | 37,881 | | | | 28,993 | | | | 62,917 | | | | 29,339 | |
Trustees fees | | | 24,444 | | | | 10,216 | | | | 5,015 | | | | 20,072 | | | | 4,177 | |
Professional fees | | | 55,397 | | | | 39,885 | | | | 33,721 | | | | 54,873 | | | | 35,704 | |
Shareholder reporting expenses | | | 95,136 | | | | 44,666 | | | | 26,181 | | | | 87,045 | | | | 17,863 | |
Shareholder servicing agent fees | | | 676 | | | | 297 | | | | 88 | | | | 342 | | | | 104 | |
Stock exchange listing fees | | | 16,065 | | | | 4,942 | | | | 3,613 | | | | — | | | | 3,783 | |
Investor relations expenses | | | 110,397 | | | | 49,350 | | | | 26,498 | | | | 94,104 | | | | 17,182 | |
Other | | | 130,085 | | | | 71,547 | | | | 32,288 | | | | 199,977 | | | | 6,614 | |
Total expenses | | | 6,556,470 | | | | 2,898,908 | | | | 1,366,453 | | | | 5,366,194 | | | | 1,242,398 | |
Net investment income (loss) | | | 4,211,368 | | | | 3,511,871 | | | | 989,538 | | | | (342,416 | ) | | | 698,769 | |
Realized and Unrealized Gain (Loss) | | | | | | | | | | | | | | | | | | | | |
Net realized gain (loss) from: | | | | | | | | | | | | | | | | | | | | |
Investments and foreign currency | | | 15,030,444 | | | | (1,580,997 | ) | | | (438,978 | ) | | | 1,563,368 | | | | (1,963,210 | ) |
Options purchased | | | — | | | | (123,063 | ) | | | (64,907 | ) | | | (146,848 | ) | | | 13,408 | |
Options written | | | 78,044,640 | | | | 38,857,648 | | | | 18,589,054 | | | | 101,740,706 | | | | 2,607,679 | |
Change in net unrealized appreciation (depreciation) of: | | | | | | | | | | | | | | | | | | | | |
Investments and foreign currency | | | (334,776,494 | ) | | | (102,773,746 | ) | | | (67,532,382 | ) | | | (414,134,425 | ) | | | (50,189,254 | ) |
Options purchased | | | (35,656,611 | ) | | | (6,926,528 | ) | | | (3,377,829 | ) | | | (17,664,543 | ) | | | (247,057 | ) |
Options written | | | 56,450,026 | | | | 7,767,033 | | | | 3,881,717 | | | | 24,347,811 | | | | 495,770 | |
Net realized and unrealized gain (loss) | | | (220,907,995 | ) | | | (64,779,653 | ) | | | (48,943,325 | ) | | | (304,293,931 | ) | | | (49,282,664 | ) |
Net increase (decrease) in net assets applicable to common shares from operations | | $ | (216,696,627 | ) | | $ | (61,267,782 | ) | | $ | (47,953,787 | ) | | $ | (304,636,347 | ) | | $ | (48,583,895 | ) |
See accompanying notes to financial statements.
58
Statement of Changes in Net Assets
| | | | | | | | | | | | | | | | |
| | | BXMX | | | DIAX | |
| | | Unaudited
Six Months Ended 06/30/22 | | | Year Ended 12/31/21 | | | Unaudited
Six Months Ended 06/30/22 | | | Year Ended 12/31/21 | |
Operations | | | | | | | | | | | | | | | | |
Net investment income (loss) | | $ | 4,211,368 | | | $ | 4,675,828 | | | $ | 3,511,871 | | | $ | 6,196,640 | |
Net realized gain (loss) from: | | | | | | | | | | | | | | | | |
Investments and foreign currency | | | 15,030,444 | | | | 177,704,116 | | | | (1,580,997 | ) | | | 32,201,967 | |
Options purchased | | | — | | | | — | | | | (123,063 | ) | | | 153,278 | |
Options written | | | 78,044,640 | | | | (116,624,336 | ) | | | 38,857,648 | | | | (23,200,656 | ) |
Change in net unrealized appreciation (depreciation) of: | | | | | | | | | | | | | | | | |
Investments and foreign currency | | | (334,776,494 | ) | | | 174,888,737 | | | | (102,773,746 | ) | | | 79,804,076 | |
Options purchased | | | (35,656,611 | ) | | | — | | | | (6,926,528 | ) | | | 5,632 | |
Options written | | | 56,450,026 | | | | 8,560,570 | | | | 7,767,033 | | | | (3,331,527 | ) |
Net increase (decrease) in net assets applicable to common shares from operations | | | (216,696,627 | ) | | | 249,204,915 | | | | (61,267,782 | ) | | | 91,829,410 | |
Distributions to Common Shareholders | | | | | | | | | | | | | | | | |
Dividends | | | (49,233,074 | ) | | | (50,306,812 | ) | | | (20,852,788 | ) | | | (12,192,825 | ) |
Return of capital | | | — | | | | (39,207,868 | ) | | | — | | | | (27,519,845 | ) |
Decrease in net assets applicable to common shares from distributions to common shareholders | | | (49,233,074 | ) | | | (89,514,680 | ) | | | (20,852,788 | ) | | | (39,712,670 | ) |
Capital Share Transactions | | | | | | | | | | | | | | | | |
Proceeds from shelf offering, net of offering costs | | | — | | | | — | | | | — | | | | — | |
Net proceeds from common shares issued to shareholders due to reinvestment of distributions | | | — | | | | — | | | | — | | | | — | |
Net increase (decrease) in net assets applicable to common shares from capital share transactions | | | — | | | | — | | | | — | | | | — | |
Net increase (decrease) in net assets applicable to common shares | | | (265,929,701 | ) | | | 159,690,235 | | | | (82,120,570 | ) | | | 52,116,740 | |
Net assets applicable to common shares at the beginning of period | | | 1,591,144,366 | | | | 1,431,454,131 | | | | 657,718,216 | | | | 605,601,476 | |
Net assets applicable to common shares at the end of period | | $ | 1,325,214,665 | | | $ | 1,591,144,366 | | | $ | 575,597,646 | | | $ | 657,718,216 | |
See accompanying notes to financial statements.
59
Statement of Changes in Net Assets (continued)
| | | | | | | | | | | | | | | | |
| | | SPXX | | | QQQX | |
| | | Unaudited
Six Months Ended 06/30/22 | | | Year
Ended
12/31/21 | | | Unaudited
Six Months Ended 06/30/22 | | | Year
Ended
12/31/21 | |
Operations | | | | | | | | | | | | | | | | |
Net investment income (loss) | | $ | 989,538 | | | $ | 1,849,198 | | | $ | (342,416 | ) | | $ | (2,531,410 | ) |
Net realized gain (loss) from: | | | | | | | | | | | | | | | | |
Investments and foreign currency | | | (438,978 | ) | | | 49,477,998 | | | | 1,563,368 | | | | 166,937,589 | |
Options purchased | | | (64,907 | ) | | | 79,037 | | | | (146,848 | ) | | | 144,380 | |
Options written | | | 18,589,054 | | | | (10,788,646 | ) | | | 101,740,706 | | | | (89,604,711 | ) |
Change in net unrealized appreciation (depreciation) of: | | | | | | | | | | | | | | | | |
Investments and foreign currency | | | (67,532,382 | ) | | | 21,506,299 | | | | (414,134,425 | ) | | | 151,243,357 | |
Options purchased | | | (3,377,829 | ) | | | 2,816 | | | | (17,664,543 | ) | | | 5,632 | |
Options written | | | 3,881,717 | | | | (1,644,623 | ) | | | 24,347,811 | | | | (6,565,544 | ) |
Net increase (decrease) in net assets applicable to common shares from operations | | | (47,953,787 | ) | | | 60,482,079 | | | | (304,636,347 | ) | | | 219,629,293 | |
Distributions to Common Shareholders | | | | | | | | | | | | | | | | |
Dividends | | | (10,205,237 | ) | | | (12,176,538 | ) | | | (45,420,551 | ) | | | (33,913,718 | ) |
Return of capital | | | — | | | | (4,722,744 | ) | | | — | | | | (44,002,163 | ) |
Decrease in net assets applicable to common shares from distributions to common shareholders | | | (10,205,237 | ) | | | (16,899,282 | ) | | | (45,420,551 | ) | | | (77,915,881 | ) |
Capital Share Transactions | | | | | | | | | | | | | | | | |
Proceeds from shelf offering, net of offering costs | | | 3,479,060 | | | | 1,804,279 | | | | 49,356,154 | | | | 99,137,676 | |
Net proceeds from common shares issued to shareholders due to reinvestment of distributions | | | — | | | | 79,716 | | | | 1,204,385 | | | | 1,707,146 | |
Net increase (decrease) in net assets applicable to common shares from capital share transactions | | | 3,479,060 | | | | 1,883,995 | | | | 50,560,539 | | | | 100,844,822 | |
Net increase (decrease) in net assets applicable to common shares | | | (54,679,964 | ) | | | 45,466,792 | | | | (299,496,359 | ) | | | 242,558,234 | |
Net assets applicable to common shares at the beginning of period | | | 323,415,438 | | | | 277,948,646 | | | | 1,334,866,679 | | | | 1,092,308,445 | |
Net assets applicable to common shares at the end of period | | $ | 268,735,474 | | | $ | 323,415,438 | | | $ | 1,035,370,320 | | | $ | 1,334,866,679 | |
See accompanying notes to financial statements.
60
| | | | | | | | |
| | | JCE | |
| | | Unaudited
Six Months Ended 06/30/22 | | | Year Ended 12/31/21 | |
Operations | | | | | | | | |
Net investment income (loss) | | $ | 698,769 | | | $ | 231,780 | |
Net realized gain (loss) from: | | | | | | | | |
Investments and foreign currency | | | (1,963,210 | ) | | | 38,732,097 | |
Options purchased | | | 13,408 | | | | (50,655 | ) |
Options written | | | 2,607,679 | | | | (3,426,456 | ) |
Change in net unrealized appreciation (depreciation) of: | | | | | | | | |
Investments and foreign currency | | | (50,189,254 | ) | | | 28,018,209 | |
Options purchased | | | (247,057 | ) | | | — | |
Options written | | | 495,770 | | | | (99,154 | ) |
Net increase (decrease) in net assets applicable to common shares from operations | | | (48,583,895 | ) | | | 63,405,821 | |
Distributions to Common Shareholders | | | | | | | | |
Dividends | | | (12,692,089 | ) | | | (29,461,455 | ) |
Return of capital | | | — | | | | — | |
Decrease in net assets applicable to common shares from distributions to common shareholders | | | (12,692,089 | ) | | | (29,461,455 | ) |
Capital Share Transactions | | | | | | | | |
Proceeds from shelf offering, net of offering costs | | | — | | | | — | |
Net proceeds from common shares issued to shareholders due to reinvestment of distributions | | | 244,280 | | | | 310,105 | |
Net increase (decrease) in net assets applicable to common shares from capital share transactions | | | 244,280 | | | | 310,105 | |
Net increase (decrease) in net assets applicable to common shares | | | (61,031,704 | ) | | | 34,254,471 | |
Net assets applicable to common shares at the beginning of period | | | 278,044,088 | | | | 243,789,617 | |
Net assets applicable to common shares at the end of period | | $ | 217,012,384 | | | $ | 278,044,088 | |
See accompanying notes to financial statements.
61
Financial Highlights
Selected data for a common share outstanding throughout each period:
| | | | | | | | | | | | | | | | | | | | | | | | | | | | | | | | | | | | | | | | | | | | | | | | |
| | | | |
| | | | | | Investment Operations | | | Less Distributions to
Common Shareholders | | | Common Shares | |
| | | Beginning
Common
Share
NAV | | | Net
Investment
Income
(Loss)(a) | | | Net
Realized/
Unrealized
Gain (Loss) | | | Total | | | From
Net
Investment
Income | | | From
Accumulated
Net Realized
Gains | | | Return
of
Capital | | | Total | | | Shelf
Offering
Costs | | | Premium
Per
Shares
Sold
through
Shelf
Offering | | | Ending
NAV | | | Ending
Share
Price | |
|
BXMX | |
Year Ended 12/31: | |
2022(d) | | $ | 15.29 | | | $ | 0.04 | | | $ | (2.13 | ) | | $ | (2.09 | ) | | $ | (0.47 | ) | | $ | — | | | $ | — | | | $ | (0.47 | ) | | $ | — | | | $ | — | | | $ | 12.73 | | | $ | 12.37 | |
2021 | | | 13.75 | | | | 0.04 | | | | 2.36 | | | | 2.40 | | | | (0.07 | ) | | | (0.41 | ) | | | (0.38 | ) | | | (0.86 | ) | | | — | | | | — | | | | 15.29 | | | | 14.65 | |
2020 | | | 13.68 | | | | 0.15 | | | | 0.80 | | | | 0.95 | | | | (0.12 | ) | | | — | | | | (0.76 | ) | | | (0.88 | ) | | | — | * | | | — | * | | | 13.75 | | | | 12.88 | |
2019 | | | 12.61 | | | | 0.16 | | | | 1.84 | | | | 2.00 | | | | (0.16 | ) | | | — | | | | (0.77 | ) | | | (0.93 | ) | | | — | * | | | — | * | | | 13.68 | | | | 13.75 | |
2018 | | | 14.35 | | | | 0.15 | | | | (0.91 | ) | | | (0.76 | ) | | | (0.16 | ) | | | (0.37 | ) | | | (0.45 | ) | | | (0.98 | ) | | | — | * | | | — | * | | | 12.61 | | | | 12.07 | |
2017 | | | 13.52 | | | | 0.16 | | | | 1.58 | | | | 1.74 | | | | (0.15 | ) | | | — | | | | (0.76 | ) | | | (0.91 | ) | | | — | | | | — | | | | 14.35 | | | | 14.25 | |
|
DIAX | |
Year Ended 12/31: | |
2022(d) | | | 18.09 | | | | 0.10 | | | | (1.79 | ) | | | (1.69 | ) | | | (0.57 | ) | | | — | | | | — | | | | (0.57 | ) | | | — | | | | — | | | | 15.83 | | | | 15.28 | |
2021 | | | 16.65 | | | | 0.17 | | | | 2.36 | | | | 2.53 | | | | (0.17 | ) | | | (0.16 | ) | | | (0.76 | ) | | | (1.09 | ) | | | — | | | | — | | | | 18.09 | | | | 17.77 | |
2020 | | | 18.20 | | | | 0.22 | | | | (0.66 | ) | | | (0.44 | ) | | | (0.22 | ) | | | (0.81 | ) | | | (0.08 | ) | | | (1.11 | ) | | | — | * | | | — | * | | | 16.65 | | | | 15.20 | |
2019 | | | 16.90 | | | | 0.27 | | | | 2.21 | | | | 2.48 | | | | (0.27 | ) | | | — | | | | (0.91 | ) | | | (1.18 | ) | | | — | * | | | — | * | | | 18.20 | | | | 17.66 | |
2018 | | | 19.05 | | | | 0.25 | | | | (1.16 | ) | | | (0.91 | ) | | | (0.25 | ) | | | (0.22 | ) | | | (0.77 | ) | | | (1.24 | ) | | | — | * | | | — | * | | | 16.90 | | | | 16.12 | |
2017 | | | 16.55 | | | | 0.26 | | | | 3.30 | | | | 3.56 | | | | (0.26 | ) | | | — | | | | (0.80 | ) | | | (1.06 | ) | | | — | | | | — | | | | 19.05 | | | | 18.84 | |
|
SPXX | |
Year Ended 12/31: | |
2022(d) | | | 18.70 | | | | 0.06 | | | | (2.83 | ) | | | (2.77 | ) | | | (0.59 | ) | | | — | | | | — | | | | (0.59 | ) | | | — | * | | | — | * | | | 15.34 | | | | 15.66 | |
2021 | | | 16.17 | | | | 0.11 | | | | 3.40 | | | | 3.51 | | | | (0.11 | ) | | | (0.60 | ) | | | (0.27 | ) | | | (0.98 | ) | | | — | * | | | — | * | | | 18.70 | | | | 18.60 | |
2020 | | | 16.27 | | | | 0.15 | | | | 0.75 | | | | 0.90 | | | | (0.15 | ) | | | — | | | | (0.85 | ) | | | (1.00 | ) | | | — | * | | | — | * | | | 16.17 | | | | 15.24 | |
2019 | | | 14.42 | | | | 0.17 | | | | 2.74 | | | | 2.91 | | | | (0.18 | ) | | | — | | | | (0.88 | ) | | | (1.06 | ) | | | — | * | | | — | * | | | 16.27 | | | | 16.47 | |
2018 | | | 16.47 | | | | 0.18 | | | | (1.12 | ) | | | (0.94 | ) | | | (0.18 | ) | | | (0.03 | ) | | | (0.91 | ) | | | (1.12 | ) | | | — | * | | | 0.01 | | | | 14.42 | | | | 14.04 | |
2017 | | | 14.98 | | | | 0.19 | | | | 2.29 | | | | 2.48 | | | | (0.19 | ) | | | — | | | | (0.80 | ) | | | (0.99 | ) | | | — | | | | — | | | | 16.47 | | | | 17.31 | |
|
QQQX | |
Year Ended 12/31: | |
2022(d) | | | 29.63 | | | | (0.01 | ) | | | (6.63 | ) | | | (6.64 | ) | | | (0.99 | ) | | | — | | | | — | | | | (0.99 | ) | | | — | * | | | 0.02 | | | | 22.02 | | | | 21.84 | |
2021 | | | 26.32 | | | | (0.06 | ) | | | 5.12 | | | | 5.06 | | | | — | | | | (0.78 | ) | | | (1.01 | ) | | | (1.79 | ) | | | — | * | | | 0.04 | | | | 29.63 | | | | 30.65 | |
2020 | | | 24.12 | | | | 0.04 | | | | 3.70 | | | | 3.74 | | | | (0.01 | ) | | | — | | | | (1.55 | ) | | | (1.56 | ) | | | — | * | | | 0.02 | | | | 26.32 | | | | 26.01 | |
2019 | | | 20.27 | | | | 0.06 | | | | 5.33 | | | | 5.39 | | | | (0.05 | ) | | | — | | | | (1.51 | ) | | | (1.56 | ) | | | — | * | | | 0.02 | | | | 24.12 | | | | 24.05 | |
2018 | | | 22.84 | | | | 0.06 | | | | (0.98 | ) | | | (0.92 | ) | | | (0.06 | ) | | | (1.37 | ) | | | (0.25 | ) | | | (1.68 | ) | | | — | * | | | 0.03 | | | | 20.27 | | | | 20.00 | |
2017 | | | 19.58 | | | | 0.04 | | | | 4.66 | | | | 4.70 | | | | (0.04 | ) | | | (0.50 | ) | | | (0.90 | ) | | | (1.44 | ) | | | — | | | | — | | | | 22.84 | | | | 24.21 | |
62
| | | | | | | | | | | | | | | | | | | | | | |
| | | | | | | Common Share Supplemental Data/
Ratios Applicable to Common Shares | |
Common Share
Total Returns | | | | | | Ratios to Average Net Assets | | | | |
Based
on
NAV(b) | | |
Based
on
Share
Price(b) | | | Ending
Net
Assets
(000) | | | Expenses | | | Net
Investment
Income (Loss) | | | Portfolio
Turnover
Rate(c) | |
| | | | | |
| | | | | | | | | | | | | | | | | | | | | | | |
| | | | | | | | | | | | | | | | | | | | | | |
| | (13.82 | )% | | | (12.53 | )% | | $ | 1,325,215 | | | | 0.90 | %** | | | 0.58 | %** | | | 2 | % |
| | 17.80 | | | | 20.75 | | | | 1,591,144 | | | | 0.89 | | | | 0.31 | | | | 7 | |
| | 7.92 | | | | 1.16 | | | | 1,431,454 | | | | 0.91 | | | | 1.14 | | | | 22 | |
| | 16.16 | | | | 22.08 | | | | 1,422,672 | | | | 0.91 | | | | 1.18 | | | | 4 | |
| | (5.56 | ) | | | (8.88 | ) | | | 1,307,669 | | | | 0.89 | | | | 1.10 | | | | 5 | |
| | 13.21 | | | | 19.59 | | | | 1,486,003 | | | | 0.91 | | | | 1.12 | | | | 2 | |
| | | | | |
| | | | | | | | | | | | | | | | | | | | | | | |
| | | | | | | | | | | | | | | | | | | | | | |
| | (9.46 | )% | | | (10.90 | )% | | | 575,598 | | | | 0.93 | ** | | | 1.13 | ** | | | 4 | |
| | 15.45 | | | | 24.60 | | | | 657,718 | | | | 0.92 | | | | 0.96 | | | | 8 | |
| | (1.49 | ) | | | (6.73 | ) | | | 605,601 | | | | 0.94 | | | | 1.40 | | | | 27 | |
| | 14.94 | | | | 17.07 | | | | 661,255 | | | | 0.95 | | | | 1.49 | | | | 6 | |
| | (5.01 | ) | | | (8.27 | ) | | | 610,220 | | | | 0.92 | | | | 1.37 | | | | 9 | |
| | 22.12 | | | | 33.65 | | | | 687,579 | | | | 0.93 | | | | 1.47 | | | | 5 | |
| | | | | |
| | | | | | | | | | | | | | | | | | | | | | | |
| | | | | | | | | | | | | | | | | | | | | | |
| | (15.04 | )% | | | (12.83 | )% | | | 268,735 | | | | 0.92 | ** | | | 0.67 | ** | | | 4 | |
| | 22.15 | | | | 29.03 | | | | 323,415 | | | | 0.90 | | | | 0.61 | | | | 26 | |
| | 6.60 | | | | (0.24 | ) | | | 277,949 | | | | 0.93 | | | | 1.03 | | | | 20 | |
| | 20.62 | | | | 25.40 | | | | 275,280 | | | | 0.99 | | | | 1.11 | | | | 8 | |
| | (6.03 | ) | | | (12.99 | ) | | | 238,344 | | | | 0.91 | | | | 1.08 | | | | 16 | |
| | 16.91 | | | | 27.91 | | | | 266,065 | | | | 0.92 | | | | 1.18 | | | | 11 | |
| | | | | |
| | | | | | | | | | | | | | | | | | | | | | | |
| | | | | | | | | | | | | | | | | | | | | | |
| | (22.72 | ) | | | (25.83 | ) | | | 1,035,370 | | | | 0.92 | ** | | | (0.06 | )** | | | 10 | |
| | 19.85 | | | | 25.39 | | | | 1,334,867 | | | | 0.90 | | | | (0.21 | ) | | | 32 | |
| | 16.61 | | | | 15.66 | | | | 1,092,308 | | | | 0.94 | | | | 0.15 | | | | 20 | |
| | 27.33 | | | | 28.73 | | | | 951,945 | | | | 0.91 | | | | 0.25 | | | | 11 | |
| | (4.39 | ) | | | (11.15 | ) | | | 766,930 | | | | 0.91 | | | | 0.25 | | | | 23 | |
| | 24.63 | | | | 39.24 | | | | 836,161 | | | | 0.93 | | | | 0.17 | | | | 17 | |
| (a) | Per share Net Investment Income (Loss) is calculated using the average daily shares method. |
| (b) | Total Return Based on Common Share NAV is the combination of changes in common share NAV, reinvested dividend income at Common Share NAV and reinvested capital gains distributions at NAV, if any. The last dividend declared in the period, which is typically paid on the first business day of the following month, is assumed to be reinvested at the ending NAV. The actual reinvest price for the last dividend declared in the period may often be based on the Fund’s market price (and not its NAV), and therefore may be different from the price used in the calculation. Total returns are not annualized. |
Total Return Based on Common Share Price is the combination of changes in the market price per share and the effect of reinvested dividend income and reinvested capital gains distributions, if any, at the average price paid per share at the time of reinvestment. The last dividend declared in the period, which is typically paid on the first business day of the following month, is assumed to be reinvested at the ending market price. The actual reinvestment for the last dividend declared in the period may take place over several days, and in some instances may not be based on the market price, so the actual reinvestment price may be different from the price used in the calculation. Total returns are not annualized.
| (c) | Portfolio Turnover Rate is calculated based on the lesser of long-term purchases or sales (as disclosed in Note 4 – Portfolio Securities and Investments in Derivatives) divided by the average long-term market value during the period. |
| (d) | Unaudited. For the six months ended June 30, 2022. |
See accompanying notes to financial statements.
63
Financial Highlights (Unaudited) (continued)
Selected data for a common share outstanding throughout each period:
| | | | | | | | | | | | | | | | | | | | | | | | | | | | | | | | | | | | | | | | | | | | | | | | |
| | | | |
| | | | | | Investment Operations | | | Less Distributions to
Common Shareholders | | | Common Shares | |
| | | Beginning
Common
Share
NAV | | | Net
Investment
Income
(Loss)(a) | | | Net
Realized/
Unrealized
Gain (Loss) | | | Total | | | From
Net
Investment
Income | | | From
Accumulated
Net Realized
Gains | | | Return
of
Capital | | | Total | | | Shelf
Offering
Costs | | | Premium
Per
Shares
Sold
through
Shelf
Offering | | | Ending
NAV | | | Ending
Share
Price | |
|
JCE | |
Year Ended 12/31: | |
2022(e) | | $ | 17.33 | | | $ | 0.04 | | | $ | (3.07 | ) | | $ | (3.03 | ) | | $ | (0.79 | ) | | $ | — | | | $ | — | | | $ | (0.79 | ) | | $ | — | | | $ | — | | | $ | 13.51 | | | $ | 13.35 | |
2021 | | | 15.21 | | | | 0.01 | | | | 3.95 | | | | 3.96 | | | | (0.07 | ) | | | (1.77 | ) | | | — | | | | (1.84 | ) | | | — | | | | — | | | | 17.33 | | | | 18.58 | |
2020 | | | 15.04 | | | | 0.14 | | | | 0.96 | | | | 1.10 | | | | (0.10 | ) | | | (0.83 | ) | | | — | | | | (0.93 | ) | | | — | | | | — | * | | | 15.21 | | | | 14.07 | |
2019 | | | 12.68 | | | | 0.09 | | | | 3.27 | | | | 3.36 | | | | (0.10 | ) | | | (0.55 | ) | | | (0.35 | ) | | | (1.00 | ) | | | — | | | | — | | | | 15.04 | | | | 14.62 | |
2018 | | | 14.76 | | | | 0.07 | | | | (1.04 | ) | | | (0.97 | ) | | | (0.07 | ) | | | (1.04 | ) | | | — | | | | (1.11 | ) | | | — | | | | — | | | | 12.68 | | | | 12.03 | |
2017 | | | 14.27 | | | | 0.18 | | | | 2.84 | | | | 3.02 | | | | (0.17 | ) | | | (2.36 | ) | | | — | | | | (2.53 | ) | | | — | | | | — | | | | 14.76 | | | | 14.60 | |
64
| | | | | | | | | | | | | | | | | | | | | | |
| | | | | | | Common Share Supplemental Data/
Ratios Applicable to Common Shares | |
Common Share
Total Returns | | | | | | Ratios to Average Net Assets | | | | |
Based
on
NAV(b) | | |
Based
on
Share
Price(b) | | | Ending
Net
Assets
(000) | | | Expenses | | | Net
Investment
Income (Loss) | | | Portfolio
Turnover
Rate(c) | |
| | | | | |
| | | | | | | | | | | | | | | | | | | | | | | |
| | | | | | | | | | | | | | | | | | | | | | |
| | (17.82 | )% | | | (24.26 | )% | | $ | 217,012 | | | | 1.00 | %** | | | 0.56 | %** | | | 46 | |
| | 26.91 | | | | 47.15 | | | | 278,044 | | | | 0.98 | | | | 0.09 | | | | 104 | |
| | 8.42 | | | | 3.62 | | | | 243,790 | | | | 1.17 | (d) | | | 1.00 | (d) | | | 169 | |
| | 26.96 | | | | 30.26 | | | | 241,024 | | | | 1.01 | | | | 0.64 | | | | 35 | |
| | (7.17 | ) | | | (10.86 | ) | | | 203,322 | | | | 1.01 | | | | 0.47 | | | | 121 | |
| | 21.72 | | | | 31.85 | | | | 236,475 | | | | 1.02 | | | | 1.18 | | | | 159 | |
| (a) | Per share Net Investment Income (Loss) is calculated using the average daily shares method. |
| (b) | Total Return Based on Common Share NAV is the combination of changes in common share NAV, reinvested dividend income at Common Share NAV and reinvested capital gains distributions at NAV, if any. The last dividend declared in the period, which is typically paid on the first business day of the following month, is assumed to be reinvested at the ending NAV. The actual reinvest price for the last dividend declared in the period may often be based on the Fund’s market price (and not its NAV), and therefore may be different from the price used in the calculation. Total returns are not annualized. |
| | Total Return Based on Common Share Price is the combination of changes in the market price per share and the effect of reinvested dividend income and reinvested capital gains distributions, if any, at the average price paid per share at the time of reinvestment. The last dividend declared in the period, which is typically paid on the first business day of the following month, is assumed to be reinvested at the ending market price. The actual reinvestment for the last dividend declared in the period may take place over several days, and in some instances may not be based on the market price, so the actual reinvestment price may be different from the price used in the calculation. Total returns are not annualized. |
| (c) | Portfolio Turnover Rate is calculated based on the lesser of long-term purchases or sales (as disclosed in Note 4 – Portfolio Securities and Investments in Derivatives) divided by the average long-term market value during the period. |
| (d) | During the period ended December 31, 2020, the Adviser voluntarily reimbursed the Fund for certain expenses incurred in connection with a common shares equity shelf program. As a result, the Expenses and Net Investment Income (Loss) Ratios to Average Net Assets reflect this voluntary expense reimbursement from Adviser. The Expenses and Net Investment Income (Loss) Ratios to Average Net Assets excluding this expense reimbursement from Adviser were as follows: |
| | | | | | | | |
| Ratios to Average Net Assets | |
| | | | Expenses | | |
| Net Investment
Income (Loss) |
|
Year Ended 12/31: | | | | | | | | |
2020 | | | 1.23 | % | | | 0.94 | % |
| (e) | Unaudited. For the six months ended June 30, 2022. |
See accompanying notes to financial statements.
65
Notes to Financial Statements
(Unaudited)
1. General Information
Fund Information
The funds covered in this report and their corresponding New York Stock Exchange (“NYSE”) or Nasdaq National Market (“Nasdaq”) symbols are as follows (each a “Fund” and collectively, the “Funds”):
| | • | | Nuveen S&P 500 Buy-Write Income Fund (BXMX) |
| | • | | Nuveen Dow 30SM Dynamic Overwrite Fund (DIAX) |
| | • | | Nuveen S&P 500 Dynamic Overwrite Fund (SPXX) |
| | • | | Nuveen Nasdaq 100 Dynamic Overwrite Fund (QQQX) |
| | • | | Nuveen Core Equity Alpha Fund (JCE) |
The Funds are registered under the Investment Company Act of 1940 (the “1940 Act”), as amended, as diversified (non-diversified for DIAX and QQQX) closed-end management investment companies. Shares of BXMX, DIAX, SPXX and JCE are traded on the NYSE while shares of QQQX are traded on the Nasdaq. BXMX, DIAX, SPXX, QQQX and JCE were organized as Massachusetts business trusts on July 23, 2004, May 20, 2014, November 11, 2004, May 20, 2014 and January 9, 2007, respectively.
Current Fiscal Period
The end of the reporting period for the Funds is June 30, 2022, and the period covered by these Notes to Financial Statements is the six months ended June 30, 2022 (the “current fiscal period”).
Investment Adviser and Sub-Adviser
The Funds’ investment adviser is Nuveen Fund Advisors, LLC (the “Adviser”), a subsidiary of Nuveen, LLC (“Nuveen”). Nuveen is the investment management arm of Teachers Insurance and Annuity Association of America (TIAA). The Adviser has overall responsibility for management of the Funds, oversees the management of the Funds’ portfolios, manages the Funds’ business affairs and provides certain clerical, bookkeeping and other administrative services, and, if necessary, asset allocation decisions. The Adviser has entered into sub-advisory agreements with Gateway Investment Advisers, LLC (“Gateway”), under which Gateway manages BXMX’s investment portfolio and Nuveen Asset Management, LLC (“NAM”), a subsidiary of the Adviser, under which NAM manages the investment portfolios of DIAX, SPXX, QQQX and JCE.
Developments Regarding the Funds’ Control Share By-Law
On October 5, 2020, the Funds and certain other closed-end funds in the Nuveen fund complex amended their by-laws. Among other things, the amended by-laws included provisions pursuant to which, in summary, a shareholder who obtains beneficial ownership of common shares in a Control Share Acquisition (as defined in the by-laws) shall have the same voting rights as other common shareholders only to the extent authorized by the other disinterested shareholders (the “Control Share By-Law”). On January 14, 2021, a shareholder of certain Nuveen closed-end funds filed a civil complaint in the U.S. District Court for the Southern District of New York (the “District Court”) against certain Nuveen funds and their trustees, seeking a declaration that such funds’ Control Share By-Laws violate the 1940 Act, rescission of such fund’s Control Share By-Laws and a permanent injunction against such funds applying the Control Share By-Laws. On February 18, 2022, the District Court granted judgment in favor of the plaintiff’s claim for rescission of such funds’ Control Share By-Laws and the plaintiff’s declaratory judgment claim, and declared that such funds’ Control Share By-Laws violate Section 18(i) of the 1940 Act. Following review of the judgment of the District Court, on February 22, 2022, the Board of Trustees (the “Board”) amended the Funds’ by-laws to provide that the Funds’ Control Share By-Law shall be of no force and effect for so long as the judgment of the District Court is effective and that if the judgment of the District Court is reversed, overturned, vacated, stayed, or otherwise nullified, the Funds’ Control Share By-Law will be automatically reinstated and apply to any beneficial owner of common shares acquired in a Control Share Acquisition, regardless of whether such Control Share Acquisition occurs before or after such reinstatement, for the duration of the stay or upon issuance of the mandate reversing, overturning, vacating or otherwise nullifying the judgment of the District Court. On February 25, 2022, the Board and the Funds appealed the District Court’s decision to the U.S. Court of Appeals for the second circuit.
Other Matters
The outbreak of the novel coronavirus (“COVID-19”) and subsequent global pandemic began significantly impacting the U.S. and global financial markets and economies during the calendar quarter ended March 31, 2020. The worldwide spread of COVID-19 has created significant uncertainty in the global economy. The duration and extent of COVID-19 over the long-term cannot be reasonably estimated at this time. The ultimate impact of COVID-19 and the extent to which COVID-19 impacts the Funds normal course of business, results of operations, investments, and cash flows will depend on future developments, which are highly uncertain and difficult to predict. Management continues to monitor and evaluate this situation.
66
2. Significant Accounting Policies
The accompanying financial statements were prepared in accordance with accounting principles generally accepted in the United States of America (“U.S. GAAP”), which may require the use of estimates made by management and the evaluation of subsequent events. Actual results may differ from those estimates. Each Fund is an investment company and follows the accounting guidance in the Financial Accounting Standards Board (“FASB”) Accounting Standards Codification 946, Financial Services – Investment Companies. The net asset value (“NAV”) for financial reporting purposes may differ from the NAV for processing security and common share transactions. The NAV for financial reporting purposes includes security and common share transactions through the date of the report. Total return is computed based on the NAV used for processing security and common share transactions. The following is a summary of the significant accounting policies consistently followed by the Funds.
Compensation
The Funds pay no compensation directly to those of its trustees or to its officers, all of whom receive remuneration for their services to the Funds from the Adviser or its affiliates. The Board has adopted a deferred compensation plan for independent trustees that enables trustees to elect to defer receipt of all or a portion of the annual compensation they are entitled to receive from certain Nuveen-advised funds. Under the plan, deferred amounts are treated as though equal dollar amounts had been invested in shares of select Nuveen-advised funds.
Distributions to Common Shareholders
Distributions to common shareholders are recorded on the ex-dividend date. The amount, character and timing of distributions are determined in accordance with federal income tax regulations, which may differ from U.S. GAAP.
Each Fund makes quarterly cash distributions to shareholders of a stated dollar amount per share. Subject to approval and oversight by the Board, each Fund seeks to maintain a stable distribution level designed to deliver the long-term return potential of each Fund’s investment strategy through regular quarterly distributions (a “Managed Distribution Program”). Total distributions during a calendar year generally will be made from each Fund’s net investment income, net realized capital gains and net unrealized capital gains in the Fund’s portfolio, if any. The portion of distributions paid attributed to net unrealized gains, if any, is distributed from the Fund’s assets and is treated by shareholders as a nontaxable distribution (“return of capital”) for tax purposes. In the event that total distributions during a calendar year exceed a Fund’s total return on NAV, the difference will reduce NAV per share. If a Fund’s total return on NAV exceeds total distributions during a calendar year, the excess will be reflected as an increase in NAV per share. The final determination of the source and character of all distributions paid by a Fund during the fiscal year is made after the end of the fiscal year and is reflected in the financial statements contained in the annual report as of December 31 each year.
Foreign Currency Transactions and Translation
To the extent that the Funds invest in securities and/or contracts that are denominated in a currency other than U.S. dollars, the Funds will be subject to currency risk, which is the risk that an increase in the U.S. dollar relative to the foreign currency will reduce returns or portfolio value. Generally, when the U.S. dollar rises in value against a foreign currency, the Funds’ investments denominated in that currency will lose value because their currency is worth fewer U.S. dollars; the opposite effect occurs if the U.S. dollar falls in relative value. Investments and other assets and liabilities denominated in foreign currencies are converted into U.S. dollars on a spot (i.e. cash) basis at the spot rate prevailing in the foreign currency exchange market at the time of valuation. Purchases and sales of investments and income denominated in foreign currencies are translated into U.S. dollars on the respective dates of such transactions.
The books and records of the Funds are maintained in U.S. dollars. Assets, including investments, and liabilities denominated in foreign currencies are translated into U.S. dollars at the end of each day. Purchases and sales of securities, income and expenses are translated into U.S. dollars at the prevailing exchange rate on the respective dates of the transactions.
Net realized foreign currency gains and losses resulting from changes in exchange rates associated with (i) foreign currency, (ii) investments and (iii) derivatives include foreign currency gains and losses between trade date and settlement date of the transactions, foreign currency transactions, and the difference between the amounts of interest and dividends recorded on the books of the Funds and the amounts actually received are recognized as a component of “Net realized gain (loss) from investments and foreign currency” on the Statement of Operations, when applicable.
The unrealized gains and losses resulting from changes in foreign currency exchange rates and changes in foreign exchange rates associated with (i) investments and (ii) other assets and liabilities are recognized as a component of “Change in net unrealized appreciation (depreciation) of investments and foreign currency” on the Statement of Operations, when applicable. The unrealized gains and losses resulting from changes in foreign exchange rates associated with investments in derivatives are recognized as a component of the respective derivative’s related “Change in net unrealized appreciation (depreciation)” on the Statement of Operations, when applicable.
Indemnifications
Under the Funds’ organizational documents, their officers and trustees are indemnified against certain liabilities arising out of the performance of their duties to the Funds. In addition, in the normal course of business, the Funds enter into contracts that provide general indemnifications to other parties. The Funds’ maximum exposure under these arrangements is unknown as this would involve future claims that may be made against the Funds that have not yet occurred. However, the Funds have not had prior claims or losses pursuant to these contracts and expect the risk of loss to be remote.
67
Notes to Financial Statements (continued)
Investments and Investment Income
Securities transactions are accounted for as of the trade date for financial reporting purposes. Realized gains and losses on securities transactions are based upon the specific identification method. Dividend income is recorded on the ex-dividend date or, for certain foreign securities, when information is available. Non-cash dividends received in the form of stock, if any, are recognized on the ex-dividend date and recorded at fair value. Interest income is recorded on an accrual basis. Interest income also reflects payment-in-kind (“PIK”) interest and paydown gains and losses, if any. PIK interest represents income received in the form of securities in lieu of cash. Securities lending income is comprised of fees earned from borrowers and income earned on cash collateral investments.
Netting Agreements
In the ordinary course of business, the Funds may enter into transactions subject to enforceable master repurchase agreements, International Swaps and Derivatives Association, Inc. (ISDA) master agreements or other similar arrangements (“netting agreements”). Generally, the right to offset in netting agreements allows each Fund to offset certain securities and derivatives with a specific counterparty, when applicable, as well as any collateral received or delivered to that counterparty based on the terms of the agreements. Generally, each Fund manages its cash collateral and securities collateral on a counterparty basis.
The Funds’ investments subject to netting agreements as of the end of the reporting period, if any, are further described in Note 4 – Portfolio Securities and Investments in Derivatives.
New Accounting Pronouncements and Rule Issuances
Reference Rate Reform
In March 2020, FASB issued Accounting Standards Update (“ASU”) 2020-04, Reference Rate Reform: Facilitation of the Effects of Reference Rate Reform on Financial Reporting. The main objective of the new guidance is to provide relief to companies that will be impacted by the expected change in benchmark interest rates, when participating banks will no longer be required to submit London Interbank Offered Rate (LIBOR) quotes by the UK Financial Conduct Authority (FCA). The new guidance allows companies to, provided the only changes to existing contracts are a change to an approved benchmark interest rate, account for modifications as a continuance of the existing contract without additional analysis. For new and existing contracts, the Funds may elect to apply the amendments as of March 12, 2020 through December 31, 2022. Management has not yet elected to apply the amendments, is continuously evaluating the potential effect a discontinuation of LIBOR could have on the Funds’ investments and has currently determined that it is unlikely the ASU’s adoption will have a significant impact on the Funds’ financial statements and various filings.
Securities and Exchange Commission (“SEC”) Adopts New Rules to Modernize Fund Valuation Framework
In December 2020, the SEC voted to adopt a new rule governing fund valuation practices. New Rule 2a-5 under the 1940 Act establishes requirements for determining fair value in good faith for purposes of the 1940 Act. Rule 2a-5 will permit fund boards to designate certain parties to perform fair value determinations, subject to board oversight and certain other conditions. Rule 2a-5 also defines when market quotations are “readily available” for purposes of Section 2(a)(41) of the 1940 Act, which requires a fund to fair value a security when market quotations are not readily available. The SEC also adopted new Rule 31a-4 under the 1940 Act, which sets forth the recordkeeping requirements associated with fair value determinations. Finally, the SEC is rescinding previously issued guidance on related issues, including the role of a board in determining fair value and the accounting and auditing of fund investments. Rule 2a-5 and Rule 31a-4 became effective on March 8, 2021, with a compliance date of September 8, 2022. A fund may voluntarily comply with the rules after the effective date, and in advance of the compliance date, under certain conditions. Management is currently assessing the impact of these provisions on the Funds’ financial statements.
3. Investment Valuation and Fair Value Measurements
The Funds’ investments in securities are recorded at their estimated fair value utilizing valuation methods approved by the Board. Fair value is defined as the price that would be received upon selling an investment or transferring a liability in an orderly transaction to an independent buyer in the principal or most advantageous market for the investment. U.S. GAAP establishes the three-tier hierarchy which is used to maximize the use of observable market data and minimize the use of unobservable inputs and to establish classification of fair value measurements for disclosure purposes. Observable inputs reflect the assumptions market participants would use in pricing the asset or liability. Observable inputs are based on market data obtained from sources independent of the reporting entity. Unobservable inputs reflect management’s assumptions about the assumptions market participants would use in pricing the asset or liability. Unobservable inputs are based on the best information available in the circumstances. The following is a summary of the three-tiered hierarchy of valuation input levels.
| | |
| Level 1 – | | Inputs are unadjusted and prices are determined using quoted prices in active markets for identical securities. |
| Level 2 – | | Prices are determined using other significant observable inputs (including quoted prices for similar securities, interest rates, credit spreads, etc.). |
| Level 3 – | | Prices are determined using significant unobservable inputs (including management’s assumptions in determining the fair value of investments). |
68
A description of the valuation techniques applied to the Funds’ major classifications of assets and liabilities measured at fair value follows:
Equity securities and exchange-traded funds listed or traded on a national market or exchange are valued based on their sale price at the official close of business of such market or exchange on the valuation date. Foreign equity securities and registered investment companies that trade on a foreign exchange are valued at the last sale price or official closing price reported on the exchange where traded and converted to U.S. dollars at the prevailing rates of exchange on the date of valuation. To the extent these securities are actively traded and that valuation adjustments are not applied, they are generally classified as Level 1. If there is no official close of business, then the latest available sale price is utilized. If no sales are reported, then the mean of the latest available bid and ask prices is utilized and these securities are generally classified as Level 2.
Prices of certain American Depositary Receipts (“ADR”) held by the Funds that trade in the United States are valued based on the last traded price, official closing price, or an evaluated price provided by the independent pricing service (“pricing service”) and are generally classified as Level 1 or 2.
Purchased and written options traded and listed on a national market or exchange are valued at the mean of the closing bid and asked prices and are generally classified as Level 1.
Over-the-counter (“OTC”) options are marked-to-market daily based upon a price supplied by a pricing service. OTC options are generally classified as Level 2.
Repurchase agreements are valued at contract amount plus accrued interest, which approximates market value. These securities are generally classified as Level 2.
Any portfolio security or derivative for which market quotations are not readily available or for which the above valuation procedures are deemed not to reflect fair value are valued at fair value, as determined in good faith using procedures approved by the Board. As a general principle, the fair value of a security would appear to be the amount that the owner might reasonably expect to receive for it in a current sale. A variety of factors may be considered in determining the fair value of such securities, which may include consideration of the following: yields or prices of investments of comparable quality, type of issue, coupon, maturity and rating, market quotes or indications of value from security dealers, evaluations of anticipated cash flows or collateral, general market conditions and other information and analysis, including the obligor’s credit characteristics considered relevant. To the extent the inputs are observable and timely, the values would be classified as Level 2 of the fair value hierarchy; otherwise they would be classified as Level 3.
The following table summarizes the market value of the Funds’ investments as of the end of the reporting period, based on the inputs used to value them:
| | | | | | | | | | | | | | | | |
| BXMX | | Level 1 | | | Level 2 | | | Level 3 | | | Total | |
Long-Term Investments*: | | | | | | | | | | | | | | | | |
Common Stocks | | $ | 1,315,587,838 | | | $ | — | | | $ | — | | | $ | 1,315,587,838 | |
| | | | |
Short-Term Investments: | | | | | | | | | | | | | | | | |
Repurchase Agreements | | | — | | | | 49,982,419 | | | | — | | | | 49,982,419 | |
| | | | |
Investment in Derivatives: | | | | | | | | | | | | | | | | |
Options Written | | | (16,475,148 | ) | | | — | | | | — | | | | (16,475,148 | ) |
Total | | $ | 1,299,112,690 | | | $ | 49,982,419 | | | $ | — | | | $ | 1,349,095,109 | |
| DIAX | | | | | | | | | | | | |
Long-Term Investments*: | | | | | | | | | | | | | | | | |
Common Stocks | | $ | 571,338,895 | | | $ | — | | | $ | — | | | $ | 571,338,895 | |
Exchange-Traded Funds | | | 17,918,900 | | | | — | | | | — | | | | 17,918,900 | |
| | | | |
Short-Term Investments: | | | | | | | | | | | | | | | | |
Repurchase Agreements | | | — | | | | 11,251,081 | | | | — | | | | 11,251,081 | |
| | | | |
Investment in Derivatives: | | | | | | | | | | | | | | | | |
Options Purchased | | | 750 | | | | — | | | | — | | | | 750 | |
Options Written | | | (14,306,400 | ) | | | — | | | | — | | | | (14,306,400 | ) |
Total | | $ | 574,952,145 | | | $ | 11,251,081 | | | $ | — | | | $ | 586,203,226 | |
| SPXX | | | | | | | | | | | | |
Long-Term Investments*: | | | | | | | | | | | | | | | | |
Common Stocks | | $ | 265,579,313 | | | $ | — | | | $ | — | | | $ | 265,579,313 | |
Exchange-Traded Funds | | | 8,110,660 | | | | — | | | | — | | | | 8,110,660 | |
Investments Purchased with Collateral from Securities Lending | | | 447,227 | | | | — | | | | — | | | | 447,227 | |
| | | | |
Short-Term Investments: | | | | | | | | | | | | | | | | |
Repurchase Agreements | | | — | | | | 5,550,958 | | | | — | | | | 5,550,958 | |
| | | | |
Investment in Derivatives: | | | | | | | | | | | | | | | | |
Options Purchased | | | 375 | | | | — | | | | — | | | | 375 | |
Options Written | | | (6,644,675 | ) | | | — | | | | — | | | | (6,644,675 | ) |
Total | | $ | 267,492,900 | | | $ | 5,550,958 | | | $ | — | | | $ | 273,043,858 | |
69
Notes to Financial Statements (continued)
| | | | | | | | | | | | | | | | |
| QQQX | | Level 1 | | | Level 2 | | | Level 3 | | | Total | |
Long-Term Investments*: | | | | | | | | | | | | | | | | |
Common Stocks | | $ | 1,028,241,430 | | | $ | — | | | $ | — | | | $ | 1,028,241,430 | |
Exchange-Traded Funds | | | 31,580,600 | | | | — | | | | — | | | | 31,580,600 | |
Investments Purchased with Collateral from Securities Lending | | | 4,521,847 | | | | — | | | | — | | | | 4,521,847 | |
| | | | |
Short-Term Investments: | | | | | | | | | | | | | | | | |
Repurchase Agreements | | | — | | | | 22,508,483 | | | | — | | | | 22,508,483 | |
| | | | |
Investment in Derivatives: | | | | | | | | | | | | | | | | |
Options Purchased | | | 750 | | | | — | | | | — | | | | 750 | |
Options Written | | | (24,320,724 | ) | | | (431,182 | ) | | | — | | | | (24,751,906 | ) |
Total | | $ | 1,040,023,903 | | | $ | 22,077,301 | | | $ | — | | | $ | 1,062,101,204 | |
| JCE | | | | | | | | | | | | |
Long-Term Investments*: | | | | | | | | | | | | | | | | |
Common Stocks | | $ | 216,023,943 | | | $ | — | | | $ | — | | | $ | 216,023,943 | |
Exchange-Traded Funds | | | 985,790 | | | | — | | | | — | | | | 985,790 | |
Investments Purchased with Collateral from Securities Lending | | | 135,181 | | | | — | | | | — | | | | 135,181 | |
| | | | |
Short-Term Investments: | | | | | | | | | | | | | | | | |
Repurchase Agreements | | | — | | | | 6,575,581 | | | | — | | | | 6,575,581 | |
| | | | |
Investment in Derivatives: | | | | | | | | | | | | | | | | |
Options Written | | | (82,188 | ) | | | — | | | | — | | | | (82,188 | ) |
Total | | $ | 217,062,726 | | | $ | 6,575,581 | | | $ | — | | | $ | 223,638,307 | |
| * | Refer to the Fund’s Portfolio of Investments for industry/sector classifications, when applicable. |
4. Portfolio Securities and Investments in Derivatives
Portfolio Securities
Repurchase Agreements
In connection with transactions in repurchase agreements, it is each Fund’s policy that its custodian take possession of the underlying collateral securities, the fair value of which exceeds the principal amount of the repurchase transaction, including accrued interest, at all times. If the counterparty defaults, and the fair value of the collateral declines, realization of the collateral may be delayed or limited.
The following table presents the repurchase agreements for the Funds that are subject to netting agreements as of the end of the reporting period, and the collateral delivered related to those repurchase agreements.
| | | | | | | | | | |
| Fund | | Counterparty | | Short-Term
Investments, at Value | | | Collateral
Pledged (From)
Counterparty | |
| BXMX | | Fixed Income Clearing Corporation | | $ | 49,982,419 | | | $ | (50,982,147 | ) |
| DIAX | | Fixed Income Clearing Corporation | | | 11,251,081 | | | | (11,476,120 | ) |
| SPXX | | Fixed Income Clearing Corporation | | | 5,550,958 | | | | (5,662,034 | ) |
| QQQX | | Fixed Income Clearing Corporation | | | 22,508,483 | | | | (22,958,732 | ) |
| JCE | | Fixed Income Clearing Corporation | | | 6,575,581 | | | | (6,707,114 | ) |
Securities Lending
Each Fund may lend securities representing up to one-third of the value of its total assets to broker-dealers, banks, and other institutions in order to generate additional income. When loaning securities, the Fund retains the benefits of owning the securities, including the economic equivalent of dividends or interest generated by the security. The loans are continuous, can be recalled at any time, and have no set maturity. The Funds’ custodian, State Street Bank and Trust Company, serves as the securities lending agent (the “Agent”).
When a Fund loans its portfolio securities, it will receive, at the inception of each loan, cash collateral equal to an amount not less than 100% of the market value of the loaned securities. The actual percentage of the cash collateral will vary depending upon the asset type of the loaned securities. Collateral for the loaned securities is invested in a government money market vehicle maintained by the Agent, which is subject to the requirements of Rule 2a-7 under the 1940 Act. The value of the loaned securities and the liability to return the cash collateral received are recognized on the Statement of Assets and Liabilities. If the market value of the loaned securities increases, the borrower must furnish additional collateral to the Fund, which is also recognized on the Statement of Assets and Liabilities. Securities out on loan are subject to termination at any time at the option of the borrower or the Fund. Upon termination, the borrower is required to return to the Fund securities identical to the securities loaned. During the term of the loan, the Fund bears the market risk with respect to the investment of collateral and the risk that the Agent may default on its contractual obligations to the Fund. The Agent bears the risk that the borrower may default on its obligation to return the loaned securities as the Agent is contractually obligated to indemnify the Fund if at the time of a default by a borrower some or all of the loan securities have not been returned.
70
Securities lending income recognized by a Fund consists of earnings on invested collateral and lending fees, net of any rebates to the borrower and compensation to the Agent. Such income is recognized on the Statement of Operations.
As of the end of the reporting period, the total value of the loaned securities and the total value of collateral received were as follows:
| | | | | | | | | | |
| Fund | | Asset Class out on Loan | | Long-Term
Investments, at Value | | | Total
Collateral Received | |
| SPXX | | Common Stocks | | $ | 131,643 | | | $ | 135,906 | |
| | | Exchange-Traded Funds | | | 301,792 | | | | 311,321 | |
| Total | | | | $ | 433,435 | | | $ | 447,227 | |
| QQQX | | Common Stocks | | | 3,051,612 | | | | 3,164,961 | |
| | | Exchange-Traded Funds | | | 1,313,672 | | | | 1,356,886 | |
| Total | | | | $ | 4,365,284 | | | $ | 4,521,847 | |
| JCE | | Common Stocks | | $ | 127,203 | | | $ | 135,181 | |
Investment Transactions
Long-term purchases and sales (excluding investments purchased with collateral from securities lending and derivative transactions, where applicable) during the current reporting period were as follows:
| | | | | | | | | | | | | | | | | | | | |
| | | BXMX | | | DIAX | | | SPXX | | | QQQX | | | JCE | |
Purchases | | $ | 82,271,798 | | | $ | 50,274,649 | | | $ | 26,335,764 | | | $ | 235,320,838 | | | $ | 115,756,742 | |
Sales | | | 31,681,965 | | | | 24,662,610 | | | | 12,055,881 | | | | 119,775,417 | | | | 124,241,471 | |
The Funds may purchase securities on a when-issued or delayed-delivery basis. Securities purchased on a when-issued or delayed-delivery basis may have extended settlement periods; interest income is not accrued until settlement date. Any securities so purchased are subject to market fluctuation during this period. The Funds have earmarked securities in their portfolios with a current value at least equal to the amount of the when-issued/delayed-delivery purchase commitments. If a Fund has outstanding when-issued/delayed-delivery purchases commitments as of the end of the reporting period, such amounts are recognized on the Statement of Assets and Liabilities.
Investments in Derivatives
Each Fund is authorized to invest in certain derivative instruments, such as futures, options and swap contracts. Each Fund limits its investments in futures, options on futures and swap contracts to the extent necessary for the Adviser to claim the exclusion from registration by the Commodity Futures Trading Commission as a commodity pool operator with respect to the Fund. The Funds record derivative instruments at fair value, with changes in fair value recognized on the Statement of Operations, when applicable. Even though the Funds’ investments in derivatives may represent economic hedges, they are not considered to be hedge transactions for financial reporting purposes.
Options Transactions
The purchase of options involves the risk of loss of all or a part of the cash paid for the options (the premium). The market risk associated with purchasing options is limited to the premium paid. The counterparty credit risk of purchasing options, however, needs to take into account the current value of the option, as this is the performance expected from the counterparty. When a Fund purchases an option, an amount equal to the premium paid (the premium plus commission) is recognized as a component of “Options purchased, at value” on the Statement of Asset and Liabilities. When a Fund writes an option, an amount equal to the net premium received (the premium less commission) is recognized as a component of “Options written, at value” on the Statement of Assets and Liabilities and is subsequently adjusted to reflect the current value of the written option until the option is exercised or expires or the Fund enters into a closing purchase transaction. The changes in the value of options purchased and/or written during the fiscal period are recognized as a component of “Change in net unrealized appreciation (depreciation) of options purchased and/or written” on the Statement of Operations. When an option is exercised or expires or a Fund enters into a closing purchase transaction, the difference between the net premium received, and any amount paid at expiration or on executing a closing purchase transaction, including commission, is recognized as a component of “Net realized gain (loss) from options purchased and/or written” on the Statement of Operations. The Fund, as writer of an option, has no control over whether the underlying instrument may be sold (called) or purchased (put) and as a result bears the risk of an unfavorable change in the market value of the instrument underlying the written option. There is also the risk the Fund may not be able to enter into a closing transaction because of an illiquid market.
During the current fiscal period, BXMX wrote call options on equity indices as per its stated strategy, with the notional amount of these options averaging 99% of the Fund’s assets.
During the current fiscal period, DIAX, SPXX and QQQX, each wrote call options on equity indices as per its stated dynamic overwriting strategy with the notional amounts of these options ranging from approximately 35-75% of each Fund’s assets. DIAX, SPXX and QQQX also wrote put and call options and purchased put and call options as part of their overwrite strategy.
During the current fiscal period, JCE continued to write call options on equity indexes, while investing in a portfolio that included equities to enhance returns while foregoing some upside potential of its equity portfolio.
71
Notes to Financial Statements (continued)
The average notional amount of outstanding options purchased and options written during the current fiscal period, was as follows:
| | | | | | | | | | | | | | | | | | | | |
| | | | | | | | | DIAX | | | SPXX | | | QQQX | |
Average notional amount of outstanding call options purchased* | | | | | | | | | | $ | 900,000 | | | $ | 450,000 | | | $ | 900,000 | |
| | | | | |
| | | BXMX | | | DIAX | | | SPXX | | | QQQX | | | JCE | |
Average notional amount of outstanding call options written* | | $ | (1,481,521,667 | ) | | $ | (358,150,000 | ) | | $ | (171,660,833 | ) | | $ | (521,280,000 | ) | | $ | (71,573,333 | ) |
| | | | | |
| | | | | | | | | DIAX | | | SPXX | | | QQQX | |
Average notional amount of outstanding put options purchased* | | | | | | | | | | $ | 220,000 | | | $ | 110,000 | | | $ | 220,000 | |
| | | | | |
| | | | | | | | | DIAX | | | SPXX | | | QQQX | |
Average notional amount of outstanding put options written* | | | | | | | | | | $ | (8,016,667 | ) | | $ | (3,700,000 | ) | | $ | (13,566,667 | ) |
| * | The average notional amount is calculated based on the outstanding notional at the beginning of the current fiscal period and at the end of each fiscal quarter within the current fiscal period. |
The following table presents the fair value of all options purchased and options written by the Funds as of the end of the reporting period, the location of these instruments on the Statement of Assets and Liabilities and the primary underlying risk exposure.
| | | | | | | | | | | | | | | | | | |
| | | | | Location on the Statement of Assets and Liabilities | |
Underlying
Risk Exposure | | Derivative
Instrument | | Asset Derivatives | | | | | | (Liability) Derivatives | |
| | Location | | Value | | | | | | Location | | Value | |
| BXMX | |
| Equity price | | Options | | — | | $ | — | | | | | | | Options written, at value | | | $(16,475,148) | |
| DIAX | |
| Equity price | | Options | | Option purchased, at value | | $ | 750 | | | | | | | Options written, at value | | $ | (14,306,400 | ) |
| SPXX | |
| Equity price | | Options | | Options purchased, at value | | $ | 375 | | | | | | | Options written, at value | | $ | (6,644,675 | ) |
| QQQX | |
| Equity price | | Options | | Options purchased, at value | | $ | 750 | | | | | | | Options written, at value | | $ | (24,751,906 | ) |
| JCE | |
| Equity price | | Options | | — | | $ | — | | | | | | | Options written, at value | | $ | (82,188 | ) |
The following table presents the amount of net realized gain (loss) and change in net unrealized appreciation (depreciation) recognized on options purchased and options written on the Statement of Operations during the current fiscal period, and the primary underlying risk exposure.
| | | | | | | | | | | | |
| Fund | | Underlying
Risk Exposure | | Derivative
Instrument | | Net Realized
Gain (Loss)
from Options
Purchased/Written | | | Change in Net
Unrealized
Appreciation
(Depreciation)
of Options
Purchased/Written | |
| BXMX | | Equity price | | Options purchased | | $ | — | | | $ | (35,656,611 | ) |
| BXMX | | Equity price | | Options written | | | 78,044,640 | | | | 56,450,026 | |
| DIAX | | Equity price | | Options purchased | | | (123,063 | ) | | | (6,926,528 | ) |
| DIAX | | Equity price | | Options written | | | 38,857,648 | | | | 7,767,033 | |
| SPXX | | Equity price | | Options purchased | | | (64,907 | ) | | | (3,377,829 | ) |
| SPXX | | Equity price | | Options written | | | 18,589,054 | | | | 3,881,717 | |
| QQQX | | Equity price | | Options purchased | | | (146,848 | ) | | | (17,664,543 | ) |
| QQQX | | Equity price | | Options written | | | 101,740,706 | | | | 24,347,811 | |
| JCE | | Equity price | | Options purchased | | | 13,408 | | | | (247,057 | ) |
| JCE | | Equity price | | Options written | | | 2,607,679 | | | | 495,770 | |
Market and Counterparty Credit Risk
In the normal course of business each Fund may invest in financial instruments and enter into financial transactions where risk of potential loss exists due to changes in the market (market risk) or failure of the other party to the transaction to perform (counterparty credit risk). The potential loss could exceed the value of the financial assets recorded on the financial statements. Financial assets, which potentially expose each Fund to counterparty credit risk,
72
consist principally of cash due from counterparties on forward, option and swap transactions, when applicable. The extent of each Fund’s exposure to counterparty credit risk in respect to these financial assets approximates their carrying value as recorded on the Statement of Assets and Liabilities.
Each Fund helps manage counterparty credit risk by entering into agreements only with counterparties the Adviser believes have the financial resources to honor their obligations and by having the Adviser monitor the financial stability of the counterparties. Additionally, counterparties may be required to pledge collateral daily (based on the daily valuation of the financial asset) on behalf of each Fund with a value approximately equal to the amount of any unrealized gain above a pre-determined threshold. Reciprocally, when each Fund has an unrealized loss, the Funds have instructed the custodian to pledge assets of the Funds as collateral with a value approximately equal to the amount of the unrealized loss above a pre-determined threshold. Collateral pledges are monitored and subsequently adjusted if and when the valuations fluctuate, either up or down, by at least the pre-determined threshold amount.
5. Fund Shares
Common Shares
Common Share Equity Shelf Programs and Offering Costs
SPXX and QQQX have each filed registration statements with the SEC authorizing each Fund to issue additional shares through one or more equity shelf program (“Shelf Offering”), which became effective with the SEC during a prior fiscal period.
Under these Shelf Offerings, the Funds, subject to market conditions, may raise additional equity capital by issuing additional shares from time to time in varying amounts and by different offering methods at a net price at or above each Fund’s NAV per common share. In the event each Fund’s Shelf Offering registration statement is no longer current, the Funds may not issue additional shares until a post-effective amendment to the registration statement has been filed with the SEC.
Additional authorized common shares, common shares sold and offering proceeds, net of offering costs under each Fund’s Shelf Offering during the Funds’ current and prior fiscal period were as follows:
| | | | | | | | | | | | | | | | |
| | | SPXX | | | QQQX | |
| | | Six months
Ended
06/30/22 | | | Year
Ended
12/31/21 | | | Six months
Ended
06/30/22 | | | Year
Ended
12/31/21 | |
Maximum aggregate offering | | | 4,993,317 | | | | 4,993,317 | * | | | Unlimited | | | | Unlimited | ** |
Common shares sold | | | 218,784 | | | | 100,336 | | | | 1,929,483 | | | | 3,478,731 | |
Offering proceeds, net of offering costs | | $ | 3,479,060 | | | $ | 1,804,279 | | | $ | 49,356,154 | | | $ | 99,137,676 | |
| * | Represents maximum aggregate offering for the period July 28, 2021 through December 31, 2021. |
| ** | Represents maximum aggregate offering for the period April 30, 2021 through December 31, 2021. |
Costs incurred by the Funds in connection with their initial shelf registrations are recorded as a prepaid expense and recognized as “Deferred offering costs” on the Statement of Assets and Liabilities. These costs are amortized pro rata as shares are sold and are recognized as a component of “Proceeds from shelf offering, net of offering costs” on the Statement of Changes in Net Assets. Any deferred offering costs remaining after the effectiveness of the initial shelf registration will be expensed. Costs incurred by the Funds to keep the shelf registration current are expensed as incurred and recognized as a component of “Other Expenses” on the Statement of Operations.
Common Share Transactions
Transactions in common shares for the Funds during the Funds’ current and prior fiscal period, where applicable, were as follows:
| | | | | | | | | | | | | | | | | | | | | | | | |
| | | SPXX | | | QQQX | | | JCE | |
| | | Six Months
Ended
6/30/22 | | | Year
Ended
12/31/21 | | | Six Months
Ended
6/30/22 | | | Year
Ended
12/31/21 | | | Six Months
Ended
6/30/22 | | | Year
Ended
12/31/21 | |
Common shares: | | | | | | | | | | | | | | | | | | | | | | | | |
Issued to shareholders due to reinvestment of distributions | | | — | | | | 4,478 | | | | 42,339 | | | | 60,886 | | | | 14,342 | | | | 18,321 | |
Sold through shelf offering | | | 218,784 | | | | 100,336 | | | | 1,929,483 | | | | 3,478,731 | | | | — | | | | — | |
Weighted average common share: | | | | | | | | | | | | | | | | | | | | | | | | |
Premium to NAV per shelf offering sold | | | 1.31 | % | | | 1.23 | % | | | 2.13 | % | | | 1.90 | % | | | — | % | | | — | % |
73
Notes to Financial Statements (continued)
6. Income Tax Information
Each Fund is a seperate taxpayer for federal income tax purposes. Each Fund intends to distribute substantially all of its net investment income and net capital gains to shareholders and otherwise comply with the requirements of Subchapter M of the Internal Revenue Code applicable to regulated investment companies. Therefore, no federal income tax provision is required.
Each Fund files income tax returns in U.S. federal and applicable state and local jurisdictions. A Fund’s federal income tax returns are generally subject to examination for a period of three fiscal years after being filed. State and local tax returns may be subject to examination for an additional period of time depending on the jurisdiction. Management has analyzed each Fund’s tax positions taken for all open tax years and has concluded that no provision for income tax is required in the Fund’s financial statements.
As of the end of the reporting period, the aggregate cost and the net unrealized appreciation/(depreciation) of all investments for federal income tax purposes was as follows:
| | | | | | | | | | | | | | | | |
| Fund | | Tax Cost | | | Gross
Unrealized
Appreciation | | | Gross
Unrealized
(Depreciation) | | | Net
Unrealized
Appreciation
(Depreciation) | |
| BXMX | | $ | 618,482,923 | | | $ | 757,246,203 | | | $ | (26,634,017 | ) | | $ | 730,612,186 | |
| DIAX | | | 278,214,730 | | | | 326,773,956 | | | | (18,785,460 | ) | | | 307,988,496 | |
| SPXX | | | 132,349,958 | | | | 152,567,877 | | | | (11,873,977 | ) | | | 140,693,900 | |
| QQQX | | | 486,286,588 | | | | 619,561,064 | | | | (43,746,448 | ) | | | 575,814,616 | |
| JCE | | | 218,980,876 | | | | 22,558,621 | | | | (17,901,190 | ) | | | 4,657,431 | |
For purposes of this disclosure, tax cost generally includes the cost of portfolio investments as well as up-front fees or premiums exchanged on derivatives and any amounts unrealized for income statement reporting but realized income and/or capital gains for tax reporting, if applicable.
As of prior fiscal period end, the components of accumulated earnings on a tax basis were as follows:
| | | | | | | | | | | | | | | | | | | | | | | | | | | | |
| Fund | | Undistributed
Ordinary
Income | | | Undistributed
Long-Term
Capital Gains | | | Unrealized
Appreciation
(Depreciation) | | | Capital Loss
Carryforwards | | | Late-Year Loss
Deferrals | | | Other
Book-to-Tax
Differences | | | Total | |
| BXMX | | $ | — | | | $ | — | | | $ | 1,065,480,400 | | | $ | — | | | $ | — | | | $ | — | | | $ | 1,065,480,400 | |
| DIAX | | | — | | | | — | | | | 410,762,242 | | | | — | | | | — | | | | — | | | | 410,762,242 | |
| SPXX | | | — | | | | — | | | | 208,240,773 | | | | — | | | | — | | | | — | | | | 208,240,773 | |
| QQQX | | | — | | | | — | | | | 989,616,038 | | | | — | | | | — | | | | — | | | | 989,616,038 | |
| JCE | | | 26,089,394 | | | | 4,996,407 | | | | 54,851,624 | | | | — | | | | — | | | | (43,618 | ) | | | 85,893,807 | |
7. Management Fees
The management fee compensates the Adviser for overall investment advisory and administrative services and general office facilities. Gateway and NAM are compensated for their services to the Funds from the management fees paid to the Adviser.
Each Fund’s management fee consists of two components – a fund-level fee, based only on the amount of assets within each individual Fund, and a complex-level fee, based on the aggregate amount of all eligible fund assets managed by the Adviser. This pricing structure enables Fund shareholders to benefit from growth in the assets within their respective Fund as well as from growth in the amount of complex-wide assets managed by the Adviser.
The annual fund-level fee, payable monthly, for each Fund is calculated according to the following schedule:
| | | | | | | | | | | | | | | | | | | | |
| Average Daily Managed Assets* | | BXMX | | | DIAX | | | SPXX | | | QQQX | | | JCE | |
For the first $500 million | | | 0.7000 | % | | | 0.7000 | % | | | 0.6600 | % | | | 0.6900 | % | | | 0.7500 | % |
For the next $500 million | | | 0.6750 | | | | 0.6750 | | | | 0.6350 | | | | 0.6650 | | | | 0.7250 | |
For the next $500 million | | | 0.6500 | | | | 0.6500 | | | | 0.6100 | | | | 0.6400 | | | | 0.7000 | |
For the next $500 million | | | 0.6250 | | | | 0.6250 | | | | 0.5850 | | | | 0.6150 | | | | 0.6750 | |
For managed assets over $2 billion | | | 0.6000 | | | | 0.6000 | | | | 0.5600 | | | | 0.5900 | | | | 0.6500 | |
74
The annual complex-level fee, payable monthly, for each Fund is calculated by multiplying the current complex-wide fee rate, determined according to the following schedule by each Fund’s daily managed assets:
| | | | |
| Complex-Level Eligible Asset Breakpoint Level* | | Effective Complex-Level Fee Rate at Breakpoint Level | |
$55 billion | | | 0.2000 | % |
$56 billion | | | 0.1996 | |
$57 billion | | | 0.1989 | |
$60 billion | | | 0.1961 | |
$63 billion | | | 0.1931 | |
$66 billion | | | 0.1900 | |
$71 billion | | | 0.1851 | |
$76 billion | | | 0.1806 | |
$80 billion | | | 0.1773 | |
$91 billion | | | 0.1691 | |
$125 billion | | | 0.1599 | |
$200 billion | | | 0.1505 | |
$250 billion | | | 0.1469 | |
$300 billion | | | 0.1445 | |
| * | For the complex-level fees, managed assets include closed-end fund assets managed by the Adviser that are attributable to certain types of leverage. For these purposes, leverage includes the funds’ use of preferred stock and borrowings and certain investments in the residual interest certificates (also called inverse floating rate securities) in tender option bond (TOB) trusts, including the portion of assets held by a TOB trust that has been effectively financed by the trust’s issuance of floating rate securities, subject to an agreement by the Adviser as to certain funds to limit the amount of such assets for determining managed assets in certain circumstances. The complex-level fee is calculated based upon the aggregate daily managed assets of all Nuveen open-end and closed-end funds that constitute “eligible assets.” Eligible assets do not include assets attributable to investments in other Nuveen funds or assets in excess of a determined amount (originally $2 billion) added to the Nuveen fund complex in connection with the Adviser’s assumption of the management of the former First American Funds effective January 1, 2011, but do not include certain assets of certain Nuveen funds that were reorganized into funds advised by an affiliate of the Adviser during the 2019 calendar year. As of June 30, 2022, the complex-level fee for each Fund was 0.1571%. |
Other Transactions with Affiliates
Each Fund is permitted to purchase or sell securities from or to certain other funds or accounts managed by the Sub-Adviser (“Affiliated Entity”) under specified conditions outlined in procedures adopted by the Board (“cross-trade”). These procedures have been designed to ensure that any cross-trade of securities by the Fund from or to an Affiliated Entity by virtue of having a common investment adviser (or affiliated investment adviser), common officer and/or common trustee complies with Rule 17a-7 under the 1940 Act. These transactions are effected at the current market price (as provided by an independent pricing service) without incurring broker commissions.
During the current fiscal period, the following Funds engaged in cross-trades pursuant to these procedures as follows:
| | | | | | | | | | | | |
| Cross-Trades | | SPXX | | | QQQX | | | JCE | |
Purchases | | $ | 898,313 | | | $ | 10,333,726 | | | $ | 2,132,771 | |
Sales | | | — | | | | 4,342,623 | | | | 5,261,689 | |
Realized gain(loss) | | | — | | | | 3,632,761 | | | | (136,317 | ) |
8. Borrowing Arrangements
Inter-Fund Borrowing and Lending
The SEC has granted an exemptive order permitting registered open-end and closed-end Nuveen funds to participate in an inter-fund lending facility whereby the Nuveen funds may directly lend to and borrow money from each other for temporary purposes (e.g., to satisfy redemption requests or when a sale of securities “fails,” resulting in an unanticipated cash shortfall) (the “Inter-Fund Program”). The closed-end Nuveen funds, including the Funds covered by this shareholder report, will participate only as lenders, and not as borrowers, in the Inter-Fund Program because such closed-end funds rarely, if ever, need to borrow cash to meet redemptions. The Inter-Fund Program is subject to a number of conditions, including, among other things, the requirements that (1) no fund may borrow or lend money through the Inter-Fund Program unless it receives a more favorable interest rate than is typically available from a bank or other financial institution for a comparable transaction; (2) no fund may borrow on an unsecured basis through the Inter-Fund Program unless the fund’s outstanding borrowings from all sources immediately after the inter-fund borrowing total 10% or less of its total assets; provided that if the borrowing fund has a secured borrowing outstanding from any other lender, including but not limited to another fund, the inter-fund loan must be secured on at least an equal priority basis with at least an equivalent percentage of collateral to loan value; (3) if a fund’s total outstanding borrowings immediately after an inter-fund borrowing would be greater than 10% of its total assets, the fund may borrow through the inter-fund loan on a secured basis only; (4) no fund may lend money if the loan would cause its aggregate outstanding loans through the Inter-Fund Program to exceed 15% of its net assets at the time of the loan; (5) a fund’s inter-fund loans to any one fund shall not exceed 5% of the lending fund’s net assets; (6) the duration of inter-fund loans will be limited to the time required to receive payment for securities sold, but in no event more than seven days; and (7) each inter-
75
Notes to Financial Statements (continued)
fund loan may be called on one business day’s notice by a lending fund and may be repaid on any day by a borrowing fund. In addition, a Nuveen fund may participate in the Inter-Fund Program only if and to the extent that such participation is consistent with the fund’s investment objective and investment policies. The Board is responsible for overseeing the Inter-Fund Program.
The limitations detailed above and the other conditions of the SEC exemptive order permitting the Inter-Fund Program are designed to minimize the risks associated with Inter-Fund Program for both the lending fund and the borrowing fund. However, no borrowing or lending activity is without risk. When a fund borrows money from another fund, there is a risk that the loan could be called on one day’s notice or not renewed, in which case the fund may have to borrow from a bank at a higher rate or take other actions to payoff such loan if an inter-fund loan is not available from another fund. Any delay in repayment to a lending fund could result in a lost investment opportunity or additional borrowing costs.
During the current reporting period, none of the Funds covered by this shareholder report have entered into any inter-fund loan activity.
76
Risk Considerations
(Unaudited)
Fund shares are not guaranteed or endorsed by any bank or other insured depository institution, and are not federally insured by the Federal Deposit Insurance Corporation.
Nuveen S&P 500 Buy-Write Income Fund (BXMX)
Investing in closed-end funds involves risk; principal loss is possible. There is no guarantee the Fund’s investment objectives will be achieved. Closed-end fund shares may frequently trade at a discount or premium to their net asset value. Common stock returns often have experienced significant volatility. The Fund may not participate in any appreciation of its equity portfolio as fully as it would if the Fund did not sell call options. In addition, the Fund will continue to bear the risk of declines in the value of the equity portfolio. Because index options are settled in cash, sellers of index call options, such as the Fund, cannot provide in advance for their potential settlement obligations by acquiring and holding the underlying securities. For these and other risks, including tax risk, please see the Fund’s web page at www.nuveen.com/BXMX.
Nuveen Dow 30SM Dynamic Overwrite Fund (DIAX)
Investing in closed-end funds involves risk; principal loss is possible. There is no guarantee the Fund’s investment objectives will be achieved. Closed-end fund shares may frequently trade at a discount or premium to their net asset value. Common stock returns often have experienced significant volatility. The Fund may not participate in any appreciation of its equity portfolio as fully as it would if the Fund did not sell call options. In addition, the Fund will continue to bear the risk of declines in the value of the equity portfolio. Because index options are settled in cash, sellers of index call options, such as the Fund, cannot provide in advance for their potential settlement obligations by acquiring and holding the underlying securities. For these and other risks, including tax risk, please see the Fund’s web page at www.nuveen.com/DIAX.
Nuveen S&P 500 Dynamic Overwrite Fund (SPXX)
Investing in closed-end funds involves risk; principal loss is possible. There is no guarantee the Fund’s investment objectives will be achieved. Closed-end fund shares may frequently trade at a discount or premium to their net asset value. Common stock returns often have experienced significant volatility. The Fund may not participate in any appreciation of its equity portfolio as fully as it would if the Fund did not sell call options. In addition, the Fund will continue to bear the risk of declines in the value of the equity portfolio. Because index options are settled in cash, sellers of index call options, such as the Fund, cannot provide in advance for their potential settlement obligations by acquiring and holding the underlying securities. For these and other risks, including tax risk, please see the Fund’s web page at www.nuveen.com/SPXX.
Nuveen Nasdaq 100 Dynamic Overwrite Fund (QQQX)
Investing in closed-end funds involves risk; principal loss is possible. There is no guarantee the Fund’s investment objectives will be achieved. Closed-end fund shares may frequently trade at a discount or premium to their net asset value. Common stock returns often have experienced significant volatility. The Fund may not participate in any appreciation of its equity portfolio as fully as it would if the Fund did not sell call options. In addition, the Fund will continue to bear the risk of declines in the value of the equity portfolio. Because index options are settled in cash, sellers of index call options, such as the Fund, cannot provide in advance for their potential settlement obligations by acquiring and holding the underlying securities. For these and other risks, including tax risk, please see the Fund’s web page at www.nuveen.com/QQQX.
Nuveen Core Equity Alpha Fund (JCE)
Investing in closed-end funds involves risk; principal loss is possible. There is no guarantee the Fund’s investment objectives will be achieved. Closed-end fund shares may frequently trade at a discount or premium to their net asset value. Common stock returns often have experienced significant volatility. The Fund may not participate in any appreciation of its equity portfolio as fully as it would if the Fund did not sell call options. In addition, the Fund will continue to bear the risk of declines in the value of the equity portfolio. Because index options are settled in cash, sellers of index call options, such as the Fund, cannot provide in advance for their potential settlement obligations by acquiring and holding the underlying securities. For these and other risks, including tax risk, please see the Fund’s web page at www.nuveen.com/JCE.
77
Additional Fund Information (Unaudited)
| | | | | | | | | | |
| Board of Trustees | | | | | | | | | | |
| Jack B. Evans | | William C. Hunter | | Amy B. R. Lancellotta | | Joanne T. Medero | | Albin F. Moschner | | John K. Nelson |
| Judith M. Stockdale | | Carole E. Stone | | Matthew Thornton III | | Terence J. Toth | | Margaret L. Wolff | | Robert L. Young |
| | | | | | | | |
| | | | | |
Investment Adviser Nuveen Fund Advisors, LLC 333 West Wacker Drive Chicago, IL 60606 | | Custodian State Street Bank & Trust Company One Lincoln Street Boston, MA 02111 | | Legal Counsel Chapman and Cutler LLP Chicago, IL 60603 | | Independent Registered Public Accounting Firm PricewaterhouseCoopers LLP One North Wacker Drive Chicago, IL 60606 | | Transfer Agent and Shareholder Services Computershare Trust Company, N.A. 150 Royall Street Canton, MA 02021 (800) 257-8787 |
Portfolio of Investments Information
The Fund is required to file its complete schedule of portfolio holdings with the Securities and Exchange Commission (SEC) for the first and third quarters of each fiscal year as an exhibit to its report on Form N-PORT. You may obtain this information on the SEC’s website at http://www.sec.gov.
Nuveen Funds’ Proxy Voting Information
You may obtain (i) information regarding how each fund voted proxies relating to portfolio securities held during the most recent twelve-month period ended June 30, without charge, upon request, by calling Nuveen toll-free at (800) 257-8787 or on Nuveen’s website at www.nuveen.com and (ii) a description of the policies and procedures that each fund used to determine how to vote proxies relating to portfolio securities without charge, upon request, by calling Nuveen toll free at (800) 257-8787. You may also obtain this information directly from the SEC. Visit the SEC on-line at http://www.sec.gov.
CEO Certification Disclosure
Each Fund’s Chief Executive Officer (CEO) has submitted to the New York Stock Exchange (NYSE) the annual CEO certification as required by Section 303A.12(a) of the NYSE Listed Company Manual. Each Fund has filed with the SEC the certification of its CEO and Chief Financial Officer required by Section 302 of the Sarbanes-Oxley Act.
Common Share Repurchases
Each Fund intends to repurchase through its open-market share repurchase program, shares of its own common stock at such times and in such amounts as is deemed advisable. During the period covered by this report, each Fund repurchased shares of its common stock as shown in the accompanying table. Any future repurchases will be reported in the next annual or semi-annual report.
| | | | | | | | | | | | | | | | | | | | |
| | | BXMX | | | DIAX | | | SPXX | | | QQQX | | | JCE | |
Common Shares repurchased | | | 0 | | | | 0 | | | | 0 | | | | 0 | | | | 0 | |
FINRA BrokerCheck
The Financial Industry Regulatory Authority (FINRA) provides information regarding the disciplinary history of FINRA member firms and associated investment professionals. This information as well as an investor brochure describing FINRA BrokerCheck is available to the public by calling the FINRA BrokerCheck Hotline number at (800) 289-9999 or by visiting www.FlNRA.org.
78
Glossary of Terms Used in this Report
(Unaudited)
| ∎ | | Average Annual Total Return: This is a commonly used method to express an investment’s performance over a particular, usually multi-year time period. It expresses the return that would have been necessary each year to equal the investment’s actual cumulative performance (including change in NAV or market price and reinvested dividends and capital gains distributions, if any) overthe time period being considered. |
| ∎ | | Chicago Board Options Exchange (Cboe) Dow Jones Industrial Average (DJIA) BuyWrite Index (BXDSM): An index designed to measure the performance of a hypothetical buy-write strategy on the Dow Jones Industrial Average. Index returns assume reinvestment of distributions, but do not reflect any applicable sales charges or management fees. |
| ∎ | | Chicago Board Options Exchange (Cboe) Nasdaq 100 BuyWrite Index (BXNSM): An index designed to measure the performance of a hypothetical buy-write strategy on the Nasdaq 100® Index returns assume reinvestment of distributions, but do not reflect any applicable sales charges or management fees. |
| ∎ | | Chicago Board Options Exchange (Cboe) S&P 500® BuyWrite Index (BXMSM): An index designed to measure the performance of a hypothetical buy-write strategy on the S&P 500® Index. Index returns assume reinvestment of distributions, but do not reflect any applicable sales charges or management fees. |
| ∎ | | Chicago Board Options Exchange (Cboe) Volatility Index® (VIX®): An index that is a key measure of market expectations of near-term volatility conveyed by S&P 500® option prices. Since its introduction in 1993, VIX has been considered by many to be the world’s premier barometer of investor sentiment and market volatility (www.cboe.com). Index returns assume reinvestment of distributions, but do not reflect any applicable sales charges or management fees. |
| ∎ | | DIAX Blended Benchmark: Consists of: 1) 55% Chicago Board Options Exchange (Cboe) DJIA BuyWrite Index (BXDSM) (defined herein), and 2) 45% Dow Jones Industrial Average Index (DJIA) (defined herein). Index returns assume reinvestment of distributions, but do not reflect any applicable sales charges or management fees. |
| ∎ | | Dow Jones Industrial Average Index (DJIA): An index designed to measure the performance of 30 actively traded U.S. large cap stocks. Index returns assume reinvestment of distributions, but do not reflect any applicable sales charges or management fees. |
| ∎ | | JCE Blended Benchmark: Consists of: 1) 50% S&P 500® Index (defined herein), and 2) 50% Chicago Board Options Exchange (Cboe) S&P 500® Buywrite Index (BXMSM) (defined herein). Index returns assume reinvestment of distributions, but do not reflect any applicable sales charges or management fees. |
| ∎ | | Nasdaq 100® Index: An index that includes 100 of the largest domestic and international non-financial equity securities listed on the Nasdaq Stock Market based on market capitalization. Index returns assume reinvestment of distributions, but do not reflect any applicable sales charges or management fees. |
| ∎ | | Net Asset Value (NAV) Per Share: A fund’s Net Assets is equal to its total assets (securities, cash, accrued earnings and receivables) less its total liabilities. NAV per share is equal to the fund’s Net Assets divided by its number of shares outstanding. |
| ∎ | | QQQX Blended Benchmark: Consists of: 1) 55% Chicago Board Options Exchange (Cboe) Nasdaq 100 BuyWrite Index (BXNSM) (defined herein), and 2) 45% Nasdaq 100® Index (defined herein). Index returns assume reinvestment of distributions, but do not reflect any applicable sales charges or management fees. |
| ∎ | | S&P 500® Index: An index generally considered representative of the U.S. equity market. The index includes 500 leading companies and covers approximately 80% of available market capitalization. Index returns assume reinvestment of distributions, but do not reflect any applicable sales charges or management fees. |
79
Glossary of Terms Used in this Report (continued)
(Unaudited)
| ∎ | | SPXX Blended Benchmark: Consists of: 1) 55% Chicago Board Options Exchange (Cboe) S&P 500® BuyWrite Index (BXMSM) (defined herein), and 2) 45% S&P 500® Index (defined herein). Index returns assume reinvestment of distributions, but do not reflect any applicable sales charges or management fees. |
80
Annual Investment Management Agreement Approval Process
(Unaudited)
At a meeting held on May 23-25, 2022 (the “May Meeting”), the Boards of Trustees (collectively, the “Board” and each Trustee, a “Board Member”) of the Funds, which are comprised entirely of Board Members who are not “interested persons” (as defined under the Investment Company Act of 1940 (the “1940 Act”)) (the “Independent Board Members”), approved, for their respective Fund, the renewal of the management agreement (each, an “Investment Management Agreement”) with Nuveen Fund Advisors, LLC (the “Adviser”), pursuant to which the Adviser serves as the investment adviser to such Fund and the sub-advisory agreement (each, a “Sub-Advisory Agreement”) with (a) in the case of Nuveen S&P 500 Buy-Write Income Fund (the “S&P Buy-Write Fund”), Gateway Investment Advisers, LLC (“Gateway”), pursuant to which Gateway serves as the investment sub-adviser to such Fund; and (b) in the case of Nuveen Dow 30sm Dynamic Overwrite Fund (the “Dow Fund”), Nuveen S&P 500 Dynamic Overwrite Fund (the “S&P Dynamic Fund”), Nuveen Nasdaq 100 Dynamic Overwrite Fund (the “Nasdaq Fund”) and Nuveen Core Equity Alpha Fund (the “Core Equity Alpha Fund”), Nuveen Asset Management, LLC (“NAM,” and Gateway and NAM are each, a “Sub-Adviser”), pursuant to which NAM serves as the investment sub-adviser to each such Fund, for an additional one-year term. As the Board is comprised of all Independent Board Members, the references to the Board and the Independent Board Members are interchangeable.
Following up to an initial two-year period, the Board considers the renewal of each Investment Management Agreement and Sub-Advisory Agreement on behalf of the applicable Fund on an annual basis. The Investment Management Agreements and Sub-Advisory Agreements are collectively referred to as the “Advisory Agreements,” and the Adviser and the Sub-Advisers are collectively, the “Fund Advisers” and each, a “Fund Adviser.” The Board has established various standing committees composed of various Independent Board Members that are assigned specific responsibilities to enhance the effectiveness of the Board’s oversight and decision making. Throughout the year, the Board and its committees meet regularly and, at these meetings, receive regular and/or special reports that cover an extensive array of topics and information that are relevant to the Board’s annual consideration of the renewal of the advisory agreements for the Nuveen funds. Such information may address, among other things, fund performance and risk information; the Adviser’s strategic plans; product initiatives for various funds; the review of the funds and investment teams; compliance, regulatory and risk management matters; the trading practices of the various sub-advisers to the Nuveen funds; management of distributions; valuation of securities; fund expenses; securities lending; liquidity management; overall market and regulatory developments; and with respect to closed-end funds, capital management initiatives, institutional ownership, management of leverage financing and the secondary market trading of the closed-end funds and any actions to address discounts. The Board also seeks to meet periodically with the Nuveen funds’ sub-advisers and/or portfolio teams, when feasible. The Board further meets, among other things, to specifically consider the annual renewal of the advisory agreements for the Nuveen funds.
In connection with its annual consideration of the advisory agreements for the Nuveen funds, the Board, through its independent legal counsel, requested and received extensive materials and information prepared specifically for its review of such advisory agreements by the Adviser and by Broadridge Financial Solutions, Inc. (“Broadridge”), an independent provider of investment company data. The materials cover a wide range of topics including, but not limited to, a description of the nature, extent and quality of services provided by the Fund Advisers; a review of product actions taken during 2021 (such as mergers, liquidations, fund launches, changes to investment teams, and changes to investment policies); a review of each sub-adviser to the Nuveen funds and/or the applicable investment teams; an analysis of fund performance in absolute terms and as compared to the performance of certain peer funds and benchmarks with a focus on any performance outliers; an analysis of the fees and expense ratios of the Nuveen funds in absolute terms and as compared to those of certain peer funds with a focus on any expense outliers; a review of management fee schedules; a description of portfolio manager compensation; an overview of the secondary market trading of shares of the Nuveen closed-end funds (including, among other things, an analysis of secondary market performance and commentary regarding the leverage management, share repurchase and shelf offering programs of Nuveen closed-end funds); a review of the performance of various service providers; a description of various initiatives Nuveen had undertaken or continued in 2021 and 2022 for the benefit of particular fund(s) and/or the complex; a description of the profitability or financial data of Nuveen and the sub-advisers to the Nuveen funds; and a description of indirect benefits received by the Adviser and the sub-advisers as a result of their relationships with the Nuveen funds. The information prepared specifically for the annual review
81
Annual Investment Management Agreement Approval Process (continued)
(Unaudited)
supplemented the information provided to the Board and its committees and the evaluations of the Nuveen funds by the Board and its committees during the year. The Board’s review of the advisory agreements for the Nuveen funds is based on all the information provided to the Board and its committees throughout the year as well as the information prepared specifically with respect to the annual review of such advisory agreements.
In continuing its practice, the Board met prior to the May Meeting to begin its considerations of the renewal of the Advisory Agreements. Accordingly, on April 13-14, 2022 (the “April Meeting”), the Board met to review and discuss, in part, the performance of the Nuveen funds and the Adviser’s evaluation of each sub-adviser to the Nuveen funds and/or its investment teams. At the April Meeting, the Board Members asked questions and requested additional information that was provided for the May Meeting.
The Independent Board Members considered the review of the advisory agreements for the Nuveen funds to be an ongoing process and employed the accumulated information, knowledge and experience the Board Members had gained during their tenure on the boards governing the Nuveen funds and working with the Adviser and sub-advisers in their review of the advisory agreements. The contractual arrangements are a result of multiple years of review, negotiation and information provided in connection with the boards’ annual review of the Nuveen funds’ advisory arrangements and oversight of the Nuveen funds.
The Independent Board Members were advised by independent legal counsel during the annual review process as well as throughout the year, including meeting in executive sessions with such counsel at which no representatives from the Adviser or the Sub-Advisers were present. In connection with their annual review, the Independent Board Members also received a memorandum from independent legal counsel outlining their fiduciary duties and legal standards in reviewing the Advisory Agreements, including guidance from court cases evaluating advisory fees.
The Board’s decision to renew the Advisory Agreements was not based on a single identified factor, but rather the decision reflected the comprehensive consideration of all the information provided to the Board and its committees throughout the year as well as the materials prepared specifically in connection with the renewal process. Each Board Member may have attributed different levels of importance to the various factors and information considered in connection with the approval process and may place different emphasis on the relevant information year to year in light of, among other things, changing market and economic conditions. A summary of the principal factors and information, but not all the factors, the Board considered in deciding to renew the Advisory Agreements is set forth below.
| A. | | Nature, Extent and Quality of Services |
In evaluating the renewal of the Advisory Agreements, the Independent Board Members received and considered information regarding the nature, extent and quality of the applicable Fund Adviser’s services provided to the respective Fund with particular focus on the services and enhancements to such services provided during the last year. The Independent Board Members considered the Investment Management Agreements and the Sub-Advisory Agreements separately in the course of their review. With this approach, they considered the respective roles of the Adviser and the Sub-Advisers in providing services to the applicable Fund(s).
The Board recognized that the Nuveen funds operate in a highly regulated industry and, therefore, the Adviser has provided a wide array of management, oversight and administrative services to manage and operate the funds, and the scope and complexity of these services have expanded over time as a result of, among other things, regulatory, market and other developments. The Board accordingly considered the Adviser’s dedication of extensive resources, time, people and capital employed to support and manage the Nuveen funds as well as the Adviser’s continued program of developing improvements and innovations for the benefit of the funds and shareholders and to meet the ever increasing regulatory requirements applicable to the funds. In this regard, the Board received and reviewed information regarding, among other things, the Adviser’s investment oversight responsibilities, regulatory and compliance services, administrative duties and other services. The Board considered the Adviser’s investment oversight team’s extensive services in overseeing the various sub-advisers to the Nuveen funds; evaluating fund performance; and preparing reports to the Board addressing, among other things, fund performance, market conditions, investment team matters, product developments and management proposals. The Board further recognized the range of services the various teams of the Adviser provided including, but not limited to, overseeing operational and risk management; managing liquidity; overseeing the daily valuation process and managing distributions in seeking to deliver long-term fund earnings to shareholders consistent with the respective Nuveen fund’s product design and
82
positioning. The Board also considered the structure of investment personnel compensation of each Fund Adviser and whether the structure provides appropriate incentives to attract and maintain qualified personnel and to act in the best interests of the respective Nuveen fund.
The Board further recognized that the Adviser’s compliance and regulatory functions were integral to the investment management of the Nuveen funds. The Board recognized such services included, but were not limited to, managing compliance policies; monitoring compliance with applicable policies, law and regulations; devising internal compliance programs and a framework to review and assess compliance programs; overseeing sub-adviser compliance testing; preparing compliance training materials; and responding to regulatory requests. The Board further considered information regarding the Adviser’s business continuity and disaster recovery plans as well as information regarding its information security program, including presentations of such program provided at a site visit in 2022, to help identify and manage information security risks.
In addition to the above functions, the Board considered that the Adviser also provides, among other things, fund administration services (such as preparing fund tax returns and other tax compliance services; preparing regulatory filings; interacting with the Nuveen funds’ independent public accountants and overseeing other service providers; and managing fund budgets and expenses); product management services (such as evaluating and enhancing products and strategies); legal services (such as helping to prepare and file registration statements and proxy statements; overseeing fund activities and providing legal interpretations regarding such activities; maintaining regulatory registrations and negotiating agreements with other fund service providers; and monitoring changes in regulatory requirements and commenting on rule proposals impacting investment companies); oversight of shareholder services and transfer agency functions (such as overseeing transfer agent service providers which include registered shareholder customer service and transaction processing; overseeing proxy solicitation and tabulation services; and overseeing the production and distribution of financial reports by service providers); and with respect to the Nuveen closed-end funds, managing leverage, monitoring asset coverage and seeking to promote an orderly secondary market.
The Board also considered the quality of support services and communications the Adviser provided the Board, including, in part, organizing and administrating Board meetings and supporting Board committees; preparing regular and ad hoc reports on fund performance, market conditions and investment team matters; providing due diligence reports addressing product development and management proposals; and coordinating site visits of the Board and presentations by investment teams and senior management.
In addition to the services provided, the Board considered the financial resources of the Adviser and its affiliates and their willingness to make investments in the technology, personnel and infrastructure to support the Nuveen funds, including maintaining a seed capital budget to support new or existing funds and/or facilitate changes for a respective fund. Further, the Board noted the benefits to shareholders of investing in a fund that is a part of a large fund complex with a variety of investment disciplines, capabilities, expertise and resources available to navigate and support the Nuveen funds including during stressed times. The Board recognized the overall reputation and capabilities of the Adviser and its affiliates, the Adviser’s continuing commitment to provide high quality services, its willingness to implement operational or organizational changes in seeking, among other things, to enhance efficiencies and services to the Nuveen funds and its responsiveness to the Board’s questions and/or concerns raised throughout the year and during the annual review of advisory agreements. The Board also considered the significant risks borne by the Adviser and its affiliates in connection with their services to the Nuveen funds, including entrepreneurial risks in sponsoring new funds and ongoing risks with managing the funds such as investment, operational, reputational, regulatory, compliance and litigation risks.
In evaluating services, the Board reviewed various highlights of the initiatives the Adviser and its affiliates have undertaken or continued in 2021 and 2022 to benefit the Nuveen complex and/or particular Nuveen funds and meet the requirements of an increasingly complex regulatory environment including, but not limited to:
| | • | | Centralization of Functions – ongoing initiatives to centralize investment leadership and create a more cohesive market approach and centralized shared support model (including through the consolidation of certain affiliated sub-advisers) in seeking to operate more effectively and enhance the research capabilities and services to the Nuveen funds; |
83
Annual Investment Management Agreement Approval Process (continued)
(Unaudited)
| | • | | Fund Improvements and Product Management Initiatives – continuing to proactively manage the Nuveen fund complex as a whole and at the individual fund level with an aim to continually improve product platforms and investment strategies to better serve shareholders through, among other things, rationalizing the product line and gaining efficiencies through mergers, repositionings and liquidations; launching new funds; reviewing and updating investment policies and benchmarks; soft closing certain funds; modifying the conversion periods on certain share classes; and evaluating and adjusting portfolio management teams as appropriate for various funds; |
| | • | | Capital Initiatives – continuing to invest capital to support new Nuveen funds with initial capital as well as to support existing funds; |
| | • | | Compliance Program Initiatives – continuing efforts to mitigate compliance risk with a focus on environmental, social and governance (“ESG”) controls and processes, increase operating efficiencies, implement enhancements to strengthen ongoing execution of key compliance program elements, support international business growth and facilitate integration of Nuveen’s operating model; |
| | • | | Investment Oversight – preparing reports to the Board addressing, among other things, fund performance; market conditions; investment team matters; product developments; changes to mandates, policies and benchmarks; and other management proposals as well as preparing and coordinating investment presentations to the Board; |
| | • | | Risk Management and Valuation Services – continuing to oversee and manage risk including, among other things, conducting ongoing calculations and monitoring of risk measures across the Nuveen funds, instituting investment risk controls, providing risk reporting throughout Nuveen, participating in internal oversight committees, dedicating the resources and time to develop the processes necessary to help address fund compliance with the new derivatives rule and continuing to implement an operational risk framework that seeks to provide greater transparency of operational risk matters across the complex as well as provide multiple other risk programs that seek to provide a more disciplined and consistent approach to identifying and mitigating Nuveen’s operational risks. Further, the securities valuation team continues, among other things, to oversee the daily valuation process of the portfolio securities of the funds, maintain the valuation policies and procedures, facilitate valuation committee meetings, manage relationships with pricing vendors, prepare relevant valuation reports and design methods to simplify and enhance valuation workflow within the organization and implement processes and procedures to help address compliance with the new valuation rule applicable to the funds; |
| | • | | Regulatory Matters – continuing efforts to monitor regulatory trends and advocate on behalf of Nuveen and/or the Nuveen funds, to implement and comply with new or revised rules and mandates and to respond to regulatory inquiries and exams; |
| | • | | Government Relations – continuing efforts of various Nuveen teams and Nuveen’s affiliates to develop policy positions on a broad range of issues that may impact the Nuveen funds, advocate and communicate these positions to lawmakers and other regulatory authorities and work with trade associations to ensure these positions are represented; |
| | • | | Business Continuity, Disaster Recovery and Information Security – continuing efforts of Nuveen to periodically test and update business continuity and disaster recovery plans and, together with its affiliates, to maintain an information security program that seeks to identify and manage information security risks, and provide reports to the Board, at least annually, addressing, among other things, management’s security risk assessment, cyber risk profile, potential impact of new or revised laws and regulations, incident tracking and other relevant information technology risk-related reports; |
| | • | | Distribution Management Services – continuing to manage the distributions among the varying types of Nuveen funds within the Nuveen complex to be consistent with the respective fund’s product design and positioning in striving to deliver those earnings to shareholders in a relatively consistent manner over time as well as assisting in the development of new products or the restructuring of existing funds; and |
84
| | • | | with respect specifically to closed-end funds, such continuing services also included: |
| | • | | Leverage Management Services – continuing to actively manage the various forms of leverage utilized across the complex, including through committing resources and focusing on sourcing/structure development and bank provider management; |
| | • | | Capital Management, Market Intelligence and Secondary Market Services – ongoing capital management efforts which may include at times shelf offerings, tender offers, capital return programs and share repurchases as well as providing market data analysis to help understand closed-end fund ownership cycles and their impact on secondary market trading as well as to improve proxy solicitation efforts; and |
| | • | | Closed-end Fund Investor Relations Program – maintaining the closed-end fund investor relations program which, among other things, raises awareness, provides educational materials and cultivates advocacy for closed-end funds and the Nuveen closed-end fund product line. |
The Board further considered the division of responsibilities between the Adviser and the respective Sub-Adviser and recognized that each Sub-Adviser and its investment personnel generally are responsible for the management of each applicable Fund’s portfolio under the oversight of the Adviser and the Board. The Board considered an analysis of each Sub-Adviser provided by the Adviser which included, among other things, information regarding the assets under management of the Sub-Adviser or applicable investment team and changes thereto, a summary of the applicable investment team and changes thereto, the investment process and philosophy of the applicable investment team, the performance of the Nuveen funds sub-advised by the Sub-Adviser over various periods of time and a summary of any significant policy and/or other changes to the Nuveen funds sub-advised by the Sub-Adviser. The Board further considered at the May Meeting or prior meetings evaluations of each Sub-Adviser’s compliance programs and trade execution. The Board noted that the Adviser recommended the renewal of the Sub-Advisory Agreements.
Based on its review, the Board determined, in the exercise of its reasonable business judgment, that it was satisfied with the nature, extent and quality of services provided to the respective Funds under each applicable Advisory Agreement.
| B. | | The Investment Performance of the Funds and Fund Advisers |
In evaluating the quality of the services provided by the Fund Advisers, the Board also received and considered a variety of investment performance data of the Nuveen funds they advise. In evaluating performance, the Board recognized that performance data may differ significantly depending on the ending date selected, particularly during periods of market volatility, and therefore considered the broader perspective of performance over a variety of time periods that may include full market cycles. In this regard, the Board reviewed, among other things, Fund performance over the quarter, one-, three- and five-year periods ending December 31, 2021 and March 31, 2022. The performance data prepared for the annual review of the advisory agreements for the Nuveen funds supplemented the fund performance data that the Board received throughout the year at its meetings representing differing time periods. In its review, the Board took into account the discussions with representatives of the Adviser; the Adviser’s analysis regarding fund performance that occurred at these Board meetings with particular focus on funds that were considered performance outliers (both overperformance and underperformance); the factors contributing to the performance; and any recommendations or steps taken to address performance concerns. Regardless of the time period reviewed by the Board, the Board recognized that shareholders may evaluate performance based on their own holding periods which may differ from the periods reviewed by the Board and lead to differing results.
In its review, the Board reviewed both absolute and relative fund performance during the annual review over the various time periods. With respect to the latter, the Board considered fund performance in comparison to the performance of peer funds (the “Performance Peer Group”) and recognized and/or customized benchmarks (i.e., generally benchmarks derived from multiple recognized benchmarks). For Nuveen funds that had changes in portfolio managers or other significant changes to their investment strategies or policies since March 2019, the Board reviewed certain tracking performance data comparing the performance of such funds before and after such changes. With respect to certain Nuveen option overwrite funds, including the S&P Dynamic Fund, the Dow Fund, the Nasdaq Fund and the Core Equity Alpha Fund, the Board recognized, as applicable, the portfolio management and/or investment strategy changes adopted by such funds and considered the respective fund’s performance relative to its blended benchmark as well as the performance attributed to the equity portion
85
Annual Investment Management Agreement Approval Process (continued)
(Unaudited)
and the options portion of the fund’s portfolio for the trailing one-year periods ended December 31, 2021 and March 31, 2022. In addition, with respect to the S&P Buy-Write Fund, the Board reviewed data reflecting the performance of the Fund relative to its benchmark as well as the performance attributed to the equity portion and options portion of the Fund’s portfolio for the trailing one-year period ended March 31, 2022.
In considering performance data, the Board is aware of certain inherent limitations with such data, including that differences between the objective(s), strategies and other characteristics of the Nuveen funds compared to the respective Performance Peer Group and/or benchmark(s); differences in the composition of the Performance Peer Group over time; and differences in the types and/or levels of any leverage and related costs with that of the Performance Peer Group would all necessarily contribute to differences in performance results and limit the value of the comparative information. Further, the Board recognized the inherent limitations in comparing the performance of an actively managed fund to a benchmark index due to the fund’s pursuit of an investment strategy that does not directly follow the index. To assist the Board in its review of the comparability of the relative performance, the Adviser has ranked the relevancy of the peer group to the Funds as low, medium or high.
The Board also evaluated performance in light of various relevant factors which may include, among other things, general market conditions, issuer-specific information, asset class information, leverage and fund cash flows. In relation to general market conditions, the Board had recognized the recent periods in 2022 of general market volatility and underperformance. In their review from year to year, the Board Members consider and may place different emphasis on the relevant information in light of changing circumstances in market and economic conditions. Further, the Board recognized that the market and economic conditions may significantly impact a fund’s performance, particularly over shorter periods, and such performance may be more reflective of such economic or market events and not necessarily reflective of management skill. Accordingly, depending on the facts and circumstances including any differences between the respective Nuveen fund and its benchmark and/or Performance Peer Group, the Board may be satisfied with a fund’s performance notwithstanding that its performance may be below that of its benchmark or peer group for certain periods. However, with respect to any Nuveen funds for which the Board has identified performance issues, the Board monitors such funds closely until performance improves, discusses with the Adviser the reasons for such results, considers whether any steps are necessary or appropriate to address such issues, and reviews the results of any steps undertaken.
The secondary market trading of shares of the Nuveen closed-end funds also continues to be a priority for the Board given its importance to shareholders, and therefore the Board and/or its Closed-end Fund committee reviews certain performance data reflecting, among other things, the premiums and discounts at which the shares of the closed-end funds have traded over specified periods throughout the year. In its review, the Board considers, among other things, changes to investment mandates and guidelines, distribution policies, leverage levels and types; share repurchases and similar capital market actions; and effective communications programs to build greater awareness and deepen understanding of closed-end funds.
The Board’s determinations with respect to each Fund are summarized below.
For the S&P Buy-Write Fund, the Board noted that although the Fund’s performance was below the performance of its benchmark for the one-year periods ended December 31, 2021 and March 31, 2022, the Fund outperformed its benchmark for the three- and five-year periods ended December 31, 2021 and March 31, 2022. In addition, the Fund ranked in the third quartile of its Performance Peer Group for the one-, three- and five-year periods ended December 31, 2021 and March 31, 2022. Based on its review, the Board was generally satisfied with the Fund’s overall performance.
For the Dow Fund, the Board noted that although the Fund’s performance was below the performance of its blended benchmark for the one-, three- and five-year periods ended December 31, 2021 and the Fund ranked in the fourth quartile of its Performance Peer Group for the three-year period ended December 31, 2021, the Fund ranked in the third quartile of its Performance Peer Group for the one- and five-year periods ended December 31, 2021. The Fund’s performance also was below the performance of its blended benchmark for the one-, three- and five-year periods ended March 31, 2022 and although the Fund ranked in the fourth quartile of its Performance Peer Group for the one- and three-year periods ended March 31, 2022, the Fund ranked in the third quartile of its Performance Peer Group for the five-year period ended March 31, 2022. In considering performance, the Board recognized that the Performance Peer Group was classified as low for relevancy.
86
The Board also noted the changes to the Fund’s portfolio management team in 2020 and considered the performance of the Fund, its equity portfolio and its options portfolio since such changes for the trailing one-year period as of March 31, 2022. Based on its review, the Board was generally satisfied with the Fund’s overall performance.
For the S&P Dynamic Fund, the Board noted that although the Fund’s performance was below the performance of its blended benchmark for the one-, three- and five-year periods ended December 31, 2021, the Fund ranked in the second quartile of its Performance Peer Group for such periods. Further, although the Fund’s performance was below the performance of its blended benchmark for the one-, three- and five-year periods ended March 31, 2022, the Fund ranked in the first quartile of its Performance Peer Group for the one-year period ended March 31, 2022 and second quartile for the three- and five-year periods ended March 31, 2022. The Board also noted the changes to the Fund’s portfolio management team in 2020 and considered the performance of the Fund, its equity portfolio and its options portfolio since such changes for the trailing one-year period as of March 31, 2022. Based on its review, the Board was generally satisfied with the Fund’s overall performance.
For the Nasdaq Fund, the Board noted that although the Fund’s performance was below the performance of its blended benchmark for the three- and five-year periods ended December 31, 2021, the Fund outperformed its blended benchmark for the one-year period ended December 31, 2021 and ranked in the second quartile of its Performance Peer Group for the one-year period ended December 31, 2021 and first quartile for the three- and five-year periods ended December 31, 2021. Further, although the Fund’s performance was below the performance of its blended benchmark for the one-, three- and five-year periods ended March 31, 2022, the Fund ranked in the second quartile of its Performance Peer Group for the one-year period ended March 31, 2022 and first quartile of its Performance Peer Group for the three- and five-year periods ended March 31, 2022. In considering performance, the Board recognized that the Performance Peer Group was classified as low for relevancy. The Board also noted the changes to the Fund’s portfolio management team in 2020 and considered the performance of the Fund, its equity portfolio and its options portfolio since such changes for the trailing one-year period as of March 31, 2022. Based on its review, the Board was generally satisfied with the Fund’s overall performance.
For the Core Equity Alpha Fund, the Board noted that the Fund outperformed its blended benchmark for the one-, three- and five-year periods ended December 31, 2021 and ranked in the first quartile of its Performance Peer Group for such periods. The Board further noted that although the Fund’s performance was below the performance of its blended benchmark for the one-year period ended March 31, 2022, the Fund outperformed its blended benchmark for the three- and five-year periods ended March 31, 2022 and ranked in the first quartile of its Performance Peer Group for the one-, three- and five-year periods ended March 31, 2022. The Board further recognized the changes to the portfolio management team and strategy of the Fund effective October 26, 2020 and considered the Fund’s performance as well as the performance attributed to the equity portfolio and options portfolio of the Fund for the trailing one-year period ended March 31, 2022. Based on its review, the Board was generally satisfied with the Fund’s overall performance.
| C. | | Fees, Expenses and Profitability |
As part of its annual review, the Board considered the contractual management fee and net management fee (the management fee after taking into consideration fee waivers and/or expense reimbursements, if any) paid by a Nuveen fund to the Adviser in light of the nature, extent and quality of the services provided. The Board also considered the total operating expense ratio of a fund before and after any fee waivers and/or expense reimbursements. More specifically, the Independent Board Members reviewed, among other things, each fund’s gross and net management fee rates (i.e., before and after expense reimbursements and/or fee waivers, if any) and net total expense ratio in relation to those of a comparable universe of funds (the “Peer Universe”) established by Broadridge (subject to certain exceptions). The Independent Board Members reviewed the methodology Broadridge employed to establish its Peer Universe and recognized that differences between the applicable fund and its respective Peer Universe as well as changes to the composition of the Peer Universe from year to year may limit some of the value of the comparative data. The Independent Board Members take these limitations and differences into account when reviewing comparative peer data. The Independent Board Members also considered a fund’s operating expense ratio as it more directly reflected the shareholder’s costs in investing in the respective fund.
87
Annual Investment Management Agreement Approval Process (continued)
(Unaudited)
In their review, the Independent Board Members considered, in particular, each fund with a net expense ratio (excluding investment-related costs of leverage) of six basis points or higher compared to that of its peer average (each, an “Expense Outlier Fund”) and an analysis as to the factors contributing to each such fund’s higher relative net expense ratio. In addition, although the Board reviewed a fund’s total net expenses both including and excluding investment-related expenses (i.e., leverage costs) for certain of the closed-end funds, the Board recognized that leverage expenses will vary across funds and in comparison to peers because of differences in the forms and terms of leverage employed by the respective fund. Accordingly, in reviewing the comparative data between a fund and its peers, the Board generally considered the fund’s net expense ratio and fees (excluding leverage costs and leveraged assets) to be higher if they were over 10 basis points higher, slightly higher if they were 6 to 10 basis points higher, in line if they were within approximately 5 basis points higher than the peer average and below if they were below the peer average of the Peer Universe. The Independent Board Members also considered, in relevant part, a fund’s net management fee and net total expense ratio in light of its performance history.
In their review of the fee arrangements for the Nuveen funds, the Independent Board Members considered the management fee schedules, including the complex-wide and fund-level breakpoint schedules, as applicable. The Board noted that across the Nuveen fund complex, the complex-wide fee breakpoints reduced fees by approximately $72.5 million and fund-level breakpoints reduced fees by approximately $89.1 million in 2021.
With respect to each Sub-Adviser, the Board also considered, among other things, the sub-advisory fee schedule paid to the Sub-Adviser in light of the sub-advisory services provided to the respective Fund and comparative data of the fees the Sub-Adviser charges to other clients, if any. In its review, the Board recognized that the compensation paid to each Sub-Adviser is the responsibility of the Adviser, not the applicable Fund(s).
The Independent Board Members noted that each Fund had a net management fee and a net expense ratio that were below the respective peer averages.
Based on its review of the information provided, the Board determined that each Fund’s management fees (as applicable) to a Fund Adviser were reasonable in light of the nature, extent and quality of services provided to the Fund.
| | 2. | | Comparisons with the Fees of Other Clients |
In determining the appropriateness of fees, the Board also considered information regarding the fee rates the respective Fund Advisers charged to certain other types of clients and the type of services provided to these other clients. With respect to the Adviser and/or NAM, such other clients may include: retail and institutional managed accounts advised by such Sub-Adviser; hedge funds or other structured products managed by such Sub-Adviser; investment companies offered outside the Nuveen family and sub-advised by such Sub-Adviser; foreign investment companies offered by Nuveen and sub-advised by such Sub-Adviser; and collective investment trusts sub-advised by such Sub-Adviser. The Board further noted that the Adviser also advised, and NAM sub-advised, certain exchange-traded funds (“ETFs”) sponsored by Nuveen. The Board recognized that NAM was an affiliated sub-adviser and, with respect to affiliated sub-advisers, the Board reviewed, among other things, the range of fees assessed for managed accounts, hedge funds (along with their performance fee), foreign investment companies and ETFs offered by Nuveen, as applicable. The Board also reviewed the fee range and average fee rate of certain selected investment strategies offered in retail and institutional managed accounts advised by NAM, the hedge funds advised by NAM (along with their performance fee) and non-Nuveen investment companies sub-advised by certain affiliated sub-advisers.
In considering the fee data of other clients, the Board recognized, among other things, that differences in the amount, type and level of services provided to the Nuveen funds relative to other types of clients as well as any differences in portfolio investment policies, the types of assets managed and related complexities in managing such assets, the entrepreneurial and other risks associated with a particular strategy, investor profiles, account sizes and regulatory requirements will contribute to the variations in the fee schedules. The Board recognized the breadth of services the Adviser had provided to the Nuveen funds compared to these other types of clients as the funds operate in a highly regulated industry with increasing regulatory requirements as well as the increased entrepreneurial, legal and regulatory risks that the Adviser incurs in sponsoring and managing the funds. Similarly, with respect to foreign funds, the Board recognized that the differences in the client base, governing bodies, distribution jurisdiction and operational complexities would also contribute to variations in management
88
fees of the Nuveen funds compared to those of the foreign funds. Further, with respect to ETFs, the Board considered that certain Nuveen ETFs were passively managed compared to the active management of other Nuveen funds which also contributed to the differences in fee levels between such Nuveen ETFs and the actively-managed funds. In general, higher fee levels reflect higher levels of service provided by the Adviser, increased investment management complexity, greater product management requirements, and higher levels of business risk or some combination of these factors. The Board further considered that NAM’s fee is essentially for portfolio management services and therefore more comparable to the fees it receives for retail wrap accounts and other external sub-advisory mandates. The Board concluded the varying levels of fees were justified given, among other things, the inherent differences in the products and the level of services provided to the Nuveen funds versus other clients, the differing regulatory requirements and legal liabilities and the entrepreneurial, legal and regulatory risks incurred in sponsoring and advising a registered investment company.
The Board recognized that Gateway was an unaffiliated sub-adviser. With respect to Gateway, the Independent Board Members reviewed the average fee rates that such Sub-Adviser charges for other clients. The Independent Board Members noted that the Sub-Advisory Agreement with Gateway, including the fees thereunder, was the result of arm’s length negotiations and that Gateway’s fees were reasonable in relation to the fees it assessed other clients.
| | 3. | | Profitability of Fund Advisers |
In their review, the Independent Board Members considered information regarding Nuveen’s level of profitability for its advisory services to the Nuveen funds for the calendar years 2021 and 2020. The Board reviewed, among other things, the net margins (pre-tax) for Nuveen Investments, Inc. (“Nuveen Investments”), the gross and net revenue margins (pre- and post-tax and excluding distribution) and the revenues, expenses and net income (pre- and post-tax and before distribution expenses) of Nuveen Investments from the Nuveen funds only; and comparative profitability data comparing the operating margins of Nuveen Investments compared to the adjusted operating margins of certain peers that had publicly available data and with the most comparable assets under management (based on asset size and asset composition) for each of the last two calendar years. The Board also reviewed the revenues, expenses and operating margin (pre- and post-tax) the Adviser derived from its ETF product line for the 2021 and 2020 calendar years.
In reviewing the profitability data, the Independent Board Members recognized the subjective nature of calculating profitability as the information is not audited and is dependent on cost allocation methodologies to allocate corporate-wide overhead/shared service expenses, TIAA (defined below) corporate-wide overhead expenses and partially fund related expenses to the Nuveen complex and its affiliates and to further allocate such expenses between the Nuveen fund and non-fund businesses. The Independent Board Members reviewed a description of the cost allocation methodologies employed to develop the financial information, a summary of the history of changes to the methodology over the years from 2010 to 2021, and the net revenue margins derived from the Nuveen funds (pre-tax and including and excluding distribution) and total company margins from Nuveen Investments compared to the firm-wide adjusted operating margins of the peers for each calendar year from 2012 to 2021.
The Board had also appointed four Independent Board Members to serve as the Board’s liaisons, with the assistance of independent counsel, to review the development of the profitability data and to report to the full Board. In its evaluation, the Board, however, recognized that other reasonable and valid allocation methodologies could be employed and could lead to significantly different results. The Independent Board Members also reviewed a summary of the key drivers that affected Nuveen’s revenues and expenses impacting profitability in 2021 versus 2020.
In reviewing the comparative peer data noted above, the Board considered that the operating margins of Nuveen Investments compared favorably to the peer group range of operating margins; however, the Independent Board Members also recognized the limitations of the comparative data given that peer data is not generally public and the calculation of profitability is subjective and affected by numerous factors (such as types of funds a peer manages, its business mix, its cost of capital, the numerous assumptions underlying the methodology used to allocate expenses and other factors) that can have a significant impact on the results.
Aside from Nuveen’s profitability, the Board recognized that the Adviser is a subsidiary of Nuveen, LLC, the investment management arm of Teachers Insurance and Annuity Association of America (“TIAA”). Accordingly, the Board also reviewed
89
Annual Investment Management Agreement Approval Process (continued)
(Unaudited)
a balance sheet for TIAA reflecting its assets, liabilities and capital and contingency reserves for the 2021 and 2020 calendar years to consider the financial strength of TIAA. The Board recognized the benefit of an investment adviser and its parent with significant resources, particularly during periods of market volatility. The Board also noted the reinvestments Nuveen, its parent and/or other affiliates made into its business through, among other things, the investment of seed capital in certain Nuveen funds and continued investments in enhancements to technological capabilities.
In addition to Nuveen, the Independent Board Members considered the profitability of each Sub-Adviser from its relationships with the Nuveen funds. In this regard, with respect to NAM, the Independent Board Members reviewed, among other things, NAM’s revenues, expenses and net revenue margins (pre- and post-tax) for its advisory activities to the respective funds for the calendar years ended December 31, 2021 and December 31, 2020. With respect to NAM, the Independent Board Members also reviewed a profitability analysis reflecting the revenues, expenses and revenue margin (pre- and post-tax) by asset type for such Sub-Adviser for the calendar years ending December 31, 2021 and December 31, 2020 and the pre- and post-tax revenue margins from 2021 and 2020. With respect to Gateway, the Independent Board Members considered a profitability and margin analysis for such Sub-Adviser, generally including revenues, expenses and operating margins for the calendar years 2021 and 2020.
In evaluating the reasonableness of the compensation, the Independent Board Members also considered any other ancillary benefits derived by the respective Fund Adviser from its relationship with the Nuveen funds as discussed in further detail below.
Based on a consideration of all the information provided, the Board noted that Nuveen’s and each Sub-Adviser’s level of profitability was acceptable and not unreasonable in light of the services provided.
| D. | | Economies of Scale and Whether Fee Levels Reflect These Economies of Scale |
The Board considered whether there have been economies of scale with respect to the management of the Nuveen funds and whether these economies of scale have been appropriately shared with the funds. The Board recognized that although economies of scale are difficult to measure and certain expenses may not decline with a rise in assets, there are several methods to help share the benefits of economies of scale, including breakpoints in the management fee schedule, fee waivers and/or expense limitations, the pricing of Nuveen funds at scale at inception and investments in Nuveen’s business which can enhance the services provided to the funds for the fees paid. The Board noted that Nuveen generally has employed these various methods, and the Board considered the extent to which the Nuveen funds will benefit from economies of scale as their assets grow. In this regard, the Board recognized that the management fee of the Adviser is generally comprised of a fund-level component and a complex-level component each with its own breakpoint schedule, subject to certain exceptions. The Board reviewed the fund-level and complex-level fee schedules. The Board considered that the fund-level breakpoint schedules are designed to share economies of scale with shareholders if the particular fund grows, and the complex-level breakpoint schedule is designed to deliver the benefits of economies of scale to shareholders when the eligible assets in the complex pass certain thresholds even if the assets of a particular fund are unchanged or have declined. Further, with respect to the Nuveen closed-end funds, the Independent Board Members noted that, although such funds may from time to time make additional share offerings, the growth of their assets would occur primarily through the appreciation of such funds’ investment portfolios. As noted above, the Independent Board Members also recognized the continued reinvestment in Nuveen’s business.
Based on its review, the Board concluded that the current fee arrangements together with the reinvestment in Nuveen’s business appropriately shared any economies of scale with shareholders.
The Independent Board Members received and considered information regarding other benefits the respective Fund Adviser or its affiliates may receive as a result of their relationship with the Nuveen funds. The Board considered the compensation that an affiliate of the Adviser received for serving as co-manager in the initial public offerings of new closed-end funds and for serving as an underwriter on shelf offerings of existing closed-end funds.
90
In addition, the Independent Board Members also noted that various sub-advisers (including NAM) may engage in soft dollar transactions pursuant to which they may receive the benefit of research products and other services provided by broker-dealers executing portfolio transactions on behalf of the applicable Nuveen funds. The Board noted, however, that NAM reimburses the equity funds that it sub-advises (subject to certain exceptions) for the research-related component of soft dollar commissions. In addition, the Board noted that any benefits for a sub-adviser when transacting in fixed-income securities may be more limited as such securities generally trade on a principal basis and therefore do not generate brokerage commissions.
The Board noted that Gateway does not participate in soft dollar arrangements with respect to Nuveen fund portfolio transactions.
Based on its review, the Board concluded that any indirect benefits received by a Fund Adviser as a result of its relationship with the applicable Fund(s) were reasonable and within acceptable parameters.
The Board Members did not identify any single factor discussed previously as all-important or controlling. The Board Members, including the Independent Board Members, concluded that the terms of each Advisory Agreement were reasonable, that the respective Fund Adviser’s fees were reasonable in light of the services provided to each Fund and that the Advisory Agreements be renewed.
91
Nuveen:
Serving Investors for Generations
Since 1898, financial professionals and their clients have relied on Nuveen to provide
dependable investment solutions through continued adherence to proven, long-term investing
principles. Today, we offer a range of high quality solutions designed to
be integral components of a well-diversified core portfolio.
Focused on meeting investor needs.
Nuveen is the investment manager of TIAA. We have grown into one of the world’s premier global asset managers, with specialist knowledge across all major asset classes and particular strength in solutions that provide income for investors and that draw on our expertise in alternatives and responsible investing. Nuveen is driven not only by the independent investment processes across the firm, but also the insights, risk management, analytics and other tools and resources that a truly world-class platform provides. As a global asset manager, our mission is to work in partnership with our clients to create solutions which help them secure their financial future.
Find out how we can help you.
To learn more about how the products and services of Nuveen may be able to help you meet your financial goals, talk to your financial professional, or call us at (800) 257-8787. Please read the information provided carefully before you invest. Investors should consider the investment objective and policies, risk considerations, charges and expenses of any investment carefully.
Where applicable, be sure to obtain a prospectus, which contains this and other relevant information. To obtain a prospectus, please contact your securities representative or Nuveen, 333 W. Wacker Dr., Chicago, IL 60606. Please read the prospectus carefully before you invest or send money.
Learn more about Nuveen Funds at: www.nuveen.com/closed-end-funds
| | | | |
| Nuveen Securities, LLC, member FINRA and SIPC | 333 West Wacker Drive Chicago, IL 60606 | www.nuveen.com | | | |
ESA-A-0622D 2329982-INV-B-08/23 |
Item 2. Code of Ethics.
Not applicable to this filing.
Item 3. Audit Committee Financial Expert.
Not applicable to this filing.
Item 4. Principal Accountant Fees and Services.
Not applicable to this filing.
Item 5. Audit Committee of Listed Registrants.
Not applicable to this filing.
Item 6. Schedule of Investments.
(a) See Portfolio of Investments in Item 1.
(b) Not applicable.
Item 7. Disclosure of Proxy Voting Policies and Procedures for Closed-End Management Investment Companies.
Not applicable to this filing.
Item 8. Portfolio Managers of Closed-End Management Investment Companies.
Not applicable to this filing.
Item 9. Purchases of Equity Securities by Closed-End Management Investment Company and Affiliated Purchasers.
Not applicable.
Item 10. Submission of Matters to a Vote of Security Holders.
There have been no material changes to the procedures by which shareholders may recommend nominees to the registrant’s Board implemented after the registrant last provided disclosure in response to this item.
Item 11. Controls and Procedures.
| (a) | The registrant’s principal executive and principal financial officers, or persons performing similar functions, have concluded that the registrant’s disclosure controls and procedures (as defined in Rule 30a-3(c) under the Investment Company Act of 1940, as amended (the “1940 Act”) (17 CFR 270.30a-3(c))) are effective, as of a date within 90 days of the filing date of this report that includes the disclosure required by this paragraph, based on their evaluation of the controls and procedures required by Rule 30a-3(b) under the 1940 Act (17 CFR 270.30a-3(b)) and Rules 13a-15(b) or 15d-15(b) under the Securities Exchange Act of 1934, as amended (the “Exchange Act”) (17 CFR 240.13a-15(b) or 240.15d-15(b)). |
| (b) | There were no changes in the registrant’s internal control over financial reporting (as defined in Rule 30a-3(d) under the 1940 Act (17 CFR 270.30a-3(d)) that occurred during the period covered by this report that has materially affected, or is reasonably likely to materially affect, the registrant’s internal control over financial reporting. |
Item 12. Disclosure of Securities Lending Activities for Closed-End Management Investment Companies.
Not applicable.
Item 13. Exhibits.
File the exhibits listed below as part of this Form.
(a)(1) Any code of ethics, or amendment thereto, that is the subject of the disclosure required by Item 2, to the extent that the registrant intends to satisfy the Item 2 requirements through filing of an exhibit: Not applicable to this filing.
(a)(2) A separate certification for each principal executive officer and principal financial officer of the registrant as required by Rule 30a-2(a) under the 1940 Act (17 CFR 270.30a-2(a)) in the exact form set forth below: See EX-99.CERT attached hereto.
(a)(3) Any written solicitation to purchase securities under Rule 23c-1 under the 1940 Act (17 CFR 270.23c-1) sent or given during the period covered by the report by or on behalf of the registrant to 10 or more persons: Not applicable.
(a)(4) Change in the registrant’s independent public accountant. Not applicable.
(b) If the report is filed under Section 13(a) or 15(d) of the Exchange Act, provide the certifications required by Rule 30a-2 (b) under the 1940 Act (17 CFR 270.30a-2(b)), Rule 13a-14(b) or Rule 15d-14(b) under the Exchange Act (17 CFR 240.13a-14(b) or 240.15d-14(b)), and Section 1350 of Chapter 63 of Title 18 of the United States Code (18 U.S.C. 1350) as an Exhibit. A certification furnished pursuant to this paragraph will not be deemed “filed” for purposes of Section 18 of the Exchange Act (15 U.S.C. 78r), or otherwise subject to the liability of that section. Such certification will not be deemed to be incorporated by reference into any filing under the Securities Act of 1933 or the Exchange Act, except to the extent that the registration specifically incorporates it by reference: See EX-99.906 CERT attached hereto.
SIGNATURES
Pursuant to the requirements of the Securities Exchange Act of 1934 and the Investment Company Act of 1940, the registrant has duly caused this report to be signed on its behalf by the undersigned, thereunto duly authorized.
(Registrant) Nuveen S&P 500 Dynamic Overwrite Fund
| | | | |
| By (Signature and Title) | | /s/ Mark L. Winget | | |
| | Mark L. Winget | | |
| | Vice President and Secretary | | |
Date: September 6, 2022
Pursuant to the requirements of the Securities Exchange Act of 1934 and the Investment Company Act of 1940, this report has been signed below by the following persons on behalf of the registrant and in the capacities and on the dates indicated.
| | | | |
| By (Signature and Title) | | /s/ David J. Lamb | | |
| | David J. Lamb | | |
| | Chief Administrative Officer | | |
| | (principal executive officer) | | |
Date: September 6, 2022
| | | | |
| By (Signature and Title) | | /s/ E. Scott Wickerham | | |
| | E. Scott Wickerham | | |
| | Vice President and Controller | | |
| | (principal financial officer) | | |
Date: September 6, 2022