UNITED STATES
SECURITIES AND EXCHANGE COMMISSION
Washington, D.C. 20549
FORM 10-Q
(Mark one)
[ x ]QUARTERLY REPORT PURSUANT TO SECTION 13 OR 15(d) OF THE SECURITIES EXCHANGE ACT OF 1934
For the quarterly period ended:June 30, 2012
OR
[ ]TRANSITION REPORT PURSUANT TO SECTION 13 OR 15(d) OF THE SECURITIES EXCHANGE ACT OF 1934
For the transition period from _______________to ________________
Commission File Number: 001-34649
CHINA GENGSHENG MINERALS, INC.
(Exact Name of Registrant as Specified in Its Charter)
| NEVADA | 91-0541437 |
| (State or Other jurisdiction of Incorporation or Organization) | (I.R.S. Employer Identification No.) |
| | |
| CHINA GENGSHENG MINERALS, INC. | |
| No. 88 Gengsheng Road, Dayugou Town, Gongyi, Henan Province P.R. China | 451271 |
| (Address of Principal Executive Offices) | (Zip Code) |
(86) 371-64059863
(Registrant’s Telephone Number, Including Area Code)
N/A
(Former Name, Former Address and Former Fiscal Year, if Changed Since Last Report)
Indicate by check mark whether the registrant (1) has filed all reports required to be filed by Section 13 or 15(d) of the Securities Exchange Act of 1934 during the preceding 12 months (or for such shorter period that the registrant was required to file such reports), and (2) has been subject to such filing requirements for the past 90 days.
Yes [ x ] No [ ]
Indicate by check mark whether the registrant has submitted electronically and posted on its corporate Web site, if any, every Interactive Data File required to be submitted and posted pursuant to Rule 405 of Regulation S-T (232.405 of this chapter) during the preceding 12 months (or for such shorter period that the registrant was required to submit and post such files).
Yes [ x ] No [ ]
Indicate by check mark whether the registrant is a large accelerated filer, an accelerated filer, a non-accelerated filer, or a smaller reporting company. See definitions of “large accelerated filer”, “accelerated filer” and “smaller reporting company” in Rule 12b-2 of the Exchange Act. (Check one)
| Large accelerated filer [ ] | Accelerated filer [ ] | Non-accelerated filer [ ] | Smaller reporting company [ x ] |
Indicate by check mark whether the registrant is a shell company (as defined in Rule 12b-2 of the Exchange Act).
Yes [ ] No [ x ]
As of August 14, 2012, there were 26,803,044 shares of Common Stock of the Company, $0.001 par value,outstanding.
Table of Contents
| | | Page |
| PART I - FINANCIAL INFORMATION | |
| Item 1. | Financial Statements. | 1 |
| | Condensed Consolidated Balance Sheets as of June 30, 2012 (Unaudited) and December 31, 2011 | 1 |
| | Condensed Consolidated Statements of Operations and Comprehensive Loss for the Three Months and Six Months Ended June 30, 2012 (Unaudited) and 2011 (Unaudited) | 3 |
| | Condensed Consolidated Statements of Cash Flows for the Six Months Ended June 30, 2012 (Unaudited) and 2011(Unaudited) | 5 |
| | Condensed Consolidated Statements of Equity for the Six Months Ended June 30, 2012 (Unaudited) | 7 |
| | Notes to Condensed Consolidated Financial Statements (Unaudited) | 8 |
| Item 2. | Management's Discussion and Analysis of Financial Condition and Results of Operations. | 25 |
| Item 3. | Quantitative and Qualitative Disclosure About Market Risk. | 41 |
| Item 4. | Controls and Procedures. | 41 |
| | |
| PART II - OTHER INFORMATION | |
| Item 1. | Legal Proceedings. | 42 |
| Item 1A. | Risk Factors. | 42 |
| Item 2. | Unregistered Sales of Equity Securities and Use of Proceeds. | 42 |
| Item 3. | Defaults Upon Senior Securities. | 42 |
| Item 4. | Mine Safety Disclosures. | 42 |
| Item 5. | Other Information. | 42 |
| Item 6. | Exhibits. | 42 |
| | |
| SIGNATURES | |
| China GengSheng Minerals, Inc. |
| Condensed Consolidated Balance Sheets |
| | | As of | | | As of | |
| | | June 30, | | | December 31, | |
| | | 2012 | | | 2011 | |
| | | (Unaudited) | | | | |
| ASSETS | | | | | | |
| Current assets: | | | | | | |
| Cash and cash equivalents | $ | 5,162,949 | | $ | 3,594,361 | |
| Restricted cash (Note 5) | | 38,465,112 | | | 21,094,008 | |
| Trade receivables, net (Note 6) | | 53,645,872 | | | 49,167,748 | |
| Bills receivable | | 12,363,231 | | | 6,331,997 | |
| Other receivables and prepayments, net (Note 7) | | 9,025,841 | | | 8,451,185 | |
| Advances to senior management (Note 7) | | - | | | 360,162 | |
| Inventories, net (Note 8) | | 18,248,768 | | | 16,956,582 | |
| Deferred tax assets, net of valuation allowance | | - | | | - | |
| | | | | | | |
| Total current assets | | 136,911,773 | | | 105,956,043 | |
| | | | | | | |
| Deposit for acquisition of a non-consolidated affiliate, net (Note 9) | | - | | | 1,092,041 | |
| Investment in a non-consolidated affiliate (Note 9) | | 1,090,412 | | | - | |
| Deposits for acquisition of land use right, property, plant and equipment | | 622,824 | | | 618,892 | |
| Goodwill, net (Note 10) | | - | | | - | |
| Intangible assets, net (Note 10) | | - | | | - | |
| Property, plant and equipment, net (Note 11) | | 37,203,990 | | | 37,164,849 | |
| Land use rights | | 3,119,516 | | | 3,137,961 | |
| | | | | | | |
| TOTAL ASSETS | $ | 178,948,515 | | $ | 147,969,786 | |
| | | | | | | |
| LIABILITIES AND EQUITY | | | | | | |
| | | | | | | |
| Current liabilities: | | | | | | |
| Trade payables | $ | 22,090,232 | | $ | 18,671,086 | |
| Bills payable (Note 5) | | 8,818,128 | | | 16,385,340 | |
| Other payables and accrued expenses | | 6,904,576 | | | 8,877,407 | |
| Deferred revenue - Government grants | | 649,202 | | | 443,632 | |
| Provision for warranty | | 110,730 | | | 184,778 | |
| Income taxes payable | | 71,345 | | | 218,038 | |
| Non-interest-bearing loans (Note 12) | | 3,568,059 | | | 3,318,472 | |
| Collateralized short-term bank loans (Note 13) | | 84,570,235 | | | 45,974,022 | |
| Loans from third parties (Note 14) | | 4,752,000 | | | - | |
| Deferred tax liabilities | | 125,270 | | | 112,625 | |
| Warrant liabilities | | - | | | - | |
| | | | | | | |
| TOTAL LIABILITIES | | 131,659,777 | | | 94,185,400 | |
| | | | | | | |
| COMMITMENTS AND CONTINGENCIES (Note 18) | | | | | | |
1
| China GengSheng Minerals, Inc. |
| Condensed Consolidated Balance Sheets (Cont’d) |
| | | As of | | | As of | |
| | | June 30, | | | December 31, | |
| | | 2012 | | | 2011 | |
| | | (Unaudited) | | | | |
| STOCKHOLDERS' EQUITY | | | | | | |
Preferred stock - $0.001 par value per share; authorized 50,000,000 shares in 2012 and 2011, none issued and outstanding | $ | - | | $ | - | |
Common stock - $0.001 par value per share; authorized 100,000,000 shares in 2012 and 2011, issued and outstanding 26,803,044 shares in 2012 and 2011 | | 26,803 | | | 26,803 | |
Additional paid-in capital | | 28,197,310 | | | 28,197,310 | |
Statutory and other reserves | | 8,110,972 | | | 8,110,972 | |
Accumulated other comprehensive income | | 7,916,345 | | | 7,713,341 | |
Retained earnings | | 2,834,958 | | | 9,541,560 | |
| | | | | | | |
| Total China GengSheng Minerals, Inc. stockholders' equity | | 47,086,388 | | | 53,589,986 | |
| NONCONTROLLING INTEREST | | 202,350 | | | 194,400 | |
| | | | | | | |
| TOTAL EQUITY | | 47,288,738 | | | 53,784,386 | |
| | | | | | | |
| TOTAL LIABILITIES AND EQUITY | $ | 178,948,515 | | $ | 147,969,786 | |
The accompanying notes are an integral part of these condensed consolidated financial statements.
2
| China GengSheng Minerals, Inc. |
| Condensed Consolidated Statements of Operations and Comprehensive Loss |
| | | Three months ended | | | Six months ended | |
| | | June 30, | | | June 30, | |
| | | (Unaudited) | | | (Unaudited) | |
| | | 2012 | | | 2011 | | | 2012 | | | 2011 | |
| | | | | | | | | | | | | |
| Sales revenue | $ | 19,620,215 | | $ | 20,435,922 | | $ | 33,330,878 | | $ | 36,619,751 | |
| Cost of goods sold | | (16,565,669 | ) | | (15,101,251 | ) | | (27,559,978 | ) | | (26,997,445 | ) |
| | | | | | | | | | | | | |
| Gross profit | | 3,054,546 | | | 5,334,671 | | | 5,770,900 | | | 9,622,306 | |
| | | | | | | | | | | | | |
| Operating expenses | | | | | | | | | | | | |
| General and administrative expenses | | 1,937,379 | | | 1,629,380 | | | 3,666,090 | | | 3,133,598 | |
| Research and development expenses | | 236,283 | | | 145,202 | | | 399,279 | | | 286,529 | |
| Selling expenses | | 2,790,552 | | | 2,761,122 | | | 5,271,143 | | | 4,733,057 | |
| | | | | | | | | | | | | |
| Total operating expenses | | 4,964,214 | | | 4,535,704 | | | 9,336,512 | | | 8,153,184 | |
| | | | | | | | | | | | | |
| (Loss) income from operations | | (1,909,668 | ) | | 798,967 | | | (3,565,612 | ) | | 1,469,122 | |
| | | | | | | | | | | | | |
| Other (expenses) income | | | | | | | | | | | | |
| Government grant income | | - | | | 16,802 | | | 385,314 | | | 17,685 | |
| Guarantee income | | 147,732 | | | 122,952 | | | 301,286 | | | 210,248 | |
| Guarantee expenses | | (107,630 | ) | | (88,877 | ) | | (236,808 | ) | | (176,392 | ) |
| Equity in net loss of a non-consolidated affiliate | | (8,567 | ) | | - | | | (8,567 | ) | | - | |
| Interest income | | 186,375 | | | 62,893 | | | 238,949 | | | 182,381 | |
| Change in fair value of warrant liabilities | | - | | | 650,000 | | | - | | | 910,000 | |
| Other income (expenses) | | 37,905 | | | (33,533 | ) | | 43,844 | | | (67,722 | ) |
| Finance costs (Note 15) | | (1,949,938 | ) | | (1,571,367 | ) | | (3,700,130 | ) | | (2,537,099 | ) |
| | | | | | | | | | | | | |
| Total other expenses | | (1,694,123 | ) | | (841,130 | ) | | (2,976,112 | ) | | (1,460,899 | ) |
| | | | | | | | | | | | | |
| (Loss) income before income taxes and noncontrolling interest | | (3,603,791 | ) | | (42,163 | ) | | (6,541,724 | ) | | 8,223 | |
| Income taxes (Note 16) | | (202,018 | ) | | (226,139 | ) | | (214,366 | ) | | (362,310 | ) |
| | | | | | | | | | | | | |
| Net loss before noncontrolling interest | | (3,805,809 | ) | | (268,302 | ) | | (6,756,090 | ) | | (354,087 | ) |
| Net loss attributable to noncontrolling interest | | 12,039 | | | 21,264 | | | 49,488 | | | 27,115 | |
| | | | | | | | | | | | | |
| Net loss attributable to Company’s common stockholders | $ | (3,793,770 | ) | $ | (247,038 | ) | $ | (6,706,602 | ) | $ | (326,972 | ) |
| | | | | | | | | | | | | |
| Net loss before noncontrolling interest | $ | (3,805,809 | ) | $ | (268,302 | ) | $ | (6,756,090 | ) | $ | (354,087 | ) |
| Other comprehensive income | | | | | | | | | | | | |
| Foreign currency translation adjustments | | 20,630 | | | 786,396 | | | 260,442 | | | 991,240 | |
| | | | | | | | | | | | | |
| Comprehensive (loss) income | | (3,785,179 | ) | | 518,094 | | | (6,495,648 | ) | | 637,153 | |
| Comprehensive loss (income) attributable to noncontrolling interest | | 12,055 | | | 21,264 | | | (7,950 | ) | | 27,115 | |
| | | | | | | | | | | | | |
| Comprehensive (loss) income attributable to Company’s common stockholders | $ | (3,773,124 | ) | $ | 539,358 | | $ | (6,503,598 | ) | $ | 664,268 | |
3
| China GengSheng Minerals, Inc. |
| Condensed Consolidated Statements of Operations and Comprehensive Loss (Cont’d) |
| | | Three months ended | | | Six months ended | |
| | | June 30, | | | June 30, | |
| | | (Unaudited) | | | (Unaudited) | |
| | | 2012 | | | 2011 | | | 2012 | | | 2011 | |
| Loss per share (Note 17) - Basic and diluted attributable to Company’s common stockholders | $ | (0.14 | ) | $ | (0.01 | ) | $ | (0.25 | ) | $ | (0.01 | ) |
| Weighted average number of shares - Basic and diluted | | 26,803,044 | | | 26,794,386 | | | 26,803,044 | | | 26,711,513 | |
The accompanying notes are an integral part of these condensed consolidated financial statements.
4
| China GengSheng Minerals, Inc. |
| Condensed Consolidated Statements of Cash Flows |
| | | Six months ended June 30, | |
| | | (Unaudited) | |
| | | 2012 | | | 2011 | |
| Cash flows from operating activities | | | | | | |
| Net loss before noncontrolling interest | $ | (6,756,090 | ) | $ | (354,087 | ) |
| Adjustments to reconcile net loss before noncontrolling interest to net cash flows used in operating activities: | | | | | | |
| Depreciation | | 1,545,430 | | | 1,040,195 | |
| Amortization of land use rights | | 38,380 | | | 10,481 | |
| Equity in net loss of a non-consolidated affiliate | | 8,567 | | | - | |
| Amortization of intangible assets | | - | | | 38,180 | |
| Deferred taxes | | 12,157 | | | 153,413 | |
| Loss on disposal of property, plant and equipment | | 115,742 | | | 29,813 | |
| Guarantee expenses | | 236,808 | | | - | |
| Guarantee income | | (301,286 | ) | | - | |
| Allowance for doubtful accounts | | 573,147 | | | 432,040 | |
| Deferred revenue amortized | | - | | | (45,816 | ) |
| Change in fair value of warrant liabilities | | - | | | (910,000 | ) |
| Exchange gain | | (65,741 | ) | | - | |
| Changes in operating assets and liabilities: | | | | | | |
| Restricted cash | | 9,833,472 | | | (4,859,443 | ) |
| Trade receivables | | (4,422,097 | ) | | 215,589 | |
| Bills receivable | | (5,921,005 | ) | | (11,064,303 | ) |
| Other receivables and prepayments | | (965,360 | ) | | (5,214,083 | ) |
| Advances to senior management | | 362,450 | | | - | |
| Inventories | | (1,184,365 | ) | | (5,821,702 | ) |
| Other payables and accrued expenses | | (1,965,058 | ) | | 1,117,543 | |
| Trade payables | | 3,513,956 | | | 5,299,877 | |
| Bills payable | | (7,741,312 | ) | | 18,440,940 | |
| Provision for warranty | | (75,223 | ) | | - | |
| Income taxes payable | | (147,762 | ) | | (54,322 | ) |
| Net cash flows used in operating activities | | (13,305,190 | ) | | (1,545,685 | ) |
| Cash flows from investing activities | | | | | | |
| Payments for deposits of acquisition of land use right, property, plant and equipment | | - | | | (3,984,119 | ) |
| Proceeds from disposal of property, plant and equipment | | - | | | 64,092 | |
| Payments for acquisition of property, plant and equipment | | (1,677,628 | ) | | (4,397,877 | ) |
| Net cash flows used in investing activities | | (1,677,628 | ) | | (8,317,904 | ) |
| | | | | | | |
| Cash flows from financing activities | | | | | | |
| Net proceeds from issuance of shares | | - | | | 9,258,466 | |
| Restricted cash | | (27,070,560 | ) | | (27,061,374 | ) |
| Proceeds from bank loans | | 49,859,412 | | | 64,935,933 | |
| Repayment of bank loans | | (11,555,280 | ) | | (28,558,640 | ) |
| Proceeds from non-interest-bearing loans | | 576,646 | | | 305,440 | |
| Repayment of non-interest-bearing loans | | (379,822 | ) | | (479,649 | ) |
| Loans from third parties | | 4,752,000 | | | - | |
| Government grant received | | 357,984 | | | - | |
| Net cash flows provided by financing activities | | 16,540,380 | | | 18,400,176 | |
5
China GengSheng Minerals, Inc.
Condensed Consolidated Statements of Cash Flows(Cont’d)
| | | Six months ended June 30, | |
| | | (Unaudited) | |
| | | 2012 | | | 2011 | |
| | | | | | | |
| Effect of foreign currency translation on cash and cash equivalents | | 11,026 | | | 27,540 | |
| | | | | | | |
| Net increase in cash and cash equivalents | | 1,568,588 | | | 8,564,127 | |
| Cash and cash equivalents - beginning of period | | 3,594,361 | | | 925,052 | |
| | | | | | | |
| Cash and cash equivalents - end of period | $ | 5,162,949 | | $ | 9,489,179 | |
| | | | | | | |
| Supplemental disclosure of cash flow information:- | | | | | | |
| Cash paid for: | | | | | | |
| Interest | $ | 1,559,143 | | $ | 2,537,099 | |
| Income taxes | $ | 346,552 | | $ | 262,133 | |
| | | | | | | |
| Non-cash operating, investing and financing activities:- | | | | | | |
| Proceeds from disposal of property, plant and equipment settled by offsetting trade payables | $ | 88,707 | | $ | - | |
| Warrants issued to investors in connection with the private placement | | - | | | 970,000 | |
| Acquisition of Yili YiQiang Silicon Limited by offsetting deposit for acquisition of a non-consolidated affiliate | $ | 1,098,979 | | $ | - | |
The accompanying notes are an integral part of these condensed consolidated financial statements.
6
| China GengSheng Minerals, Inc. |
| Condensed Consolidated Statements of Equity |
| | | China GengSheng Minerals, Inc. stockholders | | | | |
| | | | | | | | | | | | | | | Accumulated | | | | | | | | | | |
| | | Common stock | | | | | | | | | other | | | | | | | | | | |
| | | Number of | | | | | | Additional | | | Statutory and | | | comprehensive | | | Retained | | | Noncontrolling | | | | |
| | | shares | | | Amount | | | paid-in capital | | | other reserves | | | income | | | earnings | | | interest | | | Total | |
| | | | | | | | | | | | | | | | | | | | | | | | | |
| Balance, December 31, 2011 | | 26,803,044 | | $ | 26,803 | | $ | 28,197,310 | | $ | 8,110,972 | | $ | 7,713,341 | | $ | 9,541,560 | | $ | 194,400 | | $ | 53,784,386 | |
| Net loss | | - | | | - | | | - | | | - | | | - | | | (6,706,602 | ) | | (49,488 | ) | | (6,756,090 | ) |
| Foreign currency translation adjustments | | - | | | - | | | - | | | - | | | 203,004 | | | - | | | 57,438 | | | 260,442 | |
| | | | | | | | | | | | | | | | | | | | | | | | | |
| Balance, June 30, 2012 | | 26,803,044 | | $ | 26,803 | | $ | 28,197,310 | | $ | 8,110,972 | | $ | 7,916,345 | | $ | 2,834,958 | | $ | 202,350 | | $ | 47,288,738 | |
The accompanying notes are an integral part of these condensed consolidated financial statements.
7
| China GengSheng Minerals, Inc. |
| Notes to Condensed Consolidated Financial Statements |
| 1. | Basis of presentation |
| | |
| Basis of presentation |
| | |
| These unaudited condensed consolidated financial statements of the Company and its subsidiaries have been prepared in accordance with the rules and regulations of the Securities and Exchange Commission (the “SEC”) including the instructions to Form 10-Q and Regulation S-X. Certain information and note disclosures normally included in financial statements prepared in accordance with accounting principles generally accepted in the United States of America (the “US GAAP”) have been condensed or omitted from these statements pursuant to such rules and regulations and, accordingly, they do not include all the information and notes necessary for comprehensive consolidated financial statements and should be read in conjunction with our audited consolidated financial statements for the year ended December 31, 2011, included in our Annual Report on Form 10-K for the year ended December 31, 2011 as filed with the Securities and Exchange Commission on April 16, 2012. |
| | |
| In the opinion of the management of the Company, all adjustments, which are of a normal recurring nature, necessary for a fair statement of the results for the three-month period have been made. Results for the interim period presented are not necessarily indicative of the results that might be expected for the entire fiscal year. |
| | |
| 2. | Corporate information |
| | |
| The Company was originally incorporated on November 13, 1947, in accordance with the laws of the State of Washington as Silver Mountain Mining Company. On August 20, 1979, the Articles of Incorporation were amended to change the corporate name of the Company to Leadpoint Consolidated Mines Company. On August 15, 2006, the Company changed its state of incorporation from Washington to Nevada by means of a merger with and into a Nevada corporation formed on May 23, 2006, solely for the purpose of effecting the reincorporation and changed its name to Point Acquisition Corporation. On June 11, 2007, the Company changed its name to China Minerals Technologies, Inc. and on July 26, 2007, the Company changed its name to China GengSheng Minerals, Inc. On March 4, 2010, the Company’s common stock began trading on the NYSE Amex Stock Exchange (formerly the American Stock Exchange) under the symbol “CHGS.” Prior to March 4, 2010, the Company’s common stock traded on Over-the-Counter Bulletin Board under the symbol CHGS.OB. |
| | |
| Currently the Company has the following eight subsidiaries: |
Company name
| Place/date of
incorporation or
establishment | The Company's
effective ownership
interest | Common stock/
registered capital
| Principal activities
|
| | | | | |
GengSheng
International
Corporation
( “GengSheng
International” ) | The British Virgin
Islands (the “BVI”)/
November 3, 2004
| 100%
| Ordinary shares :-
Authorized: 50,000
shares of $1 each
Paid up: 100 shares
of $1 each | Investment
holding
|
| | | | | |
Henan GengSheng
Refractories Co., Ltd.
( “Refractories” )
| The People's
Republic of
China (the “PRC”)/
December 20, 1996 | 100%
| Registered capital
of $12,089,879 fully
paid up
| Manufacturing
and selling
of refractory
products |
| | | | | |
Henan GengSheng
High-Temperature
Materials Co., Ltd.
( “High-Temperature” ) | PRC/
September 4, 2002
| 89.33%
| Registered capital
of $1,246,300 fully
paid up
| Manufacturing
and selling
of functional
ceramic products |
| | | | | |
Smarthigh Holdings
Limited
( “Smarthigh” )
| BVI/
November 5, 2004
| 100%
| Ordinary shares :-
Authorized: 50,000
shares of $1 each
Paid up: 100 shares
of $1 each | Investment
holding
|
8
| China GengSheng Minerals, Inc. |
| Notes to Condensed Consolidated Financial Statements |
| 2. | Corporate information (Cont’d) |
Zhengzhou Duesail
Fracture Proppant
Co., Ltd.
( “Duesail” ) | PRC/
August 14, 2006
| 100%
| Registered capital of
$2,800,000 fully
paid up
| Manufacturing
and selling of
fracture proppant
products |
| | | | | |
Henan GengSheng
Micronized Powder
Materials Co., Ltd.
( “Micronized” ) | PRC/
March 31, 2008
| 100%
| Registered capital of
$5,823,000 fully
paid up
| Manufacturing
and selling of
fine precision
abrasives |
| | | | | |
Guizhou Southeast
Prefecture GengSheng
New Materials Co., Ltd.
( “Prefecture” ) | PRC/
April 13, 2004
| 100%
| Registered capital of
$141,840 fully
paid up
| Manufacturing
and selling of
corundum
materials |
| | | | | |
Henan Yuxing Proppant
Co., Ltd.
(“Yuxing”)
| PRC/
June 3, 2011
| 100%
| Registered capital of
$3,086,000 fully paid
up
| Manufacturing
and selling of
fracture proppant
products |
| 3. | Description of business |
| | |
| The Company is a holding company whose primary business operations are conducted through its subsidiaries located in the PRC’s Henan Province. Prefecture is located in Guizhou Province and is manufacturing corundum materials, a major raw material for monolithic refractory. Through its operating subsidiaries, the Company produces and markets a broad range of monolithic refractory, functional ceramics, fracture proppants, fine precision abrasives, and corundum materials. |
| | |
| The principal raw materials used in the products are several forms of aluminum oxide, including bauxite, processed AI2O3and calcium aluminates cement, and other materials, such as corundum, magnesia, resin and silica, which are primarily sourced from suppliers located in the PRC. The production facilities of the Company, other than the Prefecture’s sub-processing factory located in Guizhou, are also located in Henan Province. |
| | |
| Refractories products allow steel makers and other customers to improve the productivity and longevity of their equipment and machinery. Functional ceramic products mainly include abrasive balls and tiles, valves, electronic ceramics and structural ceramics. Fracture proppant products are used to reach trapped pockets of oil and natural gas deposits, which lead to higher productivities of oil and natural gas wells. Due to their heat-resistant qualities and ability to function under thermal stress, refractories serve as components in industrial furnaces and other heavy industrial machinery. Corundum materials are major raw material for producing monolithic refractory. Fine precision abrasive is the Company’s new product that was commercially launched in the fourth quarter of 2009, and is used for slicing the solar-silicon bar and polishing the equipment surface. The Company’s customers include some of the largest steel and iron producers located in 25 provinces in the PRC, as well as in the United States and other countries in Asia, and Europe. |
| | |
| 4. | Summary of significant accounting policies |
| | |
| Basis of consolidation |
| | |
| The condensed consolidated financial statements include the accounts of the Company and its subsidiaries. All significant inter-company accounts and transactions have been eliminated in consolidation. |
9
| China GengSheng Minerals, Inc. |
| Notes to Condensed Consolidated Financial Statements |
| 4. | Summary of significant accounting policies (Cont’d) |
| | |
| Concentrations of credit risk |
| | |
| Financial instruments that potentially subject the Company to significant concentrations of credit risk consist principally of cash and cash equivalents, restricted cash, trade, bills and other receivables. As of June 30, 2012 and December 31, 2011, substantially all of the Company’s cash and cash equivalents and restricted cash were held by major financial institutions located in the PRC and Hong Kong, which management believes are of high credit quality. With respect to trade and other receivables, the Company extends credit based on an evaluation of the customer’s financial condition. The Company generally does not require collateral for trade and other receivables and maintains an allowance for doubtful accounts of trade and other receivables. |
| | |
| Regarding bills receivable, they are undertaken by the banks to honor the payments at maturity and the customers are required to place deposits with the banks equivalent to a certain percentage of the bills amount as collateral. These bills receivable can be sold to any third party at a discount before maturity. The Company does not maintain allowance for bills receivable in the absence of bad debt experience and the payments are undertaken by the banks. |
| | |
| During the reporting periods, customers represented 10% or more of the Company’s condensed consolidated sales are: |
| | | | Three months ended June 30, | | | Six months ended June 30, | |
| | | | (Unaudited) | | | (Unaudited) | |
| | | | 2012 | | | 2011 | | | 2012 | | | 2011 | |
| | | | | | | | | | | | | | |
| | Shangdong Steel Co., Ltd. Rizhao Subsidiary | $ | 2,300,576 | | $ | 2,306,904 | | $ | 4,445,120 | | $ | 4,102,856 | |
| | Trina Solar | | 1,839,836 | | | 1,934,558 | | | 3,878,390 | | | 2,207,152 | |
| | AMSAT International Limited | | - | | | 2,655,875 | | | - | | | 5,327,097 | |
| | Shanghai Jolly Trading Co., Ltd. | | - | | | 3,282,103 | | | - | | | 4,371,176 | |
| | | | | | | | | | | | | | |
| | | $ | 4,140,412 | | $ | 10,179,440 | | $ | 8,323,510 | | $ | 16,008,281 | |
Acquisition of a non-consolidated affiliate
Investment in an entity over which the Company does not have control, but has significant influence, is accounted for using the equity method of accounting. The Company’s investment in Yili YiQiang Silicon Limited ("Yili") is reported in the condensed consolidated balance sheets as investment in a non-consolidated affiliate (Note 9).
Fair value of financial instruments
ASC 820 requires the disclosure of the estimated fair value of financial instruments including those financial instruments for which fair value option was not elected. The fair value of collateralized borrowings are estimated using discounted cash flow analysis, based on the Company’s current incremental borrowing rates for similar types of borrowing arrangement. The carrying amount of financial assets and liabilities approximate their fair value due to short maturities.
Recently issued accounting pronouncements
In September 2011, the FASB issued ASU 2011-08, “Intangibles - Goodwill and Other (Topic 350)”. The amendments in this update will allow an entity to first assess qualitative factors to determine whether it is necessary to perform the two-step quantitative goodwill impairment test. Under these amendments, an entity would not be required to calculate the fair value of a reporting unit unless the entity determines, based on a qualitative assessment, that it is more likely than not that its fair value is less than its carrying amount. The amendments include a number of events and circumstances for an entity to consider in conducting the qualitative assessment. The amendments in this ASU are effective for annual and interim goodwill impairment tests performed for fiscal years beginning after December 15, 2011. Early adoption is permitted. The adoption of this ASU has no material impact on the Company’s condensed consolidated financial statements.
10
| China GengSheng Minerals, Inc. |
| Notes to Condensed Consolidated Financial Statements |
| 4. | Summary of significant accounting policies (Cont’d) |
| | |
| Recently issued accounting pronouncements (cont’d) |
| | |
| In September 2011, the FASB issued ASU 2011-09, “Compensation - Retirement Benefits - Multiemployer Plans (Subtopic 715 - 80)”. The amendments in this update require additional disclosures about an employer's participation in a multiemployer plan. ASU 2011-09 is effective for annual periods for fiscal years ending after December 15, 2011, and early adoption is permitted. ASU 2011-09 should be applied retrospectively for all prior periods presented. The adoption of this ASU has no material impact on the Company’s condensed consolidated financial statements. |
| | |
| In December 2011, the FASB issued ASU 2011-11, “Balance Sheet (Topic 210)”. The objective of this update is to provide enhanced disclosures that will enable users of its financial statements to evaluate the effect or potential effect of netting arrangements on an entity’s financial position. This includes the effect or potential effect of rights of setoff associated with an entity’s recognized assets and recognized liabilities within the scope of this update. The amendments require enhanced disclosures by requiring improved information about financial instruments and derivative instruments that are either (1) offset in accordance with either Section 210-20-45 or Section 815-10-45 or (2) subject to an enforceable master netting arrangement or similar agreement, irrespective of whether they are offset in accordance with either Section 210-20-45 or Section 815-10-45. An entity is required to apply the amendments retrospectively for annual reporting periods beginning on or after January 1, 2013, and interim periods within those annual periods. The adoption of this ASU has no material impact on the Company’s condensed consolidated financial statements. |
| | |
| In December 2011, the FASB issued ASU 2011-12, “Comprehensive Income (Topic 220)”. The amendments in this update supersede certain pending paragraphs in Accounting Standards Update No. 2011-05, “Comprehensive Income (Topic 220): Presentation of Comprehensive Income”, to effectively defer only those changes in ASU 2011-05 that relate to the presentation of reclassification adjustments out of accumulated other comprehensive income. The amendments will be temporary to allow the Board time to redeliberate the presentation requirements for reclassifications out of accumulated other comprehensive income for annual and interim financial statements for public, private, and non-profit entities. The amendments are effective for fiscal years, and interim periods within those years, beginning after December 15, 2011. Early application is permitted. The adoption of this ASU has no material impact on the Company’s condensed consolidated financial statements. |
| | |
| In July 2012, the FASB issued ASU 2012-02 on impairment testing for indefinite-lived intangible assets. This ASU amends FASB Codification Topic 350, Intangibles-Goodwill and Other to allow, but not require, an entity, when performing its annual or more frequent indefinite-lived intangible asset impairment test, to first assess qualitative factors to determine whether the existence of events and circumstances indicates that it is more likely than not that the indefinite-lived intangible asset is impaired. If, after assessing the totality of events and circumstances, an entity concludes that it is not more likely than not that the indefinite-lived intangible asset is impaired, then the entity is not required to take further action. However, if an entity concludes otherwise, then it is required to determine the fair value of the indefinite-lived intangible asset and perform the quantitative impairment test by comparing the fair value with the carrying amount. ASU2012-02 is effective for annual and interim impairment tests performed for fiscal years beginning after September 15, 2012. Early adoption is permitted. The Company is currently evaluating ASU 2012-02. The adoption of this ASU will not have a material impact on the Company’s condensed consolidated financial statements. |
11
| China GengSheng Minerals, Inc. |
| Notes to Condensed Consolidated Financial Statements |
| 5. | Restricted cash and bills payable |
| | | | As of | | | As of | |
| | | | June 30, | | | December 31, | |
| | | | 2012 | | | 2011 | |
| | | | (Unaudited) | | | | |
| | | | | | | | |
| | Bank deposits held as collateral for bills payable (Note 5a) | $ | 5,650,128 | | $ | 12,552,650 | |
| | Bank deposits held as collateral for bank loans (Note 13) | | 32,772,960 | | | 8,499,600 | |
| | Other (Note 5b) | | 42,024 | | | 41,758 | |
| | | | | | | | |
| | | $ | 38,465,112 | | $ | 21,094,008 | |
Notes :-
| | a) | The Company is requested by certain suppliers to settle amounts owed to such suppliers by the issuance of bills through banks for which the banks undertake to guarantee the Company’s settlement of these amounts at maturity. These bills are interest free and would be usually matured within six months from the date of issuance. As collateral security for the banks’ undertakings, the Company is required to pay the bank charges as well as maintaining deposits with such banks amounts equal to 50% or 100% of the bills’ amounts issued. |
| | | |
| | b) | The amount was held by a third party due to the dispute with one supplier at Prefecture. |
| | | | As of | | | As of | |
| | | | June 30, | | | December 31, | |
| | | | 2012 | | | 2011 | |
| | | | (Unaudited) | | | | |
| | | | | | | | |
| | Trade receivables | $ | 55,962,043 | | $ | 51,214,568 | |
| | Allowance for doubtful accounts | | (2,316,171 | ) | | (2,046,820 | ) |
| | | | | | | | |
| | | $ | 53,645,872 | | $ | 49,167,748 | |
An analysis of the allowance for doubtful accounts for the six months ended June 30, 2012 and 2011 is as follows:
| | | | Six months ended June 30, | |
| | | | (Unaudited) | |
| | | | 2012 | | | 2011 | |
| | | | | | | | |
| | Balance at beginning of period | $ | 2,046,820 | | $ | 1,020,741 | |
| | Addition of doubtful debt expenses, net | | 256,347 | | | 432,040 | |
| | Translation adjustments | | 13,004 | | | 25,788 | |
| | | | | | | | |
| | Balance at end of period | $ | 2,316,171 | | $ | 1,478,569 | |
12
| China GengSheng Minerals, Inc. |
| Notes to Condensed Consolidated Financial Statements |
| 7. | Other receivables and prepayments, net and advances to senior management |
| | | | As of | | | As of | |
| | | | June 30, | | | December 31, | |
| | | | 2012 | | | 2011 | |
| | | | (Unaudited) | | | | |
| | | | | | | | |
| | Government grant receivables (Note 7a) | $ | 398,661 | | $ | 550,396 | |
| | Loans to third parties (Note 7b) | | 1,843,819 | | | 1,314,359 | |
| | Value added tax and other tax recoverable | | 217,810 | | | 662,151 | |
| | Deposits for purchase of raw materials | | 1,585,714 | | | 1,430,517 | |
| | Other deposit | | 94,652 | | | 198,988 | |
| | Prepayment | | 1,532,092 | | | 1,817,126 | |
| | Other receivables | | 29,241 | | | 248,731 | |
| | Advances to staff (Note 7c) | | 4,402,680 | | | 2,986,134 | |
| | | | | | | | |
| | | | 10,104,669 | | | 9,208,402 | |
| | Allowance for doubtful accounts | | (1,078,828 | ) | | (757,217 | ) |
| | | | | | | | |
| | | $ | 9,025,841 | | $ | 8,451,185 | |
| | | | | | | | |
| | Advances to senior management (Note 7b) | $ | - | | $ | 360,162 | |
An analysis of the allowance for doubtful accounts for the six months ended June 30, 2012 and 2011 is as follows:
| | | | Six months ended June 30, | |
| | | | (Unaudited) | |
| | | | 2012 | | | 2011 | |
| | | | | | | | |
| | Balance at beginning of period | $ | 757,217 | | $ | 374,590 | |
| | Addition of doubtful debt expenses, net | | 316,800 | | | - | |
| | Translation adjustments | | 4,811 | | | 7,407 | |
| | | | | | | | |
| | Balance at end of period | $ | 1,078,828 | | $ | 381,997 | |
Notes :-
| | a) | As of June 30, 2012, government grant receivables represented incentive bonus of $398,661 from the local government for successful back-door listing and good performance by Refractories. |
| | | |
| | b) | The loans to third parties mainly represent the loans to companies and government entity which have business connections with the Company. The amounts are interest-free, unsecured and repayable on demand. |
| | | |
| | | The advances to senior management are mainly for handling sourcing activities and for travel and other expenses in the ordinary course of business. |
| | | |
| | c) | The amounts mainly represent staff drawings for handling sourcing and logistic activities, and those normal operations for the Company in the ordinary course of business. |
13
| China GengSheng Minerals, Inc. |
| Notes to Condensed Consolidated Financial Statements |
| | | | As of | | | As of | |
| | | | June 30, | | | December 31, | |
| | | | 2012 | | | 2011 | |
| | | | (Unaudited) | | | | |
| | | | | | | | |
| | Raw materials | $ | 5,466,893 | | $ | 5,542,691 | |
| | Work-in-progress | | 2,554,272 | | | 619,773 | |
| | Finished goods | | 10,254,204 | | | 10,820,551 | |
| | | | | | | | |
| | | | 18,275,369 | | | 16,983,015 | |
| | Allowance for obsolete inventories | | (26,601 | ) | | (26,433 | ) |
| | | | | | | | |
| | | $ | 18,248,768 | | $ | 16,956,582 | |
No allowance for obsolete inventories was recognized in the cost of goods sold during the six months ended June 30, 2012 and 2011.
| 9. | Deposit for acquisition of a non-consolidated affiliate, net and investment in a non-consolidated affiliate |
| | |
| The Company paid RMB 15 million (equivalent to $2.37 million) in August 2010 to acquire 24.5% equity interest in Yili YiQiang Silicon Limited ("Yili"), a company established in the PRC and engaged in manufacturing and trading of silicon carbide. Due to some unexpected administrative difficulties in the completion of the acquisition, the aforesaid investment amount paid was only recognized as deposit as the ownership, risks and rewards of 24.5% equity interest in Yili had not been transferred to the Company as of December 31, 2011. The acquisition was completed on May 28, 2012 and the deposit was recognized as investment in a non-consolidated affiliate at that date. |
| | |
| The management opined that there was an indication of impairment as the financial position of Yili deteriorated subsequent to the payment of deposit. Based on the impairment review performed by the management with reference to the financial position of Yili as of December 31, 2011, an impairment loss of $1,248,804 was recognized in the consolidated statements of operations and comprehensive loss for the year ended December 31, 2011 as the management assessed the probability of recovering the whole carrying value of the deposit was unlikely. |
| | | | As of | | | As of | |
| | | | June 30, | | | December 31, | |
| | | | 2012 | | | 2011 | |
| | | | (Unaudited) | | | | |
| | | | | | | | |
| | Initial cost | $ | 2,361,000 | | $ | 2,361,000 | |
| | Less: Impairment charge | | (1,248,804 | ) | | (1,248,804 | ) |
| | Translation adjustments | | (20,155 | ) | | (20,155 | ) |
| | | | | | | | |
| | | | 1,092,041 | | | 1,092,041 | |
| | Less: Recognized as investment in a non-consolidated affiliate | | (1,092,041 | ) | | - | |
| | | | | | | | |
| | Net | $ | - | | $ | 1,092,041 | |
14
| China GengSheng Minerals, Inc. |
| Notes to Condensed Consolidated Financial Statements |
| 10. | Intangible assets, net and goodwill, net |
| | | | As of | | | As of | |
| | | | June 30, | | | December 31, | |
| | | | 2012 | | | 2011 | |
| | | | (Unaudited) | | | | |
| | | | | | | | |
| | Unpatented technology (Note 10a) | $ | 396,000 | | $ | 393,500 | |
| | Accumulated amortization | | (77,450 | ) | | (77,450 | ) |
| | Translation adjustments | | (1,750 | ) | | (6,250 | ) |
| | | | | | | | |
| | Net book value | | 316,800 | | | 309,800 | |
| | Less: Impairment charge | | (316,800 | ) | | (309,800 | ) |
| | | | | | | | |
| | Net | $ | - | | $ | - | |
| | | | As of | | | As of | |
| | | | June 30, | | | December 31, | |
| | | | 2012 | | | 2011 | |
| | | | (Unaudited) | | | | |
| | | | | | | | |
| | Goodwill (Note 10b) | $ | 441,089 | | $ | 441,089 | |
| | Less: Impairment charge | | (441,089 | ) | | (441,089 | ) |
| | | | | | | | |
| | Net | $ | - | | $ | - | |
Notes :-
| | a) | During 2007, Refractories entered into a contract with an independent third party to purchase unpatented technology in relation to the production of mortar, at a cash consideration of $342,750. This consideration was mutually agreed between Refractories and such third party and this unpatented technology can be used for an unlimited period of time. Since its acquisition, an annual impairment review was performed by management and it was stated at cost less any impairment losses. In 2011, the expected useful life of the unpatented technology was reviewed and can be used up to 2015. Unpatented technology is stated at cost less any accumulated amortization and any identified impairment losses. Based on the result of the impairment review performed by the management at the end of 2011, the management assessed the probability of recovering the carrying value of the unpatented technology was unlikely and the intangible asset was considered fully impaired. |
| | | |
| | | During the six months ended June 30, 2012 and 2011, the amortization charge was nil and $38,180 respectively. |
| | | |
| | b) | The goodwill was identified upon the acquisition of 100% equity interest in Prefecture, which represented the excess of the purchase price of $875,400 over the fair value of acquired identified net assets of Prefecture of $434,311 at the time of acquisition on June 12, 2008. Since its acquisition, annual impairment reviews have been performed by management. Based on the result of the impairment review performed by the management at the end of 2011, the management assessed the probability of recovering the carrying value of the goodwill was unlikely and the goodwill was considered fully impaired. |
15
| China GengSheng Minerals, Inc. |
| Notes to Condensed Consolidated Financial Statements |
| 11. | Property, plant and equipment, net |
| | | | As of | | | As of | |
| | | | June 30, | | | December 31, | |
| | | | 2012 | | | 2011 | |
| | | | (Unaudited) | | | | |
| | Costs: | | | | | | |
| | Buildings | $ | 24,507,922 | | $ | 24,950,339 | |
| | Plant and machinery | | 15,088,009 | | | 13,712,330 | |
| | Furniture, fixture and equipment | | 1,478,850 | | | 1,411,826 | |
| | Motor vehicles | | 2,077,901 | | | 2,157,474 | |
| | | | | | | | |
| | | | 43,152,682 | | | 42,231,969 | |
| | Accumulated depreciation | | (9,350,797 | ) | | (7,862,270 | ) |
| | Construction in progress | | 3,402,105 | | | 2,795,150 | |
| | | | | | | | |
| | Net | $ | 37,203,990 | | $ | 37,164,849 | |
| | (i) | During the reporting periods, depreciation is included in: |
| | | | Six months ended June 30, | |
| | | | (Unaudited) | |
| | | | 2012 | | | 2011 | |
| | | | | | | | |
| | Cost of goods sold and overhead of inventories | $ | 1,181,401 | | $ | 743,227 | |
| | General and administrative expenses | | 364,029 | | | 296,968 | |
| | | | | | | | |
| | | $ | 1,545,430 | | $ | 1,040,195 | |
| | | During the six months ended June 30, 2012, property, plant and equipment with carrying amounts of $204,449 was disposed of at a consideration of $88,707 to offset trade payable balance, resulting in a loss of $115,742 . During the six months ended June 30, 2011, property, plant and equipment with carrying amounts of $93,905 was disposed of at a consideration of $64,092, resulting in a loss of $29,813. |
| | | |
| | | Capitalized interest for the six months ended June 30, 2012 and 2011 was immaterial. |
| | | |
| | (ii) | Construction in progress |
| | | |
| | | Construction in progress mainly comprises capital expenditure for construction of the Company’s new offices and factories. |
| 12. | Non-interest-bearing loans |
| | |
| The loans represent interest-free and unsecured loans from the Company’s business associates and a government entity and are repayable on demand. |
16
| China GengSheng Minerals, Inc. |
| Notes to Condensed Consolidated Financial Statements |
| 13. | Collateralized short-term bank loans |
| | | | As of | | | As of | |
| | | | June 30, | | | December 31, | |
| | | | 2012 | | | 2011 | |
| | | | (Unaudited) | | | | |
| | | | | | | | |
| | Bank loans wholly repayable within 1 year | $ | 84,570,235 | | $ | 45,974,022 | |
The above bank loans are denominated in RMB and carry average interest rates at 6.86% (2011 : 9.57%) per annum with maturity dates ranging from one months to twelve months.
The bank loans as of June 30, 2012 were secured by the followings:-
| | (a) | Guarantee executed by Mr. Shunqing Zhang, the Chairman and CEO of the Company and a shareholder; |
| | | |
| | (b) | Guarantee executed by business associates (Note 18b) up to the amount of $30,292,000; |
| | | |
| | (c) | Land use rights with carrying amount of $3,119,516; |
| | | |
| | (d) | Bank deposits of $32,772,960 (Note 5); and |
| | | |
| | (e) | Bills receivable of $11,056,795. |
| 14. | Loans from third parties |
| | |
| The loans are interest-bearing at 24% per annum, guaranteed by business associates and repayable no later than August 31, 2012 and September 25, 2012. |
| | |
| 15. | Finance costs |
| | | | Three months ended June 30, | | | Six months ended June 30, | |
| | | | (Unaudited) | | | (Unaudited) | |
| | | | 2012 | | | 2011 | | | 2012 | | | 2011 | |
| | | | | | | | | | | | | | |
| | Interest expenses | $ | 853,622 | | $ | 247,815 | | $ | 1,743,223 | | $ | 1,061,541 | |
| | Bills discounting charges | | 1,096,316 | | | 1,323,552 | | | 1,956,907 | | | 1,475,558 | |
| | | | | | | | | | | | | | |
| | | $ | 1,949,938 | | $ | 1,571,367 | | $ | 3,700,130 | | $ | 2,537,099 | |
| 16. | Income taxes |
| | |
| UNITED STATES |
| | |
| The Company is incorporated in the United States of America (“U.S.”) and is subject to U.S. tax law. No provisions for income taxes have been made as the Company has no U.S. taxable income for reporting periods. The applicable income tax rate for the reporting periods is 34%. The Company has not provided deferred tax on undistributed earnings of its non-U.S. subsidiaries as of June 30, 2012, as it is the Company's current policy to reinvest these earnings in non-U.S. operations. |
17
| China GengSheng Minerals, Inc. |
| Notes to Condensed Consolidated Financial Statements |
| 16. | Income taxes (Cont’d) |
| | |
| BVI |
| | |
| GengSheng International and Smarthigh were incorporated in the BVI and are not subject to income taxes under the current laws of the BVI. |
| | |
| PRC |
| | |
| The PRC’s legislative body, the National People’s Congress, adopted the unified Corporate Income Tax Law (“CIT Law”) on March 16, 2007. This new tax law replaces the then separate income tax laws for domestic enterprises and foreign-invested enterprises and became effective on January 1, 2008. Under the new tax law, a unified income tax rate is set at 25% for both domestic enterprises and foreign-invested enterprises. However, there will be a transition period for enterprises, whether foreign-invested or domestic, that are currently receiving preferential tax treatments granted by relevant tax authorities. Enterprises that are subject to an enterprise income tax rate lower than 25% may continue to enjoy the lower rate and will transit into the new tax rate over a five year period beginning on the effective date of the CIT Law. Enterprises that are currently entitled to exemptions for a fixed term will continue to enjoy such treatment until the exemption term expires. Preferential tax treatment will continue to be granted to industries and projects that qualify for such preferential treatments under the new tax law. |
| | |
| Pursuant to the income tax rules and regulations of the PRC, provision for PRC income tax of the PRC subsidiaries is calculated based on the following rates : - |
| | | | | | | Period ended June 30, | |
| | | | Note | | | 2012 | | | 2011 | |
| | | | | | | | | | | |
| | Refractories | | (a) | | | 15% | | | 15% | |
| | High-Temperature | | (a) | | | 15% | | | 25% | |
| | Duesail | | (a) | | | 12.5% | | | 12.5% | |
| | Prefecture | | | | | 25% | | | 25% | |
| | Micronized | | | | | 25% | | | 25% | |
| | Yuxing | | | | | 25% | | | N/A | |
Note :-
| | (a) | Entities entitled to a tax holiday in which they are fully exempted from the PRC enterprise income tax for 2 years starting from their first profit-making year after netting off accumulated tax losses, followed by a 50% reduction in the PRC enterprise income tax for the next 3 years (“tax holidays”). Any unutilised tax holidays will continue until expiry while tax holidays were deemed to start from January 1, 2008, even if the entity was not yet making profit after netting off its accumulated tax losses. Duesail is in the fifth year of tax holidays in 2012. Refractories was in the fifth year of tax holidays in 2009 and starting from the fiscal year 2010, Refractories is subject to enterprise income tax at unified rate of 15% for three years due to its engagement in an advanced technology industry and has passed the inspection of the provincial high-tech item. The relevant authority granted it a certificate during 2008 and renewed it during 2011. Starting from the fiscal year 2011, High-Temperature is subject to enterprise income tax at unified rate of 15% for three years due to its engagement in an advanced technology industry. The relevant authority granted it a certificate during 2011. |
In July 2006, the FASB issued ASC 740-10-25. This interpretation requires recognition and measurement of uncertain income tax positions using a “more-likely-than-not” approach. The Company adopted this ASC 740-10-25 on January 1, 2007. Under the new CIT Law which became effective on January 1, 2008, the Company may be deemed to be a resident enterprise by the PRC tax authorities. If the Company was deemed to be resident enterprise, the Company may be subject to the CIT at 25% on the worldwide taxable income and dividends paid from the PRC subsidiaries to their overseas holding companies may be exempted from 10% PRC withholding tax. Except for certain immaterial interest income from bank deposits placed with financial institutions outside the PRC, all of the Company’s income is generated from the PRC operations. Given the immaterial amount of income generated from outside the PRC and the PRC subsidiaries do not intend to pay dividends for the foreseeable future, the management considers that the impact arising from resident enterprise on the Company’s financial position is not significant. The management evaluated the Company's tax positions and considered no provision for uncertainty in income taxes is necessary as of June 30, 2012 and December 31, 2011.
18
| China GengSheng Minerals, Inc. |
| Notes to Condensed Consolidated Financial Statements |
| 17. | Loss per share |
| | | |
| During the reporting periods, all the potential dilutive shares were not included in the computation of diluted loss per share because they were anti-dilutive. Accordingly, the basic and diluted loss per share are the same. |
| | | |
| 18. | Commitments and contingencies |
| | | |
| (a) | The Company’s operations are subject to the laws and regulations in the PRC relating to the generation, storage, handling, emission, transportation and discharge of certain materials, substances and waste into the environment, and various other health and safety matters. Governmental authorities have the power to enforce compliance with their regulations, and violators may be subject to fines, injunctions or both. The Company must devote substantial financial resources to ensure compliance and believes that it is in substantial compliance with all the applicable laws and regulations. |
| | | |
| | The Company is currently not involved in any environmental remediation and has not accrued any amounts for environmental remediation relating to its operations. Under existing legislation, management believes that there are no probable liabilities that will have a material adverse effect on the financial position, operating results or cash flows of the Company. |
| | | |
| (b) | The Company guaranteed the following debts of third parties, which is summarized as follows:- |
| | | | As of | | | As of | |
| | | | June 30, | | | December 31, | |
| | | | 2012 | | | 2011 | |
| | | | (Unaudited) | | | | |
| | | | | | | | |
| | Guaranteed amount | $ | 43,797,600 | | $ | 41,317,500 | |
In 2010, the Company, in accordance with ASC 460, commenced to recognize the liability arising from guarantees given for the debts granted to third parties by financial institutions.
An analysis of the guarantee liability is as follows:
| | | | Six months | | | | |
| | | | ended | | | Year ended | |
| | | | June 30, | | | December 31, | |
| | | | 2012 | | | 2011 | |
| | | | (Unaudited) | | | | |
| | | | | | | | |
| | Balance at beginning of period/year | $ | 309,858 | | $ | 392,978 | |
| | Recognized as expenses for the period/year | | 236,808 | | | 518,141 | |
| | Recognized as income for the period/year | | (301,286 | ) | | (614,472 | ) |
| | Translation adjustments | | 1,968 | | | 13,211 | |
| | | | | | | | |
| | Balance at end of period/year | $ | 247,348 | | $ | 309,858 | |
The fair value of such guarantees is determined by reference to fees charged in an arm’s length transaction for similar services.
19
| China GengSheng Minerals, Inc. |
| Notes to Condensed Consolidated Financial Statements |
| 18. | Commitments and contingencies (Cont’d) |
Guarantees as of June 30, 2012 are further analyzed as below:-
| | | | | | | | | | | | | | | Principal | | | Outstanding | | | Outstanding | | | | |
| | | Term loan | | | | | | Interest | | | | | | repaid up to | | | as of | | | interest as of | | | Estimated | |
| | | draw down | | | | | | rate (per | | | Loan | | | June 30, | | | June 30, | | | June 30, | | | maximum | |
| Guarantee | | date | | | Expiry date | | | annum) | | | principal | | | 2012 | | | 2012 | | | 2012 | | | exposure | |
| | | | | | | | | | | | | | | | | | | | | | | | | |
| | | | | | | | | | | | | | | | | | | | | | | | | |
| Local government | | | | | | | | | | | | | | | | | | | | | | | | |
| authorities and their | | | | | | | | | | | | | | | | | | | | | | | | |
| controlled entity | | | | | | | | | | | | | | | | | | | | | | | | |
| (Note i) | | | | | | | | | | | | | | | | | | | | | | | | |
| | | 12/30/2009 | | | 12/29/2012 | | | 7.56% | | $ | 7,920,000 | | $ | - | | $ | 7,920,000 | | $ | 313,320 | | $ | 8,233,320 | |
| | | | | | | | | | | | | | | | | | | | | | | | | |
| Business associates | | | | | | | | | | | | | | | | | | | | | | | | |
| (Note ii) | | 7/18/2011 | | | 7/17/2012 | | | 7.216% | | | 1,584,000 | | | - | | | 1,584,000 | | | 8,142 | | | 1,592,142 | |
| | | 8/22/2011 | | | 8/21/2012 | | | 8.528% | | | 712,800 | | | - | | | 712,800 | | | 10,326 | | | 723,126 | |
| | | 9/2/2011 | | | 8/31/2012 | | | 6.559% | | | 316,800 | | | - | | | 316,800 | | | 4,042 | | | 320,842 | |
| | | 9/19/2011 | | | 9/18/2012 | | | 6.560% | | | 3,168,000 | | | - | | | 3,168,000 | | | 50,674 | | | 3,218,674 | |
| | | 9/20/2011 | | | 9/19/2012 | | | 7.216% | | | 3,168,000 | | | - | | | 3,168,000 | | | 56,368 | | | 3,224,368 | |
| | | 10/8/2011 | | | 10/7/2012 | | | 8.420% | | | 792,000 | | | - | | | 792,000 | | | 19,732 | | | 811,732 | |
| | | 10/27/2011 | | | 10/26/2012 | | | 6.560% | | | 3,168,000 | | | - | | | 3,168,000 | | | 72,310 | | | 3,240,310 | |
| | | 11/25/2011 | | | 11/24/2012 | | | 6.560% | | | 3,168,000 | | | - | | | 3,168,000 | | | 88,253 | | | 3,256,253 | |
| | | 12/22/2011 | | | 12/21/2012 | | | 6.560% | | | 3,168,000 | | | - | | | 3,168,000 | | | 104,195 | | | 3,272,195 | |
| | | 1/12/2012 | | | 1/11/2013 | | | 6.588% | | | 7,920,000 | | | - | | | 7,920,000 | | | 291,619 | | | 8,211,619 | |
| | | 2/29/2012 | | | 8/9/2012 | | | 0% | | | 792,000 | | | - | | | 792,000 | | | - | | | 792,000 | |
| | | 3/6/2012 | | | 3/5/2013 | | | 7.216% | | | 2,059,200 | | | - | | | 2,059,200 | | | 105,032 | | | 2,164,232 | |
| | | 6/5/2012 | | | 6/4/2013 | | | 8.528% | | | 4,752,000 | | | - | | | 4,752,000 | | | 387,486 | | | 5,139,486 | |
| | | 6/16/2012 | | | 12/15/2012 | | | 8.528% | | | 316,800 | | | - | | | 316,800 | | | 13,101 | | | 329,901 | |
| | | 6/29/2012 | | | 6/26/2013 | | | 12.096% | | | 792,000 | | | - | | | 792,000 | | | 95,800 | | | 887,800 | |
| | | | | | | | | | | | | | | | | | | | | | | | | |
| | | | | | | | | | | $ | 43,797,600 | | $ | - | | $ | 43,797,600 | | $ | 1,620,400 | | $ | 45,418,000 | |
Notes:-
| | i) | To maintain a good relationship with the local government of Gongyi City, the Company has been so requested to act as guarantor for bank loans granted to certain local government authorities and their controlled entity. |
| | | |
| | ii) | During the period, the Company has acted as guarantor for bank loans and bank acceptance bill granted to certain business associates. Certain of these associates also provided guarantees for bank loans to the Company (Note 13). None of our directors, director nominees or executive officers is involved in normal operation or investing in the business of the guaranteed business associates. All the business associates have a healthy record to pay back loans and bank acceptance bill on a timely manner, in the People’s Bank of China’s (Central Bank of China) credit rating system. |
All the above guarantees have no recourse provision that would enable the Company to recover from third parties of any amounts paid under the guarantees and any assets held either as collateral or by third parties that the Company can obtain or liquidate to recover all or a portion of the amounts paid under the guarantees.
If the third parties fail to perform under their contractual obligation, the Company will make future payments including the contractual principal amounts, related interest and penalties.
| | (c) | As of June 30, 2012, the Company had capital commitments of $1,161,360 in respect of the acquisition of land use right; $1,066,931 in respect of the construction of new office buildings and workshops; and $588,873 in respect of the purchase of machinery, which were not contracted for and provided in these financial statements. |
20
| China GengSheng Minerals, Inc. |
| Notes to Condensed Consolidated Financial Statements |
| 18. | Commitments and contingencies (Cont’d) |
| | | |
| (d) | In accordance with the PRC tax regulations, the Company’s sales are subject to value added tax (“VAT”) at 17% upon the issuance of VAT invoices to its customers. When preparing these condensed consolidated financial statements, the Company recognized revenue when the significant risks and rewards of ownership have been transferred to the buyer at the time when the products are delivered to and accepted by customers, and made full tax provision in accordance with relevant national and local laws and regulations of the PRC. |
| | | |
| | The Company follows the practice of reporting its revenue for PRC tax purposes when invoices are issued. In the local statutory financial statements prepared under PRC GAAP, the Company recognized revenue on an “invoice basis” instead of when the significant risks and rewards of ownership have been transferred to the buyer at the time when the products are delivered to and accepted by customers. Accordingly, despite the fact that the Company has made full tax provision in the condensed consolidated financial statements, the Company may be subject to a penalty for the deferred reporting of tax obligations. The exact amount of penalty cannot be estimated with any reasonable degree of certainty. The management considers it is very unlikely that the tax penalty will be imposed. |
| | | |
| 19. | Defined contribution plan |
| | | |
| The Company has a defined contribution plan for all qualified employees in the PRC. The employer and its employees are each required to make contributions to the plan at the rates specified in the plan. The only obligation of the Company with respect to the retirement plan is to make the required contributions under the plan. No forfeited contribution is available to reduce the contribution payable in the future years. The defined contribution plan contributions were charged to the condensed consolidated statements of operations and comprehensive loss. The Company contributed $213,075 and $215,052 for the six months ended June 30, 2012 and 2011, respectively. |
| | | |
| 20. | Segment information |
| | | |
| The Company uses the “management approach” in determining reportable operating segments. The management approach considers the internal organization and reporting used by the Company's chief operating decision maker for making operating decisions and assessing performance as the source for determining the Company's reportable segments. Management, including the chief operating decision maker, reviews operating results solely by the revenue of monolithic refractory products, industrial ceramic products, fracture proppant products, fine precision abrasives and operating results of the Company. As such, the Company has determined that it has four operating segments as defined by ASC 280, “Segment Reporting”: refractories, industrial ceramic, fracture proppant and fine precision abrasives. |
| | | |
| Adjustments and eliminations of inter-company transactions were not included in determining segment (loss) profit, as they are not used by the chief operating decision maker. |
| | | |
| Three months ended June 30, (Unaudited) |
| | | Refractories | | | Industrial ceramic | | | Fracture proppant | | | Fine precision abrasives | | | Total | |
| | | 2012 | | | 2011 | | | 2012 | | | 2011 | | | 2012 | | | 2011 | | | 2012 | | | 2011 | | | 2012 | | | 2011 | |
| | | | | | | | | | | | | | | | | | | | | | | | | | | | | | | |
| Revenue from external customers | $ | 11,616,165 | | $ | 12,544,952 | | $ | 529,519 | | $ | 492,443 | | $ | 4,220,857 | | $ | 5,936,034 | | $ | 3,253,674 | | $ | 1,462,493 | | $ | 19,620,215 | | $ | 20,435,922 | |
| | | | | | | | | | | | | | | | | | | | | | | | | | | | | | | |
| Segment (loss) profit | $ | (1,567,820 | ) | $ | (915,604 | ) | $ | (112,835 | ) | $ | (51,008 | ) | $ | (114,779 | ) | $ | 132,931 | | $ | (1,679,410 | ) | $ | 33,610 | | $ | (3,474,844 | ) | $ | (800,071 | ) |
21
| China GengSheng Minerals, Inc. |
| Notes to Condensed Consolidated Financial Statements |
| 20. | Segment information (Cont'd) |
Six months ended June 30, (Unaudited)
| | | Refractories | | | Industrial ceramic | | | Fracture proppant | | | Fine precision abrasives | | | Total | |
| | | 2012 | | | 2011 | | | 2012 | | | 2011 | | | 2012 | | | 2011 | | | 2012 | | | 2011 | | | 2012 | | | 2011 | |
| | | | | | | | | | | | | | | | | | | | | | | | | | | | | | | |
| Revenue from external customers | $ | 21,557,792 | | $ | 22,479,878 | | $ | 860,798 | | $ | 722,045 | | $ | 5,219,202 | | $ | 11,135,889 | | $ | 5,693,086 | | $ | 2,281,939 | | $ | 33,330,878 | | $ | 36,619,751 | |
| | | | | | | | | | | | | | | | | | | | | | | | | | | | | | | |
| Segment (loss) profit | $ | (2,633,348 | ) | $ | (1,469,391 | ) | $ | (463,805 | ) | $ | (105,847 | ) | $ | (643,853 | ) | $ | 693,199 | | $ | (2,518,970 | ) | $ | (123,599 | ) | $ | (6,259,976 | ) | $ | (1,005,638 | ) |
| | | As of | | | As of | | | As of | | | As of | | | As of | | | As of | | | As of | | | As of | | | As of | | | As of | |
| | | June 30, | | | December | | | June 30, | | | December | | | June 30, | | | December | | | June 30, | | | December | | | June 30, | | | December | |
| | | 2012 | | | 31, 2011 | | | 2012 | | | 31, 2011 | | | 2012 | | | 31, 2011 | | | 2012 | | | 31, 2011 | | | 2012 | | | 31, 2011 | |
| | | (Unaudited) | | | | | | (Unaudited) | | | | | | (Unaudited) | | | | | | (Unaudited) | | | | | | (Unaudited) | | | | |
| | | | | | | | | | | | | | | | | | | | | | | | | | | | | | | |
| Segment assets | $ | 90,215,103 | | $ | 82,480,900 | | $ | 3,589,044 | | $ | 3,677,127 | | $ | 47,752,858 | | $ | 32,048,852 | | $ | 34,891,822 | | $ | 26,954,762 | | $ | 176,448,827 | | $ | 145,161,641 | |
Segment information by products for the three months ended June 30, 2012 and 2011
| | | | | | | | | | | | | | | | | | | | | | | | Fine | | | | |
| | | Monolithic | | | | | | Pre-cast | | | Ceramic | | | Ceramic | | | Wearable | | | Fracture | | | precision | | | | |
| | | materials1 | | | Mortar | | | roofs | | | tubes2 | | | cylinders3 | | | ceramic valves | | | proppant | | | abrasives | | | Total | |
| | |
| Three months ended June 30, 2012 (Unaudited) | |
| Revenue | $ | 6,959,840 | | $ | 9,438 | | $ | 4,646,887 | | $ | 377,538 | | $ | 147,029 | | $ | 4,952 | | $ | 4,220,857 | | $ | 3,253,674 | | $ | 19,620,215 | |
| | |
| Three months ended June 30, 2011 (Unaudited) | |
| Revenue | $ | 7,601,630 | | $ | 279,013 | | $ | 4,664,310 | | $ | 334,239 | | $ | 156,882 | | $ | 1,321 | | $ | 5,936,034 | | $ | 1,462,493 | | $ | 20,435,922 | |
Segment information by products for the six months ended June 30, 2012 and 2011
| | | | | | | | | | | | | | | | | | | | | | | | Fine | | | | |
| | | Monolithic | | | | | | Pre-cast | | | Ceramic | | | Ceramic | | | Wearable | | | Fracture | | | precision | | | | |
| | | materials1 | | | Mortar | | | roofs | | | tubes2 | | | cylinders3 | | | ceramic valves | | | proppant | | | abrasives | | | Total | |
| | |
| Six months ended June 30, 2012 (Unaudited) | |
| Revenue | $ | 12,773,831 | | $ | 36,228 | | $ | 8,747,733 | | $ | 694,173 | | $ | 155,649 | | $ | 10,976 | | $ | 5,219,202 | | $ | 5,693,086 | | $ | 33,330,878 | |
| | |
| Six months ended June 30, 2011 (Unaudited) | |
| Revenue | $ | 12,898,420 | | $ | 279,013 | | $ | 9,302,445 | | $ | 334,239 | | $ | 381,738 | | $ | 6,068 | | $ | 11,135,889 | | $ | 2,281,939 | | $ | 36,619,751 | |
1Castable, coating, and dry mix materials & low-cement and non-cement castables generally refer as Monolithic materials.
2Ceramic plates, tubes, elbows, and rollers generally refer as Ceramic tubes.
3Ceramic cylindsers and plugs comprehensively refer to Ceramic cylinders.
22
| China GengSheng Minerals, Inc. |
| Notes to Condensed Consolidated Financial Statements |
| 20. | Segment information (Cont'd) |
Reconciliation is provided for unallocated amounts relating to corporate operations which are not included in the segment information.
| | | | Three months ended June 30, | | | Six months ended June 30, | |
| | | | (Unaudited) | | | (Unaudited) | |
| | | | 2012 | | | 2011 | | | 2012 | | | 2011 | |
| | | | | | | | | | | | | | |
| | Total consolidated revenue | $ | 19,620,215 | | $ | 20,435,922 | | $ | 33,330,878 | | $ | 36,619,751 | |
| | | | | | | | | | | | | | |
| | Total loss for reportable segments | $ | (3,474,844 | ) | $ | (800,071 | ) | $ | (6,259,976 | ) | $ | (1,005,638 | ) |
| | Unallocated amounts relating to operations: | | | | | | | | | | | | |
| | General and administrative expenses | | (97,138 | ) | | - | | | (250,101 | ) | | (4,047 | ) |
| | Other income | | (31,809 | ) | | 757,908 | | | (31,647 | ) | | 1,017,908 | |
| | | | | | | | | | | | | | |
| | (Loss) income before income taxes and noncontrolling interest | $ | (3,603,791 | ) | $ | (42,163 | ) | $ | (6,541,724 | ) | $ | 8,223 | |
| | | | As of | | | As of | |
| | | | June 30, | | | December 31, | |
| | | | 2012 | | | 2011 | |
| | | | (Unaudited) | | | | |
| | Assets | | | | | | |
| | | | | | | | |
| | Total assets for reportable segments | $ | 176,448,827 | | $ | 145,161,641 | |
| | Other receivables | | 632,558 | | | 430,558 | |
| | Cash and cash equivalents | | 1,867,130 | | | 2,377,587 | |
| | | | | | | | |
| | | $ | 178,948,515 | | $ | 147,969,786 | |
All of the Company's long-lived assets are located in the PRC. Geographic information about the revenues, which are classified based on customers, is set out as follows:
| | | | Three months ended June 30, | | | Six months ended June 30, | |
| | | | (Unaudited) | | | (Unaudited) | |
| | | | 2012 | | | 2011 | | | 2012 | | | 2011 | |
| | | | | | | | | | | | | | |
| | PRC | $ | 19,099,190 | | $ | 17,063,408 | | $ | 32,533,643 | | $ | 30,313,507 | |
| | United States | | 58,148 | | | 2,745,380 | | | 82,671 | | | 5,474,481 | |
| | Others | | 462,877 | | | 627,134 | | | 714,564 | | | 831,763 | |
| | | | | | | | | | | | | | |
| | Total | $ | 19,620,215 | | $ | 20,435,922 | | $ | 33,330,878 | | $ | 36,619,751 | |
23
| China GengSheng Minerals, Inc. |
| Notes to Condensed Consolidated Financial Statements |
| 21. | Related party transactions |
| | |
| Apart from the information as disclosed in elsewhere in the condensed consolidated financial statements, the Company had no material transactions carried out with related parties during the reporting periods. |
| | |
| 22. | 2011 Stock Incentive Plan (the “2011 Plan”) |
| | |
| At the annual meeting of stockholders of the Company held on September 28, 2011, the Company’s stockholders approved the 2011 Plan. The 2011 Plan authorized the Company to grant equity awards to directors, employees (including executive officers), consultants and other service providers, as more fully described and summarized in the Company’s Proxy Statement, which was included in the Schedule 14A filed with the Securities and Exchange Commission on August 15, 2011. |
| | |
| No awards were granted during the six months ended June 30, 2012. |
| | |
| 23. | Subsequent events |
| | |
| The Company evaluated all events or transactions that occurred through the date the condensed consolidated financial statements were issued and determined that there is no material recognizable or subsequent events or transactions which would require recognition or disclosure in the condensed consolidated financial statements. |
24
ITEM 2. MANAGEMENT’S DISCUSSION AND ANALYSIS OF FINANCIAL CONDITION AND RESULTS OF OPERATIONS.
Forward-Looking Statements:
The following discussion of the financial condition and results of operations should be read in conjunction with the consolidated financial statements and related notes thereto. The following discussion contains forward-looking statements. Unless the context requires otherwise, references to “we”, “us”, “our”, “the Registrant”, or the “Company” refer to China GengSheng Minerals, Inc. and its subsidiaries. The words or phrases “would be,” “will allow,” “expect to,” “intends to,” “will likely result,” “are expected to,” “will continue,” “is anticipated,” “estimate,” or similar expressions are intended to identify forward-looking statements. Such statements include those concerning our expected financial performance, our corporate strategy and operational plans. Actual results could differ materially from those projected in the forward-looking statements as a result of a number of risks and uncertainties, including: (a) those risks and uncertainties related to general economic conditions in China, including regulatory factors that may affect such economic conditions; (b) whether we are able to manage our planned growth efficiently and operate profitable operations, including whether our management will be able to identify, hire, train, retain, motivate and manage required personnel or that management will be able to successfully manage and exploit existing and potential market opportunities; (c) whether we are able to generate sufficient revenues or obtain financing to sustain and grow our operations; and (d) whether we are able to successfully fulfill our primary requirements for cash which are explained below under “Liquidity and Capital Resources.” Unless otherwise required by applicable law, we do not undertake, and we specifically disclaim any obligation, to update any forward-looking statements to reflect occurrences, developments, unanticipated events or circumstances after the date of such statement.
Conventions
In this Form 10-Q, unless indicated otherwise, references to:
“China GengSheng Minerals”, “we”, “us”, “our”, the “Registrant” or the “Company” refer to the combined business of China GengSheng Minerals, Inc., a Nevada corporation (formerly, China Minerals Technologies, Inc.) and its wholly-owned BVI subsidiary, GengSheng International Corporation, or GengSheng International, and GengSheng International’s wholly-owned Chinese subsidiary, Zhengzhou Duesail Fracture Proppant Co. Ltd., or Duesail, and Duesail’s wholly-owned subsidiary, Henan Yuxing Proppant Co., Ltd., or Yuxing and GengSheng International’s wholly-owned Chinese subsidiary, Henan GengSheng Refractories Co., Ltd., or Refractories, and Refractories’s majority-owned subsidiary, Henan GengSheng High-Temperature Materials Co., Ltd., or High Temperature, and Refractories’s wholly-owned subsidiary, Henan GengSheng Micronized Powder Materials Co., Ltd., or Micronized, and Henan GengSheng's wholly-owned subsidiary, GengSheng Shunda New Materials Co., Ltd, Southeast Prefecture, Guizhou or Shunda;
“Powersmart” or “GengSheng International” refer to GengSheng International Corporation, a BVI company (formerly, Powersmart Holdings Limited) that is wholly-owned by China GengSheng Minerals;
“Securities Act” refers to the Securities Act of 1933, as amended, and “Exchange Act” refer to Securities Exchange Act of 1934, as amended;
“China” and “PRC” refer to the People's Republic of China, and “BVI” refers to the British Virgin Islands;
“RMB” refers to Renminbi, the legal currency of China; and
“U.S. dollar,” “$” and “US$” refers to the legal currency of the United States. For all U.S. dollar amounts reported, the dollar amount has been calculated on the basis that RMB1 = $0.1574 for its December 31, 2011 audited balance sheet, and RMB1 = $0.1584 for its June 30, 2012 unaudited balance sheet, which were determined based on the currency conversion rate at the end of each respective period. The conversion rates of RMB1 = $0.1584 is used for the condensed consolidated statement of income and comprehensive income and consolidated statement of cash flows for the second quarter of 2012, and RMB1 = $0.15272 is used for the condensed consolidated statement of income and comprehensive income and consolidated statement of cash flows for the second quarter of 2011; both of which were based on the average currency conversion rate for each respective quarter.
Overview of Company
We are a Nevada holding company operating in the materials technology industry through our subsidiaries in China. We develop, manufacture and sell a broad range of mineral-based, heat-resistant products capable of withstanding high temperatures, saving energy and boosting productivity in industries such as steel and oil. Our products include refractory products, industrial ceramics, fracture proppants and fine precision abrasives.
Currently, we conduct our operations in China through our wholly owned subsidiaries, Henan GengSheng Refractories Co., Ltd. (“Refractories”), Zhengzhou Duesail Fracture Proppant Co., Ltd. (“Duesail”), Henan GengSheng Micronized Powder Materials Co., Ltd. (“Micronized”), Guizhou Southeast Prefecture GengSheng New Materials Co., Ltd. (“Prefecture”) and Henan Yuxing Proppant Co., Ltd., (“Yuxing”), and through our majority owned subsidiary, Henan GengSheng High-Temperature Materials Co., Ltd. (“High-Temperature”). Through our wholly owned BVI subsidiary, GengSheng International, and its wholly owned Chinese subsidiary, Refractories, which has an annual production capacity of approximately 127,000 tons, we manufacture refractories products. We manufacture fracture proppant products through Duesail, which has an annual production capacity of approximately 66,000 tons, and Yuxing, which has designed annual production capacity of approximately 60,000 tons. We manufacture fine precision abrasives products through Micronized, which has designed annual production capacity of approximately 22,000 tons. Through our majority owned subsidiary, High-Temperature, which has an annual production capacity of approximately 150,000 units, we manufacture industrial and functional ceramic products.
25
We sell our products to over 170 customers in the iron, steel, oil, glass, cement, aluminum, chemical and solar industries located in China and other countries in Asia, Europe and North America. Our refractory customers are companies in the steel, iron, petroleum, chemical, coal, glass and mining industries. Our fracture proppant products are sold to oil and gas companies. Our industrial ceramics are used in the utilities and petrochemical industries. Our fine precision abrasives are marketed to solar companies and optical equipment manufacturers. Our largest customers, measured by percentage of our revenue, mainly operate in the steel industry and oil industry. Currently, most of our revenues are derived from the sale of our monolithic refractory products and fracture proppants products to customers in China.
Our principal executive offices are located at No. 88 Gengsheng Road, Dayugou Town, Gongyi, Henan, People’s Republic of China 451271 and our telephone number is (86) 371-6405-9863.
Corporate Structure
We conduct our operations in China through our wholly owned subsidiaries Refractories, Duesail, Yuxing, Micronized and Prefecture and through our majority owned subsidiary, High-Temperature.
The following chart reflects our organizational structure as of the date of this report.
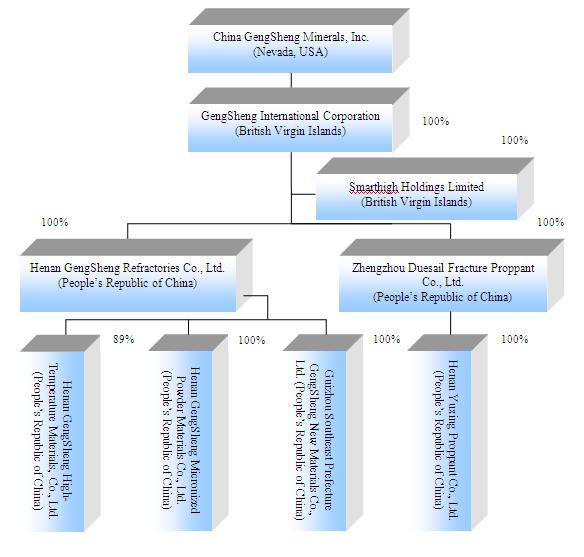
26
Corporate History
We were originally incorporated under the laws of the State of Washington, on November 13, 1947, under the name Silver Mountain Mining Company. From our inception until 2001, we operated various unpatented mining claims and deeded mineral rights in the State of Washington, but we abandoned these operations entirely by 2001. On August 15, 2006, we changed our domicile from Washington to Nevada when we merged with and into Point Acquisition Corporation, a Nevada corporation. From about 2001 until our reverse acquisition of Powersmart on April 25, 2007, which is discussed in the next section entitled "Acquisition of Powersmart and Related Financing", we were a blank check company and had no active business operations. On June 11, 2007, we changed our corporate name from "Point Acquisition Corporation" to "China Minerals Technologies, Inc." and subsequently changed our name again to "China GengSheng Minerals, Inc." on July 26, 2007.
Acquisition of Powersmart and Related Financing
On April 25, 2007, we completed a reverse acquisition transaction through a share exchange with Powersmart Holdings Limited whereby we issued to the sole shareholder of Powersmart Holdings Limited, Shunqing Zhang, 16,887,815 shares of China GengSheng Minerals, Inc. common stock, in exchange for all of the issued and outstanding capital stock of Powersmart Holdings Limited. By this transaction, Powersmart Holdings Limited became our wholly owned subsidiary and Mr. Zhang became our controlling stockholder.
On April 25, 2007, we also completed a private placement financing transaction pursuant to which we issued and sold 5,347,594 shares of our common stock to certain accredited investors for $10 million in gross proceeds. In connection with this private placement, we paid a fee of $683,618 to Brean Murray Carret & Co., LL, or Brean Murray, and Civilian Capital, Inc. for services as placement agents for the private placement. We also issued to Brean Murray Carret & Co., LLC and Civilian Capital, Inc. warrants for the purchase of 374,331 shares of our common stock in the aggregate. The warrants are immediately exercisable, have piggyback registration rights and have a three-year term, expiring on April 26, 2010. On March 10, 2010, Brean Murray Carret & Co., LLC exercised the warrant cashlessly, which was converted to 108,349 shares of the Corporation’s common stock, and on April 21, 2010, Civilian Capital, Inc. exercised the warrant cashlessly, which was converted to 27,869 shares of the Corporation’s common stock.
Also, on April 25, 2007, our majority stockholder, Shunqing Zhang, entered into an escrow agreement with the private placement investors, pursuant to which, Mr. Zhang agreed to deposit in an escrow account a total of 2,673,796 shares of the Company's common stock owned by him, to be held for the benefit of the investors. Mr. Zhang agreed that if the Company did not attain a minimum after-tax net income threshold of $8,200,000 for the fiscal year ended December 31, 2007 and $13,500,000 for the fiscal year ended December 31, 2008, the escrow agent may deliver his escrowed shares to the investors, based upon a pre-defined formula agreed to between the investors and Mr. Zhang. However, if the after-tax net income threshold is met, the shares in escrow will be returned to Mr. Zhang. In addition, on April 25, 2007, Mr. Zhang entered into a similar escrow agreement with HFG International, Limited. Under such agreement, Mr. Zhang placed into escrow a total of 638,338 shares of the Company's common stock to cover the same minimum net income thresholds as described above with respect to the investor make-good. Similarly, if the thresholds were not achieved in either year, the escrow agent must release certain amounts of the make-good shares that were put into escrow. We met the after-tax net income threshold of $8,200,000 for the fiscal year ended December 31, 2007 and the pro rata shares in escrow were returned to Mr. Zhang, while we did not meet the after-tax net income threshold of $13,500,000 for the fiscal year ended December 31, 2008, and the pro rata shares in escrow were transferred to the investors on March 8, 2010.
On January 4, 2011, the Company and certain institutional investors entered into a securities purchase agreement pursuant to which the Company sold to such investors an aggregate of 2,500,000 shares of common stock at a price of $4.00 per share for aggregate gross proceeds to the Company of $10,000,000. Each purchaser received warrants, exercisable for $4.00 per share for the six-month period beginning July 10, 2011 and ending January 11, 2012, to purchase 40% of the shares of common stock purchased by the purchaser in the offering. The net proceeds from the offering was approximately $9,350,000. The Company paid an aggregate fee equal to 5.5% of the gross proceeds received to Rodman & Renshaw, LLC for services as placement agent. The shares of common stock, warrants to purchase common stock and shares of common stock issuable upon exercise of the investor warrants were issued pursuant to a prospectus supplement dated as of January 10, 2011, which was filed with the Securities and Exchange Commission in connection with a takedown from the Company’s shelf registration statement on Form S-3 (File No. 333-165486), which became effective on April 28, 2010, and the base prospectus dated as of April 28, 2010 contained in such registration statement.
27
Our Products
The following table set forth sales information about our product mix in each of the second quarter of 2012 and 2011, and the first six months of 2012 and 2011.
(All amounts, other than percentages, in thousands of U.S. dollars)
| | | Three Months Ended June 30 | | | Six Months Ended June 30 | |
| | | 2012 | | | 2011 | | | 2012 | | | 2011 | |
| | | | | | Percentage | | | | | | Percentage | | | | | | Percentage | | | | | | Percentage | |
| | | Revenue | | | of net | | | Revenue | | | of net | | | Revenue | | | of net | | | Revenue | | | of net | |
| | | | | | revenues | | | | | | revenues | | | | | | revenues | | | | | | revenues | |
| | | | | | | | | | | | | | | | | | | | | | | | | |
| Refractories | $ | 11,616 | | | 59.2% | | $ | 12,545 | | | 61.4% | | $ | 21,558 | | | 64.7% | | $ | 22,480 | | | 61.4% | |
| Industrial Ceramics | | 529 | | | 2.7% | | | 492 | | | 2.4% | | | 861 | | | 2.5% | | | 722 | | | 2.0% | |
| Fracture Proppants | | 4,221 | | | 21.5% | | | 5,936 | | | 29.0% | | | 5,219 | | | 15.7% | | | 11,136 | | | 30.4% | |
| Fine Precision Abrasive | | 3,254 | | | 16.6% | | | 1,463 | | | 7.2% | | | 5,693 | | | 17.1% | | | 2,282 | | | 6.2% | |
| | $ | 19,620 | | | 100.0% | | $ | 20,436 | | | 100.0% | | $ | 33,331 | | | 100.0% | | $ | 36,620 | | | 100.0% | |
Refractories
Our largest product segment is the refractories segment, which accounted for approximately 59.2% of total revenue in the second quarter of 2012. Our refractory products have high-temperature resistant qualities and can function under thermal stress that is common in many heavy industrial production environments. Because of their unique high-temperature resistant qualities, the refractory products are used as linings and key components in many industrial furnaces, such as steel production furnaces, ladles, vessels, and other high-temperature processing machines that must operate at high temperatures for a long period of time without interruption. The majority of our customers are in the iron, steel, cement, chemical, coal, glass, petro-chemical and nonferrous industries.
We provide a customized solution for each order of our monolithic refractory materials based on customer-specific formulas. Upon delivery to customers, the monolithic materials are applied to the inner surfaces of our customers’ furnaces, ladles or other vessels to improve the productivity of that equipment. The product benefits our customers as it lowers the overall cost of production and improves financial performance. The reasons that the monolithic materials can help our customers improve productivity, lower production costs and achieve stronger financial performance include the following: (i) monolithic refractory castables can be cast into complex shapes which are unavailable or difficult to achieve by alternative products such as shaped bricks; (ii) monolithic refractory linings can be repaired, and in some cases, even reinstalled, without furnace cool-down periods or steel-production interruptions, and therefore improve the steel makers’ productivity; (iii) monolithic refractories can form an integral surface without joints, enhancing resistance to penetration, impact and erosion, and thereby improving the equipment’s operational safety and extending their useful service lives; (iv) monolithic refractories can be installed by specialty equipment either automatically or manually, thus saving construction and maintenance time as well as costs; and (v) monolithic refractories can be customized to specific requirements by adjusting individual formulas without the need to change batches of shaped bricks, which is a costly procedure. Our refractory products and their features are described as follows:
- Castable, coating, and dry mix materials. Offerings within this product line are used as linings in containers such as a tundish used for pouring molten metal into a mold. The primary advantages of these products are speed and ease of installation for heat treatment.
- Low-cement and non-cement castables. Our low-cement and non-cement castable products are typically used in reheating furnaces for producing steel. These castable products are highly durable and can last up to five years.
- Pre-cast roofs. These products are usually used as a component of electric arc furnaces. They are highly durable, and in the case of our corundum-based, pre-cast roof, products can endure approximately 160 to 220 complete operations of furnace heating.
We also have a production line for pressed bricks, which is a type of “shaped” refractory, for steel production. The annual designed production capacity of our shaped refractory products is approximately 15,000 metric tons.
Finally, we provide a full-service option to our steel customers, which include refractory product installation, testing, maintenance, repair and replacement. Refractory product sales are often enhanced by our on-site installation and technical support personnel. Our installation services include applying refractory materials to the walls of steel-making furnaces and other high temperature vessels to maintain and extend their lives. Our technical service staff assure that our customers can achieve their desired productivity objectives. They also measure the refractory wear at our customer sites to improve the quality of maintenance and overall performance of our customers’ equipment. Full-service customers contributed approximately 35.8% of the Company’s total sales in the first six months of 2012, compared with 32.4% in the same period of 2011. We believe that these services, together with our refractory products, provide us a strategic advantage.
28
Industrial Ceramics
Industrial Ceramics accounted for approximately 2.7% of the total revenue in the second quarter of 2012. Our industrial ceramic products, including abrasive balls and tiles, valves, electronic ceramics and structural ceramics, are components for a variety of end products such as fuses, vacuum interrupters, electrical components, mud slurry pumps, and high-pressure pumps. Such end use products are used in the electric power, electronic component, industrial pump, and metallurgy industries.
Fracture Proppants
Fracture Proppants accounted for approximately 21.5% of the total revenue in the second quarter of 2012. Our fracture proppant products are very fine ball-like pellets, used to reach pockets of oil and natural gas deposits that are trapped in the fractures under the ground. Oil drillers inject the pellets into those fractures, squeezing out the trapped oil or natural gas, which leads to higher yield. Our fracture proppant products are available in several different particle sizes (measured in millimeters). They are typically used to extract crude oil and natural gas, which increases the productivity of crude oil and natural gas wells. These products are highly resistant to pressure. In October 2007, our fracture proppant products were recognized by China National Petroleum Corporation (the “CNPC”), China Petroleum & Chemical Corporation (the “Sinopec”) and China National Offshore Oil Corporation (the “CNOOC”) as their supplier of fracture proppant products for their oil and gas-drilling operation.
Fine Precision Abrasives
Fine Precision Abrasives accounted for approximately 16.6% of our total revenue in the second quarter of 2012. Fine precision abrasives are used for producing a super-fine, super-consistent finish on certain products. A high-strength polyester backing provides a uniform base for a coating of micron-graded mineral particles that are uniformly dispersed for greater finishing efficiency. Our fine precision abrasives are made from silicon carbide (“SiC”). They are ultra-fine, high-strength pellets with uniform shape, and they are used for surface-polishing and slicing of precision instruments such as solar panels. Currently, the type of abrasives that we produce is in high demand among solar-energy companies. Solar energy companies use fine precision abrasives to cut silicon bars and to polish equipment surfaces so that they can be smooth and reflective. Our products can be utilized in a broad range of areas including machinery manufacturing, electronics, optical glass, architecture, industry development, semiconductor, silicon chip, plastic and lens.
Second Quarter of 2012 Summary
Our financial performance in the second quarter of 2012 is summarized as follows:
Sales revenue decreased by approximately $816,000, or 4.0%, to approximately $19.6 million for the second quarter of 2012, from approximately $20.4 million for the same period in 2011.
Gross profit decreased by approximately $2.2 million, or 42.7%, to approximately $3.1 million for the second quarter of 2012, from approximately $5.3 million for the same period in 2011. Gross profit margin was 15.6% for the second quarter of 2012, compared with 26.1% for the same period in 2011. The decrease in gross profit margin was largely attributed to the lower gross profit margin in our fine precision abrasives segment as sales of lower-grade products continued in the second quarter, the lower gross profit margin in fracture proppants segment as well as the rising costs of raw materials and energy in refractories segment. Net loss increased by approximately $3.5 million, to approximately $3.8 million for the second quarter of 2012, from a net loss of approximately $247,000 for the same period in 2011.
Our condensed consolidated balance sheet (unaudited) as of June 30, 2012 included current assets of approximately $136.9 million and total assets of approximately $178.9 million, with working capital of approximately $5.3 million.
Uncertainties that Affect our Financial Condition
Continued Industry Consolidation of Steel Makers Further Squeezed Our Profit in Refractories Segment
Although the crude steel output in China reached a new record of approximate 696 million metric tons in 2011, the steel industry still faces overcapacity and weak demand from both domestic and international market. In addition, the PRC government’s continued policy to squeeze out small to mid-sized steel makers reduced the overall demand for refractories. As refractories is our largest product segment and many of our customers are in the steel industry, the continued industry consolidation of steel makers have a deep impact on us and further squeezed our profit in the refractories segment.
29
Considerable Increase of Raw Material Prices and Decrease in Gross Profit Margin
In 2011, China saw its highest inflation rate in over 10 years. While the overall inflation started to ease in 2012, the increase in raw materials prices, labor costs and fuel and utilities costs continued to impact us. Also, in a fragmented market, hardly could the selling price of our products keep pace with the increase in raw materials prices on a timely basis.
Increase in Financing Costs Further Limited Our Ability to Expand Business
The unfavorable payment term offered by our customers in refractories segment and fine precision abrasives segment strained our working capital needs, and as a result significantly increased our financing costs, as banks charged higher interest rates when we discounted more bills receivables to meet our working capital needs.
Uncertainties Facing Our Fracture Proppants Segment
Starting from 2012, more and more Chinese manufacturers of fracture proppants products started to sell their products directly in the U.S. market. Since our sales of fracture proppants products in the U.S. market were mainly through wholesalers and distributors, the change in the market condition made it nearly impossible for us to continue sales in the U.S. market while still maintaining a reasonable profit margin. As a result, our sales in the U.S. market were discontinued temporarily in the first six months of 2012. We are currently looking at other alternatives to increase our sales of fracture proppants products, especially restore our profitable sales in the U.S. market; however, we cannot guarantee sales and gross profit margin in fracture proppants segment can maintain the level seen in 2011.
Deteriorating Market for Our Fine Precision Abrasives Segment
China’s solar industry is experiencing severe challenge with many large solar panel manufacturers struggling to survive. As a supplier of solar-energy companies, we are facing remarkable uncertainties in maintaining our current customers. If we cannot continue our sales of fine precision abrasives products to solar industry or have to reduce selling price significantly, our revenue will decline and we may need to discontinue our production.
Results of Operations
Comparison of Three-Month Periods ended June 30, 2012 and 2011
The following table summarizes the results of our operations during the three-month periods ended June 30, 2012 and 2011, and provides information regarding the dollar and percentage increase or (decrease) during the three-month periods ended June 30, 2012 and 2011.
(All amounts, other than percentages, in U.S. dollars)
| | | Three-Month Period | | | Three-Month Period | |
| | | Ended June 30, 2012 | | | Ended June 30, 2011 | |
| | | | | | As a | | | | | | As a | |
| | | Dollars in | | | percentage of | | | Dollars in | | | percentage of | |
| Statement of operations data: | | thousands | | | net revenues | | | thousands | | | net revenues | |
| | | | | | | | | | | | | |
| Net Sales | | 19,620 | | | 100.0% | | | 20,436 | | | 100.0% | |
| Cost of goods sold | | 16,565 | | | 84.4% | | | 15,101 | | | 73.9% | |
| Gross profit | | 3,055 | | | 15.6% | | | 5,335 | | | 26.1% | |
| | | | | | | | | | | | | |
| Operating expenses | | | | | | | | | | | | |
| General & administrative expenses | | 1,937 | | | 9.9% | | | 1,630 | | | 8.0% | |
| Research and development expenses | | 236 | | | 1.2% | | | 145 | | | 0.7% | |
| Selling expenses | | 2,791 | | | 14.2% | | | 2,761 | | | 13.5% | |
| Total operating expenses | | 4,964 | | | 25.3% | | | 4,536 | | | 22.2% | |
| | | | | | | | | | | | | |
| (Loss) income from operations | | (1,909 | ) | | -9.7% | | | 799 | | | 3.9% | |
| | | | | | | | | | | | | |
| Government grant income | | - | | | 0.0% | | | 17 | | | 0.1% | |
30
| Guarantee income | | 148 | | | 0.7% | | | 123 | | | 0.6% | |
| Guarantee expenses | | (108 | ) | | -0.6% | | | (89 | ) | | -0.4% | |
| Equity in net loss of a non-consolidated affiliate | | (9 | ) | | 0.0% | | | - | | | 0.0% | |
| Interest income | | 186 | | | 0.9% | | | 63 | | | 0.3% | |
| Change in fair value of warranty liabilities | | - | | | 0.0% | | | 650 | | | 3.2% | |
| Other income (expenses) | | 38 | | | 0.2% | | | (34 | ) | | -0.2% | |
| Finance costs | | (1,950 | ) | | -9.9% | | | (1,571 | ) | | -7.7% | |
| | | | | | | | | | | | | |
| (Loss) income before income taxes and noncontrolling interest | | (3,604 | ) | | -18.4% | | | (42 | ) | | -0.2% | |
| Income taxes | | (202 | ) | | -1.0% | | | (226 | ) | | -1.1% | |
| Noncontrolling interest | | 12 | | | 0.1% | | | 21 | | | 0.1% | |
| | | | | | | | | | | | | |
| Net loss attributable to Company’s common stockholders | | (3,794 | ) | | -19.3% | | | (247 | ) | | -1.2% | |
| | | Three-Month | | | Three-Month | | | Dollar ($) | | | Percentage | |
| | | Period Ended | | | Period Ended | | | Increase | | | Increase | |
| Dollars in thousands | | June 30, 2012 | | | June 30, 2011 | | | (Decrease) | | | (Decrease) | |
| | | | | | | | | | | | | |
| Net Sales | | 19,620 | | | 20,436 | | | (816 | ) | | -4.0% | |
| Cost of goods sold | | 16,565 | | | 15,101 | | | 1,464 | | | 9.7% | |
| Gross profit | | 3,055 | | | 5,335 | | | (2,280 | ) | | -42.7% | |
| Operating expenses | | | | | | | | | | | | |
| General & administrative expenses | | 1,937 | | | 1,630 | | | 307 | | | 18.8% | |
| Research and development expenses | | 236 | | | 145 | | | 91 | | | 62,8% | |
| Selling expenses | | 2,791 | | | 2,761 | | | 30 | | | 1.1% | |
| Total operating expenses | | 4,964 | | | 4,536 | | | 428 | | | 9.4% | |
| | | | | | | | | | | | | |
| (Loss) income from operations | | (1,909 | ) | | 799 | | | (2,708 | ) | | -339.0% | |
| | | | | | | | | | | | | |
| Government grant income | | - | | | 17 | | | (17 | ) | | -100.0% | |
| Guarantee income | | 148 | | | 123 | | | 25 | | | 20.3% | |
| Guarantee expenses | | (108 | ) | | (89 | ) | | (19 | ) | | 21.3% | |
| Equity in net loss of a non-consolidated affiliate | | (9 | ) | | - | | | (9 | ) | | -100.0% | |
| Interest income | | 186 | | | 63 | | | 123 | | | 195.2% | |
| Change in fair value of warranty liabilities | | - | | | 650 | | | (650 | ) | | -100% | |
| Other income (expenses) | | 38 | | | (34 | ) | | 72 | | | 211.8% | |
| Finance costs | | (1,950 | ) | | (1,571 | ) | | (379 | ) | | 24.1% | |
| | | | | | | | | | | | | |
| (Loss) income before income taxes and noncontrolling interest | | (3,604 | ) | | (42 | ) | | (3,562 | ) | | 8,481.0% | |
| Income taxes | | (202 | ) | | (226 | ) | | 24 | | | -10.6% | |
| Noncontrolling interest | | 12 | | | 21 | | | (9 | ) | | -42.9% | |
| | | | | | | | | | | | | |
| Net loss attributable to Company’s common stockholders | | (3,794 | ) | | (247 | ) | | (3,547 | ) | | 1,436.0% | |
Sales revenues. Sales revenues decreased approximately $816,000, or 4.0% to approximately $19.6 million for the three months ended June 30, 2012 from approximately $20.4 million in the same period of 2011. Our sales revenue is currently generated from sales of our mineral-based products, primarily our refractory products, fracture proppant products, fine precision abrasives products and industrial ceramic products. The decrease was mainly attributable to the decreased sales of our fracture proppant products.
In our refractory segment, we sold 22,842 metric tons of refractory products in the second quarter of 2012, compared with 27,686 metric tons sold in the same period of 2011. The revenue from our refractory products was approximately $11.6 million in the second quarter of 2012, compared with $12.5 million in the same period of 2011. The average selling price increased to $509 per metric ton compared with $452 per metric ton in the second quarter of 2011 and the price increase partially offset the impact of decrease in sales volume on our revenue.
31
In our fracture proppant segment, we sold 16,030 metric tons of fracture proppant products in the second quarter of 2012, compared with 16,029 metric tons sold in the same period of 2011. Revenue was approximately $4.2 million in the second quarter of 2012, a decrease of 28.9% compared with approximately $5.9 million in the same period of 2011. Average selling price decreased to $263 per metric ton in the second quarter of 2012, compared with $373 per metric ton in the same period of 2011. The decrease in average selling price and revenue were primarily due to the increased sales in domestic market where the fracture proppant products are typically priced lower than in the U.S. market.
In our industrial ceramics segment, sales revenue was approximately $530,000 in the second quarter of 2012 compared with approximately $492,000 in the same period of 2011.
In our fine precision abrasives segment, we realized sales of 1,172 ton in the second quarter of 2012, for revenue of approximately $3.3 million. We sold 421 metric tons of fine precision abrasives products for approximately $1.5 million in the same period of 2011. The increase in sales revenue was primarily due to the increased sales to a major customer.
Cost of goods sold.Our cost of goods sold is primarily comprised of the cost of raw materials, components, labor and overhead. Our cost of goods sold increased approximately $1.5 million, or 9.7%, to approximately $16.6 million in the second quarter of 2012 from approximately $15.1 million in the same period of 2011. As a percentage of net revenues, the cost of goods sold increased by 10.5% to 84.4% in the second quarter of 2012 from 73.9% in the same period of 2011. This increase was primarily due to the higher raw material costs and energy costs compared with the same period in 2011.
Gross profit.Our gross profit decreased approximately $2.2 million, or 42.7% to approximately $3.1 million in the second quarter of 2012 from approximately $5.3 million in the same period of 2011. Gross profit as a percentage of net revenues was 15.6% in the second quarter of 2012, as compared with 26.1% in the same period of 2011. The percentage decrease was primarily attributable to the decreased gross profit margin in our fine precision abrasives segment and fracture proppants segment.
General and administrative expenses.Our general and administrative expenses consist of the expenses associated with staff and support personnel who manage our business activities and professional fees paid to third parties. Our general administrative expenses increased to approximately $1.9 million in the second quarter of 2012, from approximately $1.6 million in the same period in 2011. The increase was primarily due to the loss on disposal of equipment in our fine precision abrasives segment as we upgraded the production facilities and the increase in depreciation expenses and salary expenses. As a percentage of net revenues, administrative expenses increased to 9.9% in the second quarter of 2012 as compared with 8.0% in the same period in 2011.
Selling expenses.Our selling expenses include sales commissions, expenses of advertising and promotional materials, transportation expenses, benefits of sales personnel, after-sale support services and other sales related expenses. Selling expenses stayed flat at approximately $2.8 million in the second quarter of 2012. As a percentage of net revenues, our selling expenses increased to 14.2% in the second quarter of 2012, as compared with 13.5% in the same period in 2011.
Research and development expenses.Our research and development expenses increased to approximately $236,000 in the second quarter of 2012, compared with approximately $145,000 in the same period in 2011 due to more R&D activities in the second quarter of 2012.
Government grant income.Our government grant income was nil in the second quarter of 2012 compared with approximately $17,000 in the same period in 2011.
Finance costs.Our finance costs increased by approximately $379,000, or 24.1% to approximately $2.0 million in the second quarter of 2012, from approximately $1.6 million in the same period in 2011. As a percentage of net revenues, our finance costs were 9.9% in the second quarter of 2012 and 7.7% in the same period in 2011. This increase was primarily attributable to an increase of approximately $606,000 in interest expenses as we increased borrowing activities in the second quarter of 2012.
(Loss) income before income taxes and non-controlling interests.Our loss before income taxes and non-controlling interest was approximately $3.6 million in the second quarter of 2012, compared with approximately $42,000 in the same period of 2011. The decrease was primarily attributable to the loss from operations and higher finance costs in the second quarter of 2012.
Income taxes.Our income taxes were approximately $202,000 in the second quarter of 2012, a decrease of approximately $24,000 or 10.6% from approximately $226,000 in the same period of 2011.
Net loss.Our net loss in the second quarter of 2012 was approximately $3.8 million, a decrease of approximately $3.5 million from approximately $247,000 in the same period in 2011. The decrease was attributable to the factors described above.
32
Comparison of Six-Month Periods ended June 30, 2012 and 2011
The following table summarizes the results of our operations during the six-month periods ended June 30, 2012 and 2011, and provides information regarding the dollar and percentage increase or (decrease) during the six-month periods ended June 30, 2012 and 2011.
(All amounts, other than percentages, in U.S. dollars)
| | | Six-Month Period | | | Six-Month Period | |
| | | Ended June 30, 2012 | | | Ended June 30, 2011 | |
| | | | | | As a | | | | | | As a | |
| | | Dollars in | | | percentage of | | | Dollars in | | | percentage of | |
| Statement of operations data: | | thousands | | | net revenues | | | thousands | | | net revenues | |
| | | | | | | | | | | | | |
| Net Sales | | 33,331 | | | 100.0% | | | 36,620 | | | 100.0% | |
| Cost of goods sold | | 27,560 | | | 82.7% | | | 26,998 | | | 73.7% | |
| Gross profit | | 5,771 | | | 17.3% | | | 9,622 | | | 26.3% | |
| | | | | | | | | | | | | |
| Operating expenses | | | | | | | | | | | | |
| General & administrative expenses | | 3,666 | | | 11.0% | | | 3,133 | | | 8.6% | |
| Research and development expenses | | 399 | | | 1.2% | | | 287 | | | 0.8% | |
| Selling expenses | | 5,271 | | | 15.8% | | | 4,733 | | | 12.9% | |
| Total operating expenses | | 9,336 | | | 28.0% | | | 8,153 | | | 22.3% | |
| | | | | | | | | | | | | |
| (Loss) income from operations | | (3,565 | ) | | -10.7% | | | 1,469 | | | 4.0% | |
| | | | | | | | | | | | | |
| Government grant income | | 385 | | | 1.2% | | | 18 | | | 0.0% | |
| Guarantee income | | 301 | | | 0.9% | | | 210 | | | 0.6% | |
| Guarantee expenses | | (237 | ) | | -0.7% | | | (176 | ) | | -0.5% | |
| Equity in net loss of a non-consolidated affiliate | | (9 | ) | | 0.0% | | | - | | | 0.0% | |
| Interest income | | 239 | | | 0.7% | | | 182 | | | 0.5% | |
| Change in fair value of warranty liabilities | | - | | | 0.0% | | | 910 | | | 2.5% | |
| Other income (expenses) | | 44 | | | 0.1% | | | (68 | ) | | -0.2% | |
| Finance costs | | (3,700 | ) | | -11.1% | | | (2,537 | ) | | -6.9% | |
| | | | | | | | | | | | | |
| (Loss) income before income taxes and noncontrolling interest | | (6,542 | ) | | -19.6% | | | 8 | | | 0.0% | |
| Income taxes | | (214 | ) | | -0.6% | | | (362 | ) | | -1.0% | |
| Noncontrolling interest | | 49 | | | 0.1% | | | 27 | | | 0.1% | |
| | | | | | | | | | | | | |
| Net loss attributable to Company’s common stockholders | | (6,707 | ) | | -20.1% | | | (327 | ) | | -0.9% | |
| | | Six-Month | | | Six-Month | | | Dollar ($) | | | Percentage | |
| | | Period Ended | | | Period Ended | | | Increase | | | Increase | |
| Dollars in thousands | | June 30, 2012 | | | June 30, 2011 | | | (Decrease) | | | (Decrease) | |
| | | | | | | | | | | | | |
| Net Sales | | 33,331 | | | 36,620 | | | (3,289 | ) | | -9.0% | |
| Cost of goods sold | | 27,560 | | | 26,998 | | | 562 | | | 2.1% | |
| Gross profit | | 5,771 | | | 9,622 | | | (3,851 | ) | | -40.0% | |
| Operating expenses | | | | | | | | | | | | |
| General & administrative expenses | | 3,666 | | | 3,133 | | | 533 | | | 17.0% | |
| Research and development expenses | | 399 | | | 287 | | | 112 | | | 39.0% | |
| Selling expenses | | 5,271 | | | 4,733 | | | 538 | | | 11.4% | |
| Total operating expenses | | 9,336 | | | 8,153 | | | 1,183 | | | 14.5% | |
33
| (Loss) income from operations | | (3,565 | ) | | 1,469 | | | (5,034 | ) | | -342.7% | |
| | | | | | | | | | | | | |
| Government grant income | | 385 | | | 18 | | | 367 | | | 2,038.9% | |
| Guarantee income | | 301 | | | 210 | | | 91 | | | 43.3% | |
| Guarantee expenses | | (237 | ) | | (176 | ) | | (61 | ) | | 34.7% | |
| Equity in net loss of a non-consolidated affiliate | | (9 | ) | | - | | | (9 | ) | | -100.0% | |
| Interest income | | 239 | | | 182 | | | 57 | | | 31.3% | |
| Change in fair value of warranty liabilities | | - | | | 910 | | | (910 | ) | | -100% | |
| Other income (expenses) | | 44 | | | (68 | ) | | 112 | | | 164.7% | |
| Finance costs | | (3,700 | ) | | (2,537 | ) | | (1,163 | ) | | 45.8% | |
| | | | | | | | | | | | | |
| (Loss) income before income taxes and noncontrolling interest | | (6,542 | ) | | 8 | | | (6,550 | ) | | -81,875.0% | |
| Income taxes | | (214 | ) | | (362 | ) | | 148 | | | -40.9% | |
| Noncontrolling interest | | 49 | | | 27 | | | 22 | | | 81.5% | |
| | | | | | | | | | | | | |
| Net loss attributable to Company’s common stockholders | | (6,707 | ) | | (327 | ) | | (6,380 | ) | | 1,951.1% | |
Sales revenues. Sales revenues decreased approximately $3.3 million, or 9.0% to approximately $33.3 million for the six months ended June 30, 2012, from approximately $36.6 million in the same period of 2011. The decrease was mainly attributable to the decreased sales from our fracture proppant products.
In our refractory segment, we sold 42,985 metric tons of refractory products in the six months ended June 30, 2012, compared with 47,891 metric tons sold in the same period of 2011. The revenue from our refractory products was approximately $21.6 million in the six months ended June 30, 2012, compared with $22.5 million in the same period of 2011. The average selling price reached $502 per metric ton in the six months ended June 30, 2012, representing a 6.8% increase compared with $470 per metric ton in the same period of 2011.
In our fracture proppant segment, we sold 18,703 metric tons of fracture proppant products in the six months ended June 30, 2012, compared with 28,542 metric tons sold in the same period of 2011. The decrease in sales volume was primarily due to the decreased sales in the U.S. market as we were unable to sell directly to the end users. Revenue was approximately $5.2 million in the six months ended June 30, 2012, a decrease of 53.1% compared with approximately $11.1 million in the same period of 2011. Average selling price decreased to $279 per metric ton in the six months ended June 30, 2012, compared with $390 per metric ton in the same period of 2011. The decrease in average selling price was primarily due to the increased sales in domestic market where the fracture proppant products are typically priced lower than in the U.S. market.
In our industrial ceramics segment, sales revenue was approximately $861,000 in the six months ended June 30, 2012 compared with approximately $722,000 in the same period of 2011.
In our fine precision abrasives segment, we realized sales of 2,055 ton in the six months ended June 30, 2012, for revenue of approximately $5.7 million. We sold 623 metric tons of fine precision abrasives products for approximately $2.3 million in the same period of 2011. The increase in sales revenue was primarily due to the increased sales to a major customer.
Cost of goods sold.Our cost of goods sold increased approximately $562,000, or 2.1%, to approximately $27.6 million in the six months ended June 30, 2012 from approximately $27.0 million in the same period of 2011. As a percentage of net revenues, the cost of goods sold increased by 9.0% to 82.7% in the six months ended June 30, 2012 from 73.7% in the same period of 2011. This increase was primarily due to the higher raw material costs and energy costs compared with the same period in 2011.
Gross profit.Our gross profit decreased approximately $3.8 million, or 40.0% to approximately $5.8 million in the six months ended June 30, 2012 from approximately $9.6 million in the same period of 2011. Gross profit as a percentage of net revenues was 17.3% in the six months ended June 30, 2012, as compared with 26.3% in the same period of 2011. The percentage decrease was primarily attributable to the decreased gross profit margin in our fine precision abrasives segment and fracture proppants segment.
General and administrative expenses.Our general administrative expenses increased to approximately $3.7 million in the six months ended June 30, 2012, from approximately $3.1 million in the same period in 2011. The increase was primarily due to the loss on disposal of equipment in our fine precision abrasives segment as we upgraded the production facilities, higher salary expenses and higher preliminary expenses related to Yuxing operation. As a percentage of net revenues, administrative expenses increased to 11.0% in the six months ended June 30, 2012 as compared with 8.6% in the same period in 2011.
Selling expenses.Selling expenses increased by approximately $538,000 to approximately $5.3 million in the six months ended June 30, 2012, compared with approximately $4.7 million in the same period in 2011. As a percentage of net revenues, our selling expenses increased to 15.8% in the six months ended June 30, 2012, as compared with 12.9% in the same period in 2011. The increase in selling expenses was primarily attributable to the increase in the allowance for doubtful accounts and higher transportation expenses compared to the same period in 2011.
34
Research and development expenses.Our research and development expenses increased to approximately $399,000 in the six months ended June 30, 2012, compared with approximately $287,000 in the same period in 2011. The increase was mainly due to more R&D activities in the six months ended June 30, 2012.
Government grant income.Our government grant income was approximately $385,000 in the six months ended June 30, 2012 compared with approximately $18,000 in the same period in 2011.
Finance costs.Our finance costs increased by approximately $1.2 million, or 45.8% to approximately $3.7 million in the six months ended June 30, 2012, from approximately $2.5 million in the same period in 2011. As a percentage of net revenues, our finance costs were 11.1% in the six months ended June 30, 2012 and 6.9% in the same period in 2011. This significant increase was primarily attributable to an increase of approximately $481,000 in bills discounting charges as we discounted more bills receivable instead of holding them to maturity; and an increase of approximately $682,000 in interest expenses as we increased borrowing activities in the six months ended June 30, 2012.
(Loss) income before income taxes and non-controlling interests.Our loss before income taxes and non-controlling interest was approximately $6.5 million in the six months ended June 30, 2012, compared with an income of approximately $8,000 in the same period of 2011. The decrease was primarily attributable to the loss from operations and higher finance costs in the six months ended June 30, 2012.
Income taxes.Our income taxes were approximately $214,000 in the six months ended June 30, 2012, a decrease of approximately $148,000 or 40.9% from approximately $362,000 in the same period of 2011.
Net loss.Our net loss in the six months ended June 30, 2012 was approximately $6.7 million, a decrease of approximately $6.4 million from approximately $327,000 in the same period in 2011. The decrease was attributable to the factors described above.
Liquidity and Capital Resources
As of June 30, 2012, we had cash and cash equivalents of approximately $5.2 million and restricted cash of approximately $38.5 million. Our current assets were approximately $136.9 million and our current liabilities were approximately $131.7 million as of June 30, 2012 which resulted in a current ratio of approximately 1.04. Total equity as of June 30, 2012 was approximately $47.3 million. The following table sets forth a summary of our cash flows for the periods indicated:
| | | Six Months ended June 30, | |
| (Dollars in thousands) | | 2012 | | | 2011 | |
| | | | | | | |
| Net cash used in operating activities | | (13,305 | ) | | (1,546 | ) |
| Net cash used in investing activities | | (1,677 | ) | | (8,318 | ) |
| Net cash provided by financing activities | | 16,540 | | | 18,400 | |
| Net cash inflows | | 1,569 | | | 8,564 | |
Operating Activities
Net cash used in operating activities was approximately $13.3 million in the six months ended June 30, 2012, compared with net cash used in operating activities of approximately $1.5 million in the same period of 2011. The increase in net cash used in operating activities was primarily due to the net loss, increase in trade receivables, bills receivables and decrease in bills payables in the six months ended June 30, 2012.
Investing Activities
Net cash used in investing activities in the six months ended June 30, 2012 was approximately $1.7 million, a decrease of approximately $6.6 million from net cash used in investing activities of approximately $8.3 million in the same period in 2011. The decrease in net cash used in investing activities in the six months ended June 30, 2012 was primarily due to fewer activities related to our construction of manufacturing and administrative facilities and no acquisition of land use right occurred.
Financing Activities
Net cash provided by financing activities was approximately $16.5 million in the six months ended June 30, 2012, compared with net cash provided by financing activities of approximately $18.4 million in the same period of 2011.
35
Loan Facilities
In the six months ended June 30, 2012, we secured new loans totaling approximately $50.0 million from banks for our working capital needs, and we repaid approximately $11.6 million in bank loans during the period. As a result, the balance of all bank loans and bank borrowings as of June 30, 2012 was approximately $84.6 million, which includes approximately $40.8 million short-term bank loans and approximately $43.8 million of bank borrowings secured by bank deposits.
As of June 30, 2012, the detail of all our short-term bank loans and bank borrowings are as follows:
All amounts, other than percentages, are in U.S. dollar.
| No | Type | Contracting Party | Valid Date | Duration | Amount |
1 | Facility Bank Loan | Shanghai Pudong Development Bank Village Bank | 2011-09-16 to 2012-09-14 | 1 year | $792,000 |
2 | Facility Bank Loan | Shanghai Pudong Development Bank Village Bank | 2011-09-16 to 2012-09-15 | 1 year | $396,000 |
3 | Facility Bank Loan | Shanghai Pudong Development Bank Village Bank | 2011-09-22 to 2012-09-21 | 1 year | $712,800 |
4 | Facility Bank Loan | Shanghai Pudong Development Bank | 2011-09-22 to 2012-09-21 | 1 year | $1,584,000 |
5 | Facility Bank Loan | Kaifeng Commercial Bank | 2011-09-27 to 2012-09-26 | 1 year | $4,752,000 |
6 | Facility Bank Loan | Shanghai Pudong Development Bank | 2011-10-12 to 2012-10-11 | 1 year | $1,584,000 |
7 | Facility Bank Loan | Shanghai Pudong Development Bank Village Bank | 2011-10-14 to 2012-10-13 | 1 year | $427,680 |
8 | Facility Bank Loan | City Credit Cooperatives in Gongyi | 2011-12-12 to 2012-12-5 | 1 year | $2,851,200 |
9 | Facility Bank Loan | Zhengzhou Bank | 2012-01-5 to 2013-01-04 | 1 year | $4,752,000 |
10 | Facility Bank Loan | China Construction Bank | 2012-01-10 to 2013-01-09 | 1 year | $3,168,000 |
11 | Facility Bank Loan | China EverBright Bank | 2012-01-20 to 2012-07-17 | 6 months | $1,053,202 |
12 | Facility Bank Loan | Industrial and Commercial Bank of China | 2012-02-03 to 2013-01-08 | 1 year | $2,851,200 |
13 | Facility Bank Loan | China EverBright Bank | 2012-02-16 to 2012-08-13 | 6 months | $1,252,310 |
14 | Facility Bank Loan | Agricultural Bank of China | 2012-02-20 to 2013-02-19 | 1 year | $1,853,280 |
15 | Facility Bank Loan | China CITIC Bank | 2012-03-01 to 2013-02-28 | 1 year | $1,473,120 |
16 | Facility Bank Loan | Luoyang Bank | 2012-04-25 to 2013-04-24 | 1 year | $3,168,000 |
17 | Facility Bank Loan | Agricultural Bank of China | 2012-04-28 to 2013-04-27 | 1 year | $5,068,800 |
18 | Facility Bank Loan | Industrial and Commercial Bank of China | 2012-05-09 to 2013-05-08 | 1 year | $712,800 |
19 | Facility Bank Loan | China CITIC Bank | 2012-06-26 to 2013-06-25 | 1 year | $2,376,000 |
20 | Bank Borrowing | Shanghai Pudong Development Bank Village Bank | 2012-03-02 to 2012-08-10 | 6 months | $126,720 |
21 | Bank Borrowing | Shanghai Pudong Development Bank Village Bank | 2012-03-02 to 2012-08-22 | 6 months | $364,320 |
22 | Bank Borrowing | Luoyang Bank | 2012-03-06 to 2012-09-05 | 6 months | $1,584,000 |
23 | Bank Borrowing | Puyang Commerical Bank | 2012-03-13 to 2012-09-12 | 6 months | $1,584,000 |
24 | Bank Borrowing | Shanghai Pudong Development Bank Village Bank | 2012-03-15 to 2012-07-10 | 4 months | $158,400 |
25 | Bank Borrowing | Shanghai Pudong Development Bank Village Bank | 2012-03-15 to 2012-07-18 | 5 months | $47,520 |
26 | Bank Borrowing | Shanghai Pudong Development Bank Village Bank | 2012-03-15 to 2012-09-06 | 6 months | $190,080 |
27 | Bank Borrowing | Shanghai Pudong Development Bank Village Bank | 2012-03-20 to 2012-08-28 | 6 months | $70,963 |
36
28 | Bank Borrowing | Shanghai Pudong Development Bank Village Bank | 2012-03-20 to 2012-09-07 | 6 months | $79,200 |
29 | Bank Borrowing | Puyang Commerical Bank | 2012-03-20 to 2012-09-14 | 6 months | $1,520,640 |
30 | Bank Borrowing | Shanghai Pudong Development Bank Village Bank | 2012-03-21 to 2012-07-09 | 4 months | $47,520 |
31 | Bank Borrowing | Shanghai Pudong Development Bank Village Bank | 2012-03-21 to 2012-08-29 | 6 months | $31,680 |
32 | Bank Borrowing | Puyang Commerical Bank | 2012-03-22 to 2012-09-19 | 6 months | $1,346,400 |
33 | Bank Borrowing | Shanghai Pudong Development Bank Village Bank | 2012-03-23 to 2012-08-24 | 6 months | $47,520 |
34 | Bank Borrowing | Shanghai Pudong Development Bank Village Bank | 2012-03-23 to 2012-09-09 | 6 months | $792,000 |
35 | Bank Borrowing | Shanghai Pudong Development Bank Village Bank | 2012-04-06 to 2012-09-28 | 6 months | $633,600 |
36 | Bank Borrowing | Shanghai Pudong Development Bank Village Bank | 2012-04-06 to 2012-09-30 | 6 months | $285,120 |
37 | Bank Borrowing | Puyang Commerical Bank | 2012-04-06 to 2012-10-05 | 6 months | $3,168,000 |
38 | Bank Borrowing | Puyang Commerical Bank | 2012-04-09 to 2012-10-06 | 6 months | $1,584,000 |
39 | Bank Borrowing | Shanghai Pudong Development Bank Village Bank | 2012-04-10 to 2012-08-03 | 4 months | $79,200 |
40 | Bank Borrowing | Luoyang Bank | 2012-04-11 to 2012-09-08 | 5 months | $475,200 |
41 | Bank Borrowing | Luoyang Bank | 2012-04-11 to 2012-09-19 | 6 months | $475,200 |
42 | Bank Borrowing | Luoyang Bank | 2012-04-11 to 2012-09-21 | 6 months | $792,000 |
43 | Bank Borrowing | Luoyang Bank | 2012-04-11 to 2012-09-27 | 6 months | $1,425,600 |
44 | Bank Borrowing | Puyang Commerical Bank | 2012-04-11 to 2012-10-10 | 6 months | $3,168,000 |
45 | Bank Borrowing | Puyang Commerical Bank | 2012-04-13 to 2012-10-12 | 6 months | $4,672,800 |
46 | Bank Borrowing | Shanghai Pudong Development Bank Village Bank | 2012-04-17 to 2012-07-27 | 4 months | $79,200 |
47 | Bank Borrowing | Shanghai Pudong Development Bank Village Bank | 2012-04-20 to 2012-09-15 | 5 months | $79,200 |
48 | Bank Borrowing | Shanghai Pudong Development Bank Village Bank | 2012-04-28 to 2012-10-19 | 6 months | $158,400 |
49 | Bank Borrowing | Puyang Commerical Bank | 2012-05-04 to 2012-11-03 | 6 months | $3,168,000 |
50 | Bank Borrowing | Shanghai Pudong Development Bank Village Bank | 2012-05-06 to 2012-08-16 | 4 months | $79,200 |
51 | Bank Borrowing | Puyang Commerical Bank | 2012-05-07 to 2012-11-04 | 6 months | $950,400 |
52 | Bank Borrowing | Puyang Commerical Bank | 2012-05-09 to 2012-11-07 | 6 months | $1,584,000 |
53 | Bank Borrowing | Puyang Commerical Bank | 2012-05-09 to 2012-11-08 | 6 months | $792,000 |
54 | Bank Borrowing | Shanghai Pudong Development Bank Village Bank | 2012-05-11 to 2012-11-03 | 6 months | $142,560 |
55 | Bank Borrowing | Shanghai Pudong Development Bank Village Bank | 2012-05-14 to 2012-11-09 | 6 months | $158,400 |
56 | Bank Borrowing | Shanghai Pudong Development Bank Village Bank | 2012-05-17 to 2012-11-10 | 6 months | $79,200 |
57 | Bank Borrowing | Puyang Commerical Bank | 2012-05-17 to 2012-11-16 | 6 months | $2,851,200 |
58 | Bank Borrowing | Shanghai Pudong Development Bank Village Bank | 2012-05-30 to 2012-11-10 | 6 months | $79,200 |
59 | Bank Borrowing | Shanghai Pudong Development Bank Village Bank | 2012-05-30 to 2012-11-17 | 6 months | $95,040 |
60 | Bank Borrowing | Shanghai Pudong Development Bank Village Bank | 2012-05-31 to 2012-11-17 | 6 months | $126,720 |
61 | Bank Borrowing | Shanghai Pudong Development Bank Village Bank | 2012-06-05 to 2012-09-07 | 6 months | $15,840 |
62 | Bank Borrowing | Shanghai Pudong Development Bank Village Bank | 2012-06-05 to 2012-09-14 | 6 months | $15,840 |
63 | Bank Borrowing | Shanghai Pudong Development Bank Village Bank | 2012-06-05 to 2012-09-16 | 6 months | $31,680 |
64 | Bank Borrowing | Hana Bank | 2012-06-05 to 2012-11-25 | 6 months | $633,600 |
37
65 | Bank Borrowing | Puyang Commerical Bank | 2012-06-07 to 2012-12-06 | 6 months | $3,168,000 |
66 | Bank Borrowing | Shanghai Pudong Development Bank Village Bank | 2012-06-08 to 2012-11-21 | 6 months | $79,200 |
67 | Bank Borrowing | Puyang Commerical Bank | 2012-06-08 to 2012-12-08 | 6 months | $950,400 |
68 | Bank Borrowing | Puyang Commerical Bank | 2012-06-14 to 2012-12-14 | 6 months | $633,600 |
69 | Bank Borrowing | Shanghai Pudong Development Bank Village Bank | 2012-06-15 to 2012-11-29 | 6 months | $792,000 |
70 | Bank Borrowing | Shanghai Pudong Development Bank Village Bank | 2012-06-19 to 2012-12-18 | 6 months | $950,400 |
71 | Bank Borrowing | Shanghai Pudong Development Bank Village Bank | 2012-06-20 to 2012-12-19 | 6 months | $950,400 |
72 | Bank Borrowing | Shanghai Pudong Development Bank Village Bank | 2012-06-29 to 2012-09-02 | 4 months | $15,840 |
73 | Bank Borrowing | Shanghai Pudong Development Bank Village Bank | 2012-06-29 to 2012-12-08 | 6 months | $95,040 |
74 | Bank Borrowing | Shanghai Pudong Development Bank Village Bank | 2012-06-29 to 2012-12-12 | 6 months | $158,400 |
75 | Bank Borrowing | Shanghai Pudong Development Bank Village Bank | 2012-06-29 to 2012-12-13 | 6 months | $79,200 |
We have approximately $40.8 million of facility bank loans, maturing from July 17, 2012 to June 25, 2013 and approximately $43.8 million of bank borrowings secured by bank deposits. We will also consider refinancing debts. However, we cannot provide assurance that we will be able to refinance any of our debts on terms favorable to us in a timely manner.
Below is a brief summary of the payment obligations under material contracts to which we are a party:
On September 16, 2011, our subsidiary, Refractories, entered into a short-term working capital loan agreement with Shanghai Pudong Development Bank Village Bank of Gongyi (“SPDVB”), whereby SPDVB has agreed to loan approximately $792,000 (RMB 5 million) to Refractories for a term of one year, at an interest rate of 6.56% per year on all outstanding principal.
On September 16, 2011, our subsidiary, Duesail, entered into a short-term working capital loan agreement with SPDVB, whereby SPDVB has agreed to loan approximately $396,000 (RMB 2.5 million) to Duesail for a term of one year, at an interest rate of 8.53% per year on all outstanding principal.
On September 22, 2011, our subsidiary, Refractories, entered into a short-term working capital loan agreement SPDVB, whereby SPDVB has agreed to loan approximately $713,000 (RMB 4.5 million) to Refractories for a term of one year, at an interest rate of 6.56% per year on all outstanding principal.
On September 22, 2011, our subsidiary, Duesail, entered into a short-term working capital loan agreement with Shanghai Pudong Development Bank (“SPD”), whereby SPD has agreed to loan approximately $1.6 million (RMB 10 million) to Duesail for a term of one year, at an interest rate of 7.22% per year on all outstanding principal.
On September 27, 2011, our subsidiary, Duesail, entered into a short-term working capital loan agreement with Kaifeng Commercial Bank (“KCB”), whereby KCB has agreed to loan approximately $4.8 million (RMB 30 million) to Duesail for a term of one year, at an interest rate of 8.53% per year on all outstanding principal.
On October 12, 2011, our subsidiary, Refractories, entered into a short-term working capital loan agreement with SPD, whereby SPD has agreed to loan approximately $1.6 million (RMB 10 million) to Refractories for a term of one year, at an interest rate of 7.22% per year on all outstanding principal.
On October 14, 2011, our subsidiary, Refractories, entered into a short-term working capital loan agreement with SPDVB, whereby SPDVB has agreed to loan approximately $428,000 (RMB 2.7 million) to Refractories for a term of one year, at an interest rate of 6.56% per year on all outstanding principal.
On December 12, 2011, our subsidiary, Duesail, entered into a short term working capital loan agreement with City Credit Cooperatives in Gongyi (“CCCG”), whereby CCCG has agreed to loan approximately $2.9 million (RMB18 million) to Duesail for a term of one year, at an interest rate of 11.81% per year on all outstanding principal.
On January 5, 2012, our subsidiary, Refractories, entered into a short-term working capital loan agreement with Zhengzhou Bank (“ZB”), whereby ZB has agreed to loan approximately $4.8 million (RMB 30 million) to Refractories for a term of one year, at an interest rate of 6.56% per year on all outstanding principal.
38
On January 10, 2012, our subsidiary, Duesail, entered into a short term working capital loan agreement with China Construction Bank (“CCB”), whereby CCB has agreed to loan approximately $3.2 million (RMB 20 million) to Duesail for a term of one year, at an interest rate of 8.00% per year on all outstanding principle.
On January 20, 2012, our subsidiary, Micronized, entered into a short-term working capital loan agreement with China EverBright Bank (“CEB”), whereby CEB has agreed to loan approximately $1.1 million (RMB 6.6 million) to Micronized for a term of 6 months, at an interest rate of $7.625% per year on all outstanding principal.
On February 3, 2012, our subsidiary, Refractories, entered into a short-term working capital loan agreement with Industrial and Commercial Bank of China (“ICBC”), whereby ICBC has agreed to loan approximately $2.9 million (RMB 18 million) to Refractories for a term of one year, at an interest rate of 6.89% per year on all outstanding principal.
On February 16, 2012, our subsidiary, Micronized, entered into a short-term working capital loan agreement with CEB, whereby CEB has agreed to loan approximately $1.3 million (RMB 7.9 million) to Micronized for a term of 6 months, at an interest rate of $7.625% per year on all outstanding principal.
On February 20, 2012, our subsidiary, Micronized, entered into a short-term working capital loan agreement with Agricultural Bank of China (“ABC”), whereby ABC has agreed to loan approximately $1.9 million (RMB 11.7 million) to Micronized for a term of one year, at an interest rate of 6.56% per year on all outstanding principal.
On March 1, 2012, our subsidiary, Micronized, entered into a short-term working capital loan agreement with China CITIC Bank (“CITIC”), whereby CITIC has agreed to loan approximately $1.5 million (RMB 9.3 million) to Micronized for a term of one year, at an interest rate of 6.56% per year on all outstanding principal.
On April 25, 2012, our subsidiary, Refractories, entered into a short-term working capital loan agreement with Luoyang Bank (“LYB”), whereby LYB has agreed to loan approximately $3.2 million (RMB 20 million) to Refractories for a term of one year, at an interest rate of 7.22% per year on all outstanding principal.
On April 28, 2012, our subsidiary, Refractories, entered into a short-term working capital loan agreement with ABC, whereby ABC has agreed to loan approximately $5.1 million (RMB 32 million) to Refractories for a term of one year, at an interest rate of 8.53% per year on all outstanding principal.
On May 9, 2012, our subsidiary, Micronized, entered into a short-term working capital loan agreement with ICBC, whereby ICBC has agreed to loan approximately $713,000 (RMB 4.5 million) to Micronized for a term of one year, at an interest rate of 6.56% per year on all outstanding principal.
On June 26, 2012, our subsidiary, Refractories, entered into a short-term working capital loan agreement with CITIC, whereby CITIC has agreed to loan approximately $2.4 million (RMB 15 million) to Refractories for a term of one year, at an interest rate of 6.94% per year on all outstanding principal.
Critical Accounting Policies
Basis of consolidation
The accompanying consolidated financial statements of the Company have been prepared in accordance with accounting principles generally accepted in the United States of America.
The consolidated financial statements include the accounts of the Company and its subsidiaries. All significant inter-company accounts and transactions have been eliminated in consolidation.
Use of estimates
In preparing financial statements in conformity with accounting principles generally accepted in the United States of America, management makes estimates and assumptions that affect the reported amounts of assets and liabilities and disclosures of contingent assets and liabilities at the dates of the financial statements, as well as the reported amounts of revenues and expenses during the reporting periods. These accounts and estimates include, but are not limited to, the valuation of trade receivables, other receivables, inventories, deferred income taxes, provision of warranty, the estimation on useful lives of property, plant and equipment and the impairment of goodwill, know-how and deposit for acquisition of a non-consolidated affiliate. Actual results could differ from those estimates.
39
Allowance for doubtful accounts
The Company establishes an allowance for doubtful accounts based on management’s assessment of the collectability of trade receivables. A considerable amount of judgment is required in assessing the amount of the allowance. The Company considers the historical level of credit losses and applies percentages to aged receivable categories. The Company makes judgments about the creditworthiness of each customer based on ongoing credit evaluations, and monitors current economic trends that might impact the level of credit losses in the future. If the financial condition of the customers were to deteriorate, resulting in their inability to make payments, a larger allowance may be required.
Based on the above assessment, during the reporting periods, the management established the general provisioning policy to make allowance equivalent to 5% (2011: 5%) of trade receivables due from 1 to 2 years, 40% (2011: 40%) of trade receivables due from 2 to 3 years and 90% (2011: 70%) of trade receivables due over 3 years. Additional specific provision is made against trade receivables to the extent which they are considered to be doubtful.
Bad debts are written off when identified. The Company does not accrue interest on trade receivables.
Acquisition of a non-consolidated affiliate
Investment in an entity over which the Company does not have control, but has significant influence, is accounted for using the equity method of accounting. The Company’s investment in Yili YiQiang Silicon Limited ("Yili") is reported in the condensed consolidated balance sheets as investment in a non-consolidated affiliate.
Impairment of long-lived assets
Long-lived assets are tested for impairment whenever events or changes in circumstances indicate that the carrying amount of the assets may not be recoverable. The Company recognizes impairment of long-lived assets in the event that the net book values of such assets exceed the future undiscounted cash flows attributable to such assets. During the reporting periods, the Company has not identified any indicators that would require testing for impairment.
Financial guarantee issued
The Company has acted as guarantor for bank loans granted to certain local authorities and certain business associates. The Company assessed its obligation under this guarantee pursuant to the provision of ASC 460 “Guarantee”. The Company recognized in its consolidated financial statements a liability for that guarantee at fair value at the date of inception and recognized as an expense in profit or loss immediately. The amount of guarantee liability is amortized in profit or loss over the term of the guarantee as income from financial guarantees issued.
Revenue recognition
Pure products sales - Sales revenue is recognized when the significant risks and rewards of ownership have been transferred to the buyer at the time when the products are delivered to and accepted by customers, the sales price is fixed or determinable and collection is reasonably assured.
Products sales with installation, testing, maintenance, repair and replacement - This kind of contract is signed as a whole such that all of these services are provided for one fixed fee, and it does not separate the components of products, installation, testing, maintenance, repair and replacement. After delivery of products/materials to customers, the Company will do the installation and testing works, which takes one to two days, before acceptance and usage by customers. The product life cycle is very short and can normally be used for 80 cycles of production by customers (about two to three days). Thereafter the customers will need maintenance, repair and replacement of the Company’s materials. For each maintenance, repair and replacement, the Company will supply materials and do the installation and testing works again, which are regarded as separate sales by the Company. In other words, the Company will have sales to this kind of customers every couple of days. This kind of sales revenue is recognized when the significant risks and rewards of ownership have been transferred to the buyer at the time when the installation and testing works are completed and after acceptance by customers, the sales price is fixed or determinable and collection is reasonably assured.
Revenue from sales of the Company’s product represents the invoiced value of goods, net of the value-added tax (“VAT”). The Company’s products that are sold in the PRC are subject to VAT at a rate of 17 percent of the gross sales price. The VAT may be offset by VAT paid by the Company on raw materials, other materials or costs included in the cost of producing the Company’s products.
Stock-based compensation
The Company adopted the provisions of ASC 718, which requires the use of the fair value method of accounting for share-based compensation. Under the fair value based method, compensation cost related to employee stock options or similar equity instruments which are equity-classified awards, is measured at the grant date based on the value of the award and is recognized over the requisite service period, which is usually the vesting period. ASC 718 also requires measurement of cost of a liability-classified award based on its current fair value.
40
Recently issued accounting pronouncements
In September 2011, the FASB issued ASU 2011-08, “Intangibles - Goodwill and Other (Topic 350)”. The amendments in this update will allow an entity to first assess qualitative factors to determine whether it is necessary to perform the two-step quantitative goodwill impairment test. Under these amendments, an entity would not be required to calculate the fair value of a reporting unit unless the entity determines, based on a qualitative assessment, that it is more likely than not that its fair value is less than its carrying amount. The amendments include a number of events and circumstances for an entity to consider in conducting the qualitative assessment. The amendments in this ASU are effective for annual and interim goodwill impairment tests performed for fiscal years beginning after December 15, 2011. Early adoption is permitted. The adoption of this ASU has no material impact on the Company’s condensed consolidated financial statements.
In September 2011, the FASB issued ASU 2011-09, “Compensation - Retirement Benefits - Multiemployer Plans (Subtopic 715 - 80)”. The amendments in this update require additional disclosures about an employer's participation in a multiemployer plan. ASU 2011-09 is effective for annual periods for fiscal years ending after December 15, 2011, and early adoption is permitted. ASU 2011-09 should be applied retrospectively for all prior periods presented. The adoption of this ASU has no material impact on the Company’s condensed consolidated financial statements.
In December 2011, the FASB issued ASU 2011-11, “Balance Sheet (Topic 210)”. The objective of this update is to provide enhanced disclosures that will enable users of its financial statements to evaluate the effect or potential effect of netting arrangements on an entity’s financial position. This includes the effect or potential effect of rights of setoff associated with an entity’s recognized assets and recognized liabilities within the scope of this update. The amendments require enhanced disclosures by requiring improved information about financial instruments and derivative instruments that are either (1) offset in accordance with either Section 210-20-45 or Section 815-10-45 or (2) subject to an enforceable master netting arrangement or similar agreement, irrespective of whether they are offset in accordance with either Section 210-20-45 or Section 815-10-45. An entity is required to apply the amendments retrospectively for annual reporting periods beginning on or after January 1, 2013, and interim periods within those annual periods. The adoption of this ASU has no material impact on the Company’s condensed consolidated financial statements.
In December 2011, the FASB issued ASU 2011-12, “Comprehensive Income (Topic 220)”. The amendments in this update supersede certain pending paragraphs in Accounting Standards Update No. 2011-05, “Comprehensive Income (Topic 220): Presentation of Comprehensive Income”, to effectively defer only those changes in ASU 2011-05 that relate to the presentation of reclassification adjustments out of accumulated other comprehensive income. The amendments will be temporary to allow the Board time to redeliberate the presentation requirements for reclassifications out of accumulated other comprehensive income for annual and interim financial statements for public, private, and non-profit entities. The amendments are effective for fiscal years, and interim periods within those years, beginning after December 15, 2011. Early application is permitted. The adoption of this ASU has no material impact on the Company’s condensed consolidated financial statements.
In July 2012, the FASB issued ASU 2012-02 on impairment testing for indefinite-lived intangible assets. This ASU amends FASB Codification Topic 350, Intangibles-Goodwill and Other to allow, but not require, an entity, when performing its annual or more frequent indefinite-lived intangible asset impairment test, to first assess qualitative factors to determine whether the existence of events and circumstances indicates that it is more likely than not that the indefinite-lived intangible asset is impaired. If, after assessing the totality of events and circumstances, an entity concludes that it is not more likely than not that the indefinite-lived intangible asset is impaired, then the entity is not required to take further action. However, if an entity concludes otherwise, then it is required to determine the fair value of the indefinite-lived intangible asset and perform the quantitative impairment test by comparing the fair value with the carrying amount. ASU2012-02 is effective for annual and interim impairment tests performed for fiscal years beginning after September 15, 2012. Early adoption is permitted. The Company is currently evaluating ASU 2012-02. The adoption of this ASU will not have a material impact on the Company’s condensed consolidated financial statements.
ITEM 3. QUANTITATIVE AND QUALITATIVE DISCLOSURE ABOUT MARKET RISK.
As a “smaller reporting company” as defined by Item 10 of Regulation S-K, the Company is not required to provide this information.
ITEM 4. CONTROLS AND PROCEDURES.
Evaluation of Disclosure Controls and Procedures
Our management is responsible for establishing and maintaining a system of disclosure controls and procedures (as defined in Rule 13a-15(e) under the Exchange Act) that is designed to ensure that information required to be disclosed by the Company in the reports that we file or submit under the Exchange Act is recorded, processed, summarized and reported, within the time specified in the Commission’s rules and forms. Disclosure controls and procedures include, without limitation, controls and procedures designed to ensure that information required to be disclosed by an issuer in the reports that it files or submits under the Exchange Act is accumulated and communicated to the issuer’s management, including its principal executive officer or officers and principal financial officer or officers, or persons performing similar functions, as appropriate to allow timely decisions regarding required disclosure.
41
Pursuant to Rule 13a-15(b) under the Exchange Act, the Company carried out an evaluation with the participation of the Company’s management, including our Chairman, Chief Executive Officer and President, Shunqing Zhang, our Chief Financial Officer, Ningfang Liang, of the effectiveness of the Company’s disclosure controls and procedures (as defined under Rule 13a-15(e) under the Exchange Act) as of June 30, 2012. Based on this evaluation, our chief executive officer and chief financial officer concluded that our disclosure controls and procedures were effective as of the end of the period covered by this report.
Changes in Internal Control Over Financial Reporting
There has been no change in our internal control over financial reporting (as defined in Rules 13a-15(f) and 15d-15(f) of the Exchange Act) that occurred during our fiscal quarter ended June 30, 2012 that has materially affected, or is reasonably likely to materially affect, our internal control over financial reporting.
Limitations on the Effectiveness of Controls
Our disclosure controls and procedures provide our Chief Executive Officer and Chief Financial Officer with reasonable assurances that our disclosure controls and procedures will achieve their objectives. However, our management does not expect that our disclosure controls and procedures or our internal control over financial reporting can or will prevent all human error. A control system, no matter how well designed and implemented, can provide only reasonable, not absolute, assurance that the objectives of the control system are met. Furthermore, the design of a control system must reflect the fact that there are internal resource constraints, and the benefit of controls must be weighed relative to their corresponding costs. Because of the limitations in all control systems, no evaluation of controls can provide complete assurance that all control issues and instances of error, if any, within our company are detected. These inherent limitations include the realities that judgments in decision-making can be faulty, and that breakdowns can occur due to human error or mistake. Additionally, controls, no matter how well designed, could be circumvented by the individual acts of specific persons within the organization. The design of any system of controls is also based in part upon certain assumptions about the likelihood of future events, and there can be no assurance that any design will succeed in achieving its stated objectives under all potential future conditions.
PART II - OTHER INFORMATION
ITEM 1. LEGAL PROCEEDINGS.
None for the period covered by this report.
ITEM 1A. RISK FACTORS.
As a “smaller reporting company” as defined by Item 10 of Regulation S-K, the Company is not required to provide this information.
ITEM 2. UNREGISTERED SALES OF EQUITY SECURITIES AND USE OF PROCEEDS.
We have not sold any equity securities during the fiscal quarter ended June 30, 2012.
ITEM 3. DEFAULTS UPON SENIOR SECURITIES.
There were no defaults upon senior securities during the fiscal quarter ended June 30, 2012.
ITEM 4. MINE SAFETY DISCLOSURES.
Not applicable.
ITEM 5. OTHER INFORMATION.
None.
ITEM 6. EXHIBITS.
(a) Exhibits
42
SIGNATURES
Pursuant to the requirements of the Securities Exchange Act of 1934, the registrant has duly caused this report to be signed on its behalf by the undersigned hereunto duly authorized.
| | CHINA GENGSHENG MINERALS, INC. |
| | |
| Date: August 14, 2012 | By: /s/ Shunqing Zhang |
| | Shunqing Zhang |
| | Chief Executive Officer and Chairman |
| | |
| Date: August 14, 2012 | By: /s/ Ningfang Liang |
| | Ningfang Liang |
| | Chief Financial Officer |
| | (On behalf of the Registrant and as its Principal Financial Officer) |
43