                                  United States
                       Securities and Exchange Commission
                             Washington, D.C. 20549

                                   Form N-CSR
   Certified Shareholder Report of Registered Management Investment Companies


                                      811-1

                      (Investment Company Act File Number)


                       Federated Stock and Bond Fund, Inc.
         _______________________________________________________________

               (Exact Name of Registrant as Specified in Charter)


                            Federated Investors Funds
                              5800 Corporate Drive
                       Pittsburgh, Pennsylvania 15237-7000


                                 (412) 288-1900
                         (Registrant's Telephone Number)


                           John W. McGonigle, Esquire
                            Federated Investors Tower
                               1001 Liberty Avenue
                       Pittsburgh, Pennsylvania 15222-3779
                     (Name and Address of Agent for Service)
                (Notices should be sent to the Agent for Service)


                        Date of Fiscal Year End: 10/31/03
              Date of Reporting Period: Fiscal year ended 10/31/03

                                       and

                        Date of Fiscal Year End: 11/30/03
               Date of Reporting Period: One month ended 11/30/03


Item 1.     Reports to Stockholders
Federated Investors
World-Class Investment Manager
Federated Stock and Bond Fund, Inc.
Established 1934
ANNUAL SHAREHOLDER REPORT
Year Ended October 31, 2003
Period Ended November 30, 2003
Class A Shares
Class B Shares
Class C Shares
Class K Shares
FINANCIAL HIGHLIGHTS
MANAGEMENT'S DISCUSSION OF FUND PERFORMANCE
FINANCIAL STATEMENTS
INDEPENDENT AUDITORS' REPORT
BOARD OF DIRECTORS AND FUND OFFICERS
VOTING PROXIES ON FUND PORTFOLIO SECURITIES
Financial Highlights -- Class A Shares
(For a Share Outstanding Throughout Each Period)
| | Period
Ended | | | Year Ended October 31, |
| | 11/30/2003 | 1 | | 2003 | | | 2002 | | | 2001 | | | 2000 | | | 1999 | |
Net Asset Value, Beginning of Period | | $17.32 | | | $15.61 | | | $17.22 | | | $18.78 | | | $18.71 | | | $19.14 | |
Income From Investment Operations: | | | | | | | | | | | | | | | | | | |
Net investment income | | 0.02 | | | 0.31 | | | 0.39 | | | 0.48 | | | 0.55 | | | 0.55 | |
Net realized and unrealized gain (loss) on investments, foreign currency transactions and futures contracts | | 0.11 | | | 1.71 | | |
(1.62
| ) | |
(1.04
| ) | |
0.48
| | | 0.45 | |
|
TOTAL FROM INVESTMENT OPERATIONS | | 0.13 | | | 2.02 | | | (1.23 | ) | | (0.56 | ) | | 1.03 | | | 1.00 | |
|
Less Distributions: | | | | | | | | | | | | | | | | | | |
Distributions from net investment income | | (0.07 | ) | | (0.31 | ) | | (0.38 | ) | | (0.53 | ) | | (0.54 | ) | | (0.53 | ) |
Distributions from net realized gain on investments, foreign currency transactions and futures contracts | | -- | | | -- | | | -- | | | (0.47 | ) | | (0.42 | ) | | (0.90 | ) |
|
TOTAL DISTRIBUTIONS | | (0.07 | ) | | (0.31 | ) | | (0.38 | ) | | (1.00 | ) | | (0.96 | ) | | (1.43 | ) |
|
Net Asset Value, End of Period | | $17.38 | | | $17.32 | | | $15.61 | | | $17.22 | | | $18.78 | | | $18.71 | |
|
Total Return2 | | 0.75 | % | | 13.08 | % | | (7.32 | )% | | (3.12 | )% | | 5.79 | % | | 5.35 | % |
|
| | | | | | | | | | | | | | | | | | |
Ratios to Average Net Assets: | | | | | | | | | | | | | | | | | | |
|
Expenses | | 1.26 | %3,4 | | 1.31 | %4 | | 1.26 | %4 | | 1.31 | % | | 1.29 | % | | 1.25 | % |
|
Net investment income | | 1.64 | %3 | | 1.89 | % | | 2.32 | % | | 2.64 | % | | 2.98 | % | | 2.85 | % |
|
Expense waiver/reimbursement5 | | 0.01 | %3 | | 0.00 | %6 | | 0.00 | %6 | | 0.00 | %6 | | 0.00 | %6 | | 0.00 | %6 |
|
Supplemental Data: | | | | | | | | | | | | | | | | | | |
|
Net assets, end of period (000 omitted) | | $226,701 | | $224,461 | | $184,294 | | $175,854 | | $177,236 | | $209,985 | |
|
Portfolio turnover | | 1 | % | | 74 | % | | 54 | % | | 28 | % | | 26 | % | | 46 | % |
|
1 The Fund has changed its fiscal year end from October 31 to November 30. This period represents the one-month period from November 1, 2003 to November 30, 2003.
2 Based on net asset value, which does not reflect the sales charge or contingent deferred sales charge, if applicable.
3 Computed on an annualized basis.
4 The expense ratio is calculated without the reduction for fees paid indirectly for directed brokerage arrangements.
5 This voluntary expense decrease is reflected in both the expense and the net investment income ratios shown above.
6 Represents less than 0.01%.
See Notes which are an integral part of the Financial Statements
Financial Highlights -- Class B Shares
(For a Share Outstanding Throughout Each Period)
| | Period
Ended | | | Year Ended October 31, |
| | 11/30/2003 | 1 | | 2003 | | | 2002 | | | 2001 | | | 2000 | | | 1999 | |
Net Asset Value, Beginning of Period | | $17.28 | | | $15.58 | | | $17.19 | | | $18.75 | | | $18.68 | | | $19.10 | |
Income From Investment Operations: | | | | | | | | | | | | | | | | | | |
Net investment income | | 0.01 | | | 0.19 | | | 0.26 | | | 0.35 | | | 0.41 | | | 0.42 | |
Net realized and unrealized gain (loss) on investments, foreign currency transactions and futures contracts | | 0.11 | | | 1.70 | | |
(1.62
| ) | |
(1.05
| ) | |
0.49
| | | 0.45 | |
|
TOTAL FROM INVESTMENT OPERATIONS | | 0.12 | | | 1.89 | | | (1.36 | ) | | (0.70 | ) | | 0.90 | | | 0.87 | |
|
Less Distributions: | | | | | | | | | | | | | | | | | | |
Distributions from net investment income | | (0.04 | ) | | (0.19 | ) | | (0.25 | ) | | (0.39 | ) | | (0.41 | ) | | (0.39 | ) |
Distributions from net realized gain on investments, foreign currency transactions and futures contracts | | -- | | | -- | | | -- | | | (0.47 | ) | | (0.42 | ) | | (0.90 | ) |
|
TOTAL DISTRIBUTIONS | | (0.04 | ) | | (0.19 | ) | | (0.25 | ) | | (0.86 | ) | | (0.83 | ) | | (1.29 | ) |
|
Net Asset Value, End of Period | | $17.36 | | | $17.28 | | | $15.58 | | | $17.19 | | | $18.75 | | | $18.68 | |
|
Total Return2 | | 0.68 | % | | 12.22 | % | | (8.02 | )% | | (3.85 | )% | | 5.02 | % | | 4.63 | % |
|
| | | | | | | | | | | | | | | | | | |
Ratios to Average Net Assets: | | | | | | | | | | | | | | | | | | |
|
Expenses | | 2.01 | %3,4 | | 2.06 | %4 | | 2.01 | %4 | | 2.06 | % | | 2.04 | % | | 2.00 | % |
|
Net investment income | | 0.89 | %3 | | 1.14 | % | | 1.57 | % | | 1.89 | % | | 2.26 | % | | 2.10 | % |
|
Expense waiver/reimbursement5 | | 0.01 | %3 | | 0.00 | %6 | | 0.00 | %6 | | 0.00 | %6 | | 0.00 | %6 | | 0.00 | %6 |
|
Supplemental Data: | | | | | | | | | | | | | | | | | | |
|
Net assets, end of period (000 omitted) | | $72,412 | | $71,836 | | $59,165 | | $60,058 | | $48,898 | | $53,154 | |
|
Portfolio turnover | | 1 | % | | 74 | % | | 54 | % | | 28 | % | | 26 | % | | 46 | % |
|
1 The Fund has changed its fiscal year end from October 31 to November 30. This period represents the one-month period from November 1, 2003 to November 30, 2003.
2 Based on net asset value, which does not reflect the sales charge or contingent deferred sales charge, if applicable.
3 Computed on an annualized basis.
4 The expense ratio is calculated without the reduction for fees paid indirectly for directed brokerage arrangements.
5 This voluntary expense decrease is reflected in both the expense and the net investment income ratios shown above.
6 Represents less than 0.01%.
See Notes which are an integral part of the Financial Statements
Financial Highlights -- Class C Shares
(For a Share Outstanding Throughout Each Period)
| | Period
Ended | | | Year Ended October 31, |
| | 11/30/2003 | 1 | | 2003 | | | 2002 | | | 2001 | | | 2000 | | | 1999 | |
Net Asset Value, Beginning of Period | | $17.24 | | | $15.54 | | | $17.15 | | | $18.70 | | | $18.63 | | | $19.07 | |
Income From Investment Operations: | | | | | | | | | | | | | | | | | | |
Net investment income | | 0.01 | | | 0.19 | | | 0.26 | | | 0.35 | | | 0.41 | | | 0.42 | |
Net realized and unrealized gain (loss) on investments, foreign currency transactions and futures contracts | | 0.11 | | | 1.70 | | |
(1.62
| ) | |
(1.04
| ) | |
0.49
| | | 0.43 | |
|
TOTAL FROM INVESTMENT OPERATIONS | | 0.12 | | | 1.89 | | | (1.36 | ) | | (0.69 | ) | | 0.90 | | | 0.85 | |
|
Less Distributions: | | | | | | | | | | | | | | | | | | |
Distributions from net investment income | | (0.04 | ) | | (0.19 | ) | | (0.25 | ) | | (0.39 | ) | | (0.41 | ) | | (0.39 | ) |
Distributions from net realized gain on investments, foreign currency transactions and futures contracts | | -- | | | -- | | | -- | | | (0.47 | ) | | (0.42 | ) | | (0.90 | ) |
|
TOTAL DISTRIBUTIONS | | (0.04 | ) | | (0.19 | ) | | (0.25 | ) | | (0.86 | ) | | (0.83 | ) | | (1.29 | ) |
|
Net Asset Value, End of Period | | $17.32 | | | $17.24 | | | $15.54 | | | $17.15 | | | $18.70 | | | $18.63 | |
|
Total Return2 | | 0.68 | % | | 12.25 | % | | (8.03 | )% | | (3.81 | )% | | 5.04 | % | | 4.52 | % |
|
| | | | | | | | | | | | | | | | | | |
Ratios to Average Net Assets: | | | | | | | | | | | | | | | | | | |
|
Expenses | | 2.01 | %3,4 | | 2.04 | %4 | | 2.01 | %4 | | 2.06 | % | | 2.04 | % | | 2.00 | % |
|
Net investment income | | 0.89 | %3 | | 1.16 | % | | 1.57 | % | | 1.89 | % | | 2.26 | % | | 2.10 | % |
|
Expense waiver/reimbursement5 | | 0.01 | %3 | | 0.00 | %6 | | 0.00 | %6 | | 0.00 | %6 | | 0.00 | %6 | | 0.00 | %6 |
|
Supplemental Data: | | | | | | | | | | | | | | | | | | |
|
Net assets, end of period (000 omitted) | | $27,853 | | $27,731 | | $22,567 | | $24,032 | | $21,909 | | $20,385 | |
|
Portfolio turnover | | 1 | % | | 74 | % | | 54 | % | | 28 | % | | 26 | % | | 46 | % |
|
1 The Fund has changed its fiscal year end from October 31 to November 30. This period represents the one-month period from November 1, 2003 to November 30, 2003.
2 Based on net asset value, which does not reflect the sales charge or contingent deferred sales charge, if applicable.
3 Computed on an annualized basis.
4 The expense ratio is calculated without the reduction for fees paid indirectly for directed brokerage arrangements.
5 This voluntary expense decrease is reflected in both the expense and the net investment income ratios shown above.
6 Represents less than 0.01%.
See Notes which are an integral part of the Financial Statements
Financial Highlights -- Class K Shares
(For a Share Outstanding Throughout Each Period)
| | Period
Ended
11/30/2003 | 1 | | Period
Ended
10/31/2003 | 2 |
Net Asset Value, Beginning of Period | | $17.32 | | | $15.61 | |
Income From Investment Operations: | | | | | | |
Net investment income | | 0.01 | | | 0.10 | |
Net realized and unrealized gain (loss) on investments, foreign currency transactions and futures contracts | | 0.10 | | | 1.71 | |
|
TOTAL FROM INVESTMENT OPERATIONS | | 0.11 | | | 1.81 | |
|
Less Distributions: | | | | | | |
Distributions from net investment income | | (0.05 | ) | | (0.10 | ) |
|
Net Asset Value, End of Period | | $17.38 | | | $17.32 | |
|
Total Return3 | | 0.64 | % | | 11.64 | % |
|
| | | | | | |
Ratios to Average Net Assets: | | | | | | |
|
Expenses | | 1.78 | %4,5 | | 1.81 | %4,5 |
|
Net investment income | | 1.14 | %4 | | 1.39 | % |
|
Expense waiver/reimbursement6 | | 0.01 | %4 | | 0.00 | %4,7 |
|
Supplemental Data: | | | | | | |
|
Net assets, end of period (000 omitted) | | $0 | 8 | | $0 | 8 |
|
Portfolio turnover | | 1 | % | | 74 | % |
|
1 The Fund has changed its fiscal year end from October 31 to November 30. This period represents the one-month period from November 1, 2003 to November 30, 2003.
2 Reflects operations for the period from April 8, 2003 (start of performance) to October 31, 2003.
3 Based on net asset value, which does not reflect the sales charge or contingent deferred sales charge, if applicable.
4 Computed on an annualized basis.
5 The expense ratio is calculated without the reduction for fees paid indirectly for directed brokerage arrangements.
6 This voluntary expense decrease is reflected in both the expense and the net investment income ratios shown above.
7 Represents less than 0.01%.
8 Represents less than $1,000.
See Notes which are an integral part of the Financial Statements
Management's Discussion of Fund Performance
For the 13-month reporting period ended November 30, 2003, the fund's Class A, Class B, Class C and Class K shares produced total returns of 13.93%, 12.99%, 13.02% and 13.34%, respectively, based on net asset value.1 These returns were less than the 15.24% total return1 of the Lipper Balanced Funds Average.2
STOCKS
Within the equity portion of the portfolio, we started making moves toward more cyclically oriented names in the third quarter of 2002. We reduced exposure in the Healthcare, Utilities and Energy sectors, putting proceeds into opportunities in the Information Technology and Financials sectors. These moves, which continued consistently throughout the fiscal year, proved to be correct. However, we did not fully participate in the stock market rally. In a market driven predominately by a single factor (i.e., momentum), our fundamental, valuation-driven approach was disadvantaged. Our incremental approach employing a balanced risk/reward methodology did not fare well in a market environment where returns were asymmetrically skewed toward higher risk.
Specifically, while stock selection was strong within the Consumer Staples, Consumer Discretionary and Information Technology sectors, it was offset by lackluster performance within Industrials, Healthcare and Energy. In addition to being overweight in the Telecommunication Services, Energy and underweight Financials sectors limited performance, which was somewhat offset by the fund's overweighted positions in the Industrials, Healthcare and Utilities sectors. The five largest contributors to performance for the reporting period were: Intel Corp., Citigroup, Inc., EMC Corp. MASS, Applied Materials, Inc. and Cisco Systems, Inc. Stocks that detracted most from performance were Schering Plough Corp., UnitedHealth Group, Johnson & Johnson, Merck & Co., Inc., and Lockheed Martin Corp.
1 Performance quoted is based on net asset value, reflects past performance and is not indicative of future results. Investment return and principal value will fluctuate so that an investor's shares, when redeemed, may be worth more or less than their original cost. Total returns for the period, based on offering price (i.e., less any applicable sales charge), for Class A, Class B and Class C Shares were 7.65%, 8.24% and 11.87%, respectively. No sales charge is applicable to Class K Shares.
2 Lipper figures represent the average of the total returns reported by all of the mutual funds designated by Lipper, Inc. as falling into the respective category. Lipper returns do not take sales charges into account.
BONDS
The bond portion of the portfolio benefited largely from sector positioning and yield curve positioning, while duration3 and security selection were slight drags on the fund's performance over the past year. For comparison, the Lehman Brothers Aggregate Bond Index (LBAB)4 had a total return of 4.91% for the 12-month period ended October 31, 2003. We estimate that the bond portion of the fund outperformed the LBAB by approximately 200 basis points, or 2%.
The outperformance came from a heavily overweighted position in corporate bonds, particularly in the non-investment grade portion, i.e., those rated BBB or lower. These types of bonds are more sensitive to changes in the economy and less sensitive to changes in interest rates. As a result, these bonds tend to hold up well even when interest rates are rising in an improving economic environment. Lower-quality corporate bonds, as measured by the Lehman Brothers Corporate B Index,5 had a total return of 15.86% over the past 12 months, while even lower-quality, non-investment grade bonds were up 33.77% over this same period, as measured by the Lehman Brothers High Yield Bond Index.6 For most of the past year, we were approximately neutral on mortgage-backed securities and asset-backed securities, and underweighted in Treasury and agency issues.
3 Duration is a measure of a securities price sensitivity to changes in interest rates. Securities with longer durations are more sensitive to changes in interest rates than securities of shorter durations.
4 LBAB is an unmanaged index composed of securities from the Lehman Brothers Government/Corporate Bond Index, Mortgage-Backed Securities Index and the Asset-Backed Securities Index. Total return comprises price appreciation/depreciation and income as a percentage of the original investment. Indices are rebalanced monthly by market capitalization.
5 Lehman Brothers Corporate B Index is composed of all bonds covered by Lehman Brothers High Yield Index rated BBB by Moody's Investors Service with a minimum amount outstanding of $100m, and at least one year to maturity. It is not possible to invest directly into an index.
6 Lehman Brothers High Yield Bond Index is an unmanaged index comprising all fixed-income securities having a maximum quality rating of Ba1, a minimum amount outstanding of $100m, and at least one year to maturity. It is not possible to invest directly into an index.
GROWTH OF $10,000 INVESTMENT -- CLASS A SHARES
The graph below illustrates the hypothetical investment of $10,0001 in the Federated Stock & Bond Fund, Inc. (Class A Shares) (the "Fund") from October 31, 1993 to November 30, 2003 compared to the Standard and Poor's 500 Index (S&P 500),2 the Lehman Brothers Aggregate Bond Index (LBAB)2 and the Lipper Balanced Funds Average (LBFA).3
Average Annual Total Return4 for the Period Ended 11/30/2003 | | |
1 Year | | 4.83% |
5 Years | | 1.00% |
10 Years | | 7.22% |
Start of Performance (12/31/1968) | | 7.95% |
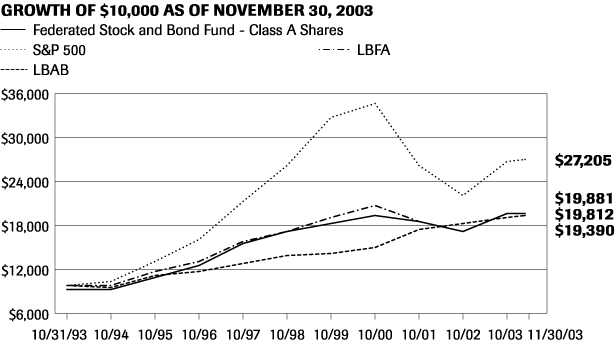
Past performance is no guarantee of future results. Returns shown do not reflect the deduction of taxes that a shareholder would pay on Fund distributions or the redemption of Fund shares. For after-tax returns, visit www.federatedinvestors.com. Investment return and principal value will fluctuate, so that an investor's shares, when redeemed, may be worth more or less than their original cost. Mutual funds are not obligations of or guaranteed by any bank and are not federally insured.
1 Represents a hypothetical investment of $10,000 in the Fund after deducting the maximum sales charge of 5.50% ($10,000 investment minus $550 sales charge = $9,450). The Fund's performance assumes the reinvestment of all dividends and distributions. The S&P 500, LBAB and LBFA have been adjusted to reflect reinvestment of dividends on securities in the indexes and average.
2 The S&P 500 and LBAB are not adjusted to reflect sales charges, expenses, or other fees that the Securities and Exchange Commission (SEC) requires to be reflected in the Fund's performance. The indexes are unmanaged. It is not possible to invest directly in an index.
3 The LBFA represents the average of the total returns reported by all of the mutual funds designated by Lipper, Inc. as falling into the respective category, and is not adjusted to reflect any sales charges. These total returns are reported net of expenses or other fees that the SEC requires to be reflected in the Fund's performance.
4 Total return quoted reflects all applicable sales charges.
GROWTH OF $10,000 INVESTMENT -- CLASS B SHARES
The graph below illustrates the hypothetical investment of $10,0001 in the Federated Stock & Bond Fund, Inc. (Class B Shares) (the "Fund") from August 30, 1996 (start of performance) to November 30, 2003 compared to the Standard and Poor's 500 Index (S&P 500),2 the Lehman Brothers Aggregate Bond Index (LBAB)2 and the Lipper Balanced Funds Average (LBFA).3
Average Annual Total Return4 for the Period Ended 11/30/2003 | | |
1 Year | | 4.59% |
5 Years | | 1.03% |
Start of Performance (8/30/1996) | | 6.40% |
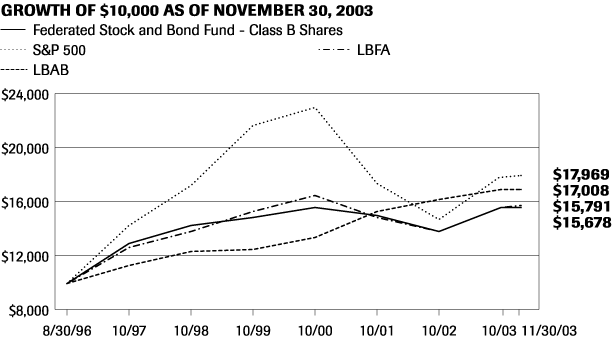
Past performance is no guarantee of future results. Returns shown do not reflect the deduction of taxes that a shareholder would pay on Fund distributions or the redemption of Fund shares. For after-tax returns, visit www.federatedinvestors.com. Investment return and principal value will fluctuate, so that an investor's shares, when redeemed, may be worth more or less than their original cost. Mutual funds are not obligations of or guaranteed by any bank and are not federally insured.
1 Represents a hypothetical investment of $10,000 in the Fund. The ending value of the Fund does not reflect a contingent deferred sales charge on any redemptions over seven years from the purchase date. The maximum contingent deferred sales charge is 5.50% on any redemption of shares held up to one year from the purchase date. The Fund's performance assumes the reinvestment of all dividends and distributions. The S&P 500, LBAB and LBFA have been adjusted to reflect reinvestment of dividends on securities in the indexes and average.
2 The S&P 500 and LBAB are not adjusted to reflect sales charges, expenses, or other fees that the SEC requires to be reflected in the Fund's performance. The indexes are unmanaged. It is not possible to invest directly in an index.
3 The LBFA represents the average of the total returns reported by all of the mutual funds designated by Lipper Analytical Services, Inc. as falling into the respective category, and is not adjusted to reflect any sales charges. These total returns are reported net of expenses or other fees that the SEC requires to be reflected in a fund's performance.
4 Total return quoted reflects all contingent deferred sales charges.
GROWTH OF $10,000 INVESTMENT -- CLASS C SHARES
The graph below illustrates the hypothetical investment of $10,0001 in the Federated Stock & Bond Fund, Inc. (Class C Shares) (the "Fund") from October 31, 1993 to November 30, 2003 compared to the Standard and Poor's 500 Index (S&P 500),2 the Lehman Brothers Aggregate Bond Index (LBAB)2 and the Lipper Balanced Funds Average (LBFA).3
Average Annual Total Return4 for the Period Ended 11/30/2003 | | |
1 Year | | 8.03% |
5 Years | | 1.17% |
10 Years | | 6.88% |
Start of Performance (4/19/1993) | | 6.85% |
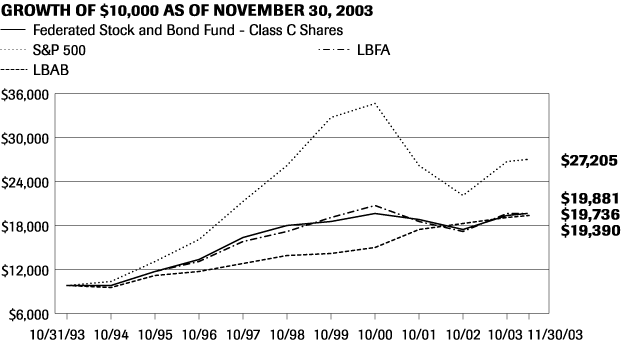
Past performance is no guarantee of future results. Returns shown do not reflect the deduction of taxes that a shareholder would pay on Fund distributions or the redemption of Fund shares. For after-tax returns, visit www.federatedinvestors.com. Investment return and principal value will fluctuate, so that an investor's shares, when redeemed, may be worth more or less than their original cost. Mutual funds are not obligations of or guaranteed by any bank and are not federally insured.
1 Represents a hypothetical investment of $10,000 in the Fund. A 1.00% contingent deferred sales charge would be applied on any redemption within one year from purchase date. Effective April 1, 2003, the Fund began to charge a maximum sales charge of 1.00%. The Fund's performance assumes the reinvestment of all dividends and distributions. The S&P 500, LBAB and LBFA have been adjusted to reflect reinvestment of dividends on securities in the indexes and average.
2 The S&P 500 and LBAB are not adjusted to reflect sales charges, expenses, or other fees that the SEC requires to be reflected in the Fund's performance. The indexes are unmanaged. It is not possible to invest directly in an index.
3 The LBFA represents the average of the total returns reported by all of the mutual funds designated by Lipper, Inc. as falling into the respective category, and is not adjusted to reflect any sales charges. These total returns are reported net of expenses or other fees that the SEC requires to be reflected in a fund's performance.
4 Total return quoted reflects all applicable sales charges and contingent deferred sales charges.
GROWTH OF $10,000 INVESTMENT -- CLASS K SHARES
The Fund's Class K Shares commenced operation on April 8, 2003. The Fund offers three other classes of shares, Class A Shares, Class B Shares and Class C Shares. For the period prior to the commencement of operations of the Class K Shares, the performance information shown is for the Fund's Class A Shares, adjusted to reflect the expenses of Class K Shares. The graph below illustrates the hypothetical investment of $10,0001 in the Federated Stock & Bond Fund, Inc. (Class K Shares) (the "Fund") from October 31, 1993 to November 30, 2003 compared to the Standard and Poor's 500 Index (S&P 500),2 the Lehman Brothers Aggregate Bond Index (LBAB)2 and the Lipper Balanced Funds Average (LBFA).3
Average Annual Total Return for the Period Ended 11/30/2003 | | |
1 Year | | 10.40% |
5 Years | | 1.66% |
10 Years | | 7.32% |
Start of Performance (12/31/1968) | | 7.62% |
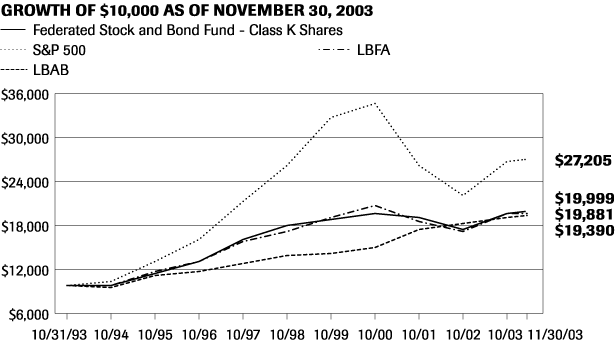
Past performance is no guarantee of future results. Returns shown do not reflect the deduction of taxes that a shareholder would pay on Fund distributions or the redemption of Fund shares. For after-tax returns, visit www.federatedinvestors.com. Your investment return and principal value will fluctuate, so that an investor's shares, when redeemed, may be worth more or less than their original cost. Mutual funds are not obligations of or guaranteed by any bank and are not federally insured.
1 Represents a hypothetical investment of $10,000 in the Fund. The Fund's performance assumes the reinvestment of all dividends and distributions. The S&P 500, LBAB and LBFA have been adjusted to reflect reinvestment of dividends on securities in the indexes and average.
2 The S&P 500 and LBAB are not adjusted to reflect sales charges, expenses, or other fees that the SEC requires to be reflected in the Fund's performance. The indexes are unmanaged. It is not possible to invest directly in an index.
3 The LBFA represents the average of the total returns reported by all of the mutual funds designated by Lipper, Inc. as falling into the respective category, and is not adjusted to reflect any sales charges. These total returns are reported net of expenses or other fees that the SEC requires to be reflected in the Fund's performance.
Portfolio of Investments
November 30, 2003
Shares | | | | | Value | |
| | | STOCKS--65.1% | | | | |
| | | COMMON STOCKS--61.9% | | | | |
| | | Consumer Discretionary--6.3% | | | | |
| 24,600 | | Clear Channel Communications, Inc. | | $ | 1,028,526 | |
| 39,600 | 1 | Comcast Corp., Class A | | | 1,242,648 | |
| 20,400 | | Gannett Co., Inc. | | | 1,766,640 | |
| 78,000 | | Home Depot, Inc. | | | 2,867,280 | |
| 36,100 | | Interpublic Group Cos., Inc. | | | 514,425 | |
| 15,800 | | Johnson Controls, Inc. | | | 1,729,152 | |
| 5,425 | 1 | Kohl's Corp. | | | 262,136 | |
| 79,000 | | McDonald's Corp. | | | 2,024,770 | |
| 22,400 | | Nike, Inc., Class B | | | 1,506,400 | |
| 15,100 | | Omnicom Group, Inc. | | | 1,202,866 | |
| 50,500 | | Target Corp. | | | 1,955,360 | |
| 88,400 | 1 | Time Warner, Inc. | | | 1,439,152 | |
| 28,100 | | Viacom, Inc., Class B | | | 1,104,892 | |
| 79,000 | | Walt Disney Co. | | | 1,824,110 | |
|
| | | TOTAL | | | 20,468,357 | |
|
| | | Consumer Staples--6.9% | | | | |
| 42,500 | | Altria Group, Inc. | | | 2,210,000 | |
| 59,600 | | Coca-Cola Co. | | | 2,771,400 | |
| 38,500 | 1 | Costco Wholesale Corp. | | | 1,379,070 | |
| 30,850 | | Gillette Co. | | | 1,040,571 | |
| 16,000 | | Hershey Foods Corp. | | | 1,243,200 | |
| 100,300 | 1 | Kroger Co. | | | 1,891,658 | |
| 48,400 | | PepsiCo, Inc. | | | 2,329,008 | |
| 26,200 | | Procter & Gamble Co. | | | 2,521,488 | |
| 106,400 | | Rite Aid Corp. | | | 654,360 | |
| 44,200 | | Sara Lee Corp. | | | 908,310 | |
| 24,900 | | UST, Inc. | | | 896,151 | |
| 69,400 | | Wal-Mart Stores, Inc. | | | 3,861,416 | |
| 26,150 | | Walgreen Co. | | | 962,582 | |
|
| | | TOTAL | | | 22,669,214 | |
|
| | | Energy--4.8% | | | | |
| 20,800 | | ChevronTexaco Corp. | | | 1,562,080 | |
| 36,900 | | ConocoPhillips | | | 2,093,706 | |
| 163,400 | | Exxon Mobil Corp. | | | 5,910,178 | |
| 66,700 | | Halliburton Co. | | | 1,557,445 | |
Shares | | | | | Value | |
| | | STOCKS--continued | | | | |
| | | COMMON STOCKS--continued | | | | |
| | | Energy--continued | | | | |
| 33,400 | | Schlumberger Ltd. | | $ | 1,567,128 | |
| 82,600 | 1 | Transocean Sedco Forex, Inc. | | | 1,600,788 | |
| 46,300 | 1 | Weatherford International, Inc. | | | 1,517,714 | |
|
| | | TOTAL | | | 15,809,039 | |
|
| | | Financials--10.2% | | | | |
| 49,600 | | Allstate Corp. | | | 2,002,848 | |
| 39,200 | | American International Group, Inc. | | | 2,271,640 | |
| 11,000 | | Bank One Corp. | | | 476,960 | |
| 36,100 | | Bank of America Corp. | | | 2,723,023 | |
| 59,800 | | Bank of New York Co., Inc. | | | 1,834,664 | |
| 99,700 | | Citigroup, Inc. | | | 4,689,888 | |
| 14,000 | | Federal HomeLoan Mortgage Corp. | | | 761,880 | |
| 17,300 | | Fannie Mae | | | 1,211,000 | |
| 11,482 | | Fifth Third Bancorp | | | 667,449 | |
| 17,000 | | FleetBoston Financial Corp. | | | 690,200 | |
| 16,000 | | Goldman Sachs Group, Inc. | | | 1,537,280 | |
| 82,200 | | J.P. Morgan Chase & Co. | | | 2,906,592 | |
| 15,500 | | Lehman Brothers Holdings, Inc. | | | 1,119,255 | |
| 39,300 | | Lincoln National Corp. | | | 1,540,953 | |
| 47,200 | | MBNA Corp. | | | 1,157,344 | |
| 55,700 | | Morgan Stanley | | | 3,079,096 | |
| 12,100 | | SLM Holding Corp. | | | 449,273 | |
| 12,300 | | Wachovia Corp. | | | 562,725 | |
| 38,000 | | Washington Mutual, Inc. | | | 1,740,780 | |
| 32,000 | | Wells Fargo & Co. | | | 1,834,560 | |
|
| | | TOTAL | | | 33,257,410 | |
|
| | | Healthcare--9.1% | | | | |
| 37,700 | | Abbott Laboratories | | | 1,666,340 | |
| 16,700 | | AmerisourceBergen Corp. | | | 1,056,943 | |
| 20,000 | 1 | Amgen, Inc. | | | 1,150,200 | |
| 50,300 | | Baxter International, Inc. | | | 1,399,346 | |
| 28,750 | 1 | Biogen, Inc. | | | 1,097,675 | |
| 43,800 | 1 | Boston Scientific Corp. | | | 1,571,982 | |
| 54,600 | | Bristol-Myers Squibb Co. | | | 1,438,710 | |
| 32,200 | 1 | Forest Laboratories, Inc., Class A | | | 1,759,408 | |
| 26,700 | | Guidant Corp. | | | 1,515,759 | |
| 48,325 | | Johnson & Johnson | | | 2,381,939 | |
| 35,800 | | Lilly (Eli) & Co. | | | 2,454,448 | |
Shares | | | | | Value | |
| | | STOCKS--continued | | | | |
| | | COMMON STOCKS--continued | | | | |
| | | Healthcare--continued | | | | |
| 5,328 | 1 | Medco Health Solutions, Inc. | | $ | 194,099 | |
| 8,800 | | Medtronic, Inc. | | | 397,760 | |
| 57,300 | | Merck & Co., Inc. | | | 2,326,380 | |
| 173,800 | | Pfizer, Inc. | | | 5,830,990 | |
| 88,700 | | Schering Plough Corp. | | | 1,423,635 | |
| 13,400 | 1 | St. Jude Medical, Inc. | | | 848,756 | |
| 32,500 | | Wyeth | | | 1,280,500 | |
|
| | | TOTAL | | | 29,794,870 | |
|
| | | Industrials--7.5% | | | | |
| 23,900 | | 3M Co. | | | 1,889,056 | |
| 9,900 | 1 | American Standard Cos. | | | 987,030 | |
| 18,000 | | Caterpillar, Inc. | | | 1,368,900 | |
| 71,300 | 1 | Cendant Corp. | | | 1,580,008 | |
| 21,800 | | Danaher Corp. | | | 1,813,760 | |
| 17,700 | | Deere & Co. | | | 1,083,771 | |
| 25,500 | | Dover Corp. | | | 978,945 | |
| 21,100 | | Eaton Corp. | | | 2,173,089 | |
| 112,400 | | General Electric Co. | | | 3,222,508 | |
| 19,300 | | Ingersoll-Rand Co., Class A | | | 1,203,162 | |
| 29,900 | | Lockheed Martin Corp. | | | 1,373,606 | |
| 48,000 | | Raytheon Co. | | | 1,330,080 | |
| 35,200 | | Textron, Inc. | | | 1,754,368 | |
| 77,300 | | Tyco International Ltd. | | | 1,774,035 | |
| 63,500 | | Waste Management, Inc. | | | 1,867,535 | |
|
| | | TOTAL | | | 24,399,853 | |
|
| | | Information Technology--10.9% | | | | |
| 61,600 | 1 | Apple Computer, Inc. | | | 1,288,672 | |
| 39,600 | 1 | Applied Materials, Inc. | | | 962,280 | |
| 91,100 | 1 | Cisco Systems, Inc. | | | 2,064,326 | |
| 57,500 | 1 | Dell, Inc. | | | 1,983,750 | |
| 128,800 | | EMC Corp. Mass | | | 1,769,712 | |
| 43,500 | | First Data Corp. | | | 1,646,475 | |
| 182,400 | | Hewlett-Packard Co. | | | 3,956,256 | |
| 134,400 | | Intel Corp. | | | 4,492,992 | |
| 30,700 | | International Business Machines Corp. | | | 2,779,578 | |
| 17,100 | 1 | Intuit, Inc. | | | 859,788 | |
| 13,200 | 1 | KLA-Tencor Corp. | | | 773,652 | |
| 24,800 | 1 | Lexmark International Group, Class A | | | 1,919,520 | |
| 254,000 | 1 | Lucent Technologies, Inc. | | | 812,800 | |
Shares or
Principal
Amount | | | | | Value | |
| | | STOCKS--continued | | | | |
| | | COMMON STOCKS--continued | | | | |
| | | Information Technology--continued | | | | |
| 31,300 | | Maxim Integrated Products, Inc. | | $ | 1,630,104 | |
| 176,900 | | Microsoft Corp. | | | 4,546,330 | |
| 88,700 | | Nokia Oyj, ADR, Class A | | | 1,594,826 | |
| 124,300 | 1 | Oracle Corp. | | | 1,492,843 | |
| 41,600 | | Texas Instruments, Inc. | | | 1,238,016 | |
|
| | | TOTAL | | | 35,811,920 | |
|
| | | Materials--1.6% | | | | |
| 65,100 | | Alcoa, Inc. | | | 2,135,931 | |
| 55,200 | | International Paper Co. | | | 2,053,992 | |
| 41,000 | | MeadWestvaco Corp. | | | 1,046,320 | |
|
| | | TOTAL | | | 5,236,243 | |
|
| | | Telecommunication Services--2.8% | | | | |
| 47,000 | | AT&T Corp. | | | 932,010 | |
| 60,100 | | BellSouth Corp. | | | 1,564,403 | |
| 130,500 | | SBC Communications, Inc. | | | 3,038,040 | |
| 46,900 | | Sprint Corp. (FON Group) | | | 703,031 | |
| 86,600 | | Verizon Communications | | | 2,837,882 | |
|
| | | TOTAL | | | 9,075,366 | |
|
| | | Utilities--1.8% | | | | |
| 47,800 | | Cinergy Corp. | | | 1,747,090 | |
| 10,600 | | FPL Group, Inc. | | | 673,630 | |
| 28,600 | | FirstEnergy Corp. | | | 990,990 | |
| 61,500 | | NiSource, Inc. | | | 1,276,125 | |
| 45,500 | | Sempra Energy | | | 1,288,560 | |
|
| | | TOTAL | | | 5,976,395 | |
|
| | | TOTAL COMMON STOCKS (IDENTIFIED COST $182,868,366) | | | 202,498,667 | |
|
| | | FUTURES CONTRACT COLLATERAL--3.2%2 | | | | |
$ | 3,000,000 | | United States Treasury Bill, 1/22/2004 | | | 2,995,980 | |
| 3,500,000 | | United States Treasury Bill, 1/29/2004 | | | 3,494,890 | |
| 4,000,000 | | United States Treasury Bill, 2/26/2004 | | | 3,991,400 | |
|
| | | TOTAL FUTURES CONTRACT COLLATERAL (IDENTIFIED COST $10,481,757) | | | 10,482,270 | |
|
| | | TOTAL STOCKS (IDENTIFIED COST $193,350,123) | | | 212,980,937 | |
|
| | | ASSET-BACKED SECURITIES--0.1% | | | | |
| 430,640 | | 125 Home Loan Owner Trust 1998-1A B1, 9.26%, 02/15/2029 | | | 441,540 | |
| 45,710 | 3 | SMFC Trust Asset-Backed Certificates, Series 1997-A 4, 1/28/2025 | | | 34,997 | |
|
| | | TOTAL ASSET-BACKED SECURITIES (IDENTIFIED COST $472,247) | | | 476,537 | |
|
Principal
Amount | | | | | Value | |
| | | COLLATERALIZED MORTGAGE OBLIGATION--0.5% | | | | |
$ | 1,760,320 | | Federal National Mortgage Association, 1.62%, 9/25/2032 (IDENTIFIED COST $1,759,219) | | $ | 1,768,276 | |
|
| | | CORPORATE BONDS--9.5% | | | | |
| | | Basic Industry - Chemicals--0.1% | | | | |
| 250,000 | | Praxair, Inc., 3.95%, 6/01/2013 | | | 233,045 | |
|
| | | Basic Industry - Metals & Mining--0.1% | | | | |
| 150,000 | | BHP Finance (USA), Inc., 4.8%, 4/15/2013 | | | 149,538 | |
| 100,000 | | Inco Ltd., 5.7%, 10/15/2015 | | | 100,568 | |
|
| | | TOTAL | | | 250,106 | |
|
| | | Basic Industry - Paper--0.1% | | | | |
| 150,000 | | Pope & Talbot, Inc., 8.375%, 6/1/2013 | | | 147,000 | |
| 275,000 | | Weyerhaeuser Co., Deb., 7.375%, 3/15/2032 | | | 292,776 | |
|
| | | TOTAL | | | 439,776 | |
|
| | | Capital Goods - Diversified Manufacturing--0.3% | | | | |
| 400,000 | 3 | Hutchison Whampoa Ltd., 6.5%, 2/13/2013 | | | 410,264 | |
| 500,000 | | Kennametal, Inc., 7.2%, 6/15/2012 | | | 531,410 | |
|
| | | TOTAL | | | 941,674 | |
|
| | | Capital Goods - Environmental--0.4% | | | | |
| 1,000,000 | | Waste Management, Inc., Deb., 8.75%, 5/01/2018 | | | 1,167,410 | |
|
| | | Capital Goods- Aerospace & Defense--0.2% | | | | |
| 50,000 | | Lockheed Martin Corp., Note, 8.2%, 12/01/2009 | | | 60,496 | |
| 500,000 | | Raytheon Co., Note, 6.3%, 3/15/2005 | | | 525,345 | |
|
| | | TOTAL | | | 585,841 | |
|
| | | Communications - Media & Cable--0.4% | | | | |
| 500,000 | | British Sky Broadcasting Group PLC, Note, 6.875%, 2/23/2009 | | | 543,395 | |
| 400,000 | | Comcast Corp., 5.3%, 1/15/2014 | | | 394,936 | |
| 250,000 | | Cox Communications Inc., Medium Term Note, 6.69%, 9/20/2004 | | | 259,745 | |
|
| | | TOTAL | | | 1,198,076 | |
|
| | | Communications - Media Noncable--0.4% | | | | |
| 250,000 | | Clear Channel Communication, 3.125%, 2/01/2007 | | | 248,178 | |
| 250,000 | | Clear Channel Communication, 7.65%, 9/15/2010 | | | 292,605 | |
| 250,000 | | Reed Elsevier, Inc., 6.75%, 8/01/2011 | | | 282,535 | |
| 500,000 | | Univision Communications, Inc., 7.85%, 7/15/2011 | | | 579,050 | |
|
| | | TOTAL | | | 1,402,368 | |
|
| | | Communications - Telecom Wirelines--0.4% | | | | |
| 200,000 | | CenturyTel, Inc., 8.375%, 10/15/2010 | | | 242,530 | |
| 250,000 | | Citizens Communications Co., Unsecd. Note, 9.25%, 5/15/2011 | | | 312,393 | |
| 100,000 | 3 | Telefonos de Mexico, 4.5%, 11/19/2008 | | | 99,941 | |
| 675,000 | | Verizon Global Funding, 7.75%, 6/15/2032 | | | 782,399 | |
|
| | | TOTAL | | | 1,437,263 | |
|
Principal
Amount | | | | | Value | |
| | | CORPORATE BONDS--continued | | | | |
| | | Consumer Cyclical - Automotive--0.3% | | | | |
$ | 250,000 | | DaimlerChrysler North Am, 6.5%, 11/15/2013 | | $ | 258,093 | |
| 250,000 | | Ford Motor Co., Unsecd. Note, 7.45%, 7/16/2031 | | | 237,480 | |
| 500,000 | | General Motors Corp., Note, 7.2%, 1/15/2011 | | | 528,280 | |
|
| | | TOTAL | | | 1,023,853 | |
|
| | | Consumer Cyclical -- Entertainment--0.5% | | | | |
| 300,000 | | AOL Time Warner, Inc., Bond, 7.7%, 5/01/2032 | | | 343,953 | |
| 300,000 | 3 | Carnival Corp., 3.75%, 11/15/2007 | | | 299,832 | |
| 1,000,000 | | International Speedway Co, 7.875%, 10/15/2004 | | | 1,046,980 | |
|
| | | TOTAL | | | 1,690,765 | |
|
| | | Consumer Cyclical - Retailers--0.3% | | | | |
| 500,000 | | CVS Corp., 5.625%, 3/15/2006 | | | 534,340 | |
| 90,000 | | Neiman-Marcus Group, Inc., Sr. Deb., 7.125%, 6/01/2028 | | | 98,920 | |
| 250,000 | | Shopko Stores, Sr. Note, 9.25%, 3/15/2022 | | | 231,250 | |
| 250,000 | | Wal-Mart Stores, Inc., Unsecd. Note, 3.375%, 10/01/2008 | | | 246,400 | |
|
| | | TOTAL | | | 1,110,910 | |
|
| | | Consumer Non-Cyclical - Healthcare--0.1% | | | | |
| 250,000 | | UnitedHealth Group, Inc., 3.3%, 1/30/2008 | | | 248,115 | |
|
| | | Consumer Non-Cyclical - Tobacco--0.0% | | | | |
| 65,000 | | Altria Group, Inc., 5.625%, 11/04/2008 | | | 65,432 | |
|
| | | Energy - Independent--0.2% | | | | |
| 250,000 | | Devon Financing Corp., 7.875%, 9/30/2031 | | | 296,613 | |
| 250,000 | | Pemex Project Funding Master, Company Guarantee, 9.125%, 10/13/2010 | | | 295,625 | |
|
| | | TOTAL | | | 592,238 | |
|
| | | Energy - Integrated--0.5% | | | | |
| 250,000 | | Conoco Funding Co., 7.25%, 10/15/2031 | | | 293,713 | |
| 250,000 | | Conoco, Inc., 5.45%, 10/15/2006 | | | 267,200 | |
| 500,000 | | Husky Oil Ltd., Company Guarantee, 8.9%, 8/15/2028 | | | 578,090 | |
| 500,000 | | Petro-Canada, Bond, 5.35%, 7/15/2033 | | | 441,325 | |
| 35,000 | | Petro-Canada, Inc., Deb., 7%, 11/15/2028 | | | 38,415 | |
|
| | | TOTAL | | | 1,618,743 | |
|
| | | Energy - Oil Field Services--0.0% | | | | |
| 50,000 | | Noble Drilling Corp., Sr. Note, 7.5%, 3/15/2019 | | | 56,733 | |
|
| | | Energy - Refining--0.1% | | | | |
| 300,000 | | Valero Energy Corp., 7.5%, 4/15/2032 | | | 328,860 | |
|
| | | Finance - Automotive--0.3% | | | | |
| 100,000 | | Ford Motor Credit Co., 7%, 10/01/2013 | | | 101,690 | |
| 250,000 | | Ford Motor Credit Corp., Note, 7.375%, 10/28/2009 | | | 265,030 | |
| 100,000 | | General Motors Acceptance, 4.5%, 7/15/2006 | | | 102,159 | |
| 500,000 | | General Motors Acceptance, 7.5%, 7/15/2005 | | | 535,575 | |
|
| | | TOTAL | | | 1,004,454 | |
|
Principal
Amount | | | | | Value | |
| | | CORPORATE BONDS--continued | | | | |
| | | Financial Institution - Banking--0.6% | | | | |
$ | 45,000 | | Associates Corp. of North America, Sr. Note, 5.5%, 2/15/2004 | | $ | 45,411 | |
| 750,000 | | FirstBank Puerto Rico, Sub. Note, 7.625%, 12/15/2005 | | | 792,870 | |
| 60,000 | | HSBC USA, Inc., Sub. Note, 6.625%, 3/01/2009 | | | 67,095 | |
| 485,801 | 3 | Regional Diversified Funding, 9.25%, 3/15/2030 | | | 561,362 | |
| 350,000 | | US BANK N.A., 6.3%, 2/04/2014 | | | 386,754 | |
| 120,000 | | Union Planters Corp., 4.375%, 12/01/2010 | | | 118,331 | |
|
| | | TOTAL | | | 1,971,823 | |
|
| | | Financial Institution -- Brokerage--0.4% | | | | |
| 200,000 | | Amvescap PLC, Sr. Note, 6.6%, 5/15/2005 | | | 212,268 | |
| 250,000 | | Goldman Sachs Group, Inc., 6.125%, 2/15/2033 | | | 249,525 | |
| 500,000 | | Lehman Brothers Holdings, 7.875%, 8/15/2010 | | | 593,100 | |
| 250,000 | | Morgan Stanley Group, In, 5.3%, 3/01/2013 | | | 252,735 | |
|
| | | TOTAL | | | 1,307,628 | |
|
| | | Financial Institution - Finance Noncaptive--0.3% | | | | |
| 200,000 | | American Express Co., 4.875%, 7/15/2013 | | | 199,748 | |
| 250,000 | | Capital One Financial, Note, 7.125%, 8/01/2008 | | | 269,265 | |
| 30,000 | | Heller Financial, Inc., Note, 7.375%, 11/01/2009 | | | 34,541 | |
| 300,000 | | Household Finance Corp., Unsecd. Note, 5.75%, 1/30/2007 | | | 321,402 | |
| 55,000 | | Newcourt Credit Group, In, Company Guarantee, 6.875%, 2/16/2005 | | | 58,118 | |
|
| | | TOTAL | | | 883,074 | |
|
| | | Financial Institution - Insurance - Life--1.1% | | | | |
| 400,000 | | AXA-UAP, Sub. Note, 8.6%, 12/15/2030 | | | 497,544 | |
| 1,250,000 | | Delphi Funding, 9.31%, 3/25/2027 | | | 983,738 | |
| 750,000 | 3 | Life Re Capital Trust I, Company Guarantee, 8.72%, 6/15/2027 | | | 797,745 | |
| 300,000 | 3 | Pacific LifeCorp., Bond, 6.6%, 9/15/2033 | | | 313,062 | |
| 100,000 | | Principal Financial Group, 6.125%, 10/15/2033 | | | 100,081 | |
| 250,000 | | Prudential Financial, 5.75%, 7/15/2033 | | | 231,873 | |
| 750,000 | 3 | Union Central Life Ins Co., Note, 8.2%, 11/1/2026 | | | 787,643 | |
|
| | | TOTAL | | | 3,711,686 | |
|
| | | Financial Institution - Insurance - P&C--0.0% | | | | |
| 100,000 | | Marsh & McLennan Cos.,, Sr. Note, 7.125%, 6/15/2009 | | | 114,845 | |
|
| | | Financial Institution - REITs--0.1% | | | | |
| 45,000 | | Mack-Cali Realty Corp., Note, 7.25%, 3/15/2009 | | | 50,745 | |
| 250,000 | | Simon Property Group, In, 6.35%, 8/28/2012 | | | 269,930 | |
|
| | | TOTAL | | | 320,675 | |
|
| | | Financial Intermediaries--0.2% | | | | |
| 500,000 | 3 | Fidelity Investments, 4.75%, 3/01/2013 | | | 494,125 | |
|
Principal
Amount | | | | | Value | |
| | | CORPORATE BONDS--continued | | | | |
| | | Food & Drug Retailers--0.1% | | | | |
$ | 250,000 | | Kroger Co., 7.5%, 4/01/2031 | | $ | 286,112 | |
|
| | | Food Products--0.1% | | | | |
| 250,000 | | General Mills, Inc., 6%, 2/15/2012 | | | 267,152 | |
|
| | | Healthcare--0.1% | | | | |
| 250,000 | | HCA - The Healthcare Corp., 6.95%, 5/01/2012 | | | 262,323 | |
|
| | | Industrial Products & Equipment--0.1% | | | | |
| 250,000 | | General Electric Co., Note, 5%, 2/01/2013 | | | 251,390 | |
|
| | | Insurance--0.1% | | | | |
| 100,000 | 3 | Oil Insurance Ltd., Sub. Deb., 5.15%, 8/15/2033 | | | 100,442 | |
| 250,000 | | Travelers Property Casua, Sr. Note, 5%, 3/15/2013 | | | 248,515 | |
|
| | | TOTAL | | | 348,957 | |
|
| | | State/Provincial--0.1% | | | | |
| 650,000 | | New South Wales, State of, Local Gov't. Guarantee, 6.5%, 5/01/2006 | | | 476,662 | |
|
| | | Supranational--0.1% | | | | |
| 300,000 | | Corp Andina De Fomento, Bond, 7.375%, 1/18/2011 | | | 338,364 | |
|
| | | Technology Services--0.3% | | | | |
| 250,000 | | Computer Sciences Corp., 5%, 2/15/2013 | | | 250,893 | |
| 200,000 | | First Data Corp., 4.7%, 8/01/2013 | | | 196,472 | |
| 500,000 | | International Business Machines Corp., 4.875%, 10/01/2006 | | | 527,325 | |
|
| | | TOTAL | | | 974,690 | |
|
| | | Telecommunications & Cellular--0.2% | | | | |
| 250,000 | | AT&T Wireless Services,, Sr. Note, 7.35%, 3/01/2006 | | | 271,568 | |
| 100,000 | | Deutsche Telekom Interna, 5.25%, 7/22/2013 | | | 99,604 | |
| 50,000 | | Insight Midwest LP, Sr. Note, 9.75%, 10/01/2009 | | | 53,125 | |
| 260,000 | | Tritel PCS, Inc., Sr. Sub. Note, 10.375%, 1/15/2011 | | | 313,633 | |
|
| | | TOTAL | | | 737,930 | |
|
| | | Transportation - Airlines--0.1% | | | | |
| 52,960 | | Northwest Airlines Pass, Pass Thru Cert., 7.575%, 3/01/2019 | | | 54,549 | |
| 255,000 | | Southwest Airlines Co., Deb., 7.375%, 3/1/2027 | | | 274,722 | |
|
| | | TOTAL | | | 329,271 | |
|
| | | Transportation - Railroads--0.1% | | | | |
| 200,000 | | Canadian Pacific RR, 6.25%, 10/15/2011 | | | 219,908 | |
|
| | | Utility - Electric--0.7% | | | | |
| 200,000 | | Alabama Power Co., 2.8%, 12/01/2006 | | | 199,092 | |
| 200,000 | | Arizona Public Service Co, 6.375%, 10/15/2011 | | | 216,628 | |
| 75,000 | | Calpine Corp., Note, 7.75%, 4/15/2009 | | | 53,625 | |
| 250,000 | | Duke Energy Corp., Note, 6.25%, 1/15/2012 | | | 268,565 | |
| 750,000 | | Homer City Funding, Sr. Secd. Note, 8.734%, 10/01/2026 | | | 795,000 | |
Principal
Amount | | | | | Value | |
| | | CORPORATE BONDS--continued | | | | |
| | | Utility - Electric--continued | | | | |
$ | 250,000 | 3 | Israel Electric Corp. Ltd., 7.95%, 5/30/2011 | | $ | 273,805 | |
| 500,000 | | MidAmerican Energy Co., Unsecd. Note, 6.75%, 12/30/2031 | | | 535,345 | |
|
| | | TOTAL | | | 2,342,060 | |
|
| | | TOTAL CORPORATE BONDS (IDENTIFIED COST $30,264,386) | | | 31,034,337 | |
|
| | | GOVERNMENT AGENCIES--1.7% | | | | |
| 1,000,000 | | Federal Home Loan Mortgage Corp., 3.250%, 11/15/2004 | | | 1,017,020 | |
| 2,000,000 | | Federal Home Loan Mortgage Corp., 4.050%, 6/21/2005 | | | 2,028,220 | |
| 1,000,000 | | Federal Home Loan Mortgage Corp., 5.750%, 4/15/2008 | | | 1,091,720 | |
| 625,000 | | Federal Home Loan Mortgage Corp., 6.250%, 7/15/2032 | | | 671,913 | |
| 500,000 | | Federal National Mortgage Association, 4.375%, 10/15/2006 | | | 522,280 | |
|
| | | TOTAL GOVERNMENT AGENCIES (IDENTIFIED COST $5,196,750) | | | 5,331,153 | |
|
| | | GOVERNMENTS/AGENCIES--1.4% | | | | |
| 700,000 | | Austria, Government of, Bond, Series 98 1, 5%, 1/15/2008 | | | 882,696 | |
| 550,000 | | Canada, Government of, Series WU42, 5%, 9/01/2004 | | | 432,093 | |
| 750,000 | | Germany, Government of, Bond, 3.75%, 1/04/2009 | | | 899,543 | |
| 700,000 | | Germany, Government of, Bond, 5.25%, 1/04/2011 | | | 895,757 | |
| 700,000 | | Germany, Government of, Bond, Series 139, 4%, 2/16/2007 | | | 857,377 | |
| 250,000 | | Quebec, Province of, Deb., 7.5%, 9/15/2029 | | | 309,738 | |
| 175,000 | | United Mexican States, 6.625%, 3/03/2015 | | | 180,469 | |
|
| | | TOTAL GOVERNMENTS/AGENCIES (IDENTIFIED COST $3,363,153) | | | 4,457,673 | |
|
| | | MORTGAGE BACKED SECURITIES--0.0% | | | | |
| 35,335 | | Federal Home Loan Mortgage Corp. Pool C25621, 6.500%, 5/1/2029 | | | 36,969 | |
| 11,889 | | Federal Home Loan Mortgage Corp. Pool E77591, 6.500%, 7/1/2014 | | | 12,537 | |
| 15,230 | | Federal National Mortgage Association Pool 303168, 9.500%, 30 Year, 2/1/2025 | | | 16,825 | |
| 11,087 | | Federal National Mortgage Association Pool 323159, 7.500%, 4/1/2028 | | | 11,891 | |
| 5,335 | | Federal National Mortgage Association Pool 323970, 7.000%, 15 Year, 10/1/2014 | | | 5,697 | |
| 16,425 | | Federal National Mortgage Association Pool 443215, 6.000%, 10/1/2028 | | | 16,990 | |
| 18,633 | | Federal National Mortgage Association Pool 511365, 7.000%, 8/1/2029 | | | 19,704 | |
| 2,615 | | Federal National Mortgage Association Pool 514184, 7.500%, 9/1/2029 | | | 2,798 | |
| 7,037 | | Government National Mortgage Association Pool 352214, 7.000%, 4/15/2023 | | | 7,560 | |
| 5,234 | | Government National Mortgage Association Pool 462739, 7.500%, 5/15/2028 | | | 5,627 | |
| 5,691 | | Government National Mortgage Association Pool 464835, 6.500%, 9/15/2028 | | | 6,024 | |
| 11,509 | | Government National Mortgage Association Pool 780339, 8.000%, 30 Year, 12/15/2023 | | | 12,585 | |
|
| | | TOTAL MORTGAGE BACKED SECURITIES (IDENTIFIED COST $146,302) | | | 155,207 | |
|
Principal
Amount
or Shares | | | | | Value | |
| | | U.S. TREASURY--2.0% | | | | |
$ | 750,000 | | United States Treasury Bond, 5.375%, 2/15/2031 | | $ | 776,603 | |
| 750,000 | | United States Treasury Bond, 8.125%, 5/15/2021 | | | 1,013,790 | |
| 790,000 | | United States Treasury Bond, 8.750%, 5/15/2017 | | | 1,100,075 | |
| 2,000,000 | | United States Treasury Note, 1.625%, 9/30/2005 | | | 1,990,000 | |
| 730,000 | | United States Treasury Note, 3.250%, 8/15/2007 | | | 739,811 | |
| 35,000 | | United States Treasury Note, 4.375%, 8/15/2012 | | | 35,498 | |
| 35,000 | | United States Treasury Note, 4.875%, 2/15/2012 | | | 36,854 | |
| 40,000 | | United States Treasury Note, 5.000%, 2/15/2011 | | | 42,688 | |
| 700,000 | | United States Treasury Note, 7.875%, 11/15/2004 | | | 742,714 | |
|
| | | TOTAL U.S. TREASURY (IDENTIFIED COST $6,320,936) | | | 6,478,033 | |
|
| | | MUTUAL FUNDS--19.5% | | | | |
| | | High Yield Bond--3.1% | | | | |
| 1,501,027 | 4 | Federated High Yield Bond Portfolio | | | 10,252,016 | |
|
| | | Mortgage Backed Securities--9.8% | | | | |
| 3,224,845 | 4 | Federated Mortgage Core Portfolio | | | 31,848,400 | |
|
| | | Money Market Fund--6.6% | | | | |
| 21,571,430 | 4 | Prime Value Obligations Fund, Class IS | | | 21,571,430 | |
|
| | | TOTAL MUTUAL FUNDS (IDENTIFIED COST $61,916,995) | | | 63,671,846 | |
|
| | | TOTAL INVESTMENTS--99.8%
(IDENTIFIED COST $302,790,111)5 | | | 326,353,999 | |
|
| | | OTHER ASSETS AND LIABILITIES -- NET--0.2% | | | 611,978 | |
|
| | | TOTAL NET ASSETS--100% | | $ | 326,965,977 | |
|
1 Non-income producing security.
2 Treasury bills held as collateral for S&P 500 futures contracts.
3 Denotes a restricted security which is subject to restrictions on resale under federal securities laws. These securities have been deemed liquid based upon criteria approved by the Fund's Board of Directors. At November 30, 2003, these securities amounted to $4,173,218 which represents 1.3% of net assets.
4 Affiliated company.
5 The cost of investments for federal tax purposes amounts to $303,470,719.
Note: The categories of investments are shown as a percentage of total net assets at November 30, 2003.
The following acronym is used throughout this portfolio:
ADR | - --American Depositary Receipt |
REITs | - --Real Estate Investment Trusts |
See Notes which are an integral part of the Financial Statements
Portfolio of Investments
October 31, 2003
Shares | | | | | Value |
| | | STOCKS--65.2% | | | |
| | | COMMON STOCKS--62.0% | | | |
| | | Consumer Discretionary--6.3% | | | |
| 24,600 | | Clear Channel Communications, Inc. | | $ | 1,004,172 |
| 39,600 | 1 | Comcast Corp., Class A | | | 1,343,232 |
| 20,400 | | Gannett Co., Inc. | | | 1,715,844 |
| 78,000 | | Home Depot, Inc. | | | 2,891,460 |
| 36,100 | | Interpublic Group Cos., Inc. | | | 537,168 |
| 15,800 | | Johnson Controls, Inc. | | | 1,698,974 |
| 5,425 | 1 | Kohl's Corp. | | | 304,180 |
| 79,000 | | McDonald's Corp. | | | 1,975,790 |
| 22,400 | | Nike, Inc., Class B | | | 1,431,360 |
| 15,100 | | Omnicom Group, Inc. | | | 1,204,980 |
| 50,500 | | Target Corp. | | | 2,006,870 |
| 88,400 | 1 | Time Warner, Inc. | | | 1,351,636 |
| 28,100 | | Viacom, Inc., Class B | | | 1,120,347 |
| 79,000 | | Walt Disney Co. | | | 1,788,560 |
|
| | | TOTAL | | | 20,374,573 |
|
| | | Consumer Staples--7.2% | | | |
| 42,500 | | Altria Group, Inc. | | | 1,976,250 |
| 59,600 | | Coca-Cola Co. | | | 2,765,440 |
| 38,500 | 1 | Costco Wholesale Corp. | | | 1,361,745 |
| 30,850 | | Gillette Co. | | | 984,115 |
| 16,000 | | Hershey Foods Corp. | | | 1,233,600 |
| 100,300 | 1 | Kroger Co. | | | 1,754,247 |
| 53,900 | | PepsiCo, Inc. | | | 2,577,498 |
| 30,600 | | Procter & Gamble Co. | | | 3,007,674 |
| 106,400 | | Rite Aid Corp. | | | 609,672 |
| 44,200 | | Sara Lee Corp. | | | 880,906 |
| 24,900 | | UST, Inc. | | | 847,098 |
| 77,500 | | Wal-Mart Stores, Inc. | | | 4,568,625 |
| 26,150 | | Walgreen Co. | | | 910,543 |
|
| | | TOTAL | | | 23,477,413 |
|
| | | Energy--5.0% | | | |
| 20,800 | | ChevronTexaco Corp. | | | 1,545,440 |
| 36,900 | | ConocoPhillips | | | 2,108,835 |
| 171,000 | | Exxon Mobil Corp. | | | 6,255,180 |
| 66,700 | | Halliburton Co. | | | 1,592,796 |
Shares | | | | | Value |
| | | STOCKS--continued | | | |
| | | COMMON STOCKS--continued | | | |
| | | Energy--continued | | | |
| 33,400 | | Schlumberger Ltd. | | $ | 1,568,798 |
| 82,600 | 1 | Transocean Sedco Forex, Inc. | | | 1,585,094 |
| 46,300 | 1 | Weatherford International, Inc. | | | 1,608,925 |
|
| | | TOTAL | | | 16,265,068 |
|
| | | Financials--10.0% | | | |
| 37,200 | | Allstate Corp. | | | 1,469,400 |
| 39,200 | | American International Group, Inc. | | | 2,384,536 |
| 11,000 | | Bank One Corp. | | | 466,950 |
| 36,100 | | Bank of America Corp. | | | 2,733,853 |
| 59,800 | | Bank of New York Co., Inc. | | | 1,865,162 |
| 99,700 | | Citigroup, Inc. | | | 4,725,780 |
| 14,000 | | Federal HomeLoan Mortgage Corp. | | | 785,820 |
| 17,300 | | Fannie Mae | | | 1,240,237 |
| 11,482 | | Fifth Third Bancorp | | | 665,497 |
| 17,000 | | FleetBoston Financial Corp. | | | 686,630 |
| 17,300 | | Goldman Sachs Group, Inc. | | | 1,624,470 |
| 60,700 | | J.P. Morgan Chase & Co. | | | 2,179,130 |
| 15,500 | | Lehman Brothers Holdings, Inc. | | | 1,116,000 |
| 39,300 | | Lincoln National Corp. | | | 1,569,249 |
| 47,200 | | MBNA Corp. | | | 1,168,200 |
| 55,700 | | Morgan Stanley | | | 3,056,259 |
| 12,100 | | SLM Holding Corp. | | | 473,836 |
| 12,300 | | Wachovia Corp. | | | 564,201 |
| 38,000 | | Washington Mutual, Inc. | | | 1,662,500 |
| 32,000 | | Wells Fargo & Co. | | | 1,802,240 |
|
| | | TOTAL | | | 32,239,950 |
|
| | | Healthcare--8.8% | | | |
| 37,700 | | Abbott Laboratories | | | 1,606,774 |
| 16,700 | | AmerisourceBergen Corp. | | | 948,059 |
| 20,000 | 1 | Amgen, Inc. | | | 1,235,200 |
| 50,300 | | Baxter International, Inc. | | | 1,336,974 |
| 25,000 | 1 | Biogen, Inc. | | | 1,011,750 |
| 15,400 | 1 | Boston Scientific Corp. | | | 1,042,888 |
| 54,600 | | Bristol-Myers Squibb Co. | | | 1,385,202 |
| 32,200 | 1 | Forest Laboratories, Inc., Class A | | | 1,610,322 |
| 26,700 | | Guidant Corp. | | | 1,361,967 |
| 48,325 | | Johnson & Johnson | | | 2,432,198 |
Shares | | | | | Value |
| | | STOCKS--continued | | | |
| | | COMMON STOCKS--continued | | | |
| | | Healthcare--continued | | | |
| 35,800 | | Lilly (Eli) & Co. | | $ | 2,384,996 |
| 5,328 | 1 | Medco Health Solutions, Inc. | | | 176,890 |
| 8,800 | | Medtronic, Inc. | | | 401,016 |
| 57,300 | | Merck & Co., Inc. | | | 2,535,525 |
| 173,800 | | Pfizer, Inc. | | | 5,492,080 |
| 88,700 | | Schering Plough Corp. | | | 1,354,449 |
| 13,400 | 1 | St. Jude Medical, Inc. | | | 779,344 |
| 32,500 | | Wyeth | | | 1,434,550 |
|
| | | TOTAL | | | 28,530,184 |
|
| | | Industrials--7.4% | | | |
| 23,900 | | 3M Co. | | | 1,884,993 |
| 9,900 | 1 | American Standard Cos. | | | 947,430 |
| 19,900 | | Caterpillar, Inc. | | | 1,458,272 |
| 71,300 | 1 | Cendant Corp. | | | 1,456,659 |
| 21,800 | | Danaher Corp. | | | 1,806,130 |
| 17,700 | | Deere & Co. | | | 1,072,974 |
| 25,500 | | Dover Corp. | | | 995,010 |
| 21,100 | | Eaton Corp. | | | 2,115,064 |
| 112,400 | | General Electric Co. | | | 3,260,724 |
| 19,300 | | Ingersoll-Rand Co., Class A | | | 1,165,720 |
| 29,900 | | Lockheed Martin Corp. | | | 1,386,164 |
| 48,000 | | Raytheon Co. | | | 1,271,040 |
| 35,200 | | Textron, Inc. | | | 1,749,088 |
| 77,300 | | Tyco International Ltd. | | | 1,614,024 |
| 63,500 | | Waste Management, Inc. | | | 1,645,920 |
|
| | | TOTAL | | | 23,829,212 |
|
| | | Information Technology--11.0% | | | |
| 64,300 | 1 | Apple Computer, Inc. | | | 1,471,827 |
| 39,600 | 1 | Applied Materials, Inc. | | | 925,452 |
| 91,100 | 1 | Cisco Systems, Inc. | | | 1,911,278 |
| 57,500 | 1 | Dell, Inc. | | | 2,076,900 |
| 128,800 | 1 | EMC Corp. Mass | | | 1,782,592 |
| 43,500 | | First Data Corp. | | | 1,552,950 |
| 182,400 | | Hewlett-Packard Co. | | | 4,069,344 |
| 134,400 | | Intel Corp. | | | 4,441,920 |
| 30,700 | | International Business Machines Corp. | | | 2,747,036 |
| 17,100 | 1 | Intuit, Inc. | | | 854,658 |
| 13,200 | 1 | KLA-Tencor Corp. | | | 756,756 |
Shares or
Principal
Amount | | | | | Value |
| | | STOCKS--continued | | | |
| | | COMMON STOCKS--continued | | | |
| | | Information Technology--continued | | | |
| 24,800 | 1 | Lexmark International Group, Class A | | $ | 1,825,528 |
| 254,000 | 1 | Lucent Technologies, Inc. | | | 812,800 |
| 31,300 | | Maxim Integrated Products, Inc. | | | 1,555,923 |
| 176,900 | | Microsoft Corp. | | | 4,625,935 |
| 88,700 | | Nokia Oyj, ADR, Class A | | | 1,507,013 |
| 130,000 | 1 | Oracle Corp. | | | 1,554,800 |
| 41,600 | | Texas Instruments, Inc. | | | 1,203,072 |
|
| | | TOTAL | | | 35,675,784 |
|
| | | Materials--1.6% | | | |
| 65,100 | | Alcoa, Inc. | | | 2,055,207 |
| 55,200 | | International Paper Co. | | | 2,172,120 |
| 41,000 | | MeadWestvaco Corp. | | | 1,062,720 |
|
| | | TOTAL | | | 5,290,047 |
|
| | | Telecommunication Services--2.9% | | | |
| 47,000 | | AT&T Corp. | | | 873,730 |
| 60,100 | | BellSouth Corp. | | | 1,581,231 |
| 130,500 | | SBC Communications, Inc. | | | 3,129,390 |
| 46,900 | | Sprint Corp. (FON Group) | | | 750,400 |
| 86,600 | | Verizon Communications | | | 2,909,760 |
|
| | | TOTAL | | | 9,244,511 |
|
| | | Utilities--1.8% | | | |
| 47,800 | | Cinergy Corp. | | | 1,735,618 |
| 10,600 | | FPL Group, Inc. | | | 675,644 |
| 28,600 | | FirstEnergy Corp. | | | 983,554 |
| 61,500 | | NiSource, Inc. | | | 1,273,665 |
| 45,500 | | Sempra Energy | | | 1,264,900 |
|
| | | TOTAL | | | 5,933,381 |
|
| | | TOTAL COMMON STOCKS (IDENTIFIED COST $183,047,484) | | | 200,860,123 |
|
| | | FUTURES CONTRACT COLLATERAL--3.2%2 | | | |
$ | 4,000,000 | | United States Treasury Bill, 11/28/2003 | | | 3,997,400 |
| 3,000,000 | | United States Treasury Bill, 1/22/2004 | | | 2,993,670 |
| 3,500,000 | | United States Treasury Bill, 1/29/2004 | | | 3,492,195 |
|
| | | TOTAL FUTURES CONTRACT COLLATERAL (IDENTIFIED COST $10,482,750) | | | 10,483,265 |
|
| | | TOTAL STOCKS (IDENTIFIED COST $193,530,234) | | | 211,343,388 |
|
| | | ASSET-BACKED SECURITIES--0.2% | | | |
| 453,697 | | 125 Home Loan Owner Trust 1998-1A B1, 9.26%, 2/15/2029 | | | 463,197 |
| 46,033 | 3 | SMFC Trust Asset-Backed Certificates, Series 1997-A 4, 1/28/2025 | | | 35,245 |
|
| | | TOTAL ASSET-BACKED SECURITIES (IDENTIFIED COST $495,590) | | | 498,442 |
|
Principal
Amount | | | | | Value |
| | | COLLATERALIZED MORTGAGE OBLIGATION--0.5% | | | |
$ | 1,842,531 | | Federal National Mortgage Association, 1.62%, 9/25/2032 (IDENTIFIED COST $1,841,380) | | $ | 1,851,136 |
|
| | | CORPORATE BONDS--9.6% | | | |
| | | Basic Industry - Chemicals--0.1% | | | |
| 250,000 | | Praxair, Inc., 3.95%, 6/01/2013 | | | 233,600 |
|
| | | Basic Industry - Metals & Mining--0.2% | | | |
| 150,000 | | BHP Finance (USA), Inc., 4.8%, 4/15/2013 | | | 149,730 |
| 100,000 | | Inco Ltd., 5.7%, 10/15/2015 | | | 101,586 |
| 500,000 | 3 | Normandy Finance Ltd., Company Guarantee, 7.5%, 7/15/2005 | | | 526,985 |
|
| | | TOTAL | | | 778,301 |
|
| | | Basic Industry - Paper--0.1% | | | |
| 150,000 | | Pope & Talbot, Inc., 8.375%, 6/1/2013 | | | 147,000 |
| 275,000 | | Weyerhaeuser Co., Deb., 7.375%, 3/15/2032 | | | 296,057 |
|
| | | TOTAL | | | 443,057 |
|
| | | Capital Goods - Diversified Manufacturing--0.3% | | | |
| 400,000 | 3 | Hutchison Whampoa Ltd., 6.5%, 2/13/2013 | | | 414,808 |
| 500,000 | | Kennametal, Inc., 7.2%, 6/15/2012 | | | 530,805 |
|
| | | TOTAL | | | 945,613 |
|
| | | Capital Goods - Environmental--0.4% | | | |
| 1,000,000 | | Waste Management, Inc., Deb., 8.75%, 5/01/2018 | | | 1,173,880 |
|
| | | Capital Goods- Aerospace & Defense--0.2% | | | |
| 50,000 | | Lockheed Martin Corp., Note, 8.2%, 12/01/2009 | | | 60,773 |
| 500,000 | | Raytheon Co., Note, 6.3%, 3/15/2005 | | | 529,380 |
|
| | | TOTAL | | | 590,153 |
|
| | | Communications - Media & Cable--0.4% | | | |
| 500,000 | | British Sky Broadcasting Group PLC, Note, 6.875%, 2/23/2009 | | | 546,015 |
| 400,000 | | Comcast Corp., 5.3%, 1/15/2014 | | | 393,872 |
| 250,000 | | Cox Communications Inc., Medium Term Note, 6.69%, 9/20/2004 | | | 260,703 |
|
| | | TOTAL | | | 1,200,590 |
|
| | | Communications - Media Noncable--0.6% | | | |
| 250,000 | | Clear Channel Communication, 7.65%, 9/15/2010 | | | 292,335 |
| 500,000 | | News America Holdings, Sr. Deb., 9.25%, 2/1/2013 | | | 647,450 |
| 250,000 | | Reed Elsevier, Inc., 6.75%, 8/01/2011 | | | 282,745 |
| 500,000 | | Univision Communications, Inc., 7.85%, 7/15/2011 | | | 579,920 |
|
| | | TOTAL | | | 1,802,450 |
|
| | | Communications - Telecom Wirelines--0.4% | | | |
| 200,000 | | CenturyTel, Inc., 8.375%, 10/15/2010 | | | 243,746 |
| 250,000 | | Citizens Communications Co., Unsecd. Note, 9.25%, 5/15/2011 | | | 312,168 |
| 675,000 | | Verizon Global Funding, 7.75%, 6/15/2032 | | | 786,402 |
|
| | | TOTAL | | | 1,342,316 |
|
Principal
Amount | | | | | Value |
| | | CORPORATE BONDS--continued | | | |
| | | Consumer Cyclical - Automotive--0.3% | | | |
$ | 250,000 | | DaimlerChrysler North Am, 6.5%, 11/15/2013 | | $ | 251,555 |
| 250,000 | | Ford Motor Co., Unsecd. Note, 7.45%, 7/16/2031 | | | 225,713 |
| 500,000 | | General Motors Corp., Note, 7.2%, 1/15/2011 | | | 522,540 |
|
| | | TOTAL | | | 999,808 |
|
| | | Consumer Cyclical - Entertainment--0.4% | | | |
| 300,000 | | AOL Time Warner, Inc., Bond, 7.7%, 5/01/2032 | | | 340,644 |
| 1,000,000 | | International Speedway Co, 7.875%, 10/15/2004 | | | 1,051,280 |
|
| | | TOTAL | | | 1,391,924 |
|
| | | Consumer Cyclical - Retailers--0.3% | | | |
| 500,000 | | CVS Corp., 5.625%, 3/15/2006 | | | 536,405 |
| 90,000 | | Neiman-Marcus Group, Inc., Sr. Deb., 7.125%, 6/01/2028 | | | 98,810 |
| 250,000 | | Shopko Stores, Sr. Note, 9.25%, 3/15/2022 | | | 231,250 |
| 200,000 | | Target Corp., Unsecd. Note, 7.5%, 8/15/2010 | | | 236,742 |
|
| | | TOTAL | | | 1,103,207 |
|
| | | Consumer Non-Cyclical - Tobacco--0.0% | | | |
| 65,000 | | Altria Group, Inc., 5.625%, 11/04/2008 | | | 64,878 |
|
| | | Energy - Independent--0.3% | | | |
| 500,000 | | Devon Financing Corp., 7.875%, 9/30/2031 | | | 594,835 |
| 250,000 | | Pemex Project Funding Master, Company Guarantee, 9.125%, 10/13/2010 | | | 293,125 |
|
| | | TOTAL | | | 887,960 |
|
| | | Energy - Integrated--0.5% | | | |
| 250,000 | | Conoco Funding Co., 7.25%, 10/15/2031 | | | 290,753 |
| 250,000 | | Conoco, Inc., 5.45%, 10/15/2006 | | | 268,693 |
| 500,000 | | Husky Oil Ltd., Company Guarantee, 8.9%, 8/15/2028 | | | 581,450 |
| 500,000 | | Petro-Canada, Bond, 5.35%, 7/15/2033 | | | 448,035 |
| 35,000 | | Petro-Canada, Inc., Deb., 7%, 11/15/2028 | | | 37,771 |
|
| | | TOTAL | | | 1,626,702 |
|
| | | Energy - Oil Field Services--0.0% | | | |
| 50,000 | | Noble Drilling Corp., Sr. Note, 7.5%, 3/15/2019 | | | 55,907 |
|
| | | Energy - Refining--0.1% | | | |
| 300,000 | | Valero Energy Corp., 7.5%, 4/15/2032 | | | 328,107 |
|
| | | Finance - Automotive--0.3% | | | |
| 100,000 | | Ford Motor Credit Co., 7%, 10/01/2013 | | | 98,784 |
| 250,000 | | Ford Motor Credit Corp., Note, 7.375%, 10/28/2009 | | | 258,373 |
| 100,000 | | General Motors Acceptance, 4.5%, 7/15/2006 | | | 100,919 |
| 500,000 | | General Motors Acceptance, 7.5%, 7/15/2005 | | | 536,190 |
|
| | | TOTAL | | | 994,266 |
|
Principal
Amount | | | | | Value |
| | | CORPORATE BONDS--continued | | | |
| | | Financial Institution - Banking--0.6% | | | |
$ | 45,000 | | Associates Corp. of North America, Sr. Note, 5.5%, 2/15/2004 | | $ | 45,563 |
| 750,000 | | FirstBank Puerto Rico, Sub. Note, 7.625%, 12/15/2005 | | | 785,670 |
| 60,000 | | HSBC USA, Inc., Sub. Note, 6.625%, 3/01/2009 | | | 67,369 |
| 485,801 | 3 | Regional Diversified Funding, 9.25%, 3/15/2030 | | | 562,679 |
| 350,000 | | US BANK N.A., 6.3%, 2/04/2014 | | | 386,879 |
|
| | | TOTAL | | | 1,848,160 |
|
| | | Financial Institution - Brokerage--0.3% | | | |
| 250,000 | | Goldman Sachs Group, Inc., 6.125%, 2/15/2033 | | | 249,198 |
| 500,000 | | Lehman Brothers Holdings, 7.875%, 8/15/2010 | | | 595,965 |
| 250,000 | | Morgan Stanley Group, In, 5.3%, 3/1/2013 | | | 253,622 |
|
| | | TOTAL | | | 1,098,785 |
|
| | | Financial Institution - Finance Noncaptive--0.3% | | | |
| 200,000 | | American Express Co., 4.875%, 7/15/2013 | | | 200,002 |
| 250,000 | | Capital One Financial, Note, 7.125%, 8/01/2008 | | | 270,178 |
| 30,000 | | Heller Financial, Inc., Note, 7.375%, 11/01/2009 | | | 34,757 |
| 300,000 | | Household Finance Corp., Unsecd. Note, 5.75%, 1/30/2007 | | | 323,376 |
| 55,000 | | Newcourt Credit Group, In, Company Guarantee, 6.875%, 2/16/2005 | | | 58,423 |
|
| | | TOTAL | | | 886,736 |
|
| | | Financial Institution - Insurance - Life--1.1% | | | |
| 400,000 | | AXA-UAP, Sub. Note, 8.6%, 12/15/2030 | | | 492,928 |
| 1,250,000 | | Delphi Funding, 9.31%, 3/25/2027 | | | 982,925 |
| 750,000 | 3 | Life Re Capital Trust I, Company Guarantee, 8.72%, 6/15/2027 | | | 796,928 |
| 300,000 | 3 | Pacific LifeCorp., Bond, 6.6%, 9/15/2033 | | | 313,923 |
| 100,000 | | Principal Financial Group, 6.125%, 10/15/2033 | | | 100,362 |
| 250,000 | | Prudential Financial, 5.75%, 7/15/2033 | | | 232,485 |
| 750,000 | 3 | Union Central Life Insurance Co., Note, 8.2%, 11/1/2026 | | | 789,443 |
|
| | | TOTAL | | | 3,708,994 |
|
| | | Financial Institution - REITs--0.3% | | | |
| 675,000 | | EOP Operating LP, 7.375%, 11/15/2003 | | | 676,809 |
| 45,000 | | Mack-Cali Realty Corp., Note, 7.25%, 3/15/2009 | | | 50,971 |
| 250,000 | | Simon Property Group, In, 6.35%, 8/28/2012 | | | 270,748 |
|
| | | TOTAL | | | 998,528 |
|
| | | Financial Intermediaries--0.2% | | | |
| 500,000 | 3 | Fidelity Investments, 4.75%, 3/01/2013 | | | 495,450 |
|
| | | Food & Drug Retailers--0.1% | | | |
| 250,000 | | Kroger Co., 7.5%, 4/01/2031 | | | 286,885 |
|
Principal
Amount | | | | | Value |
| | | CORPORATE BONDS--continued | | | |
| | | Food Products--0.1% | | | |
$ | 250,000 | | General Mills, Inc., 6%, 2/15/2012 | | $ | 267,403 |
|
| | | Healthcare--0.1% | | | |
| 250,000 | | HCA - The Healthcare Corp., 6.95%, 5/01/2012 | | | 260,373 |
|
| | | Insurance--0.1% | | | |
| 100,000 | 3 | Oil Insurance Ltd., Sub. Deb., 5.15%, 8/15/2033 | | | 100,840 |
| 250,000 | | Travelers Property Casua, Sr. Note, 5%, 3/15/2013 | | | 250,108 |
|
| | | TOTAL | | | 350,948 |
|
| | | State/Provincial--0.1% | | | |
| 650,000 | | New South Wales, State of, Local Gov't. Guarantee, 6.5%, 5/01/2006 | | | 470,063 |
|
| | | Supranational--0.1% | | | |
| 300,000 | | Corp Andina De Fomento, Bond, 7.375%, 1/18/2011 | | | 331,572 |
|
| | | Technology Services--0.3% | | | |
| 250,000 | | Computer Sciences Corp., 5%, 2/15/2013 | | | 250,108 |
| 200,000 | | First Data Corp., 4.7%, 8/01/2013 | | | 197,008 |
| 500,000 | | International Business Machines Corp., 4.875%, 10/01/2006 | | | 530,525 |
|
| | | TOTAL | | | 977,641 |
|
| | | Telecommunications & Cellular--0.2% | | | |
| 100,000 | | AT&T Wireless Services, Inc., 8.75%, 3/01/2031 | | | 120,813 |
| 100,000 | | Deutsche Telekom Interna, 5.25%, 7/22/2013 | | | 99,502 |
| 50,000 | | Insight Midwest LP, Sr. Note, 9.75%, 10/01/2009 | | | 51,500 |
| 260,000 | | Tritel PCS, Inc., Sr. Sub. Note, 10.375%, 1/15/2011 | | | 313,490 |
|
| | | TOTAL | | | 585,305 |
|
| | | Transportation - Airlines--0.1% | | | |
| 52,960 | | Northwest Airlines Pass, Pass Thru Cert., 7.575%, 3/01/2019 | | | 54,682 |
| 255,000 | | Southwest Airlines Co., Deb., 7.375%, 3/1/2027 | | | 272,883 |
|
| | | TOTAL | | | 327,565 |
|
| | | Transportation - Railroads--0.1% | | | |
| 200,000 | | Canadian Pacific RR, 6.25%, 10/15/2011 | | | 219,342 |
|
| | | Utility - Electric--0.6% | | | |
| 200,000 | | Arizona Public Service Co, 6.375%, 10/15/2011 | | | 216,862 |
| 75,000 | | Calpine Corp., Note, 7.75%, 4/15/2009 | | | 52,500 |
| 250,000 | | Duke Energy Corp., Note, 6.25%, 1/15/2012 | | | 268,820 |
| 750,000 | | Homer City Funding, Sr. Secd. Note, 8.734%, 10/1/2026 | | | 776,250 |
| 250,000 | 3 | Israel Electric Corp. Ltd., 7.95%, 5/30/2011 | | | 275,498 |
| 500,000 | | MidAmerican Energy Co., Unsecd. Note, 6.75%, 12/30/2031 | | | 534,685 |
| 25,000 | 1 | NRG Energy, Inc., Bond, 1.00%, 11/01/2003 | | | 12,563 |
|
| | | TOTAL | | | 2,137,178 |
|
| | | TOTAL CORPORATE BONDS (IDENTIFIED COST $30,368,945) | | | 31,213,647 |
|
Principal
Amount | | | | | Value |
| | | GOVERNMENT AGENCIES--1.7% | | | |
$ | 1,000,000 | | Federal Home Loan Mortgage Corp., 3.250%, 11/15/2004 | | $ | 1,018,540 |
| 2,000,000 | | Federal Home Loan Mortgage Corp., 4.050%, 6/21/2005 | | | 2,031,820 |
| 1,000,000 | | Federal Home Loan Mortgage Corp., 5.750%, 4/15/2008 | | | 1,095,330 |
| 625,000 | | Federal Home Loan Mortgage Corp., 6.250%, 7/15/2032 | | | 674,725 |
| 500,000 | | Federal National Mortgage Association, 4.375%, 10/15/2006 | | | 524,580 |
|
| | | TOTAL GOVERNMENT AGENCIES (IDENTIFIED COST $5,195,422) | | | 5,344,995 |
|
| | | GOVERNMENTS/AGENCIES--1.3% | | | |
| 700,000 | | Austria, Government of, Bond, Series 98 1, 5%, 1/15/2008 | | | 859,061 |
| 550,000 | | Canada, Government of, Series WU42, 5%, 9/1/2004 | | | 425,718 |
| 750,000 | | Germany, Government of, Bond, 3.75%, 1/4/2009 | | | 874,097 |
| 700,000 | | Germany, Government of, Bond, 5.25%, 1/4/2011 | | | 871,984 |
| 700,000 | | Germany, Government of, Bond, Series 139, 4%, 2/16/2007 | | | 832,160 |
| 250,000 | | Quebec, Province of Deb., 7.5%, 9/15/2029 | | | 308,265 |
| 175,000 | | United Mexican States, 6.625%, 3/3/2015 | | | 179,156 |
|
| | | TOTAL GOVERNMENTS/AGENCIES (IDENTIFIED COST $3,362,587) | | | 4,350,441 |
|
| | | MORTGAGE BACKED SECURITIES--0.1% | | | |
| 36,949 | | Federal Home Loan Mortgage Corp. Pool C25621, 6.500%, 5/1/2029 | | | 38,519 |
| 12,946 | | Federal Home Loan Mortgage Corp. Pool E77591, 6.500%, 7/1/2014 | | | 13,654 |
| 15,925 | | Federal National Mortgage Association Pool 303168, 9.500%, 30 Year, 2/1/2025 | | | 17,572 |
| 11,795 | | Federal National Mortgage Association Pool 323159, 7.500%, 4/1/2028 | | | 12,595 |
| 5,661 | | Federal National Mortgage Association Pool 323970, 7.000%, 15 Year, 10/1/2014 | | | 6,045 |
| 18,588 | | Federal National Mortgage Association Pool 443215, 6.000%, 10/1/2028 | | | 19,198 |
| 25,242 | | Federal National Mortgage Association Pool 511365, 7.000%, 8/1/2029 | | | 26,614 |
| 2,947 | | Federal National Mortgage Association Pool 514184, 7.500%, 9/1/2029 | | | 3,145 |
| 8,603 | | Government National Mortgage Association Pool 352214, 7.000%, 4/15/2023 | | | 9,210 |
| 5,240 | | Government National Mortgage Association Pool 462739, 7.500%, 5/15/2028 | | | 5,607 |
| 6,061 | | Government National Mortgage Association Pool 464835, 6.500%, 9/15/2028 | | | 6,389 |
| 12,288 | | Government National Mortgage Association Pool 780339, 8.000%, 30 Year, 12/15/2023 | | | 13,413 |
|
| | | TOTAL MORTGAGE BACKED SECURITIES (IDENTIFIED COST $162,240) | | | 171,961 |
|
| | | U.S. TREASURY--2.7% | | | |
| 750,000 | | United States Treasury Bond, 5.375%, 2/15/2031 | | | 775,545 |
| 750,000 | | United States Treasury Bond, 8.125%, 5/15/2021 | | | 1,014,840 |
| 790,000 | | United States Treasury Bond, 8.750%, 5/15/2017 | | | 1,100,691 |
| 2,000,000 | | United States Treasury Note, 1.625%, 9/30/2005 | | | 1,994,680 |
| 730,000 | | United States Treasury Note, 3.250%, 8/15/2007 | | | 743,118 |
| 2,035,000 | | United States Treasury Note, 4.375%, 5/15/2007 | | | 2,154,231 |
| 35,000 | | United States Treasury Note, 4.375%, 8/15/2012 | | | 35,547 |
| 35,000 | | United States Treasury Note, 4.875%, 2/15/2012 | | | 36,942 |
Principal
Amount
or Shares | | | | | Value |
| | | U.S. TREASURY--continued | | | |
$ | 40,000 | | United States Treasury Note, 5.000%, 2/15/2011 | | $ | 42,856 |
| 700,000 | | United States Treasury Note, 7.875%, 11/15/2004 | | | 747,250 |
|
| | | TOTAL U.S. TREASURY (IDENTIFIED COST $8,475,145) | | | 8,645,700 |
|
| | | MUTUAL FUNDS--18.2% | | | |
| | | High Yield Bond--3.1% | | | |
| 1,489,463 | 4 | Federated High Yield Bond Portfolio | | | 10,128,345 |
|
| | | Mortgage Backed Securities--10.1% | | | |
| 3,225,023 | 4 | Federated Mortgage Core Portfolio | | | 32,733,983 |
|
| | | Money Market Fund--5.0% | | | |
| 16,210,988 | 4 | Prime Value Obligations Fund, Class IS | | | 16,210,988 |
|
| | | TOTAL MUTUAL FUNDS (IDENTIFIED COST $57,335,757) | | | 59,073,316 |
|
| | | TOTAL INVESTMENTS--99.5%
(IDENTIFIED COST $300,767,300)5 | | | 322,493,026 |
|
| | | OTHER ASSETS AND LIABILITIES - NET--0.5% | | | 1,543,942 |
|
| | | TOTAL NET ASSETS--100% | | $ | 324,027,968 |
|
1 Non-income producing security.
2 Treasury bills held as collateral for S&P 500 futures contracts.
3 Denotes a restricted security which is subject to restrictions on resale under federal securities laws. These securities have been deemed liquid based upon criteria approved by the Fund's Board of Directors. At October 31, 2003, these securities amounted to $4,311,799 which represents 1.3% of net assets.
4 Affiliated company.
5 The cost of investments for federal tax purposes amounts to $301,374,026.
Note: The categories of investments are shown as a percentage of total net assets at October 31, 2003.
The following acronym is used throughout this portfolio:
ADR | - --American Depositary Receipt |
REITs | - --Real Estate Investment Trusts |
See Notes which are an integral part of the Financial Statements
Statements of Assets and Liabilities
| | Period
Ended
11/30/2003 | 1 | | Year Ended
10/31/2003 | |
Assets: | | | | | | | | |
Total investments, at cost | | $ | 302,790,111 | | | $ | 300,767,300 | |
|
Total investments in securities, at value2 | | | 326,353,999 | | | $ | 322,493,026 | |
Cash denominated in foreign currency (cost of $174,157 and $159,381) | | | 195,697 | | | | 174,748 | |
Income receivable | | | 1,084,686 | | | | 1,201,791 | |
Receivable for investments sold | | | 25,000 | | | | 1,654,897 | |
Receivable for shares sold | | | 591,167 | | | | 991,181 | |
Receivable for daily variation margin | | | 11,000 | | | | 10,000 | |
|
TOTAL ASSETS | | | 328,261,549 | | | | 326,525,643 | |
|
Liabilities: | | | | | | | | |
Payable for investments purchased | | | 249,523 | | | | 1,421,300 | |
Payable for shares redeemed | | | 763,790 | | | | 332,795 | |
Payable to bank | | | 8,441 | | | | 556,208 | |
Payable to adviser (Note 5) | | | -- | | | | 8,160 | |
Payable for transfer and dividend disbursing agent fees and expenses (Note 5) | | | 32,312 | | | | 22,082 | |
Payable for Directors'/Trustees' fees | | | -- | | | | 84 | |
Payable for portfolio accounting fees (Note 5) | | | 998 | | | | 1,916 | |
Payable for distribution services fee (Note 5) | | | 61,485 | | | | 62,416 | |
Payable for shareholder services fee (Note 5) | | | 66,842 | | | | 67,707 | |
Income distribution payable | | | 98,035 | | | | -- | |
Accrued expenses | | | 14,146 | | | | 25,007 | |
|
TOTAL LIABILITIES | | | 1,295,572 | | | | 2,497,675 | |
|
Net assets for 18,826,759 and 18,728,452 shares outstanding | | $ | 326,965,977 | | | $ | 324,027,968 | |
|
Net Assets Consist of: | | | | | | | | |
Paid in capital | | $ | 318,751,139 | | | $ | 317,040,963 | |
Net unrealized appreciation of investments, translation of assets and liabilities in foreign currency transactions and futures contracts | |
| 23,921,800 | | | |
21,991,082
| |
Accumulated net realized loss on investments and foreign currency transactions and futures contracts | | | (15,347,844 | ) | | | (15,393,995 | ) |
Undistributed (distributions in excess of) net investment income | | | (359,118 | ) | | | 389,918 | |
|
TOTAL NET ASSETS | | $ | 326,965,977 | | | $ | 324,027,968 | |
|
Statements of Assets and Liabilities -- continued
| | Period
Ended
11/30/2003 | 1 | | Year Ended
10/31/2003 |
Net Asset Value, Offering Price and Redemption Proceeds Per Shares | | | | | | | |
Class A Shares: | | | | | | | |
Net assets | | $ | 226,700,778 | | | $ | 224,460,862 |
|
Shares outstanding | | | 13,046,253 | | | | 12,961,568 |
|
Net asset value per share | | | $17.38 | | | | $17.32 |
|
Offering price per share3,4 | | | $18.39 | | | | $18.33 |
|
Redemption proceeds per share | | | $17.38 | | | | $17.32 |
|
Class B Shares: | | | | | | | |
Net assets | | | $72,411,837 | | | | $71,835,722 |
|
Shares outstanding | | | 4,171,954 | | | | 4,157,969 |
|
Net asset value per share | | | $17.36 | | | | $17.28 |
|
Offering price per share | | | $17.36 | | | | $17.28 |
|
Redemption proceeds per share3,5 | | | $16.41 | | | | $16.33 |
|
Class C Shares: | | | | | | | |
Net assets | | | $27,853,096 | | | | $27,731,118 |
|
Shares outstanding | | | 1,608,537 | | | | 1,608,900 |
|
Net asset value per share | | | $17.32 | | | | $17.24 |
|
Offering price per share3,6 | | | $17.49 | | | | $17.41 |
|
Redemption proceeds per share3,7 | | | $17.15 | | | | $17.07 |
|
Class K Shares: | | | | | | | |
Net assets | | | $266.38 | | | | $266.38 |
|
Shares outstanding | | | 15.331 | | | | 15.418 |
|
Net asset value per share | | | $17.38 | | | | $17.32 |
|
Offering price per share | | | $17.38 | | | | $17.32 |
|
Redemption proceeds per share | | | $17.38 | | | | $17.32 |
|
1 The Fund has changed its fiscal year end from October 31 to November 30. This period represents the one-month period from November 1, 2003 to November 30, 2003.
2 Including $63,671,846 and $59,073,316, respectively, of investments in affiliated issuers.
3 See "What Do Shares Cost?" in the Prospectus.
4 Computation of offering price per share 100/94.50 of net asset value.
5 Computation of offering price per share 94.50/100 of net asset value.
6 Computation of offering price per share 100/99.00 of net asset value.
7 Computation of offering price per share 99.00/100 of net asset value.
See Notes which are an integral part of the Financial Statements
Statements of Operations
| | | Period
Ended
11/30/2003 | 1 | | Year Ended
10/31/2003 | |
Investment Income: | | | | | | | | |
Dividends2,3 | | $ | 546,001 | | | $ | 5,327,273 | |
Interest4,5 | | | 229,684 | | | | 3,904,836 | |
|
TOTAL INCOME | | | 775,685 | | | | 9,232,109 | |
|
Expenses: | | | | | | | | |
Investment adviser fee (Note 5) | | | 181,560 | | | | 2,012,467 | |
Administrative personnel and services fee (Note 5) | | | 22,131 | | | | 216,849 | |
Custodian fees | | | 2,163 | | | | 23,192 | |
Transfer and dividend disbursing agent fees and expenses--Class A Shares (Note 5) | | | 25,524 | | | | 315,120 | |
Transfer and dividend disbursing agent fees and expenses--Class B Shares (Note 5) | | | 8,431 | | | | 100,554 | |
Transfer and dividend disbursing agent fees and expenses--Class C Shares (Note 5) | | | 3,323 | | | | 34,896 | |
Transfer and dividend disbursing agent fees and expenses--Class K Shares (Note 5) | | | 0 | 6 | | | 0 | 6 |
Directors'/Trustees' fees | | | 997 | | | | 12,635 | |
Auditing fees | | | 1,410 | | | | 13,896 | |
Legal fees | | | 528 | | | | 4,996 | |
Portfolio accounting fees (Note 5) | | | 9,078 | | | | 101,784 | |
Distribution services fee--Class B Shares (Note 5) | | | 44,356 | | | | 476,275 | |
Distribution services fee--Class C Shares (Note 5) | | | 17,129 | | | | 182,880 | |
Distribution services fee--Class K Shares (Note 5) | | | 0 | 6 | | | 1 | |
Shareholder services fee--Class A Shares (Note 5) | | | 46,347 | | | | 501,190 | |
Shareholder services fee--Class B Shares (Note 5) | | | 14,785 | | | | 158,758 | |
Shareholder services fee--Class C Shares (Note 5) | | | 5,710 | | | | 60,960 | |
Share registration costs | | | 6,486 | | | | 83,398 | |
Printing and postage | | | 5,996 | | | | 101,730 | |
Insurance premiums | | | 140 | | | | 1,700 | |
Taxes | | | 1,980 | | | | 19,810 | |
Miscellaneous | | | 1,022 | | | | 11,596 | |
|
TOTAL EXPENSES | | | 399,096 | | | | 4,434,687 | |
|
Waivers, Reimbursement and Expense Reduction (Note 5): | | | | | | | | |
Waiver/Reimbursement of investment adviser fee | | | (127 | ) | | | (10,101 | ) |
Waiver of administrative personnel and services fee | | | (1,758 | ) | | | -- | |
Fees paid indirectly from directed broker arrangements | | | (793 | ) | | | (2,063 | ) |
|
TOTAL WAIVERS, REIMBURSEMENT AND EXPENSE REDUCTION | | | (2,678 | ) | | | (12,164 | ) |
|
Net expenses | | | 396,418 | | | | 4,422,523 | |
|
Net investment income | | $ | 379,267 | | | $ | 4,809,586 | |
|
Statements of Operations -- continued
| | | Period
Ended
11/30/2003 | 1 | | | Year Ended
10/31/2003 | |
Realized and Unrealized Gain (Loss) on Investments, Foreign Currency Transactions and Futures Contracts: | | | | | | | | |
Net realized gain (loss) on investments and foreign currency transactions (including realized gain of $0 and $112,053, respectively, on sales of investments in affiliated issuers) (Note 5) | | $ | 46,905 | | | $ | (3,849,052 | ) |
Net realized gain on futures contracts | | | -- | | | | 2,039,721 | |
Net change in unrealized depreciation of investments, translation of assets and liabilities in foreign currency and futures contracts | | | 1,930,718 | | | | 32,188,419 | |
|
Net realized and unrealized gain on investments, foreign currency and futures contracts | | | 1,977,623 | | | | 30,379,088 | |
|
Change in net assets resulting from operations | | $ | 2,356,890 | | | $ | 35,188,674 | |
|
1 The Fund has changed its fiscal year end from October 31 to November 30. This period represents the one-month period from November 1, 2003 to November 30, 2003.
2 Including $237,066 and $2,291,919, respectively, received from affiliated issuers. (Note 5)
3 Net of foreign taxes withheld of $0 and $17,702, respectively.
4 Including income on securities loaned of $0 and $9,077, respectively.
5 Net of foreign taxes withheld of $223 and $974, respectively.
6 Represents less than $1.
See Notes which are an integral part of the Financial Statements
Statements of Changes in Net Assets
| | | Period
Ended
11/30/2003 | 1 | | | Year Ended
10/31/2003 | | | | Year Ended
10/31/2002 | |
Increase (Decrease) in Net Assets | | | | | | | | | | | | |
Operations: | | | | | | | | | | | | |
Net investment income | | $ | 379,267 | | | $ | 4,809,586 | | | $ | 5,743,997 | |
Net realized gain (loss) on investments, foreign currency transactions and futures contracts | | | 46,905 | | | | (1,809,331 | ) | | | (9,286,800 | ) |
Net change in unrealized appreciation/depreciation of investments, translation of assets and liabilities in foreign currency and futures contracts | | | 1,930,718 | | | | 32,188,419 | | | | (18,837,481 | ) |
|
CHANGE IN NET ASSETS RESULTING FROM OPERATIONS | | | 2,356,890 | | | | 35,188,674 | | | | (22,380,284 | ) |
|
Distributions to Shareholders: | | | | | | | | | | | | |
Distributions from net investment income | | | | | | | | | | | | |
Class A Shares | | | (909,910 | ) | | | (3,754,143 | ) | | | (4,149,628 | ) |
Class B Shares | | | (158,160 | ) | | | (735,225 | ) | | | (953,497 | ) |
Class C Shares | | | (60,986 | ) | | | (280,854 | ) | | | (363,217 | ) |
Class K Shares | | | (1 | ) | | | (2 | ) | | | -- | |
|
CHANGE IN NET ASSETS RESULTING FROM DISTRIBUTIONS TO SHAREHOLDERS | | | (1,129,057 | ) | | | (4,770,224 | ) | | | (5,466,342 | ) |
|
Share Transactions: | | | | | | | | | | | | |
Proceeds from sale of shares | | | 6,404,766 | | | | 93,228,950 | | | | 102,779,882 | |
Proceeds from shares issued in connection with the tax-free transfer of assets from Founders Common Trust Fund | | | -- | | | | 328,268 | | | | -- | |
Net asset value of shares issued to shareholders in payment of distributions declared | | | 1,031,022 | | | | 4,313,149 | | | | 4,869,260 | |
Cost of shares redeemed | | | (5,725,612 | ) | | | (70,287,307 | ) | | | (73,719,239 | ) |
|
CHANGE IN NET ASSETS RESULTING FROM SHARE TRANSACTIONS | | | 1,710,176 | | | | 27,583,060 | | | | 33,929,903 | |
|
Change in net assets | | | 2,938,009 | | | | 58,001,510 | | | | 6,083,277 | |
|
Net Assets: | | | | | | | | | | | | |
Beginning of period | | | 324,027,968 | | | | 266,026,458 | | | | 259,943,181 | |
|
End of period (including undistributed (distributions in excess of) net investment income of $(359,118), $389,918 and $279,292, respectively) | | $ | 326,965,977 | | | $ | 324,027,968 | | | $ | 266,026,458 | |
|
1 The Fund has changed its fiscal year end from October 31 to November 30. This period represents the one-month period from November 1, 2003 to November 30, 2003.
See Notes which are an integral part of the Financial Statements
Notes to Financial Statements
November 30, 2003
1. ORGANIZATION
Federated Stock and Bond Fund, Inc. (the "Fund") is registered under the Investment Company Act of 1940, as amended (the "Act"), as a diversified, open-end management investment company. The Fund offers four classes of shares: Class A Shares, Class B Shares, Class C Shares and Class K Shares. Effective April 8, 2003, the Fund added Class K Shares. The investment objective of the Fund is to provide relative safety of capital with the possibility of long-term growth of capital and income. Consideration is also given to current income.
On July 18, 2003, the Fund received a tax-free transfer of assets from Founders Common Trust Fund, as follows:
| | Class A
Shares
of the
Fund Issued | | Founders
Common
Trust Fund
Net Assets
Received | | Unrealized
Appreciation | 1 | Net Assets
of the Fund
Prior to
Combination | | Net Assets
of Founders
Common Trust
Immediately
Prior to
Combination | | Net Assets
of the Fund
Immediately
After
Combination |
Founders Common
Trust Fund | | 19,540 | | $328,268 | | $445 | | $302,884,781 | | $328,268 | | $303,213,049 |
|
1 Unrealized appreciation is included in the Founders Common Trust Fund Net Assets Received amount shown above.
2. SIGNIFICANT ACCOUNTING POLICIES
The following is a summary of significant accounting policies consistently followed by the Fund in the preparation of its financial statements. These policies are in conformity with generally accepted accounting principles ("GAAP") in the United States of America.
Investment Valuation
U.S. government securities, listed corporate bonds, other fixed income and asset-backed securities, and unlisted securities and private placement securities are generally valued at the mean of the latest bid and asked price as furnished by an independent pricing service. Listed equity securities are valued at the last sale price reported on a national securities exchange. Short-term securities are valued at the prices provided by an independent pricing service. However, short-term securities with remaining maturities of 60 days or less at the time of purchase may be valued at amortized cost, which approximates fair market value. Investments in other open-end regulated investment companies are valued at net asset value. Securities for which no quotations are readily available, or whose values have been affected by a significant event occurring after the close of their primary markets, are valued at fair value as determined in good faith using methods approved by the Board of Directors (the "Directors").
Repurchase Agreements
It is the policy of the Fund to require the custodian bank to take possession, to have legally segregated in the Federal Reserve Book Entry System, or to have segregated within the custodian bank's vault, all securities held as collateral under repurchase agreement transactions. Additionally, procedures have been established by the Fund to monitor, on a daily basis, the market value of each repurchase agreement's collateral to ensure that the value of collateral at least equals the repurchase price to be paid under the repurchase agreement.
The Fund will only enter into repurchase agreements with banks and other recognized financial institutions, such as broker/dealers, which are deemed by the Fund's adviser to be creditworthy pursuant to the guidelines and/or standards reviewed or established by the Directors. Risks may arise from the potential inability of counterparties to honor the terms of the repurchase agreement. Accordingly, the Fund could receive less than the repurchase price on the sale of collateral securities. The Fund, along with other affiliated investment companies, may utilize a joint trading account for the purpose of entering into one or more repurchase agreements.
Investment Income, Expenses and Distributions
Interest income and expenses are accrued daily. Dividend income and distributions to shareholders are recorded on the ex-dividend date. Non-cash dividends included in dividend income, if any, are recorded at fair value. The Fund offers multiple classes of shares, which differ in their respective transfer and dividend disbursing agent, distribution and service fees. All shareholders bear the common expenses of the Fund based on average daily net assets of each class, without distinction between share classes. Dividends are declared separately for each class. No class has preferential dividend rights; differences in per share dividend rates are generally due to differences in separate class expenses.
Premium and Discount Amortization/Paydown Gains and Losses
All premiums and discounts are amortized/accreted. Gains and losses realized on principal payment of mortgage-backed securities (paydown gains and losses) are classified as part of investment income.
Federal Taxes
It is the Fund's policy to comply with the Subchapter M provision of the Internal Revenue Code (the "Code") and to distribute to shareholders each year substantially all of its income. Accordingly, no provision for federal tax is necessary.
Other Taxes
As an open-end management investment company incorporated in the state of Maryland but domiciled in Pennsylvania, the fund is subject to the Pennsylvania Franchise Tax. This franchise tax is assessed annually on the value of the Fund, as represented by the average net assets for the tax year.
When-Issued and Delayed Delivery Transactions
The Funds may engage in when-issued or delayed delivery transactions. The Fund records when-issued securities on the trade date and maintains security positions such that sufficient liquid assets will be available to make payment for the securities purchased. Securities purchased on a when-issued or delayed delivery basis are marked to market daily and begin earning interest on the settlement date. Losses may occur on these transactions due to changes in market conditions or the failure of counterparties to perform under the contract.
Foreign Currency Translation
The accounting records of the Fund are maintained in U.S. Dollars. All assets and liabilities denominated in foreign currencies ("FC") are translated into U.S. dollars based on the rate of exchange of such currencies against U.S. dollars on the date of valuation. Purchases and sales of securities, income and expenses are translated at the rate of exchange quoted on the respective date that such transactions are recorded. The Fund does not isolate that portion of the results of operations resulting from changes in foreign exchange rates on investments from the fluctuations arising from changes in market prices of securities held. Such fluctuations are included with the net realized and unrealized gain or loss from investments.
Reported net realized foreign exchange gains or losses arise from sales of portfolio securities, sales and maturities of short-term securities, sales of FCs, currency gains or losses realized between the amounts of dividends, interest, and foreign withholding taxes recorded on the Fund's books, and the U.S. dollar equivalent of the amounts actually received or paid. Net unrealized foreign exchange gains and losses arise from changes in the value of assets and liabilities other than investments in securities at fiscal year end, resulting from changes in the exchange rate.
Futures Contracts
The Fund purchases stock index futures contracts to manage cashflows, enhance yield, and to potentially reduce transaction costs. Upon entering into a stock index futures contract with a broker, the Fund is required to deposit in a segregated account a specified amount of cash or U.S. government securities. Futures contracts are valued daily and unrealized gains or losses are recorded in a "variation margin" account. Daily, the Fund receives from or pays to the broker a specified amount of cash based upon changes in the variation margin account. When a contract is closed, the Fund recognizes a realized gain or loss.
Futures contracts have market risks, including the risk that the change in the value of the contract may not correlate with changes in the value of the underlying securities.
At November 30, 2003, the Fund had outstanding futures contracts as set forth below:
Expiration Date | | Contracts to Receive | | Position | | Unrealized
Appreciation |
December 2003 | | 40 S&P 500 Index Futures | | Long | | $328,000 |
|
At October 31, 2003, the Fund had outstanding futures contracts as set forth below:
Expiration Date | | Contracts to Receive | | Position | | Unrealized
Appreciation |
December 2003 | | 40 S&P 500 Index Futures | | Long | | $245,000 |
|
Securities Lending
The Fund participates in a securities lending program providing for the lending of corporate bonds, equity and government securities to qualified brokers. Collateral for securities loaned is invested in an affiliated money market fund. Collateral is maintained at a minimum level of 102% of the market value on investments loaned, plus interest, if applicable. Earnings on collateral are allocated between the securities lending agent, as a fee for its services under the program, and the Fund, according to agreed-upon rates.
As of November 30, 2003 and October 31, 2003, the Fund had no securities on loan.
Restricted Securities
Restricted securities are securities that may only be resold upon registration under federal securities laws or in transactions exempt from such registration. In some cases, the issuer of restricted securities has agreed to register such securities for resale, at the issuer's expense either upon demand by the Fund or in connection with another registered offering of the securities. Many restricted securities may be resold in the secondary market in transactions exempt from registration. Such restricted securities may be determined to be liquid under criteria established by the Directors. The Fund will not incur any registration costs upon such resales. The Fund's restricted securities are valued at the price provided by dealers in the secondary market or, if no market prices are available, at the fair value as determined in good faith using methods approved by the Directors.
Use of Estimates
The preparation of financial statements in conformity with GAAP requires management to make estimates and assumptions that affect the amounts of assets, liabilities, expenses and revenues reported in the financial statements. Actual results could differ from those estimated.
Other
Investment transactions are accounted for on a trade date basis.
3. CAPITAL STOCK
At November 30, 2003 and October 31, 2003, par value shares ($0.001 per share) authorized were as follows:
Share Class Name | | Number of Par Value
Capital Stock Authorized |
Class A Shares | | 750,000,000 |
Class B Shares | | 500,000,000 |
Class C Shares | | 500,000,000 |
Class K Shares | | 250,000,000 |
TOTAL | | 2,000,000,000 |
Transactions in capital stock were as follows:
| | Period Ended
11/30/20031 | | | Year Ended
10/31/2003 | | | Year Ended
10/31/2002 | |
Class A Shares: | | Shares | | | | Amount | | | Shares | | | | Amount | | | Shares | | | | Amount | |
Shares sold | | 286,263 | | | $ | 4,968,298 | | | 4,203,068 | | | $ | 68,136,996 | | | 4,452,697 | | | $ | 74,821,478 | |
Shares issued in connection with the tax-free transfer of assets from Founders Common Trust Fund | | -- | | | | -- | | | 19,540 | | | | 328,268 | | | -- | | | | -- | |
Shares issued to shareholders in payment of distributions declared | | 48,145 | | | | 836,767 | | | 212,982 | | | | 3,426,313 | | | 216,498 | | | | 3,696,620 | |
Shares redeemed | | (249,723 | ) | | | (4,329,801 | ) | | (3,279,825 | ) | | | (52,856,420 | ) | | (3,073,577 | ) | | | (51,181,066 | ) |
|
NET CHANGE RESULTING FROM CLASS A SHARE TRANSACTIONS | | 84,685 | | | $ | 1,475,264 | | | 1,155,765 | | | $ | 19,035,157 | | | 1,595,618 | | | $ | 27,337,032 | |
|
| | | | | | | | | | | | | | | | | | | | | |
| | Period Ended
11/30/20031 | | | Year Ended
10/31/2003 | | | Year Ended
10/31/2002 | |
Class B Shares: | | Shares | | | | Amount | | | Shares | | | | Amount | | | Shares | | | | Amount | |
Shares sold | | 58,737 | | | $ | 1,015,032 | | | 1,173,127 | | | $ | 19,023,995 | | | 1,360,605 | | | $ | 23,050,923 | |
Shares issued to shareholders in payment of distributions declared | | 8,062 | | | | 139,962 | | | 39,930 | | | | 640,472 | | | 49,499 | | | | 846,270 | |
Shares redeemed | | (52,814 | ) | | | (914,345 | ) | | (852,881 | ) | | | (13,693,047 | ) | | (1,105,827 | ) | | | (18,207,545 | ) |
|
NET CHANGE RESULTING FROM CLASS B SHARE TRANSACTIONS | | 13,985 | | | $ | 240,649 | | | 360,176 | | | $ | 5,971,420 | | | 304,277 | | | $ | 5,689,648 | |
|
| | | | | | | | | | | | | | | | | | | | | |
| | Period Ended
11/30/20031 | | | Year Ended
10/31/2003 | | | Year Ended
10/31/2002 | |
Class C Shares: | | Shares | | | | Amount | | | Shares | | | | Amount | | | Shares | | | | Amount | |
Shares sold | | 24,446 | | | $ | 421,436 | | | 372,531 | | | $ | 6,067,709 | | | 290,604 | | | $ | 4,907,481 | |
Shares issued to shareholders in payment of distributions declared | | 3,135 | | | | 54,293 | | | 15,402 | | | | 246,364 | | | 19,124 | | | | 326,370 | |
Shares redeemed | | (27,944 | ) | | | (481,464 | ) | | (231,224 | ) | | | (3,737,829 | ) | | (258,821 | ) | | | (4,330,628 | ) |
|
NET CHANGE RESULTING FROM CLASS C SHARE TRANSACTIONS | | (363 | ) | | $ | (5,735 | ) | | 156,709 | | | $ | 2,576,244 | | | 50,907 | | | $ | 903,223 | |
|
| | | | | | | | | | | | | | | | | | | | | |
| | Period Ended
11/30/20031 | | | Period Ended
10/31/20033 | | | |
Class K Shares: | | Shares | | | | Amount | | | Shares | | | | Amount | | | Shares | | | | Amount | |
Shares sold | | -- | | | $ | -- | | | 16 | | | $ | 250 | | | | | | | | |
Shares redeemed | | 0 | 2 | | | (2 | ) | | (1 | ) | | | (11 | ) | | | | | | | |
|
NET CHANGE RESULTING FROM CLASS K SHARE TRANSACTIONS | | 0 | 2 | | | (2 | ) | | 15 | | | $ | 239 | | | | | | | | |
|
NET CHANGE RESULTING FROM SHARE TRANSACTIONS | | 98,307 | | | $ | 1,710,176 | | | 1,672,665 | | | $ | 27,583,060 | | | 1,950,802 | | | $ | 33,929,903 | |
|
1 The Fund has changed its fiscal year end from October 31 to November 30. This period represents the one-month period from November 1, 2003 to November 30, 2003.
2 Represents less than $1.
3 Reflects operations for the period from April 8, 2003 (start of performance date) to October 31, 2003.
4. FEDERAL TAX INFORMATION
The timing and character of income and capital gain distributions are determined in accordance with income tax regulations, which may differ from GAAP. These differences are due in part to differing treatments for foreign currency transactions and defaulted bonds.
For the period ended November 30, 2003 and the year ended October 31, 2003, permanent differences identified and reclassified among the components of net assets were as follows:
| | Increase (Decrease) |
| | Paid In Capital | | Undistributed Net
Investment Income (Loss) | | Accumulated Net
Realized Gains (Losses) |
November 30, 2003 | | -- | | $ 754 | | $ (754) |
|
October 31, 2003 | | -- | | $71,264 | | $(71,264) |
|
Net investment income, net realized gains (losses), as disclosed on the Statement of Operations, and net assets were not affected by this reclassification.
The tax character of distributions as reported on the Statement of Changes in Net Assets for the period ended November 30, 2003 and the years ended October 31, 2003 and 2002 was as follows:
| | Period
Ended | | | Year Ended October 31, |
| | 11/30/2003 | | | 2003 | | | 2002 |
Ordinary income1 | | $1,129,057 | | $ | 4,770,224 | | $ | 5,446,342 |
|
1 For tax purposes short-term capital gain distributions are considered ordinary income distributions.
As of November 30, 2003 and October 31, 2003, the components of distributable earnings on a tax basis were as follows:
| | | 11/30/2003 | | | 10/31/2003 |
Undistributed ordinary income | | $ | 380,021 | | $ | 391,086 |
|
Net unrealized appreciation/depreciation | | $ | 22,883,280 | | $ | 21,139,356 |
|
Capital loss carryforward | | $ | 14,340,401 | | $ | 14,543,434 |
|
The difference between book-basis and tax basis unrealized appreciation/depreciation is attributable in part to defaulted bonds and the tax deferral of losses on wash sales.
At November 30, 2003, the cost of investments for federal tax purposes was $303,470,719. The net unrealized appreciation of investments for federal tax purposes excluding any unrealized appreciation resulting from changes in foreign currency exchange rates and futures contracts was $22,883,280. This consists of net unrealized appreciation from investment for those securities having an excess of value over cost of $31,025,431 and net unrealized depreciation from investment for those securities having an excess of cost over value of $8,142,151.
At October 31, 2003, the cost of investments for federal tax purposes was $301,374,026. The net unrealized appreciation of investments for federal tax purposes excluding any unrealized appreciation resulting from changes in foreign currency exchange rates and futures contracts was $21,119,000. This consists of net unrealized appreciation from investment for those securities having an excess of value over cost of $31,706,039 and net unrealized depreciation from investment for those securities having an excess of cost over value of $10,587,039.
At November 30, 2003, and October 31, 2003, the Fund had capital loss carryforwards of $14,340,401 and $14,543,434, respectively, which will reduce the Fund's taxable income arising from future net realized gain on investments, if any, to the extent permitted by the Code, and thus will reduce the amount of distributions to shareholders which would otherwise be necessary to relieve the Fund of any liability for federal tax. Pursuant to the Code, such capital loss carryforwards will expire as follows:
November 30, 2003: | | |
Expiration Year | | Expiration Amount |
2008 | | $3,397,314 |
|
2009 | | $9,387,088 |
|
2010 | | $1,555,999 |
|
| | |
October 31, 2003: | | |
Expiration Year | | Expiration Amount |
2009 | | $3,600,347 |
|
2010 | | $ 9,387,088 |
|
2011 | | $1,555,999 |
|
5. INVESTMENT ADVISER FEE AND OTHER TRANSACTIONS WITH AFFILIATES
Investment Adviser Fee
Federated Investment Management Company, the Fund's investment adviser (the "Adviser"), receives for its services an annual investment adviser fee equal to: (a) a maximum of 0.55% of the average daily net assets of the Fund; and (b) 4.50% of the gross income of the Fund, excluding capital gains or losses. The Adviser may voluntarily choose to waive any portion of its fee. The Adviser can modify or terminate this voluntary waiver at any time at its sole discretion.
Pursuant to an Exemptive Order issued by the Securities and Exchange Commission, the Fund may invest in other funds which are managed by the Adviser. The Adviser has agreed to reimburse certain investment adviser fees as a result of these transactions. Income distributions earned from investments in these funds are recorded as income in the accompanying financial statements and are listed below.
| | 11/30/2003 | | 10/31/2003 |
Prime Value Obligations Fund | | | $ 15,287 | | | $ 151,537 |
|
Federated Mortgage Core Portfolio | | | $142,792 | | | $1,619,247 |
|
High Yield Bond Portfolio | | | $ 78,987 | | | $ 521,135 |
|
Administrative Fee
Federated Administrative Services ("FAS") under the Administrative Services Agreement ("Agreement"), provides the Fund with administrative personnel and services. The fee paid to FAS is based on the average aggregate daily net assets of all Federated funds as specified below:
Maximum Administrative Fee | | Average Aggregate Daily
Net Assets of the Federated Funds |
0.150% | | on the first $5 billion |
0.125% | | on the next $5 billion |
0.100% | | on the next $10 billion |
0.075% | | on assets in excess of $20 billion |
The administrative fee received during any fiscal year shall be at least $150,000 per portfolio and $40,000 per each additional class of Shares.
FAS may voluntarily choose to waive any portion of its fee. FAS can modify or terminate this voluntary waiver at any time at its sole discretion.
Prior to November 1, 2003, Federated Services Company ("FServ") provided the Fund with administrative personnel and services. The fee paid to FServ was based on the average aggregate daily net assets of all Federated funds as specified below:
Maximum Administrative Fee | | Average Aggregate Daily
Net Assets of the Federated Funds |
0.150% | | on the first $250 million |
0.125% | | on the next $250 million |
0.100% | | on the next $250 million |
0.075% | | on assets in excess of $750 million |
The administrative fee received during any fiscal year was at least $125,000 per portfolio and $30,000 per each additional class of Shares.
For the period ended November 30, 2003, the fees paid to FAS were $20,373, after voluntary waiver, if applicable.
For the year ended October 31, 2003, the fees paid to FServ were $216,849.
Distribution Services Fee
The Fund has adopted a Distribution Plan (the "Plan") pursuant to Rule 12b-1 under the Act. Under the terms of the Plan, the Fund will compensate Federated Securities Corp. ("FSC"), the principal distributor, from the net assets of the Fund to finance activities intended to result in the sale of the Fund's Shares. The Plan provides that the Fund may incur distribution expenses according to the following schedule annually, to compensate FSC.
Share Class Name | | Percentage of Average Daily
Net Assets of Class |
Class B Shares | | 0.75% |
Class C Shares | | 0.75% |
Class K Shares | | 0.50% |
FSC may voluntarily choose to waive any portion of its fee. FSC can modify or terminate this voluntary waiver at any time at its sole discretion.
Sales Charges
For the period ended November 30, 2003 and fiscal year ended October 31, 2003, FSC retained $5,812 and $43,438, respectively, in sales charges from the sale of Class A Shares. FSC also retained $0 and $1,266, respectively, of contingent deferred sales charges relating to redemptions of Class C Shares. See "What Do Shares Cost?" in the prospectus.
Shareholder Services Fee
Under the terms of a Shareholder Services Agreement with Federated Shareholder Services Company ("FSSC"), the Fund will pay FSSC up to 0.25% of average daily net assets of the Fund's Class A Shares, Class B Shares and Class C Shares for the period. The fee paid to FSSC is used to finance certain services for shareholders and to maintain shareholder accounts. FSSC may voluntarily choose to waive any portion of its fee. FSSC can modify or terminate this voluntary waiver at any time at its sole discretion.
Transfer and Dividend Disbursing Agent Fees and Expenses
FServ, through its subsidiary FSSC, serves as transfer and dividend disbursing agent for the Fund. The fee paid to FSSC is based on the size, type, and number of accounts and transactions made by shareholders. FSSC may voluntarily choose to waive any portion of its fee. FSSC can modify or terminate this voluntary waiver at any time at its sole discretion.
Portfolio Accounting Fees
FServ maintains the Fund's accounting records for which it receives a fee. The fee is based on the level of each Fund's average daily net assets for the period, plus out-of-pocket expenses. FServ may voluntarily choose to waive any portion of its fee. FServ can modify or terminate this voluntary waiver at any time at its sole discretion.
Expense Reduction
The Fund directs certain portfolio trades to a broker that in turn pays a portion of the Fund's operating expenses. For the period ended November 30, 2003 and year ended October 31, 2003, the Fund's expenses were reduced by $793 and $2,063, respectively, under these arrangements.
General
Certain of the Officers and Directors of the Corporation are Officers and Directors or Trustees of the above companies.
6. INVESTMENT TRANSACTIONS
Purchases and sales of investments, excluding long-term U.S. government securities and short-term obligations (and in-kind contributions), for the period ended November 30, 2003 and year ended October 31, 2003, were as follows:
| | 11/30/2003 | | 10/31/2003 |
Purchases | | $4,229,656 | | $ | 202,327,129 |
|
Sales | | $7,485,900 | | $ | 161,524,972 |
|
7. LEGAL PROCEEDINGS
In October, 2003, Federated Investors, Inc. and various subsidiaries thereof (collectively, "Federated"), along with various investment companies sponsored by Federated ("Funds") were named as defendants in several class action lawsuits filed in the United States District Court for the Western District of Pennsylvania seeking damages of unspecified amounts. The lawsuits were purportedly filed on behalf of people who purchased, owned and/or redeemed shares of Federated-sponsored mutual funds during specified periods beginning November 1, 1998. The suits are generally similar in alleging that Federated engaged in illegal and improper trading practices including market timing and late trading in concert with certain institutional traders, which allegedly caused financial injury to the mutual fund shareholders. The Board of the Funds has retained the law firm of Dickstein Shapiro Morin & Oshinsky LLP to represent the Funds in these lawsuits. Federated and the Funds, and their respective counsel, are reviewing the allegations and will respond appropriately. Additional lawsuits based upon similar allegations may be filed in the future. Although Federated does not believe that these lawsuits will have a material adverse effect on the Funds, there can be no assurance that these suits, the ongoing adverse publicity and/or other developments resulting from related regulatory investigations will not result in increased Fund redemptions, reduced sales of Fund shares, or other adverse consequences for the Funds.
8. FEDERAL TAX INFORMATION (UNAUDITED)
The Fund did not designate any long-term capital gain dividends for the period ended November 30, 2003 and the fiscal year ended October 31, 2003.
Of the ordinary income (including short-term capital gain) distributions made by the Fund during the period ended November 30, 2003, 32.76% qualify for the dividend received deduction to corporate shareholders.
For the period ended November 30, 2003 and fiscal year ended October 31, 2003 certain dividends paid by the Fund may be subject to a maximum tax rate of 15%, as provided for by the Jobs and Growth Tax Relief Act of 2003 (the "Tax Relief Act"). The Fund will designate the amount allowable under the Tax Relief Act as subject to such maximum tax rate. Complete information will be reported in conjunction with your 2003 Form 1099-DIV.
Independent Auditors' Report
TO THE BOARD OF DIRECTORS AND SHAREHOLDERS OF FEDERATED STOCK AND BOND FUND, INC.:
We have audited the accompanying statement of assets and liabilities, including the portfolio of investments, of Federated Stock and Bond Fund, Inc. (the "Fund") as of November 30, 2003 and October 31, 2003, and the related statement of operations for the period ended November 30, 2003 and the year ended October 31, 2003, the statement of changes in net assets for the period ended November 30, 2003 and the years then ended October 31, 2003 and October 31, 2002 and the financial highlights for the periods presented. These financial statements and financial highlights are the responsibility of the Fund's management. Our responsibility is to express an opinion on these financial statements and financial highlights based on our audits.
We conducted our audits in accordance with auditing standards generally accepted in the United States of America. Those standards require that we plan and perform the audit to provide reasonable assurance about whether the financial statements and financial highlights are free of material misstatement. An audit includes examining, on a test basis, evidence supporting the amounts and disclosures in the financial statements. Our procedures included confirmation of the securities owned as of November 30, 2003 and October 31, 2003, by correspondence with the custodian and brokers; where replies from brokers were not received from brokers, we performed other auditing procedures. An audit also includes assessing the accounting principles used and significant estimates made by management, as well as evaluating the overall financial statement presentation. We believe our audits provide a reasonable basis for our opinion.
In our opinion, such financial statements and financial highlights present fairly, in all material respects, the financial position of the Fund as of November 30, 2003, and October 31, 2003, the results of its operations for the period ended November 30, 2003, and the year ended October 31, 2003, the changes in net assets for the period ended November 30, 2003, and the years then ended October 31, 2003 and October 31, 2002, and its financial highlights for the respective stated periods presented in conformity with accounting principles generally accepted in the United States of America.
Deloitte & Touche LLP
Boston, Massachusetts
December 30, 2003
Board of Directors and Fund Officers
The Board is responsible for managing the Fund's business affairs and for exercising all the Fund's powers except those reserved for the shareholders. The following tables give information about each Board member and the senior officers of the Funds. Where required, the tables separately list Board members who are "interested persons" of the Fund (i.e., "Interested" Board members) and those who are not (i.e., "Independent" Board members). Unless otherwise noted, the address of each person listed is Federated Investors Tower, 1001 Liberty Avenue, Pittsburgh, PA. The Federated Fund Complex consists of 44 investment companies (comprising 138 portfolios). Unless otherwise noted, each Officer is elected annually. Unless otherwise noted, each Board member oversees all portfolios in the Federated Fund Complex; serves for an indefinite term; and also serves as a Board member of the following investment company complexes: Banknorth Funds--four portfolios; Golden Oak® Family of Funds--seven portfolios; and WesMark Funds--five portfolios. The Fund's Statement of Additional Information includes additional information about Fund Directors and is available, without charge and upon request, by calling 1-800-341-7400.
INTERESTED DIRECTORS BACKGROUND
| | |
|
Name
Birth Date
Address
Positions Held with Fund
Date Service Began | | Principal Occupation(s), Other Directorships Held and Previous Position(s) |
John F. Donahue*
Birth Date: July 28, 1924
CHAIRMAN and DIRECTOR
Began serving: December 1956 | | Principal Occupations: Chairman and Director or Trustee of the Federated Fund Complex; Chairman and Director, Federated Investors, Inc. |
| | |
|
J. Christopher Donahue*
Birth Date: April 11, 1949
PRESIDENT AND DIRECTOR
Began serving: November 1998 | | Principal Occupations: Principal Executive Officer and President of the Federated Fund Complex; Director or Trustee of some of the Funds in the Federated Fund Complex; President, Chief Executive Officer and Director, Federated Investors, Inc. |
| | |
|
Lawrence D. Ellis, M.D.*
Birth Date: October 11, 1932
3471 Fifth Avenue
Suite 1111
Pittsburgh, PA
DIRECTOR
Began serving: August 1987 | | Principal Occupations: Director or Trustee of the Federated Fund Complex; Professor of Medicine, University of Pittsburgh; Medical Director, University of Pittsburgh Medical Center Downtown; Hematologist, Oncologist and Internist, University of Pittsburgh Medical Center.
Other Directorships Held: Member, National Board of Trustees, Leukemia Society of America.
Previous Positions: Trustee, University of Pittsburgh; Director, University of Pittsburgh Medical Center. |
| | |
|
* Family relationships and reasons for "interested" status: John F. Donahue is the father of J. Christopher Donahue; both are "interested" due to the positions they hold with Federated Investors, Inc. and its subsidiaries. Lawrence D. Ellis, M.D. is "interested" because his son-in-law is employed by the Fund's principal underwriter, Federated Securities Corp.
INDEPENDENT DIRECTORS BACKGROUND
| | |
|
Name
Birth Date
Address
Positions Held with Fund
Date Service Began | | Principal Occupation(s), Other Directorships Held and Previous Position(s) |
Thomas G. Bigley
Birth Date: February 3, 1934
15 Old Timber Trail
Pittsburgh, PA
DIRECTOR
Began serving: November 1994 | | Principal Occupation: Director or Trustee of the Federated Fund Complex.
Other Directorships Held: Director, Member of Executive Committee, Children's Hospital of Pittsburgh; Director, University of Pittsburgh.
Previous Position: Senior Partner, Ernst & Young LLP. |
| | |
|
John T. Conroy, Jr.
Birth Date: June 23, 1937
Grubb & Ellis/Investment
Properties Corporation
3838 North Tamiami Trail
Suite 402
Naples, FL
DIRECTOR
Began serving: August 1991 | | Principal Occupations: Director or Trustee of the Federated Fund Complex; Chairman of the Board, Investment Properties Corporation; Partner or Trustee in private real estate ventures in Southwest Florida.
Previous Positions: President, Investment Properties Corporation; Senior Vice President, John R. Wood and Associates, Inc., Realtors; President, Naples Property Management, Inc. and Northgate Village Development Corporation. |
| | |
|
Nicholas P. Constantakis
Birth Date: September 3, 1939
175 Woodshire Drive
Pittsburgh, PA
DIRECTOR
Began serving: November 1998 | | Principal Occupations: Director or Trustee of the Federated Fund Complex.
Other Directorships Held: Director and Member of the Audit Committee, Michael Baker Corporation (engineering and energy services worldwide).
Previous Position: Partner, Andersen Worldwide SC. |
| | |
|
John F. Cunningham
Birth Date: March 5, 1943
353 El Brillo Way
Palm Beach, FL
DIRECTOR
Began serving: November 1998 | | Principal Occupation: Director or Trustee of the Federated Fund Complex.
Other Directorships Held: Chairman, President and Chief Executive Officer, Cunningham & Co., Inc. (strategic business consulting); Trustee Associate, Boston College.
Previous Positions: Director, Redgate Communications and EMC Corporation (computer storage systems); Chairman of the Board and Chief Executive Officer, Computer Consoles, Inc.; President and Chief Operating Officer, Wang Laboratories; Director, First National Bank of Boston; Director, Apollo Computer, Inc. |
| | |
|
Peter E. Madden
Birth Date: March 16, 1942
One Royal Palm Way
100 Royal Palm Way
Palm Beach, FL
DIRECTOR
Began serving: November 1991 | | Principal Occupation: Director or Trustee of the Federated Fund Complex; Management Consultant.
Other Directorships Held: Board of Overseers, Babson College.
Previous Positions: Representative, Commonwealth of Massachusetts General Court; President, State Street Bank and Trust Company and State Street Corporation (retired); Director, VISA USA and VISA International; Chairman and Director, Massachusetts Bankers Association; Director, Depository Trust Corporation; Director, The Boston Stock Exchange. |
| | |
|
| | |
|
Name
Birth Date
Address
Positions Held with Fund
Date Service Began | | Principal Occupation(s), Other Directorships Held and Previous Position(s) |
Charles F. Mansfield, Jr.
Birth Date: April 10, 1945
80 South Road
Westhampton Beach, NY
DIRECTOR
Began serving: November 1998 | | Principal Occupations: Director or Trustee of the Federated Fund Complex; Management Consultant; Executive Vice President, DVC Group, Inc. (marketing communications and technology) (prior to 9/1/00).
Previous Positions: Chief Executive Officer, PBTC International Bank; Partner, Arthur Young & Company (now Ernst & Young LLP); Chief Financial Officer of Retail Banking Sector, Chase Manhattan Bank; Senior Vice President, HSBC Bank USA (formerly, Marine Midland Bank); Vice President, Citibank; Assistant Professor of Banking and Finance, Frank G. Zarb School of Business, Hofstra University. |
| | |
|
John E. Murray, Jr., J.D., S.J.D.
Birth Date: December 20, 1932
Chancellor, Duquesne University
Pittsburgh, PA
DIRECTOR
Began serving: February 1995 | | Principal Occupations: Director or Trustee of the Federated Fund Complex; Chancellor and Law Professor, Duquesne University; Consulting Partner, Mollica & Murray.
Other Directorships Held: Director, Michael Baker Corp. (engineering, construction, operations and technical services).
Previous Positions: President, Duquesne University; Dean and Professor of Law, University of Pittsburgh School of Law; Dean and Professor of Law, Villanova University School of Law. |
| | |
|
Marjorie P. Smuts
Birth Date: June 21, 1935
4905 Bayard Street
Pittsburgh, PA
DIRECTOR
Began serving: January 1985 | | Principal Occupations: Director or Trustee of the Federated Fund Complex; Public Relations/Marketing Consultant/Conference Coordinator.
Previous Positions: National Spokesperson, Aluminum Company of America; television producer; President, Marj Palmer Assoc.; Owner, Scandia Bord. |
| | |
|
John S. Walsh
Birth Date: November 28, 1957
2604 William Drive
Valparaiso, IN
DIRECTOR
Began serving: November 1998 | | Principal Occupations: Director or Trustee of the Federated Fund Complex; President and Director, Heat Wagon, Inc. (manufacturer of construction temporary heaters); President and Director, Manufacturers Products, Inc. (distributor of portable construction heaters); President, Portable Heater Parts, a division of Manufacturers Products, Inc.
Previous Position: Vice President, Walsh & Kelly, Inc. |
| | |
|
OFFICERS
| | |
|
Name
Birth Date
Positions Held with Fund
Date Service Began | | Principal Occupation(s) and Previous Position(s) |
Edward C. Gonzales
Birth Date: October 22, 1930
EXECUTIVE VICE PRESIDENT
Began serving: June 1995 | | Principal Occupations: Executive Vice President of some of the Funds in the Federated Fund Complex; Vice Chairman, Federated Investors, Inc.; Trustee, Federated Administrative Services.
Previous Positions: President and Trustee or Director of some of the Funds in the Federated Fund Complex; CEO and Chairman, Federated Administrative Services. |
| | |
|
John W. McGonigle
Birth Date: October 26, 1938
EXECUTIVE VICE PRESIDENT
and SECRETARY
Began serving: June 1995 | | Principal Occupations: Executive Vice President and Secretary of the Federated Fund Complex; Executive Vice President, Secretary and Director, Federated Investors, Inc. |
| | |
|
Richard J. Thomas
Birth Date: June 17, 1954
TREASURER
Began serving: November 1998 | | Principal Occupations: Principal Financial Officer and Treasurer of the Federated Fund Complex; Senior Vice President, Federated Administrative Services. |
| | |
|
Richard B. Fisher
Birth Date: May 17, 1923
VICE PRESIDENT
Began serving: May 1996 | | Principal Occupations: Vice Chairman or President of some of the Funds in the Federated Fund Complex; Vice Chairman, Federated Investors, Inc.; Chairman, Federated Securities Corp.
Previous Positions: President and Director or Trustee of some of the Funds in the Federated Fund Complex; Executive Vice President, Federated Investors, Inc. and Director and Chief Executive Officer, Federated Securities Corp. |
| | |
|
Stephen F. Auth
Birth Date: September 3, 1956
CHIEF INVESTMENT OFFICER
Began serving: November 2002 | | Principal Occupations: Chief Investment Officer of this Fund and various other Funds in the Federated Fund Complex; Executive Vice President, Federated Investment Counseling, Federated Global Investment Management Corp., Federated Investment Management Company and Passport Research, Ltd.
Previous Positions: Senior Vice President, Global Portfolio Management Services Division; Senior Vice President, Federated Investment Management Company and Passport Research, Ltd; Senior Managing Director and Portfolio Manager, Prudential Investments. |
| | |
|
John W. Harris
Birth Date: June 6, 1954
VICE PRESIDENT
Began serving: December 1999 | | John W. Harris has been the Fund's Portfolio Manager since (December 1999. He is Vice President of the Fund. Mr. Harris initially joined Federated in 1987 as an Investment Analyst. He served as an Investment Analyst and an Assistant Vice President from 1990 through 1992 and as a Senior Investment Analyst and Vice President through May 1993. After leaving the money management field to travel extensively, he rejoined Federated in 1997 as a Senior Investment Analyst and became a Portfolio Manager and an Assistant Vice President of the Fund's Adviser in December 1998. In January 2000, Mr. Harris became a Vice President of the Fund's Adviser. Mr. Harris is a Chartered Financial Analyst. He received his M.B.A. from the University of Pittsburgh. |
| | |
|
Mutual funds are not bank deposits or obligations, are not guaranteed by any bank, and are not insured or guaranteed by the U.S. government, the Federal Deposit Insurance Corporation, the Federal Reserve Board, or any other government agency. Investment in mutual funds involves investment risk, including the possible loss of principal.
This report is authorized for distribution to prospective investors only when preceded or accompanied by the Fund's prospectus, which contains facts concerning its objective and policies, management fees, expenses and other information.
VOTING PROXIES ON FUND PORTFOLIO SECURITIES
A description of the policies and procedures that the Fund uses to determine how to vote proxies relating to securities held in the Fund's portfolio is available, without charge and upon request, by calling 1-800-341-7400. This information is also available from the EDGAR database on the SEC's Internet site at http://www.sec.gov.
Federated Investors
World-Class Investment Manager
Federated Stock and Bond Fund, Inc.
Federated Investors Funds
5800 Corporate Drive
Pittsburgh, PA 15237-7000
www.federatedinvestors.com
Contact us at 1-800-341-7400 or
www.federatedinvestors.com/contact
Federated Securities Corp., Distributor
Cusip 313911109
Cusip 313911208
Cusip 313911307
Cusip 313911406
Federated is a registered mark of Federated Investors, Inc. 2003 ©Federated Investors, Inc.
G01454-01 (12/03)
Item 2.     Code of Ethics

As of the end of the period covered by this report, the registrant has adopted a
code of ethics (the "Section 406 Standards  for  Investment  Companies - Ethical
Standards for Principal  Executive and Financial  Officers") that applies to the
registrant's  Principal Executive Officer and Principal  Financial Officer;  the
registrant's Principal Financial Officer also serves as the Principal Accounting
Officer.

The registrant  hereby  undertakes to provide any person,  without charge,  upon
request,  a copy of the code of ethics. To request a copy of the code of ethics,
contact the registrant at 1-800-341-7400,  and ask for a copy of the Section 406
Standards for Investment  Companies - Ethical Standards for Principal  Executive
and Financial Officers.


Item 3.     Audit Committee Financial Expert

The  registrant's  Board has  determined  that each member of the Board's  Audit
Committee is an "audit committee financial expert," and that each such member is
"independent,"  for purposes of this Item. The Audit  Committee  consists of the
following  Board members:  Thomas G. Bigley,  John T. Conroy,  Jr.,  Nicholas P.
Constantakis and Charles F. Mansfield, Jr.


Item 4.     Principal Accountant Fees and Services

            Not Applicable

Item 5      Audit Committee of Listed Registrants

            Not Applicable

Item 6      [Reserved]

Item 7.     Disclosure of Proxy Voting Policies and Procedures for
            Closed-End Management Investment Companies

            Not Applicable

Item 8.     Purchases of Equity Securities by Closed-End Management
            Investment Company and Affiliated Purchasers

            Not Applicable

Item 9.     Submission of Matters to a Vote of Security Holders

            Not Applicable

Item 10.    Controls and Procedures

(a)  The   registrant's   President  and  Treasurer   have  concluded  that  the
     registrant's  disclosure  controls  and  procedures  (as  defined  in  rule
     30a-3(c)  under the Act) are  effective  in design  and  operation  and are
     sufficient to form the basis of the certifications required by Rule 30a-(2)
     under the Act, based on their evaluation of these  disclosure  controls and
     procedures within 90 days of the filing date of this report on Form N-CSR.

(b)  There were no changes in the  registrant's  internal control over financial
     reporting  (as defined in rule  30a-3(d)  under the Act),  or the  internal
     control over financial  reporting of its service  providers during the last
     fiscal  half  year  (the  registrant's  second  half year in the case of an
     annual report) that have materially  affected,  or are reasonably likely to
     materially  affect,  the  registrant's   internal  control  over  financial
     reporting.

Item 11.    Exhibits


                                   SIGNATURES

Pursuant to the  requirements  of the  Securities  Exchange  Act of 1934 and the
Investment Company Act of 1940, the registrant has duly caused this report to be
signed on its behalf by the undersigned, thereunto duly authorized.

Registrant  Federated Stock and Bond Fund, Inc.

By          /S/ Richard J. Thomas, Principal Financial Officer
Date        January 7, 2004


Pursuant to the  requirements  of the  Securities  Exchange  Act of 1934 and the
Investment  Company  Act of  1940,  this  report  has been  signed  below by the
following  persons on behalf of the  registrant and in the capacities and on the
dates indicated.


By          /S/ J. Christopher Donahue, Principal Executive Officer
Date        January 7, 2004


By          /S/ Richard J. Thomas, Principal Financial Officer
Date        January 7, 2004