United States
Securities and Exchange Commission
Washington, D.C. 20549
Form N-CSR
Certified Shareholder Report of Registered Management Investment Companies
811-1
(Investment Company Act File Number)
Federated Stock and Bond Fund
_______________________________________________________________
(Exact Name of Registrant as Specified in Charter)
Federated Investors Funds
4000 Ericsson Drive
Warrendale, Pennsylvania 15086-7561
(Address of Principal Executive Offices)
(412) 288-1900
(Registrant's Telephone Number)
John W. McGonigle, Esquire
Federated Investors Tower
1001 Liberty Avenue
Pittsburgh, Pennsylvania 15222-3779
(Name and Address of Agent for Service)
(Notices should be sent to the Agent for Service)
Date of Fiscal Year End: 11/30/2010
Date of Reporting Period: 11/30/2010
Item 1. Reports to Stockholders
Federated Stock and Bond FundEstablished 1934
(Effective January 31, 2011, the name of the fund will be Federated Asset Allocation Fund)
ANNUAL SHAREHOLDER REPORTNovember 30, 2010
Class A Shares
Class B Shares
Class C Shares
Class K Shares
(Effective December 31, 2010, the Fund's Class K Shares will be redesignated as Class R Shares)
FINANCIAL HIGHLIGHTS
SHAREHOLDER EXPENSE EXAMPLE
MANAGEMENT'S DISCUSSION OF FUND PERFORMANCE
PORTFOLIO OF INVESTMENTS SUMMARY TABLES
PORTFOLIO OF INVESTMENTS
STATEMENT OF ASSETS AND LIABILITIES
STATEMENT OF OPERATIONS
STATEMENT OF CHANGES IN NET ASSETS
NOTES TO FINANCIAL STATEMENTS
REPORT OF INDEPENDENT REGISTERED PUBLIC ACCOUNTING FIRM
BOARD OF TRUSTEES AND TRUST OFFICERS
EVALUATION AND APPROVAL OF ADVISORY CONTRACT
VOTING PROXIES ON FUND PORTFOLIO SECURITIES
QUARTERLY PORTFOLIO SCHEDULE
Financial Highlights – Class A Shares
(For a Share Outstanding Throughout Each Period)
| Year Ended November 30 | 2010 | 2009 | 2008 | 2007 | 2006 |
| Net Asset Value, Beginning of Period | $15.65 | $13.11 | $19.99 | $20.55 | $18.95 |
| Income From Investment Operations: | | | | | |
| Net investment income | 0.191 | 0.29 | 0.40 | 0.41 | 0.38 |
| Net realized and unrealized gain (loss) on investments, futures contracts, swap contracts and foreign currency transactions | 1.05 | 2.52 | (4.91) | 1.42 | 1.93 |
| TOTAL FROM INVESTMENT OPERATIONS | 1.24 | 2.81 | (4.51) | 1.83 | 2.31 |
| Less Distributions: | | | | | |
| Distributions from net investment income | (0.02) | (0.27) | (0.42) | (0.40) | (0.38) |
| Distributions from net realized gain on investments, futures contracts, swap contracts and foreign currency transactions | — | — | (1.95) | (1.99) | (0.33) |
| TOTAL DISTRIBUTIONS | (0.02) | (0.27) | (2.37) | (2.39) | (0.71) |
| Net Asset Value, End of Period | $16.87 | $15.65 | $13.11 | $19.99 | $20.55 |
| Total Return2 | 7.91% | 21.84% | (25.39)% | 9.88% | 12.55%3 |
| Ratios to Average Net Assets: | | | | | |
| Net expenses | 1.25%4 | 1.25%4 | 1.25%4 | 1.25%4 | 1.17%4 |
| Net investment income | 1.20% | 2.00% | 2.48% | 2.07% | 1.90% |
| Expense waiver/reimbursement5 | 0.21% | 0.26% | 0.19% | 0.10% | 0.12% |
| Supplemental Data: | | | | | |
| Net assets, end of period (000 omitted) | $135,002 | $149,696 | $125,373 | $195,687 | $198,289 |
| Portfolio turnover | 184% | 254% | 190% | 135% | 106% |
| 1 | Per share number has been calculated using the average shares method. |
| 2 | Based on net asset value, which does not reflect the sales charge, redemption fee or contingent deferred sales charge, if applicable. |
| 3 | During the period, the Fund was reimbursed by an affiliated shareholder services provider, which had an impact of 0.01% on the total return for the year ended November 30, 2006. |
| 4 | The net expense ratio is calculated without reduction for expense offset arrangements. The net expense ratios are 1.24%, 1.24%, 1.25%, 1.24% and 1.16% for the years ended November 30, 2010, 2009, 2008, 2007 and 2006, respectively, after taking into account these expense reductions. |
| 5 | This expense decrease is reflected in both the net expense and the net investment income ratios shown above. |
See Notes which are an integral part of the Financial Statements
Annual Shareholder Report1
Financial Highlights – Class B Shares
(For a Share Outstanding Throughout Each Period)
| Year Ended November 30 | 2010 | 2009 | 2008 | 2007 | 2006 |
| Net Asset Value, Beginning of Period | $15.61 | $13.09 | $19.96 | $20.52 | $18.93 |
| Income From Investment Operations: | | | | | |
| Net investment income | 0.071 | 0.15 | 0.26 | 0.25 | 0.20 |
| Net realized and unrealized gain (loss) on investments, futures contracts, swap contracts and foreign currency transactions | 1.03 | 2.55 | (4.89) | 1.43 | 1.94 |
| TOTAL FROM INVESTMENT OPERATIONS | 1.10 | 2.70 | (4.63) | 1.68 | 2.14 |
| Less Distributions: | | | | | |
| Distributions from net investment income | (0.02) | (0.18) | (0.29) | (0.25) | (0.22) |
| Distributions from net realized gain on investments, futures contracts, swap contracts and foreign currency transactions | — | — | (1.95) | (1.99) | (0.33) |
| TOTAL DISTRIBUTIONS | (0.02) | (0.18) | (2.24) | (2.24) | (0.55) |
| Net Asset Value, End of Period | $16.69 | $15.61 | $13.09 | $19.96 | $20.52 |
| Total Return2 | 7.03% | 20.86% | (25.97)% | 9.05% | 11.59% |
| Ratios to Average Net Assets: | | | | | |
| Net expenses | 2.05%3 | 2.05%3 | 2.05%3 | 2.03%3 | 1.99%3 |
| Net investment income | 0.42% | 1.23% | 1.72% | 1.31% | 1.07% |
| Expense waiver/reimbursement4 | 0.21% | 0.26% | 0.17% | 0.10% | 0.11% |
| Supplemental Data: | | | | | |
| Net assets, end of period (000 omitted) | $14,541 | $20,151 | $21,637 | $41,365 | $50,182 |
| Portfolio turnover | 184% | 254% | 190% | 135% | 106% |
| 1 | Per share number has been calculated using the average shares method. |
| 2 | Based on net asset value, which does not reflect the sales charge, redemption fee or contingent deferred sales charge, if applicable. |
| 3 | The net expense ratio is calculated without reduction for expense offset arrangements. The net expense ratios are 2.04%, 2.04%, 2.05%, 2.03% and 1.98% for the years ended November 30, 2010, 2009, 2008, 2007 and 2006, respectively, after taking into account these expense reductions. |
| 4 | This expense decrease is reflected in both the net expense and the net investment income ratios shown above. |
See Notes which are an integral part of the Financial Statements
Annual Shareholder Report2
Financial Highlights – Class C Shares
(For a Share Outstanding Throughout Each Period)
| Year Ended November 30 | 2010 | 2009 | 2008 | 2007 | 2006 |
| Net Asset Value, Beginning of Period | $15.55 | $13.04 | $19.90 | $20.47 | $18.88 |
| Income From Investment Operations: | | | | | |
| Net investment income | 0.061 | 0.18 | 0.26 | 0.26 | 0.22 |
| Net realized and unrealized gain (loss) on investments, futures contracts, swap contracts and foreign currency transactions | 1.03 | 2.51 | (4.87) | 1.42 | 1.94 |
| TOTAL FROM INVESTMENT OPERATIONS | 1.09 | 2.69 | (4.61) | 1.68 | 2.16 |
| Less Distributions: | | | | | |
| Distributions from net investment income | (0.02) | (0.18) | (0.30) | (0.26) | (0.24) |
| Distributions from net realized gain on investments, futures contracts, swap contracts and foreign currency transactions | — | — | (1.95) | (1.99) | (0.33) |
| TOTAL DISTRIBUTIONS | (0.02) | (0.18) | (2.25) | (2.25) | (0.57) |
| Net Asset Value, End of Period | $16.62 | $15.55 | $13.04 | $19.90 | $20.47 |
| Total Return2 | 6.99% | 20.86% | (25.98)% | 9.05% | 11.69% |
| Ratios to Average Net Assets: | | | | | |
| Net expenses | 2.05%3 | 2.05%3 | 2.05%3 | 2.00%3 | 1.95%3 |
| Net investment income | 0.40% | 1.18% | 1.66% | 1.30% | 1.11% |
| Expense waiver/reimbursement4 | 0.17% | 0.21% | 0.16% | 0.10% | 0.11% |
| Supplemental Data: | | | | | |
| Net assets, end of period (000 omitted) | $36,415 | $28,278 | $20,603 | $26,572 | $27,033 |
| Portfolio turnover | 184% | 254% | 190% | 135% | 106% |
| 1 | Per share number has been calculated using the average shares method. |
| 2 | Based on net asset value, which does not reflect the sales charge, redemption fee or contingent deferred sales charge, if applicable. |
| 3 | The net expense ratio is calculated without reduction for expense offset arrangements. The net expense ratios are 2.04%, 2.04%, 2.05%, 2.00% and 1.95% for the years ended November 30, 2010, 2009, 2008, 2007 and 2006, respectively, after taking into account these expense reductions. |
| 4 | This expense decrease is reflected in both the net expense and the net investment income ratios shown above. |
See Notes which are an integral part of the Financial Statements
Annual Shareholder Report3
Financial Highlights – Class K Shares
(For a Share Outstanding Throughout Each Period)
| Year Ended November 30 | 2010 | 2009 | 2008 | 2007 | 2006 |
| Net Asset Value, Beginning of Period | $15.68 | $13.13 | $20.02 | $20.57 | $18.98 |
| Income From Investment Operations: | | | | | |
| Net investment income | 0.111 | 0.26 | 0.30 | 0.33 | 0.28 |
| Net realized and unrealized gain (loss) on investments, futures contracts, swap contracts and foreign currency transactions | 1.04 | 2.50 | (4.90) | 1.43 | 1.94 |
| TOTAL FROM INVESTMENT OPERATIONS | 1.15 | 2.76 | (4.60) | 1.76 | 2.22 |
| Less Distributions: | | | | | |
| Distributions from net investment income | (0.02) | (0.21) | (0.34) | (0.32) | (0.30) |
| Distributions from net realized gain on investments, futures contracts, swap contracts and foreign currency transactions | — | — | (1.95) | (1.99) | (0.33) |
| TOTAL DISTRIBUTIONS | (0.02) | (0.21) | (2.29) | (2.31) | (0.63) |
| Net Asset Value, End of Period | $16.81 | $15.68 | $13.13 | $20.02 | $20.57 |
| Total Return2 | 7.32% | 21.30% | (25.76)% | 9.44% | 11.98% |
| Ratios to Average Net Assets: | | | | | |
| Net expenses | 1.74%3 | 1.75%3 | 1.75%3 | 1.70%3 | 1.68%3 |
| Net investment income | 0.71% | 1.41% | 1.93% | 1.55% | 1.42% |
| Expense waiver/reimbursement4 | 0.14% | 0.18% | 0.14% | 0.10% | 0.11% |
| Supplemental Data: | | | | | |
| Net assets, end of period (000 omitted) | $53,749 | $47,254 | $18,947 | $16,070 | $10,234 |
| Portfolio turnover | 184% | 254% | 190% | 135% | 106% |
| 1 | Per share number has been calculated using the average shares method. |
| 2 | Based on net asset value. |
| 3 | The net expense ratio is calculated without reduction for expense offset arrangements. The net expense ratios are 1.73%, 1.74%, 1.75%, 1.70% and 1.67% for the years ended November 30, 2010, 2009, 2008, 2007 and 2006, respectively, after taking into account these expense reductions. |
| 4 | This expense decrease is reflected in both the net expense and the net investment income ratios shown above. |
See Notes which are an integral part of the Financial Statements
Annual Shareholder Report4
Shareholder Expense Example (unaudited)
As a shareholder of the Fund, you incur two types of costs: (1) transaction costs, including sales charges (loads) on purchase or redemption payments; and (2) ongoing costs, including management fees and to the extent applicable, distribution (12b-1) fees and/or shareholder services fees and other Fund expenses. This Example is intended to help you to understand your ongoing costs (in dollars) of investing in the Fund and to compare these costs with the ongoing costs of investing in other mutual funds. It is based on an investment of $1,000 invested at the beginning of the period and held for the entire period from June 1, 2010 to November 30, 2010.
ACTUAL EXPENSES
The first section of the table below provides information about actual account values and actual expenses. You may use the information in this section, together with the amount you invested, to estimate the expenses that you incurred over the period. Simply divide your account value by $1,000 (for example, an $8,600 account value divided by $1,000 = 8.6), then multiply the result by the number in the first section under the heading entitled “Expenses Paid During Period” to estimate the expenses attributable to your investment during this period.
HYPOTHETICAL EXAMPLE FOR COMPARISON PURPOSES
The second section of the table below provides information about hypothetical account values and hypothetical expenses based on the Fund's actual expense ratio and an assumed rate of return of 5% per year before expenses, which is not the Fund's actual return. Thus, you should not use the hypothetical account values and expenses to estimate the actual ending account balance or your expenses for the period. Rather, these figures are required to be provided to enable you to compare the ongoing costs of investing in the Fund with other funds. To do so, compare this 5% hypothetical example with the 5% hypothetical examples that appear in the shareholder reports of the other funds.
Annual Shareholder Report
5
Please note that the expenses shown in the table are meant to highlight your ongoing costs only and do not reflect any transaction costs, such as sales charges (loads) on purchase or redemption payments. Therefore, the second section of the table is useful in comparing ongoing costs only, and will not help you determine the relative total costs of owning different funds. In addition, if these transaction costs were included, your costs would have been higher. | Beginning
Account Value
6/1/2010 | Ending
Account Value
11/30/2010 | Expenses Paid
During Period1 |
| Actual: | | | |
| Class A Shares | $1,000 | $1,091.90 | $6.56 |
| Class B Shares | $1,000 | $1,087.30 | $10.73 |
| Class C Shares | $1,000 | $1,087.00 | $10.73 |
| Class K Shares | $1,000 | $1,088.70 | $9.11 |
Hypothetical (assuming a 5% return
before expenses): | | | |
| Class A Shares | $1,000 | $1,018.80 | $6.33 |
| Class B Shares | $1,000 | $1,014.79 | $10.35 |
| Class C Shares | $1,000 | $1,014.79 | $10.35 |
| Class K Shares | $1,000 | $1,016.34 | $8.80 |
| 1 | Expenses are equal to the Fund's annualized net expense ratios, multiplied by the average account value over the period, multiplied by 183/365 (to reflect the one-half-year period). The annualized net expense ratios are as follows: |
| Class A Shares | 1.25% |
| Class B Shares | 2.05% |
| Class C Shares | 2.05% |
| Class K Shares | 1.74% |
Annual Shareholder Report6
Performance data quoted represents past performance which is no guarantee of future results. Investment return and principal value will fluctuate so that an investor's shares, when redeemed, may be worth more or less than their original cost. Mutual fund performance changes over time and current performance may be lower or higher than what is stated. For current to the most recent month-end performance and after-tax returns, visit FederatedInvestors.com or call 1-800-341-7400.
Management's Discussion of Fund Performance
For the fiscal year ended November 30, 2010, the Fund's Class A Shares, Class B Shares, Class C Shares and Class K Shares produced total returns of 7.91%, 7.03%, 6.99%, and 7.32%, respectively, at net asset value. That compares with a 10.03% return for the Fund's Blended Index and 9.02% for Morningstar's Moderate Allocation Funds Category Average.1 The Fund's Blended Index is composed of 50% of the return of the Russell 3000 Index,2 10% of the return of the MSCI All Country World ex US Index3 and 40% of the return of the Barclays Capital U.S. Universal Index4 which had total returns of 12.63%, 5.26%, and 6.77%, respectively, during the reporting period. The Fund's total return for the fiscal year reflected actual cash flows, transaction costs and other expenses which were not reflected in the total return data of the indices.
The following discussion will focus on the performance of the Fund's Class A Shares.
| 1 | Morningstar's Moderate Allocation Funds Category Average is the category of funds which seek to provide both capital appreciation and income by investing in stocks, bonds and cash. These funds typically invest between 50% to 70% of assets in equities and the remainder in fixed income and cash. Investments cannot be made in an average. |
| 2 | The Russell 3000 Index measures the performance of the largest 3000 U.S. companies representing approximately 98% of the investable U.S. equity market. The Russell 3000 Index is constructed to provide a comprehensive, unbiased, and stable barometer of the broad market and is completely reconstituted annually to ensure new and growing equities are reflected. |
| 3 | The MSCI ACWI (All Country World Index) ex US Index is a free float-adjusted market capitalization weighted index that is designed to measure the equity market performance of developed and emerging markets. As of May 2010 the MSCI ACWI consisted of 44 country indices comprising 23 developed and 21 emerging market country indices. |
| 4 | The Barclays Capital U.S. Universal Index represents the union of the U.S. Aggregate Index, U.S. Corporate High-Yield, Investment Grade 144A Index, Eurodollar Index, U.S. Emerging Markets Index and the non-ERISA eligible portion of the CMBS Index. The index covers USD-denominated, taxable bonds that are rated either investment grade or below investment-grade. |
Annual Shareholder Report7
MARKET OVERVIEW
Domestic Equities
Domestic equities, as measured by the S&P 500 Index5 (S&P 500), experienced another year of substantial volatility as the U.S. economy continued to grind through the economic recovery. Markets traded lower heading into the opening months of 2010, before rallying sharply during the spring in response to improving economic fundamentals. After peaking in April, equities were weak throughout the summer as economic data rolled over, sparking debate as to whether or not the economy was entering a double-dip recession or simply a soft patch. U.S. equities were also hurt by fears that the European sovereign debt crisis could jump across the Atlantic. Fortunately, the economic malaise of the summer proved to be a soft patch, and equities rallied strongly in the fall, as markets were boosted by the reacceleration of economic data, strong corporate profits, the results of the mid-term Congressional elections, and the announcement by the Federal Reserve of a second round of quantitative easing. All told, the S&P 500 ended the one-year period with a positive return of 9.94%. Nine out of 10 sectors posted positive returns. The three best performing S&P sectors were: Consumer Discretionary, up 28.1%; Industrials, up 19.2%; and Telecommunication Services, up 15.5%. The three lagging sectors were Financials, down 0.3%; Health Care, up 0.5%; and Utilities, up 8.0%.
International Equities
World markets followed a similar path as the United States. The severity of the summer downturn was sharper outside the United States, as Europe was acutely affected by the Greek debt crisis. International markets also were weak during November, as concerns over Irish sovereign debt pulled equities lower. For the year, the MSCI All-Country World ex-US Index returned 5.26%, underperforming relative to the United States.
On the currency front, the U.S. dollar appreciated 13.3% against the euro and 5.1% against the sterling, on superior growth prospects in the United States and sovereign debt concerns in Europe, but lost 2.6% against the yen.
| 5 | The S&P 500 Index is an unmanaged capitalization-weighted index of 500 stocks designed to measure performance of the broad domestic economy through changes in the aggregate market value of 500 stocks representing all major industries. Investment cannot be made in an index. |
Annual Shareholder Report8
Within the international markets, performance varied significantly between emerging and developed countries.6 Emerging markets, as measured by the MSCI Emerging Markets Index,7 continued to outperform on stronger growth fundamentals, returning 15.3% for the year. International developed markets, as measured by the MSCI EAFE Index,8 were considerably weaker, returning 1.1%.
Interest Rates
Interest rates moved lower over the 12-month reporting period. Intermediate maturity yields fell the most while the shortest maturities and the longest maturities were virtually unchanged. Although economic concerns related to the Gulf of Mexico oil spill caused spreads to widen over the summer, credit-related spread bonds performed well later in the reporting period on expectations that they would do well in a growing economic environment. Prospects for economic growth also improved on the overwhelming election win by Republicans in early November.
The 5-year Treasury yield fell 0.53% over the 12 months and finished the reporting period at 1.47%. The “yield to worst” of the Barclays Capital Aggregate Bond Index9 (BCAB) stood at 2.68% on November 30, 2010, compared to 3.15% 12 months earlier.
| 6 | International investing involves special risks including currency risk, increased volatility, political risks, and differences in auditing and other financial standards. Prices of emerging markets securities can be significantly more volatile than the prices of securities in developed countries and currency risk and political risks are accentuated in emerging markets. |
| 7 | The MSCI Emerging Markets Index is a free float-adjusted market capitalization index that is designed to measure equity market performance of emerging markets. |
| 8 | The MSCI EAFE Index (Europe, Australasia, Far East) is a free float-adjusted market capitalization index that is designed to measure the equity market performance of developed markets, excluding the US & Canada. As of May 27, 2010 the MSCI EAFE Index consisted of the following 22 developed market country indices: Australia, Austria, Belgium, Denmark, Finland, France, Germany, Greece, Hong Kong, Ireland, Israel, Italy, Japan, the Netherlands, New Zealand, Norway, Portugal, Singapore, Spain, Sweden, Switzerland and the United Kingdom. |
| 9 | The Barclays Capital Aggregate Bond Index (BCAB) is a broad-based benchmark that measures the investment grade, U.S. dollar-denominated, fixed-rate taxable bond market, including Treasuries, government-related and corporate securities, MBS (agency fixed-rate and hybrid ARM passthroughs), ABS, and CMBS. The BCAB rolls up into other Barclays Capital flagship indices such as the multi-currency Global Aggregate Index and the U.S. Universal Index, which includes high yield and emerging markets debt. The BCAB was created in 1986, with index history backfilled to January 1, 1976. |
Annual Shareholder Report
9
Fund PerformanceAsset Allocation Strategy Performance
For the year ended November 30, 2010, the main drivers of performance were the Fund's market cap allocation, emerging vs. developed allocation, and stock vs. bond allocation. The Fund benefited from overweight positions in small caps,10 emerging markets and stocks as small caps outperformed large caps, emerging markets outperformed developed marketsl and stocks outperformed bonds. Conversely, the Fund was negatively impacted by foreign developed country selection, an allocation to U.S. homebuilders and an allocation to commodities. During the reporting period, the Fund used exchange-traded futures contracts to gain exposure to certain foreign country markets and to adjust the Fund's relative market capitalization exposure in its domestic equity investments.
Domestic Equities Performance
In the domestic equities portion of the Fund, the Fund benefited from allocation decisions among industry groups while individual security selection was a drag on relative performance.
The Fund benefitted most from its allocation decisions in Automobiles & Components, Capital Goods, Energy, Pharmaceuticals & Biotechnology and Utilities. Conversely, the Fund was negatively impacted by allocation decisions in Consumer Services, Diversified Financials, Health Care Equipment & Services, Insurance and Materials.
| 10 | Small Company stocks may be less liquid and subject to greater price volatility than large company stocks. |
Annual Shareholder Report
10
Fixed-Income Performance11For the second year in a row, the bond portion of the Fund outperformed the BCAB by a huge margin during the 12-month reporting period. Sector management, yield curve management, and security selection all contributed positively to performance. Duration management detracted from performance as the Fund was shorter than the BCAB's interest sensitivity in a period of declining interest rates.12 Currency management had a very slight benefit. Sector call helped performance due to a considerable overweight in commercial mortgage backed securities (CMBS), emerging markets, and corporates (both investment-grade & high-yield corporates). Security selection improved over the prior year particularly in CMBS, high yield, emerging markets and investment-grade corporates. Security selection in mortgage backed securities negatively affected the Fund's performance.
Some names that added to performance included several financial names including NY Life, Pacific Life, Barclays Bank, Capital One, First Union, General Electric and a small bank trust-preferred security (TRUP) collateralized mortgage obligation (CMO) named Regional Diversified. One security that performed poorly was CVS Corp. During the reporting period, the Fund used credit default swaps to add exposure to investment-grade corporate debt and utilized Treasury futures to manage the Fund's duration and yield curve risk.
| 11 | Bond prices are sensitive to changes in interest rates and a rise in interest rates can cause a decline in their prices. |
| 12 | Duration is a measure of a security's price sensitivity to changes in interest rates. Securities with longer durations are more sensitive to changes in interest rates than securities of shorter durations. |
Annual Shareholder Report11
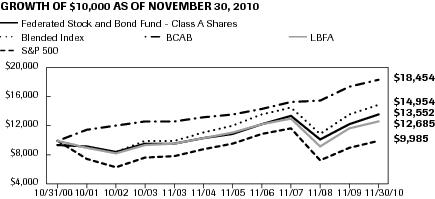
GROWTH OF A $10,000 INVESTMENT – CLASS A SHARES
The graph below illustrates the hypothetical investment of $10,0001 in Federated Stock and Bond Fund (Class A Shares) (the “Fund”) from October 31, 2000 to November 30, 2010, compared to a blend of indexes comprised of 50% of the Russell 3000 Index (RU3000),2 10% of the MSCI All Country World ex US Index (MSCI ACWI ex US)2 and 40% of the Barclays Capital U.S. Universal Index (BCUSU)2 (the “Blended Index”),2 the Standard and Poor's 500 Index (S&P 500),2 the Barclays Capital Aggregate Bond Index (BCAB)2 and the Lipper Balanced Funds Average (LBFA).3
| Average Annual Total Returns4 for the Period Ended 11/30/2010 | |
| 1 Year | 1.98% |
| 5 Years | 2.77% |
| 10 Years | 3.09% |
Performance data quoted represents past performance which is no guarantee of future results. Investment return and principal value will fluctuate so that an investor's shares, when redeemed, may be worth more or less than their original cost. Mutual fund performance changes over time and current performance may be lower or higher than what is stated. For current to the most recent month-end performance and after-tax returns, visit FederatedInvestors.com or call 1-800-341-7400. Returns shown do not reflect the deduction of taxes that a shareholder would pay on Fund distributions or the redemption of Fund shares. Mutual funds are not obligations of or guaranteed by any bank and are not federally insured. Total returns shown include the maximum sales charge of 5.50%.
Annual Shareholder Report
12
| 1 | Represents a hypothetical investment of $10,000 in the Fund after deducting the maximum sales charge of 5.50% ($10,000 investment minus $550 sales charge = $9,450). The Fund's performance assumes the reinvestment of all dividends and distributions. The Blended Index, S&P 500, BCAB and LBFA have been adjusted to reflect reinvestment of dividends on securities in the indexes and the average. |
| 2 | The Blended Index is a custom blended index comprised of 50% of the RU3000, 10% of the MSCI ACWI ex US and 40% of the BCUSU. The RU3000 measures the performance of the largest 3,000 U.S. companies representing approximately 98% of the investable U.S. equity market. The Russell 3000 Index is constructed to provide a comprehensive, unbiased and stable barometer of the broad market and is completely reconstituted annually to ensure new and growing equities are reflected. The MSCI ACWI (All Country World) Index is a free float-adjusted market capitalization weighted index that is designed to measure the equity market performance of developed and emerging markets. As of May 27, 2010, the MSCI ACWI consisted of 45 country indices comprising 24 developed and 21 emerging market country indices. The developed market country indices included are: Australia, Austria, Belgium, Canada, Denmark, Finland, France, Germany, Greece, Hong Kong, Ireland, Israel, Italy, Japan, Netherlands, New Zealand, Norway, Portugal, Singapore, Spain, Sweden, Switzerland, the United Kingdom and the United States. The emerging market country indices included are: Brazil, Chile, China, Colombia, Czech Republic, Egypt, Hungary, India, Indonesia, Korea, Malaysia, Mexico, Morocco, Peru, Philippines, Poland, Russia, South Africa, Taiwan, Thailand and Turkey. The BCUSU represents the union of the U.S. Aggregate Index, U.S. Corporate High-Yield, Investment Grade 144A Index, Eurodollar Index, U.S. Emerging Markets Index and the non-ERISA eligible portion of the CMBS Index. The index covers USD-denominated, taxable bonds that are rated either investment-grade or below investment-grade. The S&P 500 is an unmanaged, capitalization-weighted index of 500 stocks designed to measure performance of the broad domestic economy through changes in the aggregate market value of 500 stocks representing all major industries. The BCAB is an unmanaged index composed of securities from the Barclay's Capital Government/Corporate Bond Index, Mortgage-Backed Securities Index and the Asset-Backed Securities Index. The RU3000, MSCI ACWI ex US, BCUSU, S&P 500 and BCAB are not adjusted to reflect sales charges, expenses or other fees that the Securities and Exchange Commission (SEC) requires to be reflected in the Fund's performance. The indexes are unmanaged and, unlike the Fund, are not affected by cash flows. It is not possible to invest directly in an index. |
| 3 | The LBFA represents the average of the total returns reported by all of the mutual funds designated by Lipper, Inc. as falling into the category indicated, and is not adjusted to reflect any sales charges. However, these total returns are reported net of expenses or other fees that the SEC requires to be reflected in the Fund's performance. |
| 4 | Total returns quoted reflect all applicable sales charges. |
Annual Shareholder Report13
GROWTH OF A $10,000 INVESTMENT – CLASS B SHARES
The graph below illustrates the hypothetical investment of $10,0001 in Federated Stock and Bond Fund (Class B Shares) (the “Fund”) from October 31, 2000 to November 30, 2010, compared to a blend of indexes comprised of 50% of the Russell 3000 Index (RU3000),2 10% of the MSCI All Country World ex US Index (MSCI ACWI ex US)2 and 40% of the Barclays Capital U.S. Universal Index (BCUSU)2 (the “Blended Index”),2 the Standard and Poor's 500 Index (S&P 500),2 the Barclays Capital Aggregate Bond Index (BCAB)2 and the Lipper Balanced Funds Average (LBFA).3
| Average Annual Total Returns4 for the Period Ended 11/30/2010 | |
| 1 Year | 1.53% |
| 5 Years | 2.79% |
| 10 Years | 3.02% |
Performance data quoted represents past performance which is no guarantee of future results. Investment return and principal value will fluctuate so that an investor's shares, when redeemed, may be worth more or less than their original cost. Mutual fund performance changes over time and current performance may be lower or higher than what is stated. For current to the most recent month-end performance and after-tax returns, visit FederatedInvestors.com or call 1-800-341-7400. Returns shown do not reflect the deduction of taxes that a shareholder would pay on Fund distributions or the redemption of Fund shares. Mutual funds are not obligations of or guaranteed by any bank and are not federally insured. Total returns shown include the maximum contingent deferred sales charge of 5.50%, as applicable.
Annual Shareholder Report
14
| 1 | Represents a hypothetical investment of $10,000 in the Fund. The maximum contingent deferred sales charge is 5.50% on any redemption of shares held up to one year from the purchase date. The Fund's performance assumes the reinvestment of all dividends and distributions. The Blended Index, S&P 500, BCAB and LBFA have been adjusted to reflect reinvestment of dividends on securities in the indexes and the average. |
| 2 | The Blended Index is a custom blended index comprised of 50% of the RU3000, 10% of the MSCI ACWI ex US and 40% of the BCUSU. The RU3000 measures the performance of the largest 3,000 U.S. companies representing approximately 98% of the investable U.S. equity market. The Russell 3000 Index is constructed to provide a comprehensive, unbiased and stable barometer of the broad market and is completely reconstituted annually to ensure new and growing equities are reflected. The MSCI ACWI (All Country World) Index is a free float-adjusted market capitalization weighted index that is designed to measure the equity market performance of developed and emerging markets. As of May 27, 2010, the MSCI ACWI consisted of 45 country indices comprising 24 developed and 21 emerging market country indices. The developed market country indices included are: Australia, Austria, Belgium, Canada, Denmark, Finland, France, Germany, Greece, Hong Kong, Ireland, Israel, Italy, Japan, Netherlands, New Zealand, Norway, Portugal, Singapore, Spain, Sweden, Switzerland, the United Kingdom and the United States. The emerging market country indices included are: Brazil, Chile, China, Colombia, Czech Republic, Egypt, Hungary, India, Indonesia, Korea, Malaysia, Mexico, Morocco, Peru, Philippines, Poland, Russia, South Africa, Taiwan, Thailand and Turkey. The BCUSU represents the union of the U.S. Aggregate Index, U.S. Corporate High-Yield, Investment Grade 144A Index, Eurodollar Index, U.S. Emerging Markets Index and the non-ERISA eligible portion of the CMBS Index. The index covers USD-denominated, taxable bonds that are rated either investment-grade or below investment-grade. The S&P 500 is an unmanaged, capitalization-weighted index of 500 stocks designed to measure performance of the broad domestic economy through changes in the aggregate market value of 500 stocks representing all major industries. The BCAB is an unmanaged index composed of securities from the Barclay's Capital Government/Corporate Bond Index, Mortgage-Backed Securities Index and the Asset-Backed Securities Index. The RU3000, MSCI ACWI ex US, BCUSU, S&P 500 and BCAB are not adjusted to reflect sales charges, expenses or other fees that the SEC requires to be reflected in the Fund's performance. The indexes are unmanaged and, unlike the Fund, are not affected by cash flows. It is not possible to invest directly in an index. |
| 3 | The LBFA represents the average of the total returns reported by all of the mutual funds designated by Lipper, Inc. as falling into the category indicated, and is not adjusted to reflect any sales charges. However, these total returns are reported net of expenses or other fees that the SEC requires to be reflected in the Fund's performance. |
| 4 | Total returns quoted reflect all applicable contingent deferred sales charges. |
Annual Shareholder Report15
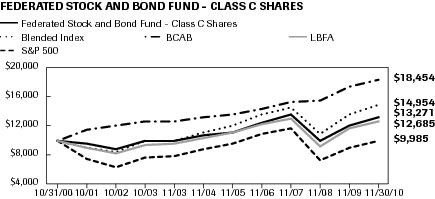
GROWTH OF A $10,000 INVESTMENT – CLASS C SHARES
The graph below illustrates the hypothetical investment of $10,0001 in Federated Stock and Bond Fund (Class C Shares) (the “Fund”) from October 31, 2000 to November 30, 2010, compared to a blend of indexes comprised of 50% of the Russell 3000 Index (RU3000),2 10% of the MSCI All Country World ex US Index (MSCI ACWI ex US)2 and 40% of the Barclays Capital U.S. Universal Index (BCUSU)2 (the “Blended Index”),2 the Standard and Poor's 500 Index (S&P 500),2 the Barclays Capital Aggregate Bond Index (BCAB)2 and the Lipper Balanced Funds Average (LBFA).3
| Average Annual Total Returns4 for the Period Ended 11/30/2010 | |
| 1 Year | 5.99% |
| 5 Years | 3.11% |
| 10 Years | 2.87% |
Performance data quoted represents past performance which is no guarantee of future results. Investment return and principal value will fluctuate so that an investor's shares, when redeemed, may be worth more or less than their original cost. Mutual fund performance changes over time and current performance may be lower or higher than what is stated. For current to the most recent month-end performance and after-tax returns, visit FederatedInvestors.com or call 1-800-341-7400. Returns shown do not reflect the deduction of taxes that a shareholder would pay on Fund distributions or the redemption of Fund shares. Mutual funds are not obligations of or guaranteed by any bank and are not federally insured. Total returns shown include the maximum contingent deferred sales charge of 1.00%, as applicable.
Annual Shareholder Report
16
| 1 | Represents a hypothetical investment of $10,000 in the Fund. A 1.00% contingent deferred sales charge would be applied on any redemption less than one year from the purchase date. The Fund's performance assumes the reinvestment of all dividends and distributions. The Blended Index, S&P 500, BCAB and the LBFA have been adjusted to reflect reinvestment of dividends on securities in the indexes and the average. |
| 2 | The Blended Index is a custom blended index comprised of 50% of the RU3000, 10% of the MSCI ACWI ex US and 40% of the BCUSU. The RU3000 measures the performance of the largest 3,000 U.S. companies representing approximately 98% of the investable U.S. equity market. The Russell 3000 Index is constructed to provide a comprehensive, unbiased and stable barometer of the broad market and is completely reconstituted annually to ensure new and growing equities are reflected. The MSCI ACWI (All Country World) Index is a free float-adjusted market capitalization weighted index that is designed to measure the equity market performance of developed and emerging markets. As of May 27, 2010, the MSCI ACWI consisted of 45 country indices comprising 24 developed and 21 emerging market country indices. The developed market country indices included are: Australia, Austria, Belgium, Canada, Denmark, Finland, France, Germany, Greece, Hong Kong, Ireland, Israel, Italy, Japan, Netherlands, New Zealand, Norway, Portugal, Singapore, Spain, Sweden, Switzerland, the United Kingdom and the United States. The emerging market country indices included are: Brazil, Chile, China, Colombia, Czech Republic, Egypt, Hungary, India, Indonesia, Korea, Malaysia, Mexico, Morocco, Peru, Philippines, Poland, Russia, South Africa, Taiwan, Thailand and Turkey. The BCUSU represents the union of the U.S. Aggregate Index, U.S. Corporate High-Yield, Investment Grade 144A Index, Eurodollar Index, U.S. Emerging Markets Index and the non-ERISA eligible portion of the CMBS Index. The index covers USD-denominated, taxable bonds that are rated either investment grade or below investment grade. The S&P 500 is an unmanaged, capitalization-weighted index of 500 stocks designed to measure performance of the broad domestic economy through changes in the aggregate market value of 500 stocks representing all major industries. The BCAB is an unmanaged index composed of securities from the Barclay's Capital Government/Corporate Bond Index, Mortgage-Backed Securities Index and the Asset-Backed Securities Index. The RU3000, MSCI ACWI ex US, BCUSU, S&P 500 and BCAB are not adjusted to reflect sales charges, expenses or other fees that the SEC requires to be reflected in the Fund's performance. The indexes are unmanaged and, unlike the Fund, are not affected by cash flows. It is not possible to invest directly in an index. |
| 3 | The LBFA represents the average of the total returns reported by all of the mutual funds designated by Lipper, Inc. as falling into the category indicated, and is not adjusted to reflect any sales charges. However, these total returns are reported net of expenses or other fees that the SEC requires to be reflected in the Fund's performance. |
| 4 | Total returns quoted reflect all applicable contingent deferred sales charges. |
Annual Shareholder Report17
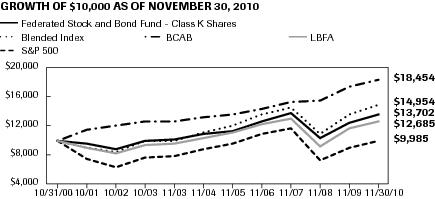
GROWTH OF A $10,000 INVESTMENT – CLASS K SHARES
The Fund's Class K Shares commenced operations on April 8, 2003. The Fund offers four other classes of shares, Class A Shares, Class B Shares, Class C Shares and Institutional Shares. For the period prior to the commencement of operations of the Class K Shares, the performance information shown is for the Fund's Class A Shares, adjusted to reflect the expenses of Class K Shares. The graph below illustrates the hypothetical investment of $10,0001 in Federated Stock and Bond Fund (Class K Shares) (the “Fund”) from October 31, 2000 to November 30, 2010, compared to a blend of indexes comprised of 50% of the Russell 3000 Index (RU3000),2 10% of the MSCI All Country World ex US Index (MSCI ACWI ex US)2 and 40% of the Barclays Capital U.S. Universal Index (BCUSU)2 (the “Blended Index”),2 the Standard and Poor's 500 Index (S&P 500),2 the Barclays Capital Aggregate Bond Index (BCAB)2 and the Lipper Balanced Funds Average (LBFA).3
| Average Annual Total Returns for the Period Ended 11/30/2010 | |
| 1 Year | 7.32% |
| 5 Years | 3.44% |
| 10 Years | 3.20% |
Performance data quoted represents past performance which is no guarantee of future results. Investment return and principal value will fluctuate so that an investor's shares, when redeemed, may be worth more or less than their original cost. Mutual fund performance changes over time and current performance may be lower or higher than what is stated. For current to the most recent month-end performance and after-tax returns, visit FederatedInvestors.com or call 1-800-341-7400. Returns shown do not reflect the deduction of taxes that a shareholder would pay on Fund distributions or the redemption of Fund shares. Mutual funds are not obligations of or guaranteed by any bank and are not federally insured.
Annual Shareholder Report
18
| 1 | Represents a hypothetical investment of $10,000 in the Fund. The Fund's performance assumes the reinvestment of all dividends and distributions. The Blended Index, S&P 500, BCAB and LBFA have been adjusted to reflect reinvestment of dividends on securities in the indexes and the average. |
| 2 | The Blended Index is a custom blended index comprised of 50% of the RU3000, 10% of the MSCI ACWI ex US and 40% of the BCUSU. The RU3000 measures the performance of the largest 3,000 U.S. companies representing approximately 98% of the investable U.S. equity market. The Russell 3000 Index is constructed to provide a comprehensive, unbiased and stable barometer of the broad market and is completely reconstituted annually to ensure new and growing equities are reflected. The MSCI ACWI (All Country World) Index is a free float-adjusted market capitalization weighted index that is designed to measure the equity market performance of developed and emerging markets. As of May 27, 2010, the MSCI ACWI consisted of 45 country indices comprising 24 developed and 21 emerging market country indices. The developed market country indices included are: Australia, Austria, Belgium, Canada, Denmark, Finland, France, Germany, Greece, Hong Kong, Ireland, Israel, Italy, Japan, Netherlands, New Zealand, Norway, Portugal, Singapore, Spain, Sweden, Switzerland, the United Kingdom and the United States. The emerging market country indices included are: Brazil, Chile, China, Colombia, Czech Republic, Egypt, Hungary, India, Indonesia, Korea, Malaysia, Mexico, Morocco, Peru, Philippines, Poland, Russia, South Africa, Taiwan, Thailand and Turkey. The BCUSU represents the union of the U.S. Aggregate Index, U.S. Corporate High-Yield, Investment Grade 144A Index, Eurodollar Index, U.S. Emerging Markets Index and the non-ERISA eligible portion of the CMBS Index. The index covers USD-denominated, taxable bonds that are rated either investment-grade or below investment-grade. The S&P 500 is an unmanaged, capitalization-weighted index of 500 stocks designed to measure performance of the broad domestic economy through changes in the aggregate market value of 500 stocks representing all major industries. The BCAB is an unmanaged index composed of securities from the Barclay's Capital Government/Corporate Bond Index, Mortgage-Backed Securities Index and the Asset-Backed Securities Index. The RU3000, MSCI ACWI ex US, BCUSU, S&P 500 and BCAB are not adjusted to reflect sales charges, expenses or other fees that the SEC requires to be reflected in the Fund's performance. The indexes are unmanaged and, unlike the Fund, are not affected by cash flows. It is not possible to invest directly in an index. |
| 3 | The LBFA represents the average of the total returns reported by all of the mutual funds designated by Lipper, Inc. as falling into the category indicated, and is not adjusted to reflect any sales charges. However, these total returns are reported net of expenses or other fees that the SEC requires to be reflected in the Fund's performance. |
Annual Shareholder Report19
Portfolio of Investments Summary Tables (unaudited)
At November 30, 2010, the Fund's portfolio composition1 was as follows:
| Portfolio Composition | Percentage of
Total Net Assets2 |
| Domestic Equity Securities | 52.3% |
| Corporate Debt Securities | 15.5% |
| International Equity Securities | 9.0% |
| Mortgage-Backed Securities3 | 4.2% |
| Asset-Backed Securities | 2.1% |
| U.S. Treasury and Agency Securities | 2.1% |
| Foreign Debt Securities | 1.5% |
| Municipal Security4 | 0.0% |
| Derivative Contracts5 | 0.5% |
| Cash Equivalents6 | 13.8% |
| Other Assets and Liabilities — Net7 | (1.0)% |
| TOTAL | 100.0% |
| 1 | See the Fund's Prospectus and Statement of Additional Information for a description of these security types. |
| 2 | As of the date specified above, the Fund owned shares of one or more affiliated investment companies. For purposes of this table, the affiliated investment company (other than an affiliated money market mutual fund) is not treated as a single portfolio security, but rather the Fund is treated as owning a pro rata portion of each security and each other asset and liability owned by the affiliated investment company. Accordingly, the percentages of total net assets shown in the table will differ from those presented on the Portfolio of Investments. |
| 3 | For purposes of this table, Mortgage-Backed Securities include mortgage-backed securities guaranteed by Government Sponsored Entities and adjustable rate mortgage-backed securities. |
| 4 | Represents less than 0.1%. |
| 5 | Based upon net unrealized appreciation (depreciation) or value of the derivative contracts as applicable. Derivative contracts may consist of futures, forwards, options and swaps. The impact of a derivative contract on the Fund's performance may be larger than its unrealized appreciation (depreciation) or value may indicate. In many cases, the notional value or amount of a derivative contract may provide a better indication of the contract's significance to the portfolio. More complete information regarding the Fund's direct investments in derivative contracts, including unrealized appreciation (depreciation), value and notional values or amounts of such contracts, can be found in the table at the end of the Portfolio of Investments included in this report. |
| 6 | Cash Equivalents include any investments in money market mutual funds and/or overnight repurchase agreements. |
| 7 | Assets, other than investments in securities and derivative contracts, less liabilities. See Statement of Assets and Liabilities. |
Annual Shareholder Report
20
At November 30, 2010, the Fund's sector composition8 was as follows:| Sector Composition of Equity Holdings | Percentage of
Equity Securities |
| Consumer Discretionary | 22.0% |
| Financials | 22.0% |
| Information Technology | 19.6% |
| Consumer Staples | 8.3% |
| Industrials | 7.8% |
| Health Care | 6.5% |
| Materials | 5.0% |
| Energy | 3.9% |
| Utilities | 3.6% |
| Telecommunication Services | 1.3% |
| TOTAL | 100.0% |
| 8 | Sector classifications are based upon, and individual portfolio securities are assigned to, the classifications of the Global Industry Classification Standard (GICS) except that the Adviser assigns a classification to securities not classified by the GICS and to securities for which the Adviser does not have access to the classification made by the GICS. |
Annual Shareholder Report21
Portfolio of Investments
November 30, 2010
Shares or
Principal
Amount | | | Value in
U.S. Dollars |
| | COMMON STOCKS – 32.4% | |
| | Consumer Discretionary – 7.1% | |
| 7,500 | 1 | Aeropostale, Inc. | 202,725 |
| 1,400 | | Autoliv, Inc. | 102,788 |
| 12,200 | | Best Buy Co., Inc. | 521,184 |
| 5,100 | 1 | Big Lots, Inc. | 156,315 |
| 2,100 | 1 | BorgWarner, Inc. | 126,714 |
| 23,600 | | CBS Corp. — Class B | 397,424 |
| 1,600 | 1 | Chipotle Mexican Grill, Inc. | 413,584 |
| 20,200 | | Comcast Corp., Class A | 404,000 |
| 9,400 | 1 | DIRECTV — CLASS A | 390,382 |
| 3,500 | 1 | Dollar Tree, Inc. | 192,325 |
| 3,700 | | Family Dollar Stores, Inc. | 185,740 |
| 5,846 | 1 | Federal-Mogul Corp., Class A | 109,320 |
| 7,500 | 1 | Ford Motor Co. | 119,550 |
| 35,000 | | Gannett Co., Inc. | 458,850 |
| 5,800 | | Gentex Corp. | 121,742 |
| 11,200 | 1 | Goodyear Tire & Rubber Co. | 107,072 |
| 3,200 | | Harley Davidson, Inc. | 100,096 |
| 27,900 | | Home Depot, Inc. | 842,859 |
| 5,100 | 1 | ITT Educational Services, Inc. | 298,299 |
| 5,200 | 1 | J Crew Group, Inc. | 227,344 |
| 22,300 | | Johnson Controls, Inc. | 812,612 |
| 10,700 | 1 | Kohl's Corp. | 603,694 |
| 1,200 | 1 | Lear Corp. | 105,324 |
| 57,200 | | Lennar Corp., Class A | 868,868 |
| 38,200 | | Lowe's Cos., Inc. | 867,140 |
| 30,000 | 1 | MGM Mirage | 366,900 |
| 8,800 | | Marriott International, Inc., Class A | 345,048 |
| 8,274 | | McDonald's Corp. | 647,854 |
| 10,800 | | McGraw-Hill Cos., Inc. | 372,492 |
| 45,500 | 1 | Meritage Corp. | 863,135 |
| 1,400 | 1 | NVR, Inc. | 867,972 |
| 1,000 | 1 | NetFlix, Inc. | 205,900 |
| 54,600 | 1 | New York Times Co., Class A | 490,854 |
| 14,500 | | Omnicom Group, Inc. | 658,880 |
Annual Shareholder Report22
Shares or
Principal
Amount | | | Value in
U.S. Dollars |
| 4,500 | | PetSmart, Inc. | 170,370 |
| 2,800 | | Ross Stores, Inc. | 181,664 |
| 39,600 | | Service Corp. International | 319,176 |
| 12,400 | | Starwood Hotels & Resorts | 704,816 |
| 3,800 | | TJX Cos., Inc. | 173,318 |
| 2,200 | 1 | TRW Automotive Holdings Corp. | 104,478 |
| 3,700 | | Thor Industries, Inc. | 109,261 |
| 12,700 | | Time Warner, Inc. | 374,523 |
| 47,700 | 1 | Toll Brothers, Inc. | 856,215 |
| 4,300 | | Tractor Supply Co. | 182,621 |
| 1,000 | | Washington Post Co., Class B | 377,020 |
| 5,300 | | Williams-Sonoma, Inc. | 176,331 |
| 11,300 | | Wyndham Worldwide Corp. | 324,875 |
| 6,600 | | Yum! Brands, Inc. | 330,528 |
| | TOTAL | 17,940,182 |
| | Consumer Staples – 2.7% | |
| 16,300 | | Archer-Daniels-Midland Co. | 472,537 |
| 1,700 | | Brown-Forman Corp., Class B | 111,214 |
| 22,400 | | Clorox Co. | 1,384,544 |
| 2,000 | | Corn Products International, Inc. | 86,240 |
| 7,600 | | Del Monte Foods Co. | 142,348 |
| 2,700 | | Dr. Pepper Snapple Group, Inc. | 98,901 |
| 4,600 | | Heinz (H.J.) Co. | 222,042 |
| 23,300 | | Herbalife Ltd. | 1,599,079 |
| 2,000 | | Hershey Foods Corp. | 93,600 |
| 19,700 | | Kroger Co. | 463,935 |
| 10,516 | | Nestle SA | 571,561 |
| 6,600 | | Procter & Gamble Co. | 403,062 |
| 1,500 | | Smucker (J.M.) Co. | 94,875 |
| 14,258 | | The Coca-Cola Co. | 900,678 |
| 6,400 | | Tyson Foods, Inc., Class A | 101,312 |
| | TOTAL | 6,745,928 |
| | Energy – 1.3% | |
| 2,800 | | Apache Corp. | 301,392 |
| 12,419 | | Chevron Corp. | 1,005,567 |
| 5,300 | | ConocoPhillips | 318,901 |
| 10,800 | | Exxon Mobil Corp. | 751,248 |
Annual Shareholder Report23
Shares or
Principal
Amount | | | Value in
U.S. Dollars |
| 27 | 1 | NRG Energy, Inc. | 523 |
| 5,740 | | Schlumberger Ltd. | 443,932 |
| 16,635 | 1 | Weatherford International Ltd. | 339,520 |
| | TOTAL | 3,161,083 |
| | Financials – 7.1% | |
| 9,700 | | AON Corp. | 389,164 |
| 6,800 | | Aflac, Inc. | 350,200 |
| 3,600 | | Alexandria Real Estate Equities, Inc. | 240,300 |
| 8,200 | | American Campus Communities, Inc. | 257,808 |
| 7,312 | | American Express Co. | 316,025 |
| 12,500 | | American Financial Group, Inc., Ohio | 384,625 |
| 9,500 | | Assurant, Inc. | 335,065 |
| 9,100 | | Avalonbay Communities, Inc. | 1,004,003 |
| 6,900 | | BB&T Corp. | 160,080 |
| 9,000 | | Boston Properties, Inc. | 754,200 |
| 4,207 | 1 | CIT Group, Inc. | 166,008 |
| 8,181 | | Capital One Financial Corp. | 304,579 |
| 38,700 | 1 | Citigroup, Inc. | 162,540 |
| 7,000 | | Comerica, Inc. | 255,430 |
| 2,400 | 1 | CommonWealth REIT | 60,072 |
| 12,100 | | Digital Realty Trust, Inc. | 635,492 |
| 10,100 | | Eaton Vance Corp. | 300,172 |
| 6,600 | | Erie Indemnity Co. | 415,536 |
| 4,500 | | Everest Re Group Ltd. | 375,705 |
| 13,300 | | Fifth Third Bancorp | 158,935 |
| 900 | | First Citizens Bancshares, Inc., Class A | 156,501 |
| 2,686 | | Franklin Resources, Inc. | 306,446 |
| 19,300 | | Fulton Financial Corp. | 166,945 |
| 4,200 | 1 | General Growth Properties, Inc. | 67,998 |
| 2,600 | | Goldman Sachs Group, Inc. | 405,964 |
| 14,000 | | HCP, Inc. | 461,020 |
| 8,400 | | Hanover Insurance Group, Inc. | 380,352 |
| 413 | 1 | Howard Hughes Corp. | 16,838 |
| 24,447 | | Invesco Ltd. | 531,478 |
| 23,188 | | JPMorgan Chase & Co. | 866,768 |
| 7,700 | | Liberty Property Trust | 241,318 |
| 2,100 | | M & T Bank Corp. | 161,616 |
Annual Shareholder Report24
Shares or
Principal
Amount | | | Value in
U.S. Dollars |
| 9,500 | | MetLife, Inc. | 362,425 |
| 14,600 | 1 | NASDAQ Stock Market, Inc. | 313,316 |
| 12,900 | | Nationwide Health Properties, Inc. | 465,045 |
| 27,156 | | OneBeacon Insurance Group Ltd. | 397,292 |
| 3,000 | | PNC Financial Services Group | 161,550 |
| 18,000 | | Progressive Corp. Ohio | 366,120 |
| 15,800 | | Protective Life Corp. | 371,616 |
| 7,200 | | Prudential Financial | 364,896 |
| 7,596 | | Reinsurance Group of America, Inc. | 379,268 |
| 14,400 | | SEI Investments Co. | 325,152 |
| 2,500 | | Simon Property Group, Inc. | 246,250 |
| 8,900 | | StanCorp Financial Group, Inc. | 370,240 |
| 6,200 | | State Street Corp. | 267,840 |
| 4,900 | | SunTrust Banks, Inc. | 114,464 |
| 5,500 | | T. Rowe Price Group, Inc. | 320,815 |
| 12,300 | | TCF Financial Corp. | 167,403 |
| 10,500 | | Taubman Centers, Inc. | 509,565 |
| 6,900 | | The Travelers Cos, Inc. | 372,531 |
| 18,326 | | U.S. Bancorp | 435,792 |
| 15,800 | | Unitrin, Inc. | 373,828 |
| 10,100 | | Waddell & Reed Financial, Inc., Class A | 311,080 |
| 6,200 | | Wells Fargo & Co. | 168,702 |
| | TOTAL | 17,954,373 |
| | Health Care – 2.1% | |
| 5,348 | | Abbott Laboratories | 248,735 |
| 5,551 | | Aetna, Inc. | 164,421 |
| 5,800 | | Allergan, Inc. | 384,366 |
| 5,100 | | AmerisourceBergen Corp. | 157,335 |
| 2,400 | 1 | Amgen, Inc. | 126,456 |
| 4,793 | | Cardinal Health, Inc. | 170,535 |
| 4,800 | 1 | Celgene Corp. | 285,024 |
| 5,500 | 1 | Community Health Systems, Inc. | 175,230 |
| 3,400 | | Cooper Cos., Inc. | 181,900 |
| 2,300 | 1 | DaVita, Inc. | 167,210 |
| 20,800 | 1 | Health Management Association, Class A | 185,328 |
| 6,200 | 1 | Health Net, Inc. | 167,400 |
| 2,800 | 1 | Hospira, Inc. | 157,528 |
Annual Shareholder Report25
Shares or
Principal
Amount | | | Value in
U.S. Dollars |
| 10,800 | 1 | Humana, Inc. | 605,232 |
| 4,443 | | Johnson & Johnson | 273,467 |
| 4,900 | 1 | LifePoint Hospitals, Inc. | 177,478 |
| 2,508 | | McKesson HBOC, Inc. | 160,261 |
| 12,884 | | Merck & Co., Inc. | 444,111 |
| 21,300 | | Pfizer, Inc. | 346,977 |
| 4,300 | 1 | SXC Health Solutions Corp. | 164,905 |
| 3,900 | | Shire PLC, ADR | 274,326 |
| 5,100 | 1 | Thoratec Laboratories Corp. | 129,821 |
| 4,635 | | UnitedHealth Group, Inc. | 169,270 |
| | TOTAL | 5,317,316 |
| | Industrials – 2.5% | |
| 1,800 | | Avery Dennison Corp. | 67,572 |
| 1,600 | | Bucyrus International | 142,656 |
| 2,800 | | CNH Global NV | 115,976 |
| 3,700 | | CSX Corp. | 224,997 |
| 6,813 | | Caterpillar, Inc. | 576,380 |
| 4,300 | 1 | Chicago Bridge & Iron Co., NV | 121,733 |
| 2,900 | | Crane Co. | 108,692 |
| 1,228 | | Cummins, Inc. | 119,263 |
| 4,000 | | Donnelley (R.R.) & Sons Co. | 63,040 |
| 1,200 | | Flowserve Corp. | 126,552 |
| 5,400 | | Fluor Corp. | 312,282 |
| 5,800 | 1 | Foster Wheeler AG | 162,400 |
| 3,900 | 1 | General Cable Corp. | 127,881 |
| 2,800 | | Ingersoll-Rand PLC | 114,800 |
| 5,200 | | Joy Global, Inc. | 396,864 |
| 5,300 | 1 | KAR Auction Services, Inc. | 63,865 |
| 5,200 | 1 | Kansas City Southern Industries, Inc. | 246,168 |
| 1,500 | | L-3 Communications Holdings, Inc. | 105,495 |
| 10,600 | | Manitowoc, Inc. | 116,388 |
| 3,700 | | Norfolk Southern Corp. | 222,629 |
| 3,800 | 1 | OshKosh Truck Corp. | 109,060 |
| 4,000 | 1 | Owens Corning, Inc. | 105,240 |
| 1,400 | | Parker-Hannifin Corp. | 112,322 |
| 4,000 | | Precision Castparts Corp. | 552,280 |
| 1,900 | | Regal Beloit Corp. | 115,900 |
Annual Shareholder Report26
Shares or
Principal
Amount | | | Value in
U.S. Dollars |
| 5,200 | | Textron, Inc. | 116,272 |
| 2,600 | | Timken Co. | 113,256 |
| 1,900 | | Toro Co. | 110,599 |
| 2,800 | 1 | URS Corp. | 110,712 |
| 2,700 | | Union Pacific Corp. | 243,297 |
| 8,028 | 1 | United Continental Holdings, Inc. | 222,215 |
| 9,000 | | United Technologies Corp. | 677,430 |
| 2,400 | 1 | Verisk Analytics, Inc. | 72,648 |
| 2,600 | 1 | WESCO International, Inc. | 124,072 |
| 2,550 | 1 | Waste Connections, Inc. | 66,300 |
| | TOTAL | 6,387,236 |
| | Information Technology – 6.4% | |
| 19,900 | | AVX Corp. | 284,769 |
| 20,700 | 1 | Advanced Micro Devices, Inc. | 150,903 |
| 7,700 | 1 | Alliance Data Systems Corp. | 485,716 |
| 15,300 | 1 | Amdocs Ltd. | 397,800 |
| 3,447 | 1 | Apple, Inc. | 1,072,534 |
| 13,200 | 1 | Autodesk, Inc. | 465,828 |
| 6,600 | 1 | Avago Technologies Ltd. | 172,326 |
| 10,300 | 1 | BMC Software, Inc. | 457,320 |
| 16,281 | | Broadcom Corp. | 724,342 |
| 21,300 | | Broadridge Financial Solutions | 438,567 |
| 20,100 | | CA, Inc. | 460,089 |
| 26,300 | 1 | Cisco Systems, Inc. | 503,908 |
| 9,500 | | Computer Sciences Corp. | 423,985 |
| 15,267 | | Corning, Inc. | 269,615 |
| 8,600 | 1 | FIserv, Inc. | 475,580 |
| 2,400 | 1 | F5 Networks, Inc. | 316,512 |
| 5,300 | | FactSet Research Systems | 469,951 |
| 13,800 | 1 | Fairchild Semiconductor International, Inc., Class A | 193,890 |
| 600 | 1 | Google, Inc. | 333,426 |
| 7,392 | | International Business Machines Corp. | 1,045,672 |
| 9,682 | 1 | Intuit, Inc. | 434,625 |
| 16,400 | | Lender Processing Services, Inc. | 504,628 |
| 498,000 | | Lenovo Group Ltd. | 331,568 |
| 7,300 | 1 | Lexmark International Group, Class A | 264,552 |
| 9,900 | 1 | MSCI, Inc., Class A | 337,194 |
Annual Shareholder Report27
Shares or
Principal
Amount | | | Value in
U.S. Dollars |
| 20,445 | 1 | Micron Technology, Inc. | 148,431 |
| 18,918 | | Microsoft Corp. | 476,923 |
| 5,300 | 1 | Network Appliance, Inc. | 269,929 |
| 5,600 | 1 | Novellus Systems, Inc. | 168,840 |
| 20,500 | 1 | ON Semiconductor Corp. | 167,177 |
| 21,400 | | Oracle Corp. | 578,656 |
| 28,500 | 1 | SAIC, Inc. | 436,620 |
| 7,600 | 1 | Sandisk Corp. | 338,960 |
| 19,521 | 1 | Seagate Technology | 261,777 |
| 4,000 | 1 | Silicon Laboratories, Inc. | 169,920 |
| 40,900 | | Tellabs, Inc. | 258,079 |
| 10,109 | 1 | Teradata Corporation | 415,379 |
| 13,200 | 1 | Teradyne, Inc. | 156,552 |
| 23,900 | 1 | Vishay Intertechnology, Inc. | 340,814 |
| 8,900 | 1 | Western Digital Corp. | 298,150 |
| 48,500 | | Xerox Corp. | 555,810 |
| | TOTAL | 16,057,317 |
| | Materials – 1.6% | |
| 5,400 | | Agnico Eagle Mines, Ltd. | 435,834 |
| 400 | | Airgas, Inc. | 24,440 |
| 4,000 | | Ashland, Inc. | 203,520 |
| 3,200 | | Ball Corp. | 210,816 |
| 1,200 | | CF Industries Holdings, Inc. | 144,924 |
| 6,000 | | Cabot Corp. | 214,800 |
| 4,100 | | Cytec Industries, Inc. | 196,103 |
| 2,679 | | Domtar Corp. | 203,390 |
| 2,600 | | Eastman Chemical Co. | 202,306 |
| 1,400 | | Freeport-McMoRan Copper & Gold, Inc. | 141,848 |
| 8,000 | | International Paper Co. | 199,760 |
| 2,000 | | Lubrizol Corp. | 209,120 |
| 4,300 | | Monsanto Co. | 257,656 |
| 2,700 | | PPG Industries, Inc. | 210,492 |
| 9,900 | | RPM International, Inc. | 202,752 |
| 4,000 | | Schnitzer Steel Industries, Inc., Class A | 228,360 |
| 3,900 | | Scotts Co. | 194,844 |
| 2,800 | | Sherwin-Williams Co. | 207,676 |
| 10,500 | 1 | Titanium Metals Corp. | 181,335 |
Annual Shareholder Report28
Shares or
Principal
Amount | | | Value in
U.S. Dollars |
| 6,400 | | Valspar Corp. | 211,456 |
| | TOTAL | 4,081,432 |
| | Telecommunication Services – 0.4% | |
| 46,000 | | Frontier Communications Corp. | 418,600 |
| 89,400 | | Qwest Communications International, Inc. | 625,800 |
| | TOTAL | 1,044,400 |
| | Utilities – 1.2% | |
| 7,700 | | CMS Energy Corp. | 138,369 |
| 11,400 | 1 | Calpine Corp. | 137,940 |
| 3,000 | | DTE Energy Co. | 133,650 |
| 1,900 | | Entergy Corp. | 135,356 |
| 6,300 | | Hawaiian Electric Industries, Inc. | 137,907 |
| 2,300 | | ITC Holdings Corp. | 139,265 |
| 2,700 | | Integrys Energy Group, Inc. | 131,490 |
| 3,400 | | NSTAR | 140,760 |
| 8,200 | | NiSource, Inc. | 137,186 |
| 3,200 | | OGE Energy Corp. | 142,432 |
| 2,900 | | ONEOK, Inc. | 148,219 |
| 3,400 | | Pinnacle West Capital Corp. | 137,428 |
| 9,975 | | Southern Co. | 376,257 |
| 8,100 | | TECO Energy, Inc. | 135,675 |
| 12,500 | | Wisconsin Energy Corp. | 752,750 |
| | TOTAL | 2,924,684 |
| | TOTAL COMMON STOCKS
(IDENTIFIED COST $73,560,000) | 81,613,951 |
| | Asset-Backed Securities – 1.0% | |
| 5,653 | 2,3 | 125 Home Loan Owner Trust 1998-1A B1, 9.76%, 2/15/2029 | 4,691 |
| 250,000 | | Banc of America Commercial Mortgage, Inc. 2007-4 A4, 5.933%, 2/10/2051 | 265,018 |
| 800,000 | | Citigroup/Deutsche Bank Commercial Mortgage 2007-CD5, 5.886%, 11/15/2044 | 855,553 |
| 350,000 | | LB-UBS Commercial Mortgage Trust 2008-C1 A2, 6.323%, 4/15/2041 | 382,281 |
| 100,000 | | Merrill Lynch Mortgage Trust 2008-C1 AM, 6.460%, 2/12/2051 | 92,761 |
| 400,000 | | Merrill Lynch/Countrywide Commercial Mortgage 2007-6, 5.485%, 03/12/2051 | 391,148 |
| 315,000 | | Morgan Stanley Capital I 2006-IQ12 A4, 5.332%, 12/15/2043 | 337,712 |
Annual Shareholder Report29
Shares or
Principal
Amount | | | Value in
U.S. Dollars |
| $250,000 | | Morgan Stanley Capital, Inc. A4, 6.075%, 6/11/2049 | 264,773 |
| | TOTAL ASSET-BACKED SECURITIES
(IDENTIFIED COST $2,428,169) | 2,593,937 |
| | Collateralized Mortgage Obligations – 1.1% | |
| 800,000 | | Citigroup/Deutsche Bank Commercial Mortgage 2007-CD4 A3, 5.293%, 12/11/2049 | 822,003 |
| 500,000 | 2,3 | Commercial Mortgage Pass-Through Certificates 2010-C1 A1, 3.156%, 7/10/2046 | 508,163 |
| 375,000 | 2,3 | Commercial Mortgage Pass-Through Certificates 2010-C1 A3, 4.205%, 9/01/2020 | 373,775 |
| 450,000 | | JP Morgan Chase Commercial Mortgage Securities 2007-C1 A4, 5.716%, 2/15/2051 | 472,182 |
| 595,332 | 2,3 | JP Morgan Chase Commercial Mortgage Securities 2010-C1 2010-C1 A1, 3.853%, 6/15/2043 | 618,141 |
| 4,770 | 2 | SMFC Trust Asset-Backed Certificates, 1997-A B1-4, 7.719%, 1/28/2027 | 3,844 |
| | TOTAL COLLATERALIZED MORTGAGE OBLIGATIONS
(IDENTIFIED COST $2,759,499) | 2,798,108 |
| | Corporate Bonds – 6.8% | |
| | Basic Industry — Chemicals – 0.1% | |
| 95,000 | | Dow Chemical Co., Note, 8.550%, 05/15/2019 | 119,996 |
| 13,000 | | Du Pont (E.I.) de Nemours & Co., 5.000%, 01/15/2013 | 14,095 |
| 100,000 | | Praxair, Inc., 4.625%, 03/30/2015 | 111,265 |
| 35,000 | | Rohm & Haas Co., 6.000%, 09/15/2017 | 38,909 |
| | TOTAL | 284,265 |
| | Basic Industry — Metals & Mining – 0.3% | |
| 80,000 | | Alcan, Inc., 5.000%, 06/01/2015 | 88,288 |
| 70,000 | | Alcoa, Inc., Note, 5.550%, 02/01/2017 | 72,914 |
| 90,000 | | Allegheny Technologies, Inc., Sr. Note, 9.375%, 06/01/2019 | 106,784 |
| 10,000 | | BHP Finance (USA), Inc., Company Guarantee, 6.500%, 4/01/2019 | 12,286 |
| 200,000 | | Barrick Gold Corp., Sr. Unsecd. Note, 6.95%, 4/01/2019 | 252,216 |
| 120,000 | | Newmont Mining Corp., Company Guarantee, 5.875%, 04/01/2035 | 127,030 |
| 100,000 | 2,3 | Xstrata Finance Canada Ltd., Unsecd. Note, 5.500%, 11/16/2011 | 103,258 |
| | TOTAL | 762,776 |
| | Basic Industry — Paper – 0.1% | |
| 30,000 | | International Paper Co., Sr. Unsecd. Note, 7.500%, 08/15/2021 | 35,832 |
| 150,000 | | Pope & Talbot, Inc., 8.375%, 6/1/2013 | 15 |
| 100,000 | | Weyerhaeuser Co., Deb., 7.375%, 03/15/2032 | 99,001 |
| | TOTAL | 134,848 |
Annual Shareholder Report30
Shares or
Principal
Amount | | | Value in
U.S. Dollars |
| | Capital Goods — Aerospace & Defense – 0.1% | |
| $50,000 | 2,3 | BAE Systems Holdings, Inc., 5.200%, 08/15/2015 | 55,116 |
| 100,000 | | Boeing Co., 4.875%, 02/15/2020 | 111,766 |
| 25,000 | | Lockheed Martin Corp., Sr. Note, 4.121%, 03/14/2013 | 26,765 |
| | TOTAL | 193,647 |
| | Capital Goods — Building Materials – 0.0% | |
| 50,000 | | RPM International, Inc., 6.500%, 02/15/2018 | 54,985 |
| 40,000 | | RPM International, Inc., Sr. Unsecd. Note, 6.125%, 10/15/2019 | 42,936 |
| | TOTAL | 97,921 |
| | Capital Goods — Diversified Manufacturing – 0.1% | |
| 20,000 | | Dover Corp., Note, 5.450%, 03/15/2018 | 22,993 |
| 70,000 | | Emerson Electric Co., 4.875%, 10/15/2019 | 78,400 |
| 68,000 | 2,3 | Hutchison Whampoa International Ltd., 6.500%, 02/13/2013 | 74,778 |
| 100,000 | | Roper Industries, Inc., Sr. Unsecd. Note, 6.250%, 09/01/2019 | 114,590 |
| 90,000 | 2,3 | Textron Financial Corp., Jr. Sub. Note, 6.000%, 02/15/2067 | 73,462 |
| | TOTAL | 364,223 |
| | Capital Goods — Environmental – 0.1% | |
| 110,000 | | Republic Services, Inc., Company Guarantee, Series WI, 5.500%, 09/15/2019 | 123,141 |
| 25,000 | | Waste Management, Inc., 7.375%, 03/11/2019 | 31,267 |
| | TOTAL | 154,408 |
| | Communications — Media & Cable – 0.2% | |
| 27,000 | | Comcast Cable Communications Holdings, Company Guarantee, 8.375%, 03/15/2013 | 31,094 |
| 100,000 | | Comcast Corp., 7.050%, 03/15/2033 | 113,657 |
| 100,000 | | Comcast Corp., Company Guarantee, 6.500%, 01/15/2017 | 118,466 |
| 120,000 | | Time Warner Cable, Inc., Company Guarantee, 6.750%, 06/15/2039 | 132,412 |
| 20,000 | | Time Warner Cable, Inc., Company Guarantee, 8.250%, 04/01/2019 | 25,417 |
| 50,000 | | Time Warner Cable, Inc., Company Guarantee, 8.750%, 02/14/2019 | 64,953 |
| 50,000 | | Time Warner Cable, Inc., Sr. Unsecd. Note, 5.850%, 05/01/2017 | 57,137 |
| | TOTAL | 543,136 |
| | Communications — Media Noncable – 0.1% | |
| 120,000 | | News America Holdings, Inc., Sr. Deb., 9.250%, 02/01/2013 | 139,636 |
| 90,000 | | News America, Inc., 5.650%, 08/15/2020 | 105,023 |
| | TOTAL | 244,659 |
| | Communications — Telecom Wireless – 0.2% | |
| 130,000 | | AT&T Wireless Services, Inc., 8.750%, 03/01/2031 | 182,576 |
| 90,000 | | America Movil S.A.B. de C.V., Note, 5.750%, 01/15/2015 | 101,929 |
Annual Shareholder Report31
Shares or
Principal
Amount | | | Value in
U.S. Dollars |
| $20,000 | | Vodafone Group PLC, 5.350%, 02/27/2012 | 21,074 |
| 90,000 | | Vodafone Group PLC, Note, 5.625%, 02/27/2017 | 103,223 |
| | TOTAL | 408,802 |
| | Communications — Telecom Wirelines – 0.2% | |
| 15,000 | | CenturyLink, Inc., Sr. Note, 6.150%, 09/15/2019 | 15,633 |
| 150,000 | | Deutsche Telekom International Finance BV, 4.875%, 07/08/2014 | 164,912 |
| 45,000 | | France Telecom SA, Sr. Unsecd. Note, 5.375%, 07/08/2019 | 51,176 |
| 100,000 | | Telefonica SA, Sr. Note, 5.855%, 02/04/2013 | 108,382 |
| 40,000 | | Verizon Communications, Inc., Sr. Unsecd. Note, 6.100%, 4/15/2018 | 46,968 |
| 50,000 | | Verizon Communications, Inc., Sr. Unsecd. Note, 6.350%, 04/01/2019 | 60,168 |
| | TOTAL | 447,239 |
| | Consumer Cyclical — Automotive – 0.0% | |
| 70,000 | | DaimlerChrysler North America Holding Corp., 6.500%, 11/15/2013 | 79,936 |
| | Consumer Cyclical — Entertainment – 0.1% | |
| 280,000 | | Time Warner, Inc., Company Guarantee, 6.875%, 05/01/2012 | 302,846 |
| | Consumer Cyclical — Lodging – 0.0% | |
| 50,000 | | Wyndham Worldwide Corp., Sr. Unsecd. Note, 6.000%, 12/01/2016 | 52,203 |
| | Consumer Cyclical — Retailers – 0.1% | |
| 172,035 | 2,3 | CVS Caremark Corp., Pass Thru Cert., 5.298%, 01/11/2027 | 173,402 |
| 60,000 | | Costco Wholesale Corp., 5.300%, 03/15/2012 | 63,551 |
| 20,000 | | JC Penney Corp., Inc., Sr. Unsecd. Note, 5.750%, 02/15/2018 | 19,800 |
| 70,000 | | Target Corp., Note, 5.875%, 07/15/2016 | 82,793 |
| 40,000 | | Wal-Mart Stores, Inc., Sr. Unsecd. Note, 6.200%, 4/15/2038 | 46,549 |
| | TOTAL | 386,095 |
| | Consumer Non-Cyclical — Food/Beverage – 0.3% | |
| 90,000 | 2,3 | Bacardi Ltd., Sr. Note, 7.450%, 04/01/2014 | 105,912 |
| 70,000 | | Bottling Group LLC, Note, 5.500%, 04/01/2016 | 81,714 |
| 30,000 | | Coca-Cola Enterprises, Inc., 4.250%, 03/01/2015 | 32,967 |
| 80,000 | | Diageo Capital PLC, Company Guarantee, 7.375%, 01/15/2014 | 93,875 |
| 60,000 | | General Mills, Inc., Note, 5.700%, 02/15/2017 | 69,741 |
| 125,000 | | Kraft Foods, Inc., Note, 5.250%, 10/01/2013 | 137,748 |
| 100,000 | | Kraft Foods, Inc., Sr. Unsecd. Note, 6.125%, 02/01/2018 | 117,889 |
| 50,000 | | PepsiCo, Inc., 4.650%, 02/15/2013 | 53,937 |
| 30,000 | | Ralcorp Holdings, Inc., Sr. Secd. Note, 6.625%, 08/15/2039 | 31,509 |
| 15,000 | | Sysco Corp., Sr. Note, 5.375%, 03/17/2019 | 17,228 |
| | TOTAL | 742,520 |
Annual Shareholder Report32
Shares or
Principal
Amount | | | Value in
U.S. Dollars |
| | Consumer Non-Cyclical — Health Care – 0.1% | |
| $50,000 | | Boston Scientific Corp., 4.500%, 01/15/2015 | 52,104 |
| 50,000 | | Boston Scientific Corp., 6.000%, 01/15/2020 | 53,983 |
| 20,000 | | Express Scripts, Inc., Sr. Unsecd. Note, 7.25%, 6/15/2019 | 24,478 |
| 75,000 | | Quest Diagnostics, Inc., Sr. Unsecd. Note, 6.400%, 07/01/2017 | 84,556 |
| | TOTAL | 215,121 |
| | Consumer Non-Cyclical — Pharmaceuticals – 0.1% | |
| 40,000 | | Abbott Laboratories, 5.150%, 11/30/2012 | 43,517 |
| 100,000 | | Genentech, Inc., Note, 4.750%, 07/15/2015 | 112,060 |
| 80,000 | | Pfizer, Inc., Sr. Unsecd. Note, 6.200%, 03/15/2019 | 97,649 |
| | TOTAL | 253,226 |
| | Consumer Non-Cyclical — Products – 0.0% | |
| 45,000 | | Philips Electronics NV, 5.750%, 03/11/2018 | 52,121 |
| | Consumer Non-Cyclical — Supermarkets – 0.0% | |
| 25,000 | | Kroger Co., Bond, 6.900%, 04/15/2038 | 29,359 |
| | Consumer Non-Cyclical — Tobacco – 0.0% | |
| 70,000 | | Altria Group, Inc., 9.250%, 08/06/2019 | 93,334 |
| | Energy — Independent – 0.1% | |
| 120,000 | | Canadian Natural Resources Ltd., 4.900%, 12/01/2014 | 133,581 |
| 30,000 | | EOG Resources, Inc., Note, 5.625%, 06/01/2019 | 34,252 |
| 25,000 | | Pemex Project Funding Master, 5.750%, 12/15/2015 | 27,922 |
| 80,000 | | Petroleos Mexicanos, Company Guarantee, Series WI, 4.875%, 03/15/2015 | 85,737 |
| 20,000 | | XTO Energy, Inc., 6.750%, 08/01/2037 | 25,954 |
| | TOTAL | 307,446 |
| | Energy — Integrated – 0.1% | |
| 60,000 | | Conoco, Inc., Sr. Unsecd. Note, 6.95%, 4/15/2029 | 75,558 |
| 100,000 | | ConocoPhillips Australia Funding Co., 5.500%, 04/15/2013 | 110,565 |
| 35,000 | | Petro-Canada, Deb., 7.000%, 11/15/2028 | 40,179 |
| 11,120 | 2,3 | Qatar Petroleum, 5.579%, 05/30/2011 | 11,307 |
| 100,000 | 2,3 | Statoil ASA, 5.125%, 04/30/2014 | 111,592 |
| | TOTAL | 349,201 |
| | Energy — Oil Field Services – 0.0% | |
| 50,000 | | Noble Drilling Corp., Sr. Note, 7.5%, 3/15/2019 | 60,978 |
| 25,000 | | Weatherford International Ltd., 6.000%, 03/15/2018 | 27,599 |
| 20,000 | | Weatherford International Ltd., 7.000%, 03/15/2038 | 21,439 |
| | TOTAL | 110,016 |
Annual Shareholder Report33
Shares or
Principal
Amount | | | Value in
U.S. Dollars |
| | Energy — Refining – 0.1% | |
| $110,000 | | Refining Group, Inc., 6.125%, 05/01/2011 | 112,397 |
| 25,000 | | Valero Energy Corp., 9.375%, 03/15/2019 | 31,722 |
| | TOTAL | 144,119 |
| | Financial Institution — Banking – 1.0% | |
| 50,000 | | Bank of America Corp., Sr. Note, 5.375%, 06/15/2014 | 52,981 |
| 120,000 | | Bank of America Corp., Sr. Note, 7.375%, 5/15/2014 | 134,188 |
| 100,000 | 2,3 | Barclays Bank PLC, 5.926%, 12/31/2049 | 93,125 |
| 70,000 | | Capital One Financial Corp., Sr. Note, 7.375%, 05/23/2014 | 81,143 |
| 80,000 | | Citigroup, Inc., Note, 5.125%, 05/05/2014 | 85,915 |
| 60,000 | 2,3 | Commonwealth Bank of Australia, Sr. Unsecd. Note, Series 144A, 3.750%, 10/15/2014 | 63,295 |
| 200,000 | | First Union Institutional, Bond, 8.04%, 12/1/2026 | 205,000 |
| 50,000 | | Goldman Sachs Group, Inc., 6.125%, 02/15/2033 | 52,545 |
| 320,000 | | Goldman Sachs Group, Inc., Sr. Unsecd. Note, 5.125%, 01/15/2015 | 344,713 |
| 150,000 | | Goldman Sachs Group, Inc., Sr. Unsecd. Note, 6.15%, 4/01/2018 | 164,877 |
| 100,000 | | HSBC Finance Capital Trust IX, Note, 5.911%, 11/30/2035 | 93,100 |
| 100,000 | | HSBC Finance Corp., 5.000%, 06/30/2015 | 108,668 |
| 75,000 | | Household Finance Corp., Unsecd. Note, 4.75%, 7/15/2013 | 79,647 |
| 90,000 | | M & T Bank Corp., 5.375%, 05/24/2012 | 95,188 |
| 30,000 | | Merrill Lynch & Co., Inc., Sr. Unsecd. Note, 6.050%, 08/15/2012 | 31,855 |
| 100,000 | | Morgan Stanley Group, Inc., 5.300%, 03/01/2013 | 107,573 |
| 100,000 | | Morgan Stanley, Sr. Unsecd. Note, 6.625%, 04/01/2018 | 109,976 |
| 30,000 | | Northern Trust Corp., 4.625%, 05/01/2014 | 32,872 |
| 15,000 | | PNC Funding Corp., Sub. Note, 5.625%, 02/01/2017 | 16,342 |
| 407,213 | 2,3 | Regional Diversified Funding, 9.250%, 03/15/2030 | 260,718 |
| 20,000 | | State Street Corp., Sr. Note, 4.300%, 05/30/2014 | 21,732 |
| 100,000 | | U.S. Bank, N.A., 6.300%, 02/04/2014 | 113,764 |
| 140,000 | | Wachovia Corp., 5.750%, 02/01/2018 | 157,218 |
| 40,000 | | Wilmington Trust Corp., Sub. Note, 8.500%, 04/02/2018 | 46,075 |
| | TOTAL | 2,552,510 |
| | Financial Institution — Brokerage – 0.3% | |
| 220,000 | | Blackrock, Inc., 6.250%, 09/15/2017 | 255,886 |
| 50,000 | | Charles Schwab Corp., Sr. Unsecd. Note, 4.950%, 06/01/2014 | 55,193 |
| 40,000 | | Eaton Vance Corp., 6.500%, 10/02/2017 | 46,423 |
| 100,000 | 2,3 | FMR LLC, 4.75%, 3/01/2013 | 105,489 |
| 25,000 | | Janus Capital Group, Inc., Sr. Note, 6.500%, 06/15/2012 | 26,120 |
| 30,000 | | Janus Capital Group, Inc., Sr. Note, 6.950%, 06/15/2017 | 31,062 |
Annual Shareholder Report34
Shares or
Principal
Amount | | | Value in
U.S. Dollars |
| $95,000 | | Jefferies Group, Inc., Sr. Unsecd. Note, 8.500%, 07/15/2019 | 110,942 |
| 60,000 | | Lehman Brothers Holdings, Note, 4.800%, 3/13/2014 | 13,275 |
| 30,000 | | Nuveen Investments, 5.500%, 09/15/2015 | 25,237 |
| 75,000 | | Raymond James Financial, Inc., 8.600%, 08/15/2019 | 89,409 |
| | TOTAL | 759,036 |
| | Financial Institution — Finance Noncaptive – 0.5% | |
| 160,000 | | American Express Co., Sr. Unsecd. Note, 8.125%, 05/20/2019 | 202,135 |
| 60,000 | | American Express Credit Corp., Sr. Unsecd. Note, 5.125%, 08/25/2014 | 65,344 |
| 120,000 | | Berkshire Hathaway, Inc., Company Guarantee, 5.000%, 08/15/2013 | 132,452 |
| 120,000 | | Capital One Capital IV, 6.745%, 02/17/2037 | 119,700 |
| 20,000 | | Capital One Capital V, 10.250%, 08/15/2039 | 21,275 |
| 510,000 | | General Electric Capital Corp., 5.625%, 05/01/2018 | 561,291 |
| 30,000 | | General Electric Capital Corp., Note, Series MTN, 6.750%, 03/15/2032 | 32,742 |
| 30,000 | 2,3 | Macquarie Group Ltd., Note, Series 144A, 7.625%, 8/13/2019 | 34,921 |
| | TOTAL | 1,169,860 |
| | Financial Institution — Insurance — Health – 0.1% | |
| 50,000 | | CIGNA Corp., 6.350%, 03/15/2018 | 57,763 |
| 50,000 | | UnitedHealth Group, Inc., Sr. Unsecd. Note, 6.000%, 2/15/2018 | 57,774 |
| 50,000 | | Wellpoint, Inc., 5.850%, 01/15/2036 | 51,557 |
| | TOTAL | 167,094 |
| | Financial Institution — Insurance — Life – 0.7% | |
| 100,000 | | AXA-UAP, Sub. Note, 8.600%, 12/15/2030 | 114,377 |
| 100,000 | 2,3 | Massachusetts Mutual Life Insurance Co., Sub. Note, 8.875%, 06/01/2039 | 134,173 |
| 90,000 | | MetLife, Inc., 6.750%, 06/01/2016 | 105,944 |
| 10,000 | | MetLife, Inc., Jr. Sub. Note, 10.750%, 08/01/2069 | 13,500 |
| 80,000 | 2,3 | New York Life Insurance Co., Sub. Note, 6.750%, 11/15/2039 | 95,943 |
| 300,000 | 2,3 | Pacific LifeCorp., Bond, 6.600%, 09/15/2033 | 300,996 |
| 50,000 | | Prudential Financial, Inc., 5.150%, 01/15/2013 | 53,566 |
| 40,000 | | Prudential Financial, Inc., 6.625%, 12/01/2037 | 43,730 |
| 10,000 | | Prudential Financial, Inc., Sr. Note, 7.375%, 06/15/2019 | 12,004 |
| 100,000 | | Prudential Financial, Inc., Sr. Unsecd. Note, 4.750%, 09/17/2015 | 107,928 |
| 750,000 | 2 | Union Central Life Ins Co, Note, 8.200%, 11/1/2026 | 748,848 |
| | TOTAL | 1,731,009 |
| | Financial Institution — Insurance — P&C – 0.2% | |
| 80,000 | | ACE INA Holdings, Inc., Sr. Note, 5.700%, 02/15/2017 | 89,583 |
| 80,000 | | CNA Financial Corp., 6.500%, 08/15/2016 | 87,096 |
Annual Shareholder Report35
Shares or
Principal
Amount | | | Value in
U.S. Dollars |
| $15,000 | | Chubb Corp., Sr. Note, 5.750%, 05/15/2018 | 17,120 |
| 50,000 | | Horace Mann Educators Corp., Sr. Note, 6.850%, 04/15/2016 | 53,833 |
| 100,000 | 2,3 | Liberty Mutual Group, Inc., Unsecd. Note, 5.750%, 03/15/2014 | 104,888 |
| 30,000 | 2,3 | Nationwide Mutual Insurance Co., Note, Series 144A, 9.375%, 08/15/2039 | 34,859 |
| 10,000 | | The Travelers Cos., Inc., Sr. Unsecd. Note, 5.500%, 12/01/2015 | 11,499 |
| | TOTAL | 398,878 |
| | Financial Institution — REITs – 0.2% | |
| 45,000 | | Avalonbay Communities, Inc., Sr. Unsecd. Note, Series MTN, 5.700%, 03/15/2017 | 50,944 |
| 75,000 | | Boston Properties LP, Sr. Unsecd. Note, 5.875%, 10/15/2019 | 84,052 |
| 40,000 | | Equity One, Inc., Bond, 6.000%, 09/15/2017 | 40,862 |
| 40,000 | | Liberty Property LP, 6.625%, 10/01/2017 | 46,804 |
| 120,000 | | Prologis, Sr. Note, 5.500%, 04/01/2012 | 124,347 |
| 20,000 | | Prologis, Sr. Note, 7.625%, 08/15/2014 | 23,074 |
| 40,000 | | Simon Property Group LP, 6.750%, 05/15/2014 | 45,657 |
| 50,000 | | Simon Property Group, Inc., 6.350%, 08/28/2012 | 53,778 |
| | TOTAL | 469,518 |
| | Foreign — Local — Government – 0.0% | |
| 50,000 | | Quebec, Province of, Note, Series MTNA, 7.035%, 3/10/2026 | 65,009 |
| | Municipal Services – 0.1% | |
| 140,000 | 2,3 | Army Hawaii Family Housing, 5.524%, 6/15/2050 | 123,851 |
| 100,000 | 2,3 | Camp Pendleton & Quantico Housing LLC, 5.572%, 10/01/2050 | 91,321 |
| | TOTAL | 215,172 |
| | Technology – 0.3% | |
| 20,000 | | Cisco Systems, Inc., Sr. Unsecd. Note, 5.500%, 02/22/2016 | 23,337 |
| 40,000 | | Dell Computer Corp., Deb., 7.100%, 04/15/2028 | 45,296 |
| 60,000 | | Dun & Bradstreet Corp., Sr. Unsecd. Note, 5.500%, 03/15/2011 | 60,757 |
| 105,000 | | Fiserv, Inc., Sr. Note, 6.800%, 11/20/2017 | 119,535 |
| 50,000 | | Harris Corp., 5.950%, 12/01/2017 | 56,648 |
| 60,000 | | Hewlett-Packard Co., Note, 5.400%, 03/01/2017 | 68,597 |
| 200,000 | | IBM Corp., Sr. Note, 5.700%, 09/14/2017 | 234,934 |
| 100,000 | | Oracle Corp., Sr. Unsecd. Note, Series WI, 5.000%, 01/15/2011 | 100,563 |
| | TOTAL | 709,667 |
| | Transportation — Railroads – 0.1% | |
| 100,000 | | Burlington Northern Santa Fe Corp., 4.875%, 01/15/2015 | 110,362 |
| 50,000 | | Union Pacific Corp., 4.875%, 01/15/2015 | 55,201 |
Annual Shareholder Report36
Shares or
Principal
Amount | | | Value in
U.S. Dollars |
| $45,000 | | Union Pacific Corp., Bond, 6.625%, 2/01/2029 | 52,563 |
| | TOTAL | 218,126 |
| | Transportation — Services – 0.0% | |
| 75,000 | 2,3 | Enterprise Rent-A-Car USA Finance Co., 6.375%, 10/15/2017 | 86,698 |
| | Utility — Electric – 0.5% | |
| 60,000 | | Appalachian Power Co., Sr. Unsecd. Note, 7.950%, 01/15/2020 | 78,067 |
| 50,000 | | Cleveland Electric Illuminating Co., Sr. Unsecd. Note, 5.950%, 12/15/2036 | 49,033 |
| 50,000 | | Commonwealth Edison Co., 1st Mtg. Bond, 5.800%, 03/15/2018 | 58,436 |
| 40,000 | | Consolidated Edison Co., Sr. Unsecd. Note, 5.500%, 09/15/2016 | 46,284 |
| 10,000 | | Consolidated Edison Co., Sr. Unsecd. Note, 6.650%, 04/01/2019 | 12,395 |
| 60,000 | 2,3 | Electricite De France SA, 5.5%, 1/26/2014 | 67,266 |
| 90,000 | | FirstEnergy Solutions Co, Company Guarantee, 4.800%, 2/15/2015 | 96,377 |
| 50,000 | | FirstEnergy Solutions Co, Company Guarantee, 6.05%, 8/15/2021 | 53,091 |
| 71,405 | 2,3 | Great River Energy, 1st Mtg. Note, 5.829%, 07/01/2017 | 81,138 |
| 120,000 | | MidAmerican Energy Co., 4.650%, 10/01/2014 | 132,297 |
| 100,000 | | National Rural Utilities Cooperative Finance Corp., Sr. Unsecd. Note, 10.375%, 11/01/2018 | 141,711 |
| 30,000 | | Northern States Power Co., MN, 1st Mtg. Bond, 5.250%, 03/01/2018 | 34,291 |
| 60,000 | | PPL Energy Supply LLC, Sr. Unsecd. Note, 6.000%, 12/15/2036 | 60,116 |
| 40,000 | | Progress Energy, Inc., 7.050%, 03/15/2019 | 49,061 |
| 100,000 | | Union Electric Co., 6.000%, 04/01/2018 | 113,308 |
| 120,000 | | Virginia Electric & Power Co., Sr. Unsecd. Note, 5.000%, 06/30/2019 | 134,733 |
| 80,000 | | Virginia Electric & Power Co., Sr. Unsecd. Note, 5.100%, 11/30/2012 | 86,706 |
| | TOTAL | 1,294,310 |
| | Utility — Natural Gas Distributor – 0.1% | |
| 120,000 | | Atmos Energy Corp., 5.125%, 01/15/2013 | 128,519 |
| 15,000 | | Atmos Energy Corp., 8.500%, 03/15/2019 | 19,432 |
| 60,000 | | Sempra Energy, Sr. Unsecd. Note, 6.500%, 06/01/2016 | 71,475 |
| | TOTAL | 219,426 |
| | Utility — Natural Gas Pipelines – 0.2% | |
| 100,000 | | Duke Capital Corp., Sr. Note, 6.250%, 02/15/2013 | 109,330 |
| 70,000 | | Enbridge, Inc., Sr. Note, 5.600%, 04/01/2017 | 79,787 |
| 110,000 | | Enterprise Products LLC, Company Guarantee, Series O, 9.75%, 1/31/2014 | 134,093 |
Annual Shareholder Report37
Shares or
Principal
Amount | | | Value in
U.S. Dollars |
| $100,000 | | Kinder Morgan Energy Partners LP, Sr. Unsecd. Note, 5.800%, 03/15/2035 | 96,431 |
| | TOTAL | 419,641 |
| | TOTAL CORPORATE BONDS
(IDENTIFIED COST $16,088,169) | 17,229,421 |
| | Governments/Agencies – 0.1% | |
| | Sovereign – 0.1% | |
| 75,000 | | United Mexican States, 6.625%, 03/03/2015 | 88,312 |
| 30,000 | | United Mexican States, Series MTNA, 6.750%, 09/27/2034 | 35,371 |
| | TOTAL GOVERNMENTS/AGENCIES
(IDENTIFIED COST $106,486) | 123,683 |
| | Mortgage-Backed Securities – 0.3% | |
| 7,915 | | Federal Home Loan Mortgage Corp. Pool C00592, 7.000%, 3/1/2028 | 8,898 |
| 5,716 | | Federal Home Loan Mortgage Corp. Pool C00896, 7.500%, 12/1/2029 | 6,467 |
| 14,387 | | Federal Home Loan Mortgage Corp. Pool C17281, 6.500%, 11/1/2028 | 16,123 |
| 15,026 | | Federal Home Loan Mortgage Corp. Pool C19588, 6.500%, 12/1/2028 | 16,857 |
| 4,413 | | Federal Home Loan Mortgage Corp. Pool C25621, 6.500%, 5/1/2029 | 4,941 |
| 18,777 | | Federal Home Loan Mortgage Corp. Pool C76361, 6.000%, 2/1/2033 | 20,725 |
| 51,216 | | Federal Home Loan Mortgage Corp. Pool E01545, 5.000%,
15 Year, 1/1/2019 | 54,784 |
| 1,533 | | Federal Home Loan Mortgage Corp. Pool E20252, 7.000%,
15 Year, 7/1/2011 | 1,556 |
| 987 | | Federal Home Loan Mortgage Corp. Pool E77591, 6.500%, 7/1/2014 | 1,050 |
| 12,746 | | Federal Home Loan Mortgage Corp. Pool E99510, 5.500%, 9/1/2018 | 13,823 |
| 15,814 | | Federal Home Loan Mortgage Corp. Pool G01444, 6.500%, 8/1/2032 | 17,812 |
| 10,553 | | Federal National Mortgage Association Pool 251697, 6.500%,
30 Year, 5/1/2028 | 11,779 |
| 27,589 | | Federal National Mortgage Association Pool 252334, 6.500%,
30 Year, 2/1/2029 | 30,465 |
| 55,927 | | Federal National Mortgage Association Pool 254720, 4.500%, 5/1/2018 | 59,572 |
| 56,310 | | Federal National Mortgage Association Pool 254802, 4.500%, 7/1/2018 | 59,787 |
| 27,936 | | Federal National Mortgage Association Pool 254905, 6.000%, 10/1/2033 | 30,831 |
| 55,247 | | Federal National Mortgage Association Pool 255075, 5.500%, 2/1/2024 | 59,927 |
| 61,959 | | Federal National Mortgage Association Pool 255079, 5.000%, 2/1/2019 | 66,423 |
| 2,785 | | Federal National Mortgage Association Pool 303168, 9.500%,
30 Year, 2/1/2025 | 3,324 |
| 1,497 | | Federal National Mortgage Association Pool 323159, 7.500%, 4/1/2028 | 1,689 |
| 12,168 | | Federal National Mortgage Association Pool 323640, 7.500%, 4/1/2029 | 13,729 |
Annual Shareholder Report38
Shares or
Principal
Amount | | | Value in
U.S. Dollars |
| $433 | | Federal National Mortgage Association Pool 323970, 7.000%,
15 Year, 10/1/2014 | 462 |
| 19,288 | | Federal National Mortgage Association Pool 428865, 7.000%, 6/1/2028 | 21,665 |
| 2,576 | | Federal National Mortgage Association Pool 443215, 6.000%, 10/1/2028 | 2,845 |
| 274 | | Federal National Mortgage Association Pool 514184, 7.500%, 9/1/2029 | 310 |
| 50,636 | | Federal National Mortgage Association Pool 545993, 6.000%, 11/1/2032 | 56,168 |
| 20,781 | | Federal National Mortgage Association Pool 555272, 6.000%, 3/1/2033 | 23,082 |
| 45,736 | | Federal National Mortgage Association Pool 713974, 5.500%, 7/1/2033 | 49,378 |
| 58,564 | | Federal National Mortgage Association Pool 721502, 5.000%, 7/1/2033 | 62,228 |
| 1,385 | | Government National Mortgage Association Pool 352214, 7.000%, 4/15/2023 | 1,542 |
| 4,943 | | Government National Mortgage Association Pool 451522, 7.500%,
30 Year, 10/15/2027 | 5,624 |
| 11,942 | | Government National Mortgage Association Pool 462556, 6.500%, 2/15/2028 | 13,472 |
| 473 | | Government National Mortgage Association Pool 462739, 7.500%, 5/15/2028 | 538 |
| 644 | | Government National Mortgage Association Pool 464835, 6.500%, 9/15/2028 | 727 |
| 10,473 | | Government National Mortgage Association Pool 469699, 7.000%, 11/15/2028 | 11,808 |
| 10,701 | | Government National Mortgage Association Pool 486760, 6.500%, 12/15/2028 | 12,078 |
| 1,971 | | Government National Mortgage Association Pool 780339, 8.000%,
30 Year, 12/15/2023 | 2,246 |
| 13,547 | | Government National Mortgage Association Pool 780453, 7.500%,
30 Year, 12/15/2025 | 15,389 |
| 12,088 | | Government National Mortgage Association Pool 780584, 7.000%,
30 Year, 6/15/2027 | 13,561 |
| | TOTAL MORTGAGE-BACKED SECURITIES
(IDENTIFIED COST $735,453) | 793,685 |
| | MUNICIPAL – 0.0% | |
| | Illinois – 0.0% | |
| 90,000 | | Chicago, IL Metropolitan Water Reclamation District, Direct Payment Taxable Limited GO Build America Bonds, 5.720%, 12/01/2038
(IDENTIFIED COST $90,000) | 95,547 |
| | U.S. Treasury – 2.1% | |
| 400,000 | 4,5 | United States Treasury Bill, 0.125%, 12/16/2010 | 399,981 |
| 2,300,000 | 4,5 | United States Treasury Bill, 0.125%, 2/3/2011 | 2,299,417 |
| 1,800,000 | 4,5 | United States Treasury Bill, 0.160%, 1/20/2011 | 1,799,644 |
Annual Shareholder Report39
Shares or
Principal
Amount | | | Value in
U.S. Dollars |
| $800,000 | 4 | United States Treasury Bond, 3.500%, 2/15/2039 | 716,312 |
| 100,000 | 4 | United States Treasury Note, 3.125%, 8/31/2013 | 106,801 |
| | TOTAL U.S. TREASURY
(IDENTIFIED COST $5,326,695) | 5,322,155 |
| | EXCHANGE-TRADED FUNDS – 18.7% | |
| 104,579 | | Energy Select Sector SPDR | 6,550,829 |
| 291,841 | | iShares MSCI Emerging Market Index Fund | 13,065,722 |
| 67,953 | | iShares Dow Jones US Pharmaceuticals Index Fund | 4,144,453 |
| 320,849 | | iShares Russell 2000 Index Fund | 23,325,722 |
| | TOTAL EXCHANGE-TRADED FUNDS
(IDENTIFIED COST $39,840,737) | 47,086,726 |
| | MUTUAL FUNDS – 37.7%;6 | |
| 189,860 | | Emerging Markets Fixed Income Core Fund | 5,201,991 |
| 276,859 | | Federated InterContinental Fund, Institutional Shares | 12,669,071 |
| 401,648 | | Federated Mid Cap Growth Strategies Fund, Institutional Shares | 13,439,154 |
| 923,667 | | Federated Mortgage Core Portfolio | 9,365,986 |
| 305,951 | | Federated Project and Trade Finance Core Fund | 3,053,394 |
| 2,802,841 | | High Yield Bond Portfolio | 18,218,469 |
| 33,132,233 | 7 | Federated Prime Value Obligations Fund, Institutional Shares, 0.21% | 33,132,233 |
| | TOTAL MUTUAL FUNDS
(IDENTIFIED COST $89,589,072) | 95,080,298 |
| | TOTAL INVESTMENTS — 100.2%
(IDENTIFIED COST $230,524,280)8 | 252,737,511 |
| | OTHER ASSETS AND LIABILITIES - NET — (0.2)%9 | (610,765) |
| | TOTAL NET ASSETS — 100% | $252,126,746 |
Annual Shareholder Report
40
At November 30, 2010, the Fund had the following outstanding futures contracts:| Description | Number of
Contracts | Notional
Value | Expiration
Date | Unrealized
Appreciation/
(Depreciation) |
| 1ASX SPI 200 Index Short Futures | 13 | $1,492,725 | December 2010 | $24,875 |
| 1CAC 40 Index Short Futures | 117 | $4,224,870 | December 2010 | $260,048 |
| 1IBEX 35 Index Short Futures | 11 | $1,014,915 | December 2010 | $74,609 |
| 1OMX 30 Index Short Futures | 125 | $13,859,375 | December 2010 | $(38,391) |
| 1S&P/TSE 60 Index Short Futures | 16 | $2,369,920 | December 2010 | $(116,902) |
| 1Hang Seng Index Short Futures | 6 | $6,908,400 | December 2010 | $(3,399) |
| 1United States Treasury Notes 2-Year Short Futures | 30 | $6,581,250 | March 2011 | $(7,096) |
| 1United States Treasury Notes 5-Year Short Futures | 60 | $7,191,094 | March 2011 | $(27,963) |
| 1United States Treasury Notes 10-Year Short Futures | 10 | $1,241,094 | March 2011 | $(5,568) |
| 1AEX Index Long Futures | 33 | $2,162,490 | December 2010 | $(132,417) |
| 1DAX Index Long Futures | 13 | $2,178,150 | December 2010 | $133,154 |
| 1FTSE 100 Index Long Futures | 27 | $1,497,015 | December 2010 | $(33,161) |
| 1Russell 2000 Mini Index Long Futures | 95 | $6,901,750 | December 2010 | $384,081 |
| 1SGX MSCI Singapore Index Long Futures | 14 | $1,037,960 | December 2010 | $(2,626) |
| 1S&P 500 Index Long Futures | 70 | $20,643,000 | December 2010 | $832,295 |
| 1Swiss Market Index Long Futures | 26 | $1,639,040 | December 2010 | $(51,039) |
| 1Topix Index Long Futures | 60 | $514,800,000 | December 2010 | $22,810 |
| 1United States Treasury Bonds 30-Year Long Futures | 19 | $2,418,344 | March 2011 | $29,349 |
| NET UNREALIZED APPRECIATION ON FUTURES CONTRACTS | $1,342,659 |
At November 30, 2010, the Fund had the following open swap contract:
| Credit Default Swap Counterparty | Goldman Sachs & Co. |
| Reference Entity | Series 13 Investment Grade Index |
| Buy/Sell | Sell |
| Pay/Receive Fixed Rate | 1.00% |
| Expiration Date | 12/20/2014 |
| Implied Credit Spread at 11/30/201010 | 0.89% |
| Notional Amount | $5,000,000 |
| Market Value | $33,391 |
| Upfront Premiums Paid/(Received) | $11,942 |
| Unrealized Appreciation | $21,449 |
Annual Shareholder Report
41
At November 30, 2010, the Fund had the following outstanding foreign exchange contracts:| Settlement Date | Foreign
Currency
Units to
Deliver/Receive | In
Exchange
For | Unrealized
Appreciation/
(Depreciation) |
| Contracts Purchased: |
| 12/6/2010 | 2,493,020 Euro | $3,500,000 | $(263,975) |
| 12/6/2010 | 6,410,622 Euro | $9,000,000 | $(678,793) |
| Contracts Sold: |
| 12/6/2010 | 8,997,531 Euro | $12,500,000 | $820,896 |
| NET UNREALIZED DEPRECIATION ON FOREIGN EXCHANGE CONTRACTS | $(121,872) |
Net Unrealized Appreciation/Depreciation on Futures Contracts, Swap Contract and Foreign Exchange Contracts is included in “Other Assets and Liabilities — Net.”
| 1 | Non-income producing security. |
| 2 | Denotes a restricted security that either: (a) cannot be offered for public sale without first being registered, or being able to take advantage of an exemption from registration, under the Securities Act of 1933; or (b) is subject to a contractual restriction on public sales. At November 30, 2010, these restricted securities amounted to $4,644,970, which represented 1.8% of total net assets. |
| 3 | Denotes a restricted security that may be resold without restriction to “qualified institutional buyers” as defined in Rule 144A under the Securities Act of 1933 and that the Fund has determined to be liquid under criteria established by the Fund's Board of Trustees (the “Trustees”). At November 30, 2010, these liquid restricted securities amounted to $3,892,278, which represented 1.5% of total net assets. |
| 4 | Pledged as collateral to ensure the Fund is able to satisfy the obligations of its outstanding futures contracts. |
| 5 | Discount rate at time of purchase. |
| 6 | Affiliated companies. |
| 7 | 7-Day net yield. |
| 8 | The cost of investments for federal tax purposes amounts to $231,927,784. |
| 9 | Assets, other than investments in securities, less liabilities. See Statement of Assets and Liabilities. |
| 10 | Implied credit spreads, represented in absolute terms, utilized in determining the market value of credit default swap agreements serve as an indicator of the current status of the payment/performance risk and represent the likelihood or risk of default for the credit derivative. The implied credit spread of a particular referenced entity reflects the cost of buying/selling protection and may include upfront payments required to be made to enter into the agreement. Wider credit spreads represent a deterioration of the referenced entity's credit soundness and a greater likelihood or risk of default or other credit event occurring as defined under the terms of the agreement. A credit spread identified as “Defaulted” indicates a credit event has occurred for the referenced entity or obligation. |
Note: The categories of investments are shown as a percentage of total net assets at November 30, 2010.
Various inputs are used in determining the value of the Fund's investments. These inputs are summarized in the three broad levels listed below:
Level 1 — quoted prices in active markets for identical securities
Level 2 — other significant observable inputs (including quoted prices for similar securities, interest rates, prepayment speeds, credit risk, etc.)
Level 3 — significant unobservable inputs (including the Fund's own assumptions in determining the fair value of investments)
Annual Shareholder Report
42
The inputs or methodology used for valuing securities are not an indication of the risk associated with investing in those securities.The following is a summary of the inputs used, as of November 30, 2010, in valuing the Fund's assets carried at fair value:
| Valuation Inputs | | | | |
| Level 1 –
Quoted
Prices and
Investments in
Mutual Funds* | Level 2 –
Other
Significant
Observable
Inputs | Level 3 –
Significant
Unobservable
Inputs | Total |
| Equity Securities: | | | | |
| Common Stock | | | | |
| Domestic | $75,199,231 | $ — | $ — | $75,199,231 |
| International | 6,414,720** | — | — | 6,414,720 |
| Debt Securities: | | | | |
| Assets-Backed Securities | — | 2,593,937 | — | 2,593,937 |
| Collateralized Mortgage Obligations | — | 2,798,108 | — | 2,798,108 |
| Corporate Bonds | — | 17,229,421 | — | 17,229,421 |
| Governments/Agencies | — | 123,683 | — | 123,683 |
| Mortgage-Backed Securities | — | 793,685 | — | 793,685 |
| Municipal | — | 95,547 | — | 95,547 |
| U.S. Treasury | — | 5,322,155 | — | 5,322,155 |
| Exchange-Traded Funds | 47,086,726 | — | — | 47,086,726 |
| Mutual Funds | 95,080,298 | — | — | 95,080,298 |
| TOTAL SECURITIES | $223,780,975 | $28,956,536 | $ — | $252,737,511 |
| OTHER FINANCIAL INSTRUMENTS*** | $1,342,659 | $(100,423) | $ — | $1,242,236 |
| * | Emerging Markets Fixed Income Core Fund, Federated Mortgage Core Portfolio, Federated Project and Trade Finance Core Fund and High Yield Bond Portfolio are affiliated holdings offered only to registered investment companies and other accredited investors. |
| ** | Includes $525,749 of securities transferred from Level 2 to Level 1 because quoted prices on equity securities traded principally in foreign markets were utilized to value securities for which fair value factors were previously applied to account for significant post market close activity. |
| *** | Other financial instruments include futures contracts, swap contract and foreign exchange contracts. |
The following acronyms are used throughout this portfolio:
| ADR | — American Depositary Receipt |
| MTN | — Medium Term Note |
| REITs | — Real Estate Investment Trusts |
See Notes which are an integral part of the Financial Statements
Annual Shareholder Report43
Statement of Assets and Liabilities
November 30, 2010
| Assets: | | |
| Total investments in securities, at value including $95,080,298 of investments in affiliated issuers (Note 5) (identified cost $230,524,280) | | $252,737,511 |
| Cash | | 12,474 |
| Cash denominated in foreign currencies (identified cost $39,664) | | 36,692 |
| Income receivable | | 425,174 |
| Swaps, at value (premium paid $11,942) | | 33,391 |
| Receivable for investments sold | | 11,436 |
| Receivable for shares sold | | 267,404 |
| Receivable for foreign exchange contracts | | 820,896 |
| Receivable for periodic payments from swap contracts | | 10,000 |
| Other receivables | | 6,249 |
| TOTAL ASSETS | | 254,361,227 |
| Liabilities: | | |
| Payable for investments purchased | $182,735 | |
| Payable for shares redeemed | 552,857 | |
| Payable for foreign exchange contracts | 942,768 | |
| Payable for daily variation margin | 286,227 | |
| Payable for transfer and dividend disbursing agent fees and expenses | 90,743 | |
| Payable for distribution services fee (Note 5) | 53,926 | |
| Payable for shareholder services fee (Note 5) | 45,454 | |
| Accrued expenses | 79,771 | |
| TOTAL LIABILITIES | | 2,234,481 |
| Net assets for 14,998,425 shares outstanding | | $252,126,746 |
| Net Assets Consist of: | | |
| Paid-in capital | | $251,457,996 |
| Net unrealized appreciation of investments, futures contracts, swap contracts and translation of assets and liabilities in foreign currency | | 23,457,651 |
| Accumulated net realized loss on investments, futures contracts, swap contracts and foreign currency transactions | | (22,889,324) |
| Undistributed net investment income | | 100,423 |
| TOTAL NET ASSETS | | $252,126,746 |
Annual Shareholder Report44
Statement of Assets and Liabilities — continued| Net Asset Value, Offering Price and Redemption Proceeds Per Share | | |
| Class A Shares: | | |
| Net asset value per share ($135,001,952 ÷ 8,004,439 shares outstanding), no par value, unlimited shares authorized | | $16.87 |
| Offering price per share (100/94.50 of $16.87) | | $17.85 |
| Redemption proceeds per share | | $16.87 |
| Class B Shares: | | |
| Net asset value per share ($14,540,532 ÷ 871,344 shares outstanding), no par value, unlimited shares authorized | | $16.69 |
| Offering price per share | | $16.69 |
| Redemption proceeds per share (94.50/100 of $16.69) | | $15.77 |
| Class C Shares: | | |
| Net asset value per share ($36,414,720 ÷ 2,190,572 shares outstanding), no par value, unlimited shares authorized | | $16.62 |
| Offering price per share | | $16.62 |
| Redemption proceeds per share (99.00/100 of $16.62) | | $16.45 |
| Class K Shares: | | |
| Net asset value per share ($53,748,692 ÷ 3,197,656 shares outstanding), no par value, unlimited shares authorized | | $16.81 |
| Offering price per share | | $16.81 |
| Redemption proceeds per share | | $16.81 |
| Institutional Shares: | | |
| Net asset value per share ($12,420,850 ÷ 734,414 shares outstanding), no par value, unlimited shares authorized | | $16.91 |
| Offering price per share | | $16.91 |
| Redemption proceeds per share | | $16.91 |
See Notes which are an integral part of the Financial Statements
Annual Shareholder Report45
Statement of Operations
Year Ended November 30, 2010
| Investment Income: | | | |
| Dividends (including $1,966,166 received from affiliated issuers (Note 5) and net of foreign taxes withheld of $1,258) | | | $4,241,248 |
| Interest | | | 1,402,451 |
| Investment income allocated from affiliated partnership (Note 5) | | | 384,029 |
| TOTAL INCOME | | | 6,027,728 |
| Expenses: | | | |
| Investment adviser fee (Note 5) | | $1,691,073 | |
| Administrative personnel and services fee (Note 5) | | 310,000 | |
| Custodian fees | | 51,730 | |
| Transfer and dividend disbursing agent fees and expenses — Class A Shares | | 297,333 | |
| Transfer and dividend disbursing agent fees and expenses — Class B Shares | | 44,548 | |
| Transfer and dividend disbursing agent fees and expenses — Class C Shares | | 69,775 | |
| Transfer and dividend disbursing agent fees and expenses — Class K Shares | | 186,350 | |
| Transfer and dividend disbursing agent fees and expenses — Institutional Shares | | 13,217 | |
| Directors'/Trustees' fees | | 8,614 | |
| Auditing fees | | 26,250 | |
| Legal fees | | 6,777 | |
| Portfolio accounting fees | | 155,536 | |
| Distribution services fee — Class B Shares (Note 5) | | 127,548 | |
| Distribution services fee — Class C Shares (Note 5) | | 242,256 | |
| Distribution services fee — Class K Shares (Note 5) | | 248,180 | |
| Shareholder services fee — Class A Shares (Note 5) | | 339,936 | |
| Shareholder services fee — Class B Shares (Note 5) | | 42,516 | |
| Shareholder services fee — Class C Shares (Note 5) | | 80,417 | |
| Account administration fee — Class A Shares | | 3,652 | |
| Share registration costs | | 78,482 | |
| Printing and postage | | 102,038 | |
| Insurance premiums | | 4,626 | |
| Taxes | | 6,839 | |
| Miscellaneous | | 13,419 | |
| TOTAL EXPENSES | | 4,151,112 | |
Annual Shareholder Report46
Statement of Operations — continued| Waivers, Reimbursements and Reduction: | | | |
| Waiver/reimbursement of investment adviser fee (Note 5) | $(263,695) | | |
| Waiver of administrative personnel and services fee (Note 5) | (62,539) | | |
| Reimbursement of transfer and dividend disbursing agent fees and expenses — Class A Shares (Note 5) | (94,428) | | |
| Reimbursement of transfer and dividend disbursing agent fees and expenses — Class B Shares (Note 5) | (12,154) | | |
| Reimbursement of transfer and dividend disbursing agent fees and expenses — Class C Shares (Note 5) | (8,701) | | |
| Reimbursement of transfer and dividend disbursing agent fees and expenses — Institutional Shares (Note 5) | (3,064) | | |
| Fees paid indirectly from directed brokerage arrangements (Note 6) | (28,581) | | |
| TOTAL WAIVERS, REIMBURSEMENTS AND REDUCTION | | $(473,162) | |
| Net expenses | | | $3,677,950 |
| Net investment income | | | 2,349,778 |
| Realized and Unrealized Gain on Investments, Futures Contracts, Swap Contracts and Foreign Currency Transactions: | | | |
| Net realized gain on investments and foreign currency transactions (including realized gain of $575,262 on sales of investments in affiliated issuers) (Note 5)) | | | 10,745,976 |
| Net realized gain on futures contracts | | | 2,320,000 |
| Net realized gain on swap contracts | | | 456,219 |
| Net realized gain/loss allocated from affiliated partnership (Note 5) | | | 49,371 |
| Net change in unrealized appreciation of investments and translation of assets and liabilities in foreign currency | | | 1,489,864 |
| Net change in unrealized appreciation of futures contracts | | | 756,681 |
| Net change in unrealized appreciation of swap contracts | | | (197,643) |
| Net realized and unrealized gain on investments, futures contracts, swap contracts and foreign currency transactions | | | 15,620,468 |
| Change in net assets resulting from operations | | | $17,970,246 |
See Notes which are an integral part of the Financial Statements
Annual Shareholder Report47
Statement of Changes in Net Assets
| Year Ended November 30 | 2010 | 2009 |
| Increase (Decrease) in Net Assets | | |
| Operations: | | |
| Net investment income | $2,349,778 | $3,626,329 |
| Net realized gain on investments including allocation from affiliated partnership, futures contracts, swap contracts and foreign currency transactions | 13,571,566 | 548,019 |
| Net change in unrealized appreciation/depreciation of investments, futures contracts, swap contracts and translation of assets and liabilities in foreign currency | 2,048,902 | 37,935,648 |
| CHANGE IN NET ASSETS RESULTING FROM OPERATIONS | 17,970,246 | 42,109,996 |
| Distributions to Shareholders: | | |
| Distributions from net investment income | | |
| Class A Shares | (158,051) | (2,629,338) |
| Class B Shares | (21,313) | (267,729) |
| Class C Shares | (30,767) | (285,201) |
| Class K Shares | (50,986) | (384,837) |
| Institutional Shares | (2,951) | (19,202) |
| CHANGE IN NET ASSETS RESULTING FROM DISTRIBUTIONS TO SHAREHOLDERS | (264,068) | (3,586,307) |
| Share Transactions: | | |
| Proceeds from sale of shares | 81,404,043 | 69,643,362 |
| Proceeds from shares issued in connection with the tax-free transfer of assets from Federated Target ETF Fund 2015 | — | 5,272,582 |
| Proceeds from shares issued in connection with the tax-free transfer of assets from Federated Target ETF Fund 2025 | — | 8,053,895 |
| Proceeds from shares issued in connection with the tax-free transfer of assets from Federated Target ETF Fund 2035 | — | 6,951,526 |
| Net asset value of shares issued to shareholders in payment of distributions declared | 249,752 | 3,363,174 |
| Cost of shares redeemed | (95,388,857) | (70,213,064) |
| CHANGE IN NET ASSETS RESULTING FROM SHARE TRANSACTIONS | (13,735,062) | 23,071,475 |
| Change in net assets | 3,971,116 | 61,595,164 |
| Net Assets: | | |
| Beginning of period | 248,155,630 | 186,560,466 |
| End of period (including undistributed (distributions in excess of) net investment income of $100,423 and $(56,725), respectively) | $252,126,746 | $248,155,630 |
See Notes which are an integral part of the Financial Statements
Annual Shareholder Report48
Notes to Financial Statements
November 30, 2010
1. ORGANIZATION
Federated Stock and Bond Fund (the “Fund”) is registered under the Investment Company Act of 1940, as amended (the “Act”), as a diversified, open-end management investment company. The Fund offers five classes of shares: Class A Shares, Class B Shares, Class C Shares, Class K Shares and Institutional Shares. All shares of the Fund have equal rights with respect to voting, except on class-specific matters. The financial highlights of the Institutional Shares are presented separately. The primary investment objective of the Fund is to provide relative safety of capital with the possibility of long-term growth of capital and income. Consideration is also given to current income.
On June 15, 2009, the Fund received assets from Federated Target ETF Fund 2015 (FT2015), Federated Target ETF Fund 2025 (FT2025) and Federated Target ETF Fund 2035 (FT2035) (collectively, “Acquired Funds”) as a result of a tax-free reorganization, as follows:
| Shares of the
Fund Issued | Acquired Funds
Net Assets
Received | Unrealized
Appreciation1 | Net Assets
of the Fund
Immediately
Prior to
Combination | Net Assets
of the Fund
Immediately
After
Combination |
| FT2015 | 374,734 | $5,272,582 | $244,522 | | |
| FT2025 | 572,336 | 8,053,895 | 705,623 | | |
| FT2035 | 494,024 | 6,951,526 | 499,642 | | |
| TOTAL | 1,441,094 | $20,278,003 | $1,449,787 | $200,320,350 | $220,598,353 |
| 1 | Unrealized appreciation is included in the Acquired Funds Net Assets Received amount shown above. |
2. SIGNIFICANT ACCOUNTING POLICIES
The following is a summary of significant accounting policies consistently followed by the Fund in the preparation of its financial statements. These policies are in conformity with U.S. generally accepted accounting principles (GAAP).
Investment Valuation
In calculating its net asset value (NAV), the Fund generally values investments as follows:
- Equity securities listed on an exchange or traded through a regulated market system are valued at their last reported sale price or official closing price in their principal exchange or market.
- Fixed-income securities acquired with remaining maturities greater than 60 days are fair valued using price evaluations provided by a pricing service approved by the Trustees.
- Fixed-income securities acquired with remaining maturities of 60 days or less are valued at their cost (adjusted for the accretion of any discount or amortization of any premium).
- Shares of other mutual funds are valued based upon their reported NAVs.
- Derivative contracts listed on exchanges are valued at their reported settlement or closing price.
- Over-the-counter (OTC) derivative contracts are fair valued using price evaluations provided by a pricing service approved by the Trustees.
Annual Shareholder Report
49
If the Fund cannot obtain a price or price evaluation from a pricing service for an investment, the Fund may attempt to value the investment based upon the mean of bid and asked quotations or fair value the investment based on price evaluations, from one or more dealers. If any price, quotation, price evaluation or other pricing source is not readily available when the NAV is calculated, the Fund uses the fair value of the investment determined in accordance with the procedures described below. There can be no assurance that the Fund could purchase or sell an investment at the price used to calculate the Fund's NAV.Fair Valuation and Significant Events Procedures
The Trustees have authorized the use of pricing services to provide evaluations of the current fair value of certain investments for purposes of calculating the NAV. Factors considered by pricing services in evaluating an investment include the yields or prices of investments of comparable quality, coupon, maturity, call rights and other potential prepayments, terms and type, reported transactions, indications as to values from dealers and general market conditions. Some pricing services provide a single price evaluation reflecting the bid-side of the market for an investment (a “bid” evaluation). Other pricing services offer both bid evaluations and price evaluations indicative of a price between the prices bid and asked for the investment (a “mid” evaluation). The Fund normally uses bid evaluations for U.S. Treasury and Agency securities, mortgage-backed securities and municipal securities. The Fund normally uses mid evaluations for other types of fixed-income securities and OTC derivative contracts. In the event that market quotations and price evaluations are not available for an investment, the fair value of the investment is determined in accordance with procedures adopted by the Trustees.
The Trustees also have adopted procedures requiring an investment to be priced at its fair value whenever the Adviser determines that a significant event affecting the value of the investment has occurred between the time as of which the price of the investment would otherwise be determined and the time as of which the NAV is computed. An event is considered significant if there is both an affirmative expectation that the investment's value will change in response to the event and a reasonable basis for quantifying the resulting change in value. Examples of significant events that may occur after the close of the principal market on which a security is traded, or after the time of a price evaluation provided by a pricing service or a dealer, include:
- With respect to securities traded in foreign markets, significant trends in U.S. equity markets or in the trading of foreign securities index futures or options contracts;
- With respect to price evaluations of fixed-income securities determined before the close of regular trading on the NYSE, actions by the Federal Reserve Open Market Committee and other significant trends in U.S. fixed-income markets;
- Political or other developments affecting the economy or markets in which an issuer conducts its operations or its securities are traded; and
- Announcements concerning matters such as acquisitions, recapitalizations, litigation developments, a natural disaster affecting the issuer's operations or regulatory changes or market developments affecting the issuer's industry.
The Trustees have approved the use of a pricing service to determine the fair value of equity securities traded principally in foreign markets when the Adviser determines that there has been a significant trend in the U.S. equity markets or in index futures trading. For other significant events, the Fund may seek to obtain more current quotations or price evaluations from alternative pricing sources. If a reliable alternative pricing source is not available, the Fund will determine the fair value of the investment using another method approved by the Trustees.
Annual Shareholder Report
50
Repurchase AgreementsIt is the policy of the Fund to require the other party to a repurchase agreement to transfer to the Fund's custodian or sub-custodian eligible securities or cash with a market value (after transaction costs) at least equal to the repurchase price to be paid under the repurchase agreement. The eligible securities are transferred to accounts with the custodian or sub-custodian in which the Fund holds a “securities entitlement” and exercises “control” as those terms are defined in the Uniform Commercial Code. The Fund has established procedures for monitoring the market value of the transferred securities and requiring the transfer of additional eligible securities if necessary to equal at least the repurchase price. These procedures also allow the other party to require securities to be transferred from the account to the extent that their market value exceeds the repurchase price or in exchange for other eligible securities of equivalent market value.
The insolvency of the other party or other failure to repurchase the securities may delay the disposition of the underlying securities or cause the Fund to receive less than the full repurchase price. Under the terms of the repurchase agreement, any amounts received by the Fund in excess of the repurchase price and related transaction costs must be remitted to the other party.
The Fund may enter into repurchase agreements in which eligible securities are transferred into joint trading accounts maintained by the custodian or sub-custodian for investment companies and other clients advised by the Fund's Adviser and its affiliates. The Fund will participate on a pro rata basis with the other investment companies and clients in its share of the securities transferred under such repurchase agreements and in its share of proceeds from any repurchase or other disposition of such securities.
Investment Income, Gains and Losses, Expenses and Distributions
Investment transactions are accounted for on a trade-date basis. Realized gains and losses from investment transactions are recorded on an identified-cost basis. Interest income and expenses are accrued daily. Dividend income and distributions to shareholders are recorded on the ex-dividend date. Foreign dividends are recorded on the ex-dividend date or when the Fund is informed of the ex-dividend date. Positive or negative inflation adjustments on Treasury Inflation-Protected Securities are included in interest income. Distributions of net investment income are declared and paid quarterly. Non-cash dividends included in dividend income, if any, are recorded at fair value. Investment income, realized and unrealized gains and losses and certain fund-level expenses are allocated to each class based on relative average daily net assets, except that Class A Shares, Class B Shares, Class C Shares, Class K Shares and Institutional Shares may bear distribution services fees, shareholder services fees, account administration fees and certain transfer and dividend disbursing agent fees unique to those classes. Dividends are declared separately for each class. No class has preferential dividend rights; differences in per share dividend rates are generally due to differences in separate class expenses.
Premium and Discount Amortization/Paydown Gains and Losses
All premiums and discounts on fixed-income securities are amortized/accreted for financial statement purposes. Gains and losses realized on principal payment of mortgage-backed securities (paydown gains and losses) are classified as part of investment income.
Annual Shareholder Report
51
Federal TaxesIt is the Fund's policy to comply with the Subchapter M provision of the Internal Revenue Code (the “Code”) and to distribute to shareholders each year substantially all of its income. Accordingly, no provision for federal income tax is necessary. As of and during the year ended November 30, 2010, the Fund did not have a liability for any uncertain tax positions. The Fund recognizes interest and penalties, if any, related to tax liabilities as income tax expense in the Statement of Operations. As of September 5, 2008, the Fund's domicile and form of organization changed from a Maryland Corporation to a Massachusetts business trust. As of November 30, 2010, tax years 2007 through 2010 remain subject to examination by the Fund's major tax jurisdictions, which include the United States of America, the state of Maryland, the Commonwealth of Massachusetts and the Commonwealth of Pennsylvania.
The Fund may be subject to taxes imposed by governments of countries in which it invests. Such taxes are generally based on either income or gains earned or repatriated. The Fund accrues and applies such taxes to net investment income, net realized gains and net unrealized gains as income and/or gains are earned.
When-Issued and Delayed Delivery Transactions
The Fund may engage in when-issued or delayed delivery transactions. The Fund records when-issued securities on the trade date and maintains security positions such that sufficient liquid assets will be available to make payment for the securities purchased. Securities purchased on a when-issued or delayed delivery basis are marked to market daily and begin earning interest on the settlement date. Losses may occur on these transactions due to changes in market conditions or the failure of counterparties to perform under the contract.
Swap Contracts
Swap contracts involve two parties that agree to exchange the returns (or the differential in rates of return) earned or realized on particular predetermined investments, instruments, indices or other measures. The gross returns to be exchanged or “swapped” between parties are generally calculated with respect to a “notional amount” for a predetermined period of time. The Fund may enter into interest rate, total return, credit default, currency and other swap agreements. Risks may arise upon entering into swap agreements from the potential inability of the counterparties to meet the terms of their contract from unanticipated changes in the value of the swap agreement. The Fund uses credit default swaps to manage exposure to a given issuer or sector by either selling protection to increase exposure, or buying protection to reduce exposure. The “buyer” in a credit default swap is obligated to pay the “seller” a periodic stream of payments over the term of the contract provided that no event of default on an underlying reference obligation has occurred. If an event of default occurs, the seller must pay the buyer the full notional value, or the “par value”, of the reference obligation in exchange for the reference obligation. In connection with these agreements, securities may be identified as collateral in accordance with the terms of the respective swap agreements to provide assets of value and recourse in the event of default or bankruptcy/insolvency. Recovery values are assumed by market makers considering either industry standard recovery rates or entity specific factors and considerations until a credit event occurs. If a credit event has occurred, the recovery value is typically determined by a facilitated auction whereby a minimum number of allowable broker bids, together with a specific valuation method, are used to calculate the settlement value. The maximum amount of the payment that may occur, as a result of a credit event payable by the protection seller, is equal to the notional amount of the underlying index or security. The Fund's maximum exposure to loss of the notional value of credit default swaps outstanding at November 30, 2010 is $5,000,000.
Annual Shareholder Report
52
The Fund's maximum risk of loss from counterparty credit risk, either as the protection buyer or as the protection seller, is the fair value of the contract. This risk is mitigated by having a master netting arrangement between the Fund and the counterparty and by the posting of collateral by the counterparty to the Fund to cover the Fund's exposure to the counterparty.Upfront payments received or paid by the Fund will be reflected as an asset or liability on the Statement of Assets and Liabilities. Changes in the value of swap contracts are included in swaps, at value on the Statement of Assets and Liabilities, and periodic payments are reported as Net realized gain (loss) on swap contracts in the Statement of Operations.
Swap contracts outstanding at period end are listed after the Fund's Portfolio of Investments.
Futures Contracts
The Fund purchases and sells financial futures contracts to manage cash flows, enhance yield and to potentially reduce transaction costs. Upon entering into a financial futures contract with a broker, the Fund is required to deposit in a segregated account a specified amount of cash or U.S. government securities. Futures contracts are valued daily and unrealized gains or losses are recorded in a “variation margin” account. Daily, the Fund receives from or pays to the broker a specified amount of cash based upon changes in the variation margin account. When a contract is closed, the Fund recognizes a realized gain or loss. Futures contracts have market risks, including the risk that the change in the value of the contract may not correlate with the changes in the value of the underlying securities. There is minimal counterparty risk to the Fund since futures are exchange traded and the exchange's clearinghouse, as counterparty to all exchange-traded futures, guarantees the futures against default.
Futures contracts outstanding at period end are listed after the Fund's Portfolio of Investments.
Foreign Exchange Contracts
The Fund may enter into foreign exchange contracts for the delayed delivery of securities or foreign currency exchange transactions. The Fund may enter into foreign exchange contracts to protect assets against adverse changes in foreign currency exchange rates or exchange control regulations. Purchased contracts are used to acquire exposure to foreign currencies, whereas, contracts to sell are used to hedge the Fund's securities against currency fluctuations. Risks may arise upon entering into these transactions from the potential inability of counterparties to meet the terms of their commitments and from unanticipated movements in security prices or foreign exchange rates. The foreign exchange contracts are adjusted by the daily exchange rate of the underlying currency and any gains or losses are recorded for financial statement purposes as unrealized until the settlement date.
Foreign exchange contracts outstanding at period end are listed after the Fund's Portfolio of Investments.
Foreign Currency Translation
The accounting records of the Fund are maintained in U.S. dollars. All assets and liabilities denominated in foreign currencies (FCs) are translated into U.S. dollars based on the rates of exchange of such currencies against U.S. dollars on the date of valuation. Purchases and sales of securities, income and expenses are translated at the rate of exchange quoted on the Annual Shareholder Report
53
respective date that such transactions are recorded. The Fund does not isolate that portion of the results of operations resulting from changes in foreign exchange rates on investments from the fluctuations arising from changes in market prices of securities held. Such fluctuations are included with the net realized and unrealized gain or loss from investments.Reported net realized foreign exchange gains or losses arise from sales of portfolio securities, sales and maturities of short-term securities, sales of FCs, currency gains or losses realized between the trade and settlement dates on securities transactions, the difference between the amounts of dividends, interest and foreign withholding taxes recorded on the Fund's books, and the U.S. dollar equivalent of the amounts actually received or paid. Net unrealized foreign exchange gains and losses arise from changes in the value of assets and liabilities other than investments in securities at fiscal year end, resulting from changes in the exchange rate.
Restricted Securities
The Fund may purchase securities which are considered restricted. Restricted securities are securities that either: (a) cannot be offered for public sale without first being registered, or being able to take advantage of an exemption from registration, under the Securities Act of 1933; or (b) are subject to contractual restrictions on public sales. In some cases, when a security cannot be offered for public sale without first being registered, the issuer of the restricted security has agreed to register such securities for resale, at the issuer's expense, either upon demand by the Fund or in connection with another registered offering of the securities. Many such restricted securities may be resold in the secondary market in transactions exempt from registration. Restricted securities may be determined to be liquid under criteria established by the Trustees. The Fund will not incur any registration costs upon such resales. The Fund's restricted securities are valued at the price provided by dealers in the secondary market or, if no market prices are available, at the fair value as determined in accordance with procedures established by and under the general supervision of the Trustees.
Additional information on restricted securities, excluding securities purchased under Rule 144A, if applicable, that have been deemed liquid by the Trustees, held at November 30, 2010, is as follows:
| Security | Acquisition Date | Acquisition Cost | Market Value |
| SMFC Trust Asset-Backed Certificates, 1997-A B1-4, 7.719%, 1/28/2027 | 2/4/1998 | $11,299 | $3,844 |
| Union Central Life Ins. Co., Note, 8.20%, 11/1/2026 | 3/31/1999 | $790,785 | $748,848 |
Annual Shareholder Report
54
Additional Disclosure Related to Derivative Instruments| Fair Value of Derivative Instruments |
| Asset | Liability |
| Statement of
Assets and
Liabilities
Location | Fair
Value | Statement of
Assets and
Liabilities
Location | Fair
Value |
Derivatives not accounted for as
hedging instruments under
ASC Topic 815 | | | | |
| Interest rate contracts | — | $ — | Payable for daily
variation margin | $11,278* |
| Equity contracts | — | $ — | Payable for daily
variation margin | $(1,353,937)* |
| Foreign exchange contracts | Receivable for foreign
exchange contracts | $820,896 | Payable for foreign
exchange contracts | $942,768 |
| Credit contracts | Receivable for
periodic payments
from swap contracts | $10,000 | — | $ — |
| Credit contracts | Swaps, at value | $33,391 | — | $ — |
Total derivatives not
accounted for as
hedging instruments under
ACS Topic 815 | | $864,287 | | $(399,891) |
| * | Includes cumulative appreciation/depreciation of futures contracts as reported in the footnotes to the Portfolio of Investments. Only the current day's variation margin is reported within the Statement of Assets and Liabilities. |
The Effect of Derivative Instruments on the Statement of Operations for the Year Ended November 30, 2010
| Amount of Realized Gain or (Loss) on Derivatives Recognized in Income |
| Credit
Default
Swaps | Futures | Forward
Currency
Contracts | Total |
| Interest rate contracts | $ — | $(584,809) | $ — | $(584,809) |
| Equity contracts | $ — | $2,904,809 | $ — | $2,904,809 |
| Foreign exchange contracts | $ — | $ — | $(420) | $(420) |
| Credit contracts | $456,219 | $ — | $ — | $456,219 |
| Total | $456,219 | $2,320,000 | $(420) | $2,775,799 |
Annual Shareholder Report55
| Change in Unrealized Appreciation or (Depreciation) on Derivatives Recognized in Income |
| Credit
Default
Swaps | Futures | Forward
Currency
Contracts | Total |
| Interest rate contracts | $ — | $(82,143) | $ — | $(82,143) |
| Equity contracts | $ — | $838,824 | $ — | $838,824 |
| Foreign exchange contracts | $ — | $ — | $251,406 | $251,406 |
| Credit contracts | $(197,643) | $ — | $ — | $(197,643) |
| Total | $(197,643) | $756,681 | $251,406 | $810,444 |
Other
The preparation of financial statements in conformity with GAAP requires management to make estimates and assumptions that affect the amounts of assets, liabilities, expenses and revenues reported in the financial statements. Actual results could differ from those estimated.
3. SHARES OF BENEFICIAL INTEREST
The following tables summarize share activity:
| Year Ended November 30 | 2010 | 2009 |
| Class A Shares: | Shares | Amount | Shares | Amount |
| Shares sold | 1,596,436 | $25,454,229 | 1,851,463 | $25,328,003 |
| Proceeds from shares issued in connection with the tax-free transfer of assets from Federated Target ETF Fund 2015 | — | — | 138,737 | 1,950,574 |
| Proceeds from shares issued in connection with the tax-free transfer of assets from Federated Target ETF Fund 2025 | — | — | 192,254 | 2,703,126 |
| Proceeds from shares issued in connection with the tax-free transfer of assets from Federated Target ETF Fund 2035 | — | — | 184,524 | 2,594,400 |
| Shares issued to shareholders in payment of distributions declared | 9,189 | 147,485 | 182,962 | 2,452,902 |
| Shares redeemed | (3,164,818) | (50,212,436) | (2,550,336) | (34,968,933) |
NET CHANGE RESULTING
FROM CLASS A SHARE TRANSACTIONS | (1,559,193) | $(24,610,722) | (396) | $60,072 |
Annual Shareholder Report56
| Year Ended November 30 | 2010 | 2009 |
| Class B Shares: | Shares | Amount | Shares | Amount |
| Shares sold | 169,159 | $2,692,461 | 274,805 | $3,808,687 |
| Shares issued to shareholders in payment of distributions declared | 1,269 | 20,305 | 19,052 | 250,988 |
| Shares redeemed | (589,834) | (9,303,277) | (656,572) | (8,884,783) |
NET CHANGE RESULTING
FROM CLASS B SHARE TRANSACTIONS | (419,406) | $(6,590,511) | (362,715) | $(4,825,108) |
| Year Ended November 30 | 2010 | 2009 |
| Class C Shares: | Shares | Amount | Shares | Amount |
| Shares sold | 1,210,690 | $19,095,474 | 1,002,107 | $13,808,180 |
| Shares issued to shareholders in payment of distributions declared | 1,789 | 28,514 | 19,606 | 258,296 |
| Shares redeemed | (840,318) | (13,222,025) | (783,732) | (10,601,445) |
NET CHANGE RESULTING
FROM CLASS C SHARE TRANSACTIONS | 372,161 | $5,901,963 | 237,981 | $3,465,031 |
| Year Ended November 30 | 2010 | 2009 |
| Class K Shares: | Shares | Amount | Shares | Amount |
| Shares sold | 1,528,082 | $24,410,879 | 1,822,012 | $25,416,459 |
| Proceeds from shares issued in connection with the tax-free transfer of assets from Federated Target ETF Fund 2015 | — | — | 192,931 | 2,716,507 |
| Proceeds from shares issued in connection with the tax-free transfer of assets from Federated Target ETF Fund 2025 | — | — | 339,137 | 4,775,071 |
| Proceeds from shares issued in connection with the tax-free transfer of assets from Federated Target ETF Fund 2035 | — | — | 269,074 | 3,788,720 |
| Shares issued to shareholders in payment of distributions declared | 3,172 | 50,979 | 28,544 | 384,790 |
| Shares redeemed | (1,348,117) | (21,519,233) | (1,080,496) | (15,220,214) |
NET CHANGE RESULTING
FROM CLASS K SHARE TRANSACTIONS | 183,137 | $2,942,625 | 1,571,202 | $21,861,333 |
Annual Shareholder Report57
| Year Ended
11/30/2010 | Period Ended
11/30/20091 |
| Institutional Shares: | Shares | Amount | Shares | Amount |
| Shares sold | 628,146 | $9,751,000 | 86,196 | $1,282,033 |
| Proceeds from shares issued in connection with the tax-free transfer of assets from Federated Target ETF Fund 2015 | — | — | 43,066 | 605,501 |
| Proceeds from shares issued in connection with the tax-free transfer of assets from Federated Target ETF Fund 2025 | — | — | 40,945 | 575,698 |
| Proceeds from shares issued in connection with the tax-free transfer of assets from Federated Target ETF Fund 2035 | — | — | 40,426 | 568,406 |
| Shares issued to shareholders in payment of distributions declared | 154 | 2,469 | 1,079 | 16,198 |
| Shares redeemed | (71,264) | (1,131,886) | (34,334) | (537,689) |
NET CHANGE RESULTING
FROM INSTITUTIONAL SHARE TRANSACTIONS | 557,036 | $8,621,583 | 177,378 | $2,510,147 |
NET CHANGE RESULTING
FROM TOTAL FUND SHARE TRANSACTIONS | (866,265) | $(13,735,062) | 1,623,450 | $23,071,475 |
| 1 | Reflects operations from June 12, 2009, (date of initial investment) to November 30, 2009. |
4. FEDERAL TAX INFORMATION
The timing and character of income and capital gain distributions are determined in accordance with income tax regulations, which may differ from GAAP. These differences are due in part to differing treatments for foreign currency transactions, partnership income reclassifications, swap income reclassifications, expiration of capital loss carryforwards and discount accretion/premium amortization on debt securities.
For the year ended November 30, 2010, permanent differences identified and reclassified among the components of net assets were as follows:
| Increase (Decrease) |
| Paid-In Capital | Undistributed
Net Investment
Income (Loss) | Accumulated
Net Realized
Gain (Loss) |
| $(184,209) | $(1,928,562) | $2,112,771 |
Net investment income (loss), net realized gains (losses), and net assets were not affected by this reclassification.
Annual Shareholder Report
58
The tax character of distributions as reported on the Statement of Changes in Net Assets for the years ended November 30, 2010 and 2009, was as follows: | 2010 | 2009 |
| Ordinary income | $264,068 | $3,586,307 |
As of November 30, 2010, the components of distributable earnings on a tax basis were as follows:
| Net unrealized appreciation | $20,684,603 |
| Capital loss carryforwards and deferrals | $(20,015,853) |
The difference between book-basis and tax-basis net unrealized appreciation/depreciation is attributable in part to differing treatments for the deferral of losses on wash sales, partnership transactions, defaulted bond interest and discount accretion/premium amortization on debt securities.
At November 30, 2010, the cost of investments for federal tax purposes was $231,927,784. The net unrealized appreciation of investments for federal tax purposes excluding any unrealized appreciation/depreciation resulting from changes in foreign currency exchange rates, outstanding foreign currency commitments, futures contracts and swap contracts was $20,809,727. This consists of net unrealized appreciation from investments for those securities having an excess of value over cost of $22,809,137 and net unrealized depreciation from investments for those securities having an excess of cost over value of $1,999,410.
At November 30, 2010, the Fund had a capital loss carryforward of $20,009,470 which will reduce the Fund's taxable income arising from future net realized gains on investments, if any, to the extent permitted by the Code and thus will reduce the amount of distributions to shareholders which would otherwise be necessary to relieve the Fund of any liability for federal income tax. Pursuant to the Code, such capital loss carryforward will expire as follows:
| Expiration Year | Expiration Amount |
| 2015 | $125,656 |
| 2016 | $15,468,975 |
| 2017 | $4,414,839 |
As a result of the tax-free transfer of assets from Federated Target ETF Fund 2015, Federated Target ETF Fund 2025 and Federated Target ETF Fund 2035, certain capital loss carryforwards listed above may be limited.
The Fund used capital loss carryforwards of $12,813,710 to offset taxable capital gains realized during the year ended November 30, 2010.
As of November 30, 2010, for federal income tax purposes, the Fund had $6,383 in straddle loss deferrals.
Annual Shareholder Report
59
5. INVESTMENT ADVISER FEE AND OTHER TRANSACTIONS WITH AFFILIATESInvestment Adviser Fee
Federated Global Investment Management Corp. is the Fund's investment adviser (the “Adviser”). The advisory agreement between the Fund and the Adviser provides for an annual fee equal to: (a) a maximum of 0.55% of the average daily net assets of the Fund; and (b) 4.50% of the gross income of the Fund, excluding gains or losses. Subject to the terms described in the Expense Limitation note, the Adviser may voluntarily choose to waive any portion of its fee. For the year ended November 30, 2010, the Adviser voluntarily waived $94,324 of its fee. For the year ended November 30, 2010, an affiliate of the Adviser reimbursed $118,347 of transfer and dividend disbursing agent fees and expenses.
Certain of the Fund's assets are managed by Federated Investment Management Company (FIMCO) and Federated Equity Management Company of Pennsylvania (FEMCOPA) (the “Sub-Advisers”). Under the terms of a sub-advisory agreement between the Adviser and the Sub-Advisers, the Sub-Advisers receive an allocable portion of the Fund's adviser fee. The fee is paid by the Adviser out of its resources and is not an incremental Fund expense. For the year ended November 30, 2010, FIMCO and FEMCOPA earned fees of $197,278 and $769,765, respectively.
Administrative Fee
Federated Administrative Services (FAS), under the Administrative Services Agreement, provides the Fund with administrative personnel and services. The fee paid to FAS is based on the average aggregate daily net assets of certain Federated funds as specified below:
| Administrative Fee | Average Aggregate Daily Net Assets
of the Federated Funds |
| 0.150% | on the first $5 billion |
| 0.125% | on the next $5 billion |
| 0.100% | on the next $10 billion |
| 0.075% | on assets in excess of $20 billion |
The administrative fee received during any fiscal year shall be at least $150,000 per portfolio and $40,000 per each additional class of Shares. Subject to the terms described in the Expense Limitation note, FAS may voluntarily choose to waive any portion of its fee. For the year ended November 30, 2010, the net fee paid to FAS was 0.100% of average daily net assets of the Fund. FAS waived $62,539 of its fee.
Annual Shareholder Report
60
Distribution Services FeeThe Fund has adopted a Distribution Plan (the “Plan”) pursuant to Rule 12b-1 under the Act. Under the terms of the Plan, the Fund will compensate Federated Securities Corp. (FSC), the principal distributor, from the daily net assets of the Fund's Class B Shares, Class C Shares and Class K Shares to finance activities intended to result in the sale of these shares. The Plan provides that the Fund may incur distribution expenses at the following percentages of average daily net assets annually, to compensate FSC:
| Share Class Name | Percentage of Average Daily
Net Assets of Class |
| Class B Shares | 0.75% |
| Class C Shares | 0.75% |
| Class K Shares | 0.50% |
Subject to the terms described in the Expense Limitation note, FSC may voluntarily choose to waive any portion of its fee. When FSC receives fees, it may pay some or all of them to financial intermediaries whose customers purchase shares. For the year ended November 30, 2010, FSC retained $9,452 of fees paid by the Fund.
Sales Charges
Front-end sales charges and contingent deferred sales charges (CDSC) do not represent expenses of the Fund. They are deducted from the proceeds of sales of Fund shares prior to investment or from redemption proceeds prior to remittance, as applicable. For the year ended November 30, 2010, FSC retained $7,371 in sales charges from the sale of Class A Shares. FSC also retained $303 of CDSC relating to redemptions of Class C Shares.
Shareholder Services Fee
The Fund may pay fees (“Service Fees”) up to 0.25% of the average daily net assets of the Fund's Class A Shares, Class B Shares and Class C Shares to financial intermediaries or to Federated Shareholder Services Company (FSSC) for providing services to shareholders and maintaining shareholder accounts. Financial intermediaries may include a company affiliated with management of Federated Investors, Inc. A financial intermediary affiliated with management of Federated Investors, Inc. received $1,630 of Service Fees for the year ended November 30, 2010. Subject to the terms described in the Expense Limitation note, FSSC may voluntarily reimburse the Fund for shareholder services fees. For the year ended November 30, 2010, FSSC did not receive any fees paid by the Fund.
Expense Limitation
The Adviser and its affiliates (which may include FSC, FAS and FSSC) have voluntarily agreed to waive their fees and/or reimburse expenses so that the total annual fund operating expenses (as shown in the financial highlights, but excluding expenses allocated from affiliated partnerships) paid by the Fund's Class A Shares, Class B Shares, Class C Shares, Class K Shares and Institutional Shares (after the voluntary waivers and/or reimbursements) will not exceed 1.25%, 2.05%, 2.05%, 1.75% and 1.00% (the “Fee Limit”), respectively, through the later of (the “Termination Date”): (a) January 31, 2012; or (b) the date of the Fund's next effective Prospectus. While the Adviser and its affiliates currently do not anticipate terminating or increasing these arrangements prior to the Termination Date, these arrangements may only be terminated or the Fee Limit increased prior to the Termination Date with the agreement of the Trustees.
Annual Shareholder Report
61
Interfund TransactionsDuring the year ended November 30, 2010, the Fund engaged in purchase and sale transactions with funds that have a common investment adviser (or affiliated investment advisers), common Directors/Trustees, and/or common Officers. These purchase and sale transactions complied with Rule 17a-7 under the Act and amounted to $143,902 and $39,293, respectively.
General
Certain Officers and Trustees of the Fund are Officers and Directors or Trustees of the above companies.
Transactions Involving Affiliated Holdings
Affiliated holdings are mutual funds which are managed by the Adviser or an affiliate of the Adviser. The Adviser has agreed to reimburse the Fund for certain investment adviser fees as a result of transactions in other affiliated mutual funds. For the year ended November 30, 2010, the Adviser reimbursed $169,371. Transactions involving affiliated holdings during the year ended November 30, 2010, were as follows:
| Affiliates | Balance of
Shares Held
11/30/2009 | Purchases/
Additions | Sales/
Reductions | Balance of
Shares Held
11/30/2010 | Value | Dividend
Income/
Affiliated
Investment
Income |
| Emerging Markets Fixed Income Core Fund | 199,106 | 102,654 | 111,900 | 189,860 | $5,201,991 | $384,029 |
| Federated InterContinental Fund, Institutional Shares | — | 290,142 | 13,283 | 276,859 | $12,669,071 | $ — |
Federated Mid
Cap Growth
Strategies Fund, Institutional Shares | — | 562,861 | 161,213 | 401,648 | $13,439,154 | $ — |
| Federated Mortgage Core Portfolio | 946,934 | 477,556 | 500,823 | 923,667 | $9,365,986 | $439,262 |
| Federated Project and Trade Finance Core Fund | — | 305,951 | — | 305,951 | $3,053,394 | $54,269 |
| Federated Prime Value Obligations Fund, Institutional Shares | 36,095,022 | 171,700,562 | 174,663,351 | 33,132,233 | $33,132,233 | $61,481 |
| High Yield Bond Portfolio | 1,867,382 | 1,055,651 | 120,192 | 2,802,841 | $18,218,469 | $1,411,154 |
TOTAL OF AFFILIATED
TRANSACTIONS | 39,108,444 | 174,495,377 | 175,570,762 | 38,033,059 | $95,080,298 | $2,350,195 |
Annual Shareholder Report62
6. EXPENSE Reduction
The Fund directs portfolio trades to a broker that in turn pays a portion of the Fund's operating expenses. For the year ended November 30, 2010, the Fund's expenses were reduced by $28,581 under these arrangements.
7. Investment TRANSACTIONS
Purchases and sales of investments, excluding long-term U.S. government securities and short-term obligations, for the year ended November 30, 2010, were as follows:
| Purchases | $388,642,074 |
| Sales | $386,962,132 |
8. LINE OF CREDIT
The Fund participates in a $100,000,000 unsecured, uncommitted revolving line of credit (LOC) agreement with PNC Bank. The LOC was made available for extraordinary or emergency purposes, primarily for financing redemption payments. Borrowings are charged interest at a rate offered to the Fund by PNC Bank at the time of the borrowing. As of November 30, 2010, there were no outstanding loans. During the year ended November 30, 2010, the Fund did not utilize the LOC.
9. INTERFUND LENDING
Pursuant to an Exemptive Order issued by the Securities and Exchange Commission, the Fund, along with other funds advised by subsidiaries of Federated Investors, Inc., may participate in an interfund lending program. This program provides an alternative credit facility allowing the Fund to borrow from other participating affiliated funds. As of November 30, 2010, there were no outstanding loans. During the year ended November 30, 2010, the program was not utilized.
10. Legal Proceedings
Since February, 2004, Federated Investors, Inc. and related entities (collectively, “Federated”), have been named as defendants in several lawsuits that are now pending in the United States District Court for the Western District of Pennsylvania. These lawsuits have been consolidated into a single action alleging excessive advisory fees involving one of the Federated-sponsored mutual funds (“Federated Funds”). Federated and its counsel have been defending this litigation. Additional lawsuits based upon similar allegations may be filed in the future. The potential impact of these lawsuits, all of which seek monetary damages, attorneys' fees and expenses, and future potential similar suits is uncertain. Although we do not believe that these lawsuits will have a material adverse effect on the Federated Funds, there can be no assurance that these suits, ongoing adverse publicity and/or other developments resulting from the allegations in these matters will not result in increased redemptions, or reduced sales, of shares of the Federated Funds or other adverse consequences for the Federated Funds.
11. Subsequent events
Effective December 31, 2010, Class K Shares will be redesignated as Class R Shares.
Effective January 31, 2011, the Fund's name will change to Federated Asset Allocation Fund.
Management has evaluated subsequent events through the date the financial statements were issued, and determined that no additional events have occurred that require disclosure.
Annual Shareholder Report
63
12. FEDERAL TAX INFORMATION (UNAUDITED)For the fiscal year ended November 30, 2010, 81.53% of total income distributions made by the Fund are qualifying dividends which may be subject to a maximum tax rate of 15%, as provided for by the Jobs and Growth Tax Relief Act of 2003. Complete information is reported in conjunction with the reporting of your distributions on Form 1099-DIV.
Of the ordinary income distributions made by the Fund during the year ended November 30, 2010, 78.12% qualify for the dividend received deduction available to corporate shareholders.
Annual Shareholder Report64
Report of Independent Registered Public Accounting Firm
TO THE BOARD OF TRUSTEES AND SHAREHOLDERS OF Federated stock and bond fund:
We have audited the accompanying statement of assets and liabilities, including the portfolio of investments, of the Federated Stock and Bond Fund (the “Fund”) as of November 30, 2010, and the related statement of operations for the year then ended, the statements of changes in net assets for each of the years in the two-year period then ended and the financial highlights for each of the years in the five-year period then ended. These financial statements and financial highlights are the responsibility of the Fund's management. Our responsibility is to express an opinion on these financial statements and financial highlights based on our audits.
We conducted our audits in accordance with the standards of the Public Company Accounting Oversight Board (United States). Those standards require that we plan and perform the audit to obtain reasonable assurance about whether the financial statements and financial highlights are free of material misstatement. An audit includes examining, on a test basis, evidence supporting the amounts and disclosures in the financial statements. Our procedures included confirmation of securities owned as of November 30, 2010 by correspondence with the custodian, transfer agent, and brokers, or by other appropriate auditing procedures. An audit also includes assessing the accounting principles used and significant estimates made by management, as well as evaluating the overall financial statement presentation. We believe that our audits provide a reasonable basis for our opinion.
In our opinion, the financial statements and financial highlights referred to above present fairly, in all material respects, the financial position of the Federated Stock and Bond Fund as of November 30, 2010 and the results of its operations for the year then ended the changes in its net assets for each of the years in the two-year period then ended and the financial highlights for each of the years in the five-year period then ended, in conformity with U.S. generally accepted accounting principles.
Boston, Massachusetts
January 25, 2011
Annual Shareholder Report65
Board of Trustees and Trust Officers
The Board of Trustees is responsible for managing the Trust's business affairs and for exercising all the Trust's powers except those reserved for the shareholders. The following tables give information about each Trustee and the senior officers of the Fund. Where required, the tables separately list Trustees who are “interested persons” of the Fund (i.e., “Interested” Trustees) and those who are not (i.e., “Independent” Trustees). Unless otherwise noted, the address of each person listed is Federated Investors Tower, 1001 Liberty Avenue, Pittsburgh, PA 15222. The address of all Independent Trustees listed is 4000 Ericsson Drive, Warrendale, PA 15086-7561; Attention: Mutual Fund Board. As of December 31, 2010, the Trust comprised one portfolio(s), and the Federated Fund Family consisted of 43 investment companies (comprising 136 portfolios). Unless otherwise noted, each Officer is elected annually. Unless otherwise noted, each Trustee oversees all portfolios in the Federated Fund Family and serves for an indefinite term. The Fund's Statement of Additional Information includes additional information about Trust Trustees and is available, without charge and upon request, by calling 1-800-341-7400.
Interested Trustees Background
Name
Birth Date
Positions Held with Trust
Date Service Began | Principal Occupation(s) for Past Five Years,
Other Directorships Held and Previous Position(s) |
John F. Donahue*
Birth Date: July 28, 1924
Trustee
Began serving: December 1956 | Principal Occupations: Director or Trustee of the Federated Fund Family; Chairman and Director, Federated Investors, Inc.; Chairman of the Federated Fund Family's Executive Committee.
Previous Positions: Chairman of the Federated Fund Family; Trustee, Federated Investment Management Company; Chairman and Director, Federated Investment Counseling. |
J. Christopher Donahue*
Birth Date: April 11, 1949
PRESIDENT AND Trustee
Began serving: November 1998 | Principal Occupations: Principal Executive Officer and President of the Federated Fund Family; Director or Trustee of some of the Funds in the Federated Fund Family; President, Chief Executive Officer and Director, Federated Investors, Inc.; Chairman and Trustee, Federated Investment Management Company; Trustee, Federated Investment Counseling; Chairman and Director, Federated Global Investment Management Corp.; Chairman, Federated Equity Management Company of Pennsylvania and Passport Research, Ltd. (investment advisory subsidiary of Federated); Trustee, Federated Shareholder Services Company; Director, Federated Services Company.
Previous Positions: President, Federated Investment Counseling; President and Chief Executive Officer, Federated Investment Management Company, Federated Global Investment Management Corp. and Passport Research, Ltd. |
| * | Family relationships and reasons for “interested” status: John F. Donahue is the father of J. Christopher Donahue; both are “interested” due to their beneficial ownership of shares of Federated Investors, Inc. and the positions they hold with Federated and its subsidiaries. |
Annual Shareholder Report66
INDEPENDENT Trustees Background
Name
Birth Date
Positions Held with Trust
Date Service Began | Principal Occupation(s) for Past Five Years,
Other Directorships Held, Previous Position(s) and Qualifications |
Nicholas P. Constantakis, CPA
Birth Date: September 3, 1939
Trustee
Began serving: November 1998 | Principal Occupation: Director or Trustee of the Federated Fund Family.
Other Directorship Held: Director and Chairman of the Audit Committee, Michael Baker Corporation (architecture, engineering and construction services).
Previous Position: Partner, Andersen Worldwide SC.
Qualifications: Public accounting and director experience. |
John F. Cunningham
Birth Date: March 5, 1943
Trustee
Began serving: November 1998 | Principal Occupation: Director or Trustee of the Federated Fund Family.
Other Directorships Held: Chairman, President and Chief Executive Officer, Cunningham & Co., Inc. (strategic business consulting); Trustee Associate, Boston College.
Previous Positions: Director, Redgate Communications and EMC Corporation (computer storage systems); Chairman of the Board and Chief Executive Officer, Computer Consoles, Inc.; President and Chief Operating Officer, Wang Laboratories; Director, First National Bank of Boston; Director, Apollo Computer, Inc.
Qualifications: Business management and director experience. |
Maureen Lally-Green
Birth Date: July 5, 1949
Trustee
Began serving: August 2009 | Principal Occupations: Director or Trustee of the Federated Fund Family; Director, Office of Church Relations, Diocese of Pittsburgh; Adjunct Professor of Law, Duquesne University School of Law.
Other Directorships Held: Director, Auberle; Trustee, St. Francis University; Director, Ireland Institute of Pittsburgh; Director, UPMC Mercy Hospital; Regent, St. Vincent Seminary; Director, Epilepsy Foundation of Western and Central Pennsylvania; Director, Saint Thomas More Society, Allegheny County; Director, Carlow University.
Previous Position: Pennsylvania Superior Court Judge.
Qualifications: Legal and director experience. |
Peter E. Madden
Birth Date: March 16, 1942
Trustee
Began serving: August 1991 | Principal Occupation: Director or Trustee, and Chairman of the Board of Directors or Trustees, of the Federated Fund Family.
Previous Positions: Representative, Commonwealth of Massachusetts General Court; President, Chief Operating Officer and Director, State Street Bank and Trust Company and State Street Corporation (retired); Director, VISA USA and VISA International; Chairman and Director, Massachusetts Bankers Association; Director, Depository Trust Corporation; Director, The Boston Stock Exchange.
Qualifications: Business management, mutual fund services and director experience. |
Annual Shareholder Report67
Name
Birth Date
Positions Held with Trust
Date Service Began | Principal Occupation(s) for Past Five Years,
Other Directorships Held, Previous Position(s) and Qualifications |
Charles F. Mansfield, Jr.
Birth Date: April 10, 1945
Trustee
Began serving: November 1998 | Principal Occupations: Director or Trustee and Chairman of the Audit Committee of the Federated Fund Family; Management Consultant.
Previous Positions: Chief Executive Officer, PBTC International Bank; Partner, Arthur Young & Company (now Ernst & Young LLP); Chief Financial Officer of Retail Banking Sector, Chase Manhattan Bank; Senior Vice President, HSBC Bank USA (formerly, Marine Midland Bank); Vice President, Citibank; Assistant Professor of Banking and Finance, Frank G. Zarb School of Business, Hofstra University; Executive Vice President, DVC Group, Inc. (marketing, communications and technology).
Qualifications: Banking, business management and director experience. |
R. James Nicholson
Birth Date: February 4, 1938
Trustee
Began serving: January 2008 | Principal Occupations: Director or Trustee of the Federated Fund Family; Senior Counsel, Brownstein Hyatt Farber Schrek, P.C.; Former Secretary of the U.S. Dept. of Veterans Affairs; Former U.S. Ambassador to the Holy See; Former Chairman of the Republican National Committee.
Other Directorships Held: Director, Horatio Alger Association; Director, The Daniels Fund.
Previous Positions: Colonel, U.S. Army Reserve; Partner, Calkins, Kramer, Grimshaw and Harring, P.C.; General Counsel, Colorado Association of Housing and Building; Chairman and CEO, Nicholson Enterprises, Inc. (real estate holding company); Chairman and CEO, Renaissance Homes of Colorado.
Qualifications: Legal, government, business management and director experience. |
Thomas M. O'Neill
Birth Date: June 14, 1951
Trustee
Began serving: October 2006 | Principal Occupations: Director or Trustee of the Federated Fund Family; Sole Proprietor, Navigator Management Company (investment and strategic consulting).
Other Directorships Held: Board of Overseers, Children's Hospital of Boston; Visiting Committee on Athletics, Harvard College.
Previous Positions: Chief Executive Officer and President, Managing Director and Chief Investment Officer, Fleet Investment Advisors; President and Chief Executive Officer, Aeltus Investment Management, Inc.; General Partner, Hellman, Jordan Management Co., Boston, MA; Chief Investment Officer, The Putnam Companies, Boston, MA; Credit Analyst and Lending Officer, Fleet Bank; Director and Consultant, EZE Castle Software (investment order management software); Director, Midway Pacific (lumber).
Qualifications: Business management, mutual fund, director and investment experience. |
Annual Shareholder Report68
Name
Birth Date
Positions Held with Trust
Date Service Began | Principal Occupation(s) for Past Five Years,
Other Directorships Held, Previous Position(s) and Qualifications |
John S. Walsh
Birth Date: November 28, 1957
Trustee
Began serving: November 1998 | Principal Occupations: Director or Trustee of the Federated Fund Family; President and Director, Heat Wagon, Inc. (manufacturer of construction temporary heaters); President and Director, Manufacturers Products, Inc. (distributor of portable construction heaters); President, Portable Heater Parts, a division of Manufacturers Products, Inc.
Previous Position: Vice President, Walsh & Kelly, Inc.
Qualifications: Business management and director experience. |
James F. Will
Birth Date: October 12, 1938
Trustee
Began serving: April 2006 | Principal Occupations: Director or Trustee of the Federated Fund Family; formerly, Vice Chancellor and President, Saint Vincent College.
Other Directorships Held: Trustee, Saint Vincent College; Director, Alleghany Corporation; Trustee, Wheeling Jesuit University; Director, Liberty Tire Recycling.
Previous Positions: Chairman, President and Chief Executive Officer, Armco, Inc.; President and Chief Executive Officer, Cyclops Industries; President and Chief Operating Officer, Kaiser Steel Corporation.
Qualifications: Business management, education and director experience. |
OFFICERS
Name
Birth Date
Address
Positions Held with Trust
Date Service Began | Principal Occupation(s) for Past Five Years
and Previous Position(s) |
John W. McGonigle
Birth Date: October 26, 1938
EXECUTIVE VICE PRESIDENT AND SECRETARY
Began serving: September 1969 | Principal Occupations: Executive Vice President and Secretary of the Federated Fund Family; Vice Chairman, Executive Vice President, Secretary and Director, Federated Investors, Inc.
Previous Positions: Trustee, Federated Investment Management Company and Federated Investment Counseling; Director, Federated Global Investment Management Corp., Federated Services Company and Federated Securities Corp. |
Richard A. Novak
Birth Date: December 25, 1963
TREASURER
Began serving: January 2006 | Principal Occupations: Principal Financial Officer and Treasurer of the Federated Fund Family; Senior Vice President, Federated Administrative Services; Financial and Operations Principal for Federated Securities Corp., Edgewood Services, Inc. and Southpointe Distribution Services, Inc.
Previous Positions: Controller of Federated Investors, Inc.; Vice President, Finance of Federated Services Company; held various financial management positions within The Mercy Hospital of Pittsburgh; Auditor, Arthur Andersen & Co. |
Annual Shareholder Report69
Name
Birth Date
Address
Positions Held with Trust
Date Service Began | Principal Occupation(s) for Past Five Years
and Previous Position(s) |
Richard B. Fisher
Birth Date: May 17, 1923
VICE PRESIDENT
Began serving: May 1976 | Principal Occupations: Vice Chairman or Vice President of some of the Funds in the Federated Fund Family; Vice Chairman, Federated Investors, Inc.; Chairman, Federated Securities Corp.
Previous Positions: President and Director or Trustee of some of the Funds in the Federated Fund Family; Executive Vice President, Federated Investors, Inc.; Director and Chief Executive Officer, Federated Securities Corp. |
John B. Fisher
Birth Date: May 16, 1956
VICE PRESIDENT
Began serving: November 2004 | Principal Occupations: President, Director/Trustee and CEO, Federated Advisory Services Company, Federated Equity Management Company of Pennsylvania, Federated Global Investment Management Corp., Federated Investment Counseling, Federated Investment Management Company; President and CEO of Passport Research, Ltd.; President of some of the Funds in the Federated Fund Family; Director, Federated Investors Trust Company.
Previous Positions: President and Director of the Institutional Sales Division of Federated Securities Corp.; President and Director of Federated Investment Counseling; Director, Edgewood Securities Corp.; Director, Federated Services Company; Director, Federated Investors, Inc.; Chairman and Director, Southpointe Distribution Services, Inc.; President, Technology, Federated Services Company. |
Brian P. Bouda
Birth Date: February 28, 1947
CHIEF COMPLIANCE OFFICER AND SENIOR VICE PRESIDENT
Began serving: August 2004 | Principal Occupations: Senior Vice President and Chief Compliance Officer of the Federated Fund Family; Vice President and Chief Compliance Officer of Federated Investors, Inc. and Chief Compliance Officer of its subsidiaries. Mr. Bouda joined Federated in 1999 and is a member of the American Bar Association and the State Bar Association of Wisconsin. |
Stephen F. Auth
Birth Date: September 3, 1956
450 Lexington Avenue
Suite 3700
New York, NY 10017-3943
CHIEF INVESTMENT OFFICER
Began serving: November 2002 | Principal Occupations: Mr. Auth is Chief Investment Officer of this Fund and various other Funds in the Federated Fund Family; Executive Vice President, Federated Investment Counseling, Federated Global Investment Management Corp. and Federated Equity Management Company of Pennsylvania.
Previous Positions: Executive Vice President, Federated Investment Management Company, and Passport Research, Ltd. (investment advisory subsidiary of Federated); Senior Vice President, Global Portfolio Management Services Division; Senior Vice President, Federated Investment Management Company and Passport Research, Ltd.; Senior Managing Director and Portfolio Manager, Prudential Investments. |
Annual Shareholder Report70
Evaluation and Approval of Advisory Contract – May 2010
Federated Stock and Bond Fund (the “Fund”)
The Fund's Board reviewed the Fund's investment advisory and subadvisory contracts at meetings held in May 2010. The Board's decision regarding these contracts reflects the exercise of its business judgment on whether to continue the existing arrangements.
In this connection, the Federated funds' Board had previously appointed a Senior Officer, whose duties include specified responsibilities relating to the process by which advisory fees are to be charged to a Federated fund. The Senior Officer has the authority to retain consultants, experts, or staff as may be reasonably necessary to assist in the performance of his duties, reports directly to the Board, and may be terminated only with the approval of a majority of the independent members of the Board. The Senior Officer prepared and furnished to the Board an independent, written evaluation that covered topics discussed below. The Board considered that evaluation, along with other information, in deciding to approve the advisory and subadvisory contracts.
During its review of these contracts, the Board considered compensation and benefits received by the Adviser and subadvisers. This included the fees received for services provided to the Fund by other entities in the Federated organization and research services (if any) received by the Adviser from brokers that execute Federated fund trades, as well as advisory fees. The Board is also familiar with and considered judicial decisions concerning allegedly excessive investment advisory fees, which have indicated that the following factors may be relevant to an Adviser's fiduciary duty with respect to its receipt of compensation from a fund: the nature and quality of the services provided by the Adviser, including the performance of the fund; the Adviser's cost of providing the services; the extent to which the Adviser may realize “economies of scale” as a fund grows larger; any indirect benefits that may accrue to the Adviser and its affiliates as a result of the Adviser's relationship with a fund; performance and expenses of comparable funds; and the extent to which the independent Board members are fully informed about all facts the Board deems relevant bearing on the Adviser's services and fees. The Board further considered management fees (including any components thereof) charged to institutional and other clients of the Adviser and subadvisers for what might be viewed as like services, and the cost to the Adviser and its affiliates of supplying services pursuant to the management fee agreements, excluding any intra-corporate profit and profit margins of the Adviser and its affiliates for supplying such services. The Board was aware of these factors and was guided by them in its review of the Fund's advisory and subadvisory contracts to the extent it considered them to be appropriate and relevant, as discussed further below.
Annual Shareholder Report
71
The Board considered and weighed these circumstances in light of its substantial accumulated experience in governing the Fund and working with Federated on matters relating to the Federated funds, and was assisted in its deliberations by independent legal counsel. Throughout the year, the Board has requested and received substantial and detailed information about the Fund and the Federated organization that was in addition to the extensive materials that comprise and accompany the Senior Officer's evaluation. Federated provided much of this information at each regular meeting of the Board, and furnished additional reports in connection with the particular meeting at which the Board's formal review of the advisory and subadvisory contracts occurred. Between regularly scheduled meetings, the Board also received information on particular matters as the need arose. Thus, the Board's consideration of the advisory and subadvisory contracts included review of the Senior Officer's evaluation, accompanying data and additional reports covering such matters as: the Adviser's and subadvisers' investment philosophy, revenue, profitability, personnel and processes; investment and operating strategies; the Fund's short- and long-term performance (in absolute terms, both on a gross basis and net of expenses, as well as in relationship to its particular investment program and certain competitor or “peer group” funds and/or other benchmarks, as appropriate), and comments on the reasons for performance; the Fund's investment objectives; the Fund's expenses (including the advisory fee itself and the overall expense structure of the Fund, both in absolute terms and relative to similar and/or competing funds, with due regard for contractual or voluntary expense limitations); the use and allocation of brokerage commissions derived from trading the Fund's portfolio securities (if any); and the nature, quality and extent of the advisory and other services provided to the Fund by the Adviser and its affiliates. The Board also considered the preferences and expectations of Fund shareholders and their relative sophistication; the continuing state of competition in the mutual fund industry and market practices; the range of comparable fees for similar funds in the mutual fund industry; the Fund's relationship to the Federated family of funds which include a comprehensive array of funds with different investment objectives, policies and strategies which are available for exchange without the incurrence of additional sales charges; compliance and audit reports concerning the Federated funds and the Federated companies that service them (including communications from regulatory agencies), as well as Federated's responses to any issues raised therein; and relevant developments in the mutual fund industry and how the Federated funds and/or Federated are responding to them. The Board's evaluation process is evolutionary. The criteria considered and the emphasis placed on relevant criteria change in recognition of changing circumstances in the mutual fund marketplace.Annual Shareholder Report
72
With respect to the Fund's performance and expenses in particular, the Board has found the use of comparisons to other mutual funds with comparable investment programs to be relevant, given the high degree of competition in the mutual fund business. The Board focused on comparisons with other similar mutual funds more heavily than non-mutual fund products or services because it is believed that they are more relevant. For example, other mutual funds are the products most like the Fund, they are readily available to Fund shareholders as alternative investment vehicles, and they are the type of investment vehicle in fact chosen and maintained by the Fund's investors. The range of their fees and expenses therefore appears to be a generally reliable indication of what consumers have found to be reasonable in the precise marketplace in which the Fund competes. The Fund's ability to deliver competitive performance when compared to its peer group was a useful indicator of how the Adviser is executing the Fund's investment program, which in turn assisted the Board in reaching a conclusion that the nature, extent, and quality of the Adviser's investment management services were such as to warrant continuation of the advisory contract. In this regard, the Senior Officer has reviewed Federated's fees for providing advisory services to products outside the Federated family of funds (e.g., institutional and separate accounts). He concluded that mutual funds and institutional accounts are inherently different products. Those differences include, but are not limited to, different types of targeted investors; being subject to different laws and regulations; different legal structures; different average account sizes; different associated costs; different portfolio management techniques made necessary by different cash flows; and portfolio manager time spent in review of securities pricing. The Senior Officer did not consider these fee schedules to be determinative in judging the appropriateness of mutual fund advisory contracts.The Senior Officer reviewed reports compiled by Federated, using data supplied by independent fund ranking organizations, regarding the performance of, and fees charged by, other mutual funds, noting his view that comparisons to fund peer groups are relevant in judging the reasonableness of proposed fees.
For the periods covered by the report, the Fund's performance for the three-year and five-year periods was above the median of the relevant peer group, and the Fund's performance fell below the median of the relevant peer group for the one-year period. The Board discussed the Fund's performance with the Adviser and recognized the efforts being undertaken by the Adviser. The Board will continue to monitor these efforts and the performance of the Fund.
The Board also received financial information about Federated, including reports on the compensation and benefits Federated derived from its relationships with the Federated funds. These reports covered not only the fees under the advisory contracts, but also fees received by Federated's subsidiaries for providing other services to the Federated funds under separate contracts (e.g., for serving as the Federated funds' administrator). The reports also discussed any indirect benefit Federated may derive from its receipt of research Annual Shareholder Report
73
services from brokers who execute Federated fund trades. In addition, the Board considered the fact that, in order for a fund to be competitive in the marketplace, Federated and its affiliates frequently waived fees and/or reimbursed expenses and have disclosed to fund investors and/or indicated to the Board their intention to do so in the future, where appropriate. Moreover, the Board receives regular reports regarding the institution or elimination of these voluntary waivers.Federated furnished reports, requested by the Senior Officer, that reported revenues on a fund-by-fund basis and made estimates of the allocation of expenses on a fund-by-fund basis, using allocation methodologies specified by the Senior Officer. The Senior Officer noted that, although they may apply consistent allocation processes, the inherent difficulties in allocating costs (and the unavoidable arbitrary aspects of that exercise) and the lack of consensus on how to allocate those costs may render such allocation reports unreliable. The allocation reports were considered in the analysis by the Board but were determined to be of limited use.
The Board and the Senior Officer also reviewed a report compiled by Federated comparing profitability information for Federated to other publicly held fund management companies. In this regard, the Senior Officer noted the limited availability of such information, but nonetheless concluded that Federated's profit margins did not appear to be excessive and the Board agreed.
The Senior Officer's evaluation also discussed the notion of possible realization of “economies of scale” as a fund grows larger. The Board considered in this regard that the Adviser has made significant and long-term investments in areas that support all of the Federated funds, such as personnel and processes for the portfolio management, compliance, and risk management functions; and systems technology; and that the benefits of these efforts (as well as any economies, should they exist) were likely to be enjoyed by the fund complex as a whole. Finally, the Board also noted the absence of any applicable regulatory or industry guidelines on this subject, which (as discussed in the Senior Officer's evaluation) is compounded by the lack of any common industry practice or general pattern with respect to structuring fund advisory fees with “breakpoints” that serve to reduce the fee as the fund attains a certain size. The Senior Officer did not recommend institution of breakpoints in pricing Federated's fund advisory services at this time.
It was noted in the materials for the Board meeting that for the period covered by the report, the Fund's investment advisory fee, after waivers and expense reimbursements, if any, was above the median of the relevant peer group. The Board reviewed the fees and other expenses of the Fund with the Adviser and was satisfied that the overall expense structure of the Fund remained competitive. The Board will continue to monitor advisory fees and other expenses borne by the Fund.
Annual Shareholder Report
74
The Senior Officer's evaluation noted his belief that the information and observations contained in his evaluation supported a finding that the proposed management fees are reasonable, and that Federated appeared to provide appropriate administrative services to the Fund for the fees paid. Under these circumstances, no changes were recommended to, and no objection was raised to, the continuation of the Fund's advisory and subadvisory contracts. The Board concluded that the nature, quality and scope of services provided the Fund by the Adviser and its affiliates were satisfactory.In its decision to continue an existing investment advisory contract, the Board was mindful of the potential disruptions of the Fund's operations and various risks, uncertainties and other effects that could occur as a result of a decision to terminate or not renew an advisory contract. In particular, the Board recognized that many shareholders have invested in the Fund on the strength of the Adviser's industry standing and reputation and with the expectation that the Adviser will have a continuing role in providing advisory services to the Fund. Thus, the Board's approval of the advisory contract reflected the fact that it is the shareholders who have effectively selected the Adviser by virtue of having invested in the Fund.
The Board based its decision to approve the advisory and subadvisory contracts on the totality of the circumstances and relevant factors and with a view to past and future long-term considerations. Not all of the factors and considerations identified above were necessarily relevant to the Fund, nor did the Board consider any one of them to be determinative. With respect to the factors that were relevant, the Board's decision to approve the contract reflects its determination that Federated's performance and actions provided a satisfactory basis to support the decision to continue the existing arrangements.
Annual Shareholder Report75
Voting Proxies on Fund Portfolio Securities
A description of the policies and procedures that the Fund uses to determine how to vote proxies, if any, relating to securities held in the Fund's portfolio is available, without charge and upon request, by calling 1-800-341-7400. A report on “Form N-PX” of how the Fund voted any such proxies during the most recent 12-month period ended June 30 is available from Federated's website at FederatedInvestors.com. To access this information from the “Products” section of the website, click on the “Prospectuses and Regulatory Reports” link under “Related Information,” then select the appropriate link opposite the name of the Fund; or select the name of the Fund and from the Fund's page, click on the “Prospectuses and Regulatory Reports” link. Form N-PX filings are also available at the SEC's website at www.sec.gov.
Quarterly Portfolio Schedule
The Fund files with the SEC a complete schedule of its portfolio holdings, as of the close of the first and third quarters of its fiscal year, on “Form N-Q.” These filings are available on the SEC's website at www.sec.gov and may be reviewed and copied at the SEC's Public Reference Room in Washington, DC. (Call 1-800-SEC-0330 for information on the operation of the Public Reference Room.) You may also access this information from the “Products” section of Federated's website at FederatedInvestors.com by clicking on “Portfolio Holdings” under “Related Information,” then selecting the appropriate link opposite the name of the Fund; or select the name of the Fund and from the Fund's page, click on the “Portfolio Holdings” link.
Annual Shareholder Report76
Mutual funds are not bank deposits or obligations, are not guaranteed by any bank and are not insured or guaranteed by the U.S. government, the Federal Deposit Insurance Corporation, the Federal Reserve Board or any other government agency. Investment in mutual funds involves investment risk, including the possible loss of principal.
This Report is authorized for distribution to prospective investors only when preceded or accompanied by the Fund's Prospectus, which contains facts concerning its objective and policies, management fees, expenses and other information.
Federated Stock and Bond Fund
Federated Investors Funds
4000 Ericsson Drive
Warrendale, PA 15086-7561
Contact us at FederatedInvestors.com
or call 1-800-341-7400.
Federated Securities Corp., Distributor
Cusip 31422C108
Cusip 31422C207
Cusip 31422C306
Cusip 31422C405
G01454-01 (1/11)
Federated is a registered mark of Federated Investors, Inc.
2011 ©Federated Investors, Inc.
Federated Stock and Bond Fund
(Effective January 31, 2011, the name of the fund will be Federated Asset Allocation Fund)
ANNUAL SHAREHOLDER REPORTNovember 30, 2010
Institutional Shares
FINANCIAL HIGHLIGHTS
SHAREHOLDER EXPENSE EXAMPLE
MANAGEMENT'S DISCUSSION OF FUND PERFORMANCE
PORTFOLIO OF INVESTMENTS SUMMARY TABLES
PORTFOLIO OF INVESTMENTS
STATEMENT OF ASSETS AND LIABILITIES
STATEMENT OF OPERATIONS
STATEMENT OF CHANGES IN NET ASSETS
NOTES TO FINANCIAL STATEMENTS
REPORT OF INDEPENDENT REGISTERED PUBLIC ACCOUNTING FIRM
BOARD OF TRUSTEES AND TRUST OFFICERS
EVALUATION AND APPROVAL OF ADVISORY CONTRACT
VOTING PROXIES ON FUND PORTFOLIO SECURITIES
QUARTERLY PORTFOLIO SCHEDULE
Financial Highlights – Institutional Shares
(For a Share Outstanding Throughout Each Period)
| Year Ended
11/30/2010 | Period Ended
11/30/20091 |
| Net Asset Value, Beginning of Period | $15.65 | $14.06 |
| Income From Investment Operations: | | |
| Net investment income | 0.232 | 0.13 |
| Net realized and unrealized gain on investments, futures contracts, swap contracts and foreign currency transactions | 1.05 | 1.56 |
| TOTAL FROM INVESTMENT OPERATIONS | 1.28 | 1.69 |
| Less Distributions: | | |
| Distributions from net investment income | (0.02) | (0.10) |
| Net Asset Value, End of Period | $16.91 | $15.65 |
| Total Return3 | 8.16% | 12.07% |
| Ratios to Average Net Assets: | | |
| Net expenses | 1.00%4 | 1.00%4,5 |
| Net investment income | 1.47% | 1.91%5 |
| Expense waiver/reimbursement6 | 0.19% | 0.13%5 |
| Supplemental Data: | | |
| Net assets, end of period (000 omitted) | $12,421 | $2,776 |
| Portfolio turnover | 184% | 254%7 |
| 1 | Reflects operations for the period from June 12, 2009 (date of initial investment) to November 30, 2009. |
| 2 | Per share number has been calculated using the average shares method. |
| 3 | Based on net asset value. Total returns for periods of less than one year are not annualized. |
| 4 | The net expense ratio is calculated without reduction for expense offset arrangements. The net expense ratios are 0.99% and 1.00% for the year ended November 30, 2010 and for the period ended November 30, 2009, respectively, after taking into account these expense reductions. |
| 5 | Computed on an annualized basis. |
| 6 | This expense decrease is reflected in both the net expense and the net investment income ratios shown above. |
| 7 | Portfolio turnover is calculated at the Fund level. Percentage indicated was calculated for the year ended November 30, 2009. |
See Notes which are an integral part of the Financial Statements
Annual Shareholder Report1
Shareholder Expense Example (unaudited)
As a shareholder of the Fund, you incur ongoing costs, including management fees and to the extent applicable, distribution (12b-1) fees and/or shareholder services fees and other Fund expenses. This Example is intended to help you to understand your ongoing costs (in dollars) of investing in the Fund and to compare these costs with the ongoing costs of investing in other mutual funds. It is based on an investment of $1,000 invested at the beginning of the period and held for the entire period from June 1, 2010 to November 30, 2010.
ACTUAL EXPENSES
The first section of the table below provides information about actual account values and actual expenses. You may use the information in this section, together with the amount you invested, to estimate the expenses that you incurred over the period. Simply divide your account value by $1,000 (for example, an $8,600 account value divided by $1,000 = 8.6), then multiply the result by the number in the first section under the heading entitled “Expenses Paid During Period” to estimate the expenses attributable to your investment during this period.
HYPOTHETICAL EXAMPLE FOR COMPARISON PURPOSES
The second section of the table below provides information about hypothetical account values and hypothetical expenses based on the Fund's actual expense ratio and an assumed rate of return of 5% per year before expenses, which is not the Fund's actual return. Thus, you should not use the hypothetical account values and expenses to estimate the actual ending account balance or your expenses for the period. Rather, these figures are required to be provided to enable you to compare the ongoing costs of investing in the Fund with other funds. To do so, compare this 5% hypothetical example with the 5% hypothetical examples that appear in the shareholder reports of the other funds.
Annual Shareholder Report
2
Please note that the expenses shown in the table are meant to highlight your ongoing costs only. Therefore, the second section of the table is useful in comparing ongoing costs only, and will not help you determine the relative total costs of owning different funds. | Beginning
Account Value
6/1/2010 | Ending
Account Value
11/30/2010 | Expenses Paid
During Period1 |
| Actual | $1,000 | $1,093.10 | $5.25 |
Hypothetical (assuming a 5% return
before expenses) | $1,000 | $1,020.05 | $5.06 |
| 1 | Expenses are equal to the Fund's annualized net expense ratio of 1.00%, multiplied by the average account value over the period, multiplied by 183/365 (to reflect the one-half-year period). |
Annual Shareholder Report3
Performance data quoted represents past performance which is no guarantee of future results. Investment return and principal value will fluctuate so that an investor's shares, when redeemed, may be worth more or less than their original cost. Mutual fund performance changes over time and current performance may be lower or higher than what is stated. For current to the most recent month-end performance and after-tax returns, visit FederatedInvestors.com or call 1-800-341-7400.
Management's Discussion of Fund Performance
For the 12-month reporting period ended November 30, 2010, the Fund's Institutional Shares produced a total return of 8.16% at net asset value. That compares with a 10.03% return for the Fund's Blended Index and 9.02% for Morningstar's Moderate Allocation Funds Category Average.1 The Fund's Blended Index is composed of 50% of the return of the Russell 3000 Index,2 10% of the return of the MSCI All Country World ex US Index3 and 40% of the return of the Barclays Capital U.S. Universal Index4 which had total returns of 12.63%, 5.26%, and 6.77%, respectively, during the reporting period. The Fund's total return for the fiscal year reflected actual cash flows, transaction costs and other expenses which were not reflected in the total return data of the indices.
| 1 | Morningstar's Moderate Allocation Funds Average Category is the category of funds which seek to provide both capital appreciation and income by investing in stocks, bonds and cash. These funds typically invest between 50% to 70% of assets in equities and the remainder in fixed income and cash. Investments cannot be made in an average. |
| 2 | The Russell 3000 Index measures the performance of the largest 3000 U.S. companies representing approximately 98% of the investable U.S. equity market. The Russell 3000 Index is constructed to provide a comprehensive, unbiased, and stable barometer of the broad market and is completely reconstituted annually to ensure new and growing equities are reflected. |
| 3 | The MSCI ACWI (All Country World Index) ex US Index is a free float-adjusted market capitalization weighted index that is designed to measure the equity market performance of developed and emerging markets. As of May 2010 the MSCI ACWI consisted of 44 country indices comprising 23 developed and 21 emerging market country indices. |
| 4 | The Barclays Capital U.S. Universal Index represents the union of the U.S. Aggregate Index, U.S. Corporate High-Yield, Investment Grade 144A Index, Eurodollar Index, U.S. Emerging Markets Index, and the non-ERISA eligible portion of the CMBS Index. The index covers USD- denominated, taxable bonds that are rated either investment-grade or below investment-grade. |
Annual Shareholder Report
4
MARKET OVERVIEWDomestic Equities
Domestic equities, as measured by the S&P 500 Index5 (S&P 500), experienced another year of substantial volatility as the U.S. economy continued to grind through the economic recovery. Markets traded lower heading into the opening months of 2010, before rallying sharply during the spring in response to improving economic fundamentals. After peaking in April, equities were weak throughout the summer as economic data rolled over, sparking debate as to whether or not the economy was entering a double-dip recession or simply a soft patch. U.S. equities were also hurt by fears that the European sovereign debt crisis could jump across the Atlantic. Fortunately, the economic malaise of the summer proved to be a soft patch, and equities rallied strongly in the fall, as markets were boosted by the reacceleration of economic data, strong corporate profits, the results of the mid-term Congressional elections, and the announcement by the Federal Reserve of a second round of quantitative easing. All told, the S&P 500 ended the one-year period with a positive return of 9.94%. Nine out of 10 sectors posted positive returns. The three best performing S&P sectors were Consumer Discretionary, up 28.1%; Industrials, up 19.2%; and Telecommunication Services, up 15.5%. The three lagging sectors were Financials, down 0.3%; Health Care, up 0.5%; and Utilities, up 8.0%.
| 5 | The S&P 500 Index is an unmanaged capitalization-weighted index of 500 stocks designed to measure performance of the broad domestic economy through changes in the aggregate market value of 500 stocks representing all major industries. Investment cannot be made in an index. |
Annual Shareholder Report
5
International EquitiesWorld markets followed a similar path as the United States. The severity of the summer downturn was sharper outside the U.S., as Europe was acutely affected by the Greek debt crisis. International markets also were weak during November, as concerns over Irish sovereign debt pulled equities lower. For the year, the MSCI All-Country World ex-US Index returned 5.26%, underperforming relative to the United States.
Within the international markets, performance varied significantly between emerging and developed countries.6 Emerging markets, as measured by the MSCI Emerging Markets Index,7 continued to outperform on stronger growth fundamentals, returning 15.3% for the year. International developed markets, as measured by the MSCI EAFE Index,8 were considerably weaker, returning 1.1%.
On the currency front, the U.S. dollar appreciated 13.3% against the euro and 5.1% against the sterling, on superior growth prospects in the United States and sovereign debt concerns in Europe, but lost 2.6% against the yen.
| 6 | International investing involves special risks including currency risk, increased volatility, political risks, and differences in auditing and other financial standards. Prices of emerging markets securities can be significantly more volatile than the prices of securities in developed countries and currency risk and political risks are accentuated in emerging markets. |
| 7 | The MSCI Emerging Markets Index is a free float-adjusted market capitalization index that is designed to measure equity market performance of emerging markets. |
| 8 | The MSCI EAFE Index (Europe, Australasia, Far East) is a free float-adjusted market capitalization index that is designed to measure the equity market performance of developed markets, excluding the US & Canada. As of May 27, 2010 the MSCI EAFE Index consisted of the following 22 developed market country indices: Australia, Austria, Belgium, Denmark, Finland, France, Germany, Greece, Hong Kong, Ireland, Israel, Italy, Japan, the Netherlands, New Zealand, Norway, Portugal, Singapore, Spain, Sweden, Switzerland, and the United Kingdom. |
Annual Shareholder Report
6
Interest RatesInterest rates moved lower over the 12-month reporting period. Intermediate maturity yields fell the most while the shortest maturities and the longest maturities were virtually unchanged. Although economic concerns related to the Gulf of Mexico oil spill caused spreads to widen over the summer, credit-related spread bonds performed well later in the reporting period on expectations that they would do well in a growing economic environment. Prospects for economic growth also improved on the overwhelming election win by Republicans in early November.
The 5-year Treasury yield fell 0.53% over the 12 months and finished the reporting period at 1.47%. The “yield to worst” of the Barclays Capital Aggregate Bond Index9 (BCAB) stood at 2.68% on November 30, 2010, compared to 3.15% 12 months earlier.
Fund Performance
Asset Allocation Strategy Performance
For the year ended November 30, 2010, the main drivers of performance were the Fund's market cap allocation, emerging vs. developed allocation, and stock vs. bond allocation. The Fund benefited from overweight positions in small caps,10 emerging markets and stocks as small caps outperformed large caps, emerging markets outperformed developed markets and stocks outperformed bonds. Conversely, the Fund was negatively impacted by foreign developed country selection, an allocation to U.S. homebuilders, and an allocation to commodities. During the reporting period, the Fund used exchange-traded futures contracts to gain exposure to certain foreign country markets and to adjust the Fund's relative market capitalization exposure in its domestic equity investments.
| 9 | The Barclays Capital Aggregate Bond Index (BCAB) is a broad-based benchmark that measures the investment grade, U.S. dollar-denominated, fixed-rate taxable bond market, including Treasuries, government-related and corporate securities, MBS (agency fixed-rate and hybrid ARM passthroughs), ABS, and CMBS. The BCAB rolls up into other Barclays Capital flagship indices such as the multi-currency Global Aggregate Index and the U.S. Universal Index, which includes high yield and emerging markets debt. The BCAB was created in 1986, with index history backfilled to January 1, 1976. |
| 10 | Small Company stocks may be less liquid and subject to greater price volatility than large company stocks. |
Annual Shareholder Report7
Domestic Equities Performance
In the domestic equities portion of the Fund, the Fund benefited from allocation decisions among industry groups while individual security selection was a drag on relative performance.
The Fund benefitted most from its allocation decisions in Automobiles & Components, Capital Goods, Energy, Pharmaceuticals & Biotechnology, and Utilities. Conversely, the Fund was negatively impacted by allocation decisions in Consumer Services, Diversified Financials, Health Care Equipment & Services, Insurance, and Materials.
Fixed-Income Performance11
For the second year in a row, the bond portion of the Fund outperformed the BCAB by a huge margin during the 12-month reporting period. Sector management, yield curve management, and security selection all contributed positively to performance. Duration management detracted from performance as the Fund was shorter than the BCAB's interest sensitivity in a period of declining interest rates.12 Currency management had a very slight benefit. Sector call helped performance due to a considerable overweight in commercial mortgage backed securities (CMBS), emerging markets, and corporates (both investment-grade & high yield corporates). Security selection improved over the prior year particularly in CMBS, high yield, emerging markets and investment-grade corporates. Security selection in mortgage-backed securities negatively affected the Fund's performance.
Some names that added to performance included several financial names including NY Life, Pacific Life, Barclays Bank, Capital One, First Union, General Electric, and a small bank trust-preferred security (TRUP) collateralized mortgage obligation (CMO) named Regional Diversified. One security that performed poorly was CVS Corp. During the reporting period, the Fund used credit default swaps to add exposure to investment grade corporate debt and utilized Treasury futures to manage the Fund's duration and yield curve risk.
| 11 | Bond prices are sensitive to changes in interest rates and a rise in interest rates can cause a decline in their prices. |
| 12 | Duration is a measure of a security's price sensitivity to changes in interest rates. Securities with longer durations are more sensitive to changes in interest rates than securities of shorter durations. |
Annual Shareholder Report8
GROWTH OF A $10,000 INVESTMENT – INSTITUTIONAL SHARES
The Fund's Institutional Shares commenced operations on June 12, 2009. The Fund offers four other classes of shares: Class A Shares, Class B Shares, Class C Shares and Class K Shares. For the period prior to the commencement of operations of the Institutional Shares, the performance information shown is for the Fund's Class A Shares. The performance of Class A Shares has not been adjusted to reflect the expenses of the Institutional Shares since the Institutional Shares have a lower expense ratio than the expense ratio of the Class A Shares. The graph below illustrates the hypothetical investment of $10,0001 in Federated Stock and Bond Fund (Institutional Shares) (the “Fund”) from October 31, 2000 to November 30, 2010, compared to a blend of indexes comprised of 50% of the Russell 3000 Index (RU3000),2 10% of the MSCI All Country World ex US Index (MSCI ACWI ex US)2 and 40% of the Barclays Capital U.S. Universal Index (BCUSU)2 (the “Blended Index”),2 the Standard and Poor's 500 Index (S&P 500),2 the Barclays Capital Aggregate Bond Index (BCAB)2 and the Lipper Balanced Funds Average (LBFA).3
| Average Annual Total Returns for the Period Ended 11/30/2010 | |
| 1 Year | 8.16% |
| 5 Years | 3.80% |
| 10 Years | 3.53% |
Performance data quoted represents past performance which is no guarantee of future results. Investment return and principal value will fluctuate so that an investor's shares, when redeemed, may be worth more or less than their original cost. Mutual fund performance changes over time and current performance may be lower or higher than what is stated. For current to the most recent month-end performance and after-tax returns, visit FederatedInvestors.com or call 1-800-341-7400. Returns shown do not reflect the deduction of taxes that a shareholder would pay on Fund distributions or the redemption of Fund shares. Mutual funds are not obligations of or guaranteed by any bank and are not federally insured.
Annual Shareholder Report
9
| 1 | Represents a hypothetical investment of $10,000 in the Fund. The Fund's performance assumes the reinvestment of all dividends and distributions. The Blended Index, S&P 500, BCAB and LBFA have been adjusted to reflect reinvestment of dividends on securities in the indexes and the average. |
| 2 | The Blended Index is a custom blended index comprised of the 50% of the RU3000, 10% of MSCI ACWI ex-US and 40% of the BCUSU. The RU3000 measures the performance of the largest 3,000 U.S. companies representing approximately 98% of the investable U.S. equity market. The Russell 3000 Index is constructed to provide a comprehensive, unbiased and stable barometer of the broad market and is completely reconstituted annually to ensure new and growing equities are reflected. The MSCI ACWI (All Country World) Index is a free float-adjusted market capitalization weighted index that is designed to measure the equity market performance of developed and emerging markets. As of May 27, 2010, the MSCI ACWI consisted of 45 country indices comprising 24 developed and 21 emerging market country indices. The developed market country indices included are: Australia, Austria, Belgium, Canada, Denmark, Finland, France, Germany, Greece, Hong Kong, Ireland, Israel, Italy, Japan, Netherlands, New Zealand, Norway, Portugal, Singapore, Spain, Sweden, Switzerland, the United Kingdom and the United States. The emerging market country indices included are: Brazil, Chile, China, Colombia, Czech Republic, Egypt, Hungary, India, Indonesia, Korea, Malaysia, Mexico, Morocco, Peru, Philippines, Poland, Russia, South Africa, Taiwan, Thailand and Turkey. The BCUSU represents the union of the U.S. Aggregate Index, U.S. Corporate High-Yield, Investment Grade 144A Index, Eurodollar Index, U.S. Emerging Markets Index and the non-ERISA eligible portion of the CMBS Index. The index covers USD-denominated, taxable bonds that are rated either investment grade or below investment grade. The S&P 500 is an unmanaged, capitalization-weighted index of 500 stocks designed to measure performance of the broad domestic economy through changes in the aggregate market value of 500 stocks representing all major industries. The BCAB is an unmanaged index composed of securities from the Barclay's Capital Government/Corporate Bond Index, Mortgage-Backed Securities Index and the Asset-Backed Securities Index. The RU3000, MSCI ACWI ex-US, BCUSU, S&P 500 and BCAB are not adjusted to reflect sales charges, expenses or other fees that the Securities and Exchange Commission (SEC) requires to be reflected in the Fund's performance. The indexes are unmanaged and, unlike the Fund, are not affected by cash flows. It is not possible to invest directly in an index. |
| 3 | The LBFA represents the average of the total returns reported by all of the mutual funds designated by Lipper, Inc. as falling into the category indicated, and is not adjusted to reflect any sales charges. However, these total returns are reported net of expenses or other fees that the SEC requires to be reflected in the Fund's performance. |
Annual Shareholder Report10
Portfolio of Investments Summary Tables (unaudited)
At November 30, 2010, the Fund's portfolio composition1 was as follows:
| Portfolio Composition | Percentage of
Total Net Assets2 |
| Domestic Equity Securities | 52.3% |
| Corporate Debt Securities | 15.5% |
| International Equity Securities | 9.0% |
| Mortgage-Backed Securities3 | 4.2% |
| Asset-Backed Securities | 2.1% |
| U.S. Treasury and Agency Securities | 2.1% |
| Foreign Debt Securities | 1.5% |
| Municipal Security4 | 0.0% |
| Derivative Contracts5 | 0.5% |
| Cash Equivalents6 | 13.8% |
| Other Assets and Liabilities — Net7 | (1.0)% |
| TOTAL | 100.0% |
| 1 | See the Fund's Prospectus and Statement of Additional Information for a description of these security types. |
| 2 | As of the date specified above, the Fund owned shares of one or more affiliated investment companies. For purposes of this table, the affiliated investment company (other than an affiliated money market mutual fund) is not treated as a single portfolio security, but rather the Fund is treated as owning a pro rata portion of each security and each other asset and liability owned by the affiliated investment company. Accordingly, the percentages of total net assets shown in the table will differ from those presented on the Portfolio of Investments. |
| 3 | For purposes of this table, Mortgage-Backed Securities include mortgage-backed securities guaranteed by Government Sponsored Entities and adjustable rate mortgage-backed securities. |
| 4 | Represents less than 0.1%. |
| 5 | Based upon net unrealized appreciation (depreciation) or value of the derivative contracts as applicable. Derivative contracts may consist of futures, forwards, options and swaps. The impact of a derivative contract on the Fund's performance may be larger than its unrealized appreciation (depreciation) or value may indicate. In many cases, the notional value or amount of a derivative contract may provide a better indication of the contract's significance to the portfolio. More complete information regarding the Fund's direct investments in derivative contracts, including unrealized appreciation (depreciation), value and notional values or amounts of such contracts, can be found in the table at the end of the Portfolio of Investments included in this report. |
| 6 | Cash Equivalents include any investments in money market mutual funds and/or overnight repurchase agreements. |
| 7 | Assets, other than investments in securities and derivative contracts, less liabilities. See Statement of Assets and Liabilities. |
Annual Shareholder Report
11
At November 30, 2010, the Fund's sector composition8 was as follows:| Sector Composition of Equity Holdings | Percentage of
Equity Securities |
| Consumer Discretionary | 22.0% |
| Financials | 22.0% |
| Information Technology | 19.6% |
| Consumer Staples | 8.3% |
| Industrials | 7.8% |
| Health Care | 6.5% |
| Materials | 5.0% |
| Energy | 3.9% |
| Utilities | 3.6% |
| Telecommunication Services | 1.3% |
| TOTAL | 100.0% |
| 8 | Sector classifications are based upon, and individual portfolio securities are assigned to, the classifications of the Global Industry Classification Standard (GICS) except that the Adviser assigns a classification to securities not classified by the GICS and to securities for which the Adviser does not have access to the classification made by the GICS. |
Annual Shareholder Report12
Portfolio of Investments
November 30, 2010
Shares or
Principal
Amount | | | Value in
U.S. Dollars |
| | COMMON STOCKS – 32.4% | |
| | Consumer Discretionary – 7.1% | |
| 7,500 | 1 | Aeropostale, Inc. | 202,725 |
| 1,400 | | Autoliv, Inc. | 102,788 |
| 12,200 | | Best Buy Co., Inc. | 521,184 |
| 5,100 | 1 | Big Lots, Inc. | 156,315 |
| 2,100 | 1 | BorgWarner, Inc. | 126,714 |
| 23,600 | | CBS Corp. — Class B | 397,424 |
| 1,600 | 1 | Chipotle Mexican Grill, Inc. | 413,584 |
| 20,200 | | Comcast Corp., Class A | 404,000 |
| 9,400 | 1 | DIRECTV — CLASS A | 390,382 |
| 3,500 | 1 | Dollar Tree, Inc. | 192,325 |
| 3,700 | | Family Dollar Stores, Inc. | 185,740 |
| 5,846 | 1 | Federal-Mogul Corp., Class A | 109,320 |
| 7,500 | 1 | Ford Motor Co. | 119,550 |
| 35,000 | | Gannett Co., Inc. | 458,850 |
| 5,800 | | Gentex Corp. | 121,742 |
| 11,200 | 1 | Goodyear Tire & Rubber Co. | 107,072 |
| 3,200 | | Harley Davidson, Inc. | 100,096 |
| 27,900 | | Home Depot, Inc. | 842,859 |
| 5,100 | 1 | ITT Educational Services, Inc. | 298,299 |
| 5,200 | 1 | J Crew Group, Inc. | 227,344 |
| 22,300 | | Johnson Controls, Inc. | 812,612 |
| 10,700 | 1 | Kohl's Corp. | 603,694 |
| 1,200 | 1 | Lear Corp. | 105,324 |
| 57,200 | | Lennar Corp., Class A | 868,868 |
| 38,200 | | Lowe's Cos., Inc. | 867,140 |
| 30,000 | 1 | MGM Mirage | 366,900 |
| 8,800 | | Marriott International, Inc., Class A | 345,048 |
| 8,274 | | McDonald's Corp. | 647,854 |
| 10,800 | | McGraw-Hill Cos., Inc. | 372,492 |
| 45,500 | 1 | Meritage Corp. | 863,135 |
| 1,400 | 1 | NVR, Inc. | 867,972 |
| 1,000 | 1 | NetFlix, Inc. | 205,900 |
| 54,600 | 1 | New York Times Co., Class A | 490,854 |
| 14,500 | | Omnicom Group, Inc. | 658,880 |
Annual Shareholder Report13
Shares or
Principal
Amount | | | Value in
U.S. Dollars |
| 4,500 | | PetSmart, Inc. | 170,370 |
| 2,800 | | Ross Stores, Inc. | 181,664 |
| 39,600 | | Service Corp. International | 319,176 |
| 12,400 | | Starwood Hotels & Resorts | 704,816 |
| 3,800 | | TJX Cos., Inc. | 173,318 |
| 2,200 | 1 | TRW Automotive Holdings Corp. | 104,478 |
| 3,700 | | Thor Industries, Inc. | 109,261 |
| 12,700 | | Time Warner, Inc. | 374,523 |
| 47,700 | 1 | Toll Brothers, Inc. | 856,215 |
| 4,300 | | Tractor Supply Co. | 182,621 |
| 1,000 | | Washington Post Co., Class B | 377,020 |
| 5,300 | | Williams-Sonoma, Inc. | 176,331 |
| 11,300 | | Wyndham Worldwide Corp. | 324,875 |
| 6,600 | | Yum! Brands, Inc. | 330,528 |
| | TOTAL | 17,940,182 |
| | Consumer Staples – 2.7% | |
| 16,300 | | Archer-Daniels-Midland Co. | 472,537 |
| 1,700 | | Brown-Forman Corp., Class B | 111,214 |
| 22,400 | | Clorox Co. | 1,384,544 |
| 2,000 | | Corn Products International, Inc. | 86,240 |
| 7,600 | | Del Monte Foods Co. | 142,348 |
| 2,700 | | Dr. Pepper Snapple Group, Inc. | 98,901 |
| 4,600 | | Heinz (H.J.) Co. | 222,042 |
| 23,300 | | Herbalife Ltd. | 1,599,079 |
| 2,000 | | Hershey Foods Corp. | 93,600 |
| 19,700 | | Kroger Co. | 463,935 |
| 10,516 | | Nestle SA | 571,561 |
| 6,600 | | Procter & Gamble Co. | 403,062 |
| 1,500 | | Smucker (J.M.) Co. | 94,875 |
| 14,258 | | The Coca-Cola Co. | 900,678 |
| 6,400 | | Tyson Foods, Inc., Class A | 101,312 |
| | TOTAL | 6,745,928 |
| | Energy – 1.3% | |
| 2,800 | | Apache Corp. | 301,392 |
| 12,419 | | Chevron Corp. | 1,005,567 |
| 5,300 | | ConocoPhillips | 318,901 |
| 10,800 | | Exxon Mobil Corp. | 751,248 |
Annual Shareholder Report14
Shares or
Principal
Amount | | | Value in
U.S. Dollars |
| 27 | 1 | NRG Energy, Inc. | 523 |
| 5,740 | | Schlumberger Ltd. | 443,932 |
| 16,635 | 1 | Weatherford International Ltd. | 339,520 |
| | TOTAL | 3,161,083 |
| | Financials – 7.1% | |
| 9,700 | | AON Corp. | 389,164 |
| 6,800 | | Aflac, Inc. | 350,200 |
| 3,600 | | Alexandria Real Estate Equities, Inc. | 240,300 |
| 8,200 | | American Campus Communities, Inc. | 257,808 |
| 7,312 | | American Express Co. | 316,025 |
| 12,500 | | American Financial Group, Inc., Ohio | 384,625 |
| 9,500 | | Assurant, Inc. | 335,065 |
| 9,100 | | Avalonbay Communities, Inc. | 1,004,003 |
| 6,900 | | BB&T Corp. | 160,080 |
| 9,000 | | Boston Properties, Inc. | 754,200 |
| 4,207 | 1 | CIT Group, Inc. | 166,008 |
| 8,181 | | Capital One Financial Corp. | 304,579 |
| 38,700 | 1 | Citigroup, Inc. | 162,540 |
| 7,000 | | Comerica, Inc. | 255,430 |
| 2,400 | 1 | CommonWealth REIT | 60,072 |
| 12,100 | | Digital Realty Trust, Inc. | 635,492 |
| 10,100 | | Eaton Vance Corp. | 300,172 |
| 6,600 | | Erie Indemnity Co. | 415,536 |
| 4,500 | | Everest Re Group Ltd. | 375,705 |
| 13,300 | | Fifth Third Bancorp | 158,935 |
| 900 | | First Citizens Bancshares, Inc., Class A | 156,501 |
| 2,686 | | Franklin Resources, Inc. | 306,446 |
| 19,300 | | Fulton Financial Corp. | 166,945 |
| 4,200 | 1 | General Growth Properties, Inc. | 67,998 |
| 2,600 | | Goldman Sachs Group, Inc. | 405,964 |
| 14,000 | | HCP, Inc. | 461,020 |
| 8,400 | | Hanover Insurance Group, Inc. | 380,352 |
| 413 | 1 | Howard Hughes Corp. | 16,838 |
| 24,447 | | Invesco Ltd. | 531,478 |
| 23,188 | | JPMorgan Chase & Co. | 866,768 |
| 7,700 | | Liberty Property Trust | 241,318 |
| 2,100 | | M & T Bank Corp. | 161,616 |
Annual Shareholder Report15
Shares or
Principal
Amount | | | Value in
U.S. Dollars |
| 9,500 | | MetLife, Inc. | 362,425 |
| 14,600 | 1 | NASDAQ Stock Market, Inc. | 313,316 |
| 12,900 | | Nationwide Health Properties, Inc. | 465,045 |
| 27,156 | | OneBeacon Insurance Group Ltd. | 397,292 |
| 3,000 | | PNC Financial Services Group | 161,550 |
| 18,000 | | Progressive Corp. Ohio | 366,120 |
| 15,800 | | Protective Life Corp. | 371,616 |
| 7,200 | | Prudential Financial | 364,896 |
| 7,596 | | Reinsurance Group of America, Inc. | 379,268 |
| 14,400 | | SEI Investments Co. | 325,152 |
| 2,500 | | Simon Property Group, Inc. | 246,250 |
| 8,900 | | StanCorp Financial Group, Inc. | 370,240 |
| 6,200 | | State Street Corp. | 267,840 |
| 4,900 | | SunTrust Banks, Inc. | 114,464 |
| 5,500 | | T. Rowe Price Group, Inc. | 320,815 |
| 12,300 | | TCF Financial Corp. | 167,403 |
| 10,500 | | Taubman Centers, Inc. | 509,565 |
| 6,900 | | The Travelers Cos, Inc. | 372,531 |
| 18,326 | | U.S. Bancorp | 435,792 |
| 15,800 | | Unitrin, Inc. | 373,828 |
| 10,100 | | Waddell & Reed Financial, Inc., Class A | 311,080 |
| 6,200 | | Wells Fargo & Co. | 168,702 |
| | TOTAL | 17,954,373 |
| | Health Care – 2.1% | |
| 5,348 | | Abbott Laboratories | 248,735 |
| 5,551 | | Aetna, Inc. | 164,421 |
| 5,800 | | Allergan, Inc. | 384,366 |
| 5,100 | | AmerisourceBergen Corp. | 157,335 |
| 2,400 | 1 | Amgen, Inc. | 126,456 |
| 4,793 | | Cardinal Health, Inc. | 170,535 |
| 4,800 | 1 | Celgene Corp. | 285,024 |
| 5,500 | 1 | Community Health Systems, Inc. | 175,230 |
| 3,400 | | Cooper Cos., Inc. | 181,900 |
| 2,300 | 1 | DaVita, Inc. | 167,210 |
| 20,800 | 1 | Health Management Association, Class A | 185,328 |
| 6,200 | 1 | Health Net, Inc. | 167,400 |
| 2,800 | 1 | Hospira, Inc. | 157,528 |
Annual Shareholder Report16
Shares or
Principal
Amount | | | Value in
U.S. Dollars |
| 10,800 | 1 | Humana, Inc. | 605,232 |
| 4,443 | | Johnson & Johnson | 273,467 |
| 4,900 | 1 | LifePoint Hospitals, Inc. | 177,478 |
| 2,508 | | McKesson HBOC, Inc. | 160,261 |
| 12,884 | | Merck & Co., Inc. | 444,111 |
| 21,300 | | Pfizer, Inc. | 346,977 |
| 4,300 | 1 | SXC Health Solutions Corp. | 164,905 |
| 3,900 | | Shire PLC, ADR | 274,326 |
| 5,100 | 1 | Thoratec Laboratories Corp. | 129,821 |
| 4,635 | | UnitedHealth Group, Inc. | 169,270 |
| | TOTAL | 5,317,316 |
| | Industrials – 2.5% | |
| 1,800 | | Avery Dennison Corp. | 67,572 |
| 1,600 | | Bucyrus International | 142,656 |
| 2,800 | | CNH Global NV | 115,976 |
| 3,700 | | CSX Corp. | 224,997 |
| 6,813 | | Caterpillar, Inc. | 576,380 |
| 4,300 | 1 | Chicago Bridge & Iron Co., NV | 121,733 |
| 2,900 | | Crane Co. | 108,692 |
| 1,228 | | Cummins, Inc. | 119,263 |
| 4,000 | | Donnelley (R.R.) & Sons Co. | 63,040 |
| 1,200 | | Flowserve Corp. | 126,552 |
| 5,400 | | Fluor Corp. | 312,282 |
| 5,800 | 1 | Foster Wheeler AG | 162,400 |
| 3,900 | 1 | General Cable Corp. | 127,881 |
| 2,800 | | Ingersoll-Rand PLC | 114,800 |
| 5,200 | | Joy Global, Inc. | 396,864 |
| 5,300 | 1 | KAR Auction Services, Inc. | 63,865 |
| 5,200 | 1 | Kansas City Southern Industries, Inc. | 246,168 |
| 1,500 | | L-3 Communications Holdings, Inc. | 105,495 |
| 10,600 | | Manitowoc, Inc. | 116,388 |
| 3,700 | | Norfolk Southern Corp. | 222,629 |
| 3,800 | 1 | OshKosh Truck Corp. | 109,060 |
| 4,000 | 1 | Owens Corning, Inc. | 105,240 |
| 1,400 | | Parker-Hannifin Corp. | 112,322 |
| 4,000 | | Precision Castparts Corp. | 552,280 |
| 1,900 | | Regal Beloit Corp. | 115,900 |
Annual Shareholder Report17
Shares or
Principal
Amount | | | Value in
U.S. Dollars |
| 5,200 | | Textron, Inc. | 116,272 |
| 2,600 | | Timken Co. | 113,256 |
| 1,900 | | Toro Co. | 110,599 |
| 2,800 | 1 | URS Corp. | 110,712 |
| 2,700 | | Union Pacific Corp. | 243,297 |
| 8,028 | 1 | United Continental Holdings, Inc. | 222,215 |
| 9,000 | | United Technologies Corp. | 677,430 |
| 2,400 | 1 | Verisk Analytics, Inc. | 72,648 |
| 2,600 | 1 | WESCO International, Inc. | 124,072 |
| 2,550 | 1 | Waste Connections, Inc. | 66,300 |
| | TOTAL | 6,387,236 |
| | Information Technology – 6.4% | |
| 19,900 | | AVX Corp. | 284,769 |
| 20,700 | 1 | Advanced Micro Devices, Inc. | 150,903 |
| 7,700 | 1 | Alliance Data Systems Corp. | 485,716 |
| 15,300 | 1 | Amdocs Ltd. | 397,800 |
| 3,447 | 1 | Apple, Inc. | 1,072,534 |
| 13,200 | 1 | Autodesk, Inc. | 465,828 |
| 6,600 | 1 | Avago Technologies Ltd. | 172,326 |
| 10,300 | 1 | BMC Software, Inc. | 457,320 |
| 16,281 | | Broadcom Corp. | 724,342 |
| 21,300 | | Broadridge Financial Solutions | 438,567 |
| 20,100 | | CA, Inc. | 460,089 |
| 26,300 | 1 | Cisco Systems, Inc. | 503,908 |
| 9,500 | | Computer Sciences Corp. | 423,985 |
| 15,267 | | Corning, Inc. | 269,615 |
| 8,600 | 1 | FIserv, Inc. | 475,580 |
| 2,400 | 1 | F5 Networks, Inc. | 316,512 |
| 5,300 | | FactSet Research Systems | 469,951 |
| 13,800 | 1 | Fairchild Semiconductor International, Inc., Class A | 193,890 |
| 600 | 1 | Google, Inc. | 333,426 |
| 7,392 | | International Business Machines Corp. | 1,045,672 |
| 9,682 | 1 | Intuit, Inc. | 434,625 |
| 16,400 | | Lender Processing Services, Inc. | 504,628 |
| 498,000 | | Lenovo Group Ltd. | 331,568 |
| 7,300 | 1 | Lexmark International Group, Class A | 264,552 |
| 9,900 | 1 | MSCI, Inc., Class A | 337,194 |
Annual Shareholder Report18
Shares or
Principal
Amount | | | Value in
U.S. Dollars |
| 20,445 | 1 | Micron Technology, Inc. | 148,431 |
| 18,918 | | Microsoft Corp. | 476,923 |
| 5,300 | 1 | Network Appliance, Inc. | 269,929 |
| 5,600 | 1 | Novellus Systems, Inc. | 168,840 |
| 20,500 | 1 | ON Semiconductor Corp. | 167,177 |
| 21,400 | | Oracle Corp. | 578,656 |
| 28,500 | 1 | SAIC, Inc. | 436,620 |
| 7,600 | 1 | Sandisk Corp. | 338,960 |
| 19,521 | 1 | Seagate Technology | 261,777 |
| 4,000 | 1 | Silicon Laboratories, Inc. | 169,920 |
| 40,900 | | Tellabs, Inc. | 258,079 |
| 10,109 | 1 | Teradata Corporation | 415,379 |
| 13,200 | 1 | Teradyne, Inc. | 156,552 |
| 23,900 | 1 | Vishay Intertechnology, Inc. | 340,814 |
| 8,900 | 1 | Western Digital Corp. | 298,150 |
| 48,500 | | Xerox Corp. | 555,810 |
| | TOTAL | 16,057,317 |
| | Materials – 1.6% | |
| 5,400 | | Agnico Eagle Mines, Ltd. | 435,834 |
| 400 | | Airgas, Inc. | 24,440 |
| 4,000 | | Ashland, Inc. | 203,520 |
| 3,200 | | Ball Corp. | 210,816 |
| 1,200 | | CF Industries Holdings, Inc. | 144,924 |
| 6,000 | | Cabot Corp. | 214,800 |
| 4,100 | | Cytec Industries, Inc. | 196,103 |
| 2,679 | | Domtar Corp. | 203,390 |
| 2,600 | | Eastman Chemical Co. | 202,306 |
| 1,400 | | Freeport-McMoRan Copper & Gold, Inc. | 141,848 |
| 8,000 | | International Paper Co. | 199,760 |
| 2,000 | | Lubrizol Corp. | 209,120 |
| 4,300 | | Monsanto Co. | 257,656 |
| 2,700 | | PPG Industries, Inc. | 210,492 |
| 9,900 | | RPM International, Inc. | 202,752 |
| 4,000 | | Schnitzer Steel Industries, Inc., Class A | 228,360 |
| 3,900 | | Scotts Co. | 194,844 |
| 2,800 | | Sherwin-Williams Co. | 207,676 |
| 10,500 | 1 | Titanium Metals Corp. | 181,335 |
Annual Shareholder Report19
Shares or
Principal
Amount | | | Value in
U.S. Dollars |
| 6,400 | | Valspar Corp. | 211,456 |
| | TOTAL | 4,081,432 |
| | Telecommunication Services – 0.4% | |
| 46,000 | | Frontier Communications Corp. | 418,600 |
| 89,400 | | Qwest Communications International, Inc. | 625,800 |
| | TOTAL | 1,044,400 |
| | Utilities – 1.2% | |
| 7,700 | | CMS Energy Corp. | 138,369 |
| 11,400 | 1 | Calpine Corp. | 137,940 |
| 3,000 | | DTE Energy Co. | 133,650 |
| 1,900 | | Entergy Corp. | 135,356 |
| 6,300 | | Hawaiian Electric Industries, Inc. | 137,907 |
| 2,300 | | ITC Holdings Corp. | 139,265 |
| 2,700 | | Integrys Energy Group, Inc. | 131,490 |
| 3,400 | | NSTAR | 140,760 |
| 8,200 | | NiSource, Inc. | 137,186 |
| 3,200 | | OGE Energy Corp. | 142,432 |
| 2,900 | | ONEOK, Inc. | 148,219 |
| 3,400 | | Pinnacle West Capital Corp. | 137,428 |
| 9,975 | | Southern Co. | 376,257 |
| 8,100 | | TECO Energy, Inc. | 135,675 |
| 12,500 | | Wisconsin Energy Corp. | 752,750 |
| | TOTAL | 2,924,684 |
| | TOTAL COMMON STOCKS
(IDENTIFIED COST $73,560,000) | 81,613,951 |
| | Asset-Backed Securities – 1.0% | |
| 5,653 | 2,3 | 125 Home Loan Owner Trust 1998-1A B1, 9.76%, 2/15/2029 | 4,691 |
| 250,000 | | Banc of America Commercial Mortgage, Inc. 2007-4 A4, 5.933%, 2/10/2051 | 265,018 |
| 800,000 | | Citigroup/Deutsche Bank Commercial Mortgage 2007-CD5, 5.886%, 11/15/2044 | 855,553 |
| 350,000 | | LB-UBS Commercial Mortgage Trust 2008-C1 A2, 6.323%, 4/15/2041 | 382,281 |
| 100,000 | | Merrill Lynch Mortgage Trust 2008-C1 AM, 6.460%, 2/12/2051 | 92,761 |
| 400,000 | | Merrill Lynch/Countrywide Commercial Mortgage 2007-6, 5.485%, 03/12/2051 | 391,148 |
| 315,000 | | Morgan Stanley Capital I 2006-IQ12 A4, 5.332%, 12/15/2043 | 337,712 |
Annual Shareholder Report20
Shares or
Principal
Amount | | | Value in
U.S. Dollars |
| $250,000 | | Morgan Stanley Capital, Inc. A4, 6.075%, 6/11/2049 | 264,773 |
| | TOTAL ASSET-BACKED SECURITIES
(IDENTIFIED COST $2,428,169) | 2,593,937 |
| | Collateralized Mortgage Obligations – 1.1% | |
| 800,000 | | Citigroup/Deutsche Bank Commercial Mortgage 2007-CD4 A3, 5.293%, 12/11/2049 | 822,003 |
| 500,000 | 2,3 | Commercial Mortgage Pass-Through Certificates 2010-C1 A1, 3.156%, 7/10/2046 | 508,163 |
| 375,000 | 2,3 | Commercial Mortgage Pass-Through Certificates 2010-C1 A3, 4.205%, 9/01/2020 | 373,775 |
| 450,000 | | JP Morgan Chase Commercial Mortgage Securities 2007-C1 A4, 5.716%, 2/15/2051 | 472,182 |
| 595,332 | 2,3 | JP Morgan Chase Commercial Mortgage Securities 2010-C1 2010-C1 A1, 3.853%, 6/15/2043 | 618,141 |
| 4,770 | 2 | SMFC Trust Asset-Backed Certificates, 1997-A B1-4, 7.719%, 1/28/2027 | 3,844 |
| | TOTAL COLLATERALIZED MORTGAGE OBLIGATIONS
(IDENTIFIED COST $2,759,499) | 2,798,108 |
| | Corporate Bonds – 6.8% | |
| | Basic Industry — Chemicals – 0.1% | |
| 95,000 | | Dow Chemical Co., Note, 8.550%, 05/15/2019 | 119,996 |
| 13,000 | | Du Pont (E.I.) de Nemours & Co., 5.000%, 01/15/2013 | 14,095 |
| 100,000 | | Praxair, Inc., 4.625%, 03/30/2015 | 111,265 |
| 35,000 | | Rohm & Haas Co., 6.000%, 09/15/2017 | 38,909 |
| | TOTAL | 284,265 |
| | Basic Industry — Metals & Mining – 0.3% | |
| 80,000 | | Alcan, Inc., 5.000%, 06/01/2015 | 88,288 |
| 70,000 | | Alcoa, Inc., Note, 5.550%, 02/01/2017 | 72,914 |
| 90,000 | | Allegheny Technologies, Inc., Sr. Note, 9.375%, 06/01/2019 | 106,784 |
| 10,000 | | BHP Finance (USA), Inc., Company Guarantee, 6.500%, 4/01/2019 | 12,286 |
| 200,000 | | Barrick Gold Corp., Sr. Unsecd. Note, 6.95%, 4/01/2019 | 252,216 |
| 120,000 | | Newmont Mining Corp., Company Guarantee, 5.875%, 04/01/2035 | 127,030 |
| 100,000 | 2,3 | Xstrata Finance Canada Ltd., Unsecd. Note, 5.500%, 11/16/2011 | 103,258 |
| | TOTAL | 762,776 |
| | Basic Industry — Paper – 0.1% | |
| 30,000 | | International Paper Co., Sr. Unsecd. Note, 7.500%, 08/15/2021 | 35,832 |
| 150,000 | | Pope & Talbot, Inc., 8.375%, 6/1/2013 | 15 |
| 100,000 | | Weyerhaeuser Co., Deb., 7.375%, 03/15/2032 | 99,001 |
| | TOTAL | 134,848 |
Annual Shareholder Report21
Shares or
Principal
Amount | | | Value in
U.S. Dollars |
| | Capital Goods — Aerospace & Defense – 0.1% | |
| $50,000 | 2,3 | BAE Systems Holdings, Inc., 5.200%, 08/15/2015 | 55,116 |
| 100,000 | | Boeing Co., 4.875%, 02/15/2020 | 111,766 |
| 25,000 | | Lockheed Martin Corp., Sr. Note, 4.121%, 03/14/2013 | 26,765 |
| | TOTAL | 193,647 |
| | Capital Goods — Building Materials – 0.0% | |
| 50,000 | | RPM International, Inc., 6.500%, 02/15/2018 | 54,985 |
| 40,000 | | RPM International, Inc., Sr. Unsecd. Note, 6.125%, 10/15/2019 | 42,936 |
| | TOTAL | 97,921 |
| | Capital Goods — Diversified Manufacturing – 0.1% | |
| 20,000 | | Dover Corp., Note, 5.450%, 03/15/2018 | 22,993 |
| 70,000 | | Emerson Electric Co., 4.875%, 10/15/2019 | 78,400 |
| 68,000 | 2,3 | Hutchison Whampoa International Ltd., 6.500%, 02/13/2013 | 74,778 |
| 100,000 | | Roper Industries, Inc., Sr. Unsecd. Note, 6.250%, 09/01/2019 | 114,590 |
| 90,000 | 2,3 | Textron Financial Corp., Jr. Sub. Note, 6.000%, 02/15/2067 | 73,462 |
| | TOTAL | 364,223 |
| | Capital Goods — Environmental – 0.1% | |
| 110,000 | | Republic Services, Inc., Company Guarantee, Series WI, 5.500%, 09/15/2019 | 123,141 |
| 25,000 | | Waste Management, Inc., 7.375%, 03/11/2019 | 31,267 |
| | TOTAL | 154,408 |
| | Communications — Media & Cable – 0.2% | |
| 27,000 | | Comcast Cable Communications Holdings, Company Guarantee, 8.375%, 03/15/2013 | 31,094 |
| 100,000 | | Comcast Corp., 7.050%, 03/15/2033 | 113,657 |
| 100,000 | | Comcast Corp., Company Guarantee, 6.500%, 01/15/2017 | 118,466 |
| 120,000 | | Time Warner Cable, Inc., Company Guarantee, 6.750%, 06/15/2039 | 132,412 |
| 20,000 | | Time Warner Cable, Inc., Company Guarantee, 8.250%, 04/01/2019 | 25,417 |
| 50,000 | | Time Warner Cable, Inc., Company Guarantee, 8.750%, 02/14/2019 | 64,953 |
| 50,000 | | Time Warner Cable, Inc., Sr. Unsecd. Note, 5.850%, 05/01/2017 | 57,137 |
| | TOTAL | 543,136 |
| | Communications — Media Noncable – 0.1% | |
| 120,000 | | News America Holdings, Inc., Sr. Deb., 9.250%, 02/01/2013 | 139,636 |
| 90,000 | | News America, Inc., 5.650%, 08/15/2020 | 105,023 |
| | TOTAL | 244,659 |
| | Communications — Telecom Wireless – 0.2% | |
| 130,000 | | AT&T Wireless Services, Inc., 8.750%, 03/01/2031 | 182,576 |
| 90,000 | | America Movil S.A.B. de C.V., Note, 5.750%, 01/15/2015 | 101,929 |
Annual Shareholder Report22
Shares or
Principal
Amount | | | Value in
U.S. Dollars |
| $20,000 | | Vodafone Group PLC, 5.350%, 02/27/2012 | 21,074 |
| 90,000 | | Vodafone Group PLC, Note, 5.625%, 02/27/2017 | 103,223 |
| | TOTAL | 408,802 |
| | Communications — Telecom Wirelines – 0.2% | |
| 15,000 | | CenturyLink, Inc., Sr. Note, 6.150%, 09/15/2019 | 15,633 |
| 150,000 | | Deutsche Telekom International Finance BV, 4.875%, 07/08/2014 | 164,912 |
| 45,000 | | France Telecom SA, Sr. Unsecd. Note, 5.375%, 07/08/2019 | 51,176 |
| 100,000 | | Telefonica SA, Sr. Note, 5.855%, 02/04/2013 | 108,382 |
| 40,000 | | Verizon Communications, Inc., Sr. Unsecd. Note, 6.100%, 4/15/2018 | 46,968 |
| 50,000 | | Verizon Communications, Inc., Sr. Unsecd. Note, 6.350%, 04/01/2019 | 60,168 |
| | TOTAL | 447,239 |
| | Consumer Cyclical — Automotive – 0.0% | |
| 70,000 | | DaimlerChrysler North America Holding Corp., 6.500%, 11/15/2013 | 79,936 |
| | Consumer Cyclical — Entertainment – 0.1% | |
| 280,000 | | Time Warner, Inc., Company Guarantee, 6.875%, 05/01/2012 | 302,846 |
| | Consumer Cyclical — Lodging – 0.0% | |
| 50,000 | | Wyndham Worldwide Corp., Sr. Unsecd. Note, 6.000%, 12/01/2016 | 52,203 |
| | Consumer Cyclical — Retailers – 0.1% | |
| 172,035 | 2,3 | CVS Caremark Corp., Pass Thru Cert., 5.298%, 01/11/2027 | 173,402 |
| 60,000 | | Costco Wholesale Corp., 5.300%, 03/15/2012 | 63,551 |
| 20,000 | | JC Penney Corp., Inc., Sr. Unsecd. Note, 5.750%, 02/15/2018 | 19,800 |
| 70,000 | | Target Corp., Note, 5.875%, 07/15/2016 | 82,793 |
| 40,000 | | Wal-Mart Stores, Inc., Sr. Unsecd. Note, 6.200%, 4/15/2038 | 46,549 |
| | TOTAL | 386,095 |
| | Consumer Non-Cyclical — Food/Beverage – 0.3% | |
| 90,000 | 2,3 | Bacardi Ltd., Sr. Note, 7.450%, 04/01/2014 | 105,912 |
| 70,000 | | Bottling Group LLC, Note, 5.500%, 04/01/2016 | 81,714 |
| 30,000 | | Coca-Cola Enterprises, Inc., 4.250%, 03/01/2015 | 32,967 |
| 80,000 | | Diageo Capital PLC, Company Guarantee, 7.375%, 01/15/2014 | 93,875 |
| 60,000 | | General Mills, Inc., Note, 5.700%, 02/15/2017 | 69,741 |
| 125,000 | | Kraft Foods, Inc., Note, 5.250%, 10/01/2013 | 137,748 |
| 100,000 | | Kraft Foods, Inc., Sr. Unsecd. Note, 6.125%, 02/01/2018 | 117,889 |
| 50,000 | | PepsiCo, Inc., 4.650%, 02/15/2013 | 53,937 |
| 30,000 | | Ralcorp Holdings, Inc., Sr. Secd. Note, 6.625%, 08/15/2039 | 31,509 |
| 15,000 | | Sysco Corp., Sr. Note, 5.375%, 03/17/2019 | 17,228 |
| | TOTAL | 742,520 |
Annual Shareholder Report23
Shares or
Principal
Amount | | | Value in
U.S. Dollars |
| | Consumer Non-Cyclical — Health Care – 0.1% | |
| $50,000 | | Boston Scientific Corp., 4.500%, 01/15/2015 | 52,104 |
| 50,000 | | Boston Scientific Corp., 6.000%, 01/15/2020 | 53,983 |
| 20,000 | | Express Scripts, Inc., Sr. Unsecd. Note, 7.25%, 6/15/2019 | 24,478 |
| 75,000 | | Quest Diagnostics, Inc., Sr. Unsecd. Note, 6.400%, 07/01/2017 | 84,556 |
| | TOTAL | 215,121 |
| | Consumer Non-Cyclical — Pharmaceuticals – 0.1% | |
| 40,000 | | Abbott Laboratories, 5.150%, 11/30/2012 | 43,517 |
| 100,000 | | Genentech, Inc., Note, 4.750%, 07/15/2015 | 112,060 |
| 80,000 | | Pfizer, Inc., Sr. Unsecd. Note, 6.200%, 03/15/2019 | 97,649 |
| | TOTAL | 253,226 |
| | Consumer Non-Cyclical — Products – 0.0% | |
| 45,000 | | Philips Electronics NV, 5.750%, 03/11/2018 | 52,121 |
| | Consumer Non-Cyclical — Supermarkets – 0.0% | |
| 25,000 | | Kroger Co., Bond, 6.900%, 04/15/2038 | 29,359 |
| | Consumer Non-Cyclical — Tobacco – 0.0% | |
| 70,000 | | Altria Group, Inc., 9.250%, 08/06/2019 | 93,334 |
| | Energy — Independent – 0.1% | |
| 120,000 | | Canadian Natural Resources Ltd., 4.900%, 12/01/2014 | 133,581 |
| 30,000 | | EOG Resources, Inc., Note, 5.625%, 06/01/2019 | 34,252 |
| 25,000 | | Pemex Project Funding Master, 5.750%, 12/15/2015 | 27,922 |
| 80,000 | | Petroleos Mexicanos, Company Guarantee, Series WI, 4.875%, 03/15/2015 | 85,737 |
| 20,000 | | XTO Energy, Inc., 6.750%, 08/01/2037 | 25,954 |
| | TOTAL | 307,446 |
| | Energy — Integrated – 0.1% | |
| 60,000 | | Conoco, Inc., Sr. Unsecd. Note, 6.95%, 4/15/2029 | 75,558 |
| 100,000 | | ConocoPhillips Australia Funding Co., 5.500%, 04/15/2013 | 110,565 |
| 35,000 | | Petro-Canada, Deb., 7.000%, 11/15/2028 | 40,179 |
| 11,120 | 2,3 | Qatar Petroleum, 5.579%, 05/30/2011 | 11,307 |
| 100,000 | 2,3 | Statoil ASA, 5.125%, 04/30/2014 | 111,592 |
| | TOTAL | 349,201 |
| | Energy — Oil Field Services – 0.0% | |
| 50,000 | | Noble Drilling Corp., Sr. Note, 7.5%, 3/15/2019 | 60,978 |
| 25,000 | | Weatherford International Ltd., 6.000%, 03/15/2018 | 27,599 |
| 20,000 | | Weatherford International Ltd., 7.000%, 03/15/2038 | 21,439 |
| | TOTAL | 110,016 |
Annual Shareholder Report24
Shares or
Principal
Amount | | | Value in
U.S. Dollars |
| | Energy — Refining – 0.1% | |
| $110,000 | | Refining Group, Inc., 6.125%, 05/01/2011 | 112,397 |
| 25,000 | | Valero Energy Corp., 9.375%, 03/15/2019 | 31,722 |
| | TOTAL | 144,119 |
| | Financial Institution — Banking – 1.0% | |
| 50,000 | | Bank of America Corp., Sr. Note, 5.375%, 06/15/2014 | 52,981 |
| 120,000 | | Bank of America Corp., Sr. Note, 7.375%, 5/15/2014 | 134,188 |
| 100,000 | 2,3 | Barclays Bank PLC, 5.926%, 12/31/2049 | 93,125 |
| 70,000 | | Capital One Financial Corp., Sr. Note, 7.375%, 05/23/2014 | 81,143 |
| 80,000 | | Citigroup, Inc., Note, 5.125%, 05/05/2014 | 85,915 |
| 60,000 | 2,3 | Commonwealth Bank of Australia, Sr. Unsecd. Note, Series 144A, 3.750%, 10/15/2014 | 63,295 |
| 200,000 | | First Union Institutional, Bond, 8.04%, 12/1/2026 | 205,000 |
| 50,000 | | Goldman Sachs Group, Inc., 6.125%, 02/15/2033 | 52,545 |
| 320,000 | | Goldman Sachs Group, Inc., Sr. Unsecd. Note, 5.125%, 01/15/2015 | 344,713 |
| 150,000 | | Goldman Sachs Group, Inc., Sr. Unsecd. Note, 6.15%, 4/01/2018 | 164,877 |
| 100,000 | | HSBC Finance Capital Trust IX, Note, 5.911%, 11/30/2035 | 93,100 |
| 100,000 | | HSBC Finance Corp., 5.000%, 06/30/2015 | 108,668 |
| 75,000 | | Household Finance Corp., Unsecd. Note, 4.75%, 7/15/2013 | 79,647 |
| 90,000 | | M & T Bank Corp., 5.375%, 05/24/2012 | 95,188 |
| 30,000 | | Merrill Lynch & Co., Inc., Sr. Unsecd. Note, 6.050%, 08/15/2012 | 31,855 |
| 100,000 | | Morgan Stanley Group, Inc., 5.300%, 03/01/2013 | 107,573 |
| 100,000 | | Morgan Stanley, Sr. Unsecd. Note, 6.625%, 04/01/2018 | 109,976 |
| 30,000 | | Northern Trust Corp., 4.625%, 05/01/2014 | 32,872 |
| 15,000 | | PNC Funding Corp., Sub. Note, 5.625%, 02/01/2017 | 16,342 |
| 407,213 | 2,3 | Regional Diversified Funding, 9.250%, 03/15/2030 | 260,718 |
| 20,000 | | State Street Corp., Sr. Note, 4.300%, 05/30/2014 | 21,732 |
| 100,000 | | U.S. Bank, N.A., 6.300%, 02/04/2014 | 113,764 |
| 140,000 | | Wachovia Corp., 5.750%, 02/01/2018 | 157,218 |
| 40,000 | | Wilmington Trust Corp., Sub. Note, 8.500%, 04/02/2018 | 46,075 |
| | TOTAL | 2,552,510 |
| | Financial Institution — Brokerage – 0.3% | |
| 220,000 | | Blackrock, Inc., 6.250%, 09/15/2017 | 255,886 |
| 50,000 | | Charles Schwab Corp., Sr. Unsecd. Note, 4.950%, 06/01/2014 | 55,193 |
| 40,000 | | Eaton Vance Corp., 6.500%, 10/02/2017 | 46,423 |
| 100,000 | 2,3 | FMR LLC, 4.75%, 3/01/2013 | 105,489 |
| 25,000 | | Janus Capital Group, Inc., Sr. Note, 6.500%, 06/15/2012 | 26,120 |
| 30,000 | | Janus Capital Group, Inc., Sr. Note, 6.950%, 06/15/2017 | 31,062 |
Annual Shareholder Report25
Shares or
Principal
Amount | | | Value in
U.S. Dollars |
| $95,000 | | Jefferies Group, Inc., Sr. Unsecd. Note, 8.500%, 07/15/2019 | 110,942 |
| 60,000 | | Lehman Brothers Holdings, Note, 4.800%, 3/13/2014 | 13,275 |
| 30,000 | | Nuveen Investments, 5.500%, 09/15/2015 | 25,237 |
| 75,000 | | Raymond James Financial, Inc., 8.600%, 08/15/2019 | 89,409 |
| | TOTAL | 759,036 |
| | Financial Institution — Finance Noncaptive – 0.5% | |
| 160,000 | | American Express Co., Sr. Unsecd. Note, 8.125%, 05/20/2019 | 202,135 |
| 60,000 | | American Express Credit Corp., Sr. Unsecd. Note, 5.125%, 08/25/2014 | 65,344 |
| 120,000 | | Berkshire Hathaway, Inc., Company Guarantee, 5.000%, 08/15/2013 | 132,452 |
| 120,000 | | Capital One Capital IV, 6.745%, 02/17/2037 | 119,700 |
| 20,000 | | Capital One Capital V, 10.250%, 08/15/2039 | 21,275 |
| 510,000 | | General Electric Capital Corp., 5.625%, 05/01/2018 | 561,291 |
| 30,000 | | General Electric Capital Corp., Note, Series MTN, 6.750%, 03/15/2032 | 32,742 |
| 30,000 | 2,3 | Macquarie Group Ltd., Note, Series 144A, 7.625%, 8/13/2019 | 34,921 |
| | TOTAL | 1,169,860 |
| | Financial Institution — Insurance — Health – 0.1% | |
| 50,000 | | CIGNA Corp., 6.350%, 03/15/2018 | 57,763 |
| 50,000 | | UnitedHealth Group, Inc., Sr. Unsecd. Note, 6.000%, 2/15/2018 | 57,774 |
| 50,000 | | Wellpoint, Inc., 5.850%, 01/15/2036 | 51,557 |
| | TOTAL | 167,094 |
| | Financial Institution — Insurance — Life – 0.7% | |
| 100,000 | | AXA-UAP, Sub. Note, 8.600%, 12/15/2030 | 114,377 |
| 100,000 | 2,3 | Massachusetts Mutual Life Insurance Co., Sub. Note, 8.875%, 06/01/2039 | 134,173 |
| 90,000 | | MetLife, Inc., 6.750%, 06/01/2016 | 105,944 |
| 10,000 | | MetLife, Inc., Jr. Sub. Note, 10.750%, 08/01/2069 | 13,500 |
| 80,000 | 2,3 | New York Life Insurance Co., Sub. Note, 6.750%, 11/15/2039 | 95,943 |
| 300,000 | 2,3 | Pacific LifeCorp., Bond, 6.600%, 09/15/2033 | 300,996 |
| 50,000 | | Prudential Financial, Inc., 5.150%, 01/15/2013 | 53,566 |
| 40,000 | | Prudential Financial, Inc., 6.625%, 12/01/2037 | 43,730 |
| 10,000 | | Prudential Financial, Inc., Sr. Note, 7.375%, 06/15/2019 | 12,004 |
| 100,000 | | Prudential Financial, Inc., Sr. Unsecd. Note, 4.750%, 09/17/2015 | 107,928 |
| 750,000 | 2 | Union Central Life Ins Co, Note, 8.200%, 11/1/2026 | 748,848 |
| | TOTAL | 1,731,009 |
| | Financial Institution — Insurance — P&C – 0.2% | |
| 80,000 | | ACE INA Holdings, Inc., Sr. Note, 5.700%, 02/15/2017 | 89,583 |
| 80,000 | | CNA Financial Corp., 6.500%, 08/15/2016 | 87,096 |
Annual Shareholder Report26
Shares or
Principal
Amount | | | Value in
U.S. Dollars |
| $15,000 | | Chubb Corp., Sr. Note, 5.750%, 05/15/2018 | 17,120 |
| 50,000 | | Horace Mann Educators Corp., Sr. Note, 6.850%, 04/15/2016 | 53,833 |
| 100,000 | 2,3 | Liberty Mutual Group, Inc., Unsecd. Note, 5.750%, 03/15/2014 | 104,888 |
| 30,000 | 2,3 | Nationwide Mutual Insurance Co., Note, Series 144A, 9.375%, 08/15/2039 | 34,859 |
| 10,000 | | The Travelers Cos., Inc., Sr. Unsecd. Note, 5.500%, 12/01/2015 | 11,499 |
| | TOTAL | 398,878 |
| | Financial Institution — REITs – 0.2% | |
| 45,000 | | Avalonbay Communities, Inc., Sr. Unsecd. Note, Series MTN, 5.700%, 03/15/2017 | 50,944 |
| 75,000 | | Boston Properties LP, Sr. Unsecd. Note, 5.875%, 10/15/2019 | 84,052 |
| 40,000 | | Equity One, Inc., Bond, 6.000%, 09/15/2017 | 40,862 |
| 40,000 | | Liberty Property LP, 6.625%, 10/01/2017 | 46,804 |
| 120,000 | | Prologis, Sr. Note, 5.500%, 04/01/2012 | 124,347 |
| 20,000 | | Prologis, Sr. Note, 7.625%, 08/15/2014 | 23,074 |
| 40,000 | | Simon Property Group LP, 6.750%, 05/15/2014 | 45,657 |
| 50,000 | | Simon Property Group, Inc., 6.350%, 08/28/2012 | 53,778 |
| | TOTAL | 469,518 |
| | Foreign — Local — Government – 0.0% | |
| 50,000 | | Quebec, Province of, Note, Series MTNA, 7.035%, 3/10/2026 | 65,009 |
| | Municipal Services – 0.1% | |
| 140,000 | 2,3 | Army Hawaii Family Housing, 5.524%, 6/15/2050 | 123,851 |
| 100,000 | 2,3 | Camp Pendleton & Quantico Housing LLC, 5.572%, 10/01/2050 | 91,321 |
| | TOTAL | 215,172 |
| | Technology – 0.3% | |
| 20,000 | | Cisco Systems, Inc., Sr. Unsecd. Note, 5.500%, 02/22/2016 | 23,337 |
| 40,000 | | Dell Computer Corp., Deb., 7.100%, 04/15/2028 | 45,296 |
| 60,000 | | Dun & Bradstreet Corp., Sr. Unsecd. Note, 5.500%, 03/15/2011 | 60,757 |
| 105,000 | | Fiserv, Inc., Sr. Note, 6.800%, 11/20/2017 | 119,535 |
| 50,000 | | Harris Corp., 5.950%, 12/01/2017 | 56,648 |
| 60,000 | | Hewlett-Packard Co., Note, 5.400%, 03/01/2017 | 68,597 |
| 200,000 | | IBM Corp., Sr. Note, 5.700%, 09/14/2017 | 234,934 |
| 100,000 | | Oracle Corp., Sr. Unsecd. Note, Series WI, 5.000%, 01/15/2011 | 100,563 |
| | TOTAL | 709,667 |
| | Transportation — Railroads – 0.1% | |
| 100,000 | | Burlington Northern Santa Fe Corp., 4.875%, 01/15/2015 | 110,362 |
| 50,000 | | Union Pacific Corp., 4.875%, 01/15/2015 | 55,201 |
Annual Shareholder Report27
Shares or
Principal
Amount | | | Value in
U.S. Dollars |
| $45,000 | | Union Pacific Corp., Bond, 6.625%, 2/01/2029 | 52,563 |
| | TOTAL | 218,126 |
| | Transportation — Services – 0.0% | |
| 75,000 | 2,3 | Enterprise Rent-A-Car USA Finance Co., 6.375%, 10/15/2017 | 86,698 |
| | Utility — Electric – 0.5% | |
| 60,000 | | Appalachian Power Co., Sr. Unsecd. Note, 7.950%, 01/15/2020 | 78,067 |
| 50,000 | | Cleveland Electric Illuminating Co., Sr. Unsecd. Note, 5.950%, 12/15/2036 | 49,033 |
| 50,000 | | Commonwealth Edison Co., 1st Mtg. Bond, 5.800%, 03/15/2018 | 58,436 |
| 40,000 | | Consolidated Edison Co., Sr. Unsecd. Note, 5.500%, 09/15/2016 | 46,284 |
| 10,000 | | Consolidated Edison Co., Sr. Unsecd. Note, 6.650%, 04/01/2019 | 12,395 |
| 60,000 | 2,3 | Electricite De France SA, 5.5%, 1/26/2014 | 67,266 |
| 90,000 | | FirstEnergy Solutions Co, Company Guarantee, 4.800%, 2/15/2015 | 96,377 |
| 50,000 | | FirstEnergy Solutions Co, Company Guarantee, 6.05%, 8/15/2021 | 53,091 |
| 71,405 | 2,3 | Great River Energy, 1st Mtg. Note, 5.829%, 07/01/2017 | 81,138 |
| 120,000 | | MidAmerican Energy Co., 4.650%, 10/01/2014 | 132,297 |
| 100,000 | | National Rural Utilities Cooperative Finance Corp., Sr. Unsecd. Note, 10.375%, 11/01/2018 | 141,711 |
| 30,000 | | Northern States Power Co., MN, 1st Mtg. Bond, 5.250%, 03/01/2018 | 34,291 |
| 60,000 | | PPL Energy Supply LLC, Sr. Unsecd. Note, 6.000%, 12/15/2036 | 60,116 |
| 40,000 | | Progress Energy, Inc., 7.050%, 03/15/2019 | 49,061 |
| 100,000 | | Union Electric Co., 6.000%, 04/01/2018 | 113,308 |
| 120,000 | | Virginia Electric & Power Co., Sr. Unsecd. Note, 5.000%, 06/30/2019 | 134,733 |
| 80,000 | | Virginia Electric & Power Co., Sr. Unsecd. Note, 5.100%, 11/30/2012 | 86,706 |
| | TOTAL | 1,294,310 |
| | Utility — Natural Gas Distributor – 0.1% | |
| 120,000 | | Atmos Energy Corp., 5.125%, 01/15/2013 | 128,519 |
| 15,000 | | Atmos Energy Corp., 8.500%, 03/15/2019 | 19,432 |
| 60,000 | | Sempra Energy, Sr. Unsecd. Note, 6.500%, 06/01/2016 | 71,475 |
| | TOTAL | 219,426 |
| | Utility — Natural Gas Pipelines – 0.2% | |
| 100,000 | | Duke Capital Corp., Sr. Note, 6.250%, 02/15/2013 | 109,330 |
| 70,000 | | Enbridge, Inc., Sr. Note, 5.600%, 04/01/2017 | 79,787 |
| 110,000 | | Enterprise Products LLC, Company Guarantee, Series O, 9.75%, 1/31/2014 | 134,093 |
Annual Shareholder Report28
Shares or
Principal
Amount | | | Value in
U.S. Dollars |
| $100,000 | | Kinder Morgan Energy Partners LP, Sr. Unsecd. Note, 5.800%, 03/15/2035 | 96,431 |
| | TOTAL | 419,641 |
| | TOTAL CORPORATE BONDS
(IDENTIFIED COST $16,088,169) | 17,229,421 |
| | Governments/Agencies – 0.1% | |
| | Sovereign – 0.1% | |
| 75,000 | | United Mexican States, 6.625%, 03/03/2015 | 88,312 |
| 30,000 | | United Mexican States, Series MTNA, 6.750%, 09/27/2034 | 35,371 |
| | TOTAL GOVERNMENTS/AGENCIES
(IDENTIFIED COST $106,486) | 123,683 |
| | Mortgage-Backed Securities – 0.3% | |
| 7,915 | | Federal Home Loan Mortgage Corp. Pool C00592, 7.000%, 3/1/2028 | 8,898 |
| 5,716 | | Federal Home Loan Mortgage Corp. Pool C00896, 7.500%, 12/1/2029 | 6,467 |
| 14,387 | | Federal Home Loan Mortgage Corp. Pool C17281, 6.500%, 11/1/2028 | 16,123 |
| 15,026 | | Federal Home Loan Mortgage Corp. Pool C19588, 6.500%, 12/1/2028 | 16,857 |
| 4,413 | | Federal Home Loan Mortgage Corp. Pool C25621, 6.500%, 5/1/2029 | 4,941 |
| 18,777 | | Federal Home Loan Mortgage Corp. Pool C76361, 6.000%, 2/1/2033 | 20,725 |
| 51,216 | | Federal Home Loan Mortgage Corp. Pool E01545, 5.000%,
15 Year, 1/1/2019 | 54,784 |
| 1,533 | | Federal Home Loan Mortgage Corp. Pool E20252, 7.000%,
15 Year, 7/1/2011 | 1,556 |
| 987 | | Federal Home Loan Mortgage Corp. Pool E77591, 6.500%, 7/1/2014 | 1,050 |
| 12,746 | | Federal Home Loan Mortgage Corp. Pool E99510, 5.500%, 9/1/2018 | 13,823 |
| 15,814 | | Federal Home Loan Mortgage Corp. Pool G01444, 6.500%, 8/1/2032 | 17,812 |
| 10,553 | | Federal National Mortgage Association Pool 251697, 6.500%,
30 Year, 5/1/2028 | 11,779 |
| 27,589 | | Federal National Mortgage Association Pool 252334, 6.500%,
30 Year, 2/1/2029 | 30,465 |
| 55,927 | | Federal National Mortgage Association Pool 254720, 4.500%, 5/1/2018 | 59,572 |
| 56,310 | | Federal National Mortgage Association Pool 254802, 4.500%, 7/1/2018 | 59,787 |
| 27,936 | | Federal National Mortgage Association Pool 254905, 6.000%, 10/1/2033 | 30,831 |
| 55,247 | | Federal National Mortgage Association Pool 255075, 5.500%, 2/1/2024 | 59,927 |
| 61,959 | | Federal National Mortgage Association Pool 255079, 5.000%, 2/1/2019 | 66,423 |
| 2,785 | | Federal National Mortgage Association Pool 303168, 9.500%,
30 Year, 2/1/2025 | 3,324 |
| 1,497 | | Federal National Mortgage Association Pool 323159, 7.500%, 4/1/2028 | 1,689 |
| 12,168 | | Federal National Mortgage Association Pool 323640, 7.500%, 4/1/2029 | 13,729 |
Annual Shareholder Report29
Shares or
Principal
Amount | | | Value in
U.S. Dollars |
| $433 | | Federal National Mortgage Association Pool 323970, 7.000%,
15 Year, 10/1/2014 | 462 |
| 19,288 | | Federal National Mortgage Association Pool 428865, 7.000%, 6/1/2028 | 21,665 |
| 2,576 | | Federal National Mortgage Association Pool 443215, 6.000%, 10/1/2028 | 2,845 |
| 274 | | Federal National Mortgage Association Pool 514184, 7.500%, 9/1/2029 | 310 |
| 50,636 | | Federal National Mortgage Association Pool 545993, 6.000%, 11/1/2032 | 56,168 |
| 20,781 | | Federal National Mortgage Association Pool 555272, 6.000%, 3/1/2033 | 23,082 |
| 45,736 | | Federal National Mortgage Association Pool 713974, 5.500%, 7/1/2033 | 49,378 |
| 58,564 | | Federal National Mortgage Association Pool 721502, 5.000%, 7/1/2033 | 62,228 |
| 1,385 | | Government National Mortgage Association Pool 352214, 7.000%, 4/15/2023 | 1,542 |
| 4,943 | | Government National Mortgage Association Pool 451522, 7.500%,
30 Year, 10/15/2027 | 5,624 |
| 11,942 | | Government National Mortgage Association Pool 462556, 6.500%, 2/15/2028 | 13,472 |
| 473 | | Government National Mortgage Association Pool 462739, 7.500%, 5/15/2028 | 538 |
| 644 | | Government National Mortgage Association Pool 464835, 6.500%, 9/15/2028 | 727 |
| 10,473 | | Government National Mortgage Association Pool 469699, 7.000%, 11/15/2028 | 11,808 |
| 10,701 | | Government National Mortgage Association Pool 486760, 6.500%, 12/15/2028 | 12,078 |
| 1,971 | | Government National Mortgage Association Pool 780339, 8.000%,
30 Year, 12/15/2023 | 2,246 |
| 13,547 | | Government National Mortgage Association Pool 780453, 7.500%,
30 Year, 12/15/2025 | 15,389 |
| 12,088 | | Government National Mortgage Association Pool 780584, 7.000%,
30 Year, 6/15/2027 | 13,561 |
| | TOTAL MORTGAGE-BACKED SECURITIES
(IDENTIFIED COST $735,453) | 793,685 |
| | MUNICIPAL – 0.0% | |
| | Illinois – 0.0% | |
| 90,000 | | Chicago, IL Metropolitan Water Reclamation District, Direct Payment Taxable Limited GO Build America Bonds, 5.720%, 12/01/2038
(IDENTIFIED COST $90,000) | 95,547 |
| | U.S. Treasury – 2.1% | |
| 400,000 | 4,5 | United States Treasury Bill, 0.125%, 12/16/2010 | 399,981 |
| 2,300,000 | 4,5 | United States Treasury Bill, 0.125%, 2/3/2011 | 2,299,417 |
| 1,800,000 | 4,5 | United States Treasury Bill, 0.160%, 1/20/2011 | 1,799,644 |
Annual Shareholder Report30
Shares or
Principal
Amount | | | Value in
U.S. Dollars |
| $800,000 | 4 | United States Treasury Bond, 3.500%, 2/15/2039 | 716,312 |
| 100,000 | 4 | United States Treasury Note, 3.125%, 8/31/2013 | 106,801 |
| | TOTAL U.S. TREASURY
(IDENTIFIED COST $5,326,695) | 5,322,155 |
| | EXCHANGE-TRADED FUNDS – 18.7% | |
| 104,579 | | Energy Select Sector SPDR | 6,550,829 |
| 291,841 | | iShares MSCI Emerging Market Index Fund | 13,065,722 |
| 67,953 | | iShares Dow Jones US Pharmaceuticals Index Fund | 4,144,453 |
| 320,849 | | iShares Russell 2000 Index Fund | 23,325,722 |
| | TOTAL EXCHANGE-TRADED FUNDS
(IDENTIFIED COST $39,840,737) | 47,086,726 |
| | MUTUAL FUNDS – 37.7%;6 | |
| 189,860 | | Emerging Markets Fixed Income Core Fund | 5,201,991 |
| 276,859 | | Federated InterContinental Fund, Institutional Shares | 12,669,071 |
| 401,648 | | Federated Mid Cap Growth Strategies Fund, Institutional Shares | 13,439,154 |
| 923,667 | | Federated Mortgage Core Portfolio | 9,365,986 |
| 305,951 | | Federated Project and Trade Finance Core Fund | 3,053,394 |
| 2,802,841 | | High Yield Bond Portfolio | 18,218,469 |
| 33,132,233 | 7 | Federated Prime Value Obligations Fund, Institutional Shares, 0.21% | 33,132,233 |
| | TOTAL MUTUAL FUNDS
(IDENTIFIED COST $89,589,072) | 95,080,298 |
| | TOTAL INVESTMENTS — 100.2%
(IDENTIFIED COST $230,524,280)8 | 252,737,511 |
| | OTHER ASSETS AND LIABILITIES - NET — (0.2)%9 | (610,765) |
| | TOTAL NET ASSETS — 100% | $252,126,746 |
Annual Shareholder Report
31
At November 30, 2010, the Fund had the following outstanding futures contracts:| Description | Number of
Contracts | Notional
Value | Expiration
Date | Unrealized
Appreciation/
(Depreciation) |
| 1ASX SPI 200 Index Short Futures | 13 | $1,492,725 | December 2010 | $24,875 |
| 1CAC 40 Index Short Futures | 117 | $4,224,870 | December 2010 | $260,048 |
| 1IBEX 35 Index Short Futures | 11 | $1,014,915 | December 2010 | $74,609 |
| 1OMX 30 Index Short Futures | 125 | $13,859,375 | December 2010 | $(38,391) |
| 1S&P/TSE 60 Index Short Futures | 16 | $2,369,920 | December 2010 | $(116,902) |
| 1Hang Seng Index Short Futures | 6 | $6,908,400 | December 2010 | $(3,399) |
| 1United States Treasury Notes 2-Year Short Futures | 30 | $6,581,250 | March 2011 | $(7,096) |
| 1United States Treasury Notes 5-Year Short Futures | 60 | $7,191,094 | March 2011 | $(27,963) |
| 1United States Treasury Notes 10-Year Short Futures | 10 | $1,241,094 | March 2011 | $(5,568) |
| 1AEX Index Long Futures | 33 | $2,162,490 | December 2010 | $(132,417) |
| 1DAX Index Long Futures | 13 | $2,178,150 | December 2010 | $133,154 |
| 1FTSE 100 Index Long Futures | 27 | $1,497,015 | December 2010 | $(33,161) |
| 1Russell 2000 Mini Index Long Futures | 95 | $6,901,750 | December 2010 | $384,081 |
| 1SGX MSCI Singapore Index Long Futures | 14 | $1,037,960 | December 2010 | $(2,626) |
| 1S&P 500 Index Long Futures | 70 | $20,643,000 | December 2010 | $832,295 |
| 1Swiss Market Index Long Futures | 26 | $1,639,040 | December 2010 | $(51,039) |
| 1Topix Index Long Futures | 60 | $514,800,000 | December 2010 | $22,810 |
| 1United States Treasury Bonds 30-Year Long Futures | 19 | $2,418,344 | March 2011 | $29,349 |
| NET UNREALIZED APPRECIATION ON FUTURES CONTRACTS | $1,342,659 |
At November 30, 2010, the Fund had the following open swap contract:
| Credit Default Swap Counterparty | Goldman Sachs & Co. |
| Reference Entity | Series 13 Investment Grade Index |
| Buy/Sell | Sell |
| Pay/Receive Fixed Rate | 1.00% |
| Expiration Date | 12/20/2014 |
| Implied Credit Spread at 11/30/201010 | 0.89% |
| Notional Amount | $5,000,000 |
| Market Value | $33,391 |
| Upfront Premiums Paid/(Received) | $11,942 |
| Unrealized Appreciation | $21,449 |
Annual Shareholder Report
32
At November 30, 2010, the Fund had the following outstanding foreign exchange contracts:| Settlement Date | Foreign
Currency
Units to
Deliver/Receive | In
Exchange
For | Unrealized
Appreciation/
(Depreciation) |
| Contracts Purchased: |
| 12/6/2010 | 2,493,020 Euro | $3,500,000 | $(263,975) |
| 12/6/2010 | 6,410,622 Euro | $9,000,000 | $(678,793) |
| Contracts Sold: |
| 12/6/2010 | 8,997,531 Euro | $12,500,000 | $820,896 |
| NET UNREALIZED DEPRECIATION ON FOREIGN EXCHANGE CONTRACTS | $(121,872) |
Net Unrealized Appreciation/Depreciation on Futures Contracts, Swap Contract and Foreign Exchange Contracts is included in “Other Assets and Liabilities — Net.”
| 1 | Non-income producing security. |
| 2 | Denotes a restricted security that either: (a) cannot be offered for public sale without first being registered, or being able to take advantage of an exemption from registration, under the Securities Act of 1933; or (b) is subject to a contractual restriction on public sales. At November 30, 2010, these restricted securities amounted to $4,644,970, which represented 1.8% of total net assets. |
| 3 | Denotes a restricted security that may be resold without restriction to “qualified institutional buyers” as defined in Rule 144A under the Securities Act of 1933 and that the Fund has determined to be liquid under criteria established by the Fund's Board of Trustees (the “Trustees”). At November 30, 2010, these liquid restricted securities amounted to $3,892,278, which represented 1.5% of total net assets. |
| 4 | Pledged as collateral to ensure the Fund is able to satisfy the obligations of its outstanding futures contracts. |
| 5 | Discount rate at time of purchase. |
| 6 | Affiliated companies. |
| 7 | 7-Day net yield. |
| 8 | The cost of investments for federal tax purposes amounts to $231,927,784. |
| 9 | Assets, other than investments in securities, less liabilities. See Statement of Assets and Liabilities. |
| 10 | Implied credit spreads, represented in absolute terms, utilized in determining the market value of credit default swap agreements serve as an indicator of the current status of the payment/performance risk and represent the likelihood or risk of default for the credit derivative. The implied credit spread of a particular referenced entity reflects the cost of buying/selling protection and may include upfront payments required to be made to enter into the agreement. Wider credit spreads represent a deterioration of the referenced entity's credit soundness and a greater likelihood or risk of default or other credit event occurring as defined under the terms of the agreement. A credit spread identified as “Defaulted” indicates a credit event has occurred for the referenced entity or obligation. |
Note: The categories of investments are shown as a percentage of total net assets at November 30, 2010.
Various inputs are used in determining the value of the Fund's investments. These inputs are summarized in the three broad levels listed below:
Level 1 — quoted prices in active markets for identical securities
Level 2 — other significant observable inputs (including quoted prices for similar securities, interest rates, prepayment speeds, credit risk, etc.)
Level 3 — significant unobservable inputs (including the Fund's own assumptions in determining the fair value of investments)
Annual Shareholder Report
33
The inputs or methodology used for valuing securities are not an indication of the risk associated with investing in those securities.The following is a summary of the inputs used, as of November 30, 2010, in valuing the Fund's assets carried at fair value:
| Valuation Inputs | | | | |
| Level 1 –
Quoted
Prices and
Investments in
Mutual Funds* | Level 2 –
Other
Significant
Observable
Inputs | Level 3 –
Significant
Unobservable
Inputs | Total |
| Equity Securities: | | | | |
| Common Stock | | | | |
| Domestic | $75,199,231 | $ — | $ — | $75,199,231 |
| International | 6,414,720** | — | — | 6,414,720 |
| Debt Securities: | | | | |
| Assets-Backed Securities | — | 2,593,937 | — | 2,593,937 |
| Collateralized Mortgage Obligations | — | 2,798,108 | — | 2,798,108 |
| Corporate Bonds | — | 17,229,421 | — | 17,229,421 |
| Governments/Agencies | — | 123,683 | — | 123,683 |
| Mortgage-Backed Securities | — | 793,685 | — | 793,685 |
| Municipal | — | 95,547 | — | 95,547 |
| U.S. Treasury | — | 5,322,155 | — | 5,322,155 |
| Exchange-Traded Funds | 47,086,726 | — | — | 47,086,726 |
| Mutual Funds | 95,080,298 | — | — | 95,080,298 |
| TOTAL SECURITIES | $223,780,975 | $28,956,536 | $ — | $252,737,511 |
| OTHER FINANCIAL INSTRUMENTS*** | $1,342,659 | $(100,423) | $ — | $1,242,236 |
| * | Emerging Markets Fixed Income Core Fund, Federated Mortgage Core Portfolio, Federated Project and Trade Finance Core Fund and High Yield Bond Portfolio are affiliated holdings offered only to registered investment companies and other accredited investors. |
| ** | Includes $525,749 of securities transferred from Level 2 to Level 1 because quoted prices on equity securities traded principally in foreign markets were utilized to value securities for which fair value factors were previously applied to account for significant post market close activity. |
| *** | Other financial instruments include futures contracts, swap contract and foreign exchange contracts. |
The following acronyms are used throughout this portfolio:
| ADR | — American Depositary Receipt |
| MTN | — Medium Term Note |
| REITs | — Real Estate Investment Trusts |
See Notes which are an integral part of the Financial Statements
Annual Shareholder Report34
Statement of Assets and Liabilities
November 30, 2010
| Assets: | | |
| Total investments in securities, at value including $95,080,298 of investments in affiliated issuers (Note 5) (identified cost $230,524,280) | | $252,737,511 |
| Cash | | 12,474 |
| Cash denominated in foreign currencies (identified cost $39,664) | | 36,692 |
| Income receivable | | 425,174 |
| Swaps, at value (premium paid $11,942) | | 33,391 |
| Receivable for investments sold | | 11,436 |
| Receivable for shares sold | | 267,404 |
| Receivable for foreign exchange contracts | | 820,896 |
| Receivable for periodic payments from swap contracts | | 10,000 |
| Other receivables | | 6,249 |
| TOTAL ASSETS | | 254,361,227 |
| Liabilities: | | |
| Payable for investments purchased | $182,735 | |
| Payable for shares redeemed | 552,857 | |
| Payable for foreign exchange contracts | 942,768 | |
| Payable for daily variation margin | 286,227 | |
| Payable for transfer and dividend disbursing agent fees and expenses | 90,743 | |
| Payable for distribution services fee (Note 5) | 53,926 | |
| Payable for shareholder services fee (Note 5) | 45,454 | |
| Accrued expenses | 79,771 | |
| TOTAL LIABILITIES | | 2,234,481 |
| Net assets for 14,998,425 shares outstanding | | $252,126,746 |
| Net Assets Consist of: | | |
| Paid-in capital | | $251,457,996 |
| Net unrealized appreciation of investments, futures contracts, swap contracts and translation of assets and liabilities in foreign currency | | 23,457,651 |
| Accumulated net realized loss on investments, futures contracts, swap contracts and foreign currency transactions | | (22,889,324) |
| Undistributed net investment income | | 100,423 |
| TOTAL NET ASSETS | | $252,126,746 |
Annual Shareholder Report35
Statement of Assets and Liabilities — continued| Net Asset Value, Offering Price and Redemption Proceeds Per Share | | |
| Class A Shares: | | |
| Net asset value per share ($135,001,952 ÷ 8,004,439 shares outstanding), no par value, unlimited shares authorized | | $16.87 |
| Offering price per share (100/94.50 of $16.87) | | $17.85 |
| Redemption proceeds per share | | $16.87 |
| Class B Shares: | | |
| Net asset value per share ($14,540,532 ÷ 871,344 shares outstanding), no par value, unlimited shares authorized | | $16.69 |
| Offering price per share | | $16.69 |
| Redemption proceeds per share (94.50/100 of $16.69) | | $15.77 |
| Class C Shares: | | |
| Net asset value per share ($36,414,720 ÷ 2,190,572 shares outstanding), no par value, unlimited shares authorized | | $16.62 |
| Offering price per share | | $16.62 |
| Redemption proceeds per share (99.00/100 of $16.62) | | $16.45 |
| Class K Shares: | | |
| Net asset value per share ($53,748,692 ÷ 3,197,656 shares outstanding), no par value, unlimited shares authorized | | $16.81 |
| Offering price per share | | $16.81 |
| Redemption proceeds per share | | $16.81 |
| Institutional Shares: | | |
| Net asset value per share ($12,420,850 ÷ 734,414 shares outstanding), no par value, unlimited shares authorized | | $16.91 |
| Offering price per share | | $16.91 |
| Redemption proceeds per share | | $16.91 |
See Notes which are an integral part of the Financial Statements
Annual Shareholder Report36
Statement of Operations
Year Ended November 30, 2010
| Investment Income: | | | |
| Dividends (including $1,966,166 received from affiliated issuers (Note 5) and net of foreign taxes withheld of $1,258) | | | $4,241,248 |
| Interest | | | 1,402,451 |
| Investment income allocated from affiliated partnership (Note 5) | | | 384,029 |
| TOTAL INCOME | | | 6,027,728 |
| Expenses: | | | |
| Investment adviser fee (Note 5) | | $1,691,073 | |
| Administrative personnel and services fee (Note 5) | | 310,000 | |
| Custodian fees | | 51,730 | |
| Transfer and dividend disbursing agent fees and expenses — Class A Shares | | 297,333 | |
| Transfer and dividend disbursing agent fees and expenses — Class B Shares | | 44,548 | |
| Transfer and dividend disbursing agent fees and expenses — Class C Shares | | 69,775 | |
| Transfer and dividend disbursing agent fees and expenses — Class K Shares | | 186,350 | |
| Transfer and dividend disbursing agent fees and expenses — Institutional Shares | | 13,217 | |
| Directors'/Trustees' fees | | 8,614 | |
| Auditing fees | | 26,250 | |
| Legal fees | | 6,777 | |
| Portfolio accounting fees | | 155,536 | |
| Distribution services fee — Class B Shares (Note 5) | | 127,548 | |
| Distribution services fee — Class C Shares (Note 5) | | 242,256 | |
| Distribution services fee — Class K Shares (Note 5) | | 248,180 | |
| Shareholder services fee — Class A Shares (Note 5) | | 339,936 | |
| Shareholder services fee — Class B Shares (Note 5) | | 42,516 | |
| Shareholder services fee — Class C Shares (Note 5) | | 80,417 | |
| Account administration fee — Class A Shares | | 3,652 | |
| Share registration costs | | 78,482 | |
| Printing and postage | | 102,038 | |
| Insurance premiums | | 4,626 | |
| Taxes | | 6,839 | |
| Miscellaneous | | 13,419 | |
| TOTAL EXPENSES | | 4,151,112 | |
Annual Shareholder Report37
Statement of Operations — continued| Waivers, Reimbursements and Reduction: | | | |
| Waiver/reimbursement of investment adviser fee (Note 5) | $(263,695) | | |
| Waiver of administrative personnel and services fee (Note 5) | (62,539) | | |
| Reimbursement of transfer and dividend disbursing agent fees and expenses — Class A Shares (Note 5) | (94,428) | | |
| Reimbursement of transfer and dividend disbursing agent fees and expenses — Class B Shares (Note 5) | (12,154) | | |
| Reimbursement of transfer and dividend disbursing agent fees and expenses — Class C Shares (Note 5) | (8,701) | | |
| Reimbursement of transfer and dividend disbursing agent fees and expenses — Institutional Shares (Note 5) | (3,064) | | |
| Fees paid indirectly from directed brokerage arrangements (Note 6) | (28,581) | | |
| TOTAL WAIVERS, REIMBURSEMENTS AND REDUCTION | | $(473,162) | |
| Net expenses | | | $3,677,950 |
| Net investment income | | | 2,349,778 |
| Realized and Unrealized Gain on Investments, Futures Contracts, Swap Contracts and Foreign Currency Transactions: | | | |
| Net realized gain on investments and foreign currency transactions (including realized gain of $575,262 on sales of investments in affiliated issuers) (Note 5)) | | | 10,745,976 |
| Net realized gain on futures contracts | | | 2,320,000 |
| Net realized gain on swap contracts | | | 456,219 |
| Net realized gain/loss allocated from affiliated partnership (Note 5) | | | 49,371 |
| Net change in unrealized appreciation of investments and translation of assets and liabilities in foreign currency | | | 1,489,864 |
| Net change in unrealized appreciation of futures contracts | | | 756,681 |
| Net change in unrealized appreciation of swap contracts | | | (197,643) |
| Net realized and unrealized gain on investments, futures contracts, swap contracts and foreign currency transactions | | | 15,620,468 |
| Change in net assets resulting from operations | | | $17,970,246 |
See Notes which are an integral part of the Financial Statements
Annual Shareholder Report38
Statement of Changes in Net Assets
| Year Ended November 30 | 2010 | 2009 |
| Increase (Decrease) in Net Assets | | |
| Operations: | | |
| Net investment income | $2,349,778 | $3,626,329 |
| Net realized gain on investments including allocation from affiliated partnership, futures contracts, swap contracts and foreign currency transactions | 13,571,566 | 548,019 |
| Net change in unrealized appreciation/depreciation of investments, futures contracts, swap contracts and translation of assets and liabilities in foreign currency | 2,048,902 | 37,935,648 |
| CHANGE IN NET ASSETS RESULTING FROM OPERATIONS | 17,970,246 | 42,109,996 |
| Distributions to Shareholders: | | |
| Distributions from net investment income | | |
| Class A Shares | (158,051) | (2,629,338) |
| Class B Shares | (21,313) | (267,729) |
| Class C Shares | (30,767) | (285,201) |
| Class K Shares | (50,986) | (384,837) |
| Institutional Shares | (2,951) | (19,202) |
| CHANGE IN NET ASSETS RESULTING FROM DISTRIBUTIONS TO SHAREHOLDERS | (264,068) | (3,586,307) |
| Share Transactions: | | |
| Proceeds from sale of shares | 81,404,043 | 69,643,362 |
| Proceeds from shares issued in connection with the tax-free transfer of assets from Federated Target ETF Fund 2015 | — | 5,272,582 |
| Proceeds from shares issued in connection with the tax-free transfer of assets from Federated Target ETF Fund 2025 | — | 8,053,895 |
| Proceeds from shares issued in connection with the tax-free transfer of assets from Federated Target ETF Fund 2035 | — | 6,951,526 |
| Net asset value of shares issued to shareholders in payment of distributions declared | 249,752 | 3,363,174 |
| Cost of shares redeemed | (95,388,857) | (70,213,064) |
| CHANGE IN NET ASSETS RESULTING FROM SHARE TRANSACTIONS | (13,735,062) | 23,071,475 |
| Change in net assets | 3,971,116 | 61,595,164 |
| Net Assets: | | |
| Beginning of period | 248,155,630 | 186,560,466 |
| End of period (including undistributed (distributions in excess of) net investment income of $100,423 and $(56,725), respectively) | $252,126,746 | $248,155,630 |
See Notes which are an integral part of the Financial Statements
Annual Shareholder Report39
Notes to Financial Statements
November 30, 2010
1. ORGANIZATION
Federated Stock and Bond Fund (the “Fund”) is registered under the Investment Company Act of 1940, as amended (the “Act”), as a diversified, open-end management investment company. The Fund offers five classes of shares: Class A Shares, Class B Shares, Class C Shares, Class K Shares and Institutional Shares. All shares of the Fund have equal rights with respect to voting, except on class-specific matters. The financial highlights of the Class A Shares, Class B Shares, Class C Shares and Class K Shares are presented separately. The primary investment objective of the Fund is to provide relative safety of capital with the possibility of long-term growth of capital and income. Consideration is also given to current income.
On June 15, 2009, the Fund received assets from Federated Target ETF Fund 2015 (FT2015), Federated Target ETF Fund 2025 (FT2025) and Federated Target ETF Fund 2035 (FT2035) (collectively, “Acquired Funds”) as a result of a tax-free reorganization, as follows:
| Shares of the
Fund Issued | Acquired Funds
Net Assets
Received | Unrealized
Appreciation1 | Net Assets
of the Fund
Immediately
Prior to
Combination | Net Assets
of the Fund
Immediately
After
Combination |
| FT2015 | 374,734 | $5,272,582 | $244,522 | | |
| FT2025 | 572,336 | 8,053,895 | 705,623 | | |
| FT2035 | 494,024 | 6,951,526 | 499,642 | | |
| TOTAL | 1,441,094 | $20,278,003 | $1,449,787 | $200,320,350 | $220,598,353 |
| 1 | Unrealized appreciation is included in the Acquired Funds Net Assets Received amount shown above. |
2. SIGNIFICANT ACCOUNTING POLICIES
The following is a summary of significant accounting policies consistently followed by the Fund in the preparation of its financial statements. These policies are in conformity with U.S. generally accepted accounting principles (GAAP).
Investment Valuation
In calculating its net asset value (NAV), the Fund generally values investments as follows:
- Equity securities listed on an exchange or traded through a regulated market system are valued at their last reported sale price or official closing price in their principal exchange or market.
- Fixed-income securities acquired with remaining maturities greater than 60 days are fair valued using price evaluations provided by a pricing service approved by the Trustees.
- Fixed-income securities acquired with remaining maturities of 60 days or less are valued at their cost (adjusted for the accretion of any discount or amortization of any premium).
- Shares of other mutual funds are valued based upon their reported NAVs.
- Derivative contracts listed on exchanges are valued at their reported settlement or closing price.
- Over-the-counter (OTC) derivative contracts are fair valued using price evaluations provided by a pricing service approved by the Trustees.
Annual Shareholder Report
40
If the Fund cannot obtain a price or price evaluation from a pricing service for an investment, the Fund may attempt to value the investment based upon the mean of bid and asked quotations or fair value the investment based on price evaluations, from one or more dealers. If any price, quotation, price evaluation or other pricing source is not readily available when the NAV is calculated, the Fund uses the fair value of the investment determined in accordance with the procedures described below. There can be no assurance that the Fund could purchase or sell an investment at the price used to calculate the Fund's NAV.Fair Valuation and Significant Events Procedures
The Trustees have authorized the use of pricing services to provide evaluations of the current fair value of certain investments for purposes of calculating the NAV. Factors considered by pricing services in evaluating an investment include the yields or prices of investments of comparable quality, coupon, maturity, call rights and other potential prepayments, terms and type, reported transactions, indications as to values from dealers and general market conditions. Some pricing services provide a single price evaluation reflecting the bid-side of the market for an investment (a “bid” evaluation). Other pricing services offer both bid evaluations and price evaluations indicative of a price between the prices bid and asked for the investment (a “mid” evaluation). The Fund normally uses bid evaluations for U.S. Treasury and Agency securities, mortgage-backed securities and municipal securities. The Fund normally uses mid evaluations for other types of fixed-income securities and OTC derivative contracts. In the event that market quotations and price evaluations are not available for an investment, the fair value of the investment is determined in accordance with procedures adopted by the Trustees.
The Trustees also have adopted procedures requiring an investment to be priced at its fair value whenever the Adviser determines that a significant event affecting the value of the investment has occurred between the time as of which the price of the investment would otherwise be determined and the time as of which the NAV is computed. An event is considered significant if there is both an affirmative expectation that the investment's value will change in response to the event and a reasonable basis for quantifying the resulting change in value. Examples of significant events that may occur after the close of the principal market on which a security is traded, or after the time of a price evaluation provided by a pricing service or a dealer, include:
- With respect to securities traded in foreign markets, significant trends in U.S. equity markets or in the trading of foreign securities index futures or options contracts;
- With respect to price evaluations of fixed-income securities determined before the close of regular trading on the NYSE, actions by the Federal Reserve Open Market Committee and other significant trends in U.S. fixed-income markets;
- Political or other developments affecting the economy or markets in which an issuer conducts its operations or its securities are traded; and
- Announcements concerning matters such as acquisitions, recapitalizations, litigation developments, a natural disaster affecting the issuer's operations or regulatory changes or market developments affecting the issuer's industry.
The Trustees have approved the use of a pricing service to determine the fair value of equity securities traded principally in foreign markets when the Adviser determines that there has been a significant trend in the U.S. equity markets or in index futures trading. For other significant events, the Fund may seek to obtain more current quotations or price evaluations from alternative pricing sources. If a reliable alternative pricing source is not available, the Fund will determine the fair value of the investment using another method approved by the Trustees.
Annual Shareholder Report
41
Repurchase AgreementsIt is the policy of the Fund to require the other party to a repurchase agreement to transfer to the Fund's custodian or sub-custodian eligible securities or cash with a market value (after transaction costs) at least equal to the repurchase price to be paid under the repurchase agreement. The eligible securities are transferred to accounts with the custodian or sub-custodian in which the Fund holds a “securities entitlement” and exercises “control” as those terms are defined in the Uniform Commercial Code. The Fund has established procedures for monitoring the market value of the transferred securities and requiring the transfer of additional eligible securities if necessary to equal at least the repurchase price. These procedures also allow the other party to require securities to be transferred from the account to the extent that their market value exceeds the repurchase price or in exchange for other eligible securities of equivalent market value.
The insolvency of the other party or other failure to repurchase the securities may delay the disposition of the underlying securities or cause the Fund to receive less than the full repurchase price. Under the terms of the repurchase agreement, any amounts received by the Fund in excess of the repurchase price and related transaction costs must be remitted to the other party.
The Fund may enter into repurchase agreements in which eligible securities are transferred into joint trading accounts maintained by the custodian or sub-custodian for investment companies and other clients advised by the Fund's Adviser and its affiliates. The Fund will participate on a pro rata basis with the other investment companies and clients in its share of the securities transferred under such repurchase agreements and in its share of proceeds from any repurchase or other disposition of such securities.
Investment Income, Gains and Losses, Expenses and Distributions
Investment transactions are accounted for on a trade-date basis. Realized gains and losses from investment transactions are recorded on an identified-cost basis. Interest income and expenses are accrued daily. Dividend income and distributions to shareholders are recorded on the ex-dividend date. Foreign dividends are recorded on the ex-dividend date or when the Fund is informed of the ex-dividend date. Positive or negative inflation adjustments on Treasury Inflation-Protected Securities are included in interest income. Distributions of net investment income are declared and paid quarterly. Non-cash dividends included in dividend income, if any, are recorded at fair value. Investment income, realized and unrealized gains and losses and certain fund-level expenses are allocated to each class based on relative average daily net assets, except that Class A Shares, Class B Shares, Class C Shares, Class K Shares and Institutional Shares may bear distribution services fees, shareholder services fees, account administration fees and certain transfer and dividend disbursing agent fees unique to those classes. Dividends are declared separately for each class. No class has preferential dividend rights; differences in per share dividend rates are generally due to differences in separate class expenses.
Premium and Discount Amortization/Paydown Gains and Losses
All premiums and discounts on fixed-income securities are amortized/accreted for financial statement purposes. Gains and losses realized on principal payment of mortgage-backed securities (paydown gains and losses) are classified as part of investment income.
Annual Shareholder Report
42
Federal TaxesIt is the Fund's policy to comply with the Subchapter M provision of the Internal Revenue Code (the “Code”) and to distribute to shareholders each year substantially all of its income. Accordingly, no provision for federal income tax is necessary. As of and during the year ended November 30, 2010, the Fund did not have a liability for any uncertain tax positions. The Fund recognizes interest and penalties, if any, related to tax liabilities as income tax expense in the Statement of Operations. As of September 5, 2008, the Fund's domicile and form of organization changed from a Maryland Corporation to a Massachusetts business trust. As of November 30, 2010, tax years 2007 through 2010 remain subject to examination by the Fund's major tax jurisdictions, which include the United States of America, the state of Maryland, the Commonwealth of Massachusetts and the Commonwealth of Pennsylvania.
The Fund may be subject to taxes imposed by governments of countries in which it invests. Such taxes are generally based on either income or gains earned or repatriated. The Fund accrues and applies such taxes to net investment income, net realized gains and net unrealized gains as income and/or gains are earned.
When-Issued and Delayed Delivery Transactions
The Fund may engage in when-issued or delayed delivery transactions. The Fund records when-issued securities on the trade date and maintains security positions such that sufficient liquid assets will be available to make payment for the securities purchased. Securities purchased on a when-issued or delayed delivery basis are marked to market daily and begin earning interest on the settlement date. Losses may occur on these transactions due to changes in market conditions or the failure of counterparties to perform under the contract.
Swap Contracts
Swap contracts involve two parties that agree to exchange the returns (or the differential in rates of return) earned or realized on particular predetermined investments, instruments, indices or other measures. The gross returns to be exchanged or “swapped” between parties are generally calculated with respect to a “notional amount” for a predetermined period of time. The Fund may enter into interest rate, total return, credit default, currency and other swap agreements. Risks may arise upon entering into swap agreements from the potential inability of the counterparties to meet the terms of their contract from unanticipated changes in the value of the swap agreement. The Fund uses credit default swaps to manage exposure to a given issuer or sector by either selling protection to increase exposure, or buying protection to reduce exposure. The “buyer” in a credit default swap is obligated to pay the “seller” a periodic stream of payments over the term of the contract provided that no event of default on an underlying reference obligation has occurred. If an event of default occurs, the seller must pay the buyer the full notional value, or the “par value”, of the reference obligation in exchange for the reference obligation. In connection with these agreements, securities may be identified as collateral in accordance with the terms of the respective swap agreements to provide assets of value and recourse in the event of default or bankruptcy/insolvency. Recovery values are assumed by market makers considering either industry standard recovery rates or entity specific factors and considerations until a credit event occurs. If a credit event has occurred, the recovery value is typically determined by a facilitated auction whereby a minimum number of allowable broker bids, together with a specific valuation method, are used to calculate the settlement value. The maximum amount of the payment that may occur, as a result of a credit event payable by the protection seller, is equal to the notional amount of the underlying index or security. The Fund's maximum exposure to loss of the notional value of credit default swaps outstanding at November 30, 2010 is $5,000,000.
Annual Shareholder Report
43
The Fund's maximum risk of loss from counterparty credit risk, either as the protection buyer or as the protection seller, is the fair value of the contract. This risk is mitigated by having a master netting arrangement between the Fund and the counterparty and by the posting of collateral by the counterparty to the Fund to cover the Fund's exposure to the counterparty.Upfront payments received or paid by the Fund will be reflected as an asset or liability on the Statement of Assets and Liabilities. Changes in the value of swap contracts are included in swaps, at value on the Statement of Assets and Liabilities, and periodic payments are reported as Net realized gain (loss) on swap contracts in the Statement of Operations.
Swap contracts outstanding at period end are listed after the Fund's Portfolio of Investments.
Futures Contracts
The Fund purchases and sells financial futures contracts to manage cash flows, enhance yield and to potentially reduce transaction costs. Upon entering into a financial futures contract with a broker, the Fund is required to deposit in a segregated account a specified amount of cash or U.S. government securities. Futures contracts are valued daily and unrealized gains or losses are recorded in a “variation margin” account. Daily, the Fund receives from or pays to the broker a specified amount of cash based upon changes in the variation margin account. When a contract is closed, the Fund recognizes a realized gain or loss. Futures contracts have market risks, including the risk that the change in the value of the contract may not correlate with the changes in the value of the underlying securities. There is minimal counterparty risk to the Fund since futures are exchange traded and the exchange's clearinghouse, as counterparty to all exchange-traded futures, guarantees the futures against default.
Futures contracts outstanding at period end are listed after the Fund's Portfolio of Investments.
Foreign Exchange Contracts
The Fund may enter into foreign exchange contracts for the delayed delivery of securities or foreign currency exchange transactions. The Fund may enter into foreign exchange contracts to protect assets against adverse changes in foreign currency exchange rates or exchange control regulations. Purchased contracts are used to acquire exposure to foreign currencies, whereas, contracts to sell are used to hedge the Fund's securities against currency fluctuations. Risks may arise upon entering into these transactions from the potential inability of counterparties to meet the terms of their commitments and from unanticipated movements in security prices or foreign exchange rates. The foreign exchange contracts are adjusted by the daily exchange rate of the underlying currency and any gains or losses are recorded for financial statement purposes as unrealized until the settlement date.
Foreign exchange contracts outstanding at period end are listed after the Fund's Portfolio of Investments.
Foreign Currency Translation
The accounting records of the Fund are maintained in U.S. dollars. All assets and liabilities denominated in foreign currencies (FCs) are translated into U.S. dollars based on the rates of exchange of such currencies against U.S. dollars on the date of valuation. Purchases and sales of securities, income and expenses are translated at the rate of exchange quoted on the Annual Shareholder Report
44
respective date that such transactions are recorded. The Fund does not isolate that portion of the results of operations resulting from changes in foreign exchange rates on investments from the fluctuations arising from changes in market prices of securities held. Such fluctuations are included with the net realized and unrealized gain or loss from investments.Reported net realized foreign exchange gains or losses arise from sales of portfolio securities, sales and maturities of short-term securities, sales of FCs, currency gains or losses realized between the trade and settlement dates on securities transactions, the difference between the amounts of dividends, interest and foreign withholding taxes recorded on the Fund's books, and the U.S. dollar equivalent of the amounts actually received or paid. Net unrealized foreign exchange gains and losses arise from changes in the value of assets and liabilities other than investments in securities at fiscal year end, resulting from changes in the exchange rate.
Restricted Securities
The Fund may purchase securities which are considered restricted. Restricted securities are securities that either: (a) cannot be offered for public sale without first being registered, or being able to take advantage of an exemption from registration, under the Securities Act of 1933; or (b) are subject to contractual restrictions on public sales. In some cases, when a security cannot be offered for public sale without first being registered, the issuer of the restricted security has agreed to register such securities for resale, at the issuer's expense, either upon demand by the Fund or in connection with another registered offering of the securities. Many such restricted securities may be resold in the secondary market in transactions exempt from registration. Restricted securities may be determined to be liquid under criteria established by the Trustees. The Fund will not incur any registration costs upon such resales. The Fund's restricted securities are valued at the price provided by dealers in the secondary market or, if no market prices are available, at the fair value as determined in accordance with procedures established by and under the general supervision of the Trustees.
Additional information on restricted securities, excluding securities purchased under Rule 144A, if applicable, that have been deemed liquid by the Trustees, held at November 30, 2010, is as follows:
| Security | Acquisition Date | Acquisition Cost | Market Value |
| SMFC Trust Asset-Backed Certificates, 1997-A B1-4, 7.719%, 1/28/2027 | 2/4/1998 | $11,299 | $3,844 |
| Union Central Life Ins. Co., Note, 8.20%, 11/1/2026 | 3/31/1999 | $790,785 | $748,848 |
Annual Shareholder Report
45
Additional Disclosure Related to Derivative Instruments| Fair Value of Derivative Instruments |
| Asset | Liability |
| Statement of
Assets and
Liabilities
Location | Fair
Value | Statement of
Assets and
Liabilities
Location | Fair
Value |
Derivatives not accounted for as
hedging instruments under
ASC Topic 815 | | | | |
| Interest rate contracts | — | $ — | Payable for daily
variation margin | $11,278* |
| Equity contracts | — | $ — | Payable for daily
variation margin | $(1,353,937)* |
| Foreign exchange contracts | Receivable for foreign
exchange contracts | $820,896 | Payable for foreign
exchange contracts | $942,768 |
| Credit contracts | Receivable for
periodic payments
from swap contracts | $10,000 | — | $ — |
| Credit contracts | Swaps, at value | $33,391 | — | $ — |
Total derivatives not
accounted for as
hedging instruments under
ACS Topic 815 | | $864,287 | | $(399,891) |
| * | Includes cumulative appreciation/depreciation of futures contracts as reported in the footnotes to the Portfolio of Investments. Only the current day's variation margin is reported within the Statement of Assets and Liabilities. |
The Effect of Derivative Instruments on the Statement of Operations for the Year Ended November 30, 2010
| Amount of Realized Gain or (Loss) on Derivatives Recognized in Income |
| Credit
Default
Swaps | Futures | Forward
Currency
Contracts | Total |
| Interest rate contracts | $ — | $(584,809) | $ — | $(584,809) |
| Equity contracts | $ — | $2,904,809 | $ — | $2,904,809 |
| Foreign exchange contracts | $ — | $ — | $(420) | $(420) |
| Credit contracts | $456,219 | $ — | $ — | $456,219 |
| Total | $456,219 | $2,320,000 | $(420) | $2,775,799 |
Annual Shareholder Report46
| Change in Unrealized Appreciation or (Depreciation) on Derivatives Recognized in Income |
| Credit
Default
Swaps | Futures | Forward
Currency
Contracts | Total |
| Interest rate contracts | $ — | $(82,143) | $ — | $(82,143) |
| Equity contracts | $ — | $838,824 | $ — | $838,824 |
| Foreign exchange contracts | $ — | $ — | $251,406 | $251,406 |
| Credit contracts | $(197,643) | $ — | $ — | $(197,643) |
| Total | $(197,643) | $756,681 | $251,406 | $810,444 |
Other
The preparation of financial statements in conformity with GAAP requires management to make estimates and assumptions that affect the amounts of assets, liabilities, expenses and revenues reported in the financial statements. Actual results could differ from those estimated.
3. SHARES OF BENEFICIAL INTEREST
The following tables summarize share activity:
| Year Ended November 30 | 2010 | 2009 |
| Class A Shares: | Shares | Amount | Shares | Amount |
| Shares sold | 1,596,436 | $25,454,229 | 1,851,463 | $25,328,003 |
| Proceeds from shares issued in connection with the tax-free transfer of assets from Federated Target ETF Fund 2015 | — | — | 138,737 | 1,950,574 |
| Proceeds from shares issued in connection with the tax-free transfer of assets from Federated Target ETF Fund 2025 | — | — | 192,254 | 2,703,126 |
| Proceeds from shares issued in connection with the tax-free transfer of assets from Federated Target ETF Fund 2035 | — | — | 184,524 | 2,594,400 |
| Shares issued to shareholders in payment of distributions declared | 9,189 | 147,485 | 182,962 | 2,452,902 |
| Shares redeemed | (3,164,818) | (50,212,436) | (2,550,336) | (34,968,933) |
NET CHANGE RESULTING
FROM CLASS A SHARE TRANSACTIONS | (1,559,193) | $(24,610,722) | (396) | $60,072 |
Annual Shareholder Report47
| Year Ended November 30 | 2010 | 2009 |
| Class B Shares: | Shares | Amount | Shares | Amount |
| Shares sold | 169,159 | $2,692,461 | 274,805 | $3,808,687 |
| Shares issued to shareholders in payment of distributions declared | 1,269 | 20,305 | 19,052 | 250,988 |
| Shares redeemed | (589,834) | (9,303,277) | (656,572) | (8,884,783) |
NET CHANGE RESULTING
FROM CLASS B SHARE TRANSACTIONS | (419,406) | $(6,590,511) | (362,715) | $(4,825,108) |
| Year Ended November 30 | 2010 | 2009 |
| Class C Shares: | Shares | Amount | Shares | Amount |
| Shares sold | 1,210,690 | $19,095,474 | 1,002,107 | $13,808,180 |
| Shares issued to shareholders in payment of distributions declared | 1,789 | 28,514 | 19,606 | 258,296 |
| Shares redeemed | (840,318) | (13,222,025) | (783,732) | (10,601,445) |
NET CHANGE RESULTING
FROM CLASS C SHARE TRANSACTIONS | 372,161 | $5,901,963 | 237,981 | $3,465,031 |
| Year Ended November 30 | 2010 | 2009 |
| Class K Shares: | Shares | Amount | Shares | Amount |
| Shares sold | 1,528,082 | $24,410,879 | 1,822,012 | $25,416,459 |
| Proceeds from shares issued in connection with the tax-free transfer of assets from Federated Target ETF Fund 2015 | — | — | 192,931 | 2,716,507 |
| Proceeds from shares issued in connection with the tax-free transfer of assets from Federated Target ETF Fund 2025 | — | — | 339,137 | 4,775,071 |
| Proceeds from shares issued in connection with the tax-free transfer of assets from Federated Target ETF Fund 2035 | — | — | 269,074 | 3,788,720 |
| Shares issued to shareholders in payment of distributions declared | 3,172 | 50,979 | 28,544 | 384,790 |
| Shares redeemed | (1,348,117) | (21,519,233) | (1,080,496) | (15,220,214) |
NET CHANGE RESULTING
FROM CLASS K SHARE TRANSACTIONS | 183,137 | $2,942,625 | 1,571,202 | $21,861,333 |
Annual Shareholder Report48
| Year Ended
11/30/2010 | Period Ended
11/30/20091 |
| Institutional Shares: | Shares | Amount | Shares | Amount |
| Shares sold | 628,146 | $9,751,000 | 86,196 | $1,282,033 |
| Proceeds from shares issued in connection with the tax-free transfer of assets from Federated Target ETF Fund 2015 | — | — | 43,066 | 605,501 |
| Proceeds from shares issued in connection with the tax-free transfer of assets from Federated Target ETF Fund 2025 | — | — | 40,945 | 575,698 |
| Proceeds from shares issued in connection with the tax-free transfer of assets from Federated Target ETF Fund 2035 | — | — | 40,426 | 568,406 |
| Shares issued to shareholders in payment of distributions declared | 154 | 2,469 | 1,079 | 16,198 |
| Shares redeemed | (71,264) | (1,131,886) | (34,334) | (537,689) |
NET CHANGE RESULTING
FROM INSTITUTIONAL SHARE TRANSACTIONS | 557,036 | $8,621,583 | 177,378 | $2,510,147 |
NET CHANGE RESULTING
FROM TOTAL FUND SHARE TRANSACTIONS | (866,265) | $(13,735,062) | 1,623,450 | $23,071,475 |
| 1 | Reflects operations from June 12, 2009, (date of initial investment) to November 30, 2009. |
4. FEDERAL TAX INFORMATION
The timing and character of income and capital gain distributions are determined in accordance with income tax regulations, which may differ from GAAP. These differences are due in part to differing treatments for foreign currency transactions, partnership income reclassifications, swap income reclassifications, expiration of capital loss carryforwards and discount accretion/premium amortization on debt securities.
For the year ended November 30, 2010, permanent differences identified and reclassified among the components of net assets were as follows:
| Increase (Decrease) |
| Paid-In Capital | Undistributed
Net Investment
Income (Loss) | Accumulated
Net Realized
Gain (Loss) |
| $(184,209) | $(1,928,562) | $2,112,771 |
Net investment income (loss), net realized gains (losses), and net assets were not affected by this reclassification.
Annual Shareholder Report
49
The tax character of distributions as reported on the Statement of Changes in Net Assets for the years ended November 30, 2010 and 2009, was as follows: | 2010 | 2009 |
| Ordinary income | $264,068 | $3,586,307 |
As of November 30, 2010, the components of distributable earnings on a tax basis were as follows:
| Net unrealized appreciation | $20,684,603 |
| Capital loss carryforwards and deferrals | $(20,015,853) |
The difference between book-basis and tax-basis net unrealized appreciation/depreciation is attributable in part to differing treatments for the deferral of losses on wash sales, partnership transactions, defaulted bond interest and discount accretion/premium amortization on debt securities.
At November 30, 2010, the cost of investments for federal tax purposes was $231,927,784. The net unrealized appreciation of investments for federal tax purposes excluding any unrealized appreciation/depreciation resulting from changes in foreign currency exchange rates, outstanding foreign currency commitments, futures contracts and swap contracts was $20,809,727. This consists of net unrealized appreciation from investments for those securities having an excess of value over cost of $22,809,137 and net unrealized depreciation from investments for those securities having an excess of cost over value of $1,999,410.
At November 30, 2010, the Fund had a capital loss carryforward of $20,009,470 which will reduce the Fund's taxable income arising from future net realized gains on investments, if any, to the extent permitted by the Code and thus will reduce the amount of distributions to shareholders which would otherwise be necessary to relieve the Fund of any liability for federal income tax. Pursuant to the Code, such capital loss carryforward will expire as follows:
| Expiration Year | Expiration Amount |
| 2015 | $125,656 |
| 2016 | $15,468,975 |
| 2017 | $4,414,839 |
As a result of the tax-free transfer of assets from Federated Target ETF Fund 2015, Federated Target ETF Fund 2025 and Federated Target ETF Fund 2035, certain capital loss carryforwards listed above may be limited.
The Fund used capital loss carryforwards of $12,813,710 to offset taxable capital gains realized during the year ended November 30, 2010.
As of November 30, 2010, for federal income tax purposes, the Fund had $6,383 in straddle loss deferrals.
Annual Shareholder Report
50
5. INVESTMENT ADVISER FEE AND OTHER TRANSACTIONS WITH AFFILIATESInvestment Adviser Fee
Federated Global Investment Management Corp. is the Fund's investment adviser (the “Adviser”). The advisory agreement between the Fund and the Adviser provides for an annual fee equal to: (a) a maximum of 0.55% of the average daily net assets of the Fund; and (b) 4.50% of the gross income of the Fund, excluding gains or losses. Subject to the terms described in the Expense Limitation note, the Adviser may voluntarily choose to waive any portion of its fee. For the year ended November 30, 2010, the Adviser voluntarily waived $94,324 of its fee. For the year ended November 30, 2010, an affiliate of the Adviser reimbursed $118,347 of transfer and dividend disbursing agent fees and expenses.
Certain of the Fund's assets are managed by Federated Investment Management Company (FIMCO) and Federated Equity Management Company of Pennsylvania (FEMCOPA) (the “Sub-Advisers”). Under the terms of a sub-advisory agreement between the Adviser and the Sub-Advisers, the Sub-Advisers receive an allocable portion of the Fund's adviser fee. The fee is paid by the Adviser out of its resources and is not an incremental Fund expense. For the year ended November 30, 2010, FIMCO and FEMCOPA earned fees of $197,278 and $769,765, respectively.
Administrative Fee
Federated Administrative Services (FAS), under the Administrative Services Agreement, provides the Fund with administrative personnel and services. The fee paid to FAS is based on the average aggregate daily net assets of certain Federated funds as specified below:
| Administrative Fee | Average Aggregate Daily Net Assets
of the Federated Funds |
| 0.150% | on the first $5 billion |
| 0.125% | on the next $5 billion |
| 0.100% | on the next $10 billion |
| 0.075% | on assets in excess of $20 billion |
The administrative fee received during any fiscal year shall be at least $150,000 per portfolio and $40,000 per each additional class of Shares. Subject to the terms described in the Expense Limitation note, FAS may voluntarily choose to waive any portion of its fee. For the year ended November 30, 2010, the net fee paid to FAS was 0.100% of average daily net assets of the Fund. FAS waived $62,539 of its fee.
Annual Shareholder Report
51
Distribution Services FeeThe Fund has adopted a Distribution Plan (the “Plan”) pursuant to Rule 12b-1 under the Act. Under the terms of the Plan, the Fund will compensate Federated Securities Corp. (FSC), the principal distributor, from the daily net assets of the Fund's Class B Shares, Class C Shares and Class K Shares to finance activities intended to result in the sale of these shares. The Plan provides that the Fund may incur distribution expenses at the following percentages of average daily net assets annually, to compensate FSC:
| Share Class Name | Percentage of Average Daily
Net Assets of Class |
| Class B Shares | 0.75% |
| Class C Shares | 0.75% |
| Class K Shares | 0.50% |
Subject to the terms described in the Expense Limitation note, FSC may voluntarily choose to waive any portion of its fee. When FSC receives fees, it may pay some or all of them to financial intermediaries whose customers purchase shares. For the year ended November 30, 2010, FSC retained $9,452 of fees paid by the Fund.
Sales Charges
Front-end sales charges and contingent deferred sales charges (CDSC) do not represent expenses of the Fund. They are deducted from the proceeds of sales of Fund shares prior to investment or from redemption proceeds prior to remittance, as applicable. For the year ended November 30, 2010, FSC retained $7,371 in sales charges from the sale of Class A Shares. FSC also retained $303 of CDSC relating to redemptions of Class C Shares.
Shareholder Services Fee
The Fund may pay fees (“Service Fees”) up to 0.25% of the average daily net assets of the Fund's Class A Shares, Class B Shares and Class C Shares to financial intermediaries or to Federated Shareholder Services Company (FSSC) for providing services to shareholders and maintaining shareholder accounts. Financial intermediaries may include a company affiliated with management of Federated Investors, Inc. A financial intermediary affiliated with management of Federated Investors, Inc. received $1,630 of Service Fees for the year ended November 30, 2010. Subject to the terms described in the Expense Limitation note, FSSC may voluntarily reimburse the Fund for shareholder services fees. For the year ended November 30, 2010, FSSC did not receive any fees paid by the Fund.
Expense Limitation
The Adviser and its affiliates (which may include FSC, FAS and FSSC) have voluntarily agreed to waive their fees and/or reimburse expenses so that the total annual fund operating expenses (as shown in the financial highlights, but excluding expenses allocated from affiliated partnerships) paid by the Fund's Class A Shares, Class B Shares, Class C Shares, Class K Shares and Institutional Shares (after the voluntary waivers and/or reimbursements) will not exceed 1.25%, 2.05%, 2.05%, 1.75% and 1.00% (the “Fee Limit”), respectively, through the later of (the “Termination Date”): (a) January 31, 2012; or (b) the date of the Fund's next effective Prospectus. While the Adviser and its affiliates currently do not anticipate terminating or increasing these arrangements prior to the Termination Date, these arrangements may only be terminated or the Fee Limit increased prior to the Termination Date with the agreement of the Trustees.
Annual Shareholder Report
52
Interfund TransactionsDuring the year ended November 30, 2010, the Fund engaged in purchase and sale transactions with funds that have a common investment adviser (or affiliated investment advisers), common Directors/Trustees, and/or common Officers. These purchase and sale transactions complied with Rule 17a-7 under the Act and amounted to $143,902 and $39,293, respectively.
General
Certain Officers and Trustees of the Fund are Officers and Directors or Trustees of the above companies.
Transactions Involving Affiliated Holdings
Affiliated holdings are mutual funds which are managed by the Adviser or an affiliate of the Adviser. The Adviser has agreed to reimburse the Fund for certain investment adviser fees as a result of transactions in other affiliated mutual funds. For the year ended November 30, 2010, the Adviser reimbursed $169,371. Transactions involving affiliated holdings during the year ended November 30, 2010, were as follows:
| Affiliates | Balance of
Shares Held
11/30/2009 | Purchases/
Additions | Sales/
Reductions | Balance of
Shares Held
11/30/2010 | Value | Dividend
Income/
Affiliated
Investment
Income |
| Emerging Markets Fixed Income Core Fund | 199,106 | 102,654 | 111,900 | 189,860 | $5,201,991 | $384,029 |
| Federated InterContinental Fund, Institutional Shares | — | 290,142 | 13,283 | 276,859 | $12,669,071 | $ — |
Federated Mid
Cap Growth
Strategies Fund, Institutional Shares | — | 562,861 | 161,213 | 401,648 | $13,439,154 | $ — |
| Federated Mortgage Core Portfolio | 946,934 | 477,556 | 500,823 | 923,667 | $9,365,986 | $439,262 |
| Federated Project and Trade Finance Core Fund | — | 305,951 | — | 305,951 | $3,053,394 | $54,269 |
| Federated Prime Value Obligations Fund, Institutional Shares | 36,095,022 | 171,700,562 | 174,663,351 | 33,132,233 | $33,132,233 | $61,481 |
| High Yield Bond Portfolio | 1,867,382 | 1,055,651 | 120,192 | 2,802,841 | $18,218,469 | $1,411,154 |
TOTAL OF AFFILIATED
TRANSACTIONS | 39,108,444 | 174,495,377 | 175,570,762 | 38,033,059 | $95,080,298 | $2,350,195 |
Annual Shareholder Report53
6. EXPENSE Reduction
The Fund directs portfolio trades to a broker that in turn pays a portion of the Fund's operating expenses. For the year ended November 30, 2010, the Fund's expenses were reduced by $28,581 under these arrangements.
7. Investment TRANSACTIONS
Purchases and sales of investments, excluding long-term U.S. government securities and short-term obligations, for the year ended November 30, 2010, were as follows:
| Purchases | $388,642,074 |
| Sales | $386,962,132 |
8. LINE OF CREDIT
The Fund participates in a $100,000,000 unsecured, uncommitted revolving line of credit (LOC) agreement with PNC Bank. The LOC was made available for extraordinary or emergency purposes, primarily for financing redemption payments. Borrowings are charged interest at a rate offered to the Fund by PNC Bank at the time of the borrowing. As of November 30, 2010, there were no outstanding loans. During the year ended November 30, 2010, the Fund did not utilize the LOC.
9. INTERFUND LENDING
Pursuant to an Exemptive Order issued by the Securities and Exchange Commission, the Fund, along with other funds advised by subsidiaries of Federated Investors, Inc., may participate in an interfund lending program. This program provides an alternative credit facility allowing the Fund to borrow from other participating affiliated funds. As of November 30, 2010, there were no outstanding loans. During the year ended November 30, 2010, the program was not utilized.
10. Legal Proceedings
Since February, 2004, Federated Investors, Inc. and related entities (collectively, “Federated”), have been named as defendants in several lawsuits that are now pending in the United States District Court for the Western District of Pennsylvania. These lawsuits have been consolidated into a single action alleging excessive advisory fees involving one of the Federated-sponsored mutual funds (“Federated Funds”). Federated and its counsel have been defending this litigation. Additional lawsuits based upon similar allegations may be filed in the future. The potential impact of these lawsuits, all of which seek monetary damages, attorneys' fees and expenses, and future potential similar suits is uncertain. Although we do not believe that these lawsuits will have a material adverse effect on the Federated Funds, there can be no assurance that these suits, ongoing adverse publicity and/or other developments resulting from the allegations in these matters will not result in increased redemptions, or reduced sales, of shares of the Federated Funds or other adverse consequences for the Federated Funds.
11. Subsequent events
Effective December 31, 2010, Class K Shares will be redesignated as Class R Shares.
Effective January 31, 2011, the Fund's name will change to Federated Asset Allocation Fund.
Management has evaluated subsequent events through the date the financial statements were issued, and determined that no additional events have occurred that require disclosure.
Annual Shareholder Report
54
12. FEDERAL TAX INFORMATION (UNAUDITED)For the fiscal year ended November 30, 2010, 81.53% of total income distributions made by the Fund are qualifying dividends which may be subject to a maximum tax rate of 15%, as provided for by the Jobs and Growth Tax Relief Act of 2003. Complete information is reported in conjunction with the reporting of your distributions on Form 1099-DIV.
Of the ordinary income distributions made by the Fund during the year ended November 30, 2010, 78.12% qualify for the dividend received deduction available to corporate shareholders.
Annual Shareholder Report55
Report of Independent Registered Public Accounting Firm
TO THE BOARD OF TRUSTEES AND SHAREHOLDERS OF Federated stock and bond fund:
We have audited the accompanying statement of assets and liabilities, including the portfolio of investments, of the Federated Stock and Bond Fund (the “Fund”) as of November 30, 2010, and the related statement of operations for the year then ended, the statements of changes in net assets for each of the years in the two-year period then ended and the financial highlights for each of the years in the five-year period then ended. These financial statements and financial highlights are the responsibility of the Fund's management. Our responsibility is to express an opinion on these financial statements and financial highlights based on our audits.
We conducted our audits in accordance with the standards of the Public Company Accounting Oversight Board (United States). Those standards require that we plan and perform the audit to obtain reasonable assurance about whether the financial statements and financial highlights are free of material misstatement. An audit includes examining, on a test basis, evidence supporting the amounts and disclosures in the financial statements. Our procedures included confirmation of securities owned as of November 30, 2010 by correspondence with the custodian, transfer agent, and brokers, or by other appropriate auditing procedures. An audit also includes assessing the accounting principles used and significant estimates made by management, as well as evaluating the overall financial statement presentation. We believe that our audits provide a reasonable basis for our opinion.
In our opinion, the financial statements and financial highlights referred to above present fairly, in all material respects, the financial position of the Federated Stock and Bond Fund as of November 30, 2010 and the results of its operations for the year then ended the changes in its net assets for each of the years in the two-year period then ended and the financial highlights for each of the years in the five-year period then ended, in conformity with U.S. generally accepted accounting principles.
Boston, Massachusetts
January 25, 2011
Annual Shareholder Report56
Board of Trustees and Trust Officers
The Board of Trustees is responsible for managing the Trust's business affairs and for exercising all the Trust's powers except those reserved for the shareholders. The following tables give information about each Trustee and the senior officers of the Fund. Where required, the tables separately list Trustees who are “interested persons” of the Fund (i.e., “Interested” Trustees) and those who are not (i.e., “Independent” Trustees). Unless otherwise noted, the address of each person listed is Federated Investors Tower, 1001 Liberty Avenue, Pittsburgh, PA 15222. The address of all Independent Trustees listed is 4000 Ericsson Drive, Warrendale, PA 15086-7561; Attention: Mutual Fund Board. As of December 31, 2010, the Trust comprised one portfolio(s), and the Federated Fund Family consisted of 43 investment companies (comprising 136 portfolios). Unless otherwise noted, each Officer is elected annually. Unless otherwise noted, each Trustee oversees all portfolios in the Federated Fund Family and serves for an indefinite term. The Fund's Statement of Additional Information includes additional information about Trust Trustees and is available, without charge and upon request, by calling 1-800-341-7400.
Interested Trustees Background
Name
Birth Date
Positions Held with Trust
Date Service Began | Principal Occupation(s) for Past Five Years,
Other Directorships Held and Previous Position(s) |
John F. Donahue*
Birth Date: July 28, 1924
Trustee
Began serving: December 1956 | Principal Occupations: Director or Trustee of the Federated Fund Family; Chairman and Director, Federated Investors, Inc.; Chairman of the Federated Fund Family's Executive Committee.
Previous Positions: Chairman of the Federated Fund Family; Trustee, Federated Investment Management Company; Chairman and Director, Federated Investment Counseling. |
J. Christopher Donahue*
Birth Date: April 11, 1949
PRESIDENT AND Trustee
Began serving: November 1998 | Principal Occupations: Principal Executive Officer and President of the Federated Fund Family; Director or Trustee of some of the Funds in the Federated Fund Family; President, Chief Executive Officer and Director, Federated Investors, Inc.; Chairman and Trustee, Federated Investment Management Company; Trustee, Federated Investment Counseling; Chairman and Director, Federated Global Investment Management Corp.; Chairman, Federated Equity Management Company of Pennsylvania and Passport Research, Ltd. (investment advisory subsidiary of Federated); Trustee, Federated Shareholder Services Company; Director, Federated Services Company.
Previous Positions: President, Federated Investment Counseling; President and Chief Executive Officer, Federated Investment Management Company, Federated Global Investment Management Corp. and Passport Research, Ltd. |
| * | Family relationships and reasons for “interested” status: John F. Donahue is the father of J. Christopher Donahue; both are “interested” due to their beneficial ownership of shares of Federated Investors, Inc. and the positions they hold with Federated and its subsidiaries. |
Annual Shareholder Report57
INDEPENDENT Trustees Background
Name
Birth Date
Positions Held with Trust
Date Service Began | Principal Occupation(s) for Past Five Years,
Other Directorships Held, Previous Position(s) and Qualifications |
Nicholas P. Constantakis, CPA
Birth Date: September 3, 1939
Trustee
Began serving: November 1998 | Principal Occupation: Director or Trustee of the Federated Fund Family.
Other Directorship Held: Director and Chairman of the Audit Committee, Michael Baker Corporation (architecture, engineering and construction services).
Previous Position: Partner, Andersen Worldwide SC.
Qualifications: Public accounting and director experience. |
John F. Cunningham
Birth Date: March 5, 1943
Trustee
Began serving: November 1998 | Principal Occupation: Director or Trustee of the Federated Fund Family.
Other Directorships Held: Chairman, President and Chief Executive Officer, Cunningham & Co., Inc. (strategic business consulting); Trustee Associate, Boston College.
Previous Positions: Director, Redgate Communications and EMC Corporation (computer storage systems); Chairman of the Board and Chief Executive Officer, Computer Consoles, Inc.; President and Chief Operating Officer, Wang Laboratories; Director, First National Bank of Boston; Director, Apollo Computer, Inc.
Qualifications: Business management and director experience. |
Maureen Lally-Green
Birth Date: July 5, 1949
Trustee
Began serving: August 2009 | Principal Occupations: Director or Trustee of the Federated Fund Family; Director, Office of Church Relations, Diocese of Pittsburgh; Adjunct Professor of Law, Duquesne University School of Law.
Other Directorships Held: Director, Auberle; Trustee, St. Francis University; Director, Ireland Institute of Pittsburgh; Director, UPMC Mercy Hospital; Regent, St. Vincent Seminary; Director, Epilepsy Foundation of Western and Central Pennsylvania; Director, Saint Thomas More Society, Allegheny County; Director, Carlow University.
Previous Position: Pennsylvania Superior Court Judge.
Qualifications: Legal and director experience. |
Peter E. Madden
Birth Date: March 16, 1942
Trustee
Began serving: August 1991 | Principal Occupation: Director or Trustee, and Chairman of the Board of Directors or Trustees, of the Federated Fund Family.
Previous Positions: Representative, Commonwealth of Massachusetts General Court; President, Chief Operating Officer and Director, State Street Bank and Trust Company and State Street Corporation (retired); Director, VISA USA and VISA International; Chairman and Director, Massachusetts Bankers Association; Director, Depository Trust Corporation; Director, The Boston Stock Exchange.
Qualifications: Business management, mutual fund services and director experience. |
Annual Shareholder Report58
Name
Birth Date
Positions Held with Trust
Date Service Began | Principal Occupation(s) for Past Five Years,
Other Directorships Held, Previous Position(s) and Qualifications |
Charles F. Mansfield, Jr.
Birth Date: April 10, 1945
Trustee
Began serving: November 1998 | Principal Occupations: Director or Trustee and Chairman of the Audit Committee of the Federated Fund Family; Management Consultant.
Previous Positions: Chief Executive Officer, PBTC International Bank; Partner, Arthur Young & Company (now Ernst & Young LLP); Chief Financial Officer of Retail Banking Sector, Chase Manhattan Bank; Senior Vice President, HSBC Bank USA (formerly, Marine Midland Bank); Vice President, Citibank; Assistant Professor of Banking and Finance, Frank G. Zarb School of Business, Hofstra University; Executive Vice President, DVC Group, Inc. (marketing, communications and technology).
Qualifications: Banking, business management and director experience. |
R. James Nicholson
Birth Date: February 4, 1938
Trustee
Began serving: January 2008 | Principal Occupations: Director or Trustee of the Federated Fund Family; Senior Counsel, Brownstein Hyatt Farber Schrek, P.C.; Former Secretary of the U.S. Dept. of Veterans Affairs; Former U.S. Ambassador to the Holy See; Former Chairman of the Republican National Committee.
Other Directorships Held: Director, Horatio Alger Association; Director, The Daniels Fund.
Previous Positions: Colonel, U.S. Army Reserve; Partner, Calkins, Kramer, Grimshaw and Harring, P.C.; General Counsel, Colorado Association of Housing and Building; Chairman and CEO, Nicholson Enterprises, Inc. (real estate holding company); Chairman and CEO, Renaissance Homes of Colorado.
Qualifications: Legal, government, business management and director experience. |
Thomas M. O'Neill
Birth Date: June 14, 1951
Trustee
Began serving: October 2006 | Principal Occupations: Director or Trustee of the Federated Fund Family; Sole Proprietor, Navigator Management Company (investment and strategic consulting).
Other Directorships Held: Board of Overseers, Children's Hospital of Boston; Visiting Committee on Athletics, Harvard College.
Previous Positions: Chief Executive Officer and President, Managing Director and Chief Investment Officer, Fleet Investment Advisors; President and Chief Executive Officer, Aeltus Investment Management, Inc.; General Partner, Hellman, Jordan Management Co., Boston, MA; Chief Investment Officer, The Putnam Companies, Boston, MA; Credit Analyst and Lending Officer, Fleet Bank; Director and Consultant, EZE Castle Software (investment order management software); Director, Midway Pacific (lumber).
Qualifications: Business management, mutual fund, director and investment experience. |
Annual Shareholder Report59
Name
Birth Date
Positions Held with Trust
Date Service Began | Principal Occupation(s) for Past Five Years,
Other Directorships Held, Previous Position(s) and Qualifications |
John S. Walsh
Birth Date: November 28, 1957
Trustee
Began serving: November 1998 | Principal Occupations: Director or Trustee of the Federated Fund Family; President and Director, Heat Wagon, Inc. (manufacturer of construction temporary heaters); President and Director, Manufacturers Products, Inc. (distributor of portable construction heaters); President, Portable Heater Parts, a division of Manufacturers Products, Inc.
Previous Position: Vice President, Walsh & Kelly, Inc.
Qualifications: Business management and director experience. |
James F. Will
Birth Date: October 12, 1938
Trustee
Began serving: April 2006 | Principal Occupations: Director or Trustee of the Federated Fund Family; formerly, Vice Chancellor and President, Saint Vincent College.
Other Directorships Held: Trustee, Saint Vincent College; Director, Alleghany Corporation; Trustee, Wheeling Jesuit University; Director, Liberty Tire Recycling.
Previous Positions: Chairman, President and Chief Executive Officer, Armco, Inc.; President and Chief Executive Officer, Cyclops Industries; President and Chief Operating Officer, Kaiser Steel Corporation.
Qualifications: Business management, education and director experience. |
OFFICERS
Name
Birth Date
Address
Positions Held with Trust
Date Service Began | Principal Occupation(s) for Past Five Years
and Previous Position(s) |
John W. McGonigle
Birth Date: October 26, 1938
EXECUTIVE VICE PRESIDENT AND SECRETARY
Began serving: September 1969 | Principal Occupations: Executive Vice President and Secretary of the Federated Fund Family; Vice Chairman, Executive Vice President, Secretary and Director, Federated Investors, Inc.
Previous Positions: Trustee, Federated Investment Management Company and Federated Investment Counseling; Director, Federated Global Investment Management Corp., Federated Services Company and Federated Securities Corp. |
Richard A. Novak
Birth Date: December 25, 1963
TREASURER
Began serving: January 2006 | Principal Occupations: Principal Financial Officer and Treasurer of the Federated Fund Family; Senior Vice President, Federated Administrative Services; Financial and Operations Principal for Federated Securities Corp., Edgewood Services, Inc. and Southpointe Distribution Services, Inc.
Previous Positions: Controller of Federated Investors, Inc.; Vice President, Finance of Federated Services Company; held various financial management positions within The Mercy Hospital of Pittsburgh; Auditor, Arthur Andersen & Co. |
Annual Shareholder Report60
Name
Birth Date
Address
Positions Held with Trust
Date Service Began | Principal Occupation(s) for Past Five Years
and Previous Position(s) |
Richard B. Fisher
Birth Date: May 17, 1923
VICE PRESIDENT
Began serving: May 1976 | Principal Occupations: Vice Chairman or Vice President of some of the Funds in the Federated Fund Family; Vice Chairman, Federated Investors, Inc.; Chairman, Federated Securities Corp.
Previous Positions: President and Director or Trustee of some of the Funds in the Federated Fund Family; Executive Vice President, Federated Investors, Inc.; Director and Chief Executive Officer, Federated Securities Corp. |
Brian P. Bouda
Birth Date: February 28, 1947
CHIEF COMPLIANCE OFFICER AND SENIOR VICE PRESIDENT
Began serving: August 2004 | Principal Occupations: Senior Vice President and Chief Compliance Officer of the Federated Fund Family; Vice President and Chief Compliance Officer of Federated Investors, Inc. and Chief Compliance Officer of its subsidiaries. Mr. Bouda joined Federated in 1999 and is a member of the American Bar Association and the State Bar Association of Wisconsin. |
Stephen F. Auth
Birth Date: September 3, 1956
450 Lexington Avenue
Suite 3700
New York, NY 10017-3943
CHIEF INVESTMENT OFFICER
Began serving: November 2002 | Principal Occupations: Mr. Auth is Chief Investment Officer of this Fund and various other Funds in the Federated Fund Family; Executive Vice President, Federated Investment Counseling, Federated Global Investment Management Corp. and Federated Equity Management Company of Pennsylvania.
Previous Positions: Executive Vice President, Federated Investment Management Company, and Passport Research, Ltd. (investment advisory subsidiary of Federated); Senior Vice President, Global Portfolio Management Services Division; Senior Vice President, Federated Investment Management Company and Passport Research, Ltd.; Senior Managing Director and Portfolio Manager, Prudential Investments. |
Annual Shareholder Report61
Evaluation and Approval of Advisory Contract – May 2010
Federated Stock and Bond Fund (the “Fund”)
The Fund's Board reviewed the Fund's investment advisory and subadvisory contracts at meetings held in May 2010. The Board's decision regarding these contracts reflects the exercise of its business judgment on whether to continue the existing arrangements.
In this connection, the Federated funds' Board had previously appointed a Senior Officer, whose duties include specified responsibilities relating to the process by which advisory fees are to be charged to a Federated fund. The Senior Officer has the authority to retain consultants, experts, or staff as may be reasonably necessary to assist in the performance of his duties, reports directly to the Board, and may be terminated only with the approval of a majority of the independent members of the Board. The Senior Officer prepared and furnished to the Board an independent, written evaluation that covered topics discussed below. The Board considered that evaluation, along with other information, in deciding to approve the advisory and subadvisory contracts.
During its review of these contracts, the Board considered compensation and benefits received by the Adviser and subadvisers. This included the fees received for services provided to the Fund by other entities in the Federated organization and research services (if any) received by the Adviser from brokers that execute Federated fund trades, as well as advisory fees. The Board is also familiar with and considered judicial decisions concerning allegedly excessive investment advisory fees, which have indicated that the following factors may be relevant to an Adviser's fiduciary duty with respect to its receipt of compensation from a fund: the nature and quality of the services provided by the Adviser, including the performance of the fund; the Adviser's cost of providing the services; the extent to which the Adviser may realize “economies of scale” as a fund grows larger; any indirect benefits that may accrue to the Adviser and its affiliates as a result of the Adviser's relationship with a fund; performance and expenses of comparable funds; and the extent to which the independent Board members are fully informed about all facts the Board deems relevant bearing on the Adviser's services and fees. The Board further considered management fees (including any components thereof) charged to institutional and other clients of the Adviser and subadvisers for what might be viewed as like services, and the cost to the Adviser and its affiliates of supplying services pursuant to the management fee agreements, excluding any intra-corporate profit and profit margins of the Adviser and its affiliates for supplying such services. The Board was aware of these factors and was guided by them in its review of the Fund's advisory and subadvisory contracts to the extent it considered them to be appropriate and relevant, as discussed further below.
Annual Shareholder Report
62
The Board considered and weighed these circumstances in light of its substantial accumulated experience in governing the Fund and working with Federated on matters relating to the Federated funds, and was assisted in its deliberations by independent legal counsel. Throughout the year, the Board has requested and received substantial and detailed information about the Fund and the Federated organization that was in addition to the extensive materials that comprise and accompany the Senior Officer's evaluation. Federated provided much of this information at each regular meeting of the Board, and furnished additional reports in connection with the particular meeting at which the Board's formal review of the advisory and subadvisory contracts occurred. Between regularly scheduled meetings, the Board also received information on particular matters as the need arose. Thus, the Board's consideration of the advisory and subadvisory contracts included review of the Senior Officer's evaluation, accompanying data and additional reports covering such matters as: the Adviser's and subadvisers' investment philosophy, revenue, profitability, personnel and processes; investment and operating strategies; the Fund's short- and long-term performance (in absolute terms, both on a gross basis and net of expenses, as well as in relationship to its particular investment program and certain competitor or “peer group” funds and/or other benchmarks, as appropriate), and comments on the reasons for performance; the Fund's investment objectives; the Fund's expenses (including the advisory fee itself and the overall expense structure of the Fund, both in absolute terms and relative to similar and/or competing funds, with due regard for contractual or voluntary expense limitations); the use and allocation of brokerage commissions derived from trading the Fund's portfolio securities (if any); and the nature, quality and extent of the advisory and other services provided to the Fund by the Adviser and its affiliates. The Board also considered the preferences and expectations of Fund shareholders and their relative sophistication; the continuing state of competition in the mutual fund industry and market practices; the range of comparable fees for similar funds in the mutual fund industry; the Fund's relationship to the Federated family of funds which include a comprehensive array of funds with different investment objectives, policies and strategies which are available for exchange without the incurrence of additional sales charges; compliance and audit reports concerning the Federated funds and the Federated companies that service them (including communications from regulatory agencies), as well as Federated's responses to any issues raised therein; and relevant developments in the mutual fund industry and how the Federated funds and/or Federated are responding to them. The Board's evaluation process is evolutionary. The criteria considered and the emphasis placed on relevant criteria change in recognition of changing circumstances in the mutual fund marketplace.Annual Shareholder Report
63
With respect to the Fund's performance and expenses in particular, the Board has found the use of comparisons to other mutual funds with comparable investment programs to be relevant, given the high degree of competition in the mutual fund business. The Board focused on comparisons with other similar mutual funds more heavily than non-mutual fund products or services because it is believed that they are more relevant. For example, other mutual funds are the products most like the Fund, they are readily available to Fund shareholders as alternative investment vehicles, and they are the type of investment vehicle in fact chosen and maintained by the Fund's investors. The range of their fees and expenses therefore appears to be a generally reliable indication of what consumers have found to be reasonable in the precise marketplace in which the Fund competes. The Fund's ability to deliver competitive performance when compared to its peer group was a useful indicator of how the Adviser is executing the Fund's investment program, which in turn assisted the Board in reaching a conclusion that the nature, extent, and quality of the Adviser's investment management services were such as to warrant continuation of the advisory contract. In this regard, the Senior Officer has reviewed Federated's fees for providing advisory services to products outside the Federated family of funds (e.g., institutional and separate accounts). He concluded that mutual funds and institutional accounts are inherently different products. Those differences include, but are not limited to, different types of targeted investors; being subject to different laws and regulations; different legal structures; different average account sizes; different associated costs; different portfolio management techniques made necessary by different cash flows; and portfolio manager time spent in review of securities pricing. The Senior Officer did not consider these fee schedules to be determinative in judging the appropriateness of mutual fund advisory contracts.The Senior Officer reviewed reports compiled by Federated, using data supplied by independent fund ranking organizations, regarding the performance of, and fees charged by, other mutual funds, noting his view that comparisons to fund peer groups are relevant in judging the reasonableness of proposed fees.
For the periods covered by the report, the Fund's performance for the three-year and five-year periods was above the median of the relevant peer group, and the Fund's performance fell below the median of the relevant peer group for the one-year period. The Board discussed the Fund's performance with the Adviser and recognized the efforts being undertaken by the Adviser. The Board will continue to monitor these efforts and the performance of the Fund.
The Board also received financial information about Federated, including reports on the compensation and benefits Federated derived from its relationships with the Federated funds. These reports covered not only the fees under the advisory contracts, but also fees received by Federated's subsidiaries for providing other services to the Federated funds under separate contracts (e.g., for serving as the Federated funds' administrator). The reports also discussed any indirect benefit Federated may derive from its receipt of research Annual Shareholder Report
64
services from brokers who execute Federated fund trades. In addition, the Board considered the fact that, in order for a fund to be competitive in the marketplace, Federated and its affiliates frequently waived fees and/or reimbursed expenses and have disclosed to fund investors and/or indicated to the Board their intention to do so in the future, where appropriate. Moreover, the Board receives regular reports regarding the institution or elimination of these voluntary waivers.Federated furnished reports, requested by the Senior Officer, that reported revenues on a fund-by-fund basis and made estimates of the allocation of expenses on a fund-by-fund basis, using allocation methodologies specified by the Senior Officer. The Senior Officer noted that, although they may apply consistent allocation processes, the inherent difficulties in allocating costs (and the unavoidable arbitrary aspects of that exercise) and the lack of consensus on how to allocate those costs may render such allocation reports unreliable. The allocation reports were considered in the analysis by the Board but were determined to be of limited use.
The Board and the Senior Officer also reviewed a report compiled by Federated comparing profitability information for Federated to other publicly held fund management companies. In this regard, the Senior Officer noted the limited availability of such information, but nonetheless concluded that Federated's profit margins did not appear to be excessive and the Board agreed.
The Senior Officer's evaluation also discussed the notion of possible realization of “economies of scale” as a fund grows larger. The Board considered in this regard that the Adviser has made significant and long-term investments in areas that support all of the Federated funds, such as personnel and processes for the portfolio management, compliance, and risk management functions; and systems technology; and that the benefits of these efforts (as well as any economies, should they exist) were likely to be enjoyed by the fund complex as a whole. Finally, the Board also noted the absence of any applicable regulatory or industry guidelines on this subject, which (as discussed in the Senior Officer's evaluation) is compounded by the lack of any common industry practice or general pattern with respect to structuring fund advisory fees with “breakpoints” that serve to reduce the fee as the fund attains a certain size. The Senior Officer did not recommend institution of breakpoints in pricing Federated's fund advisory services at this time.
It was noted in the materials for the Board meeting that for the period covered by the report, the Fund's investment advisory fee, after waivers and expense reimbursements, if any, was above the median of the relevant peer group. The Board reviewed the fees and other expenses of the Fund with the Adviser and was satisfied that the overall expense structure of the Fund remained competitive. The Board will continue to monitor advisory fees and other expenses borne by the Fund.
Annual Shareholder Report
65
The Senior Officer's evaluation noted his belief that the information and observations contained in his evaluation supported a finding that the proposed management fees are reasonable, and that Federated appeared to provide appropriate administrative services to the Fund for the fees paid. Under these circumstances, no changes were recommended to, and no objection was raised to, the continuation of the Fund's advisory and subadvisory contracts. The Board concluded that the nature, quality and scope of services provided the Fund by the Adviser and its affiliates were satisfactory.In its decision to continue an existing investment advisory contract, the Board was mindful of the potential disruptions of the Fund's operations and various risks, uncertainties and other effects that could occur as a result of a decision to terminate or not renew an advisory contract. In particular, the Board recognized that many shareholders have invested in the Fund on the strength of the Adviser's industry standing and reputation and with the expectation that the Adviser will have a continuing role in providing advisory services to the Fund. Thus, the Board's approval of the advisory contract reflected the fact that it is the shareholders who have effectively selected the Adviser by virtue of having invested in the Fund.
The Board based its decision to approve the advisory and subadvisory contracts on the totality of the circumstances and relevant factors and with a view to past and future long-term considerations. Not all of the factors and considerations identified above were necessarily relevant to the Fund, nor did the Board consider any one of them to be determinative. With respect to the factors that were relevant, the Board's decision to approve the contract reflects its determination that Federated's performance and actions provided a satisfactory basis to support the decision to continue the existing arrangements.
Annual Shareholder Report66
Voting Proxies on Fund Portfolio Securities
A description of the policies and procedures that the Fund uses to determine how to vote proxies, if any, relating to securities held in the Fund's portfolio is available, without charge and upon request, by calling 1-800-341-7400. A report on “Form N-PX” of how the Fund voted any such proxies during the most recent 12-month period ended June 30 is available from Federated's website at FederatedInvestors.com. To access this information from the “Products” section of the website, click on the “Prospectuses and Regulatory Reports” link under “Related Information,” then select the appropriate link opposite the name of the Fund; or select the name of the Fund and from the Fund's page, click on the “Prospectuses and Regulatory Reports” link. Form N-PX filings are also available at the SEC's website at www.sec.gov.
Quarterly Portfolio Schedule
The Fund files with the SEC a complete schedule of its portfolio holdings, as of the close of the first and third quarters of its fiscal year, on “Form N-Q.” These filings are available on the SEC's website at www.sec.gov and may be reviewed and copied at the SEC's Public Reference Room in Washington, DC. (Call 1-800-SEC-0330 for information on the operation of the Public Reference Room.) You may also access this information from the “Products” section of Federated's website at FederatedInvestors.com by clicking on “Portfolio Holdings” under “Related Information,” then selecting the appropriate link opposite the name of the Fund; or select the name of the Fund and from the Fund's page, click on the “Portfolio Holdings” link.
Annual Shareholder Report67
Mutual funds are not bank deposits or obligations, are not guaranteed by any bank and are not insured or guaranteed by the U.S. government, the Federal Deposit Insurance Corporation, the Federal Reserve Board or any other government agency. Investment in mutual funds involves investment risk, including the possible loss of principal.
This Report is authorized for distribution to prospective investors only when preceded or accompanied by the Fund's Prospectus, which contains facts concerning its objective and policies, management fees, expenses and other information.
Federated Stock and Bond Fund
Federated Investors Funds
4000 Ericsson Drive
Warrendale, PA 15086-7561
Contact us at FederatedInvestors.com
or call 1-800-341-7400.
Federated Securities Corp., Distributor
Cusip 31422C504
Q450123 (1/11)
Federated is a registered mark of Federated Investors, Inc.
2011 ©Federated Investors, Inc.
Item 2. Code of Ethics
(a) As of the end of the period covered by this report, the registrant has adopted a code of ethics (the "Section 406 Standards for Investment Companies - Ethical Standards for Principal Executive and Financial Officers") that applies to the registrant's Principal Executive Officer and Principal Financial Officer; the registrant's Principal Financial Officer also serves as the Principal Accounting Officer.
(c) Not Applicable
(d) Not Applicable
(e) Not Applicable
(f)(3) The registrant hereby undertakes to provide any person, without charge, upon request, a copy of the code of ethics. To request a copy of the code of ethics, contact the registrant at 1-800-341-7400, and ask for a copy of the Section 406 Standards for Investment Companies - Ethical Standards for Principal Executive and Financial Officers.
Item 3. Audit Committee Financial Expert
The registrant's Board has determined that each of the following members of the Board's Audit Committee is an “audit committee financial expert,” and is "independent," for purposes of this Item: Nicholas P. Constantakis, Charles F. Mansfield, Jr. and Thomas M. O’Neill.
Item 4. Principal Accountant Fees and Services
(a) Audit Fees billed to the registrant for the two most recent fiscal years:
Fiscal year ended 2010 - $26,250
Fiscal year ended 2009 - $26,250
(b) Audit-Related Fees billed to the registrant for the two most recent fiscal years:
Fiscal year ended 2010 - $48
Fiscal year ended 2009 - $0
Audit Committee Meeting.
Amount requiring approval of the registrant’s audit committee pursuant to paragraph (c)(7)(ii) of Rule 2-01 of Regulation S-X, $0 and $6,664 respectively. Fiscal year ended 2009 - Audit consent fee for N-14 merger document.
(c) Tax Fees billed to the registrant for the two most recent fiscal years:
Fiscal year ended 2010 - $0
Fiscal year ended 2009 - $0
Amount requiring approval of the registrant’s audit committee pursuant to paragraph (c)(7)(ii) of Rule 2-01 of Regulation S-X, $0 and $0 respectively.
(d) All Other Fees billed to the registrant for the two most recent fiscal years:
Fiscal year ended 2010 - $0
Fiscal year ended 2009 - $0
Amount requiring approval of the registrant’s audit committee pursuant to paragraph (c)(7)(ii) of Rule 2-01 of Regulation S-X, $0 and $0 respectively.
(e)(1) Audit Committee Policies regarding Pre-approval of Services.
The Audit Committee is required to pre-approve audit and non-audit services performed by the independent auditor in order to assure that the provision of such services do not impair the auditor’s independence. Unless a type of service to be provided by the independent auditor has received general pre-approval, it will require specific pre-approval by the Audit Committee. Any proposed services exceeding pre-approved cost levels will require specific pre-approval by the Audit Committee.
Certain services have the general pre-approval of the Audit Committee. The term of the general pre-approval is 12 months from the date of pre-approval, unless the Audit Committee specifically provides for a different period. The Audit Committee will annually review the services that may be provided by the independent auditor without obtaining specific pre-approval from the Audit Committee and may grant general pre-approval for such services. The Audit Committee will revise the list of general pre-approved services from time to time, based on subsequent determinations. The Audit Committee will not delegate its responsibilities to pre-approve services performed by the independent auditor to management.
The Audit Committee has delegated pre-approval authority to its Chairman. The Chairman will report any pre-approval decisions to the Audit Committee at its next scheduled meeting. The Committee will designate another member with such pre-approval authority when the Chairman is unavailable.
AUDIT SERVICES
The annual Audit services engagement terms and fees will be subject to the specific pre-approval of the Audit Committee. The Audit Committee must approve any changes in terms, conditions and fees resulting from changes in audit scope, registered investment company (RIC) structure or other matters.
In addition to the annual Audit services engagement specifically approved by the Audit Committee, the Audit Committee may grant general pre-approval for other Audit Services, which are those services that only the independent auditor reasonably can provide. The Audit Committee has pre-approved certain Audit services, all other Audit services must be specifically pre-approved by the Audit Committee.
AUDIT-RELATED SERVICES
Audit-related services are assurance and related services that are reasonably related to the performance of the audit or review of the Company’s financial statements or that are traditionally performed by the independent auditor. The Audit Committee believes that the provision of Audit-related services does not impair the independence of the auditor, and has pre-approved certain Audit-related services, all other Audit-related services must be specifically pre-approved by the Audit Committee.
TAX SERVICES
The Audit Committee believes that the independent auditor can provide Tax services to the Company such as tax compliance, tax planning and tax advice without impairing the auditor’s independence. However, the Audit Committee will not permit the retention of the independent auditor in connection with a transaction initially recommended by the independent auditor, the purpose of which may be tax avoidance and the tax treatment of which may not be supported in the Internal Revenue Code and related regulations. The Audit Committee has pre-approved certain Tax services, all Tax services involving large and complex transactions must be specifically pre-approved by the Audit Committee.
ALL OTHER SERVICES
With respect to the provision of services other than audit, review or attest services the pre-approval requirement is waived if:
| (1) | The aggregate amount of all such services provided constitutes no more than five percent of the total amount of revenues paid by the registrant, the registrant’s adviser (not including any sub-adviser whose role is primarily portfolio management and is subcontracted with or overseen by another investment adviser), and any entity controlling, controlled by, or under common control with the investment adviser that provides ongoing services to the registrant to its accountant during the fiscal year in which the services are provided; |
| (2) | Such services were not recognized by the registrant, the registrant’s adviser (not including any sub-adviser whose role is primarily portfolio management and is subcontracted with or overseen by another investment adviser), and any entity controlling, controlled by, or under common control with the investment adviser that provides ongoing services to the registrant at the time of the engagement to be non-audit services; and |
| (3) | Such services are promptly brought to the attention of the Audit Committee of the issuer and approved prior to the completion of the audit by the Audit Committee or by one or more members of the Audit Committee who are members of the board of directors to whom authority to grant such approvals has been delegated by the Audit Committee. |
The Audit Committee may grant general pre-approval to those permissible non-audit services classified as All Other services that it believes are routine and recurring services, and would not impair the independence of the auditor.
The SEC’s rules and relevant guidance should be consulted to determine the precise definitions of prohibited non-audit services and the applicability of exceptions to certain of the prohibitions.
PRE-APPROVAL FEE LEVELS
Pre-approval fee levels for all services to be provided by the independent auditor will be established annually by the Audit Committee. Any proposed services exceeding these levels will require specific pre-approval by the Audit Committee.
PROCEDURES
Requests or applications to provide services that require specific approval by the Audit Committee will be submitted to the Audit Committee by both the independent auditor and the Principal Accounting Officer and/or Internal Auditor, and must include a joint statement as to whether, in their view, the request or application is consistent with the SEC’s rules on auditor independence.
(e)(2) Percentage of services identified in items 4(b) through 4(d) that were approved by the registrants audit committee pursuant to paragraph (c)(7)(i)(C) of Rule 2-01 of Regulation S-X:
4(b)
Fiscal year ended 2010– 0%
Fiscal year ended 2009- 0%
Percentage of services provided to the registrants investment adviser and any entity controlling, controlled by, or under common control with the investment adviser that provides ongoing services to the registrant that were approved by the registrants audit committee pursuant to paragraph (c)(7)(i)(C) of Rule 2-01 of Regulation S-X, 0% and 0% respectively.
4(c)
Fiscal year ended 2010– 0%
Fiscal year ended 2009– 0%
Percentage of services provided to the registrants investment adviser and any entity controlling, controlled by, or under common control with the investment adviser that provides ongoing services to the registrant that were approved by the registrants audit committee pursuant to paragraph (c)(7)(i)(C) of Rule 2-01 of Regulation S-X, 0% and 0% respectively.
4(d)
Fiscal year ended 2010– 0%
Fiscal year ended 2009– 0%
Percentage of services provided to the registrants investment adviser and any entity controlling, controlled by, or under common control with the investment adviser that provides ongoing services to the registrant that were approved by the registrants audit committee pursuant to paragraph (c)(7)(i)(C) of Rule 2-01 of Regulation S-X, 0% and 0% respectively.
| (g) | Non-Audit Fees billed to the registrant, the registrant’s investment adviser, and certain entities controlling, controlled by or under common control with the investment adviser: |
Fiscal year ended 2010- $37,133
Fiscal year ended 2009- $31,541
(h) The registrant’s Audit Committee has considered that the provision of non-audit services that were rendered to the registrant’s adviser (not including any sub-adviser whose role is primarily portfolio management and is subcontracted with or overseen by another investment adviser), and any entity controlling, controlled by, or under common control with the investment adviser that provides ongoing services to the registrant that were not pre-approved pursuant to paragraph (c)(7)(ii) of Rule 2-01 of Regulation S-X is compatible with maintaining the principal accountant’s independence.
Item 5. Audit Committee of Listed Registrants
Not Applicable
Item 6. Schedule of Investments
Not Applicable
| Item 7. | Disclosure of Proxy Voting Policies and Procedures for Closed-End Management Investment Companies |
| Item 8. | Portfolio Managers of Closed-End Management Investment Companies |
| Item 9. | Purchases of Equity Securities by Closed-End Management Investment Company and Affiliated Purchasers |
Item 10. Submission of Matters to a Vote of Security Holders
Not Applicable
Item 11. Controls and Procedures
(a) The registrant’s President and Treasurer have concluded that the
registrant’s disclosure controls and procedures (as defined in rule 30a-3(c) under the Act) are effective in design and operation and are sufficient to form the basis of the certifications required by Rule 30a-(2) under the Act, based on their evaluation of these disclosure controls and procedures within 90 days of the filing date of this report on Form N-CSR.
(b) There were no changes in the registrant’s internal control over financial reporting (as defined in rule 30a-3(d) under the Act) during the last fiscal quarter that have materially affected, or are reasonably likely to materially affect, the registrant’s internal control over financial reporting.
Item 12. Exhibits
SIGNATURES
Pursuant to the requirements of the Securities Exchange Act of 1934 and the Investment Company Act of 1940, the registrant has duly caused this report to be signed on its behalf by the undersigned, thereunto duly authorized.
Registrant Federated Stock and Bond Fund
| By | /S/ Richard A. Novak |
| | Richard A. Novak, Principal Financial Officer |
Date ___January 24, 2011____
Pursuant to the requirements of the Securities Exchange Act of 1934 and the Investment Company Act of 1940, this report has been signed below by the following persons on behalf of the registrant and in the capacities and on the dates indicated.
| By | /S/ J. Christopher Donahue |
| | J. Christopher Donahue |
| | Principal Executive Officer |
Date ___January 25, 2011____
| By | /S/ Richard A. Novak |
| | Richard A. Novak, Principal Financial Officer |
Date ___January 24, 2011____