United States
Securities and Exchange Commission
Washington, D.C. 20549
Form N-CSR
Certified Shareholder Report of Registered Management Investment Companies
811-1
(Investment Company Act File Number)
Federated Global Allocation Fund
_______________________________________________________________
(Exact Name of Registrant as Specified in Charter)
Federated Investors Funds
4000 Ericsson Drive
Warrendale, Pennsylvania 15086-7561
(Address of Principal Executive Offices)
(412) 288-1900
(Registrant's Telephone Number)
Peter J. Germain, Esquire
Federated Investors Tower
1001 Liberty Avenue
Pittsburgh, Pennsylvania 15222-3779
(Name and Address of Agent for Service)
(Notices should be sent to the Agent for Service)
Date of Fiscal Year End: 11/30/17
Date of Reporting Period: 11/30/17
| Item 1. | Reports to Stockholders |

| Share Class | Ticker | A | FSTBX | B | FSBBX | C | FSBCX |
| R | FSBKX | Institutional | SBFIX | R6 | FSBLX |

| 1 | Please see the footnotes to the line graphs under “Fund Performance and Growth of a $10,000 Investment” below for the definition of, and more information about, the Blended Index. |
| 2 | The Fund's broad-based security market indexes are the S&P 500 Index and the Bloomberg Barclays U.S. Aggregate Bond Index, which had total returns of 22.87% and 3.21%, respectively. Please see the footnotes to the line graphs under “Fund Performance and Growth of a $10,000 Investment” below for the definition of, and more information about, the S&P 500 Index and the Bloomberg Barclays U.S. Aggregate Bond Index. |
| 3 | Please see the footnotes to the line graphs under “Fund Performance and Growth of a $10,000 Investment” below for the definition of, and more information about, the MWAFA. |
| 4 | The Russell 2000® Index measures the performance of the small-cap segment of the U.S. equity universe. The Russell 2000® Index is a subset of the Russell 3000® Index representing approximately 10% of the total market capitalization of that index. It includes approximately 2000 of the smallest securities based on a combination of their market cap and current index membership. The Russell 2000® Index is constructed to provide a comprehensive and unbiased small-cap barometer and is completely reconstituted annually to ensure larger stocks do not distort the performance and characteristics of the true small-cap opportunity set.* |
| 5 | International investing involves special risks including currency risk, increased volatility, political risks, and differences in auditing and other financial standards. |
| 6 | The MSCI EAFE Index is an equity index which captures large- and mid-cap representation across developed markets countries around the world, excluding the United States and Canada. With 906 constituents, the index covers approximately 85% of the free float-adjusted market capitalization in each country.* |
| 7 | The MSCI Europe Index captures large- and mid-cap representation across 15 developed markets countries in Europe.* |
| 8 | The MSCI country indexes are designed to measure the performance of the large- and mid-cap segments of the respective country's market. Each index covers approximately 85% of the free float-adjusted market capitalization in each country.* |
| 9 | Prices of emerging markets securities can be significantly more volatile than the prices of securities in developed countries, and currency risk and political risks are accentuated in emerging markets. |
| 10 | The MSCI Emerging Markets Index captures large- and mid-cap representation across 21 Emerging Markets (EM) countries. The index covers approximately 85% of the free float-adjusted market capitalization in each country.* |
| 11 | The U.S. Dollar Index indicates the general international value of the U.S. dollar by averaging the exchange rates between the U.S. dollar and six major world currencies.* |
| 12 | Bond prices are sensitive to changes in interest rates, and a rise in interest rates can cause a decline in their prices. |
| 13 | High-yield, lower-rated securities generally entail greater market, credit and liquidity risks than investment-grade securities and may include higher volatility and higher risk of default. |
| 14 | The Bloomberg Barclays U.S. Corporate High Yield 2% Issuer Capped Index is an issuer-constrained version of the Bloomberg Barclays U.S. Corporate High-Yield Index that measures the market of USD-denominated, noninvestment-grade, fixed-rate, taxable corporate bonds. The index follows the same rules as the uncapped index but limits the exposure of each issuer to 2% of the total market value and redistributes any excess market value index-wide on a pro-rata basis.* |
| 15 | The Bloomberg Barclays U.S. Corporate Credit Index is composed of all publicly issued, fixed-rate, nonconvertible, investment-grade corporate debt and a non-corporate component that includes foreign agencies, sovereigns, supranationals and local authorities.* |
| * | The index is unmanaged, and it is not possible to invest directly in an index. |
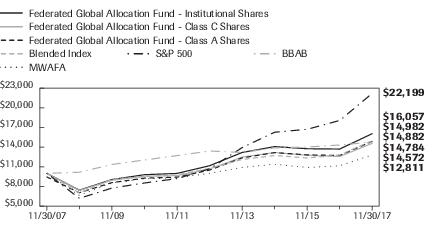
| Federated Global Allocation Fund - | Institutional Shares | Class C Shares | Class A Shares | Blended Index | S&P 500 | BBAB | MWAFA |
| F | F | F | I | I | I | I | |
| 11/30/2007 | 10,000 | 10,000 | 9,452 | 10,000 | 10,000 | 10,000 | 10,000 |
| 11/30/2008 | 7,437 | 7,402 | 7,052 | 7,023 | 6,191 | 10,174 | 6,636 |
| 11/30/2009 | 9,059 | 8,946 | 8,592 | 9,087 | 7,762 | 11,357 | 8,545 |
| 11/30/2010 | 9,798 | 9,571 | 9,272 | 9,516 | 8,534 | 12,041 | 9,177 |
| 11/30/2011 | 9,993 | 9,657 | 9,422 | 9,763 | 9,202 | 12,705 | 9,297 |
| 11/30/2012 | 11,162 | 10,672 | 10,495 | 10,765 | 10,687 | 13,405 | 10,019 |
| 11/30/2013 | 13,184 | 12,474 | 12,362 | 12,114 | 13,924 | 13,190 | 10,910 |
| 11/30/2014 | 14,082 | 13,185 | 13,163 | 12,732 | 16,272 | 13,885 | 11,387 |
| 11/30/2015 | 13,759 | 12,754 | 12,823 | 12,347 | 16,719 | 14,019 | 10,898 |
| 11/30/2016 | 13,708 | 12,571 | 12,736 | 12,794 | 18,067 | 14,324 | 11,165 |
| 11/30/2017 | 16,057 | 14,572 | 14,882 | 14,982 | 22,199 | 14,784 | 12,811 |
| ■ | Total returns shown for the Class A Shares include the maximum sales charge of 5.50% ($10,000 investment minus $550 sales charge = $9,450). |
| ■ | Total returns shown for Class C Shares include the maximum contingent deferred sales charge of 1.00% as applicable. |
| 1 Year | 5 Years | 10 Years | |
| Class A Shares | 10.41% | 6.03% | 4.06% |
| Class B Shares | 10.34% | 6.06% | 3.97% |
| Class C Shares | 14.92% | 6.43% | 3.84% |
| Class R Shares | 16.32% | 6.78% | 4.18% |
| Institutional Shares6 | 17.13% | 7.54% | 4.85% |
| Class R6 Shares7 | 17.14% | 7.31% | 4.68% |
| Blended Index | 17.10% | 6.83% | 4.13% |
| S&P 500 | 22.87% | 15.74% | 8.30% |
| BBAB | 3.21% | 1.98% | 3.99% |
| MWAFA | 15.12% | 6.01% | 4.05% |
| 1 | Represents a hypothetical investment of $10,000 in the Fund after deducting applicable sales charges: for Class A Shares, the maximum sales charge of 5.50% ($10,000 investment minus $550 sales charge = $9,450); for Class B Shares, the maximum contingent deferred sales charge is 5.50% on any redemption of shares held up to one year from the purchase date; for Class C Shares, the maximum contingent deferred sales charge is 1.00% on any redemption less than one year from the purchase date. The Fund's performance assumes the reinvestment of all dividends and distributions. The Blended Index, S&P 500 and BBAB have been adjusted to reflect reinvestment of dividends on securities in the indexes. |
| 2 | The Blended Index is a custom blended index comprised of 60% of the MSCI ACWI and 40% of the BBGA. The MSCI ACWI captures large- and mid-cap representation across 23 developed markets countries and 23 emerging markets countries. The index covers approximately 85% of the global investable equity opportunity set. The BBGA is a measure of global investment grade debt from 24 different local currency markets. This multi-currency benchmark includes fixed-rate treasury, government-related, corporate and securitized bonds from both developed and emerging markets issuers. The indexes are not adjusted to reflect sales loads, expenses or other fees that the Securities and Exchange Commission (SEC) requires to be reflected in the Fund's performance. The indexes are unmanaged and, unlike the Fund, are not affected by cash flows. It is not possible to invest directly in an index. |
| 3 | The S&P 500 is an unmanaged, capitalization-weighted index of 500 stocks designed to measure performance of the broad domestic economy through changes in the aggregate market value of 500 stocks representing all major industries. The index is not adjusted to reflect sales loads, expenses or other fees that the SEC requires to be reflected in the Fund's performance. The index is unmanaged and, unlike the Fund, is not affected by cash flows. It is not possible to invest directly in an index. |
| 4 | The BBAB is a broad-based benchmark that measures the investment grade, U.S. dollar-denominated, fixed-rate taxable bond market, including Treasuries, government-related and corporate securities, mortgage-backed securities (agency fixed-rate and hybrid adjustable rate mortgage pass-throughs), asset-backed securities and commercial mortgage-backed securities. The index is not adjusted to reflect sales loads, expenses or other fees that the SEC requires to be reflected in the Fund's performance. The index is unmanaged and, unlike the Fund, is not affected by cash flows. It is not possible to invest directly in an index. |
| 5 | The Morningstar figures represent the average of the total returns reported by all the funds designated by Morningstar as falling into the respective category indicated. They do not reflect sales charges. The Morningstar figures in the Growth of $10,000 line graph are based on historical return information published by Morningstar and reflect the return of the funds comprising the category in the year of publication. Because the funds designated by Morningstar as falling into the category can change over time, the Morningstar figures in the line graph may not match the Morningstar figures in the Average Annual Total Returns table, which reflect the return of the funds that currently comprise the category. |
| 6 | The Fund's Institutional Shares commenced operations on June 12, 2009. For the period prior to the commencement of operations of Institutional Shares, the performance information shown is for the Fund's Class A Shares. The performance of Class A Shares has not been adjusted to reflect the expenses of Institutional Shares since Institutional Shares have a lower expense ratio than the expense ratio of the Class A Shares. The performance of Class A Shares has been adjusted to remove any voluntary waiver of Fund expenses related to the Class A Shares that may have occurred during the period prior to the commencement of operations of Institutional Shares. Additionally, the performance information shown below has been adjusted to reflect the absence of sales charges applicable to Class A Shares. |
| 7 | The Fund's R6 Shares commenced operations on June 29, 2016. For the period prior to the commencement of operations of the R6 Shares, the performance information shown is for the Fund's Class A Shares. The performance of Class A Shares has not been adjusted to reflect the expenses of R6 Shares since R6 Shares have a lower expense ratio than the expense ratio of the Class A Shares. The performance of Class A Shares has been adjusted to remove any voluntary waiver of Fund expenses related to the Class A Shares that may have occurred during the period prior to the commencement of operations of R6 Shares. Additionally, the performance information shown below has been adjusted to reflect the absence of sales charges applicable to Class A Shares. |
| Portfolio Composition | Percentage of Total Net Assets2 |
| Domestic Equity Securities | 33.0% |
| International Equity Securities | 25.0% |
| Corporate Debt Securities | 12.6% |
| Foreign Debt Securities | 10.0% |
| Mortgage-Backed Securities3 | 2.8% |
| U.S. Treasury and Agency Securities | 2.4% |
| Trade Finance Agreements | 0.9% |
| Collateralized Mortgage-Backed Obligations | 0.8% |
| Floating Rate Loan | 0.7% |
| Asset-Backed Securities | 0.5% |
| Commercial Mortgage-Backed Securities | 0.2% |
| Municipal Securities4 | 0.0% |
| Other Security Type5 | 7.9% |
| Derivative Contracts6 | 0.3% |
| Cash Equivalents7 | 0.6% |
| Other Assets and Liabilities—Net8 | 2.3% |
| TOTAL | 100.0% |
| 1 | See the Fund's Prospectus and Statement of Additional Information for a description of these security types. |
| 2 | As of the date specified above, the Fund owned shares of one or more affiliated investment companies. For purposes of this table, the affiliated investment company (other than an affiliated money market mutual fund) is not treated as a single portfolio security, but rather the Fund is treated as owning a pro rata portion of each security and each other asset and liability owned by the affiliated investment company. Accordingly, the percentages of total net assets shown in the table will differ from those presented on the Portfolio of Investments. |
| 3 | For purposes of this table, Mortgage-Backed Securities include mortgage-backed securities guaranteed by Government Sponsored Entities and adjustable rate mortgage-backed securities. |
| 4 | Represents less than 0.1%. |
| 5 | Other Security Type consists of exchange-traded funds and purchased put options. |
| 6 | Based upon net unrealized appreciation (depreciation) or value of the derivative contracts as applicable. Derivative contracts may consist of futures, forwards, options and swaps. The impact of a derivative contract on the Fund's performance may be larger than its unrealized appreciation (depreciation) or value may indicate. In many cases, the notional value or amount of a derivative contract may provide a better indication of the contract's significance to the portfolio. More complete information regarding the Fund's direct investments in derivative contracts, including unrealized appreciation (depreciation), value and notional values or amounts of such contracts, can be found in the table at the end of the Portfolio of Investments included in this Report. |
| 7 | Cash Equivalents include any investments in money market mutual funds and/or overnight repurchase agreements. |
| 8 | Assets, other than investments in securities and derivative contracts, less liabilities. See Statement of Assets and Liabilities. |
| Sector Composition of Equity Holdings | Percentage of Equity Securities |
| Financials | 18.9% |
| Information Technology | 15.5% |
| Consumer Discretionary | 14.9% |
| Industrials | 14.3% |
| Health Care | 10.7% |
| Consumer Staples | 7.1% |
| Materials | 5.1% |
| Energy | 4.5% |
| Real Estate | 3.4% |
| Utilities | 3.4% |
| Telecommunication Services | 2.2% |
| TOTAL | 100.0% |
| 9 | Sector classifications are based upon, and individual portfolio securities are assigned to, the classifications of the Global Industry Classification Standard (GICS) except that the Adviser assigns a classification to securities not classified by the GICS and to securities for which the Adviser does not have access to the classification made by the GICS. |
| Shares, Contracts or Principal Amount | Value in U.S. Dollars | ||
| COMMON STOCKS—58.0% | |||
| Consumer Discretionary—8.6% | |||
| 98 | Aaron's, Inc. | $3,697 | |
| 3,615 | Adidas AG | 753,819 | |
| 9,900 | Aisin Seiki Co. | 532,726 | |
| 2,534 | 1 | Amazon.com, Inc. | 2,981,884 |
| 1,516 | 1 | American Outdoor Brands Corp. | 21,269 |
| 565 | 1 | Asbury Automotive Group, Inc. | 37,177 |
| 4,700 | Asics Corp. | 69,725 | |
| 2,137 | Bloomin' Brands, Inc. | 45,881 | |
| 600 | Bridgestone Corp. | 27,347 | |
| 339 | 1 | Caesars Entertainment Corp. | 4,492 |
| 1,308 | Caleres, Inc. | 42,693 | |
| 3,982 | Callaway Golf Co. | 57,779 | |
| 69 | Capella Education Co. | 5,886 | |
| 41 | 1 | Cavco Industries, Inc. | 6,279 |
| 1,460 | 1 | Charter Communications, Inc. | 476,267 |
| 18 | Children's Place, Inc./The | 2,392 | |
| 1,971 | Choice Hotels International, Inc. | 154,724 | |
| 349 | Cie Financiere Richemont SA | 30,039 | |
| 39,958 | Comcast Corp., Class A | 1,500,023 | |
| 33,527 | Compass Group PLC | 680,356 | |
| 41 | 1 | Conn's, Inc. | 1,267 |
| 2,484 | Continental Ag | 661,758 | |
| 308 | Cooper Tire & Rubber Co. | 11,319 | |
| 1,646 | Dana, Inc. | 54,384 | |
| 13 | 1 | Dave & Buster's Entertainment, Inc. | 689 |
| 3,804 | 1 | Denny's Corp. | 51,544 |
| 6,200 | Dollarama, Inc. | 757,898 | |
| 13,265 | Extended Stay America, Inc. | 231,740 | |
| 500 | Fast Retailing Co. Ltd. | 194,719 | |
| 6,667 | Ferrari NV | 724,282 | |
| 28,019 | 1 | Fiat Chrysler Automobiles NV | 481,452 |
| 58,327 | Ford Motor Co. | 730,254 | |
| 1,931 | General Motors Co. | 83,207 |
| Shares, Contracts or Principal Amount | Value in U.S. Dollars | ||
| COMMON STOCKS—continued | |||
| Consumer Discretionary—continued | |||
| 20,885 | Gentex Corp. | $427,725 | |
| 232 | 1 | Grand Canyon Education, Inc. | 22,031 |
| 611 | 1 | Gray Television, Inc. | 8,798 |
| 30,400 | Hakuhodo DY Holdings, Inc. | 409,462 | |
| 113,800 | Harvey Norman Holdings Ltd. | 347,715 | |
| 309 | Hasbro, Inc. | 28,743 | |
| 20,639 | 1 | Hilton Grand Vacations, Inc. | 824,941 |
| 12,076 | Hilton Worldwide Holdings, Inc. | 936,615 | |
| 10,333 | Home Depot, Inc. | 1,858,080 | |
| 161 | Hooker Furniture Corp. | 8,050 | |
| 31,148 | 1 | i-CABLE Communications Ltd. | 894 |
| 222 | 1 | IRobot Corp. | 15,234 |
| 257,018 | ITV PLC | 556,160 | |
| 14,500 | Iida Group Holdings Co. Ltd. | 268,707 | |
| 25,349 | Industria de Diseno Textil SA | 898,382 | |
| 8,125 | InterContinental Hotels Group | 476,679 | |
| 1,600 | Isuzu Motors Ltd. | 25,354 | |
| 585 | Jack in the Box, Inc. | 60,553 | |
| 121 | Johnson Outdoors, Inc., Class A | 8,850 | |
| 1,533 | KB Home | 48,075 | |
| 4,000 | Koito Manufacturing Co. Ltd. | 277,400 | |
| 523 | LCI Industries | 68,461 | |
| 2,399 | LVMH Moet Hennessy Louis Vuitton SE | 698,743 | |
| 3,508 | 1 | La Quinta Holdings, Inc. | 62,477 |
| 1,738 | La-Z-Boy, Inc. | 57,180 | |
| 16,133 | Lagardere SCA | 528,781 | |
| 606,000 | Li & Fung Ltd. | 267,331 | |
| 2,316 | 1 | Liberty TripAdvisor Holdings, Inc. | 21,655 |
| 9,630 | Linamar Corp. | 520,631 | |
| 537 | 1 | Lions Gate Entertainment Corp. | 16,668 |
| 8,800 | Lowe's Cos., Inc. | 733,656 | |
| 5,700 | MGM Resorts Intl. | 194,484 | |
| 1,094 | 1 | MSG Networks, Inc. | 19,528 |
| 11,460 | Magna International, Inc. | 642,840 | |
| 724 | Marine Products Corp. | 10,889 | |
| 508 | Marriott Vacations Worldwide Corp. | 68,199 |
| Shares, Contracts or Principal Amount | Value in U.S. Dollars | ||
| COMMON STOCKS—continued | |||
| Consumer Discretionary—continued | |||
| 20,100 | Mazda Motor Corp. | $269,707 | |
| 84 | McDonald's Corp. | 14,445 | |
| 2,214 | Michelin, Class B | 321,295 | |
| 33,600 | Mitsubishi Motors Corp. | 235,829 | |
| 2,652 | 1 | Mohawk Industries, Inc. | 749,482 |
| 136 | 1 | NVR, Inc. | 472,600 |
| 6,000 | Namco Bandai Holdings, Inc. | 195,614 | |
| 3,911 | 1 | NetFlix, Inc. | 733,625 |
| 2,793 | New York Times Co., Class A | 52,508 | |
| 600 | Nexstar Media Group, Inc. | 40,740 | |
| 5,989 | Next PLC | 362,572 | |
| 933 | Nutri/System, Inc. | 47,350 | |
| 3,478 | Office Depot, Inc. | 11,373 | |
| 1,228 | 1 | Ollie's Bargain Outlet Holdings, Inc. | 58,269 |
| 7,686 | PSA Peugeot Citroen | 158,972 | |
| 53,200 | Panasonic Corp. | 794,181 | |
| 2,396 | 1 | Party City Holdco, Inc. | 33,304 |
| 10,660 | Penske Automotive Group, Inc. | 515,518 | |
| 3,973 | 1 | Persimmon PLC | 136,502 |
| 50 | PetMed Express, Inc. | 1,968 | |
| 1,007 | 1 | Pinnacle Entertainment, Inc. | 30,895 |
| 138 | 1 | RH | 13,992 |
| 2,359 | Restaurant Brands International, Inc. | 146,515 | |
| 296 | Royal Caribbean Cruises, Ltd. | 36,668 | |
| 800 | Ryohin Keikaku Co. Ltd. | 250,327 | |
| 31,200 | Sands China Ltd. | 152,744 | |
| 12,100 | Sankyo Co. Ltd. | 390,800 | |
| 6,900 | Sega Sammy Holdings, Inc. | 83,566 | |
| 7,800 | Sekisui Chemical Co. Ltd. | 151,253 | |
| 5,200 | Sekisui House Ltd. | 97,327 | |
| 3,600 | Shimamura Co. Ltd. | 434,940 | |
| 78 | 1 | Shutterfly, Inc. | 3,446 |
| 42 | Sinclair Broadcast Group, Inc. | 1,430 | |
| 6,862 | Sodexo SA | 897,176 | |
| 1,261 | Sonic Corp. | 32,181 | |
| 6,600 | Start Today Co. Ltd. | 203,394 |
| Shares, Contracts or Principal Amount | Value in U.S. Dollars | ||
| COMMON STOCKS—continued | |||
| Consumer Discretionary—continued | |||
| 325 | Sturm Ruger & Co., Inc. | $17,794 | |
| 7,900 | Subaru Corp. | 259,048 | |
| 42,821 | Taylor Woodrow PLC | 113,262 | |
| 11,039 | Time Warner, Inc. | 1,010,179 | |
| 10,700 | Toho Co. Ltd. | 361,706 | |
| 17,400 | Toyoda Gosei Co. Ltd. | 436,158 | |
| 10,100 | Toyota Motor Corp. | 636,402 | |
| 1,321 | 1 | Ulta Beauty, Inc. | 292,879 |
| 4,013 | Valeo SA | 291,349 | |
| 28,580 | Vivendi SA | 760,885 | |
| 3,992 | Walt Disney Co. | 418,441 | |
| 3,001 | Whirlpool Corp. | 505,879 | |
| 3,263 | Wynn Resorts Ltd. | 515,815 | |
| 600 | Yamaha Motor Co | 18,894 | |
| 30,500 | Yue Yuen Industrial Holdings Ltd. | 109,265 | |
| TOTAL | 36,719,403 | ||
| Consumer Staples—4.1% | |||
| 2,454 | Alimentation Couche-Tard, Inc., Class B | 125,139 | |
| 1,896 | Altria Group, Inc. | 128,606 | |
| 165 | Andersons, Inc. | 5,330 | |
| 782 | Anheuser-Busch InBev SA/NV | 89,662 | |
| 9,804 | Archer-Daniels-Midland Co. | 390,984 | |
| 73 | Bob Evans Farms, Inc. | 5,697 | |
| 2,599 | CVS Health Corp. | 199,083 | |
| 672 | 1 | Cal-Maine Foods, Inc. | 33,432 |
| 653 | Calavo Growers, Inc. | 49,889 | |
| 2,400 | Calbee, Inc. | 84,188 | |
| 4,579 | Church and Dwight, Inc. | 215,625 | |
| 14,063 | 1 | Coca-Cola HBC AG | 449,194 |
| 3,581 | Dean Foods Co. | 39,964 | |
| 31,420 | Diageo PLC | 1,085,538 | |
| 1,210 | 1 | Edgewell Personal Care Co. | 70,168 |
| 5,290 | Energizer Holdings, Inc. | 242,970 | |
| 443 | Fresh Del Monte Produce, Inc. | 21,574 | |
| 572 | George Weston Ltd. | 48,730 | |
| 567 | 1 | HRG Group, Inc. | 9,837 |
| Shares, Contracts or Principal Amount | Value in U.S. Dollars | ||
| COMMON STOCKS—continued | |||
| Consumer Staples—continued | |||
| 5,097 | 1 | Hain Celestial Group, Inc. | $209,487 |
| 1,472 | 1 | Herbalife Ltd. | 103,246 |
| 6,955 | ICA Gruppen AB | 251,662 | |
| 49 | J & J Snack Foods Corp. | 7,404 | |
| 25,784 | Koninklijke Ahold Delhaize NV | 552,622 | |
| 1,315 | Kraft Heinz Co. (The) | 107,002 | |
| 2,872 | L'OREAL | 635,207 | |
| 14,871 | Lamb Weston Holdings, Inc. | 808,536 | |
| 15,300 | Lion Corp | 288,134 | |
| 12,313 | Marine Harvest ASA | 217,091 | |
| 2,700 | Meiji Holdings Co. Ltd. | 235,483 | |
| 9,114 | Metro, Inc. | 285,468 | |
| 3,237 | 1 | Monster Beverage Corp. | 202,863 |
| 10,000 | NH Foods Ltd. | 246,913 | |
| 9,952 | Nestle SA | 852,061 | |
| 5,096 | Nu Skin Enterprises, Inc. | 346,069 | |
| 12,488 | ORKLA ASA | 125,263 | |
| 1,348 | PepsiCo, Inc. | 157,069 | |
| 1,380 | 1 | Performance Food Group Co. | 40,917 |
| 197 | Philip Morris International, Inc. | 20,242 | |
| 13,585 | Pinnacle Foods, Inc. | 791,055 | |
| 4,010 | 1 | Post Holdings, Inc. | 318,595 |
| 10,064 | Procter & Gamble Co. | 905,659 | |
| 64 | Sanderson Farms, Inc. | 10,860 | |
| 15 | Sanfilippo (John B. & Sons), Inc. | 906 | |
| 13,218 | Saputo, Inc. | 448,540 | |
| 2,177 | Spectrum Brands Holdings, Inc. | 250,094 | |
| 4,900 | Sundrug Co., Ltd. | 227,177 | |
| 10,959 | Sysco Corp. | 632,663 | |
| 48 | 1 | The Boston Beer Co., Inc., Class A | 8,633 |
| 33,800 | The Coca-Cola Co. | 1,547,026 | |
| 1,300 | Tsuruha Holdings, Inc. | 180,056 | |
| 12,082 | Tyson Foods, Inc., Class A | 993,744 | |
| 246 | 1 | USANA Health Sciences, Inc. | 17,638 |
| 162 | WD 40 Co. | 19,343 | |
| 14,337 | Wal-Mart Stores, Inc. | 1,393,987 |
| Shares, Contracts or Principal Amount | Value in U.S. Dollars | ||
| COMMON STOCKS—continued | |||
| Consumer Staples—continued | |||
| 1,100 | Walgreens Boots Alliance, Inc. | $80,036 | |
| 100 | Weis Markets, Inc. | 4,117 | |
| 110,841 | William Morrison Supermarkets PLC | 324,331 | |
| 17,700 | Yamazaki Baking Co. Ltd. | 340,851 | |
| TOTAL | 17,483,660 | ||
| Energy—2.6% | |||
| 219 | Andeavor Logistics LP | 23,098 | |
| 1,128 | Archrock, Inc. | 10,716 | |
| 773 | 1 | C&J Energy Services, Inc. | 24,164 |
| 1,817 | CVR Energy, Inc. | 59,325 | |
| 4,188 | Chevron Corp. | 498,330 | |
| 2,048 | Delek US Holdings, Inc. | 68,035 | |
| 357 | 1 | Exterran Corp. | 10,938 |
| 14,332 | Exxon Mobil Corp. | 1,193,712 | |
| 1,616 | Green Plains, Inc. | 27,230 | |
| 16,268 | Halliburton Co. | 679,677 | |
| 107,550 | JXTG Holdings, Inc. | 607,309 | |
| 1,323 | 1 | Keane Group, Inc. | 19,792 |
| 634 | 1 | Mammoth Energy Services, Inc. | 11,951 |
| 14,284 | Marathon Petroleum Corp. | 894,607 | |
| 6,452 | 1 | McDermott International, Inc. | 46,841 |
| 8,542 | Neste Oyj | 531,334 | |
| 403 | OMV AG | 25,080 | |
| 12,283 | ONEOK, Inc. | 637,488 | |
| 16,757 | PBF Energy, Inc. | 542,424 | |
| 140 | 1 | Par Petroleum Corp. | 2,906 |
| 15,745 | Patterson-UTI Energy, Inc. | 339,935 | |
| 613 | 1 | Peabody Energy Corp. | 20,419 |
| 5,568 | Phillips 66 | 543,214 | |
| 1,689 | 1 | Propetro Holding Corp. | 31,703 |
| 32,749 | RPC, Inc. | 787,286 | |
| 1,545 | 1 | Sandridge Energy, Inc. | 28,752 |
| 36,500 | Showa Shell Sekiyu KK | 467,676 | |
| 23,394 | Tenaris SA | 340,214 | |
| 20,731 | Total SA | 1,170,472 | |
| 196 | US Silica Holdings, Inc. | 6,501 |
| Shares, Contracts or Principal Amount | Value in U.S. Dollars | ||
| COMMON STOCKS—continued | |||
| Energy—continued | |||
| 11,547 | Valero Energy Corp. | $988,654 | |
| 16,363 | World Fuel Services Corp. | 459,309 | |
| TOTAL | 11,099,092 | ||
| Financials—11.0% | |||
| 19,793 | ABN AMRO Group NV–GDR | 585,820 | |
| 11,975 | AGEAS | 588,623 | |
| 29,854 | AGNC Investment Corp. | 594,095 | |
| 9,400 | AIA Group Ltd. | 76,619 | |
| 91,739 | AMP Ltd. | 356,720 | |
| 5,308 | Admiral Group PLC | 137,818 | |
| 3,464 | Aegon N.V. | 21,558 | |
| 9,947 | Aflac, Inc. | 871,755 | |
| 5,416 | Allianz SE | 1,277,301 | |
| 31,412 | Ally Financial, Inc. | 843,726 | |
| 968 | American Equity Investment Life Holding Co. | 30,715 | |
| 20,007 | American International Group, Inc. | 1,199,620 | |
| 1,152 | American National Insurance Co. | 144,403 | |
| 157 | Amerisafe, Inc. | 10,307 | |
| 67 | Argo Group International Holdings Ltd. | 4,104 | |
| 6,417 | Assurant, Inc. | 647,283 | |
| 4,112 | Assured Guaranty Ltd. | 149,307 | |
| 29,346 | Australia & New Zealand Banking Group, Melbourne | 637,441 | |
| 124,500 | BOC Hong Kong (Holdings) Ltd. | 632,227 | |
| 1,777 | BancorpSouth Bank | 59,085 | |
| 62,232 | Bank Leumi Le-Israel | 345,549 | |
| 78,395 | Bank of America Corp. | 2,208,387 | |
| 5,603 | Bank of Montreal | 431,120 | |
| 8,878 | Bank of Nova Scotia | 560,900 | |
| 32,436 | Bank of Queensland | 325,756 | |
| 36,486 | Bendigo Bank | 323,324 | |
| 3,228 | 1 | Berkshire Hathaway, Inc., Class B | 623,036 |
| 2,994 | Boston Private Financial Holdings | 48,952 | |
| 2,965 | CNO Financial Group, Inc. | 74,748 | |
| 22,689 | CNP Assurances | 511,366 | |
| 5,159 | CYS Investments, Inc. | 41,736 | |
| 6,104 | Canadian Imperial Bank of Commerce | 558,948 |
| Shares, Contracts or Principal Amount | Value in U.S. Dollars | ||
| COMMON STOCKS—continued | |||
| Financials—continued | |||
| 931 | 1 | Cannae Holdings, Inc. | $16,953 |
| 1,460 | Cathay Bancorp, Inc. | 63,349 | |
| 899 | CenterState Bank Corp. | 24,390 | |
| 788 | Chemical Financial Corp. | 44,435 | |
| 3,500 | Chugoku Bank Ltd. | 45,774 | |
| 24,309 | Citigroup, Inc. | 1,835,329 | |
| 54,318 | 1 | Commerzbank AG | 786,233 |
| 4,900 | Concordia Financial Group Ltd. | 26,958 | |
| 117,244 | Corp Mapfre SA | 394,678 | |
| 37,933 | Credit Agricole SA | 639,702 | |
| 129 | 1 | Customers Bancorp, Inc. | 3,496 |
| 10,070 | Danske Bank | 376,468 | |
| 1,237 | Deutsche Boerse AG | 140,252 | |
| 6,047 | DnB ASA | 110,390 | |
| 18,418 | 1 | E*Trade Financial Corp. | 886,642 |
| 142 | 1 | Eagle Bancorp, Inc. | 9,393 |
| 11,602 | East West Bancorp, Inc. | 713,987 | |
| 960 | 1 | Enova International, Inc. | 14,256 |
| 459 | Enterprise Financial Services Corp. | 20,770 | |
| 2,057 | Erste Group Bank AG | 89,482 | |
| 1,126 | 1 | Essent Group Ltd. | 49,825 |
| 191 | Evercore, Inc. | 16,588 | |
| 1,941 | Exor NV | 117,718 | |
| 815 | 1 | FCB Financial Holdings, Inc. | 43,073 |
| 134 | Federal Agricultural Mortgage Association, Class C | 9,949 | |
| 4,344 | 1 | First BanCorp | 21,633 |
| 14 | First Citizens Bancshares, Inc., Class A | 5,971 | |
| 141 | First Commmonwealth Financial Corp. | 2,129 | |
| 652 | First Interstate BancSystem, Inc., Class A | 25,884 | |
| 2,120 | First Midwest Bancorp, Inc. | 52,936 | |
| 5,810 | 1 | Genworth Financial, Inc. , Class A | 19,696 |
| 12,294 | Gjensidige Forsikring ASA | 223,044 | |
| 1,132 | Great Western Bancorp, Inc. | 46,774 | |
| 1,247 | Great-West Lifeco, Inc. | 33,936 | |
| 256 | 1 | Green Dot Corp. | 15,821 |
| 26,850 | HSBC Holdings PLC | 266,936 |
| Shares, Contracts or Principal Amount | Value in U.S. Dollars | ||
| COMMON STOCKS—continued | |||
| Financials—continued | |||
| 1,300 | Hang Seng Bank Ltd. | $32,192 | |
| 4,041 | Hannover Rueck SE | 531,229 | |
| 15,649 | Hargreaves Lansdown PLC | 339,169 | |
| 374 | Heartland Financial USA, Inc. | 18,887 | |
| 2,173 | Home Bancshares, Inc. | 51,717 | |
| 857 | Hope Bancorp, Inc. | 16,043 | |
| 467 | Houlihan Lokey, Inc. | 20,847 | |
| 54,034 | ING Groep N.V. | 975,555 | |
| 272 | 1 | INTL FCStone, Inc. | 11,935 |
| 420 | Iberiabank Corp. | 32,655 | |
| 168 | Independent Bank Corp.–Michigan | 3,763 | |
| 5,890 | Industrial Alliance Insurance & Financial Services, Inc. | 274,698 | |
| 501 | Industrivarden AB | 12,225 | |
| 5 | International Bancshares Corp. | 206 | |
| 3,338 | Invesco Mortgage Capital, Inc. | 58,949 | |
| 4,505 | Investors Bancorp, Inc., New | 64,286 | |
| 26,971 | JPMorgan Chase & Co. | 2,819,009 | |
| 405 | James River Group Holdings Ltd. | 16,394 | |
| 2,065 | KBC Groupe | 169,068 | |
| 654 | LegacyTexas Financial Group, Inc. | 27,383 | |
| 93,464 | Legal & General Group PLC | 337,863 | |
| 761,254 | Lloyds Banking Group PLC | 678,106 | |
| 4,734 | London Stock Exchange Group PLC | 242,230 | |
| 11,344 | MFA Financial, Inc. | 90,752 | |
| 5,279 | 1 | MGIC Investment Corp. | 77,179 |
| 6,320 | MSCI Inc., Class A | 813,384 | |
| 2,114 | MTGE Investment Corp. | 39,215 | |
| 65,260 | Medibank Private Ltd. | 162,100 | |
| 20,964 | Morgan Stanley | 1,081,952 | |
| 1,301 | 1 | NMI Holdings, Inc., Class A | 22,182 |
| 14,084 | NN Group NV | 619,036 | |
| 17,835 | National Australia Bank Ltd., Melbourne | 402,185 | |
| 6,859 | National Bank of Canada, Montreal | 337,966 | |
| 202 | 1 | Nationstar Mortgage Holdings, Inc. | 3,650 |
| 40,346 | Navient Corp. | 508,763 | |
| 56,663 | Nordea Bank AB | 664,356 |
| Shares, Contracts or Principal Amount | Value in U.S. Dollars | ||
| COMMON STOCKS—continued | |||
| Financials—continued | |||
| 2,864 | Northwest Bancshares, Inc. | $48,488 | |
| 697 | OM Asset Management PLC | 11,431 | |
| 2,620 | Oritani Financial Corp. | 45,195 | |
| 900 | Oversea-Chinese Banking Corp. Ltd. | 8,353 | |
| 73 | PJT Partners, Inc. | 3,105 | |
| 339 | PNC Financial Services Group | 47,650 | |
| 12,705 | Pargesa Holding Porteur | 1,091,899 | |
| 1,211 | Partners Group Holding AG | 831,891 | |
| 1,590 | Pennymac Mortgage Investment Trust | 24,899 | |
| 3,219 | Popular, Inc. | 113,824 | |
| 248 | Preferred Bank Los Angeles, CA | 15,525 | |
| 757 | Primerica, Inc. | 78,728 | |
| 40,690 | RSA Insurance Group PLC | 334,920 | |
| 2,666 | Radian Group, Inc. | 54,626 | |
| 284 | 1 | Raiffeisen Bank International AG | 10,068 |
| 15,867 | Royal Bank of Canada, Montreal | 1,240,311 | |
| 4,670 | Schroders PLC | 218,151 | |
| 20,997 | Schwab (Charles) Corp. | 1,024,444 | |
| 13,063 | Scor Regroupe | 533,111 | |
| 1,614 | 1 | Signature Bank | 221,570 |
| 46,661 | Skand Enskilda BKN, Class A | 554,351 | |
| 8,937 | State Street Corp. | 852,143 | |
| 2,371 | Sterling Bancorp | 60,105 | |
| 69 | Stewart Information Services Corp. | 2,783 | |
| 10,799 | Svenska Handelsbanken AB - A Shares | 147,644 | |
| 23,531 | Swedbank SA | 562,237 | |
| 431 | TRYG A/S | 10,463 | |
| 291 | The Bank of NT Butterfield & Son Ltd. | 11,576 | |
| 5,943 | The Travelers Cos, Inc. | 805,692 | |
| 53,568 | Three I Group | 653,168 | |
| 16,451 | Toronto-Dominion Bank | 933,900 | |
| 821 | Trustmark Corp. | 27,865 | |
| 329 | U.S. Bancorp | 18,144 | |
| 242 | Union Bankshares Corp. | 9,121 | |
| 457 | United Financial Bancorp, Inc. | 8,518 | |
| 7,861 | United Mizrahi Bank Ltd. | 143,435 |
| Shares, Contracts or Principal Amount | Value in U.S. Dollars | ||
| COMMON STOCKS—continued | |||
| Financials—continued | |||
| 38,300 | United Overseas Bank Ltd. | $747,593 | |
| 719 | Universal Insurance Holdings, Inc. | 18,982 | |
| 578 | 1 | Walker & Dunlop, Inc. | 28,484 |
| 1,052 | Washington Federal, Inc. | 36,610 | |
| 12,016 | Wells Fargo & Co. | 678,544 | |
| 29,468 | Westpac Banking Corp. Ltd. | 707,703 | |
| 236 | Wintrust Financial Corp. | 19,789 | |
| TOTAL | 46,671,367 | ||
| Health Care—6.2% | |||
| 12,603 | Abbott Laboratories | 710,431 | |
| 2,365 | 1 | Aduro Biotech, Inc. | 22,467 |
| 4,616 | Aetna, Inc. | 831,711 | |
| 9,498 | 1 | Agios Pharmaceuticals, Inc. | 584,602 |
| 273 | 1 | Akebia Therapeutics, Inc. | 4,248 |
| 21,200 | Alfresa Holdings Corp. | 456,195 | |
| 786 | 1 | Amedisys, Inc. | 42,444 |
| 5,930 | Amgen, Inc. | 1,041,664 | |
| 271 | 1 | Amphastar Pharmaceuticals, Inc. | 5,309 |
| 2,729 | Anthem, Inc. | 641,206 | |
| 1,132 | 1 | Array BioPharma, Inc. | 12,735 |
| 3,890 | 1 | Axovant Sciences Ltd. | 21,473 |
| 190 | Baxter International, Inc. | 12,451 | |
| 446 | 1 | BioTelemetry, Inc. | 12,934 |
| 18,229 | Bristol-Myers Squibb Co. | 1,151,890 | |
| 18,804 | Bruker Corp. | 661,525 | |
| 1,449 | CIGNA Corp. | 306,797 | |
| 931 | 1 | Cambrex Corp. | 45,479 |
| 5,473 | Cardinal Health, Inc. | 323,947 | |
| 365 | 1 | Cardiovascular Systems, Inc. | 9,147 |
| 1,960 | 1 | Catalent, Inc. | 77,988 |
| 6,000 | Chugai Pharmaceutical Co., Ltd. | 311,645 | |
| 1,469 | 1 | Coherus Biosciences, Inc. | 13,148 |
| 290 | Coloplast, Class B | 22,747 | |
| 493 | 1 | Corcept Therapeutics, Inc. | 8,844 |
| 1,071 | 1 | Corvel Corp. | 59,173 |
| 154 | 1 | Cotiviti Holdings, Inc. | 5,033 |
| Shares, Contracts or Principal Amount | Value in U.S. Dollars | ||
| COMMON STOCKS—continued | |||
| Health Care—continued | |||
| 2,200 | Daiichi Sankyo Co. Ltd. | $53,130 | |
| 1,616 | 1 | Diplomat Pharmacy, Inc. | 28,926 |
| 1,200 | 1,2,3 | Dyax Corp., CVR | 2,880 |
| 1,078 | 1 | Emergent Biosolutions, Inc. | 47,357 |
| 1,568 | 1 | Enzo Biochem, Inc. | 15,382 |
| 11,463 | 1 | Express Scripts Holding Co. | 747,158 |
| 1,544 | 1 | FibroGen, Inc. | 73,340 |
| 8,183 | Fresenius SE & Co. KGaA | 590,283 | |
| 329 | 1 | Genmab A/S | 64,757 |
| 1,349 | 1 | Genomic Health, Inc. | 40,861 |
| 55 | 1 | Glaukos Corp. | 1,472 |
| 90,182 | GlaxoSmithKline PLC | 1,560,393 | |
| 5,727 | 1 | HCA Healthcare, Inc. | 486,795 |
| 465 | 1 | HMS Holdings Corp. | 7,686 |
| 1,197 | 1 | Haemonetics Corp. | 69,187 |
| 122 | 1 | Halozyme Therapeutics, Inc. | 2,278 |
| 1,299 | 1 | Halyard Health, Inc. | 63,053 |
| 3,378 | Humana, Inc. | 881,185 | |
| 34 | 1 | ICU Medical, Inc. | 7,256 |
| 1,337 | 1 | Illumina, Inc. | 307,550 |
| 1,519 | 1 | Immunogen, Inc. | 9,646 |
| 1,744 | 1 | Impax Laboratories, Inc. | 29,038 |
| 5,276 | 1 | Incyte Genomics, Inc. | 522,271 |
| 1,882 | 1 | Inovio Pharmaceuticals, Inc. | 8,638 |
| 765 | 1 | Intercept Pharmaceuticals, Inc. | 46,979 |
| 8,934 | 1 | Intrexon Corp. | 121,860 |
| 10,323 | Johnson & Johnson | 1,438,304 | |
| 23,967 | 1 | Juno Therapeutics, Inc. | 1,309,078 |
| 645 | 1 | LHC Group, Inc. | 42,422 |
| 10,970 | Lilly (Eli) & Co. | 928,501 | |
| 3,440 | Luminex Corp. | 73,478 | |
| 577 | 1 | MacroGenics, Inc. | 11,148 |
| 711 | 1 | Magellan Health, Inc. | 60,079 |
| 115 | 1 | Masimo Corp. | 10,217 |
| 26,800 | Medipal Holdings Corp. | 521,507 | |
| 5,826 | Merck & Co., Inc. | 322,003 |
| Shares, Contracts or Principal Amount | Value in U.S. Dollars | ||
| COMMON STOCKS—continued | |||
| Health Care—continued | |||
| 1,506 | 1 | Merit Medical Systems, Inc. | $65,436 |
| 834 | 1 | Natus Medical, Inc. | 33,402 |
| 2,498 | Novartis AG | 213,736 | |
| 11,755 | Novo Nordisk A/S | 608,140 | |
| 876 | 1 | Nxstage Medical, Inc. | 22,504 |
| 461 | 1 | Omnicell, Inc. | 24,156 |
| 38,311 | 1 | Opko Health, Inc. | 201,133 |
| 1,115 | Orion Oyj | 41,171 | |
| 34 | 1 | Orthofix International NV | 1,843 |
| 789 | 1 | PRA Health Sciences, Inc. | 64,990 |
| 9,765 | PerkinElmer, Inc. | 719,485 | |
| 13,675 | Pfizer, Inc. | 495,855 | |
| 184 | 1 | PharMerica Corp. | 5,382 |
| 14,677 | 1 | Premier, Inc. | 425,927 |
| 191 | 1 | Providence Service Corp. | 11,563 |
| 1,912 | 1 | Regeneron Pharmaceuticals, Inc. | 691,876 |
| 1,397 | 1 | Repligen Corp. | 49,524 |
| 5,966 | Roche Holding AG | 1,505,471 | |
| 4,061 | Sanofi | 370,746 | |
| 1,568 | 1 | Supernus Pharmaceuticals, Inc. | 59,270 |
| 10,200 | Suzuken Co. Ltd. | 404,116 | |
| 693 | 1 | Tivity Health, Inc. | 25,502 |
| 4,487 | UCB SA | 334,499 | |
| 8,248 | UnitedHealth Group, Inc. | 1,881,946 | |
| 558 | 1 | Vertex Pharmaceuticals, Inc. | 80,514 |
| 1,949 | 1 | Voyager Therapeutics, Inc. | 28,514 |
| 528 | 1 | Wellcare Health Plans, Inc. | 112,459 |
| TOTAL | 26,382,491 | ||
| Industrials—8.3% | |||
| 213 | 3M Co. | 51,789 | |
| 1,324 | AAR Corp. | 55,052 | |
| 12,833 | ABB Ltd. | 328,480 | |
| 1,088 | 1 | Acco Brands Corp. | 14,307 |
| 5,244 | Adecco Group AG | 396,442 | |
| 15,340 | Alfa Laval | 362,733 | |
| 15,973 | Allison Transmission Holdings, Inc. | 655,532 |
| Shares, Contracts or Principal Amount | Value in U.S. Dollars | ||
| COMMON STOCKS—continued | |||
| Industrials—continued | |||
| 101 | 1 | American Woodmark Corp. | $10,060 |
| 805 | Andritz AG | 45,116 | |
| 400 | Applied Industrial Technologies, Inc. | 25,580 | |
| 309 | Argan, Inc. | 18,231 | |
| 16,091 | Ashtead Group PLC | 413,616 | |
| 477 | 1 | Atkore International Group, Inc. | 10,151 |
| 47,497 | BAE Systems PLC | 354,776 | |
| 3,888 | BWX Technologies, Inc. | 242,806 | |
| 2,520 | Boeing Co. | 697,536 | |
| 12,506 | Bouygues SA | 647,010 | |
| 832 | Brady (W.H.) Co. | 32,531 | |
| 209 | Brinks Co. (The) | 16,898 | |
| 199 | 1 | Builders Firstsource, Inc. | 4,060 |
| 8,272 | Bunzl PLC | 236,740 | |
| 386 | 1 | CBIZ, Inc. | 5,693 |
| 9,519 | Canadian National Railway, Co. | 743,060 | |
| 2,131 | Caterpillar, Inc. | 300,791 | |
| 55 | Comfort Systems USA, Inc. | 2,362 | |
| 1,809 | 1 | Continental Building Product, Inc. | 50,471 |
| 10,880 | Crane Co. | 928,826 | |
| 717 | Cummins, Inc. | 120,026 | |
| 3,973 | DSV, De Sammensluttede Vognmad AS | 306,018 | |
| 20,700 | Dai Nippon Printing Co. Ltd. | 454,833 | |
| 4,004 | Delta Air Lines, Inc. | 211,892 | |
| 5,622 | Deutsche Lufthansa AG | 193,329 | |
| 19,460 | Deutsche Post AG | 923,699 | |
| 20 | EnerSys, Inc. | 1,382 | |
| 266 | 1 | Engility Holdings, Inc. | 7,765 |
| 567 | EnPro Industries, Inc. | 48,972 | |
| 101 | 1 | FTI Consulting, Inc. | 4,344 |
| 508 | Federal Signal Corp. | 10,922 | |
| 4,398 | FedEx Corp. | 1,017,961 | |
| 6,007 | Ferguson PLC | 433,691 | |
| 1,254 | Fraport AG | 124,946 | |
| 66 | 1 | GMS, Inc. | 2,462 |
| 1,287 | Geberit AG | 559,496 |
| Shares, Contracts or Principal Amount | Value in U.S. Dollars | ||
| COMMON STOCKS—continued | |||
| Industrials—continued | |||
| 640 | 1 | Genco Shipping & Trading Ltd. | $7,277 |
| 850 | Global Brass & Copper Holdings, Inc. | 29,410 | |
| 636 | Graco, Inc. | 83,691 | |
| 4,420 | Group 4 Securicor PLC | 15,248 | |
| 528 | 1 | Harsco Corp. | 9,530 |
| 1,059 | Hawaiian Holdings, Inc. | 45,696 | |
| 11,943 | Heico Corp., Class A | 906,474 | |
| 1,462 | Hillenbrand, Inc. | 66,594 | |
| 2,776 | Hochtief AG | 487,985 | |
| 800 | Hoshizaki Electric Co. Ltd. | 77,168 | |
| 67 | 1 | Hub Group, Inc. | 3,203 |
| 1,041,900 | Hutchison Port Holdings TR-U | 442,927 | |
| 125 | Hyster-Yale Materials Handling, Inc. | 10,604 | |
| 46 | 1 | ICF International, Inc. | 2,486 |
| 29,676 | IMI PLC | 501,859 | |
| 5,786 | Illinois Tool Works, Inc. | 979,280 | |
| 10,534 | Ingersoll-Rand PLC | 922,989 | |
| 601 | Insperity, Inc. | 70,858 | |
| 1,866 | Interface, Inc. | 46,557 | |
| 32,705 | International Consolidated Airlines Group SA | 270,585 | |
| 12,184 | Intertek Group PLC | 862,251 | |
| 16,500 | JGC Corp. | 287,667 | |
| 15,600 | JTEKT Corp. | 269,394 | |
| 2,600 | Japan Airlines Co. Ltd. | 95,518 | |
| 3,500 | Japan Airport Terminal Co. Ltd. | 131,151 | |
| 8,000 | Kajima Corp. | 84,349 | |
| 778 | Kimball International, Inc., Class B | 14,424 | |
| 891 | Knight-Swift Transportation Holdings, Inc. | 38,028 | |
| 24 | Kone Corp. OYJ, Class B | 1,236 | |
| 899 | Korn/Ferry International | 39,412 | |
| 466 | Kuehne + Nagel International AG | 81,918 | |
| 723 | LSC Communications, Inc. | 11,828 | |
| 3,825 | L3 Technologies, Inc. | 759,607 | |
| 194 | 1 | MOOG, Inc., Class A | 16,317 |
| 2,417 | 1 | MRC Global, Inc. | 37,971 |
| 255 | MSA Safety, Inc. | 21,930 |
| Shares, Contracts or Principal Amount | Value in U.S. Dollars | ||
| COMMON STOCKS—continued | |||
| Industrials—continued | |||
| 349 | 1 | MYR Group, Inc. | $12,410 |
| 6,058 | Manpower Group, Inc. | 780,876 | |
| 107,900 | Marubeni Corp. | 718,759 | |
| 191 | 1 | Masonite International Corp. | 14,067 |
| 1,291 | 1 | Mastec, Inc. | 57,901 |
| 2,902 | 1 | Meritor, Inc. | 72,492 |
| 10,300 | Misumi Corp. | 301,213 | |
| 18,200 | Mitsubishi Electric Corp. | 301,830 | |
| 13,900 | Mitsui & Co. Ltd. | 211,695 | |
| 1,340 | Mueller Industries, Inc. | 48,776 | |
| 3,904 | Mueller Water Products, Inc. | 48,761 | |
| 20,200 | NGK Insulators Ltd. | 389,708 | |
| 1,448 | 1 | NOW, Inc. | 14,943 |
| 56,000 | NWS Holdings Ltd. | 102,156 | |
| 3,000 | Nippon Express Co. Ltd. | 190,936 | |
| 5,846 | Norfolk Southern Corp. | 810,431 | |
| 185 | 1 | On Assignment, Inc. | 11,833 |
| 7,681 | Osram Licht AG | 658,358 | |
| 2,163 | Owens Corning, Inc. | 191,101 | |
| 3,642 | Parker-Hannifin Corp. | 682,839 | |
| 94 | 1 | Patrick Industries, Inc. | 9,513 |
| 640 | Primoris Services Corp. | 17,914 | |
| 8,435 | Prysmian S.p.A | 282,011 | |
| 26,169 | Qantas Airways Ltd. | 113,904 | |
| 1,372 | RPX Corporation | 18,097 | |
| 8,669 | Randstad Holdings N.V. | 534,579 | |
| 50,585 | Relx PLC | 1,176,051 | |
| 18,051 | Rexel SA | 332,948 | |
| 2,187 | 1 | Rexnord Corp. | 54,500 |
| 5,164 | Rockwell Automation, Inc. | 997,065 | |
| 4,523 | Rollins, Inc. | 209,641 | |
| 39 | 1 | Rush enterprises, Inc. Class A | 1,900 |
| 500 | SMC Corp. | 203,415 | |
| 4,858 | SNC-Lavalin Group, Inc. | 211,882 | |
| 664 | 1 | SPX Corp. | 21,175 |
| 2,365 | Schindler Holding AG | 534,123 |
| Shares, Contracts or Principal Amount | Value in U.S. Dollars | ||
| COMMON STOCKS—continued | |||
| Industrials—continued | |||
| 237 | Schindler Holding AG - REG | $52,762 | |
| 442 | Scorpio Bulkers, Inc. | 3,182 | |
| 14,000 | Shimizu Corp. | 157,422 | |
| 7,516 | Siemens AG | 1,022,095 | |
| 1,430 | SkyWest, Inc. | 74,431 | |
| 22,726 | Smiths Group PLC | 456,455 | |
| 13,788 | Southwest Airlines Co. | 836,518 | |
| 1,043 | Spartan Motors, Inc. | 16,636 | |
| 192 | 1 | Standard Plus Corp. | 7,526 |
| 4,020 | Stanley Black & Decker, Inc. | 681,913 | |
| 81,748 | Sydney Airport | 460,284 | |
| 1,122 | 1 | TPI Composites, Inc. | 21,251 |
| 1,600 | Taisei Corp. | 84,904 | |
| 12,716 | Toro Co. | 829,719 | |
| 42,000 | 1 | Toshiba Corp. | 103,572 |
| 13,200 | Toyota Tsusho Corp. | 498,335 | |
| 61 | 1 | Trex Co., Inc. | 7,183 |
| 1,993 | 1 | TriMas Corp. | 51,619 |
| 433 | Triumph Group, Inc. | 13,380 | |
| 144 | 1 | TrueBlue, Inc. | 4,097 |
| 48 | Universal Forest Products, Inc. | 1,880 | |
| 163 | VSE Corp. | 7,786 | |
| 316 | 1 | Veritiv Corp. | 8,611 |
| 2,430 | Vestas Wind Systems A/S | 155,707 | |
| 6,554 | Volvo AB | 125,750 | |
| 2,712 | Wolters Kluwer NV | 140,578 | |
| 15,900 | Yamato Holdings Co. Ltd. | 323,396 | |
| TOTAL | 35,292,604 | ||
| Information Technology—9.0% | |||
| 1,977 | 1 | ACI Worldwide, Inc. | 45,234 |
| 365 | AVX Corp. | 6,621 | |
| 2,535 | 1 | A10 Networks, Inc. | 20,331 |
| 2,264 | 1 | Adobe Systems, Inc. | 410,848 |
| 796 | 1 | Advanced Energy Industries, Inc. | 59,676 |
| 86 | 1 | Alarm.com Holdings, Inc. | 3,525 |
| 875 | 1 | Alphabet, Inc., Class A Shares | 906,649 |
| Shares, Contracts or Principal Amount | Value in U.S. Dollars | ||
| COMMON STOCKS—continued | |||
| Information Technology—continued | |||
| 2,150 | 1 | Alphabet, Inc., Class C Shares | $2,196,031 |
| 3,900 | Alps Electric Co. | 124,908 | |
| 11,084 | Amadeus IT Group SA | 800,268 | |
| 3,888 | 1 | Amkor Technology, Inc. | 41,096 |
| 88 | 1 | AppFolio, Inc. - A | 3,797 |
| 23,412 | Apple, Inc. | 4,023,352 | |
| 4,287 | Applied Materials, Inc. | 226,225 | |
| 183 | 1 | Applied Optoelectronics, Inc. | 7,990 |
| 456 | 1 | Aspen Technology, Inc. | 30,516 |
| 74,007 | Auto Trader Group PLC | 336,602 | |
| 7,994 | Automatic Data Processing, Inc. | 914,993 | |
| 581 | Avnet, Inc. | 24,059 | |
| 110 | 1 | Barracuda Networks, Inc. | 3,042 |
| 1,632 | 1 | Benchmark Electronics, Inc. | 49,776 |
| 108 | 1 | Benefitfocus, Inc. | 2,927 |
| 242 | 1 | Blackline, Inc. | 8,874 |
| 353 | 1 | Blucora, Inc. | 7,254 |
| 570 | 1 | Bottomline Technologies, Inc. | 18,998 |
| 806 | Brooks Automation, Inc. | 20,061 | |
| 21,300 | Brother Industries Ltd. | 528,201 | |
| 4,441 | CDW Corp. | 310,914 | |
| 253 | 1 | Cirrus Logic, Inc. | 13,976 |
| 45,180 | Cisco Systems, Inc. | 1,685,214 | |
| 1,738 | Cognizant Technology Solutions Corp. | 125,623 | |
| 3,335 | 1 | CommScope Holdings Co., Inc. | 120,027 |
| 203 | Constellation Software, Inc. | 118,903 | |
| 662 | Convergys Corp. | 16,338 | |
| 1,122 | 1 | Cornerstone OnDemand, Inc. | 41,480 |
| 9,903 | 1 | Dell Technologies, Inc. | 774,811 |
| 258 | 1 | Diodes, Inc. | 7,559 |
| 201 | 1 | EPAM Systems, Inc. | 20,389 |
| 132 | 1 | Electronics for Imaging, Inc. | 4,060 |
| 3,673 | 1 | Endurance International Group Holdings, Inc. | 34,343 |
| 500 | Entegris, Inc. | 15,150 | |
| 63 | 1 | Envestnet, Inc. | 3,096 |
| 451 | 1 | ePlus, Inc. | 36,621 |
| Shares, Contracts or Principal Amount | Value in U.S. Dollars | ||
| COMMON STOCKS—continued | |||
| Information Technology—continued | |||
| 775 | 1 | Etsy, Inc. | $12,757 |
| 2,583 | Evertec, Inc. | 35,904 | |
| 141 | 1 | Fabrinet | 4,499 |
| 6,870 | 1 | Facebook, Inc. | 1,217,227 |
| 1,767 | 1 | Finisar Corp. | 35,358 |
| 20,544 | 1 | Fortinet, Inc. | 864,081 |
| 22,000 | Fujitsu Ltd. | 164,719 | |
| 58 | 1 | GTT Communications, Inc. | 2,346 |
| 524 | 1 | Gigamon, Inc. | 20,357 |
| 3,300 | Hitachi High-Technologies Corp. | 137,436 | |
| 91,000 | Hitachi Ltd. | 678,822 | |
| 288 | 1 | HubSpot, Inc. | 23,314 |
| 630 | 1 | Ichor Holdings Ltd. | 17,898 |
| 383 | 1 | Imperva, Inc. | 15,799 |
| 786 | 1 | Insight Enterprises, Inc. | 30,654 |
| 12,389 | Intel Corp. | 555,523 | |
| 651 | InterDigital, Inc. | 49,541 | |
| 866 | International Business Machines Corp. | 133,338 | |
| 7,610 | Intuit, Inc. | 1,196,444 | |
| 366 | j2 Global, Inc. | 27,618 | |
| 1,221 | 1 | Kemet Corp. | 18,828 |
| 878 | 1 | Kimball Electronics, Inc. | 18,306 |
| 4,490 | Lam Research Corp. | 863,562 | |
| 129 | 1 | Lumentum Holdings, Inc. | 6,972 |
| 9,891 | Mastercard, Inc. Class A | 1,488,299 | |
| 112 | Maximus, Inc. | 7,737 | |
| 528 | Methode Electronics, Inc., Class A | 24,869 | |
| 49,796 | Microsoft Corp. | 4,191,329 | |
| 263 | 1 | MindBody, Inc. | 8,574 |
| 8,600 | Mixi, Inc. | 400,443 | |
| 1,278 | Monotype Imaging Holdings, Inc. | 32,206 | |
| 12,999 | 1 | NCR Corp. | 406,739 |
| 343 | NIC, Inc. | 5,694 | |
| 7,226 | NVIDIA Corp. | 1,450,330 | |
| 2,419 | 1 | NXP Semiconductors NV | 274,290 |
| 609 | 1 | Netgear, Inc. | 31,363 |
| Shares, Contracts or Principal Amount | Value in U.S. Dollars | ||
| COMMON STOCKS—continued | |||
| Information Technology—continued | |||
| 1,200 | Nexon Co. Ltd. | $34,468 | |
| 6,100 | Omron Corp. | 361,211 | |
| 2,527 | Oracle Corp. | 123,975 | |
| 3,000 | Otsuka Corp. | 224,987 | |
| 285 | 1 | Paycom Software, Inc. | 23,370 |
| 3,755 | 1 | PayPal Holdings, Inc. | 284,366 |
| 227 | 1 | Perficient, Inc. | 4,395 |
| 396 | Plantronics, Inc. | 20,719 | |
| 1,442 | Progress Software Corp. | 59,612 | |
| 213 | 1 | Proofpoint, Inc. | 19,181 |
| 305 | 1 | RealPage, Inc. | 13,832 |
| 377 | 1 | RingCentral, Inc. | 17,776 |
| 1,893 | SAP SE | 213,254 | |
| 295 | 1 | SMART Global Holdings, Inc. | 8,847 |
| 33,085 | STMicroelectronics N.V. | 751,175 | |
| 29,426 | Symantec Corp. | 852,471 | |
| 142 | 1 | Sanmina Corp. | 4,828 |
| 586 | 1 | ScanSource, Inc. | 21,096 |
| 1,699 | 1 | Semtech Corp. | 57,851 |
| 1,900 | Shimadzu Corp. | 45,471 | |
| 6,886 | Skyworks Solutions, Inc. | 721,240 | |
| 35 | 1 | Stamps.com, Inc. | 5,894 |
| 469 | 1 | Sykes Enterprises, Inc. | 14,924 |
| 86 | Synnex Corp. | 11,713 | |
| 8,779 | 1 | Synopsys, Inc. | 793,446 |
| 3,125 | 1 | Syntel, Inc. | 80,031 |
| 293 | Systemax, Inc. | 8,937 | |
| 912 | 1 | Take-Two Interactive Software, Inc. | 101,734 |
| 176 | TeleTech Holdings, Inc. | 7,128 | |
| 10,053 | Texas Instruments, Inc. | 978,056 | |
| 2,761 | TiVo Corp. | 49,146 | |
| 3,500 | Tokyo Electron Ltd. | 652,101 | |
| 1,560 | 1 | Ultra Clean Holdings, Inc. | 32,729 |
| 6,677 | 1 | VMware, Inc., Class A | 801,974 |
| 586 | 1 | Verint Systems, Inc. | 25,637 |
| 5,257 | 1 | Viavi Solutions, Inc. | 49,258 |
| Shares, Contracts or Principal Amount | Value in U.S. Dollars | ||
| COMMON STOCKS—continued | |||
| Information Technology—continued | |||
| 3,501 | Visa, Inc., Class A Shares | $394,178 | |
| 496 | Vishay Intertechnology, Inc. | 10,862 | |
| 8,873 | Worldpay Group PLC | 50,621 | |
| 985 | 1 | Xcerra Corp. | 9,761 |
| 26,542 | Xerox Corp. | 787,236 | |
| 2,000 | Yokogawa Electric Corp. | 37,136 | |
| 1,567 | 1 | Zebra Technologies Co., Class A | 172,871 |
| 197,654 | 1 | Zynga, Inc. | 810,381 |
| TOTAL | 38,353,413 | ||
| Materials—3.0% | |||
| 614 | 1 | AdvanSix, Inc. | 26,433 |
| 6,500 | Air Water, Inc. | 139,709 | |
| 914 | Akzo Nobel NV | 82,362 | |
| 334 | 1 | Alcoa Corp. | 13,864 |
| 5,887 | Amcor Ltd. | 68,887 | |
| 10,449 | Anglo American PLC | 192,241 | |
| 15,168 | ArcelorMittal | 459,217 | |
| 20,900 | Asahi Kasei Corp. | 262,840 | |
| 5,912 | Avery Dennison Corp. | 674,677 | |
| 6,005 | BHP Billiton PLC | 109,194 | |
| 5,285 | 1 | Berry Global Group, Inc. | 315,885 |
| 1,562 | Boise Cascade Co. | 60,137 | |
| 4,550 | Cabot Corp. | 278,642 | |
| 1,585 | 1 | Cleveland-Cliffs, Inc. | 10,556 |
| 2,479 | Commercial Metals Corp. | 49,183 | |
| 6,749 | Covestro AG | 703,456 | |
| 759 | Croda International PLC | 43,899 | |
| 844 | EMS-Chemie Holdings Ag | 563,110 | |
| 5,107 | 1,2 | Ferroglobe Representation & Warranty Insurance Trust | 0 |
| 87,100 | Fortescue Metals Group Ltd. | 304,792 | |
| 188,900 | Glencore PLC | 868,389 | |
| 15,556 | Grace (W.R.) & Co. | 1,140,410 | |
| 884 | Greif, Inc., Class A | 48,240 | |
| 46 | Innophos Holdings, Inc. | 2,131 | |
| 241 | KMG Chemicals, Inc. | 13,108 | |
| 1,286 | Koninklijke DSM NV | 120,657 |
| Shares, Contracts or Principal Amount | Value in U.S. Dollars | ||
| COMMON STOCKS—continued | |||
| Materials—continued | |||
| 248 | 1 | Koppers Holdings, Inc. | $12,375 |
| 548 | Kronos Worldwide, Inc. | 15,295 | |
| 28,400 | Kuraray Co. Ltd. | 548,987 | |
| 3,602 | Lanxess | 273,863 | |
| 899 | 1 | Louisiana-Pacific Corp. | 24,821 |
| 26,000 | Mitsubishi Chemical Holdings Corp. | 283,209 | |
| 12,877 | Mondi PLC | 307,500 | |
| 753 | Myers Industries, Inc. | 16,077 | |
| 17,675 | Newmont Mining Corp. | 653,798 | |
| 3,000 | Nitto Denko Corp. | 296,484 | |
| 11,252 | Nucor Corp. | 646,990 | |
| 22,337 | Rio Tinto PLC | 1,058,754 | |
| 87 | Sika AG | 671,881 | |
| 308 | Stepan Co. | 25,598 | |
| 704 | Trinseo SA | 51,955 | |
| 14,824 | UPM - Kymmene Oyj | 445,316 | |
| 551 | 1 | US Concrete, Inc. | 44,548 |
| 25,843 | Valvoline, Inc. | 637,288 | |
| 1,544 | Voest-alpine Stahl | 89,749 | |
| 832 | Warrior Met Coal, Inc. | 18,487 | |
| TOTAL | 12,674,994 | ||
| Real Estate—1.9% | |||
| 887 | Alexander & Baldwin, Inc. | 25,776 | |
| 6,667 | American Tower Corp. | 959,581 | |
| 7,200 | Ascendas REIT | 14,112 | |
| 18,794 | Brixmor Property Group, Inc. | 339,608 | |
| 18,700 | Capitacommercial Trust | 26,279 | |
| 26,800 | CapitaLand Ltd. | 70,427 | |
| 20,900 | CapitaLand Mall Trust | 31,831 | |
| 1,326 | Cousins Properties, Inc. | 11,894 | |
| 1,100 | Daito Trust Construction Co. Ltd. | 201,464 | |
| 58,072 | Dexus Property Group | 456,997 | |
| 1,822 | DiamondRock Hospitality Co. | 20,388 | |
| 21,440 | Duke Realty Corp. | 603,107 | |
| 137 | First Industrial Realty Trust | 4,459 | |
| 66 | 1 | Forestar Group, Inc. | 1,469 |
| Shares, Contracts or Principal Amount | Value in U.S. Dollars | ||
| COMMON STOCKS—continued | |||
| Real Estate—continued | |||
| 501 | Four Corners Property Trust, Inc. | $13,076 | |
| 111,770 | GPT Group/The - REIT | 458,907 | |
| 771 | Geo Group, Inc. | 20,462 | |
| 738 | Gladstone Commercial Corp. | 16,856 | |
| 149 | Global Net Lease, Inc. - REIT | 3,223 | |
| 1,619 | 1 | HFF, Inc. | 73,082 |
| 1,820 | InfraREIT, Inc. | 38,438 | |
| 445 | Invitation Homes, Inc. | 10,480 | |
| 938 | 1 | iStar Financial, Inc. | 10,787 |
| 538 | Kite Realty Group Trust | 10,346 | |
| 617 | LaSalle Hotel Properties | 17,547 | |
| 830 | Liberty Property Trust | 37,250 | |
| 41,500 | Link REIT | 370,358 | |
| 134 | 1 | Marcus & Millichap Co., Inc. | 4,283 |
| 156 | National Storage Affiliates Trust | 4,156 | |
| 1,484 | New Senior Investment Group, Inc. | 12,169 | |
| 2,206 | NorthStar Realty Europe Corp. | 32,009 | |
| 1,047 | Pebblebrook Hotel Trust | 40,278 | |
| 1,157 | Potlatch Corp. | 59,701 | |
| 1,389 | Preferred Apartment Communities, Inc. | 29,530 | |
| 13,526 | ProLogis, Inc. | 895,827 | |
| 1,078 | RLJ Lodging Trust | 23,371 | |
| 19,504 | Rayonier, Inc. | 615,351 | |
| 841 | Re/Max Holdings, Inc. | 44,867 | |
| 326 | Rexford Industrial Realty, Inc. | 10,227 | |
| 144 | Ryman Hospitality Properties, Inc. | 10,005 | |
| 345 | STAG Industrial, Inc. | 9,763 | |
| 350 | Sabra Health Care REIT, Inc. | 6,734 | |
| 118,350 | Scentre Group | 380,669 | |
| 135,142 | Stockland | 482,429 | |
| 806 | Summit Hotel Properties, Inc. | 12,179 | |
| 1,525 | Sunstone Hotel Investors, Inc. | 25,483 | |
| 6,000 | Suntec Real Estate Investment | 9,102 | |
| 99 | Tier RIET, Inc | 1,983 | |
| 7,396 | Ventas, Inc. | 473,418 | |
| 7,008 | Vornado Realty Trust | 543,961 |
| Shares, Contracts or Principal Amount | Value in U.S. Dollars | ||
| COMMON STOCKS—continued | |||
| Real Estate—continued | |||
| 4,275 | WP Carey, Inc. | $304,294 | |
| 2,090 | Washington Prime Group, Inc. | 14,860 | |
| 40,000 | Wharf Holdings Ltd./The | 126,177 | |
| 40,000 | 1 | Wharf Real Estate Investment Co. Ltd. | 241,737 |
| 832 | Xenia Hotels & Resorts, Inc. | 18,296 | |
| TOTAL | 8,281,063 | ||
| Telecommunication Services—1.3% | |||
| 37,844 | AT&T, Inc. | 1,376,765 | |
| 1,012 | 1 | Cincinnati Bell, Inc. | 21,960 |
| 257 | Cogent Communications Holdings, Inc. | 12,040 | |
| 36 | 1 | General Communications, Inc., Class A | 1,437 |
| 293,095 | HKT Trust and HKT Ltd. | 367,687 | |
| 23,900 | KDDI Corp. | 686,070 | |
| 23,900 | NTT Docomo, Inc. | 619,910 | |
| 592 | 1 | Orbcomm, Inc. | 6,370 |
| 53,000 | PCCW Ltd. | 31,525 | |
| 12,247 | Rogers Communications, Inc., Class B | 635,631 | |
| 245 | Shenandoah Telecommunications Co. | 9,396 | |
| 10,235 | 1 | T-Mobile USA, Inc. | 625,051 |
| 20,825 | Telefonica Deutschland Holding AG | 99,050 | |
| 3,411 | Telephone and Data System, Inc. | 94,451 | |
| 166,221 | Telstra Corp. Ltd. | 432,330 | |
| 7,650 | Verizon Communications | 389,309 | |
| 3,136 | 1 | Vonage Holdings Corp. | 31,924 |
| TOTAL | 5,440,906 | ||
| Utilities—2.0% | |||
| 881 | American States Water Co. | 50,825 | |
| 4,476 | Atmos Energy Corp. | 413,090 | |
| 60,623 | AusNet Services | 86,270 | |
| 55,000 | CLP Holdings Ltd. | 560,790 | |
| 22,894 | CenterPoint Energy, Inc. | 687,049 | |
| 6,561 | DTE Energy Co. | 758,255 | |
| 4,236 | Endesa SA | 94,517 | |
| 37,016 | Engie | 647,936 | |
| 278,000 | HK Electric Investments Ltd. | 255,638 | |
| 102,910 | Iberdrola SA | 817,809 |
| Shares, Contracts or Principal Amount | Value in U.S. Dollars | ||
| COMMON STOCKS—continued | |||
| Utilities—continued | |||
| 726 | Idacorp, Inc. | $71,736 | |
| 2,603 | NRG Yield, Inc. | 49,587 | |
| 82 | New Jersey Resources Corp. | 3,657 | |
| 6,515 | NextEra Energy, Inc. | 1,029,631 | |
| 81 | NorthWestern Corp. | 5,205 | |
| 856 | ONE Gas, Inc. | 67,838 | |
| 2,384 | Orsted A/S | 138,589 | |
| 18,700 | Osaka Gas Co. | 359,494 | |
| 18,471 | PPL Corp. | 677,332 | |
| 7,444 | Severn Trent | 211,368 | |
| 507 | Spire, Inc. | 41,701 | |
| 55,563 | Terna S.p.A | 343,588 | |
| 11,300 | Toho Gas Co. Ltd. | 321,566 | |
| 12,640 | UGI Corp. | 619,486 | |
| 721 | WGL Holdings, Inc. | 60,953 | |
| TOTAL | 8,373,910 | ||
| TOTAL COMMON STOCKS (IDENTIFIED COST $194,884,351) | 246,772,903 | ||
| ASSET-BACKED—0.3% | |||
| $150,000 | 4 | American Express Credit Account Master Trust 2014-1, Class A, (1-month USLIBOR +0.370%), 1.620%, 2/15/2021 | 150,608 |
| 18,250 | AmeriCredit Automobile Receivables Trust 2015-1, A3, 1.26%, 11/08/2019 | 18,249 | |
| 232,589 | 4 | Chesapeake Funding II LLC 2016-2A, Class A2, (1-month USLIBOR +1.000%), 2.250%, 06/15/2028 | 233,763 |
| 34,308 | 4 | Navient Student Loan Trust 2014-1, Class A2, (1-month USLIBOR +0.310%), 1.637%, 03/27/2023 | 34,326 |
| 265,000 | 4 | Navistar Financial Dealer Note Master Trust 2016-1, Class A, (1-month USLIBOR +1.350%), 2.587%, 09/27/2021 | 266,758 |
| 171,000 | PFS Financing Corp. 2016-BA, A, 1.87%, 10/15/2021 | 169,020 | |
| 160,000 | Santander Drive Auto Receivables Trust 2016-2, C, 2.66%, 11/15/2021 | 161,094 | |
| 102,776 | Sofi Consumer Loan Program Trust 2016-3, A, 3.05%, 12/26/2025 | 103,607 | |
| TOTAL ASSET-BACKED SECURITIES (IDENTIFIED COST $1,133,881) | 1,137,425 | ||
| COMMERCIAL MORTGAGE-BACKED SECURITIES—0.2% | |||
| Financials—0.2% | |||
| 152,044 | Federal Home Loan Mortgage Corp., 2.263%, 4/25/2025 | 150,477 |
| Shares, Contracts or Principal Amount | Value in U.S. Dollars | ||
| COMMERCIAL MORTGAGE-BACKED SECURITIES—continued | |||
| Financials—continued | |||
| $580,000 | 4 | Federal Home Loan Mortgage Corp., 2.566%, 9/25/2020 | $585,319 |
| TOTAL COMMERCIAL MORTGAGE-BACKED SECURITIES (IDENTIFIED COST $752,479) | 735,796 | ||
| COLLATERALIZED MORTGAGE OBLIGATIONS—0.5% | |||
| 250,000 | Banc of America Commercial Mortgage Trust 2016-UBS10 A4, 3.17%, 7/15/2049 | 251,699 | |
| 255,000 | Bank A4, 3.488%, 11/15/2050 | 260,993 | |
| 225,000 | CD Commercial Mortgage Trust 2016-CD1 A4, 2.724%, 8/10/2049 | 218,142 | |
| 200,000 | Citigroup Commercial Mortgage Trust 2015-GC33, AS, 4.114%, 9/10/2058 | 209,598 | |
| 450,000 | Commercial Mortgage Trust 2015-DC1 Class AM, 3.724%, 2/10/2048 | 459,400 | |
| 300,000 | JPMDB Commercial Mortgage Securities Trust 2016-C4 A3, 3.1413%, 12/15/2049 | 300,123 | |
| 50,000 | WF-RBS Commercial Mortgage Trust 2012-C6 B, 4.697%, 4/15/2045 | 52,842 | |
| 400,000 | WF-RBS Commercial Mortgage Trust 2014-C25, Class AS, 3.984%, 11/15/2047 | 413,046 | |
| 100,000 | 4 | WF-RBS Commercial Mortgage Trust 2014-C25, Class B, 4.236%, 11/15/2047 | 102,087 |
| TOTAL COLLATERALIZED MORTGAGE OBLIGATIONS (IDENTIFIED COST $2,315,814) | 2,267,930 | ||
| CORPORATE BONDS—6.6% | |||
| Basic Industry - Chemicals—0.2% | |||
| 300,000 | Albemarle Corp., Sr. Unsecd. Note, 5.45%, 12/01/2044 | 347,022 | |
| 50,000 | RPM International, Inc., 6.500%, 02/15/2018 | 50,443 | |
| 15,000 | RPM International, Inc., Sr. Unsecd. Note, 6.125%, 10/15/2019 | 16,010 | |
| 250,000 | Sherwin-Williams Co., Sr. Unsecd. Note, 3.300%, 02/01/2025 | 248,660 | |
| TOTAL | 662,135 | ||
| Basic Industry - Metals & Mining—0.1% | |||
| 100,000 | Reliance Steel & Aluminum Co., Sr. Unsecd. Note, 4.500%, 04/15/2023 | 105,672 | |
| 300,000 | Southern Copper Corp., Sr. Unsecd. Note, 6.75%, 04/16/2040 | 387,757 | |
| TOTAL | 493,429 | ||
| Basic Industry - Paper—0.0% | |||
| 150,000 | 1,2,5 | Pope & Talbot, Inc., 8.375%, 12/01/2099 | 0 |
| Capital Goods - Aerospace & Defense—0.1% | |||
| 180,000 | Lockheed Martin Corp., Sr. Unsecd. Note, 3.550%, 01/15/2026 | 186,580 | |
| 90,000 | 4 | Textron Financial Corp., Jr. Sub. Note, Series 144A, (3-month USLIBOR +1.735%), 3.150%, 2/15/2042 | 78,075 |
| Shares, Contracts or Principal Amount | Value in U.S. Dollars | ||
| CORPORATE BONDS—continued | |||
| Capital Goods - Aerospace & Defense—continued | |||
| $80,000 | Textron, Inc., Sr. Unsecd. Note, 4.000%, 03/15/2026 | $83,501 | |
| TOTAL | 348,156 | ||
| Capital Goods - Building Materials—0.1% | |||
| 130,000 | Masco Corp., Sr. Unsecd. Note, 4.375%, 04/01/2026 | 137,722 | |
| 185,000 | Masco Corp., Unsecd. Note, 4.450%, 4/01/2025 | 197,062 | |
| TOTAL | 334,784 | ||
| Capital Goods - Diversified Manufacturing—0.1% | |||
| 30,000 | General Electric Capital, Note, Series MTNA, 6.750%, 3/15/2032 | 40,702 | |
| 100,000 | Roper Industries, Inc., Sr. Unsecd. Note, 6.250%, 09/01/2019 | 106,665 | |
| 300,000 | Valmont Industries, Inc., 5.250%, 10/01/2054 | 306,724 | |
| 40,000 | Xylem, Inc., Sr. Unsecd. Note, 4.375%, 11/01/2046 | 41,943 | |
| TOTAL | 496,034 | ||
| Communications - Cable & Satellite—0.1% | |||
| 200,000 | CCO Safari II LLC, 4.908%, 07/23/2025 | 211,583 | |
| 20,000 | Time Warner Cable, Inc., Company Guarantee, 8.250%, 04/01/2019 | 21,514 | |
| TOTAL | 233,097 | ||
| Communications - Media & Entertainment—0.3% | |||
| 100,000 | 21st Century Fox America, Inc., Sr. Unsecd. Note, 5.400%, 10/01/2043 | 115,285 | |
| 310,000 | British Sky Broadcasting Group PLC, Series 144A, 3.750%, 9/16/2024 | 318,889 | |
| 20,000 | Discovery Communications, Sr. Unsecd. Note, 4.9%, 03/11/2026 | 21,216 | |
| 70,000 | Grupo Televisa S.A., Sr. Unsecd. Note, 6.125%, 01/31/2046 | 81,957 | |
| 350,000 | Omnicom Group, Inc., Sr. Unsecd. Note, 3.600%, 04/15/2026 | 352,167 | |
| 200,000 | Viacom, Inc., Sr. Unsecd. Note, 3.875%, 04/01/2024 | 198,554 | |
| TOTAL | 1,088,068 | ||
| Communications - Telecom Wireless—0.3% | |||
| 22,500,000 | America Movil S.A.B. de C, Sr. Secd. Note, 6.000%, 06/09/2019 | 1,167,673 | |
| 180,000 | Crown Castle International Corp., Sr. Unsecd. Note, 3.700%, 06/15/2026 | 179,548 | |
| TOTAL | 1,347,221 | ||
| Communications - Telecom Wirelines—0.1% | |||
| 300,000 | AT&T, Inc., Sr. Unsecd. Note, 5.150%, 03/15/2042 | 305,687 | |
| 200,000 | Verizon Communications, Inc., Sr. Unsecd. Note, 4.150%, 03/15/2024 | 210,630 | |
| 120,000 | Verizon Communications, Inc., Sr. Unsecd. Note, 5.250%, 03/16/2037 | 131,592 | |
| TOTAL | 647,909 | ||
| Consumer Cyclical - Automotive—0.1% | |||
| 275,000 | Ford Motor Credit Co., Sr. Unsecd. Note, 3.336%, 03/18/2021 | 280,376 |
| Shares, Contracts or Principal Amount | Value in U.S. Dollars | ||
| CORPORATE BONDS—continued | |||
| Consumer Cyclical - Automotive—continued | |||
| $70,000 | General Motors Co., Sr. Unsecd. Note, 4.000%, 4/01/2025 | $71,134 | |
| 200,000 | General Motors Financial Co., Inc., Sr. Unsecd. Note, 3.100%, 01/15/2019 | 201,881 | |
| TOTAL | 553,391 | ||
| Consumer Cyclical - Retailers—0.3% | |||
| 100,000 | Advance Auto Parts, Inc., 4.500%, 12/01/2023 | 104,919 | |
| 300,000 | AutoZone, Inc., Sr. Unsecd. Note, 3.250%, 04/15/2025 | 298,165 | |
| 112,553 | CVS Caremark Corp., Pass Thru Cert., Series 144A, 5.298%, 1/11/2027 | 120,798 | |
| 200,000 | CVS Health Corp., Sr. Unsecd. Note, 2.875%, 06/01/2026 | 189,740 | |
| 110,000 | Dollar General Corp., Sr. Unsecd. Note, 4.150%, 11/01/2025 | 116,398 | |
| 140,000 | O'Reilly Automotive, Inc., Sr. Unsecd. Note, 3.550%, 03/15/2026 | 140,883 | |
| 300,000 | Tiffany & Co., Sr. Unsecd. Note, 4.900%, 10/01/2044 | 296,967 | |
| 120,000 | Under Armour, Inc., Sr. Unsecd. Note, 3.250%, 06/15/2026 | 105,634 | |
| TOTAL | 1,373,504 | ||
| Consumer Cyclical - Services—0.1% | |||
| 200,000 | Alibaba Group Holding Ltd, Sr. Unsecd. Note, 2.800%, 06/06/2023 | 200,652 | |
| 250,000 | Expedia, Inc., Sr. Unsecd. Note, 5.000%, 02/15/2026 | 268,562 | |
| 130,000 | Visa, Inc., Sr. Unsecd. Note, 3.150%, 12/14/2025 | 132,512 | |
| TOTAL | 601,726 | ||
| Consumer Non-Cyclical - Food/Beverage—0.2% | |||
| 210,000 | Flowers Foods, Inc., Sr. Unsecd. Note, 3.500%, 10/01/2026 | 206,474 | |
| 250,000 | Kraft Heinz Foods Co., Sr. Unsecd. Note, 3.950%, 07/15/2025 | 257,622 | |
| 100,000 | McCormick & Co., Inc., Sr. Unsecd. Note, 3.400%, 08/15/2027 | 100,859 | |
| 120,000 | Mead Johnson Nutrition Co., Sr. Unsecd. Note, 4.125%, 11/15/2025 | 127,681 | |
| 70,000 | PepsiCo, Inc., Sr. Unsecd. Note, 4.450%, 04/14/2046 | 78,074 | |
| TOTAL | 770,710 | ||
| Consumer Non-Cyclical - Health Care—0.0% | |||
| 50,000 | Stryker Corp., Sr. Unsecd. Note, 3.500%, 03/15/2026 | 51,507 | |
| Consumer Non-Cyclical - Pharmaceuticals—0.0% | |||
| 90,000 | Gilead Sciences, Inc., Sr. Unsecd. Note, 3.650%, 3/01/2026 | 93,098 | |
| Consumer Non-Cyclical - Products—0.1% | |||
| 270,000 | Newell Rubbermaid, Inc., Sr. Unsecd. Note, 4.200%, 04/01/2026 | 282,683 | |
| Consumer Non-Cyclical - Tobacco—0.1% | |||
| 24,000 | Altria Group, Inc., 9.250%, 08/06/2019 | 26,775 | |
| 200,000 | Reynolds American, Inc., Sr. Unsecd. Note, 5.850%, 8/15/2045 | 244,464 | |
| TOTAL | 271,239 |
| Shares, Contracts or Principal Amount | Value in U.S. Dollars | ||
| CORPORATE BONDS—continued | |||
| Energy - Independent—0.1% | |||
| $375,000 | Canadian Natural Resources Ltd., 3.900%, 02/01/2025 | $384,261 | |
| 225,000 | Marathon Oil Corp., Sr. Unsecd. Note, 3.850%, 6/01/2025 | 227,516 | |
| 20,000 | XTO Energy, Inc., 6.750%, 08/01/2037 | 28,197 | |
| TOTAL | 639,974 | ||
| Energy - Integrated—0.2% | |||
| 135,000 | BP Capital Markets PLC, 3.119%, 5/04/2026 | 135,510 | |
| 155,000 | Husky Energy, Inc., 4.000%, 04/15/2024 | 161,447 | |
| 100,000 | Husky Energy, Inc., Sr. Unsecd. Note, 3.950%, 04/15/2022 | 103,638 | |
| 35,000 | Petro-Canada, Deb., 7.000%, 11/15/2028 | 44,936 | |
| 100,000 | Petroleos Mexicanos, 6.500%, 06/02/2041 | 104,471 | |
| 150,000 | Petroleos Mexicanos, Sr. Unsecd. Note, 4.875%, 1/18/2024 | 156,375 | |
| TOTAL | 706,377 | ||
| Energy - Midstream—0.3% | |||
| 350,000 | Energy Transfer Partners LP, Sr. Unsecd. Note, 5.150%, 03/15/2045 | 335,789 | |
| 325,000 | Energy Transfer Partners, Sr. Unsecd. Note, 4.05%, 3/15/2025 | 325,819 | |
| 230,000 | Enterprise Products Operating, Sr. Unsecd. Note, 3.950%, 02/15/2027 | 239,123 | |
| 100,000 | Kinder Morgan, Inc., 5.050%, 2/15/2046 | 101,192 | |
| 80,000 | MPLX LP, Sr. Unsecd. Note, 4.125%, 03/01/2027 | 81,436 | |
| 55,000 | ONEOK, Inc, Sr Unsecured Note, Series 0, 4.95%, 07/13/2047 | 55,621 | |
| 100,000 | Williams Partners LP, 4.900%, 1/15/2045 | 104,108 | |
| TOTAL | 1,243,088 | ||
| Energy - Oil Field Services—0.1% | |||
| 140,000 | Halliburton Co., Sr. Unsecd. Note, 3.800%, 11/15/2025 | 144,459 | |
| 100,000 | Nabors Industries, Inc., Company Guarantee, 5.000%, 09/15/2020 | 101,375 | |
| 250,000 | Schlumberger Holdings Corp., Sr. Unsecd. Note, Series 144A, 4.000%, 12/21/2025 | 261,260 | |
| 100,000 | Weatherford International Ltd., Sr. Unsecd. Note, 5.950%, 04/15/2042 | 76,750 | |
| TOTAL | 583,844 | ||
| Energy - Refining—0.1% | |||
| 250,000 | Marathon Petroleum Corp., Sr. Unsecd. Note, 4.750%, 9/15/2044 | 255,368 | |
| 25,000 | Valero Energy Corp., 9.375%, 03/15/2019 | 27,244 | |
| 100,000 | Valero Energy Corp., Sr. Unsecd. Note, 6.625%, 06/15/2037 | 128,697 | |
| TOTAL | 411,309 | ||
| Financial Institution - Banking—1.0% | |||
| 340,000 | Associated Banc-Corp., Sub., 4.250%, 1/15/2025 | 351,577 | |
| 250,000 | 4 | Bank of America Corp., Sr. Unsecd. Note, Series MTN, (3-month USLIBOR +0.650%), 1.971%, 10/01/2021 | 251,103 |
| Shares, Contracts or Principal Amount | Value in U.S. Dollars | ||
| CORPORATE BONDS—continued | |||
| Financial Institution - Banking—continued | |||
| $100,000 | Bank of America Corp., Sr. Unsecd. Note, Series MTN, 4.875%, 04/01/2044 | $116,617 | |
| 355,000 | Bank of America Corp., Sub. Note, Series L, 3.950%, 4/21/2025 | 365,304 | |
| 300,000 | Bank of America Corp., Sub. Note, Series MTN, 4.000%, 1/22/2025 | 310,116 | |
| 180,000 | Capital One Financial Corp., Sr. Sub., 4.200%, 10/29/2025 | 184,499 | |
| 300,000 | Citigroup, Inc., Sr. Unsecd. Note, 2.700%, 03/30/2021 | 301,453 | |
| 250,000 | Citigroup, Inc., Sr. Unsecd. Note, 3.300%, 04/27/2025 | 251,834 | |
| 150,000 | Citigroup, Inc., Sub. Note, 4.450%, 09/29/2027 | 157,766 | |
| 250,000 | Compass Bank, Birmingham, Sub. Note, Series BKNT, 3.875%, 4/10/2025 | 250,415 | |
| 330,000 | Fifth Third Bancorp, Sr. Unsecd. Note, 2.875%, 7/27/2020 | 334,291 | |
| 400,000 | Goldman Sachs Group, Inc., Sr. Unsecd. Note, 3.500%, 1/23/2025 | 405,151 | |
| 5,000 | Goldman Sachs Group, Inc., Sr. Unsecd. Note, 5.750%, 01/24/2022 | 5,561 | |
| 50,000 | Goldman Sachs Group, Inc., Sr. Unsecd. Note, 6.125%, 02/15/2033 | 63,186 | |
| 50,000 | J.P. Morgan Chase & Co., Sub. Note, 3.375%, 05/01/2023 | 50,922 | |
| 100,000 | 4 | JPMorgan Chase & Co., Series S, 6.750%, 01/29/2049 | 114,481 |
| 300,000 | 4 | Morgan Stanley, Sr. Unsecd. Note, (3-month USLIBOR +1.140%), 2.514%, 01/27/2020 | 304,666 |
| 146,153 | 2 | Regional Diversified Funding, Series 144A, 9.250%, 03/15/2030 | 89,514 |
| 80,000 | Regions Financial Corp., Sr. Unsecd. Note, 3.200%, 02/08/2021 | 81,530 | |
| 230,000 | SunTrust Banks, Inc., Sr. Unsecd. Note, 2.900%, 03/03/2021 | 232,782 | |
| 50,000 | 4 | Wells Fargo & Co., Sr. Unsecd. Note, (3-month USLIBOR +1.230%), 2.610%, 10/31/2023 | 51,359 |
| 40,000 | Wilmington Trust Corp., Sub. Note, 8.500%, 04/02/2018 | 40,842 | |
| TOTAL | 4,314,969 | ||
| Financial Institution - Broker/Asset Mgr/Exchange—0.1% | |||
| 140,000 | Invesco Finance PLC, Sr. Unsecd. Note, 3.750%, 1/15/2026 | 145,313 | |
| 95,000 | Jefferies Group LLC, Sr. Unsecd. Note, 8.500%, 07/15/2019 | 103,945 | |
| 240,000 | Stifel Financial Corp., Sr. Unsecd. Note, 3.500%, 12/01/2020 | 243,571 | |
| 70,000 | TIAA Asset Management Finance Co., LLC, Sr. Unsecd. Note, Series 144A, 4.125%, 11/01/2024 | 73,790 | |
| TOTAL | 566,619 | ||
| Financial Institution - Finance Companies—0.1% | |||
| 210,000 | AerCap Ireland Capital Ltd., Sr. Unsecd. Note, 3.950%, 02/01/2022 | 217,330 | |
| Financial Institution - Insurance - Life—0.3% | |||
| 27,000 | Aflac, Inc., Sr. Unsecd. Note, 6.450%, 08/15/2040 | 35,735 | |
| 400,000 | American International Group, Inc., Unsecd. Note, 3.875%, 01/15/2035 | 392,299 |
| Shares, Contracts or Principal Amount | Value in U.S. Dollars | ||
| CORPORATE BONDS—continued | |||
| Financial Institution - Insurance - Life—continued | |||
| $325,000 | Mass Mutual Global Funding II, Series 144A, 2.000%, 04/15/2021 | $319,858 | |
| 10,000 | MetLife, Inc., Jr. Sub. Note, 10.750%, 8/01/2039 | 16,775 | |
| 100,000 | Principal Life Global Funding II, Series 144A, 2.200%, 04/08/2020 | 99,733 | |
| 200,000 | Prudential Financial, Inc., Sr. Unsecd. Note, Series MTN, 4.600%, 05/15/2044 | 223,018 | |
| TOTAL | 1,087,418 | ||
| Financial Institution - Insurance - P&C—0.1% | |||
| 75,000 | ACE INA Holdings, Inc., Sr. Unsecd. Note, 3.350%, 05/15/2024 | 77,101 | |
| 300,000 | Liberty Mutual Group, Inc., Sr. Unsecd. Note, Series 144A, 6.500%, 03/15/2035 | 379,174 | |
| 30,000 | Nationwide Mutual Insurance Co., Sub. Note, Series 144A, 9.375%, 08/15/2039 | 49,962 | |
| TOTAL | 506,237 | ||
| Financial Institution - REIT - Apartment—0.1% | |||
| 195,000 | Avalonbay Communities, Inc., Sr. Unsecd. Note, Series MTN, 3.35%, 05/15/2027 | 196,196 | |
| 300,000 | Mid-America Apartment Communities LP, Sr. Unsecd. Note, 3.750%, 06/15/2024 | 307,925 | |
| 140,000 | UDR, Inc., Sr. Unsecd. Note, Series MTN, 2.950%, 09/01/2026 | 134,296 | |
| TOTAL | 638,417 | ||
| Financial Institution - REIT - Healthcare—0.0% | |||
| 100,000 | Health Care REIT, Inc., Sr. Unsecd. Note, 4.125%, 04/01/2019 | 102,095 | |
| Financial Institution—REIT - Office—0.1% | |||
| 100,000 | Alexandria Real Estate Eq, Sr. Unsecd. Note, 3.95%, 01/15/2028 | 102,326 | |
| 300,000 | Alexandria Real Estate Equities, Inc., Sr. Unsecd. Note, 4.500%, 07/30/2029 | 318,237 | |
| TOTAL | 420,563 | ||
| Financial Institution - REIT - Other—0.1% | |||
| 100,000 | ProLogis LP, Sr. Unsecd. Note, 3.350%, 02/01/2021 | 103,386 | |
| 160,000 | WP Carey, Inc., Sr. Unsecd. Note, 4.600%, 04/01/2024 | 167,342 | |
| TOTAL | 270,728 | ||
| Financial Institution - REIT - Retail—0.0% | |||
| 30,000 | Kimco Realty Corp., Sr. Unsecd. Note, 3.400%, 11/01/2022 | 30,649 | |
| Foreign - Local - Government—0.0% | |||
| 50,000 | Quebec, Province of, Note, Series MTNA, 7.035%, 03/10/2026 | 63,557 | |
| Municipal Services—0.1% | |||
| 137,277 | Army Hawaii Family Housing, Series 144A, 5.524%, 6/15/2050 | 155,776 |
| Shares, Contracts or Principal Amount | Value in U.S. Dollars | ||
| CORPORATE BONDS—continued | |||
| Municipal Services—continued | |||
| $100,000 | Camp Pendleton & Quantic, 5.572%, 10/01/2050 | $109,936 | |
| TOTAL | 265,712 | ||
| Sovereign—0.1% | |||
| 30,000,000 | KfW, 2.050%, 02/16/2026 | 312,056 | |
| Technology—0.5% | |||
| 300,000 | Adobe Systems, Inc., Sr. Unsecd. Note, 3.250%, 02/01/2025 | 307,786 | |
| 100,000 | Apple, Inc., Sr. Unsecd. Note, 3.850%, 08/04/2046 | 101,628 | |
| 270,000 | Automatic Data Processing, Inc., 3.375%, 9/15/2025 | 279,064 | |
| 320,000 | Diamond 1 Finance Corp./D, Sr. Secd. Note, Series 144A, 6.02%, 06/15/2026 | 352,100 | |
| 125,000 | Equifax, Inc., Sr. Unsecd. Note, 2.300%, 06/01/2021 | 121,389 | |
| 59,000 | Fidelity National Informa, Sr. Unsecd. Note, 5%, 10/15/2025 | 65,098 | |
| 28,000 | Fidelity National Information Services, Inc., Sr. Unsecd. Note, 3.875%, 06/05/2024 | 29,025 | |
| 150,000 | Hewlett Packard Enterpris, Sr. Unsecd. Note, 3.6%, 10/15/2020 | 153,765 | |
| 300,000 | Keysight Technologies, Inc., 4.550%, 10/30/2024 | 318,069 | |
| 380,000 | Molex Electronics Technologies LLC, Unsecd. Note, Series 144A, 3.900%, 4/15/2025 | 388,734 | |
| 70,000 | Total System Services, Inc., Sr. Unsecd. Note, 4.800%, 04/01/2026 | 76,006 | |
| TOTAL | 2,192,664 | ||
| Transportation - Railroads—0.0% | |||
| 140,000 | Burlington Northern Santa Fe Corp., Sr. Unsecd. Note, 4.150%, 4/01/2045 | 150,271 | |
| 45,000 | Union Pacific Corp., Bond, 6.625%, 02/01/2029 | 58,407 | |
| TOTAL | 208,678 | ||
| Transportation - Services—0.2% | |||
| 62,000 | Enterprise Rent-A-Car USA Finance Co., Sr. Unsecd. Note, Series 144A, 3.850%, 11/15/2024 | 64,153 | |
| 100,000 | Penske Truck Leasing Co. LP & PTL Finance Corp., Series 144A, 2.500%, 06/15/2019 | 100,393 | |
| 335,000 | Penske Truck Leasing Co. LP & PTL Finance Corp., Sr. Unsecd. Note, Series 144A, 3.375%, 2/01/2022 | 341,962 | |
| 100,000 | Ryder System, Inc., Sr. Unsecd. Note, Series MTN, 2.450%, 11/15/2018 | 100,374 | |
| 140,000 | Ryder System, Inc., Sr. Unsecd. Note, Series MTN, 2.80%, 03/01/2022 | 140,142 | |
| TOTAL | 747,024 | ||
| Utility - Electric—0.6% | |||
| 130,000 | Ameren Corp., Sr. Unsecd. Note, 3.650%, 2/15/2026 | 133,299 | |
| 120,000 | Duke Energy Corp., Sr. Unsecd. Note, 2.650%, 09/01/2026 | 114,621 |
| Shares, Contracts or Principal Amount | Value in U.S. Dollars | ||
| CORPORATE BONDS—continued | |||
| Utility - Electric—continued | |||
| $190,000 | Emera US Finance LP, Sr. Unsecd. Note, 4.75%, 06/15/2046 | $203,935 | |
| 270,000 | EverSource Energy, Sr. Unsecd. Note, 3.350%, 03/15/2026 | 271,303 | |
| 300,000 | Exelon Corp., Sr. Unsecd. Note, 3.400%, 04/15/2026 | 301,619 | |
| 100,000 | Indiana Michigan Power Co., Sr. Unsecd. Note, Series K, 4.550%, 03/15/2046 | 111,387 | |
| 140,000 | 4 | National Rural Utilities Cooperative Finance Corp., Sr. Sub., 5.250%, 04/20/2046 | 149,670 |
| 300,000 | National Rural Utilities Cooperative Finance Corp., 2.000%, 01/27/2020 | 299,132 | |
| 200,000 | NextEra Energy Capital Holdings, Inc., Sr. Unsecd. Note, 2.400%, 09/15/2019 | 200,239 | |
| 200,000 | NiSource Finance Corp., Sr. Unsecd. Note, 3.950%, 03/30/2048 | 200,863 | |
| 400,000 | Northeast Utilities, Sr. Unsecd. Note, Series H, 3.150%, 1/15/2025 | 402,526 | |
| 40,000 | Progress Energy, Inc., 7.050%, 03/15/2019 | 42,455 | |
| 125,000 | Wisconsin Electric Power Co., Sr. Unsecd. Note, 4.300%, 12/15/2045 | 133,686 | |
| TOTAL | 2,564,735 | ||
| Utility - Natural Gas—0.1% | |||
| 200,000 | Sempra Energy, Sr. Unsecd. Note, 2.850%, 11/15/2020 | 202,280 | |
| 300,000 | Sempra Energy, Sr. Unsecd. Note, 3.550%, 06/15/2024 | 307,912 | |
| TOTAL | 510,192 | ||
| TOTAL CORPORATE BONDS (IDENTIFIED COST $27,621,569) | 28,252,926 | ||
| MORTGAGE-BACKED SECURITIES—0.0% | |||
| 2,029 | Federal Home Loan Mortgage Corp. Pool C00592, 7.000%, 3/1/2028 | 2,324 | |
| 1,221 | Federal Home Loan Mortgage Corp. Pool C00896, 7.500%, 12/1/2029 | 1,423 | |
| 1,285 | Federal Home Loan Mortgage Corp. Pool C17281, 6.500%, 11/1/2028 | 1,446 | |
| 1,943 | Federal Home Loan Mortgage Corp. Pool C19588, 6.500%, 12/1/2028 | 2,200 | |
| 958 | Federal Home Loan Mortgage Corp. Pool C25621, 6.500%, 5/1/2029 | 1,090 | |
| 2,148 | Federal Home Loan Mortgage Corp. Pool C76361, 6.000%, 2/1/2033 | 2,420 | |
| 1,507 | Federal Home Loan Mortgage Corp. Pool E01545, 5.000%, 15 Year, 1/1/2019 | 1,528 | |
| 297 | Federal Home Loan Mortgage Corp. Pool E99510, 5.500%, 9/1/2018 | 300 | |
| 2,792 | Federal Home Loan Mortgage Corp. Pool G01444, 6.500%, 8/1/2032 | 3,195 | |
| 2,087 | Federal National Mortgage Association Pool 251697, 6.500%, 30 Year, 5/1/2028 | 2,356 | |
| 7,835 | Federal National Mortgage Association Pool 252334, 6.500%, 30 Year, 2/1/2029 | 8,735 | |
| 494 | Federal National Mortgage Association Pool 254720, 4.500%, 5/1/2018 | 496 |
| Shares, Contracts or Principal Amount | Value in U.S. Dollars | ||
| MORTGAGE-BACKED SECURITIES—continued | |||
| $778 | Federal National Mortgage Association Pool 254802, 4.500%, 7/1/2018 | $782 | |
| 4,905 | Federal National Mortgage Association Pool 254905, 6.000%, 10/1/2033 | 5,546 | |
| 7,898 | Federal National Mortgage Association Pool 255075, 5.500%, 2/1/2024 | 8,693 | |
| 2,128 | Federal National Mortgage Association Pool 255079, 5.000%, 2/1/2019 | 2,159 | |
| 812 | Federal National Mortgage Association Pool 303168, 9.500%, 30 Year, 2/1/2025 | 937 | |
| 348 | Federal National Mortgage Association Pool 323159, 7.500%, 4/1/2028 | 401 | |
| 3,343 | Federal National Mortgage Association Pool 323640, 7.500%, 4/1/2029 | 3,842 | |
| 537 | Federal National Mortgage Association Pool 428865, 7.000%, 6/1/2028 | 550 | |
| 38 | Federal National Mortgage Association Pool 443215, 6.000%, 10/1/2028 | 39 | |
| 7,427 | Federal National Mortgage Association Pool 545993, 6.000%, 11/1/2032 | 8,371 | |
| 3,075 | Federal National Mortgage Association Pool 555272, 6.000%, 3/1/2033 | 3,464 | |
| 2,359 | Federal National Mortgage Association Pool 713974, 5.500%, 7/1/2033 | 2,620 | |
| 5,799 | Federal National Mortgage Association Pool 721502, 5.000%, 7/1/2033 | 6,288 | |
| 7,313 | Government National Mortgage Association Pool 2796, 7.000%, 8/20/2029 | 8,479 | |
| 3,956 | Government National Mortgage Association Pool 3040, 7.000%, 2/20/2031 | 4,630 | |
| 9,898 | Government National Mortgage Association Pool 3188, 6.500%, 1/20/2032 | 11,436 | |
| 14,119 | Government National Mortgage Association Pool 3239, 6.500%, 5/20/2032 | 16,290 | |
| 401 | Government National Mortgage Association Pool 352214, 7.000%, 4/15/2023 | 439 | |
| 2,060 | Government National Mortgage Association Pool 451522, 7.500%, 30 Year, 10/15/2027 | 2,407 | |
| 1,384 | Government National Mortgage Association Pool 462556, 6.500%, 2/15/2028 | 1,546 | |
| 339 | Government National Mortgage Association Pool 462739, 7.500%, 5/15/2028 | 396 | |
| 187 | Government National Mortgage Association Pool 464835, 6.500%, 9/15/2028 | 213 | |
| 3,673 | Government National Mortgage Association Pool 469699, 7.000%, 11/15/2028 | 4,216 | |
| 3,158 | Government National Mortgage Association Pool 486760, 6.500%, 12/15/2028 | 3,592 | |
| 384 | Government National Mortgage Association Pool 780339, 8.000%, 30 Year, 12/15/2023 | 427 |
| Shares, Contracts or Principal Amount | Value in U.S. Dollars | ||
| MORTGAGE-BACKED SECURITIES—continued | |||
| $3,788 | Government National Mortgage Association Pool 780453, 7.500%, 30 Year, 12/15/2025 | $4,314 | |
| 3,174 | Government National Mortgage Association Pool 780584, 7.000%, 30 Year, 6/15/2027 | 3,587 | |
| TOTAL MORTGAGE-BACKED SECURITIES (IDENTIFIED COST $118,843) | 133,177 | ||
| FOREIGN GOVERNMENTS/AGENCIES—7.4% | |||
| Sovereign—7.4% | |||
| 700,000 | Australia, Government of, Sr. Unsecd. Note, Series 148, 2.75%, 11/21/2027 | 540,561 | |
| 690,000 | Belgium, Government of, Series 68, 2.25%, 6/22/2023 | 930,155 | |
| 680,000 | Belgium, Government of, Series 74, 0.8%, 6/22/2025 | 842,473 | |
| 200,000 | Canada, Government of, Bond, 3.25%, 6/01/2021 | 163,975 | |
| 480,000 | Canada, Government of, Series WL43, 5.750%, 06/01/2029 | 517,544 | |
| 936,000 | France, Government of, 0.5%, 05/25/2025 | 1,138,377 | |
| 620,000 | France, Government of, 3.25%, 10/25/2021 | 842,818 | |
| 550,000 | France, Government of, Bond, 4.500%, 04/25/2041 | 1,064,837 | |
| 870,000 | Germany, Government of, 1.75%, 2/15/2024 | 1,155,844 | |
| 300,000 | Germany, Government of, Bond, Series 03, 4.75%, 7/04/2034 | 577,457 | |
| 760,000 | Germany, Government of, Unsecd. Note, 1.000%, 08/15/2025 | 969,078 | |
| 150,000 | Germany, Government of, Unsecd. Note, 1.000%, 8/15/2024 | 191,106 | |
| 200,000 | Italy, Government of, 2.500%, 5/01/2019 | 247,690 | |
| 1,000,000 | Italy, Government of, 3.750%, 5/01/2021 | 1,337,604 | |
| 220,000 | Italy, Government of, 4.250%, 3/01/2020 | 288,125 | |
| 1,280,000 | Italy, Government of, Sr. Unsecd. Note, 0.65%, 10/15/2023 | 1,506,304 | |
| 500,000 | Italy, Government of, Unsecd. Note, 1.60%, 06/01/2026 | 598,731 | |
| 58,000 | Italy, Government of, Unsecd. Note, 3.25%, 9/01/2046 | 74,176 | |
| 210,000,000 | Japan, Government of, Series 313, 1.3%, 3/20/2021 | 1,954,160 | |
| 170,000,000 | Japan, Government of, Series 65, 1.9%, 12/20/2023 | 1,692,055 | |
| 142,000,000 | Japan, Government of, Sr. Unsecd. Note, Series 114, 2.1%, 12/20/2029 | 1,555,635 | |
| 185,000,000 | Japan, Government of, Sr. Unsecd. Note, Series 153, 1.3%, 06/20/2035 | 1,877,320 | |
| 140,000,000 | Japan, Government of, Sr. Unsecd. Note, Series 44, 1.7%, 9/20/2044 | 1,524,208 | |
| 90,000,000 | Japan, Government of, Sr. Unsecd. Note, Series 92, 2.10%, 12/20/2026 | 949,964 | |
| 30,000 | Mexico, Government of, Series MTNA, 6.750%, 09/27/2034 | 39,300 | |
| 850,000 | Netherlands, Government of, 1.75%, 7/15/2023 | 1,119,382 | |
| 255,000 | Queensland Treasury Corp., Sr. Unsecd. Note, 4%, 06/21/2019 | 199,103 | |
| 535,000 | Spain, Government of, 2.75%, 4/30/2019 | 664,601 | |
| 260,000 | Spain, Government of, Sr. Unsecd. Note, 1.95%, 7/30/2030 | 314,333 |
| Shares, Contracts or Principal Amount | Value in U.S. Dollars | ||
| FOREIGN GOVERNMENTS/AGENCIES—continued | |||
| Sovereign—continued | |||
| $880,000 | Spain, Government of, Sr. Unsecd. Note, 2.75%, 10/31/2024 | $1,183,680 | |
| 400,000 | Spain, Government of, Sr. Unsub., 4.000%, 4/30/2020 | 524,403 | |
| 2,600,000 | Sweden, Government of, Series 1059, 1.00%, 11/12/2026 | 324,364 | |
| 930,000 | United Kingdom, Government, Unsecd. Note, 4.25%, 6/07/2032 | 1,680,871 | |
| 700,000 | United Kingdom, Government, Unsecd. Note, 1.50%, 01/22/2021 | 972,335 | |
| 170,000 | United Kingdom, Government of, 2.75%, 9/07/2024 | 255,643 | |
| 480,000 | United Kingdom, Government of, 3.25%, 1/22/2044 | 827,539 | |
| 550,000 | United Kingdom, Government of, 4.25%, 12/07/2027 | 946,932 | |
| TOTAL FOREIGN GOVERNMENTS/AGENCIES (IDENTIFIED COST $29,982,957) | 31,592,683 | ||
| MUNICIPAL BOND—0.0% | |||
| Illinois—0.0% | |||
| 90,000 | Chicago, IL Metropolitan Water Reclamation District, Direct Payment Taxable Limited GO Build America Bonds, 5.720%, 12/01/2038 (IDENTIFIED COST $90,000) | 116,285 | |
| U.S. TREASURY—2.4% | |||
| 218,424 | U.S. Treasury Inflation-Protected Bond, 0.750%, 2/15/2042 | 213,066 | |
| 1,053,780 | U.S. Treasury Inflation-Protected Note, 0.125%, 4/15/2020 | 1,048,679 | |
| 312,366 | U.S. Treasury Inflation-Protected Note, 0.125%, 4/15/2021 | 310,210 | |
| 25,328 | U.S. Treasury Inflation-Protected Note, 0.125%, 4/15/2022 | 25,087 | |
| 605,292 | U.S. Treasury Inflation-Protected Note, 0.375%, 7/15/2027 | 595,279 | |
| 83,000 | United States Treasury Bond, 2.500%, 5/15/2046 | 77,479 | |
| 200,000 | United States Treasury Bond, 2.750%, 8/15/2047 | 196,501 | |
| 3,000 | United States Treasury Bond, 3.000%, 11/15/2045 | 3,096 | |
| 200,000 | United States Treasury Note, 0.750%, 2/28/2018 | 199,715 | |
| 500,000 | United States Treasury Note, 0.750%, 7/31/2018 | 497,440 | |
| 600,000 | United States Treasury Note, 0.875%, 5/31/2018 | 598,268 | |
| 1,300,000 | United States Treasury Note, 1.000%, 5/15/2018 | 1,297,548 | |
| 100,000 | United States Treasury Note, 1.000%, 10/15/2019 | 98,557 | |
| 650,000 | United States Treasury Note, 1.250%, 12/31/2018 | 646,902 | |
| 650,000 | United States Treasury Note, 1.250%, 4/30/2019 | 645,499 | |
| 2,300,000 | United States Treasury Note, 1.250%, 8/31/2019 | 2,279,072 | |
| 975,000 | United States Treasury Note, 1.500%, 4/15/2020 | 967,018 | |
| 550,000 | United States Treasury Note, 2.125%, 7/31/2024 | 544,113 | |
| TOTAL U.S. TREASURY (IDENTIFIED COST $10,305,089) | 10,243,529 |
| Shares, Contracts or Principal Amount | Value in U.S. Dollars | ||
| EXCHANGE-TRADED FUND—7.9% | |||
| 602,411 | iShares Core MSCI Emerging Markets ETF (IDENTIFIED COST $27,228,038) | $33,644,654 | |
| PURCHASED PUT OPTION—0.0% | |||
| 1,069,920 | JPM GBP PUT/USD CALL, Notional Amount $1,069,920, Exercise Price $1.34, Expiration Date 12/12/2017 (IDENTIFIED COST $6,237) | 1,833 | |
| INVESTMENT COMPANIES—14.2%3 | |||
| 3,335,878 | Emerging Markets Core Fund | 33,925,874 | |
| 275,758 | Federated Bank Loan Core Fund | 2,779,644 | |
| 1,488,261 | Federated Mortgage Core Portfolio | 14,570,073 | |
| 498,315 | Federated Project and Trade Finance Core Fund | 4,534,664 | |
| 761,390 | High Yield Bond Portfolio | 4,880,513 | |
| TOTAL INVESTMENT COMPANIES (IDENTIFIED COST $59,891,918) | 60,690,768 | ||
| TOTAL INVESTMENT IN SECURITIES—97.5% (IDENTIFIED COST $354,331,176)6 | 415,589,909 | ||
| OTHER ASSETS AND LIABILITIES - NET—2.5%7 | 10,352,739 | ||
| TOTAL NET ASSETS—100% | $425,942,648 |
| Description | Number of Contracts | Notional Value | Expiration Date | Value and Unrealized Appreciation (Depreciation) |
| 1Australia 10-Year Bond Short Futures | 268 | $26,483,501 | December 2017 | $(229,677) |
| 1Canada 10-Year Bond Short Futures | 8 | $847,653 | March 2018 | $(297) |
| 1DAX Index Short Futures | 17 | $6,602,686 | December 2017 | $(2,656) |
| 1Euro Bund Short Futures | 63 | $12,201,676 | December 2017 | $(1,612) |
| 1FTSE 100 Index Short Futures | 253 | $25,076,708 | December 2017 | $354,068 |
| 1FTSE/MIB Index Short Futures | 13 | $1,731,224 | December 2017 | $7,898 |
| 1IBEX 35 Index Short Futures | 49 | $5,948,692 | December 2017 | $8,898 |
| 1Japan 10-Year Bond Short Futures | 3 | $4,023,191 | December 2017 | $2,134 |
| 1KOSPI2 Index Short Futures | 162 | $12,117,436 | December 2017 | $389,701 |
| 1MSCI Emerging Market Short Futures | 185 | $10,360,000 | December 2017 | $252,300 |
| 1MSCI Singapore IX ETS Short Futures | 298 | $8,578,051 | December 2017 | $1,931 |
| 1S&P/TSX 60 IX Short Futures | 101 | $14,893,028 | December 2017 | $24,550 |
| 1SPI 200 Short Futures | 13 | $1,471,538 | December 2017 | $3,691 |
| 1Swiss Market Index Short Futures | 2 | $189,845 | December 2017 | $(158) |
| Description | Number of Contracts | Notional Value | Expiration Date | Value and Unrealized Appreciation (Depreciation) |
| 1United States Treasury Notes 2-Year Short Futures | 37 | $7,933,031 | March 2018 | $2,921 |
| 1Amsterdam Index Long Futures | 67 | $8,614,240 | December 2017 | $(6,878) |
| 1CAC 40 10-Year Euro Long Futures | 54 | $3,449,879 | December 2017 | $(19,950) |
| 1Euro BTP Long Futures | 8 | $1,341,364 | December 2017 | $8,889 |
| 1FTSE JSE Top 40 Long Futures | 95 | $3,706,143 | December 2017 | $(39,536) |
| 1Hang Seng Index Long Futures | 40 | $7,507,922 | December 2017 | $(189,528) |
| 1Long GILT Long Futures | 67 | $11,199,498 | March 2018 | $(62,681) |
| 1MSCI Taiwan Index Long Futures | 102 | $3,999,420 | December 2017 | $(164,730) |
| 1OMXS 30 Index Long Futures | 558 | $10,732,115 | December 2017 | $(81,978) |
| 1S&P 500 E-Mini Long Futures | 290 | $38,394,550 | December 2017 | $685,667 |
| 1TOPIX Index Long Futures | 65 | $10,378,515 | December 2017 | $385,459 |
| 1United States Treasury Long Bond Long Futures | 2 | $303,438 | March 2018 | $(3,147) |
| 1United States Treasury Notes 10-Year Long Futures | 117 | $14,513,484 | March 2018 | $(65,740) |
| 1United States Treasury Notes 10-Year Ultra Long Futures | 9 | $1,198,547 | March 2018 | $(7,534) |
| 1United States Treasury Notes 5-Year Long Futures | 63 | $7,329,656 | March 2018 | $(22,782) |
| 1United States Treasury Ultra Bond Long Futures | 9 | $1,483,875 | March 2018 | $(18,394) |
| NET UNREALIZED APPRECIATION ON FUTURES CONTRACTS | $1,210,829 | |||
| Settlement Date | Counterparty | Currency Units to Deliver/Receive | In Exchange For | Unrealized Appreciation (Depreciation) |
| Contracts Purchased: | ||||
| 12/1/2017 | Citibank N.A. | 2,643,000 AUD | $1,996,498 | $2,667 |
| 12/1/2017 | Goldman Sachs | 8,804,000 CAD | $6,890,603 | $(66,591) |
| 12/1/2017 | JPMorgan Chase | 20,525,000 CHF | $20,898,221 | $(34,181) |
| 12/1/2017 | JPMorgan Chase | 848,000 EUR | $998,775 | $10,556 |
| 12/1/2017 | JPMorgan Chase | 9,682,000 GBP | $12,853,173 | $240,767 |
| 12/1/2017 | JPMorgan Chase | 1,142,910,000 JPY | $10,195,331 | $(40,193) |
| 12/1/2017 | JPMorgan Chase | 122,974,000 MXN | $6,636,499 | $(37,465) |
| 12/1/2017 | JPMorgan Chase | 58,038,000 NOK | $7,019,083 | $(42,901) |
| 12/1/2017 | JPMorgan Chase | 4,843,000 NZD | $3,302,485 | $7,705 |
| 12/1/2017 | JPMorgan Chase | 103,593,000 SEK | $12,448,619 | $(73,321) |
| 12/1/2017 | JPMorgan Chase | 9,080,000 SGD | $6,755,450 | $(22,542) |
| Settlement Date | Counterparty | Currency Units to Deliver/Receive | In Exchange For | Unrealized Appreciation (Depreciation) |
| Contracts Purchased: (continued) | ||||
| 12/1/2017 | Barclays Bank PLC | 27,919,000 TRY | $7,101,921 | $27,730 |
| 12/4/2017 | Citibank N.A. | 354,500 BRL | $111,132 | $(2,836) |
| 12/8/2017 | Citibank N.A. | 55,600 AUD | $43,639 | $(1,584) |
| 12/8/2017 | Citibank N.A. | 62,100 CAD | $49,361 | $(1,223) |
| 12/8/2017 | Goldman Sachs | 2,808,000 CAD | $2,195,151 | $(18,474) |
| 12/8/2017 | Citibank N.A. | 126,500 EUR | $149,237 | $1,360 |
| 12/8/2017 | JPMorgan Chase | 17,227,000 EUR | $20,494,600 | $13,961 |
| 12/8/2017 | Citibank N.A. | 134,800 GBP | $179,362 | $2,959 |
| 12/8/2017 | BNP Paribas SA | 4,955,000 GBP | $6,581,627 | $120,168 |
| 12/8/2017 | Bank of America N.A. | 15,749,800 JPY | $140,391 | $(428) |
| 12/8/2017 | Barclays Bank PLC | 39,633,475 JPY | $350,000 | $2,210 |
| 12/8/2017 | JPMorgan Chase | 1,044,340,000 JPY | $9,391,530 | $(110,810) |
| 12/8/2017 | JPMorgan Chase | 58,038,000 NOK | $7,084,639 | $(107,814) |
| 12/8/2017 | Citibank N.A. | 52,000 NZD | $36,475 | $(936) |
| 12/8/2017 | JPMorgan Chase | 3,473,000 NZD | $2,408,807 | $(35,170) |
| 12/8/2017 | Barclays Bank PLC | 24,228,000 TRY | $6,150,144 | $24,373 |
| 12/19/2017 | JPMorgan Chase | 170,116,380 JPY | $1,500,000 | $12,767 |
| 12/19/2017 | Citibank N.A. | 1,615,112,000 KRW | $1,428,241 | $56,037 |
| 12/19/2017 | Citibank N.A. | 1,832,704,000 KRW | $1,598,521 | $85,723 |
| 12/19/2017 | Citibank N.A. | 6,819,900,000 KRW | $6,024,114 | $243,331 |
| 12/19/2017 | Citibank N.A. | 8,488,200,000 KRW | $7,526,668 | $273,935 |
| 12/19/2017 | Citibank N.A. | 9,934,760,000 KRW | $8,810,536 | $319,447 |
| 12/19/2017 | Citibank N.A. | 19,536,390,000 KRW | $17,804,867 | $148,954 |
| 2/8/2018 | Citibank N.A. | 850,000 AUD | $653,081 | $(10,363) |
| 2/8/2018 | Citibank N.A. | 2,171,962 CAD | 1,300,000 GBP | $(77,216) |
| 2/8/2018 | Bank of America N.A. | 1,200,000 EUR | 1,064,797 GBP | $(9,067) |
| 2/8/2018 | JPMorgan Chase | 800,000 EUR | 61,168,000 INR | $14,343 |
| 2/8/2018 | Citibank N.A. | 1,700,000 EUR | 225,107,880 JPY | $24,623 |
| 2/8/2018 | JPMorgan Chase | 555,556 EUR | 5,273,572 NOK | $28,892 |
| 2/8/2018 | JPMorgan Chase | 694,444 EUR | 6,725,389 NOK | $20,043 |
| 2/8/2018 | Citibank N.A. | 850,000 EUR | 8,225,085 NOK | $25,351 |
| 2/8/2018 | Citibank N.A. | 850,000 EUR | 8,311,836 NOK | $14,902 |
| 2/8/2018 | JPMorgan Chase | 566,667 EUR | 5,545,710 SEK | $11,620 |
| 2/8/2018 | JPMorgan Chase | 850,000 EUR | 8,498,054 SEK | $(4,118) |
| 2/8/2018 | JPMorgan Chase | 1,133,333 EUR | 11,039,831 SEK | $29,433 |
| 2/8/2018 | JPMorgan Chase | 400,000 EUR | $476,702 | $1,458 |
| 2/8/2018 | JPMorgan Chase | 590,000 EUR | $687,179 | $18,105 |
| 2/8/2018 | JPMorgan Chase | 600,000 EUR | $715,053 | $2,186 |
| Settlement Date | Counterparty | Currency Units to Deliver/Receive | In Exchange For | Unrealized Appreciation (Depreciation) |
| Contracts Purchased: (continued) | ||||
| 2/8/2018 | JPMorgan Chase | 1,020,000 EUR | $1,205,037 | $14,270 |
| 2/8/2018 | JPMorgan Chase | 1,100,000 EUR | $1,289,072 | $25,868 |
| 2/8/2018 | Goldman Sachs | 1,300,000 GBP | 193,156,470 JPY | $39,804 |
| 2/8/2018 | JPMorgan Chase | 300,000 GBP | $403,270 | $3,440 |
| 2/8/2018 | JPMorgan Chase | 319,112,451 JPY | $2,810,000 | $35,907 |
| 2/8/2018 | JPMorgan Chase | 6,417,566 PLN | $1,800,000 | $19,225 |
| 2/8/2018 | JPMorgan Chase | 1,438,457 SEK | $171,429 | $1,261 |
| Contracts Sold: | ||||
| 12/1/2017 | Citibank N.A. | 2,643,000 AUD | $2,009,983 | $10,818 |
| 12/1/2017 | Goldman Sachs | 8,804,000 CAD | $6,881,980 | $57,967 |
| 12/1/2017 | JPMorgan Chase | 20,525,000 CHF | $20,708,561 | $(155,480) |
| 12/1/2017 | JPMorgan Chase | 848,000 EUR | $1,008,483 | $(848) |
| 12/1/2017 | JPMorgan Chase | 9,682,000 GBP | $12,825,135 | $(268,804) |
| 12/1/2017 | JPMorgan Chase | 1,142,910,000 JPY | $10,275,085 | $119,947 |
| 12/1/2017 | JPMorgan Chase | 122,974,000 MXN | $6,463,792 | $(135,242) |
| 12/1/2017 | JPMorgan Chase | 58,038,000 NOK | $7,083,371 | $107,188 |
| 12/1/2017 | JPMorgan Chase | 4,843,000 NZD | $3,359,478 | $49,288 |
| 12/1/2017 | JPMorgan Chase | 103,593,000 SEK | $12,242,031 | $(133,267) |
| 12/1/2017 | JPMorgan Chase | 9,080,000 SGD | $6,696,817 | $(36,091) |
| 12/1/2017 | Barclays Bank PLC | 27,919,000 TRY | $7,101,307 | $(28,344) |
| 12/4/2017 | Citibank N.A. | 175,965 BRL | $55,172 | $1,417 |
| 12/4/2017 | Citibank N.A. | 178,535 BRL | $56,041 | $1,501 |
| 12/8/2017 | Citibank N.A. | 55,600 AUD | $44,118 | $2,063 |
| 12/8/2017 | Bank of America N.A. | 13,940,000 AUD | $10,600,534 | $56,638 |
| 12/8/2017 | Citibank N.A. | 62,100 CAD | $49,748 | $1,610 |
| 12/8/2017 | JPMorgan Chase | 20,525,000 CHF | $20,907,098 | $37,966 |
| 12/8/2017 | Citibank N.A. | 126,500 EUR | $151,297 | $700 |
| 12/8/2017 | Citibank N.A. | 134,800 GBP | $174,772 | $(7,549) |
| 12/8/2017 | Citibank N.A. | 15,749,800 JPY | $143,890 | $3,927 |
| 12/8/2017 | Bank of America N.A. | 39,242,350 JPY | $350,000 | $1,266 |
| 12/8/2017 | JPMorgan Chase | 37,206,000 MXN | $2,005,147 | $10,066 |
| 12/8/2017 | Citibank N.A. | 52,000 NZD | $37,269 | $1,730 |
| 12/8/2017 | JPMorgan Chase | 29,894,000 SEK | $3,593,669 | $21,748 |
| 12/8/2017 | JPMorgan Chase | 9,080,000 SGD | $6,755,671 | $22,620 |
| 12/19/2017 | JPMorgan Chase | 169,936,140 JPY | $1,500,000 | $(11,165) |
| 12/19/2017 | Citibank N.A. | 1,197,493,000 KRW | $1,107,754 | $7,265 |
| 12/19/2017 | Citibank N.A. | 2,262,720,000 KRW | $2,000,106 | $(79,320) |
| 12/19/2017 | Citibank N.A. | 2,398,137,000 KRW | $2,094,809 | $(109,064) |
| Settlement Date | Counterparty | Currency Units to Deliver/Receive | In Exchange For | Unrealized Appreciation (Depreciation) |
| Contracts Sold: (continued) | ||||
| 12/19/2017 | Citibank N.A. | 5,200,000,000 KRW | $4,568,216 | $(210,552) |
| 12/19/2017 | Citibank N.A. | 5,791,708,000 KRW | $5,201,821 | $(120,722) |
| 12/19/2017 | Citibank N.A. | 8,488,200,000 KRW | $7,450,364 | $(350,239) |
| 12/19/2017 | Citibank N.A. | 13,335,735,000 KRW | $11,943,162 | $(312,295) |
| 2/8/2018 | Citibank N.A. | 850,000 AUD | $648,423 | $5,706 |
| 2/8/2018 | Citibank N.A. | 2,180,887 CAD | 1,300,000 GBP | $70,292 |
| 2/8/2018 | JPMorgan Chase | 575,000 EUR | 509,622 GBP | $3,540 |
| 2/8/2018 | JPMorgan Chase | 1,200,000 EUR | 1,061,225 GBP | $4,224 |
| 2/8/2018 | JPMorgan Chase | 800,000 EUR | 60,840,000 INR | $(19,394) |
| 2/8/2018 | Citibank N.A. | 170,000 EUR | 22,670,486 JPY | $(1,038) |
| 2/8/2018 | Citibank N.A. | 510,000 EUR | 67,903,389 JPY | $(4,078) |
| 2/8/2018 | Citibank N.A. | 1,020,000 EUR | 136,077,180 JPY | $(5,745) |
| 2/8/2018 | Citibank N.A. | 850,000 EUR | 8,237,943 NOK | $(23,802) |
| 2/8/2018 | Citibank N.A. | 850,000 EUR | 8,294,574 NOK | $(16,981) |
| 2/8/2018 | JPMorgan Chase | 1,250,000 EUR | 11,855,937 NOK | $(66,163) |
| 2/8/2018 | JPMorgan Chase | 850,000 EUR | 8,396,862 SEK | $(8,030) |
| 2/8/2018 | Bank of America N.A. | 1,700,000 EUR | 16,588,515 SEK | $(40,696) |
| 2/8/2018 | JPMorgan Chase | 400,000 EUR | $473,818 | $(4,341) |
| 2/8/2018 | JPMorgan Chase | 405,556 EUR | $480,400 | $(4,402) |
| 2/8/2018 | JPMorgan Chase | 590,000 EUR | $697,672 | $(7,614) |
| 2/8/2018 | JPMorgan Chase | 694,444 EUR | $820,238 | $(9,900) |
| 2/8/2018 | JPMorgan Chase | 1,020,000 EUR | $1,206,145 | $(13,162) |
| 2/8/2018 | Goldman Sachs | 1,300,000 GBP | 194,335,440 JPY | $(29,289) |
| 2/8/2018 | JPMorgan Chase | 750,000 GBP | $986,297 | $(30,479) |
| 2/8/2018 | JPMorgan Chase | 156,753,100 JPY | $1,400,000 | $2,045 |
| 2/8/2018 | JPMorgan Chase | 7,756,531 MXN | $400,000 | $(11,473) |
| 2/8/2018 | JPMorgan Chase | 15,141,214 MXN | $775,000 | $(28,218) |
| 2/8/2018 | JPMorgan Chase | 4,603,317 PLN | $1,300,000 | $(4,929) |
| 2/8/2018 | JPMorgan Chase | 1,433,862 SEK | $171,429 | $(709) |
| NET UNREALIZED DEPRECIATION ON FOREIGN EXCHANGE CONTRACTS | $(459,745) | |||
| 1 | Non-income-producing security. |
| 2 | Market quotations and price evaluations are not available. Fair value determined using significant unobservable unputs in accordance with procedures established by and under the general supervision of the Trustees. |
| 3 | Affiliated holdings and company. |
| Balance of Shares Held 11/30/2016 | Purchases/ Additions | Sales/ Reductions | |
| Emerging Markets Core Fund | 3,909,381 | 838,940 | (1,412,443) |
| Federated Bank Loan Core Fund | 328,747 | 43,550 | (96,539) |
| Federated Mortgage Core Portfolio | 2,299,720 | 215,325 | (1,026,784) |
| Federated Project and Trade Finance Core | 477,719 | 20,596 | — |
| Federated Institutional Prime Value Obligations Fund, Institutional Shares | 2,515,694 | 142,997,332 | (145,513,026) |
| High Yield Bond Portfolio | 965,365 | 139,202 | (343,177) |
| TOTAL OF AFFILIATED TRANSACTIONS | 10,496,626 | 144,254,945 | (148,391,969) |
| Balance of Shares Held 11/30/2017 | Value | Change in Unrealized Appreciation/ Depreciation | Net Realized Gain/(Loss) | Dividend Income | Gain Distributions Received |
| 3,335,878 | $33,925,874 | $1,687,038 | $(703,446) | $1,943,914 | $314,673 |
| 275,758 | $2,779,644 | $(2,873) | $1,664 | $140,405 | $— |
| 1,488,261 | $14,570,073 | $60,385 | $(169,655) | $448,431 | $— |
| 498,315 | $4,534,664 | $(97,343) | $— | $189,209 | $— |
| — | $— | $(252) | $2,674 | $45,897 | $— |
| 761,390 | $4,880,513 | $43,530 | $105,909 | $295,807 | $— |
| 6,359,602 | $60,690,768 | $1,690,485 | $(762,854) | $3,063,663 | $314,673 |
| 4 | Floating/variable note with current rate and current maturity or next reset date shown. Certain variable rate securities are not based on a published reference rate and spread but are determined by the issuer or agent and are based on current market conditions. These securities do not indicate a reference rate and spread in their description above. |
| 5 | Issuer in default. |
| 6 | The cost of investments for federal tax purposes amounts to $358,383,710. |
| 7 | Assets, other than investments in securities, less liabilities. See Statement of Assets and Liabilities. |
| Valuation Inputs | ||||
| Level 1— Quoted Prices | Level 2— Other Significant Observable Inputs | Level 3— Significant Unobservable Inputs | Total | |
| Equity Securities: | ||||
| Common Stocks | ||||
| Domestic | $142,129,826 | $— | $2,880 | $142,132,706 |
| International | 9,298,753 | 95,341,444 | — | 104,640,197 |
| Debt Securities: | ||||
| Asset-Backed Securities | — | 1,137,425 | — | 1,137,425 |
| Commercial Mortgage-Backed Securities | — | 735,796 | — | 735,796 |
| Collateralized Mortgage Obligations | — | 2,267,930 | — | 2,267,930 |
| Corporate Bonds | — | 28,163,412 | 89,514 | 28,252,926 |
| Mortgage-Backed Securities | — | 133,177 | — | 133,177 |
| Foreign Governments/Agencies | — | 31,592,683 | — | 31,592,683 |
| Municipal Bond | — | 116,285 | — | 116,285 |
| U.S. Treasury | — | 10,243,529 | — | 10,243,529 |
| Exchange-Traded Funds | 33,644,654 | — | — | 33,644,654 |
| Purchased Put Options | — | 1,833 | — | 1,833 |
| Investment Companies1 | — | — | — | 60,690,768 |
| TOTAL SECURITIES | $185,073,233 | $169,733,514 | $92,394 | $415,589,909 |
| Other Financial Instruments2 | ||||
| Assets | ||||
| Futures Contracts | $2,128,107 | $— | $— | $2,128,107 |
| Foreign-Exchange Contracts | — | 2,526,913 | — | 2,526,913 |
| Liabilities | ||||
| Futures Contracts | (917,278) | — | — | (917,278) |
| Foreign-Exchange Contracts | — | (2,986,658) | — | (2,986,658) |
| TOTAL OTHER FINANCIAL INSTRUMENTS | $1,210,829 | $(459,745) | $— | $751,084 |
| 1 | As permitted by U.S. generally accepted accounting principles (GAAP), Investment Companies valued at $60,690,768 are measured at fair value using the net asset value (NAV) per share practical expedient and have not been categorized in the chart above but are included in the Total column. The amount included herein is intended to permit reconciliation of the fair value classifications to the amounts presented on the Statement of Assets and Liabilities. The price of shares redeemed in Emerging Markets Core Fund, Federated Bank Loan Core Fund, Federated Mortgage Core Portfolio and High Yield Bond Portfolio is the next determined NAV after receipt of a shareholder redemption request. The price of shares redeemed of Federated Project and Trade Finance Core Fund may be determined as of the closing NAV of the fund up to twenty-four days after receipt of a shareholder redemption request. |
| 2 | Other financial instruments include futures contracts and foreign-exchange contracts. |
| AUD | —Australian Dollar |
| BKNT | —Bank Notes |
| BRL | —Brazilian Real |
| CAD | —Canadian Dollar |
| CHF | —Swiss Franc |
| CVR | —Contingent Value Right |
| ETF | —Exchange-Traded Fund |
| EUR | —Euro |
| GBP | —British Pound |
| GDR | —Global Depository Receipt |
| GO | —General Obligation |
| JPY | —Japanese Yen |
| KRW | —South Korean Won |
| LIBOR | —London Interbank Offered Rate |
| MTN | —Medium Term Note |
| MXN | —Mexican Peso |
| NOK | —Norwegian Krone |
| NZD | —New Zealand Dollar |
| PLN | —Polish Zloty |
| REIT | —Real Estate Investment Trust |
| SEK | —Swedish Krona |
| SGD | —Singapore Dollar |
| TRY | —Turkish Lira |
| USD | —United States Dollar |
| Year Ended November 30 | 2017 | 2016 | 2015 | 2014 | 2013 |
| Net Asset Value, Beginning of Period | $17.49 | $17.87 | $20.29 | $21.47 | $18.68 |
| Income From Investment Operations: | |||||
| Net investment income | 0.281 | 0.291 | 0.271 | 0.181 | 0.171 |
| Net realized and unrealized gain (loss) on investments, futures contracts, written options and foreign currency transactions | 2.63 | (0.37) | (0.80) | 1.10 | 3.07 |
| TOTAL FROM INVESTMENT OPERATIONS | 2.91 | (0.08) | (0.53) | 1.28 | 3.24 |
| Less Distributions: | |||||
| Distributions from net investment income | (0.31) | (0.29) | (0.17) | (0.12) | (0.16) |
| Distributions from net realized gain on investments, futures contracts, written options and foreign currency transactions | — | (0.01) | (1.72) | (2.34) | (0.29) |
| TOTAL DISTRIBUTIONS | (0.31) | (0.30) | (1.89) | (2.46) | (0.45) |
| Redemption Fees | — | — | — | 0.002 | — |
| Net Asset Value, End of Period | $20.09 | $17.49 | $17.87 | $20.29 | $21.47 |
| Total Return3 | 16.85% | (0.68)% | (2.80)% | 6.53% | 17.73% |
| Ratios to Average Net Assets: | |||||
| Net expenses | 1.14% | 1.14% | 1.16% | 1.14% | 1.17% |
| Net investment income | 1.50% | 1.65% | 1.45% | 0.93% | 0.88% |
| Expense waiver/reimbursement4 | 0.18% | 0.17% | 0.13% | 0.10% | 0.10% |
| Supplemental Data: | |||||
| Net assets, end of period (000 omitted) | $169,424 | $169,443 | $187,183 | $196,067 | $193,678 |
| Portfolio turnover | 58% | 105% | 76% | 100% | 106% |
| 1 | Per share numbers have been calculated using the average shares method. |
| 2 | Represents less than $0.01. |
| 3 | Based on net asset value, which does not reflect the sales charge, redemption fee or contingent deferred sales charge, if applicable. |
| 4 | This expense decrease is reflected in both the net expense and the net investment income ratios shown above. |
| Year Ended November 30 | 2017 | 2016 | 2015 | 2014 | 2013 |
| Net Asset Value, Beginning of Period | $17.06 | $17.43 | $19.86 | $21.17 | $18.46 |
| Income From Investment Operations: | |||||
| Net investment income | 0.131 | 0.141 | 0.121 | 0.021 | 0.011 |
| Net realized and unrealized gain (loss) on investments, futures contracts, written options and foreign currency transactions | 2.55 | (0.35) | (0.78) | 1.07 | 3.04 |
| TOTAL FROM INVESTMENT OPERATIONS | 2.68 | (0.21) | (0.66) | 1.09 | 3.05 |
| Less Distributions: | |||||
| Distributions from net investment income | (0.16) | (0.15) | (0.05) | (0.06) | (0.05) |
| Distributions from net realized gain on investments, futures contracts, written options and foreign currency transactions | — | (0.01) | (1.72) | (2.34) | (0.29) |
| TOTAL DISTRIBUTIONS | (0.16) | (0.16) | (1.77) | (2.40) | (0.34) |
| Redemption Fees | — | — | — | 0.002 | — |
| Net Asset Value, End of Period | $19.58 | $17.06 | $17.43 | $19.86 | $21.17 |
| Total Return3 | 15.84% | (1.46)% | (3.59)% | 5.67% | 16.82% |
| Ratios to Average Net Assets: | |||||
| Net expenses | 1.95% | 1.95% | 1.97% | 1.95% | 1.99% |
| Net investment income | 0.70% | 0.85% | 0.64% | 0.12% | 0.06% |
| Expense waiver/reimbursement4 | 0.20% | 0.18% | 0.12% | 0.10% | 0.10% |
| Supplemental Data: | |||||
| Net assets, end of period (000 omitted) | $14,342 | $16,037 | $21,384 | $26,163 | $30,675 |
| Portfolio turnover | 58% | 105% | 76% | 100% | 106% |
| 1 | Per share numbers have been calculated using the average shares method. |
| 2 | Represents less than $0.01. |
| 3 | Based on net asset value, which does not reflect the sales charge, redemption fee or contingent deferred sales charge, if applicable. |
| 4 | This expense decrease is reflected in both the net expense and the net investment income ratios shown above. |
| Year Ended November 30 | 2017 | 2016 | 2015 | 2014 | 2013 |
| Net Asset Value, Beginning of Period | $17.00 | $17.37 | $19.80 | $21.11 | $18.40 |
| Income From Investment Operations: | |||||
| Net investment income | 0.141 | 0.151 | 0.131 | 0.031 | 0.021 |
| Net realized and unrealized gain (loss) on investments, futures contracts, written options and foreign currency transactions | 2.55 | (0.35) | (0.78) | 1.07 | 3.03 |
| TOTAL FROM INVESTMENT OPERATIONS | 2.69 | (0.20) | (0.65) | 1.10 | 3.05 |
| Less Distributions: | |||||
| Distributions from net investment income | (0.18) | (0.16) | (0.06) | (0.07) | (0.05) |
| Distributions from net realized gain on investments, futures contracts, written options and foreign currency transactions | — | (0.01) | (1.72) | (2.34) | (0.29) |
| TOTAL DISTRIBUTIONS | (0.18) | (0.17) | (1.78) | (2.41) | (0.34) |
| Redemption Fees | — | — | — | 0.002 | — |
| Net Asset Value, End of Period | $19.51 | $17.00 | $17.37 | $19.80 | $21.11 |
| Total Return3 | 15.92% | (1.44)% | (3.55)% | 5.70% | 16.89% |
| Ratios to Average Net Assets: | |||||
| Net expenses | 1.89% | 1.89% | 1.91% | 1.89% | 1.95% |
| Net investment income | 0.75% | 0.91% | 0.70% | 0.17% | 0.10% |
| Expense waiver/reimbursement4 | 0.21% | 0.20% | 0.15% | 0.13% | 0.10% |
| Supplemental Data: | |||||
| Net assets, end of period (000 omitted) | $78,445 | $82,845 | $89,640 | $81,703 | $71,450 |
| Portfolio turnover | 58% | 105% | 76% | 100% | 106% |
| 1 | Per share numbers have been calculated using the average shares method. |
| 2 | Represents less than $0.01. |
| 3 | Based on net asset value, which does not reflect the sales charge, redemption fee or contingent deferred sales charge, if applicable. |
| 4 | This expense decrease is reflected in both the net expense and the net investment income ratios shown above. |
| Year Ended November 30 | 2017 | 2016 | 2015 | 2014 | 2013 |
| Net Asset Value, Beginning of Period | $17.38 | $17.74 | $20.16 | $21.40 | $18.62 |
| Income From Investment Operations: | |||||
| Net investment income | 0.201 | 0.211 | 0.191 | 0.101 | 0.091 |
| Net realized and unrealized gain (loss) on investments, futures contracts, written options and foreign currency transactions | 2.61 | (0.36) | (0.80) | 1.08 | 3.07 |
| TOTAL FROM INVESTMENT OPERATIONS | 2.81 | (0.15) | (0.61) | 1.18 | 3.16 |
| Less Distributions: | |||||
| Distributions from net investment income | (0.25) | (0.20) | (0.09) | (0.08) | (0.09) |
| Distributions from net realized gain on investments, futures contracts, written options and foreign currency transactions | — | (0.01) | (1.72) | (2.34) | (0.29) |
| TOTAL DISTRIBUTIONS | (0.25) | (0.21) | (1.81) | (2.42) | (0.38) |
| Redemption Fees | — | — | — | 0.002 | — |
| Net Asset Value, End of Period | $19.94 | $17.38 | $17.74 | $20.16 | $21.40 |
| Total Return3 | 16.32% | (1.12)% | (3.26)% | 6.06% | 17.29% |
| Ratios to Average Net Assets: | |||||
| Net expenses | 1.57% | 1.56% | 1.59% | 1.57% | 1.57% |
| Net investment income | 1.07% | 1.24% | 1.02% | 0.50% | 0.48% |
| Expense waiver/reimbursement4 | 0.18% | 0.18% | 0.14% | 0.09% | 0.10% |
| Supplemental Data: | |||||
| Net assets, end of period (000 omitted) | $51,768 | $52,430 | $59,229 | $67,588 | $67,769 |
| Portfolio turnover | 58% | 105% | 76% | 100% | 106% |
| 1 | Per share numbers have been calculated using the average shares method. |
| 2 | Represents less than $0.01. |
| 3 | Based on net asset value. |
| 4 | This expense decrease is reflected in both the net expense and the net investment income ratios shown above. |
| Year Ended November 30 | 2017 | 2016 | 2015 | 2014 | 2013 |
| Net Asset Value, Beginning of Period | $17.61 | $17.98 | $20.40 | $21.54 | $18.74 |
| Income From Investment Operations: | |||||
| Net investment income | 0.331 | 0.341 | 0.321 | 0.241 | 0.231 |
| Net realized and unrealized gain (loss) on investments, futures contracts, written options and foreign currency transactions | 2.65 | (0.37) | (0.80) | 1.10 | 3.08 |
| TOTAL FROM INVESTMENT OPERATIONS | 2.98 | (0.03) | (0.48) | 1.34 | 3.31 |
| Less Distributions: | |||||
| Distributions from net investment income | (0.38) | (0.33) | (0.22) | (0.14) | (0.22) |
| Distributions from net realized gain on investments, futures contracts, written options and foreign currency transactions | — | (0.01) | (1.72) | (2.34) | (0.29) |
| TOTAL DISTRIBUTIONS | (0.38) | (0.34) | (1.94) | (2.48) | (0.51) |
| Redemption Fees | — | — | — | 0.002 | — |
| Net Asset Value, End of Period | $20.21 | $17.61 | $17.98 | $20.40 | $21.54 |
| Total Return3 | 17.13% | (0.37)% | (2.51)% | 6.85% | 18.07% |
| Ratios to Average Net Assets: | |||||
| Net expenses | 0.85% | 0.85% | 0.87% | 0.85% | 0.89% |
| Net investment income | 1.77% | 1.95% | 1.74% | 1.21% | 1.16% |
| Expense waiver/reimbursement4 | 0.20% | 0.20% | 0.14% | 0.12% | 0.10% |
| Supplemental Data: | |||||
| Net assets, end of period (000 omitted) | $105,720 | $91,167 | $115,108 | $62,451 | $48,353 |
| Portfolio turnover | 58% | 105% | 76% | 100% | 106% |
| 1 | Per share numbers have been calculated using the average shares method. |
| 2 | Represents less than $0.01. |
| 3 | Based on net asset value. |
| 4 | This expense decrease is reflected in both the net expense and the net investment income ratios shown above. |
| Year Ended 11/30/2017 | Period Ended 11/30/20161 | |
| Net Asset Value, Beginning of Period | $17.51 | $16.97 |
| Income From Investment Operations: | ||
| Net investment income | 0.332 | 0.112 |
| Net realized and unrealized gain on investments, futures contracts and foreign currency transactions | 2.63 | 0.56 |
| TOTAL FROM INVESTMENT OPERATIONS | 2.96 | 0.67 |
| Less Distributions: | ||
| Distributions from net investment income | (0.37) | (0.13) |
| Distributions from net realized gain on investments, futures contracts, written options and foreign currency transactions | — | — |
| TOTAL DISTRIBUTIONS | (0.37) | (0.13) |
| Net Asset Value, End of Period | $20.10 | $17.51 |
| Total Return3 | 17.14% | 3.94% |
| Ratios to Average Net Assets: | ||
| Net expenses | 0.83% | 0.84%4 |
| Net investment income | 1.78% | 1.48%4 |
| Expense waiver/reimbursement5 | 0.17% | 0.16%4 |
| Supplemental Data: | ||
| Net assets, end of period (000 omitted) | $6,243 | $4,853 |
| Portfolio turnover | 58% | 105%6 |
| 1 | Reflects operations for the period from June 29, 2016 (date of initial investment) to November 30, 2016. |
| 2 | Per share numbers have been calculated using the average shares method. |
| 3 | Based on net asset value. Total returns for periods of less than one year are not annualized. |
| 4 | Computed on an annualized basis. |
| 5 | This expense decrease is reflected in both the net expense and the net investment income ratios shown above. |
| 6 | Portfolio turnover is calculated at the Fund level. Percentage indicated was calculated for the year ended November 30, 2016. |
| Assets: | ||
| Investment in securities, at value including $60,690,768 of investment in affiliated holdings (identified cost $354,331,176) | $415,589,909 | |
| Cash denominated in foreign currencies (identified cost $4,927,030) | 5,078,522 | |
| Restricted cash (Note 2) | 9,345,041 | |
| Income receivable | 1,362,758 | |
| Receivable for investments sold | 351,517 | |
| Receivable for shares sold | 148,035 | |
| Unrealized appreciation on foreign exchange contracts | 2,526,913 | |
| Receivable for daily variation margin on futures contracts | 1,178,587 | |
| TOTAL ASSETS | 435,581,282 | |
| Liabilities: | ||
| Payable for investments purchased | $287,479 | |
| Payable for shares redeemed | 435,593 | |
| Unrealized depreciation on foreign exchange contracts | 2,986,658 | |
| Bank overdraft | 5,461,572 | |
| Payable to adviser (Note 5) | 6,838 | |
| Payable for administrative fees (Note 5) | 932 | |
| Payable for distribution services fee (Note 5) | 77,947 | |
| Payable for other service fees (Notes 2 and 5) | 52,617 | |
| Accrued expenses (Note 5) | 328,998 | |
| TOTAL LIABILITIES | 9,638,634 | |
| Net assets for 21,323,323 shares outstanding | $425,942,648 | |
| Net Assets Consist of: | ||
| Paid-in capital | $373,139,014 | |
| Net unrealized appreciation of investments, futures contracts and translation of assets and liabilities in foreign currency | 62,164,827 | |
| Accumulated net realized loss on investments, futures contracts, written options and foreign currency transactions | (11,109,212) | |
| Undistributed net investment income | 1,748,019 | |
| TOTAL NET ASSETS | $425,942,648 |
| Net Asset Value, Offering Price and Redemption Proceeds Per Share | ||
| Class A Shares: | ||
| Net asset value per share ($169,423,703 ÷ 8,433,610 shares outstanding), no par value, unlimited shares authorized | $20.09 | |
| Offering price per share (100/94.50 of $20.09) | $21.26 | |
| Redemption proceeds per share | $20.09 | |
| Class B Shares: | ||
| Net asset value per share ($14,341,784 ÷ 732,409 shares outstanding), no par value, unlimited shares authorized | $19.58 | |
| Offering price per share | $19.58 | |
| Redemption proceeds per share (94.50/100 of $19.58) | $18.50 | |
| Class C Shares: | ||
| Net asset value per share ($78,445,232 ÷ 4,019,811 shares outstanding), no par value, unlimited shares authorized | $19.51 | |
| Offering price per share | $19.51 | |
| Redemption proceeds per share (99.00/100 of $19.51) | $19.31 | |
| Class R Shares: | ||
| Net asset value per share ($51,768,498 ÷ 2,595,802 shares outstanding), no par value, unlimited shares authorized | $19.94 | |
| Offering price per share | $19.94 | |
| Redemption proceeds per share | $19.94 | |
| Institutional Shares: | ||
| Net asset value per share ($105,720,102 ÷ 5,231,121 shares outstanding), no par value, unlimited shares authorized | $20.21 | |
| Offering price per share | $20.21 | |
| Redemption proceeds per share | $20.21 | |
| Class R6 Shares: | ||
| Net asset value per share ($6,243,329 ÷ 310,570 shares outstanding), no par value, unlimited shares authorized | $20.10 | |
| Offering price per share | $20.10 | |
| Redemption proceeds per share | $20.10 |
| Investment Income: | |||
| Dividends (including $3,063,663 received from affiliated holdings and net of foreign taxes withheld of $280,320) | $9,351,737 | ||
| Interest | 1,715,024 | ||
| TOTAL INCOME | 11,066,761 | ||
| Expenses: | |||
| Investment adviser fee (Note 5) | $2,927,258 | ||
| Administrative fee (Note 5) | 331,065 | ||
| Custodian fees | 243,080 | ||
| Transfer agent fee (Note 2) | 681,436 | ||
| Directors'/Trustees' fees (Note 5) | 11,638 | ||
| Auditing fees | 36,074 | ||
| Legal fees | 8,020 | ||
| Portfolio accounting fees | 181,715 | ||
| Distribution services fee (Note 5) | 979,126 | ||
| Other service fees (Notes 2 and 5) | 654,974 | ||
| Share registration costs | 102,374 | ||
| Printing and postage | 47,469 | ||
| Miscellaneous (Note 5) | 46,717 | ||
| TOTAL EXPENSES | 6,250,946 | ||
| Waiver and Reimbursements: | |||
| Waiver/reimbursement of investment adviser fee (Note 5) | $(711,230) | ||
| Reimbursements of other operating expenses (Notes 2 and 5) | (94,024) | ||
| TOTAL WAIVER AND REIMBURSEMENTS | (805,254) | ||
| Net expenses | 5,445,692 | ||
| Net investment income | 5,621,069 |
| Realized and Unrealized Gain (Loss) on Investments, Futures Contracts, Written Options, Foreign Exchange Contracts and Foreign Currency Transactions: | |||
| Net realized gain on investments (including realized loss of $(762,854) on sales of investments in affiliated holdings) | $14,383,129 | ||
| Net realized loss on foreign currency and foreign currency related transactions | (48,598) | ||
| Net realized loss on foreign exchange contracts | (1,544,497) | ||
| Net realized gain on futures contracts | 1,088,833 | ||
| Net realized gain on written options | 14,480 | ||
| Realized gain distribution from affiliated investment company shares | 314,673 | ||
| Net change in unrealized appreciation of investments (including change in unrealized appreciation of $1,690,485 on investments in affiliated holdings) | 45,151,009 | ||
| Net change in unrealized appreciation/depreciation of translation of assets and liabilities in foreign currency | 298,441 | ||
| Net change in unrealized appreciation of foreign currency exchange contracts | (1,551,852) | ||
| Net change in unrealized appreciation of futures contracts | 845,486 | ||
| Net realized and unrealized gain on investments, futures contracts, written options and foreign currency transactions | 58,951,104 | ||
| Change in net assets resulting from operations | $64,572,173 |
| Year Ended November 30 | 2017 | 2016 |
| Increase (Decrease) in Net Assets | ||
| Operations: | ||
| Net investment income | $5,621,069 | $6,695,715 |
| Net realized gain (loss) on investments, investments including allocation from affiliated partnership, futures contracts, written option transactions and foreign currency transactions | 14,208,020 | (18,571,355) |
| Net change in unrealized appreciation/depreciation of investments, futures contracts and foreign currency translation of assets and liabilities in foreign currency | 44,743,084 | 8,901,923 |
| CHANGE IN NET ASSETS RESULTING FROM OPERATIONS | 64,572,173 | (2,973,717) |
| Distributions to Shareholders: | ||
| Distributions from net investment income | ||
| Class A Shares | (2,871,842) | (2,974,140) |
| Class B Shares | (143,286) | (166,132) |
| Class C Shares | (806,356) | (848,140) |
| Class R Shares | (723,829) | (650,652) |
| Institutional Shares | (1,924,996) | (2,108,995) |
| Class R6 Shares | (106,550) | (12,378) |
| Distributions from net realized gain on investments, investments including allocation from affiliated partnership, futures contracts, written option transactions and foreign currency transactions | ||
| Class A Shares | — | (61,424) |
| Class B Shares | — | (7,046) |
| Class C Shares | — | (30,958) |
| Class R Shares | — | (19,376) |
| Institutional Shares | — | (37,846) |
| Class R6 Shares | — | — |
| CHANGE IN NET ASSETS RESULTING FROM DISTRIBUTIONS TO SHAREHOLDERS | (6,576,859) | (6,917,087) |
| Share Transactions: | ||
| Proceeds from sale of shares | 74,058,895 | 104,578,274 |
| Net asset value of shares issued to shareholders in payment of distributions declared | 6,150,103 | 6,476,003 |
| Cost of shares redeemed | (129,036,005) | (156,933,274) |
| CHANGE IN NET ASSETS RESULTING FROM SHARE TRANSACTIONS | (48,827,007) | (45,878,997) |
| Change in net assets | 9,168,307 | (55,769,801) |
| Net Assets: | ||
| Beginning of period | 416,774,341 | 472,544,142 |
| End of period (including undistributed net investment income of $1,748,019 and $1,925,795, respectively) | $425,942,648 | $416,774,341 |
| ■ | Equity securities listed on an exchange or traded through a regulated market system are valued at their last reported sale price or official closing price in their principal exchange or market. |
| ■ | Fixed-income securities are fair valued using price evaluations provided by a pricing service approved by the Trustees. |
| ■ | Shares of other mutual funds or non-exchange-traded investment companies are valued based upon their reported NAVs. |
| ■ | Derivative contracts listed on exchanges are valued at their reported settlement or closing price, except that options are valued at the mean of closing bid and asked quotations. |
| ■ | Over-the-counter (OTC) derivative contracts are fair valued using price evaluations provided by a pricing service approved by the Trustees. |
| ■ | For securities that are fair valued in accordance with procedures established by and under the general supervision of the Trustees, certain factors may be considered, such as: the last traded or purchase price of the security, information obtained by contacting the issuer or dealers, analysis of the issuer's financial statements or other available documents, fundamental analytical data, the nature and duration of restrictions on disposition, the movement of the market in which the security is normally traded, public trading in similar securities or derivative contracts of the issuer or comparable issuers, movement of a relevant index, or other factors including but not limited to industry changes and relevant government actions. |
| ■ | With respect to securities traded principally in foreign markets, significant trends in U.S. equity markets or in the trading of foreign securities index futures contracts; |
| ■ | Political or other developments affecting the economy or markets in which an issuer conducts its operations or its securities are traded; |
| ■ | Announcements concerning matters such as acquisitions, recapitalizations, litigation developments, or a natural disaster affecting the issuer's operations or regulatory changes or market developments affecting the issuer's industry. |
| Transfer Agent Fees Incurred | Transfer Agent Fees Reimbursed | |
| Class A Shares | $228,326 | $(6,456) |
| Class B Shares | 30,997 | (2,448) |
| Class C Shares | 129,958 | (24,984) |
| Class R Shares | 169,004 | (4,178) |
| Institutional Shares | 119,299 | (30,688) |
| Class R6 Shares | 3,852 | — |
| TOTAL | $681,436 | $(68,754) |
| Other Service Fees Incurred | |
| Class A Shares | $416,942 |
| Class B Shares | 37,730 |
| Class C Shares | 200,302 |
| TOTAL | $654,974 |
| Fair Value of Derivative Instruments | ||||
| Asset | Liability | |||
| Statement of Assets and Liabilities Location | Fair Value | Statement of Assets and Liabilities Location | Fair Value | |
| Derivatives not accounted for as hedging instruments under ASC Topic 815 | ||||
| Interest rate contracts | Receivable for daily variation margin on futures contracts | $(397,920)* | — | $— |
| Equity contracts | Receivable for daily variation margin on futures contracts | 1,608,749* | — | — |
| Foreign exchange contracts | Unrealized appreciation on foreign exchange contracts | $2,526,913 | Unrealized depreciation on foreign exchange contracts | $2,986,658 |
| Total derivatives not accounted for as hedging instruments under ASC Topic 815 | $3,737,742 | $2,986,658 | ||
| * | Includes cumulative appreciation of futures contracts as reported in the footnotes to the Portfolio of Investments. Only the current day's variation margin is reported within the Statement of Assets and Liabilities. |
| Amount of Realized Gain or (Loss) on Derivatives Recognized in Income | |||||
| Futures Contracts | Foreign Exchange Contracts1 | Purchased Options1 | Written Options | Total | |
| Interest rate contracts | $(405,705) | $— | $— | $(405,705) | |
| Foreign exchange contracts | — | (1,544,497) | (85,297) | 14,480 | (1,615,314) |
| Equity contracts | 1,494,538 | — | — | — | 1,494,538 |
| TOTAL | $1,088,833 | $(1,544,497) | $(85,297) | $14,480 | $(526,481) |
| Change in Unrealized Appreciation or (Depreciation) on Derivatives Recognized in Income | |||
| Futures Contracts | Foreign Exchange Contracts | Total | |
| Interest rate contracts | $(255,608) | $— | $(255,608) |
| Foreign exchange contracts | — | (1,551,852) | (1,551,852) |
| Equity contracts | 1,101,094 | — | 1,101,094 |
| TOTAL | $845,486 | $(1,551,852) | $(706,366) |
| 1 | The net realized gain (loss) on Purchased Options Contracts is found within the Net realized gain on investments on the Statement of Operations. |
| Gross Amounts Not Offset in the Statement of Assets and Liabilities | ||||
| Transaction | Gross Asset Derivatives Presented in Statement of Assets and Liabilities | Financial Instruments | Collateral Received | Net Amount (not less than $0) |
| Foreign exchange contracts | $2,526,913 | $(2,526,913) | $— | $— |
| TOTAL | $2,526,913 | $(2,526,913) | $— | $— |
| Transaction | Gross Liability Derivatives Presented in Statement of Assets and Liabilities | Financial Instruments | Collateral Received | Net Amount (not less than $0) |
| Foreign exchange contracts | $2,986,658 | $(2,526,913) | $— | $459,745 |
| TOTAL | $2,986,658 | $(2,526,913) | $— | $459,745 |
| Year Ended November 30 | 2017 | 2016 | ||
| Class A Shares: | Shares | Amount | Shares | Amount |
| Shares sold | 804,238 | $15,031,309 | 1,493,146 | $25,748,895 |
| Shares issued to shareholders in payment of distributions declared | 147,474 | 2,687,430 | 164,300 | 2,842,977 |
| Shares redeemed | (2,203,862) | (41,027,283) | (2,446,367) | (42,394,903) |
| NET CHANGE RESULTING FROM CLASS A SHARE TRANSACTIONS | (1,252,150) | $(23,308,544) | (788,921) | $(13,803,031) |
| Year Ended November 30 | 2017 | 2016 | ||
| Class B Shares: | Shares | Amount | Shares | Amount |
| Shares sold | 73,315 | $1,328,192 | 78,698 | $1,325,465 |
| Shares issued to shareholders in payment of distributions declared | 7,688 | 135,106 | 9,736 | 164,083 |
| Shares redeemed | (288,854) | (5,243,193) | (375,205) | (6,312,592) |
| NET CHANGE RESULTING FROM CLASS B SHARE TRANSACTIONS | (207,851) | $(3,779,895) | (286,771) | $(4,823,044) |
| Year Ended November 30 | 2017 | 2016 | ||
| Class C Shares: | Shares | Amount | Shares | Amount |
| Shares sold | 816,064 | $14,783,955 | 1,291,187 | $21,626,173 |
| Shares issued to shareholders in payment of distributions declared | 43,243 | 759,165 | 48,235 | 810,230 |
| Shares redeemed | (1,712,796) | (30,997,211) | (1,625,405) | (27,285,886) |
| NET CHANGE RESULTING FROM CLASS C SHARE TRANSACTIONS | (853,489) | $(15,454,091) | (285,983) | $(4,849,483) |
| Year Ended November 30 | 2017 | 2016 | ||
| Class R Shares: | Shares | Amount | Shares | Amount |
| Shares sold | 721,640 | $13,174,307 | 753,777 | $12,891,329 |
| Shares issued to shareholders in payment of distributions declared | 39,431 | 709,062 | 38,455 | 659,433 |
| Shares redeemed | (1,181,396) | (21,853,540) | (1,114,237) | (19,098,340) |
| NET CHANGE RESULTING FROM CLASS R SHARE TRANSACTIONS | (420,325) | $(7,970,171) | (322,005) | $(5,547,578) |
| Year Ended November 30 | 2017 | 2016 | ||
| Institutional Shares: | Shares | Amount | Shares | Amount |
| Shares sold | 1,495,396 | $28,254,413 | 2,180,465 | $37,581,864 |
| Shares issued to shareholders in payment of distributions declared | 95,370 | 1,753,702 | 114,230 | 1,986,903 |
| Shares redeemed | (1,537,907) | (28,957,302) | (3,520,051) | (61,347,144) |
| NET CHANGE RESULTING FROM INSTITUTIONAL SHARE TRANSACTIONS | 52,859 | $1,050,813 | (1,225,356) | $(21,778,377) |
| Year Ended 11/30/2017 | Period Ended 11/30/20161 | |||
| Class R6 Shares: | Shares | Amount | Shares | Amount |
| Shares sold | 78,839 | $1,486,719 | 304,757 | $5,404,548 |
| Shares issued to shareholders in payment of distributions declared | 5,764 | 105,638 | 695 | 12,377 |
| Shares redeemed | (51,238) | (957,476) | (28,247) | (494,409) |
| NET CHANGE RESULTING FROM CLASS R6 SHARE TRANSACTIONS | 33,365 | $634,881 | 277,205 | $4,922,516 |
| NET CHANGE RESULTING FROM TOTAL FUND SHARE TRANSACTIONS | (2,647,591) | $(48,827,007) | (2,631,831) | $(45,878,997) |
| 1 | Reflects operations for the period from June 29, 2016 (commencement of operations) to November 30, 2016. |
| Increase (Decrease) | |
| Undistributed Net Investment Income (Loss) | Accumulated Net Realized Gain (Loss) |
| $778,014 | $(778,014) |
| 2017 | 2016 | |
| Ordinary income1 | $6,576,859 | $6,760,437 |
| Long-term capital gains | $— | $156,650 |
| 1 | For tax purposes, short-term capital gain distributions are considered as ordinary income distributions. |
| Undistributed ordinary income | $2,145,556 |
| Net unrealized appreciation | $57,396,533 |
| Capital loss carryforwards | $(6,738,455) |
| Expiration Year | Short-Term | Long-Term | Total |
| No Expiration | $1,342,209 | $1,999,201 | $3,341,410 |
| 2018 | $3,397,045 | NA | $3,397,045 |
| Administrative Fee | Average Daily Net Assets of the Investment Complex |
| 0.100% | on assets up to $50 billion |
| 0.075% | on assets over $50 billion |
| Administrative Fee | Average Daily Net Assets of the Investment Complex |
| 0.150% | on the first $5 billion |
| 0.125% | on the next $5 billion |
| 0.100% | on the next $10 billion |
| 0.075% | on assets in excess of $20 billion |
| Share Class Name | Percentage of Average Daily Net Assets of Class |
| Class B Shares | 0.75% |
| Class C Shares | 0.75% |
| Class R Shares | 0.50% |
| Distribution Services Fees Incurred | |
| Class B Shares | $113,191 |
| Class C Shares | 600,907 |
| Class R Shares | 265,028 |
| TOTAL | $979,126 |
| Purchases | $220,090,029 |
| Sales | $270,060,764 |
January 23, 2018
| Beginning Account Value 6/1/2017 | Ending Account Value 11/30/2017 | Expenses Paid During Period1 | |
| Actual: | |||
| Class A Shares | $1,000 | $1,083.10 | $6.01 |
| Class B Shares | $1,000 | $1,078.60 | $10.21 |
| Class C Shares | $1,000 | $1,079.20 | $9.90 |
| Class R Shares | $1,000 | $1,080.80 | $8.24 |
| Institutional Shares | $1,000 | $1,084.70 | $4.49 |
| Class R6 Shares | $1,000 | $1,084.70 | $4.39 |
| Hypothetical (assuming a 5% return before expenses): | |||
| Class A Shares | $1,000 | $1,019.30 | $5.82 |
| Class B Shares | $1,000 | $1,015.30 | $9.90 |
| Class C Shares | $1,000 | $1,015.60 | $9.60 |
| Class R Shares | $1,000 | $1,017.20 | $7.99 |
| Institutional Shares | $1,000 | $1,020.80 | $4.36 |
| Class R6 Shares | $1,000 | $1,020.90 | $4.26 |
| 1 | Expenses are equal to the Fund's annualized net expense ratios, multiplied by the average account value over the period, multiplied by 183/365 (to reflect the one-half-year period). The annualized net expense ratios are as follows: |
| Class A Shares | 1.15% |
| Class B Shares | 1.96% |
| Class C Shares | 1.90% |
| Class R Shares | 1.58% |
| Institutional Shares | 0.86% |
| Class R6 Shares | 0.84% |
| Name Birth Date Positions Held with Trust Date Service Began | Principal Occupation(s) for Past Five Years, Other Directorships Held and Previous Position(s) |
| J. Christopher Donahue* Birth Date: April 11, 1949 President and Trustee Indefinite Term Began serving: November 1998 | Principal Occupations: Principal Executive Officer and President of certain of the Funds in the Federated Fund Family; Director or Trustee of the Funds in the Federated Fund Family; President, Chief Executive Officer and Director, Federated Investors, Inc.; Chairman and Trustee, Federated Investment Management Company; Trustee, Federated Investment Counseling; Chairman and Director, Federated Global Investment Management Corp.; Chairman and Trustee, Federated Equity Management Company of Pennsylvania; Trustee, Federated Shareholder Services Company; Director, Federated Services Company. Previous Positions: President, Federated Investment Counseling; President and Chief Executive Officer, Federated Investment Management Company, Federated Global Investment Management Corp. and Passport Research, Ltd; Chairman, Passport Research, Ltd. |
| Name Birth Date Positions Held with Trust Date Service Began | Principal Occupation(s) for Past Five Years, Other Directorships Held and Previous Position(s) |
| John B. Fisher* Birth Date: May 16, 1956 Trustee Indefinite Term Began serving: May 2016 | Principal Occupations: Principal Executive Officer and President of certain of the Funds in the Federated Fund Family; Director or Trustee of certain of the Funds in the Federated Fund Family; Vice President, Federated Investors, Inc.; President, Director/Trustee and CEO, Federated Advisory Services Company, Federated Equity Management Company of Pennsylvania, Federated Global Investment Management Corp., Federated Investment Counseling, Federated Investment Management Company; President of some of the Funds in the Federated Fund Complex and Director, Federated Investors Trust Company. Previous Positions: President and Director of the Institutional Sales Division of Federated Securities Corp.; President and Director of Federated Investment Counseling; President and CEO of Passport Research, Ltd.; Director, Edgewood Securities Corp.; Director, Federated Services Company; Director, Federated Investors, Inc.; Chairman and Director, Southpointe Distribution Services, Inc. and President, Technology, Federated Services Company. |
| * | Reasons for “interested” status: J. Christopher Donahue and John B. Fisher are interested due to their beneficial ownership of shares of Federated Investors, Inc. and due to positions they hold with Federated and its subsidiaries. |
| Name Birth Date Positions Held with Trust Date Service Began | Principal Occupation(s) for Past Five Years, Other Directorships Held, Previous Position(s) and Qualifications |
| John T. Collins Birth Date: January 24, 1947 Trustee Indefinite Term Began serving: October 2013 | Principal Occupations: Director or Trustee of the Federated Fund Family; formerly, Chairman and CEO, The Collins Group, Inc. (a private equity firm) (Retired). Other Directorships Held: Director, Current Chair of the Compensation Committee, KLX Corp. Qualifications: Mr. Collins has served in several business and financial management roles and directorship positions throughout his career. Mr. Collins previously served as Chairman and CEO, The Collins Group, Inc. (a private equity firm). Mr. Collins serves as Chairman Emeriti, Bentley University. Mr. Collins previously served as Director and Audit Committee Member, Bank of America Corp.; Director, FleetBoston Financial Corp.; and Director, Beth Israel Deaconess Medical Center (Harvard University Affiliate Hospital). |
| Name Birth Date Positions Held with Trust Date Service Began | Principal Occupation(s) for Past Five Years, Other Directorships Held, Previous Position(s) and Qualifications |
| G. Thomas Hough Birth Date: February 28, 1955 Trustee Indefinite Term Began serving: August 2015 | Principal Occupations: Director or Trustee of the Federated Fund Family; formerly, Vice Chair, Ernst & Young LLP (public accounting firm) (Retired). Other Directorships Held: Director, Chair of the Audit Committee, Governance Committee, Publix Super Markets, Inc.; Director, Member of the Audit Committee and Technology Committee of Equifax, Inc. Qualifications: Mr. Hough has served in accounting, business management and directorship positions throughout his career. Mr. Hough most recently held the position of Americas Vice Chair of Assurance with Ernst & Young LLP (public accounting firm). Mr. Hough is an Executive Committee member of the United States Golf Association, he serves on the President's Cabinet and Business School Board of Visitors for the University of Alabama and is on the Business School Board of Visitors for Wake Forest University. |
| Maureen Lally-Green Birth Date: July 5, 1949 Trustee Indefinite Term Began serving: August 2009 | Principal Occupations: Director or Trustee of the Federated Fund Family; Dean of the Duquesne University School of Law; Professor and Adjunct Professor of Law, Duquesne University School of Law; formerly, Interim Dean of the Duquesne University School of Law; Associate General Secretary and Director, Office of Church Relations, Diocese of Pittsburgh. Other Directorships Held: Director, CNX Resources Corporation (formerly known as CONSOL Energy Inc.). Qualifications: Judge Lally-Green has served in various legal and business roles and directorship positions throughout her career. Judge Lally-Green previously served as: Associate General Secretary, Diocese of Pittsburgh; a member of the Superior Court of Pennsylvania; and as a Professor of Law, Duquesne University School of Law. Judge Lally-Green also currently holds the positions on either a public or not for profit Board of Directors as follows: Director and Chair, UPMC Mercy Hospital; Director and Vice Chair, Our Campaign for the Church Alive!, Inc.; Director, Saint Vincent College; Member, Pennsylvania State Board of Education (public); and Director CNX Resources Corporation (formerly known as CONSOL Energy Inc.), where she currently serves as a member of the Compensation, Nominating and Corporate Governance Committee (Chair) and the Health, Safety and Environmental Committee. Judge Lally-Green has held the positions of: Director, Auberle; Director, Epilepsy Foundation of Western and Central Pennsylvania; Director, Ireland Institute of Pittsburgh; Director, Saint Thomas More Society; Director and Chair, Catholic High Schools of the Diocese of Pittsburgh, Inc.; Director, Pennsylvania Bar Institute; Regent, St. Vincent Seminary; and Director and Chair, Cardinal Wuerl North Catholic High School, Inc. |
| Charles F. Mansfield, Jr. Birth Date: April 10, 1945 Trustee Indefinite Term Began serving: November 1998 | Principal Occupations: Director or Trustee of the Federated Fund Family; Management Consultant. Other Directorships Held: None. Qualifications: Mr. Mansfield has served as a Marine Corps officer and in several banking, business management, educational roles and directorship positions throughout his long career. He remains active as a Management Consultant. |
| Name Birth Date Positions Held with Trust Date Service Began | Principal Occupation(s) for Past Five Years, Other Directorships Held, Previous Position(s) and Qualifications |
| Thomas M. O'Neill Birth Date: June 14, 1951 Trustee Indefinite Term Began serving: August 2006 | Principal Occupations: Director or Trustee, Chair of the Audit Committee of the Federated Fund Family; Sole Proprietor, Navigator Management Company (investment and strategic consulting). Other Directorships Held: None. Qualifications: Mr. O'Neill has served in several business, mutual fund and financial management roles and directorship positions throughout his career. Mr. O'Neill serves as Director, Medicines for Humanity and Director, The Golisano Children's Museum of Naples, Florida. Mr. O'Neill previously served as Chief Executive Officer and President, Managing Director and Chief Investment Officer, Fleet Investment Advisors; President and Chief Executive Officer, Aeltus Investment Management, Inc.; General Partner, Hellman, Jordan Management Co., Boston, MA; Chief Investment Officer, The Putnam Companies, Boston, MA; Credit Analyst and Lending Officer, Fleet Bank; Director and Consultant, EZE Castle Software (investment order management software); and Director, Midway Pacific (lumber). |
| P. Jerome Richey Birth Date: February 23, 1949 Trustee Indefinite Term Began serving: October 2013 | Principal Occupations: Director or Trustee of the Federated Fund Family; Management Consultant; formerly, Senior Vice Chancellor and Chief Legal Officer, University of Pittsburgh and Executive Vice President and Chief Legal Officer, CNX Resources Corporation (formerly known as CONSOL Energy Inc.) Other Directorships Held: None. Qualifications: Mr. Richey has served in several business and legal management roles and directorship positions throughout his career. Mr. Richey most recently held the positions of Senior Vice Chancellor and Chief Legal Officer, University of Pittsburgh. Mr. Richey previously served as Chairman of the Board, Epilepsy Foundation of Western Pennsylvania and Chairman of the Board, World Affairs Council of Pittsburgh. Mr. Richey previously served as Chief Legal Officer and Executive Vice President, CNX Resources Corporation (formerly known as CONSOL Energy Inc.); and Board Member, Ethics Counsel and Shareholder, Buchanan Ingersoll & Rooney PC (a law firm). |
| John S. Walsh Birth Date: November 28, 1957 Trustee Indefinite Term Began serving: November 1998 | Principal Occupations: Director or Trustee, and Chair of the Board of Directors or Trustees, of the Federated Fund Family; President and Director, Heat Wagon, Inc. (manufacturer of construction temporary heaters); President and Director, Manufacturers Products, Inc. (distributor of portable construction heaters); President, Portable Heater Parts, a division of Manufacturers Products, Inc. Other Directorships Held: None. Qualifications: Mr. Walsh has served in several business management roles and directorship positions throughout his career. Mr. Walsh previously served as Vice President, Walsh & Kelly, Inc. (paving contractors). |
| Name Birth Date Address Positions Held with Trust Date Service Began | Principal Occupation(s) for Past Five Years and Previous Position(s) |
| Lori A. Hensler Birth Date: January 6, 1967 TREASURER Officer since: April 2013 | Principal Occupations: Principal Financial Officer and Treasurer of the Federated Fund Family; Senior Vice President, Federated Administrative Services; Financial and Operations Principal for Federated Securities Corp. and Edgewood Services, Inc.; and Assistant Treasurer, Federated Investors Trust Company. Ms. Hensler has received the Certified Public Accountant designation. Previous Positions: Controller of Federated Investors, Inc.; Senior Vice President and Assistant Treasurer, Federated Investors Management Company; Treasurer, Federated Investors Trust Company; Assistant Treasurer, Federated Administrative Services, Federated Administrative Services, Inc., Federated Securities Corp., Edgewood Services, Inc., Federated Advisory Services Company, Federated Equity Management Company of Pennsylvania, Federated Global Investment Management Corp., Federated Investment Counseling, Federated Investment Management Company, Passport Research, Ltd., and Federated MDTA, LLC; Financial and Operations Principal for Federated Securities Corp., Edgewood Services, Inc. and Southpointe Distribution Services, Inc. |
| Peter J. Germain Birth Date: September 3, 1959 CHIEF LEGAL OFFICER, SECRETARY and EXECUTIVE VICE PRESIDENT Officer since: January 2005 | Principal Occupations: Mr. Germain is Chief Legal Officer, Secretary and Executive Vice President of the Federated Fund Family. He is General Counsel, Chief Legal Officer, Secretary and Executive Vice President, Federated Investors, Inc.; Trustee and Senior Vice President, Federated Investors Management Company; Trustee and President, Federated Administrative Services; Director and President, Federated Administrative Services, Inc.; Director and Vice President, Federated Securities Corp.; Director and Secretary, Federated Private Asset Management, Inc.; Secretary, Federated Shareholder Services Company; and Secretary, Retirement Plan Service Company of America. Mr. Germain joined Federated in 1984 and is a member of the Pennsylvania Bar Association. Previous Positions: Deputy General Counsel, Special Counsel, Managing Director of Mutual Fund Services, Federated Investors, Inc.; Senior Vice President, Federated Services Company; and Senior Corporate Counsel, Federated Investors, Inc. |
| Richard B. Fisher Birth Date: May 17, 1923 VICE PRESIDENT Officer since: May 1976 | Principal Occupations: Vice Chairman or Vice President of some of the Funds in the Federated Fund Family; Vice Chairman, Federated Investors, Inc.; Chairman, Federated Securities Corp. Previous Positions: President and Director or Trustee of some of the Funds in the Federated Fund Family; Executive Vice President, Federated Investors, Inc.; Director and Chief Executive Officer, Federated Securities Corp. |
| Name Birth Date Address Positions Held with Trust Date Service Began | Principal Occupation(s) for Past Five Years and Previous Position(s) |
| Stephen Van Meter Birth Date: June 5, 1975 CHIEF COMPLIANCE OFFICER AND SENIOR VICE PRESIDENT Officer since: July 2015 | Principal Occupations: Senior Vice President and Chief Compliance Officer of the Federated Fund Family; Vice President and Chief Compliance Officer of Federated Investors, Inc. and Chief Compliance Officer of certain of its subsidiaries. Mr. Van Meter joined Federated in October 2011. He holds FINRA licenses under Series 3, 7, 24 and 66. Previous Positions: Mr. Van Meter previously held the position of Compliance Operating Officer, Federated Investors, Inc. Prior to joining Federated, Mr. Van Meter served at the United States Securities and Exchange Commission in the positions of Senior Counsel, Office of Chief Counsel, Division of Investment Management and Senior Counsel, Division of Enforcement. |
| Stephen F. Auth Birth Date: September 13, 1956 101 Park Avenue 41st Floor New York, NY 10178 CHIEF INVESTMENT OFFICER Officer since: November 2002 | Principal Occupations: Stephen F. Auth is Chief Investment Officer of various Funds in the Federated Fund Family; Executive Vice President, Federated Investment Counseling, Federated Global Investment Management Corp. and Federated Equity Management Company of Pennsylvania. Previous Positions: Executive Vice President, Federated Investment Management Company and Passport Research, Ltd. (investment advisory subsidiary of Federated); Senior Vice President, Global Portfolio Management Services Division; Senior Vice President, Federated Investment Management Company and Passport Research, Ltd.; Senior Managing Director and Portfolio Manager, Prudential Investments. |

4000 Ericsson Drive
Warrendale, PA 15086-7561
or call 1-800-341-7400.
CUSIP 314183203
CUSIP 314183302
CUSIP 314183401
CUSIP 314183500
CUSIP 314183609
2018 ©Federated Investors, Inc.
| Item 2. | Code of Ethics |
(a) As of the end of the period covered by this report, the registrant has adopted a code of ethics (the "Section 406 Standards for Investment Companies - Ethical Standards for Principal Executive and Financial Officers") that applies to the registrant's Principal Executive Officer and Principal Financial Officer; the registrant's Principal Financial Officer also serves as the Principal Accounting Officer.
(c) There was no amendment to the registrant’s code of ethics described in Item 2(a) above during the period covered by the report.
(d) There was no waiver granted, either actual or implicit, from a provision to the registrant’s code of ethics described in Item 2(a) above during the period covered by the report.
(e) Not Applicable
(f)(3) The registrant hereby undertakes to provide any person, without charge, upon request, a copy of the code of ethics. To request a copy of the code of ethics, contact the registrant at 1-800-341-7400, and ask for a copy of the Section 406 Standards for Investment Companies - Ethical Standards for Principal Executive and Financial Officers.
Item 3. Audit Committee Financial Expert
The registrant's Board has determined that each of the following members of the Board's Audit Committee is an “audit committee financial expert,” and is "independent," for purposes of this Item: John T. Collins, G. Thomas Hough and Thomas M. O'Neill.
| Item 4. | Principal Accountant Fees and Services |
(a) Audit Fees billed to the registrant for the two most recent fiscal years:
Fiscal year ended 2017 - $33,400
Fiscal year ended 2016 - $32,270
(b) Audit-Related Fees billed to the registrant for the two most recent fiscal years:
Fiscal year ended 2017 - $2,675
Fiscal year ended 2016 - $4,275
Fiscal year ended 2017- Audit consent fee for N-1A filing.
Fiscal year ended 2016- Audit consent fee for N-1A filing.
Amount requiring approval of the registrant’s audit committee pursuant to paragraph (c)(7)(ii) of Rule 2-01 of Regulation S-X, $0 and $0 respectively.
(c) Tax Fees billed to the registrant for the two most recent fiscal years:
Fiscal year ended 2017 - $0
Fiscal year ended 2016 - $0
Amount requiring approval of the registrant’s audit committee pursuant to paragraph (c)(7)(ii) of Rule 2-01 of Regulation S-X, $0 and $0 respectively.
(d) All Other Fees billed to the registrant for the two most recent fiscal years:
Fiscal year ended 2017 - $0
Fiscal year ended 2016 - $0
Amount requiring approval of the registrant’s audit committee pursuant to paragraph (c)(7)(ii) of Rule 2-01 of Regulation S-X, $0 and $0 respectively.
(e)(1) Audit Committee Policies regarding Pre-approval of Services.
The Audit Committee is required to pre-approve audit and non-audit services performed by the independent auditor in order to assure that the provision of such services do not impair the auditor’s independence. Unless a type of service to be provided by the independent auditor has received general pre-approval, it will require specific pre-approval by the Audit Committee. Any proposed services exceeding pre-approved cost levels will require specific pre-approval by the Audit Committee.
Certain services have the general pre-approval of the Audit Committee. The term of the general pre-approval is 12 months from the date of pre-approval, unless the Audit Committee specifically provides for a different period. The Audit Committee will annually review the services that may be provided by the independent auditor without obtaining specific pre-approval from the Audit Committee and may grant general pre-approval for such services. The Audit Committee will revise the list of general pre-approved services from time to time, based on subsequent determinations. The Audit Committee will not delegate its responsibilities to pre-approve services performed by the independent auditor to management.
The Audit Committee has delegated pre-approval authority to its Chairman. The Chairman will report any pre-approval decisions to the Audit Committee at its next scheduled meeting. The Committee will designate another member with such pre-approval authority when the Chairman is unavailable.
AUDIT SERVICES
The annual Audit services engagement terms and fees will be subject to the specific pre-approval of the Audit Committee. The Audit Committee must approve any changes in terms, conditions and fees resulting from changes in audit scope, registered investment company (RIC) structure or other matters.
In addition to the annual Audit services engagement specifically approved by the Audit Committee, the Audit Committee may grant general pre-approval for other Audit Services, which are those services that only the independent auditor reasonably can provide. The Audit Committee has pre-approved certain Audit services, all other Audit services must be specifically pre-approved by the Audit Committee.
AUDIT-RELATED SERVICES
Audit-related services are assurance and related services that are reasonably related to the performance of the audit or review of the Company’s financial statements or that are traditionally performed by the independent auditor. The Audit Committee believes that the provision of Audit-related services does not impair the independence of the auditor, and has pre-approved certain Audit-related services, all other Audit-related services must be specifically pre-approved by the Audit Committee.
TAX SERVICES
The Audit Committee believes that the independent auditor can provide Tax services to the Company such as tax compliance, tax planning and tax advice without impairing the auditor’s independence. However, the Audit Committee will not permit the retention of the independent auditor in connection with a transaction initially recommended by the independent auditor, the purpose of which may be tax avoidance and the tax treatment of which may not be supported in the Internal Revenue Code and related regulations. The Audit Committee has pre-approved certain Tax services, all Tax services involving large and complex transactions must be specifically pre-approved by the Audit Committee.
ALL OTHER SERVICES
With respect to the provision of services other than audit, review or attest services the pre-approval requirement is waived if:
| (1) | The aggregate amount of all such services provided constitutes no more than five percent of the total amount of revenues paid by the registrant, the registrant’s adviser (not including any sub-adviser whose role is primarily portfolio management and is subcontracted with or overseen by another investment adviser), and any entity controlling, controlled by, or under common control with the investment adviser that provides ongoing services to the registrant to its accountant during the fiscal year in which the services are provided; |
| (2) | Such services were not recognized by the registrant, the registrant’s adviser (not including any sub-adviser whose role is primarily portfolio management and is subcontracted with or overseen by another investment adviser), and any entity controlling, controlled by, or under common control with the investment adviser that provides ongoing services to the registrant at the time of the engagement to be non-audit services; and |
| (3) | Such services are promptly brought to the attention of the Audit Committee of the issuer and approved prior to the completion of the audit by the Audit Committee or by one or more members of the Audit Committee who are members of the board of directors to whom authority to grant such approvals has been delegated by the Audit Committee. |
The Audit Committee may grant general pre-approval to those permissible non-audit services classified as All Other services that it believes are routine and recurring services, and would not impair the independence of the auditor.
The SEC’s rules and relevant guidance should be consulted to determine the precise definitions of prohibited non-audit services and the applicability of exceptions to certain of the prohibitions.
PRE-APPROVAL FEE LEVELS
Pre-approval fee levels for all services to be provided by the independent auditor will be established annually by the Audit Committee. Any proposed services exceeding these levels will require specific pre-approval by the Audit Committee.
PROCEDURES
Requests or applications to provide services that require specific approval by the Audit Committee will be submitted to the Audit Committee by both the independent auditor and the Principal Accounting Officer and/or Internal Auditor, and must include a joint statement as to whether, in their view, the request or application is consistent with the SEC’s rules on auditor independence.
(e)(2) Percentage of services identified in items 4(b) through 4(d) that were approved by the registrants audit committee pursuant to paragraph (c)(7)(i)(C) of Rule 2-01 of Regulation S-X:
4(b)
Fiscal year ended 2017– 0%
Fiscal year ended 2016- 0%
Percentage of services provided to the registrants investment adviser and any entity controlling, controlled by, or under common control with the investment adviser that provides ongoing services to the registrant that were approved by the registrants audit committee pursuant to paragraph (c)(7)(i)(C) of Rule 2-01 of Regulation S-X, 0% and 0% respectively.
4(c)
Fiscal year ended 2017– 0%
Fiscal year ended 2016– 0%
Percentage of services provided to the registrants investment adviser and any entity controlling, controlled by, or under common control with the investment adviser that provides ongoing services to the registrant that were approved by the registrants audit committee pursuant to paragraph (c)(7)(i)(C) of Rule 2-01 of Regulation S-X, 0% and 0% respectively.
4(d)
Fiscal year ended 2017– 0%
Fiscal year ended 2016– 0%
Percentage of services provided to the registrants investment adviser and any entity controlling, controlled by, or under common control with the investment adviser that provides ongoing services to the registrant that were approved by the registrants audit committee pursuant to paragraph (c)(7)(i)(C) of Rule 2-01 of Regulation S-X, 0% and 0% respectively.
| (f) | NA |
| (g) | Non-Audit Fees billed to the registrant, the registrant’s investment adviser, and certain entities controlling, controlled by or under common control with the investment adviser: |
Fiscal year ended 2017- $22,077
Fiscal year ended 2016- $9,382
| (h) | The registrant’s Audit Committee has considered that the provision of non-audit services that were rendered to the registrant’s adviser (not including any sub-adviser whose role is primarily portfolio management and is subcontracted with or overseen by another investment adviser), and any entity controlling, controlled by, or under common control with the investment adviser that provides ongoing services to the registrant that were not pre-approved pursuant to paragraph (c)(7)(ii) of Rule 2-01 of Regulation S-X is compatible with maintaining the principal accountant’s independence. |
In its required communications to the Audit Committee of the registrant’s Board, KPMG LLP (“KPMG”), the registrant’s independent public accountant, informed the Audit Committee that KPMG and/or covered person professionals within KPMG maintain lending relationships with certain owners of greater than 10% of the shares of certain investment companies within the “investment company complex” as defined under Rule 2-01(f)(14) of Regulation S-X, which are affiliates of the registrant. KPMG has advised the Audit Committee that these lending relationships implicate Rule 2-01(c)(1)(ii)(A) of Regulation S-X (referred to as the “Loan Rule”). The Loan Rule prohibits an independent public accountant, or covered person professionals at such firm, from having a financial relationship (such as a loan) with a lender that is a record or beneficial owner of more than 10% of an audit client’s equity securities. For purposes of the Loan Rule, audit clients include the registrant, as well as all registered investment companies audited by KPMG (collectively, the “KPMG Funds”).
KPMG informed the Audit Committee that KPMG believes that these lending relationships described above do not and will not impair KPMG’s ability to exercise objective and impartial judgment in connection with financial statement audits of the registrant and a reasonable investor with knowledge of all relevant facts and circumstances would conclude that KPMG has been and is capable of objective and impartial judgment on all issues encompassed within KPMG’s audits.
On June 20, 2016, the Division of Investment Management of the Securities and Exchange Commission (“SEC”) issued a no-action letter to another mutual fund complex (see Fidelity Management & Research Company et al., No-Action Letter) related to similar Loan Rule matters as those described above (the “Letter”). In the Letter, the SEC Staff confirmed that it would not recommend enforcement action against an investment company that relied on the audit services performed by an independent public accountant where the Loan Rule was implicated in certain specified circumstances provided that: (1) the auditor has complied with PCAOB Rule 3526(b)(1) and 3526(b)(2); (2) the Loan Rule is implicated because of lending relationships; and (3) notwithstanding such lending relationships that implicate the Loan Rule, the auditor has concluded that it is objective and impartial with respect to the issues encompassed within its engagement as auditor of the funds. The circumstances described in the Letter are substantially similar to the circumstances that implicated the Loan Rule with respect to KPMG and the registrant. On September 22, 2017, the SEC issued another no-action letter to Fidelity Management & Research Company et al extending the expiration of the Letter until the effectiveness of any amendments to the Loan Rule designed to address the concerns in the Letter (the “Letters”).
If it were to be determined that the relief available under the Letters was improperly relied upon, or that the independence requirements under the federal securities laws were not otherwise complied with regarding the registrant, for certain periods, any of the registrant’s filings with the SEC which contain financial statements of the registrant for such periods may not comply with applicable federal securities laws, the registrant’s ability to offer shares under its current registration statement may be impacted, and certain financial reporting and/or other covenants with, and representations and warranties to, the registrant’s lender under its committed line of credit may be impacted. Such events could have a material adverse effect on the registrant and the KPMG Funds.
| Item 5. | Audit Committee of Listed Registrants |
Not Applicable
| Item 6. | Schedule of Investments |
(a) The registrant’s Schedule of Investments is included as part of the Report to Stockholders filed under Item 1 of this form.
(b) Not Applicable; Fund had no divestments during the reporting period covered since the previous Form N-CSR filing.
| Item 7. | Disclosure of Proxy Voting Policies and Procedures for Closed-End Management Investment Companies |
Not Applicable
| Item 8. | Portfolio Managers of Closed-End Management Investment Companies |
Not Applicable
| Item 9. | Purchases of Equity Securities by Closed-End Management Investment Company and Affiliated Purchasers |
Not Applicable
| Item 10. | Submission of Matters to a Vote of Security Holders |
No Changes to Report
| Item 11. | Controls and Procedures |
(a) The registrant’s President and Treasurer have concluded that the
registrant’s disclosure controls and procedures (as defined in rule 30a-3(c) under the Act) are effective in design and operation and are sufficient to form the basis of the certifications required by Rule 30a-(2) under the Act, based on their evaluation of these disclosure controls and procedures within 90 days of the filing date of this report on Form N-CSR.
(b) There were no changes in the registrant’s internal control over financial reporting (as defined in rule 30a-3(d) under the Act) during the second fiscal quarter of the period covered by this report that have materially affected, or are reasonably likely to materially affect, the registrant’s internal control over financial reporting.
| Item 12. | Disclosure of Securities Lending Activities for Closed-End Management Investment Companies |
Not Applicable
| Item 13. | Exhibits |
(a)(1) Code of Ethics- Not Applicable to this Report.
(a)(2) Certifications of Principal Executive Officer and Principal Financial Officer.
(a)(3) Not Applicable.
(b) Certifications pursuant to 18 U.S.C. Section 1350.
SIGNATURES
Pursuant to the requirements of the Securities Exchange Act of 1934 and the Investment Company Act of 1940, the registrant has duly caused this report to be signed on its behalf by the undersigned, thereunto duly authorized.
Registrant Federated Global Allocation Fund
By /S/ Lori A. Hensler
Lori A. Hensler, Principal Financial Officer
Date January 23, 2018
Pursuant to the requirements of the Securities Exchange Act of 1934 and the Investment Company Act of 1940, this report has been signed below by the following persons on behalf of the registrant and in the capacities and on the dates indicated.
By /S/ J. Christopher Donahue
J. Christopher Donahue, Principal Executive Officer
Date January 23, 2018
By /S/ Lori A. Hensler
Lori A. Hensler, Principal Financial Officer
Date January 23, 2018