POTLATCH CORPORATION
MARCH 2010
POTLATCH CORPORATION
Eric J. Cremers Vice President, Finance and Chief Financial Officer
Goldman Sachs 2010 Montreal Paper and Forest Products Investor Conference
Potlatch®
WWW.POTLATCHCORP.COM
POTLATCH CORPORATION
Forward-Looking Statements
This presentation contains certain forward-looking statements within the meaning of the Private Litigation Reform Act of 1995 as amended, including without limitation statements about future company performance, the company’s business model, strength of the company’s balance sheet and credit metrics, dividend levels and yields, direction of markets and the economy, management of timberlands to optimize values, pursuit of creative transaction structures, acquisition strategy, timber inventory and growth, future harvest levels and their relation to market trends, stumpage and log pricing, wood fiber demand forecasts, forecast of housing starts, timberland values, the company’s capital structure, cash flow generation, revenue from non-timber related activities, real estate business potential and land development potential, biomass opportunities, management of the output of our Wood Products facilities, and dividend policy. These forward-looking statements are based on current expectations, estimates, assumptions and projections that are subject to change, and actual results may differ materially from the forward-looking statements. Factors that could cause actual results to differ materially include, but are not limited to, changes in timberland values; changes in timber harvest levels on the company’s lands; changes in timber prices; changes in policy regarding governmental timber sales; changes in the United States and international economies; changes in the level of construction activity; changes in tariffs, quotas and trade agreements involving wood products; changes in demand for Potlatch’s products; changes in production and production capacity in the forest products industry; competitive pricing pressures for the company’s products; unanticipated manufacturing disruptions; changes in general and industry-specific environmental laws and regulations; unforeseen environmental liabilities or expenditures; weather conditions; changes in raw material and other costs; the ability to satisfy complex rules in order to remain qualified as a REIT; changes in tax laws that could reduce the benefits associated with REIT status; and other risks and uncertainties described from time to time in the company’s public filings with the Securities and Exchange Commission. All forward-looking statements are made as of the date of this presentation, and the company does not undertake to update any forward-looking statements.
2
POTLATCH CORPORATION
Company Overview
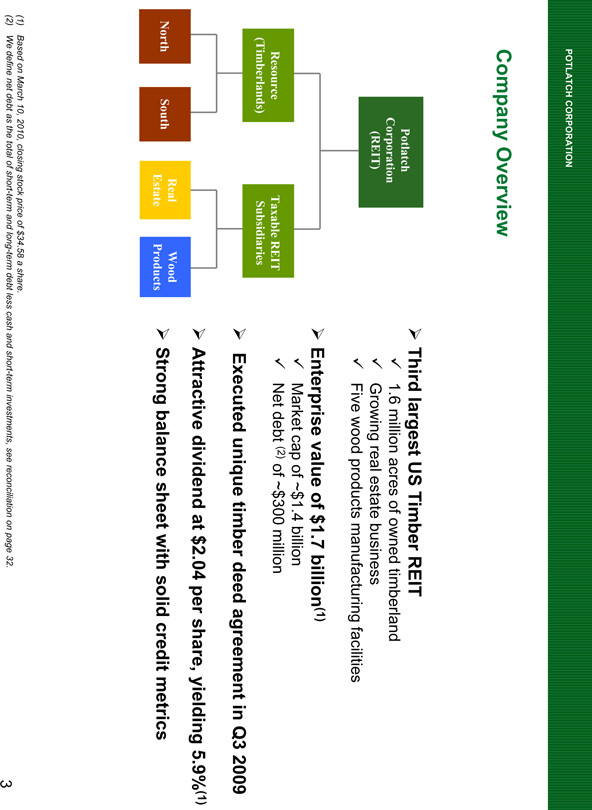
Potlatch Corporation (REIT)
Resource (Timberlands)
Taxable REIT Subsidiaries
North
South
Wood Products
Third largest US Timber REIT
1.6 million acres of owned timberland
Growing real estate business
Five wood products manufacturing facilities
Enterprise value of $1.7 billion(1)
Market cap of ~$1.4 billion
Net debt (2) of ~$300 million
Executed unique timber deed agreement in Q3 2009
Attractive dividend at $2.04 per share, yielding 5.9%(1)
Strong balance sheet with solid credit metrics
(1) Based on March 10, 2010, closing stock price of $34.58 a share.
(2) We define net debt as the total of short-term and long-term debt less cash and short-term investments, see reconciliation on page 32.
3
POTLATCH CORPORATION
Potlatch Business Overview
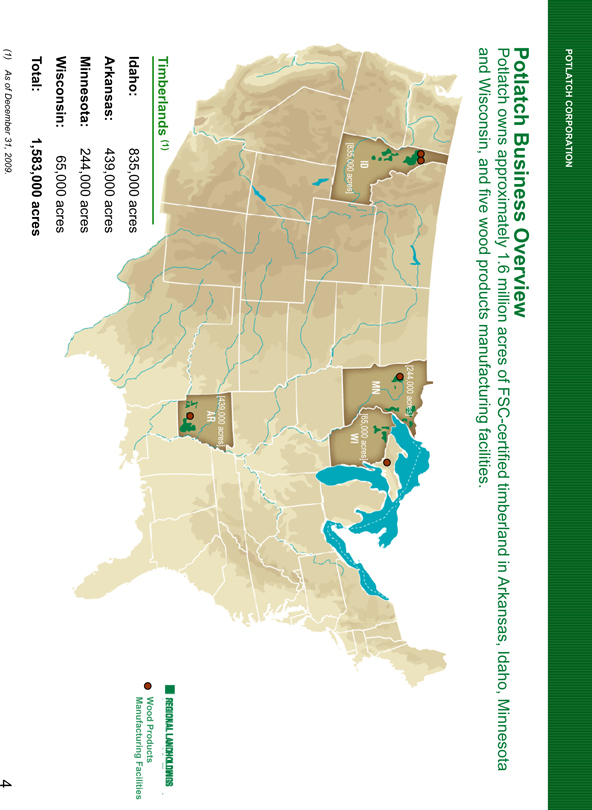
Potlatch owns approximately 1.6 million acres of FSC-certified timberland in Arkansas, Idaho, Minnesota and Wisconsin, and five wood products manufacturing facilities.
ID
[835,000 acres]
[244,000 acres]
MN
[65,000 acres]
WI
[439,000 acres]
AR
Timberlands (1)
Idaho: 835,000 acres
Arkansas: 439,000 acres
Minnesota: 244,000 acres
Wisconsin: 65,000 acres
Total: 1,583,000 acres
REGIONAL LANDHOLDINGS
Wood Products
Manufacturing Facilities
(1) As of December 31, 2009.
4
POTLATCH CORPORATION
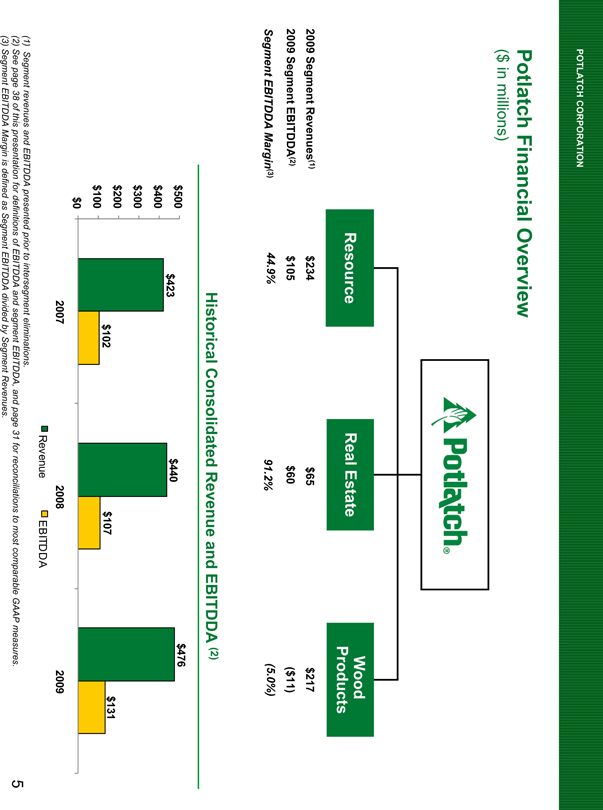
Potlatch Financial Overview
($ in millions)
Potlatch®
Resource Real Estate Wood Products
2009 Segment Revenues(1) $234 $65 $217
2009 Segment EBITDDA(2) $105 $60 ($11)
Segment EBITDDA Margin(3) 44.9% 91.2% (5.0%)
Historical Consolidated Revenue and EBITDDA (2)
$500
$400
$300
$200
$100
$0
$423
$102
2007
$440
$107
2008
$476
$131
2009
Revenue EBITDDA
(1) Segment revenues and EBITDDA presented prior to intersegment eliminations.
(2) See page 38 of this presentation for definitions of EBITDDA and segment EBITDDA, and page 31 for reconciliations to most comparable GAAP measures.
(3) Segment EBITDDA Margin is defined as Segment EBITDDA divided by Segment Revenues.
5
POTLATCH CORPORATION
Resource Segment
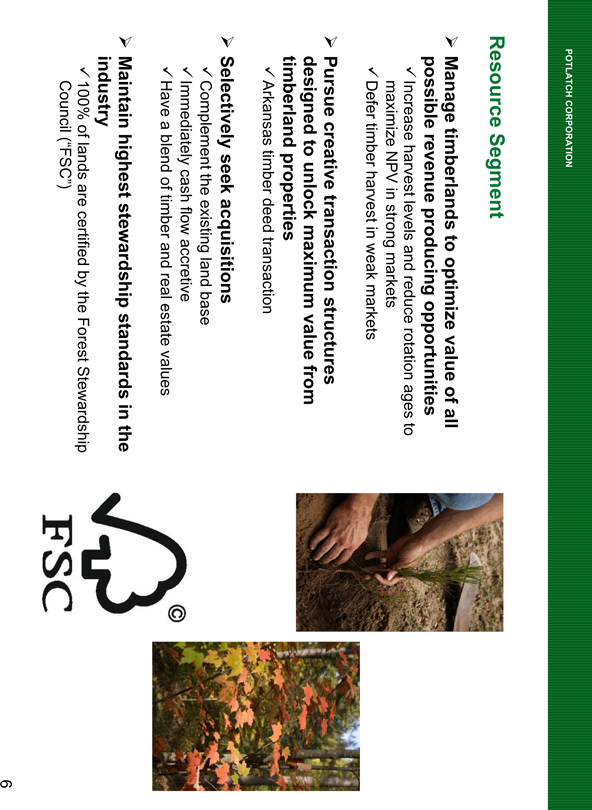
Manage timberlands to optimize value of all possible revenue producing opportunities
Increase harvest levels and reduce rotation ages to maximize NPV in strong markets
Defer timber harvest in weak markets
Pursue creative transaction structures designed to unlock maximum value from timberland properties
Arkansas timber deed transaction
Selectively seek acquisitions
Complement the existing land base
Immediately cash flow accretive
Have a blend of timber and real estate values
Maintain highest stewardship standards in the industry
100% of lands are certified by the Forest Stewardship Council (“FSC”)
©
FSC
6
POTLATCH CORPORATION
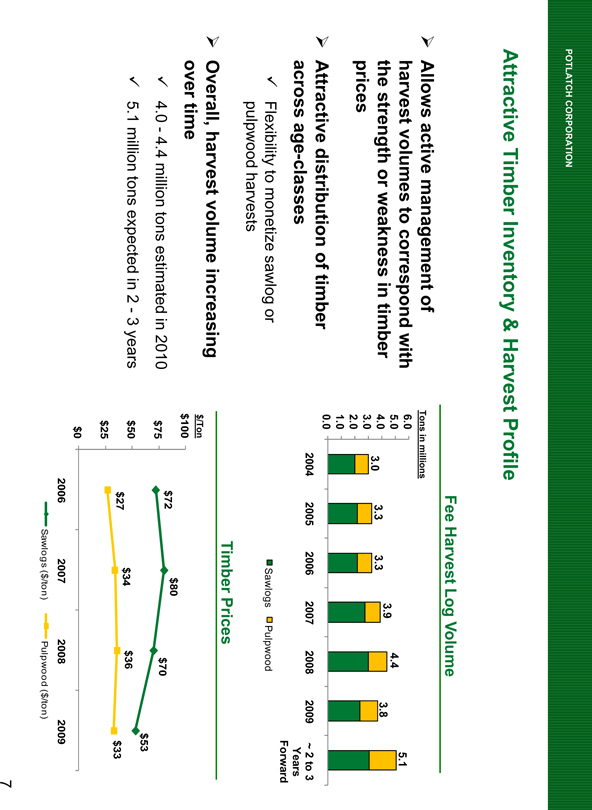
Attractive Timber Inventory & Harvest Profile
Allows active management of harvest volumes to correspond with the strength or weakness in timber prices
Attractive distribution of timber across age-classes
Flexibility to monetize sawlog or pulpwood harvests
Overall, harvest volume increasing over time
4.0 - 4.4 million tons estimated in 2010
5.1 million tons expected in 2 - 3 years
Fee Harvest Log Volume
Tons in millions
6.0
5.0
4.0
3.0
2.0
1.0
0.0
3.0
3.3
3.3
3.9
4.4
3.8
5.1
2004 2005 2006 2007 2008 2009 ~ 2 to 3 Years Forward
Sawlogs Pulpwood
Timber Prices
$/Ton
$100
$75
$50
$25
$0
$72
$80
$70
$53
$27
$34
$36
$33
2006
2007
2008
2009
Sawlogs ($/ton) Pulpwood ($/ton)
7
POTLATCH CORPORATION
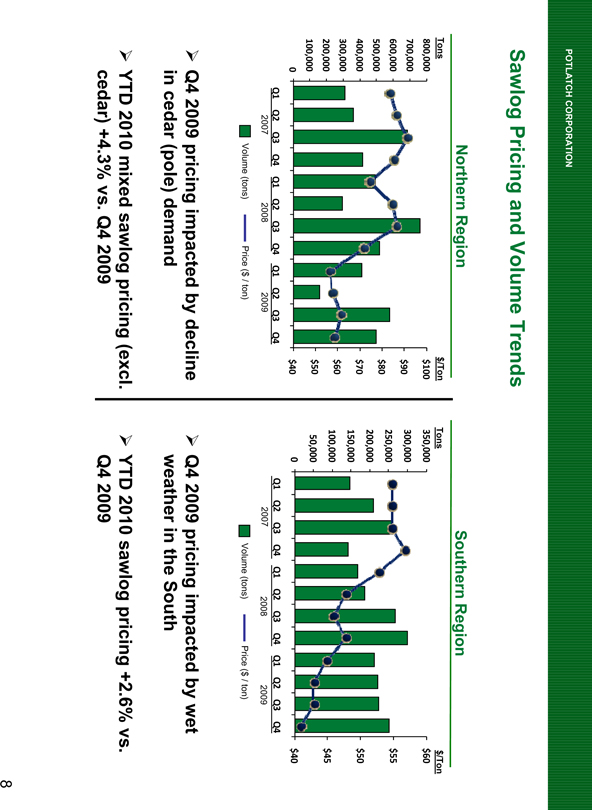
Sawlog Pricing and Volume Trends
Northern Region
Tons
800,000
700,000
600,000
500,000
400,000
300,000
200,000
100,000
0
$/Ton
$100
$90
$80
$70
$60
$50
$40
Q1 Q2 Q3 Q4 Q1 Q2 Q3 Q4 Q1 Q2 Q3 Q4
2007 2008 2009
Volume (tons) Price ($ / ton)
Q4 2009 pricing impacted by decline in cedar (pole) demand
YTD 2010 mixed sawlog pricing (excl. cedar) +4.3% vs. Q4 2009
Southern Region
Tons
350,000
300,000
250,000
200,000
150,000
100,000
50,000
0
$/Ton
$60
$55
$50
$45
$40
Q1 Q2 Q3 Q4 Q1 Q2 Q3 Q4 Q1 Q2 Q3 Q4
2007 2008 2009
Volume (tons) Price ($ / ton)
Q4 2009 pricing impacted by wet weather in the South
YTD 2010 sawlog pricing +2.6% vs. Q4 2009
8
POTLATCH CORPORATION
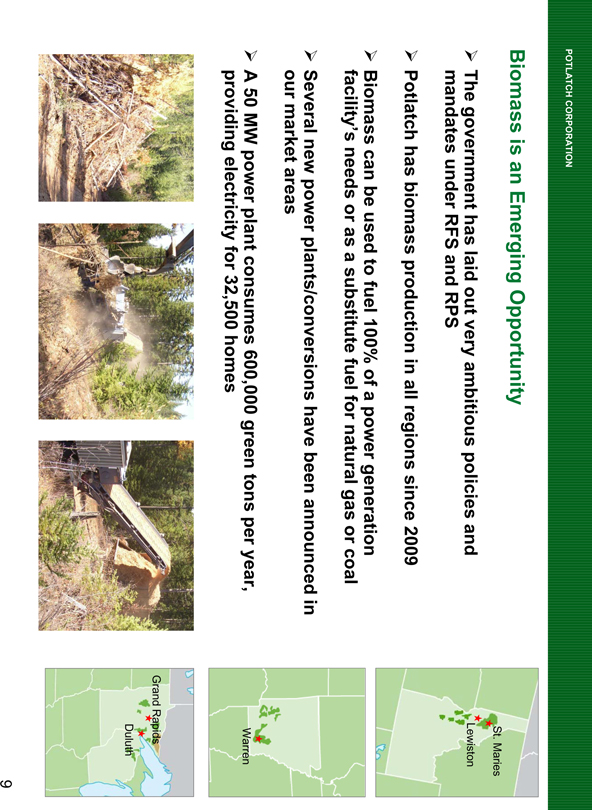
Biomass is an Emerging Opportunity
The government has laid out very ambitious policies and mandates under RFS and RPS
Potlatch has biomass production in all regions since 2009
Biomass can be used to fuel 100% of a power generation facility’s needs or as a substitute fuel for natural gas or coal
Several new power plants/conversions have been announced in our market areas
A 50 MW power plant consumes 600,000 green tons per year, providing electricity for 32,500 homes
St. Maries
Lewiston
Warren
Grand Rapids
Duluth
9
POTLATCH CORPORATION
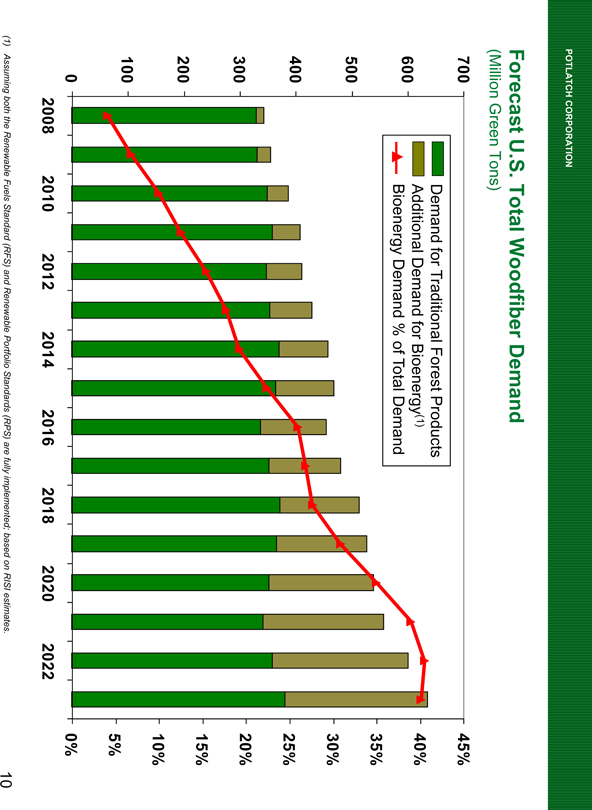
Forecast U.S. Total Woodfiber Demand
(Million Green Tons)
700
600
500
400
300
200
100
0
Demand for Traditional Forest Products
Additional Demand for Bioenergy(1)
Bioenergy Demand % of Total Demand
45%
40%
35%
30%
25%
20%
15%
10%
5%
0%
2008 2010 2012 2014 2016 2018 2020 2022
(1) Assuming both the Renewable Fuels Standard (RFS) and Renewable Portfolio Standards (RPS) are fully implemented; based on RISI estimates.
10
POTLATCH CORPORATION
Arkansas Timber Deed Transaction
Potlatch entered into a timber deed transaction in early Q3 2009
A timber deed sale includes the standing timber only
Key terms of the transaction:
Potlatch sold the timber on approximately 49,500 acres in Southern Arkansas
Proceeds from the sale were approximately $49 million
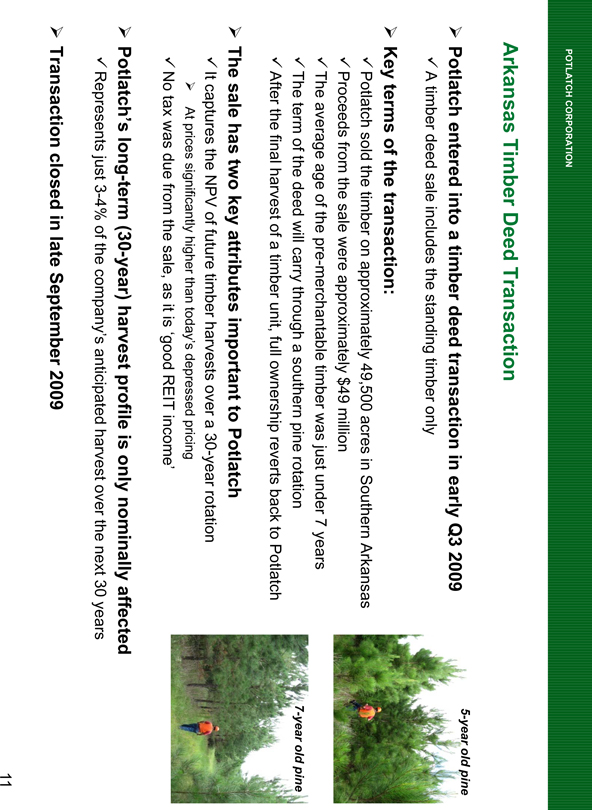
The average age of the pre-merchantable timber was just under 7 years
The term of the deed will carry through a southern pine rotation
After the final harvest of a timber unit, full ownership reverts back to Potlatch
The sale has two key attributes important to Potlatch
It captures the NPV of future timber harvests over a 30-year rotation
At prices significantly higher than today’s depressed pricing
No tax was due from the sale, as it is ‘good REIT income’
Potlatch’s long-term (30-year) harvest profile is only nominally affected
Represents just 3-4% of the company’s anticipated harvest over the next 30 years
Transaction closed in late September 2009
5-year old pine
7-year old pine
11
POTLATCH CORPORATION
Wood Products Segment
Manufacture lumber and plywood
Sell to wholesalers for use in homebuilding and construction
Potlatch operates four sawmills in Idaho, Arkansas, Minnesota and Michigan as well as one industrial-grade plywood mill in Idaho
Actively manage output of facilities to match supply and demand
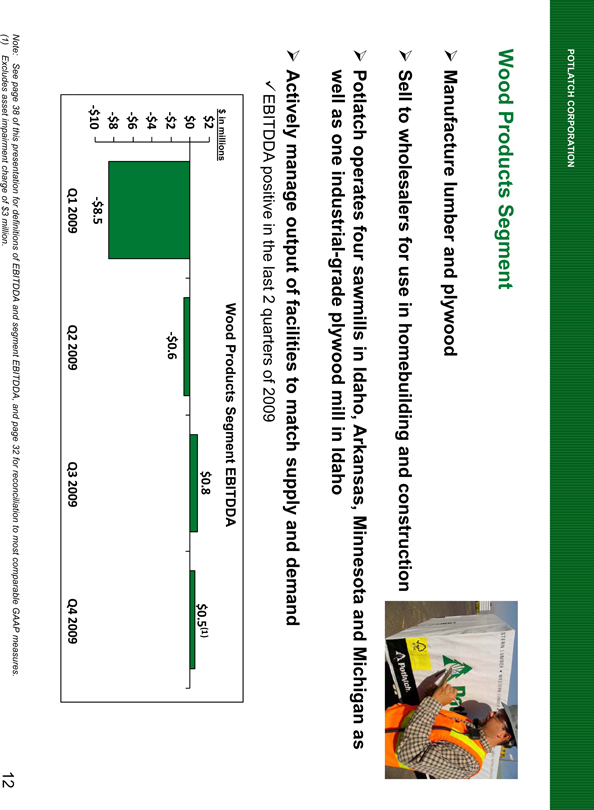
EBITDDA positive in the last 2 quarters of 2009
Wood Products Segment EBITDDA
$ in millions
$2
$0
-$2
-$4
-$6
-$8
-$10
-$8.5
-$0.6
$0.8
$0.5(1)
Q1 2009 Q2 2009 Q3 2009 Q4 2009
Note: See page 38 of this presentation for definitions of EBITDDA and segment EBITDDA, and page 32 for reconciliation to most comparable GAAP measures.
(1) Excludes asset impairment charge of $3 million.
12
POTLATCH CORPORATION
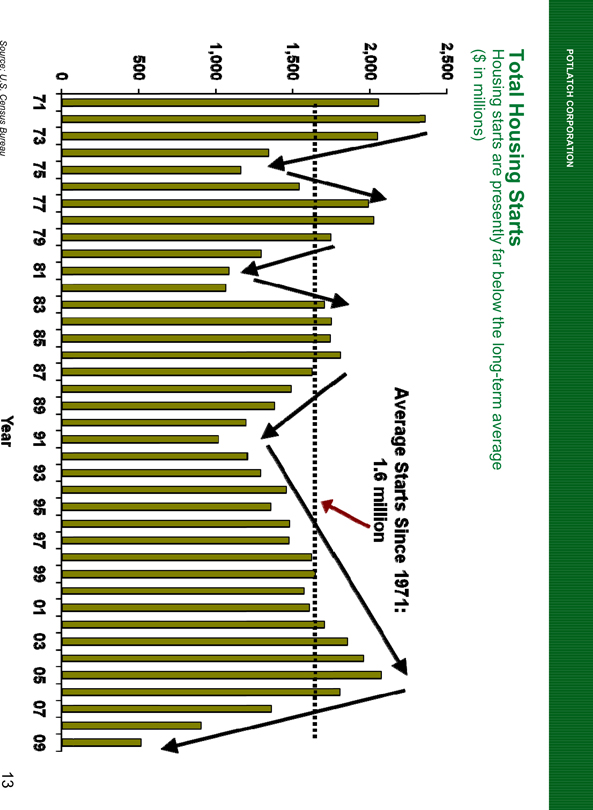
Total Housing Starts
Housing starts are presently far below the long-term average
($ in millions)
2,500
2,000
1,500
1,000
500
0
Average Starts Since 1971:
1.6 million
71 73 75 77 79 81 83 85 87 89 91 93 95 97 99 01 03 05 07 09
Year
Source: U.S. Census Bureau
13
POTLATCH CORPORATION
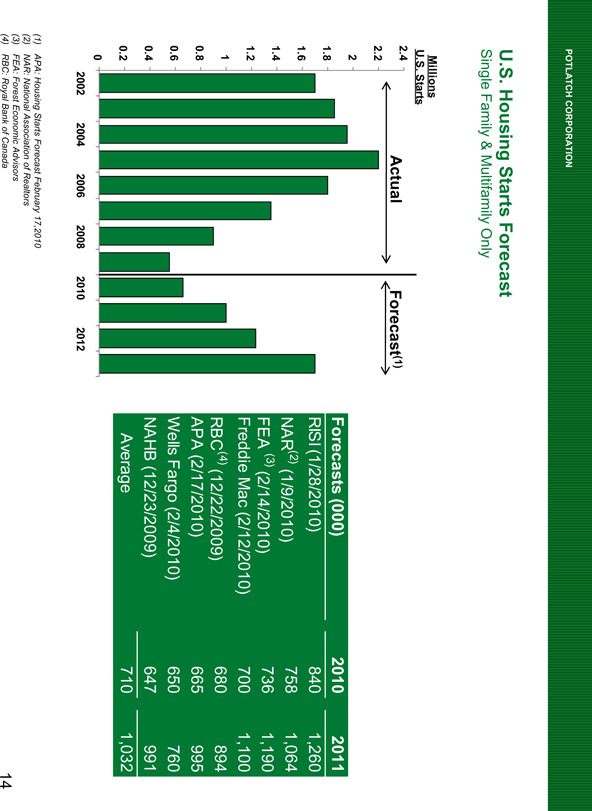
U.S. Housing Starts Forecast
Single Family & Multifamily Only
Millions
U.S. Starts
2.4
2.2
2
1.8
1.6
1.4
1.2
1
0.8
0.6
0.4
0.2
0
Actual Forecast(1)
2002 2004 2006 2008 2010 2012
Forecasts (000)
RISI (1/28/2010)
NAR(2) (1/9/2010)
FEA (3) (2/14/2010)
Freddie Mac (2/12/2010)
RBC(4) (12/22/2009)
APA (2/17/2010)
Wells Fargo (2/4/2010)
NAHB (12/23/2009)
Average
2010
840
758
736
700
680
665
650
647
710
2011
1,260
1,064
1,190
1,100
894
995
760
991
1,032
(1) APA: Housing Starts Forecast February 17,2010
(2) NAR: National Association of Realtors
(3) FEA: Forest Economic Advisors
(4) RBC: Royal Bank of Canada
14
POTLATCH CORPORATION
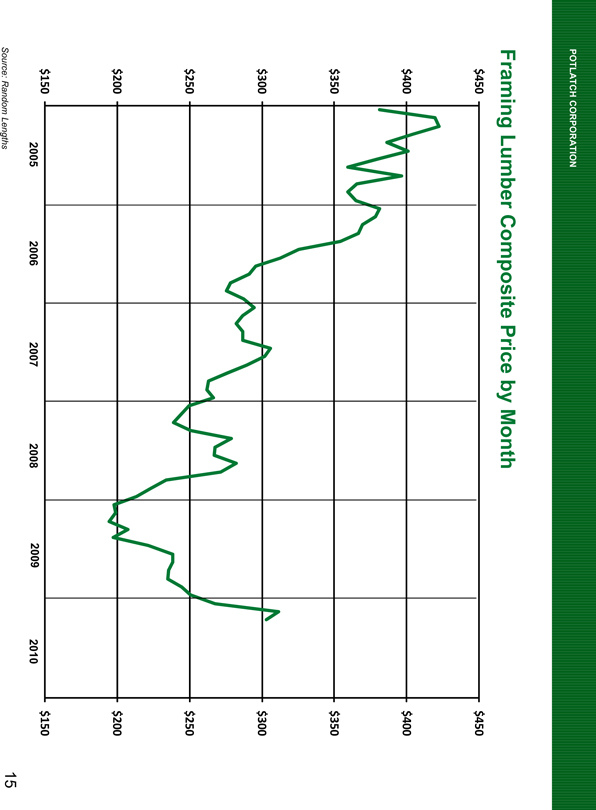
Framing Lumber Composite Price by Month
$450
$400
$350
$300
$250
$200
$150
$450
$400
$350
$300
$250
$200
$150
2005 2006 2007 2008 2009 2010
Source: Random Lengths
15
POTLATCH CORPORATION
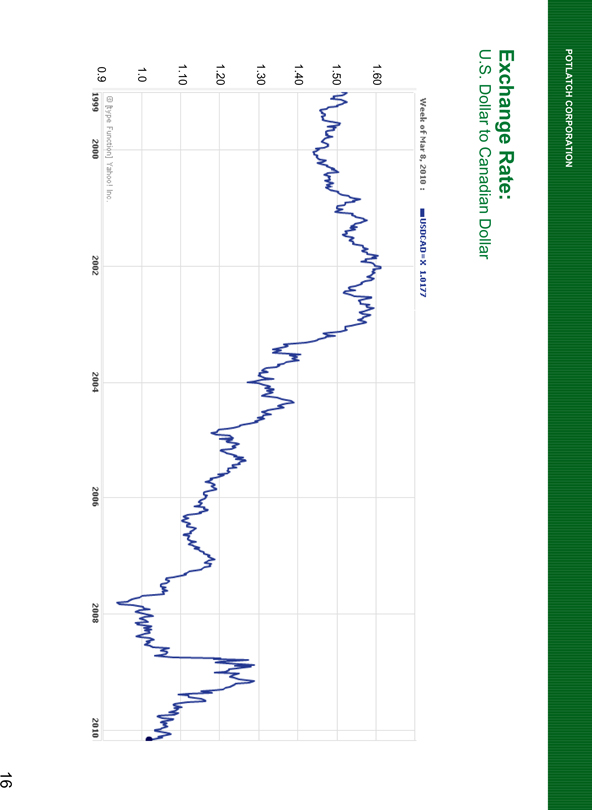
Exchange Rate:
U.S. Dollar to Canadian Dollar
Week of Mar 8, 2010 : USDCAD=X 1.0177
1.60
1.50
1.40
1.30
1.20
1.10
1.0
0.9
1999 2000 2002 2004 2006 2008 2010
16
POTLATCH CORPORATION
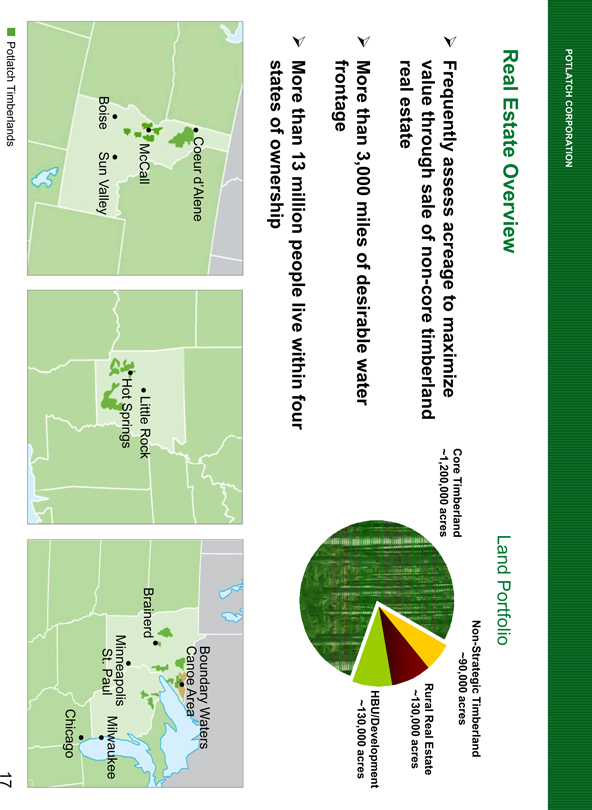
Real Estate Overview
Frequently assess acreage to maximize value through sale of non-core timberland real estate
More than 3,000 miles of desirable water frontage
More than 13 million people live within four states of ownership
Land Portfolio
Core Timberland
~1,200,000 acres
Non-Strategic Timberland
~90,000 acres
Rural Real Estate
~130,000 acres
HBU/Development
~130,000 acres
Coeur d’Alene
McCall
Boise
Sun Valley
Little Rock
Hot Springs
Boundary Waters
Canoe Area
Brainerd
Minneapolis
St. Paul
Milwaukee
Chicago
Potlatch Timberlands
17
POTLATCH CORPORATION
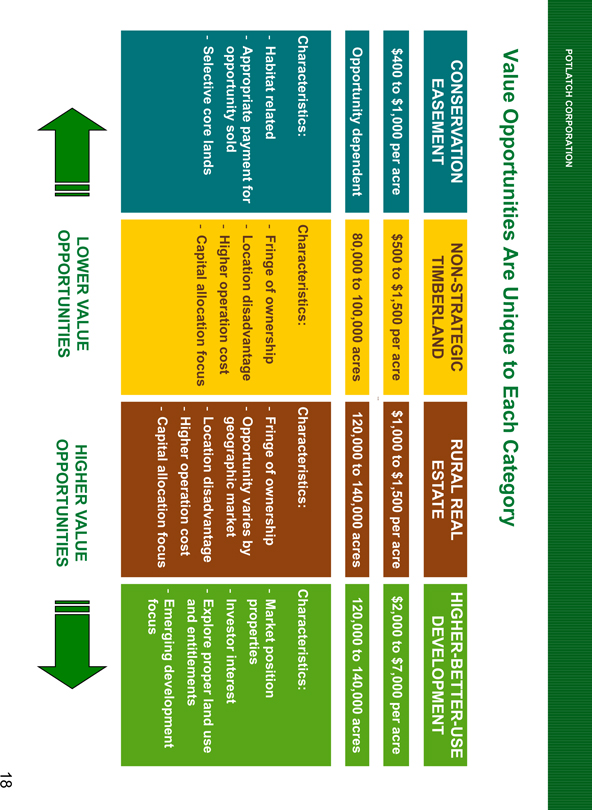
Value Opportunities Are Unique to Each Category
CONSERVATION EASEMENT
$400 to $1,000 per acre
Opportunity dependent
Characteristics:
- Habitat related
- Appropriate payment for opportunity sold
- Selective core lands
NON-STRATEGIC TIMBERLAND
$500 to $1,500 per acre
80,000 to 100,000 acres
Characteristics:
- Fringe of ownership
- Location disadvantage
- Higher operation cost
- Capital allocation focus
RURAL REAL ESTATE
$1,000 to $1,500 per acre
120,000 to 140,000 acres
Characteristics:
- Fringe of ownership
- Opportunity varies by geographic market
- Location disadvantage
- Higher operation cost
- Capital allocation focus
HIGHER-BETTER-USE DEVELOPMENT
$2,000 to $7,000 per acre
120,000 to 140,000 acres
Characteristics:
- Market position properties
- Investor interest
- Explore proper land use and entitlements
- Emerging development focus
LOWER VALUE OPPORTUNITIES
HIGHER VALUE OPPORTUNITIES
18
POTLATCH CORPORATION
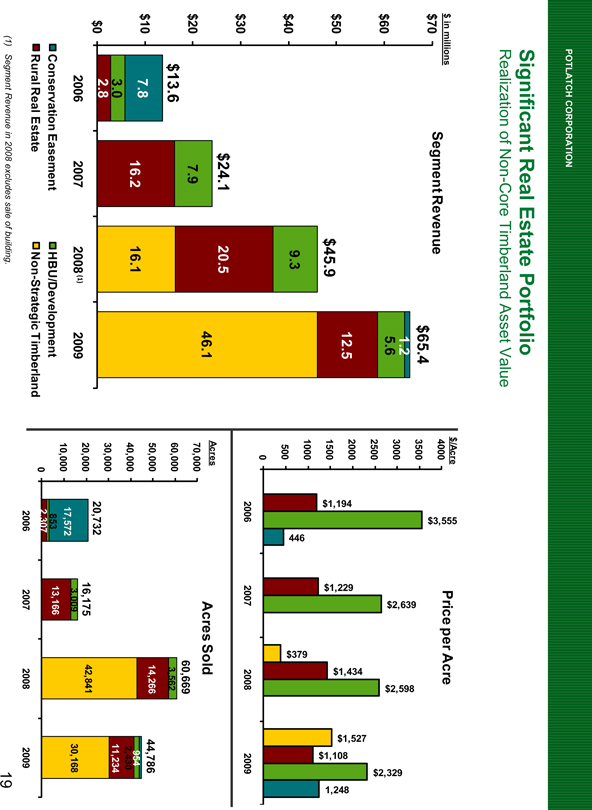
Significant Real Estate Portfolio
Realization of Non-Core Timberland Asset Value
$ in millions
$70
$60
$50
$40
$30
$20
$10
$0
Segment Revenue
$13.6
7.8
3.0
2.8
$24.1
7.9
16.2
$45.9
9.3
20.5
16.1
$65.4
1.2
5.6
12.5
46.1
2006
2007
2008(1)
2009
Conservation Easement
Rural Real Estate
HBU/Development
Non-Strategic Timberland
$/Acre
4000
3500
3000
2500
2000
1500
1000
500
0
Price per Acre
$1,194
$3,555
446
$1,229
$2,639
$379
$1,434
$2,598
$1,527
$1,108
$2,329
1,248
2006 2007 2008 2009
Acres
70,000
60,000
50,000
40,000
30,000
20,000
10,000
0
Acres Sold
20,732
17,572
853
2,307
16,175
3,009
13,166
60,669
3,562
14,266
42,841
44,786
954
2,430
11,234
30,168
2006 2007 2008 2009
(1) Segment Revenue in 2008 excludes sale of building.
19
POTLATCH CORPORATION
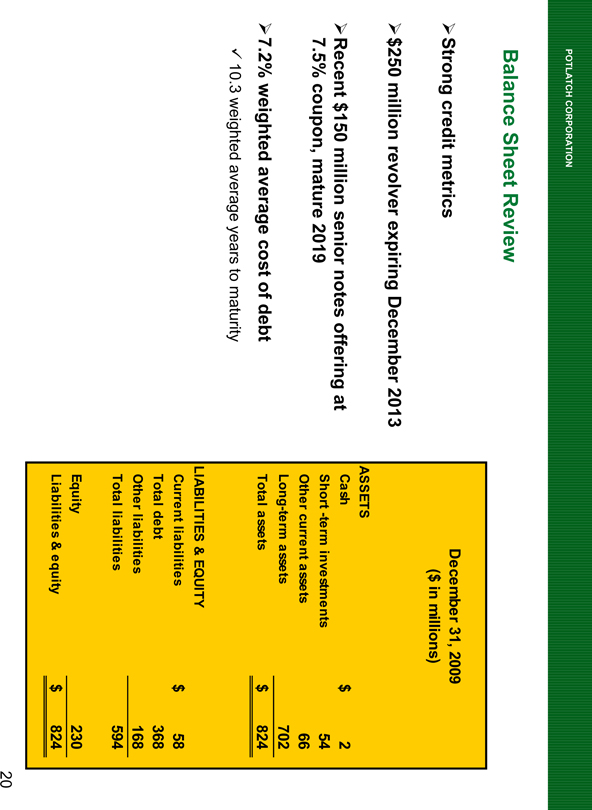
Balance Sheet Review
Strong credit metrics
$250 million revolver expiring December 2013
Recent $150 million senior notes offering at 7.5% coupon, mature 2019
7.2% weighted average cost of debt
10.3 weighted average years to maturity
December 31, 2009
($ in millions)
ASSETS
Cash $ 2
Short-term investments 54
Other current assets 66
Long-term assets 702
Total assets $ 824
LIABILITIES & EQUITY
Current liabilities $ 58
Total debt 368
Other liabilities 168
Total liabilities 594
Equity 230
Liabilities & equity $ 824
20
POTLATCH CORPORATION
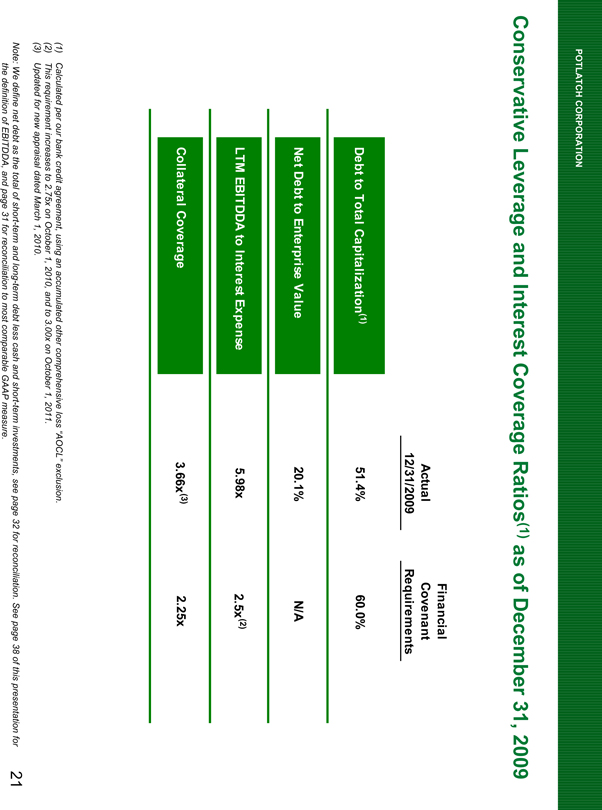
Conservative Leverage and Interest Coverage Ratios(1) as of December 31, 2009
Actual 12/31/2009
Financial Covenant Requirements
Debt to Total Capitalization(1) 51.4% 60.0%
Net Debt to Enterprise Value 20.1% N/A
LTM EBITDDA to Interest Expense 5.98x 2.5x(2)
Collateral Coverage 3.66x(3) 2.25x
(1) Calculated per our bank credit agreement, using an accumulated other comprehensive loss “AOCL” exclusion.
(2) This requirement increases to 2.75x on October 1, 2010, and to 3.00x on October 1, 2011.
(3) Updated for new appraisal dated March 1, 2010.
Note: We define net debt as the total of short-term and long-term debt less cash and short-term investments, see page 32 for reconciliation. See page 38 of this presentation for the definition of EBITDDA, and page 31 for reconciliation to most comparable GAAP measure.
21
POTLATCH CORPORATION
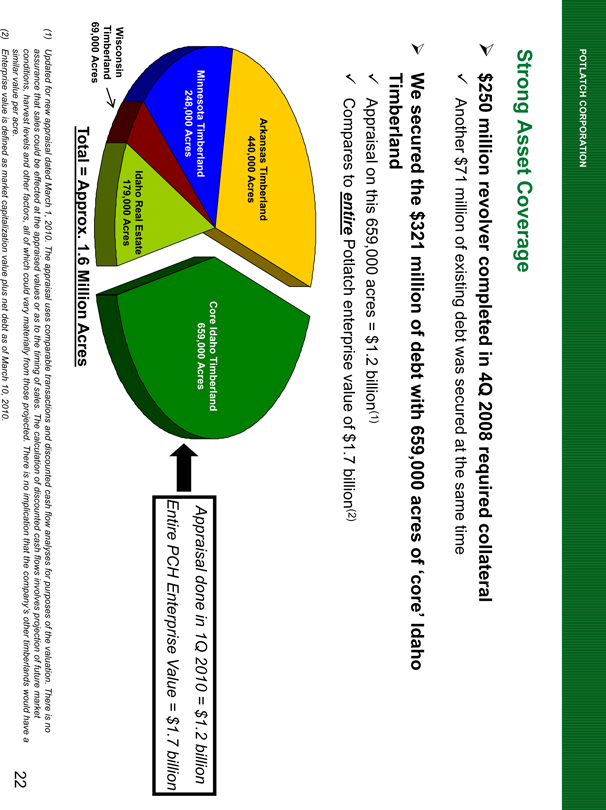
Strong Asset Coverage
$250 million revolver completed in 4Q 2008 required collateral
Another $71 million of existing debt was secured at the same time
We secured the $321 million of debt with 659,000 acres of ‘core’ Idaho Timberland
Appraisal on this 659,000 acres = $1.2 billion(1)
Compares to entire Potlatch enterprise value of $1.7 billion(2)
Arkansas Timberland
440,000 Acres
Minnesota Timberland
248,000 Acres
Core Idaho Timberland
659,000 Acres
Idaho Real Estate
179,000 Acres
Wisconsin
Timberland
69,000 Acres
Total = Approx. 1.6 Million Acres
Appraisal done in 1Q 2010 = $1.2 billion
Entire PCH Enterprise Value = $1.7 billion
(1) Updated for new appraisal dated March 1, 2010. The appraisal uses comparable transactions and discounted cash flow analyses for purposes of the valuation. There is no assurance that sales could be effected at the appraised values or as to the timing of sales. The calculation of discounted cash flows involves projection of future market conditions, harvest levels and other factors, all of which could vary materially from those projected. There is no implication that the company’s other timberlands would have a 22
similar value per acre.
(2) Enterprise value is defined as market capitalization value plus net debt as of March 10, 2010.
22
POTLATCH CORPORATION
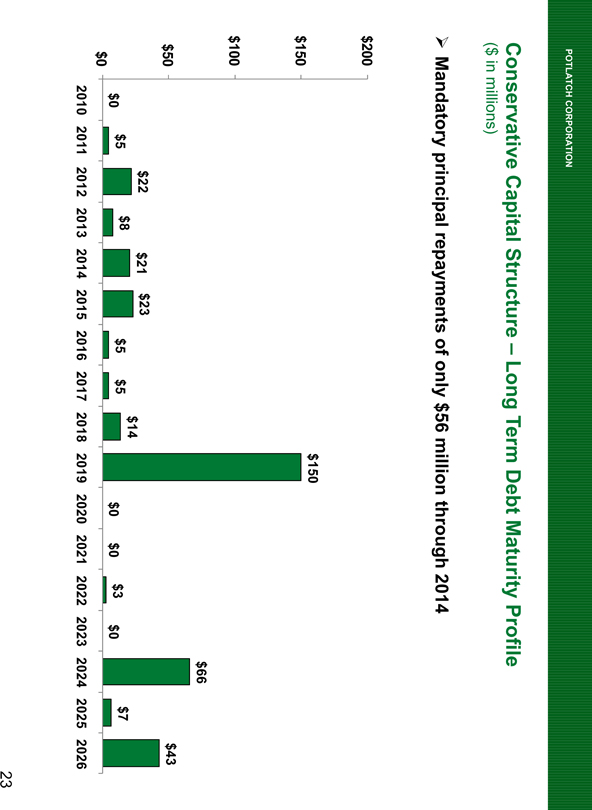
Conservative Capital Structure – Long Term Debt Maturity Profile
($ in millions)
Mandatory principal repayments of only $56 million through 2014
$200
$150
$100
$50
$0
$0
$5
$22
$8
$21
$23
$5
$5
$14
$150
$0
$0
$3
$0
$66
$7
$43
2010 2011 2012 2013 2014 2015 2016 2017 2018 2019 2020 2021 2022 2023 2024 2025 2026
23
POTLATCH CORPORATION
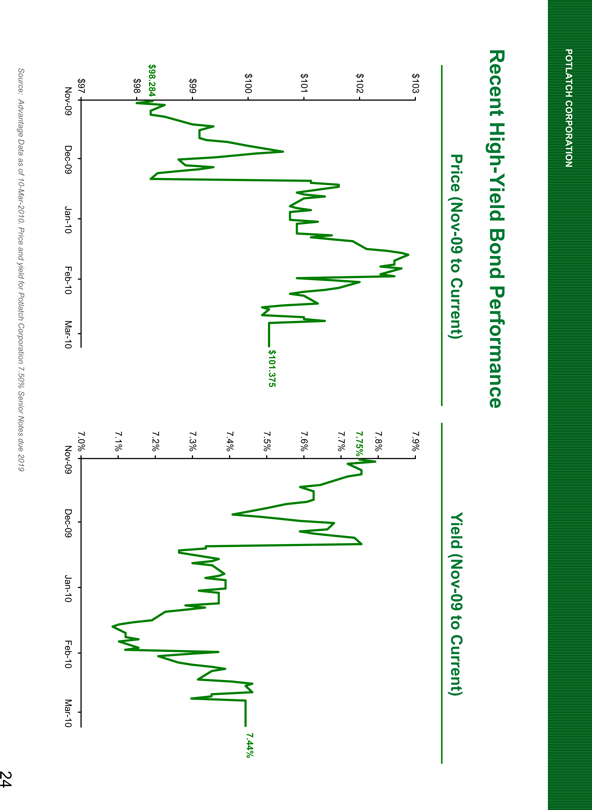
Recent High-Yield Bond Performance
Price (Nov-09 to Current)
$103
$102
$101
$100
$99
$98.284
$98
$97
$101.375
Nov-09 Dec-09 Jan-10 Feb-10 Mar-10
Yield (Nov-09 to Current)
7.9%
7.8%
7.75%
7.7%
7.6%
7.5%
7.4%
7.3%
7.2%
7.1%
7.0%
7.44%
Nov-09 Dec-09 Jan-10 Feb-10 Mar-10
Source: Advantage Data as of 10-Mar-2010. Price and yield for Potlatch Corporation 7.50% Senior Notes due 2019
24
POTLATCH CORPORATION
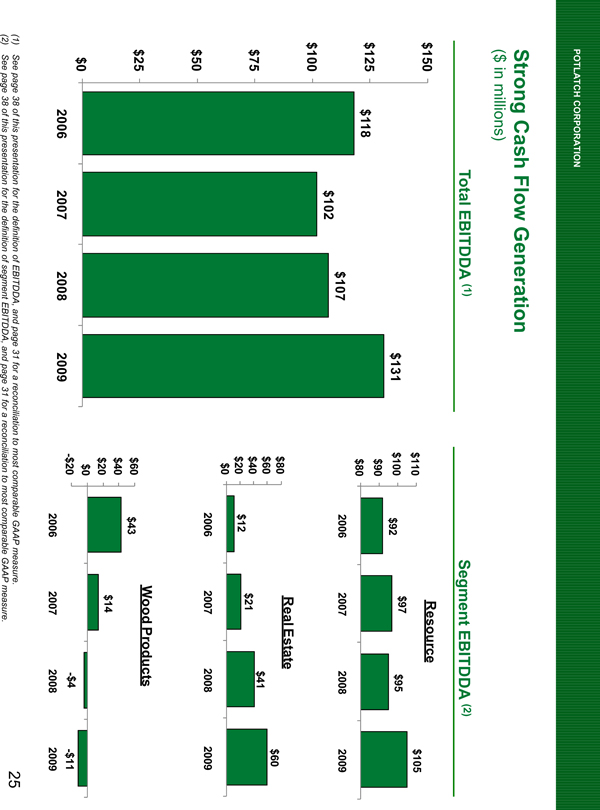
Strong Cash Flow Generation
($ in millions)
Total EBITDDA (1)
$150
$125
$100
$75
$50
$25
$0
$118 $102 $107 $131
2006 2007 2008 2009
Segment EBITDDA (2)
Resource
$110
$100
$90
$80
$92 $97 $95 $105
2006 2007 2008 2009
Real Estate
$80
$60
$40
$20
$0
$12 $21 $41 $60
2006 2007 2008 2009
Wood Products
$60
$40
$20
$0
-$20
$43 $14 -$4 -$11
2006 2007 2008 2009
(1) See page 38 of this presentation for the definition of EBITDDA, and page 31 for a reconciliation to most comparable GAAP measure.
(2) See page 38 of this presentation for the definition of segment EBITDDA, and page 31 for a reconciliation to most comparable GAAP measure.
25
POTLATCH CORPORATION
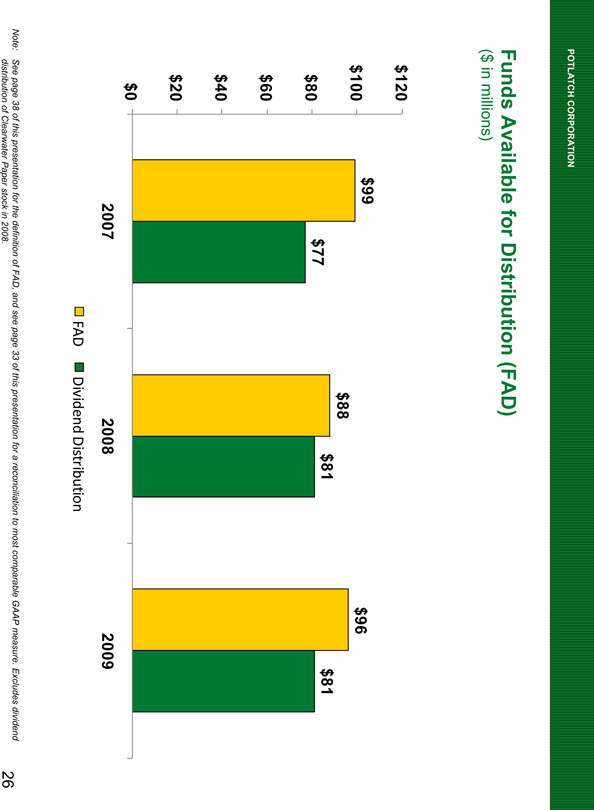
Funds Available for Distribution (FAD)
($ in millions)
$120
$100
$80
$60
$40
$20
$0
$99 $77 $88 $81 $96 $81
2007 2008 2009
FAD Dividend Distribution
Note: See page 38 of this presentation for the definition of FAD, and see page 33 of this presentation for a reconciliation to most comparable GAAP measure. Excludes dividend distribution of Clearwater Paper stock in 2008.
26
POTLATCH CORPORATION
Attractive Dividend
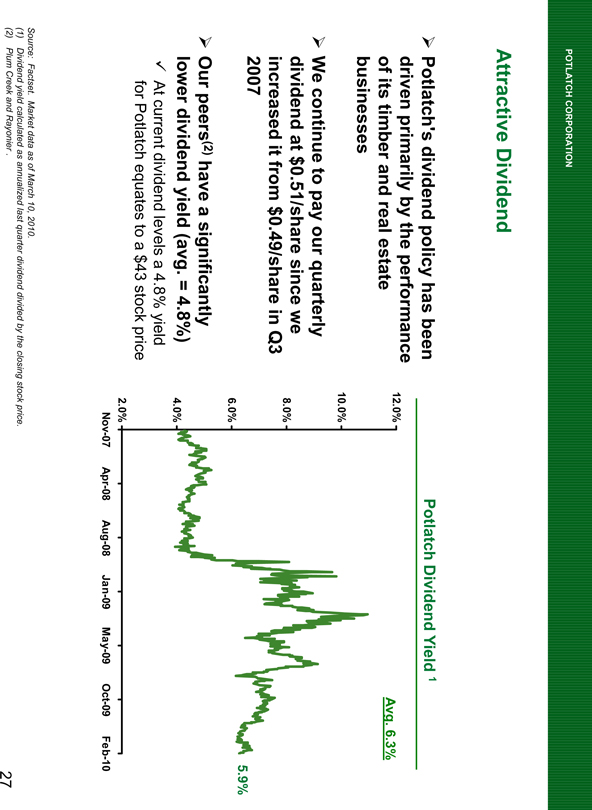
Potlatch’s dividend policy has been driven primarily by the performance of its timber and real estate businesses
We continue to pay our quarterly dividend at $0.51/share since we increased it from $0.49/share in Q3 2007
Our peers(2) have a significantly lower dividend yield (avg. = 4.8%)
At current dividend levels a 4.8% yield for Potlatch equates to a $43 stock price
Potlatch Dividend Yield 1
12.0%
10.0%
8.0%
6.0%
4.0%
2.0%
Avg. 6.3%
5.9%
Nov-07 Apr-08 Aug-08 Jan-09 May-09 Oct-09 Feb-10
Source: Factset. Market data as of March 10, 2010.
(1) Dividend yield calculated as annualized last quarter dividend divided by the closing stock price.
(2) Plum Creek and Rayonier.
27
POTLATCH CORPORATION
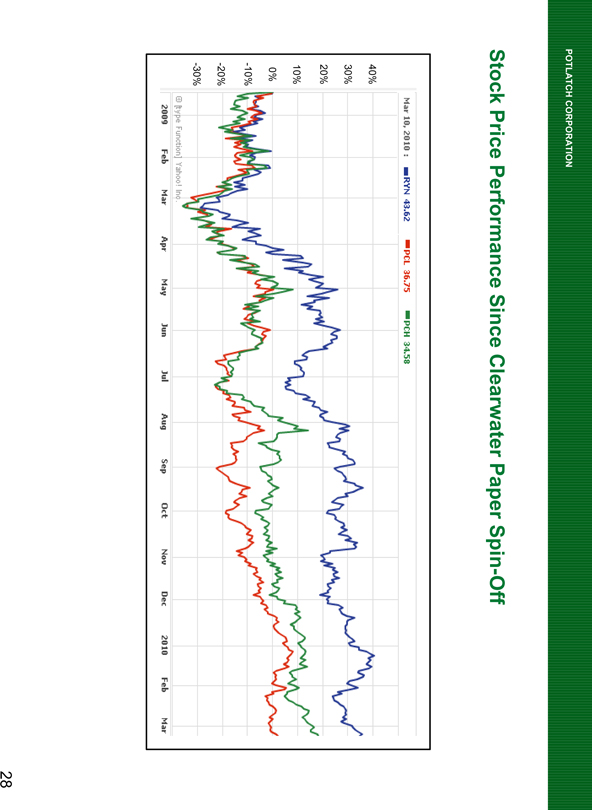
Stock Price Performance Since Clearwater Paper Spin-Off
Mar 10, 2010 : RYN 43.62 PCL 36.75 PCH 34.58
40%
30%
20%
10%
0%
-10%
-20%
-30%
© [type Function] Yahoo! Inc.
2009 Feb Mar Apr May Jun Jul Aug Sep Oct Nov Dec 2010 Feb Mar
28
POTLATCH CORPORATION
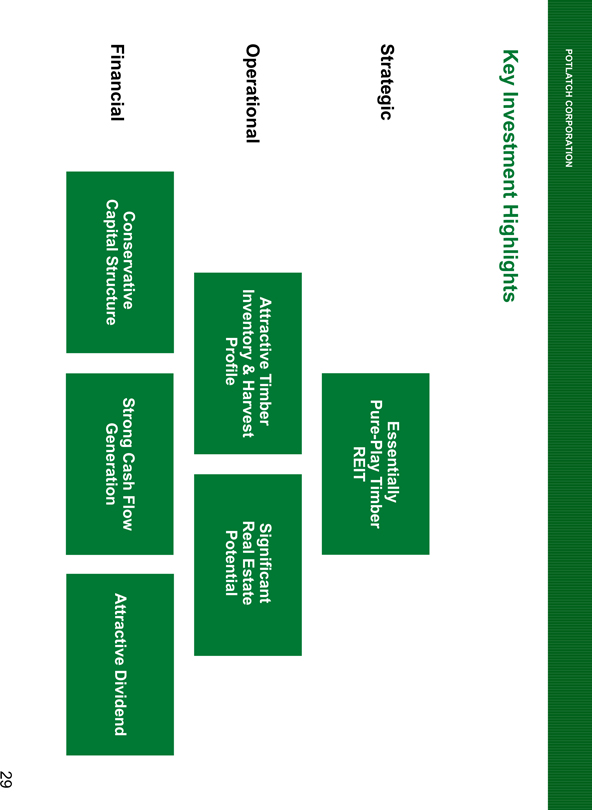
Key Investment Highlights
Strategic
Operational
Financial
Essentially Pure-Play Timber REIT
Attractive Timber Inventory & Harvest Profile
Significant Real Estate Potential
Conservative Capital Structure
Strong Cash Flow Generation
Attractive Dividend
29
POTLATCH CORPORATION
MARCH 2010
Appendix
Potlatch®
WWW.POTLATCHCORP.COM
POTLATCH CORPORATION
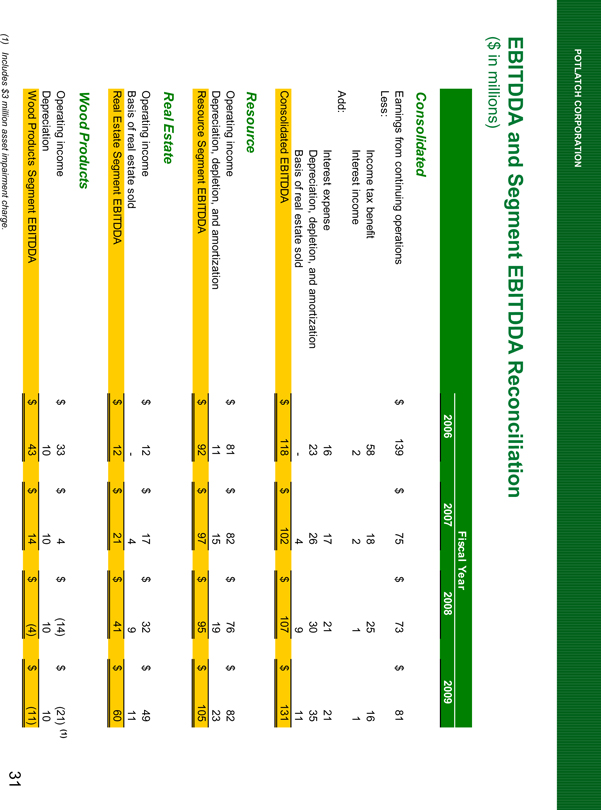
EBITDDA and Segment EBITDDA Reconciliation
($ in millions)
Fiscal Year
2006 2007 2008 2009
Consolidated
Earnings from continuing operations $ 139 $ 75 $ 73 $ 81
Less:
Income tax benefit 58 18 25 16
Interest income 2 2 1 1
Add:
Interest expense 16 17 21 21
Depreciation, depletion, and amortization 23 26 30 35
Basis of real estate sold - 4 9 11
Consolidated EBITDDA $ 118 $ 102 $ 107 $ 131
Resource
Operating income $ 81 $ 82 $ 76 $ 82
Depreciation, depletion, and amortization 11 15 19 23
Resource Segment EBITDDA $ 92 $ 97 $ 95 $ 105
Real Estate
Operating income $ 12 $ 17 $ 32 $ 49
Basis of real estate sold - 4 9 11
Real Estate Segment EBITDDA $ 12 $ 21 $ 41 $ 60
Wood Products
Operating income $ 33 $ 4 $ (14) $ (21) (1)
Depreciation 10 10 10 10
Wood Products Segment EBITDDA $ 43 $ 14 $ (4) $ (11)
(1) Includes $3 million asset impairment charge.
31
POTLATCH CORPORATION
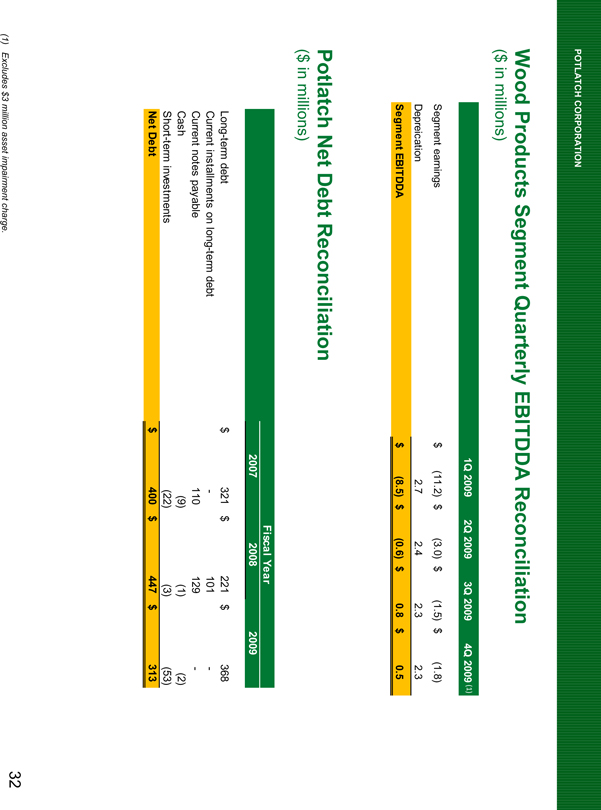
Wood Products Segment Quarterly EBITDDA Reconciliation
($ in millions)
1Q 2009 2Q 2009 3Q 2009 4Q 2009 (1)
Segment earnings $ (11.2) $ (3.0) $ (1.5) $ (1.8)
Depreciation 2.7 2.4 2.3 2.3
Segment EBITDDA $ (8.5) $ (0.6) $ 0.8 $ 0.5
Potlatch Net Debt Reconciliation
($ in millions)
Fiscal Year
2007 2008 2009
Long-term debt $ 321 $ 221 $ 368
Current installments on long-term debt - 101 -
Current notes payable 110 129 -
Cash (9) (1) (2)
Short-term investments (22) (3) (53)
Net Debt $ 400 $ 447 $ 313
(1) Excludes $3 million asset impairment charge.
32
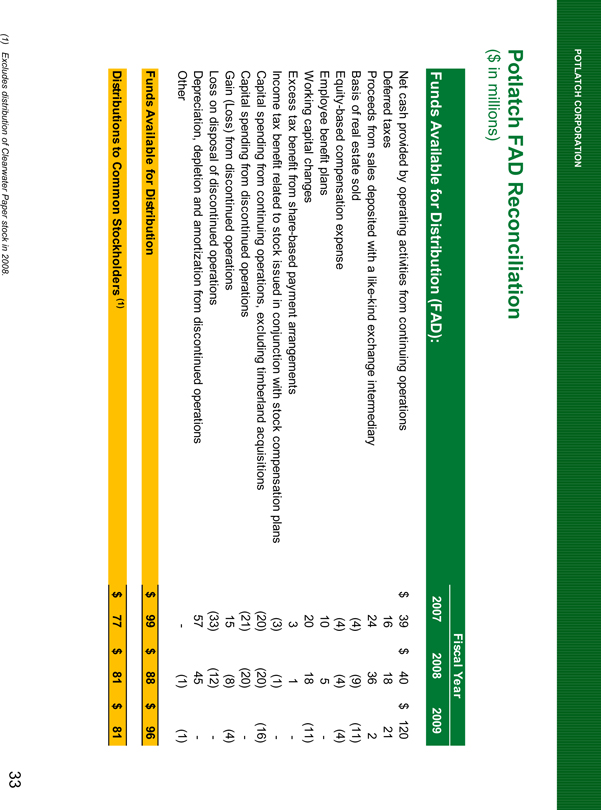
POTLATCH CORPORATION
Potlatch FAD Reconciliation
($ in millions)
Fiscal Year
Funds Available for Distribution (FAD): 2007 2008 2009
Net cash provided by operating activities from continuing operations $ 39 $ 40 $ 120
Deferred taxes 16 18 21
Proceeds from sales deposited with a like-kind exchange intermediary 24 36 2
Basis of real estate sold (4) (9) (11)
Equity-based compensation expense (4) (4) (4)
Employee benefit plans 10 5 -
Working capital changes 20 18 (11)
Excess tax benefit from share-based payment arrangements 3 1 -
Income tax benefit related to stock issued in conjunction with stock compensation plans (3) (1) -
Capital spending from continuing operations, excluding timberland acquisitions (20) (20) (16)
Capital spending from discontinued operations (21) (20) -
Gain (Loss) from discontinued operations 15 (8) (4)
Loss on disposal of discontinued operations (33) (12) -
Depreciation, depletion and amortization from discontinued operations 57 45 -
Other - (1) (1)
Funds Available for Distribution $ 99 $ 88 $ 96
Distributions to Common Stockholders (1) $ 77 $ 81 $ 81
(1) Excludes distribution of Clearwater Paper stock in 2008.
33
POTLATCH CORPORATION
Growing Revenue from Non-Timber Resources
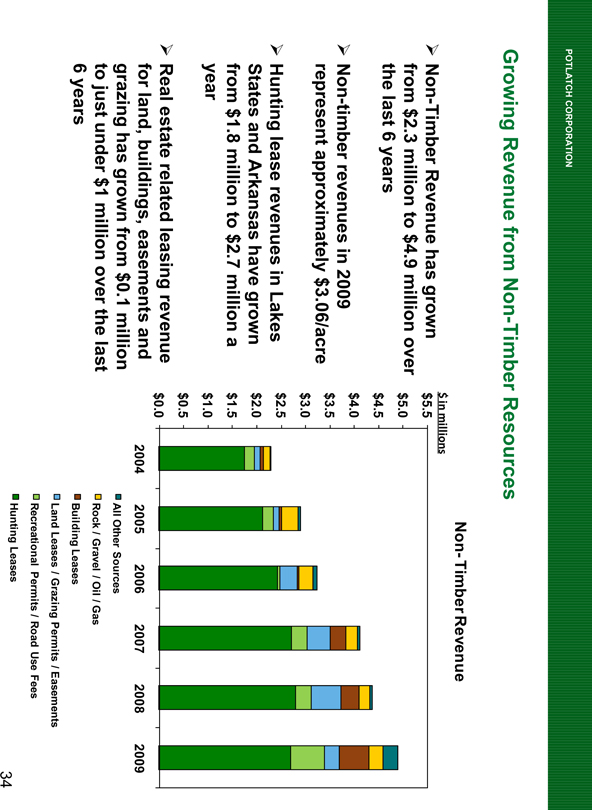
Non-Timber Revenue has grown from $2.3 million to $4.9 million over the last 6 years
Non-timber revenues in 2009 represent approximately $3.06/acre
Hunting lease revenues in Lakes States and Arkansas have grown from $1.8 million to $2.7 million a year
Real estate related leasing revenue for land, buildings, easements and grazing has grown from $0.1 million to just under $1 million over the last 6 years
Non-Timber Revenue
$ in millions
$5.5
$5.0
$4.5
$4.0
$3.5
$3.0
$2.5
$2.0
$1.5
$1.0
$0.5
$0.0
2004 2005 2006 2007 2008 2009
All Other Sources
Rock / Gravel / Oil / Gas
Building Leases
Land Leases / Grazing Permits / Easements
Recreational Permits / Road Use Fees
Hunting Leases
34
POTLATCH CORPORATION
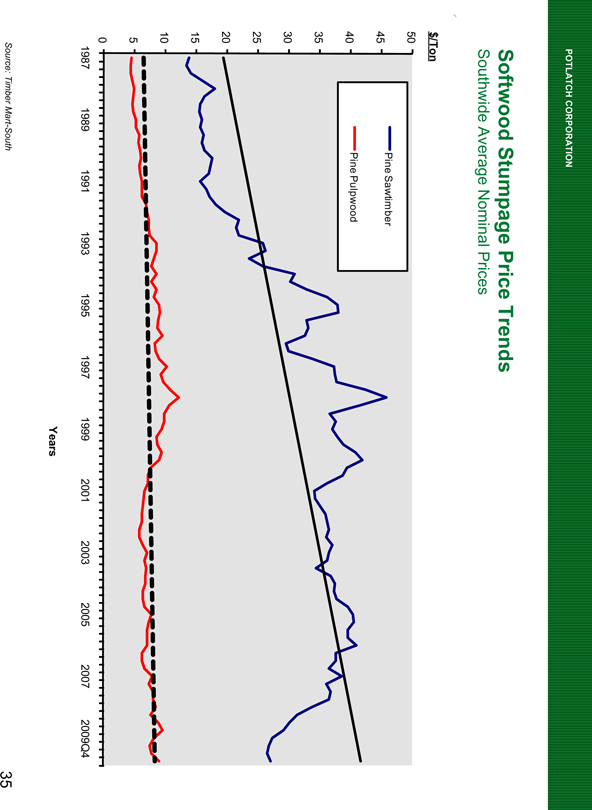
Softwood Stumpage Price Trends
Southwide Average Nominal Prices
$/Ton
50
45
40
35
30
25
20
15
10
5
0
Pine Sawtimber
Pine Pulpwood
1987 1989 1991 1993 1995 1997 1999 2001 2003 2005 2007 2009Q4
Years
Source: Timber Mart-South
35
POTLATCH CORPORATION
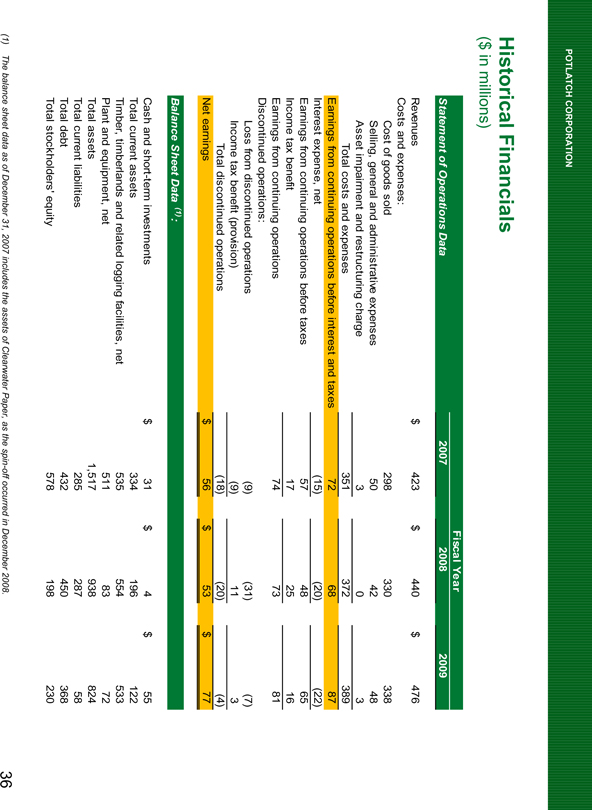
Historical Financials
($ in millions)
Fiscal Year
Statement of Operations Data 2007 2008 2009
Revenues $ 423 $ 440 $ 476
Costs and expenses:
Cost of goods sold 298 330 338
Selling, general and administrative expenses 50 42 48
Asset impairment and restructuring charge 3 0 3
Total costs and expenses 351 372 389
Earnings from continuing operations before interest and taxes 72 68 87
Interest expense, net (15) (20) (22)
Earnings from continuing operations before taxes 57 48 65
Income tax benefit 17 25 16
Earnings from continuing operations 74 73 81
Discontinued operations:
Loss from discontinued operations (9) (31) (7)
Income tax benefit (provision) (9) 11 3
Total discontinued operations (18) (20) (4)
Net earnings $ 56 $ 53 $ 77
Balance Sheet Data (1):
Cash and short-term investments $ 31 $ 4 $ 55
Total current assets 334 196 122
Timber, timberlands and related logging facilities, net 535 554 533
Plant and equipment, net 511 83 72
Total assets 1,517 938 824
Total current liabilities 285 287 58
Total debt 432 450 368
Total stockholders’ equity 578 198 230
(1) The balance sheet data as of December 31, 2007 includes the assets of Clearwater Paper, as the spin-off occurred in December 2008.
36
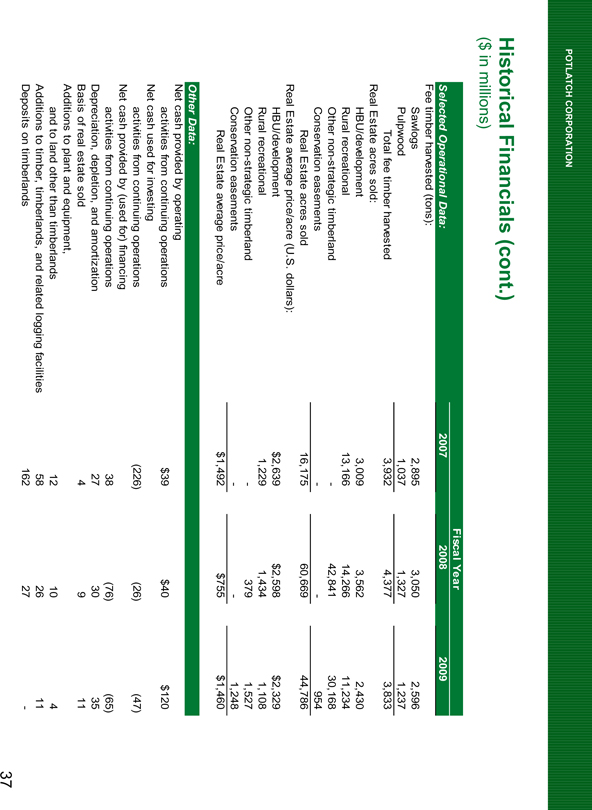
POTLATCH CORPORATION
Historical Financials (cont.)
($ in millions)
Fiscal Year
Selected Operational Data: 2007 2008 2009
Fee timber harvested (tons):
Sawlogs 2,895 3,050 2,596
Pulpwood 1,037 1,327 1,237
Total fee timber harvested 3,932 4,377 3,833
Real Estate acres sold:
HBU/development 3,009 3,562 2,430
Rural recreational 13,166 14,266 11,234
Other non-strategic timberland - 42,841 30,168
Conservation easements - - 954
Real Estate acres sold 16,175 60,669 44,786
Real Estate average price/acre (U.S. dollars):
HBU/development $2,639 $2,598 $2,329
Rural recreational 1,229 1,434 1,108
Other non-strategic timberland - 379 1,527
Conservation easements - - 1,248
Real Estate average price/acre $1,492 $755 $1,460
Other Data:
Net cash provided by operating
activities from continuing operations $39 $40 $120
Net cash used for investing
activities from continuing operations (226) (26) (47)
Net cash provided by (used for) financing
activities from continuing operations 38 (76) (65)
Depreciation, depletion, and amortization 27 30 35
Basis of real estate sold 4 9 11
Additions to plant and equipment,
and to land other than timberlands 12 10 4
Additions to timber, timberlands, and related logging facilities 58 26 11
Deposits on timberlands 162 27 -
37
POTLATCH CORPORATION
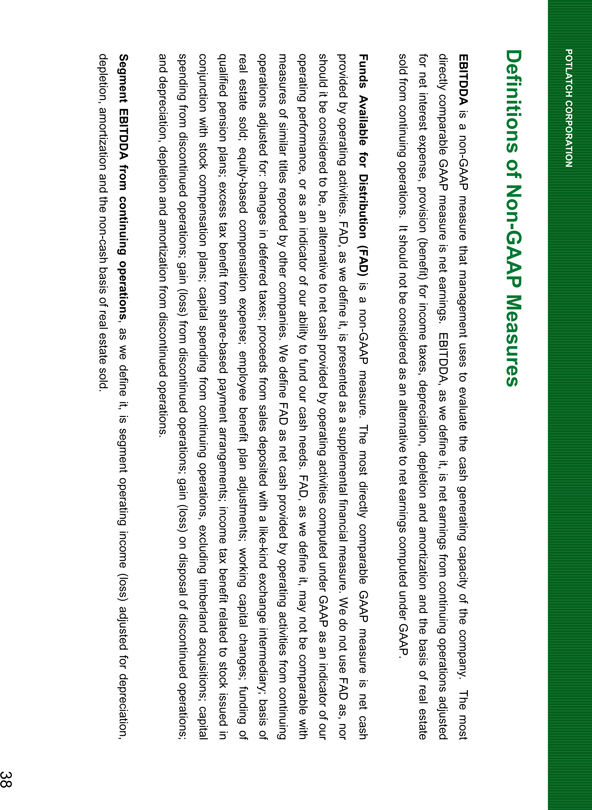
Definitions of Non-GAAP Measures
EBITDDA is a non-GAAP measure that management uses to evaluate the cash generating capacity of the company. The most directly comparable GAAP measure is net earnings. EBITDDA, as we define it, is net earnings from continuing operations adjusted for net interest expense, provision (benefit) for income taxes, depreciation, depletion and amortization and the basis of real estate sold from continuing operations. It should not be considered as an alternative to net earnings computed under GAAP.
Funds Available for Distribution (FAD) is a non-GAAP measure. The most directly comparable GAAP measure is net cash provided by operating activities. FAD, as we define it, is presented as a supplemental financial measure. We do not use FAD as, nor should it be considered to be, an alternative to net cash provided by operating activities computed under GAAP as an indicator of our operating performance, or as an indicator of our ability to fund our cash needs. FAD, as we define it, may not be comparable with measures of similar titles reported by other companies. We define FAD as net cash provided by operating activities from continuing operations adjusted for: changes in deferred taxes; proceeds from sales deposited with a like-kind exchange intermediary; basis of real estate sold; equity-based compensation expense; employee benefit plan adjustments; working capital changes; funding of qualified pension plans; excess tax benefit from share-based payment arrangements; income tax benefit related to stock issued in conjunction with stock compensation plans; capital spending from continuing operations, excluding timberland acquisitions; capital spending from discontinued operations; gain (loss) from discontinued operations; gain (loss) on disposal of discontinued operations; and depreciation depletion and amortization from discontinued operations.
Segment EBITDDA from continuing operations, as we define it, is segment operating income (loss) adjusted for depreciation, depletion, amortization and the non-cash basis of real estate sold.
38

POTLATCH CORPORATION
Potlatch®
WWW.POTLATCHCORP.COM


