Exhibit 99.1
POTLATCH CORPORATION
MARCH 2012
POTLATCH CORPORATION
Michael J. Covey Chairman, President & Chief Executive Officer
Eric J. Cremers Executive Vice President & Chief Financial Officer
POTLATCH CORPORATION
MARCH 2012
Forward-Looking Statements
This presentation contains certain forward-looking statements within the meaning of the Private Litigation Reform Act of 1995 as amended, including without limitation statements about future company performance, the company’s business model, strength of the company’s balance sheet and credit metrics, dividend levels and yields, direction of markets and the economy, long term trend of higher sawlog prices, pulpwood prices, management of timberlands to optimize values, projected inland private timber growth and harvest, future harvest levels and their relation to market trends, potential EBITDDA and cashflows from improved harvest and pricing, impact of the pine beetle on North American lumber supply, forecasts of North American exports of lumber to China, North American lumber demand, forecast of U.S. housing starts, the company’s capital structure, weighted average cost of debt, cash flow generation, Canadian/U.S. dollar exchange rate, funds available for distribution, real estate business potential and land development potential, real estate value opportunities, biomass opportunities, forecasts of U.S. biomass consumed to produce electricity, management of the output of our Wood Products facilities, leverage and interest coverage ratios, debt repayment, net asset value, and dividend policy. These forward-looking statements are based on current expectations, estimates, assumptions and projections that are subject to change, and actual results may differ materially from the forward-looking statements. Factors that could cause actual results to differ materially include, but are not limited to, changes in timberland values; changes in timber harvest levels on the company’s lands; changes in timber prices; changes in policy regarding governmental timber sales; changes in the United States and international economies; changes in the level of domestic construction activity; changes in international tariffs, quotas and trade agreements involving wood products; changes in domestic and international demand for wood products; changes in production and production capacity in the forest products industry; competitive pricing pressures for the company’s products; unanticipated manufacturing disruptions; changes in general and industry-specific environmental laws and regulations; unforeseen environmental liabilities or expenditures; weather conditions; changes in fuel and energy costs; changes in raw material and other costs; the ability to satisfy complex rules in order to remain qualified as a REIT; changes in tax laws that could reduce the benefits associated with REIT status; and other risks and uncertainties described from time to time in the company’s public filings with the Securities and Exchange Commission. All forward-looking statements are made as of the date of this presentation, and the company does not undertake to update any forward-looking statements.
POTLATCH CORPORATION
MARCH 2012
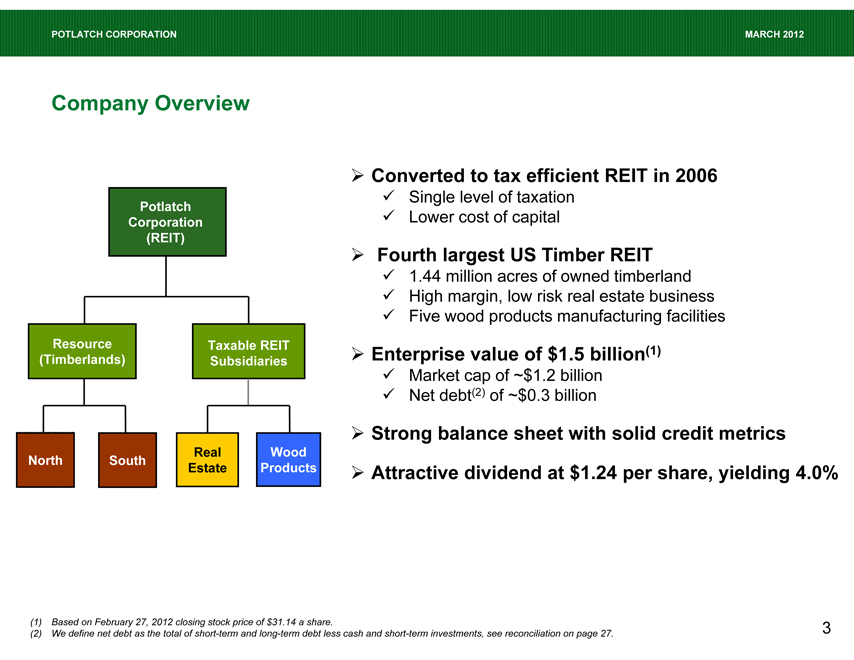
Potlatch Corporation (REIT)
Resource (Timberlands)
Taxable REIT Subsidiaries
North
South
Real Estate
Wood
Products
Converted to tax efficient REIT in 2006
Single level of taxation Lower cost of capital
Fourth largest US Timber REIT
1.44 million acres of owned timberland High margin, low risk real estate business Five wood products manufacturing facilities
Enterprise value of $1.5 billion(1)
Market cap of ~$1.2 billion Net debt(2) of ~$0.3 billion
Strong balance sheet with solid credit metrics
Attractive dividend at $1.24 per share, yielding 4.0%
(1) Based on February 27, 2012 closing stock price of $31.14 a share.
(2) We define net debt as the total of short-term and long-term debt less cash and short-term investments, see reconciliation on page 27.
3
POTLATCH CORPORATION
MARCH 2012
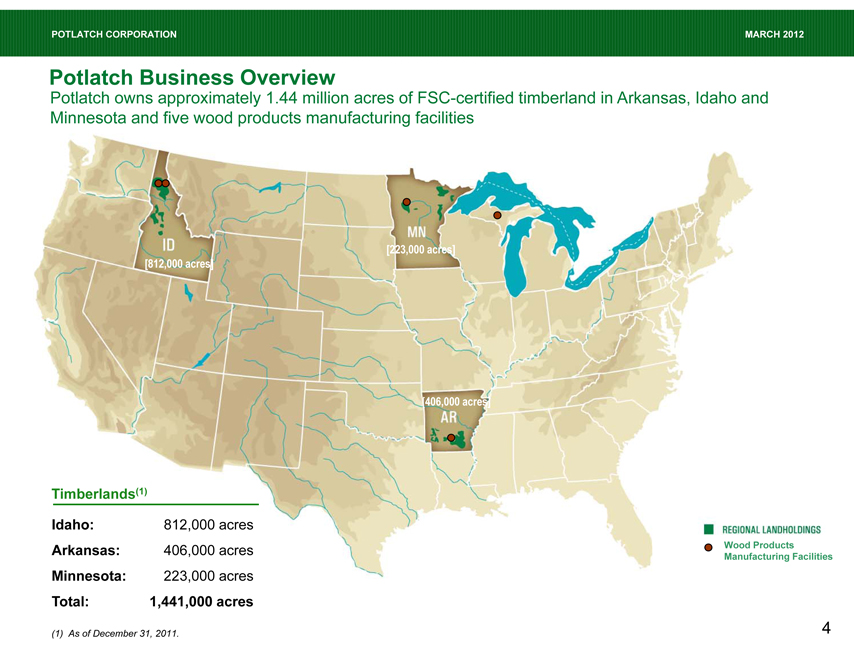
Potlatch Business Overview
Potlatch owns approximately 1.44 million acres of FSC-certified timberland in Arkansas, Idaho and Minnesota and five wood products manufacturing facilities
[812,000 acres] ID
[223,000 acres] MN
[406,000 acres] AR
Timberlands(1)
Idaho: 812,000 acres
Arkansas: 406,000 acres
Minnesota: 223,000 acres
Total: 1,441,000 acres
REGIONAL LANDHOLDINGS
Wood Products Manufacturing Facilities
(1) As of December 31, 2011.
Wood Products Manufacturing Facilities
4
POTLATCH CORPORATION
MARCH 2012
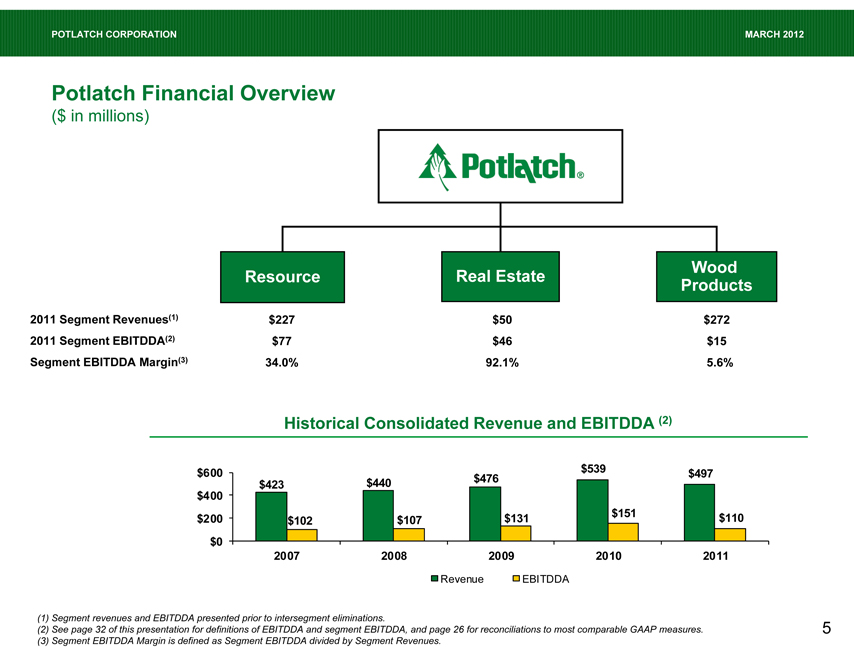
Potlatch Financial Overview
($ in millions)
Resource
Real Estate
Wood Products
2011 Segment Revenues(1) $227 $50 $272
2011 Segment EBITDDA(2) $77 $46 $15
Segment EBITDDA Margin(3) 34.0% 92.1% 5.6%
Historical Consolidated Revenue and EBITDDA (2)
$600 $539 $497
$423 $440 $476
$400
$200 $102 $107 $131 $151 $110
$0
2007 2008 2009 2010 2011
Revenue
EBITDDA
(1) | | Segment revenues and EBITDDA presented prior to intersegment eliminations. |
(2) See page 32 of this presentation for definitions of EBITDDA and segment EBITDDA, and page 26 for reconciliations to most comparable GAAP measures. (3) Segment EBITDDA Margin is defined as Segment EBITDDA divided by Segment Revenues.
POTLATCH CORPORATION
MARCH 2012
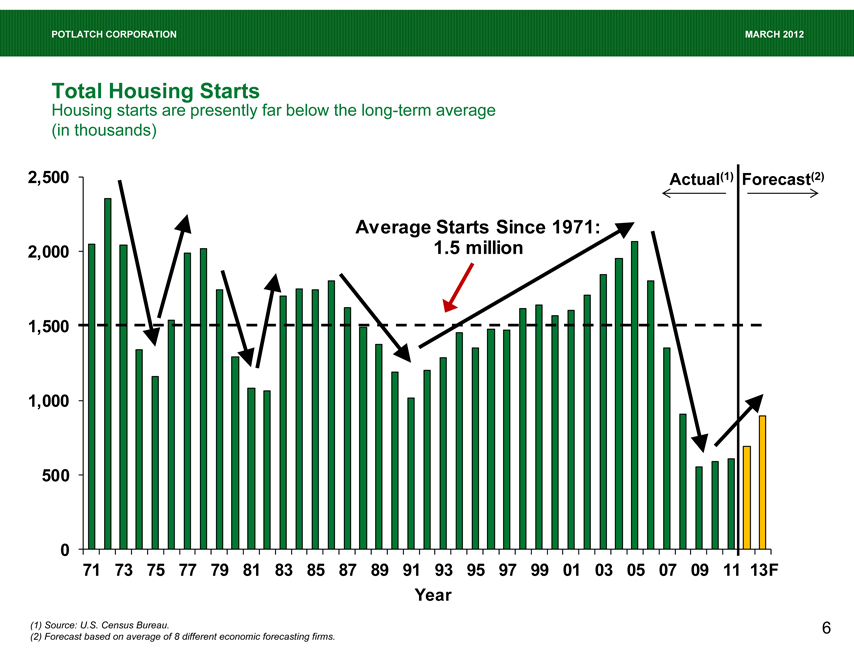
Total Housing Starts
Housing starts are presently far below the long-term average (in thousands)
Actual(1)
Forecast(2)
Average Starts Since 1971: 1.5 million
2,500
2,000
1,500
1,000
500
0
71 73 75 77 79 81 83 85 87 89 91 93 95 97 99 01 03 05 07 09 11 13F
Year
(1) | | Source: U.S. Census Bureau. |
(2) | | Forecast based on average of 8 different economic forecasting firms. |
POTLATCH CORPORATION
MARCH 2012
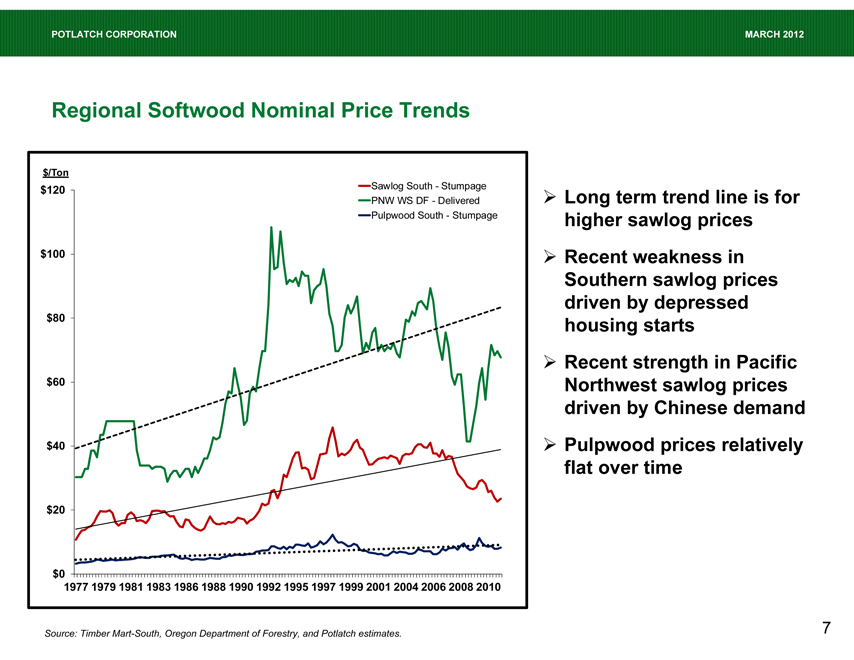
Regional Softwood Nominal Price Trends
$/Ton
$120 Sawlog South - Stumpage
PNW WS DF - Delivered
Pulpwood South - Stumpage
$100
$80
$60
$40
$20
$0
1977 1979 1981 1983 1986 1988 1990 1992 1995 1997 1999 2001 2004 2006 2008 2010
Long term trend line is for higher sawlog prices Recent weakness in Southern sawlog prices driven by depressed housing starts Recent strength in Pacific Northwest sawlog prices driven by Chinese demand Pulpwood prices relatively flat over time
Source: Timber Mart-South, Oregon Department of Forestry, and Potlatch estimates.
7
POTLATCH CORPORATION
MARCH 2012
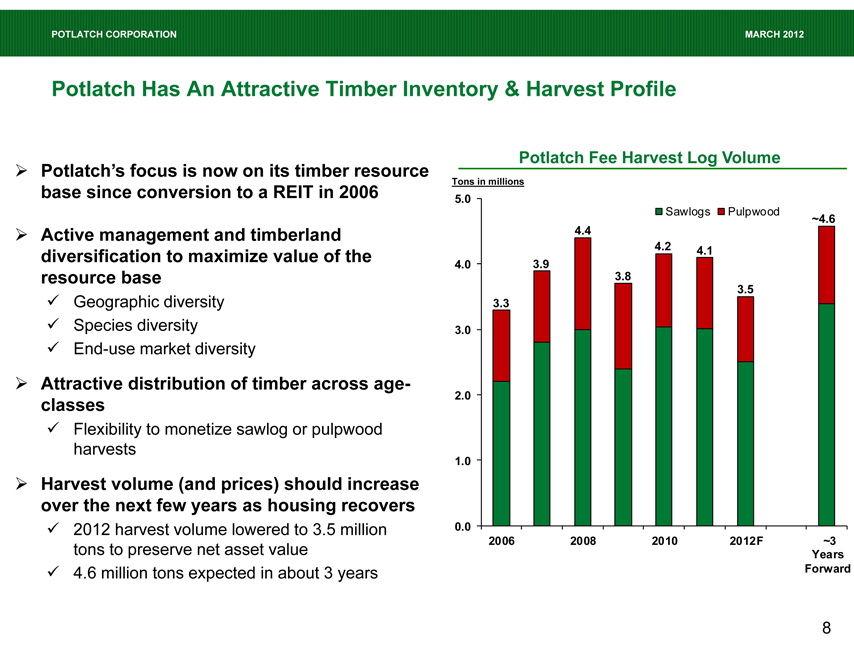
Potlatch Has An Attractive Timber Inventory & Harvest Profile
Potlatch’s focus is now on its timber resource base since conversion to a REIT in 2006
Active management and timberland diversification to maximize value of the resource base
Geographic diversity Species diversity End-use market diversity
Attractive distribution of timber across age-classes
Flexibility to monetize sawlog or pulpwood harvests
Harvest volume (and prices) should increase over the next few years as housing recovers
2012 harvest volume lowered to 3.5 million tons to preserve net asset value 4.6 million tons expected in about 3 years
Potlatch Fee Harvest Log Volume
Tons in millions
Sawlogs
Pulpwood
5.0
~4.6
4.4
4.2 4.1
4.0 3.9
3.8
3.5
3.3
3.0
2.0
1.0
0.0
2006 2008 2010 2012F ~3
Years
Forward
8
 POTLATCH CORPORATION
MARCH 2012
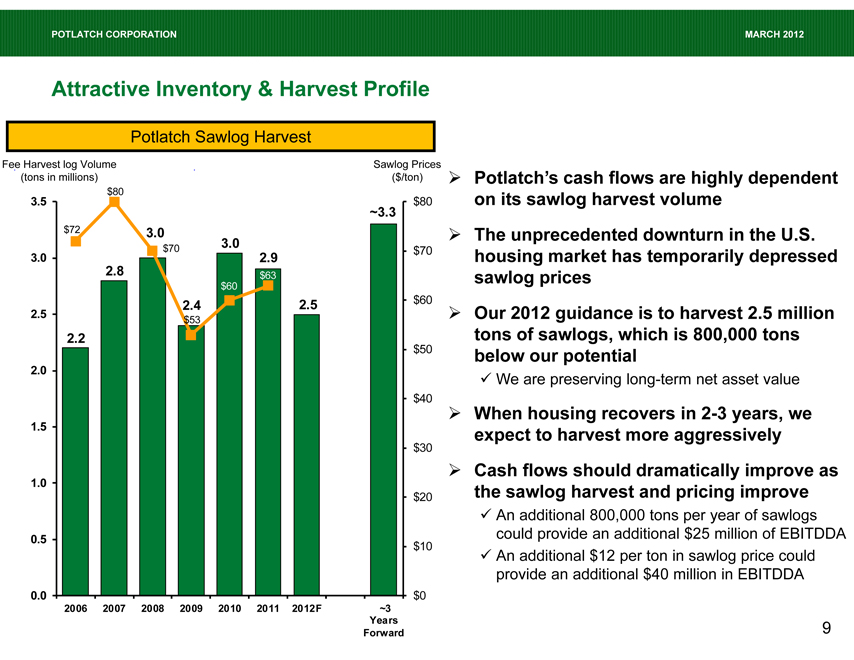
Attractive Inventory & Harvest Profile
Potlatch Sawlog Harvest
Fee Harvest log Volume Sawlog Prices
(tons in millions) ($/ton)
$80 3.5 $80 ~3.3
$72 3.0
3.0
$70 $70
3.0 2.9
2.8 $63
$60
2.4 2.5 $60
2.5 $53
2.2
$50
2.0
$40
1.5
$30
1.0
$20
0.5 $10
0.0 $0
2006 2007 2008 2009 2010 2011 2012F ~3
Years
Forward
Potlatch’s cash flows are highly dependent on its sawlog harvest volume The unprecedented downturn in the U.S. housing market has temporarily depressed sawlog prices Our 2012 guidance is to harvest 2.5 million tons of sawlogs, which is 800,000 tons below our potential
We are preserving long-term net asset value
When housing recovers in 2-3 years, we expect to harvest more aggressively Cash flows should dramatically improve as the sawlog harvest and pricing improve
An additional 800,000 tons per year of sawlogs could provide an additional $25 million of EBITDDA An additional $12 per ton in sawlog price could provide an additional $40 million in EBITDDA
9
POTLATCH CORPORATION
MARCH 2012
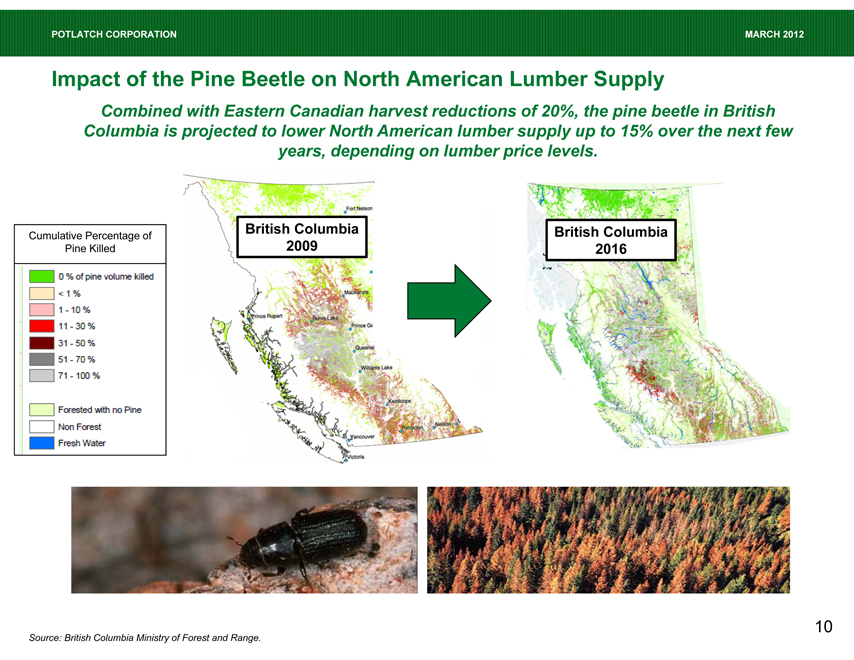
Impact of the Pine Beetle on North American Lumber Supply
Combined with Eastern Canadian harvest reductions of 20%, the pine beetle in British Columbia is projected to lower North American lumber supply up to 15% over the next few years, depending on lumber price levels.
Cumulative Percentage of Pine Killed
0% of pine volume killed
<1% 1 -10% 11—30% 31 – 50% 51 – 70% 71 – 100%
Forested with no Pine Non Forest Fresh Water
British Columbia 2009
British Columbia British Columbia 2016
Source: British Columbia Ministry of Forest and Range.
10
POTLATCH CORPORATION
MARCH 2012
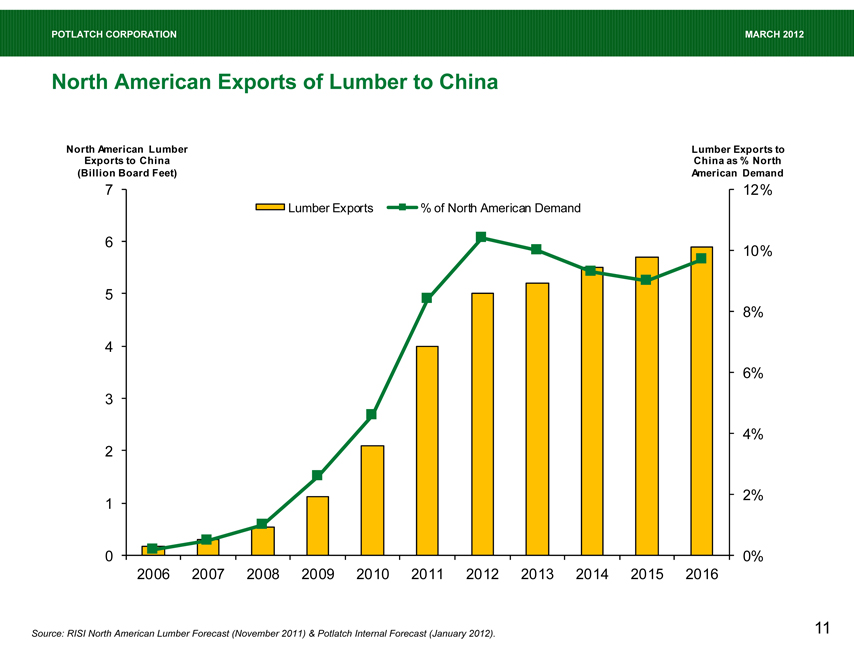
North American Exports of Lumber to China
North American Lumber Lumber Exports to
Exports to China China as % North
(Billion Board Feet) American Demand
7 12%
Lumber Exports % of North American Demand
6 10%
5
8%
4
6%
3
4%
2
1 2%
0 0%
2006 2007 2008 2009 2010 2011 2012 2013 2014 2015 2016
Source: RISI North American Lumber Forecast (November 2011) & Potlatch Internal Forecast (January 2012).
11
POTLATCH CORPORATION
MARCH 2012
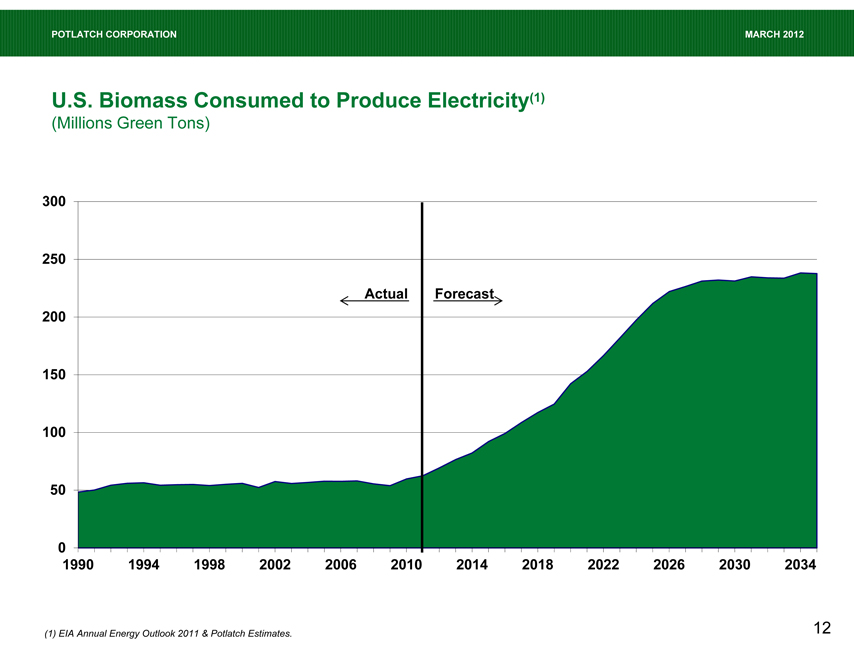
U.S. Biomass Consumed to Produce Electricity(1)
(Millions Green Tons)
300
250
Actual Forecast
200
150
100
50
0
1990 1994 1998 2002 2006 2010 2014 2018 2022 2026 2030 2034
(1) | | EIA Annual Energy Outlook 2011 & Potlatch Estimates. |
12
POTLATCH CORPORATION
MARCH 2012
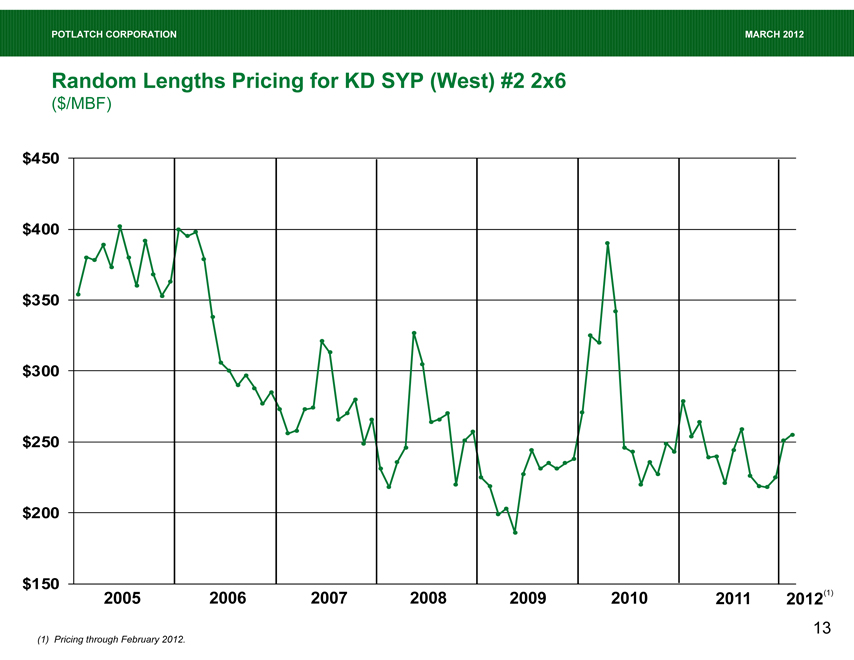
Random Lengths Pricing for KD SYP (West) #2 2x6
($/MBF)
$450$400$350$300$250$200$150
2005
2006
2007
2008
2009
2010
2011
2012(1)
(1) | | Pricing through February 2012. |
13
POTLATCH CORPORATION
MARCH 2012
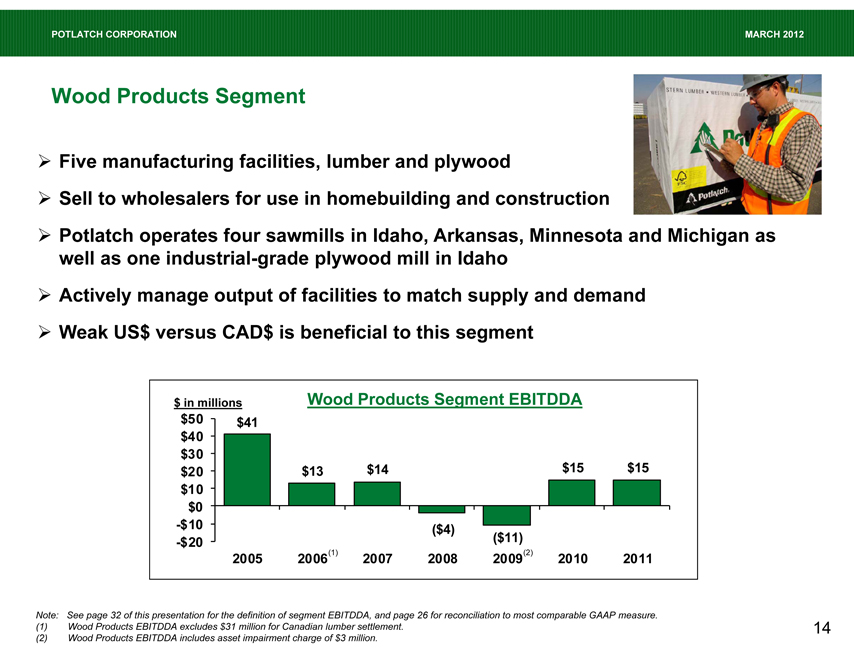
Wood Products Segment
Five manufacturing facilities, lumber and plywood
Sell to wholesalers for use in homebuilding and construction
Potlatch operates four sawmills in Idaho, Arkansas, Minnesota and Michigan as well as one industrial-grade plywood mill in Idaho Actively manage output of facilities to match supply and demand Weak US$ versus CAD$ is beneficial to this segment
Wood Products Segment EBITDDA
$ in millions
$50 $41
$40
$30
$20 $13 $14 $15 $15
$10
$0
-$10 ($4)
-$20 ($11)
2005 2006(1) 2007 2008 2009(2) 2010 2011
Note: See page 32 of this presentation for the definition of segment EBITDDA, and page 26 for reconciliation to most comparable GAAP measure. (1) Wood Products EBITDDA excludes $31 million for Canadian lumber settlement.
(2) Wood Products EBITDDA includes asset impairment charge of $3 million.
14
POTLATCH CORPORATION
MARCH 2012
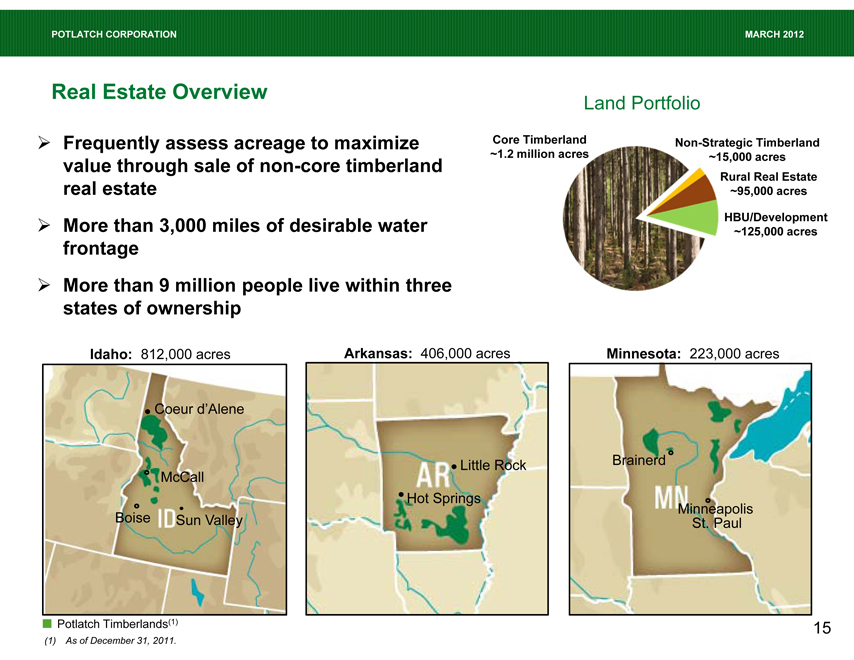
Real Estate Overview
Land Portfolio
Frequently assess acreage to maximize value through sale of non-core timberland real estate More than 3,000 miles of desirable water frontage More than 9 million people live within three states of ownership
Core Timberland ~1.2 million acres
Non-Strategic Timberland ~15,000 acres Rural Real Estate ~95,000 acres
HBU/Development ~125,000 acres
Idaho: 812,000 acres
Arkansas: 406,000 acres
Minnesota: 223,000 acres
Coeur d’Alene
McCall
Boise
Sun Valley
Little Rock
Hot Springs
Brainerd
Minneapolis St. Paul
Potlatch Timberlands(1)
(1) As of December 31, 2011.
15
POTLATCH CORPORATION
MARCH 2012
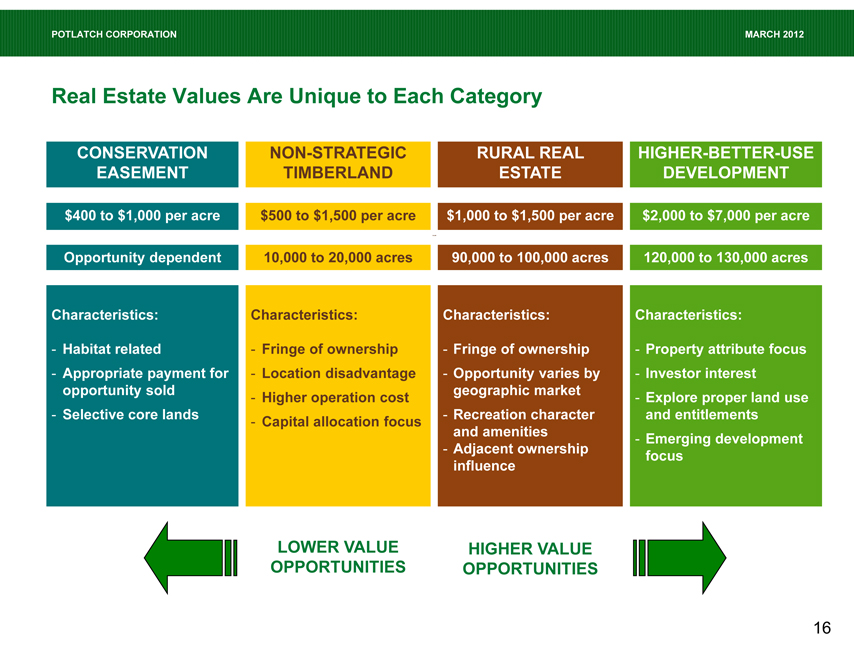
Real Estate Values Are Unique to Each Category
CONSERVATION NON-STRATEGIC RURAL REAL HIGHER-BETTER-USE
EASEMENT TIMBERLAND ESTATE DEVELOPMENT
$400 to $1,000 per acre $500 to $1,500 per acre $1,000 to $1,500 per acre $2,000 to $7,000 per acre
Opportunity dependent 10,000 to 20,000 acres 90,000 to 100,000 acres 120,000 to 130,000 acres
Characteristics: Characteristics: Characteristics: Characteristics:
- Habitat related—Fringe of ownership—Fringe of ownership—Property attribute focus
- Appropriate payment for—Location disadvantage—Opportunity varies by—Investor interest
opportunity sold geographic market
—Higher operation cost —Explore proper land use
- Selective core lands —Recreation character and entitlements
—Capital allocation focus
and amenities—Emerging development
—Adjacent ownership focus
influence
LOWER VALUE HIGHER VALUE OPPORTUNITIES OPPORTUNITIES
16

POTLATCH CORPORATION
MARCH 2012
Significant Real Estate Portfolio
Realization of Non-Core Timberland Asset Value
$ in millions
$90 Segment Revenue
$85.2
$80 5.9
9.2
$70 $65.4
1.2
$60 5.6
12.5 $50.0
$50 $46.1 5.4
$40 9.3
12.4
70.1
$30
$24.1 20.5
46.1
$20 7.9
32.2
$10 16.2 16.3
$0
2007 2008 (1) 2009 2010 2011
Conservation Easement HBU/Development
Rural Real Estate Non-Strategic Timberland
Price Per Acre
$ $ $ $ $ $ $
0 $ 500 1,000 1,500 2,000 2,500 3,000 /Acre
$1,229 2007 $2,639
$379 $1,434
2008 $2,598 $1,527 $1,108 2009 $2,329 $1,248
$745 $1,182 2010 $2,007 $1,345 $1,259 2011 $2,054
Acres Sold
Acres
120,000 104,737 2,967 100,000 7,796 80,000 60,669 60,000 3,562 44,786
14,266 954 93,974 36,458 40,000 2,430 2,592 11,234 16,175 9,851 20,000 42,841 3,009 30,168 24,015 13,166
0 (2)
2007 2008 2009 2010 2011
(1) Segment Revenue in 2008 excludes sale of building.
(2) Excludes the sale of the Boardman, Oregon tree farm of 17,000 acres.
17
POTLATCH CORPORATION
MARCH 2012
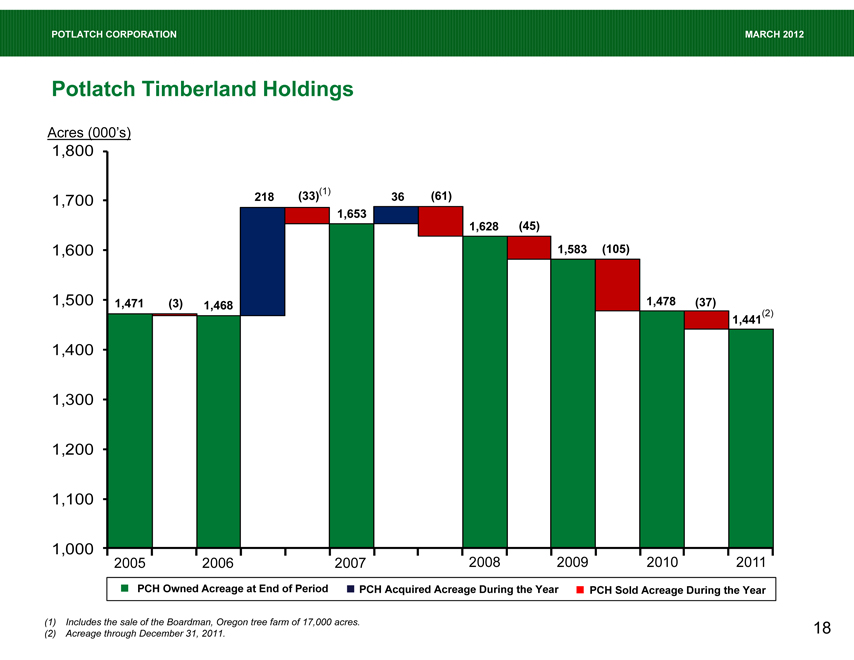
Potlatch Timberland Holdings
Acres (000’s)
1,800
1,700 218 (33)(1) 36 (61)
1,653
1,628 (45)
1,600 1,583 (105)
1,500 1,471 (3) 1,468 1,478 (37)
1,441(2)
1,400
1,300
1,200
1,100
1,000
2005 2006 2007 2008 2009 2010 2011
PCH Owned Acreage at End of Period PCH Acquired Acreage During the Year PCH Sold Acreage During the Year
(1) Includes the sale of the Boardman, Oregon tree farm of 17,000 acres. (2) Acreage through December 31, 2011.
18
POTLATCH CORPORATION
MARCH 2012
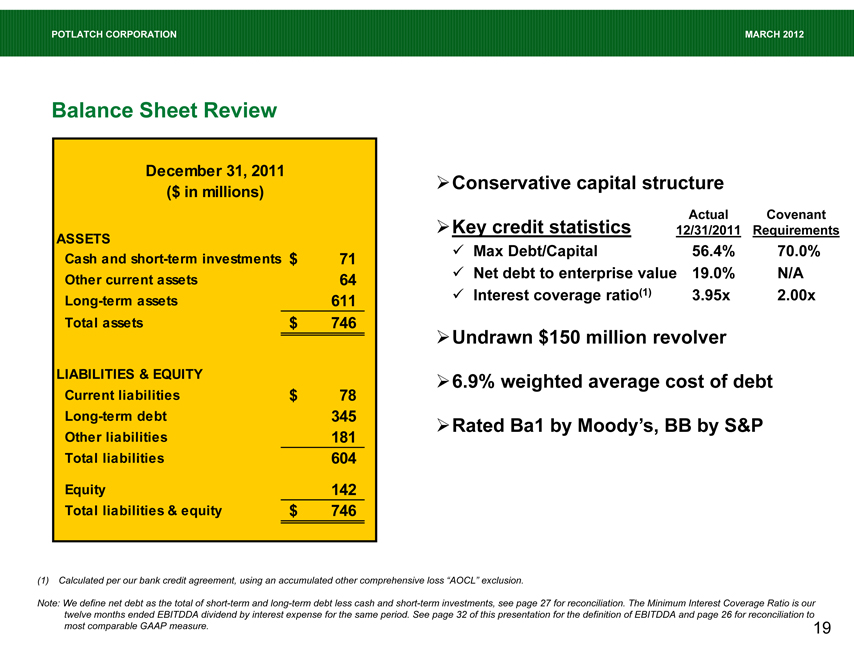
Balance Sheet Review
December 31, 2011
($ in millions)
ASSETS
Cash and short-term investments $ 71
Other current assets 64
Long-term assets 611
Total assets $ 746
LIABILITIES & EQUITY
Current liabilities $ 78
Long-term debt 345
Other liabilities 181
Total liabilities 604
Equity 142
Total liabilities & equity $ 746
Conservative capital structure
Actual Covenant
Key credit statistics 12/31/2011 Requirements
Max Debt/Capital 56.4% 70.0%
Net debt to enterprise value 19.0% N/A
Interest coverage ratio(1) 3.95x 2.00x
Undrawn $150 million revolver 6.9% weighted average cost of debt Rated Ba1 by Moody’s, BB by S&P
(1) Calculated per our bank credit agreement, using an accumulated other comprehensive loss “AOCL” exclusion.
Note: We define net debt as the total of short-term and long-term debt less cash and short-term investments, see page 27 for reconciliation. The Minimum Interest Coverage Ratio is our twelve months ended EBITDDA dividend by interest expense for the same period. See page 32 of this presentation for the definition of EBITDDA and page 26 for reconciliation to most comparable GAAP measure.
19
POTLATCH CORPORATION
MARCH 2012
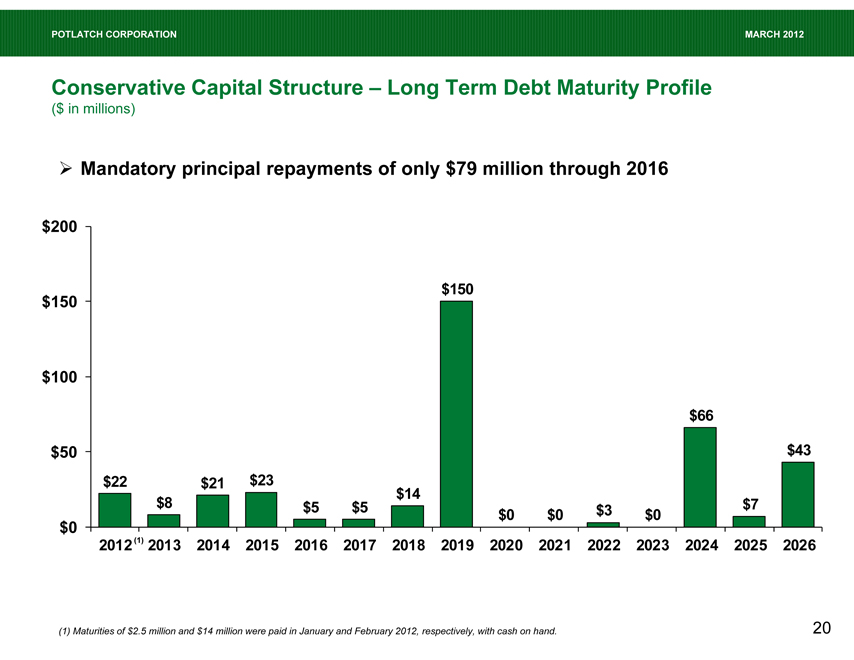
Conservative Capital Structure – Long Term Debt Maturity Profile
($ in millions)
Mandatory principal repayments of only $79 million through 2016
$200
$150
$150
$100
$66
$50 $43
$22 $21 $23
$14
$8 $5 $5 $0 $0 $3 $0 $7
$0
2012 (1) 2013 2014 2015 2016 2017 2018 2019 2020 2021 2022 2023 2024 2025 2026
(1) Maturities of $2.5 million and $14 million were paid in January and February 2012, respectively, with cash on hand.
20
POTLATCH CORPORATION
MARCH 2012
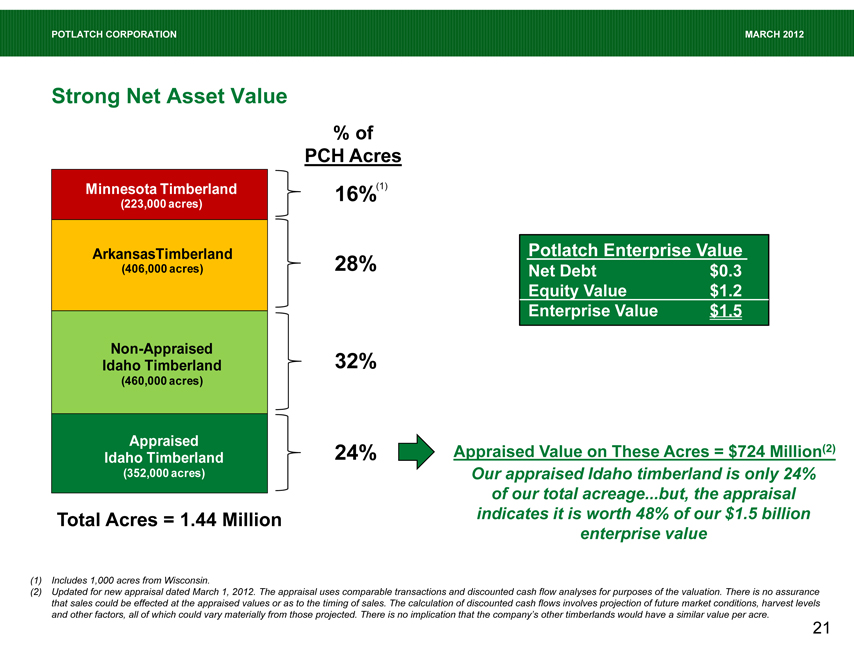
Strong Net Asset Value
% of
PCH Acres
Minnesota Timberland 16%(1)
(223,000 acres)
ArkansasTimberland
(406,000 acres) 28%
Non-Appraised
Idaho Timberland 32%
(460,000 acres)
Appraised
Idaho Timberland 24%
(352,000 acres)
Total Acres = 1.44 Million
Potlatch Enterprise Value
Net Debt $0.3
Equity Value $1.2
Enterprise Value $1.5
Appraised Value on These Acres = $724 Million(2)
Our appraised Idaho timberland is only 24% of our total acreage.but, the appraisal indicates it is worth 48% of our $1.5 billion enterprise value
(1) | | Includes 1,000 acres from Wisconsin. |
(2) Updated for new appraisal dated March 1, 2012. The appraisal uses comparable transactions and discounted cash flow analyses for purposes of the valuation. There is no assurance that sales could be effected at the appraised values or as to the timing of sales. The calculation of discounted cash flows involves projection of future market conditions, harvest levels and other factors, all of which could vary materially from those projected. There is no implication that the company’s other timberlands would have a similar value per acre.
21
POTLATCH CORPORATION
MARCH 2012
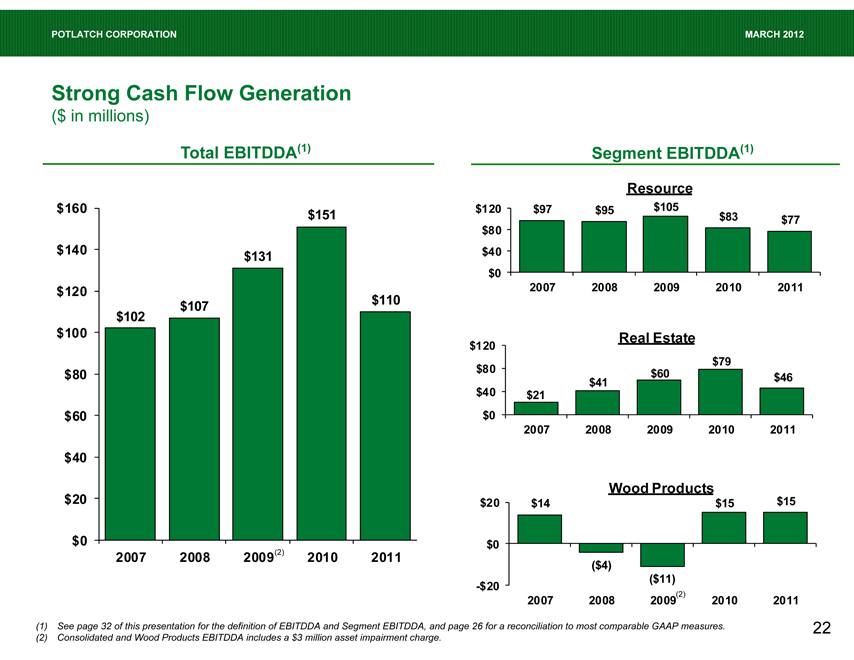
Strong Cash Flow Generation
($ in millions)
Total EBITDDA(1)
$160 $151
$140 $131
$120
$107 $110
$102
$100
$80
$60
$40
$20
$0
2007 2008 2009(2) 2010 2011
Segment EBITDDA(1)
Resource
$120 $97 $95 $105 $83 $77
$80
$40
$0
2007 2008 2009 2010 2011
$120 Real Estate
$79
$80 $60 $46
$41
$40 $21
$0
2007 2008 2009 2010 2011
Wood Products
$20 $14 $15 $15
$0
($4)
-$20 ($11)
2007 2008 2009(2) 2010 2011
(1) See page 32 of this presentation for the definition of EBITDDA and Segment EBITDDA, and page 26 for a reconciliation to most comparable GAAP measures. (2) Consolidated and Wood Products EBITDDA includes a $3 million asset impairment charge.
22
POTLATCH CORPORATION
MARCH 2012
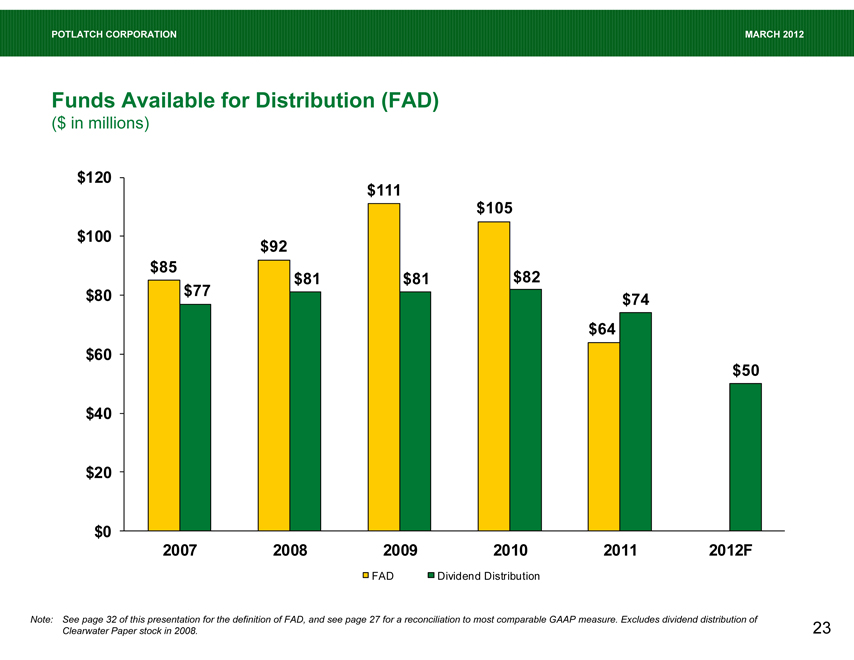
Funds Available for Distribution (FAD)
($ in millions)
$120
$111
$105
$100 $92
$85 $81 $81 $82
$80 $77 $74
$64
$60
$50
$40
$20
$0
2007 2008 2009 2010 2011 2012F
FAD Dividend Distribution
Note: See page 32 of this presentation for the definition of FAD, and see page 27 for a reconciliation to most comparable GAAP measure. Excludes dividend distribution of Clearwater Paper stock in 2008.
23
POTLATCH CORPORATION
MARCH 2012
Conclusion
Potlatch maintains a very attractive asset base of 1.44 million acres of timberland
We have deferred significant harvest volumes to preserve and enhance NAV We have the ability to meaningfully expand high margin sawlog harvest levels
Wood Products business has stabilized and is generating solid cash flow Real Estate segment has low risk, high margin attributes Attractive dividend Strong balance sheet with attractive debt cost and maturity profile Industry trends beginning to turn positive
Housing starts beginning to grow, albeit slowly
Exports to China from North America continue to expand Pine beetle to impact supply from Canada Biomass continues to hold promise
24
POTLATCH CORPORATION
MARCH 2012
Appendix
25
POTLATCH CORPORATION
MARCH 2012
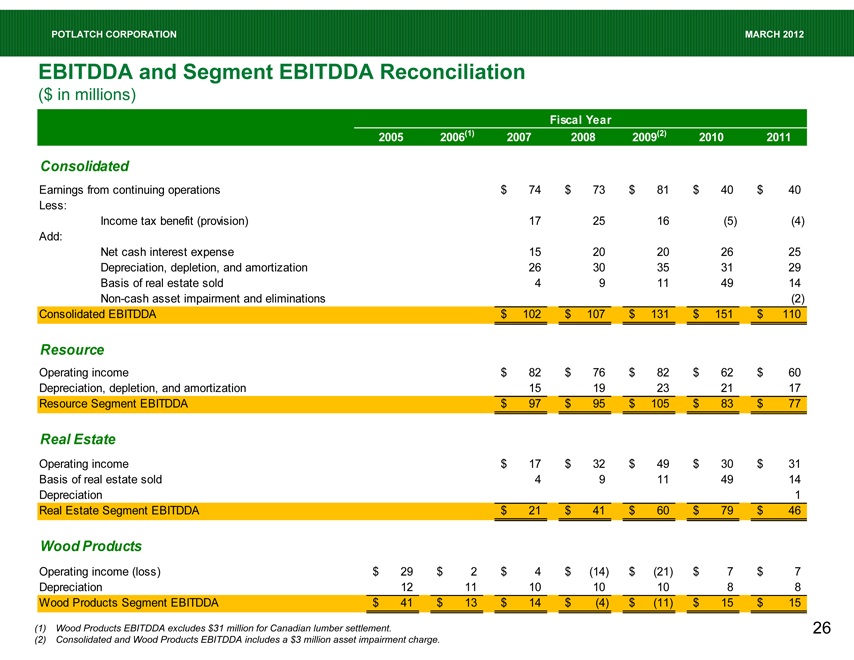
EBITDDA and Segment EBITDDA Reconciliation
($ in millions)
Fiscal Year
2005 2006(1) 2007 2008 2009(2) 2010 2011
Consolidated
Earnings from continuing operations $ 74 $ 73 $ 81 $ 40 $ 40
Less:
Income tax benefit (provision) 17 25 16 (5) (4)
Add:
Net cash interest expense 15 20 20 26 25
Depreciation, depletion, and amortization 26 30 35 31 29
Basis of real estate sold 4 9 11 49 14
Non-cash asset impairment and eliminations (2)
Consolidated EBITDDA $ 102 $ 107 $ 131 $ 151 $ 110
Resource
Operating income $ 82 $ 76 $ 82 $ 62 $ 60
Depreciation, depletion, and amortization 15 19 23 21 17
Resource Segment EBITDDA $ 97 $ 95 $ 105 $ 83 $ 77
Real Estate
Operating income $ 17 $ 32 $ 49 $ 30 $ 31
Basis of real estate sold 4 9 11 49 14
Depreciation 1
Real Estate Segment EBITDDA $ 21 $ 41 $ 60 $ 79 $ 46
Wood Products
Operating income (loss) $ 29 $ 2 $ 4 $ (14) $ (21) $ 7 $ 7
Depreciation 12 11 10 10 10 8 8
Wood Products Segment EBITDDA $ 41 $ 13 $ 14 $ (4) $ (11) $ 15 $ 15
(1) | | Wood Products EBITDDA excludes $31 million for Canadian lumber settlement. |
(2) | | Consolidated and Wood Products EBITDDA includes a $3 million asset impairment charge. |
26
POTLATCH CORPORATION
MARCH 2012
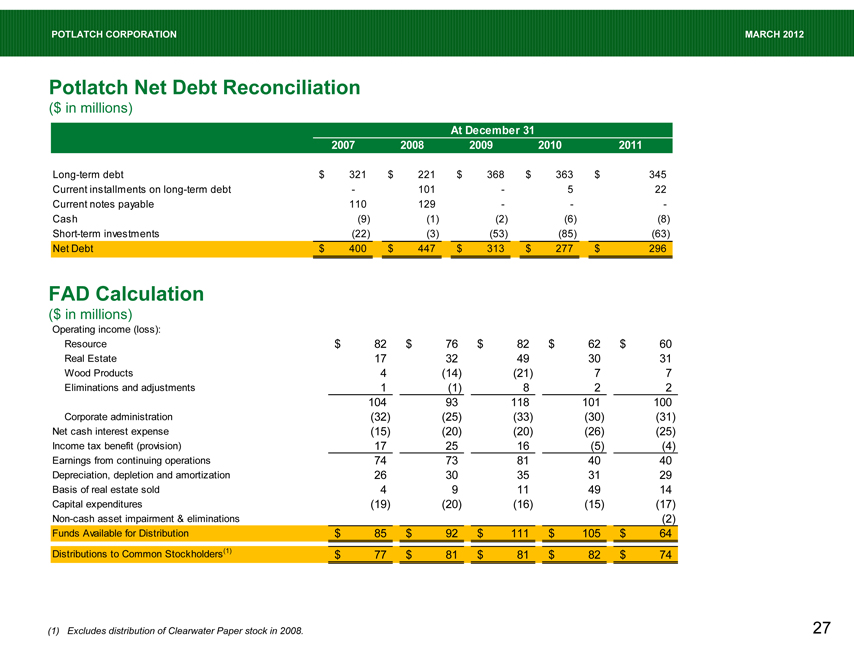
Potlatch Net Debt Reconciliation
($ in millions)
At December 31
2007 2008 2009 2010 2011
Long-term debt $ 321 $ 221 $ 368 $ 363 $ 345
Current installments on long-term debt — 101 — 5 22
Current notes payable 110 129 —— -
Cash (9) (1) (2) (6) (8)
Short-term investments (22) (3) (53) (85) (63)
Net Debt $ 400 $ 447 $ 313 $ 277 $ 296
FAD Calculation
($ in millions)
Operating income (loss):
Resource $ 82 $ 76 $ 82 $ 62 $ 60
Real Estate 17 32 49 30 31
Wood Products 4 (14) (21) 7 7
Eliminations and adjustments 1 (1) 8 2 2
104 93 118 101 100
Corporate administration (32) (25) (33) (30) (31)
Net cash interest expense (15) (20) (20) (26) (25)
Income tax benefit (provision) 17 25 16 (5) (4)
Earnings from continuing operations 74 73 81 40 40
Depreciation, depletion and amortization 26 30 35 31 29
Basis of real estate sold 4 9 11 49 14
Capital expenditures (19) (20) (16) (15) (17)
Non-cash asset impairment & eliminations (2)
Funds Available for Distribution $ 85 $ 92 $ 111 $ 105 $ 64
Distributions to Common Stockholders(1) $ 77 $ 81 $ 81 $ 82 $ 74
(1) | | Excludes distribution of Clearwater Paper stock in 2008. |
27
POTLATCH CORPORATION
MARCH 2012
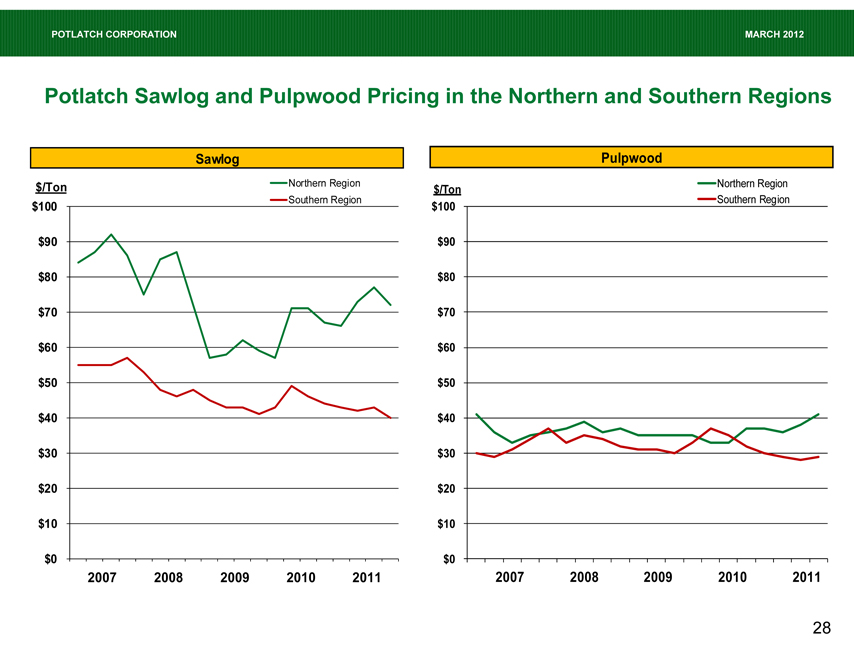
Potlatch Sawlog and Pulpwood Pricing in the Northern and Southern Regions
Sawlog
$/Ton Northern Region
$100 Southern Region
$90
$80
$70
$60
$50
$40
$30
$20
$10
$0
2007 2008 2009 2010 2011
Pulpwood
$/Ton Northern Region
$100 Southern Region
$90
$80
$70
$60
$50
$40
$30
$20
$10
$0
2007 2008 2009 2010 2011
28
POTLATCH CORPORATION
MARCH 2012
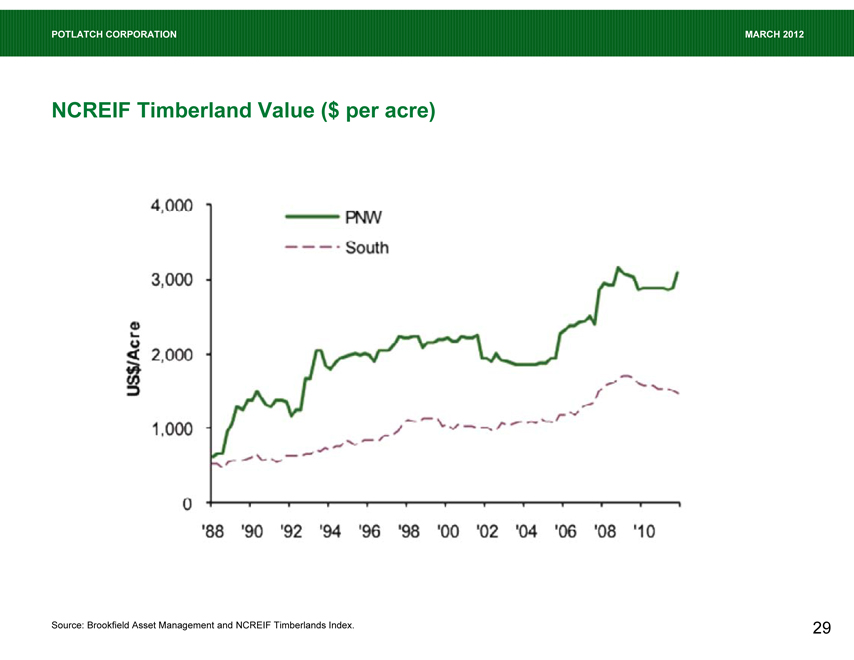
NCREIF Timberland Value ($ per acre)
US$/Acre PNW
South
4,000 3,000 2,000 1,000 0
‘88 ‘90 ‘92 ‘94 ‘96 ‘98 ‘00 ‘02 ‘04 ‘06 ‘08 ‘10
Source: Brookfield Asset Management and NCREIF Timberlands Index.
29
POTLATCH CORPORATION
MARCH 2012
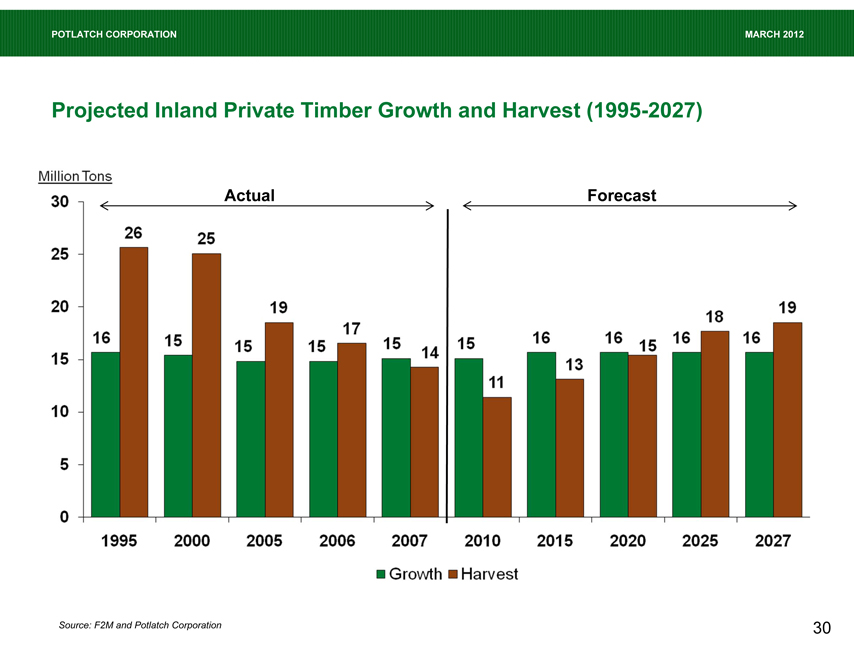
Projected Inland Private Timber Growth and Harvest (1995-2027)
Million Tons
Actual
30 25 20 15 10 5 0
16 26 15 25 15 19 15 17 15 14 15 11 16 13 16 15 16 18 16 19
1995 2000 2005 2006 2007 2010 2015 2020 2025 2027
Forecast
Growth
Harvest
Source: F2M and Potlatch Corporation
30
POTLATCH CORPORATION
MARCH 2012
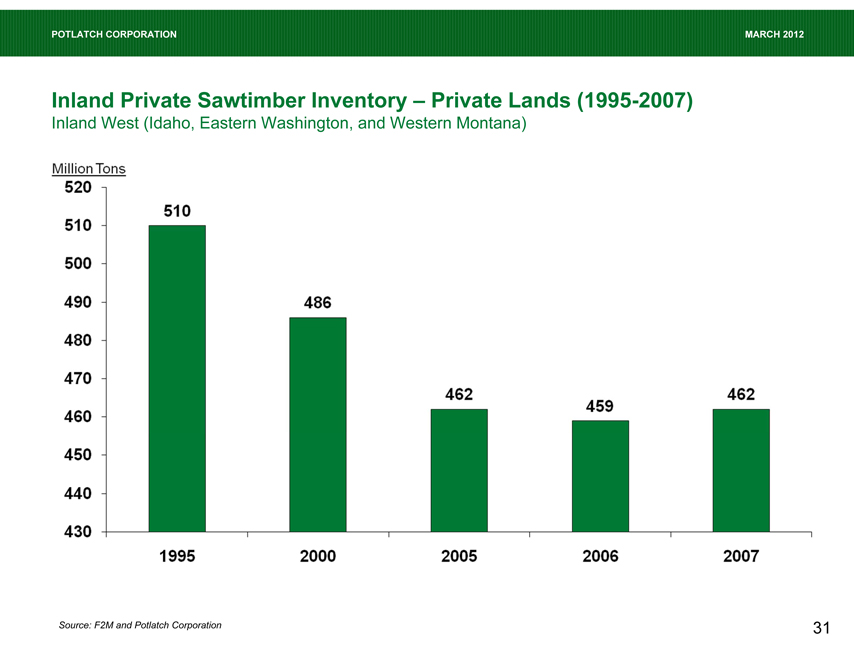
Inland Private Sawtimber Inventory – Private Lands (1995-2007)
Inland West (Idaho, Eastern Washington, and Western Montana)
Million Ton
520 510 500 490 480 470 460 450 440 430
510 486 462 459 462
1995 2000 2005 2006 2007
Source: F2M and Potlatch Corporation
31
POTLATCH CORPORATION
MARCH 2012
Definitions of Non-GAAP Measures
EBITDDA is a non-GAAP measure that management uses to evaluate the cash generating capacity of the company. The most directly comparable GAAP measure is net earnings. EBITDDA, as we define it, is net earnings from continuing operations adjusted for net cash interest expense, provision/benefit for income taxes, depreciation, depletion and amortization, basis of real estate sold and non-cash asset impairment and eliminations. It should not be considered as an alternative to net earnings computed under GAAP.
Funds Available for Distribution (FAD) is a non-GAAP measure. FAD, as defined in the indenture governing our senior notes, is earnings from continuing operations, plus depreciation, depletion and amortization, plus basis of real estate sold, less capital expenditures and non-cash asset impairment and eliminations. For purposes of this definition, capital expenditures exclude all expenditures relating to direct or indirect timberland purchases in excess of $5 million. We do not use FAD as, nor should it be considered to be, an alternative to net cash provided by operating activities computed under GAAP as an indicator of our operating performance, or as an indicator of our ability to fund our cash needs. FAD, as defined in the indenture governing our senior notes may not be comparable with measures of similar titles reported by other companies.
Segment EBITDDA from continuing operations, as we define it, is segment operating income (loss) adjusted for depreciation, depletion, amortization and the basis of real estate sold.
32