Potlatch Corporation Michael J. Covey Chairman & Chief Executive Officer Jerald W. Richards Vice President & Chief Financial Officer May 2014 Investor Presentation
FORWARD-LOOKING STATEMENTS This presentation contains certain forward-looking statements within the meaning of the Private Litigation Reform Act of 1995 as amended, including without limitation, statements about future company performance, the company’s business model, direction of markets and the economy, forecast of U.S. housing starts, forecast U.S. lumber consumption, incremental lumber production from the U.S. South, forecast U.S. lumber supply, ability to increase or decrease harvest volume to meet market conditions, forecast harvest in 2014, forecast North American log and lumber exports to China, log, lumber and panel price trends, effect of mountain pine beetle and allowable cut on Canadian supply, debt maturities, management of timberlands to optimize values, real estate value opportunities, real estate business potential and land development potential, typical annual “same-store” sales, expected 2014 real estate sales, expected closing in Q2 of large transaction, and similar matters. These forward-looking statements are based on current expectations, estimates, assumptions and projections that are subject to change, and actual results may differ materially from the forward-looking statements. Factors that could cause actual results to differ materially include, but are not limited to, changes in timberland values; changes in timber harvest levels on the company’s lands; changes in timber prices; changes in policy regarding governmental timber sales; changes in the United States and international economies; changes in the level of domestic construction activity; changes in international tariffs, quotas and trade agreements involving wood products; changes in domestic and international demand for wood products; changes in production and production capacity in the forest products industry; competitive pricing pressures for the company’s products; unanticipated manufacturing disruptions; changes in general and industry-specific environmental laws and regulations; unforeseen environmental liabilities or expenditures; weather conditions; changes in fuel and energy costs; changes in raw material and other costs; the ability to satisfy complex rules in order to remain qualified as a REIT; changes in tax laws that could reduce the benefits associated with REIT status; satisfaction of closing conditions for large Q2 transaction; and other risks and uncertainties described from time to time in the company’s public filings with the Securities and Exchange Commission. All forward-looking statements are made as of the date of this presentation, and the company does not undertake to update any forward-looking statements. NON-GAAP MEASURES This presentation presents non-U.S. GAAP financial information. A reconciliation of those numbers to U.S. GAAP is included in this presentation which is available on the company’s website at www.potlatchcorp.com. Forward-Looking Statements & Non-GAAP Measures May 2014 - Investor Presentation Slides 2
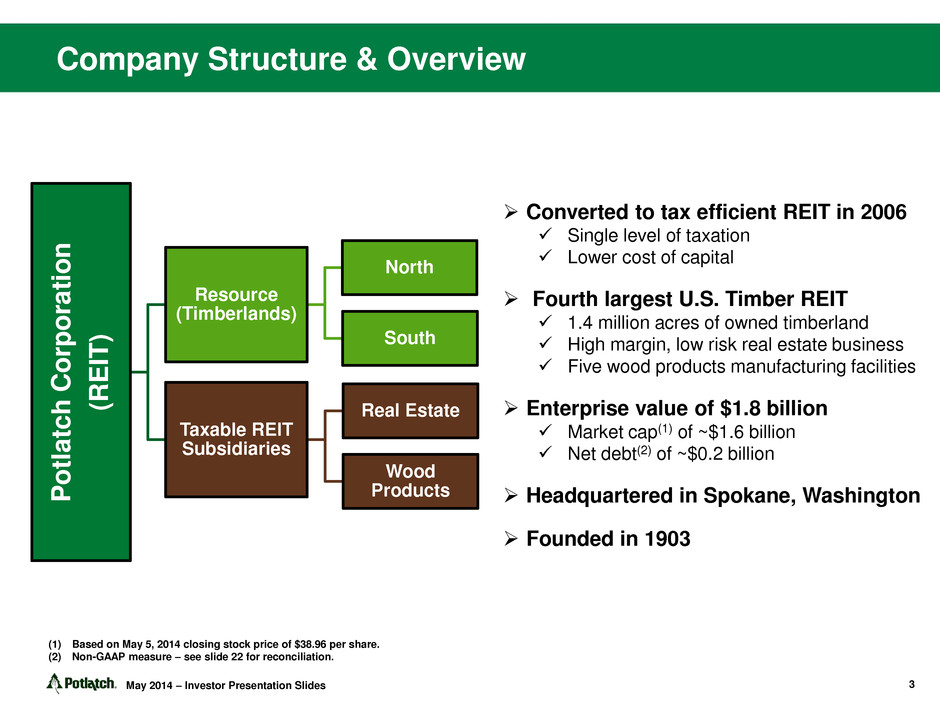
Company Structure & Overview P otlatch Corporati o n (R E IT ) Resource (Timberlands) North South Taxable REIT Subsidiaries Real Estate Wood Products Converted to tax efficient REIT in 2006 Single level of taxation Lower cost of capital Fourth largest U.S. Timber REIT 1.4 million acres of owned timberland High margin, low risk real estate business Five wood products manufacturing facilities Enterprise value of $1.8 billion Market cap(1) of ~$1.6 billion Net debt(2) of ~$0.2 billion Headquartered in Spokane, Washington Founded in 1903 May 2014 – Investor Presentation Slides (1) Based on May 5, 2014 closing stock price of $38.96 per share. (2) Non-GAAP measure – see slide 22 for reconciliation. 3

Potlatch Timberlands Potlatch owns approximately 1.4 million acres of third party-certified timberland in Arkansas, Idaho and Minnesota. We are the largest private landowner in Idaho. (1) As of March 31, 2014. Excludes 1,000 acres in Wisconsin. Coeur d’Alene Boise Sun Valley McCall Little Rock Hot Springs Brainerd Minneapolis May 2014 - Investor Presentation Slides 4 Idaho 792,000 acres Arkansas 410,000 acres Minnesota 195,000 acres Total 1,397,000 acres Timberlands(1)

Resource: Segment Overview Stable and significant source of cash since REIT conversion Actively manage timberlands to increase value over time Increase long-term sustainable yield Maximize non-timber returns; examples include permits, leases, carbon credits Sell when returns are compelling Grow via attractive acquisitions Standalone timberlands, or Timberlands and associated wood products manufacturing Higher EBITDA driven by recovery of Northern sawlog prices May 2014 - Investor Presentation Slides $0 $20 $40 $60 $80 $100 $120 2006 2007 2008 2009 2010 2011 2012 2013 2014 LTM $92 $97 $95 $105 $83 $77 $66 $92 $92 Segment EBITDA (1) ($ in millions) (1) Non-GAAP measure – see slide 22 for reconciliation. 5

Product Change EBITDA (in millions) Northern sawlogs $5 / ton 100,000 tons $10.2 $4.2 Southern sawlogs $5 / ton 100,000 tons $3.5 $2.0 Resource: Harvest Profile (tons in millions) 0.0 1.0 2.0 3.0 4.0 5.0 6.0 2006 2007 2008 2009 2010 2011 2012 2013 2014F Sawlogs Pulpwood 3.3 3.9 4.4 3.8 3.7 4.2 4.1 3.6 May 2014 - Investor Presentation Slides 6 We preserved value by deferring Southern harvest during the downturn The effect that changes in price or volume could have on annual results follows: 3.8 Approximately 75% of log volume is sold to third party customers
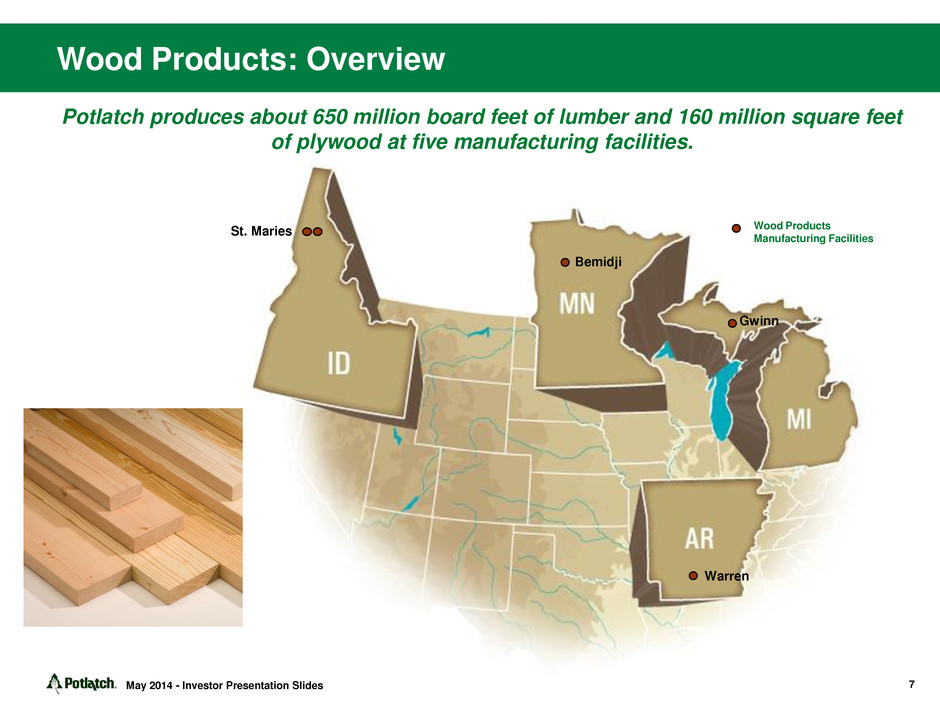
Wood Products: Overview Wood Products Manufacturing Facilities Potlatch produces about 650 million board feet of lumber and 160 million square feet of plywood at five manufacturing facilities. St. Maries Gwinn Bemidji Warren May 2014 - Investor Presentation Slides 7
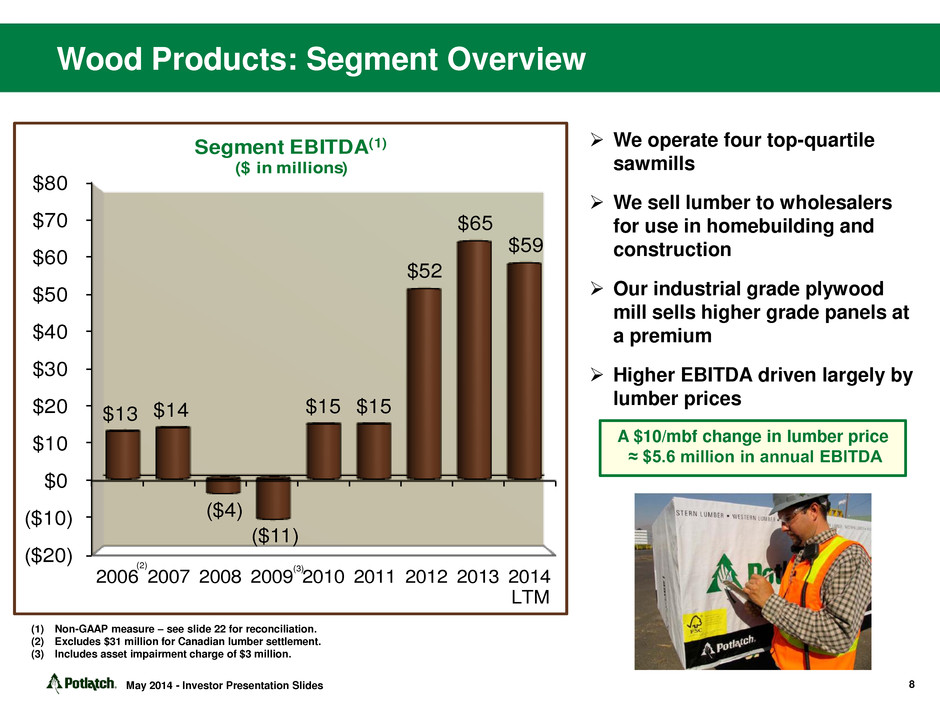
($20) ($10) $0 $10 $20 $30 $40 $50 $60 $70 $80 2006 2007 2008 2009 2010 2011 2012 2013 2014 LTM $13 $14 ($4) ($11) $15 $15 $52 $65 $59 Segment EBITDA(1) ($ in millions) Wood Products: Segment Overview We operate four top-quartile sawmills We sell lumber to wholesalers for use in homebuilding and construction Our industrial grade plywood mill sells higher grade panels at a premium Higher EBITDA driven largely by lumber prices (1) Non-GAAP measure – see slide 22 for reconciliation. (2) Excludes $31 million for Canadian lumber settlement. (3) Includes asset impairment charge of $3 million. (2) (3) May 2014 - Investor Presentation Slides 8 A $10/mbf change in lumber price ≈ $5.6 million in annual EBITDA

Real Estate: Segment Overview 9 May 2014 - Investor Presentation Slides Continually assess acreage and maximize value by selling non-core holdings at significant multiples to timberland values Business has low risk, high margin attributes Portfolio consists of desirable property More than 3,000 miles of water frontage More than 9 million people live within three states of ownership Activity can be lumpy Typically plan “same-store” sales of 20,000 to 25,000 acres per year Opportunistically sell additional tracts at compelling premiums Sold close to 19,000 acres and generated $22 million(1) of EBITDA in 2013 Expect to sell 30,000 to 35,000 acres in 2014 Core Timberland ~1.2 million acres Land Portfolio Rural Real Estate ~85,000 acres Non-Strategic Timberland ~15,000 acres HBU/Development ~115,000 acres (1) Non-GAAP measure – see slide 22 for reconciliation. Includes an 11,000 acre sale closed in Q1 Working on a second large transaction expected to close in Q2 at a price slightly more than $10 million
Industry Growth Drivers Overview U.S. housing starts are recovering U.S. lumber consumption is increasing Canada’s ability to participate in U.S. recovery is limited by effect of the pine beetle and reduction in allowable cut Incremental lumber production will come from the U.S. South North American exports to China are robust and here to stay Log and lumber prices are expected to increase May 2014 - Investor Presentation Slides

Total U.S. Housing Starts (in thousands) 0 500 1,000 1,500 2,000 2,500 71 73 75 77 79 81 83 85 87 89 91 93 95 97 99 01 03 05 07 09 11 13 15F Average Starts Since 1971: 1.5 million Housing starts are recovering, but still far below the long-term average. Forecasters calling for starts above long-term trend in second half of decade. (1) Source: U.S. Census Bureau. (2) Forecast based on average of 8 different economic forecasting firms. Forecast(2) Actual(1) May 2014 - Investor Presentation Slides 11
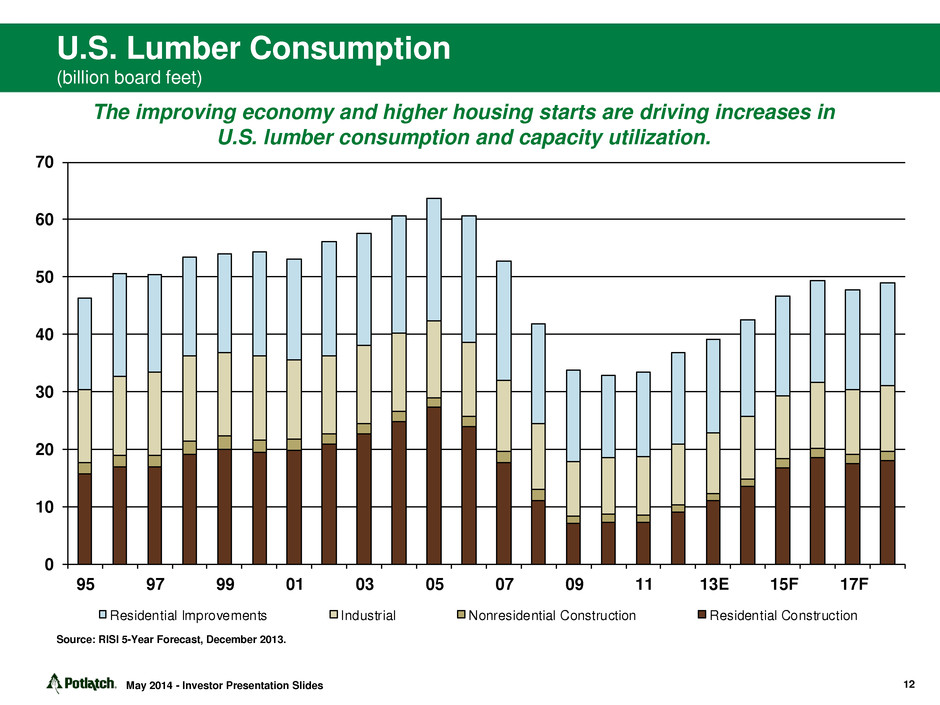
U.S. Lumber Consumption (billion board feet) May 2014 - Investor Presentation Slides 0 10 20 30 40 50 60 70 95 97 99 01 03 05 07 09 11 13E 15F 17F Residential Improvements Industrial Nonresidential Construction Residential Construction Source: RISI 5-Year Forecast, December 2013. The improving economy and higher housing starts are driving increases in U.S. lumber consumption and capacity utilization. 12
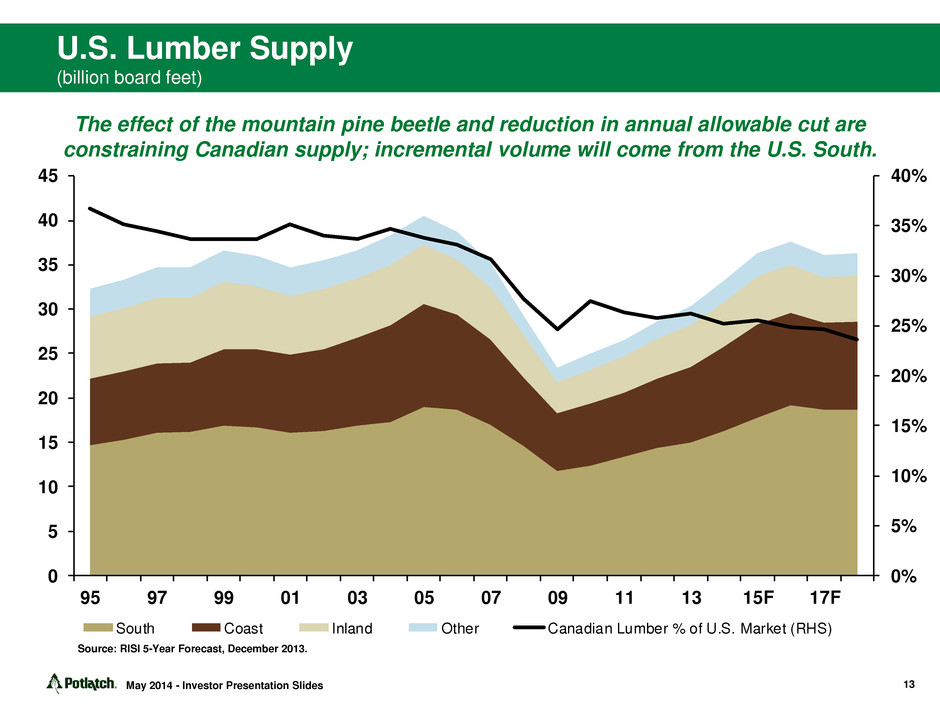
U.S. Lumber Supply (billion board feet) May 2014 - Investor Presentation Slides 0% 5% 10% 15% 20% 25% 30% 35% 40% 0 5 10 15 20 25 30 35 40 45 95 97 99 01 03 05 07 09 11 13 15F 17F South Coast Inland Other Canadian Lumber % of U.S. Market (RHS) Source: RISI 5-Year Forecast, December 2013. The effect of the mountain pine beetle and reduction in annual allowable cut are constraining Canadian supply; incremental volume will come from the U.S. South. 13
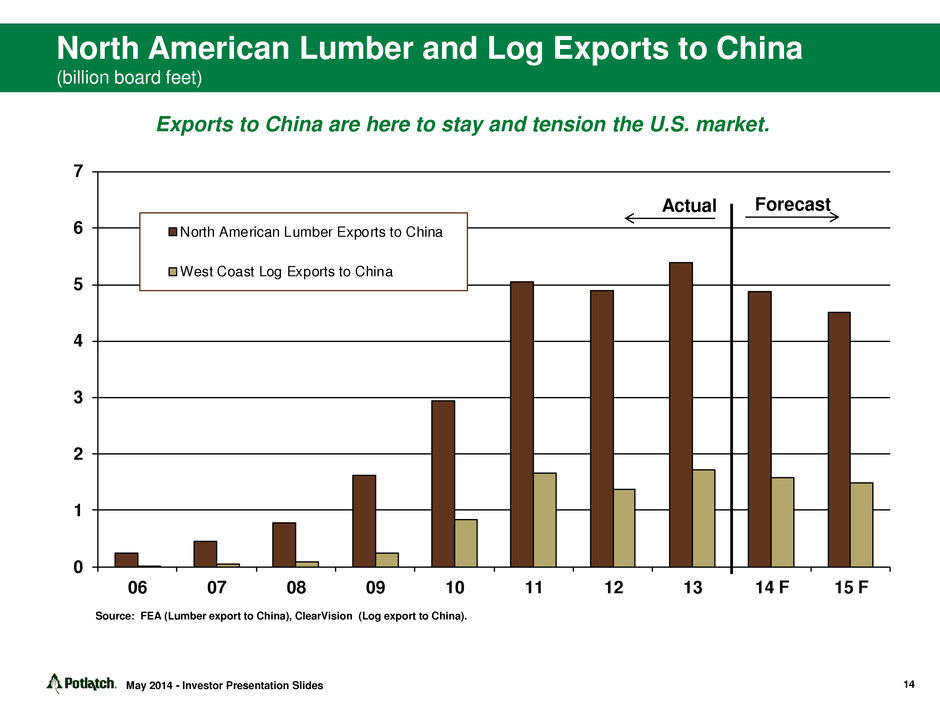
0 1 2 3 4 5 6 7 06 07 08 09 10 11 12 13 14 F 15 F North American Lumber Exports to China West Coast Log Exports to China North American Lumber and Log Exports to China (billion board feet) Forecast Actual Exports to China are here to stay and tension the U.S. market. Source: FEA (Lumber export to China), ClearVision (Log export to China). 14 May 2014 - Investor Presentation Slides
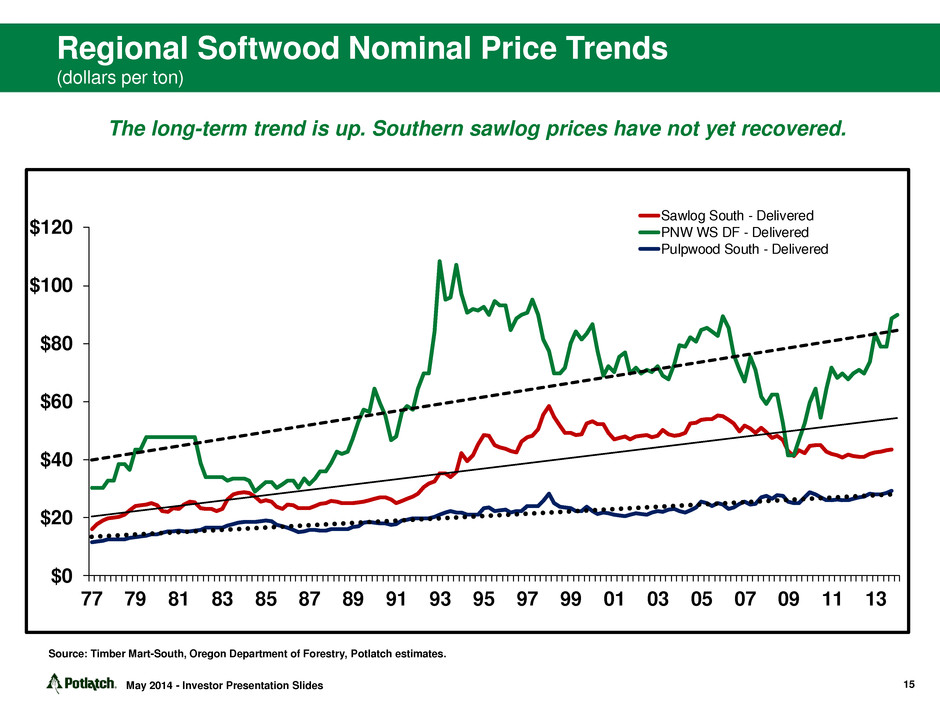
$0 $20 $40 $60 $80 $100 $120 77 79 81 83 85 87 89 91 93 95 97 99 01 03 05 07 09 11 13 Sawlog South - Delivered PNW WS DF - Delivered Pulpwood South - Delivered Regional Softwood Nominal Price Trends (dollars per ton) Source: Timber Mart-South, Oregon Department of Forestry, Potlatch estimates. May 2014 - Investor Presentation Slides The long-term trend is up. Southern sawlog prices have not yet recovered. 15

Real Price vs. Capacity Utilization May 2014 - Investor Presentation Slides Lumber prices increase as manufacturing capacity utilization increases. Source: Random Lengths, RISI, RBC Capital Markets estimates. 16

Potlatch Financial Overview ($ in millions) $0 $200 $400 $600 $800 2006 2007 2008 2009 2010 2011 2012 2013 2014 LTM $606 $607 $575 $516 $585 $549 $575 $630 $633 $101 $106 $107 $131 $151 $110 $114 $136 $145 Revenue EBITDDA 2014 LTM Revenues(1) 2014 LTM EBITDA(2) Segment EBITDA Margin(3) Resource $235 $92 39.1% Real Estate $35 $31 88.6% Wood Products $363 $59 16.3% (1) Segment revenues and historical consolidated revenues presented prior to intersegment eliminations. Revenues of discontinued operations are excluded. (2) Non-GAAP measure – see slide 22 for reconciliation. Excludes discontinued operations. (3) Segment EBITDA Margin is defined as Segment EBITDA divided by Segment Revenues. Historical Consolidated Revenue(1) and EBITDA(2) May 2014 - Investor Presentation Slides 17
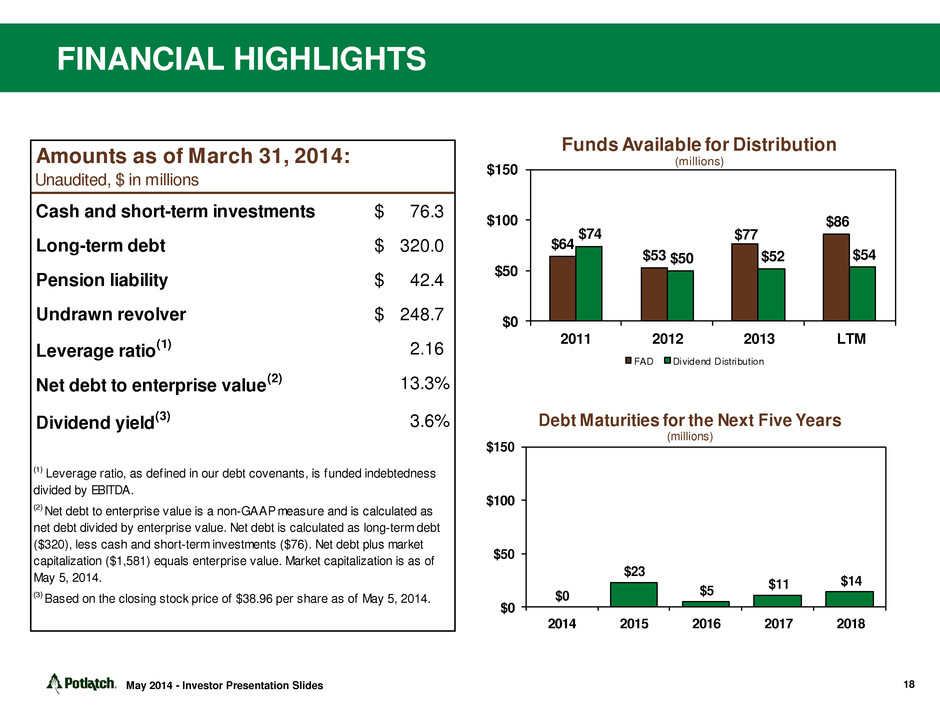
FINANCIAL HIGHLIGHTS 18 Amounts as of March 31, 2014: Unaudited, $ in millions Cash and short-term investments 76.3$ Long-term debt 320.0$ Pension liability 42.4$ Undrawn revolver 248.7$ Leverage ratio (1) 2.16 Net debt to enterprise value (2) 13.3% Dividend yield (3) 3.6% (1) Leverage ratio, as defined in our debt covenants, is funded indebtedness divided by EBITDA. (2) Net debt to enterprise value is a non-GAAP measure and is calculated as net debt divided by enterprise value. Net debt is calculated as long-term debt ($320), less cash and short-term investments ($76). Net debt plus market capitalization ($1,581) equals enterprise value. Market capitalization is as of May 5, 2014. (3) Based on the closing stock price of $38.96 per share as of May 5, 2014. $0 $23 $5 $11 $14 $0 $50 $100 $150 2014 2015 2016 2017 2018 Debt Maturities for the Next Five Years (millions) May 2014 - Investor Presentation Slides $64 $53 $77 $86 $74 $50 $52 $54 $0 $50 $100 $150 2011 2012 2013 LTM Funds Available for Distribution (millions) FAD Dividend Distribution

Conclusion: Investment Takeaways Potlatch manages a very attractive asset base of ~1.4 million acres of timberland Attractive dividend yield currently at 3.6%(1) Wood Products business is generating strong cash flow Real Estate segment has low risk, high margin attributes Long-term industry trends are very favorable Housing starts on solid recovery path; expected to be above long-term trend in second half of decade North American exports to China remain robust Lower supply from Canada Log and lumber prices are expected to increase Potlatch is highly leveraged to the housing recovery and higher lumber prices These factors also drive higher harvest volumes and log prices May 2014 - Investor Presentation Slides (1) Based on May 5, 2014 closing stock price of $38.96 per share. 19

Appendix
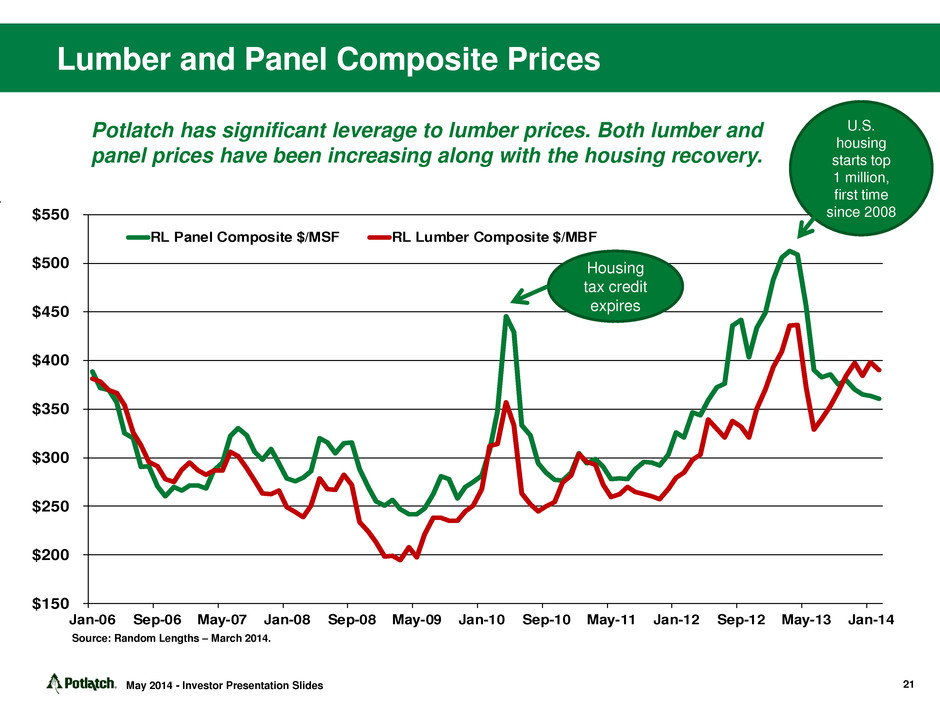
$150 $200 $250 $300 $350 $400 $450 $500 $550 Jan-06 Sep-06 May-07 Jan-08 Sep-08 May-09 Jan-10 Sep-10 May-11 Jan-12 Sep-12 May-13 Jan-14 RL Panel Composite $/MSF RL Lumber Composite $/MBF May 2014 - Investor Presentation Slides Lumber and Panel Composite Prices Source: Random Lengths – March 2014. Potlatch has significant leverage to lumber prices. Both lumber and panel prices have been increasing along with the housing recovery. Housing tax credit expires U.S. housing starts top 1 million, first time since 2008 21

EBITDA and Segment EBITDA Reconciliation ($ in millions) 2006(3) 2007 2008 2009(4) 2010 2011 2012 2013 2014 LTM Consolidated (1) Net income 120$ 75$ 73$ 81$ 40$ 40$ 43$ 71$ 75$ Adjustments: Income tax (benefit) provision (58) (18) (25) (16) 5 4 17 14 15 Interest expense(2) 14 15 20 22 28 28 26 23 22 Depreciation, depletion and amortization 25 30 30 33 29 26 23 25 25 Basis of real estate sold - 4 9 11 49 14 5 4 8 Non-cash asset impairment and eliminations - - - - - (2) - (1) (1) Consolidated EBITDA 101$ 106$ 107$ 131$ 151$ 110$ 114$ 136$ 144$ Resource Operating income 81$ 82$ 76$ 82$ 62$ 60$ 50$ 74$ 74$ Depreciation, depletion and amortization 11 15 19 23 21 17 16 18 18 Resource Segment EBITDA 92$ 97$ 95$ 105$ 83$ 77$ 66$ 92$ 92$ Wood Products Operating income (loss) 2$ 4$ (14)$ (21)$ 7$ 7$ 45$ 59$ 53$ Depreciation 11 10 10 10 8 8 7 6 6 Wood Products Segment EBITDA 13$ 14$ (4)$ (11)$ 15$ 15$ 52$ 65$ 59$ Real Estate Operating income 12$ 17$ 31$ 49$ 30$ 31$ 28$ 18$ 23$ Basis of real estate sold - 4 9 11 49 14 5 4 8 Real Estate Segment EBITDA 12$ 21$ 40$ 60$ 79$ 45$ 33$ 22$ 31$ Fiscal Year (1) Consolidated amounts exclude amounts related to discontinued operations. (2) Interest expense includes amortization of bond discounts and deferred loan fees. (3) Consolidated and Wood Products EBITDA exclude amounts related to the Canadian lumber settlement. The amount is $31 million before taxes and $19 million after taxes. (4) Consolidated and Wood Products EBITDA include a $3 million asset impairment charge. May 2014 - Investor Presentation Slides 22

Potlatch Net Debt & FAD Reconciliations ($ in millions) Net Debt March 31 2006 2007 2008 2009 2010 2011 2012 2013 2014 Long-t rm debt 321$ 321$ 221$ 368$ 363$ 345$ 349$ 320$ 320$ Current installments on long-term debt 6 - 101 - 5 22 8 - - Current notes payable - 110 129 - - - - - - Cash (8) (9) (1) (2) (6) (8) (17) (6) (9) Short-term investments (22) (22) (3) (53) (85) (63) (63) (52) (67) Net debt 297$ 400$ 447$ 313$ 277$ 296$ 277$ 262$ 244$ At December 31 FAD Calculati n 2014 2006 2007 2008 2009 2010 2011 2012 2013 LTM Net income 139$ 75$ 73$ 81$ 40$ 40$ 43$ 71$ 75$ Dep eciation, depletion and amortization 3 7 30 35 31 29 26 27 26 Basis of real estate sold - 4 9 1 49 14 5 3 8 Non-cash asset impairment & eliminations - - - - - (2) - - - Capital expenditures (23) (20) (20) (16) (15) (17) (21) (24) (23) Funds available for distribution 139$ 86$ 92$ 111$ 105$ 64$ 53$ 77$ 86$ Distributions to common stockholders (1)(2) 76$ 77$ 81$ 81$ 82$ 74$ 50$ 52$ 54$ Fiscal Year (1) Excludes the cash portion of the earnings and profit distribution paid in 2006 in conjunction with the REIT conversion. (2) Excludes distribution of Clearwater Paper stock in 2008. May 2014 - Investor Presentation Slides 23
Definitions of Non-GAAP Measures EBITDA is a non-GAAP measure that management uses to evaluate the cash generating capacity of the company. EBITDA, as we define it, is net income (loss) adjusted for net cash interest expense, provision (benefit) for income taxes, depreciation, depletion and amortization, basis of real estate sold and non-cash asset impairment and eliminations. Funds Available for Distribution (FAD), as we define it, is net income (loss) adjusted for depreciation, depletion and amortization, basis of real estate sold, non-cash asset impairment and eliminations and capital expenditures. For purposes of this definition, capital expenditures exclude all expenditures relating to direct or indirect timberland purchases in excess of $5 million. Segment EBITDA from continuing operations, as we define it, is segment operating income (loss) adjusted for depreciation, depletion, amortization and the basis of real estate sold. May 2014 - Investor Presentation Slides 24