Q4 2017 Earnings Release Michael J. Covey Chairman and Chief Executive Officer Eric J. Cremers President and Chief Operating Officer Jerald W. Richards Vice President and Chief Financial Officer January 30, 2018
Forward-Looking Statements & Non-GAAP Measures Q4 2017 Earnings Release – January 30, 2018 Additional Information This communication is being made in respect of the proposed merger transaction involving Potlatch Corporation (“Potlatch”) and Deltic Timber Corporation (“Deltic”). This communication does not constitute an offer to sell or the solicitation of an offer to buy any securities or a solicitation of any vote or approval, nor shall there be any sale of securities in any jurisdiction in which such offer, solicitation or sale would be unlawful prior to registration or qualification under the securities laws of such jurisdiction. In connection with the proposed merger, Potlatch and Deltic filed a registration statement on Form S-4 that was declared effective on January 17, 2018, and Potlatch filed a joint proxy statement/prospectus on Form 424B3 on January 18, 2018 that has been mailed to stockholders of Potlatch and Deltic. BEFORE MAKING ANY VOTING OR INVESTMENT DECISION, SECURITY HOLDERS OF POTLATCH AND DELTIC ARE URGED TO READ THE JOINT PROXY STATEMENT/PROSPECTUS REGARDING THE PROPOSED TRANSACTION AND ANY OTHER RELEVANT DOCUMENTS CAREFULLY IN THEIR ENTIRETY WHEN THEY BECOME AVAILABLE BECAUSE THEY WILL CONTAIN IMPORTANT INFORMATION ABOUT THE PROPOSED TRANSACTION. The joint proxy statement/prospectus, as well as other filings containing information about Potlatch and Deltic will be available without charge, at the SEC’s Internet site (http://www.sec.gov). Copies of the joint proxy statement/prospectus and the filings with the SEC that will be incorporated by reference in the joint proxy statement/prospectus can also be obtained, when available, without charge, from Potlatch’s website at http://www.Potlatchcorp.com under the Investor Resources tab (in the case of documents filed by Potlatch) and on Deltic’s website at https://www.Deltic.com under the Investor Relations tab (in the case of documents filed by Deltic). Potlatch and Deltic, and certain of their respective directors, executive officers and other members of management and employees may be deemed to be participants in the solicitation of proxies from the stockholders of Deltic and Potlatch in respect of the proposed merger transaction. Certain information about the directors and executive officers of Potlatch is set forth in its Annual Report on Form 10-K for the year ended December 31, 2016, which was filed with the SEC on February 17, 2017, its proxy statement for its 2017 annual meeting of stockholders, which was filed with the SEC on April 3, 2017, its Current Report on Form 8-K, which was filed on May 1, 2017, and its joint proxy statement and prospectus that was filed with the SEC on Form 424B3 on January 18, 2018. Certain Information about the directors and executive officers of Deltic is set forth in its Annual Report on Form 10-K for the year ended December 31, 2016, which was filed with the SEC on March 7, 2017, its proxy statement for its 2017 annual meeting of stockholders, which was filed with the SEC on March 20, 2017, its supplement to the proxy statement for its 2017 annual meeting of the stockholders, which was filed with the SEC on March 30, 2017, its Current Reports on Form 8-K, which were filed with the SEC on September 1, 2017, May 2, 2017, March 8, 2017 and February 27, 2017, and its joint proxy statement/prospectus that was filed with the SEC on Form DEFM14A on January 18, 2018.
Forward-Looking Statements & Non-GAAP Measures FORWARD-LOOKING STATEMENTS This presentation contains certain forward-looking statements within the meaning of the Private Litigation Reform Act of 1995 as amended, including without limitation, our expectations regarding the U.S. housing market; strong repair and remodel market; increased capital investment in manufacturing in the U.S. South; lumber demand and pricing; future company performance; the direction of our business markets; business conditions, pricing, EBITDDA and earnings in our Resource, Wood Products and Real Estate segments; company earnings in the first quarter of 2019 and for the full year; harvest volumes in the first quarter of 2018 and for the full year; percentage of total harvest that will occur in the North and South and the percentage of sawlogs to be harvested in the North and the South in the first quarter of 2018 and the full year; lumber shipments in the first quarter of 2018 and for the year; real estate sales and land basis in the first quarter of 2018 and for the full year; capital projects and capital expenditures in the first quarter of 2018; corporate expenses in the first quarter of 2018; tax rate for the first quarter of 2018 and full year; debt maturities; interest expense in the first quarter of 2018 and for the full year; closing of $380 million revolver; the expected closing of the merger of Potlatch and Deltic; the proposed impact of the merger on Potlatch’s financial results, the estimated distribution of Deltic’s accumulated earnings and profits, and the integration of Deltic’s operations. You should carefully read forward-looking statements, including statements that contain these words, because they discuss the future expectations or state other “forward-looking” information about Potlatch. A number of important factors could cause actual results or events to differ materially from those indicated by such forward-looking statements, many of which are beyond Potlatch’s control; the U.S. housing market, changes in timberland values; changes in timber harvest levels on the company's lands; changes in timber prices; changes in policy regarding governmental timber sales; availability of logging contractors and shipping capacity; changes in the United States and international economies; changes in interest rates; changes in the level of construction activity; changes in Asia demand; changes in tariffs, quotas and trade agreements involving wood products; currency fluctuation; changes in demand for our products; changes in production and production capacity in the forest products industry; competitive pricing pressures for our products; unanticipated manufacturing disruptions; changes in general and industry-specific environmental laws and regulations; unforeseen environmental liabilities or expenditures; weather conditions; restrictions on harvesting due to fire danger; changes in raw material, fuel and other costs; changes in share price; the successful execution of the company’s strategic plans; the company’s ability to consummate the merger with Deltic or satisfy the conditions to the completion of the transaction, including the receipt of stockholder approvals, the company’s ability to meet expectations regarding the timing, completion and accounting and tax treatments of the merger transaction; the possibility that any of the anticipated benefits of the proposed merger will not be realized or will not be realized within the expected time period; the risk that integration of Deltic’s operations with those of Potlatch will be materially delayed or will be more costly or difficult than expected; the failure of the proposed merger to close for any other reason; the effect of the announcement of the merger on customer relationships and operating results (including, without limitation, difficulties in maintaining relationships with employees or customers); dilution caused by Potlatch’s issuance of additional shares of its common stock in connection with the merger; the possibility that the merger may be more expensive to complete than anticipated, including as a result of unexpected factors or events; the diversion of management time on transaction related issues; the estimation of Deltic’s accumulated earnings and profits is preliminary and may change with further due diligence; and the other factors described in Potlatch’s Annual Report on Form 10-K and in the company’s other filings with the SEC, including the risks discussed in the definitive joint proxy statement/prospectus filed with the SEC on Form 424B3 on January 18, 2018 in connection with the proposed transaction with Deltic. Potlatch assumes no obligation to update the information in this communication, except as otherwise required by law. Readers are cautioned not to place undue reliance on these forward-looking statements, all of which speak only as of the date hereof. NON-GAAP MEASURES This presentation includes non-GAAP financial information. A reconciliation of those numbers to U.S. GAAP is included in this presentation, which is available on the company’s website at www.potlatchcorp.com. Q4 2017 Earnings Release – January 30, 2018
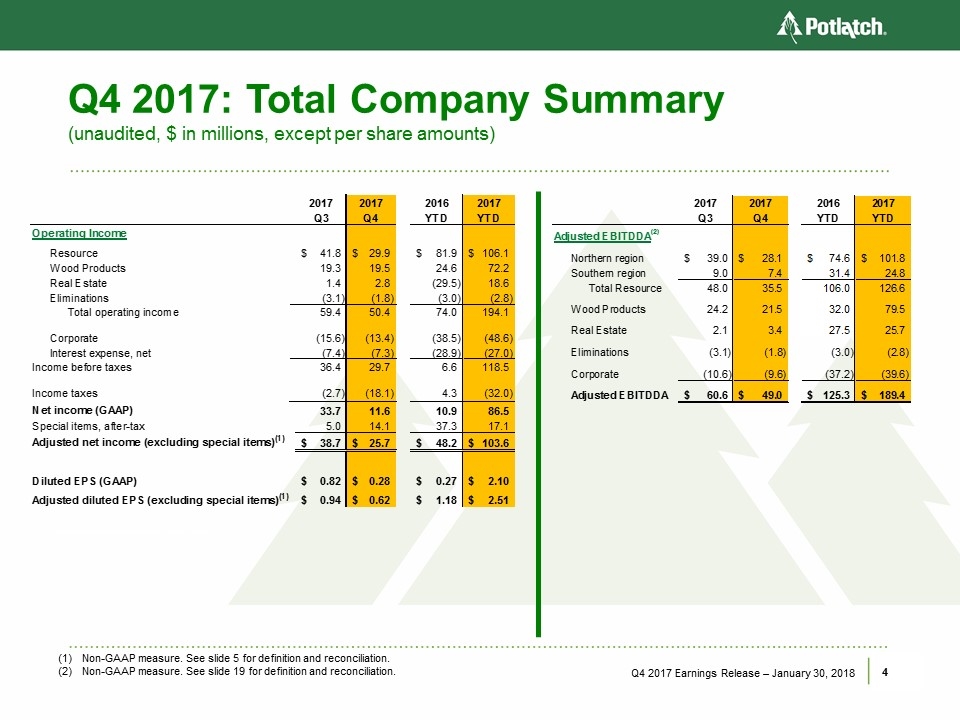
Q4 2017: Total Company Summary (unaudited, $ in millions, except per share amounts) Q4 2017 Earnings Release – January 30, 2018 Non-GAAP measure. See slide 5 for definition and reconciliation. Non-GAAP measure. See slide 19 for definition and reconciliation. 2017 2017 2016 2017 Q3 Q4 YTD YTD Operating Income Resource $34.1 $41.8 $29.9 $81.9 $106.1 Wood Products 15.8 19.3 19.5 24.6 72.2 Real Estate 4.6 1.4 2.8 (29.5) 18.6 Eliminations (2.0) (3.1) (1.8) (3.0) (2.8) Total operating income 52.5 59.4 50.4 74.0 194.1 Corporate (7.6) (15.6) (13.4) (38.5) (48.6) Interest expense, net (5.5) (7.4) (7.3) (28.9) (27.0) Income before taxes 39.4 36.4 29.7 6.6 118.5 Income taxes (6.2) (2.7) (18.1) 4.3 (32.0) Net income (GAAP) $33.2 33.7 11.6 10.9 86.5 Special items, after-tax 5.0 14.1 37.3 17.1 Adjusted net income (excluding special items)(1) $38.7 $25.7 $48.2 $103.6 Diluted EPS (GAAP) $0.82 $0.28 $0.27 $2.10 Adjusted diluted EPS (excluding special items)(1) $0.94 $0.62 $0.82 $1.18 $2.51 2017 2017 2016 2017 Q3 Q4 YTD YTD Adjusted EBITDDA(2) Northern region $39.0 $28.1 $74.6 $101.8 Southern region 9.0 7.4 31.4 24.8 Total Resource 48.0 35.5 106.0 126.6 Wood Products 24.2 21.5 32.0 79.5 Real Estate 2.1 3.4 27.5 25.7 Eliminations (3.1) (1.8) (3.0) (2.8) Corporate (10.6) (9.6) (37.2) (39.6) Adjusted EBITDDA $60.6 $49.0 $125.3 $189.4
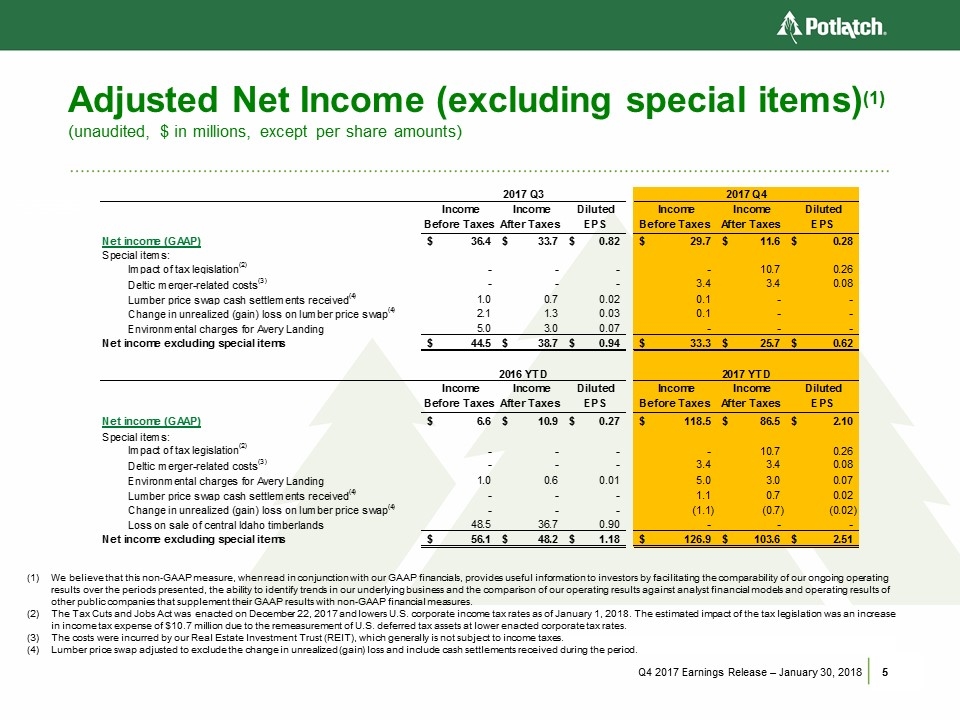
Adjusted Net Income (excluding special items)(1) (unaudited, $ in millions, except per share amounts) Q4 2017 Earnings Release – January 30, 2018 We believe that this non-GAAP measure, when read in conjunction with our GAAP financials, provides useful information to investors by facilitating the comparability of our ongoing operating results over the periods presented, the ability to identify trends in our underlying business and the comparison of our operating results against analyst financial models and operating results of other public companies that supplement their GAAP results with non-GAAP financial measures. The Tax Cuts and Jobs Act was enacted on December 22, 2017 and lowers U.S. corporate income tax rates as of January 1, 2018. The estimated impact of the tax legislation was an increase in income tax expense of $10.7 million due to the remeasurement of U.S. deferred tax assets at lower enacted corporate tax rates. The costs were incurred by our Real Estate Investment Trust (REIT), which generally is not subject to income taxes. Lumber price swap adjusted to exclude the change in unrealized (gain) loss and include cash settlements received during the period. 2017 Q3 2017 Q4 Income Before Taxes Income After Taxes " Diluted EPS " Income Before Taxes Income After Taxes " Diluted EPS " Net income (GAAP) $36.4 $33.7 $0.82 $29.7 $11.6 $0.28 Special items: Impact of tax legislation(2) - - - - 10.7 0.26 Deltic merger-related costs(3) - - - 3.4 3.4 0.08 Lumber price swap cash settlements received(4) 1.0 0.7 0.02 0.1 - - Change in unrealized (gain) loss on lumber price swap(4) 2.1 1.3 0.03 0.1 - - Environmental charges for Avery Landing 5.0 3.0 0.07 - - - Net income excluding special items $44.5 $38.7 $0.94 $33.3 $25.7 $0.62 2016 YTD 2017 YTD Income Before Taxes Income After Taxes " Diluted EPS " Income Before Taxes Income After Taxes " Diluted EPS " Net income (GAAP) $6.6 $10.9 $0.27 $118.5 $86.5 $2.10 Special items: Impact of tax legislation(2) - - - - 10.7 0.26 Deltic merger-related costs(3) - - - 3.4 3.4 0.08 Environmental charges for Avery Landing 1.0 0.6 0.01 5.0 3.0 0.07 Lumber price swap cash settlements received(4) - - - 1.1 0.7 0.02 Change in unrealized (gain) loss on lumber price swap(4) - - - (1.1) (0.7) (0.02) Loss on sale of central Idaho timberlands 48.5 36.7 0.90 - - - Net income excluding special items $56.1 $48.2 $1.18 $126.9 $103.6 $2.51
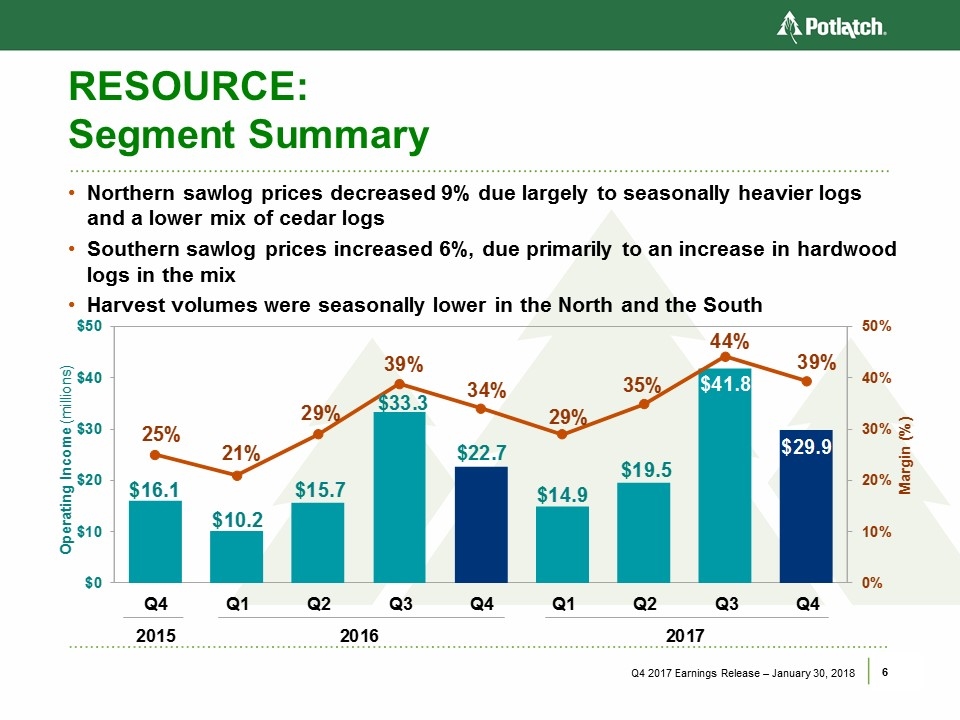
RESOURCE: Segment Summary Northern sawlog prices decreased 9% due largely to seasonally heavier logs and a lower mix of cedar logs Southern sawlog prices increased 6%, due primarily to an increase in hardwood logs in the mix Harvest volumes were seasonally lower in the North and the South Q4 2017 Earnings Release – January 30, 2018 2015 Q4 $16.1 25% 2016 Q1 $10.2 21% Q2 $15.7 29% Q3 $33.3 39% Q4 $22.7 34% 2017 Q1 $14.9 29% Q2 $19.5 35% Q3 $41.8 44% Q4 $29.9 39%
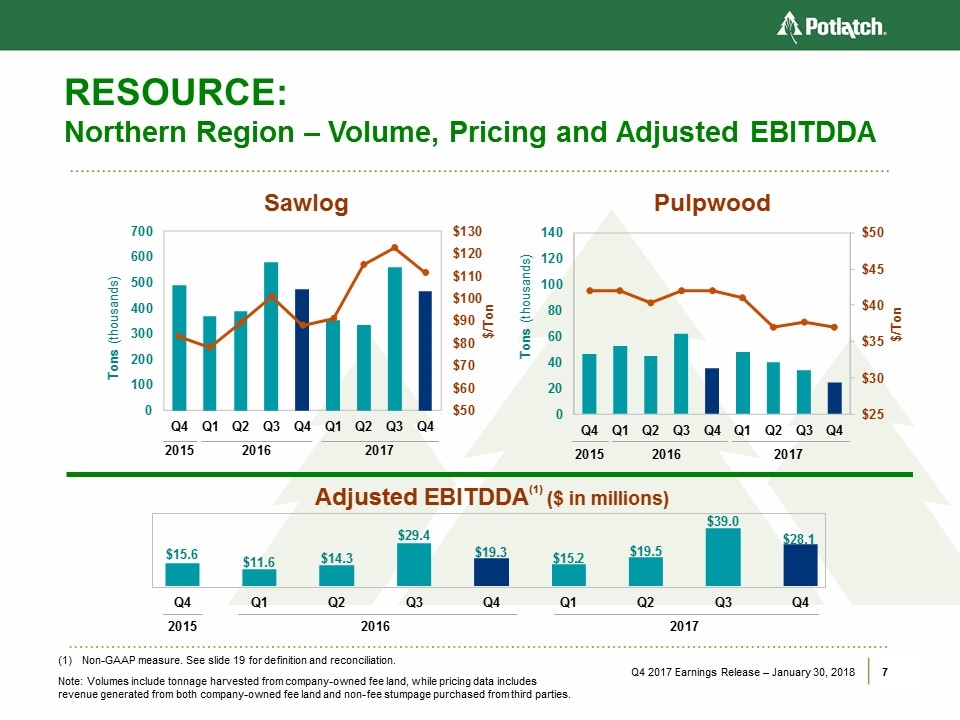
RESOURCE: Northern Region – Volume, Pricing and Adjusted EBITDDA Q4 2017 Earnings Release – January 30, 2018 Non-GAAP measure. See slide 19 for definition and reconciliation. Note: Volumes include tonnage harvested from company-owned fee land, while pricing data includes revenue generated from both company-owned fee land and non-fee stumpage purchased from third parties. Year Qtr $/Ton Tons Q3 $92 762,813 2015 Q4 $83 490,625 2016 Q1 $78 366,852 Q2 $89 388,576 Q3 $101 579,837 Q4 $88 474,024 2017 Q1 $91 354,104 Q2 $115 333,926 Q3 $123 559,580 Q4 $111 463,978 Year Qtr $/Ton Tons Q3 $41 69,329 2015 Q4 $42 46,449 2016 Q1 $42 52,361 Q2 $40 44,497 Q3 $42 62,138 Q4 $42 35,418 2017 Q1 $41 47,785 Q2 $37 40,054 Q3 $38 33,742 Q4 $37 24,821 Q3 $33.9 2015 Q4 $15.6 2016 Q1 $11.6 Q2 $14.3 Q3 $29.4 Q4 $19.3 2017 Q1 $15.2 Q2 $19.5 Q3 $39.0 Q4 $28.1
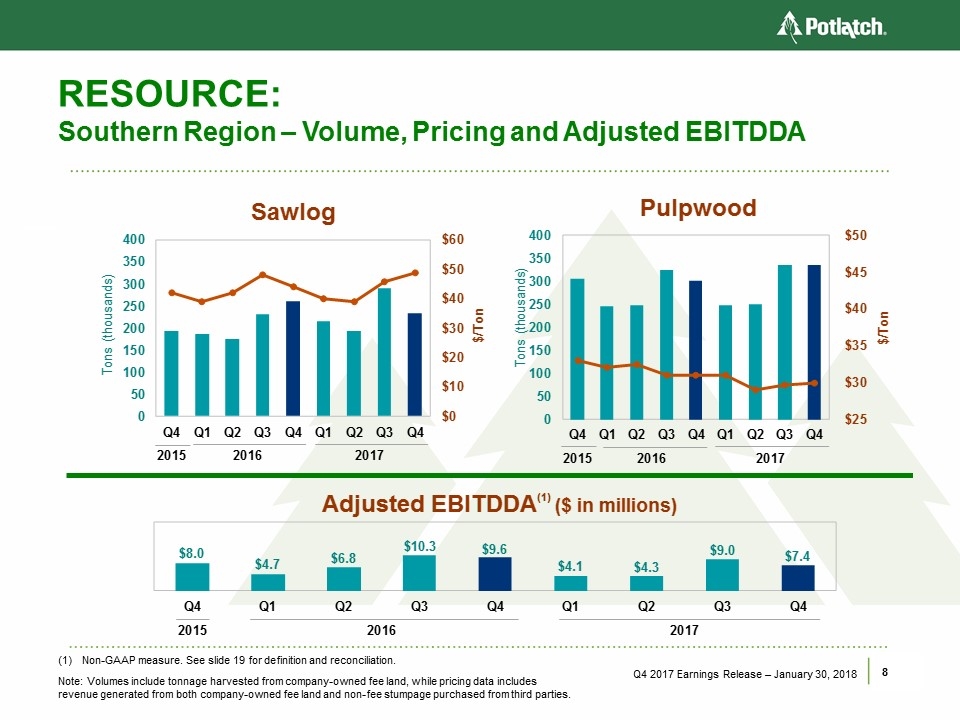
RESOURCE: Southern Region – Volume, Pricing and Adjusted EBITDDA Q4 2017 Earnings Release – January 30, 2018 Non-GAAP measure. See slide 19 for definition and reconciliation. Note: Volumes include tonnage harvested from company-owned fee land, while pricing data includes revenue generated from both company-owned fee land and non-fee stumpage purchased from third parties. Q3 $48 246,566 2015 Q4 $42 192,930 2016 Q1 $39 185,051 Q2 $42 175,498 Q3 $48 231,677 Q4 $44 261,151 2017 Q1 $40 216,097 Q2 $39 192,391 Q3 $46 290,362 Q4 $49 234,378 Q3 $34 375,097 2015 Q4 $33 304,601 2016 Q1 $32 245,152 Q2 $33 248,152 Q3 $31 325,348 Q4 $31 301,870 2017 Q1 $31 247,999 Q2 $29 251,167 Q3 $30 334,399 Q4 $30 334,660 Q3 $12.8 2015 Q4 $8.0 2016 Q1 $4.7 Q2 $6.8 Q3 $10.3 Q4 $9.6 2017 Q1 $4.1 Q2 $4.3 Q3 $9.0 Q4 $7.4

WOOD PRODUCTS: Segment Summary Lumber shipments declined seasonally to 184 MBF; total shipments for the year increased almost 50 MBF Average lumber prices increased 4% to $447 per MBF in Q4 Q4 2017 Earnings Release – January 30, 2018 Excludes gain of $3.3 million Q2 2017, a loss of $2.1 million Q3 2017 and a loss of $0.1 million in Q4 2017 on lumber price swap. Operating Income (millions) Margin (%) Q3 $(5.4) -7% 2015 Q4 $(1.3) -2% 2016 Q1 $1.0 1% Q2 $4.7 5% Q3 $10.6 11% Q4 $8.3 9% 2017 Q1 $8.7 9% Q2 $21.4 19% Q3 $21.4 18% Q4 $19.6 17%
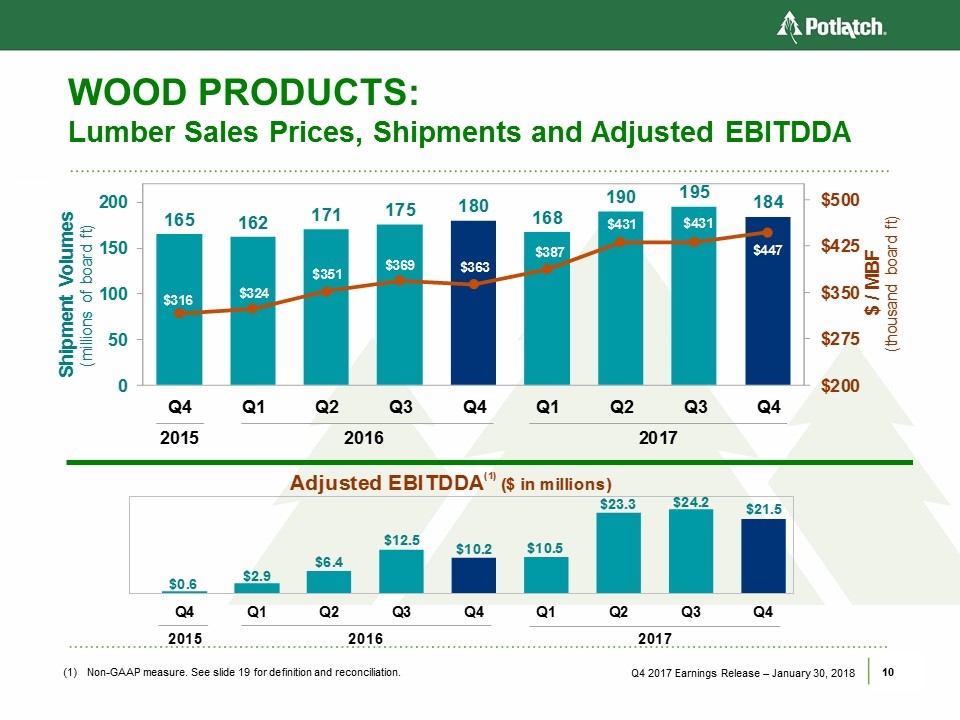
WOOD PRODUCTS: Lumber Sales Prices, Shipments and Adjusted EBITDDA Q4 2017 Earnings Release – January 30, 2018 Non-GAAP measure. See slide 19 for definition and reconciliation. Volume Price Q3 155,388 $335 2015 Q4 164,965 $316 2016 Q1 161,992 $324 Q2 170,829 $351 Q3 175,358 $369 Q4 180,050 $363 2017 Q1 167,559 $387 Q2 189,781 $431 Q3 195,296 $431 Q4 184,031 $447 Q3 ($2.8) 2015 Q4 $0.6 2016 Q1 $2.9 Q2 $6.4 Q3 $12.5 Q4 $10.2 2017 Q1 $10.5 Q2 $23.3 Q3 $24.2 Q4 $21.5
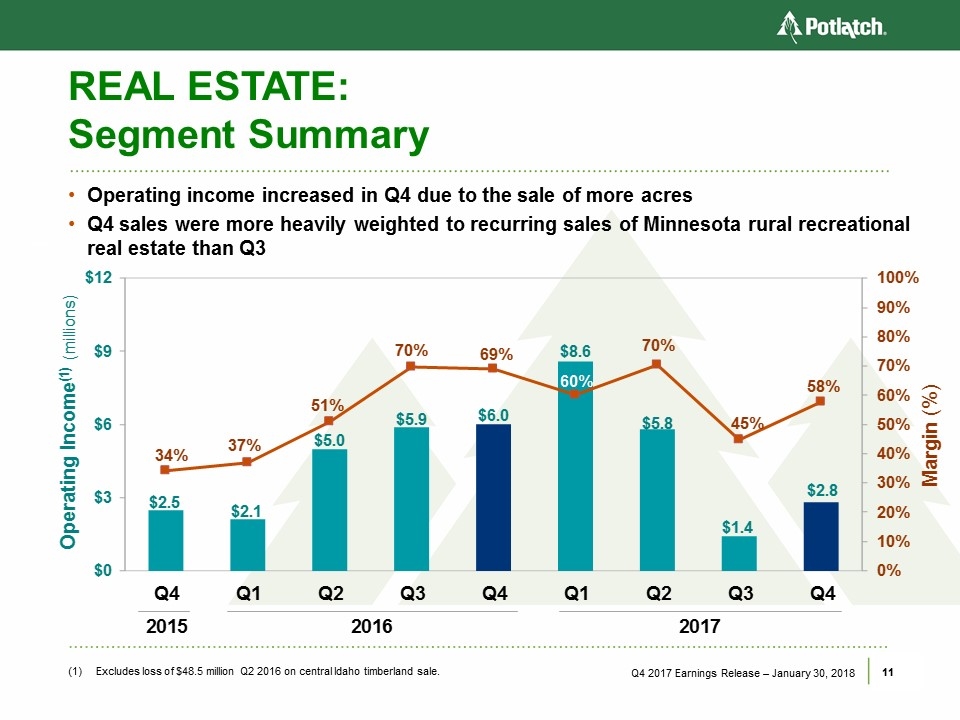
REAL ESTATE: Segment Summary Operating income increased in Q4 due to the sale of more acres Q4 sales were more heavily weighted to recurring sales of Minnesota rural recreational real estate than Q3 Q4 2017 Earnings Release – January 30, 2018 (1) Excludes loss of $48.5 million Q2 2016 on central Idaho timberland sale. Operating Income Margin (%) Q3 $4.2 54% 2015 Q4 $2.5 34% 2016 Q1 $2.1 37% Q2 $5.0 51% Q3 $5.9 70% Q4 $6.0 69% 2017 Q1 $8.6 60% Q2 $5.8 70% Q3 $1.4 45% Q4 $2.8 58%
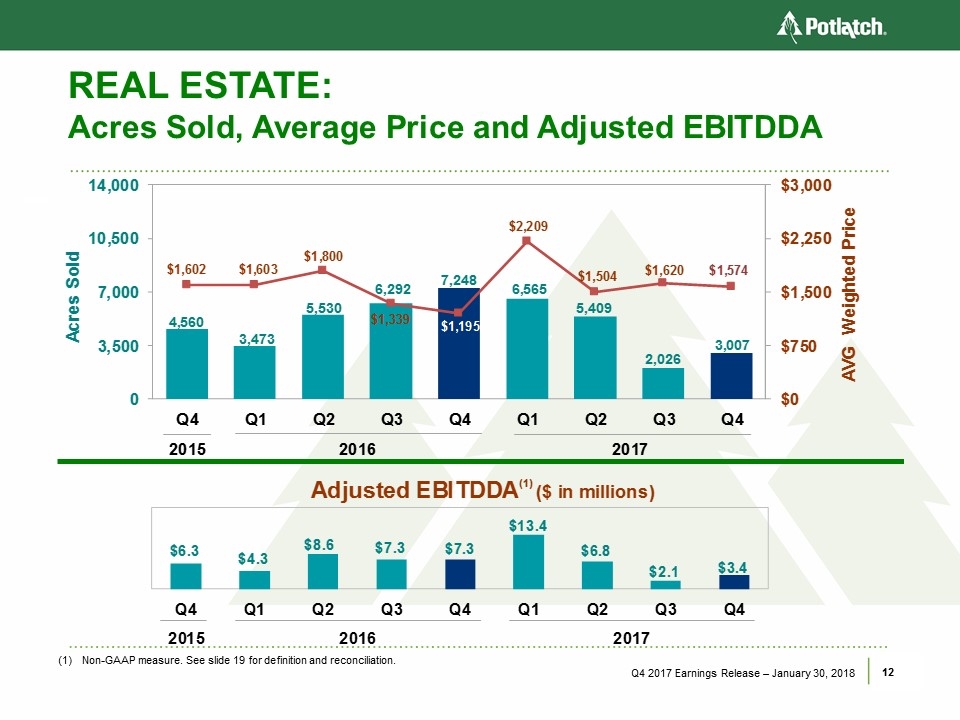
REAL ESTATE: Acres Sold, Average Price and Adjusted EBITDDA Q4 2017 Earnings Release – January 30, 2018 Non-GAAP measure. See slide 19 for definition and reconciliation. Acrers Sold Avg Weighted Price Q3 4,535 $1,726 2015 Q4 4,560 $1,602 2016 Q1 3,473 $1,603 Q2 5,530 $1,800 Q3 6,292 $1,339 Q4 7,248 $1,195 2017 Q1 6,565 $2,209 Q2 5,409 $1,504 Q3 2,026 $1,620 Q4 3,007 $1,574 Q3 $6.7 2015 Q4 $6.3 2016 Q1 $4.3 Q2 $8.6 Q3 $7.3 Q4 $7.3 2017 Q1 $13.4 Q2 $6.8 Q3 $2.1 Q4 $3.4
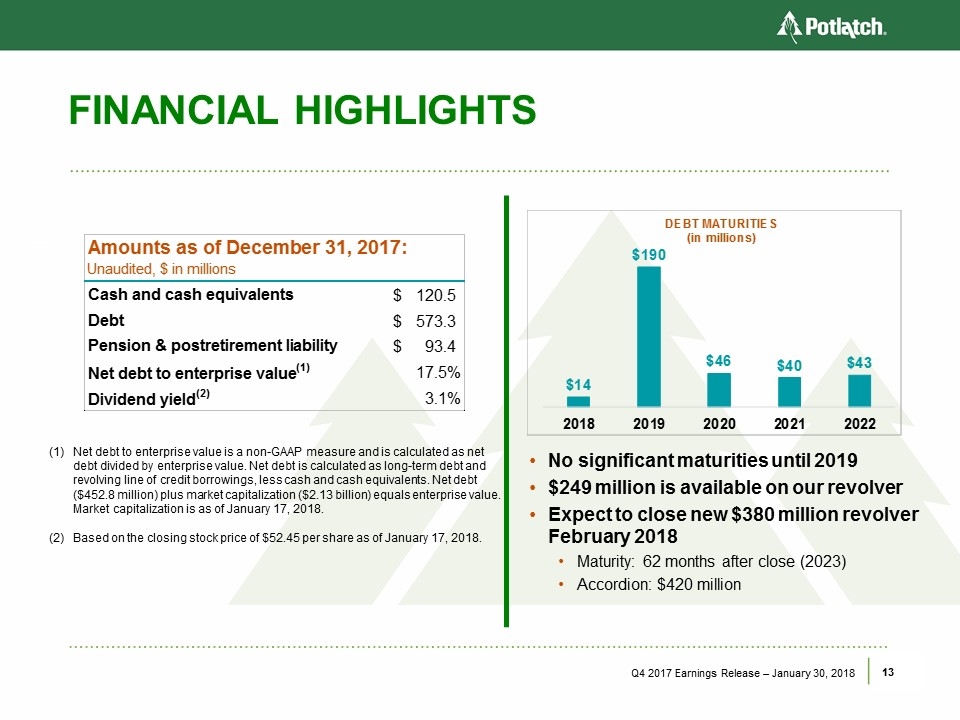
FINANCIAL HIGHLIGHTS Q4 2017 Earnings Release – January 30, 2018 Net debt to enterprise value is a non-GAAP measure and is calculated as net debt divided by enterprise value. Net debt is calculated as long-term debt and revolving line of credit borrowings, less cash and cash equivalents. Net debt ($452.8 million) plus market capitalization ($2.13 billion) equals enterprise value. Market capitalization is as of January 17, 2018. Based on the closing stock price of $52.45 per share as of January 17, 2018. No significant maturities until 2019 $249 million is available on our revolver Expect to close new $380 million revolver February 2018 Maturity: 62 months after close (2023) Accordion: $420 million Amounts as of December 31, 2017: Unaudited, $ in millions Cash and cash equivalents $120.5 Debt $573.3 Pension & postretirement liability $93.4 Net debt to enterprise value(1) 17.5% Dividend yield(2) 3.1% Covenants: Interest coverage ( > 3.0X ) 8.3 Maximum leverage ratio ( < 40% ) 26% Debt Maturities for the Next Five Years (in millions) 2018 $14 2019 $190 2020 $46 2021 $40 2022 $43

OUTLOOK Harvest a little over 4 million tons for the year Slightly more than half of annual volume in the South Sawlogs ≈90% of Northern volume and ≈45% of Southern volume Harvest 850,000 – 950,000 tons Q1 Northern sawlog prices expected to be flat Seasonally lower mix of hardwood and a higher percentage of pine sawlogs in weaker markets in the South: price decrease ≈20% Q4 2017 Earnings Release – January 30, 2018 Expect to ship just under 180 million board feet Q1 Lumber prices expected to be up modestly Q1 compared to strong Q4 Expect to sell a bit over 20,000 acres for the year Land basis to be 25% – 30% of revenue for year Expect to sell ≈5,000 acres Q1 at an average price of ≈$1,500 per acre Corporate expected to be just under $8 million Q1 Interest expense expected to be $5 million in Q1 and $7 million in the remaining 2018 quarters Consolidated tax rate of 10% – 15% for Q1 and full year RESOURCE WOOD PRODUCTS REAL ESTATE OTHER
Appendix

STATISTICS: Resource (unaudited) Q4 2017 Earnings Release – January 30, 2018 2015 2016 2017 Fee Volumes (tons) Q4 Q1 Q2 Q3 Q4 Q1 Q2 Q3 Q4 Northern Region Sawlog 490,625 366,852 388,575 579,837 474,024 354,104 333,926 559,580 463,978 Pulpwood 46,449 52,361 44,497 62,138 35,418 47,785 40,054 33,742 24,821 Stumpage 790 16,207 1,061 1,261 63 10,693 - 1,434 - Total 537,864 435,420 434,133 643,236 509,505 412,582 373,980 594,756 488,799 Southern Region Sawlog 192,930 185,051 175,498 231,677 261,151 216,097 192,391 290,362 234,378 Pulpwood 304,601 248,152 240,277 325,348 301,870 247,999 251,167 334,399 334,660 Stumpage 90,941 56,079 65,596 68,228 54,298 5,674 9,782 14,024 11,671 Total 588,472 489,282 481,371 625,253 617,319 469,770 453,340 638,785 580,709 Total Fee Volume 1,126,336 924,702 915,504 1,268,489 1,126,824 882,352 827,320 1,233,541 1,069,508 Sales Price/Unit ($ per ton) Northern Region Sawlog $83 $78 $89 $101 $88 $91 $115 $123 $111 Pulpwood $42 $42 $40 $42 $42 $41 $37 $38 $37 Stumpage $13 $13 $11 $12 $4 $13 $- $7 $- Southern Region Sawlog $42 $39 $42 $48 $44 $40 $39 $46 $49 Pulpwood $33 $32 $33 $31 $31 $31 $29 $30 $30 Stumpage $17 $18 $23 $33 $27 $14 $15 $14 $12

STATISTICS: Wood Products & Real Estate (unaudited) Q4 2017 Earnings Release – January 30, 2018 Excludes Q2 2016 central Idaho timberland sale. 2015 2016 2017 Wood Products Q4 Q1 Q2 Q3 Q4 Q1 Q2 Q3 Q4 Lumber Shipments (MBF) 164,965 161,992 170,829 175,358 180,050 167,559 189,781 195,296 184,031 Lumber Sales Prices ($ per MBF) $316 $324 $351 $369 $363 $387 $431 $431 $447 Real Estate(1) Acres Sold HBU Development 2,092 1,088 3,348 371 460 4,628 700 628 484 Rural Real Estate 2,038 2,281 1,489 5,708 3,433 1,740 4,523 1,207 2,523 Non-Strategic Timberlands 430 104 693 213 3,355 197 186 191 - 4,560 3,473 5,530 6,292 7,248 6,565 5,409 2,026 3,007 Revenues by Product Type (millions) HBU Development $4.4 $2.3 $7.6 $1.1 $1.3 $11.7 $1.8 $1.4 $1.2 Rural Real Estate 2.5 3.2 1.8 7.1 3.9 2.6 6.1 1.7 3.5 Non-Strategic Timberlands 0.4 0.1 0.6 0.2 3.4 0.2 0.2 0.2 - $7.3 $5.6 $10.0 $8.4 $8.6 $14.5 $8.1 $3.3 $4.7 Sales Price per Acre HBU Development $2,086 $2,113 $2,263 $3,039 $2,854 $2,523 $2,577 $2,278 $2,526 Rural Real Estate $1,227 $1,406 $1,215 $1,247 $1,150 $1,510 $1,356 $1,375 $1,391 Non-Strategic Timberlands $1,021 $565 $818 $842 $1,013 $1,019 $1,074 $1,007 $- Transactions by Product Type HBU Development 23 11 16 13 18 18 21 14 15 Rural Real Estate 29 20 26 23 18 9 38 22 32 Non-Strategic Timberlands 3 3 3 4 10 4 5 6 - 55 34 45 40 46 31 64 42 47
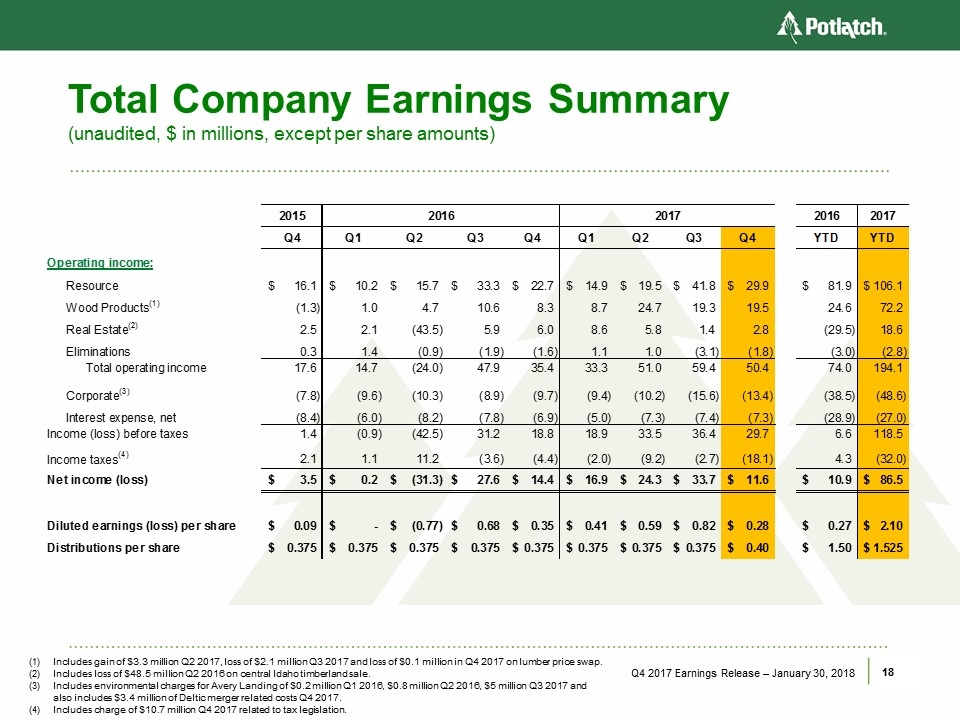
Total Company Earnings Summary (unaudited, $ in millions, except per share amounts) Q4 2017 Earnings Release – January 30, 2018 Includes gain of $3.3 million Q2 2017, loss of $2.1 million Q3 2017 and loss of $0.1 million in Q4 2017 on lumber price swap. Includes loss of $48.5 million Q2 2016 on central Idaho timberland sale. Includes environmental charges for Avery Landing of $0.2 million Q1 2016, $0.8 million Q2 2016, $5 million Q3 2017 and also includes $3.4 million of Deltic merger related costs Q4 2017. Includes charge of $10.7 million Q4 2017 related to tax legislation. 2015 2016 2017 2016 2017 Q4 Q1 Q2 Q3 Q4 Q1 Q2 Q3 Q4 YTD YTD Operating income: Resource $16.1 $10.2 $15.7 $33.3 $22.7 $14.9 $19.5 $41.8 $29.9 $81.9 $106.1 Wood Products(1) (1.3) 1.0 4.7 10.6 8.3 8.7 24.7 19.3 19.5 24.6 72.2 Real Estate(2) 2.5 2.1 (43.5) 5.9 6.0 8.6 5.8 1.4 2.8 (29.5) 18.6 Eliminations 0.3 1.4 (0.9) (1.9) (1.6) 1.1 1.0 (3.1) (1.8) (3.0) (2.8) Total operating income 17.6 14.7 (24.0) 47.9 35.4 33.3 51.0 59.4 50.4 74.0 194.1 Corporate(3) (7.8) (9.6) (10.3) (8.9) (9.7) (9.4) (10.2) (15.6) (13.4) (38.5) (48.6) Interest expense, net (8.4) (6.0) (8.2) (7.8) (6.9) (5.0) (7.3) (7.4) (7.3) (28.9) (27.0) Income (loss) before taxes 1.4 (0.9) (42.5) 31.2 18.8 18.9 33.5 36.4 29.7 6.6 118.5 Income taxes(4) 2.1 1.1 11.2 (3.6) (4.4) (2.0) (9.2) (2.7) (18.1) 4.3 (32.0) Net income (loss) $3.5 $0.2 $(31.3) $27.6 $14.4 $16.9 $24.3 $33.7 $11.6 $10.9 $86.5 Diluted earnings (loss) per share $0.09 $- $(0.77) $0.68 $0.35 $0.41 $0.59 $0.82 $0.28 $0.27 $2.10 Distributions per share $0.375 $0.375 $0.375 $0.375 $0.375 $0.375 $0.375 $0.375 $0.40 $1.50 $1.525
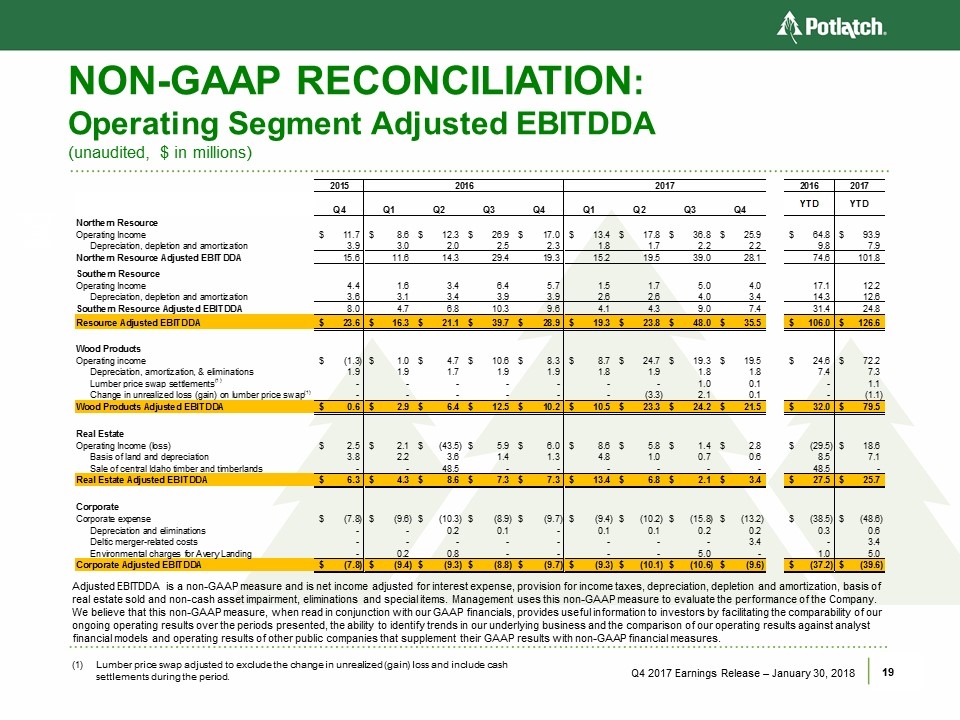
NON-GAAP RECONCILIATION: Operating Segment Adjusted EBITDDA (unaudited, $ in millions) Q4 2017 Earnings Release – January 30, 2018 Lumber price swap adjusted to exclude the change in unrealized (gain) loss and include cash settlements during the period. Adjusted EBITDDA is a non-GAAP measure and is net income adjusted for interest expense, provision for income taxes, depreciation, depletion and amortization, basis of real estate sold and non-cash asset impairment, eliminations and special items. Management uses this non-GAAP measure to evaluate the performance of the Company. We believe that this non-GAAP measure, when read in conjunction with our GAAP financials, provides useful information to investors by facilitating the comparability of our ongoing operating results over the periods presented, the ability to identify trends in our underlying business and the comparison of our operating results against analyst financial models and operating results of other public companies that supplement their GAAP results with non-GAAP financial measures. 2015 2016 2017 2016 2017 Q4 Q1 Q2 Q3 Q4 Q1 Q2 Q3 Q4 YTD YTD Northern Resource Operating Income $11.7 $8.6 $12.3 $26.9 $17.0 $13.4 $17.8 $36.8 $25.9 $64.8 $93.9 Depreciation, depletion and amortization 3.9 3.0 2.0 2.5 2.3 1.8 1.7 2.2 2.2 9.8 7.9 Northern Resource Adjusted EBITDDA 15.6 11.6 14.3 29.4 19.3 15.2 19.5 39.0 28.1 74.6 101.8 - - - - - Southern Resource Operating Income 4.4 1.6 3.4 6.4 5.7 1.5 1.7 5.0 4.0 17.1 12.2 Depreciation, depletion and amortization 3.6 3.1 3.4 3.9 3.9 2.6 2.6 4.0 3.4 14.3 12.6 Southern Resource Adjusted EBITDDA 8.0 4.7 6.8 10.3 9.6 4.1 4.3 9.0 7.4 31.4 24.8 Resource Adjusted EBITDDA $23.6 $16.3 $21.1 $39.7 $28.9 $19.3 $23.8 $48.0 $35.5 $106.0 $126.6 Wood Products Operating income $(1.3) $1.0 $4.7 $10.6 $8.3 $8.7 $24.7 $19.3 $19.5 $24.6 $72.2 Depreciation, amortization, & eliminations 1.9 1.9 1.7 1.9 1.9 1.8 1.9 1.8 1.8 7.4 7.3 Lumber price swap settlements(1) - - - - - - - 1.0 0.1 - 1.1 Change in unrealized loss (gain) on lumber price swap(1) - - - - - - (3.3) 2.1 0.1 - (1.1) Wood Products Adjusted EBITDDA $0.6 $2.9 $6.4 $12.5 $10.2 $10.5 $23.3 $24.2 $21.5 $32.0 $79.5 Real Estate Operating Income (loss) $2.5 $2.1 $(43.5) $5.9 $6.0 $8.6 $5.8 $1.4 $2.8 $(29.5) $18.6 Basis of land and depreciation 3.8 2.2 3.6 1.4 1.3 4.8 1.0 0.7 0.6 8.5 7.1 Sale of central Idaho timber and timberlands - - 48.5 - - - - - - 48.5 - Real Estate Adjusted EBITDDA $6.3 $4.3 $8.6 $7.3 $7.3 $13.4 $6.8 $2.1 $3.4 $27.5 $25.7 Corporate Corporate expense $(7.8) $(9.6) $(10.3) $(8.9) $(9.7) $(9.4) $(10.2) $(15.8) $(13.2) $(38.5) $(48.6) Depreciation and eliminations - - 0.2 0.1 - 0.1 0.1 0.2 0.2 0.3 0.6 Deltic merger-related costs - - - - - - - - 3.4 - 3.4 Environmental charges for Avery Landing - 0.2 0.8 - - - - 5.0 - 1.0 5.0 Corporate Adjusted EBITDDA $(7.8) $(9.4) $(9.3) $(8.8) $(9.7) $(9.3) $(10.1) $(10.6) $(9.6) $(37.2) $(39.6)


