INVESTOR PRESENTATION JUNE 2019 Exhibit 99.1
FORWARD-LOOKING STATEMENTS & NON-GAAP MEASURES 2 FORWARD-LOOKING STATEMENTS. This presentation contains certain forward-looking statements within the meaning of the Private Litigation Reform Act of 1995 as amended, including without limitation, statements about the effect of $10 change in lumber prices on annual EBITTDA, favorable fundamentals, estimated 2019 and future harvest volumes, acres harvested and seedlings planted each year, percentage of merchantable timber inventory that is comprised of sawlogs, percentage of sawlogs used internally, southern manufacturing capacity expansions, effect of 10% change in Southern log prices on company cash generation, capital spending in 2019, 2019 forecasted lumber shipments, North American lumber demand, forecasted real estate sales, real estate business potential and land development potential, land stratification values, capital allocation, dividend run rate, future capital expenditures, share repurchases, flexibility to grow and return capital to shareholders, debt maturities, future company performance, the company’s business model, U.S. housing starts, shift of North American lumber production to the South and similar matters. These forward-looking statements are based on current expectations, estimates, assumptions and projections that are subject to change, and actual results may differ materially from the forward-looking statements. Factors that could cause actual results to differ materially include, but are not limited to, changes in timberland values; changes in timber harvest levels on the company’s lands; changes in timber prices; changes in policy regarding governmental timber sales; changes in the United States and international economies; changes in U.S. job growth; changes in U.S. bank lending practices; changes in the level of domestic construction activity; changes in international tariffs, quotas and trade agreements involving wood products; changes in domestic and international demand for wood products; changes in production and production capacity in the forest products industry; competitive pricing pressures for the company’s products; unanticipated manufacturing disruptions; changes in general and industry-specific environmental laws and regulations; unforeseen environmental liabilities or expenditures; climate change and weather conditions; changes in fuel and energy costs; changes in raw material and other costs; the ability to satisfy complex rules in order to remain qualified as a REIT; changes in tax laws that could reduce the benefits associated with REIT status; and other risks and uncertainties described from time to time in the company’s public filings with the Securities and Exchange Commission. All forward-looking statements are made as of the date of this presentation, and the company does not undertake to update any forward-looking statements. .NON-GAAP MEASURES. This presentation presents non-U.S. GAAP financial information. A reconciliation of those numbers to U.S. GAAP is included in this presentation which is available on the company’s website at www.PotlatchDeltic.com.
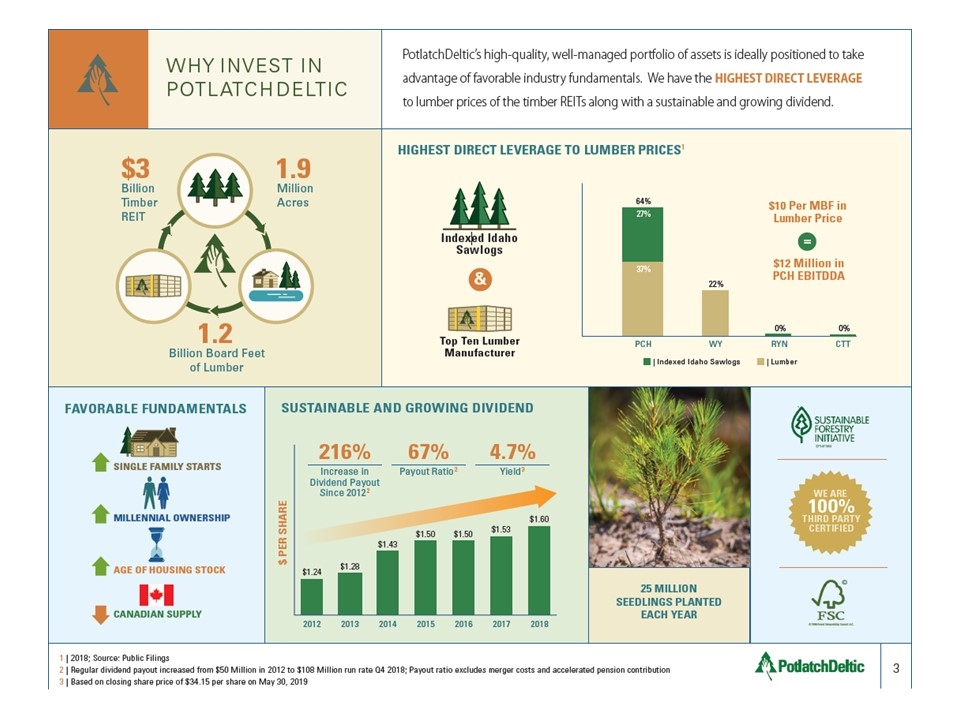
WHY INVEST INPOTLATCHDELTIC 2019PotlatchDeltic’s high-quality, well-managed portfolio of assets is ideally positioned to take advantage of favorable industry fundamentals. We have the HIGHEST DIRECT LEVERAGE to lumber prices of the timber REITs along with a sustainable and growing dividend. $3 Billion Timber REIT $3 Billion Timber REIT 1.9 Million Acres 1.2 Billion Board Feet of Lumber DIVIDEND HIGHEST DIRECT LEVERAGE TO LUMBER PRICES1 Indexed Idaho Sawlogs Idaho SawlogsTop Ten Lumber Manufacturer$10 Per MBF in Lumber Price$12 Million in PCH EBITDDA Indexed Idaho Sawlogs Lumber 1 | 2018; Source: Public Filings 2 | Regular dividend payout increased from $50 Million in 2012 to $108 Million run rate Q4 2018; Payout ratio excludes merger costs and accelerated pension contribution 3 | Based on closing share price of $34.15 per share on May 30, 2019 FAVORABLE FUNDAMENTALS CANADIAN SUPPLY AGE OF HOUSING STOCK MILLENNIAL OWNERSHIP SUSTAINABLE AND GROWING DIVIDEND 2012 2013 2014 2015 2016 2017 2018 216% Increase in Dividend Payout Since 2012 2 4.7% Yield 367%Payout Ratio2 $1.24 $1.28 $1.43 $1.50 $1.50 $1.53 $1.60 25 MILLION SEEDLINGS PLANTED EACH YEAR WE ARE 100% THIRD PARTY CERTIFIED 3
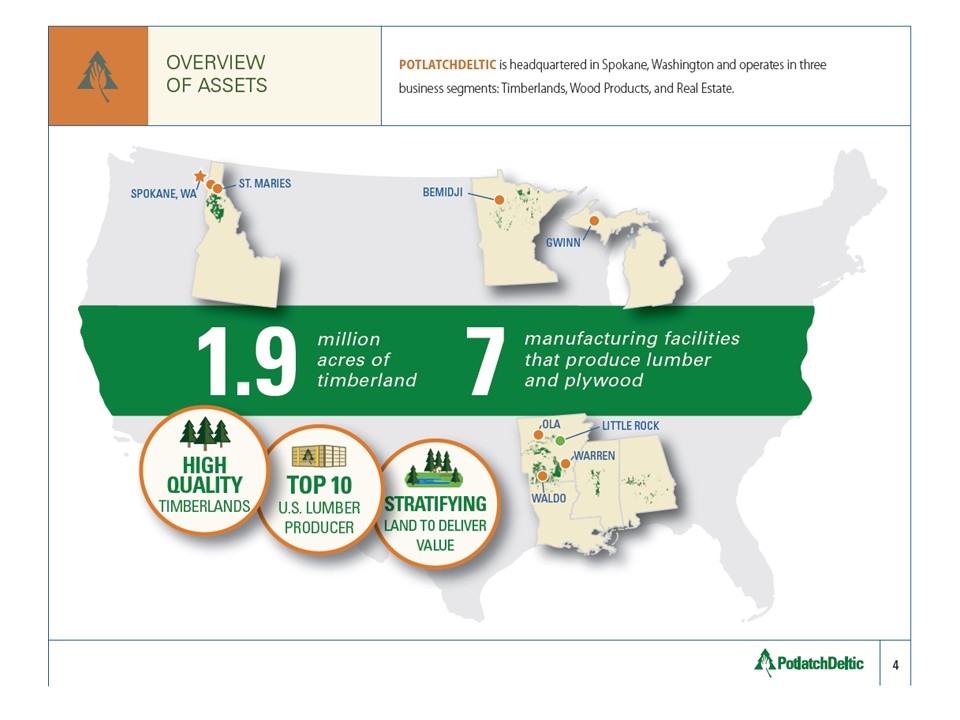
OVERVIEWOF ASSETS4POTLATCHDELTIC is headquartered in Spokane, Washington and operates in three business segments: Timberlands, Wood Products, and Real Estate. HIGH QUALITY TIMBERLANDS TOP 10 U.S. LUMBER PRODUCER STRATIFYING LAND TO DELIVER VALUE ST. MARIES BEMIDJI GWINN 1.9 million acres of timberland 7 manufacturing facilities that produce lumber and plywood OLA LITTLE ROCK WARREN WALDO 4
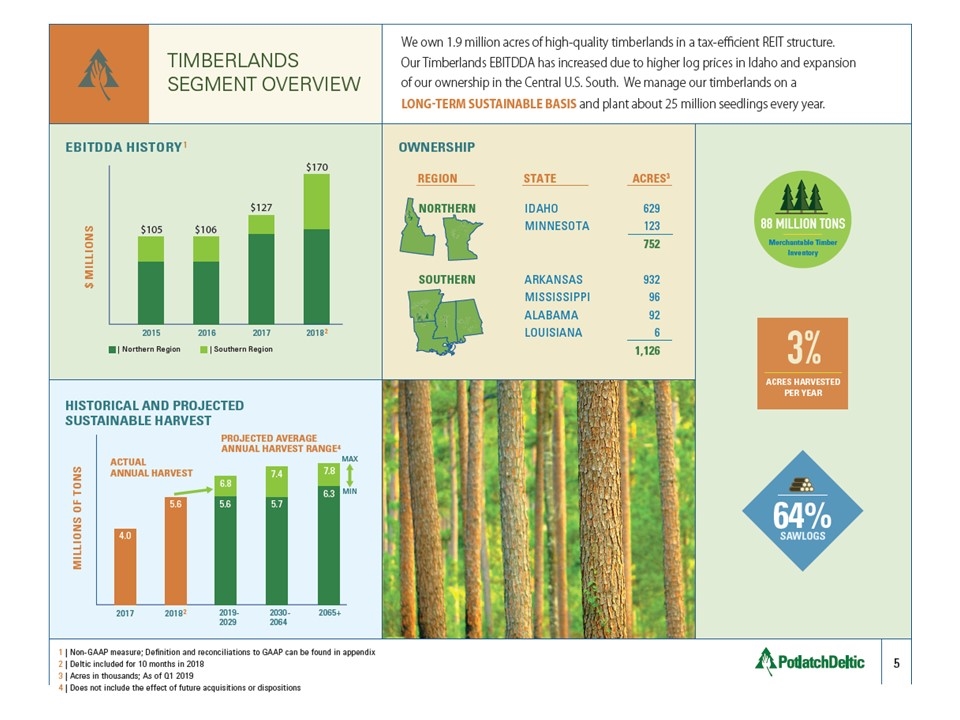
TIMBERLANDS SEGMENT OVERVIEW1 | Non-GAAP measure; Definition and reconciliations to GAAP can be found in appendix 2 | Deltic included for 10 months in 2018 3 | Acres in thousands; As of Q1 2019 4 | Does not include the effect of future acquisitions or dispositions 5 EBITDDA HISTORY 1 | Northern Region 2018 2 | Southern Region $ MILLIONS OWNERSHIP 2015 $105 2016 $106 2017 $127 $170 REGION STATE ACRES3NORTHERN IDAHO 629 MINNESOTA 123 752 SOUTHERN ARKANSAS 932 MISSISSIPPI 96 ALABAMA 92 LOUISIANA 6 1,126 HISTORICAL AND PROJECTED SUSTAINABLE HARVEST MILLIONS OF TONSACTUALANNUAL HARVEST PROJECTED AVERAGE ANNUAL HARVEST RANGE 4 2018 25.6 2017 4.0 MAXMIN 2019-2029 6.85.67.4 2030-2064 5.7 2065+ 7.86.3We own 1.9 million acres of high-quality timberlands in a tax-efficient REIT structure. Our Timberlands EBITDDA has increased due to higher log prices in Idaho and expansion of our ownership in the Central U.S. South. We manage our timberlands on a LONG_TERM SUSTAINABLE BASIS and plant about 25 million seedlings every year. 88 MILLION TONS Merchantable TimberInventory3%ACRES HARVESTED PER YEAR 64% SAWLOGS
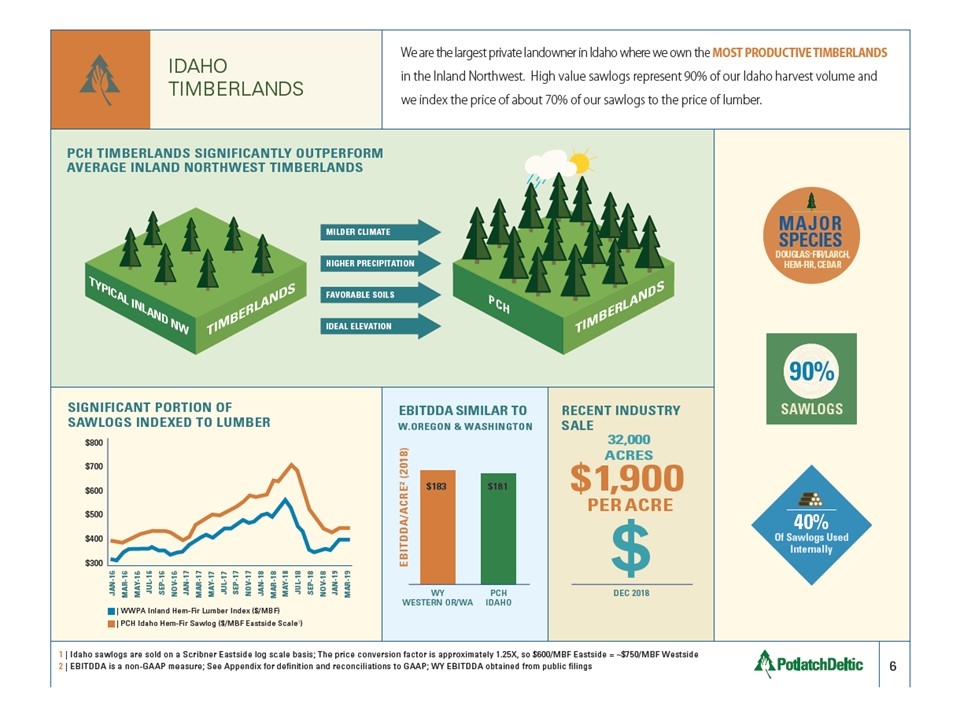
IDAHO TIMBERLANDS 6 We are the largest private landowner in Idaho where we own the MOST PRODUCTIVE TIMBERLANDS in the Inland Northwest. High value sawlogs represent 90% of our Idaho harvest volume and we index the price of about 70% of our sawlogs to the price of lumber. PCH TIMBERLANDS SIGNIFICANTLY OUTPERFORM AVERAGE INLAND NORTHWEST TIMBERLANDS1 | Idaho sawlogs are sold on a Scribner Eastside log scale basis; The price conversion factor is approximately 1.25X, so $600/MBF Eastside = ~$750/MBF Westside 2 | EBITDDA is a non-GAAP measure; See Appendix for definition and reconciliations to GAAP; WY EBITDDA obtained from public filings EBITDDA SIMILAR TO W.OREGON & WASHINGTON WY WESTERN OR/WA PCH IDAHO EBITDDA/ACRE2 (2018) 40% Of Sawlogs Used Internally$183 $181 RECENT INDUSTRY SALE DEC 2018 $1,900 PER ACRE 32,000 ACRES MAJOR SPECIES DOUGLAS-FIR/LARCH,HEM-FIR, CEDAR $ SIGNIFICANT PORTION OF SAWLOGS INDEXED TO LUMBER $300 $400 $500 $600 $700 $800 JAN-16 MAR-16 MAY-16 JUL-16 SEP-16 NOV-16 JAN-17 MAR-17 MAY-17 JUL-17 SEP-17 NOV-17 JAN-18 MAR-18 MAY-18 JUL-18 SEP-18 NOV-18 JAN-19 MAR-19 | WWPA Inland Hem-Fir Lumber Index ($/MBF) | PCH Idaho Hem-Fir Sawlog ($/MBF Eastside Scale1) TYPICAL INLAND NW _ TIMBERLANDS _ PCH _ TIMBERLANDS _ MILDER CLIMATE HIGHER PRECIPITATION FAVORABLE SOILS IDEAL ELEVATION 90% SAWLOGS
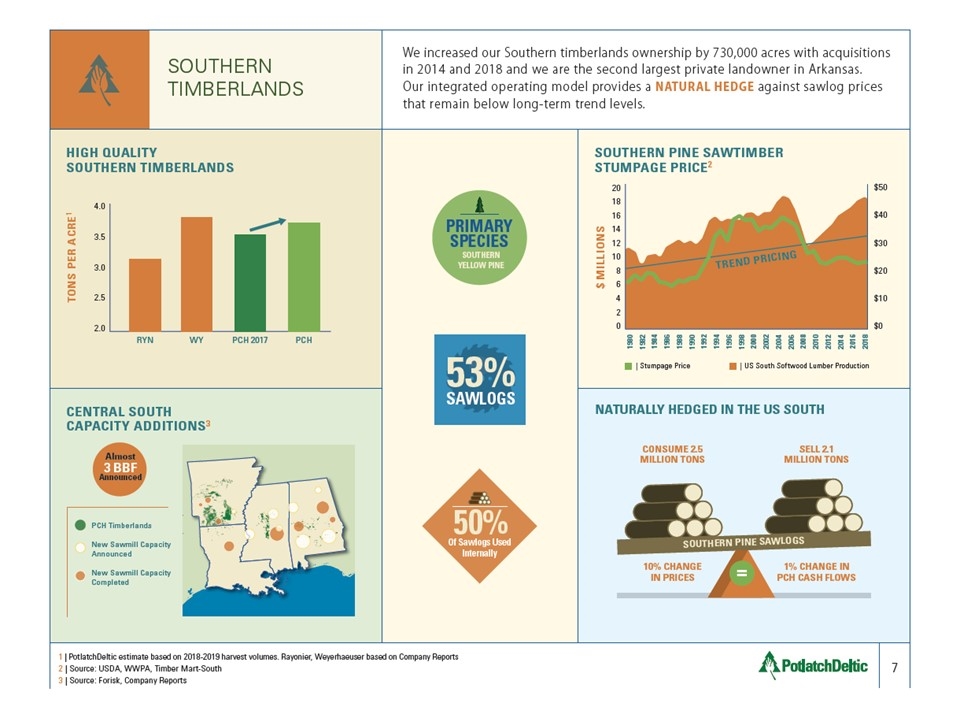
SOUTHERN TIMBERLANDS 7 We increased our Southern timberlands ownership by 730,000 acres with acquisitions in 2014 and 2018 and we are the second largest private landowner in Arkansas. Our integrated operating model provides a NATURAL HEDGE against sawlog prices that remain below long-term trend levels.1 | PotlatchDeltic estimate based on 2018-2019 harvest volumes. Rayonier, Weyerhaeuser based on Company Reports 2 | Source: USDA, WWPA, Timber Mart-South 3 | Source: Forisk, Company Reports CENTRAL SOUTH CAPACITY ADDITIONS3 50% Of Sawlogs Used Internally HIGH QUALITY SOUTHERN TIMBERLANDS 2.0 2.5 3.0 3.5 4.0 PCH PCH 2017 WY RYN PRIMARY SPECIES SOUTHERN YELLOW PINE 53% SAWLOGS Almost 3 BBF Announced SOUTHERN PINE SAWTIMBER STUMPAGE PRICE2 0$0 $10 $20 $30 $40 $50 2468101214161820 $ MILLIONS 1980 1982 1984 1986 1988 1990 1992 1994 1996 1998 2000 2002 2004 2006 2008 2010 2012 2014 2016 2018 | US South Softwood Lumber Production | Stumpage Price TREND PRICING NATURALLY HEDGED IN THE US SOUTH CONSUME 2.5 MILLION TONS SELL 2.1 MILLION TONS10% CHANGEIN PRICES 1% CHANGE INPCH CASH FLOWS SOUTHERN PINE SAWLOGS PCH Timberlands NEW SAWMILL CAPACITY ANNOUNCED NEW SAWMILL CAPACITY COMPLETED PCH Timberlands New Sawmill Capacity Announced New Sawmill Capacity Completed=TONS PER ACRE1
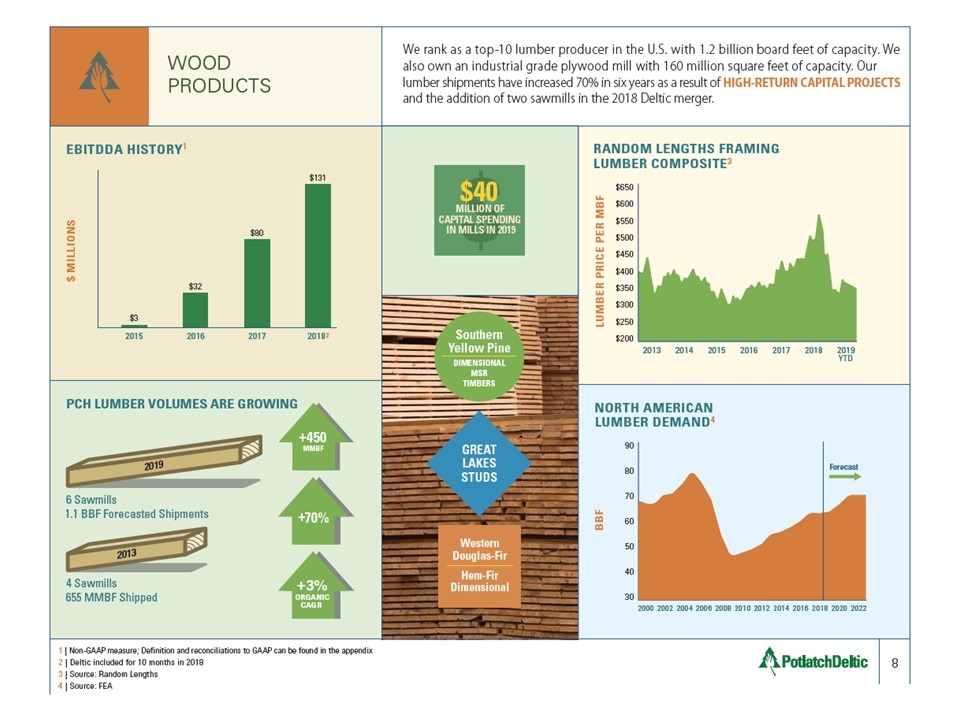
WOOD PRODUCTS 8 We rank as a top-10 lumber producer in the U.S. with 1.2 billion board feet of capacity. We also own an industrial grade plywood mill with 160 million square feet of capacity. Our lumber shipments have increased 70% in six years as a result of HIGH-RETURN CAPITAL PROJECTS and the addition of two sawmills in the 2018 Deltic merger.1 | Non-GAAP measure; Definition and reconciliations to GAAP can be found in the appendix 2 | Deltic included for 10 months in 2018 3 | Source: Random Lengths 4 | Source: FEAEBITDDA HISTORY1 $ MILLIONSPCH LUMBER VOLUMES ARE GROWINGNORTH AMERICAN LUMBER DEMAND4 RANDOM LENGTHS FRAMIN GLUMBER COMPOSITE3 $200 $250 $300 $350 $400 $450 $550 $600 $500 $650 LUMBER PRICE PER MBF30 40 50 60 70 80 90 2000 2002 2004 2006 2008 2010 2012 2014 2016 2018 2020 2022 Forecast BBF 6 Sawmills1.1 BBF Forecasted Shipments4 Sawmills655 MMBF Shipped+450MMBF +70%+3% ORGANIC CAGR 2013 2014 2015 2016 2017 2018 2019YTD 2019 2013 2013 $40 MILLION OF CAPITAL SPENDINGIN MILLS IN 2019 Southern Yellow Pine DIMENSIONAL MSR TIMBERS GREAT LAKES STUDS Western Douglas-FirHem-Fir Dimensional 2015 2016 2017 20182 $3 $32 $80 $131
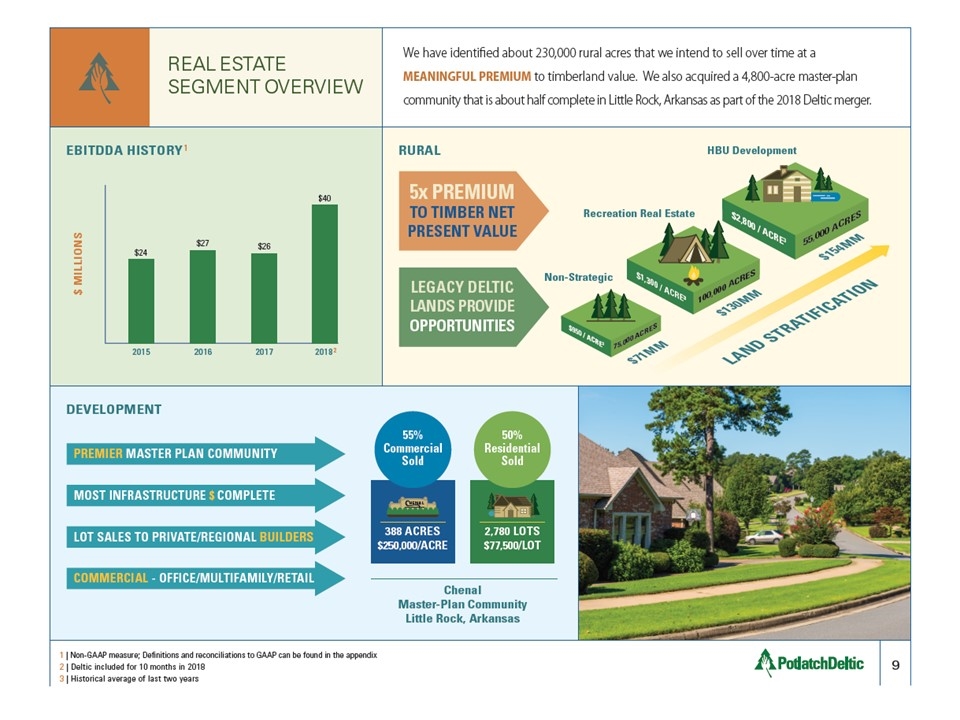
REAL ESTATESEGMENT OVERVIEW 9 We have identified about 230,000 rural acres that we intend to sell over time at a MEANINGFUL PREMIUM to timberland value. We also acquired a 4,800-acre master-plan community that is about half complete in Little Rock, Arkansas as part of the 2018 Deltic merger.EBITDDA HISTORY1 1 | Non-GAAP measure; Definitions and reconciliations to GAAP can be found in the appendix 2 | Deltic included for 10 months in 2018 3 | Historical average of last two years $ MILLIONSHBU Development$2,800 / ACRE3 _ 55,000 ACRES _ $1,300 / ACRE3 _ 100,000 ACRES _ Recreation Real Estate $950 / ACRE3 _ 75,000 ACRES _ Non-Strategic Chenal Master-Plan Community Little Rock, Arkansas DEVELOPMENT LAND STRATIFICATION RURAL PREMIER MASTER PLAN COMMUNITYMOST INFRA STRUCTURE $ COMPLETELOT SALES TO PRIVATE/REGIONAL BUILDERS COMMERCIAL - OFFICE/MULTIFAMILY/RETAIL5 x PREMIUM TO TIMBER NET PRESENT VALUE LEGACY DELTIC LANDS PROVIDE OPPORTUNITIES2,780 LOTS $77,500/LOT50% Residential Sold 388 ACRES $250,000/ACRE55% Commercial Sold $71MM $130MM $154MM 2015 2016 2017 20182 $24 $27 $26 $40 HENAL
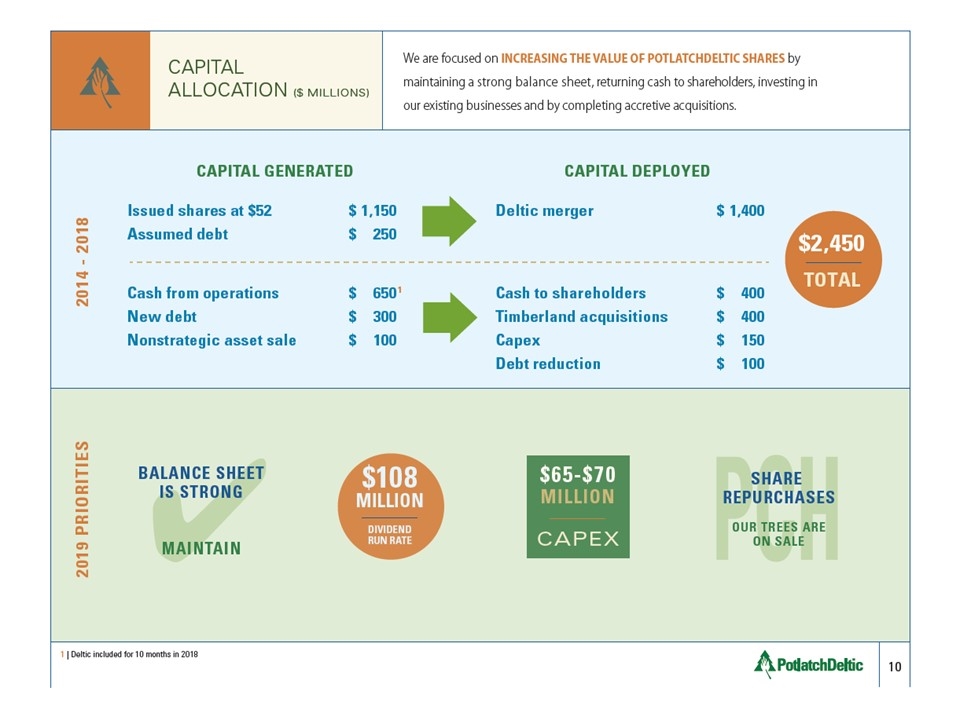
CAPITAL ALLOCATION ($ MILLIONS) 10 We are focused on INCREASING THE VALUE OF POTLATCHDELTIC SHARES by maintaining a strong balance sheet, returning cash to shareholders, investing in our existing businesses and by completing accretive acquisitions.1 | Deltic included for 10 months in 2018 CAPITAL GENERATED CAPITAL DEPLOYED Issued shares at $52 $ 1,150 Assumed debt $ 250Cash from operations $ 650 1New debt $ 300Nonstrategic asset sale $ 100 Deltic merger $ 1,400 Cash to shareholders $ 400 Timberland acquisitions $ 400 Capex $ 150 Debt reduction $ 100 2014 – 2018 $2,450 TO TAL BALANCE SHEETIS STRONG MAINTAIN SHARE REPURCHASES OUR TREES ARE ON SALE 2019 PRIORITIES $108 MILLION DIVIDEND RUN RATE $65-$70 MILLION CAPEX
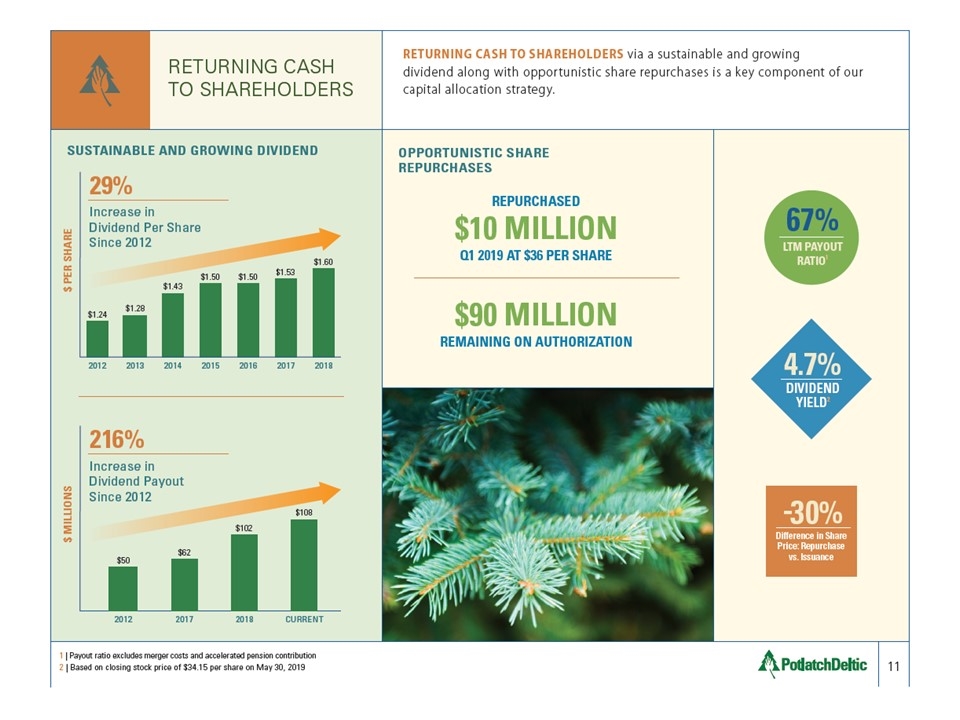
RETURNING CASHTO SHAREHOLDERS 11 RETURNING CASH TO SHAREHOLDERS via a sustainable and growing dividend along with opportunistic share repurchases is a key component of our capital allocation strategy.1 | Payout ratio excludes merger costs and accelerated pension contribution 2 | Based on closing stock price of $34.15 per share on May 30, 20194.7% DIVIDEND YIELD2 OPPORTUNISTIC SHARE REPURCHASES SUSTAINABLE AND GROWING DIVIDEND 2012 2013 2014 2015 2016 2017 2018 Increase in Dividend Per Share Since 2012 $ PER SHARE $1.24 $1.28 $1.43 $1.50 $1.50 $1.53 $1.6029% Increase in Dividend Payout Since 2012 $ MILLIONS 216% 2012 $50 2017 $62 2018 $102 CURRENT $108 67%LTM PAYOUTRATIO1-30% Difference in Share Price: Repurchase vs. Issuance $90 MILLION REMAINING ON AUTHORIZATION $10 MILLION Q1 2019 AT $36 PER SHARE REPURCHASED
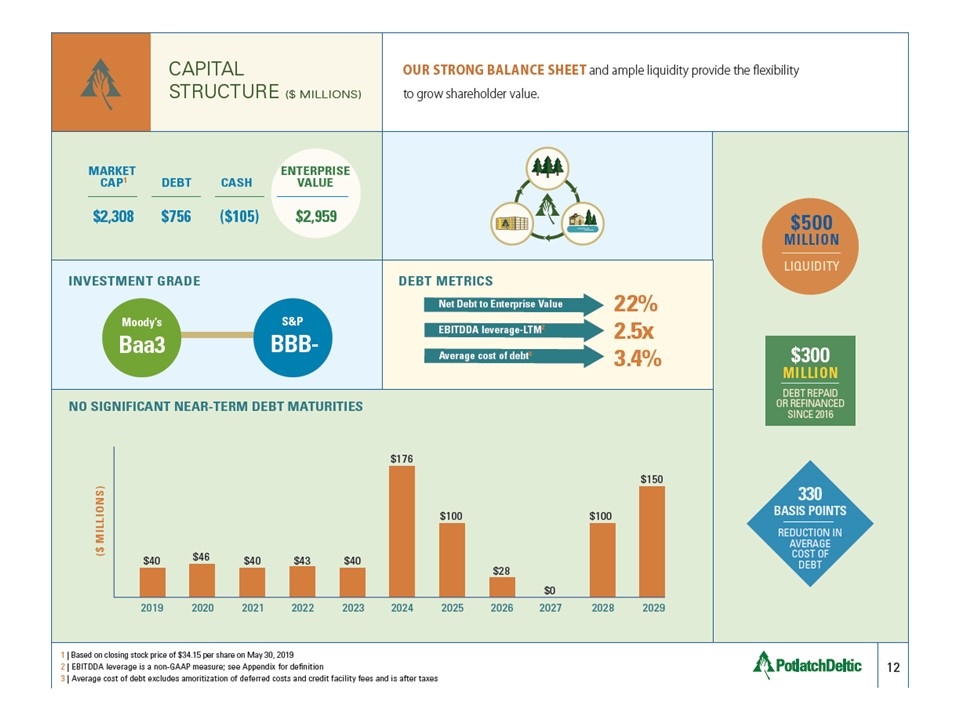
CAPITAL STRUCTURE ($ MILLIONS)12 OUR STRONG BALANCE SHEET and ample liquidity provide the flexibility to grow shareholder value. 1 | Based on closing stock price of $34.15 per share on May 30, 2019 2 | EBITDDA leverage is a non-GAAP measure; see Appendix for definition 3 | Average cost of debt excludes amoritization of deferred costs and credit facility fees and is after taxes NO SIGNIFICANT NEAR-TERM DEBT MATURITIES 330 BASIS POINTS REDUCTION IN AVERAGE COST OF DEBT $500 MILLION LIQUIDITY $300 MILLION DEBT REPAID OR REFINANCED SINCE 2016 2019 2020 2021 2022 2023 2024 2025 2026 2027 2028 2029 $40 $46 $40 $43 $40 $176 $100 $28 $0 $100 $150 ($ MILLIONS) INVESTMENT GRADE DEBT METRICS Moody’s Baa3 S&P BBB- Net Debt to Enterprise Value EBITDDA leverage-LTM2 Average cost of debt 322% 2.5x 3.4% MARKET ENTERPRISE CAP1 DEBT CASH VALUE $2,308 $756 ($105) $2,959
APPENDIX JUNE 2019
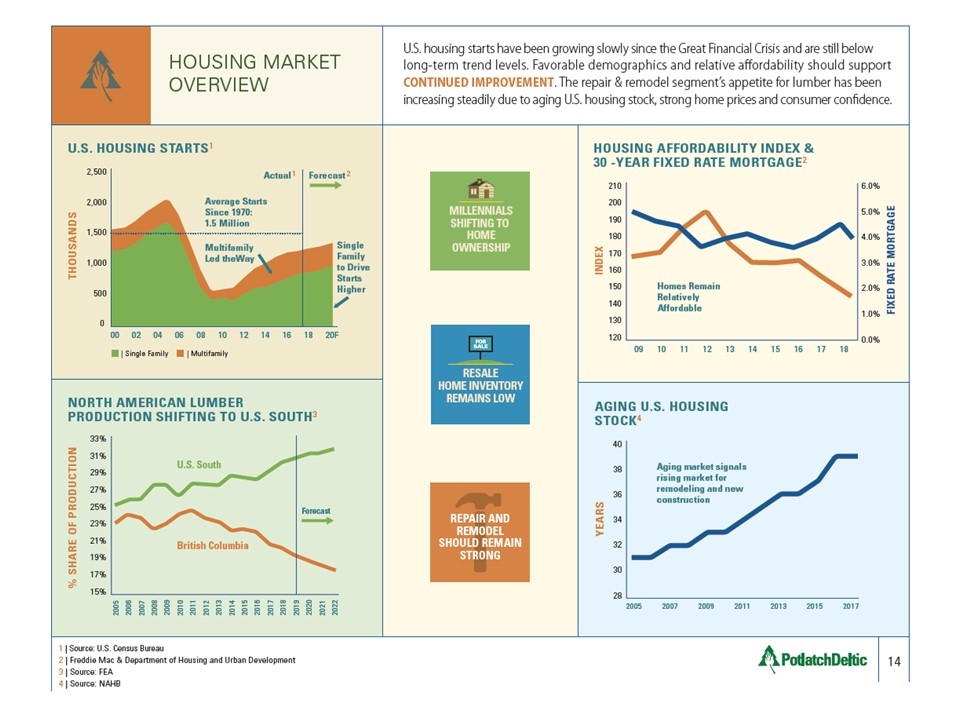
HOUSING MARKET OVERVIEW 14 U.S. housing starts have been growing slowly since the Great Financial Crisis and are still below long-term trend levels. Favorable demographics and relative affordability should support CONTINUED IMPROVEMENT. The repair & remodel segment’s appetite for lumber has been increasing steadily due to aging U.S. housing stock, strong home prices and consumer confidence.1 | Source: U.S. Census Bureau 2 | Freddie Mac & Department of Housing and Urban Development 3 | Source: FEA 4 | Source: NAHBU.S. HOUSING STARTS1 00 02 04 06 08 10 12 14 16 18 20F 0 5001, 0002, 5002, 0001, 500 THOUSANDSNORTH AMERICAN LUMBER PRODUCTION SHIFTING TO U.S. SOUTH 315% 17% 19% 21% 23% 25% 27% 29% 31% 33% 2005 2006 2007 2008 2009 2010 2011 2012 2013 2014 2015 2016 2017 2018 2019 2020 2021 2022 AGING U.S. HOUSING STOCK4 British Columbia U.S. South Forecast | Single Family | Multifamily HOUSING AFFORDABILITY INDEX &30 -YEAR FIXED RATE MORTGAGE 2 120 0.0% 1.0% 2.0% 3.0% 4.0% 5.0% 6.0% 140 160 180 130 150 170 190 200 210 09 10 11 12 13 14 15 16 17 18 28 30 32 34 36 38 40 2005 2007 2009 2011 2013 2015 2017 YEARS FIXED RATE MORTGAGE INDEX Homes Remain Relatively Affordable Multifamily Led the Way Average Starts Since 1970:1.5 Million Single Family to Drive Starts Higher RESALE HOME INVENTORY REMAINS LOW FOR SALE Aging market signals rising market for remodeling and new construction MILLENNIALSSHIFTING TO HOMEO WNERSHIP Actual 1 Forecast 2 REPAIR AND REMODEL SHOULD REMAIN STRONG % SHARE OF PRODUCTION
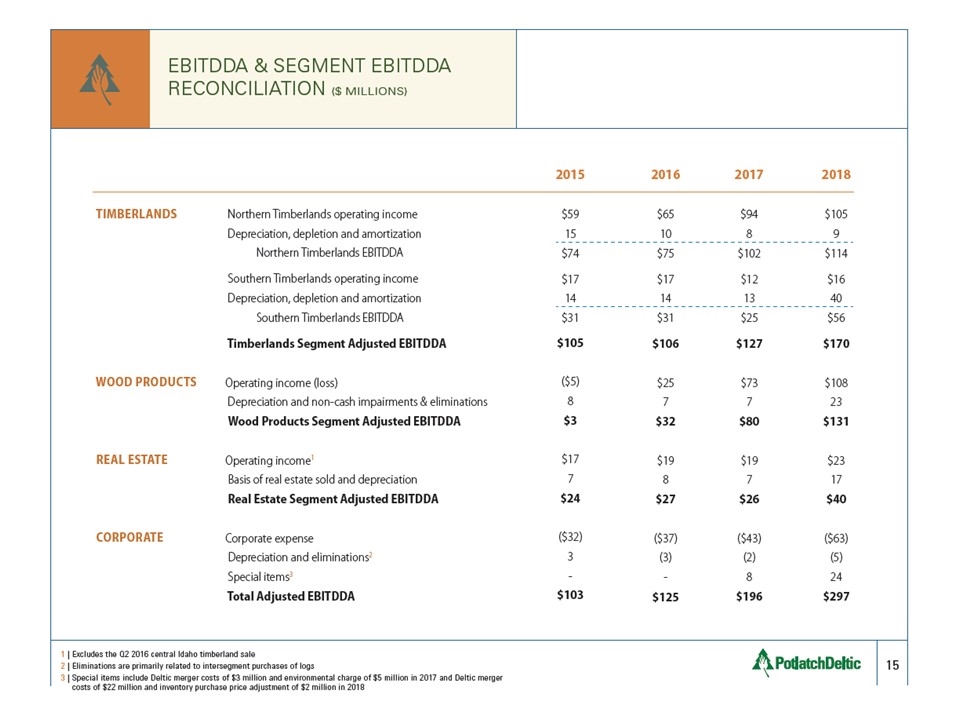
EBITDDA & SEGMENT EBITDDA RECONCILIATION ($ MILLIONS) 15_TIMBERLANDS_______WOOD PRODUCTS___REAL ESTATE___CORPORATE __Northern Timberlands operating income Depreciation, depletion and amortization___________ Northern Timberlands EBITDDA Southern Timberlands operating income Depreciation, depletion and amortization___________ Southern Timberlands EBITDDA Timberlands Segment Adjusted EBITDDA Operating income (loss)_Depreciation and non-cash impairments & eliminations Wood Products Segment Adjusted EBITDDA Operating income1_Basis of real estate sold and depreciation Real Estate Segment Adjusted EBITDDA Corporate expense Depreciation and eliminations2_Special items3_Total Adjusted EBITDDA 2015 $59 15 $74 $17 14 $31 $105 ($5) 8 $3 $17 7 $24 ($32) 3-$103 2016 $65 10 $75 $17 14$ 31 $106 $25 7 $32 $19 8 $27 ($37) (3)-$125 2017 $94 8 $102 $12 13 $25 $127 $73 7 $80 $19 7 $26 ($43) (2) 8 $196 2018 $105 9 $114 $16 40 $56 $170 $108 23 $131 $23 17 $40 ($63) (5) 24 $297 1 | Excludes the Q2 2016 central Idaho timberland sale 2 | Eliminations are primarily related to intersegment purchases of logs 3 | Special items include Deltic merger costs of $3 million and environmental charge of $5 million in 2017 and Deltic merger costs of $22 million and inventory purchase price adjustment of $2 million in 2018
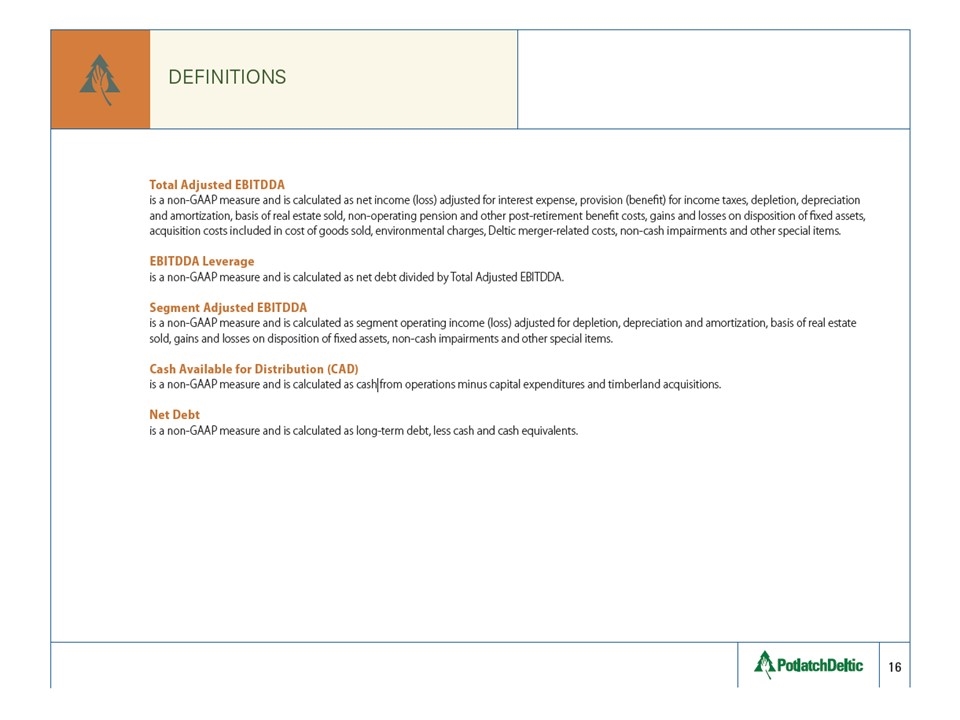
DEFINITIONS 16 Total Adjusted EBITDDA is a non-GAAP measure and is calculated as net income (loss) adjusted for interest expense, provision (benefit) for income taxes, depletion, depreciation and amortization, basis of real estate sold, non-operating pension and other post-retirement benefit costs, gains and losses on disposition of fixed assets, acquisition costs included in cost of goods sold, environmental charges, Deltic merger-related costs, non-cash impairments and other special items EBITDDA Leverage is a non-GAAP measure and is calculated as net debt divided by Total Adjusted EBITDDA Segment Adjusted EBITDDA is a non-GAAP measure and is calculated as segment operating income (loss) adjusted for depletion, depreciation and amortization, basis of real estate sold, gains and losses on disposition of fixed assets, non-cash impairments and other special items Cash Available for Distribution (CAD) is a non-GAAP measure and is calculated as cash from operations minus capital expenditures and timberland acquisitions. Net Debt is a non-GAAP measure and is calculated as long-term debt, less cash and cash equivalents.
Jerry Richards Vice President & Chief Financial Officer 509-835-1521potlatchdeltic.com NASDAQ: PCH JUNE 2019


