Exhibit 99.1
Investor Presentation November 14, 2006 |
Forward-Looking Statements FORWARD-LOOKING STATEMENTS This presentation contains statements that may be considered forward looking within the meaning of Section 27A of the Securities Act of 1933 and Section 21E of the Securities Exchange Act of 1934, such as estimates of our Fourth Quarter Fiscal 2006 results, contract values, anticipated revenues from indefinite delivery, indefinite quantity contracts; expected percentages of future revenues represented by fixed-price contracts; and statements covering our business strategy. These statements speak of DynCorp International’s plans, goals, beliefs, or expectations, refer to estimates or use similar terms. Actual results could differ materially, because the realization of those results is subject to many uncertainties, some of which are discussed in more detail in the registration statement on Form S-1 filed with the U.S. Securities and Exchange Commission. All forward looking statements included in this presentation are based upon information presently available. DynCorp International undertakes no obligation to publicly update or revise any forward-looking statement. The risks and uncertainties relating to the forward-looking statements in this presentation include those described under the caption “Risk Factors” and “Forward-Looking Statements” in DynCorp International’s registration statement on Form S-1 filed with the U.S. Securities and Exchange Commission. This presentation includes non-GAAP financial measures, including EBITDA, that are different from financial measures calculated in accordance with GAAP and may be different from non-GAAP calculations made by other companies. A quantitative reconciliation of non-GAAP information to the most directly comparable GAAP financial measures has been included in this presentation. |
Company Snapshot Global Headquarters: Falls Church, Virginia History: We trace our beginnings to 1946 IPO Date: May 4, 2006 FY End Date: Closest Friday to March 31st Yearly Revenue: $1.97 Billion (Year Ended March 31, 2006) First Half FY07 Revenue: $1,012.4 Million (Six months ended September 29, 2006) |
Established & Strong Global Presence Approximately 14,000 employees worldwide Experienced recruiter, screener and trainer of personnel in more than 30 countries United States 6,781 DynCorp International has the global infrastructure to provide rapid response support anywhere in the world. Latin America 1,205 Europe 529 Africa 139 Middle East 5,064 Asia Pacific 290 Australia 7 |
Investment Highlights Unique Global Provider of Outsourced Technical Services Leading Market Position Strong, Long-Standing and Strong Customer Relationships Attractive Industry Fundamentals Diversified, Stable Platform for Growth Global Business Growth Opportunities Attractive Cash Flow Dynamics Experienced Management Team |
Government Services Law Enforcement & Security Counter-Drug Operations Facility Operations & Construction Management Contingency & Logistics Operations Aviation & Maintenance Services Unique Mission-Critical Service Provider Maintenance & Technical Support Services Field Services FY06 Revenue: $1,264.6 million FY06 Revenue: $702.4 million Contractor Logistics Support |
Five Core Service Offerings Maintenance & Technical Support Services The Maintenance & Technical Support Services Group provides maintenance, modifications, repairs, and engineering and logistics support for various commercial and Department of Defense aircraft and weapons systems and associated support equipment at many locations worldwide. Law Enforcement & Security The Law Enforcement & Security Group will manage all of DI’s international law enforcement and security contracts, including the Department of State’s Civilian Police Program (CIVPOL) and Worldwide Personal Protective Service (WPPS). The SBU will leverage the experience and infrastructure developed in these large programs to pursue international police and security work with the U.S. government, foreign governments, and international organizations Contingency & Logistics Operations The Logistics & Contingency Group will provide contingency and logistics support—including combat support, combat service support, and disaster and humanitarian relief—to U.S. civilian agencies, the U.S. military, state and local governments, and international organizations such as the United Nations. Facility Operations & Construction Management The Facility Operations & Construction Management Group will provide base operations support (BOS) and facility management for established U.S. military and civilian installations in the U.S. and abroad. The SBU will also manage any construction associated with its operation of facilities and will support construction associated with DI’s contingency operations. Specialty Aviation and Counter-drug Operations The Specialty Aviation & Counter-drug Operations Group will manage drug interdiction operations throughout the world as well as aviation its operations in to detect and suppress forest and brush fires. Using aviation assets, the SBU will seek to increase business with federal and state government agencies in both these areas. |
Leading Market Position DI has significant potential to provide services to foreign governments. Company provides unique capabilities to U.S. and foreign governments Provider of over 90% of services under Civilian Police (CIVPOL) program for the Department of State Sole supplier of International Narcotics and Law Enforcement (INL) Eradication services to the Department of State Largest provider of Contract Field Team (CFT) services to Department of Defense (Government of Nigeria) (NATO) (Armed Forces of the United Kingdom) (Australian Defense Force) (Kuwaiti Air Force) |
Key Government Services Contracts ContractPrincipal CustomerInitial/CurrentAward DateRecompete DateEstimatedValue(4)Civilian Police ProgramDepartment of StateFeb. 1994/Feb. 2004February 2009$1.75 billion(1)International Narcotics and Law EnforcementDepartment of StateJan. 1991/May 2005October 2015$806 million(2)War Reserve MaterialU.S. Air ForceMay 2000December 2006$493 millionForward Operating LocationsU.S. Air ForceMarch 2002December 2006$141 millionQatar SecurityU.S. ArmyAug. 1997/Feb. 2003September 2007$ 93 millionSudanDepa rtment of StateMay 2001Not applicable$ 30 million(1)(1) Indefinite delievery/Indefinite quantity contract(2) Estimated value for the first three years of this ten-year contract through May 2015.(3) As of September 29, 2006. |
Rising Number of IPLOs The number of International Police Liaison Officers (IPLOs) has steadily increased, driving greater revenue under the CIVPOL contract. Afghanistan Iraq 0100200300400500600700800Jan-04Mar-04May-04Jul-04Sep-04Nov-04Jan-05Mar-05May-05Jul-05Sep-05Nov-05Jan-06Mar-06May-06Jul-06Sep-06 |
Increasing Government & DoD Outsourcing Department of Defense Budget (excl. Supplemental) ($ in billions) CAGR: 6% Source: Department of Defense and CSP. Note: Other includes personnel and retired pay. ‘04-’09 CAGR 2.6% 7.3% 1.8% 8.7% Dyncorp International benefits from the decreasing size of US military and consequent need for outsourced services. 5.2% Total U.S. Military Personnel Source: Department of Defense Budget and www.GlobalSecurity.org. (In thousands) 53% Decrease ProcurementR&DOperations & MaintenanceOther2000200120022003200420052006E2007E2008E2009E$291$310$346$364$378$397$420$439$467$489$96$102$116$114$116$138$143$152$157$1650500 100015002000250030003500197019721974197619781980198219841986198819901992199419961998200020022004 |
DI’s Role Increases Post-Conflict Activities in Iraq and Afghanistan are long-term and sustainable. DI’s CIVPOL Revenue vs. U.S. Troop Level in Kosovo ($ in thousands) Kosovo peace proposal signed Source: Department of Defense, “Active Military Personnel Strengths by Regional Area and by Country.” Note: Revenue reflects DynCorp International’s fiscal year ending March 31. Troop levels are reported as of the United States Government’s prior fiscal year ending September 30. $59,363$31,199$1,186$56,451$53,220$47,1895,6792,8043191,8141,8015,427DI Revenue U.S. Troop LevelFY1999FY2000FY2001FY2002FY2003FY2004 |
Key Maintenance and Technical Support Services Contracts Contract Principal Customer Initial/Current Award Date Recompete Date Estimated Value (3)Contract Field TeamsDepartment of DefenseOct. 1951/Oct. 1997September 2007$2.25 billion(1)Life Cycle Contractor SupportU.S. Army and U.S. NavyAugust 2000January 2010$944 millionAH-1/UH-1U.S. Army / FMSMarch 2004March 2014$406 million(1)Andrews Air Force BaseU.S. Air ForceJanuary 2001December 2011$337 millionColumbus Air Force BaseU.S. Air ForceOct. 1998/July 2005September 2012$244 millionArmy Prepositioned StocksAfloatU.S. ArmyFebruary 1999February 2009$218 millionHolloman Air Force BaseU.S. Air ForceSeptember 1999September 2006$107 millionEglin Air Force BaseU.S. Air ForceNovember 2002November 2010$ 80 millionF/A-18Kuwaiti Air Force(2)Sept. 1997/Dec.2005December 2010$ 70 millionCalifornia Department ofForestryState of CaliforniaJanuary 2002June 2007$ 82 million______________________(1) Indefinite delivery, indefinite quantity contracts.(2) Reflects end user under the contract rather than the contract party.(3) As of September 29, 2006. |
Domestic Growth Opportunities Under previous ownership, DI was precluded from competing in domestic U.S. markets DI can now apply its core international competencies in the US: Homeland Security Budget ($ in billions) Source: http://www.cbo.gov. (1) FY 2005 budget request. 29.0% CAGR $41.5$36.1$32.1$17.0$15.02001200220032004E2005E(1)FOCUSMARKETSMARKETSIZEContingency Response„Dept. Homeland Sec urity„AFCAP/LOGCAP„Disaster support~$10-20 billion (varies by crisis)O&M / Engineering„All federal agencies’ facilities and installations~$20 billionRanges„DoD & Other~$3 billion |
Financial Review |
Revenue Breakdown Revenue by Customer – FY 2006 Revenue by Region – FY 2006 Revenues = $2.0 Billion Revenues = $2.0 Billion United States 36%Iraq 26%Afghanistan 13%Other Middle East 10%Other Americas 11%Europe 4%U.S. State Dept.53%Army 24%Air Force 11%Other DoD 3%Navy 6%Other 3% |
Historical Operating Performance Strong growth and expanding margins. Revenues EBITDA and Margin ($ in millions) 27.3% CAGR ($ in millions) 45.1% CAGR Note: The Company uses a 52-53 week fiscal year ending on the Friday closest to March 31. (1) 52-week period ended March 28, 2003 and April 2, 2005. Sum of predecessor and successor DynCorp International entities. $148$115$60$34$34$234.0%4.5%3.7%4.9%6.0%7.6% EBITDAEBITDA MarginFY2001FY2002FY2003FY2004FY2005FY2006(1)(1)FY2001FY2002FY2003FY2004FY2005FY2006(1)(1)$584$755$918$1,214$1,921$1,956 |
Current Year Operating Performance Revenues EBITDA and Margin |
Total Debt and Leverage $0$100$200$300$400$500$600$700$800$900$1,000FY05FY06Q1 FY07Q2FY07Total Debt ($ in Millions)012345678Leverage Ratio |
Diversified, Stable Platform for Growth Total backlog of $2.7 billion as of September 29, 2006 Estimated Remaining Contract Value of $5.7 billion as of September 29, 2006 Historically, virtually all backlog has been converted into revenue at or above contract values Backlog by Contract Remaining Contract Value By ContractNote: Backlog represents remaining contract value. For Indefinite Delivery Indefinite Quantity, or IDIQ contracts, backlog represents only task orders awarded. Estimated Remaining Contract Value is backlog plus management’s estimate of future revenues under IDIQ contracts. Total Backlog as of 9/29/06: $2.7 billion Estimated Remaining Contract Value as of 9/29/06: $5.7 billion APS-31%WRM2%Andrews6%FOL1%CFT7%Columbus8%LCCS13%Other15%INL21%CIVPOL26%Columbus4%Andrews3%APS-31%WRM1%LCCS6%CFT8%Other13%CIVPOL35%INL29% |
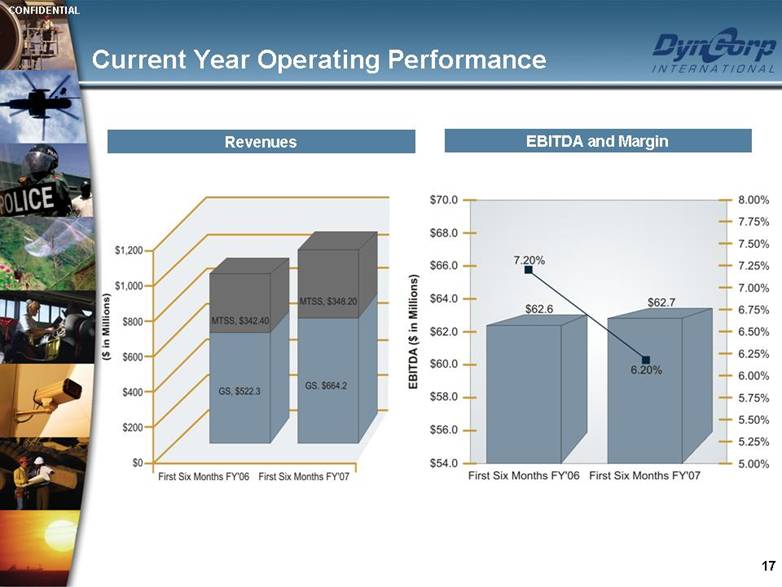
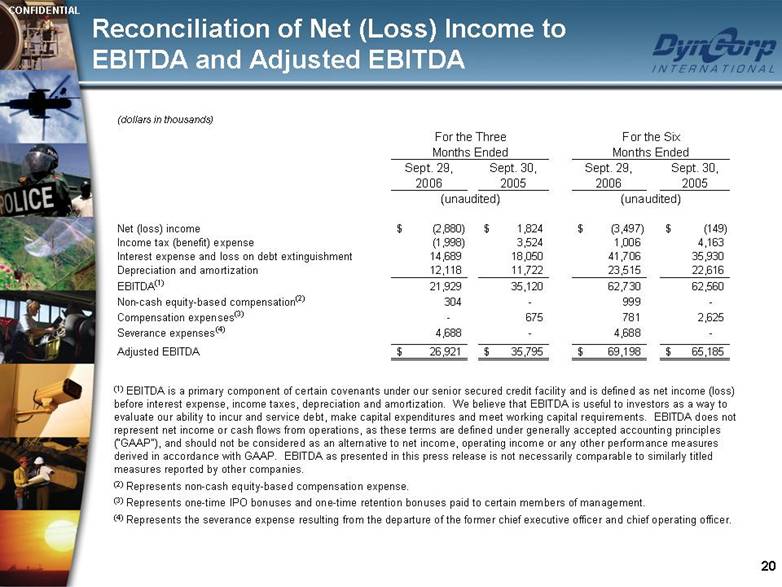
Reconciliation of Net (Loss) Income to EBITDA and Adjusted EBITDA(1) EBITDA is a primary component of certain covenants under our senior secured credit facility and is defined as net income (loss) before interest expense, income taxes, depreciation and amortization. We believe that EBITDA is useful to investors as a way to evaluate our ability to incur and service debt, make capital expenditures and meet working capital requirements. EBITDA does not represent net income or cash flows from operations, as these terms are defined under generally accepted accounting principles (“GAAP”), and should not be considered as an alternative to net income, operating income or any other performance measures derived in accordance with GAAP. EBITDA as presented in this press release is not necessarily comparable to similarly titled measures reported by other companies. (2) Represents non-cash equity-based compensation expense. (3) Represents one-time IPO bonuses and one-time retention bonuses paid to certain members of management. (4) Represents the severance expense resulting from the departure of the former chief executive officer and chief operating officer. (dollars in thousands)Sept. 29, 2006Sept. 30, 2005Sept. 29, 2006Sept. 30, 2005Net (loss) income(2,880)$ 1,824$ (3,497)$ (149)$ Income tax (benefit) expense(1,998)3,5241,0064,163Interest expense and loss on debt extinguishment14,68918,05041,70635,930Depreciation and amortization12,11811,72223,51522,616EBITDA(1)21,92935,12062,73062,560Non-cash equity-based compensation(2)304-999-Compensation expenses(3)-6757812,625Severance expenses(4)4,688-4,688-Adjusted EBITDA26,921$ 35,795$ 69,198$ 65,185$ For the Three Months EndedFor the Six Months Ended(unaudited)(unaudited) |
Sell-side Analysts Bear Stearns – Peter Barry CIBC – Myles Walton Credit Suisse – Robert Spingarn Goldman Sachs – Richard Safran Jeffries & Company – Joseph Vafi Stanford Group Company – Erik Olbeter Wachovia Securities – Edward Caso |
Thank You For Your Interest |