| TECHNICAL REPORT ON THE HERBERT GOLD PROPERTY |
| |
| |
| JUNEAU DISTRICT, SOUTHEAST ALASKA |
| Prepared for: |
| |
| |
| Grande Portage Resources Ltd. |
| Suite 280 – 1090 West Georgia Steet |
| Vancouver, BC V6E 3V7 |
| |
| And |
| |
| Quaterra Resources Inc. |
| Suite 1100 – 1199 West Hastings Street |
| Vancouver, BC V6E 3T5 |
| |
| |
| |
| |
| Prepared by: |
| David G. DuPre, P.GEO. QP |
| Dave Webb, P. Geol. QP |
| |
| D.G. DuPre and Associates Inc. |
| |
| |
| |
| |
| April 10, 2013 |
| |
| |
| |
| |
| Effective Date: |
| April 10, 2013 |
| Technical Report on the Herbert Gold Property | April 10, 2013 |
DATE AND SIGNATURE PAGE
I, David G. DuPre, P. Geo., HEREBY CERTIFY THAT:
1) I am an independent consulting geologist with a business address at 56 Parkgrove Crescent, Delta, BC V4L 2G3
2) I am a graduate of the University of Calgary with a B.Sc. Honors with a Subject of Specialization in Geology (1969).
3) I am a registered Professional Geologist in good standing with the Association of Professional Engineers and Geoscien-tists of British Columbia (APEGBC) with member number 19888.
4) I have worked as a geologist for a total of 41 years since graduation from university. I have work experience Canada, and throughout the world. In particular I have significant experience working in Northern North America and have visited and studied many mesothermal deposits. In particular, I supervised an exploration program and co-authored a resource estimation of the Discovery Mine Project, north of Yellowknife, Northwest Territories.
5) I have read the definition of "qualified person" set out in National Instrument 43-101 ("NI 43-101") and certify that by reason of my education, affiliation with a professional association (as defined in NI 43-101) and past relevant work experience, I fulfill the requirement to be a "qualified person" for the purposes of NI 43-101.
6) I am responsible for the preparation of all sections 1 to 12 and 14 to 19 of the technical report “TECHNICAL REPORT ON THE HERBERT GOLD PROPERTY” and dated April 10, 2013 prepared for Grande Portage Resources Ltd. (the "Technical Report"). I visited the property during the period of August 13 to 16, 2012.
7) I have not had prior involvement with the property that is the subject of the Technical Report.
8) I am not aware of any material fact or material change with respect to the subject matter of the Technical Report that is not reflected in the Technical Report, the omission to disclose which makes the Technical Report misleading.
9) I am fully independent of the issuer and the vendor applying all of the tests in section 1.5 of National Instrument 43-101
10) I have read National Instrument 43-101 and Form 43-101F1, and the Technical Report has been prepared in compliance with that instrument and form.
11) I consent to the filing of the Technical Report with any stock exchange or other regulatory Authority and any publication by them, including electronic publication in the public company files on their websites accessible to the public, provided that I am given the opportunity to read the written disclose before filed to ensure its authenticity.
12) I have read this the document entitled “TECHNICAL REPORT ON THE HERBERT GOLD PROPERTY” and dated April 10, 2013.
Dated this 10th Day of April, 2013
| | |
| Signature of Qualified Person | |
| D.G. DuPre and Associates Inc. | Page 2 |
| Technical Report on the Herbert Gold Property | April 10, 2013 |
I, Dave R. Webb B.A.Sc (Engineering), M.Sc., Ph.D., P.Geol. (Lic 601, NAPGEGG), herby certify that:
1) I am an independent consulting geologist with a business address at 6120 185A St., Surrey, B.C., V3S 7P9
2) I am a graduate of:
| | 1. | The University of Toronto (1981) in Geological Engineering. (B.A.Sc. (Engineering)) |
| | | |
| | 2. | Queen’s University (1983) in Geological Sciences. (M.Sc.) |
| | | |
| | 3. | The University of Western Ontario (1992) in Geological Sciences. (Ph.D.) |
3) I am a registered Professional Geologist in good standing with the Association of Professional Engineers and Geoscien-tists of the Northwest Territories (NAPEG) (L601).
4) I have worked as a geologist for a total of 32 years since graduation from university. I have work experience Canada, the United States of America, Mexico, Asia, Europe and Africa.
5) I have read the definition of "qualified person" set out in National Instrument 43-101 ("NI 43-101") and certify that by reason of my education, affiliation with a professional association (as defined in NI 43-101) and past relevant work experience, I fulfill the requirement to be a "qualified person" for the purposes of NI 43-101.
6) I am responsible for the preparation of all of section 13 and contributed to section 25 and 26 of the technical report “TECHNICAL REPORT ON THE HERBERT GOLD PROPERTY” and dated April 10, 2013 prepared for Grande Portage Resources Ltd. (the "Technical Report"). I have not visited the property.
7) I have not had prior involvement with the property that is the subject of the Technical Report.
8) I am not aware of any material fact or material change with respect to the subject matter of the Technical Report that is not reflected in the Technical Report, the omission to disclose which makes the Technical Report misleading.
9) I am fully independent of the issuer and the vendor applying all of the tests in section 1.5 of National Instrument 43-101
10) I have read National Instrument 43-101 and Form 43-101F1, and the Technical Report has been prepared in compliance with that instrument and form.
11) I consent to the filing of the Technical Report with any stock exchange or other regulatory Authority and any publication by them, including electronic publication in the public company files on their websites accessible to the public, provided that I am given the opportunity to read the written disclose before filed to ensure its authenticity.
12) I have read this the document entitled “TECHNICAL REPORT ON THE HERBERT GOLD PROPERTY” and dated April 10, 2013.
| D.G. DuPre and Associates Inc. | Page 3 |
| Technical Report on the Herbert Gold Property | April 10, 2013 |
CONTENTS OF THE TECHNICAL REPORT
| D.G. DuPre and Associates Inc. | Page 4 |
| Technical Report on the Herbert Gold Property | April 10, 2013 |
LIST OFFIGURES
| D.G. DuPre and Associates Inc. | Page 5 |
| Technical Report on the Herbert Gold Property | April 10, 2013 |
| FIGURE 16. GOLD GRADE VERSUS SAMPLE INTERVAL SHOWS DECREASING GOLD GRADES WITH INCREASING SAMPLE INTERVAL (DASHED LINE) | 41 |
| FIGURE 17. GENERAL LOCATION OF THE FOUR PRINCIPAL VEIN STRUCTURES WITH RESPECT TO TOPOGRAPHY. | 42 |
| FIGURE 18. LOGNORMAL PROBABILITY PLOTS OF ALL RAW SAMPLE DATA >0.01 G/T WITHIN THE MAIN VEIN SOLID. | 44 |
| FIGURE 19. LOGNORMAL PROBABILITY PLOTS OF ALL 1M COMPOSITE DATA >0.01 G/T WITHIN THE MAIN VEIN SOLID | 45 |
| FIGURE 20. LOGNORMAL PROBABILITY PLOTS OF ALL RAW SAMPLE DATA >0.01 G/T WITHIN THE DEEP TRENCH VEIN SOLID | 46 |
| FIGURE 21. LOGNORMAL PROBABILITY PLOTS OF ALL 1M COMPOSITE DATA >0.01 G/T WITHIN THE DEEP TRENCH VEIN SOLID. | 47 |
| FIGURE 22. LOGNORMAL PROBABILITY PLOTS OF ALL BLOCK DATA >0.01 G/T WITHIN THE MAIN VEIN SOLID. | 48 |
| FIGURE 23. LOGNORMAL PROBABILITY PLOTS OF ALL BLOCK DATA >0.01 G/T WITHIN THE DEEP TRENCH VEIN SOLID | 49 |
| FIGURE 24. OBLIQUE VIEW, DOWN TO THE NORTHWEST SHOWING ALL OF THE VEIN SOLIDS AND THE WESTERN SEDIMENTARY ROCK PACKAGE, WITH AN AIR PHOTOGRAPH DRAPED OVER TOPOGRAPHY GHOSTED FOR REFERENCE. | 50 |
| FIGURE 25. LONGITUDINAL SECTION OF THE MAIN VEIN SHOWING RESOURCE BLOCKS ABOVE 0.5 G/T GOLD CUT-OFF, VIEWED TO THE SOUTH, PERPENDICULAR TO THE SOLID. | 51 |
| FIGURE 26. LONGITUDINAL SECTION OF THE RESOURCE BLOCKS FOR THE DEEP TRENCH VEIN ABOVE A 0.5 G/T GOLD CUT-OFF, VIEWED TO THE SOUTH PERPENDICULAR TO THE SOLID | 52 |
| FIGURE 27. LONGITUDINAL SECTION OF THE RESOURCE BLOCKS FOR THE DEEP TRENCH VEIN ABOVE A 2.0 G/T GOLD CUT-OFF. BLOCKS BETWEEN 0.5 AND 2.0 G/T ARE SHOWN GHOSTED. | 53 |
| FIGURE 28. LONGITUDINAL SECTION OF THE DEEP TRENCH HANGING WALL VEIN SHOWING ALL RESOURCE BLOCKS >0.5 G/T GOLD CUT-OFF, VIEWED PERPENDICULAR TO THE SOLID. PURPLE SOLID IN BACKGROUND IS THE DEEP TRENCH VEIN. | 54 |
| FIGURE 29. LONGITUDINAL SECTION FACING SOUTH OF THE GOAT CREEK FOOTWALL VEIN SHOWING ALL RESOURCE BLOCKS >0.5 G/T GOLD CUT-OFF, ORIENTED PERPENDICULAR TO THE SOLID. | 55 |
| FIGURE 30. LONGITUDINAL SECTION OF THE GOAT CREEK HANGING WALL VEIN SHOWING ALL RESOURCE BLOCKS >0.5 G/T CUT- OFF, ORIENTED PERPENDICULAR TO THE SOLID. | 56 |
| FIGURE 31. EAST-FACING CROSS-SECTION OF THE DEEP TRENCH VEIN WITH RESOURCE BLOCKS AND SOLIDS MODEL (PURPLE). | 57 |
| FIGURE 32. INCLINED LONGITUDINAL SECTION, VIEWED TO THE SOUTH OF THE DEEP TRENCH VEIN SHOWING ID2 BLOCKS OF "GOLD FACTOR" VALUES. | 59 |
| FIGURE 33. ALL RESOURCE BLOCKS WITHIN 60 M OF A COMPOSITE IN THE MAIN VEIN ARE SHOWN. | 60 |
| FIGURE 34. ALL RESOURCE BLOCKS WITHIN 60 M OF A COMPOSITE IN THE DEEP TRENCH VEIN ARE SHOWN, VIEWED TO THE NORTH. | 61 |
| FIGURE 35. PROPOSED DRILL HOLES ON AN INCLINED LONGITUDINAL SECTION OF THE DEEP TRENCH VEIN, VIEWED TO THE SOUTH. | 65 |
| FIGURE 36. PROPOSED DRILL HOLES ON AN INCLINED LONGITUDINAL SECTION OF THE MAIN VEIN, VIEWED TO THE SOUTH. | 66 |
| FIGURE 37. PROPOSED DRILL HOLES ON AN INCLINED LONGITUDINAL SECTION OF THE GOAT VEINS, VIEWED TO THE SOUTH. | 67 |
| FIGURE 38. PROPOSED DRILL PLAN AND BUDGET | 67 |
| FIGURE 39. SIMPLE LINEAMENT ANALYSIS OF THE DRAPED AIR PHOTOGRAPH OF A PORTION OF THE HERBERT GOLD PROPERTY SHOWING LINEAMENTS THAT SUB PARALLEL KNOWN VEINS STRUCTURES | 69 |
| FIGURE 40. POTENTIAL PORTAL LOCATION (RED OVAL) AND TRACE OF RAMP (PURPLE) DRIVEN TO THE SOUTHEAST AT -15% | 70 |
| FIGURE 41. INCLINED LONGITUDINAL SECTION OF THE DEEP TRENCH VEIN SHOWING A POTENTIAL 15% RAMP WITHIN THE RESOURCE BLOCKS (2 G/T CUT-OFF), VIEWED TO THE SOUTH | 71 |
List of Tables
| D.G. DuPre and Associates Inc. | Page 6 |
| Technical Report on the Herbert Gold Property | April 10, 2013 |
| D.G. DuPre and Associates Inc. | Page 7 |
| Technical Report on the Herbert Gold Property | April 10, 2013 |
Grande Portage Resources Ltd. (GPR) has retained D. G. DuPre and Associates Inc. (DGD) to prepare a technical report (the Report) on the Herbert Property (the Property) in accordance with National Instrument 43-101 (NI 43-101) and Form 43-101F. Grande Portage Resources Ltd. is a publicly traded mineral exploration company focused primarily on precious metals in Alaska and British Columbia, with its head office in Vancouver, British Columbia, Canada. The Report supports an updated Mineral Resource Estimate of the Property and provides an up-to-date assessment of the Property. The changes in this Report are the results of the 2011 and 2012 drilling programs. Form 43-101 items 15 through 22 (Mineral Reserve Estimates, Mining Methods, Recovery Methods, Project Infrastructure, Market Studies and Contracts, Environmental Studies, Permitting and Social or Community Impact, Capital and Operating Costs, and Economic Analysis, respectively) are not required for a Technical Report on Resources and are not incorporated in this Report.
The Herbert Property consists of 91 federal mining claims covering approximately 1,881 acres located 32 kilometers north of Juneau, Alaska. The infrastructure is well developed in this area. The Property is 6 kilometers from a paved highway, 10 kilometers from a power line and 10 kilometers from tidewater.
A mining lease was signed by Quaterra Resources Inc. (QR) from Juneau Exploration and Development, Inc. (JEDI) in No-vember 2007. In June, 2010, QR optioned the Herbert Property to GPR. By fulfilling the option terms, GPR and QR formed a Joint Venture Agreement in October, 2011 resulting in GPR holding a 65% interest and QR holding the remaining 35%. The Agreement also outlined the collective responsibilities between the JV participants. Funding is on a pro-rata basis, with standard dilution applying in the event either party declines to participate. An annual advance royalty payment is payable on the property
The Property is located within the historic, 160 kilometer-long Juneau Mining District (JMD) which hosts over 200 gold-quartz-vein deposits with production nearing 7,000,000 ounces of gold since 1880. More than three-quarters of Alaska's historic lode gold production was mined from the Juneau gold belt. Most of the prospects and mines within the JMD are in close proximity to the Coastal Range Megalineament – a major crustal structure defined by northwest – striking, moderately to steeply dipping, penetrative foliation. This structure is parallel to the boundary between the Gravina Belt to the west and the Taku terrane to the east. Regional metamorphism and deformation, including the Coastal Range Megalineament, are linked to the emplacement of multiple intrusive bodies of varied composition.
Historic production from the Juneau Mining District was mainly from mesothermal quartz veins and stringers hosted by greenschist to amphibolite – facies metasedimentary rocks and relatively competent igneous bodies. Many of the mineralized veins in the Juneau District extend over significant distances along strike and down-dip. The Juneau gold belt has been Alaska's largest lode gold producer, yielding approximately 6.8 million ounces of gold, largely from the Alaska-Juneau and Treadwell mines.
The empirical relationship between orogeny and gold- vein formation in the Juneau gold belt is well established. A belt of tonalitic plutons were intruded approximately 5 km east of the Megalineament between 68-61 Ma (Barker et al., 1986; and Wood et al., 1991). The tonalities are believed to have been the primary source of heat and fluids that produced the gold deposits.
The resource estimation was prepared by D. G. DuPre and Associates. D.R. Webb P. Geol. is the Qualified Person, within the meaning of NI 43-101, responsible for the reserve and resource calculations while D.G. Dupre P. Geo. is the Qualified Person responsible for all other aspects of the Technical Report. Quality-control data, generated during the various drill programs conducted at the Herbert Property, were independently verified by Mr. Dupre and Dr. Webb as part of the project review.
| D.G. DuPre and Associates Inc. | Page 8 |
| Technical Report on the Herbert Gold Property | April 10, 2013 |
The results from a total of 127 diamond drill holes and 4 trenches comprised the digital database for this study. This resource estimate is updated to include the results from the 2012 infill drilling campaign which was designed to upgrade the previously identified "inferred" resources” to "indicated" resources. Several exploratory drill holes also tested the other targets (Goat and Ridge Veins) and along the open extents of the Main and Deep Trench Veins. Utilizing a base case cut-off of 2 g/t, the eight veins on the property contain an indicated resource of 821,079 tonnes grading 6.91 g/t gold (“g/t”) for 182,406 oz of gold. The Inferred resource is 51,611 tonnes grading 7.73 g/t gold for 12,819 oz of gold.In Table 1 mineral resources are highlighted above a 2 g/t cut off, assuming an average gold price of $1,500 per ounce. This cut off reflects the potential economic, marketing and other issues relevant to an underground shrinkage stope mining scenario based on a conventional mill operation.
Table 1. Herbert Property NI 43-101 Indicated and Inferred Mineral Resource Statement
| Herbert Property NI 43-101 Indicated and Inferred Mineral Resource Statement |
| Total Indicated |
| Cut-off (g/t) | Tonnes | Au Grade (g/t) | Ounces Au |
| 3.0 | 532,400 | 9.34 | 159,800 |
| 2.5 | 637,900 | 8.25 | 169,200 |
| 2.0 | 821,100 | 6.91 | 182,400 |
| 1.5 | 1,081,300 | 5.66 | 196,900 |
| 1.0 | 1,645,500 | 4.14 | 219,000 |
| 0.5 | 2,867,500 | 2.69 | 248,100 |
| Total Inferred |
| Cut-off (g/t) | Tonnes | Au Grade (g/t) | Ounces Au |
| 3.0 | 38,600 | 9.55 | 11,900 |
| 2.5 | 42,100 | 8.99 | 12,200 |
| 2.0 | 51,600 | 7.73 | 12,800 |
| 1.5 | 112,600 | 4.46 | 16,100 |
| 1.0 | 585,400 | 1.85 | 34,900 |
| 0.5 | 1,509,800 | 1.18 | 57,300 |
| D.G. DuPre and Associates Inc. | Page 9 |
| Technical Report on the Herbert Gold Property | April 10, 2013 |
Metallic or screened assays were used in all instances where they were available (921 samples). All other assays are standard one assay ton results reported using ICP finish or where over limit (>10 g/t) are reported using gravimetric finish.
A series of cross sections were developed for each of eight different zones where correlations in gold assays, alteration zones, and multi-element data appear to generate discreet veins down-dip on section and between sections. These correlations were corrected and modified as supported by surface mapping and geology.
MapInfo’s 3D solid generation routine was used to construct three dimensional models from the sections. These were examined to conform to geology and all analytical data and adjusted where necessary.
Some areas of the Main Vein provided multiple options for correlations that were permissive by geology and sample geochemistry. The correlation that best matched surface geology was selected. The Deep Trench vein was remarkable in the simplicity and consistency of a very planar orientation of the correlations.
Block model parameters are based on geostatistical applications, and block size varies between the veins. Based on numerous iterations, it was decided that the Inverse Distance Squared (ID2) method was appropriate. It was determined that a block model approximately 8m x 1.5m x 6m provided suitable detail without creating an unnecessarily large database. This was applied to the Main and Deep Trench Veins. Smaller solids (such as the Deep Trench Vein Hanging Wall) were modeled using smaller block sizes down to 2m x 2m x 2m. The raw and composited assay data for the veins display a mixture of three populations on the lognormal probability plots. These can be modeled smoothly without any obvious outliers that can over-influence the estimation and to account for the nugget effect. Statistical studies showed that capping or averaging was not necessary. The resource remains open in multiple directions along these defined veins.
The long axis of the blocks is aligned with the strike of the structural domain, and the shorter dimension is aligned perpendicular to the strike direction. Interpolation parameters are defined based on a combination of geology, drill hole spacing and geostatistical analysis of the data. Individual structural zones, interpreted in the various deposit areas, are segregated for modeling purposes and dynamic search orientations are utilized which retain vein geometry of the gold mineralization in the resource model.
A graphical validation was done on the block model where cross sections, plans, and a 3D examination were conducted, testing intersections, solids and surface boundaries, and geology. Additional models were constructed by removing selected drill holes to test for the robustness of the model. Each block appears to be well represented by the immediately adjoining composites as would be expected using the ID2method.
The resources are classified according to their proximity to the sample locations and are reported, as required by NI 43-101, according to the CIM Definition Standards for Mineral Resources and Mineral Reserves. Indicated resources comprise blocks that are situated within 60 meters of assays derived from drill holes or trenches. Variography is equivocal and can be shown to support the assignment of inferred resources to blocks located between 60 and 200 meters of assays.
| | 2.1 | Terms of Reference and Purpose of the Report |
This technical report was commissioned by Mr. Ian Klassen (President of Grande Portage Resources Ltd.) to update a mineral resource for the Herbert Property in Southeast Alaska. The new mineral resource estimate described in this re-port was prepared in accordance the with Canada National Instrument 43-101, Standards of Disclosure for Mineral Projects (NI 43-101) and Canadian Institute of Mining, Metallurgy and Petroleum (CIM) “Best Practices and Reporting Guidelines”.
| D.G. DuPre and Associates Inc. | Page 10 |
| Technical Report on the Herbert Gold Property | April 10, 2013 |
This report makes use of all relevant information provided by GPR and other information gathered by the authors. The purpose of this report is to summarize and present applicable information regarding GPR’s Herbert Project, and provide an independent estimate of mineral resources contained within the property. The mandate also called for the authors to recommend specific areas and methodologies (if warranted) for further exploration. The identification of these areas would be based on their observations and interpretations.
This report has been prepared to support public disclosure of the updated mineral resources and, as such, does not include information normally disclosed in items 15 through 22 of NI 43-101F1. The intended users of this report are GPR and its agents, as well as members of the general public via their company website or the SEDAR information filing system. SEDAR is the official site for public access to most securities documents and information filed with the Canadian Securities Administrator by public companies and investment funds.
| | 2.2 | Qualifications of Consultants |
The authors are very familiar with the exploration techniques being applied by GPR on the Herbert Property. In particular, both authors participated in the Resource Estimation at Tyhee Gold’s Discovery Project in the Yellowknife area. This property is a mesothermal gold deposit with many similarities to the Herbert Property.
Mr. David Dupre P.Geo. is a Qualified Person as described by NI 43-101. Mr. Dupre contributed to the resource estimate and is responsible for report sections 1 through 12 and 14 through 19.
Dr. David Webb P.Geol. is a Qualified Person as described by NI 43-101. Dr. Webb completed the resource estimate for the Herbert Project and is, thus, responsible for Section 13 of this report.
| | 2.3 | Details of Site Inspection |
Mr. Dupre visited the Herbert Property from September 21 to 24, 2012. While on site, Mr. Dupre conducted general field geologic reconnaissance and witnessed core drilling operations including a review of core logging procedures and evaluating sampling methods and security protocols. In addition, he collected 12 quarter-core samples for assay validation.
Data used for the resource estimate were taken from drilling at the Herbert Property through November 2012. GPR provided a drill hole database update with the results of the 2012 exploration activities, including drilling, on January 8, 2013. The effective date of this report is April 10, 2013.
| | 2.5 | Sources of Information |
This report is based upon data and information compiled by the authors from a personal site inspection, published geological assessments and maps, raw data and technical reports by geologists and/or engineers (some independent and some in the employ of GPR or Quaterra). These sources of information are presented throughout this report and in Section 19 – References. The Author has no reason to doubt the reliability of the information provided by GPR. Mr. Dupre independently reviewed legal title to the mineral properties described in this NI 43-101 report. .
| D.G. DuPre and Associates Inc. | Page 11 |
| Technical Report on the Herbert Gold Property | April 10, 2013 |
Five rock samples were collected by the author and analyzed by ACME Laboratories in Vancouver. The analyses were consistent with previous analytical results.
Unless otherwise stated, all measurements reported in this report are in metric units and currencies are expressed in 2012 US dollars.
| D.G. DuPre and Associates Inc. | Page 12 |
| Technical Report on the Herbert Gold Property | April 10, 2013 |
| 3 | RELIANCE ON OTHER EXPERTS |
Grande Portage has provided copies of all the relevant maps, analytical data, presentations, assessment reports, photographs, database and documents relating to the Property. The authors have no reason to believe that any of the data supplied by GPR is either incorrect or incomplete. This report is based upon personal examination by the Authors of all available reports and maps on the Herbert property, as well the site examination carried out between September 21 and 24, 2012 to appraise the geological setting and assess its precious metal potential.
The information, opinions and conclusions contained herein are based on:
- Information available to the Authors at the time of preparation of this report;
- Assumptions, conditions, and qualifications as set forth in this report; and
- Data, reports, and other information supplied by Grande Portage and other third party sources
The qualified persons are not relying on any other experts for technical information material to this report. The Authors are not aware of any material fact or material change with respect to the subject matter of this technical report that is not presented in this report, which the omission to disclose would make this report misleading.
GPR supplied information regarding property ownership and permitting. The authors have not made any attempt to verify the legal status and ownership agreements of the Herbert Property, nor are they qualified to do so and have not made any attempt to verify the permitting status of the property. The authors have relied upon GPR for information on the status of property title, agreements, permit status and other pertinent conditions. In addition, the authors have not independently conducted any mining, processing, economic studies, permitting or environmental studies on the Herbert Property.
Mr. Dupre conducted an on-line search of the Herbert Property status by utilizing the Alaska Mapper Program. (http://dnr.alaska.gov/MapAK/mapper). The results of this search are presented in Item 4. Political, financial or other similar issues are all deemed to be outside the scope of this report.
| 4 | PROPERTY LOCATION AND DESCRIPTION |
The Herbert Property is situated in UTM Zone 8 between 516600m and 521000 East, 6485000m and 6848500m North (NAD 83 Alaska) in southeastern Alaska approximately 32 kilometers north of Juneau (Fig. 1). The project lies entirely within the Juneau 1:250,000 map sheet, and within the Juneau C-3 and C-2 1:63,000 quadrangles.
Elevations on the property range from 40m to 1,200m above mean sea level. The property comprises 91 Federal claims registered under the legal names listed in Table 1. The aggregate area of the claims is 761.5 hectares (1881 acres). The claims are situated within Townships 38 and 39S and Range 65E of the Copper River Meridian.
Annual fees of $13,000 are payable to the Alaska Bureau of Lands for claim fees. This amount was paid in August 2012 and GPR (Mr. Ian Klassen – President of GPR) intends to pay these fees in the coming years.
The Herbert Property (Figure 1) consists of three groups of claims. Table 2 lists the currently active claims at the effective date. The central 17 claims, shown in yellow, were the original claims acquired by Juneau Exploration and Develop-ment Inc. (“JEDI”) from Echo Bay Exploration Inc. in 1997. QR and JEDI signed a mining lease agreement in April 2007, at which time 67 additional claims were staked and an area of interest around the 17 core claims agreed upon. A final set of 7 claims were added by QR in February 2008, bringing the current total to 91 active claims. There is not distinction between the claims within the agreements and all claims lie within the proscribed area of interest. Intent to hold filings for all claims have been properly recorded through September 1, 2013.
| D.G. DuPre and Associates Inc. | Page 13 |
| Technical Report on the Herbert Gold Property | April 10, 2013 |
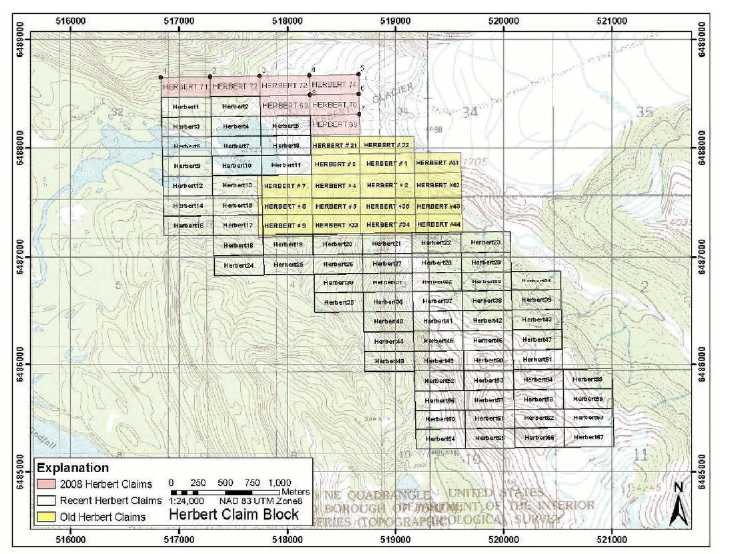
Figure 1. Herbert Property Claim Map
| D.G. DuPre and Associates Inc. | Page 14 |
| Technical Report on the Herbert Gold Property | April 10, 2013 |
Table 2. Herbert Property Claim Status (April 1, 2013)
| Casetype | Claimant | Claim | Claim Num | Location Date | District | Mrs. | Status |
| 384101 | JUNEAU EXPLORATION AND DEVELOPMENT INC | Herbert #01 | AKAA 059363 | 15-Aug-86 | Anchorage | C 38S 65E 34 SW | RECORDED |
| 384101 | JUNEAU EXPLORATION AND DEVELOPMENT INC | Herbert #02 | AKAA 059364 | 15-Aug-86 | Anchorage | C 38S 65E 34 SW | RECORDED |
| 384101 | JUNEAU EXPLORATION AND DEVELOPMENT INC | Herbert #03 | AKAA 059365 | 15-Aug-86 | Anchorage | C 38S 65E 33 SE | RECORDED |
| 384101 | JUNEAU EXPLORATION AND DEVELOPMENT INC | Herbert #04 | AKAA059366 | 15-Aug-86 | Anchorage | C 38S 65E 33 SE | RECORDED |
| 384101 | JUNEAU EXPLORATION AND DEVELOPMENT INC | Herbert #05 | AKAA059367 | 15-Aug-86 | Anchorage | C 39S 65E 4 NE | RECORDED |
| 384101 | JUNEAU EXPLORATION AND DEVELOPMENT INC | Herbert #06 | AKAA059369 | 15-Aug-86 | Anchorage | C 38S 65E 33 SW | RECORDED |
| 384101 | JUNEAU EXPLORATION AND DEVELOPMENT INC | Herbert #07 | AKAA059370 | 15-Aug-86 | Anchorage | C 39S 65E 4 NW | RECORDED |
| 384101 | JUNEAU EXPLORATION AND DEVELOPMENT INC | Herbert #08 | AKAA059371 | 15-Aug-86 | Anchorage | C 39S 65E 4 NW | RECORDED |
| 384101 | JUNEAU EXPLORATION AND DEVELOPMENT INC | Herbert #09 | AKAA059383 | 19-Aug-86 | Anchorage | C 38S 65E 33 SE | RECORDED |
| 384101 | JUNEAU EXPLORATION AND DEVELOPMENT INC | Herbert #32 | AKAA059394 | 19-Aug-86 | Anchorage | C 38S 65E 34 SW | RECORDED |
| 384101 | JUNEAU EXPLORATION AND DEVELOPMENT INC | Herbert #33 | AKAA059981 | 16-Sep-86 | Anchorage | C 39S 65E 4 NE | RECORDED |
| 384101 | JUNEAU EXPLORATION AND DEVELOPMENT INC | Herbert #34 | AKAA059982 | 16-Sep-86 | Anchorage | C 39S 65E 4 NE | RECORDED |
| 384101 | JUNEAU EXPLORATION AND DEVELOPMENT INC | Herbert #35 | AKAA059983 | 16-Sep-86 | Anchorage | C 39S 65E 4 NE | RECORDED |
| 384101 | JUNEAU EXPLORATION AND DEVELOPMENT INC | Herbert #41 | AKAA059989 | 16-Sep-86 | Anchorage | C 38S 65E 34 SW | RECORDED |
| 384101 | JUNEAU EXPLORATION AND DEVELOPMENT INC | Herbert #42 | AKAA059990 | 16-Sep-86 | Anchorage | C 38S 65E 34 SW | RECORDED |
| 384101 | JUNEAU EXPLORATION AND DEVELOPMENT INC | Herbert #43 | AKAA059991 | 16-Sep-86 | Anchorage | C 39S 65E 3 NW | RECORDED |
| 384101 | JUNEAU EXPLORATION AND DEVELOPMENT INC | Herbert #44 | AKAA059992 | 16-Sep-86 | Anchorage | C 39S 65E 3 NW | RECORDED |
| 384101 | QUATERRA ALASKA, INC | Herbert 1 | AKAA087165 | 18-Apr-07 | Anchorage | C 38S 65E 33 SW | RECORDED |
| 384101 | QUATERRA ALASKA, INC | Herbert 2 | AKAA087166 | 18-Apr-07 | Anchorage | C 38S 65E 33 SW | RECORDED |
| 384101 | QUATERRA ALASKA, INC | Herbert 3 | AKAA087167 | 18-Apr-07 | Anchorage | C 38S 65E 33 SW | RECORDED |
| 384101 | QUATERRA ALASKA, INC | Herbert 4 | AKAA087168 | 18-Apr-07 | Anchorage | C 38S 65E 33 SW | RECORDED |
| 384101 | QUATERRA ALASKA, INC | Herbert 5 | AKAA087169 | 18-Apr-07 | Anchorage | C 38S 65E 33 SW | RECORDED |
| 384101 | QUATERRA ALASKA, INC | Herbert 6 | AKAA087170 | 18-Apr-07 | Anchorage | C 38S 65E 33 SW | RECORDED |
| 384101 | QUATERRA ALASKA, INC | Herbert 7 | AKAA087171 | 18-Apr-07 | Anchorage | C 38S 65E 33 SW | RECORDED |
| 384101 | QUATERRA ALASKA, INC | Herbert 8 | AKAA087172 | 18-Apr-07 | Anchorage | C 38S 65E 33 SW | RECORDED |
| 384101 | QUATERRA ALASKA, INC | Herbert 9 | AKAA087173 | 18-Apr-07 | Anchorage | C 38S 65E 33 SW | RECORDED |
| 384101 | QUATERRA ALASKA, INC | Herbert 10 | AKAA087174 | 18-Apr-07 | Anchorage | C 38S 65E 33 SW | RECORDED |
| 384101 | QUATERRA ALASKA, INC | Herbert 11 | AKAA087175 | 18-Apr-07 | Anchorage | C 38S 65E 33 SW | RECORDED |
| 384101 | QUATERRA ALASKA, INC | Herbert 12 | AKAA087176 | 18-Apr-07 | Anchorage | C 38S 65E 33 SW | RECORDED |
| 384101 | QUATERRA ALASKA, INC | Herbert 13 | AKAA087177 | 18-Apr-07 | Anchorage | C 38S 65E 33 SW | RECORDED |
| 384101 | QUATERRA ALASKA, INC | Herbert 14 | AKAA087178 | 18-Apr-07 | Anchorage | C 38S 65E 5 NE | RECORDED |
| 384101 | QUATERRA ALASKA, INC | Herbert 15 | AKAA087179 | 18-Apr-07 | Anchorage | C 39S 65E 4 NW | RECORDED |
| 384101 | QUATERRA ALASKA, INC | Herbert 16 | AKAA087180 | 18-Apr-07 | Anchorage | C 39S 65E 5 NE | RECORDED |
| 384101 | QUATERRA ALASKA, INC | Herbert 17 | AKAA087181 | 18-Apr-07 | Anchorage | C 39S 65E 4 NW | RECORDED |
| 384101 | QUATERRA ALASKA, INC | Herbert 18 | AKAA087182 | 18-Apr-07 | Anchorage | C 39S 65E 4 NW | RECORDED |
| 384101 | QUATERRA ALASKA, INC | Herbert 19 | AKAA087183 | 18-Apr-07 | Anchorage | C 39S 65E 4 NW | RECORDED |
| 384101 | QUATERRA ALASKA, INC | Herbert 20 | AKAA087184 | 18-Apr-07 | Anchorage | C 39S 65E 4 NE | RECORDED |
| 384101 | QUATERRA ALASKA, INC | Herbert 21 | AKAA087185 | 18-Apr-07 | Anchorage | C 39S 65E 4 NE | RECORDED |
| 384101 | QUATERRA ALASKA, INC | Herbert 22 | AKAA087186 | 18-Apr-07 | Anchorage | C 39S 65E 3 NW | RECORDED |
| 384101 | QUATERRA ALASKA, INC | Herbert 23 | AKAA087187 | 18-Apr-07 | Anchorage | C 39S 65E 3 NW | RECORDED |
| 384101 | QUATERRA ALASKA, INC | Herbert 24 | AKAA087188 | 18-Apr-07 | Anchorage | C 39S 65E 4 NW | RECORDED |
| 384101 | QUATERRA ALASKA, INC | Herbert 25 | AKAA087189 | 18-Apr-07 | Anchorage | C 39S 65E 4 NW | RECORDED |
| 384101 | QUATERRA ALASKA, INC | Herbert 26 | AKAA087190 | 18-Apr-07 | Anchorage | C 39S 65E 4 NE | RECORDED |
| 384101 | QUATERRA ALASKA, INC | Herbert 27 | AKAA087191 | 18-Apr-07 | Anchorage | C 39S 65E 4 NE | RECORDED |
| 384101 | QUATERRA ALASKA, INC | Herbert 28 | AKAA087192 | 18-Apr-07 | Anchorage | C 39S 65E 3 NW | RECORDED |
| 384101 | QUATERRA ALASKA, INC | Herbert 29 | AKAA087193 | 18-Apr-07 | Anchorage | C 39S 65E 3 NW | RECORDED |
| 384101 | QUATERRA ALASKA, INC | Herbert 30 | AKAA087194 | 18-Apr-07 | Anchorage | C 39S 65E 4 SE | RECORDED |
| 384101 | QUATERRA ALASKA, INC | Herbert 31 | AKAA087195 | 18-Apr-07 | Anchorage | C 39S 65E 4 SE | RECORDED |
| 384101 | QUATERRA ALASKA, INC | Herbert 32 | AKAA087196 | 18-Apr-07 | Anchorage | C 39S 65E 3 SW | RECORDED |
| 384101 | QUATERRA ALASKA, INC | Herbert 33 | AKAA087197 | 18-Apr-07 | Anchorage | C 39S 65E 3 SW | RECORDED |
| 384101 | QUATERRA ALASKA, INC | Herbert 34 | AKAA087198 | 18-Apr-07 | Anchorage | C 39S 65E 3 SE | RECORDED |
| 384101 | QUATERRA ALASKA, INC | Herbert 35 | AKAA087199 | 18-Apr-07 | Anchorage | C 39S 65E 4 SE | RECORDED |
| 384101 | QUATERRA ALASKA, INC | Herbert 36 | AKAA087200 | 18-Apr-07 | Anchorage | C 39S 65E 4 SE | RECORDED |
| 384101 | QUATERRA ALASKA, INC | Herbert 37 | AKAA087201 | 18-Apr-07 | Anchorage | C 39S 65E 3 SW | RECORDED |
| 384101 | QUATERRA ALASKA, INC | Herbert 38 | AKAA087202 | 18-Apr-07 | Anchorage | C 39S 65E 3 SW | RECORDED |
| 384101 | QUATERRA ALASKA, INC | Herbert 39 | AKAA087203 | 18-Apr-07 | Anchorage | C 39S 65E 3 SE | RECORDED |
| 384101 | QUATERRA ALASKA, INC | Herbert 40 | AKAA087204 | 18-Apr-07 | Anchorage | C 39S 65E 4 SE | RECORDED |
| 384101 | QUATERRA ALASKA, INC | Herbert 41 | AKAA087205 | 18-Apr-07 | Anchorage | C 39S 65E 3 SW | RECORDED |
| 384101 | QUATERRA ALASKA, INC | Herbert 42 | AKAA087206 | 18-Apr-07 | Anchorage | C 39S 65E 3 SW | RECORDED |
| 384101 | QUATERRA ALASKA, INC | Herbert 43 | AKAA087207 | 18-Apr-07 | Anchorage | C 39S 65E 3 SE | RECORDED |
| 384101 | QUATERRA ALASKA, INC | Herbert 44 | AKAA087208 | 18-Apr-07 | Anchorage | C 39S 65E 4 SE | RECORDED |
| 384101 | QUATERRA ALASKA, INC | Herbert 45 | AKAA087209 | 18-Apr-07 | Anchorage | C 39S 65E 3 SW | RECORDED |
| 384101 | QUATERRA ALASKA, INC | Herbert 46 | AKAA087210 | 18-Apr-07 | Anchorage | C 39S 65E 3 SW | RECORDED |
| 384101 | QUATERRA ALASKA, INC | Herbert 47 | AKAA087211 | 18-Apr-07 | Anchorage | C 39S 65E 3 SE | RECORDED |
| 384101 | QUATERRA ALASKA, INC | Herbert 48 | AKAA087212 | 18-Apr-07 | Anchorage | C 39S 65E 4 SE | RECORDED |
| 384101 | QUATERRA ALASKA, INC | Herbert 49 | AKAA087213 | 18-Apr-07 | Anchorage | C 39S 65E 3 SW | RECORDED |
| 384101 | QUATERRA ALASKA, INC | Herbert 50 | AKAA087214 | 18-Apr-07 | Anchorage | C 39S 65E 3 SW | RECORDED |
| 384101 | QUATERRA ALASKA, INC | Herbert 51 | AKAA087215 | 18-Apr-07 | Anchorage | C 39S 65E 3 SE | RECORDED |
| 384101 | QUATERRA ALASKA, INC | Herbert 52 | AKAA087216 | 18-Apr-07 | Anchorage | C 39S 65E 10 NW | RECORDED |
| 384101 | QUATERRA ALASKA, INC | Herbert 53 | AKAA087217 | 18-Apr-07 | Anchorage | C 39S 65E 10 NW | RECORDED |
| 384101 | QUATERRA ALASKA, INC | Herbert 54 | AKAA087218 | 18-Apr-07 | Anchorage | C 39S 65E 11 NW | RECORDED |
| 384101 | QUATERRA ALASKA, INC | Herbert 55 | AKAA087219 | 18-Apr-07 | Anchorage | C 39S 65E 11 NW | RECORDED |
| 384101 | QUATERRA ALASKA, INC | Herbert 56 | AKAA087220 | 18-Apr-07 | Anchorage | C 39S 65E 10 NW | RECORDED |
| 384101 | QUATERRA ALASKA, INC | Herbert 57 | AKAA087221 | 18-Apr-07 | Anchorage | C 39S 65E 10 NW | RECORDED |
| 384101 | QUATERRA ALASKA, INC | Herbert 58 | AKAA087222 | 18-Apr-07 | Anchorage | C 39S 65E 11 NW | RECORDED |
| 384101 | QUATERRA ALASKA, INC | Herbert 59 | AKAA087223 | 18-Apr-07 | Anchorage | C 39S 65E 11 NW | RECORDED |
| 384101 | QUATERRA ALASKA, INC | Herbert 60 | AKAA087224 | 18-Apr-07 | Anchorage | C 39S 65E 10 NW | RECORDED |
| 384101 | QUATERRA ALASKA, INC | Herbert 61 | AKAA087225 | 18-Apr-07 | Anchorage | C 39S 65E 10 NW | RECORDED |
| 384101 | QUATERRA ALASKA, INC | Herbert 62 | AKAA087226 | 18-Apr-07 | Anchorage | C 39S 65E 11 NW | RECORDED |
| 384101 | QUATERRA ALASKA, INC | Herbert 63 | AKAA087227 | 18-Apr-07 | Anchorage | C 39S 65E 11 NW | RECORDED |
| 384101 | QUATERRA ALASKA, INC | Herbert 64 | AKAA087228 | 18-Apr-07 | Anchorage | C 39S 65E 10 NW | RECORDED |
| 384101 | QUATERRA ALASKA, INC | Herbert 65 | AKAA087229 | 18-Apr-07 | Anchorage | C 39S 65E 10 NW | RECORDED |
| 384101 | QUATERRA ALASKA, INC | Herbert 66 | AKAA087230 | 18-Apr-07 | Anchorage | C 39S 65E 11 NW | RECORDED |
| 384101 | QUATERRA ALASKA, INC | Herbert 67 | AKAA087231 | 18-Apr-07 | Anchorage | C 39S 65E 11 NW | RECORDED |
| 384101 | QUATERRA ALASKA, INC | Herbert 68 | AKAA087875 | 5-Feb-08 | Anchorage | C 39S 65E 3 SW | RECORDED |
| 384101 | QUATERRA ALASKA, INC | Herbert 69 | AKAA087876 | 5-Feb-08 | Anchorage | C 39S 65E 3 SW | RECORDED |
| 384101 | QUATERRA ALASKA, INC | Herbert 70 | AKAA087877 | 5-Feb-08 | Anchorage | C 39S 65E 3 SW | RECORDED |
| 384101 | QUATERRA ALASKA, INC | Herbert 71 | AKAA087878 | 5-Feb-08 | Anchorage | C 39S 65E 3 SW | RECORDED |
| 384101 | QUATERRA ALASKA, INC | Herbert 72 | AKAA087879 | 5-Feb-08 | Anchorage | C 39S 65E 3 SW | RECORDED |
| 384101 | QUATERRA ALASKA, INC | Herbert 73 | AKAA087880 | 5-Feb-08 | Anchorage | C 39S 65E 3 SW | RECORDED |
| 384101 | QUATERRA ALASKA, INC | Herbert 74 | AKAA087881 | 5-Feb-08 | Anchorage | C 39S 65E 3 SW | RECORDED |
| D.G. DuPre and Associates Inc. | Page 15 |
| Technical Report on the Herbert Gold Property | April 10, 2013 |
| Report Information | | | | | | | | |
| Report ID | 76 | | | | | | | |
| Report Name | Federal Mining Claims | | | | | | | |
| Report Description | Federal issued mining claims in Alaska. | | | | | | | |
| Report Date | 02/03/2013 | | | | | | | |
| # of Records | 100 | | | | | | | |
| Report Parameters | | | | | | | | |
| Location | | | | | | | | |
| SQL Statement | | | | | | | | |
| not available | | | | | | | | |
The recorded sale (Book 476 – page 45) of the original 17 claims by Echo Bay makes no mention of an underlying royalty interest in these claims and they were sold unencumbered to JEDI.
The Mining Lease signed by JEDI and QR has an effective date of November 1, 2007. The lease includes a sliding scale Net Smelter Return on production up to five percent (5%) when the price of gold exceeds $601 per troy ounce, and a minimum annual advance production royalty of $12,000 increasing to a maximum of $30,000 payable to JEDI after the tenth anniversary of the effective date of the lease.
On June 16, 2010 QR optioned the property to GPR. The option agreement granted the right to earn 65% of the Herbert Property if:
GPR spent at least $750,000 before June 15, 2011 to earn 51%
GPR spent an additional $500,000 before June 15, 2012 to earn the full 65% interest
GPR has fulfilled both of these obligations and is fully vested at the 65% ownership interest.
On October 24, 2011 GPR and QR signed a Joint Venture Agreement outlining the collective responsibilities between the JV participants. Funding is on a pro-rata basis, with standard dilution applying in the event either partner declines to participate.
| | 4.3 | Environmental Liabilities |
There are no known environmental liabilities associated with this property.
| | 4.4 | Other Significant Risks and Factors |
The authors know of no other significant risks or factors that may affect title, access or the right or ability to perform work on the Herbert Property.
The property is entirely on Federal lands administered by the U.S. Forest Service. The area has a land use designation as semi-remote recreation with a minerals overlay. Forest lands within this designation are open to minerals exploration and development, and guidelines allow reasonable access according to the provisions of an approved Plan of Operations. Exploration on the property has proceeded under approved Plan of Operations since 2009; although at present the project likely will be impacted by theSequoia Forestkeeper v. Tidwelllawsuit requiring all permits nationwide to undergo NEPA review including public notice, comment, and administrative appeals provisions. At the effective date of this report, the 2013 U.S. Forest Service Plan of Operations was still under review.
A baseline water sampling program by Admiralty Environmental started at the project site in 2012. The purpose of the program is to assess baseline water quality at the Herbert project site prior to any major operations taking place. Admiralty Environmental, in consultation with some of the resource management agencies that would be part of the future permitting process, have selected ten surface sampling sites both above and below the proposed mining area. These locations have been analyzed for a wide range of materials including trace metals, solids, mineral content, cyanide and explosion residues such as nitrate and ammonia. Additional sampling in 2012 included groundwater sampling locations. The government agencies will eventually use the data collected to draft permits and establish monitoring regimes based on potential environmental impacts to the site.
| D.G. DuPre and Associates Inc. | Page 16 |
| Technical Report on the Herbert Gold Property | April 10, 2013 |
A City/Borough of Juneau exploration permit has been submitted but will not be approved until May 2013.
| 5 | ACCESSIBILITY, CLIMATE, LOCAL RESOURCES, INFRASTRUCTURE AND PHYSIOGRAPHY (Section 5) |
Note: Much of this material is excerpted from Van Wyck and Burnett, 2012 Technical Report on the Herbert Property.
The Herbert Property is located within the Juneau Recording District, approximately 32 km northwest of Juneau, Alaska – along the eastern shore of Lynn Canal (Figure 1). Juneau is not directly accessible by road, although there are road connections to several areas immediately adjacent to the city. Primary access to the city is by air and sea. Cars and trucks are transported to and from Juneau by barge or the Alaska Marine Highway ferry system. There are also several taxicab companies, and tour buses used mainly for cruise ship visitors.
The City and Borough of Juneau is a unified municipality located on the Gastineau Channel in the panhandle of the U.S. state of Alaska and the 2nd largest city in the United States by area. It has been the capital of Alaska since 1906, when the government of the then-District of Alaska was moved from Sitka as dictated by the U.S. Congress in 1900. Juneau International Airport serves the city and borough of Juneau. Alaska Airlines is the sole commercial jet passenger operator. Alaska Airlines provides service to Anchorage and Sitka as well as to many small communities in the state. Seattle is a common destination for Juneau residents. Wings of Alaska, Alaska Seaplanes and Air Excursions offer scheduled flights on smaller aircraft to villages in Southeast Alaska. Some air carriers provide U.S. mail service.
Juneau is a regional mining center supporting active mining operations at Greens Creek and Kensington. It is well provided with qualified support personnel. Other nearby communities including Haines and Skagway add to the potential employment base.
Access to the property is currently by helicopter from Juneau but the main public paved highway (Glacier Highway or Route 7) from Juneau to Berners Bay passes 5.5 km west of the property where it crosses the Herbert River. Physiographically, there is no obvious impediment for road access from the highway to the property along a route following the Herbert River. This most likely hurdle for direct access to the property from the public highway will be permitting, as this route is likely to include wetlands. The Herbert property lies on the western flank of the Coast Range Mountains. Terrain varies from moderate to rugged within the project area (Figure 3), ranging in elevation from 40 m to 1200 m above sea level. Vegetation ranges from dense alder brush to bare rock. The Herbert Glacier terminates at the eastern edge of the claim block. Its rapid retreat in the past 30 years is responsible for the recent exposure of large areas of bare rock at low elevations. Bedrock exposure produced by this retreat is transitory, as rapid vegetation growth is advancing at a similar rate.
| D.G. DuPre and Associates Inc. | Page 17 |
| Technical Report on the Herbert Gold Property | April 10, 2013 |
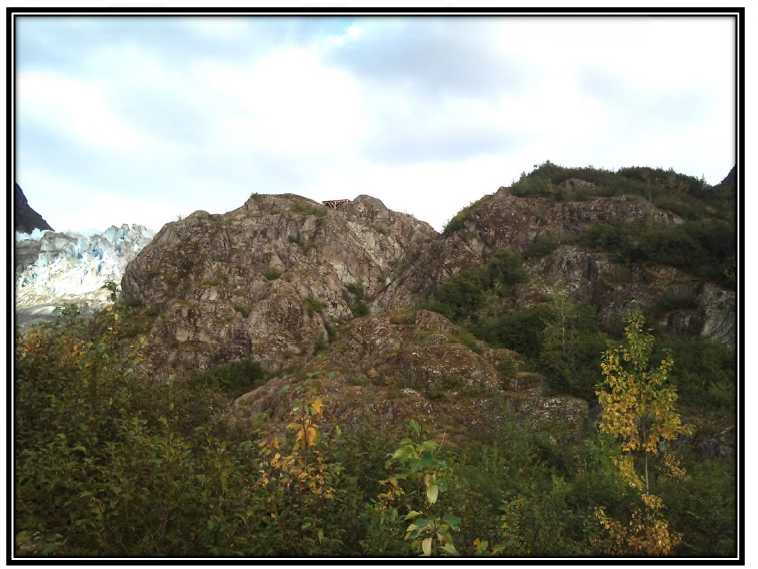
Figure 2. Photograph of Herbert Property
Juneau features a humid continental climate though just short of being subarctic. The city has a climate that is milder than its latitude may suggest, due to the influence of the Pacific Ocean. Winters are moist and long, but only slightly cold by Alaskan standards: the average low temperature is 23 °F (-5 °C) in January, and highs are frequently above freezing.
Spring, summer, and fall are cool to mild, with highs peaking in July at 65 °F (18.3 °C). Snowfall averages 86.8 inches (220 cm) and occurs chiefly from November to March. Precipitation falls on an average 230 days per year, averaging 62.5 inches (1,590 mm) at the airport (1981–2010 normals), but ranging from 55 to 90 inches (1,400 to 2,290 mm), depending on location.[9] The spring months are the driest while September and October are the wettest months.
| D.G. DuPre and Associates Inc. | Page 18 |
| Technical Report on the Herbert Gold Property | April 10, 2013 |
Climate data for Juneau, Alaska (Juneau Int'l, 1981-2010 normals)
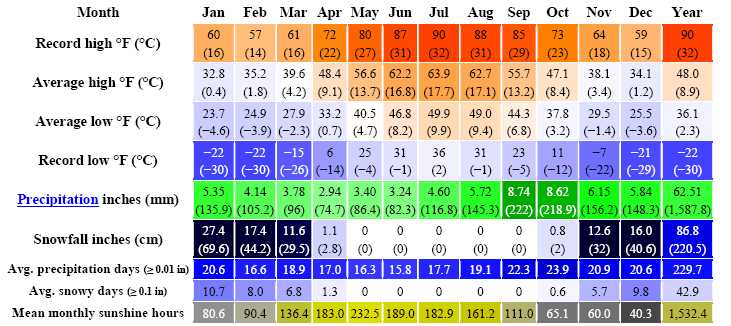
Source: NOAA (extremes 1890–present)[10] HKO (sun only, 1961-1990)[11
| 6 | HISTORY(MOST OF THIS SECTION HAS BEEN EXCERPTED FROM Van Wyck and Burnett, 2012). |
Early exploration of the property was hampered by cover of the Herbert Glacier. Glacieal retreat during the past century has exposed additional bedrock . Two named prospects (St. Louis and Summit) and a 22 foot shaft at high elevations were identified in 1889 (Barnett and Miller, 2003). The Juneau Gold Belt hosts numerous high grade fold deposits that were active from 1883 until 1943 and is likely that the porject area was prospected at that time. Current interest in the project area began in 1986 when claims were staked to cover several obvious quartz veins. At this time Houston Oil and Minerals discovered the main gold bearing quartz veins in outcrops recently exposed by the retreating ice. They drill tested these prospects with 9 holes (BQ size) totaling 1,100 m. Some of the historic data is somewhat vague as there was additional shallow “Winky” drilling with as much as 230 m completed from 12 holes. Although encouraging assay results from 12 dill holes were obtained, Echo Bay abandoned the property as part of their divestiture of its Alaskan proprterties.
In 1997, a group of three local prospectors (d.b.a. JEDI) purchased the core Herbert claims. In 2006 the property was brought to the attention ofQR who signed a mining lease with JEDI effective November 1, 2007. Afield program in 2007 resulted in the collection of 299 rock ship, soil, and stream sediment samples and the initiation of a property wide geology map..
In2010the property was optioned by Grande Portage, who immediately started a drilling campaign on the previously identified targets. The 2010 drilling program comprised 16 NQ holes totalling 2,600 meters. The best intercept was from hole 10C-1 from 119.29 to 120.9 grading 17.1 g/t gold.
In2011an additional 30 holes totaling 5,181 m were drilled. Results were encouraging and are highlighted by:
| D.G. DuPre and Associates Inc. | Page 19 |
| Technical Report on the Herbert Gold Property | April 10, 2013 |
In addtion a total of 19.72m of hand-held rock saw channel samples from four trences across the Deep Trench Vein outcrop trace were collected. The highest value returned (Trench A) 6.48 g/t gold over 6.13 meters.
During the 2012 exploration campaign, 62 holes totaling 8805.03 meters were completed. That does not include three failed holes with the small drill which total up to 29.87 meters. The large drill recovered NQTW diameter core and the small obtained BQTW diameter core.
Many high grade intersections were obtained from several of the veins. These results are highlighted by hole 326B2, drilled on the western Deep Trench vein, which intersected rich mineralization consisting of 11.58 meters (6.14 meters true thickness) of 24.37 grams per tonne gold (0.712 ounces per ton)
| 7 | GEOLOGICAL SETTING AND MINERALIZATION |
The Herbert Property is situated in close proximity to the Coastal Shear Zone – a major crustal dislocation defined by northwest striking penetrative foliation. This structure parallels the boundary between the Gravina belt to the west and the Taku terrane to the east.
 | The Gravina belt comprises Upper Jurassic to Mid- Cretaceous marine argillite and greywacke, interbedded andesite to basaltic volcanic and volcaniclastic rocks, and plutons ranging from quartz diorite to peridotite (Gehrels and Berg, 1992 and 1994). The Taku terrane differs from the Gravina belt by having an older Permian to Triassic aged basement consisting of marbles, phyllites, pillowed basalts, and flysch-related rocks, which are overlain by Upper Jurassic to Mid-Cretaceous greywacke and, likely, related to similar aged rocks in the Gravina belt. Meta- morphic grade ranges from greenschist to amphibolite facies and generally increases from west to east. Region- al metamorphism and deformation, including the Coastal Shear Zone, are broadly linked to emplacement of multi- ple intrusive rocks in the Coast Mountains with isotopic ages ranging from 10 to 55 Ma (Gehrels and Berg, 1994). |
Figure 3. Regional Geology of the Juneau Gold Belt (Gehrels, 1992)
| | 7.2 | Property Geology (excerpted from Van Wyck and Burnett, 2011) |
Published regional geologic mapping (Figure 3) indicates that Herbert Gold project is largely underlain by Tertiary gran-odiorite and metasediments. To date the majority of the mapping and drilling has been within a quartz diorite stock or sill that hosts the mineralized veins. Although there is no independent mapping or geochronology evidence in support, it seems reasonable to correlate the quartz diorite stock with regional map unit TKt (Figure 6) and a belt of deformed metasedimentary rocks on the western edge of the claim block with map unit KPsv. One drill hole from the western-most drill pad (hole 111-4) passed out of diorite into strongly foliated metasedimentary rocks confirming the strongly tectonized contact between the two units. At present, four principal and parallel sets of east-northeast- trending quartz veins hosted in quartz-diorite have been identified on the property
| D.G. DuPre and Associates Inc. | Page 20 |
| Technical Report on the Herbert Gold Property | April 10, 2013 |
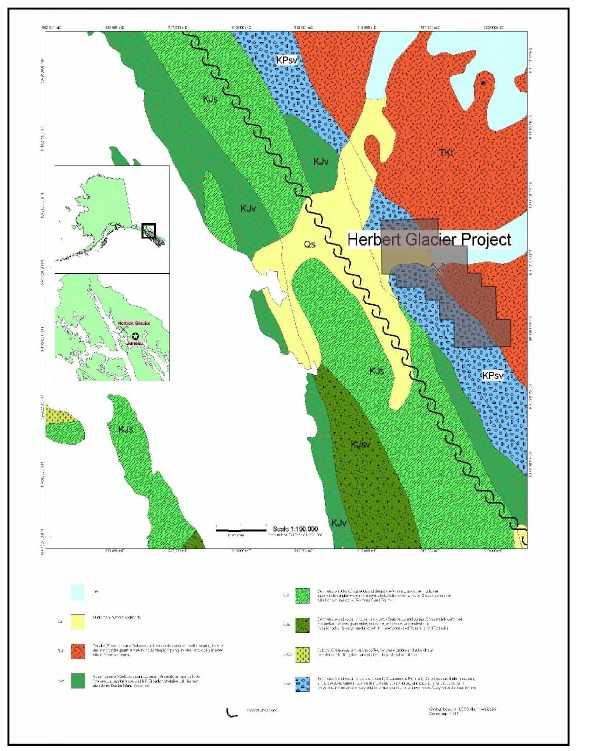
Figure 4. Local Geology of Herbert Property Area
| D.G. DuPre and Associates Inc. | Page 21 |
| Technical Report on the Herbert Gold Property | April 10, 2013 |
| | 7.3 | Mineralization of the Juneau Gold Belt |
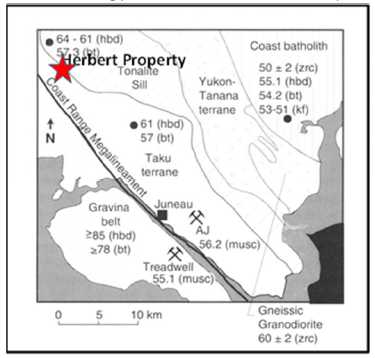
The Juneau Gold Belt (JGB) has been Alaska’s largest lode gold producer, yielding approximately 6.8 million ounces of gold, largely from the Alaska-Juneau and Treadwell mines. An equal amount of gold reserves are estimated to be still present within the Alaska-Juneau and Kensington mines (Swainbanket al., 1991. Deposits of the JGB are located on either side and within a few kilometers of a major crustal structure termed the Coast Range Megalineament (Fig 4). Auriferous veins show a strong spatial association with the relatively competent igneous bodies of varied composition: These rocks are, however, much older than the veining (Goldfarbet al, 1993). The veins are also associated with greenschist facies rocks of an inverted metamorphic gradient up to 8 km in thickness (Himmelberget al., 1991).
Gold- veins along 200 km of the Coast Range Megalineament were emplaced between 56 – 55 Ma, near the end of a 60 m.y. period of orogenic activity (Goldfarbet al, 1991b{TA \l "GOLDFARB ET AL, 1991B" \s "Goldfarb et al, 1991b" \c 1}{TA \s "Goldfarb et al, 1991b"}{TA \s "Goldfarb et al, 1991b"}). Relaxation along this shear zone, during a shift from orthogonal to more oblique convergence and resulting strike-slip motion, is hypothesized as having led to increased permeability and widespread fluid migration. A belt of tonalitic plutons were intruded approximately 5 km east of the Meg-alineament between 68-61 Ma (Barker et al., 1986; Wood et al., 1991{XE "Wood et al., 1991"}). Most of the gold prospects in the Juneau Gold Belt are hosted by metasedimentary rocks.
| | 7.4 | Herbert Property Mineralization |
Most of the gold mineralization discovered on the Herbert Property is hosted by shear/quartz vein systems within a quartz diorite intrusion. Several of the 2012 drill holes intersected sheared metasediments along strike from the Main Vein but these did not contain significant amounts of quartz vein material or appreciable gold. The preferential association of gold with shear/vein zones in the quartz diorite is likely due to the mechanical contrast between brittle fracturing of the intrusive host rocks compared to more plastic deformation of the metasedimentary rocks.
The auriferous veins delineated to date on the Herbert Property consistently dip steeply to the north with a minor NE trending vein set splaying off or intersecting the main vein set. Vein thicknesses range from several meters to decime-ters and, within the host structures, several generations of veining can be observed. The vein set commonly comprises multiple anastomosing, lenticular and irregular white quartz veins within a shear zone characterized by strong foliation, grain-size reduction and structural offsets indicating that mineralization was contemporaneous with deformation. In places, the quartz veins have been folded and brecciated. Alteration and foliation occurs between quartz sub-veins and extends as much as a meter into the wall rock adjacent to the veining. The photograph of the Ridge Vein (Figure 6) splendidly displays this feature. It consists of sericite, chlorite and carbonate-altered quartz diorite. As a result of the preferential erosion of the alteration selvages, steep walled canyons typically mark the locations of the veins on the property. These gullies are easily visible on aerial photos and provide a convenient prospecting tool.
| D.G. DuPre and Associates Inc. | Page 22 |
| Technical Report on the Herbert Gold Property | April 10, 2013 |
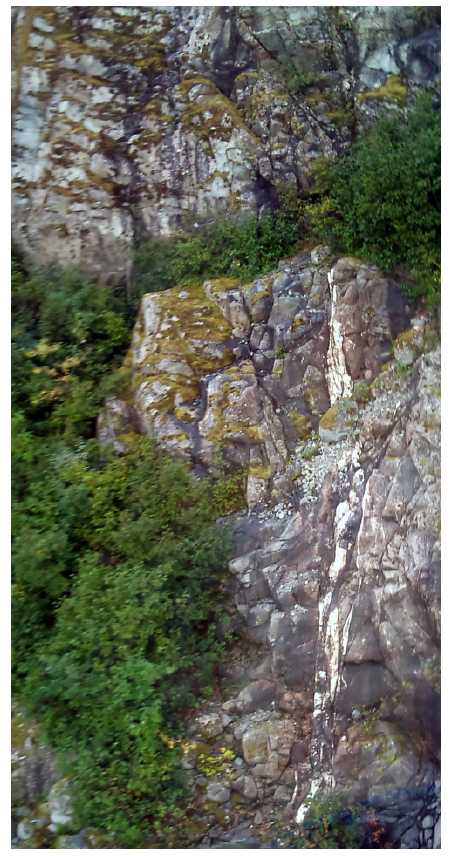
Figure 5. Photo of Ridge Vein on Cliff Face (taken from helicopter)
| D.G. DuPre and Associates Inc. | Page 23 |
| Technical Report on the Herbert Gold Property | April 10, 2013 |
This leads to variable mineralized thicknesses noted both at the surface and in drill intercepts with mineralized widths up to 8 m true thickness encountered. Importantly, however, surface mapping and drilling shows consistent along –strike and down-dip continuity of the host structures. For example, the Deep Trench Vein has been traced over a one kilometer strike length and 300 meters down-dip.
The mineralogy of the veins is dominantly quartz with lesser carbonate, arsenopyrite, pyrite, galena, sphalerite, scheelite and, rarely, visible gold. Visible gold tends to be associated with galena in the veins. A review of the screened metallic Gold Analyses (ALS Code Au-SCR24) shows that coarse gold grains (>100 microns) are an important component of the total gold distribution. This coarse gold contributes to the nugget effect of the gold distribution.
Fine grained arsenopyrite is a very common constituent of the alteration zones. A review of the multivariate statistics show that lead, zinc, arsenic, tungsten and selenium display a high degree of correlation to the gold content. Due to the “nugget effect” of the gold distribution, these proxy elements can be utilized to determine trends of gold concentration (see Table 21).
The highest grade concentrations of gold appear to be in moderately east raking shoots (Figure 34 and Figure 35). The distribution of the gold proxy elements supports this supposition. This is the case in both the Main Vein and the Deep Trench Vein.
Exploration on the property consists of a property-scale rock chip, stream silt, and soil sampling program started in 2007 and continued to a lesser degree during the 2010 and 2011 drilling programs. Two hundred and ninety nine (299) samples collected and assayed in 2007 are recorded in the property database. Samples have been collected from 50% of the project area. There has been no systematic grid sampling program, which is appropriate based on the exposure level and the narrow, high-grade targets sought. A high resolution aerial photograph covers the entire claim block and a detailed 5 m spacing contour map has been prepared in a digital format over 12.5% of the claim area.
A hand-drafted geologic map centered on the drill targets at an approximate scale of 1:2200 has been compiled onto the 5 m spacing contour map. The high-resolution aerial photograph is particularly useful on account of the large areas of rock exposure and the association of veining with pronounced linear features, making it a valuable prospecting tool.
The 2007 sampling results show that all the major vein structures have been covered by multiple surface samples on the claim block. The majority of the anomalous gold samples are located on the northern portion of the claim block on the Main, Deep Trench, and Goat veins. South of this area the number of anomalous gold samples decreases, where only a single sample out of a population of 112 returned a value above 5 ppm Au. This area with low surface gold values correspond to that portion of the claim block south of the 6487400 Northing, comprising approximately half the area of the claim block.
The rock chip program was successful in identifying veins with anomalous gold values. Exposure limitations results in non-uniform sampling making it difficult to apply the results to quantitative resource modeling. In 2011 a small channel sampling program was started across surface exposed veins. Four trenches (A through D) totaling 19.72 m across the Deep Trench Vein were collected using a portable rock saw. The method consisted two parallel cuts approximately 3 cm deep and 6 cm wide with sample lengths on the order of 0.5 to 1.5 m long. The samples collected approximated a drill core rock volume and typical sample length. This is a valuable exploration tool precisely because it standardizes the sampling process and was incorporated into the solid resource model. It was because of this standardized sampling of the trenches that it was decided by DRW to incorporate the trench results into the resource model.
| D.G. DuPre and Associates Inc. | Page 24 |
| Technical Report on the Herbert Gold Property | April 10, 2013 |
During the 2012 site visit by DGD, all check assay samples collected from the property provided excellent agreement with reported assay values, testifying to the repeatability of this sampling method.
Substantially all work completed in 2012 consisted of diamond drilling with minor field mapping and sampling.
The 2012 drilling program on the Herbert Gold property employed 2 drill rigs. A larger rig using NQTW diameter tools to complete the deeper holes and a small rig coring with BQTW size tools for the shallow holes. The program completed 8,805 meters of drilling in 62 holes. The total meterage does not include three failed holes. All collar locations were surveyed with survey-grade GPS receivers and down-hole deviations recorded with a multi-shot survey tool at approximately 100 foot intervals during the final removal of the drill string. Helicopters based out of Juneau, supported all phases of the drill program including slinging supplies, drill equipment, fuel, and returning boxed core for logging and sampling. Crew shifts were also helicopter supported. Drill pads 6 m by 6 m in size were constructed from precut lumber at selected areas and multiple angle holes were fanned towards the vein targets from each pad. Water was locally sourced from small creeks.
| 10 | SAMPLE PREPARATION, ANALYSIS AND SECURITY(ITEM 10) |
Transportation: Core is slung by helicopter to either the secure Coastal Helicopter hanger area where it was re- ceived by the GPR crew, or slung to the GPR warehouse and logging facilities on Crazy Horse Drive.
Core was laid out on logging tables in the warehouse by crew or if tables are full, stored on pallets in the front open area inside the big opening door.
Initial Processing: The GPR geotechnical crew converted all marker blocks in the core boxes into meters straight- ened and arranged the core to the approximate original bedrock and cleaned off the core in preparation for photographing.
Geotechnical information was gathered at this point. Core recovery, RQD measurements and rock competency determinations were noted.
Geologists marked the core and boxes for intervals to be sampled and placed the numbered sample tag at the start of the interval. Tags were reserved and removed from the sequence in the boxes at this point for the inser- tion of blanks and standards. The sample tickets have two tear-off tags; one for the core box and one for inside the sample bag.
Standards were inserted at the rate of 5% or one for every 20 samples.
Blanks were used at the same rate in general but they are also inserted after high grade intercepts.
| D.G. DuPre and Associates Inc. | Page 25 |
| Technical Report on the Herbert Gold Property | April 10, 2013 |
Photographing: Photos of each box were taken by geotechnicians with the label board clearly and accurately marked for hole number, box number and footage. Photos were incorporated into the master database.
Logging: The core was then logged by a geologist.
Sampling: When the geologist was confident that the hole or part of the hole was completely logged, the ge- otechnical crew then began to saw/split the intervals to be sampled.
The splitter determined how best to cut the core so both halves are equally mineralized and maintained the structural integrity of the remaining half so future inspection will be most meaningful.
The sample intervals were sawn and bagged; plastic bags inside of cloth bags for highly broken, powdered, gougey, crumbly, or clay-rich samples and just canvas bags for competent intervals.
The sample saw was kept clean and especially cleaned after cutting samples from a known high grade mineral- ized zone.
Bagging and Shipping: Samples were then placed inside the secure warehouse in the area reserved for shipment preparation.
Blanks and standards were added to the sample stream for shipment at this point using the tags which were re- served out of the sequence while first marking the intervals to be sampled earlier.
When the hole is finished being sampled, the sample transmittal forms are then filled out, the samples placed into larger rice bags, labeled for shipment, hauled to Alaska Air Freight and shipped to the ALS Prep Lab in An- chorage.
The core logging facilities and core storage containers were locked at all times when not under direct supervi- sion and observation by Grande Portage employees.
Special care was taken at all times to keep core in order to minimize the possibility of errors as a result of num- ber recordation, notes, sequences, bag labeling, etc.
Communication between Coastal Helicopters, the drillers, and the GPR core handling crew was maintained. If the core is delivered to the Coastal hanger, the time in storage was kept to a minimum.
Sample shipments to the ALS prep lab in Anchorage were made for each hole as soon as the hole was finished being logged and the samples cut and bagged.
Crushing Procedures
a) ALS Crushing Procedure 21
The entire sample is passed through a primary crusher to yield a crushed product that 70% of which passes 6mm.
| D.G. DuPre and Associates Inc. | Page 26 |
| Technical Report on the Herbert Gold Property | April 10, 2013 |
b) ALS Preparation Procedure 41-g
The sample is logged in the tracking system, weighed, dried and finely crushed to better than 70% passing a 2 mm screen. A split of up to 1000 g is taken and pulverized to better than 85% passing a 75 micron screen.
Analytical Procedures (Several Analytical Procedures were used)
a) Au GR21
A 30 g prepared sample is fused with a mixture of lead oxide, sodium carbonate, borax and other reagents in order to produce a lead button. This button is cupelled to remove the lead. The remaining gold bead is parted in dilute nitric acid, annealed and weighed as gold.
b) Au-ACR24
The sample pulp is passed through a 100 micron stainless steel screen. Any material remaining on the screen (>100 mm) is retained and analyzed in its entirety by fire assay with gravimetric finish and reported as the Au (+) fraction. The material passing through the screen (<100 micron) is homogenized and two sub-samples (50g) are analyzed by fire assay with AA finish (Au AA26 and Au AA26D). The average of the two AAS results is taken and reported as the Au (-) fraction. All three results are used in calculating the combined gold content of the plus and minus fractions. The gold values for both the (+) 100 and (-) fractions are reported together with the weight of each fraction as well as the calculated gold content of the sample.
c) Au – AA25
Seventeen samples were analyzed by ALS Chemex Procedure Au-AA25 in which a 30 g prepared sample is fused a mixture of lead oxide, sodium carbonate, borax and other reagents as required, inquarted with 6 mg of gold-free and then cupelled to yield a precious metal button. The bead is digested in 0.5 mL dilute nitric acid in the microwave oven. 0.5 mL concentrated hydrochloric acid is then added and the bead is further digested in the microwave at a lower power setting. The digested solution is cooled, diluted to a total volume of 10 mL with de-mineralized water, and analyzed by atomic absorption against matrix-matched standards.
| 11 | DATA VERIFICATION (Item 11) |
Grande Portage Resources employed a QA/QC program that consisted of inserting blanks, standard reference materials and duplicates into the sample stream at the rate of approximately one per 20 project samples. The author’s opinion is that the results fall within acceptable margins of laboratory error and provide adequate confidence in the data collection and laboratory methods.
During his site visit, Dupre collected 14 quarter-core samples from the core that had previously been sampled and assayed by GPR staff. These samples were obtained by sawing the previously cut samples in half, then bagging and tagging them prior to shipment to the ALS Chemex sample preparation facility in Anchorage. The prepared samples were then shipped to the ALS Chemex lab in Vancouver where they were analyzed using the same procedures as GPR (Au-ICP21 and Au—GRA21). These procedures are described in Section 10 of this report.
The results of this validation sampling and assaying are presented below in table and chart format.
| D.G. DuPre and Associates Inc. | Page 27 |
| Technical Report on the Herbert Gold Property | April 10, 2013 |
Table 3. Comparison of Author's check samples with original samples.
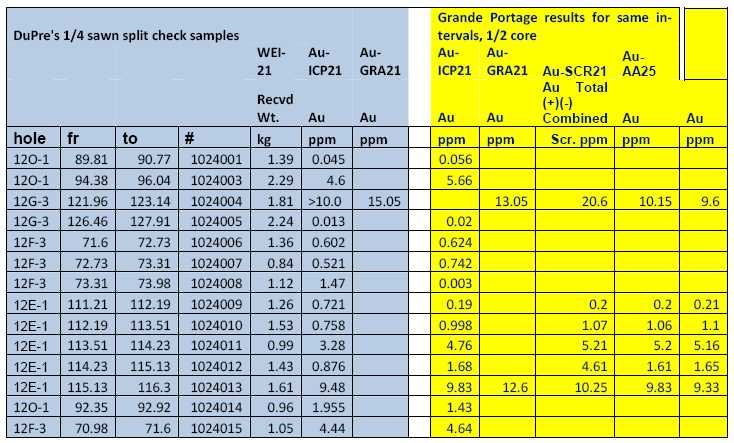

Figure 6. Author's sample assays compared to original assays, Herbert Gold Project.
| D.G. DuPre and Associates Inc. | Page 28 |
| Technical Report on the Herbert Gold Property | April 10, 2013 |
Both the Chart and the table show that there is very good correlation between the analytical results from Dupre’s quarter-core sampling and the original assays carried out for GPR. Therefore, it can be concluded that the sampling and analytical techniques employed by GPR are valid and reliable.
Standard Samples
Three different standard samples obtained from Analytical Solutions Ltd. were used in 2012. The values for these standards are:
Standard 62d = 10.540 (=/- 0.14)
Standard 10c = 6.5340 (=/- 0.08)
Standard 65a = 0.52 (=/- 0.007)
*All values are reported as ppm Au
Twenty-nine standard samples with an ID of 65a were inserted into the sample stream. Only two samples produced assays that were slightly below two standard deviations from the known standard value.
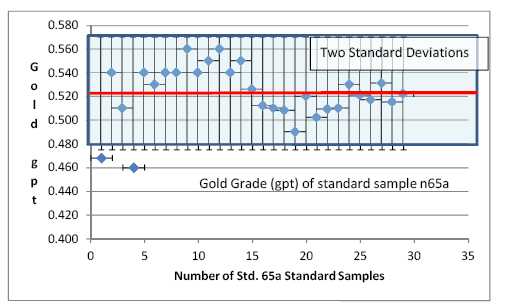
Figure 7. Sample standard 65a from 2012 program, Herbert Gold Project.
Twenty-six samples of Standard 62d were analyzed. This standard has a value of 10.54 g/t gold. The twenty-six 2012 assays ranged from 8.51 – 11.32 ppm. Only three of these produced gold results that were outside the acceptable range of two standard deviations. In the authors’ opinion, this is within an acceptable range of laboratory reproducibility and accuracy.
| D.G. DuPre and Associates Inc. | Page 29 |
| Technical Report on the Herbert Gold Property | April 10, 2013 |

Figure 8. Sample standard 62d from 2012 program, Herbert Gold Project.
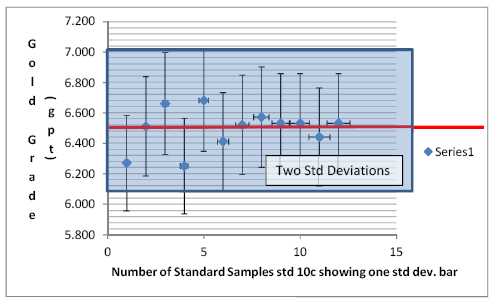
Figure 9. Sample standard 10c from 2012 program, Herbert Gold Project.
All of the 12 Standards (10c) fall within in two standard deviation range.
| D.G. DuPre and Associates Inc. | Page 30 |
| Technical Report on the Herbert Gold Property | April 10, 2013 |

Figure 10. Comparison of the AA25 and GR21 assay techniques.
The plot of AA25 vs. GR21 assay results shows a scattered distribution with poor correlation. This is likely due to the nugget effect which is exemplified by the metallic screened analyses
Blank Samples
The blanks were obtained from crushed river gravel. For the most part, they returned very low values and support the validity of the assaying. Three samples, however) are anomalously high (0.39 – 0.41 ppm Au) and are problematic. Likely, these gravel samples contained a modest amount of gold. It is the author’s opinion that these three samples are not significant enough to cast any doubt on the reliability of the sample collection, preparation and analytical methods employed.
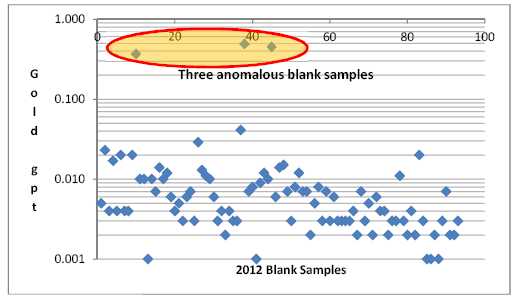
Figure 11. Plot of the blank samples inserted into the 2012 program on the Herbert Gold Project
The author’s opinion on the adequacy of sample preparation, security and analytical procedures is that they are acceptable, largely based on the good agreement between the original data and the author’s verification samples. The blank samples returned three anomalously high gold values. It is recommended that a more reliable source of blank material be obtained and utilized in future programs.
| D.G. DuPre and Associates Inc. | Page 31 |
| Technical Report on the Herbert Gold Property | April 10, 2013 |
| 12 | MINERAL PROCESSING AND METALLURGICAL TESTING(Item 12) |
Neither mineral processing nor metallurgical testing was carried out in 2012.
In 1988 the U.S. Bureau of Mines collected a 240-pound metallurgical sample for analysis and beneficiation tests and gravity separation tests recovered 88.8 % of the gold and 80.7 % of the silver (Redman and others, 1989). In 2010 a sample prepared from drill core was tested for grindability and gold recoveries. The results calculated 15.7 kw-hr/tonne for a bond work index (BWI) and gold and silver recoveries of 91 and 78 % respectively using gravity concentration followed by cyanidization of the concentrates and tails (G & T Metallurgical Services, Ltd., 2011). The report recommends further metallurgical testing to understand the large consumption of sodium cyanide in the process. Though the metallurgical study consisted of representative material from core, the material collected was uniformly from relatively low-grade material recovered during the 2010 drilling campaign and did not include the high-grade with visible gold drilled during the 2011 and 2012 seasons.
The regional characteristics of ores from past mining operations in the Juneau district appear to be quite consistent, containing a very high percentage of gravity recoverable gold, and much of the remainder of the gold to be cyanide recoverable or reporting with the base metal sulphides. It is reasonable to expect, based on these regional characteristics and the character of the core samples obtained to date, that potential ore from the Herbert Gold project will behave similarly (Van Wyck and Burnett, 2012).
| 13 | MINERAL RESOURCE AND MINERAL RESERVE ESTIMATE |
| | 13.1 | Resource Estimation Procedures |
All reference to distance, tonnes, and grade are in SI units of meters (m), tonnes (t), and grams per tonne (g/t). All references to ounces will be troy ounces which are 31.1035 grams. North on the accompanying diagrams will be UTM north which is 0.38oeast of true north at Juneau, Alaska.
A total of 127 diamond drill holes and 4 trenches test mineralization on the Herbert Property. Two thousand two hundred and forty eight (2,248) ICP gold assays, 86 gold assays with gravimetric finish, 921 screened metallic gold assays and 2,124 ICP multi-element (33 element) analyses were presented in a digital database. Dave Webb, P.Geol., president of DRW Geological Consultants Ltd. was engaged to review the data and produce a resource estimate if possible. A resource for this property completed by Garth D Kirkham, P.Geo of Kirkham Geosystems Ltd. has been published in theTechnical Report on the Herbert Glacier Gold Project dated May 28, 2012 (Van Wyck and Burnett, 2012).
The database was validated and corrected as needed. The following sections detail the procedures, methods and strategies employed in creating the resource estimate for the Herbert Project.
Solid Model Construction
A series of cross sections were developed for each of eight different zones where correlations between trends identified in gold assays, alteration zones, and multi-element data appears to exist down-dip on section and between sections. These correlations were corrected and modified as supported by surface mapping and geology.
| D.G. DuPre and Associates Inc. | Page 32 |
| Technical Report on the Herbert Gold Property | April 10, 2013 |
MapInfo’s 3D solid generation routine was used to construct three dimensional models of the sections. These were examined to conform to geology and all analytical data and adjusted where necessary.
Some areas of the Main Vein provided multiple options for correlations that were permissive by geology and sample geochemistry. The correlation that best matched surface geology was selected. The Deep Trench vein was remarkable in the extreme simplicity and consistency in a very planar orientation of the correlations.
Assay Database
The database consists of 127 diamond drill holes (total 18,261.1 m). Nineteen diamond drill holes (total 1,607.0 m) were completed by a previous operator in 1986 and 1988 (Van Wyck and Burnett, 2012). In 2010 and 2011, 46 additional diamond drill-holes were completed with collar and downhole surveys. This and the four trenches (total 19.7 m) provided the database for the previous resource estimate which only used the 2010 and 2011 drill holes due to uncertainty in the location of the collars and data quality (Van Wyck and Burnett, 2012).
All unsampled drill hole intervals were assigned zero grades to facilitate resource calculations. Metallic or screened assays were used in all instances where they were available (921 samples). All other assays are standard one assay ton results reported using ICP finish or where over limit (>10 g/t) are reported using gravimetric finish.
Table 4. Total number of holes and metreage drilled on the Herbert Gold Project.
| Year | # Holes | Total m |
| 1986 and 88 | 19 | 1607 |
| 2010 | 16 | 2600 |
| 2011 | 30 | 5181 |
| 2012 | 62 | 8873 |
| Total | 127 | 18261 |
13.1.1.1Univariate Statistics
The univariate statistics for the entire database is shown on Table 5.
Table 5. Univariate statistics for all of the raw analytical data from the drill and trench database.
Field |
Count | Count
Valid | Count
Invalid |
Minimum |
Maximum |
Mean |
Median |
Range |
Mode | Standard
Deviation |
| Au_ICP21 | 3373 | 2448 | 925 | 0.001 | 432.88 | 2.98 | 0.31 | 432.88 | 0.00 | 17.74 |
| Ag | 3373 | 973 | 2400 | 0.2 | 4010 | 8.98 | 1.20 | 4009.80 | 0.60 | 129.63 |
| Al | 3373 | 2124 | 1249 | 0.03 | 11.2 | 7.33 | 7.73 | 11.17 | 8.20 | 1.52 |
| As | 3373 | 2275 | 1098 | 3.38 | 153000 | 5031.78 | 1580.00 | 152996.62 | 10.00 | 9740.48 |
| Ba | 3373 | 2124 | 1249 | 10 | 3660 | 1087.75 | 1090.00 | 3650.00 | 960.00 | 375.84 |
| Be | 3373 | 2030 | 1343 | 0.5 | 2.2 | 1.07 | 1.10 | 1.70 | 1.10 | 0.16 |
| Bi | 3373 | 428 | 2945 | 2 | 39 | 3.32 | 3.00 | 37.00 | 2.00 | 3.26 |
| Ca | 3373 | 2124 | 1249 | 0.02 | 11.85 | 4.19 | 4.26 | 11.83 | 4.18 | 1.15 |
| Cd | 3373 | 747 | 2626 | 0.5 | 605 | 5.57 | 1.00 | 604.50 | 0.50 | 33.68 |
| Co | 3373 | 2113 | 1260 | 1 | 90 | 13.38 | 14.00 | 89.00 | 13.00 | 4.29 |
| Cr | 3373 | 2124 | 1249 | 3 | 287 | 19.05 | 16.00 | 284.00 | 14.00 | 17.07 |
| Cu | 3373 | 2108 | 1265 | 1 | 3780 | 21.04 | 15.00 | 3779.00 | 15.00 | 85.06 |
| Fe | 3373 | 2124 | 1249 | 0.5 | 14.7 | 4.37 | 4.46 | 14.20 | 4.48 | 0.94 |
| Ga | 3373 | 2064 | 1309 | 10 | 30 | 19.00 | 20.00 | 20.00 | 20.00 | 3.19 |
| K | 3373 | 2124 | 1249 | 0.01 | 3.1 | 1.34 | 1.32 | 3.09 | 1.30 | 0.42 |
| D.G. DuPre and Associates Inc. | Page 33 |
| Technical Report on the Herbert Gold Property | April 10, 2013 |
| La | 3373 | 2047 | 1326 | 10 | 40 | 12.85 | 10.00 | 30.00 | 10.00 | 4.86 |
| Mg | 3373 | 2122 | 1251 | 0.01 | 5.01 | 1.50 | 1.58 | 5.00 | 1.73 | 0.46 |
| Mn | 3373 | 2124 | 1249 | 42 | 2160 | 809.05 | 821.00 | 2118.00 | 848.00 | 207.55 |
| Mo | 3373 | 1213 | 2160 | 1 | 98 | 1.85 | 1.00 | 97.00 | 1.00 | 3.57 |
| Na | 3373 | 2123 | 1250 | 0.01 | 5.67 | 2.20 | 2.34 | 5.66 | 2.45 | 0.73 |
| Ni | 3373 | 2052 | 1321 | 1 | 147 | 6.15 | 4.00 | 146.00 | 4.00 | 10.07 |
| P | 3373 | 2123 | 1250 | 10 | 2960 | 1065.56 | 1110.00 | 2950.00 | 1160.00 | 265.84 |
| Pb | 3373 | 2184 | 1189 | 2 | 31800 | 191.12 | 15.00 | 31798.00 | 12.00 | 1310.42 |
| S | 3373 | 2097 | 1276 | 0.01 | 7.47 | 0.43 | 0.26 | 7.46 | 0.02 | 0.55 |
| Sb | 3373 | 657 | 2716 | 5 | 6210 | 18.88 | 7.00 | 6205.00 | 5.00 | 242.43 |
| Sc | 3373 | 2118 | 1255 | 1 | 59 | 12.53 | 13.00 | 58.00 | 13.00 | 3.33 |
| Sr | 3373 | 2124 | 1249 | 4 | 1485 | 520.94 | 547.00 | 1481.00 | 547.00 | 187.93 |
| Th | 3373 | 8 | 3365 | 20 | 30 | 21.25 | 20.00 | 10.00 | 20.00 | 3.54 |
| Ti | 3373 | 2121 | 1252 | 0.01 | 1.12 | 0.41 | 0.43 | 1.11 | 0.46 | 0.11 |
| Tl | 3373 | 97 | 3276 | 10 | 10 | 10.00 | 10.00 | 0.00 | 10.00 | 0.00 |
| U | 3373 | 255 | 3118 | 10 | 40 | 10.51 | 10.00 | 30.00 | 10.00 | 2.69 |
| V | 3373 | 2124 | 1249 | 1 | 435 | 114.31 | 118.00 | 434.00 | 110.00 | 31.44 |
| W | 3373 | 1632 | 1741 | 10 | 6020 | 80.27 | 30.00 | 6010.00 | 10.00 | 278.02 |
| Zn | 3373 | 2123 | 1250 | 5 | 31200 | 143.12 | 104.00 | 31195.00 | 103.00 | 772.98 |
Gold values broken down by zone is shown below on Table 6 to Table 12
Table 6. Univariate statistics for the raw, unweighted analytical data for the Main Vein
Field |
Count_n | Count
Valid | Count
Invalid |
Minimum |
Maximum |
Mean |
Median |
Range |
Mode | Standard
Deviation |
| Au_ICP21 | 338 | 279 | 59 | 0.001 | 432.88 | 6.23 | 0.62 | 432.879 | 0.03 | 31.101 |
| Ag | 338 | 146 | 192 | 0.2 | 243 | 7.34 | 1.75 | 242.8 | 0.6 | 26.155 |
| Al | 338 | 175 | 163 | 0.11 | 9.1 | 6.63 | 7.32 | 8.99 | 7 | 1.942 |
| As | 338 | 229 | 109 | 5 | 53500 | 6032.81 | 2290 | 53495 | 10 | 8266.940 |
| Ba | 338 | 175 | 163 | 20 | 2000 | 981.89 | 970 | 1980 | 960 | 370.541 |
| Be | 338 | 159 | 179 | 0.5 | 1.5 | 1.00 | 1 | 1 | 1.1 | 0.174 |
| Bi | 338 | 46 | 292 | 2 | 16 | 3.57 | 3 | 14 | 2 | 2.872 |
| Ca | 338 | 175 | 163 | 0.23 | 7.06 | 3.80 | 4.07 | 6.83 | 3.12 | 1.172 |
| Cd | 338 | 84 | 254 | 0.5 | 173 | 6.04 | 1.2 | 172.5 | 0.5 | 21.424 |
| Co | 338 | 173 | 165 | 2 | 21 | 11.62 | 12 | 19 | 13 | 3.539 |
| Cr | 338 | 175 | 163 | 6 | 158 | 18.88 | 15 | 152 | 14 | 17.416 |
| Cu | 338 | 174 | 164 | 1 | 183 | 17.09 | 14 | 182 | 13 | 16.815 |
| Fe | 338 | 175 | 163 | 0.5 | 7.55 | 3.95 | 4.08 | 7.05 | 3.88 | 1.051 |
| Ga | 338 | 163 | 175 | 10 | 20 | 17.85 | 20 | 10 | 20 | 4.119 |
| K | 338 | 175 | 163 | 0.04 | 3.1 | 1.35 | 1.3 | 3.06 | 1.29 | 0.558 |
| La | 338 | 161 | 177 | 10 | 30 | 12.42 | 10 | 20 | 10 | 4.441 |
| Mg | 338 | 175 | 163 | 0.05 | 2.6 | 1.31 | 1.39 | 2.55 | 1.57 | 0.466 |
| Mn | 338 | 175 | 163 | 71 | 1605 | 766.31 | 793 | 1534 | 771 | 225.186 |
| Mo | 338 | 110 | 228 | 1 | 3 | 1.48 | 1 | 2 | 1 | 0.660 |
| Na | 338 | 175 | 163 | 0.01 | 3.98 | 1.88 | 1.98 | 3.97 | 2.32 | 0.819 |
| Ni | 338 | 160 | 178 | 1 | 106 | 6.11 | 3 | 105 | 3 | 12.929 |
| P | 338 | 175 | 163 | 20 | 1540 | 934.06 | 1020 | 1520 | 1070 | 309.920 |
| Pb | 338 | 206 | 132 | 5 | 20500 | 410.55 | 18.5 | 20495 | 11 | 1856.872 |
| S | 338 | 175 | 163 | 0.01 | 3.61 | 0.58 | 0.37 | 3.6 | 0.04 | 0.582 |
| Sb | 338 | 80 | 258 | 5 | 173 | 12.53 | 7.5 | 168 | 6 | 20.733 |
| Sc | 338 | 174 | 164 | 1 | 20 | 10.90 | 12 | 19 | 12 | 3.523 |
| Sr | 338 | 175 | 163 | 8 | 807 | 429.93 | 424 | 799 | 367 | 205.955 |
| Th | 338 | 0 | 338 | 0.00 | 0.00 | 0.00 | 0.00 | 0.00 | 0.00 | 0.000 |
| Ti | 338 | 174 | 164 | 0.02 | 0.61 | 0.35 | 0.39 | 0.59 | 0.39 | 0.125 |
| Tl | 338 | 12 | 326 | 10 | 10 | 10.00 | 10 | 0 | 10 | 0.000 |
| U | 338 | 21 | 317 | 10 | 10 | 10.00 | 10 | 0 | 10 | 0.000 |
| V | 338 | 175 | 163 | 1 | 180 | 98.18 | 108 | 179 | 111 | 33.947 |
| W | 338 | 146 | 192 | 10 | 1650 | 108.49 | 40 | 1640 | 10 | 221.039 |
| Zn | 338 | 174 | 164 | 5 | 3820 | 141.14 | 102 | 3815 | 104 | 321.229 |
| D.G. DuPre and Associates Inc. | Page 34 |
| Technical Report on the Herbert Gold Property | April 10, 2013 |
Table 7. Univariate statistics for the raw, unweighted analytical data for the Deep Trench Vein.
Field |
Count_n | Count
Valid | Count
Invalid |
Minimum |
Maximum |
Mean |
Median |
Range |
Mode | Standard
Deviation |
| Au_ICP21 | 646 | 612 | 34 | 0.002 | 338.33333 | 5.515 | 0.7575 | 338.33133 | 0.007 | 24.883 |
| Ag | 646 | 315 | 331 | 0.5 | 92.8 | 5.409 | 1.7 | 92.3 | 0.5 | 11.360 |
| Al | 646 | 612 | 34 | 0.03 | 9.66 | 6.983 | 7.67 | 9.63 | 7.85 | 1.986 |
| As | 646 | 574 | 72 | 6 | 153000 | 8068.777 | 3535 | 152994 | 52 | 12458.025 |
| Ba | 646 | 612 | 34 | 10 | 3090 | 1048.709 | 1090 | 3080 | 1160 | 398.762 |
| Be | 646 | 558 | 88 | 0.5 | 1.5 | 1.055 | 1.1 | 1 | 1.1 | 0.166 |
| Bi | 646 | 119 | 527 | 2 | 39 | 3.924 | 2 | 37 | 2 | 5.206 |
| Ca | 646 | 612 | 34 | 0.02 | 11.85 | 4.042 | 4.245 | 11.83 | 4.1 | 1.289 |
| Cd | 646 | 300 | 346 | 0.5 | 605 | 6.105 | 1.2 | 604.5 | 0.5 | 36.651 |
| Co | 646 | 603 | 43 | 1 | 28 | 13.121 | 14 | 27 | 15 | 3.794 |
| Cr | 646 | 612 | 34 | 9 | 193 | 18.904 | 17 | 184 | 17 | 10.354 |
| Cu | 646 | 606 | 40 | 1 | 263 | 18.139 | 16 | 262 | 16 | 18.386 |
| Fe | 646 | 612 | 34 | 0.7 | 14.7 | 4.297 | 4.48 | 14 | 4.61 | 1.018 |
| Ga | 646 | 570 | 76 | 10 | 20 | 18.789 | 20 | 10 | 20 | 3.265 |
| K | 646 | 612 | 34 | 0.01 | 2.78 | 1.300 | 1.3 | 2.77 | 1.36 | 0.491 |
| La | 646 | 564 | 82 | 10 | 30 | 12.553 | 10 | 20 | 10 | 4.937 |
| Mg | 646 | 610 | 36 | 0.01 | 2.87 | 1.465 | 1.61 | 2.86 | 1.71 | 0.497 |
| Mn | 646 | 612 | 34 | 42 | 2160 | 788.072 | 827.5 | 2118 | 920 | 235.084 |
| Mo | 646 | 337 | 309 | 1 | 46 | 1.947 | 1 | 45 | 1 | 2.654 |
| Na | 646 | 611 | 35 | 0.01 | 5.67 | 2.145 | 2.31 | 5.66 | 2.53 | 0.853 |
| Ni | 646 | 582 | 64 | 1 | 99 | 5.529 | 5 | 98 | 4 | 5.925 |
| P | 646 | 611 | 35 | 10 | 1970 | 1019.083 | 1110 | 1960 | 1190 | 312.999 |
| Pb | 646 | 608 | 38 | 2 | 26800 | 303.058 | 16 | 26798 | 12 | 1600.415 |
| S | 646 | 610 | 36 | 0.01 | 7.47 | 0.551 | 0.36 | 7.46 | 0.02 | 0.624 |
| Sb | 646 | 227 | 419 | 5 | 104 | 9.269 | 7 | 99 | 5 | 8.224 |
| Sc | 646 | 607 | 39 | 1 | 27 | 12.254 | 13 | 26 | 14 | 3.673 |
| Sr | 646 | 612 | 34 | 4 | 1025 | 507.982 | 537.5 | 1021 | 639 | 206.954 |
| Th | 646 | 3 | 643 | 20 | 20 | 20.000 | 20 | 0 | 20 | 0.000 |
| Ti | 646 | 610 | 36 | 0.01 | 0.91 | 0.393 | 0.43 | 0.9 | 0.46 | 0.128 |
| Tl | 646 | 27 | 619 | 10 | 10 | 10.000 | 10 | 0 | 10 | 0.000 |
| U | 646 | 40 | 606 | 10 | 40 | 10.750 | 10 | 30 | 10 | 4.743 |
| V | 646 | 612 | 34 | 1 | 199 | 109.618 | 121 | 198 | 124 | 35.257 |
| W | 646 | 530 | 116 | 10 | 6020 | 75.642 | 30 | 6010 | 10 | 302.555 |
| Zn | 646 | 612 | 34 | 5 | 12500 | 143.219 | 104 | 12495 | 115 | 529.830 |
Table 8. Univariate statistics for the raw, unweighted analytical data from the Deep Trench Hanging Wall Vein.
Field |
Count_n | Count
Valid | Count
Invalid |
Minimum |
Maximum |
Mean |
Median |
Range |
Mode | Standard
Deviation |
| Au_ICP21 | 72 | 61 | 11 | 0.002 | 70.7 | 4.508 | 0.973 | 70.698 | 0.004 | 10.857 |
| Ag | 72 | 33 | 39 | 0.5 | 27.4 | 3.503 | 1.4 | 26.9 | 0.5 | 5.645 |
| Al | 72 | 61 | 11 | 4.18 | 8.52 | 7.286 | 7.61 | 4.34 | 4.18 | 1.003 |
| As | 72 | 58 | 14 | 12 | 64400 | 9203.362 | 4845 | 64388 | 87 | 13262.453 |
| Ba | 72 | 61 | 11 | 360 | 1600 | 1006.393 | 1010 | 1240 | 610 | 255.480 |
| Be | 72 | 61 | 11 | 0.5 | 1.3 | 1.030 | 1.1 | 0.8 | 1.1 | 0.166 |
| Bi | 72 | 10 | 62 | 2 | 6 | 3.100 | 2.5 | 4 | 2 | 1.449 |
| Ca | 72 | 61 | 11 | 2.78 | 11.85 | 4.891 | 4.34 | 9.07 | 4.13 | 1.701 |
| Cd | 72 | 31 | 41 | 0.5 | 38.4 | 4.045 | 1.2 | 37.9 | 0.6 | 8.388 |
| Co | 72 | 61 | 11 | 7 | 28 | 14.016 | 14 | 21 | 15 | 3.875 |
| Cr | 72 | 61 | 11 | 11 | 77 | 19.557 | 15 | 66 | 14 | 13.408 |
| Cu | 72 | 61 | 11 | 1 | 50 | 14.820 | 13 | 49 | 10 | 9.632 |
| Fe | 72 | 61 | 11 | 2.53 | 7.36 | 4.392 | 4.25 | 4.83 | 4.63 | 0.802 |
| Ga | 72 | 61 | 11 | 10 | 20 | 18.525 | 20 | 10 | 20 | 3.576 |
| K | 72 | 61 | 11 | 0.49 | 2.29 | 1.409 | 1.45 | 1.8 | 1.38 | 0.349 |
| La | 72 | 60 | 12 | 10 | 20 | 11.500 | 10 | 10 | 10 | 3.601 |
| Mg | 72 | 61 | 11 | 0.46 | 2.87 | 1.489 | 1.56 | 2.41 | 1.4 | 0.443 |
| Mn | 72 | 61 | 11 | 434 | 2160 | 852.033 | 812 | 1726 | 592 | 335.181 |
| Mo | 72 | 40 | 32 | 1 | 6 | 1.725 | 1 | 5 | 1 | 1.109 |
| Na | 72 | 61 | 11 | 0.44 | 5.67 | 2.546 | 2.47 | 5.23 | 2.01 | 0.976 |
| Ni | 72 | 61 | 11 | 1 | 50 | 7.328 | 5 | 49 | 5 | 7.554 |
| P | 72 | 61 | 11 | 500 | 1970 | 1089.836 | 1110 | 1470 | 1110 | 219.078 |
| Pb | 72 | 60 | 12 | 5 | 8980 | 201.967 | 15.5 | 8975 | 12 | 1166.584 |
| S | 72 | 56 | 16 | 0.01 | 3.15 | 0.653 | 0.395 | 3.14 | 0.03 | 0.699 |
| Sb | 72 | 17 | 55 | 5 | 11 | 7.412 | 7 | 6 | 5 | 2.181 |
| Sc | 72 | 61 | 11 | 6 | 20 | 12.705 | 13 | 14 | 13 | 2.584 |
| Sr | 72 | 61 | 11 | 97 | 1025 | 481.820 | 498 | 928 | 439 | 196.686 |
| Th | 72.00 | 0.00 | 72.00 | 0.00 | 0.00 | 0.00 | 0.00 | 0.00 | 0.00 | 0.00 |
| Ti | 72 | 61 | 11 | 0.17 | 0.91 | 0.416 | 0.42 | 0.74 | 0.41 | 0.106 |
| Tl | 72 | 2 | 70 | 10 | 10 | 10.000 | 10 | 0 | 10 | 0.000 |
| U | 72 | 13 | 59 | 10 | 10 | 10.000 | 10 | 0 | 10 | 0.000 |
| V | 72 | 61 | 11 | 42 | 184 | 117.098 | 120 | 142 | 114 | 25.205 |
| D.G. DuPre and Associates Inc. | Page 35 |
| Technical Report on the Herbert Gold Property | April 10, 2013 |
| W | 72 | 51 | 21 | 10 | 510 | 50.784 | 30 | 500 | 10 | 74.104 |
| Zn | 72 | 61 | 11 | 12 | 1030 | 129.066 | 99 | 1018 | 112 | 164.989 |
Table 9. Univariate statistics for the raw, unweighted analytical data from the Goat Vein Footwall Zone.
Field |
Count_n | Count
Valid | Count
Invalid |
Minimum |
Maximum |
Mean |
Median |
Range |
Mode | Standard
Deviation |
| Au_ICP21 | 108 | 77 | 31 | 0.002 | 17.1 | 0.935 | 0.194 | 17.098 | 0.007 | 2.406 |
| Ag | 108 | 29 | 79 | 0.5 | 16.8 | 2.093 | 0.9 | 16.3 | 0.7 | 3.214 |
| Al | 108 | 77 | 31 | 1.73 | 8.87 | 7.386 | 7.91 | 7.14 | 8.01 | 1.452 |
| As | 108 | 73 | 35 | 10 | 31900 | 3227.767 | 1875 | 31890 | 59 | 4572.954 |
| Ba | 108 | 77 | 31 | 190 | 1840 | 1132.208 | 1170 | 1650 | 1080 | 346.086 |
| Be | 108 | 73 | 35 | 0.6 | 1.2 | 1.052 | 1.1 | 0.6 | 1.1 | 0.133 |
| Bi | 108 | 20 | 88 | 2 | 5 | 2.650 | 2 | 3 | 2 | 0.875 |
| Ca | 108 | 77 | 31 | 1.3 | 7.16 | 3.911 | 3.96 | 5.86 | 3.88 | 0.907 |
| Cd | 108 | 25 | 83 | 0.5 | 46.1 | 4.116 | 0.6 | 45.6 | 0.6 | 9.845 |
| Co | 108 | 77 | 31 | 3 | 29 | 12.234 | 13 | 26 | 13 | 3.145 |
| Cr | 108 | 77 | 31 | 9 | 75 | 15.857 | 14 | 66 | 14 | 7.882 |
| Cu | 108 | 77 | 31 | 3 | 44 | 14.013 | 13 | 41 | 14 | 5.403 |
| Fe | 108 | 77 | 31 | 1.09 | 6.33 | 4.195 | 4.31 | 5.24 | 4.28 | 0.738 |
| Ga | 108 | 75 | 33 | 10 | 30 | 18.533 | 20 | 20 | 20 | 3.923 |
| K | 108 | 77 | 31 | 0.29 | 2.07 | 1.312 | 1.32 | 1.78 | 1.31 | 0.316 |
| La | 108 | 75 | 33 | 10 | 30 | 14.933 | 10 | 20 | 10 | 5.295 |
| Mg | 108 | 77 | 31 | 0.28 | 1.94 | 1.371 | 1.44 | 1.66 | 1.44 | 0.357 |
| Mn | 108 | 77 | 31 | 210 | 914 | 750.818 | 772 | 704 | 713 | 132.775 |
| Mo | 108 | 33 | 75 | 1 | 3 | 1.303 | 1 | 2 | 1 | 0.529 |
| Na | 108 | 77 | 31 | 0.19 | 3.03 | 2.154 | 2.3 | 2.84 | 2.57 | 0.569 |
| Ni | 108 | 73 | 35 | 1 | 7 | 3.603 | 3 | 6 | 3 | 1.341 |
| P | 108 | 77 | 31 | 240 | 1260 | 1017.403 | 1090 | 1020 | 1060 | 218.917 |
| Pb | 108 | 77 | 31 | 5 | 1600 | 46.870 | 14 | 1595 | 14 | 183.779 |
| S | 108 | 77 | 31 | 0.01 | 1.5 | 0.258 | 0.2 | 1.49 | 0.04 | 0.267 |
| Sb | 108 | 24 | 84 | 5 | 17 | 6.833 | 6 | 12 | 5 | 2.792 |
| Sc | 108 | 77 | 31 | 3 | 15 | 11.792 | 12 | 12 | 12 | 2.494 |
| Sr | 108 | 77 | 31 | 105 | 783 | 493.779 | 512 | 678 | 232 | 172.258 |
| Th | 108 | 0.00 | 108.00 | 0.00 | 0.00 | 0.000 | 0.00 | 0.00 | 0.00 | 0.000 |
| Ti | 108 | 77 | 31 | 0.09 | 0.51 | 0.394 | 0.43 | 0.42 | 0.43 | 0.091 |
| Tl | 108 | 2 | 106 | 10 | 10 | 10.000 | 10 | 0 | 10 | 0.000 |
| U | 108 | 14 | 94 | 10 | 20 | 12.143 | 10 | 10 | 10 | 4.258 |
| V | 108 | 77 | 31 | 24 | 130 | 103.714 | 112 | 106 | 115 | 22.138 |
| W | 108 | 57 | 51 | 10 | 980 | 79.298 | 20 | 970 | 10 | 156.112 |
| Zn | 108 | 77 | 31 | 17 | 1140 | 124.403 | 103 | 1123 | 98 | 141.859 |
Table 10. Univariate statistics for the raw, unweighted analytical data for the Goat Vein Hanging Wall Zone.
Field |
Count_n | Count
Valid | Count
Invalid |
Minimum |
Maximum |
Mean |
Median |
Range |
Mode | Standard
Deviation |
| Au_ICP21 | 63 | 44 | 19 | 0.002 | 31.9 | 2.138 | 0.3815 | 31.898 | 0.032 | 5.446 |
| Ag | 63 | 5 | 58 | 0.8 | 5.5 | 2.380 | 1.2 | 4.7 | 0.00 | 2.066 |
| Al | 63 | 44 | 19 | 2.79 | 8.67 | 7.261 | 7.57 | 5.88 | 6.52 | 1.243 |
| As | 63 | 44 | 19 | 3.38 | 35500 | 5330.804 | 3105 | 35496.62 | 0.00 | 6932.793 |
| Ba | 63 | 44 | 19 | 450 | 1940 | 1385.000 | 1455 | 1490 | 1310.00 | 316.158 |
| Be | 63 | 42 | 21 | 0.7 | 1.6 | 1.040 | 1 | 0.9 | 1.10 | 0.145 |
| Bi | 63 | 6 | 57 | 2 | 5 | 2.667 | 2 | 3 | 2.00 | 1.211 |
| Ca | 63 | 44 | 19 | 2 | 8.74 | 3.910 | 3.845 | 6.74 | 4.11 | 1.019 |
| Cd | 63 | 6 | 57 | 0.5 | 1.2 | 0.917 | 0.95 | 0.7 | 0.00 | 0.248 |
| Co | 63 | 44 | 19 | 5 | 22 | 12.409 | 12.5 | 17 | 13 | 3.142 |
| Cr | 63 | 44 | 19 | 8 | 30 | 15.295 | 14 | 22 | 14 | 3.885 |
| Cu | 63 | 43 | 20 | 2 | 20 | 11.535 | 12 | 18 | 15 | 4.344 |
| Fe | 63 | 44 | 19 | 1.66 | 5.31 | 4.152 | 4.325 | 3.65 | 4.38 | 0.734 |
| Ga | 63 | 44 | 19 | 10 | 20 | 18.864 | 20 | 10 | 20 | 3.210 |
| K | 63 | 44 | 19 | 0.37 | 1.88 | 1.169 | 1.21 | 1.51 | 1.21 | 0.257 |
| La | 63 | 43 | 20 | 10 | 20 | 11.163 | 10 | 10 | 10 | 3.244 |
| Mg | 63 | 44 | 19 | 0.19 | 1.84 | 1.406 | 1.55 | 1.65 | 1.56 | 0.371 |
| Mn | 63 | 44 | 19 | 330 | 1590 | 739.886 | 744 | 1260 | 721 | 215.633 |
| Mo | 63 | 27 | 36 | 1 | 14 | 1.815 | 1 | 13 | 1 | 2.512 |
| Na | 63 | 44 | 19 | 0.73 | 3.4 | 2.420 | 2.525 | 2.67 | 2.37 | 0.512 |
| Ni | 63 | 42 | 21 | 1 | 6 | 3.214 | 3 | 5 | 4 | 1.474 |
| P | 63 | 44 | 19 | 350 | 1260 | 1024.545 | 1080 | 910 | 1070 | 206.076 |
| Pb | 63 | 44 | 19 | 5 | 1580 | 77.250 | 14.5 | 1575 | 13 | 282.797 |
| S | 63 | 43 | 20 | 0.01 | 1.77 | 0.381 | 0.3 | 1.76 | 0.13 | 0.383 |
| Sb | 63 | 8 | 55 | 5 | 8 | 5.875 | 5.5 | 3 | 5 | 1.126 |
| Sc | 63 | 44 | 19 | 4 | 18 | 11.705 | 12 | 14 | 12 | 2.455 |
| Sr | 63 | 44 | 19 | 85 | 739 | 540.636 | 573 | 654 | 520 | 147.075 |
| D.G. DuPre and Associates Inc. | Page 36 |
| Technical Report on the Herbert Gold Property | April 10, 2013 |
| Th | 63 | 0.00 | 63.00 | 0.00 | 0.00 | 0.000 | 0.00 | 0.00 | 0.00 | 0.000 |
| Ti | 63 | 44 | 19 | 0.12 | 0.5 | 0.390 | 0.42 | 0.38 | 0.43 | 0.089 |
| Tl | 63 | 1 | 62 | 10 | 10 | 10.000 | 10 | 0 | 10 | 0.000 |
| U | 63 | 3 | 60 | 10 | 10 | 10.000 | 10 | 0 | 10 | 0.000 |
| V | 63 | 44 | 19 | 34 | 131 | 103.523 | 108.5 | 97 | 108 | 21.392 |
| W | 63 | 33 | 30 | 10 | 90 | 27.576 | 20 | 80 | 10 | 21.218 |
| Zn | 63 | 44 | 19 | 24 | 145 | 93.932 | 101.5 | 121 | 98 | 23.561 |
Table 11. Univariate statistics for the raw, unweighted analytical data for the Ridge Vein.
Field |
Count_n | Count
Valid | Count
Invalid |
Minimum |
Maximum |
Mean |
Median |
Range |
Mode | Standard
Deviation |
| Au_ICP21 | 108 | 77 | 31 | 0.002 | 17.1 | 0.935 | 0.194 | 17.098 | 0.007 | 2.406 |
| Ag | 108 | 29 | 79 | 0.5 | 16.8 | 2.093 | 0.9 | 16.3 | 0.7 | 3.214 |
| Al | 108 | 77 | 31 | 1.73 | 8.87 | 7.386 | 7.91 | 7.14 | 8.01 | 1.452 |
| As | 108 | 73 | 35 | 10 | 31900 | 3227.767 | 1875 | 31890 | 59 | 4572.954 |
| Ba | 108 | 77 | 31 | 190 | 1840 | 1132.208 | 1170 | 1650 | 1080 | 346.086 |
| Be | 108 | 73 | 35 | 0.6 | 1.2 | 1.052 | 1.1 | 0.6 | 1.1 | 0.133 |
| Bi | 108 | 20 | 88 | 2 | 5 | 2.650 | 2 | 3 | 2 | 0.875 |
| Ca | 108 | 77 | 31 | 1.3 | 7.16 | 3.911 | 3.96 | 5.86 | 3.88 | 0.907 |
| Cd | 108 | 25 | 83 | 0.5 | 46.1 | 4.116 | 0.6 | 45.6 | 0.6 | 9.845 |
| Co | 108 | 77 | 31 | 3 | 29 | 12.234 | 13 | 26 | 13 | 3.145 |
| Cr | 108 | 77 | 31 | 9 | 75 | 15.857 | 14 | 66 | 14 | 7.882 |
| Cu | 108 | 77 | 31 | 3 | 44 | 14.013 | 13 | 41 | 14 | 5.403 |
| Fe | 108 | 77 | 31 | 1.09 | 6.33 | 4.195 | 4.31 | 5.24 | 4.28 | 0.738 |
| Ga | 108 | 75 | 33 | 10 | 30 | 18.533 | 20 | 20 | 20 | 3.923 |
| K | 108 | 77 | 31 | 0.29 | 2.07 | 1.312 | 1.32 | 1.78 | 1.31 | 0.316 |
| La | 108 | 75 | 33 | 10 | 30 | 14.933 | 10 | 20 | 10 | 5.295 |
| Mg | 108 | 77 | 31 | 0.28 | 1.94 | 1.371 | 1.44 | 1.66 | 1.44 | 0.357 |
| Mn | 108 | 77 | 31 | 210 | 914 | 750.818 | 772 | 704 | 713 | 132.775 |
| Mo | 108 | 33 | 75 | 1 | 3 | 1.303 | 1 | 2 | 1 | 0.529 |
| Na | 108 | 77 | 31 | 0.19 | 3.03 | 2.154 | 2.3 | 2.84 | 2.57 | 0.569 |
| Ni | 108 | 73 | 35 | 1 | 7 | 3.603 | 3 | 6 | 3 | 1.341 |
| P | 108 | 77 | 31 | 240 | 1260 | 1017.403 | 1090 | 1020 | 1060 | 218.917 |
| Pb | 108 | 77 | 31 | 5 | 1600 | 46.870 | 14 | 1595 | 14 | 183.779 |
| S | 108 | 77 | 31 | 0.01 | 1.5 | 0.258 | 0.2 | 1.49 | 0.04 | 0.267 |
| Sb | 108 | 24 | 84 | 5 | 17 | 6.833 | 6 | 12 | 5 | 2.792 |
| Sc | 108 | 77 | 31 | 3 | 15 | 11.792 | 12 | 12 | 12 | 2.494 |
| Sr | 108 | 77 | 31 | 105 | 783 | 493.779 | 512 | 678 | 232 | 172.258 |
| Th | 108 | 0 | 108 | 0.00 | 0.00 | 0.000 | 0.00 | 0.00 | 0.00 | 0.000 |
| Ti | 108 | 77 | 31 | 0.09 | 0.51 | 0.394 | 0.43 | 0.42 | 0.43 | 0.091 |
| Tl | 108 | 2 | 106 | 10 | 10 | 10.000 | 10 | 0 | 10 | 0.000 |
| U | 108 | 14 | 94 | 10 | 20 | 12.143 | 10 | 10 | 10 | 4.258 |
| V | 108 | 77 | 31 | 24 | 130 | 103.714 | 112 | 106 | 115 | 22.138 |
| W | 108 | 57 | 51 | 10 | 980 | 79.298 | 20 | 970 | 10 | 156.112 |
| Zn | 108 | 77 | 31 | 17 | 1140 | 124.403 | 103 | 1123 | 98 | 141.859 |
Table 12. Univariate statistics for the raw, unweighted analytical data for the Main Vein Hanging Wall 2 Zone.
Field |
Count_n | Count
Valid | Count
Invalid |
Minimum |
Maximum |
Mean |
Median |
Range |
Mode | Standard
Deviation |
| Au_ICP21 | 228 | 143 | 85 | 0.001 | 16.44 | 0.924 | 0.293 | 16.439 | 0.002 | 1.857 |
| Ag | 228 | 35 | 193 | 0.2 | 62.2 | 3.049 | 0.9 | 62 | 0.5 | 10.361 |
| Al | 228 | 102 | 126 | 2.19 | 8.97 | 7.677 | 7.915 | 6.78 | 7.39 | 1.097 |
| As | 228 | 104 | 124 | 5 | 52300 | 2777.894 | 791 | 52295 | 10 | 5809.835 |
| Ba | 228 | 102 | 126 | 330 | 1830 | 1180.000 | 1185 | 1500 | 810 | 338.207 |
| Be | 228 | 100 | 128 | 0.5 | 1.5 | 1.090 | 1.1 | 1 | 1.1 | 0.149 |
| Bi | 228 | 29 | 199 | 2 | 7 | 2.862 | 2 | 5 | 2 | 1.274 |
| Ca | 228 | 102 | 126 | 1.61 | 7.8 | 4.435 | 4.4 | 6.19 | 4.24 | 0.859 |
| Cd | 228 | 19 | 209 | 0.5 | 5.8 | 1.005 | 0.6 | 5.3 | 0.6 | 1.221 |
| Co | 228 | 102 | 126 | 3 | 24 | 13.000 | 13 | 21 | 13 | 2.740 |
| Cr | 228 | 102 | 126 | 8 | 31 | 14.265 | 14 | 23 | 15 | 3.121 |
| Cu | 228 | 102 | 126 | 1 | 104 | 14.343 | 13 | 103 | 13 | 11.261 |
| Fe | 228 | 102 | 126 | 1.9 | 6.13 | 4.438 | 4.47 | 4.23 | 4.32 | 0.611 |
| Ga | 228 | 102 | 126 | 10 | 30 | 19.216 | 20 | 20 | 20 | 3.046 |
| K | 228 | 102 | 126 | 0.33 | 2.44 | 1.290 | 1.3 | 2.11 | 1.3 | 0.323 |
| La | 228 | 102 | 126 | 10 | 20 | 14.020 | 10 | 10 | 10 | 4.927 |
| Mg | 228 | 102 | 126 | 0.38 | 2.1 | 1.485 | 1.53 | 1.72 | 1.44 | 0.339 |
| Mn | 228 | 102 | 126 | 360 | 1300 | 838.853 | 831.5 | 940 | 743 | 149.947 |
| Mo | 228 | 59 | 169 | 1 | 28 | 2.034 | 1 | 27 | 1 | 3.596 |
| Na | 228 | 102 | 126 | 0.67 | 4.54 | 2.349 | 2.385 | 3.87 | 2.63 | 0.672 |
| Ni | 228 | 95 | 133 | 1 | 19 | 4.021 | 4 | 18 | 4 | 2.539 |
| P | 228 | 102 | 126 | 290 | 1460 | 1083.039 | 1120 | 1170 | 1150 | 187.235 |
| D.G. DuPre and Associates Inc. | Page 37 |
| Technical Report on the Herbert Gold Property | April 10, 2013 |
| Pb | 228 | 102 | 126 | 2 | 1650 | 64.902 | 15 | 1648 | 14 | 222.272 |
| S | 228 | 102 | 126 | 0.02 | 2.39 | 0.394 | 0.22 | 2.37 | 0.02 | 0.458 |
| Sb | 228 | 26 | 202 | 5 | 11 | 6.808 | 6 | 6 | 6 | 1.789 |
| Sc | 228 | 102 | 126 | 3 | 18 | 12.490 | 13 | 15 | 13 | 2.268 |
| Sr | 228 | 102 | 126 | 86 | 841 | 569.137 | 603 | 755 | 336 | 139.485 |
| Th | 228 | 0 | 228 | 0.00 | 0.00 | 0.000 | 0.00 | 0.00 | 0.00 | 0.000 |
| Ti | 228 | 102 | 126 | 0.09 | 0.54 | 0.411 | 0.43 | 0.45 | 0.44 | 0.079 |
| Tl | 228 | 2 | 226 | 10 | 10 | 10.000 | 10 | 0 | 10 | 0.000 |
| U | 228 | 28 | 200 | 10 | 20 | 10.357 | 10 | 10 | 10 | 1.890 |
| V | 228 | 102 | 126 | 32 | 165 | 112.951 | 114.5 | 133 | 110 | 21.176 |
| W | 228 | 83 | 145 | 10 | 1690 | 124.337 | 30 | 1680 | 10 | 281.395 |
| Zn | 228 | 102 | 126 | 22 | 212 | 99.284 | 101 | 190 | 104 | 23.491 |
Comparing metallic check assays with the 1 AT analyses shows excellent correlation with a slight tendency for the ICP analysis to overstate the assay compared to the metallic assay when considering all of the data presented on Figure 12. Considering data above 50 g/t, 1 AT results exceed screened metallic assays 13 times out of 19.
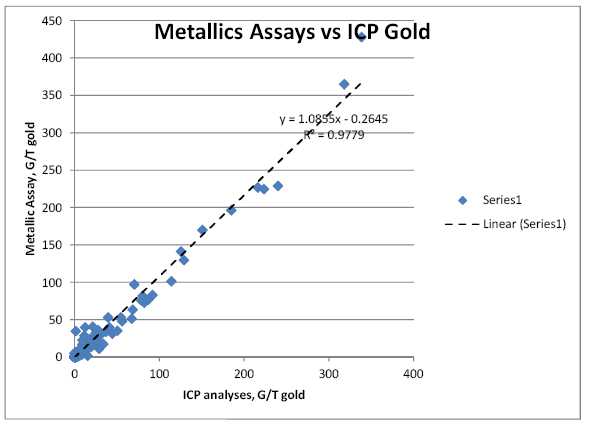
Figure 12. Plot of metallic assays vs. ICP analyses on all check assays.
A similar plot (Figure 13) of the lower grade samples shows an excellent correlation with a slight tendency for the ICP analysis to understate the assays compared to the metallic assays.
| D.G. DuPre and Associates Inc. | Page 38 |
| Technical Report on the Herbert Gold Property | April 10, 2013 |

Figure 13. Plot of metallic assays vs. ICP analyses for all samples <10 g/t (Metallic).
Excluding all assays over 5 g/t it is apparent that the one assay ton results report higher gold grades than the metallic assays. This is significant in that, of the 921 samples run for metallic assays, 768 or 83% are <5.0 g/t gold, and these lower grade samples (ICP results are 8% higher grade than screened metallic assays @ <5.0 g/t gold) are on average 34% larger than the higher grade samples.
| D.G. DuPre and Associates Inc. | Page 39 |
| Technical Report on the Herbert Gold Property | April 10, 2013 |
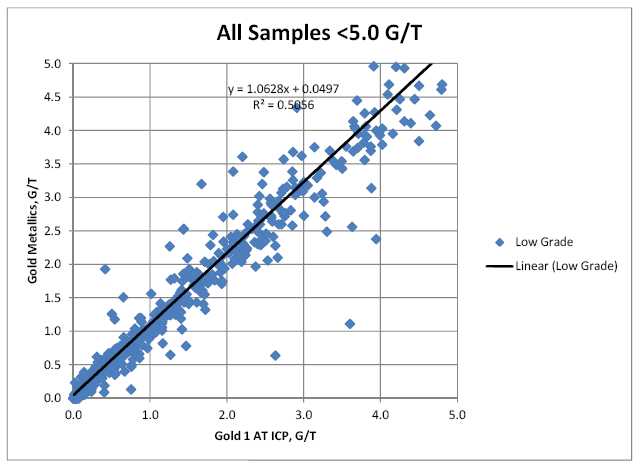
Figure 14. Gold assays by screened metallic vs. standard one assay ton samples showing higher grades from 1 AT samples.
A comparison of the gold grade versus sample interval shows that the gold grade is not independent of sample interval (Figure 15).
| D.G. DuPre and Associates Inc. | Page 40 |
| Technical Report on the Herbert Gold Property | April 10, 2013 |
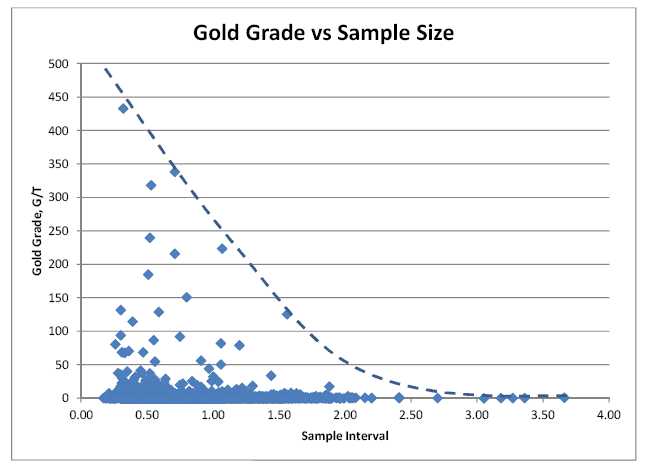
Figure 15. Gold grade versus sample interval shows decreasing gold grades with increasing sample interval (dashed line).
This phenomena is to be expected, but suggests any data treatment (cutting, averaging, etc.) should take place with the composites to remove a degree of freedom and enable the statistics to be more valid.
Topography
The topographic relief is fairly steep with valleys incised east-west across a generally rising trend from 40m AMSL to 340m AMSL to the east and then more rapidly rising to >600m AMSL to the southeast. Mapping has shown that mineralization extends to surface in places and that in places these outcropping zones are constrained to topographic lows.
| D.G. DuPre and Associates Inc. | Page 41 |
| Technical Report on the Herbert Gold Property | April 10, 2013 |
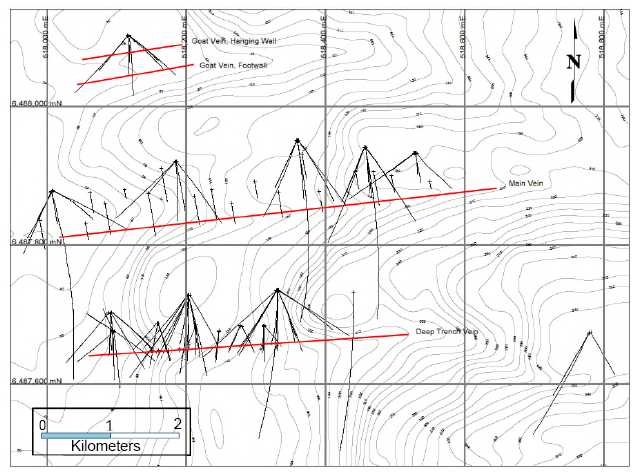
Figure 16. General location of the four principal vein structures with respect to topography.
Density
A total of 30 mineralized samples from diamond drilling in 2012 were submitted for bulk density measurements (Table 13) using specific gravity/immersion methods. The average density of 2.757 gm/cm3is used in all calculations.
Table 13. Bulk density measurements on 30 mineralized intersections from the 2012 diamond drilling.
SAMPLE | Recvd
Wt. |
B.D. |
| DESCRIPTION | kg | g/cm3 |
| 1023405 | 1.42 | 2.76 |
| 1023406 | 1.26 | 2.76 |
| 1023407 | 0.58 | 2.66 |
| 1023408 | 1.95 | 2.83 |
| 1023409 | 2.34 | 2.78 |
| 1023410 | 1.07 | 2.85 |
| 1023411 | 2.22 | 2.82 |
| 1023412 | 1.09 | 2.73 |
| 1023413 | 0.84 | 2.63 |
| 1023414 | 1.68 | 2.78 |
| 1023415 | 0.92 | 2.80 |
| 1023416 | 1.58 | 2.71 |
| 1023417 | 2.05 | 2.79 |
| D.G. DuPre and Associates Inc. | Page 42 |
| Technical Report on the Herbert Gold Property | April 10, 2013 |
| 1023418 | 0.93 | 2.83 |
| 1023419 | 0.58 | 2.73 |
| 1023420 | 1.78 | 2.78 |
| 1023421 | 0.51 | 2.70 |
| 1023422 | 1.13 | 2.77 |
| 1023423 | 1.03 | 2.76 |
| 1023424 | 0.71 | 2.74 |
| 1023425 | 1.38 | 2.75 |
| 1023426 | 0.63 | 2.75 |
| 1023427 | 0.56 | 2.63 |
| 1023428 | 0.55 | 2.78 |
| 1023429 | 0.58 | 2.78 |
| 1023430 | 1.17 | 2.75 |
| 1023431 | 1.08 | 2.71 |
| 1023432 | 0.56 | 2.72 |
| 1023433 | 0.82 | 2.74 |
| 1023434 | 0.57 | 2.89 |
| Average | | 2.757 |
Compositing
For compositing and resource purposes, metallic assay data were used whenever they existed. All other data used the 1 AT values. Composites over the length of the drill holes were calculated to a maximum of 1m in order to provide interval-independent grades over lengths that compromise between grade delineation and dilution.
Table 14. Univariate statistics on 1m composites from the seven principal mineralized structures. All zero grades were omitted for these data.
Vein |
Count | Count
Valid | Count
Invalid |
Minimum |
Maximum |
Mean |
Median |
Range |
Mode | Standard
Deviation |
| DTV | 898 | 621 | 277 | 0.000 | 214.60 | 4.22 | 0.77 | 214.60 | 0.01 | 17.45 |
| DTVHW1b | 170 | 63 | 107 | 0.001 | 28.06 | 3.18 | 0.87 | 28.06 | 0.00 | 5.22 |
| MVHW2 | 1578 | 165 | 1413 | 0.000 | 5.10 | 0.49 | 0.19 | 5.10 | 0.02 | 0.82 |
| Ridge | 466 | 91 | 375 | 0.000 | 5.40 | 0.52 | 0.14 | 5.40 | 0.01 | 0.95 |
| Goat FW | 193 | 37 | 156 | 0.002 | 122.57 | 4.45 | 0.11 | 122.57 | 0.00 | 20.10 |
| Goat HW | 376 | 42 | 334 | 0.001 | 13.64 | 1.20 | 0.19 | 13.64 | 0.00 | 2.58 |
| MV1 | 588 | 232 | 356 | 0.000 | 157.74 | 3.80 | 0.46 | 157.74 | 0.01 | 15.85 |
Treatment of High-grade outliers
High-grade outliers are defined as ones that appear to deviate markedly from other members of the sample in which it occurs (Grubbs, F.E., 1969).
The raw sample data for the two largest datasets of significance (only samples >0.01 g/t plotted) were considered and showed similar trends of mixed sample populations.
13.1.1.2Main Vein
| D.G. DuPre and Associates Inc. | Page 43 |
| Technical Report on the Herbert Gold Property | April 10, 2013 |
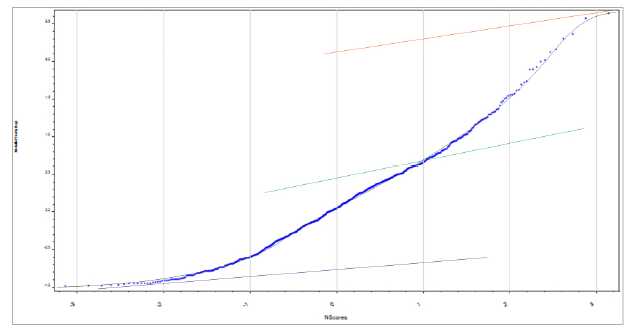
Figure 17. Lognormal probability plots of all raw sample data >0.01 g/t within the Main Vein solid.
The raw sample data for the Main Vein displays a mixture of three populations on the lognormal probability plot in Figure 17 with the statistics estimated for the lower (blue), middle (green) and upper (red) populations shown on Table 15.
Table 15. Statistics of the three populations of raw assay data for the Main Vein estimated from Figure 17.
| MV | Percent | Mean (g/t) |
| Upper | 0.2 | 199.53 |
| Middle | 57.8 | 3.16 |
| Lower | 42.0 | 0.25 |
The three populations can be modeled smoothly without any obvious outliers.
The 1m composite data for the Main Vein 1m composites (only samples >0.01 g/t plotted) were considered and showed trends of mixed sample populations similar to that identified in the raw data when plotted on a lognormal probability plot Figure 18.
| D.G. DuPre and Associates Inc. | Page 44 |
| Technical Report on the Herbert Gold Property | April 10, 2013 |
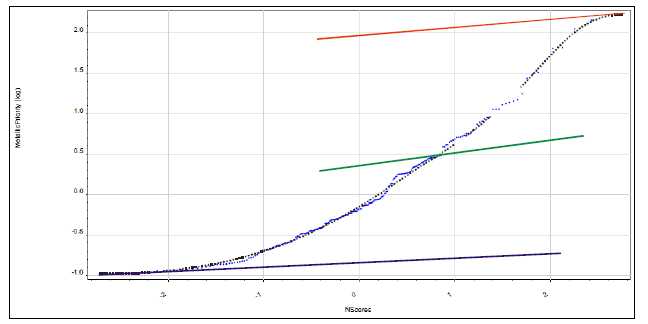
Figure 18. Lognormal probability plots of all 1m composite data >0.01 g/t within the Main Vein solid.
The 1m composite data for the Main Vein displays a mixture of three populations with the statistics for the lower (blue), middle (green), and upper (red) sample populations shown on Table 16.
Table 16. Statistics of the three populations of the 1m composites of gold assays for the Main Vein.
| MV | Percent | Mean (g/t) |
| Upper | 2.30 | 79.43 |
| Middle | 41.70 | 2.24 |
| Lower | 56.00 | 0.16 |
The three populations can be modeled smoothly. The lowering of the mean of the higher-grade populations is likely accounted for by the dilution of the highest-grade samples to 1m intervals. No obvious outliers can be observed.
13.1.1.3Deep Trench Vein
| D.G. DuPre and Associates Inc. | Page 45 |
| Technical Report on the Herbert Gold Property | April 10, 2013 |
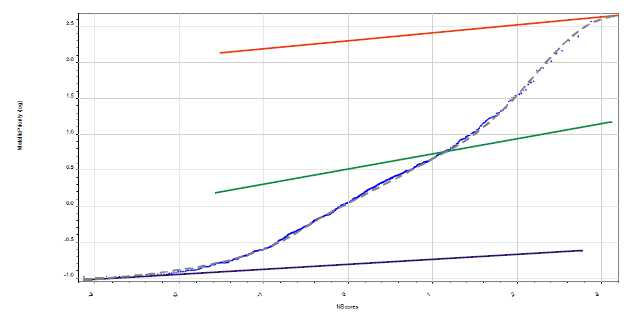
Figure 19. Lognormal probability plots of all raw sample data >0.01 g/t within the Deep Trench Vein solid.
The raw sample data for the Deep Trench Vein displays a mixture of three populations with the statistics for the lower (blue), middle (green) and upper (red) populations shown on Table 17.
Table 17. Statistics of the three populations of the raw gold assays for the Deep Trench Vein
| DTV | Percent | Mean (g/t) |
| Upper | 1.4 | 199.53 |
| Middle | 60.00 | 3.16 |
| Lower | 38.6 | 0.16 |
The three populations can be modeled smoothly with only minor perturbations in an otherwise smooth plot.
The 1m composite data for the Deep Trench Vein (only samples >0.01 g/t plotted) were considered and showed trends of mixed sample populations similar to that identified in the raw data.
| D.G. DuPre and Associates Inc. | Page 46 |
| Technical Report on the Herbert Gold Property | April 10, 2013 |
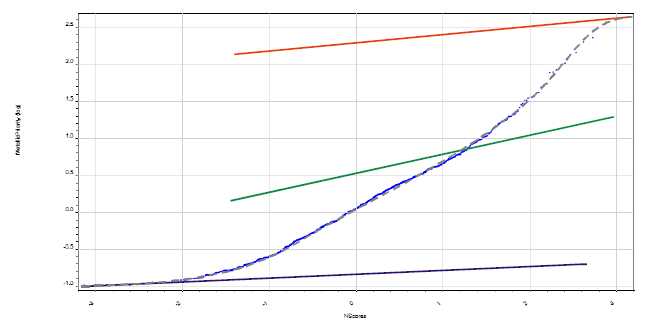
Figure 20. Lognormal probability plots of all 1m composite data >0.01 g/t within the Deep Trench Vein solid.
The 1m composite data for the Deep Trench Vein displays a mixture of three populations with the statistics for the lower (blue) middle (green) and upper (red) populations shown on Table 18.
Table 18. Statistics of the three populations of the 1m composites of gold assays for the Deep Trench Vein
| DTV | Percent | Mean (g/t) |
| Upper | 1.1 | 199.53 |
| Middle | 56.40 | 3.16 |
| Lower | 42.5 | 0.16 |
The three populations can be modeled to be very similar to the raw data with either reduction in the composite grades for the upper populations and/or an increase in the component of the lower grade populations. This is consistent with the effects of smoothing short, higher grade values to a minimum interval of 1 m.
Variography
The low number of sample points provides only limited meaningful results from variography. The larger significant data sets were modeled to provide some evidence of trends in the plane of the mineralized structures plunging down to the east at moderate trends.
Block Model Estimate
It was determined that a block model approximately 8m x 1.5m x 6m provided suitable detail without creating an unnecessarily large database. This was applied to the Main and Deep Trench Veins. Smaller solids (such as the Deep Trench Vein Hanging Wall) were modeled using smaller block sizes down to 2m x 2m x 2m.
Only composites whose center lies within the solid were used in the estimation. Sub-blocking was not applied due to the small size of the blocks relative to the solids model.
Blocks were constrained to surface topography, and by geology. Blocks west of the inclined sedimentary contact on the western side of the Main Vein and Deep Trench Vein were omitted.
| D.G. DuPre and Associates Inc. | Page 47 |
| Technical Report on the Herbert Gold Property | April 10, 2013 |
Probability plots of the block data for the Main Vein and Deep Trench Vein were completed to compare to the raw and composite assay data.
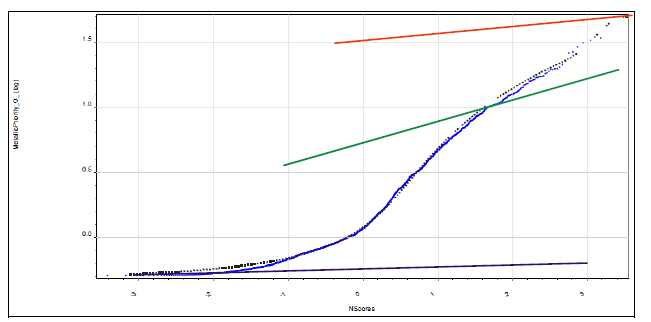
Figure 21. Lognormal probability plots of all block data >0.01 g/t within the Main Vein solid.
The block data for the Main Vein displays a mixture of three populations with the statistics for the lower (blue) middle (green) and upper (red) populations shown on Table 19.
Table 19. Statistics of the three populations of the 1m composites of gold assays for the Main Vein
| MV | Percent | Mean (g/t) |
| Upper | 0.30 | 31.62 |
| Middle | 43.70 | 5.62 |
| Lower | 56.00 | 0.32 |
The three populations can be modeled to be very similar to the raw and composite data with a reduction in the composite grades for the upper population concomitant with an increase in the component of the lower grade population. This is consistent with the effects of smoothing grades towards the average grade of the composites.
The block data for the Deep Trench Vein shows similar trends.
| D.G. DuPre and Associates Inc. | Page 48 |
| Technical Report on the Herbert Gold Property | April 10, 2013 |
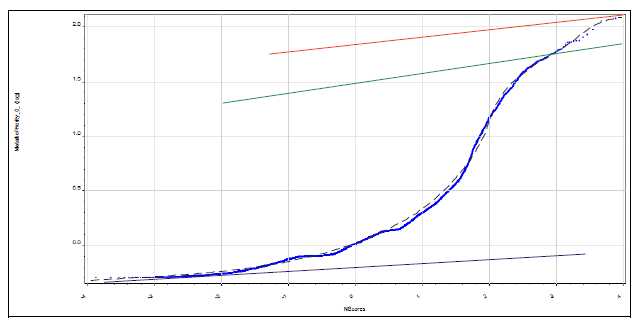
Figure 22. Lognormal probability plots of all block data >0.01 g/t within the Deep Trench Vein solid.
The Deep Trench Vein displays a mixture of three populations with the statistics for the lower (blue) middle (green) and upper (red) populations shown on Table 20.
Table 20. Statistics of the three populations of the 1m composites of gold assays for the Deep Trench Vein
| DTV | Percent | Mean (g/t) |
| Upper | 0.10 | 70.79 |
| Middle | 4.40 | 31.62 |
| Lower | 95.50 | 0.63 |
The three populations can be modeled to be very similar to the raw and composite data with a reduction in the composite grades for the upper populations and an increase in the component of the lower grade populations. This is consistent with the effects of smoothing grades to the average composite grades.
Interpretation Method
The grades of each block were estimated using inverse distance squared methods. It was determined that there was insufficient data to estimate using variography.
Estimation Plans
A single pass search strategy was employed using the maximum supported ellipsoid size. The search ellipsoid was oriented to each solid to lie within the structure. A minimum of 3 and a maximum of 12 composites were allowed for each block, with no restrictions on the maximum from each drill hole due to the oblique nature of many of the intercepts.
| D.G. DuPre and Associates Inc. | Page 49 |
| Technical Report on the Herbert Gold Property | April 10, 2013 |

Figure 23. Oblique view, down to the northwest showing all of the vein solids and the western sedimentary rock package, with an air photograph draped over topography ghosted for reference.
| D.G. DuPre and Associates Inc. | Page 50 |
| Technical Report on the Herbert Gold Property | April 10, 2013 |
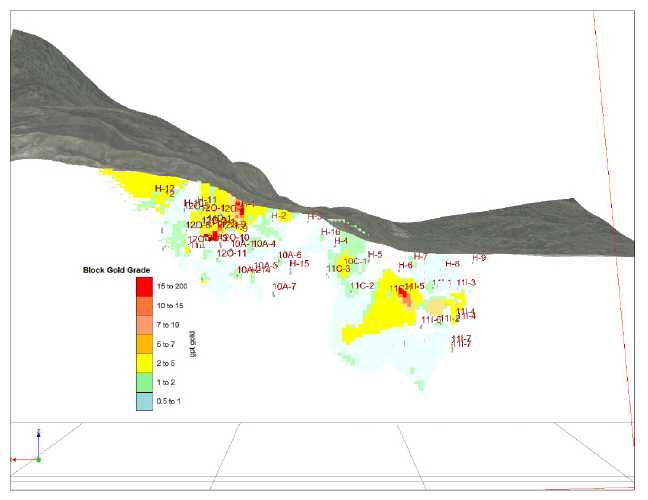
Figure 24. Longitudinal section of the Main Vein showing resource blocks above 0.5 g/t gold cut-off, viewed to the south, perpendicular to the solid.
| D.G. DuPre and Associates Inc. | Page 51 |
| Technical Report on the Herbert Gold Property | April 10, 2013 |
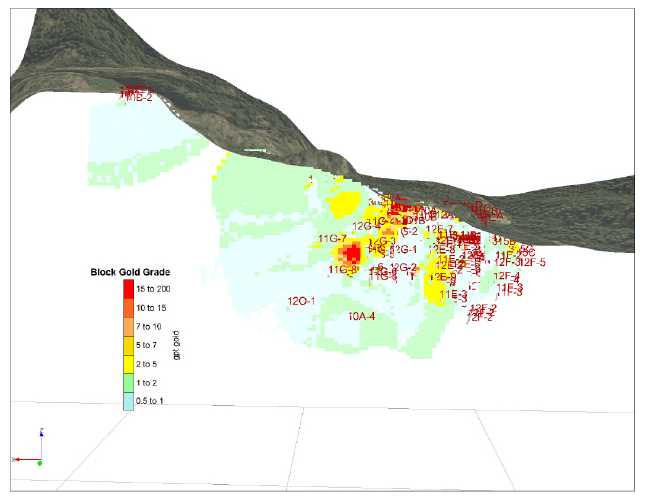
Figure 25. Longitudinal section of the resource blocks for the Deep Trench Vein above a 0.5 g/t gold cut-off, viewed to the south perpendicular to the solid.
| D.G. DuPre and Associates Inc. | Page 52 |
| Technical Report on the Herbert Gold Property | April 10, 2013 |
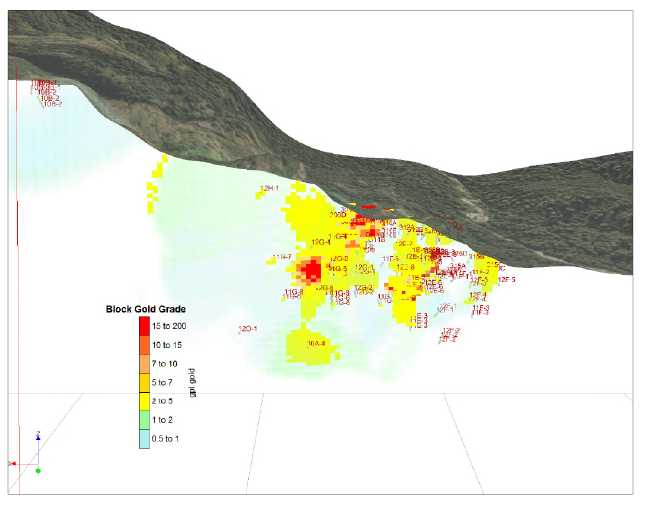
Figure 26. Longitudinal section of the resource blocks for the Deep Trench Vein above a 2.0 g/t gold cut-off. Blocks between 0.5 and 2.0 g/t are shown ghosted.
| D.G. DuPre and Associates Inc. | Page 53 |
| Technical Report on the Herbert Gold Property | April 10, 2013 |
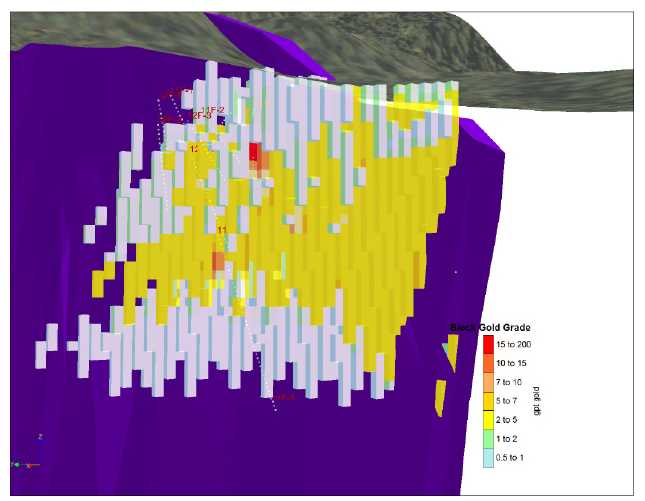
Figure 27. Longitudinal section of the Deep Trench Hanging Wall vein showing all resource blocks >0.5 g/t gold cut-off, viewed perpendicular to the solid. Purple solid in background is the Deep Trench Vein.
| D.G. DuPre and Associates Inc. | Page 54 |
| Technical Report on the Herbert Gold Property | April 10, 2013 |

Figure 28. Longitudinal section facing south of the Goat Creek Footwall Vein showing all resource blocks >0.5 g/t gold cut-off, oriented perpendicular to the solid.
| D.G. DuPre and Associates Inc. | Page 55 |
| Technical Report on the Herbert Gold Property | April 10, 2013 |
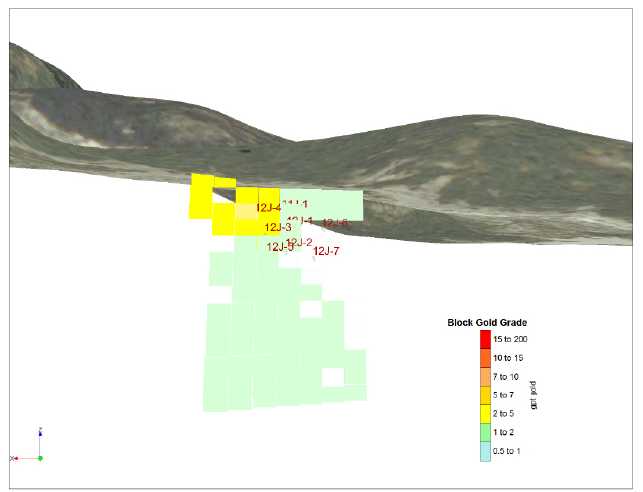
Figure 29. Longitudinal section of the Goat Creek Hanging Wall Vein showing all resource blocks >0.5 g/t cut-off, oriented perpendicular to the solid.
Validation of the Block Model
A graphical validation was done on the block model where cross sections, plans, and a 3D examination were conducted, testing intersections, solids and surface boundaries, and geology. Additional models were constructed removing selected drill holes to test for the robustness of the model. Each block appears to be well represented by the immediately adjoining composites as would be expected using the ID2 method.
The block models were also estimated using only the 1 AT assays yielding similar results at all cut-offs.
| D.G. DuPre and Associates Inc. | Page 56 |
| Technical Report on the Herbert Gold Property | April 10, 2013 |
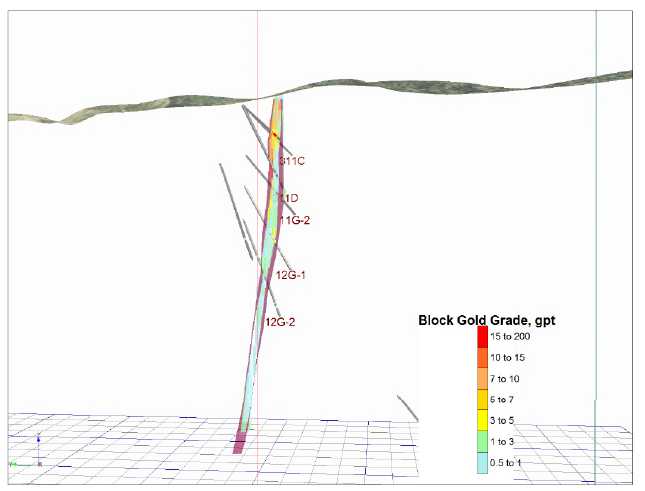
Figure 30. East-facing cross-section of the Deep Trench Vein with resource blocks and solids model (purple).
An alternative modeling procedure using image factors to develop solids models was attempted. This method uses the Pearson Correlation coefficients that were established using the geochemical data shown in Table 21.
Table 21. Pearson correlation coefficients for gold geochemistry of the Main and Deep Trench veins.
Field
Au_ICP21
Ag
Al
As
Ba
Be
Bi
Ca
Cd
Co
Cr
Cu
Fe
Ga
K
La | N
1070
438
762
940
762
732
186
762
248
760
762
759
762
746
762
739 | MV Au
1.0000
0.1014
-0.2964
0.2268
-0.1899
-0.2187
0.3600
-0.2089
0.4685
-0.1268
-0.0044
0.0335
-0.1250
-0.2004
-0.1678
-0.0183 | N
1191
504
1192
1141
1192
1133
218
1192
468
1183
1192
1181
1192
1149
1192
1139 | DTV Au
1.0000
0.6262
-0.3546
0.2904
-0.1937
-0.2750
0.5627
-0.2553
0.5925
-0.2487
-0.0014
-0.0464
-0.1124
-0.3028
-0.2227
0.0213 |
| D.G. DuPre and Associates Inc. | Page 57 |
| Technical Report on the Herbert Gold Property | April 10, 2013 |
Mg
Mn
Mo
Na
Ni
P
Pb
S
Sb
Sc
Sr
Th
Ti
Tl
U
V
W
Zn | 762
762
469
762
727
762
826
760
250
761
762
3
761
29
136
762
582
761 | -0.2151
-0.1849
0.0046
-0.1683
-0.0184
-0.2576
0.5337
0.2096
0.0338
-0.2250
-0.2092
-0.6025
-0.2566
NA
0.0704
-0.2238
-0.0041
0.2234 | 1190
1192
643
1191
1158
1191
1183
1171
377
1187
1192
5
1190
61
114
1192
940
1192 | -0.2871
-0.2807
0.0102
-0.2465
-0.0468
-0.3241
0.7813
0.3035
0.0742
-0.2950
-0.2504
NA
-0.3202
NA
-0.0229
-0.3140
0.0422
0.5794 |
These geochemistry data was standardized by subtracting the mean and dividing each number by the standard deviation creating a geochemical database where each element had a mean of zero and a standard deviation of 1. This geochemistry matrix was multiplied by the Pearson correlation coefficient creating a factor image, or a single number that incorporated all of the available geochemical data that correlates best with gold. For example, a sample that is within the Deep Trench Vein system with low gold values might be viewed more favorably if it has elevated Ag, As, Bi, Cd, Pb, S, and Zn and is depleted in Al, Be, P, Sc, Ti, and V. The depletions appear to correlate with quartz rich samples.
A plot of the gold factors for the Deep Trench Vein (Figure 31) shows that the high-grade gold trends defined by the red lines on Figure 31 correlate well with the high-grade trends identified using gold values alone as shown on Figure 34. Additional high-grade trends are suggested by the elevated Gold Factor figures to the east (left side). The western trends are truncated by a sedimentary sequence (not shown).
| D.G. DuPre and Associates Inc. | Page 58 |
| Technical Report on the Herbert Gold Property | April 10, 2013 |
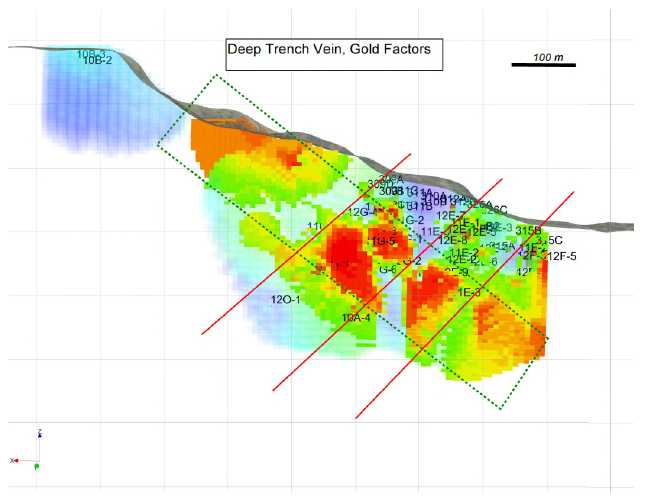
Figure 31. Inclined longitudinal section, viewed to the south of the Deep Trench Vein showing ID2 blocks of "Gold Factor" values.
Surface mapping, trenching and diamond drilling demonstrates continuity of mineralization on sections and between sections and enables three dimensional solids models to be constructed. Further modeling of the diamond drill and trench information within the solids enables the grade distribution to be estimated. An analysis of the resource blocks in the Main Vein and Deep Trench Vein reveals that many of the blocks are within 60m of composites, and these form cohesive, well defined domains. It was decided to classify these blocks as Indicated Mineral Resources and the balance as Inferred Mineral Resources. All other resource blocks are considered inferred.
This is presented on Table 22 (below) at various cut-offs. It is believed that for the location, geometry and grade distribution, it is reasonable to report the resource at the 2 g/t cut-off. All figures use a specific gravity of 2.757, tonnes are rounded to the nearest thousand and ounces are rounded to the nearest ten.
A breakdown of the Mineral Resource by reference to the solids is presented in Table 23 to Table 24.
| D.G. DuPre and Associates Inc. | Page 59 |
| Technical Report on the Herbert Gold Property | April 10, 2013 |
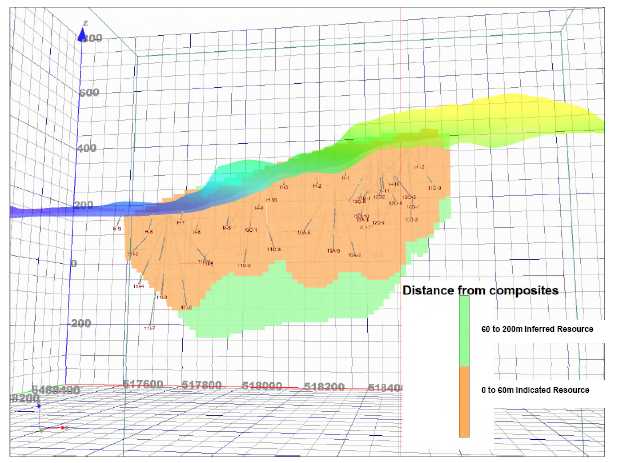
Figure 32. All resource blocks within 60 m of a composite in the Main Vein are shown.
| D.G. DuPre and Associates Inc. | Page 60 |
| Technical Report on the Herbert Gold Property | April 10, 2013 |
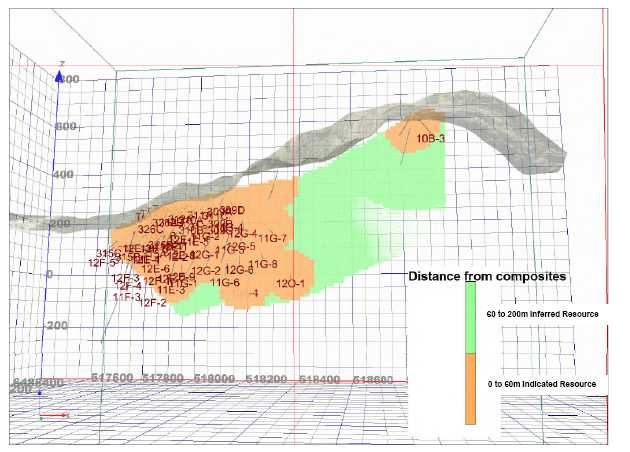
Figure 33. All resource blocks within 60 m of a composite in the Deep Trench Vein are shown, viewed to the north.
Table 22. Estimated Mineral Resource for the Herbert Property, uncut, ID2 methods as reported in this section. Tonnes and Ounces have been rounded to the nearest 100.
| Total Indicated |
| Cut-off | Tonnes | Au Grade (g/t) | Ounces Au |
| 3.0 | 532,400 | 9.34 | 159,800 |
| 2.5 | 637,900 | 8.25 | 169,200 |
| 2.0 | 821,100 | 6.91 | 182,400 |
| 1.5 | 1,081,300 | 5.66 | 196,900 |
| 1.0 | 1,645,500 | 4.14 | 219,000 |
| 0.5 | 2,867,500 | 2.69 | 248,100 |
| Total Inferred |
| Cut-off | Tonnes | Au Grade (g/t) | Ounces Au |
| 3.0 | 38,600 | 9.55 | 11,900 |
| 2.5 | 42,100 | 8.99 | 12,200 |
| 2.0 | 51,600 | 7.73 | 12,800 |
| 1.5 | 112,600 | 4.46 | 16,100 |
| 1.0 | 585,400 | 1.85 | 34,900 |
| 0.5 | 1,509,800 | 1.18 | 57,300 |
Table 23. Indicated Mineral Resource details for the Herbert Property.
| Deep Trench Vein |
| Cut-off | Tonnes | Au Grade (g/t) | Ounces Au |
| D.G. DuPre and Associates Inc. | Page 61 |
| Technical Report on the Herbert Gold Property | April 10, 2013 |
| 3.0 | 232,250 | 12.42 | 92,752 |
| 2.5 | 289,617 | 10.50 | 97,814 |
| 2.0 | 407,132 | 8.12 | 106,248 |
| 1.5 | 581,021 | 6.21 | 115,970 |
| 1.0 | 969,494 | 4.21 | 131,367 |
| 0.5 | 1,788,720 | 2.63 | 150,988 |
| Main Vein |
| Cut-off | Tonnes | Au Grade (g/t) | Ounces Au |
| 3.0 | 300,138 | 6.95 | 67,095 |
| 2.5 | 348,308 | 6.37 | 71,376 |
| 2.0 | 413,947 | 5.72 | 76,158 |
| 1.5 | 500,230 | 5.03 | 80,896 |
| 1.0 | 675,972 | 4.03 | 87,679 |
| 0.5 | 1,078,803 | 2.80 | 97,113 |
Table 24. Inferred Mineral Resource details for the Herbert Property.
| Deep Trench Vein |
| Cut-off | Tonnes | Au Grade (g/t) | Ounces Au |
| 3.0 | | | - |
| 2.5 | | | - |
| 2.0 | 3,375 | 2.02 | 219 |
| 1.5 | 32,952 | 1.74 | 1,845 |
| 1.0 | 402,169 | 1.28 | 16,579 |
| 0.5 | 877,586 | 1.01 | 28,607 |
| Main Vein |
| Cut-off | Tonnes | Au Grade (g/t) | Ounces Au |
| 3.0 | | | - |
| 2.5 | | | - |
| 2.0 | | | - |
| 1.5 | | | - |
| 1.0 | 3,705 | 1.09 | 130 |
| 0.5 | 115,397 | 0.78 | 2,882 |
| Deep Trench Vein Hanging Wall |
| Cut-off | Tonnes | Au Grade (g/t) | Ounces Au |
| 3.0 | 14,226 | 4.59 | 2,101 |
| 2.5 | 16,079 | 4.39 | 2,267 |
| 2.0 | 17,865 | 4.17 | 2,396 |
| 1.5 | 20,247 | 3.88 | 2,526 |
| 1.0 | 23,269 | 3.54 | 2,649 |
| 0.5 | 34,032 | 2.63 | 2,881 |
| Main Vein Splay |
| Cut-off | Tonnes | Au Grade (g/t) | Ounces Au |
| D.G. DuPre and Associates Inc. | Page 62 |
| Technical Report on the Herbert Gold Property | April 10, 2013 |
| 3.0 | 596 | 3.45 | 66 |
| 2.5 | 1,390 | 3.02 | 135 |
| 2.0 | 3,970 | 2.49 | 318 |
| 1.5 | 27,195 | 1.80 | 1,570 |
| 1.0 | 91,510 | 1.39 | 4,082 |
| 0.5 | 236,617 | 0.98 | 7,423 |
| Goat Vein Footwall |
| Cut-off | Tonnes | Au Grade (g/t) | Ounces Au |
| 3.0 | 21,438 | 13.62 | 9,390 |
| 2.5 | 22,034 | 13.33 | 9,445 |
| 2.0 | 23,423 | 12.67 | 9,539 |
| 1.5 | 27,394 | 11.08 | 9,758 |
| 1.0 | 48,832 | 6.73 | 10,558 |
| 0.5 | 229,074 | 1.98 | 14,569 |
| Goat Vein Hanging Wall |
| Cut-off | Tonnes | Au Grade (g/t) | Ounces Au |
| 3.0 | 2,382 | 3.97 | 304 |
| 2.5 | 2,581 | 3.86 | 320 |
| 2.0 | 2,978 | 3.62 | 347 |
| 1.5 | 4,764 | 2.85 | 437 |
| 1.0 | 15,880 | 1.77 | 902 |
| 0.5 | 17,071 | 1.69 | 926 |
In accordance with the Canadian Institute of Mining, Metallurgy and Petroleum (CIM) Standards on Mineral Resource and Mineral Reserves, adopted by the CIM Council, as amended; the classification of the resource is inferred except as noted at this time.
Mineral Resources that are not Mineral Reserves do not have demonstrated economic viability. The mineral resource estimates will be affected by environmental, permitting, taxation, socio-economic, marketing, political metallurgical, mining and infrastructure issues. These issues are mainly economic impacts that have not been examined so are not discussed in this report.
| 14 | Mineral Reserve Estimates |
There are no mineral reserve estimates for this property.
There are five active claim blocks in close proximity to the Herbert Gold project area. Figure 1 depicts these claims in yellow with the Herbert Gold project claims in red. The edge of the closest Isa claim block centered on the Mitchell and McPherson prospect (Barnett and Miller, 2003 - JU096) located 1100 m to the northwest. The next claim block 5 km to the northwest includes the Eagle River/Amalga Mine (Barnett and Miller, 2003 - JU094). This currently inactive mine had a reported 30,000 feet of underground workings and a 20-stamp mill dating from the 1930's. To the south within a 6 km radius are two other small claim blocks. The shape and orientation of all the claim blocks suggest a strong NW-SE structural orientation and are consistent with the regional mineralized trend.
| D.G. DuPre and Associates Inc. | Page 63 |
| Technical Report on the Herbert Gold Property | April 10, 2013 |
| 16 | OTHER RELEVANT DATA AND INFORMATION |
The authors are not aware of any other data that has material bearing on the Herbert Gold property.
| 17 | Interpretation and Conclusions |
The Herbert Gold project is located in the heart of the historic Juneau Gold District, SE Alaska. Mineralization at the property consists of mesothermal quartz-carbonate-gold-base metal veining and is typical to that seen throughout the district. Four principal veins have been named from south to north and are the Floyd, Trench, Main, and Goat veins. Minor veins include the North, Ridge and Lake. The principal veins strike N80E and dip steeply to the north. The cumulative strike length of all mapped veins at present is over 3,700 m. Drilling at the Herbert Gold project has been used to define an Indicated and Inferred mineral resource along a portion of the Main and Trench veins (and associated splays) and the Goat Veins.
The authors conclude from observation and work completed to date that the Herbert Gold project mineralization conforms to a model of orogenic-mesothermal gold mineralization and that such systems in Alaska have potential to develop economically recoverable resources. Work to date has made good progress in identifying continuity of mineralization in the Main and Deep Trench veins along a strike length of 680 m and 410 m along strike respectively and down dip extents from 200 m (Main Vein) to 300 m (Deep Trench Vein). Based on surface mapping and topography there is a reasonable possibility that these veins extend along strike an additional 280 m on the Main Vein and 520 m on the Deep Trench Vein. No geological evidence has been found to limit the down dip extension of these veins. In addition the Goat vein offers a strong potential for additional resources and four more minor veins are largely un-drill tested.
A mineral resource estimate has been calculated for the Herbert Gold property based on results from 127 diamond drill-core holes (total 18,361.1m meters of drilling) and 4 trenches (19.7 meters of trenching). The drill holes have partially tested the Goat, Ridge, Main and Deep Trench Veins. Utilizing a base case cut-off of 2 g/t, the property contains an Indicated Mineral Resource of 182,400 ounces of gold at an average grade of 6.91 g/t (821,100 tonnes) and an Inferred Mineral Resource of 12,800 ounces of gold at an average grade of 7.73 g/t gold (51,600 tonnes).
Preliminary resource estimates are strongly influenced by high-grade shoots along the veins. The best example to date is the zone encountered off the E-pad in 2011 where the Deep Trench vein dramatically thickens and grade increases. A second potential shoot may exist along the Main vein. Infill drilling in 2012 returned some lower than expected grades in close proximity to these high-grade shoots, reducing the resources estimated in these locations. It is entirely possible that a nugget effect wherein the gold was NOT intersected in these holes.
The resource model is largely dependent on these high-grade zones and drill delineation of the down dip extensions and identification of additional shoots are a priority. The resource remains open in multiple directions along these defined veins in addition to there being several highly prospective structures spread over the property.
| D.G. DuPre and Associates Inc. | Page 64 |
| Technical Report on the Herbert Gold Property | April 10, 2013 |
| | 18.1 | PHASE 1 EXPLORATION PROGRAM |
An exploration program designed to increase resources is proposed. Alternatively, depending on corporate objectives, it may be better to commence an underground sampling program to demonstrate continuity at depth, establish initial mining parameters, and commence base line studies.
Increase Resource
The total cost of the program is dependent upon on-going success, and the location of drill platforms, as such a range of costs will be presented.
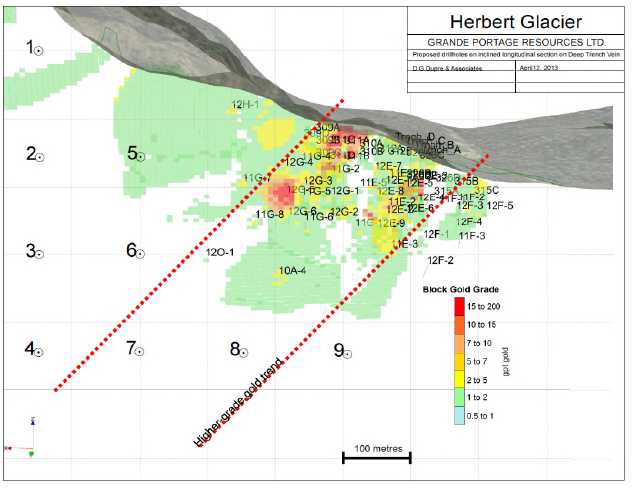
Figure 34. Proposed drill holes on an inclined longitudinal section of the Deep Trench Vein, viewed to the south.
Figure 34 shows nine pierce points for drill holes on an inclined longitudinal section of the Deep Trench Vein with the existing drill holes and resource blocks color-coded by grade, viewed to the south. A potential eastern-rake for the higher-grade zone is proposed and shown in the red-dashed lines. These holes are planned to be approximately 150 m apart to enable resource development should adjacent holes intersect significant mineralization. The drill holes would be between 175 and 850 m long assuming collar locations can be found allowing for a reasonable orientation on the vein.
| D.G. DuPre and Associates Inc. | Page 65 |
| Technical Report on the Herbert Gold Property | April 10, 2013 |
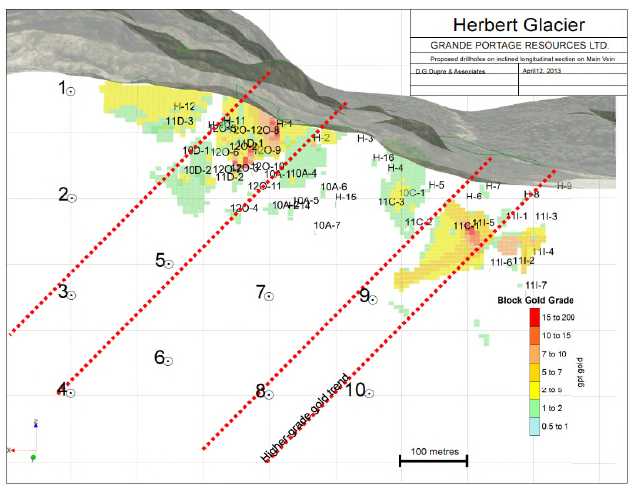
Figure 35. Proposed drill holes on an inclined longitudinal section of the Main Vein, viewed to the south.
Figure 35 shows nine pierce points for drill holes on an inclined longitudinal section of the Main Vein with the existing drill holes and resource blocks color-coded by grade, viewed to the south. A potential eastern-rake for the higher-grade zones are proposed and shown in the red-dashed lines. These holes are planned to be approximately 150 m apart to enable resource development should adjacent holes intersect significant mineralization. The drill holes would be between 125 and 800 m long assuming collar locations can be found allowing for a reasonable orientation on the vein. Some of the shallower pierce points could have the drill hole extend through the Main Vein to intersect the Deep Trench Vein in the footwall.
| D.G. DuPre and Associates Inc. | Page 66 |
| Technical Report on the Herbert Gold Property | April 10, 2013 |
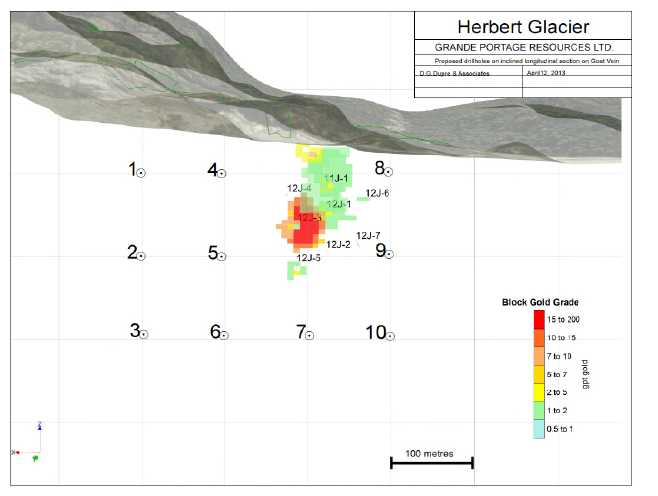
Figure 36. Proposed drill holes on an inclined longitudinal section of the Goat Veins, viewed to the south.
Figure 36 shows nine pierce points for drill holes on an inclined longitudinal section of the Goat Veins with the existing drill holes and resource blocks color-coded by grade, viewed to the south. These holes are planned to be approximately 100 m apart to enable resource development should adjacent holes intersect significant mineralization. The drill holes would be between 125 and 600 m long assuming collar locations can be found allowing for a reasonable orientation on the vein. Some of these drill holes could be pushed through the Goat Vein to intersect deep Main Vein intersections and should be considered.
A total of 29 drill holes have been proposed in this phase one program, totaling an estimated 16,000 m. Some of the holes can test multiple targets, and priorities should be given to the Deep Trench Vein first, followed by the Goat Vein and then Main Vein based on grades and anticipated results.
| Vein | Meters Proposed | Number of drill holes | Cost (@$350/m loaded) |
| Deep Trench Vein | 5,850 | 9 | 2,047,500 |
| Main Vein | 6,000 | 10 | 2,100,000 |
| Goat Veins | 4,500 | 10 | 1,575,000 |
| Total | 16,350 | 29 | 5,722,500 |
Figure 37. Proposed drill plan and budget
| D.G. DuPre and Associates Inc. | Page 67 |
| Technical Report on the Herbert Gold Property | April 10, 2013 |
In addition, continued mapping and sampling as well as soil and surficial water geochemistry should be tested to evaluate its effectiveness in detecting buried mineralization. Full multi-element geochemical packages should be considered. This should costs approximately $50,000 if conducted in conjunction with a drill program.
A relatively simple lineament analysis, not intending to be comprehensive illustrates some of the potential veins structures that sub parallel the known veins (Figure 38).
| D.G. DuPre and Associates Inc. | Page 68 |
| Technical Report on the Herbert Gold Property | April 10, 2013 |
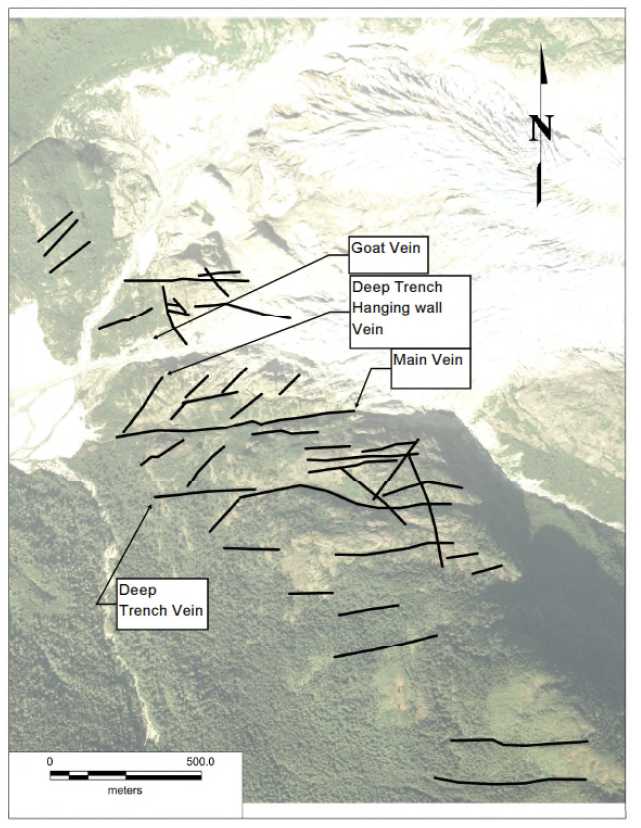
Figure 38. Simple lineament analysis of the draped air photograph of a portion of the Herbert Gold Property showing lineaments that sub parallel known veins structures.
Underground Program
| D.G. DuPre and Associates Inc. | Page 69 |
| Technical Report on the Herbert Gold Property | April 10, 2013 |
Topography allows for a relatively short decline to access a significant portion of the mineralization in the Deep Trench or Main Vein. The continuity and apparent simplicity of the Deep Trench Vein, along with its average grade and width makes this the preferred target for an underground program.
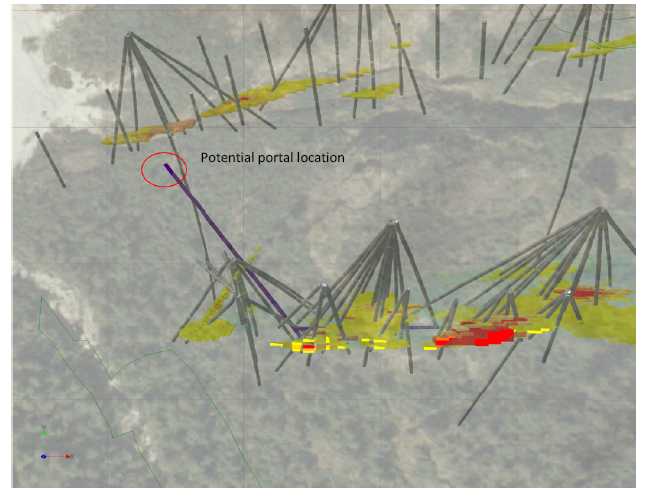
Figure 39. Potential portal location (red oval) and trace of ramp (purple) driven to the southeast at -15%.
The ramp would be at minimum production size, possibly 4m x 5m and at a maximum grade permitted or -15% az 143omight allow for a 300 to 400 tpd operation. Contract rates for driving 320 m of ramp may be around $2 million. It should be collared at back elevation 48m AMSL, be 190 m long and intersect the Deep Trench Vein around drill hole 12E-4 at elevation 24m. A turn to the east to follow the vein using geological controls for at least 120 m at -15% would allow for a reasonable confirmation of the length, width and grade of mineralization in the Deep Trench Vein at this location.
| D.G. DuPre and Associates Inc. | Page 70 |
| Technical Report on the Herbert Gold Property | April 10, 2013 |
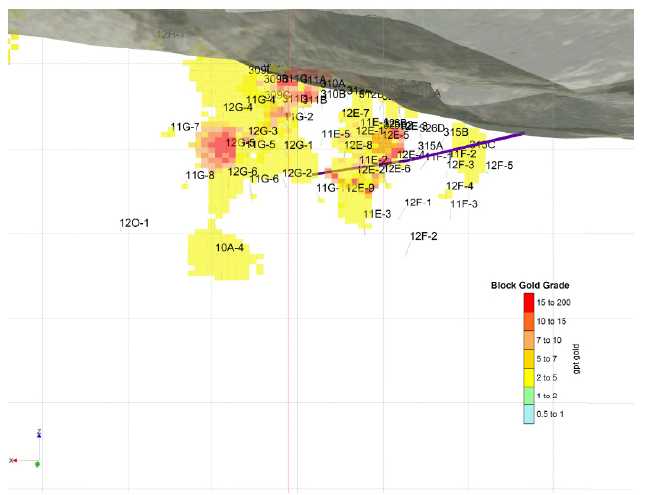
Figure 40. Inclined longitudinal section of the Deep Trench Vein showing a potential 15% ramp within the resource blocks (2 G/T cut-off), viewed to the south.
Additional benefits could be obtained by raising in mineralization for a larger and less diluted sample, more characteristic of what might actually be mined. Further, underground drill platforms could be established that would negate the need for helicopter support which in 2012 cost $440,000 or approximately $50 per meter drilled. Development in the hanging wall would provide for better drill platforms, however given that there are 5 to 6 mineralized veins over the 420 m between the Goat and Deep Trench veins, one might anticipate additional veins structures in the footwall of the Deep Trench Vein.
| D.G. DuPre and Associates Inc. | Page 71 |
| Technical Report on the Herbert Gold Property | April 10, 2013 |
Barnett, J.C., and Miller, L.D., 2003, ARDF report for the Juneau Quadrangle. USGS Open File Report 03-456, 587 p.
Gehrels, G.E. and Berg, H.C. 1992. Geologic map of Southeastern Alaska. USGS Miscellaneous Investigation Series Map 1-1867. 1:600,000 map sheet and accompanying booklet 24p.
Gehrels, G.E. and Berg, H.C. 1994, Geology of southeastern Alaska, in: Plafker, G. and Berg, H.C. eds. The Geology of Alaska, Geological Society of America, The Geology of North America, v. G-1.
Groves, D. I., Goldfarb, R. J., Robert, F., Hart, C. J. R., 2003, Gold Deposits in Metamorphic Belts: Overview of Current Understanding, Outstanding Problems, Future Research, and Exploration Significance. Economic Geology 98: 1-29.
Goldfarb, R.J., Miller, L.D., Leach, D.L., and Snee, L.W, 1997, Gold deposits in metamorphic rocks in Alaska, in Goldfarb, R.J., and Miller, L.D., eds., Mineral Deposits of Alaska: Economic Geology Monograph 9:151-190.
G & T Metallurgical Services, Ltd., 2011. Metallurgical testing report on the Herbert Glacier Project, dated March 15, 2011. Internal report, 49 p.
Hawley Resource Group, 2007 to 2011. Digital data files of sampling and assay results, aerial photography and geologic mapping at 1:2200 at Herbert Glacier Project.
Light, T.D., Brew, D.A., and Ashley, R.P., 1989, Gold deposits in metamorphic rocks. USGS Bulletin 1857D 27- 36.
Moerlein, G.A., 1986, Preliminary summary report Herbert Glacier, Juneau, Alaska. Internal report, 17 p.
Moerlein, G.A., 1988, 1988 diamond drilling, Herbert Vein - Juneau, Alaska. Internal report, 38 p.
Redman, E.C., Maas, K.M., Kurtak, J.M., and Miller, L.D., 1989, Bureau of Mines Mineral Investigations in the Juneau Mining District, Alaska, 1984-1988, Volume 2--Detailed mine, prospect, and mineral occurrence descriptions, Section D, Ju-neau Gold Belt Subarea: U.S. Bureau of Mines Special Publication, 424 p.
Van Wyck, N. and Burnett, W., 2012. Technical Report on the Herbert Glacier Gold Property, Southeast Alaska. Internal corporate report, Grande Portage Resources Ltd. and Quaterra Resources Inc., SEDAR. 64p.
| D.G. DuPre and Associates Inc. | Page 72 |
| Technical Report on the Herbert Gold Property | April 10, 2013 |
APPENDIX I
Glossary of Terms and Abbreviations
Glossary of Technical Terms
Adit – common mining term for a horizontal to sub–horizontal tunnel driven into a hillside to access an ore body.
Agglomerate – a volcanic rock consisting of fragments ofpyroclasticrocks more than 2 cm in size.
Alkaline – a term applied to igneous rocks which are characterised by relatively high concentrations of sodium and potassium.
Alluvial – deposits of sediment, usually sand and gravel transported and deposited by a river.
Argillaceous rocks – a group of detrital, fine grained, sedimentary rocks subdivided into silt grade (particle size range 1/16 to 1/256 mm) and clay grade (particle size < 1/256 mm).
Arsenide – a mineral formed by the combination of arsenic with another chemical
Barite – a white, yellow or colorless mineral, BaSO4. The principal ore of barium used in paints, drilling muds and as filler for paper and textiles. Syn: baryte, barytes.
Basic – describes an igneous rock with relatively low silica content (between 45–52% SiO2). Basic rocks are relatively rich in iron, magnesium and calcium and thus include most mafic rocks.
Beneficiation – the process of concentration of the valuable components of an ore or other mineral commodity. Commonly includes multiple stages such as crushing, grinding, washing, screening, flotation, roasting, etc.
Breccia – a rock that has been mechanically, hydraulically or pneumatically broken into angular fragments and re–cemented
Bulk Leach Extractable Gold - more commonly shortened to BLEG is a geochemical sampling/analysis tool used during exploration for gold. It was developed in the early 1980s to address concerns relating to the accurately measuring fine grained gold, and dealing with problems associated with sample heterogeneity.
Calcite – a very common rock forming mineral comprising calcium, carbon and oxygen (CaCO3).
Cenozoic Era – period of geological time extending from 65 million years ago to the present.
Chert – sedimentary rock that is ultra–fine grained and composed almost entirely of silica. May be of organic or inorganic origin.
Core strategy: sets out the long-term spatial vision for the local planning authority area, the spatial objectives and strategic policies to deliver that vision. The core strategy will have the status of adevelopment plan document.
Cretaceous – period of geological time from 142 to 65.5 million years ago. Marks the end of theMesozoic Era.
Devonian – period of geological time from 417 to 354 million years ago.
| D.G. DuPre and Associates Inc. | Page 73 |
| Technical Report on the Herbert Gold Property | April 10, 2013 |
Electrolytic – the process of extracting metal based on passing an electric current through a solution containing dissolved metals, causing the metals to be deposited on the cathode.
Extrusive – describes igneous rocks that have been formed by solidification of magma on or above the Earth's surface.
Felsic – In modern usage, the term felsic rock, although sometimes used as a synonym, refers to a high-silica-content(greater than 63% SiO2by weight)volcanicrock, such asrhyolite. In order to be classified as felsic, it generally needs to contain >75% felsic minerals; namely quartz, orthoclase and plagioclase. Rocks with greater than 90% felsic minerals can also be calledleucocratic, meaning 'light-colored'.
Footwall – the name given to the host rock of an ore deposit that is physically below the ore deposit.
Gangue – the undesirable or unwanted minerals in an ore deposit.
Graben - An elongated block of the earth's crust lying between two faults and displaced downward relative to the blocks on either side, as in a rift valley.
Hangingwall – the name given to the host rock of an ore deposit that is physically above the ore deposit.
Highwall mining – mining method used to maximize the output of an open–pit coal mine. Remotely operated cutting or boring machines are used to penetrate the coal seam at the foot of the highwall (the final wall in an open–pit) to extract coal.
Hydrometallurgy – the treatment of ores by wet processes, resulting in the dissolution of a particular component and its subsequent recovery by precipitation, adsorption or electrolysis.
Igneous – one of the three main groups of rocks on Earth. They have a crystalline texture and appear to have consolidated from a silicate melt (magma).
Inductively coupled plasma mass spectrometry (ICP-MS) -- a type of mass spectrometry that is highly sensitive and capable of the determination of a range of metals and several non-metals at concentrations below one part in 1012 (part per trillion). It is based on coupling together an inductively coupled plasma as a method of producing ions (ionization) with a mass spectrometer as a method of separating and detecting the ions. ICP-MS is also capable of monitoring isotopic speciation for the ions of choice.
Intrusion – a body ofigneousrock emplaced into pre–existing rocks, either along some structural feature such as a fault or by deformation and rupturing of the invaded rocks. (Intrusive,adj).
Jurassic – period of geological time from 205.1 –142 million years ago.
Kaolin – group of pale coloured clay minerals. In the UK kaolin is an industrial mineral extracted from kaolinised granites in south–west England. It is used as a paper filler and coater, and for high grade ceramics and pottery (china clay). .
Lenticular – lens shaped body of rock.
Lode – mining term for a mineralizedvein(used irrespective of whether theveincan be economically extracted).
Mesozoic Era – period of geological time from 250 to 65.5 million years ago.Subdivided into theTriassic,JurassicandCretaceousperiods.
Miocene – period of geological time from 23.8 to 5.32 million years ago.
| D.G. DuPre and Associates Inc. | Page 74 |
| Technical Report on the Herbert Gold Property | April 10, 2013 |
Mudstone – fine grained sedimentary rocks that are similar toshalesin their non–plasticity, cohesion and low water content but lack fissility.
Neogene – part of theCenozoic Era, comprising theMioceneandPlioceneepochs from 23.8 to 1.81 million years ago.
Oligocene – period of geological time from 28.5 to 23.8 million years ago.
Ordovician – period of geological time from 495 to 440 million years ago.
Paleogene – part of theCenozoic Eracomprising thePaleocene,EoceneandOligoceneepochs, from 65.5 to 23.8 million years ago.
Paleozoic Era – period of geological time from 545 to 245 million years ago.Subdivided into theCambrian,Ordovician,Silurian,Devonian,CarboniferousandPermian Periods.
Permian – period of geological time from 280 to 255 million years ago marks the end of the Paleozoic Era. Globally important source of coal.
Pliocene – period of geological time from 5.3 to 1.81 million years ago.
Precambrian - an informal name for the span of time before the currentPhanerozoicEon, and is divided into several eons of the geologic time scale. It spans from the formation of Earth around 4600 Ma (million years ago) to the beginning of the Cambrian Period, about 542 Ma, when macroscopic hard-shelled animals first appeared in abundance. Accounts for 90% of all geological time and ends approximately 545 million years ago.
Proterozoic - a geological eon representing a period before the first abundant complex life on Earth. The Proterozoic Eon extended from 2500 Ma to 542.0 ± 1.0 Ma (million years ago), and is the most recent part of the old, informally named ‘Precambrian’ time.
Pyroclastic – fragmental volcanic material that has been blown into the atmosphere by an explosive eruption.
Pyrometallurgical – the treatment of ores by processes involving heating.
Quarrying (mining) – the extraction of rock from an open pit site.
Quaternary – the uppermost part of theCenozoic Erafrom 1.81 million years ago to present day.
Refractory – a general term for a material that resists chemical or physical change.
Refractory ore – ore from which it is difficult to extract the valuable constituents. This material may require special treatments, such as pressure leaching, to recover the valuable minerals.
Sedimentary rocks – rocks formed from material derived from other rocks by weathering. Deposited by water, wind or ice.
Silurian – period of geological time from 440 to 417 million years ago.
Stope – mining term for the underground void left after ore extraction has taken place.
Stratabound – an ore deposit that is confined to a single stratigraphic bed or horizon but which does not constitute the entire bed.
| D.G. DuPre and Associates Inc. | Page 75 |
| Technical Report on the Herbert Gold Property | April 10, 2013 |
Stratiform – an ore deposit that occurs as a specific stratigraphic (i.e. sedimentary) bed.
Sulphide – a mineral formed by the combination of sulphur with another chemical element. Most economic deposits of non–ferrous metals occur as sulphide minerals e.g. galena, PbS; sphalerite, ZnS; chalcopyrite, CuFeS2.
Triassic – period of geological time from 250 to 205.1 million years ago. This period marks the beginning of theMesozoic Era.
Tuff -- (from the Italiantufo) is a type of rock consisting of consolidated volcanic ash ejected from vents during a volcanic eruption.
Tuff Breccia and Volcanic Agglomerate - as distinguished from the true ashes, these tend to occur in angular fragments; and when they form a large part of the mass the rock is more properly a "volcanic breccia" than a tuff. The ashes vary in size from large blocks ten meters or more in diameter to the minutest impalpable dust. Any ash in which large angular blocks are very abundant is called an agglomerate.
Ultrabasic – describes an igneous rock containing less than 45% silica (SiO2), including most ultramafic rocks.
Ultramafic – composed chiefly offerromagnesian(Fe–Mg) minerals, such as olivine and pyroxene.
Vein – A tabular or sheet–like assemblage of minerals that has been intruded into a joint or fissure in rocks.
Volcanogenic massive sulphide, VMS – an ore deposit typically comprising a lens of massive sulphide minerals (>60% sulphide) formed by volcanic processes normally on the sea–floor. VMS deposits are important sources of copper, lead and zinc.
Wallrock – an economic geology term used to describe the rock adjacent to an accumulation of ore minerals (veins, layers, disseminations, etc.).
Workings – the current or past underground or surface openings and tunnels of a mine. More specifically, the area where the ore has been extracted.
Zoning – in economic geology, the spatial distribution of distinct mineral assemblages or chemical elements associated with an ore–forming process.
Abbreviations
Unless otherwise indicated, the metric system of measure has been used throughout this report, including metric tons (tonnes, t), kilograms (kg) or grams (g) for weight, kilometers (km) or meters (m) for distance, hectares (ha) for area, liters (L) for volume and grams per tonne for gold (g/t Au) and silver (g/t Ag) grades. Base metal grades are usually expressed in weight percent (%). Geochemical results or precious metal grades may be expressed in parts per million (ppm) or parts per billion (ppb) (1 ppm = 1 g/t). Precious metal quantities may also be reported in troy ounces (ounces, oz), a common practice in the mining industry. In the Imperial System, significant gold concentrations are reported as troy ounces per short ton. In the metric system, gold concentration is now reported in grams per metric tonne. One troy ounce per short ton= 34.2857 grams per metric tonne. Currency values are in Canadian dollars ($CDN).
| D.G. DuPre and Associates Inc. | Page 76 |
| Technical Report on the Herbert Gold Property | April 10, 2013 |
| Description | Abbreviation |
| Atomic absorption | AA |
| Banded Iron Formation | BIF |
| Bulk Leach Extractable Gold | BLEG |
| Canadian Dollars | $CDN |
| Canadian National Instrument 43-101 | NI 43-101 |
| Centimeter(s) | Cm |
| Degree(s) | 0 |
| Degrees Centigrade/Celsius | 0c |
| Foot/feet | ft. |
| Fire Assay | FA |
| Gold | Au |
| Gram(s) | g |
| Grams per tonne | G/T |
| Micron(s) | µ |
| Meter(s) | m |
| Meters above sea level | masl |
| Inch(es) | in |
| Description | Abbreviation |
| Millions of years ago | Ma |
| Inductively coupled plasma mass spectrometry | ICPAR-UT |
| Kilometer(s) | km |
| Lead | Pb |
| Methyl isobutyl ketone | MIBK |
| Ounce(s)/Troy ounce(s) | oz |
| Ounce per ton | Oz/t |
| Parts per billion | ppb |
| Parts per million | ppm |
| Percent | % |
| Qualified Person(s) | QP(s) |
| Quality Assurance/Quality Control | QA/QC |
| Reduced Level | RL |
| Rock quality designation | RQD |
| Silver | Ag |
| Specific gravity | SG |
| Square kilometers | km2 |
| Three-dimensional | 3D |
| Tonnes per cubic meter | t/m3 |
| D.G. DuPre and Associates Inc. | Page 77 |
| Technical Report on the Herbert Gold Property | April 10, 2013 |
| Two-dimensional | 2D |
| Volcanogenic massive sulphide deposits | VMS |
| Zinc | Zn |
| D.G. DuPre and Associates Inc. | Page 78 |