UNITED STATES
SECURITIES AND EXCHANGE COMMISSION
Washington, D.C. 20549
FORM 20-F
[ ] REGISTRATION STATEMENT PURSUANT TO SECTION 12(b) OR (g) OF THE SECURITIES EXCHANGE ACT OF 1934
or
[X] ANNUAL REPORT PURSUANT TO SECTION 13 OR 15(d) OF THE SECURITIES EXCHANGE ACT OF 1934
For the fiscal year endedDecember 31, 2014
or
[ ] TRANSITION REPORT PURSUANT TO SECTION 13 OR 15(d) OF THE SECURITIES EXCHANGE ACT OF 1934
or
[ ] SHELL COMPANY REPORT PURSUANT TO SECTION 13 OR 15(d) OF THE SECURITIES EXCHANGE ACT OF 1934
Commission file number0-55139
Quaterra Resources Inc.
(Exact name of Registrant as specified in its charter)
British Columbia, Canada
(Jurisdiction of incorporation or organization)
1100 – 1199 West Hastings Street, Vancouver, British Columbia, Canada V6E 3T5
(Address of principal executive offices)
Scott B. Hean, Chief Financial Officer
1100 – 1199 West Hastings Street, Vancouver, British Columbia, Canada V6E 3T5
Phone (604) 681-9059 and Fax (604) 688-4670
(Name, telephone, e-mail and/or facsimile number and address of company contact person)
Securities registered or to be registered pursuant to Section 12(b) of the Act:None
Securities registered or to be registered pursuant to Section 12(g) of the Act:Common Shares, no par value
Securities for which there is a reporting obligation pursuant to Section 15(d) of the Act:None
Indicate the number of outstanding shares of each of the issuer’s classes of capital or common stock as of the close of the period covered by the annual report.
193,479,416 common shares
Indicate by check mark if the registrant is a well-known seasoned issuer, as defined in Rule 405 of the Securities Act.
[ ] Yes [X] No
If this report is an annual or transition report, indicate by check mark if the registrant is not required to file reports pursuant to Section 13 or 15(d) of the Securities Exchange Act of 1934.
[ ] Yes [X] No
Indicate by check mark whether the registrant: (1) has filed all reports required to be filed by Section 13 or 15(d) of the Securities Exchange Act of 1934 during the preceding 12 months (or for such shorter period that the registrant was required to file such reports), and (2) has been subject to such filing requirements for the past 90 days.
[X] Yes [ ] No
Indicate by check mark whether the registrant has submitted electronically and posted on its corporate web site, if any, every Interactive Data File required to be submitted and posted pursuant to Rule 405 of Regulation S-T (§232.405 of this chapter) during the preceding 12 months (or for such shorter period that the registrant was required to submit and post such files).
[ ] Yes [X] No
Indicate by check mark whether the registrant is a large accelerated filer, an accelerated filer or a non-accelerated filer. See definition of “accelerated filer and large accelerated filer” in Rule 12b-2 of the Exchange Act.
| Large accelerated filer [ ] | Accelerated filer [ ] | Non-accelerated filer [X] |
Indicate by check mark which basis of accounting the registration has used to prepare the financial statements included in this filing:
U.S. GAAP [ ]
International Financial Reporting Standards as issued by the International Accounting Standards board [X]
Other [ ]
If “Other” has been checked in response to the previous question, indicate by check mark which financial statement item the registrant has elected to follow.
Item 17 [ ]
Item 18 [ ]
If this is an annual report, indicate by check mark whether the registrant is a shell company (as defined in Rule 12b-2 of the Exchange Act).
[ ] Yes [X] No
TABLE OF CONTENTS
CAUTIONARY STATEMENT REGARDING FORWARD-LOOKING INFORMATION
This annual report contains forward-looking statements about our operations and planned future activities within the meaning of the safe harbor for such statements under the Private Securities Litigation Reform Act of 1995. Statements that are not historical fact and relate to predictions, expectations, belief, plans, projections, objectives, assumptions, future events, or future performance may be “forward-looking statements.” Forward-looking statements may be identified by such terms as “believes”, “anticipates”, “expects”, “estimates”, “may”, “could”, “would”, “will”, “plan” or similar words. You are cautioned not to place undue reliance on forward-looking statements. Forward-looking statements are subject to a variety of risks and uncertainties which could cause actual events or results to differ from those reflected in the forward-looking statements, including, without limitation:
| • | our ability to finance the continued exploration of our mineral properties; |
| | |
| • | our history of losses and expectation of future losses; |
| | |
| • | our ability to obtain adequate financing for our planned development activities; |
| | |
| • | uncertainty of production at our mineral exploration properties; |
| | |
| • | the lack of Proven Mineral Reserves or Probable Mineral Reserves; |
| | |
| • | the impact governmental regulations, including environmental regulations; and |
| | |
| • | commodity price fluctuations. |
These forward-looking statements are based on the beliefs of our management as well as on assumptions made by and information currently available to us at the time such statements were made. We undertake no obligation to update forward-looking statements should circumstances or estimates or opinions change.
DIFFERENCES IN UNITED STATES AND CANADIAN REPORTING PRACTICES
Financial Information
All financial information in this annual report is prepared in accordance with International Financial Reporting Standards, (“IFRS”) as issued by International Accounting Standards Board (“IASB”). IFRS differs in some respects from United States generally accepted accounting principles, (“U.S. GAAP”), and thus our financial statements may not be comparable to financial statements of United States companies. The term Canadian generally accepted accounting principles (“Canadian GAAP”) refers to the accounting principles and standards before the adoption of IFRS.
Resource and Reserve Estimates
None of the Company’s properties have Mineral Reserves. Disclosure about the Company’s exploration properties in this Annual Report on Form 20-F uses the term “Mineral Resources”, “Measured Mineral Resources”, “Indicated Mineral Resources” and “Inferred Mineral Resources”, which are Canadian geological and mining terms as defined in accordance with National Instrument 43-101 (“NI 43-101”), standards of disclosure for mineral projects of the Canadian Securities Administrators, set out in the Canadian Institute of Mining (CIM) Standards. These terms are not defined in the U.S. Securities and Exchange Commission (SEC) Industry Guide 7,Description of Property by Issuers Engaged or to be engaged in Significant Mining Operations, and are normally not permitted to be used in reports and registration statements filed with the SEC. Accordingly, information contained in this Annual Report on Form 20-F contain descriptions of our mineral deposits that may not be comparable to similar information made public by U.S. companies subject to the reporting and disclosure requirements under the United States federal securities laws and the rules and regulations thereunder.
Cautionary Note to U.S. Readers concerning estimates of Measured Mineral Resources and Indicated Mineral Resources: This Annual Report on Form 20-F may use the terms “Mineral Resources,” “Measured Mineral Resource” and “Indicated Mineral Resource.” The Company advises U.S. investors that while such terms are recognized and permitted under Canadian regulations, the SEC does not recognize them. U.S. investors are cautioned not to assume that any part or all of the Mineral Resources in these categories will ever be converted into Mineral Reserves.
- ii -
Cautionary Note to U.S. Readers concerning estimates of Inferred Mineral Resources:This Annual Report on Form 20-F may use the term “Inferred Mineral Resource.” The Company advises U.S. investors that while such a term is recognized and permitted under Canadian regulations, the SEC does not recognize it. “Inferred Mineral Resources” have a great amount of uncertainty as to their existence, and great uncertainty as to their economic and legal feasibility. It cannot be assumed that all or any part of an inferred Mineral Resource will ever be upgraded to a higher category. Under Canadian rules estimates of Inferred Mineral Resources may not form the basis of feasibility or other economic studies. U.S. investors are cautioned not to assume that any part of all of the Inferred Mineral Resources exist, or is economically or legally mineable.
EMERGING GROWTH COMPANY STATUS
The Company is an “emerging growth company” as defined in section 3(a) of the U.S. Securities Exchange Act of 1934 (as amended by the U.S. Jumpstart Our Business Startups Act (the “JOBS Act”), enacted on April 5, 2012), and the Company will continue to qualify as an “emerging growth company” until the earliest to occur of: (a) the last day of the fiscal year during which the Company has total annual gross revenues of US$1,000,000,000 (as such amount is indexed for inflation every five years by the SEC) or more; (b) the last day of the fiscal year of the Company following the fifth anniversary of the date of the first sale of common equity securities of the Company pursuant to an effective registration statement under the U.S. Securities Act of 1933, as amended; (c) the date on which the Company has, during the previous three-year period, issued more than US$1,000,000,000 in non-convertible debt; or (d) the date on which the Company is deemed to be a ‘large accelerated filer’, as defined in Rule 12b–2 of the U.S. Securities Exchange Act of 1934, as amended. The Company expects that it will continue to qualify as an emerging growth company for the foreseeable future.
GLOSSARY OF GEOLOGIC AND MINING TERMS
| Anomaly: | A geological feature distinguished by geological, geochemical or geophysical means, which is detectably different than the general surroundings and is sometimes of potential economic value. |
| | |
| Breccia: | Rock consisting of more or less angular fragments in a matrix of finer-grained material or cementing material. |
| | |
| Diamond drill: | A type of drill in which the cutting is done by abrasion using diamonds embedded in a matrix rather than by percussion. The drill cuts a core of rock which is recovered in long cylindrical sections. |
| | |
| Dilution: | Process whereby unwanted gangue or waste rock is mixed with ore during mining. |
| | |
| Epithermal: | A class of ore deposits that form generally less than 1 km from surface. These deposits, which can host economic quantities of gold, silver, copper, lead and zinc are formed as a result of the precipitation of ore minerals from up-welling hydrothermal fluids. There are several classes of epithermal deposits that are defined on the basis of fluid chemistry and resulting alteration and ore mineralogy. Fluid chemistry is largely controlled by the proximity to igneous intrusive rocks and as a result igneous fluid content. |
| | |
| Extrusive Rock: | Igneous rock that has solidified on the earth’s surface from volcanic action. |
| | |
| Fluid inclusion: | A cavity, with or without negative crystal faces, containing one or two fluid phases, and possibly one or more minute crystals, in a host crystal. If two fluid phases are present, the vapor phase (bubble) may show Brownian motion. |
| | |
| Folds: | Flexures in bedded or layered rock formed when forces are applied gradually to rocks over a long period of time. |
- iii -
| Fracture: | Breaks in a rock, usually due to intensive folding or faulting. |
| | |
| Gambusino: | An individual miner working without machinery. |
| | |
| Gangue: | Term used to describe worthless minerals or rock waste mixed in with the valuable minerals. |
| | |
| Gouge: | The finely ground rock that result from the abrasion along a fault surface. |
| | |
| Grade: | The concentration of each ore metal in a rock sample, usually given as weight percent. Where extremely low concentrations are involved, the concentration may be given in grams per tonne (g/t) or ounces per ton (oz/t). The grade of an ore deposit is calculated, often using sophisticated statistical procedures, as an average of the grades of a very large number of samples collected from throughout the deposit. |
| | |
| Hectare: | A square of 100 metres on each side. |
| | |
| Indicated MineralResource: | An Indicated Mineral Resource is that part of a Mineral Resource for which quantity, grade or quality, densities, shape and physical characteristics can be estimated with a level of confidence sufficient to allow the appropriate application of technical and economic parameters, to support mine planning and evaluation of the economic viability of the deposit. The estimate is based on detailed and reliable exploration and testing information gathered through appropriate techniques from locations such as out-crops, trenches, pits, workings and drill holes that are spaced closely enough for geological and grade continuity to be reasonably assumed. |
| | |
| Inferred MineralResource: | An Inferred Mineral Resource is that part of a Mineral Resource for which quantity and grade or quality can be estimated on the basis of geological evidence and limited sampling and reasonably assumed, but not verified, geological and grade continuity. The estimate is based on limited information and sampling gathered through appropriate techniques from locations such as outcrops, trenches, pits, workings and drill holes. |
| | |
| Lithology: | The physical characteristics of a rock or a rock formation. |
| | |
| Mafic: | A term used to describe ferromagnesian minerals. Rocks composed mainly of ferromagnesian minerals are correctly termed melanocratic. |
| | |
| Massive: | A term used to describe sulfide ores containing more than 50% volume of sulphide. |
| | |
| Measured MineralResource: | A Measured Mineral Resource is that part of a Mineral Resource for which quantity, grade or quality, densities, shape, physical characteristics are so well established that they can be estimated with confidence sufficient to allow the appropriate application of technical and economic parameters, to support production planning and evaluation of the economic viability of the deposit. The estimate is based on detailed and reliable exploration, sampling and testing information gathered through appropriate techniques from locations such as outcrops, trenches, pits, workings and drill holes that are spaced closely enough to confirm both geological and grade continuity. |
| | |
| Mineral Deposit orMineralized Material: | A mineralized body which has been intersected by sufficient closely spaced drill holes and or underground sampling to support sufficient tonnage and average grade of metal(s) to warrant further exploration-development work. This deposit does not qualify as a commercially mineable ore body (Reserves), as prescribed under SEC standards, until a final and comprehensive economic, technical, and legal feasibility study based upon the test results is concluded. |
- iv -
| MineralResource: | A Mineral Resource is a concentration or occurrence of natural, solid, inorganic or fossilized organic material in or on the earth’s crust in such form and quantity and of such a grade or quality that it has reasonable prospects for economic extraction. The location, quantity, grade, geological characteristics and continuity of a Mineral Resource are known, estimated or interpreted from specific geological evidence and knowledge. |
| | |
| Mineral Reserve: | A Mineral Reserve is the economically mineable part of a Measured or Indicated Mineral Resource demonstrated by at least a Preliminary Feasibility Study. This Study must include adequate information on mining, processing, metallurgical, economic and other relevant factors that demonstrate, at the time of reporting, that economic extraction can be justified. A Mineral Reserve includes diluting materials and allowances for losses that may occur when the material is mined. |
| | |
| Mineralization: | Usually implies minerals of value occurring in rocks. |
| | |
| Ore: | A natural aggregate of one or more minerals which may be mined and sold at a profit, or from which some part may be profitably separated. |
| | |
| Probable MineralReserve: | A Probable Mineral Reserve is the economically mineable part of an Indicated, and in some circumstances a Measured, Mineral Resource demonstrated by at least a Preliminary Feasibility Study. This study must include adequate information on mining, processing, metallurgical, economic, and other relevant factors that demonstrate, at the time of reporting, that economic extraction can be justified. |
| | |
| Properties asprospects: | A property is a claim owned by a company and a prospect is a claim in which a company holds an interest. |
| | |
| Proven MineralReserve: | A Proven Mineral Reserve is the economically mineable part of a Measured Mineral Resource demonstrated by at least a Preliminary Feasibility Study. This study must include adequate information on mining, processing, metallurgical, economic, and other relevant factors that demonstrate, at the time of reporting, that economic extraction is justified. |
| | |
| Reserve(s): | A natural aggregate of one or more minerals which, at a specified time and place, may be mined and sold at a profit, or from which some part may be profitably separated. |
| | |
| Reversecirculation drill: | A rotary percussion drill in which the drilling mud and cuttings return to the surface through the drill pipe. |
| | |
| Tailings: | Material rejected from a mill after recoverable valuable minerals have been extracted. |
GLOSSARY OF ABBREVIATIONS
| | Ag: | Silver |
| | Ag g/t: | Silver grade measured in grams per metric tonne |
| | AMR: | Advance minimum royalty payments |
| | Au: | Gold |
| | Au g/t: | Gold grade measured in grams per metric tonne |
| | Ba: | Barium |
- v -
| | Co: | Cobalt |
| | CSAMT: | Controlled source audio-frequency magneto telluric geophysical survey |
| | Cu: | Copper |
| | EIS: | Environmental Impact Statement |
| | Fe: | Iron |
| | 43-101: | Canadian National Instrument 43-101 |
| | gpm: | gallons per minute |
| | gpt: | grams per tonne |
| | g/t: | grams per tonne |
| | IP: | Induced Polarization geophysical survey |
| | m.y: | Million years |
| | Ni: | Nickel |
| | NSR: | Net smelter return royalty |
| | Oz: | Troy ounce |
| | oz/t or opt: | Ounces per ton. |
| | Pb: | Lead |
| | Pd: | Palladium |
| | PGE: | Platinum Group Element |
| | PGM: | Platinum group minerals |
| | PPB: | Parts per billion |
| | PPM: | Parts per million |
| | Pt: | Platinum |
| | S: | Sulphur |
| | TD: | Total depth of a drill hole. |
| | tpd: | Tonnes per day |
| | U3O8: | Uranium oxide known as “yellow cake”. |
| | VLF: | Very low frequency electromagnetic geophysical survey |
| | VMS: | Volcanogenic massive sulphide |
CONVERSION TABLES
| Conversion Table |
| Imperial | | Metric |
| | | | |
| 1 Acre | = | 0.404686 | Hectares |
| 1 Foot | = | 0.304800 | Metres |
| 1 Mile | = | 1.609344 | Kilometres |
| 1 Ton | = | 0.907185 | Tonnes |
| 1 Ounce (troy)/ton | = | 34.285700 | Grams/Tonne |
| Precious metal units and conversion factors |
| | | | | | | | | | | | | |
| ppb | - Part per billion | 1 | | ppb | = | 0.0010 | | ppm | = | | 0.000030 | oz/t |
| ppm | - Part per million | 100 | | ppb | = | 0.1000 | | ppm | = | | 0.002920 | oz/t |
| oz | - Ounce (troy) | 10,000 | | ppb | = | 10.0000 | | ppm | = | | 0.291670 | oz/t |
| oz/t | - Ounce per ton (avdp.) | 1 | | ppm | = | 1.0000 | | ug/g | = | | 1.000000 | g/tonne |
| g | - Gram | | | | | | | | | | | |
| g/tonne | - gram per metric ton | 1 | | oz/t | = | 34.2857 | | ppm | | | | |
| mg | - milligram | 1 | | Carat | = | 41.6660 | | mg/g | | | | |
| kg | - kilogram | 1 | | ton (avdp.) | = | 907.1848 | | kg | | | | |
| ug | - microgram | 1 | | oz (troy) | = | 31.1035 | | g | | | | |
- vi -
PART I
| ITEM 1. | IDENTITY OF DIRECTORS, SENIOR MANAGEMENT AND ADVISERS |
Not applicable.
| ITEM 2. | OFFER STATISTICS AND EXPECTED TIMETABLE |
Not applicable.
A. Selected Financial Data- Unless otherwise indicated, all monetary references herein are denominated in Canadian Dollars. References to “$” or “Dollars” are to Canadian Dollars and references to “US$” or “U.S. Dollars” are to United States Dollars.
The following table sets forth our selected consolidated financial data for the five years ended December 31, 2014 prepared in accordance with IFRS as issued by IASB for the years ended December 31, 2014, 2013, 2012, 2011 and 2010. This information should be read in conjunction with our consolidated financial statements included in Item 17 of this annual report.
| | Fiscal year ended December 31, |
| IFRS | 2014 | 2013 | 2012 | 2011 | 2010 |
| Sales or operating revenues | Nil | Nil | Nil | Nil | Nil |
| | | | | | (2,769,248) |
| Net (loss) for the year | (2,484,716) | (28,817,916) | (4,853,976) | (11,264,539) | |
| | | | | | (0.08) |
| (Loss) per common share - basic and diluted | (0.01) | (0.17) | (0.03) | (0.08) | |
| Total assets | 43,920,079 | 46,237,523 | 73,312,971 | 73,610,822 | 65,460,923 |
| Net assets | 41,586,923 | 43,816,046 | 71,855,193 | 71,733,234 | 64,564,355 |
| Capital stock | 116,135,532 | 116,135,532 | 115,816,740 | 111,923,521 | 95,800,950 |
| Number of common shares outstanding | 193,479,416 | 193,479,416 | 162,990,836 | 152,353,283 | 136,464,161 |
| | | | | | |
| Derivative liability - warrants | 1,500,467 | 1,191,784 | 774,673 | - | |
| Cash dividends per common share | Nil | Nil | Nil | Nil | Nil |
| (1) | The adoption of IFRS by the Company did not require restatement of fiscal years prior to 2010. |
Exchange Rate Data
For the past five fiscal years ended December 31, 2014, the average rates calculated by using the average of the exchange rates on the last day of each month during the period) and for each of the previous six months, the high and low exchange rates for Canadian dollars expressed in terms of U.S. dollars (i.e., U.S. dollars required to purchase one Canadian dollar). The information was provided by the Bank of Canada:
| Financial Year | Average Exchange Rate |
| 2014 | 0.9058 |
| 2013 | 0.9699 |
| 2012 | 0.998917 |
| 2011 | 0.988667 |
| 2010 | 1.0295 |
| Financial Month | Exchange Rate |
| High | Low |
| February 2015 | 0.8054 | 0.7851 |
| January 2015 | 0.8620 | 0.7897 |
| December 2014 | 0.8806 | 0.8587 |
| November 2014 | 0.8906 | 0.8756 |
| October 2014 | 0.8994 | 0.8833 |
| September 2014 | 0.9201 | 0.8962 |
- 7 -
On March 24, 2015, the ending exchange rate for the conversion of one U.S. dollar into one Canadian dollar was 0.7823.
| B. | Capitalization and Indebtedness |
Not applicable.
| C. | Reasons for the Offer and Use of Proceeds |
Not applicable.
RISK FACTORS
Investing in common stock of Quaterra Resources Inc. (the “Company” or Quaterra”) involves a high degree of risk. Before deciding to purchase, hold or sell the Company’s common stock, you should carefully consider the risks described below in addition to the cautionary statements and risks described elsewhere and the other information contained in this 20-F and in the Company’s other filings with securities regulatory authorities. The risks and uncertainties described below are not the Company’s only ones. Additional risks and uncertainties not presently known to Quaterra or that Quaterra currently deems immaterial may also impair the Company’s business operations. If any of these known or unknown risks or uncertainties actually occurs with material adverse effects on Quaterra, the Company’s business, financial condition, results of operations and/or liquidity could be seriously harmed, which could cause the Company’s actual results to vary materially from recent results or from the Company’s anticipated future results. In addition, the trading price of the Company’s common stock could decline due to any of these known or unknown risks or uncertainties, and you could lose all or part of your investment.
The Company may not have sufficient funds to complete further exploration programs.
The Company does not generate operating revenue and must finance exploration activity by other means, such as raising funds through the continued sale of non-core assets, optioning certain property interests, such as the Yerington project copper assets to Freeport McMoran, the outright sale of properties, and finally, the issuance of debt and/or equity. The Company cannot provide any assurance that additional funding will be available for further exploration of the Company’s projects or to fulfill anticipated obligations under existing property agreements.
The consolidated audited financial statements have been prepared on a going concern basis, which assumes that the Company will be able to realize its assets and discharge its liabilities in the normal course of business. The ability of the Company to continue as a going concern and meet its commitments as they become due, including completion of the exploration and development of its mineral properties, is dependent on the Company’s ability to obtain the necessary funding. Two sale transactions totaling US$9 million (Nieves and the sale of residual United States mineral properties to Freeport McMoRan Mineral Properties, Inc.) occurred in the fourth quarter 2014. With the closing of these transactions, management believes the Company has sufficient funds for the next full year of operations.
The Company has a history of losses and expects to incur losses for the foreseeable future.
The Company has incurred losses during each of the reporting periods. Quaterra expects to continue to incur losses unless and until such time as one or more of the properties enter into commercial production and generate sufficient revenues to fund the Company’s continuing operations. The Company had a positive working capital of $3,754,387 at December 31, 2014.
Future equity transactions could cause dilution of present and prospective shareholders.
Historically, the Company has financed operations through private placements of common equity shares. In order to finance future operations and development efforts, the Company may raise funds through the issue of common shares, the issuance of securities convertible into common shares through private placements or public offerings, or the sale of assets. The common shares in these financings often are sold at a discount to market prices, and the exercise price of the warrants sometimes is at or may be lower than market prices. The Company cannot predict the size of future issues of common shares or the issue of securities convertible into common shares or the effect, if any, that issues and sales of the Company’s common shares will have on the market price of its common shares. Any transaction involving the issue of common shares, or securities or convertible into common shares, could result in dilution, possibly substantial, to present and prospective holders of common shares, either at the time of the financing or subsequently when restrictions if any expire and the common shares are resold into the public markets. Similarly, the Company cannot predict the value of any asset sale nor its effect on the market price of its common shares.
- 8 -
The Company’s exploration programs may not result in a commercial mining operation.
Mineral exploration involves significant risk because few properties that are explored contain bodies of ore that would be commercially economic to develop into producing mines. Quaterra’s mineral properties are without a known body of commercial ore and the proposed programs are an exploratory search for ore. The Company cannot provide any assurance that current exploration programs will result in any commercial mining operation. If the exploration programs do not result in the discovery of commercial ore, the Company will be required to acquire additional properties and write-off all investments in existing properties.
The Company does not have Proven Mineral Reserves or Probable Mineral Reserves.
The Company has not established the presence of any Proven Mineral Reserves or Probable Mineral Reserves (as such terms are defined in National Instrument 43-101 of the Canadian Securities Administrators) at any of Quaterra’s mineral properties. The Company cannot provide any assurance that future feasibility studies will establish Proven Mineral Reserves or Probable Mineral Reserves at Quaterra’s properties. The failure to establish Proven Mineral Reserves or Probable Mineral Reserves could restrict the Company’s ability to successfully implement its strategies for long-term growth.
Mineral resource estimates are subject to updates which may differ from prior estimates and adversely affect the value of the Company’s properties.
The estimating of mineralization is a subjective process and the accuracy of estimates is a function of the quantity and quality of available data, the accuracy of statistical computations, and the assumptions used and judgments made in interpreting engineering and geological information. There is significant uncertainty in these Mineral Resource estimates, and the actual deposits encountered and the economic viability of mining a deposit may differ significantly from our estimates. From time to time, Quaterra obtains updated resource estimates and technical reports related to the Company’s mineral properties.
The Company’s future business and financial condition are dependent upon resource prices.
Resource prices have fluctuated widely, particularly in recent years, and are affected by numerous factors beyond the Company’s control. These include international economic and political trends, inflation, currency exchange fluctuations, interest rates, global or regional consumption patterns, speculative activities and increased production due to new and improved extraction and production methods. These factors may negatively affect the marketability of any ore or minerals discovered at, and extracted from, Quaterra’s properties. If, because of a sustained decline in prices, financing were not available to meet cash operating costs, the feasibility of continuing operations would be evaluated and if warranted, would be discontinued.
The Company’s common share price has been and may continue to be subject to volatility.
U.S. and Canadian securities markets in recent years have experienced high levels of price and volume volatility, and the market price of securities of many companies have experience wide fluctuation in price which have not necessarily been related to the operating performance underlying assets values or prospects of such companies. Factors unrelated to Quaterra’s financial performance or prospects include macroeconomic developments in North America and globally, and market perceptions of the attractiveness of particular industries. The Company’s share price, financial condition, and results of operations are all also likely to be significantly affected by short-term changes in copper, gold, and silver prices. Continual fluctuations in metal prices may occur. As a result of any of these factors, the market price of the Company’s shares at any given point in time may be subject to wide swings unrelated to any direct action by Quaterra’s operations.
Some of the Company’s directors and officers may have conflicts of interest due to their involvement with other natural resource companies.
Some the Company’s directors and officers are directors or officers of other natural resource or mining-related companies and these associations may give rise to conflicts of interest from time to time. As a result of these conflicts of interest, Quaterra may miss the opportunity to participate in certain transactions, which may have a material, adverse effect on the Company’s financial position.
- 9 -
The Company may experience difficulty attracting and retaining qualified management to grow Quaterra’s business.
The Company is dependent on the services of key executives including the Chief Executive Officer and other highly skilled and experienced executives and personnel focused on advancing corporate objectives as well as the identification of new opportunities for growth and funding. Due to the Company’s relatively small size, the loss of these persons or the Quaterra’s inability to attract and retain additional highly skilled employees required for activities may have a material adverse effect on the Company’s business and financial condition.
The Company may be limited in its ability to manage growth.
Should the Company be successful in its efforts to develop mineral properties or to raise capital for such development or for the development of other mining ventures, it may experience significant growth in operations. Any expansion of the Company’s business would place demands on management, operational capacity, and financial resources. The Company anticipates that it will need to recruit qualified personnel in all areas of operations. There can be no assurance that Quaterra will be effective in retaining current personnel or attracting and retaining additional qualified personnel, expanding operational capacity or otherwise managing growth. The failure to manage growth effectively could have a material adverse effect on the Company’s business, financial condition and results of operations.
Environmental and other regulatory requirements may limit the Company’s operations and increase expenses.
The Company’s operations are subject to environmental regulations promulgated by various Canadian, U.S., and Mexican government agencies. Claims and current and future operations will be governed by laws and regulations governing mineral concession acquisition, prospecting, development, mining, production, exports, taxes, labor standards, occupational health, waste disposal, toxic substances, land use, environmental protection, mine safety and other matters. Companies such as ours that engage in exploration activities often experience increased costs and delays in production and other schedules as a result of the need to comply with applicable laws, regulations and permits. Issuance of permits for Quaterra’s exploration activities is subject to the discretion of government authorities, and the Company may be unable to obtain or maintain such permits. Permits required for future exploration or development may not be obtainable on reasonable terms or on a timely basis. Existing and possible future laws, regulations and permits governing operations and activities of exploration companies, or more stringent implementation thereof, could have a material adverse impact and cause increases in capital expenditures or require abandonment or delays in exploration.
Operating hazards associated with mining may expose the Company to liability.
Mining operations generally involve a high degree of risk, including hazards such as unusual or unexpected geological formations. Operations in which the Company has an interest are subject to all the hazards and risks normally incidental to exploration, development and production of minerals, any of which could result in work stoppages, damage to or destruction of mines and other producing facilities, damage to or loss of life and property, environmental damage and possible legal liability for any or all damage or loss. The Company currently does not maintain standard insurance policies on Quaterra’s properties. The Company may become subject to liability for cave-ins and other hazards for which cannot be fully insured or against which the Company may elect not to insure where premium costs are disproportionate to the Company’s perception of the relevant risks. For example, the Company is not currently covered by any form of political risk insurance or any form of environmental liability insurance. The payment of such insurance premiums and the incurring of such liabilities would reduce the funds available for exploration activities.
The Company’s properties may be subject to uncertain title
The acquisition of title to resource properties or interest therein is a very detailed and time consuming process. Title to and the area of resource concessions may be disputed. The Company has investigated title to all of its mineral properties and, to the best of the Company’s knowledge, title to all of Quaterra’s properties are in good standing.
- 10 -
The properties may be subject to prior, and in some cases, not fully ascertainable unregistered agreements or transfers, and title may be affected by undetected defects. Title may be based upon interpretation of a country’s laws, which laws may be ambiguous, inconsistently applied and subject to reinterpretation or change.
Enforcement of judgments or bringing actions outside the United States against the Company and its directors and officers may be difficult.
Quaterra is organized under the law of and headquartered in British Columbia, Canada, and several of the Company’s directors and officers are not citizens or residents of the U.S. In addition, a substantial part of the Company’s assets are located outside the U.S. and Canada. As a result, it may be difficult or impossible for one to (a) enforce in courts outside the U.S. judgments against the Company and a majority of Quaterra’s directors and officers, obtained in U.S. courts based upon the civil liability provisions of U.S. federal securities laws or (b) bring in courts outside the U.S. an original action against the Company and its directors and officers to enforce liabilities based upon such U.S. securities laws.
| ITEM 4. | INFORMATION ON THE COMPANY |
| A. | History and Development of the Company |
Quaterra was incorporated under the Company Act (British Columbia) on May 11, 1993 originally under the name Acquaterre Mineral Development Ltd. On November 30, 1993, the Company changed its name to Aquaterre Mineral Development Ltd. and ultimately became Quaterra Resources Inc. on October 23, 1997. Quaterra’s domicile is British Columbia, Canada and the Company operates under the British Columbia Business Corporations Act SBC 2002 Chapter 57.
On March 4, 1997, the Company increased its authorized capital from 20,000,000 common shares without par value to 100,000,000 common shares without par value.
On October 23, 1997, the Company consolidated its issued and un-issued share capital on the basis of five pre-consolidation shares for one post-consolidation share, and increased its authorized capital to 100,000,000 common shares without par value.
On August 3, 1998, the Company cancelled its previous form of Articles and adopted a new form of Articles.
On April 25, 2005, the Company completed the transition procedures in accordance with the Business Corporations Act (British Columbia), (the “New Act”).
On June 17, 2005, the Company increased the number of common shares which were authorized to issue to an unlimited number of common shares and, on June 13, 2005, cancelled its former Articles and adopted new Articles to take advantage of provisions of the New Act. The New Act was adopted in British Columbia on March 29, 2004 replacing the Company Act (the “Former Act”). The New Act requires the provisions formerly required in the Memorandum to be in the Company’s Articles. The New Act eliminates the requirement for a Memorandum.
The Company’s registered office is located at 1200 – 750 West Pender Street, Vancouver, British Columbia, Canada, V6C 2T8, Telephone: (604) 681-1194. The Company’s head office is located at 1100 – 1199 West Hastings Street, Vancouver, British Columbia, Canada V6E 3T5. Telephone: (604) 684-9384, Facsimile: (604) 641-2740. The Company’s website is www.quaterra.com. We are not including the information contained on our website as part of, or incorporating it by reference into, this Annual Report on Form 20-F.
Since our incorporation, substantially all our capital has been deployed to development of our exploration stage business. We have not undertaken any material mergers or acquisitions other than in the ordinary course of business. There have been no public takeover offers by third parties with respect to our shares and we have made no public takeover offers with respect to another company’s shares.
On January 1, 2011, the Company entered into an option agreement with North Exploration LLC to acquire 41 mining claims in White Pine County, Nevada, known as Butte Valley property. The Company could earn a 100% interest in the claims by making staged payments totaling US$1 million. The Company had an option at any time to purchase the property for the difference between US$1 million and the sum of amounts previously paid or if the full amounts had been paid under the above the sum of US$1. The property was subject to 2.5% NSR upon commencement of commercial production of which 1% could be bought down for US$1 million. On October 2, 2012, Quaterra sold the Butte Valley porphyry copper prospect to Freeport-McMoRan Mineral Properties Inc. (FMMP). FMMP paid Quaterra US$2 million, with a contingent acquisition bonus of US$1 million possible in the future if FMMP acquired certain additional designated properties in the area. The bonus was subsequently paid on July 29, 2013. Quaterra also retained the right, if and when FMMP completed a positive feasibility study, to elect to have either a 30% working interest in the project or a 2% NSR royalty. Please see the note for October 3, 2014, below for subsequent developments.
- 11 -
On February 7, 2011, Quaterra completed a private placement of 3,293,407 units for gross proceeds of US$6.0M (C$5,994,000) received from Goldcorp of Vancouver, B.C., pursuant to the 2010 Goldcorp-Quaterra Investment Framework Agreement (“IFA”). Each unit consisted of one common share and one-half of one share purchase warrant with an exercise price of $2.27 per full warrant expiring February 7, 2013.
On April 27, 2011, Quaterra completed the purchase of the Yerington property from Arimetco, Inc. Assets purchased include 4.2 square miles of patented claims and fee mineral properties centered on the former Anaconda open pit copper mine including 8,600 acre feet per year of water rights. This property, together with 9.3 and 13.2 square miles of unpatented claims at Yerington and nearby MacArthur respectively, provides the Company with a significant land position in the center of an historic copper camp. Quaterra has paid the remaining cash acquisition cost and has released 250,000 common shares of the Company stock previously issued and under escrow.
On May 12, 2011, pursuant to its January 1, 2011 option, Quaterra announced its acquisition of the Butte Valley porphyry copper prospect, located in White Pine County, Nevada. The property consists of approximately 45 square miles of mineral rights obtained by optioning and staking a total of 1,483 unpatented U.S. lode claims. The property was subsequently sold to FMMP in 2014 as mentioned above.
On May 26, 2011, the Company entered into a mining lease with an option to purchase agreement with Majuba Mining Ltd. to earn an interest in certain unpatented mining claims in Lyon County, Nevada, for US$1.61 million. The Company is required to incur a total of US$300,000 exploration work on or before the third anniversary and any difference between the actual expenditures and US$300,000 is required to be paid in the event that less than US$300,000 is so expended. The project is subject to 3% NSR upon commencing commercial production of which 1% can be bought for US$1,500,000. Subsequently, the work commitment has been extended to August 1, 2016.
On June 15, 2011, the Company entered into an option agreement with Nevada Alaska Mining Co., Inc. to acquire a 100% interest in certain mining claims in Esmeralda County, Nevada for US$1 million over ten years. A 2% NSR was required upon commercial production. The agreement was terminated on May 27, 2014, and the property returned to the lessee with no further obligation for Quaterra.
On July 4, 2011, Quaterra announced that it had finalized an option agreement with La Cuesta International, Inc. (LCI) to acquire a 100% interest in the Microondas prospect located in Zacatecas State, Mexico, about 17 kilometers south-southeast of Rio Grande. Quaterra had the right to earn a 100% interest in the property by making semi-annual lease/preproduction payments and paying a 1% Net Smelter Return royalty (“NSR”) payment that was capped at US$5 million. A portion of the property carried an uncapped 2% NSR royalty. Quaterra, at its option, could issue to LCI 20,000 common shares or its cash equivalent on or before June 12, 2012. The claims were dropped in April 2014 and the agreement terminated. The property was returned to the lessees with no further obligation for Quaterra.
On October 20, 2011, Quaterra added two properties to the Goldcorp IFA: El Calvo gold, located in the central Mexican state of San Luis Potosi, and Microondas gold-silver, located in Zacatecas State, Mexico. Microondas has subsequently been dropped from the Goldcorp IFA, and El Calvo has been sold to Goldcorp as detailed below in the note for September 19, 2013.
On October 26, 2011, as contemplated by their June 17, 2010 agreement, Quaterra entered into a joint venture agreement with Grande Portage Resources Ltd. for the Herbert Glacier gold project located near Juneau, Alaska. Grande Portage has acquired a 65% interest and the Company retains a 35% interest in this project. Each party has agreed to bear its proportionate share of costs for the further exploration and development of the project. Quaterra is currently in process of monetizing it non-core assets, including its 35% interest in Herbert Glacier. In the event that Grande Portage elects to drill before Quaterra has monetized its interest, the Company will be subject to dilution if it elects not to participate.
- 12 -
On March 21, 2012, Quaterra entered into an Amended and Restated Investment Framework Agreement (“ARIFA”) with Goldcorp. This agreement extended the IFA entered into with Goldcorp on January 29, 2010, through the first quarter of 2013. See June 10, 2013, and September 19, 2013, below for further amendments to the Goldcorp agreement involving this and other properties.
On April 12, 2012, Quaterra received $2.48 million from Goldcorp to fund additional exploration on certain properties in Mexico by issuing 4 million shares at the price of $0.62 per share.
On December 28, 2012, Quaterra completed a private placement of 6,541,571 units at the price of US$0.35 per unit for gross proceeds of US$2,289,550. Each unit consisted of one common share and one share purchase warrant with an exercise price of US$0.53 per warrant which expired unexercised on December 28, 2014.
On March 20, 2013, the Company entered into an exclusive exploration agreement with Desert Pearl Farms, LLC for an option to purchase the surface rights, mineral rights and surface water rights to the Hunewill Ranch property (approximately 800 acres) in Lyon County, Nevada. This agreement was amended in August 2014 and the total of the annual option payments over the same eight-year period is now US$1,885,000.
On March 28, June 5 and July 4, 2013, the Company borrowed a total of US$800,000 unsecured loans at an interest rate of 10% per annum from its Chairman of the board, Thomas Patton. As of December 31, 2013, US$200,000 was repaid and the balance of US$600,000 was amended on March 18, 2014 to a demand basis with a 40-day notice period. As of December 29, 2014, the Company had repaid all loans and related interest owed to the Chairman.
On June 10, 2013, Quaterra and Goldcorp entered into an amendment agreement with respect to the IFA dated January 29, 2010. This amendment extended the expiration for designation of Advanced Properties from January 2014 to January 2016. The amended terms include: i) lowering the spending requirement to earn a 2% NSR royalty to $1 million over first three years from $2 million over two years; ii) lowering the minimum annual expenditure requirement after three years to $250,000 from $1.0 million; and iii) allowing Goldcorp to pool expenditures from other projects to one project to meet the earn-in requirement described above. Goldcorp could earn a 70% interest in any Advanced Property by completing a feasibility study (increased from 65%). At the time a production decision was made, the Company could either participate at 30% or ask Goldcorp to underwrite loan guarantees in return for an additional 6% interest in the property.
Effective July 31, 2013, the Company implemented changes to management and composition of the Board of Directors.
On September 13, 2013, Quaterra completed a private placement of 29,810,000 units at the price of US$0.10 per unit for gross proceeds of US$2,981,000. Each unit consisted of one common share and one share purchase warrant with an exercise price of US$0.15 per warrant expiring September 13, 2016.
In September 2013, Quaterra and Goldcorp agreed that it was to the mutual benefit of both parties to reduce the number and size of properties currently in the IFA in response to changes in Mexico’s property tax and assessment work requirements. On September 19, 2013, Quaterra sold three properties (Sabino, Marijo, and El Calvo) in central Mexico to Goldcorp for a total cash consideration of US$375,000. Quaterra retained a 2% net smelter returns royalty (“NSR”) on each of the three properties capped at USD$2,000,000 per property.
On November 12, 2013, the Company entered into an exclusive exploration and option agreement with Yerington Mining LLC for a property known as Yerington Mining property (approximately 400 acres) located in Lyon County, Nevada. To earn the rights to conduct mineral exploration on the property, the Company is required to make an annual payment of US$200,000 in the first two years and then US$100,000 on each anniversary date until November 12, 2021. These payments also provide the Company the exclusive right to purchase the property during this eight-year period.
On November 19, 2013, the Company entered into an amendment agreement with La Cuesta International, Inc. with respect to the Santo Domingo property, pursuant to which the Company issued 347,150 common shares in satisfaction of two property payments. On the same date, the Company entered into an amendment agreement with La Cuesta International, Inc. with respect to the Microondas property, pursuant to which the Company issued 321,430 common shares in satisfaction of two property payments. Subsequently, both properties have been dropped by Quaterra with no further obligation.
- 13 -
On March 14, 2014, the Company closed a transaction to sell its uranium properties and assets located in the states of Arizona, Utah and Wyoming for gross proceeds of $500,000. The transaction provides working capital for the Company to focus on its Yerington-district copper properties. On April 30, 2014, the Company received a US$85,000 reclamation bond refund related to the uranium properties sold.
On June 16, 2014, the Company through its subsidiary Singatse Peak Services (SPS) announced it entered into a Membership Interest and Option Agreement (“Option Agreement”) with Freeport-McMoRan Nevada LLC (“Freeport”) which set out the terms for due diligence and exploration of the Company’s Yerington Nevada copper assets, including MacArthur, Yerington Pit, Bear Deposit and all other properties that SPS and Quaterra controls in the Yerington District. Details of the Option Agreement were disclosed in a June 16, 2014, press release. They are summarized here below:
| • | Under the Option Agreement, after conducting additional due diligence about SPS over the next year, Freeport has the right to earn an initial 55% interest in SPS by providing funds to SPS to complete three staged investigation and work programs totaling US$38,600,000 in project funding. During these stages, Freeport provides funding to SPS for property maintenance, G&A, environmental compliance and, in later stages, exploration. Freeport can earn a further 20% interest in SPS (increasing its holding to 75%) should it elect to fund SPS with a further US$100 million of spending, or complete a feasibility study, whichever comes first. |
| | |
| • | In the first 12-month stage of the Option Agreement, Freeport provided SPS US$2,500,000 for land, water and mineral rights title acquisitions and maintenance costs; G&A; and compliance with environmental laws. Freeport can terminate the agreement within the first stage of the Option Agreement at its discretion, with the US$2,500,000 being a firm commitment not being required to be repaid. Freeport can extend stage one of the agreement for up to a further 12 months upon payment of a US$400,000 extension fee and commitment of funds of US$1,250,000 for each six month extension. |
| | |
| • | In order for the second stage of the Option Agreement to commence, Freeport must commit to fund US$6,100,000 over the ensuing post-stage one 12-month period for property maintenance costs; G&A; environmental compliance; and exploration of the property. Freeport has until June 13, 2015 to decide to proceed. |
| | |
| • | During the 24 month third stage of the agreement Freeport may fund up to US$30,000,000 for exploration of the property; property maintenance costs; G&A; and environmental compliance. If Freeport completes the stage three funding it will have invested approximately US$39,000,000 in the Yerington Project and will have earned the right to own a 55% interest in SPS. |
| | |
| • | If Freeport chooses to proceed beyond Stage 3, it can elect to fund a further US$100,000,000, or fund the costs of completion of a feasibility study, to earn an additional 20% interest for a total 75% interest in SPS (the Additional Sole Funding). Alternatively, Freeport can choose to fund with Quaterra, proportional to their 55% and 45% working interests. If Freeport completes the Additional Sole Funding, Quaterra may elect to fund 25% of project expenditures or transfer an additional 5% interest to Freeport in return for Freeport carrying the first US$50,000,000 of Quaterra’s proportionate share of funding which is repayable from 90% of Quaterra’s project proceeds. |
| | |
| • | At any time when the parties are proportionally funding their share of costs, and before an affirmative decision to begin production, a non-funding party will suffer ordinary dilution. Should either party’s interest fall below 10%, it will be converted into a 1% NSR royalty. After a production decision, a non-funding party will dilute to a 1% NSR royalty. |
On July 2, 2014, the Company closed a non-brokered private placement of US$500,000 of units (the “Unit”), where each Unit comprised of one non-transferable convertible redeemable US$1,000 principal amount promissory note (the “Note”) and 11,442 non-transferable share purchase warrants. The Company issued US$500,000 Notes and 5,721,000 warrants exercisable at $0.16 per share until January 2, 2016, subject to acceleration right of the Company.
- 14 -
On July 18, 2014, the Company re-priced the exercise price of 6,541,571 warrants from USD$0.53 to USD$0.16 per warrant. The warrants expired unexercised on December 28, 2014.
On October 3, 2014, the Company closed the transaction in which it sold its residual interests including royalties in three non-core copper and molybdenum assets—Butte Valley, Nevada; SW Tintic, Utah; and Cave Peak, Texas—to Freeport-McMoRan Mineral Properties Inc. (“FMMP”) for US$5.0 million of which US$1.0 million was paid at Closing with the balance payable in US$500,000 quarterly increments commencing January 1, 2015 (which was paid on January 6, 2015), for eight consecutive quarters. At Closing, the Company issued 19 million share purchase warrants to FMMP; each warrant entitles FMMP to purchase one common share of the Company at a price of US$0.16 per share for five years, subject to vesting and termination provisions corresponding to the payment of the Purchase Price in tranches.
On December 29, 2014, the Company closed the sale of its 50% interest in the Nieves silver property in Zacatecas State, Mexico, to joint-venture partner Blackberry Ventures I, LLC (“Blackberry”), for US$4.0 million. Under the terms of the agreement, Quaterra will receive four payments over 15 months of US$1 million each, with each payment earning Blackberry an additional 12.5% interest in the project. All costs for maintaining and exploring the property will be the sole responsibility of Blackberry, with no dilution to Quaterra, through the end of 2015 or until Blackberry completes the acquisition, whichever is earlier. Upon closing, Blackberry will become the operator of the Nieves project. In the event that Blackberry subsequently sells the project, Quaterra will receive 5% of the future net sale price. In addition, Quaterra agreed to transfer its Americas claims in Durango State, Mexico, adjacent to Hecla Mining’s San Sebastian project, to Blackberry.
With the transfer of the Americas claims as part of the December 29, 2014 Nieves Sales Agreement, all remaining Mexico properties have either been returned to the underlying lessors or dropped, with the result that Quaterra presently controls no prospects subject to the terms of the Goldcorp IFA, which will expire on January 29, 2016. These changes reflect the objective of Quaterra and its Mexican subsidiaries to transition all operations out of Mexico.
With the closing of these transactions management believes the Company has sufficient funds for the next full year of operations.
For more information about our business, please refer to Item 4.D “Property, Plants and Equipment” below.
- 15 -
| C. | Organizational Structure |
Inter-corporate Relationships
The flow chart below presents the Company’s legal corporate structure and the jurisdictions of the incorporation.
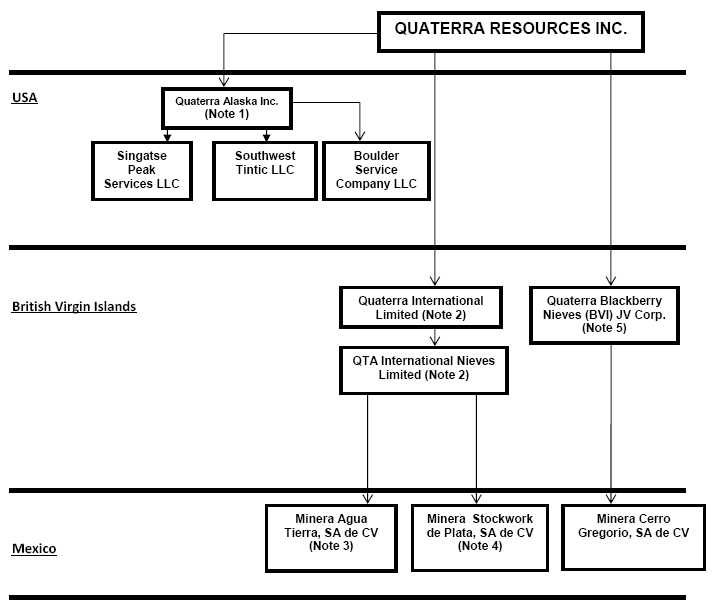
| Note 1: | Quaterra Alaska, Inc. is 100% owned by Quaterra Resources Inc. and holds Herbert Gold. Singatse Peak Services LLC holds MacArthur, Bear, Yerington and Wassuk properties. |
| | |
| Note 2: | Quaterra International Limited is 100% owned by Quaterra Resources Inc. and QTA International Nieves Limited is 100% owned by Quaterra International Limited. |
| | |
| Note 3: | Minera Agua Tierra S.A. de C.V. is 100% owned by QTA International Nieves Limited and holds no claims. |
| | |
| Note 4: | Minera Stockwork de Plata, S.A. de C.V. is 100% owned by QTA International Nieves Limited and holds no mineral claims. |
| | |
| Note 5: | Quaterra Blackberry Nieves (BVI) JV Corp. including its ownership of Minera Cerro Gregorio was sold to Blackberry Ventures I, LLC on December 29, 2014 for US$4 million which sale will be completed with staged payments concluding in December 2015. |
- 16 -
| D. | Property, Plants and Equipment |
GENERAL DEVELOPMENT OF THE BUSINESS
MacArthur, Nevada, USA
Acquisition and Staking of Mineral Claims
The MacArthur property consists of 897 unpatented lode claims totaling approximately 18,533 acres on lands administered by the US Bureau of Land Management (“BLM”). The total reflects the addition of 345 claims transferred from Quaterra’s wholly owned subsidiary, Singatse Peak Services LLC (SPS) to Quaterra Alaska’s MacArthur project in July 2012. A significant number of the claims are held by means of a mineral lease with option to purchase, executed on August 27, 2005 and subsequently amended. The agreement gives Quaterra the right to purchase the claims from North Exploration LLC (“North”) by making 3 annual payments of $524,000 (option balance) plus interest at the rate of 6% per annum by January 15, 2013. The second of these three annual payments was paid January 11, 2012. The third payment was renegotiated on December 14, 2012 to defray the final option balance by making a $100,000 payment plus $31,440 in interest prior to January 15, 2013 to extend the lease and option to January 15, 2014. The final payment was subsequently spilt and delayed to July 1, 2014 for US$212,000 with the payment of $36,940 interest to be paid on March 31, 2014 and the reaming US$212,000 plus interest by January 15, 2015. (The final payment of $212,000 plus interest to North was made on February 10, 2015) Quaterra’s purchase is subject to a two percent Net Smelter Return (NSR) royalty with a royalty buy down option of $1,000,000 to purchase one percent of the NSR, leaving a perpetual one percent NSR. The agreement with North is in good standing.
Expenditures to Date
Acquisition costs incurred by the Company to December 31, 2014 were $3,636,565 (2013 - $3,363,308) and exploration expenditures were $19,670,055 (2013 - $19,501,476) for a total of $23,306,620 (2013 - $22,864,784).
Location, Access and Infrastructure
The MacArthur Copper Project is located near the geographic center of Lyon County, Nevada, USA along the northeastern flank of the Singatse Range approximately seven miles northwest of the town of Yerington, Nevada. The project is accessible from Yerington by approximately five miles of paved roads and two miles of maintained gravel road. A 100-foot wide gravel haul road that accessed the MacArthur open pit copper mine during the 1990s leads 5 miles south to the Yerington Mine. Beyond the MacArthur pit area are several existing historic two-track dirt roads that provide access throughout the property. Topographic coverage is on US Geological Survey “Mason Butte” and “Lincoln Flat” 7.5’ topographic quadrangles. The nearest major city is Reno, Nevada approximately 75 miles to the northwest.
History
The MacArthur project has been the subject of exploration and drilling by several operators who have contributed to the current database of more than 740 holes totaling approximately 282,000 feet. During the late 1940s, Consolidated Copper Mines attracted the interest of the US Bureau of Mines to conduct 7,680 feet of trenching in 1948 and followed up with the completion of eight core holes for 3,414 feet in 1950. The Anaconda Company (“Anaconda”) began investigations at MacArthur including 33 shallow drill holes during 1955, 1956, and 1957. In 1963, Bear Creek Mining Company (“Bear Creek”) optioned claims and drilled at least fourteen air rotary holes, the deepest to 663 feet. At least four holes for 1,237 feet were drilled to satisfy claim staking location work. During 1967 to 1968, The Superior Oil Company optioned the claims formerly held by Bear Creek and drilled eleven holes as rotary pre-collar, core finish, for 13,116 feet testing the concept that a deep primary sulfide-bearing porphyry copper ore shell might underlie the MacArthur oxide mineralization heretofore tested no deeper than 663 feet. During the early 1970s, Anaconda conducted an extensive trenching and rotary drilling program consisting of more than 280 rotary holes totaling approximately 56,000 feet over and adjacent to the present day MacArthur pit.
- 17 -
Metech Pty. Ltd., of Perth, Australia was commissioned to prepare an ore reserve and mining planning study of the MacArthur deposit in 1989 The Metech study initiated the purchase of the Anaconda Yerington district properties by Arimetco International (“Arimetco”). Arimetco mined a total of six million tons at an estimated grade of 0.36 % total copper using open pit methods from the MacArthur deposit in the period of 1995 to 1998. Due to financial difficulties resulting primarily from the low price of copper, Arimetco sought protection under Chapter 11 of the U. S. bankruptcy Code in January 1997 and suspended all operations in 2000. After Arimetco’s departure, the mining claims over the deposit were allowed to expire. No consistent, large-scale mining has occurred on the site.
Quaterra acquired the MacArthur property in August, 2005. The acquisition was motivated by Quaterra’s belief in the potential of the property to host a copper deposit capable of sustaining a large run-of-mine heap leach operation using a solution extraction/electrowinning (SXEW) process for low cost production. The Company initiated exploration drilling in April 2007 and by November 2011, completed a total of 204,700 feet of drilling in 401 holes on the property. The drilling program has defined a widespread blanket of acid soluble copper oxide and chalcocite mineralization above primary copper mineralization that is believed to be the fringes of a major copper porphyry system.
Geology
The MacArthur copper deposit forms part of the Yerington mining district which includes at least three, large, porphyry copper deposits (Yerington, Ann Mason, Bear), as well as two large iron-oxide copper gold (IOCG) deposits (Pumpkin Hollow, and Minnesota). Mineralization ranges from disseminated porphyry copper occurrences to skarn, limestone replacement, and vein type deposits.
The Yerington area is underlain by early Mesozoic volcanic and sedimentary rocks now exposed along uplands in the Singatse Range in the west and the Wassuk Range to the east. These Mesozoic rocks were intruded by two Middle Jurassic batholiths, an older granodiorite (Yerington Batholith) and younger quartz monzonite (Bear Quartz Monzonite) that comprise the majority of outcropping rocks in the district. The batholiths were themselves intruded by another Middle Jurassic quartz monzonite event moderately to steeply north dipping quartz-biotite-hornblende porphyry dike swarms, associated with copper mineralization, striking north-northwesterly across the entire mining district. The Mesozoic section is overlain by Early to Middle Tertiary volcanics deposited ash flow tuffs prior to the advent of normal, faulting associated with Late Tertiary basin-and-range extension that displaced and tilted all of the above-mentioned rocks. These faults dip east and are curved, concave upward, so that the dip of the fault flattens eastward. Net displacements are in an east-west direction. The geologic section is completed by post-faulting conglomerates and alluvium.
At MacArthur, the older granodiorite underlies most of the northern and western parts of the Company’s claim block. Along the east part of the claim block quartz monzonite is dominant and underlies the MacArthur pit. In bench walls at the MacArthur Pit, the quartz monzonite hosts conspicuous light brown limonite alteration banding (averaging 4 to 6 per foot) sub-parallel to the steeply north dipping, west-northwest trending quartz porphyry dikes. Along the eastern portions of the property, including the eastern third of the MacArthur pit, quartz monzonite assumes a light gray color due to widespread sodic-calcic alteration. A “border-phase quartz monzonite” commonly lies at the contact between the granodiorite and the quartz monzonite. The border-phase quartz monzonite is finer-grained than the quartz monzonite and has more abundant potassium feldspar.
Quartz porphyry dikes that host a large portion of the primary copper mineralization at Anaconda’s Yerington mine are associated with all copper occurrences in the district. The porphyry dikes at MacArthur are classified by dominate mafic minerals into quartz biotite porphyry and quartz hornblende porphyry, each subdivided further based on composition and alteration. Dikes contain feldspar crystals and either hornblende or biotite crystals set in an aphanitic matrix. The structures are typically ridge-formers with widths to 50 feet, dip steeply to the north, and follow a penetrative north-northwest (S60°E to S80°E) structural fabric. Narrow (<10 feet) fine grained, post porphyry andesite dikes follow the same NNW structural fabric.
Both Jurassic and Tertiary age andesite dikes in the walls of the MacArthur Pit can be traced from bench to bench and projected across the pit floors. The Jurassic dikes are commonly very fine grained, plagioclase-bearing porphyries that pinch and swell as they fill fractures and intrude the hornblende and biotite quartz porphyry dikes. Tertiary hornblende andesite dikes are similar, but coarser grained than the Jurassic andesite dikes, containing abundant, acicular, black hornblende phenocrysts and occasionally plagioclase phenocrysts. Mid-Tertiary ash flow tuff units unconformably overlay the Mesozoic intrusive rocks in the southeast and western margins of the property.
- 18 -
Mineralization
The MacArthur deposit is part of a large, partially defined porphyry copper system that has been complicated by complex faulting and possible post-mineral tilting. Events leading to the current geometry and distribution of known mineralization include 1) emplacement of primary porphyry copper mineralization; 2) supergene enrichment resulting in the formation of a widespread, tabular zone of secondary chalcocite mineralization below outcrops of totally oxidized rocks called a leached cap; 3) oxidation of outcropping and near-surface parts of this chalcocite blanket, as well as oxidation of the primary porphyry sulfide system coupled with partial remobilization of copper to form the upper zone of oxide copper now exposed in the MacArthur pit and throughout the MacArthur property. Oxide, chalcocite, and primary copper mineralization on the MacArthur property is hosted in both granodiorite and quartz monzonite, and in lesser amounts within quartz biotite-hornblende (monzonite) porphyry dikes, all of middle Jurassic age. Oxide copper is also hosted in northwest striking andesite dikes less than one to ten feet wide with contacts forming favorable loci for mineralization. Andesite dikes make up less than approximately one to two percent of the host rocks on the property. Fracturing and ground preparation supplied the passage ways for the copper to migrate.
Copper oxide minerals are exposed throughout Quaterra’s MacArthur property, particularly in MacArthur pit walls as primarily green and greenish-blue chrysocolla CuSiO3.2H20 along with black neotocite, aka copper wad (Cu, Fe, Mn) SiO2, azurite Cu3(OH2)(CO3) and malachite Cu2(OH2)CO3, while tenorite (CuO) was identified with the electron microprobe (Schmidt, 1996). Copper-enriched limonite was identified by Anaconda as the mineral delafossite (CuFeO2). Chalcocite has been identified in drill holes below the MacArthur pit and in drilling throughout the property. The sulfides digenite (Cu9S5) and covellite (CuS) have been identified petrographically in drill cuttings from the western part of the property. The oxide copper mineralization is strongly fracture controlled, coating joint and fracture surfaces and within shears and faults. Both green and black copper oxides are frequently found on 1-5 millimeter fractures, as coatings and selvages and may be mixed with limonite. The fractures trend overall N60°W to N80°W (bearing 300° to 280° azimuth) and generally dip to the north. Limited turquoise is found on the property, mainly in one- to five-millimeter veinlets. On a minor scale, oxide copper mineralization replaces feldspar phenocrysts in the igneous host units, favoring andesite.
A significant amount of chalcocite has been intersected in drillholes. Chalcocite is seen on drill chips or drill core coating pyrite and chalcopyrite as weak to strong coatings and is strongest when occurring around the MacArthur fault. Chalcopyrite is present as disseminations and veinlets, with or without chalcocite. As much of the historic drilling was stopped at shallow (<400 foot) depths, the scope and extent of chalcopyrite mineralization have not been fully defined.
Both copper oxide and chalcocite mineralization occur over approximately 9,000 feet east-west by 4,500 feet north-south. Copper oxides are structurally controlled coating fractures, joint surfaces, and developed as green or black “streaks” within shears and faults over several feet. Chalcocite may similarly be seen as grayish “streaks” within shears. Oxide mineralization exhibits a generally flat-lying geometry extending with good continuity 150 feet below surface and less continuously up to 600 feet below surface. Chalcocite mineralization generally occurs as flat-lying zones 50 feet or more in thickness, mixed with or below oxide mineralization.
Primary chalcopyrite mineralization occurs irregularly with chalcocite and as porphyry style disseminations or as veinlets in quartz monzonite associated with potassic alteration below both the oxide and chalcocite mineralization. Quaterra’s drilling program in the Gallagher area has delineated a zone of chalcopyrite mineralization that extends over a north-south distance of 2,500 feet. The primary sulfide zone has a defined width of 500 feet and extends to a depth of approximately 650 feet.
Porphyry copper style sulfide mineralization below the low-angle MacArthur fault zone at the North Porphyry Target has been defined over a distance of 2,500 feet between holes QM-68 and QM-164. Veinlet and disseminated primary chalcopyrite mineralization intercepted at a depth of 485 feet in QM-68 assayed 1.19% copper over a thickness of 110 feet. The same zone in QM-70 averaged 0.82% copper over a thickness of 60 feet at a depth of 420 feet and correlates to a thickness of 15 feet averaging 1.20% at a depth of 770 feet in hole QM-72. QM-100 intersected the sulfide mineralization with 0.58% copper over 65 feet. Approximately 1,000 feet to the north, hole QM-164 intercepted 64 feet of disseminated chalcopyrite mineralization in sodic altered granodiorite averaging 1.31% copper at a depth of 1,673 feet. The intercept includes a high-grade zone of 29 feet averaging 2.21% . Mineralized zones within potassic halos in holes QM-165 to the west and in QM-163 to the east are consistent with those that could fringe a porphyry copper center.
- 19 -
Exploration and Drilling Results
Quaterra acquired the digitized Anaconda exploration and drilling data package in August 2006 and commenced a review of the deposit geology and mineralization model using Datamine software. The data was used to assess the required drilling and sampling to complete a technical report on the MacArthur Project with the objective of preparing a NI 43-101 compliant resource estimate.
The lateral zonation of supergene copper minerals visible at the surface, a possible chalcocite blanket to the north of the pit, and a large, pervasive phyllic alteration zone to the north and west of the mine workings, all suggested to Quaterra that the MacArthur deposit could have a potential for growth; both in the form of copper oxides and as primary sulfides in a related porphyry system.
In April 2007, the Company commenced a drilling program to twin approximately 10% of the shallow holes that defined the previously explored copper oxide mineralization at MacArthur and to identify extensions of copper oxide and chalcocite mineralization in the vicinity of the open pit. The 20-month drilling program totaled 80,100 feet in 173 holes including 23,900 feet of core in 49 holes and 56,200 feet of reverse circulation drilling in 124 holes. The drilling successfully targeted a deeper chalcocite zone in step-out holes from the pit, expanded the known oxide mineralization, and encountered a large, underlying tabular blanket of mixed oxide-chalcocite mineralization that overlies primary chalcopyrite mineralization verified by deeper drillholes in the western and northern margins of the drilled area.
Drilling on the MacArthur project was suspended through most of 2009 pending receipt of a Plan of Operations (POO) drilling permit. On October 28th the Company received the approval of the MacArthur POO and the BLM Record of Decision with a Finding of No Significant Impact (FONSI). The POO environmental assessment anticipates a total surface disturbance of 200 acres as a result of drilling activities throughout much of the project area.
Quaterra initiated a second phase of reverse circulation and deep core drilling in early December 2009. Completed in August 2010, the program tested the northern extension to higher grade acid soluble copper mineralization on 500 foot centers northwest of the pit in-filled on 500 ft centers an undrilled area west of the pit. In the southern Gallagher area, the program confirmed a band of continuous near surface oxide mineralization ranging in thickness from 15 to 60 feet over a distance of 1,900 feet between holes QM-155 and 156.
Three deep holes tested IPR anomalies to the north and northwest of the MacArthur pit where earlier drill holes intersected ore grade porphyry copper style sulfide mineralization below the low-angle MacArthur fault zone over a strike length of 1,000 feet. Hole QM-100, located 1,400 feet north of QM-68, intercepted porphyry-style chalcopyrite/biotite-chlorite veining at a depth 1,203 feet that assayed 0.58% copper over a thickness of 65 feet below the shallow-dipping MacArthur fault zone. QM-109, spotted on an IPR anomaly, failed to reach projected depth due to fractured, caving ground while QM-99 intersected massive pyrite impregnated breccia and scattered zones of secondary biotite and chlorite alteration; common elements of a porphyry system.
A total of 81,650 feet were drilled in 153 holes including 69,890 feet in 147 RC holes and 11,760 feet in 6 core holes during the 2011 drilling program. The program had the twin goals of enlarging and upgrading the status of the inferred resources through step-out and infill drilling and exploring for primary sulfide mineralization related to a copper porphyry system at depth.
The infill program encountered high grades of continuous chalcocite and copper oxide mineralization in zones averaging 40 feet or more in thickness along the western and northern margins of the deposit in the area referred to as the “Ridge Zone”. To test the high-angle mineralized structures that form an important component of the acid-soluble copper deposit, the program was completed on 250-foot centers in areas with higher grade potential and encountered some of the highest grades and best intercepts of acid soluble copper mineralization ever drilled on the property. Hole QM-187, drilled 2,000 feet north of the MacArthur pit, intersected 90 feet of predominantly chalcocite mineralization averaging 1.66% total copper (TCu) starting at a depth of 310 feet. This intercept includes 40 feet assaying 3.49% TCu. Hole QM-180 along the northwestern margin of the zone intercepted 40 feet averaging 1.37% TCu at a depth of 360 feet.
Exploration for a deep porphyry system at MacArthur intercepted one of the best primary copper intercepts yet identified on the project with 64 feet of disseminated chalcopyrite mineralization in sodic altered granodiorite averaging 1.31% TCu at a depth of 1,673 feet. The intercept includes a high-grade zone of 29 feet averaging 2.21% TCu. QM-164 also intercepted a shallower zone of both vein and disseminated chalcopyrite at a depth of 685 feet that averages 0.34% TCu over a thickness of 96.5 feet. QM-164 extended the mineralized zone identified in QM-100 a distance of 1,000 feet to the north where it remains open for extension.
- 20 -
Geophysics
Quaterra Resources contracted three surveys at the MacArthur project in 2011 and 2012. A borehole geophysical survey and a surface IP/resistivity (IPR) survey were carried out by Zonge International in 2011. A detailed helicopter magnetic survey was flown by Geosolutions Pty. Ltd. in 2012. These surveys supplement previous geophysical work on the property that includes: a 2009 IPR survey carried out by Zonge; a 2007 helicopter magnetic survey carried out by EDCON-PRJ; a series of historic aeromagnetic surveys (1966 to 1975) available in analog form from the Anaconda Archives; and a series of historic IPR surveys (1963 – 1964) carried out by Kennecott Exploration Services/Bear Creek Mining Company and Superior Oil.
The mineralized system at MacArthur has an anomalous IP and resistivity response first detected in the Kennecott and Superior Oil IPR surveys in the 1960’s. The Quaterra 2009 and 2011 IPR surveys confirmed the reliability of the earlier surveys and further defined the depth extent of the IP anomalies. The 2009 and 2011 Quaterra surveys confirmed that the 1963-64 Kennecott data is of good quality and is useful for mapping anomalous IP zones within the upper 1,000-1,200 feet from the surface. Below this depth, the older data cannot effectively resolve the bottom of the IP anomalies nor determine if any of the anomalies extend to great depths.
The 2009 and 2011 data sets show this increased depth of exploration is important. Portions of the IP response are flat lying with limited depth extent. However both the 2009 and 2011 surveys have identified anomalous IP responses with depth extent in excess of 2000 feet and possibly feeder zones of the near surface zones. In 2011, two borehole IP surveys were run that demonstrate Quaterra’s ability to explore for deep sulfide responses below the depth of exploration of surface techniques. The modern data maps subtle low resistivity features which are interpreted to be porphyry alteration systems and have identified anomalous IP responses that extend under post-mineral volcanic cover to the north and west of the main MacArthur system. These buried anomalies are high priority drill targets.
Two high resolution helicopter magnetic surveys were flown over the MacArthur project in 2007 (EDCON-PRJ) and 2012 (Geosolutions). The modern, high-resolution data has a broad frequency bandwidth and will be used for 3D modeling and exploring beneath the magnetic volcanic cover.
Sampling, Analysis and Security of Samples
Quaterra has explored the MacArthur property with both reverse circulation (RC) and diamond core drilling methods. Reverse circulation holes were drilled by Diversified Drilling LLC, Missoula, Montana, USA, DeLong Construction Inc., Winnemucca, Nevada, USA and by Leach Drilling Inc., Silver Springs, Nevada, USA. During 2007-2008 the core drilling was contracted to Kirkness Diamond Drilling of Dayton, Nevada, USA and Kirkness Brothers Diamond Drilling (aka KB Drilling Co, Inc) of Carson City, Nevada, USA. Major Drilling America, Inc., Salt Lake City, Utah, conducted core drilling during 2009-2010. Core drilling during 2011 was contracted to Ruen Drilling Inc, Clark Fork, Idaho, USA. The RC crews ran one 10-12 hour shift per day; the core drill crews operated 24 hours per day.
The MacArthur drilling program is supervised in the field by the project geologist for monitoring recovery, proper sample handling and accuracy in labeling. Drill core (HQ diameter) and reverse circulation samples are delivered from the drilling rigs to the core and sample storage facility in Yerington by the drillers at the end of each 12 hour shift for logging and sampling by the project geologists.
At the core storage/logging facility, core is photographed, measured, core recovery calculated, and the rock types, alteration minerals, textural features, structures, veining, and mineralized zones documented. Sample intervals on the first three holes were fixed at five feet. In subsequent drill holes the sample intervals are taken at each of the core runs marked by the driller’s blocks. Exceptions are where full recovery occurs in numerous, short core runs in intervals less than about 6 feet, or where the geologists visually selected sample intervals based on rock type or structure. Sample intervals are measured and marked with permanent marker, orange ribbon and aluminum tag that is stapled to the core tray showing the sample number. Where the core sample is coherent a line is drawn with permanent marker along the stick so that it is sawn in half perpendicular to the “grain” in order to get a representative split. The core is stored on pallets to be picked up by the analytical laboratory.
- 21 -
When core from the project arrives at the laboratory, it is split, using a core saw, into halves and one half of each interval is placed into a sample bag that is marked with the sample number. The sample is then dried, crushed to –10 mesh, rotary split to 1,000 grams, pulverized to –150 mesh, and split to 350 gram pulps. The pulps are assayed for total copper using a 2 gram-3 acid volumetric ore grade atomic-absorption (AA) spectroscopy analysis. The solution from the total Cu analysis is assayed by inductively coupled plasma (ICP) spectrometry for 34 elements. The acid soluble copper oxide (asCu) content of the sample is then analyzed by using a weak, sulfuric acid solution leach of a 1 gram pulp. The acid leachable copper sulfide content is analyzed by using ambient temperature concentrated sulfuric acid and hydrated ferric sulphate to determine Ferric Sulfate Soluble Copper (FSCu) content. Internal quality assurance and quality control procedures include the insertion of standards and duplicates into the sample sequences. Rejects from the previously analyzed samples are also sent to another accredited laboratory for check analyses. The remaining half core is placed back into the core box in its original position and the core boxes are returned to the Yerington core storage/logging facility by the laboratory truck, where it is then stacked and stored in order and by hole number. Reject and pulps are also returned with the core to the Yerington facility for archiving.
American Assay Laboratories (AAL) located in Sparks, Nevada prepared and assayed samples from the MacArthur drilling program in 2007. AAL is ISO/IEC 17025 certified and participates in CANMET, PTP MAL certification analyses twice a year and in GEOSTATS, SMA, and IOAG testing twice a year. Core samples from subsequent programs have been prepared and analyzed by ISO17025 compliant ALS Chemex Laboratories in Sparks, Nevada and Skyline Assayers and Laboratories (Skyline) in Tucson, Arizona.
The MacArthur reverse circulation drilling program is supervised in the field by the project geologist for sample accuracy, proper handling and accuracy in labeling. Methods and procedures for splitting and packaging of samples are conducted such that the quality of the sample splitting meets or exceeds standards required under NI 43-101 and a chain of custody starts with the drillers collecting, splitting and bagging of RC drill cuttings.
For logging of drilled lithologies, a continuous chip sample is collected in a plastic chip tray over five foot intervals and stored for logging by the project geologists. A 5/16 continuous split of five foot sample intervals is collected for assaying from 5.2 inch diameter drill holes through a wet splitter mounted on the rig. The samples are placed in sample bags and transported from the drilling rig to the Company’s storage facility in Yerington at the end of each 12-hour shift. The samples are then inventoried by Company personnel, dried, placed on pallets, wrapped in plastic and shipped via United Parcel Service to the Skyline laboratory in Tucson, Arizona for sample preparation and assaying. Rejects and pulps are returned to the Yerington facility for archiving.
Skyline Assayers & Laboratories is accredited by the American Association for Laboratory Accreditation (A2LA - certificate no. 2953.01) in the Chemical field of Testing. Skyline is a recognized industry leader for all types of base metal, ferrous and non-ferrous analysis including high quality ore-grade assays, sequential copper analyses of ores, and umpire assays of metallurgical products. The Tucson laboratory has provided analytical service to the copper mining industry for over 70 years.
At Skyline, the RC samples are crushed to plus 75% passing a -10 mesh, split and pulverized at the Skyline laboratories for assay using analytical techniques as described for the core drilling program. Internal quality assurance and quality control procedures include the insertion of standards into the sample sequences. Rejects from the previously analyzed samples are sent to ALS Chemex Laboratories in Sparks, Nevada for check assays.
Mineral Resources
Tetra Tech completed an updated National Instrument (“NI”) 43-101 compliant independent resource estimate for the MacArthur PEA titled “MacArthur Copper Project – Amended NI 43-101 Technical Report Preliminary Economic Assessment Lyon County, Neveda, USA” and dated January 17, 2014 (effective date May 23, 2012). At a 0.12% cutoff, the tonnage of the measured oxide and chalcocite resourcewas 71,829 million tons at 0.218% copper containing 313 million lbs. of copper, the indicated oxide and chalcocite resourcewas 87,264 million tons at 0.208% copper containing 362 million lbs. of copper, and the inferred oxide and chalcocite resource was 243.4 million tons at 0.201% copper containing 979.5 million lbs. of copper.
- 22 -
MacArthur’s indicated sulfide resource at a 0.15% cutoff is 1.1 million tons averaging 0.292% copper containing 6.4 million pounds of copper and the inferred sulfideresource was 134.9 million tons averaging 0.283% copper containing 764 million lbs. of copper.
MACARTHUR COPPER PROJECT1,2,3,4
| Oxide and Chalcocite Material | Primary Material |
| Cutoff | Tons | Average | Contained | Cutoff | Tons | Average | Contained |
| Grade | | Grade | Copper | Grade | | Grade | Copper |
| (%TCu) | (x1000) | (%TCu) | (lbs x 1000) | (%TCu) | (x1000) | (%TCu) | (lbs x 1000) |
| Measured Copper Resources | Measured Copper Resources |
| 0.25 | 15,929 | 0.350 | 111,599 | 0.25 | | | |
| 0.20 | 33,472 | 0.283 | 189,518 | 0.20 | | | |
| 0.15 | 58,388 | 0.237 | 276,993 | 0.18 | | | |
| 0.12 | 71,829 | 0.218 | 313,174 | 0.15 | N/A | N/A | N/A |
| Indicated Copper Resources | Indicated Copper Resources |
| 0.25 | 13,930 | 0.379 | 105,478 | 0.25 | 507 | 0.416 | 4,216 |
| 0.20 | 31,949 | 0.290 | 185,049 | 0.20 | 670 | 0.369 | 4,938 |
| 0.15 | 67,271 | 0.229 | 308,639 | 0.18 | 796 | 0.340 | 5,414 |
| 0.12 | 87,264 | 0.208 | 362,320 | 0.15 | 1,098 | 0.292 | 6,408 |
| Inferred Copper Resources | Inferred Copper Resources |
| 0.25 | 43,695 | 0.366 | 311,108 | 0.25 | 53,060 | 0.423 | 449,312 |
| 0.20 | 82,610 | 0.293 | 483,929 | 0.20 | 89,350 | 0.341 | 609,188 |
| 0.15 | 166,930 | 0.232 | 774,889 | 0.18 | 101,375 | 0.323 | 654,680 |
| 0.12 | 243,417 | 0.201 | 979,510 | 0.15 | 134,900 | 0.283 | 764,074 |
1Independent qualified person, Dr. Rex Bryan, prepared and supervised the preparation of these mineral resources.
2All estimated resources are shown using a 0.12% and 0.15% copper cutoff for oxide and sulfide respectively
3Minor rounding errors may occur
4Amended NI 43-101 Technical Report Preliminary Economic Assessment - Issue date: 17 January 2014 Effective Date: 23 May 2012
Tetra Tech used 0.12% Cu (or TCu) as the base case cutoff grade for the leachable resource while applying a base case a 0.15% Cu cutoff grade for the primary sulfide resources. Both of these values are believed representative of actual operating cutoff grades in use as of the date of this report. It is the conclusion of Tetra Tech that the MacArthur Mineral Resources meet current CIM definitions for classified resources.
The updated mineral resource estimate was generated using drill hole sample assays results and the interpretation of a geologic model which relates to the spatial distribution of copper in the MacArthur deposit. Interpolation characteristics have been defined based on geology, drill hole spacing and geostatistical analysis of the data. A block size of 25 feet by 25 feet by 20 feet and an assay composite length of 10 feet were defined to best reflect both the drill hole spacing and current geologic model.
The database provided by Quaterra contained the pertinent drill hole and assay information for the MacArthur Copper deposit. The database contained 737 drill holes of which 676 drill holes from Quaterra and Anaconda (sometimes referred to as the Metech holes) were used. The 61 holes removed included holes with limited or no information on the assays (Pangea Gold 1991, Superior, USBM 1952, Anaconda 1955-57), and six Quaterra holes outside the model limits. Of the 676 holes used, there are 280 Anaconda (Metech) RC holes and 396 Quaterra holes (58 core and 338 RC holes). These drill holes traversed 257,895 feet, producing 51,258 total copper sample assay values at a nominal five feet in length. The variables available in the database are for total copper from Quaterra and Anaconda intervals, and acid-soluble copper, a limited number of ferric sulfate soluble (QLT) copper assays and a very limited number of cyanide leach copper assays from Quaterra holes.
- 23 -
A total of 22 (21 directional and a omni-directional) variograms were calculated using MicroModel® for each MinZone within each area. The program searches along each direction for data pairs within a 12.5 -degree window angle and five-feet tolerance band. All experimental variograms are inspected so that spatial continuity along a primary, secondary and tertiary direction can be modeled. Each variogram model was then validated using the “jackknifing” method. This method sequentially removes values and then uses the remaining composites to krige the missing value using the proposed variogram.
To classify the total copper resources Tetra Tech used an approach that takes into account the spatial distribution of the drilling, the distance to the nearest data points used to estimate a block, and finally the relative kriging error generated by the estimate. Tetra Tech has found this approach to be very robust and provide highly reproducible results.
The Qualified Person for the updated MacArthur resource estimate is Dr. Rex Clair Bryan with Tetra Tech.
Metallurgy
The MacArthur Project has a long history of metallurgical testing from 1976 through 2011 including bottle roll and column leach testing and full-scale heap leach operations. Anaconda performed the first test work in 1976 and multiple subsequent owners continued test work through 2011. The most comprehensive test work was performed by Quaterra during 2010 and 2011. Quaterra contracted METCON Research of Tucson, Arizona to run a substantial number of bottle roll leach tests along with 32 column leach tests, on samples from 27 large diameter (PQ) size core drill holes. These drill holes are generally representative of the MacArthur Project mineral resources. The test work, both historic and that most recently performed, shows the mineralized material is amenable to standard heap leaching with good copper extraction.
Considering both recent and historical test work, along with information from previous mining operations at the MacArthur site, the design basis for the M3 MacArthur Copper Project May 23, 2012 Preliminary Economic Assessment (PEA) considers a ROM heap leach operation with processing of the pregnant leach solution (PLS) through traditional solvent extraction / electrowinning (SX/EW). Copper extraction is predicted to range between 60 and 70 percent depending on material type. Acid consumption projections range between 30 and 35 pounds of acid per ton of material. The historic MacArthur Pit contains 133 million tons of oxide material which is predicted to yield 70% copper extraction with acid consumption of 30 pounds of acid per ton of material leached. Material from the MacArthur pit is predominately mined and processed over the first 7 years of operation.
The leach pad will be constructed using an HDPE liner system meeting Nevada requirements (NR 455). Conventional solvent extraction will be used. Electrowinning will include permanent mother blank stainless steel technology and harvesting of Grade A copper cathode on a 7 day pull schedule. All process facilities will incorporate proven industry standard designs and equipment.
The Qualified Person for the metallurgical portion of the MacArthur Copper Project PEA is Dr. Richard Jolk of Tetra Tech.
Preliminary Economic Assessment
M3 Engineering & Technology Corp. (“M3”) of Tucson, Arizona completed a preliminary economic assessment (“PEA”) for the MacArthur project on May 23, 2012 and titled “MacArthur Copper Project – Amended NI 43-101 Technical Report Preliminary Economic Assessment Lyon County, Neveda, USA”. The PEA was amended and restated on January 27, 2014. The study concluded that the project has potential for development as a large-scale copper oxide heap leach operation that would provide long-term cash flows for a relatively modest capital outlay.
A PEA should not be considered to be a pre-feasibility or feasibility study as the economics and technical viability of the Project have not been demonstrated at this time. Mineral resources that are not mineral reserves do not have demonstrated economic viability . A PEA is preliminary in nature and includes Inferred Mineral Resources that are considered too geologically speculative at this time to have economic considerations applied to them to be categorized as Mineral Reserves. Thus, there is no certainty that the production profile concluded in the PEA will be realized. Actual results may vary, perhaps materially.
The PEA set out the following key project parameters:
- 24 -
• | An open pit mine based on an acid soluble measured and indicated copper resource model of 159 million tons at 0.212% copper and an inferred resource of 243 million tons at 0.201% copper. |
• | Recovery of 747 million pounds of copper over the 18-year mine life at an average mining rate of 15 million tons per year with a waste to ore stripping ratio averaging 0.90. |
• | Initial capital expenditure of US$232.7 million. |
• | Average life-of-mine operating costs of US$1.89 per pound. |
• | An after tax net present value (“NPV”) of US$201.6 million at an 8% discount rate and a base case copper price of US$3.48 per pound. (The project breaks even at a copper price of $2.56 per pound until the capital is paid off in 3.1 years. Thereafter, the breakeven is US$2.23 per pound.) |
• | An after tax internal rate of return (“IRR”) of 24.2% with a 3.1-year pay back. |
Mine operating costs were provided by Independent Mining Consultants Inc. (“IMC”) of Tucson, Arizona, based on an average 41,000 ton per day mine plan.
The project financials were enhanced by including in the above cash flows a sulfuric acid plant at the site compared to purchasing and transporting acid to the site. An on-site acid plant provides more long term certainty for the highest operating cost item (sulfuric acid), reduces the requirement for purchased electric power, and would leverage future consolidation and development of other oxide deposits in the District.
The SX/EW capital cost estimate was prepared based on recent M3 in-house information of similar SX/EW facilities. It includes the heap leach pads, SX/EW facility and tank farm based on a design flow rate of 10,400 gal/min. Additional upfront capital costs were included for mining equipment and infrastructure improvements (power, water, roads) needed at the site. Capital costs are considered accurate to -20% to +25%.
The Qualified Person for the preliminary economic assessment is Mr. Rex Henderson with M3. The Qualified Person for the mining portion of the report is Herb Welhener of IMC. The NI43-101 MacArthur Copper Project may 23, 2013 PEA is available at www.sedar.com.
Future Plans
The results of the PEA are being used to determine what additional drilling will be required to bring the project to a prefeasibility status and to evaluate the potential to integrate the MacArthur resource into a larger operation that includes the Yerington Copper resource. This stage of a project generally includes additional infill and condemnation drilling, metallurgical testing and geotechnical work as well as environmental studies, permitting and engineering.
Some of the options being considered to add additional value to the project include:
• | Processing the Yerington site oxide residuals as part of a District-wide oxide project. |
• | Additional drilling particularly at the north end of the MacArthur site to investigate integrating both deeper acid- soluble and primary sulfide copper into an expanded MacArthur mine plan. |
• | Pit studies to raise grades, lower the strip ratio and optimize production rates. |
• | Inclusion of other smaller oxide deposits on the Company’s land position in the Yerington Copper District. |
In August 2014, as part of the Freeport Nevada Option Agreement, the MacArthur project was transferred into SPS, a wholly owned subsidiary of Quaterra Alaska.
Yerington Copper Project – Nevada, USA
Acquisition and Staking of Claims
The Yerington Copper project property totals approximately 11 square miles. The project mineral rights consist of 2,768 acres of fee mineral properties and patented mining claims as well as 201 unpatented lode and placer claims totaling 4,153 acres on lands administered by the US Department of Interior, Bureau of Land Management (BLM). The total reflects the transfer of 345 claims from Quaterra’s wholly owned subsidiary, Singatse Peak Services LLC (SPS) to Quaterra Alaska’s MacArthur project in July 2012.
- 25 -
On May 1, 2007, SPS received the bankruptcy court approval for the acquisition of certain assets of Arimetco, Inc. (Arimetco) in the Yerington Mining District, subject to completion of due diligence. The purchase price comprised US$500,000 cash, 250,000 of the Company’s common shares and a 2% net smelter return royalty capped at US$7.5 million dollars on production from any claims owned by the Company in the Yerington and MacArthur mine areas.
Private land, patented claims, and 23 unpatented mining claims related to the Yerington Copper project were acquired by SPS from the Arimetco bankruptcy court in April, 2011. The acquisition followed three years of due-diligence studies and negotiations with state and federal agencies and the receipt of Bona Fide Prospective Purchaser (BFPP) letters from the US Environmental Agency (EPA), the Nevada Division of Environmental Protection (NDEP) and the BLM to protect SPS from liability emanating from activities of the former mine owners and operations.
Singatse Peak Services (SPS) purchased the Anaconda Mine and MacArthur Mine properties along with the appurtenant ground water rights in 2011. SPS owns a total of 8,621 acre-feet/yr of primary ground water rights which have senior priority standing. The purchased water rights are primary ground water rights specifically permitted for mining and milling. These water rights have significant value. Recent sales of primary ground water in Mason Valley Nevada have sold for over $3,000 per ac-ft.
Private properties related to the Arimetco acquisition are located in Township 13 North, Range 25 East in Sections 4, 5, 8, 9, 16, 17, and 21, and patented claims are located within Township 13 North, Range 25 East in Sections 16, 17, 19, 21, 31, and 32 and in Township 13 North, Range 24 East in Sections 22-25 and 36. An additional 434 unpatented claims in Sections 1, 2, 11-13, 22- 27, 35, and 36 Township 13 North, Range 24 East and in Sections 4- 9, 16- 21, and 30-32 Township 13 North, Range 25 East, Mount Diablo Base & Meridian were staked prior to or subsequent to the acquisition by SPS.
Expenditures to Date
Acquisition costs incurred by the Company to December 31, 2014 were $3,902,149 (net of recovery under the Option Agreement) (2013 - $3,368,518) and exploration expenditures were $7,358,911 (2013 - $7,047,920) for a total of $ 10,571,676 after accounting for recoveries allocated to the property recied from Freeport McMoRan Nevada LLC under the option agreement (2013 - $10,416,438).
Location, Access and Infrastructure
The Yerington Copper Property is located near the geographic center of Lyon County, Nevada, USA, along the eastern flank of the Singatse Range. The property centers on the historical Yerington open pit mine, flanked on the west by Weed Heights, Nevada (a small private community; the original company town of The Anaconda Company) and on the east by the town of Yerington, Nevada. The property is easily accessed from Yerington by a network of paved roads that were used as principal transportation and access routes during the former operating period of the Yerington Mine. SPS controls approximately 8,600 acre feet of groundwater rights and the Yerington pit contains an estimated 37,000 acre feet of water. Power is available on site at the Yerington Mine area. Nevada Energy operates a 30 million kW propane-fired, electrical generating power plant within ten miles of the site. The power infrastructure at the Yerington Mine site is expected to be readily available for a future mining operation due to the historical mine operations at the site. Topographic coverage is on US Geological Survey “Yerington” and “Mason Butte” 7.5’ topographic quadrangles. The nearest major city is Reno, Nevada, approximately 80 miles to the northwest.
History
Recorded production in the Yerington mining district dates back to 1883 (Moore, 1969) as prospectors were attracted to and investigated colorful oxidized copper staining throughout the Singatse Range. Knopf (1914) reported that oxidized copper cropped out at the historic Nevada-Empire mine located above the south center of the present-day Yerington open pit. Knopf does not show or reference other mines or prospects that are underlain by the Yerington open pit footprint, as gravel and alluvial cover obscure bedrock over an approximate 0.75 -mile radius around the Nevada-Empire Mine.
Information is sparse for the period from Knopf’s reporting in 1914 until World War II, although it is likely that lessees worked the Nevada-Empire during spikes in the copper price. Private reports (Hart, 1915 and Sales, 1915) describe ore shipments and planned underground exploration from a northwest striking, southwest dipping structure at the historic Montana-Yerington Mine area located approximately one mile west of the present-day Yerington pit.
- 26 -
During the 1940s, The Anaconda Company (Anaconda), at that time one of world’s major copper producers, outlined a 60 million-ton resource over the Yerington pit. During the early 1950s, the US government, citing the need for domestic copper production, offered “start-up” subsidies to Anaconda to open a copper mine in the Yerington district. Anaconda sank two approximately 400-foot-deep shafts in the present-day open pit and drove cross cuts to obtain bulk samples of oxidized rock for metallurgical study. Anaconda began operating the Yerington Mine in 1952 and mined continuously through 1979, producing approximately 1.744 billion pounds of copper from an ore body that contained 162 million tons averaging 0.54% Cu. Approximately 104 million tons of this total were oxidized copper ore that was “vat-leached” with sulfuric acid in 13,000-ton cement vats on a seven day leach cycle. Sulfide ores were concentrated on site in a facility that was dismantled and sold following termination of mining in 1979.
In 1976, all assets of The Anaconda Company, including the Yerington Mine, were purchased by the Atlantic Richfield Company (ARCO) which in 1979 shut down dewatering pumps in the pit and closed the Yerington Mine due to low copper prices. In 1982, ARCO sold the entire Yerington Mine complex and Weed Heights town site to Mr. Don Tibbals of Yerington, Nevada, who scrapped the plant and equipment. At closure, before dewatering pumps were shut off, the Yerington mine plan hosted a pre-stripped, non NI 43-101 compliant historic “reserve” of 98 million tons averaging 0.36% Cu containing approximately 696 million pounds of copper (K. L. Howard, Jr., Anaconda Internal Memo, 1979) within the ultimate pit design. The (Howard, 1979) estimate was prepared from a geologic section calculation using a 0.2 %TCu cut-off grade. A qualified person has not done sufficient work to classify these historic estimates as a current mineral resource and Quaterra does not treat them as such. Although the 1979 estimate contained no classification for measured, indicated, or inferred resources as defined by NI 43-101, the total estimate compares favorably to a Tetra Tech NI43-101 compliant independent resource estimate completed in February 2012. An additional 22.8 million tons of material containing 136.8 million pounds copper was identified adjacent to the pit in this historic estimate. The (Howard, 1975) memo addressing this material is considered reliable because it cites mine reconciliation calculations and geologic projections from drill holes using a 0.2% Cu grade cut-off in an internal Anaconda memo by T. Leigh to W.C. Norem (1979).
In 1989, Arimetco Inc. (Arimetco) purchased the mine property from Tibbals, commissioned a 50,000-pound-per-day solvent extraction/electrowinning plant, and began heap leaching “sub-grade” dump rock stripped from the Yerington pit by Anaconda. Arimetco also added an unknown tonnage of “vat leach tailings” (minus 3/8 inch oxidized tailings leached during Anaconda’s operation) to some heap leach pads (HLP's) as well as trucking oxidized ore from the MacArthur property located approximately five miles north of the Yerington mine site. Arimetco produced some 95 million pounds of copper from 1989 to 1999 before declaring bankruptcy due to low copper prices and abandoning the property.
Soil and groundwater contamination, alleged to stem from the former mining operations at Yerington, have been identified on the property. As a result, a portion of the property acquired by SPS in 2011 is now under the jurisdiction of the EPA. Liability for the contamination on site is the responsibility of a third party which is actively engaged in remedial investigation and remediation activities under the supervision of the EPA.
In order to establish SPS’s position and rights, the acquisition by SPS of the Arimetco properties required a series of rigorous environmental, legal, and technical due diligence studies. The Chambers Group Inc. and Golder Associates Inc. completed a Phase 1 Environmental Site Assessment Report to allow SPS to establish liability protection as a bona fide prospective purchaser (BFPP). Prior to closing on the property, SPS received letters from the Nevada Department of Environmental Protection (NDEP), US Bureau of Land Management (BLM) and the USEPA indicating the post-closing requirements then applicable to the Site for SPS to maintain its defense to liability as a BFPP regarding the activities of the former mine owners and operators.
In September 2012, SPS entered into a voluntary agreement with the U.S. Environmental Protection Agency (EPA) to participate in upgrading the system which manages fluids from the historic mining operation at the Yerington mine site. In exchange for SPS's participation in this work, the Company obtained a site-wide 'Covenant Not to Sue' for the contamination left at the site by former owners and operators of the historic mine operations.
The agreement provides for immediate environmental improvements to the site and allows SPS to continue exploration at the site while working cooperatively with the EPA, Nevada Department of Environmental Protection and the community. The Agreement's 'Covenant Not to Sue' strengthens SPS's 'Bona Fide Prospective Purchaser Defense' against liability resulting from the contamination at the site prior to SPS's purchase.
- 27 -
The first phase of the fluid management project was completed in Q4 of 2012. The Company co-funded the repairs to the on-site fluid management system (FMS) by the EPA as well as the relining of one of the system ponds. During Phase 2 of the project, the Company completed a study of the FMS to determine what additional repairs or other modifications are necessary to ensure that the system is capable of handling the fluids from the former mine operations for a period of five years. The Study was completed by the Company’s contractor in June 2013. EPA decided not to implement the five-year capacity alternative recommended in the Study. Rather, EPA decided to build now ponds to address the FMS capacity issues. The Company decided not to fund construction of the additional ponds. Rather, the Company agreed to provide property at the site to construct the new ponds.
In September 2014, SPS submitted to EPA a Final Report that documented the work SPS performed under the EPA Agreement. SPS incurred costs of US$93,254 during calendar year 2014 which included the final payment to the EPA for the Work to Be Performed and Payment of Response Costs as defined in the Agreement. On January 7, 2015, the EPA issued a Notice of Completion to SPS confirming that the obligations of the Work to Be Performed and the Payment of Response Costs sections of the Settlement Agreement had been met. With the issuance of the Notice of Completion, SPS believes it does not have further obligations under the Agreement, except for those as a landowner and as a BFPP.
Geology and Mineralization
The Yerington property includes both the Yerington Deposit (Yerington Mine) and a portion of the Bear Deposit which represent two of three known porphyry copper deposits in the Yerington copper district. The porphyry systems are hosted in middle Jurassic intrusive rocks of the Yerington Batholith. Unless noted otherwise, the following discussions refer to the Yerington Deposit
Mineralized porphyry dikes associated with three phases of intrusive activity related to the Yerington Batholith form an elongate body of mineralization that extends 6,600 feet along a strike of N118ºE. The mineralization has an average width of 2,000 feet and has been defined by drilling to an average depth of 250 feet below the Yerington Mine pit bottom at the 3,800-ft elevation. Because of the economic constraints of low copper prices at the time, many of the 792 historic Anaconda drill holes used in the SPS study were stopped in mineralization and very few were drilled below the 3,400-ft level where the porphyry system remains nearly unexplored.
Only four historic holes have actually explored the deep vertical projection of copper mineralization in the pit. Three of the holes were drilled along a single N-S oriented section through the center of the pit. According to M. T. Einaudi in an internal 1970 Anaconda report, the deep drilling program defined a series of nested, concave upward, grade shells that are elongated down the N 70º dip of the dikes with the 0.2% Cu zone extending to approximately the 2,600-ft level; an overall dip distance of 2,200 feet. Although the program encountered an increasing ratio of pyrite to chalcopyrite, there was no indication of a “barren core”, the porphyry dikes showed a “remarkable continuity” down dip and molybdenum mineralization became more abundant with increasing depth.
The orientation of the Yerington Deposit is due to mid-Tertiary extensional faulting that rotated the near vertically-emplaced batholith 60° to 90° westerly. The west to east dilation-displacement positioned the porphyry copper deposit on its side, resulting in a cross section of the of the porphyry system visible in the pit with its top toward the west end. Mining has revealed an alteration geometry displaying the original pyrite-rich cap (present-day leached sericite-limonite on the west end of the Yerington pit, grading downward easterly to quartz-sericite-pyrite alteration and potassic alteration in the central portion of the pit, continuing to a soda-flooded root zone at the eastern end).
Secondary oxide copper formed much of the upper Yerington Deposit. Chrysocolla was the dominant copper oxide mineral, occurring as fracture coatings and fillings to a depth of approximately 400 feet below the surface. Below the 4,100-ft level, chalcopyrite is the dominant copper sulfide mineral with minor bornite primarily hosted in A-type quartz veins in the older porphyry dikes. The un-mined mineralized material below the current pit bottom is primarily of chalcopyrite mineralization.
Exploration and Drilling Results
Exploration work on the Yerington Copper project commenced with a technical review of all available historical information relating to mineralization in and around the Yerington pit. A huge inventory of Anaconda data was available at the Anaconda Collection – American Heritage Center, University of Wyoming at Laramie. Approximately 10,000 pages of drill hole records from the library were scanned. The records included drill hole lithology, assays, and/or survey coordinates for almost 800 drill holes. Although some holes contained only lithologic or assay summary information, 892 holes contained adequate detailed assay, hole location and orientation information to be used in a resource estimation. Core from historical drilling left on site by Anaconda was photographed, described and selected intervals from 45 Anaconda core holes were shipped to Skyline Labs for re-assay.
- 28 -
Information obtained from the review of historical information was used to guide a two-pronged program of drilling during the last half of 2011. A total of 21.887 feet were drilled in 42 holes. The core holes and four RC holes were drilled to twin Anaconda core holes, while the remaining RC holes were targeted for expansion of mineralization laterally and below historic drill intercepts along the perimeter of the Yerington pit to support a NI 43-101 compliant resource estimate and technical report.
The data review and drilling results of the 2011 program clearly indicated that mineralization at Yerington is open to depth and along strike. Many of the historic holes in the pit were stopped in mineralization. Drill hole intercepts along the western edge of the pit are some of the best in the SPS database. Twin hole SP-04, drilled by SPS at the northwest end of the pit, intercepted 524.5 feet averaging 0.35%TCu starting at a depth of 228 feet including 88 feet of 0.69%TCu at a depth of 265 feet. Exploration hole SP-36, located along south central margin of the pit intercepted 95 feet averaging 0.28% TCu at a depth of 230 feet. Details of the 2011 drilling program are in the NI 43-101 compliant technical report for the Yerington Copper Project completed by Tetra Tech, Inc. of Golden, Colorado in February 2012.
A drilling program to sample residuals (historic dumps and tailings) at the Yerington site was completed in September 2012. A total of 9,585 feet of sonic drilling in 95 holes have provided material for the characterization of the vat leach tails, heap leach pads, and the W-3 sub-grade waste dump. Selected samples were sent to Metcon Labs in Tucson, Arizona for metallurgical testing. These residuals have been historically estimated to total 124 million tons of mineralized material. The residuals are referenced in the MacArthur PEA and the Yerington Mine 43-101 Resource reports, as “mineralized material” and therefore are neither a NI 43-101 compliant resource nor a historical resource. Additional details regarding the residuals are described in the NI 43-101 Technical Reports. The residuals are not included in the resource estimate at the Yerington site or in the PEA or resource estimate at the MacArthur site.
Sampling, Analysis and Security of Samples
Tetra Tech’s review of sample preparation, handling, analyses, and security procedures for the Yerington drilling and sampling program has determined that the Company’s current practices meet NI 43-101 and CIM defined requirements.
Samples taken during the period from 1952 to 1979, when Anaconda operated the Yerington Mine, including samples used for the determination of mine head grades, lithology, densities, and metallurgical performance were determined by Tetra Tech to be representative of the deposit. While no details are available regarding Anaconda’s exact assaying protocol and quality control during the period the Yerington copper mine was operating, public records of profit and cost confirmed that the techniques and procedures implemented conformed to industry standards for that era.
SPS explored the Yerington Mine Copper property with both RC and diamond core drilling methods. The drilling program was supervised in the field by the project geologist for monitoring recovery, proper sample handling and accuracy in labeling. Approximately 4,300 samples were collected during the 2011 program and shipped for sample analyses. The samples were analyzed for total copper (TCu), gold, and a 47-element trace element package. Samples representing oxide mineralization and acid soluble sulfide copper were also analyzed for acid soluble copper and for ferric sulfate soluble copper. Rock quality designations (RQD) and magnetic susceptibility measurements were taken on all core which was photographed following geologic logging.
The RC samples are collected in a conventional manner via a cyclone and standard wet splitter, placed in cloth bags that are pre-marked by SPS personnel at five-foot intervals and include a numbered tag inserted into a plastic bag bearing the hole number and footage interval. Collected samples, weighing approximately 15 to 20 pounds each, are wire tied and then loaded onto a ten-foot trailer with wood bed allowing initial draining and drying. Each day SPS personnel or the drillers at the end of their shift, haul the samples to SPS’s secure sample preparation warehouse in Yerington, Nevada where the samples are dried, loaded on plastic lined pallets, weighed, and trucked by Skyline Assayers & Laboratories (Skyline) personnel to Skyline’s sample preparation facility in Battle Mountain, Nevada. A chain of custody form accompanies all shipments from Yerington to Battle Mountain. Once Skyline preps each sample in its Battle Mountain facility, approximately 50-gram sample pulps are air-freighted to Skyline’s analytical laboratory in Tucson, Arizona for analyses and assay.
- 29 -
Samples from the core drilling program are handled in a similar manner. Core samples with a diameter of approximately 2.75 -inches (HQ) are placed in wax-impregnated, ten-foot capacity cardboard boxes and delivered to SPS’s secure sample warehouse in Yerington, Nevada by the drill crew following each 12-hour shift. The core is logged by a SPS geologist who marks appropriate sample intervals (one to nominal five feet) with colored flagging tape. Lines are marked along the length of core with red wax crayons to indicate where the core piece should be sawed. Each core box, bearing a label tag showing drill hole number, box number, and box footage interval, is then photographed. Rock quality designations (RQD), magnetic susceptibility, and recovery measurements are taken. Core is then loaded on a pallet, shrink wrapped, and secured with wire bands for trucking by Skyline personnel to Skyline’s sample preparation facility in Battle Mountain, Nevada. The core is sawed in half by Skyline personnel, one half designated for sample preparation/assay, the second half placed in its core box for return to SPS. Chain of custody procedures for core shipments picked up by Skyline at the SPS core shed follow the format for RC samples.
Drilling samples from the Yerington Copper Project were analyzed by Skyline in Tucson, Arizona, which is accredited by the American Association for Laboratory Accreditation (A2LA - certificate no. 2953.01) and by ISO17025-compliant ALS Minerals Laboratories in Sparks, Nevada. SPS implements a quality assurance and quality control assay protocol whereby either one blank or one standard is inserted with every ten samples into the assay stream. Rejects from the previously analyzed samples are sent to ALS Minerals in Reno, Nevada for check assays.
Mineral Resources
Tetra Tech, Inc. of Golden, Colorado completed a NI 43-101 compliant independent resource estimate and technical report update for the mineralization in and around the historic Yerington Mine titled “NI 43-101 Technical Report Mineral Resource Update Yerington Copper Project Lyon County, Nevada” and dated January 3, 2014 (effective November 20, 2013), which supersedes its previous report completed in February 2012. The updated resource is based upon an additional 232 historic Anaconda holes unavailable when the previous report was completed. The current resource now includes over 800 boreholes.
These additional holes are well distributed throughout the deposit and provided infill and extensional information to the previously used data, allowing upgrades in classification, improved grade estimate and a new resource definition.
The increases to the February 2012 resource are as follows. Using a 0.12% TCu copper cutoff, measured and indicated oxide and chalcocite resources increased 28% in tons, 9% in grade, and 37% in pounds of contained copper while the inferred resource increased 5% in tons, 14% in grade, and 21% in contained copper. Using a 0.15% TCu copper cutoff, the primary measured and indicated resources increased 12% in tons, 12% in grade, and 25% in contained copper while the inferred resource increased 4% in tons, 11% in grade, and 13% in contained copper.
Using a cutoff grade of 0.12%, the Yerington Mine’s measured and indicated acid-soluble oxide/chalcocite mineralization includes a measured and indicated resource of 23.5 million tons averaging 0.25% TCu (118 million pounds of copper) and an inferred resource of 25.9 million tons of 0.23% TCu (118 million pounds of copper). Using a cutoff of 0.15% TCu, the measured and indicated primary copper resource contains 105 million tons averaging 0.30% TCu (633 million pounds of copper) and an inferred primary copper resource of 128 million tons of 0.23% TCu (600 million pounds of copper).
The updated tons, grades, and pounds are presented in the table below as well as the percent increase from the February 2012 resource estimate.
YERINGTON COPPER PROJECT RESOURCES USING SELECTIVE CUTOFF FOR OXIDE AND SULFIDE1,2,3
| | | | | | % CHANGE FROM 2012 |
| MEASURED | Cutoff | 2013 ESTIMATE | ESTIMATE4 |
| | %Cu | Tonsx1000 | Grade | Lbsx1000 | Tonsx1000 | Grade | Lbsx1000 |
| Oxide and Chalcocite Material | 0.12 | 6,500 | 0.25 | 33,000 | 8% | 10% | 17% |
| Sulfide (Primary Material) | 0.15 | 31,000 | 0.33 | 205,000 | -3% | 10% | 8% |
| Combined | 0.12,0.15 | 37,500 | 0.32 | 238,000 | -1% | 10% | 9% |
| | | | | | % CHANGE FROM 2012 |
| INDICATED | Cutoff | 2013 ESTIMATE | ESTIMATE4 |
| | %Cu | Tonsx1000 | Grade | Lbsx1000 | Tonsx1000 | Grade | Lbsx1000 |
| Oxide and Chalcocite Material | 0.12 | 17,000 | 0.25 | 85,000 | 37% | 9% | 47% |
| Sulfide (Primary Material) | 0.15 | 74,000 | 0.30 | 428,000 | 19% | 15% | 35% |
| Combined | 0.12,0.15 | 90,000 | 0.29 | 513,000 | 22% | 12% | 37% |
| | | | | | % CHANGE FROM 2012 |
| MEASURED + INDICATED | Cutoff | 2013 ESTIMATE | ESTIMATE4 |
| | %Cu | Tonsx1000 | Grade | Lbsx1000 | Tonsx1000 | Grade | Lbsx1000 |
| Oxide and Chalcocite Material | 0.12 | 23,500 | 0.25 | 118,000 | 28% | 9% | 37% |
| Sulfide (Primary Material) | 0.15 | 105,000 | 0.30 | 633,000 | 12% | 12% | 25% |
| Combined | 0.12,0.15 | 128,000 | 0.29 | 751,000 | 14% | 11% | 26% |
| | | | | | | | |
| | | | | | % CHANGE FROM 2012 |
| INFERRED | Cutoff | 2013 ESTIMATE | ESTIMATE4 |
| | %Cu | Tonsx1000 | Grade | Lbsx1000 | Tonsx1000 | Grade | Lbsx1000 |
| Oxide and Chalcocite Material | 0.12 | 25,900 | 0.23 | 118,000 | 5% | 14% | 21% |
| Sulfide (Primary Material) | 0.15 | 128,000 | 0.23 | 600,000 | 4% | 11% | 13% |
| Combined | 0.12,0.15 | 154,000 | 0.23 | 718,000 | 4% | 10% | 14% |
- 30 -
1Independent qualified person, Dr. Rex Bryan, prepared and supervised the preparation of these mineral resources.
2All estimated resources are shown using a 0.12% and 0.15% copper cutoff for oxide and sulfide respectively.
3Minor rounding errors may occur
4 NI 43-101 Technical Report, Feb. 17, 2012
Based on benchmarking of the Yerington Deposit to similar deposits, Tetra Tech has determined that reasonable base case cutoff grades for the leachable (oxide/chalcocite) SX/EW recoverable copper and for flotation recoverable primary sulfide resources are 0.12% TCu and 0.15% TCu, respectively.
The results of the 2013 NI 43-101 compliant resource estimate compare favorably to the estimates of copper remaining in and around the Yerington pit after the mine shut down (K.L. Howard, Jr., Anaconda Internal Memo, 1979). The 1979 estimate contained no classification for measured, indicated, or inferred, so direct comparison can only be made when considering all classes of the current estimate, but was reported at 121 million tons with an average grade of 0.34% TCu.
The 1979 estimate cited approximately 84% of the total contained copper (696 million pounds of copper in 97.8 million tons with an average grade of 0.356% Cu) as being within the original Anaconda pit design, suggesting that a significant portion of the Yerington resource may be mined without a pushback or major changes to the upper walls of the Anaconda pit.
The current Tetra Tech resource estimate is based upon SPS's 2011 drilling as well as 792 historic drill holes taken from approximately 10,000 scanned pages of assay and/or geologic data which were reviewed and digitally recorded by SPS personnel and from 57 Anaconda cross sections in use at the time of mine closure. The digital data entry was validated by Tetra Tech against historic sections and was considered to be compliant, based upon results of 18 twin holes and 5,446 feet of core from Anaconda holes which were assayed by SPS. The twinned drill intercepts statistically confirmed that the new compliant data support use of the historical data, as did the new core assays which were well within the expected norms for corroborating the old with new data.
The Tetra Tech resource estimate is included with a description of the project history, geology, mineralization, sampling procedures, and laboratory Quality Assurance/Quality Control procedures. The NI 43-101 Technical Report is available at www.sedar.com. The Qualified Person for the Yerington Copper Project resource estimate and the technical report is Rex Clair Bryan, Ph.D., Sr. Geostatistician for Tetra Tech, Golden Colorado.
Future Work Plans
Quaterra believes the Yerington Copper Project has potential for significant additional copper resources. Historic and current drilling data indicate that horizontal and vertical limits to the mineralization at the Yerington Mine have not yet been found. Additional exploration and in-fill drilling is planned to both expand and upgrade the current NI 43-101 compliant copper resources of the project.
- 31 -
Future drilling will target the pit area below the 3,000 feet level (elevation) where only four deep historic holes (D158, D152, D174, and V2-28-33) have actually explored the deep vertical projection of mineralization. Three of five holes drilled along a N-S oriented section through the pit during the period of 1969 to 1970 defined a series of nested, concave upward, grade shells that are elongated down the N 70º dip of the dikes with the 0.2% Cu zone extending to approximately the 2,600 level; an overall dip distance of 2,200 feet. Although the program encountered an increasing ratio of pyrite to chalcopyrite, there was no indication of a “barren core”, and the porphyry dikes showed a “remarkable continuity” down dip. The drilling data also established a 250 to 500 foot thick zone of fracture hosted and disseminated molybdenum mineralization that wraps around the sulfide zone near the chalcopyrite/ chalcopyrite-pyrite transition. IP geophysics in the pit area is also being considered to target deep holes to explore this keel of the Yerington porphyry system.
A review of historic information and additional metallurgical testing is planned for both the residuals and core from sulfide mineralized zones below the pit and oxide copper mineralization in the vicinity of the mine. The test results will be used in an economic assessment of the property and an assessment of the merits of a possible integration of the MacArthur and Yerington operations.
Bear Deposit
A portion of the Bear deposit lies on the northeast portion of the Yerington Mine property that was acquired with the SPS purchase of Arimetco’s assets from bankruptcy court. In December 2013, Quaterra announced the signing of four option agreements totaling 1,305 acres of private land north and east of the Yerington Mine Site that covers additional portions of the Bear copper deposit. Under the terms of the agreements Quaterra (now SPS) has an exclusive right to explore these parcels and has an option to purchase the properties, surface water rights and supplemental storage water rights.
The Bear deposit was discovered in 1961 by Anaconda condemnation drilling in the sulfide tailings disposal area and was further delineated in the 1960s and 1970s. Currently the deposit is open in several directions and has never been consolidated under a single owner. A part of Quaterra’s recently acquired acreage was not previously accessible for exploration and is adjacent to the highest grade mineralization discovered during previous exploration of the area.
Historical information compiled for the Bear Deposit includes 126,400 feet of drilling in 49 drill holes that define a mineralized system covering an area of at least two square miles. The portion controlled by Anaconda in the 1960s covered approximately 25% of this area and includes an estimated 500 million tons of mineralized material averaging 0.40% copper (Dilles and Proffett, 1995). The Bear tonnage and grade estimate is historic in nature. A qualified person has not done sufficient work to classify this historic estimate as a current mineral resource and Quaterra does not treat it as such. In order to do so, this estimate will have to be confirmed by additional drilling.
The Bear deposit is a large porphyry copper system that occurs below 500 to 1,000 feet of valley fill and volcanic rocks of Tertiary age. Mineralization occurs predominantly in quartz monzonite, border phase quartz monzonite, and quartz monzonite porphyry dikes of Jurassic age. There does not seem to be any relation between the Jurassic rock type and the sulfide occurrence. Copper mineralization occurs most commonly as chalcopyrite with minor bornite within platings and veinlets of fresh feldspar and shreddy biotite. No copper oxide mineralization is present and only minor occurrences of chalcocite have been noted. Molybdenite is a common sulfide within the deposit, usually occurring with the best copper mineralization. However, only about 20% of the historic core samples have been analyzed for molybdenite and more studies are necessary to better understand its average grade and distribution.
The deposit is displaced by the gently east-dipping normal fault known as the Bear fault. The fault is defined by strongly sheared dark clay gouge with andesite and sulfide fragments. On the western part of the deposit the mineralization occurs within the foot wall of the fault while to the east the mineralization occurs deeper within the hanging wall.
The Bear project is a high priority because of its very large size, historic drilling and potential for higher grades than district averages. Molybdenum could also represent a by-product credit. Exploration to expand and upgrade the historic Bear resource into a compliant NI 43-101 resource is a high priority.
- 32 -
Acquisition costs incurred to December 31, 2014 were $496,519 (2013 - $340,646) and exploration expenditures were $17,879 (2013 - $12,366) for a total of $514,398 (2013 - $353,012). There were no acquisition or exploration expenditures at the Bear Deposit prior to 2013.
Nieves Silver Project, Mexico
On December 29, 2104, the Company closed the sale of its 50% interest in the Nieves silver property in Zacatecas State, Mexico, to joint-venture partner Blackberry Ventures I, LLC (“Blackberry”), for US$4 million. Under the terms of the agreement, Quaterra will receive four payments over 15 months of US$1 million each, with each payment earning Blackberry an additional 12.5% interest in the project. All costs for maintaining and exploring the property will be the sole responsibility of Blackberry, with no dilution to Quaterra, through the end of 2015 or until Blackberry completes the acquisition, whichever is earlier. Upon closing, Blackberry will become the operator of the Nieves project. In the event that Blackberry subsequently sells the project, Quaterra will receive 5% of the future net sale price. In addition, Quaterra has agreed to transfer its Americas claims in Durango State, Mexico, adjacent to Hecla Mining’s San Sebastian project, to Blackberry.
As at March 26, 2015, the Company owned 37.5% of this project.
Property Description and Acquisition
The Nieves Project is located in the Francisco R. Murguía Municipality of the Zacatecas Mining District near the southeastern boundary of the Sierra Madre Occidental Physiographic Province in central Mexico. The Property is located approximately 150 km northwest of the state capital of Zacatecas and 90 km north of the mining community of Fresnillo. The property consists of 18 concessions covering approximately 12,064.1 ha. The concessions are registered in the name Minera Cerro Gregorio, as of August 5, 2011, a Mexican company wholly owned by Quaterra. The Nieves Property is jointly owned by Quaterra (50%) and Blackberry Ventures 1, LLC. (“Blackberry”) (50%).
Kennecott Exploration Company (“Kennecott”) acquired the Nieves property on January 16th, 1995, through an option agreement with Mexican concessionaires by making specified option payments over five years, and advance minimum royalty payments. On March 13th, 1998, Kennecott transferred its rights under the Nieves option to Western Copper Holdings Ltd. (“Western”) in consideration for an uncapped 2% NSR on certain core concessions and a 1% NSR on others. Western assigned its rights to the Nieves Project to Quaterra on March 26, 1999. The Nieves concessions are subject to a maximum 3% NSR to the original concession holders, which the Company may purchase at any time for US$2 million. Kennecott’s royalties on the property were later sold to Royal Gold Inc. on January 24, 2007.
On April 10th, 2003, Quaterra completed a limited partnership financing with Blackberry Ventures 1, LLC (Blackberry), whereby Blackberry could earn a 50% interest in the Property by funding two exploration programs of US$750,000 each. The initial payment of US$750,000 received in the 2003 Fiscal Year was expended on a 5,300-meter drill program on the Nieves Property. During the 2004 Fiscal Year, Blackberry elected to continue by advancing a further US$750,000 towards a follow-up drill program completed in May 2005, thereby earning a 50% interest in the Property. The partners signed a joint venture agreement in 2006 and have jointly contributed to all exploration costs subsequently incurred.
There are no known significant environmental liabilities related to the current exploration of the Nieves Property. The areas of primary mineral exploration are generally flat-lying, sparsely populated with a few cultivated areas and the remaining land area used for the periodic grazing of livestock. Minimal rehabilitation measures such as stabilizing slopes and planting local flora in areas of disturbance is usually sufficient to satisfy the ecological authorities, the Instituto de Investigaciones Forestales, Agricolas y Pecuarias (“INIFAP”), a government office based in Calera, Zacatecas.
There is little to no surface water for exploration or mining activities but an abundance of ground water exists and the ownership of mineral rights generally allows access to ground water as needed. There are no significant factors or risks that may affect access, title, or the right or ability to perform work on the property. Exploration drilling has been conducted under a permit issued by the Secretaria de Medio Ambiente y Recursos Naturales (SEMARNAT). The permit expired on October 15, 2012, but may be renewed by application.
Since inception to December 31, 2014, the Company had incurred $736,136 (net of recovery) (2013 - $1,754,434) for acquisition costs and $2,009,224 (net of impairment) (2013 - $4,811,803) for exploration expenditures giving a total of $2,745,360 (2013 - $6,566,237) for its interest in Nieves. The Company’s joint venture partner, Blackberry JV had spent, US$7,275,019 (2013 - $7,024,128) including the Company’s administration fee, for its 62.5% interest in Nieves.
- 33 -
Location, Access and Infrastructure
Exploration activities are coordinated from the small town of Nieves (now re-named Francisco R. Murguia) where an office and a house is maintained. Subsequent to the of Quaterra’s 50% share of Nieves to Blackberry as detailed above, Blackberry is responsible for all costs of the office and exploration activities, and is operator of the project. The town of Nieves is accessed via a 17-kilometer paved road from Highway 49. The nearest major population and service centre to Nieves is the mining town of Fresnillo located 90 km to the south. Fresnillo has a population of approximately 75,000 and services the Fresnillo Mine operated by Peñoles. Fresnillo offers a professional work force experienced in mining and related activities in addition to most other supplies and services. International airports are located within approximately a three hour drive of the property in the city of Zacatecas to the south, and in Torreõn (Coahuila State) to the north. Road access is excellent with the main paved highway to Nieves running along the northern portion of the property. A network of dirt roads and trails provide access to the historical mining operations and extend southward to all areas of the property. Drill and access roads can be built easily as most of the Nieves Property is flat-lying with only a few dry creek beds.
The Nieves property lies within the Mexican Altiplano or Mesa Central region. This region is flanked to the west by the Sierra Madre Occidental and to the east by the Sierra Madre Oriental mountain ranges. The Altiplano is dominated by broad alluvium filled plains between rolling to rugged mountain ranges and hills reaching up to 3,000m above mean sea level and average elevations in valleys of approximately 1,700m. Elevations on the Nieves property range from 1,900m. to 2,000m. The terrain is generally flat-lying with a prominent north-south trending ridge along the eastern portion of the property with moderate to vertical slopes. There is very little human habitation on the property, with only a few widely scattered farm houses, although the town of Nieves directly borders the property to the northeast.
The La Quinta field office, as well as core logging, cutting and storage facilities are located on the Nieves Property. Other infrastructure in the area includes: (1) a power line adequate to support a small mill (eg. 100 tonnes per day), (2) a spur of the main Zacatecas rail line that connects the city of Rio Grande, located 18 km to the south, and (3) operating smelters in San Luis Potosi (copper and zinc, approximately 350 km to the south) and in Torreõn, Coahuila state (Peñoles lead-zinc smelter, approximately 200 km north).
History
The first discovery on the area covered by the Nieves Property was the Santa Rita Vein in 1560 by Spanish explorers. Soon after in 1574 the Concordia vein was discovered. The Santa Rita and Concordia-San Gregorio-Dolores veins were the focus of mining by the Spanish and Mexican miners until 1880 when an English company, the Mexican Rosario Mining Company, and two Californian companies, the Almaden Mining Company and the Concordia M. and M. Company, worked in the area. These companies worked primarily on the Concordia vein while a small independent miner Gonzáles Piñera worked concurrently on the San Gregorio vein. Prior to the 1910 revolution, which halted all production in the Nieves District, total ore production in the District was estimated at 50,000 tonnes. The only production reported is from the Concordia Mine where 5,414 tonnes at a grade of 4,065 g/t silver were produced.
Between 1910 and 1978 several companies attempted to de-water, sample, and re-open the historical workings in the Concordia and Santa Rita mines, and were largely unsuccessful. The Santa Rita vein and refurbished mill and flotation plant were purchased by Fomento Minero in 1978; they operated the mine until 1987. Fomento Minero also sank three shafts and deepened a historic shaft along the Concordia-San Gregorio vein system during the 1970’s. The flotation mill was capable of running 100 tonnes/day during this time and was fed 50% tailings and 50% ore with an average head grade of 130 g/t silver, 2% lead, 2.4% zinc and 2.5% antimony, according to Consejo Recursos Minerales. Today, all that remains on the site are the building foundations, abandoned shafts and power lines.
In the early 1990’s, a group of Mexican concessionaires assembled a land position that Kennecott optioned on January 16th, 1995. Exploration work completed by Kennecott included geologic mapping, surface sampling, geophysical surveying and reverse circulation (RC) drilling of the Gregorio North, California and Orion West veins. The drilling intersected several zones of significant silver mineralization hosted by two distinct styles of mineralization. Drill hole NV08 in the California area intercepted two separate 2m intervals of high-grade silver vein mineralization that returned assay values of 367 g/t and 795 g/t silver at depths of 108m and 116m, respectively. In contrast, drill hole NV03 intersected a large low-grade zone of silver mineralization at a depth of 180m depth that averaged 82 g/t silver over 28m. Drill hole NV03 also encountered a high-grade silver vein at 148m depth that returned 254 g/t silver over 2m. Drill hole NV06 also encountered a large zone of low-grade silver mineralization that returned 67 g/t silver over 68m.
- 34 -
After acquiring the Nieves option from Kennecott in 1998, Western Copper drilled 5 RC holes testing the California vein system. The holes were drilled in the area around hole NV08. Western Copper also twinned hole NV08 and reproduced similar assay values for the intercepts reported by Kennecott including 890 g/t silver over 1.0m in drill hole WCNV01. Holes drilled to intercept mineralization below drill hole NV08 returned assay values of 841 g/t silver over 0.45m, 109 g/t silver over 0.8m, and 1,081 g/t silver over 0.35m in drill hole WCNV04.
Systematic drilling began after Quaterra bought the property from Western Copper in 1999. Since Kennecott imitated exploration drilling in 1995, a total of 61,608 meters have been drilled in 205 holes, all but thirteen of which were completed during the Quaterra/Blackberry earn-in and JV.
Geology
The Nieves Property lies on the western flank of the Central Altiplano in Mexico, just east of the Sierra Madre Occidental ranges. Basement rocks underlying the western Altiplano are a Mesozoic assemblage of marine sedimentary and submarine volcanic rocks belonging to the Guerrero Terrane that sit unconformably on Precambrian continental rocks.
The late Cretaceous to early Tertiary Laramide Orogeny folded and thrust faulted the basement rocks throughout area and preceded the emplacement of mid-Tertiary plutons and related dykes and stocks. Unconformably overlying the Mesozoic basement rocks in the western Altiplano are units from the late Cretaceous to Tertiary, Sierra Madre Occidental magmatic arc. These rocks consist of a “lower volcanic complex” comprising an assemblage of late Cretaceous to Tertiary volcanic, volcaniclastic, conglomerate, and limestone rocks unconformably overlain by a Tertiary “upper volcanic supergroup” of caldera related, rhyolite ash-flow tuffs and flows. Eocene to Oligocene intrusions occur throughout the Altiplano and are related to the later felsic volcanic event. A final stage of NE-SW extensional tectonics accompanied by major strike-slip fault movement during the Miocene developed much of the basin and range topography currently exhibited in the area. Subsequent erosion of the ranges has covered most of the valleys.
The Mesozoic section on the Nieves property is represented by a thick sequence of fine laminar grey to dark green argillite beds up to 1m thick belonging to the late Cretaceous Caracol Formation which is host to silver mineralization on the property. The argillite beds are more abundant to the south in the Santa Rita area and to the west in the Concordia area. The Mesozoic section is isoclinally folded with an axial plane cleavage. Fold axes strike east-northeast to east and beds strike east-west and dip steeply south to near vertical.
Tertiary clastic rocks unconformably overlie the Caracol Formation on the east side of the Nieves Property. The shallow dipping Tertiary clastic section includes a 1 to 10 meter thick conglomerate composed of rounded to sub-rounded limestone boulders in a sandstone groundmass. Above the limestone conglomerate there is up to 130m of conglomeratic sandstone with thin bands of calcareous conglomerate. Overlying the conglomerate is 40 meter to 50 meter of Tertiary volcanic rocks composed of rhyodacitic to andesitic welded tuff. A thin 1.5 to 2 meter unit of grey to dark grey basalt occurs above the tuff and is in turn overlain by at least 56m of porphyritic rhyolite flows striking north-northwest and dipping northeast. These flows underlie a prominent north trending ridge on the east side of the Nieves property and are the host rock for manganese-calcite veins and breccia mineralization previously exploited by local miners.
The oldest structures on the Nieves Property are the folds which affect the Mesozoic argillite beds. These structures are likely related to compression during the Laramide Orogeny in the Cretaceous. Thrust faults are also common features of structures attributed to the Laramide Orogeny and several have been suspected to occur on the Nieves Property. Post-Laramide structures affected both the Mesozoic Caracol Formation sedimentary rocks and the Tertiary volcanic and sedimentary rocks. These structures include: (1) faults that strike 330º to 000º and dip moderately northeast to east with east plunging slicken-sides, (2) faults that strike 170º to 180º and dip steeply to the west, and (3) major vein structures that strike 240º to 270º and dip 60º to 90º to the south.
- 35 -
Mineralization
Silver mineralization on the Nieves Property is classified as low-sulphidation epithermal mineralization and is the primary exploration target. Epithermal silver veins are the dominant type of deposit within the Altiplano Region of Mexico that includes world-class examples such as Pachuca, Zacatecas, Fresnillo, and Guanajuato. The closest example is the Fresnillo deposit, located 90 km to the south of the Nieves Property. The Fresnillo deposit includes mantos and chimneys, stockworks, disseminated mineralization, and veins that show vertical mineralogical zonation. Typically in these veins, the high-grade silver (gold) zone is constrained in elevation within the vein structure to up to 500 meters vertically, or between 180 meters and 750 meters depths below which the veins becomes dominated by base-metal sulfides and progressively lower in precious metal content.
The most economically significant mineralization at Nieves occurs in anastomosing carbonate-quartz-sulphide vein systems and stockworks that have been defined over a total strike length of 3.8 kilometers by 54,814 meters of drilling in 187 holes. The system develops to a maximum true width of in excess of 200 meters and has a proven down dip extent of approximately 525 meters.
The carbonate-quartz-sulphide veins contain the best grades of silver, gold, lead and zinc. They consist of calcite that is partially to totally replaced by grey to white, chalcedonic, fine-grained quartz veins and veinlets. Individual veins are from centimetres to 1.5 meters wide with up to 50% sulphide minerals. Sulphides include pyrite, stibnite, sphalerite, galena, chalcopyrite and the silver sulphosalt freibergite, as well as minor proustite, pyrargyrite, and jamesonite.
The central and most important of the three vein systems is the Concordia-San Gregorio-Dolores system which includes both the La Quinta and Gregorio North zones. Mineralization along the Concordia-San Gregorio-Dolores vein has a known total strike length of 1,300 meters and a true width up to 100 meters. The mineralized zone in the Gregorio North area is approximately 1,200 meters long and up to 200 meters wide. The La Quinta and Gregorio North zones are the subject of the August 9, 2012 Caracle Creek 43-101 compliant resource estimate but only the La Quinta zone is included in a proposed open pit as shown in the October 31, 2012 preliminary economic assessment.
The attitude and size of the mineralized zones along the Santa Rita zone to the south and California vein system to the north are not well understood at this stage of exploration. Drilling along the Santa Rita system suggests that the mineralized zone is at least 750 meters long and may be up to 340 meters wide. The mineralized zone along the California vein system is at least 550 meters long and may be up to 130 meters wide.
Recent drilling has expanded the size of mineralized zones along all vein systems and additional drilling may significantly enhance the resources and economics of the project. Many of the vein systems are open along strike and all remain open to depth. Because some zones could be terminated along strike by late vertical fault structures, the discovery of strike extensions to the Nieves vein systems will only require continued drilling guided by the promising results of surface geophysical surveys.
Exploration and Drilling Results
Exploration between 2003 and 2010 by Quaterra and Blackberry included air photograph interpretation, surface sampling, geologic mapping, two geophysical surveys, six drill programs and three 43-101 independent technical reports, two of which include 43-101 compliant resource estimates, all prepared by Caracle Creek International Consulting Inc. of Toronto, Ontario (“Caracle Creek”).
In April 2011, Quaterra contracted Mira Geoscience to invert ground magnetic data from the Nieves Property. The results indicated that the geophysics model was poorly constrained due to insufficient data particularly along the western edge of the magnetic low anomaly. In December 2011, Zonge International (Zonge) was contracted to conduct additional ground magnetometer surveying along 14 N-S lines with a spacing of 200m between lines. The survey extended the magnetic low an additional 1200 meters west for a total E-W length of 2200m.
In June and July 2011, Zonge conducted IPR surveys along nine lines that indicated that several of the vein systems including the Santa Rita, Dolores, Nino and Orion veins extended to the western edge of the existing survey coverage. The coverage was extended in the first quarter of 2012, with a survey consisting of six lines totalling 28.4 line-kilometers, of vector CSAMT and CSIP and nine follow-up lines of pole-dipole IPR totalling 16.5 line-kilometers. The six lines of vector CSAMT/CSIP were spaced 400 meters apart and covered 1,000 hectares west of the main veins in the area of the enigmatic magnetic low.
- 36 -
The geophysical anomalies were followed up by surface mapping and sampling. The most interesting area identified to date is West Santa Rita, where the mapping identified two groups of narrow, sub-parallel two to 30 centimeters wide calcite-quartz veinlets, some of which contain strong gold and silver mineralization. Gold values range from nil to 8.11 g/t over 0.2 meters and silver values range from nil up to 253 g/t over 0.4 meters. Outcrop in the area is sparse but at least one sample from a fault zone coinciding with the anomalous IP zone defining the Nino vein is anomalous in gold and silver.
Quaterra and Blackberry completed two more phases of drilling (VII and VIII) between March 2010 and October 2011, consisting of 73 drill holes and totalling 18,547 meters. Most of the drilling concentrated on the Concordia-Dolores-San Gregorio vein system, but significant amount of drilling is located in the California and Santa Rita vein systems as well.
The drill program was successful at increasing the size of known mineralized zones along all the major vein systems. Mineralization along the Concordia vein system was extended an additional 400 meters, to a total of approximately 1,300 meters. The length of known mineralization along the California vein system was increased to a total of approximately 550 meters and it remains open to the east. Phase VII and VIII drill programs were successful in doubling the strike length of the Gregorio North mineralized zone located north of the San Gregorio vein, extending the strike length of the mineralized zone to approximately 1200 meters. A total of 15 drill holes systematically tested the Santa Rita vein system over 500 meters along strike, and the total length of mineralization was extended to approximately 750 m and remains open to the west.
The best intersections include 149 g/t Ag and 0.11 g/t Au over 31.25 m, which includes 6320 g/t Ag and 1.82 g/t Au over 0.25 meters in drill hole QTA123 along the Concordia West vein, 104 g/t Ag over 19 meteres, including 6410 g/t Ag over 0.1 meters and 5960 g/t over 0.1 meters in drill hole QTA137 along the California vein, and 152.2 g/t Ag and 0.12 g/t Au over 57 meters in drill hole QTA144 in the Concordia West area.
The results of the program were the subject of a fourth technical report and the third NI 43-101 compliant independent resource estimate prepared for the Nieves project by Caracle Creek titled “Nieves Project From 43-101 Technical Report Preliminary Economic Assessment Zacatecas, Mexico” and dated October 31, 2012. The most recent estimate, dated August 9, 2012, was incorporated into the October 31, 2012 preliminary economic assessment (“PEA”) for the Nieves project by M3 Engineering & Technology Corp. (“M3”) of Tucson, Arizona.
During preparation of the PEA, Quaterra tested the strike extension of mineralization at Nieves with eight core holes totaling 3,060 meters. Hole QTA 190 was collared to test an induced polarization (IP) anomaly on the Orion vein, a two-kilometer westward extension of the Gregorio vein. The hole intersected 0.8 meters of 1,865 grams per tonne (g/t) silver (54.5 oz/ton) which is part of a larger vein interval starting at 243.6 meters averaging 341 g/t silver (10.0 oz/ton). Holes QTA 191 and QTA 192, drilled 200 meters west and east of QTA 190, intersected 0.85 meters of 289 g/t silver and 1.1 meters of 284 g/t silver respectively. The new zone is open laterally and at depth.
Three holes (QTA 185-187) tested coincident IP and geochemical gold anomalies on the western extension of the Santa Rita vein. Holes QTA 186 and QTA 187 intersected 5.1 -meter intervals averaging 0.7 g/t gold and 0.55 g/t gold respectively. The gold anomalies may represent the upper levels of deeper and as yet undiscovered silver mineralization.
Wildcat holes QTA 188 and QTA 189, drilled two kilometers further west from holes QTA 185-187 to test anomalous vein occurrences, did not intersect significant mineralization.
Sampling, Analysis and Security of Samples
Quaterra and Blackberry have drilled 192 holes on the Nieves property. All but 10 holes completed by Quaterra in 1999-2000 were core holes. Major Drilling of Mexico S.A. de C.V. was the drill contractor for drill programs completed during 1999 to 2006 and B.D.W. International Drilling of Mexico S.A. de C.V. has been the drilling contractor since 2006.
Drill hole orientations are generally perpendicular to the strike of the overall structural trend of the vein(s) targeted. HQ (63.5 mm) was the standard drill core diameter. NQ (47.6 mm) was used locally as an extension (a tail) where drill conditions were difficult. Drill hole locations are surveyed using a RTK Trimble (model R8), double frequency GPS with precision to 1 cm. Down-hole survey readings were recorded on average approximately every 50 or 100m depending on the length of the hole using an Eastman Single Shot instrument. Survey results have been corrected for magnetic declination (+9º).
- 37 -
All drilling is conducted under the supervision of Quaterra personnel. The compound containing the core logging and core storage facility is protected by a chain link fence with locked gate. The individual storage rooms are locked to prevent access to the core logging and core cutting areas. The onsite geology office is a separate building within the compound and is also kept locked. The main working office is located in the town of Nieves within a locked house compound and also serves as a field house for the geologists. Paper and digital maps, cross-sections and long sections are stored in the Nieves field house office.
Core boxes were collected from the drill site and brought to the core storage facility on the Nieves Property for logging and sampling by the project or assistant geologists on a daily basis. The drill core is washed and core recovery estimated. Rock types, alteration minerals, textural and structural features, veining, and mineralized zones are documented. Sample intervals are measured, marked with permanent marker, and given a sample number and sample tag by the geologists. From this point, technicians core saw the core into halves where one half of each interval is placed with the sample tag into a sample bag and marked with the sample number. The other half is placed back into the core box in its original position and the core boxes are then stacked on racks and stored in order and by hole number in their core storage facility. Where the veins are coherent they are sawed in half perpendicular to the “grain” to get a representative split. Samples are placed into individual plastic bags marked with a unique sample identification number and with a sample tag placed into the bag. Sample ID numbers and meterages are also written on the core trays.
Samples are then packaged into sealed sacks and taken by Quaterra employees to ALS Chemex Laboratories in Guadalajara for preparation. No employees, officers, directors or associates of Quaterra or Blackberry JV are involved in the preparation of the samples.
Standard and blank samples are also included with the primary core samples for analysis. Standards are inserted directly into the sample sequence with a frequency of ~ 1 in 50. Blanks are inserted directly into the sample sequence with a frequency of ~ 1 in 25. The final prepared samples are shipped to the ALS laboratory in Vancouver, Canada for analysis. All samples were analyzed using a 41 element ICP method (ME-ICP41), in addition to analyzing gold and silver by standard fire assay (ME-GRA21). Lead and zinc values over 10,000 ppm and silver values over 100 ppm were re-assayed by atomic-absorption methods (ME-OG62). The Company is unaware of any known drilling, sampling or recovery factors that could materially impact the accuracy and reliability of the results. The Company believes the sampling procedure is appropriate for the type of mineralization being assayed such that samples are representative and there is no sampling bias.
ALS Chemex is an ISO 9001:2008, ISO 17025:2005 and Standard Council of Canada accredited laboratory with preparation and analytical laboratories operating in over 16 countries. Samples are sent to ALS Chemex in Guadalajara for preparation using their PREP-32 procedure. Upon receipt samples are dried, weighed and crushed. Two hundred and fifty grams of material is split and pulverized to at least 85% passing 75 microns. Reject material is retained at ALS Chemex in Guadalajara.
Samples were analyzed using fire assay – gravimetric finish method in addition to ICP. Silver was analyzed with two methods including aqua regia digest and a combination of ICP-AES (Inductively Coupled Plasma – Atomic Emission Spectroscopy) finish and fire assay and gravimetric finish. Gold was analyzed with fire assay and gravimetric finish. The rest of the elements were analyzed with aqua regia digestion and ICP-AES finish. In the aqua regia digest and ICP-AES finish, the samples are digested in aqua regia in a graphite heating block. After cooling, the solution is diluted to 12.5 ml with deionized water, mixed and analyzed by ICP-AES. The results are corrected for inter-element spectral interferences. In the fire assay and gravimetric finish, the samples are decomposed with fire assay fusion, during which the sample is fused with a mixture of lead oxide, sodium carbonate, borax, silica and other reagents to produce a lead button, which is cupelled to remove the lead. The remaining gold and silver bead is separated in dilute nitric acid, annealed and weighed as gold. Silver is determined by the difference in weights.
Internal quality assurance and quality control (QA/QC) procedures such as the insertion of blanks and standards into the sample sequences were not utilized by Quaterra and Blackberry JV during initial phases of exploration. Routine analysis of standard reference material (standards) began in 2007 with the insertion of a commercially prepared standard. Duplicate sampling began in 2008, and continued through the 2011 drill program. Duplicate samples were packaged and shipped using the same security protocols as the primary drill core samples and submitted to Skyline Assayers & Laboratories (“Skyline”) in Tucson, Arizona. Skyline is ISO 17025 accredited including analyses for Au and Ag by fire assay (including gravimetric methods), which is the method of analyses used for the submitted samples.
- 38 -
A review of the Nieves data in the October 16, 2012 M3 technical report concluded that the data quality is adequate at this stage of the project and can be used in 3D modelling for the purpose of resource estimation. The quality control review indicates that there were no major problems in the core shack such as sample mix ups or contamination. The slightly high failure rate of core duplicates is probably an indication of the nature of the ore that is characterized by narrow veinlets.
The failure rates of external standard (KM2653) are high for silver, but this is due to the different analytical method and not the poor quality of the data, which is suggested by the performance of the laboratory standards. Also, silver analyzed with the ME-ICP41 method is slightly biased high and silver analyzed with the ME-GRA21 method is slightly biased low, but these biases are not always consistent with the laboratory standard, suggesting that the problem is with the external standard. In the previous phases silver was analyzed with the same methods and a commercially available certified standard (CDN-SE-1) was used and performed well for silver. Recommendations for future programs include the use of an external standard with a similar certified value as the silver grades at Nieves that is certified for the same analytical method and has similar matrix.
The average gold value in phases at Nieves is 0.058 g/t including all data and 0.22 g/t including only data above the detection limit. The quality of the Au assay data is considered adequate to include Au in the resource calculation at this stage of the project, especially because the grade of Au is fairly low and it is not the main commodity at Nieves. Also, Au analyzed with ICP-OES and gravimetric method is comparable. Recommendations for future programs include using fire assay and instrument finish (AAS or ICP) for Au assays and that a certified standard with a low grade value, same analytical method and similar matrix is inserted and that the frequency of the quality control samples be increased to include one standard, one blank and one core duplicate with every twenty samples.
Metallurgical Testing
Preliminary metallurgical testwork on the composite sample from the Nieves property was completed in June 2010 by G & T Metallurgical Services Ltd. Approximately 100 kg of coarse crush material was composited from reject core material from selected intervals in 12 holes drilled through the La Quinta mineralization in 2009-2010. The sample was determined to contain ~ 79 g/t Ag (theoretical grade of 83 g/t Ag). Freibergite was the major silver phase present in the sample. Ore hardness tests indicated that the sample was moderately soft with a Bond work index of 10.8 kWh/tonne. Open circuit floatation tests showed that ~ 86% of the Ag can be recovered into a final concentrate with a grade of ~ 2.3 kg/tonnes Ag. Rougher tests suggested that Ag recovery was relatively independent of primary grind size between 67 and 104µm K80. Additional testwork was recommended to investigate coarser primary grind sizes. Rougher tests also indicated that silver recovery could also be increased by using a collector such as EROPHINE 3418A which would increase the selectivity of Ag over pyrite. Open circuit cleaner tests suggest that regrinding the rougher concentrate to 20µm K80 had no significant benefit on silver metallurgy. However, increasing the pH of the cleaner circuit to 10 significantly improved the Ag grade in the final concentrate. For the purposes of the preliminary economic assessment, design parameters of 86% silver recovery with a final concentrate grade of 2,300 g/t were used.
Mineral Resource Estimate
Caracle Creek completed an updated NI43-101 independent mineral resource estimate for the Nieves project in June 2012. A summary of the resource estimate within the Concordia and San Gregorio vein systems using a reporting cut-off grade of 15 g/t Ag is shown below:
| Vein | Zone | Resource Class | Quantity
Tonnes (t)1,2 | Grade3
Ag (g/t) | Grade4
Au (g/t) | Ag (oz) 5 | Au (oz)5 |
|
|
| Concordia | La Quinta | Indicated | 33,040,000 | 50.1 | 0.04 | 53,220,000 | 42,500 |
| Concordia | La Quinta | Inferred | 39,260,000 | 32.0 | 0.02 | 40.390,000 | 25,200 |
| San Gregorio | North | Inferred | 18,770,000 | 27.0 | 0.08 | 16,293,900 | 48,300 |
1 Reported at a cut-off grade of 15 g/t Ag. Mineral resources are not mineral reserves and do not have demonstrated economic viability.
2 Tonnes have been rounded to the nearest 10,000.
3 Ag grade has been rounded to one (1) significant digit.
- 39 -
4 Au grade has been rounded to two (2) significant digits.
5 Ounces have been rounded to nearest 100. One (1) troy ounce = 31.103 grams.
The mineral resource is based on drilling information as of June 22, 2012. The database includes collars, assays, survey and lithology information from 8 drill holes from programs of previous operators between 1995 and 1996, 10 drill holes drilled by Quaterra between 1999 and 2000, as well as 174 drill holes drilled by Quaterra and Blackberry between 2004 and 2012. The estimation used geostatistical block modeling methods constrained by a mineralised wireframe. GEMCOM’s GEMS resource modeling software V.6.3 was used to generate the block model and perform the grade estimation. Grades for Ag & Au were estimated using the inverse distance method of interpolation. The mineral resources were classified according to the CIM Standard Definition for Mineral Resources and Mineral Reserves (December 2005) guidelines and reported in accordance with the Canadian Securities Administrators National Instrument 43-101.
The mineralized domains were constructed primarily from the Ag grade assay data. The La Quinta mineralized domain was defined using 99 drill holes and 5072 samples. The Gregorio North mineralized domain was defined using 25 drill holes and 1729 samples. The drill holes were drilled in a sectional pattern with a drill hole spacing ranging from 20 - 100 meters, in the La Quinta area, and 20 - 175 meters in the Gregorio North area. The mineralized domain was projected 100 meters beyond the last drill hole. Due to the potential for bulk open pit mining, a grade cut-off was not used when constructing the mineralized domain. However, if the last assay in the interval was less than 0.1 g/t Au, then it was not included in the mineralized domain unless it had a significant Ag grade component of 10 g/t Ag. The estimation parameters set for the mineral resources were not allowed to interpolate through un-sampled intervals. An Ag value of 0.1 g/t (Half Detection Limit) was assigned to the missing intervals.
The Qualified Person responsible for the updated Nieves project resource estimate is Jason Baker, P. Eng., of Caracle Creek. Zsuzsanna Magyarosi Ph.D., also of Caracle Creek, is the Qualified Person responsible for the QA/QC evaluation. Doris M. Fox M.Sc., P. Geo,, also of Caracle Creek, is the Qualified Person responsible for the site visit and sampling procedures.
Preliminary Economic Assessment
M3 Engineering & Technology Corp. (“M3”) of Tucson, Arizona used the Caracle Creek mineral resource estimate to complete a preliminary economic assessment (“PEA”) for the Nieves project October 31, 2012 and titled “Nieves Project Form 43-101 Technical Report Preliminary Economic Assessment Zacatecas, Mexico”. The PEA was amended and restated on January 7, 2014 in a document titled “Nieves Project Form 43-101 Technical Report Preliminary Economic Assessment Zacatecas, Mexico”. The study concluded that the project has potential for development as an open pit silver mine that would produce 55.5 million ounces of silver over 10-year mine life.
A PEA should not be considered to be a pre-feasibility or feasibility study as the economics and technical viability of the Project have not been demonstrated at this time. Mineral resources that are not mineral reserves do not have demonstrated economic viability. A PEA is preliminary in nature and includes Inferred Mineral Resources that are considered too geologically speculative at this time to have economic considerations applied to them to be categorized as Mineral Reserves. Thus, there is no certainty that the production profile concluded in the PEA will be realized. Actual results may vary, perhaps materially.
The PEA set out the following key project parameters:
| • | An open pit mine centered on the Concordia vein that contains a total of 35.4 million tonnes of mineable material. The pit includes 28.3 million tonnes of higher grade material averaging 65 g/t silver and 0.045 g/t gold (at a cutoff of 30.5 g/t silver); and 7.1 million tonnes of lower grade material averaging 24 g/t (at a cutoff of 21.3 g/t silver). The open pit mine plan was developed based on an indicated resource of 33.0 million tonnes at 50.1g/t silver and an inferred resource of 39.3 million tonnes at 32.0 g/t silver, using a cutoff of 15 g/t |
| | |
| • | Recovery of 55.5 million ounces of silver and 41,000 ounces of gold over the 10-year mine life at an average mining rate of 3.5 million tonnes per year. Silver recoveries of 86% were based on testwork completed to date. |
| | |
| • | Initial capital expenditure of US$231.6 million with a sustaining capital cost of $64.1 million. Capital costs are considered accurate to +/- 35%. |
- 40 -
| • | Average life-of-mine operating costs of $14.98 per ounce of payable silver. |
| | |
| • | An after tax net present value (NPV) of $77.1 million at an 8% discount rate and a base case silver price of $27 per ounce and a before tax NPV of $142.32 million. At a silver price of $32.40 the after tax NPV is $204 million. The project breaks even at a silver price of about $21.37 per ounce (about $15.25 after payback). |
| | |
| • | An after tax internal rate of return (IRR) of 15.7% with a 4.4-year pay back and a before tax IRR of 21.9% with a 3.4- year pay back. |
The mine plan for the Nieves project is an open pit that straddles the Concordia vein and includes three pit phases. A 35.4 -million tonne mineralized zone would be mined at a rate of 10,000 tonnes per day resulting in a 10-year mine life and at a 5.4:1 (waste to ore) strip ratio. The pit includes 28.3 million tonnes of higher grade material averaging 65 g/t silver and 0.045 g/t gold (at a cutoff of 30.5 g/t silver); and 7.1 million tonnes of lower grade material averaging 24 g/t silver (at a cutoff of 21.3 g/t silver). The San Gregorio zone was not included in the mine plan but may become viable with additional drilling.
The financial analysis is based on a silver price of $27 per ounce and a gold price of $1,300 per ounce, rounded numbers which are both less than the SEC-recommended three-year historical price through the end of August. The analysis includes deductions for all royalty payments and a contingency of 20%. No credits are assumed for lead or zinc. Sensitivities were run for the price of silver, operating cost and initial capital cost.
The Qualified Person for the preliminary economic assessment is Joshua Snider P.E. with M3 Engineering & Technology Corp., Tucson, Arizona. The Qualified Person for the mining portion of the PEA is Jeffery Choquette P.E. of Butte, Montana, and for metallurgy Thomas L. Drielick P.E. M3 Engineering & Technology Corp., Tucson, Arizona.
The PEA emphasizes that additional exploration and drilling could both expand the current pit and upgrade the San Gregorio inferred resource which was not included in this study. The San Gregorio inferred resource includes 16.3 million ounces of silver and 48,300 ounces of gold using a cutoff of 15 grams. Vein systems to the north and south of the pit also have potential for additional resources.
Herbert Gold Project, Alaska
The Herbert gold project is an early stage, partially drill-tested, high-grade, gold mineralized mesothermal quartz vein system in the historic Juneau Gold Belt of southeast Alaska. The project consists of 91 unpatented lode claims located 30 kilometers north of Juneau and 42 kilometers south of Coeur Alaska's new Kensington gold mine. The property covers six parallel vein structures exposed at the toe of a retreating glacier.
Mineralization consists of mesothermal quartz-carbonate-gold-base metal veins similar to those in other historic mines in the district. Four principal veins have been identified, which from south to north include the Floyd, Deep Trench, Main, and Goat veins. Minor veins include the North, Ridge and Lake veins. The principal veins strike N80E and dip steeply to the north. The cumulative strike length of all mapped veins at present is over 3,700 meters.
Quaterra (35%) and Grande Portage (65%) formed joint venture for the further exploration and development of the property with each party bearing its proportionate share of costs. Grande Portage is the operator of the Herbert gold project.
A total of 127 diamond drill holes and four trenches have investigated the Herbert Gold Property since its discovery in 1986. The 2012 drilling campaign was designed to upgrade the previously identified inferred resources to indicated resources and to test extensions of mineralization in the Main and Deep Trench veins as well as new targets in the Goat and Ridge veins.
The results of the 2012 drilling program were included in the database used by D.G. DuPre & Associates for an NI 43-101-compliant resource estimate released in a document titled “Technical Report on the Herbert Gold Property Juneau District, Southeast Alaska” and dated April 10, 2013. The updated estimate contains an indicated resource of 821,100 tonnes grading 6.91 grams per tonne gold (gpt) containing 182,400 ounces of gold in the Deep Trench and Main veins. The resource was calculated using a base case cut-off of 2 gpt. The Deep Trench and five veins that have had limited drill testing contain an inferred resource of 51,600 tonnes grading 7.73 gpt gold for a total of 12,800 ounces of gold. The mineralization is open at depth and along strike.
- 41 -
Herbert Gold Project
Mineral Resource Estimate
| Cutoff Grade | | Av. Grade | Au |
| (g/t Au) | Tonnes | (g/t Au) | (Ounces) |
| | | | |
| Total Indicated Gold Resources | | |
| 0.5 | 2,867,500 | 2.69 | 248,100 |
| 1.0 | 1,645,500 | 4.14 | 219,000 |
| 1.5 | 1,081,300 | 5.66 | 196,900 |
| 2.0 | 821,100 | 6.91 | 182,400 |
| 2.5 | 637,900 | 8.25 | 169,200 |
| 3.0 | 532,400 | 9.34 | 159,800 |
| | | | |
| Total Inferred Gold Resources | | |
| 0.5 | 1,509,800 | 1.18 | 57,300 |
| 1.0 | 585,400 | 1.85 | 34,900 |
| 1.5 | 112,600 | 4.46 | 16,100 |
| 2.0 | 51,600 | 7.73 | 12,800 |
| 2.5 | 42,100 | 8.99 | 12,200 |
| 3.0 | 38,600 | 9.55 | 11,900 |
The estimate classifies resources according to proximity to the sample locations as required by NI 43-101, according to the CIM Definition Standards for Mineral Resources and Mineral Reserves. Three dimensional models were constructed from a series of cross sections for each of eight different zones. Some areas of the Main vein provided multiple options for correlations that were permissive by geology and sample geochemistry. These correlations were corrected and modified as supported by surface mapping and geology. The Deep Trench vein was remarkable in the simplicity and consistency of a very planar orientation of the correlations.
An Inverse Distance Squared (ID2) method using a block model approximately 8m x 1.5m x 6m was applied to the Main and Deep Trench veins. Smaller solids (such as the Deep Trench Vein Hanging Wall) were modeled using smaller block sizes down to 2m x 2m x 2m. Blocks required a minimum of 3 and a maximum of 12 composites within a 180m x 18m x 180m search ellipsoid, oriented parallel to the vein. Statistical studies showed that capping or averaging was not indicated. The resource remains open in multiple directions along these defined veins.
D.R. Webb P. Geol. is the Qualified Person responsible for the reserve and resource calculations while D.G. Dupre P. Geo. is the Qualified Person responsible for all other aspects of the Technical Report.
No drilling was performed during 2013. All wooden drilling platforms were dismantled and flown to an offsite location as specified in the operating permit. The third year of baseline environmental water studies was completed.
Although the 2014 Operating Plan was approved by the US Forest Service on February 27, 2014, the joint venture elected not to drill due to a lack of funds. The Company is currently in the process of monetizing non-core assets, including its 35% interest in the Herbert project. In the event that Grande Portage elects to drill before Quaterra has monetized its interest, the Company will be subject to dilution if it elects not to participate.
Acquisition costs incurred to December 31, 2014, were $164,031 and exploration expenditures were $1,595,062 for a total of $1,759,093 for its 35% interest. Acquisition costs incurred to December 31, 2013 were $150,615 and exploration expenditures were $1,579,962 for a total of $1,730,577 for its 35% interest.
- 42 -
Uranium Claims, USA
On March 14, 2014, the Company closed a transaction to sell its uranium properties and assets located in the states of Arizona, Utah and Wyoming for gross proceeds of $500,000.
Other Properties
The Company has divested itself of all non-copper properties except Herbert Gold which is being evaluated for sale.
| ITEM 4A. | UNRESOLVED STAFF COMMENTS |
None.
| ITEM 5. | OPERATING AND FINANCIAL REVIEW AND PROSPECTS |
The information in this section is presented in accordance with International Financial Reporting Standards, (“IFRS”) as issued by International Accounting Standards Board. The following discussion of our financial condition and results of operations for the fiscal years ended December 31 and should be read in conjunction with our consolidated financial statements included in Item 17 of this annual report.
Critical Accounting Estimates
The accounting estimates believed to require the most difficult, subjective or complex judgments, and which are the most critical to our reporting of results of operations and financial position, are as follows:
Mineral Properties
We capitalize all costs related to the acquisition and exploration of mineral properties on a property by property basis, net of recoveries until such time as these mineral properties are placed into commercial production, sold or abandoned. If commercial production is achieved from a mineral property, the related deferred costs will be amortized prospectively on a unit-of-production basis over the estimated life of the ore reserves. If a mineral property is abandoned, the related deferred costs are written down and expensed. From time to time, we may acquire or dispose of all or part of the mineral property interests under the terms of property option agreements. As such options are exercisable entirely at the discretion of the optionee, option payments are recorded as property costs or recoveries when paid or received.
Long-lived assets, such as equipment and deferred exploration, are reviewed for impairment at each reporting period or more frequently as economic events indicate that the carrying amount of an asset may not be recoverable.
On an ongoing basis, we evaluate each mineral property for potential impairment based on results obtained to date to determine the nature of exploration, other assessment and development work, if any, that is warranted in the future and the potential for recovery of the deferred costs. If there is little prospect of future work on a property being carried out within a three-year period from completion of previous activities, the deferred costs related to that property are written down to the estimated amount recoverable unless there is persuasive evidence that an impairment allowance is not required.
Stock-based Compensation Expense
From time to time, we may grant share purchase options to directors, officers, employees and consultants. We use the Black-Scholes option pricing model to estimate the fair value for these options. This model, and other models which are used to value options, require inputs such as expected volatility, expected life to exercise and interest rates. Changes to any of these inputs could cause a significant change in the stock-based compensation expense charged in a period.
Fair value of derivative liabilities
The fair value of derivative liabilities that are not traded in an active market is determined by using a valuation technique. Management makes estimates and utilizes assumptions in determining the fair value for share-based payments, warrants, and the (gain) loss on the revaluation of the derivative liability;
- 43 -
Income Taxes
Income tax comprises current and deferred tax. Income tax is recognized in net income (loss), except to the extent related to items recognized directly in equity or in other comprehensive loss.
Deferred tax is recognized in respect of temporary differences arising between the tax bases of assets and liabilities and their carrying amounts in the consolidated financial statements. Deferred tax is determined on a non-discounted basis using tax rates and laws that have been enacted or substantively enacted by the reporting date and are expected to apply when the deferred tax asset or liability is settled. Deferred tax assets are recognized to the extent that it is probable that the assets can be recovered.
2014 versus 2013
For the year ended December 31, 2014 (“2014”), the Company reported a net loss of $2,484,716 compared to a net loss of $28,917,916 for prior year, the differences are mainly due to the impairments for mineral properties in the United States and central Mexico plus unrealized non cash fair value gain on derivative liabilities and gain on disposal of mineral properties. To preserve cash, the Company has reduced its general administration and corporate activities, and focused on supporting its exploration and development activities in its Nevada copper assets. Other general fluctuations are discussed below:
Exploration Costs
Exploration costs represent expenditures to undertake and support exploration activities on our properties. If they do not have characteristics of property, plant and equipment, they are expensed as incurred. Exploration costs charged to operations during 2014 were $424,875 compared to $67,448 for the prior year resulting from an impairment of Mexico properties in prior years resulting in current year costs being expensed.
General Administrative Expenses
General administrative expenses include overheads associated with administering the Company’s regulatory requirements and supporting the exploration activities.
| • | Administration and general office decreased by $291,263 from $657,751 in 2013 to $366,488 in 2014 reflecting the amended service agreement with Manex Resources Group Inc. (“Manex”). Manex is a private company controlled by the Corporate Secretary of the Company. It provides furnished office space, selected administration, accounting, and corporate secretarial services to the Company. These services are provided in the normal course of operations for consideration established and accepted by the Company and Manex. On February 9, 2012, the Company renewed its service agreement with Manex for its Vancouver head office administration and corporate services at a monthly rate of $15,750 for office rent plus accounting and administration services provided at agreed market rates for a five-year term expiring August 31, 2017. The service agreement was amended September 1, 2013, March 1, 2014 and January 1, 2015 to reduce the fee for services to a monthly rate of $5,000 with the monthly office lease remaining at $8,000. The Company may terminate the services portion of the agreement upon 30 day notice without penalty, and the office lease portion of the agreement by paying Manex the lesser of $96,000 or a total fee owing for the remainder of the lease term (through August 31, 2017). |
| • | Consulting decreased by $219,135 from $258,350 in 2013 to $39,215 in 2013 due to the cancellation of the contract with Atherton Enterprises and the direct employment of Scott Hean, our CFO, instead of as a consultant. |
| • | Directors’ fees have been suspended since January 1, 2013. By resolution, the board agreed in May 2013 to forego fee accruals until further notice. |
|
- 44 -
| • | Investor relations and communications increased by $50,475 from $39,821 in 2013 to $90,296 in 2014 primarily to our contract use of our former VP of Investor Relations. |
| • | Personnel costs increased by $247,955 from $806,443 in 2013 to $1,054,398 in 2014 due the hiring of Scott Hean as the CFO from the contract basis in December of 2013. |
| • | Professional fees increased by $18,826 from $643,243 in 2013 to $662,069 in 2014 reflecting the increased legal fees for the Arizona uranium property sale, Nieves Property sale, Non-core asset sale, and the Freeport Option agreement. |
| • | In June 2014, the Company issued 2,880,000 stock options at an exercise price of $0.10 for five years. In December 2014, the Company issued 1,000,000 stock options at an exercise price of $0.05 for five years. In September 2013, the Company granted 3,955,000 stock options at an exercise price of $0.16 for five years. The fair value as calculated by the Black Scholes model, of the Company’s stock options has decreased in line with a reduction on the Company’s share price. |
Other and Non-Cash Items
| • | Foreign exchange: The Company recognized a foreign exchange loss of $7,866 in 2013 compared to a foreign exchange gain of $211,781 in 2014 due to the strengthening of the US dollar over the year in 2014. Volatility in the foreign exchange rate could continue to result in significant foreign exchange gains or losses. The Company does not hedge its exposure to changes in the value of the Canadian dollar. |
| • | Fair value gain on derivative liability: Warrants denominated in a currency other than the Company’s functional currency are deemed to be a derivative and valued at fair value. On each reporting date, the derivative liability is adjusted for fair value changes with the difference being recorded in profit and loss. Due to the decline in the Company’s share price and also through the passage of time, the Company realized a non-cash gain of $693,121 in 2014 compared to $2,363,892 in 2013 subsequent to the initial fair value recognition. |
| • | Gain (loss) on sale of mineral property: On October 3, 2014, the Company sold three properties to Freeport- McMoran for US$5,000,000. At the date of disposal the total capitalized exploration expenditures for these three properties were US$1,193,417 which was written off resulting in a gain on disposal of US$2,917,162. On September 19, 2013, the Company sold three properties in central Mexico to Goldcorp for US$375,000 plus applicable taxes. At the date of disposal the total capitalized exploration expenditures for these three properties were $3,225,818 which was written down to nil and resulted in a loss on disposal of $2,774,114. In July 2013, the Company received an additional US$1,000,000 ($1,038,000) from Freeport as a contingent bonus from the sale of Butte Valley. |
| • | General exploration costs: These costs represent expenditures to undertake and support exploration activities on the Company’s properties, including costs incurred prior to the Company obtaining the rights to the mineral properties. In addition, if the expenditures are deemed not to be specifically related to individual properties or not recoverable, they are expensed as incurred. |
| • | Impairments: due to the current market condition, the Company has entered into an agreement to sell or has abandoned inactive non-core mineral properties so as to focus its effort and resources in its copper properties in the Yerington District. As a result, $3,550,874 impairments were recorded in the year ended December 31, 2014. Comparatively, $26,212,984 impairments were recorded in the year ended December 31, 2013. In 2014, management assessed the Company’s ability to continue exploration activities on all of its mineral properties and made a decision to focus exploration efforts only on certain key properties and allow other claims to lapse. Accordingly, the following mineral properties were impaired to net loss during 2014: |
| | (i) | Other US properties – $637,514 |
| | (ii) | Nieves – $2,913,394. |
| • | Interest income (expenses): interest earned varies based on the timing, type and amount of equity placements and resultant fluctuations in cash. The interest expense in 2013 was related to the unsecured loans from the Company’s Chairman. As of December 31, 2013, US$600,000 remained unpaid. On March 18, 2014, the loans were converted to a demand basis with a 40-day notice period. |
2013 versus 2012
For the year ended December 31, 2013 (“2013”), the Company reported a net loss of $28,817,916 compared to a net loss of $4,853,976 for prior year, the differences are mainly due to the impairments for mineral properties in the United States and central Mexico plus unrealized non cash fair value gain on derivative liabilities and loss on disposal of mineral properties. To preserve cash, the Company has reduced its general administration and corporate activities, and focused on supporting its exploration and development activities in its Nevada copper assets. Other general fluctuations are discussed below:
- 45 -
Exploration Costs
Exploration costs represent expenditures to undertake and support exploration activities on our properties. If they do not have characteristics of property, plant and equipment, they are expensed as incurred. Exploration costs charged to operations during 2013 were $67,448 compared to $182,852 for the prior year resulting from a reduced exploration activity level in Mexico.
General Administrative Expenses
General administrative expenses include overheads associated with administering the Company’s regulatory requirements and supporting the exploration activities.
| • | Administration and general office decreased by $68,362 from $726,113 in 2012 to $657,751 in 2013 reflecting the amended service agreement with Manex Resources Group Inc. (“Manex”). Manex, owned by the Company’s Corporate Secretary Mr. Lawrence Page, has provided head office premises, corporate accounting and administration services to Quaterra at market rates. The service agreement was renewed commencing June 30, 2012 for five years. On September 1, 2013 and March 1, 2014, the Company renegotiated to a reduced level at a monthly fixed fee of $8,000 for its Vancouver office space and $11,667 for its corporate services from Manex representing a 50% reduction from its previous year’s charges. |
| • | Consulting decreased by $108,014 from $366,364 in 2012 to $258,350 in 2013 due to the termination of the financial advisory service agreement on April 15, 2012 as well as a downward renegotiated community communication service in August 2012. |
| • | Directors’ fees have been suspended since January 1, 2013. By resolution, the board agreed in May 2013 to forego fee accruals until further notice. |
| • | Investor relations and communications decreased by $184,588 from $224,409 in 2012 to $39,821 in 2013 due to the reduced number of tradeshow trips. |
| • | Personnel costs reduced by $329,543 from $1,135,986 in 2012 to $806,443 in 2013 due to staff reductions and the voluntarily salary reductions from management. Further staff reductions have been made in the first quarter of 2014. |
| • | Professional fees increased by $47,490 from $595,753 in 2012 to $643,243 in 2013 reflecting the increased legal fees for the Arizona uranium law suit which commenced early 2012. |
| • | In September 2013, the Company granted 3,955,000 stock options at an exercise price of $0.16 for five years. In 2012, the Company granted 3,295,000 stock options at a weighted average exercise price of $0.45 for five years. The fair value as calculated by the Black Scholes model, of the Company’s stock options has decreased in line with a reduction on the Company’s share price. |
Other and Non-Cash Items
| • | Foreign exchange: The Company recognized a foreign exchange loss of $166,914 in 2012 compared to $7,866 in 2013 due to the strengthening of the US dollar over the year in 2013. Volatility in the foreign exchange rate could continue to result in significant foreign exchange gains or losses. The Company does not hedge its exposure to changes in the value of the Canadian dollar. |
| • | Fair value gain on derivative liability: Warrants denominated in a currency other than the Company’s functional currency are deemed to be a derivative and valued at fair value. On each reporting date, the derivative liability is adjusted for fair value changes with the difference being recorded in profit and loss. Due to the decline in the Company’s share price and also through the passage of time, the Company realized a non-cash gain of $2,363,892 in 2013 subsequent to the initial fair value recognition. |
| • | Gain (loss) on sale of mineral property: On September 19, 2013, the Company sold three properties in central Mexico to Goldcorp for US$375,000 plus applicable taxes. At the date of disposal the total capitalized exploration expenditures for these three properties were $3,225,818 which was written down to nil and resulted in a loss on disposal of $2,774,114. In October 2012, the Company sold its Butte Valley copper project to Freeport for US$2,000,000, and realized $820,712 gain. In July 2013, the Company received an additional US$1,000,000 ($1,038,000) from Freeport as a contingent bonus from the sale of Butte Valley. |
- 46 -
| • | General exploration costs: These costs represent expenditures to undertake and support exploration activities on the Company’s properties, including costs incurred prior to the Company obtaining the rights to the mineral properties. In addition, if the expenditures are deemed not to be specifically related to individual properties or not recoverable, they are expensed as incurred. |
| • | Impairments: due to the current market condition, the Company has abandoned inactive non-core mineral properties so as to focus its effort and resources in its copper properties in the Yerington District. As a result, $26,212,984 impairments were recorded in the year ended December 31, 2013. |
| • | Interest income (expenses): interest earned varies based on the timing, type and amount of equity placements and resultant fluctuations in cash. The interest expense in 2013 was related to the unsecured loans from the Company’s Chairman. As of December 31, 2013, US$600,000 remained unpaid. On March 18, 2014, the loans were converted to a demand basis with a 40-day notice period. |
| B. | Liquidity and Capital Reserves |
As at March 26, 2015, the Company had cash of $1,089,000. With the asset sale transactions during 2014, management believes the Company has sufficient funds for the next full year of operations. The Company continues to take steps to reduce costs including reduction in management remuneration. Since the Company does not generate any revenue from operations, its long-term profitability will be directly related to the success of its mineral property acquisition, divestment and exploration activities.
The following sales of non-core assets occurred in 2014:
| • | On March 14, 2014, a transaction to sell its uranium properties and assets located in the states of Arizona, Utah and Wyoming for gross proceeds of $500,000. |
| • | On October 3, 2014, a transaction to sell its residual interests including royalties in three non-core copper and molybdenum assets—Butte Valley, Nevada, SW Tintic, Utah and Cave Peak, Texas—to Freeport-McMoRan Mineral Properties Inc. for US$5 million of which US$1 million was paid at Closing with the balance payable in US$500,000 quarterly increments commencing January 1, 2015 (which was paid), for eight consecutive quarters. |
| • | On December 29, 2014, the sale of Quaterra’s 50% interest in the Nieves silver property in Zacatecas State, Mexico, to joint-venture partner Blackberry Ventures I, LLC (“Blackberry”), for US$4 million. Under the terms of the agreement, Quaterra will receive four payments over 15 months of US$1 million each, with each payment earning Blackberry an additional 12.5% interest in the project. As of March 25, 2015, the Company has 37.5% ownership in Nieves. |
The proceeds from these property sales have been used to continue advancing its Yerington copper projects and general corporate expenditures.
During the year ended December 31, 2014, the Company expended $2,785,258 (2013 - $2,430,403) cash in operating activities with allocations of 26% in professional and consulting expenses, 40% in personnel costs, 14% in administration and general office expenses, 5% in travel and shareholder communications, and 4% in transfer agent and regulatory fees.
The Company also had $1,791,579 (net of recoveries) (2013 - $4,205,935) in mineral property acquisition and exploration costs: allocated as 80% in Yerington district copper projects, 13% in Nieves, 2% in Herbert Gold, and 5% in other U.S. properties. The Company has decided to focus its efforts on Yerington copper projects and continue to monetize its non-core assets.
The ability of the Company to continue its exploration programs is dependent on the continuing success of its programs and on generating sufficient additional funding to support those exploration programs. Management is continuing to consider ways to monetize its remaining non-core exploration properties. The business of mining exploration involves a high degree of risk and there is no assurance that current exploration projects will result in future profitable mining operations. The Company has no source of revenue, and has significant cash requirements to meet its administrative overhead, pay its liabilities, and maintain its mineral interests.
- 47 -
On February 6, 2014 the Company voluntarily withdrew its common shares from listing on the NYSE MKT. The withdrawal from listing on the NYSE MKT and subsequent listing on the OTCQX market under the symbol “QTRRF” does not affect the listing of the shares on the TSX Venture Exchange.
| C. | Research and Development, Patents and Licenses, etc. |
We do not have a research and development policy, nor do we hold any patents, licenses, or other intellectual property.
Mineral property expenditures can vary from quarter to quarter depending when option payments are due and the stage of the exploration program. For example, drilling may slow down for a period of time when results are analyzed, resulting in lower costs during that period.
We have had no revenue from mining operations since our inception. Income was generated through management fees on certain properties and interest earned on banker’s acceptance investments.
| E. | Off- Balance Sheet Arrangements |
None.
| F. | Tabular Disclosure of Contractual Obligations |
The following table outlines our contractual and optional obligations at December 31, 2014 and the period such payments are due by:
| | | Total | | | 1 Year | | | 2-3 Years | | | 4-5 years | | | > 5 years | |
| Mineral properties(a) | $ | 4,327,607 | | $ | 674,666 | | $ | 1,230,737 | | $ | 1,531,576 | | $ | 890,628 | |
| Office lease(b) | | 263,906 | | | 103,906 | | | 160,000 | | | - | | | - | |
| | $ | 4,591,513 | | $ | 778,572 | | $ | 1,390,737 | | $ | 1,531,576 | | $ | 890,628 | |
| | (a) | We are required to make option payments and other expenditure commitments to maintain control of these properties. |
| | | |
| | (b) | Manex is a private company controlled by the Corporate Secretary of the Company. It provides furnished office space, selected administration, accounting, and corporate secretarial services to the Company. These services are provided in the normal course of operations for consideration established and accepted by the Company and Manex. On February 9, 2012, the Company renewed its service agreement with Manex for its Vancouver head office administration and corporate services at a monthly rate of $15,750 for office rent plus accounting and administration services provided at agreed market rates for a five-year term expiring August 31, 2017. The service agreement was amended September 1, 2013, March 1, 2014 and January 1, 2015 to reduce the fee for services to a monthly rate of $5,000 with the monthly office lease remaining at $8,000. The Company may terminate the services portion of the agreement upon 30 day notice without penalty, and the office lease portion of the agreement by paying Manex the lesser of $96,000 or a total fee owing for the remainder of the lease term (through August 31, 2017). |
The safe harbor provided in Section 27A of the Securities Act of 1933, as amended, and Section 21E of the Securities Exchange Act of 1934, as amended, shall apply to forward-looking information provided pursuant to Item 5.F. Please see “Cautionary Statement Regarding Forward-Looking Information” at the outset of this annual report.
- 48 -
| ITEM 6. | DIRECTORS, SENIOR MANAGEMENT AND EMPLOYEES |
| A. | Directors and senior management |
The following tables and biographies set forth information about our directors and executive officers:
| Name | Age | Positions Held | Period as Director
or Officer | Jurisdiction of Residence
|
|
| Steve Dischler | 57 | Director & President & Chief
Executive Officer | Since 2011 | Nevada, U.S.A. |
|
| Thomas C. Patton | 71 | Director & Chairman | Since 1998 | Washington, U.S.A. |
|
| John Kerr | 74 | Director | Since 1993 | British Columbia, Canada |
|
| LeRoy Wilkes | 72 | Director | Since 2006 | Colorado, U.S. |
|
Anthony Walsh1 | 63 | Director | Since 2012 | British Columbia, Canada |
|
| Todd Hilditch | 47 | Director | Since 2012 | British Columbia, Canada |
|
| Michael Berry | 67 | Director | Since 2013 | Whippany, New Jersey |
| Lawrence Page, Q.C | 75 | Corporate Secretary | Since 1995 | British Columbia, Canada |
|
| Scott Hean | 67 | Chief Financial Officer | Since 2006 | British Columbia Canada |
|
| 1. | Mr. Walsh resigned as a Director on March 26, 2015 |
Steven Dischler
Mr. Dischler graduated from the University of Wisconsin in 1981 (BS) and from the University of Arizona in 1984 (MS). Both of his degrees are in Mining Engineering. From 2007 through 2011, Mr. Dischler was a Project General Manager and Strategy Manager for a global oil company, BP. In his roles at BP he was responsible for managing major capital projects up to $250MM (US) and for managing a portfolio of legacy mining sites across the western US for the company. In prior roles Mr. Dischler was a consultant for 25 years which included permitting and development of major mining sites at numerous locations in the US. Mr. Dischler is a registered Professional Engineer in 8 states and has been a member of the Society of Mining Engineers since 1978.
Dr. Thomas Patton
Dr. Patton graduated from the University of Washington in 1971 (Ph.D.) and has worked with both junior and senior mining companies. He served as the President and Chief Operating Officer for Western Silver Corporation from January 1998 to May 2006. Among his accomplishments at Western Silver were the discovery and delineation of the class Peñasquito silver-gold-lead zinc deposit in Zacatecas, Mexico and the subsequent sale of the company to Glamis Gold Ltd. Prior to joining Western Silver, Dr. Patton held senior positions with Rio Tinto PLC and Kennecott Corporation, where he served as Senior Vice President, Exploration and Business Development. Dr. Patton is a member of the Society of Economic Geologists and the American Institute of Mining & Metallurgical Engineers.
John R Kerr
John R. Kerr graduated from the University of British Columbia in 1964 with a Bachelor of Applied Science (B. ASc) degree in Geological Engineering. He has participated in the mining industry continuously since graduation as an exploration geologist. Mr. Kerr has gained experience in recognition and identification of mineral potential in a diversified field of geological environments. Mr. Kerr also serves as director of Bravada Gold Corporation. He currently operates a geological consulting practice out of Vancouver, B.C., with projects located in all areas of North America.
LeRoy Wilkes
Mr. Wilkes was President of Washington Group International’s mining business unit where he was responsible for the operating and financial performance of the unit’s international operations in the coal, metals and industrial minerals markets. He has 38 years of mining experience in the precious metals, coal industrial metals, and base metals mining and processing. Prior to joining the Washington Group, Mr. Wilkes served as executive vice-president and chief operating officer of Santa Fe Pacific Gold Corporation of Albuquerque, New Mexico from 1988 to 1995. Mr. Wilkes also previously served as executive vice-president of Washington Corporation of Missoula, Montana, responsible for merger and acquisition activities. He earlier served as vice-president and general manager of Kennecott Ridgeway Mining Company of Ridgeway, South Carolina, and director of business development of Anaconda Minerals Co. of Denver, Colorado. He has held management and supervisory positions at surface and underground mines producing molybdenum, copper, limestone, lead silver and zinc. Mr. Wilkes has a degree in mining engineering from the Montana School of Mines. Mr. Wilkes also serves as a director and chairman of the Board of Sabina Gold & Silver Corp.
- 49 -
Anthony Walsh
Mr. Walsh graduated from Queen’s University (Canada) in 1973 and became a member of The Canadian Institute of Chartered Accountants in 1976. Mr. Walsh has over 20 years’ experience in the field of exploration, mining and development. From 2008 to 2011, Mr. Walsh was President and CEO and a Director of Sabina Gold & Silver Corp. From 1995 to 2007, Mr. Walsh was President and Chief Executive Officer of Miramar, from 1993 to 1995 was the Senior Vice-President and Chief Financial Officer of a computer leasing company and from 1989 to 1992 was Chief Financial Officer and Senior Vice-President, Finance of International Corona Resources Ltd., a gold producer Mr. Walsh is currently Chairman of Stornoway Diamonds Ltd. and serves as a director of several other public companies, namely: Sabina Gold & Silver Corp., Dundee Precious Metals Ltd., Avala Resources Ltd., Nova Gold Ltd., and TMX Group Ltd.
Todd Hilditch
Mr. Hilditch is President, Chief Executive Officer and a Director of Terraco Gold Corp., a TSXV-listed gold exploration company focussed in the western United States. He is a Director of Sama Resources Inc., a TSXV-listed base metals company focussed in West Africa, and was its President and Chief Executive Officer until 2010. Until 2010, Mr. Hilditch was President, Chief Executive Officer and a Director of Salares Lithium Inc., which was acquired by Australia-based Talison Lithium Limited, the world's largest lithium producer and a TSE-listed company. Mr. Hilditch is the President and owner of Rock Management Consulting Ltd., a private mining management services and consulting company.
Michael Berry
Dr. Berry served as a professor of investments at the Colgate Darden Graduate School of Business Administration at the University of Virginia, and as the Wheat First Endowed Chair at James Madison University. He has managed small- and mid-cap value portfolios for Heartland Advisors and Kemper Scudder. For the past decade he has been a highly regarded lecturer at the Federal Reserve Bank of the United States of America and is a well-known author and speaker in the Discovery Investing world. He is co-developer of the Discovery Investing Scoreboard software which ranks companies relative to their discovery potential. He publishes Morning Notes which discusses geopolitical, technological and economic trends and their effect on capital markets, and identifies opportunities in the area of natural resources, high technology, infrastructure development and biotech.
Lawrence Page, Q.C.
Lawrence Page, Q.C. obtained his law degree from the University of British Columbia in 1964 and was called to the Bar of British Columbia in 1965. He has been admitted to the Bar of Ontario for the purpose of acting as counsel in specified litigation. Mr. Page was awarded the distinction of Queen’s Counsel in 1988. Mr. Page practices on his own in Vancouver in the areas of natural resource law and corporate and securities law. He is the principal of Manex Resource Group, which provides administrative, financial, corporate and geological services to a number of public companies in the mineral resource sector, including Quaterra. Mr. Page also serves as a director of five public companies: Duncastle Gold Corp., Valterra Resource Corporation, Southern Silver Exploration Corp., Bravada Gold Corporation and Homestake Resource Corporation.
Eugene Spiering
Mr. Spiering’s VP Exploration contract with Quaterra Resources ended December 31, 2014 and was not renewed. He is no longer employed by the Company.
Mr. Spiering has a Bachelor of Science-Geology degree from the University of Utah. He has over 30 years of experience in the mining exploration industry. Mr. Spiering previously held the position of Vice President, Exploration at Rio Narcea Mines Ltd., where he managed a team that discovered the El Valle and Corcoesto gold deposits and completed the final definition of the Carles and Salave gold deposits and the Aguablanca nickel deposit in Spain. Prior to his tenure at Rio Narcea, Mr. Spiering held the position of senior geologist with Energy Fuels Nuclear, Inc. where he participated in the discovery of the Arizona 1 and Hermit uranium deposits. His responsibilities with Energy Fuels included drilling supervision, geologic mapping, and ore reserve calculations related to uranium exploration in northern Arizona and gold exploration in the western US and Venezuela. Mr. Spiering is a member of the Society of Economic Geologists, the Society for Mining, Metallurgy & Exploration, the American Association of Petroleum Geologists, and is a Fellow member of the Australasian Institute of Mining and Metallurgy.
- 50 -
Scott B. Hean
Mr. Hean joined the Company as Chief Financial Officer in March 2006. He is director and past chair of the audit committee for Sabina Gold & Silver Corp. (SBB on the TSX) and chair of the Compensation Committee for Sabina. He also serves as chair of the audit committee for Formation Metals Ltd (FCO on the TSX) Previously, Mr. Heane held senior management and executive positions with Bank of Montreal as Senior Vice President and Managing Director responsible for financing in the natural resources sectors in North America and with J.P. Morgan of New York, where he was involved in financing oil and gas companies. In the non-profit sector, he serves as a director and past chair of the Bill Reid Trust, a not for profit organization concerning the work of the internationally renowned First Nations Haida artist, Bill Reid and has served on numerous not-for-profit Boards, including Outward Bound Canada and B.C. Children’s Hospital. Mr. Hean graduated from Simon Fraser University in 1973 and from the Ivey School of Business, London, Ontario, in 1975. He completed the Institute of Corporate Directors Director Education program in May 2006.
Executive Officers
The following table sets forth the compensation paid to executive officers for the fiscal year ended December 31, 2014.
Name
| Salary
($)
| Bonus
($)
| Securities Under
Options Granted (#)
5, 6 | Share-Based
Payment Under
Options ($)4 | All other
Compensation
| Total
($)
|
|
|
Thomas C. Patton
President & CEO |
150,000
|
nil
| 800,000
|
$40,696
|
nil
|
190,696
|
|
|
Eugene Spiering(1)
VP of Exploration |
200,000
|
nil
| 50,000
|
$3,110
|
nil
|
203,110
|
|
|
Scott Hean(2)
Chief Financial Officer
|
150,000
|
nil
| 450,000
|
$23,458
|
nil
|
173,458
|
|
|
Steve Dischler(3)
President and Chief
Executive Officer |
250,000
|
nil
| 1,100,000
|
$66,460
|
nil
|
316,460
|
|
|
| (1) | Mr. Spiering’s contract was not renewed at December 31, 2014 and he is no longer employed with the Company. |
| | |
| (2) | Consulting fees paid to Atherton Enterprises, a company owned by Mr. Scott Hean in consideration of Mr. Hean’s services as Chief Financial Officer. Effective December 1, 2013, Mr. Hean became a salaried employee of the Company. |
| | |
| (3) | Share-based payment under options for Mr. Dischler reflected the 300,000 options vested during 2014 as part of Mr. Dischler’s appointment to President and CEO in September 2013. |
| | |
| (4) | The assumptions used to calculate share-based payment for June 2014 options were risk-free interest rate 1.31%, expected share price volatility 101.69%, expected option life 5 years, forfeiture rate 0%, and expected dividend yield 0%. The assumptions used to calculate share-based payment for December 2014 options were risk-free interest rate 1.01%, expected share price volatility 139.74%, expected option life 5 years, forfeiture rate 0%, and expected dividend yield 0%. |
- 51 -
| (5) | We granted stock options on June 25, 2014 under our Incentive Stock Option Plan at an exercise price of $0.10 per share for a five year term to the executive officers named above in the following amounts: Dr. Thomas Patton received 400,000 options; Mr. Spiering received 50,000 options; Mr. Hean received 250,000 options, and Mr. Dischler received 400,000 options. |
| | |
| (6) | We granted stock options on December 31, 2014 under our Incentive Stock Option Plan at an exercise price of $0.05 per share for a five year term to the executive officers named above in the following amounts: Dr. Thomas Patton received 400,000 options; Mr. Hean received 200,000 options, and Mr. Dischler received 400,000 options. |
Board of Directors
The Company previously approved annual compensation to non-executive directors including payment of $500 per meeting attended, $500 per travel day and annual fees as follows:
| | Independent Directors | $ | 12,000 | |
| | Chairman of the Board of Directors | $ | 24,000 | |
| | Chairman of the Audit Committee | $ | 15,000 | |
| | Chairman of any other committee | $ | 13,500 | |
As approved by a resolution of the Board of Directors, no directors’ fees were paid or accrued in 2013. No fees were paid or accrued in 2014.
The Company granted stock options on June 25, 2014 under our Incentive Stock Option Plan at an exercise price of $0.10 per share for a five year term to the directors above in the following amounts: John Kerr received 200,000 options; Roy Wilkes received 200,000 options; Anthony Walsh received 200,000 options, Todd Hilditch received 200,000 options, and Michael Berry received 200,000 options.
Term of Office
Our directors are elected annually at our annual general meeting and each officer holds such office for one year, until the next annual general meeting of shareholders, or until replaced by his or her predecessor.
Employment and Service Contracts
During the most recently completed financial year, five of our executive officers had service contracts in place which provide for benefits upon termination of employment.
Thomas Patton – In January 2010, Dr. Thomas Patton entered into an employment agreement with the Company and its subsidiary, Quaterra Alaska, Inc. for a period of five years which replaced a prior employment agreement dated January 1, 2009. Under the employment agreement, Dr. Patton is entitled to receive an annual base salary of $150,000. Upon the expiration of one year following the date of the employment agreement and each year thereafter, the Company will review Dr. Patton’s salary with a view to its increase, giving consideration to the Company’s financial position and the scope of its activities. Dr. Patton may be eligible to participate in future stock option grants. The Company may terminate the employment of Dr. Patton only for breach of the employment agreement or for cause. Dr. Patton is entitled to two months’ notice of such discharge. If Dr. Patton becomes disabled and unable to perform his regular duties, he shall be entitled to receive his full salary for two months. Upon a change of control, as defined in the employment agreement, Dr. Patton has the right to terminate the employment agreement and receive an amount of money equal to his annual salary for two (2) years, that amount being $300,000.
Lawrence Page:On July 15, 2011, Lawrence Page, Q.C. entered into a consulting agreement with the Company for a period of five years, whereby Mr. Page provides corporate secretarial services to the Company and is entitled to receive an annual fee of $50,000. Mr. Page may be eligible to participate in future stock option grants. Upon a change of control, as defined in the agreement, Mr. Page has the right to terminate the agreement and receive an amount of money equal to his annual salary for two (2) years, that amount being $100,000. Mr. Page resigned as a director on July 31, 2013 but continues to serve the Company as Corporate Secretary.
- 52 -
Steven Dischler:On October 24, 2011, Steven Dischler entered into an employment agreement with the Company for a period of five years for his position as Vice President, General Manager, Yerington District. Mr. Dischler was subsequently appointed President and CEO and a director of the Company on July 31, 2013. Pursuant to the agreement, Mr. Dischler earns an annual salary of US$250,000, is entitled to participate in future stock option grants, and may only have his employment terminated by the Company for breach of the employment agreement or for cause. Upon a change of control, as defined in the employment agreement, Mr. Dischler has the right to terminate the employment agreement and receive an amount of money equal to his annual salary for two (2) years, that amount being US$500,000.
Scott Hean:Scott Hean and his wholly-owned company entered into a services agreement with the Company effective January 1, 2010 for a term of five years. Pursuant to the agreement, Mr. Hean earns an annual salary of $175,000, is entitled to participate in future stock option grants, and may only have his employment terminated by the Company in the event of default. Upon a change of control, as defined in the agreement, Mr. Hean has the right to terminate the services agreement and receive an amount of money equal to his annual salary for two (2) years, that amount being $350,000. Effective December 1, 2013, Mr. Hean became a full time employee of the Company with a salary of $150,000.
Committees
Our Board of Directors has established an Audit Committee and Corporate, Governance, Nomination and Compensation Committee.
Audit Committee –The Company’s Board of Directors has a separately-designated standing audit committee established in accordance with Section 3(a)(58)(A) of the Securities Exchange Act of 1934, as amended. The members of the Audit Committee are Anthony Walsh, Todd Hilditch and John Kerr. The Company’s Board of Directors has determined that each of Messrs. Walsh, Hilditch, and Kerr are independent (as provided for under Rule 10A-3 of the Exchange Act) and are financially literate. The Audit Committee is responsible for assisting directors to meet their responsibilities, providing better communication between directors and external auditors, enhancing the independence of the external auditor, increasing the credibility and objectivity of financial reports, and strengthening the role of the directors, facilitating in-depth discussions among directors, management, and the external auditor. The Audit Committee meets at least four times during a year. A copy of the Audit Committee Charter is available through our website at www.quaterraresources.com.
Corporate Governance, Nomination and Compensation Committee – The members of the Corporate Governance Nomination Compensation Committee (the “CGNCC”) are LeRoy Wilkes, Anthony Walsh, and Todd Hilditch all of whom are independent. The Board of Directors has determined that the composition of the CGNCC ensures an objective process for determining compensation of executive officers. The CGNCC meets regularly and considers matters of governance and compensation. The CGNCC may seek the advice of third party independent consultants as may be required in particular circumstances and submits reports to the full Board of Directors on a regular basis.
During the fiscal years ended December 31, 2014, 2013 and 2012, we had direct employees as outlined below.
| | Company | | 2014 | | | 2013 | | | 2012 | |
| | Quaterra Resources Inc. | | 2 | | | 4 | | | 4 | |
| | Quaterra Alaska Inc./Singatse Peak Services LLC | | 6 | | | 9 | | | 10 | |
| | Minera Agua Tierra S.A. de C.V. | | Nil | | | Nil | | | Nil | |
| | Quaterra International Limited | | Nil | | | Nil | | | Nil | |
| | Total | | 8 | | | 13 | | | 14 | |
- 53 -
Manex is a private company controlled by the Corporate Secretary of the Company. It provides furnished office space, selected administration, accounting, and corporate secretarial services to the Company. These services are provided in the normal course of operations for consideration established and accepted by the Company and Manex. On February 9, 2012, the Company renewed its service agreement with Manex for its Vancouver head office administration and corporate services at a monthly rate of $15,750 for office rent plus accounting and administration services provided at agreed market rates for a five-year term expiring August 31, 2017. The service agreement was amended September 1, 2013, March 1, 2014 and January 1, 2015 to reduce the fee for services to a monthly rate of $5,000 with the monthly office lease remaining at $8,000. The Company may terminate the services portion of the agreement upon 30 day notice without penalty, and the office lease portion of the agreement by paying Manex the lesser of $96,000 or a total fee owing for the remainder of the lease term (through August 31, 2017). During the three years ended December 31, 2014, we paid Manex the following:
| | | | Fiscal year ended December 31 | |
| | | | 2014 | | | 2013 | | | 2012 | |
| | Office space and administration | $ | 113,124 $ | | | 237,948 | | $ | 267,124 | |
| | Accounting | | 140,000 | | | 165,864 | | | 164,088 | |
| | Corporate Secretary | | 51,304 | | | 56,591 | | | 100,454 | |
| | 15% charges on recovery | | 867 | | | 2,621 | | | 3,683 | |
| | | $ | 305,294 $ | | | 463,024 | | $ | 535,349 | |
Manex is located at the same address as our company at suite 1100, 1199 West Hastings Street, Vancouver, British Columbia. Manex is a private company controlled by Lawrence Page, the Company’s Corporate Secretary.
All persons listed in subsection 6.B above beneficially own an aggregate of 8,185,318 Common shares or 4.23% of our common shares outstanding. Dr. Thomas Patton beneficially owns 5,214,762 or 2.70% of our common shares and he has the right to exercise or redeem various stock options that if fully exercised he will beneficially own 6,974,762 common shares of the Company or 3.57% of our outstanding shares. No other director or officer beneficially owns greater than 1% of our common shares.
We grant stock options to directors, officers, employees and consultants who provide services to us, including our subsidiaries, pursuant to our Incentive Stock Option Plan. The purpose of the Incentive Stock Option Plan is to provide increased incentive to contribute to our future success and prosperity, thus enhancing the value of our shares for the benefit of all the shareholders and increasing our ability to attract and retain skilled and motivated individuals in the service of us. Our Incentive Stock Option Plan is a “rolling” plan through which the maximum number of issuable shares underlying options is equal to 10% of our outstanding shares. As of December 31, 2014, there were 15,400,000 options outstanding under the Incentive Stock Option Plan.
| ITEM 7. | MAJOR SHAREHOLDERS AND RELATED PARTY TRANSACTIONS |
We are not aware of any beneficial shareholder holding greater than 5% of our common shares as of the date of this annual report or during the prior three years, other than:
| Goldcorp Inc. | 10,294,825 common shares | 5.32% |
Goldcorp’s ownership of the Company has not changed in three years. The Company’s major shareholder does not have different voting rights.
- 54 -
As of December 31, 2014, approximately 56% of our common shares were held in Canada and approximately 43.9% of our common shares were held in the U.S., with the balance held in various other countries.
There are no arrangements known to us that may, at a subsequent date, result in a change in control.
| B. | Related Party Transactions |
During fiscal 2014, the Company paid legal fees of $9,139 to a law firm of which Lawrence Page is the principal.
Additionally, the Company amended the service agreement with related party Manex Resource Corp (“Manex”), a private company controlled by the Corporate Secretary of the Company. It provides furnished office space, selected administration, accounting, and corporate secretarial services to the Company. These services are provided in the normal course of operations for consideration established and accepted by the Company and Manex. On February 9, 2012, the Company renewed its service agreement with Manex for its Vancouver head office administration and corporate services at a monthly rate of $15,750 for office rent plus accounting and administration services provided at agreed market rates for a five-year term expiring August 31, 2017. The service agreement was amended September 1, 2013, March 1, 2014 and January 1, 2015 to reduce the fee for services to a monthly rate of $5,000 with the monthly office lease remaining at $8,000. The Company may terminate the services portion of the agreement upon 30 day notice without penalty, and the office lease portion of the agreement by paying Manex the lesser of $96,000 or a total fee owing for the remainder of the lease term (through August 31, 2017). During the year ended December 31, 2014 the Company paid $305,294 to Manex. Manex is located at the same address as the Company at suite 1100, 1199 West Hastings Street, Vancouver, British Columbia, V6E 3T5. We believe the terms of the Manex agreement are similar to that which would be obtainable from an unrelated party.
On March 28, June 5 and July 4 of 2013, the Company borrowed a total of US$800,000 unsecured loans at an interest rate of 10% per annum from our Chairman of the board, Mr. Thomas Patton. As of December 31, 2013, US$200,000 was repaid and the balance of US$600,000 was amended on March 18, 2014 to a demand basis with a 40-day notice period. On December 29, 2014, the Company repaid the balance of the Chairman’s loan and related interest.
| C. | Interests of Experts and Counsel |
Not applicable.
| ITEM 8. FINANCIAL INFORMATION |
Financial Statements
The consolidated statements of financial position of Quaterra Resources Inc. as of December 31, 2014 and 2013 and the consolidated statements of comprehensive loss, changes in equity and cash flows of Quaterra Resources Inc. for the years ended December 31, 2014, 2013 and 2012, as well as the auditors’ report thereon, are presented at Item 17 of this annual report.
Legal Proceedings
From time to time, we may be a party to pending or threatened legal proceedings and arbitrations that are routine and incidental to our business. Based upon information presently available, our management is not aware of any threatened or pending litigation.
Dividends
We have never declared or paid any cash dividends on our common stock and we do not anticipate paying any cash dividends in the foreseeable future.
- 55 -
Significant Changes
Except as otherwise disclosed in this annual report, including under Item 5. “Operating and Financial Review and Prospects”, there has been no significant change in our financial position since December 31, 2014.
| ITEM 9. | THE OFFER AND LISTING |
| A. | Offer and listing details |
Our common shares have traded on the TSX Venture Exchange since November 14, 1997 under the symbol QTA. Our common shares also have traded on the NYSE MKT (previously known as the NYSE AMEX) from March 4, 2008 until February 6, 2014 under the symbol QMM. On February 7, 2014, our shares began trading on the OTCQX under the symbol QTRRF.
The following table set forth the price history of our common shares for the periods indicated.
| TSX Venture Exchange
(C$) | NYSE MKT
(US$) | OTCQX
(US$) |
| | High | Low | High | Low | High | Low |
Fiscal Year Ended
December 31, 2014 | 0.11 | 0.035 | - | - | 0.089 | 0.03 |
Fiscal Year Ended
December 31, 2013 | 0.36 | 0.065 | 0.37 | 0.07 | - | - |
Fiscal Year Ended
December 31, 2012 | 0.74 | 0.32 | 0.71 | 0.32 | - | - |
Fiscal Year Ended
December 31, 2011 | 2.08 | 0.54 | 2.21 | 0.50 | - | - |
Fiscal Year Ended
December 31, 2010 | 2.50 | 1.05 | 2.42 | 1.01 | - | - |
| | | | | | | |
Fiscal Year Ended
December 31, 2014 | | | | | | |
| First Quarter | 0.10 | 0.06 | - | - | 0.085 | 0.035 |
| Second Quarter | 0.095 | 0.055 | - | - | 0.089 | 0.041 |
| Third Quarter | 0.06 | 0.04 | - | - | 0.079 | 0.03 |
| Fourth Quarter | 0.06 | 0.035 | - | - | 0.055 | 0.029 |
| | | | | | | |
Fiscal Year Ended
December 31, 2013 | | | | | | |
| First Quarter | 0.36 | 0.20 | 0.37 | 0.19 | - | - |
| Second Quarter | 0.23 | 0.09 | 0.22 | 0.09 | - | - |
| Third Quarter | 0.17 | 0.09 | 0.17 | 0.09 | - | - |
| Fourth Quarter | 0.15 | 0.065 | 0.15 | 0.07 | - | - |
| | | | | | | |
| February 2014 | 0.09 | 0.045 | - | - | 0.045- | 0.03- |
| February 7-28, 2014 | - | - | - | - | 0.0795 | 0.05 |
| February 1-6, 2014 | - | - | 0.08 | 0.04 | - | - |
| January 2014 | 0.11 | 0.06 | 0.10 | 0.05 | - | - |
| December 2013 | 0.10 | 0.07 | 0.11 | 0.07 | - | - |
| November 2013 | 0.115 | 0.065 | 0.10 | 0.07 | - | - |
| October 2013 | 0.15 | 0.105 | 0.15 | 0.10 | - | - |
| September 2013 | 0.17 | 0.15 | 0.17 | 0.15 | - | - |
- 56 -
Not applicable.
See subsection 9.A. “Offer and Listing Details” above.
Not applicable.
Not applicable.
Not applicable.
| ITEM 10. | ADDITIONAL INFORMATION |
Not applicable.
| B. | Memorandum and Articles of Association |
Incorporation
We are governed by Articles dated June 13, 2005 and amended December 11, 2007. Our Articles are on file with the Office of the British Columbia Registrar of Companies under Certificate of Incorporation No. BC0446713. Under the provisions of the Business Corporations Act (BC), we have the capacity and the rights, powers, and privileges of an individual of full capacity. There are no restrictions in our Articles on the business that we can carry on or the powers we can exercise.
Powers and Functions of the Directors
Under Article 17, a director is obligated to disclose a potential interest in a contract or transaction being considered by us, and may not vote on a contract or transaction with a disclosurable interest, but the director shall be counted in the quorum at the meeting of the Board of Directors at which the contract or transaction is approved.
Under Article 13, the Board of Directors may, in the absence of an independent quorum, vote compensation to themselves.
Under Article 8, there are no limitations on borrowing powers exercisable by our Board of Directors.
There are no provisions in our Articles for the retirement or non-retirement of a director under an age limit.
There is no requirement in our Articles for a director to hold any of our common shares.
Rights and Restrictions Attached to the Common Shares
Our common shares rank equally as to dividend rights, voting rights, profits, and liquidation rights. The common shares are not subject to redemption or sinking fund provisions, liability to further capital calls, nor any provisions discriminating against any existing or prospective holder of such shares as a result of such shareholder owning a substantial number of shares.
- 57 -
Alteration of Share Rights
In accordance with theBusiness Corporations Act (BC) and our Articles, a special resolution is required to change the rights of common shares, and must be (a) passed at a general meeting by a majority of not less than 2/3 of the voting common shareholders; or (b) consented to in writing by all common shareholders.
Annual General Meetings
Articles 10 and 11 of our Articles, together with applicable corporate and securities laws, contain the conditions governing the manner in which annual and extraordinary general meetings of shareholders are called, including notice, proxy solicitation, and quorum requirements. Annual general meetings are called and scheduled upon decision by the Board of Directors. The Board of Directors may convene an extraordinary general meeting of the shareholders. Holders of common shares may not requisition an extraordinary meeting of the shareholders. All meetings may be attended by registered shareholders or persons who hold powers of attorney or proxies given to them by registered shareholders.
Foreign Ownership Limitation
Our Articles do not contain limitations on the rights of non-residents, foreigners, or other groups to own common shares.
Change of Control
There are no provisions in our Articles that would have the effect of delaying, deferring or preventing a change in control, or that operate only with respect to a merger, acquisition or corporate restructuring involving us or any of our subsidiaries.
Share Ownership Reporting Obligation
Our Articles do not contains provisions governing the threshold above which shareholder ownership must be disclosed.
Differences between Canadian and U.S. Law
The securities laws of the Province of British Columbia require disclosure of shareholdings by (i) persons who are our directors or senior officers; and (ii) a person who has direct or indirect beneficial ownership of, control or direction over, or a combination of direct or indirect beneficial ownership of and control or direction over our securities carrying more than 10% of the voting rights attached to all of our outstanding voting securities.
The threshold of share ownership percentage requiring disclosure of ownership is higher in the home jurisdiction of British Columbia than the U.S. where U.S. securities law prescribes a 5% threshold for ownership disclosure.
Capital Changes
There are no conditions imposed by our Articles governing changes in our share capital that are more stringent than is required by law.
We have not entered into any material contracts other than in the ordinary course of business and other than those described in Item 4. “Information on the Company” or elsewhere in this annual report.
There currently are no laws, decrees, regulations, or other legislation in Canada that restrict the export or import of capital, or impose foreign exchange controls or affect the remittance of interest, dividends, or other payments to non-resident holders of our common shares, other than the withholding tax requirements described under subsection E. “Taxation” below. Canada has no system of exchange controls.
- 58 -
There are no limitations imposed by Canadian law or our Articles on the right of non-resident to hold our common shares, other than as provided by theInvestment Canada Act, as amended (the “Act”), as amended by theNorth American Free Trade Agreement Implementation Act(Canada), and theWorld Trade Organization (WTO) Agreement Implementation Act. The Act requires notification and, in certain cases, advance review and approval by the Government of Canada of the acquisition by a “non-Canadian” of “control of a Canadian business”, all as defined in the Act. Generally, the threshold for review will be higher in monetary terms for a member of the WTO or NAFTA.
We encourage you to consult with your own tax advisors about the Canadian and U.S. federal, state, provincial, local, and foreign tax consequences of purchasing, owning, and disposing of our common shares. |
Certain Canadian Federal Income Tax Consequences
The discussion under this heading summarizes the principal Canadian federal income tax consequences of acquiring, holding and disposing of shares of common shares for a shareholder who is not a resident of Canada but is a resident of the United States and who will acquire and hold a corporation’s common shares as capital property for the purposes of the Income Tax Act (Canada) (the “Canadian Tax Act”). This summary does not apply to a shareholder who carries on business in Canada through a “permanent establishment” situated in Canada or performs independent personal services in Canada through a fixed base in Canada if the shareholder’s holding is effectively connected with such permanent establishment or fixed base. This summary is based on the provisions of the Canadian Tax Act and the regulations thereunder and on an understanding of the administrative practices of Canada Customs & Revenue Agency, and takes into account all specific proposals to amend the Canadian Tax Act or regulations made by the Minister of Finance of Canada as of the date hereof.
This discussion is general only and is not, nor is it intended to provide a detailed analysis of the income tax implications of any particular shareholder’s interest. Investors are advised to obtain independent advice from a shareholder’s own Canadian and U.S. tax advisors with respect to income tax implications pertinent to their particular circumstances.The provisions of the Canadian Tax Act are subject to income tax treaties to which Canada is a party, including the Canada-United States Income Tax Convention (1980), as amended (the “Convention”).
Dividends on Common Shares and Other Income
Under the Canadian Tax Act, a non-resident of Canada is generally subject to Canadian withholding tax at the rate of 25 percent on dividends paid or deemed to have been paid to him or her by a corporation resident in Canada. The corporation is responsible for the withholding of tax at the source. The Convention limits the rate to 15 percent if the shareholder is a resident of the United States and the dividends are beneficially owned by and paid to such shareholder and to 5 percent if the shareholder is also a corporation that beneficially owns at least 10 percent of the voting stock of the payor corporation.
The amount of a stock dividend (for tax purposes) would generally be equal to the amount by which the paid up or stated capital of the corporation had increased by reason of the payment of such dividend. The corporation will furnish additional tax information to shareholders in the event of such a dividend. Interest paid or deemed to be paid on the corporation’s debt securities held by non-Canadian residents may also be subject to Canadian withholding tax, depending upon the terms and provisions of such securities and any applicable tax treaty.
The Convention generally exempts from Canadian income tax dividends paid to a religious, scientific, literary, educational or charitable organization or to an organization constituted and operated exclusively to administer a pension, retirement or employee benefit fund or plan, if the organization is a resident of the United States and is exempt from income tax under the laws of the United States.
Dispositions of Common Shares
Under the Canadian Tax Act, a taxpayer’s capital gain or capital loss from a disposition of a common share is the amount, if any, by which his or her proceeds of disposition exceed (or are exceeded by, respectively) the aggregate of his or her adjusted cost base of the share and reasonable expenses of disposition. The capital gain or loss must be computed in Canadian currency using a weighted average adjusted cost base for identical properties. The capital gains net of losses included in income since October 17, 2000 is 50%. The amount by which a shareholder’s capital loss exceeds the capital gain in a year may be deducted from a capital gain realized by the shareholder in the three previous years or any subsequent year, subject to certain restrictions in the case of a corporate shareholder.
- 59 -
Under the Canadian Tax Act, a non-resident of Canada is subject to Canadian tax on taxable capital gains, and may deduct allowable capital losses realized on a disposition of “taxable Canadian property.” Common shares of a corporation will constitute the taxable Canadian property of a shareholder at a particular time if the shareholder used the shares in carrying on business in Canada, or if at any time in the five years immediately preceding the disposition, 25% or more of the issued shares of any class or series in the capital stock of the corporation belonged to one or more persons in a group comprising the shareholder and persons with whom the shareholder and persons with whom the shareholder did not deal at arm’s length and in certain other circumstances.
The Convention relieves United States residents from liability for Canadian tax on capital gains derived on a disposition of shares, unless: (i) the value of the shares is derived principally from “real property” in Canada, including the right to explore for or exploit natural resources and rights to amounts computed by reference to production; (ii) the shareholder was resident in Canada for 120 months during any period of 20 consecutive years preceding, and at any time during the 10 years immediately preceding, the disposition and the shares were owned by him when he ceased to be resident in Canada; or (iii) the shares formed part of the business property of a “permanent establishment” that the holder has or had in Canada within the 12 months preceding the disposition.
Certain United States Federal Income Tax Consequences
The following is a discussion of material United States federal income tax consequences generally applicable to a U.S. Holder (as defined below) of our common shares. This discussion does not cover any state, local or foreign tax consequences. This discussion is based upon the sections of the Internal Revenue Code of 1986, as amended (“the Code”), Treasury Regulations, published Internal Revenue Service (“IRS”) rulings, published administrative positions of the IRS and court decisions that are currently applicable, any or all of which could be materially and adversely changed, possibly on a retroactive basis, at any time. In addition, the discussion does not consider the potential effects, both adverse and beneficial, or recently proposed legislation which, if enacted, could be applied, possibly on a retroactive basis, at any time.
U.S. Holders
As used herein, a U.S. Holder includes a holder of common shares who is a citizen or resident of the United States, a corporation (or an entity which has elected to be treated as a corporation under Treasury Regulations created or organized in or under the laws of the United States or of any political subdivision thereof, any estate other than a foreign estate (as defined in the Code) or, a trust subject to the primary supervision of a court within the United States and control of a United States fiduciary as described in the Code. This summary does not address the tax consequences to, and U.S. Holder does not include, persons subject to special provisions of federal income tax law, such as tax-exempt organizations, qualified retirement plans, financial institutions, insurance companies, real estate investment trusts, regulated investment companies, broker-dealers, non-resident alien individuals, persons or entities that have a “functional currency” other than the U.S. dollar, shareholders who hold common shares as part of a straddle, hedging or conversion transaction, and shareholders who acquired their common shares through the exercise of employee stock options or otherwise as compensation for services. This summary is limited to U.S. Holders who own common shares as capital assets. This summary does not address the consequences to a person or entity holding an interest in a shareholder or the consequences to a person of the ownership, exercise or disposition of any options, warrants or other rights to acquire common shares.
Distribution on Common Shares
U.S. Holders receiving dividend distributions (including constructive dividends) with respect to common shares are required to include in gross income for United States federal income tax purposes the gross amount of such distributions equal to the U.S. dollar value of such distributions on the date of receipt (based on the exchange rate on such date), to the extent that the corporation has current or accumulated earnings and profits, without reduction for any Canadian income tax withheld from such distributions. Such Canadian tax withheld may be credited, subject to certain limitations, against the U.S. Holder’s United States federal income tax liability or, alternatively, may be deducted in computing the U.S. Holder’s United States federal taxable income (see more detailed discussion at “Foreign Tax Credit” below). To the extent that distributions exceed current or accumulated earnings and profits of the corporation, they will be treated first as a return of capital up to the U.S. Holder’s adjusted basis in the common shares and thereafter as gain from the sale or exchange of the common shares. Dividend income will be taxed at marginal tax rates applicable to ordinary income while preferential tax rates for long-term capital gains are applicable to a U.S. Holder which is an individual, estate or trust. There are currently no preferential tax rates for long-term capital gains for a U.S. Holder which is a corporation.
- 60 -
In the case of foreign currency received as a dividend that is not converted by the recipient into U.S. dollars on the date of receipt, a U.S. Holder will have a tax basis in the foreign currency equal to its U.S. dollar value on the date of receipt. Gain or loss may be recognized upon a subsequent sale of other disposition of the foreign currency, including the exchange for U.S. dollars.
Dividends paid on the common shares of a corporation will not generally be eligible for the dividends received deduction provided to corporations receiving dividends from certain United States corporations. A U.S. Holder which is a corporation may, under certain circumstances, be entitled to a 70% deduction of the United States source portion of dividends received from a corporation (unless the corporation qualifies as a “foreign personal holding company” or a “passive foreign investment company”, as defined below) if such U.S. Holder owns shares representing at least 10% of the voting power and value of the corporation. The availability of this deduction is subject to several complex limitations which are beyond the scope of this discussion.
Foreign Tax Credit
A U.S. Holder who pays (or has withheld from distributions) Canadian income tax with respect to the ownership of common shares may be entitled, at the option of the U.S. Holder, to either a deduction or a tax credit for such foreign tax paid or withheld. Generally, it will be more advantageous to claim a credit because a credit reduces United States Federal income taxes on a dollar-for-dollar basis, while a deduction merely reduces the taxpayer’s income subject to tax. This election is made on a year-by-year basis and applies to all foreign income taxes (or taxes in lieu of income tax) paid by (or withheld from) the U.S. Holder during the year. There are significant and complex limitations which apply to the credit, among which is the general limitation that the credit cannot exceed the proportionate share of the U.S. Holder’s United States income tax liability that the U.S. Holder’s foreign source income bears to his/her or its worldwide taxable income. The various items of income and deduction must be classified into foreign and domestic sources. Complex rules govern this classification process. In addition, this limitation is calculated separately with respect to specific classes of income such as “passive income”, “high withholding tax interest”, “financial services income”, “shipping income”, and certain other classifications of income. Dividends distributed will generally constitute “passive income” or, in the case of certain U.S. Holders, “financial services income” for these purposes. The availability of the foreign tax credit and the application of the limitations on the credit are fact specific and holders and prospective holders of common shares of should consult their own tax advisors regarding their individual circumstances.
For individuals whose entire income from sources outside the United States consists of qualified passive income whose total amount of creditable foreign taxes paid or accrued during the taxable year does not exceed US$300 (US$600 in the case of a joint return) and for whom an election is made under section 904(j), the limitation on credit does not apply.
Disposition of Common Shares
A U.S. Holder will recognize gain or loss upon the sale of common shares equal to the difference, if any, between (i) the amount of cash plus the fair market value of any property received, and (ii) the tax basis in the common shares. Preferential tax rates apply to long-term capital gains of U.S. Holders which are individuals, estates, or trusts. This gain or loss will be capital gain or loss if the common shares are capital assets in the hands of the U.S. Holder, which will be a short-term or long-term capital gain or loss depending upon the holding period of the U.S. Holder. Gains and losses are netted and combined according to special rules in arriving at the overall capital gain or loss for a particular tax year. Deductions for net capital losses are subject to significant limitations. For U.S. Holders which are not corporations, any unused portion of such net capital loss may be carried over to be used in later tax years until such net capital loss is thereby exhausted, but individuals may not carry back capital losses. For U.S. Holders which are corporations (other than corporations subject to Subchapter S of the Code), an unused net capital loss may be carried back three years from the loss year and carried forward five years from the loss year to be offset against capital gains until such net capital loss is thereby exhausted.
Foreign Personal Holding Company
If at any time during a taxable year more than 50% of the total combined voting power or the total value of the our outstanding shares is owned, actually or constructively, by five or fewer individuals who are citizens or residents of the United States and 60% (50% after the first tax year) or more of our gross income for such year was derived from certain passive sources, then we would be treated as a “foreign personal holding company.” In that event, U.S. Holders that hold common shares would be required to include in gross income for such year their allocable portions of such passive income to the extent we do not actually distribute such income.
- 61 -
We do not believe we currently have the status of a “foreign personal holding company”. However, there can be no assurance that we will not be considered a foreign personal holding company for any future taxable year.
Passive Foreign Investment Company
As a foreign corporation with U.S. Holders, we potentially could be treated as a passive foreign investment company (“PFIC”), as defined in Section 1297 of the Code, depending upon the percentage of our income which is passive, or the percentage of our assets which are held for the purpose of producing passive income. We believe we currently are a PFIC.
The rule governing PFICs can have significant tax effects on U.S. Holders of foreign corporations. These rules do not apply to non-U.S. Holders. Section 1297 of the Code defines a PFIC as a corporation that is not formed in the United States and, for any taxable year, either (i) 75% or more of its gross income is “passive income”, which includes interest, dividends and certain rents and royalties or (ii) the average percentage, by fair market value (or, if the corporation is a controlled foreign corporation or makes an election, by adjusted tax basis), of its assets that produce or are held for the production of “passive income” is 50% or more. The taxation of a US Holder who owns stock in a PFIC is extremely complex and is therefore beyond the scope of this discussion. U.S. Holders should consult with their own tax advisors with regards to the impact of these rules.
Controlled Foreign Corporation
If more than 50% of the voting power of all classes of our common shares entitled to vote is owned, actually or constructively, by citizens or residents of the United States, United States partnerships, corporations, or estates or trusts other than foreign estates or trusts, each of whom own actually or constructively own 10% or more of the total combined voting power of all classes of our capital stock (“United States Shareholders”), then we would be a “controlled foreign corporation” (CFC). We do not believe we currently are a CFC.
The CFC classification would affect many complex results, one of which is that certain income of a CFC would be subject to current U.S. tax. The United States generally taxes United States Shareholders of a CFC currently on their pro rata shares of the Subpart F income of the CFC. Such United States Shareholders are generally treated as having received a current distribution out of the CFC’s Subpart F income and are also subject to current U.S. tax on their pro rata shares of the CFC’s earnings invested in U.S. property. The foreign tax credit described above may reduce the U.S. tax on these amounts. In addition, under Section 1248 of the Code, gain from the sale or exchange of shares by a U.S. Holder of common shares of a corporation which is or was a United States Shareholder at any time during the five-year period ending with the sale or exchange is treated as ordinary income to the extent of earnings and profits of the corporation (accumulated only while the shares were held by the United States Shareholder and while the corporation was a CFC attributable to the shares sold or exchanged). If a foreign corporation is both a PFIC and a CFC, the foreign corporation generally will not be treated as a PFIC with respect to the United States Shareholders of the CFC. This rule generally will be effective for taxable years of United States Shareholders beginning after 1997 and for taxable years of foreign corporations ending with or within such taxable years of United States Shareholders. The PFIC provisions continue to apply in the case of a PFIC that is also a CFC with respect to the U.S. Holders that are less than 10% shareholders.
| F. | Dividends and Paying Agents |
Not applicable.
Not applicable.
- 62 -
Any document referred to in this annual report may be inspected at our principal executive offices at Suite 1100, 1199 West Hastings Street, Vancouver, British Columbia Canada V6E 3T5 during regular business hours.
Various documents referenced in this annual report also are included as exhibits to this annual report in accordance with Item 19 of this Form 20-F. We are required to file periodic reports and other information with the SEC. You may read and copy any materials we file with the SEC at its Public Reference Room at 100 F Street, NE, Washington, DC 20549. Please call the SEC at 1-800-SEC-0330 for further information on the operation of the Public Reference Room. The SEC further maintains an internet website at www.sec.gov that contains reports and other information about issuers like us who file electronically with the SEC.
In addition, we file various documents on the Canadian Securities Administrator’s System for Electronic Document Analysis and Retrieval (SEDAR) at www.sedar.com as required by applicable Canadian law and stock exchanges.
Not applicable.
| ITEM 11. | QUANTITATIVE AND QUALITATIVE DISCLOSURES ON MARKET RISK |
The significant market risks to which the Company is exposed are currency, interest rate and other price risk.
Currency risk
The Company operates internationally and is exposed to foreign currency risk from fluctuations in exchange rates between the Canadian dollar and various currencies, primarily US dollars and Mexican pesos. The Company has not hedged its exposure to foreign currency fluctuations.
The Company is exposed to currency risk as follows:
Based on the above net foreign currency exposures as at December 31, 2013, and assuming all other variables remain constant, a 5% weakening or strengthening of the Canadian dollar against a) the US dollar would result in a change of $202,774 (2012 - $49,374) in the Company’s loss; and b) the Mexican peso would have no material impact in the Company’s loss for the year.
Interest rate risk
The Company’s cash and cash equivalents are held in bank accounts that earn interest at variable interest rates. Due to the short-term nature of these financial instruments, fluctuations in market rates do not have a significant impact on the estimated fair value as of December 31, 2013. The Company manages interest rate risk by maintaining an investment policy that focuses primarily on preservation of capital and liquidity.
Other price risk
Other price risk is the risk that the future cash flows of a financial instrument will fluctuate due to changes in market prices, other than those arising from currency risk or interest rate risk. The Company’s marketable securities are carried at market value and are therefore directly affected by fluctuations in the market value of the underlying securities. The Company’s sensitivity analysis suggests that a 10% change in market prices would have no material impact on the value of the Company’s marketable securities.
| ITEM 12. | DESCRIPTION OF SECURITIES OTHER THAN EQUITY SECURITIES |
Not applicable.
- 63 -
PART II
| ITEM 13. | DEFAULTS, DIVIDEND ARREARAGES AND DELINQUENCIES |
None.
| ITEM 14. | MATERIAL MODIFICATIONS TO THE RIGHTS OF SECURITY HOLDERS AND USE OF PROCEEDS |
Effective June 12, 2013, in accordance with the vote of shareholders at the 2013 Annual General Meeting on June 12, 2013, we adopted a rights plan applicable to our common shares (the “Rights Plan”). This Rights Plan replaced an earlier shareholder rights plan dated June 18, 2008. Under the Rights Plan, we issued one right for no consideration in respect of each outstanding common share. All common shares we subsequently issue during the term of the Rights Plan will have one right represented for each common share. The term of the Rights Plan is through the first annual meeting of shareholders held after June 12, 2018. The rights issued under the Rights Plan become exercisable only if a party acquires 20% or more of our common shares without complying with the Rights Plan or without a waiver from our Board of Directors.
Each right entitles the registered holder to purchase from us on the occurrence of certain events, one common share at the price of CDN$100 per share, subject to adjustment (the “Exercise Price”). If a “Flip-in Event” as defined in the Rights Plan occurs, each right would then entitle the registered holder to receive, upon payment of the Exercise Price, that number of common shares that have a market value at the date of that occurrence equal to twice the Exercise Price. The rights are not exercisable until the “Separation Time” as defined in the Rights Plan.
The purpose of the Rights Plan is to ensure, to the extent possible, that all shareholders are treated equally and fairly in connection with any take-over bid or similar proposal to acquire our common shares. Take-over bids may be structured in such a way as to be coercive or discriminatory in effect, or may be initiated at a time when it will be difficult for our Board of Directors to prepare an adequate response. Such offers may result in shareholders receiving unequal or unfair treatment, or not realizing the full or maximum value of their investment in us. The Rights Plan discourages the making of any such offers by creating the potential of significant dilution to any offeror who does so.
An offeror can avoid that potential by making an offer that either: (i) qualifies as a “Permitted Bid” under the Rights Plan, and therefore meets certain specified conditions (including a minimum deposit period of 90 days) which aim to ensure that all shareholders are treated fairly and equally; or (ii) does not qualify as a “Permitted Bid” but is negotiated with and has been exempted by our Board of Directors from the application of the Rights Plan in light of the opportunity to bargain for agreed terms and conditions to the offer that are believed to be in the best interests of shareholders.
Under current Canadian securities laws, any party wishing to make a formal take-over bid for our common shares is required to leave the offer open for acceptance for at least 35 days. To qualify as a “Permitted Bid” under the Rights Plan, however, a take-over bid must remain open for acceptance for not less than 90 days. The Board of Directors believes that the statutory minimum period of 35 days may be insufficient for the directors to: (i) evaluate a take-over bid (particularly if the consideration consists, wholly or in part, of shares of another issuer); (ii) explore, develop and pursue alternative transactions that could better maximize shareholder value; and (iii) make reasoned recommendations to the shareholders. The additional time afforded under a “Permitted Bid” is intended to address these concerns by providing the Board of Directors with a greater opportunity to assess the merits of the offer and identify other possible suitors or alternative transactions, any by providing other bidders or proponents of alternative transactions with time to come forward with competing, and potentially superior, proposals.
| ITEM 15. | CONTROLS AND PROCEDURES |
Disclosure Controls and Procedures
Our management carried out an evaluation, under the supervision and with the participation of our Chief Executive Officer and Chief Financial Officer, of the effectiveness of our disclosure controls and procedures (as such term is defined in Rule 13a-15(e) under the Securities Exchange Act of 1934, as amended) as of the end of the fiscal year covered by this report.
- 64 -
Based on the evaluation, our Chief Executive Officer and Chief Financial Officer concluded that, as of December 31, 2014, our disclosure controls and procedures were effective.
Management’s Annual Report on Internal Control Over Financial Reporting
Our management is responsible for establishing and maintaining adequate internal control over financial reporting (“ICFR”) as such term is defined in Rule 13a-15(f) or Rule 15d-15(f) promulgated under the Exchange Act. Management (under the supervision and with the participation of the Chief Executive Officer and the Chief Financial Officer) assessed the effectiveness of our ICFR as of December 31, 2014, using the framework set forth in Internal Control - Integrated Framework issued by the Committee of Sponsoring Organizations of the Treadway Commission (the COSO 1992 framework). Based on this assessment, our management concluded that our ICFR were effective as of December 31, 2014.
This annual report does not include an attestation report of our registered public accounting firm regarding our ICFR. Our management's report was not subject to attestation by our registered independent public accounting firm because we are not an accelerated filer or large accelerated filer and exempt as an Emerging Growth Company.
Changes in Internal Control Over Financial Reporting
There were no changes in our internal control over financial reporting during the fiscal year ended December 31, 2014 that have materially affected, or are reasonably likely to materially affect, our internal control over financial reporting.
| Item 16A. | Audit Committee financial expert |
Our Board of Directors has determined that Anthony Walsh is an “audit committee financial expert” serving on the Audit Committee of the Company within the criteria prescribed under SEC and NYSE MKT rules. Our Board of Directors has determined that Anthony Walsh is an “independent” director as that term is defined under NYSE MKT rules.
We have adopted a Code of Business Conduct and Ethics for all our directors, officers, and employees. It includes a Code of Ethical Conduct for Financial Managers that applies to our principal executive officer, principal financial officer, principal accounting officer or controller, or persons performing similar functions. The Code of Business Conduct and Ethics is available in the Governance section of our website at www.quaterraaresources.com. All applicable amendments to and waivers of the Code of Business Conduct Ethics governing our principal executive officer, principal financial officer, principal accounting officer or controller, or persons performing similar functions will be posted on our website and furnished to the SEC on Form 6-K.
The Company will provide to any person without charge, upon request via email at info@quaterra.com, a copy of the Code of Business Conduct and Ethics.
| Item 16C. | Principal Accountant Fees and Services |
The following table shows the aggregate fees billed to us by our principal accountant Smythe Ratcliffe LLP, Chartered Accountants, in each of the last two fiscal years.
| | Year ended December 31, |
| | 2014 | 2013 |
| Audit Fees | $65,330 | $52,000 |
| Audit-Related Fees | Nil | Nil |
| Tax Fees | $2,500 | $6,000 |
| All Other Fees | - | - |
- 65 -
Audit feesare the aggregate fees billed by the Company’s independent auditor for the audit of the Company’s annual consolidated financial statements, reviews of interim consolidated financial statements and attestation services that are provided in connection with statutory and regulatory filings or engagements.
Audit-related fees are fees charged by the Company’s independent auditor for assurance and related services that are reasonably related to the performance of the audit or review of financial statements and are not reported under “Audit Fees”.
Tax fees are fees for professional services rendered by the Company’s independent auditors for tax compliance and tax advice on actual or contemplated transactions.
The Audit Committee recommends to the Board of the Directors the external auditor to perform audit, review, and attestation services. The Audit Committee pre-approves all non-audit services provided by our external auditors, and pre-approved the tax fees and the all other fees listed in the table above.
| Item 16D. | Exemptions from the listing standards for Audit Committees |
Not applicable.
| Item 16E. | Purchases of Equity Securities by the Issuer and Affiliated Purchasers |
None.
| Item 16F. | Change in Registrant’s Certifying Accountant |
Not applicable.
| Item 16G. | Corporate Governance |
Not applicable.
| Item 16H. | Mine Safety Disclosure |
Pursuant to Section 1503(a) of the Dodd-Frank Wall Street Reform and Consumer Protection Act (The “Dodd-Frank Act”), issuers that are operators, or that have a subsidiary that is an operator, of a coal or other mine in the United States are required to disclose in their periodic reports filed with the SEC information regarding specified health and safety violations, orders and citations, related assessments and legal actions, and mining-related fatalities. During the fiscal year ended December 31, 2014, the Company had no such specified health and safety violations, orders or citations, related assessments or legal actions, mining-related fatalities, or similar events in relation to the Company’s United States operations requiring disclosure pursuant to Section 1503(a) of the Dodd-Frank Act.
- 66 -
PART III
| ITEM 17. | FINANCIAL STATEMENTS |
Index to Consolidated Financial Statements:
| Report of Independent Registered Public Accounting Firm dated March 24, 2014 | 71 |
| Consolidated Statements of Financial Position as at December 31, 2014 and 2013 | 72 |
| Consolidated Statements of Comprehensive Loss for the fiscal years ended December 31, 2014, 2013 and 2012 | 73 |
| Consolidated Statements of Cash Flows for the fiscal years ended December 31, 2014, 2013 and 2012 | 74 |
| Consolidated Statements of Changes in Equity for the fiscal years ended December 31,2014, 2013 and 2012 | 75 |
| Notes to consolidated financial statements | 76 |
| ITEM 18. | FINANCIAL STATEMENTS |
Not applicable.
The following documents are filed as exhibits to this annual report on Form 20-F:
- 67 -
SIGNATURES
The registrant hereby certifies that it meets all of the requirements for filing on Form 20-F and that it has duly caused and authorized the undersigned to sign this annual report on its behalf.
| | QUATERRA RESOURCES INC. |
| | |
| | |
| | |
| Dated: March 31, 2015 | By: /s/ Scott Hean |
| | Scott B. Hean |
| | Chief Financial Officer |
- 68 -

(An Exploration Stage Company)
Audited Consolidated Financial Statements
December 31, 2014
(Expressed in Canadian Dollars)
Management’s Responsibility for Financial Reporting
The management of Quaterra Resources Inc. is responsible for the integrity and fair presentation of the financial information contained in this annual report. Where appropriate, the financial information, including consolidated financial statements, reflects amounts based on management’s best estimates and judgments. The consolidated financial statements have been prepared in accordance with International Financial Reporting Standards, as issued by the International Accounting Standards Board. Financial information presented elsewhere in the annual report is consistent with that disclosed in the consolidated financial statements.
Management is responsible for establishing and maintaining adequate internal control over financial reporting. Management has established and maintains a system of internal accounting control designed to provide reasonable assurance that assets are safeguarded from loss or unauthorized use, financial information is reliable and accurate and transactions are properly recorded and executed in accordance with management’s authorization. This system includes established policies and procedures, the selection and training of qualified personnel, and an organization providing for appropriate delegation of authority and segregation of responsibilities. Any system of internal control over financial reporting, no matter how well designed, has inherent limitations. Therefore, even those systems determined to be effective can provide only reasonable assurance with respect to financial statement preparation and presentation.
The Board of Directors oversees management’s responsibility for financial reporting and internal control systems through an Audit Committee, which is composed entirely of independent directors. The Audit Committee meets periodically with management and the independent auditors to review the scope and results of the annual audit and to review the consolidated financial statements and related financial reporting and internal control matters before the consolidated financial statements are approved by the Board of Directors and submitted to the Company’s shareholders.
Smythe Ratcliffe LLP, an independent registered public accounting firm, appointed by the shareholders, has audited the Company’s consolidated financial statements in accordance with Canadian generally accepted auditing standards and the standards of the Public Company Accounting Oversight Board (United States) and has expressed its opinion in the independent auditors’ report.
| “Steven Dischler” (signed) | “Scott Hean” (signed) |
| | |
| Steven Dischler | Scott Hean |
| President and Chief Executive Officer | Chief Financial Officer |
| | |
| March 26, 2015 | |
| Vancouver, British Columbia, Canada | |
70
INDEPENDENT AUDITORS’ REPORT
TO THE SHAREHOLDERS OF QUATERRA RESOURCES INC.
We have audited the accompanying consolidated financial statements of Quaterra Resources Inc., which comprise the consolidated statements of financial position as at December 31, 2014 and 2013, and the consolidated statements of comprehensive loss, changes in equity and cash flows for the years ended December 31, 2014, 2013 and 2012, and a summary of significant accounting policies and other explanatory information.
Management's Responsibility for the Consolidated Financial Statements
Management is responsible for the preparation and fair presentation of these consolidated financial statements in accordance with International Financial Reporting Standards, as issued by the International Accounting Standards Board, and for such internal control as management determines is necessary to enable the preparation of consolidated financial statements that are free from material misstatement, whether due to fraud or error.
Auditors’ Responsibility
Our responsibility is to express an opinion on these consolidated financial statements based on our audits. We conducted our audits in accordance with Canadian generally accepted auditing standards and the standards of the Public Company Accounting Oversight Board (United States). Those standards require that we comply with ethical requirements and plan and perform the audit to obtain reasonable assurance about whether the consolidated financial statements are free from material misstatement.
An audit involves performing procedures to obtain audit evidence about the amounts and disclosures in the consolidated financial statements. The procedures selected depend on the auditors’ judgment, including the assessment of the risks of material misstatement of the consolidated financial statements, whether due to fraud or error. In making those risk assessments, the auditor considers internal control relevant to the entity's preparation and fair presentation of the consolidated financial statements in order to design audit procedures that are appropriate in the circumstances. An audit also includes evaluating the appropriateness of accounting policies used and the reasonableness of accounting estimates made by management, as well as evaluating the overall presentation of the consolidated financial statements.
We believe that the audit evidence we have obtained in our audits is sufficient and appropriate to provide a basis for our audit opinion.
Opinion
In our opinion, the consolidated financial statements present fairly, in all material respects, the financial position of Quaterra Resources Inc. as at December 31, 2014 and 2013, and its financial performance and its cash flows for the years ended December 31, 2014, 2013 and 2012 in accordance with International Financial Reporting Standards, as issued by the International Accounting Standards Board.

Chartered Accountants
Vancouver, Canada
March 26, 2015
71
| Quaterra Resources Inc. |
| Consolidated Statements of Financial Position |
| (Expressed in Canadian dollars) |
| |
| | | Note | | | December 31, 2014 | | | December 31, 2013 | |
| Assets | | | | | | | | | |
| Current assets: | | | | | | | | | |
| Cash | | | | $ | 1,720,800 | | $ | 894,265 | |
| Restricted cash | | | | | 32,491 | | | 42,444 | |
| Amounts due from exploration partners | | | | | 29,336 | | | 49,468 | |
| Taxes | | | | | 4,920 | | | 6,709 | |
| Current portion of amount due from Freeport Nevada LLC | | 6 | | | 2,303,719 | | | - | |
| Prepaid and deposits | | | | | 44,023 | | | 42,864 | |
| | | | | | 4,135,289 | | | 1,035,750 | |
| Non-current assets: | | | | | | | | | |
| Marketable securities | | 4 | | | - | | | 4,167 | |
| Amount due from Freeport Nevada LLC | | 6 | | | 2,148,172 | | | - | |
| Equipment | | 5 | | | 76,521 | | | 150,374 | |
| Mineral properties | | 6 | | | 37,488,476 | | | 44,865,186 | |
| Reclamation bonds | | | | | 71,621 | | | 182,046 | |
| | | | | | 39,784,790 | | | 45,201,773 | |
| Total Assets | | | | $ | 43,920,079 | | $ | 46,237,523 | |
| | | | | | | | | | |
| Liabilities | | | | | | | | | |
| Current liabilities: | | | | | | | | | |
| Accounts payable and accrued liabilities | | | | $ | 377,607 | | $ | 540,655 | |
| Due to related parties | | 12 (a) | | | 3,295 | | | - | |
| Loan payable | | 12 (b) | | | - | | | 689,038 | |
| | | | | | 380,902 | | | 1,229,693 | |
| Non-current liabilities | | | | | | | | | |
| Promissory notes payable | | 7 | | | 451,787 | | | - | |
| Derivative liability – warrants | | 8 | | | 1,500,467 | | | 1,191,784 | |
| | | | | | 1,952,254 | | | 1,191,784 | |
| Total Liabilities | | | | | 2,333,156 | | | 2,421,477 | |
| | | | | | | | | | |
| Shareholders' Equity | | | | | | | | | |
| Share capital | | 9 | | | 116,135,532 | | | 116,135,532 | |
| Share-based payment reserve | | 10 | | | 19,735,627 | | | 19,480,034 | |
| Deficit | | | | | (94,284,236 | ) | | (91,799,520 | ) |
| | | | | | 41,586,923 | | | 43,816,046 | |
| Total Liabilities and Shareholders' Equity | | | | $ | 43,920,079 | | $ | 46,237,523 | |
Approved on behalf of the Board of Directors:
| “Steven Dischler”(signed) | “Anthony Walsh” (signed) |
| Steven Dischler | Anthony Walsh |
(See the accompanying notes to consolidated financial statements)
72
| Quaterra Resources Inc. |
| Consolidated Statements of Comprehensive Loss |
| (Expressed in Canadian dollars) |
| |
| | | Note | | | Years ended December 31, | |
| | | | | | 2014 | | | 2013 | | | 2012 | |
| General administrative expenses | | | | | | | | | | | | |
| Administration and general office | | | | $ | 366,488 | | $ | 657,751 | | $ | 726,113 | |
| Consulting | | | | | 39,215 | | | 258,350 | | | 366,364 | |
| Depreciation | | 5 | | | 34,462 | | | 74,503 | | | 133,595 | |
| Directors' fees | | | | | - | | | - | | | 126,971 | |
| Investor relations and communications | | | | | 90,296 | | | 39,821 | | | 224,409 | |
| Personnel costs | | | | | 1,054,398 | | | 806,443 | | | 1,135,986 | |
| Professional fees | | | | | 662,069 | | | 643,243 | | | 595,753 | |
| Share-based payments | | 10 (a) | | | 255,593 | | | 459,977 | | | 1,046,517 | |
| Transfer agent and regulatory fees | | | | | 111,982 | | | 104,838 | | | 142,561 | |
| Travel and promotion | | | | | 45,919 | | | 80,518 | | | 53,137 | |
| | | | | | (2,660,422 | ) | | (3,125,444 | ) | | (4,551,406 | ) |
| | | | | | | | | | | | | |
| Exploration partner administration income | | | | | 22,808 | | | 26,442 | | | 90,847 | |
| Fair value gain on derivative liability | | 8 | | | 693,121 | | | 2,363,892 | | | - | |
| Foreign exchange gain (loss) | | | | | 211,781 | | | (7,866 | ) | | (166,914 | ) |
| General exploration costs | | | | | (424,875 | ) | | (67,448 | ) | | (182,852 | ) |
| Impairment of marketable securities | | 4 | | | (4,167 | ) | | (8,166 | ) | | (66,533 | ) |
| Impairment of mineral properties | | 6 (e), 6(f) | | | (3,508,465 | ) | | (26,212,984 | ) | | - | |
| Gain on disposal of equipment | | | | | 8,093 | | | - | | | 39,954 | |
| Gain (loss) on disposal of mineral properties | | | | | 3,312,632 | | | (1,735,714 | ) | | 820,712 | |
| Interest expense and other | | | | | (135,222 | ) | | (50,628 | ) | | 57,985 | |
| Write-off of taxes receivable | | | | | - | | | - | | | (895,769 | ) |
| Net loss for the year | | | | | (2,484,716 | ) | | (28,817,916 | ) | | (4,853,976 | ) |
| Unrealized loss on marketable securities | | | | | - | | | (8,166 | ) | | (15,334 | ) |
| Transfer on impairment of marketable securities | | | | | - | | | 8,166 | | | 66,533 | |
| | | | | | - | | | - | | | 51,199 | |
| Comprehensive loss for the year | | | | $ | (2,484,716 | ) | $ | (28,817,916 | ) | $ | (4,802,777 | ) |
| Loss per share - basic and diluted | | | | $ | (0.01 | ) | $ | (0.17 | ) | $ | (0.03 | ) |
| Weighted average number of common shares outstanding | | | | | 193,479,416 | | | 172,117,694 | | | 155,378,395 | |
(See the accompanying notes to consolidated financial statements)
73
| Quaterra Resources Inc. |
| Consolidated Statements of Cash Flows |
| (Expressed in Canadian dollars) |
| |
| | | Years ended December 31, | |
| | | 2014 | | | 2013 | | | 2012 | |
| Operating activities | | | | | | | | | |
| Net loss for the year | $ | (2,484,716 | ) | $ | (28,817,916 | ) | $ | (4,853,976 | ) |
| Items not involving cash: | | | | | | | | | |
| Depreciation | | 34,462 | | | 74,503 | | | 133,595 | |
| Fair value gain on derivative liability | | (693,121 | ) | | (2,363,892 | ) | | - | |
| Loss (gain) on sale of mineral property | | (3,312,632 | ) | | 1,735,714 | | | (820,712 | ) |
| Loan interest expense accrued | | 104,931 | | | 50,877 | | | - | |
| Loan interest income accrued | | (29,761 | ) | | - | | | - | |
| Share-based payments | | 255,593 | | | 459,977 | | | 1,046,517 | |
| Shares issued for services | | - | | | - | | | 30,000 | |
| Impairment of mineral property | | 3,508,465 | | | 26,212,984 | | | - | |
| Impairment of marketable securities | | 4,169 | | | 8,266 | | | 66,533 | |
| Unrealized loss (gain) on foreign exchange | | (136,137 | ) | | (11,759 | ) | | 43,266 | |
| Write-off of taxes and other receivables | | 2,558 | | | - | | | 895,769 | |
| Gain on disposal of equipment | | (8,093 | ) | | - | | | - | |
| | | (2,754,282 | ) | | (2,651,346 | ) | | (3,459,008 | ) |
| Changes in non-cash working capital | | | | | | | | | |
| Taxes and other receivables | | 1,789 | | | 23,585 | | | (14,796 | ) |
| Prepaid and deposits | | (1,158 | ) | | 177,300 | | | 37,324 | |
| Accounts payable and accrued liabilities | | (77,343 | ) | | 47,048 | | | (60,356 | ) |
| Due to related parties | | 3,295 | | | (26,990 | ) | | (20,894 | ) |
| Cash used in operating activities | | (2,827,699 | ) | | (2,430,403 | ) | | (3,517,730 | ) |
| Financing activities | | | | | | | | | |
| Shares and warrants issued for cash, net of issue costs | | - | | | 3,004,795 | | | 3,848,219 | |
| Repayment of loan payable | | (638,160 | ) | | 638,160 | | | - | |
| Convertible note payable | | 533,350 | | | - | | | - | |
| Derivative liability – warrants | | - | | | - | | | 774,673 | |
| Cash (used) provided by financing activities | | (104,810 | ) | | 3,642,955 | | | 4,622,892 | |
| Investing activities | | | | | | | | | |
| Expenditures on mineral properties | | (1,942,052 | ) | | (4,205,935 | ) | | (13,397,677 | ) |
| Due from exploration partners | | 20,132 | | | 564,285 | | | (373,531 | ) |
| Mineral property recovery | | 2,765,330 | | | - | | | - | |
| Purchase of equipment | | - | | | - | | | (9,676 | ) |
| Proceeds from disposal of equipment | | 40,013 | | | - | | | - | |
| Reclamation bonds | | 90,427 | | | - | | | 348,805 | |
| Proceeds from sale of mineral property | | 2,775,241 | | | 1,490,104 | | | 1,980,381 | |
| Restricted cash | | 9,953 | | | 37,704 | | | 11,500 | |
| Cash provided by (used in) investing activities | | 3,759,044 | | | (2,113,842 | ) | | (11,440,198 | ) |
| Effect of foreign exchange on cash | | - | | | - | | | (16,730 | ) |
| Increase (decrease) in cash during the year | | 826,535 | | | (901,290 | ) | | (10,351,766 | ) |
| Cash, beginning of year | | 894,265 | | | 1,795,555 | | | 12,147,321 | |
| Cash, end of year | $ | 1,720,800 | | $ | 894,265 | | $ | 1,795,555 | |
| Supplemental cash flow information (Note 14) | | | | | | | | | |
(See the accompanying notes to consolidated financial statements)
74
| Quaterra Resources Inc. |
| Statements of Changes in Equity |
| (Expressed in Canadian dollars) |
| |
| | | Common Shares | | | Share-based | | | Accumulated Other | | | | | | | |
| | | | | | | | | payment | | | Comprehensive | | | | | | | |
| | | Shares | | | Amount | | | reserve | | | Loss | | | Deficit | | | Total | |
| Balance, December 31, 2011 | | 152,353,283 | | $ | 111,923,521 | | $ | 17,988,540 | | $ | (51,199 | ) | $ | (58,127,628 | ) | $ | 71,733,234 | |
| Common shares issued for cash, net of issue costs | | 10,541,571 | | | 3,848,219 | | | | | | | | | | | | 3,848,219 | |
| Cancelled shares | | (2,501 | ) | | | | | | | | | | | | | | - | |
| Common shares issued for services | | 98,483 | | | 45,000 | | | (15,000 | ) | | | | | | | | 30,000 | |
| Share-based payments | | | | | | | | 1,046,517 | | | | | | | | | 1,046,517 | |
| Unrealized loss on available-for-sale marketable securities | | | | | | | | | | | (15,334 | ) | | | | | (15,334 | ) |
| Impairment of available-for-sale marketable securities | | | | | | | | | | | 66,533 | | | | | | 66,533 | |
| Net loss for the year | | | | | | | | | | | | | | (4,853,976 | ) | | (4,853,976 | ) |
| Balance, December 31, 2012 | | 162,990,836 | | | 115,816,740 | | | 19,020,057 | | | - | | | (62,981,604 | ) | | 71,855,193 | |
| Common shares issued for cash, net of issue costs | | 29,810,000 | | | 3,004,795 | | | | | | | | | | | | 3,004,795 | |
| Common shares issued for mineral properties | | 678,580 | | | 95,000 | | | | | | | | | | | | 95,000 | |
| Derivative liability - warrants | | | | | (2,781,003 | ) | | | | | | | | | | | (2,781,003 | ) |
| Share-based payments | | | | | | | | 459,977 | | | | | | | | | 459,977 | |
| Unrealized loss on available-for-sale marketable securities | | | | | | | | | | | (8,166 | ) | | | | | (8,166 | ) |
| Impairment of available-for-sale marketable securities | | | | | | | | | | | 8,166 | | | | | | 8,166 | |
| Net loss for the year | | | | | | | | | | | | | | (28,817,916 | ) | | (28,817,916 | ) |
| Balance, December 31, 2013 | | 193,479,416 | | | 116,135,532 | | | 19,480,034 | | | - | | | (91,799,520 | ) | | 43,816,046 | |
| Share-based payments | | | | | | | | 255,593 | | | | | | | | | 255,593 | |
| Net loss for the year | | | | | | | | | | | | | | (2,484,716 | ) | | (2,484,716 | ) |
| Balance, December 31, 2014 | | 193,479,416 | | $ | 116,135,532 | | $ | 19,735,627 | | $ | - | | $ | (94,284,236 | ) | $ | 41,586,923 | |
(See the accompanying notes to consolidated financial statements)
75
| Quaterra Resources Inc. |
| Notes to Consolidated Financial Statements |
| For the Years Ended December 31, 2014, 2013 and 2012 |
| (Expressed in Canadian dollars) |
| |
| 1. | Nature and Continuance of operations |
Quaterra Resources Inc. (“Quaterra” or the “Company”) is engaged in the exploration and development of its copper properties in Nevada, United States of America. Quaterra is a publicly listed company incorporated in Canada under the Business Corporations Act(British Columbia). The Company’s shares are listed on the TSX Venture Exchange (“TSX-V”) and OTCQX. The head office, principal address and records office of the Company are located at 1100 – 1199 West Hastings Street, Vancouver, British Columbia, Canada, V6E 3T5. The Company’s registered office is 1200 – 750 West Pender Street, Vancouver, British Columbia, Canada, V6C 2T8.
The Company is in the process of exploring its mineral properties and has not yet determined whether its mineral properties contain economically recoverable mineral reserves. The underlying value and the recoverability of the amounts recorded as mineral properties is entirely dependent upon the existence of economically recoverable mineral reserves and the ability of the Company to obtain the necessary funding to complete its exploration and development of its mineral properties. The carrying value of the Company’s mineral properties does not reflect current or future values.
The business of mining exploration involves a high degree of risk and there is no assurance that current exploration projects will result in future profitable mining operations. The Company has no source of revenue (other than the potential sale of assets), and has significant cash requirements to meet its administrative overhead, pay its liabilities and maintain its mineral interests, which cash requirements management believes are adequate for the next few years.
The Company incurred a net loss of $2,484,716 for the year ended December 31, 2014 (2013 - $28,817,916; 2012 - $4,853,976). As at December 31, 2014, the Company had an accumulated deficit of $94,284,236 with a working capital surplus of $3,754,387 (2013 - deficiency of $193,943).
The consolidated financial statements have been prepared on a going concern basis, which assumes that the Company will be able to realize its assets and discharge its liabilities in the normal course of business. The ability of the Company to continue as a going concern and meet its commitments as they become due, including completion of the acquisition, exploration and development of its mineral properties, is dependent on the Company’s ability to obtain the necessary financing. Due to two transactions occurring in the 4th quarter 2014 (see Note 6) management believes that it has sufficient funds for the next full year of operations. These consolidated financial statements do not include the adjustments that would result if the Company is unable to continue as a going concern.
These consolidated financial statements were approved by the board of directors for issue on March 26, 2015.
| 2. | Summary of significant accounting policies |
These consolidated financial statements have been prepared in accordance with International Financial Reporting Standards (“IFRS”), as issued by the International Accounting Standards Board (“IASB”), effective as of December 31, 2014. The principal accounting policies applied in the preparation of these consolidated financial statements are set out below. These policies have been consistently applied to all the years presented, unless otherwise stated.
76
| Quaterra Resources Inc. |
| Notes to Consolidated Financial Statements |
| For the Years Ended December 31, 2014, 2013 and 2012 |
| (Expressed in Canadian dollars) |
| |
| 2. | Summary of significant accounting policies(Continued) |
| | a) | Basis of presentation and consolidation |
These consolidated financial statements have been prepared on a historical cost basis, except for financial instruments classified as available-for-sale and derivative financial liability, which are stated at their fair values. These consolidated financial statements are presented in Canadian dollars, the Company and subsidiaries’ functional currency.
These consolidated financial statements incorporate the financial statements of the Company and the entities controlled (directly or indirectly) by the Company (its subsidiaries) including Quaterra Alaska Inc. and Singatse Peak Services LLC, incorporated in the United States; Minera Agua Tierra S.A. de C.V., incorporated in Mexico; and Quaterra International Limited, incorporated in the British Virgin Islands. All significant intercompany transactions and balances have been eliminated.
Control is based on whether an investor has power over the investee and the ability to use its power over the investee to affect the amount of the returns.
| | b) | Accounting estimates and judgments |
The preparation of financial statements requires the use of certain critical accounting estimates. It also requires management to exercise its judgment in the process of applying the Company’s accounting policies. Management believes the estimates are reasonable; however, actual results could differ from those estimates and could impact future results of operations. The areas where assumptions, estimates and judgments are significant to the consolidated financial statements relate to, but are not limited to, the following:
| | i) | The recoverability of the carrying value of the mineral properties: the assessment of the impairment indicators involves the application of a number of significant judgments and estimates to certain variables including metal price trends, plans for properties, and the results of exploration and evaluation to date; |
| | | |
| | ii) | Fair value of derivative liabilities and share-based payments: the fair value of derivative liabilities that are not traded in an active market is determined by using a valuation technique. Management makes estimates and utilizes assumptions in determining the fair value for share-based payments, warrants and the (gain) loss on the revaluation of the derivative liability in determining inputs to be used for the Black- Scholes option pricing model; |
| | | |
| | iii) | The Company applies judgment in assessing the functional currency of each entity consolidated in these financial statements; |
| | | |
| | iv) | Deferred tax assets: the assessment of availability of future taxable profits involves judgment. A deferred tax asset is recognized to the extent that it is probable that taxable profits will be available against which deductible temporary differences and the carry-forward of unused tax credits and unused tax losses can be utilized. |
| | | |
| | v) | The Company recognizes receivables at the date of inception based upon the present value of payments to be received discounted at fair market rate. |
| | | |
| | vi) | Fair value of derivative liabilities and convertible debt: Management makes estimates and utilizes assumptions in bifurcating the components of convertible notes with attached warrants that are priced in currency other than the Company’s functional currency. |
77
| Quaterra Resources Inc. |
| Notes to Consolidated Financial Statements |
| For the Years Ended December 31, 2014, 2013 and 2012 |
| (Expressed in Canadian dollars) |
| |
| 2. | Summary of significant accounting policies(Continued) |
| | c) | Foreign currency translation |
Items included in the financial statements of each consolidated entity are measured using the currency of the primary economic environment in which the entity operates (the “functional currency”). The functional currency of the Company and each of its subsidiaries is the Canadian dollar. Foreign currency transactions are translated into the functional currency using the exchange rates prevailing at the dates of transactions. Monetary assets and liabilities are translated at exchange rates prevailing at each reporting date. Non-monetary assets and liabilities are translated using the historical rate on the date of the transaction. Non-monetary assets and liabilities that are stated at fair value are translated using the historical rate on the date that the fair value was determined. Foreign exchange gains and losses resulting from the settlement of foreign currency transactions and from the translation at period-end exchange rates of monetary assets and liabilities denominated in currencies other than the Company’s functional currency are recognized in net loss.
Certain cash is held in long-term reclamation bonds to support future reclamation work on the Company’s mineral properties in the United States. No interest is earned on these bonds.
Equipment is measured at cost less accumulated depreciation and impairment losses. Cost comprises expenditures that are directly attributable to the acquisition of the asset. Gains and losses on disposal of an item of equipment are determined by comparing the proceeds from disposal with the carrying amount of the equipment, and are recognized in net loss.
Depreciation is calculated over the estimated useful life of the assets using the declining-balance method at an annual rate of 30% for vehicles and field equipment, and up to 75% for computer equipment.
The cost of acquiring mineral properties and related exploration and development costs are deferred on an individual area of interest basis until the properties are placed into production, sold or determined to be impaired. Once a license to explore an area has been secured, directly attributable expenditures on exploration and evaluation activities are capitalized to mineral properties. Costs incurred to acquire an interest in a mineral property are capitalized as a mineral property acquisition cost. Costs incurred prior to obtaining the right to explore are expensed as incurred. Proceeds from the sale of properties or cash proceeds received from farm-out agreements are recorded as a reduction of the related mineral interest, with any excess proceeds accounted for in net loss.
Management reviews the carrying value of capitalized acquisition and exploration costs at least quarterly to consider whether there are any conditions that may indicate impairment.
The Company uses the residual value method with respect to the measurement of common shares and share purchase warrants issued as units. The proceeds from the issue of units is allocated between common shares and share purchase warrants on a residual value basis, wherein the fair value of the common shares is based on the market value on the date of announcement of the placement and the balance, if any, is allocated to the attached warrants. Share issuance costs are netted against share proceeds.
78
| Quaterra Resources Inc. |
| Notes to Consolidated Financial Statements |
| For the Years Ended December 31, 2014, 2013 and 2012 |
| (Expressed in Canadian dollars) |
| |
| 2. | Summary of significant accounting policies(Continued) |
The Company has a stock option plan that is described in note 10. Share-based payments to employees are measured at the fair value of the equity instruments issued and are amortized over the vesting periods. Share-based payments to non-employees are measured at the fair value of the goods or services received or at the fair value of the equity instruments issued (if it is determined the fair value of the goods or services cannot be reliably measured), and are recorded at the date the goods or services are received. The offset to the recorded cost is to share-based payment reserve. If and when the stock options or warrants are ultimately exercised, the applicable amount of reserve is transferred to share capital.
| | i) | Earnings (loss) per share |
Basic earnings (loss) per share is calculated using the weighted average number of common shares outstanding during the year. The Company uses the treasury stock method to compute the dilutive effect of options, warrants and similar instruments. Under this method the dilutive effect on earnings per share is calculated presuming the exercise of outstanding options, warrants and similar instruments. It assumes that the proceeds of such exercise would be used to repurchase common shares at the average market price during the year. However, the calculation of diluted loss per share excludes the effects of various conversions and exercise of options and warrants that would be anti-dilutive.
Income tax comprises current and deferred tax. Income tax is recognized in net loss, except to the extent related to items recognized directly in equity or in other comprehensive loss.
Deferred tax is recognized in respect of temporary differences arising between the tax bases of assets and liabilities and their carrying amounts in the consolidated financial statements. Deferred tax is determined on a non-discounted basis using tax rates and laws that have been enacted or substantively enacted by the reporting date and are expected to apply when the deferred tax asset or liability is settled. Deferred tax assets are recognized to the extent that it is probable that the assets can be recovered.
Financial instruments are classified as one of the following: fair value through profit or loss (“FVTPL”), held-to-maturity, loans and receivables, available-for-sale financial assets or other financial liabilities. Financial assets held-to-maturity, loans and receivables, and other financial liabilities are measured at amortized cost using the effective interest method. Available-for-sale instruments are measured at fair value with unrealized gains and losses recognized in other comprehensive loss and reported in shareholders’ equity.
The Company’s available-for-sale assets are marketable securities.
At each reporting date, the Company assesses whether there is objective evidence that a financial asset is impaired. If such evidence exists, the Company recognizes an impairment loss accordingly.
The Company’s warrants that have an exercise price denominated in US dollars, which is different from the Company’s functional currency, are treated as derivative liabilities, and accordingly, recorded in the Company’s consolidated statements of financial position at fair value calculated using the Black-Scholes option pricing model. Changes in fair values are recorded In profit or loss.
79
| Quaterra Resources Inc. |
| Notes to Consolidated Financial Statements |
| For the Years Ended December 31, 2014, 2013 and 2012 |
| (Expressed in Canadian dollars) |
| |
| 3. | Recent and future accounting changes |
At the date of authorization of these consolidated financial statements, the IASB and International Financial Reporting Interpretation Committee have issued the following new and revised standards and interpretations, which are not yet effective for the relevant reporting periods. Some of these new and revised standards and interpretations have little if any impact on the Company.
IFRS 9Financial Instruments (2014)
This is a finalized version ofIFRS 9, which contains accounting requirements for financial instruments, replacing IAS 39Financial Instruments: Recognition and Measurement. The standard contains requirements in the following areas:
| • | Classification and measurement. Financial assets are classified by reference to the business model within which they are held and their contractual cash flow characteristics. The 2014 version of IFRS 9 introduces a “fair value through other comprehensive income” category for certain debt instruments. Financial liabilities are classified in a similar manner to under IAS 39; however, there are differences in the requirements applying to the measurement of an entity's own credit risk. |
| • | Impairment. The 2014 version of IFRS 9 introduces an “expected credit loss” model for the measurement of the impairment of financial assets, so it is no longer necessary for a credit event to have occurred before a credit loss is recognized. |
| • | Hedge accounting. Introduces a new hedge accounting model that is designed to be more closely aligned with how entities undertake risk management activities when hedging financial and non-financial risk exposures. |
| • | Derecognition. The requirements for the derecognition of financial assets and liabilities are carried forward from IAS 39. |
Applicable to annual periods beginning on or after January 1, 2018.
Accounting for Acquisitions of Interests in Joint Operations (Amendments to IFRS 11)
Amends IFRS 11Joint Arrangements to require an acquirer of an interest in a joint operation in which the activity constitutes a business (as defined in IFRS 3Business Combinations) to:
| • | apply all of the business combinations accounting principles in IFRS 3 and other IFRS, except for those principles that conflict with the guidance in IFRS 11 |
| • | disclose the information required by IFRS 3 and other IFRS for business combinations. |
The amendments apply both to the initial acquisition of an interest in joint operation, and the acquisition of an additional interest in a joint operation (in the latter case, previously held interests are not remeasured).
Note: The amendments apply prospectively to acquisitions of interests in joint operations in which the activities of the joint operations constitute businesses, as defined in IFRS 3, for those acquisitions occurring from the beginning of the first period in which the amendments apply. Amounts recognized for acquisitions of interests in joint operations occurring in prior periods are not adjusted.
Applicable to annual periods beginning on or after July 1, 2016.
80
| Quaterra Resources Inc. |
| Notes to Consolidated Financial Statements |
| For the Years Ended December 31, 2014, 2013 and 2012 |
| (Expressed in Canadian dollars) |
| |
| 3. | Recent and future accounting changes(Continued) |
Sale or Contribution of Assets between an Investor and its Associate or Joint Venture (Amendments to IFRS 10 and IAS 28)
Amends IFRS 10Consolidated Financial Statements and IAS 28Investments in Associates and Joint Ventures (2011) to clarify the treatment of the sale or contribution of assets from an investor to its associate or joint venture, as follows:
| • | require full recognition in the investor's financial statements of gains and losses arising on the sale or contribution of assets that constitute a business (as defined in IFRS 3Business Combinations) |
| • | require the partial recognition of gains and losses where the assets do not constitute a business, i.e. a gain or loss is recognized only to the extent of the unrelated investors’ interests in that associate or joint venture. |
These requirements apply regardless of the legal form of the transaction, e.g. whether the sale or contribution of assets occurs by an investor transferring shares in an subsidiary that holds the assets (resulting in loss of control of the subsidiary), or by the direct sale of the assets themselves.
Applicable to annual periods beginning on or after July 1, 2016.
The fair value of marketable securities, determined by reference to closing quoted share prices at each reporting date, was as follows:
| | | | | | | | | December 31, 2014 | | | | | | | | | December 31, 2013 | | | | |
| | | Number of | | | | | | Accumulated | | | | | | | | | Accumulated | | | | |
| | | shares | | | Cost | | | unrealized losses | | | Carrying value | | | Cost | | | unrealized losses | | | Carrying value | |
| Redtail | | 66,667 | | $ | 38,866 | | $ | (38,866 | ) | $ | - | | $ | 38,866 | | $ | (38,199 | ) | $ | 667 | |
| Auramex | | 100,000 | | | 40,000 | | | (40,000 | ) | | - | | | 40,000 | | | (36,500 | ) | | 3,500 | |
| | | | | $ | 78,866 | | $ | (78,866 | ) | $ | - | | $ | 78,866 | | $ | (74,699 | ) | $ | 4,167 | |
During the year ended December 31, 2014, management made the assessment that its investments in Redtail Metals Corp. (“Redtail”) and Auramex Resource Corp. (“Auramex”) had experienced a prolonged decline in their fair values. Accordingly, an impairment of $4,167 (2013 - $8,166) was recognized in net loss.
81
| Quaterra Resources Inc. |
| Notes to Consolidated Financial Statements |
| For the Years Ended December 31, 2014, 2013 and 2012 |
| (Expressed in Canadian dollars) |
| |
| | | Computer equipment | | | Field Equipment | | | Vehicles | | | Total | |
| Cost | | | | | | | | | | | | |
| Balance, December 31, 2012 | $ | 148,031 | | $ | 174,870 | | $ | 491,292 | | $ | 814,193 | |
| Balance, December 31, 2013 | | 148,031 | | | 174,870 | | | 491,292 | | | 814,193 | |
| Disposal during the period | | - | | | - | | | (92,505 | ) | | (92,505 | ) |
| Balance, December 31, 2014 | $ | 148,031 | | $ | 174,870 | | $ | 398,787 | | $ | 721,688 | |
| Accumulated depreciation | | | | | | | | | | | | |
| Balance, December 31, 2012 | $ | 140,112 | | $ | 119,558 | | $ | 329,646 | | $ | 589,316 | |
| Depreciation for the year | | 5,939 | | | 17,362 | | | 51,202 | | | 74,503 | |
| Balance, December 31, 2013 | | 146,051 | | | 136,920 | | | 380,848 | | | 663,819 | |
| Depreciation for the period | | 1,980 | | | 11,385 | | | 21,097 | | | 34,462 | |
| Disposal of fixed asset | | - | | | - | | | (53,114 | ) | | (53,114 | ) |
| Balance, December 31, 2014 | $ | 148,031 | | $ | 148,305 | | $ | 348,831 | | $ | 645,167 | |
| Carrying value | | | | | | | | | | | | |
| At December 31, 2013 | $ | 1,980 | | $ | 37,950 | | $ | 110,444 | | $ | 150,374 | |
| At December 31, 2014 | $ | - | | $ | 26,565 | | $ | 49,956 | | $ | 76,521 | |
82
| Quaterra Resources Inc. |
| Notes to Condensed Consolidated Financial Statements |
| For the Years Ended December 31, 2014, 2013 and 2012 |
| (Expressed in Canadian dollars) |
| |
Total mineral property acquisition and exploration costs for the year ended December 31, 2014 were as follows:
| | | United States | | | Mexico | | | | |
| | | MacArthur | | | Yerington | | | Bear | | | Herbert Gold | | | Uranium | | | Other | | | Nieves | | | Total | |
| Mineral Properties | | Copper | | | Copper | | | Copper | | | Project | | | Properties | | | Properties | | | | | | | |
| Acquisition | | | | | | | | | | | | | | | | | | | | | | | | |
| Balance, December 31, 2013 | $ | 3,363,308 | | $ | 3,368,518 | | $ | 340,646 | | $ | 150,615 | | $ | 500,000 | | $ | 2,036,029 | | $ | 1,754,434 | | $ | 11,513,550 | |
| Additions | | 273,257 | | | 533,631 | | | 155,873 | | | 13,416 | | | - | | | 87,136 | | | 117,302 | | | 1,180,615 | |
| Recovery | | - | | | - | | | - | | | - | | | (500,000 | ) | | - | | | (1,135,600 | ) | | (1,635,600 | ) |
| Disposal | | - | | | - | | | - | | | - | | | - | | | (1,230,375 | ) | | - | | | (1,230,375 | ) |
| Impairments | | - | | | - | | | - | | | - | | | - | | | (362,439 | ) | | - | | | (362,439 | ) |
| Balance, December 31, 2014 | | 3,636,565 | | | 3,902,149 | | | 496,519 | | | 164,031 | | | - | | | 530,351 | | | 736,136 | | | 9,465,751 | |
| | | | | | | | | | | | | | | | | | | | | | | | | |
| Exploration | | | | | | | | | | | | | | | | | | | | | | | | |
| Balance, December 31, 2013 | | 19,501,476 | | | 7,047,920 | | | 12,366 | | | 1,579,962 | | | - | | | 398,109 | | | 4,811,803 | | | 33,351,636 | |
| Geological | | 155,463 | | | 189,686 | | | 5,513 | | | 787 | | | - | | | - | | | 77,865 | | | 429,314 | |
| Geophysical | | 3,310 | | | - | | | - | | | - | | | - | | | - | | | - | | | 3,310 | |
| Technical Studies | | 9,746 | | | 21,787 | | | - | | | - | | | - | | | - | | | - | | | 31,533 | |
| Other | | 60 | | | 99,518 | | | - | | | 14,313 | | | - | | | - | | | 32,916 | | | 146,807 | |
| Additions | | 168,579 | | | 310,991 | | | 5,513 | | | 15,100 | | | - | | | - | | | 110,781 | | | 610,964 | |
| Impairments | | - | | | - | | | - | | | - | | | | | | (275,075 | ) | | (2,913,360 | ) | | (3,188,435 | ) |
| Balance, December 31, 2014 | | 19,670,055 | | | 7,358,911 | | | 17,879 | | | 1,595,062 | | | - | | | 123,034 | | | 2,009,224 | | | 30,774,165 | |
| | | | | | | | | | | | | | | | | | | | | | | | | |
| Recovery from sales of properties | | (1,873,258 | ) | | (677,004 | ) | | (49,412 | ) | | (151,766 | ) | | - | | | - | | | - | | | (2,751,440 | ) |
| Balance, December 31, 2014 | $ | 21,433,362 | | $ | 10,584,056 | | $ | 464,986 | | $ | 1,607,327 | | | - | | $ | 653,385 | | $ | 2,745,360 | | $ | 37,488,476 | |
83
| Quaterra Resources Inc. |
| Notes to Condensed Consolidated Financial Statements |
| For the Years Ended December 31, 2014, 2013 and 2012 |
| (Expressed in Canadian dollars) |
| |
| 6. | Mineral properties(Continued) |
| | | United States | | | Mexico | | | |
| | | MacArthur | | | Yerington | | | Bear | | | Herbert Gold | | | Uranium | | | Other | | | Nieves | | | Other | | | Total | |
| Mineral Properties | | Copper | | | Copper | | | Copper | | | Project | | | Properties | | | Properties | | | | | | Properties | | | | |
| Acquisition | | | | | | | | | | | | | | | | | | | | | | | | | | | |
| Balance, December 31, 2012 | $ | 3,077,838 | | $ | 3,193,862 | | $ | - | | $ | 136,492 | | $ | 4,962,589 | | $ | 2,054,693 | | $ | 1,623,310 | | $ | 2,472,887 | | $ | 17,521,671 | |
| Additions during the year | | 285,470 | | | 174,656 | | | 340,646 | | | 14,123 | | | 110,996 | | | 315,536 | | | 131,124 | | | 553,149 | | | 1,925,700 | |
| Recovery - Goldcorp | | - | | | - | | | - | | | - | | | - | | | - | | | - | | | (24,226 | ) | | (24,226 | ) |
| Disposal of mineral properties | | - | | | - | | | - | | | - | | | - | | | - | | | - | | | (572,796 | ) | | (572,796 | ) |
| Impairments | | - | | | - | | | - | | | - | | | (4,573,585 | ) | | (334,200 | ) | | - | | | (2,429,014 | ) | | (7,336,799 | ) |
| Balance, December 31, 2013 | | 3,363,308 | | | 3,368,518 | | | 340,646 | | | 150,615 | | | 500,000 | | | 2,036,029 | | | 1,754,434 | | | - | | | 11,513,550 | |
| | | | | | | | | | | | | | | | | | | | | | | | | | | | |
| Exploration | | | | | | | | | | | | | | | | | | | | | | | | | | | |
| Balance, December 31, 2012 | | 18,783,675 | | | 6,521,961 | | | - | | | 1,512,046 | | | 7,867,075 | | | 717,824 | | | 4,692,483 | | | 12,548,826 | | | 52,643,890 | |
| Geological | | 509,680 | | | 328,365 | | | 12,013 | | | 30,916 | | | 137,279 | | | 40,301 | | | 82,070 | | | 513,817 | | | 1,654,441 | |
| Geophysical | | 51,761 | | | 9,975 | | | 353 | | | - | | | 6,171 | | | 177 | | | 30,817 | | | 7,676 | | | 106,930 | |
| Geochemical | | - | | | 2,672 | | | - | | | 227 | | | - | | | - | | | 932 | | | - | | | 3,831 | |
| Drilling | | - | | | - | | | - | | | 11,002 | | | - | | | - | | | - | | | - | | | 11,002 | |
| Technical Studies | | 112,243 | | | 174,228 | | | - | | | 6,896 | | | - | | | - | | | 1,281 | | | - | | | 294,648 | |
| Other | | 44,117 | | | 10,719 | | | - | | | 18,875 | | | 5,004 | | | - | | | 4,220 | | | 87,110 | | | 170,045 | |
| Additions during the year | | 717,801 | | | 525,959 | | | 12,366 | | | 67,916 | | | 148,454 | | | 40,478 | | | 119,320 | | | 608,603 | | | 2,240,897 | |
| Recovery - Goldcorp | | - | | | - | | | - | | | - | | | - | | | - | | | - | | | (3,945 | ) | | (3,945 | ) |
| Disposal of mineral properties | | | | | | | | | | | | | | | | | | | | | | | (2,653,022 | ) | | (2,653,022 | ) |
| Impairments | | - | | | - | | | - | | | - | | | (8,015,529 | ) | | (360,193 | ) | | - | | | (10,500,462 | ) | | (18,876,184 | ) |
| Balance, December 31, 2013 | | 19,501,476 | | | 7,047,920 | | | 12,366 | | | 1,579,962 | | | - | | | 398,109 | | | 4,811,803 | | | - | | | 33,351,636 | |
Total acquisition and exploration
Balance,December 31, 2013 | $ | 22,864,784 | | $ | 10,416,438 | | $ | 353,012 | | $ | 1,730,577 | | $ | 500,000 | | $ | 2,434,138 | | $ | 6,566,237 | | $ | - | | $ | 44,865,186 | |
84
| Quaterra Resources Inc. |
| Notes to Condensed Consolidated Financial Statements |
| For the Years Ended December 31, 2014, 2013 and 2012 |
| (Expressed in Canadian dollars) |
| |
| 6. | Mineral properties(Continued) |
The Company is in the business of exploring and developing its copper assets in the state of Nevada. Exploration programs are carried out through the Company’s management expertise and the use of consultants and contractors. Continuation of these programs is dependent on the Company’s ability to raise additional funds from the market, the continuing participation of its exploration partners and sale of non-Yerington assets.
On June 16, 2014, the Company entered into a Membership Interest Option Agreement (the “Option Agreement”) with Freeport-McMoRan Nevada LLC ("Freeport-McMoRan"), which sets out terms for exploration of the Company’s copper properties in and around Yerington, Nevada. These include MacArthur (6.a), Yerington (6.b), Bear (6.c) and Wassuk (6.d). By August 11, 2014, the Company had transferred all its Yerington copper properties (MacArthur, Yerington, Bear and Wassuk) to its wholly-owned subsidiary Singatse Peak Services LLC. (“SPS”). As part of the Option Agreement closing on June 16, 2014, the Company received US$600,000. Additionally, on August 13, 2014 the Company received US$1,000,000 from Freeport-McMoRan Nevada in accordance with the Option Agreement. On December 17, 2014, the Company received the remaining US$900,000 due under its commitment for the first twelve-month stage of the Option Agreement.
Under the Option Agreement, after conducting additional due diligence about SPS over the first year, Freeport-McMoRan has the right to earn an initial 55% interest in SPS by providing up to US$36,100,000 funds to SPS to complete three staged investigation and work program. During these stages, Freeport-McMoRan provides funding to SPS for property maintenance, general adminstration (“G&A”), environmental compliance and, in later stages, exploration. Freeport-McMoRan can earn a further 20% interest in SPS (increasing its holding to 75%) should it elect to fund SPS with a further US$100 million of spending, or complete a feasibility study, whichever comes first.
In the first twelve-month stage of the Option Agreement, Freeport provided SPS US$2,500,000 for land, water and mineral rights title acquisitions and maintenance costs, G&A and compliance with environmental laws. Freeport-McMoRan can terminate the agreement within the first stage of the agreement at its discretion, with the US$2,500,000 being a firm commitment. Freeport-McMoRan can extend stage one of the Option Agreement for up to a further twelve months upon payment of an extension fee of US$400,000 and commitment of budget funds of US$1,250,000 for each six month extension.
In order for the second stage of the Option Agreement to commence, Freeport-McMoRan must commit to fund US$6,100,000 over the ensuing post-stage twelve-month period for property maintenance costs, G&A, environmental compliance and exploration of the property. During the 24-month third stage of the Option Agreement, Freeport-McMoRan may fund up to US$30,000,000 for exploration of the property, property maintenance costs, G&A and environmental compliance. If Freeport-McMoRan completes stage three funding it will have invested approximately US$38,600,000 in the Yerington Project and will have earned the right to own a 55% interest in SPS.
If Freeport-McMoRan chooses to proceed beyond stage three, it can elect to fund a further US$100,000,000, or fund the costs of completion of a feasibility study, to earn an additional 20% interest for a total 75% interest in SPS (the “Additional Sole Funding”). Alternatively, Freeport-McMoRan can choose to fund with Quaterra, proportional to their 55% and 45% working interests, respectively. If Freeport-McMoRan completes the Additional Sole Funding, Quaterra may elect to fund 25% of project expenditures or transfer an additional 5% interest to Freeport-McMoRan in return for Freeport-McMoRan carrying the first US$50,000,000 of Quaterra’s proportionate share of funding, which is repayable from 90% of Quaterra’s project proceeds.
At any time when the parties are proportionally funding their share of costs, and before an affirmative decision to begin production, a non-funding party will suffer ordinary dilution. Should either party’s interest fall below 10%, it will be converted into a 1% net smelter return royalty (“NSR”). After a production decision, a non-funding party will dilute to a 1% NSR royalty.
85
| Quaterra Resources Inc. |
| Notes to Condensed Consolidated Financial Statements |
| For the Years Ended December 31, 2014, 2013 and 2012 |
| (Expressed in Canadian dollars) |
| |
| 6. | Mineral properties(Continued) |
| | a) | MacArthur Property, Nevada |
Pursuant to an agreement dated September 13, 2005, and subsequently amended, with North Exploration LLC, the Company acquired the right to earn an interest in certain unpatented mining claims covering the former MacArthur copper-oxide mine, in the Yerington Mining District of Lyon County, Nevada. The Company may elect to acquire the property by making the following staged payments totaling US$2,207,000, of which US$212,000 was outstanding as of December 31, 2014:
| | (i) | US$635,000 and 150,000 shares by January 15, 2010 (paid and issued) |
| | (ii) | US$524,000 on or before January 15, 2011 (paid) |
| | (iii) | US$524,000 plus interest at the rate of 6% per annum by January 15, 2012 (paid) |
| | (iv) | US$100,000 plus US$31,440 interest by January 15, 2013 (paid) |
| | (v) | US$212,000 plus interest of US$36,940 by July 15, 2014 (paid on July 1, 2014) |
| | (vi) | US$212,000 plus interest by January 15, 2015. (Paid subsequent to year-end, see subsequent Events Note 18). |
The property is subject to a 2% NSR, which may be reduced to 1% for US$1,000,000.
| | b) | Yerington Property, Nevada |
On April 27, 2011, the Company completed the acquisition of the Yerington property after more than three years of legal and environmental due diligence. The purchase price was US$500,000 cash, 250,000 of the Company’s common shares and a 2% NSR capped at US$7.5 million on commencement of commercial production.
The Yerington property is a historic mining site formerly owned and operated by the Anaconda Company, Atlantic Richfield Company (“ARC”) and Arimetco. The property has a history of environmental releases, which are outlined in an environmental site assessment undertaken for the Company by the Chambers Group and subsequently updated by SRK Consulting. The Yerington mine site is aComprehensive Environmental Response Compensation and Liability Act (“CERLA”) site, but has not been listed on the National Priorities List.
Prior to closing on the property, the Company obtained Bona Fide Prospective Purchaser (“BFPP”) Reasonable Steps letters from the US Environmental Protection Agency (“EPA”), the State of Nevada Department of Environmental Protection (“NDEP”) and the Bureau of Land Management (“BLM”). These letters define reasonable steps that the Company could take to retain its status as a BFPP.
During the year ended December 31, 2012, the Company entered into a voluntary settlement agreement (the “Agreement”) with the EPA to assist in upgrading the fluid management system (the “System”), which manages fluids from the former Arimetco operations at the property. Under the terms of the Agreement, the Company agreed to complete a study of the System in order to determine additional repairs or modifications that may be required and to work with the EPA to determine which, if any, of the conclusions of the study should be implemented. As part of the Agreement, the Company obtained a site-wide covenant not to sue from the EPA for existing environmental contamination related to historic mining operations at the site.
86
| Quaterra Resources Inc. |
| Notes to Condensed Consolidated Financial Statements |
| For the Years Ended December 31, 2014, 2013 and 2012 |
| (Expressed in Canadian dollars) |
| |
| 6. | Mineral properties(Continued) |
| | b) | Yerington Property, Nevada (Continued) |
In September 2014, SPS submitted to EPA a Final Report that documented the work SPS performed under the EPA Agreement. SPS incurred costs of US$93,254 during calendar year 2014, which included the final payment to the EPA for the Work to Be Performed and Payment of Response Costs, as defined in the Agreement. On January 7, 2015, the EPA issued a Notice of Completion to SPS confirming that the obligations of the Work to Be Performed and the Payment of Response Costs sections of the Settlement Agreement had been met. With the issuance of the Notice of Completion, SPS believes it does not have further obligations under the Agreement, except for those as a landowner and as a BFPP.
| | c) | Bear Copper Deposit, Nevada |
In December 2013, the Company announced that it had entered into four option agreements completed throughout 2013, covering 1,305 acres of private land north and east of the Yerington mine site, known as the Bear Deposit, that covers additional portions of the Bear copper deposit.
The Bear deposit was discovered in 1961 by Anaconda condemnation drilling in the sulfide tailings disposal area and was further delineated in the 1960s and 1970s. Currently the deposit is open in several directions and has never been consolidated under a single owner. A part of the Company’s recently acquired acreage was not previously accessible for exploration and is adjacent to the highest grade mineralization discovered during previous exploration of the area.
Under the terms of the option agreements, the Company (through its wholly owned subsidiary, SPS) has an exclusive right to explore these parcels and has an option to purchase surface water rights and supplemental storage water rights.
Pursuant to the four option agreements, the Company is required to make payments totaling US$3,040,548 in order to maintain the exclusive right to conduct mineral exploration on these properties. Payments due under the option agreements by year are as follows:
| | (i) | US$329,258 due in 2013 (paid) |
| | (ii) | US$341,258 due in 2014 (paid) |
| | (iii) | US$288,258 due in 2015 |
| | (iv) | US$313,258 due in 2016 |
| | (v) | US$345,258 due in 2017 |
| | (vi) | US$425,258 due in 2018 |
| | (vii) | US$462,000 due in 2019 |
| | (viii) | US$512,000 due in 2020 |
| | (ix) | US$12,000 due in 2021 |
| | (x) | US$12,000 due in 2022. |
87
| Quaterra Resources Inc. |
| Notes to Condensed Consolidated Financial Statements |
| For the Years Ended December 31, 2014, 2013 and 2012 |
| (Expressed in Canadian dollars) |
| |
| 6. | Mineral properties(Continued) |
| | d) | Wassuk Copper Project, Nevada |
On May 26, 2011, the Company entered into a mining lease with an option to purchase agreement with Majuba Mining Ltd. to earn an interest in certain unpatented mining claims in Lyon County, Nevada, for US$1.61 million. On May 12, 2014, the agreement was amended to reflect a change in the anniversary date to August 1 as follows:
| | (i) | US$140,000 on or before May 26, 2011 (paid) |
| | (ii) | US$130,000 on or before May 26, 2012 (paid) |
| | (iii) | US$120,000 on or before August 23, 2013 (paid) |
| | (iv) | US$80,000 on or before each of August 1, 2014 (paid) and 2015 |
| | (v) | US$200,000 on or before each of August 1, 2016, 2017 and 2018 |
| | (vi) | US$230,000 each on or before August 1, 2019 and August 1, 2020. |
The Company is required to incur a total of US$300,000 exploration work on or before August 1, 2016 and any difference between the actual expenditures and US$300,000 is required to be paid in the event that less than US$300,000 is so incurred.
The project is subject to a 3% NSR upon commencing commercial production of which 1% can be bought for US$1,500,000.
| | e) | Nieves Silver Concessions, Mexico |
Prior to December 29, 2014, the Company owned equal interest in the Nieves silver property located in northern Zacatecas, Mexico, with its US-based joint venture partner, Blackberry Ventures 1, LLC (“Blackberry”). All work plans were made in consultation with the joint venture partner, which contributed its share of ongoing exploration costs plus a 10% administration fee. As at December 31, 2014, Blackberry owed $29,336 (2013 - $49,468) for their share of exploration expenditures incurred during the three months ended December 31, 2014.
The Nieves concessions are subject to a maximum 3% NSR to the original concession holders, which the Company may purchase at any time for US$2,000,000. In addition, Kennecott Exploration Company, the optionor in the initial Underlying Agreement, retained a 2% NSR on certain core claims and 1% on certain peripheral claims. On January 24, 2007, this NSR was purchased by Royal Gold Inc. Commencing January 26, 2004, an AMR payment of US$75,000 is due to the concession holders until the commencement of commercial production.
On December 29, 2014, the Company entered into an agreement whereby it would transfer its 50% ownership in the stock of the entity holding the Nieves project to Blackberry, the joint venture partner, for US$4,000,000. Payments of $1,000,000 under the agreement are due upon the closing of the agreement March 1, 2015, September 1, 2015, and March 1, 2016. At the time of each payment, the Company will transfer one quarter of its interest in Nieves to Blackberry (representing 12.5% interest in the total project). On December 29, 2014, Blackberry made the initial $1,000,000 payment due under the agreement. Additionally, due to the prevalent market conditions from the transaction as indicators of impairment, the Company recorded a provision against the Nieves properties totalling $2,913,360.
88
| Quaterra Resources Inc. |
| Notes to Condensed Consolidated Financial Statements |
| For the Years Ended December 31, 2014, 2013 and 2012 |
| (Expressed in Canadian dollars) |
| |
| 6. | Mineral properties(Continued) |
On March 14, 2014, the Company closed an agreement to sell its uranium properties and assets located in the states of Arizona, Utah and Wyoming for Cdn $500,000 in an all cash transaction.
During the year ended December 31, 2014, the Company considered prevalent market conditions as indicators of impairment, and accordingly recorded a provision against the Reveille, Goldfield and Poker Brown properties totalling $637,514. Reveille and Goldfield properties were returned to their respective owners who are responsible for making 2014 BLM and County payments. On July 17, 2014, Poker Brown was under contract to be sold and the purchaser was responsible for BLM and County payments in return for the extinguishment of a US$37,376 payable owed to this third party and a 0.5% NSR capped at US$500,000.
On October 3, 2014, the Company entered into an agreement with Freeport-McMoRan to sell the Company’s remaining interest in three of its non-core assets, SW Tintic Utah, Cave Peak Texas and Butte Valley for US$5,000,000. At time of closing, US$1 million was paid with further payments to be paid the first day of each quarter starting January 1, 2015 (paid see Note 18 (a) for Subsequent Events) through October 1, 2016 in the amount of US$500,000 each quarter. In order to induce Freeport-McMoRan into the agreement, the Company issued 19,000,000 warrants to the purchaser, which vest at the rate of 1,900,000 warrants per US$500,000 payment made. The warrants carry an exercise price of US$0.16 per warrant exercisable into one common share of the Company. The Company determined that the present value of the payments to be made was US$4,787,717. The Company received the first payment at the date of closing leaving US$3,787,717 due as of December 31, 2014. Additionally, the Company accretes interest income at the effective rate of 5.13% from the date of agreement until paid in full. The Company recorded US$26,208 ($29,761) of interest income receivable due under the agreement for the year ended December 31, 2014 resulting in US$3,813,925 due as of December 31, 2014 ($4,434,451).
On July 2, 2014, the Company closed an 18-month non-brokered private placement of US$500,000 ($533,350) units where each unit was priced at US$1,000 and comprised one non-transferable convertible redeemable US$1,000 principal amount promissory note (“note”) and 11,442 non-transferable common share purchase warrants. The Company issued notes aggregating US$500,000 in principal and 5,721,000 warrants entitling the purchase of up to 5,721,000 common shares of the Company at $0.16 per share until January 2, 2016 (the “Term”), subject to the Company's right to accelerate the expiry date in certain circumstances.
Each note bears simple interest at a rate of 10% per annum in arrears payable to the extent accrued on the earlier of the due date, conversion or redemption of the note. Subject to provisions set forth in each note, upon conversion or redemption, interest will be paid in the form of shares at the market price determined in accordance with the policies of the TSX-V.
At any time after the expiration of four months after July 2, 2014 ("Closing Date"), the holder of a note may convert the principal amount of the note outstanding into shares in the ratio of $0.095 of the principal amount of the note converted during the first twelve months of the Term, or $0.10 of the principal amount of the note converted during the last six months of the Term, to one share. Any interest payable will be converted into shares at the market price determined in accordance with the policies of the TSX-V. However, as to any note, the Company reserves the right to pay some or all of the interest in cash (US funds) if necessary to satisfy any regulatory standard. In the event that, at any time after the expiration of four months after the Closing Date, the Company's common shares have achieved or exceeded a closing price of $0.12 per share for a ten consecutive trading day period on the TSX-V, the principal amount of the notes outstanding will be automatically redeemed and converted into shares in the ratio of $0.095 of the principal amount of the note redeemed during the first twelve months of the Term, or $0.10 of the principal amount of the note redeemed during the last six months of the Term, for one share. Any interest payable will be converted into shares at the market price determined in accordance with the policies of the TSX-V. However, as to any note, the Company reserves the right to pay some or all of the interest in cash (US funds) if necessary to satisfy any regulatory standard.
89
| Quaterra Resources Inc. |
| Notes to Condensed Consolidated Financial Statements |
| For the Years Ended December 31, 2014, 2013 and 2012 |
| (Expressed in Canadian dollars) |
| |
| 7. | Promissory notes(Continued) |
At any time after the expiration of four months after the Closing Date, the Company may, prior to conversion, on thirty days’ notice in writing, redeem the principal amount of the notes outstanding by paying the holders, in cash, the principal amount of the notes outstanding together with interest, in cash or, at the Company's option, in shares at the market price determined in accordance with the policies of the TSX-V, at the rate of 15% per annum calculated from the date of issue of the notes.
The Company evaluated the notes payable and determined that the shares issuable pursuant to the conversion option were not determinable due to the fact that the note is in US dollars and convert into a fixed Canadian dollar price resulting in a variable number of shares that could be issued and, as such, constitute a derivative liability. Based on the Company’s valuation of the debt portion and the derivative component at the time of issue, the proceeds were allocated as US$298,329 ($318,227) to the debt component and US$201,671 ($215,122) to the derivative component of the instrument representing an effective interest rate of 35% to the debt component. The resulting discount to the debt component will be amortized and accreted back to the debt over the 1.5 year term. The fair value of the derivative liability component was valued on inception of the note using the Black-Scholes option pricing model using the following assumptions: volatility of 173.5%, expected term of 1.5 years, discount rate of 1.1% and dividend yield of 0%
The derivative component was further revalued at December 31, 2014 resulting in an ending balance of $85,731. The derivative liability component was revalued using the following assumptions: volatility of 140%, expected term of 1.01 years, discount rate of 1.01% and dividend yield of 0%.
The resulting $451,787 of accreted interest expense and convertible note payable was recorded as a liability on the balance sheet at December 31, 2014. The derivative liability balance is shown separate as a component of derivative liability (Note 8).
In accordance with the agreement entered into with Freeport-McMoRan noted in 6(f), the Company issued 19,000,000 warrants to the purchaser, which vest at the rate of 1,900,000 warrants per US$500,000 payment made. The warrants carry an exercise price of US$0.16 per warrant exercisable into one common share of the Company with an expiration in October 2019. As these warrants have an exercise price denominated in a currency that is different from the Company’s functional currency, they are classified as derivative liabilities and carried at their fair values. Any changes in the fair value from period to period are recorded in profit or loss.
The fair value of each warrant issued in 2014 was estimated to be US$0.037 on the date issued and subsequently remeasured at December 31, 2014 to be US$0.034 using the Black-Scholes option pricing model assuming an expected volatility of 174%, a risk-free interest rate of 1.13%, a dividend yield of 0% and an expected term of 4.75 years for a total value of US$654,090 ($760,510).
90
| Quaterra Resources Inc. |
| Notes to Condensed Consolidated Financial Statements |
| For the Years Ended December 31, 2014, 2013 and 2012 |
| (Expressed in Canadian dollars) |
| |
| 8. | Derivative liability(Continued) |
During the year ended December 31, 2013, the Company issued 29,810,000 share purchase warrants as part of a private placement offering (2012 - 6,541,571). As these warrants have an exercise price denominated in a currency that is different from the Company’s functional currency, they are classified as derivative liabilities and carried at their fair values. Any changes in the fair value from period to period are recorded in profit or loss.
During 2012, the Company issued 6,541,571 warrants with an exercise price denominated in a currency that is different from the Company’s functional currency. As of December 31, 2014, the warrants expired without being exercised and any remaining derivative liability was written off to profit and loss during the year.
The fair value of each warrant issued in 2013 was estimated to be US$0.089 on the date issued and subsequently remeasured at December 31, 2014 to be US$0.02 using the Black-Scholes option pricing model assuming an expected volatility of 140%, a risk-free interest rate of 1.01%, a dividend yield of 0% and an expected term of 1.75 years for a total value of US$562,697 ($654,226).
The fair value of promissory notes issued in 2014 was estimated to be $0.05 on the date issued and subsequently remeasured at December 31, 2014 to be $0.01 using the Black-Scholes option pricing model assuming an expected volatility of 173%, a risk-free interest rate of 1.01%, a dividend yield of 0% and an expected term of 1.01 years for a total value of $85,731.
Option pricing models require the input of subjective assumptions including the expected price volatility, which was determined based on the historical volatility over the estimated life of the warrants. Changes in the assumptions can materially affect the fair value estimate.
The following table sets out the changes in derivative liability warrants:
| | | | Number of | | | | | Weighted Average Exercise | |
| | | | Warrants | | | Fair value assigned | | Price | |
| | At December 31, 2012 | | 6,541,571 | | $ | 774,673 | | US$ | 0.53 | |
| | Issuance of derivative warrants | | 29,810,000 | | | 2,781,003 | | US$ | 0.15 | |
| | Change in fair value estimates | | - | | | (2,363,892 | ) | US$ | 0.00 | |
| | At December 31, 2013 | | 36,351,571 | | | 1,191,784 | | US$ | 0.22 | |
| | Issuance of promissory notes | | - | | | 215,122 | | US$ | 0.00 | |
| | Issuance of derivative warrants | | 19,000,000 | | | 786,682 | | US$ | 0.16 | |
| | Expiration of warrants | | (6,541,571 | ) | | - | | US$ | 0.53 | |
| | Change in fair value estimates | | - | | | (693,121 | ) | US$ | 0.00 | |
| | At December 31, 2014 | | 48,810,000 | | $ | 1,500,467 | | US$ | 0.15 | |
The Company has an unlimited number of common shares authorized without par value.
91
| Quaterra Resources Inc. |
| Notes to Condensed Consolidated Financial Statements |
| For the Years Ended December 31, 2014, 2013 and 2012 |
| (Expressed in Canadian dollars) |
| |
The Company has a stock option plan (the “Plan”), which is approved by the shareholders annually. The Plan is designed to attract and retain individuals and to reward them for current and expected future performance. Options generally are granted for a maximum term of five years and expire 90 days following the termination of the optionee’s agreement. The exercise price for the options is set at the closing market price of the common shares on the grant date. The vesting period of options vary with terms determined by the board of directors. Under the Plan, the Company is authorized to grant stock options of up to 10% of the number of common shares issued and outstanding of the Company at any given time.
On June 25, 2014, the Company granted 2,880,000 fully vested stock options to directors and officers (2,100,000), employees (200,000) and consultants (580,000). Each option was fair valued at $0.06 using the Black-Scholes option pricing model assuming an expected volatility of 102%, a risk-free interest rate of 1.31%, a dividend yield of 0% and an expected term of 5 years.
On December 31, 2014, the Company granted 1,000,000 fully vested stock options to certain officers. These options have a five-year expiry date and a strike price of $0.05 each. Each option was fair valued at $0.04 using the Black-Scholes option pricing model assuming an expected volatility of 140%, a risk-free interest rate of 1.01%, a dividend yield of 0% and an expected term of 5 years.
The following table presents changes in stock options outstanding and exercisable:
| | | | December 31, 2014 | | | December 31, 2013 | |
| | | | | | | | | | | | | | |
| | | | Number of | | | Weighted Average | | | Number of | | | Weighted Average | |
| | | | Options | | | Exercise Price | | | Options | | | Exercise Price | |
| | Outstanding, beginning of year | | 16,310,000 | | $ | 0.78 | | | 14,010,000 | | $ | .16 | |
| | Granted | | 3,880,000 | | $ | 0.09 | | | 3,955,000 | | $ | 0.16 | |
| | Expired | | (4,790,000 | ) | $ | (0.96 | ) | | (1,655,000 | ) | $ | (2.86 | ) |
| | | | | | | | | | | | | | |
| | Outstanding, end of year | | 15,400,000 | | $ | 0.55 | | | 16,310,000 | | $ | 0.78 | |
| | | | | | | | | | | | | | |
| | Exercisable, end of year | | 15,100,000 | | $ | 0.56 | | | 15,710,000 | | $ | 0.93 | |
92
| Quaterra Resources Inc. |
| Notes to Condensed Consolidated Financial Statements |
| For the Years Ended December 31, 2014, 2013 and 2012 |
| (Expressed in Canadian dollars) |
| |
| 10. | Share-based payments(Continued) |
| | a) | Stock options (Continued) |
The following table summarizes information about the stock options outstanding by expiry dates:
| | | | | | Options Outstanding |
| | | | | | |
| | Exercise price | Fair Value | Expire Date | December 31, 2014 | December 31, 2013 |
| | $ 0.98 | $ 0.52 | November 9, 2014 | - | 1,705,000 |
| | $ 1.02 | $ 0.51 | November 9, 2014 | - | 2,095,000 |
| | $ 1.80 | $ 0.85 | April 1, 2015 | 100,000 | 100,000 |
| | $ 1.76 | $ 0.97 | April 22, 2015 | 200,000 | 200,000 |
| | $ 1.29 | $ 0.75 | August 9, 2015 | 1,405,000 | 1,535,000 |
| | $ 1.55 | $ 0.90 | October 6, 2015 | 65,000 | 65,000 |
| | $ 1.51 | $ 0.90 | November 3, 2015 | 100,000 | 100,000 |
| | $ 0.60 | $ 0.12 | December 31, 2015 | 400,000 | 400,000 |
| | $ 1.60 | $ 0.96 | March 24, 2016 | 200,000 | 275,000 |
| | $ 1.25 | $ 0.74 | August 9, 2016 | 2,370,000 | 2,635,000 |
| | $ 0.90 | $ 0.51 | October 24, 2016 | 300,000 | 300,000 |
| | $ 0.50 | $ 0.32 | March 27, 2017 | 100,000 | 100,000 |
| | $ 0.45 | $ 0.28 | June 28, 2017 | 2,520,000 | 2,845,000 |
| | $ 0.16 | $ 0.12 | September 19, 2018 | 3,810,000 | 3,955,000 |
| | $ 0.10 | $ 0.06 | June 25, 2019 | 2,830,000 | - |
| | $ 0.05 | $ 0.04 | December 31, 2019 | 1,000,000 | - |
| | | Total stock options outstanding | 15,400,000 | 16,310,000 |
The weighted average remaining contractual life for options outstanding and exercisable at December 31, 2014 was 2.89 and 2.87 years (2013 - 2.73 and 2.65 years), respectively.
The Company uses the following weighted average assumptions in the Black-Scholes option pricing model to fair value the options granted:
| | | | December 31, 2014 | | | December 31, 2013 | | | December 31, 2012 | |
| | Weighted average share price | $ | 0.09 | | $ | 0.19 | | $ | 0.44 | |
| | Risk-free interest rate | | 1.25% | | | 1.72% | | | 1.11% | |
| | Expected share price volatility | | 111% | | | 96% | | | 82% | |
| | Expected option life in years | | 5.0 | | | 5.0 | | | 3.9 | |
| | Forfeiture rate | | 0% | | | 0% | | | 0% | |
| | Expected dividend yield | | 0% | | | 0% | | | 0% | |
93
| Quaterra Resources Inc. |
| Notes to Condensed Consolidated Financial Statements |
| For the Years Ended December 31, 2014, 2013 and 2012 |
| (Expressed in Canadian dollars) |
| |
| 10. | Share-based payments(Continued) |
| | a) | Stock options (Continued) |
Share-based payments expense of $255,593 was recognized in the year ended December 31, 2014 allocated as to directors and officers ($207,077), employees ($12,440) and consultants ($36,076).
| | | | Years ended December 31, | |
| | | | 2014 | | | 2013 | | | 2012 | |
| | Consultants | $ | 12,440 | | $ | 96,559 | | $ | 368,835 | |
| | Directors and officers | | 207,077 | | | 336,745 | | | 460,455 | |
| | Employees | | 36,076 | | | 26,673 | | | 217,227 | |
| | | $ | 255,593 | | $ | 459,977 | | $ | 1,046,517 | |
Volatility was determined based on the historical volatility over the estimated lives of the options.
| | b) | Share purchase warrants |
The following table presents changes in warrants outstanding:
| | | | December 31, 2014 | | | December 31, 2013 | |
| | | | Number of | | | Weighted Average | | | | | | Weighted Average | |
| | | | Warrants | | | Exercise Price | | | Number of Warrants | | | Exercise Price | |
| | Outstanding, beginning of year | | 36,351,571 | | $ | 0.23 | | | 8,188,274 | | $ | 0.88 | |
| | Issued | | 24,721,000 | | $ | 0.18 | | | 29,810,000 | | $ | 0.15 | |
| | Expired | | (6,541,571 | ) | $ | 0.62 | | | (1,646,703 | ) | $ | 2.27 | |
| | Outstanding, end of year | | 54,531,000 | | $ | 0.18 | | | 36,351,571 | | $ | 0.23 | |
The following table summarizes information about the warrants outstanding by expiry dates as of December 31, 2014 and 2013:
| | | | | | | Number of Warrants | |
| | Expiry date | | Exercise price | | | December 31, 2014 | | | December 31, 2013 | |
| | December 28, 2014 | | US$ 0.53 | | | - | | | 6,541,571 | |
| | September 13, 2016 | | US$ 0.15 | | | 29,810,000 | | | 29,810,000 | |
| | January 2, 2016 | | CA$ 0.16 | | | 5,721,000 | | | - | |
| | October 3, 2019 | | US$ 0.16 | | | 19,000,000 | | | - | |
| | | | | | | 54,531,000 | | | 36,351,571 | |
94
| Quaterra Resources Inc. |
| Notes to Condensed Consolidated Financial Statements |
| For the Years Ended December 31, 2014, 2013 and 2012 |
| (Expressed in Canadian dollars) |
| |
| 10. | Share-based payments(Continued) |
| | b) | Share purchase warrants (Continued) |
On July 28, 2014, the Company repriced the exercise price of 6,541,571 warrants from US$0.53 to US$0.16 per warrant. The expiration date of the warrants remained at December 28, 2014, subject to an accelerated exercise period provision, which provided that, if the closing price of the Company’s shares is US$0.215 or higher for ten consecutive trading days (the “Premium Trading Days”), warrant holders would have thirty calendar days, commencing seven calendar days after the last Premium Trading Day, to exercise the warrants. The warrants would automatically expire if the warrant holders do not exercise them within this thirty-day period. On December 28, 2014, the warrants expired unexercised.
| 11. | Compensation of key management |
Key management comprises directors and executive officers. Certain executive officers are entitled to termination benefits equal to up to two years’ gross salary amounting to $1,100,000 in the event of a change of control. The Company has no post-employment benefits and other long-term employee benefits. Compensation awarded to key management was as follows:
| | | | Years ended December | |
| | | | 2014 | | | 2013 | | | 2012 | |
| | Salaries and employee benefits | $ | 677,122 | | $ | 393,230 | | $ | 918,297 | |
| | Directors' fees | | - | | | 174 | | | 126,971 | |
| | Share-based payments | | 207,077 | | | 329,167 | | | 460,455 | |
| | | $ | 884,199 | | $ | 722,571 | | $ | 1,505,723 | |
Personnel costs reflect staff reductions, change of CFO status from contractor to employee near the end of 2013 and certain temporary management salary reductions in the previous period.
As per a board resolution in May 2013, until further notice, directors’ fees continue to be suspended with no accrual.
| 12. | Related party transactions |
| | a) | The Company’s related parties consist of companies owned by executive officers or directors. The following fees and expenses were incurred in the normal course of operations: |
| | | | Years ended December 31, | |
| | | | 2014 | | | 2013 | | | 2012 | |
| | Manex Resources Group(a) | $ | 305,294 | | $ | 463,024 | | $ | 535,349 | |
| | Lawrence Page Q.C. Law Corp.(b) | | 9,139 | | | 14,187 | | | 4,115 | |
| | Atherton Enterprises Ltd.(c) | | - | | | 88,542 | | | 157,880 | |
| | | $ | 314,433 | | $ | 565,753 | | $ | 697,344 | |
95
| Quaterra Resources Inc. |
| Notes to Condensed Consolidated Financial Statements |
| For the Years Ended December 31, 2014, 2013 and 2012 |
| (Expressed in Canadian dollars) |
| |
| 12. | Related party transactions(Continued) |
| | a) | Manex Resource Group (“Manex”) is a private company owned by the Corporate Secretary that provides general office and administrative services. As of December 31, 2014, $3,295 (2013 - $nil) was owing. |
| | | |
| | b) | Lawrence Page, Q.C. Law Corp. is a company owned by the Corporate Secretary that provides legal services. As of December 31, 2014, $nil (2013 - $nil) was owing due to related parties. |
| | | |
| | c) | Atherton Enterprises Ltd. is a private company owned by Mr. Scott Hean, the CFO of the Company. Effective December 1, 2013, Mr. Hean became a salaried employee of the Company. As of December 31, 2014, $nil (2013 - $nil) was payable. |
During the year ended December 31, 2013, the former president and CEO and current chairman of the Company advanced three loans to the Company in the principal amount of US$800,000, of which US$200,000 was repaid during 2013. The loans are unsecured, bear annual interest of 10% and are due on demand with 40 days’ notice.
On March 18, 2014, the loans were renegotiated so that the entire balance of US$600,000 was due on demand with 40 days’ notice. Total principal and interest amounts of US$707,342 owing to the chairman were repaid December 28, 2014.
| | a) | Manex is a private company controlled by the Corporate Secretary of the Company. It provides furnished office space, selected administration, accounting and corporate secretarial services to the Company. These services are provided in the normal course of operations for consideration established and accepted by the Company and Manex. On February 9, 2012, the Company renewed its service agreement with Manex for its Vancouver head office administration and corporate services at a monthly rate of $15,750 for office rent plus accounting and administration services provided at agreed market rates for a five-year term expiring August 31, 2017. The service agreement was amended September 1, 2013, March 1, 2014 and January 1, 2015 to reduce the fee for services to a monthly rate of $5,000 with the monthly office lease remaining at $8,000. The Company may terminate the services portion of the agreement upon 30 days’ notice without penalty, and the office lease portion of the agreement by paying Manex the lesser of $96,000 or a total fee owing for the remainder of the lease term (through August 31, 2017). |
| | | |
| | b) | On March 1, 2011, the Company’s US subsidiary entered into a lease agreement for its premises located in Yerington, Nevada. The initial term of the lease is three years with an option to extend for an additional three years. The lease is currently extended to February 28, 2015 at US$3,400 per month. |
| | | |
| | c) | As of December 31, 2014, the Company had the following commitments related to its office premises in Vancouver, British Columbia, and Yerington, Nevada: |
| December 31, 2015 | $ | 103,906 | |
| December 31, 2016 | | 96,000 | |
| December 31, 2017 | | 64,000 | |
| | $ | 263,906 | |
96
| Quaterra Resources Inc. |
| Notes to Condensed Consolidated Financial Statements |
| For the Years Ended December 31, 2014, 2013 and 2012 |
| (Expressed in Canadian dollars) |
| |
| 14. | Supplemental cash flow information |
| For the years ended | | | | | | | | | |
| | | December 31, 2014 | | | December 31, 2013 | | | December 31, 2012 | |
| Non-cash items | | | | | | | | | |
| Mineral property expenditures included in accounts payable | $ | 3,279 | | $ | 139,860 | | $ | 302,366 | |
| Non-cash share issue costs | $ | - | | $ | - | | $ | - | |
| Shares received for mineral properties | $ | - | | $ | - | | $ | - | |
| Shares issued for mineral properties | $ | - | | $ | 95,000 | | $ | - | |
| 15. | Deferred income taxes |
| | | |
| a) | A reconciliation of income tax provision computed at Canadian statutory rates to the reported income tax provision is provided as follows: |
| | | | 2014 | | | 2013 | |
| | | | | | | | |
| | Loss for the year | $ | 2,484,716 | | $ | 28,817,916 | |
| | Canadian statutory tax rate | | 26% | | | 26% | |
| | | | | | | | |
| | Income tax benefit computed at statutory rates | | 646,026 | | | 7,492,658 | |
| | Foreign tax rates different from statutory rates | | 61,942 | | | (36,163 | ) |
| | Temporary differences | | 865,437 | | | (12,239 | ) |
| | Change in timing differences | | 1,230,338 | | | (2,996,296 | ) |
| | Rate difference between current and deferred taxes | | 370,316 | | | 68,671 | |
| | Foreign exchange gains or losses | | 1,867,053 | | | 1,600,854 | |
| | Permanent differences | | 96,224 | | | (120,846 | ) |
| | Unused tax losses and tax offsets not recognized in tax asset | | (5,137,336 | ) | | (5,996,639 | ) |
| | | | | | | | |
| | | $ | - | | $ | - | |
Effective April 1, 2013, the British Columbia provincial tax increased from 10% to 11% and the Canadian federal corporate tax rate remained unchanged at 15%. The overall increase in tax rates has resulted in an increase in the Company’s statutory tax rate from 25% to 26%. This rate remained unchanged through 2014.
| | b) | The tax effected items that give rise to significant portions of the deferred income tax assets and deferred income tax liabilities at December 31, 2014 and 2013 are presented below: |
| | | 2014 | | | 2103 | |
| Deferred tax assets | | | | | | |
| Tax losses carried forward | $ | 737,184 | | $ | 1,838,546 | |
| Tax value over book value of equipment | | - | | | - | |
| Deferred tax assets | | 737,184 | | | 1,838,546 | |
| Deferred tax liability | | | | | | |
| Book value over tax value of mineral properties | | (737,184 | ) | | (1,838,546 | ) |
| Net deferred tax assets | $ | - | | $ | - | |
97
| Quaterra Resources Inc. |
| Notes to Condensed Consolidated Financial Statements |
| For the Years Ended December 31, 2014, 2013 and 2012 |
| (Expressed in Canadian dollars) |
| |
| 15. | Deferred income taxes(Continued) |
| | | |
| c) | The Company recognizes tax benefits on losses or other deductible amounts generated in countries where it is probable the deferred tax assets will be recovered. The Company’s unrecognized deductible temporary differences and unused tax losses for which no deferred tax asset is recognized consist of the following amounts: |
| | | | 2014 | | | 2013 | |
| | | | | | | | |
| | Non-capital losses | $ | 53,019,289 | | $ | 42,394,557 | |
| | Share issue costs | | 629,896 | | | 947,700 | |
| | Tax value over book value of mineral properties | | 16,999,491 | | | 7,864,928 | |
| | Tax value over book value of equipment | | 715,053 | | | 641,500 | |
| | Tax value over book value of investments | | 41,266 | | | 37,400 | |
| | Unrecognized deductible temporary differences | $ | 71,404,995 | | $ | 51,886,085 | |
The Company’s unused non-capital losses expire as follows:
| | | | Canada | | | United States | | | Mexico | |
| | 2015 - 2019 | $ | 360,000 | | $ | - | | $ | 8,318,000 | |
| | 2020 - 2024 | | - | | | 769,000 | | | 15,493,000 | |
| | 2025 - 2034 | | 20,328,000 | | | 7,380,000 | | | - | |
| | Total | $ | 20,688,000 | | $ | 8,149,000 | | $ | 23,811,000 | |
| 16. | Segmented information |
| | |
| The Company has one business segment, the exploration of mineral properties. The Company’s significant non- current assets are distributed by geographic locations as follows: |
| | | | December 31, 2014 | | | December 31, 2013 | |
| | | | | | | | | | | | | | |
| | | | Property equipment | | | Mineral property | | | Property equipment | | | Mineral property | |
| | Mexico | $ | 53,313 | | $ | 2,745,360 | | $ | 78,142 | | $ | 6,566,237 | |
| | USA | | 23,208 | | | 34,743,116 | | | 72,232 | | | 38,298,949 | |
| | Total | $ | 76,521 | | $ | 37,488,476 | | $ | 150,374 | | $ | 44,865,186 | |
| 17. | Capital management and financial instruments |
| | |
| The Company considers its capital under management to consist of shareholders’ equity. The Company manages the capital structure and makes adjustments in light of changes in economic conditions and the risk characteristics of the Company’s assets. |
| | |
| The Company’s objectives of capital management are intended to ensure the entity’s ability to support the Company’s normal operating requirements on an ongoing basis, continue the development and exploration of its mineral properties, and support any expansionary plans. |
98
| Quaterra Resources Inc. |
| Notes to Condensed Consolidated Financial Statements |
| For the Years Ended December 31, 2014, 2013 and 2012 |
| (Expressed in Canadian dollars) |
| |
| 17. | Capital management and financial instruments(Continued) |
To effectively manage the entity’s capital requirements, the Company has in place a planning and budgeting process to help determine the funds required to ensure the Company has the appropriate liquidity to meet its operating and growth objectives.
There were no changes in the Company’s approach to capital management during the year ended December 31, 2014.
The Company designates the fair value of financial instruments according to the following:
| Level 1 - | Unadjusted quoted prices in active markets that are accessible at the measurement date for identical, unrestricted assets or liabilities. |
| Level 2 - | Quoted prices in markets that are not active, or inputs that are observable, either directly or indirectly, for substantially the full term of the asset or liability. |
| Level 3 - | Prices or valuation techniques that require inputs that are both significant to the fair value measurement and unobservable (supported by little or no market activity). |
The Company’s activities expose it to a variety of risks arising from financial instruments. These risks and management’s objectives, policies and procedures for managing these risks are disclosed as follows.
The following is a summary classification of financial instruments as of December 31, 2014 and 2013:
| | | | | | | | | | | | | | | Other | | | Total | |
| | | Loans and | | | Available-for- | | | Held-for- | | | Held-for- | | | financial | | | carrying | |
| December 31, 2014 | | receivables | | | sale | | | trading | | | maturity | | | liabilities | | | value | |
| Financial assets | | | | | | | | | | | | | | | | | | |
| Cash and cash equivalents | $ | - | | $ | - | | $ | 1,720,800 | | $ | - | | $ | - | | $ | 1,720,800 | |
| Restricted cash | | 32,491 | | | - | | | - | | | - | | | - | | | 32,491 | |
| Amount due from Joint Venture Partner | | 29,336 | | | - | | | - | | | - | | | - | | | 29,336 | |
| Amounts due on sale of mineral properties | | 4,451,891 | | | - | | | - | | | - | | | - | | | 4,451,891 | |
| Reclamation bonds | | 71,621 | | | - | | | - | | | - | | | - | | | 71,621 | |
| Financial liabilities | | | | | | | | | | | | | | | | | | |
| Accounts payable and accrued liabilities | | - | | | - | | | - | | | - | | | (829,394 | ) | | (829,394 | ) |
| Due to related parties | | - | | | - | | | - | | | - | | | (3,295 | ) | | (3,295 | ) |
| Derivative liability - warrants | | - | | | - | | | (1,500,467 | ) | | - | | | - | | | (1,500,467 | ) |
| | $ | 4,585,339 | | $ | - | | $ | 220,333 | | $ | - | | $ | (832,689 | ) | $ | 3,972,983 | |
99
| Quaterra Resources Inc. |
| Notes to Condensed Consolidated Financial Statements |
| For the Years Ended December 31, 2014, 2013 and 2012 |
| (Expressed in Canadian dollars) |
| |
| 17. | Capital management and financial instruments(Continued) |
| | | | | | | | | | | | | | | Other | | | | |
| | | Loans and | | | Available-for- | | | Held-for- | | | Held-for- | | | financial | | | Total | |
| December 31, 2013 | | receivables | | | sale | | | trading | | | maturity | | | liabilities | | | carrying value | |
| Financial assets | | | | | | | | | | | | | | | | | | |
| Cash | $ | - | | $ | - | | $ | 894,265 | | $ | - | | $ | - | | $ | 894,265 | |
| Restricted cash | | 42,444 | | | | | | | | | | | | | | | 42,444 | |
| Amount due from Joint Venture Partner | | 49,468 | | | | | | | | | | | | | | | 49,468 | |
| Marketable securities | | | | | 4,167 | | | | | | | | | | | | 4,167 | |
| Reclamation bonds | | 182,046 | | | | | | | | | | | | | | | 182,046 | |
| Financial liabilities | | | | | | | | | | | | | | | | | | |
| Accounts payable and accrued liabilities | | | | | | | | | | | | | | (540,655 | ) | | (540,655 | ) |
| Derivative liability - warrants | | | | | | | | (1,191,784 | ) | | | | | | | | (1,191,784 | ) |
| | $ | 273,958 | | $ | 4,167 | | $ | 297,519 | | $ | - | | $ | (540,655 | ) | $ | (560,049 | ) |
Fair value
The Company’s marketable securities measured at fair value were categorized in Level 1 at $nil (2013 - $4,167). The fair value of the Company’s marketable securities is based on active market prices at the reporting date.
The derivative liability is measured at fair value and categorized in Level 2 at $1,500,467 (2013 - $1,191,784). The fair value of the derivative liability is based on the Black-Scholes option pricing model inputs disclosed in note 7, as determined at the reporting date.
The recorded amount for cash, restricted cash, amount due from exploration partners, amounts due from and to related parties, and accounts payable and accrued liabilities approximate their fair values due to their short-term nature. The carrying values of the reclamation bonds approximate their fair values, as these balances are redeemable on demand.
Market risk
Market risk is the risk that the fair value or future cash flows of a financial instrument will fluctuate due to changes in market prices. Market risk comprises three types of risks: currency risk, interest rate risk and other price risk.
100
| Quaterra Resources Inc. |
| Notes to Condensed Consolidated Financial Statements |
| For the Years Ended December 31, 2014, 2013 and 2012 |
| (Expressed in Canadian dollars) |
| |
| 17. | Capital management and financial instruments(Continued) |
Currency risk
The Company operates internationally and is exposed to foreign currency risk from fluctuations in exchange rates between the Canadian dollar and various currencies, primarily US dollars and Mexican pesos. The Company has not hedged its exposure to foreign currency fluctuations.
The Company is exposed to currency risk as follows:
| | | | December 31, 2014 | | | December 31, 2013 | |
| | | | US | | | Pesos | | | US | | | Pesos | |
| | Cash | $ | 1,453,433 | | | - | | $ | 809,466 | | | 70,656 | |
| | Other receivables and restricted cash | | 3,851,925 | | | - | | | 34,500 | | | - | |
| | Due from exploration partners | | 25,231 | | | - | | | 45,510 | | | - | |
| | Reclamation bond | | 61,600 | | | - | | | 171,160 | | | - | |
| | Accounts payable and accrued liabilities | | (119,931 | ) | | (61,479 | ) | | (306,991 | ) | | (74,114 | ) |
| | Loan payable | | - | | | - | | | (638,160 | ) | | - | |
| | Derivative liabilities - warrants | | (1,216,787 | ) | | - | | | (1,102,970 | ) | | - | |
| | Net foreign exposure | $ | 4,055,471 | | | (61,479 | ) | $ | (987,485 | ) | | (3,458 | ) |
Based on the above net foreign currency exposures as at December 31, 2014 and 2013, and assuming all other variables remain constant, a 5% weakening or strengthening of the Canadian dollar against a) the US dollar would result in a change of $202,774 (2013 - $49,374) in the Company’s loss; and b) the Mexican peso would have no material impact in the Company’s loss for the year.
Interest rate risk
The Company’s cash is held in bank accounts that earn interest at variable interest rates. Due to the short-term nature of these financial instruments, fluctuations in market rates do not have a significant impact on the estimated fair value as of December 31, 2014. The Company manages interest rate risk by maintaining an investment policy that focuses primarily on preservation of capital and liquidity.
Other price risk
Other price risk is the risk that the future cash flows of a financial instrument will fluctuate due to changes in market prices, other than those arising from currency risk or interest rate risk. The Company’s marketable securities are carried at market value and are therefore directly affected by fluctuations in the market value of the underlying securities. The Company’s sensitivity analysis suggests that a 10% change in market prices would have no material impact on the value of the Company’s marketable securities.
101
| Quaterra Resources Inc. |
| Notes to Condensed Consolidated Financial Statements |
| For the Years Ended December 31, 2014, 2013 and 2012 |
| (Expressed in Canadian dollars) |
| |
| 17. | Capital management and financial instruments(Continued) |
Credit risk
Credit risk is the risk of a financial loss to the Company if a customer or counterparty to a financial instrument fails to meet its contractual obligations.
The Company’s financial instruments that are exposed to credit risk and for which the balances represent the maximum exposure to credit risk are cash, restricted cash, amounts due from exploration partners, and taxes and other receivables. The Company manages its credit risk on cash and restricted cash by maintaining these balances at Canadian chartered banks and financial institutions that have high credit ratings assigned by international credit ratings agencies. The Company’s credit risk associated with amounts due from exploration partners is minimized as a result of a strong and continuing working relationship with the partners. Taxes receivable include balances due from the Canadian federal government.
Liquidity risk
Liquidity risk is the risk that the Company will not be able to meet its financial obligations as they fall due. The Company manages liquidity risk by forecasting cash flows from operations and anticipated investing and financing activities and through the management of its capital structure. Accounts payable and accrued liabilities of $380,901 are due in the first quarter of fiscal 2015 and US$451,787 of convertible notes payable.
| | a. | On January 6, 2015, the second installment payment due under the non-core residual asset sale to Freeport- McMoRan of US$500,000 was received. Additionally, with the receipt of payment, an additional 1,900,000 warrants became vested and exercisable immediately at an exercise price of US$0.16 per share. |
| | | |
| | b. | On February 10, 2015, the Company paid the final property payment for the MacArthur property and therefore, owns 100% of MacArthur. The property is subject to a 2% NSR, which may be reduced to 1% for US$1,000,000. |
| | | |
| | c. | On March 1, 2015, the Company granted Blackberry Ventures a two month extension for the second US$1,000,000 payment, which is now due no later than April 30, 2015. |
102