Exhibit (c)(iii)
November 12, 2009 Draft Presentation to the
Special Committee of the Board of Directors of
The Orchard Enterprises, Inc.
Special Committee of the Board of Directors of
The Orchard Enterprises, Inc.
| DRAFT |
| FOR DISCUSSION PURPOSES ONLY |
| SUBJECT TO REVISION |
The Orchard Enterprises, Inc.
Indications of Value Summary
As of September 30, 2009
(000’s Except per Share Value)
| Method | Indicated Value | Weight Applied | Weighted Value | |||||||||
| Discounted Cash Flow Method | $ | 30,344 | 40 | % | $ | 12,138 | ||||||
| Guideline Market Transaction Method | $ | 37,037 | 40 | % | $ | 14,815 | ||||||
| Guideline Public Company Method | $ | 46,764 | 20 | % | $ | 9,353 | ||||||
| Indication of Controlling, Marketable Equity Value | 36,306 | |||||||||||
| Less: Series A Preferred Stock Liquidation Preference | (24,993 | ) | ||||||||||
| Residual Value Available for Common Shareholders | 11,313 | |||||||||||
| Divided by Common Shares Outstanding | 6,396 | |||||||||||
| Common Stock on a Per Share Value | $ | 1.77 | ||||||||||
Note: Some amounts may not foot due to rounding
| DRAFT |
| FOR DISCUSSION PURPOSES ONLY |
| SUBJECT TO REVISION |
The Orchard Enterprises, Inc.
Business Enterprise Value - Without eMusic Synergies and Private Company Cost Savings
Discounted Cash Flow Method
September 30, 2009
(000’s)
| Aggressive Case | Q4 2009 | 2010 | 2011 | 2012 | 2013 | 2014 | Residual | |||||||||||||||||||||
| Debt Free Cash Flow (Net Cash Flow to Invested Capital) | $ | (53 | ) | $ | 4,645 | $ | 6,054 | $ | 6,227 | $ | 6,291 | $ | 6,896 | $ | 7,172 | |||||||||||||
| Capitalized Residual Value | 44,824 | |||||||||||||||||||||||||||
| Present Value Mid-Year Discount Factor @ 20% | 0.97747 | 0.87220 | 0.72683 | 0.60569 | 0.50474 | 0.42062 | 0.42062 | |||||||||||||||||||||
| Net Present Value of Cash Flow | (52 | ) | 4,051 | 4,400 | 3,772 | 3,175 | 2,901 | 18,854 | ||||||||||||||||||||
| Indicated Enterprise Value (Market Value of Invested Capital) | 37,101 | |||||||||||||||||||||||||||
| Less: Interest Bearing Debt | 0 | |||||||||||||||||||||||||||
| Plus- present value of NOL carryforward tax benefit after 2014 | 0 | |||||||||||||||||||||||||||
| Less: Series A Preferred Stock Liquidation Preference | (24,993 | ) | ||||||||||||||||||||||||||
| Indication of Controlling, Marketable Equity Value - Common Stock | $ | 12,108 | ||||||||||||||||||||||||||
| Neutral Case | Q4 2009 | 2010 | 2011 | 2012 | 2013 | 2014 | Residual | |||||||||||||||||||||
| Debt Free Cash Flow (Net Cash Flow to Invested Capital) | $ | (53 | ) | $ | 3,445 | $ | 4,719 | $ | 6,426 | $ | 5,378 | $ | 5,908 | $ | 6,144 | |||||||||||||
| Capitalized Residual Value | 38,402 | |||||||||||||||||||||||||||
| Present Value Mid-Year Discount Factor @ 20% | 0.97747 | 0.87220 | 0.72683 | 0.60569 | 0.50474 | 0.42062 | 0.42062 | |||||||||||||||||||||
| Net Present Value of Cash Flow | (52 | ) | 3,005 | 3,430 | 3,892 | 2,715 | 2,485 | 16,153 | ||||||||||||||||||||
| Indicated Enterprise Value (Market Value of Invested Capital) | 31,627 | |||||||||||||||||||||||||||
| Less: Interest Bearing Debt | 0 | |||||||||||||||||||||||||||
| Plus- present value of NOL carryforward tax benefit after 2014 | 0 | |||||||||||||||||||||||||||
| Less: Series A Preferred Stock Liquidation Preference | (24,993 | ) | ||||||||||||||||||||||||||
| Indication of Controlling, Marketable Equity Value - Common Stock | $ | 6,634 | ||||||||||||||||||||||||||
| Worst Case | Q4 2009 | 2010 | 2011 | 2012 | 2013 | 2014 | Residual | |||||||||||||||||||||
| Debt Free Cash Flow (Net Cash Flow to Invested Capital) | $ | (53 | ) | $ | 513 | $ | 1,421 | $ | 2,848 | $ | 3,803 | $ | 4,418 | $ | 4,595 | |||||||||||||
| Capitalized Residual Value | 28,717 | |||||||||||||||||||||||||||
| Present Value Mid-Year Discount Factor @ 20% | 0.97747 | 0.87220 | 0.72683 | 0.60569 | 0.50474 | 0.42062 | 0.42062 | |||||||||||||||||||||
| Net Present Value of Cash Flow | (52 | ) | 447 | 1,033 | 1,725 | 1,920 | 1,858 | 12,079 | ||||||||||||||||||||
| Indicated Enterprise Value (Market Value of Invested Capital) | 19,010 | |||||||||||||||||||||||||||
| Less: Interest Bearing Debt | 0 | |||||||||||||||||||||||||||
| Plus- present value of NOL carryforward tax benefit after 2014 | 727 | |||||||||||||||||||||||||||
| Less: Series A Preferred Stock Liquidation Preference | (24,993 | ) | ||||||||||||||||||||||||||
| Indication of Controlling, Marketable Equity Value - Common Stock | $ | (5,256 | ) | |||||||||||||||||||||||||
Enterprise Value | Common Stock | |||||||||||||||||||||||||||||||
Indicated Enterprise Value | Probability | Probability Adjusted Value | Indicated Common Value | Probability | Probability Adjusted Value | Common Shares o/s | Common Share Price | |||||||||||||||||||||||||
| Aggressive Case | $ | 37,101 | 20 | % | $ | 7,420 | $ | 12,108 | 20 | % | $ | 2,422 | 6,396,115 | $ | 1.89 | |||||||||||||||||
| Neutral Case | 31,627 | 60 | % | 18,976 | 6,634 | 60 | % | 3,980 | 6,396,115 | $ | 1.04 | |||||||||||||||||||||
| Worst Case | 19,737 | 20 | % | 3,947 | 0 | 20 | % | 0 | 6,396,115 | $ | 0.00 | |||||||||||||||||||||
| Probability Adjusted | $ | 30,344 | $ | 6,402 | 6,396,115 | $ | 1.00 | |||||||||||||||||||||||||
PV of NOL CF Tax Savings | ||||||||||||||||||||
Per Client | NOL | Tax Rate | Tax Savings | PV Factor | PV of Tax Svgs | |||||||||||||||
| 2015 | 3,135 | 40 | % | 1,254 | 0.35052 | 440 | ||||||||||||||
| 2016 | 2,462 | 40 | % | 985 | 0.29210 | 288 | ||||||||||||||
| 727 | ||||||||||||||||||||
| DRAFT |
| FOR DISCUSSION PURPOSES ONLY |
| SUBJECT TO REVISION |
The Orchard Enterprises, Inc.
Guideline Company Transaction Method
September 30, 2009
(000’s)
Enterprise Value Approach:
| as of 9/30/09 | Indicated | |||||||||||||||||||||||||||
| Selected Pricing | Normalized | Industry Multiples | Value | |||||||||||||||||||||||||
| Multiple | (000’s) | Low | High | Mean | Median | Selected | (000’s) | |||||||||||||||||||||
| MVIC/Revenues | $ | 61,729 | 0.24 | 3.54 | 1.44 | 1.12 | 0.60 | $ | 37,037 | |||||||||||||||||||
| Indication of Market Value of Invested Capital | 37,037 | |||||||||||||||||||||||||||
| Less: Interest Bearing Debt | - | |||||||||||||||||||||||||||
| Indication of Controlling, Marketable Equity Value | $ | 37,037 | ||||||||||||||||||||||||||
Note: Some amounts may not foot due to rounding
Multiple selected is lower than the median primarily due to: decline in economic conditions (DOW is off 30% from high) and several of the selected guideline transactions have positive EBITDA.
| DRAFT |
| FOR DISCUSSION PURPOSES ONLY |
| SUBJECT TO REVISION |
The Orchard Enterprises, Inc.
Guideline Company Transaction Detail
September 30, 2009
(000’s)
| Sale | Latest Fiscal Year | MVIC/ | MVIC/ | |||||||||||||||||||||||
Business Description | Target Company Name | Acquiring Company Name | Date | Revenues | EBITDA | MVIC | Revenues | EBITDA | ||||||||||||||||||
| Digital media and IPTV solutions provider | Visual Connection | KIT Digital,Inc | 10/5/2008 | 10,356 | N/M | 4,344 | 0.42 | N/M | ||||||||||||||||||
| Provides Audio services for content download and playback on personal computers | Audible, Inc. | Amazon.com Inc. | 3/19/2008 | 101,979 | 2,326 | 277,377 | 2.72 | 119.25 | ||||||||||||||||||
| Provider of video and audio content distribution to advertisers | Vyvz Ads Business | DG FastChannel, Inc. | 6/5/2008 | 36,411 | 10,516 | 129,000 | 3.54 | 12.27 | ||||||||||||||||||
| Distribution of program and advertising content to television and radio stations | Applied Graphics Technologies, Inc. | Digital Generation Systems, Inc. | 6/10/2004 | 21,546 | 274 | 14,100 | 0.65 | 51.46 | ||||||||||||||||||
| Distribution of entertainment programming and home video products | GoodTimes Entertainment | Gaiam Inc | 9/13/2005 | 141,954 | N/M | 34,405 | 0.24 | N/M | ||||||||||||||||||
| Digital distribution of motion pictures over the internet | Movielink | Blockbuster | 8/8/2007 | 4,053 | N/M | 7,000 | 1.73 | N/M | ||||||||||||||||||
| Markets and distributes digital images and provides visual content | Creatas LLC | Jupitermedia Corp | 3/7/2005 | 43,073 | 2,949 | 60,400 | 1.40 | 20.48 | ||||||||||||||||||
| Provides digital background music and messaging services via the internet | Trusonic Inc. | Fluide Media Networks, Inc. | 10/17/2007 | 2,838 | N/M | 6,000 | 2.11 | N/M | ||||||||||||||||||
| Provides downloadable mobile content including ringtones and background wallpaper and text alerts | Ringtone.com LLC | New Motion, Inc. | 6/30/2008 | 10,226 | N/M | 8,653 | 0.85 | N/M | ||||||||||||||||||
| Direct to consumer mobile internet content and services | AMV Holding Limited | Mandalay Media, Inc. | 10/23/2008 | 29,497 | 4,244 | 22,522 | 0.76 | 5.31 | ||||||||||||||||||
| Note: Some amounts may not foot due to rounding | ||||||||||||||||||||||||||
| Low | 0.24 | 5.31 | ||||||||||||||||||||||||
| High | 3.54 | 119.25 | ||||||||||||||||||||||||
| Mean | 1.44 | 41.75 | ||||||||||||||||||||||||
| Median | 1.12 | 20.48 | ||||||||||||||||||||||||
| Standard Deviation | 1.08 | 46.77 | ||||||||||||||||||||||||
| Coefficient of Variation (Standard Deviation\Mean) | 0.75 | 1.12 | ||||||||||||||||||||||||
SOURCE: Pratt's Stats, Public Stats and Mergerstat
N/M = Not Meaningful
MVIC = Market Value of Invested Capital
| DRAFT |
| FOR DISCUSSION PURPOSES ONLY |
| SUBJECT TO REVISION |
The Orchard Enterprises, Inc.
Conclusion of Value - Guideline Public Company Method
September 30, 2009
(000’s)
| Normalized | Indicated | |||||||||||||||||||||||||||
| Selected Pricing | as of September 30, 2009 | Industry Multiples | Value | |||||||||||||||||||||||||
| Multiple | (000’s) | Low | High | Mean | Median | Selected | (000’s) | |||||||||||||||||||||
| MVIC/Revenues | $ | 61,729 | 0.21 | 15.36 | 2.18 | 0.53 | 0.53 | $ | 32,716 | |||||||||||||||||||
| Indication of Minority, Market Value of Invested Capital | 32,716 | |||||||||||||||||||||||||||
| Less: Interest Bearing Debt | - | |||||||||||||||||||||||||||
| Add: Cash and Marketable Securities | 4,695 | |||||||||||||||||||||||||||
| Indication of Minority, Marketable Equity Value | 37,411 | |||||||||||||||||||||||||||
| Add: 25% Control Premium | 9,353 | |||||||||||||||||||||||||||
| Indication of Controlling, Marketable Equity Value | $ | 46,764 | ||||||||||||||||||||||||||
Note: Some amounts may not foot due to rounding
| DRAFT |
| FOR DISCUSSION PURPOSES ONLY |
| SUBJECT TO REVISION |
The Orchard Enterprises, Inc.
Guideline Public Company Method
As of September 30, 2009
(000’s)
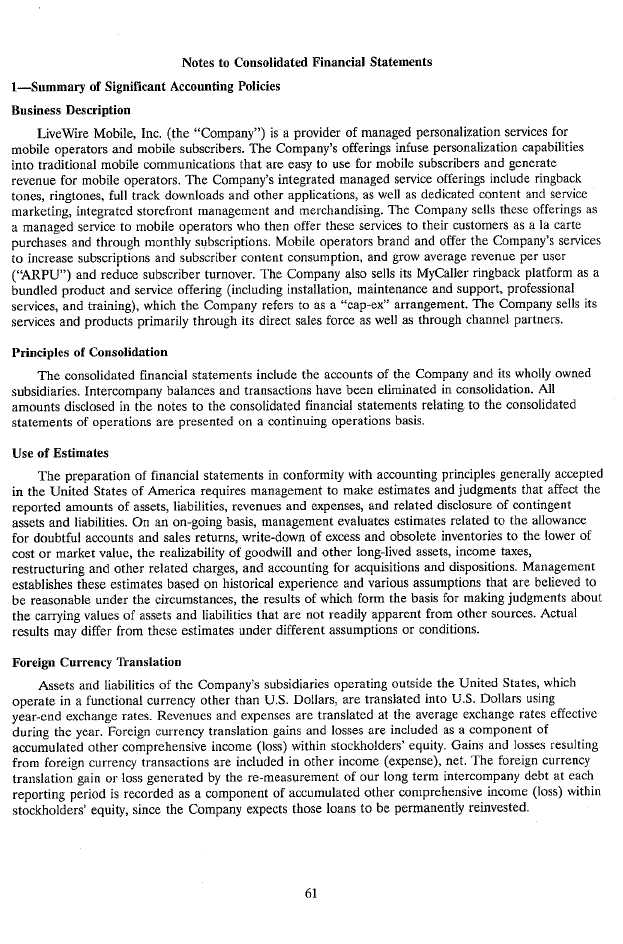
| Limelight | Salary.Com, Inc. | Image | Internap | Fluid Music | LiveWire | |||||||||||||||||||||||||||||||||||||||
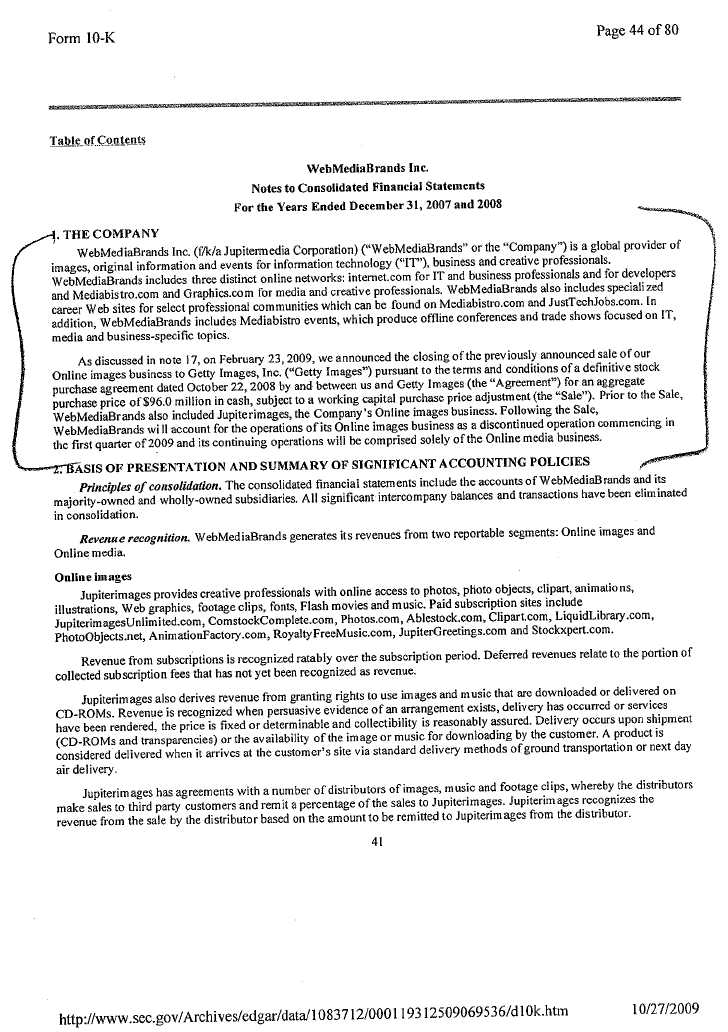
Exchange/Symbol | Orchard | Glu Mobile, Inc. | EDGAR Online, Inc. | Networks, Inc. | and Subsidiaries | WebMediaBrands Inc. | Entertainment, Inc. | RealNetworks, Inc. | Network Services | Canada, Inc. | Mobile, Inc. | |||||||||||||||||||||||||||||||||
Last Twelve Months | NASDAQ: ORCD | NASDAQ: GLUU | NASDAQ: EDGR | NASDAQ: LLNW | NASDAQ: SLRY | NASDAQ: WEBM | NASDAQ: DISK | NASDAQ: RNWK | NASDAQ: INAP | Toronto; FMN - T | NASDAQ; INAP.PK | |||||||||||||||||||||||||||||||||
| (LTM) Ending | September 30, 2009 | June 30, 2009 | June 30, 2009 | June 30, 2009 | June 30, 2009 | June 30, 2009 | June 30, 2009 | June 30, 2009 | June 30, 2009 | June 30, 2009 | June 30, 2009 | |||||||||||||||||||||||||||||||||
| Stock Price as of 10/27/09 | $ | 1.27 | $ | 1.07 | $ | 1.58 | $ | 3.60 | $ | 2.97 | $ | 0.65 | $ | 0.80 | $ | 4.03 | $ | 3.15 | $ | 1.80 | $ | 0.33 | ||||||||||||||||||||||
| Shares Out (000) | 6,396 | 29,663 | 26,734 | 84,457 | 16,146 | 36,732 | 21,856 | 134,784 | 50,725 | 52,522 | 46,010 | |||||||||||||||||||||||||||||||||
| Minority Value Indication | 8,123 | 31,739 | 42,240 | 304,045 | 47,954 | 23,876 | 17,485 | 543,180 | 159,784 | 94,540 | 15,183 | |||||||||||||||||||||||||||||||||
| Preferred Stock | 7,017 | - | - | - | - | - | - | - | - | - | - | |||||||||||||||||||||||||||||||||
| M.V. of Total Equity | 15,140 | 31,739 | 42,240 | 304,405 | 47,954 | 23,876 | 17,485 | 543,180 | 159,784 | 94,540 | 15,183 | |||||||||||||||||||||||||||||||||
| Add: Short and Long Term Interest Bearing Debt | - | 21,100 | 2,147 | - | - | 7,197 | 26,408 | - | 20,000 | 1,000 | 533 | |||||||||||||||||||||||||||||||||
| Less: Cash and Marketable Securities | 4,695 | 12,811 | 1,431 | 164,303 | 17,018 | 5,520 | 241 | 362,000 | 54,514 | 13,884 | 7,325 | |||||||||||||||||||||||||||||||||
| Market Value of Invested Capital (Minority Value) | 10,444 | 40,028 | 42,956 | 139,742 | 30,936 | 25,553 | 43,652 | 181,180 | 125,270 | 81,656 | 8,391 | |||||||||||||||||||||||||||||||||
Comparative Balance Sheets: | ||||||||||||||||||||||||||||||||||||||||||||
| Current Assets | 19,368 | 45,291 | 4,131 | 198,449 | 26,971 | 12,153 | 802,000 | 470,000 | 88,395 | 15,775 | 14,539 | |||||||||||||||||||||||||||||||||
| Net Plant and Equipment | 2,451 | 4,014 | 2,343 | 35,169 | 2,697 | 2,199 | 174,000 | 60,000 | 94,301 | 509 | 1,522 | |||||||||||||||||||||||||||||||||
| Other Assets | 34,607 | 26,174 | 5,345 | 6,003 | 35,597 | 34,401 | 1,012,000 | 72,000 | 80,094 | 2,751 | 544 | |||||||||||||||||||||||||||||||||
| Total Assets | 56,426 | 75,479 | 11,819 | 239,621 | 65,265 | 48,753 | 1,988,000 | 602,000 | 262,790 | 19,035 | 16,605 | |||||||||||||||||||||||||||||||||
| Current Liabilities Including Short Term Debt | 22,533 | 38,336 | 6,942 | 25,742 | 44,245 | 7,915 | 90,000 | 203,000 | 29,435 | 4,644 | 7,826 | |||||||||||||||||||||||||||||||||
| Long Term Debt | - | 6,125 | 1,647 | - | - | 7,197 | 200,000 | - | 20,000 | - | 257 | |||||||||||||||||||||||||||||||||
| Other Long Term Liabilities | - | 10,498 | 206 | 4,640 | 3,734 | 1,772 | 17,000 | 20,000 | 28,907 | 711 | 1,984 | |||||||||||||||||||||||||||||||||
| Stockholder's Equity | 33,893 | 20,520 | 3,024 | 209,239 | 17,286 | 31,869 | 1,681,000 | 379,000 | 184,448 | 13,680 | 6,538 | |||||||||||||||||||||||||||||||||
| Total Liabilities and Equity | 56,426 | 75,479 | 11,819 | 239,621 | 65,265 | 48,753 | 1,988,000 | 602,000 | 262,790 | 19,035 | 16,605 | |||||||||||||||||||||||||||||||||
Comparative Income Statements: | ||||||||||||||||||||||||||||||||||||||||||||
| Revenues | 61,729 | 86,118 | 18,353 | 134,522 | 44,198 | 122,683 | 121,798 | 581,097 | 257,907 | 5,317 | 14,647 | |||||||||||||||||||||||||||||||||
| Cost of Revenues | 44,233 | 40,548 | 3,893 | 85,987 | 13,550 | 85,078 | - | 253,507 | 207,916 | 3,597 | 8,679 | |||||||||||||||||||||||||||||||||
| Gross Margin | 17,496 | 45,570 | 14,460 | 48,535 | 30,648 | 37,605 | 121,798 | 327,590 | 49,991 | 1,720 | 5,968 | |||||||||||||||||||||||||||||||||
| Operating Expenses | 21,741 | 74,800 | 16,776 | 91,985 | 52,775 | 46,643 | 128,984 | 426,971 | 62,699 | 8,955 | 22,339 | |||||||||||||||||||||||||||||||||
| Income (Loss) from Operations | (4,245 | ) | (29,230 | ) | (2,316 | ) | (43,450 | ) | (22,127 | ) | (9,038 | ) | (7,186 | ) | (99,381 | ) | (12,708 | ) | (7,235 | ) | (16,371 | ) | ||||||||||||||||||||||
| Other Income (Expense) | - | - | - | - | - | - | - | - | - | - | - | |||||||||||||||||||||||||||||||||
| Interest Income | 14 | 281 | 37 | 2,592 | 294 | 483 | - | 7,057 | (1,884 | ) | 344 | 223 | ||||||||||||||||||||||||||||||||
| Interest Expense | (48 | ) | (786 | ) | (468 | ) | (44 | ) | - | (5,071 | ) | (3,074 | ) | - | 1,251 | (107 | ) | (374 | ) | |||||||||||||||||||||||||
| Earnings Before Tax (EBT) | (4,279 | ) | (29,735 | ) | (2,747 | ) | (40,902 | ) | (21,833 | ) | (13,626 | ) | (10,260 | ) | (92,324 | ) | (13,341 | ) | (6,998 | ) | (16,522 | ) | ||||||||||||||||||||||
| Tax Expense (Benefit) | - | 3,341 | - | 716 | 148 | 16,116 | 46 | 20,879 | 359 | (3 | ) | 491 | ||||||||||||||||||||||||||||||||
| Net Income (Loss) From Continuing Operations | (4,279 | ) | (33,076 | ) | (2,747 | ) | (41,618 | ) | (21,981 | ) | (29,742 | ) | (10,306 | ) | (113,203 | ) | (13,700 | ) | (6,995 | ) | (17,013 | ) | ||||||||||||||||||||||
| Depreciation and Amortization | 1,822 | 13,453 | 1,685 | 28,022 | 5,635 | 20,114 | (7,385 | ) | 35,789 | 30,964 | 1,437 | 4,161 | ||||||||||||||||||||||||||||||||
| Stock Based Compensation | 1,194 | 1,403 | 18,581 | 9,260 | 3,956 | ) | 75 | 22,829 | 6,413 | 1,028 | 1,385 | |||||||||||||||||||||||||||||||||
| Gross Cash Flow (Net Income + Depreciation and Amortization) | (2,457 | ) | (19,623 | ) | (1,062 | ) | (13,596 | ) | (16,346 | ) | (9,628 | ) | (2,921 | ) | (77,414 | ) | 17,264 | (5,558 | ) | (12,852 | ) | |||||||||||||||||||||||
| Earnings Before Interest, Taxes, Depreciation and Amortization (EBITDA) | (2,423 | ) | (15,777 | ) | (631 | ) | (15,428 | ) | (16,492 | ) | 11,076 | 199 | (63,592 | ) | 18,256 | (5,798 | ) | (12,210 | ) | |||||||||||||||||||||||||
| EBITDA + Stock Based Compensation | (2,423 | ) | (14,583 | ) | 772 | 3,153 | (7,232 | ) | 15,032 | 274 | (40,763 | ) | 24,669 | (4,770 | ) | (10,825 | ) | |||||||||||||||||||||||||||
| Earnings Before Interest and Taxes (EBIT) | (4,245 | ) | (29,230 | ) | (2,316 | ) | (43,450 | ) | (22,127 | ) | (9,038 | ) | (7,186 | ) | (99,381 | ) | (12,708 | ) | (7,.235 | ) | (16,371 | ) | ||||||||||||||||||||||
| Earnings Per Share | $ | -0.67 | $ | -1.12 | $ | -0.10 | $ | -0.49 | $ | -1.36 | $ | -0.81 | $ | -0.47 | $ | -0.84 | $ | -0.27 | $ | -0.13 | $ | -0.37 | ||||||||||||||||||||||
| Gross Margin/Revenues | 28.3 | % | 52.9 | % | 78.8 | % | 36.1 | % | 69.3 | % | 30.7 | % | 100.0 | % | 56.4 | % | 19.4 | % | 32.3 | % | 40.7 | % | ||||||||||||||||||||||
| Operating Expenses/Revenues | 35.2 | % | 86.9 | % | 91.4 | % | 68.4 | % | 119.4 | % | 38.0 | % | 105.9 | % | 73.5 | % | 24.3 | % | 168.40 | % | 152.5 | % | ||||||||||||||||||||||
| EBITDA/Revenues | -3.9 | % | -18.3 | % | -3.4 | % | -11.5 | % | -37.3 | % | 9.0 | % | 0.2 | % | -10.9 | % | 7.1 | % | -109.0 | % | -83.4 | % | ||||||||||||||||||||||
| EBITDA + Stock Based Compensation/Revenues | -3.9 | % | -16.9 | % | 4.2 | % | 2.3 | % | -16.4 | % | 12.3 | % | 0.0 | % | -7.0 | % | 9.6 | % | -89.7 | % | -73.9 | % | ||||||||||||||||||||||
| EBITDA/Revenues | -6.9 | % | -33.9 | % | -12.6 | % | -32.3 | % | -50.1 | % | -7.4 | % | -5.9 | % | -17.1 | % | -4.9 | % | -136.1 | % | -111.8 | % | ||||||||||||||||||||||
| Depr. & Amort./Revenues | 3.0 | % | 15.6 | % | 9.2 | % | 20.8 | % | 12.7 | % | 16.4 | % | 6.1 | % | 6.2 | % | 12.0 | % | 27.0 | % | 28.4 | % | ||||||||||||||||||||||
| Depr. & Amort./Total Assets | 3.2 | % | 17.8 | % | 14.3 | % | 11.7 | % | 8.6 | % | 41.3 | % | 0.4 | % | 5.9 | % | 11.8 | % | 7.5 | % | 25.1 | % | ||||||||||||||||||||||
| Net Income/Revenues | -6.9 | % | -38.4 | % | -15.0 | % | -30.9 | % | -49.7 | % | -24.2 | % | -8.5 | % | -19.5 | % | -5.3 | % | -131.6 | % | -116.2 | % | ||||||||||||||||||||||
| Net Income/Equity | -12.6 | % | -161.2 | % | -90.8 | % | -19.9 | % | -127.2 | % | -93.3 | % | -0.6 | % | -29.9 | % | -7.4 | % | -51.1 | % | -260.2 | % | ||||||||||||||||||||||
| Gross Cash Flow/Revenues | -4.0 | % | -22.8 | % | -5.8 | % | -10.1 | % | -37.0 | % | -7.8 | % | -2.4 | % | -13.3 | % | 6.7 | % | -104.5 | % | -87.7 | % | ||||||||||||||||||||||
| Long Term Debt/Equity | 0.0 | % | 0.3 | 0.5 | 0.0 | 0.0 | 0.2 | 0.1 | 0.0 | 0.1 | 0.0 | 0.0 | ||||||||||||||||||||||||||||||||
| Working Capital | -3.165 | 6.955 | -2.811 | 172,707 | -17,274 | 4.238 | 712,000 | 267,000 | 58,960 | 11,131 | 6,713 | |||||||||||||||||||||||||||||||||
| Working Cap/Revenues | -5.1 | % | 8.1 | % | -15.3 | % | 128.4 | % | -39.1 | % | 3.5 | % | 584.6 | % | 45.9 | % | 22.9 | % | 209.3 | % | 45.8 | % | ||||||||||||||||||||||
| Current Ratio | 0.9 | 1.2 | 0.6 | 7.7 | 0.6 | 1.5 | 8.9 | 2.3 | 3.0 | 3.4 | 1.9 | |||||||||||||||||||||||||||||||||
| Market Value of Invested Capital to: | ||||||||||||||||||||||||||||||||||||||||||||
| Revenues | 0.17 | 0.46 | 2.34 | 1.04 | 0.70 | 0.21 | 0.36 | 0.31 | 0.49 | 15.36 | 0.57 | |||||||||||||||||||||||||||||||||
| EBITDA | NM | NM | NM | NM | NM | 2.31 | 219.36 | NM | 6.86 | NM | NM | |||||||||||||||||||||||||||||||||
| EBITDA + Stock Based Competition | NM | NM | 55.64 | 44.32 | NM | 1.70 | 159.31 | NM | 5.08 | NM | NM | |||||||||||||||||||||||||||||||||
| EBIT | NM | NM | NM | NM | NM | NM | NM | NM | NM | NM | NM | |||||||||||||||||||||||||||||||||